Tethyan subducted slabs under India
14
ELSEVIER Earth and Planetary Science Letters 171 (1999) 7–20 www.elsevier.com/locate/epsl Tethyan subducted slabs under India Rob Van der Voo a,L , Wim Spakman b , Harmen Bijwaard b a Department of Geological Sciences, the University of Michigan, Ann Arbor, MI 48109-1063, USA b Vening Meinesz School ofGeodynamics, Institute of Earth Sciences, Utrecht University, Budapestlaan 4, 3584 CD Utrecht, Netherlands Received 5 January 1999; revised version received 1 June 1999; accepted 2 June 1999 Abstract Tomographic imaging of the mantle under Tibet, India and the adjacent Indian Ocean reveals several zones of relatively high P-wave velocities at various depths. Under the Hindu Kush region in northeastern Afghanistan and southern Tajikistan, a regional northward-dipping slab is seen in the entire upper 600 km of the mantle and is apparently still attached to the lithosphere of the Indian plate. Under northern Pakistan this same slab shows a roll-over structure with the deeper portion overturned and dipping southward, as can also be seen in the distribution of earthquake hypocenters. Farther east-southeast (e.g., in the vicinity of Nepal), a well-resolved anomaly below 450 km depth is connected to the slab under the Hindu Kush, but seems to be separated from the lithosphere above 350 km. These upper-mantle anomalies are interpreted as the remnants of delaminated sub-continental lithosphere that went down when Greater India continued to converge northward with Asia after ¾45 Ma. The deeper high-velocity anomalies under the Indian sub-continent appear clearly separated from the shallower ones as well as from each other, and are inferred to represent remnants of oceanic lithospheric slabs that have sunk into the lower mantle and were subsequently overridden by the Indian plate. They occur at depths between 1000 and 2300 km and occasionally descend down to the core–mantle boundary. The anomalies form three parallel WNW–ESE striking zones. We interpret the two southern zones as remnants of oceanic lithosphere that was subducted when the Neo-Tethys Ocean closed between India and Tibet in the Cretaceous and earliest Tertiary. The northern deep-mantle zone under northern Afghanistan, the Himalayas and the Lhasa block in southern Tibet may represent the last-subducted remnant of the Paleo-Tethys Ocean, which is thought to have closed before the Hauterivian stage of the Early Cretaceous. The middle zone continues southeastward as a rather straight high-velocity zone towards Sumatra, where it becomes convex southward and parallel to the subduction zone under the Sunda arc. Comparison of this straight middle zone near India with the shallower (upper 600–1000 km) northern zone, which displays a cusp-like shape near the Yunnan (SW China) Syntaxis of the eastern Himalayas, supports the notion that the shallow northern zone represents later subduction than the deeper middle zone. The suggestion of a counterclockwise rotation (>20º) of the Indian plate during Tertiary indentation of Asia is supported by these features. The present-day latitudes of 5º–35ºN of the deep slabs under India and adjacent areas correspond to the approximate paleolatitudes of the Cretaceous subduction zones. The slab remnants in the middle mantle occur therefore near the ancient locations where they started their downward journey, which implies that lateral movements in the deeper mantle were not large. 1999 Elsevier Science B.V. All rights reserved. Keywords: Tethys; tomography; India; subduction; slabs L Corresponding author. Tel.: C1-313-764-8322; Fax: C1-313-763-4690; E-mail: [email protected] 0012-821X/99/$ – see front matter 1999 Elsevier Science B.V. All rights reserved. PII:S0012-821X(99)00131-4
Transcript of Tethyan subducted slabs under India

ELSEVIER Earth and Planetary Science Letters 171 (1999) 7–20www.elsevier.com/locate/epsl
Tethyan subducted slabs under India
Rob Van der Voo a,Ł, Wim Spakman b, Harmen Bijwaard b
a Department of Geological Sciences, the University of Michigan, Ann Arbor, MI 48109-1063, USAb Vening Meinesz School of Geodynamics, Institute of Earth Sciences, Utrecht University, Budapestlaan 4, 3584 CD Utrecht, Netherlands
Received 5 January 1999; revised version received 1 June 1999; accepted 2 June 1999
Abstract
Tomographic imaging of the mantle under Tibet, India and the adjacent Indian Ocean reveals several zones of relativelyhigh P-wave velocities at various depths. Under the Hindu Kush region in northeastern Afghanistan and southern Tajikistan,a regional northward-dipping slab is seen in the entire upper 600 km of the mantle and is apparently still attached to thelithosphere of the Indian plate. Under northern Pakistan this same slab shows a roll-over structure with the deeper portionoverturned and dipping southward, as can also be seen in the distribution of earthquake hypocenters. Farther east-southeast(e.g., in the vicinity of Nepal), a well-resolved anomaly below 450 km depth is connected to the slab under the HinduKush, but seems to be separated from the lithosphere above 350 km. These upper-mantle anomalies are interpreted as theremnants of delaminated sub-continental lithosphere that went down when Greater India continued to converge northwardwith Asia after ¾45 Ma. The deeper high-velocity anomalies under the Indian sub-continent appear clearly separated fromthe shallower ones as well as from each other, and are inferred to represent remnants of oceanic lithospheric slabs thathave sunk into the lower mantle and were subsequently overridden by the Indian plate. They occur at depths between 1000and 2300 km and occasionally descend down to the core–mantle boundary. The anomalies form three parallel WNW–ESEstriking zones. We interpret the two southern zones as remnants of oceanic lithosphere that was subducted when theNeo-Tethys Ocean closed between India and Tibet in the Cretaceous and earliest Tertiary. The northern deep-mantle zoneunder northern Afghanistan, the Himalayas and the Lhasa block in southern Tibet may represent the last-subducted remnantof the Paleo-Tethys Ocean, which is thought to have closed before the Hauterivian stage of the Early Cretaceous. Themiddle zone continues southeastward as a rather straight high-velocity zone towards Sumatra, where it becomes convexsouthward and parallel to the subduction zone under the Sunda arc. Comparison of this straight middle zone near Indiawith the shallower (upper 600–1000 km) northern zone, which displays a cusp-like shape near the Yunnan (SW China)Syntaxis of the eastern Himalayas, supports the notion that the shallow northern zone represents later subduction than thedeeper middle zone. The suggestion of a counterclockwise rotation (>20º) of the Indian plate during Tertiary indentationof Asia is supported by these features. The present-day latitudes of 5º–35ºN of the deep slabs under India and adjacentareas correspond to the approximate paleolatitudes of the Cretaceous subduction zones. The slab remnants in the middlemantle occur therefore near the ancient locations where they started their downward journey, which implies that lateralmovements in the deeper mantle were not large. 1999 Elsevier Science B.V. All rights reserved.
Keywords: Tethys; tomography; India; subduction; slabs
Ł Corresponding author. Tel.: C1-313-764-8322; Fax: C1-313-763-4690; E-mail: [email protected]
0012-821X/99/$ – see front matter 1999 Elsevier Science B.V. All rights reserved.PII: S 0 0 1 2 - 8 2 1 X ( 9 9 ) 0 0 1 3 1 - 4

8 R. Van der Voo et al. / Earth and Planetary Science Letters 171 (1999) 7–20
1. Introduction
Asia is an amalgamation of continental elementsthat assembled mostly in the Mesozoic [1], with oneof the latest arrivals occurring when the Indian sub-continent began to collide with Tibet in the EarlyTertiary (¾65–50 Ma [2–6]), initiating the forma-tion of the Himalayas and the Tibetan Plateau. Itis generally accepted that the surface area of theIndian sub-continent is much smaller today than itused to be before collision, and that ‘Greater In-dia’ extended some 1000 km or more farther northbeyond the present-day Himalayan mountain front[7]. Two different proposals for the extent of GreaterIndia [2,8] are illustrated in Figs. 1 and 2. The crustof the missing, underthrust part of Greater India ispresumably buried today somewhere within the Ti-betan lithosphere [9–11]. Underthrusting most likelyoccurred below one of the major decollement zonesin the Himalayas (e.g., the Main Central Thrust).
The Tibetan Plateau consists of the Qiangtangblock in the north and the Lhasa block in the south,which joined the growing Asian continent in the Tri-assic and latest Jurassic–earliest Cretaceous, respec-tively [1,12,13]. The Qiangtang and Lhasa blocksformed part of the Cimmerian continental array [14]that separated from Gondwana and swept northwardin the earlier half of the Mesozoic. This motion wasaccompanied by the disappearance through subduc-tion of older (Paleo- and Meso-) Tethys Oceaniclithosphere, while the Neo-Tethys Ocean opened tothe south of these blocks. Various parts of Turkey,Iran, and Indochina also formed part of the Cimme-rian continent [14]. By Late Jurassic time, a smallremnant of the older (Paleo- or Meso-) Tethys stillexisted (Fig. 1). Even though the earlier history ofthe Paleo-Tethys is depicted in very different fash-ions by different authors, there is general agreementthat this basin closed during Early Cretaceous times[1,15].
Before the Cretaceous, the Neo-Tethys Oceanstretched in a north–south sense from India’s north-ern (passive) margin, when it was still a part ofGondwana, all the way to the Asian margin insouthern Tibet (Fig. 1). During the Cretaceous, theNeo-Tethys gradually disappeared by northward sub-duction (Fig. 2), resulting in the India–Asia collisionin the earliest Tertiary [1]. The original (Late Juras-
AFRICA
AUSTRALIA
NEO - TETHYS
MESO-TETHYS
PALEO- OR
HELMAND-LHASA BLOCK
30O
-30O
0O
30O
-30O
EURASIA
0O
INDIA
Fig. 1. Late Jurassic (Kimmeridgian–Tithonian, ¾150 Ma) pale-ogeographic map showing the extent of the Neo-Tethys Oceanbetween India and the Lhasa block, as well as the last rem-nant of the Paleo-Tethys Ocean between the Asian mainland andthe Lhasa and Helmand (Afghanistan) blocks. The Paleo-Tethysremnant is sometimes called ‘Meso-Tethys’ [1]. Double linesrepresent mid-ocean ridges and heavy single lines represent sub-duction zones with teeth in the upper plate. The approximaterelative positions of the major continents is taken from Scoteseand Golonka [2] with permission of the authors, whereas theposition of the Helmand–Lhasa block is transposed from Sengorand Natal’in [1], also with the permission of the authors and ofCambridge University Press. The paleolatitudes of the Helmand–Lhasa and northern Tibetan blocks, and the Paleo-Tethys Basinare rather uncertain at this time. The shape of Greater India de-picted here (dark shading) is from Sahabi [57] as used by Matteet al. [8] and Mattauer et al. [46].
sic) width of the Neo-Tethys is estimated as largeas about 60º ([2]) or as small as about 35º [6,15].The difference between these estimates arises not somuch from uncertainties in India’s paleolatitude, butinstead from the variably estimated paleolatitudes ofthe Tibetan margin of Asia [6,15,16]. As can be seenin Figs. 1 and 2, the extent of Greater India alsoplays a role, of course. Because Jurassic–Cretaceoussea-floor spreading likely occurred within the Neo-Tethys, we expect that at least 4000 km, and perhapsas much as 7000 km, of Neo-Tethyan oceanic litho-sphere has gone down into the mantle during theCretaceous to earliest Tertiary. Remnants of materialderived from this much subducted oceanic litho-

R. Van der Voo et al. / Earth and Planetary Science Letters 171 (1999) 7–20 9
INDIA
AFRICA
EURASIA
NEO-TETHYS
AUSTRALIA
?
-30O-30O
0O 0O
30O30O
GreaterIndia
Fig. 2. Late Cretaceous (¾94 Ma) paleogeographic map showingthe extent of the Neo-Tethyan Ocean at that time. Continen-tal and ridge positions are taken from Scotese and Golonka[2] with permission of the authors. Double lines represent mid-ocean ridges and heavy single lines represent subduction zoneswith teeth in the upper plate. Dual northward subduction zonesare shown, one north of India [15,21–25], and the other atthe Tibetan–Asian margin. The shape of Greater India is fromScotese and Golonka [2].
sphere (herein simply called ‘slabs’), of late Meso-zoic age, should still be visible with tomographictechniques [17–19]. It has recently been shown, forinstance, that slab remnants of Jurassic age are stillvisible in the deep mantle under Siberia [20]. In thispaper, we examine the nature of the deep-mantleanomalies under India and its vicinity. The broaderarea of interest and the deeper-mantle anomalies re-ported on in this paper (I, II and III) are outlined inFig. 3.
Fig. 2 shows in fact two northward subductionzones in the Neo-Tethys, both active during the mid-dle to Late Cretaceous. The northern zone is foundat the Tibetan margin of Eurasia. The southern zonefringes the Arabian margin of Africa, where it ledto obduction of the Oman ophiolites according toSengor and Natal’in [1] and Scotese and Golonka[2]. These authors do not show this subduction zoneas continuing from near Arabia towards the south-east, but others [15,21,22] have extended it eastwardin front of the northward drifting Indian subconti-nent, as illustrated here in Fig. 2. This intra-Tethyan
subduction zone would imply the presence of intra-oceanic thrusting, an island arc, and obduction, forwhich there is some [23–25], but not widespread,evidence. As we will see later, a southern zone ofdeeper-mantle anomalies (III in Fig. 3) is indeedfound, lending support to this extension.
2. Tomographic results
2.1. Methods
Significant improvements in tomographic tech-niques and data quality in the last few years havemade it possible to image deep fossil slabs with in-creasing resolution. Whereas in earlier global-mantlestudies the sizes of the cells ranged from ¾10º [26]to¾5º [27–29], recent global parameterizations haveemployed cells between 2º and 0.6º [17,19,30]. Inour study area regional tomography has revealedsmall-scale structure, but generally only in the uppermantle (e.g., [31–34]).
In the global study [19] that contributed the to-mographic model on which the interpretations of thispaper are based, some 4.7 million narrow compos-ite ray bundles [35] have been combined from P,pP and pwP phases from 82,000 well-constrainedearthquakes. These phases constitute the major partof the reprocessed global travel-time data set ofEngdahl et al. [36], and are inverted to estimatethe P-wave speed variations with respect to Earthreference model ak135 [37]. Variably sized cellswere chosen to minimize the difference in cell hitcount between adjacent cells [38]. In the well sam-pled regions of the upper mantle the irregular cellsare generally traversed by an average of some 500composite rays. Exceptions occur in low-ray densityregions in the upper mantle under the major oceans,such as the Pacific. Similarly, such irregular cells inthe lower mantle are traversed by about 1000 com-posite rays. This effectively limits the minimum cellsize in the lower mantle to about 100–200 km inthickness and >100 km extent laterally (e.g., 1.8ºnear the core–mantle boundary), whereas in the up-per-mantle cells can be as small as 0.6º in width and35 km in thickness.
Model variance has been estimated by so-calledpermuted data tests [19,39] in which the actual

10 R. Van der Voo et al. / Earth and Planetary Science Letters 171 (1999) 7–20
T ibet
India
Indian Ocean
China
IranTurkey
SaudiArabia
Indonesia
A
P
N B My
M
TY
SD
PHK
Sunda Arc
MBT
[10S, 90E]
[50 N
, 20 E]
b
a
Fig. 3. Geographic location map (a) and locations of the three (I, II and III) approximately parallel deeper-mantle high P-wave velocityanomalies (b), for the broader area discussed in this paper. The map corresponds to the tomographic maps of Fig. 5c–h at the same scale.The latitude–longitude frame (10º intervals) is defined at two points (solid dots). The contours of the high-velocity zones I, II and III aretaken from the tomographic results at 1325 km depth (Fig. 5e), and are solid where the anomalies are pronounced and dashed where lesspronounced. A D Afghanistan, B D Bangladesh, D D Deccan Traps in western India, M D Malaysia, MBT D the Main Boundary Thrustof the Himalayas, which occurs slightly to the south of the plate boundary (dashed line) in the Himalayas, My D Myanmar (Burma), N DNepal, P D Pakistan, PHK D Pamir–Hindu Kush, S D Sumatra, T D Tajikistan, Y D Yunnan Syntaxis.
travel-time residuals are randomly permuted to ren-der noise vectors for inversion. These permuted datacan be considered pure noise with the same bulkstatistics as the actual data. These tests show [19]that the estimated errors (upper limits) are generallymuch smaller than the anomaly amplitudes through-out the model. Spatial resolution is estimated with‘spike tests’ [19,35] and tests using the shapes andamplitudes of the images obtained from actual data,while selectively removing a set of layers at specific
depth intervals. Such ‘layer-cake’ models are partic-ularly designed to investigate vertical smearing ofheterogeneity (see Bijwaard et al. [19]).
2.2. P-wave velocity anomalies; the upper 1000 km
Figs. 4 and 5 show cross-sections and map viewsat various mantle depths under India and its vicinity.The thin red line in the maps of these figures canbe compared to the dashed (plate boundary) lines
R. Van der Voo et al. / Earth and Planetary Science Letters 171 (1999) 7–20 11
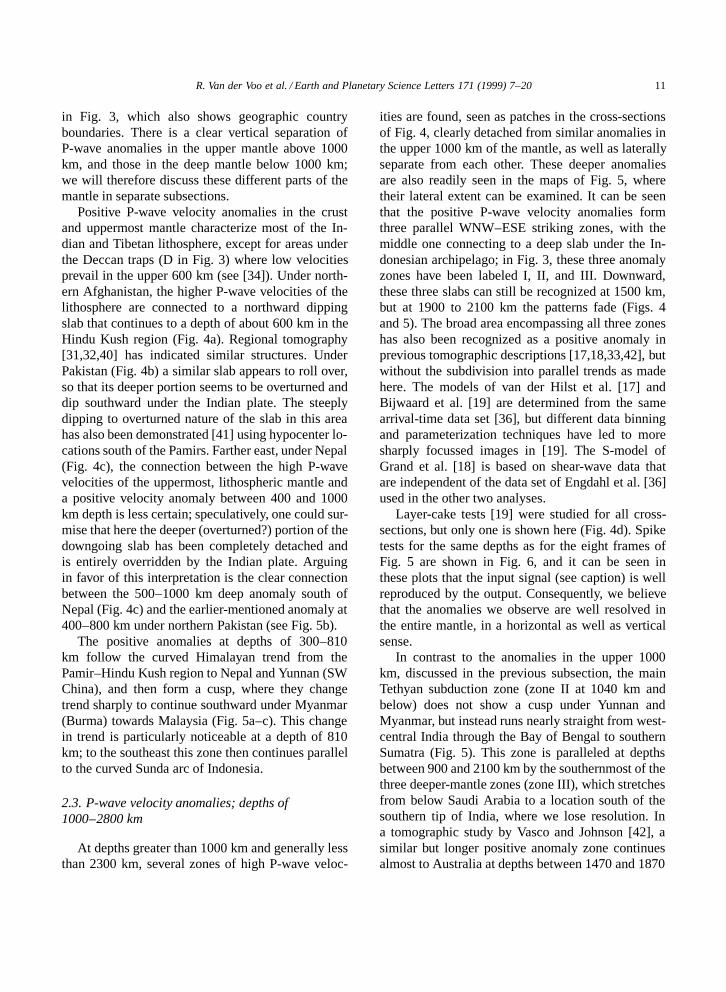
in Fig. 3, which also shows geographic countryboundaries. There is a clear vertical separation ofP-wave anomalies in the upper mantle above 1000km, and those in the deep mantle below 1000 km;we will therefore discuss these different parts of themantle in separate subsections.
Positive P-wave velocity anomalies in the crustand uppermost mantle characterize most of the In-dian and Tibetan lithosphere, except for areas underthe Deccan traps (D in Fig. 3) where low velocitiesprevail in the upper 600 km (see [34]). Under north-ern Afghanistan, the higher P-wave velocities of thelithosphere are connected to a northward dippingslab that continues to a depth of about 600 km in theHindu Kush region (Fig. 4a). Regional tomography[31,32,40] has indicated similar structures. UnderPakistan (Fig. 4b) a similar slab appears to roll over,so that its deeper portion seems to be overturned anddip southward under the Indian plate. The steeplydipping to overturned nature of the slab in this areahas also been demonstrated [41] using hypocenter lo-cations south of the Pamirs. Farther east, under Nepal(Fig. 4c), the connection between the high P-wavevelocities of the uppermost, lithospheric mantle anda positive velocity anomaly between 400 and 1000km depth is less certain; speculatively, one could sur-mise that here the deeper (overturned?) portion of thedowngoing slab has been completely detached andis entirely overridden by the Indian plate. Arguingin favor of this interpretation is the clear connectionbetween the 500–1000 km deep anomaly south ofNepal (Fig. 4c) and the earlier-mentioned anomaly at400–800 km under northern Pakistan (see Fig. 5b).
The positive anomalies at depths of 300–810km follow the curved Himalayan trend from thePamir–Hindu Kush region to Nepal and Yunnan (SWChina), and then form a cusp, where they changetrend sharply to continue southward under Myanmar(Burma) towards Malaysia (Fig. 5a–c). This changein trend is particularly noticeable at a depth of 810km; to the southeast this zone then continues parallelto the curved Sunda arc of Indonesia.
2.3. P-wave velocity anomalies; depths of1000–2800 km
At depths greater than 1000 km and generally lessthan 2300 km, several zones of high P-wave veloc-
ities are found, seen as patches in the cross-sectionsof Fig. 4, clearly detached from similar anomalies inthe upper 1000 km of the mantle, as well as laterallyseparate from each other. These deeper anomaliesare also readily seen in the maps of Fig. 5, wheretheir lateral extent can be examined. It can be seenthat the positive P-wave velocity anomalies formthree parallel WNW–ESE striking zones, with themiddle one connecting to a deep slab under the In-donesian archipelago; in Fig. 3, these three anomalyzones have been labeled I, II, and III. Downward,these three slabs can still be recognized at 1500 km,but at 1900 to 2100 km the patterns fade (Figs. 4and 5). The broad area encompassing all three zoneshas also been recognized as a positive anomaly inprevious tomographic descriptions [17,18,33,42], butwithout the subdivision into parallel trends as madehere. The models of van der Hilst et al. [17] andBijwaard et al. [19] are determined from the samearrival-time data set [36], but different data binningand parameterization techniques have led to moresharply focussed images in [19]. The S-model ofGrand et al. [18] is based on shear-wave data thatare independent of the data set of Engdahl et al. [36]used in the other two analyses.
Layer-cake tests [19] were studied for all cross-sections, but only one is shown here (Fig. 4d). Spiketests for the same depths as for the eight frames ofFig. 5 are shown in Fig. 6, and it can be seen inthese plots that the input signal (see caption) is wellreproduced by the output. Consequently, we believethat the anomalies we observe are well resolved inthe entire mantle, in a horizontal as well as verticalsense.
In contrast to the anomalies in the upper 1000km, discussed in the previous subsection, the mainTethyan subduction zone (zone II at 1040 km andbelow) does not show a cusp under Yunnan andMyanmar, but instead runs nearly straight from west-central India through the Bay of Bengal to southernSumatra (Fig. 5). This zone is paralleled at depthsbetween 900 and 2100 km by the southernmost of thethree deeper-mantle zones (zone III), which stretchesfrom below Saudi Arabia to a location south of thesouthern tip of India, where we lose resolution. Ina tomographic study by Vasco and Johnson [42], asimilar but longer positive anomaly zone continuesalmost to Australia at depths between 1470 and 1870

12 R. Van der Voo et al. / Earth and Planetary Science Letters 171 (1999) 7–20
Fig. 4. Tomographic results displayed in three vertical sections (a–c) along the lines indicated in the maps, showing the P-wave velocityanomalies under India and adjacent areas. Velocity anomalies are displayed in percentages with respect to the average P-wave velocityat depth from model ak135 [37]; note the scale of �0.5% to C0.5%, which is adapted to amplitudes of average lower-mantle structure.In the upper-mantle anomaly amplitudes up to 5% are imaged which are not well represented by this contouring scale. White dots

R. Van der Voo et al. / Earth and Planetary Science Letters 171 (1999) 7–20 13
Fig. 5. Tomographic P-wave velocity anomaly patterns in the deep mantle under India, for eight different depths (320, 628, 810, 1040,1325, 1500, 1900 and 2100 km). Velocity anomalies are displayed in percentages with respect to the average P-wave velocity at depthfrom model ak135 [37]. The map areas of the lower six frames (panels c–h) correspond to the geographic map of Fig. 3, whereas theareas of the top two frames (a and b) are enlarged to illustrate details of the upper-mantle anomalies under the Himalayas. The thin redlines are plate boundaries and correspond to the dashed lines of Fig. 3.
are earthquakes and the thin red lines in the maps are plate boundaries, which correspond to the dashed lines of Fig. 3. The bottom rightframe (d) depicts a slice through a layer-cake test, demonstrating that a simulated input of a whole-mantle layered model is resolved and(partially to completely) reproduced in the inversion analysis [19]. Input is shown by the thin lines (contours at C0.2%) and the outputby the colored areas.

14 R. Van der Voo et al. / Earth and Planetary Science Letters 171 (1999) 7–20
Fig. 6. Spike resolution tests [19] for our mantle volume of interest. For the depths of 350, 595, 860 and 1040 km (panels a–d) the ‘spike’size is 3º (about 300 km at these depths) and about 120 km in thickness. For the greater depths (panels e–h) the spike size is 6º (520 kmin panel (e) to 435 km in panel (h)) and spike thickness is 200 km. The exact synthetic spikes have amplitudes of C5% or �5% and theirshapes are outlined by the thin solid lines. The non-square character of some of the input-spikes is due to the model parameterizationwith irregular cells. The mantle region between the spikes has 0%-anomaly value. This void volume between spikes permits detectionof smearing effects between spikes in all directions. Synthetic data were generated from the global spike models by integration of thesynthetic slowness along the same ray paths as used in the real data experiment. A normal distributed error with standard deviation of0.5 s was added to the synthetic data prior to inversion. The color contouring depicts the inversion result. We have chosen contour limits

R. Van der Voo et al. / Earth and Planetary Science Letters 171 (1999) 7–20 15
km (P-wave results). One of the reasons they see agreater extent of the anomaly may be that they madeuse of more and different types of phase arrivalsthan just P and pP, which probably improved thedeep-mantle sampling in the Southern Hemisphere.
Whether the deep-mantle anomalies of zones Iand III continue below 2300 km (not shown on themaps, but visible in Fig. 4 to some extent, and alsoshown in [19]) is not clear, but zone II definitelyappears to terminate at about 2200 km depth. Forzone I, e.g., east of the Caspian and Aral Seas,there is a suggestion (Fig. 4a) that the anomaliescontinue to the core–mantle boundary (CMB). Ahigh-velocity anomaly also occurs near the CMBunder east- and north-central India (Fig. 4c), and islaterally separated from a very broad zone with highP-wave velocities at the same depths under north-ern and eastern China by a ¾400-km-wide, NW–SEstriking zone of average to negative P-wave velocityanomalies (see Bijwaard et al. [19], plate 1f). Thebroad lowermost-mantle area of high P-wave veloc-ities under China and Siberia has been interpretedas a graveyard of slabs resulting from the Meso-zoic amalgamation of eastern Asia [20,43] and fromwestward subduction of Pacific oceanic lithosphere[19,44].
3. Interpretation
There is little doubt that the broad trend ofhigh P-wave velocities in the deeper mantle underthe Mediterranean–Himalayan–Indonesian orogenicsystem (Fig. 3) represents slab remnants of Tethyanlithospheric material that was subducted in LateJurassic to earliest Tertiary times. These features arepart of the ‘Tethys anomaly’ of van der Hilst et al.[17] and Grand et al. [18]. But it is intriguing thatthis broad trend appears to be subdivided into threezones (I, II, and III), which are apparently separatefrom each other. As we will show below, however,
of š3% (60% of the input value) as a compromise between showing high-amplitude spike response and low-amplitude smearing effects.Imaged amplitudes in excess of the contouring limits are color coded with the first or last color of the contouring scale. For the majorityof the spikes the amplitudes returned from inversion are larger than 60% of the input value. Spatially the spikes correspond well to theirinput locations and severe smearing effects along possible dominant ray directions do not occur. We infer from this that the imagedmantle structures reported in this paper (Figs. 4 and 5) are sufficiently resolved for our purposes.
it is possible to provide an interpretation that canexplain why three separate and parallel deeper zonesare observed.
The interpretation of the deeper zones as fos-sil Tethyan slabs and their location under the Indiansub-continent and the adjacent Indian Ocean, suggestthat India has moved northward over these slabs sub-sequent to their sinking into the deeper mantle. Thisis easily explained by the fact that India underwentcontinued northward convergence towards Siberiaafter its initial collision with Tibet in the earliest Ter-tiary. While India continued to converge with Tibet,it underwent a counterclockwise rotation. Paleomag-netic data indicate that the amount of this rotationis about 20º since the early Tertiary with respect tothe rotation axis [9] and about 35º with respect toSiberia (calculated from table 7.6 in [45]), whereascontinued northward motion during the Tertiary wassome 2000 km or more. The roll-over structure ofthe upper-mantle slab under Pakistan (Fig. 4b) —but not under Afghanistan — and the apparently de-tached slab of (overturned?) lithosphere at 400–1000km depth under Nepal are suggestive of these rela-tive motions. It appears that India was ‘pinned’ in thevicinity of the Hindu Kush, while the more easterlyunderthrust component of Greater India underwentconsiderable continental subduction as the subconti-nent rotated. The notion that subducted lithosphereunder Tibet was originally sub-continental in naturewas highlighted in recent papers [8,46] in terms ofthe available geological evidence.
The rotation of India during indentation is alsodeduced by examining in Fig. 5 the cusp formedby the upper-mantle high-velocity zone parallelthe Himalayas towards Yunnan, and the approxi-mately north–south zone under Myanmar (Burma)and Malaysia. This cusp occurs in the anomalies atdepths shallower than 900 km, whereas the deepermiddle zone (II) between central India and Sumatraat depths >1000 km is straight. The angle betweenthe shallow Himalayan trend and the orientation

16 R. Van der Voo et al. / Earth and Planetary Science Letters 171 (1999) 7–20
of the deeper zone II is about 30º, which com-pares well with the paleomagnetically determinedTertiary rotation angle of India. The different lo-cations suggest that later northward indentation bythe northeastern Indian region (e.g., the ShillongPlateau, east-northeast of Bangladesh, B in Fig. 3)occurred well after earlier subduction of Jurassic–Cretaceous Neo-Tethys oceanic lithosphere. This isagain in agreement with the suggestion that theIndian plate rotated counterclockwise during its pro-tracted Tertiary collision with Tibet. It also indicatesthat the shallow northern slab remnants are muchyounger — or, to be more precise, were subductedlater — than the material of the deeper middle zone(II), because the indentation and rotation of the In-dian sub-continent occurred during the later Tertiary.This, in turn, implies that the shallow northern slabsank into the upper mantle well after the initial col-lision of Greater India with Tibet at about 60–50Ma. Although it is clearly impossible to infer theage or the ancient geological setting of slab rem-nants from tomographic images, we speculate thatthe upper-mantle slab found under the Himalayasconsists of delaminated sub-continental lithosphericmantle that became detached from the underthrustGreater Indian crust that is now presumably locatedsomewhere within the Tibetan lithosphere [10,11].The former north–south extent of the subductedlithospheric–mantle material can be estimated fromthe cross-sections (Fig. 4) as about 1000 km, whichis consistent with the estimated extent of the missingsub-continental lithospheric part of Greater India.
The paleolatitudes of the Tibetan margin of theNeo-Tethys in Cretaceous and earliest Tertiary timesare provided by paleomagnetic data as between 0ºand 25ºN [6,15,16,47–50] (see also Fig. 2 and [45]).These paleolatitudes are on average slightly to thesouth of the present-day location of the middle deep-mantle slab (zone II) at the longitude of centralIndia. Given a likely northward dip of the subductionzone under Tibet, this indicates that slab remnant IIis found approximately under the ancient positionwhere it sank below the transition zone. This impliesthat lateral movements in the deeper mantle were notlarge and that the slab sank more or less verticallyinto the deeper mantle.
Our explanation for the deeper zones I and IIIinvokes the two other Mesozoic subduction zones
shown in Figs. 1 and 2, with our proposed evolutionof the total of three roughly parallel subduction zonesbeing illustrated in the cartoon of Fig. 7. The deepernorthern zone (I) in the middle mantle is found underTajikistan, northern Afghanistan, Tibet and the Hi-malayas at depths of ¾1000–1900 km (and, locally,down to the core–mantle boundary). It appears tobe vertical under the Hindu Kush and Pamirs andshows a southward dip under Nepal and adjacentTibet (Fig. 4c). If, as argued above, zone II is themain remnant of Neo-Tethyan oceanic lithosphere,subsequently overridden by the Indian sub-continent,then this northern deeper high-velocity anomaly (I)can be attributed to the subduction zone shown inFig. 1 to the north of the Lhasa block. The oceanthat disappeared in that location between the Lhasablock and the Qiangtang margin of mainland Asiaduring the Late Jurassic–earliest Cretaceous was thelast remnant of Paleo-Tethys [13], sometimes alsocalled Meso-Tethys (by Shvolman and also Belov, asquoted in Sengor and Natal’in [1]). Its former east–west extent (Fig. 1), including the part to the northof the Helmand block in Afghanistan, as well as itsestimated Jurassic north–south width, roughly matchthe horizontal as well as vertical dimensions of thenorthern high-velocity anomaly in the middle mantle(see zone I as depicted in Fig. 3). Although Sengorand Natal’in [1] show this subduction occurring witha southward dip under the Lhasa block, almost everyother depiction of this subduction zone is with a dipto the north [15,21,51,52]. We have therefore alsoshown this subduction as northward in Figs. 1 and7, dipping under the Qiangtang (north Tibet) block.From the tomographic results, we cannot determinethe sense of subduction with certainty.
The third, deeper-mantle zone of high-velocityanomalies is the southernmost one (zone III inFigs. 3 and 7), stretching from the eastern Mediter-ranean, through the mantle under Saudi Arabia, tosouth of the southern tip of India, or perhaps evenfurther according to the model of Vasco and Johnson[42]. We admit that our interpretation of this zone isthe most speculative among all anomalies, as thereare no indications of the age of the remnants or theirformer position in the general Tethys configuration.It appears, however, that if there was indeed north-ward intra-Tethyan subduction to the north of Arabiaas well as India (Fig. 2 [15,21–25]), then it may

R. Van der Voo et al. / Earth and Planetary Science Letters 171 (1999) 7–20 17
Fig. 7. Cartoon depicting the evolution of Mesozoic Tethyan subduction zones (I, II and III) and the Tertiary lithospheric delaminationduring the India–Asia collision and continued north–south convergence (zone IV), next to a summary diagram of our tomographic results(based on a combination of Fig. 4a and b, with deep-mantle anomalies dashed where less well established). The evolutionary scenariois based on a figure from ‘The Behavior of the Earth’ by Claude Allegre [21], Copyright 1988 by Claude Allegre and reprinted bypermission of Harvard University Press. The existence of subduction zone III in the Late Cretaceous is inferred from evidence for mid-to Late Cretaceous intra-oceanic subduction and ophiolite obduction onto the northern margins of Arabia and India [15,21–25].
well be that this intra-oceanic subduction zone wasresponsible for the southern deeper-mantle anomalyzone (zone III, Fig. 7). The depth and location of thisanomaly match expectations of the timing of subduc-tion (middle to Late Cretaceous [15,21,22]) and itspaleolatitude (near-equatorial, compare Figs. 2 and3). Thus we can infer from the locations of zonesII and III, as well as those of other anomalies un-der Asia (e.g., Siberia [20]) that Eurasia has movedvery little with respect to the deep mantle since theJurassic.
The depth of the upper portions of the threedeeper-mantle slabs (Fig. 7, right-hand side) allowsus to estimate an average sinking rate, if we knowthe approximate timing when subduction ceased. Forzone I, this cessation is thought to have occurred atabout 130 Ma [1], for zone II at 65–55 Ma, whereas
for zone III this may have been at about 85–70 Ma.If our interpretation is correct, these dates indicatean average sinking rate of 1–2 cm=yr, which iscomparable to estimates for the slabs under theAmericas [53] and under Siberia [20] and somewhatless than the 3 cm=yr calculated by Ricard et al. [54].
An estimate of the total volume of subductedmaterial that our tomographic images allow us toidentify as Neo- and Paleo-Tethyan oceanic litho-sphere is, of necessity, very imprecise. The threedeeper-mantle zones collectively appear to repre-sent about 3200 km in an original north–south (butnow nearly vertical) dimension, but the extent towhich the material has been thickened from its orig-inal lithospheric plate thickness is very uncertain. Aproper interpretation also depends on whether the ve-locity anomalies represent the effects of temperature,

18 R. Van der Voo et al. / Earth and Planetary Science Letters 171 (1999) 7–20
pressure, chemical composition or a combinationthereof. The deeper-mantle anomalies have horizon-tal widths of up to 900 km, as also observed underthe Americas [53], which is much greater than typi-cal lithospheric thickness near the surface and couldimply thickening. Whatever the case may be, theoverall dimensions of the deeper anomalies (Figs. 4and 7) very tentatively suggest a factor of at least 2.5for this thickening; note that Lithgow-Bertelloni andRichards [55] argue that their data best fit a thicken-ing (or ‘slowing-down’) factor of 4. If the factor 2.5(or greater) is correct, this would imply that morethan 8000 km (in a north–south sense) of Tethyanlithospheric remnants are seen in the mantle, whichis close to our upper estimate (¾7000 km) for theoriginal (Jurassic–Cretaceous) extent of the oceanbasins to the north of India.
4. Conclusions
We conclude that each of the high P-wave veloc-ity anomalies in the mantle under India and adjacentareas can be interpreted as fossil slabs due to sub-duction of Tethyan oceanic lithosphere, or — asin the case of the upper mantle — delaminatedsub-continental Indian lithosphere. Combined withearlier interpretations of slabs in the deep mantleunder Asia [17,20], this confirms that interpretationof tomographic results is a fruitful tool for paleo-geographers. Our observation of the southernmost ofthe three deeper fossil slabs (zone III), for instance,supports the idea that an intra-Neo-Tethys subduc-tion zone existed to the north of India during theCretaceous.
The collective horizontal and vertical extent ofthe high-velocity anomalies under India suggeststhat some 7000 km of oceanic lithosphere is repre-sented. Previous estimates of the north–south extentof Jurassic–Cretaceous Tethyan ocean between Indiaand northern Tibet (Qiangtang) have ranged from¾4000 to ¾7000 km. The deep slabs occur mostlybetween 1000 and 2300 km, but are occasionallyseen to reach the core–mantle boundary, which isof importance for discussions about lower-mantlecompositional stratification [56].
The upper-mantle P-wave velocity anomalieshave a cusp-like form, sharply changing their trend
near the Yunnan Syntaxis from east–west underthe Himalayas to north–south under Burma. Thiscontrasts with the straight NW–SE trend of thedeeper-mantle fossil slab (zone II) between India andSumatra across the Bay of Bengal. The differencebetween these trends, and the apparent occurrence ofa roll-over structure of the delaminated former sub-continental Indian lithosphere under the Himalayas,support the model of continued northward conver-gence and indentation by northeastern India oversome 2000 km or more, after initial earliest Tertiarycollision. During this continued convergence, Indiarotated counterclockwise over an angle between 20ºand 35º, having been pinned near the Pamirs, while itunderthrust and indented progressively more towardsthe east, thereby producing the Yunnan Syntaxis.
Acknowledgements
We thank Rinus Wortel, Peter van Keken,Phillippe Matte and Stephane Guillot for valuablediscussions. RVdV thanks the Institute of Earth Sci-ences and the Paleomagnetic Laboratory Fort Hoofd-dijk of the University of Utrecht for the hospital-ity extended to him during his 1997–1998 sabbati-cal year. Constructive reviews by Chris Klootwijk,Jean Besse and Steve Grand helped to improvethe manuscript. HB was financially supported bythe Netherlands Organization for Scientific Research(NWO). Partial financial support was provided bythe National Science Foundation, Division of EarthSciences, grants EAR 97-05755 and EAR 95-08316.[FA]
References
[1] A.M.C. Sengor, B.A. Natal’in, Paleotectonics of Asia: frag-ments of a synthesis, in: A. Yin, M. Harrison (Eds.), TheTectonic Evolution of Asia, Cambridge Univ. Press, Cam-bridge, 1996, pp. 486–640.
[2] C.R. Scotese, J. Golonka, Paleomap Paleogeographic Atlas,Paleomap Project, Univ. Texas, Arlington, 1992, 33 pp.
[3] D.B. Rowley, Age of initiation of collision between Indiaand Asia: a review of stratigraphic data, Earth Planet. Sci.Lett. 145 (1996) 1–13.
[4] T.-Y. Lee, L.A. Lawver, Cenozoic plate reconstruction ofSoutheast Asia, Tectonophysics 251 (1995) 85–138.
[5] Ph. Patriat, J. Achache, India–Eurasia collision chronology
R. Van der Voo et al. / Earth and Planetary Science Letters 171 (1999) 7–20 19
has implications for crustal shortening and driving mecha-nism of plates, Nature 311 (1984) 615–621.
[6] C.T. Klootwijk, J.S. Gee, H.W. Peirce, G.M. Smith, P.L.McFadden, An early India–Asia contact: paleomagneticconstraints from Ninetyeast Ridge, ODP Leg 121, Geology20 (1992) 395–398.
[7] J.J. Veevers, C.McA. Powell, B.D. Johnson, Greater India’splace in Gondwanaland and in Asia, Earth Planet. Sci. Lett.27 (1975) 383–387.
[8] Ph. Matte, M. Mattauer, J.M. Olivet, D.A. Griot, Continen-tal subduction beneath Tibet and the Himalayan orogeny: areview, Terra Nova 9 (1997) 264–270.
[9] C.T. Klootwijk, P.J. Conaghan, C.McA. Powell, The Hi-malayan arc: large-scale continental subduction, oroclinalbending and back-arc spreading, Earth Planet. Sci. Lett. 75(1985) 167–183.
[10] W.-L. Zhao, W.J. Morgan, Injection of Indian crust intoTibetan lower crust: a two-dimensional finite element modelstudy, Tectonics 6 (1987) 489–504.
[11] K.O. Nelson, W. Zhao, L.D. Brown et al., Partially moltenmiddle crust beneath southern Tibet: synthesis of projectINDEPTH results, Science 274 (1996) 1684–1687.
[12] J.F. Dewey, R.M. Shackleton, C. Chang, Y. Sun, The tec-tonic evolution of the Tibetan Plateau, Philos. Trans. R.Soc. London A 327 (1988) 379–413.
[13] J. Dercourt, L.E. Ricou, B. Vrielynck, Atlas of TethysPalaeoenvironmental Maps, 14 maps, 1 pl., Gauthier-Vil-lars, Paris, 1993, 307 pp.
[14] A.M.C. Sengor, The Cimmeride orogenic system and thetectonics of Eurasia, Geol. Soc. Am. Spec. Pap. 195, 1984,88 pp.
[15] J. Besse, V. Courtillot, Paleogeographic maps of the conti-nents bordering the Indian Ocean since the Early Jurassic,J. Geophys. Res. 93 (1988) 11791–11808.
[16] A. Patzelt, H. Li, J. Wang, E. Appel, Paleomagnetismof Cretaceous to Tertiary sediments from Southern Tibet:evidence for the extent of the northern margin of India priorto the collision with Eurasia, Tectonophysics 259 (1996)259–284.
[17] R.D. van der Hilst, S. Widiyantoro, E.R. Engdahl, Evidencefor deep-mantle circulation from global tomography, Nature386 (1997) 578–584.
[18] S.P. Grand, R.D. van der Hilst, S. Widiyantoro, Globalseismic tomography: a snapshot of convection in the Earth,GSA Today 7 (1997) 1–7.
[19] H. Bijwaard, W. Spakman, E.R. Engdahl, Closing the gapbetween regional and global travel time tomography, J.Geophys. Res. 103 (1998) 30055–30078.
[20] R. Van der Voo, W. Spakman, H. Bijwaard, A Mesozoicsubducted slab under Siberia, Nature 397 (1999) 246–249.
[21] C. Allegre, The behavior of the Earth, Harvard UniversityPress, Cambridge, MA, 1988, 272 pp.
[22] R.A. Beck, D.W. Burbank, W.J. Sercombe, A.M. Khan,R.D. Lawrence, Late Cretaceous ophiolite obduction andPaleocene India–Asia collision in the westernmost Hi-malaya, Geodin. Acta 9 (1996) 114–144.
[23] I. Reuber, Geometry of accretion and oceanic thrusting
of the Spontang Ophiolite, Ladakh–Himalaya, Nature 321(1986) 592–596.
[24] K. Honegger, P. Le Fort, G. Mascle, J.L. Zimmermann, Theblueschists along the Indus Suture Zone in Ladakh, NWHimalaya, J. Metamorph. Geol. 7 (1989) 57–72.
[25] M.P. Searle, R.I. Corfield, B. Stephenson, J. McCarron,Structure of the north Indian continental margin in theLadakh–Zanskar Himalayas: implications for the timing ofobduction of the Spontang ophiolite, India–Asia collisionand deformation events in the Himalaya, Geol. Mag. 134(1997) 297–316.
[26] M. Sengupta, M.N. Toksoz, Three-dimensional model ofseismic velocity variation in the Earth’s mantle, Geophys.Res. Lett. 3 (1976) 84–86.
[27] R.W. Clayton, R.P. Comer, A tomographic analysis of man-tle heterogeneities from body wave travel times, EOS 64(1983) 776.
[28] H. Inoue, Y. Fukao, K. Tanabe, Y. Ogota, Whole mantleP-wave travel time tomography, Phys. Earth Planet. Inter.59 (1990) 294–328.
[29] Y. Zhang, T. Tanimoto, High-resolution global upper mantlestructure and plate tectonics, J. Geophys. Res. 98 (1993)9793–9823.
[30] H. Zhou, A high resolution P-wave model for the top 1200km of the mantle, J. Geophys. Res. 101 (1996) 27791–27810.
[31] G. Mohan, S.S. Rai, Large-scale three-dimensional seismictomography of the Zagros and Pamir–Hindukush regions,Tectonophysics 242 (1995) 255–265.
[32] S.W. Roecker, Velocity structure of the Pamir–Hindu Kushregion: possible evidence of subducted crust, J. Geophys.Res. 87 (1982) 945–959.
[33] S. Widiyantoro, Studies of Seismic Tomography on Re-gional and Global Scale, Ph.D. thesis, Australian NationalUniversity, Canberra, 1997, 256 pp.
[34] B.L.N. Kennett, S. Widiyantoro, A low seismic wavespeedanomaly beneath northwestern India — a seismic signatureof the Deccan traps, Earth Planet. Sci. Lett. 165 (1999)145–156.
[35] W. Spakman, G. Nolet, Imaging algorithms, accuracy andresolution in delay time tomography, in: N.J. Vlaar, G. No-let, M.J.R. Wortel, S.A.P.L. Cloetingh (Eds.), MathematicalGeophysics: a Survey of Recent Developments in Seismol-ogy and Geodynamics, Reidel, Dordrecht, 1988, pp. 155–187.
[36] E.R. Engdahl, R.D. van der Hilst, R.P. Buland, Global tele-seismic earthquake relocation with improved travel timesand procedures for depth determination, Bull. Seismol. Soc.Am. 88 (1998) 722–743.
[37] B.L.N. Kennett, E.R. Engdahl, R. Buland, Constraints onseismic velocities in the Earth from traveltimes, Geophys.J. Int. 122 (1995) 108–124.
[38] W. Spakman, H. Bijwaard, Irregular cell parameterizationof tomographic problems, Ann. Geophys. 16 (1998) 28.
[39] W. Spakman, Delay-time tomography of the upper mantlebelow Europe, the Mediterranean, and Asia Minor, Geo-phys. J. Int. 107 (1991) 309–332.

20 R. Van der Voo et al. / Earth and Planetary Science Letters 171 (1999) 7–20
[40] R.J. Mellors, G.L. Pavlis, M.W. Hamburger, H.J. Al-Shukri,Evidence for a high-velocity slab associated with theHindu-Kush zone, J. Geophys. Res. 100 (1995) 4067–4078.
[41] G. Pegler, S. Das, An enhanced image of the Pamir–HinduKush seismic zone from relocated earthquake hypocenters,Geophys. J. Int. 134 (1998) 573–595.
[42] D.W. Vasco, L.R. Johnson, Whole Earth structure estimatedfrom seismic arrival times, J. Geophys. Res. 103 (1998)2633–2671.
[43] M.E. Wysession, Imaging cold rock at the base of themantle: the sometimes fate of slabs? in: G. Bebout, D.W.Scholl, S.H. Kirby, J.P. Platt (Eds.), Subduction: Top toBottom, Am. Geophys. Union Monogr. 96 (1996) 369–384.
[44] R.D. van der Hilst, R. Engdahl, W. Spakman, G. No-let, Tomographic imaging of subducted lithosphere belownorthwest Pacific island arcs, Nature 353 (1991) 37–43.
[45] R. van der Voo, Paleomagnetism of the Atlantic, Tethys andIapetus Ocean, Cambridge University Press, Cambridge,UK, 1993, 411 pp.
[46] M. Mattauer, Ph. Matte, J.-L. Olivet, A 3D model of theIndia–Asia collision at plate scale, C. R. Acad. Sci. Paris(Earth & Planet. Sci.) 328 (1999) 499–508.
[47] J.P. Pozzi, M. Westphal, J. Girardeau, J.P. Besse, Y.-X.Zhou, Paleomagnetism of the Xigaze ophiolite and flysch:latitude and direction of spreading, Earth Planet. Sci. Lett.70 (1984) 383–394.
[48] J. Besse, V. Courtillot, J.P. Pozzi, M. Westphal, Y.-X. Zhou,Paleomagnetic estimates of crustal shortening in the Hi-malayan thrusts and Zangbo suture, Nature 311 (1984)621–626.
[49] M. Westphal, J.P. Pozzi, Y.-X. Zhou, L.S. Xing, X.Y. Chen,Paleomagnetic data about southern Tibet (Xizang), I, TheCretaceous formations of the Lhasa block, Geophys. J. R.Astron. Soc. 73 (1983) 507–521.
[50] J.L. Lin, D.R. Watts, Paleomagnetic results from the Ti-betan Plateau, Philos. Trans. R. Soc. London A 327 (1988)239–262.
[51] M.P. Coward, W.S.F. Kidd, Y. Pan, F.R.S. Shackleton, H.Zhang, The structure of the 1985 Tibet Geotraverse, Lhasato Golmud, Philos. Trans. R. Soc. London A 327 (1988)307–336.
[52] J. Girardeau, J. Marcoux, C. Allegre, J.P. Bassoulet, Y.Tang, X. Xiao, Y. Zao, X. Wang, Tectonic environment andgeodynamic significance of the Neo-Cimmerian Donqiaoophiolite, Bangong-Nujiang suture zone, Tibet, Nature 307(1984) 27–31.
[53] S.P. Grand, Mantle shear structure beneath the Ameri-cas and surrounding oceans, J. Geophys. Res. 99 (1994)11591–11621.
[54] Y. Ricard, M.A. Richards, C. Lithgow-Bertelloni, Y. LeStunff, A geodynamic model of mantle density heterogene-ity, J. Geophys. Res. 98 (1993) 21895–21909.
[55] C. Lithgow-Bertelloni, M.A. Richards, The dynamics ofCenozoic and Mesozoic plate motions, Rev. Geophys. 36(1998) 27–78.
[56] L.H. Kellogg, B.H. Hager, R.D. van der Hilst, Composi-tional stratification in the deep mantle, Science 283 (1999)1881–1884.
[57] M. Sahabi, Un modele general de l’evolution de l’oceanindien, Ph.D. Thesis, Univ. Bretagne, Brest, 1993, 330 pp.