composite behaviour of hollowcore slabs and cast-in-situ
20
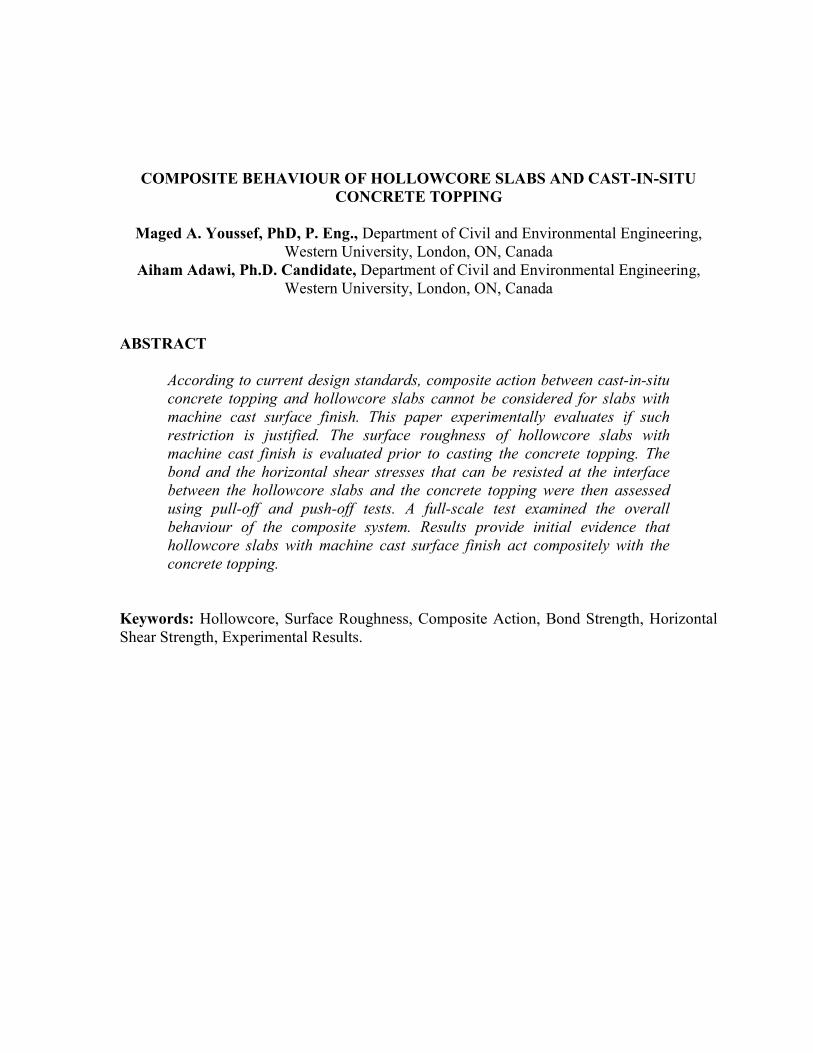
COMPOSITE BEHAVIOUR OF HOLLOWCORE SLABS AND CAST-IN-SITU CONCRETE TOPPING Maged A. Youssef, PhD, P. Eng., Department of Civil and Environmental Engineering, Western University, London, ON, Canada Aiham Adawi, Ph.D. Candidate, Department of Civil and Environmental Engineering, Western University, London, ON, Canada ABSTRACT According to current design standards, composite action between cast-in-situ concrete topping and hollowcore slabs cannot be considered for slabs with machine cast surface finish. This paper experimentally evaluates if such restriction is justified. The surface roughness of hollowcore slabs with machine cast finish is evaluated prior to casting the concrete topping. The bond and the horizontal shear stresses that can be resisted at the interface between the hollowcore slabs and the concrete topping were then assessed using pull-off and push-off tests. A full-scale test examined the overall behaviour of the composite system. Results provide initial evidence that hollowcore slabs with machine cast surface finish act compositely with the concrete topping. Keywords: Hollowcore, Surface Roughness, Composite Action, Bond Strength, Horizontal Shear Strength, Experimental Results.
-
Upload
khangminh22 -
Category
Documents
-
view
0 -
download
0
Transcript of composite behaviour of hollowcore slabs and cast-in-situ
COMPOSITE BEHAVIOUR OF HOLLOWCORE SLABS AND CAST-IN-SITU CONCRETE TOPPING
Maged A. Youssef, PhD, P. Eng., Department of Civil and Environmental Engineering,
Western University, London, ON, Canada Aiham Adawi, Ph.D. Candidate, Department of Civil and Environmental Engineering,
Western University, London, ON, Canada ABSTRACT
According to current design standards, composite action between cast-in-situ concrete topping and hollowcore slabs cannot be considered for slabs with machine cast surface finish. This paper experimentally evaluates if such restriction is justified. The surface roughness of hollowcore slabs with machine cast finish is evaluated prior to casting the concrete topping. The bond and the horizontal shear stresses that can be resisted at the interface between the hollowcore slabs and the concrete topping were then assessed using pull-off and push-off tests. A full-scale test examined the overall behaviour of the composite system. Results provide initial evidence that hollowcore slabs with machine cast surface finish act compositely with the concrete topping.
Keywords: Hollowcore, Surface Roughness, Composite Action, Bond Strength, Horizontal Shear Strength, Experimental Results.

Youssef and Adawi 2013 PCI/NBC
Pg 2
INTRODUCTION Hollowcore slabs are structural concrete elements produced at precast/prestressed concrete manufacturing plants and transferred to the job site for installation. Following installation, a cast-in-situ concrete topping might be placed to accommodate interior floor finishes, due to the potential camber in the slabs. The stiffness and load resistance of the hollowcore slabs are enhanced when the concrete topping is considered to act compositely with them. To consider the composite action, North American concrete design standards require that the shear strength of the interface between the hollowcore slab and the concrete topping exceeds 0.70 MPa (102 psi) [CSA A23.3-041] and 0.55 MPa (80 psi) [ACI 318-082]. Roughening the surface of the hollowcore slabs before placing the cast-in-situ concrete topping satisfies this requirement. The amplitude of surface roughening is defined in clause R17.5.3.3 of the ACI 318-082 commentary as 6.4 mm (0.25 in) and in explanatory note N17.4.3.2 of the CSA A23.3-041 as 5.0 mm (0.20 in). This roughening process induces considerable additional cost in the manufacturing process. The default surface finish for the hollowcore slabs is generally referred to as “machine cast finish”. This finish, although different from manufacturer to manufacturer, is generally considered to have a surface roughness less than the aforementioned requirement.
This paper experimentally investigates the bond and shear behaviour at the interface between hollowcore slabs with machine cast surface finish and cast-in-situ concrete topping. PULL-OFF TESTS To consider the concrete topping as fully bonded to the hollowcore slab, clause 7.6.4.3.2 of CSA A23.1-093 requires that bond strength between the hollowcore slab and the concrete topping be 0.90 MPa (131 psi) or higher. The bond strength can be evaluated using test method A23.2-6B “Determination of bond strength of bonded toppings and overlays and of direct tensile strength of concrete, mortar, and grout” (CSA A23.24). This test procedure involves core drilling of an annular ring into the hollowcore slab and the topping and applying a tensile force that pulls out the topping from the slab. The test is considered satisfactory when the strength exceeds 0.9 MPa (131 psi). Similar procedure is used in Europe (FIP5). Surface roughness evaluation and pull-off tests were performed on three hollowcore slabs with machine cast surface finish (MA1, MA2, and MA3). The slabs were 1220 mm by 1220 mm (4 ft by 4 ft) with a thickness of 203 mm (8.0 in). The concrete compressive strength was 41 MPa (5947 psi) as per manufacturer’s specifications. Fig. 1 shows the surface finish of slab MA1.

Youssef and Adawi 2013 PCI/NBC
Pg 3
Fig. 1: Surface finish of slab MA1 SURFACE ROUGHNESS EVALUATION The surface roughness of the tested slabs was evaluated using ASTM E9656 “Standard Test Method for Measuring Pavement Macrotexture Depth Using a Volumetric Technique”. This test is generally used for pavements and is considered suitable for surfaces that have voids smaller than 25.4 mm (1.0 in.), which is the case for the considered surface. The mean depth of roughness is obtained by dividing the volume of the glass beads that pass through sieve No. 60 and are retained on sieve No. 80 by the area covered by them. The tested surface is first cleaned using compressed air and a steel brush. Glass beads are then spread over the slab surface in a circular motion using a hard plastic disk, Fig. 2. When the beads are flush with the surface, three measurements of the diameter of the resulting circle are taken. Mean surface depth is then calculated by dividing the volume of the used beads by the average area of the circle. The mean roughness depths for slabs MA1, MA2, and MA3 were found to be 0.3401 mm (0.0134 in), 0.3603 (0.0142 in), and 0.3646 mm (0.0144 in), respectively. It is noted that this roughness is significantly less than the roughness stipulated in the design standards.
(a) Tools (b) Circle diameter
Fig. 2: Surface Roughness Test ASTM E9656
steel brush
volume measuring scoop
plastic disk
Diameter
glass beads circle
Youssef and Adawi 2013 PCI/NBC
Pg 4
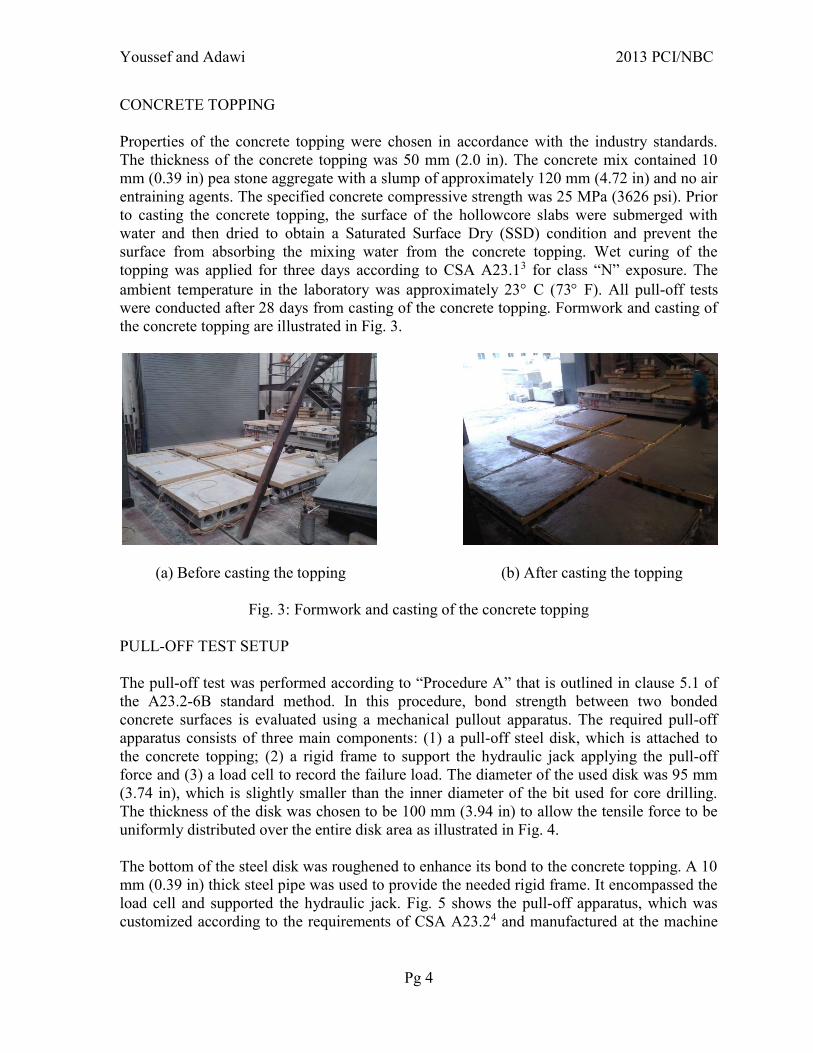
CONCRETE TOPPING Properties of the concrete topping were chosen in accordance with the industry standards. The thickness of the concrete topping was 50 mm (2.0 in). The concrete mix contained 10 mm (0.39 in) pea stone aggregate with a slump of approximately 120 mm (4.72 in) and no air entraining agents. The specified concrete compressive strength was 25 MPa (3626 psi). Prior to casting the concrete topping, the surface of the hollowcore slabs were submerged with water and then dried to obtain a Saturated Surface Dry (SSD) condition and prevent the surface from absorbing the mixing water from the concrete topping. Wet curing of the topping was applied for three days according to CSA A23.13 for class “N” exposure. The ambient temperature in the laboratory was approximately 23 C (73 F). All pull-off tests were conducted after 28 days from casting of the concrete topping. Formwork and casting of the concrete topping are illustrated in Fig. 3.
(a) Before casting the topping (b) After casting the topping
Fig. 3: Formwork and casting of the concrete topping
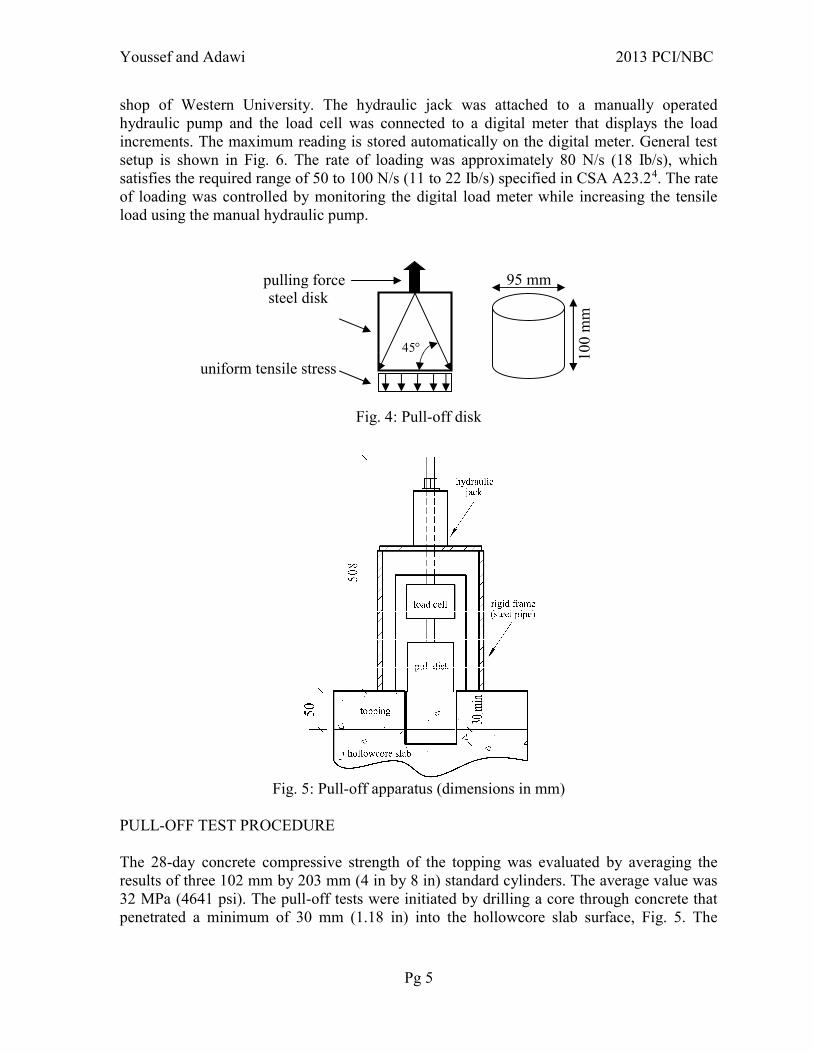
PULL-OFF TEST SETUP The pull-off test was performed according to “Procedure A” that is outlined in clause 5.1 of the A23.2-6B standard method. In this procedure, bond strength between two bonded concrete surfaces is evaluated using a mechanical pullout apparatus. The required pull-off apparatus consists of three main components: (1) a pull-off steel disk, which is attached to the concrete topping; (2) a rigid frame to support the hydraulic jack applying the pull-off force and (3) a load cell to record the failure load. The diameter of the used disk was 95 mm (3.74 in), which is slightly smaller than the inner diameter of the bit used for core drilling. The thickness of the disk was chosen to be 100 mm (3.94 in) to allow the tensile force to be uniformly distributed over the entire disk area as illustrated in Fig. 4. The bottom of the steel disk was roughened to enhance its bond to the concrete topping. A 10 mm (0.39 in) thick steel pipe was used to provide the needed rigid frame. It encompassed the load cell and supported the hydraulic jack. Fig. 5 shows the pull-off apparatus, which was customized according to the requirements of CSA A23.24 and manufactured at the machine
Youssef and Adawi 2013 PCI/NBC
Pg 5
shop of Western University. The hydraulic jack was attached to a manually operated hydraulic pump and the load cell was connected to a digital meter that displays the load increments. The maximum reading is stored automatically on the digital meter. General test setup is shown in Fig. 6. The rate of loading was approximately 80 N/s (18 Ib/s), which satisfies the required range of 50 to 100 N/s (11 to 22 Ib/s) specified in CSA A23.24. The rate of loading was controlled by monitoring the digital load meter while increasing the tensile load using the manual hydraulic pump.
Fig. 4: Pull-off disk
Fig. 5: Pull-off apparatus (dimensions in mm)
PULL-OFF TEST PROCEDURE The 28-day concrete compressive strength of the topping was evaluated by averaging the results of three 102 mm by 203 mm (4 in by 8 in) standard cylinders. The average value was 32 MPa (4641 psi). The pull-off tests were initiated by drilling a core through concrete that penetrated a minimum of 30 mm (1.18 in) into the hollowcore slab surface, Fig. 5. The
pulling forcesteel disk
45 100
mm
95 mm
uniform tensile stress

Youssef and Adawi 2013 PCI/NBC
Pg 6
diameter of the core was 100 mm (3.9 in). Fig. 7 illustrates the typical core drilling process and locations of the three cores for each of the tested slabs (corner, edge, and center cores). Core locations were chosen far enough from the formed edge of the specimens to eliminate the effect of differential shrinkage between the hollowcore slabs and the concrete topping on the test results.
Fig. 6: Pull-off test setup
(a) Locations of cores (b) Drilling process
Fig. 7: Core drilling
Cores were carefully dried and cleaned of the residue resulting from the core drilling process. The top surface of each core was roughened using a grinder, Fig. 8. The steel pull-off disks were bonded to the roughened surface of the cores using epoxy compound. Pull-off tests were conducted after 24 hours of the epoxy application. PULL-OFF TEST RESULTS AND DISCUSSION The maximum load prior to failure was retrieved from the digital load meter and recorded for each pull-off test. The weights of the steel disk, load cell, threaded rods and the hydraulic jack were deducted from the maximum load. The maximum load was divided by the cross
corner core
edge core
center core

Youssef and Adawi 2013 PCI/NBC
Pg 7
section area of the interface diameter, 100 mm (3.94 in.), to obtain the bond strength at failure. The bond strength for each slab was determined by calculating the average bond strength of its three cores as shown in Table 1. The type of failure for each pull-off test is shown in the table.
(a) Drilled core (b) Roughening of core surface
Fig. 8: Procedure for pull-off test
Fig. 9 shows the two observed failure mechanisms. Cores for slabs MA1 and MA3 failed when the concrete toppings were separated from the hollowcore slabs at the interface (interface failure). Failure loads for these cores provide a direct measure of the interface bond strength. Failure of cores for slab MA2 was due to concrete tensile failure of the hollowcore slab (HC failure). It is clear that the interface bond strength for slab MA2 is higher than the recorded failure stresses. Table 1: Pull-off test results
Corner Core Edge Core Center Core Average Bond
Strength/ slab, MPa (psi)
Specimen Label
Bond Strength, MPa (psi)
failure type
Bond Strength,
MPa (psi)
failure type
Bond Strength
, MPa (psi)
failure type
MA1 1.51 (219)
interface 1.78 (258)
interface 2.63 (381)
interface 1.97 (286)
MA2 3.91 (567)
HC 3.06 (444)
HC 2.81 (408)
HC 3.26 (473)
MA3 1.12 (162)
interface 0.48 (70)
interface 0.61 (88)
interface 0.74 (107)
Note: underlined values indicate average bond strength less than that required by CSA A23.24 (0.90 MPa). Test results are also presented in a graphical format in Fig. 10 and compared to the 0.9 MPa (131 psi) limit (CSA A23.24). The average bond strength in two slabs exceeded the CSA A23.24 limit. Slab MA3 failed to achieve the required bond strength; however, at least one

Youssef and Adawi 2013 PCI/NBC
Pg 8
pull-off test for that slab has exceeded the limit. This inadequate strength might be related to atypical surface conditions of the slab surface prior to casting of the topping.
(a) Interface failure (b) Hollowcore failure
Fig. 9: Observed failures in pull-off tests
Fig. 10: Pull-off test results
Fig. 11 shows the surface condition of slab MA3 before casting the concrete topping. It can be noticed that green paint was used on the edge of the slab as an identifier by the manufacturer. Rust stains were also noted at the center of the slab. Pull-off test results of slab MA3 show that the edge core achieved 0.48 MPa (69 psi) and the center core achieved 0.61
0
100
200
300
400
500
600
0.00
0.50
1.00
1.50
2.00
2.50
3.00
3.50
4.00
4.50
MA1 MA2 MA3
Bon
d S
tren
gth
, psi
Bon
d S
teen
gth
, MP
a
Hollowcore Spcimen Label
corner
edge
middle
average
MA2
A23.24 limit = 0.9 MPa (131 psi)
MA1

Youssef and Adawi 2013 PCI/NBC
Pg 9
MPa (89 psi), which are less than the CSA A23.24 limit. However, the corner core achieved an acceptable 1.12 MPa (162 psi) bond strength.
(a) Locations of stains (b) Edge core showing green stains
Fig. 11: Slab MA3 surface condition (unrepresentative of typical hollowcore surfaces) PUSH-OFF TESTS A hollowcore slab with machine cast finish was tested to evaluate the horizontal shear strength at the interface between the hollowcore slab and the concrete topping. The slab was 1220 mm by 1220 mm (4 ft by 4 ft) in area and 203 mm (8 in) thick. Concrete compressive strength was 41 MPa (5947 psi) as per manufacturer. Compressive strength of the concrete topping was 30 MPa (4351 psi). The concrete topping area was 508 mm by 508 mm (20 in by 20 in).
Fig. 12: Push-off test setup TEST SETUP The push-off test was conducted in a vertical orientation to permit easier alignment of the MTS hydraulic actuator with the existing vertical support frame at the structures lab. Figs. 12
edge core ed
ge
center
corn
er
paint stain paint stain

Youssef and Adawi 2013 PCI/NBC
Pg 10
and 13 show the test setup where the hollowcore slab specimen is installed in the vertical direction and the concrete topping rests on a 50 mm (2.0 in) thick steel plate. The shear force is applied by the MTS hydraulic actuator on a spreader steel beam that pushes the hollowcore slab specimen downward. The steel plate develops a reaction force that is applied on the concrete topping. This force generates a shear stress along the interface between the hollowcore slab and the topping. The steel frame positioned behind the hollowcore specimen was designed to prevent the overturning of the test specimen during the test. The soffit side of the hollowcore slab specimen was sufficiently smooth to allow free movement of the steel frame and guarantee that it does not provide additional resistance. 50 mm (2.0 in) wide by 3 mm (0.12 in) thick Korolath brand bearing pads were used under the steel spreader beam and between the steel plate and the concrete topping to guarantee a uniform stress distribution at those locations.
Fig. 13: Push-off test layout
INSTRUMENTATION To capture the state of strains in the concrete topping, strain gauges were attached on its top surface as illustrated in Fig. 14. Strain gauges S1, S3, and S5 measured strains in the direction of the applied load. Strain gauges S2 and S4 ensured that the load was distributed uniformly over the slab cross section. The push-off test induced two types of stresses on the interface between the concrete topping and the hollowcore slab: (1) shear stresses (stresses parallel to the interface) and (2) peel stresses (stresses perpendicular to the interface). Movements in the shear and peel directions were recorded using four Linear Variable Displacement Transducers (LVDTs), L1 to L4, as shown in Fig. 14. LVDTs L3 and L4 were attached to the hollowcore slab with their armatures resting on angle brackets attached to the

Youssef and Adawi 2013 PCI/NBC
Pg 11
side of the concrete topping. This setup allowed LVDTs to read the differential displacement between the hollowcore slab and the concrete topping.
Fig. 14: Push-off test instrumentation
TEST PROCEDURE The push-off test was conducted following 28 days of curing for the concrete topping. The load was applied via the hydraulic actuator at a loading rate of 25 kN/min (5.4 kips/min). The load was increased until the concrete topping separated from the hollowcore slab.
Fig. 15: Load versus slippage curve
0.00 0.01 0.02 0.03
0
20
40
60
80
0
50
100
150
200
250
300
350
400
0 0.2 0.4 0.6 0.8
Slippage, inchL
oad
, kip
s
Loa
d, k
N
Slippage, mm

Youssef and Adawi 2013 PCI/NBC
Pg 12
PUSH-OFF TEST RESULTS AND DISCUSSION Extremely brittle and abrupt failure was observed at a load of 359 kN (81 kips). This corresponds to an average horizontal shear stress, h avg, of 1.39 MPa (202 psi), which is higher than the limits stipulated by CSA A23.31 [0.7 MPa (102 psi)] and ACI 3182 [0.55 MPa (80 psi)]. The measured slippage at failure (average of LVDTs L3 and L4) was 0.61 mm (0.024 in). The load versus slippage curve is shown in Fig. 15. The slippage readings in the graph were calculated based on the average readings recorded from LVDTs L3 and L4. Very small slippage values were measured up to a load of about 50 kN (11 kips). The shear stiffness was significantly reduced after this load. The shear force is resisted at the interface by two mechanisms, bond and friction. The bond between the hollow core slab and the topping might have been lost at the mentioned load and resulted in the reduced stiffness. Peel displacement measured by LVDTs L2 is shown in Fig. 16. The decrease in peel stiffness at a load of about 50 kN (11 kips) is consistent with the slippage behaviour.
Fig. 16: Peel displacement (LVDT L2)
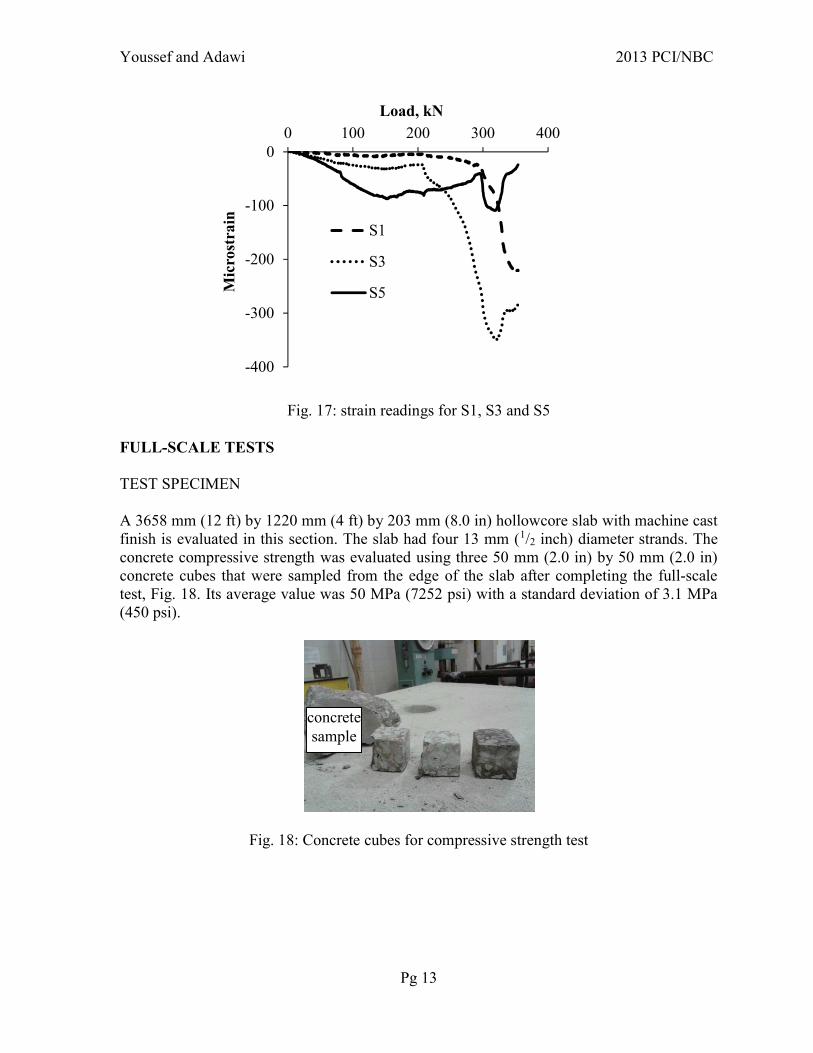
The measurements of concrete strains recorded by gauges S2, S3 and S4 were in close agreement. Fig. 17 shows the strain readings from strain gauges S1, S3 and S5. It is clear that the strains in the topping are varying. Strain gauge S5 initially recorded the highest readings as it is the closest to the loaded end. However, at the load of 200 kN (45 kips), readings for strain gauge S3 started to increase at a higher rate than S5, which indicates that the interface layer was fractured in the region of S5. The interface layer was further fractured at a load of 300 kN (68 kips) and the load started to transfer to region of S1.
0.00 0.01 0.01 0.02 0.02
0
20
40
60
80
0
50
100
150
200
250
300
350
400
0 0.1 0.2 0.3 0.4 0.5
Peel, inch
Loa
d, k
ips
Loa
d, k
N
Peel, mm
Youssef and Adawi 2013 PCI/NBC
Pg 13
Fig. 17: strain readings for S1, S3 and S5 FULL-SCALE TESTS TEST SPECIMEN A 3658 mm (12 ft) by 1220 mm (4 ft) by 203 mm (8.0 in) hollowcore slab with machine cast finish is evaluated in this section. The slab had four 13 mm (1/2 inch) diameter strands. The concrete compressive strength was evaluated using three 50 mm (2.0 in) by 50 mm (2.0 in) concrete cubes that were sampled from the edge of the slab after completing the full-scale test, Fig. 18. Its average value was 50 MPa (7252 psi) with a standard deviation of 3.1 MPa (450 psi).
Fig. 18: Concrete cubes for compressive strength test
-400
-300
-200
-100
00 100 200 300 400
Mic
rost
rain
Load, kN
S1
S3
S5
concretesample

Youssef and Adawi 2013 PCI/NBC
Pg 14
CONCRETE TOPPING The slab specimen was formed as shown in Fig. 19 (a). Prior to casting, the slab surface was cleaned using compressed air and a regular broom. Water was sprayed on top of the hollowcore slab until a saturated surface dry condition was achieved. Concrete topping of 50 mm (2.0 in) thickness was then cast over the slab. The specified concrete compressive strength of the concrete topping was 30 MPa (4351 psi); concrete cylinders were prepared to confirm the concrete compressive strength at the time of testing. The slab was covered with plastic sheets to prevent moisture evaporation and cured for three days according to CSA A23.1-093 for class “N” exposure, Fig. 19 (b).
(a) Before casting the topping (b) After casting the topping
Fig. 19: Formwork and casting of concrete topping
TEST SETUP AND PROCEDURE The bond strength of the concrete topping was first evaluated using two pull-off tests. The full-scale test was then conducted using three point bending method to generate the highest possible horizontal shear stress, Fig. 20. The total length of the slab was 3658 mm (144 in) with the supports located 500 mm (19.7 in) from each end. Including the 50 mm (2.0 in) concrete topping thickness, the depth of the composite slabs was 254 mm (10.0 in). The distance between the support reaction and the point load was 1329 mm (52.3 in), which results in shear span to depth ratio of 5.23. The horizontal shear resistance is related to the strength of the interface layer between the hollowcore slab and the concrete topping along the shear span. To increase the values of the horizontal shear stresses and the corresponding slip, the contact surface was reduced by inducing a separation in the concrete topping. This was achieved by saw cutting the concrete topping across the span as illustrated in Fig. 21. The saw cut created a 2 mm (0.08 in) wide separation in the topping that is 50 mm ± 3 mm (2.0 in ± 0.12) deep.

Youssef and Adawi 2013 PCI/NBC
Pg 15
(a) Full-scale test setup schematic, mm (in.)
(b) Testing machine
Fig. 20: Full-scale test setup
Fig. 21: Saw cutting of the concrete topping
dry-saw
cutting line
gap after cuttingguide angle
topping
hollowcore slab
50 mm
Youssef and Adawi 2013 PCI/NBC
Pg 16
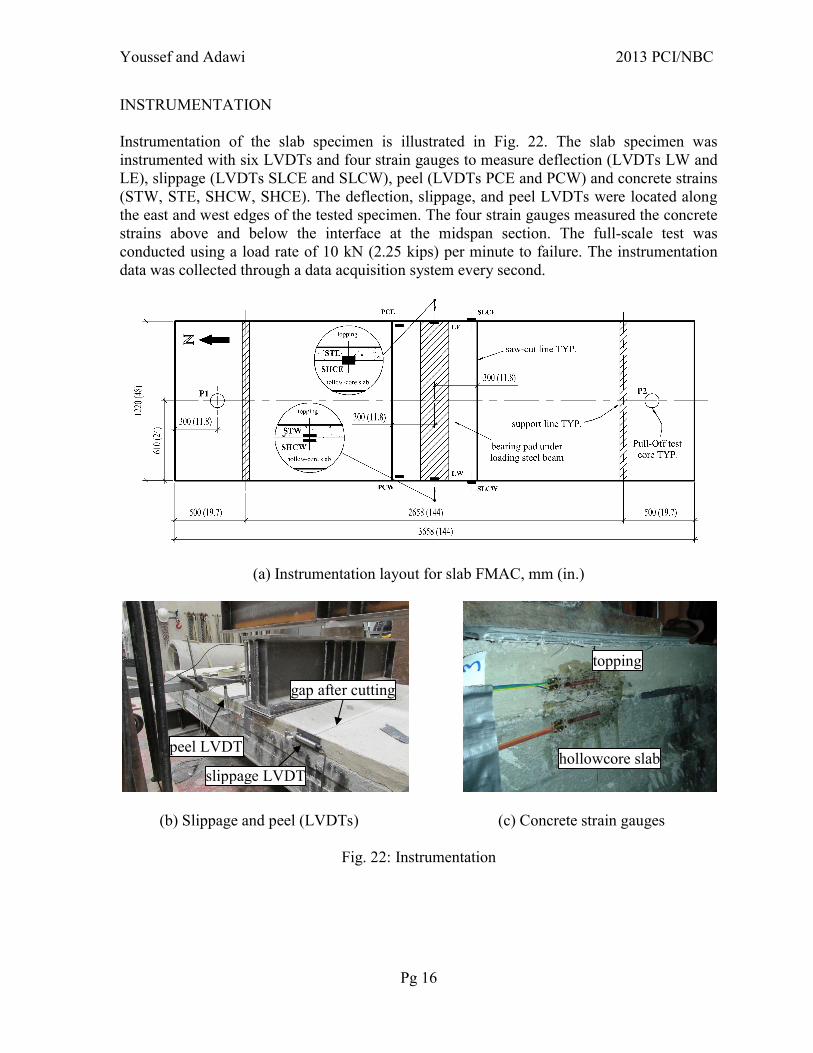
INSTRUMENTATION Instrumentation of the slab specimen is illustrated in Fig. 22. The slab specimen was instrumented with six LVDTs and four strain gauges to measure deflection (LVDTs LW and LE), slippage (LVDTs SLCE and SLCW), peel (LVDTs PCE and PCW) and concrete strains (STW, STE, SHCW, SHCE). The deflection, slippage, and peel LVDTs were located along the east and west edges of the tested specimen. The four strain gauges measured the concrete strains above and below the interface at the midspan section. The full-scale test was conducted using a load rate of 10 kN (2.25 kips) per minute to failure. The instrumentation data was collected through a data acquisition system every second.
(a) Instrumentation layout for slab FMAC, mm (in.)
(b) Slippage and peel (LVDTs) (c) Concrete strain gauges
Fig. 22: Instrumentation
topping
hollowcore slab
gap after cutting
slippage LVDT
peel LVDT
Youssef and Adawi 2013 PCI/NBC
Pg 17
FULL-SCALE TEST RESULTS AND DISCUSSION Pull-off tests were conducted at locations P1 and P2 shown in Fig. 22(a). The bond strength at those locations was evaluated as 1.96 MPa (284 psi) and 1.14 MPa (165 psi). The observed failure mechanism for the full-scale test is shown in Fig. 23. The slab failed at a load of 245 kN (55 kips) due to strands rupture. The corresponding mid-span deflection is 71 mm (2.8 in). The slippage at failure was measured as 1.95 mm (0.077 in) on the east edge and 3.28 mm (0.13 in) on the west edge. The peel at failure was 0.32 mm (0.013 in) on the east edge and 1.63 mm (0.064 in) on the west edge.
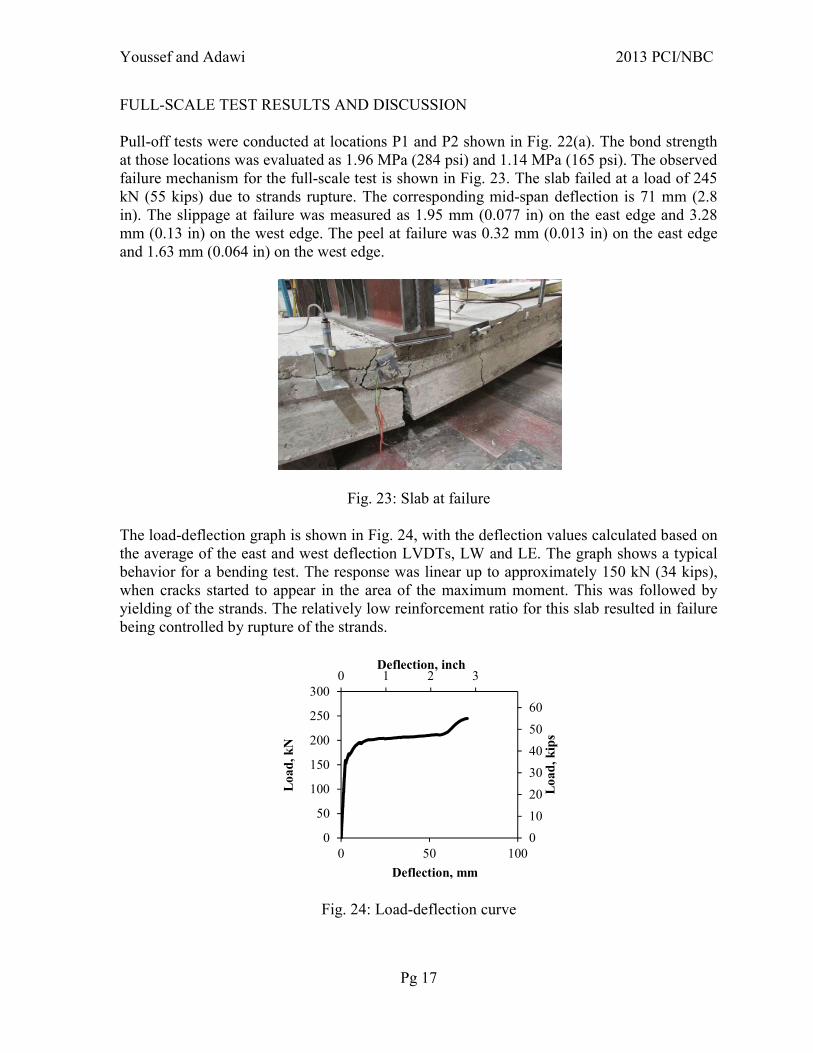
Fig. 23: Slab at failure The load-deflection graph is shown in Fig. 24, with the deflection values calculated based on the average of the east and west deflection LVDTs, LW and LE. The graph shows a typical behavior for a bending test. The response was linear up to approximately 150 kN (34 kips), when cracks started to appear in the area of the maximum moment. This was followed by yielding of the strands. The relatively low reinforcement ratio for this slab resulted in failure being controlled by rupture of the strands.
Fig. 24: Load-deflection curve
0 1 2 3
0
10
20
30
40
50
60
0
50
100
150
200
250
300
0 50 100
Deflection, inch
Loa
d, k
ips
Loa
d, k
N
Deflection, mm

Youssef and Adawi 2013 PCI/NBC
Pg 18
Slippage and peel readings obtained from the displacement LVDTs are illustrated in Fig. 25. Negative LVDT readings indicate that the LVDT has expanded, which means that a slippage or peel has occurred. Positive values indicate that the LVDT has compressed, which results from the curvature of the slab specimen due to bending under loading. The slippage values show an initial high horizontal shear stiffness that is significantly reduced at a load of about 186 kN (42 kips). This might be due to loosing the bond resistance at the interface as previously mentioned in the push-off test. The slippage measured at the west side was higher than that measured at the east side. This clearly linked to the peel deformations that show higher values at the west side than the east side.
Fig. 25: Slippage and peel readings
Measurements of the strain gauges are shown in Fig. 26. The positive strain readings indicate that concrete is in tension, while the negative ones indicate compressive strains. Strain gauges attached to the hollowcore slab, SHCW and SHCW showed abrupt and unrealistic strain readings, which suggest that the strain gauges malfunctioned. This could be related to loss of bond between the strain gauges and the concrete surface. Those readings are excluded from the stains graph. Readings at the west and east side of the topping were similar.
Fig. 26: Strain readings

Youssef and Adawi 2013 PCI/NBC
Pg 19
The horizontal shear force at failure was calculated based on the maximum moment section procedure outlined in A23.3-041 clause 17.4.4 and ACI 318-082 clause 17.5.4, and found equal to 764 kN (172 kips). The corresponding shear stress is 1.04 MPa (151 psi). It was also calculated using the shear force diagram as mentioned in clause 17.5.3 of ACI 318-082 and found equal to 0.51 MPa (74 psi). Horizontal shear failure was not observed for the tested slab, and thus a clear conclusion cannot be made. Finite Element Analysis of the tested slab is being conducted to evaluate the actual value of shear stresses. CONCLUSIONS A total of nine pull-off tests were performed on three hollowcore slab specimens with machine cast surface. The mean roughness depth for these slabs was first evaluated as 0.355 mm, which is significantly less than the roughness stipulated in the design standards to account for the composite behaviour. Three pull-off tests were carried out for each slab specimen. The majority of the tested specimens achieved bond strength higher than the 0.9 MPa (131 psi) limit specified by CSA A23.13. Slabs that did not achieve the required bond strength were from the atypical slab surfaces where the cores were drilled in contaminated areas. Hollowcore slabs are used to cover large floor areas, thus localized contamination might not affect the overall composite behaviour of the slab. Based on the test results and observations, it can be concluded that hollowcore slabs having machine cast finish can provide the necessary bond strength with the concrete topping if their surface is clean and free of any contamination. They qualify as a “bonded topping” according to CSA A23.13 clause 7.6.4 without the need for any additional bonding agents. The push-test results demonstrated that slabs with machine cast finish can achieve horizontal shear strength higher than the limits set by ACI 3182 and CSA A23.31. This result is consistent with the research work conducted by Mones7. The push-off behaviour suggests that slippage values starts to increase when the bond between the topping and the hollowcore slab is reduced. In view of the full-scale test results presented in this paper, it can be concluded that hollowcore slabs with machine cast surface finish can act compositely with the topping without the need for intentional roughening. This is consistent with the presented push-off test results. Additional tests and numerical studies are needed to draw a clear conclusion regarding the level of shear stresses that can develop at the interface. ACKNOWLEDGMENT This research is funded by the Canadian Precast/Prestressed Concrete Institute (CPCI) and the Ontario Centres of Excellence (OCE).

Youssef and Adawi 2013 PCI/NBC
Pg 20
REFERENCES 1. CSA A23.3-04, “Design of concrete structures,” Canada Standard Association, Mississauga, Canada, December 2004. 2. ACI 318-08, “Building Code Requirements for Structural Concrete (ACI 318-08) and Commentary,” American Concrete Institute, Michigan, United States, January 2008. 3. CSA A23.1, “Concrete materials and methods of concrete construction,” Canada Standard Association, Mississauga, Canada, July 2009. 4. CSA A23.2, “Concrete materials and methods of concrete construction,” Canada Standard Association, Mississauga, Canada, July 2009. 5. FIP, “Shear at the interface of precast and in situ concrete,” FIP Commission on Prefabrication, Guide to Good Practice, Sweden, January 1982. 6. ASTM Standard E965, “Standard Test Method for Measuring Pavement Macrostructure Depth Using a Volumetric Technique,” ASTM International, West Conshohocken, PA, 2006. 7. Mones R.M., “Interfacial Strength Between Prestressed Hollow Core Slabs and Cast-in-Place Concrete Toppings,” Masters of Science in Civil Engineering Thesis, University of Massachusetts, Amherst, Massachusetts, United States, February 2012.