Nonlinear analysis of orthotropic composite slabs in fire
53
promoting access to White Rose research papers White Rose Research Online Universities of Leeds, Sheffield and York http://eprints.whiterose.ac.uk/ This is an author produced version of a paper published in Engineering Structures. White Rose Research Online URL for this paper: http://eprints.whiterose.ac.uk/3666/ Published paper Yu, X.M., Huang, Z.H., Burgess, I. and Plank, R. (2008) Nonlinear analysis of orthotropic composite slabs in fire, Engineering Structures, Volume 30 (1), 67 - 80. [email protected]
-
Upload
independent -
Category
Documents
-
view
0 -
download
0
Transcript of Nonlinear analysis of orthotropic composite slabs in fire
promoting access to White Rose research papers
White Rose Research Online
Universities of Leeds, Sheffield and York http://eprints.whiterose.ac.uk/
This is an author produced version of a paper published in Engineering Structures. White Rose Research Online URL for this paper: http://eprints.whiterose.ac.uk/3666/
Published paper Yu, X.M., Huang, Z.H., Burgess, I. and Plank, R. (2008) Nonlinear analysis of orthotropic composite slabs in fire, Engineering Structures, Volume 30 (1), 67 - 80.

* Corresponding author: Tel: +44 114 222 5362; Fax: +44 114 222 5700 E-mail address: [email protected]
Non-linear Analysis of Orthotropic Composite Slabs in Fire
Xinmeng Yua *, Zhaohui Huanga, Ian Burgessa, Roger Plankb
a Department of Civil and Structural Engineering, The University of Sheffield , Sheffield S1 3JD, UK
b School of Architectural Studies, The University of Sheffield, Sheffield S10 2TN, UK
ABSTRACT
In this study an orthotropic slab finite element is developed to model orthotropic slabs in fire,
using a layered 9-noded iso-parametric slab element and a 3-noded beam element. The
element is assembled from a solid slab element which represents the continuous upper portion
of the profile, and a special beam element which represents the ribbed lower portion. An
equivalent width for the cross-section of this beam element is determined according to the
dimensions of the solid slab element and the cross-section of the ribbed profile, and the beam
shares the nodes of the solid slab element. The temperature within each layer of the slab
element can vary between adjacent Gauss integration points so as to reflect temperature
variations in the horizontal plane. Several fire tests on composite slabs have been modelled
to validate the approach. Cases of orthotropic slabs with wide range of parameters defining
the ribbed profile have been studied, which show that the orthotropic slab model is robust and
effective in reflecting the influence of the shape of ribs on the thermal and structural
performance of the slabs in fire. The study shows the influence of decking shape on the
thermal and structural behaviours of orthotropic slabs. A simple evaluation method for
profile selection is proposed.
Keywords: Orthotropic slabs; Composite structures; Fire resistance; Decking shapes,
Numerical modelling

NOTATION
The geometric parameters defining the decking may be referred to Fig. 1:
h Slab depth
Heff Effective depth of an orthotropic slab (defined in EN 1994-1-2:2005(E), Annex D)
Hs Depth of concrete slab (continuous upper portion)
Hr Depth of rib (height of steel decking)
L Wave-length of the decking profile
L0 Average of L1 and L2
L1 Distance between two upper flanges
L2 Width of the lower flange
L3 Width of the upper flange
RWR Rib width ratio = L0/(L1+L3)
RDF Rib depth factor = Depth of rib (mm) / 100 (mm)
α Angle between lower flange and web of decking
A45 α=45º; similarly for A90, A120, etc.
EC4eff A slab in its effective depth , Heff
Ph Reinforcement position in the symmetry axis across the thinner part of the slab
Pc Reinforcement position in the symmetry axis across the thicker part of the slab
Th Temperature at Ph
Tc Temperature at Pc
Tec4 Reinforcement temperature of an orthotropic slab at its effective depth
φtf View factor at top flange of the decking
φweb View factor at web of the decking
NWC Normal-weight concrete
LWC Light-weight concrete

1
Non-linear Analysis of Orthotropic Composite Slabs in Fire
Xinmeng Yu, Zhaohui Huang, Ian Burgess, Roger Plank
1. INTRODUCTION
Orthotropic metal-decked composite slabs have been widely used in recent decades. These
composite slabs consist of a cold-formed profiled thin-walled (typically, 0.6-1.2mm) steel
decking, and concrete which is cast on top of this. Normally, the concrete is reinforced with
a light anti-crack mesh, and may also contain individual bars, usually placed within the ribs.
The profiles can be classified into trapezoidal and re-entrant types. Trapezoidal decking
may occasionally be used over long spans using extra-deep ribs which contain individual bars.
However, the decking acts as reinforcement, being bonded to the slab surface through
indentations in the profile, and the composite slab itself has a very low centre of
reinforcement compared to a conventionally reinforced slab. Due to the intrinsic efficiency
of composite construction and the displacement of concrete by the profile shape, considerably
less concrete is used than in conventional reinforced concrete slab construction [1]. Another
advantage of an orthotropic slab over a flat one is that it saves construction time since the
decking is a permanent formwork which does not require propping. Trapezoidal decking
slabs are more popular than re-entrant ones because of the relative ease of casting of concrete.
When the concrete is subjected to heating, there are distinct temperatures at which: (a) the
free water is vaporised as steam, (b) the chemically bound water in the cement gel is released
by dehydration into the liquid phase as free water, which subsequently vaporises. The water
phase (bound, liquid or gaseous), the dimensions of the structure, the mixture type, concrete
porosity and the heating history all affect the temperatures in the slab [2, 3]. An added
complexity comes from the coupled thermo-hydral-mechanical processes in the heated
concrete. It is obvious that modelling of heat and mass transfer within concrete in fire is
very complicated. In fact, in Eurocode 4, the thermal properties are treated in a very simple
way. In this study, for simplicity, Huang’s model [4] is adopted to predict temperature
distribution within the cross section of the composite slab. In this model, the moisture
evaporation in the concrete and the specific heat and thermal conductivity properties of
concrete and steel are considered as temperature-dependent. This is good enough for civil
and structural engineering analyses.
Thermal analyses show that, when an orthotropic slab is subjected to fire attack, the
temperature within its continuous upper portion varies in the horizontal plane due to the

2
presence of the ribs. The thinner part is subject to higher temperatures than the thicker part.
The Cardington fire tests [5] showed that reinforcement temperatures in the thinner portions
were much higher than in the thicker portions. This issue should be taken into account in the
development of orthotropic slab model to analyse ribbed slabs in fire.
In Eurocode 4 [6] (EC4), orthotropic slabs may be treated as equivalent solid slabs with an
effective depth (Heff), and the steel decking is ignored in fire conditions. This method is not
applicable to deep-deck slabs with rebar in the ribs. For these slabs, the fire resistance is
usually expressed in standard classes, ranging from 30 to 120 minutes (and beyond) in
30-minute intervals. Only exposure from below is considered, which in practical cases will
always be decisive. These rules are “highly empirical in nature, and lack a fundamental
scientific basis” [7]. As stated above, the presence of the ribs makes orthotropic slabs
different from flat ones in both their thermal and structural behaviour.
A number of models have been developed for modelling of orthotropic composite slabs in fire.
In the first phase of an ECSC research project [7], a special-purpose model was developed for
simulation of the mechanical behaviour of fire-exposed composite slabs. In order to obtain
reasonable agreement between numerical and experimental results for the continuous decking
slab, a full continuous horizontal crack separating the ribs from the concrete plane was
assumed and explicitly taken into account. This was done simply by ignoring the
contribution of the ribs and the steel decking to the stiffness.
Elghazouli and Izzuddin [8] developed a model in which the composite slab was treated as an
orthogonal elasto-plastic grillage of beam-column elements, and temperature variations were
introduced across the two orthogonal cross-section directions as well as along the element
length. The deflections were obtained from the integration of the orthogonal beam-column
elements. The shortcoming of this type of grillage model is that the realistic slab behaviour
cannot be modelled properly in this way, since the effects of in-plane shear and Poisson’s
Ratio are ignored. This implies that tensile membrane action, which may cause a
considerable reduction of displacements [9] of slabs deforming in double-curvature due to
two-way support conditions, cannot be modelled.
Gillie et al. [10] described a method of modelling composite floor slabs using a
stress-resultant approach. This approach combined the material behaviour and geometry of a
plate into one set of equations. The internal membrane forces and moments per unit width of
plate were calculated based on the strain, curvature and temperature of the plate reference
surface. The set of stress resultants are two normal membrane forces, an in-plane shear force,

3
two bending moments and a twisting moment. In this model an unrealistic concrete material
model was employed in which concrete was treated as elastic-perfectly plastic material.
Another drawback of this method is that the model does not allow stresses within the slabs to
be output from the analysis.
In the University of Sheffield’s software, Vulcan, an effective-stiffness model [11] was
developed in which the orthotropic slab was treated as a solid slab with different orthogonal
stiffnesses and layered temperatures which are uniformly distributed horizontally. In this
method the nominal thickness of the slab is from the top surface to the bottom level of the ribs.
The effective-stiffness factors obtained from cross-sectional bending stiffnesses at ambient
temperature are applied as constants to modify the material stiffness of the layered concrete
slab throughout the fire duration. In reality, the effective-stiffness factors will change at
elevated temperatures, due to the degradation of the material properties as temperature
distributions change.
In Lim et al.’s model [12, 13], the solid part of the ribbed slab was modelled as an assembly
of brick-like shell elements (Fig. 2a), and each individual rib was modelled using beam
elements. The beam element was modelled in two parts, with concrete and steel properties
in the lower part and non-load-bearing properties in the upper part. It is obvious that a large
number of elements are needed for modelling composite slabs of practical dimensions in this
way, and computation is extremely expensive. It is difficult for this approach to model
certain types of decking slab which have very shallow indents, as shown in Fig. 2b.
The main objectives of this study are:
(1) To develop a more robust and flexible procedure for modelling of orthotropic composite
decking slabs subject to fire conditions. One of the most important developments is to
apply realistic temperature distributions within the decking slabs, especially the
different representation of temperatures of the steel mesh within the thick and thin
cross-sections of the slabs.
(2) To perform a series of numerical studies to investigate the thermal and structural
behaviour of the most commonly-used composite decking slabs currently in use in the
construction industry.

4
2. NON-LINEAR PROCEDURE FOR MODELLING OF ORTHOTROPIC COMPOSITE SLABS
2.1 The Orthotropic slab element
The software Vulcan has been developed at the University of Sheffield for three-dimensional
analysis of composite and steel-framed buildings in fire. The program is based on a 3D
non-linear finite element procedure in which a composite building is modelled as an assembly
of beam-column, spring, shear connector and slab elements. The beam-column line element
is three-noded, and its cross-section is divided into a matrix of segments, or fibres, to allow
for variation of temperature, stress and strain through the cross-section [14]. Slabs are
modelled using nine-noded layered plate elements based on Mindlin-Reissner theory, in
which each layer can have different temperature and material properties [9]. Both material
and geometric non-linearities are considered in beam-column and slab elements.
As shown in Fig. 3, the current orthotropic slab element is based on the pre-existing beam and
solid slab elements in Vulcan. The element is assembled from a solid slab element, which
represents the continuous upper portion of the profile, and an equivalent special beam element
which represents the ribbed lower portion. It is assumed that the reference axis of the beam
element coincides with the mid-plane of the slab element. An equivalent width for the
cross-section of this beam element is determined according to the cross-sectional dimensions
of the ribbed slab, and it shares the 3 middle nodes of the solid slab element on the reference
plane. The previous non-linear formulations of both the solid slab and beam elements are
employed. For slab elements, degraded stiffness is assembled at nine Gauss integration
points according to the degradation status. Membrane locking is not an issue for thick
composite slab elements. To mitigate shear locking, a reduced integration rule is used for
the quadratic beam element. One important development in the current model, which differs
from the previous model [9], is that the temperature of each layer of a slab element is not
necessarily uniform in the horizontal plane, and it is assumed that the temperature can be
varied between adjacent Gauss integration points. Therefore, realistic temperature
distributions within the slabs can be represented by the current model. The cross-section of
the beam element uses its segmented nature to represent different temperatures and materials
within the ribs. In this model the beam element is normally used to represent a group of ribs
of the composite slab, rather than just a single rib, and hence the width of the beam element is
an equivalent width calculated from the Rib Width Ratio (RWR), a proportion of the width of

5
the solid slab element. It is therefore reasonable to assume that the beam element has only
uniaxial properties, without significant torsional resistance.
The stiffness matrix of an orthotropic slab element orthK is assembled from the stiffness
matrices of a nine-noded solid slab element slabK and a three-noded beam element beamK :
beamslaborth KKK += (1)
The slab element tangent stiffness matrix, slabK , is composed of the usual
small-displacement stiffness matrix, the large-displacement stiffness matrix, and the stress
level dependent geometric matrix. The detailed formulations can be found in Reference [9].
The beam elements, which represent the ribs below the continuous, thinner portion of the slab,
share the three middle nodes of the upper slab elements, and it is assumed that they are fully
attached (see Fig. 3). For the beam element the tangent stiffness matrix is composed of
linear and non-linear stiffness matrices specified in Reference [14]. In this study the beam
element represents a group of ribs of the composite slab, and hence the width of the beam
element is an equivalent width calculated from the rib width as a proportion of the width of
the solid slab element (see Fig. 3). As stated above, it is assumed that the beam element has
only uniaxial properties, without torsional resistance. Hence the material constitutive matrix
for the beam element can be represented as
⎥⎥⎥
⎦
⎤
⎢⎢⎢
⎣
⎡=
00000000t
'
ED (2)
where tE is the tangent modulus of the material.
The internal forces of the orthotropic slab element is obtained from the total of the solid slab
element and the equivalent beam element. The detailed formulations can be found in
References [9] and [14], respectively.
2.2 The simplified temperature distribution within each layer of the solid slab element
Due to the presence of the ribs, the temperature distribution within any layer of the solid slab
element is non-uniform. In order to take this factor into account within the model a
simplifying assumption has been made; the temperatures within a layer are divided into two
zones, (hotter and cooler zones) at the Gauss integration points (see Fig. 4). The higher

6
temperatures at the thin parts of the slab (see Line 2 of Fig. 1) are defined at six Gauss
integration points (1, 2, 3, 7, 8, 9), and the cooler temperatures at the thick part (see Line 1 of
Fig. 1) are assigned to three Gauss integration points (4, 5, 6). The temperature distribution
within the rib part is used to represent the temperature distribution of the cross-section of the
beam element. This is a reasonable representation of the real temperature distribution within
a ribbed slab (see Fig. 5). Hence, at each Gauss Integration Point, the material stiffness,
strength, and thermal expansion are calculated according to the corresponding temperature.
3. MODEL VALIDATION
3.1 TNO fire test on a one-way simply supported slab
A major fire test was carried out at TNO in the Netherlands in September 1996 as part of an
ECSC research project [1]. The test specimen consisted of a single span of slab with two
Rectangular Hollow Section edge beams. The test specimen was 5.6m long x 4.6m wide,
the beams spanning in the shorter distance. The test load was typical of normal office
loading (imposed test load 23.55 /kN m , self weight 23.10 /kN m ). The depth of the
normal-weight concrete slab was 290mm, with A192 mesh (Ф6) positioned in such a way that
the distance from the centre of the longitudinal bars to the unexposed face was 20mm. A
25mm diameter rebar was placed in each of the ribs. The constructional details are shown in
Fig. 6. The compressive strength of the concrete was 249.5 /N mm . The structural steel
strengths were 2409 /N mm for the hollow section and 2349 /N mm for the plate,
respectively, in the edge beams. The slab was unrestrained against thermal expansion, and
the 200mm x 100mm RHS edge beams were restrained against rotation at both ends. The
edge beams were designed to achieve at least 60 minutes’ fire resistance, and the composite
slab was reinforced to achieve 120 minutes’ fire resistance. In order to gain information on
the fire resistance of the slab, the beam was prevented from collapsing completely by
blockwork pillars within the furnace, the tops of which were positioned 200mm below the
beams. In this numerical study, the test load and the tested material properties of structural
steel, concrete and reinforcement were used. Further details are available from Reference
[1]. Before modelling the test, a thermal analysis was conducted to predict the temperature
distributions within the cross-sections of the beams and ribbed slabs using Vulcan. Fig. 7
shows the comparison between predicted and tested temperatures at some key positions
within the cross-sections of the beams and ribbed slabs. It is evident that very good
agreement was achieved. These temperature predictions were used in the structural analysis.

7
Fig. 8 compares the predicted deflections using the current model and the previous
effective-stiffness model at two key positions P1 and P2 (see Fig. 6), together with the test
results. It can be seen that the curves predicted by the current model agree well with test
results up to 70 minutes into the test. It is evident that the structural behaviour predicted by
the two models differs beyond this point.
3.2 BRANZ fire test on a two-way simply supported slab
A series of full-scale fire tests conducted at the Cardington in the UK have shown that the fire
resistance of unprotected composite floor structures is much better than standard furnace fire
testing suggests. The composite concrete slabs may play an important role in increasing the
fire resistance of the structure due to tensile membrane action, and so it is important to model
the composite slabs correctly. Recently, six two-way simply supported concrete slabs
subjected to the ISO834 fire curve were tested at the BRANZ fire test furnace in New Zealand.
One of the tests, carried out on the 1st July 2002 [15], was on a Hibond orthotropic ribbed slab.
The tested slab had the dimensions 4300x3300x130mm, measuring 4150mm by 3150mm
between supports, and was made of normal-weight concrete with 30MPa compressive
strength. The D147 reinforcement mesh ( 2198 /mm m , Ф8.7) was cold-worked with a yield
strength of 565MPa placed at 20mm above the decking. The slab was subject to a uniformly
distributed live load of 23.0 /kN m during the fire test. The self weight was 22.47 /kN m .
A thermal analysis was performed using Vulcan to predict the temperature distributions
within the cross-section of the slabs. Fig. 9 shows the comparisons of some predicted and
tested key temperatures from bottom to top of the cross-section of the tested slabs. It is clear
that a reasonable agreement was obtained, and the predicted temperatures were used in the
structural modelling.
Fig. 10 shows a comparison of the central deflections predicted by the current orthotropic
model and two other models with test results. The result predict by current model is closer to
the test data than that predicted by Lim’s model [13] before 120 minutes of fire, but the latter
is closer to the test data beyond this fire stage. In the effective stiffness model the average
temperatures layer-by-layer between the thinner and thicker parts were applied because this
model assumes uniform temperatures for each layer. Reasonable agreement was achieved
by the current and effective stiffness models with the test results up to 130 minutes in the test.
Beyond this point the test deflections accelerated, while the predictions by both models were
more stable. The reason for this difference between test and prediction may be due to the

8
large cracks which formed in the middle of the test slab. Certain observations made during
the test [15] support this. Flames were seen to penetrate through the discrete crack in the
middle of the slab at a late stage of the test, and significant corner cracking was observed.
3.3 Modelling full-scale fire test - Cardington Test 7
To study global structural and thermal behaviour, a full-scale fire test was conducted on the
4th floor of the eight-storey steel framed building at the Building Research Establishment’s
Cardington laboratory in January 2003 [16, 17]. The fire compartment was 11m long by 7m
wide (Fig. 11). The building had been designed for a dead load of 3.65kN/m2 and an
imposed load of 3.5kN/m2. Sandbags each of 1.1 tonne were applied over an area of 18m by
10.5m, spaced so that a uniform live loading of 3.05kN/m2 was simulated for the fire test [16].
The exposed structure consisted of two secondary beams (305x165x40UB) of nominally S275
steel (of measured fy=303MPa), an edge beam (356x171x51UB), two primary beams
(356x171x51UB), nominally S350 (measured fy=396MPa), and four columns (internal
column sections were 305x305x198UC and external column sections were 305x305x137UC,
of S350 steel). The overall depth of the slab was 130mm with rib depth 60mm, with A142
mesh 15mm above the decking. The profile of the decking can be obtained from Reference
[8]. The compressive strength of the concrete was 37.01MPa. The yield strength of the
reinforcement was 460MPa.
It was observed [18] that, after the fire test had finished and the structure had cooled, the
composite slab had extensive cracking in both the longitudinal and transverse directions,
though it cannot be stated definitively that this happened entirely during the heating phase.
The main longitudinal crack was off-centre of the bay of the column grid. The main
longitudinal and transverse cracks penetrated the full depth of the slab, and the longitudinal
crack was 90mm wide near to their intersection. This extent of rupture seems unusual
without a complete failure of the slab, but it can be seen that the ends of the reinforcing bars
in two sheets of mesh had slipped relative to one another across the crack. This was clearly
due to inadequate overlap of the adjacent sheets of mesh during construction of the building,
so that only “fingers” of undeformed bars were overlapping, and that the anchorage which
might have been achieved by overlapping the welds to the orthogonal reinforcement was not
achieved. This situation would also have dictated the location of the longitudinal crack.
In order to model this inadequate overlapping of the mesh, three cases (Cases I, II, III) were
modelled by reducing the strength of the reinforcement in this area by ¾, ½, and ¼

9
respectively. Thermal analysis was also conducted to obtain the temperature distribution
within the cross section of the slabs. Fig. 12 shows both tested and predicted temperature
distributions at some key positions within the cross-section of the slabs. The predicted
temperature distribution in the slab, and the tested temperatures of the beams (in which the
maximum temperature was 1000°C at 60 min test time), together with the material properties
and loads detailed above, were applied to model the structural behaviour in the test. The
predicted deflections at key position P1 (see Fig. 11) are shown in Fig. 13 for three different
cases, together with the test results. It is evident that Case I had the most effective prediction
up to 60 minutes of the test. In the cooling phase, the current model predicted less deflection
than the test result. This is almost certainly due to the localised failure (the large ruptures) of
the concrete slabs which happened during cooling stage. The current model cannot handle
localisation of failure of concrete slabs. However, the accuracy of the current model’s
predictions is reasonably good considering the complexity of such a large-scale fire test.
4. THE INFLUENCE OF RIB SHAPES OF DECKING SLABS IN FIRE: A PARAMETRIC STUDY
4.1 Decking shape parameters
Reference [7] lists a number of decking types with trapezoidal and re-entrant profiles. These
different decking types have been re-sorted and grouped according to the depths (Hr) and
average widths (L0) of their ribs. Considering the popularity and the rib width ratio (RWR)
of existing profiles, in this study the 7 groups shown in Fig. 14 have been used to carry out
the parametric study. The parameters of these groups are listed in Table 1.
When an orthotropic slab is subjected to fire, the heat flux due to radiation which acts on the
bottom surface of the decking differs with profile shape and distance. The View Factor is
used to quantify this relationship. In this study, a simplified model has been adopted to
address this factor as follows:
(1) Unit view factor is assumed at bottom of the rib, as the reference level.
(2) The view factors at the top flange (φtf) and web (φweb) of the indented surfaces of the
slab were assumed to be uniform and determined according to Fig. 15. This
approximation was developed by Wickström et al. [19] in 1990 and subsequently
accepted by EC4.
(3) The view factors stay constant throughout the fire stage.

10
4.2 Thermal and structural behaviour of profiled slabs
A two-way simply supported 9m x 6m composite floor with a secondary beam placed in the
middle of the shorter span (see Fig. 16) subject to ISO834 fire was selected for this study.
This dimension is similar to those used in Cardington fire tests. The secondary beam was
assumed to be protected so that the bottom flange and web temperatures linearly increased to
620°C at 180 minutes. This secondary beam is protected for the purpose of
large-displacement comparison because slabs of some groups can not last long in fire without
the secondary beam being protected. The thickness of the continuous thinner portion was
70mm, with A142 mesh located 20mm above the top flange of the decking. The uniformly
distributed load was assumed as 5kN/mm2. The compressive strengths of both
normal-weight concrete (NWC) and light-weight concrete (LWC) at ambient temperature
were 30N/mm2. Only a quarter of the structure was analysed due to the inherent symmetry
of the slab. The study focused on the influence of the decking shape on the thermal and
structural behaviours of the composite floor in fire.
The thermal analyses were conducted using Vulcan, again based on Huang’s model [4], and
the structural behaviour was predicted by the model developed in this paper. In this study 80
cases (see Table 1) were modelled for both NWC and LWC, including slabs (EC4eff) treated
as solid with nominal effective thicknesses (Heff) obtained according to Eurocode 4. In order
to present the results more effectively all notations used in the following figures are defined in
the Notation section.
Figs. 17 and 18 show the temperatures of reinforcing steel at the thicker and thinner sections
(Tc and Th) of NWC and LWC slabs, respectively, for various groups with α=90º (A90). In
order to save space here, only the influence of decking shapes on the reinforcement
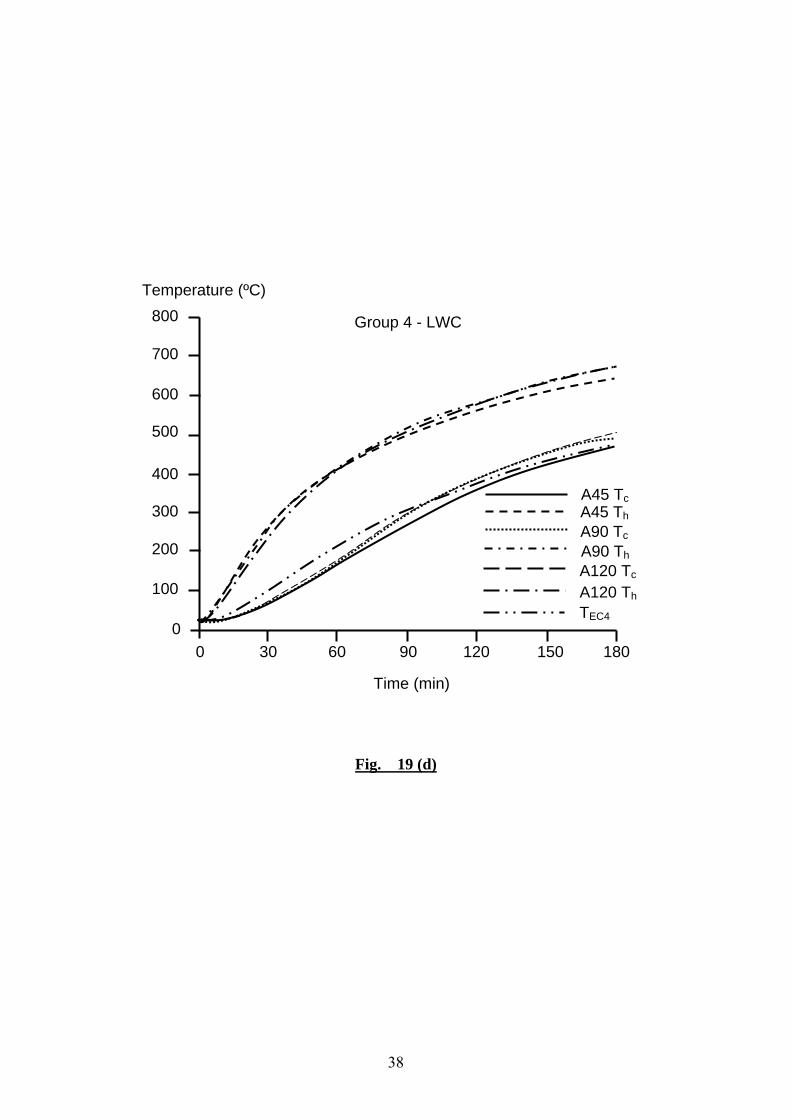
temperatures of LWC slabs of various groups are shown in Fig. 19. After analysing the
results, some general conclusions about the temperatures of reinforcement within the
cross-sections of different decking slabs can be drawn as follows:
• The influence of rib shape on the reinforcement temperature is not very significant.
However, the effects on the LWC slabs are more significant than on NWC slabs.
• Generally speaking, Tc decreases with increase of RWR, but the depth of the rib also
influences the temperature; this makes the Tc values in Group 7 higher than those in
Group 6 (see Figs. 17a and 18a). The difference of Th between different groups is not
very great.

11
• The influence of the angle α on Tc decreases with RWR, from more than 15% (based on
A90) for Groups 1 and 2 to less than 5% for Group 7. The effect on Th is the reverse.
• For the slabs with RWR ≤ 0.32 (Groups 1-3), the shape of the rib has little influence on
Th, but considerably influences Tc. The greater the angle α, the lower Tc becomes.
Deeper ribs (with greater Hr) also affect the influence of the angle α on Tc. For those
with RWR over 0.6 (Groups 4-7) the shape of rib does not influence Tc very much,
especially when α is between 60º and 105º.
• After 180min of the ISO834 fire, for NWC slabs with 90º rib angle, Th is in the range
650ºC-750ºC and Tc in the range 450ºC-700ºC. For LWC slabs with 90º rib angle, Th
is in the range 650ºC-700ºC and Tc in the range 350ºC-650ºC.
• If a profiled slab is treated as solid, with an effective thickness obtained according to
EC4, the reinforcing mesh temperature obtained from thermal analysis is close to Tc.
This gives the slab a better fire resistance than the real ribbed slab, especially in the later
stages of the fire.
Figs. 20 and 21 show comparisons of the deflections at Position A (see Fig. 16) among the
seven groups of profiled NWC and LWC slabs, respectively. Detailed comparisons of
deflection with the rib angle within each group are shown in Figs. 22. Again, to save space,
only the results for LWC are shown. From results obtained, some general conclusions
concerning the structural behaviour of composite slabs in fire can be drawn.
Deflections using the EC4 assumption, which defines an effective flat slab and a tabulated
temperature distribution at standard fire resistance ratings, are always on the unsafe (low) side
compared with those modelled by the current process, except for Group 1. If the likelihood
of localised failure is taken into consideration, EC4eff is even less conservative.
Given the Eurocode definitions of the thermal properties of concrete, LWC slabs give better
thermal performance than NWC slabs with the same compressive strength. The rib angle α
has less influence on LWC slabs than on NWC slabs, and the influence of α decreases with
increasing RWR. The influence of the rib angle on LWC slab deflections is within 20%
(based on A90). Comparing the predicted deflections using EC4eff and the current model,
closer results were obtained for NWC slabs than for LWC ones. The influence of
α decreases with increasing RWR, but increases with the rib depth.

12
• In common with its influence on temperatures, the influence of the rib shape on the
structural performance is not very significant. In each group, the slab with α = 90º has
higher deflection than those with other angles. This means that it is reasonable to
assume α = 90º as a conservative assumption when evaluating the fire resistance of an
orthotropic slab.
• Considering Figs. 20 and 21 in detail, it is evident that the Groups 5 and 6 have better
fire resistance than Groups 3, 4 and 7, which in turn have better fire resistance than
Groups 1 and 2. It is interesting that the relative fire resistance level of slabs can be
evaluated roughly by the summation of the RWR and the Rib Depth Factor (RDF, the
depth of rib divided by 100). The fire resistance level of the slab increases with (RWR
+ RDF), as shown in Table 2, in which Classes A, B and C correspond to fire resistance
levels (A>B>C). These dimensionless values can be interpreted in general terms;
given the same slab thickness (in the continuous portion) and material properties, the
greater the value the better the fire resistance. However the fire resistance of a slab
also depends on the thickness, the load, the boundary conditions, material properties,
etc., so we can not relate these values to hours of fire resistance directly.
5. CONCLUSIONS
In this paper the development of orthotropic slab model to model ribbed slabs in fire has been
described. The model has been developed from the slab and beam element formulations
contained within the software Vulcan developed at the University of Sheffield. The two
main new features of the model are:
(1) The continuous top part of the ribbed slab is represented by solid slab elements, and the
lower (rib) part is modelled as an equivalent beam element with uniaxial properties.
Both the orthotropic character and membrane actions of ribbed slabs are taken into
account in a logical manner. This approach also allows the modelling of deep-deck
slabs.
(2) The model allows non-uniform temperature distribution within each layer of the solid
slab element. Hence, the temperature distributions across the cross-section of the
profiled slabs can be represented more accurately than in uniform-thickness layered
shell elements. This overcomes the drawbacks of the previous effective-stiffness
model, in which uniform average layer temperatures are used. In particular, a better

13
representation of reinforcement temperatures across the thin and thick sections of the
ribbed slab is achieved by the current model.
A series of parametric studies using various decking shapes have been carried out. By
representing the hotter and cooler temperatures in the thinner and thicker portions of the slab,
it can be seen that the current model can sensitively reflect the influence of shape on the
thermal and structural behaviours. It also shows that the Simplified Method in EC4, which
treats the orthotropic slab as an equivalent solid slab with an effective thickness, is not
sufficiently conservative, especially in the later stages of a fire. LWC slabs have better fire
performance than NWC ones. When considering the choice of suitable decking profiles for
orthotropic slabs in construction, a simple calculation (Table 2) can be used as an alternative
method for approximate evaluation of the fire resistance level.
REFERENCES [1] Corus Construction Centre website: http://www.corusconstruction.com.
[2] Bazant, Z.P. and Kaplan, M., “Concrete at high temperatures”, Longman Group Limited, 1996, (ISBN 0-582-08626-4).
[3] Tenchev, R.T., Li, L.Y., Purkiss, J.A. and Khalafallah, B.H., “Finite element analysis of coupled heat and mass transfer in concrete when it is in a fire”, Magazine of Concrete Research, 53 (2), (2001) pp117-125.
[4] Huang, Z., Platten, A., and Roberts, J. “Non-linear finite element model to predict temperature histories within reinforced concrete in fires”, Building and Environment, 31(2) (1996), pp 109-118.
[5] Bentley P.K., Shaw D., and Tomlinson L., “ECSC Project: Behaviour of a Multi-Storey Steel-Framed Building Subjected to Natural Fires. Test 2: Plane Frame Data Files: Temperature Measurements”, Report S423/2/Part T1-T2, Swinden Technology Centre, British Steel plc, South Yorkshire, UK, 1996.
[6] European Committee for Standardisation, “prEN1994-1-2: Eurocode 4 - Design of composite steel and concrete structures”, Final Draft (Stage 34), CEN, Brussels, 2003.
[7] Both, C., “The fire resistance of composite steel-concrete slabs”, PhD thesis, TU Delft, Delft University Press, 1998, (ISBN 90-407-1803-2-Y).
[8] Elghazouli, A.Y. and Izzuddin, B.A., “Analytical assessment of the structural performance of composite floors subject to compartment fires”, Fire Safety Journal, 36, (2001) pp769-793.
[9] Huang, Z., Burgess, I.W. and Plank, R.J., “Modelling membrane action of concrete slabs in composite buildings in fire - Part I: Theoretical development”, Journal of Structural Engineering, ASCE, 129 (8) (2003) pp1093-1102.
[10] Gillie, M., Usmani, A., Rotter, M. and O’Connor, M., “Modelling of heated composite floor slabs with reference to the Cardington experiments”, Fire Safety Journal, 36 (2001) pp745-767.

14
[11] Huang, Z., Burgess, I.W. and Plank, R.J., “Effective stiffness modelling of composite concrete slabs in fire”, Engineering Structures, 22 (2000) pp1133-1144.
[12] Lim, L.C.S., “Membrane action in fire exposed concrete floor systems”, PhD thesis, University of Canterbury, New Zealand, 2003.
[13] Lim, L.C.S., Buchanan, A., Moss, P. and Franssen, J.-M., “Numerical modelling of two-way reinforced concrete slabs in fire”, Engineering Structures, 26 (2004) pp1081-1091.
[14] Huang, Z., Burgess, I.W. and Plank, R.J., “3D modelling of beam-columns with general cross-sections in fire”, Paper S6-5, Third International Workshop on Structures in Fire, Ottawa, Canada, 2004, pp323-334
[15] Lim, L.C.S. and Wade, C., “Experimental fire tests of two-way concrete slabs”, Fire Engineering Research Report 02/12, University of Canterbury, New Zealand, September 2002.
[16] Lennon, T., “Results and observations from full-scale fire test at BRE Cardington, 16 January 2003”, BRE client report 215-741, 2004.
[17] Wald, F., Chladná, M., Moore, D., Santiago, A., and Lennon, T., “The temperature distribution in a full-scale steel framed building subject to a natural fire”, Steel and Composite Structures, 6 (2) (2006).
[18] Foster, S., Chladná, M., Hsieh, C., Burgess, I., and Plank, R., “Thermal and structural behaviour of a full-scale composite building subject to a severe compartment fire”, Fire Safety Journal, (In press).
[19] Wickström, U. and Sterner, E., “TASEF-temperature analysis of structures exposed to fire-User’s manual”, Swedish National Testing Institute, SP Report 05, 1990.

15
TABLES
Table 1: Orthotropic slab deckings used in the parametric study (cases studied marked ).
α(º) Group
Decking wavelength
L (mm) L0 (mm) Hs
(mm)
Rib Width Ratio
(RWR) 45 60 75 90 105 120
1 200 40 60 0.2
2 200 60 40 0.3
3 250 80 80 0.32
4 200 120 40 0.6
5 200 120 60 0.6
6 250 175 60 0.7
7 300 210 40 0.7
Table 2: A simple method to evaluate the structural performance of orthotropic slabs (fire resistance level increases with the summation of RWR and RDF).
Group (1) Rib Width Ratio (RWR)
(2) Rib Depth Factor (RDF) = Depth of rib (mm) ÷ 100(mm) (1) + (2) Fire resistance
level
1 0.20 0.60 0.80 C
2 0.30 0.40 0.70 C
3 0.32 0.80 1.12 B
4 0.60 0.40 1.00 B
5 0.60 0.60 1.20 A
6 0.70 0.60 1.30 A
7 0.70 0.40 1.10 B

16
FIGURE CAPTIONS Fig. 1 Geometric parameters defining decking.
Fig. 2 A description of the Lim et al. [13] model and its limitations.
Fig. 3 An orthotropic slab element model.
Fig. 4 Temperature distribution at Gauss integration points within a layer of the orthotropic slab element.
Fig. 5 Contour lines of temperature distribution in an orthotropic slab at 120min of ISO834 fire.
Fig. 6 Details of the TNO Fire Test.
Fig. 7 Predicted temperatures at some key positions compared with test results for the TNO Fire Test.
Fig. 8 Comparison of predicted deflections with test results for the TNO Fire Test.
Fig. 9 Comparison of predicted temperature with test results at some key positions for the BRANZ Fire Test.
Fig. 10 Comparison of predicted central deflections using the current and the previous effective stiffness models, also including test results for the BRANZ Fire Test.
Fig. 11 Location of the fire compartment of Cardington Fire Test 7.
Fig. 12 Comparison of predicted temperatures with test results for the cross section of the slab in Cardington Fire Test 7.
Fig. 13 Comparison of predicted deflections for three cases with test results at the key position P1 in Cardington Fire Test 7.
Fig. 14 Distribution of Decking Groups (1-7) for parametric study.
Fig. 15 Determination of view factor φ in 2-dimensional cases (radiation from |CD| to |AB|).
Fig. 16 Parametric study: A two-way simply supported composite floor in an ISO834 fire.
Fig. 17 Parametric study: Reinforcement temperatures at thin and thick positions of NWC slabs in ISO834 fire.
Fig. 18 Parametric study: Reinforcement temperatures at thin and thick positions of LWC slabs in ISO834 fire.
Fig. 19 Parametric study: The influence of rib angle α on Tc and Th for different groups of LWC ribbed slabs.
Fig. 20 Parametric study: Deflections at Position A (see Fig. 16) of NWC ribbed slabs of Groups 1 to 7 in the ISO834 fire.
Fig. 21 Parametric study: Deflections at Position A (see Fig. 16) of LWC ribbed slabs of Groups 1 to 7 in the ISO834 fire.
Fig. 22 Parametric study: The influence of rib angle α on the deflections at position A (see Fig. 16) for LWC ribbed slabs of Groups 1 to 7, including EC4eff, in the ISO834 fire.

17
Fig. 1

18
Fig. 2
Shell B Shell A
Beam Element
(a) Lim et al.’s model
(b) A typical decking for which Lim’s model is unsuitable

19
Fig. 3
1 2
3 4
5
6
7
8 9
T1 T1 T1 T1 T1 T2 T2 T2
T1 T2 T2
W (width of slab element)
W x Rib Width Ratio (RWR)
Solid slab
Beam
Reinforcement
Ribs
In-plane temperature distribution
A real slab
element
Hs
Hr
Hs
Hr
An orthotropic
element
3D view of the element
Divide the slab into layers
Steel layers
Reference plane Divide the beam into segments
Concrete layers

20
Fig. 4
Hotter Hotter Cooler
s
r
1
2
3 6
4
5
9
8
7
r = -0.774 r = 0 r = 0.774
s =
-0.7
74
s =
0
s =
0.77
4

21
Fig. 5
60°
60mm
34mm
70
(°C) 200 400 600 800 1000 0
(mm)
240°C290°C390°C480°C580°C690°C800°C850°C 80
mm
0

22
Fig. 6
4200
550
600
B
B A A
4800
P1 P2
Plan
290
A192
Dia25
200
75
15
250
Section A-A
290
210
75 Dia 25
Section B-B
20
All dimensions in mm

23
Fig. 7
Temperature (°C)
900
600
300
0
30 60 90 120Time (min)
0
Rib rebar Rib rebar (tested)
Top surface of slab Top surface of slab (tested)
Bottom flange of beam Bottom flange of beam (tested)

24
Fig. 8
P1 (tested)
P2 (tested)
Time (min) 0 30 60 90 120
0
-100
-200
-300
-400
-500
Deflection (mm)
P2 (Effective Stiffness Model)
P1 (Effective Stiffness Model)
P2 (Current model)
P1 (Current Model)

25
Fig. 9
Fig. 10
Time (min) 1815129630
0
20
40
60
80
100
120
P1
P3
P2
P1
P1 (tested)
P2
P2 (tested)P3 (tested)
P3
Central Deflection (mm)
-300
-250
-200
-150
-100
-50
-0
0 30 60 90 120 150 180Time (min)
Temperature (ºC)
Tested Predicted ( Effective Stinessness Model)
Predicted ( Current Model)
Predicted ( Linus Lim’s Model)

26
Fig. 11
9000 9000 9000 9000 9000
00090006
0009
1
2
3
4
A B C D E F
Sandbag loading area
Fire Zone
Mesh overlapping
P1
Area modelled
All dimensions in mm

27
Fig. 12
Time (min)
Temperature (ºC)
100 80 60 40 20 0 0
50
100
150
200
250
300
350
400
450
A
B
CD A (test)
B (test) C (test)
D (test)
A
B
C
D

28
Fig. 13
Time (min)
Deflection (mm)
-200
-400
-600
-800
-1000 100
0
0 20 40 60 80
Case I
Case II
Case III
Tested

29
Fig. 14
Fig. 15
ABBDACBCAD
×
−−+=
2φ
B
D
A
Rib Width Ratio
Depth of Rib (mm)
80
60
40
0.2 0.3 0.6 0.7
1
2
3
4
5 6
7
0
C

30
Fig. 16
9m
6m
Quarter of the slab analysed
Position A
Secondary beam UB305x165x40

31
Fig. 17 (a)
NWC Slabs: A90 Tc
Time (min)
Temperature (ºC)
700
600
500
400
300
200
100
0 0 30 60 90 120 150 180
Group 3 Group 4 Group 5 Group 6 Group 7
Group 2 Group 1

32
Fig. 17 (b)
NWC Slabs: A90 Th
Time (min)
Temperature (ºC)
0 0 30 60 90 120 150 180
Group 3 Group 4 Group 5 Group 6 Group 7
Group 2 Group 1
100
200
300
400
500
600
700
800

33
Fig. 18 (a)
LWC Slabs: A90 Tc
Time (min)
Temperature (ºC)
700
600
500
400
300
200
100
0 0 30 60 90 120 150 180
Group 3 Group 4 Group 5 Group 6 Group 7
Group 2 Group 1

34
Fig. 18 (b)
LWC Slabs: A90 Th
Time (min)
Temperature (ºC)
0 30 60 90 120 150 180
Group 3 Group 4 Group 5 Group 6 Group 7
Group 2 Group 1
700
600
500
400
300
200
100
0

35
Fig. 19 (a)
Time (min)
0 30 60 90 120 180 150 0
200
300
400
500
700
Temperature (ºC) 800 Group 1 - LWC
A75 Th
A90 Tc
A75 Tc
A90 Th
600
100

36
Fig. 19 (b)
Time (min)
0 30 60 90 120 180 150 0
200
300
400
500
700
Temperature (ºC) 800 Group 2 - LWC
600
100
A45 Th
A90 Tc
A45 Tc
A90 Th
TEC4

37
Fig. 19 (c)
Time (min)
0 30 60 90 120 180 150 0
200
300
400
500
700
Temperature (ºC)
Group 3 - LWC
600
100
A60 Th
A90 Tc
A60 Tc
A90 Th
TEC4
38
Fig. 19 (d)
Time (min)
0 30 60 90 120 180 150 0
200
300
400
500
700
Temperature (ºC) 800 Group 4 - LWC
600
100
A45 Tc A45 Th A90 Tc A90 Th
TEC4
A120 Tc A120 Th

39
Fig. 19 (e)
Time (min)
0 30 60 90 120 180 150 0
200
300
400
500
700
Temperature (ºC)
Group 5 - LWC
600
100
A45 Tc A45 Th A90 Tc A90 Th
TEC4
A120 Tc A120 Th

40
Fig. 19 (f)
Time (min)
0 30 60 90 120 180 150 0
200
300
400
500
700
Temperature (ºC)
Group 6 - LWC
600
100
A45 Tc A45 Th A90 Tc A90 Th
TEC4
A120 Tc A120 Th

41
Fig. 19 (g)
Time (min)
0 30 60 90 120 180 150 0
200
300
400
500
700
Temperature (ºC)
Group 7 - LWC
600
100
A45 Tc A45 Th A90 Tc A90 Th
TEC4
A120 Tc A120 Th

42
Fig. 20
Time (min)
Deflection (mm) NWC Slabs: A90
-700
-600
-500
-400
-300
-200
-100
0
0 30 60 90 120 180 150
Group 2
Group 3 Group 4
Group 5
Group 6
Group 7
Group 1

43
Fig. 21
Time (min)
Deflection (mm)
LWC Slabs: A90
-700
-600
-500
-400
-300
-200
-100
0
0 30 60 90 120 180 150
Group 2
Group 3 Group 4
Group 5
Group 6
Group 7
Group 1

44
Fig. 22 (a)
Time (min)
0 30 60 90 120 180 150 -700
-600
-500
-400
-300
-200
-100
Deflection (mm)
0
A75
A90
EC4eff
Group 1 - LWC

45
Fig. 22 (b)
Time (min)
0 30 60 90 120 180 150 -700
-600
-500
-400
-300
-200
-100
Deflection (mm) 0
A45
A90
EC4eff
Group 2 - LWC

46
Fig. 22 (c)
Time (min)
0 30 60 90 120 180 150 -350
-300
-250
-200
-150
-100
-50
Deflection (mm) 0
A60
A90
EC4eff
Group 3 - LWC

47
Fig. 22 (d)
Time (min)
0 30 60 90 120 180 150 -500
-400
-300
-200
-100
Deflection (mm) 0
A45
A90
EC4eff
Group 4 - LWC
A120

48
Fig. 22 (e)
Time (min)
0 30 60 90 120 180 150
-350
-300
-400
-200
-150
-100
-50
Deflection (mm) 0 Group 5 - LWC
-250 A45
A90
EC4eff
A120

49
Fig. 22 (f)
Time (min)
0 30 60 90 120 180 150 -350
-300
-250
-200
-150
-100
-50
Deflection (mm) 0 Group 6 - LWC
A45
A90
EC4eff
A120

50
Fig. 22 (g)
Time (min)
0 30 60 90 120 180 150
-350
-300
-400
-200
-150
-100
-50
Deflection (mm) 0 Group 7 - LWC
-250 A45
A90
EC4eff
A120


![[Composite Cultures] - CORE](https://static.fdokumen.com/doc/165x107/6325e67de491bcb36c0a86c0/composite-cultures-core.jpg)