Ligand Binding Alters the Backbone Mobility of Intestinal Fatty Acid-Binding Protein as Monitored by...
13
Ligand Binding Alters the Backbone Mobility of Intestinal Fatty Acid-Binding Protein as Monitored by 15 N NMR Relaxation and 1 H Exchange ² Michael E. Hodsdon and David P. Cistola* Department of Biochemistry & Molecular Biophysics, Washington UniVersity School of Medicine, St. Louis, Missouri 63110 ReceiVed August 13, 1996; ReVised Manuscript ReceiVed NoVember 26, 1996 X ABSTRACT: The backbone dynamics of the liganded (holo) and unliganded (apo) forms of Escherichia coli-derived rat intestinal fatty acid-binding protein (I-FABP) have been characterized and compared using amide 15 N relaxation and 1 H exchange NMR measurements. The amide 1 H/ 15 N resonances for apo and holo I-FABP were assigned at 25 °C, and gradient- and sensitivity-enhanced 2D experiments were employed to measure 15 N T 1 , T 2 , and { 1 H} 15 N NOE values and relative 1 H saturation transfer rates. The 15 N relaxation parameters were analyzed using five different representations of the spectral density function based on the Lipari and Szabo formalism. A majority of the residues in both apo and holo I-FABP were characterized by relatively slow hydrogen exchange rates, high generalized order parameters, and no conformational exchange terms. However, residues V26-N35, S53-R56, and A73-T76 of apo I-FABP were characterized by rapid hydrogen exchange, low order parameters, and significant conformational exchange. These residues are clustered in a single region of the protein where variability and apparent disorder were previously observed in the chemical shift analyses and in the NOE-derived NMR structures of apo I-FABP. The increased mobility and discrete disorder in the backbone of the apo protein may permit the entry of ligand into the binding cavity. We postulate that the bound fatty acid participates in a series of long- range cooperative interactions that cap and stabilize the C-terminal half of helix II and lead to an ordering of the portal region. This ligand-modulated order-disorder transition has implications for the role of I-FABP in cellular fatty acid transport and targeting. Intestinal fatty acid-binding protein (I-FABP) 1 is a pre- dominately -sheet protein that binds a single molecule of long chain fatty acid. It is abundantly expressed in small intestinal enterocytes and thought to function in the transport and trafficking of fatty acids absorbed from the lumen. However, the precise function of I-FABP is not well- understood, and the molecular mechanisms by which it regulates fatty acid transfer within the cell have not been defined. In particular, it is not clear how fatty acid enters and exits the protein and how the protein delivers fatty acid to target sites in the cell. We recently determined the NMR solution structures of the liganded and unliganded forms of I-FABP in order to learn more about its conformational properties in solution (Hodsdon et al., 1995, 1996; Hodsdon & Cistola, 1997). The holo and apo structures were determined using essentially identical 3D (three-dimensional) triple-resonance NMR protocols, and each structure was based on over 3300 conformational restraints. Unlike the holo form, the en- semble of NMR structures of apo I-FABP exhibited vari- ability in a discrete region of the protein backbone (Hodsdon & Cistola, 1997). The apparent disorder was most pro- nounced in residues 29-36 and 54-57, corresponding to the distal half of R-helix II, the linker between helix II and -strand B, and the turn between -strands C and D (Figure 1). The disorder in apo I-FABP was also shown by dif- ferences in the 1 H/ 13 C consensus chemical shift indices and the positions of missing amide proton resonances relative to the holo protein. This backbone disorder, which was not a feature of the 1.2 Å X-ray crystal structure (Scapin et al., 1992), 2 was characterized by a destabilization of long-range interactions between helix II and the C-D turn and a fraying of the C-terminal half of helix II. This disordered region of the protein backbone appears to consititute a flexible, dynamic portal that permits the entry of fatty acid. We proposed that the binding of fatty acid leads to an ordering of helix II by stabilizing a series of long-range cooperative interactions resembling a C-terminal helix capping box (Hodsdon & Cistola, 1997). In the present study, we have characterized the dynamic properties of I-FABP in order to further evaluate the apparent backbone disorder observed in the NMR structure of the apo ² This work was supported by grants from the National Science Foundation (MCB-9205665 to D.P.C.), the American Digestive Health Foundation, and institutional startup funds. The Unity-500 spectrometer was supported in part by the Markey Center for Research in the Molecular Biology of Disease at Washington University. D.P.C. gratefully acknowledges a Johnson & Johnson/Merck Research Scholar Award from the American Digestive Health Foundation. * To whom correspondence should be addressed: Campus Box 8231, Washington University School of Medicine, 660 South Euclid Ave., St. Louis, MO 63110-1093. Phone: 314-362-4382. Fax: 314-362-4153. E-mail: [email protected]. X Abstract published in AdVance ACS Abstracts, February 1, 1997. 1 Abbreviations: iLBPs, intracellular lipid-binding proteins; I-FABP, intestinal fatty acid-binding protein; H-FABP, heart/muscle fatty acid- binding protein; A-LBP, adipocyte lipid-binding protein; I-LBP, ideal lipid-binding protein; NOE, nuclear Overhauser effect; HSQC, hetero- nuclear single-quantum correlation spectroscopy; T1, longitudinal relaxation time constant; T2, transverse relaxation time constant; τm, overall correlation time; τe, effective correlation time for internal motions; S 2 , generalized order parameter; Rex, conformational exchange term; 2D, two-dimensional. 2 In the 1.2 Å X-ray crystal structure of apo I-FABP, helix II is well- defined. In addition, the main chain temperature factors for residues 25-36 and 54-57 are low and not significantly different from the rest of the protein backbone (1IFC; Brookhaven PDB). There are no obvious or specific intermolecular contacts in the crystalline lattice that might lead to an ordering of these residues. 2278 Biochemistry 1997, 36, 2278-2290 S0006-2960(96)02018-1 CCC: $14.00 © 1997 American Chemical Society
Transcript of Ligand Binding Alters the Backbone Mobility of Intestinal Fatty Acid-Binding Protein as Monitored by...
Ligand Binding Alters the Backbone Mobility of Intestinal Fatty Acid-BindingProtein as Monitored by15N NMR Relaxation and1H Exchange†
Michael E. Hodsdon and David P. Cistola*
Department of Biochemistry & Molecular Biophysics, Washington UniVersity School of Medicine, St. Louis, Missouri 63110
ReceiVed August 13, 1996; ReVised Manuscript ReceiVed NoVember 26, 1996X
ABSTRACT: The backbone dynamics of the liganded (holo) and unliganded (apo) forms ofEscherichiacoli-derived rat intestinal fatty acid-binding protein (I-FABP) have been characterized and compared usingamide15N relaxation and1H exchange NMR measurements. The amide1H/15N resonances for apo andholo I-FABP were assigned at 25°C, and gradient- and sensitivity-enhanced 2D experiments were employedto measure15N T1, T2, and{1H}15N NOE values and relative1H saturation transfer rates. The15N relaxationparameters were analyzed using five different representations of the spectral density function based onthe Lipari and Szabo formalism. A majority of the residues in both apo and holo I-FABP were characterizedby relatively slow hydrogen exchange rates, high generalized order parameters, and no conformationalexchange terms. However, residues V26-N35, S53-R56, and A73-T76 of apo I-FABP werecharacterized by rapid hydrogen exchange, low order parameters, and significant conformational exchange.These residues are clustered in a single region of the protein where variability and apparent disorder werepreviously observed in the chemical shift analyses and in the NOE-derived NMR structures of apo I-FABP.The increased mobility and discrete disorder in the backbone of the apo protein may permit the entry ofligand into the binding cavity. We postulate that the bound fatty acid participates in a series of long-range cooperative interactions that cap and stabilize the C-terminal half of helix II and lead to an orderingof the portal region. This ligand-modulated order-disorder transition has implications for the role ofI-FABP in cellular fatty acid transport and targeting.
Intestinal fatty acid-binding protein (I-FABP)1 is a pre-dominatelyâ-sheet protein that binds a single molecule oflong chain fatty acid. It is abundantly expressed in smallintestinal enterocytes and thought to function in the transportand trafficking of fatty acids absorbed from the lumen.However, the precise function of I-FABP is not well-understood, and the molecular mechanisms by which itregulates fatty acid transfer within the cell have not beendefined. In particular, it is not clear how fatty acid entersand exits the protein and how the protein delivers fatty acidto target sites in the cell.We recently determined the NMR solution structures of
the liganded and unliganded forms of I-FABP in order tolearn more about its conformational properties in solution(Hodsdonet al., 1995, 1996; Hodsdon & Cistola, 1997). The
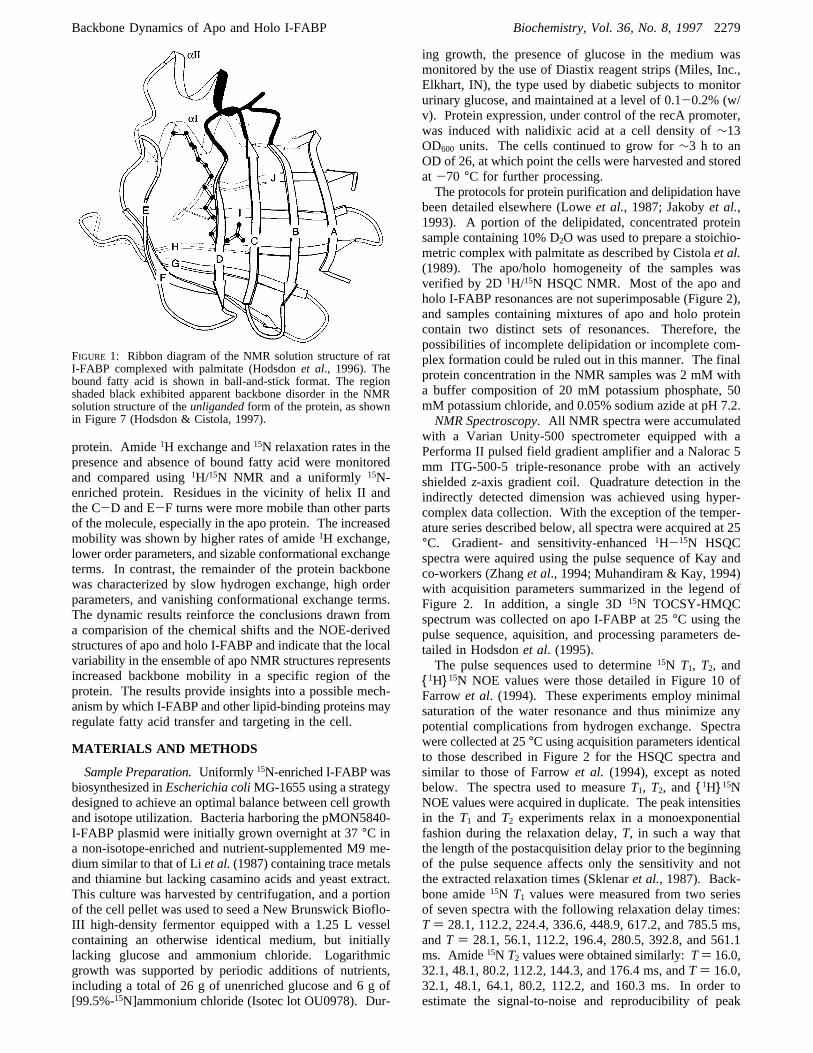
holo and apo structures were determined using essentiallyidentical 3D (three-dimensional) triple-resonance NMRprotocols, and each structure was based on over 3300conformational restraints. Unlike the holo form, the en-semble of NMR structures of apo I-FABP exhibited vari-ability in a discrete region of the protein backbone (Hodsdon& Cistola, 1997). The apparent disorder was most pro-nounced in residues 29-36 and 54-57, corresponding tothe distal half ofR-helix II, the linker between helix II andâ-strand B, and the turn betweenâ-strands C and D (Figure1). The disorder in apo I-FABP was also shown by dif-ferences in the1H/13C consensus chemical shift indices andthe positions of missing amide proton resonances relative tothe holo protein. This backbone disorder, which was not afeature of the 1.2 Å X-ray crystal structure (Scapinet al.,1992),2 was characterized by a destabilization of long-rangeinteractions between helix II and the C-D turn and a frayingof the C-terminal half of helix II. This disordered region ofthe protein backbone appears to consititute a flexible,dynamic portal that permits the entry of fatty acid. Weproposed that the binding of fatty acid leads to an orderingof helix II by stabilizing a series of long-range cooperativeinteractions resembling a C-terminal helix capping box(Hodsdon & Cistola, 1997).In the present study, we have characterized the dynamic
properties of I-FABP in order to further evaluate the apparentbackbone disorder observed in the NMR structure of the apo
† This work was supported by grants from the National ScienceFoundation (MCB-9205665 to D.P.C.), the American Digestive HealthFoundation, and institutional startup funds. The Unity-500 spectrometerwas supported in part by the Markey Center for Research in theMolecular Biology of Disease at Washington University. D.P.C.gratefully acknowledges a Johnson & Johnson/Merck Research ScholarAward from the American Digestive Health Foundation.* To whom correspondence should be addressed: Campus Box 8231,
Washington University School of Medicine, 660 South Euclid Ave.,St. Louis, MO 63110-1093. Phone: 314-362-4382. Fax: 314-362-4153.E-mail: [email protected].
X Abstract published inAdVance ACS Abstracts,February 1, 1997.1 Abbreviations: iLBPs, intracellular lipid-binding proteins; I-FABP,
intestinal fatty acid-binding protein; H-FABP, heart/muscle fatty acid-binding protein; A-LBP, adipocyte lipid-binding protein; I-LBP, ideallipid-binding protein; NOE, nuclear Overhauser effect; HSQC, hetero-nuclear single-quantum correlation spectroscopy;T1, longitudinalrelaxation time constant;T2, transverse relaxation time constant;τm,overall correlation time;τe, effective correlation time for internalmotions;S2, generalized order parameter;Rex, conformational exchangeterm; 2D, two-dimensional.
2 In the 1.2 Å X-ray crystal structure of apo I-FABP, helix II is well-defined. In addition, the main chain temperature factors for residues25-36 and 54-57 are low and not significantly different from the restof the protein backbone (1IFC; Brookhaven PDB). There are no obviousor specific intermolecular contacts in the crystalline lattice that mightlead to an ordering of these residues.
2278 Biochemistry1997,36, 2278-2290
S0006-2960(96)02018-1 CCC: $14.00 © 1997 American Chemical Society
protein. Amide1H exchange and15N relaxation rates in thepresence and absence of bound fatty acid were monitoredand compared using1H/15N NMR and a uniformly15N-enriched protein. Residues in the vicinity of helix II andthe C-D and E-F turns were more mobile than other partsof the molecule, especially in the apo protein. The increasedmobility was shown by higher rates of amide1H exchange,lower order parameters, and sizable conformational exchangeterms. In contrast, the remainder of the protein backbonewas characterized by slow hydrogen exchange, high orderparameters, and vanishing conformational exchange terms.The dynamic results reinforce the conclusions drawn froma comparision of the chemical shifts and the NOE-derivedstructures of apo and holo I-FABP and indicate that the localvariability in the ensemble of apo NMR structures representsincreased backbone mobility in a specific region of theprotein. The results provide insights into a possible mech-anism by which I-FABP and other lipid-binding proteins mayregulate fatty acid transfer and targeting in the cell.
MATERIALS AND METHODS
Sample Preparation.Uniformly 15N-enriched I-FABP wasbiosynthesized inEscherichia coliMG-1655 using a strategydesigned to achieve an optimal balance between cell growthand isotope utilization. Bacteria harboring the pMON5840-I-FABP plasmid were initially grown overnight at 37°C ina non-isotope-enriched and nutrient-supplemented M9 me-dium similar to that of Liet al.(1987) containing trace metalsand thiamine but lacking casamino acids and yeast extract.This culture was harvested by centrifugation, and a portionof the cell pellet was used to seed a New Brunswick Bioflo-III high-density fermentor equipped with a 1.25 L vesselcontaining an otherwise identical medium, but initiallylacking glucose and ammonium chloride. Logarithmicgrowth was supported by periodic additions of nutrients,including a total of 26 g of unenriched glucose and 6 g of[99.5%-15N]ammonium chloride (Isotec lot OU0978). Dur-
ing growth, the presence of glucose in the medium wasmonitored by the use of Diastix reagent strips (Miles, Inc.,Elkhart, IN), the type used by diabetic subjects to monitorurinary glucose, and maintained at a level of 0.1-0.2% (w/v). Protein expression, under control of the recA promoter,was induced with nalidixic acid at a cell density of∼13OD600 units. The cells continued to grow for∼3 h to anOD of 26, at which point the cells were harvested and storedat -70 °C for further processing.The protocols for protein purification and delipidation have
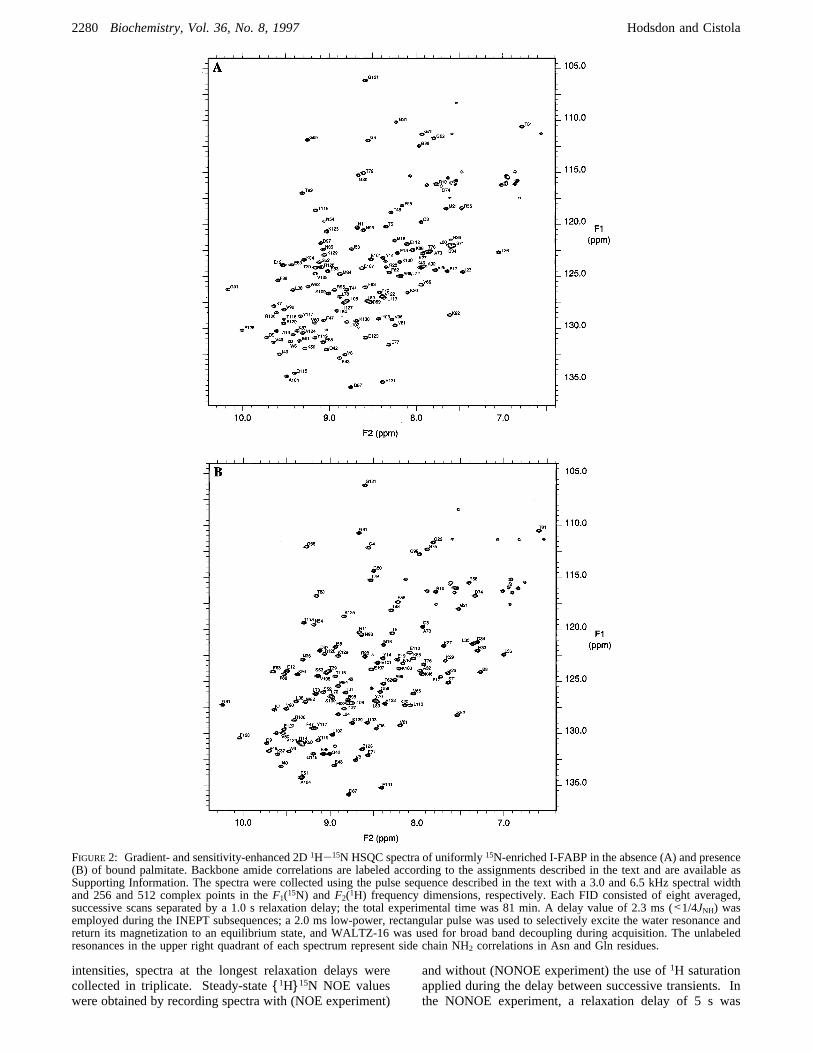
been detailed elsewhere (Loweet al., 1987; Jakobyet al.,1993). A portion of the delipidated, concentrated proteinsample containing 10% D2O was used to prepare a stoichio-metric complex with palmitate as described by Cistolaet al.(1989). The apo/holo homogeneity of the samples wasverified by 2D1H/15N HSQC NMR. Most of the apo andholo I-FABP resonances are not superimposable (Figure 2),and samples containing mixtures of apo and holo proteincontain two distinct sets of resonances. Therefore, thepossibilities of incomplete delipidation or incomplete com-plex formation could be ruled out in this manner. The finalprotein concentration in the NMR samples was 2 mM witha buffer composition of 20 mM potassium phosphate, 50mM potassium chloride, and 0.05% sodium azide at pH 7.2.NMR Spectroscopy. All NMR spectra were accumulated
with a Varian Unity-500 spectrometer equipped with aPerforma II pulsed field gradient amplifier and a Nalorac 5mm ITG-500-5 triple-resonance probe with an activelyshieldedz-axis gradient coil. Quadrature detection in theindirectly detected dimension was achieved using hyper-complex data collection. With the exception of the temper-ature series described below, all spectra were acquired at 25°C. Gradient- and sensitivity-enhanced1H-15N HSQCspectra were aquired using the pulse sequence of Kay andco-workers (Zhanget al., 1994; Muhandiram & Kay, 1994)with acquisition parameters summarized in the legend ofFigure 2. In addition, a single 3D15N TOCSY-HMQCspectrum was collected on apo I-FABP at 25°C using thepulse sequence, aquisition, and processing parameters de-tailed in Hodsdonet al. (1995).The pulse sequences used to determine15N T1, T2, and
{1H}15N NOE values were those detailed in Figure 10 ofFarrowet al. (1994). These experiments employ minimalsaturation of the water resonance and thus minimize anypotential complications from hydrogen exchange. Spectrawere collected at 25°C using acquisition parameters identicalto those described in Figure 2 for the HSQC spectra andsimilar to those of Farrowet al. (1994), except as notedbelow. The spectra used to measureT1, T2, and{1H}15NNOE values were acquired in duplicate. The peak intensitiesin the T1 and T2 experiments relax in a monoexponentialfashion during the relaxation delay,T, in such a way thatthe length of the postacquisition delay prior to the beginningof the pulse sequence affects only the sensitivity and notthe extracted relaxation times (Sklenaret al., 1987). Back-bone amide15N T1 values were measured from two seriesof seven spectra with the following relaxation delay times:T ) 28.1, 112.2, 224.4, 336.6, 448.9, 617.2, and 785.5 ms,andT ) 28.1, 56.1, 112.2, 196.4, 280.5, 392.8, and 561.1ms. Amide15N T2 values were obtained similarly:T) 16.0,32.1, 48.1, 80.2, 112.2, 144.3, and 176.4 ms, andT ) 16.0,32.1, 48.1, 64.1, 80.2, 112.2, and 160.3 ms. In order toestimate the signal-to-noise and reproducibility of peak
FIGURE 1: Ribbon diagram of the NMR solution structure of ratI-FABP complexed with palmitate (Hodsdonet al., 1996). Thebound fatty acid is shown in ball-and-stick format. The regionshaded black exhibited apparent backbone disorder in the NMRsolution structure of theunligandedform of the protein, as shownin Figure 7 (Hodsdon & Cistola, 1997).
Backbone Dynamics of Apo and Holo I-FABP Biochemistry, Vol. 36, No. 8, 19972279
intensities, spectra at the longest relaxation delays werecollected in triplicate. Steady-state{1H}15N NOE valueswere obtained by recording spectra with (NOE experiment)
and without (NONOE experiment) the use of1H saturationapplied during the delay between successive transients. Inthe NONOE experiment, a relaxation delay of 5 s was
FIGURE2: Gradient- and sensitivity-enhanced 2D1H-15N HSQC spectra of uniformly15N-enriched I-FABP in the absence (A) and presence(B) of bound palmitate. Backbone amide correlations are labeled according to the assignments described in the text and are available asSupporting Information. The spectra were collected using the pulse sequence described in the text with a 3.0 and 6.5 kHz spectral widthand 256 and 512 complex points in theF1(15N) andF2(1H) frequency dimensions, respectively. Each FID consisted of eight averaged,successive scans separated by a 1.0 s relaxation delay; the total experimental time was 81 min. A delay value of 2.3 ms (<1/4JNH) wasemployed during the INEPT subsequences; a 2.0 ms low-power, rectangular pulse was used to selectively excite the water resonance andreturn its magnetization to an equilibrium state, and WALTZ-16 was used for broad band decoupling during acquisition. The unlabeledresonances in the upper right quadrant of each spectrum represent side chain NH2 correlations in Asn and Gln residues.
2280 Biochemistry, Vol. 36, No. 8, 1997 Hodsdon and Cistola
employed between transients, while the NOE experimentemployed a 2 s delay plus 3 s of proton presaturationachieved with the use of 120° 1H pulses applied every 5 ms(Markley et al., 1971).Data Processing and Analysis. Initial processing of the
time-domain spectra was performed on a Sun SPARC-2workstation using VNMR v. 4.2 (Varian Associates). Thespectra were zero-filled to 512× 1024 real points andpseudo-echo weighted along theF1 dimension with a-5Hz line broadening and a Gaussian factor of 0.056. Forspectral analysis, the processed and phased frequency-domainspectra were imported into NMR Compass v. 2.5 (MolecularSimulations, Inc.) running on a Silicon Graphics INDY/R4400 workstation. Peak intensities in the spectra wereestimated from their peak heights obtained using theautomated peak-picking and refinement routine containedwithin the software. An analysis of selected relaxation decaycurves revealed essentially identical decay results whenintensities were measured according to peak heights orvolumes. However, measurement of peak volumes generallyproduced increased scatter and uncertainty in the resultingdecay curves, possibly resulting from the difficulty ofdetermining the appropriate spectral baseline for volumemeasurements. Hence, peak heights were considered moreprecise and reliable indicators of relative intensity.For both theT1 andT2 spectra, peak intensities from the
two time courses were normalized according to the first delaytime and combined for fitting. Relaxation times weredetermined by fitting to a two-parameter function of the form
whereI(t) is the intensity after a delay of timet andI0 is theinitial intensity. Optimum values for the parameters weredetermined by the method of least-squares fitting performedusing a modified Powell minimization algorithm in thesoftware package SCIENTIST (MicroMath Scientific Soft-ware, Salt Lake City, UT). The goodness of fit of theexperimental data to the monoexponential decay function wasassessed in SCIENTIST using 95% confidence limits cal-culated by a rigorous search3 of the error function. Forpurposes of input to the spectral density function analysissoftware described below, the standard errors of theT1 andT2 relaxation times were estimated as1/2 of the 95%confidence limits.4
Steady-state{1H}15N NOE values were determined fromthe ratio of the peak intensities with and without1H saturationand averaged for the duplicate spectra. The standarddeviation of the NOE was estimated from an analysis of the
background noise in these spectra as detailed in Farrowetal. (1994). Standard deviations calculated in this fashionwere found to be comparable to the difference between thevalues calculated from the separate spectra; the larger of thetwo was utilized as the estimate of the standard error forinput to the spectral density calculations.The T1 and T2 relaxation times and the NOE of the
backbone amide15N are influenced by the strength of thedipolar interaction with its attached proton and, to a lesserextent, the chemical shift anisotropy of the15N nucleus(Abragam, 1961). In solution, the motions of the N-H bondaxis are responsible for the strength of the dipolar interactionand, hence, the relaxation of the amide15N. These motionsare characterized by a set of spectral density functions,J(ω),at five distinct frequencies. The spectral densities areproportional to the amplitude of the fluctuating magneticfields at specific frequencies and can be directly related tothe three15N relaxation parameters (Abragam, 1961; Farrowet al., 1994).
The constantsd2 andc2 are defined as
whereγH andγN are the gyromagnetic ratios of the1H and15N nuclei, respectively,ωH and ωN are their Larmorprecessional frequencies, respectively,rNH is their inter-nuclear distance (1.02 Å), andH0 is the magnetic fieldstrength. The parallel and perpendicular components of theaxially symmetrical15N chemical shift tensor are representedby σ| andσ⊥, respectively. The assumption of an axiallysymmetric chemical shift tensor has been shown to be validfor protein-backbone amides and has a value of-160 ppmfor σ| - σ⊥ (Hiyamaet al., 1988).In order to obtain useful information about protein
dynamics from the15N relaxation parameters, a functionalform for the spectral density is required. Three separatedescriptions of the spectral density are often used, eachexpressing a different dependence on the molecular motionsresponsible for relaxation. The first of these is known asthe model-free formalism (Lipari & Szabo, 1982a,b) andemploys a minimum of parameters to describe the overalltumbling of the macromolecule and its internal motions withthe expression
The dynamics of each backbone amide are characterized bya time-correlation function factorizable into two independentcomponents: the overall tumbling of the macromolecule and
3 Statistical calculations were performed in SCIENTIST using arigorous modeling of the support plane confidence ranges (Boxet al.,1978) with the underlying assumption of correlated fitting parametersand nonlinearity of the error function near the minimum.
4 The spectral density analysis algorithm of Farrowet al. (1994)required estimates of the standard deviation of the measured relaxationparameters. The standard deviation is defined for a Gaussian or normalpopulation distribution at the 67% confidence limit, and the 95% limitis equal to 1.96 times the standard deviation. However, 95% confidencelimits were determined in SCIENTIST without the assumption of anormal distribution. For the relaxation analysis, the standard deviationswere estimated by dividing the 95% confidence limits by 1.96. Becausethe 95% confidence limits determined in the more rigorous support-plane analysis are at least twice those determined using a normaldistribution, the estimates of the standard deviations were larger thanif a simpler statistical model had been used.
I(t) ) I0 exp(-t/T1,2) (1)
T1-1 ) d2[J(ωH-ωN) + 3J(ωN) + 6J(ωH+ωN)] +
c2J(ωN) (2)
T22 ) 0.5d2[4J(0)+ J(ωH-ωN) + 3J(ωN) + 6J(ωH) +
6J(ωH+ωN)] + (1/6)c2[3J(ωN) + 4J(0)] (3)
NOE) 1+ (γH/γN)d2[6J(ωH+ωN) - J(ωH-ωN)]T1 (4)
d2 ) 0.1γH2γN
2h2/(4π2)⟨1/rNH3⟩2 (5)
c2 ) (2/15)γN2H0
2(σ| -σ⊥)2 (6)
J(ω) )S2τm
1+ ω2τm2
+(1- S2)τ
(1+ ω2τ2)(7)
Backbone Dynamics of Apo and Holo I-FABP Biochemistry, Vol. 36, No. 8, 19972281
the internal motions of the N-H bond vector. The correla-tion function for the overall tumbling is assumed to beisotropic and monoexponential with the time constantτm.The internal motions are approximated by a correlationfunction of the form
whereS2 is known as the generalized order parameter, amodel-independent measure of the degree of spatial restric-tion of the motion bounded by 0e S2 e 1. If the internalmotion is isotropic,S2 vanishes; whereas, when the amideis completely restricted in its motion,S2 equals unity. Theeffective correlation time resulting from internal motions isτe, where
The second model of the spectral density function con-sidered invokes the use of an additional term,Rex, to accountfor the contribution to the transverse relaxation rate fromprocesses other than the dipole-dipole interaction andchemical shift anisotropy. In most cases, these contributionsare the result of conformational exchange averaging. Theadditional term is included by a modification of the transverserelaxation rate:
where the DD and the CSA subscripts refer to the contribu-tions of the dipole-dipole interaction and the chemical shiftanisotropy to the relaxation, respectively. Whereas thegeneralized order parameter and internal correlation time aresensitive to motions faster than the overall correlation time(τe is generally in the range of nanoseconds to picoseconds),chemical exchange processes contributing to theRex termoccur on a time scale several orders of magnitude slower(milliseconds to microseconds). Nicholsonet al.(1995) haveshown that for a single exchange process involving twoequally populated statesRex is insignificant unless theexchange time constanttex ()2/k), wherek is the rate constantfor the exchange, is greater than 10-6 s.Finally, an extended form of the model-free formalism has
been developed (Cloreet al., 1990a,b) to describe internalmotions that take place on two distinct time scales, differingby at least 1 order of magnitude, and affecting all three NMRrelaxation parameters:T1, T2, and NOE. The generalizedorder parameter then becomes a product of the individualfast and slow time scale order parameters,
Assuming that the correlation time describing the faster ofthe two time scales,τf, is sufficiently small so as to make aneglibible contribution to the relaxation, the extended spectraldensity can be described
where the effective correlation time for slow internal motions,τs, is included in the relationship
In order to determine the most appropriate form of thespectral density for modeling the15N NMR relaxation of eachresidue, the protocol described by Farrowet al. (1994) wasfollowed. Each spectral density function was fit to therelaxation parameters using a nonlinear least-squares opti-mization and Monte Carlo error analysis according to theequation
where T1c, T2c, and NOEc are the relaxation parameterscalculated from the spectral density function andσT1, σT2,andσNOE are the estimates of the standard error (describedabove) of the experimentally determined parameters:T1e,T2e, and NOEe. Overall, five representations of the spectraldensity function were considered. The first two were basedsimply on the single time scale model-free formalism givenin eq 7 with fitting ofS2 alone andτe fixed at zero or fittingof bothS2 andτe. The next two added anRex term to themodel-free formalism and provided fits to either all threeparameters (S2, τe, andRex) or justS2 andRex. The extendedform of the model-free formalism served as the finalrepresentation of the spectral density function, fitting to theparametersS2, Ss2, andτe.The various representations of the spectral density function
described above, all based on the Lipari and Szabo formal-ism, have been widely used and provide a generallyacceptable framework for interpreting15N relaxation data forproteins. However, there are several known limitations,including the inherent assumptions about the functional formof the spectral density function, the insensitivity ofS2 tomotions slower than the nanosecond time scale, and thedifficulty evaluating the exact physical meaning ofτe. Tocircumvent these limitations, several elegant proceduresemploying full and reduced spectral density mapping havebeen proposed (Peng & Wagner, 1992; Farrowet al., 1995;Ishima & Nagayama, 1995; Lefe`vre et al., 1996). In thecurrent study, we were more concerned with identifyingpatterns of relative mobility throughout the sequence andchanges on ligand binding; we were less concerned withdetermining the exact physical meaning of specific valuesof a given motional parameter. Therefore, with the abovelimitations in mind, we considered the various Lipari andSzabo analyses described above to be adequate for the currentstudy.
RESULTS1H/15N HSQC Spectra and Resonance Assignments. Back-
bone amide1H and 15N assignments at 25°C were estab-lished for 119 of the 131 residues of both apo and holoI-FABP. In previous studies, the1H, 13C, and15N chemicalshift assignments for I-FABP complexed with palmitate at37 °C (Hodsdonet al., 1995, 1996) and apo I-FABP at 33°C (Hodsdon & Cistola, 1997) were reported. In order toassign backbone amide resonances at 25°C for the currentstudy, a series of 2D1H-15N HSQC experiments werecollected at temperature values of 37, 33, 29, and 25°C.With a few exceptions, backbone amide resonance assign-ments easily migrated across the temperature range. A 3D15N TOCSY-HMQC spectrum was aquired at 25°C toconfirm and/or establish any remaining assignments. In the
C1(t) ) S2 + (1- S2)e-t/τe (8)
1/τ ) 1/τm + 1/τe (9)
1/T2 ) 1/T2(DD) + 1/T2(CSA)) Rex (10)
S2 ) Sf2Ss
2 (11)
J(ω) )S2tm
1+ ω2τm2
+(Sf
2 - S2)τ
1+ ω2τ2(12)
1/τ ) 1/τm + 1/τs (13)
ø2 )(T1c - T1e)
2
σT12
+(T2c - T2e)
2
σT22
+(TNOEc - TNOEe)
2
σNOE2
(14)
2282 Biochemistry, Vol. 36, No. 8, 1997 Hodsdon and Cistola
original assignment of apo I-FABP at 33°C, backbone1H/15N resonances were missing for 23 residues (Hodsdon &Cistola, 1997), 11 more than were missing in a nearlyidentical study of holo protein (Hodsdonet al., 1995). Inthe current study, we were able to observe these 11 missingresonances by using gradient-enhanced pulse sequencesdesigned to minimize saturation of the solvent resonance andby decreasing the temperature from 33 to 25°C to lowerthe amide hydrogen exchange rate. Figure 2 displays the25°C 1H/15N HSQC spectra of apo (panel A) and holo (panelB) I-FABP. The backbone amide assignments used in thepresent study are labeled in the figure and are available asSupporting Information.Amide Hydrogen Exchange Measured by Saturation
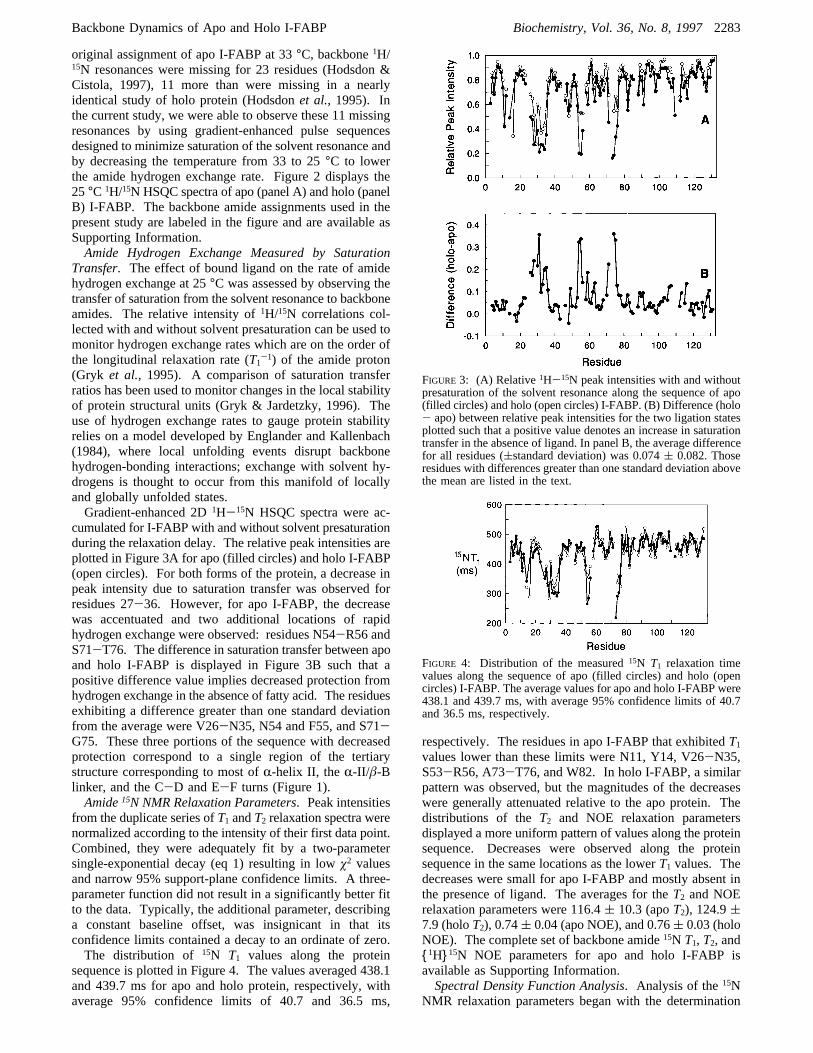
Transfer. The effect of bound ligand on the rate of amidehydrogen exchange at 25°C was assessed by observing thetransfer of saturation from the solvent resonance to backboneamides. The relative intensity of1H/15N correlations col-lected with and without solvent presaturation can be used tomonitor hydrogen exchange rates which are on the order ofthe longitudinal relaxation rate (T1-1) of the amide proton(Gryk et al., 1995). A comparison of saturation transferratios has been used to monitor changes in the local stabilityof protein structural units (Gryk & Jardetzky, 1996). Theuse of hydrogen exchange rates to gauge protein stabilityrelies on a model developed by Englander and Kallenbach(1984), where local unfolding events disrupt backbonehydrogen-bonding interactions; exchange with solvent hy-drogens is thought to occur from this manifold of locallyand globally unfolded states.Gradient-enhanced 2D1H-15N HSQC spectra were ac-
cumulated for I-FABP with and without solvent presaturationduring the relaxation delay. The relative peak intensities areplotted in Figure 3A for apo (filled circles) and holo I-FABP(open circles). For both forms of the protein, a decrease inpeak intensity due to saturation transfer was observed forresidues 27-36. However, for apo I-FABP, the decreasewas accentuated and two additional locations of rapidhydrogen exchange were observed: residues N54-R56 andS71-T76. The difference in saturation transfer between apoand holo I-FABP is displayed in Figure 3B such that apositive difference value implies decreased protection fromhydrogen exchange in the absence of fatty acid. The residuesexhibiting a difference greater than one standard deviationfrom the average were V26-N35, N54 and F55, and S71-G75. These three portions of the sequence with decreasedprotection correspond to a single region of the tertiarystructure corresponding to most ofR-helix II, the R-II/â-Blinker, and the C-D and E-F turns (Figure 1).Amide15N NMR Relaxation Parameters. Peak intensities
from the duplicate series ofT1 andT2 relaxation spectra werenormalized according to the intensity of their first data point.Combined, they were adequately fit by a two-parametersingle-exponential decay (eq 1) resulting in lowø2 valuesand narrow 95% support-plane confidence limits. A three-parameter function did not result in a significantly better fitto the data. Typically, the additional parameter, describinga constant baseline offset, was insignicant in that itsconfidence limits contained a decay to an ordinate of zero.The distribution of 15N T1 values along the protein
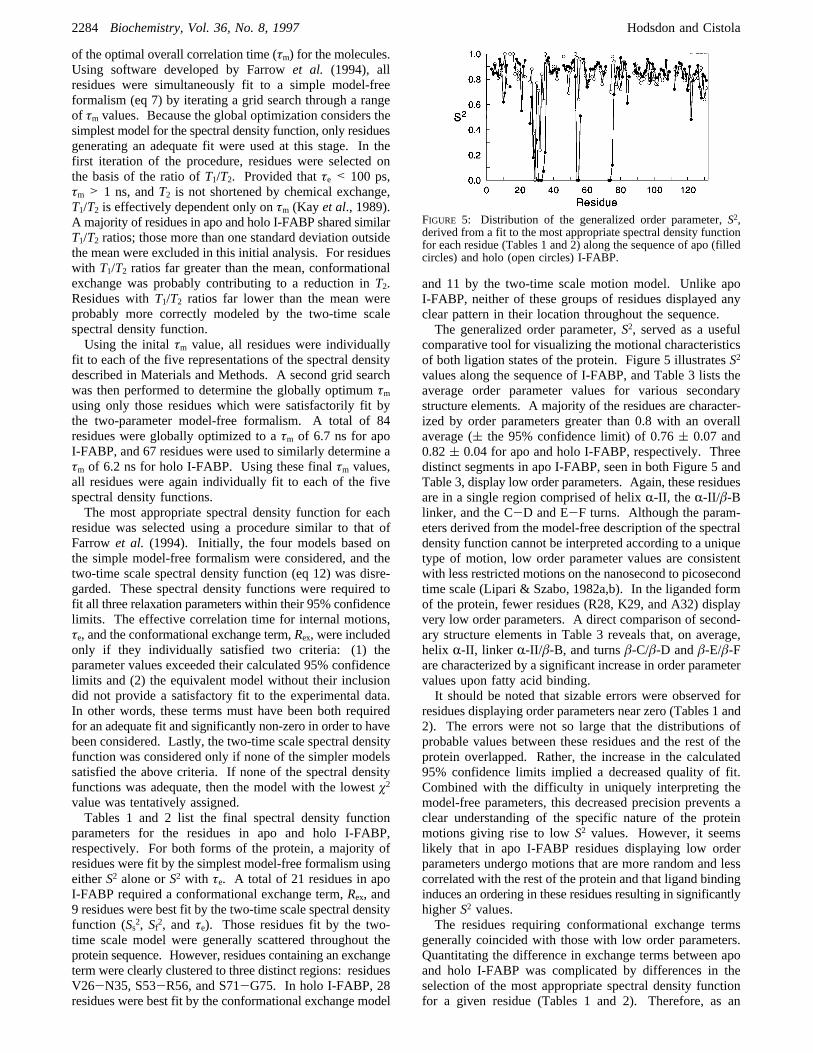
sequence is plotted in Figure 4. The values averaged 438.1and 439.7 ms for apo and holo protein, respectively, withaverage 95% confidence limits of 40.7 and 36.5 ms,
respectively. The residues in apo I-FABP that exhibitedT1values lower than these limits were N11, Y14, V26-N35,S53-R56, A73-T76, and W82. In holo I-FABP, a similarpattern was observed, but the magnitudes of the decreaseswere generally attenuated relative to the apo protein. Thedistributions of theT2 and NOE relaxation parametersdisplayed a more uniform pattern of values along the proteinsequence. Decreases were observed along the proteinsequence in the same locations as the lowerT1 values. Thedecreases were small for apo I-FABP and mostly absent inthe presence of ligand. The averages for theT2 and NOErelaxation parameters were 116.4( 10.3 (apoT2), 124.9(7.9 (holoT2), 0.74( 0.04 (apo NOE), and 0.76( 0.03 (holoNOE). The complete set of backbone amide15N T1, T2, and{1H}15N NOE parameters for apo and holo I-FABP isavailable as Supporting Information.Spectral Density Function Analysis. Analysis of the15N
NMR relaxation parameters began with the determination
FIGURE 3: (A) Relative1H-15N peak intensities with and withoutpresaturation of the solvent resonance along the sequence of apo(filled circles) and holo (open circles) I-FABP. (B) Difference (holo- apo) between relative peak intensities for the two ligation statesplotted such that a positive value denotes an increase in saturationtransfer in the absence of ligand. In panel B, the average differencefor all residues ((standard deviation) was 0.074( 0.082. Thoseresidues with differences greater than one standard deviation abovethe mean are listed in the text.
FIGURE 4: Distribution of the measured15N T1 relaxation timevalues along the sequence of apo (filled circles) and holo (opencircles) I-FABP. The average values for apo and holo I-FABP were438.1 and 439.7 ms, with average 95% confidence limits of 40.7and 36.5 ms, respectively.
Backbone Dynamics of Apo and Holo I-FABP Biochemistry, Vol. 36, No. 8, 19972283
of the optimal overall correlation time (τm) for the molecules.Using software developed by Farrowet al. (1994), allresidues were simultaneously fit to a simple model-freeformalism (eq 7) by iterating a grid search through a rangeof τm values. Because the global optimization considers thesimplest model for the spectral density function, only residuesgenerating an adequate fit were used at this stage. In thefirst iteration of the procedure, residues were selected onthe basis of the ratio ofT1/T2. Provided thatτe < 100 ps,τm > 1 ns, andT2 is not shortened by chemical exchange,T1/T2 is effectively dependent only onτm (Kay et al., 1989).A majority of residues in apo and holo I-FABP shared similarT1/T2 ratios; those more than one standard deviation outsidethe mean were excluded in this initial analysis. For residueswith T1/T2 ratios far greater than the mean, conformationalexchange was probably contributing to a reduction inT2.Residues withT1/T2 ratios far lower than the mean wereprobably more correctly modeled by the two-time scalespectral density function.Using the initalτm value, all residues were individually
fit to each of the five representations of the spectral densitydescribed in Materials and Methods. A second grid searchwas then performed to determine the globally optimumτmusing only those residues which were satisfactorily fit bythe two-parameter model-free formalism. A total of 84residues were globally optimized to aτm of 6.7 ns for apoI-FABP, and 67 residues were used to similarly determine aτm of 6.2 ns for holo I-FABP. Using these finalτm values,all residues were again individually fit to each of the fivespectral density functions.The most appropriate spectral density function for each
residue was selected using a procedure similar to that ofFarrow et al. (1994). Initially, the four models based onthe simple model-free formalism were considered, and thetwo-time scale spectral density function (eq 12) was disre-garded. These spectral density functions were required tofit all three relaxation parameters within their 95% confidencelimits. The effective correlation time for internal motions,τe, and the conformational exchange term,Rex, were includedonly if they individually satisfied two criteria: (1) theparameter values exceeded their calculated 95% confidencelimits and (2) the equivalent model without their inclusiondid not provide a satisfactory fit to the experimental data.In other words, these terms must have been both requiredfor an adequate fit and significantly non-zero in order to havebeen considered. Lastly, the two-time scale spectral densityfunction was considered only if none of the simpler modelssatisfied the above criteria. If none of the spectral densityfunctions was adequate, then the model with the lowestø2value was tentatively assigned.Tables 1 and 2 list the final spectral density function
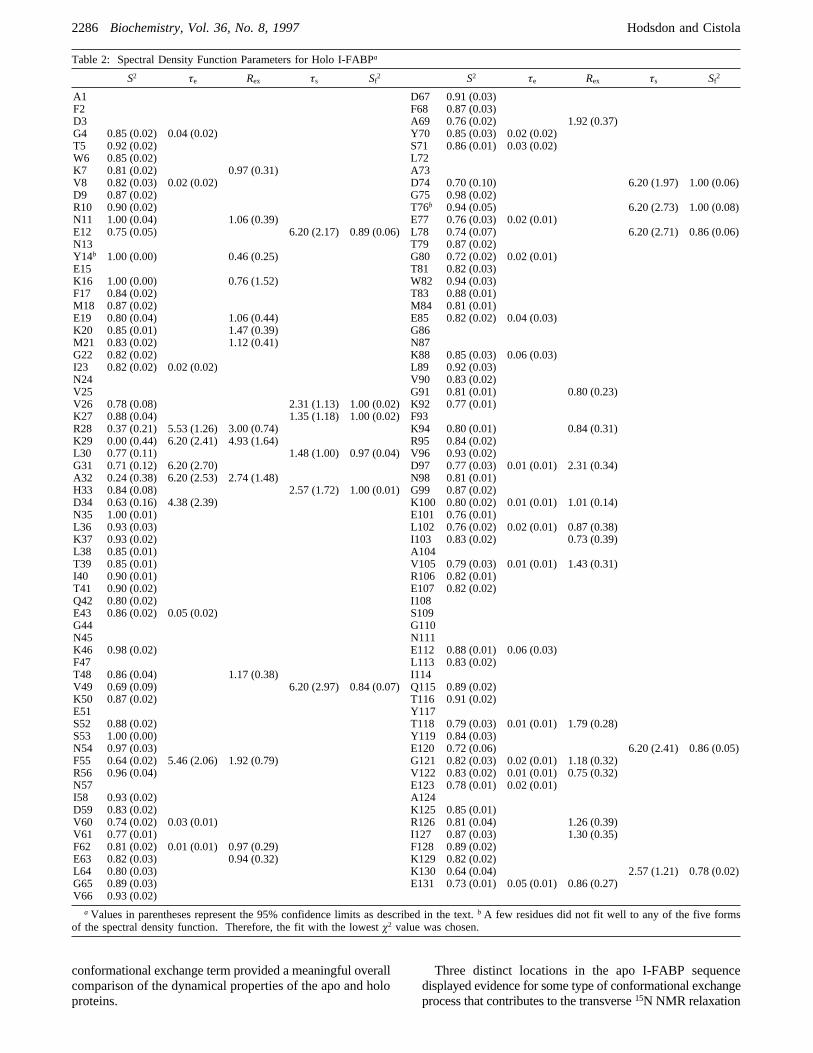
parameters for the residues in apo and holo I-FABP,respectively. For both forms of the protein, a majority ofresidues were fit by the simplest model-free formalism usingeitherS2 alone orS2 with τe. A total of 21 residues in apoI-FABP required a conformational exchange term,Rex, and9 residues were best fit by the two-time scale spectral densityfunction (Ss2, Sf2, and τe). Those residues fit by the two-time scale model were generally scattered throughout theprotein sequence. However, residues containing an exchangeterm were clearly clustered to three distinct regions: residuesV26-N35, S53-R56, and S71-G75. In holo I-FABP, 28residues were best fit by the conformational exchange model
and 11 by the two-time scale motion model. Unlike apoI-FABP, neither of these groups of residues displayed anyclear pattern in their location throughout the sequence.The generalized order parameter,S2, served as a useful
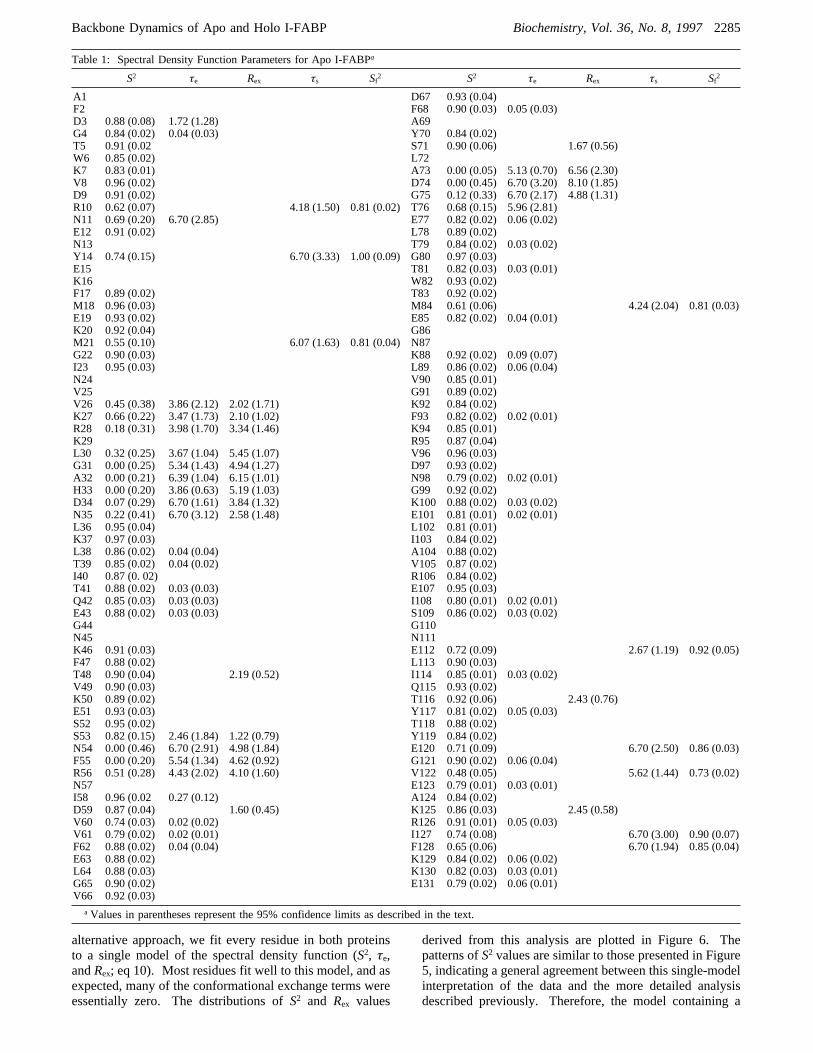
comparative tool for visualizing the motional characteristicsof both ligation states of the protein. Figure 5 illustratesS2
values along the sequence of I-FABP, and Table 3 lists theaverage order parameter values for various secondarystructure elements. A majority of the residues are character-ized by order parameters greater than 0.8 with an overallaverage (( the 95% confidence limit) of 0.76( 0.07 and0.82( 0.04 for apo and holo I-FABP, respectively. Threedistinct segments in apo I-FABP, seen in both Figure 5 andTable 3, display low order parameters. Again, these residuesare in a single region comprised of helixR-II, the R-II/â-Blinker, and the C-D and E-F turns. Although the param-eters derived from the model-free description of the spectraldensity function cannot be interpreted according to a uniquetype of motion, low order parameter values are consistentwith less restricted motions on the nanosecond to picosecondtime scale (Lipari & Szabo, 1982a,b). In the liganded formof the protein, fewer residues (R28, K29, and A32) displayvery low order parameters. A direct comparison of second-ary structure elements in Table 3 reveals that, on average,helix R-II, linker R-II/â-B, and turnsâ-C/â-D andâ-E/â-Fare characterized by a significant increase in order parametervalues upon fatty acid binding.It should be noted that sizable errors were observed for
residues displaying order parameters near zero (Tables 1 and2). The errors were not so large that the distributions ofprobable values between these residues and the rest of theprotein overlapped. Rather, the increase in the calculated95% confidence limits implied a decreased quality of fit.Combined with the difficulty in uniquely interpreting themodel-free parameters, this decreased precision prevents aclear understanding of the specific nature of the proteinmotions giving rise to lowS2 values. However, it seemslikely that in apo I-FABP residues displaying low orderparameters undergo motions that are more random and lesscorrelated with the rest of the protein and that ligand bindinginduces an ordering in these residues resulting in significantlyhigherS2 values.The residues requiring conformational exchange terms
generally coincided with those with low order parameters.Quantitating the difference in exchange terms between apoand holo I-FABP was complicated by differences in theselection of the most appropriate spectral density functionfor a given residue (Tables 1 and 2). Therefore, as an
FIGURE 5: Distribution of the generalized order parameter,S2,derived from a fit to the most appropriate spectral density functionfor each residue (Tables 1 and 2) along the sequence of apo (filledcircles) and holo (open circles) I-FABP.
2284 Biochemistry, Vol. 36, No. 8, 1997 Hodsdon and Cistola
alternative approach, we fit every residue in both proteinsto a single model of the spectral density function (S2, τe,andRex; eq 10). Most residues fit well to this model, and asexpected, many of the conformational exchange terms wereessentially zero. The distributions ofS2 and Rex values
derived from this analysis are plotted in Figure 6. Thepatterns ofS2 values are similar to those presented in Figure5, indicating a general agreement between this single-modelinterpretation of the data and the more detailed analysisdescribed previously. Therefore, the model containing a
Table 1: Spectral Density Function Parameters for Apo I-FABPa
S2 τe Rex τs Sf2 S2 τe Rex τs Sf2
A1 D67 0.93 (0.04)F2 F68 0.90 (0.03) 0.05 (0.03)D3 0.88 (0.08) 1.72 (1.28) A69G4 0.84 (0.02) 0.04 (0.03) Y70 0.84 (0.02)T5 0.91 (0.02 S71 0.90 (0.06) 1.67 (0.56)W6 0.85 (0.02) L72K7 0.83 (0.01) A73 0.00 (0.05) 5.13 (0.70) 6.56 (2.30)V8 0.96 (0.02) D74 0.00 (0.45) 6.70 (3.20) 8.10 (1.85)D9 0.91 (0.02) G75 0.12 (0.33) 6.70 (2.17) 4.88 (1.31)R10 0.62 (0.07) 4.18 (1.50) 0.81 (0.02) T76 0.68 (0.15) 5.96 (2.81)N11 0.69 (0.20) 6.70 (2.85) E77 0.82 (0.02) 0.06 (0.02)E12 0.91 (0.02) L78 0.89 (0.02)N13 T79 0.84 (0.02) 0.03 (0.02)Y14 0.74 (0.15) 6.70 (3.33) 1.00 (0.09) G80 0.97 (0.03)E15 T81 0.82 (0.03) 0.03 (0.01)K16 W82 0.93 (0.02)F17 0.89 (0.02) T83 0.92 (0.02)M18 0.96 (0.03) M84 0.61 (0.06) 4.24 (2.04) 0.81 (0.03)E19 0.93 (0.02) E85 0.82 (0.02) 0.04 (0.01)K20 0.92 (0.04) G86M21 0.55 (0.10) 6.07 (1.63) 0.81 (0.04) N87G22 0.90 (0.03) K88 0.92 (0.02) 0.09 (0.07)I23 0.95 (0.03) L89 0.86 (0.02) 0.06 (0.04)N24 V90 0.85 (0.01)V25 G91 0.89 (0.02)V26 0.45 (0.38) 3.86 (2.12) 2.02 (1.71) K92 0.84 (0.02)K27 0.66 (0.22) 3.47 (1.73) 2.10 (1.02) F93 0.82 (0.02) 0.02 (0.01)R28 0.18 (0.31) 3.98 (1.70) 3.34 (1.46) K94 0.85 (0.01)K29 R95 0.87 (0.04)L30 0.32 (0.25) 3.67 (1.04) 5.45 (1.07) V96 0.96 (0.03)G31 0.00 (0.25) 5.34 (1.43) 4.94 (1.27) D97 0.93 (0.02)A32 0.00 (0.21) 6.39 (1.04) 6.15 (1.01) N98 0.79 (0.02) 0.02 (0.01)H33 0.00 (0.20) 3.86 (0.63) 5.19 (1.03) G99 0.92 (0.02)D34 0.07 (0.29) 6.70 (1.61) 3.84 (1.32) K100 0.88 (0.02) 0.03 (0.02)N35 0.22 (0.41) 6.70 (3.12) 2.58 (1.48) E101 0.81 (0.01) 0.02 (0.01)L36 0.95 (0.04) L102 0.81 (0.01)K37 0.97 (0.03) I103 0.84 (0.02)L38 0.86 (0.02) 0.04 (0.04) A104 0.88 (0.02)T39 0.85 (0.02) 0.04 (0.02) V105 0.87 (0.02)I40 0.87 (0. 02) R106 0.84 (0.02)T41 0.88 (0.02) 0.03 (0.03) E107 0.95 (0.03)Q42 0.85 (0.03) 0.03 (0.03) I108 0.80 (0.01) 0.02 (0.01)E43 0.88 (0.02) 0.03 (0.03) S109 0.86 (0.02) 0.03 (0.02)G44 G110N45 N111K46 0.91 (0.03) E112 0.72 (0.09) 2.67 (1.19) 0.92 (0.05)F47 0.88 (0.02) L113 0.90 (0.03)T48 0.90 (0.04) 2.19 (0.52) I114 0.85 (0.01) 0.03 (0.02)V49 0.90 (0.03) Q115 0.93 (0.02)K50 0.89 (0.02) T116 0.92 (0.06) 2.43 (0.76)E51 0.93 (0.03) Y117 0.81 (0.02) 0.05 (0.03)S52 0.95 (0.02) T118 0.88 (0.02)S53 0.82 (0.15) 2.46 (1.84) 1.22 (0.79) Y119 0.84 (0.02)N54 0.00 (0.46) 6.70 (2.91) 4.98 (1.84) E120 0.71 (0.09) 6.70 (2.50) 0.86 (0.03)F55 0.00 (0.20) 5.54 (1.34) 4.62 (0.92) G121 0.90 (0.02) 0.06 (0.04)R56 0.51 (0.28) 4.43 (2.02) 4.10 (1.60) V122 0.48 (0.05) 5.62 (1.44) 0.73 (0.02)N57 E123 0.79 (0.01) 0.03 (0.01)I58 0.96 (0.02 0.27 (0.12) A124 0.84 (0.02)D59 0.87 (0.04) 1.60 (0.45) K125 0.86 (0.03) 2.45 (0.58)V60 0.74 (0.03) 0.02 (0.02) R126 0.91 (0.01) 0.05 (0.03)V61 0.79 (0.02) 0.02 (0.01) I127 0.74 (0.08) 6.70 (3.00) 0.90 (0.07)F62 0.88 (0.02) 0.04 (0.04) F128 0.65 (0.06) 6.70 (1.94) 0.85 (0.04)E63 0.88 (0.02) K129 0.84 (0.02) 0.06 (0.02)L64 0.88 (0.03) K130 0.82 (0.03) 0.03 (0.01)G65 0.90 (0.02) E131 0.79 (0.02) 0.06 (0.01)V66 0.92 (0.03)
a Values in parentheses represent the 95% confidence limits as described in the text.
Backbone Dynamics of Apo and Holo I-FABP Biochemistry, Vol. 36, No. 8, 19972285
conformational exchange term provided a meaningful overallcomparison of the dynamical properties of the apo and holoproteins.
Three distinct locations in the apo I-FABP sequencedisplayed evidence for some type of conformational exchangeprocess that contributes to the transverse15N NMR relaxation
Table 2: Spectral Density Function Parameters for Holo I-FABPa
S2 τe Rex τs Sf2 S2 τe Rex τs Sf2
A1 D67 0.91 (0.03)F2 F68 0.87 (0.03)D3 A69 0.76 (0.02) 1.92 (0.37)G4 0.85 (0.02) 0.04 (0.02) Y70 0.85 (0.03) 0.02 (0.02)T5 0.92 (0.02) S71 0.86 (0.01) 0.03 (0.02)W6 0.85 (0.02) L72K7 0.81 (0.02) 0.97 (0.31) A73V8 0.82 (0.03) 0.02 (0.02) D74 0.70 (0.10) 6.20 (1.97) 1.00 (0.06)D9 0.87 (0.02) G75 0.98 (0.02)R10 0.90 (0.02) T76b 0.94 (0.05) 6.20 (2.73) 1.00 (0.08)N11 1.00 (0.04) 1.06 (0.39) E77 0.76 (0.03) 0.02 (0.01)E12 0.75 (0.05) 6.20 (2.17) 0.89 (0.06) L78 0.74 (0.07) 6.20 (2.71) 0.86 (0.06)N13 T79 0.87 (0.02)Y14b 1.00 (0.00) 0.46 (0.25) G80 0.72 (0.02) 0.02 (0.01)E15 T81 0.82 (0.03)K16 1.00 (0.00) 0.76 (1.52) W82 0.94 (0.03)F17 0.84 (0.02) T83 0.88 (0.01)M18 0.87 (0.02) M84 0.81 (0.01)E19 0.80 (0.04) 1.06 (0.44) E85 0.82 (0.02) 0.04 (0.03)K20 0.85 (0.01) 1.47 (0.39) G86M21 0.83 (0.02) 1.12 (0.41) N87G22 0.82 (0.02) K88 0.85 (0.03) 0.06 (0.03)I23 0.82 (0.02) 0.02 (0.02) L89 0.92 (0.03)N24 V90 0.83 (0.02)V25 G91 0.81 (0.01) 0.80 (0.23)V26 0.78 (0.08) 2.31 (1.13) 1.00 (0.02) K92 0.77 (0.01)K27 0.88 (0.04) 1.35 (1.18) 1.00 (0.02) F93R28 0.37 (0.21) 5.53 (1.26) 3.00 (0.74) K94 0.80 (0.01) 0.84 (0.31)K29 0.00 (0.44) 6.20 (2.41) 4.93 (1.64) R95 0.84 (0.02)L30 0.77 (0.11) 1.48 (1.00) 0.97 (0.04) V96 0.93 (0.02)G31 0.71 (0.12) 6.20 (2.70) D97 0.77 (0.03) 0.01 (0.01) 2.31 (0.34)A32 0.24 (0.38) 6.20 (2.53) 2.74 (1.48) N98 0.81 (0.01)H33 0.84 (0.08) 2.57 (1.72) 1.00 (0.01) G99 0.87 (0.02)D34 0.63 (0.16) 4.38 (2.39) K100 0.80 (0.02) 0.01 (0.01) 1.01 (0.14)N35 1.00 (0.01) E101 0.76 (0.01)L36 0.93 (0.03) L102 0.76 (0.02) 0.02 (0.01) 0.87 (0.38)K37 0.93 (0.02) I103 0.83 (0.02) 0.73 (0.39)L38 0.85 (0.01) A104T39 0.85 (0.01) V105 0.79 (0.03) 0.01 (0.01) 1.43 (0.31)I40 0.90 (0.01) R106 0.82 (0.01)T41 0.90 (0.02) E107 0.82 (0.02)Q42 0.80 (0.02) I108E43 0.86 (0.02) 0.05 (0.02) S109G44 G110N45 N111K46 0.98 (0.02) E112 0.88 (0.01) 0.06 (0.03)F47 L113 0.83 (0.02)T48 0.86 (0.04) 1.17 (0.38) I114V49 0.69 (0.09) 6.20 (2.97) 0.84 (0.07) Q115 0.89 (0.02)K50 0.87 (0.02) T116 0.91 (0.02)E51 Y117S52 0.88 (0.02) T118 0.79 (0.03) 0.01 (0.01) 1.79 (0.28)S53 1.00 (0.00) Y119 0.84 (0.03)N54 0.97 (0.03) E120 0.72 (0.06) 6.20 (2.41) 0.86 (0.05)F55 0.64 (0.02) 5.46 (2.06) 1.92 (0.79) G121 0.82 (0.03) 0.02 (0.01) 1.18 (0.32)R56 0.96 (0.04) V122 0.83 (0.02) 0.01 (0.01) 0.75 (0.32)N57 E123 0.78 (0.01) 0.02 (0.01)I58 0.93 (0.02) A124D59 0.83 (0.02) K125 0.85 (0.01)V60 0.74 (0.02) 0.03 (0.01) R126 0.81 (0.04) 1.26 (0.39)V61 0.77 (0.01) I127 0.87 (0.03) 1.30 (0.35)F62 0.81 (0.02) 0.01 (0.01) 0.97 (0.29) F128 0.89 (0.02)E63 0.82 (0.03) 0.94 (0.32) K129 0.82 (0.02)L64 0.80 (0.03) K130 0.64 (0.04) 2.57 (1.21) 0.78 (0.02)G65 0.89 (0.03) E131 0.73 (0.01) 0.05 (0.01) 0.86 (0.27)V66 0.93 (0.02)
a Values in parentheses represent the 95% confidence limits as described in the text.b A few residues did not fit well to any of the five formsof the spectral density function. Therefore, the fit with the lowestø2 value was chosen.
2286 Biochemistry, Vol. 36, No. 8, 1997 Hodsdon and Cistola
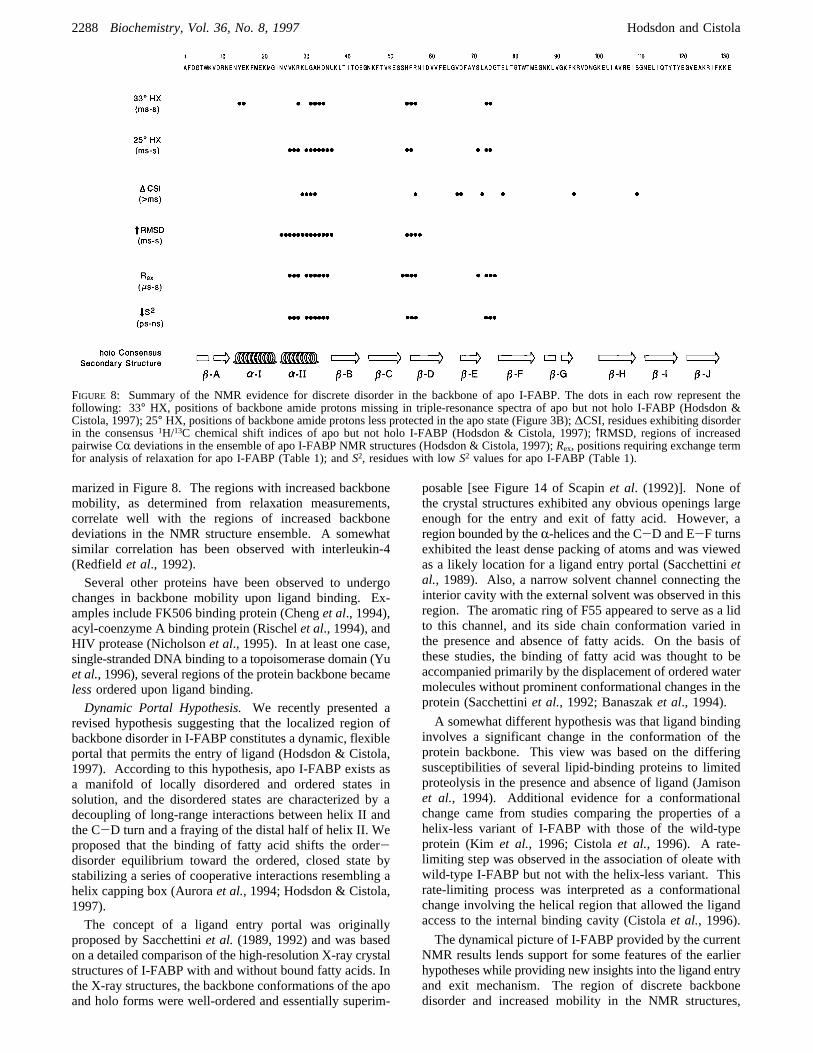
time (Figure 6). The specific interpretation of theRex termis complicated and depends on knowledge of all the statesinvolved in the exchange process and their chemical shiftdifferences (Palmeret al., 1991). However, as described inMaterials and Methods, the presence of a non-zeroRexparameter in the fit of the relaxation data to the spectraldensity function implies that an exchange process occurringon the microsecond to millisecond time scale.
DISCUSSION
To date, rat I-FABP is the only member of the iLBP familyfor which the NMR solution structures and backbonedynamics have been characterized in the presence andabsence of bound ligand. Therefore, the results for I-FABPprovide a unique opportunity to assess the effect of boundligand on the solution-state properties of the protein at theatomic level. In the present study, the backbone mobilityof I-FABP in the presence and absence of bound fatty acidwas directly compared using NMR measurements of amide1H exchange rates and15N NMR relaxation rates. In bothtypes of measurements, we observed that a single region ofthe tertiary structure had unusual dynamic properties. Resi-dues inR-helix II, the R-II/â-B linker, and the C-D andE-F turns were more mobile than other parts of the protein,particularly in the absence of bound fatty acid. Within helixII, the increased mobility was most pronounced in theC-terminal portion. The local disorder in apo I-FABP wasshown by higher rates of amide1H exchange, lower orderparameters, and sizable conformational exchange terms. Incontrast, the remainder of the protein backbone was char-acterized by slow amide hydrogen exchange, high orderparameters, and vanishing conformational exchange termsfor both ligation states of the protein.We previously established evidence for a discrete region
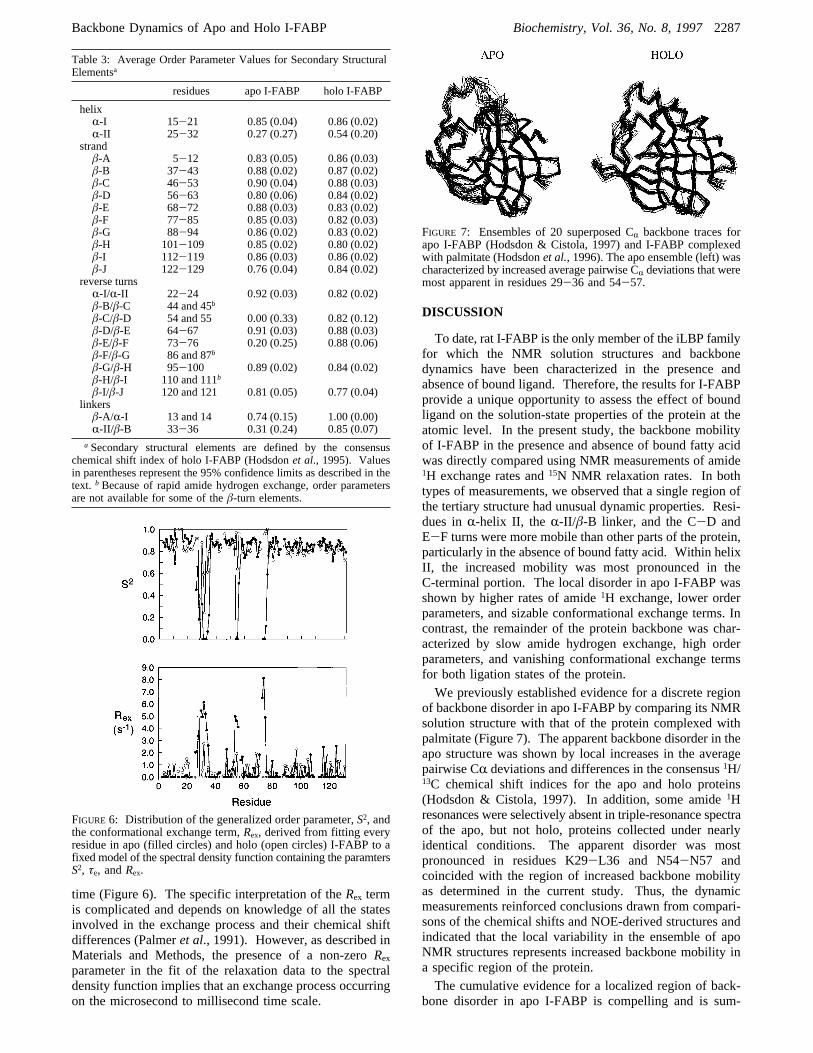
of backbone disorder in apo I-FABP by comparing its NMRsolution structure with that of the protein complexed withpalmitate (Figure 7). The apparent backbone disorder in theapo structure was shown by local increases in the averagepairwise CR deviations and differences in the consensus1H/13C chemical shift indices for the apo and holo proteins(Hodsdon & Cistola, 1997). In addition, some amide1Hresonances were selectively absent in triple-resonance spectraof the apo, but not holo, proteins collected under nearlyidentical conditions. The apparent disorder was mostpronounced in residues K29-L36 and N54-N57 andcoincided with the region of increased backbone mobilityas determined in the current study. Thus, the dynamicmeasurements reinforced conclusions drawn from compari-sons of the chemical shifts and NOE-derived structures andindicated that the local variability in the ensemble of apoNMR structures represents increased backbone mobility ina specific region of the protein.The cumulative evidence for a localized region of back-
bone disorder in apo I-FABP is compelling and is sum-
Table 3: Average Order Parameter Values for Secondary StructuralElementsa
residues apo I-FABP holo I-FABP
helixR-I 15-21 0.85 (0.04) 0.86 (0.02)R-II 25-32 0.27 (0.27) 0.54 (0.20)
strandâ-A 5-12 0.83 (0.05) 0.86 (0.03)â-B 37-43 0.88 (0.02) 0.87 (0.02)â-C 46-53 0.90 (0.04) 0.88 (0.03)â-D 56-63 0.80 (0.06) 0.84 (0.02)â-E 68-72 0.88 (0.03) 0.83 (0.02)â-F 77-85 0.85 (0.03) 0.82 (0.03)â-G 88-94 0.86 (0.02) 0.83 (0.02)â-H 101-109 0.85 (0.02) 0.80 (0.02)â-I 112-119 0.86 (0.03) 0.86 (0.02)â-J 122-129 0.76 (0.04) 0.84 (0.02)
reverse turnsR-I/R-II 22-24 0.92 (0.03) 0.82 (0.02)â-B/â-C 44 and 45b
â-C/â-D 54 and 55 0.00 (0.33) 0.82 (0.12)â-D/â-E 64-67 0.91 (0.03) 0.88 (0.03)â-E/â-F 73-76 0.20 (0.25) 0.88 (0.06)â-F/â-G 86 and 87b
â-G/â-H 95-100 0.89 (0.02) 0.84 (0.02)â-H/â-I 110 and 111b
â-I/â-J 120 and 121 0.81 (0.05) 0.77 (0.04)linkers
â-A/R-I 13 and 14 0.74 (0.15) 1.00 (0.00)R-II/â-B 33-36 0.31 (0.24) 0.85 (0.07)
a Secondary structural elements are defined by the consensuschemical shift index of holo I-FABP (Hodsdonet al., 1995). Valuesin parentheses represent the 95% confidence limits as described in thetext. b Because of rapid amide hydrogen exchange, order parametersare not available for some of theâ-turn elements.
FIGURE 6: Distribution of the generalized order parameter,S2, andthe conformational exchange term,Rex, derived from fitting everyresidue in apo (filled circles) and holo (open circles) I-FABP to afixed model of the spectral density function containing the paramtersS2, τe, andRex.
FIGURE 7: Ensembles of 20 superposed CR backbone traces forapo I-FABP (Hodsdon & Cistola, 1997) and I-FABP complexedwith palmitate (Hodsdonet al., 1996). The apo ensemble (left) wascharacterized by increased average pairwise CR deviations that weremost apparent in residues 29-36 and 54-57.
Backbone Dynamics of Apo and Holo I-FABP Biochemistry, Vol. 36, No. 8, 19972287
marized in Figure 8. The regions with increased backbonemobility, as determined from relaxation measurements,correlate well with the regions of increased backbonedeviations in the NMR structure ensemble. A somewhatsimilar correlation has been observed with interleukin-4(Redfieldet al., 1992).Several other proteins have been observed to undergo
changes in backbone mobility upon ligand binding. Ex-amples include FK506 binding protein (Chenget al., 1994),acyl-coenzyme A binding protein (Rischelet al., 1994), andHIV protease (Nicholsonet al., 1995). In at least one case,single-stranded DNA binding to a topoisomerase domain (Yuet al., 1996), several regions of the protein backbone becamelessordered upon ligand binding.Dynamic Portal Hypothesis.We recently presented a
revised hypothesis suggesting that the localized region ofbackbone disorder in I-FABP constitutes a dynamic, flexibleportal that permits the entry of ligand (Hodsdon & Cistola,1997). According to this hypothesis, apo I-FABP exists asa manifold of locally disordered and ordered states insolution, and the disordered states are characterized by adecoupling of long-range interactions between helix II andthe C-D turn and a fraying of the distal half of helix II. Weproposed that the binding of fatty acid shifts the order-disorder equilibrium toward the ordered, closed state bystabilizing a series of cooperative interactions resembling ahelix capping box (Auroraet al., 1994; Hodsdon & Cistola,1997).The concept of a ligand entry portal was originally
proposed by Sacchettiniet al. (1989, 1992) and was basedon a detailed comparison of the high-resolution X-ray crystalstructures of I-FABP with and without bound fatty acids. Inthe X-ray structures, the backbone conformations of the apoand holo forms were well-ordered and essentially superim-
posable [see Figure 14 of Scapinet al. (1992)]. None ofthe crystal structures exhibited any obvious openings largeenough for the entry and exit of fatty acid. However, aregion bounded by theR-helices and the C-D and E-F turnsexhibited the least dense packing of atoms and was viewedas a likely location for a ligand entry portal (Sacchettinietal., 1989). Also, a narrow solvent channel connecting theinterior cavity with the external solvent was observed in thisregion. The aromatic ring of F55 appeared to serve as a lidto this channel, and its side chain conformation varied inthe presence and absence of fatty acids. On the basis ofthese studies, the binding of fatty acid was thought to beaccompanied primarily by the displacement of ordered watermolecules without prominent conformational changes in theprotein (Sacchettiniet al., 1992; Banaszaket al., 1994).
A somewhat different hypothesis was that ligand bindinginvolves a significant change in the conformation of theprotein backbone. This view was based on the differingsusceptibilities of several lipid-binding proteins to limitedproteolysis in the presence and absence of ligand (Jamisonet al., 1994). Additional evidence for a conformationalchange came from studies comparing the properties of ahelix-less variant of I-FABP with those of the wild-typeprotein (Kim et al., 1996; Cistolaet al., 1996). A rate-limiting step was observed in the association of oleate withwild-type I-FABP but not with the helix-less variant. Thisrate-limiting process was interpreted as a conformationalchange involving the helical region that allowed the ligandaccess to the internal binding cavity (Cistolaet al., 1996).
The dynamical picture of I-FABP provided by the currentNMR results lends support for some features of the earlierhypotheses while providing new insights into the ligand entryand exit mechanism. The region of discrete backbonedisorder and increased mobility in the NMR structures,
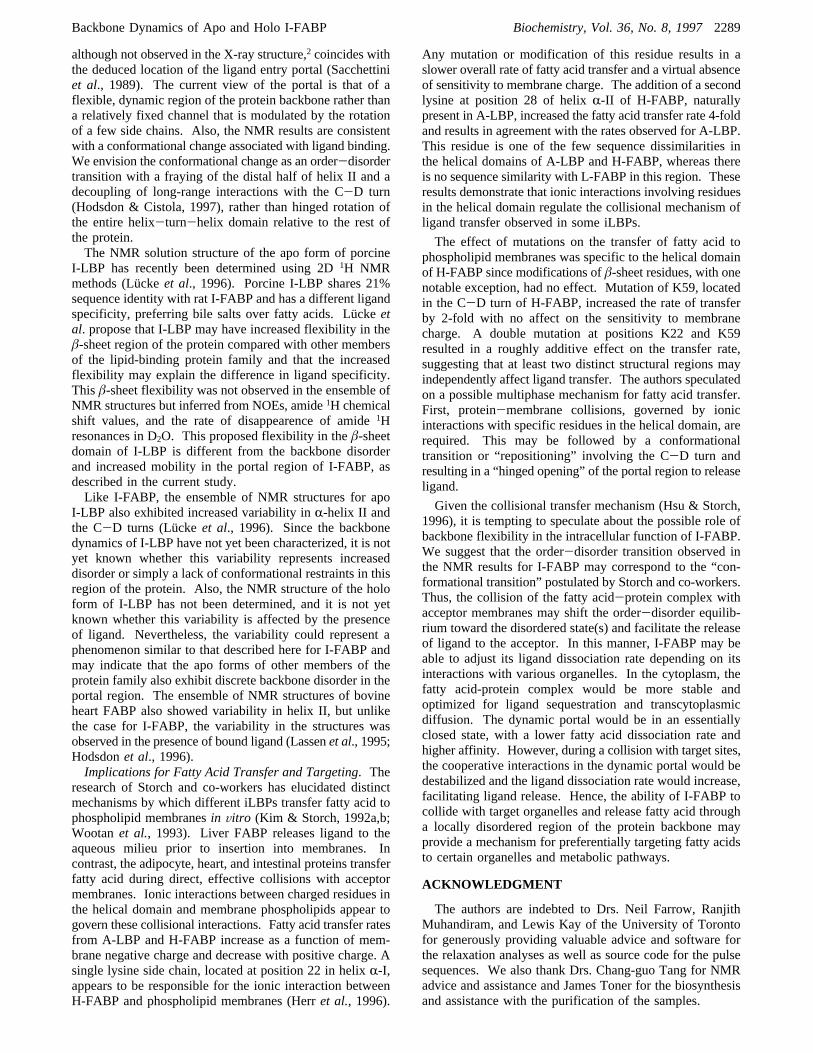
FIGURE 8: Summary of the NMR evidence for discrete disorder in the backbone of apo I-FABP. The dots in each row represent thefollowing: 33° HX, positions of backbone amide protons missing in triple-resonance spectra of apo but not holo I-FABP (Hodsdon &Cistola, 1997); 25° HX, positions of backbone amide protons less protected in the apo state (Figure 3B);∆CSI, residues exhibiting disorderin the consensus1H/13C chemical shift indices of apo but not holo I-FABP (Hodsdon & Cistola, 1997);vRMSD, regions of increasedpairwise CR deviations in the ensemble of apo I-FABP NMR structures (Hodsdon & Cistola, 1997);Rex, positions requiring exchange termfor analysis of relaxation for apo I-FABP (Table 1); andS2, residues with lowS2 values for apo I-FABP (Table 1).
2288 Biochemistry, Vol. 36, No. 8, 1997 Hodsdon and Cistola
although not observed in the X-ray structure,2 coincides withthe deduced location of the ligand entry portal (Sacchettiniet al., 1989). The current view of the portal is that of aflexible, dynamic region of the protein backbone rather thana relatively fixed channel that is modulated by the rotationof a few side chains. Also, the NMR results are consistentwith a conformational change associated with ligand binding.We envision the conformational change as an order-disordertransition with a fraying of the distal half of helix II and adecoupling of long-range interactions with the C-D turn(Hodsdon & Cistola, 1997), rather than hinged rotation ofthe entire helix-turn-helix domain relative to the rest ofthe protein.The NMR solution structure of the apo form of porcine
I-LBP has recently been determined using 2D1H NMRmethods (Lu¨cke et al., 1996). Porcine I-LBP shares 21%sequence identity with rat I-FABP and has a different ligandspecificity, preferring bile salts over fatty acids. Lu¨cke etal. propose that I-LBP may have increased flexibility in theâ-sheet region of the protein compared with other membersof the lipid-binding protein family and that the increasedflexibility may explain the difference in ligand specificity.Thisâ-sheet flexibility was not observed in the ensemble ofNMR structures but inferred from NOEs, amide1H chemicalshift values, and the rate of disappearence of amide1Hresonances in D2O. This proposed flexibility in theâ-sheetdomain of I-LBP is different from the backbone disorderand increased mobility in the portal region of I-FABP, asdescribed in the current study.Like I-FABP, the ensemble of NMR structures for apo
I-LBP also exhibited increased variability inR-helix II andthe C-D turns (Lucke et al., 1996). Since the backbonedynamics of I-LBP have not yet been characterized, it is notyet known whether this variability represents increaseddisorder or simply a lack of conformational restraints in thisregion of the protein. Also, the NMR structure of the holoform of I-LBP has not been determined, and it is not yetknown whether this variability is affected by the presenceof ligand. Nevertheless, the variability could represent aphenomenon similar to that described here for I-FABP andmay indicate that the apo forms of other members of theprotein family also exhibit discrete backbone disorder in theportal region. The ensemble of NMR structures of bovineheart FABP also showed variability in helix II, but unlikethe case for I-FABP, the variability in the structures wasobserved in the presence of bound ligand (Lassenet al., 1995;Hodsdonet al., 1996).Implications for Fatty Acid Transfer and Targeting. The
research of Storch and co-workers has elucidated distinctmechanisms by which different iLBPs transfer fatty acid tophospholipid membranesin Vitro (Kim & Storch, 1992a,b;Wootanet al., 1993). Liver FABP releases ligand to theaqueous milieu prior to insertion into membranes. Incontrast, the adipocyte, heart, and intestinal proteins transferfatty acid during direct, effective collisions with acceptormembranes. Ionic interactions between charged residues inthe helical domain and membrane phospholipids appear togovern these collisional interactions. Fatty acid transfer ratesfrom A-LBP and H-FABP increase as a function of mem-brane negative charge and decrease with positive charge. Asingle lysine side chain, located at position 22 in helixR-I,appears to be responsible for the ionic interaction betweenH-FABP and phospholipid membranes (Herret al., 1996).
Any mutation or modification of this residue results in aslower overall rate of fatty acid transfer and a virtual absenceof sensitivity to membrane charge. The addition of a secondlysine at position 28 of helixR-II of H-FABP, naturallypresent in A-LBP, increased the fatty acid transfer rate 4-foldand results in agreement with the rates observed for A-LBP.This residue is one of the few sequence dissimilarities inthe helical domains of A-LBP and H-FABP, whereas thereis no sequence similarity with L-FABP in this region. Theseresults demonstrate that ionic interactions involving residuesin the helical domain regulate the collisional mechanism ofligand transfer observed in some iLBPs.
The effect of mutations on the transfer of fatty acid tophospholipid membranes was specific to the helical domainof H-FABP since modifications ofâ-sheet residues, with onenotable exception, had no effect. Mutation of K59, locatedin the C-D turn of H-FABP, increased the rate of transferby 2-fold with no affect on the sensitivity to membranecharge. A double mutation at positions K22 and K59resulted in a roughly additive effect on the transfer rate,suggesting that at least two distinct structural regions mayindependently affect ligand transfer. The authors speculatedon a possible multiphase mechanism for fatty acid transfer.First, protein-membrane collisions, governed by ionicinteractions with specific residues in the helical domain, arerequired. This may be followed by a conformationaltransition or “repositioning” involving the C-D turn andresulting in a “hinged opening” of the portal region to releaseligand.
Given the collisional transfer mechanism (Hsu & Storch,1996), it is tempting to speculate about the possible role ofbackbone flexibility in the intracellular function of I-FABP.We suggest that the order-disorder transition observed inthe NMR results for I-FABP may correspond to the “con-formational transition” postulated by Storch and co-workers.Thus, the collision of the fatty acid-protein complex withacceptor membranes may shift the order-disorder equilib-rium toward the disordered state(s) and facilitate the releaseof ligand to the acceptor. In this manner, I-FABP may beable to adjust its ligand dissociation rate depending on itsinteractions with various organelles. In the cytoplasm, thefatty acid-protein complex would be more stable andoptimized for ligand sequestration and transcytoplasmicdiffusion. The dynamic portal would be in an essentiallyclosed state, with a lower fatty acid dissociation rate andhigher affinity. However, during a collision with target sites,the cooperative interactions in the dynamic portal would bedestabilized and the ligand dissociation rate would increase,facilitating ligand release. Hence, the ability of I-FABP tocollide with target organelles and release fatty acid througha locally disordered region of the protein backbone mayprovide a mechanism for preferentially targeting fatty acidsto certain organelles and metabolic pathways.
ACKNOWLEDGMENT
The authors are indebted to Drs. Neil Farrow, RanjithMuhandiram, and Lewis Kay of the University of Torontofor generously providing valuable advice and software forthe relaxation analyses as well as source code for the pulsesequences. We also thank Drs. Chang-guo Tang for NMRadvice and assistance and James Toner for the biosynthesisand assistance with the purification of the samples.
Backbone Dynamics of Apo and Holo I-FABP Biochemistry, Vol. 36, No. 8, 19972289
SUPPORTING INFORMATION AVAILABLE
Five tables containing1H/15N assignments for apo and holoI-FABP at 25°C, complete15N NMR relaxation parametersfor apo and holo I-FABP, and complete spectral densityfunction analyses and parameters for apo and holo I-FABP(36 pages). Ordering information is given on any currentmasthead page.
REFERENCES
Abragam, A. (1961)Principles of Nuclear Magnetism, ClarendonPress, Oxford.
Aurora, R., Srinivasan, R., & Rose, G. D. (1994)Science 264,1126-1130.
Banaszak, L. J., Winter, N., Xu, Z., Bernlohr, D. A., Cowan, S., &Jones, T. A. (1994)AdV. Protein Chem. 45, 89-151.
Box, G. P., Hunter, W. G., & Hunter, J. S. (1978)Statistics forExperimenters, John Wiley & Sons, New York.
Cavanagh, J., Palmer, A. G., III, Wright, P. E., & Rance, M. (1991)J. Magn. Reson. 91, 429.
Cheng, J.-W., Lepre, C. A., & Moore, J. M. (1994)Biochemistry33, 4093-4100.
Cistola, D. P., & Hall, K. B. (1995)J. Biomol. NMR 5, 415-419.Cistola, D. P., Sacchettini, J. C., Banaszak, L. J., Walsh, M. T., &Gordon, J. I. (1989)J. Biol. Chem. 264, 2700-2710.
Cistola, D. P., Kim, K., Rogl, H., & Frieden, C. (1996)Biochemistry35, 7559-7565.
Clore, G. M., Driscoll, P. C., Wingfield, P. T., & Gronenborn, A.M. (1990a)Biochemistry 29, 7387-7401.
Clore, G. M., Szabo, A., Bax, A., Kay, L. E., Driscoll, P. C., &Gronenborn, A. M. (1990b)J. Am. Chem. Soc. 112, 4989.
Englander, S. W., & Kallenbach, N. R. (1984)Q. ReV. Biophys.16, 521-655.
Farrow, N. A., Muhandiram, R., Singer, A. U., Pascal, S. M., Kay,C. M., Gish, G., Shoelson, S. E., Pawson, T., Forman-Kay, J.D., & Kay, L. E. (1994)Biochemsitry 33, 5984-6003.
Farrow, N. A., Zhang, O., Szabo, A., Torchia, D. A., & Kay, L. E.(1995)J. Biomol. NMR 6, 153-162.
Gryk, M. R., & Jardetzky, O. (1996)J. Mol. Biol. 255, 204-214.Gryk, M. R., Finucaine, M. D., Zheng, Z., & Jardetzky, O. (1995)J. Mol. Biol. 246, 618-627.
Herr, F. M., Aronson, J., & Storch, J. (1996)Biochemistry 35,1296-1303.
Hiyama, Y., Niu, C., Silverton, J. V., Bavoso, A., & Torchia, D.A. (1988)J. Am. Chem. Soc. 110, 2378.
Hodsdon, M. E., & Cistola, D. P. (1997)Biochemistry 36, 1450-1460.
Hodsdon, M. E., Toner, J. J., & Cistola, D. P. (1995)J. Biomol.NMR 6, 198-210.
Hodsdon, M. E., Ponder, J. W., & Cistola, D. P. (1996)J. Mol.Biol. 264, 585-602.
Hsu, K. T., & Storch, J. (1996)J. Biol. Chem. 271, 13317-13323.Ishima, R., & Nagayama, K. (1995)Biochemistry 34, 3162-3171.Jakoby, M. G., Miller, K. R., Toner, J. J., Bauman, A., Cheng, L.,Li, E., & Cistola, D. P. (1993)Biochemistry 32, 872-878.
Jamison, R. S., Newcomer, M. E., & Ong, D. E. (1994)Biochem-istry 33, 2873-2879.
Kay, L. E., Torchia, D. A., & Bax, A. (1989)Biochemistry 28,8972-8979.
Kay, L. E., Keifer, P., & Saarinen, T. (1992)J. Am. Chem. Soc.114, 10663.
Kim, H. K., & Storch, J. (1992a)J. Biol. Chem. 267, 20051-20056.Kim, H. K., & Storch, J. (1992b)J. Biol. Chem. 267, 77-82.Kim, K., Cistola, D. P., & Frieden, C. (1996)Biochemistry 35,7553-7558.
Lassen, D., Lu¨cke, C., Kveder, M., Mesgarzadeh, A., Schmidt, J.M., Specht, B., Lezius, A., Spener, F., & Ru¨terjans, H. (1995)Eur. J. Biochem. 230, 266-280.
Lefevre, J.-F., Dayie, K. T., Peng, J. W., & Wagner, G. (1996)Biochemistry 35, 2674-2686.
Li, E., Locke, B., Yang, N. C., Ong, D. E., & Gordon, J. I. (1987)J. Biol. Chem. 262, 13773-13779.
Lipari, G., & Szabo, A. (1982a)J. Am. Chem. Soc. 104, 4546-4559.
Lipari, G., & Szabo, A. (1982b)J. Am. Chem. Soc. 104, 4559-4570.
Lowe, J. B., Sacchettini, J. C., Laposata, M., McQuillan, J. J., &Gordon, J. I. (1987)J. Biol. Chem. 262, 5931-5937.
Lucke, C., Zhang, F., Ru¨terjans, H., Hamilton, J. A., & Sacchettini,J. C. (1996)Structure 4, 785-800.
Markley, J. L., Horsley, W. J., & Klein, M. P. (1971)J. Chem.Phys. 55, 3604.
Muhandiram, D. R., & Kay, L. E. (1994)J. Magn. Reson. Ser. B103, 203-216.
Nicholson, L. K., Yamazaki, T., Torchia, D. A., Grzesiek, S., Bax,A., Stahl, S. J., Kaufman, J. D., Wingfield, P. T., Lam, P. Y. S.,Jadhav, P. K., Hodge, C. N., Domaille, P. J., & Chang, C. H.(1995)Nat. Struct. Biol. 2, 274-280.
Palmer, A. G., III, Rance, M., & Wright, P. E. (1991)J. Am. Chem.Soc. 113, 4371.
Peng, J. W., & Wagner, G. (1992)Biochemistry 31, 8571-8586.Redfield, C., Boyd, J., Smith, L. J., Smith, R. A. G., & Dobson, C.M. (1992)Biochemistry 31, 10431-10437.
Rischel, C., Madsen, J. C., Andersen, K., & Poulsen, F. M. (1994)Biochemistry 33, 13997-14002.
Sacchettini, J. C., Gordon, J. I., & Banaszak, L. J. (1989)J. Mol.Biol. 208, 327-339.
Sacchettini, J. C., Scapin, G., Gopaul, D., & Gordon, J. I. (1992)J. Biol. Chem. 267, 23534-23545.
Scapin, G., Gordon, J. I., & Sacchettini, J. C. (1992)J. Biol. Chem.267, 4253-4269.
Seale, J. W., Srinivasan, R., & Rose, G. D. (1994)Protein Sci. 3,1741-1745.
Shaka, A. J., Keeler, J., Frenkiel, T., & Freeman, R. (1983)J. Magn.Reson. 52, 335-338.
Sklenar, V., Torchia, D. A., & Bax, A. (1987)J. Magn. Reson. 73,375.
Wagner, G. (1995)Nat. Struct. Biol. 2, 255-257.Wootan, M. G., Bernlohr, D. A., & Storch, J. (1993)Biochemistry32, 8622-8627.
Yu, L., Zhu, C.-X., Tse-Dinh, Y.-K., & Fesik, S. W. (1996)Biochemistry 35, 9661-9666.
Zhang, O., Kay, L. E., Olivier, J. P., & Forman-Kay, J. D. (1994)J. Biomol. NMR 4, 845-858.
BI962018L
2290 Biochemistry, Vol. 36, No. 8, 1997 Hodsdon and Cistola