Life Science Journal
155
MARSLAND PRESS Multidisciplinary Academic Journal Publisher http://www.lifesciencesite.com Emails: [email protected] [email protected] Website: Life Science Journal Volume 10, Number 1, Part 13 ISSN: March 25, 2013 1097-8135 9 771097 813002 ISSN 1097-8135 Life Science Journal Volume 10, Number 1 ISSN: (Cumulative No.32) Part 13 March 25, 2013 1097-8135 Copyright © 2013 Marsland Press / Zhengzhou University Marsland Press PO Box 180432 Richmond Hill, New York 11418, USA Website: http://www.lifesciencesite.com Emails: [email protected] [email protected] Phone: (347) 321-7172 Life Science Journal 2013 Volume 10, Number 1 ISSN:1097-8135 , Part 13 Acta Zhengzhou University Overseas Edition Cover design: CAO, Zhaolong Photograph: YANG, Yizhong; YOUNG, Mary
-
Upload
khangminh22 -
Category
Documents
-
view
0 -
download
0
Transcript of Life Science Journal

MARSLAND PRESSMultidisciplinary Academic Journal Publisher
http://www.lifesciencesite.com
Emails:[email protected]@gmail.com
Website:
Life Science Journal
Volume 10, Number 1, Par t 13 ISSN:March 25, 2013 1097-8135
9 771097 813002
ISSN 1097-8135
Life Science Journal
Volume 10, Number 1 ISSN:(Cumulative No.32) Part 13 March 25, 2013 1097-8135
Copyright © 2013 Marsland Press / Zhengzhou University
Marsland PressPO Box 180432Richmond Hill, New York 11418, USA
Website:http://www.lifesciencesite.com
Emails:[email protected]@gmail.com
Phone: (347) 321-7172
Life Science Journal 2013 Volume 10, N
umber 1
ISSN:1097-8135
, Part 13
Acta Zhengzhou University Overseas Edition
Cover design: CAO, Zhaolong
Photograph: YANG, Yizhong; YOUNG, Mary

MARSLAND PRESSMultidisciplinary Academic Journal Publisher
http://www.lifesciencesite.com
Emails:[email protected]@gmail.com
Website:
Life Science Journal
Volume 10, Number 1, Par t 13 ISSN:March 25, 2013 1097-8135
Life Science Journal ISSN: 1097-8135 http://www.lifesciencesite.com
Life Science Journal - Acta Zhengzhou University Oversea Version ISSN: 1097-8135
Life Science Journal, the Acta Zhengzhou University Oversea Version, is an international journal with the purpose to enhance our natural and scientific knowledge dissemination in the world under the free publication principle. The journal is calling for papers from all who are associated with Zhengzhou University-home and abroad. Any valuable papers or reports that are related to life science - in their broadest sense - are welcome. Other academic articles that are less relevant but are of high quality will also be considered and published. Papers submitted could be reviews, objective descriptions, research reports, opinions/debates, news, letters, and other types of writings. Let's work together to disseminate our research results and our opinions. Editor-in-Chief: Shen, Changyu, Ph.D., Professor, Chinese Academy of Sciences Associate Editors-in-Chief: Ma, Hongbao; Cherng, Shen; Xin, Shijun Editorial Boards: Aghdam, Hashemi; An, Xiuli; Cao, Zhaolong; Chandra, Avinash; Chen, George; Dong, Ziming; Duan, uangcai; Edmondson, Jingjing; Fu, Qiang; Fu, Xianzhen; Gao, Danying; Han, Quancheng; Han, Zhijiang; Hosseini, Seyyed Mousa; Huang, Shuan-Yu; Kan, Quancheng; Lang, Jinghe; Li, Hui; Li, Xinhua; Li, Yan; Li, Yuhua; Li, Yusheng; Li, Zhen; Lindley, Mark; Liu, Hongmin; Liu, Hua; Liu, Xinjing; Ma, Changsheng; Ma, Margret; Ma, Yongsheng; Maio, Zhongrong; Ming, Gongguang; Mousavi, Amin; Nie, Wei; Qi, Yuanming; Qiao, Nancy X; Qin, Jie; Qin, Qin; Qin, Yuhua; Ouyang, Da; Sabyasachi Chatterjee; Seryasat, Omid Rahmani; Shang, Fude; Shi, Lifeng; Song, Chunpeng; Song, Yongping; Spurr, Lydia; Sun, Yan; Sun, Yingpu; Sun, Yiwu; Tan, Song; Venkatesh, Jaganathan; Wang, Jianliu; Wang, Lidong; Wang, Longde; Wang, Xiaoying; Wang, Yilong; Wang, Yongjun; Wang, Zhonggao; Wen, Jianguo; Wu, Ziying; Xu, Cunshuan; Xu, Yuming; Xue, Changgui; Yang, Qian; Young, Jenny; Zaki, Mona; Zhang, Guangxian; Zhang, Hong; Zhang, Jianying; Zhang, Kehao; Zhang, Liusuo; Zhang, Mingzhi; Zhang, Rui; Zhang, Shengjun; Zhang, Shuijun; Zhang, Suming; Zhang, Wei; Zhang, Xueguo; Zhang, Yanzhou; Zhang, Zhan; Zhang, Zhao; Zhang, Zhenxiang; Zhu, Huaijie.
Introductions to Authors 1. General Information: (1) Goals: As an international journal published both in print and on internet, Life Science Journal is dedicated to the dissemination of fundamental knowledge in all areas of nature and science. The main purpose of Life Science Journal is to enhance our knowledge spreading in the world under the free publication principle. It publishes full-length papers (original contributions), reviews, rapid communications, and any debates and opinions in all the fields of nature and science. (2) What to Do: The Life Science Journal provides a place for discussion of scientific news, research, theory, philosophy, profession and technology - that will drive scientific progress. Research reports and regular manuscripts that contain new and significant information of general interest are welcome. (3) Who: All people are welcome to submit manuscripts in life science fields. Papers of other fields are also considered. (4) Copyright and Responsibility of Authors to their Articles: When the manuscript(s) is submitted to the journal, the authors agree the following: All the authors have participated sufficiently in this work; The article is not published elsewhere; Authors are responsibility on the contents of the article; The journal and author(s) have same right for the copyright of the article and either of the journal or author(s) can use it by anyway without noting the other party. (5) Publication Costs: US$640 per article to defray costs of the publication will be paid by the authors when it is received. (6) Advertisements: The price will be US$400/page, and we normally accept one advertisement for one page. Other size of the advertisement please contact with our editorial office through email. 2. Manuscript Preparation - Each manuscript is suggested to include the following components but authors can do their own ways: (1) Title: including the complete article title; each author’s full name; institution(s) with which each author is affiliated, with city, state/province, zip code, and country; and the name, complete mailing address, telephone number, facsimile number (if available), and at least one email address for author(s). (2) Abstract: including Background, Materials and Methods, Results, and Discussions. (3) Key Words. (4) Introduction. (5) Materials and Methods. (6) Results. (7) Discussions. (8) Acknowledgments. (9) References. 3. Manuscripts Submission: (1) Submission Methods: Submission through email ([email protected] or [email protected]) is encouraged. (2) Software: The Microsoft Word file. (3) Font: Normal, Times New Roman, 10 pt, single space. (4) Page Setup: Paper-Letter size; Margins-2.54 cm each side; Header/Footer-1.27 cm. (5) Indent: Type 8 spaces in the beginning of each new paragraph. (6) Manuscript: Don’t use “Footnote” or “Header and Footer”. (7) Email: At least one author’s email must be put under title. (8) Title: Use Title Case in the title and subtitles, e.g. “Molecular Study of Stem Cell”. (9) Figures and Tables: Use full word of figure and table, e.g. Figure 1. Annul Income of Different Groups, Table 1. Annual Increase of Investment. (10) References: Cite references by “last name, year”, e.g. “(Smith, 2003)”. References should include all the authors’ last names and initials, title, journal, year, volume, issue, and pages etc. Reference Examples: Journal Article: Hacker J, Hentschel U, Dobrindt U. Prokaryotic chromosomes and disease. Science 2003;301(34):790-3. Book: Berkowitz BA, Katzung BG. Basic and clinical evaluation of new drugs. In: Katzung BG, ed. Basic and clinical pharmacology. Appleton & Lance Publisher. Norwalk, Connecticut, USA. 1995:60-9. (11) Submission Address: [email protected] or [email protected], Marsland Press, PO Box 180432, Richmond Hill, New York 11418, USA, 347-321-7172.
Life Science Journal - Acta Zhengzhou University Overseas Edition (Life Sci J), ISSN: 1097-8135
PO Box 180432, Richmond Hill, New York 11418, USA http://www.lifesciencesite.com; http://www.sciencepub.net; [email protected]; [email protected]
© 2013 Marsland Press / Zhengzhou University
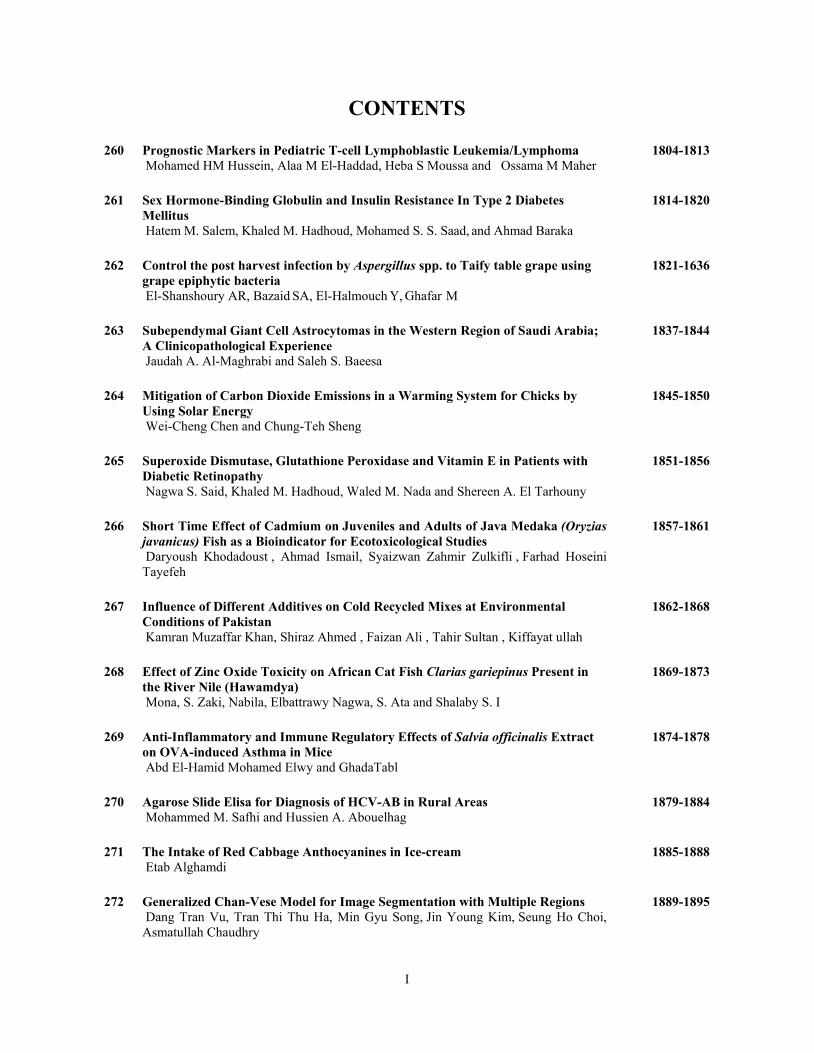
CONTENTS
260 Prognostic Markers in Pediatric T-cell Lymphoblastic Leukemia/Lymphoma Mohamed HM Hussein, Alaa M El-Haddad, Heba S Moussa and Ossama M Maher
1804-1813
261 Sex Hormone-Binding Globulin and Insulin Resistance In Type 2 Diabetes Mellitus Hatem M. Salem, Khaled M. Hadhoud, Mohamed S. S. Saad, and Ahmad Baraka
1814-1820
262 Control the post harvest infection by Aspergillus spp. to Taify table grape using grape epiphytic bacteria El-Shanshoury AR, Bazaid SA, El-Halmouch Y, Ghafar M
1821-1636
263 Subependymal Giant Cell Astrocytomas in the Western Region of Saudi Arabia; A Clinicopathological Experience Jaudah A. Al-Maghrabi and Saleh S. Baeesa
1837-1844
264 Mitigation of Carbon Dioxide Emissions in a Warming System for Chicks by Using Solar Energy Wei-Cheng Chen and Chung-Teh Sheng
1845-1850
265 Superoxide Dismutase, Glutathione Peroxidase and Vitamin E in Patients with Diabetic Retinopathy Nagwa S. Said, Khaled M. Hadhoud, Waled M. Nada and Shereen A. El Tarhouny
1851-1856
266 Short Time Effect of Cadmium on Juveniles and Adults of Java Medaka (Oryzias javanicus) Fish as a Bioindicator for Ecotoxicological Studies Daryoush Khodadoust , Ahmad Ismail, Syaizwan Zahmir Zulkifli , Farhad Hoseini Tayefeh
1857-1861
267 Influence of Different Additives on Cold Recycled Mixes at Environmental Conditions of Pakistan Kamran Muzaffar Khan, Shiraz Ahmed , Faizan Ali , Tahir Sultan , Kiffayat ullah
1862-1868
268 Effect of Zinc Oxide Toxicity on African Cat Fish Clarias gariepinus Present in the River Nile (Hawamdya) Mona, S. Zaki, Nabila, Elbattrawy Nagwa, S. Ata and Shalaby S. I
1869-1873
269 Anti-Inflammatory and Immune Regulatory Effects of Salvia officinalis Extract on OVA-induced Asthma in Mice Abd El-Hamid Mohamed Elwy and GhadaTabl
1874-1878
270 Agarose Slide Elisa for Diagnosis of HCV-AB in Rural Areas Mohammed M. Safhi and Hussien A. Abouelhag
1879-1884
271 The Intake of Red Cabbage Anthocyanines in Ice-cream Etab Alghamdi
1885-1888
272 Generalized Chan-Vese Model for Image Segmentation with Multiple Regions Dang Tran Vu, Tran Thi Thu Ha, Min Gyu Song, Jin Young Kim, Seung Ho Choi, Asmatullah Chaudhry
1889-1895
I
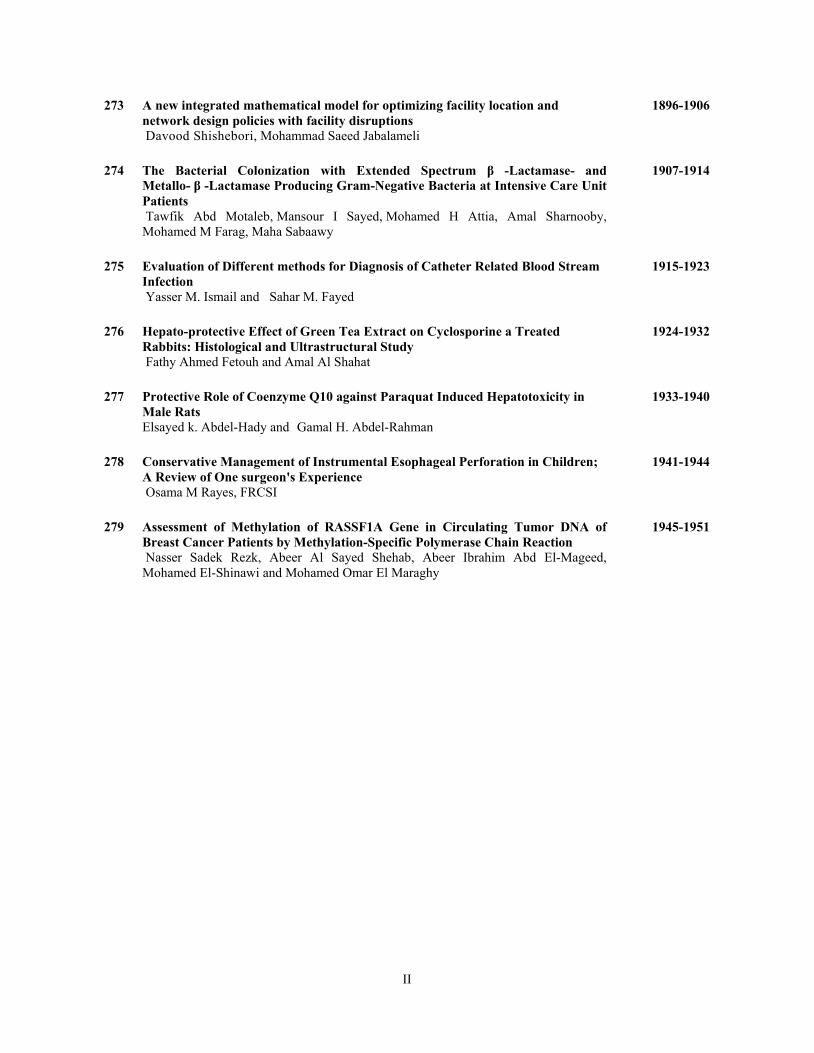
273 A new integrated mathematical model for optimizing facility location and network design policies with facility disruptions Davood Shishebori, Mohammad Saeed Jabalameli
1896-1906
274 The Bacterial Colonization with Extended Spectrum β -Lactamase- and Metallo- β -Lactamase Producing Gram-Negative Bacteria at Intensive Care Unit Patients Tawfik Abd Motaleb, Mansour I Sayed, Mohamed H Attia, Amal Sharnooby, Mohamed M Farag, Maha Sabaawy
1907-1914
275 Evaluation of Different methods for Diagnosis of Catheter Related Blood Stream Infection Yasser M. Ismail and Sahar M. Fayed
1915-1923
276 Hepato-protective Effect of Green Tea Extract on Cyclosporine a Treated Rabbits: Histological and Ultrastructural Study Fathy Ahmed Fetouh and Amal Al Shahat
1924-1932
277 Protective Role of Coenzyme Q10 against Paraquat Induced Hepatotoxicity in Male Rats Elsayed k. Abdel-Hady and Gamal H. Abdel-Rahman
1933-1940
278 Conservative Management of Instrumental Esophageal Perforation in Children; A Review of One surgeon's Experience Osama M Rayes, FRCSI
1941-1944
279 Assessment of Methylation of RASSF1A Gene in Circulating Tumor DNA of Breast Cancer Patients by Methylation-Specific Polymerase Chain Reaction Nasser Sadek Rezk, Abeer Al Sayed Shehab, Abeer Ibrahim Abd El-Mageed, Mohamed El-Shinawi and Mohamed Omar El Maraghy
1945-1951
II
Life Science Journal 2013;10(1) http://www.lifesciencesite.com
1804
Prognostic Markers in Pediatric T-cell Lymphoblastic Leukemia/Lymphoma
Mohamed HM Hussein, Alaa M El-Haddad, Heba S Moussa and Ossama M Maher
Pediatric Oncology, Clinical Pathology National Cancer Institute, Cairo University [email protected]
Abstract: Background: Historically, the diagnosis of T-cell acute lymphoblastic leukemia (T-ALL) or T-cell lymphoblastic lymphoma (T-LBL) predicted a higher risk of induction failure, early relapse, and worse event-free survival (EFS) compared with B-precursor childhood leukemia or lymphoma. Treatment intensification has dramatically improved the general prognosis of childhood T-cell precursor acute lymphoblastic leukaemia (T-ALL). Nevertheless, approximately20–25% of cases still relapse early. Various prognostic parameters have been sought for better risk stratification and treatment adjustments for patients with markers of poor prognosis. A task that has been considerably difficult, with conflicting results from different studies. In this study we aimed at highlighting prognostic parameters that would help in better risk stratification and treatment planning of pediatric T cell ALL and LBL patients. Material and methods: 105 pediatric T-cell leukemia/lymphoma patients were enrolled in the study. T-ALL were 72 cases and 33 cases were T lymphoblastic Leukemia (LBL), stage III. Patients were diagnosed by thorough examination and extensive lab workup. Patients were further evaluated for response to therapy. The T ALL cases at days 8, 14 and again at day 43, end of induction, together with the LBL cases. Patients were followed up for a median of 20 months and survival was correlated to parameters that could carry prognostic significance. Results: The patients' mean age was 9.75 years and male : female ratio was 3.2:1. The 3 years overall survival (OS) was, for the whole 105 patients 77.4 ±5.1%, for the leukemia group 81.6±5%, and for the lymphoma group 77.6±8.1%. The disease free survival (DFS) was 60.42±5.6%, 93.3±6.4%, 47.1±8.6% and event free survival (EFS) was 50.71 ±8.3%, 48.5±6.2% and 59.2 ±9.2% respectively. Age significantly correlated with OS of patients (p= 0.04). For T ALL, male gender, TLC <50 x109/L and good prednisone responders correlated with DFS (p = 0.01), (p < 0.001) and (p =0.02) respectively. Also, male gender and good prednisone response correlated with EFS ( p = 0.05) and (p < 0.001) respectively. Conclusion: further studies are needed to establish concrete prognostic markers that would be used for better risk stratification of pediatric T-cell L/L and hence improve the management of pediatric T-cell ALL and LBL and achieve better outcome for the patients. [Mohamed HM Hussein, Alaa M El-Haddad, Heba S Moussa and Ossama M Maher. Prognostic Markers in Pediatric T-cell Lymphoblastic Leukemia/Lymphoma. Life Sci J 2013;10(1):1804-1813]. (ISSN: 1097-8135). http://www.lifesciencesite.com. 260 Key words: T-cell ALL, T-LBL, prognostic parameters. 1. Introduction
ALL being the most common cancer diagnosed in children, represents 23% of cancer diagnoses among children younger than 15 years, with T-cell ALL, accounting for about 10-15% of the pediatric ALL cases (1, 2).
Through the Cancer registration at the NCI Egypt 2002-2003, ALL was recorded to constitute 19.6% of all childhood malignancies. TALL accounted for about 26% of the pediatric ALL (3, 4).
T-cell lymphoid malignancies are associated with distinctive biologic, cytogenetic, and clinical features which set them apart from non-T lymphoid malignancies. (5-9)
T-cell ALL and advanced stage lymphoblastic lymphomas (LBL) are aggressive malignancies once associated with a very poor prognosis (10)
The distinction between T-cell ALL and T-cell lymphoblastic lymphoma is also ill-defined. There is some evidence that these disorders arise from different stages of T-cell differentiation and consequently have
immunophenotypes reflecting different stages of T-cell maturation. Because this distinction does not occur in every case, it does not provide a reliable basis for delineating between the two diseases. In the absence of more refined biologic criteria, the percentage of blasts in the bone marrow is conventionally used to differentiate between T-cell ALL and T-cell non-Hodgkin's lymphoma according to the WHO2008.
The Children's Oncology Group adopted a strategy of lineage-specific treatment for T-ALL and T-LBL using protocols different from those used to treat patients with B lineage disease. (11, 12).
Despite the improvements of the past 3 decades, outcomes for patients with T-ALL and T- LBL are not optimal (10).
Risk-based treatment assignment has been utilized for children with ALL so that those children who have a very good outcome with modest therapy can be spared more intensive and toxic treatment, while a more aggressive, thus more toxic, therapeutic

Life Science Journal 2013;10(1) http://www.lifesciencesite.com
1805
approach can be provided for patients who have a lower probability of long-term survival (13).
Identifying reliable prognostic factors for T-ALL treatment planning has been considerably more difficult than for B-precursor ALL (14). Nevertheless, age, WBC at diagnosis, and gender held prognostic significance (5-10, 15-18). Also assessment of day 8 peripheral blood blast count, day 7 and/or day 14 marrow blast percentage, and minimal residual disease determinations in bone marrow and/or peripheral blood during or at the end of induction have been shown to be of strong prognostic significance (10, 15, 19, 20).
It is noteworthy that T-ALL is infrequently characterized by cytogenetic or molecular markers such as hyperdiploidy or chromosomal translocations that are considered parameters of good prognosis (21). In addition our Egyptian pediatric T ALL cases showed low frequency of the most recurring abnormalities that has a possible impact on prognosis. SIL/TAL occurs in about 4% and HOX11L2 ectopic expression in about 12% (22), compared to about 25% of either molecular event in patients in developed countries (23, 24). The specificity of immunoglobulin and TCR gene rearrangements is useful basically as marker of clonality and for MRD detection (25).
In this study we aimed at highlighting prognostic parameters that would help in better risk stratification and treatment planning of pediatric T cell ALL and LBL patients. 2. Patient and Methods: Patients:
Cases enrolled in this study were 105 newly diagnosed T-cell ALL and stage III T lymphoblastic Leukemia (LBL) cases. They presented to the Pediatric Oncology Department at the National Cancer Institute, during the time period from beginning of November 2004 till the end of July 2007. The age range was 2-18 years. Patient characteristics are shown in Table 1. Patients were diagnosed by thorough examination including history, physical examination with complete nodal assessment, cytologic assessment of CSF, pleural, peritoneal fluids and radiography. The lab workup included chemistry profile, complete blood count, Bone marrow (BM) aspiration/biopsy, immunophenotyping and molecular testing for T cell receptor (TCR) γ, δ, and immunoglobulin heavy chain (IgH) gene rearrangements. Written informed consent was obtained from the patients’ parents and the protocol was approved by the Institutional Review Board (IRB)
Immunophenotyping: on peripheral blood (PB) or bone marrow for T ALL cases and pleural effusion for T LBL, included the monoclonal antibodies panel (obtained from Becman coulter and Dako), CD1, CD2, CD3, CD4,CD5, CD7, CD8, CD10, CD19, CD22, anti
κ, anti λ, CD13, CD33, anti class II MHC (26), cytoplasmic µ and TdT (27) analyzed on Coulter XL. T- Cell ALL cases were diagnosed by the expression of T-cell antigens and the absence of B-cell and myeloid antigens. Molecular testing for antigen receptor gene rearrangement by Polymerase Chain Reaction (PCR):
Antigen receptor gene rearrangements, T cell receptor (TCR) γ and δ and immunoglobulin heavy chain (IgH) gene were done on peripheral blood (PB) or bone marrow for T-cell ALL cases and on bone marrow for NHL cases, as previously described, (28-30). Molecular testing was done on confirmation of the immunophenotyping and immunohistochemical studies. In brief: DNA was isolated from peripheral blood and/or B.M at diagnosis (31). TCR-γ gene rearrangement analysis:
The demonstration of TCR-γ gene rearrangements was performed by using two rounds of multiplex PCR with a set of seven primers (Table 2). These primers were used in two mixes: Mix 1 contained VγIcons in Jγ2S2, JP and JP1/2 primers, and Mix 2 contained V γ 9.2, Vγ10, and Vγ11, Jγ2S2, JP and JP1/2 primers. For each sample, two PCR amplifications were performed, using first Mix 1 and then Mix 2, respectively.
The amplification reaction was performed in 25 µL reaction mix, containing 0.5 µg of genomic DNA, 0.3 µmol of each primer, 100 µmol of each
dNTPs, 1.5 mmol MgCl2, 10 mmol Tris-HCl (pH 8.3), 50 mmol KCl, and 2U NativeTaq DNA polymerase (Finnzymes). After initial denaturation for 6 minutes at 94°C, the PCR was performed for 45 cycles of 1 minute at 94°C, 1 minute at 55°C, and 1 minute at 72°C. The last elongation step was extended to 20 minutes. Positive control sample was included in each amplification series. PCR products were separated on ethidium bromide-stained 3% agarose gels, at 100 volt for 30 min. PCR products for TcR-γ chain gene rearrangements were approximately of 230 and 125 bp for Mix 1 and Mix 2 primer pairs, respectively (29). TCRδ and IgH gene rearrangement analysis:
The reaction mixtures contained 1μg DNA, 0.5 µmol of each oligonucleotide primer (table 2), 100 µmol dNTPs, 10 mmol Tris-HCl (pH 8.3), 1.5 mmol MgCl2, 50 mmol KCl, and, 2U NativeTaq DNA polymerase (Finnzymes). The PCR cyclic conditions consisted of an initial denaturation at 94°C for 6 min, followed by 35 cycles at 94°C, 55°C, and 72°C, each for 30 sec, and a final extension at 72°C for7 min. The PCR product was analyzed by electrophoresis on a 3 % agarose gel, at 100 volt for 30 min.
Life Science Journal 2013;10(1) http://www.lifesciencesite.com
1806
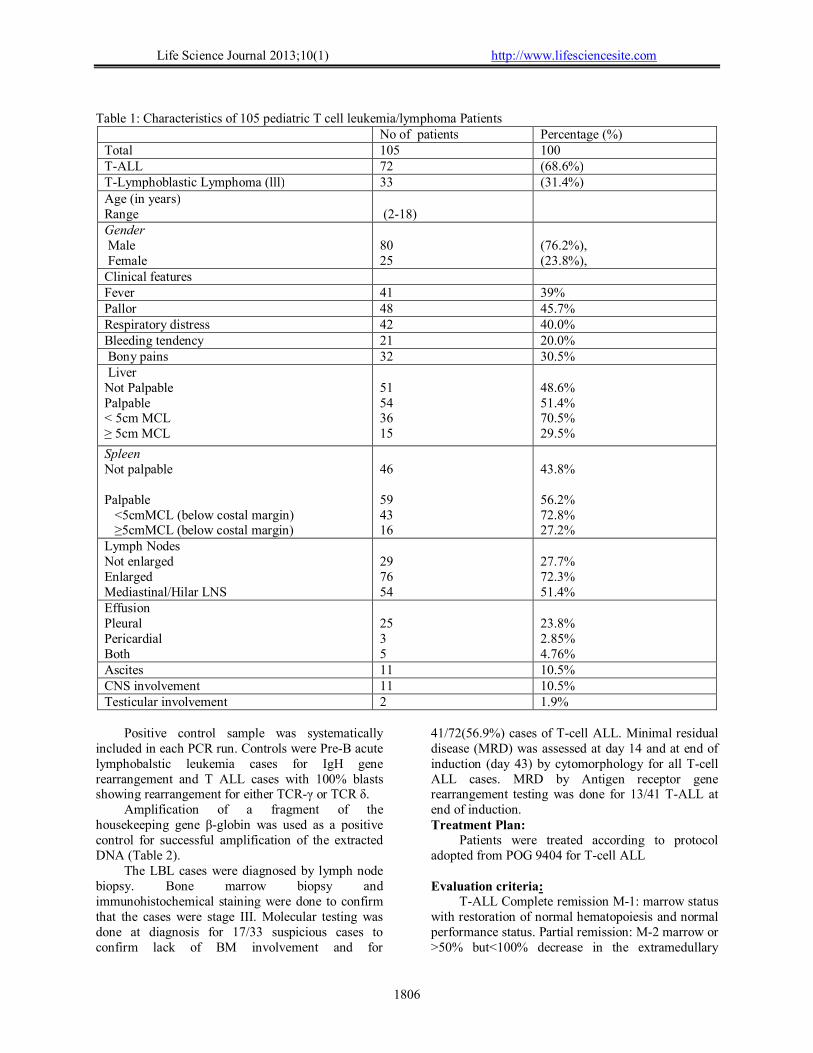
Table 1: Characteristics of 105 pediatric T cell leukemia/lymphoma Patients
No of patients Percentage (%) Total 105 100 T-ALL 72 (68.6%) T-Lymphoblastic Lymphoma (lll) 33 (31.4%) Age (in years) Range
(2-18)
Gender Male Female
80 25
(76.2%), (23.8%),
Clinical features Fever 41 39% Pallor 48 45.7% Respiratory distress 42 40.0% Bleeding tendency 21 20.0% Bony pains 32 30.5% Liver Not Palpable Palpable < 5cm MCL ≥ 5cm MCL
51 54 36 15
48.6% 51.4% 70.5% 29.5%
Spleen Not palpable Palpable <5cmMCL (below costal margin) ≥5cmMCL (below costal margin)
46 59 43 16
43.8% 56.2% 72.8% 27.2%
Lymph Nodes Not enlarged Enlarged Mediastinal/Hilar LNS
29 76 54
27.7% 72.3% 51.4%
Effusion Pleural Pericardial Both
25 3 5
23.8% 2.85% 4.76%
Ascites 11 10.5% CNS involvement 11 10.5% Testicular involvement 2 1.9%
Positive control sample was systematically
included in each PCR run. Controls were Pre-B acute lymphobalstic leukemia cases for IgH gene rearrangement and T ALL cases with 100% blasts showing rearrangement for either TCR-γ or TCR δ.
Amplification of a fragment of the housekeeping gene β-globin was used as a positive control for successful amplification of the extracted DNA (Table 2).
The LBL cases were diagnosed by lymph node biopsy. Bone marrow biopsy and immunohistochemical staining were done to confirm that the cases were stage III. Molecular testing was done at diagnosis for 17/33 suspicious cases to confirm lack of BM involvement and for
41/72(56.9%) cases of T-cell ALL. Minimal residual disease (MRD) was assessed at day 14 and at end of induction (day 43) by cytomorphology for all T-cell ALL cases. MRD by Antigen receptor gene rearrangement testing was done for 13/41 T-ALL at end of induction. Treatment Plan:
Patients were treated according to protocol adopted from POG 9404 for T-cell ALL Evaluation criteria:
T-ALL Complete remission M-1: marrow status with restoration of normal hematopoiesis and normal performance status. Partial remission: M-2 marrow or >50% but<100% decrease in the extramedullary

Life Science Journal 2013;10(1) http://www.lifesciencesite.com
1807
leukemia. LBL: Complete remission was defined as disappearance of all evidence of disease from all sites, Partial remission: >50% decrease in the sum of the products of the maximum perpendicular diameter of the lesions, no new lesion
Any of the above findings must be present for at least one month.
No response: Failure to qualify for a PR. Progressive disease: Worsening of disease or appearance of new disease. Relapse: ≥25% leukemic blasts in marrow or histophathologically documented disease in the CNS, testes or else where after initial remission. Follow up period:
The follow-up period was 6-36 months, with a median of 20 months. Overall Survival (OS):
Calculated from the date of first admission till the date of last follow up for patients who ended the study in continuous complete remission (CCR), or to the date of death. Disease Free Survival (DFS):
Included time to relapse or development of a second malignancy, measured from the end of induction for patients who achieved CR (induction deaths and non responders were excluded). Event Free Survival (EFS):
Measured from the time of CR till the time of occurrence of any events leading to remission failure (early death, non responders) or the end of a first remission period (relapse, second malignancy or death of any causes). Statistical analysis
SPSS for Windows (32) was used for data management. Data was described in terms of mean, standard deviation, median, range, frequencies (number of cases) and relative frequencies (percentages). For comparing categorical data, Chi square test and Fisher exact tests were performed. A probability value (p ≤ 0.05) is considered significant. Survival was estimated using Kaplan Meier method and log-rank test for comparing curves. Cox regression analysis was done to detect effect of independent prognostic factors on different outcome including overall survival, disease free survival and event free survival.
Table 2: The oligonucleotide primer sequences used for amplification of the candidate genes Primer Primer sequence Gene Specificity Reference VγI cons 5 َ◌-CTGGTACCTACACCAGGAGGGGAA-3 َ◌ TCR-γ 28, 29 Vγ9.2 5 َ◌-GAAAGGAATCTGGCATTCCG-3 َ◌ Vγ10 5 َ◌-GCAGCATGGGTAAGACAAGC-3 َ◌ V γ 11 5 َ◌-GATTGCTCAGGTGGGAAGAC-3 َ◌ Jγ2S2 5 َ◌-CCTGTGACAACAAGTGTTGT-3 َ◌ JP 5 َ◌-TTGTTCCGGGACCAAATACC-3 َ◌ JP1/2 5 َ◌-CCAGGTGAAGTTACTATGAG-3 َ◌ Vδ2 5 َ◌-CAAGGTGACATTGATA TTGC-3 َ◌ TCR-δ
30
Dδ2 5 َ◌-CGGGTGGTGATGGCAAAGTGCC-3 َ◌ Dδ3 5 َ◌-GAAATGGCACTTTTGCCCCTGCAG-3 َ◌ VU 5 َ◌-ACGGCCGTGTATTACTG-3 َ◌ IgH 30) JU 5 َ◌-CTGAGGAGACGGTGACC-3 َ◌ HBG7-F 5 َ◌-GAAGAGCCAAGGACAGGTAC-3 َ◌ β-globin 30 HBG7-R 5 َ◌-CAACTTCATCCACGTTCACC-3 َ◌ 3.Results
This study included 105 eligible patients with newly diagnosed T-cell ALL and advanced stage lymphoblastic lymphoma (stage III) who were presented to the Pediatric Oncology Department at the National Cancer Institute, Cairo University during the time period from November 2004 till July 2007. T-cell ALL represented 72 cases (68.6%), while stage III lymphoblastic lymphoma represented 33 cases (31.4%). Originally, the T- ALL were 66 patients and the advanced LBL 39 but with bone marrow aspirate examination and immunophenotyping, 6
patients turned out to be in leukemic phase (BM blasts >20%) and hence were added to the leukemia group.
The age of the patients ranged between 2 and 18 years. The mean age was 9.75 years and the median was 10 years, the peak incidence was recorded in the (> 10 -15 years age group) constituting around 34.3% of patients.
In this study, 80 patients were males (76.2%) and 25 were females (23.8%). The male: female ratio was 3.2:1. Initial laboratory findings are shown it Table 3.
Life Science Journal 2013;10(1) http://www.lifesciencesite.com
1808
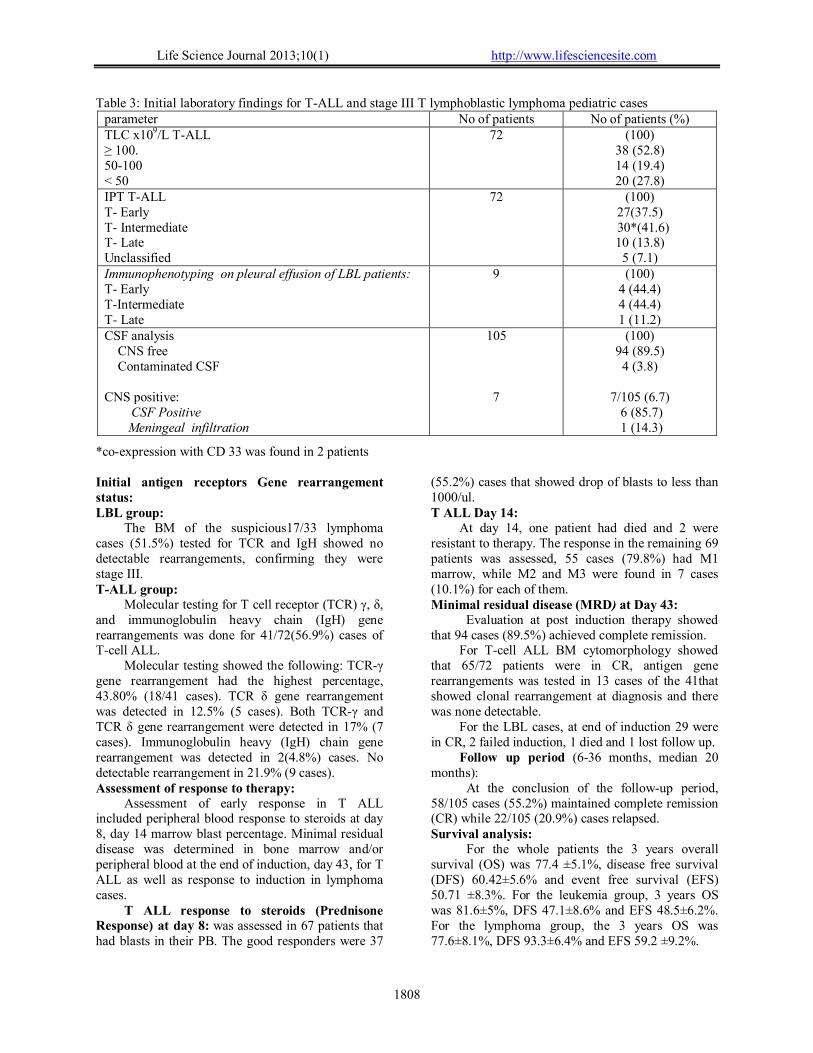
Table 3: Initial laboratory findings for T-ALL and stage III T lymphoblastic lymphoma pediatric cases parameter No of patients No of patients (%) TLC x109/L T-ALL ≥ 100.
50-100
< 50
72 (100) 38 (52.8) 14 (19.4) 20 (27.8)
IPT T-ALL T- Early T- Intermediate T- Late Unclassified
72 (100) 27(37.5)
30*(41.6) 10 (13.8)
5 (7.1) Immunophenotyping on pleural effusion of LBL patients: T- Early T-Intermediate T- Late
9 (100) 4 (44.4) 4 (44.4) 1 (11.2)
CSF analysis CNS free Contaminated CSF CNS positive: CSF Positive Meningeal infiltration
105
7
(100) 94 (89.5)
4 (3.8)
7/105 (6.7) 6 (85.7) 1 (14.3)
*co-expression with CD 33 was found in 2 patients Initial antigen receptors Gene rearrangement status: LBL group:
The BM of the suspicious17/33 lymphoma cases (51.5%) tested for TCR and IgH showed no detectable rearrangements, confirming they were stage III. T-ALL group:
Molecular testing for T cell receptor (TCR) γ, δ, and immunoglobulin heavy chain (IgH) gene rearrangements was done for 41/72(56.9%) cases of T-cell ALL.
Molecular testing showed the following: TCR-γ gene rearrangement had the highest percentage, 43.80% (18/41 cases). TCR δ gene rearrangement was detected in 12.5% (5 cases). Both TCR-γ and TCR δ gene rearrangement were detected in 17% (7 cases). Immunoglobulin heavy (IgH) chain gene rearrangement was detected in 2(4.8%) cases. No detectable rearrangement in 21.9% (9 cases). Assessment of response to therapy:
Assessment of early response in T ALL included peripheral blood response to steroids at day 8, day 14 marrow blast percentage. Minimal residual disease was determined in bone marrow and/or peripheral blood at the end of induction, day 43, for T ALL as well as response to induction in lymphoma cases.
T ALL response to steroids (Prednisone Response) at day 8: was assessed in 67 patients that had blasts in their PB. The good responders were 37
(55.2%) cases that showed drop of blasts to less than 1000/ul. T ALL Day 14:
At day 14, one patient had died and 2 were resistant to therapy. The response in the remaining 69 patients was assessed, 55 cases (79.8%) had M1 marrow, while M2 and M3 were found in 7 cases (10.1%) for each of them. Minimal residual disease (MRD) at Day 43:
Evaluation at post induction therapy showed that 94 cases (89.5%) achieved complete remission.
For T-cell ALL BM cytomorphology showed that 65/72 patients were in CR, antigen gene rearrangements was tested in 13 cases of the 41that showed clonal rearrangement at diagnosis and there was none detectable.
For the LBL cases, at end of induction 29 were in CR, 2 failed induction, 1 died and 1 lost follow up.
Follow up period (6-36 months, median 20 months):
At the conclusion of the follow-up period, 58/105 cases (55.2%) maintained complete remission (CR) while 22/105 (20.9%) cases relapsed. Survival analysis:
For the whole patients the 3 years overall survival (OS) was 77.4 ±5.1%, disease free survival (DFS) 60.42±5.6% and event free survival (EFS) 50.71 ±8.3%. For the leukemia group, 3 years OS was 81.6±5%, DFS 47.1±8.6% and EFS 48.5±6.2%. For the lymphoma group, the 3 years OS was 77.6±8.1%, DFS 93.3±6.4% and EFS 59.2 ±9.2%.
Life Science Journal 2013;10(1) http://www.lifesciencesite.com
1809
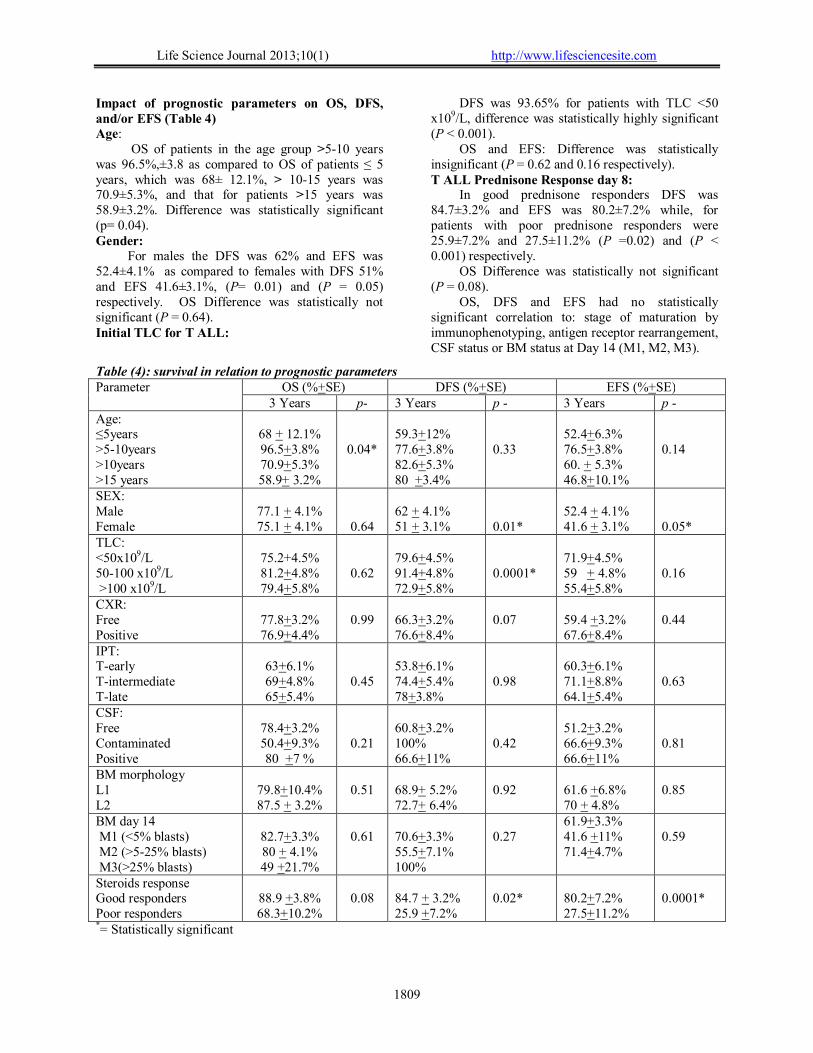
Impact of prognostic parameters on OS, DFS, and/or EFS (Table 4) Age:
OS of patients in the age group >5-10 years was 96.5%,±3.8 as compared to OS of patients ≤ 5 years, which was 68± 12.1%, > 10-15 years was 70.9±5.3%, and that for patients >15 years was 58.9±3.2%. Difference was statistically significant (p= 0.04). Gender:
For males the DFS was 62% and EFS was 52.4±4.1% as compared to females with DFS 51% and EFS 41.6±3.1%, (P= 0.01) and (P = 0.05) respectively. OS Difference was statistically not significant (P = 0.64). Initial TLC for T ALL:
DFS was 93.65% for patients with TLC <50 x109/L, difference was statistically highly significant (P < 0.001).
OS and EFS: Difference was statistically insignificant (P = 0.62 and 0.16 respectively). T ALL Prednisone Response day 8:
In good prednisone responders DFS was 84.7±3.2% and EFS was 80.2±7.2% while, for patients with poor prednisone responders were 25.9±7.2% and 27.5±11.2% (P =0.02) and (P < 0.001) respectively.
OS Difference was statistically not significant (P = 0.08).
OS, DFS and EFS had no statistically significant correlation to: stage of maturation by immunophenotyping, antigen receptor rearrangement, CSF status or BM status at Day 14 (M1, M2, M3).
Table (4): survival in relation to prognostic parameters Parameter OS (%+SE) DFS (%+SE) EFS (%+SE)
3 Years p- 3 Years p - 3 Years p - Age: ≤5years >5-10years >10years >15 years
68 + 12.1% 96.5+3.8% 70.9+5.3% 58.9+ 3.2%
0.04*
59.3+12% 77.6+3.8% 82.6+5.3% 80 +3.4%
0.33
52.4+6.3% 76.5+3.8% 60. + 5.3% 46.8+10.1%
0.14
SEX: Male Female
77.1 + 4.1% 75.1 + 4.1%
0.64
62 + 4.1% 51 + 3.1%
0.01*
52.4 + 4.1% 41.6 + 3.1%
0.05*
TLC: <50x109/L 50-100 x109/L >100 x109/L
75.2+4.5% 81.2+4.8% 79.4+5.8%
0.62
79.6+4.5% 91.4+4.8% 72.9+5.8%
0.0001*
71.9+4.5% 59 + 4.8% 55.4+5.8%
0.16
CXR: Free Positive
77.8+3.2% 76.9+4.4%
0.99
66.3+3.2% 76.6+8.4%
0.07
59.4 +3.2% 67.6+8.4%
0.44
IPT: T-early T-intermediate T-late
63+6.1% 69+4.8% 65+5.4%
0.45
53.8+6.1% 74.4+5.4% 78+3.8%
0.98
60.3+6.1% 71.1+8.8% 64.1+5.4%
0.63
CSF: Free Contaminated Positive
78.4+3.2% 50.4+9.3% 80 +7 %
0.21
60.8+3.2% 100% 66.6+11%
0.42
51.2+3.2% 66.6+9.3% 66.6+11%
0.81
BM morphology L1 L2
79.8+10.4% 87.5 + 3.2%
0.51
68.9+ 5.2% 72.7+ 6.4%
0.92
61.6 +6.8% 70 + 4.8%
0.85
BM day 14 M1 (<5% blasts) M2 (>5-25% blasts) M3(>25% blasts)
82.7+3.3% 80 + 4.1% 49 +21.7%
0.61
70.6+3.3% 55.5+7.1% 100%
0.27
61.9+3.3% 41.6 +11% 71.4+4.7%
0.59
Steroids response Good responders Poor responders
88.9 +3.8% 68.3+10.2%
0.08
84.7 + 3.2% 25.9 +7.2%
0.02*
80.2+7.2% 27.5+11.2%
0.0001*
*= Statistically significant
Life Science Journal 2013;10(1) http://www.lifesciencesite.com
1810
4.Discussion Historically, the diagnosis of T-cell acute
lymphoblastic leukemia (T-ALL) or T-cell lymphoblastic lymphoma (T-LBL) predicted a higher risk of induction failure, early relapse, and worse event-free survival (EFS) compared with B-precursor childhood leukemia or lymphoma (33-38). With increasingly intensive regimens of multi-agent chemotherapy, survival rates have improved to more than 70%. (10-12). Although these regimens all demonstrate some degree of efficacy in T-cell disease, true lineage-specific, highly efficacious therapy has not been identified (10). Treatment intensification has dramatically improved the general prognosis of childhood T-cell precursor acute lymphoblastic leukaemia (T-ALL). Nevertheless, approximately20–25% of cases still relapse early, which significantly diminishes the prognostic outlook of this phenotypic ALL subtype (24, 39-41)
Various prognostic markers have been sought for better risk stratification and treatment adjustments for those patients with parameters of poor prognosis. A task that has been considerably difficult, with conflicting results from different studies (10, 15-18).
In view of this study, for the whole 105 patients, the OS was (77.4%), the estimated 3 years DFS and EFS were (60.4%) and (50.71%) respectively. These figures were mostly lower than reported (16, 17, 39, 42, 44).
When comparing groups, the leukemia group had better OS 81.6±5%, than the lymphoma group (77.6±8.1%).
However, the lymphoma group had better DFS and EFS (93.3±6.4%, 59.2 ±9.2%) compared to the DFS and EFS (47.1±8.6% and 48.5±6.2%) of the leukemia group. In an overview, this was in agreement to a recent report in which patients received the same therapy protocol as our patients. However, the report gave a higher 5 years EFS for T-ALL patients (73.4% ± 2.6%) and T-NHL (84.6% ± 3.2%) (10). Only one report had comparable OS (78%) for T-cell ALL. (45).
When analyzing the prognostic parameters, the following were of statistical significant; the age groups of the 105 patients, gender, initial total leucocytic count, and initial steroids response to therapy for the T ALL patients.
As regards age, it had impact on OS which was higher in the age group >5-10 years (96.5%)(p= 0.04), but was low for the other age groups which was in agreement with various studies (16-18). However age had no statistical significance on EFS contrary to report by others (10).
More controversy occurred with the statistical significance of gender on survival of T ALL cases. We reported a statistically significant DFS and EFS
(62% and 52.4±4.1%) for males as compared to DFS and EFS (51% 41.6±3.1%) for females (p = 0.01) and (p = 0.05). Some clinical trials showed that male gender was no longer an adverse risk factor (44) and most reports showed that gender has no statistical significance to survival (16, 17, 42, 45). One report showed that the gender could be of statistical significance on the EFS depending on the treatment protocol applied (10).
Initial TLC for our T ALL was statistically insignificant on OS and EFS (p = 0.62 and 0.16 respectively). Patients with TLC <50 x109/L, had a statistically highly significant DFS, 93.65% (p < 0.001). Different studies reported contradicting results, some reported that TLC had no effect on survival (16, 17, 42, 45, 46), while others reported initial TLC a significant prognostic factor on EFS. Patients with TLC <50 x109/L, had EFS, 81.5% ±3.6%, vs EFS 67.6% ±3.6% for patients with TLC higher than 50 000 x109/L) (p < 0.009) (10).
The rapidity with which leukemia cells are eliminated following onset of treatment (cytomorphological) is also associated with outcome. For many years, cytomorphological response has been the leading criterion for stratifying patients into risk groups within the ALL trials. Poor cytomorphological response at a response evaluation point qualified a patient for high-risk treatment. (15). Day 8, 14 and 43 are the important response evaluation points. In this study, assessment of the Prednisone response day 8 for T ALL, good prednisone responders had significantly better DFS and EFS (84.7±3.2% and 80.2±7.2%) (p =0.02) and (p < 0.001), however, had no effect on the OS. This was in agreement to other reports (15, 46)
Other factors showed statistically insignificant impact on OS, DFS, and EFS of our patients, although many studies reported their prognostic significance as mediastinal masses (47), initial CSF analysis (17, 42, 48), immunophenotyping (37, 49, 43) bone marrow day 14, Minimal Residual Disease (MRD) at the end of induction (day 43) (15, 16, 50). On the other hand some reports gave findings similar to our study. (10, 45)
In this study, univariate analysis indicated that age groups, gender, initial Total leucocytic count, and initial steroids response to therapy were significant prognostic factors. However, on multivariate analysis, poor response to steroids therapy and TLC counts >100x109/L were found to be independent prognostic factors for DFS (p = 0.03 and 0.05) respectively. Similarly, poor response to steroids therapy was found to be an adverse prognostic factor for EFS. Poor responders to steroid therapy developed an earlier event than good responders.
Life Science Journal 2013;10(1) http://www.lifesciencesite.com
1811
In conclusion, management of pediatric T-cell ALL and LBL still needs modifications to achieve better outcome for patients. Further multicentric studies are needed to provide accumulating evidences of which prognostic parameters are the most valuable in risk stratification of the patients and hence a consensus treatment protocol can be applied. Also, true lineage-specific, highly efficacious therapy seems to be the hope to true cure. Corresponding author Heba S Moussa Clinical Pathology National Cancer Institute, Cairo University [email protected] References: 1- Ries LA, Kosary CL, Hankey BF, et al.: SEER
Cancer Statistics Review, 1973-1996. Bethesda, Md: National Cancer Institute. Last accessed April 19, 2007.
2- van Grotel, M., Meijerink, J.P., Beverloo, H.B., et al.The outcome of molecular-cytogenetic subgroups in pediatric T-cell acute lymphoblastic leukemia: a retrospective study of patients treated according to DCOG or COALL protocols. Haematologica 2006: 91: 1212–1221.
3- El Attar IA and the Department of Statistics, NCI. Cancer Statistics at the National Cancer Institute, Cairo, Egypt; 2002-2003.
4- Hussein MH, Naga SA, Sidhom I, Kamel A, Hattab O and Hamza MR. Heterogeneity of presenting features and their relation to treatment outcome in children with T-cell acute lymphoblastic leukemia in NCI, Egypt. J. Egyptian Natl. Cancer Inst, 1998; 10(1): 33-41.
5-9Coppat 2011: 1-5 5- Sen L, Borella L. Clinical importance of
lymphoblasts with T markers in childhood acute leukemia. N Engl J Med. 1975;292(16):828-832.
6- Dowell BL, Borowitz MJ, Boyett JM, et al. Immunologic and clinicopathologic features of common acute lymphoblastic leukemia antigen-positive childhood T-cell leukemia: a Pediatric Oncology Group study. Cancer. 1987; 59(12):2020-2026.
7- Pui CH, Christ WM, Look AT. Biology and clinical significance of cytogenetic abnormalities in childhood acute lymphoblastic leukemia. Blood. 1990; 76(8):1449-1463.
8- Steinherz PG, Siegel SE, Bleyer WA, et al. Lymphomatous presentation of childhood acute lymphoblastic leukemia. A subgroup at high risk of early treatment failure. Cancer. 1991;68(4):751-758.
9- Uckun FM, Sensel MG, Sun L, et al. Biology and treatment of childhood T-lineage acute lymphoblastic leukemia. Blood 1998; 91(3):735-746.
10- Asselin B, Devidas, M, Wang C, Pullen J, Borowitz, M, Hutchison R et al. Effectiveness of high-dose methotrexate in T-cell lymphoblastic leukemia and advanced-stage lymphoblastic lymphoma: a randomized study by the Children’s Oncology Group (POG 9404). BLOOD 2011, 118(4), 874-883.
11- Amylon MD, Shuster J, Pullen J, et al. Intensive high dose asparaginase consolidation improves survival for pediatric patients with T-cell acute lymphoblastic leukemia and advanced stage lymphoblastic lymphoma: a Pediatric Oncology Group study. Leukemia. 1999;13:335-342.
12- Winter SS, Holdsworth MT, Devidas M, et al. Antimetabolite-based therapy in childhood T-cell acute lymphoblastic leukemia:a report of POG study 9296. Pediatr Blood Cancer. 2006;46(2):179-186.
13- Carroll WL, Bhojwani D, Min DJ, et al. Pediatric acute lymphoblastic leukemia. Hematology (Am Soc Hematol Educ Program), 2003: 102-31.
14- Pullen J, Shuster JJ, Link M, et al. Significance of commonly used prognostic factors differs for children with T cell acute lymphoblastic leukemia (ALL), as compared to those with B-precursor ALL. A Pediatric Oncology Group (POG) study. Leukemia. 1999;13: 1696-1707. 5-10 1-5+2011,
15- Lauten M, Möricke A ,Beier R, et al. Prediction of outcome by early bone marrow response in childhood acute lymphoblastic leukemia treated in the ALL-BFM 95 trial: differential effects in precursor B-cell and T-cell leukemia. Haematologica 2012 97(7) 1048-1056
16- El Nadi IM: Protocol Therapy for newly diagnosed ALL patients with different Risk Groups. National Cancer Institute. M.D. Thesis Cairo University, 2002.
17- Zekri W: Treatment plan for newly diagnosed pediatric patients with acute lymphoblastic at intermediate leukemia or higher risk of suspected treatment failure at the national cancer institute, M D. thesis in pediatrics. Cairo University,2005.
18- Möricke A, Zimmermann M, Reiter A, et al.: Prognostic impact of age in children and adolescents with acute lymphoblastic leukemia: data from the trials ALL-BFM 86, 90, and 95. Klin Padiatr 2005 217 (6): 310-20,
19- Relling MV, Dervieux T: Pharmacogenetics and cancer therapy. Nat Rev Cancer 2001, 1 (2): 99-108.
Life Science Journal 2013;10(1) http://www.lifesciencesite.com
1812
20- Campana D: Determination of minimal residual disease in leukaemia patients. Br J Haematol 2003, 121 (6): 823-38.
21- Cavé H, Suciu S, Preudhomme C, et al. The EORTC-CLG. Clinical significance of HOX11L2 expression linked to t(5;14)(q35;q32), of HOX11 expression, and of SIL-TAL fusion in childhood T-cell malignancies: results of EORTC studies 58881 and 58951. Blood 2004: 103: 442-449.
22- Moussa H. and Sidhom I: HOX11L2 Expression in Egyptian Pediatric T-Cell Acute Lymphoblastic Leukemia. Pediatric Blood & Cancer 2006: 47: 474
23- van Dongen J, Macintyre EA, Gabert JA, et al. Standardized RT-PCR analysis of fusion gene transcripts from chromosome aberrations in acute leukemia for detection of minimal residual disease. Report of the BIOMED-1 Concerted Action: Investigation of minimal residual disease in acute leukemia. Leukemia 1999: 13: 1901–1928
24- Attarbaschi A, Pisecker M, Inthal A, et al. Prognostic relevance of TLX3 (HOX11L2) expression in childhood T-cell acute lymphoblastic leukaemia treated with Berlin-Frankfurt-Münster (BFM) protocols containing early and late re-intensification elements. Br J Haematol. 2010; 148: 293-300
25- Nakao M, Janssen JW, Flohr T, Bartram CR. Rapid and reliable quantification of minimal residual disease in acute lymphoblastic leukemia using rearranged immunoglobulin and T-cell receptor loci by Light Cycler technology. Cancer Res. 2000 Jun 15;60 (12):3281-9.
26- Loken MR, Wells DA. Immuneflorescence of surface markers in flowcyometry: A practical approach. The practical approach series. Series editors: D rickwood and BD Hames. Edited by MG Ormerod; New York Oxford University press. 2000. 77-79
27- Larsen JK: measurement of cytoplasmic and nuclear antigens in flowcyometry: A practical approach. The practical approach series. Series editors: D rickwood and BD Hames. Edited by MG Ormerod; New York Oxford University press. 2000. 105-107.
28- Macintyre EA, d’Auriol L, Duparc N, et al. Use of oligonucleotide probes directed against T cell antigen receptor gamma delta variable-(diversity)-joining junctional sequences as a general method for detecting minimal residual disease in acute lymphoblastic leukemias. J Clin Invest, 1990, 86: 2125–35.
29- Al Saati T, Galoin S, Gravel S, et al. IgH and TcR-[gamma] gene rearrangements in Hodgkin’s disease by PCR demonstrate lack of correlation
between genotype, phenotype and Epstein-Barr virus status. J Pathol, 1997 181: 387–93,
30- Mayer SP, Giamelli J, Sandoval C, et al. Quantitation of leukemia clone-specific antigen gene rearrangements by a single-step PCR and fluorescence-based detection method. Leukemia, 1999, 13: 1843-1852.
31- Miller S.A, Dykes D.D and Polesky H.F. A simple salting out procedure for extracting DNA from human nucleated cells. Nucleic Acids Research, 1988, 16 (3) 1215
32- Saunders DB and Trap GR: Basic and clinical biostatistics, 3rd edition. Connecticut, Appleton and Lang, 2001.
33- Pullen DJ, Sullivan MP, Falletta JM, et al. Modified LSA2-L2 treatment in 53 children with E-rosette-positive T-cell leukemia: results and prognostic factors (a Pediatric Oncology Group study). Blood. 1982; 60(5):1159-1168.
34- Borowitz MJ, Dowell BL, Boyett JM, et al. Clinicopathologic aspects of E rosette negative T cell acute lymphoblastic leukemia: a Pediatric Oncology Group study. J Clin Oncol. 1986;4(2):170-177.
35- Crist WM, Shuster JJ, Falletta J, et al. Clinical features and outcome in childhood T-cell leukemia-lymphoma according to stage of thymocyte differentiaion. Blood. 1988;72(6):1891-2081.
36- Shuster JJ, Falletta JM, Pullen DJ, et al. Prognostic factors in childhood T-cell acute lymphoblastic leukemia: a Pediatric Oncology Group study. Blood. 1990;75(1):166-173.
37- Pui CH, Behm FG, Singh B, et al. Heterogeneity of presenting features and their relation to treatment outcome in 120 children with T-cell acute lymphoblastic leukemia. Blood. 1990;75(1): 174-179.
38- Pui CH, Behm FG, Christ WM, et al. Clinical and biologic relevance of immunologic marker studies in childhood acute lymphoblastic leukemia. Blood. 1993; 82(2):343-362.
39- Schrappe, M., Reiter, A., Zimmermann, M., et al. Long-term results of four consecutive trials in childhood ALL performed by the ALL-BFM study group from 1981 to 1995. Berlin–Frankfurt–Munster. Leukemia, 2000: 14: 2205–2222.
40- Pui, C.H. & Evans, W.E. Treatment of acute lymphoblastic leukemia. New England Journal of Medicine 2006: 354: 166–178.
41- Mo ¨ricke, A., Reiter, A., Zimmermann, M., et al. Risk-adjusted therapy of acute lymphoblastic leukemia can decrease treatment burden and improve survival: treatment results of 2169 unselected pediatric and adolescent patients
Life Science Journal 2013;10(1) http://www.lifesciencesite.com
1813
enrolled in the trial ALL-BFM 95. Blood, 2008: 111: 4477–4489.
42- Hussein H, Sidhom I, Abou El Naga S, et al. Survival and prognostic factors of acute lymphoblastic leukemia in children at the National Cancer Institute. Egypt. J. Egyptian Natl. Cancer Inst, 2003; 15(3): 33-41.
43- Sidhom I, Shaaban K, Soliman S et al. Clinical significance of immunophenotypic markers in pediatric T-cell acute lymphoblastic leukemia. J Egypt Natl Canc Inst. 2008; 20(2):111-20.
44- Pui CH, John T, Deqing P, et al. Improved outcome for children with acute lymphoblastic leukemia: results of total therapy study XIII b at SJCRH. Blood. 2004; 104, 2690-2696).
45- Goldberg, JM, Silverman LB, Levy DE, et al. Childhood T-cell acute lymphoblastic leukemia: the Dana-Farber Cancer Institute acute lymphoblastic leukemia consortium experience. J.Clin.Oncol. 2003, 21, 3616-3622.
46- Sidhom I: Species Specific therapy o f Acute Lymphoblastic Leukemia in Children. M.D. Thesis, National Cancer Institue, 1998
47-Attarbaschi A, Mann G, Dworzak M, et al.: Mediastinal mass in childhood T-cell acute lymphoblastic leukemia: significance and therapy response. Med Pediatr Oncol 2002, 39 (6): 558-65,.
48- Bürger B, Zimmermann M, Mann G, et al.: Diagnostic cerebrospinal fluid examination in children with acute lymphoblastic leukemia: significance of low leukocyte counts with blasts or traumatic lumbar puncture. J Clin Oncol 2003, 21 (2): 184-8,.
49- Rivera GK, Zhou Y, Hancock ML, et al.: Bone marrow recurrence after initial intensive treatment for childhood acute lymphoblastic leukemia. Cancer 2005, 103 (2): 368-76,.
50- Willemse MJ, Seriu T, Hettinger K, et al. Detection of minimal residual disease identifies differences in treatment response between T-ALL and precursor B-ALL. Blood, 2002; 99(12): 4386-4393.
1/27/2013
http://www.lifesciencesite.com )12013;10(Life Science Journal
1814
Sex Hormone-Binding Globulin and Insulin Resistance In Type 2 Diabetes Mellitus
Hatem M. Salem,1 Khaled M. Hadhoud, 1 Mohamed S. S. Saad, 1 and Ahmad Baraka 2
Departments of 1Internal Medicine and 2 Clinical Pathology, Faculty of Medicine, Zagazig University, Egypt. [email protected]
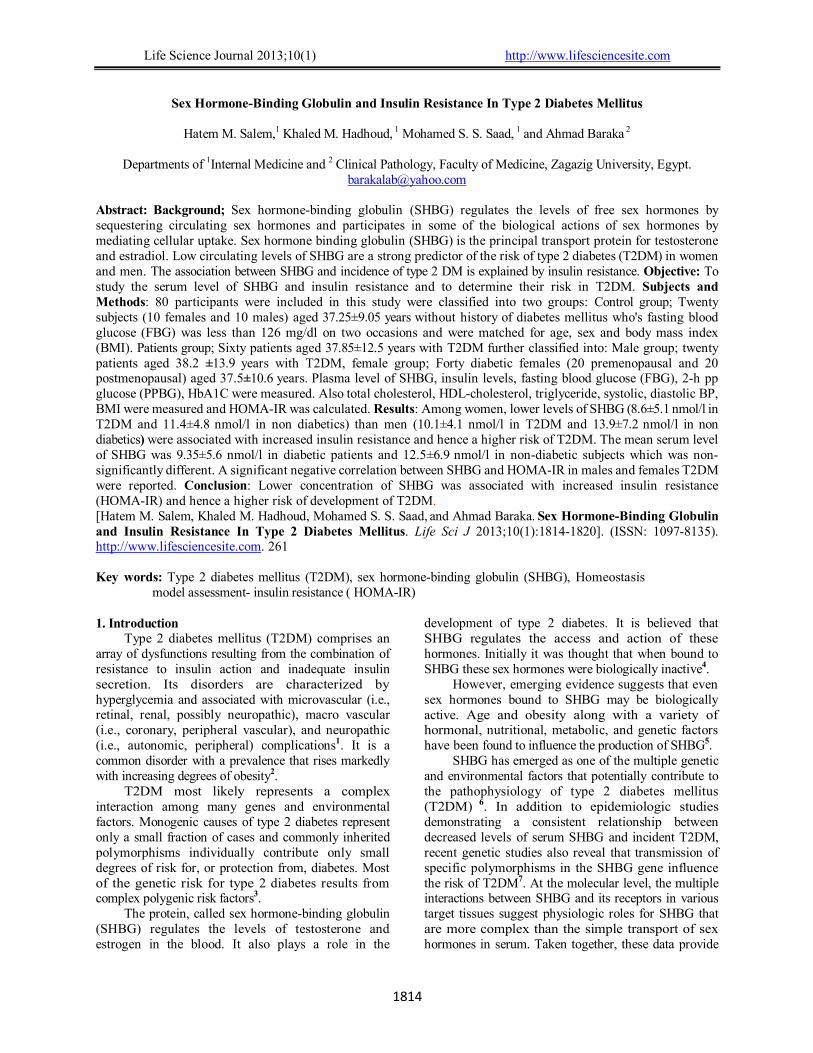
Abstract: Background; Sex hormone-binding globulin (SHBG) regulates the levels of free sex hormones by sequestering circulating sex hormones and participates in some of the biological actions of sex hormones by mediating cellular uptake. Sex hormone binding globulin (SHBG) is the principal transport protein for testosterone and estradiol. Low circulating levels of SHBG are a strong predictor of the risk of type 2 diabetes (T2DM) in women and men. The association between SHBG and incidence of type 2 DM is explained by insulin resistance. Objective: To study the serum level of SHBG and insulin resistance and to determine their risk in T2DM. Subjects and Methods: 80 participants were included in this study were classified into two groups: Control group; Twenty subjects (10 females and 10 males) aged 37.25±9.05 years without history of diabetes mellitus who's fasting blood glucose (FBG) was less than 126 mg/dl on two occasions and were matched for age, sex and body mass index (BMI). Patients group; Sixty patients aged 37.85±12.5 years with T2DM further classified into: Male group; twenty patients aged 38.2 ±13.9 years with T2DM, female group; Forty diabetic females (20 premenopausal and 20 postmenopausal) aged 37.5±10.6 years. Plasma level of SHBG, insulin levels, fasting blood glucose (FBG), 2-h pp glucose (PPBG), HbA1C were measured. Also total cholesterol, HDL-cholesterol, triglyceride, systolic, diastolic BP, BMI were measured and HOMA-IR was calculated. Results: Among women, lower levels of SHBG (8.6±5.1 nmol/l in T2DM and 11.4±4.8 nmol/l in non diabetics) than men (10.1±4.1 nmol/l in T2DM and 13.9±7.2 nmol/l in non diabetics) were associated with increased insulin resistance and hence a higher risk of T2DM. The mean serum level of SHBG was 9.35±5.6 nmol/l in diabetic patients and 12.5±6.9 nmol/l in non-diabetic subjects which was non-significantly different. A significant negative correlation between SHBG and HOMA-IR in males and females T2DM were reported. Conclusion: Lower concentration of SHBG was associated with increased insulin resistance (HOMA-IR) and hence a higher risk of development of T2DM. [Hatem M. Salem, Khaled M. Hadhoud, Mohamed S. S. Saad, and Ahmad Baraka. Sex Hormone-Binding Globulin and Insulin Resistance In Type 2 Diabetes Mellitus. Life Sci J 2013;10(1):1814-1820]. (ISSN: 1097-8135). http://www.lifesciencesite.com. 261 Key words: Type 2 diabetes mellitus (T2DM), sex hormone-binding globulin (SHBG), Homeostasis
model assessment- insulin resistance ( HOMA-IR) 1. Introduction
Type 2 diabetes mellitus (T2DM) comprises an array of dysfunctions resulting from the combination of resistance to insulin action and inadequate insulin secretion. Its disorders are characterized by hyperglycemia and associated with microvascular (i.e., retinal, renal, possibly neuropathic), macro vascular (i.e., coronary, peripheral vascular), and neuropathic (i.e., autonomic, peripheral) complications1. It is a common disorder with a prevalence that rises markedly with increasing degrees of obesity2.
T2DM most likely represents a complex interaction among many genes and environmental factors. Monogenic causes of type 2 diabetes represent only a small fraction of cases and commonly inherited polymorphisms individually contribute only small degrees of risk for, or protection from, diabetes. Most of the genetic risk for type 2 diabetes results from complex polygenic risk factors3.
The protein, called sex hormone-binding globulin (SHBG) regulates the levels of testosterone and estrogen in the blood. It also plays a role in the
development of type 2 diabetes. It is believed that SHBG regulates the access and action of these hormones. Initially it was thought that when bound to SHBG these sex hormones were biologically inactive4.
However, emerging evidence suggests that even sex hormones bound to SHBG may be biologically active. Age and obesity along with a variety of hormonal, nutritional, metabolic, and genetic factors have been found to influence the production of SHBG5.
SHBG has emerged as one of the multiple genetic and environmental factors that potentially contribute to the pathophysiology of type 2 diabetes mellitus (T2DM) 6. In addition to epidemiologic studies demonstrating a consistent relationship between decreased levels of serum SHBG and incident T2DM, recent genetic studies also reveal that transmission of specific polymorphisms in the SHBG gene influence the risk of T2DM7. At the molecular level, the multiple interactions between SHBG and its receptors in various target tissues suggest physiologic roles for SHBG that are more complex than the simple transport of sex hormones in serum. Taken together, these data provide

http://www.lifesciencesite.com )12013;10(Life Science Journal
1815
support for an expanded role of SHBG in the pathophysiology of insulin resistance and T2DM 8. Over the last few years, there have been several reports demonstrating that men with T2DM have a higher prevalence of low circulating testosterone levels comparing with normal population9. There is further evidence suggesting that a low testosterone level is a risk factor for diabetes10. Low concentration of SHBG is an independent risk factor for development of type 2 diabetes mellitus in women and is strongly associated with insulin resistance11.
Classically, the primary function of SHBG was thought to be the binding of circulating hormones in order to affect the bioavailable fraction and sequester circulating androgens and estrogens, in particular, from biologic action. However, emerging experimental evidence indicates that even sex hormones bound to SHBG may directly mediate cell-surface signaling, cellular delivery, and biologic action of sex hormones12. Moreover, clinical studies have associated low circulating levels of SHBG with impaired glucose control13, implicating the globulin in the maintenance of glucose homeostasis. In addition, strong associations recently reported, between plasma levels of sex hormones and the risk of type 2 diabetes show associations of similar magnitude for free sex hormones and total sex hormones 14, further indicating the bioactivity of both free and bound fractions. However, long-term studies examining the role of SHBG in the development of type 2 diabetes remain limited, particularly among women15.
Regardless of obesity, total testosterone and SHBG were associated inversely and estradiol was associated positively with impaired fasting glucose (IFG) and diabetes in men. Further research is warranted to better understand the underlying biological mechanisms; a large type 2 diabetes case-control study provides strong statistical support for a role of SHBG and sex hormones in the etiology of type 2 diabetes16.
In men, however, the low level of plasma testosterone has been observed to be associated with obesity, upper body fat distribution, and increased level of glucose17. SHBG and total testosterone appear to be higher in male children and young adults with diabetes compared with non-diabetic male siblings, which is apparently related to the absence of endogenous insulin. This may have implications for sex hormone-dependent processes across the life span in male individuals diagnosed with diabetes as children11.
Because SHBG concentrations differ between men and women, the association between this variable and incident diabetes may differ by sex. The relationship between low SHBG and the risk of incident type 2diabetes has been reported to be
stronger in women than in men18, 19. The aim of this works; was to study the serum level of SHBG and insulin resistance and to determine their risk in T2DM. 2. Subjects and Methods:
This study was carried out in the Inpatient and Outpatient Clinics of Endocrinology, Diabetes Unit and Clinical Pathology Department in Zagazig University Hospitals. 80 participants included in this study were classified into two groups: Control group: Twenty subjects (10 females and 10 males) aged 37.25±9.05 yeras without history of diabetes mellitus who's FBG was less than126 mg/dl on two occasions and were matched for age, sex and BMI. Patients group: Sixty patients aged 37.85±2.25 years with newly diagnosed T2DM further classified into; (1) Male group: Twenty patients aged 38.2 ±13.9 years with T2DM. (2)Female group: Forty diabetic females (20 premenopausal and 20 postmenopausal) aged 37.5±10.6 years. Methods: After informed consent was obtained, all the participants were subjected to the following: 1.Full history taking. Personal and family history. Present and past history of disease (surgery or other investigations), Past history of drug intake or hospital admission. 2. General examination included (measuring blood pressure, pulse rate, weight and height, body mass index (BMI) was computed by dividing weight (in kg) by the square of height (in meters),(kg/m²). 3.Clinical investigations included (pelvi-abdominal ultrasonography). 4. Laboratory investigations included: ▪ FBG and PPBG levels. ▪ Complete blood picture (CBC). ▪ Urine analysis. ▪Liver function test, kidney function test and lipid profile. ▪ HbAlC and insulin levels. ▪ Insulin resistance was estimated by a recently validated quantitative insulin sensitivity check index based on fasting insulin and glucose concentrations ([log {insulin} + log {glucose}]-
1).20 The insulin resistance was also calculated using Homeostasis model assessment (HOMA-IR = [insulin (µU/ml)) × glucose(mmol/l)]/22.5)21. 5. Measurement of Sex hormone-binding globulin (SHBG) by Chemiluminescence immunoassay (Elecsys 2010 autoanalyzer, Roche Diagnostics)22.

http://www.lifesciencesite.com )12013;10(Life Science Journal
1816
Principle; Sandwich technique; 1st incubation; 10 μL of sample, a biotinylated monoclonal SHBG-specific antibody and a monoclonal SHBG-specific antibody labeled with a ruthenium complex forming a sandwich complex. 2nd incubation; After addition of streptavidin-coated microparticles, the complex becomes bound to the solid phase via interaction of biotin and streptavidin. The reaction mixture is aspirated into the measuring cell where the microparticles are magnetically captured onto the surface of the electrode, Unbound substances are then removed with ProCell. Application of a voltage to the electrode then induces chemiluminescent emission which is measured by a photomultiplier. Results are determined via a calibration curve which is instrument- specifically generated by 2-point calibration and a master curve provided via the reagent barcode. Measuring range by the instrument; 0.350-200 nmol/L. Values below the detection limit are reported as < 0.350 nmol/L, where values above the measuring range are reported as > 200 nmol/L.
The exclusion criteria in our study; females on contraceptive pills (CCPs), all patients with chronic liver or renal diseases affecting levels of hormone binding proteins. Statistical Analysis
All analyses were performed using SPSS for windows (SPSS Inc., Chicago, IL, USA, version 15.0). Data were presented as means ± SD. For the assessment of correlation between variables, Pearson correlation was used. Statistical significance was set at P< 0.05. T-student tests (t) and "F" test were used to compare variables. Correlation coefficients (r) were calculated for BMI, SHBG, HOMA-IR, insulin and to check the magnitude of the relation between these parameters. 3. Results
In this study, 60 T2DM patients were randomly
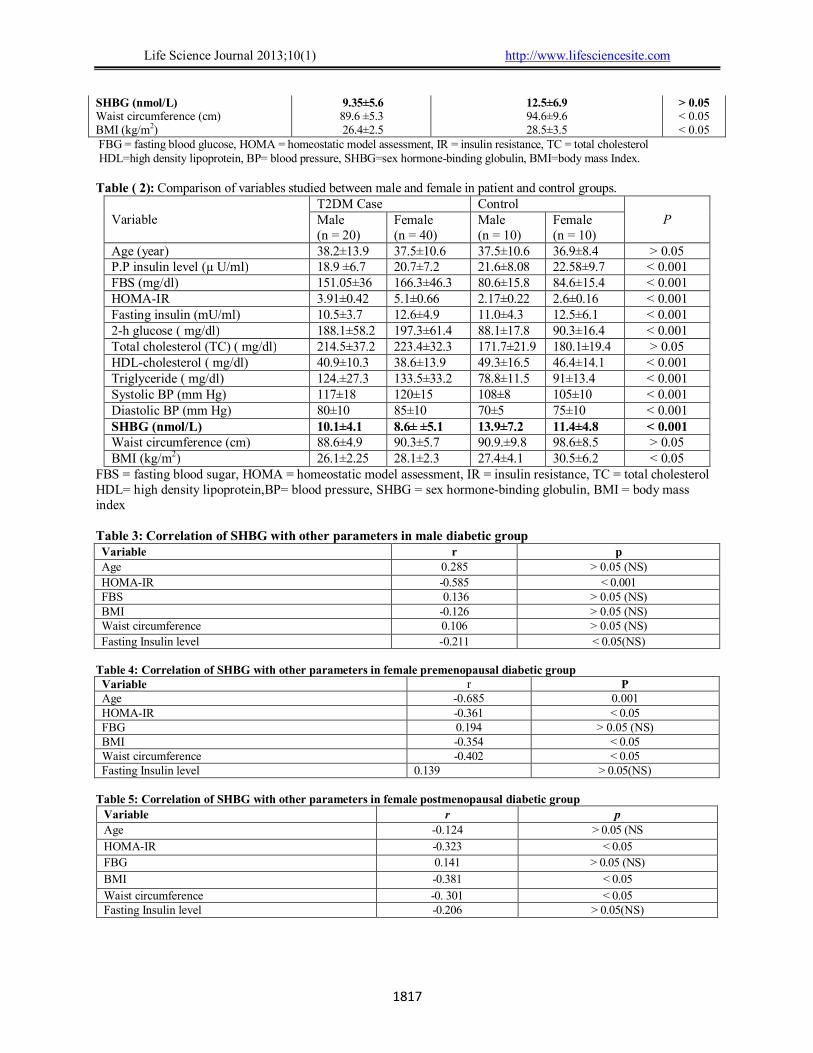
selected with mean age 37±12.25 compared to 20 control group with mean age 37.25±9.05 years. Non-significant difference in age, SHBG, PP insulin and total cholesterol levels between T2DM and non-diabetic control group were reported. In the other hand, fasting and 2-hour blood glucoses (FBG-PPBG), homeostasis model assessment- insulin resistance (HOMA- IR) HA1C, triglyceride, systolic BP, diastolic BP were significantly increased in the patient than control group. HDL cholesterol, fasting insulin level, waist circumference and BMI were significantly lower in the patient than control group (table -1).
By comparing variables studied between males and females in diabetics and non diabeticts control groups, we found non-significant differences as regards age, total cholesterol and waist circumference. A significant increased of HDL-cholesterol and SHBG in males than in females. In the other hand, FBG, 2-hour glucose, insulin level, HOMA-IR,triglyceride, systolic BP, diastolic BP and BMI were significantly increased in females than males. (Table -2).
As regards, insulin resistance can be assessed by using HOMA; we calculated HOMA-IR. A significant negative correlation between SHBG and HOMA-IR in male and females was observed. Low SHBG is linked with an elevated HOMA-IR (consistent with increased insulin resistance). In female premenopausal diabetic group, there was a significant correlation between age and SHBG, also there was a significant negative correlation between SHBG with obesity indices (BMI and waist circumference) in female (pre- and post-menopause) but not in men diabetics patients. On the other hand, no significant correlation between SHBG and fasting insulin in both male and female (pre-and post-menopausal) diabetic patients. (Tables; 3-4-5). HOMA = insulin level (µU/ml) × fasting glucose level (mg/dl) −−−−−−−−−−−−−−−−−−−−−−−−−−−−−−− 405
Table (1): Comparison of variables studied in T2DM and non-diabetic control group Parameters T2DM group (n=60) Non-diabetic Control group (n = 20) P value Age (year) 37.85±12.25 37.25±9.05 >0.05
P.P insulin level (µU/ml) 19.8±6.95 22.09±8.89 > 0.05 FBS (mg/dl) 158.5±41.1 81.7±14.6 < 0.001 HOMA-IR 4.52±0.54 2.44±0.18 < 0.05 Fasting insulin (µU/ml) 11.55±4.3 12.2±5.2 < 0.001 2-h glucose ( mg/dl) 192.5±59.6 89±17.1 < 0.001 HbAlc (%) 7.7±1.83 4.8±0.6 0.001 Total cholesterol (TC ) ( mg/dl) 218.9±34.35 175.5±20.64 > 0.05 HDL-cholesterol ( mg/dl) 39.6±12.1 47.8±15.3 < 0.001 Triglyceride ( mg/dl) 129±30.25 84.9±12.8 < 0.001 Systolic BP (mm Hg) 118.5±16.5 106.5 ±9 < 0.001 Diastolic BP (mm Hg) 83±10 73±7.5 < 0.001
http://www.lifesciencesite.com )12013;10(Life Science Journal
1817
SHBG (nmol/L) 9.35±5.6 12.5±6.9 > 0.05
Waist circumference (cm) 89.6 ±5.3 94.6±9.6 < 0.05
BMI (kg/m2) 26.4±2.5 28.5±3.5 < 0.05
FBG = fasting blood glucose, HOMA = homeostatic model assessment, IR = insulin resistance, TC = total cholesterol HDL=high density lipoprotein, BP= blood pressure, SHBG=sex hormone-binding globulin, BMI=body mass Index. Table ( 2): Comparison of variables studied between male and female in patient and control groups.
Variable T2DM Case Control
P Male (n = 20)
Female (n = 40)
Male (n = 10)
Female (n = 10)
Age (year) 38.2±13.9 37.5±10.6 37.5±10.6 36.9±8.4 > 0.05 P.P insulin level (µ U/ml) 18.9 ±6.7 20.7±7.2 21.6±8.08 22.58±9.7 < 0.001 FBS (mg/dl) 151.05±36 166.3±46.3 80.6±15.8 84.6±15.4 < 0.001 HOMA-IR 3.91±0.42 5.1±0.66 2.17±0.22 2.6±0.16 < 0.001
Fasting insulin (mU/ml) 10.5±3.7 12.6±4.9 11.0±4.3 12.5±6.1 < 0.001 2-h glucose ( mg/dl) 188.1±58.2 197.3±61.4 88.1±17.8 90.3±16.4 < 0.001 Total cholesterol (TC) ( mg/dl) 214.5±37.2 223.4±32.3 171.7±21.9 180.1±19.4 > 0.05 HDL-cholesterol ( mg/dl) 40.9±10.3 38.6±13.9 49.3±16.5 46.4±14.1 < 0.001 Triglyceride ( mg/dl) 124.±27.3 133.5±33.2 78.8±11.5 91±13.4 < 0.001 Systolic BP (mm Hg) 117±18 120±15 108±8 105±10 < 0.001 Diastolic BP (mm Hg) 80±10 85±10 70±5 75±10 < 0.001 SHBG (nmol/L) 10.1±4.1 8.6± ±5.1 13.9±7.2 11.4±4.8 < 0.001 Waist circumference (cm) 88.6±4.9 90.3±5.7 90.9.±9.8 98.6±8.5 > 0.05 BMI (kg/m2) 26.1±2.25 28.1±2.3 27.4±4.1 30.5±6.2 < 0.05
FBS = fasting blood sugar, HOMA = homeostatic model assessment, IR = insulin resistance, TC = total cholesterol HDL= high density lipoprotein,BP= blood pressure, SHBG = sex hormone-binding globulin, BMI = body mass index Table 3: Correlation of SHBG with other parameters in male diabetic group Variable r p Age 0.285 > 0.05 (NS)
HOMA-IR -0.585 < 0.001 FBS 0.136 > 0.05 (NS) BMI -0.126 > 0.05 (NS) Waist circumference 0.106 > 0.05 (NS)
Fasting Insulin level 0.211- < 0.05(NS) Table 4: Correlation of SHBG with other parameters in female premenopausal diabetic group
Variable r P Age -0.685 0.001 HOMA-IR -0.361 < 0.05 FBG 0.194 > 0.05 (NS) BMI -0.354 < 0.05 Waist circumference -0.402 < 0.05 Fasting Insulin level 0.139 > 0.05(NS)
Table 5: Correlation of SHBG with other parameters in female postmenopausal diabetic group
Variable r p
Age -0.124 > 0.05 (NS
HOMA-IR -0.323 < 0.05
FBG 0.141 > 0.05 (NS)
BMI -0.381 < 0.05
Waist circumference -0. 301 < 0.05 Fasting Insulin level -0.206 > 0.05(NS)
http://www.lifesciencesite.com )12013;10(Life Science Journal
1818
4. Discussion Low circulating levels of sex hormone-binding
globulin (SHBG) are a strong predictor for type 2 diabetes in both women and men. Circulating sex hormone-binding globulin levels are inversely associated with insulin resistance, but these levels can predict the risk of developing type 2 diabetes is uncertain.4
The aim of this work was to study the serum level of SHBG and insulin resistance and to determine their risk in T2DM. Our results showed that, HA1C, triglyceride, systolic BP, diastolic BP, were significantly increased in the patient than control group, but, HDL cholesterol was significantly lower in the patient than control group.
These results were in agreement with Afkhami- Ardekani et al., who found non-significant difference in SHBG in DM and control groups. Also, they found statistical significant difference of HbA1C in DM and control groups.11
Vikan et al., suggested that the patients with T2DM had significantly higher mean triglycerides, systolic, diastolic blood pressure and lower HDL-cholesterol.23
Our results was showed that a lower SHBG level was consistent with increased insulin resistance and hence increased risk of T2DM, this in concordant with Ding et al., who found that decreased SHBG level is associated with increased incidence of DM in male and female.4 Bonnet et al., found that a decrease of SHBG level is associated with increased incidence of DM in female only. 24 But in an earlier study Ding et al., found aprotective relation between higher levels of SHBG and diabetes more in female than in male as female with high SHBG has 80% lower risk versus 52% lower risk in male .19 while Onat et al.,
reported that low SHBG level is associated with an increasing incidence of DM in male only in absence of obesity.25 The same previous results obtained by Lakshman et al., who studied on middle aged males, and found that SHBG may contribute to the risk of T2DM through non androgenic mechanisms (independent of action of total and free testosterone).26
A significant increased of SHBG in male than in female (diabetics and control). Also SHBG is negatively correlated with age of the diabetic premenopausal patients. On the other hand, there was no correlation between SHBG and age neither in diabetic male nor in diabetic postmenopausal female.
This agreed with the studies of Onat et al., who found age-related decline in SHBG; this decline appeared to include ‘menopause’ transition component identifiable as a greater decline in the 4-year period around the female menopause and a secondary decline about 6 years after the female menopause 25.
Our T2DM patients demonstrated non-significant difference in SHBG levels with control subjects. In the other hand, a significant increased of insulin resistance in T2DM than control group was observed. Jayagopal et al., suggest that a low SHBG concentration is a stable integrated marker of insulin resistance and therefore has the characteristics to be potentially used as a surrogate measure of insulin resistance, perhaps in monitoring the response of an individual to insulin sensitizers. 27
In our study there was non-significant correlation between fasting insulin level and SHBG. This finding differs from that of Osuana et al.,28 who found a negative correlation between fasting insulin level and SHBG levels in men and also differs from the findings of Onat et al., who found also a negative correlation between fasting insulin level and SHBG levels in elderly men and women25. Araujo and Wittert, concluded that there is a comprehensive discussion of the epidemiology of sex hormone changes, including their age associations, prevalence of symptomatic hypogonadism, secular changes, risk factors and the association of sex hormones with outcomes. They also found a positive correlation between fasting insulin level and SHBG level29.
Akin et al., found that there is no correlation between SHBG and fasting insulin levels among the study group of obese female30. Sørensen et al., found in their study of hormonal changes at puberty that there is a negative correlation between SHBG and fasting insulin level 31.
As regards, insulin resistance can be assessed using HOMA; we calculated HOMA-IR and our findings point to a significant negative correlation between SHBG and HOMA in both men and women, this in harrmony with Onat et al., who found a negative correlation between SHBG, and HOMA, fasting glucose level thus has a negative correlation with insulin resistance25. Also, Bonnet et al., found a negative relation between SHBG and HOMA, fasting glucose level and hence insulin resistance in female but not in male24. Our results not coincided with the findings of Lewis, who found a positive correlation between SHBG and HOMA in male and not in female and he concluded that SHBG is another surrogate marker for insulin resistance in obese males but not in obese females32.
SHBG level found in this study to had a negative correlation with obesity indices (waist circumference and BMI) in female pre- and post-menopause, but not in male group. These results are similar to that of Akin et al., who concluded that SHBG had a negative correlation with BMI and waist circumference among women30. Onat et al., supported our findings as they found that SHBG has

http://www.lifesciencesite.com )12013;10(Life Science Journal
1819
a negative correlation with BMI and waist circumference.25 In conclusion; the prospective study of diabetics men and women showed that decreased SHBG level was associated with increased insulin resistance and hence increased risk of T2DM. Further studies are recommended to find a more relationship between SHBG and T2DM. Corresponding author Ahmad Baraka Department of Clinical Pathology, Faculty of Medicine, Zagazig University [email protected]
References 1. Haffner SM, D'Agostino R Jr, Mykkänen L,
Tracy R, Howard B, Rewers M, et al. Insulin sensitivity in subjects with type 2 diabetes. Relationship to cardiovascular risk factors: the Insulin Resistance Atherosclerosis Study. Diabetes Care. 1999; 22(4):562-8.
2. Shah AS, Khoury PR, Dolan LM, et al. The effects of obesity and type 2 diabetes mellitus on cardiac structure and function in adolescents and young adults. Diabetologia., 2011; 54(4):722-30.
3. Hectors TL, Vanparys C, van der Ven K, et al. Environmental pollutants and type 2 diabetes: a review of mechanisms that can disrupt beta cell function. Diabetologia., 2011; 54(6):1273-90.
4. Ding EL, Song Y, Manson JE, Hunter DJ, Lee CC, Rifai N, et al. Sex Hormone–Binding Globulin and Risk of Type 2 Diabetes in Women and Men. N Engl J Med., 2009; 361:1152-63.
5. Carter J. Sex hormone-binding globulin and risk of type 2 diabetes in women and men Ann Clin Biochem., 2010; 47:184.
6. Bacha F, Lee S, Gungor N, Arslanian SA. From pre-diabetes to type 2 diabetes in obese youth: pathophysiological characteristics along the spectrum of glucose dysregulation. Diabetes Care. 2010; 33(10):2225-31.
7. Eriksson AL, Lorentzon M, Mellstrom D, et al. SHBG gene promoter polymorphisms in men are associated with serum sex hormone-binding globulin, androgen and androgen metabolite levels, and hip bone mineral density. J Clin Endocrinol Metab., 2006; 91:5029-37.
8. Le TN, Nestler JE, Strauss III JF, Wickham II I EP. Sex hormone-binding globulin and type 2 diabetes mellitus. 2011; in press.
9. Chandel A, Dhindsa S, Topiwala S, Chaudhuri A, Dandona P. Testosterone Concentration in Young Patients With Diabetes. Diabetes Care , 2008; 31(10): 2013-2017.
10. Laaksonen DE, Niskanen L, Punnonen K, Nyyssn ِ◌en K, Tuomainen TP, Valkonen VP, et al. Testosterone and sex hormone binding globulin predict the metabolic syndrome and diabetes in middle-aged men. Diabetes Care, 2004; 27(5): 1036–1041.
11. Afkhami–Ardekani M, Borgian L, Mohiti –Ardekani J, Chiti Z, Rashidi M, Azod L et al. The Evaluation of Serum Level of Testosterone and Sex Hormone- Binding Globulin in Men with Type 2 Diabetes. Iranian Journal of Diabetes and Obesity, 2010; 2 (1):12-15.
12. Kahn SM, Hryb DJ, Nakhla AM, Romas NA, Rosner W. Sex hormone-binding globulin is synthesized in target cells. J Endocrinol., 2002; 175:113-20.
13. Golden SH, Dobs AS, Vaidya D, et al. Endogenous sex hormones and glucose tolerance status in postmenopausal women. J Clin Endocrinol Metab., 2007; 92: 1289-95.
14. Torkamani A, Ding EL, Song Y, Manson JE, et al. Sex Hormone-Binding Globulin and Risk of Type 2 Diabetes in Women and Men N Engl J Med., 2009; 361:1152-1163.
15. Stefan N, Schick F, Häring HU. Sex Hormone–Binding Globulin and Risk of Type 2 Diabetes. N Engl J Med., 2009; 361:2675-2678.
16. Ludwig J, Sanbonmatsu L, Gennetian L, et al. Neighborhoods, obesity, and diabetes--a randomized social experiment. N Engl J Med., 2011; 365(16):1509-19.
17. Abate N, Haffner SM, Garg A, Peshock RM, Grundy SM. Sex steroid hormones, upper body obesity, and insulin resistance. J Clin Endocrinol Metab., 2002; 87(10): 4522 -4527.
18. Haffner SM, Valdez RA, Morales PA, Hazuda HP. and Stern MP. Decreased sex hormone-binding globulin predicts noninsulindependent diabetes mellitus in women but not in men. Journal of Clinical Endocrinology and Metabolism, 1993; 77 56–60.
19. Ding EL, Song Y, Malik VS and Liu S. Sex differences of endogenous sex hormones and risk of type 2 diabetes: a systematic review and meta-analysis. Journal of the American Medical Association, 2006; 295 1288–1299.
20. Katz A, Nambi SS, Mather K, Baron AD, Follmann DA, Sullivan G, et al. Quantitative Insulin sensitivity check index: a simple, accurate method for assessing insulin sensitivity in humans. J Clin End Metab., 2000; 85:2402–10.
21. Fraser CG, Harris EK: Generation and application of data on biological variation in clinical chemistry. Crit Rev Clin Lab Sci., 1989; 27:409–437.
http://www.lifesciencesite.com )12013;10(Life Science Journal
1820
22. Reynders M, Anckaert 26. E, Schiettecatte J, Smitz J. Evaluation of a new automated electrochemiluminescent sex hormonebinding globulin (SHBG) immunoassay. Clin Chem Lab Med., 2005;43:86-9.
23. Vikan T, Schirmer H, Njølstad I. and Svartberg J. Low testosterone and sex hormone-binding globulin levels and high estradiol levels are independent predictors of type 2 diabetes in men. European Journal of Endocrinology, 2010; 162 747–754.
24. Bonnet F, Balkau B, Malécot JM, Picard P, et al. Sex hormone-binding globulin predicts the incidence of hyperglycemia in women: interactions with adiponectin levels. Eur J Endocrinol., 2009; 161(1):81-5.
25. Onat A, Hergenç G, Karabulut A, Albayrak S, Can G, Kaya Z. Serum sex hormone-binding globulin, a determinant of cardiometabolic disorders independent of abdominal obesity and insulin resistance in elderly men and women. Metabolism, 2007; 56(10):1356-62.
26. Lakshman KM, Bhasin S, Araujo AB. Sex hormone-binding globulin as an independent predictor of incident type 2 diabetes mellitus in men. J Gerontol A Biol Sci Med Sci., 2010; 65(5):503-9.
27. Jayagopal V, Kilpatrick ES, Jennings PE, Holding S, Hepburn DA, and Atkin SL, The
Biological Variation of Sex Hormone-Binding Globulin in Type 2 Diabetes Implications for sex hormone-binding globulin as a surrogate marker of insulin resistance Diabetes Care, 2004; 27 (1):278-280.
28. Osuna JA, Gómez-Pérez R, Arata-Bellabarba G, Villaroel V. Relationship between BMI, total testosterone, sex hormone-binding-globulin, leptin, insulin and insulin resistance in obese men. Arch Androl., 2006; 52(5):355-61.
29. Araujo AB, Wittert GA. Endocrinology of the aging male. Best Pract Res Clin Endocrinol Metab., 2011; 25(2):303-19.
30. Akin F, Bastemir M, Kaptanoglu B. Relationship between insulin and sex hormone-binding globulin levels during weight loss in obese women. Ann Nutr Metab., 2007; 51(6):557-62.
31. S ّ◌rensen K, Aksglaede L, Munch-Andersen T, Aachmann-Andersen NJ, et al. Sex hormone-binding globulin levels predict insulin sensitivity, disposition index, and cardiovascular risk during puberty. Diabetes Care, 2009; 32(5):909-14.
32. Lewis JG, Shand BI. Elder PA. Plasma sex hormone-binding globulin rather than corticosteroid-binding globulin is a marker of insulin resistance in obese adult males. Diabetes, Obesity and Metabolism, 2004; (6): 259– 263.
2/1/2013

Life Science Journal 2013;10(1) http://www.lifesciencesite.com
http://www.lifesciencesite.com [email protected] 1821
Control the post harvest infection by Aspergillus spp. to Taify table grape using grape epiphytic bacteria
Abd El-Raheem Ramadan El-Shanshoury 1, 3*, Saleh Ali Bazaid 2, Yasser El-Halmouch1, 4 and Mohamed Waheed Eldin Ghafar 1, 5
1. Department of Biotechnology, Faculty of Science, Taif University, P.O. Box 888, Taif 21974, Kingdom of Saudi
Arabia 2. Department of Biology, Faculty of Science, Taif University, P.O. Box 888, Taif 21974, Kingdom of Saudi Arabia
3. Department of Botany, Bacteriology Unit, Faculty of Science, Tanta University, Tanta 31527, Egypt 4. Department of Botany, Faculty of Science, Damanhour University, Damanhour 22511, Egypt
5. Department of Zoonoses, College of Veterinary Medicine, Cairo University, Cairo, Egypt [email protected]
Abstract: This study aimed to control the common fungi causing post-harvest black rot of Taify table grape (Vitis vinefra L.) and to induce resistance against black Aspergilli. Six fungal genera belonging to Aspergillus, Penicillium, Trichoderma, Mucor, Rhizopus and Botrytis were isolated from contaminated grape samples, with different frequencies. The predominant fungal species belonged to the genus Aspergillus and the isolation frequency ranged between 2.40-18.66%. The most predominant black Aspergilli were identified to the molecular level based on 18S- rRNA, ITS1 and 5.8S-rRNA gene sequence as A. niger BAVSH1, A. parasiticus BAVSH4 and A. tubingensis BAVSH5. Forty one bacterial isolates were obtained from soil, meswak and the surface of grape fruits, and screened for antagonistic activity. In vitro dual microbial culture showed variable % inhibition of fungal growth values. Out of the active antagonistic bacteria, five epiphytic from grape fruits and one from meswak, being the most antagonistic were identified to the molecular level based on 16S rRNA gene sequence as Pseudomonas aeruginosa EBMSH1, P. aeruginosa EBVSH13, P. aeruginosa EBVSH14, P. aeruginosa EBVHSH17, Bacillus vallismortis EBHVSH28 and B. amyloliquefaciens EBHVSH29. The ability of living cells or crude cell extracts of the best three latter antagonistic bacteria to induce the resistance in intact- flooded grape fruits against black Aspergillus rot disease progress were demonstrated. Higher reduction or complete absences of disease incidence% and lesion diameter were obtained, compared to those induced by living bacteria and no treated control. [El-Shanshoury AR, Bazaid SA, El-Halmouch Y, Ghafar M. Control the post harvest infection by Aspergillus spp. to Taify table grape using grape epiphytic bacteria. Life Sci J 2013; 10(1):1821-1836] (ISSN: 1097-8135). http://www.lifesciencesite.com. Keywords: Aspergillus spp.; Bacillus spp.; biological control; epiphytic bacteria; Pseudomonas sp.; post harvest 1. Introduction
Grape (Vitis vinifera L.) represents 8.5 % of fruit crops planted area in Saudi Arabia. The most cultivated regions are Medinah and Tabouk which produce about 33.4 and 14.9 % of the total grape production, respectively (ARDA 2006). Taif area is also famous of fruits and grape is considered as one of the important summer fruits in this area. Significant portion of the grape is lost due to diseases caused by fungi and / or bacteria, physical injuries, over ripening and non-disease disorders (Boyette et al., 1992). If efficient steps are not taken to prevent the spread of these organisms and their toxins (Abrunhosa et al., 2001; Cabañes et al., 2002; Sage et al., 2002; Battilani et al., 2003; Medina et al., 2005 and Lui et al., 2010), it can infect all the products that are subsequently processed and pose a public health hazard (International programme on chemical safety, 1990; Majerus and Otteneder 1996; Heenan et al., 1998; Codex Alimentarius Commission, 1999; Abrunhosa et al., 2002 and Bayman et al., 2002). The contamination of grapes with fungi attracted the
attention of some investigators (Sage et al., 2002; Battilani et al., 2003; Medina et al., 2005; Guzev et al., 2008; Allam et al., 2008 and Al-Qurashi, 2010).
Formation of fruit pathogens resistance to fungicides, contamination with chemical and detrimental effects of chemical control encouraged scientists to search for alternative control methods based on biological control of plant pathogens by means of non-pathogenic bacteria and fungi. However, considerable success has been achieved by utilizing antagonistic microorganisms for controlling post harvest diseases and mycotoxins (Pusey and Wilson, 1984; Spotts and Cervantes, 1986; Ferreira, 1990; El-Abyad et al., 1993,1996; El-Shanshoury, 1994; El-Ghaouth and Wilson, 1995,1998; El-Ghaouth et al., 2003; Gonzalez et al., 2005; Visconti et al., 2008; Abrunhosa et al., 2010; Lui et al., 2010 and Somma et al., 2012). In this context, the epiphytic and endophytic microorganisms existing in the fruits were the object of studies conducted by many investigators (Wisniewski and Wilson, 1992; Sobiczewski and Bryk, 1995; He et al., 2003; Han et

Life Science Journal 2013;10(1) http://www.lifesciencesite.com
http://www.lifesciencesite.com [email protected] 1822
al., 2004; Bleve et al., 2006; El-Tarabily, 2006; Slavov, 2006; Chanchaichaovivata et al., 2007; Haıssam, 2011 and Parani et al., 2011). Recently, Somma et al. (2012) reviewed the prevention and control of black Aspergilli and Ponsone et al. (2011) demonstrated the efficacy of two yeast strains of Kluyveromyces thermotolerans for reducing the growth rate of ochratoxigenic fungi (from 11 to 82.5%), in the field.
The production of grapevine metabolites is highly conditioned by environment or pathogen attacks (Ali et al., 2010). Several abiotic and biotic agents have been reported to induce plant resistance to pathogens (Sticher et al., 1997; Sholberg and Conway, 2004; Nandeeshkumar et al., 2008; Yu et al., 2008 and Poiatti et al., 2009) in order to mobilize appropriate cellular defense responses before or upon pathogen attack (Sticher et al., 1997) triggered by non-pathogenic bacteria (Sholberg and Conway, 2004; Compant et al., 2005; Bakker et al., 2007; Magnin-Robert et al., 2007; Nandeeshkumar et al., 2008; Trotel-Aziz et al., 2008; Yu et al., 2008; Poiatti et al., 2009; Verhagen et al., 2010 and Baz et al., 2012).
The objectives of this study aimed to record the post harvest mycobiota of Taify table grape, to identify those causing black rot in different Taify farms to monitor their growth. This is in order to search for better management by using specific and preventive treatments. The potential of three biocontrol bacteria Pseudomonas aeruginosa EBVHSH17, Bacillus vallismortis EBHVSH28 and B. amyloliquefaciens EBHVSH29 to control Aspergillus black rot on Taify table grape and to enhance the resistance to subsequent infection with A. niger BAVSH1, A. parasiticus BAVSH4 and A. tubingensis BAVSH5 were explored. 2. Material and Methods Samples
In the present study, a total of 30 Taify table grape samples (Vitis vinifera L.) were collected from six private farms at Taif city. Samples were harvested in July during the grape harvest. Grape bunches (each about 1 kg) were taken and placed in previously sterilized cardboard boxes, which were kept at 4°C until analysis. Isolation and identification of fungi
Fungi were isolated from the infected grape fruits. Five weighted fruits were cut into small pieces and vigorously shaken in 100 ml of phosphate buffer (pH 6.5) for 20 min. The number of fungi was determined using serial dilution plate method on Sabouraud's agar medium containing the following ingredients 10 g l_1 meat peptone, 40 g l_1 dextrose and 15 g l_1 agar. Rose pengal (0.05 g l_1) was added
to the medium to suppress any bacterial growth. Colonies from fruits appeared on solid medium were chosen on the basis of their different visual characteristics. After 48-72 h of incubation at 280C, the number of CFU of filamentous fungi per gram of fruit was evaluated. The morphologically differing colonies of fungi were retransferred onto new plates for purification. Fungal colonies with different morphologies were maintained on Sabouraud's agar slants and stored at 4-8ºC for further studies.
Taxonomic identification of all fungal isolates was achieved through macroscopic and microscopic observation with the aid of guidelines published for each genus or general guidelines (Barnett and Hunter, 1972; Pitt and Ailsa, 1985 and Tuite and Cantone, 1990). Molecular identification was also applied on the selected black Aspergillii on the basis of determination of restriction patterns of PCR-amplified rRNA gene products. Fungal DNA was isolated according to the method described by Lee and Taylor (1990). The ITS1-5.8S-rRNA gene-ITS2 region was amplified by PCR. Two oligonucleotide fungal primers (ITS1 and ITS2) described by White et al. (1990) were used for amplification. Amplified products were digested overnight at 37°C with restriction endonuclease RsaI (Boehringer Mannheim). To perform DNA sequencing, PCR products were cleaned with the Gene Clean II Purification kit (Bio 101, La Jolla, Calif.). Then, PCR products were sequenced using the Taq DyeDeoxy terminator cycle sequencing kit (Applied Biosystems, Falmer, Brighton, United Kingdom) and an Applied Biosystems automated DNA sequencer (model 3130xI) according to the manufacturer's instructions. The universal primers for ITS1 and ITS2 were used to obtain the sequence of both strands. The National Center for Biotechnology Information (NCBI) Nucleotide Database was used to compare nucleotide sequences and aligned using CLUSTAL W (1.81) Multiple Sequence Alignment generating phylogenetic tree. The sequences of fungal isolates reported here were deposited in the DDBJ/EMBL/GenBank nucleotide sequence database under the accession numbers: AB761050 (Aspergillus niger BAVSH1), AB761051 (Aspergillus parasiticus BAVSH4), AB761052 (Aspergillus tubingensis BAVSH5) and AB761053 (Rhizopus oryzae BRVSH7). Isolation of antagonistic bacteria
Naturally occurring epiphytic bacteria were isolated from the surface of Taify table grape at harvest and periods of storage according to the methods of Assis and Mariano (1999) and Yrjälä et al. (2010), with some modifications. Five grapes were picked from bunches, rinsed in 100 ml of sterile distilled water in Erlenmeyer flask, mixed with 1 g

Life Science Journal 2013;10(1) http://www.lifesciencesite.com
http://www.lifesciencesite.com [email protected] 1823
sterilized glass beads (0.2 cm diameter) and shaken at 150 rpm and at 28oC for 20 minutes. Another five grapes were picked up for isolation of rare epiphytic bacteria, rinsed in 100 ml of sterile distilled water in Erlenmeyer flask, boiled for 20 minutes, mixed with 1 g sterilized glass beads (0.2 cm diameter) and shaken at 150 rpm and at 28oC for 20 minutes. One gram of soil was also dispensed in 100 ml sterile distilled water and shaken for 20 minutes. The rinsing waters resulted from the grape and soils were subjected to decimal dilutions under sterile conditions. An aliquot of 1 ml of each dilution was placed in plates containing nutrient yeast dextrose agar (NYDA) medium (containing 8 g of nutrient broth, 5 g of yeast extract, 10 g of glucose, and 20 g of agar in 1 liter of distilled water). Colonies appeared were chosen on the basis of their different visual characteristics. After 24-48h of incubation, the morphologically differing colonies of the isolates were re-streaked on the corresponding medium to obtain pure cultures. These pure cultures were maintained on slants containing the corresponding medium and stored at 4oC until further study. Identification of antagonistic bacteria
Morphological, physiological and biochemical confirmatory tests in Butler (1986) were followed for characterization of the antagonistic bacteria. The results on morphological and physiological characteristics were used, in addition to 16S rRNA sequencing technique for the confirmation of bacteria identification. Molecular characterization of bacterial isolates
Genomic DNA was extracted from bacterial isolates as described by Sambrook and Russell (2001) using GenEluteTm bacterial genomic DNA kit, Sigma Aldrich. The genomic DNA was resuspended in 50 ml of TE buffer (10 mM Tris, 1mM EDETA), pH 8.0 and stored at -20oC until used in PCR amplification. The 16S rRNA gene about 1.5 Kb long was PCR amplified using set of the universal primers; forward primer, 5'-AGAGTTTGATCCTGGTCAGAACGCT-3' and reverse primer, 5'TACGGCTACCTTGTTACGACTTCACCCC-3' (Yanagi and Yamasato, 1993), 27F (5′AGAGTTTGATCMTGGCTCAG-3′) and 1525R (5′AAGGAGGTGWTCCARCC-3′) (11, Lane) and forward: AGA GTT TGA TCC TGGCTC AG; reverse: ACG GCT ACC TTG TTA CGA CTT (Weisburg et al., 1991). The PCR reactions were carried out according to the method described by Chouari et al. (2005). The PCR products of 16S rRNA gene were purified using 3130XI genetic analysis (Applied Biosystems). DNA sequencing and phylogenetic tree
The 1.5 Kb-PCR products of 16S rRNA genes were used for DNA sequencing. Sequence analysis of the DNA fragments was performed. The PCR products were sequenced using the Taq DyeDeoxy terminator cycle sequencing kit (Applied Biosystems, Falmer, Brighton, United Kingdom) and an Applied Biosystems automated DNA sequencer (model 3130xI) according to the manufacturer's instructions. Selected sequences of other microorganisms with greatest similarity to the 16S rRNA sequences of bacterial isolates were extracted from the nucleotide sequence databases in The National Center for Biotechnology Information (NCBI) Nucleotide Database and aligned using CLUSTAL W (1.81) Multiple Sequence Alignment generating phylogenetic tree. The 16S rRNA sequences of bacterial isolates reported here were deposited in the DDBJ/EMBL/GenBank nucleotide sequence database under the accession numbers: AB758242 (Pseudomonas aeruginosa EBMSH1), AB760555 (Pseudomonas aeruginosa EBVSH13), AB761046 (Pseudomonas aeruginosa EBVSH14), AB761047 (Pseudomonas aeruginosa EBVHVSH17), AB761048 (Bacillus vallismortis EBHVSH28) and AB761049 (Bacillus amyloliquefaciens EBHVSH29). In Vitro antagonism tests
The forty one isolated bacterial strains were tested In Vitro, using the dual culture method (modified procedure of Fuhrmann (1994). Plates (90 mm) diameters containing Sabouraud,s agar medium were inoculated with bacteria, 48 hr prior to the fungal inoculation. Each isolate was placed on a Petri dish making uniformly crossed streaks equidistantly near the periphery of each plate. Agar plugs (5-mm diameter) were taken from a growing edge of a 5-day-old test fungal colony and transferred to the centre of the test agar plate surface (3 replicates). Cultures were incubated at 28oC and when growing edges of control fungi (without any antagonistic inoculums) were at the edge of the plates, the diameters of the test fungal colonies toward each bacterium were measured. Antagonism against the fungi was evaluated using percentage inhibition values (I). I = radius of control fungus - radius of test fungus x100/ radius of control fungus
Antagonistic activity of the highly antagonistic strains was repeated on plates with a single individual antagonistic streak and checked after three and 10 days of co-cultivation. Each treatment (each isolate) was done in triplicate and each experiment was conducted three times. The isolates that showed the highest inhibition or completely inhibited fungal growth called antagonistic isolates were used for further studies.

Life Science Journal 2013;10(1) http://www.lifesciencesite.com
http://www.lifesciencesite.com [email protected] 1824
Nature of the interactions between antagonists and fungi
The morphology of test fungal mycelia adjacent to the bacteria growth was examined under compound microscope (400x) for abnormal growth patterns and to ascertain whether or not there were direct contacts between bacterial and fungal colonies. The response of spores or mycelia plugs of the three susceptible fungi to form viable colonies was evaluated on agar blocks (5mmx5mm) cut from clear zones formed in dual culture plates. Fruit material, antagonists and fungal pathogens
Taify table grape fruits (Vitis vinifera L.) were harvested at maturity and those having uniformity in size and ripeness, and lack of any apparent injuries or infection were selected. Fruit samples were surface-disinfected with sodium hypochlorite at 0.1% (v/v) for 1 min, rinsed with sterile tap water for three times, and allowed to air dry at room temperature (20oC).
The best antagonistic bacteria P. aeruginosa EBVHSH17, B. vallismortis EBHVSH28 and B. amyloliquefaciens EBHVSH29 that were originally isolated from the surface of grape fruit as mentioned before, streaked on nutrient yeast dextrose agar (NYDA) and incubated at 28°C for 48 hr. The bacterial cells were cultured in nutrient yeast dextrose broth (NYDB) and incubated for 24 h at 28oC on a rotatory shaker at 200 rpm. The cells were harvested by centrifuging at 4,000 rpm for 20 min and washed twice with sterile distilled water. The concentrations of inoculants of biocontrol agents were adjusted to 108 cells/ml colony forming unit (CFU) by dilution plating onto NYDA.
The pathogens A. niger BAVSH1, A. parasiticus BAVSH4 and A. tubingensis BAVSH5 that originally isolated from grape fruits and showing typical black rot were cultivated on Sabouraud,s agar medium at 28oC in the dark for seven days. Spore suspensions were prepared by gently rubbing the culture surface of sporulating cultures of the test fungi by glass rod after adding adequate amount of sterile distilled water contained 0.1% Tween 80. The spore concentration was adjusted to 104 spores/ml CFU by dilution plating on Sabouraud,s agar. In vivo biocontrol of black Aspergilli rot
For postharvest disease assays, the surface-disinfected grape fruits were wounded in the middle with a sterile cylindrical tool (approximately 2 mm diameter and 3 mm deep) and the cut tissue was removed. Into each wound, 30 µl of sterile water or bacterial living cells suspension of the antagonistic bacteria in sterile distilled water, P. aeruginosa EBVHSH17, B. vallismortis EBHVSH28 and B. amyloliquefaciens EBHVSH29, adjusted at 1×10⁸
cells/ml was pipetted and inoculated. Intact grape fruits were flooded and shaked with either the living bacterial cell suspension at 1×10⁸ cells/ml or with crude cell extracts from freeze dried and thawed bacterial cell suspension at 1×10⁸ cells/ml for 20 min at 120 rpm. After the suspensions were absorbed, the fruits were wounded after 72 hr. Then after, the fruits were challenged each with 30 µl containing 1×10⁴ spores/ml CFU with the pathogens A. niger BAVSH1, A. parasiticus BAVSH4 or A. tubingensis BAVSH5. Wounds treated with sterile distilled water and with fungal spore suspension served as the inoculated positive disease controls. In each experiment, wounds treated with either sterile distilled water, or antagonistic bacteria suspension, without pathogen inoculation was used as negative controls. For all experiments, negative controls did not show disease symptoms. After air drying, the treated grapes were stored at 20 and 5oC in pre-disinfected, covered plastic containers to maintain a high relative humidity. The number of infected fruits and their lesion diameters were examined daily and recorded every fourth day after fungal challenge, started after four and ten days for those incubated at 20oC and 5oC, respectively.
3. Results Fungal contamination of grapes
Table 1 shows the contamination levels of the Taify table grape, collected from six different private farms at Taif by the fungal genera and the total counts. Umm El-Erad number 3 was the most contaminated farm with 3.25×10² CFU/ g. Mathnaa farm number 1 showed the lowest level of fungal contamination 0.79×10² CFU/g, followed with Umm El-Erad number 4 that contaminated with 1.58×10² CFU/ g. The remaining grape farms showed nearly similar contamination levels which were 2.56×10², 2.56×10² and 2.30×10², respectively. In the 30 fungal infected samples, 11 species with variable frequencies from the grape samples were purified and identified. They were mainly assigned to six genera namely Aspergillus, Penicillium, Mucor, Rhizopus, Trichoderma and Botrytis. Penicillium was isolated from four farms but not found in the remaining farms. Aspergillus fumigatus, Mucor and Botrytis spp. were isolated from three farms but not found in the remaining farms, while Rhizopous sp. was isolated from only two farms and not found in the remaining farms. Occurrence of Penicillium, Mucor, Rhizopus and Botrytis was very low.
The genus Aspergillus was the most frequently isolated from all farms with average count ranged between 2.6-43.7 CFU/ml and 2.4-18.66%, compared to the total count of fungi. The isolates
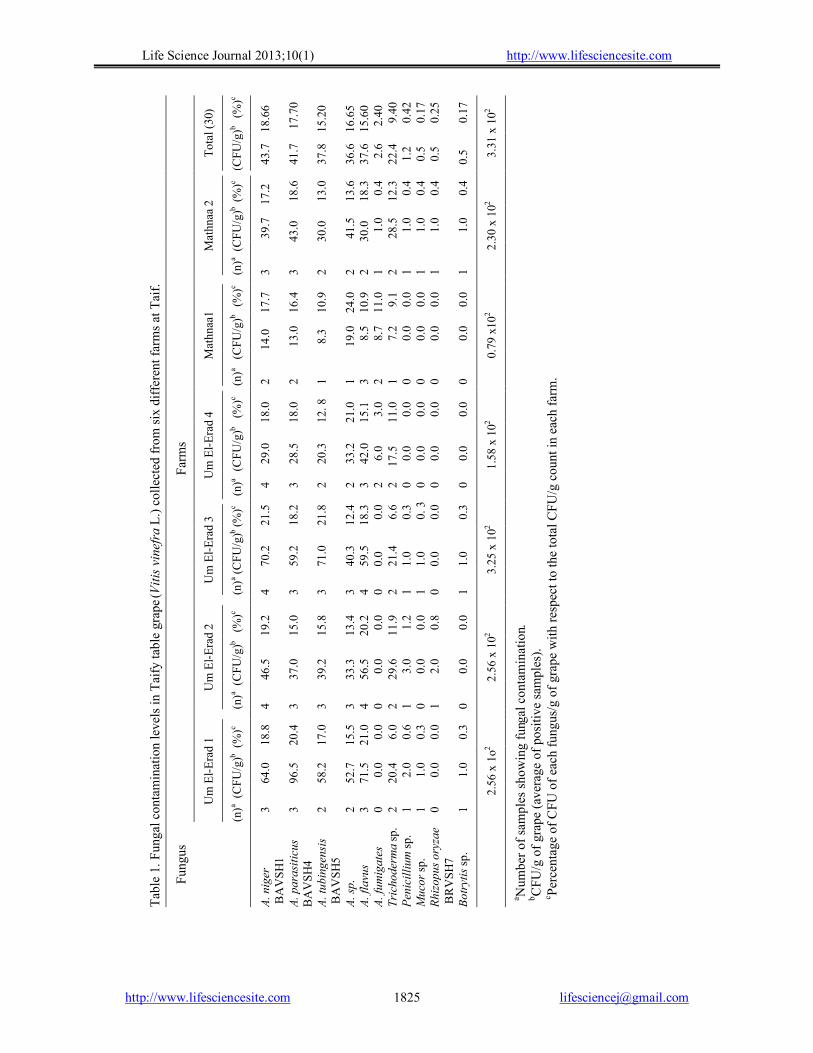
Life Science Journal 2013;10(1) http://www.lifesciencesite.com
http://www.lifesciencesite.com [email protected] 1825
aN
umbe
r of s
ampl
es sh
owin
g fu
ngal
con
tam
inat
ion.
bC
FU/g
of g
rape
(ave
rage
of p
ositi
ve sa
mpl
es).
c Perc
enta
ge o
f CFU
of e
ach
fung
us/g
of g
rape
with
resp
ect t
o th
e to
tal C
FU/g
cou
nt in
eac
h fa
rm.
3.31
x 1
02
18.6
6 1
7.70
15
.20
16.6
5 15
.60
2.4
0
9.40
0.42
0.17
0.25
0.17
(CFU
/g)b
%
)(
c
Tota
l (30
)
Farm
s
Tabl
e 1.
Fun
gal c
onta
min
atio
n le
vels
in T
aify
tabl
e gr
ape (
Vitis
vin
efra
L.)
colle
cted
from
six
diff
eren
t far
ms a
t Tai
f.
43.
7 4
1.7
37.
8 3
6.6
37.
6
2.6
2
2.4
1.
2
0.5
0.
5 0
.5
2.30
x 1
02 17.2
1
8.6
13.
0 1
3.6
18.
3
0.4
12.
3
0.4
0.
4
0.4
0.
4
(n)a (
CFU
/g)b
%)
(c
Mat
hnaa
2
39.
7 43
.0
30.0
4
1.5
30.0
1.0
28.
5
1.0
1.
0
1.0
1.
0
3 3 2 2 2 1 2 1 1 1 1
17.7
16
.4
10.9
24
.0
10.9
11
.0
9.1
0
.0
0.0
0
.0
0.0
0.79
x10
2
(n)a
(CFU
/g)b
%
)(
c
Mat
hnaa
1
14.0
1
3.0
8.3
1
9.0
8.
5
8.7
7.
2
0.0
0.
0
0.0
0.
0
2
2
1
1
3
2
1
0
0
0
0
1.58
x 1
02 18.0
18
.0
12. 8
21
.0
15.1
3
.0
11.0
0
.0
0.0
0
.0
0.0
(n)a
(CFU
/g)b
%)
(c
Um
El-E
rad
4
29.
0 2
8.5
20.
3 3
3.2
42.
0
6.0
17.
5
0.0
0.
0
0.0
0.
0
4 3 2 2 3 2 2 0 0 0 0
21.5
18
.2
21.8
12
.4
18.3
0
.0
6.6
0
.3
0. 3
0
.0
0.3
3.25
x 1
02
(n)a (C
FU/g
)b %)
(c
Um
El-E
rad
3
70.2
59
.2
71.0
40
.3
59.5
0.
0 21
.4
1.0
1.0
0.0
1.0
4 3 3 3 4 0 2 1 1 0 1
2.56
x 1
02 19.2
15
.0
15.8
13
.4
20.2
0
.0
11.9
1
.2
0.0
0
.8
0.0
(n)a (
CFU
/g)b
%)
(c
Um
El-E
rad
2
46.5
37
.0
39.2
33
.3
56.5
0
.0
29.6
3
.0
0.0
2
.0
0.0
4 3 3 3 4 0 2 1 0 1 0
2.56
x 1
o2 18.8
20
.4
17.0
15
.5
21.0
0
.0
6.0
0
.6
0.3
0
.0
0.3
(n)a (
CFU
/g)b (
%)c
Um
El-E
rad
1
64.0
96
.5
58.2
52
.7
71.5
0
.0
20.4
2
.0
1.0
0
.0
1.0
3
3
2
2
3
0
2
1
1
0
1
A. n
iger
B
AV
SH1
A. p
aras
iticu
s B
AV
SH4
A. tu
bing
ensi
s B
AV
SH5
A. sp
. A.
flav
us
A. fu
mig
ates
Tr
icho
derm
a sp
. Pe
nici
llium
sp.
Muc
or sp
. Rh
izop
us o
ryza
e B
RV
SH7
Botr
ytis
sp.
Fung
us

Life Science Journal 2013;10(1) http://www.lifesciencesite.com
http://www.lifesciencesite.com [email protected] 1826
belonged to the genus were identified in most samples at harvest and it survived through cold storage. Storage of table grapes for 7 days at 5 and 20oC resulted in occasional increase in the number of isolates recovered from the grape fruits. The highest contaminants to Taify table grape were A. niger BAVSH1, A. parasiticus BAVSH4, A. tubingensis BAVSH5 and A. flavus. A. niger was the most dominant species (18.66%) compared to other isolated Aspergillus species. However, A. fumigatus was isolated at a low level (2.6 CFU/ml) and in only 3 of the 6 grape farms. The three former isolates were then selected and subjected to In vitro control by dual culture antagonism with the most antagonistic bacteria. Molecular characterization of Aspergillus isolates
Identification of isolates of Aspergillus was based on PCR amplification of the ITS1-5.8S-rRNA gene-ITS2 region, followed by the subsequent digestion of PCR products with restriction endonuclease RsaI. The product size was about 600 bp (596 to 600 bp). The ribosomal ITS1-5.8S-rRNA gene-ITS2 region was amplified using two oligonucleotide fungal primers (ITS1 and ITS2), sequenced and compared with the database library using analysis soft ware. The program Blast (http://www.ncbi.nlm.nih.gov/BLAST/) was used to assess the DNA similarities. Phylogenetic tree was constructed by aligning sequences of different fungi taken from NCIB and the sequences of ITS1-5.8S-rRNA gene-ITS2 of the most contaminating Aspergillus isolates to Taify table grape. Phylogenetic identification indicated that the selected isolates were confirmed to be: Aspergillus niger BAVSH1 that shares high similarity to Aspergillus niger strain A-3207 (100%), Aspergillus parasiticus BAVSH4 that shares similarity to Aspergillus parasiticus strain MTCC 2796 (77%), Aspergillus tubingensis BAVSH5 that shares similarity to Aspergillus tubingensis strain T. TT. A2 (89%) and Rhizopus oryzae BRVSH7 that shares similarity to Rhizopus oryzae isolate 1289 (93%). Comparative ITS1-5.8S-rRNA gene-ITS2 region sequence analysis of these isolates showed that Aspergillus isolates could be allocated in one phylogenetic cluster (Fig. 1) and Rhizopous isolate in another cluster. These similarities are sufficient to deduce that the highest contaminants Aspergilli to Taify table grape are belonging to A. niger BAVSH1, A. parasiticus BAVSH4, A. tubingensis BAVSH5 and Rhizopus oryzae BRVSH7. Isolation and identification of antagonistic bacteria
Forty one pure bacterial isolates (10 from grape fruit surface, 19 from boiled grape fruit surface, 6 from soil samples, 6 from meswak) were obtained and stored at -20oC in 50% glycerol for further study.
Figure 1. Neighbor-joining polygenetic tree constructed using partial 18S rRNA gene sequences of fungi producing significant alignments to closely related strains. Fungal isolates in each phylogenetic cluster occurring on grapes are highlighted in bold. The geneBank accession numbers are shown in parentheses. Among the best antagonistic isolates, 5 epiphytic bacterial isolates of grape fruit and one from meswak were selected for morphological, physiological and biochemical characterization. These isolates were further subjected to PCR amplification and identified using 16S rRNA gene sequences. The 1500 bp of 16S rRNA gene sequences of the isolates were amplified using the universal primers for the 16S rRNA gene, sequenced and compared with the database library using analysis soft ware. The program Blast (http://www.ncbi.nlm.nih.gov/BLAST/) was used to assess the DNA similarities. Phylogenetic tree was constructed by aligning 16S rRNA gene sequences of different bacteria taken from NCIB and the sequence analysis of these isolates showed that they could be allocated in two phylogenetically different clusters (Fig. 2). Phylogenetic analysis based on 16S rRNA gene sequences showed that strain Esp-1(T) formed a cluster together with Pseudomonas
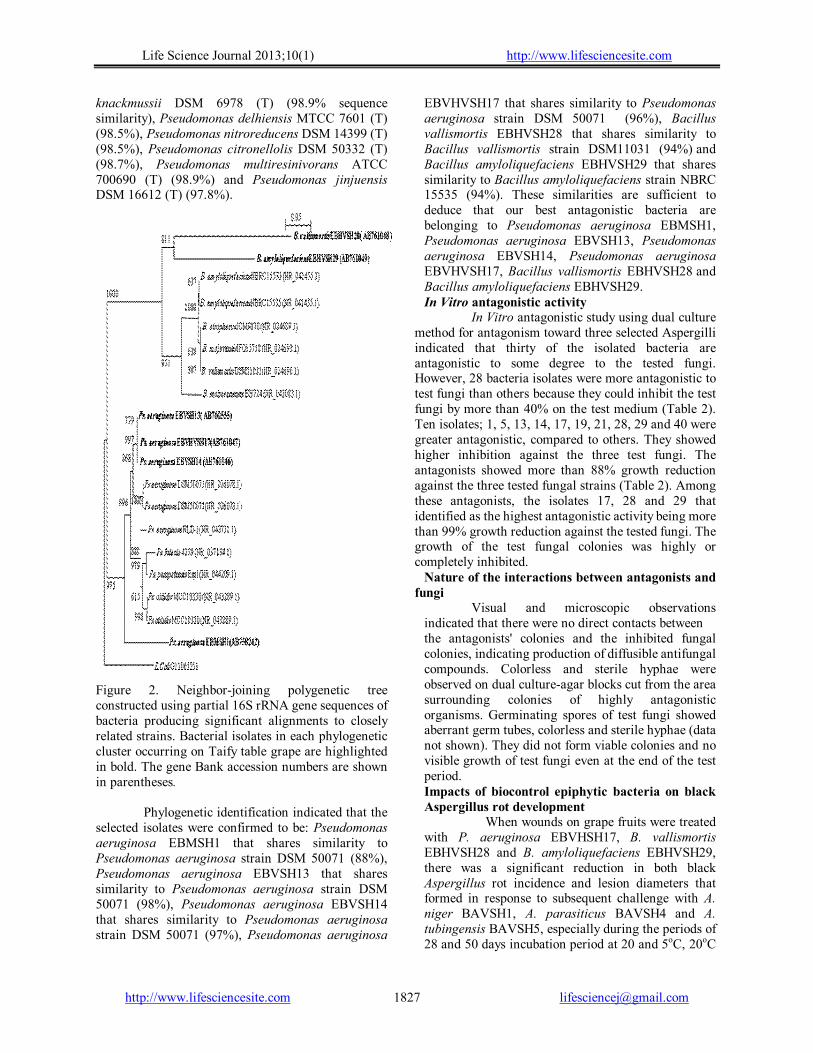
Life Science Journal 2013;10(1) http://www.lifesciencesite.com
http://www.lifesciencesite.com [email protected] 1827
knackmussii DSM 6978 (T) (98.9% sequence similarity), Pseudomonas delhiensis MTCC 7601 (T) (98.5%), Pseudomonas nitroreducens DSM 14399 (T) (98.5%), Pseudomonas citronellolis DSM 50332 (T) (98.7%), Pseudomonas multiresinivorans ATCC 700690 (T) (98.9%) and Pseudomonas jinjuensis DSM 16612 (T) (97.8%).
Figure 2. Neighbor-joining polygenetic tree constructed using partial 16S rRNA gene sequences of bacteria producing significant alignments to closely related strains. Bacterial isolates in each phylogenetic cluster occurring on Taify table grape are highlighted in bold. The gene Bank accession numbers are shown in parentheses. Phylogenetic identification indicated that the selected isolates were confirmed to be: Pseudomonas aeruginosa EBMSH1 that shares similarity to Pseudomonas aeruginosa strain DSM 50071 (88%), Pseudomonas aeruginosa EBVSH13 that shares similarity to Pseudomonas aeruginosa strain DSM 50071 (98%), Pseudomonas aeruginosa EBVSH14 that shares similarity to Pseudomonas aeruginosa strain DSM 50071 (97%), Pseudomonas aeruginosa
EBVHVSH17 that shares similarity to Pseudomonas aeruginosa strain DSM 50071 (96%), Bacillus vallismortis EBHVSH28 that shares similarity to Bacillus vallismortis strain DSM11031 (94%) and Bacillus amyloliquefaciens EBHVSH29 that shares similarity to Bacillus amyloliquefaciens strain NBRC 15535 (94%). These similarities are sufficient to deduce that our best antagonistic bacteria are belonging to Pseudomonas aeruginosa EBMSH1, Pseudomonas aeruginosa EBVSH13, Pseudomonas aeruginosa EBVSH14, Pseudomonas aeruginosa EBVHVSH17, Bacillus vallismortis EBHVSH28 and Bacillus amyloliquefaciens EBHVSH29. In Vitro antagonistic activity
In Vitro antagonistic study using dual culture method for antagonism toward three selected Aspergilli indicated that thirty of the isolated bacteria are antagonistic to some degree to the tested fungi. However, 28 bacteria isolates were more antagonistic to test fungi than others because they could inhibit the test fungi by more than 40% on the test medium (Table 2). Ten isolates; 1, 5, 13, 14, 17, 19, 21, 28, 29 and 40 were greater antagonistic, compared to others. They showed higher inhibition against the three test fungi. The antagonists showed more than 88% growth reduction against the three tested fungal strains (Table 2). Among these antagonists, the isolates 17, 28 and 29 that identified as the highest antagonistic activity being more than 99% growth reduction against the tested fungi. The growth of the test fungal colonies was highly or completely inhibited.
Nature of the interactions between antagonists and fungi
Visual and microscopic observations indicated that there were no direct contacts between the antagonists' colonies and the inhibited fungal colonies, indicating production of diffusible antifungal compounds. Colorless and sterile hyphae were observed on dual culture-agar blocks cut from the area surrounding colonies of highly antagonistic organisms. Germinating spores of test fungi showed aberrant germ tubes, colorless and sterile hyphae (data not shown). They did not form viable colonies and no visible growth of test fungi even at the end of the test period. Impacts of biocontrol epiphytic bacteria on black Aspergillus rot development
When wounds on grape fruits were treated with P. aeruginosa EBVHSH17, B. vallismortis EBHVSH28 and B. amyloliquefaciens EBHVSH29, there was a significant reduction in both black Aspergillus rot incidence and lesion diameters that formed in response to subsequent challenge with A. niger BAVSH1, A. parasiticus BAVSH4 and A. tubingensis BAVSH5, especially during the periods of 28 and 50 days incubation period at 20 and 5oC, 20oC

Life Science Journal 2013;10(1) http://www.lifesciencesite.com
http://www.lifesciencesite.com [email protected] 1828
and after 10 days at 5oC, respectively (Fig. 3 and Fig. 4). The disease incidence and lesion diameter started to appear after 4 and 10 days. Table 2. Inhibition levels of different bacterial isolates against Aspergillus spp. causing black rot of grape isolated from Taify table grape.
Fungus [Percentage inhibition value (I)] Isolate No
A. niger BAVSH1
A. parasiticus BAVSH4
A. tubingensis
BAVSH5 1 92.60 91.00 88.88 2 94.44 86.22 92.22 3 83.77 91.11 90.00 4 94.44 88.88 85.55 5 93.33 93.33 94.44 6 90.00 90.00 90.00 7 66.66 60.00 64.00 8 90.00 90.00 90.00 9 91.11 81.50 74.88 10 00.00 00.00 00.00 11 04.88 03.44 08.22 12 77.00 72.00 82.22 13 94.44 93.77 94.66 14 90.00 90.00 91.01 15 66.66 72.00 71.00 16 72.22 72.22 72.22 17 94.44 94.44 94.44 18 92.22 92.22 92.22 19 94.44 90.39 91.00 20 02.22 02.88 02.84 21 93.77 90.00 90.00 22 34.66 40.00 40.00 23 04.53 04.88 04.44 24 22.22 28.88 33.33 25 06.66 04.88 04.88 26 00.00 00.00 00.00 27 00,00 00.00 00.00 28 94.44 94.44 94.44 29 94.44 94.44 94.44 30 88.88 91.00 92.22 31 92.11 91.11 92.22 32 54.00 82.20 80.00 33 60.15 66.66 68.88 34 68.22 68.88 71.00 35 71.77 72.00 71.00 36 60.00 54.44 55.55 37 38.66 40.00 40.00 38 00.00 00.00 00.00 39 60.00 94.44 60.00 40 65.33 60.00 66.66 41 92.22 90.27 94.44
The incidence of disease and the average lesion diameter of A. niger BAVSH1, A. parasiticus BAVSH4 and A. tubingensis BAVSH5 were zero % and zero mm of those in the inoculated controls. This happened in case of flooding the intact grape fruits with living cells and crude cell extracts of all the antagonistic bacteria used (data not shown). The
incidence of disease and the average lesion diameters were also zero% and zero mm of those in the inoculated controls. This happened in wounds treated with living cells of P. aeruginosa, B. vallismortis and B. amyloliquefaciens, and challenged with Asp. niger at 20oC (Fig. 3A1 and 4A1), wounds inoculated with living cells of B. amyloliquefaciens and challenged with A. parasiticus 20oC (Fig. 3B1 and 4B1), wounds inoculated with living cells of P. aeruginosa and B. vallismortis and challenged with A. tubingensis 20oC (Fig. 3C1 and 4C1) and wounds inoculated with living cells of P. aeruginosa, B. vallismortis and B. amyloliquefaciens, and challenged with A. tubingensis 5oC (Fig. 3C2 and 4C2). The effects of other treatments varied of those in the inoculated control according to the antagonistic bacteria and black rot fungus. The inhibitory effects were more pronounced at 20oC than at 5oC (Fig. 3 and 4). However, the efficacy of the antagonistic bacteria decreased with incubation time, although the mean values for lesion diameter in wounds inoculated with the antagonistic bacteria were lower than that in wounds of the fungal inoculated control (P < 0.01).
4. Discussion
Black Aspergillus rot is among one of the many rots occurring on grapes. The disease appears on the fruits as a black rot due to prolific fungal sporulation after it has invaded. This disease has received more attention since, in the last decade, it was associated with contamination of grapes and wine by ochratoxin A (OTA). This study demonstrates the mycoflora of Taify table grape and possible antagonistic activity of its microflora to control fungi causing postharvest diseases, with special emphasis to black Aspergillus rot. The objective of this study was to find out potential epiphytic bacteria of Taify table grape to antagonize and control the grape pathogens, causing the black Aspergillus rot disease.
The results found in this work about the occurrence of contaminant mycobiota in Taify table grape looks different from other grapes collected from other geographic locations reported by other authors (Abrunhosa et al., 2001; Cabañs et al., 2002; Medina et al., 2005 and Somma et al., 2012). It should be noted that despite the differences in geographic location, the varieties studied by the different authors were different as well, which could explain the disagreement of the results found among the samples. The fact that Aspergillus species was the most dominant species in the Taify table grape samples under study was reported by different investigators in different areas around the world (Magnoli et al., 2003; Medina et al., 2005; Samson et al., 2007; Guzev et al., 2008; Leong et al., 2008; Allam et al., 2011 and Somma et al., 2012). However, more studies are
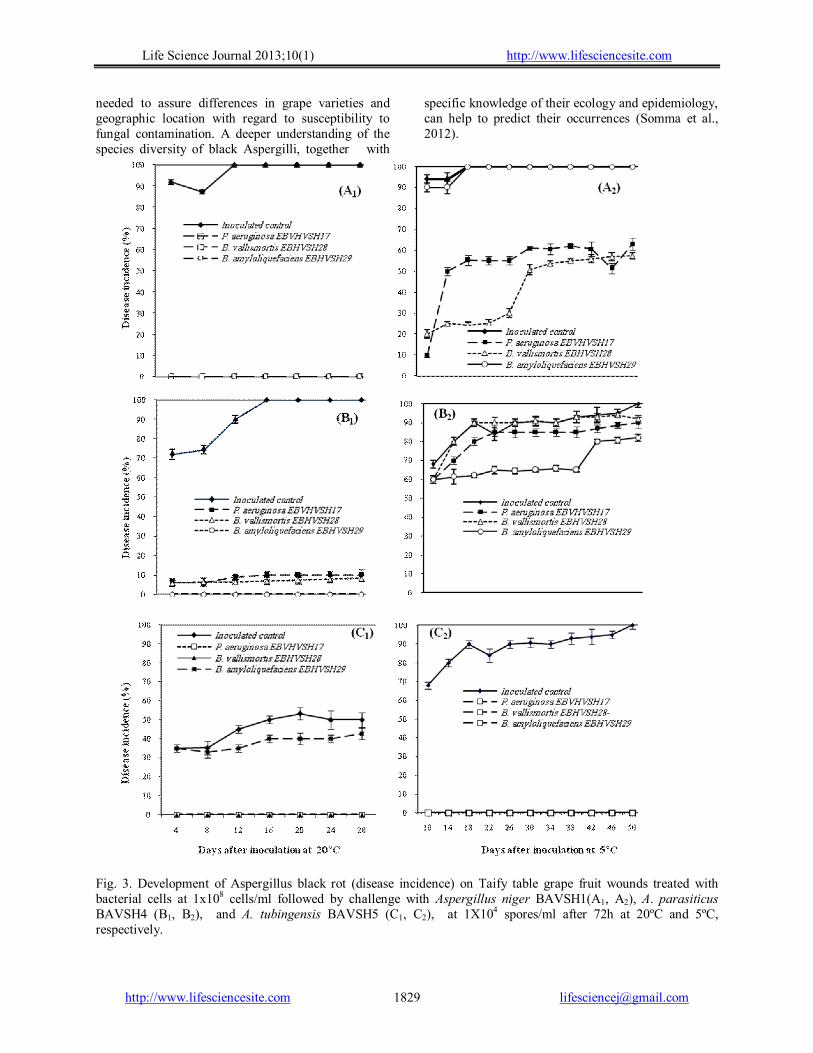
Life Science Journal 2013;10(1) http://www.lifesciencesite.com
http://www.lifesciencesite.com [email protected] 1829
needed to assure differences in grape varieties and geographic location with regard to susceptibility to fungal contamination. A deeper understanding of the species diversity of black Aspergilli, together with
specific knowledge of their ecology and epidemiology, can help to predict their occurrences (Somma et al., 2012).
Fig. 3. Development of Aspergillus black rot (disease incidence) on Taify table grape fruit wounds treated with bacterial cells at 1x10⁸ cells/ml followed by challenge with Aspergillus niger BAVSH1(A1, A2), A. parasiticus BAVSH4 (B1, B2), and A. tubingensis BAVSH5 (C1, C2), at 1X10⁴ spores/ml after 72h at 20ºC and 5ºC, respectively.

Life Science Journal 2013;10(1) http://www.lifesciencesite.com
http://www.lifesciencesite.com [email protected] 1830
Fig. 4. Development of Aspergillus black rot (lesion diameter) on Taify table grape fruit wounds treated with living bacterial cells at 1x10⁸ cells/ml followed by challenge with Aspergillus niger BAVSH1(A1, A2), A. parasiticus BAVSH4 (B1, B2), and A. tubingensis BAVSH5 (C1, C2), at 1X10⁴ spores/ml after 72h at 20ºC and 5ºC, respectively.
Life Science Journal 2013;10(1) http://www.lifesciencesite.com
http://www.lifesciencesite.com [email protected] 1831
With regard to the different fungi encountered in grape in the present study, black Aspergilli were dominant and exhibited the highest relative abundance, accounting for 18.66 % of all fungi isolated. This predominance supports the findings of other investigators (El-Ghaouth and Wilson, 1995; Allam et al., 2008; Guzev et al., 2008 and Allam et al., 2012) where they found that Aspergilli are the most dominant filamentous fungi, the causative agents of black rot of grapes and the responsible for OTA and AFB1 production. The classification of this fungus was traditionally based on morphological identification (Accensi et al., 1999), which can lead to misidentification. Thus, different molecular tools reviewed by Samson et al. (2007) and Somma et al. (2012) have been used to differentiate taxa within section Nigri. On the basis of PCR with species- specific primers, based on internal transcribed spacer (ITS) regions used in this study and by Gherbawy and Hussein (2010), in addition to phylogenetic analysis based on 16S rRNA gene sequences, the results showed high levels of sequence similarity of our isolates to closely related species in the nucleotide sequence databases in The National Center for Biotechnology Information (NCBI) Nucleotide Database. These similarities are sufficient to deduce that the most occurred fungi that are responsible for black rot in Taify table grape are belonging to Aspergillus niger BAVSH1, Aspergillus parasiticus BAVSH4 and Aspergillus tubingensis BAVSH5. Five epiphytic bacterial isolates of Taify table grape fruit and one from meswak showed the highest antagonistic activities against the previously identified black Aspergilli, and were selected out of 41 isolates for further studies. They were identified by partial sequencing of 16S rRNA gene using set of universal primers. The obtained sequences were deposited in the DDBJ/EMBL/GenBank nucleotide sequence database. The isolated strains are facultative aerobes and distributed into two phylogenetic clusters. On the basis of PCR with universal primers, based on 16S rRNA genes region, used in this study, and phylogenetic analysis based on 16S rRNA gene sequences that showed high levels of sequence similarity of our isolates to closely related species in the nucleotide sequence databases in The National Center for Biotechnology Information (NCBI) Nucleotide Database are sufficient to deduce that our best antagonistic bacteria are belonging to Pseudomonas aeruginosa EBMSH1, Pseudomonas aeruginosa EBVSH13, Pseudomonas aeruginosa EBVSH14, Pseudomonas aeruginosa EBVHVSH17, Bacillus vallismortis EBHVSH28 and Bacillus amyloliquefaciens
EBHVSH29. Table grapes which could be subjected to
fungal infection during storage, the infection could be reduced by several treatments. Among these treatments, the reduction of storage time and discarding visibly rotted bunches. In addition, the incidence of black Aspergilli in post-harvest could be reduced with sulphur dioxide in cold storage at 0°C (Lichter et al., 2005). However, attempts to reduce fungal colonization and mycotoxin content of grapes including agronomic practices, chemical and biological treatments have met with varying degrees of success, and the data obtained are sometimes controversial (Somma et al., 2012). Biocontrol as a strategy to reduce fruit diseases using biocontrol agents (BCAs) of fruit diseases, with special interest to grapes are reported elsewhere (Pitt and Ailsa, 1985; Janisiewicz et al., 2000; Janisiewicz and Korsten, 2002; He et al., 2003; Ruenwongsa and Panijpan, 2007 and Pusey et al., 2009). Most of the potential BCAs are yeasts followed by bacteria and then fungi. The results of the present study demonstrated that out of forty one bacteria isolated, the largest inhibitions were obtained with three grape epiphytic bacteria; P. aeruginosa EBVHVSH17, B. vallismortis EBHVSH28 and B. amyloliquefaciens EBHVSH29. In this context Zhao et al. (2013) used B. amyloliquefaciens for the control post harvest soft rot caused by Erwinia carotovora of vegetables. The inhibition of fungal development by the antagonistic organisms suggests the diffusion of antifungal metabolites in agar blocks and the hyperparasitism demonstrated in viability tests. Antifungal production seems to be the major mode of action of most antagonists identified so far (Wilson and Wisniewski, 1989 and Ferreira, 1990). Some reports indicated that antibiotic substances induced malfunctions such as stunting, distortion, swelling, hyphal protuberances or highly branched appearance of fungal germ tubes (Gunji et al., 1983; Getha and Vikineswary, 2002). In some affected fungal colonies, colorless and sterile hyphae were observed in colony margins adjacent to the antagonistic colonies.
In this study, prophylactic treatment of Taify table grape fruits with isolates P. aeruginosa EBVHVSH17, B. vallismortis EBHVSH28 and B. amyloliquefaciens EBHVSH29, resulted in a dramatic reduction of Aspergillus black rot. The data indicated that the antagonistic bacteria interfered with rot initiation, even when the fruits were challenged with A. niger BAVSH1, A. parasiticus BAVSH4 and A. tubingensis BAVSH5 72 h, after they had been treated with the biocontrol bacteria. The presence of any one of the three biocontrol agents, in the three applied forms, resulted in
Life Science Journal 2013;10(1) http://www.lifesciencesite.com
http://www.lifesciencesite.com [email protected] 1832
disappearance of lesions, smaller lesions and lower or zero disease incidence, compared to the control, when the biocontrol agents were introduced 3 days before the pathogen .This ability to suppress the disease continued to 50 days after the biocontrol agents were applied. This period is adequate for the biocontrol agents to synthesize significant amounts of antimicrobial compounds to effectively prevent the disease progress by the tested fungi. Pseudomonas species have been established as promoters of biofilms (Beattie and Marcell, 2002; Pimenta et al., 2003 and Citterio et al., 2004), and the ability of these bacteria to adhere to plant cells (Garrood et al., 2004) and fungi (Russo et al., 2003) has been reported. Carbohydrates and proteins have been implicated in the adhesion reaction (Mclean et al., 1997; Bodilis et al., 2004 and Ranjbariyan et al., 2011). The inhibition of black Aspergillus rot by P. aeruginosa EBVHVSH17 is the result of association of P. aeruginosa to the challenge fungi or to the plant cells at the wound site. The inhibitory compounds produced by B. vallismortis EBHVSH28 and B. amyloliquefaciens EBHVSH29 seems to be bactericidal rather than bacteriostatic in accordance with Ranjbariyan et al. (2011). Populations of many biocontrol agents that are introduced into artificial environments decline with time (Acea et al., 1988), thus the necessary quantities of antimicrobial agents may be lost with the resulting cessation in the synthesis of inhibitory compounds as observed in our study. The better response of black rot pathogens to flooding intact fruits with either living cells or cell-free extracts from the antagonistic bacteria, used in this study suggests that these biocontrol agents could be useful as a surface treatment during grape storage period to prevent the formation of black Aspergillus rot. Although the potential biocontrol agents isolated from V. vinifera were not successfully into grapevine (Bell et al., 1995), the bacteria used in this study appear capable of effectively re-introduced and have excellent antagonistic activity. If these bacteria persist on the fruit surface, it may provide additional benefit by preventing infection of grape fruits stored in contaminated habitats. Conclusion
The microbiota of Taify table grape showed the predominance of filamentous black Aspergilli and epiphytic bacteria, some with antagonistic relationship that has been led to fungal growth reduction. Results of this study showed In vitro reduction to Taify table grape post harvest black rot disease causing organisms. This happened by isolates of bacteria from natural epiphytic microbiota of grape that could be of great interest for the control of quality of grape. Among these isolates,
Pseudomonas aeruginosa EBVHSH17, Bacillus vallismortis EBHVSH28 and B. amyloliquefaciens EBHVSH29 controlled induced the resistance of grape fruits against the black Aspergilli. This suggests the production of bacterial compounds serving as inducers of disease resistance. Thus, these isolates could be used In vivo for controlling the black rot disease. This is because these organisms can easily be grown in large quantities in simple media and in very short time. Depending on the flooding as potentially effective in inducing defense response, this highlights the importance of flooding grape fruits with living cells or crude cell extracts that induced grape fruits resistance by the bacteria P. aeruginosa EBVHSH17, B. vallismortis EBHVSH28 and B. amyloliquefaciens EBHVSH29 against black rot Aspergilli. Application of these organisms could be preferred and recommended over other antagonistic organisms for field level management, after doing more toxicity and safety tests. Acknowledgements: This work is a part of the research project No. 1384/432/1 funded by Taif University, Taif, Kingdom of Saudi Arabia. Corresponding Author: Prof. Dr. Abd El-Raheem Ramadan El-Shanshoury1,2 1Department of Biotechnology, Faculty of Science, Taif University, P.O. Box 888, Taif 21974, Kingdom of Saudi Arabia. 2Department of Botany, Bacteriology Unit, Faculty of Science, Tanta University, Tanta 31527, Egypt. E-mail: [email protected] References 1. ARDA. Agriculture statistical year book,
Agriculture Research and Development Affairs, Department of Economic Studies and Statistics. Fourteenth issue, Bordelon 2006:2003.
2. Boyette MD, Estes EA, Rubin AR. Hydrocooling, North Carolina Cooperative Extension Service. 1992; AG:414-504.
3. Abrunhosa L, Paterson RR, Kozakiewicz Z, Lima N, Venāncio A. Mycotoxin production from fungi isolated from grapes. Lett Appl Microbiol 2001;32:240-242.
4. Cabañes FJ, Accensi F, Bragulat MR, Abarca ML, Castellá G, Minguez S, Pons A. What is the source of ochratoxin A in wine? Int J Food Microbiol 2002;79:213-215.
5. Sage L, Krivobok S, Delbos É, Seigle-Murand F, Creppy EE. Fungal flora and ochratoxin A production in grapes and musts from France. J Agric Food Chem 2002; 50:1306-1311.

Life Science Journal 2013;10(1) http://www.lifesciencesite.com
http://www.lifesciencesite.com [email protected] 1833
6. Battilani P, Pietro A, Bertuzzi T, Languasco L, Giorni P, Kozakiewicz Z. Occurrence of ochratoxin A-producing fungi in grapes grown in Italy. J Food Prot 2003;66:633-636.
7. Medina A, Rufino M, López-Ocaña L, Valle-Algarra FM, Jiménez M. Study of Spanish grape mycobiota and ochratoxin A production by isolates of Aspergillus tubingensis and other members of Aspergillus section Nigri. Appl Environ Microbiol 2005;71(8):4696-4702.
8. Lui HM, Guo JH, Cheng YG, Luo L, Lui P, Wang BQ, Deng BX, Long CA. Control of gray mold of grape by Hanseniaspora uvum and its effects on postharvest quality parameters. Ann Microbiol 2010;60 (1):31-35.
9. International programme on chemical safety. Selected mycotoxins: ochratoxins, trichotecenes, ergot. Environ. Health Criter 1990;105:27-69.
10. Majerus P, Otteneder H. Detection and occurrence of ochratoxin A in wine and grape juice. Dtsch. Lebensmitt. Rundsch 1996;92:388-390.
11. Heenan CN, Shaw KJ, Pitt JI. Ochratoxin A production by Aspergillus carbonarius and A. niger isolates and detection using coconut cream agar. J Food Mycol 1998;1:67-72.
12. Codex Alimentarius Commission. Position paper on ochratoxin A. In: Codex committee on food additives and contaminants, 31st session, the Hague, the Netherlands 1999:1-9.
13. Abrunhosa L, Serra R, Venāncio A. Biodegradation of ochratoxin A by fungi isolated from grapes. J Agric Food Chem 2002;50:7493-7496.
14. Bayman P, Baker JL, Doster MA, Michailides TJ, Mahoney NE. Ochratoxin production by Aspergillus ochraceus group and Aspergillus alliaceus. Appl Environ Microbiol 2002;68:2326-2329.
15. Guzev L, Danshin A, Zahav T, Ovadia A, Lichter A. The effects of cold storage of table grapes, sulphur dioxide and ethanol on species of black Aspergillus producing ochratoxin A. Int J Food Sci Technol 2008;43: 1187-1194.
16. Allam NG, El-Shanshoury AR, Emara HA, Mohamed AZ. Fungi, toxigenic fungi, mycotoxins, pathogenic bacteria and heavy metal levels in some medicinal and food herbs. In: Proc. 5th Int Con Biol Sci (Botany) 5:29-39 Tanta, Egypt, 5 - 6 November 2008.
17. Al-Qurashi A D. Quality of Taify table grapes fumigated with carbon dioxide and sufur dioxide. JKAU: Met., Env and Arid Land Agric Sci 2010;21(1):51-64.
18. Pusey PL, Wilson CL. Postharvest biological control of stone fruit brown rot by Bacillus subtilis. Plant Dis 1984;68:753–756.
19. Spotts RA, Cervantes LA. Population, pathogenicity and benomyl resistance of Botrytis spp., Penicillium spp. and Mucor piriformis in packing houses. Plant Dis 1986;70: 106-108.
20. Ferreira JHS. In vitro evaluation of epiphytic bacteria from table grapes for the suppression of Botrytis cinerea. S AFR J Enol Vitic 1990;11(1):38-41.
21. El-Abyad MS, El-Sayed MA, El-Shanshoury AR, El-Sabbagh SM. Towards the biological control of fungal and bacterial diseases of tomato using antagonistic Streptomyces spp. Plant and Soil 1993;149:185-195.
22. El-Abyad MS, El-Sayed MA, El-Shanshoury AR, El-Batanony N H. Effect of culture conditions on the antibacterial activities of UV mutants of Streptomyces corchorusii and S. spiroverticillatus against bean and banana wilt pathogens. Microbiol Res 1996;151:201-211.
23. El-Shanshoury AR. Azotobacter chroococcum and Streptomyces atroolivaceus as biocontrol agents of Xanthomonas campestris. Acta Microbiol Polon 1994;43(1):79-87.
24. El-Ghaouth A, Wilson CL. Biologically-based technologies for the control of postharvest diseases. Postharv. Biol Technol 1995;6: 5-11.
25. El-Ghaouth A, Wilson CL, Wisniewski M. Ultrastructural and cytochemical aspects of the biological control of Botrytis cinerea by Candida saitoana in apple fruit. Phytopathol 1998;88(4):282-291.
26. El-Ghaouth A, Wilson CL, Wisniewski M. Control of postharvest decay of apple fruits with Candida saitoana and induction of defense. Phytopathol 2003;9 (3):344-348.
27. Gonzalez G, Hinojo MJ, Mateo R, Medina A, Jiménez M. Occurrence of mycotoxin producing fungi in bee pollen. Inter J Food Microbiol 2005;105:1-9.
28. Visconti A, Perrone G, Cozzi G, Solfrizzo M. Managing ochratoxin A risk in the grape-wine food chain. Food Additv and Contamin 2008; Part A 25(2):193-220.
29. Abrunhosa L, Paterson RRM, Venancio A. Biodegradation of ochratoxin A for food and feed decontamination. Toxins 2010;2:1078-1099.
30. Somma S, Perrone G, logrieco FL. Diversity of black Aspergilli and mycotoxin risks in grape, wine and derived vine fruits. Phytopathol Mediterran 2012;51(1):131-147.
Life Science Journal 2013;10(1) http://www.lifesciencesite.com
http://www.lifesciencesite.com [email protected] 1834
31. Wisniewski M, Wilson C. Biological control of postharvest diseases of fruits and vegetables: recent advances. Hort Sci 1992;27(2):94-98.
32. Sobiczewski P, Bryk H. Bacteria for control of postharvest diseases of fruits. In: Environmental biotic factors in integrated plant disease control. Proceedings of 3rd Conference of European Foundation for Plant Pathology, Poznań, Poland, September 5–9, 1994. Ed. M. Mańka. The Polish Phytopathological Society, Poznań:1995;105-111.
33. He D, Zheng XD, Yin Y-M, Sun P, Zhang HY. Bot Bull Acad Sin 2003;44:211-216.
34. Han WC, Lee JY, Park DH, Lim CK, Hwang BK. Isolation and antifungal and antioomycete activity of Streptomyces scabiei strain PK-A41, the causal agent of common scab disease. Plant Pathol J 2004;20(2):115-126.
35. Bleve G, Grieco F, Cozzi G, Logrieco A, Visconti A. Isolation of epiphytic yeasts with potential for biocontrol of Aspergillus carbonarius and A. niger on grape. Int J Food Microbiol 2006;108:204-209.
36. El-Tarabily KA, Sivasithamparam K. Potential of yeasts as biocontrol agents of soil-borne fungal plant pathogens and as plant growth promoters. Mycosci 2006;47:25-35.
37. Slavov I. Preliminary studies on the epiphytes for postharvest biological control of blue mould on apple fruits. Phytopathol Pol 2006;39:119-123.
38. Chanchaichaovivata A, Ruenwongsa P, Panijpan B. Screening and identification of yeast strains from fruits and vegetables: Potential for biological control of postharvest chilli anthracnose (Colletotrichum capsici). Biol Cont 2007;42:326-335.
39. Haıssam JM. Pichia anomala in biocontrol for apples: 20 years of fundamental research and practical applications. Anton van Leeuwen 2011;99:93-105.
40. Parani K, Shetty GP, Saha BK. Isolation of Serratia marcescens SR1 as a source of chitinase having potentiality of using as a biocontrol agent. Ind J Microbiol 2011;51(3):247-250.
41. Ponsone ML, Chiotta ML, Combina M, Dalcero A, Chulze S. Biocontrol as a strategy to reduce the impact of ochratoxin A and Aspergillus section Nigri in grapes. Int J Food Microbiol.2011;151:70-77.
42. Ali K, Federica M, Young HC, Robert V. Metabolic constituents of grapevine and grape-derived products. Phytochem Rev 2010;9(3):357-378.
43. Sticher L, Mauch-Mani B, Metraux J-P. Systemic acquired resistance. Annu Rev Phytopathol 1997;35:235-270.
44. Sholberg PL, Conway WS. Postharvest Pathology. In: Gross, KC; Wang CY; Saltveit M. The commercial storage of fruits, vegetables, and florist and nursery stocks. USDA, ARS: Agricultural Handbook 2004:66-130.
45. Nandeeshkumar P, Sudisha J, Ramachandra KK, Prakash HS, Niranjana SR, Shekar SH. Chitosan induced resistance to downy mildew in sunflower caused by Plasmopara halstedii. Physiol and Mol Plant Pathol 2008;72:188-94.
46. Yu H, Braun P, Yildirim MA, Lemmens I, Venkatesan K, Sahalie J, Hirozane-Kishikawa T, Gebreab F, Li N, Simonis N, Hao J, Rual F, Dricot A, Vazquez A, Murray RR, Simon CT, Tardivo L, Tam S, Svrzikapa N, Fan C et al. High-quality binary protein interaction map of the yeast interactome network. Science 2008;322:104-110.
47. Poiatti VAD, Dalmas FR, Astarita LV. Defence mechanisms of Solanum tuberosum L. in response to attack by plant-pathogenic bacteria. Biol Res 2009;42:205-215.
48. Compant S, Reiter B, Sessitsch A, Nowak J, Clement C, Aı¨t Barka E. Endophytic colonization of Vitis vinifera L. by plant growth-promoting bacterium Burkholderia sp. strain PsJN. Appl and Environ Microbiol 2005;71:1685-1693.
49. Bakker PAH, Pieterse CMJ, Van Loon LC. Induced systemic resistance by fluorescent Pseudomonas spp. Phytopathol 2007;97:239-243.
50. Magnin-Robert M, Trotel-Aziz P, Quantinet D, Biagianti S, Aziz A. Biological control of Botrytis cinerea by selected grapevine-associated bacteria and stimulation of chitinase and B-1, 3 glucanase activities under field conditions. Eur J Plant Pathol 2007;118:43-57.
51. Trotel-Aziz P, Couderchet M, Biagianti S, Aziz A. Characterization of new bacterial biocontrol agents Acinetobacter, Bacillus, Pantoea and Pseudomonas spp. mediating grapevine resistance against Botrytis cinerea. Environ Exp Bot 2008;64:21-32.
52. Verhagen BWM, Trotel-Aziz1 P, Couderchet M, Hoafte M, Aziz A. Pseudomonas spp.-induced systemic resistance to Botrytis cinerea is associated with induction and priming of defence responses in grapevine. J Exp Bot 2010;61(1):249-260.
53. Baz M, Tran D, Kettani-Halabi M, Samri SE, Jamjari A, Biligui B, Meimoun P, El-Maarouf-

Life Science Journal 2013;10(1) http://www.lifesciencesite.com
http://www.lifesciencesite.com [email protected] 1835
Bouteau H, Garmier M, Saindrenan P, Ennaji MM, Barakate M, Bouteau F. Calcium- and ROS-mediated defence responses in BY2 tobacco cells by nonpathogenic Streptomyces sp. J Appl Microbiol 2012;112(4):782-792.
54. Barnett HL, Hunter BB. Illustrated genera of imperfect fungi, Burgess Pub. Co., 3rd ed. 1972;217-237.
55. Pitt JI, Ailsa HD. Fungi and food spoilage. Acad Press Australia 1985:411-420.
56. Tuite J, Cantone F. Plant pathology methods, Purdue Univ USA 1990:130.
57. Lee SL, Taylor JW. Isolation of DNA from fungal mycelia and single spores. In: Innis MA, Gelfand DH, Sninsky JJ, White TJ, ed. PCR protocols: a guide to methods and applications. Academic Press Inc San Diego Calif 1990:282-286.
58. White TJ, Bruns T, Lee S, Taylor J. Amplification and direct sequencing of fungal ribosomal RNA genes for phylogenetics. In: Innis MA, Gelfand DH, Sninsky JJ, White TJ, ed. PCR protocols: a guide to methods and applications. Academic Press Inc San Diego California 1990:315-322.
59. Assis SMP, Mariano RLR. Antagonism of yeasts to Xanthomonas campestris pv. Campestris on cabbage phylloplane in field. Rev Microbiol 1999;30:191-195.
60. Yrjälä K, Mancano G, Carola F, Akerman ML, Sipilä TP. The incience of Burkholderia in epiphytic and endophytic bacterial cenoses in hybrid aspen grown on sandy peat. Boreal Environ Res 2010;15:81-96.
61. Butler JP. Bergey's Manual of Systematic Bateriology (9th edition), Willaims and Wilkins (eds.), 428 east preston streat, Baltmor, Md: USA 1986:21202.
62. Sambrook J and Russell DW. Molecular cloning: A Laboratory Manual, Third Ed. Cold Spring Harbor Laboratory Press 2001.
63. Yanagi M, Yamasato K. Phylogenetic analysis of the family Rhizobiaceae and related bacteria by sequencing of 16S rRNA gene using PCR and DNA sequencer. FEMS Microbiol Lett 1993;107:115-120.
64. Weisburg WG, Barns SM, Pelletier DA, Lane DJ. 16S Ribosomal DNA amplification for phylogenetic study. J Bacteriol 1991;173(2):697-703.
65. Chouari R, Le Paslie D, Daegelen P. Novel predominant archaeal and bacterial groups revealed by molecular analysis of an anaerobic sludge digester. Enviro Microbiol 2005;7:1104-1115.
66. Fuhrmann JJ. Isolation of soil microorganisms producing antibiotics. In: Weaver RW, Angle S, Bottomley P, Bezdicek S, Smith S, Tabatabai A, Wollum A, eds. Methods of Soil Analysis. SSSA Book Series (No. 5). Soil Science Society of America Madison WI 1994:379-405.
67. Abrunhosa L, Paterson RRM, Kozakiewicz Z, Lima N, Venancio A. Mycotoxin production from fungi isolated from grapes. Lett Appl Microbiol 2001;32:240-242.
68. Cabañes FJ, Accensi F, Bragulat MR, Abarca ML, Castella´ G, Minguez S, Pons A. What is the source of ochratoxin A in wine? Int. J Food Microbiol 2002;79:213-215.
69. Magnoli C, Violante M, Combina M, Palacio G, Dalcero A. Mycoflora and ochratoxin producing strains of Aspergillus section Nigri in wine grapes in Argentina. Lett Appl Microbiol 2003;37:179-184.
70. Samson RA, Noonim P, Meijer M, Houbraken J, Frisvad JC, Varga J. Diagnostic tools to identify black Aspergilli. Studies in Mycology 2007;59:129-146.
71. Leong S, Hocking AD, Pitt JI. Occurrence of fruit rots fungi (Aspergillus section Nigri) on some drying varieties of irrigated grape. Aust. J Grape and Wine Res 2008;10(1): 83-88.
72. Allam NG, El-Shanshoury AR, Emara HA, Zaky AZ. Biological activity of Streptomyces noursei against ochratoxin A producing Aspergillus niger. Afr J Biotechnol 2011;11(3):666-677.
73. Allam NG, El-Shanshoury AR, Emara HA, Zaky AZ. Decontamination of ochratoxin-A producing Aspergillus niger and ochratoxin A in medicinal plants by gamma irradiation and essential oils. J Int Environ Appl Sci 2012;7(1):161-169.
74. Accensi F, Cano J, Figuera L, Abarca ML, Caban˜es FJ. New PCR method to differentiate species in the Aspergillus niger aggregate. FEMS Microbiol Lett 1999;180:191-196.
75. Gherbawy YA, Hussein NA. Molecular characterization of Mucor circinelloides and Rhizopous stolonifer strains isolated from some Saudi fruits. Foodborne pathogens and disease 2010;7(2):137-142.
76. Lichter A, Danshin A, Zahavi T, Ovadia A, Cuzev L. Survival of OTA producing fungi during storage of table grapes. In: Abstracts, Ochratoxin A in grapes and wine: Prevention and control, October 20-21, 2005, Sicily, Italy.
77. Janisiewicz WJ, Tworkoski TJ, Sharer C. Characterizing the mechanism of biological control of postharvest diseases on fruits with a
Life Science Journal 2013;10(1) http://www.lifesciencesite.com
http://www.lifesciencesite.com [email protected] 1836
simple method to study competition for nutrients. Phytopathol 2000;90:1196-1200.
78. Janisiewicz WJ, Korsten L. Biological control of postharvest diseases of fruits. Annu Rev Phytopathol 2002; 40: 411- 441.
79. Ruenwongsa P, Panijpan B. Screening and identification of yeast strains from fruits and vegetables: Potential for biological control of postharvest chilli anthracnose (Colletotrichum capsici) Arun Chanchaichaovivat a. Biol Cont 2007;42:326-335.
80. Pusey PL, Stockwell VO, Mazzola M. Epiphytic bacteria and yeasts on apple blossoms and their potential as antagonists of Erwinia amylovora. Phytopathol 2009;99:571-581.
81. Zhao Y, Li p, Huang Y. Control of post harvest soft rot caused bu Erwinia carotovora of vegetables by a strain of Bacillus amyloliquefaciens and its potential modes of action. World J Microbiol and Biochem 2013; 29(3):411-420.
82. Wilson CL, Wisniewski ME. Biological control of post harvest diseases of fruits and vegetables: an emerging technology. Annu Rev Phytopathol 1989;27:425-441.
83. Ferreira JHS. In vitro evaluation of epiphytic bacteria from table grapes for the suppression of Botrytis cinerea. S Afr J Enol Vitic 1990;11(1):38-41.
84. Gunji S, Arima K, Beppu T. Screening antifungal activities according morphological abnormalities. Agric Biol Chem 1983;47:2061-2069.
85. Getha K, Vikineswary S. Antagonistic effects of Streptomyces violaceusniger strain G10 on Fusarium oxysporum f. sp. cubense race 4: indirect evidence for the role of antibiosis in the antagonistic process. J Ind Microbiol 2002;28:303-310.
86. Beattie GW, Marcell LM. Comparative dynamics of adherent and nonadherent bacterial populations on maize leaves. Phytopathol 2002;92:1015-1023.
87. Pimenta A, Di Martino P, Le Bouder E, Hulen C, Blight MA. In vitro identification of two adherence factors required for In vivo virulence of Pseudomonas fluorescens. Microbes Infect 2003;5:1177-1187.
88. Citterio B, Patrone V, Baldelli B, Malatesta M. Adhesion of ectomycorrhizal bacteria to plant cells: In vitro evidence. Eur J Histochem 2004;48:191-193.
89. Garrood MJ, Wilson PDG, Brocklehurst TF. Modeling the rate of attachment of Listeria monocytogenes, Pantoea agglomerans and Pseudomonas fluorescens to, and the probability of their detachment from potato tissue at 10 degrees C. Appl Environ Microbiol 2004;70:3558-3565.
90. Russo A, Filippi C, Tombolini R, Toffanin A, Bedini S, Agnolucci M, Nuti M. Interaction between gfp-tagged Pseudomonas tolaasii P12 and Pleurotus eryngii. Microbiol Res 2003;158:265-270.
91. McLean RJC, Whiteley M, Stickler DJ, Fuqua WC. Evidence of autoinducer activity in naturally occurring biofilms. FEMS Lett 1997;154:259-263.
92. Bodilis J, Calbrix R, Guerillon J, Merieau A, Pawlak B, Orange N, Barray S. Phylogenetic relationships between environmental and clinical isolates of Pseuodomonas fluorescens and related species deduced from 16S rRNA gene and OprF protein sequences. Syst Appl Microbiol 2004;27:93-108.
93. Ranjbariyan AR, Shams-Ghahfarokhi M, Srazzaghi-Abyaneh MK. Molecular identification of antagonistic bacteria from Tehran soils and evaluation of their inhibitory activities toward pathogenic fungi. Iran J Microbiol 2011;3(3):140-146.
94. Acea MJ, Moore CR, Alexander M. Survival and growth of bacteria introduced into soil. Soil Biol Biochem 1988;20:509-515.
95. Bell CR, Dickie GA, Chan JWYF. Variable response of bacteria isolated from grapevine xylem to control grape crown gall disease in planta. Am J Enol Vitic 1995;46:499-508.
1/22/2013

Life Science Journal 2013;10(1) http://www.lifesciencesite.com
1837
Subependymal Giant Cell Astrocytomas in the Western Region of Saudi Arabia; A Clinicopathological Experience
Jaudah A. Al-Maghrabi 1, 3 (MD, FRCPC) and Saleh S. Baeesa (MD, FRCSC) 2, 4
Departments of Pathology1 and Neurosurgery2, Faculty of Medicine, King Abdulaziz University Departments of
Pathology3 and Neuroscience4, King Faisal Specialist Hospital and Research Centre, Jeddah, Saudi Arabia
[email protected] Abstract: Background: Subependymal giant cell astrocytomas (SEGAs) are rare slowly growing tumors that usually occur in the setting of tuberous sclerosis complex (TSC). Histologically they may simulate high-grade gliomas and such a misleading diagnosis might result in unnecessarily aggressive chemo-or radiotherapy. The aim of this study is to review the pathological pattern of SEGAs in two tertiary medical centres in the western region of Saudi Arabia. Methods: We retrospectively analyzed the pathological and clinical data of patients diagnosed with SEGAs in 2 tertiary medical centers (king Abdulaziz university hospital, [January 2000 to April 2012], and king Faisal specialist hospital and research center [January 2001 to April 2012]). Results: Ten cases were diagnosed as SEGAs. The age range was 5-35 years (mean 18.7 years). There were 5 Males and 5 female patients. Only three patients were diagnosed with TSC preoperatively and one patient diagnosed with TSC during the follow-up period. All the ten tumors developed in the lateral ventricles. All tumors showed similar histological features irrespective of their association with tuberous sclerosis. All the patients treated with complete microsurgical resection only. Clinical follow-up of the patients ranged from 2 to 144 months (mean 32 months), none of the patients had recurrence after surgery. Conclusion: SEGA should be considered in the differential diagnosis of intraventricular tumor even in the absence of TSC features. It is very important for pathologists to be aware with the morphological features of SEGA to avoid misdiagnosis and subsequent overtreatment. Surgical resection is usually sufficient treatment. Long term prognosis of patients with SEGA is excellent even in the presence of worrisome atypical histological features. [Jaudah A. Al-Maghrabi and Saleh S. Baeesa. Subependymal Giant Cell Astrocytomas in the Western Region of Saudi Arabia; A Clinicopathological Experience. Life Sci J 2013;10(1):1837-1844]. (ISSN: 1097-8135). http://www.lifesciencesite.com. 263
Keywords: Subependymal giant cell astrocytomas. Tuberous sclerosis. Misdiagnosis. Pathology. Pitfalls. 1. Introduction:
Subependymal giant cell astrocytoma (SEGA) is a rare and unique benign astrocytoma that usually arises in patients with tuberous sclerosis complex (TSC) and considered a major criterion for diagnosis of TSC (1). Occasionally the histopathology of these tumors mimics malignant gliomas because of the presence of high cellularity, considerable nuclear pleomorphism and multinucleated and giant cells. The difficulty in the differential diagnosis becomes more evident in those SEGAs that show unusual atypical features such as necrosis, microvascular proliferation and mitotic figures. It is very important for pathologists to be aware with morphological features of these tumors to avoid unnecessarily excessive treatment of basically low-grade neoplasms. In this study the histopathological and immunohistochemical features of SEGAs diagnosed at two large medical centres in the western region of Saudi Arabia are reviewed.
2. Methods:
This is a retrospective study of patients diagnosed with SEGAs in 2 tertiary medical centers in Jeddah; King Abdulaziz University Hospital
(KAUH) during the period January 2000 to April 2012, and King Faisal Specialized Hospital and Research Centre (KFSHRC) during the period January 2001 to April 2012. The study was in accordance with the Research Ethic Committee of KAUH and according to the ethical guidelines of the 1975 Declaration of Helsinki. Patients’ histological materials were retrieved from the archive. Hematoxylin and eosin stained slides together with the immunohistochemistry material were reviewed. The immunohistochemistry panel was completed in those cases with slides available and not all the markers were done at the time of the diagnosis. The clinical and radiological data of the patients was reviewed. We used Chi square test to compare the distribution of variables. Data analysis was performed using the Statistical Package for Social Sciences (SPSS Inc., Chicago, IL, USA), Version 16. A p-value <0.05 was considered significant. 3. Results:
Of 1060 intracranial tumors sampled and/ or resected at both institutions during this period, 10 cases of SEGAs were diagnosed. The age range was 5-35 years (mean 18.7 years). The male to female
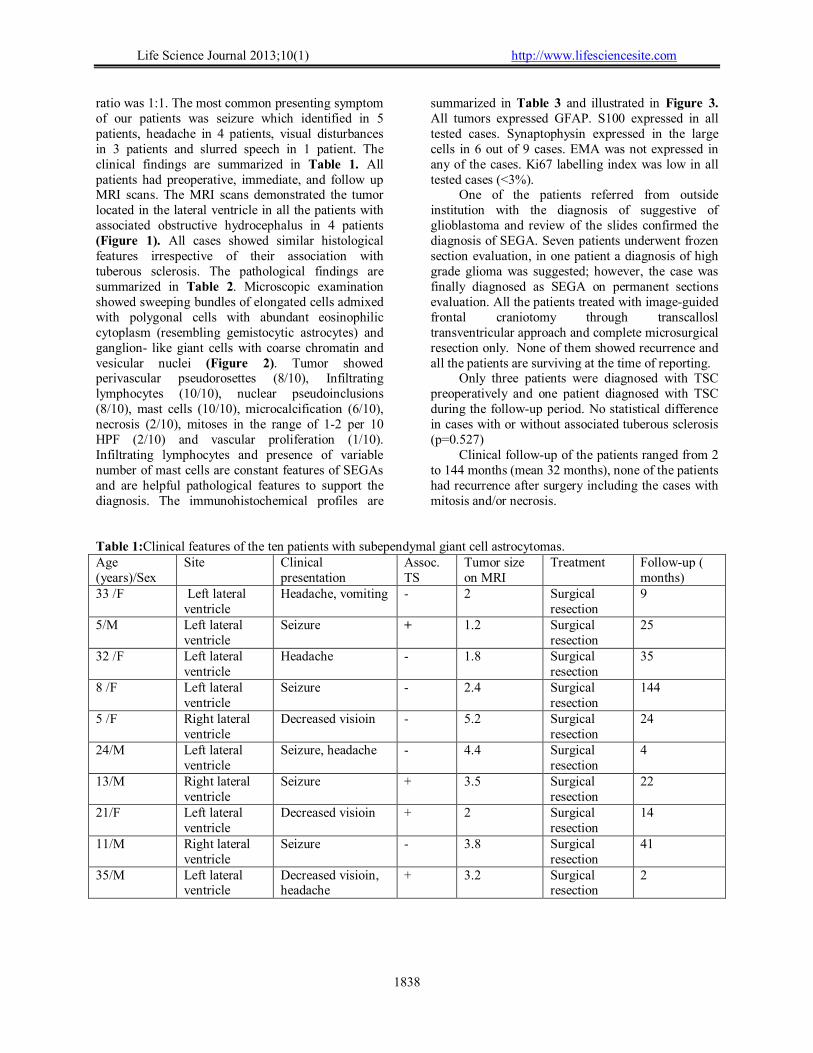
Life Science Journal 2013;10(1) http://www.lifesciencesite.com
1838
ratio was 1:1. The most common presenting symptom of our patients was seizure which identified in 5 patients, headache in 4 patients, visual disturbances in 3 patients and slurred speech in 1 patient. The clinical findings are summarized in Table 1. All patients had preoperative, immediate, and follow up MRI scans. The MRI scans demonstrated the tumor located in the lateral ventricle in all the patients with associated obstructive hydrocephalus in 4 patients (Figure 1). All cases showed similar histological features irrespective of their association with tuberous sclerosis. The pathological findings are summarized in Table 2. Microscopic examination showed sweeping bundles of elongated cells admixed with polygonal cells with abundant eosinophilic cytoplasm (resembling gemistocytic astrocytes) and ganglion- like giant cells with coarse chromatin and vesicular nuclei (Figure 2). Tumor showed perivascular pseudorosettes (8/10), Infiltrating lymphocytes (10/10), nuclear pseudoinclusions (8/10), mast cells (10/10), microcalcification (6/10), necrosis (2/10), mitoses in the range of 1-2 per 10 HPF (2/10) and vascular proliferation (1/10). Infiltrating lymphocytes and presence of variable number of mast cells are constant features of SEGAs and are helpful pathological features to support the diagnosis. The immunohistochemical profiles are
summarized in Table 3 and illustrated in Figure 3. All tumors expressed GFAP. S100 expressed in all tested cases. Synaptophysin expressed in the large cells in 6 out of 9 cases. EMA was not expressed in any of the cases. Ki67 labelling index was low in all tested cases (<3%).
One of the patients referred from outside institution with the diagnosis of suggestive of glioblastoma and review of the slides confirmed the diagnosis of SEGA. Seven patients underwent frozen section evaluation, in one patient a diagnosis of high grade glioma was suggested; however, the case was finally diagnosed as SEGA on permanent sections evaluation. All the patients treated with image-guided frontal craniotomy through transcallosl transventricular approach and complete microsurgical resection only. None of them showed recurrence and all the patients are surviving at the time of reporting.
Only three patients were diagnosed with TSC preoperatively and one patient diagnosed with TSC during the follow-up period. No statistical difference in cases with or without associated tuberous sclerosis (p=0.527)
Clinical follow-up of the patients ranged from 2 to 144 months (mean 32 months), none of the patients had recurrence after surgery including the cases with mitosis and/or necrosis.
Table 1:Clinical features of the ten patients with subependymal giant cell astrocytomas. Age (years)/Sex
Site Clinical presentation
Assoc. TS
Tumor size on MRI
Treatment Follow-up ( months)
33 /F Left lateral ventricle
Headache, vomiting - 2 Surgical resection
9
5/M Left lateral ventricle
Seizure + 1.2 Surgical resection
25
32 /F Left lateral ventricle
Headache - 1.8 Surgical resection
35
8 /F Left lateral ventricle
Seizure - 2.4 Surgical resection
144
5 /F Right lateral ventricle
Decreased visioin - 5.2 Surgical resection
24
24/M Left lateral ventricle
Seizure, headache - 4.4 Surgical resection
4
13/M Right lateral ventricle
Seizure + 3.5 Surgical resection
22
21/F Left lateral ventricle
Decreased visioin + 2 Surgical resection
14
11/M Right lateral ventricle
Seizure - 3.8 Surgical resection
41
35/M Left lateral ventricle
Decreased visioin, headache
+ 3.2 Surgical resection
2

Life Science Journal 2013;10(1) http://www.lifesciencesite.com
1839
Table 2: Pathological features of subependymal giant cell astrocytomas. Pathological features Patients p-value
1 2 3 4 5 6 7 8 9 10 Sweeping bundles of spindle cells and ganglion-like cells + + + + + + + + + + 0.011 Perivascular pseudorosettes - + + + + + + - + + 0.206 Infiltrating lymphocytes + + + + + + + + + + 0.011 Nuclear pseudoinclusions + + - + + + + + - + 0.05 calcification + + + - + + - + - - 0.527 Mast cells + + + + + + + + + + 0.011 Necrosis - - + - - - - - + - 0.05 mitosis - - + - - - - + - - 0.05 Vascular proliferation - - - - - - - + - - 0.011 Table 3: Immunohistochemical features of subependymal giant cell astrocytomas. ient GFAP S100 Synaptophysin EMA ki-67 1 + + + - <1 2 + + + - <1 3 + + - - <1 4 + + + - 3 5 + + - - <1 6 + + - - <1 7 + + + - 2% 8 + + + - 1 9 + ND ND ND ND 10 + + + - 2 ND: Not done
1A
1b
1c
Figure 1: Radiology of SEGA: Sagittal (A), Axial (B), and Coronal (C) T1 weighted MRI post-contrast administration, of 35-yr-old male presented with headache and decreased vision, demonstrating large left lateral ventricular solid and cystic SEGA with strong enhancement of the solid portion.
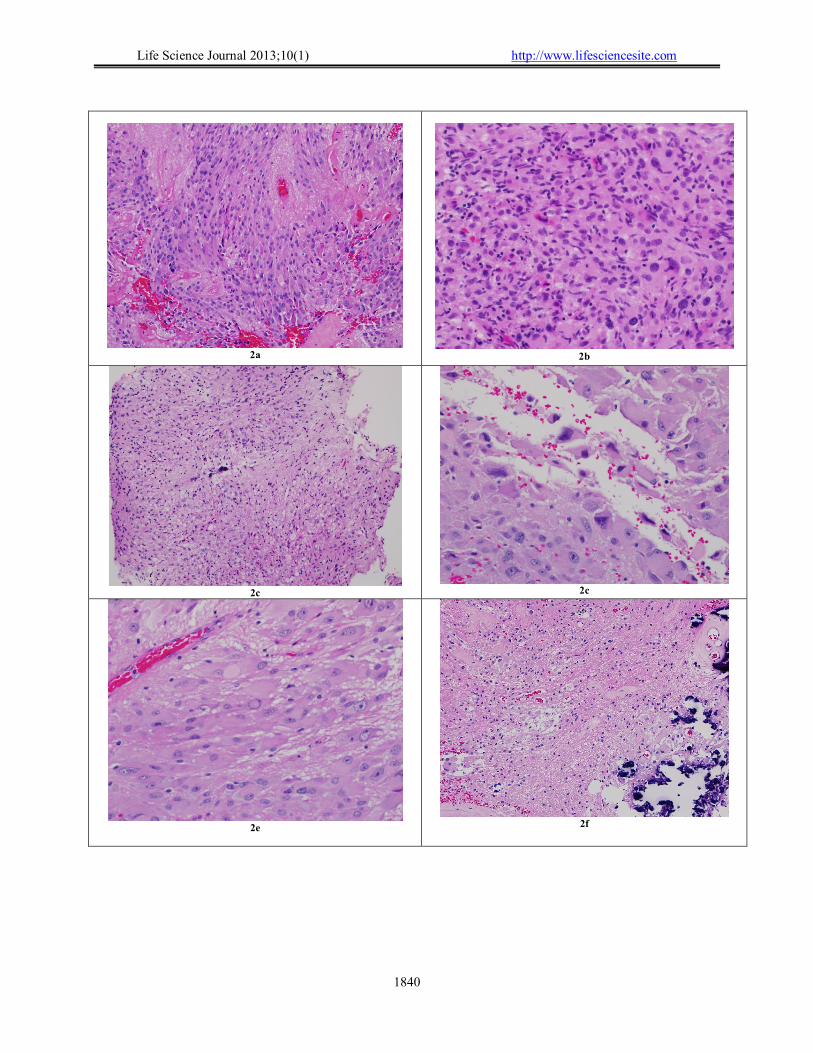
Life Science Journal 2013;10(1) http://www.lifesciencesite.com
1840
2a
2b
2c
2c
2e
2f

Life Science Journal 2013;10(1) http://www.lifesciencesite.com
1841
2g
2h
Figure 2: Histopathology of SEGA:
A. Tumor composed of Sweeping bundles of spindle cells and ganglion-like cells with Perivascular pseudorosettes (H&E)
B. Tumor with small focus of necrosis identified in a frozen section in the center (H&E). C. Tumor reveals cells with nuclear pseudo inclusion (arrow) (H&E). D. Tumor composed predominantly of spindle ells (H&E). E. Very cellular tumor with sprinkling of inflammatory cells (H&E). F. Tumor with large cells revealing nuclear pleomorphism (H&E). G. Tumor with areas of calcification and degenerative changes (H&E).
3a
3b
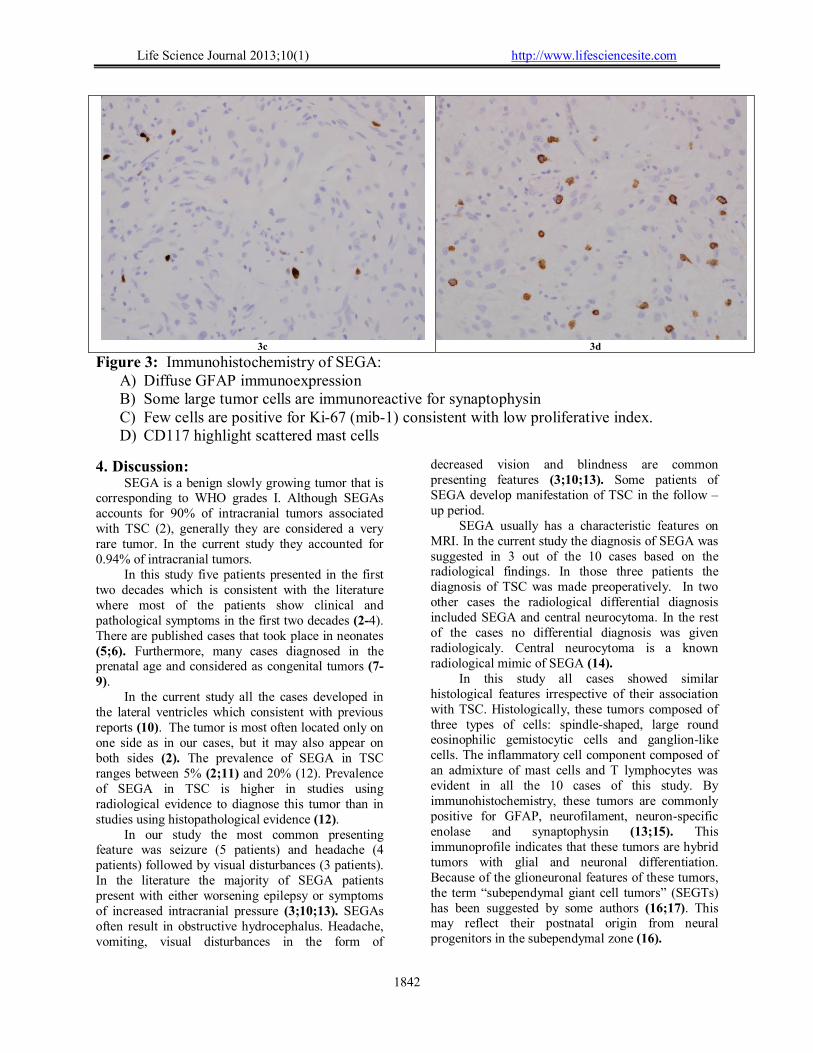
Life Science Journal 2013;10(1) http://www.lifesciencesite.com
1842
3c 3d
Figure 3: Immunohistochemistry of SEGA: A) Diffuse GFAP immunoexpression B) Some large tumor cells are immunoreactive for synaptophysin C) Few cells are positive for Ki-67 (mib-1) consistent with low proliferative index. D) CD117 highlight scattered mast cells
4. Discussion: SEGA is a benign slowly growing tumor that is
corresponding to WHO grades I. Although SEGAs accounts for 90% of intracranial tumors associated with TSC (2), generally they are considered a very rare tumor. In the current study they accounted for 0.94% of intracranial tumors.
In this study five patients presented in the first two decades which is consistent with the literature where most of the patients show clinical and pathological symptoms in the first two decades (2-4). There are published cases that took place in neonates (5;6). Furthermore, many cases diagnosed in the prenatal age and considered as congenital tumors (7-9).
In the current study all the cases developed in the lateral ventricles which consistent with previous reports (10). The tumor is most often located only on one side as in our cases, but it may also appear on both sides (2). The prevalence of SEGA in TSC ranges between 5% (2;11) and 20% (12). Prevalence of SEGA in TSC is higher in studies using radiological evidence to diagnose this tumor than in studies using histopathological evidence (12).
In our study the most common presenting feature was seizure (5 patients) and headache (4 patients) followed by visual disturbances (3 patients). In the literature the majority of SEGA patients present with either worsening epilepsy or symptoms of increased intracranial pressure (3;10;13). SEGAs often result in obstructive hydrocephalus. Headache, vomiting, visual disturbances in the form of
decreased vision and blindness are common presenting features (3;10;13). Some patients of SEGA develop manifestation of TSC in the follow –up period.
SEGA usually has a characteristic features on MRI. In the current study the diagnosis of SEGA was suggested in 3 out of the 10 cases based on the radiological findings. In those three patients the diagnosis of TSC was made preoperatively. In two other cases the radiological differential diagnosis included SEGA and central neurocytoma. In the rest of the cases no differential diagnosis was given radiologicaly. Central neurocytoma is a known radiological mimic of SEGA (14).
In this study all cases showed similar histological features irrespective of their association with TSC. Histologically, these tumors composed of three types of cells: spindle-shaped, large round eosinophilic gemistocytic cells and ganglion-like cells. The inflammatory cell component composed of an admixture of mast cells and T lymphocytes was evident in all the 10 cases of this study. By immunohistochemistry, these tumors are commonly positive for GFAP, neurofilament, neuron-specific enolase and synaptophysin (13;15). This immunoprofile indicates that these tumors are hybrid tumors with glial and neuronal differentiation. Because of the glioneuronal features of these tumors, the term “subependymal giant cell tumors” (SEGTs) has been suggested by some authors (16;17). This may reflect their postnatal origin from neural progenitors in the subependymal zone (16).
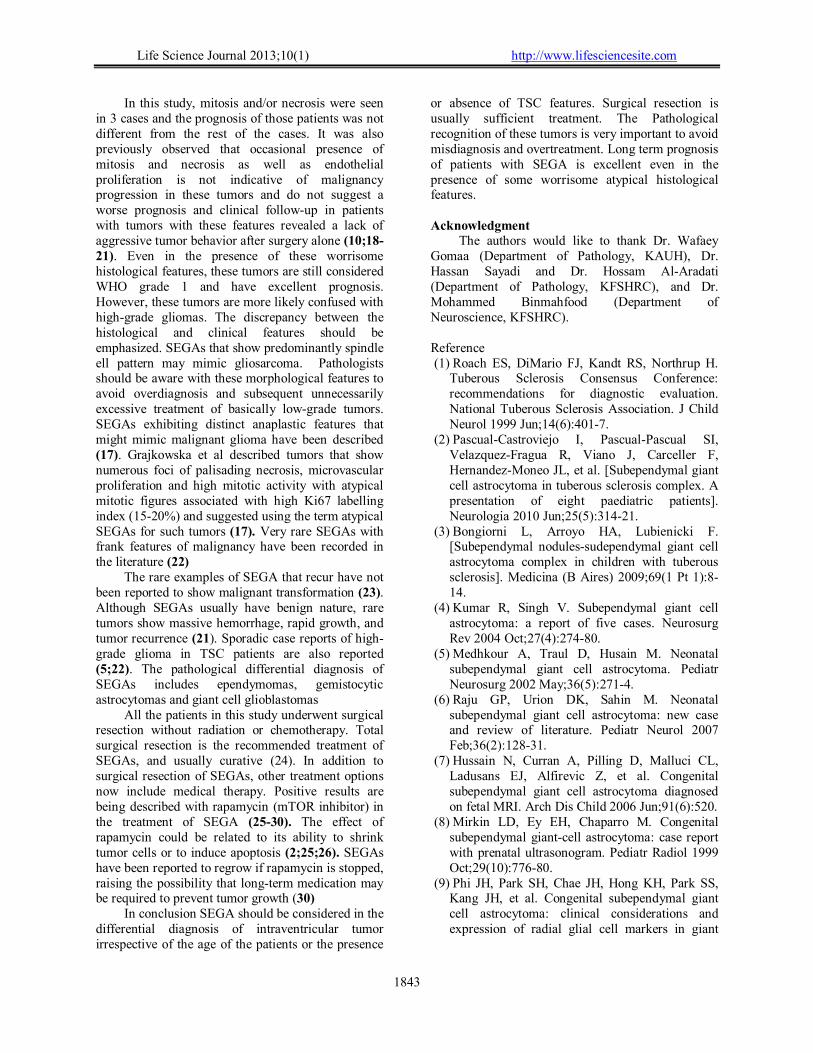
Life Science Journal 2013;10(1) http://www.lifesciencesite.com
1843
In this study, mitosis and/or necrosis were seen in 3 cases and the prognosis of those patients was not different from the rest of the cases. It was also previously observed that occasional presence of mitosis and necrosis as well as endothelial proliferation is not indicative of malignancy progression in these tumors and do not suggest a worse prognosis and clinical follow-up in patients with tumors with these features revealed a lack of aggressive tumor behavior after surgery alone (10;18-21). Even in the presence of these worrisome histological features, these tumors are still considered WHO grade 1 and have excellent prognosis. However, these tumors are more likely confused with high-grade gliomas. The discrepancy between the histological and clinical features should be emphasized. SEGAs that show predominantly spindle ell pattern may mimic gliosarcoma. Pathologists should be aware with these morphological features to avoid overdiagnosis and subsequent unnecessarily excessive treatment of basically low-grade tumors. SEGAs exhibiting distinct anaplastic features that might mimic malignant glioma have been described (17). Grajkowska et al described tumors that show numerous foci of palisading necrosis, microvascular proliferation and high mitotic activity with atypical mitotic figures associated with high Ki67 labelling index (15-20%) and suggested using the term atypical SEGAs for such tumors (17). Very rare SEGAs with frank features of malignancy have been recorded in the literature (22)
The rare examples of SEGA that recur have not been reported to show malignant transformation (23). Although SEGAs usually have benign nature, rare tumors show massive hemorrhage, rapid growth, and tumor recurrence (21). Sporadic case reports of high-grade glioma in TSC patients are also reported (5;22). The pathological differential diagnosis of SEGAs includes ependymomas, gemistocytic astrocytomas and giant cell glioblastomas
All the patients in this study underwent surgical resection without radiation or chemotherapy. Total surgical resection is the recommended treatment of SEGAs, and usually curative (24). In addition to surgical resection of SEGAs, other treatment options now include medical therapy. Positive results are being described with rapamycin (mTOR inhibitor) in the treatment of SEGA (25-30). The effect of rapamycin could be related to its ability to shrink tumor cells or to induce apoptosis (2;25;26). SEGAs have been reported to regrow if rapamycin is stopped, raising the possibility that long-term medication may be required to prevent tumor growth (30)
In conclusion SEGA should be considered in the differential diagnosis of intraventricular tumor irrespective of the age of the patients or the presence
or absence of TSC features. Surgical resection is usually sufficient treatment. The Pathological recognition of these tumors is very important to avoid misdiagnosis and overtreatment. Long term prognosis of patients with SEGA is excellent even in the presence of some worrisome atypical histological features. Acknowledgment
The authors would like to thank Dr. Wafaey Gomaa (Department of Pathology, KAUH), Dr. Hassan Sayadi and Dr. Hossam Al-Aradati (Department of Pathology, KFSHRC), and Dr. Mohammed Binmahfood (Department of Neuroscience, KFSHRC). Reference (1) Roach ES, DiMario FJ, Kandt RS, Northrup H.
Tuberous Sclerosis Consensus Conference: recommendations for diagnostic evaluation. National Tuberous Sclerosis Association. J Child Neurol 1999 Jun;14(6):401-7.
(2) Pascual-Castroviejo I, Pascual-Pascual SI, Velazquez-Fragua R, Viano J, Carceller F, Hernandez-Moneo JL, et al. [Subependymal giant cell astrocytoma in tuberous sclerosis complex. A presentation of eight paediatric patients]. Neurologia 2010 Jun;25(5):314-21.
(3) Bongiorni L, Arroyo HA, Lubienicki F. [Subependymal nodules-sudependymal giant cell astrocytoma complex in children with tuberous sclerosis]. Medicina (B Aires) 2009;69(1 Pt 1):8-14.
(4) Kumar R, Singh V. Subependymal giant cell astrocytoma: a report of five cases. Neurosurg Rev 2004 Oct;27(4):274-80.
(5) Medhkour A, Traul D, Husain M. Neonatal subependymal giant cell astrocytoma. Pediatr Neurosurg 2002 May;36(5):271-4.
(6) Raju GP, Urion DK, Sahin M. Neonatal subependymal giant cell astrocytoma: new case and review of literature. Pediatr Neurol 2007 Feb;36(2):128-31.
(7) Hussain N, Curran A, Pilling D, Malluci CL, Ladusans EJ, Alfirevic Z, et al. Congenital subependymal giant cell astrocytoma diagnosed on fetal MRI. Arch Dis Child 2006 Jun;91(6):520.
(8) Mirkin LD, Ey EH, Chaparro M. Congenital subependymal giant-cell astrocytoma: case report with prenatal ultrasonogram. Pediatr Radiol 1999 Oct;29(10):776-80.
(9) Phi JH, Park SH, Chae JH, Hong KH, Park SS, Kang JH, et al. Congenital subependymal giant cell astrocytoma: clinical considerations and expression of radial glial cell markers in giant
Life Science Journal 2013;10(1) http://www.lifesciencesite.com
1844
cells. Childs Nerv Syst 2008 Dec;24(12):1499-503.
(10) Sharma MC, Ralte AM, Gaekwad S, Santosh V, Shankar SK, Sarkar C. Subependymal giant cell astrocytoma--a clinicopathological study of 23 cases with special emphasis on histogenesis. Pathol Oncol Res 2004;10(4):219-24.
(11) O'Callaghan FJ, Martyn CN, Renowden S, Noakes M, Presdee D, Osborne JP. Subependymal nodules, giant cell astrocytomas and the tuberous sclerosis complex: a population-based study. Arch Dis Child 2008 Sep;93(9):751-4.
(12) Adriaensen ME, Schaefer-Prokop CM, Stijnen T, Duyndam DA, Zonnenberg BA, Prokop M. Prevalence of subependymal giant cell tumors in patients with tuberous sclerosis and a review of the literature. Eur J Neurol 2009 Jun;16(6):691-6.
(13) Chen H, Sun XF, Wu JS. [Clinicopathologic study of subependymal giant cell astrocytoma]. Zhonghua Bing Li Xue Za Zhi 2006 Nov;35(11):656-9.
(14) Beltran-Marin M, Riaguas-Almenara A, Mazas-Artasona LV, Vela-Marin A, Marin-Cardenas MA, Solanas-Alava S. [Central neurocytoma: findings from magnetic resonance imaging and computerised tomography]. Rev Neurol 2009 Oct 1;49(7):383-4.
(15) Buccoliero AM, Franchi A, Castiglione F, Gheri CF, Mussa F, Giordano F, et al. Subependymal giant cell astrocytoma (SEGA): Is it an astrocytoma? Morphological, immunohistochemical and ultrastructural study. Neuropathology 2009 Feb;29(1):25-30.
(16) Ess KC, Kamp CA, Tu BP, Gutmann DH. Developmental origin of subependymal giant cell astrocytoma in tuberous sclerosis complex. Neurology 2005 Apr 26;64(8):1446-9.
(17) Grajkowska W, Kotulska K, Jurkiewicz E, Roszkowski M, Daszkiewicz P, Jozwiak S, et al. Subependymal giant cell astrocytomas with atypical histological features mimicking malignant gliomas. Folia Neuropathol 2011;49(1):39-46.
(18) Sharma M, Ralte A, Arora R, Santosh V, Shankar SK, Sarkar C. Subependymal giant cell astrocytoma: a clinicopathological study of 23 cases with special emphasis on proliferative markers and expression of p53 and retinoblastoma gene proteins. Pathology 2004 Apr;36(2):139-44.
(19) Chow CW, Klug GL, Lewis EA. Subependymal giant-cell astrocytoma in children. An unusual discrepancy between histological and clinical features. J Neurosurg 1988 Jun;68(6):880-3.
(20) Shepherd CW, Scheithauer BW, Gomez MR, Altermatt HJ, Katzmann JA. Subependymal giant cell astrocytoma: a clinical, pathological, and flow cytometric study. Neurosurgery 1991 Jun;28(6):864-8.
(21) Kim SK, Wang KC, Cho BK, Jung HW, Lee YJ, Chung YS, et al. Biological behavior and tumorigenesis of subependymal giant cell astrocytomas. J Neurooncol 2001 May;52(3):217-25.
(22) Padmalatha C, Harruff RC, Ganick D, Hafez GB. Glioblastoma multiforme with tuberous sclerosis. Report of a case. Arch Pathol Lab Med 1980 Dec;104(12):649-50.
(23) Yamamoto K, Yamada K, Nakahara T, Ishihara A, Takaki S, Kochi M, et al. Rapid regrowth of solitary subependymal giant cell astrocytoma--case report. Neurol Med Chir (Tokyo) 2002 May;42(5):224-7.
(24) Murai N, Kaneko T. [Case of jugular foramen schwannoma associated with tuberous sclerosis]. No Shinkei Geka 2007 Oct;35(10):1007-11.
(25) Franz DN, Leonard J, Tudor C, Chuck G, Care M, Sethuraman G, et al. Rapamycin causes regression of astrocytomas in tuberous sclerosis complex. Ann Neurol 2006 Mar;59(3):490-8.
(26) Koenig MK, Butler IJ, Northrup H. Regression of subependymal giant cell astrocytoma with rapamycin in tuberous sclerosis complex. J Child Neurol 2008 Oct;23(10):1238-9.
(27) Curran MP. Everolimus: in patients with subependymal giant cell astrocytoma associated with tuberous sclerosis complex. Paediatr Drugs 2012 Feb 1;14(1):51-60.
(28) Tillema JM, Leach JL, Krueger DA, Franz DN. Everolimus alters white matter diffusion in tuberous sclerosis complex. Neurology 2012 Feb 21;78(8):526-31.
(29) Alvarado Y, Mita MM, Vemulapalli S, Mahalingam D, Mita AC. Clinical activity of mammalian target of rapamycin inhibitors in solid tumors. Target Oncol 2011 Jun;6(2):69-94.
(30) Campen CJ, Porter BE. Subependymal Giant Cell Astrocytoma (SEGA) Treatment Update. Curr Treat Options Neurol 2011 Aug;13(4):380-5.
1/22/2013

Life Science Journal 2013;10(1) http://www.lifesciencesite.com
http://www.lifesciencesite.com [email protected]
MitigationMitigationMitigationMitigation ofofofof CarbonCarbonCarbonCarbon DDDDioxideioxideioxideioxide EEEEmismismismisssssionsionsionsions inininin aaaa WarmingWarmingWarmingWarming SystemSystemSystemSystem forforforfor ChicksChicksChicksChicks bybybyby UsingUsingUsingUsing SolarSolarSolarSolar EnergyEnergyEnergyEnergy
Wei-Cheng Chen and Chung-Teh Sheng
Department of Bio-industrial Mechatronics Engineering National Chung Hsing University, TaichungTaiwan, R.O.C.
AbstractAbstractAbstractAbstract:::: Controlling the environmental temperature during in the incubation period of a poultry heater is ofpriority concern. In practice, the poultry heater of this warming system is operated by using a tungsten lighter,subsequently making it difficult to maintain the temperature for chicks between 30 and 32℃ for chicks and alsolowering the electronic-energy effect. Therefore, this study investigates the feasibility of using a highly effectivewarming system for chicks by using solar energy. A poultry heater structure is also developed for saving energy andensuring comfort of the chicks. When raising chicks, the warming system should function continuously for 1-4weeks, depending on the season. When water in the solar system has a fluidity of 5.7 kg/min and of 35-57℃, theproposed poultry heater is more effective than the tungsten lighter heater, saving around 148.6 Kg of carbon dioxideemissions for growth of approximately 1000 chicks.[Chen WC, Sheng CT. MitigationMitigationMitigationMitigation ofofofof CarbonCarbonCarbonCarbon DDDDioxideioxideioxideioxide EEEEmismismismisssssionsionsionsions inininin aaaa WarmingWarmingWarmingWarming SystemSystemSystemSystem forforforfor ChicksChicksChicksChicks bybybyby UsingUsingUsingUsingSolarSolarSolarSolar EnergyEnergyEnergyEnergy. Life Sci J 2013;10(1):1845-1850] (ISSN:1097-8135). http://www.lifesciencesite.com. 264
KeywordsKeywordsKeywordsKeywords:::: Solar energy; poultry heater; chicks warming system; carbon dioxide emmision.
1.1.1.1. IntroductionIntroductionIntroductionIntroductionGlobal environmental efforts highly prioritize
energy savings and carbon reduction. 97% of GHGemissions originate from fossil fuels (Mohammed etal., 2012). Based on data, carbon dioxide emissionsof 1 kg of petroleum gas, 1℃ of natural gas and 1 ofdiesel during burning are around 3.0 kg, 2.0 kg and2.7 kg, respectively. According to 1999 data of, theelectricity emission factor of power plants is about0.638 kg of carbon dioxide emissions for 1℃ ofelectricity. During hatching of chicks, thetemperature should remain constant, allowing for thechicks to stay warm. In practice, chicks are keptwarm by using two to three 60W lighter as the heatsource. Additionally, in Taiwan, chicks maygradually stop keeping warm for about one week inthe summer, two weeks in the spring and autumn, andthree or four weeks in the winter. According actualcircumstances, a change may be made to use of a120W tungsten lighter during the winter. Eachpoultry heater can accommodate about 150-200chicks. After hatching, the temperature reaches itsmaximum, and the time and temperature to keep thechicks warm should be decreased. Moreover, thepoultry heater system should function for anadditional two weeks. However, body temperature ofthe chicks can be controlled with them increment ofweight and the growth of feather gradually (Charles,1986; Deaton, 1995; Purswell et al., 2012). From anenergy waste perspective, each poultry heater thatuses a tungsten lighter costs an average of about50.4℃ of electricity for two weeks, subsequently
increasing 32 kg of carbon dioxide emissions in apower plant.
Located in a subtropical environment, Taiwanhas abundant sunlight, which is an environmentallyfriendly and inexhaustible natural energy source.Taiwan is thus highly attractive for developing solarenergy, greatly facilitating alternative energy andenvironmental protection efforts. For energy savingsand carbon reduction policies, solar energy canreplace a portion of the demand for animal husbandryin the manufacturing process (Daneshmand et al.,2012; Eman and Hegazy, 2011; Han et al., 2007;Huang et al., 2005; Lin and Lee, 2012). For instance,solar energy can be used to keep chicks warm. Byusing solar energy technology to supply many poultryheaters, this work presents a novel poultry heater tokeep chicks warm for the local poultry sector andachieve carbon reduction targets.
2.2.2.2. MaterialsMaterialsMaterialsMaterials andandandand MethodsMethodsMethodsMethods2.1.2.1.2.1.2.1. SolarSolarSolarSolar thermalthermalthermalthermal collectorscollectorscollectorscollectors
Figure 1 shows a commercial solar hot watersystem with high efficiency vacuum tube collectors.The vacuum tube collectors must be vacuumedbetween double transparent glass of inner and outerglass tubes. Vacuum degree must lower than 10-4mmHg, subsequently inhibiting air convection andconduction heat loss. The inner glass tube is coatedwith selective absorbing coating to ensure radiationheat loss. The absorptive effect of the current solarthermal collectors is higher than 93% (Kalogirou,2004). The current system with water pump forced

Life Science Journal 2013;10(1) http://www.lifesciencesite.com
http://www.lifesciencesite.com [email protected]
circulation possesses 18 vacuum tubes and the area is1.6 m2.
Figure 1. the solar thermal collectors
2.2.2.2.2.2.2.2. EfficiencyEfficiencyEfficiencyEfficiency ofofofof thethethethe solarsolarsolarsolar hothothothot waterwaterwaterwater systemsystemsystemsystemEfficiency of the solar hot water system can
be defined as the ratio of the heat absorbed capacityin the water-storage tank and solar-radiation ratio inthe collector board for a complete work day. Thesystem efficiency is described in formula 1.Additionally, based on the measurement data,efficiency of the collector can be calculated(Daneshmand et al., 2012; Huang and Du, 1991;Huang, 1993).
AcH t
T iT fc pM
I T
Qa⎟⎠⎞
⎜⎝⎛ −
=∑
∑=η
.
ΣQa: total heat absorption of a water-storage tank,MJ/ m2
ΣIT : total heat absorption of a solar collector,MJ/ m2
M : mass of water-storage tank,㎏Cp : specific heat of water, 4.184 kJ/㎏℃Ac : area of collector, m2
Ti : initial temperature of water in water-storagetank,℃Tf : final temperature of water in the water-storagetank℃Ht : total sunshine on solar collector, kJ/m2
2.3.2.3.2.3.2.3. ConstructingConstructingConstructingConstructing thethethethe loopsloopsloopsloops ofofofof solarsolarsolarsolar keepkeepkeepkeep warmwarmwarmwarmsystemsystemsystemsystem
The proposed solar hot-water systemattempts to provide a heater source in order to keep
chicks warm during their early growth. Figure 2illustrates those loops. Four loops and the function ofeach loop are described as follows.
Figure 2. the loops of solar keep warm system
Loop1: Loop 1 is the main circle of the solarenergy collection system. The hot water-storage tankfacilitates heat exchange and storage. This loop startsto operate when the temperature (T1) of the copperinside the solar collector is higher than 65℃, and T1is higher than the temperature (T2) in the hot water-storage tank water more than 5℃.
Loop2: For increasing the efficiency of thesolar energy collection system, loop 2 is designedwhen the heat exchange is no longer sufficient inloop 1 during the daytime. After passing through thepoultry heater, water can heat exchange with the solarcollector by passing loop 2, resulting in absorption ofmore solar heat. Loop 2 operates when loop 1 and/orloop 4 is inactive. It includes that fact thattemperature T1 is higher than return watertemperature T4 and/or temperature T3 of theadjusting tank in the poultry heater, which mustmaintain the temperature between 50℃ and 55℃.
Loop3: If the adjusting tank temperature islower than 50 ℃ , Loop 3 is forced to operate,especially OR particularly when loop 2 no longerfunctions and T2 is 5℃ higher than T3. Additionally,loop 3 stops when T3 is higher than 55℃.
Loop4: Loop 4 is a system that keeps chickswarm. The heat source of the poultry heater uses hotwater from the adjusting tank. Notably loop 2 stopsfunctioning when this loop 4 starts to perform.
2.4.2.4.2.4.2.4. ProposedProposedProposedProposed ppppoultryoultryoultryoultry heaterheaterheaterheaterThis work develops a poultry heater, whose
shape is similar to that of the traditional tungstenlighter system. As depicting in Figure 3., installedunder the poultry heater, a fin plate is embedded incopper tubes, subsequently causing the passage of hotwater. Additionally, above the fin plate, a fan isinstalled to force convection heat transfer with thebottom-up flow, subsequently forming a thermal

Life Science Journal 2013;10(1) http://www.lifesciencesite.com
http://www.lifesciencesite.com [email protected]
convection field. Moreover, to achieve heatconcentration and prevent heat loss, a deflector plateis established on the bottom edge of the proposedpoultry heater. Some parameters of the poultry heaterin the examination are described as follows.Maximum ventilation is 19.8 CMM; thermalconductivity of the fin plate is 237 W/m·K ° ;dissipation area is 3 m2; and heat convectioncoefficient is 20 W/m2·K°.
Figure 3. View of Poultry-heater structure
2.5.2.5.2.5.2.5. ExperimentalExperimentalExperimentalExperimental proceduresproceduresproceduresproceduresA circulating pump is established in the
solar collectors system, allowing for water to flowthrough the collector and exchange; hot water is thenstored in a hot water-storage tank. Temperature of thewater-storage tank is recorded by using the DataLogger record, and efficiency of the solar system iscalculated as well. When the temperature reaches55℃, water is automatically sent to the adjusting tank,subsequently providing a heat source of chicks tokeep them warm. To demonstrate the effectiveness ofthe proposed poultry heater, the experimentalconditions of the system to keep the chicks warm areproceeded with in low environmental temperatures(e.g., 15, 20 and 25℃), various water temperatures(e.g., 40, 50, 60 and 70℃), and various heights (e.g.,10, 15, 20, 25, 30, 35, 40 and 45cm). A thermocoupleis set at 10cm above the ground (i.e. similar to heightof the chicks). Data logger records the temperaturedistribution. Both measurements and simulations areobserved.
Reliability of the system to keep the chickswarm by using tungsten lighter is also examined torecord electric consumption for a group of chicksrequired. Meanwhile, electrical consumption of themotor transport in the current solar-energy system isalso recorded. Next, the two systems are comparedwith respect to the electrical consumptions. Theamount of CO2 emissions is calculated as well.
3.3.3.3. ResultsResultsResultsResults andandandand DiscussionsDiscussionsDiscussionsDiscussions3.1.3.1.3.1.3.1. EEEEfficiencyfficiencyfficiencyfficiency ofofofof solarsolarsolarsolar hothothothot waterwaterwaterwater systemsystemsystemsystem
Efficiency of the solar system was determinedat low surrounding temperatures of around 14.31℃
on January 1, 2011. Table 1 displays the temperatureand sunlight on an hourly basis. The flow rate ofwater through the solar collector is 5.7 kg/min, andthe maximum intensity of sunshine is 329 W/m2.After 115 liters of water were poured from thestorage tank through the collector to the heatexchange, Figure 4 displays the water temperature.The highest water temperature reached 57℃. From9:00 am to 16:00 pm, the initial temperature of waterTi was 41.22℃, and the final temperature Tf was51.89℃. The total sunshine Ht was 1620.2 W/m2.According to formula 1, the collection efficiency ofsolar hot water system was 51.5%. Figure 5 showsthe cooling rate of the water with the initialtemperatures of 40, 50, 60 and 70℃ without any heatsource. This figure reveals that the useful time ofwater in the storage tank with the temperatures of 40,50, 60 and 70℃ for maintaining the temperature of32℃ for chick growth was 90, 140, 145 and 155minutes, respectively.
Table 1. average temperature and sunlight
H o t W a te r -sto r a n g T a n kH o t W a te r -sto r a n g T a n kH o t W a te r -sto r a n g T a n kH o t W a te r -sto r a n g T a n k
3 5
4 0
4 5
5 0
5 5
6 0
16
:30
16
:30
16
:30
16
:30
17
:30
17
:30
17
:30
17
:30
18
:30
18
:30
18
:30
18
:30
19
:30
19
:30
19
:30
19
:30
20
:30
20
:30
20
:30
20
:30
21
:30
21
:30
21
:30
21
:30
22
:31
22
:31
22
:31
22
:31
23
:31
23
:31
23
:31
23
:31
00
:31
00
:31
00
:31
00
:31
01
:31
01
:31
01
:31
01
:31
02
:31
02
:31
02
:31
02
:31
03
:31
03
:31
03
:31
03
:31
04
:31
04
:31
04
:31
04
:31
05
:31
05
:31
05
:31
05
:31
06
:31
06
:31
06
:31
06
:31
07
:31
07
:31
07
:31
07
:31
08
:31
08
:31
08
:31
08
:31
09
:31
09
:31
09
:31
09
:31
10
:31
10
:31
10
:31
10
:31
11
:31
11
:31
11
:31
11
:31
12
:31
12
:31
12
:31
12
:31
13
:31
13
:31
13
:31
13
:31
14
:31
14
:31
14
:31
14
:31
15
:31
15
:31
15
:31
15
:31
16
:31
16
:31
16
:31
16
:31
T im eT im eT im eT im e
T e m p (T e m p (T e m p (T e m p (℃ ))))
T a n k T e m p e ra tu reT a n k T e m p e ra tu reT a n k T e m p e ra tu reT a n k T e m p e ra tu re
Figure 4. Temperature distribution of storage tank

Life Science Journal 2013;10(1) http://www.lifesciencesite.com
http://www.lifesciencesite.com [email protected]
The Situation of Tank Cooling(at environment 20℃)
25
30
35
40
45
50
55
60
65
70
75
00
:00
00
:20
00
:40
01
:00
01
:20
01
:40
02
:00
02
:20
02
:40
03
:00
03
:20
03
:40
04
:00
04
:20
04
:40
05
:00
05
:20
05
:40
Time
Water Temp.(Water Temp.(Water Temp.(Water Temp.(℃))))
initial water temperature 40℃
initial water temperature 50℃
initial water temperature 60℃
initial water temperature 70℃
Figure 5. The cooling rate of water without any heatsource
3.2.3.2.3.2.3.2. ExaminationExaminationExaminationExamination ofofofof poultrypoultrypoultrypoultry heaterheaterheaterheaterFigure 6 shows the region for the
temperature to keep the chicks warm at variousenvironmental temperatures (e.g., 15, 20 and 25℃ )and various poultry heater heights. According to thisfigure, a higher heat loss of thermal convection in thepoultry heater occurs at a higher environmentaltemperature, which is initially lower. For instance, awater temperature under 70℃ and a poultry heaterheight of 10cm, the heat loss with environmentaltemperatures at 15, 20 and 25℃ is 19.74℃, 17.19℃
and 14.84 ℃ , respectively. However, it is a non-linear curve. This figure also clearly reveals that theheight of the poultry heater may depend on the initialwater temperature and environmental temperature forthe region to keep the chicks warm region, which isset at 30-32 ℃ . This finding suggests that height ofthe poultry heater can be adjusted, allowing for aconstant temperature of the region to keep the chickswarm. For instance, on January 1, 2011, temperaturesoutdoor and those of the water storage tank are 17.4and 45 ℃ , respectively. Therefore, the optimumheight of poultry heater should be adjusted to around13 cm.
The temperature under the poultry heater isdetermined at different set heights in theexperimental process. Analysis results of thestatistical turnkey test analysis indicate an almostuniform temperature distribution under the poultryheater range and temperature (center ± 45cm, insideor outside of the poultry heater). Additionally, insidethe poultry heater (center ± 30cm), the temperature
can remain in the range of 30-34℃. However,
analysis results indicate a significant difference underthe poultry heater within and outside the range.Moreover, according to turnkey test analysis results
the P value is 0.827 <0.05. This finding suggests thatthe poultry heater can supply a uniform temperaturefor chicks to keep warm. As for 150-200 chicks, thepoultry heater range (60cm) should be sufficient forchicks activity, yet not outside the scope. Figure 7shows the temperature distribution under the poultryheater. Temperatures of the outdoor and water
storage tank are 17.4 and 45℃, respectively. Figure
7(1) shows the computer simulated figures, whileFigure 7(2) shows the experimental measurements.
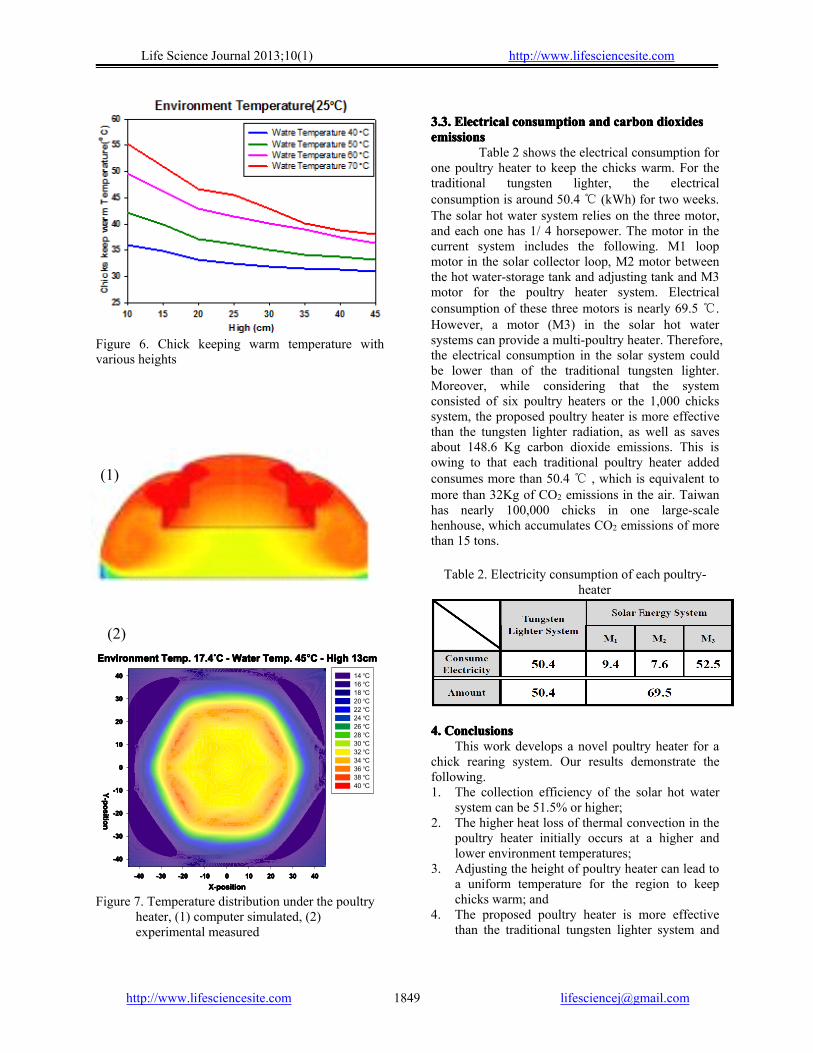
Life Science Journal 2013;10(1) http://www.lifesciencesite.com
http://www.lifesciencesite.com [email protected]
Figure 6. Chick keeping warm temperature withvarious heights
Environment Temp. 17.4Environment Temp. 17.4Environment Temp. 17.4Environment Temp. 17.4ooooC - Water Temp. 45C - Water Temp. 45C - Water Temp. 45C - Water Temp. 45ooooC - High 13cmC - High 13cmC - High 13cmC - High 13cm
X-positionX-positionX-positionX-position-40-40-40-40 -30-30-30-30 -20-20-20-20 -10-10-10-10 0000 10101010 20202020 30303030 40404040
Y-positionY-positionY-positionY-position
-40-40-40-40
-30-30-30-30
-20-20-20-20
-10-10-10-10
0000
10101010
20202020
30303030
40404040 14 oC16 oC18 oC20 oC22 oC24 oC26 oC28 oC30 oC32 oC34 oC36 oC38 oC40 oC
Figure 7. Temperature distribution under the poultryheater, (1) computer simulated, (2)experimental measured
3.3.3.3.3.3.3.3. ElectricalElectricalElectricalElectrical consumconsumconsumconsumptionptionptionption andandandand carboncarboncarboncarbon dioxidesdioxidesdioxidesdioxidesemissionsemissionsemissionsemissions
Table 2 shows the electrical consumption forone poultry heater to keep the chicks warm. For thetraditional tungsten lighter, the electricalconsumption is around 50.4 ℃ (kWh) for two weeks.The solar hot water system relies on the three motor,and each one has 1/ 4 horsepower. The motor in thecurrent system includes the following. M1 loopmotor in the solar collector loop, M2 motor betweenthe hot water-storage tank and adjusting tank and M3motor for the poultry heater system. Electricalconsumption of these three motors is nearly 69.5 ℃.However, a motor (M3) in the solar hot watersystems can provide a multi-poultry heater. Therefore,the electrical consumption in the solar system couldbe lower than of the traditional tungsten lighter.Moreover, while considering that the systemconsisted of six poultry heaters or the 1,000 chickssystem, the proposed poultry heater is more effectivethan the tungsten lighter radiation, as well as savesabout 148.6 Kg carbon dioxide emissions. This isowing to that each traditional poultry heater addedconsumes more than 50.4 ℃ , which is equivalent tomore than 32Kg of CO2 emissions in the air. Taiwanhas nearly 100,000 chicks in one large-scalehenhouse, which accumulates CO2 emissions of morethan 15 tons.
Table 2. Electricity consumption of each poultry-heater
4.4.4.4. CCCConclusionsonclusionsonclusionsonclusionsThis work develops a novel poultry heater for a
chick rearing system. Our results demonstrate thefollowing.1. The collection efficiency of the solar hot water
system can be 51.5% or higher;2. The higher heat loss of thermal convection in the
poultry heater initially occurs at a higher andlower environment temperatures;
3. Adjusting the height of poultry heater can lead toa uniform temperature for the region to keepchicks warm; and
4. The proposed poultry heater is more effectivethan the traditional tungsten lighter system and
(1)
(2)
Life Science Journal 2013;10(1) http://www.lifesciencesite.com
http://www.lifesciencesite.com [email protected]
saves about 148.6 Kg of carbon dioxideemissions for a 1,000 chicks system.We recommend that future research examine
the total amount of GHG when using the traditionalpoultry heater, by using electricity, natural gas anddiesel or the proposed solar energy system.
Acknowledgements:Acknowledgements:Acknowledgements:Acknowledgements:This work was financially supported by
Agriculture and Food Agency, Council of Agriculture,the henhouse, Department of Animal Science ofNCHU.
CorrespondingCorrespondingCorrespondingCorresponding Author:Author:Author:Author:Wei-Cheng ChenDepartment of Bio-industrial MechatronicsEngineeringNational Chung Hsing University, TaichungTaiwan, R.O.C.E-mail: [email protected]
ReferencesReferencesReferencesReferences1. Charles DR. Temperature for broilers. World’s
Poult. Sci J 1986;42:249-258.2. Daneshmand S, Mortaji A, Mortaji Z.
Investigation and Design Seawater Desalinationwith Solar Energy. Life Sci J 2012;9(3):770-773.
3. Deaton JW, Environmental factors involved ingrowth and development. In: Hunton, P. (Ed.),Poultry Production. Elsevier Science,Wageningen, The Netherlands, 1995;119-138.
4. Eman M, Hegazy A. Effect of Powder andEssential Oil of Lemon grass on AflatoxinsProduction in Dried Water Melon Seed, Life SciJ 2011;8(3):516-522.
5. Han LT, Su QY, Chen H, Wu MG, Xie J, Xia CF. Tech-economic comparison between domesticsolar water heater and solar water heatingsystems. Renewable Energy Resources2007;25(4):49-52.
6. Huang BJ, Du SC. A performance test method ofsolar ther-mosyphon systems. Transactions ofthe ASME Solar Energy Engineering1991;113:172–179.
7. Huang BJ. Performance rating method of ther-mosyphon solar water heaters. Solar Energy1993;59(5):435-440.
8. Huang KD, Tzeng SC, Ma WP, Wu MF.Intelligent Solar-Powered Automobile-ventilation System. Applied Energy2005;80(2):141-154.
9. Kalogirou SA, Solar Thermal Collectors andApplications. Progress in Energy andCombustion Science 2004;30(3):231-295.
10. Lin YH, Lee SL. An Novel Approach for theAssembly of Bio-nanocapsules by DetonationProcess. Life Sci J 2012;9(3):171-174.
11. Mohammed KZ, Hammdy A, Abdel-wahab NA.Temperature Effect on Corrosion Inhibition ofCarbon Steel in Formation Water by Non-ionicInhibitor and Synergistic Influence of HalideIons. Life Sci J 2012;9(2):424-434.
12. Purswell L, Lott BD, Dozier WA, Roush WB,Branton SL. Assessing Thermal Comfort ofBroiler Chicks. International Journal of PoultryScience 2008;7(3):202-206.
1/8/2013
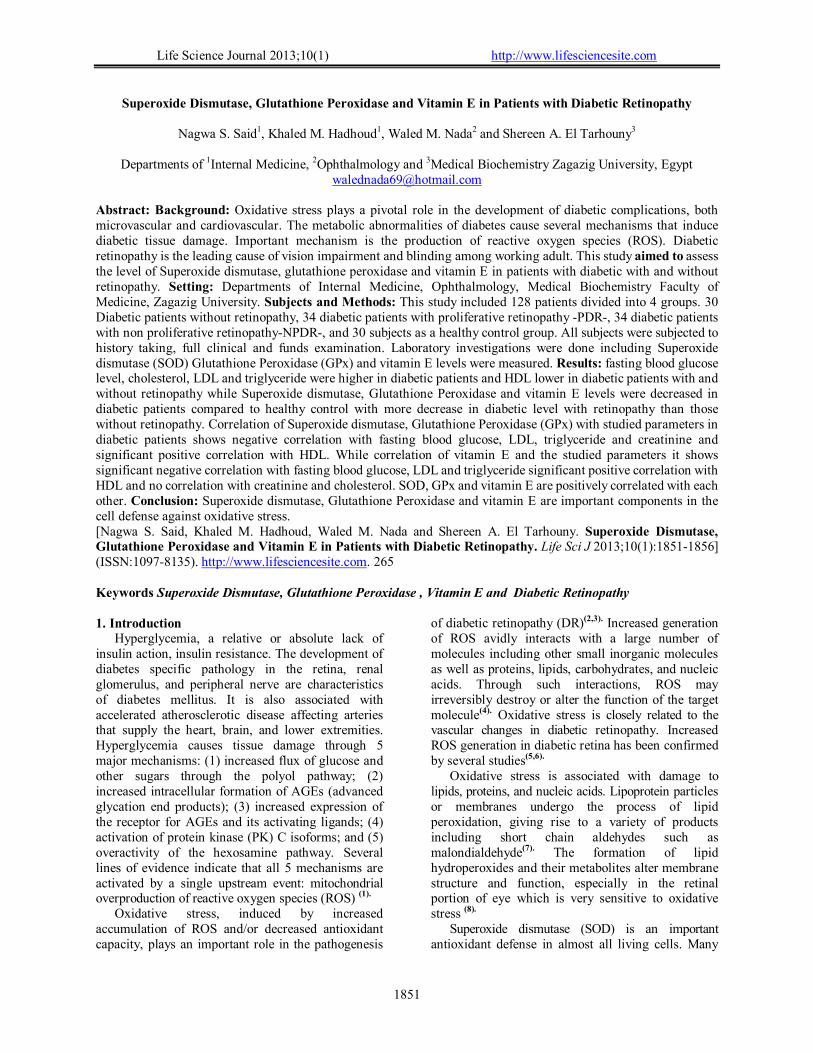
Life Science Journal 2013;10(1) http://www.lifesciencesite.com
1851
Superoxide Dismutase, Glutathione Peroxidase and Vitamin E in Patients with Diabetic Retinopathy
Nagwa S. Said1, Khaled M. Hadhoud1, Waled M. Nada2 and Shereen A. El Tarhouny3
Departments of 1Internal Medicine, 2Ophthalmology and 3Medical Biochemistry Zagazig University, Egypt
Abstract: Background: Oxidative stress plays a pivotal role in the development of diabetic complications, both microvascular and cardiovascular. The metabolic abnormalities of diabetes cause several mechanisms that induce diabetic tissue damage. Important mechanism is the production of reactive oxygen species (ROS). Diabetic retinopathy is the leading cause of vision impairment and blinding among working adult. This study aimed to assess the level of Superoxide dismutase, glutathione peroxidase and vitamin E in patients with diabetic with and without retinopathy. Setting: Departments of Internal Medicine, Ophthalmology, Medical Biochemistry Faculty of Medicine, Zagazig University. Subjects and Methods: This study included 128 patients divided into 4 groups. 30 Diabetic patients without retinopathy, 34 diabetic patients with proliferative retinopathy -PDR-, 34 diabetic patients with non proliferative retinopathy-NPDR-, and 30 subjects as a healthy control group. All subjects were subjected to history taking, full clinical and funds examination. Laboratory investigations were done including Superoxide dismutase (SOD) Glutathione Peroxidase (GPx) and vitamin E levels were measured. Results: fasting blood glucose level, cholesterol, LDL and triglyceride were higher in diabetic patients and HDL lower in diabetic patients with and without retinopathy while Superoxide dismutase, Glutathione Peroxidase and vitamin E levels were decreased in diabetic patients compared to healthy control with more decrease in diabetic level with retinopathy than those without retinopathy. Correlation of Superoxide dismutase, Glutathione Peroxidase (GPx) with studied parameters in diabetic patients shows negative correlation with fasting blood glucose, LDL, triglyceride and creatinine and significant positive correlation with HDL. While correlation of vitamin E and the studied parameters it shows significant negative correlation with fasting blood glucose, LDL and triglyceride significant positive correlation with HDL and no correlation with creatinine and cholesterol. SOD, GPx and vitamin E are positively correlated with each other. Conclusion: Superoxide dismutase, Glutathione Peroxidase and vitamin E are important components in the cell defense against oxidative stress. [Nagwa S. Said, Khaled M. Hadhoud, Waled M. Nada and Shereen A. El Tarhouny. Superoxide Dismutase, Glutathione Peroxidase and Vitamin E in Patients with Diabetic Retinopathy. Life Sci J 2013;10(1):1851-1856] (ISSN:1097-8135). http://www.lifesciencesite.com. 265 Keywords Superoxide Dismutase, Glutathione Peroxidase , Vitamin E and Diabetic Retinopathy 1. Introduction
Hyperglycemia, a relative or absolute lack of insulin action, insulin resistance. The development of diabetes specific pathology in the retina, renal glomerulus, and peripheral nerve are characteristics of diabetes mellitus. It is also associated with accelerated atherosclerotic disease affecting arteries that supply the heart, brain, and lower extremities. Hyperglycemia causes tissue damage through 5 major mechanisms: (1) increased flux of glucose and other sugars through the polyol pathway; (2) increased intracellular formation of AGEs (advanced glycation end products); (3) increased expression of the receptor for AGEs and its activating ligands; (4) activation of protein kinase (PK) C isoforms; and (5) overactivity of the hexosamine pathway. Several lines of evidence indicate that all 5 mechanisms are activated by a single upstream event: mitochondrial overproduction of reactive oxygen species (ROS) (1).
Oxidative stress, induced by increased accumulation of ROS and/or decreased antioxidant capacity, plays an important role in the pathogenesis
of diabetic retinopathy (DR)(2,3). Increased generation of ROS avidly interacts with a large number of molecules including other small inorganic molecules as well as proteins, lipids, carbohydrates, and nucleic acids. Through such interactions, ROS may irreversibly destroy or alter the function of the target molecule(4). Oxidative stress is closely related to the vascular changes in diabetic retinopathy. Increased ROS generation in diabetic retina has been confirmed by several studies(5,6).
Oxidative stress is associated with damage to lipids, proteins, and nucleic acids. Lipoprotein particles or membranes undergo the process of lipid peroxidation, giving rise to a variety of products including short chain aldehydes such as malondialdehyde(7). The formation of lipid hydroperoxides and their metabolites alter membrane structure and function, especially in the retinal portion of eye which is very sensitive to oxidative stress (8).
Superoxide dismutase (SOD) is an important antioxidant defense in almost all living cells. Many
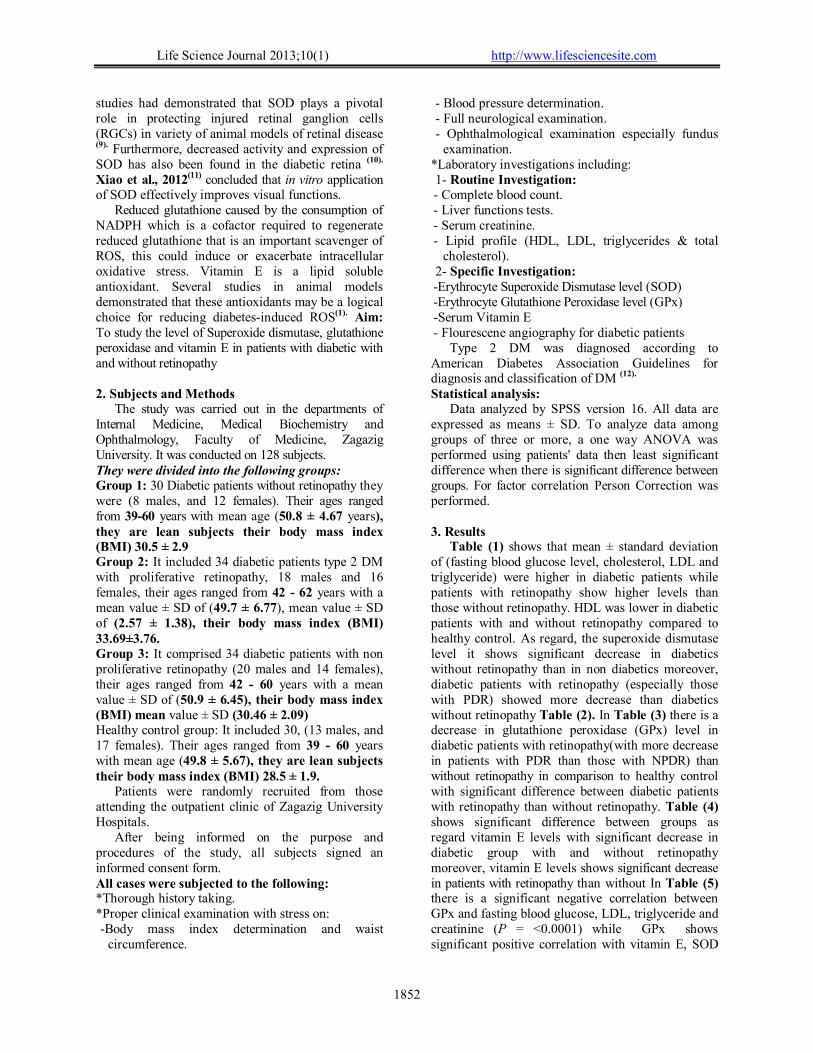
Life Science Journal 2013;10(1) http://www.lifesciencesite.com
1852
studies had demonstrated that SOD plays a pivotal role in protecting injured retinal ganglion cells (RGCs) in variety of animal models of retinal disease (9). Furthermore, decreased activity and expression of SOD has also been found in the diabetic retina (10). Xiao et al., 2012(11) concluded that in vitro application of SOD effectively improves visual functions.
Reduced glutathione caused by the consumption of NADPH which is a cofactor required to regenerate reduced glutathione that is an important scavenger of ROS, this could induce or exacerbate intracellular oxidative stress. Vitamin E is a lipid soluble antioxidant. Several studies in animal models demonstrated that these antioxidants may be a logical choice for reducing diabetes-induced ROS(1). Aim: To study the level of Superoxide dismutase, glutathione peroxidase and vitamin E in patients with diabetic with and without retinopathy 2. Subjects and Methods
The study was carried out in the departments of Internal Medicine, Medical Biochemistry and Ophthalmology, Faculty of Medicine, Zagazig University. It was conducted on 128 subjects. They were divided into the following groups: Group 1: 30 Diabetic patients without retinopathy they were (8 males, and 12 females). Their ages ranged from 39-60 years with mean age (50.8 ± 4.67 years), they are lean subjects their body mass index (BMI) 30.5 ± 2.9 Group 2: It included 34 diabetic patients type 2 DM with proliferative retinopathy, 18 males and 16 females, their ages ranged from 42 - 62 years with a mean value ± SD of (49.7 ± 6.77), mean value ± SD of (2.57 ± 1.38), their body mass index (BMI) 33.69±3.76. Group 3: It comprised 34 diabetic patients with non proliferative retinopathy (20 males and 14 females), their ages ranged from 42 - 60 years with a mean value ± SD of (50.9 ± 6.45), their body mass index (BMI) mean value ± SD (30.46 ± 2.09) Healthy control group: It included 30, (13 males, and 17 females). Their ages ranged from 39 - 60 years with mean age (49.8 ± 5.67), they are lean subjects their body mass index (BMI) 28.5 ± 1.9.
Patients were randomly recruited from those attending the outpatient clinic of Zagazig University Hospitals.
After being informed on the purpose and procedures of the study, all subjects signed an informed consent form. All cases were subjected to the following: *Thorough history taking. *Proper clinical examination with stress on: -Body mass index determination and waist
circumference.
- Blood pressure determination. - Full neurological examination. - Ophthalmological examination especially fundus
examination. *Laboratory investigations including: 1- Routine Investigation: - Complete blood count. - Liver functions tests. - Serum creatinine. - Lipid profile (HDL, LDL, triglycerides & total
cholesterol). 2- Specific Investigation: -Erythrocyte Superoxide Dismutase level (SOD) -Erythrocyte Glutathione Peroxidase level (GPx) -Serum Vitamin E - Flourescene angiography for diabetic patients
Type 2 DM was diagnosed according to American Diabetes Association Guidelines for diagnosis and classification of DM (12). Statistical analysis:
Data analyzed by SPSS version 16. All data are expressed as means ± SD. To analyze data among groups of three or more, a one way ANOVA was performed using patients' data then least significant difference when there is significant difference between groups. For factor correlation Person Correction was performed. 3. Results
Table (1) shows that mean ± standard deviation of (fasting blood glucose level, cholesterol, LDL and triglyceride) were higher in diabetic patients while patients with retinopathy show higher levels than those without retinopathy. HDL was lower in diabetic patients with and without retinopathy compared to healthy control. As regard, the superoxide dismutase level it shows significant decrease in diabetics without retinopathy than in non diabetics moreover, diabetic patients with retinopathy (especially those with PDR) showed more decrease than diabetics without retinopathy Table (2). In Table (3) there is a decrease in glutathione peroxidase (GPx) level in diabetic patients with retinopathy(with more decrease in patients with PDR than those with NPDR) than without retinopathy in comparison to healthy control with significant difference between diabetic patients with retinopathy than without retinopathy. Table (4) shows significant difference between groups as regard vitamin E levels with significant decrease in diabetic group with and without retinopathy moreover, vitamin E levels shows significant decrease in patients with retinopathy than without In Table (5) there is a significant negative correlation between GPx and fasting blood glucose, LDL, triglyceride and creatinine (P = <0.0001) while GPx shows significant positive correlation with vitamin E, SOD
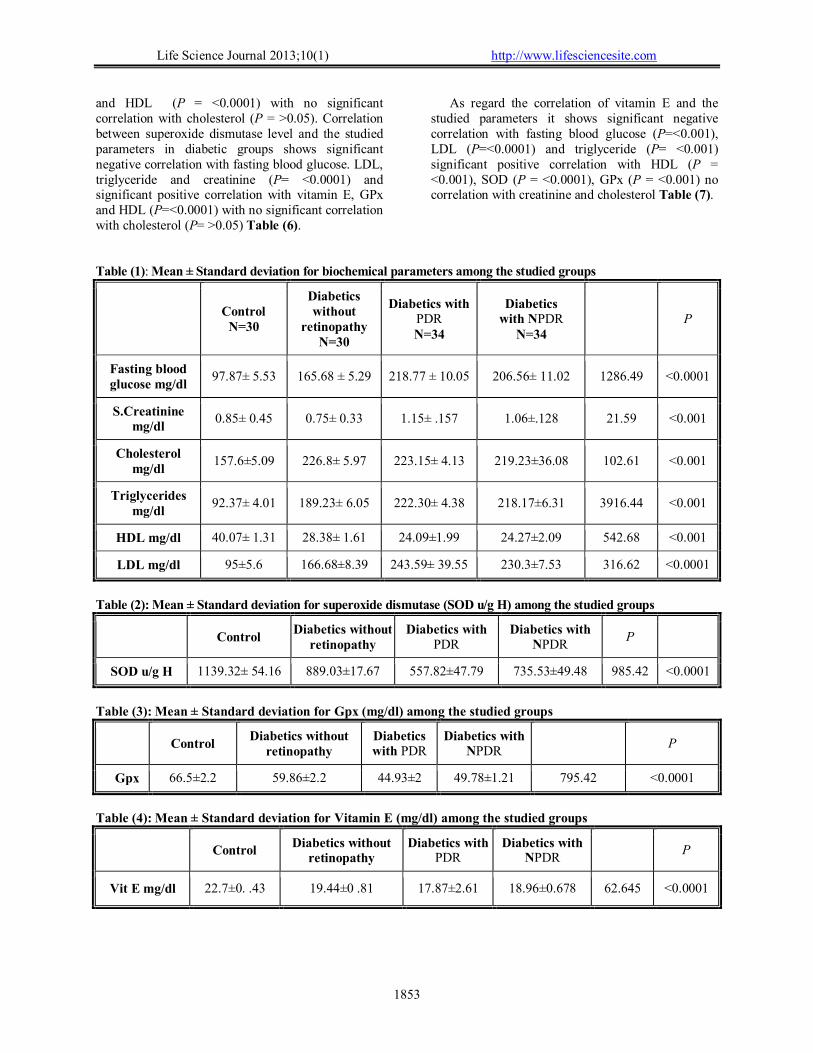
Life Science Journal 2013;10(1) http://www.lifesciencesite.com
1853
and HDL (P = <0.0001) with no significant correlation with cholesterol (P = >0.05). Correlation between superoxide dismutase level and the studied parameters in diabetic groups shows significant negative correlation with fasting blood glucose. LDL, triglyceride and creatinine (P= <0.0001) and significant positive correlation with vitamin E, GPx and HDL (P=<0.0001) with no significant correlation with cholesterol (P= >0.05) Table (6).
As regard the correlation of vitamin E and the studied parameters it shows significant negative correlation with fasting blood glucose (P=<0.001), LDL (P=<0.0001) and triglyceride (P= <0.001) significant positive correlation with HDL (P = <0.001), SOD (P = <0.0001), GPx (P = <0.001) no correlation with creatinine and cholesterol Table (7).
Table (1): Mean ± Standard deviation for biochemical parameters among the studied groups
Control
N=30
Diabetics without
retinopathy N=30
Diabetics with PDR N=34
Diabetics with NPDR
N=34 P
Fasting blood glucose mg/dl
97.87± 5.53 165.68 ± 5.29 218.77 ± 10.05 206.56± 11.02 1286.49 <0.0001
S.Creatinine mg/dl
0.85± 0.45 0.75± 0.33 1.15± .157 1.06±.128 21.59 <0.001
Cholesterol mg/dl
157.6±5.09 226.8± 5.97 223.15± 4.13 219.23±36.08 102.61 <0.001
Triglycerides mg/dl
92.37± 4.01 189.23± 6.05 222.30± 4.38 218.17±6.31 3916.44 <0.001
HDL mg/dl 40.07± 1.31 28.38± 1.61 24.09±1.99 24.27±2.09 542.68 <0.001
LDL mg/dl 95±5.6 166.68±8.39 243.59± 39.55 230.3±7.53 316.62 <0.0001
Table (2): Mean ± Standard deviation for superoxide dismutase (SOD u/g H) among the studied groups
Control
Diabetics without retinopathy
Diabetics with PDR
Diabetics with NPDR
P
SOD u/g H 1139.32± 54.16 889.03±17.67 557.82±47.79 735.53±49.48 985.42 <0.0001
Table (3): Mean ± Standard deviation for Gpx (mg/dl) among the studied groups
Control
Diabetics without retinopathy
Diabetics with PDR
Diabetics with NPDR
P
Gpx 66.5±2.2 59.86±2.2 44.93±2 49.78±1.21 795.42 <0.0001
Table (4): Mean ± Standard deviation for Vitamin E (mg/dl) among the studied groups
Control Diabetics without
retinopathy Diabetics with
PDR Diabetics with
NPDR P
Vit E mg/dl 22.7±0. .43 19.44±0 .81 17.87±2.61 18.96±0.678 62.645 <0.0001

Life Science Journal 2013;10(1) http://www.lifesciencesite.com
1854
Table (5): Correlation of Glutathione peroxidase with the studied parameters in diabetic groups
r P FBG -0.781 <0.0001 LDL -0.786 <0.0001 HDL 0.696 <0.0001 S.Cr -0.793 <0.0001 S.Cr -0.51 <0.0001 SOD 0.900 <0.0001 Vit E 0.336 <0. 001 Cholesterol .043 >0.05
Table (6): Correlation of Superoxide Dismutase with the studied parameters in diabetic groups
r P FBG -0.754 <0.0001 LDL -0.733 <0.0001 HDL 0.664 <0.0001 trig -0.730 <0.0001 S.Cr -0.452 <0.0001 GPx 0.900 <0.0001 Vit E 0.444 <0.0001 Cholesterol -0.004 >0.001
Table (7): Correlation of Vitamin E with the studied parameters in diabetic groups
r P FBG -.317 <0.001 LDL -.487 <0.0001 HDL .339 <0.001 trig -.323 <0.001 S.Cr -.121 >0.05 GPx 0.336 <0. 001 SOD 0.444 <0.0001 Cholesterol -.046 >0.05
4. Discussion
Diabetic retinopathy is the most common micro- vascular complication of diabetes and the leading cause of vision impairment and blinding among working adult. The number of people worldwide at risk of vision loss from diabetes is predicted to double in the next 30 years so it is imperative to develop better means to identify prevent and treat retinopathy in its earliest stages rather than wait for the onset of vision threatening lesions(13).
Early detection of retinopathy in individuals with diabetes is critical in preventing vision loss. The control of diabetes associated metabolic abnormalities (hyperglycemia, hyperlipemia) play an important role(14).
Many researchers Memisogullari et al.,(15) and Turk et al.(16) have studied the comparison of
antioxidant enzymes level in diabetic and non diabetic patients. This study aimed to evaluate the level of erythrocytes superoxide dismutase, glutathione peroxidase and vitamin E in diabetic patients with and without retinopathy. In this study fasting blood glucose level, cholesterol, LDL and triglyceride were higher in diabetic patients and HDL lower in diabetic patients with and without retinopathy than healthy control while patients with retinopathy show higher levels than those without retinopathy.
Similar results were reported by others(17). Chronic hyperglycemia, as well ashyperlipidemia contributes to the pathogenesis of diabetic retinopathy by initiating vascular disruptions through several biochemical mechanisms. High concentrations of glucose leads to an elevation of intracellular sorbitol concentrations with the enzymatic activity of aldose reductase, which cause osmotic damage to vascular cells. Also, high blood glucose leads to the formation of advanced glycation end products (AGEs) which cause vascular disruptions (18).
Oxidative stress is increased in the retina in diabetes; this is mainly due to an imbalance between increased generation of free radicals and impaired antioxidant protective mechanisms. The retina is the neurosensorial tissue of the eye and is extremely rich in polyunsaturated lipids membranes. This feature makes it especially sensitive to oxygen and nitrogen activated species and lipid peroxidation(19). Antioxidants are substances that neutralize free radicals or their actions. Each cell is armed with adequate protective mechanisms against any harmful effects of free radicals. Superoxide dismutase (SOD), glutathione peroxidase (GPx), glutathione reductase are buffering systems in every cell. Also, vitamin E is an essential nutrient which functions as a chain-breaking antioxidant which prevents the propagation of free radical reactions in all cell membranes in the human body. Vitamin E is also part of the protecting mechanism(20).
The present study showed that the erythrocyte SOD level was significantly lower in diabetic patient without retinopathy and diabetic patients with retinopathy either PDR or NPDR when compared to healthy control group. Moreover, the diabetic group with retinopathy shows more significant decrease than diabetic group without retinopathy. Also, PDR group shows significant decrease in comparison to NPDR group.
SOD is an endogenously produced intracellular enzyme that plays a key role in defending the cell against oxygen free radicals toxicity by accelerating the dismutation of the toxic superoxide radical, produced during oxidative energy processes, to hydrogen peroxide and molecular oxygen (21). The

Life Science Journal 2013;10(1) http://www.lifesciencesite.com
1855
decrease of SOD activity in diabetic retinopathy might be attributed to; (1) Hyperglycemia activates various biochemical pathways such as glucose autooxidation, nonenzymatic glycation of proteins and activation of protein kinase C, which, in turn, overproduce oxidants like superoxide and hydroxyl radicals as well as hydrogen peroxide; (2) The increase of glycosylated SOD that leads to the inactivation of this enzyme; and (3) Loss of its two factors Zn and Cu which act as cofactors for the antioxidant defence system. They not only constitute the active sites and/or stabilize the conformation of several antioxidant enzymes, but they also compete for iron and copper binding sites and can provide protection against transition metal- mediated and free radical-induced injury (16).
Gupta et al., (20) proved that the level of SOD was significantly decreased in patients with diabetic retinopathy. Moreover, superoxide anion plays an important role in the determination of its level and products of membrane lipid peroxidation. Other oxidants like H2O2 may react with SOD resulting in oxidative modification thereby causing loss of its activity.
Regarding erythrocyte GPx level, it was significantly lower in diabetic patients without retinopathy and diabetic patients with retinopathy either PDR or NPDR and when compared to healthy control group. Moreover, the diabetic group with retinopathy shows more significant decrease than diabetic group without retinopathy. Also, PDR group shows significant decrease in comparison to NPDR group.
These results are in agreement with Colak et al., (22) who attributed the decrease of GPx activity in diabetic patients with complications to the effect of protein glycosylation. However, they found that in diabetic group without complications, the increase of glucose concentration is followed by higher GPx activity as a positive response.
Kumar et al., (23) found that the decreased GPx activity in diabetic patients with microvascular complications could be due to decreased activity of SOD, which is required for scavenging superoxide radicals, leading to their increase and by turn inhibition of GPx. However, Gupta et al., (20) found significant increase in erythrocyte activity of GPx in the later part of the disease. GPx is a selenium (Se) dependent enzyme and any alterations in the tissue levels of selenium would alter GPx activity. Insulin deficiency promotes oxidation of fatty acids with resulting increase in H2O2 formation. Thus with increase in the lipid peroxide levels, the paradoxical increase in the levels of GPx could be a compensatory mechanism by the body to prevent tissue damage.
Regarding vitamin E level, it was found to be significantly lower in diabetic patients without retinopathy and diabetic patients with retinopathy either PDR or NPDR and when compared to healthy control group. Moreover, the diabetic group with retinopathy shows more significant decrease than diabetic group without retinopathy. However, there was no significant difference between PDR and NPDR groups.
Similar results were found by Gupta et al., (20), Ahmed (8), and Van Reyk et al., (24). All proved that vitamin E is an important component of cell defense against oxidative stress. Its level is decreased in diabetics and more so in diabetic retinopathy. There is strong evidence that antioxidant therapy with vitamin E might normalizes diabetic retinal hemodynamics, known to be affected in preclinical retinopathy and therefore might be important therapeutically in altering the course of diabetic retinopathy.
The antioxidant function of vitamin E is to prevent the peroxidation of membrane phospholipids and avoids cell membrane damage. It is a single oxygen quencher, neutralizing these highly reactive and unstable singlet oxygen molecules..Vitamin E is a lipid phase chain breaking antioxidant, it reacts more rapidly than polyunsaturated fatty acids with peroxyl radicals and hence act to break the chain reaction of lipid peroxidation(25).
The present study showed positive correlation between SOD level and GPx, vit E and HDL and negative correlation between SOD level and fasting blood glucose, creatinine, triglycerides, and LDL and non significant correlation between SOD level and cholesterol There was positive correlation between GPx level and SOD, HDL and vit E and negative correlation between GPx level and fasting blood glucose, creatinine, triglycerides, and LDL and non significant correlation between GPx level and. cholesterol
There was positive correlation between vit E level and SOD, GPx, and HDL and negative correlation between vit E level and fasting blood glucose, LDL and triglycerides and non significant correlation between vit E level and creatinine, cholesterol.
These correlations can confirm the hypothesis that hyperglycemia, hypercholesterolemia and hyperlipidemia lead to generation of oxidative stress and by turn diminished antioxidant protective enzymes such as SOD, GPx, and vit E(26, 20).
Results of this study indicate that ROS in diabetes mellitus are increasing over the time course of the disease and might contribute to the development of diabetic retinopathy. Antioxidant as a protective mechanism might not always be able to compensate for increased oxidation stress. This may be a reason
Life Science Journal 2013;10(1) http://www.lifesciencesite.com
1856
for divergent results obtained in various studies. Further work is needed to confirm whether there is an association between antioxidant nutrient intake and reduction in the development of diabetic complications particularly retinopathy. References 1- Giacco and Brownlee: Oxidative Stress and
Diabetic Complications Circ Res. 2010; 107:1058-1070.
2- Baynes JW () Role of oxidative stress in development of complications in diabetes. Diabetes 1991; 40: 405–412.
3- Du Y, Miller CM, Kern TS: Hyperglycemia increases mitochondrial superoxide in retina and retinal cells. Free Radic Biol Med 2003; 35: 1491–1499.
4- Bedard K, Lardy B, Krause KH NOX family NADPH oxidases: not just in mammals. Biochimie 2007; 89(9): 1107–12.
5- Cheung AK, Fung MK, Lo AC, Lam TT, So KF, et al.: Aldose reductase deficiency prevents diabetes-induced blood–retinal barrier breakdown, apoptosis, and glial reactivation in the retina of db/db mice. Diabetes 2005; 54: 3119–3125.
6- Li J, Wang J, Qiang Yu, Kai Q, Chen K, et al.: Inhibition of reactive oxygen species by Lovastatin downregulates vascular endothelial growth factor expression and ameliorates blood-retinal barrier breakdown in db/db mice: role of NADPH oxidase 4. Diabetes 2010: 59: 1528–38.
7- Young IS and Woodside JV: Antioxidants in health and disease. J.Clin. Pathol 2001;54;176-186.
8- Ahmed R.G: The physiological and biochemical effects of diabetes on the balance between oxidative stress and antioxidant defense system. Med J of Islamic World Acad of Sci. 2005;15:1,31-42.
9- Qi X, Lewin AS, Hauswirth WW, Guy J: Optic neuropathy induced by reductions in mitochondrial superoxide dismutase. Invest Ophthalmol Vis Sci 2003; 44(3): 1088–96.
10- Li W, Yanoff Jian B, He Z: Altered mRNA levels of antioxidant enzymes in pre-apoptotic pericytes from human diabetic retinas. Cell Mol Biol 1999;45:59–66.
11- Xiao C, He M, Nan Y, Zhang D, Chen B, et al. Physiological Effects of Superoxide Dismutase on Altered Visual Function of Retinal Ganglion Cells in db/db Mice. PLoS ONE 2012; 7(1): e30343.
12- American Diabetes Association (ADA): Standards of Medical Care in Diabetes 2012 Diabetes Care ; 2012:35:S11-S 63.
13- Antonetti D, Barber A, Bronson S, Freeman W, Gardener T, Jefferson L, et al. Diabetic retinopathy: Seeing beyond glucose-induced
microvascular disease. Diabetes 2006; 55(9):2401–11. 149.
14- Diabetes Control and Complications Trial Research Group. The effect of intensive treatment of diabetes on the development and progression of long-term complications in insulin-dependent diabetes mellitus. N Engl J Med. 1993;329: 977–86.
15- Memisogullar R, Taysi S, Bakan E: Antioxidant status and lipid peroxidation in type 2 diabetes mellitus. Ell Biochem Funct;2003;21:291-396.
16- Turk HM, Sevine A,Camei C,Savli H: Plasma lipid peroxidation products and antioxidant activities in patients with type 2 diabetes mellitus. Act Diabetol 2002; 39:117-122.
17- Abou-SeifMA: Evaluation of some biochemical changes in diabetic patients. Clin Chim Acta, 2004; 16; 346(2): 161-70.
18- Wautier JL, Guillausseau PJ: Advanced glycation end products, their receptors and diabetic angiopathy. Diabetes Metab 2001; 27:535-542.
19- Miranda M, Muriach M, Roma J, Genoves JM, Barcia J: Oxidative stress in a model of experimental diabetic retinopathy. Arch Soc Esp Oftalmol 2006; 81(l):27-32.
20- Gupta MM and Chari S: Lipid peroxidation and antioxidant status in patients with diabetic retinopathy. Indian J Physiol Pharmacol. 2005; 49(2): 187-192.
21- Friedman JS., Rebel VI., Derby R. and Burakoff.: Absence of mitochondrial superoxide dismutase results in a hemolytic anemia responsive to therapy with a catalytic antioxidant. J. Exp. Med. 2001;193: 925.
22- Colak E, Stankovic S, Dordevic P, Lalic K (): The effect of hyperglycemia on the values of antioxidative parameters in type 2 diabetic patients. Jugoslov Med Biochem 2006; 25 (2): 173.
23- Kumar RS, Anthrayose CV, Iyer KV, Vimala B, Shashidhar S: Lipid peroxidation and diabetic retinopathy. Indian J Med Sci 2001;55 (3): 133- 8.
24- Van Reyk DM, Gillies MC, Davies MJ: The retina: oxidative stress and diabetes. Redox Rep 2003; 8(4): 187-92.
25- Devasagayam TPA, Tilak JC, Boloor KK, Sane K, Lele RD: Free radicals and antioxidants in human health. Current status and future prospects. JAPI. 2004; vol 52.
26- Fong D.S, Lioyd P.Aiello, Frederick L.Ferris, and Ronald Klein: Diabetic retinopathy. Diabetes care 2004; 27:2540-2553.
11/23/2012
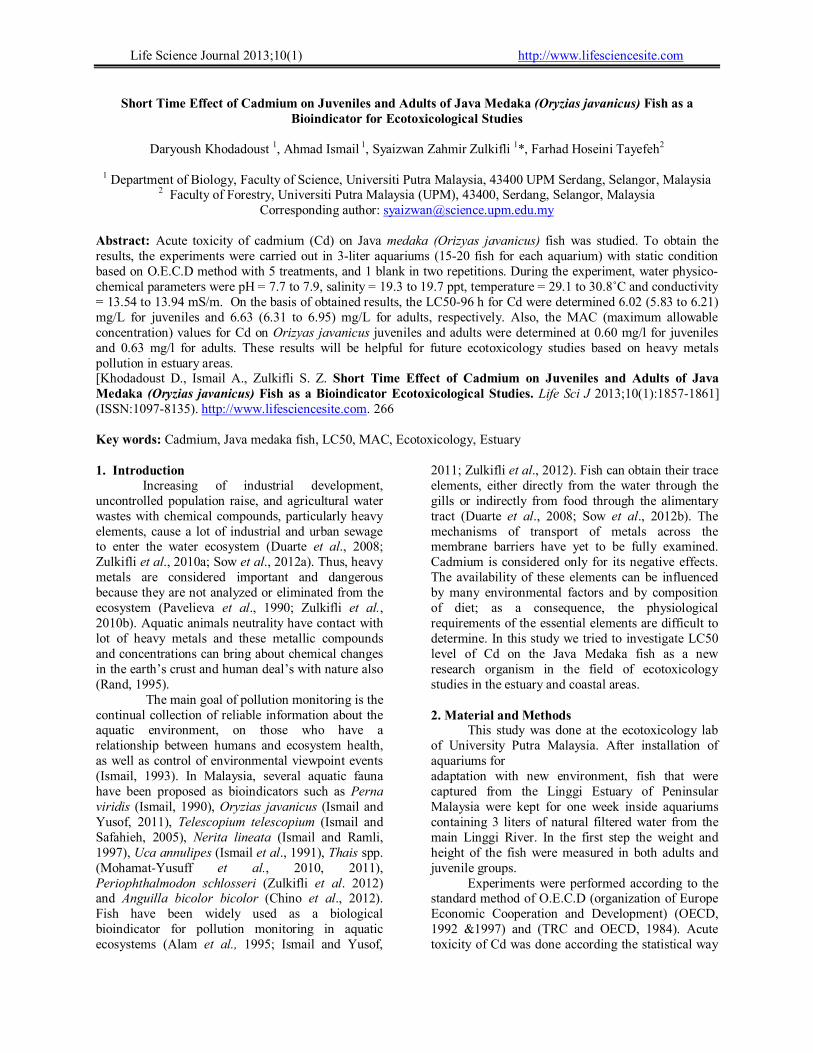
Life Science Journal 2013;10(1) http://www.lifesciencesite.com
Short Time Effect of Cadmium on Juveniles and Adults of Java Medaka (Oryzias javanicus) Fish as a Bioindicator for Ecotoxicological Studies
Daryoush Khodadoust 1, Ahmad Ismail 1, Syaizwan Zahmir Zulkifli 1*, Farhad Hoseini Tayefeh2
1 Department of Biology, Faculty of Science, Universiti Putra Malaysia, 43400 UPM Serdang, Selangor, Malaysia 2 Faculty of Forestry, Universiti Putra Malaysia (UPM), 43400, Serdang, Selangor, Malaysia
Corresponding author: [email protected]
Abstract: Acute toxicity of cadmium (Cd) on Java medaka (Orizyas javanicus) fish was studied. To obtain the results, the experiments were carried out in 3-liter aquariums (15-20 fish for each aquarium) with static condition based on O.E.C.D method with 5 treatments, and 1 blank in two repetitions. During the experiment, water physico-chemical parameters were pH = 7.7 to 7.9, salinity = 19.3 to 19.7 ppt, temperature = 29.1 to 30.8˚C and conductivity = 13.54 to 13.94 mS/m. On the basis of obtained results, the LC50-96 h for Cd were determined 6.02 (5.83 to 6.21) mg/L for juveniles and 6.63 (6.31 to 6.95) mg/L for adults, respectively. Also, the MAC (maximum allowable concentration) values for Cd on Orizyas javanicus juveniles and adults were determined at 0.60 mg/l for juveniles and 0.63 mg/l for adults. These results will be helpful for future ecotoxicology studies based on heavy metals pollution in estuary areas. [Khodadoust D., Ismail A., Zulkifli S. Z. Short Time Effect of Cadmium on Juveniles and Adults of Java Medaka (Oryzias javanicus) Fish as a Bioindicator Ecotoxicological Studies. Life Sci J 2013;10(1):1857-1861] (ISSN:1097-8135). http://www.lifesciencesite.com. 266 Key words: Cadmium, Java medaka fish, LC50, MAC, Ecotoxicology, Estuary 1. Introduction Increasing of industrial development, uncontrolled population raise, and agricultural water wastes with chemical compounds, particularly heavy elements, cause a lot of industrial and urban sewage to enter the water ecosystem (Duarte et al., 2008; Zulkifli et al., 2010a; Sow et al., 2012a). Thus, heavy metals are considered important and dangerous because they are not analyzed or eliminated from the ecosystem (Pavelieva et al., 1990; Zulkifli et al., 2010b). Aquatic animals neutrality have contact with lot of heavy metals and these metallic compounds and concentrations can bring about chemical changes in the earth’s crust and human deal’s with nature also (Rand, 1995). The main goal of pollution monitoring is the continual collection of reliable information about the aquatic environment, on those who have a relationship between humans and ecosystem health, as well as control of environmental viewpoint events (Ismail, 1993). In Malaysia, several aquatic fauna have been proposed as bioindicators such as Perna viridis (Ismail, 1990), Oryzias javanicus (Ismail and Yusof, 2011), Telescopium telescopium (Ismail and Safahieh, 2005), Nerita lineata (Ismail and Ramli, 1997), Uca annulipes (Ismail et al., 1991), Thais spp. (Mohamat-Yusuff et al., 2010, 2011), Periophthalmodon schlosseri (Zulkifli et al. 2012) and Anguilla bicolor bicolor (Chino et al., 2012). Fish have been widely used as a biological bioindicator for pollution monitoring in aquatic ecosystems (Alam et al., 1995; Ismail and Yusof,
2011; Zulkifli et al., 2012). Fish can obtain their trace elements, either directly from the water through the gills or indirectly from food through the alimentary tract (Duarte et al., 2008; Sow et al., 2012b). The mechanisms of transport of metals across the membrane barriers have yet to be fully examined. Cadmium is considered only for its negative effects. The availability of these elements can be influenced by many environmental factors and by composition of diet; as a consequence, the physiological requirements of the essential elements are difficult to determine. In this study we tried to investigate LC50 level of Cd on the Java Medaka fish as a new research organism in the field of ecotoxicology studies in the estuary and coastal areas. 2. Material and Methods This study was done at the ecotoxicology lab of University Putra Malaysia. After installation of aquariums for adaptation with new environment, fish that were captured from the Linggi Estuary of Peninsular Malaysia were kept for one week inside aquariums containing 3 liters of natural filtered water from the main Linggi River. In the first step the weight and height of the fish were measured in both adults and juvenile groups. Experiments were performed according to the standard method of O.E.C.D (organization of Europe Economic Cooperation and Development) (OECD, 1992 &1997) and (TRC and OECD, 1984). Acute toxicity of Cd was done according the statistical way
Life Science Journal 2013;10(1) http://www.lifesciencesite.com
http://www.lifesciencesite.com [email protected] 1858
on the fishes over four days (96hours). Amount of motility was recorded every 24 hours over 96 hours. The fish were divided into groups of 15-20 fish (depending on fish age) and placed in aquariums, each containing three liters Linggi Estuary water and exposed to different concentrations of metal. Mean of weights and heights of fish and concentrations of metal are shown in Table 2. Every experiment for every age was done twice and Cd was ordered in five concentrations. There was one aquarium without any concentration of any metal as a control group. Every 24 hours, the aquariums were evaluated and the mortality recorded every day at the same time over 96 hours. (Tables 3a & 3b). In the experiment period the fish were not fed and physic-chemical parameters such as temperature, pH and dissolved O₂ were measured also (Table 1). Behaviors and positions of the fish were recorded and dead fish were immediately removed from the aquarium. After 4 days and on completion of the first experiment, water of the aquariums was emptied and the aquariums washed using salty water and double dissolved water prepared for the second experiment. After repeating the experiment various results were recorded, including the amount of LC50 Cd in 48 and 96 hours, determined by using Probit statistical analysis method (Finney, 1990), with attention on the metals concentrations used and recorded for motility amounts (Table 4). 3. Results According to the said method, the acute toxicity test (LC50) was done followed by the recording of fish mortality in metal concentration at different times (every 24 hours). Meanwhile, for greater focus and less error, the top test was done in two repeats and the results were found to be almost similar in both experiments (Table 2). In the end, results were analyzed using SPSS package and Probit Analysis method (Table 4). Fish behaviors at different times of the experiment were observed and recorded: when they were excited and showed unusual stir, unnatural discharge on the skin and body, and slow movement to relatively complete stop (dying in the continuous position). Maximum Allowable Toxicant Concentration (MATC) was determined with attention to LC50 amounts also (TRC and OECD, 1984). Maximum allowable toxicant concentration is the concentration that has no negative effect on fish in the experiment period. Amounts of NOEC and LOEC were determined in this study with attention to LC50 amounts also. NOEC or No Observed Effect
Concentration in a toxicity experiment is the maximum concentration of a substance that has no statistical effect on the population of samples when compared with the control group. LOEC or Lowest Observed Effect Concentration in a toxicity experiment is the least concentration of substance that has no statistical effect on the population of samples when compared with the control group. The maximum allowable toxicity concentration is higher than the lowest observed effect concentration and is lower than no observed effect concentration also (NOEC <MATC <LOEC). According to the results of the acute toxicity test of cadmium on the adults and juveniles of Java Medaka fish, the amount of lethal concentration of Cd in the 4 days (96 hours) for 50% of the fish were 6.63 for adults and 0.60 for juveniles respectively. In comparing results between adults and juveniles it was observed that there was no high difference of Cd amounts between 96 hours results in adults and juveniles, meaning this metal (Cd) is a toxic and killer for both adult and juveniles in low concentration and at same levels. Fish exposed to Cd did not show any unnatural signals but after a while they showed a state of restlessness, unbalanced and fast swimming. Then they skin color took on certain brightness, with mucus on the skin increased while curvature of the spine and gill hyperemia was noticed in some of fish. Results of researches about acute toxicity test effects on fish indicate that some fresh water and marine fish are comparable to Java Medaka in terms of acute toxicity test results. Researches about Cd show that LC50-96h this metal for Common Carp is 2.84 and 4.55 mg/L respectively for juveniles and adults (Ramesha et al., 1996), for Trout fish and Salmon were 0.32 and 3.11 mg/L respectively (Mance, 1987) and for finger height fish of Phytofag and Amor respectively were 0.721 and 1.04 mg/L. Also LC50 of Cd for juveniles of Rohu (Labeo rohita) were 89.5 mg/L (Dutta et al., 2001) and 2.5 mg/L for Flag fish (Sphar., 1996). In comparing LC50 of Cd in the above species with Java Medaka fish, the position of Java Medaka fish is: Rohu < Java Medaka (Adult) < Java Medaka (Juvenile) < Common Carp < Salmon < Flagfish < Amor < Phytofag < Trut fish Small fish like Killifish and Medaka fish have been suitable models for ecotoxicology studies in different researches (Inoue and Takei, 2002). In another study, it was reported that LC50-96h, 4-chlorophenol, zinc, hexavalent chromium and residue chlorine were from 3.0 to 4.1, from 12.4 to 14.7, 7.4 and 0.05 mg/L respectively (Koyama et al., 2008).

Life Science Journal 2013;10(1) http://www.lifesciencesite.com
http://www.lifesciencesite.com [email protected] 1859
Table1 – Data range of physico-chemical parameters in treatment aquaria Parameter Salinity (ppt) pH Temperature (°C) Conductivity (mS/m) O2(mg/L)
Mean 19.3 – 19.7 7.7– 7.9 29.1 – 30.8 13.54-13.94 6.7-6.9
Table2: Mean of weight and height and Cd concentrations in adults and juveniles of O. javanicus
Juveniles Adults Number of fish 15 10
Mean of length 1.4±0.3 cm 2.8±0.3 cm Mean of weight 0.099±0.03 g 0.213±0.05 g
Range of heavy metal concentration 1-15 mg/L 1-15 mg/L
Table 3a: Number of dead O. javanicus adults in the 4 days for Cd in two repeats
Cd (I) time
Control 1(mg/L) 3.5(mg/L) 7(mg/L) 11(mg/L) 15(mg/L)
24 0 0 0 0 0 1
48 0 0 2 1 2 2 72 0 0 0 0 8 7
96 0 3 2 4 - - Cd (II)
time Control 1(mg/L) 3.5(mg/L) 7(mg/L) 11(mg/L) 15(mg/L)
24 0 0 0 0 0 1 48 0 0 1 1 3 4
72 1 2 2 1 7 5 96 0 1 2 3 1 -
Table 3b: Number of dead O. javanicus juveniles in the 4 days for Cd in two repeats.
Cd (I) time
Control 1(mg/L) 3.5(mg/L) 7(mg/L) 11(mg/L) 15(mg/L)
24 0 0 0 0 4 3
48 0 0 1 2 4 6 72 0 2 3 2 7 6 96 1 3 2 4 - -
Cd II) time
Control 1(mg/L) 3.5(mg/L) 7(mg/L) 11(mg/L) 15(mg/L)
24 0 0 0 0 3 4 48 0 1 2 3 5 7 72 0 2 3 2 7 4
96 0 2 3 3 - -
Table 4:LC50 Results of Cd for adults and juveniles of O. javanicus in two repeats
Java Medaka did not show higher sensitivity for chemicals than fresh water fish (Koyama et al., 2008). It is also reported that LC50-48h on one type of killifish named Fundulus heteroclitus for Zn, Cu and Cd were determined at 96.5, 44.4 and 19.0 mg/L respectively (Burton et al., 1990).
Subject Probit Line
Estimate of log (LC50)
Estimate of LC50 (mg/L)
SE of log (LC50)
95% c.l. for Log (LC50)
95% c.l. for LC50
Cd.48h Adult-1
Y = 2.0011 X + 2.8161
1.09 13.34 0.13 0.88, 1.85 7.61, 71.77
Cd.48h Adult-2
Y = 1.2923 X + 3.5146
1.15 13.90 0.21 0.84, 2.49 7.00, 68.7
Cd.96h Adult-1
Y= 1.3463X + 3.8659
0.84 6.96 0.15 0.52, 1.35 3.11, 16.6
Cd.96h Adult-2
Y= 1.4322 + 3.8537
0.80 6.32 0.14 0.49, 1.22 3.11, 16.6
Cd.48h Juvenile-1
Y = 2.6305 X + 2.1629
1.08 11.98 0.10 0.91 , 1.51 8.21, 32.86
Cd.48h Juvenile-2
Y = 1.2923 X + 3.5146
1.15 13.11 0.21 0.85, 2.50 7.02, 53.7
Cd.96h Juvenile-1
Y = 1.5307 X + 3.8276
0.77 5.83 0.13 0.47, 1.14 2.96, 13.7
Cd.96h Juvenile-2
Y = 1.4888 X + 3.8182
0.79 6.22 0.14 0.50, 1.22 3.14, 16.5

Life Science Journal 2013;10(1) http://www.lifesciencesite.com
http://www.lifesciencesite.com [email protected] 1860
One of the most important events of environmental pollution depends on heavy metals and industrial discharges, which are important contributing source of pollutants in the ecosystems (Imai et al., 2005). The use of bioindicator is proven to be very useful. To obtain quick information on ecotoxicology, short-term tests are more useful than long-term tests. These tests are used to determine total toxicity of solutions when there is no information about their toxicity levels. Moreover to assess different organisms’ answers to toxicity tests, knowing the different positions of some parameters such as temperature and pH is necessary. 4. Conclusion An amount of LC50 is a useful criterion for acute toxicity but it is not a representative amount of pollutants substances in aquatic habitats. Content of waste materials that are not toxic in 96 hours, will be harmful in the longer run inside a water habitat, thus LC96h may be seen only in some parts of long-term toxicity. According to these study results, the indications are that Java Medaka fish is a suitable species for ecotoxicological study and it is introduced as an important fish in the toxicity tests because it is easy to grow under laboratory conditions. Additionally, this fish can be useful for testing the endocrine effect of chemicals in long-term as well as all period of life. Acknowledgements
This study was jointly supported by the Research University Grant Scheme, RUGS (03-01-11-1155RU) awarded by Universiti Putra Malaysia, the Fundamental Research Grant Scheme, FRGS (Project No.: FRGS/1/11/ST/UPM/02/12), the Exploratory Research Grant Scheme, ERGS (Project No.: ERGS/1-2012/5527109) awarded by the Ministry of Higher Education, Malaysia, and the Japan Society for Promotion of Science (Asian CORE Program). Corresponding Author: Dr. Syaizwan Zahmir Zulkifli Department of Biology, Faculty of Science, Universiti Putra Malaysia, 43400 UPM Serdang, Selangor, Malaysia. E-mail: [email protected] References 1. Alam, M. K., Maughan O. E. 1995. Acute toxicity
of heavy metals to common carp (Cyprinus carpio); Journal of Environmental Science and Health A 30(8): 1807-1816.
2. Burton D. T., Fisher, D. J. 1990. Acute toxicity of
cadmium, copper, zinc, ammonia, 3, 3 ′ -dichlorobenzidine, 2, 6-dichloro-4-nitroaniline,
methylene chloride, and 2, 4, 6-trichlorophenol to juvenile grass shrimp and killifish. Bulletin of Environmental Contamination and Toxicology 44(5): 776-783.
3. Chino, N., Arai, T., Zulkifli, S. Z., Ismail, A. (2012). Notes on the occurrence of the tropical eel Anguilla bicolor bicolor in Peninsular Malaysia, Malaysia. Journal of Fish Biology 80(3): 692-697.
4. Duarte R. M., Menezes A. C., da Silveira Rodrigues L., de Almeida-Val V. M., Val A. L. 2008. Copper sensivity of wild ornamental fish of Amazon. Ecotoxicology and Environmental Safety 72(3): 693-698.
5. Dutta T. K., Kaviraj A. 2001. Acute toxicity of cadmium to fish Labeo rohita and copepod Diaptomus forbesi pre-exposed to CaO and KMnO4. Chemosphere 42(8): 955-958.
6. Finney D. J. 1971. Probit Analysis. London: Cambridge University Press.
7. Inoue K., Takei Y. 2002. Diverse adaptability in Oryzias species to high environmental salinity. Zoological Science 19(7): 727-734.
8. Imai S., Koyama J., Fujii, K. 2005. Effects of 17β-estradiol on the reproduction of Java-medaka (Oryzias javanicus), a new test fish species. Marine Pollution Bulletin 51(8): 708-714.
9. Ismail A. 1990. Heavy metals Pb, Cu, Cd and Zn in green mussel and catfish from Port Dickson coastal area. IRPA/UKM Workshop on Heavy metals I. Frazer Hill. 25-28 November 1990.
10. Ismail, A. 1993. Heavy metal concentrations in sediments off Bintulu, Malaysia. Marine Pollution Bulletin 27(12): 706-707.
11. Ismail A., Badri M. A., Ramlan M. N. 1991. Heavy metal contamination in fiddler crabs (Uca annulipes) and hermit crabs (Clibanarius sp.) in a coastal area of northern Peninsular Malaysia. Environmental technology 12(10): 923-926.
12. Ismail A., Ramli R. 1997. Trace metals in sediments and molluscs from an estuary receiving pig farms effluent. Environmental Technology 18:509-515.
13. Ismail A., Safahieh A. 2005. Copper and zinc in intertidal surface sediment and Telescopium telescopium from Lukut River, Malaysia. Coastal Marine Science 29:111-115.
14. Ismail, A., Yusof, S. 2011. Effect of mercury and cadmium on early life stages of Java medaka (Oryzias javanicus): A potential tropical test fish. Marine Pollution Bulletin 63(5): 347-349.
15. Khodadoust D., Ismail A., Zulkifli S. Z. 2012. Application of Java Medaka (Oryzias javanicus) fish and surface sediments to assess Cd and Cu contamination in Linggi Estuary, Malaysia. Acta Biologica Malaysiana 1(2): 46-54.
Life Science Journal 2013;10(1) http://www.lifesciencesite.com
http://www.lifesciencesite.com [email protected] 1861
16. Koyama J., Kawamata M., Imai S., Fukunaga M., Uno S., Kakuno A. 2008. Java medaka: A proposed new marine test fish for ecotoxicology. Environmental Toxicology 23(4), 487-491.
17. Mance G. 1987. Pollution threat of heavy metals in aquatic environments. New York: Elsevier Science Pub. Co. Inc.
18. Mohamat-Yusuff F., Zulkifli S. Z., Ismail A., Harino H., Yusoff M. K., Arai T. 2010. Imposex in Thais gradata as a biomarker for TBT contamination on the southern coast of Peninsular Malaysia. Water, Air & Soil Pollution 211(1): 443-457.
19. Mohamat-Yusuff F., Zulkifli S. Z., Ismail A. 2011. Imposex study in Thais tuberosa from port and non-port areas along the west coast of Peninsular Malaysia. Journal of Tropical Marine Ecosystem 2: 1-9.
20. OECD. 1992. Fish, acute toxicity test (TG203). In: OECD Guideline for Testing of Chemicals. Paris: Organisation for Economic Cooperation and Development. pp 170-178.
21. OECD. 1997. Detailed review paper on aquatic testing methods from pesticides and industrial chemicals. Series on Testing and Assessment. Paris: Organisation for Economic Cooperation and Development.
22. Paveliva L. G., Zimakov I. Y., Komarova A. V.,
Golik, Y. M. 1990. Some aspects of the impact of
anthropogenic pollution on fishes of the Volga
Caspian Basin. In: V. P. Ivanov 2000. Biological
Resources of the Caspian Sea (pp. 45-50).
Astrakhan; KaspNIRKH Publication.
23. Ramesha, A. M., Guptha, T. R. C., Katti, R. J., Gowda, G., Lingdhal, C. 1996. Toxicity of
cadmium to common carp Cyprinus carpio (Linn.). Environment and Ecology 14 (2): 329-333.
24. Rand G. M. 1995. Fundamentals of aquatic toxicology: Effects, environmental fate, and risk assessment. Second edition. Washington: Taylor & Francis.
25. Sow A. Y., Ismail A, Zulkifli S. Z. 2012a. Heavy metals uptake by Asian swamp eel, Monopterus albus from paddy fields of Kelantan, Peninsular Malaysia: Preliminary study. Tropical Life Sciences Research 23(2): 27-38.
26. Sow A. Y., Ismail A., Zulkifli S. Z. 2012b. Copper and Zinc Speciation in Soils from Paddy Cultivation Areas in Kelantan, Malaysia. Acta Biologica Malaysiana 1(1): 26-35.
27. TRC and OECD. (1984). Guideline for Testing of Chemical Section 2, Effects on biotic systems; pp: 1-39.
28. Zulkifli S. Z., Mohamat-Yusuff F., Arai T., Ismail A., Miyazaki N. 2010a. An assessment of selected trace elements in intertidal sediments collected from the Peninsular Malaysia. Environmental Monitoring and Assessment 169 (1-4): 457-472.
29. Zulkifli S. Z., Ismail A., Mohamat-Yusuff F., Arai T., Miyazaki N. 2010b. Johor Strait as a hotspot for trace elements contamination in Peninsular Malaysia. Bulletin of Environmental Contamination and Toxicology 84(5): 568-573.
30. Zulkifli S. Z., Mohamat-Yusuff F., Ismail A., Miyazaki N. 2012. Food preference of the giant mudskipper Periophthalmodon schlosseri (Teleostei: Gobiidae). Knowledge and Management of Aquatic Ecosystems 405: art. no. 07. (doi: 10.1051/kmae/2012013).
11/29/2012
Life Science Journal 2013;10(1) http://www.lifesciencesite.com
1862
Influence of Different Additives on Cold Recycled Mixes at Environmental Conditions of Pakistan
Kamran Muzaffar Khan1, Shiraz Ahmed2 , Faizan Ali2 , Tahir Sultan3 , Kiffayat ullah4
1. Associate Professor, Civil Engineering Department, UET Taxila, Pakistan 2. Research Associate, Civil Engineering Department, UET Taxila, Pakistan
3. Lecturer, Civil Engineering Department, BZU Multan, Pakistan 4. Professor, Iqra University Peshawar, Pakistan
[email protected] Abstract: As with the passage of time, natural resources become extinct. Different recycling techniques are being developed for the use of recycled materials. Reclaimed asphalt pavement materials (RAP) have been used in cold in place recycled pavements worldwide from early nineties. The performance of CIPR technique varies in different zones of the world and up till now its mix design is under development stage. This research work is done to evaluate the behavior of CIPR mixes using different additives keeping in view the local conditions of Pakistan. For this purpose resilient modulus and static creep test has been performed on Marshall Samples of CIPR mixes using UTM-5P with foam and emulsified bitumen as additives. It was concluded that samples with foam bitumen showed more structural adequacy as compare to emulsified bitumen samples at various temperatures and loading frequencies according to Pakistani traffic conditions. [Khan K M , Ahmed S , Ali F , Sultan T , Kiffayat Ullah. Influence of Different Additives on Cold Recycled Mixes at Environmental Conditions of Pakistan. Life Sci J 2013;10(1):1862-1868] (ISSN:1097-8135). http://www.lifesciencesite.com. 267 Key words: CIPR, Foam bitumen, emulsified bitumen, RAP. 1. Introduction
Road Transportation system is one of the key components of the economic and social development process, often absorbing a high proportion of national budget. Pakistan, with more than 180 million people, has a reasonably developed transport infrastructure. Road transport is the backbone of Pakistan's transport system.
The current road density of Pakistan is 0.32 Km/Sq.Km with total road network of 260,000 Km (Both high and low type). It is much less even from regional standards; the road density of India is approximately 1.00. The maximum value of road density is considered of Japan, which are approximately 3.07. (Pakistan Economic Survey, 2009-10). Pakistan is endeavoring hard to double its road density, which is possible if maintenance and rehabilitation expenditure is controlled to an acceptable limit.
NHA has been experimenting new maintenance and rehabilitation techniques, including hot and cold recycling, to meet the demands of growing road network with scarce resources. Funds requirement for annual maintenance (2009-10) of highways is approximately Rs. 18.961 billion: Rs. 13.774 Billion are required for rehabilitation and periodic maintenance (structural and functional overlay), and about Rs. 5.187 billion for routine maintenance, highway safety, and other maintenance schemes. But NHA has resources of only Rs. 13 Billion for FY 2009-10. It is foreseen by the authority
that a maintenance backlog would be created in 1 – 3 years’ time if additional funding is not provided. It is an alarming situation for the developing country (NHA, AMP 2009-10).
Construction materials preservation, environment friendly construction, speedy and cost effective rehabilitation alternatives are the requirements of current age. Road roughness and condition surveys on NHA network have revealed that conventional methods of maintenance and rehabilitation could not perform up to the mark in the past due to several reasons; especially labour factor (Human) for patch works and quality control issues associated with bitman and even with pre-mix asphalt overlays in the small rehabilitation stretches far-off from the Asphalt Plant. In contrary, by adopting new techniques of asphalt pavement recycling, particularly cold in place recycling, a quality controlled final product is achieved using latest equipment i.e. Cold Recycler along with recycling train.
Cold in-place recycling (CIR) has become an attractive and popular method in the developed countries for rehabilitating asphalt roads that have good subgrade support and are suffering distress related to non-structural aging and cracking of the pavement layer. However, CIR pavement performance remains somewhat unpredictable. It has been observed in most parts of the world that roads recycled under similar weather and construction conditions perform very differently for no clear
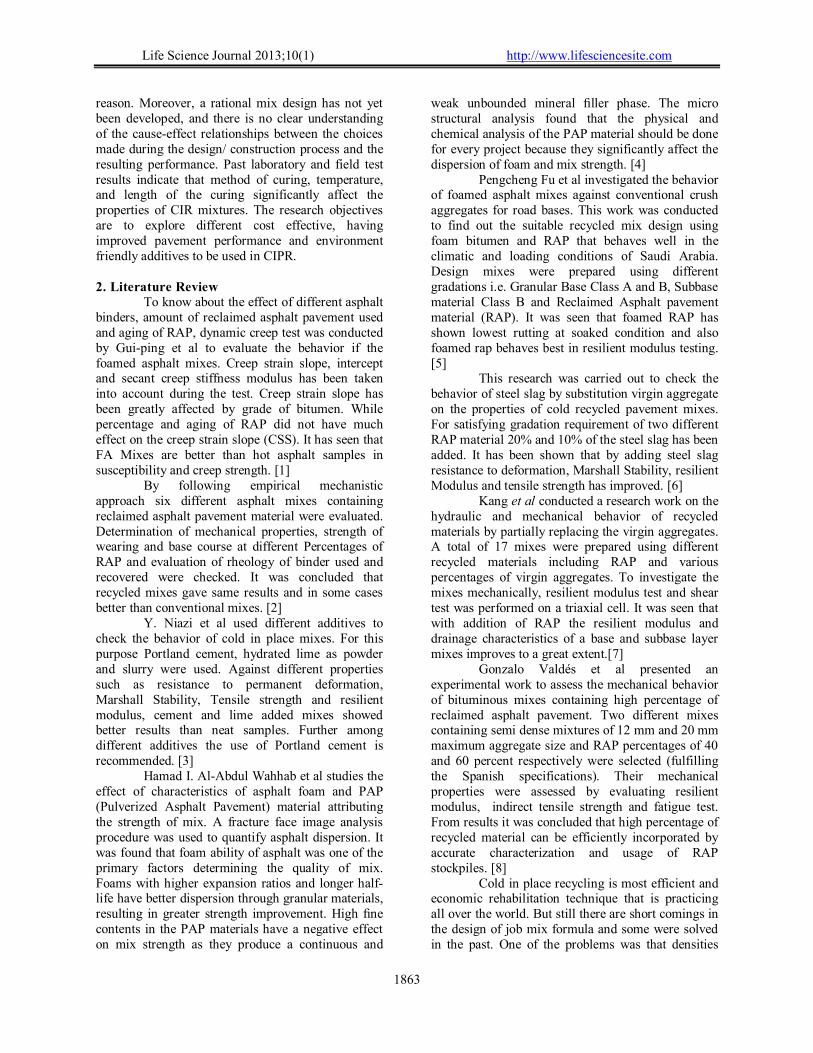
Life Science Journal 2013;10(1) http://www.lifesciencesite.com
1863
reason. Moreover, a rational mix design has not yet been developed, and there is no clear understanding of the cause-effect relationships between the choices made during the design/ construction process and the resulting performance. Past laboratory and field test results indicate that method of curing, temperature, and length of the curing significantly affect the properties of CIR mixtures. The research objectives are to explore different cost effective, having improved pavement performance and environment friendly additives to be used in CIPR. 2. Literature Review
To know about the effect of different asphalt binders, amount of reclaimed asphalt pavement used and aging of RAP, dynamic creep test was conducted by Gui-ping et al to evaluate the behavior if the foamed asphalt mixes. Creep strain slope, intercept and secant creep stiffness modulus has been taken into account during the test. Creep strain slope has been greatly affected by grade of bitumen. While percentage and aging of RAP did not have much effect on the creep strain slope (CSS). It has seen that FA Mixes are better than hot asphalt samples in susceptibility and creep strength. [1]
By following empirical mechanistic approach six different asphalt mixes containing reclaimed asphalt pavement material were evaluated. Determination of mechanical properties, strength of wearing and base course at different Percentages of RAP and evaluation of rheology of binder used and recovered were checked. It was concluded that recycled mixes gave same results and in some cases better than conventional mixes. [2]
Y. Niazi et al used different additives to check the behavior of cold in place mixes. For this purpose Portland cement, hydrated lime as powder and slurry were used. Against different properties such as resistance to permanent deformation, Marshall Stability, Tensile strength and resilient modulus, cement and lime added mixes showed better results than neat samples. Further among different additives the use of Portland cement is recommended. [3]
Hamad I. Al-Abdul Wahhab et al studies the effect of characteristics of asphalt foam and PAP (Pulverized Asphalt Pavement) material attributing the strength of mix. A fracture face image analysis procedure was used to quantify asphalt dispersion. It was found that foam ability of asphalt was one of the primary factors determining the quality of mix. Foams with higher expansion ratios and longer half-life have better dispersion through granular materials, resulting in greater strength improvement. High fine contents in the PAP materials have a negative effect on mix strength as they produce a continuous and
weak unbounded mineral filler phase. The micro structural analysis found that the physical and chemical analysis of the PAP material should be done for every project because they significantly affect the dispersion of foam and mix strength. [4]
Pengcheng Fu et al investigated the behavior of foamed asphalt mixes against conventional crush aggregates for road bases. This work was conducted to find out the suitable recycled mix design using foam bitumen and RAP that behaves well in the climatic and loading conditions of Saudi Arabia. Design mixes were prepared using different gradations i.e. Granular Base Class A and B, Subbase material Class B and Reclaimed Asphalt pavement material (RAP). It was seen that foamed RAP has shown lowest rutting at soaked condition and also foamed rap behaves best in resilient modulus testing. [5]
This research was carried out to check the behavior of steel slag by substitution virgin aggregate on the properties of cold recycled pavement mixes. For satisfying gradation requirement of two different RAP material 20% and 10% of the steel slag has been added. It has been shown that by adding steel slag resistance to deformation, Marshall Stability, resilient Modulus and tensile strength has improved. [6]
Kang et al conducted a research work on the hydraulic and mechanical behavior of recycled materials by partially replacing the virgin aggregates. A total of 17 mixes were prepared using different recycled materials including RAP and various percentages of virgin aggregates. To investigate the mixes mechanically, resilient modulus test and shear test was performed on a triaxial cell. It was seen that with addition of RAP the resilient modulus and drainage characteristics of a base and subbase layer mixes improves to a great extent.[7]
Gonzalo Valdés et al presented an experimental work to assess the mechanical behavior of bituminous mixes containing high percentage of reclaimed asphalt pavement. Two different mixes containing semi dense mixtures of 12 mm and 20 mm maximum aggregate size and RAP percentages of 40 and 60 percent respectively were selected (fulfilling the Spanish specifications). Their mechanical properties were assessed by evaluating resilient modulus, indirect tensile strength and fatigue test. From results it was concluded that high percentage of recycled material can be efficiently incorporated by accurate characterization and usage of RAP stockpiles. [8]
Cold in place recycling is most efficient and economic rehabilitation technique that is practicing all over the world. But still there are short comings in the design of job mix formula and some were solved in the past. One of the problems was that densities

Life Science Journal 2013;10(1) http://www.lifesciencesite.com
1864
obtained from the laboratory samples are higher than the samples that are taken from the field. María José et al was designed an in laboratory compaction procedure based on the dynamic modulus values that simulated best the onsite conditions of compaction.[9]
Jinhai Yan et al investigated the fatigue properties of cold recycled mixes with emulsion and foam bitumen using Cooper NU-14 tester. In this experimental study indirect tensile strength, stiffness modulus and fatigue life were evaluated. The results showed that with increase in temperature and stress levels stiffness modulus decreases. It was observed during indirect fatigue testing that foam mixes were more resistant at high fatigue levels as compared to emulsion mixes. According to law of vertical displacement three and two states of displacement development were seen from emulsion and foam bitumen mixes respectively.[10]
Amir Modarres et al conducted laboratory study to assess the fatigue behavior of cold recycling mixes with asphalt emulsion and different types of cement. Samples were prepared in the laboratory containing CSS-1h asphalt emulsion and two different types of cement. Resilient modulus and indirect tensile fatigue test were performed on specimens at various temperature and curing times. It was concluded after testing that curing time has no significant effect on the fatigue behavior but with increase in cement content and decrease in
temperature, slope of fatigue line will be decreased. [11] 3. Methodology
To evaluate and check the structural performance of CIR mixes with foam and emulsified bitumen as an additive, resilient modulus and static creep test has been performed on UTM-5P machine at different temperature and loading conditions. The flow sheet for methodology and testing conditions are shown in the figure 1 and 2. Material selection
After the collection of RAP material from the field it has been properly milled. Through sieving it has come to know that it falls in the ranges of type B gradation as mentioned in MS 21 Manual. The detail of the adopted gradation has been mentioned in table 1.
Table 1: Adopted gradation from MS 21 Type B [12]
Sieve No:
% Passing
% Retained
Commutative Percentage
25mm 100 0 0 19mm 95 5 5 9.5mm 50 45 50
4.75 mm 10 40 90 2.36 mm 5 5 95 No: 200 2 3 98
Pan 0 2 100 Total 100%
Figure 1. Flow sheet of methodology
CONCLUSIONS
RESULTS AND DISCUSSIONS
LAB INVESTIGSTION FOR STRUCTURAL ASSESSMENTModulus of Resilience Test Static Creep Test
SAMPLE PREPARATION I.E. MARSHALL MOULDS
COLLECTION OF RAP MATERIAL
VISIT AND FIELD SURVEY OF DIFFERENT CIPR ROAD SECTIONS
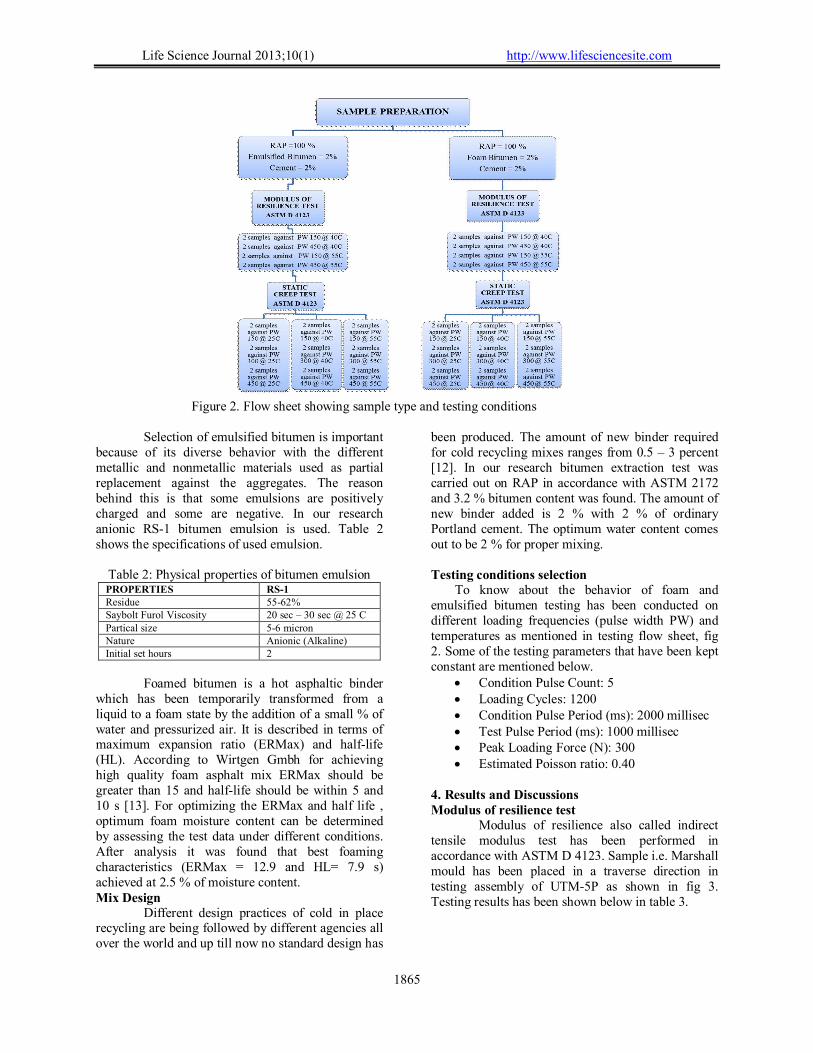
Life Science Journal 2013;10(1) http://www.lifesciencesite.com
1865
Figure 2. Flow sheet showing sample type and testing conditions
Selection of emulsified bitumen is important
because of its diverse behavior with the different metallic and nonmetallic materials used as partial replacement against the aggregates. The reason behind this is that some emulsions are positively charged and some are negative. In our research anionic RS-1 bitumen emulsion is used. Table 2 shows the specifications of used emulsion.
Table 2: Physical properties of bitumen emulsion PROPERTIES RS-1 Residue 55-62% Saybolt Furol Viscosity 20 sec – 30 sec @ 25 C Partical size 5-6 micron Nature Anionic (Alkaline) Initial set hours 2
Foamed bitumen is a hot asphaltic binder
which has been temporarily transformed from a liquid to a foam state by the addition of a small % of water and pressurized air. It is described in terms of maximum expansion ratio (ERMax) and half-life (HL). According to Wirtgen Gmbh for achieving high quality foam asphalt mix ERMax should be greater than 15 and half-life should be within 5 and 10 s [13]. For optimizing the ERMax and half life , optimum foam moisture content can be determined by assessing the test data under different conditions. After analysis it was found that best foaming characteristics (ERMax = 12.9 and HL= 7.9 s) achieved at 2.5 % of moisture content. Mix Design
Different design practices of cold in place recycling are being followed by different agencies all over the world and up till now no standard design has
been produced. The amount of new binder required for cold recycling mixes ranges from 0.5 – 3 percent [12]. In our research bitumen extraction test was carried out on RAP in accordance with ASTM 2172 and 3.2 % bitumen content was found. The amount of new binder added is 2 % with 2 % of ordinary Portland cement. The optimum water content comes out to be 2 % for proper mixing. Testing conditions selection
To know about the behavior of foam and emulsified bitumen testing has been conducted on different loading frequencies (pulse width PW) and temperatures as mentioned in testing flow sheet, fig 2. Some of the testing parameters that have been kept constant are mentioned below.
Condition Pulse Count: 5 Loading Cycles: 1200 Condition Pulse Period (ms): 2000 millisec Test Pulse Period (ms): 1000 millisec Peak Loading Force (N): 300 Estimated Poisson ratio: 0.40
4. Results and Discussions Modulus of resilience test
Modulus of resilience also called indirect tensile modulus test has been performed in accordance with ASTM D 4123. Sample i.e. Marshall mould has been placed in a traverse direction in testing assembly of UTM-5P as shown in fig 3. Testing results has been shown below in table 3.
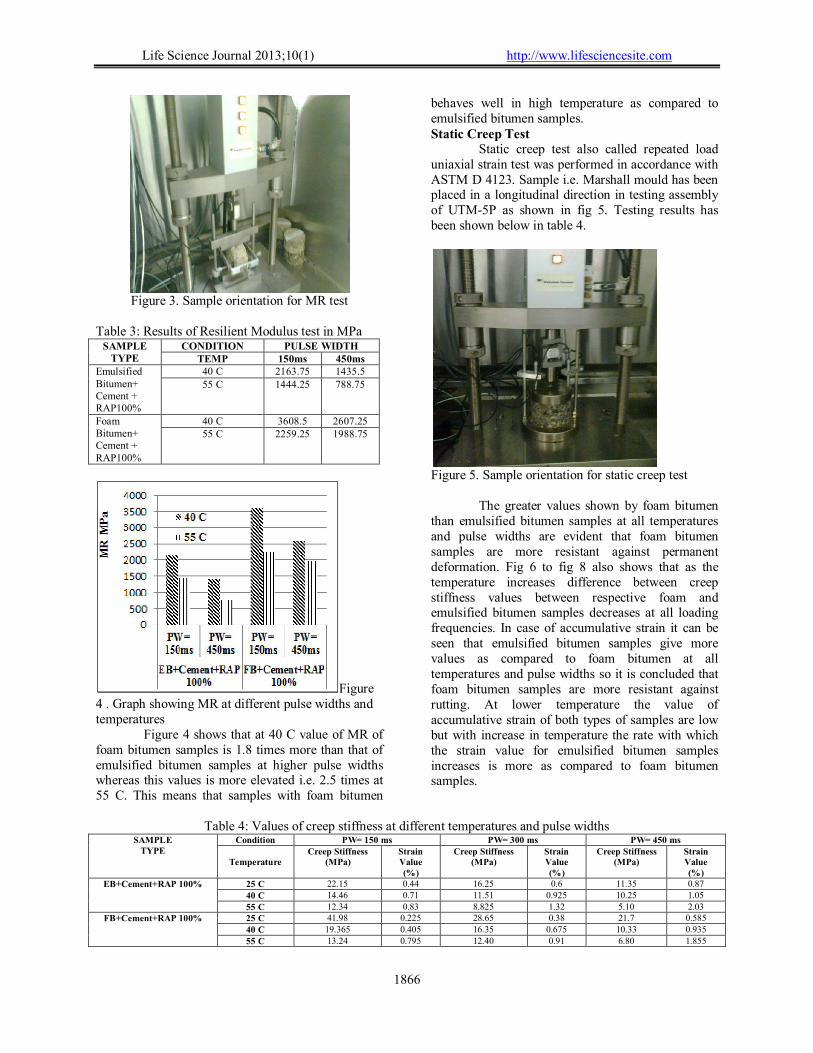
Life Science Journal 2013;10(1) http://www.lifesciencesite.com
1866
Figure 3. Sample orientation for MR test
Table 3: Results of Resilient Modulus test in MPa
SAMPLE TYPE
CONDITION PULSE WIDTH TEMP 150ms 450ms
Emulsified Bitumen+ Cement + RAP100%
40 C 2163.75 1435.5 55 C 1444.25 788.75
Foam Bitumen+ Cement + RAP100%
40 C 3608.5 2607.25 55 C 2259.25 1988.75
Figure 4 . Graph showing MR at different pulse widths and temperatures
Figure 4 shows that at 40 C value of MR of foam bitumen samples is 1.8 times more than that of emulsified bitumen samples at higher pulse widths whereas this values is more elevated i.e. 2.5 times at 55 C. This means that samples with foam bitumen
behaves well in high temperature as compared to emulsified bitumen samples. Static Creep Test
Static creep test also called repeated load uniaxial strain test was performed in accordance with ASTM D 4123. Sample i.e. Marshall mould has been placed in a longitudinal direction in testing assembly of UTM-5P as shown in fig 5. Testing results has been shown below in table 4.
Figure 5. Sample orientation for static creep test
The greater values shown by foam bitumen than emulsified bitumen samples at all temperatures and pulse widths are evident that foam bitumen samples are more resistant against permanent deformation. Fig 6 to fig 8 also shows that as the temperature increases difference between creep stiffness values between respective foam and emulsified bitumen samples decreases at all loading frequencies. In case of accumulative strain it can be seen that emulsified bitumen samples give more values as compared to foam bitumen at all temperatures and pulse widths so it is concluded that foam bitumen samples are more resistant against rutting. At lower temperature the value of accumulative strain of both types of samples are low but with increase in temperature the rate with which the strain value for emulsified bitumen samples increases is more as compared to foam bitumen samples.
Table 4: Values of creep stiffness at different temperatures and pulse widths
SAMPLE TYPE
Condition PW= 150 ms PW= 300 ms PW= 450 ms
Temperature Creep Stiffness
(MPa) Strain Value (%)
Creep Stiffness (MPa)
Strain Value (%)
Creep Stiffness (MPa)
Strain Value (%)
EB+Cement+RAP 100% 25 C 22.15 0.44 16.25 0.6 11.35 0.87
40 C 14.46 0.71 11.51 0.925 10.25 1.05
55 C 12.34 0.83 8.825 1.32 5.10 2.03 FB+Cement+RAP 100% 25 C 41.98 0.225 28.65 0.38 21.7 0.585
40 C 19.365 0.405 16.35 0.675 10.33 0.935
55 C 13.24 0.795 12.40 0.91 6.80 1.855

Life Science Journal 2013;10(1) http://www.lifesciencesite.com
1867
Figure 6. Graph b/w creep stiffness & pulse width at 25 C
Figure 7. Graph b/w creep stiffness & pulse width at 40 C
Figure 8. Graph b/w creep stiffness and pulse width at 55 C
Figure 9. Graph b/w accumulative strain and pulse width at 25 C
Figure 10. Graph b/w accumulative strain and pulse width at 40 C
Figure 11. Graph b/w accumulative strain and pulse width at 55 C
5. Conclusions:
MR modulus of resilience decreases as the temperature increases for both the mixes and at all the Pulse width.
As the pulse width increases the MR decreases for both the mixes i.e. Foam Bitumen and Emulsified Bitumen Mixes.
The foam bitumen showed higher Modulus than Emulsified Bitumen Mixes for all the temperature and loading pulse conditions
The result of Creep stiffness shows that as the temperature increases the value of Creep stiffness modulus decreases considerably.
For all the three testing temperatures creep stiffness is higher for Foam bitumen mixes.
Life Science Journal 2013;10(1) http://www.lifesciencesite.com
1868
Accumulated strain shows the vice versa trend of Creep stiffness for the three testing temperatures as the temperature increases the accumulated strain also increases.
The mixes containing Foam Bitumen as the recycling agent and 2 % Cement are better rehabilitation option for cold recycling of pavements.
The MR of Foam bitumen mixes are remarkably high showing their ability and acceptability as a most suitable rehabilitation option.
Corresponding Author: Dr. Kamran Muzaffar Khan Associate Professor Civil Engineering Department University of engineering and technology Taxila, Pakistan Email: [email protected] References
[1] He Gui-ping et al, “Laboratory Study on permanent deformation of foamed asphalt mix incorporating reclaimed Asphalt pavement materials” Construction and Building Materials 21 (2007) 1809–1819.
[2] Iswandaru Widyatmoko, “Mechanistic-Empirical Mixture design for hot mix asphalt pavement recycling”. Construction and Building Materials 22 (2008) 77–87
[3] Y. Niazi et al, “Effect of Portland cement and lime additives on properties of cold in-place recycled mixtures with asphalt emulsion” Construction and Building Materials 23 (2009) 1338–1343
[4] Hamad I. Al-Abdul Wahhab et al, “Study of road bases construction in Saudi Arabia using foam asphalt” Construction and Building Materials xxx (2011) xxx–xxx (Article in press).
[5] Pengcheng Fu et al, “The effects of asphalt binder and granular material characteristics on foamed asphalt mix strength”
Construction and Building Materials 25 (2011) 1093–1101
[6] Mahmoud Ameri et al, “Laboratory studies to investigate the properties of CIR mixes containing steel slag as a substitute for virgin aggregates” Construction and Building Materials 26 (2012) 475–480
[7] Kang D., Gupta S.C., Ranaivoson A.Z., Siekmer J., Roberson R., “Recycled Materials as Substitutes for Virgin Aggregates in Road Construction: 1. Hydraulic and Mechanical Characteristics”, Soil Science Society of America Journal, Vol. 75, No. 4, Soil Science Society of America, Madison, WI, 2011
[8] Gonzalo Valdés, Félix Pérez-Jiménez, Rodrigo Miró , Adriana Martínez , Ramón Botel, “Experimental study of recycled asphalt mixtures with high percentages of reclaimed asphalt pavement (RAP)” Construction and Building Materials 25 (2011) 1289–1297
[9] María José Martínez-Echevarría, Rodrigo Miró Recasens, María del Carmen Rubio Gámez, Antonio Menéndez Ondina, “In-laboratory compaction procedure for cold recycled mixes with bituminous emulsions”, Construction and Building Materials 36 (2012) 918–924
[10] Jinhai Yan , Fujian Ni, Meikun Yang, Jian Li, “An experimental study on fatigue properties of emulsion and foam cold recycled mixes”, Construction and Building Materials 24 (2010) 2151–2156.
[11] Amir Modarres, Fereidoon Moghadas Nejad, Amir Kavussi, Abolfazl Hassani, Ehsan Shabanzadeh, “A parametric study on the laboratory fatigue characteristics of recycled mixes”, Construction and Building Materials 25 (2011) 2085–2093
[12] The asphalt cold- mix recycling. The Asphalt Institute Series, No 21; 1983
[13] Gmbh Wirtgen. Wirtgen Cold Recycling Manual. 2nd ed. Germany: Windhagen; 1998
12/31/2012

Life Science Journal 2013;10(1) http://www.lifesciencesite.com
1869
Effect of Zinc Oxide Toxicity on African Cat Fish Clarias gariepinus Present in the River Nile (Hawamdya)
Mona, S. Zaki*1, Nabila, Elbattrawy2 Nagwa, S. Ata3 and Shalaby S. I4
1Department of Hydrobiology, National Research Centre, Cairo, Egypt 2Department of Microbiology, Reproductive institute, Cairo, Egypt
3Department of Microbiology, National Research Centre, Cairo, Egypt 4Deptartment of Animal Reproduction, National Research Center, Giza, Egypt
*[email protected] Abstract: The effect of dietary carbohydrates and mercuric oxide on haematalogical profile, blood chemistry and hormonal level was studied in African cat fish (Clarias gariepinus). Thirty Fish were divided into 3 equal groups, exposed to different doses of zinc oxide and carbohydrate. Group (1) was served as control. Group (2) was fed with carbohydrate and mercuric oxide (10 mg Kg-1 diet ration). Group (3) was fed with carbohydrate and zinc oxide (1 5 rng Kg-1 diet ration). There is a significant decrease in hemoglobin and P .C.V in group (3). There is a significant increase in serum corlisol, cholesterol, AST, ALT, urea, creatinine and alkaline phosphorous in group (3). Also there is a significant decrease in serum phosphorous, sodium and potassium in treated fish. There is a significant high level of zinc content in kidney, muscles, heart and spleen in group (3) suggesting toxic effects of zinc oxide on African cat fish (Clarias gariepinus). The total viable count of bacteria identified higher in fish fed on carbohydrate zinc and the predominate bacteria were identified as, E. coli and Pseudomonas, fluorscences. We emphasize the finding that an increase carbohydrate concentration causes harmful pathological effect which reduces humoral immune responses and enhances dietary zinc toxicity. [Mona, S. Zaki, Nabila, Elbattrawy Nagwa, S. Ata and Shalaby S. I. Effect of Zinic Oxide Toxicity on African Cat Fish Clarias gariepinus Present in the River Nile. Life Sci J 2013;10(1):1869-1873] (ISSN:1097-8135). http://www.lifesciencesite.com. 268 Keywords: Clarias gariepinis, mercuric pollution, haematalogical, biochemical, clinicopathological, Bacteria
account 1. Introduction:
Fish plays an important role, not only in human food diets but also in animal and poultry rations. It is a palatable and easily digested food which is rich in vitamins, calcium, phosphorous and iodine. In Egypt, fish is considered as a cheap food article if compared with other foods of animal origin. The flesh of healthy fish is considered as a marker for the natural aquatic environment. Because of the relatively high solubility of zinc compounds, this metal is widely detected in freshwater. Indeed, it is important that it should do so because it is an essential element for aquatic life: for example, it occurs in the enzyme carbonic anhydrase, catalyses the formation of carbonic acid from carbon dioxide in the blood. Small amount in the water or in the diet are therefore essential. It is also follows that the organisms will have an internal mechanism to transport zinc around the body in order to manufacture such vital enzymes. When the zinc, in the water rises to a level where the amount entering the organism through the gills exceeds the requirement for this metal, the surplus has to be excreted and this will require a certain amount of energy. At higher levels this detoxification mechanism may be insufficient to copy with the influx and the zinc will then exert a direct action. It was originally thought that the direct toxic action of
zinc on fish was to precipitate the layer of mucus on the surface of the gill, causing suffocation. While this may be true for those species which produce a copious supply of mucus, the white precipitate observed on the gills of say rainbow trout is mainly composed of disintegrating epithelial cells which may be associated with the onset of mortality. However, zinc may also cause a certain amount of tissue damage by reacting with protein and this could effected the respiratory efficiency as well as the osmoregulatory of function of the gills. The major environmental factor which affects the toxicity of zinc to fish is the calcium concentration of the water. Calcium, like zinc and zinc is a divalent ion and both complete for binding sites on protein molecules. Although some completion may occur on the gill surface, the main site of action may be inside the epithelial cell where the calcium concentration is in equilibrium with that in the surrounding water. Therefore, if fish are removed from hard calcium-rich, water to a soft water, they will slowly lose their resistance to zinc toxicity as their body calcium is reduced to a lower equilibrium level. The relationship between the concentration of zinc acutely toxic to rainbow trout and hardness of the water. Similar data exist for other species of fish, although in some cases in inadequate acclimation period to different water
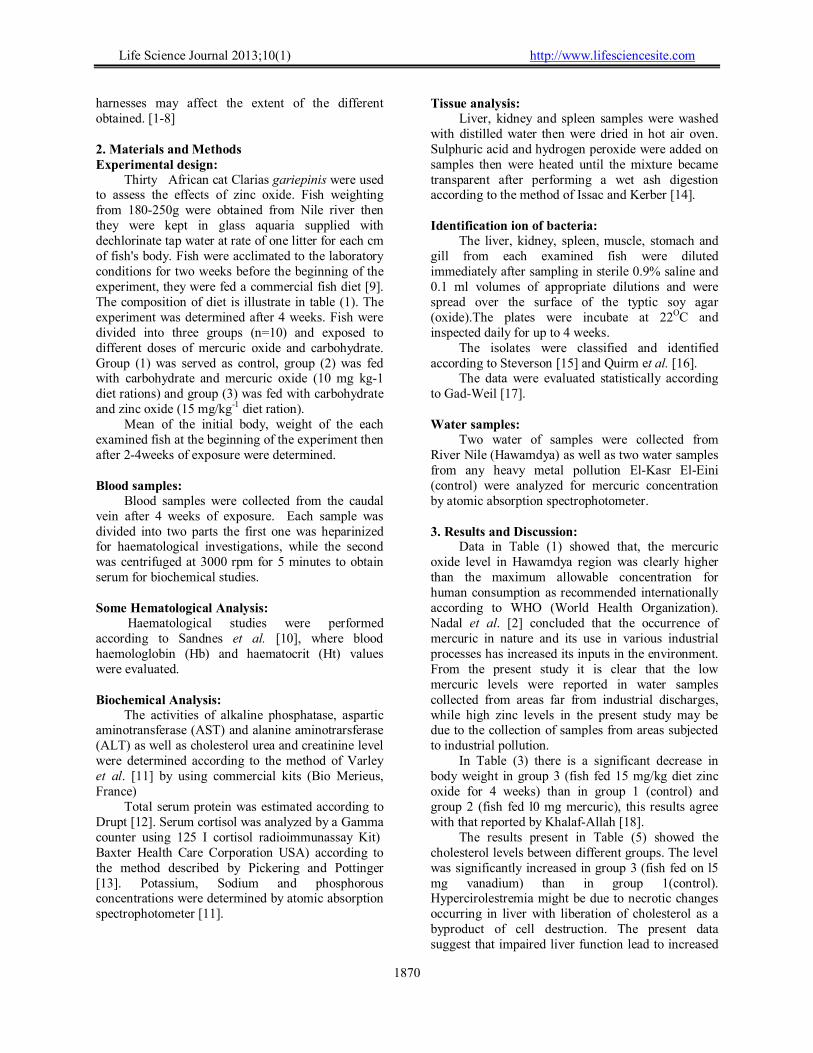
Life Science Journal 2013;10(1) http://www.lifesciencesite.com
1870
harnesses may affect the extent of the different obtained. [1-8] 2. Materials and Methods Experimental design:
Thirty African cat Clarias gariepinis were used to assess the effects of zinc oxide. Fish weighting from 180-250g were obtained from Nile river then they were kept in glass aquaria supplied with dechlorinate tap water at rate of one litter for each cm of fish's body. Fish were acclimated to the laboratory conditions for two weeks before the beginning of the experiment, they were fed a commercial fish diet [9]. The composition of diet is illustrate in table (1). The experiment was determined after 4 weeks. Fish were divided into three groups (n=10) and exposed to different doses of mercuric oxide and carbohydrate. Group (1) was served as control, group (2) was fed with carbohydrate and mercuric oxide (10 mg kg-1 diet rations) and group (3) was fed with carbohydrate and zinc oxide (15 mg/kg-1 diet ration).
Mean of the initial body, weight of the each examined fish at the beginning of the experiment then after 2-4weeks of exposure were determined. Blood samples:
Blood samples were collected from the caudal vein after 4 weeks of exposure. Each sample was divided into two parts the first one was heparinized for haematological investigations, while the second was centrifuged at 3000 rpm for 5 minutes to obtain serum for biochemical studies. Some Hematological Analysis:
Haematological studies were performed according to Sandnes et al. [10], where blood haemologlobin (Hb) and haematocrit (Ht) values were evaluated. Biochemical Analysis:
The activities of alkaline phosphatase, aspartic aminotransferase (AST) and alanine aminotrarsferase (ALT) as well as cholesterol urea and creatinine level were determined according to the method of Varley et al. [11] by using commercial kits (Bio Merieus, France)
Total serum protein was estimated according to Drupt [12]. Serum cortisol was analyzed by a Gamma counter using 125 I cortisol radioimmunassay Kit) Baxter Health Care Corporation USA) according to the method described by Pickering and Pottinger [13]. Potassium, Sodium and phosphorous concentrations were determined by atomic absorption spectrophotometer [11].
Tissue analysis: Liver, kidney and spleen samples were washed
with distilled water then were dried in hot air oven. Sulphuric acid and hydrogen peroxide were added on samples then were heated until the mixture became transparent after performing a wet ash digestion according to the method of Issac and Kerber [14]. Identification ion of bacteria:
The liver, kidney, spleen, muscle, stomach and gill from each examined fish were diluted immediately after sampling in sterile 0.9% saline and 0.1 ml volumes of appropriate dilutions and were spread over the surface of the typtic soy agar (oxide).The plates were incubate at 22OC and inspected daily for up to 4 weeks.
The isolates were classified and identified according to Steverson [15] and Quirm et al. [16].
The data were evaluated statistically according to Gad-Weil [17]. Water samples:
Two water of samples were collected from River Nile (Hawamdya) as well as two water samples from any heavy metal pollution El-Kasr El-Eini (control) were analyzed for mercuric concentration by atomic absorption spectrophotometer.
3. Results and Discussion:
Data in Table (1) showed that, the mercuric oxide level in Hawamdya region was clearly higher than the maximum allowable concentration for human consumption as recommended internationally according to WHO (World Health Organization). Nadal et al. [2] concluded that the occurrence of mercuric in nature and its use in various industrial processes has increased its inputs in the environment. From the present study it is clear that the low mercuric levels were reported in water samples collected from areas far from industrial discharges, while high zinc levels in the present study may be due to the collection of samples from areas subjected to industrial pollution.
In Table (3) there is a significant decrease in body weight in group 3 (fish fed 15 mg/kg diet zinc oxide for 4 weeks) than in group 1 (control) and group 2 (fish fed l0 mg mercuric), this results agree with that reported by Khalaf-Allah [18].
The results present in Table (5) showed the cholesterol levels between different groups. The level was significantly increased in group 3 (fish fed on l5 mg vanadium) than in group 1(control). Hypercirolestremia might be due to necrotic changes occurring in liver with liberation of cholesterol as a byproduct of cell destruction. The present data suggest that impaired liver function lead to increased

Life Science Journal 2013;10(1) http://www.lifesciencesite.com
1871
serum levels of alkaline phosphat, AST and ALT among group 3 (fish fed on l5 mg mercuric) and among group 2 (fish fed 10 mg mercuric) compared with group 1(control). In this concern Khalaf-Allah [8] concluded that ALT and AST enzymes are good indices for the health status of liver parenchymatous, tissue necrosis is considered as the main source of AST and its increase in the serum of African cat fish (Clarias Gariepinus) and declared these necrotic changes [18]. In addition, exposure of fish to environmental pollutants might result in stimulation or depression of the enzyme activity depending on the concentration of pollutant and the duration of exposure [19, 20].
Regarding the effect of zinc oxide on serum cortisol level in African cat fish (Claias gariepinus) highest level was obtained in group 3 (fish fed on 15 mg mercuric ) then in group 2 (fish fed on 10 mg vanadium) as compared to that obtained in group 1 (control). The significant increase of cortisol level is probably due to the activation of hypothalamus pituitary internal axis [21].
From the data present in Table (5), it is clear that elevation of zinc oxide level in the diets fed to (Clarias gariepinus) was positively correlated to hemoglobin (Hb) levels and haematocrit (Ht). A marked decrease in the IIb and Ht was recorded after feeding diet containing 15 mg and 10 mg mercuric , respectively. Reduced Hb reflects metabolic adjustment according to reduced need for oxygen by change in blood PH.
Moyle and Ceeh, Hall and Cliffs recorded actived acetchlinesterase of erthrocytes [22, 23] Further more Pickeringand Dusten [24] concluded that a consistent effect of cortisol was the reduction in the hemoglobin and iron levels as a result of decrease in appetite in rainbow trout fish or more likely to be the direct-result of catabolic effect of cortisol in the fish tissues [24].
The mean phosphorus, sodium and potassium values in the serum of fish of group 3 (fish fed 15 mg zinc oxide) were significantly increased respectively than those recorded in the group 1 (control). This retention maybe attributed to kidney dysfunction, whereas, the kidney is the normal pass for sodium and potassium.
Kidney dysfunction may also explain the increase in serurn urea and creatinine especially in group3, but little known about the mechanisms involved in this association.
The results displayed also in Table (5) showed that there was general decrease in the mean total protein value in serum samples collected from the fish of group 3 and 2, respectively. The mean value of these parameters was lower than in group 1. Jagadeesh et al. [25] estimated marked decrease in
glycogen in tissues of fresh water fish after exposure to vanadium [25].
This experiment showed that the body weight of the examined fish was significantly decreased than the initial body weight after 4 weeks of exposure to 15mg zinc oxide. Also, Hilton and Better [25] recorded a significantly reduced growth and increased mortality among feeding diets of mercuric (0, 10, 100, 1000, 10000mg Kg-') [26]. The increase in muscles and tissue lactic acid (2 fold) in association with decrease in pyruvic acid (72 in muscles +26% in liver) reflect a shift towards an anaerobic metabolism of fish following long term exposure to zinc [26]
Table (6) showed that, the bacterial isolates and counts were increased by feeding the fish with CHO and zinc. The carbohydrates affect immunity and resistance to infection as recorded by Waagbo et al. [19] Utility of vanadate, zinc protein phosphate inhibitors to protect fish from microorganism [27]. The increase of bacterial count among the fish fed on mercuric may be related to the increased level of corlisol which decreases the host immunity.
In the course of experiment, a high concentration or zinc levels has been found in kidney, liver, spleen, heart and muscles of cat African catfish (Clarias gariepinus) fed 15 mg mercuric (Table 4). This suggests that these organs could be useful as a marker for vanadium in the aquatic environment. In this concern Ray et al. recorded a high concentration of mercuric in kidney liver and other organs of African cat fish as the concentration of mercuric in the tissues increased with its concentration in the aquatic environment and exposure time[28].After exposure of fish to increased doses for 4 days, the mercuric content in the muscle then increased in all tissues [20, 25, 26] The capability of zinc to be present in fish muscle is of particular interest in assessing the exposure of man to environmental mercuric as ingested by food. Clinicopathological observations:
Abnormal swimming darkling of the skin, scale loss and haemorrhasges, water seen on the external body surface. In addition to congestion of gills, eyes mouth, liver, kidney, spleen, and intestine. This was notice in fish exposed to mercuric oxide 15mg (group 3) but not in fish exposed to zinc oxide 10 mg (group 2).
In conclusion: we emphasize that, the reported finding increase of carbohydrate concentrations causes harmful physiological effects, reduces hormonal immune response and enhances dietary toxicity.
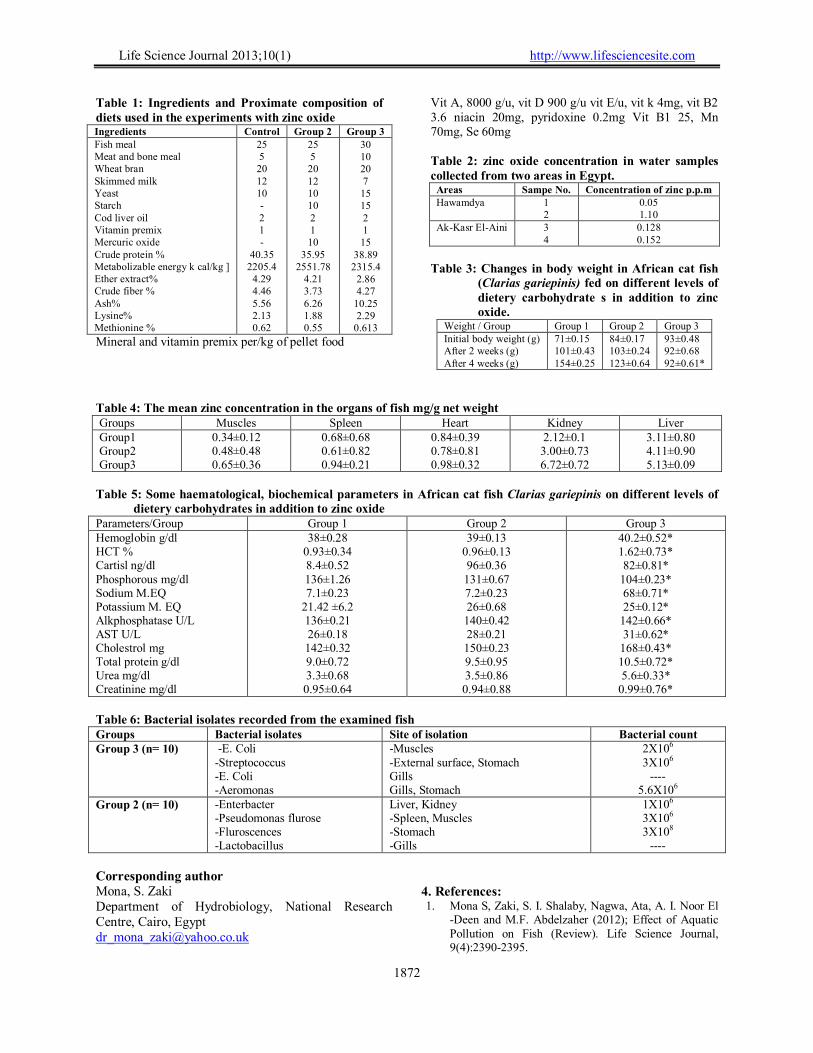
Life Science Journal 2013;10(1) http://www.lifesciencesite.com
1872
Table 1: Ingredients and Proximate composition of diets used in the experiments with zinc oxide Ingredients Control Group 2 Group 3 Fish meal Meat and bone meal Wheat bran Skimmed milk Yeast Starch Cod liver oil Vitamin premix Mercuric oxide Crude protein % Metabolizable energy k cal/kg ] Ether extract% Crude fiber % Ash% Lysine% Methionine %
25 5 20 12 10 - 2 1 -
40.35 2205.4
4.29 4.46 5.56 2.13 0.62
25 5 20 12 10 10 2 1 10
35.95 2551.78
4.21 3.73 6.26 1.88 0.55
30 10 20 7 15 15 2 1 15
38.89 2315.4
2.86 4.27
10.25 2.29
0.613
Mineral and vitamin premix per/kg of pellet food
Vit A, 8000 g/u, vit D 900 g/u vit E/u, vit k 4mg, vit B2 3.6 niacin 20mg, pyridoxine 0.2mg Vit B1 25, Mn 70mg, Se 60mg Table 2: zinc oxide concentration in water samples collected from two areas in Egypt.
Areas Sampe No. Concentration of zinc p.p.m Hawamdya 1
2 0.05 1.10
Ak-Kasr El-Aini 3 4
0.128 0.152
Table 3: Changes in body weight in African cat fish
(Clarias gariepinis) fed on different levels of dietery carbohydrate s in addition to zinc oxide.
Weight / Group Group 1 Group 2 Group 3 Initial body weight (g) After 2 weeks (g) After 4 weeks (g)
71±0.15 101±0.43 154±0.25
84±0.17 103±0.24 123±0.64
93±0.48 92±0.68 92±0.61*
Table 4: The mean zinc concentration in the organs of fish mg/g net weight Groups Muscles Spleen Heart Kidney Liver Group1 Group2 Group3
0.34±0.12 0.48±0.48 0.65±0.36
0.68±0.68 0.61±0.82 0.94±0.21
0.84±0.39 0.78±0.81 0.98±0.32
2.12±0.1 3.00±0.73 6.72±0.72
3.11±0.80 4.11±0.90 5.13±0.09
Table 5: Some haematological, biochemical parameters in African cat fish Clarias gariepinis on different levels of
dietery carbohydrates in addition to zinc oxide Parameters/Group Group 1 Group 2 Group 3 Hemoglobin g/dl HCT % Cartisl ng/dl Phosphorous mg/dl Sodium M.EQ Potassium M. EQ Alkphosphatase U/L AST U/L Cholestrol mg Total protein g/dl Urea mg/dl Creatinine mg/dl
38±0.28 0.93±0.34 8.4±0.52 136±1.26 7.1±0.23
21.42 ±6.2 136±0.21 26±0.18 142±0.32 9.0±0.72 3.3±0.68 0.95±0.64
39±0.13 0.96±0.13 96±0.36 131±0.67 7.2±0.23 26±0.68 140±0.42 28±0.21 150±0.23 9.5±0.95 3.5±0.86 0.94±0.88
40.2±0.52* 1.62±0.73* 82±0.81*
104±0.23* 68±0.71* 25±0.12*
142±0.66* 31±0.62*
168±0.43* 10.5±0.72* 5.6±0.33*
0.99±0.76*
Table 6: Bacterial isolates recorded from the examined fish Groups Bacterial isolates Site of isolation Bacterial count Group 3 (n= 10) -E. Coli
-Streptococcus -E. Coli -Aeromonas
-Muscles -External surface, Stomach Gills Gills, Stomach
2X10⁶ 3X10⁶
---- 5.6X10⁶
Group 2 (n= 10) -Enterbacter -Pseudomonas flurose -Fluroscences -Lactobacillus
Liver, Kidney -Spleen, Muscles -Stomach -Gills
1X10⁶ 3X10⁶ 3X10⁸
----
Corresponding author Mona, S. Zaki Department of Hydrobiology, National Research Centre, Cairo, Egypt [email protected]
4. References: 1. Mona S, Zaki, S. I. Shalaby, Nagwa, Ata, A. I. Noor El
-Deen and M.F. Abdelzaher (2012); Effect of Aquatic Pollution on Fish (Review). Life Science Journal, 9(4):2390-2395.

Life Science Journal 2013;10(1) http://www.lifesciencesite.com
1873
2. Nadal, M., M and Schulmacherand J.L. Dommgo (2007):` Levels of metals, PCB's PCN's and PAH's in soils of highly industrialized chemical/petrochemical area Chemosphere, 66: 267 -76.
3. Papagiannis, I. ; Kagalou, J. Leonardos, D. Petridis, I. and V. Kalfakakou (2004): Copper and zinc in four freshwater fish species from Lake Pamvotis (Greece). Environment International 30(3): 357–362
4. Andres, S, F.; Ribeyre, J. ; Tourencq, N.and Boudou, A. (2000): Interspecific comparison of cadmium and zinc contamination in the organs of four fish species along a polymetallic pollution gradient (Lot River, France) Science of The Total Environment, 29 (1) 11–25.
5. Huang, Y.C. and A.J. Ghio (2006): Vascular effects of ambient pollutant particles and metals, curr. Vasc. Pharmacol, 4:199-203.
6. Li, Z., J.D. Carter, L.A. Dailey and Y.C.T. Huang (2004): 4-vanadyl sulfate inhibits NO production via threonine phosphorylation of eNOS, Environ Health Prospect, 112:20l-206.
7. Worle, J.M., K. Kem C. Schelh A.C. Helmy, C. Feldman and H.F. Krug (2007). Nanoparticulate vanadium oxide potentiated vanadium toxicity in human lung cells, Environ. Sci. Technol., 41 331-6.
8. Figuero, D.A., C.I. Rodriquez-Sierra and B.D. Jimenez-velez (2006): Toxicol & health, 22:87-99.
9. Waagbo, R., J. Glette, K. Sandnes and G.F. Hemre (1994): .J. Fish Dis., 1 7:l 45.
10. Sarndnes, K., Q. Lee and R. Waagatn, 1998. J. of Fish Biol., 3l: I19.
11. Varley, H., A. HI. Gwenbek and M. Bell (1980): Practical clinical chemistry, vol. I General I top's comneuer test 5th ed. London, William medical books Ltd.
12. Dmpt, F. (1974): Pharm. Biol, 9: 77. 13. Pickering, A.D. and I. Pottinger (1983): Gen Comp
Ender. 49: 232 14. Issac, R.A. and kerber, I (1971): Amer. Madison. 17. 15. Steverson P., (1987): "Field Guide Systematic
Bacteriology". University of Cuelphontaria, Canada, pp: 280.
16. Quinn, P.J., M.E. Carter, B.K. Makey and G.R Carter (1994): "Clinical Veterinary Microbiology", wolf publishing Mosby, Year Book Europe limited.
17. Gad, S.C. and C.S. Weil, (1986):. Statistics for toxicologists. In, Hages A.W. (2nd ed.), "Principles and Methods of toxicology", Raven Press, New York, pp: 273-32
18. Khalaf-Allah, (1998) Screening the effect of water pollution with some pesticides on the immune response in Oreochromis nilolicus fish. Vet. Mid. J. Giza., 46: 883-393.
19. Venberg, F.G. and W.B. Venbcrg, (1974): Pollution and Physiology of marine organisms. Academic Press New York, pp: 59.
20. Edel, J. and E. Sabioni (1993): Accumulation and distribution of mussel myails edulis and the gold fish carassits auratus. Sci. Total-Envilon. 133: 139-151.
21. Carballo, M.J., M.J. Torroba, C. Munoz, D.V. Sanchez, I.D. Txazora and J. Dominguez (1992) J. Fish and Shell Fish Immunology, Z. 121.
22. Moyle, P.B. and J.J. Cech (1982): Blood And Its Circulation In Fish-An Introduction to Ichthyology" (Ed. by, P.B. Moyle, J.H. Cech) pp: 52-73 Prentice.
23. Hall, I. and E. Cliffs (1982). Aspects and energy response in an Indian catfish Babachus, Biometais, 11: 95 – 100.
24. Pickering, A.P. and J. Duston (1983): J. Fish Biol., 23: 163.
25. Jagadeesh K.B., S.A. Shaffi and S. Jeelani, (1989): Acta Physiologia Hungarica 74: 43.
26. Hitton" J.W. and W.G. Bettgeo (1988): Aquatic Toxicology, l2: 63.
27. Evans-Donald L. and L. Jaso. Friedmarur (2001): Protection of Teleost fish. Biotclr, Nav., 15: 777.
28. Ray, D., S.K. Panerjeo and M.I. Chattejee, (1999): Bioaccumulation of Nickel and Vanadium in tissues of Catfish Batracchus. J.Inorg-Biochem., 38: I 69-173.
29. Dunford, D. K.; Salinaro, A.; Car, L.; Serpone M. N.; Harikoshi, S.; Hidaka, H. and Knowland, J. (1997): Chemical oxidation and DNA damage catalyzed by inorganic sunscreen ingredients. FEBS letters, 418: 97-90.
30. Bann, R.; Straif, K.; Grosse, Y.; Secreton, B.; Ghissassi, F.F. and Cogliano, V. (2006): Carcinogenicity of carbon black, titanium dioxide and talc. J. of the Lancet Oncol, 7: 295-296.
31. Ghoropade,V.M.; Desphande,S.S.and Salunkhe, D.K. (1995): Food colors in food additive toxicology by Joseph ,A.M. and Authony,T.Tu, , New York . Basal, Hony Kong. Chapter 4 Page 214.
32. Wang, J.; Zhou, G.; Chen,C.; Yu, H. ; Wang, T.; Ma, Y.; Jia, G.; Gao, Y.; Li, B.; Sun,J. ; Li, Y. ; Jiao, F.; Zhao, Y. and Chai, Z. (2007): Acute toxicity and biodistribution of different sized titanium dioxide particles in mice after oral administration . Toxicology Letters, 168: 176-185.
33. Leone, J. (1973): Collaborative study of the quantitative determination of titanium dioxide in cheese. J. Assoc. Offic. Anal Chem., 56: 535-558.
34. Mahrousa, M. H. Kandiel (2004): Cytogenetic and biochemical effects of some food colors in rats. Ph. Dr. Thesis Submitted to animal Production department, Faculty of Agriculture, Cairo University.
1/20/2013
Life Science Journal 2013;10(1) http://www.lifesciencesite.com
1874
Anti-Inflammatory and Immune Regulatory Effects of Salvia officinalis Extract on OVA-induced Asthma in Mice
Abd El-Hamid Mohamed Elwy1 and GhadaTabl2
1 Forensic Medicine and Toxicology Department, Faculty of Medicine, Tanta University
2 Zoology Department, Faculty of Science, Tanta University [email protected]
Abstract: The study designed to evaluate the protective effect of Salvia officinalis (SO) water extract against OVA- induced asthma in mice. The OVA-induced asthmatic mice exhibited significant increase in total leukocytes count, IL-4 and IL-5 levels in bronchoalveolar lavage fluid (BALF) and eosinophils count in (BALF), in addition, to the serum total IgE level. Pathological changes in the lung were evaluated and compared to either treated OVA-challenged SO group or control- Salvia Officinalis oral administered group. Salvia Officinalis extract reduced significantly the number of inflammatory cells and cytokines in the BALF and the level of IgE as compared to OVA-challenged group. Moreover, Salvia Officinalis extract (SO) reduced the eosinophils infiltration in the lung tissue. These results suggest that Salvia officinalis extract via oral treatment may have anti-inflammatory and immune regulatory effects on bronchial allergic asthma. [Abd El-Hamid Mohamed Elwy and GhadaTabl. Anti-Inflammatory and Immune Regulatory Effects of Salvia officinalis Extract on OVA-induced Asthma in Mice. Life Sci J 2013;10(1):1874-1878] (ISSN:1097-8135). http://www.lifesciencesite.com. 269 Keywords: Salvia officinalis extract- OVA-induced asthma-Leukocytes-Cytokines- Eosinophils-Serum IgE level. 1. Introduction
The genus Salvia L. (Lamiaceae), with about 900 species, is one of the most widespread members of the family Lamiaceae. (Longaray Delamare et al., 2007).Salvia officinalis (SO),a plant endemic to the Mediterranean region is the most popular herbal remedy in the Middle East to treat common health complications such as cold and abdominal pain (Gali-Muhtasib et al., 2000). Salvia species are considered with curative properties (Kintzios, 2000). They possess antiseptic, antibacterial (Soković et al., 2010), antinociceptive and anti-inflammatory (Baricevic et al., 2001;Rodrigues et al., 2012), antiviral (Geuenich et al., 2008), Cytotoxic (Loizzo et al., 2007), spasmolytic, anticonvulsant (Baricevic and Bartol, 2000) in addition, to the antimicrobial and antioxidant activities (Bozin et al., 2007; Abu-Darwish et al., 2012).
Allergic asthma is characterized by airway hyperesponsiveness to specific and/or nonspecific stimuli, chronic pulmonary eosinophilia, elevated serum IgE level, and excessive mucus production (Kuperman et al., 1998) . The pathology associated with asthma is thought to be mediated by CD4+T lymphocytes producing the type 2 cytokines, Il-4 and IL-5, as both messenger RNA and protein levels of these cytokines are elevated in bronchial biopsies bronchoalveolar lavage (BAL) cells , and blood of allergic proteins as compared to normal individuals. Since these cytokines promote the accumulation and activation of eosinophils as well as IgE synthesis by B cells, this cytokine pattern has been thought to be important in the pathogenesis of asthma
(Wills-Karp, 1999; Renauld, 2001; Elias et al., 2003; Boyce et al., 2012; Lommatzsch, 2012). Asthma is usually divided into allergic asthma and non-allergic asthma, and approximately two-thirds of asthma cases are allergic (Hamelmann, 2007 ; Bollag et al., 2009). It is widely accepted that antigen-specific T helper cell type 2 (Th2) and their cytokines such as IL-5, IL-4, and IL-13 orchestrate the feature of asthma (Kay, 2001; Boyce et al., 2012).
The study designed to evaluate the protective effects of salvia officinalis(SO)water extract on allergic asthma, so we used OVA-induced asthma mouse model which used as a reference method by other investigators (Secor et al., 2008; Yim et al., 2010). 2.Material and Methods Experimental animals
The study used Balb/c mice weighing 25-35g obtained from Theodor Bilharz Research Institute, AL-Giza Egypt. They were acclimatized to the environment for two weeks prior to experimental use and had access to water and food ad libitum. The Laboratory Animal Welfare including environment, housing and management are carried out with recommendations for the proper care and use of laboratory animals of American Association for Accreditation of Laboratory Animal Care (AAALAC) (1996). Preparation of Salvia officinalis L. leaves aqueous extract.
Aqueous extracts were prepared as described previously by Nolkemper et al. (2006). Briefly, boiling water (100 ml) was added to dried leaves (10 g) and incubated for 15 min, subsequently filtered and cooled

Life Science Journal 2013;10(1) http://www.lifesciencesite.com
1875
down. The resulting extracts were sterile filtered, aliquoted, and stored at -20°C. The extract was given orally (100 mg/ kg b.wt.). OVA-Induced Asthmatic Mouse Model
According to the methods described by Henderson et al. (1996) and Erb et al. (1998) mice were injected intraperitoneally with 2μg OVA chicken egg albumin (Sigma Chemical Co., St. Louis,MO) in 100μl aluminum hydroxide (alum adjuvant) on day 0 (starting time) and boosted again intraperitoneally with 2μg OVA/alum at day 14. Fourteen days after the second intraperitoneal immunization mice were anesthetized by i.p. injection (0.2 ml) of a mixture of ketamine (0.44mg /ml) and xylazine (6.3mg/ml) then 100μg OVA in a 50 μl volume of phosphate buffered saline (PBS) was administered by intranasal challenge. Experimental design:
Mice were divided into four groups, the 1st
control mice and the 2nd control-Salvia officinalis (SO),while the 3rd and 4th groups were underwent OVA exposure as OVA-challenged, and OVA- challenged SO, respectively. The second and fourth groups received Salvia officinalis extract (100 mg/kg p.o.) from day 0 to the day of challenge. Sacrification of mice was done after 48hrs of intranasal OVA challenge (Figure 1).The blood collected and centrifuged for 10 min. and stored at -80°C.
Figure(1): Diagram of the experimental design
Detection of Different Cell Types in Bronchoalveolar Lavage Fluid
The mouse trachea was cannulated and lungs were washed 3 times with 1ml phosphate buffer saline (PBS). Bronchoalveolar lavage fluid (BALF) cells from a 0.05-ml aliquot of the pooled sample were counted
using a hemocytometer to determine the total leukocytes count. The remaining fluid was immediately centrifuged at 40Cfor 10 min at 200 g. The supernatant was collected for cytokines measurements, by ELISA. The cell pellets were re-suspended in normal saline containing 10% bovine serum albumin ( BSA). BALF cell smears were made on glass slides. The dried slides were stained for eosinophil's count with eosin and methylene blue according to Henderson et al. (1996). Detection of cytokines in BALF
Cytokines, IL-4 and IL-5 were evaluated with an ELISA kit (California, USA) according to the manufacturer’s protocol. Measurement of serum level IgE:
Forty-eight hours post intranasal challenge, animals were sacrificed and Serum IgE was evaluating with an enzyme linked immune sorbent assay (ELISA) using Mouse Serum Anti-OVA IgE Antibody Assay Kit Catalog # 3010 Chondrex, Inc. Histological analysis
Forty-eight hours after the intranasal challenge, the lungs were removed, washed with PBS and infused with 10% formalin in PBS for fixation. The lung tissue was sectioned and stained with hematoxylin and eosin (H& E) Statistical analysis
Data were fed to the computer using IBM SPSS software package version 20.0. Quantitative data were described using mean and standard error. Comparison between different groups was analyzed using F-test (ANOVA) and Post Hoc test (Scheffe) for pair wise comparison. Significance test results are quoted as two-tailed probabilities. Significance of the obtained results was judged at the 5% level. 3. Results
Data represented in table (1) showed that the number of total leukocytes and eosinophils cells as well as IL-4 and IL-5 levels in BALF and the serum total IgE were significantly increased in OVA-challenged group as compared to the control group values. The data of OVA-SO group showed significant decrease in the aforementioned parameters as compared to the corresponding values of OVA-challenged group.
Table (1): Effect of Salvia officinalis extract on BALF cells migration, cytokines production (IL-4, IL-5) and IgE level Control (n=5) control-SO (n=5) OVA-challenged (n=5) OVA-SO challenged (n=5) p Total leukocyte (106/ml) 0.43 ± 0.05 0.46 ± 0.05 6.51a ± 0.12 3.22b ± 0.36 <0.001*
<0.001*
<0.001*
<0.001*
<0.001*
Eosinophil (105/ml) 0.25 ± 0.04 0.23 ± 0.01 5.27 a ± 0.08 2.32b ± 0.08 IL_4 (pg/ml) 10.4 ± 0.64 10.54 ± 1.14 80.46a ± 0.35 12.40b ± 1.46
IL_5(pg/ml) 11.34 ± 0.58 11.28 ± 0.13 41.22a ± 0.5 13.34b ± 0.13 Total IgE (ng/ml) 14.52 ± 0.66 15.30 ± 1.55 70.26 a ± 0.11 13.56b ± 1.79
Salvia officinalis extract was given orally from the first day of immunization to the day of intranasal challenge Data was expressed in mean ± SE; p: p value for F test (ANOVA) pair wise between any two groups was assessed using Post Hoc test (Scheffe); a: Significant with control group; b: Significant with OVA- challenged group; *: Statistically significant at p ≤0.05

Life Science Journal 2013;10(1) http://www.lifesciencesite.com
1876
Histological analysis
Lungs in the OVA-challenged group showed a large increase in eosinophils recruitment compared to the control group. The lungs of mice treated with Salvia officinalis (SO) extract showed significantly fewer eosinophils than in the OVA-challenged group (Figure 2).
Figure (2): Histological analysis of mouse lung sections. Mouse lung sections were stained with hematoxylin and eosin. Lung tissue from the OVA challenged-SO mouse group (D) showed fewer eosinophils than the OVA challenged(C), scale bars = 100µm. 4.Discussion
Airway inflammation is the key factor in the pathogenesis of asthma and current strategies for the management focus on suppressing airway inflammation (Kumar, 2001; Walsh, 2006).
In oriental medicine, herb was widely used to treat bronchial asthma (Stockert et al., 2007), theoretically by clearing the pathogenic factors and reinforcing the body’s resistance. In the present study, Salvia officinalis (SO) extract was used for the herbal treatment. To investigate the effect of Salvia officinalis on allergic bronchial asthma, the OVA-induced asthmatic mouse model was used.
The cellular infiltrate that characterizes asthma and the ability to control leukocyte migration and eosinophils infiltration into the lungs is viewed as the key to regulating disease severity. (Lukacs, 2001) .
After infiltration at site of allergic inflammation, these inflammatory cells release mediators, e.g., (cytokines and chemokines). Salvia officinalis decreased the total leukocyte and eosinophils infiltration in BALF of OVA- induced asthmatic mice. From these results, Salvia officinalis may have therapeutic effect in allergic asthma via inhibiting leukocytes and eosinophils migration in the lungs.
Asthma is generally regarded as a T-cell mediated disease. Antigen cause the differentiation of naïve T-cell into helper cells, which then secrete cytokines such as IL-4and IL-5. IL-4, which is pivotal in the pathogenesis of allergic disorder acts on B cells to facilitate (Switch) IgE production (Haas et al., 1999; Ramshaw et al., 2001). Increased IgE production in response to common environmental antigens is the hallmark of atopic diseases such as bronchial asthma (Hamelmann et al., 1999).
IL-4 also induces the rolling and adhesion of circulating eosinophils to endothelial cells.IL-4, which at least in murine system is essential in instructing B cells to switch to IgE production. Therefore, inhibitors of IL-4 signaling pathway have been suggested as therapeutic targets (Barnes, 2000; Romagnani, 2002).
The present work showed that Salvia officinalis (SO) extract significantly decreased IL-4 in BAL. the eosinophils migration observed here showed that (100mg/kg),Salvia officinalis extract (SO) caused the reduction of eosinophils infiltration in the BAL and this may be due to decrease in IL-4 by Salvia officinalis (SO) extract. Based on these results, it is inferred that Salvia officinalis(SO) extract may have an anti-allergic effect on allergic asthma by suppressing IL-4 secretion and, in consequence, inhibiting IgE secretion from lymphocyte B cells. Further, reduced IL-4 may reduce eosinophils infiltration into lungs by inhibition the adhesion of circulating eosinophils to endothelial cells.
IL-5 is a Th2-type cytokine that promotes the recruitment and activation of eosinophils, IL-5 stimulates the release of chemical mediators from eosinophils (Broide 2001). Airway eosinophils inflammation is one of the characteristics of allergic asthma. Therefore IL-5 has been implicated in the pathogenesis of allergic diseases (Rothenberg et al., 1997; Hogen et al., 2001), and many studies appeared that IL-5 is an important target for improved asthma therapy.(Costa et al., 1997; Okudaira and Mori, 1998; VanWauwe et al., 2000). Furthermore, activated Th2- type cells, which can produce IL-5 and several other cytokines, are activated in a greater proportion in asthmatic individuals, in this study, Salvia officinalis significantly reduced IL-5 in BAL and reduced eosinophils infiltration and activation in OVA-induced asthmatic mice.
The present data demonstrate that Salvia officinalis can inhibit the excess activity of T- helper cells cytokines which play an important role in the maintenance of bronchial asthma not only by inhibiting IL-4 production from T cells to suppress IgE production from B cells but also by reducing IL-5 to decrease eosinophils infiltration.
Life Science Journal 2013;10(1) http://www.lifesciencesite.com
1877
In addition, histological analysis of lung tissue showed that Salvia officinalis inhibited eosinophil infiltration in the lung. From these results, Salvia officinalis extract may have therapeutic activity against eosinophilic infilammation in allergic asthma via inhibiting cellular infiltration in the lung.
The control Salvia officinalis extract group did not show any considerable differences from the control group this result indicates that Salvia officinalis extract does not cause any changes in normal condition, so it does not interrupt the homeostasis of healthy subjects.
Moreover, the present study showed that water extract of Salvia officinalis had an anti-inflammatory effect on asthmatic mice induced by OVA.
The anti-inflammatory activity of plant has been attributed to their triterpene (Ghannadi et al., 2005), or flavonoid contents (Palgan and Bartuzi, 2011). Biflavonoids, and triterpenoids produced significant anti-inflammatory activities (La Casa et al., 2000; Calixto et al., 2000 ; Sabu and Kuttan, 2002 ; Silva et al., 2005)
Previous studies showed that Salvia species are rich in phenolic compounds, such as phenolic acids and flavonoids, in addition to terpenoids (LaCasa et al., 2000).
Therefore, the presence of anti-inflammatory activity may be due to phenol and terpenoid contents in the plant.
In summary, We conclude that Salvia officinalis may be used to bronchial allergic asthma to reduce airways hyperreactivity by suppressing IL-4, IL-5 and IgE. The present data suggest that Salvia officinalis(SO)has a therapeutic effect on bronchial asthma by inhibiting T cells activation and reducing eosinophils infiltration in the airway. References 1. Abu-Darwish MS, Al-Ramamneh EA, Kyslychenko
VS, Karpiuk UV. (2012): The antimicrobial activity of essential oils and extracts of some medicinal plants grown in Ash-shoubak region - South of Jordan. Pak J Pharm Sc.i.; 25(1):239-246.
2. American Association for Accreditation of Laboratory Animal Care (AAALAC): The National Academic Press (1996): Appendix B: Selected Organizations Related to Laboratory animal Science.
3. Baricevic, D., Bartol, T., (2000): The biological/pharmacological activity of the Salvia genus. In: Kintzios, S.E. (Ed.), SAGE - The Genus Salvia. Harwood Academic Publishers, Amsterdam, pp. 143-184.
4. Baricevic D, Sosa S, Della Loggia R, Tubaro A, Simonovska B, Krasna A, Zupancic A. (2001): Topical anti-inflammatory activity of Salvia officinalis L. leaves: the relevance of ursolic acid. J Ethnopharmacol.; 75(2-3):125-132.
5. Barnes P. J.(2000 ) New directions in allergic disease: mechanism-based anti-inflammatory therapies. J. Allergy. Clin. Immunol; 106: 5-16.
6. Bollag U, Grize L, Braun-Fahrländer C. (2009): Is the ebb of asthma due to the decline of allergic asthma? A prospective consultation-based study by the Swiss Sentinel Surveillance Network, 1999–2005. FamPract, ; 6: 96–101.
7. Boyce JA, Bochner B, Finkelman FD, Rothenberg ME. (2012): Advances in mechanisms of asthma, allergy, and immunology in 2011. J Allergy Clin Immunol.; 129(2):335-341.
8. Bozin B, Mimica-Dukic N, Samojlik I, Jovin E (2007). Antimicrobial and antioxidant properties of rosemary and sage (Rosmarinus officinalis L. and Salvia officinalis L., Lamiaceae) essential oils. J Agric Food Chem; 55(19): 7879-85.
9. Broide, D. H .(2001). Molecular and Cellular mechanisms of allergic disease. J. Allergy. Clin. Immunol; 108(Suppl 2): S 65-71.
10. Calixto AB, Beirith A, Ferreira J et al. (2000). Naturally occurring antinociceptive substances from plants. Phytother Res. ; 14: 401-418.
11. Costa, J. J., Weller, P. F., Galli, S. J (1997). The cell of the allergic response: most cells, basophils, and eosinophilis. JAMA; 278: 1815-22.
12. Elias, J.A., C.G. Lee, T. Zheng, B. Ma, R.J. Homer, and Z. Zhu. (2003): New insights into the pathogenesis of asthma. J. Clin. Invest.; 111:291–297.
13. Erb KJ, Holloway JW, Sobeck A, Moll H, Le Gros G. (1998): Infection of mice with Mycobacterium bovis-Bacillus Calmette-Guérin (BCG) suppresses allergen-induced airway eosinophilia. J Exp Med.; 187(4):561-569.
14. Gali-Muhtasib, H., C. Hilan and C. Khater (2000). Traditional uses of Salvia libanotica (East Mediterranean sage) and the effects of its essential oils. J. Ethnopharmacol.; 71(3): 513-520.
15. Geuenich S, Goffinet C, Venzke S, Nolkemper S, Baumann I, Plinkert P, Reichling J, Keppler OT. (2008): Aqueous extracts from peppermint, sage and lemon balm leaves display potent anti-HIV-1 activity by increasing the virion density. Retrovirology. ; 5:27.
16. Ghannadi A, Hajhashemi V, Jafarabadi H (2005). An investigation of the analgesic and anti-inflammatory effects of Nigella sativa seed polyphenols. J Med Food; 8: 488-493.
17. Haas, H., Falcone, F. H., Holland, M. J., Schramm, G., Haisch, K., Gibbs, B. F., et al. (1999). Early interleukin-4 its role in the switch towards a Th2 response and IgE-mediated allergy. Int Arch Allergy Immunol; 119: 86-94.
18. Hamelmann E (2007): The rationale for treating allergic asthma with anti-IgE. European Respiratory Review; 16: 61–66.
19. Hamelmann, E., Tadeda, K., Oshiba, A., Gelfand, E. W(1999). Role of IgE in the development of allergic airway inflammation and airway hyperresponsiveness- murine model. Allergy; 54: 297-305.
20. Henderson WR Jr, Lewis DB, Albert RK, Zhang Y, Lamm WJ, Chiang GK, Jones F, Eriksen P, Tien YT, Jonas M, Chi EY. (1996): The importance of
Life Science Journal 2013;10(1) http://www.lifesciencesite.com
1878
leukotrienes in airway inflammation in a mouse model of asthma. J Exp Med.; 184(4):1483-1494.
21. Hogan, S. P. Mishra, A., Brandt, E. B., Royalty, M. P., Pope, S. M., Zimmermann, N., et al (2001). A pathological function for eotaxin and eosinophils in eosinophilic gastrointestinal inflammation. Nat. Immunol; 2: 353-360.
22. Kay AB (2001): Allergy and allergic diseases First of two parts. N Engl J Med,
23. Kintzios, S.E. (2000). Medicinal and aromatic plants-Industrial profiles, sage, the genus Salvia, vol. 14, Harwood Academic Publishers, The Netherlands.
24. Kumar RK (2001). Understanding airway wall remodling in asthma : a basis for improvement in therapy? Pharmacol.Ther.;91 (2):93-104
25. Kumperman D., Schofield B., Wills- karp M., and Grusby M.J. (1998):Signal transducer and activator of transcriptions factor 6 (state 6) – deficient mice are protected from antigen-induced airway hyper responsiveness and mucus production. J.Exp. Med.;187:939-948.
26. La Casa C, Villegas I, Alarcon de la Lastra C et al. (2000). Evidence for protective and antioxidant properties of rutin, a natural flavones, against ethanol induced gastric lesions. J Ethnopharmacol; 71: 45-53,.
27. Loizzo MR, Tundis R, Menichini F, Saab AM, Statti GA, Menichini F. (2007): Cytotoxic activity of essential oils from labiatae and lauraceae families against in vitro human tumor models. Anticancer Res.; 27(5A):3293-3299.
28. Lommatzsch M. (2012): Airway hyperresponsiveness: new insights into the pathogenesis. Semin Respir Crit Care Med.; 33(6):579-587.
29. Longaray Delamare, A.P., Moschen-Pistorello, I.T., Artico, L., Atti-Serafini, L., Echeverrigaray, S. (2007). Antibacterial activity of the essential oils of Salvia officinalis L. and Salvia triloba L. cultivated in South Brazil. Food Chemistry; 100: 603–608.
30. Lukacs N. W (2001). Role of chemokines in the pathogenesis of asthma Nat. Rev. Immunol.; 1: 108-16.
31. Nolkemper S, Reichling J, Stintzing FC, Carle R, Schnitzler P (2006): Antiviral effect of aqueous extracts from species of the Lamiaceae family against Herpes simplex virus type 1 and type 2 in vitro. Planta Med.; 72(15):1378-1382.
32. Okudaria, H., Mori, A (1998) . Simple understanding and optimistic strategy for coping with atopic diseases. IL-5 central hypothesis on eosinophilic inflammation. Int. Arch. Allergy Immunol; 117: 11-19.
33. Palgan K. and Bartuzi Z. (2011) :The role of flavonoids in asthma , Post Dermatol Alergol . XXVIII ;5:396-401
34. Ramshaw H. S. Woodcock J. M., Bagley. C. T., McClure, B. J., Hercus, T. R., Loperz, A. R (2001).
New approaches in the treatment of asthma. Immunol Cell Biol; 79: 154-159.
35. Renauld, J.C. (2001): New insights into the role of cytokines in asthma. J. Clin. Pathol. 54:577–589.
36. Rodrigues MR, Kanazawa LK, das Neves TL, da Silva CF, Horst H, Pizzolatti MG, Santos AR, Baggio CH, Werner MF. (2012): Antinociceptive and anti-inflammatory potential of extract and isolated compounds from the leaves of Salvia officinalis in mice. J Ethnopharmacol.; 139 (2):519-526.
37. Romagnani, S.,(2002): Cytokines and chemo attractants in allergic disease. J. Allergy. Clin. Immunol.; 38: 881-885.
38. Rothenberg, M. E., MacLcan, J. A., Pearlman E., Luster A. D., Leder, P (1997). Targeted disruption of the chemokine eotaxin partially reduces antigen-induced tissue eosinophilia. J. Exp. Med.; 185: 785-90.
39. Sabu MC, Kuttan R (2002). anti-diabetic activity for medicinal plants and its relationship with their antioxidant property. J Ethnopharmacol; 81: 155-160.
40. Secor ER, Carson WF, Singh A, Pensa M, Guernsey LA, Schramm CM, Thrall RS. (2008): Oral Bromelain Attenuates Inflammation in an Ovalbumin-induced Murine Model of Asthma. Evid Based Complement Alternat Med.; 5(1):61-69.
41. Silva GN, Martins FRF, Matheus ME et al. (2005). Investigation of anti-inflammatory and antinoclceptive activities of Lantana trifolia. J Ethnopharmacol; 100: 254-259.
42. Soković M, Glamočlija J, Marin PD, Brkić D, van Griensven LJ. (2010): Antibacterial effects of the essential oils of commonly consumed medicinal herbs using an in vitro model. Molecules.; 15(11):7532-7546.
43. StockertK,Schneider B, Porenta G, Rath R, Nissel H, Eichler I. Laser acupuncture and probiotics in school age children with asthma : a randomized, principles of Traditional Chinese Medicine. Pediatr Allergy Immunol 2007; 18:160-6
44. Van Wauwe J., AertsF., Cools, M., Deroose, F., Freyne, E., Goossens, J., et al(2000). Identification of R146225 as a novel, orally active inhibitor of interleukin-5 biosynthesis J. Pharmacol. Exp. Ther.; 295: 655-661.
45. Walsh GM.,(2006). Targeting airway inflammation : novel therapies for the treatment of asthma. Curr Med Chem:13 (25): 3105-11.
46. Wills-Karp, M. (1999): Immunologic basis of antigen-induced airway hyperresponsiveness. Annu. Rev. Immunol. 17:255–281.
47. Yim YK, Lee H, Hong KE, Kim YI, Ko SK, Kim JE, Lee SY, Park KS. (2010): Anti-inflammatory and Immune-regulatory effects of Subcutaneous Perillae fructus extract injections on OVA-induced asthma in mice. Evid Based Complement Alternat Med.; 7(1):79-86.
1/20/2013
Life Science Journal 2013;10(1) http://www.lifesciencesite.com
1879
Agarose Slide Elisa for Diagnosis of HCV-AB in Rural Areas
Mohammed M. Safhi1 and Hussien A. Abouelhag2
1Department of Pharmacology, College of Pharmacy, Jazan University, Kingdom of Saudi Arabia 2Microbiology and Immunology Department, National Research Centre, Dokki, Egypt
Abstract: Hepatitis C virus (HCV) infection is a viral infection of the liver affecting 170 million people around the world. Commercially available tests for HCV today are based on enzyme immunosorbent assay (EIA) for detection of HCV-Ab. Regarding the sophisticated equipments required for diagnosis of HCV, this this work targeted offering a dependable field serological test that can be used in rural areas as preliminary screening test for HCV patients. Hundred and fifty serum samples were collected from Jazan clinics in Saudi Arabia for HCV patients and 50 serum samples were collected from healthy volunteers. All samples were tested for HCV-Ab using slides coated with 1.5% agarose and saturated with HCV capside synthetic peptide (BIORAD) (10%). Fifty microliter of each sample were applied onto spot of HCV-Ag saturated agarose and incubated in humidified incubator for 90 min at 37οC. After which the slides were wash. Mouse antihuman IgG labeled conjugate was added to the slides and incubated for 30 min at 37οC. After washing the slides, 50µl substrate (BIORAD) were added and incubated for 30 min at room temperature then washed out. The slides were examined by naked eye and by light microscope against controls. The obtained results were compared with standard Monolisa HCV Ag-Ab Ultra assay and both results were matched. The results proved that agarose slide EIA have accuracy exceeding ˃ 99%. So, agarose slide EIA can be suggested for use in preliminary diagnosis of HCV in the field clinics of rural areas or even in screening of blood donors in emergence cases. [Mohammed M. Safhi and Hussien A. Abouelhag. Agarose Slide Elisa for Diagnosis of Hcv-Ab in Rural Areas. L Life Sci J 2013;10(1):1879-1884] (ISSN:1097-8135). http://www.lifesciencesite.com. 270 Key words: HCV, slide ELISA, HCV EIA, agarose and rural areas. 1. Introduction
Hepatitis C virus (HCV) infection is a viral infection of the liver which is referred to as parentrally transmitted “non A, non B hepatitis”. HCV is an enveloped RNA virus in the flaviviridae family which appears to have a narrow host range (Bachy et al., 2010).
WHO estimated that about 170 million people, 3% of the world’s population, are infected with HCV and are at risk of developing liver cirrhosis and/or liver cancer (Hepatocellular carcinoma) (Li et al., 2012). The prevalence of HCV infection in some countries in Africa, the East Mediterranean, south East Asia and the Western Pacific is high compared to some countries in North America and Europe (Zamani et al., 2007).
In both developed and developing countries, high risk groups include injecting drug users, recipients of unscreened blood, haemophiliace, dialysis patients and persons with multiple sexual partners who are engage in unprotected sex (Crofts et al., 1997 and Kassaian et al., 2012).
Diagnostic tests for HCV are used to prevent infection through screening of donor blood and plasma, to establish the clinical diagnosis and to make better decisions regarding medical care cost and medical management of a patient (Schnuriger et al., 2006).
Diagnostic tests commercially available today are based on enzyme immunosorbent assay (EIA) for the detection of HCV specific antibodies. EIAs can detect
more than 95% of chronically infected patients. A recombinant immunoblot assay (RIBA) that identifies antibodies which react with individual HCV antigen is often used as supplemental test for confirmation of a positive EIA result. Testing for HCV circulating by amplification test RNA (PCR) is also being utilized for confirmation of serological results as well as for assessing the effectiveness of antiviral therapy (Kim et al., 2006). So RIBA and PCR viral load is considered to be highly confirmatory tests for HCV which can be carried on in the central clinics.
In this work slide EIA was developed to simplify the process of screening for HCV in rural areas where there is no availability of refined equipments. So, the agarose slide ELISA assay may be suitable for the primary screening for HCV of positive and negative HCV Ab individuals in rural areas and also in screening of blood donors in emergency cases. 2. Materials and Methods Slides preparation:
Halls were made by a metallic ring 0.5 cm in diameter in previously coated glass slide with parafilm at 56οC and cooled to 4οC later.
The previously made halls were filed with 1.5% agarose previously cooked at 100οC for 10 min and cooled to 45οC before pouring in the halls (50 µl in each well). This loaded agarose was saturated at 45 οC with 10% HCV capsid synthetic peptide (Biorad) with the same concentration provided by manufacture just

Life Science Journal 2013;10(1) http://www.lifesciencesite.com
1880
before pouring. The coated slides were kept at 4οC in humified sealed slide box till use. Sample collection:
Five ml of blood sample were collected from 150 established HCV infected patients in Jazan clinics and 50 samples were collected from healthy volunteers. For keeping the privacy instead of a block for the patient’s name, the test tube had an anonymous identification code. The blood samples were cooled to 4οC for 60 min then centrifuged at 3000 rpm for 30 min where the serum samples were collected and separated in clean sterile tubes. Sample application:
Fifty microliter of serum samples were applied onto the surface of previously prepared saturated agarose with HCV Ag slides and incubated in inverted position at 37οC for 90 min. Ag-Ab reaction:
The slides were washed thoroughly with 20 ml of washing solution (Tris NaCl buffer pH 7.4 contains Proclin 0.04%). After that the slides were socked in coplin jar containing the washing buffer. After 10 min the slides were removed from coplin jars and blotted from edges on filter papers to remove excess of buffer remains. After which 50 µl of conjugate (anti-human mouse IgG /peroxidase and streptavidine/peroxidase green colored) were added directly on the slides and incubated at inverted position in humified chamber at 37οC. After 30 min the slides were washed as mention before and blotted from edges on filter papers to remove excess of buffer remains. The substrate chromogen [citric acid and sodium acetate solution pH 4 containing H2O2 (0.015%)] and DMSO 4% containing tetramthyl benizdine (TMB)] was added onto the slide and incubated in inverted position at 37οC. After 30 min the excess of the substrate were removed by blotting against filter paper and the agarose spots were covered with three evenly distributed drops of mountain medium. The slides were covered by cover slips with avoiding undue pressure. The slides were examined by nicked eyes comparing with control positive and control negative. The positive results were confirmed by examining under light microscope. Quality control:
The HCV negative and positive obtained results were compared with regular HCV Monolisa HCV Ag-Ab Ultra assay [Biorad] which was carried out according to Lambert et al.,(2004) and the obtained results were matched statistically according to Schnuriger et al., (2006). The results of Monolisa HCV Ag-Ab Ultra assay are expressed as the ratio of the absorbance to the cutoff; a ratio above 1 is considered a positive result. The sensitized threshold (gray zone) was also considered at a ratio of 0.5 (Laperche et al., 2003, Laperche et al., 2005 and Ansaldi et al., 2006).
Statistical analysis: The statistical analysis was performed according
to Bailey (1994). The research protocol was approved by the
Ethical Committee of College of Pharmacy, Jazan University. 3. Results
The agarose slides were examined by naked eye for the presence of bluish coloration of the positive HCV tested samples and light yellowish coloration for the negative HCV tested samples as shown in figure (1). The obtained results as illustrated by Fig.(1) cleared that the negative HCV samples (Fig.1D) gave a yellowish coloration same as that given by uninoculated slide (fig.1E), while the positive HCV tested samples (Fig.1A & B and Fig. 2) gave a bluish coloration same as that given by control positive HCV (Fig. 1C). The intensity of the color was directly proportional to the titer of ELISA unites obtained by Monolisa HCV Ag-Ab Ultra assay.
It was remarkably noticed that the color intensity of the HCV positive samples (Fig.2) was varied among them and this was referred to the concentration of the reaction between the bonded anti-HCV IgG and the loaded HCV viral capside Ag in the agarose and this also was confirmed by the microscopical examination of the tested slide as shown in figure (3). The microscopic examination of HCV positively reacted agarose slides under power 200 and 400X cleared that the bluish coloration referred to the bluish purple formazan crystals formed by the tetramthyl benizdine (TMB) present in the substrate that react with the anti-human IgG conjugate enzyme.
It was recorded that the bluish coloration of HCV positive samples was varied from light blue to deep bluish coloration and the bluish coloration intensity distribution in the same spot was varied from central point of agarose spot to the spot periphery, however no bluish coloration was recorded in the HCV negative control or normal control samples. According to the obtained color intensity the HCV positive slides were graded from (+ve) to (++++ve) by naked eye evaluation.
When the obtained results and color intensity of HCV positive slides were compared with the Monolisa HCV Ag-Ab Ultra assay reading it was clear that the obtained results by naked eye is matching (99.66%) as described in figure (4) and (5). However by examining figures (4) and (5) it was recorded that only one sample out of 150 HCV positive samples gave negative reaction by EIA agarose slide while it gave positive reaction with Monolisa HCV Ag-Ab Ultra assay with O.D. 1.309 nm.
The statistical analysis of the obtained results from Monolisa HCV Ag-Ab Ultra assay optical density and positive slides coloration gave an idea about the
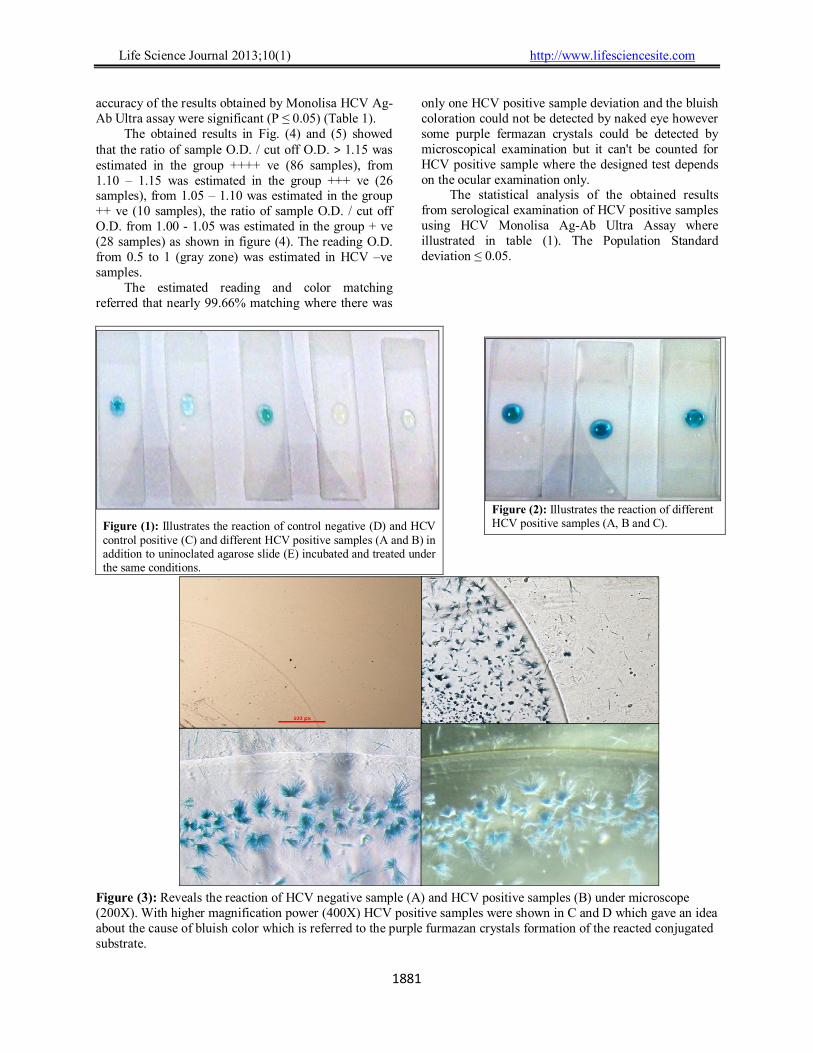
Life Science Journal 2013;10(1) http://www.lifesciencesite.com
1881
accuracy of the results obtained by Monolisa HCV Ag-Ab Ultra assay were significant (P ≤ 0.05) (Table 1).
The obtained results in Fig. (4) and (5) showed that the ratio of sample O.D. / cut off O.D. ˃ 1.15 was estimated in the group ++++ ve (86 samples), from 1.10 – 1.15 was estimated in the group +++ ve (26 samples), from 1.05 – 1.10 was estimated in the group ++ ve (10 samples), the ratio of sample O.D. / cut off O.D. from 1.00 - 1.05 was estimated in the group + ve (28 samples) as shown in figure (4). The reading O.D. from 0.5 to 1 (gray zone) was estimated in HCV –ve samples.
The estimated reading and color matching referred that nearly 99.66% matching where there was
only one HCV positive sample deviation and the bluish coloration could not be detected by naked eye however some purple fermazan crystals could be detected by microscopical examination but it can't be counted for HCV positive sample where the designed test depends on the ocular examination only.
The statistical analysis of the obtained results from serological examination of HCV positive samples using HCV Monolisa Ag-Ab Ultra Assay where illustrated in table (1). The Population Standard deviation ≤ 0.05.
Figure (1): Illustrates the reaction of control negative (D) and HCV control positive (C) and different HCV positive samples (A and B) in addition to uninoclated agarose slide (E) incubated and treated under the same conditions.
Figure (3): Reveals the reaction of HCV negative sample (A) and HCV positive samples (B) under microscope (200X). With higher magnification power (400X) HCV positive samples were shown in C and D which gave an idea about the cause of bluish color which is referred to the purple furmazan crystals formation of the reacted conjugated substrate.
Figure (2): Illustrates the reaction of different HCV positive samples (A, B and C).
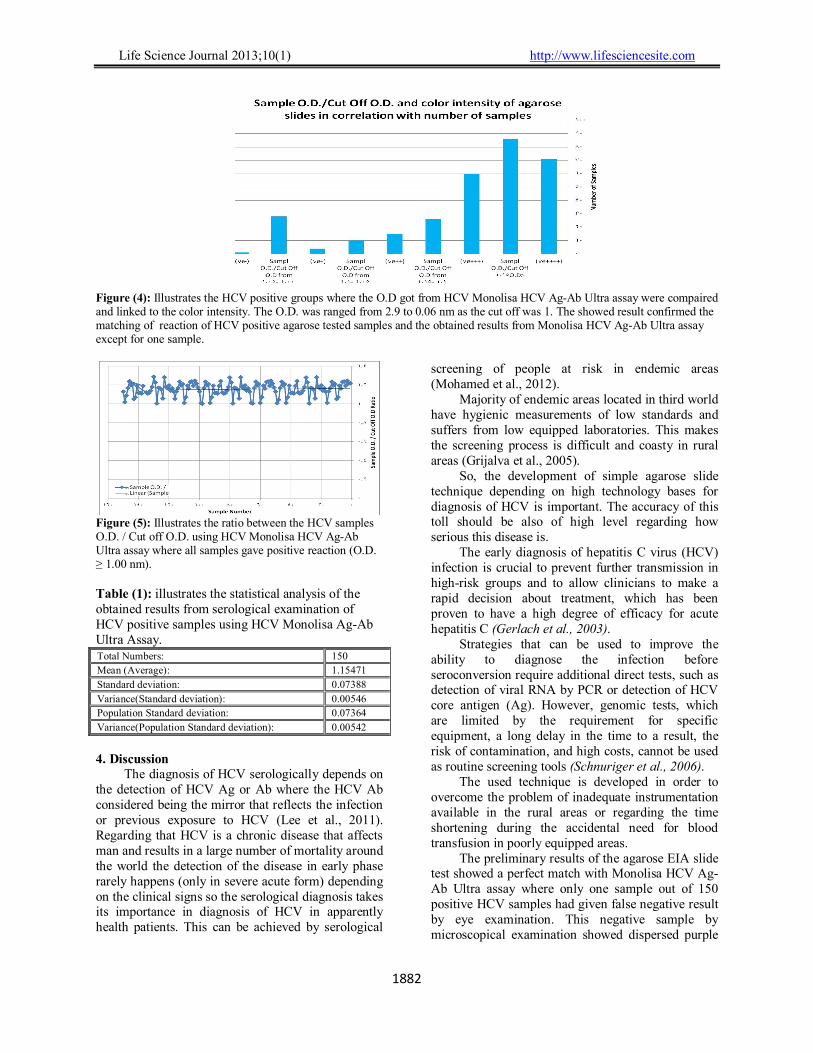
Life Science Journal 2013;10(1) http://www.lifesciencesite.com
1882
Figure (4): Illustrates the HCV positive groups where the O.D got from HCV Monolisa HCV Ag-Ab Ultra assay were compaired and linked to the color intensity. The O.D. was ranged from 2.9 to 0.06 nm as the cut off was 1. The showed result confirmed the matching of reaction of HCV positive agarose tested samples and the obtained results from Monolisa HCV Ag-Ab Ultra assay except for one sample.
Figure (5): Illustrates the ratio between the HCV samples O.D. / Cut off O.D. using HCV Monolisa HCV Ag-Ab Ultra assay where all samples gave positive reaction (O.D. ≥ 1.00 nm). Table (1): illustrates the statistical analysis of the obtained results from serological examination of HCV positive samples using HCV Monolisa Ag-Ab Ultra Assay.
Total Numbers: 150
Mean (Average): 1.15471
Standard deviation: 0.07388
Variance(Standard deviation): 0.00546
Population Standard deviation: 0.07364
Variance(Population Standard deviation): 0.00542
4. Discussion
The diagnosis of HCV serologically depends on the detection of HCV Ag or Ab where the HCV Ab considered being the mirror that reflects the infection or previous exposure to HCV (Lee et al., 2011). Regarding that HCV is a chronic disease that affects man and results in a large number of mortality around the world the detection of the disease in early phase rarely happens (only in severe acute form) depending on the clinical signs so the serological diagnosis takes its importance in diagnosis of HCV in apparently health patients. This can be achieved by serological
screening of people at risk in endemic areas (Mohamed et al., 2012).
Majority of endemic areas located in third world have hygienic measurements of low standards and suffers from low equipped laboratories. This makes the screening process is difficult and coasty in rural areas (Grijalva et al., 2005).
So, the development of simple agarose slide technique depending on high technology bases for diagnosis of HCV is important. The accuracy of this toll should be also of high level regarding how serious this disease is.
The early diagnosis of hepatitis C virus (HCV) infection is crucial to prevent further transmission in high-risk groups and to allow clinicians to make a rapid decision about treatment, which has been proven to have a high degree of efficacy for acute hepatitis C (Gerlach et al., 2003).
Strategies that can be used to improve the ability to diagnose the infection before seroconversion require additional direct tests, such as detection of viral RNA by PCR or detection of HCV core antigen (Ag). However, genomic tests, which are limited by the requirement for specific equipment, a long delay in the time to a result, the risk of contamination, and high costs, cannot be used as routine screening tools (Schnuriger et al., 2006).
The used technique is developed in order to overcome the problem of inadequate instrumentation available in the rural areas or regarding the time shortening during the accidental need for blood transfusion in poorly equipped areas.
The preliminary results of the agarose EIA slide test showed a perfect match with Monolisa HCV Ag-Ab Ultra assay where only one sample out of 150 positive HCV samples had given false negative result by eye examination. This negative sample by microscopical examination showed dispersed purple
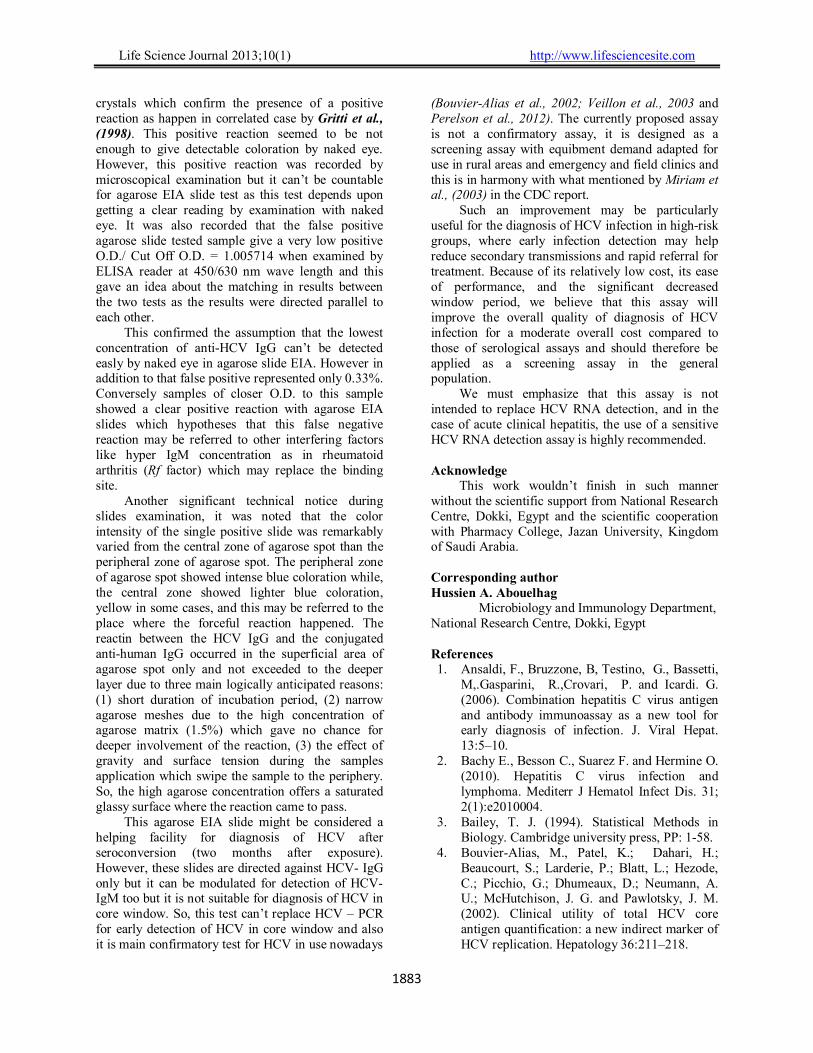
Life Science Journal 2013;10(1) http://www.lifesciencesite.com
1883
crystals which confirm the presence of a positive reaction as happen in correlated case by Gritti et al., (1998). This positive reaction seemed to be not enough to give detectable coloration by naked eye. However, this positive reaction was recorded by microscopical examination but it can’t be countable for agarose EIA slide test as this test depends upon getting a clear reading by examination with naked eye. It was also recorded that the false positive agarose slide tested sample give a very low positive O.D./ Cut Off O.D. = 1.005714 when examined by ELISA reader at 450/630 nm wave length and this gave an idea about the matching in results between the two tests as the results were directed parallel to each other.
This confirmed the assumption that the lowest concentration of anti-HCV IgG can’t be detected easly by naked eye in agarose slide EIA. However in addition to that false positive represented only 0.33%. Conversely samples of closer O.D. to this sample showed a clear positive reaction with agarose EIA slides which hypotheses that this false negative reaction may be referred to other interfering factors like hyper IgM concentration as in rheumatoid arthritis (Rf factor) which may replace the binding site.
Another significant technical notice during slides examination, it was noted that the color intensity of the single positive slide was remarkably varied from the central zone of agarose spot than the peripheral zone of agarose spot. The peripheral zone of agarose spot showed intense blue coloration while, the central zone showed lighter blue coloration, yellow in some cases, and this may be referred to the place where the forceful reaction happened. The reactin between the HCV IgG and the conjugated anti-human IgG occurred in the superficial area of agarose spot only and not exceeded to the deeper layer due to three main logically anticipated reasons: (1) short duration of incubation period, (2) narrow agarose meshes due to the high concentration of agarose matrix (1.5%) which gave no chance for deeper involvement of the reaction, (3) the effect of gravity and surface tension during the samples application which swipe the sample to the periphery. So, the high agarose concentration offers a saturated glassy surface where the reaction came to pass.
This agarose EIA slide might be considered a helping facility for diagnosis of HCV after seroconversion (two months after exposure). However, these slides are directed against HCV- IgG only but it can be modulated for detection of HCV-IgM too but it is not suitable for diagnosis of HCV in core window. So, this test can’t replace HCV – PCR for early detection of HCV in core window and also it is main confirmatory test for HCV in use nowadays
(Bouvier-Alias et al., 2002; Veillon et al., 2003 and Perelson et al., 2012). The currently proposed assay is not a confirmatory assay, it is designed as a screening assay with equibment demand adapted for use in rural areas and emergency and field clinics and this is in harmony with what mentioned by Miriam et al., (2003) in the CDC report.
Such an improvement may be particularly useful for the diagnosis of HCV infection in high-risk groups, where early infection detection may help reduce secondary transmissions and rapid referral for treatment. Because of its relatively low cost, its ease of performance, and the significant decreased window period, we believe that this assay will improve the overall quality of diagnosis of HCV infection for a moderate overall cost compared to those of serological assays and should therefore be applied as a screening assay in the general population.
We must emphasize that this assay is not intended to replace HCV RNA detection, and in the case of acute clinical hepatitis, the use of a sensitive HCV RNA detection assay is highly recommended. Acknowledge
This work wouldn’t finish in such manner without the scientific support from National Research Centre, Dokki, Egypt and the scientific cooperation with Pharmacy College, Jazan University, Kingdom of Saudi Arabia. Corresponding author Hussien A. Abouelhag Microbiology and Immunology Department, National Research Centre, Dokki, Egypt References 1. Ansaldi, F., Bruzzone, B, Testino, G., Bassetti,
M,.Gasparini, R.,Crovari, P. and Icardi. G. (2006). Combination hepatitis C virus antigen and antibody immunoassay as a new tool for early diagnosis of infection. J. Viral Hepat. 13:5–10.
2. Bachy E., Besson C., Suarez F. and Hermine O. (2010). Hepatitis C virus infection and lymphoma. Mediterr J Hematol Infect Dis. 31; 2(1):e2010004.
3. Bailey, T. J. (1994). Statistical Methods in Biology. Cambridge university press, PP: 1-58.
4. Bouvier-Alias, M., Patel, K.; Dahari, H.; Beaucourt, S.; Larderie, P.; Blatt, L.; Hezode, C.; Picchio, G.; Dhumeaux, D.; Neumann, A. U.; McHutchison, J. G. and Pawlotsky, J. M. (2002). Clinical utility of total HCV core antigen quantification: a new indirect marker of HCV replication. Hepatology 36:211–218.

Life Science Journal 2013;10(1) http://www.lifesciencesite.com
1884
5. Crofts N., Jolley D., Kaldor J. and Wodak A. (1997). Epidemiology of hepatitis C virus infection among injecting drug users in Australia. J Epidemiol Community Health.;51:692–7.
6. Gerlach, J. T., Diepolder, H. M.; Zachoval, R.; Gruener, N. H.; Jung, M. C.; Ulsenheimer, A.; Schraut, W. W.; Schirren, C. A.; Waechtler, M.; Backmund, M. and Pape G. R. (2003). Acute hepatitis C: high rate of both spontaneous and treatment-induced viral clearance. Gastroenterology 125:80–88.
7. Grijalva M. J., Chiriboga R. F., Vanhassel H., and Arcos-Teran L. (2005). Improving the safety of the blood supply in Ecuador through external performance evaluation of serological screening of blood donors,” Journal of Clinical Virology.; vol. 34, no. 2, supplement, pp. S47–S52.
8. Gritti I. , Mariotti M. and Mancia M. (1998). Gabaergic and cholinergic basal forebrain and preoptic-anterior hypothalamic projections to the mediodorsal nucleus of the thalamus in the cat. Neuroscience, Volume 85, Issue 1, Pages 149–178.
9. Kassaian N., Adibi P., Kafashaian A., Yaran M., Nokhodian Z., Shoaei P., Hassannejad R., Babak A. and Ataei B. (2012). Hepatitis C Virus and Associated Risk Factors among Prison Inmates with History of Drug Injection in Isfahan, Iran. Int J Prev Med.;3(Suppl 1):S156-61.
10. Kim M. H., Lee H. J., Park S. Y., Lee Y. S., Suh J. T. (2006). Usefulness of Anti-HCV ELISA Test and HCV Reverse Transcriptase-PCR for the Diagnosis of Hepatits C Viral Infection. Korean J Lab Med.; 26(6):418-23.
11. Lambert N., Vermet L., Bordier M., Clement A., Costaille M., Priget V., Flecheux O.and Sanjuan A. (2004). Performance features of new Bio-Rad HCV antigen and antibody assay:Monolisa HCV Ag-Ab ULTRA. Vox sanguinis. 87 (suppl 3) : 61-62.
12. Laperche, S., Le Marrec, N.; Girault, A.; Bouchardeau, F.; Servant-Delmas, A.; Maniez-Montreuil, M.; Gallian, P.; Levayer, T.; Morel, P. and Simon N. (2005). Simultaneous detection of hepatitis C virus (HCV) core antigen and anti-HCV antibodies improves the early detection of HCV infection. J. Clin. Microbiol. 43:3877–3883.
13. Lee CE, Sri Ponnampalavanar S, Syed Omar SF, Mahadeva S, Ong LY, Kamarulzaman A. (2011).Evaluation of the dried blood spot (DBS) collection method as a tool for detection of HIV Ag/Ab, HBsAg, anti-HBs and anti-HCV in a Malaysian tertiary referral hospital. Ann. Acad. Med. Singapore. 40(10):448-53.
14. Li H., Stoddard M. B., Wang S., Blair L. M., Giorgi E. E., Parrish E. H., Learn G. H., Hraber P., Goepfert P. A., Saag M. S., Denny T. N., Haynes B. F., Hahn B. H., Ribeiro R. M., Perelson A. S., Korber B. T., Bhattacharya T., Shaw G. M. (2012). Elucidation of hepatitis C virus transmission and early diversification by single genome sequencing. PLoS Pathog. 8(8):e1002880.
15. Miriam J. Alter, Wendi L. Kuhnert, Lyn Finelli (2003). Guidelines for Laboratory Testing and Result Reporting of Antibody to Hepatitis C Virus. Center for Disease Control, February 7, / 52(RR03); 1-1.
16. Mohamed A. Daw, Aghnaya A. Dau. (2012). Hepatitis C Virus in Arab World: A State of Concern. Scientific World Journal. Volume 2012, Article ID 719494, 12 pages.
17. Perelson A. S., Korber B. T., Bhattacharya T. and Shaw G. M. (2012). Elucidation of hepatitis C virus transmission and early diversification by single genome sequencing. PLoS Pathog. 8(8):e1002880. Epub 2012 Aug 23.
18. Schnuriger A., Dominguez S., Valantin M. A., Tubiana R., Duvivier C., Ghosn J., Simon A., Katlama C. and Thibault V. (2006). Early detection of hepatitis C virus infection by use of a new combined antigen-antibody detection assay: potential use for high-risk individuals. J Clin Microbiol. 44(4):1561-3.
19. Veillon, P., Payan, C.; Picchio, G.; Maniez-Montreuil, M.; Guntz, P. and Lunel F. (2003). Comparative evaluation of the total hepatitis C virus core antigen, branched-DNA, and AMPLICOR MONITOR assays in determining viremia for patients with chronic hepatitis C during interferon plus ribavirin combination therapy. J. Clin. Microbiol. 41:3212–3220.
20. Zamani S., Ichikawa S., Nassirimanesh B., Vazirian M., Ichikawa K. and Gouya M. M. (2007). Prevalence and correlates of hepatitis C virus infection among injecting drug users in Tehran. In J Drug Policy. 18:359–63.
1/20/2013
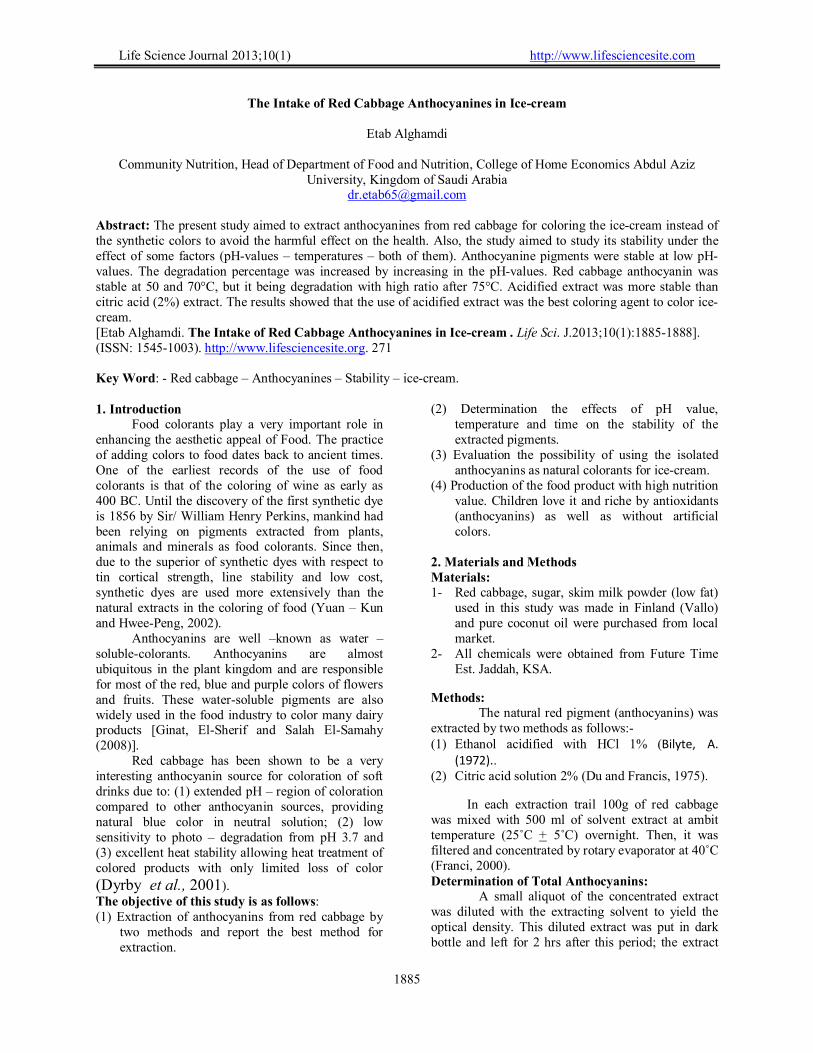
Life Science Journal 2013;10(1) http://www.lifesciencesite.com
1885
The Intake of Red Cabbage Anthocyanines in Ice-cream
Etab Alghamdi
Community Nutrition, Head of Department of Food and Nutrition, College of Home Economics Abdul Aziz University, Kingdom of Saudi Arabia
Abstract: The present study aimed to extract anthocyanines from red cabbage for coloring the ice-cream instead of the synthetic colors to avoid the harmful effect on the health. Also, the study aimed to study its stability under the effect of some factors (pH-values – temperatures – both of them). Anthocyanine pigments were stable at low pH-values. The degradation percentage was increased by increasing in the pH-values. Red cabbage anthocyanin was stable at 50 and 70°C, but it being degradation with high ratio after 75°C. Acidified extract was more stable than citric acid (2%) extract. The results showed that the use of acidified extract was the best coloring agent to color ice-cream. [Etab Alghamdi. The Intake of Red Cabbage Anthocyanines in Ice-cream . Life Sci. J.2013;10(1):1885-1888]. (ISSN: 1545-1003). http://www.lifesciencesite.org. 271 Key Word: - Red cabbage – Anthocyanines – Stability – ice-cream. 1. Introduction
Food colorants play a very important role in enhancing the aesthetic appeal of Food. The practice of adding colors to food dates back to ancient times. One of the earliest records of the use of food colorants is that of the coloring of wine as early as 400 BC. Until the discovery of the first synthetic dye is 1856 by Sir/ William Henry Perkins, mankind had been relying on pigments extracted from plants, animals and minerals as food colorants. Since then, due to the superior of synthetic dyes with respect to tin cortical strength, line stability and low cost, synthetic dyes are used more extensively than the natural extracts in the coloring of food (Yuan – Kun and Hwee-Peng, 2002).
Anthocyanins are well –known as water –soluble-colorants. Anthocyanins are almost ubiquitous in the plant kingdom and are responsible for most of the red, blue and purple colors of flowers and fruits. These water-soluble pigments are also widely used in the food industry to color many dairy products [Ginat, El-Sherif and Salah El-Samahy (2008)].
Red cabbage has been shown to be a very interesting anthocyanin source for coloration of soft drinks due to: (1) extended pH – region of coloration compared to other anthocyanin sources, providing natural blue color in neutral solution; (2) low sensitivity to photo – degradation from pH 3.7 and (3) excellent heat stability allowing heat treatment of colored products with only limited loss of color
(Dyrby et al., 2001). The objective of this study is as follows: (1) Extraction of anthocyanins from red cabbage by
two methods and report the best method for extraction.
(2) Determination the effects of pH value, temperature and time on the stability of the extracted pigments.
(3) Evaluation the possibility of using the isolated anthocyanins as natural colorants for ice-cream.
(4) Production of the food product with high nutrition value. Children love it and riche by antioxidants (anthocyanins) as well as without artificial colors.
2. Materials and Methods Materials: 1- Red cabbage, sugar, skim milk powder (low fat)
used in this study was made in Finland (Vallo) and pure coconut oil were purchased from local market.
2- All chemicals were obtained from Future Time Est. Jaddah, KSA.
Methods: The natural red pigment (anthocyanins) was extracted by two methods as follows:- (1) Ethanol acidified with HCl 1% (Bilyte, A.
(1972).. (2) Citric acid solution 2% (Du and Francis, 1975).
In each extraction trail 100g of red cabbage was mixed with 500 ml of solvent extract at ambit temperature (25˚C + 5˚C) overnight. Then, it was filtered and concentrated by rotary evaporator at 40˚C (Franci, 2000). Determination of Total Anthocyanins: A small aliquot of the concentrated extract was diluted with the extracting solvent to yield the optical density. This diluted extract was put in dark bottle and left for 2 hrs after this period; the extract

Life Science Journal 2013;10(1) http://www.lifesciencesite.com
1886
absorbance was measured by spectrophotometer at 520nm, (Giustic and Wrolstad, 2005).
Total anthocyanins pigment (mg/L) = (A x MW x DF x 1000) / (Ƹx 1) Where: A is the absorption value obtained at 520nm; MW is the molecular weight of anthocyanin (494 g / mol); DF is the dilution factor and Ƹ is the molar absorptive (26,300 L/mol). Determination of factors affecting on anthocyanin stability: (1) Effect of different pH values ranged from 3 at 9
at room temperature (25˚C + 5˚C). (2) Effect of different temperatures (50, 75 and
90˚C). (3) Effect of different pH values and different
temperatures on the stability of anthocyanins (Castellar et al., 2003).
Preparation of Ice-cream: Ice-cream was prepared to contain 8% fat
(pure coconut oil), 15% sucrose (sugar), 0.25% CMC as stabilizer, 5 ml and 10 ml concentrated anthocyanins and 5 ml of strawberry flavoring agent. All mixes were pasteurized at 80˚C for 30 second as given by Arbuckile (1986). The mixes were cooled to 5˚C and kept at this temperature for 4 hours prior to freezing. After aging each batch was frozen in an experimental ice-cream freezing machine. The resultant ice-cream was packaged in cups 100 ml and placed in the deep freezer at (-18˚C) for hardening for 24 hours (Rothwell, 1976). Color parameters:
Color values were measured with Minolta Chroma Meter (CM- 3600d, Minolta, and Ramsey,
NJ) (Rizk, E. M. S. (1997).. The measurements were displayed in “L”, “a” and “b” values. Sensory Evaluation:
A sensory evaluation of color acceptability was made in the products. This test was carried out
according to (Rizk, E. M. S. (1997). Statistical Analysis:
Statistical analysis was carried out on data of sensory evaluation applying analysis of variance (ANOVA) followed by multiple compa. 3. Results and Discussion Quantification of Anthocyanins of Red Cabbage:
Table (1) was showed the photometric quantification on anthocyanins of red cabbage. Extract of acidified ethanol showed the highest quantification of anthocyanins (135.98 mg / 100 g on fresh weight) as cyaniding -3, 5 – diglucoside, while citric acid (2%) gave the lowest (120.18 mg / 100g on fresh weight). The obtained results agree with Malien-Aubert et al. (2001) reported that, red
cabbage contained (141.9 mg / g) as acylated anthocyanins. On the other side, Piccaglia, et al. (2002) stated that, the anthocyanins content in red cabbage corresponds to 125 mg / 100 g fresh plant tissue. Table (1) Quantification of Anthocyanins of Red Cabbage Extraction Solvent Concentration (mg / 100 g as cyanidin -3,5
- diglucoside Ethanol + HCl (1%) (acidified ethanol) Citric acid (2%).
135.98
120.18
Factors Effecting on Anthocyanins Stability:- 1- Effect of different pH values on the stability of anthocyanins inr cabbage:-
Data illustrated in figure (1) showed the results of the effect of different pH values on the natural red pigment in red cabbage. The pH values ranged from 3 to 9. This was confirmed using the spectrophotometer, which showed different absorbance values at different pH value, data in fig. (1) Indicated that, acidified ethanol extract was more stable at pH (4 – 6). While, citric acid (2%) extract less stable. Citric acid (2%) extract was stable at pH 4-5. McDoogall, et al. (2007) decided that, red cabbage anthocyanins are stable over a broader pH range while, Sapers, et al., (1981) reported that, pH had little effect on color stability of red cabbage.
Fig.(1):- Effect of different pH values on the stability
of anthocyanins inr cabbage 2-Effect of different temperature and time of the stability of anthocyanins in red cabbage Extracts:-
Several physical and chemical factors have a negative effect on the stability of anthocyanins, one of the most important being heat. Measurements of changing in absorbance at wavelength 520 nm of anthocyanins extracts from red cabbage heated within different temperature (50, 75 and 90°C) for different times (10, 20 and 30 min.) are shown in figs (2). Data indicated that, red cabbage anthocyanins were stable at 50 and 75˚C but it recorded high degradation after 75˚C. Acidified ethanol extract was more stable
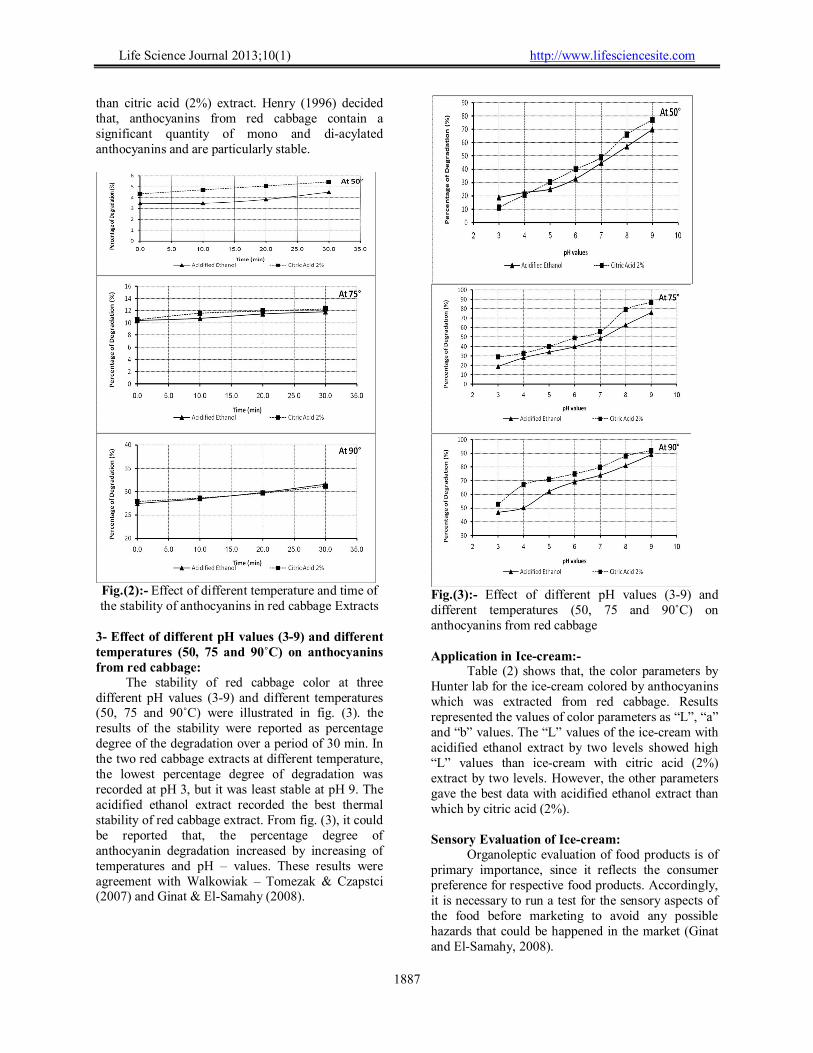
Life Science Journal 2013;10(1) http://www.lifesciencesite.com
1887
than citric acid (2%) extract. Henry (1996) decided that, anthocyanins from red cabbage contain a significant quantity of mono and di-acylated anthocyanins and are particularly stable.
Fig.(2):- Effect of different temperature and time of the stability of anthocyanins in red cabbage Extracts
3- Effect of different pH values (3-9) and different temperatures (50, 75 and 90˚C) on anthocyanins from red cabbage:
The stability of red cabbage color at three different pH values (3-9) and different temperatures (50, 75 and 90˚C) were illustrated in fig. (3). the results of the stability were reported as percentage degree of the degradation over a period of 30 min. In the two red cabbage extracts at different temperature, the lowest percentage degree of degradation was recorded at pH 3, but it was least stable at pH 9. The acidified ethanol extract recorded the best thermal stability of red cabbage extract. From fig. (3), it could be reported that, the percentage degree of anthocyanin degradation increased by increasing of temperatures and pH – values. These results were agreement with Walkowiak – Tomezak & Czapstci (2007) and Ginat & El-Samahy (2008).
Fig.(3):- Effect of different pH values (3-9) and different temperatures (50, 75 and 90˚C) on anthocyanins from red cabbage Application in Ice-cream:-
Table (2) shows that, the color parameters by Hunter lab for the ice-cream colored by anthocyanins which was extracted from red cabbage. Results represented the values of color parameters as “L”, “a” and “b” values. The “L” values of the ice-cream with acidified ethanol extract by two levels showed high “L” values than ice-cream with citric acid (2%) extract by two levels. However, the other parameters gave the best data with acidified ethanol extract than which by citric acid (2%). Sensory Evaluation of Ice-cream:
Organoleptic evaluation of food products is of primary importance, since it reflects the consumer preference for respective food products. Accordingly, it is necessary to run a test for the sensory aspects of the food before marketing to avoid any possible hazards that could be happened in the market (Ginat and El-Samahy, 2008).
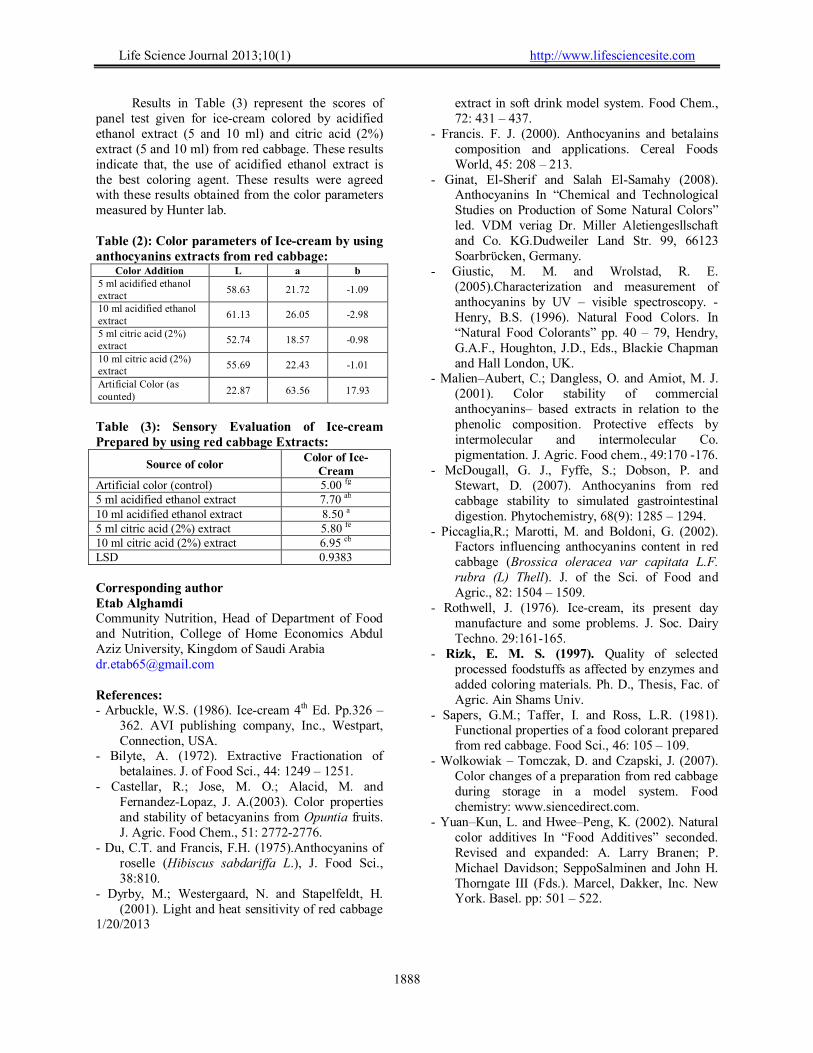
Life Science Journal 2013;10(1) http://www.lifesciencesite.com
1888
Results in Table (3) represent the scores of panel test given for ice-cream colored by acidified ethanol extract (5 and 10 ml) and citric acid (2%) extract (5 and 10 ml) from red cabbage. These results indicate that, the use of acidified ethanol extract is the best coloring agent. These results were agreed with these results obtained from the color parameters measured by Hunter lab. Table (2): Color parameters of Ice-cream by using anthocyanins extracts from red cabbage:
Color Addition L a b 5 ml acidified ethanol extract
58.63 21.72 -1.09
10 ml acidified ethanol extract
61.13 26.05 -2.98
5 ml citric acid (2%) extract
52.74 18.57 -0.98
10 ml citric acid (2%) extract
55.69 22.43 -1.01
Artificial Color (as counted)
22.87 63.56 17.93
Table (3): Sensory Evaluation of Ice-cream Prepared by using red cabbage Extracts:
Source of color Color of Ice-
Cream Artificial color (control) 5.00 fg 5 ml acidified ethanol extract 7.70 ab 10 ml acidified ethanol extract 8.50 a 5 ml citric acid (2%) extract 5.80 fe 10 ml citric acid (2%) extract 6.95 cb LSD 0.9383
Corresponding author Etab Alghamdi Community Nutrition, Head of Department of Food and Nutrition, College of Home Economics Abdul Aziz University, Kingdom of Saudi Arabia [email protected] References: - Arbuckle, W.S. (1986). Ice-cream 4th Ed. Pp.326 –
362. AVI publishing company, Inc., Westpart, Connection, USA.
- Bilyte, A. (1972). Extractive Fractionation of betalaines. J. of Food Sci., 44: 1249 – 1251.
- Castellar, R.; Jose, M. O.; Alacid, M. and Fernandez-Lopaz, J. A.(2003). Color properties and stability of betacyanins from Opuntia fruits. J. Agric. Food Chem., 51: 2772-2776.
- Du, C.T. and Francis, F.H. (1975).Anthocyanins of roselle (Hibiscus sabdariffa L.), J. Food Sci., 38:810.
- Dyrby, M.; Westergaard, N. and Stapelfeldt, H. (2001). Light and heat sensitivity of red cabbage
extract in soft drink model system. Food Chem., 72: 431 – 437.
- Francis. F. J. (2000). Anthocyanins and betalains composition and applications. Cereal Foods World, 45: 208 – 213.
- Ginat, El-Sherif and Salah El-Samahy (2008). Anthocyanins In “Chemical and Technological Studies on Production of Some Natural Colors” led. VDM veriag Dr. Miller Aletiengesllschaft and Co. KG.Dudweiler Land Str. 99, 66123 Soarbrϋcken, Germany.
- Giustic, M. M. and Wrolstad, R. E. (2005).Characterization and measurement of anthocyanins by UV – visible spectroscopy. - Henry, B.S. (1996). Natural Food Colors. In “Natural Food Colorants” pp. 40 – 79, Hendry, G.A.F., Houghton, J.D., Eds., Blackie Chapman and Hall London, UK.
- Malien–Aubert, C.; Dangless, O. and Amiot, M. J. (2001). Color stability of commercial anthocyanins– based extracts in relation to the phenolic composition. Protective effects by intermolecular and intermolecular Co. pigmentation. J. Agric. Food chem., 49:170 -176.
- McDougall, G. J., Fyffe, S.; Dobson, P. and Stewart, D. (2007). Anthocyanins from red cabbage stability to simulated gastrointestinal digestion. Phytochemistry, 68(9): 1285 – 1294.
- Piccaglia,R.; Marotti, M. and Boldoni, G. (2002). Factors influencing anthocyanins content in red cabbage (Brossica oleracea var capitata L.F. rubra (L) Thell). J. of the Sci. of Food and Agric., 82: 1504 – 1509.
- Rothwell, J. (1976). Ice-cream, its present day manufacture and some problems. J. Soc. Dairy Techno. 29:161-165.
- Rizk, E. M. S. (1997). Quality of selected processed foodstuffs as affected by enzymes and added coloring materials. Ph. D., Thesis, Fac. of Agric. Ain Shams Univ.
- Sapers, G.M.; Taffer, I. and Ross, L.R. (1981). Functional properties of a food colorant prepared from red cabbage. Food Sci., 46: 105 – 109.
- Wolkowiak – Tomczak, D. and Czapski, J. (2007). Color changes of a preparation from red cabbage during storage in a model system. Food chemistry: www.siencedirect.com.
- Yuan–Kun, L. and Hwee–Peng, K. (2002). Natural color additives In “Food Additives” seconded. Revised and expanded: A. Larry Branen; P. Michael Davidson; SeppoSalminen and John H. Thorngate III (Fds.). Marcel, Dakker, Inc. New York. Basel. pp: 501 – 522.
1/20/2013
1889
Life Science Journal 2013;10(1) http://www.lifesciencesite.com
Generalized Chan-Vese Model for Image Segmentation with Multiple Regions
Dang Tran Vu1, Tran Thi Thu Ha1, Min Gyu Song1, Jin Young Kim 1, Seung Ho Choi2, Asmatullah Chaudhry1, 3
1School of Electronics & Computer Engineering, Chonnam National University, 300 Yongbong Dong, Buk-gu, Gwangju, 500 757, South Korea
2Department of Computer Science, Donshin University, Information Center, Kunjae-ro Naju, Chonnam, 520 714, South Korea
3HRD, PINSTECH, P.O. Nilore, Islamabad, Pakistan [email protected], [email protected], [email protected], [email protected], [email protected]
Abstract: In this paper, we propose a modified region-based active contour model by integrating the local information of foreground region into Chan-Vese model. Considering local spatial information term in the conventional energy function, our proposed model is able to overcome two limitations of the previous region-based level set methods: a) high sensitivity to the location of initial contours, 2) inability to segment multiple objects. Experimental results show the effectiveness of our proposed method as compared with other major level set-based techniques in terms of both efficiency and accuracy for 2D image segmentation. [Vu DT, Ha TTT, Song MG, Kim JY, Choi SH, Chaudhry A. Generalized Chan-Vese Model for Image Segmentation with Multiple Regions. Life Sci J 2013;10(1):1889-1895] (ISSN:1097-8135). http://www.lifesciencesite.com. 272 Keywords: Generalized Chan-Vese model, region-based active contour, level set method, image segmentation, local information 1. Introduction
Deformable models, referred by various names such as snakes, active contours or surfaces, balloons, and deformable contours or surfaces, are one of the most active and successful approaches in image segmentation. The basic idea of deformable models is that modeling curves or surfaces are adjusted for balancing them between internal and external forces (Kass et al., 1987), (Black and Yuille, 1993). Generally, the deformable models can be classified into two categories: parametric deformable models (Amini et al., 1990), (Cohen, 1991), (McInerney et al., 1995) and geometric or level set-based deformable models (Caselles et al., 1993), (Malladi et al., 1995), (Caselles et al., 1997), (Whitaker, 1994). The parametric deformable models represent curves and surfaces explicitly in their parametric forms during deformation. This representation allows direct interaction with the model and leads to a compact representation for real-time implementation. However, adaptation of the model topology, such as splitting or merging parts during the deformation, is not easy using parametric models. On the other hand, geometric deformable models can handle topological changes naturally. These models are based on the theory of curve evolution (Sapiro and Tannenbaum, 1993), (Kimia et al., 1995), (Kimmel et al., 1995), (Alvarez et al., 1993) and the level set method (Osher and Sethian, 1988), (Sethian, 1999) which represent curves and surfaces implicitly as a level set of higher-dimensional scalar function. Such
methodologies are best suited for the recovery of objects with unknown topologies. As a novel approach, geometric deformable models avoid the evolution process of tracing the curve after expressing closed planar curves and 3D closed surfaces. Thus problem of curve evolution is converted to a pure search for the numerical solutions of partial differential equation. The main idea of level set methods is to embed the propagating interface as the zero level set of a higher dimensional hyper-surface. By controlling the evolution of the hyper-surface, we can control the evolution of the curve. In literature, two general types of level set methods have been described: edge-based level set methods (Malladi et al., 1995), (Zhu et al., 2007), (Li et al., 2005), (Vasilevskiy and Siddiqi, 2002) and region-based level set methods (Chan and Vese, 2001), (Shi and Karl, 2008), (Li et al., 2008), (Lankton and Tannenbaum, 2008). The edge-based geodesic model is based on the relation between active contours and the computation of geodesics or minimal distance curves. This geodesic approach for object segmentation allows connecting classical “snakes” based on energy minimization and geometric active contours. However, main drawback of boundary-based level set segmentation methods is related to contour leakage at locations having weak or missing boundary data information. Specifically, these methods rely on the gradient-based edge function to stop curve evolution, and these models can detect only objects with edges defined by the gradients. In practice, discrete gradients are bounded;
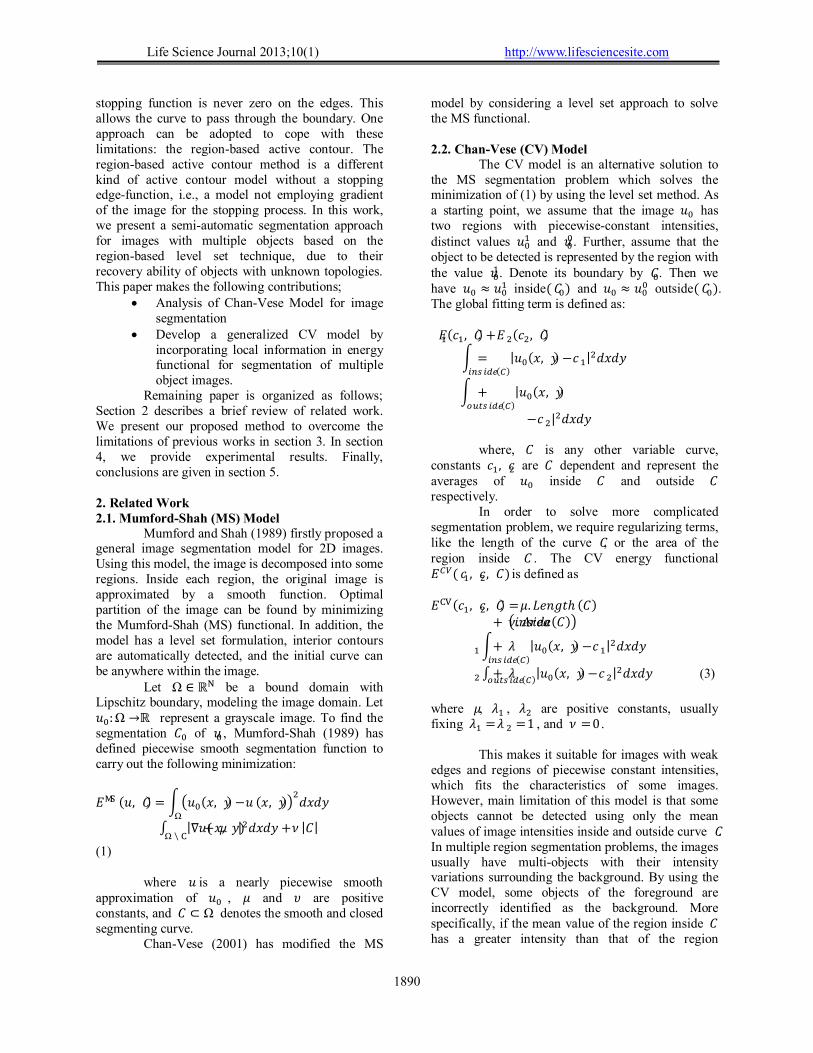
1890
Life Science Journal 2013;10(1) http://www.lifesciencesite.com
stopping function is never zero on the edges. This allows the curve to pass through the boundary. One approach can be adopted to cope with these limitations: the region-based active contour. The region-based active contour method is a different kind of active contour model without a stopping edge-function, i.e., a model not employing gradient of the image for the stopping process. In this work, we present a semi-automatic segmentation approach for images with multiple objects based on the region-based level set technique, due to their recovery ability of objects with unknown topologies. This paper makes the following contributions;
Analysis of Chan-Vese Model for image segmentation
Develop a generalized CV model by incorporating local information in energy functional for segmentation of multiple object images.
Remaining paper is organized as follows; Section 2 describes a brief review of related work. We present our proposed method to overcome the limitations of previous works in section 3. In section 4, we provide experimental results. Finally, conclusions are given in section 5.
2. Related Work 2.1. Mumford-Shah (MS) Model
Mumford and Shah (1989) firstly proposed a general image segmentation model for 2D images. Using this model, the image is decomposed into some regions. Inside each region, the original image is approximated by a smooth function. Optimal partition of the image can be found by minimizing the Mumford-Shah (MS) functional. In addition, the model has a level set formulation, interior contours are automatically detected, and the initial curve can be anywhere within the image.
Let Ω ∈ ℝ� be a bound domain with Lipschitz boundary, modeling the image domain. Let ��:Ω → ℝ represent a grayscale image. To find the segmentation �� of �� , Mumford-Shah (1989) has defined piecewise smooth segmentation function to carry out the following minimization:
��� (�, �)= ����(�,�)− � (�,�)������
Ω
+ �∫ |∇�(�,�)|����� + �|�|Ω\�
(1) where � is a nearly piecewise smooth
approximation of �� , � and � are positive constants, and � ⊂ Ω denotes the smooth and closed segmenting curve.
Chan-Vese (2001) has modified the MS
model by considering a level set approach to solve the MS functional. 2.2. Chan-Vese (CV) Model
The CV model is an alternative solution to the MS segmentation problem which solves the minimization of (1) by using the level set method. As a starting point, we assume that the image �� has two regions with piecewise-constant intensities, distinct values ��
� and ���. Further, assume that the
object to be detected is represented by the region with the value ��
�. Denote its boundary by ��. Then we have �� ≈ ��
� inside(��) and �� ≈ ��� outside(��).
The global fitting term is defined as: ��(��,�)+ ��(��,�)
=� |��(�, �)− ��|�����
������(�)
+� |��(�,�)�������(�)
− � �|����� (2)
where, � is any other variable curve,
constants ��, �� are � dependent and represent the averages of �� inside � and outside � respectively.
In order to solve more complicated segmentation problem, we require regularizing terms, like the length of the curve �, or the area of the region inside � . The CV energy functional ���(��, ��,�) is defined as
���(��, ��,�)= �. �����ℎ (�) + �. �����������(�)�
+ �� � |��(�,�)− ��|�����
������(�)
+ �� ∫ |��(�, �)− ��|�����
�������(�) (3)
where �, �� , �� are positive constants, usually fixing �� = � � = 1 , and � = 0 .
This makes it suitable for images with weak
edges and regions of piecewise constant intensities, which fits the characteristics of some images. However, main limitation of this model is that some objects cannot be detected using only the mean values of image intensities inside and outside curve �. In multiple region segmentation problems, the images usually have multi-objects with their intensity variations surrounding the background. By using the CV model, some objects of the foreground are incorrectly identified as the background. More specifically, if the mean value of the region inside � has a greater intensity than that of the region
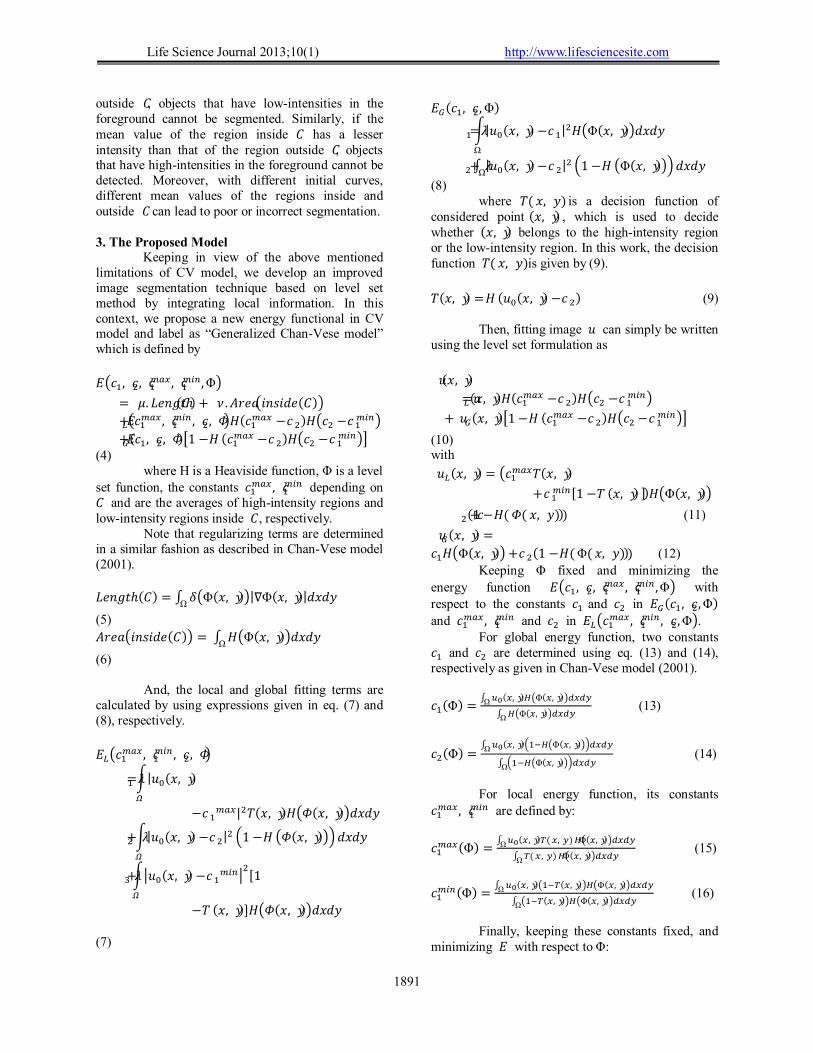
1891
Life Science Journal 2013;10(1) http://www.lifesciencesite.com
outside �, objects that have low-intensities in the foreground cannot be segmented. Similarly, if the mean value of the region inside � has a lesser intensity than that of the region outside �, objects that have high-intensities in the foreground cannot be detected. Moreover, with different initial curves, different mean values of the regions inside and outside � can lead to poor or incorrect segmentation.
3. The Proposed Model
Keeping in view of the above mentioned limitations of CV model, we develop an improved image segmentation technique based on level set method by integrating local information. In this context, we propose a new energy functional in CV model and label as “Generalized Chan-Vese model” which is defined by
����, ��, c����, c�
���,�
= �. �����ℎ(�)+ �.�����������(�)�
+��������, ��
���, ��,���(����� − � �)���� − ��
����
+��(��, ��,�)�1 − �(����� − � �)���� − ��
����� (4)
where H is a Heaviside function, Φ is a level set function, the constants ��
���, ����� depending on
� and are the averages of high-intensity regions and low-intensity regions inside �, respectively.
Note that regularizing terms are determined in a similar fashion as described in Chan-Vese model (2001).
�����ℎ(�)= ∫ ��Φ(�,�)�|∇Φ(�,�)|����Ω
(5)
�����������(�)� = ∫ ��Φ(�,�)�����Ω
(6) And, the local and global fitting terms are
calculated by using expressions given in eq. (7) and (8), respectively.
��������, ��
���, ��,��
= �� �|��(�, �)
�
− �����|��(�,�)���(�, �)�����
+ �� �|��(�,�)− ��|� �1 − � ��(�,�)������
�
+�� ����(�,�)− ������
�[1
�
− � (�,�)]���(�,�)����� (7)
��(��, ��,Φ)
= �� �|��(�,�)− ��|���Φ(�, �)�����
Ω
+ �� ∫ |��(�, �)− ��|� �1 − � �Φ(�,�)������
Ω
(8) where �(�, �) is a decision function of
considered point (�, �), which is used to decide whether (�,�) belongs to the high-intensity region or the low-intensity region. In this work, the decision function �(�, �) is given by (9).
�(�, �)= �(��(�,�)− ��) (9) Then, fitting image � can simply be written
using the level set formulation as
�(�,�)
= ��(�,�)�(����� − � �)���� − ��
����
+ ��(�,�)�1 − � (����� − � �)���� − ��
�����
(10) with
��(�,�)= �������(�, �)
+ �����[1 − � (�, �)])��Φ(�,�)�
+��(1 − �(�(�, �))) (11)
��(�,�)=
����Φ(�, �)� + � �(1 − �(Φ(�, �))) (12)
Keeping Φ fixed and minimizing the
energy function ����, ��, c����, c�
���,Φ� with respect to the constants �� and �� in ��(��, ��,Φ)
and �����, ��
��� and �� in ��������, ��
���, ��,�. For global energy function, two constants
�� and �� are determined using eq. (13) and (14), respectively as given in Chan-Vese model (2001).
��(Φ)=∫ ��(�,�)��Φ(�,�)�����Ω
∫ ��Φ(�,�)�����Ω
(13)
��(Φ)=∫ ��(�,�)�����Φ(�,�)������Ω
∫ �����Φ(�,�)������Ω
(14)
For local energy function, its constants
�����, ��
��� are defined by:
�����(Φ)=
∫ ��(�,�)�(�,�)��Φ(�,�)�����Ω
∫ �(�,�)��Φ(�,�)�����Ω
(15)
�����(Φ)=
∫ ��(�,�)����(�,�)���Φ(�,�)�����Ω
∫ ����(�,�)���Φ(�,�)�����Ω
(16)
Finally, keeping these constants fixed, and
minimizing � with respect to Φ:
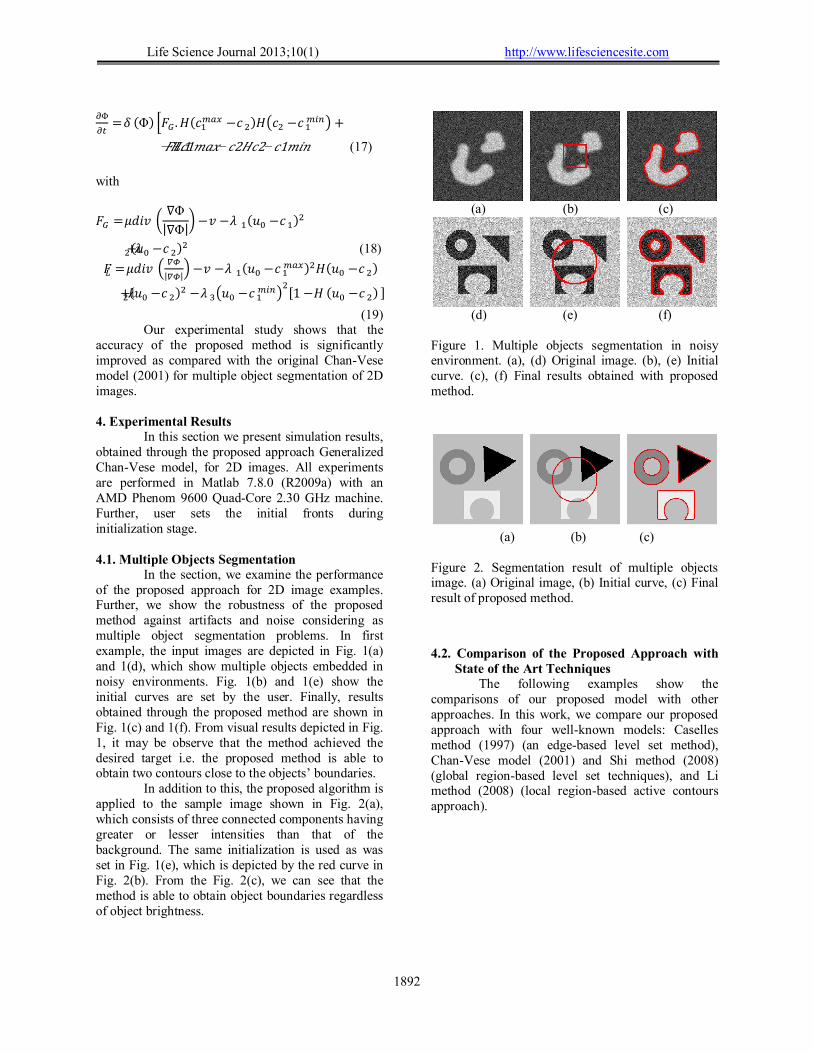
1892
Life Science Journal 2013;10(1) http://www.lifesciencesite.com
�Φ
��= � (Φ)���.�(��
��� − � �)���� − ������ +
��.1−��1���−�2��2−�1��� (17)
with
�� = ���� �∇Φ
|∇Φ|� − � − � �(�� − ��)
�
+��(�� − � �)� (18)
�� = ���� ���
|��|� − � − � �(�� − ��
���)��(�� − � �)
+��(�� − � �)� − � ���� − ��
�����[1 − � (�� − � �)]
(19) Our experimental study shows that the
accuracy of the proposed method is significantly improved as compared with the original Chan-Vese model (2001) for multiple object segmentation of 2D images.
4. Experimental Results
In this section we present simulation results, obtained through the proposed approach Generalized Chan-Vese model, for 2D images. All experiments are performed in Matlab 7.8.0 (R2009a) with an AMD Phenom 9600 Quad-Core 2.30 GHz machine. Further, user sets the initial fronts during initialization stage. 4.1. Multiple Objects Segmentation
In the section, we examine the performance of the proposed approach for 2D image examples. Further, we show the robustness of the proposed method against artifacts and noise considering as multiple object segmentation problems. In first example, the input images are depicted in Fig. 1(a) and 1(d), which show multiple objects embedded in noisy environments. Fig. 1(b) and 1(e) show the initial curves are set by the user. Finally, results obtained through the proposed method are shown in Fig. 1(c) and 1(f). From visual results depicted in Fig. 1, it may be observe that the method achieved the desired target i.e. the proposed method is able to obtain two contours close to the objects’ boundaries.
In addition to this, the proposed algorithm is applied to the sample image shown in Fig. 2(a), which consists of three connected components having greater or lesser intensities than that of the background. The same initialization is used as was set in Fig. 1(e), which is depicted by the red curve in Fig. 2(b). From the Fig. 2(c), we can see that the method is able to obtain object boundaries regardless of object brightness.
(a) (b) (c)
(d) (e) (f) Figure 1. Multiple objects segmentation in noisy environment. (a), (d) Original image. (b), (e) Initial curve. (c), (f) Final results obtained with proposed method.
(a) (b) (c)
Figure 2. Segmentation result of multiple objects image. (a) Original image, (b) Initial curve, (c) Final result of proposed method.
4.2. Comparison of the Proposed Approach with
State of the Art Techniques The following examples show the
comparisons of our proposed model with other approaches. In this work, we compare our proposed approach with four well-known models: Caselles method (1997) (an edge-based level set method), Chan-Vese model (2001) and Shi method (2008) (global region-based level set techniques), and Li method (2008) (local region-based active contours approach).

1893
Life Science Journal 2013;10(1) http://www.lifesciencesite.com
Figure 3. Segmentation of a fluorescence micrograph of yeast cells with different initializations. Each column corresponds to a given initialization. Top row: original images with the level set initialization. Second row: segmentation results using the proposed method. Third row: Segmentation results using a Caselles method (1997). Fourth row: Segmentation results using Chan-Vese model (2001). Last row: Segmentation results using Li method (2008).
(a) (b) (c)
(d) (e) (f) Figure 4. Segmentation results of brain MRI image. (a) Original image and its initial curve, (b) Caselles method, (c) Chan-Vese model, (d) Li method, (e) Proposed method, (f) Shi method.
(a) (b) (c)
(d) (e) (f) Figure 5. Segmentation results of brain Nucleus Fluorescence Micrograph image. (a) Original image and its initial curve, (b) Caselles method, (c) Chan-Vese model, (d) Li method, (e) Proposed method, (f) Shi method.
These segmentation approaches are qualitatively compared in the aspects of sensitivity to the location of initial contours and the accuracy of sub-pixel segmentation. Fig. 3 shows the segmentation results on a fluorescence micrograph – that contains labeled yeast cells – with different initializations. From Fig. 3, it can be observe that our proposed method is significantly less sensitive to noise and has better performance for images with weak edges or without edges.
To explore and present more comparison of the proposed approach with other related techniques, we have also considered many other examples including medical images and have carried out experimental analysis. Fig. 4 and Fig. 5 show the segmentation results of a brain MRI image and Water Country image, respectively. As we can observe from Fig. 4 and Fig. 5, the segmentation results of our proposed approach obtain the best performance compared with other methods.
(a) (b) (c)
(d) (e) (f) Figure 6. Medical images. (a) Two Cells Microscopy segmentation result, (b) Segmentation result of heart MRI image, (c) 2D MR image of the heart left ventricle segmentation result.

1894
Life Science Journal 2013;10(1) http://www.lifesciencesite.com
(a) (b) (c)
(d) (e) (f) Figure 7. Real images segmentation. (a), (b) and (c) real images with their initial curves, (d), (e) and (f) segmentation results using the proposed approach.
In addition to this, obtained segmentation
results on another medical and real image are shown in Fig. 6 and Fig. 7. Segmentation results shown in Fig. 6 demonstrate the usefulness of the proposed method in medical image segmentation applications. The first column of Fig. 6 shows a two cell microscopy image, the second column shows a heart MRI image and the last column shows a magnetic resonance image of the left ventricle of a human heart. As we can see from the experiment, the desired segmentation results can be obtained (the second row in Fig. 6).
Fig. 7 shows the segmentation results of real images by our proposed method (i.e., an image exhibiting saturation and noise, a galaxy image). The first row shows the initial contours which contain some parts of the objects. The second row shows the segmentation results using the proposed approach. We can see that the contours outlining the objects are accurately detected by our approach.
5. Conclusions
In this paper we have proposed a new region-based deformable model for image segmentation by integrating local information into the Chan-Vese model in order to overcome some limitations of this model. Performance comparison of the proposed technique with the well-known methods such as Caselles method, Chan-Vese model, Li method, Shi method shows that the proposed approach Generalized Chan-Vese model significantly improves the image segmentation results. Further, experimental results on real images also confirm its suitability for real image based applications.
Acknowledgment: This research was supported by Basic
Science Research Program through the National Research Foundation of Korea (NRF) funded by the Ministry of Education, Science and Technology (No. 2011-0012586). Corresponding Author: Professor, Jin Young Kim School of Electronics & Computer Engineering, Chonnam National University, Gwangju, South Korea E-mail: [email protected]
References 1. M. Kass, A. Witkin, and D. Terzopoulos,
Snakes: active contour models, Int’l J. Comp. Vis., vol.1, no.4, pp. 321–331, 1987.
2. Black A, and Yuille A., Active vision (Cambridge: MIT Press, eds. 1993).
3. A. A. Amini, T. E. Weymouth, and R. C. Jain, Using dynamic programming for solving variational problems in vision, IEEE Trans. Patt. Anal. Mach. Intell., vol.12, no.9, pp. 855–867, 1990.
4. L. D. Cohen, On active contour models and balloons, CVGIP: Imag. Under., vol.53, no.2, pp. 211–218, 1991.
5. T. McInerney and D. Terzopoulos, A dynamic finite element surface model for segmentation and tracking in multidimensional medical images with application to cardiac 4D image analysis, Comp. Med. Imag. Graph., vol.19, no.1, pp. 69–83, 1995.
6. V. Caselles, F. Catte, T. Coll, and F. Dibos, A geometric model for active contours, Numerische Mathematik, vol.66, pp. 1–31, 1993.
7. R. Malladi, J. A. Sethian, and B. C. Vemuri, Shape modeling with front propagation: a level set approach, IEEE Trans. Patt. Anal. Mach. Intell., vol.17, no.2, pp. 158–175, 1995.
8. V. Caselles, R. Kimmel, and G. Sapiro, Geodesic active contours, Int. J. of Computer Vision, vol.22, pp.61-79, 1997.
9. R. T. Whitaker, Volumetric deformable models: active blobs, Tech. Rep. ECRC-94- 25, European Computer-Industry Research Centre GmbH, 1994.
10. G. Sapiro and A. Tannenbaum, Affine invariant scale-space, Int’l J. Comp. Vis., vol.11, no.1, pp. 25–44, 1993.
11. B. B. Kimia, A. R. Tannenbaum, and S. W. Zucker, Shapes, shocks, and deformations I: the components of two-dimensional shape and the reaction-diffusion space, Int’l J. Comp. Vis., vol.15, pp. 189–224, 1995.

1895
Life Science Journal 2013;10(1) http://www.lifesciencesite.com
12. R. Kimmel, A. Amir, and A. M. Bruckstein, Finding shortest paths on surfaces using level sets propagation, IEEE Trans. Patt. Anal. Mach. Intell., vol.17, no.6, pp. 635–640, 1995.
13. L. Alvarez, F. Guichard, P. L. Lions, and J. M. Morel, Axioms and fundamental equations of image processing, Archive for Rational Mechanics and Analysis, vol.123, no.3, pp. 199–257, 1993.
14. S. Osher and J. A. Sethian, Fronts propagating with curvature-dependent speed: algorithms based on Hamilton-Jacobi formulations, J. Computational Physics, vol.79, pp. 12–49, 1988.
15. J. A. Sethian, Level Set Methods and Fast Marching Methods: Evolving Interfaces in Computational Geometry, Fluid Mechanics, Computer Vision, and Material Science (Cambridge, UK: Cambridge University Press, 2nd ed., 1999).
16. G. P. Zhu, Sh. Q. Zhang, Q. SH. Zeng, Ch. H. Wang, Boundary-based image segmentation using binary level set method, SPIE OE Letters, vol.46, no.5, 2007.
17. C. M. Li, C. Y. Xu, C. F. Gui, M. D. Fox, Level set evolution without re-initialization: a new variational formulation, Proc. of IEEE
Conference on Computer Vision and Pattern Recognition, San Diego, pp. 430-436, 2005.
18. A. Vasilevskiy and K. Siddiqi, Flux-maximizing geometric flows, IEEE Trans. Patt. Anal. Mach. Intell., vol.24, pp. 1565-1578, 2002.
19. T. Chan, L. Vese, Active contour without edges, IEEE Trans. Image Process., vol.10, no.2, pp. 266-277, 2001.
20. Y. Shi and W. C. Karl, A real-time algorithm for the approximation of level-set based curve evolution, IEEE Trans. Image Process., vol.17, no.5, pp. 645-656, 2008.
21. C. Li, C. Kao, J. Gore, and Z. Ding, Minimization of region-scalable fitting energy for image segmentation, IEEE Trans. Image Process., vol.17, pp. 1940-1949, 2008.
22. S. Lankton and A. Tannenbaum, Localizing region-based active contours, IEEE Trans. Image Process., vol.17, no.11, pp.2029-2039, 2008.
23. D. Mumford, and J. Shah, Optimal approximation by piecewise smooth function and associated variational problems, Communication on Pure and Applied Mathematics, vol.42, pp. 577–685, 1989.
02/05/2013

Life Science Journal 2013;10(1) http://www.lifesciencesite.com
http://www.lifesciencesite.com [email protected] 1896
A new integrated mathematical model for optimizing facility location and network design policies with facility disruptions
Davood Shishebori 1,*, Mohammad Saeed Jabalameli 1
1 Department of Industrial Engineering, Iran University of Science and Technology, P.C.1684613114, Tehran,
Iran 1,* Corresponding author: Davood Shishebori, Email address: [email protected],
Tel.:+98 2177240541, Address: Iran University of Science and Technology- Narmak- Tehran- Iran, P.C.1684613114
Abstract: Considering the reliability in modeling of facility location problems is one of the most effective ways to hedge against failures of system from time to time. In reality, the combined facility location network design problem with respect to system reliability has a number of applications in industries and services. In this paper, a mixed integer non linear programming formulation is developed to model the combined facility location network design problem incorporating the option of facility hardening to hedge against the risk of facility disruptions. The new mathematical formulation first considers different costs including facility location, link construction, and transportation costs; it particularly takes the facility hardening cost of the system into account. Then, the proposed model is linearized by suitable techniques and, at the follow; a practical numerical example is presented in detail to illustrate the application of the proposed mathematical model. The results demonstrate the capability of the model. [Davood Shishebori, Mohammad Saeed Jabalameli. A new integrated mathematical model for optimizing facility location and network design policies with facility disruptions. Life Sci J 2013;10(1):1896-1906] (ISSN:1097-8135). http://www.lifesciencesite.com. 273 Keywords: Facility location, Network design, Reliability, Facility disruption, facility hardening 1. Introduction
In general, the facility location problems seeks optimal facility locations to minimize the one-time investment for facility constructions and the long-run transportation costs for serving spatially distributed customers. This topic has been studied extensively; see (Daskin 1995; Drezner and Hamacher 2004; Farahani and Hekmatfar 2009) for comprehensive surveys. As a significant point in modeling of facility location problems, proposing an efficient mathematical model which displays a more realistic description of the problem can give more practical solutions and also considerably reduce the related costs. Two significant topics that help reach such intention are network design and system reliability. The importance of these topics in modeling of facility location problems will be explained further.
In most of the typical facility location problems, it is assumed that the link arcs among potential facility locations in the considered network are predetermined. On the other hands, in network design, the basic problem is to optimally construct a network that enables some kind of flow, and possibly that satisfies additional constraints. The nodes are given and the network is constructed from a set of potential edges, or links and the flow involved is that between clients and facilities. As is suggested by the name, facility location–network design problem (FLNDP) combines facility location and network design topics. Facility location deals with optimally
locating facilities. There are two main parties involved in any facility location problem: the facilities themselves and the clients of the facilities. Typically we want the facilities to be close to the clients, which can be defined in several ways, such as minimizing total travel cost. In FLNDP, the objective may be met using the means of both facility location and network design: by building both facilities and links (Cocking and Reinelt 2009).
In the literature review, FLNDP was first considered by Daskin et al. in 1993 (Daskin, Hurter et al. 1993). They presented some preliminary results which showed the effect of network design topic in mathematical modeling of facility location problems and their optimal solution. Later, Melkote (Melkote 1996) in his doctoral thesis researched three models for the FLNDP including UFLNDP, the capacitated facility location-network design problem (CFLNDP), and the maximum covering location-network design problem (MCLNDP). The results of the thesis were published in (Melkote and Daskin 2001a; Melkote and Daskin 2001b). Drezner and Wesolowsky (Drezner and Wesolowsky 2003) proposed a new network design problem with potential links, each of which could be either constructed at a given cost or not. Moreover, each constructed link could be constructed as either a one-way or two-way link. They developed four basic problems subject to two objective functions; finally, they solved the problems by a descent algorithm, a simulated annealing, a tabu

Life Science Journal 2013;10(1) http://www.lifesciencesite.com
http://www.lifesciencesite.com [email protected] 1897
search, and a genetic algorithm as main solution procedures. In another doctoral thesis, Cocking (Cocking 2008; Cocking and Reinelt 2009) expanded some efficient approaches to solve the static budget constrained (FLND) problem. Some useful algorithms were developed to find good upper bounds and good lower bounds on the optimal solution. Simple greedy heuristics, a local search heuristic, and meta -heuristics including simulated annealing (SA) and variable neighborhood search (VNS), as well as a custom heuristic based on the problem-specific structure of FLND were the main heuristics and metaheuristics that were proposed in Cocking’s doctoral thesis. Besides, a branch-and-cut algorithm using heuristic solutions as upper bounds, and cutting planes to improve the lower bound of the problem were developed. The method reduced the number of nodes which were needed to approach optimality. Recently, Bigotte et al. (Bigotte, Krass et al. 2010) have proposed a mixed-integer optimization model for integrated urban hierarchy and transportation network planning. The model simultaneously determines which urban centers and which network links should be transferred to a new level of hierarchy in order to improve availability of all groups of facilities. Jabalameli and Mortezaei (JabalAmeli and Mortezaei 2011) proposed an extension of the CFLNDP in which the maximum amount of demands can be carried by a link is limited. They presented a bi-objective mixed integer programming formulation of the problem and developed a hybrid algorithm to solve the resulted problem. Contreras and Fernandez (Contreras and Fernández 2011) reviewed the relevant modeling aspects, alternative formulations and several algorithmic strategies for the FLNDP. In fact, they studied general network design problems in which, design decisions to locate facilities and to select links on an underlying network are combined with operational allocation and routing decisions to satisfy demands. Contreras et al. (Contreras, Fernández et al. 2012) presented a combined FLNDP to minimize the maximum customer-facility travel time. They developed and compared two mixed integer programming formulations by generalizing the model of the classical P-center problem so that the models simultaneously consider the location of facilities and the design of its underlying network.
As another significant subject, traditional models generally assume that the facilities, once built, remain operational forever. In reality, however, facility operations may be disrupted from time to time due to reasons such as natural disasters, power outages, operational accidents, labor actions or terrorist attacks. The failure of a facility will force its customers to either travel longer distances to obtain
service from another facility, or give up service and incur a penalty. Both way, system operation cost increases and customer satisfaction deteriorates. The adverse effect may be further exacerbated if multiple facilities fail simultaneously(Zhang, Berman et al. 2009). So it can be easily said that system reliability is another important topic that can affect facility location and allocation. The importance of the reliability of system is recognized when a set of facilities has been constructed, but one or some of facilities occasionally become unavailable in situations such as inclement weather, labor actions, sabotage, or changes in ownership. There are different types of such catastrophic plight, many of which caused facilities to shut down including a series of mail-based anthrax attacks in the United States in 2001-2002 (Snyder 2003; Snyder and Ülker 2005; Snyder and Daskin 2005; Berman, Krass et al. 2007) and SARS outbreak in Toronto, Canada, in the summer of 2003 (Berman, Krass et al. 2007). It is observed that when a facility failure occurs, customers may have to be reassigned from their original facilities to the other available facilities, a condition that surely requires higher transportation or other special costs. Therefore, study of facility location problems with respect to the reliability of system and also network design can practically ameliorate solving of the mentioned problems in industries and services by obtaining more accurate and efficient solutions.
In the related traditional literature, Snyder and Daskin in 2003 were the first to propose an implicit formulation of the stochastic P-median and fixed charge problems based on the level assignments, in which the candidate sites are affected by random disruptions with equal probability (Snyder 2003; Snyder and Ülker 2005; Snyder and Daskin 2005). Shen et al. (Shen 2009) and Berman et al. (Berman, Krass et al. 2007) relaxed the assumption of uniform failure probabilities, formulated the stochastic fixed-charged facility location problem as a nonlinear mixed integer program, and expanded several heuristic solution algorithms. Berman et al. (Berman, Krass et al. 2007) concentrated on an asymptotic property of the problem and verified that the solution to the stochastic P-median problem coincides with the deterministic problem as the failure probabilities approach zero. They also presented some efficient heuristics with bounds on the worst-case performance. Lim et al. (Lim, Bassamboo et al. 2009) suggested a reliability continuum approximation (CA) approach for facility location problems with uniform customer density. For simplification, a specific form of failure-proof facility was supposed to exist; a customer was always reassigned to a failure-proof facility after its nearest regular facility

Life Science Journal 2013;10(1) http://www.lifesciencesite.com
http://www.lifesciencesite.com [email protected] 1898
failed, regardless of other regular facilities. With respect to the huge investment for facility location and network design, the attention to the failures of system based on facility disruptions in facility locating and network design has been increased recently (Qi and Shen 2007; Qi, Shen et al. 2010). Hanley and Church (O’Hanley and Church 2011) developed a new facility location–interdiction covering model for finding a robust alignment of facilities that has a suitable efficiency in the worst situations of facility loss. They formulated the problem as two mathematical models. At the first model, all possible interdiction patterns are considered and a standard MIP formulation is proposed. In the second model, the optimal interdiction pattern is implicitly defined in terms of the chosen facility location layout and more compact bi-level programming formulation is developed. Peng et al. (Peng, Snyder et al. 2011) studied the effect of considering of reliability topic on logistic networks design with facility disruptions and illustrated that applying a reliable network design are often possible with negligible increases in total location and allocation costs depends on decision makers opinion. They considered the commodity production/delivery system without respect to open/close decisions on the arcs of supply chain system and by applying the p-robustness criterion (which bounds the cost in disruption scenarios), they simultaneously minimize the nominal cost (the cost when no disruptions occur) and reduce the disruption risk. Recently, Liberatore et al. (Liberatore, Scaparra et al. 2012) introduced the problem of optimizing fortification plans in median distribution systems in the face of disruptions that involve large areas. They developed an effective exact solution algorithm to solve it optimally. Also, they showed empirically that ignoring correlation effects in a system can lead to suboptimal protection plans that result in an unnecessary increase in the system cost when disruptions take place. Moreover, Aryanezhad et al. (Aryanezhad 2011) studied a supply chain design problem with an unreliable supplier and random demand. Due to imperfect performance of the supplier, the quantity of the product received from the supplier may be less than the quantity ordered by distribution centers. A nonlinear integer programming model has been presented that minimizes the expected total costs including costs of location, inventory, transportation, and lost sales. The presented model simultaneously determines which customers are served, where distribution centers are located and how distribution centers are assigned to the customers. In order to solve the model, a heuristic approach based on genetic algorithm has been proposed. Computational
results for different data sets have revealed that the proposed solution approach is quiet effective.
The literature review shows that there is an unfulfilled research in facility locating with respect to more realistic factors such as network design and system reliability to manage the practical facility location problems. In fact, considering simultaneously network design and reliability of system in facility location problems is relatively rare. However, there are numerous practical instances of facility location problems with such constitution that can lead to a more realistic and practical mathematical modeling of the problem. One can refer to locating health care service centers, locating gas compressor stations, and designing water tubing networks as the most obvious and practical examples. As a result, proposing a new mathematical model formulation, which can obtain optimum facility location and link constructing under some special conditions such as predetermined maximum failure cost, can lead decision makers to more accurate solutions for the considered problem. In other words, the proposed model provides an enough effective and confidant approach to be applied in industries and services.
In this paper, we study the facility location-network design problem: how to design a reliable facility location with respect to network design in the presence of random facility disruptions with the option of hardening selected facilities. We consider a reliable facility location-network design problem (RFLNDP) incorporating two types of facilities, one that is unreliable and another that is reliable (which is not subject to disruption, but is more expensive). The motivation of this research is to consider simultaneously two practical factors (network design and reliability of facilities) to develop the mathematical modeling of facility location problems, which has not been considered until now based on the authors' best knowledge. The main contributions that differentiate this paper from the existing ones in the related literature can be summarized as follows: By formulating and solving the RFLNDP, we
study the relationship between the facility and network decisions (e.g., facility locations, network design, hardening investment) and some key factors (e.g., disruption probability and customer demand) in the presence of random disruptions.
The option of “facility hardening;” is considered here; hence another set of decisions is made. The notion of facility hardening implies various protection plans ranging from physical facility preservation to exogenous outsourcing agreements.
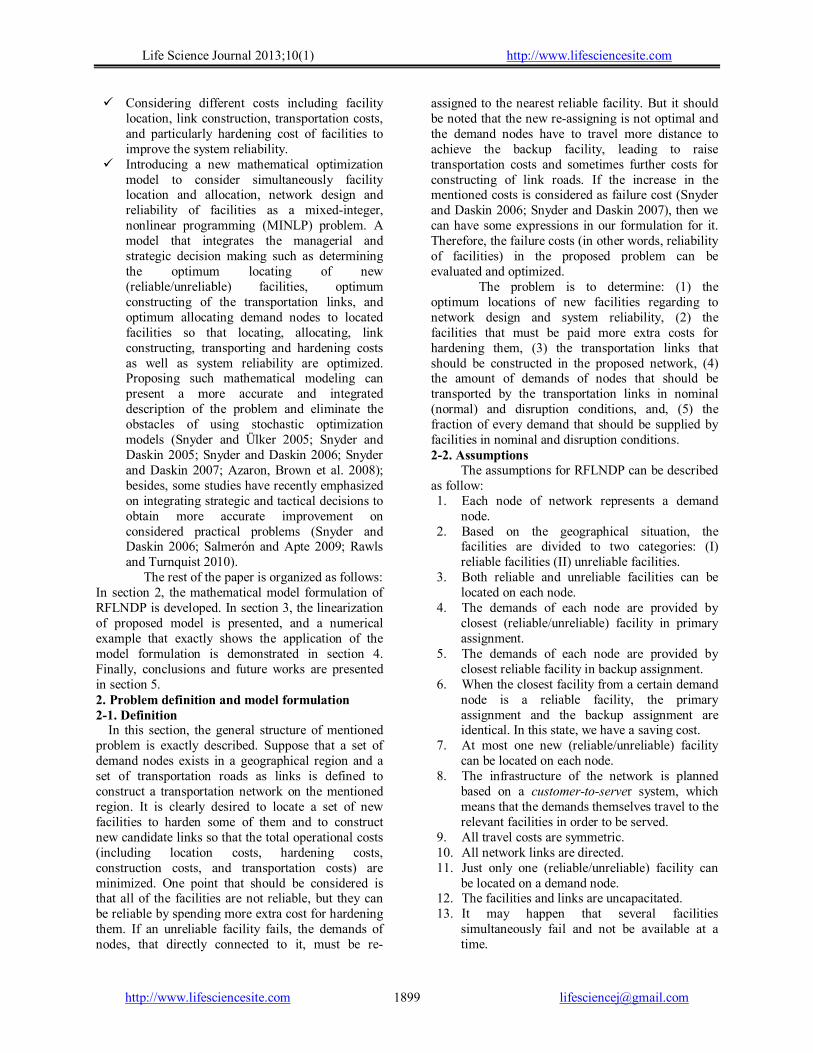
Life Science Journal 2013;10(1) http://www.lifesciencesite.com
http://www.lifesciencesite.com [email protected] 1899
Considering different costs including facility location, link construction, transportation costs, and particularly hardening cost of facilities to improve the system reliability.
Introducing a new mathematical optimization model to consider simultaneously facility location and allocation, network design and reliability of facilities as a mixed-integer, nonlinear programming (MINLP) problem. A model that integrates the managerial and strategic decision making such as determining the optimum locating of new (reliable/unreliable) facilities, optimum constructing of the transportation links, and optimum allocating demand nodes to located facilities so that locating, allocating, link constructing, transporting and hardening costs as well as system reliability are optimized. Proposing such mathematical modeling can present a more accurate and integrated description of the problem and eliminate the obstacles of using stochastic optimization models (Snyder and Ülker 2005; Snyder and Daskin 2005; Snyder and Daskin 2006; Snyder and Daskin 2007; Azaron, Brown et al. 2008); besides, some studies have recently emphasized on integrating strategic and tactical decisions to obtain more accurate improvement on considered practical problems (Snyder and Daskin 2006; Salmerón and Apte 2009; Rawls and Turnquist 2010).
The rest of the paper is organized as follows: In section 2, the mathematical model formulation of RFLNDP is developed. In section 3, the linearization of proposed model is presented, and a numerical example that exactly shows the application of the model formulation is demonstrated in section 4. Finally, conclusions and future works are presented in section 5. 2. Problem definition and model formulation 2-1. Definition
In this section, the general structure of mentioned problem is exactly described. Suppose that a set of demand nodes exists in a geographical region and a set of transportation roads as links is defined to construct a transportation network on the mentioned region. It is clearly desired to locate a set of new facilities to harden some of them and to construct new candidate links so that the total operational costs (including location costs, hardening costs, construction costs, and transportation costs) are minimized. One point that should be considered is that all of the facilities are not reliable, but they can be reliable by spending more extra cost for hardening them. If an unreliable facility fails, the demands of nodes, that directly connected to it, must be re-
assigned to the nearest reliable facility. But it should be noted that the new re-assigning is not optimal and the demand nodes have to travel more distance to achieve the backup facility, leading to raise transportation costs and sometimes further costs for constructing of link roads. If the increase in the mentioned costs is considered as failure cost (Snyder and Daskin 2006; Snyder and Daskin 2007), then we can have some expressions in our formulation for it. Therefore, the failure costs (in other words, reliability of facilities) in the proposed problem can be evaluated and optimized.
The problem is to determine: (1) the optimum locations of new facilities regarding to network design and system reliability, (2) the facilities that must be paid more extra costs for hardening them, (3) the transportation links that should be constructed in the proposed network, (4) the amount of demands of nodes that should be transported by the transportation links in nominal (normal) and disruption conditions, and, (5) the fraction of every demand that should be supplied by facilities in nominal and disruption conditions. 2-2. Assumptions
The assumptions for RFLNDP can be described as follow: 1. Each node of network represents a demand
node. 2. Based on the geographical situation, the
facilities are divided to two categories: (I) reliable facilities (II) unreliable facilities.
3. Both reliable and unreliable facilities can be located on each node.
4. The demands of each node are provided by closest (reliable/unreliable) facility in primary assignment.
5. The demands of each node are provided by closest reliable facility in backup assignment.
6. When the closest facility from a certain demand node is a reliable facility, the primary assignment and the backup assignment are identical. In this state, we have a saving cost.
7. At most one new (reliable/unreliable) facility can be located on each node.
8. The infrastructure of the network is planned based on a customer-to-server system, which means that the demands themselves travel to the relevant facilities in order to be served.
9. All travel costs are symmetric. 10. All network links are directed. 11. Just only one (reliable/unreliable) facility can
be located on a demand node. 12. The facilities and links are uncapacitated. 13. It may happen that several facilities
simultaneously fail and not be available at a time.
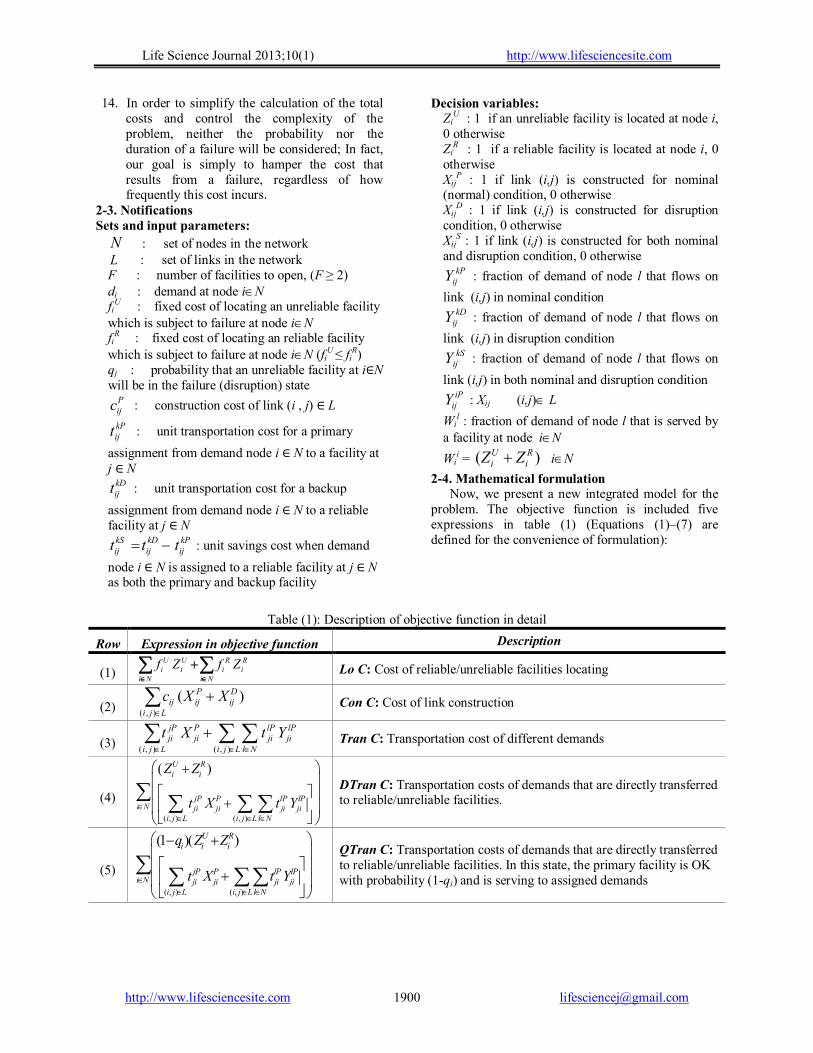
Life Science Journal 2013;10(1) http://www.lifesciencesite.com
http://www.lifesciencesite.com [email protected] 1900
14. In order to simplify the calculation of the total costs and control the complexity of the problem, neither the probability nor the duration of a failure will be considered; In fact, our goal is simply to hamper the cost that results from a failure, regardless of how frequently this cost incurs.
2-3. Notifications Sets and input parameters:
N : set of nodes in the network L : set of links in the network F : number of facilities to open, (F ≥ 2) di : demand at node iN fi
U : fixed cost of locating an unreliable facility which is subject to failure at node iN fi
R : fixed cost of locating an reliable facility which is subject to failure at node iN (fi
U ≤ fiR)
qj : probability that an unreliable facility at i∈N will be in the failure (disruption) state
Pijc : construction cost of link (i , j) ∈ L
kPijt : unit transportation cost for a primary
assignment from demand node i ∈ N to a facility at j ∈ N
kDijt : unit transportation cost for a backup
assignment from demand node i ∈ N to a reliable facility at j ∈ N
kPij
kDij
kSij ttt : unit savings cost when demand
node i ∈ N is assigned to a reliable facility at j ∈ N as both the primary and backup facility
Decision variables: Zi
U : 1 if an unreliable facility is located at node i, 0 otherwise Zi
R : 1 if a reliable facility is located at node i, 0 otherwise Xij
P : 1 if link (i,j) is constructed for nominal (normal) condition, 0 otherwise Xij
D : 1 if link (i,j) is constructed for disruption condition, 0 otherwise Xij
S : 1 if link (i,j) is constructed for both nominal and disruption condition, 0 otherwise
kPijY : fraction of demand of node l that flows on
link (i,j) in nominal condition kD
ijY : fraction of demand of node l that flows on
link (i,j) in disruption condition kS
ijY : fraction of demand of node l that flows on
link (i,j) in both nominal and disruption condition iP
ijY : Xij (i,j) L
Wil : fraction of demand of node l that is served by
a facility at node iN
Wii = )( R
iUi ZZ iN
2-4. Mathematical formulation Now, we present a new integrated model for the
problem. The objective function is included five expressions in table (1) (Equations (1)–(7) are defined for the convenience of formulation):
Table (1): Description of objective function in detail
Description Expression in objective function Row
Lo C: Cost of reliable/unreliable facilities locating
Ni Ni
Ri
Ri
Ui
Ui ZfZf
(1)
Con C: Cost of link construction
Lji
Dij
Pijij XXc
),(
)( (2)
Tran C: Transportation cost of different demands
Lji Nl
lPji
lPji
Lji
Pji
jPji YtXt
),(),(
(3)
DTran C: Transportation costs of demands that are directly transferred to reliable/unreliable facilities.
( , ) ( , )
( )U Ri i
jP P lP lPi N ji ji ji ji
i j L i j L l N
Z Z
t X t Y
(4)
QTran C: Transportation costs of demands that are directly transferred to reliable/unreliable facilities. In this state, the primary facility is OK with probability (1-qi) and is serving to assigned demands
( , ) ( , )
(1 )( )U Ri i i
jP P lP lPi N ji ji ji ji
i j L i j L l N
q Z Z
t X t Y
(5)

Life Science Journal 2013;10(1) http://www.lifesciencesite.com
http://www.lifesciencesite.com [email protected] 1901
BTran C: Transportation costs of demands that are directly transferred to backup reliable facilities. In this state, the primary facility has disrupted with probability qi and the related assigned demands are served by backup facility ( , ) ( , )
Ri i
jD D lD lDi N ji ji ji ji
i j L i j L l N
Z q
t X t Y
(6)
STran C: Saving transportation cost of demands that are assigned to reliable facilities. In this state, the reliable facilities are known as both facility for primary conditions and facility for disruption conditions
( , ) ( , )
Ri i
jS S lS lSi N ji ji ji ji
i j L i j Ll N
Z q
t X t Y
(7)
We recast the above discussion in the following integrated mathematical formulation:
(8)
( , ) ( , ) ( , )
( , ) ( , )
( )
( )
U U R Ri i i i
i N i N
P D jP P lP lPij ij ij ji ji ji ji
i j L i j L i j L l N
U R jP P lP lPi i ji ji ji ji
i i j L i j L l N
Minmize Lo C Con C Tran C DTran C
QTran C BTran C STran C
Minmize f Z f Z
c X X t X t Y
Z Z t X t Y
( , ) ( , )
( , ) ( , )
( , ) ( , )
(1 )( )
N
U Ri i i
jP P lP lPi N ji ji ji ji
i j L i j L l N
R jD D lD lDi i ji ji ji ji
i N i j L i j L l N
R jS S lS lSi i ji ji ji ji
i N i j L i j L l N
q Z Z
t X t Y
Z q t X t Y
Z q t X t Y
..ts (RFLNDP)
(9) ( ) 1U R Pi i ij
j N
Z Z X i N
(10) :
, : , ( , )
P lP lP lli ji ij i
j N j l j N
X Y Y W
i l N i l l i L
(11) :
, : , ( , )
lP lP lji ij i
j N j l j N
Y Y W
i l N i l l i L
(12) :
( ) 1U R li i i
i N i l
Z Z W l N
(13) ( ) , :l U Ri i iW Z Z i l N i l
(14) NiZZ Ri
Ui 1
(15) FZZNi
Ri
Ui
)(
(16) 1Ni
RiZ
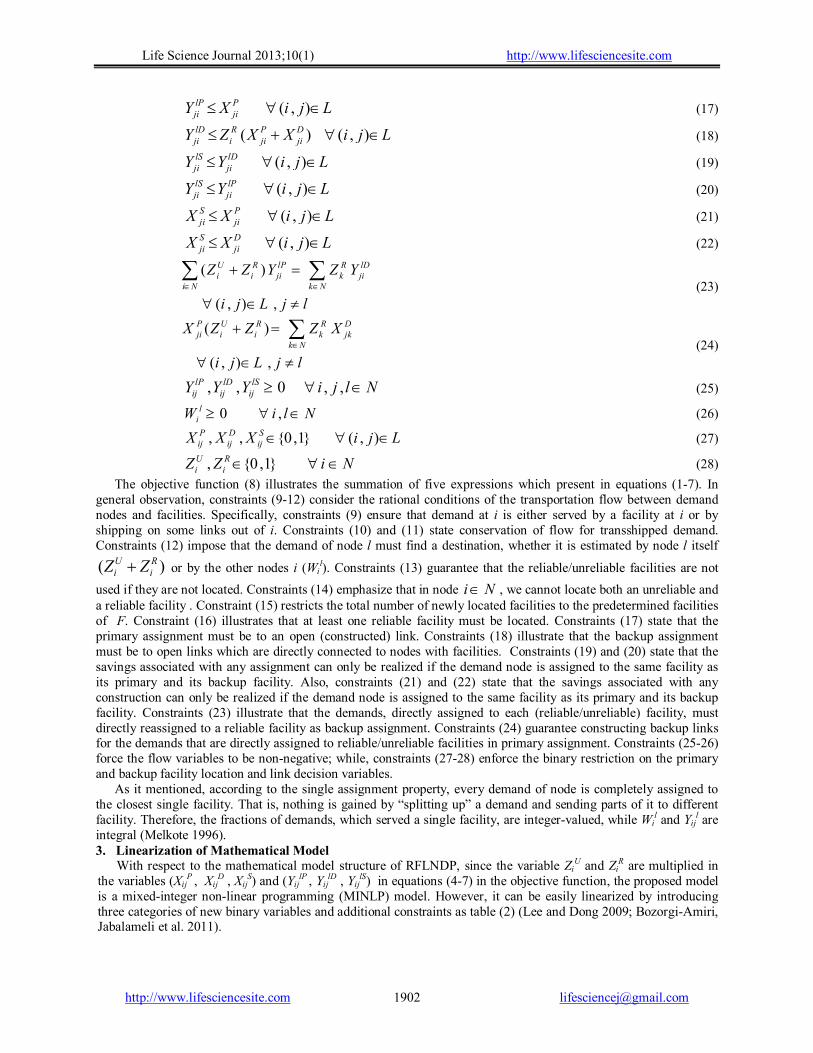
Life Science Journal 2013;10(1) http://www.lifesciencesite.com
http://www.lifesciencesite.com [email protected] 1902
(17) ( , )lP Pji jiY X i j L
(18) ( ) ( , )lD R P Dji i ji jiY Z X X i j L
(19) ( , )lS lDji jiY Y i j L
(20) ( , )lS lPji jiY Y i j L
(21) ( , )S Pji jiX X i j L
(22) ( , )S Dji jiX X i j L
(23) ( )
( , ) ,
U R lP R lDi i ji k ji
i N k N
Z Z Y Z Y
i j L j l
(24) ( )
( , ) ,
P U R R Dji i i k jk
k N
X Z Z Z X
i j L j l
(25) , , 0 , ,lP lD lSij ij ijY Y Y i j l N
(26) 0 ,liW i l N
(27) , , {0,1} ( , )P D Sij ij ijX X X i j L
(28) , {0 ,1}U Ri iZ Z i N
The objective function (8) illustrates the summation of five expressions which present in equations (1-7). In general observation, constraints (9-12) consider the rational conditions of the transportation flow between demand nodes and facilities. Specifically, constraints (9) ensure that demand at i is either served by a facility at i or by shipping on some links out of i. Constraints (10) and (11) state conservation of flow for transshipped demand. Constraints (12) impose that the demand of node l must find a destination, whether it is estimated by node l itself
)( Ri
Ui ZZ or by the other nodes i (Wi
l). Constraints (13) guarantee that the reliable/unreliable facilities are not
used if they are not located. Constraints (14) emphasize that in node Ni , we cannot locate both an unreliable and a reliable facility . Constraint (15) restricts the total number of newly located facilities to the predetermined facilities of F. Constraint (16) illustrates that at least one reliable facility must be located. Constraints (17) state that the primary assignment must be to an open (constructed) link. Constraints (18) illustrate that the backup assignment must be to open links which are directly connected to nodes with facilities. Constraints (19) and (20) state that the savings associated with any assignment can only be realized if the demand node is assigned to the same facility as its primary and its backup facility. Also, constraints (21) and (22) state that the savings associated with any construction can only be realized if the demand node is assigned to the same facility as its primary and its backup facility. Constraints (23) illustrate that the demands, directly assigned to each (reliable/unreliable) facility, must directly reassigned to a reliable facility as backup assignment. Constraints (24) guarantee constructing backup links for the demands that are directly assigned to reliable/unreliable facilities in primary assignment. Constraints (25-26) force the flow variables to be non-negative; while, constraints (27-28) enforce the binary restriction on the primary and backup facility location and link decision variables.
As it mentioned, according to the single assignment property, every demand of node is completely assigned to the closest single facility. That is, nothing is gained by “splitting up” a demand and sending parts of it to different facility. Therefore, the fractions of demands, which served a single facility, are integer-valued, while Wi
l and Yijl are
integral (Melkote 1996). 3. Linearization of Mathematical Model
With respect to the mathematical model structure of RFLNDP, since the variable ZiU and Zi
R are multiplied in the variables (Xij
P , XijD , Xij
S) and (YijlP
, YijlD , Yij
lS) in equations (4-7) in the objective function, the proposed model is a mixed-integer non-linear programming (MINLP) model. However, it can be easily linearized by introducing three categories of new binary variables and additional constraints as table (2) (Lee and Dong 2009; Bozorgi-Amiri, Jabalameli et al. 2011).
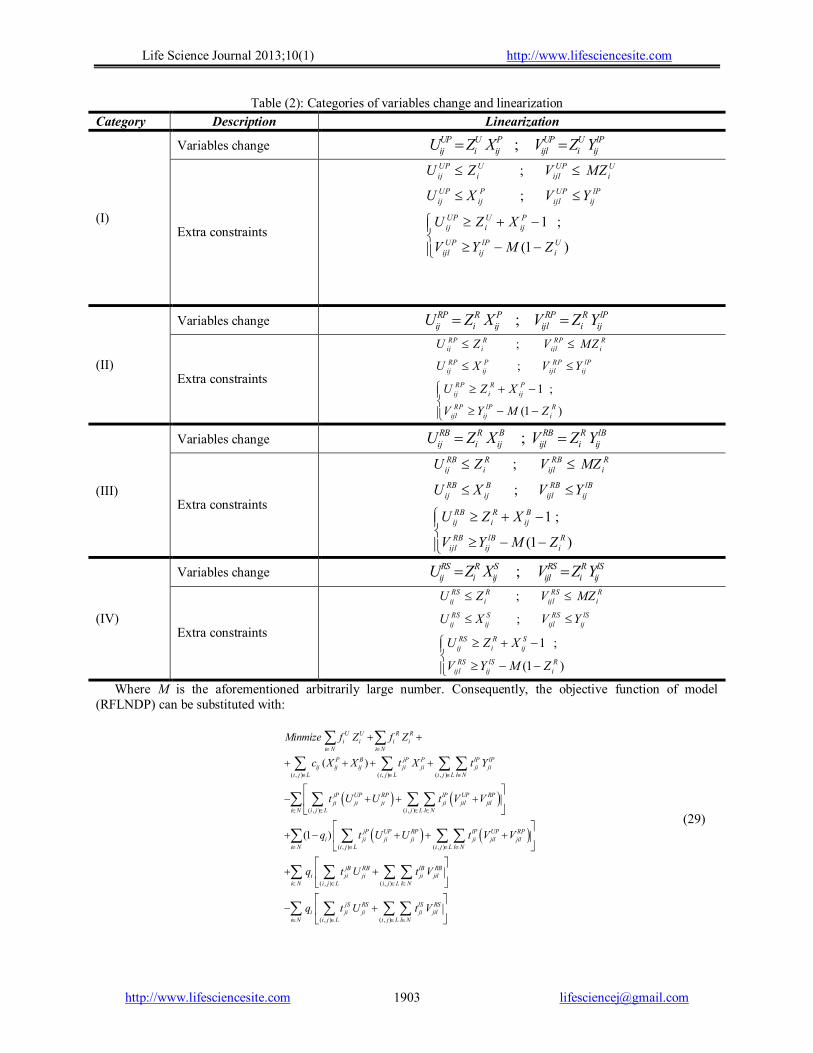
Life Science Journal 2013;10(1) http://www.lifesciencesite.com
http://www.lifesciencesite.com [email protected] 1903
Table (2): Categories of variables change and linearization
Category Description Linearization
(I)
Variables change ;UP U P UP U lPij i ij ijl i ijU Z X V Z Y
Extra constraints
;
;
1 ;
(1 )
UP U UP Uij i ijl i
UP P UP lPij ij ijl ij
UP U Pij i ij
UP lP Uijl ij i
U Z V MZ
U X V Y
U Z X
V Y M Z
(II)
Variables change ;RP R P RP R lPij i ij ijl i ijU Z X V Z Y
Extra constraints
;
;
1 ;
(1 )
RP R RP Rij i ijl i
RP P RP lPij ij ijl ij
RP R Pij i ij
RP lP Rijl ij i
U Z V MZ
U X V Y
U Z X
V Y M Z
(III)
Variables change ;RB R B RB R lBij i ij ijl i ijU Z X V Z Y
Extra constraints
;
;
1 ;
(1 )
RB R RB Rij i ijl i
RB B RB lB
ij ij ijl ij
RB R Bij i ij
RB lB Rijl ij i
U Z V MZ
U X V Y
U Z X
V Y M Z
(IV)
Variables change ;RS R S RS R lSij i ij ijl i ijU Z X V Z Y
Extra constraints
;
;
1 ;
(1 )
RS R RS Rij i ijl i
RS S RS lSij ij ijl ij
RS R Sij i ij
RS lS Rijl ij i
U Z V MZ
U X V Y
U Z X
V Y M Z
Where M is the aforementioned arbitrarily large number. Consequently, the objective function of model (RFLNDP) can be substituted with:
( , ) ( , ) ( , )
( , ) ( , )
( , )
( )
(1 )
U U R Ri i i i
i N i N
P B jP P lP lPij ij ij ji ji ji ji
i j L i j L i j L l N
jP UP RP lP UP RPji ji ji ji jil jil
i N i j L i j L l N
jP UP RP lPi ji ji ji ji jil
i j L
Minmize f Z f Z
c X X t X t Y
t U U t V V
q t U U t V
( , )
( , ) ( , )
( , ) ( , )
UP RPjil
i N i j L l N
jB RB lB RBi ji ji ji jil
i N i j L i j L l N
jS RS lS RSi ji ji ji jil
i N i j L i j L l N
V
q t U t V
q t U t V
(29)

Life Science Journal 2013;10(1) http://www.lifesciencesite.com
http://www.lifesciencesite.com [email protected] 1904
Therefore, the final model of RFLNDP converted to mixed integer linear programming (MILP) model easily. 4. Numerical Example
An application of the proposed mathematical model is described in as a numerical example. The example is referenced from literature review (Melkote 1996). 4-1. Definition
A 21 node network with the travel costs scaled up by a factor of ten is supposed in which 38 potential links can be constructed. This network is shown in Figure 1. The demands, which are shown in parentheses beside each node, are normalized so that they sum to 1000. The fixed unreliable facility location costs are taken from a uniform (500, 1500) distribution and normalized so that their mean is $1000. These costs are assigned to the demand nodes in ascending order, that is, they increase with the amount of demand. Also, the fixed location costs of reliable facility are defined as fi
R = 1.5×fiU. The travel
cost tij of each candidate link may be interpreted as its length. Also, all distances on this network satisfy the triangle inequality. We again assume that we have a unit link construction cost that is distinguished as cij=30×tij; in other words, for each link, the unit link construction cost is a fixed coefficient of unit transportation cost.
Figure 1: The 21 node network (Melkote 1996)
4-2. Computational results
Due to the above description and the predetermined value of different parameters, the numerical example was coded in GAMS 23.8 and solved by CPLEX solver. The results are presented in Figure 2 which visually illustrates the obtained
optimal solution. As Figure 2 illustrates, the value of Z2
R , Z10R , Z12
U and Z18U are determined to 1. This
means that the optimum locations for four new facilities are nodes 2 , 10 , 12 and 18. Also the facilities, located in nodes 2 and 10, should be selected for hardening.
In additions, 17 new roads must be constructed between several nodes (X1,2 =1; X5,4 =1; X3,2=1; X4,2=1; X6,7=1; X7,8=1; X9,8=1; X8,10=1; X13,10=1; X14,10=1; X19,20=1; X21,20=1; X20,18=1; X17,16=1; X16,12=1; X11,12=1; X15,12=1). As well as, 4 new roads should be constructed between several nodes as a potential links for disruption conditions (X8,11 =1; X19,14 =1; X21,14=1, X17,18=1). The optimal value of objective function for the numerical example is $59332.
Figure 2: The optimal solution of the numerical
example
Figure 3: The changing procedure of CPU time
for different sizes of problem
0
1000
2000
3000
4000
5000
6000
5 8 10 12 14 16 18 20 21 23 25 30
Tim
e (S
ec)
Nodes
Solution Time

Life Science Journal 2013;10(1) http://www.lifesciencesite.com
http://www.lifesciencesite.com [email protected] 1905
As a remarkable point, the CPU time of the model is one of the key factors in applying of the proposed methodology. Different instance problems, that the number of their demand nodes was set from 5 to 30, were generated randomly and solved on a PC with Pentium IV-2.33 GHz and 2 GB RAM DDR 3 under win XP SP3. Figure 3 presents the changing procedure of CPU time according to different increasing values in the number of demand nodes.
As expected, the CPU times increase exponentially. Therefore, the model is not suitable for large scale problems. However, with respect to the several applications of the RFLNDP in different industrial and services environments, developing of a mathematical formulation for the RFLNDP is an auspicious beginning point for starting works on this kind of facility location problem as future studies. 5. Conclusions and future research
In this paper, the combined facility location-network design problem with respect to the system reliability, named reliable facility location-network design problem (RFLNDP), was considered and a mixed integer non linear programming (MINLP) formulation for the mentioned problem was proposed. The basic principal in the proposed formulation is the concept of “facility hardening investment” to hedge against the risk of facility disruptions which implies various protection plans ranging from physical facility protection to exogenous outsourcing contracts.
The proposed model was linearized by the efficient techniques. Also, a practical numerical example was presented in detail to illustrate the application of the proposed mathematical model (RFLNDP). The results illustrate that the proposed model not only can present a more accurate description of RFLNDP but also can propose efficient feasible solutions to use in industries and services.
Our findings raise some appropriate questions for future research. First, the size of the numerical example may be small and if the size of the problem increases, a suitable solution procedure should be proposed to obtain optimal or near optimal solution. We are particularly interested in seeking apposite and efficient heuristics and metaheuristics such as tabu search (TS) and particle swarm optimization (PSO) for the mentioned propose. Second, only a single objective function was studied in this paper; however, considering the RFLNDP as a multi objective problem such as minimizing the operating costs and maximizing the system reliability can have more practical application in industries and services. Finally, we would explore other applications of the proposed model, especially in the fields of integrated facility sitting and supply chain design.
References: 1. Aryanezhad, M. B., Jalali Naini, S.G.,
Jabbarzadeh, A. (2011). "An Integrated Location Inventory Model for Designing a Supply Chain Network under Uncertainty." Life Science Journal 8(4): 670-679.
2. Azaron, A., K. Brown, et al. (2008). "A multi-objective stochastic programming approach for supply chain design considering risk." International Journal of Production Economics 116(1): 129-138.
3. Berman, O., D. Krass, et al. (2007). "Facility reliability issues in network p-median problems: Strategic centralization and co-location effects." Operations Research 55(2): 332.
4. Bigotte, J. F., D. Krass, et al. (2010). "Integrated modeling of urban hierarchy and transportation network planning." Transportation Research Part A 44(7): 506–522.
5. Bozorgi-Amiri, A., M. Jabalameli, et al. (2011). "A multi-objective robust stochastic programming model for disaster relief logistics under uncertainty." OR Spectrum: 1-29.
6. Cocking, C. (2008). Solutions to Facility Location–Network Design Problems. Department of Computer Science, University of Heidelberg, Doctor of Philosophy Thesis.
7. Cocking, C. and G. Reinelt (2009). Heuristics for budget facility location-network design problems with minisum objective. Operations Research Proceedings 2008, Springer Berlin Heidelberg.
8. Contreras, I. and E. Fernández (2011). "General network design: A unified view of combined location and network design problems." European Journal of Operational Research.
9. Contreras, I., E. Fernández, et al. (2012). "Minimizing the maximum travel time in a combined model of facility location and network design." Omega.
10. Daskin, M. (1995). "Network and Discrete Location: Models, Algorithms, and Applications." John Wiley New York.
11. Daskin, M. S., A. P. Hurter, et al. (1993). Toward an integrated model of facility location and transportation network design. Working Paper, , Transportation Center, Northwestern University.
12. Drezner, Z. and H. W. Hamacher (2004). Facility location: applications and theory, Springer Verlag.
13. Drezner, Z. and G. O. Wesolowsky (2003). "Network Design: Selection and Design of Links and Facility Location." Transportation Research Part A 37(3): 241–256.
Life Science Journal 2013;10(1) http://www.lifesciencesite.com
http://www.lifesciencesite.com [email protected] 1906
14. Farahani, R. Z. and M. Hekmatfar (2009). Facility location: concepts, models, algorithms and case studies, Springer.
15. JabalAmeli, M. S. and M. Mortezaei (2011). "A hybrid model for multi-objective capacitated facility location network design problem."
16. Lee, D. H. and M. Dong (2009). "Dynamic network design for reverse logistics operations under uncertainty." Transportation Research Part E: Logistics and Transportation Review 45(1): 61-71.
17. Liberatore, F., M. P. Scaparra, et al. (2012). "Hedging against disruptions with ripple effects in location analysis." Omega 40(1): 21-30.
18. Lim, M., Daskin, M.S., A. Bassamboo, et al. (2009). "Facility location decisions in supply chain networks with random disruption and imperfect information." Working paper,” Department of Business Administration, University of Illinois.
19. Melkote, S. (1996). Integrated models of facility location and network design,. EVASTON, ILLINIOS, Northwestern University, Doctor of Philosophy.
20. Melkote, S. and M. S. Daskin (2001a). "An integrated model of facility location and transportation network design." Transportation Research Part A 35(6): 515-538.
21. Melkote, S. and M. S. Daskin (2001b). "Capacitated facility location-network design problems." European Journal of Operational Research 129(3): 481-495.
22. O’Hanley, J. R. and R. L. Church (2011). "Designing robust coverage networks to hedge against worst-case facility losses." European Journal of Operational Research 209(1): 23-36.
23. Peng, P., L. V. Snyder, et al. (2011). "Reliable logistics networks design with facility disruptions." Transportation Research Part B: Methodological 45(8): 1190-1211.
24. Qi, L. and Z. J. M. Shen (2007). "A supply chain design model with unreliable supply." Naval Research Logistics (NRL) 54(8): 829-844.
25. Qi, L., Z. J. M. Shen, et al. (2010). "The effect of supply disruptions on supply chain design
decisions." Transportation Science 44(2):274-289.
26. Rawls, C. G. and M. A. Turnquist (2010). "Pre-positioning of emergency supplies for disaster response." Transportation Research Part B: Methodological 44(4): 521-534.
27. Salmerón, J. and A. Apte (2009). "Stochastic optimization for natural disaster asset prepositioning." Production and Operations Management.
28. Shen, Z.-J. M., R. L. Zhan, J. Zhang. (2009). "The reliable facility location problem: Formulations, heuristics, and approximation algorithms." Working paper, University of California, Berkeley.
29. Snyder, L. and N. Ülker (2005). A model for locating capacitated, unreliable facilities. IERC Conference,, Atlanta, GA, May 2005.
30. Snyder, L. V. (2003). Supply chain robustness and reliability: Models and algorithms (PHD Thesis). Dept. of Industrial Engineering and Management Sciences. Evanston, IL,, Northwestern University. PhD thesis.
31. Snyder, L. V. and M. S. Daskin (2005). "Reliability models for facility location: The expected failure cost case." Transportation Science 39(3): 400-416.
32. Snyder, L. V. and M. S. Daskin (2007). "Models for reliable supply chain network design." Critical Infrastructure: Reliability and Vulnerability, A.T. Murray and T.H. Grubesic (eds.), Chapter 13: 257-289.
33. Snyder, L. V., Scaparra, M.P. and M. S. Daskin, Church, R.L. (2006). "Planning for disruptions in supply chain networks." Tutorials in Operations Research: Models, Methods, and Applications for Innovative Decision Making ISBN: 13 978-1-877640-20-9(DOI 10.1287 / educ.1063.0025): 234–257.
34. Zhang, Y., O. Berman, et al. (2009). "Incorporating congestion in preventive healthcare facility network design." European Journal of Operational Research 198(3): 922-935.
2/2/2013
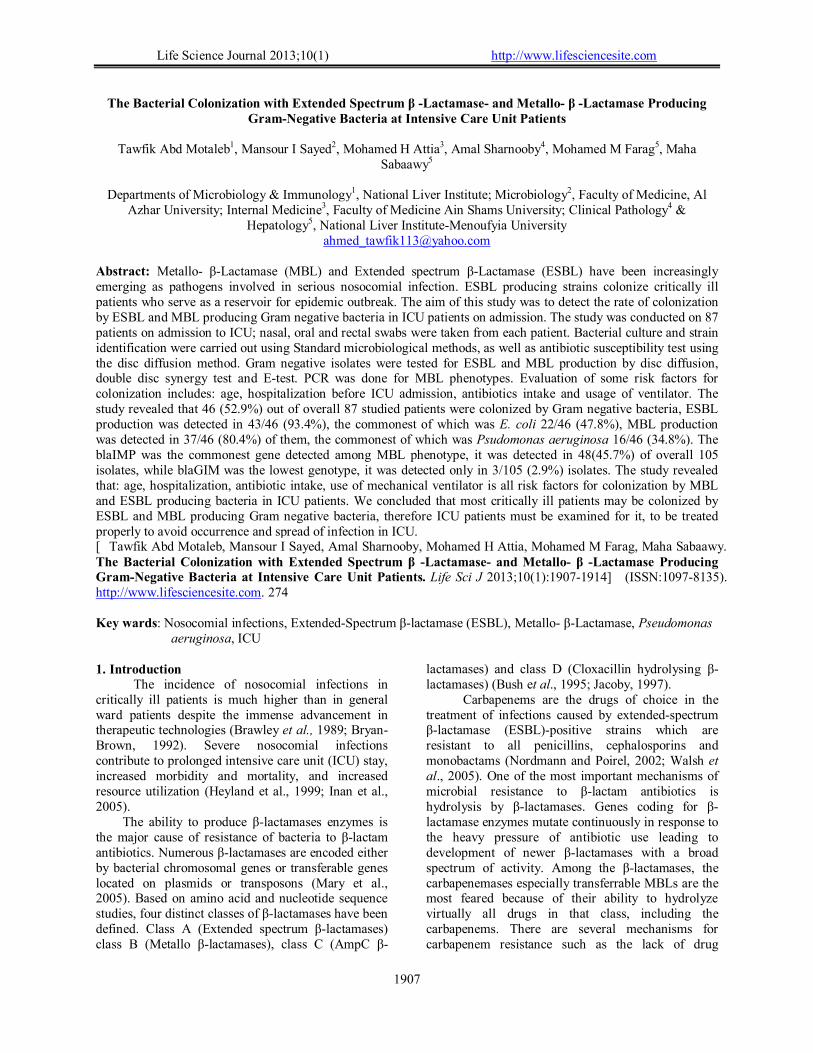
Life Science Journal 2013;10(1) http://www.lifesciencesite.com
1907
The Bacterial Colonization with Extended Spectrum β -Lactamase- and Metallo- β -Lactamase Producing Gram-Negative Bacteria at Intensive Care Unit Patients
Tawfik Abd Motaleb1, Mansour I Sayed2, Mohamed H Attia3, Amal Sharnooby4, Mohamed M Farag5, Maha
Sabaawy5
Departments of Microbiology & Immunology1, National Liver Institute; Microbiology2, Faculty of Medicine, Al Azhar University; Internal Medicine3, Faculty of Medicine Ain Shams University; Clinical Pathology4 &
Hepatology5, National Liver InstituteMenoufyia University [email protected]
Abstract: Metallo βLactamase (MBL) and Extended spectrum βLactamase (ESBL) have been increasingly emerging as pathogens involved in serious nosocomial infection. ESBL producing strains colonize critically ill patients who serve as a reservoir for epidemic outbreak. The aim of this study was to detect the rate of colonization by ESBL and MBL producing Gram negative bacteria in ICU patients on admission. The study was conducted on 87 patients on admission to ICU; nasal, oral and rectal swabs were taken from each patient. Bacterial culture and strain identification were carried out using Standard microbiological methods, as well as antibiotic susceptibility test using the disc diffusion method. Gram negative isolates were tested for ESBL and MBL production by disc diffusion, double disc synergy test and Etest. PCR was done for MBL phenotypes. Evaluation of some risk factors for colonization includes: age, hospitalization before ICU admission, antibiotics intake and usage of ventilator. The study revealed that 46 (52.9%) out of overall 87 studied patients were colonized by Gram negative bacteria, ESBL production was detected in 43/46 (93.4%), the commonest of which was E. coli 22/46 (47.8%), MBL production was detected in 37/46 (80.4%) of them, the commonest of which was Psudomonas aeruginosa 16/46 (34.8%). The blaIMP was the commonest gene detected among MBL phenotype, it was detected in 48(45.7%) of overall 105 isolates, while blaGIM was the lowest genotype, it was detected only in 3/105 (2.9%) isolates. The study revealed that: age, hospitalization, antibiotic intake, use of mechanical ventilator is all risk factors for colonization by MBL and ESBL producing bacteria in ICU patients. We concluded that most critically ill patients may be colonized by ESBL and MBL producing Gram negative bacteria, therefore ICU patients must be examined for it, to be treated properly to avoid occurrence and spread of infection in ICU. [Tawfik Abd Motaleb, Mansour I Sayed, Amal Sharnooby, Mohamed H Attia, Mohamed M Farag, Maha Sabaawy.
The Bacterial Colonization with Extended Spectrum β -Lactamase- and Metallo- β -Lactamase Producing Gram-Negative Bacteria at Intensive Care Unit Patients. Life Sci J 2013;10(1):19071914] (ISSN:10978135). http://www.lifesciencesite.com. 274 Key wards: Nosocomial infections, ExtendedSpectrum βlactamase (ESBL), Metallo βLactamase, Pseudomonas
aeruginosa, ICU 1. Introduction
The incidence of nosocomial infections in critically ill patients is much higher than in general ward patients despite the immense advancement in therapeutic technologies (Brawley et al., 1989; BryanBrown, 1992). Severe nosocomial infections contribute to prolonged intensive care unit (ICU) stay, increased morbidity and mortality, and increased resource utilization (Heyland et al., 1999; Inan et al., 2005). The ability to produce βlactamases enzymes is the major cause of resistance of bacteria to βlactam antibiotics. Numerous βlactamases are encoded either by bacterial chromosomal genes or transferable genes located on plasmids or transposons (Mary et al., 2005). Based on amino acid and nucleotide sequence studies, four distinct classes of βlactamases have been defined. Class A (Extended spectrum βlactamases) class B (Metallo βlactamases), class C (AmpC β
lactamases) and class D (Cloxacillin hydrolysing βlactamases) (Bush et al., 1995; Jacoby, 1997). Carbapenems are the drugs of choice in the treatment of infections caused by extendedspectrum βlactamase (ESBL)positive strains which are resistant to all penicillins, cephalosporins and monobactams (Nordmann and Poirel, 2002; Walsh et al., 2005). One of the most important mechanisms of microbial resistance to βlactam antibiotics is hydrolysis by βlactamases. Genes coding for βlactamase enzymes mutate continuously in response to the heavy pressure of antibiotic use leading to development of newer βlactamases with a broad spectrum of activity. Among the βlactamases, the carbapenemases especially transferrable MBLs are the most feared because of their ability to hydrolyze virtually all drugs in that class, including the carbapenems. There are several mechanisms for carbapenem resistance such as the lack of drug
Life Science Journal 2013;10(1) http://www.lifesciencesite.com
1908
penetration due to mutation in pores, loss of certain outer membrane proteins and efflux mechanisms (Walsh et al., 2002). ESBLproducing strains causing hospitalacquired infections are a serious therapeutical and epidemiological problem, especially in ICU patients who are of high risk for infections caused by multidrugresistant bacterial strains (Livermore, 2008). Klebsiella pneumoniae is one of the most frequently isolated pathogens from ICU patients (Rudnicka et al., 2005), and one of the most frequent ESBL producers (Empel et al., 2008). A more disturbing problem has emerged, which is the growing number of reports on MBL positive Enterobacteriaceae strains, which follow the Gramnegative nonfermenters (Giakkoupi et al., 2003; Luzzaro et al., 2004; Pournaras et al., 2005). MBLs hydrolyze penicillins, cephalosporins and carbapenems and are not inhibited by betalactamase inhibitors (Walsh et al., 2005; Queenan and Bush, 2007). The acquired metallo– β lactamases (MBLs) represent an emerging threat in the field of infectious diseases because of their rapid spread, increasing diversity, and broad hydrolytic spectrum, which includes the carbapenems. Five types of acquired MBLs have been identified: VIM, IMP, SPM, GIM, and SIMtype enzymes. Since the first description of VIM2 in a Pseudomonas aeruginosa strain isolated in Portugal in 1995 and of VIM1 in a P. aeruginosa strain isolated in Verona, Italy, in 1997 (Yong et. al.,2002), the VIMtype MBLs remain the most prevalent in Europe. P. aeruginosa represents the most important known reservoir of the VIMtype enzymes, but some studies have reported the dissemination of these enzymes in members of the family enterobacteriaceae (Shibata et. al., 2003).
The routine susceptibility tests done by clinical laboratories fail to detect βlactamases positive strains and can detect isolates erroneously sensitive to any of the broadspectrum cephalosporin like cefotaxime, ceftazidime, ceftriaxone and for imipenem or meropenem (Mathur et al., 2002; Chaudhary & Aggarwal, 2004). Hence, it is necessary to know the prevalence of βlactamase positive strains in the ICU so as to formulate a policy of empirical therapy in these high risk units where infections due to resistant organisms are much higher. The aim of this study was to determine the rate of occurrence of colonization by ESBL and MBL producing Gram negative Bacteria among patients admitted to ICU, to study the role of some risk factors that may predispose to bacterial colonization and to optimize the therapeutic use of antimicrobials for treating these microbial infections with to formulation of antibiotic policy accordingly.
2. Patients and methods: The present study was carried out from January 2011 to August 2012 in the National Liver Institute Menoufiya University, Al Azhar and Ain Shams University Hospitals. The studied patients were 87 ICU patients (57 males and 30 females), their mean age was 59.3±10.2 years. Full history was taken from each patient. Patients who had taken antibiotic in the previous week were excluded from the study.A written consent was taken from each patient . Samples & microbiological examination: Nasal, oral and rectal swabs were taken from each patient on admission to the ICU and sent immediately to the microbiology laboratory for processing, culture and sensitivity for detection of ESBL and MBL isolates, Genotype analysis for suspected strain were done. 1- Culture:
Samples were inoculated on Nutrient agar, MacConkey’s agar, and mannitol salt agar, isolated bacteria were identified to the species level by the standard laboratory techniques (Baird,1996) including colony morphology, pigment production, Gram staining, and biochemical reactions; automated identification was carried out, for nonfermenters Gram negative bacilli by using the Vitek2C2 system (USA). 2- Antimicrobial susceptibility testing: Antimicrobial sensitivity was performed on Mueller Hinton agar plates by KirbyBauer disk diffusion method according to CLSI full guidelines (Clinical and Lab Standards Institute (CLSI), 2006) for detection of ESBL and MBL. The Antibiotic discs used for detection of ESBL and BML were (Augmentin, cefotaxime, cefodexine, cefoxtine, ciprofloxacin, amikacin, gentamycin, piperacillin, imipenem, and meropenem). a) Detection of ESBL: All positive isolates of Gram negative bacteria including Enterobactericea, Pseudomonas earuginosa and Acinetobacter spp were screened for ESBL production by inoculation of a suspension of the growing colonies making a turbidity equal to 0.5 Macferlands opacity standard on a Muller Hinton agar plates and placing the AB discs of ceftazidime, cefotaxime, ceftrioxone and cefpodoxime at a distance of 15 mm apart, after incubation at 37ºC for 1618 hours. Resistance to these antibiotics indicated a suspicion of ESBL production (Paterson et.al., 2005) confirmed by the combined disc test which was done by the inoculation of a suspension of the growing colonies making a turbidity equal to 0.5 Macferlands opacity standard on a Muller Hinton agar plate, putting a disc of ceftazidime (30µg) and ceftazidime plus clavulanic acid disc (30/10 μg) on the Mueller Hinton agar plate and incubated it at 37c for 18h.

Life Science Journal 2013;10(1) http://www.lifesciencesite.com
1909
Organism was considered as ESBL producer if there was a ≥ 5mm increase in diameter of ceftazidime plus clavulenic disc than that of ceftazidime disc alone (Bhattacharya, 2006). b) MBL screening: The Gramnegative isolates (including members of the family Entero-bacteriaceae, Pseudomonas spp. and Acinetobacter spp.) that were nonsusceptible to imipenem (10 mg disc) and/or meropenem (10 mg disc) indicated suspicion of MBL production, confirmed by confirmatory phenotypic tests: 1- Double Disc Synergy Test (DDST):
The test was formed as described by (Yong et al., 2002) to differentiate metalloenzymes from other carbapenemases. Ceftazidime disc (30μg) was placed on MH agar medium inoculated with test organism and 10 mm apart, a blank filter study disc impregnated with 10μl of 750μg EDTA solution was added, another ceftazidime disc was placed on the far side of the medium. The zone of inhibition around ceftazidime disc that expanded towards EDTA disc, compared to ceftazidime disc placed on the far side of the medium, was indicative of a positive result. The same test was conducted with imipenem disc with10μl of 750μg EDTA solution as well. 2-Combined-disk method Ethylenediaminetetraacetic acid (EDTA):
Half milliter EDTA (Sigma Chemicals, St. Louis, MO) solution was prepared by dissolving 18.6 gram of disodium EDTA.2H2O in 100 ml of distilled water and its pH was adjusted to 7.8 by using NaOH. The mixture was then sterilized by filtration through a .45µm pore size filter. EDTA sol (4.5 μl) was poured on imipenem disc of 10µg. Antibiotic disks were dried immediately in an incubator and stored at 20°C in airtight vials without desiccant until used. An overnight broth culture of test strain (turbidity adjusted to 0.5 McFarland opacity standards) was inoculated on a plate of Mueller Hinton agar. One 10 μg imipenem discs with and without EDTA were placed onto the agar surface. The inhibition zones of imipenem and imipenemEDTA discs were compared after 1618 hours of incubation at 37ºC. Organisms were considered MBL producers if the zone around the IMPEDTA disc is ≥8mm compared to the zone around the IMP disc alone (Petropoulou et al., 2006) 3- E-testt metallo-beta-lactamase strips (Ab Biodisk Solna, Sweden) consist of a double sided seven dilution range of imipenem IP (4 to 256 μg/ml) and IP (1 to 64 μg/ml) overlaid with a constant gradient of EDTA (320 mg/L), inoculation and incubation were performed according to the manufacturer’s instructions. Individual colonies were picked from overnight agar plates and suspended in 0.85% saline to a turbidity of 0.5% McFarland’s standard. A sterile cotton swab was dipped into the inoculum’s
suspension and inoculated onto the MuellerHinton agar. Imipenem E test strip was laid on the surface of MuellerHinton agar plate in a position that the whole length of strip be in complete contact with the agar surface. Plates were incubated for 16 to 18 h at 37°C. The MIC end points were read where the inhibition ellipses intersected the strip. Isolate was considered as MBL producer when the MIC ratio of IP/IPI is ≥8 or ≥3 log dilutions. Additionally, a strain was considered MBL producer if a phantom zone or deformation of the ellipse is observed regardless of IP/IPI ratio (Walsh et al., 2002). c- Genotypic detection of MBL genes by PCR (Ellington et al., 2007): A PCR assay was performed to detect and differentiate the five families of acquired MBL encoding genes (VIM, IMP, SPM, GIM and SIM families) in a single reaction.
Preparation of plasmid and genomic DNA: Plasmid DNA was isolated from the bacterial cells by alkaline lysis method (Strunburg and Mack, 2003), genomic DNA was purified by phenol extraction and ethanol precipitation method (Sambrook et. al.,2001) . Primer design: Conserved regions of all available blaIMP, blaVIM, blaSPM1, blaGIM1, blaSM1 alleles were identified. Five primer pairs, specific for each family of acquired MBLs, were designed to amplify products of 188 bp (IMP), 390 bp (VIM), 271 bp (SPM1), 477 bp (GIM1), 570 bp (SIM1): IMP (188 bp) Forward 5´ GAATAGAGTGGCTTAAYTCTC3´ Reverse 5´CCAAACYACTASGTTATCT3´ VIM (390 bp) Forward 5´GATGGTGTTTGGTCGCATA3´ Reverse 5´CGAATGCGCAGCACCAG39 SPM1 (271 bp) Forward 5´AAAATCTGGGTACGCAAACG3´ Reverse 5´ACATTATCCGCTGGAACAGG3´ GIM1 (477 bp) Forward 5´TCGACACACCTTGGTCTGAA3´ Reverse 5´AACTTCCAACTTTGCCATGC3´ SIM1 (570 bp) Forward 5´TACAAGGGATTCGGCATCG3´ Reverse 5´TAATGGCCTGTTCCCATGTG3´
Amplification, The cycling conditions were: initial DNA release and denaturation at 94 °C for 5 min; followed by 40 cycles of 94 °C for 30 s, 52 °C for 40 s and 72 °C for 50 s; followed by a single, final, elongation step at 72 °C for 5 min. The amplified PCR product was analyzed with appropriate DNA size marker (1001000 bp) on 2% agarose gel containing 1 ml ethidium bromide. The amplified product was examined for the presence of multiple bands under UV 3. Results:
The demographic and clinical criteria of the studied patients are shown in table (1), whereas the total number of the studied patients was 87 (57males and 30 females) with age ranged from 15 to70 years old. 55 (63.2%) of the studied patients had been admitted in the hospital ≥48 hours prior to ICU admission, 17 (19.5%) of the studied patients were surgical patients, while the remaining 70 (80.5%)

Life Science Journal 2013;10(1) http://www.lifesciencesite.com
1910
were medical patients, 65 (74.7%) had a previous exposure to antimicrobial drugs intake and 22 (25.2%) had been exposed to mechanical ventilation.
Table (2) shows the pattern of bacterial colonization in the studied patients, 46/87 (52.9%) of the studied patients were colonized by bacteria at one or more of the swabbed sites, Gram negative enterobactericeae were the commonest ESBL producing bacteria isolated from the colonized patients, as the highest rate of isolation was for E.coli 22/46 (47.8%), followed by Klebsiella pneumonia 16/46 (34.8%), Citrobacter spp. 3/46 (6.5%), and the lowest rate of isolation was for Enterbacter spp. 2/46 (4.3%).
Meanwhile, the rate of total MBL isolated cases were 37/46 (80.4%), Pseudomonas aeruginosa was the commonest detected organism and was in 22/46 (43.5%) of cases, followed by Acinetobacter 11/46 (23.9%), E.coli 3/46 (6.5%), Klebsiella pneumonia 2/46 (4.3%) and Enterbacter spp.1/46 (2.2%) as shown in table (3).
Regarding the genotypic detection of MBLencoding genes in the 105 isolates (from nasal, oral or rectal swabs), blaIMP subtype was the commonest, and was detected in 48/105(45.7%) of overall isolates, the commonest organism detected was in Pseudomonas earuginosa (21), followed by in Acinetobacter baumannii (17), Klebsiella pneumonia (3), Enterobacterspp (2), E. coli (5). The blaVIM genotype was detected in 34/105 (32.4%), followed by blaSIM in 16/105 (15.2%), then blaSPM 4/105 (3.8%). Meanwhile, blaGIM was the lowest genotype detected in overall 105 isolates, it was detected only in 3/105 (2.9%) isolates, 2 of them was Pseudomonas spp and one isolate was E coli (Table 4).
Table (5) shows the risk factors for bacterial colonization on admission at ICU, the patients aged above 50 years have a higher rate of colonization (62.5%), than patients with age below 50 years (37.5%) (p=0.04). Regarding gender, males had a higher rate of colonization (61.4%) than females (36.7%), (p=0.02). An important risk factor is the hospital stay >48 hs, hospitalised patients had a significant higher rate of colonization (74%), than the non hospitalised (24%) (p=0.0001). Uses of antibiotics was observed as risk factors for colonization as
patients who used antibiotic had a significant higher rate of colonization (60.7%) than the non user (20%) (p=0.004). Patients who undergone mechanical ventilation, had a significant higher rate of colonization (53.6%), than no mechanical ventilators (22%) (p=0.003). Smokers were significantly of higher bacterial colonization (80%) than non smokers (34.6%) (p=0.007). Table (1) Demographic data of the studied patients upon admission to the ICU (No=87) Variables Number of
patients %
Age: ≥50 <50
48 39
55.2% 44.8%
Gender Males females
57 30
66% 34%
Diabetes mellitus 28 32.2% Cardiac 16 18.4%
Cerebral stroke 11 12.8 Hepatic coma 21 24.1%
Renal failure 8 9.2% Respiratory disease 25 28% Surgical admission 17 19.5% Previous hospitalization for ≥48hours 55 63.2% Mechanical ventilation 22 25.2%
History of A.B intake 71 815%
Table (2) Prevalence of colonization by ESBL producing bacteria in ICU patients upon admission Organisms Patients colonized (N=46)
No %
Prevalence of ESBL: E. coli Klebsiella pneumonia Citrobacter species Enterobacter species
22 16 3 2
47.8% 34.8% 6.5% 4.3%
Total ESBL isolated 43 93.4%
Table (3) Prevalence of colonization by MBL producing bacteria in ICU patients upon admission Organisms Patients colonized (N=46)
No %
Prevalence of MBL: Pseudomonas aeruginosa Acinetobacter baumannii E. coli Klebsiella pneumoniae Enterobacter species
20 11 3 2 1
43.5% 23.9% 6.5% 4.3% 2.2%
Total MBL isolated 37 80.4%
Table (4) PCR results of MBL phenotypes in bacterial isolates (N=105) MBL subtype
Overall MBL types Pseudomonas aeruginosa
Acinetobacter baumannii
Klebsiella pneumonia
Enterobacter spp E. coli
blaIMP 48 (45.7%) 21 17 3 2 5 blaVIM 34 (32.4%) 16 9 5 1 3 blaSIM 16 (15.2%) 7 4 1 2 2 blaSPM 4 (3.8%) 3 1 0 0 0 blaGIM 3 (2.9%) 2 0 0 0 1 Total 105(100%) 49 31 8 5 11

Life Science Journal 2013;10(1) http://www.lifesciencesite.com
1911
Table (5) Study of risk factors for bacterial colonization on admission at ICU Risk factors
Colonization on admission P value Present (n=46)
No (%) Absent (n=41)
No (%) Age (years): ≥50 (n=48) <50 (n=39)
30 (62.5%) 16 (41%)
18 (37.5%) 23 (59%)
0.04*
Gender : Males (n=57) Females (n=30)
35 (61.4%) 11 (36.7%)
22 (38.6%) 19 (63.3%)
0.02*
Hospital stay>48 hrs.: Hospitalised (no=50) Not hospitalised (no=37)
37 (74%) 9 (24%)
13 (26%) 28 (76%)
0.0001**
Antibiotic intake ≥2groups : Yes (no=71) No (no=15)
43 (60.7%)
3 (20%)
28 (39.4%) 12 (80%)
0.004**
Mechanical ventilation (n=28) No mechanical vent. (no=59)
15 (53.6%) 13 (22%)
13 (46.4%) 46 (77%)
0.003**
Smoking: Smokers (no=35) Nonsmokers (n=52)
28 (80%)
18 (34.6%)
7 (20%)
34 (65.4%)
0.007**
*Significant p<0.05, **highly significant p<0.01, <0.001.
Figure (1) Combined disk test showing enhanced inhibition zone of ≥8 mm around IPM + EDTA disc indicating MBL producers.
Figure (2) Shows PCR product of MBL phenotypes: lane 1 (1001500 bp ladder), lanes 2, 3, 4 (390 bp positive strain for blaVIM), lane 5 (390 bp blaVIM positive control), lane 6 (positive strain for blaIMP
4. Discussion:
Extended spectrum beta lactamase (ESBL) –producing Gram negative bacteria are new emerging pathogens, Clinicians, microbiologists, infection control practitioners and hospital epidemiologists are concerned about ESBL producing microorganisms because of the increasing incidence of such infections, the limitation of effective antimicrobial drug therapy and adverse patients outcome (http/wwne.gov/eid/article/13/8/070071, article. htm≠r5|).
The socioeconomic impact of this colonization leading to nosocomial infections can cause economic burden on the personal and/or governmental scale burden. Therefore, the analysis of the incidence and pattern of bacterial colonization including multidrug
IMP alone IMP+EDTA
1 2 3 4 5 6

Life Science Journal 2013;10(1) http://www.lifesciencesite.com
1912
resistance Gram negative bacteria in patients on ICU admission is very important (Jarves, 1996).
Although MBLproducing strains represent a serious therapeutic challenge, to date, clinical experience regarding the most appropriate treatment and outcome of infections due to these strains is surprisingly rare. Therefore, detection of MBL producing gram negative bacilli especially P. aeruginosa is crucial for optimal treatment of patient's particularly critically ill and hospitalized patients and for better control the spread of resistance.
In the present study, bacterial colonization by Gram negative bacteria was detected in 46/87 (52.9%) of the studied patients, positive for ESBL production was detected in 43/46 (93.5%), the commonest of which was E.coli 22/46 (47.8%), followed by Klebsiella pneumonia 16/46 (34.8%), Citrobacter spp. 3/46 (6.5%), and the lowest rate of isolation was for Enterbacter spp. 2/46 (4.3%). These results were in agreement with the previous studies by Afazi et al. (2010), who reported that E.coli was the commonest isolates among ESBL producing Gram negative bacteria (57%) followed by Klebsiella pneumonia (59%),while it was (6%), and (8%) for Enterobacter and Citrobacter spp respectively. Another study by Ozgumus et al. (2008), E.coli was the commonest isolated ESBL producing pathogen followed by Klebsiella spp in ICU patients. In the same manner, Mona et al. (2009), reported that (60%) of isolates from ICU patients, were confirmed as ESBL producer Gve bacilli, mostly E.coli (34%), followed by Klebsiella spp. (30.2%).
In the current study, the rate of total MBL isolated was 37/46 (80.4%), the non fermenter Gram negative bacterial; (Pseudomonas aeruginosa and Acinetobacter baumamnii) were the predominant MBL producing bacteria isolated from the studied patients as it was isolated at a rate of 31/46 (67.4%) of MBL isolates, Pseudomonas aeruginosa was detected in 22/46 (43.5%) isolates, followed by Acinetobacter 11/46 (23.9%) isolates, E.coli 3/46 (6.5%) isolates, Klebsiella pneumonia 2/46 (4.3%) isolates and Enterbacter spp.1/46 (2.2%).
Afazi et al. (2010) stated that the rate of detection of Pseudomonas earuginosa was 57% and the colonizing MBL producing Gve bacilli for E.coli and Klebsiella pneumonia were 16% and 10% respectively. Over the last decade MBL producing isolates have emerged particularly in Pseudomonas aeruginosa. These isolates have been responsible for serious infections such as septicemia and pneumonia and have been associated with failure of therapy with carbapenems. MBL genes have spread from P. aeruginosa to Enterobacteriaceae, and a clinical scenario appears to be developing that could simulate
the global spread of ESBL. Carbapenems are the drug of choice for treatment of infections by penicillin or cephalosporin resistant gram negative bacilli especially in ESBL producing gram negative infections (Pitout et al., 2007). It is well known that poor outcome occurs when patients with serious infections due to MBL producing organisms are treated with antibiotics to which the organism is completely resistant (Marra et al., 2006).
The occurrence of a MBL positive isolate poses not only a therapeutic problem but is also a serious concern for infection control management. As a result of being difficult to detect, such organisms poses significant risks particularly due to their role in unnoticed spread within institution and their ability to participate in horizontal MBL gene transfer, with other pathogens in the hospital (Agarwal et al. 2006).
Regarding the genotypic detection of MBLencoding genes in the isolates, blaIMP subtype was the commonest, it was detected in 45.7% of overall isolates, the commonest organism detected was in Pseudomonas aeruginosa, while balGIM was the lowest genotype detected (2.9%). The blaVIM genotype was detected in 32.4%, followed by blaSIM in 15.2%, then blaSPM 3.8%. Meanwhile, blaGIM was the lowest genotype detected in overall 105 isolates; it was detected only in 2.9% isolates.
The presence of high prevalence of blaIMP may be due to the clonally spread of the plasmid containing this gene amongst the various members of the Gram negative bacilli in different hospitals including ours. This result agrees with the result of Afazi et al. (2010) which stated that the commonest genotype was blaMP (33.7%), followed by blaVIM (22.9%), while it was (20%) for blaGIM,and (0.2%) for blaSPM.
Most of Research conducted in this issue has focused on identifying risk factors for colonization with multidrugresistant, Gram positive bacteria, in contrast, little research has been conducted to identify the risk factors for colonization with Gram negative multidrugresistant bacteria in non outbreak setting (Harris et al., 2007). Understanding risk factors for colonization is important for several reasons. First, understanding the potential causal mechanisms of colonization can lead to successful infection control, involving antimicrobial stewardship and public health intervention aimed at controlling the emergence of ESBL –producing bacteria. Second, such knowledge can help identify which patients should receive empiric ESBLtargeted antimicrobial therapy (Harris et al., 2007).
The present study had focused on several risk factors for colonization. It was observed that patients aged above 50 years have a higher rate of colonization (63%), than patients with age below 50
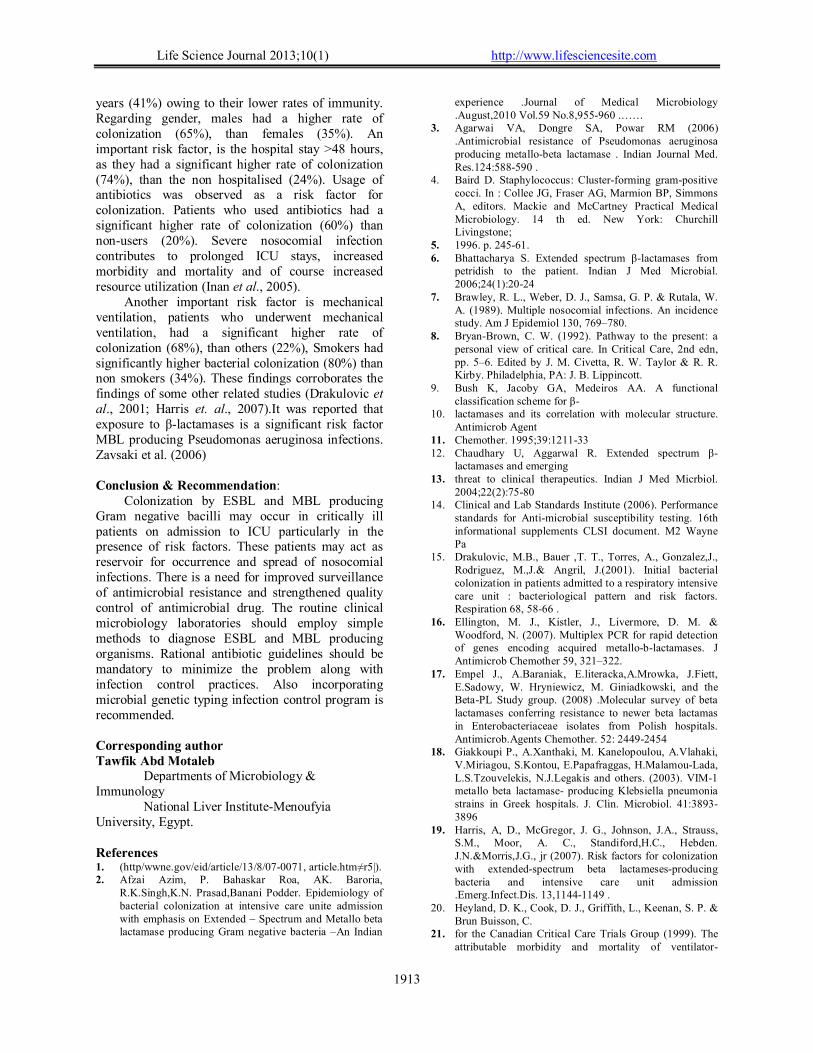
Life Science Journal 2013;10(1) http://www.lifesciencesite.com
1913
years (41%) owing to their lower rates of immunity. Regarding gender, males had a higher rate of colonization (65%), than females (35%). An important risk factor, is the hospital stay >48 hours, as they had a significant higher rate of colonization (74%), than the non hospitalised (24%). Usage of antibiotics was observed as a risk factor for colonization. Patients who used antibiotics had a significant higher rate of colonization (60%) than nonusers (20%). Severe nosocomial infection contributes to prolonged ICU stays, increased morbidity and mortality and of course increased resource utilization (Inan et al., 2005).
Another important risk factor is mechanical ventilation, patients who underwent mechanical ventilation, had a significant higher rate of colonization (68%), than others (22%), Smokers had significantly higher bacterial colonization (80%) than non smokers (34%). These findings corroborates the findings of some other related studies (Drakulovic et al., 2001; Harris et. al., 2007).It was reported that exposure to βlactamases is a significant risk factor MBL producing Pseudomonas aeruginosa infections. Zavsaki et al. (2006) Conclusion & Recommendation:
Colonization by ESBL and MBL producing Gram negative bacilli may occur in critically ill patients on admission to ICU particularly in the presence of risk factors. These patients may act as reservoir for occurrence and spread of nosocomial infections. There is a need for improved surveillance of antimicrobial resistance and strengthened quality control of antimicrobial drug. The routine clinical microbiology laboratories should employ simple methods to diagnose ESBL and MBL producing organisms. Rational antibiotic guidelines should be mandatory to minimize the problem along with infection control practices. Also incorporating microbial genetic typing infection control program is recommended. Corresponding author Tawfik Abd Motaleb
Departments of Microbiology & Immunology
National Liver InstituteMenoufyia University, Egypt. References 1. (http/wwne.gov/eid/article/13/8/070071, article.htm≠r5|). 2. Afzai Azim, P. Bahaskar Roa, AK. Baroria,
R.K.Singh,K.N. Prasad,Banani Podder. Epidemiology of bacterial colonization at intensive care unite admission with emphasis on Extended – Spectrum and Metallo beta lactamase producing Gram negative bacteria –An Indian
experience .Journal of Medical Microbiology .August,2010 Vol.59 No.8,955960 .……
3. Agarwai VA, Dongre SA, Powar RM (2006) .Antimicrobial resistance of Pseudomonas aeruginosa producing metallobeta lactamase . Indian Journal Med. Res.124:588590 .
4. Baird D. Staphylococcus: Clusterforming grampositive cocci. In : Collee JG, Fraser AG, Marmion BP, Simmons A, editors. Mackie and McCartney Practical Medical Microbiology. 14 th ed. New York: Churchill Livingstone;
5. 1996. p. 24561. 6. Bhattacharya S. Extended spectrum βlactamases from
petridish to the patient. Indian J Med Microbial. 2006;24(1):2024
7. Brawley, R. L., Weber, D. J., Samsa, G. P. & Rutala, W. A. (1989). Multiple nosocomial infections. An incidence study. Am J Epidemiol 130, 769–780.
8. BryanBrown, C. W. (1992). Pathway to the present: a personal view of critical care. In Critical Care, 2nd edn, pp. 5–6. Edited by J. M. Civetta, R. W. Taylor & R. R. Kirby. Philadelphia, PA: J. B. Lippincott.
9. Bush K, Jacoby GA, Medeiros AA. A functional classification scheme for β
10. lactamases and its correlation with molecular structure. Antimicrob Agent
11. Chemother. 1995;39:121133 12. Chaudhary U, Aggarwal R. Extended spectrum β
lactamases and emerging 13. threat to clinical therapeutics. Indian J Med Micrbiol.
2004;22(2):7580 14. Clinical and Lab Standards Institute (2006). Performance
standards for Antimicrobial susceptibility testing. 16th informational supplements CLSI document. M2 Wayne Pa
15. Drakulovic, M.B., Bauer ,T. T., Torres, A., Gonzalez,J., Rodriguez, M.,J.& Angril, J.(2001). Initial bacterial colonization in patients admitted to a respiratory intensive care unit : bacteriological pattern and risk factors. Respiration 68, 5866 .
16. Ellington, M. J., Kistler, J., Livermore, D. M. & Woodford, N. (2007). Multiplex PCR for rapid detection of genes encoding acquired metalloblactamases. J Antimicrob Chemother 59, 321–322.
17. Empel J., A.Baraniak, E.literacka,A.Mrowka, J.Fiett, E.Sadowy, W. Hryniewicz, M. Giniadkowski, and the BetaPL Study group. (2008) .Molecular survey of beta lactamases conferring resistance to newer beta lactamas in Enterobacteriaceae isolates from Polish hospitals. Antimicrob.Agents Chemother. 52: 24492454
18. Giakkoupi P., A.Xanthaki, M. Kanelopoulou, A.Vlahaki, V.Miriagou, S.Kontou, E.Papafraggas, H.MalamouLada, L.S.Tzouvelekis, N.J.Legakis and others. (2003). VIM1 metallo beta lactamase producing Klebsiella pneumonia strains in Greek hospitals. J. Clin. Microbiol. 41:38933896
19. Harris, A, D., McGregor, J. G., Johnson, J.A., Strauss, S.M., Moor, A. C., Standiford,H.C., Hebden. J.N.&Morris,J.G., jr (2007). Risk factors for colonization with extendedspectrum beta lactamesesproducing bacteria and intensive care unit admission .Emerg.Infect.Dis. 13,11441149 .
20. Heyland, D. K., Cook, D. J., Griffith, L., Keenan, S. P. & Brun Buisson, C.
21. for the Canadian Critical Care Trials Group (1999). The attributable morbidity and mortality of ventilator
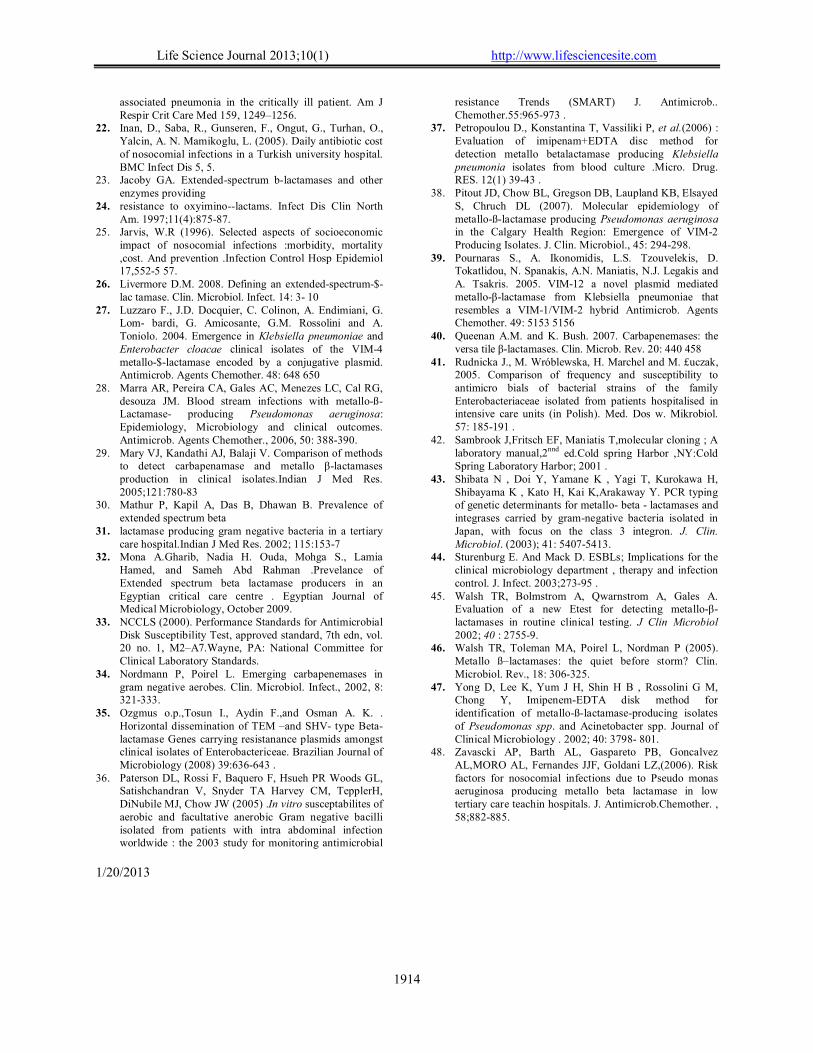
Life Science Journal 2013;10(1) http://www.lifesciencesite.com
1914
associated pneumonia in the critically ill patient. Am J Respir Crit Care Med 159, 1249–1256.
22. Inan, D., Saba, R., Gunseren, F., Ongut, G., Turhan, O., Yalcin, A. N. Mamikoglu, L. (2005). Daily antibiotic cost of nosocomial infections in a Turkish university hospital. BMC Infect Dis 5, 5.
23. Jacoby GA. Extendedspectrum blactamases and other enzymes providing
24. resistance to oxyiminolactams. Infect Dis Clin North Am. 1997;11(4):87587.
25. Jarvis, W.R (1996). Selected aspects of socioeconomic impact of nosocomial infections :morbidity, mortality ,cost. And prevention .Infection Control Hosp Epidemiol 17,5525 57.
26. Livermore D.M. 2008. Defining an extendedspectrum$lac tamase. Clin. Microbiol. Infect. 14: 3 10
27. Luzzaro F., J.D. Docquier, C. Colinon, A. Endimiani, G. Lom bardi, G. Amicosante, G.M. Rossolini and A. Toniolo. 2004. Emergence in Klebsiella pneumoniae and Enterobacter cloacae clinical isolates of the VIM4 metallo$lactamase encoded by a conjugative plasmid. Antimicrob. Agents Chemother. 48: 648 650
28. Marra AR, Pereira CA, Gales AC, Menezes LC, Cal RG, desouza JM. Blood stream infections with metalloßLactamase producing Pseudomonas aeruginosa: Epidemiology, Microbiology and clinical outcomes. Antimicrob. Agents Chemother., 2006, 50: 388390.
29. Mary VJ, Kandathi AJ, Balaji V. Comparison of methods to detect carbapenamase and metallo βlactamases production in clinical isolates.Indian J Med Res. 2005;121:78083
30. Mathur P, Kapil A, Das B, Dhawan B. Prevalence of extended spectrum beta
31. lactamase producing gram negative bacteria in a tertiary care hospital.Indian J Med Res. 2002; 115:1537
32. Mona A.Gharib, Nadia H. Ouda, Mohga S., Lamia Hamed, and Sameh Abd Rahman .Prevelance of Extended spectrum beta lactamase producers in an Egyptian critical care centre . Egyptian Journal of Medical Microbiology, October 2009.
33. NCCLS (2000). Performance Standards for Antimicrobial Disk Susceptibility Test, approved standard, 7th edn, vol. 20 no. 1, M2–A7.Wayne, PA: National Committee for Clinical Laboratory Standards.
34. Nordmann P, Poirel L. Emerging carbapenemases in gram negative aerobes. Clin. Microbiol. Infect., 2002, 8: 321333.
35. Ozgmus o.p.,Tosun I., Aydin F.,and Osman A. K. . Horizontal dissemination of TEM –and SHV type Betalactamase Genes carrying resistanance plasmids amongst clinical isolates of Enterobactericeae. Brazilian Journal of Microbiology (2008) 39:636643 .
36. Paterson DL, Rossi F, Baquero F, Hsueh PR Woods GL, Satishchandran V, Snyder TA Harvey CM, TepplerH, DiNubile MJ, Chow JW (2005) .In vitro susceptabilites of aerobic and facultative anerobic Gram negative bacilli isolated from patients with intra abdominal infection worldwide : the 2003 study for monitoring antimicrobial
resistance Trends (SMART) J. Antimicrob.. Chemother.55:965973 .
37. Petropoulou D., Konstantina T, Vassiliki P, et al.(2006) : Evaluation of imipenam+EDTA disc method for detection metallo betalactamase producing Klebsiella pneumonia isolates from blood culture .Micro. Drug. RES. 12(1) 3943 .
38. Pitout JD, Chow BL, Gregson DB, Laupland KB, Elsayed S, Chruch DL (2007). Molecular epidemiology of metalloßlactamase producing Pseudomonas aeruginosa in the Calgary Health Region: Emergence of VIM2 Producing Isolates. J. Clin. Microbiol., 45: 294298.
39. Pournaras S., A. Ikonomidis, L.S. Tzouvelekis, D. Tokatlidou, N. Spanakis, A.N. Maniatis, N.J. Legakis and A. Tsakris. 2005. VIM12 a novel plasmid mediated metalloβlactamase from Klebsiella pneumoniae that resembles a VIM1/VIM2 hybrid Antimicrob. Agents Chemother. 49: 5153 5156
40. Queenan A.M. and K. Bush. 2007. Carbapenemases: the versa tile βlactamases. Clin. Microb. Rev. 20: 440 458
41. Rudnicka J., M. Wróblewska, H. Marchel and M. £uczak, 2005. Comparison of frequency and susceptibility to antimicro bials of bacterial strains of the family Enterobacteriaceae isolated from patients hospitalised in intensive care units (in Polish). Med. Dos w. Mikrobiol. 57: 185191 .
42. Sambrook J,Fritsch EF, Maniatis T,molecular cloning ; A laboratory manual,2nnd ed.Cold spring Harbor ,NY:Cold Spring Laboratory Harbor; 2001 .
43. Shibata N , Doi Y, Yamane K , Yagi T, Kurokawa H, Shibayama K , Kato H, Kai K,Arakaway Y. PCR typing of genetic determinants for metallo beta lactamases and integrases carried by gramnegative bacteria isolated in Japan, with focus on the class 3 integron. J. Clin. Microbiol. (2003); 41: 54075413.
44. Sturenburg E. And Mack D. ESBLs; Implications for the clinical microbiology department , therapy and infection control. J. Infect. 2003;27395 .
45. Walsh TR, Bolmstrom A, Qwarnstrom A, Gales A. Evaluation of a new Etest for detecting metalloβlactamases in routine clinical testing. J Clin Microbiol 2002; 40 : 27559.
46. Walsh TR, Toleman MA, Poirel L, Nordman P (2005). Metallo ß–lactamases: the quiet before storm? Clin. Microbiol. Rev., 18: 306325.
47. Yong D, Lee K, Yum J H, Shin H B , Rossolini G M, Chong Y, ImipenemEDTA disk method for identification of metalloßlactamaseproducing isolates of Pseudomonas spp. and Acinetobacter spp. Journal of Clinical Microbiology . 2002; 40: 3798 801.
48. Zavascki AP, Barth AL, Gaspareto PB, Goncalvez AL,MORO AL, Fernandes JJF, Goldani LZ,(2006). Risk factors for nosocomial infections due to Pseudo monas aeruginosa producing metallo beta lactamase in low tertiary care teachin hospitals. J. Antimicrob.Chemother. , 58;882885.
1/20/2013

Life Science Journal 2013;10(1) http://www.lifesciencesite.com
1915
Evaluation of Different methods for Diagnosis of Catheter Related Blood Stream Infection
Yasser M. Ismail and Sahar M. Fayed
Clinical & Chemical Pathology Department, Benha Faculty of Medicine [email protected]
Abstract: Introduction: Intravascular catheters are crucial in modern medical practice, particularly in intensive care units (ICUs). However, vascular catheter-related bloodstream infections (CRBSIs) have become a leading cause of health-care-associated bloodstream infections and are associated with substantial morbidity and mortality. Aim of the work: to determine whether the Gram stain-acridine orange leucocyte cytospin (AOLC) test could offer accuracy comparable to other methods for the diagnosis of catheter-related blood stream infection and to avoid inconvenient, unnecessary and costly central venous catheter removal. Material and methods: This study included 36 patients with central venous catheterization. All patients with CVC were clinically suspected to have CR-BSI, as suggested by their physicians. They were 24 males and 12 females with their ages ranging between 20 years and 68 years with the mean age 51.3 ± 14.9 years. The samples were subjected to two major diagnostic strategies: the first implemented catheter sparing approach, while the other strategy required catheter removal. Catheter sparing diagnostic methods included paired quantitative blood cultures, pour-plate technique and acridine orange leukocyte cytospin/Gram test (AOLC/G test), while methods that required device removal were semiquantitative catheter segment culture (roll- plate method) and quantitative catheter segment culture (tip-flush method). Results: Taking the roll- plate technique as the reference method, there was fair agreement (66.7%) between the results of pour plate and roll plate techniques (kappa=0.226), there was moderate agreement between the results of paired quantitative blood culture (83.3%), tip flush method (83.3%) and AOLC / G (80.6%) and the reference method (kappa=0.429, 0.429 ,0.40 respectively). The diagnostic validity tests for AOLC showed that the specificity of AOLC was 100% and the sensitivity was 78.8%. Conclusion: From this study, it was concluded that the Gram stain-AOLC test is a simple, rapid, sensitive and specific test that could be used as a first line screening test for the in situ diagnosis of CRBSI. This policy can prevent the unnecessary removal of uninfected catheters and significantly extends the life span of catheters and lowers the risks and costs of mechanical complications associated with new catheter placement. [Yasser M. Ismail and Sahar M. Fayed. Evaluation of Different methods for Diagnosis of Catheter Related Blood Stream Infection. Life Sci J 2013;10(1):1915-1923] (ISSN:1097-8135). http://www.lifesciencesite.com. 275 Keyword: Catheter related blood stream infection; CRBSI; cytospin; AOLC 1. Introduction Intravascular catheters are crucial in modern medical practice, particularly in intensive care units (ICUs). Even though such catheters provide necessary vascular access, their use puts patients at risk for local and systemic complications, including catheter related infection (CRIs), particularly catheter related blood- stream infections (CR-BSIs) which are associated with increased morbidity, mortality rates of 10% to 20%, prolonged hospitalization, and increased medical costs (1). (CRBSIs) are considered "silent" medical errors since they may be caused without operator personnel knowledge during placement, site care, or line manipulation. About 20% of central venous catheters (CVCs) are removed because of suspected infection actually prove to be infected, and the diagnosis is always retrospective (2). In the ICU setting, the incidence of infection is often higher than in the less acute in-patient or ambulatory setting. In the ICU, central venous access might be needed for extended periods of time; patients
can be colonized with hospital- acquired organisms; and the catheter can be manipulated multiple times per day for the administration of fluids, drugs, and blood products. Moreover, some catheters can be inserted in urgent situations, during which optimal attention to aseptic technique might not be feasible (3). Several factors have been described in the adult population as playing a role in the occurrence of nosocomial CRBSI. These factors include prolonged catheterization, poor aseptic insertion technique, emergent catheter placement, size of catheter, number of lumens, type of catheter material, location of catheter and frequency of catheter manipulations (4). Other factors include presence of an infusion therapy team, use of sterile barrier precautions, type of insertion site dressing, and frequency of system entry (hospital factors). Patient- related factors have also been identified, which include age, granulocytopenia, immune suppression and severity of underlying disease (5).
The present study was carried out to determine whether the Gram stain-acridine orange
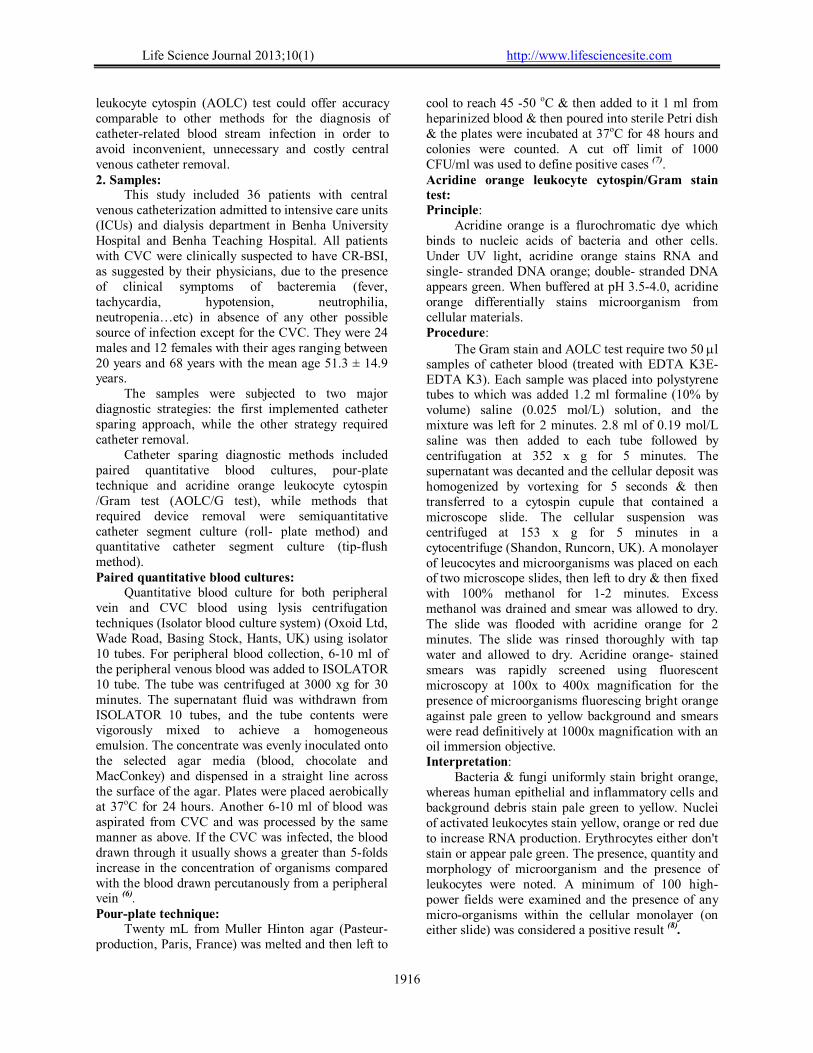
Life Science Journal 2013;10(1) http://www.lifesciencesite.com
1916
leukocyte cytospin (AOLC) test could offer accuracy comparable to other methods for the diagnosis of catheter-related blood stream infection in order to avoid inconvenient, unnecessary and costly central venous catheter removal. 2. Samples:
This study included 36 patients with central venous catheterization admitted to intensive care units (ICUs) and dialysis department in Benha University Hospital and Benha Teaching Hospital. All patients with CVC were clinically suspected to have CR-BSI, as suggested by their physicians, due to the presence of clinical symptoms of bacteremia (fever, tachycardia, hypotension, neutrophilia, neutropenia…etc) in absence of any other possible source of infection except for the CVC. They were 24 males and 12 females with their ages ranging between 20 years and 68 years with the mean age 51.3 ± 14.9 years.
The samples were subjected to two major diagnostic strategies: the first implemented catheter sparing approach, while the other strategy required catheter removal.
Catheter sparing diagnostic methods included paired quantitative blood cultures, pour-plate technique and acridine orange leukocyte cytospin /Gram test (AOLC/G test), while methods that required device removal were semiquantitative catheter segment culture (roll- plate method) and quantitative catheter segment culture (tip-flush method). Paired quantitative blood cultures:
Quantitative blood culture for both peripheral vein and CVC blood using lysis centrifugation techniques (Isolator blood culture system) (Oxoid Ltd, Wade Road, Basing Stock, Hants, UK) using isolator 10 tubes. For peripheral blood collection, 6-10 ml of the peripheral venous blood was added to ISOLATOR 10 tube. The tube was centrifuged at 3000 xg for 30 minutes. The supernatant fluid was withdrawn from ISOLATOR 10 tubes, and the tube contents were vigorously mixed to achieve a homogeneous emulsion. The concentrate was evenly inoculated onto the selected agar media (blood, chocolate and MacConkey) and dispensed in a straight line across the surface of the agar. Plates were placed aerobically at 37oC for 24 hours. Another 6-10 ml of blood was aspirated from CVC and was processed by the same manner as above. If the CVC was infected, the blood drawn through it usually shows a greater than 5-folds increase in the concentration of organisms compared with the blood drawn percutanously from a peripheral vein (6). Pour-plate technique:
Twenty mL from Muller Hinton agar (Pasteur- production, Paris, France) was melted and then left to
cool to reach 45 -50 oC & then added to it 1 ml from heparinized blood & then poured into sterile Petri dish & the plates were incubated at 37oC for 48 hours and colonies were counted. A cut off limit of 1000 CFU/ml was used to define positive cases (7). Acridine orange leukocyte cytospin/Gram stain test: Principle:
Acridine orange is a flurochromatic dye which binds to nucleic acids of bacteria and other cells. Under UV light, acridine orange stains RNA and single- stranded DNA orange; double- stranded DNA appears green. When buffered at pH 3.5-4.0, acridine orange differentially stains microorganism from cellular materials. Procedure:
The Gram stain and AOLC test require two 50 l samples of catheter blood (treated with EDTA K3E-EDTA K3). Each sample was placed into polystyrene tubes to which was added 1.2 ml formaline (10% by volume) saline (0.025 mol/L) solution, and the mixture was left for 2 minutes. 2.8 ml of 0.19 mol/L saline was then added to each tube followed by centrifugation at 352 x g for 5 minutes. The supernatant was decanted and the cellular deposit was homogenized by vortexing for 5 seconds & then transferred to a cytospin cupule that contained a microscope slide. The cellular suspension was centrifuged at 153 x g for 5 minutes in a cytocentrifuge (Shandon, Runcorn, UK). A monolayer of leucocytes and microorganisms was placed on each of two microscope slides, then left to dry & then fixed with 100% methanol for 1-2 minutes. Excess methanol was drained and smear was allowed to dry. The slide was flooded with acridine orange for 2 minutes. The slide was rinsed thoroughly with tap water and allowed to dry. Acridine orange- stained smears was rapidly screened using fluorescent microscopy at 100x to 400x magnification for the presence of microorganisms fluorescing bright orange against pale green to yellow background and smears were read definitively at 1000x magnification with an oil immersion objective. Interpretation:
Bacteria & fungi uniformly stain bright orange, whereas human epithelial and inflammatory cells and background debris stain pale green to yellow. Nuclei of activated leukocytes stain yellow, orange or red due to increase RNA production. Erythrocytes either don't stain or appear pale green. The presence, quantity and morphology of microorganism and the presence of leukocytes were noted. A minimum of 100 high- power fields were examined and the presence of any micro-organisms within the cellular monolayer (on either slide) was considered a positive result (8).

Life Science Journal 2013;10(1) http://www.lifesciencesite.com
1917
Central venous catheter tip cultures: Tip-roll method (roll-plate technique) :
The roll- plate technique was used as the reference method (9). The roll- plate technique was performed by transferring each distal 3-4 cm of the catheter (its tip) on blood agar plate and was rolled back & forth across the surface at least 3 to 4 times (10). The plates were examined for growth after overnight incubation at 37oC. The threshold of colony-forming units (C.F.U) per plate is 15 (9). The tip-flush:
The catheter was placed back & rubbed with a cotton wool swab impregnated with 2.5% chlorhexidine along the outer surface of the catheter tip and allowed to dry (10). The catheter lumen was then flushed with a nutrient broth by introducing a sterile syringe into the proximal end of the catheter tip lumen. The endoluminal flushing was repeated five times using 1 ml of nutrient broth and then the borth was vortexed for 15 seconds, 10 l and 100 l were inoculated over the entire surface of two 5% blood agar plates using sterile loop. Following overnight aerobic incubation at 37oC colonies were enumerated and colony count per milliliter of broth was calculated. Significant counts were defined as more than 100 CFU/ml broth. 3. Results:
The results of different methods used in detection of CRBSI was illustrated in Tables (1 & 2).Taking the roll- plate technique as the reference method (11), it was noted that in the diagnosis of CRBSI there was fair agreement (66.7%) between the results of pour plate and roll plate techniques (kappa=0.226), there was moderate agreement between the results of paired quantitative blood culture (83.3%), tip flush method (83.3%) and AOLC / G (80.6%) and the reference method (kappa=0.429, 0.429 ,0.40 respectively).
The diagnostic validity test was done for different techniques used for diagnosis of CRBSI taking roll plate as a reference method and the results was illustrated in Table (3). The diagnostic validity tests for AOLC revealed that the sensitivity and specificity of AOLC were 78.8% and 100% respectively.
There was no significant statistical difference between sex of the patients and the incidence of CRBSI (X2=0.41 & p>0.05). Also there was no significant statistical difference between the incidence of CRBSI and the different indication for applying CVCs (Corrected X2=5.46 & p>0.05) as illustrated in Table (4).
Regarding the duration of catheter insertion, there was high significant statistical difference between CRBSI and duration of catheter insertion (X2=7.44 & p<0.001) as it was 96.6% in catheters
which kept in place for more than one week (32 out of 33) but it was only 33.3% in catheters which kept in place for less than one week (1 out of 3).
The incidence of CRBSI was higher when the catheter was inserted in the internal jugular vein (100%) (6 out of 6) than when inserted in the subclavian vein (83.4%) (27 out of 30) and this difference was of statistical significance ( X2=5.04 -p<0.05).
It was found that there was no significant statistical difference as regarding the incidence of CRBSI and the different underlying diseases of the patients as illustrated in Table(5), however there was a highly significant statistical difference in the incidence of CRBSI with different location of insertion of CVCs (Corrected X2 =10.47 & P <0.001) as it was (100%), (27 out of 27) when the catheter was inserted in dialysis room and it was (75%), (3 out of 4) when the catheter was inserted in ICU while it was only (60%), (3 out of 5) when the catheter was inserted in the operating room (the most sterile).
As regards the number of catheter lumens, there was no significant statistical difference between the incidence of CRBSI and the number of catheter lumens (Corrected X2 = 0.312 & P > 0.05) in spite of higher frequencies of significant colonization occurred in those catheters with 3 lumens (100%), (3 out of 3) versus those with 2 lumens (90.4%) (19 out of 21) and catheters with one lumen (91.6%) (11 out of 12).
There was a significant statistical difference between the incidence of CRBSI and the administration of antimicrobial therapy (Corrected X2=5.04 - p<0.05) as the CRBSI was 100% in patients who didn’t receive antimicrobial therapy and it was (90%) in patients who received antimicrobial therapy.
There was a significant statistical difference between the incidence of CRBSI and the application of maximal sterile barriers precautions during catheter insertion (X2=5.04 - p<0.05) and also there was a significant statistical difference between the incidence of CRBSI and the application of daily care of the catheter as it was (100%) (27 out of 27) in patients not applying daily care of catheter while it was only (66.7%) (6 out of 9) in patients applying daily care of the catheter (Corrected X2=5.94 & P < 0.05).
Regarding the type of infusated fluids there was a significant statistical difference in the rate of incidence of CRBSI and the type of infusated fluids through the catheter lumen as it was (71.4%)(5 out of 7) when the parentral fluid is the only infusate and it was (100%) (23 out of 23) when blood is added to the parentral fluid (Corrected X2=6.39 & p<0.05).
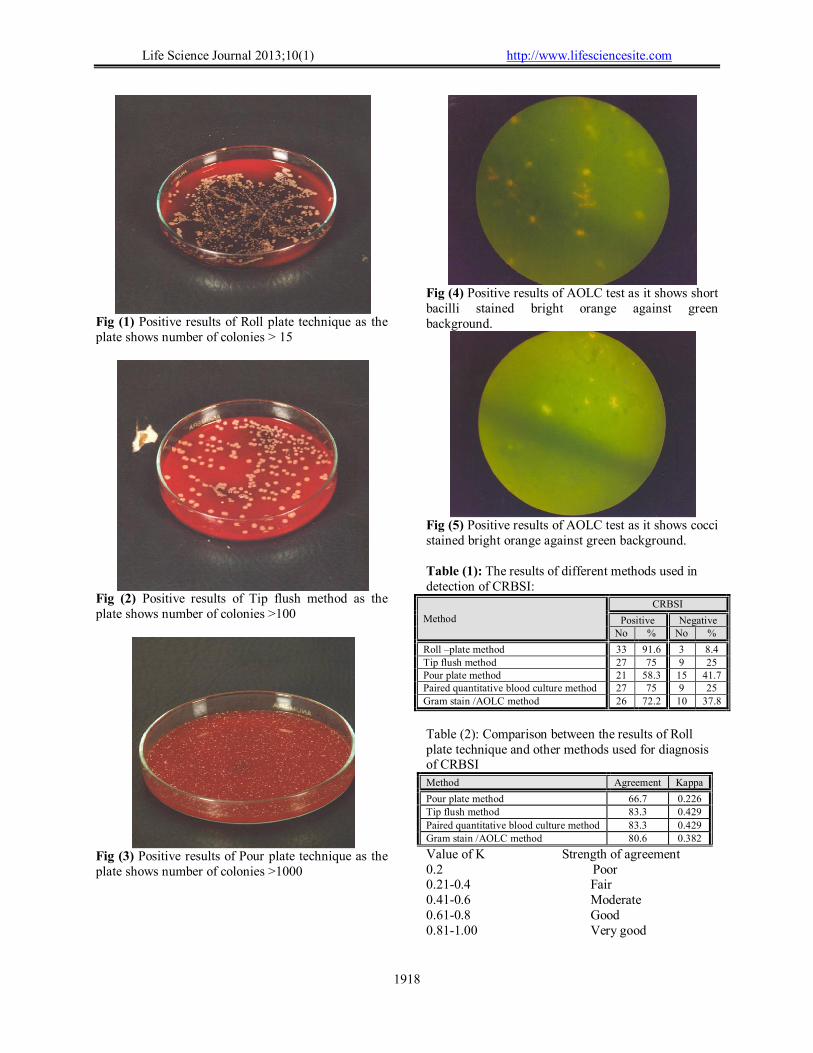
Life Science Journal 2013;10(1) http://www.lifesciencesite.com
1918
Fig (1) Positive results of Roll plate technique as the plate shows number of colonies > 15
Fig (2) Positive results of Tip flush method as the plate shows number of colonies >100
Fig (3) Positive results of Pour plate technique as the plate shows number of colonies >1000
Fig (4) Positive results of AOLC test as it shows short bacilli stained bright orange against green background.
Fig (5) Positive results of AOLC test as it shows cocci stained bright orange against green background. Table (1): The results of different methods used in detection of CRBSI:
Method
CRBSI
Positive Negative No % No %
Roll –plate method 33 91.6 3 8.4 Tip flush method 27 75 9 25 Pour plate method 21 58.3 15 41.7 Paired quantitative blood culture method 27 75 9 25 Gram stain /AOLC method 26 72.2 10 37.8
Table (2): Comparison between the results of Roll plate technique and other methods used for diagnosis of CRBSI
Method Agreement Kappa
Pour plate method 66.7 0.226 Tip flush method 83.3 0.429
Paired quantitative blood culture method 83.3 0.429 Gram stain /AOLC method 80.6 0.382
Value of K Strength of agreement 0.2 Poor 0.21-0.4 Fair 0.41-0.6 Moderate 0.61-0.8 Good 0.81-1.00 Very good

Life Science Journal 2013;10(1) http://www.lifesciencesite.com
1919
Table (3): Sensitivity, specificity, positive predictive value (PPV), negative predictive value (NPV), false positive and false negative results of different techniques used for diagnosis of CRBSI taking roll plate as a reference method:
Test Sensitivity Specificity PPV NPV False positive False negative Pour plate Method 63.6 100 100 20 0 12
Tip flush Method 81.8 100 100 33.3 0 6
Paired quantitative blood culture 81.8 100 100 33.3 0 6
AOLC 78.8 100 100 30 0 7
Table (4): Incidence of CRBSI with different indications for applying CVC.
Parameter NO % Positive Negative
NO % NO %
Monitoring fluid 2 5.5 1 50 1 50 No peripheral access 8 22.4 7 87.5 1 12.5 Monitoring CVP 2 5.5 2 100 0 0 Hemodialysis 24 66.6 23 95.8 1 4.2
Corrected X2=5.46 p>0.05 Table (5): Incidence of CRBSI with different underlying diseases of the patients.
Parameter NO % Positive Negative No % No %
Renal failure 24 66.6 23 95.8 1 4.2 Cardiac disease 2 5.5 1 50 1 50 Cerebrovascular stroke 2 5.5 2 100 0 0 Surgical 8 22.4 7 87.5 1 12.5
X2=5.46 p >0.05 4. Discussion:
The use of vascular catheters is essential for the care of critically and chronically ill cancer and haemodialysis patients (12). However, vascular catheter-related bloodstream infections (CRBSIs) have become a leading cause of health-care-associated bloodstream infections and are associated with substantial morbidity and mortality (13).
The clinical diagnosis of CRI is complex as the patient is often presented with fever without another obvious source of infection. It also lacks accuracy; as when infection is suspected, a confident diagnosis requires removal of the CVC, and up to 85% of those catheters removed on clinical grounds alone are subsequently proven to be sterile (14). Therefore, the clinician suspecting CR-BSI is faced with a difficult dilemma given that CVC removal will result in loss of venous access, while an infected catheter left in-situ may lead to overwhelming sepsis (15).
There is often a poor correlation between the clinical assessment and laboratory findings. One of the main problems in establishing a diagnosis of CRI has been the lack of gold standard definitions for contamination, colonization and infections (localized and systemic) associated with intravascular devices including CVCs (16).
As the coagulase negative staphylococci (CoNS) are the predominant causative microorganism associated with CRI, the interpretation of microbiological findings is often complex as positive blood or catheter segment cultures may represent catheter colonization, infection, or sample contamination (17).
Rapid and accurate diagnosis of CRI is therefore essential for providing both optimal patient care and management, and reducing additional healthcare costs related to anti-microbial therapy and extended hospitalization. A wide range of approaches were used to overcome this obstacle and to diagnose CRBSI. These techniques can be distinguished into two categories: 1) techniques requiring CVC removal; and 2) CVC-sparing methods (in-situ methods) (18). These methods are expensive, time-consuming, and depend on culture techniques that require 24 to 48 hours for in-vitro culture to confirm the diagnosis of CR-BSI (19;
20). Acridine orange leukocyte cytospin (AOLC) test is an alternative to conventional microbiological techniques. The test has the advantage of reporting data within 30 minutes with high sensitivity and specificity (18).
The aim of the present study is to determine whether the Gram stain-acridine orange leucocyte

Life Science Journal 2013;10(1) http://www.lifesciencesite.com
1920
cytospin (AOLC) test could offer accuracy comparable to other methods for the diagnosis of catheter-related blood stream infection and to avoid inconvenient, unnecessary and costly central venous catheter removal.
The rate of the CVC related blood stream infection in the present study was 91.6% by the reference roll plate method. In agreement with our result Abdulla et al., (21) reported a rate of 92% for CRBSI and Friedman et al., (22) reported that the incidence of BSI was 88% and the study demonstrated that intravascular devices and urinary tract infection were the most common sources of BSI, however lower rate of detection was reported by Rao et al.,(23) as they reported a colonization rate of 62.5% for the central venous catheters and Oncu et al.,(24) who reported that 30.3% of the CVCs were colonized.
These differences in the incidence of CRBSI in different studies may be explained by: difference in the type of patients as most of patients in our study were haemodialysis patients who kept the CVCs for long period of time with increased the chance for the incidence of CRBSI.
In the present study as regarding techniques requiring catheter removal, semi-quantitative method described by Maki (25) (roll plate method) was used in order to detect any case of significant catheter infection, and was used as a reference method on which the rest of the studied techniques had been evaluated. By this method 33 catheters out of 36 catheters were positive (91.6%) for CRBSI and only 3 catheters were negative.
Regarding the another method requiring catheter removal, quantitative method described by Cleri et al., (26) (tip flush method) was used in our study and diagnosed 27 CRBSI cases (75%) out of 36 cases. Comparing the performance of the tip flush method with the reference method, the sensitivity was 81.8%, and the specificity was 100%. Our result was in agreement with Farr, (27) and Raad et al., (28) who reported specificity 100 % and 98% respectively of tip flush method. However the sensitivities of the previous studies were 92% and 93% respectively. Their higher sensitivities of tip flush in comparison with our study may be attributed to their use of catheter sonication which greatly increases the number of microorganisms that can be quantified and thus potentially increasing the sensitivity.
Other methods not requiring catheter removal like pour plate, paired quantitative blood cultures and AOLC /G were used in this study. Using a simple pour plate technique, we determined the microbial concentration in sample of blood collected via the hub of CVCs while they were in position. The pour plate technique was positive in 21 cases only (58.3%) out of 36 cases.
The sensitivity of the pour plate method in comparison with the reference method was 63.6%, and the specificity was 100%. This result was in agreement with Andremont et al., (7) who demonstrated that the specificity of this test in their study on cancer patients was 99%, and Chan et al.,(29) who reported that the sensitivity and the specificity of the pour plate technique were 77.8% & 100% respectively. The higher sensitivity in their study may be due to large number of patients (90 patients) in comparison with our study (36 patients).
In the present study the sensitivity and the specificity of the paired quantitative blood culture technique were 81.1% & 100% respectively. The results of our study is close to the result of a prospective cohort study by Catton and his colleagues which compared the accuracy of three techniques not requiring catheter removal (quantitative blood culture technique, differential time to positivity and endoluminal brushing) for diagnosis of CRI, quantitative blood cultures yielded in their study a sensitivity and a specificity of 84% and 97% respectively (30).
Safdar et al., (6) reported that quantitative blood culture has a specificity of 98% and concluded that paired quantitative blood cultures is the most accurate diagnostic method in patients with long-term CVCs. This result was in agreement with our study, but they reported a sensitivity of 87% which was slightly higher than of our result. This may be due to the use of empirical antimicrobial therapy which affects the sensitivity of our test as 83.3% of our patients were on antimicrobial therapy, while Safdar et al., (6) started their test before the empirical antimicrobial therapy was given.
The acridine orange leucocyte cytospin (AOLC) test is an alternative to conventional microbiological techniques. The test has the advantage of reporting data within 30 minutes with high sensitivity and specificity (31). In our study the acridine orange leucocyte cytospin test diagnosed 26 (72.2%) cases out of 36 cases with specificity of 100%. Similar results were obtained by Rushforth et al., (32) and Bong et al., (33) who reported that the AOLC test has a specificty of 100% in diagnosing CR-BSI.
However the sensitivity of AOLC was 78.8%. The sensitivity of our result was less than that of Rushforth et al., (32) and Bong et al., (33) who reported a sensitivity of 87% for AOLC test. The relatively high sensitivity recorded by Rushforth et al.,(32) and Bong et al., (33) may be due to the use of AOLC test alone - not combined by Gram stain- with possibility of false positive results in AOLC test which may occur due to granules from disintegrating leukocytes that may be mistaken as cocci. Such a mis-interpretation may be
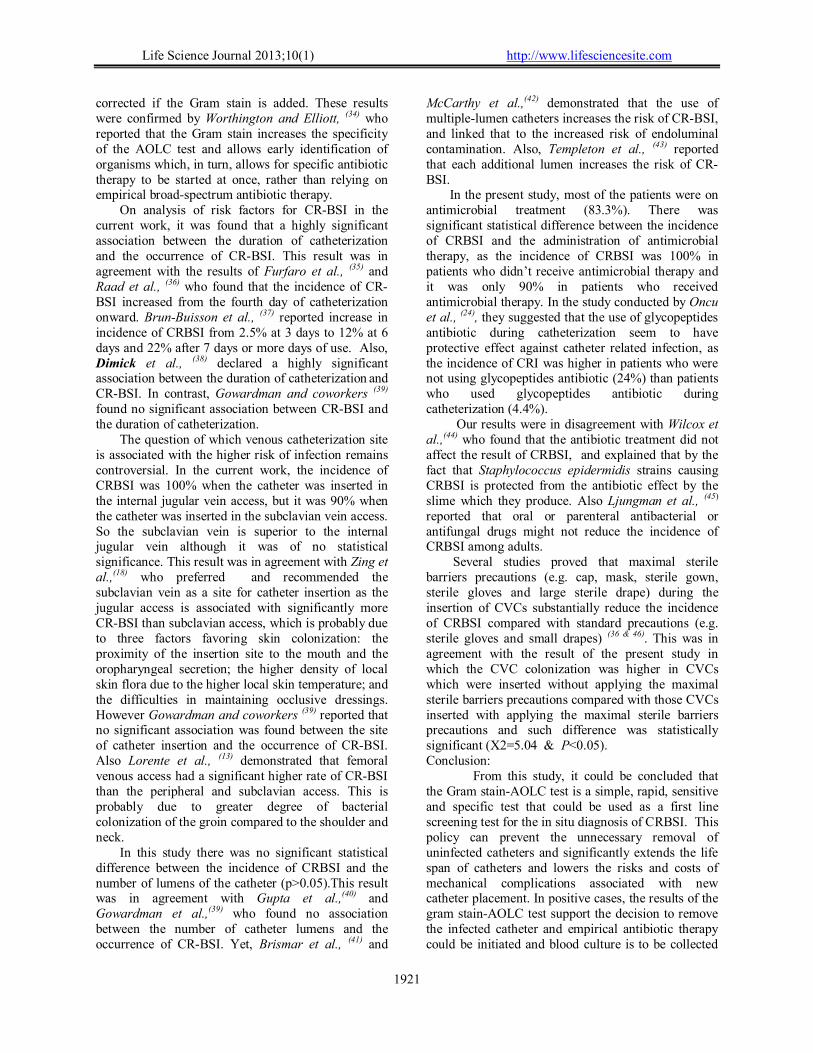
Life Science Journal 2013;10(1) http://www.lifesciencesite.com
1921
corrected if the Gram stain is added. These results were confirmed by Worthington and Elliott, (34) who reported that the Gram stain increases the specificity of the AOLC test and allows early identification of organisms which, in turn, allows for specific antibiotic therapy to be started at once, rather than relying on empirical broad-spectrum antibiotic therapy.
On analysis of risk factors for CR-BSI in the current work, it was found that a highly significant association between the duration of catheterization and the occurrence of CR-BSI. This result was in agreement with the results of Furfaro et al., (35) and Raad et al., (36) who found that the incidence of CR-BSI increased from the fourth day of catheterization onward. Brun-Buisson et al., (37) reported increase in incidence of CRBSI from 2.5% at 3 days to 12% at 6 days and 22% after 7 days or more days of use. Also, Dimick et al., (38) declared a highly significant association between the duration of catheterization and CR-BSI. In contrast, Gowardman and coworkers (39) found no significant association between CR-BSI and the duration of catheterization.
The question of which venous catheterization site is associated with the higher risk of infection remains controversial. In the current work, the incidence of CRBSI was 100% when the catheter was inserted in the internal jugular vein access, but it was 90% when the catheter was inserted in the subclavian vein access. So the subclavian vein is superior to the internal jugular vein although it was of no statistical significance. This result was in agreement with Zing et al.,(18) who preferred and recommended the subclavian vein as a site for catheter insertion as the jugular access is associated with significantly more CR-BSI than subclavian access, which is probably due to three factors favoring skin colonization: the proximity of the insertion site to the mouth and the oropharyngeal secretion; the higher density of local skin flora due to the higher local skin temperature; and the difficulties in maintaining occlusive dressings. However Gowardman and coworkers (39) reported that no significant association was found between the site of catheter insertion and the occurrence of CR-BSI. Also Lorente et al., (13) demonstrated that femoral venous access had a significant higher rate of CR-BSI than the peripheral and subclavian access. This is probably due to greater degree of bacterial colonization of the groin compared to the shoulder and neck.
In this study there was no significant statistical difference between the incidence of CRBSI and the number of lumens of the catheter (p>0.05).This result was in agreement with Gupta et al.,(40) and Gowardman et al.,(39) who found no association between the number of catheter lumens and the occurrence of CR-BSI. Yet, Brismar et al., (41) and
McCarthy et al.,(42) demonstrated that the use of multiple-lumen catheters increases the risk of CR-BSI, and linked that to the increased risk of endoluminal contamination. Also, Templeton et al., (43) reported that each additional lumen increases the risk of CR-BSI. In the present study, most of the patients were on antimicrobial treatment (83.3%). There was significant statistical difference between the incidence of CRBSI and the administration of antimicrobial therapy, as the incidence of CRBSI was 100% in patients who didn’t receive antimicrobial therapy and it was only 90% in patients who received antimicrobial therapy. In the study conducted by Oncu et al., (24), they suggested that the use of glycopeptides antibiotic during catheterization seem to have protective effect against catheter related infection, as the incidence of CRI was higher in patients who were not using glycopeptides antibiotic (24%) than patients who used glycopeptides antibiotic during catheterization (4.4%). Our results were in disagreement with Wilcox et al.,(44) who found that the antibiotic treatment did not affect the result of CRBSI, and explained that by the fact that Staphylococcus epidermidis strains causing CRBSI is protected from the antibiotic effect by the slime which they produce. Also Ljungman et al., (45) reported that oral or parenteral antibacterial or antifungal drugs might not reduce the incidence of CRBSI among adults. Several studies proved that maximal sterile barriers precautions (e.g. cap, mask, sterile gown, sterile gloves and large sterile drape) during the insertion of CVCs substantially reduce the incidence of CRBSI compared with standard precautions (e.g. sterile gloves and small drapes) (36 & 46). This was in agreement with the result of the present study in which the CVC colonization was higher in CVCs which were inserted without applying the maximal sterile barriers precautions compared with those CVCs inserted with applying the maximal sterile barriers precautions and such difference was statistically significant (X2=5.04 & P<0.05). Conclusion: From this study, it could be concluded that the Gram stain-AOLC test is a simple, rapid, sensitive and specific test that could be used as a first line screening test for the in situ diagnosis of CRBSI. This policy can prevent the unnecessary removal of uninfected catheters and significantly extends the life span of catheters and lowers the risks and costs of mechanical complications associated with new catheter placement. In positive cases, the results of the gram stain-AOLC test support the decision to remove the infected catheter and empirical antibiotic therapy could be initiated and blood culture is to be collected

Life Science Journal 2013;10(1) http://www.lifesciencesite.com
1922
in order to isolate the organism and determine its antimicrobial susceptibility pattern. Corresponding author Yasser M. Ismail Clinical & Chemical Pathology Department, Benha Faculty of Medicine [email protected] References 1- Centers for Disease control and Prevention:
(2002).Guidelines for the prevention of intravascular catheter related infections. MMWR; 51(No.RR-10):1-30.
2- Krause R, Auner HW, Gorkiewicz G, Wolfler A, Daxboeck F and Linkesch W: (2004). Detection of catheter-related bloodstream infections by the differential-time-to-positivity method and gram stain-acridine orange leukocyte cytospin test in neutropenic patients after hematopoietic stem cell transplantation. J Clin Microbiol.;42:4835e7.
3- McGee D and Gould M: (2003). Preventing Complications of Central Venous Catheterization. The New England Journal of Medicine; 348(12), 1123-1133.
4- Raad II, Darouiche R, Hachem R, Mansouri M and Bodey GP: (1996). The broad spectrum activity and efficacy of catheters coated with minocycline and rifampin. J Infect Dis; 173: 418-424.
5- Singh- Naz N, Sprague BM, Patel KM and Pollack MM: (1996). Risk factors for nosocomial infection in critically ill children: a prospective cohort study. Crit. Care Med. 24:875-878.
6- Safdar N, Fine JP and Maki DG: (2005). Meta- analysis: methods for diagnosing intravascular device-related bloodstream infection. Ann Intern Med.; 142:451-466.
7- Andremont A, Paulet R, Nitenberg G and Hill C: (1988.). Value of semi quantitative cultures of blood drawn through catheter hubs for estimating the risk of catheter tip colonization in cancer patients. Service de microbiologie medicale, unite de Reanimation and Department de statistique medicale. France. Antimicrob. Agents Chemother. 36: 1208-14.
8- Brian A, Lauer L, Barth R and Stanley M: (1981). Comparison of acridine orange and gram stains for detection of micro organisms in cerebrospinal fluid and other clinical specimens. J Clin Microbiol. August; 14(2): 201–205.
9- Bouza E, Burillo A and Munoz, P: (2002).Catheter- related infections: diagnosis and intravascular treatment. Clin. Microbial. Infect. 8:265-274.
10 Maki DG, Weise C and Sarafin H: (1977). A semiquantitiative culture method for identifying intravenous-catheter- related infection. N. Engl. J. Med. 296: 1305-1309.
11- Bouza E, Alvarado N, Alcalá L, Sánchez-Conde M, Pérez MJ, Muñoz P, Martín-Rabadán P and
Rodríguez-Créixems M: (2005). A prospective, randomized, and comparative study of 3 different methods for the diagnosis of intravascular catheter colonization. Clin Infect Dis. 15;40(8):1096-100.
12- Maki DG, Goldmann DA and Rhame FS: (1973) .Infection Control in Intravenous Therapy. Infection control in intravenous therapy. Annals of Internal Medicine. 79(6):867-87.
13- Lorente L, Villegas J, Martín M, Jimenez A and Mora ML: (2004). Catheter- related infection in critically ill patients. Journal of Intensive Care Medicine; 30(8):1681-1684.
14- Gast P, Hagley M, Martin B and Traeger SM: (1992).Infectious and mechanical complications of central venous catheters placed by percutaneous venipuncture and over guide wires. Crit. Care Med.; 20:1426–1430.
15- Hodge D and Puntis J: (2002) .Diagnosis, prevention, and management of catheter related bloodstream infection during long term parenteral nutrition. Arch. Dis. Child Fetal Neonatal Ed.; 87:21-24.
16- Mermel LA, Farr BM, Sherertz RJ, Raad II, O’Grady N, Harris JS and Craven DE: (2001). Guidelines for the management of intra vascular catheter – related infection/ clin infect Dis 32; 1249-1272.
17- Elliott TSJ, O’Grady NP and Pittet D: (2004). The management and treatment of intravascular catheter-related infections in the critically ill. Kluwer Academic publishers Group, The Netherlands; 5:113-126.
18- Zing W, Vanessa CF and Walder B: (2008). Central venous catheter related infection. Best practice and research clinical anaesthesiology.22; 407-421.
19- Kite P, Dobbins B, Wilcox M, Fawley WN, Kindon AJ, Thomas D, Tighe MJ and McMahon MJ: (1997). Evaluation of a novel endoluminal brush method for in situ diagnosis of catheter related sepsis. J. Clin. Pathol.; 50:278-82.
20- Blot F, Schmidt E, Nitenberg G, Tancrède C, Leclercq B, Laplanche A and Andremont A: (1998). Earlier positivity of central venous versus peripheral cultures is highly predictive of catheter- related sepsis. J. Clin. Microbiol.; 36:105–109.
21- Abdulla SM, Hassan FB, Mohamed EK and Mahmoud H: (2009). Gram stain-acridine orange leukocyte cytospin test for rapid diagnosis of central venous catheter-related blood stream infection. Thesis submitted for partial fulfillment of master degree in clinical and chemical pathology. Faculty of medicine, Ain Shams University.
22- Friedman NB, Kaye KS and Stout JE: (2002). Health care- associated bloodstream infections in adults. Ann. Intern. Med. 137: 791-797.
23- Rao SD, Preetha MJ, Lavi R and Macaden R: (2005). Infections related to vascular catheters in a

Life Science Journal 2013;10(1) http://www.lifesciencesite.com
1923
pediatric intensive care unit. Indian Pediatrics. 42: 667-672.
24- Oncu S and Sakarya S: (2003).Central Venous Catheter Related Infections: An Overview with Special Emphasis on Diagnosis, Prevention and Management. The Internet Jouranl of Anesthesiology; 7(1). Available at: http://www.ispub.com/journal/the-internet-journal-of-anesthesiology/volume-7-number-1/central-venous-catheter-related-infections-an-overview-with-special-emphasis-on-diagnosis-prevention-and-management.html.
25- Maki DG: (1977). Preventing infection in intravenous therapy. Anesthesia and analgesia 1977;56(1):141-53.
26- Cleri DJ, Corrado ML and Seligman SJ: (1980). Quantitative culture of intravenous catheters and other intravascular inserts. J Infect Dis. 141:781-6.
27- Farr BM: (2004). Catheters, microbes, time, and gold standards. Ann Intern Med; 140:62-64.
28- Raad II and Bodey GP: (1992). Infectious complications of indwelling vascular catheters. Clin Infect Dis; 15:197-208.
29- Chan DCW, Chan HB and Ip LS: (2005). Occasional survey diagnosis and treatment of catheter-related blood stream infection in neonates and childrens.HK J.Paediatr.;10:26-33.
30- Catton JA, Dobbins BM, Kite P, Wood JM, Eastwood K, Sugden S, Sandoe JAT, Burke D, McMahon MJ, Wilcox MH: (2005). In situ diagnosis of intravascular catheter related blood stream infection: A comparison of quantitative culture, differential time to positivity, and endoluminal brushing. Crit Care Med. 33; 787-791.
31- Kite P, Dobbins BM, Wilcox MK and McMahon MJ: (1999). Rapid diagnosis of central venous catheter-related bloodstream infection without catheter removal. Lancet; 354: 1504-1507.
32- Rushforth JA, Hot CM, Kite P and Puntis JWL: (1993). Rapid diagnosis of central venous catheter sepsis. Lancet; 342: 402-403.
33- Bong J, Kite P, Ammori B, Wilcox MH and McMahon MJ: (2003). The use of a rapid in situ test in the detection of central venous catheter-related bloodstream infection: A prospective study. J. Parenter. Enteral Nutr.; 27(2):146-150.
34- Worthington T and Elliott TS: (2005). Diagnosis of central venous catheter related infection in adult patients. The Journal of Infection. 51 (4): 267-80
35- Furfaro S, Gauthier M, Lacroix J, Nadeau D, Lafleur L, Mathews S,: 1991. Arterial catheter-related infections in children. Am. J. Dis. Child; 145:1037–1042.
36- Raad II, Hohn DC and Gilbreath BJ: (1994). Prevention of central venous catheter related infections by using maximal sterile barrier precautions during insertion. Infect Control Hosp Epidemiol; 15: 231-238.
37- Brun- Buisson C, Abrar F, Legrand P, Huet Y, Larabi S and Rapin M: (1987). Diagnosis of central venous catheter related sepsis. Critical level of quantitative tip cultures. Arch. Intern. Med. 147: 873-877.
38- Dimick JB, Swoboda S, Talamini MA, Pelz, RK, Hendrix CW and Lipsett PA: (2003). Risk of colonization of central venous catheters: catheters for total parenteral nutrition vs other catheters. American Journal of Critical Care, 12: 328-335.
39- Gowardman J, Montgomery C, Thirlwell S, Shewan J, Idema A, Larsen PD and Havill JH:
(1998). Central venous catheter-related bloodstream infections: an analysis of incidence and risk factors in a cohort of 400 patients. Intensive care med.; 24:1034-1039.
40- Gupta S, Batra YK, Puri GD, Panigrahi D and Roy S: (1995). Infection rates in single- and double-lumen central venous catheters in critically ill patients. Natl. Med. J. India; 8:114–7.
41- Brismar B, Jordahl L, Nystrom B and Petterson, N: (1982).Bacterial contamination of intravenous line side ports of different designs. Clin. Nutr. 6: 31-40.
42- McCarthy MC, Shives JK, Robison RJ, Broadie TA.: (1987). Prospective evaluation of single and triple lumen catheters in total parenteral nutrition. JPEN J Parenter Enteral Nutr. 1987 May-Jun;11(3):259-62.
43- Templeton A, Schlegel M, Fleisch F, Rettenmund G, Schöbi B, Henz S and Eich G: (2008). Multilumen Central Venous Catheters Increase Risk for Catheter-Related Bloodstream Infection: Prospective Surveillance Study. Journal of infection; 36:322-327.
44- Wilcox HM, Kite P, Mills K and Sugden S: (2001). In-situ measurement of linezolid and vancomycin concentrations in intravascular catheter-associated biofilm.Journal of Antimicrobial Chemotherapy; 47:171-175.
45- Ljungman P, Hagglund H, Bjorkstrand B, Lonnqvist B and Ringden O: (1997): Peroperative teicoplanin for prevention of gram positive infections in neutropenic patients with indwelling central venous catheters: a randomized, controlled study. Support Care Cancer; 5:485-488.
46- Pittet D, Hugonnet S and Harbath S: (2000). Effectiveness of a hospital- wide program to improve compliance with hand hygiene. Lancet; 356: 1307-1309.
2/2/2013

Life Science Journal 2013;10(1) http://www.lifesciencesite.com
1924
Hepato-protective Effect of Green Tea Extract on Cyclosporine a Treated Rabbits: Histological and Ultrastructural Study
Fathy Ahmed Fetouh and Amal Al Shahat Ibrahim
Department of Anatomy, Faculty of Medicine, Zagazig University
Abstract: Cyclosporine A (CsA) has a biologic activities, including anti-parasitic, fungicidal and anti-inflammatory effects by inhibiting T-cell activation. CsA and its metabolites are taken and excreted by the hepatocytes into the bile and a small portion into the blood. Green tea contains several antioxidants and has a role as an antioxidant. Objective: The present work aimed to study the structural hepato-protective effect of green tea extract on rabbits treated with cyclosporine A (CsA). Materials and methods: Three groups of adult rabbits were used for this study; the 1st group was used as a control, the 2nd group was treated with cyclosporine A (CsA) as oral solution in a dose of 15 mg/kg for 4 weeks and the 3rd group was treated with cyclosporine A in the same dose simultaneously with green tea extract for the same period. The animals were anaesthetized and liver specimens were obtained and semi-thin sections of 1 µm thick were obtained, stained with 1% toluidine blue and examined by light microscopy and ultrathin sections for electron microscopic examination. Results: The cyclosporine A had adverse effects on the liver cells of cyclosporine A-treated animals in comparison with that of the control group where, the hepatocytes showed extensive vacuolization and variable areas of fatty degeneration. Also, the cytoplasm showed reduced organelles, as few mitochondria with loss of their transverse cristae, few glycogen particles and loss of endoplasmic reticulum. In some cells the cytoplasm showed loss of the organelles and depletion of glycogen content. The nucleus appeared irregular with deformed nuclear membrane. A concomitant administration of green tea extract to cyclosporine A treated rabbits markedly prevented the adverse effects of cyclosporine A where the hepatocytes preserved their normal appearance. The cytoplasm showed numerous mitochondria with well developed transverse cristae, smooth and rough endoplasmic reticulum, Golgi apparatus and abundant amount of glycogen particles. The nucleus appeared round and light with well formed nuclear membrane. Also, bile canaliculi and the microvilli projecting from the cells were preserved. Conclusion: The green tea extract had beneficial effects against cyclosporine A induced hepatic toxicity and should be used in combination with cyclosporine A transplant treatment to improve the cyclosporine A induced oxidative stress parameters and other adverse effects. [Fathy Ahmed Fetouh and Amal Al Shahat Ibrahim. Hepato-protective Effect of Green Tea Extract on Cyclosporine a Treated Rabbits: Histological and Ultrastructural Study. Life Sci J 2013;10(1):1924-1932] (ISSN:1097-8135). http://www.lifesciencesite.com. 276 Key words: Green tea extract, Cyclosporine A, Hepatocytes, Ultrastructure. 1. Introduction
Cyclosporine A (CsA), a neutral lipophilic cyclic undecapeptide isolated from the fungus Tolypocladium inflatum gams, was first identified in 1976 during screening for novel antibiotic agents. It exerted a wide spectrum of biologic activities, including anti-parasitic, fungicidal and anti-inflammatory effects. It was subsequently discovered to be a powerful immunosuppressive agents(1). The drug exerts its major therapeutic effects by inhibiting T-cell activation(2). The use of cyclosporine A has improved quality of life and survival of transplant patients(3,4). CsA has largely contributed to the decrease in morbidity, rejection episodes and hospitalization days in these patients. The immunosuppressive properties of CsA allowed its utilization in several diseases as uveitis, rheumatoid arthritis, nephrotic syndrome and others (5,6). It is preferentially bound in blood to cells and lipoproteins. Openings in the liver capillaries allow
blood cells and lipoproteins to enter Disse's space and to get into close contact to the hepatocytes membrane and then diffuses into the hepatocytes(7). In the liver, CsA and its metabolites are taken up into the hepatocytes. The metabolites are mainly excreted from the hepatocytes into bile, a small portion into blood(8). Hydrogen peroxide generation and enhancement of the lipid peroxidation have been proposed as causative factors associated with the potential of CsA in inducing structural and functional damage (9). More attentions have been paid to the protective effects of natural antioxidant against drug-induced toxicities. Tea has been one of the most commonly consumed beverages since ancient times, and it is still the beverage most available to general populations in many countries all over the world(10). As a naturally safe beverage, it has many advantages over chemical preventive agents. It contains several antioxidants, including polyphenols of the catechin (green tea) and theaflavin (black tea) groups. Green

Life Science Journal 2013;10(1) http://www.lifesciencesite.com
1925
tea has recently received a lot of attention owing to its role as an antioxidant and free radicals scavenger(11,12).
The present study aimed to study the histological and ultrastructural hepato-protective effects of green tea extract on CsA treated rabbits. 2. Materials and Methods Animals:
Twenty adult rabbits weighing 1.5-2 kg were used in this study. The animals were maintained in cages with food and water ad libitum under controlled conditions of light, humidity and temperature. They were obtained from Animal House Colony of Faculty of Medicine, Zagazig University. All experimental procedures were conducted in accordance with the guide for the care and use of laboratory animals and in accordance with the local Animal Care and Use Committee. Green tea extract:
The green tea was made according to Maity et al.(13). Briefly, 10 gram of instant green tea powder (lyophilized water extract) were soaked in 1 L of boiling water for 5 minutes and filtered to make 1% instant green tea solution. The filtrate, designated as green tea extract (GTE), was provided to rabbits as their sole source of drinking water. Chemicals:
Cyclosporine A used in the present study was in the form of oral solution (Sandimmum Neoral 100 g/ml) and given to the animals in a distilled water by gavage using sterile equipments. CsA was administered in a dose of 15 mg/kg of body weight for 4 weeks according to Rezzani(8) who stated that daily administration of CsA ranging from 15 to 25 mg/kg was well tolerated and showed immunosuppressive effects like those observed in transplant patients. Also, Thomson et al.(14) and Blair et al.(15) found that, impairment of liver architecture has been reported in rats given CsA for 3-15 weeks. Experimental design:
The rabbits were divided into 3 groups (6-7 rabbits for each) and treated as follow: the 1st group served as control group and received distilled water, the 2nd group (CsA-treated rabbits) were daily administered 15 mg/kg of body weight for 4 weeks while those of the 3rd group (CsA treated rabbits co-administered with GTE) were treated with CsA in the same dose (15 mg/kg) simultaneously with green tea extract for the same period (4 weeks). The animals were anaesthetized by intra-abdominal injection of thiopental, then rapid dissection of the abdomen was done and the liver specimens were obtained and cut into small blocks less than 1 mm. The specimens were immediately fixed in 2.5% glutaraldehyde buffered with 0.1 M phosphate buffer at pH 7.4 for 2
hours at 4°C and then washed with the phosphate buffer, postfixed in 1% osmium tetraoxide in the same buffer for one hour at 4°C. After washing in phosphate buffer, specimens were dehydrated with ascending grades of ethanol and then were put in propylene oxide for 30 minutes at room temperature, impregnated in a mixture of propylene oxide and resin (1:1) for 24 hours and in a pure resin for another 24 hours. Then, the specimens were embedded in embed 812 resin in BEEM capsules at 60°C for 24 hours(16,17). Semi-thin sections of about one micron thick were obtained by glass knives and stained with 1% toluidine blue and examined by light microscopy. Ultrathin section of about 50-70 nm thick were cut using diamond knives and mounted on a copper grids, stained with uranyle acetate and lead citrate(16,17) and examined using a JEOL JEM 1010 transmission electron microscope in Electron Microscope Research Laboratory (EMRL) of Histology Department, Faculty of Medicine, Zagazig University. 3. Results
In control animals, the liver lobule examined by light microscopy appeared surrounding the portal triad; branch of the portal vein, branch of hepatic artery and bile canaliculi . The lobules were formed of plates of cells separated from each other by blood sinusoids (Fig. 1). The wall of the sinusoids are formed of hepatocytes and Kupffer cells. The cytoplasm of the hepatocytes appeared finely granulated and the nuclei appeared lightly stained and vesicular with prominent nucleoli, the Kupffer cells are small with pale cytoplasm and small nuclei (Fig. 2). By electron microscopic examination, the liver cell appeared polyhedral in shape. Their cytoplasm showed copious smooth endoplasmic reticulum in the entire perinuclear space and also membrane of rough endoplasmic reticulum. Numerous mitochondria were observed in the cytoplasm in addition to few glycogen particles. The nuclei of the cells appeared light, round with chromatin bodies inside and the nuclear membrane appeared regular and well formed (Figs. 3, 4 & 6). Numerous microvilli appeared protruding into the space of Disse and the Kupffer cells were observed to surround the sinusoids (Figs. 5 & 6).
In animals treated with CsA, the liver sinusoids were widened and surrounded by the cells of the liver cords when examined by light microscopy. The hepatocytes showed extensive vacuolization of different sizes in most of the cells with loss of the fine granulation (Figs. 7 & 8). By electron microscopic examination, the cytoplasm of the hepatocyte showed multiple vacuolization with variable areas of fatty degeneration. Few organelles
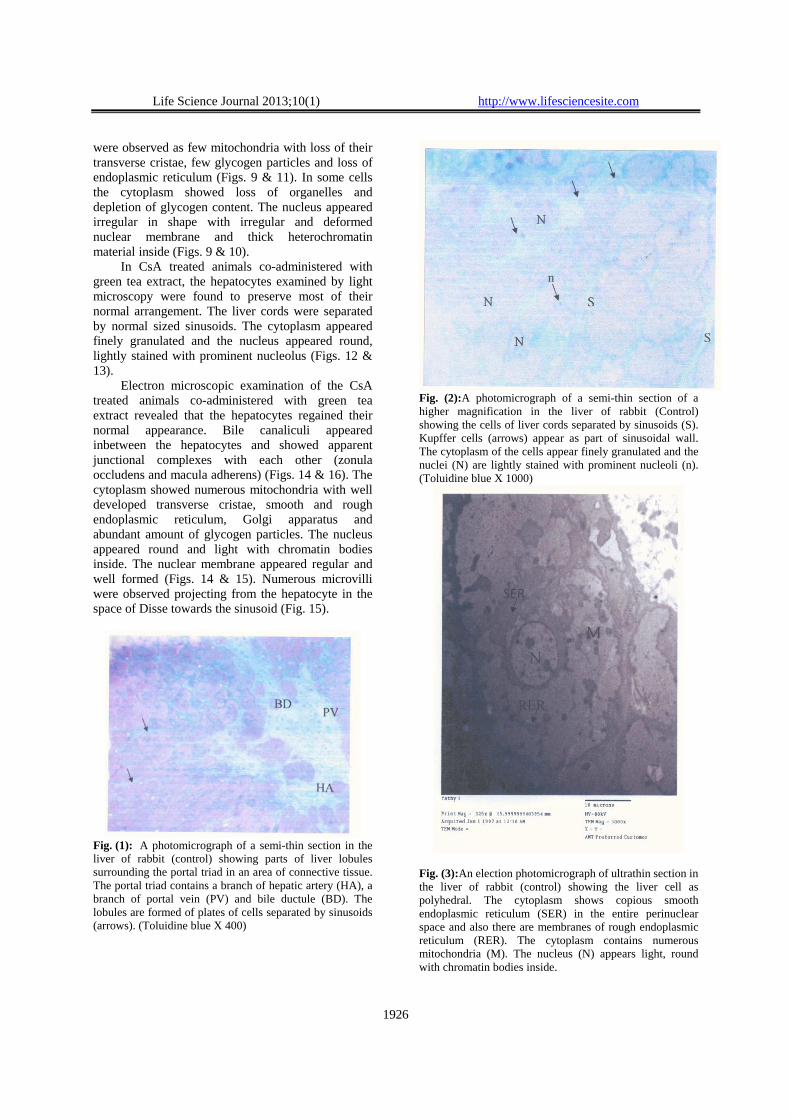
Life Science Journal 2013;10(1) http://www.lifesciencesite.com
1926
were observed as few mitochondria with loss of their transverse cristae, few glycogen particles and loss of endoplasmic reticulum (Figs. 9 & 11). In some cells the cytoplasm showed loss of organelles and depletion of glycogen content. The nucleus appeared irregular in shape with irregular and deformed nuclear membrane and thick heterochromatin material inside (Figs. 9 & 10).
In CsA treated animals co-administered with green tea extract, the hepatocytes examined by light microscopy were found to preserve most of their normal arrangement. The liver cords were separated by normal sized sinusoids. The cytoplasm appeared finely granulated and the nucleus appeared round, lightly stained with prominent nucleolus (Figs. 12 & 13).
Electron microscopic examination of the CsA treated animals co-administered with green tea extract revealed that the hepatocytes regained their normal appearance. Bile canaliculi appeared inbetween the hepatocytes and showed apparent junctional complexes with each other (zonula occludens and macula adherens) (Figs. 14 & 16). The cytoplasm showed numerous mitochondria with well developed transverse cristae, smooth and rough endoplasmic reticulum, Golgi apparatus and abundant amount of glycogen particles. The nucleus appeared round and light with chromatin bodies inside. The nuclear membrane appeared regular and well formed (Figs. 14 & 15). Numerous microvilli were observed projecting from the hepatocyte in the space of Disse towards the sinusoid (Fig. 15).
Fig. (1): A photomicrograph of a semi-thin section in the liver of rabbit (control) showing parts of liver lobules surrounding the portal triad in an area of connective tissue. The portal triad contains a branch of hepatic artery (HA), a branch of portal vein (PV) and bile ductule (BD). The lobules are formed of plates of cells separated by sinusoids (arrows). (Toluidine blue X 400)
Fig. (2):A photomicrograph of a semi-thin section of a higher magnification in the liver of rabbit (Control) showing the cells of liver cords separated by sinusoids (S). Kupffer cells (arrows) appear as part of sinusoidal wall. The cytoplasm of the cells appear finely granulated and the nuclei (N) are lightly stained with prominent nucleoli (n). (Toluidine blue X 1000)
Fig. (3):An election photomicrograph of ultrathin section in the liver of rabbit (control) showing the liver cell as polyhedral. The cytoplasm shows copious smooth endoplasmic reticulum (SER) in the entire perinuclear space and also there are membranes of rough endoplasmic reticulum (RER). The cytoplasm contains numerous mitochondria (M). The nucleus (N) appears light, round with chromatin bodies inside.
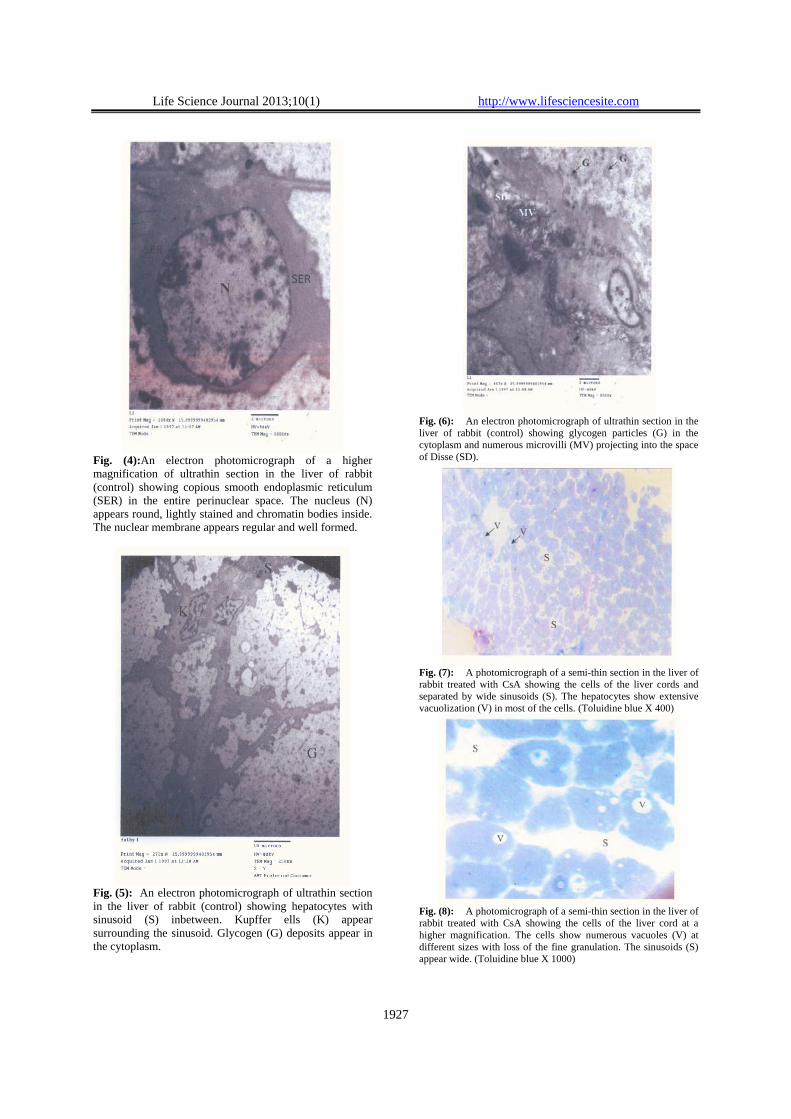
Life Science Journal 2013;10(1) http://www.lifesciencesite.com
1927
Fig. (4):An electron photomicrograph of a higher magnification of ultrathin section in the liver of rabbit (control) showing copious smooth endoplasmic reticulum (SER) in the entire perinuclear space. The nucleus (N) appears round, lightly stained and chromatin bodies inside. The nuclear membrane appears regular and well formed.
Fig. (5): An electron photomicrograph of ultrathin section in the liver of rabbit (control) showing hepatocytes with sinusoid (S) inbetween. Kupffer ells (K) appear surrounding the sinusoid. Glycogen (G) deposits appear in the cytoplasm.
Fig. (6): An electron photomicrograph of ultrathin section in the liver of rabbit (control) showing glycogen particles (G) in the cytoplasm and numerous microvilli (MV) projecting into the space of Disse (SD).
Fig. (7): A photomicrograph of a semi-thin section in the liver of rabbit treated with CsA showing the cells of the liver cords and separated by wide sinusoids (S). The hepatocytes show extensive vacuolization (V) in most of the cells. (Toluidine blue X 400)
Fig. (8): A photomicrograph of a semi-thin section in the liver of rabbit treated with CsA showing the cells of the liver cord at a higher magnification. The cells show numerous vacuoles (V) at different sizes with loss of the fine granulation. The sinusoids (S) appear wide. (Toluidine blue X 1000)
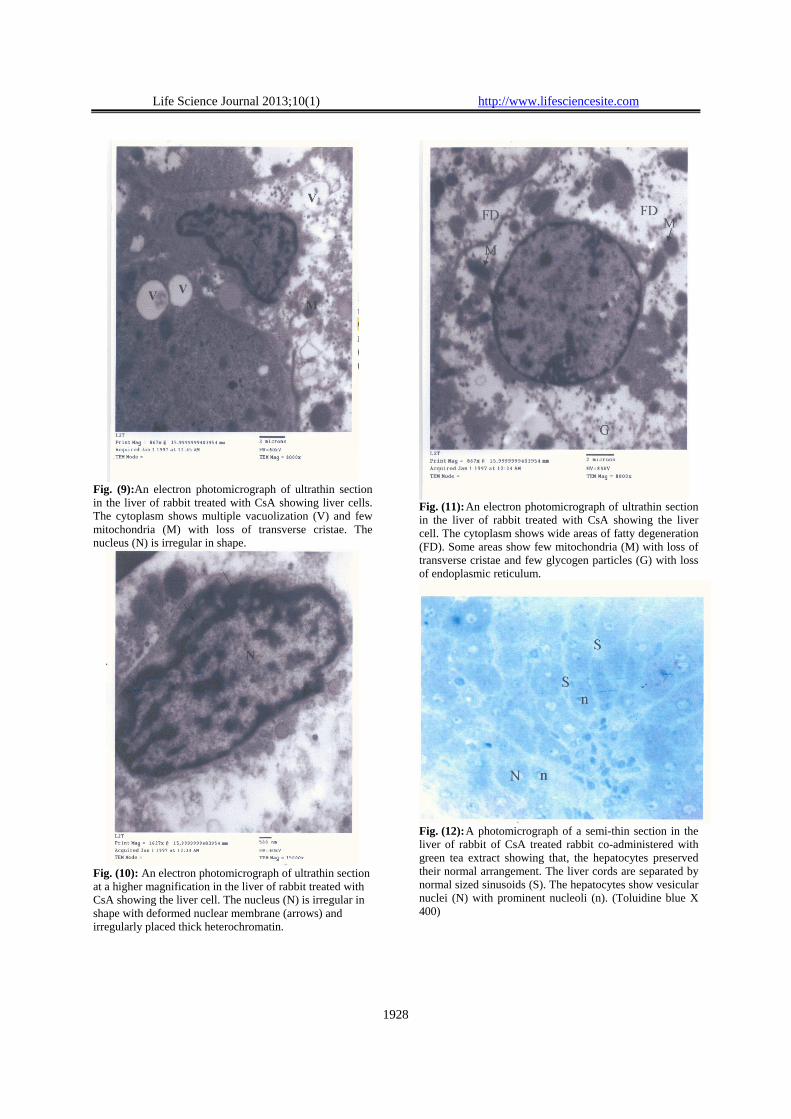
Life Science Journal 2013;10(1) http://www.lifesciencesite.com
1928
Fig. (9):An electron photomicrograph of ultrathin section in the liver of rabbit treated with CsA showing liver cells. The cytoplasm shows multiple vacuolization (V) and few mitochondria (M) with loss of transverse cristae. The nucleus (N) is irregular in shape.
Fig. (10): An electron photomicrograph of ultrathin section at a higher magnification in the liver of rabbit treated with CsA showing the liver cell. The nucleus (N) is irregular in shape with deformed nuclear membrane (arrows) and irregularly placed thick heterochromatin.
Fig. (11): An electron photomicrograph of ultrathin section in the liver of rabbit treated with CsA showing the liver cell. The cytoplasm shows wide areas of fatty degeneration (FD). Some areas show few mitochondria (M) with loss of transverse cristae and few glycogen particles (G) with loss of endoplasmic reticulum.
Fig. (12): A photomicrograph of a semi-thin section in the liver of rabbit of CsA treated rabbit co-administered with green tea extract showing that, the hepatocytes preserved their normal arrangement. The liver cords are separated by normal sized sinusoids (S). The hepatocytes show vesicular nuclei (N) with prominent nucleoli (n). (Toluidine blue X 400)
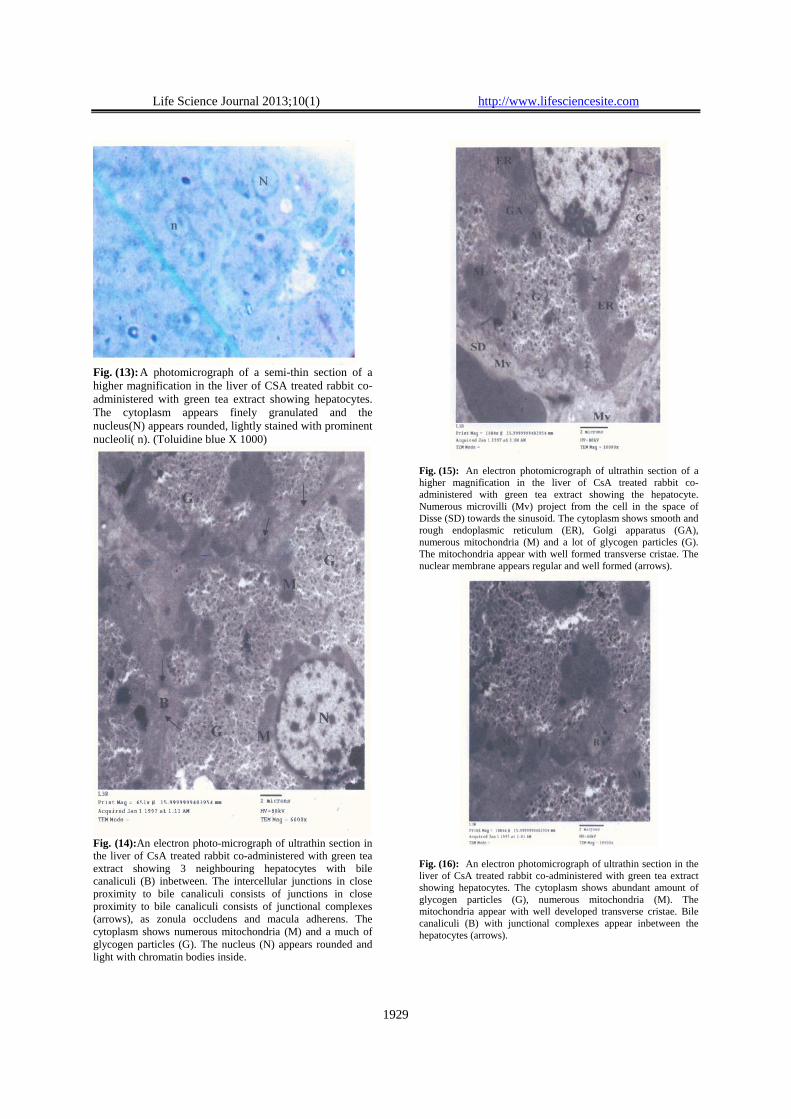
Life Science Journal 2013;10(1) http://www.lifesciencesite.com
1929
Fig. (13): A photomicrograph of a semi-thin section of a higher magnification in the liver of CSA treated rabbit co-administered with green tea extract showing hepatocytes. The cytoplasm appears finely granulated and the nucleus(N) appears rounded, lightly stained with prominent nucleoli( n). (Toluidine blue X 1000)
Fig. (14):An electron photo-micrograph of ultrathin section in the liver of CsA treated rabbit co-administered with green tea extract showing 3 neighbouring hepatocytes with bile canaliculi (B) inbetween. The intercellular junctions in close proximity to bile canaliculi consists of junctions in close proximity to bile canaliculi consists of junctional complexes (arrows), as zonula occludens and macula adherens. The cytoplasm shows numerous mitochondria (M) and a much of glycogen particles (G). The nucleus (N) appears rounded and light with chromatin bodies inside.
Fig. (15): An electron photomicrograph of ultrathin section of a higher magnification in the liver of CsA treated rabbit co-administered with green tea extract showing the hepatocyte. Numerous microvilli (Mv) project from the cell in the space of Disse (SD) towards the sinusoid. The cytoplasm shows smooth and rough endoplasmic reticulum (ER), Golgi apparatus (GA), numerous mitochondria (M) and a lot of glycogen particles (G). The mitochondria appear with well formed transverse cristae. The nuclear membrane appears regular and well formed (arrows).
Fig. (16): An electron photomicrograph of ultrathin section in the liver of CsA treated rabbit co-administered with green tea extract showing hepatocytes. The cytoplasm shows abundant amount of glycogen particles (G), numerous mitochondria (M). The mitochondria appear with well developed transverse cristae. Bile canaliculi (B) with junctional complexes appear inbetween the hepatocytes (arrows).

Life Science Journal 2013;10(1) http://www.lifesciencesite.com
1930
4. Discussion In the present study, the CsA had adverse
effects on the liver cells where the cytoplasm showed multiple vacuolization with variable areas of fatty degeneration and few organelles were observed. In some cells, the cytoplasm showed loss of organelles and depletion of glycogen content. This is in agreement with many authors; Thomson et al.(14), Blair et al.(15), Ryffel(18) and Sweny and Tidman(19)
who reported the impairment of liver architecture in rats given CsA for 3-15 weeks. Ryffel(18) added that fatty changes and dilatation of endoplasmic reticulum together with loss of ribosomes in several hepatocytes and individual hepatic necrosis were found in CsA treated rats. Also Abdurrauf(20) found that, CsA caused marked damage in the histo-pathological status in kidney, liver and heart tissues.
In this study, CsA treated rabbits showed that the mitochondria appeared few with loss of transverse cristae. This may be explained by de Arriba et al.(21) who suggested that CsA induces several consequences in mitochondrial structure and function. Also CsA induces pores in mitochondrial membrane allowing the release of protein to cytosol and triggering the activation of caspases and in turn the process of programmed cell death. Fatty degeneration observed in the present study could be attributed to impaired protein synthesis as a result of rough endoplasmic reticulum damage and therefore inhibition of lipoprotein manufacture and its inhibition results in accumulation of fats in the cytoplasm (22).
In the present study, the nucleus appeared irregular in shape with irregular and deformed nuclear membrane and thick heterochromatin materials inside. Junqueira et al.(23) explained the nuclear degeneration of liver cells as a result of inhibition of the dihydrofolate reductase enzyme that interferes with the synthesis of DNA. Many studies revealed the functional impairment of the liver in transplant recipients receiving CsA. Lorber et al.(24) and Li et al.(25) observed impaired liver functions in a number of renal, cardiac, bone marrow transplant recipients. Pickrell et al.(26) reported the transient increase of bilirubin or hepatic aminotransferase levels which return to normal with reduction of CsA dosage. Rezzani(8) observed hepatotoxicity in the first 90 post-transplant days.
Oxidative stress and an increase in different enzymatic activity (i.e. alkaline phosphatase, lactate dehydrogenase, NADPH-diaphorase) has been proposed as a causative factor in CsA induced toxicity in liver cells(27,28,29). Hagar(30) and Rezzani(31) stated that CsA generates reactive oxygen species(ROS) such as superoxide anion and hydroxyl radicals and stimulates renal, hepatic and cardiac
lipid peroxidation. Packer et al.(32) mentioned that lipid peroxidation leads to oxidative damage of cell component (e.g. proteins, lipids and nucleic acids). The normal balance between radical formations and antioxidants system protects the cells against oxidative stress(33). Turk et al.(34) found that, reduced activity of one or more antioxidant systems due to the direct toxic effect of CsA caused increase of lipid peroxidation and oxidative stress in transplanted and non-transplanted human being and animals.
In the present study, co-administration of GTE significantly prevented the injury in CsA treated animals where the hepatocytes regained their normal appearance. Bile canaliculi appeared inbetween the hepatocytes with junctional complexes. The cytoplasm showed numerous mitochondria with well developed transverse cristae, smooth and rough endoplasmic reticulum, Golgi apparatus and abundant amount of glycogen particles. The nucleus appeared round, light and the nuclear membrane appeared regular and well formed. Numerous microvilli were observed projecting from the cells in the space of Disse. This is concomitant with Fadhel and Amran(35) who reported that green and black tea have anti-oxidant effects and chemo-protective activity against CCL4-induced lipid peroxidation in liver, kidneys and testes. A similar study by Mohamadin et al.(36), observed the reno-protective potential of GTE in CsA-induced nephrotoxicity and added that, the anti-lipoperoxidative effect of GTE and its ability to restore the levels and activity of antioxidant machinery and lysosomal enzymes, all contribute to GTE's beneficial effects. Also some studies reported the effect of other antioxidants. Chen et al.(37) and Zal et al.(38) reported the role of vitamin E and Quercetin in decreasing the lipid peroxidation induced by CsA. Also, Olaleye and Rocha(39), Kanbur et al.(40) and Mohamed et al.(41) reported the hepato-protective effects of medicinal plants and royal Jelly and that the mechanism by which they do this is by acting as antioxidants. Thus, from the above findings, it could be concluded that GTE had beneficial effects against cyclosporine A induced hepatic toxicity and may be used in combination with CsA transplant treatment to improve the CsA-induced oxidative stress parameters and other adverse effects.
Corresponding author Amal Al Shahat Department of Anatomy, Faculty of Medicine, Zagazig University [email protected]
Life Science Journal 2013;10(1) http://www.lifesciencesite.com
1931
References 1- Borel JF, Feurer C, Gubler HU and Stahelin H:
Biological effects of CsA: a new anti-lymphocytic agents. Agents Action 1976; 6: 468-475.
2- Reynolds NI and Al-Daraii WI: Calcineurin inhibitors and sirolimus mechanisms of action and applications in dermatology. Rev Clin Exp Dermatol 2002; 27: 555-561.
3- Calne RY, Rolles K and White DJG: Cyclosporine A initially as the only immunosuppressant in 34 recipients of cadaveric organs: 32 kidneys, 2 pancreases and 2 livers. Lancet 1979; 2: 1033-1041.
4- Parracid T, Conejo Garcia JR, Carballo Alvarez F and De Arriba G: Antioxidant nutrients protects against cyclosporine A nephrotoxicity. Toxicology 2003; 189: 99-111.
5- Bougneres PF, Carel JC, Castano L, Boitard C, Gardin JP, Landais P, Hors J, Mihatsch MJ, Paillard M, Chaussain JL and Bach JF: Factors associated with early remission of type 1 diabetes in children treated with cyclosporine. New Engl J Med 1988; 318: 663-670.
6- Durkan AM, Hodson EM, Willis NS and Craig JC: Immunosuppressive agents in childhood nephrotic syndrome: a meta-analysis of randomized controlled trails. Kidney Int 2001; 59: 1919-1927.
7- Watkins PB: The role of cytochrome P-450 in cyclosporine metabolism. J Am Acad Dermatol 1990; 6: 1301-9.
8- Rezzani R: Cyclosporine A and adverse effects on organs: histochemical studies. Progr Histochem Cytochem 2004; 39: 85-128.
9- Durak I, Karabacak HI, Buyukkocak S, Cimen MY, Kacmaz M, O'Meroglu E, et al.: Impaired antioxidant defense system in the kidney tissues from rabbits treated with cyclosporine. Protective effects of vitamin E and C. Nephron 1998; 78 (2): 207-11.
10- Bordoni A, Hrelia S, Angeloni C, Giordano E, Guarnieri C, Caldarera CM, et al.: Green tea protection of hypoxia/reoxgenation injury in cultured cardiac cells. J Nutr Biochem 2002; 13 (2): 103-11.
11- Jung YD, Kim MS, Shin BA, Chay KO, Ahn BW, Liu W, et al.: EGCG, a major component of green tea, inhibits tumour growth by inhibiting VEGF induction in human colon carcinoma cells. Br J Cancer 2001; 84: 844-50.
12- Tsubono Y, Nishino Y, Komatsu S, Hsieh CC, Kanemura S, Tsuji L, et al.: Green tea and the risk of gastric cancer in Japan. N Engl J Med 2001; 344: 632-6.
13- Maity S, Vadasiromoni JR, Ganguly DK: Role of glutathione in the anti-ulcer effect of hot water
extract of black tea (Camellia Sinensis). Jpn J Pharmacol 1998; 78: 285-92.
14- Thomson AW, Whiting PH, Cameron ID, Lessels SF, Simpson JG: A toxicological study in rats receiving immunotherapeutic doses of cyclosporine A. Transplantation 1981; 31: 121-8.
15- Blair JT, Thompson AW, Whiting PH, Davidson RJL, Simpson JG: Toxicity of the immune suppressant cyclosporine A in the rat. J Path 1982; 138: 163-78.
16- Glauert AM, Lewis PR: Biological specimen preparation for transmission electron microscopy. Vol. 17, Portland Press, London, 1998.
17- Bozzola JJ and Rusell LD: Electron microscopy principles and techniques for biologists. Jones and Bartlett Publisher, Boston 1995.
18- Ryffel B: Experimental toxicological studies with cyclosporine A. Elsevier Biomedical Press, Amsterdam, 1982, pp. 45-75.
19- Sweny P and Tidman N: The effect of cyclosporine A on peripheral blood T cell subpopulation in renal allografts. Clin Exp Immunol 1982; 47: 445-8.
20- Abdurrauf Y, Ahmet A and Ali OC: Amelioration of cyclosporine A-induced renal, hepatic and cardiac damages by ellagic acid in rats. Basic Clin Pharmacol 2008; 103: 186-191.
21- de Arriba G, de Hornedo JP, Rubio SR, Fernandez MC, Martinez SB, Camarero MM and Cid TP: Vitamin E protects against the mitochondrial damage causd by cyclosporine A in LLC-PK1 cells. Toxicol and Appl Pharmacol 2009; doi:10.10.1016/j.taap.2009.05.028.
22- Slater TF: Free radical mechanism in tissue injury. Biochem J 1984; 222: 1-15.
23- Junqueira LC, Carneiro J and Kelly RO: Basic Histology, Appleton and Lange Medical Publication, San Mateo, California, Eighth ed. 1995; pp. 320.
24- Lorber MI, Vanburen CT, Flechner SM, Williams C and Kahan BD: Hepatobiliary and pancreatic complications of cyclosporine therapy in 466 renal transplant recipients. Transplantation 1987; 43 (Suppl. 1): 35-40.
25- Li J, Brown LF, Hibberd MG, Grossman JD and Morgan JP: VEGF, FLK-1 and FLT-1 expression in a rat myocardial infarction model of angiogenesis. Am Physiol Soc 1996; 37: 1803-11.
26- Pickrell MD, Sawers R and Michael J: Pregnancy after renal transplantation: Severe intrauterine growth retardation during treatment with cyclosporine A. Br Med J 1988; 296: 825-36.
27- Walker RJ, Lazzaro VA, Duggin GG, Horvath JS, Tiller DJ: Evidence that alterations in renal metabolism and lipid peroxidation may contribute

Life Science Journal 2013;10(1) http://www.lifesciencesite.com
1932
to cyclosporine nephrotoxicity. Tansplantation 1990; 50 (3): 487-92.
28- Suleymanlar G, Suleymanlar I, Shapiro JI, Chan L: Possible role of lipid peroxidation in cyclosporine nephrotoxicity in rats. Transplant Proc 1994; 26 (5): 2888-9.
29- Wolf A, Trendelenburg CF, Diez-Fernandez C, Prieto P, Houy S, Trommer WE and Cordier A: Cyclosporine A-induced oxidative stress in rat hepatocytes. J Pharmacol Exp Ther 1997; 280: 1328-34.
30- Hagar HH: The protective effect of taurine against cyclosporine A-induced oxidative stress and hepatoxicity in rats. Toxicol Lett 2004; 151: 335- 43.
31- Rezzani R, Buffoli B, Rodella L, Stacchiotti A and Bianchi R: Protective role of melatonin in cyclosporine A-induced oxidative stress in rat liver. Int Immunopharmacol 2005; 5: 1397-405.
32- Packer L and Landvik S: Vitamin E in biological systems. In: Emerit I, Packer L, Auclair C (eds). Antioxidants in therapy and preventive medicine. Plenum Press. New York, 1990; 93-104.
33- Conklin KA: Dietary antioxidants during cancer chemotherapy: impact on chemotherapeutic effectiveness and development of side effects. Nutr Cancer 2000; 37: 1-18.
34- Turk G, Atessahin A, Sonmez M, Yuce A and Ceribasi AO: Lycopene protects against cyclosporine A-induced testicular toxicity in rats. Theriogenology 2007; 67: 778-85.
35- Fadhel ZA and Amran S: Effects of black tea extract on carbon tetrachloride-induced lipid
peroxidation in liver, kidneys and testes of rats. Phytother Res 2002; 16 (Suppl. 1): 28-32.
36- Mohamadin AM, El-Beshbishy HA and El-Mahdy MA: Green tea extract attenuates cyclosporine A-induced oxidative stress in rats: Pharmacol Res 2005; 51: 51-57.
37- Chen C, Johnston TD, Reddy KS and Merrick JC, Mastrangelo M and Ranjan D: Cyclosporine directly causes oxidative stress and promotes Epstein-Bar virus transformation of human B cells. J Surg Res 2001; 100 (2): 166-70.
38- Zal F, Mostafavi-Pour Z and Vessal M: Comparison of the effects of vitamin E and/or quercetin in attenuating chronic cyclosporine A-induced nephrotoxicity in male rats. Clin Exp Pharmacol and Physiol 2007; 34: 720-724.
39- Olaleye MT and Rocha BTJ: Acetaminophen-induced liver damage in mice: Effects of some medicinal plants on the oxidative defense system. Exp Toxicol Path 2008; 59: 319-327.
40- Kanbur M, Eraslan G, Beyaz L, Silici S, Liman BC, Altinodulu S and Atasever A: The effects of royal jelly on liver damage induced by paracetamol in mice. Exp Toxicol Path 2009; 61: 123-132.
41- Mohamed ET, Mahran HA and Mahmoud MS: Hepato-ameliorative effects of Azadirachta indica leaves extract against mercuric chloride environmental pollution. J Amr Sci 2010; 6 (9): 735-751.
2/2/2013
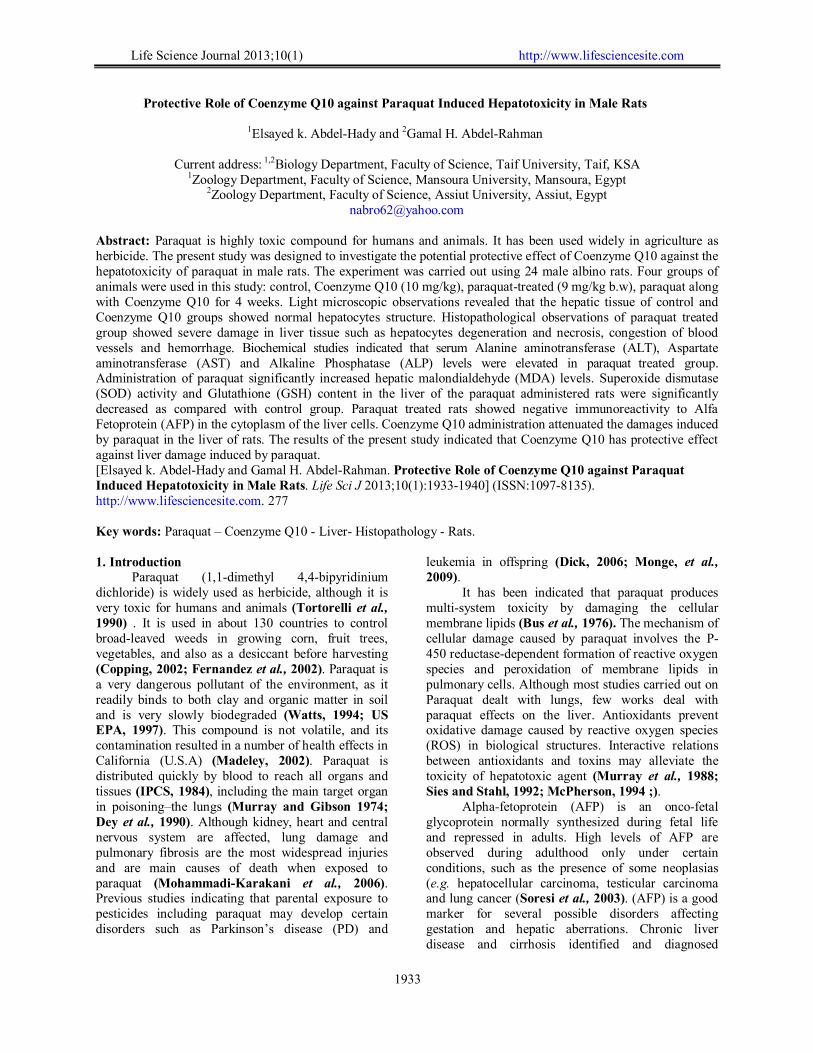
Life Science Journal 2013;10(1) http://www.lifesciencesite.com
1933
Protective Role of Coenzyme Q10 against Paraquat Induced Hepatotoxicity in Male Rats
1Elsayed k. Abdel-Hady and 2Gamal H. Abdel-Rahman
Current address: 1,2Biology Department, Faculty of Science, Taif University, Taif, KSA 1Zoology Department, Faculty of Science, Mansoura University, Mansoura, Egypt
2Zoology Department, Faculty of Science, Assiut University, Assiut, Egypt [email protected]
Abstract: Paraquat is highly toxic compound for humans and animals. It has been used widely in agriculture as herbicide. The present study was designed to investigate the potential protective effect of Coenzyme Q10 against the hepatotoxicity of paraquat in male rats. The experiment was carried out using 24 male albino rats. Four groups of animals were used in this study: control, Coenzyme Q10 (10 mg/kg), paraquat-treated (9 mg/kg b.w), paraquat along with Coenzyme Q10 for 4 weeks. Light microscopic observations revealed that the hepatic tissue of control and Coenzyme Q10 groups showed normal hepatocytes structure. Histopathological observations of paraquat treated group showed severe damage in liver tissue such as hepatocytes degeneration and necrosis, congestion of blood vessels and hemorrhage. Biochemical studies indicated that serum Alanine aminotransferase (ALT), Aspartate aminotransferase (AST) and Alkaline Phosphatase (ALP) levels were elevated in paraquat treated group. Administration of paraquat significantly increased hepatic malondialdehyde (MDA) levels. Superoxide dismutase (SOD) activity and Glutathione (GSH) content in the liver of the paraquat administered rats were significantly decreased as compared with control group. Paraquat treated rats showed negative immunoreactivity to Alfa Fetoprotein (AFP) in the cytoplasm of the liver cells. Coenzyme Q10 administration attenuated the damages induced by paraquat in the liver of rats. The results of the present study indicated that Coenzyme Q10 has protective effect against liver damage induced by paraquat. [Elsayed k. Abdel-Hady and Gamal H. Abdel-Rahman. Protective Role of Coenzyme Q10 against Paraquat Induced Hepatotoxicity in Male Rats. Life Sci J 2013;10(1):1933-1940] (ISSN:1097-8135). http://www.lifesciencesite.com. 277 Key words: Paraquat – Coenzyme Q10 - Liver- Histopathology - Rats. 1. Introduction
Paraquat (1,1-dimethyl 4,4-bipyridinium dichloride) is widely used as herbicide, although it is very toxic for humans and animals (Tortorelli et al., 1990) . It is used in about 130 countries to control broad-leaved weeds in growing corn, fruit trees, vegetables, and also as a desiccant before harvesting (Copping, 2002; Fernandez et al., 2002). Paraquat is a very dangerous pollutant of the environment, as it readily binds to both clay and organic matter in soil and is very slowly biodegraded (Watts, 1994; US EPA, 1997). This compound is not volatile, and its contamination resulted in a number of health effects in California (U.S.A) (Madeley, 2002). Paraquat is distributed quickly by blood to reach all organs and tissues (IPCS, 1984), including the main target organ in poisoning–the lungs (Murray and Gibson 1974; Dey et al., 1990). Although kidney, heart and central nervous system are affected, lung damage and pulmonary fibrosis are the most widespread injuries and are main causes of death when exposed to paraquat (Mohammadi-Karakani et al., 2006). Previous studies indicating that parental exposure to pesticides including paraquat may develop certain disorders such as Parkinson’s disease (PD) and
leukemia in offspring (Dick, 2006; Monge, et al., 2009).
It has been indicated that paraquat produces multi-system toxicity by damaging the cellular membrane lipids (Bus et al., 1976). The mechanism of cellular damage caused by paraquat involves the P-450 reductase-dependent formation of reactive oxygen species and peroxidation of membrane lipids in pulmonary cells. Although most studies carried out on Paraquat dealt with lungs, few works deal with paraquat effects on the liver. Antioxidants prevent oxidative damage caused by reactive oxygen species (ROS) in biological structures. Interactive relations between antioxidants and toxins may alleviate the toxicity of hepatotoxic agent (Murray et al., 1988; Sies and Stahl, 1992; McPherson, 1994 ;).
Alpha-fetoprotein (AFP) is an onco-fetal glycoprotein normally synthesized during fetal life and repressed in adults. High levels of AFP are observed during adulthood only under certain conditions, such as the presence of some neoplasias (e.g. hepatocellular carcinoma, testicular carcinoma and lung cancer (Soresi et al., 2003). (AFP) is a good marker for several possible disorders affecting gestation and hepatic aberrations. Chronic liver disease and cirrhosis identified and diagnosed
Life Science Journal 2013;10(1) http://www.lifesciencesite.com
1934
according to liver biopsy showed variations in AFP (Gad, 2005).
Coenzyme Q10 (CoQ10) is known as ubiquinone, a vitamin-like substance present in all cells in the membranes of endoplasmic reticulum, peroxisomes, lysosomes, and the inner membrane of mitochondria. In recent years, CoQ10 has gained considerable attention as a dietary supplement capable of influencing cellular bioenergetics and counteracting some of the damage caused by ROS ( Linnane et al., 2002; Butler et al., 2003; Rosenfeldt et al., 2003; Zhou et al., 2005). Previous studies demonstrated the protective effects of CoQ10 in various models of oxidative and inflammatory tissue damage (Upaganlawar et al., 2006; Sohet et al., 2009 ; Spindler et al., 2009), and therefore it protects the body against the deleterious effects of ROS. The enzyme has hence been therapeutically employed in many disorders for its cytoprotective and antioxidant properties (Alleva et al., 2001; Ruiz-Jimenez et al., 2007). In clinical populations, CoQ10 has been used as a supplementary treatment for chronic diseases such as Chronic Heart Failure (CHF), muscular dystrophies, Parkinson's disease, cancer, and diabetes (Keith et al.,1998; Shults et al., 2002). The aim of the present study was to examine the protective effect of CoQ10 against herbicide paraquat-induced hepatotoxicity in male rats. 2. Materials and Methods Animals and experimental design
Adult male albino rats were obtained from animal farm in Taif, Saudi Arabia. The animals were kept at standard housing facilities (24±1 ◦C, 45±5% humidity and 12 h light/dark cycle). They supplied with standard laboratory food and water ad-libitum and left to acclimatize for one week before the experiments. The animals were then divided into 4 groups, 6 animals each. Group I: animals of this group were served as control received saline solution orally. Group II: animals were orally given CoQ10 (10 mg/kg b.w.). Group III: animals were given Paraquat intraperitoneally at dose of (9 mg/kg b.w.) (1\10) LD50. Group IV: animals were intraperitoneally injected with Paraquat at a dose of 9 mg / kg b.w. plus Coenzyme Q10 (10 mg/kg b.w.) orally daily. Time of the experiment was four weeks. All the treatments were done in compliance with the Guide for the Care and Use of Laboratory animals. Histological and Histopathological Examinations
At the end of the experiment, animals were sacrificed under ether anaesthesia. Liver from animals was carefully separated and immediately fixed in 10% neutral buffered formalin (PH 7.2), dehydrated in ascending series of ethanol, cleared in methyl benzoate and embedded in paraffin wax. Paraffin
sections of 5μm thickness were prepared for histopathological examination. Sections were stained with haematoxylin and eosin (H&E) using the standard techniques (Bancroft and Stevens, 1982) and then were examined under light microscope. Biochemical determinations
Blood samples were collected from the marginal ear vein of the rats, placed into plain Vacutainer silicone-coated tubes, and allowed to clot at room temperature. The blood samples were centrifuged at 3000 rpm for 15 minutes. Serum samples were frozen immediately at -20°C and stored until required for analysis. Serum marker enzyme assays
AST, ALT, ALP levels were determined in the serum by routine colorimetric methods on a Roche modular autoanalyser (Roche modular autoanalyser, Tokyo, Japan). Oxidative stress and antioxidant enzyme assays
For determination of oxidative stress and antioxidant enzymes in the liver, supernatant obtained after centrifugation of hepatic tissue homogenates was used. Reduced Glutathione was assayed as described by Beutler et al., (1963). Superoxide Dismutase activity was determined according to the method of Nishikimi et al. (1972). Malondialdehyde, as an indicator of lipid peroxidation, was determined according to Ohkawa et al. (1979). Immunolocalization of AFP in rats hepatocytes
For immunolocalization by light microscope, the liver section were fixed in 99% ethanol and 1% acetic acid for 12-15 hours at 40◦C and rehydrated. The endogenous peroxidase activity was blocked with 0.05% hydrogen peroxidase in absolute methanol for 30 min. The slides were then washed 5 min in phosphate buffered saline (PBS) at pH 7.4 after each incubation step. The slides were incubated for 5 min in an ultra violet light at room temperature in order to block non specific background staining of excess stain. Primary antibody (Anti-rat. IGg) were applied for 10 min followed by biotinylated Goat anti polyvalent and incubated for 10 min as well. Slides were treated with streptovidin peroxidase and incubated for 10 min at room temperature, as a final step for AFP localization. Statistical analysis
The results were tested by univariate Analysis of Variance (ANOVA) followed by Mann–Whitney Rank Sum Test. The values were considered significantly at P<0.05. The statistical analysis was performed using SPSS . 3. Results Biochemical determinations a-Liver functions

Life Science Journal 2013;10(1) http://www.lifesciencesite.com
1935
The serum ALT , AST and ALP levels were significantly elevated in paraquat treated group as compared with control group (Table1). Treatment with CoQ10 decreased remarkably the levels of serum ALT,
AST and ALP in the liver of paraquat-treated rats, although the enzyme levels were still higher than in the control (Table1).
Table (1): Effect of Coenzyme Q10 on Paraquat- induced changes in the Liver functions of different groups.
Values are mean ± SD, n = 6 animals. ALP (U/L)
AST (U/L)
ALT (U/L)
Parameters Groups
79.45 ± 2.01 106.83 ±5.88 54.87 ± 2.73 Control
81.12 ± 2.12 110.54 ± 5.48 57.9 ± 2.71 Coenzyme Q10
134.7 ± 1.95 * 187.12 ± 3.55 * 139.47 ± 1.98 * Paraquat
111.81 ± 2.62 ☻ 131.63 ± 2.21 ☻ 112.52 ± 1.11☻ Paraquat & Coenzyme Q10
* Significant difference at P<0.05 compared with the control group. ☻ Significant difference at P<0.05 compared with the paraquat treated group. b- Oxidative stress and antioxidant enzymes Lipid peroxidation
Malondialdehyde (MDA) is the main oxidation product of peroxidized polyunsaturated fatty acids and represents an important index of lipid peroxidation. Administration of paraquat significantly increased (38.1%) hepatic MDA levels in rats as compared to the control group (Table 2). CoQ10 treatment resulted in a significant decrease (10.3%) in MDA as compared to the paraquat group (Table 2). Glutathione (GSH)
GSH content in the liver of the paraquat administered rats was significantly decreased as
compared to control group (Table 2). The GSH content decreased by 12.9% in the paraquat treated group. However, the GSH content was significantly increased (11.4%) in rats treated with paraquat along with CoQ10 as compared to the paraquat group (Table 2). Superoxide dismutase (SOD)
Administration with paraquat resulted in decreased activity (31.0%) of the enzyme in the liver as compared to the control group (Table2). Administration of CoQ10 along with paraquat increased the activity (19.1%) of SOD as compared to the paraquat group (Table 2).
Table (2): Oxidative stress and antioxidant enzymes in the liver of different groups. Values are mean ± SE, n
= 6 animals. Parameters Groups
Superoxide dismutase (SOD) (units/mg protein)
Glutathione (µmole /g wet tissue)
Lipid peroxidation (nmoles MDA/mg protein)
2.58 ± 0.09 51.2 ± 0.23 4.2 ± 0.09 Control 2.66 ± 0.11 53.2 ± 0.12 4.6 ± 0.15 Co Q10 1.78 ± 0.08* 44.6 ± 0.15* 5.8 ± 0.25* Paraquat
31.0 lower than control
12.9 lower than control
38.1 higher than control
%
2.12 ± 0.18☻ 49.7 ± 0.19☻ 5.2 ± 0.21☻ Paraquat & Co Q10 19.1
higher than Paraquat 11.4
higher than araquat 10.3
lower than araquat %
* Significant difference at P<0.05 compared with the control group. ☻ Significant difference at P<0.05 compared with the paraquat group. Histopathological examinations
The microscopic examinations of sections of liver of control (Fig.1A). and CoQ10 treated rats (Fig.1B) showed the normal structure of the hepatic lobule. The hepatocytes appeared polyhydral in shape, bood sinusoid were situated between cords of hepatocytes The central vein is surrounded by the hepatocytes with eosinophilic cytoplasm and distinct nuclei.
The histopathological examination of the liver of paraquat-treated rats revealed remarkable changes versus control animals.
Fig.1C showed cellular infiltration, congested portal vein and a lot of degenerative cells in portal areas. (Fig.1D) revealed that there are interstitial haemorrhage and cytoplasmic vacuolation. (Fig.1E) exhibit that there is a severe hepatocyte necrosis. Treatment with CoQ10 ameliorated the paraquat-induced liver injuries and improved the histological liver appearance (Fig.1F).
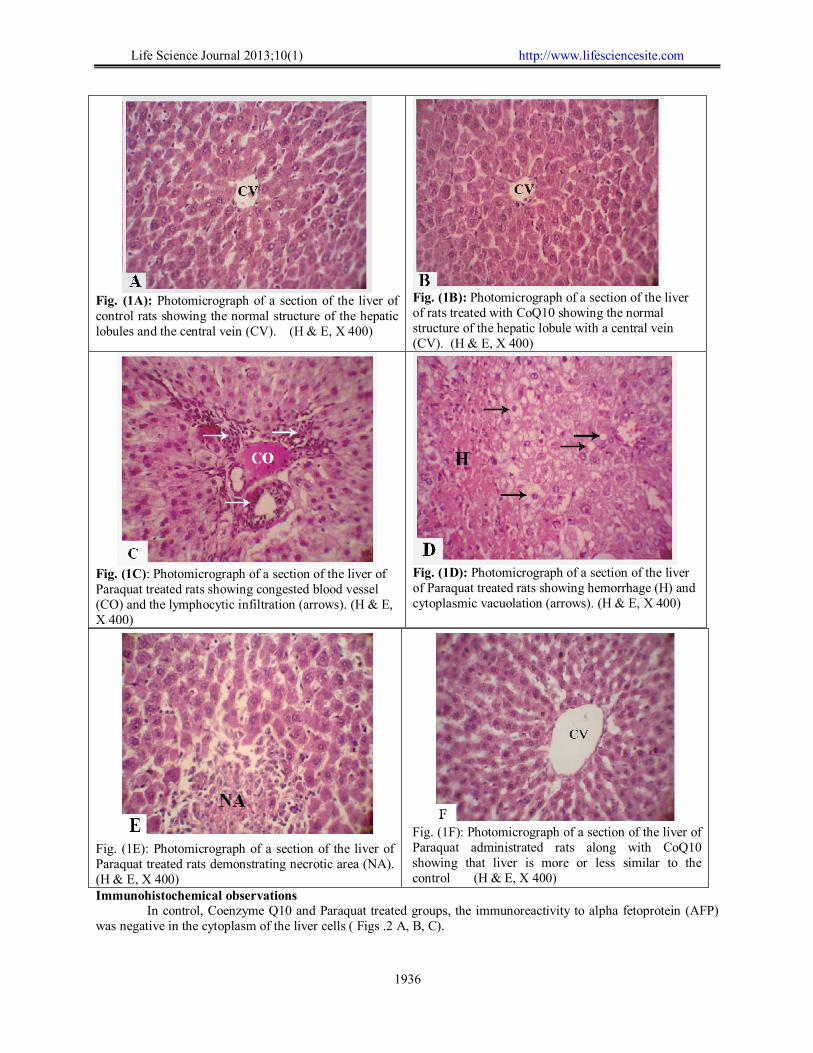
Life Science Journal 2013;10(1) http://www.lifesciencesite.com
1936
Fig. (1A): Photomicrograph of a section of the liver of control rats showing the normal structure of the hepatic lobules and the central vein (CV). (H & E, X 400)
Fig. (1B): Photomicrograph of a section of the liver of rats treated with CoQ10 showing the normal structure of the hepatic lobule with a central vein (CV). (H & E, X 400)
Fig. (1C): Photomicrograph of a section of the liver of Paraquat treated rats showing congested blood vessel (CO) and the lymphocytic infiltration (arrows). (H & E, X 400)
Fig. (1D): Photomicrograph of a section of the liver of Paraquat treated rats showing hemorrhage (H) and cytoplasmic vacuolation (arrows). (H & E, X 400)
Fig. (1E): Photomicrograph of a section of the liver of Paraquat treated rats demonstrating necrotic area (NA). (H & E, X 400)
Fig. (1F): Photomicrograph of a section of the liver of Paraquat administrated rats along with CoQ10 showing that liver is more or less similar to the control (H & E, X 400)
Immunohistochemical observations In control, Coenzyme Q10 and Paraquat treated groups, the immunoreactivity to alpha fetoprotein (AFP)
was negative in the cytoplasm of the liver cells ( Figs .2 A, B, C).
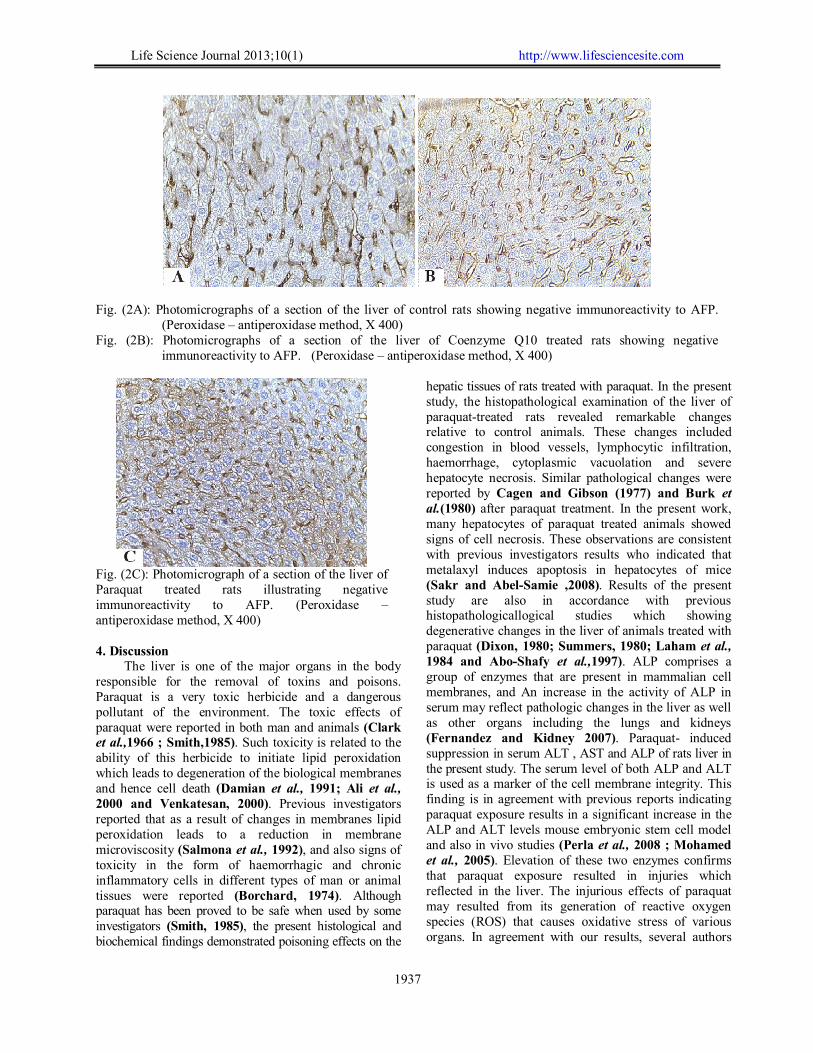
Life Science Journal 2013;10(1) http://www.lifesciencesite.com
1937
Fig. (2A): Photomicrographs of a section of the liver of control rats showing negative immunoreactivity to AFP.
(Peroxidase – antiperoxidase method, X 400) Fig. (2B): Photomicrographs of a section of the liver of Coenzyme Q10 treated rats showing negative
immunoreactivity to AFP. (Peroxidase – antiperoxidase method, X 400)
Fig. (2C): Photomicrograph of a section of the liver of Paraquat treated rats illustrating negative immunoreactivity to AFP. (Peroxidase – antiperoxidase method, X 400)
4. Discussion
The liver is one of the major organs in the body responsible for the removal of toxins and poisons. Paraquat is a very toxic herbicide and a dangerous pollutant of the environment. The toxic effects of paraquat were reported in both man and animals (Clark et al.,1966 ; Smith,1985). Such toxicity is related to the ability of this herbicide to initiate lipid peroxidation which leads to degeneration of the biological membranes and hence cell death (Damian et al., 1991; Ali et al., 2000 and Venkatesan, 2000). Previous investigators reported that as a result of changes in membranes lipid peroxidation leads to a reduction in membrane microviscosity (Salmona et al., 1992), and also signs of toxicity in the form of haemorrhagic and chronic inflammatory cells in different types of man or animal tissues were reported (Borchard, 1974). Although paraquat has been proved to be safe when used by some investigators (Smith, 1985), the present histological and biochemical findings demonstrated poisoning effects on the
hepatic tissues of rats treated with paraquat. In the present study, the histopathological examination of the liver of paraquat-treated rats revealed remarkable changes relative to control animals. These changes included congestion in blood vessels, lymphocytic infiltration, haemorrhage, cytoplasmic vacuolation and severe hepatocyte necrosis. Similar pathological changes were reported by Cagen and Gibson (1977) and Burk et al.(1980) after paraquat treatment. In the present work, many hepatocytes of paraquat treated animals showed signs of cell necrosis. These observations are consistent with previous investigators results who indicated that metalaxyl induces apoptosis in hepatocytes of mice (Sakr and Abel-Samie ,2008). Results of the present study are also in accordance with previous histopathologicallogical studies which showing degenerative changes in the liver of animals treated with paraquat (Dixon, 1980; Summers, 1980; Laham et al., 1984 and Abo-Shafy et al.,1997). ALP comprises a group of enzymes that are present in mammalian cell membranes, and An increase in the activity of ALP in serum may reflect pathologic changes in the liver as well as other organs including the lungs and kidneys (Fernandez and Kidney 2007). Paraquat- induced suppression in serum ALT , AST and ALP of rats liver in the present study. The serum level of both ALP and ALT is used as a marker of the cell membrane integrity. This finding is in agreement with previous reports indicating paraquat exposure results in a significant increase in the ALP and ALT levels mouse embryonic stem cell model and also in vivo studies (Perla et al., 2008 ; Mohamed et al., 2005). Elevation of these two enzymes confirms that paraquat exposure resulted in injuries which reflected in the liver. The injurious effects of paraquat may resulted from its generation of reactive oxygen species (ROS) that causes oxidative stress of various organs. In agreement with our results, several authors
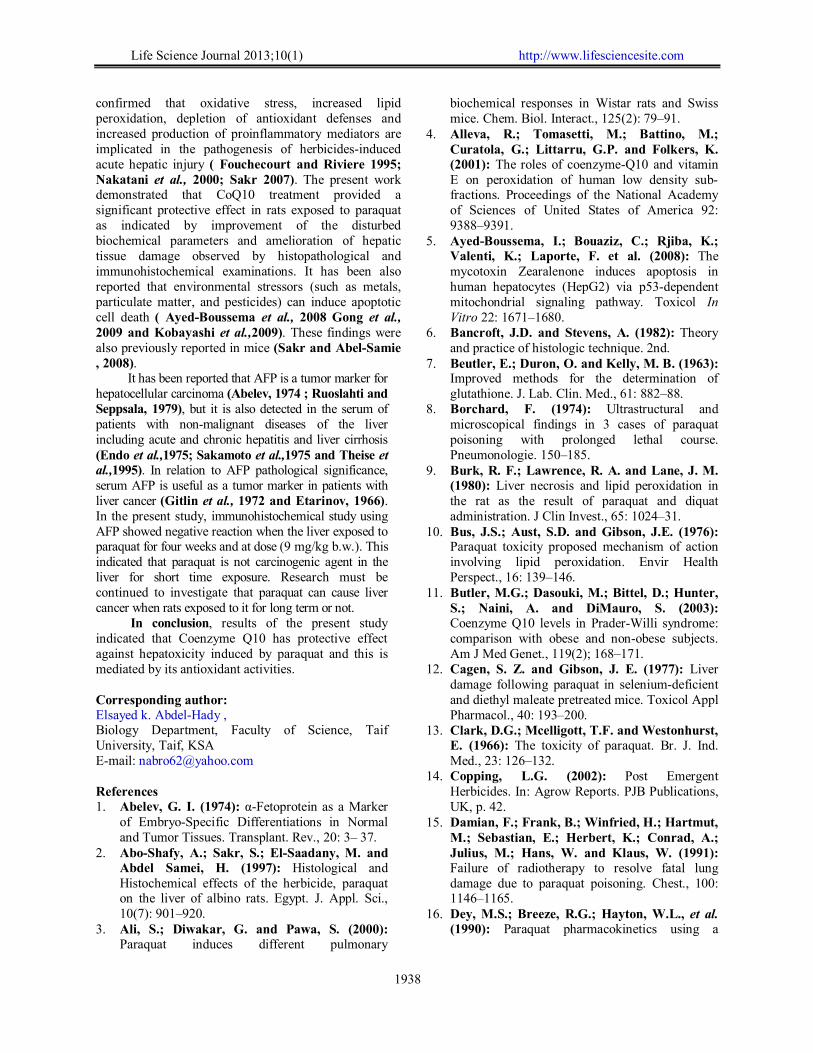
Life Science Journal 2013;10(1) http://www.lifesciencesite.com
1938
confirmed that oxidative stress, increased lipid peroxidation, depletion of antioxidant defenses and increased production of proinflammatory mediators are implicated in the pathogenesis of herbicides-induced acute hepatic injury ( Fouchecourt and Riviere 1995; Nakatani et al., 2000; Sakr 2007). The present work demonstrated that CoQ10 treatment provided a significant protective effect in rats exposed to paraquat as indicated by improvement of the disturbed biochemical parameters and amelioration of hepatic tissue damage observed by histopathological and immunohistochemical examinations. It has been also reported that environmental stressors (such as metals, particulate matter, and pesticides) can induce apoptotic cell death ( Ayed-Boussema et al., 2008 Gong et al., 2009 and Kobayashi et al.,2009). These findings were also previously reported in mice (Sakr and Abel-Samie , 2008).
It has been reported that AFP is a tumor marker for hepatocellular carcinoma (Abelev, 1974 ; Ruoslahti and Seppsala, 1979), but it is also detected in the serum of patients with non-malignant diseases of the liver including acute and chronic hepatitis and liver cirrhosis (Endo et al.,1975; Sakamoto et al.,1975 and Theise et al.,1995). In relation to AFP pathological significance, serum AFP is useful as a tumor marker in patients with liver cancer (Gitlin et al., 1972 and Etarinov, 1966). In the present study, immunohistochemical study using AFP showed negative reaction when the liver exposed to paraquat for four weeks and at dose (9 mg/kg b.w.). This indicated that paraquat is not carcinogenic agent in the liver for short time exposure. Research must be continued to investigate that paraquat can cause liver cancer when rats exposed to it for long term or not.
In conclusion, results of the present study indicated that Coenzyme Q10 has protective effect against hepatoxicity induced by paraquat and this is mediated by its antioxidant activities. Corresponding author: Elsayed k. Abdel-Hady , Biology Department, Faculty of Science, Taif University, Taif, KSA E-mail: [email protected] References 1. Abelev, G. I. (1974): α-Fetoprotein as a Marker
of Embryo-Specific Differentiations in Normal and Tumor Tissues. Transplant. Rev., 20: 3– 37.
2. Abo-Shafy, A.; Sakr, S.; El-Saadany, M. and Abdel Samei, H. (1997): Histological and Histochemical effects of the herbicide, paraquat on the liver of albino rats. Egypt. J. Appl. Sci., 10(7): 901–920.
3. Ali, S.; Diwakar, G. and Pawa, S. (2000): Paraquat induces different pulmonary
biochemical responses in Wistar rats and Swiss mice. Chem. Biol. Interact., 125(2): 79–91.
4. Alleva, R.; Tomasetti, M.; Battino, M.; Curatola, G.; Littarru, G.P. and Folkers, K. (2001): The roles of coenzyme-Q10 and vitamin E on peroxidation of human low density sub-fractions. Proceedings of the National Academy of Sciences of United States of America 92: 9388–9391.
5. Ayed-Boussema, I.; Bouaziz, C.; Rjiba, K.; Valenti, K.; Laporte, F. et al. (2008): The mycotoxin Zearalenone induces apoptosis in human hepatocytes (HepG2) via p53-dependent mitochondrial signaling pathway. Toxicol In Vitro 22: 1671–1680.
6. Bancroft, J.D. and Stevens, A. (1982): Theory and practice of histologic technique. 2nd.
7. Beutler, E.; Duron, O. and Kelly, M. B. (1963): Improved methods for the determination of glutathione. J. Lab. Clin. Med., 61: 882–88.
8. Borchard, F. (1974): Ultrastructural and microscopical findings in 3 cases of paraquat poisoning with prolonged lethal course. Pneumonologie. 150–185.
9. Burk, R. F.; Lawrence, R. A. and Lane, J. M. (1980): Liver necrosis and lipid peroxidation in the rat as the result of paraquat and diquat administration. J Clin Invest., 65: 1024–31.
10. Bus, J.S.; Aust, S.D. and Gibson, J.E. (1976): Paraquat toxicity proposed mechanism of action involving lipid peroxidation. Envir Health Perspect., 16: 139–146.
11. Butler, M.G.; Dasouki, M.; Bittel, D.; Hunter, S.; Naini, A. and DiMauro, S. (2003): Coenzyme Q10 levels in Prader-Willi syndrome: comparison with obese and non-obese subjects. Am J Med Genet., 119(2); 168–171.
12. Cagen, S. Z. and Gibson, J. E. (1977): Liver damage following paraquat in selenium-deficient and diethyl maleate pretreated mice. Toxicol Appl Pharmacol., 40: 193–200.
13. Clark, D.G.; Mcelligott, T.F. and Westonhurst, E. (1966): The toxicity of paraquat. Br. J. Ind. Med., 23: 126–132.
14. Copping, L.G. (2002): Post Emergent Herbicides. In: Agrow Reports. PJB Publications, UK, p. 42.
15. Damian, F.; Frank, B.; Winfried, H.; Hartmut, M.; Sebastian, E.; Herbert, K.; Conrad, A.; Julius, M.; Hans, W. and Klaus, W. (1991): Failure of radiotherapy to resolve fatal lung damage due to paraquat poisoning. Chest., 100: 1146–1165.
16. Dey, M.S.; Breeze, R.G.; Hayton, W.L., et al. (1990): Paraquat pharmacokinetics using a

Life Science Journal 2013;10(1) http://www.lifesciencesite.com
1939
subcutaneous toxic low dose in rat. Fundam. Appl. Toxicol., 14: 208–216.
17. Dick, F.D. (2006): Parkinson’s disease and pesticide exposures, Br. Med. Bull., 79: 219–231.
18. Dixon, R. (1980): In Casarett and Doull,s Toxicology "2nd ed. John, D. (ed.) Macmillan publishing Co. New York. P.332.
19. Endo, Y.; Kanai, K.; Mitamura, K.; Lino, S. and Suzuki, H. (1975): Clinical significance of Alpha- Fetoprotein in hepatitis and liver cirrhosis. Ann. NY. Acad. Sci., 259: 234–238.
20. Etarinov, Y.S. (1966): Content of embryo-a specific alpha-globlin in fetal and neonatal sera and sera from adult humans with primary carcinoma of the liver. Fed Proc Transl Suppl., 25: 344–346.
21. Fernandez, I.; Thomas, E.; Anhoni, J.M. and Rengam, S. (2002): Poisaned and Silernced: A Study on Women Spraying Pesticides on Plantations. Tenaganita and Pesticide Action Network (PAN) Asia and the Pacific Malaysia.
22. Fernandez, N. J. and Kidney, B. A. (2007): Alkaline phosphatase: beyond the liver. Vet. Clin. Pathol., 36: 223–233.
23. Fouchecourt, M. and Riviere, J. (1995): Activities of cytochrome P450-dependent monooxyganases and antioxidant enzymes in different organs of Norway rats (Rattus norvegicus) inhabiting reference and contaminated sites. Chemosphere., 31: 4375 - 4386.
24. Gad, A. (2005): Ethnic difference in validity of a-fetoprotein. Asia–Pac. J. Clin.Oncol., 1: 64–70.
25. Gitlin, D.; Perricelli, A. And Gitlin, G.M. (1972): Synthesis of alpha- fetoprotein by liver yolk sac and Gastrointestinal tract of human conceptus. Cancer Res., 32: 979–982.
26. Gong, Y.; Wu, J.; Huang, Y.; Shen, S. and Han, X. (2009): Nonylphenol induces apoptosis in rat testicular Sertoli cells via endoplasmic reticulum stress. Toxicol. Lett., 186: 84–95.
27. IPCS, (1984): Environmental Health Criteria. In: Document No. 39-Paraquat and Diquat. International Programme on Chemical Safety. World Health Organization, Geneva.
28. Keith, M.; Geranmayegan, A.; Sole, M.J.; Kurian, R.; Robinson, A.; Omran, A.S. and Jeejeebhoy, K.N. (1998): Increased oxidative stress in patients with congestive heart failure. J. Am. Coll. Cardiol., 31(6): 1352–1356.
29. Kobayashi, D.; Ahmed, S.; Ishida, M.; Kasai, S. and Kikuchi, H. (2009): Calcium/calmodulin signaling elicits release of cytochrome c during 2,3,7,8-tetrachlorodibenzop- dioxin-induced apoptosis in the human lymphoblastic T-cell line, L-MAT. Toxicology 258: 25–32.
30. Laham, S.; Long, G. and Broxop, B. (1984): Subacute oral toxicity of tri-n-butylphosphate in the Sprague Dawley rat. J. Appl. Toxicol., 4(3): 150–154.
31. Linnane, A.W.; Kopsidas, G.; Zhang, C.; Yarovaya, N.; Kovalenko, S.; Papakostopoulos, P.; Eastwood, H.; Graves, S. and Richardson, M. (2002): Cellular redox activity of coenzyme Q10: effect of CoQ10 supplementation on human skeletal muscle. Free Radic Res., 36(4): 445–453.
32. Madeley, J. (2002): Paraquat – Syngenta’s controversial herbicide. Berne Declaration, PAN UK. In: Swedish Society for Nature Conservation.PAN Asia and the Pacific, Foro Emaus.
33. McPherson, A. (1994): Selenium vitamin E and biological oxidation. In: Cole DJ, Garnsworthy PJ editors. Recent advances in animal nutrition. Oxford: Butterworth and Heinemann’s; p. 3–30.
34. Mohamed, A. F.; Ali Hasan, A. G.; Hamamy, M. I. and Abdel-Sattar, E. (2005): Antioxidant and hepatoprotective effects of Eucalyptus maculate, Med. Sci. Monit., 11: 426–431.
35. Mohammadi-Karakani, A.; Ghazi-Khansari, M. and Sotoudeh, M. (2006): Lisinopril ameliorates paraquat-induced lung fibrosis. Clin. Chim. Acta., 367: 170–174.
36. Monge, P.; Wesseling, C.; Guardado, J.; Lundberg, I.; Ahlbom,A.; Cantor, K.P.; Weiderpass, E. and Partanen, T. (2009): Parental occupational exposure to pesticides and the risk of childhood leukemia in Costa Rica, Scand. J. Work. Environ. Health., 33: 293–303.
37. Murray, R. K.; Granner, D. K.; Mayes, P. A. and Rodwell, V. W. (1988): Harper’s biochemistry (a Lange medical book), international ed. Appleton and Lang Lange Medical Publication; p. 574–576.
38. Murray, R.E. and Gibson, J.E. (1974): Paraquat disposition in rats, guinea pigs and monkeys. Toxicol. Appl. Pharmacol., 27: 283.
39. Nakatani, T.; Tawaramato, M.; Kennedy, D.; Kojima, A. and Yuasa, I., (2000): Apoptosis induced by chelation of interacellular zinc is associated with depletion of cellular reduced glutathione level in rat hepatocytes. Chem. Biol. Interact., 125: 51–163.
40. Nishikimi, M.; Roa, N.A. and Yogi, K. (1972): Measurement of superoxide dismutase. Biochem. Bioph. Res. Common., 46: 849–854.
41. Ohkawa, H.; Ohishi, N. and Yagi, K. (1979): Assay for lipid peroxides in animal tissues by thiobarbituric acid reaction. Anal. Biochem., 95: 351–358.
Life Science Journal 2013;10(1) http://www.lifesciencesite.com
1940
42. Perla, V.; Perrin, N.A. and Greenlee, A.R. (2008): Paraquat toxicity in a mouse embryonic stem cell model. Toxicol. In Vitro 22: 515–524.
43. Rosenfeldt, F.; Hilton, D.; Pepe, S. and Krum, H. (2003): Systematic review of effect of coenzyme Q10 in physical exercise, hypertension and heart failure. Biofactors., 18(1–4): 91–100.
44. Ruiz-Jimenez, J.; Priego-Capote, F.; Mata, J.M.; Quesada, J.M. and Luque de Castro, M.D. (2007): Determination of the ubiquinol-10 and ubiquinone-10 (coenzyme-Q10) in human serum by lipid chromatography tandem mass spectrometry to evaluate the oxidative stress. Journal of Chromatography A., 1175: 242–248.
45. Ruoslahti, E. and Seppsala, M. (1979): Alpha- Fetoprotein in cancer and fetal development. Adv. Cancer Res., 29: 346–375.
46. Sakamoto, S.; Yachi, A. and Anzai, T. (1975): AFP- producing cells in hepatitis and in liver cirrhosis. Ann. NY. Acad. Sci., 259: 253–258.
47. Sakr, S.A. (2007): Ameliorative effect of ginger (Zingiber officinale) on mancozeb fungicide induced liver injury in albino rats. Australian J. Basic Appl. Sci., 1(14): 650-656.
48. Sakr, S. A. and Abel-Samie, H. A. (2008): Apoptosis related protein bax In liver of metalaxyl fungicide –Treated mice: The effect of Antox. Ozean. J. Appl. Sci., 1: 17–27.
49. Salmona, M.; Donnini, M.; Perin, L.; Diomede, G.; Romano, M.; Marini, M.; Tacconi, M. I. and Luisetti, M. (1992): A novel pharmacological approach for paraquat poisoning in rat and A549 cell line using Ambroxol, a lung surfactant synthesis inducer.
50. Shults, C.W.; Oakes, D.; Kieburtz, K.; Beal, M.F.; Haas, R.; Plumb, S.; Juncos, J.L.; Nutt, J.; Shoulson, I.; Carter, J. et al. (2002): Effects of coenzyme Q10 in early Parkinson disease: evidence of slowing of the functional decline. Arch Neurol., 59(10): 1541–1550.
51. Sies, H. and Stahl, W. (1992): Antioxidant functions of vitamins: vitamin C and E b-carotene and other carotenoids. Ann NY Acad Sci., 669: 7–21.
52. Smith, L. L. (1985): Paraquat toxicity. Phil. Trans. Roy. Soc. London. 311: 647–652.
53. Sohet, F.M.; Neyrinck, A.M.; Pachikian, B.D.; de Backer, F.C.; Bindels, L.B.; Niklowitz, P.; Menke, T.; Cani, P.D. and Delzenne, N.M. (2009): Coenzyme Q10 supplementation lowers hepatic oxidative stress and inflammation
associated with diet-induced obesity in mice. Biochem. Pharmacol., 78: 1391–1400.
54. Spindler, M.; Beal, M.F. and Henchcliffe, C. (2009): Coenzyme Q10 effects in neurodegenerative disease. Neuropsychiatr. Dis. Treat., 5: 597–610.
55. Soresi M.; Magliarisi C.; Campagna P.; Leto G.; Bonfissuto G. and Riili A: (2003): Usefulness of alpha-fetoprotein in the diagnosis of hepatocellular carcinoma. Anticancer Res. 2003;23:1747-53
56. Summers, L. (1980): " The Bipyridinium Herbicides" (A.P. Autor, ed.) P.2 Academic press, New York.
57. Theise, N.D.; Fiel, I. M.; Hytiroglou, P.; Ferrell, L.; Schwartz, M.; Miller, C. and Thung, S. N. (1995): Macroregenerative nodules in cirrhosis are not associated with elevated serum or stainable tissue alpha- fetoprotein . Liver 15: 30–34 .
58. Tortorelli, M.C.; Hernandez, D.A.; Vazquez, G.R. and Salibian, A. (1990): Effects of paraquat on mortality and cardiorespiratory function of catfish fry Plecostomus commersoni. Arch Environ. Contam. Toxicol., 19: 523–529.
59. Upaganlawar, A.; Farswan, M.; Rathod, S. and Balaraman, R. (2006): Modification of biochemical parameters of gentamicin nephrotoxicity by coenzyme Q10 and green tea in rats. Indian J. Exp. Biol., 44: 416–418.
60. US EPA, (1997): Paraquat dichloride. Registration eligibility decision (RED). US Environmental Protection Agency, Washington, D.C., EPA 738-F-96-018. US National Library of Medicine, 1995. Hazardous Substances Databank. Bethesda, MD, pp. 10–19.
61. Venkatesan, N. (2000): Pulmonary protective effects of curcumin against paraquat toxicity. Life Sci., 66(2): 21–28.
62. Watts, M.A. (1994): Poisons in Paradise: Pesticides in the Pacific. Greenpeace New Zealand and Pesticide Action Network Asia and the Pacific, Auckland.
63. Zhou, S.; Zhang, Y.; Davie, A.; Marshall-Gradisnik, S.; Hu, H.; Wang, J. and Brushett, D. (2005): Muscle and plasma coenzyme Q10 concentration, aerobic power and exercise economy of healthy men in response to four weeks of supplementation. J Sports Med Phys Fitness. 45(3): 337.
2/2/2013
Life Science Journal 2013;10(1) http://www.lifesciencesite.com
1941
Conservative Management of Instrumental Esophageal Perforation in Children; A Review of One surgeon's Experience
Osama M Rayes, FRCSI
Department of Surgery, Faculty of Medicine, King Abdulaziz University, Jeddah, Saudi Arabia
Abstract: Instrumentation of the esophagus to dilate stricture can very occasionally result in many complications, esophageal perforation may be is the most serious one. The main corner stone in the management of which is urgent exploration to define the extent of the lesion and drain the area. To avoid this aggressive, approach to our patients, we choosed to apply conservative management. We reviewed retrospectively records of all the five patients of instrumental esophageal perforations done or referred to pediatric surgery unit in King Abdulaziz University Hospital, Jeddah, Saudi Arabia who were treated by the author conservatively in the period from 1997 to 2011 in our institution. The aim of this study was to review our experience in the conservative management of esophageal perforation in pediatric population, thus to add to the growing evidence with this modality of treatment.The results of successful non operative management of all the cases supports our conclusion that conservative management guided by the clinical response is a safe and effective modality of treatment for esophageal perforation in pediatric population. [Osama M Rayes, FRCSI. Conservative Management of Instrumental Esophageal Perforation in Children; A Review of One surgeon's Experience. Life Sci J 2013;10(1):1941-1944] (ISSN:1097-8135). http://www.lifesciencesite.com. 278
Keywords: esophageal, perforation, conservative management, instrumental, pediatric. 1. Introduction
Esophageal perforation is a rare, but potentially life threatening injury that can quickly lead to the development of mediastinitis, sepsis and multi-organ failure in the absence of prompt recognition and treatment[1]. Controversy persists concerning appropriate treatment of this condition[2]. Reports began to surface showing success of conservative management in children, and the contemporary management of esophageal perforation has seemingly shifted to a conservative (non-operative) approach for the majority of cases[3-5].The overall goal of conservative management is to promote healing with control of infection and nutritional support. However, the consensus of what constitutes conservative management is still unclear, with various therapies and protocols have been described.
The aim of this study was to review our experience in the conservative management of esophageal perforation in pediatric population, thus to add to the growing evidence with this modality of treatment. 2. Material and Methods:
We reviewed retrospectively records of cases of instrumental esophageal perforations who were treated non-surgically in the period from 1997 to 2011, by the author in King Abdulaziz University Hospital, Jeddah, Saudi Arabia. Intercostal drain and gastrostomy tube insertions weren't considered as
exclusion criteria. Data collected included patient demographics, etiology, diagnosis, treatment, complications and outcome. 3. Results:
Five patients were identified who met inclusion criteria (kindly describe inclusion criteria). The average age at diagnosis of esophageal perforation was 4.6 years (range 1-12 years). In all cases the cause of perforation was instrumental esophageal dilatation; three of them were post balloon dilatation with direct endoscopic visualization while the remaining two were post balloon dilation with fluoroscopic control. The three endoscopic cases were referred from the pediatric gastroenterology unit while the fluoroscopy cases were done by the senior author. The three referred cases were diagnosed by plain chest radiograph showing pneumothorax, pneumomediastinum and subcutaneous emphysema. Our two cases, however, were diagnosed by visualizing the guide wire in the left pleural Cavity during the procedure in one case and by CT chest with oral contrast in the other case.
Our protocol of non operative treatment plan in cases of esophageal perforation consists of three main pillars; pillar of flow where we aim at decreasing the proximal flow and maintaining the distal flow using NPO status and Replogle` tube proximally on continuous suctioning to achieve the first aim and through a stent tube to achieve the second aim. The

Life Science Journal 2013;10(1) http://www.lifesciencesite.com
1942
second pillar is the pillar of minimizing contamination through IV antibiotics and chest drainage when necessary. Finally, the pillar of nutrition which should be provided through TPN. Throughout the journey of treatment patients should be observed vigilantly for any signs of sepsis and/or unresponsiveness to treatment.
Four patients needed PICU admission with an average length of stay of 8.8 days (range 2-19 d).Chest tube insertion was needed in three cases out of five. Gastrostomy tube insertion wasn't done except in one patient. Esophagogram was done –on average- on the 10th day post perforation (range 7th-17th d).There was no mortality. All perforations healed, with an average length of hospital stay of 31.2 days (range 10-64d).
CASE I (referred from pediatric gastroenterology)
A boy with a history of ingestion of an alkaline corrosive at age of two years old. He developed a mid esophageal stricture of around 4 cm length. He underwent 3 dilatations before his esophagus perforated during balloon dilatation with direct endoscopic visualization at age of 3 years. He presented with respiratory distress and left sided pneumothorax. He was admitted to PICU for 2 days, Intercostal tube was inserted and left for 8 days. Patient was kept NPO on TPN for 12 days and IV antibiotic coverage. NGT was inserted under fluoroscopy guidance. Contrast esophagogram was done in the 7th post perforation day and showed no leakage so patient started feeding on the 9th day and was discharged in good condition.
Following the perforation he underwent eight further dilatations for the preexisting stricture he has.
CASE II(referred from pediatric gastroenterology)
A boy with a history of ingestion of an alkaline corrosive at age of 1 year which caused two esophageal strictures; at mid and lower esophagus.The patient had esophageal perforation during balloon esophageal dilatation under direct endoscopic visualization. He presented with respiratory distress, subcutaneous emphysema in the neck and the chest and right sided pneumothorax. He was admitted to PICU for 19 days, intercostal tube was inserted and left for 7 days. Patient was kept NPO on TPN for 31 days and on IV antibiotic coverage. NGT was inserted under endoscopy guidance during the dilatation procedure. Replogle tube was kept in the upper esophagus for 30 days. Contrast esophagogram was done on the 16th post perforation day and showed no leakage and/or definite stricture in the esophagus. Feeding was started through the NGT on the 17th day. CASE III(referred from gastroenterology)
A girl with a history of ingestion of an alkaline corrosive at age of 4 years. She developed long stricture involving mid to lower esophagus. She had esophageal dilatation on the first dilatation under direct endoscopy visualization. She presented with subcutaneous emphysema. She was admitted to PICU for 19 days. Chest drainage was done through right sided intercostal tube. Patient was kept NPO on TPN for 12 days. Gastrostomy tube was inserted and feeding was started through it on the 7th day post perforation. NGT, Replogle tube were inserted. CASE IV (a case perforated during a balloon dilation done in our unit)
A twelve years old girl who is a known case of esophageal atresia repaired outside our hospital after birth. Two months post repair she developed dysphagia and repeated attacks of chocking and cyanosis. Gastrostomy was fashioned and was used for feeding for three years. Trials of esophageal dilations failed during this period. The girl was referred to us at this stage; retrograde balloon esophageal dilation was done through the gastrostomy tube and over a period of two years the patient underwent 25 esophageal dilations however, symptoms recurred persistently. We proceeded with resection and anastomosis of the area of esophageal stricture. Postoperatively, the patient underwent 5 esophageal dilatations on yearly basis. She had perforation during the last balloon dilation. She presented with respiratory distress, tachycardia, tachypnea and desaturation. She was admitted to PICU for 7 days to start the conservative management after we confirmed the diagnosis with a CT chest with contrast which showed a contained contrast leak through a perforation in the lower esophagus with no pleural effusion. Patient was kept NPO on TPN for 10 days. Dye swallow was done after 10 days and showed no further leakage so oral feeding was resumed and patient was discharged on the 15th post operative day.
CASE V( a case perforated during a balloon dilation done in our unit)
A 3 years old girl; known case of esophageal atresia with radial anomalies. Esophageal atresia repair was done outside our hospital and was referred to our hospital with severe esophageal stricture and was depending entirely on the gastrostomy tube. Gastroenterology team failed to dilate her through balloon under direct endoscopic visualization. The patient was referred to us and retrograde esophageal dilatation was done successfully but during the procedure the guidewire was seen passing into the left pleural cavity during one of the trials. Patient was admitted in PICU for 5 days postoperatively for

Life Science Journal 2013;10(1) http://www.lifesciencesite.com
1943
observation. During that period the patient was diagnosed with hypothyroidism which manifested itself with bradycardia spells. Other than those spells which were at first attributed to the perforation, there was no other symptom and/or sign. No dye esophagogram was done to confirm the diagnosis. Patient was kept NPO for seven days with an NGT in place, then an esophagogram was done on seventh day post-perforation to delineate the esophagus and to rule out leakage. Patient started orally after the esophagogram and was discharged with the
gastrostomy to follow a program of esophageal dilatations (on the tenth day post perforation). Later, she was dilated three times and gastrostomy was closed. After around ten months from the last dilatation the patient came almost obstructed and dilatation failed, thus gastrostomy was refashioned. Another trial of dilatation failed and finally the patient underwent thoracotomy with resection of the strictured area with reanastomosis. Patient is still on postoperative follow-up.
Table (1): Summary of studied cases of esophageal perforation Patient Case I Case II Case III Case IV Case V Age at perforation
4 years old 1 year 4 years 12years old 3 years
Cause of perforation
Balloon Esophageal Dilatation under direct endoscopic visualization Balloon Esophageal Dilatation under fluoroscopic guidance (antegrade) (retrograde)
Symptoms Respiratory distress Almost Nil CXR findings Lt pneumothorax,
pneumo-mediastinum & S.C. emphysema
Rt pneumothorax, pneumo-mediastinum & S.C. emphysema
Rt pneumothorax, pneumo-mediastinum & S.C. emphysema
___
___
Retrograde dilation
Not done Not done Done Not done Done
ICT insertion Done Done Done Not done Not done Gastrostomy Not done Not done Done Done Done Contrast esophagogram
On 7th day post perforation
On 17th day post perforation
Not done On 10th day On 7th day
Feeding On 9th day On 17th day On 7th day (thru gastrostomy)
On 10th day On 7th day
PICU stay Hospital stay 16 days 64 days 51 days 15 days 10 days
4. Discussion
Oesophageal perforation is an abnormal communication of the esophagus into the pleural cavity or mediastinum. It is produced by introduction of an object into the esophageal lumen. These lesions are traumatic and, in many cases, result from diagnostic or therapeutic manipulation. Iatrogenic trauma by nasogastric tube has been reported in very premature infants[6].
Dilatation of an existing stricture is the most commonly reported cause of iatrogenic perforation in children[7]. Garey et al., in his review stated that being aware of this risk, they currently obtain an on-table esophagogram after dilatation in patients who have an existing stricture[1]. The early diagnosis of esophageal perforation is indicated by clinical findings and confirmed by radiological procedures[8]. Pain, fever, dyspnea, and tachycardia are early symptoms of esophageal perforation after dilation for an esophageal stricture. Radiological findings include pneumomediastinum, pleural effusion, subcutaneous emphysema, and pneumothorax. Proximal thoracic
perforations lead to signs in the left thoracic cavity, whereas distal perforation usually show findings on the right side. Complications include mediastinitis, septicemia, empyema, and death[9].
The current management of esophageal perforation in children has shifted towards conservative management, with operative intervention reserved for those who clinically worsen with conservative management. Hemodynamically stable patients with a contained perforation may be managed medically. Exploration of the chest for attempted direct repair of the injury is now only rarely indicated. Mortality rates have been reported between 20 and 28% with delays in diagnosis and treatment appearing to be most strongly correlated with poor outcome[10].
Conservative management is based on the tenant that spontaneous healing will occur if proximal flow is minimized, contamination is controlled, downstream patency is maintained, and the patient's overall clinical and nutritional status is optimized[1]. Engrum et al., in 1996, studied retrospectively 24 cases of esophageal perforation and reported that one
Life Science Journal 2013;10(1) http://www.lifesciencesite.com
1944
third of the series were successfully treated non-operatively[11]. Martinez et al., however, in 2003 employed what he described as aggressive conservative management in 19 patients of esophageal perforation. In this series the authors advocated aggressive drainage of the perforation near the site of leakage. One patient of those 19 cases required subsequent surgical intervention though[5]. In china, in 2006, a series reported eight patients with esophageal perforation who were treated conservatively with thoracoscopic insertion of an intercostal tube[12].
In all those series we have noticed the importance of drainage as part of the conservative approach to esophageal perforation. Although our report has the drawbacks of a small, heterogeneous sample of patients, it supports the notion that conservative management guided by the clinical response is a safe and effective modality of treatment for esophageal perforation in pediatric population. References:
1. Garey C, Laituri C, Kaye A, Ostlie D, et al., Esophageal perforation in children: A review of one institute's experience. Journal of Surgical Research 2010: 164: 13-17.
2. Skinner B, Little A, DeMeester T. Management of esophageal perforation. The American Journal of Surgery 1980: 139(6):760–76.
3. Mollit D, Schullinger J, Santulli T. Selective management of iatrogenic esophageal perforation in the newborn. J Pediatr Surg 1981:16:989.
4. Van der Zee D, Festen C, Severijnen R, et al., Management of Pediatric esophageal
perforation. J Thorac Cardiovasc Surg 1998:95:692.
5. Martinez L, Rivas S, Henandez F, et al., Aggressive conservative treatment of esophageal perforations in children. J Pediatr Surg 2003:38:685.
6. Gasparella M, Schiavon G, Bordignon L, Buffo M, Benetton C, Zanatta C, Ferro M, Zoppellaro F, PerrinoG,Iatrogenic traumas by nasogastric tube in very premature infants: our cases and literature review. Pediatr Med Chir. 2011 Mar-Apr;33(2):85-8.
7. Panieri E, Millar A, Rode H, et al., Iatrogenic esophageal perforation in children; patterns of injury, presentation, management, and outcome. J Pediatr Surg 1996:31:890.
8. Weber T. Esophageal rupture and perforation. In: Grosfeld J, O'Neill J, Jr, editors. Pediatric surgery.6thedn. Mosby. 2006: P 1047-1050.
9. Chandler N, Colombani P. The esophagus. In: Holocomb G, Murphy J, editors. Ashcraft's Pediatric surgery.5thedn. Saunders. 2010: P 330- 344.
10. Gander JW, Berdon WE, Cowles RA.Iatrogenic esophageal perforation in children.PediatrSurg Int. 2009 May;25(5):395-401. Epub2009 Apr 21.
11. 11-Engum S, Grosfeld J, West K, et al., Improved survival in children with esophageal perforation. Arch Surg 1996:131:604.
12. Peng L, Quan X, Zongzheng J, et al., Video-thoracoscopic drainage for esophageal perforation with mediastinitis in children. J Pediatr Surg 2006:41:514.
1/20/2013
Life Science Journal 2013;10(1) http://www.lifesciencesite.com
1945
Assessment of Methylation of RASSF1A Gene in Circulating Tumor DNA of Breast Cancer Patients by Methylation-Specific Polymerase Chain Reaction
Nasser Sadek Rezk1, Abeer Al Sayed Shehab1, Abeer Ibrahim Abd El-Mageed1, Mohamed El-Shinawi2 and
Mohamed Omar El Maraghy1
Departments of Clinical Pathology1 and General Surgery2, Faculty of Medicine, Ain Shams University [email protected]
Abstract: Background: The aim of the present study was to evaluate the methylation status of RASSF1A tumor suppressor gene in circulating tumor DNA in sera of a group of Egyptian breast cancer patients by methylation-specific PCR. Methods: 50 subjects were included: 36 breast cancer patients and 14 healthy controls. Following breast examination, imaging studies and tissue biopsies (for patients group), CA 15-3 was assessed by electrochemiluminescence and RASSF1A gene methylation status was evaluated by methylation-specific PCR. Results: RASSF1A gene was methylated in 17/36 (47.2%) of patients and in none of the 14 control samples. Heterozygous pattern of RASSF1A gene methylation was detected in 2 patient samples. There was a significant association between tumor stage subgroups and each of CA 15-3 serum levels and RASSF1A gene methylation. Conclusion: RASSF1A gene methylation is a potential epigenetic marker for breast cancer. Further improvement of its screening efficiency might be reached by the use of more than one gene in combination. This gene is a likely candidate for tumor demethylation therapy. [Nasser Sadek Rezk, Abeer Al Sayed Shehab, Abeer Ibrahim Abd El-Mageed, Mohamed El-Shinawi and Mohamed Omar El Maraghy. Assessment of Methylation of Rassf1a Gene in Circulating Tumor Dna of Breast Cancer Patients by Methylation-Specific Polymerase Chain Reaction. Life Sci J 2013;10(1):1945-1951] (ISSN:1097-8135). http://www.lifesciencesite.com. 279 Key words: RASSF1A, gene methylation, epigenetics, CA 15-3, breast cancer, methylation PCR 1. Introduction
In Egypt, breast cancer is the most frequent malignancy among women, constituting in certain governorate up to 38.6% and is more prominent among young premenopausal Egyptian women characterized by poor prognosis and low survival rate (1). Worldwide, it is the most frequent malignancy among women (2), with more than 1.15 million new cases diagnosed each year (3), and is the second leading cause of cancer-related deaths (4).
Epigenetic changes, as DNA methylation and acetylation, are one of the most common molecular alterations in human neoplasia including breast cancer. DNA methylation occurs in cytosine ring of those cytosines preceding a guanosine (referred to as CpG dinucleotides) to form 5-methyl cytosine. CpG dinucleotides are found at increased frequency in the promoter region of many genes and are referred to as CpG islands (CpGIs). Methylation in the promoter region is frequently associated with “gene silencing” (5). Many reports demonstrated epigenetic inactivation of tumor suppressor genes playing important roles in cancer development, including Ras-association domain family of genes. Epigenetic inactivation of RASSF1A (Ras-association domain family 1, isoform A) through methylation of its CpGI silences expression of the gene in many cancers including breast cancer (6).
The aim of the present study was to test for the presence of methylation of RASSF1A tumor suppressor gene in sera of a group of Egyptian breast cancer patients by methylation-specific PCR (MSP). 2. Material and Methods: I-Study Design:
This study was approved by the Institutional Review Board of Ain Shams University Ethic committee. It is a cross-sectional study conducted on 36 female patients with breast cancer, with median age and interquartile range (IQR) of 51.5 (44.0-56.0) years, recruited from General Surgery and Oncology Departments at Ain Shams University Hospital, in addition to 14 age matched healthy women serving as a normal control group, with median age and IQR of 46.5 (37.7-52.5) years.
According to the primary tumor (T) of the Tumor-Node-Metastasis (TNM) staging system, patients were subdivided into: Tis, T1 and T2 subgroup (n = 22) and T3, T4 subgroup (n = 14). Moreover, according to the histopathological types, patients were subdivided into ductal carcinoma subgroup (n = 27) and lobular carcinoma subgroup (n = 9). Lastly, according to the RASSF1A gene methylation status, patients were subdivided into: methylated RASSF1A gene subgroup (n= 17) and unmethylated RASSF1A gene subgroup (n= 19).
Life Science Journal 2013;10(1) http://www.lifesciencesite.com
1946
All individuals included in this study were subjected to full history taking with emphasis on family history of breast cancer and reproductive history, local breast examination, imaging studies (ultrasound for both groups followed by mammography and CT in patients group only), breast biopsy (for patients only), serum CA 15-3 assay by electrochemiluminescence and evaluation of RASSF1A gene methylation status by methylation-specific PCR. II. Samples: Five milliliters of venous blood were withdrawn under complete aseptic conditions, 24 hours before surgical intervention from patients, and from healthy controls. Samples were left to clot for 30 minutes in sterile dry vacutainers. Serum was separated by centrifugation and divided into 2 aliquots to be stored at -20 ºC until the assay of CA 15-3 and RASSF1A gene methylation. III. Laboratory Analysis: A- Assay of CA 15-3 by electrochemiluminescence: This was done on Cobas e 411 immunoassay autoanalyser (Roche Diagnostics, Indianapolis, USA) using the manufacturer's reagents. The antigen (sample) and the two provided antibodies, one biotinylated and the other monoclonal CA15-3-specific labeled with ruthenium complex, are allowed to react to form a sandwich complex. After addition of streptavidin-coated microparticles (solid phase), the complex becomes bound to the solid phase via interaction of biotin and streptavidin. The reaction mixture is aspirated into the measuring cell where the microparticles are magnetically captured onto the surface of the electrode. Unbound substances are then removed by wash using system buffer. Application of a voltage to the electrode induces chemiluminescent emission which is measured by a photomultiplier. Results are determined via a calibration curve generated by a 2-point calibration. B- RASSF1A Gene Methylation Assay: Serum was used for detection tumor DNA instead of whole blood in which a huge amount of white blood cells DNA could be extracted alongside with tumor DNA. All reagents were supplied by Q1AGEN (Q1AGEN Incorporation, Stanford Valencia, USA). 1) DNA Extraction: This was performed using QIAamp DNA Blood Midi kit 2) Bisulfite Modification: using EpiTect Bisulfite kit, where incubation of the target DNA with sodium bisulfite results in conversion of unmethylated cytosine residues to uracil, leaving the methylated cytosines unchanged. Therefore, bisulfite treatment gives rise to different DNA sequences for methylated and unmethylated DNA. Bisulfite modification comprised the following steps: i) bisulfite-mediated
conversion of unmethylated cytosines, by thermal cycling through 3 alternating denaturation and incubation cycles (denaturation always being at 99ºC for 5 minutes, while the 3 incubations being at 60 ºC for 25 minutes, 85 minutes and 175 minutes); ii) binding of the converted single-stranded DNA to the membrane of an EpiTect spin column; iii) washing; iv) desulfonation of membrane-bound DNA; v) washing of the membrane-bound DNA to remove desulfonation agent; and vi) elution of the pure, converted DNA from the spin column. 3) Amplification by PCR: Amplification of modified DNA was done using EpiTect MSP and primers. Two sets of primers were used: the first set for methylated RASSF1A gene (forward: 5′-GTTGGTATTCGTTGGGCGC-3′ and reverse: 5′-GCACCACGTATACGTAACG-3′) and the second for the unmethylated gene (forward: 5′-GGTTGTATTTGGTTGGAGTG-3′ and reverse: 5′-CTACAAACCT TTACACACAACA-3′). Amplification was repeated in 30 cycles according to the following protocol: 15 seconds at 94 ºC (denaturation), 30 seconds at 56 ºC (annealing), 30 seconds at 72 ºC (extension) and, lastly, 10 minutes at 72 ºC (final extension). In each run, a negative control tube containing water instead of DNA was included to exclude contamination. The amplified products were stored at -20˚C until time of detection step. 4) DNA Detection by Gel Electrophoresis: Amplified products were run on 2% agarose gel stained with ethidium bromide. A DNA molecular weight marker was also run in each gel to identify different separated bands. The amplified products were loaded on 2 wells for each studied subject, one for methylated and the other for unmethylated. Methylated samples gave bands at 160 bp and unmethylated ones at 180 bp. Heterozygous samples gave 2 bands (160 and 180 bp) at both methylated and unmethylated lanes as shown in figure (1). IV- Statistical Analysis:
Statistical analysis was done through IBM SPSS statistics (Version 20.0, 2011, IBM Corporation, USA). Data were expressed descriptively as median and IQR for quantitative non-parametric values and as percent for qualitative data. Comparison between 2 independent non-parametric groups was done using the Mann Whitney U test while Chi square test was used for comparison of categorical data. p < 0.05 was considered significant and p < 0.01 was considered highly significant. 3. Results:
On comparing the demographic and laboratory data of patients and controls (Table 1), a significantly higher percentage of breast cancer cases

Life Science Journal 2013;10(1) http://www.lifesciencesite.com
1947
of 47.2% (17/36) had methylated RASSF1A gene than controls (0%) (p < 0.01). This also applies for CA15.3 which was significantly higher in patients (25.5 IU/mL) than controls (19 IU/mL) (p < 0.05). However, no significant difference was found between patients and control groups as regard age, menopausal age and menopausal status.
Statistical comparison between RASSF1A gene methylated and unmethylated patients' groups (Table 2) revealed no significant difference as regards age, family history of breast cancer, menopausal age, menopausal status and CA15.3 serum levels.
Table (3) shows different stage subgroups where the median serum CA15.3 levels ( 22.0
IU/mL) of Tis, T1 and T2 subgroup was significantly lower than that of T3, T4 subgroup ( 45.5 IU/mL ) (p < 0.05). Also, RASSF1A gene was methylated in a significantly lower percentage of 31.8 % (7/22) in Tis, T1 and T2 subgroup than in T3, T4 subgroup which was 71.4 % (10/14) (p < 0.05).
The same comparison was performed among different breast cancer histological type subgroups (Table 4), where median CA15.3 serum levels were 27.0 IU/mL in lobular type and 23.0 IU/mL in ductal type with no significant difference. Also, no significant difference was found between lobular and ductal type subgroups as regards RASSF1A gene methylation [6/9 (66.6%) versus 11/27 (40.7%), respectively).
Table (1): Statistical Comparison of the Demographic and Laboratory Data Among Breast Cancer Patients and Healthy Controls Using Mann Whitney U Test and Chi square Test*
Significance (P) Z/ X2* Controls (n=14) Patients (n=36) Parameter
> 0.05
-1.33
46.5 37.7 - 52.5
51.5
44.0-56.0
Age (years): Median IQR
> 0.05
-0.326
47.0
43.7- 53.5
49.0
46.0-52.0
Menopausal age (years): Median IQR
> 0.05
1.053*
8 (57.1 %) 6 (42.8 %)
26 (72.2 %) 10 (27.8 %)
Menopausal status: Menopaused Non-menopaused
< 0.05
-2.337
19
13.7- 25.2
25.5
20.0 - 39.0
CA15.3 (IU/mL): Median IQR
< 0.01
10.017*
0 (0 %)
14 (100 %)
17 (47.2 %) 19 (52.8 %)
RASSF1A methylation status Methylated Unmethylated IQR: Interquartile range. Table (2): Statistical Comparison of the Demographic and Laboratory Data among RASSF1A Gene Methylated versus Unmethylated Patients’ Subgroups
Significance (P)
Z\ X2* RASSF1A gene unmethylated patients (n=19)
RASSF1A gene methylated patients (n=17)
Parameter
> 0.05
-0.286
52.0
44.0-57.0
51.0
44.0 – 55.0
Age (years): Median IQR
> 0.05
0.007*
1 (5.3%)
18 (94.7 %)
1 (5.9%)
16 (94.1 %)
Family history of breast cancer: Positive Negative
> 0.05
-0.801
51.0
45.5-52.5
48.0
46.0 -49.7
Menopausal age (years): Median IQR
> 0.05
0.043*
14 (73.7 %) 5 (26.3 %)
12 (70.5 %) 5 (29.5 %)
Menopausal status: Menopaused Non-menopaused
> 0.05
-0.46
25.0
20-36.0
27.0
18.0 -77.0
CA15.3 (IU/mL): Median IQR
IQR: Interquartile range.

Life Science Journal 2013;10(1) http://www.lifesciencesite.com
1948
Table (3): Statistical Comparison of CA15.3 Serum Levels and RASSF1A Gene Methylation Status Among Different Stage Subgroups of Breast Cancer Patients using Mann Whitney U Test and Chi Square test* Parameter T3, T4 subgroup (n=14) Tis, T1 and T2 subgroup (n=22) Z \X2* P CA15.3(IU/mL) Median IQR
45.5
22.2-279.0
22.0
17.5-27.0 2.876 < 0.05
RASSF1A methylation 10 (71.4 %) 7 (31.8%) 5.386* < 0.05 IQR: Interquartile range. Table (4): Statistical Comparison of CA15.3 Serum Levels and RASSF1A Gene Methylation Status among Different Histological Type Subgroups of Breast Cancer Patients using Mann Whitney U Test and Chi Square test*
Parameter Lobular type (n=9) Ductal type (n=27) Z /X2* P CA15.3(IU/mL) Median IQR
27.0
18.5-160.5
23.0
20.0-36.0
0.494
> 0.05
RASSF1A methylation 6 (66.6 %) 11 (40.7 %) 7.34* > 0.05 IQR: Interquartile range.
Figure (1): RASSF1A gene methylation pattern. Lanes viewed from left to right include a 50-bp ladder as a molecular weight marker, a water negative control, a methylated DNA band in patient 1, an unmethylated DNA band in patient 2, a heterozygous pattern (both methylated and unmethylated bands) in patient 3 and an unmethylated DNA band in a control sample. 4. Discussion:
Data of the present study revealed highly significant increase of RASSF1A methylation in patients serum versus controls, with methylation detected in 47.2% (17/36) and in none of the controls (100% specificity). These data are in accordance with the finding of Hoque and his colleagues (5) where RASSF1A methylation was detected in plasma of
43% (16/37) breast cancer patients and 13% (5/38) of controls. The methylation found in some of the controls might reflect chronic exposure of healthy subjects to still unidentified environmental carcinogenic factors, or could be a sign of an early starting neoplastic event, or both. Dulaimi et al. (7) revealed RASSF1A methylation in 56% (19/34) of breast cancer patients and none of controls. In

Life Science Journal 2013;10(1) http://www.lifesciencesite.com
1949
another study by Shukla et al. (8), RASSF1A was found to be methylated in 75% (15/20) of sera from breast cancer patients.
The low diagnostic sensitivity of assaying a single gene methylation is most probably related to the presence of normal DNA in serum which masks minute amounts of circulating tumor-related DNA. Therefore, detection of multiple genes increases the probability of detecting circulating tumor-related DNA (9). In a study conducted by Dulaimi et al. (7) examining the promoter methylation status of three normally unmethylated genes; RASSF1A, adenomatous polyposis coli (APC), and death-associated protein kinase (DAP-kinase) in serum; hypermethylation of one or more genes was found in 76% (26/34) versus 56% (19/34) for RASSF1A only. The same was concluded in a study by Hoque and his colleagues (5) who determined aberrant methylation of four genes (APC, GSTP1, RASSF1A, and RARβ2) in plasma. Methylation of one of the four genes of interest was detected in 62% (29/47) versus 43% (16/37) for RASSF1A only. Furthermore, Jing et al. (10) investigated methylation profile of ten genes in serum of 50 breast cancer subjects and 50 healthy controls and found that methylation of at least one gene was found in 92% (46/50) versus 74% (37/50) for RASSF1A only.
Data of the present study showed no significant difference of age between RASSF1A gene methylated and unmethylated patients, in accordance to the studies of Burbee et al. (11), Shukla et al. (8) and Feng et al. (12). In contrast, Euhus and his colleagues (13) reported that methylation increases in benign breast epithelium with increasing age and linearly between 32 and 55 years, and Hoque et al. (5) who found that RASSF1A gene methylated was associated with increasing age.
No statistically significant difference was found in the present study between RASSF1A gene methylated and unmethylated patients as regards presence of family history of breast cancer. This suggests the possibility of environmental factors having the upper hand for the methylation process, which was supported by many studies linking environmental risks to DNA methylation, as low folate (14), high alcohol intake (14, 15), smoking (15), menopausal status (5), early age of menarche and late age of menopause (16). Some of these risk factors, namely menopausal status and menopausal age, were non-significantly different in the present study between those patients with methylated gene and those without, denoting the necessity of further exploration of these risks on a wider-scale study.
As regards, CA 15-3 serum levels, no statistically significant difference was found between RASSF1A gene methylated and unmethylated
patients. This is in accordance with Jing et al. (10) who found that RASSF1A methylation was not associated with elevated serum CA 15-3 levels. This may be related to our study group which included breast cancer patients of different stages, with or without metastasis. CA15-3 is known to fall within normal reference limits in primary breast cancer, and is more observed to increase in cases of metastasis (17).
One prognostic aspect of CA15-3 and RASSF1A in breast cancer was evaluated in the current study through studying association of CA15-3 concentration and RASSF1A methylation status with tumor invasiveness. There was a significant association between stage subgroups and each of CA 15-3 serum levels and RASSF1A gene methylation status. Similarly, Safi et al. (18) and Gion et al. (19) concluded that CA 15-3 serum levels were associated with tumor burden, being significantly higher in late versus early stages. Also, it was reported that RASSF1A methylation was associated with advanced stage in a study carried out by Hoque et al. (5). This may be referred to that the normally unmethylated RASSF1A gene inhibits cell migration and enhances cell adhesion (20). Therefore, RASSF1A gene methylation and down-regulation result in disruption of cell adhesion. Furthermore, more methylation and loss of function, which inhibits cell growth and induces cell death, is a characteristic of aggressive malignant cells with high proliferative power (21). Both increased malignant cell shedding and amplified proliferation contribute to tumor invasiveness and metastasis. Other prognostic aspects of RASSF1A were evaluated in different studies. Shukla and his colleagues (8) determined that RASSF1A methylation correlated with poor breast cancer prognosis and distant metastases. Furthermore, RASSF1A gene methylation proved to be associated with lower disease-free survival, increased chance of disease recurrence and was identified as an independent predictor of poor prognosis (22). The same was revealed by a study conducted by Gobel et al. (23) on 428 breast cancer patients' plasma. They concluded that methylated RASSF1A was also an indicator for poor overall survival and distant disease free survival and, therefore, methylated RASSF1A appears to have promising potential as prognostic markers in clinical use. Because of their potential for reversal, epigenetic modifications are also appealing as targets for preventive care and therapeutics (24).
In the context of histological type, we found no statistically significant association between RASSF1A gene methylation and lobular or ductal types, which was in accordance with Burbee et al. (11) and Bae et al. (25).
Life Science Journal 2013;10(1) http://www.lifesciencesite.com
1950
It is noteworthy that we observed heterozygous pattern of RASSF1A gene methylation in 5.5% of patient samples (2/36) which gave 2 bands at both methylated and unmethylated lanes (160 and 180 bp, respectively). Most probably, the unmethylated band originated from normal DNA circulating in serum. The same pattern of RASSF1A gene methylation was observed by Maat et al. (26) in uveal melanoma tissue. They found a mixture of methylated and unmethylated DNA in 23% samples (9/39) and concluded that it was probably a result of contamination of the sample with normal tissue. Another explanation of heterozygous pattern by Peters and his colleagues (27) was due to the presence of undetected fibroblasts or tumor infiltrating lymphocytes. The probability of methylation of only one RASSF1A allele as a cause of our observed heterogenous pattern is unlikely. This is supported by the finding of many studies, in different tumors, that a "second hit" through promoter methylation of the remaining allele, following allelic loss, is indispensable for gene inactivation and tumor development(28). Grote and his colleagues (28) demonstrated that allelic loss is found in 90% of small cell lung cancer and 80% of non-small cell lung cancer. However, promoter methylation is necessary before gene inactivation and tumor development. This is also supported by Maat et al. (26) who concluded that loss of one copy of chromosome 3 (monosomy 3) in approximately 50% of all uveal melanomas and hypermethylation of the other copy could promote progression of uveal melanoma tumor.
In conclusion, RASSF1A gene methylation was statistically higher in cases than controls. Therefore, it can be considered a potential epigenetic marker for breast cancer, preferably as a part of a panel of genes to improve the diagnostic performance. Also, RASSF1A gene methylation was significantly associated with stage subgroups, which gives it an additional prognostic benefit. Its role as a demethylation anti-cancer therapy awaits further investigation. References: 1. National Cancer Registry Program of Egypt:
Reports and Statistics: Aswan (2008). Available at http://www.cancerregistry.gov.eg/reports.aspx [accessed November 18, 2012].
2. Palmeri L, Vaglica M, Palmeri S. Weekly docetaxel in the treatment of metastatic breast cancer. Therapeutics and Clinical Risk Management 2008; 4(5):1047–1059.
3. Widschwendter M, Apostolidou S, Raum E, et al., Epigenotyping in peripheral blood cell DNA and breast cancer risk: A proof of principle
study. American Cancer Society 2008;3(7):2656.
4. Koduru S, Sowmyalakshmi S, Kumar R, et al., Identification of a potent herbal molecule for the treatment of breast cancer. BMC Cancer 2009;9:41-52.
5. Hoque MO, Feng Q, Toure P, et al., Detection of aberrant methylation of four genes in plasma DNA for the detection of breast cancer. J Clin Oncol 2006;24:4262-4269.
6. Hesson LB, Cooper WN, Latif F. The role of RASSF1A methylation in cancer. Dis Markers 2007;23:73-87.
7. Dulaimi E, Hillinck J, Ibanez de Caceres I, et al., Tumor suppressor gene promoter hypermethylation in serum of breast cancer patients. Clin Cancer Res 2004;10:6189-6193.
8. Shukla S, Mirza S, Sharma G, et al., Detection of RASSF1A and RARβ2 hypermethylation in serum DNA from breast cancer patients. Epigenetics 2006;1(2):88-93.
9. Auwera IV, Elst HJ, Van Laere, et al., The presence of circulating total DNA and methylated genes is associated with circulating tumour cells in blood from breast cancer patients. British Journal of Cancer 2009;100:1277 -1286.
10. Jing F, Yuping W, Yong C, et al., CpG island methylator phenotype of multigene in serum of sporadic breast carcinoma. Tumor Biology 2010; 31(4):321-331.
11. Burbee DG, Forgacs E, Zöchbauer-Müller S, et al., Epigenetic inactivation of RASSF1A in lung and breast cancers and malignant phenotype suppression. J Natl. Cancer Inst 2001; 93:691-699.
12. Feng W, Shen L, Wen S, et al., Correlation between CpG methylation profiles and hormone receptor status in breast cancers. Breast Cancer Res 2007;9(4):57-70.
13. Euhus DM, Bu D, Milchgrub S, et al., DNA methylation in benign breast epithelium in relation to age and breast cancer risk. Cancer Epidemiol Biomarkers Prev 2008; 17(5):1051-1059.
14. Engeland MV, Weijenberg MP, Roemen GM, et al., Effects of dietary folate and alcohol intake on promoter methylation in sporadic colorectal cancer: The Netherlands cohort study on diet and cancer. Cancer Research 2003; 63:3133–3137.
15. Swarner KL, Peters ED, Furniss S, et al., Increased RASSF1A methylation among light drinkers and smokers with head and neck squamous cell carcinoma. Proc Amer Assoc Cancer Res 2004; 45:112-123.
Life Science Journal 2013;10(1) http://www.lifesciencesite.com
1951
16. Liu Y, Gao C, Ding J, et al., Physiological, reproductive factors and breast cancer risk in Jiangsu province of china. Asian Pacific J Cancer Prev 2011; 12:787-790.
17. Antoine E, Kayitalire L, Spielmann M. CA 15-3 and breast cancer. Rev Med Interne 1994; 15:650 –662.
18. Safi F, Kohler I, Röttinger E, et al., The value of the tumor marker CA 15-3 in diagnosing and monitoring breast cancer. A comparative study with carcinoembryonic antigen. Cancer 1991;68(3):574-582.
19. Gion M, Mione R, Leon AE, et al., Comparison of the Diagnostic Accuracy of CA27.29 and CA15.3 in Primary Breast Cancer. Clin Chem 1999;45(5):630–637.
20. Donninger H, Vos MD, Clark GJ. The RASSF1A tumor suppressor. Journal of Cell Science 2007;120:3163-3172.
21. Weyden LV, Adams DJ. The Ras-association domain family (RASSF) members and their role in human tumourigenesis. Biochim Biophys Acta 2007; 1776(1):58–85.
22. Buhmeida A, Merdad A, EL-Maghradi J, et al., RASSF1A methylation is predictive of poor prognosis in female breast cancer in a background of overall low methylation frequency. Anticancer Res 2011;31(9):2975-2981.
23. Gobel G, Auer D, Gaugg I, et al., Prognostic significance of methylated RASSF1A and PITX2 genes in blood- and bone marrow plasma of breast cancer patients. Breast Cancer Res Treat 2011; 130:109–117.
24. Dworkinan AM, Huangb TH, Tolandb AE. Epigenetic alterations in the breast: Implications for breast cancer detection, prognosis and treatment. Semin Cancer Biol 2009;19(3):165–171.
25. Bae YK, Brown A, Garrett E, et al., Hypermethylation in histologically distinct classes of breast banker. Clin Cancer Res 2004; 10:5998-6005.
26. Maat W, van der Velden PA, Out-Luiting C, et al., Epigenetic inactivation of RASSF1a in uveal melanoma. Investigative Ophthalmology and Visual Science 2007;48(2):486-490.
27. Peters I, Rehmet K, Wilke N, et al., RASSF1A promoter methylation and expression analysis in normal and neoplastic kidney indicates a role in early tumorigenesis. Molecular Cancer 2007; 6:49-58.
28. Grote HJ, Schmiemann V, Geddert H, Bocking A, Kappes R, Gabbert HE, Sarbi M. Methylation of RAS association domain family protein 1A as a biomarker of lung cancer. Cancer Cytopathology 2006; 108(2):129-134.
2/2/2013

Life Science Journal ISSN: 1097-8135 http://www.lifesciencesite.com
Life Science Journal
Acta Zhengzhou University Overseas Edition
(Life Sci J)
ISSN: 1097-8135
Call for Papers
The academic journal “Life Science Journal” (ISSN: 1097-8135) is inviting you to publish your papers. Life Science Journal, the Acta Zhengzhou University Oversea Version registered in the United States, is an international journal with the purpose to enhance our natural and scientific knowledge dissemination in the world under the free publication principle. The journal is calling for papers from all of the world. Any valuable papers or reports that are related to life science - in their broadest sense - are welcome. Other academic articles that are less relevant but are of high quality will also be considered and published. Papers submitted could be reviews, objective descriptions, research reports, opinions/debates, news, letters, and other types of writings. Let's work together to disseminate our research results and our opinions. Please send your manuscript to [email protected]; [email protected] Address: Life Science Journal - Acta Zhengzhou University Overseas Edition Marsland Press PO Box 180432, Richmond Hill, New York 11418, USA Telephone: (347) 321-7172 Emails: [email protected]; [email protected]; [email protected] Websites: http://www.lifesciencesite.com; http://www.sciencepub.net
9 771097 813002
ISSN 1097-8135
Life Science Journal
Volume 10, Number 1 ISSN:(Cumulative No.32) Part 13 March 25, 2013 1097-8135
Copyright © 2013 Marsland Press / Zhengzhou University
Marsland PressPO Box 180432Richmond Hill, New York 11418, USA
Website:http://www.lifesciencesite.com
Emails:[email protected]@gmail.com
Phone: (347) 321-7172
Acta Zhengzhou University Overseas Edition