
Global Journal of Human Social Science
102
An Analysis of Health Evaluation of Bio-Engineering Sustainable Development of Bioenergy Flood Risk Reduction VOLUME 16 ISSUE 2 VERSION 1.0 Online ISSN : 2249-460X Print ISSN : 0975-587X DOI : 10.17406/GJHSS
-
Upload
khangminh22 -
Category
Documents
-
view
4 -
download
0
Transcript of Global Journal of Human Social Science

An Analysis of Health
Evaluation of Bio-Engineering Sustainable Development of Bioenergy
Flood Risk Reduction
VOLUME 16 ISSUE 2 VERSION 1.0
Online ISSN : 2249-460X
Print ISSN : 0975-587X
DOI : 10.17406/GJHSS

Global Journal of Human-Social Science: B Geography, Geo-Sciences, Environmental Science & Disaster Management

Global Journal of Human-Social Science: B Geography, Geo-Sciences, Environmental Science & Disaster Management
Volume 16 Issue 2 (Ver. 1.0)
Open Association of Research Society

Global Journals Inc. (A Delaware USA Incorporation with “Good Standing”; Reg. Number: 0423089)Sponsors: Open Scientific Standards
Publisher’s Headquarters office
Offset Typesetting
Packaging & Continental Dispatching
Find a correspondence nodal officer near you
To find nodal officer of your country, pleaseemail us at [email protected]
eContacts
Press Inquiries: [email protected] Inquiries: [email protected] Support: [email protected] & Releases: [email protected]
Pricing (Including by Air Parcel Charges):
For Authors: 22 USD (B/W) & 50 USD (Color) Yearly Subscription (Personal & Institutional): 200 USD (B/W) & 250 USD (Color)
Open Association of Research Society
Global Journals Incorporated2nd, Lansdowne, Lansdowne Rd., Croydon-Surrey, Pin: CR9 2ER, United Kingdom
Global JournalsE-3130 Sudama Nagar, Near Gopur Square, Indore, M.P., Pin:452009, India
Incorporation No.: 0423089 License No.: 42125/022010/1186
Registration No.: 430374 Import-Export Code: 1109007027
Employer Identification Number (EIN): USA Tax ID: 98-0673427
us1463/
Social Sciences. 2016.
USA Toll Free: +001-888-839-7392 USA Toll Free Fax: +001-888-839-7392
945th Concord Streets,
United States of AmericaFramingham Massachusetts Pin: 01701,
Global Journals Headquarters®
John A. Hamilton,"Drew" Jr., Ph.D., Professor, Management Computer Science and Software Engineering Director, Information Assurance Laboratory Auburn University
Dr. Wenying FengProfessor, Department of Computing & Information Systems Department of Mathematics Trent University, Peterborough, ON Canada K9J 7B8
Dr. Henry Hexmoor IEEE senior member since 2004 Ph.D. Computer Science, University at Buffalo Department of Computer Science Southern Illinois University at Carbondale
Dr. Thomas WischgollComputer Science and Engineering, Wright State University, Dayton, Ohio B.S., M.S., Ph.D. (University of Kaiserslautern)
Dr. Osman Balci, ProfessorDepartment of Computer Science Virginia Tech, Virginia University Ph.D. and M. S. Syracuse University, Syracuse, New York M. S. and B. S. Bogazici University, Istanbul, Turkey
Dr. Abdurrahman ArslanyilmazComputer Science & Information Systems Department Youngstown State University Ph.D., Texas A&M University University of Missouri, Columbia Gazi University, Turkey
Yogita Bajpai M.Sc. (Computer Science), FICCT U.S.A.Email: [email protected]
Dr. T. David A. Forbes Associate Professor and Range Nutritionist Ph.D. Edinburgh University - Animal Nutrition M. S. Aberdeen University - Animal NutritionB. A. University of Dublin- Zoology
Integrated Editorial Board(Computer Science, Engineering, Medical, Management, Natural
Science, Social Science)
Dr. Xiaohong He Professor of International Business University of Quinnipiac BS, Jilin Institute of Technology; MA, MS, PhD,. (University of Texas-Dallas)
Burcin Becerik-Gerber University of Southern California Ph.D. in Civil Engineering DDes from Harvard University M. S. from University of California, Berkeley & Istanbul University

Dr. Bart LambrechtDirector of Research in Accounting and Finance Professor of Finance Lancaster University Management School BA (Antwerp); MPhil, MA, PhD (Cambridge)
Dr. Söhnke M. BartramDepartment of Accounting and Finance Lancaster University Management SchoolPh.D. (WHU Koblenz) MBA/BBA (University of Saarbrücken)
Dr. Carlos García PontAssociate Professor of Marketing IESE Business School, University of Navarra Doctor of Philosophy (Management), Massachusetts Institute of Technology (MIT) Master in Business Administration, IESE, University of Navarra Degree in Industrial Engineering, Universitat Politècnica de Catalunya
Dr. Miguel Angel AriñoProfessor of Decision Sciences IESE Business School Barcelona, Spain (Universidad de Navarra) CEIBS (China Europe International Business School). Beijing, Shanghai and Shenzhen Ph.D. in Mathematics University of Barcelona BA in Mathematics (Licenciatura) University of Barcelona
Dr. Fotini LabropuluMathematics - Luther College University of ReginaPh.D., M.Sc. in Mathematics B.A. (Honors) in Mathematics University of Windso
Philip G. Moscoso Technology and Operations Management IESE Business School, University of Navarra Ph.D in Industrial Engineering and Management, ETH Zurich M.Sc. in Chemical Engineering, ETH Zurich
Dr. Lynn LimReader in Business and Marketing Roehampton University, London BCom, PGDip, MBA (Distinction), PhD, FHEA
Dr. Sanjay Dixit, M.D.Director, EP Laboratories, Philadelphia VA Medical Center Cardiovascular Medicine - Cardiac Arrhythmia Univ of Penn School of Medicine
Dr. Mihaly MezeiASSOCIATE PROFESSOR Department of Structural and Chemical Biology, Mount Sinai School of Medical Center Ph.D., Etvs Lornd University Postdoctoral Training, New York University
Dr. Han-Xiang DengMD., Ph.D Associate Professor and Research Department Division of Neuromuscular Medicine Davee Department of Neurology and Clinical Neuroscience Northwestern University Feinberg School of Medicine

Dr. Pina C. Sanelli Associate Professor of Public Health Weill Cornell Medical College Associate Attending Radiologist NewYork-Presbyterian Hospital MRI, MRA, CT, and CTA Neuroradiology and Diagnostic Radiology M.D., State University of New York at Buffalo, School of Medicine and Biomedical Sciences
Dr. Roberto SanchezAssociate Professor Department of Structural and Chemical Biology Mount Sinai School of Medicine Ph.D., The Rockefeller University
Dr. Wen-Yih SunProfessor of Earth and Atmospheric Sciences Purdue University Director National Center for Typhoon and Flooding Research, Taiwan University Chair Professor Department of Atmospheric Sciences, National Central University, Chung-Li, Taiwan University Chair Professor Institute of Environmental Engineering, National Chiao Tung University, Hsin-chu, Taiwan. Ph.D., MS The University of Chicago, Geophysical Sciences BS National Taiwan University, Atmospheric Sciences Associate Professor of Radiology
Dr. Michael R. RudnickM.D., FACP Associate Professor of Medicine Chief, Renal Electrolyte and Hypertension Division (PMC) Penn Medicine, University of Pennsylvania Presbyterian Medical Center, Philadelphia Nephrology and Internal Medicine Certified by the American Board of Internal Medicine
Dr. Bassey Benjamin EsuB.Sc. Marketing; MBA Marketing; Ph.D Marketing Lecturer, Department of Marketing, University of Calabar Tourism Consultant, Cross River State Tourism Development Department Co-ordinator , Sustainable Tourism Initiative, Calabar, Nigeria
Dr. Aziz M. Barbar, Ph.D.IEEE Senior Member Chairperson, Department of Computer Science AUST - American University of Science & Technology Alfred Naccash Avenue – Ashrafieh
Dr. George Perry, (Neuroscientist) Dean and Professor, College of Sciences
Denham Harman Research Award (American Aging Association)
ISI Highly Cited Researcher, Iberoamerican Molecular Biology Organization
AAAS Fellow, Correspondent Member of Spanish Royal Academy of Sciences
University of Texas at San Antonio
Postdoctoral Fellow (Department of Cell Biology)
Baylor College of Medicine
Houston, Texas, United States
Dr. R.K. Dixit M.Sc., Ph.D., FICCT Chief Author, India Email: [email protected]
Vivek Dubey(HON.) MS (Industrial Engineering),
MS (Mechanical Engineering)
University of Wisconsin, FICCT
Editor-in-Chief, USA
Er. Suyog Dixit (M. Tech), BE (HONS. in CSE), FICCT SAP Certified Consultant CEO at IOSRD, GAOR & OSS Technical Dean, Global Journals Inc. (US) Website: www.suyogdixit.com Email:[email protected]
Pritesh Rajvaidya (MS) Computer Science Department California State University BE (Computer Science), FICCT Technical Dean, USA Email: [email protected]
Sangita Dixit M.Sc., FICCT
Dean & Chancellor (Asia Pacific) [email protected]
Luis Galárraga J!Research Project Leader Saarbrücken, Germany
President Editor (HON.)
Chief Author (HON.)
Dean & Editor-in-Chief (HON.)
Suyash Dixit
(B.E., Computer Science Engineering), FICCTT President, Web Administration and
Development CEO at IOSRD COO at GAOR & OSS
,
Contents of the Issue
i. Copyright Notice ii. Editorial Board Members iii. Chief Author and Dean iv. Contents of the Issue
1. Assessment of Urban Heat Island (UHI) using Remote Sensing and GIS. 1-8 2. An Analysis of Health Situation of Women and Children at the Char of
Gangachara Upazilla: A GIS based Case Study. 9-22 3. A Review of Flooding and Flood Risk Reduction in Nigeria. 23-42 4. Evaluation of Bio-Engineering for Pollution Prevention through Sustainable
Development of Bioenergy Management. 43-63
v.
Fellows
vi.
Auxiliary Memberships vii.
Process
of Submission of Research Paper viii.
Preferred Author Guidelines
ix.
Index
Global Journal of HUMAN-SOCIAL SCIENCE: B Geography, Geo-Sciences, Environmental Science & Disaster ManagementVolume 16 Issue 2 Version 1.0 Year 2016 Type: Double Blind Peer Reviewed International Research JournalPublisher: Global Journals Inc. (USA)Online ISSN: 2249-460x & Print ISSN: 0975-587X
Assessment of Urban Heat Island (UHI) using Remote Sensing and GIS
Abstract- This study assesses the Urban Heat Island (UHI) effect and evaluates the impact of urban/suburban areas in Lahore District on its land surface temperature using Remote Sensing and GIS techniques. The satellite brightness temperature information derived from the medium resolution satellite LANDSAT 5 (Thematic Mapper) is analyzed and compared with the land use/land cover types acquired by classifying the image. The results reveal that urban heat island in Lahore District is significant, with average Land surface temperature values ranging from 23ºC to 44ºC, and maximum urban/non-urban temperature difference reaching 5ºC. The high built-up area exhibits the maximum surface temperature ranges from 31 to 44ºC compared to other land use types. The relationship between thermal behavior and NDVI is also analyzed and negative correlation is identified by the results from the extracted surface temperature and NDVI from Landsat. This suggests that vegetation is the primary determinant controlling the spatial distribution of land surface heat. An effort to compare the population density and air pollution parameters with surface temperature is also made and the air pollution concentration is considered in relation with urban areas of high temperature and high population density.
GJHSS-B Classification : FOR Code: 291003
AssessmentofUrbanHeatIslandUHIusingRemoteSensingandGIS
Strictly as per the compliance and regulations of:
By Aneeqa Azeem, Muhammad A Butt , Khadija Nisar & Huma Anwar
© 2016. Aneeqa Azeem, Muhammad A Butt , Khadija Nisar & Huma Anwar. This is a research/review paper, distributed under the terms of the Creative Commons Attribution-Noncommercial 3.0 Unported License http://creativecommons.org/licenses/by-nc/3.0/), permitting all non-commercial use, distribution, and reproduction in any medium, provided the original work is properly cited.
University of Engineering and Technology, Pakistan
Assessment of Urban Heat Island (UHI) usingRemote Sensing and GIS
Abstract- This study assesses the Urban Heat Island (UHI) effect and evaluates the impact of urban/suburban areas in Lahore District on its land surface temperature using Remote Sensing and GIS techniques. The satellite brightness temperature information derived from the medium resolution satellite LANDSAT 5 (Thematic Mapper) is analyzed and compared with the land use/land cover types acquired by classifying the image. The results reveal that urban heat island in Lahore District is significant, with average Land surface temperature values ranging from 23ºC to 44ºC, and maximum urban/non-urban temperature difference reaching 5ºC. The high built-up area exhibits the maximum surface temperature ranges from 31 to 44ºC compared to other land use types. The relationship between thermal behavior and NDVI is also analyzed and negative correlation is identified by the results from the extracted surface temperature and NDVI from Landsat. This suggests that vegetation is the primary determinant controlling the spatial distribution of land surface heat. An effort to compare the population density and air pollution parameters with surface temperature is also made and the air pollution concentration is considered in relation with urban areas of high temperature and high population density.
I. Background
pproximately 2% of the Earth’s land surface is covered by urban regions, contains about half of the human population (UNDP, 2001). The
increased urbanization trend has various environmental impacts and it seems to be never ending with a continuous and rapid increase throughout the last century and still projected to increase even faster. Developing and improving urban infrastructure is important for human welfare but it has somehow hindered the natural eco-system especially within the urban areas.
More and more people move from rural to urban areas in order to provide themselves with better opportunities for progress. This rural urban migration is inevitable and has implications on economic growth and development. But as population influx in the urban areas increases, it puts a burden on the localized urban environment and somehow this development is accompanied by environmental deterioration.
Consistent development of urban areas results in the formation of more and more impervious surfaces
(Zhou et al., 2004). These unreceptive surfaces seal soil surface that results in elimination of rain water penetration (infiltration) and ground water recharge. This enhances ground water runoff which ultimately plays a part in natural catastrophes like floods. When this heat is released, it increases temperature thus increasing energy consumption within urban areas to modify the environment.
Quality of urban life and energy cost are mainly affected by Urban Heat Island. With each degree temperature the power used for air conditioning is enhanced. The level of atmospheric temperature elevates due to the subsequent increased use of electricity for cooling. The earth’s rising temperature are the hot issues today in the world. Since the industrial revolution the temperature of the planet has been increased. Today the main cause of CO2 level rise isdue to increased energy use. (Irfanet al, 2001).
The knowledge of urban heat island is important for a range of issues and themes in earth sciences and also in planning and management practices as the impact of urbanization is huge and affects the natural ecology.
II. Objectives
The research analyses and verifies the spatial pattern of surface temperature with urban spatial information related with landuse/cover and NDVI using remotely sensed data and GIS.The main objectives of the research are listed below:
• To estimate the urban heat Island Effect using remote sensing data.
• To analyze the relationship between LST and Vegetation Density in urban area.
• Evaluate the connection between LST and other urbanization parameters. (Population Density, Air Pollution, etc)
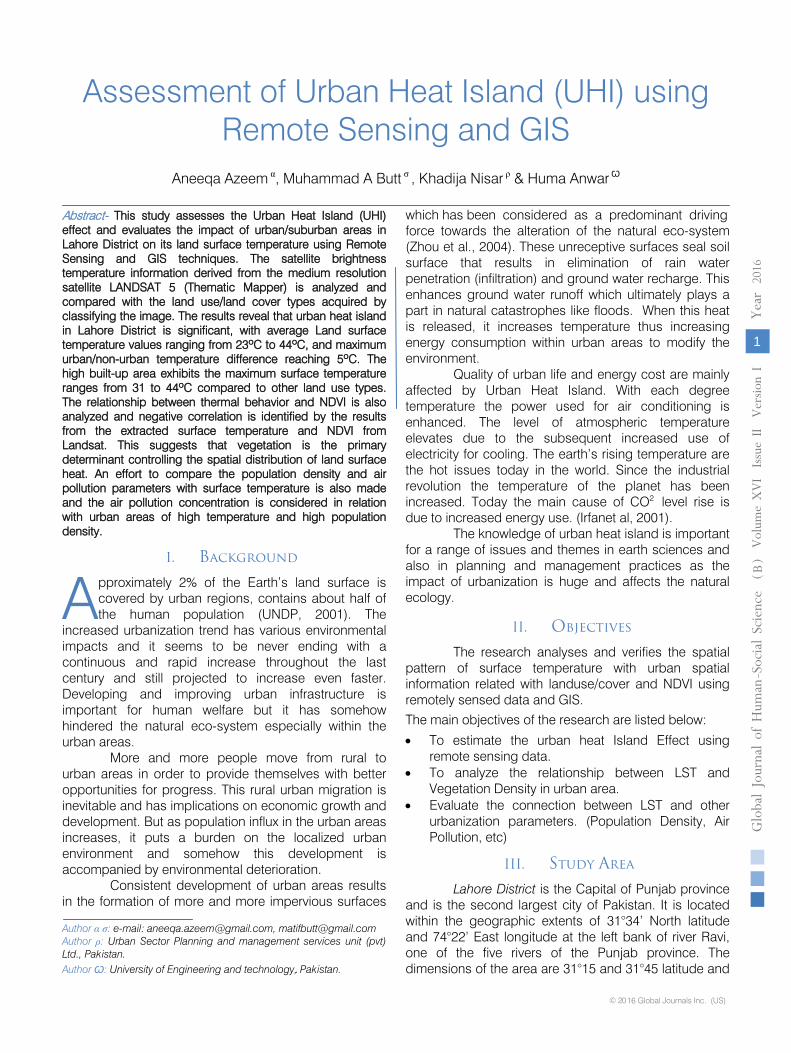
III. Study Area
Lahore District is the Capital of Punjab province and is the second largest city of Pakistan. It is located within the geographic extents of 31°34’ North latitude and 74°22’ East longitude at the left bank of river Ravi, one of the five rivers of the Punjab province. Thedimensions of the area are 31°15 and 31°45 latitude and
A
V
olum
e XVI Issue
II V
ersio
n I
1
( B)
Globa
l Jo
urna
l of H
uman
Soc
ial Sc
ienc
e
-
Year
2016
© 2016 Global Journals Inc. (US)
Aneeqa Azeem α, Muhammad A Butt σ , Khadija Nisar ρ & Huma AnwarѠ
which has been considered as a predominant driving force towards the alteration of the natural eco-system
Author α σ: e-mail: [email protected], [email protected] ρ: Urban Sector Planning and management services unit (pvt) Ltd., Pak istan.Author Ѡ: University of Engineering and technology, Pak istan..
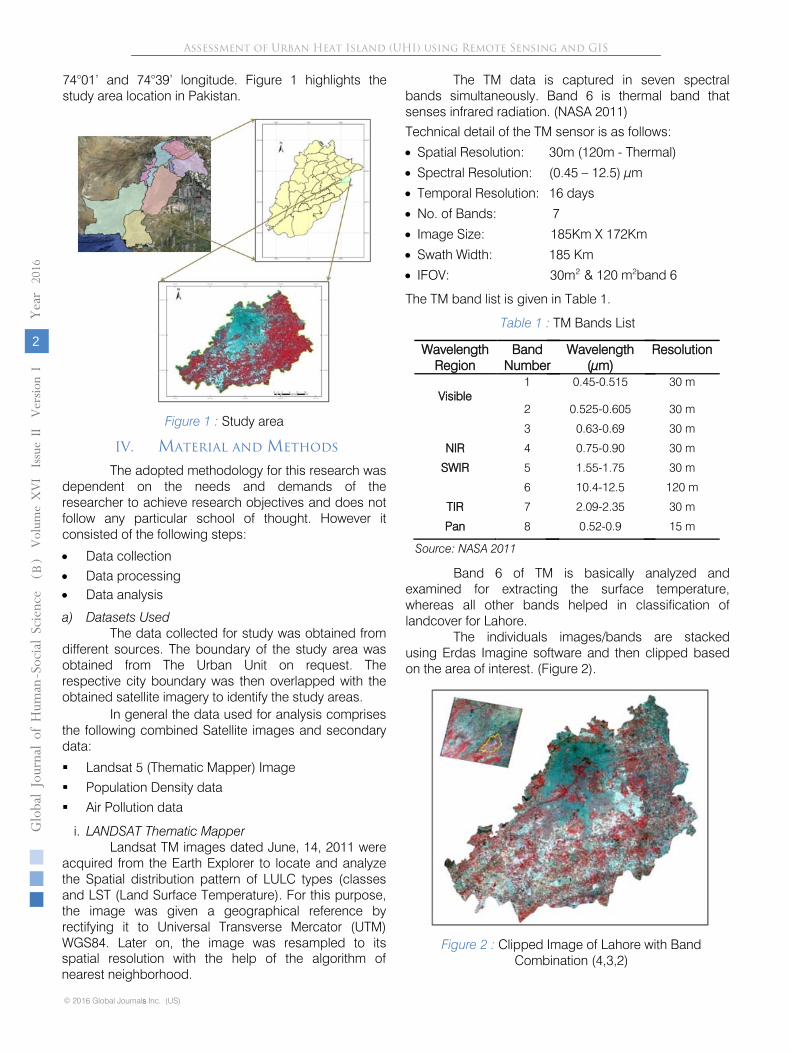
Figure 1 : Study area
IV. Material and Methods
The adopted methodology for this research was dependent on the needs and demands of the researcher to achieve research objectives and does not follow any particular school of thought. However it consisted of the following steps:
• Data collection• Data processing• Data analysis
a) Datasets UsedThe data collected for study was obtained from
different sources. The boundary of the study area was obtained from The Urban Unit on request. The respective city boundary was then overlapped with the obtained satellite imagery to identify the study areas.
Landsat 5 (Thematic Mapper) Image Population Density data Air Pollution data
i. LANDSAT Thematic MapperLandsat TM images dated June, 14, 2011 were
acquired from the Earth Explorer to locate and analyze the Spatial distribution pattern of LULC types (classes and LST (Land Surface Temperature). For this purpose, the image was given a geographical reference by rectifying it to Universal Transverse Mercator (UTM) WGS84. Later on, the image was resampled to its spatial resolution with the help of the algorithm of nearest neighborhood.
The TM data is captured in seven spectral bands simultaneously. Band 6 is thermal band that senses infrared radiation. (NASA 2011)Technical detail of the TM sensor is as follows:
• Spatial Resolution: 30m (120m - Thermal)
• Spectral Resolution: (0.45 – 12.5) µm
• Temporal Resolution: 16 days
• No. of Bands: 7
• Image Size: 185Km X 172Km
• Swath Width: 185 Km
• IFOV: 30m2 & 120 m2band 6
The TM band list is given in Table 1.
Table 1 : TM Bands List
WavelengthRegion
BandNumber
Wavelength (µm)
Resolution
Visible1 0.45-0.515 30 m
2 0.525-0.605 30 m
3 0.63-0.69 30 m
NIR 4 0.75-0.90 30 m
SWIR 5 1.55-1.75 30 m
6 10.4-12.5 120 m
TIR 7 2.09-2.35 30 m
Pan 8 0.52-0.9 15 m
Source: NASA 2011
Band 6 of TM is basically analyzed and examined for extracting the surface temperature, whereas all other bands helped in classification of landcover for Lahore.
The individuals images/bands are stacked using Erdas Imagine software and then clipped based on the area of interest. (Figure 2).
Assessment of Urban Heat Island (UHI) using Remote Sensing and GIS
© 2016 Global Journals Inc. (US)
V
olum
e XVI Issue
II V
ersio
n I
2
( B)
Globa
l Jo
urna
l of H
uman
Soc
ial Sc
ienc
e
s
-
Year
2016
Figure 2 : Clipped Image of Lahore with Band Combination (4,3,2)
In general the data used for analysis comprises the following combined Satellite images and secondary data:
74°01’ and 74°39’ longitude. Figure 1 highlights the study area location in Pakistan.
Landsat TM
Digital No.
Temperature (K)
Spectral Radiance
Temperature (C)
b)
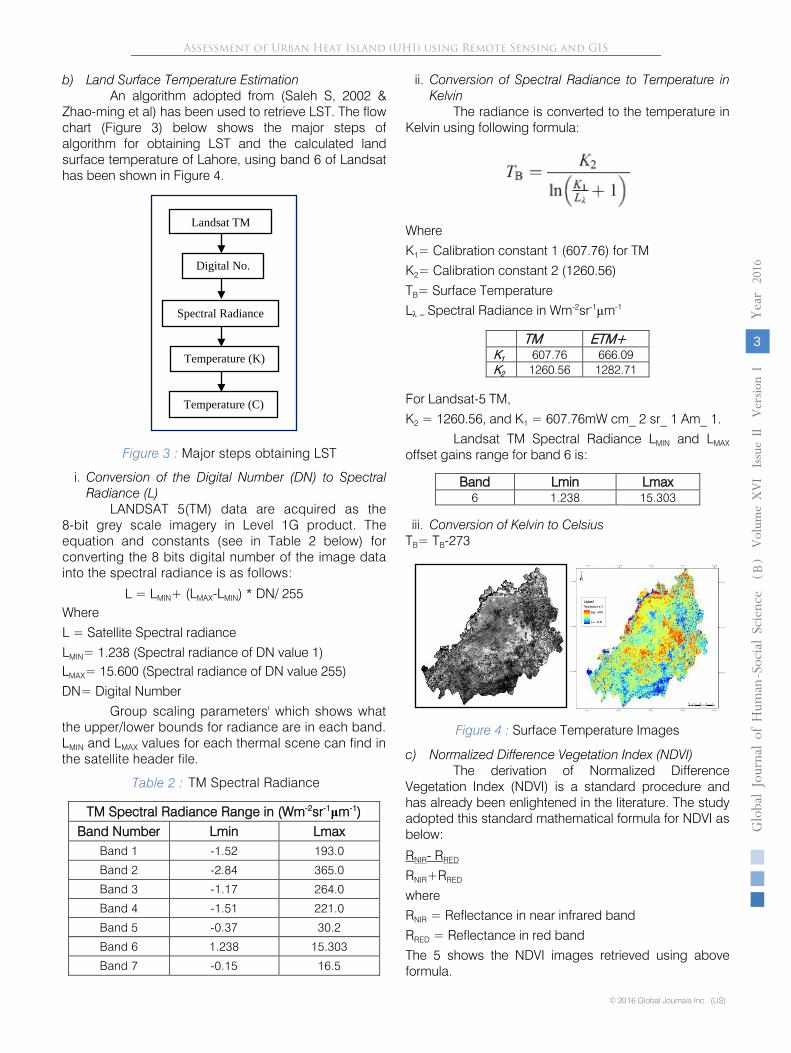
Land Surface Temperature Estimation
An algorithm adopted from (Saleh S, 2002 & Zhao-ming et al) has been used to retrieve LST. The flow chart (Figure 3) below shows the major steps of algorithm for obtaining LST and the calculated land surface temperature of Lahore, using band 6 of Landsat has been shown in Figure 4.
Figure 3 :
Major steps obtaining LST
i.
Conversion of the Digital Number (DN) to Spectral Radiance (L)
LANDSAT 5(TM) data are acquired as the
8-bit grey scale imagery in Level 1G product. The equation and constants (see in Table 2 below) for converting the 8 bits digital number of the image data into the spectral radiance is as follows:
L = LMIN+ (LMAX-LMIN) * DN/ 255
Where
L = Satellite Spectral radiance
LMIN= 1.238 (Spectral radiance of DN value 1)
LMAX= 15.600 (Spectral radiance of DN value 255)
DN= Digital Number
Group scaling parameters' which shows what the upper/lower bounds for radiance are in each band. LMIN
and LMAX
values for each thermal scene can find in the satellite header file.
Table 2 :
TM Spectral Radiance Range in (Wm-2sr-1μm-1)
Band Number
Lmin
Lmax
Band 1
-1.52
193.0
Band 2
-2.84
365.0
Band 3
-1.17
264.0
Band 4
-1.51
221.0
Band 5 -0.37
30.2
Band 6
1.238
15.303
Band 7
-0.15
16.5
ii.
Conversion of Spectral Radiance to Temperature in Kelvin
The radiance is converted to the temperature in Kelvin using following formula:
Where
K1= Calibration constant 1 (607.76) for TM
K2= Calibration constant 2 (1260.56)
TB= Surface Temperature
Lλ
= Spectral Radiance in Wm-2sr-1μm-1
TM
ETM+
K1
607.76
666.09
K2
1260.56
1282.71
For Landsat-5 TM,
K2
= 1260.56, and K1
= 607.76mW cm_ 2 sr_ 1 Am_ 1.
Landsat TM Spectral Radiance LMIN
and LMAX
offset gains range for band 6 is:
Band
Lmin
Lmax
6 1.238
15.303
Assessment of Urban Heat Island (UHI) using Remote Sensing and GIS
V
olum
e XVI Issue
II V
ersio
n I
3
( B)
Globa
l Jo
urna
l of H
uman
Soc
ial Sc
ienc
e
-
Year
2016
© 2016 Global Journals Inc. (US)
iii. Conversion of Kelvin to CelsiusTB= TB-273
Figure 4 : Surface Temperature Images
c) Normalized Difference Vegetation Index (NDVI)The derivation of Normalized Difference
Vegetation Index (NDVI) is a standard procedure and has already been enlightened in the literature. The study adopted this standard mathematical formula for NDVI as below:
RNIR- RRED
RNIR+RRED
whereRNIR = Reflectance in near infrared band RRED = Reflectance in red bandThe 5 shows the NDVI images retrieved using above formula.
TM Spectral Radiance
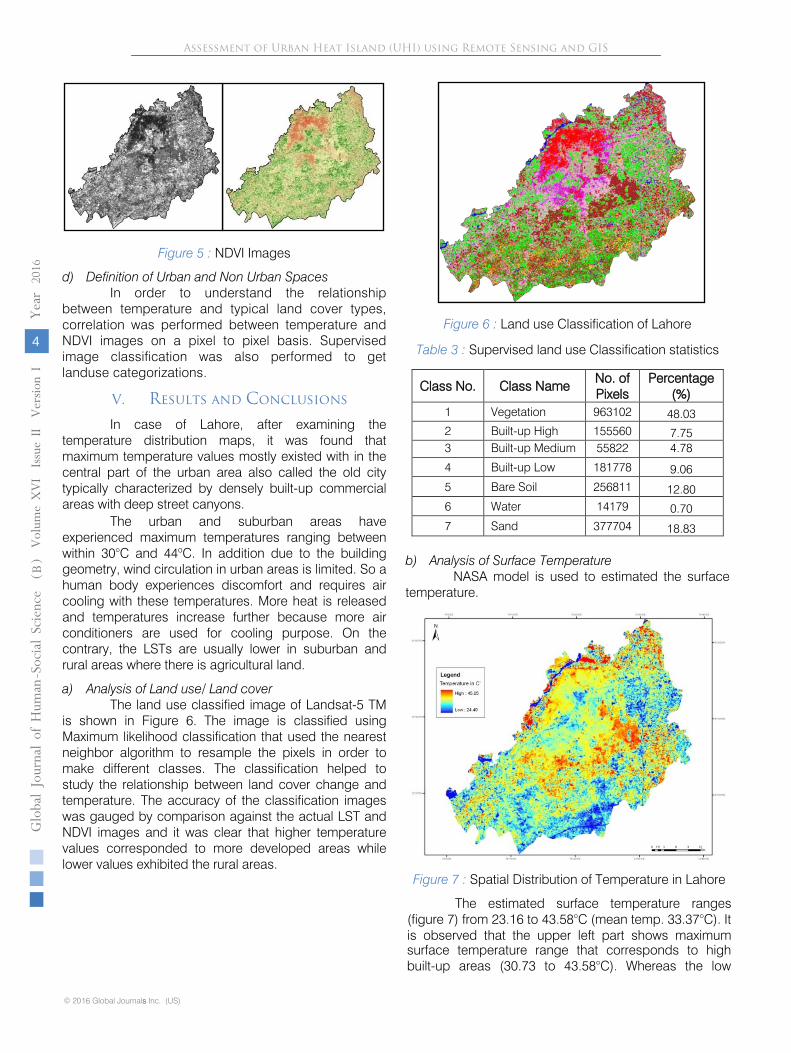
Figure 5 :
NDVI Images
d)
Definition of Urban and Non Urban Spaces
In order to understand the relationship between temperature and typical land cover types, correlation was performed between temperature and NDVI images on a pixel to pixel basis. Supervised image classification was also performed to get landuse categorizations.
V.
Results
and
Conclusions
In case of Lahore, after examining the temperature distribution maps, it was found that maximum temperature values mostly existed with in the central part of the urban area also called the old city typically characterized by densely built-up commercial areas with deep street canyons.
The urban and suburban areas have experienced maximum temperatures ranging between within 30°C and 44oC. In addition due to the building geometry, wind circulation in urban areas is limited. So a human body experiences discomfort and requires air cooling with these temperatures. More heat is released and temperatures increase further because more air conditioners are used for cooling purpose. On the contrary, the LSTs are usually lower in suburban and rural areas where there is
agricultural land.
a)
Analysis of Land use/ Land cover
The land use classified image of Landsat-5 TM is shown in Figure 6. The image is classified using Maximum likelihood classification that used the nearest neighbor algorithm to resample the pixels in order to make different classes. The classification helped to study the relationship between land cover change and temperature. The accuracy of the classification images was gauged by comparison against the actual LST and NDVI images and it was clear that higher temperature values corresponded to more developed areas while lower values exhibited the rural areas.
Figure 6 :
Land use Classification of Lahore
Table 3
: Supervised land use Classification statistics
Class No.
Class Name
No. of Pixels
Percentage (%)
1 Vegetation
963102
48.03
2 Built-up High
155560
7.75
3 Built-up Medium
55822
4.78
4 Built-up Low
181778
9.06
5 Bare Soil
256811
12.80
6 Water
14179
0.70
7 Sand
377704
18.83
b)
Analysis of Surface Temperature
NASA model is used to estimated the surface temperature.
Assessment of Urban Heat Island (UHI) using Remote Sensing and GIS
© 2016 Global Journals Inc. (US)
V
olum
e XVI Issue
II V
ersio
n I
4
( B)
Globa
l Jo
urna
l of H
uman
Soc
ial Sc
ienc
e
s
-
Year
2016
Figure 7 : Spatial Distribution of Temperature in Lahore
The estimated surface temperature ranges (figure 7) from 23.16 to 43.58°C (mean temp. 33.37°C). It is observed that the upper left part shows maximum surface temperature range that corresponds to high built-up areas (30.73 to 43.58°C). Whereas the low
dense built-up ranges from 29.91 to 38.11°C. Water bodies exhibit minimum surface temperature compared to other land use/land cover features (23.16 to 33.32°C). Table 4 shows the surface temperature statistics, followed by vegetation (27.30 to 37.21°C). Hence Water bodies and sparse vegetation is cooler as compared to other land use/land cover features.
Table 4 :
Temperature statistics per land cover/ land use classes
Class No.
Class Name
Temperature
Mean
Min
Max
1 Vegetation
32.00
27.30
37.21
2 Water
28.08
23.16
33.32
3 Built-up High
37.15
30.73
43.58
4 Built-up Medium
35.30
31.95
38.66
5 Built-up Low
33.95
29.91
38.11
c)
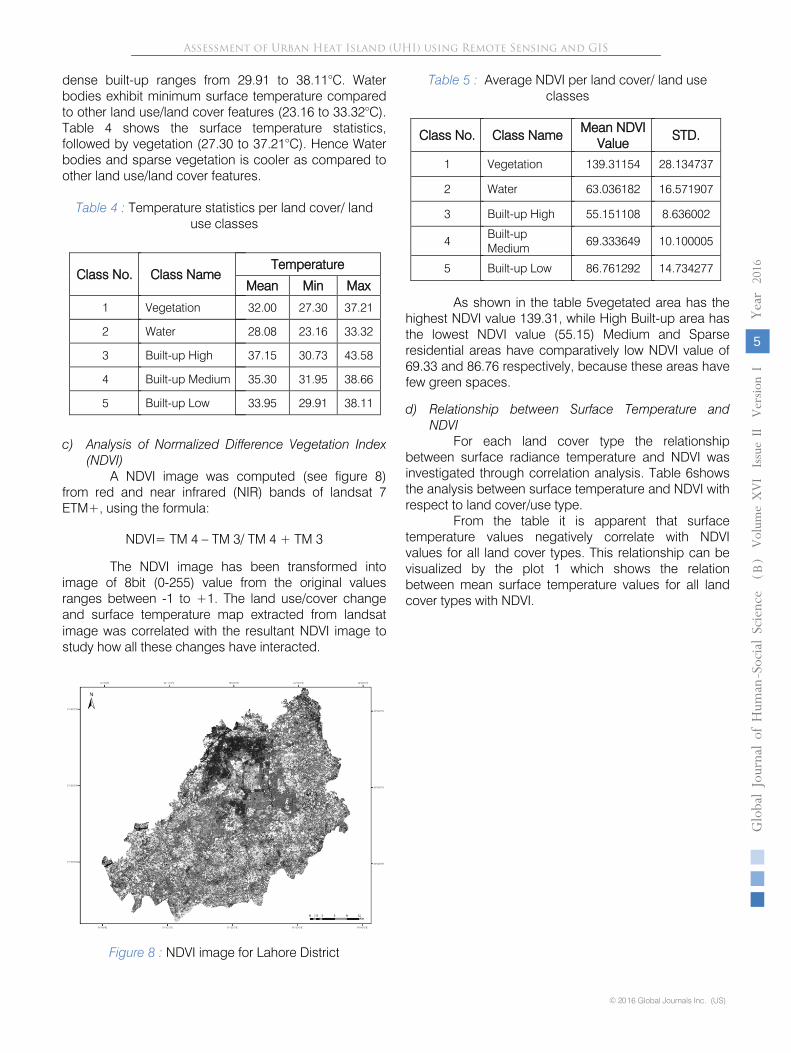
Analysis of Normalized Difference
Vegetation Index (NDVI)
A NDVI image was computed (see figure 8) from red and near infrared
(NIR) bands of landsat 7 ETM+, using the formula:
NDVI= TM 4 – TM 3/ TM 4 + TM 3
The NDVI image has been transformed into image of 8bit (0-255) value from the original values ranges between -1 to +1. The land use/cover change and surface temperature map extracted from landsat image was correlated with the resultant NDVI image to study how all these changes have interacted.
Figure 8 :
NDVI image for Lahore District
Table 5 : Average NDVI per land cover/ land use classes
Class No.
Class Name
Mean NDVI Value
STD.
1 Vegetation
139.31154
28.134737
2 Water
63.036182
16.571907
3 Built-up High
55.151108
8.636002
4 Built-up Medium
69.333649
10.100005
5 Built-up Low
86.761292
14.734277
As shown in the table 5vegetated area has the highest NDVI value 139.31, while High Built-up area has the lowest NDVI value (55.15) Medium and Sparse residential areas have comparatively low NDVI value of 69.33 and 86.76 respectively, because these areas have few green spaces.
d)
Relationship between Surface Temperature and NDVI
For each land cover type the relationship between surface radiance temperature and NDVI was investigated through correlation analysis. Table 6shows the analysis between surface temperature and NDVI with respect to land cover/use type.
From the table it is apparent that surface temperature values negatively correlate with NDVI values for all land cover types. This relationship can be visualized by the plot 1 which shows the relation between mean surface temperature values for all land cover types with NDVI.
Assessment of Urban Heat Island (UHI) using Remote Sensing and GIS
V
olum
e XVI Issue
II V
ersio
n I
5
( B)
Globa
l Jo
urna
l of H
uman
Soc
ial Sc
ienc
e
-
Year
2016
© 2016 Global Journals Inc. (US)
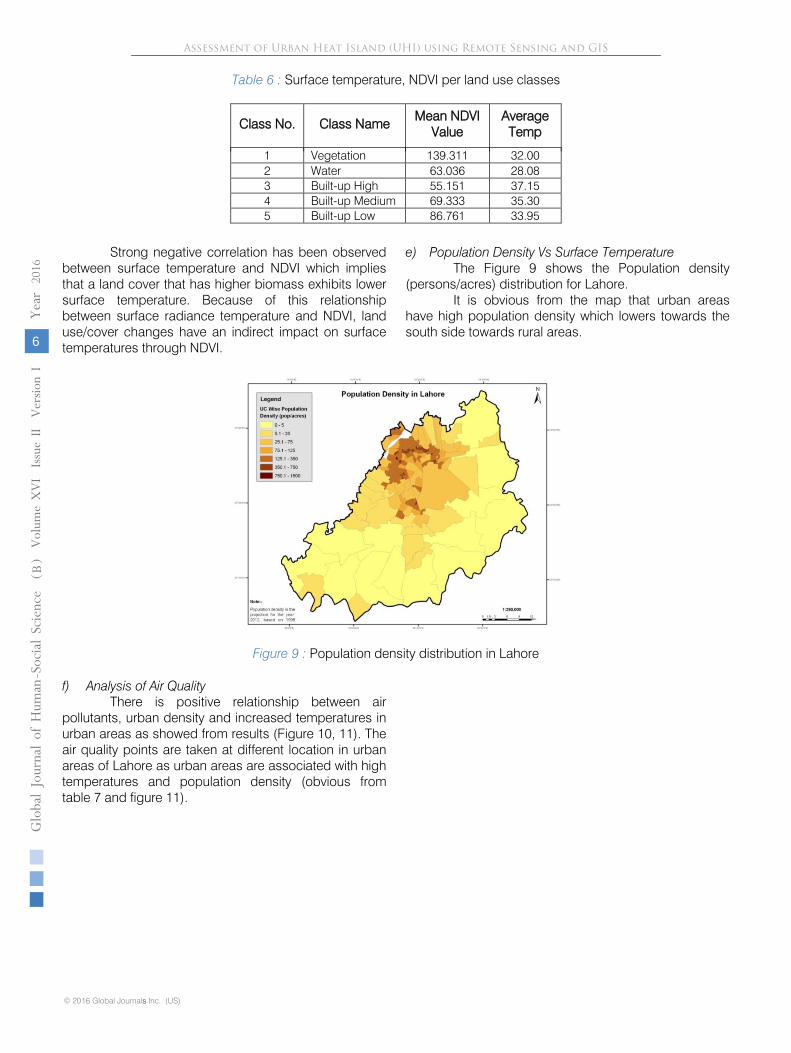
Table 6 : Surface temperature, NDVI per land use classes
Strong negative correlation has been observed between surface temperature and NDVI which implies that a land cover that has higher biomass exhibits lower surface temperature. Because of this relationship between surface radiance temperature and NDVI, land use/cover changes have an indirect impact on surface temperatures through NDVI.
e)
Population Density Vs Surface Temperature The Figure 9 shows the Population density
(persons/acres) distribution for Lahore. It is obvious from the map that urban areas
have high population density which lowers towards the south side towards rural areas.
Figure 9 : Population density distribution in Lahore
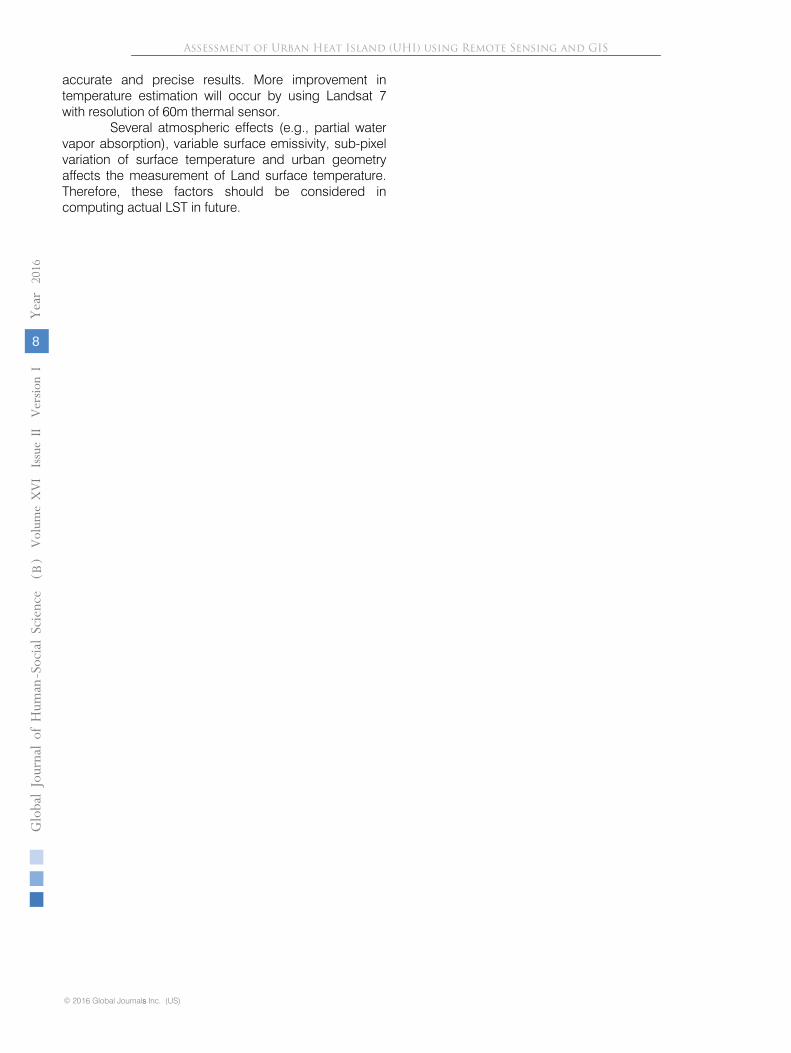
f)
Analysis of Air Quality
There is positive relationship between air pollutants, urban density and increased temperatures in urban areas as showed from results (Figure 10,
11).
The
air quality points are taken at different location in urban
areas of Lahore as urban areas are associated with high temperatures and population density (obvious from table 7 and figure 11).
Class No.
Class Name
Mean NDVI Value
Average Temp
1 Vegetation
139.311
32.00
2 Water
63.036
28.08 3 Built-up High
55.151
37.15
4 Built-up Medium
69.333
35.30 5 Built-up Low
86.761
33.95
Assessment of Urban Heat Island (UHI) using Remote Sensing and GIS
© 2016 Global Journals Inc. (US)
V
olum
e XVI Issue
II V
ersio
n I
6
( B)
Globa
l Jo
urna
l of H
uman
Soc
ial Sc
ienc
e
s
-
Year
2016
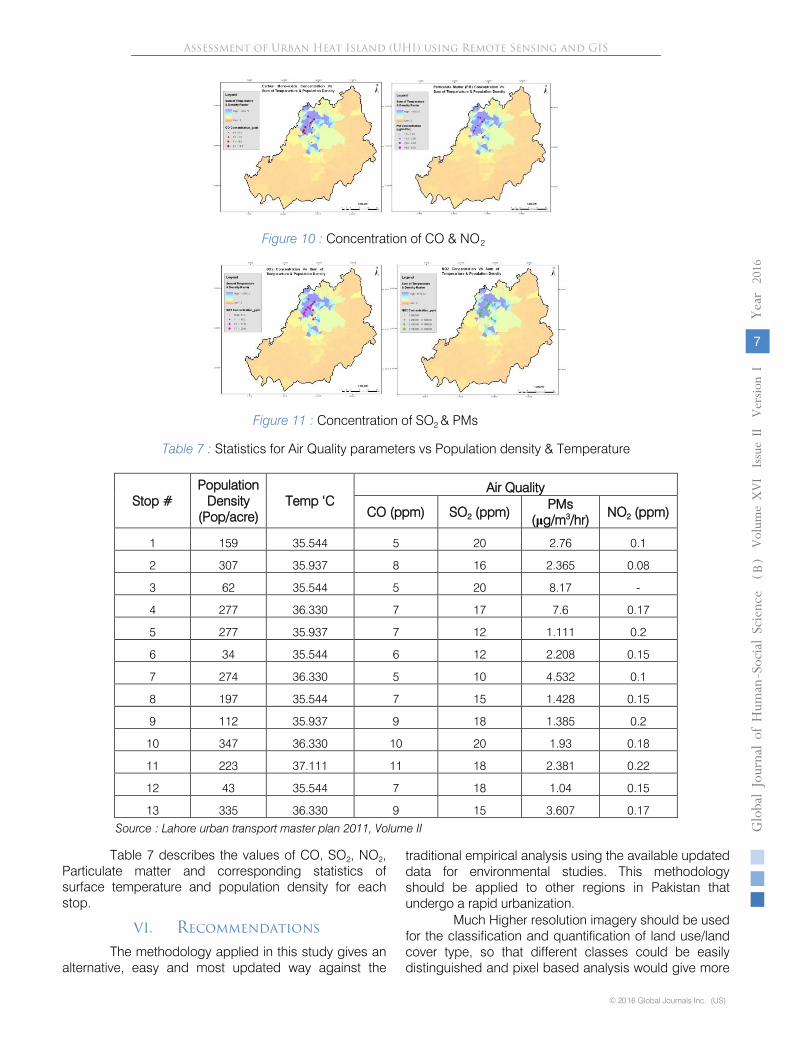
Figure
10 :
Concentration of CO & NO
Figure 11 :
Concentration of SO2 & PMs
Table 7 :
Statistics for Air Quality parameters vs Population density & Temperature
Source : Lahore urban transport master plan 2011, Volume II
Table 7 describes the values of CO, SO2, NO2, Particulate matter and corresponding statistics of surface temperature and population density for each stop.
VI.
Recommendations
The methodology applied in this study gives an alternative, easy and most updated way against the
traditional empirical analysis using the available updated data for environmental studies. This methodology should be applied to other regions in Pakistan that undergo a rapid urbanization.
Much Higher resolution imagery should be used for the classification and quantification of land use/land cover type, so that different classes could be easily distinguished and pixel based analysis would give more
Stop #
Population
Density
(Pop/acre)
Temp
‘C
Air Quality
CO (ppm)
SO2
(ppm)
PMs
(μg/m3/hr)
NO2
(ppm)
1 159
35.544
5 20
2.76
0.1
2 307
35.937
8 16
2.365
0.08
3 62
35.544
5 20
8.17
-
4 277
36.330
7 17
7.6
0.17
5 277
35.937
7 12
1.111
0.2
6 34
35.544
6 12
2.208
0.15
7 274
36.330
5 10
4.532
0.1
8 197
35.544
7 15
1.428
0.15
9 112
35.937
9 18
1.385
0.2
10
347
36.330
10
20
1.93
0.18
11
223
37.111
11
18
2.381
0.22
12
43
35.544
7 18
1.04
0.15
13
335
36.330
9 15
3.607
0.17
Assessment of Urban Heat Island (UHI) using Remote Sensing and GIS
V
olum
e XVI Issue
II V
ersio
n I
7
( B)
Globa
l Jo
urna
l of H
uman
Soc
ial Sc
ienc
e
-
Year
2016
© 2016 Global Journals Inc. (US)
2
accurate and precise results. More improvement in temperature estimation will occur by using Landsat 7 with resolution of 60m thermal sensor.
Several atmospheric effects (e.g., partial water vapor absorption), variable surface emissivity, sub-pixel variation of surface temperature and urban geometry affects the measurement of Land surface temperature. Therefore, these factors should be considered in computing actual LST in future.
Assessment of Urban Heat Island (UHI) using Remote Sensing and GIS
© 2016 Global Journals Inc. (US)
V
olum
e XVI Issue
II V
ersio
n I
8
( B)
Globa
l Jo
urna
l of H
uman
Soc
ial Sc
ienc
e
s
-
Year
2016
© 2016. Mehjabin Elahi, Dr. Shahedur Rashid & Dr. Prosannajid Sarkar. This is a research/review paper, distributed under the terms of the Creative Commons Attribution-Noncommercial 3.0 Unported License http://creativecommons.org/licenses/by-nc/3.0/), permitting all non-commercial use, distribution, and reproduction in any medium, provided the original work is properly cited.
Global Journal of HUMAN-SOCIAL SCIENCE: B Geography, Geo-Sciences, Environmental Science & Disaster Management Volume 16 Issue 2 Version 1.0 Year 2016 Type: Double Blind Peer Reviewed International Research Journal Publisher: Global Journals Inc. (USA) Online ISSN: 2249-460x & Print ISSN: 0975-587X
An Analysis of Health Situation of Women and Children at the Char of Gangachara Upazilla: A GIS based Case Study
By Mehjabin Elahi, Dr. Shahedur Rashid & Dr. Prosannajid Sarkar Jahangirnagar University, Bangladesh
Abstract- Every year in Bangladesh substantial life of women and children are lost through various diseases. The study area of Gangachara is one of the monga-prone areas in Bangladesh. The river, Tista has a big influence on the livelihoods of the people of Gangachara. Healthcare situation in the chars is poor. But health is a basic requirement to improve the quality of life. Floods and erosion disrupted the lives of char dwellers. The victims of erosion lose their settlements, agricultural lands and employment and are forced to move elsewhere sometimes on a yearly basis. Bangladesh is still lagging behind in the field of environmental health. The Level of morbidity remains very high in Bangladesh. Much of the sickness, ill health and resultant deaths in this country are due the overall degradation of the environment. More than 80% population in Bangladesh live in rural areas and environmental problems are more acute in the rural areas of the country.
Keywords: women, children, health situation, gangachara, GIS.
GJHSS-B Classification : FOR Code: 059999p
AnAnalysisofHealthSituationofWomenandChildrenattheCharofGangacharaUpazillaAGISbasedCaseStudy
Strictly as per the compliance and regulations
of:
An Analysis of Health Situation of Women and Children at the Char of Gangachara Upazilla: A
GIS based Case Study
Mehjabin Elahi α, Dr. Shahedur Rashid σ & Dr. Prosannajid Sarkar ρ
Abstract- Every year in Bangladesh substantial life of women and children are lost through various diseases. The study area of Gangachara is one of the monga-prone areas in Bangladesh. The river, Tista has a big influence on the livelihoods of the people of Gangachara. Healthcare situation in the chars is poor. But health is a basic requirement to improve the quality of life. Floods and erosion disrupted the lives of char dwellers. The victims of erosion lose their settlements, agricultural lands and employment and are forced to move elsewhere sometimes on a yearly basis. Bangladesh is still lagging behind in the field of environmental health. The Level of morbidity remains very high in Bangladesh. Much of the sickness, ill health and resultant deaths in this country are due the overall degradation of the environment. More than 80% population in Bangladesh live in rural areas and environmental problems are more acute in the rural areas of the country. Keywords: women, children, health situation, gangachara, GIS.
I. Introduction
he riverine sand and silt landmasses known as char in Bengali are home to over 5 million people in Bangladesh. These areas are highly vulnerable
to sudden and forceful flooding as well as erosion and loss of land, which makes living in the chars both hazardous and insecure. Many char dwellers struggle to produce or buy enough food to eat and malnutrition and micronutrient deficiencies are more common than elsewhere in the country. The chars- some midstream islands and others attached to the mainland–are created from river sediment and are in a constant state of formation and erosion. Emerging chars create new areas for settlement and cultivation, an important resource in a land scarce country such as Bangladesh. However, a constant threat of riverbank erosion and flooding, combined with a lack of physical infrastructure, government services and employment opportunities in the chars, makes for a vulnerable, difficult and fragile way of life. Char dwellers are considered poorer than the mainland population and are increasingly becoming the targets of efforts to reduce property. Nevertheless, there
Author α σ:
Department of Geography and Environment, Jahangirnagar University,
Savar, Dhaka, Bangladesh. e-mails: [email protected], [email protected]
Author ρ:
Researcher, Dr. Wazed Research Institute, Begum Rokeya University,
Rangpur, Rangpur, Bangladesh. e-mail: [email protected]
is still very little quantitative information on the health,
nutrition, and food security of these vulnerable people, partly because they are highly mobile and access to the chars is physically difficult. Floods damage or destroy crops, homes, water and sanitation facilities and other assets and hinder access to food, medical care, schools and work. The victims of erosion lose their settlements, agricultural land and employment and are forced to move elsewhere, sometimes on a yearly basis.
The main
concern of this study is to assess the health situation of women and children at the chars of Gangachara Upazilla. It will also focus on the present problems of healthcare system to provide the char dwellers a better health care system.
II.
Statement of the
Problem
Every year in Bangladesh substantial life of women and children are lost through various diseases. Gangachara, the study area, is one of the monga-prone areas in Bangladesh. The river Teesta has a big influence on the livelihoods of the people of Gangachara. Name of the major chars of Gangachara are Binbinia char, Motukpur char, Kolkond char, kholair char, Nohalir char and Malai char. Healthcare situation in all the above mentioned chars is poor. But healthy is a basic requirement to improve the quality of life. A national economic and social development depends on the state of health. A large number of Bangladesh’s people, particularly in char areas, remained with no or little access
to healthcare facilities. Gangachara Upazilla
has an area of 9.86 sq. km. The town has a population of 12,600 out of which 52.02% is male and 47.98% is female. Only 15.1% female are literate. There are ten family planning centre, two satellite clinics and
a health
complex. This study will determine the health situation of women and children at the major char areas of Gangachara Upazilla.
a)
Aim of the Study
To demonstrate the present health situation of women and children at the char areas of Gangachara Upazilla.
b)
Objectives of the Study
The objectives of the study are:
T
V
olum
e XVI Issue
II V
ersio
n I
9
( B)
Globa
l Jo
urna
l of H
uman
Soc
ial Sc
ienc
e
-
Year
2016
© 2016 Global Journals Inc. (US)
To know about the health problems and facilities of study area.
To know about the consciousness level of women and children health of study area.
To know about the environmental effect on women and children health of study area.
To analyze related aspects of concern areas from maps and satellite images by using GPS.
c)
Study Area
Study area is uttar kolkanda
mouza located in Gangachara
upazila of Rangpur district, Bangladesh.
Gangachara upazila was established in 1917 and consists of 9 union parishads, 93 mouzas and 149 villages. Total area of Gangachara Upazila is 209.61 sq km. Gangachara (Town) consists of two mouzas. It has an area of 9.86 sq km. The town has a population of 12600; male 52.02%, female 47.98%. The density of population is 1278 per sq km. Literacy rate among the town people is 28.6%. Gangachara is noted for tobacco production.
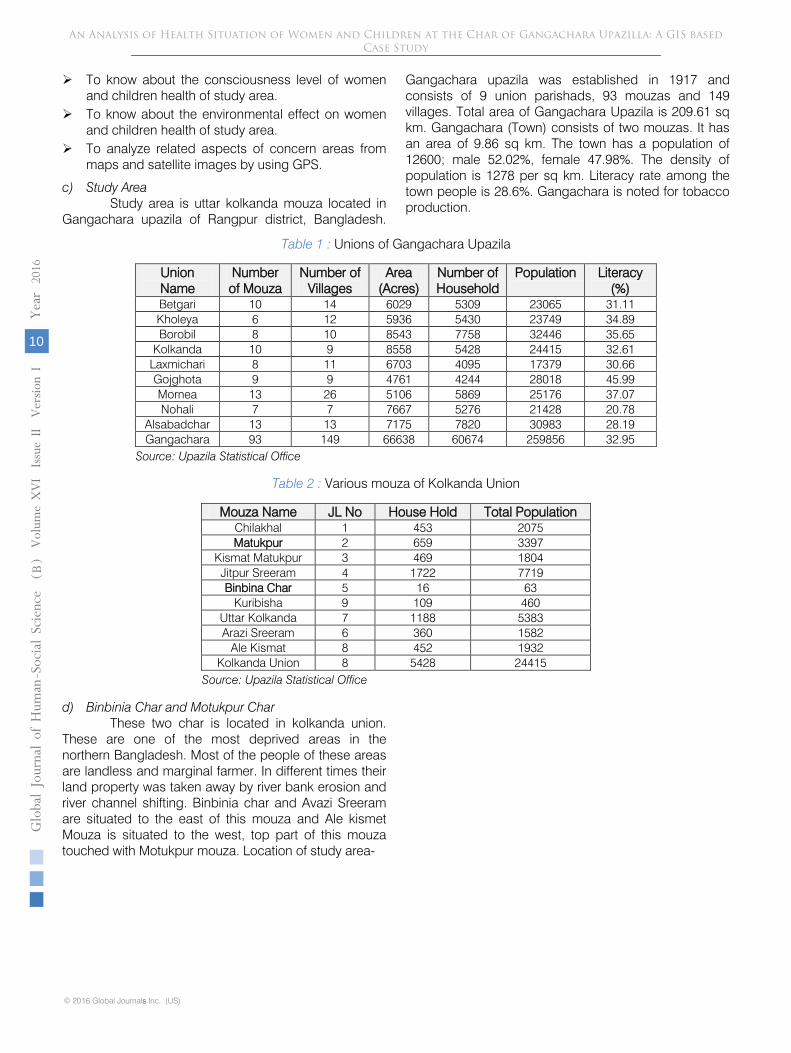
Table 1 :
Unions
of Gangachara Upazila
Union Name
Number of Mouza
Number of Villages
Area (Acres)
Number of Household
Population
Literacy
(%)
Betgari
10 14
6029
5309
23065
31.11
Kholeya
6 12
5936
5430
23749
34.89
Borobil 8 10
8543
7758
32446
35.65
Kolkanda
10
9 8558
5428
24415
32.61
Laxmichari
8 11
6703
4095
17379
30.66
Gojghota
9 9 4761
4244
28018 45.99
Mornea
13
26
5106
5869
25176
37.07
Nohali
7 7 7667
5276
21428
20.78
Alsabadchar
13
13
7175
7820
30983
28.19
Gangachara
93
149
66638
60674
259856
32.95
Source: Upazila Statistical Office
Table 2 :
Various mouza of Kolkanda Union
Mouza Name
JL No
House Hold
Total Population
Chilakhal
1 453
2075
Matukpur
2 659
3397
Kismat Matukpur
3
469
1804
Jitpur Sreeram
4 1722
7719
Binbina Char
5 16
63
Kuribisha
9 109
460
Uttar Kolkanda
7 1188
5383
Arazi Sreeram
6 360
1582
Ale Kismat
8 452
1932
Kolkanda Union
8 5428
24415
Source: Upazila Statistical Office
d)
Binbinia Char and Motukpur Char
These two char is located in kolkanda union.
These are one of the most deprived areas in the northern Bangladesh. Most of the people of these areas
are landless and marginal farmer. In different times their land property was taken away by river bank erosion and river channel shifting.
Binbinia char and Avazi Sreeram are situated to the east of this mouza and Ale kismet Mouza is situated to the west, top part of this mouza touched with Motukpur mouza.
Location of study area-
An Analysis of Health Situation of Women and Children at the Char of Gangachara Upazilla: A GIS based Case Study
© 2016 Global Journals Inc. (US)
V
olum
e XVI Issue
II V
ersio
n I
10
( B)
Globa
l Jo
urna
l of H
uman
Soc
ial Sc
ienc
e
s
-
Year
2016
III.
Research
Methodology
Systematically sampling has taken to collect social data or information.
To have performed the analysis on the data sets and derived the findings, GIS, as usual descriptive statistical tools and techniques have been applied in the study.
Here, two types of primary data (socio-economic and geographical) are
collected from the field by conducting questionnaire survey, FGD and GPS device etc. Major primary sources which will be conducted in four ways- (i)In-situ Observation, (ii) Formal Questionnaire Survey, (iii) FGD, (iv)
GPS Survey. Here, noted, The GPS technology has
tremendous amount of applications in GIS data collection, surveying, and mapping.
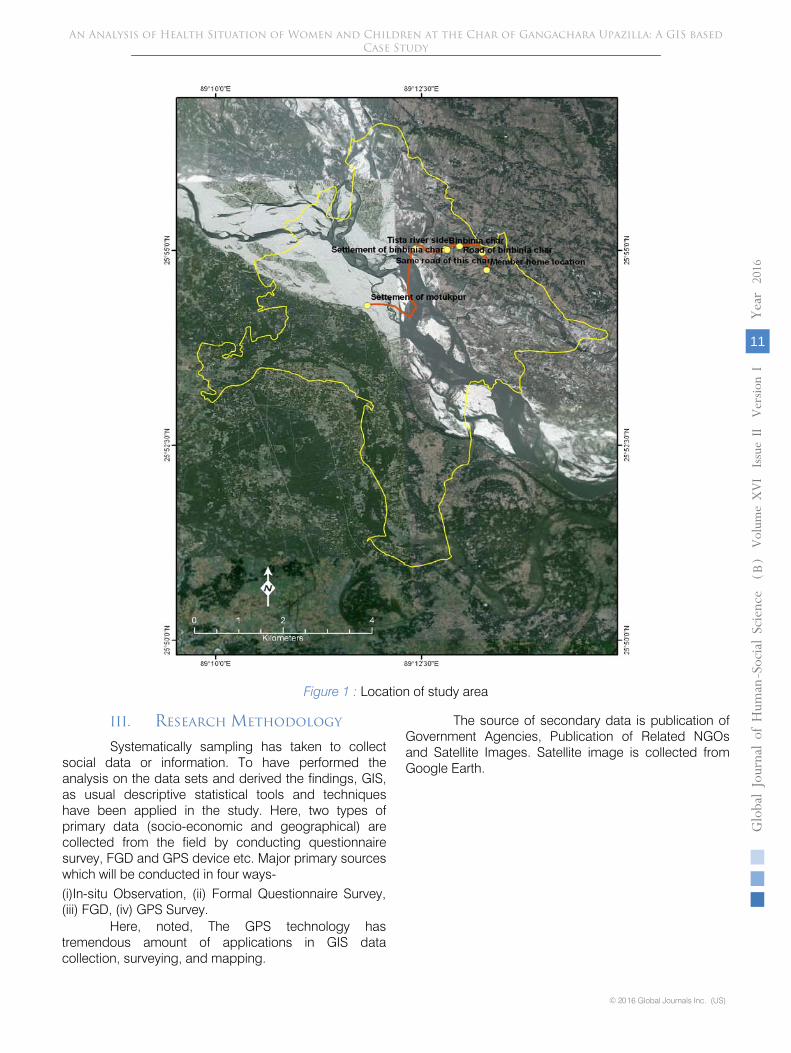
The source
of secondary data is
publication of Government Agencies, Publication of Related NGOs and Satellite Images. Satellite image is collected from Google Earth.
V
olum
e XVI Issue
II V
ersio
n I
11
( B)
Globa
l Jo
urna
l of H
uman
Soc
ial Sc
ienc
e
-
Year
2016
© 2016 Global Journals Inc. (US)
An Analysis of Health Situation of Women and Children at the Char of Gangachara Upazilla: A GIS based Case Study
Figure 1 : Location of study area
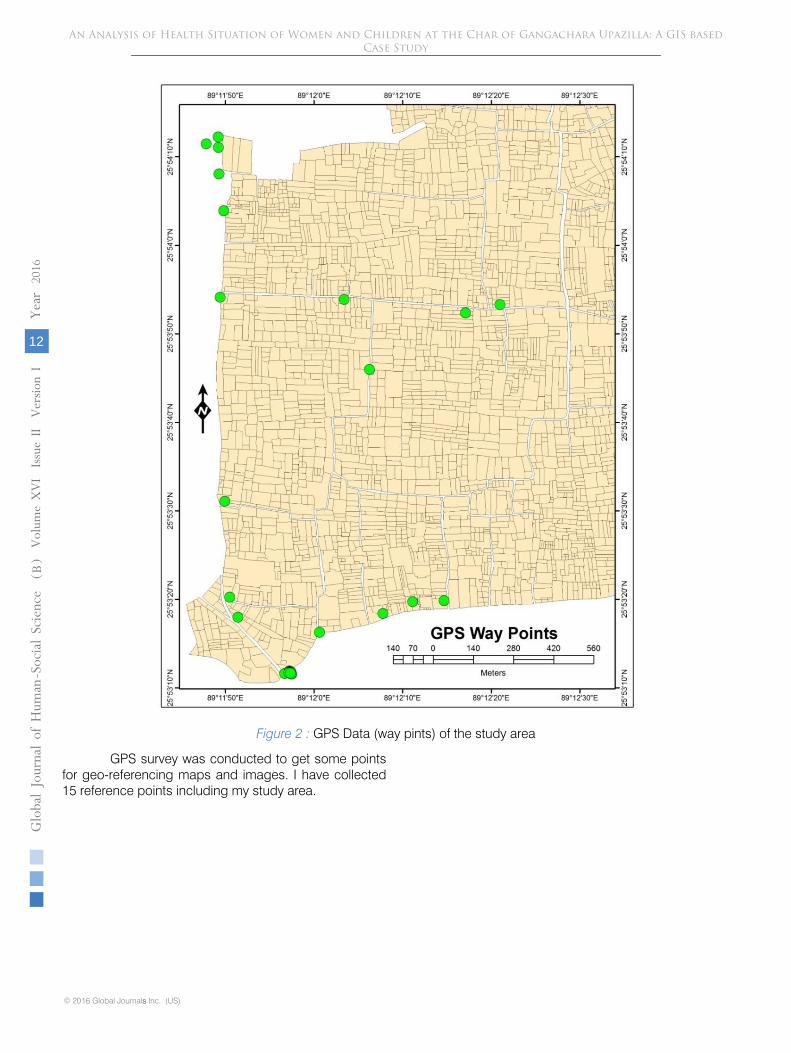
Figure 2 : GPS Data (way pints) of the study area
GPS survey was conducted to get some points
for geo-referencing maps and images. I have collected 15 reference points including my study area.
An Analysis of Health Situation of Women and Children at the Char of Gangachara Upazilla: A GIS based Case Study
© 2016 Global Journals Inc. (US)
V
olum
e XVI Issue
II V
ersio
n I
12
( B)
Globa
l Jo
urna
l of H
uman
Soc
ial Sc
ienc
e
s
-
Year
2016
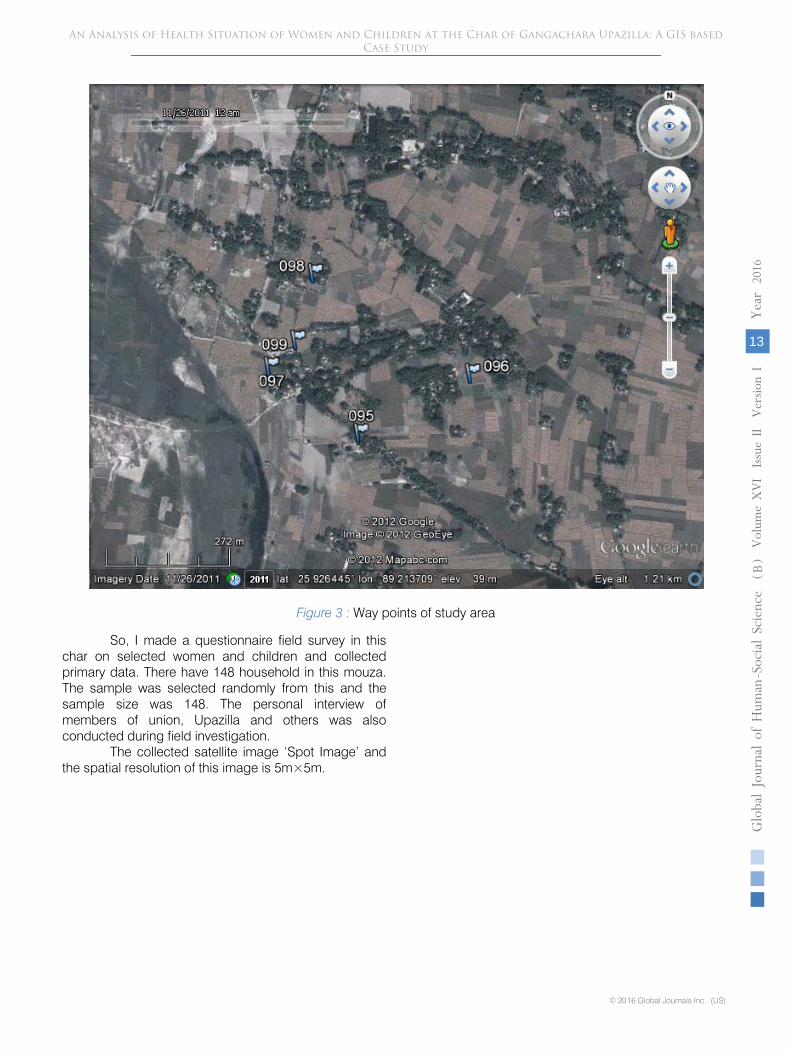
Figure 3 : Way points of study area
So, I made a questionnaire field survey in this char on selected women and children and collected primary data. There have 148 household in this mouza. The sample was selected randomly from this and the sample size was 148. The personal interview of members of union, Upazilla and others was also conducted during field investigation.
The collected satellite image ‘Spot Image’ and the spatial resolution of this image is 5m×5m.
An Analysis of Health Situation of Women and Children at the Char of Gangachara Upazilla: A GIS based Case Study
V
olum
e XVI Issue
II V
ersio
n I
13
( B)
Globa
l Jo
urna
l of H
uman
Soc
ial Sc
ienc
e
-
Year
2016
© 2016 Global Journals Inc. (US)
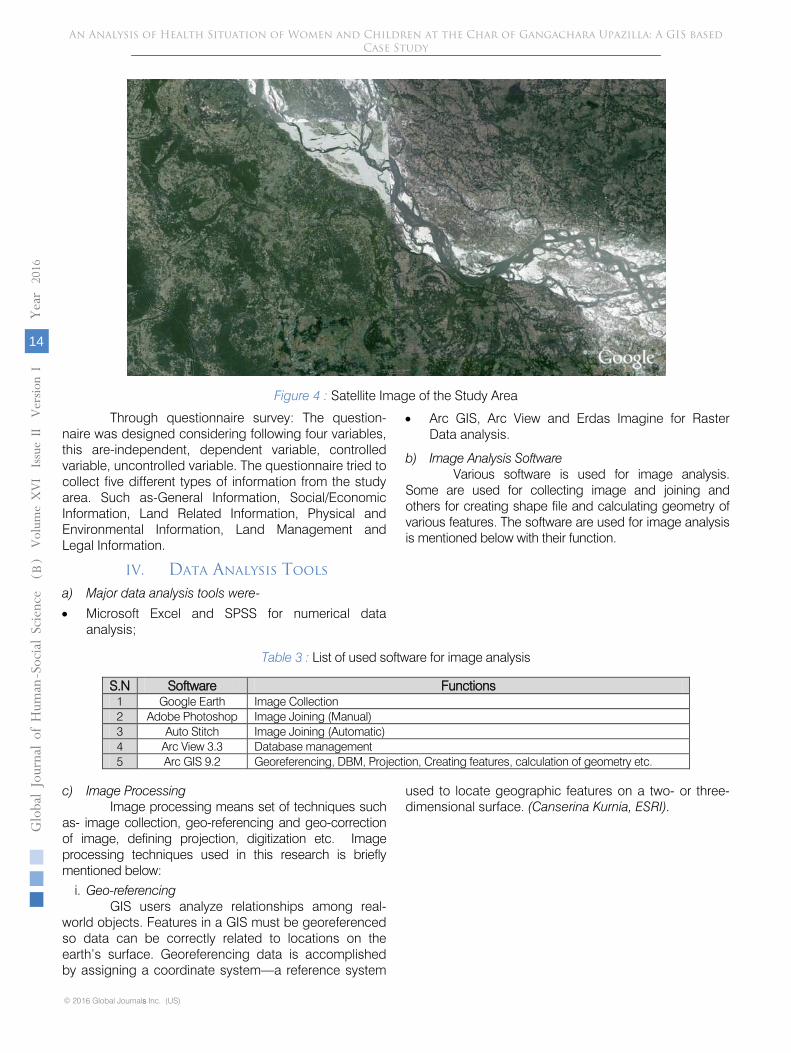
Figure 4 : Satellite Image of the Study Area
Through questionnaire survey:
The question-naire was designed considering following four variables, this are-independent, dependent variable, controlled variable, uncontrolled variable. The questionnaire tried to collect five different types of information from the study area. Such as-General Information, Social/Economic Information, Land Related Information, Physical and Environmental Information, Land Management and Legal Information.
IV. Data Analysis Tools
a) Major data analysis tools were-
• Microsoft Excel and SPSS for numerical data analysis;
•
Arc GIS, Arc View and Erdas Imagine for Raster Data analysis.
b)
Image Analysis Software
Various software
is
used for image analysis. Some are used for collecting image and joining and others for creating shape file and calculating geometry of various features. The software are used for image analysis is mentioned below with their function.
Table 3 : List of used software for image analysis
S.N
Software
Functions
1 Google Earth
Image Collection
2 Adobe Photoshop
Image Joining (Manual)
3
Auto Stitch
Image Joining (Automatic)
4 Arc View 3.3
Database management
5 Arc GIS 9.2
Georeferencing, DBM, Projection, Creating features, calculation of geometry etc.
c)
Image Processing
Image processing means set of techniques such as- image collection, geo-referencing and geo-correction of image, defining projection, digitization etc. Image processing techniques used in this research is briefly mentioned below:
i. Geo-referencing
GIS users analyze relationships among real-world objects. Features in a GIS must be georeferenced so data can be correctly related to locations on the earth’s surface. Georeferencing data is accomplished by assigning a coordinate system—a reference system
used to locate geographic features on a two- or three-dimensional surface.
(Canserina Kurnia, ESRI).
An Analysis of Health Situation of Women and Children at the Char of Gangachara Upazilla: A GIS based Case Study
© 2016 Global Journals Inc. (US)
V
olum
e XVI Issue
II V
ersio
n I
14
( B)
Globa
l Jo
urna
l of H
uman
Soc
ial Sc
ienc
e
s
-
Year
2016
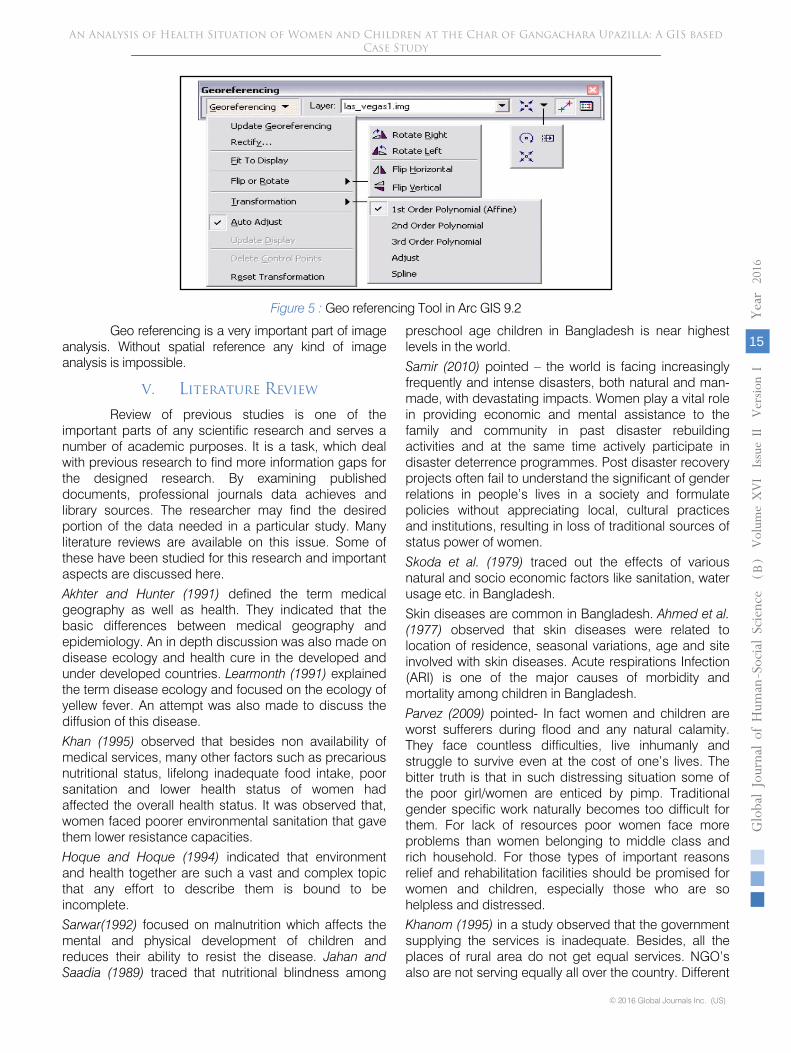
Figure 5 : Geo referencing Tool in Arc GIS 9.2
Geo referencing is a very important part of image analysis. Without spatial reference any kind of image analysis is impossible.
V. Literature Review
Review of previous studies is one of the important parts of any scientific research and serves a number of academic purposes. It is a task, which deal with previous research to find more information gaps for the designed research. By examining published documents, professional journals data achieves and library sources. The researcher may find the desired portion of the data needed in a particular study. Many literature reviews are available on this issue. Some of these have been studied for this research and important aspects are discussed here.
Akhter and Hunter (1991) defined the term medical geography as well as health. They indicated that the basic differences between medical geography and epidemiology. An in depth discussion was also made on disease ecology and health cure in the developed and under developed countries. Learmonth (1991) explained the term disease ecology and focused on the ecology of yellew fever. An attempt was also made to discuss the diffusion of this disease.
Khan (1995) observed that besides non availability of medical services, many other factors such as precarious nutritional status, lifelong inadequate food intake, poor sanitation and lower health status of women had affected the overall health status. It was observed that, women faced poorer environmental sanitation that gave them lower resistance capacities.
Hoque and Hoque (1994) indicated that environment and health together are such a vast and complex topic that any effort to describe them is bound to be incomplete.
Sarwar(1992) focused on malnutrition which affects the mental and physical development of children and reduces their ability to resist the disease. Jahan and Saadia (1989) traced that nutritional blindness among
preschool age children in Bangladesh is near highest levels in the world.
Samir (2010) pointed – the world is facing increasingly frequently and intense disasters, both natural and man-made, with devastating impacts. Women play a vital role in providing economic and mental assistance to the family and community in past disaster rebuilding activities and at the same time actively participate in disaster deterrence programmes. Post disaster recovery projects often fail to understand the significant of gender relations in people’s lives in a society and formulate policies without appreciating local, cultural practices and institutions, resulting in loss of traditional sources of status power of women.
Skoda et al. (1979) traced out the effects of various natural and socio economic factors like sanitation, water usage etc. in Bangladesh.
Skin diseases are common in Bangladesh. Ahmed et al. (1977) observed that skin diseases were related to location of residence, seasonal variations, age and site involved with skin diseases. Acute respirations Infection (ARI) is one of the major causes of morbidity and mortality among children in Bangladesh.
Parvez (2009) pointed- In fact women and children are worst sufferers during flood and any natural calamity. They face countless difficulties, live inhumanly and struggle to survive even at the cost of one’s lives. The bitter truth is that in such distressing situation some of the poor girl/women are enticed by pimp. Traditional gender specific work naturally becomes too difficult for them. For lack of resources poor women face more problems than women belonging to middle class and rich household. For those types of important reasons relief and rehabilitation facilities should be promised for women and children, especially those who are so helpless and distressed.
Khanom (1995) in a study observed that the government supplying the services is inadequate. Besides, all the places of rural area do not get equal services. NGO’s also are not serving equally all over the country. Different
An Analysis of Health Situation of Women and Children at the Char of Gangachara Upazilla: A GIS based Case Study
V
olum
e XVI Issue
II V
ersio
n I
15
( B)
Globa
l Jo
urna
l of H
uman
Soc
ial Sc
ienc
e
-
Year
2016
© 2016 Global Journals Inc. (US)

NGO’s working in different areas. Some areas are having services from more than one NGO on the country; some areas do not have any access to any kind of services. This study also indicated that insufficiency of doctor’s, especially female doctor is a major problem in rural area. As a result, different maternal complicacies do not get treatment. Besides for ‘Pardah’ tradition, women do not want to see a male doctor in some casas any doctor at all. This study further noticed that the services of the government health workers are not regular in some places.
The above studies have addressed health-related issues of Bangladesh from the perspective of health practitioners. Very few studies in that past have focused on the spatial variation of mortality and morbidity in Bangladesh (Huq, 1996). He focused on the spatial epidemiological aspect of child health in a small area (Savar thana, Dhaka) of Bangladesh using GIS tools. He observed that both social and physical environments played significant roles on the morbidity and mortality of the children aged (0-5) years. Kingham et al. (1995) outlined spatial clustering of health events using environmental epidemiological data in a study on the child health situation in Lancashire in England. This study examined spatial clustering problems of disease with the aid of GIS (quoted in Huq, 1996).
Twigg
(1990)
in a study on health care indicated that GIS has much potential in hhealth care planning and further argued that although Gis offers much potential, its use in the health service is crucially dependent upon the availability of geo referenced, accurate and up to
date data.
VI.
Results
and Discussions
a)
Women and Children Health Condition of Char Area
Binbinia and Motukpur char of Gangachara
Upazilla is one of the most flood vulnerable areas which are affected by flood and riverbank erosion almost every year. To assess the health situation of women and children of this area, field survey is needed to acquire the real picture. So, I made a questionnaire field survey in this char on selected women and
children and collected primary data. There have 148 household in this mouza. The sample was selected randomly from this and the sample size was 148. The personal interview of members of union, Upazilla and others was also conducted during field investigation. Those collected data are needed to analyze and arrange to find out the problem and there coping and adapting strategies. The analyzed data are given below:
Table 4 : Women and children health condition (Food, Water, and Sanitation)
Questions Total
Respondents Number of Respondents
Yes No Can you manage the right proportion of food materials for your family members
148 49 99
Do you face scarcity of water 148 69 79 Do you face any sanitation problem 148 32 116 Do you think your sanitary system is hygienic? 148 31 117 Do you think women and children need extra privacy and protection in any form like time of bathing, using latrine, collecting water and others
148 148 0
Source: Field Survey, 2012 i. Comments
Those women and children stay in char area; they also have to face different kind of difficulties than the male person. Women cook their food in their house
but for this they have to face various kinds of problems such as deficiency of food materials, scarcity of drinking water and sufficient fuel. Moreover maximum women families sanitary system are non hygienic.
Table 5 : Women and children health condition of char area
Questions Total Respondents
Number of Respondents Yes No
For pregnant women has there any special facilities in your area 148 0 148 Ever you and your children attacked by water born diseases 148 72 76 Do you get any doctors facility in your area 148 25 123 Do you get any private organization or govt. free medical facilities 148 37 111
Source: Field Survey, 2012
ii. Comments
Women and children face different kinds of health problems. Specially, pregnant women do not get any kinds of facilities in the study area. They are also
affected with several kinds of water born diseases and they do not get any doctoral facility.
An Analysis of Health Situation of Women and Children at the Char of Gangachara Upazilla: A GIS based Case Study
© 2016 Global Journals Inc. (US)
V
olum
e XVI Issue
II V
ersio
n I
16
( B)
Globa
l Jo
urna
l of H
uman
Soc
ial Sc
ienc
e
s
-
Year
2016
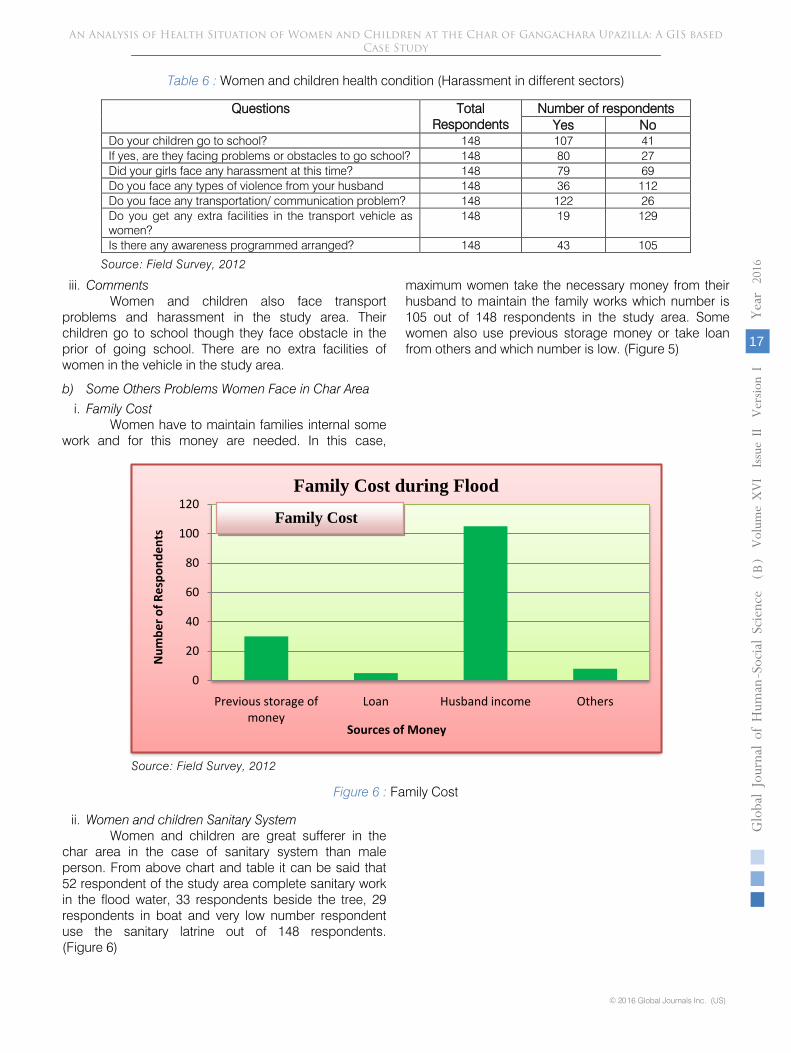
Table 6 : Women and children health condition (Harassment in different sectors)
Questions Total Respondents
Number of respondents Yes No
Do your children go to school? 148 107 41 If yes, are they facing problems or obstacles to go school? 148 80 27 Did your girls face any harassment at this time? 148 79 69 Do you face any types of violence from your husband 148 36 112 Do you face any transportation/ communication problem? 148 122 26 Do you get any extra facilities in the transport vehicle as women?
148 19 129
Is there any awareness programmed arranged? 148 43 105
Source: Field Survey, 2012 iii. Comments
Women and children also face transport problems and harassment in the study area. Their children go to school though they face obstacle in the prior of going school. There are no extra facilities of women in the vehicle in the study area.
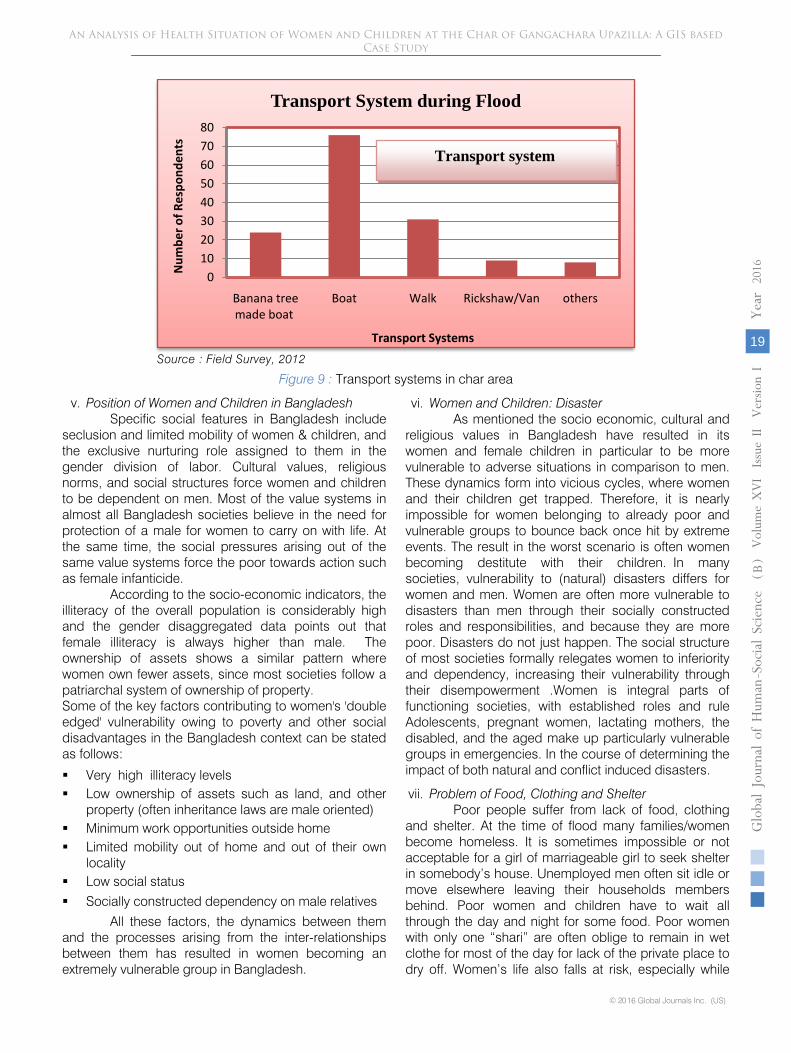
b) Some Others Problems Women Face in Char Area i. Family Cost
Women have to maintain families internal some work and for this money are needed. In this case,
maximum women take the necessary money from their husband to maintain the family works which number is 105 out of 148 respondents in the study area. Some women also use previous storage money or take loan from others and which number is low. (Figure 5)
Source: Field Survey, 2012
Figure 6 : Family Cost
ii. Women and children Sanitary System
Women and children are great sufferer in the char area in the case of sanitary system than male person. From above chart and table it can be said that 52 respondent of the study area complete sanitary work in the flood water, 33 respondents beside the tree, 29 respondents in boat and very low number respondent use the sanitary latrine out of 148 respondents.
(Figure 6)
0
20
40
60
80
100
120
Previous storage of money
Loan Husband income Others
Num
ber o
f Res
pond
ents
Sources of Money
Family Cost during Flood
Family Cost
An Analysis of Health Situation of Women and Children at the Char of Gangachara Upazilla: A GIS based Case Study
V
olum
e XVI Issue
II V
ersio
n I
17
( B)
Globa
l Jo
urna
l of H
uman
Soc
ial Sc
ienc
e
-
Year
2016
© 2016 Global Journals Inc. (US)

Source: Field Survey, 2012
Figure 7 : Women and children Sanitary System
iii. Diseases Spread in char area Different kinds of disease are spread in the char
area. From above chart and table it can be said that among them most of the women and children are
affected by skin disease which number is 71 out of 148 respondents. Some are also affected by typhoid, Diarrhea etc related diseases in the prior of flood. (Figure 7)
Source: Field Survey, 2012
Figure 8 : Diseases Spread in char area
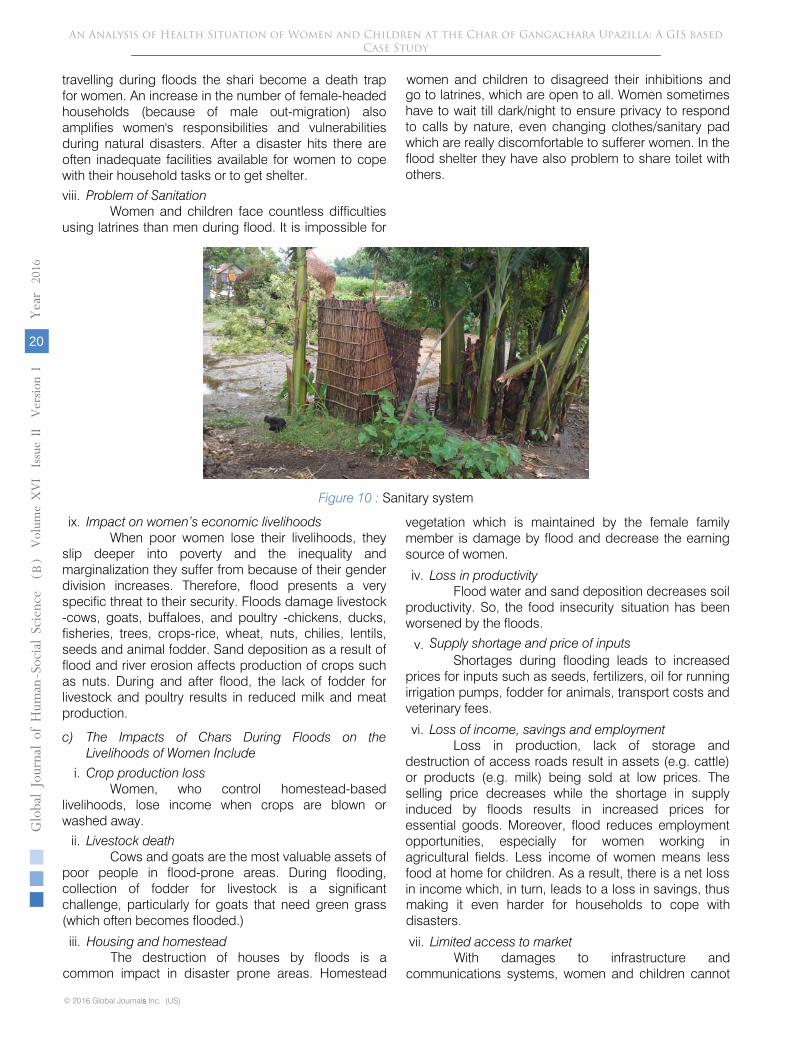
iv. Transport system in char area
From below data chart (Figure 8) it is found that maximum women use boat as a mode of transportation in the study area which number is 76 out of 148 respondents where as 31 respondents go to their destination on foot.
0
10
20
30
40
50
60
Sanitary Latrine
In the flood water
Beside the Tree
Boat in the tong Others
Num
ber o
f Res
pond
ents
Sanitary System during Flood
Women Sanitary System during Flood
0
20
40
60
80
Diarrohea Typhoid Skin disease othersNum
ber o
f Res
pond
ents
Diseases
Diseases Spread during Flood
Women and children Sanitary
Sanitary System
Diseases Spread in char area
An Analysis of Health Situation of Women and Children at the Char of Gangachara Upazilla: A GIS based Case Study
© 2016 Global Journals Inc. (US)
V
olum
e XVI Issue
II V
ersio
n I
18
( B)
Globa
l Jo
urna
l of H
uman
Soc
ial Sc
ienc
e
s
-
Year
2016
Source : Field Survey, 2012
Figure 9 : Transport systems in char area
v. Position of Women and Children in Bangladesh Specific social features in Bangladesh include
seclusion and limited mobility of women & children, and the exclusive nurturing role assigned to them in the gender division of labor. Cultural values, religious norms, and social structures force women and children to be dependent on men. Most of the value systems in almost all Bangladesh societies believe in the need for protection of a male for women to carry on with life. At the same time, the social pressures arising out of the same value systems force the poor towards action such as female infanticide.
According to the socio-economic indicators, the illiteracy of the overall population is considerably high and the gender disaggregated data points out that female illiteracy is always higher than male. The ownership of assets shows a similar pattern where women own fewer assets, since most societies follow a patriarchal system of ownership of property. Some of the key factors contributing to women's 'double edged' vulnerability owing to poverty and other social disadvantages in the Bangladesh context can be stated as follows:
Very high illiteracy levels Low ownership of assets such as land, and other
property (often inheritance laws are male oriented) Minimum work opportunities outside home Limited mobility out of home and out of their own
locality Low social status Socially constructed dependency on male relatives
All these factors, the dynamics between them and the processes arising from the inter-relationships between them has resulted in women becoming an extremely vulnerable group in Bangladesh.
vi. Women and Children: Disaster As mentioned the socio economic, cultural and
religious values in Bangladesh have resulted in its women and female children in particular to be more vulnerable to adverse situations in comparison to men. These dynamics form into vicious cycles, where women and their children get trapped. Therefore, it is nearly impossible for women belonging to already poor and vulnerable groups to bounce back once hit by extreme events. The result in the worst scenario is often women becoming destitute with their children. In many societies, vulnerability to (natural) disasters differs for women and men. Women are often more vulnerable to disasters than men through their socially constructed roles and responsibilities, and because they are more poor. Disasters do not just happen. The social structure of most societies formally relegates women to inferiority and dependency, increasing their vulnerability through their disempowerment .Women is integral parts of functioning societies, with established roles and rule Adolescents, pregnant women, lactating mothers, the disabled, and the aged make up particularly vulnerable groups in emergencies. In the course of determining the impact of both natural and conflict induced disasters. vii. Problem of Food, Clothing and Shelter
Poor people suffer from lack of food, clothing and shelter. At the time of flood many families/women become homeless. It is sometimes impossible or not acceptable for a girl of marriageable girl to seek shelter in somebody’s house. Unemployed men often sit idle or move elsewhere leaving their households members behind. Poor women and children have to wait all through the day and night for some food. Poor women with only one “shari” are often oblige to remain in wet clothe for most of the day for lack of the private place to dry off. Women’s life also falls at risk, especially while
01020304050607080
Banana tree made boat
Boat Walk Rickshaw/Van others
Num
ber o
f Res
pond
ents
Transport Systems
Transport System during Flood
Transport system
An Analysis of Health Situation of Women and Children at the Char of Gangachara Upazilla: A GIS based Case Study
V
olum
e XVI Issue
II V
ersio
n I
19
( B)
Globa
l Jo
urna
l of H
uman
Soc
ial Sc
ienc
e
-
Year
2016
© 2016 Global Journals Inc. (US)
travelling during floods the shari become a death trap for women. An increase in the number of female-headed households (because of male out-migration) also amplifies women's responsibilities and vulnerabilities during natural disasters. After a disaster hits there are often inadequate facilities available for women to cope with their household tasks or to get shelter. viii. Problem of Sanitation
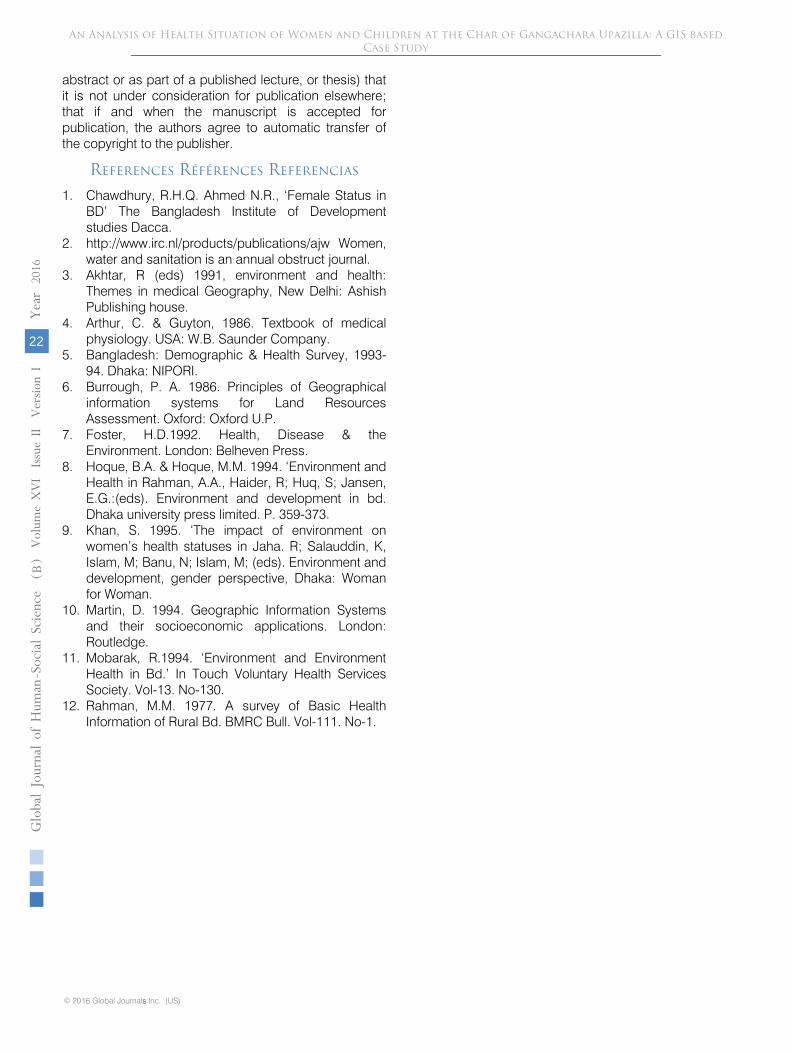
Women and children face countless difficulties using latrines than men during flood. It is impossible for
women and children to disagreed their inhibitions
and go to latrines, which are open to all. Women sometimes have to wait till dark/night to ensure privacy to respond to calls by nature, even changing clothes/sanitary pad which are really discomfortable to sufferer women. In the flood shelter they have also problem to share toilet with others.
Figure 10 :
Sanitary system
ix. Impact on women’s economic livelihoods
When poor women lose their livelihoods, they slip deeper into poverty and the inequality and marginalization they
suffer from because of their gender
division increases. Therefore, flood presents a very specific threat to their security. Floods damage livestock -cows, goats, buffaloes, and poultry -chickens, ducks, fisheries, trees, crops-rice, wheat, nuts, chilies,
lentils,
seeds and animal fodder. Sand deposition as a result of flood and river erosion affects production of crops such as nuts. During and after flood, the lack of fodder for livestock and poultry results in reduced milk and meat production.
c) The Impacts of Chars During Floods on the Livelihoods of Women Include
i. Crop production loss
Women, who control homestead-based livelihoods, lose income when crops are blown or washed away.
ii. Livestock death
Cows and goats are the most valuable assets of poor people
in flood-prone areas. During flooding,
collection of fodder for livestock is a significant challenge, particularly for goats that need green grass (which often becomes flooded.)
iii.
Housing and homestead
The destruction of houses by floods is a common impact in disaster prone areas. Homestead
vegetation which is maintained by the female family member is damage by flood and decrease the earning source of women.
iv.
Loss in productivity
Flood water and sand deposition decreases soil productivity. So, the food insecurity
situation has been worsened by the floods.
v.
Supply shortage and price of inputs
Shortages during flooding leads to increased prices for inputs such as seeds, fertilizers, oil for running irrigation pumps, fodder for animals, transport costs and veterinary fees.
vi.
Loss of
income, savings and employment
Loss in production, lack of storage and destruction of access roads result in assets (e.g. cattle) or products (e.g. milk) being sold at low prices. The selling price decreases while the shortage in supply induced by floods results in increased prices for essential goods. Moreover, flood reduces employment opportunities, especially for women working in agricultural fields. Less income of women means less food at home for children. As a result, there is a net loss in income which, in turn, leads to a loss in savings, thus
An Analysis of Health Situation of Women and Children at the Char of Gangachara Upazilla: A GIS based Case Study
© 2016 Global Journals Inc. (US)
V
olum
e XVI Issue
II V
ersio
n I
20
( B)
Globa
l Jo
urna
l of H
uman
Soc
ial Sc
ienc
e
s
-
Year
2016
making it even harder for households to cope with disasters.
vii. Limited access to marketWith damages to infrastructure and
communications systems, women and children cannot

access the market to buy or sell food such as milk, eggs, vegetables or other products. Women are forced to trade within the village or accept lower prices offered by male buyers from other area.
Also much another socio-economic impact of chars during flood on women
and children are seen in the study area. Among them those mentioned are more common and miserable.
VII.
Research
Findings
Through this study, it becomes clear that chars environment create a great impact on women and children life. By studying this, there found some information which can be summarized that-
The negative impact of char’s environment is widely seen on live, livelihood, agricultures and health.
Most of the women lose their livelihoods; they sink deeper into poverty and the inequality and marginalization they suffer from because of their gender division.
Women who had comparatively less knowledge about their child health and its impact and were dependent on male decision.
Most of the women have no ability to take steps like, pregnancy time, medicine, child education etc.
Most of the women and child suffer from physical injury, water born diseases, malnutrition and other health problems than man.
Woman and children are not get proper health facilities in the health complex only Sunday health worker come and their health facilities are not good.
VIII.
Recommendation
Create an environment in which women’s engagement in adaptation discussion and governance structures is fully supported in order to do so exiting coping strategies and constructing to adaption should be studied.
Empower women and children as agents of adaptation, and provide women with opportunities to control greater percentages of resources (including land) and services and to make independent decisions.
Prevent cultural practices from hindering women’s capacity to adapt.
Assist women and their coalitions and networks at community, national and international levels to ensure that recovery and adaptation measures respond to women’s needs and concerns.
Provide training to women’s organizations, networks and support groups and opportunities to share experiences—women and their organizations should demonstrate exemplary leadership and serve as gender advocates and credible ambassadors on climate change.
Acknowledge women’s social, economic, physical and psychological vulnerabilities in community-based preparedness and response plans in order to reduce the impact of disasters on women.
Recognize women’s abilities and incorporate them into flood relief efforts with the goal of changing gendered roles and perception of rights.
Endeavor to ensure that activities are appropriate for women, and that they receive positive encouragement and support for participation.
Create adaptation finance mechanisms that support livelihood adaptation priorities of poor women, and include gender-disaggregated indicators in adaptation funds for targeting and monitoring the benefits to poor women.
Safe water supply should be provided immediately in the char areas and public awareness should be increased about the contamination
of the water.
The households who have no toilet facilities should be motivated to dispose human excreta at the proper place and sanitary latrines should be constructed at a safe distance from their sources of drinking water.
Medical facilities should be made available to the people in remote areas and service of Upazilla health complex and community health complexes should be developed.
The existing road networks should be developed, so that the people living in the remote areas can easily reach to the health centres.
Primary health education programmes are to be conducted so as to inform, motivate and help people to adopt and maintain health and hygiene practice and lifestyle.
IX.
Limitation of the Study
This study did not incorporate qualitative data in its
methodology. This incorporate of qualitative data in GIS could be more acceptable findings and results. Some of the respondents feel introverted
to give answers of some questions related to their personal income, personal savings and security. Despite all
the above limitations this study might be a model for further research on health aspects of Bangladesh.
a)
Conflict f Interests
The authors declare that there is no conflict of interests regarding the publication of this paper.
An Analysis of Health Situation of Women and Children at the Char of Gangachara Upazilla: A GIS based Case Study
V
olum
e XVI Issue
II V
ersio
n I
21
( B)
Globa
l Jo
urna
l of H
uman
Soc
ial Sc
ienc
e
-
Year
2016
© 2016 Global Journals Inc. (US)
X. Acknowledgment
Financial support by the research Grant of RDRS Bangladesh is gratefully acknowledged.a) Copy Right
All authors declared that the work described has not been published before (except in the form of an
abstract or as part of a published lecture, or thesis) that it is not under consideration for publication elsewhere; that if and when the manuscript is accepted for publication, the authors agree to automatic transfer of the copyright to the publisher.
References Références Referencias
1.
Chawdhury, R.H.Q. Ahmed N.R., ‘Female Status in BD’ The Bangladesh Institute of Development studies Dacca.
2.
http://www.irc.nl/products/publications/ajw
Women, water and sanitation is an annual obstruct journal.
3.
Akhtar, R (eds) 1991, environment and health:
Themes in medical Geography, New Delhi: Ashish Publishing house.
4.
Arthur, C. & Guyton, 1986. Textbook of medical physiology. USA: W.B. Saunder Company.
5.
Bangladesh: Demographic & Health Survey, 1993-94. Dhaka: NIPORI.
6.
Burrough, P.
A.
1986. Principles of Geographical information systems for Land Resources Assessment. Oxford: Oxford U.P.
7.
Foster, H.D.1992. Health, Disease & the Environment. London: Belheven Press.
8.
Hoque, B.A. & Hoque, M.M. 1994. ‘Environment and Health in Rahman, A.A., Haider, R; Huq, S; Jansen, E.G.:(eds). Environment and development in bd. Dhaka university press limited. P. 359-373.
9.
Khan, S. 1995. ‘The impact of environment on women’s health statuses in Jaha. R; Salauddin, K, Islam, M; Banu, N; Islam, M; (eds). Environment and development, gender perspective, Dhaka: Woman for Woman.
10.
Martin, D. 1994. Geographic Information Systems and their socioeconomic applications. London: Routledge.
11.
Mobarak, R.1994. ‘Environment and Environment Health in Bd.’ In Touch Voluntary Health Services Society. Vol-13. No-130.
12.
Rahman, M.M. 1977. A survey of Basic Health Information of Rural Bd. BMRC Bull. Vol-111. No-1.
An Analysis of Health Situation of Women and Children at the Char of Gangachara Upazilla: A GIS based Case Study
© 2016 Global Journals Inc. (US)
V
olum
e XVI Issue
II V
ersio
n I
22
( B)
Globa
l Jo
urna
l of H
uman
Soc
ial Sc
ienc
e
s
-
Year
2016

© 2016. Nkwunonwo, Ugonna C. This is a research/review paper, distributed under the terms of the Creative Commons Attribution-Noncommercial 3.0 Unported License http://creativecommons.org/licenses/by-nc/3.0/), permitting all non-commercial use, distribution, and reproduction in any medium, provided the original work is properly cited.
Global Journal of HUMAN-SOCIAL SCIENCE: B Geography, Geo-Sciences, Environmental Science & Disaster Management Volume 16 Issue 2 Version 1.0 Year 2016 Type: Double Blind Peer Reviewed International Research Journal Publisher: Global Journals Inc. (USA) Online ISSN: 2249-460x & Print ISSN: 0975-587X
A Review of Flooding and Flood Risk Reduction in Nigeria By Nkwunonwo, Ugonna C.
University of Nigeria, Nigeria
Abstract- The prevalence of flooding within Nigeria which has been generally attributed to climate change and poor urban planningis an issue of critical importance within the context of national development.Over the period 1985 to 2014, flooding in Nigeria has affected more than 11 million lives with a total of 1100 deaths and property damage exceeding US$17 billion. Although more frequent floods are recorded in Niger, Adamawa, Oyo, Kano and Jigawa states possibly due to the influence of rivers Niger, Benue, Ogun and Hadeja, Lagos state seems to have experienced most of the floods in the country. With rapid population growth and urbanization in the country the risk of flooding to human lives and properties assumes critical dimensions.Critically, poor awareness of the hazard is a major impasse towards its management. This creates a significant gap in the knowledge of how to improve on the current efforts towards addressing the challenges of flooding in Nigeria. Since attempts to tackle the hazard appear to be limited, the present study is driven by the need to identify those limitations in the flood management efforts in Nigeria. Possible way-forward are suggested based on a critical review of flooding and its management in Nigeria, allied with globally acknowledged 'best practices' in flood risk reduction and lessons learned from other countries’ experiences of flooding.
Keywords: flooding, developing countries, nigeria, flood risk, climate change, flood modelling, flood vulnerability assessment.
GJHSS-B Classification : FOR Code: 920407, 300899
AReviewofFloodingandFloodRiskReductioninNigeria
Strictly as per the compliance and regulations of:
A Review of Flooding and Flood Risk Reduction in Nigeria
Nkwunonwo, Ugonna C.
V
olum
e XVI Issue
II V
ersio
n I
23
( B)
Globa
l Jo
urna
l of H
uman
Soc
ial Sc
ienc
e
-
Year
2016
© 2016 Global Journals Inc. (US)
Abstract- The prevalence of flooding within Nigeria which has been generally attributed to climate change and poor urban planning is an issue of critical importance within the context of national development. Over the period 1985 to 2014, flooding in Nigeria has affected more than 11 million lives with a total of 1100 deaths and property damage exceeding US$17 billion. Although more frequent floods are recorded in Niger, Adamawa, Oyo, Kano and Jigawa states possibly due to the influence of rivers Niger, Benue, Ogun and Hadeja, Lagos state seems to have experienced most of the floods in the country. With rapid population growth and urbanization in the country the risk of flooding to human lives and properties assumes critical dimensions. Critically, poor awareness of the hazard is a major impasse towards its management. This creates a significant gap in the knowledge of how to improve on the current efforts towards addressing the challenges of flooding in Nigeria. Since attempts to tackle the hazard appearto be limited, the present study is driven by the need to identify those limitations in the flood management efforts in Nigeria. Possible way-forward are suggested based on a critical review of flooding and its management in Nigeria, allied with globally acknowledged 'best practices' in flood risk reduction and lessons learned from other countries’ experiences of flooding. It is argued that more robust and scientific approaches to flood risk reduction such as: flood modelling and assessment of vulnerability to flooding are lacking. Ultimately, this study makes recommendations based on three key issues, one of which is to align the focus of flood risk reduction in Nigeria with the objectives of such a task in more developed countries such as the United States, United Kingdom and the Netherlands.Keywords: flooding, developing countries, nigeria, flood risk, climate change, flood modelling, flood vulnerability assessment.
I. Introduction
oncerns for flooding has increased in recent times due to climate change (especially in more frequent and severe rainfall events), sea level
rise, rapid population growth and urbanization, the level of awareness of flood risk, the limited efforts towards flood disaster risk reduction in many places and the exposure and vulnerabilities of large numbers of human population (Peduzzi et al. 2011, Gill et al. 2004, Action aid 2006, Raaijmakers et al. 2008). The impacts of flooding reported in the last two decades have been significant, amounting to tens of billions of US dollars
Author: Department of Geoinformatics and Surveying, University of Nigeria, Enugu Campus. e-mail: [email protected]
In Nigeria, flooding and solutions to its impacts are critical issues (Obeta 2014). With history of devastating floods which affected millions of human populations and caused fiscal losses amounting to billions of US dollars, the importance of exploring more realistic flood risk mitigation measures for Nigeria should be paramount (OCHA 2012). Flooding in Nigeria are fluvial (resulting from rivers overtopping their natural and manmade defences), coastal (affecting mainly the coastal areas) and pluvial (flash, arriving unannounced following a heavy storm) in nature and have been a major cause of concern for rural areas and cities within the country (Houston et al. 2011, Andjelkovic 2001, Bashir et al. 2012, Douglas et al. 2008). Whilst stake holders' efforts towards tackling the hazard have not yielded satisfactory results, they have been criticized as ad-hoc, poorly coordinated, non-generalizable and not well established (Obeta 2014). However, in the light of 'best practices' in flood risk reduction and 'lessons learned' from other countries' experiences of flooding, it can be argued that such stake holders' efforts are limited due to lack of quality data, which are needed to systematically tackle flooding, poor perception of flooding among the general populace, lack of funds and improved technology as well as poor political will power.
The growing number of flood victims and the constrained sustainable development caused by flooding within the country suggest that much of what is known regarding flooding in the country is deficient on remedies. More critical is the subject-matter of Nigeria being one of the most populated countries of the world with population size estimated at over 170 million people (World Bank 2013). Considering the theory that future population growth will drive future flood risk, this population size along with future estimates spurs
C
(Guha-Sapir et al. 2013). Over 3700 flood disasters are recorded in the EM-DAT database, covering the period
interest towards building the capacities of human populations to cope with flooding.
1985 to 2014 (EM-DAT 2014). These events were responsible for hundreds of thousands of deaths mainly in Asia (most notably China, Thailand and Bangladesh) and adversely affected billions of people mostly through homelessness, mortality (mainly through drowning), physical injuries, fecal-oral and rodent-borne diseases, vector-borne diseases (mainly in tropical areas) and psychological conditions through depression, anxiety and post-traumatic stress (Ahern et al. 2005, Hunter 2003, Few et al. 2004, Tapsell & Tunstall 2008, Keith, 2013).

The widespread flooding in Nigeria along with how to deal with associated challenges has received considerable attention, although more discussions focused on local communities, geopolitical regions and states within the country (for examples: Aderogba 2012a, Adeoye et al. 2009, Ali & Hamidu 2012, Bashir et al. 2012, Agbonkhese et al. 2014, Adedeji et al. 2012, Terungwa & Torkwase 2013, Obeta 2014, Ologunorisa 2004, Ojigi et al. 2013, Aderogba et al. 2012, Ogwuche & Abah 2014, Nwilo et al. 2012, Adelekan 2010). In view of the causes of the hazard, climate change, poor urban planning and environmental management along with anthropogenic activities have been generally listed (Adeoye et al. 2009, Aderogba et al. 2012, Adeloye and Rustum 2011). Although the lack of definite measures and capacity to radically tackle the hazard within the country has been arguably overwhelming, concerted efforts in the form of environmental and infrastructural planning, policy directives, social responses, physical intervention and enhanced public enlightenment programmes have been extensively considered (Agbola et al. 2012, Ali & Hamidu 2012, Bashir et al. 2012). Other measures considered are community based early warning systems (Agbonkhese et al. 2014), humanitarian aids from government and private sectors (Adeoye et al. 2009) and appropriate level of preparedness and capacity building (Adedeji et al. 2012). The need for science and technology to embrace environmental education in Nigeria is highlighted (Terungwa & Torkwase 2013) while food hazard mapping as well as assessment of vulnerabilities of lives and properties which play key roles in building community resilience to flooding is considered (Adeaga 2008, Ajibade et al. 2013, Adelekan 2010, Ologunorisa 2004). The importance of reinforcing present strength and capacities of all agencies, including local communities within Nigeria to deal with flood hazard situations is underlined (Obeta 2014).
Despite the attention flooding received in these studies, still the question: “what is the remedy to the recurrent flooding in Nigeria?” remains unanswered. The lack of flood data and other ancillary data which is a major setback towards containing the threats of flooding in the country were raised but not addressed. Attention has solely rested on general knowledge of the causes, impacts and remedies of flooding; suggesting that the broad view of the situation in these studies has been lop-sided and sloppy. The need for more scientific approaches such a flood modelling which drives flood risk management in more developed countries was not highlighted. A general critique, which should provide a nuanced understanding of the strengths and limitations of present efforts to addressing the threats of flooding in the country, is lacking and gaps between increasing flood occurrences and vulnerabilities of local communities were not identified.
For this reason, the present study besides advancing existing knowledge relating to flooding in Nigeria is an attempt to provide answers to key questions with regards to remedy to flood challenges in Nigeria. The importance of flood modelling in flood risk reduction and the need for it to be included in the country's present efforts at reducing the impacts of flooding is emphasized. The study generally is driven by three key issues – (1) to demonstrate the roles more robust and scientific techniques such as flood modelling can play in flood risk reduction within the context of Nigeria, (2) to align the focus of flood risk reduction in Nigeria with the objectives of such a task in more developed countries such as the US, the Netherlands and United Kingdom, and (3) to promote flood risk awareness in the general public as well as to facilitate delineation of more suitable locations for relocation of human populations during flooding in Nigeria. In pursuance of these goals, the study considers the following specific objectives: • to investigate and summarize evidence of flooding
in Nigeria and to critically review efforts towards addressing its threats in the country,
• to identify knowledge gaps relevant to the reduction of flood risk in the country,
• to present flood modelling as a way-forward towards pro-active flood management activities, and
• to make supported recommendations towards building flood resilient communities.
The general concept of flooding and its remedies are presented in section 2. The methodology and data for the research are discussed in section 3 while the study area is described in section 4. Section 5 focuses on general discussions on flooding in Nigeria and present efforts at tackling the challenge. Section 6 presents relevant recommendations towards a possible way-forward while section 7 gives a general conclusion of the study.
II. Conceptual Framework of Flooding and its Remedies
Flooding along with its severe impacts on human lives, properties and economic activities is globally acknowledged (Keith 2013, Penning-Rowsell et al. 2005). Conceptually, flooding is the result of water overtopping its natural and manmade defences and overflowing places not typically submerged (Smith & Ward 1998). It is also a result of sudden arrival of heavy storms, which overwhelms soil infiltration capacity and urban drainage systems. In the literature, it is claimed that flooding is the most widespread hazard phenomenon on natural environments, accounting for more than 40% (both in frequency of occurrence and potential for losses) of the total disasters globally (Nwilo
A Review of Flooding and Flood Risk Reduction in Nigeria
© 2016 Global Journals Inc. (US)
V
olum
e XVI Issue
II V
ersio
n I
24
( B)
Globa
l Jo
urna
l of H
uman
Soc
ial Sc
ienc
e
s
-
Year
2016
et al. 2012, van der Sande et al. 2003). From wave dynamics, flooding is described as a down-slope propagation of attenuated longitudinal wave motion with inundation extent, depth and duration, as well as water flow velocity (Chow et al. 1988). Various forms of flooding can be identified including fluvial, coastal and those resulting from pluvial events which in recent times have threatened many urban areas (Ward & Robinson 2000, Lauber 1996, Hassan 2013).
Arguably, these urban floods are becoming more widespread nowadays and causing significant loss of life and property due to the large number of population exposed within the cities (EA 2007, Gupta 2007, Jha et al. 2012 Chen et al. 2009, Jeffers 2013). In the US, 32.9% of the total natural disasters in 2012 were hydrological with urban floods accounting for the most part, affecting more than 9 million people and causing about US$ 0.58 billion worth of damage (CRED 2013). The same source shows, for that year, more than US$4.7 billion worth of damage recorded for Europe, and about US$0.83 billion and US$19.3 billion damage for Africa and Asia respectively resulting from urban flooding. Four different floods that hit United Kingdom cities in 2012 caused a total loss of $2.9 billion, with many human populations affected (CRED 2013).
Increased frequency and intensity of rainfall drives pluvial floods and is a major cause of concern for urban areas (IPCC 2007). Urban areas are significant in the economic and political development of regions and states (Holton 1998, Sassen 2000, Cohen 2004). However, urbanization is an important anthropogenic influence on climate change especially in forcing increased rainfall intensity and frequency (Kalnay & Cai 2003, Seto & Shepherd, 2009). Impervious surfaces which are extensive in urban areas influence local and regional hydrology by increasing surface water runoffs and causing peak discharge and reduced time of peak (Mujumdar 2001, Hümanna et al. 2011). These are pertinent issues to environmental management, urban planning and flood risk reduction. However, urbanization along with rapid population growth in most places for example the developing countries (DCs) have been unaccompanied by adequate urban planning (Adeloye & Rustum 2011).
Flood risk is linked to exposure of social systems to flood hazards (in the form of flood water depth, extent, duration and velocity of flow) and their vulnerabilities (the propensity to be adversely affected by flooding caused mainly by lack of coping capacity) (Birkmann 2006, Crichton 1999, Balbi et al. 2012). It is also the product of likelihood of occurrence of flood hazard and its consequences identified as possible losses resulting from flooding (Brooks 2003, Smith & Ward 1998, Jeffers 2013). Likelihood of occurrence of flooding can be defined as the percentage probability of flood return period. Within research spheres, the likelihood of flood occurrence is generally delineated by
the 100-year flood (EA 2010). Globally, these are key issues which are driving activities towards reducing the risk of flooding across various regions and states (Houston et al. 2011, Agbola et al. 2012, EA 2009, Merz et al. 2010).
Driven by the predictions of worsened flood risk in the future coupled with the notion that floods are inevitable phenomenon which can never be fully constrained within the natural environment (Milly et al. 2002, Nijland 2005, IPCC 2008, Hirabayashi et al. 2013), efforts towards tackling flooding are based on reducing its impacts on human population, development infrastructure and economic activities (DEFRA 2013, UN/ISDR 2004). These efforts have been fundamental to the "living with floods and not fighting them" idea, which dominates key environmental risk research themes (for examples: Disaster Risk Reduction (DRR) and Climate Change Adaptation (CCA)) (Balbi et al. 2012, 2004Di Baldassarre & Uhlenbrook 2012), and by improving the awareness of flooding in local communities, provision ofdata and technical know-how as well as provision of funds towards building a community of human populations who are able live with floods as well as securing critical infrastructure against flood losses, has driven approaches towards addressing the challenges of flooding in places like China, the Netherlands, United Kingdom and the United States (Burby 2000, Kazmierczak & Carter 2010, EA 2009, Merz et al. 2010, Zhu et al. 2011, UN/ISDR 2004, Merz et al. 2010, CEA 2007, CRED 2013).
Flood risk reduction is a multi-disciplinary approach which integrates structural and non-structural measures to achieve the key elements of risk management which are: prevention/mitigation, prote-ction, preparedness, emergency response, recovery and lessons learned (Zhu et al. 2011, EC 2004, Tarlock 2012, UN/ISDR 2007). The realization of these key elements appeared to have undermined structural measures which basically include engineering works aimed at containing water disruptions in rivers, thereby reducing exposure to flooding and susceptibility to flood damage (WMO 2008). On the contrary, non-structural measures do not involve physical constructions; instead focus is on knowledge, practice or agreement to reduce risks and impacts, in particular through policies and laws, public awareness raising, training, education and research and include: flood insurance, assessment of vulnerability to flooding which provides information that will enable the classification of a given population with regards to their lack of capacity to cope with the hazard, flood risk/hazard mapping, creating public awareness, relocation of exposed human populations, land-use zoning, flood proofing, flood forecasting and flood early warning systems (WMO 2008, Keith 2013, UN/ISDR 2009 Tate and Cutter 2010 Brilly & Polic 2005, Kundzewicz 2002, Plate 2002).
A Review of Flooding and Flood Risk Reduction in Nigeria
V
olum
e XVI Issue
II V
ersio
n I
25
( B)
Globa
l Jo
urna
l of H
uman
Soc
ial Sc
ienc
e
-
Year
2016
© 2016 Global Journals Inc. (US)
The success of flood risk reduction can be said to depend to a large extent on knowledge-based decision, robust institutional framework and flood risk communication. Knowledge-based decision uses available information relating to flooding to draw conclusions on possible strategies to be adopted for flood risk reduction. The creation of awareness in stake holders and local communities regarding flooding and its impacts is driven by flood risk communication. Institutional framework includes government response procedures, policies, regulations, guidelines as well as to government agencies engaged in planning and managing flood emergency conditions or in helping victims to cope and recover speedily from extreme flood events (Obeta 2014). Invariably, these three factors require information relating to flood hazard and its consequences which flood risk/hazard maps or some form of graphical representation delineate within an area, as well as public opinion, research findings, empirical results and expert knowledge.
Research has shown that flood characteristics (most notably flood water depth, extent and duration as well as flow velocity) obtained through accurate assessment of flooding are required to produce flood risk/hazard maps (de Moel et al. 2009, Merz et al. 2007).Thus for flood risk/hazard mapping accurate assessment of flooding should not be ignored. Meanwhile, the making of these maps is of scientific significance as it requires critical understanding of the drivers of flood hazard/risk. In the flood risk/hazard assessment literature, flood modelling plays considerable roles. Under the EU commission directive on flood, the United States flood control policy, national flood insurance program (NFIP) and other regionally-based flood risk management policies, the relevance of flood information to both flood risk/hazard mapping and flood risk reduction highlights the significance of flood modelling. For this reason, the key roles of flood modelling can be summarized as follows:
• Description of flow behaviour around groups of buildings and other complex geomorphological features especially in assessment of urban flooding (Bates et al. 2010).
• Ability to provide critical information for strategic planning of flood defence measures and effective flood risk management such as temporal inundation information about the onset, duration and passing of a flood event. (Zerger, 2004, Grimier 2013).
• Leads to an improved understanding of the flood phenomena, provides insight into the causes of flooding and guide through more appropriate measures to be taken to reduce flood damage (Chow et al. 1988).
• Promotes understanding of the complicated nature of flow patterns around floodplain and promotes
• Serves as the basis for flood forecasting, flood early warning system and flood damage estimation, as well as provides the basis for the decision making of flood risk management (EA, 2007).
• Serves as the basis for producing flood risk/hazard maps that community officials or the general public can use to evaluate their flood risk and analyse possible evacuation procedures (de Moel 2009).
Flood modelling generally predicts flood hazard characteristics such as water flow depth, flow velocity and inundation extent which are required for estimating the likelihood of flood hazard and its impacts required for flood risk/hazard mapping (Moussa and Bocquillon 2009, Chow et al. 1988). Although possible ways of acquiring these data include ground survey methods and remote sensing technology, however, ground survey methods often require enormous field work and keeping of long-term records while remote sensing requires expert knowledge. The cost of acquiring remote sensing data and software for processing them can be overwhelming. Although in a number of investigations, globally available datasets such as Advanced Spec-borne Thermal Emission and Reflection Radiometers Global Digital Elevation Model (ASTER GDEM), Shuttle Radar Topographic Mission (SRTM) and global flood data have been utilized (Ho et al. 2010, Manfreda et al. 2011). However, it can be shown that due to scale and accuracy requirements, these global datasets do not provide realistic estimates of flood assessment and using them as basis for making decision towards flood management can be misleading (van de Sande et al. 2012, Tarekegn et al. 2010).
A Review of Flooding and Flood Risk Reduction in Nigeria
© 2016 Global Journals Inc. (US)
V
olum
e XVI Issue
II V
ersio
n I
26
( B)
Globa
l Jo
urna
l of H
uman
Soc
ial Sc
ienc
e
s
-
Year
2016
community's confidence in the process of flood risk reduction (Bedient et al. 2008).
These challenges and perhaps the recognition of the relevance of data in flood risk reduction further highlight the importance of flood modelling, which is governed by the science and mathematics of hydrology. The prospects of flood modelling in assisting flood risk management in various parts of the world are acknowledged. In the Netherlands, flood modelling, among other roles, supports investigation into estimation of damage caused by flooding (Jonkman et al. 2008, Vis et al. 2003). Within European Union framework, flood modelling plays a considerable role towards flood hazard/risk mapping of the constituting States, as well as development of flood forecasting and early warning systems (EC 2007). Several flood modelling packages exist in the US for tackling fluvial and urban flood through simulation of discharge hydrographs (EA 2010). Several engineering works aimed at constraining floods from River Thames are based on water levels simulated by means of existing flood models (Neil et al. 2011). Many Asian countries, notably China, Vietnam and Bangladesh although having 'not too well' established flood management
Based on ample evidence, the results of flood risk mitigation supported by flood modelling in these exemplar locations have been satisfactory (Van Alphenet al. 2009, Kovacs & Sandink 2013). For this reason and on the basis of effectiveness and robustness as well as enhanced efforts in flood risk mitigation in Nigeria, the present study makes argument in favour of flood modelling. Although, existing flood models are rife with limitations which may constrain their applications in Nigeria, however, developing bespoke flood models for Nigeria can be a priority. This need for flood models was emphasized by the DG of Nigerian Hydrological Services Agency (NIHSA 2013) in a recent mission statement:
“…in view of flooding in Nigeria, governments at all levels should create awareness on the need for communities to relocate to safer terrain. Moreover, while the current trends in climate variations prevails, the need to develop flood modelling and early warning systems cannot be overemphasized… There is also need to carry out a comprehensive flood hazard mapping for all areas considered at risk of flooding in the country…”
III. Method and Data
A search process to identify the body of literature relevant to flooding and efforts towards addressing its threats in Nigeria was undertaken. Combination of terms such as "flooding and management in Nigeria", "flooding and human health in Nigeria", "flooding and modelling in Nigeria" and "flooding and climate change in Nigeria" was applicable to the search. Overall, 429 publications were identified of which 17 focused on the causes of flooding in Nigeria, 132 addressed the impacts, 181 discussed the remedies, 54 looked at climate change issues, 14 discussed public perception of flooding while 31 addressed urban management and planning. These findings are fundamental to discussions presented in this paper. The scientific quality of these papers was assessed based on the publishing journal. This is consistent with academic standard and regulations. Although locally published articles provided most of the information to establish the case in the present study, however, the greater weight was given to articles published by Elsevier, Science Direct, Taylor and Francis, Wiley and sons, ASCE, Nature, Sage, Springer and Copernicus publishers and on International conferences.
The data that provided much of the evidence regarding the prevalence of flooding in Nigeria was sourced from EM-DAT database, Nigerian ministry of Environment and from previous studies.
a) Description of the study areaNigeria, a sub-Saharan West African country, is
on the Gulf of Guinea, east of the Greenwich and north of the equator. The country, made up of 36 states including the federal capital territory (FCT), Abuja, lies between latitudes 4° and 14°N, and longitudes 2° and 15°E, with a total land area of 923,768 km2 (See figure 1), and borders with Republics of Benin and Niger, Chad, and Cameroon. It maintains a large expanse of coastline, over 853 km in magnitude, with hydrological features which includes the rivers Niger and Benue, both of which confluence at Lokoja, and flows further southwards through the Niger Delta into the Atlantic ocean.
The 2006 census confirmed over 140 million people in Nigeria, but this population has grown steadily, and is presently estimated at more than 170 million people, making the country the seventh most populous country in the world (NPC 2007, World Bank2013). According to United Nations projections, Nigeria is one of the eight countries expected to account collectively for half of the total population increase in the world from 2005-2050, and will by 2100, record a population amounting between 505 million and 1.03 billion people (United Nations 2004). Rapidly growing population along with urbanization which appear not to be accompanied by corresponding strategies to support humanitarian needs and anthropogenic activities characterize Nigeria. This concern has not received adequate attention in the literature, especially with regards to the implications of future urban scenarios on environmental sustainability.
A Review of Flooding and Flood Risk Reduction in Nigeria
V
olum
e XVI Issue
II V
ersio
n I
27
( B)
Globa
l Jo
urna
l of H
uman
Soc
ial Sc
ienc
e
-
Year
2016
© 2016 Global Journals Inc. (US)
policies utilize flood modelling methodologies for flood risk assessment and mitigation (Renyi & Nan 2002, Huong & Pathirana 2011).
IV. Result and Discussion
a) Flooding in NigeriaFlooding in Nigeria is generally linked to poor
urban planning and climate change (Adeloye & Rustum 2011, Action Aid 2006, Cline 2007, BNRCC 2008). The impacts have been severe and every part of the country's life stream is affected with significant economic losses (mainly through destruction of farmlands, social and developmental infrastructure) and economic disruption (most notably in oil exploration in the Niger delta, traffic congestion in many cities in Nigeria, disruption in telecommunication and power supply) (Ogunbodede & Sunmola 2014, Ologunorisa 2005, Fadairo & Ganiyu 2010). In 2012, the country experienced the worst flooding in more than 40 years as a result of heavy storms that lasted many days. The incidence affected 32 states with 24 considered severely affected (NEMA 2013). The floods lasted from July to October that year and affected 7.7 million people with more than 2 million others reckoned as internally displaced (IDPs). More than 5000 people were physically injured along with over 5900 houses which were destroyed.
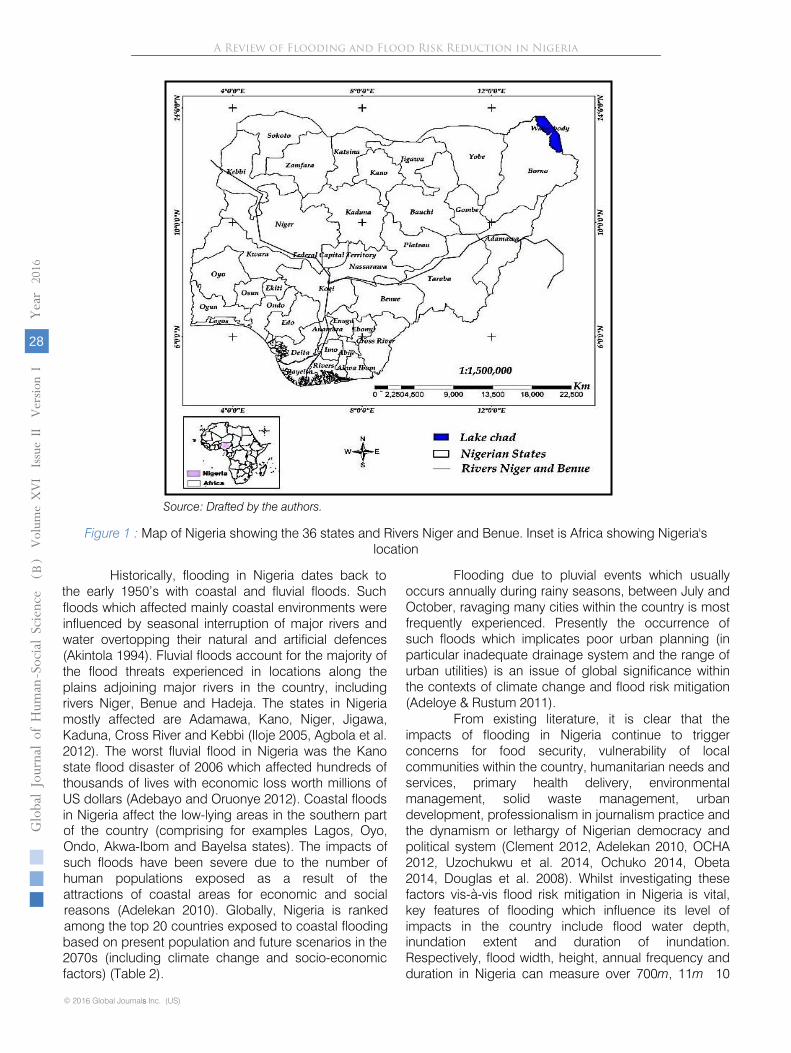
Source: Drafted by the authors.
Figure 1 : Map of Nigeria showing the 36 states and Rivers Niger and Benue. Inset is Africa showing Nigeria's location
Historically, flooding in Nigeria dates back to the early 1950’s with coastal and fluvial floods. Such floods which affected mainly coastal environments were influenced by seasonal interruption of major rivers and water overtopping their natural and artificial defences (Akintola 1994). Fluvial floods account for the majority of the flood threats experienced in locations along the plains adjoining major rivers in the country, including rivers Niger, Benue and Hadeja. The states in Nigeria mostly affected are Adamawa, Kano, Niger, Jigawa, Kaduna, Cross River and Kebbi (Iloje 2005, Agbola et al. 2012). The worst fluvial flood in Nigeria was the Kano state flood disaster of 2006 which affected hundreds of thousands of lives with economic loss worth millions of US dollars (Adebayo and Oruonye 2012). Coastal floods in Nigeria affect the low-lying areas in the southern part
A Review of Flooding and Flood Risk Reduction in Nigeria
© 2016 Global Journals Inc. (US)
V
olum
e XVI Issue
II V
ersio
n I
28
( B)
Globa
l Jo
urna
l of H
uman
Soc
ial Sc
ienc
e
s
-
Year
2016
of the country (comprising for examples Lagos, Oyo, Ondo, Akwa-Ibom and Bayelsa states). The impacts of such floods have been severe due to the number of human populations exposed as a result of the attractions of coastal areas for economic and social reasons (Adelekan 2010). Globally, Nigeria is ranked among the top 20 countries exposed to coastal flooding based on present population and future scenarios in the 2070s (including climate change and socio-economic factors) (Table 2).
Flooding due to pluvial events which usually occurs annually during rainy seasons, between July and October, ravaging many cities within the country is most frequently experienced. Presently the occurrence of such floods which implicates poor urban planning (in particular inadequate drainage system and the range of urban utilities) is an issue of global significance within the contexts of climate change and flood risk mitigation (Adeloye & Rustum 2011).
From existing literature, it is clear that the impacts of flooding in Nigeria continue to trigger concerns for food security, vulnerability of local communities within the country, humanitarian needs and services, primary health delivery, environmental management, solid waste management, urban development, professionalism in journalism practice and the dynamism or lethargy of Nigerian democracy and political system (Clement 2012, Adelekan 2010, OCHA 2012, Uzochukwu et al. 2014, Ochuko 2014, Obeta 2014, Douglas et al. 2008). Whilst investigating these factors vis-à-vis flood risk mitigation in Nigeria is vital, key features of flooding which influence its level of impacts in the country include flood water depth, inundation extent and duration of inundation. Respectively, flood width, height, annual frequency and duration in Nigeria can measure over 700m, 11m 10
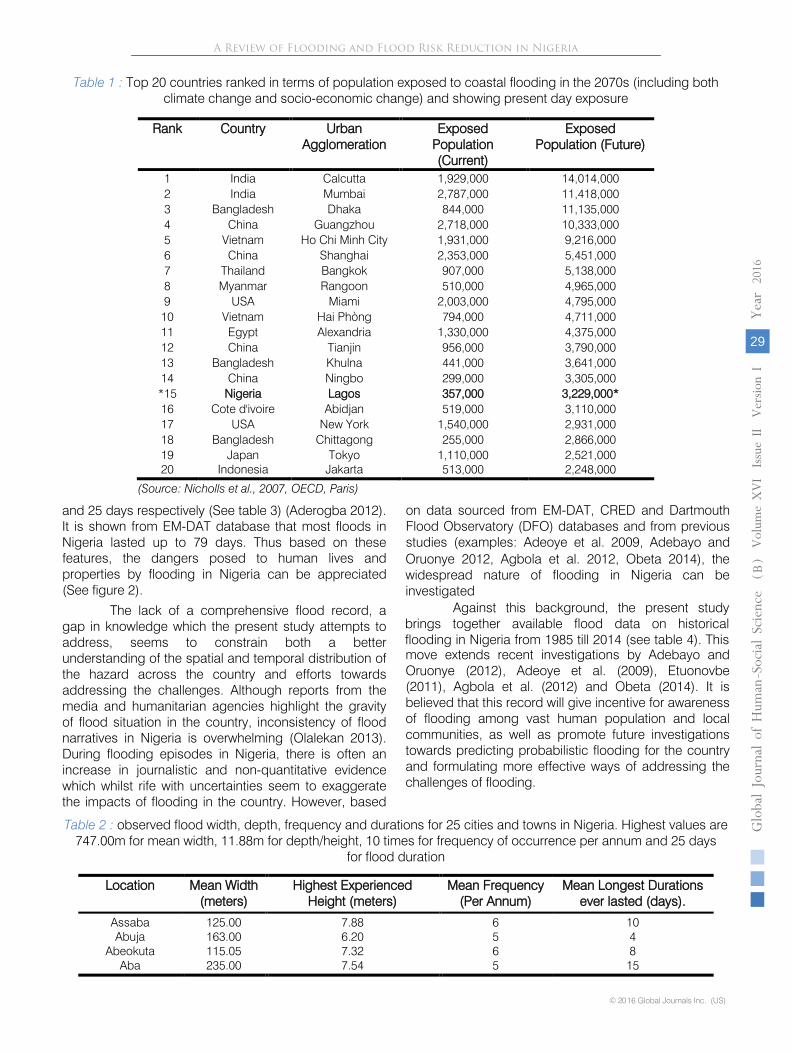
Table 1 : Top 20 countries ranked in terms of population exposed to coastal flooding in the 2070s (including both climate change and socio-economic change) and showing present day exposure
(Source: Nicholls et al., 2007, OECD, Paris)
and 25 days respectively (See table 3) (Aderogba 2012). It is shown from EM-DAT database that most floods in Nigeria lasted up to 79 days. Thus based on these features, the dangers posed to human lives and properties by flooding in Nigeria can be appreciated (See figure 2).
Rank Country Urban Agglomeration
Exposed Population (Current)
Exposed Population (Future)
1 India Calcutta 1,929,000 14,014,0002 India Mumbai 2,787,000 11,418,0003 Bangladesh Dhaka 844,000 11,135,0004 China Guangzhou 2,718,000 10,333,0005 Vietnam Ho Chi Minh City 1,931,000 9,216,0006 China Shanghai 2,353,000 5,451,0007 Thailand Bangkok 907,000 5,138,0008 Myanmar Rangoon 510,000 4,965,0009 USA Miami 2,003,000 4,795,00010 Vietnam Hai Phòng 794,000 4,711,00011 Egypt Alexandria 1,330,000 4,375,00012 China Tianjin 956,000 3,790,00013 Bangladesh Khulna 441,000 3,641,00014 China Ningbo 299,000 3,305,000*15 Nigeria Lagos 357,000 3,229,000*16 Cote d'ivoire Abidjan 519,000 3,110,00017 USA New York 1,540,000 2,931,00018 Bangladesh Chittagong 255,000 2,866,00019 Japan Tokyo 1,110,000 2,521,00020 Indonesia Jakarta 513,000 2,248,000
A Review of Flooding and Flood Risk Reduction in Nigeria
V
olum
e XVI Issue
II V
ersio
n I
29
( B)
Globa
l Jo
urna
l of H
uman
Soc
ial Sc
ienc
e
-
Year
2016
© 2016 Global Journals Inc. (US)
The lack of a comprehensive flood record, a gap in knowledge which the present study attempts to address, seems to constrain both a better understanding of the spatial and temporal distribution of the hazard across the country and efforts towards addressing the challenges. Although reports from the media and humanitarian agencies highlight the gravity of flood situation in the country, inconsistency of flood narratives in Nigeria is overwhelming (Olalekan 2013). During flooding episodes in Nigeria, there is often an increase in journalistic and non-quantitative evidence which whilst rife with uncertainties seem to exaggerate the impacts of flooding in the country. However, based
on data sourced from EM-DAT, CRED and Dartmouth Flood Observatory (DFO) databases and from previous studies (examples: Adeoye et al. 2009, Adebayo and Oruonye 2012, Agbola et al. 2012, Obeta 2014), the widespread nature of flooding in Nigeria can be investigated
Against this background, the present study brings together available flood data on historical flooding in Nigeria from 1985 till 2014 (see table 4). This move extends recent investigations by Adebayo and Oruonye (2012), Adeoye et al. (2009), Etuonovbe (2011), Agbola et al. (2012) and Obeta (2014). It is believed that this record will give incentive for awareness of flooding among vast human population and local communities, as well as promote future investigationstowards predicting probabilistic flooding for the country and formulating more effective ways of addressing the challenges of flooding.
Table 2 : observed flood width, depth, frequency and durations for 25 cities and towns in Nigeria. Highest values are 747.00m for mean width, 11.88m for depth/height, 10 times for frequency of occurrence per annum and 25 days
for flood duration
Location Mean Width (meters)
Highest Experienced Height (meters)
Mean Frequency (Per Annum)
Mean Longest Durations ever lasted (days).
Assaba 125.00 7.88 6 10Abuja 163.00 6.20 5 4
Abeokuta 115.05 7.32 6 8 Aba 235.00 7.54 5 15

Ibadan 521.45 9.20 3 7Owerri 124.04 8.21 5 7 Warri 221.25 7.28 6 16
Benin City 198.00 8.90 8 12Jalingo 115.00 7.37 4 5 Enugu 147.72 7.35 5 6 Lagos
Metropolis747.00 11.88 10 25
Kano 110.00 9.72 3 8 Kaduna 128.00 9.53 5 12Katsina 122.00 6.25 4 11Sokoto 114.25 7.02 6 4
Port-Harcourt 121.21 8.12 4 18Ondo 124.75 7.80 8 11
Ogbomosho 118.00 9.55 3 12Osogbo 111.00 9.73 8 13Onisha 128.00 7.65 4 4 Calabar 213.00 7.53 8 11
Source: Aderogba 2012
Figure 2 : Evidence of flooding impacts in Nigeria
A Review of Flooding and Flood Risk Reduction in Nigeria
© 2016 Global Journals Inc. (US)
V
olum
e XVI Issue
II V
ersio
n I
30
( B)
Globa
l Jo
urna
l of H
uman
Soc
ial Sc
ienc
e
s
-
Year
2016
Source: Online images of flooding in Nigeria. www.floodinginnigeria
Table 4 : Spatial and temporal distribution of significant floods in Nigeria from 1985 to 2014
S/No. DATE (BEGAN) CITY (LGAs) STATE (S) DURATIO
N (DAYS) CAUSE (S) NO OF PEOPLE AFFECTED MORTALITY SIZE OF LAND
(KM2)
ECONOMIC LOSS
(billion US$)
AFFECTED HOUSES
1. 13-Sept-2014 Ibadan and environs Oyo 1 Torrential
rainfall 10000 15 N/A Many
2. 14-Apr-2013 Various Southern area 5 Torrential
rainfall 81506 19 N/A Many
3. July 2012 Many* 32 States in Nigeria 120
Heavy rain, dam/levee
break,7705378 363 Large expanse
of farmlands. 16.9
Many* Registered
IDPs amount to more than
2000000.
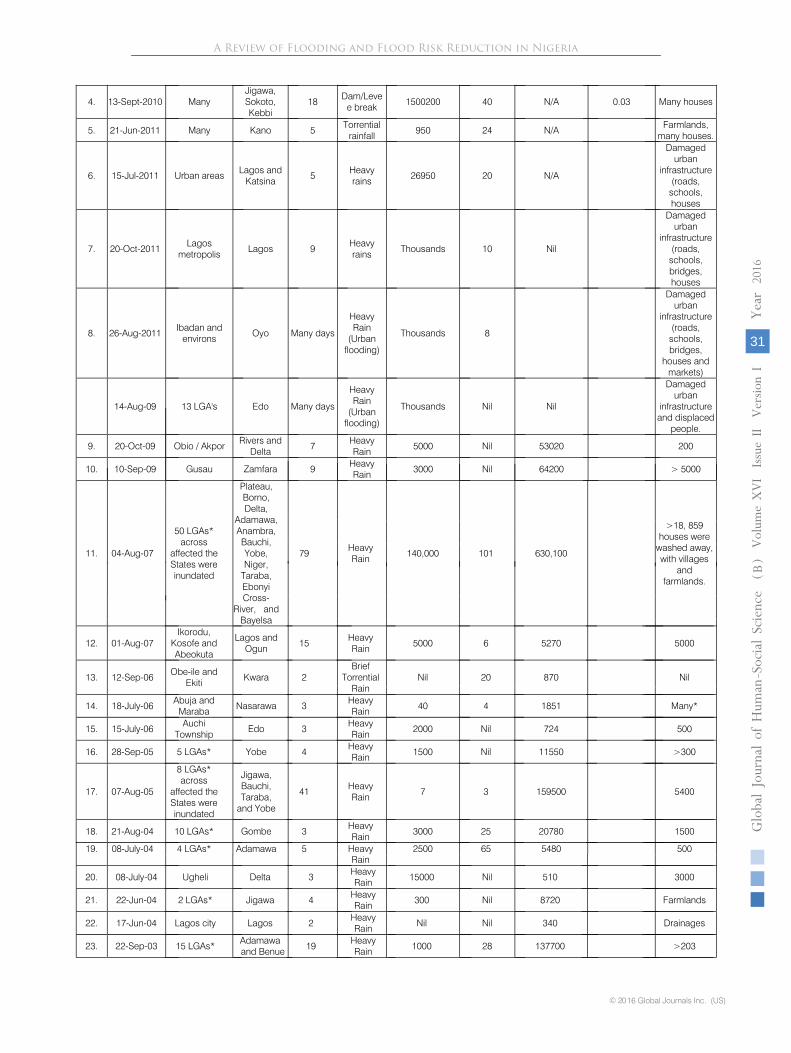
A Review of Flooding and Flood Risk Reduction in Nigeria
V
olum
e XVI Issue
II V
ersio
n I
31
( B)
Globa
l Jo
urna
l of H
uman
Soc
ial Sc
ienc
e
-
Year
2016
© 2016 Global Journals Inc. (US)
4. 13-Sept-2010 ManyJigawa, Sokoto, Kebbi
18 Dam/Levee break 1500200 40 N/A 0.03 Many houses
5. 21-Jun-2011 Many Kano 5 Torrential rainfall 950 24 N/A Farmlands,
many houses.
6. 15-Jul-2011 Urban areas Lagos and Katsina 5 Heavy
rains 26950 20 N/A
Damagedurban
infrastructure (roads,
schools, houses
7. 20-Oct-2011 Lagos metropolis Lagos 9 Heavy
rains Thousands 10 Nil
Damaged urban
infrastructure (roads,
schools, bridges, houses
8. 26-Aug-2011 Ibadan and environs Oyo Many days
Heavy Rain
(Urban flooding)
Thousands 8
Damaged urban
infrastructure (roads,
schools, bridges,
houses and markets)
14-Aug-09 13 LGA's Edo Many days
Heavy Rain
(Urban flooding)
Thousands Nil Nil
Damaged urban
infrastructure and displaced
people.
9. 20-Oct-09 Obio / Akpor Rivers and Delta 7 Heavy
Rain 5000 Nil 53020 200
10. 10-Sep-09 Gusau Zamfara 9 Heavy Rain 3000 Nil 64200 > 5000
11. 04-Aug-07
50 LGAs* across
affected the States were inundated
Plateau, Borno, Delta,
Adamawa, Anambra, Bauchi, Yobe, Niger,
Taraba, Ebonyi Cross-
River, and Bayelsa
79 Heavy Rain 140,000 101 630,100
>18, 859 houses were
washed away, with villages
and farmlands.
12. 01-Aug-07Ikorodu,
Kosofe and Abeokuta
Lagos and Ogun 15 Heavy
Rain 5000 6 5270 5000
13. 12-Sep-06 Obe-ile and Ekiti Kwara 2
Brief Torrential
RainNil 20 870 Nil
14. 18-July-06 Abuja and Maraba Nasarawa 3 Heavy
Rain 40 4 1851 Many*
15. 15-July-06 Auchi Township Edo 3 Heavy
Rain 2000 Nil 724 500
16. 28-Sep-05 5 LGAs* Yobe 4 Heavy Rain 1500 Nil 11550 >300
17. 07-Aug-05
8 LGAs* across
affected the States were inundated
Jigawa, Bauchi, Taraba,
and Yobe
41 Heavy Rain 7 3 159500 5400
18. 21-Aug-04 10 LGAs* Gombe 3 Heavy Rain 3000 25 20780 1500
19. 08-July-04 4 LGAs* Adamawa 5 Heavy 2500 65 5480 500Rain
20. 08-July-04 Ugheli Delta 3 Heavy Rain 15000 Nil 510 3000
21. 22-Jun-04 2 LGAs* Jigawa 4 Heavy Rain 300 Nil 8720 Farmlands
22. 17-Jun-04 Lagos city Lagos 2 Heavy Rain Nil Nil 340 Drainages
23. 22-Sep-03 15 LGAs* Adamawa and Benue 19 Heavy
Rain 1000 28 137700 >203

A Review of Flooding and Flood Risk Reduction in Nigeria
24. 05-Sep-03 41 LGAs*
Kaduna, Kano,
Niger and Jigawa
54
Heavy Rain 210000 16 134900 0.00257 >30000
25. 08-Aug-03 18 LGAs*Jigawa
and Katsina 17Heavy Rain 16000 1 19630 0.04
1500 with farmlands
26. 05-Aug-03 5 LGAs* Sokoto and Niger 69 Heavy
Rain 10000 7 138900 30000
27. 27-July-03 3 LGAs* Benue 1 Heavy Rain 3000 2 2620 52
28. 22-July-03 4 LGAs* Gombe 3 Heavy Rain 160 Nil 1520 40
29. 23-July-03 6 LGAs* Cross-River 3 Heavy
Rain Nil 5 8170 Unknown*
30. 28-July-03 3 LGAs* Kano 2 Brief
Torrential Rain
800 1 790 200
31. 07-Jun-03 6 LGAs* Jigawa 2 Heavy Rain 2000 Nil 5710 100
32. 24-July-02 Lagos city Lagos 3 Heavy Rain Nil 2 1650 Many*
33. 27-Aug-01 14 LGAs* Kano and Jigawa 9 Dam/Levee
break 80000 200 14300 60 Villages
34. Sept 2000 Pai Taraba N/A Flash Thousands of people
35. 22-July-01 Talata and Maraba Zamfara 1 Heavy
Rain 3802 Nil 1060 3802
36. 20-Sep-00 Lagos city Lagos 2 Brief
Torrential Rain
Nil Nil 7700 Tens of thousands
37. Aug/Sept-00 Ibaji-Gurar Kogi N/A Levee break 150000 Nil N/A Many*
38. Sept/Oct-00 Katsina-Ala Benue N/A Fluvial causes Nil Nil N/A
Several sizes of farmlands and crops
39. 26-Oct-99 7 LGAs* Imo 14 Heavy Rain Nil 50 251300 Many*
© 2016 Global Journals Inc. (US)
V
olum
e XVI Issue
II V
ersio
n I
32
( B)
Globa
l Jo
urna
l of H
uman
Soc
ial Sc
ienc
e
s
-
Year
2016
40. 15-Sep-99 Not specified
Niger, Sokoto, Kaduna,
Adamawa and Borno, with some
parts of Ghana and
Togo
27 Heavy Rain 396748 85 862000 0.021
Many*, but worst in
Ghana and Togo
41. 12-Oct-98 Western area Kwara 7 Heavy Rain 110000 Nil 29090 Many*, not
specified
42. 15-Aug-98 Okunmi Kano 2 HeavyRain 5000 15 39720 Many*, not
specified
43. 30-Apr-97 Ibadan Oyo 2 Heavy Rain Nil 5 17290 Many houses
collapsed
44. 07-Aug-95 Jos Plateau 4Heavy Rain Nil 30 19770
5300 domestic
animals killed
45. 11-Sep-94 Mai and Agadez
Borno and Niger 5
Heavy Rain
180000 142 317300
Properties up to millions of naira, with foodstuffs
and livestock
46. 22-Sep-92 Mubi and Madagali
Adamawa and Borno 2 Heavy
Rain 13000 9 42370 Roads and Farmlands
47. 04-Aug-91 Hadeia Kano 2 Heavy Rain 10000 4 22910 Farmlands
48. 16-Sep-90 Not specified Edo 6 Heavy Rain 300000 6 36120 Farmlands
49. 02-Aug-90 Agbara and Gbakolo Cross-River 2 Heavy
Rain Nil 100 5520 Hundreds of farmlands
50. 03-Jul-90 Lagos city Lagos 2 Heavy Rain 3000 5 3420 Many*, not
specified
51. 27-Oct-88 Kaissama Bayelsa 2 Heavy Rain 12000 10 2830 12000
52. 21-Sep-88 Abuja city and FCT, Niger 15 Dam/Leve 70000 Nil 8880 0.001 Many*, not 12
ommunities in Anambra
and Anambra
e break specified
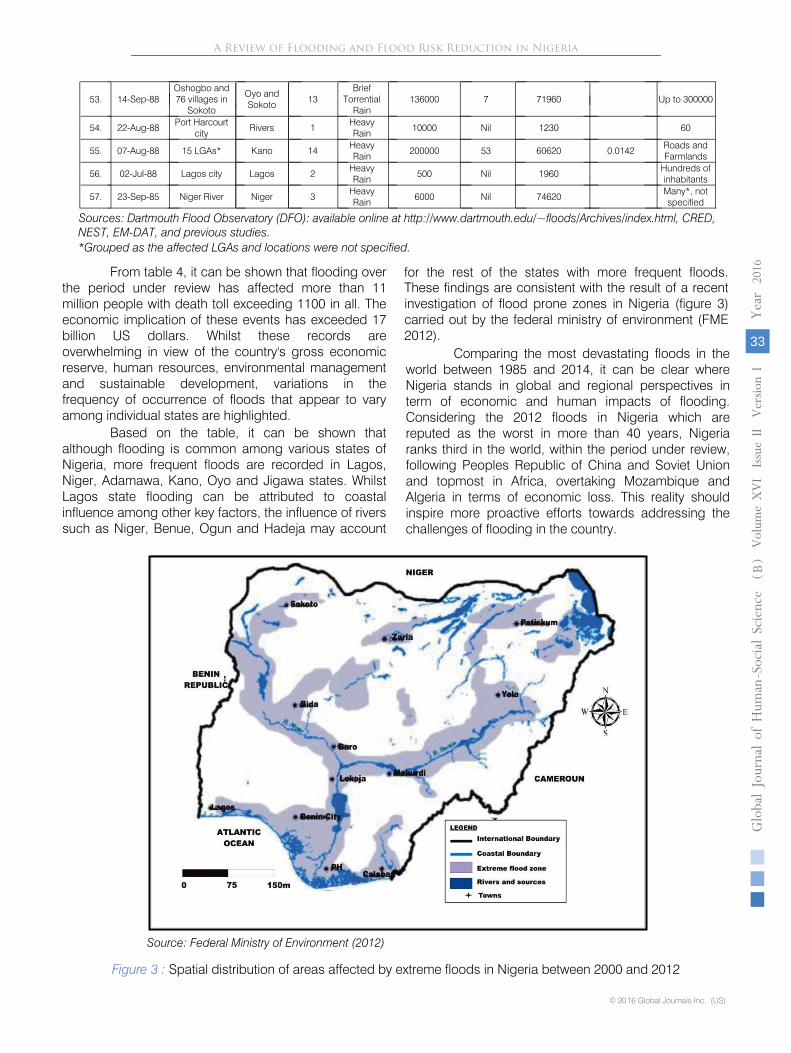
A Review of Flooding and Flood Risk Reduction in Nigeria
53. 14-Sep-88Oshogbo and 76 villages in
Sokoto
Oyo and Sokoto 13
Brief Torrential
Rain136000 7 71960 Up to 300000
54. 22-Aug-88 Port Harcourt city Rivers 1 Heavy
Rain 10000 Nil 1230 60
55. 07-Aug-88 15 LGAs* Kano 14 Heavy Rain 200000 53 60620 0.0142 Roads and
Farmlands
56. 02-Jul-88 Lagos city Lagos 2 Heavy Rain 500 Nil 1960 Hundreds of
inhabitants
57. 23-Sep-85 Niger River Niger 3 Heavy Rain 6000 Nil 74620 Many*, not
specified
Sources: Dartmouth Flood Observatory (DFO): available online at http://www.dartmouth.edu/~floods/Archives/index.html, CRED, NEST, EM-DAT, and previous studies.*Grouped as the affected LGAs and locations were not specified.
V
olum
e XVI Issue
II V
ersio
n I
33
( B)
Globa
l Jo
urna
l of H
uman
Soc
ial Sc
ienc
e
-
Year
2016
© 2016 Global Journals Inc. (US)
From table 4, it can be shown that flooding over the period under review has affected more than 11 million people with death toll exceeding 1100 in all. The economic implication of these events has exceeded 17 billion US dollars. Whilst these records are overwhelming in view of the country's gross economic reserve, human resources, environmental management and sustainable development, variations in the frequency of occurrence of floods that appear to vary among individual states are highlighted.
Based on the table, it can be shown that although flooding is common among various states of Nigeria, more frequent floods are recorded in Lagos, Niger, Adamawa, Kano, Oyo and Jigawa states. WhilstLagos state flooding can be attributed to coastal influence among other key factors, the influence of rivers such as Niger, Benue, Ogun and Hadeja may account
for the rest of the states with more frequent floods. These findings are consistent with the result of a recent investigation of flood prone zones in Nigeria (figure 3) carried out by the federal ministry of environment (FME 2012).
Comparing the most devastating floods in the world between 1985 and 2014, it can be clear where Nigeria stands in global and regional perspectives in term of economic and human impacts of flooding. Considering the 2012 floods in Nigeria which are reputed as the worst in more than 40 years, Nigeria ranks third in the world, within the period under review, following Peoples Republic of China and Soviet Union and topmost in Africa, overtaking Mozambique and Algeria in terms of economic loss. This reality should inspire more proactive efforts towards addressing the challenges of flooding in the country.
Source: Federal Ministry of Environment (2012)
Figure 3 : Spatial distribution of areas affected by extreme floods in Nigeria between 2000 and 2012
A Review of Flooding and Flood Risk Reduction in Nigeria
© 2016 Global Journals Inc. (US)
V
olum
e XVI Issue
II V
ersio
n I
34
( B)
Globa
l Jo
urna
l of H
uman
Soc
ial Sc
ienc
e
s
-
Year
2016
Apart from China which presently reputes as the most flood prone country in the world, characterized by recurrent perennial floods due to among other things, the influence of population growth and mainly the River Yangtze (Zhang et al 2006). The fact that other countries with known extreme flooding experience (for examples: Netherlands, the US, Brazil, United Kingdom and many other European countries) are presently ranked below Nigeria suggest among other things that more effective flood risk mitigation measures are presently in place in those countries.
The Netherlands with more than half of the country at or below sea level experienced a severe flood in 1953 which devastated majority of the nation’s economic and human infrastructure. The estimated impact of the flood was 1835 deaths and 1 billion Dutch guilders (US$ 558 million). That flood challenged various stake holders, particularly the local communities and Dutch government towards more effective strategies of mitigating the threats of flooding. The result of this is seen in the reduced impacts of flooding in the country in recent times. The flood of 1972 in the US caused 238 deaths, 357 injuries, about 1335 homes destroyed with estimated fiscal loss of over 800 million US$. In the UK, the 1947 floods were considered the worst in recent history with overall impact estimated at merely £4.5 million (USD$ 6.81 million) at current value, with millions of devastated human populations, farm animals and agricultural products (EA 1993). Recent floods in the US and UK have not reached this magnitude in their impacts. For Brazil, compared to the floods of 2010, the flood of 1967 which claimed 610 lives, costing about US$1.2 was considered the deadliest in that country's history.
In view of these analogies, it can be argued with regards to these countries, that considerable progresses have been made at reducing the impacts of flooding especially on human population and critical infrastructure whilst building the resilience of the people and encouraging adaptability strategies. For this reason, Nigeria's position in global and regional perspective requires that various stake holders should focus attention on ways of improving more effective flood reduction measures for the country such as inclusion of flood modelling techniques. This need is more urgent considering climate change scenarios, poor urban planning, along with a number of remote factors such as the topography of the country (most places for example the Lagos metropolis, are almost flat), anthropogenic activities (mainly through indiscriminate disposal of solid waste, concentration of slum developments, non-compliance with regulations, sloppy attitude towards weather warnings and alerts, roadside car washing), poor perception of flooding among local communities, poor legislation and enforcement of regulations, and the presence of large hydrological network (for example
rivers Niger and Benue, canals, harbour, lagoons and beaches and the Atlantic ocean) which are influencing flooding and other conditions in Nigeria (Ologunorisa 2005, Aderogba et al. 2012, Aderogba 2012a, Agbola et al., 2012),
b) Present efforts towards tackling flooding in NigeriaThe means of tackling flooding in Nigeria
include but not limited to structural measures (such as dams, bridges and drainage systems), policy formulation, physical intervention, social measures and research, relocation of human populations and relief assistance to internally displaced persons (Olorunfemi 2011, Odunuga 2008, NIHSA 2013, Obeta 2014). These efforts are driven by institutional approach (including government ministries, departments and agencies), local communities and the general public, humanitarian organizations and international bodies, the media and the academia.
Institutional approach in Nigeria is as old as disasters in the country and generally includes agencies and departments under the Federal Ministry of Environment (FME). For tackling floods in the country, the key institutions include: Federal Emergency Management Agency (FEMA), National Emergency Management Agency (NEMA), State Emergency Management Agency (SEMA), Local Emergency Management Agency (LEMA), National Orientation Agency (NOA), National Environmental Standards and Regulations Enforcement Agency (NESREA) which by 2009 Nigerian Acts supersedes the FEPA, Nigerian Meteorological Agency (NIMET) and Nigerian Hydrological Services Agency (NIHSA) (Ibitoye 2007).
With NEMA as a coordinating body, specific actions towards tackling flooding in Nigeria can be conceived as follows: policy formulation, data collation from relevant agencies, education of the general public on flooding, distribution of relief materials to disaster victims within the states and local government areas (LGAs), protection and development of the environment through enforcement of all environmental laws, guidelines, policies, standards and regulations in Nigeria, as well as enforcing compliance with provisions of international agreements, protocols, conventions and treaties on the environment to which Nigeria is a signatory (key roles of NESREA), provision of reliable and high quality hydrological and hydrogeological services and data on a continuous basis (key roles of NIHSA, which since 2013 has been creating awareness of flooding through the "flood outlook" initiative), flood forecast and weather report along with other meteorological information (NIMET).
Specific actions by local communities and the general public, humanitarian organizations and international bodies, the media and the academia are equally acknowledged (Terungwa & Torkwase 2013, Olalekan 2013, Obeta 2014, OCHA 2012). Co-habitation

A Review of Flooding and Flood Risk Reduction in Nigeria
V
olum
e XVI Issue
II V
ersio
n I
35
( B)
Globa
l Jo
urna
l of H
uman
Soc
ial Sc
ienc
e
-
Year
2016
© 2016 Global Journals Inc. (US)
among families in Nigeria offers a comparative advantage in the event of flooding as individuals within family setting offer mutual assistance to cope with the hazard and to recover speedily from losses incurred. In many flooding incidences in Nigerian cities, the general public has often converged at the scenes the incidence to offer help to victims, assist in evacuation of those displaced and in protecting property from further damage. Many IDPs easily find shelter and other humanitarian needs from families and friends while awaiting intervention by authorities. However, unlike the developed countries, the vulnerabilities of local communities to flooding in Nigeria may indicate among other factors the overwhelming lack of responsibility towards flooding and ways of addressing its challenges. For examples failure to comply with environmental laws and regulations and to adhere to weather warnings and alerts are possible situations where lack of responsibilities of local communities and the general public is highlighted (Aderogba 2012a). The indifference of most people towards research questionnaires and surveys most likely compounds the situation.
Humanitarian response to flooding in Nigeria has been overwhelming. Almost in all cases of flooding in Nigeria have victims received humanitarian supports with most notably the International Federation of Red Cross (IFRC), United Nations, World Bank, Foreign countries including UK, the United States, China, Japan, France as well as religious organizations including theCatholic, Anglican and Pentecostal churches and missionary societies. The 2012 flooding saw humanitarian response amounting to over US$70 million (OCHA 2012).
Considerable attention has been given to flooding in Nigeria through research and scientific studies. However, the need for science and technology to embrace environmental education in Nigeria has been identified (Terungwa & Torkwase 2013). Similarly, the media have played important roles in reporting flooding in Nigeria, but as argued by (Olalekan 2013), there have been inconsistencies in flood reporting in the country which may be attributed to some disconnect between the media and agencies tackling flooding in the country particularly the NEMA.
Despite these progresses, there are a number of critical issues regarding these present efforts at tackling flooding in Nigeria (Obeta 2014, Agbola 2012, Kolawole et al. 2010). With regards to facilitating the evacuation of victims affected by floods and providing them with urgent humanitarian needs, the level of dissatisfaction and agitations from large numbers of the flood victims, especially the IDPs, queries the effectiveness of these measures. Although it is unjustifiable to claim that the limitation with these present efforts probably leads to more frequent flooding in the country, however, the fact that such measures have not improved the country with regards to the idea
of "living with floods" is clearly acknowledged (Adelekan 2010, Adebayo & Oruonye 2013, Akintola & Ikwuyatum 2013).
V. Recommendations
Based on these critical issues relating to tackling flooding in Nigeria, lessons learned from other countries’ experiences of flooding and “best practices” in flood risk reduction (Water UK 2008, Pitt 2008, Sayer et al. 2013), the authors propose that inclusion of flood modelling in the present effort will be a way forward towards a more proactive flood risk reduction within the country. In addition to this proposal, the following recommendations are relevant:
• In view of global focus towards tackling floodingusing United Kingdom, the US and the Netherlands as exemplars and considering the specific situation of Nigeria regarding flooding, the nation’s academia should focus attention on more scientific investigations. Flooding and climate change concepts should be integrated into curriculum of studies in Nigerian schools. Current issues in flood research such as flood modelling, vulnerability assessment, uncertainty analyses and early warning systems should be promoted.
• From previous studies (for example Nkwunonwo et al. 2015), it is clear that perception of flooding in Nigeria has only received little attention. Due to lack of funds and the indifference of political leaders towards research, a number of researches relating to flooding in the country seem to recycle issues that are well known such as causes and impacts of flooding. To tackle this challenge, we recommend that annual budgeting for Nigeria should be specific and more realistic with funds for research.
• The old English adage “God created the world, but the Dutch created Netherlands” is often used to highlight the commitment and responsibilities of the Dutch towards tackling flooding and its challenges. Flood defence in the Netherlands cost each person a few hundred Euros each year and the people rarely flinched at the responsibility (Vis et al. 2003). The high level of adherence to regulations and rules shown by British citizens is highlighted in the conservation of nature and high environmental standards which the country upholds (Pitt 2007). Such positive attitude is also exhibited towards weather reports, disaster warning and alerts informing a significant level preparedness which appears to influence reduced damage following flooding event. Against this background, Nigerians need a change of attitude towards flooding its management. Ideally, Nigerians should participate in matters relating to flooding which most largely affects their lives. This can be done by asking relevant questions, seeking to know and willing to
A Review of Flooding and Flood Risk Reduction in Nigeria
© 2016 Global Journals Inc. (US)
V
olum
e XVI Issue
II V
ersio
n I
36
( B)
Globa
l Jo
urna
l of H
uman
Soc
ial Sc
ienc
e
s
-
Year
2016
adapt to individual actions which can potentially influence flood risk reduction within the country. Individuals in politics should ensure that laws which underlie the enforcement of environmental standards and regulations are made. Equally, the general public and local communities in Nigeria should support research through positive and accurate responses to questionnaire and surveys.
• The lack of detailed plan and strategy for disbursing funds and inaccurate information relating to those who have been affected by flooding most probably undermine humanitarian support in Nigeria and account for financial mismanagement. Humanitarian actions in Nigeria are generally for post-disaster and emergency situations suggesting some limitation based on what can be achieved through financial support. Given that most local communities in Nigeria consist of poor human populations, we recommend that the focus and priority of humanitarian supports should be on improving the living condition of the population people whilst not undermining the need for assistance in eventualities. Thus focus will not only ultimately reduce their chances of people being vulnerable to flooding and assist in minimizing financial mismanagement, but also it will boost the credence of humanitarian supports towards natural disasters in general and flooding in particular in Nigeria.
• The European Union framework on flooding requires all constituting States to prepare flood hazard/risk maps (EA 2003). Whilst this policy highlights the relevance of flood modelling, it also underlines strong commitment towards tackling flooding across the region of Europe. A policy of such will benefit West Africa in general and Nigeria in particular. However, whilst a regional policy towards flood risk map may be unrealistic for West Africa in the interim, a strong legislation that requires each state of Nigeria to produce a flood hazard/risk map is recommended for Nigeria. This will to a large extent strengthen existing institutional framework and stimulate increased responsibility towards flood risk reduction among the states in the country.
• Flood risk reduction under the “living with floods” idea is multi-disciplinary indicating that various industries can assist in reducing the impacts of flooding. In UK, evidences of collaboration from various companies and institutions towards addressing flood challenges are undisputable (EA 2010, Water UK 2008, Pitt 2008). Thus, the need for multinationals and banking industries in Nigeria to sponsor research and promote sustainable development within Nigerian cities, as well as augment humanitarian supports to improve the living standards of local communities whilst reducing their vulnerabilities and building their resilience to flooding should not be ignored.
• Flood insurance is a non-structural approach which many property owners have benefitted from in developed countries following flood disasters. To support the roles of flood insurance in Nigeria, it is recommended that the role of FEMA in this regard should be extended to states and whilst encouraging insurance companies to commence sensitization exercises for properties owners to take positive step in this direction.
VI. Conclusion
Critical issues relating to widespread flooding in Nigeria have been explored with view to charting a more proactive solution towards addressing the challenge within the country. Fluvial and coastal types of flooding are experienced in Nigeria. However pluvial flooding which is a major cause of concern for urban areas within the country appears to be more frequent and arguably unprecedented from the point of view of flood impacts. Over the period 1985 to 2014, the effects of flooding on people, properties and economic activities have been arguably overwhelming. Whilst virtually all states in Nigeria have experienced the hazard, more frequent floods are experienced in Niger, Adamawa, Oyo, Kano and Jigawa states, possibly due to the influence of rivers Niger, Benue, Ogun and Hadeja. Lagos state seems to have experienced most of the floods in the country and this has been associated to poor urban planning and climate change with more frequent and intense rainfall.
Present efforts at tackling flooding in Nigeria appear to be limited and have been grossly criticized as ad-hoc, poorly coordinated and not in line with globally acknowledged ‘best practices’ in flood risk reduction. Whilst such practices do not seem to be governed by the idea of ‘living with floods and not fighting them’, which dominates in flood risk reduction literature and many international and regional flood management policies such as the European Union Flood Directive, flood modelling approaches are evidently lacking.
Given the relevance of flood risk/hazard mapping within the framework of flood risk reduction, the specific roles of flood modelling are presented. Basically, it is shown that flood modelling simulates flood hazard data (flood water depth, extent, and duration as well as flow velocity) for flood risk/hazard mapping. However, the dearth of these data among other factor constrains efforts at tackling flooding in Nigeria. Although ground survey and remote sensing approaches can be applied to acquire these data, limitations inherent in these approaches undermine their applications in Nigeria.
With flood modelling presented, recommend-dations which the authors deemed relevant towards achieving the key drivers of this study were made. Most importantly, bearing in mind that flooding cannot be constrained within human environment and that it will

A Review of Flooding and Flood Risk Reduction in Nigeria
V
olum
e XVI Issue
II V
ersio
n I
37
( B)
Globa
l Jo
urna
l of H
uman
Soc
ial Sc
ienc
e
-
Year
2016
© 2016 Global Journals Inc. (US)
worsen in the future, the need for Nigerians to create a society where social systems are resilient to the hazard is recognized.
It is recognized that a major limitation of this study is in the negligence of flood events prior to 1985. This is due to the lack of accurate and well-coordinated historical data for those periods. However the study recommends this for future investigations, especially with regards to developing a repository where various historical flood data can be lodged, irrespective of their magnitudes and return periods. There is urgent need for bespoke flood models for simulating flood hazard in Nigeria in line with the objectives of NIHSA. That way the barriers associated with existing flood models such as copyright restriction, limited calibration and strict insistence on quality data requirement to run the commercial flood models in Nigeria can be overcome.
References Références Referencias
1. ActionAid. (2006). Climate change, urban flooding and the rights of the urban poor in Africa: Key findings from six African cities. London: Action Aid International.
2. Adeaga, O. (2008). Flood Hazard Mapping and Risk Management in Parts of Lagos N. E. Available at: www.gsdi.org/gsdi10pages/Ts.13paper/pdf
3. Adebayo, A.A., & Oruonye, E.D. (2013). An Assessment of the effects of the 2012 Floods in Taraba State, Nigeria. Paper delivered at the Annual National Conference, organized by the Association Hydrological Science at University of Agriculture, Abeokuta, Ogun, state, Nigeria. Pp. 13-18.
4. Adedeji, O. H., Odufuwa, B. O., & Adebayo, O. H. (2012). Building capabilities for flood disaster and hazard preparedness and risk reduction in Nigeria: need for spatial planning and land management. Journal of Sustainable Development in Africa, 14(1), 45-58.
5. Adegbola, A. A., & Jolayemi, J. K. (2012). Historical rainfall-runoff modelling of river Ogunpa, Ibadan, Nigeria. Indian Journal of Science and Technology, 5(5), 2725-2728.
VII. Acknowledgement
The author wishes to thank the Surveyors Council of Nigeria (SURCON) for the provision of supplementary grants towards this research. Most of the secondary flood data were accessed from the centre for research in epidemiology of disasters (CRED), Nigeria Environmental Study Action/Team (NEST). All the authors whose previous work and published data have contributed to the present study are acknowledged, and so are the efforts of the reviewers of this paper.
6. Adelekan, O. (2010). Vulnerability of poor urban coastal communities to flooding in Lagos, Nigeria. Environment and Urbanization, 22, 433-450.
7. Adeloye, A.J. and Rustum, R. (2011). Lagos (Nigeria) flooding and influence of urban planning. Urban Design and Planning, 164 (DP3), 175-187.
8. Adeoye, N. O., Ayanlade, A., & Babatimehin, O. (2009). Climate change and menace of floods in Nigerian cities: Socio-economic implications. Advances in Natural and Applied Sciences, 3(3), 369-377.
9. Aderogba, K. A. (2012a). Qualitative studies of recent flood and sustainable growth and development of cities and towns in Nigeria. International Journal of academic research in Economics and management science, 1(3), 1-25.
10. Aderogba, K. A. (2012b). Global warming and challenges of floods in Lagos metropolis, Nigeria. Academic Research International, 2(1), 448-468.
11. Aderogba, K.C., Martins, O. M., Oderinde, S. and Afelumo, T. (2012). Challenges of Poor Drainage Systems and Floods in Lagos Metropolis, Nigeria. International Journal of Social Science and Education, 2(30) 412-427.
12. Adewale, P. O., Sangodoyin, A. Y., & Adamowski, J. (2010). Flood routing in the Ogunpa river in Nigeria using HEC-RAS. Journal of Environmental Hydrology, 18. Paper 25. http://www.hydroweb.-com/journal-hydrology-2010-paper-25.html
13. Agbola, B.S, Ajayi, O. Taiwo, O.J. and Wahab, B.W. (2012). The August 2011 flood in Ibadan, Nigeria: anthropogenic causes and consequences. International Journal of Disaster Risk Science, 3(4)207-217.
14. Agbonkhese, O., Agbonkhese, E. G., Aka, E. O., Joe-Abaya, J., Ocholi, M., & Adekunle, A. (2014). Flood Menace in Nigeria: impacts, remedial and management strategies. Civil and Environmental Research, 6(4), 32-40.
15. Ahern, M., Kovats, R. S., Wilkinson, P., Few, R., & Matthies, F. (2005). Global health impacts of floods: epidemiologic evidence. Epidemiologic reviews, 27(1), 36-46.
16. Ajibade, I., McBean, G. and Bezner-Kerr, R. (2013). Urban flooding in Lagos, Nigeria: Patterns of vulnerability and resilience among women. Global Environmental Change, 23, 1714-1725.
17. Akintola, E. O. (1994). Flooding phenomenon. Ibadan Region. Ibadan: Rex Charles Publication, pp.244-255.
18. Akintola, F.O., & Ikwuyatum, G.O. (2012). Issues in sustainable flood management in Nigeria. In Ivbijaro FA, Akintola FO. Editors; Sustainable Environmental Management in Nigeria. Ibadan, Oxford University Publishers. pp.197-207.
19. Ali, D. & Hamidu, S. (2014). Environmental hazard: climate change and flooding, the impact on the built
A Review of Flooding and Flood Risk Reduction in Nigeria
© 2016 Global Journals Inc. (US)
V
olum
e XVI Issue
II V
ersio
n I
38
( B)
Globa
l Jo
urna
l of H
uman
Soc
ial Sc
ienc
e
s
-
Year
2016
Sciences and Resources Management, 6(1),136-144.
20. Andjelkovic. (2001). Guide line on non-structural measures in urban flood management 1HP-V. Paris: Technical Document in Hydrology, UNESCO, Paris, 50.
21. Anih, S. C. (2004). Effective survival measures against natural hazards in settled area. In L. Mbah, U. Uchegbu, & L. Muoghalu, Management of environmental problems and hazards in Nigeria.England: Ashgate publishing limited.
22. Balbi, S., Giupponi, C., Gain, A., Mojtahed, V., Gallina, V., Torresan, S., & Marcomini, A. (2012). A conceptual framework for ComprehensiveAssessment of Risk Prevention Measures: The KULTU Risk Framework (KR-FWK). Available at SSRN 2184193
environment in Nigeria. Journal of Environmental
23. Bashir, O., Oludare, H., Johnson, O., & Aloysius, B. (2012). Floods of fury in Nigerian cities. Journal of Sustainable Development, 5(7), 69-79.
24. Bates, P.D., Dawson R.J., Hall, W.J., Horritt, M.S., Nichollos, R.J., Jon Wicks, Hassan A.M. (2005). Simple two-dimensional numerical modeling of coastal flooding and example applications. Coastal Engineering 52, 793-810.
25. Bates, P.D., Matthew, S.H., Fewtrell, T.J.(2010). A simple inertial formulation of the shallow water equation for efficient two-dimensional flood inundation modeling. Journal of Hydrology, 387,33-45.
26. Bedient, P. B. & Huber, W. C. (2008). Hydrology and Floodplain Analysis, 4th Ed. Prentice-Hall Publishing Co., Upper Saddle River, NJ, 2008, 795 pp.
27. Birkmann, J. (2006). Measuring vulnerability to promote disaster-resilient societies: conceptual frameworks and definitions. In J. Birkmann, Measuring vulnerability to natural hazards: towards disaster resilient societies. (pp. 9-54). Hong Kong: United Nations University Press.
28. Brilly, M., & Polic, M. (2005). Public perception of flood risks, flood forecasting and mitigation. Natural Hazards and Earth System Science, 5(3), 345-355.
29. Brooks, N. (2003). Vulnerability, risk and adaptation: A conceptual framework. Tyndall Centre for Climate Change Research Working Paper, 38, 1-16.
30. Building Nigeria’s Response to Climate Change (BNRCC). (2008). Vulnerability, impacts and adaptation. Climate Change in Nigeria. [email protected].
31. Burby, R. J., Deyle, R. E., Godschalk, D. R., & Olshansky, R. B. (2000). Creating hazard resilient communities through land-use planning. Natural hazards review, 1(2), 99-106.
32. CEA (Comit´e Europ´een des Assurances). (2007). Reducing the social and economic impact of climate change and natural catastrophes –
insurance solutions and public-private partnerships, CEA,Brussels, Belgium.
33. Chen, J., Hill, A.A., Urbano, D.L. (2009). A GIS-based model for urban flood inundation. Journal of Hydrology 373, 184-192.
34. Chow, V.T., Maidment, D.R., Mays, L.W. (1988). Applied Hydrology. New York: McGraw-Hill.
35. Clement, A. R. (2013). An application of GeographicInformation System in mapping flood risk zones in a north central city in Nigeria. African Journal of Environmental Science and Technology, 7(6),365-371.
36. Cline, W.R., (2007). Global Warming and Agriculture. Centre for Global Development, Peterson Institute for International Economics, Washington, DC, pp. 186.
37. Cohen, B. (2004). Urban growth in developing countries: a review of current trends and a caution
regarding existing forecasts. World Development, 32(1), 23-51.
38. Crichton, D. (1999). The Risk Triangle. In I. J, Natural Disaster Management (pp. 102-103). London: Tudor Rose.
39. De Moel, H., van Alphen, J., Aerts, J.C. (2009). Flood maps in Europe – methods, availability and use. Natural Hazards and Earth System Sciences, 9, 289-301.
40. DEFRA (Department for Environment Food and Rural Affairs) (2013). Desktop review of 2D hydraulic modeling packages. Environmental Agency. Bristol.
41. DFO (Dartmouth Flood Observatory). (2004). Available at: www.dartmouth. edu/~floods/ (Acce-ssed 30 July 2012).ref
42. Di Baldassarre, G. and Uhlenbrook, S. (2012). Is the current flood of data enough? A treatise on research needs for the improvement of flood modeling. Hydrological Processes 26, 153-158.
43. Douglas, I., Alam, K., Maghenda, M., Mcdonnell, Y., McLean, L., & Campbell, J. (2008). Unjust waters: climate change, flooding and the urban poor in Africa. Environment and Urbanization, 20(1),187-205.
44. draft copy (with contributions from S Pauleit, REnnos, S Lindley, J Handley, J
45. EA (Environment Agency). (1997). Tyne Estuary Project 1996. Report of the Tyne Estuary Group. Newcastle. 183pp.
46. EA (Environment Agency). (2003). Risk Assessment for Flood & Coastal Defence for Strategic Planning R&D Technical Report W5B-030/TR1, Authors Sayers PB, Hall JW, Meadowcroft, IC, Dawson, R, Deakin R, Rosu C.
47. EA (Environment Agency). (2010). Working with natural processes to manage flood and coastal erosion risk. London, Environment Agency.
48. EC (European Commission). (2004). Flood risk management - Flood prevention, protection and
A Review of Flooding and Flood Risk Reduction in Nigeria
V
olum
e XVI Issue
II V
ersio
n I
39
( B)
Globa
l Jo
urna
l of H
uman
Soc
ial Sc
ienc
e
-
Year
2016
© 2016 Global Journals Inc. (US)
mitigation. Communication from the Commission to the Council, the European Parliament, the European Economic and Social Committee and the Committee of the Regions.
49. EM-DAT (The International Disaster Database). CRED. (2014). Flooding data for Nigeria.www.emdat.be/
50. Etuonovbe, A. K. (2011, May). The devastating effect of flooding in Nigeria. In FIG Working Week.
51. Fadairo, G., & Ganiyu, S. A. (2010). Effects of flooding on the built environment in Akure, Nigeria. In West Africa built environment research (water) conference. pp. 281.
52. Fewtrell, L., & Kay, D. (2008). An attempt to quantify the health impacts of flooding in the UK using an urban case study. Public Health, 122(5), 446-451.
53. FME (Federal Ministry of the Environment). (2012). Bulletin on Ecological Disasters, Abuja, Nigeria. FME.Garba, H., Ismail, A., Ibrahim, A., Ahmed, S., & Faustinus, B. Hydrological modelling of the impact of climate change on a tropical perennial river flooding. Research Inventory: International Journal of Engineering and Science, 3(6), 30-35.
55. Gill, S., Pauleit, S., Ennos, A.R., Lindley, S.J., Handley, J. F., G. William, J. and Ueberjahn -Tritta, A. (2004). Literature review: Impacts of climate change on urban environments. Centre for Urban and Regional Ecology (CURE), University of Manchester. Available at: http://www.seed.-manchester.ac.uk/cure/medialibrary/research/asccue/downloads/ascc ue_litreview.pdf
56. Guha-Sapir, D., Hoyois. P.H., Below, R. (2013). Annual Disaster Statistical Review 2012: The Numbers and Trends. Brussels: CRED; 2013.
57. Gupta, K. (2007). Urban flood resilience planning and management and lessons for the future: a case study of Mumbai, India. Urban Water Journal, 4(3), 183-194.
58. Hassan, F. A. (2013). A River Runs Through Egypt: Nile Floods and Civilization. Retrieved from Geotimes: http://www.geotimes.org/apr05/feature_-NileFloods.html
59. Hirabayashi, Y., Mahendran, R., Koirala, S., Konoshima, L., Yamazaki, D., Watanabe, S., & Kanae, S. (2013). Global flood risk under climate change. Nature Climate Change, 3(9), 816-821.
60. Ho, L. T. K., Umitsu, M., & Yamaguchi, Y. (2010). Flood hazard mapping by satellite images and SRTM DEM in the Vu Gia–Thu Bon alluvial plain, Central Vietnam. International archives of thePhotogrammetry, remote sensing and spatial information science, 38(Part 8), 275-280.
61. Holton, R. J. (1998). Globalization and the nation state. International Research Journal of Arts & Humanities (IRJAH), 160.
54.
62. Houston, D., Werritty, A., Bassett, D., Geddes, A., Hoolachan, A. and McMillan M. (2011). Pluvial (rain-related) flooding in urban areas: the invinsible hazard. York, UK: Joseph Rowntree Foundation.
63. Hunter, P. R. (2003). Climate change and waterborne and vector‐borne disease. Journal of Applied Microbiology, 94(s1), 37-46.
64. Huong, H. T. L., & Pathirana, A. (2011). Urbanization and climate change impacts on future urban flood risk in Can Tho city, Vietnam. Hydrology and Earth System Sciences Discussions, 8(6), 10781-10824.
65. Ibitoye, M. (2007). The need for planning of peri-urban growth in south western Nigeria: the surveyors' perspective. Symposium organized by the Nigerian Institution of Surveyors (NIS), (pp. 42-48). University of Lagos, Lagos.
66. ICIMOD (International Centre for Integrated Mountain Development). (2009). Local responses to too much and too little water in the Greater Himalayan region. Kathmandu, Nepal: International Centre for Integrated Mountain Development.
67. Iloje N.P. (2004). A New Geography of Nigeria. Lagos, Longman publishers.
68. IPCC (Intergovernmental Panel on Climate Change). (2007). Climate Change Impacts, adaptation and Vulnerability. Contribution of Working Group II to the Fourth Assessment Report of the IPCC Assessment. Report, Summary for Policymakers. http://www.icpc.-ch/pdf/assessment-report/ar4/wg2/ar4-wg2-spm.-pdf
69. Jeffers, M. J. (2013). Integrating Vulnerability Analysis and Risk Assessment in Floods LossMitigation: An Evaluation of Barriers and Challenges based on Evidence from Ireland. Applied Geography, 37, 44-51.
70. Jha, A. K., Bloch, R., & Lamond, J. (2012). Cities and flooding: a guide to integrated urban flood risk management for the 21st century. World Bank Publications.
71. Jonkman, S. N., Bočkarjova, M., Kok, M., & Bernardini, P. (2008). Integrated hydrodynamic and economic modeling of flood damage in the Netherlands. Ecological economics, 66(1), 77-90.
72. Kalnay, E., & Cai, M. (2003). Impact of urbanization and land-use change on climate. Nature, 423(6939), 528-531.
73. Kazmierczak, A., & Carter, J. (2010). Adaptation to climate change using green and blue infrastructure. A database of case studies. University of Manchester, GRaBS project.
74. Keith, C. (1999). Getting started with Geographic Information System. Upper Saddle River, New Jersey, USA: Prentice-Hall Inc.
75. Kolawole, O. M., Olayemi, A. B., & Ajayi, K. T. (2011). Managing flood in Nigerian cities: Risk analysis and adaptation options–Ilorin city as a case
A Review of Flooding and Flood Risk Reduction in Nigeria
© 2016 Global Journals Inc. (US)
V
olum
e XVI Issue
II V
ersio
n I
40
( B)
Globa
l Jo
urna
l of H
uman
Soc
ial Sc
ienc
e
s
-
Year
2016
study. Archives of Applied Science Research, 3(1), 17-24.
76. Kovacs, P. & Sandink, D. (2013). Best practices for reducing the risk of future damage to homes from riverine and urban flooding: A report on recovery and rebuilding in southern Alberta. Toronto, Ontario, Canada: Institute for Catastrophic Loss Reduction.
77. Kundzewicz, Z. W. (2002). Non-structural flood protection and sustainability. Water International, 27(1), 3-13.
78. Lauber, P. (1996). Floods: Wrestling with the Mississippi. Washington, D.C.: National Geographic Society.
79. Li, Y., & Wang, C, (2009). Impacts of urbanization on surface runoff of the dardenne creek watershed, St. Charles county, Missouri. Physical Geography, 30(6). 556-573. DOI: 10.2747/0272-3646.30.6.556
80. Manfreda, S., Di Leo, M., & Sole, A. (2011). Detection of flood-prone areas using digital elevation models. Journal of Hydrologic Engineering, 16(10), 781-790.
81. Merz, B., Thieken, A. H., & Gocht, M. (2007). Flood risk mapping at the local scale: concepts and challenges. In Flood risk management in Europe(pp. 231-251). Springer Netherlands.
82. Milly, P. C. Wetherald, R. T., Dunne, K. A. and Delworth, T.L. (2002). Increasing risk of great floods in a changing climate. Nature, 415, 514-517.
83. Moussa, R. and Bocquillon, C. (2009). On the use of diffusive wave for modeling extremeflood events with overbank flow in the floodplain. Journal of Hydrology 374, 116-135.
84. Mujumdar, P.P. (2001). Flood wave propagation: The St. Venant equations. Resonance, 6(5)66-73DOI: 10.1007/BF02839085
85. National Population Commission (NPC) (2007). 2006 Population and Housing Census: National and State Population and Housing Tables: Priority Tables I-IV. FCT, Abuja: Federal Government of Nigeria.
86. Neal, J., Schumann, G., Fewtrell, T., Budimir, M., Bates, P., & Mason, D. (2011). Evaluating a new LISFLOOD‐FP formulation with data from the summer 2007 floods in Tewkesbury, UK. Journal of Flood Risk Management, 4(2), 88-95.
87. NEMA (Nigeerina Emergency Manageent Agency). (2013). Report on flood disasters in Nigeria. Abuja: Government Press.
88. NEST (Nigeria Environmental Study/Action Team). (1991). Nigeria's threatened environment: A national profile. Ibadan, Nigeria: NEST. Location: IRC Main, 824 NG91, 9582.
89. NIHSA (Nigeria Hydrological Services Agency). (2013). 2013 Flood outlook. http://www.nihydro.ng/wp-content/uploads/2012/08/AMENDED -REPORTOF-The-Nigerian-Hydrological-Services-Agency.pdf
gov.-
90. Nijland, H. (2005). Sustainable development of floodplains (SDF) project. Environmental Science and Policy, 8, 245–252.
91. Nkwunonwo, U. C., Whitworth, M., Baily, B., & Inkpen, R. (2014). The Development of a Simplified Model for Urban Flood Risk Mitigation in Developing Countries. In Vulnerability, Uncertainty, and Risk@ Quantification, Mitigation, and Management(pp. 1116-1127). ASCE.
92. Nwilo, P.C., Olayinka, D.N., Adzandeh, A.E. (2012). Flood modeling and vulnerability assessment of settlements in the Adamawa state floodplain usingGIS and cellular framework. Global Journal of Human Social Science 12 (3), 10-20.
93. Obeta, C. M. (2014). Institutional Approach to Flood Disaster Management in Nigeria: Need for a Preparedness Plan. British Journal of Applied Science & Technology, 4(33), 4575-4590.
,
94. Obeta, M.C. (2009). Extreme river flood events in Nigeria: A geographical perspective of Nigerian. Journal of Geography and the Environment, 1,170-179.
95. OCHA (UN office for the Coordination of Humanitarian Affairs). (2012). Nigeria: floods, emergency situation report no 2. Available at: www.ochaonline.un.org/rowca
96. Ochuko, M. O. (2014). Solid waste management in Obantoko area of Abeokuta, Nigeria. Journal of Emerging Trends in Engineering and Applied Sciences, 5(2), 111-115.
97. Odunuga, S. (2008). Urban land use change and the flooding in Ashimowu watershed, Lagos, Nigeria.University of Lagos, Nigeria: PhD thesis.
98. Ogunbodede, E. F., & Sunmola, R. A. (2014). Flooding and traffic management in Akure (Nigeria) metropolitan environment. International Journal of Innovation and Scientific Research, 7(2), 121-130.
99. Ogwuche, J. A., & Abah, I. A. (2014). Assessment of Flood Disaster Vulnerability for Flood Insurance Programme in Part of Makurdi Floodplain, Benue State, Nigeria. Donnish Journal of Ecology and the Natural Environment, 1(1), 1-5.
100. Ojigi, M. L., Abdulkadir, F. I. and Aderoju, M. O. (2013). Geospatial Mapping and Analysis of the 2012 Flood Disaster in Central Parts of Nigeria. 8th National GIS Symposium. Dammam. Saudi Arabia. April 15-17, 2013, 1067-1077.
101. Oki, T., & Kanae, S. (2006). Global hydrological cycles and world water resources. Science, 313(5790), 1068-1072.
102. Olalekan, A. (2013).The Inconsistency of the Flood Narrative in Nigeria. http://www.eir.info/2013/-02/04/the-inconsistency-of-the-flood-narrative-in-nigeria/
103. Ologunorisa, T. E., & Adeyemo, A. (2005). Public perception of flood hazard in the Niger Delta, Nigeria. Environmentalist, 25(1), 39-45.

A Review of Flooding and Flood Risk Reduction in Nigeria
V
olum
e XVI Issue
II V
ersio
n I
41
( B)
Globa
l Jo
urna
l of H
uman
Soc
ial Sc
ienc
e
-
Year
2016
© 2016 Global Journals Inc. (US)
104. Ologunorisa, T.E. (2004). An assessment of flood vulnerability zones in the Niger delta, Nigeria.International Journal of Environmental Studies, 61(1), 31-38.
105. Olorunfemi, F.B. (2011). Managing flood disastersunder a changing climate: lessons from Nigeria and South Africa. Paper presented at NISER Research Seminar Series, NISER, Ibadan. 3rd May, 2011.
106. Onwuteaka, J. (2014). GIS Modeling of Flooding Exposure in Nigerian Coastal Areas from Sea Level Rise. Journal of Environment and Earth Science, 4(12), 81-94.
107. Peduzzi, P., Dao, H., Herold, C., & Mouton, F.(2009). Assessing global exposure and vulnerability towards natural hazards: the disaster risk index, Natural. Hazards Earth System. Science, 9, 1149–1159, doi: 10.5194/nhess-9-1149-2009
108. Penning-Rowsell, E., Floyd, P., Ramsbottom, D., & Surendran, S. (2005). Estimating injury and loss of life in floods: a deterministic framework. Natural Hazards, 36(1-2), 43-64.
109. Pinho, J., Ferreira, R., Vieira, L., & Schwanenberg, D. (2014). Comparison between two hydrodynamic models for flooding simulations at river Lima basin. Water Resources Management, 1-14.
110. Pitt, M. (2008). Lessons from the 2007 floods.London: Pitt Review.
111. Plate, E. J. (2002). Flood risk and flood management. Journal of Hydrology, 267(1), 2-11.
112. Raaijmakers, R., Krywkow, J., & van der Veen, A. (2008). Flood risk perceptions and spatial multi-criteria analysis: an exploratory research for hazard mitigation. Natural Hazards, 46(3), 307-322.
113. Renyi, L., & Nan, L. (2002). Flood area and damage estimation in Zhejiang, China. Journal of environmental management, 66(1), 1-8.
114. Sassen, S. (2000). The global city: strategic site/new frontier. American Studies, 79-95.
115. Sayers, P., L.i, Y., Galloway, G., Penning-Rowsell,E., Shen, F., Wen, K., Chen, Y., & Le Quesne, T. (2013). Flood Risk Management: A Strategic Approach. Paris, UNESCO.
116. Sayers, P.B., J.W. Hall, J.W., & I. C. Meadowcroft, I.C. (2002). Towards risk-based flood hazard management in the UK. Proceedings of ICE Civil Engineering 150 May 2002, Pages 36-42 Paper 12803
117. Seto, K. C., & Shepherd, J. M. (2009). Global urban land-use trends and climate impacts. Current Opinion in Environmental Sustainability, 1(1), 89-95.
118. Shuster, W. D., Bonta, J., Thurston, H., Warnemuende, E., & Smith, D. R. (2005). Impacts of impervious surface on watershed hydrology: A review. Urban Water Journal, 2(4), 263-275.
119. Smith, K. and Ward, R. (1998). Floods: Physical Processes and Human Impacts. Chichester: John Wiley and Sons Ltd.
120. Tapsell, S. M., & Tunstall, S. M. (2008). “I wish I’d never heard of Banbury”: The relationship between ‘place’ and the health impacts from flooding. Health & place, 14(2), 133-154.
121. Tapsell, S. M., Penning-Rowsell, E. C., Tunstall, S. M., & Wilson, T. L. (2002). Vulnerability to flooding: health and social dimensions. Philosophical Transactions of the Royal Society of London. Series A: Mathematical, Physical and Engineering Sciences, 360(1796), 1511-1525.
122. Tarekegn, T. H., Haile, A. T., Rientjes, T., Reggiani, P., & Alkema, D. (2010). Assessment of an ASTER-generated DEM for 2D hydrodynamic flood modeling. International Journal of Applied Earth Observation and Geoinformation, 12(6), 457-465.
123. Tarlock, A. D. (2012). United States Flood Control Policy: The Incomplete Transition from the Illusion of total protection to risk management.
124. Tate, E. and Cutter, S. (2010). Integrated multihazard mapping. Environmental and Planning B: Planning and Design, 37, 646-663.
125. Terungwa, U. C., & Torkwase, I.C. (2013). Current issues in flood disaster: challenges and implications for science and technology to enhance environmental education. Academic Journal of Interdisciplinary Studies, 2(6), 61-65.
126. Thompson, J. R., & Hollis, G. E. (1995). Hydrological modeling and the sustainable development of the Hadejia-Nguru wetlands, Nigeria. Hydrological Sciences Journal, 40(1), 97-116.
127. Tunstall, S., Tapsell, S., Green, C., Floyd, P., & George, C. (2006). The health effects of flooding: social research results from England and Wales. J Water Health, 4, 365-380.
128. UN (United Nations). (2007). World Population Prospects: the 2006 revision - executive summary. Department of Economic and Social Affairs, population division, United Nations. New York.
129. UN International Strategy for Disaster Reduction (UNISDR). (2008). Indigenous Knowledge for Disaster Risk Reduction: Good Practices and Lessons Learned from Experiences in the Asia-Pacific Region. Bangkok, UNISDR Asia and Pacific.
130. UN/ISDR: United Nations International Strategy for Disaster Reduction. (2004). Living with Risks: A global Review of Disaster Reduction Initiatives. 2004 Version Volume 1. Retrieved from UN/ISDR: http://www.unisdr.org/files/657_lwr1.pdf
131. United Nations. (2004). World Population to 2300.New York: United Nations Department of Economic and Social Affairs, Population Division.
132. UNSTTPUNDA (United Nations System Task Team on the Post-2015 UN Development Agenda). (2012). Disaster and Resilience. United Nations. New York.
133. Uzochukwu, C. E., Ekwugha, U. P., & Marion, N. E. (2014). Media coverage of the environment in
A Review of Flooding and Flood Risk Reduction in Nigeria
© 2016 Global Journals Inc. (US)
V
olum
e XVI Issue
II V
ersio
n I
42
( B)
Globa
l Jo
urna
l of H
uman
Soc
ial Sc
ienc
e
s
-
Year
2016
Nigeria: issues and prospects. International Journal of Social Sciences and Humanities Review, 4(4).
134. Van Alphen, J., Martini, F., Loat, R., Slomp, R., & Passchier, R. (2009). Flood risk mapping in Europe, experiences and best practices. Journal of Flood Risk Management, 2(4), 285-292.
135. Van de Sande, B., Lansen, J., & Hoyng, C. (2012). Sensitivity of Coastal Flood Risk Assessments to Digital Elevation Models. Water, 4(3), 568-579.
136. Van der Sande, C.J., de Jong, S.M., de Roo,A.P.J. (2003). A segmentation and classification approach of IKONOS-2 imagery for land cover mapping to assist flood risk and flood damage assessment. International Journal of Applied Earth Observation and Geoinformation, 4, 217-229.
137. Vis, M., Klijn, F., De Bruijn, K. M., & Van Buuren, M. (2003). Resilience strategies for flood risk management in the Netherlands. International journal of river basin management, 1(1), 33-40.
138. Ward, R.C. and Robinson, M. (2000). Principles of Hydrology: 4th Edition. London: McGraw-Hill Publishing Company. ISBN 0077095022
139. Water UK (2008). Lesson Learned from Summer Floods 2007 – Phase 1 report – Emergency Response. Review Group on Flooding.
140. Wilson, S., Temple, B., Milliron, M., Vazquez, C., Packard, M., & Rudy, B. (2007). The Lack of Disaster Preparedness by the Public and it's Affect on Communities. The Internet Journal of Rescue and Disaster Medicine, 7(2). Available at: https://ispub.com/IJRDM/7/2/11721
141. WMO (World Meteorological Organization). (2008). Urban flood risk management: a tool for integrated flood management. World Meteurological Organization.
142. Wolski, P., Savenije, H. H. G., Murray-Hudson, M., & Gumbricht, T. (2006). Modeling of the flooding in the Okavango Delta, Botswana, using a hybrid reservoir-GIS model. Journal of Hydrology, 331(1), 58-72.
143. World Bank. (2013). The world Bank: Working for a world free of poverty, Population (Total). Washington, DC: World Bank Group.
144. Zerger, A., & Wealands, S. (2004). Beyond modeling: linking models with GIS for flood risk management. Natural Hazards, 33(2), 191-208.
145. Zhang, Q., Liu, C., Xu, C. Y., Xu, Y., & Jiang, T. (2006). Observed trends of annual maximum water level and stream flow during past 130 years in the Yangtze River basin, China. Journal of Hydrology, 324(1), 255-265.
146. Zhu, D., Zhou, N., Jiang, S. (2011). Research overview of runoff model for urban rainwater. Journal of Water Resources and Water Engineering 22. 132-137 (in Chinese).
© 2016. Abdeen Mustafa Omer. This is a research/review paper, distributed under the terms of the Creative Commons Attribution-Noncommercial 3.0 Unported License http://creativecommons.org/licenses/by-nc/3.0/), permitting all non-commercial use, distribution, and reproduction in any medium, provided the original work is properly cited.
Global Journal of HUMAN-SOCIAL SCIENCE: B Geography, Geo-Sciences, Environmental Science & Disaster Management Volume 16 Issue 2 Version 1.0 Year 2016 Type: Double Blind Peer Reviewed International Research Journal Publisher: Global Journals Inc. (USA) Online ISSN: 2249-460x & Print ISSN: 0975-587X
Evaluation of Bio-Engineering for Pollution Prevention through Sustainable Development of Bioenergy Management
By Abdeen Mustafa Omer Energy Research Institute, United Kingdom
Abstract- This communication discusses a comprehensive review of biomass energy sources, environment and sustainable development. This includes all the biomass energy technologies, energy efficiency systems, energy conservation scenarios, energy savings and other mitigation measures necessary to reduce emissions globally. The current literature is reviewed regarding the ecological, social, cultural and economic impacts of biomass technology. This study gives an overview of present and future use of biomass as an industrial feedstock for production of fuels, chemicals and other materials. However, to be truly competitive in an open market situation, higher value products are required. Results suggest that biomass technology must be encouraged, promoted, invested, implemented, and demonstrated, but especially in remote rural areas.
Keywords: biomass resources, wastes, energy, environment, sustainable development.
GJHSS-B Classification : FOR Code: 879899p
EvaluationofBioEngineeringforPollutionPreventionthroughSustainableDevelopmentofBioenergyManagement
Strictly as per the compliance and regulations of:
Evaluation of Bio-Engineering for Pollution Prevention through Sustainable Development
of Bioenergy Management Abdeen Mustafa Omer
Abstract- This communication discusses a comprehensive review of biomass energy sources, environment and sustainable development. This includes all the biomass energy technologies, energy efficiency systems, energy conservation scenarios, energy savings and other mitigation measures necessary to reduce emissions globally. The current literature is reviewed regarding the ecological, social, cultural and economic impacts of biomass technology. This study gives an overview of present and future use of biomass as an industrial feedstock for production of fuels, chemicals and other materials. However, to be truly competitive in an open market situation, higher value products are required. Results suggest that biomass technology must be encouraged, promoted, invested, implemented, and demonstrated, but especially in remote rural areas. Keywords: biomass resources, wastes, energy, environment, sustainable development.
I. Introduction
his study highlights the energy problem and the possible saving that can be achieved through the use of biomass sources energy. Also, this study
clarifies the background of the study, highlights the potential energy saving that could be achieved through use of biomass energy source and describes the objectives, approach and scope of the theme.
The aim of any modern biomass energy systems must be:
• To maximise yields with minimum inputs.
• Utilisation and selection of adequate plant materials and processes.
• Optimum use of land, water, and fertiliser.
• Create an adequate infrastructure and strong R and D base.
There is strong scientific evidence that the average temperature of the earth’s surface is rising. This was a result of the increased concentration of carbon dioxide (CO2), and other greenhouse gases (GHGs) in the atmosphere as released by burning fossil fuels (Robinson, 2007; and Omer, 2008). This global warming will eventually lead to substantial changes in the world’s climate, which will, in turn, have a major impact on human life and the environment. Energy use can be
Author: Energy Research Institute (ERI), Nottingham, United Kingdom.
e-mail: [email protected]
achieved by minimising the energy demand, by rational energy use, by recovering heat and the use of more green energies. This will lead to fossil fuels emission reduction. This study was a step towards achieving this goal. The adoption of green or sustainable approaches to the way in which society is run is seen as an important strategy in finding a solution to the energy problem. The key factors to reducing and controlling CO2, which is the major contributor to global warming, are the use of alternative approaches to energy generation and the exploration of how these alternatives are used today and may be used in the future as green energy sources. The non-technical issues, which have recently gained attention, include: (1) Environmental and ecological factors, e.g., carbon sequestration, reforestation and revegetation. (2) Renewables as a CO2 neutral replacement for fossil fuels. (3) Greater recognition of the importance of renewable energy, particularly modern biomass energy carriers, at the policy and planning levels. (4) Greater recognition of the difficulties of gathering good and reliable biomass energy data, and efforts to improve it. (5) Studies on the detrimental health efforts of biomass energy particularly from traditional energy users. There is a need for some further development to suit local conditions, to minimise spares holdings, to maximise interchangeability both of engine parts and of the engine application. Emphasis should be placed on full local manufacture (Abdeen, 2008a).
Fossil fuels, especially oil and natural gas, are finite in extent, and should be regarded as depleting assets, and efforts are oriented to search for new sources of energy. The clamour all over the world for the need to conserve energy and the environment has intensified as traditional energy resources continue to dwindle whilst the environment becomes increasingly degraded (Abdeen, 2008b).
Large-scale, conventional, power plant such as hydropower has an important part to play in development. It does not, however, provide a complete solution. There is an important complementary role for the greater use of small scale, rural based-power plants. Such plant can be used to assist development since it can be made locally using local resources, enabling a rapid built-up in total equipment to be made without a corresponding and unacceptably large demand on
T
V
olum
e XVI Issue
II V
ersio
n I
43
( B)
Globa
l Jo
urna
l of H
uman
Soc
ial Sc
ienc
e
-
Year
2016
© 2016 Global Journals Inc. (US)

central funds. Renewable resources are particularly suitable for providing the energy for such equipment and its use is also compatible with the long-term aims (Abdeen, 2008c). In compiling energy consumption data one can categorise usage according to a number of different schemes: • Traditional sector- industrial, transportation, etc. • End-use- space heating, process steam, etc. • Final demand- total energy consumption related to
automobiles, to food, etc. •
Energy source- oil, coal, etc. •
Energy form at point of use- electric drive, low temperature heat, etc.
II.
Bioenergy Development
Bioenergy is energy from the sun stored in materials of biological origin. This includes plant matter
and animal waste, known as biomass. Plants store solar energy through photosynthesis in cellulose and lignin, whereas animals store energy as fats. When burned, these sugars break down and release energy exothermically, releasing carbon dioxide (CO2), heat and steam. The by-products of this reaction can be captured and manipulated to create power, commonly called bioenergy. Biomass is considered renewable because the carbon (C) is taken out of the atmosphere and replenished more quickly than the millions of years required for fossil fuels to form. The use of biofuels to replace fossil fuels contributes to a reduction in the overall release of carbon dioxide into the atmosphere and hence helps to tackle global warming (Abdeen, 2008d).
Table 1 :
Sources of energy (Omer, 2008)
Energy source
Energy carrier
Energy end-use
Vegetation
Fuel-wood
Cooking
Water heating
Building materials
Animal fodder preparation
Oil
Kerosene
Lighting
Ignition fires
Dry cells
Dry cell batteries
Lighting
Small appliances
Muscle power
Animal power and human power
Transport Land preparation for farming
Food preparation (threshing)
Table 2 :
Renewable applications (Omer, 2008)
Systems
Applications
Water supply
Wastes disposal
Cooking
Food
Electrical demands
Space heating
Water heating
Control system
Building fabric
Rain collection, purification, storage and recycling
Anaerobic digestion (CH4) Methane
Cultivate the 1 hectare plot and greenhouse for four people Wind generator
Solar collectors
Solar collectors and excess wind energy
Ultimately hardware
Integration of subsystems to cut costs
The biomass energy resources are particularly suited for the provision of rural power supplies and a major advantage is that equipment such as flat plate solar driers, wind machines, etc., can be constructed using local resources and without the high capital cost of more conventional equipment. Further advantage results from the feasibility of local maintenance and the general encouragement such local manufacture gives to the build up of small scale rural based industry. Table 1 lists the energy sources available. Currently the ‘non-commercial’ fuels wood, crop residues and animal dung are used in large amounts in the rural areas of developing countries, principally for heating and cooking; the method of use is highly inefficient. Table 2
presented some renewable applications. Table 3 lists the most important of energy needs. Table 4 listed methods of energy conversion.
Table 3 :
Energy needs in rural areas (Omer, 2008)
Transport Agricultural machinery
Crop processing
Water pumping
Small industries
e.g., small vehicles and boats
e.g., two-wheeled tractors
e.g., milling
e.g., drinking water
e.g., workshop equipment
Evaluation of Bio-Engineering for Pollution Prevention through Sustainable Development of Bioenergy Management
© 2016 Global Journals Inc. (US)
V
olum
e XVI Issue
II V
ersio
n I
44
( B)
Globa
l Jo
urna
l of H
uman
Soc
ial Sc
ienc
e
s
-
Year
2016
Electricity generationDomestic
e.g., hospitals and schoolse.g., cooking, heating, lighting
Considerations when selecting power plant include the following:

•
Power level- whether continuous or discontinuous.
•
Cost-initial cost, total running cost including fuel, maintenance and capital amortised over life.
•
Complexity of operation.
•
Maintenance and availability of spares.
•
Life and suitability for local manufacture.
The internal combustion engine is a major contributor to rising CO2
emissions worldwide and some pretty dramatic new thinking is needed if our planet is to counter the effects. With its use increasing in
developing world economies, there is something to be said for the argument that the vehicles we use to help keep our inner-city environments free from waste, litter and grime should be at the forefront of developments in low-emissions technology. Materials handled by waste management companies are becoming increasingly valuable. Those responsible for the security of facilities that treat waste or manage scrap will testify to the precautions needed to fight an ongoing battle against unauthorised access by criminals and crucially, to prevent the damage they can cause through theft, vandalism or even arson. Of particular concern is the escalating level of metal theft, driven by various factors including the demand for metal in rapidly developing economies such
as India and China (Abdeen, 2008e).
Table 4 :
Methods of energy conversion (Omer, 2007)
Muscle power
Internal combustion engines
Reciprocating
Rotating
Heat engines
Vapour (Rankine)
Reciprocating
Rotating
Gas Stirling (Reciprocating)
Gas Brayton (Rotating)
Electron gas
Electromagnetic radiation
Hydraulic engines
Wind engines (wind machines)
Electrical/mechanical
Man, animals
Petrol- spark ignition
Diesel- compression ignition
Humphrey water piston
Gas turbines
Steam engine
Steam turbine
Steam engine
Steam turbine
Thermionic, thermoelectric
Photo devices
Wheels, screws, buckets, turbines
Vertical axis, horizontal axis
Dynamo/alternator, motor
There is a need for greater attention to be devoted to this field in the development of new
designs, the dissemination of information and the encouragement of its use. International and government bodies and independent organisations all have a role to play in biomass energy technologies.
Environment has no precise limits because it is in fact a part of everything. Indeed, environment is, as anyone probably already knows, not only flowers
blossoming or birds singing in the spring, or a lake surrounded by beautiful mountains.
It is also human settlements, the places where people live, work, rest, the quality of the food we eat, the noise or silence of the street they live in. Environment is not only the fact that our cars consume a good deal of energy and pollute the air, but also, that we often need them to go to work and for holidays. Obviously man
uses energy just as plants, bacteria, mushrooms, bees, fish and rats do. Man largely uses solar energy- food, hydropower, wood- and thus participates harmoniously in the natural flow of energy through the environment. But man also uses oil, gas, coal and nuclear power. We always modify our environment with or without this source of energy (Brain, and Mark, 2007). Economic importance of environmental issue is increasing, and new technologies are expected to reduce pollution derived both from productive processes and products, with costs that are still unknown. This is due to market uncertainty, weak appropriability regime, lack of a dominant design, and difficulties in reconfiguring organisational routines. The degradation of the global environment is one of
the most serious energy issues (Abdeen, 2009a).
III.
Energy
use
and
the
Environment
The range of waste treatment technologies that are tailored to produce bioenergy is growing.
There are a number of key areas of bioenergy from wastes including (but not limited to) biogas, biofuels and bioheat. When considering using bioenergy, it is important to take into account the overall emission of carbon in the process of electricity production.
In addition to the drain on resources, such an increase in consumption consequences, together with the increased hazards of pollution and the safety problems associated with a large nuclear fission programmes. It would be equally unacceptable to suggest that the difference in energy between the developed and developing countries and prudent for the developed countries to move towards a way of life which, whilst maintaining or even increasing quality of life, reduce significantly the energy consumption per capita. Such savings can be achieved in a number of ways:
•
Improved efficiency of energy use, for example environmental cost of thermal insulation must be taken into account, energy recovery, and total energy.
V
olum
e XVI Issue
II V
ersio
n I
45
( B)
Globa
l Jo
urna
l of H
uman
Soc
ial Sc
ienc
e
-
Year
2016
© 2016 Global Journals Inc. (US)
Evaluation of Bio-Engineering for Pollution Prevention through Sustainable Development of Bioenergy Management
• Conservation of energy resources by design for long life and recycling rather than the short life throwaway product and systematic replanning of our way of life, for example in the field of transport.

Energy ratio (Er) is defined as the ratio of Energy content (Ec) of the food product / Energy input (Ei) to produce the food as in equation (1).
Er = Ec/Ei (1)
IV.
Combined Heat
and
Power (chp)
The atmospheric emissions of fossil fuelled installations are mostly aldehydes (CH3CH2CH2CHO), carbon monoxide (CO), nitrogen oxides (NOX), sulpher oxides (SOx) and particles (i.e., ash) as well as carbon dioxide. Table 5 shows estimates include not only the
releases occurring at the power plant itself but also cover fuel extraction and treatment, as well as the storage of wastes and the area of land required for operation (Table 6). A review of the potential range of recyclables is presented in Table 7.
Scientific assumptions for a short-term energy
strategy suggest that the most economically efficient way to replace the thermal plants is to modernise existing power plants to increase their energy efficiency and to improve their environmental performance (Pernille, 2004). Figure 1 summarises the biomass utilisation cycle concept.
Figure 1 :
Biomass utilisation cycle concepts (Omer, 2006)
Table 5 :
Annual GHG emissions from different types of power plants (Robinson, 2007)
Primary source of energy
Emissions (x 103
metric tones CO2)
Waste (x 103
metric tones CO2)
Area (km2)
Atmosphere
Water
Coal
Oil
Gas
Nuclear
380
70-160
24
6
7-41
3-6 1
21
60-3000
Negligible
-
2600
120
70-84
84
77
Table 6 :
Energy consumption per person (Robinson, 2007)
Region
Population (millions)
Energy per person (Watt) Africa
Asia Central America
North America South America Western Europe Eastern Europe Oceania
Russia
820 3780 180
335 475 445 130 35
330
0.54 2.74 1.44 0.34 0.52 2.24 2.57 0.08 0.29
However, utilisation of wind power and the conversion of gas-fired CHP plants to biomass would significantly reduce the dependence on imported fossil fuels. Although a lack of generating capacity is forecasted in the long-term, utilisation of the existing renewable energy potential and the huge possibilities for increasing energy efficiency are sufficient to meet future energy demands in the short-term (Pernille, 2004).
A total shift towards a sustainable energy system is a complex and long process, but is one that
can be achieved within a period of about 20 years. A vision that used methodologies and calculations based on computer modelling can utilised:
•
Data from existing governmental programmes.
•
Potential renewable energy sources and energy efficiency improvements.
Evaluation of Bio-Engineering for Pollution Prevention through Sustainable Development of Bioenergy Management
© 2016 Global Journals Inc. (US)
V
olum
e XVI Issue
II V
ersio
n I
46
( B)
Globa
l Jo
urna
l of H
uman
Soc
ial Sc
ienc
e
s
-
Year
2016
• Assumptions for future economy growth.• Information from studies and surveys on the recent
situation in the energy sector.
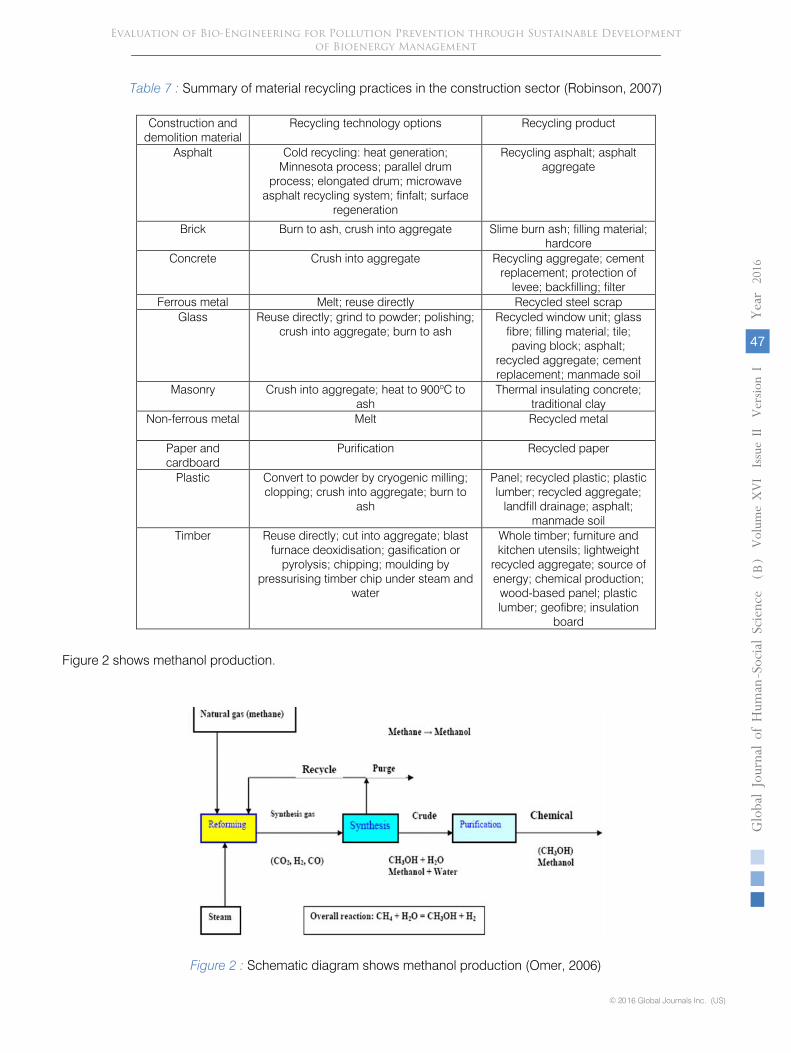
Table 7 :
Summary of material recycling practices in the construction sector (Robinson, 2007)
Construction and demolition material
Recycling technology options
Recycling product
Asphalt
Cold recycling: heat generation; Minnesota process; parallel drum
process; elongated drum; microwave asphalt recycling system; finfalt; surface
regeneration
Recycling asphalt; asphalt aggregate
Brick
Burn to ash, crush into aggregate
Slime burn ash; filling material; hardcore
Concrete
Crush into aggregate
Recycling aggregate; cement replacement; protection of
levee; backfilling; filter
Ferrous metal
Melt; reuse directly
Recycled steel scrap
Glass
Reuse directly; grind to powder; polishing; crush into aggregate; burn to ash
Recycled window unit; glass fibre; filling material; tile; paving block; asphalt;
recycled aggregate; cement replacement; manmade soil
Masonry
Crush into aggregate; heat to 900oC to ash
Thermal insulating concrete; traditional clay
Non-ferrous metal
Melt
Recycled metal
Paper and cardboard
Purification
Recycled paper
Plastic
Convert to powder by cryogenic milling; clopping; crush into aggregate; burn to
ash
Panel; recycled plastic; plastic lumber; recycled aggregate;
landfill drainage; asphalt; manmade soil
Timber
Reuse directly; cut into aggregate; blast furnace deoxidisation; gasification or
pyrolysis; chipping; moulding by pressurising timber chip under steam and
water
Whole timber; furniture and kitchen utensils; lightweight
recycled aggregate; source of energy; chemical production;
wood-based panel; plastic lumber; geofibre; insulation
board
Figure 2 shows methanol production.
Figure 2 : Schematic diagram shows methanol production (Omer, 2006)
V
olum
e XVI Issue
II V
ersio
n I
47
( B)
Globa
l Jo
urna
l of H
uman
Soc
ial Sc
ienc
e
-
Year
2016
© 2016 Global Journals Inc. (US)
Evaluation of Bio-Engineering for Pollution Prevention through Sustainable Development of Bioenergy Management

In some countries, a wide range of economic incentives and other measures are already helping to protect the environment. These include:
• Taxes and user charges that reflect the costs of using the environment, e.g., pollution taxes and waste disposal charges.
• Subsidies, credits and grants that encourage environmental protection.
• Deposit-refund systems that prevent pollution on resource misuse and promote product reuse or recycling.
• Financial enforcement incentives, e.g., fines for non-compliance with environmental regulations.
• Tradable permits for activities that harm the environment.
The district Heating (DH), also known as community heating can be a key factor to achieve energy savings, reduce CO2 emissions and at the same time provide consumers with a high quality heat supply at a competitive price. The DH should generally only be considered for areas where the heat density is sufficiently high to make DH economical. In countries like Denmark DH may today be economical even to new developments with lower density areas due to the high level of taxation on oil and gas fuels combined with the efficient production of the DH. To improve the opportunity for the DH local councils can adapt the following plan:
• Analyse the options for heat supply during local planning stage.
• In areas where DH is the least cost solution it should be made part of the infrastructure just like for instance water and sewage connecting all existing and new buildings.
• Where possible all public buildings should be connected to the DH.
• The government provides low interest loans or funding to minimise conversion costs for its citizens.
• Use other powers, for instance national legislation to ensure the most economical development of the heat supply and enable an obligation to connect buildings to a DH scheme.
Denmark has broadly seen three scales of the CHP which where largely implemented in the following order (Pernille, 2004):
• Large-scale CHP in cities (>50 MWe).
• Small (5 kWe – 5 MWe) and medium-scale (5-50 MWe).
• Industrial and small-scale CHP. Most of the heat is produced by large CHP
plants (gas-fired combined cycle plants using natural gas, biomass, waste or biogas). The DH is energy
efficient because of the way the heat is produced and the required temperature level is an important factor. Buildings can be heated to temperature of 21oC and domestic hot water can be supplied with a temperature of 55oC using energy sources that are most efficient when producing low temperature levels (<95oC) for the DH water. Most of these heat sources are CO2 neutral or emit low levels. Only a few of these sources are available to small individual systems at a reasonably cost, whereas DH schemes because of the plant’s size and location can have access to most of the heat sources and at a low cost. Low temperature DH, with return temperatures of around 30-40oC can utilise the following heat sources:
• Efficient use of the CHP by extracting heat at low calorific value.
• Efficient use of biomass or gas boilers by condensing heat in economisers (Table 8).
• Efficient utilisation of geothermal energy.
• Direct utilisation of excess low temperature heat from industrial processes.
• Efficient use of large-scale solar heating plants. Heat tariffs may include a number of
components such as: a connection charge, a fixed charge and a variable energy charge. Also, consumers may be incentivised to lower the return temperature. Hence, it is difficult to generalise but the heat practice for any DH company no matter what the ownership structure can be highlighted as follows:
• To develop and maintain a development plan for the connection of new consumers.
• To evaluate the options for least cost production of heat.
• To implement the most competitive solutions by signing agreements with other companies or by implementing own investment projects.
• To monitor all internal costs and with the help of benchmarking, improve the efficiency of the company.
• To maintain a good relationship with the consumer and deliver heat supply services at a sufficient quality.
Installing DH should be pursued to meet the objectives for improving the environment through the improvement of energy efficiency in the heating sector. At the same time DH can serve the consumer with a reasonable quality of heat at the lowest possible cost. The variety of possible solutions combined with the collaboration between individual companies, the DH association, the suppliers and consultants can, as it has been in Denmark, be the way forward for developing DH in the United Kingdom (Pernille, 2004).
Evaluation of Bio-Engineering for Pollution Prevention through Sustainable Development of Bioenergy Management
© 2016 Global Journals Inc. (US)
V
olum
e XVI Issue
II V
ersio
n I
48
( B)
Globa
l Jo
urna
l of H
uman
Soc
ial Sc
ienc
e
s
-
Year
2016
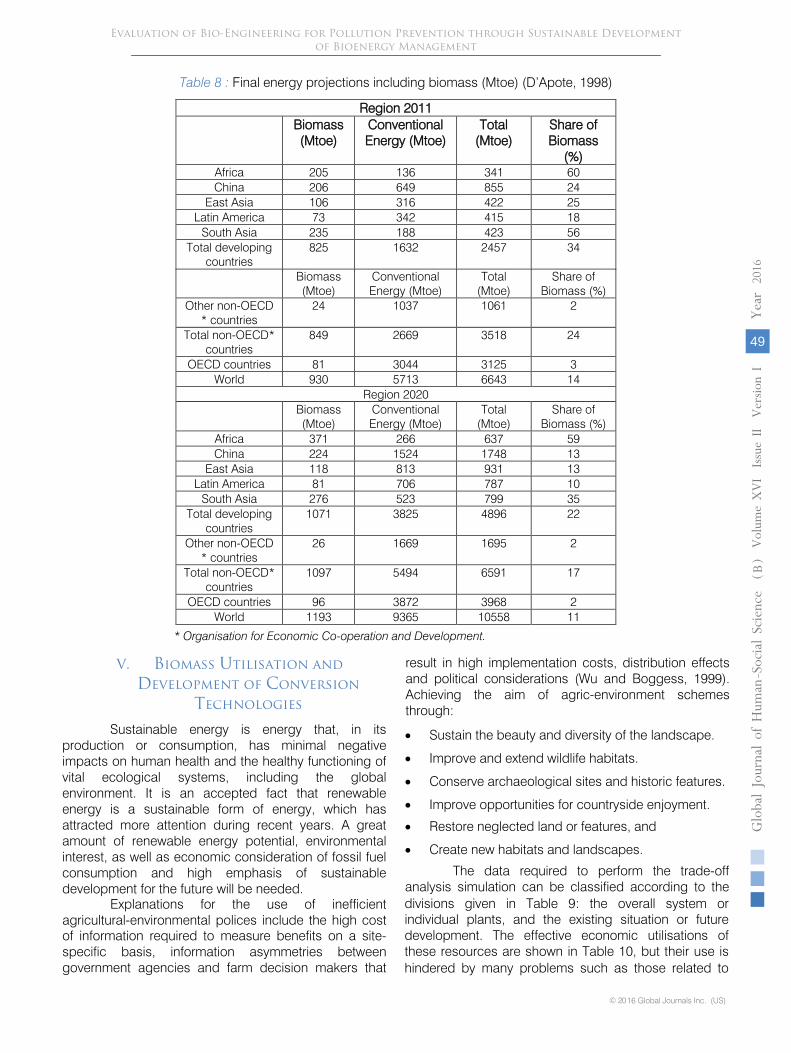
Table 8 : Final energy projections including biomass (Mtoe) (D’Apote, 1998)
Region 2011 Biomass
(Mtoe)
Conventional Energy (Mtoe)
Total (Mtoe)
Share of Biomass
(%) Africa 205 136 341 60 China 206 649 855 24
East Asia 106 316 422 25 Latin America 73 342 415 18
South Asia 235 188 423 56 Total developing
countries
825 1632 2457 34
Other non-OECD * countries
24
1037
1061
2
Total non-OECD* countries
849
2669
3518
24
OECD countries
81
3044
3125
3 World
930
5713
6643
14
Region 2020
Biomass (Mtoe)
Conventional Energy (Mtoe)
Total (Mtoe)
Share of Biomass (%)
Africa
371
266
637
59
China
224
1524
1748
13
East Asia
118
813
931
13
Latin America
81
706
787
10
South Asia
276
523
799
35
Total developing countries
1071
3825
4896
22
Other non-OECD * countries
26
1669
1695
2
Total non-OECD* countries
1097
5494
6591
17
OECD countries
96
3872
3968
2 World
1193
9365
10558
11
* Organisation for Economic Co-operation and Development.
V.
Biomass Utilisation and
Development of
Conversion Technologies
Sustainable energy is energy that, in its production or consumption, has minimal negative impacts on human health and the healthy functioning of vital ecological systems, including the global environment. It is an accepted fact that renewable energy is a sustainable form of energy, which has attracted more attention during recent years. A great amount of renewable energy potential, environmental interest, as well as economic consideration of fossil fuel consumption and high emphasis of sustainable development for the future will be needed.
•
Sustain the beauty and diversity of the landscape.
•
Improve and extend wildlife habitats.
•
Conserve archaeological sites and historic features.
•
Improve opportunities for countryside enjoyment.
•
Restore neglected land or features, and
•
Create new habitats and landscapes.
V
olum
e XVI Issue
II V
ersio
n I
49
( B)
Globa
l Jo
urna
l of H
uman
Soc
ial Sc
ienc
e
-
Year
2016
© 2016 Global Journals Inc. (US)
Evaluation of Bio-Engineering for Pollution Prevention through Sustainable Development of Bioenergy Management
Explanations for the use of inefficient agricultural-environmental polices include the high cost of information required to measure benefits on a site-specific basis, information asymmetries between government agencies and farm decision makers that
result in high implementation costs, distribution effects and political considerations (Wu and Boggess, 1999). Achieving the aim of agric-environment schemes through:
The data required to perform the trade-off analysis simulation can be classified according to the
Biomass (Mtoe)
Conventional Energy (Mtoe)
Total (Mtoe)
Share of Biomass (%)
divisions given in Table 9: the overall system or individual plants, and the existing situation or future development. The effective economic utilisations of these resources are shown in Table 10, but their use is hindered by many problems such as those related to
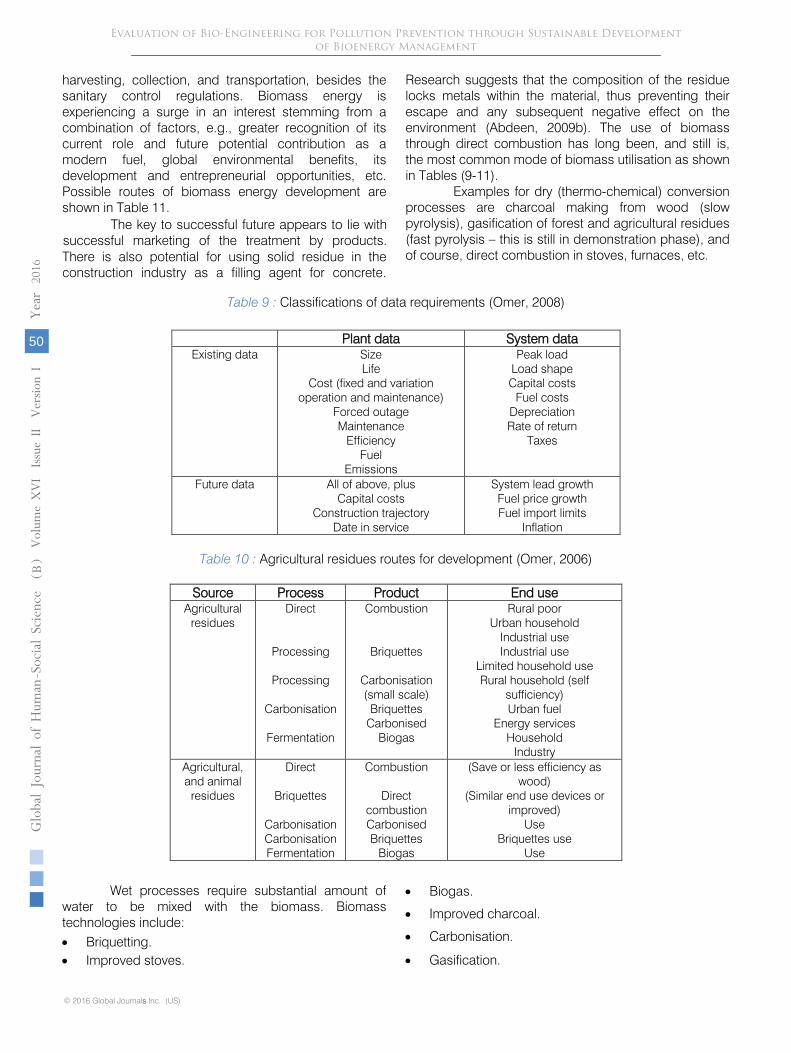
harvesting, collection, and transportation, besides the sanitary control regulations. Biomass energy is experiencing a surge in an interest stemming from a combination of factors, e.g., greater recognition of its current role and future potential contribution as a modern fuel, global environmental benefits, its development and entrepreneurial opportunities, etc. Possible routes of biomass energy development are shown in Table 11.
The key to successful future appears to lie with successful marketing of the
treatment by products. There is also potential for using solid residue in the construction industry as a filling agent for concrete.
Research suggests that the composition of the residue locks metals within the material, thus preventing their escape and any subsequent negative effect on the environment (Abdeen, 2009b). The use of biomass through direct combustion has long been, and still is, the most common mode of biomass utilisation as shown in Tables (9-11).
Examples for dry (thermo-chemical) conversion
processes are charcoal making from wood (slow pyrolysis), gasification of forest and agricultural residues (fast pyrolysis – this is still in demonstration phase), and of course, direct combustion in stoves, furnaces, etc.
Table 9 : Classifications of data requirements
(Omer, 2008)
Plant data
System data
Existing data
Size
Life
Cost (fixed and variation
operation and maintenance)
Forced outage
Maintenance
Efficiency
Fuel
Emissions
Peak load
Load shape
Capital costs
Fuel costs
Depreciation
Rate of return
Taxes
Future data
All of above, plus
Capital costs
Construction trajectory
Date in service
System lead growth
Fuel price growth
Fuel import limits
Inflation
Table 10
: Agricultural residues routes for development (Omer, 2006)
Source
Process
Product
End use
Agricultural residues
Direct
Processing
Processing
Carbonisation
Fermentation
Combustion
Briquettes
Carbonisation
(small scale) Briquettes
Carbonised Biogas
Rural poor Urban household
Industrial use Industrial use Limited household use
Rural household (self sufficiency)
Urban fuel Energy services
Household Industry
Agricultural, and animal
residues
Direct
Briquettes
Carbonisation Carbonisation Fermentation
Combustion
Direct combustion
Carbonised Briquettes
Biogas
(Save or less efficiency as wood)
(Similar end use devices or improved)
Use Briquettes use
Use
Wet processes require substantial amount of
water to be mixed with the biomass. Biomass technologies include: • Briquetting. •
Improved stoves.
• Biogas. • Improved charcoal. • Carbonisation.
• Gasification.
Evaluation of Bio-Engineering for Pollution Prevention through Sustainable Development of Bioenergy Management
© 2016 Global Journals Inc. (US)
V
olum
e XVI Issue
II V
ersio
n I
50
( B)
Globa
l Jo
urna
l of H
uman
Soc
ial Sc
ienc
e
s
-
Year
2016
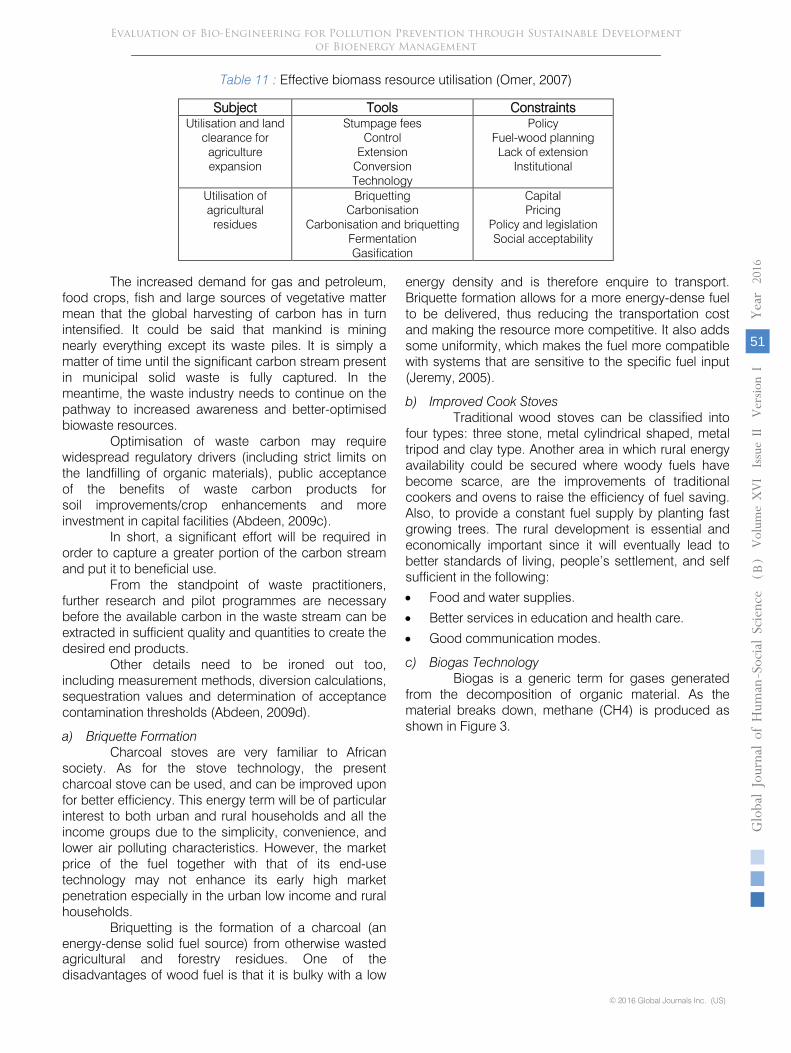
Table 11 : Effective biomass resource utilisation (Omer, 2007)
Subject Tools Constraints Utilisation and land
clearance for agriculture expansion
Stumpage fees Control
Extension Conversion Technology
Policy Fuel-wood planning Lack of extension
Institutional
Utilisation of agricultural
residues
Briquetting Carbonisation
Carbonisation and briquetting Fermentation Gasification
Capital Pricing
Policy and legislation Social acceptability
The increased demand for gas and petroleum,
food crops, fish and large sources of vegetative matter mean that the global harvesting of carbon has in turn intensified. It could be said that mankind is mining nearly everything except its waste piles. It is simply a matter of time until the significant carbon stream present in municipal solid waste is fully captured. In the meantime, the waste industry needs to continue on the pathway to increased awareness and better-optimised biowaste resources.
Optimisation of waste carbon may require widespread regulatory drivers (including strict limits on the landfilling of organic materials), public acceptance of the benefits of waste carbon products for
soil improvements/crop enhancements and more investment in capital facilities (Abdeen, 2009c).
In short, a significant effort will be required in order to capture a greater portion of the carbon stream and put it to beneficial use.
From the standpoint of waste practitioners, further research and pilot programmes are necessary before the available carbon in the waste stream can be extracted in sufficient quality and quantities to create the desired end products.
Other details need to be ironed out too, including measurement methods, diversion calculations, sequestration values and determination of acceptance contamination thresholds (Abdeen, 2009d).
a) Briquette Formation Charcoal stoves are very familiar to African
society. As for the stove technology, the present charcoal stove can be used, and can be improved upon for better efficiency. This energy term will be of particular interest to both urban and rural households and all the income groups due to the simplicity, convenience, and lower air polluting characteristics. However, the market price of the fuel together with that of its end-use technology may not enhance its early high market penetration especially in the urban low income and rural households.
Briquetting is the formation of a charcoal (an energy-dense solid fuel source) from otherwise wasted agricultural and forestry residues. One of the disadvantages of wood fuel is that it is bulky with a low
energy density and is therefore enquire to transport. Briquette formation allows for a more energy-dense fuel to be delivered, thus reducing the transportation cost and making the resource more competitive. It also adds some uniformity, which makes the fuel more compatible with systems that are sensitive to the specific fuel input (Jeremy, 2005).
b)
Improved Cook Stoves
Traditional wood stoves can be classified into
four types: three stone, metal cylindrical shaped, metal tripod and clay type. Another area in which rural energy availability could be secured where woody fuels have become scarce, are the improvements of traditional cookers and ovens to raise the efficiency of fuel saving. Also, to
provide a constant fuel supply by planting fast growing trees. The rural development is essential and economically important since it will eventually lead to better standards of living, people’s settlement, and self sufficient in the following:
•
Food and water supplies.
•
Better services in education and health care.
•
Good communication modes.
c)
Biogas Technology
Biogas is a generic term for gases generated
from the decomposition of organic material. As the material breaks down, methane (CH4) is produced as shown in Figure 3.
V
olum
e XVI Issue
II V
ersio
n I
51
( B)
Globa
l Jo
urna
l of H
uman
Soc
ial Sc
ienc
e
-
Year
2016
© 2016 Global Journals Inc. (US)
Evaluation of Bio-Engineering for Pollution Prevention through Sustainable Development of Bioenergy Management
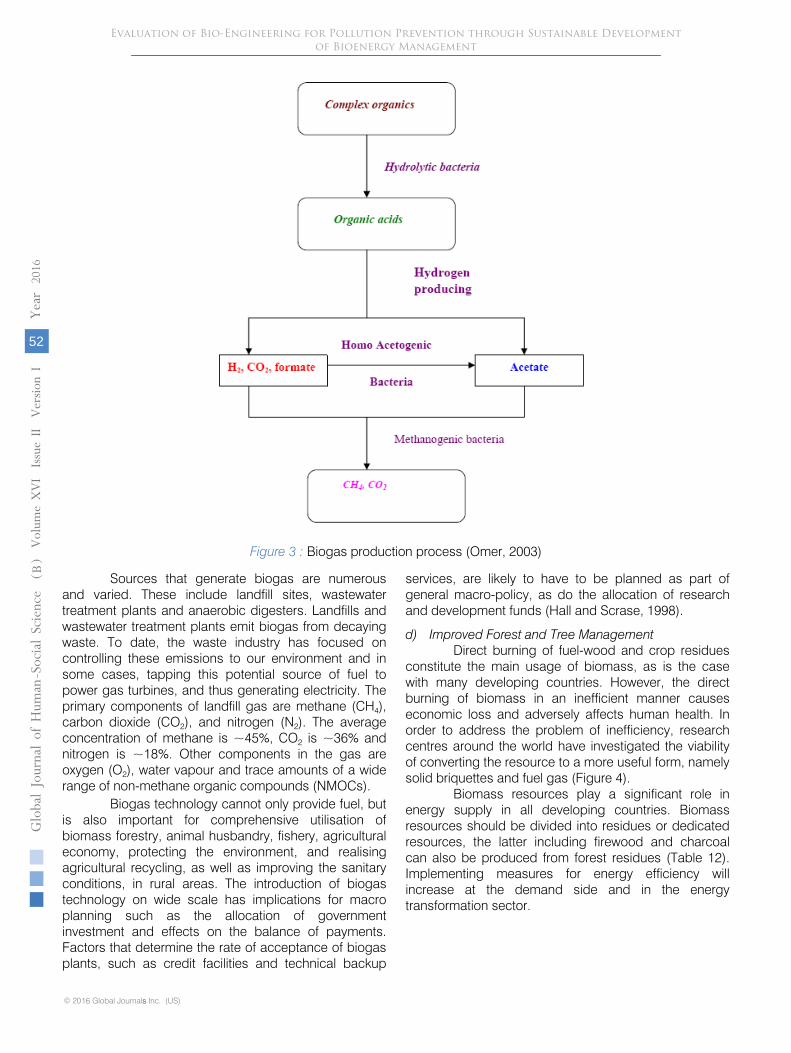
Figure 3 : Biogas production process (Omer, 2003)
Sources that generate biogas are numerous and varied. These include landfill sites, wastewater treatment plants and anaerobic digesters. Landfills and wastewater treatment plants emit biogas from decaying waste. To date, the waste industry has focused on controlling these emissions to our environment and in some cases, tapping this potential source of fuel to power gas turbines, and thus generating electricity. The primary components of landfill gas are methane (CH4), carbon dioxide (CO2), and nitrogen (N2). The average concentration of methane is ~45%, CO2
is ~36% and nitrogen is ~18%. Other components in the gas are oxygen (O2), water vapour and trace amounts of a wide range of non-methane organic compounds (NMOCs).
Biogas technology cannot only provide fuel, but is also important for comprehensive utilisation of biomass forestry, animal husbandry, fishery, agricultural economy, protecting the environment, and realising agricultural recycling, as well as improving the sanitary conditions, in rural areas. The introduction of biogas technology on wide scale has implications for macro planning such as the allocation of government investment and effects on the balance of payments. Factors that determine the rate of acceptance of biogas plants, such as credit facilities and technical backup
services, are likely to have to be planned as part of general macro-policy, as do the allocation of research and development funds (Hall and Scrase, 1998).
d) Improved Forest and Tree Management
Direct burning of fuel-wood and crop residues constitute the main usage of biomass, as is the case with many developing countries. However, the direct burning of biomass in an inefficient manner causes economic loss and adversely affects human health. In order to address the problem of inefficiency, research centres around the world have investigated the viability of converting the resource to a more useful form, namely solid briquettes and fuel gas (Figure 4).
Biomass resources play a significant role in energy supply in all developing countries. Biomass resources should be divided into residues or dedicated resources, the latter including firewood and charcoal can also be produced from forest residues (Table 12). Implementing measures for energy efficiency will increase at the demand side and in the energy transformation sector.
Evaluation of Bio-Engineering for Pollution Prevention through Sustainable Development of Bioenergy Management
© 2016 Global Journals Inc. (US)
V
olum
e XVI Issue
II V
ersio
n I
52
( B)
Globa
l Jo
urna
l of H
uman
Soc
ial Sc
ienc
e
s
-
Year
2016
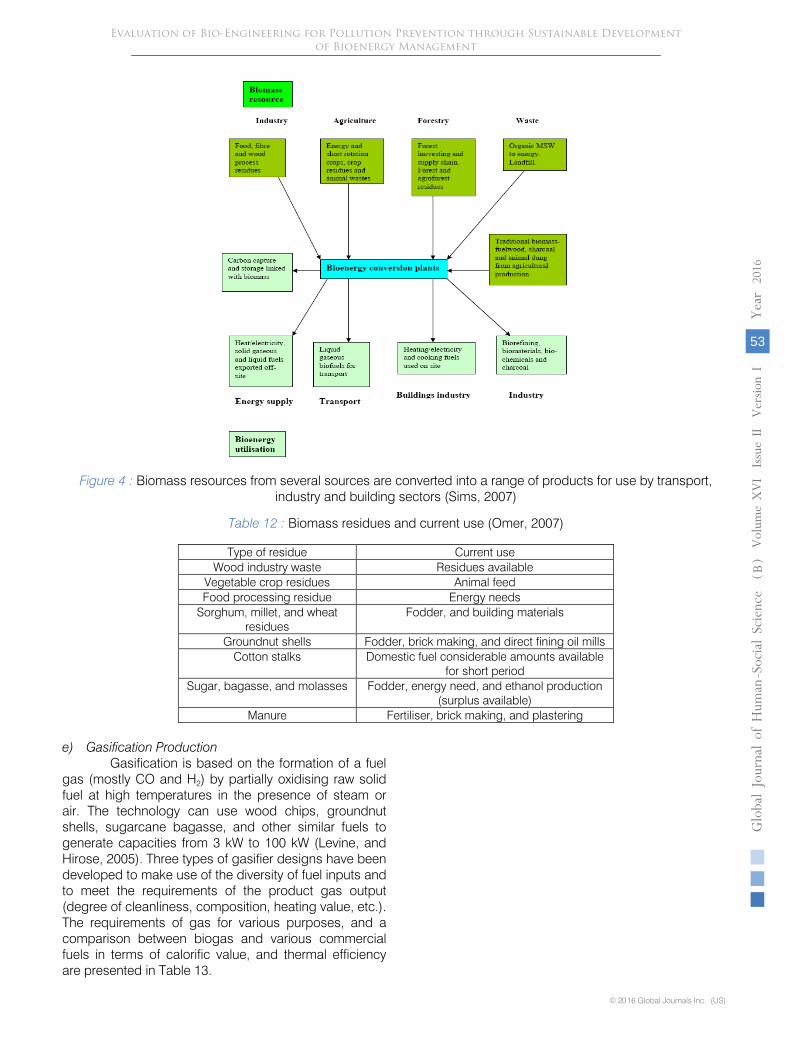
Figure 4 :
Biomass resources from several sources are converted into a range of products for use by transport,
industry and building sectors (Sims, 2007)
Table 12 : Biomass residues and current use (Omer, 2007)
Type of residue Current use Wood industry waste Residues available
Vegetable crop residues Animal feed Food processing residue Energy needs
Sorghum, millet, and wheat residues
Fodder, and building materials
Groundnut shells Fodder, brick making, and direct fining oil mills Cotton stalks Domestic fuel considerable amounts available
for short period Sugar, bagasse, and molasses Fodder, energy need, and ethanol production
(surplus available) Manure Fertiliser, brick making, and plastering
e) Gasification Production
Gasification is based on the formation of a fuel gas (mostly CO and H2) by partially oxidising raw solid fuel at high temperatures in the presence of steam or air. The technology can use wood chips, groundnut shells, sugarcane bagasse, and other similar fuels to generate capacities from 3 kW to 100 kW (Levine, and Hirose, 2005). Three types of gasifier designs have been developed to make use of the diversity of fuel inputs and to meet the requirements of the product gas output (degree of cleanliness, composition, heating value, etc.). The requirements of gas for various purposes, and a comparison between biogas and various commercial fuels in terms of calorific value, and thermal efficiency are presented in Table 13.
V
olum
e XVI Issue
II V
ersio
n I
53
( B)
Globa
l Jo
urna
l of H
uman
Soc
ial Sc
ienc
e
-
Year
2016
© 2016 Global Journals Inc. (US)
Evaluation of Bio-Engineering for Pollution Prevention through Sustainable Development of Bioenergy Management

Table 13 : Comparison of various fuels (Omer, 2003)
Fuel Calorific value (kcal)
Burning mode Thermal efficiency (%)
Electricity, kWh 880 Hot plate 70
Coal gas, kg 4004 Standard burner 60
Biogas, m3 5373 Standard burner 60
Kerosene, l 9122 Pressure stove 50
Charcoal, kg 6930 Open stove 28
Soft coke, kg 6292 Open stove 28
Firewood, kg 3821 Open stove 17
Cow dung, kg 2092 Open stove 11
The organic matter was biodegradable to produce biogas and the variation show a normal methanogene bacteria activity and good working biological process as shown in Figures 5-7. The success of promoting any technology depends on careful planning, management, implementation, training and monitoring. Main features of gasification project are:
• Networking and institutional development/ strengthening.
• Promotion and extension.
• Construction of demonstration projects.
• Research and development, and training and monitoring.
Biomass is a raw material that has been utilised for a wide variety of tasks since the dawn of civilisation. Important as a supply of fuel in the third world, biomass was also the first raw material in the production of textiles.
Figure 5 : Organic matters before and after treatment in digester (Omer, 2006)
Figure 6 : Potential of hydrogen sludge before and after treatment in the digester (Omer, 2006)
The gasification of the carbon char with steam can make a large difference to the surface area of the carbon as shown in equations (2-4). The corresponding
stream gasification reactions are endothermic and demonstrate how the steam reacts with the carbon char (Bacaoui, 1998).
Evaluation of Bio-Engineering for Pollution Prevention through Sustainable Development of Bioenergy Management
© 2016 Global Journals Inc. (US)
V
olum
e XVI Issue
II V
ersio
n I
54
( B)
Globa
l Jo
urna
l of H
uman
Soc
ial Sc
ienc
e
s
-
Year
2016
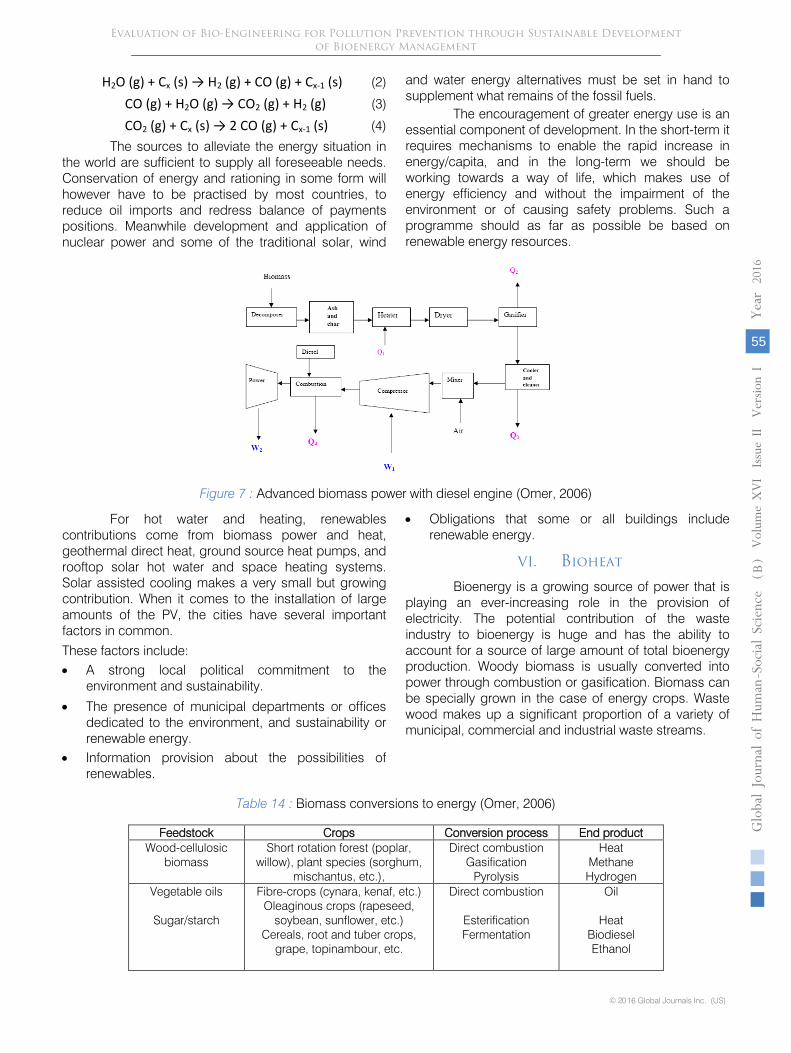
H2O (g) + Cx (s) → H2 (g) + CO (g) + Cx-1 (s) (2) CO (g) + H2O (g) → CO2 (g) + H2 (g) (3) CO2 (g) + Cx (s) → 2 CO (g) + Cx-1 (s) (4)
The sources to alleviate the energy situation in the world are sufficient to supply all foreseeable needs. Conservation of energy and rationing in some form will however have to be practised by most countries, to reduce oil imports and redress balance of payments positions. Meanwhile development and application of nuclear power and some of the traditional solar, wind
and water energy alternatives must be set in hand to supplement what remains of the fossil fuels.
The encouragement of greater energy use is an essential component of development. In the short-term it requires mechanisms to enable the rapid increase in energy/capita, and in the long-term we should be working towards a way of life, which makes use of energy efficiency and without the impairment of the environment or of causing safety problems. Such a programme should as far as possible be based on renewable energy resources.
Figure 7 : Advanced biomass power with diesel engine (Omer, 2006)
For hot water and heating, renewables contributions come from biomass power and heat, geothermal direct heat, ground source heat pumps, and rooftop solar hot water and space heating systems. Solar assisted cooling makes a very small but growing contribution. When it comes to the installation of large amounts of the PV, the cities have several important factors in common.
These factors include:
• A strong local political commitment to the environment and sustainability.
• The presence of municipal departments or offices dedicated to the environment, and sustainability or renewable energy.
•
Information provision about the possibilities of renewables.
•
Obligations that some or all buildings include renewable energy.
VI.
Bioheat
Bioenergy is a growing source of power that is playing an ever-increasing role in the provision of electricity. The potential contribution of the waste industry to bioenergy is huge and has the ability to account for a source of large amount of total bioenergy production. Woody biomass is usually converted into power through combustion or gasification. Biomass can be specially grown in the case of energy crops. Waste wood makes up a significant proportion of a variety of
municipal, commercial and industrial waste streams.
Table 14 :
Biomass conversions to energy (Omer, 2006)
Feedstock
Crops Conversion process
End product
Wood-cellulosic biomass
Short rotation forest (poplar,
willow), plant species (sorghum, mischantus, etc.),
Direct combustion
Gasification
Pyrolysis
Heat
Methane
Hydrogen
Vegetable oils
Sugar/starch
Fibre-crops (cynara, kenaf, etc.)
Oleaginous crops (rapeseed, soybean, sunflower, etc.)
Cereals, root and tuber crops, grape, topinambour, etc.
Direct combustion
Esterification
Fermentation
Oil
Heat
Biodiesel
Ethanol
V
olum
e XVI Issue
II V
ersio
n I
55
( B)
Globa
l Jo
urna
l of H
uman
Soc
ial Sc
ienc
e
-
Year
2016
© 2016 Global Journals Inc. (US)
Evaluation of Bio-Engineering for Pollution Prevention through Sustainable Development of Bioenergy Management

It is common practice to dispose of this waste wood in landfill where it slowly degraded and takes up valuable void space. This wood is a good source of energy and is an alternative to energy crops. The biomass directly produced by cultivation can be
transformed by different processes into gaseous, liquid or solid fuels (Table 14). The whole process of production of methyl or ethyl esters (biodiesel) is summarised in Figures 8-9.
Figure 8 : Biofuel pathways for renewable alcohol fuels (Omer, 2006)
Figure 9 : Flow chart of biodiesel production (Omer, 2006)
a)
Waste Policy in Context
In terms of solid waste management policy, many NGOs have changed drastically in the past ten years from a mass production and mass consumption society to ‘material-cycle society’. In addition to national legislation, municipalities are legally obliged to develop a plan for handling the municipal solid waste generated in administrative areas.
Such plans contain:
•
Estimates of future waste volume.
•
Measures to reduce waste.
•
Measures to encourage source separation.
•
A framework for solid waste disposal and the construction and management of solid waste management facilities.
Landfilling is in the least referred tier of the hierarchy of waste management options: waste minimisation, reuse and recycling, incineration with energy recovery, and optimised final disposal.
The key elements are as follows: construction impacts, atmospheric emissions, noise, water quality, landscape, visual impacts, socio economics, ecological impacts, traffic, solid waste disposal and cultural heritage (Barton, 2007).
b)
Energy from Agricultural Biomass
The main advantages are related to energy, agriculture and environment
problems, are foreseeable both at regional level and at worldwide level and can be summarised as follows:
•
Reduction of dependence on import of energy and related products.
Evaluation of Bio-Engineering for Pollution Prevention through Sustainable Development of Bioenergy Management
© 2016 Global Journals Inc. (US)
V
olum
e XVI Issue
II V
ersio
n I
56
( B)
Globa
l Jo
urna
l of H
uman
Soc
ial Sc
ienc
e
s
-
Year
2016
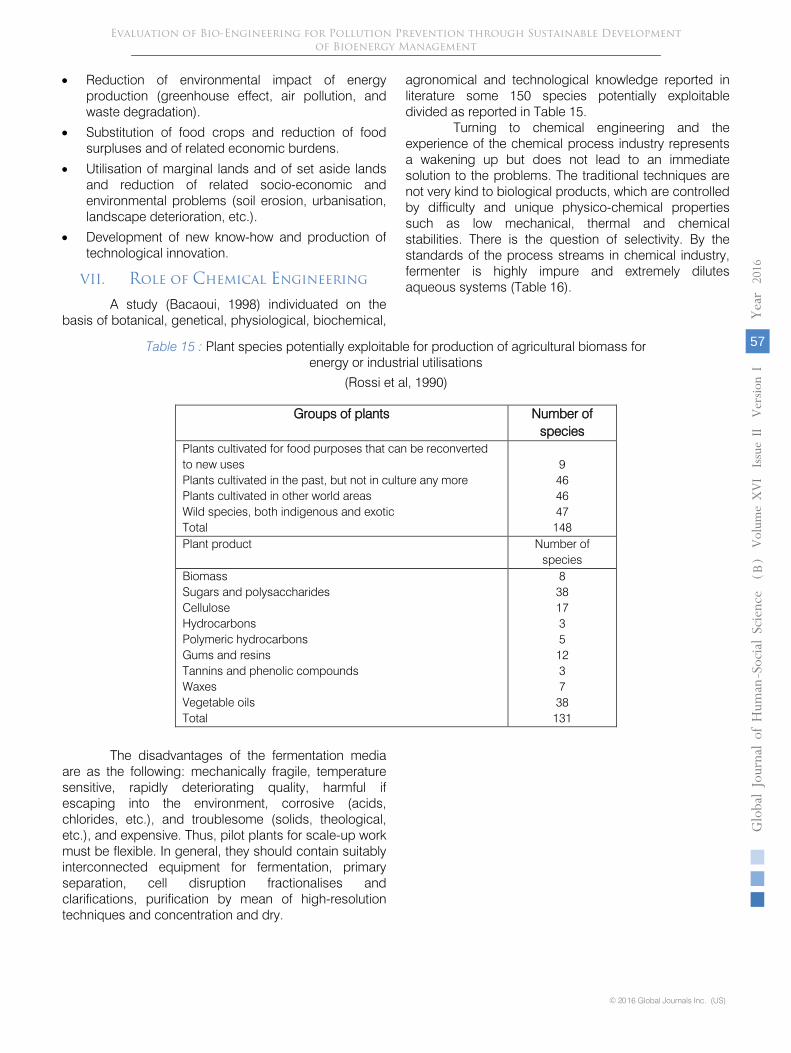
• Reduction of environmental impact of energy production (greenhouse effect, air pollution, and waste degradation).
• Substitution of food crops and reduction of food surpluses and of related economic burdens.
• Utilisation of marginal lands and of set aside lands and reduction of related socio-economic and environmental problems (soil erosion, urbanisation, landscape deterioration, etc.).
• Development of new know-how and production of technological innovation.
VII. Role of Chemical Engineering
A study (Bacaoui, 1998) individuated on the basis of botanical, genetical, physiological, biochemical,
agronomical and technological knowledge reported in literature some 150 species potentially exploitable divided as reported in Table 15.
Turning to chemical engineering and the experience of the chemical process industry represents a wakening up but does not lead to an immediate solution to the problems. The traditional techniques are not very kind to biological products, which are controlled by difficulty and unique physico-chemical properties such as low mechanical, thermal and chemical stabilities. There is the question of selectivity. By the standards of the process streams in chemical industry, fermenter is highly impure and extremely dilutes aqueous systems (Table 16).
Table 15 : Plant species potentially exploitable for production of agricultural biomass for energy or industrial utilisations
(Rossi et al, 1990)
Groups of plants Number of species
Plants cultivated for food purposes that can be reconverted to new uses
Plants cultivated in the past, but not in culture any more
Plants cultivated in other world areas
Wild species, both indigenous and exotic
Total
9 46
46
47
148
Plant product
Number of species
Biomass
Sugars and polysaccharides
Cellulose
Hydrocarbons
Polymeric hydrocarbons
Gums and resins
Tannins and phenolic compounds
Waxes
Vegetable oils
Total
8 38
17
3 5
12
3 7
38
131
The disadvantages of the fermentation media are as the following: mechanically fragile, temperature sensitive, rapidly deteriorating quality, harmful if escaping into the environment, corrosive (acids, chlorides, etc.), and troublesome (solids, theological, etc.), and expensive. Thus, pilot plants for scale-up work must be flexible. In general, they should contain suitably interconnected equipment for fermentation, primary separation, cell disruption fractionalises and clarifications, purification by mean of high-resolution techniques and concentration and dry.
V
olum
e XVI Issue
II V
ersio
n I
57
( B)
Globa
l Jo
urna
l of H
uman
Soc
ial Sc
ienc
e
-
Year
2016
© 2016 Global Journals Inc. (US)
Evaluation of Bio-Engineering for Pollution Prevention through Sustainable Development of Bioenergy Management

Table 16 : Typical product concentrations exiting fermenters (Rossi et al, 1990)
Product Concentration (kg/m3)
Ethanol Organic acids (e.g., citric) Vitamin B12 Interferon Single-cell protein Antibiotics (e.g., Penicillin G) Enzyme protein (e.g., protease)
70-120 40-100
0.02 50-70 30-50 10-30 2-5
a)
Fluidised Bed Drying
An important consideration for operators of wastewater treatment plants is how to handle the disposal of the residual sludge in a reliable, sustainable, legal and economical way. The benefits of drying sludge can be seen in two main treatment options:
•
Use of the dewatered sludge as a fertiliser or in fertiliser blends.
•
Incineration with energy recovery. Use as a fertiliser takes advantage of the high
organic content 40%-70% of the dewatered sludge and its high levels of phosphorous and other nutrients. However, there are a number of concerns about this route including:
•
The chemical composition of the sludge (e.g., heavy metals, hormones and other pharmaceutical residues).
•
Pathogen risk (e.g., Salmonella, Escherichia coli, prionic proteins, etc.).
•
Potential accumulation of heavy metals and other chemicals in the soil.
Sludge can be applied as a fertiliser in three forms: liquid sludge, wet cake blended into compost, and dried granules.
The advantages of energy recovery sludge include: •
The use of dewatered sludge is a ‘sink’ for pollutants such as heavy metals, toxic organic compounds and pharmaceutical residues. Thus, offering a potential disposal route for these substances provided the combustion plant has adequate flue gas cleaning.
•
The potential, under certain circumstances, to utilise the inorganic residue from sludge incineration (incinerator ash), such as in cement or gravel.
•
The high calorific value (similar to lignite) of dewatered sludge.
•
The use of dewatered sludge as a carbon dioxide neutral substitute for primary fuels such as oil, gas and coal.
b)
Energy Efficiency
Energy efficiency is the most cost-effective way of cutting carbon dioxide emissions and improvements
to households and businesses. It can also have many other additional social, economic and health benefits, such as warmer and healthier homes, lower fuel bills and company running costs and, indirectly, jobs. Britain wastes 20 per cent of its fossil fuel and electricity use in transportation. This implies that it would be
cost-effective to cut £10 billion a year off the collective fuel bill
and reduce CO2
emissions by some 120 million tones CO2. Yet, due to lack of good information and advice on energy saving, along with the capital to finance energy efficiency improvements, this huge potential for reducing energy demand is not being realised. Traditionally, energy utilities have been essentially fuel providers and the industry has pursued profits from increased volume of sales. Institutional and market arrangements have favoured energy consumption rather than conservation. However, energy is
at the centre of the sustainable development paradigm as few activities affect the environment as much as the continually increasing use of energy. Most of the used energy depends on finite resources, such as coal, oil, gas and uranium. In addition, more than three quarters of the world’s consumption of these fuels is used, often inefficiently, by only one quarter of the world’s population. Without even addressing these inequities or the precious, finite nature of these resources, the scale of environmental damage will force the reduction of the usage of these fuels long before they run out (Cheng, 2010).
Throughout the energy generation process there are impacts on the environment on local, national and international levels, from opencast mining and oil exploration to emissions of the potent greenhouse gas carbon dioxide in ever increasing concentration. Recently, the world’s leading climate scientists reached an agreement that human activities, such as burning fossil fuels for energy and transport, are causing the world’s temperature to rise. The Intergovernmental Panel on Climate Change has concluded that ‘‘the balance of evidence suggests a discernible human influence on global climate’’. It predicts a rate of warming greater
Evaluation of Bio-Engineering for Pollution Prevention through Sustainable Development of Bioenergy Management
© 2016 Global Journals Inc. (US)
V
olum
e XVI Issue
II V
ersio
n I
58
( B)
Globa
l Jo
urna
l of H
uman
Soc
ial Sc
ienc
e
s
-
Year
2016
than any one seen in the last 10,000 years, in other words, throughout human history. The exact impact of climate change is difficult to predict and will vary regionally. It could, however, include sea level rise,
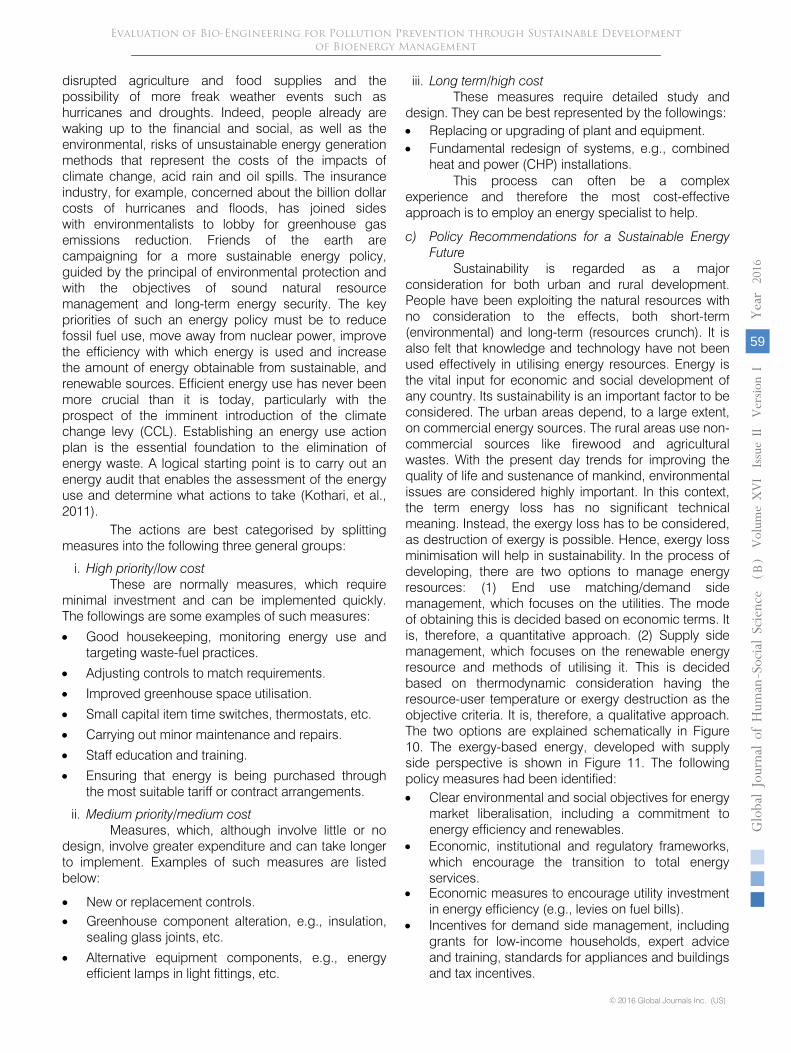
disrupted agriculture and food supplies and the possibility of more freak weather events such as hurricanes and droughts. Indeed, people already are waking up to the financial and social, as well as the environmental, risks of unsustainable energy generation methods that represent the costs of the impacts of climate change, acid rain and oil spills. The insurance industry, for example, concerned about the billion dollar costs of hurricanes and floods, has joined sides
with environmentalists to lobby for greenhouse gas emissions reduction. Friends of the earth are campaigning for a more sustainable energy policy, guided by the principal of environmental protection and with the objectives of sound natural resource management and long-term energy security. The key priorities of such an energy policy must be to reduce fossil fuel use, move away from nuclear power, improve the efficiency with which energy is used and increase the amount of energy obtainable from sustainable, and renewable sources. Efficient energy use has never been more crucial than it is today, particularly with the prospect of the imminent introduction of the climate change levy (CCL). Establishing an energy use action plan is the essential foundation to the elimination of energy waste. A logical starting point is to carry out an energy audit that enables the assessment of the energy use and determine what actions to take (Kothari, et al., 2011).
The actions are best categorised by splitting measures into the following three general groups:
i.
High priority/low cost
These are normally measures, which require minimal investment and can be implemented quickly. The followings are some examples of such measures:
•
Good housekeeping, monitoring energy use and targeting waste-fuel practices.
•
Adjusting controls to match requirements.
•
Improved greenhouse space utilisation.
•
Small capital item time switches, thermostats, etc.
•
Carrying out minor maintenance and repairs.
•
Staff education and training.
•
Ensuring that energy is being purchased through the most suitable tariff or contract arrangements.
ii.
Medium priority/medium cost
Measures, which, although involve little or no design, involve greater expenditure and can take longer to implement. Examples of such measures are listed below:
•
New or replacement controls.
•
Greenhouse component alteration, e.g., insulation, sealing glass joints, etc.
•
Alternative equipment components, e.g., energy efficient lamps in light fittings, etc.
iii.
Long term/high cost
These measures require detailed study and design. They can be best represented by the followings:
•
Replacing or upgrading of plant and equipment.
•
Fundamental redesign of systems, e.g., combined heat and power (CHP) installations.
This process can often be a complex experience and therefore the most cost-effective approach is to employ an energy specialist to help.
c)
Policy Recommendations for a Sustainable Energy Future
Sustainability is regarded as a major consideration for both urban and rural development. People have been exploiting the natural resources with no consideration to the effects, both short-term (environmental) and long-term (resources crunch). It is also felt that knowledge and technology have not been used effectively in utilising energy resources. Energy is the vital input for economic and social development of any country. Its sustainability is an important factor to be considered. The urban areas depend, to a large extent, on commercial energy sources. The rural areas use non-commercial sources like firewood and agricultural wastes. With the present day trends for improving the quality of life and sustenance of mankind, environmental issues are considered highly important. In this context, the term energy loss has no significant technical meaning. Instead, the exergy loss has to be considered, as destruction of exergy is possible. Hence, exergy loss minimisation will help in sustainability. In the process of developing, there are two options to manage energy resources: (1) End use matching/demand side management, which focuses on the utilities. The mode of obtaining this is decided based on economic terms. It is, therefore, a quantitative approach. (2) Supply side management, which focuses on the renewable energy resource and methods of utilising it. This is decided based on thermodynamic consideration having the resource-user temperature or exergy destruction as the objective criteria. It is, therefore, a qualitative approach. The two options are explained schematically in Figure 10. The exergy-based energy, developed with supply side perspective is shown in Figure 11. The following policy measures had been identified:
•
Clear environmental and social objectives for energy market liberalisation, including a commitment to energy efficiency and renewables.
V
olum
e XVI Issue
II V
ersio
n I
59
( B)
Globa
l Jo
urna
l of H
uman
Soc
ial Sc
ienc
e
-
Year
2016
© 2016 Global Journals Inc. (US)
Evaluation of Bio-Engineering for Pollution Prevention through Sustainable Development of Bioenergy Management
• Economic, institutional and regulatory frameworks, which encourage the transition to total energy services.
• Economic measures to encourage utility investment in energy efficiency (e.g., levies on fuel bills).
• Incentives for demand side management, including grants for low-income households, expert advice and training, standards for appliances and buildings and tax incentives.
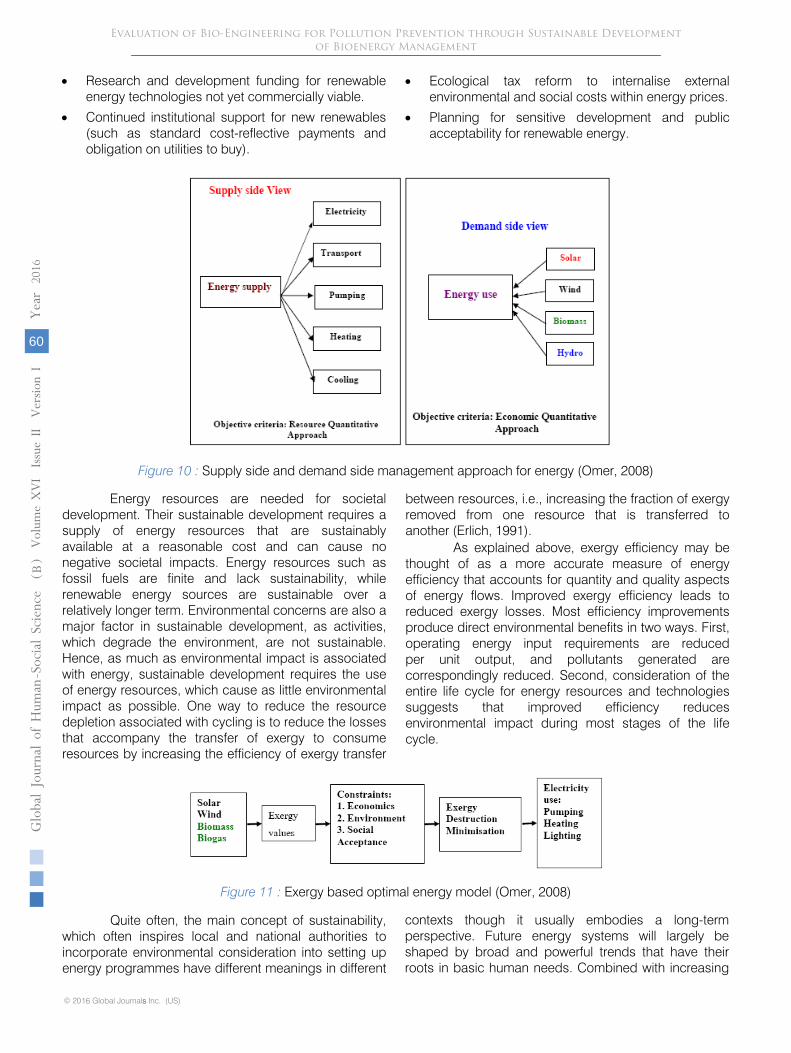
•
Ecological tax reform to internalise external environmental and social costs within energy prices.
•
Planning for sensitive development and public acceptability for renewable energy.
Figure 10 : Supply side and demand side management approach for energy
(Omer, 2008)
Energy resources are needed for societal development. Their sustainable development requires a supply of energy resources that are sustainably available at a reasonable cost and can cause no negative societal impacts.
Energy resources such as fossil fuels are finite and lack sustainability, while renewable energy sources are sustainable over a relatively longer term. Environmental concerns are also a major factor in sustainable development, as activities, which degrade
the environment, are not sustainable. Hence, as much as environmental impact is associated with energy, sustainable development requires the use of energy resources, which cause as little environmental impact as possible. One way to reduce the resource depletion associated with cycling is to reduce the losses that accompany the transfer of exergy to consume resources by increasing the efficiency of exergy transfer
between resources, i.e., increasing the fraction of exergy removed from one resource that is transferred to another (Erlich, 1991).
As explained above, exergy efficiency may be thought of as a more accurate measure of energy efficiency that accounts for quantity and quality aspects of energy flows. Improved exergy efficiency leads to reduced exergy losses. Most efficiency improvements produce direct environmental benefits in two ways. First, operating energy input requirements are reduced per unit output, and pollutants generated are correspondingly reduced. Second, consideration of the entire life cycle for energy resources and technologies suggests that improved efficiency reduces environmental impact during most stages of the life cycle.
Figure 11 :
Exergy based optimal energy model (Omer, 2008)
Evaluation of Bio-Engineering for Pollution Prevention through Sustainable Development of Bioenergy Management
© 2016 Global Journals Inc. (US)
V
olum
e XVI Issue
II V
ersio
n I
60
( B)
Globa
l Jo
urna
l of H
uman
Soc
ial Sc
ienc
e
s
-
Year
2016
• Research and development funding for renewable energy technologies not yet commercially viable.
• Continued institutional support for new renewables (such as standard cost-reflective payments and obligation on utilities to buy).
Quite often, the main concept of sustainability, which often inspires local and national authorities to incorporate environmental consideration into setting up energy programmes have different meanings in different
contexts though it usually embodies a long-term perspective. Future energy systems will largely be shaped by broad and powerful trends that have their roots in basic human needs. Combined with increasing
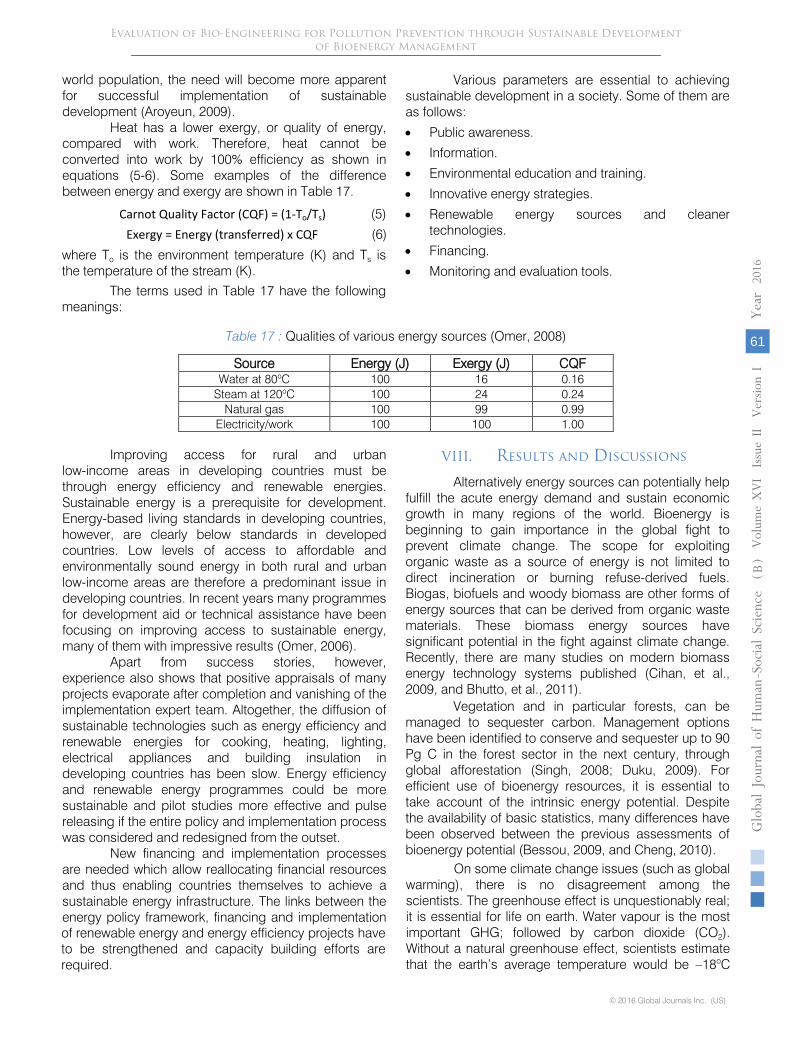
world population, the need will become more apparent for successful implementation of sustainable development (Aroyeun, 2009).
Heat has a lower exergy, or quality of energy, compared with work. Therefore, heat cannot be converted into work by 100% efficiency as shown in equations (5-6). Some examples of the difference between energy and exergy are shown in Table 17.
Carnot Quality Factor (CQF) = (1-To/Ts)
(5)
Exergy = Energy (transferred) x CQF
(6)
where To
is
the environment temperature (K) and Ts
is
the temperature of the stream (K).
The terms used in Table 17 have the following meanings:
Various parameters are essential to achieving sustainable development in a society. Some of them are as follows:
•
Public awareness.
•
Information.
•
Environmental education and training.
•
Innovative energy strategies.
•
Renewable energy sources and cleaner technologies.
•
Financing.
•
Monitoring and evaluation tools.
Table 17 :
Qualities of various energy sources (Omer, 2008)
Source
Energy (J)
Exergy (J)
CQF
Water at 80oC
100
16
0.16
Steam at 120oC
100
24
0.24
Natural gas
100
99
0.99
Electricity/work
100
100
1.00
Improving access for rural and urban
low-income areas in developing countries must be through energy efficiency and renewable energies. Sustainable energy is a prerequisite for development. Energy-based living standards in developing countries, however, are clearly below standards in developed countries. Low levels of access to affordable and environmentally sound energy in both rural and urban low-income areas are therefore a predominant issue in developing countries. In recent years many programmes for development aid or technical assistance have been focusing on improving access to sustainable energy, many of them with impressive results (Omer, 2006).
Apart from success stories, however, experience also shows that positive appraisals of many projects evaporate after completion and vanishing of the implementation expert team. Altogether, the diffusion of sustainable technologies such as energy efficiency and renewable energies for cooking, heating, lighting, electrical appliances and building insulation in developing countries has been slow.
Energy efficiency and renewable energy programmes could be more sustainable and pilot studies more effective and pulse releasing if the entire policy and implementation process was considered and redesigned from the outset.
New financing and implementation processes are needed which allow reallocating financial resources and thus enabling countries themselves to achieve a sustainable energy infrastructure. The links between the energy policy framework, financing and implementation of renewable energy and energy efficiency projects have to be strengthened and capacity building efforts are required.
VIII.
Results
and
Discussions
Alternatively energy sources can potentially help fulfill the acute energy demand and sustain economic growth in many regions of the world. Bioenergy is beginning to gain importance in the global fight to prevent climate change. The scope for exploiting organic waste as a source of energy is not limited to direct incineration or burning refuse-derived fuels. Biogas, biofuels and woody biomass are other forms of energy sources that can be derived from organic waste materials. These biomass energy sources have significant potential in the fight against climate change. Recently, there are many studies on modern biomass energy technology systems published (Cihan, et al., 2009, and Bhutto, et al., 2011).
Vegetation and in particular forests, can be managed to sequester carbon. Management options have been identified to conserve and sequester up to 90 Pg C in the forest sector in the next century, through global afforestation (Singh, 2008; Duku, 2009). For efficient use of bioenergy resources, it is essential to take account of the intrinsic energy potential. Despite the availability of basic statistics, many differences have been observed between the previous assessments of bioenergy potential (Bessou, 2009, and Cheng, 2010).
V
olum
e XVI Issue
II V
ersio
n I
61
( B)
Globa
l Jo
urna
l of H
uman
Soc
ial Sc
ienc
e
-
Year
2016
© 2016 Global Journals Inc. (US)
Evaluation of Bio-Engineering for Pollution Prevention through Sustainable Development of Bioenergy Management
On some climate change issues (such as global warming), there is no disagreement among the scientists. The greenhouse effect is unquestionably real; it is essential for life on earth. Water vapour is the most important GHG; followed by carbon dioxide (CO2). Without a natural greenhouse effect, scientists estimate that the earth’s average temperature would be –18oC

instead of its present 14oC (Kothari, et al., 2011). There is also no scientific debate over the fact that human activity has increased the concentration of the GHGs in the atmosphere (especially CO2
from combustion of coal, oil and gas). The greenhouse effect is also being amplified by increased concentrations
of other gases, such as methane, nitrous oxide, and Chlorofluoro carbons (CFCs) as a result of human emissions. Most scientists predict that rising global temperatures will raise the sea level and increase the frequency of intense rain or snowstorms (Andrea and Fernando, 2012).
Globally, buildings are responsible for approximately 40% of the total world annual energy consumption. Most of this energy is for the provision of lighting, heating, cooling, and air conditioning. Increasing awareness of the environmental impact of CO2, NOx
and CFCs emissions triggered a renewed interest in environmentally friendly cooling, and heating technologies. Under the 1997 Montreal Protocol, governments agreed to phase out chemicals used as refrigerants that have the potential to destroy stratospheric ozone. It was therefore considered desirable to reduce energy consumption and decrease the rate of depletion of world energy reserves and pollution of the environment. One way of reducing building energy consumption is to design
buildings, which are more economical in their use of energy for heating, lighting, cooling, ventilation and hot water supply. Passive measures, particularly natural or
hybrid ventilation rather than air-conditioning, can
dramatically reduce primary energy
consumption. However, exploitation of renewable energy in buildings and agricultural greenhouses can, also, significantly contribute towards reducing dependency on fossil fuels. Therefore, promoting innovative renewable applications and reinforcing the renewable energy market will contribute to preservation of the ecosystem by reducing emissions at local and global levels.
IX.
Conclusion
Even with modest assumptions about the availability of land, comprehensive fuel-wood farming programmes offer significant energy, economic and environmental benefits. These benefits would be dispersed in rural areas where they are greatly needed and can serve as linkages for further rural economic development. The nations, as a whole would benefit from savings in foreign exchange, improved energy security, and socio-economic improvements. With a nine-fold increase in forest – plantation cover, the nation’s resource base would be greatly improved. The international community would benefit from pollution reduction, climate mitigation, and the increased trading opportunities that arise from new income sources. Furthermore, investigating the potential is needed to make use of more and more of its waste. Household waste, vegetable market waste, and waste from the
cotton stalks, leather, and pulp; and paper industries can be used to produce useful energy either by direct incineration, gasification, digestion (biogas production), fermentation, or cogeneration. Therefore, effort has to be made to reduce fossil energy use and to promote green energies, particularly in the building sector. Energy use reductions can be achieved by minimising the energy demand, by rational energy use, by recovering heat and the use of more green energies. This study was a step towards achieving that goal. The adoption of green or sustainable approaches to the way in which society is run is seen as an important strategy in finding a solution to the energy problem. The key factors to reducing and controlling CO2, which is the major contributor to global warming, are the use of alternative approaches to energy generation and the exploration of how these alternatives are used today and may be used in the future as green energy sources. Even with modest assumptions about the availability of land, comprehensive fuel-wood farming programmes offer significant energy, economic and environmental benefits. These benefits would be dispersed in rural areas where they are greatly needed and can serve as linkages for further rural economic development. The nations as a whole would benefit from savings in foreign exchange, improved energy security, and socio-economic improvements. With a nine-fold increase in forest – plantation cover, a nation’s resource base would be greatly improved. The international community would benefit from pollution reduction, climate mitigation, and the increased trading opportunities that arise from new income sources.
References Références Referencias
1.
Abdeen M. O. (2008a). Renewable building energy systems and passive human comfort solutions. Renewable and Sustainable Energy Reviews, 12(6): 1562-1587.
2.
Abdeen, M. O. (2008b). People, power and
pollution. Renewable and Sustainable Energy Reviews, 12(7): 1864-1889.
3.
Abdeen, M. O. (2008c). Energy, environment and sustainable development. Renewable and Sustainable Energy Reviews, 12(9): 2265-2300.
4.
Abdeen, M. O. (2008d). Focus on low carbon technologies: The positive solution. Renewable and Sustainable Energy Reviews, 12(9): 2331-2357.
Evaluation of Bio-Engineering for Pollution Prevention through Sustainable Development of Bioenergy Management
© 2016 Global Journals Inc. (US)
V
olum
e XVI Issue
II V
ersio
n I
62
( B)
Globa
l Jo
urna
l of H
uman
Soc
ial Sc
ienc
e
s
-
Year
2016
5. Abdeen, M. O. (2008e). Chapter 10: Development of integrated bioenergy for improvement of quality of life of poor people in developing countries. In F. L. Magnusson & O. W. Bengtsson (Eds.), Energy in Europe: Economics, policy and strategy (pp. 341-373). New York, NY: NOVA Science Publishers.
6. Abdeen, M. O. (2009a). Environmental and socio-economic aspect of possible development in
renewable energy use. In Proceedings of the 4th
International Symposium on Environment, Athens, Greece, 21-24 May 2009.
7.
Abdeen, M. O. (2009b). Energy use, environment and sustainable development. In Proceedings of the 3rd
International Conference on Sustainable Energy and Environmental Protection
(SEEP 2009), Paper No.1011, Dublin, Republic of Ireland, 12-15 August 2009.
8.
Abdeen, M. O. (2009c). Energy use and environmental: Impacts: A general review. Journal of Renewable and Sustainable Energy, 1(5), 1-29.
9.
Abdeen, M. O. (2009d). Chapter 3: Energy use, environment and sustainable development. In R. T. Mancuso (Ed.), Environmental cost management, New York, NY: NOVA Science Publishers.
(pp. 129-166).
10.
Andrea S. and Fernando R. (2012). Identifying, developing, and moving sustainable communities through renewable energy. World Journal of Science, Technology and Sustainable Development, 9(4): 273-281.
Aroyeun, S. O. (2009). Reduction of aflatoxin B1 and Ochratoxin A in cocoa beans infected with Aspergillus via Ergosterol Value. World Review of Science, Technology and Sustainable Development, 6(1),
75-90.
12.
Bacaoui, A., Yaacoubi, A., Dahbi, C., Bennouna, J., and Mazet, A. (1998). Activated carbon production from Moroccan olive wastes-influence of some factors. Environmental Technology 19: 1203-1212.
13.
Barton A, L. (2007). Focus on sustainable development research advances. New York, NY: NOVA Science Publishers, Inc. pp. 189-205.
14.
Bessou, S. (2009). Biofuels, greenhouse gases and climate change. Agronomy for Sustainable Development, DOI: 10. 1051/agro/2009039
15.
Bhutto A, Bazmi A, Zahwdi G (2011). Greener energy: issues and challenges for Pakistan – Biomass energy prospective. Renewable and Sustainable Energy Reviews, 15 (6): 3207-32-19.
16.
Brain, G., & Mark, S. (2007). Garbage in, energy out: Landfill gas opportunities for the CHP projects. Cogeneration and On-Site Power, 8(5), 37-45.
17.
Cheng, R. (2010). Advanced biofuel technologies: status and barriers. World Bank Report, WPS5411.
18.
Cihan G, Dursun B, Bora A, Erkan S (2009). Importance of biomass energy as alternative to other sources in Turkey. Energy Policy, 37
(2): 424-431.
19.
D’Apote, S.L. (1998). IEA biomass energy analysis and projections. In: Proceedings of Biomass Energy Conference: Data, analysis and Trends, Paris: OECD; 23-24 March 1998.
20.
Duku, B. (2009). Comprehensive review of biomass resources and biofuels potential in Ghana.
Renewable and Sustainable Energy Review,
15: 404-415.
21.
Erlich, P. (1991). Forward facing up to climate change, in Global Climate Change and Life on Earth. R.C. Wyman (Ed), Chapman and Hall, London.
22.
Hall O. and Scrase J. (1998). Will biomass be the environmentally friendly fuel of the future? Biomass and Bioenergy
15: 357-67.
23.
Jeremy, L. (2005). The energy crisis, global warming and the role of renewables. Renewable Energy World,
8(2).
24.
Kothari, D. P., Singal, K. C., Rakesh, Ranjan (2011). Renewable energy sources and emerging technologies. 2nd
Edition, Private Ltd, New Delhi, 2011.
25.
Levine, M., & Hirose, M. (2005). Energy efficiency improvement utilising high technology: An assessment of energy use in industry and buildings. Report and Case Studies. London, UK: World Energy Council.
26.
Omer, A.M., Yemen, F.
(2003). Biogas energy technology in Sudan. Renewable Energy,
28 (3): 499-507.
27.
Omer, A.M. (2006). Review: Organic waste treatment for power production and energy supply. Cells and Animal Biology
1 (2): 34-47.
28.
Omer, A.M. (2008). Green energies and environment. Renewable and Sustainable Energy Reviews
12: 1789-1821.
29.
Omer, A.M. (2007). Renewable energy resources for electricity generation in Sudan. Renewable and Sustainable Energy Reviews
11: 1481-1497. 30.
Pernille, M. (2004). Feature: Danish lessons on district heating. Energy Resource Sustainable Management and Environmental March/April 2004: 16-17.
31.
Robinson, G. (2007). Changes in construction
waste management. Waste Management World,
pp. 43-49. May-June 2007.
32.
Rossi, S., Arnone, S., Lai, A., Lapenta, E., and Sonnino, A. (1990). ENEA’s activities for developing new crops for energy and industry. In: Biomass for Energy and Industry (G. Grassi, G. Gosse, G. dos Santos Eds.). Vol.1, pp.107-113, Elsevier Applied Science, London and New York.
33.
Sims, R.H. (2007). Not too late: IPCC identifies renewable energy as a key measure to limit climate change. Renewable Energy World
10 (4): 31-39.
V
olum
e XVI Issue
II V
ersio
n I
63
( B)
Globa
l Jo
urna
l of H
uman
Soc
ial Sc
ienc
e
-
Year
2016
© 2016 Global Journals Inc. (US)
Evaluation of Bio-Engineering for Pollution Prevention through Sustainable Development of Bioenergy Management
11.
34. Singh, A. (2008). Biomass conversion to energy in India: a critique. Renewable and Sustainable Energy Review, 14: 1367-1378.
35. Wu, J. and Boggess, W. (1999). The optimal allocation of conservation funds. Journal Environmental Economic Management. 1999: 38-46.

Global Journals Inc. (US)
Guidelines Handbook 2016
www.GlobalJournals.org
© Copyright by Global Journals Inc.(US) | Guidelines Handbook
I
FELLOW OF ASSOCIATION OF RESEARCH SOCIETY IN HUMAN SCIENCE (FARSHS)Global Journals Incorporate (USA) is accredited by Open Association of Research Society (OARS), U.S.A and in turn, awards “FARSHS” title to individuals. The 'FARSHS' title is accorded to a selected professional after the approval of the Editor-in-Chief/Editorial Board Members/Dean.
FARSHS accrediting is an honor. It authenticates your research activities. After recognition as FARSHS, you can add 'FARSHS' title with your name as you use this recognition as additional suffix to your status. This will definitely enhance and add more value and repute to your name. You may use it on your professional Counseling Materials such as CV, Resume, and Visiting Card etc.
The following benefits can be availed by you only for next three years from the date of certification:
FARSHS designated members are entitled to avail a 40% discount while publishing their research papers (of a single author) with Global Journals Incorporation (USA), if the same is accepted by Editorial Board/Peer Reviewers. If you are a main author or co-author in case of multiple authors, you will be entitled to avail discount of 10%.
Once FARSHS title is accorded, the Fellow is authorized to organize a symposium/seminar/conference on behalf of Global Journal Incorporation (USA). The Fellow can also participate in conference/seminar/symposium organized by another institution as representative of Global Journal. In both the cases, it is mandatory for him to discuss with us and obtain our consent.
You may join as member of the Editorial Board of Global Journals Incorporation (USA) after successful completion of three years as Fellow and as Peer Reviewer. In addition, it is also desirable that you should organize seminar/symposium/conference at
We shall provide you intimation regarding launching of e-version of journal of your stream time to time.This may be utilized in your library for the enrichment of knowledge of your students as well as it can also be helpful for the concerned faculty members.
least once.
Fellows
The “FARSHS” is a dignified title which is accorded to a person’s name viz. Dr. John E. Hall, FARSS or William Walldroff, M.S., FARSHS.
Ph.D.,

II
II
The FARSHS can go thany suggestions so that proper amendment can take place to improve the same for the
rough standards of OARS. You can also play vital role if you have
benefit of entire research community.
As FARSHS, you will be given a renowned, secure and free professional email address with 100 GB of space e.g. [email protected]. This will include Webmail, Spam Assassin, Email Forwarders,Auto-Responders, Email Delivery Route tracing, etc.
The FARSHS will be eligible for a free application of standardization of their researches. Standardization of research will be subject to acceptability within stipulated norms as the next step after publishing in a journal. We shall depute a team of specialized research professionals who will render their services for elevating your researches to next higher level, which is worldwide open standardization.
The FARSHS member can apply for grading and certification of standards of their educational and Institutional Degrees to Open Association of Research, Society U.S.A.Once you are designated as FARSHS, you may send us a scanned copy of all of your credentials. OARS will verify, grade and certify them. This will be based on your academic records, quality of research papers published by you, and some more criteria. After certification of all your credentials by OARS, they will be published on your Fellow Profile link on website https://associationofresearch.org which will be helpful to upgrade the dignity.
The FARSHS members can avail the benefits of free research podcasting in Global Research Radio with their research documents. After publishing the work, (including published elsewhere worldwide with proper authorization) you can upload your research paper with your recorded voice or you can utilize
request.chargeable services of our professional RJs to record your paper in their voice on
The FARSHS member also entitled to get the benefits of free research podcasting of their research documents through video clips. We can also streamline your conference videos and display your slides/ online slides and online research video clips at reasonable charges, on request.
© Copyright by Global Journals Inc.(US)| Guidelines Handbook

The FARSHS is eligible to earn from sales proceeds of his/her researches/reference/review Books or literature, while publishing with Global Journals. The FARSHS can decide whether he/she would like to publish his/her research in a closed manner. In this case, whenever readers purchase that individual research paper for reading, maximum 60% of its profit earned as royalty by Global Journals, will
be credited to his/her bank account. The entire entitled amount will be credited to his/her bank account exceeding limit of minimum fixed balance. There is no minimum time limit for collection. The FARSS member can decide its price and we can help in making the right decision.
The FARSHS member is eligible to join as a paid peer reviewer at Global Journals Incorporation (USA) and can get remuneration of 15% of author fees, taken from the author of a respective paper. After reviewing 5 or more papers you can request to transfer the amount to your bank account.
MEMBER OF ASSOCIATION OF RESEARCH SOCIETY IN HUMAN SCIENCE (MARSHS)
The ' MARSHS ' title is accorded to a selected professional after the approval of the Editor-in-Chief / Editorial Board Members/Dean.
The “MARSHS” is a dignified ornament which is accorded to a person’s name viz. Dr. John E. Hall, Ph.D., MARSHS or William Walldroff, M.S., MARSHS.
MARSHS accrediting is an honor. It authenticates your research activities. Afterbecoming MARSHS, youcan add 'MARSHS' title with your name as you use this recognition as additional suffix to your status. This will definitely enhance and add more value and repute to your name. You may use it on your professional Counseling Materials such as CV, Resume, Visiting Card and Name Plate etc.
The following benefitscan be availed by you only for next three years from the date of certification.
MARSHS designated members are entitled to avail a 25% discount while publishing their research papers (of a single author) in Global Journals Inc., if the same is accepted by our Editorial Board and Peer Reviewers. If you are a main author or co-author of a group of authors, you will get discount of 10%.
© Copyright by Global Journals Inc.(US) | Guidelines Handbook
As MARSHS, you willbe given a renowned, secure and free professional email address with 30 GB of space e.g. [email protected]. This will include Webmail, Spam Assassin, Email Forwarders,Auto-Responders, Email Delivery Route tracing, etc.
III

We shall provide you intimation regarding launching of e-version of journal of your stream time to time.This may be utilized in your library for the enrichment of knowledge of your students as well as it can also be helpful for the concerned faculty members.
The MARSHS member can apply for approval, grading and certification of standards of their educational and Institutional Degrees to Open Association of Research, Society U.S.A.
Once you are designated as MARSHS, you may send us a scanned copy of all of your credentials. OARS will verify, grade and certify them. This will be based on your academic records, quality of research papers published by you, and some more criteria.
It is mandatory to read all terms and conditions carefully.
© Copyright by Global Journals Inc.(US)| Guidelines Handbook
IV
Auxiliary Memberships
Institutional Fellow of Open Association of Research Society (USA) - OARS (USA)Global Journals Incorporation (USA) is accredited by Open Association of Research Society, U.S.A (OARS) and in turn, affiliates research institutions as “Institutional Fellow of Open Association of Research Society” (IFOARS).The “FARSC” is a dignified title which is accorded to a person’s name viz. Dr. John E. Hall, Ph.D., FARSC or William Walldroff, M.S., FARSC.The IFOARS institution is entitled to form a Board comprised of one Chairperson and three to five board members preferably from different streams. The Board will be recognized as “Institutional Board of Open Association of Research Society”-(IBOARS).
The Institute will be entitled to following benefits:
The IBOARS can initially review research papers of their institute and recommend them to publish with respective journal of Global Journals. It can also review the papers of other institutions after obtaining our consent. The second review will be done by peer reviewer of Global Journals Incorporation (USA) The Board is at liberty to appoint a peer reviewer with the approval of chairperson after consulting us. The author fees of such paper may be waived off up to 40%.
The Global Journals Incorporation (USA) at its discretion can also refer double blind peer reviewed paper at their end to the board for the verification and to get recommendation for final stage of acceptance of publication.
The IBOARS can organize symposium/seminar/conference in their country on behalf of Global Journals Incorporation (USA)-OARS (USA). The terms and conditions can be discussed separately.
© Copyright by Global Journals Inc.(US) | Guidelines Handbook
The Board can also play vital role by exploring and giving valuable suggestions regarding the Standards of “Open Association of Research Society, U.S.A (OARS)” so that proper amendment can take place for the benefit of entire research community. We shall provide details of particular standard only on receipt of request from the Board.
The board members can also join us as Individual Fellow with 40% discount on total fees applicable to Individual Fellow. They will be entitled to avail all the benefits as declared. Please visit Individual Fellow-sub menu of GlobalJournals.org to have more relevant details.
V

We shall provide you intimation regarding launching of e-version of journal of your stream time to time. This may be utilized in your library for the enrichment of knowledge of your students as well as it can also be helpful for the concerned faculty members.
After nomination of your institution as “Institutional Fellow” and constantly functioning successfully for one year, we can consider giving recognition to your institute to function as Regional/Zonal office on our behalf.The board can also take up the additional allied activities for betterment after our consultation.
The following entitlements are applicable to individual Fellows:
Open Association of Research Society, U.S.A (OARS) By-laws states that an individual Fellow may use the designations as applicable, or the corresponding initials. The Credentials of individual Fellow and Associate designations signify that the individual has gained knowledge of the fundamental concepts. One is magnanimous and proficient in an expertise course covering the professional code of conduct, and follows recognized standards of practice.
Open Association of Research Society (US)/ Global Journals Incorporation (USA), as described in Corporate Statements, are educational, research publishing and professional membership organizations. Achieving our individual Fellow or Associate status is based mainly on meeting stated educational research requirements.
Disbursement of 40% Royalty earned through Global Journals : Researcher = 50%, Peer Reviewer = 37.50%, Institution = 12.50% E.g. Out of 40%, the 20% benefit should be passed on to researcher, 15 % benefit towards remuneration should be given to a reviewer and remaining 5% is to be retained by the institution.
We shall provide print version of 12 issues of any three journals [as per your requirement] out of our 38 journals worth $ 2376 USD.
© Copyright by Global Journals Inc.(US)| Guidelines Handbook
Other:
The individual Fellow and Associate designations accredited by Open Association of Research Society (US) credentials signify guarantees following achievements:
The professional accredited with Fellow honor, is entitled to various benefits viz. name, fame, honor, regular flow of income, secured bright future, social status etc.
VI

Note :
″
″
© Copyright by Global Journals Inc.(US) | Guidelines Handbook
In addition to above, if one is single author, then entitled to 40% discount on publishing research paper and can get 10%discount if one is co-author or main author among group of authors.
The Fellow can organize symposium/seminar/conference on behalf of Global Journals Incorporation (USA) and he/she can also attend the same organized by other institutes on behalf of Global Journals.
The Fellow can become member of Editorial Board Member after completing 3yrs. The Fellow can earn 60% of sales proceeds from the sale of reference/review
books/literature/publishing of research paper. Fellow can also join as paid peer reviewer and earn 15% remuneration of author charges and
can also get an opportunity to join as member of the Editorial Board of Global Journals Incorporation (USA)
• This individual has learned the basic methods of applying those concepts and techniques to common challenging situations. This individual has further demonstrated an in–depth understanding of the application of suitable techniques to a particular area of research practice.
In future, if the board feels the necessity to change any board member, the same can be done with the consent of the chairperson along with anyone board member without our approval.
In case, the chairperson needs to be replaced then consent of 2/3rd board members are required and they are also required to jointly pass the resolution copy of which should be sent to us. In such case, it will be compulsory to obtain our approval before replacement.
In case of “Difference of Opinion [if any]” among the Board members, our decision will be final and binding to everyone.
VII
Process of submission of Research Paper
The Area or field of specialization may or may not be of any category as mentioned in ‘Scope of Journal’ menu of the GlobalJournals.org website. There are 37 Research Journal categorized with Six parental Journals GJCST, GJMR, GJRE, GJMBR, GJSFR, GJHSS. For Authors should prefer the mentioned categories. There are three widely used systems UDC, DDC and LCC. The details are available as ‘Knowledge Abstract’ at Home page. The major advantage of this coding is that, the research work will be exposed to and shared with all over the world as we are being abstracted and indexed worldwide.
The paper should be in proper format. The format can be downloaded from first page of ‘Author Guideline’ Menu. The Author is expected to follow the general rules as mentioned in this menu. The paper should be written in MS-Word Format (*.DOC,*.DOCX).
The Author can submit the paper either online or offline. The authors should prefer online submission.Online Submission: There are three ways to submit your paper:
(A) (I) First, register yourself using top right corner of Home page then Login. If you are already registered, then login using your username and password.
(II) Choose corresponding Journal.
(III) Click ‘Submit Manuscript’. Fill required information and Upload the paper.
(B) If you are using Internet Explorer, then Direct Submission through Homepage is also available.
(C) If these two are not conveninet , and then email the paper directly to [email protected].
Offline Submission: Author can send the typed form of paper by Post. However, online submission should be preferred.
© Copyright by Global Journals Inc.(US)| Guidelines Handbook
VIII

Preferred Author Guidelines
MANUSCRIPT STYLE INSTRUCTION (Must be strictly followed)
Page Size: 8.27" X 11'"
• Left Margin: 0.65 • Right Margin: 0.65 • Top Margin: 0.75 • Bottom Margin: 0.75 • Font type of all text should be Swis 721 Lt BT. • Paper Title should be of Font Size 24 with one Column section. • Author Name in Font Size of 11 with one column as of Title. • Abstract Font size of 9 Bold, “Abstract” word in Italic Bold. • Main Text: Font size 10 with justified two columns section • Two Column with Equal Column with of 3.38 and Gaping of .2 • First Character must be three lines Drop capped. • Paragraph before Spacing of 1 pt and After of 0 pt. • Line Spacing of 1 pt • Large Images must be in One Column • Numbering of First Main Headings (Heading 1) must be in Roman Letters, Capital Letter, and Font Size of 10. • Numbering of Second Main Headings (Heading 2) must be in Alphabets, Italic, and Font Size of 10.
You can use your own standard format also. Author Guidelines:
1. General,
2. Ethical Guidelines,
3. Submission of Manuscripts,
4. Manuscript’s Category,
5. Structure and Format of Manuscript,
6. After Acceptance.
1. GENERAL
Before submitting your research paper, one is advised to go through the details as mentioned in following heads. It will be beneficial, while peer reviewer justify your paper for publication.
Scope
The Global Journals Inc. (US) welcome the submission of original paper, review paper, survey article relevant to the all the streams of Philosophy and knowledge. The Global Journals Inc. (US) is parental platform for Global Journal of Computer Science and Technology, Researches in Engineering, Medical Research, Science Frontier Research, Human Social Science, Management, and Business organization. The choice of specific field can be done otherwise as following in Abstracting and Indexing Page on this Website. As the all Global
© Copyright by Global Journals Inc.(US) | Guidelines Handbook
IX
Journals Inc. (US) are being abstracted and indexed (in process) by most of the reputed organizations. Topics of only narrow interest will not be accepted unless they have wider potential or consequences.
2. ETHICAL GUIDELINES
Authors should follow the ethical guidelines as mentioned below for publication of research paper and research activities.
Papers are accepted on strict understanding that the material in whole or in part has not been, nor is being, considered for publication elsewhere. If the paper once accepted by Global Journals Inc. (US) and Editorial Board, will become the copyright of the Global Journals Inc. (US).
Authorship: The authors and coauthors should have active contribution to conception design, analysis and interpretation of findings. They should critically review the contents and drafting of the paper. All should approve the final version of the paper before submission
The Global Journals Inc. (US) follows the definition of authorship set up by the Global Academy of Research and Development. According to the Global Academy of R&D authorship, criteria must be based on:
1) Substantial contributions to conception and acquisition of data, analysis and interpretation of the findings.
2) Drafting the paper and revising it critically regarding important academic content.
3) Final approval of the version of the paper to be published.
All authors should have been credited according to their appropriate contribution in research activity and preparing paper. Contributors who do not match the criteria as authors may be mentioned under Acknowledgement.
Acknowledgements: Contributors to the research other than authors credited should be mentioned under acknowledgement. The specifications of the source of funding for the research if appropriate can be included. Suppliers of resources may be mentioned along with address.
Appeal of Decision: The Editorial Board’s decision on publication of the paper is final and cannot be appealed elsewhere.
Permissions: It is the author's responsibility to have prior permission if all or parts of earlier published illustrations are used in this paper.
Please mention proper reference and appropriate acknowledgements wherever expected.
If all or parts of previously published illustrations are used, permission must be taken from the copyright holder concerned. It is the author's responsibility to take these in writing.
Approval for reproduction/modification of any information (including figures and tables) published elsewhere must be obtained by the authors/copyright holders before submission of the manuscript. Contributors (Authors) are responsible for any copyright fee involved.
3. SUBMISSION OF MANUSCRIPTS
Manuscripts should be uploaded via this online submission page. The online submission is most efficient method for submission of papers, as it enables rapid distribution of manuscripts and consequently speeds up the review procedure. It also enables authors to know the status of their own manuscripts by emailing us. Complete instructions for submitting a paper is available below.
Manuscript submission is a systematic procedure and little preparation is required beyond having all parts of your manuscript in a given format and a computer with an Internet connection and a Web browser. Full help and instructions are provided on-screen. As an author, you will be prompted for login and manuscript details as Field of Paper and then to upload your manuscript file(s) according to the instructions.
© Copyright by Global Journals Inc.(US)| Guidelines Handbook
X
To avoid postal delays, all transaction is preferred by e-mail. A finished manuscript submission is confirmed by e-mail immediately and your paper enters the editorial process with no postal delays. When a conclusion is made about the publication of your paper by our Editorial Board, revisions can be submitted online with the same procedure, with an occasion to view and respond to all comments.
Complete support for both authors and co-author is provided.
4. MANUSCRIPT’S CATEGORY
Based on potential and nature, the manuscript can be categorized under the following heads:
Original research paper: Such papers are reports of high-level significant original research work.
Review papers: These are concise, significant but helpful and decisive topics for young researchers.
Research articles: These are handled with small investigation and applications
Research letters: The letters are small and concise comments on previously published matters.
5.STRUCTURE AND FORMAT OF MANUSCRIPT
The recommended size of original research paper is less than seven thousand words, review papers fewer than seven thousands words also.Preparation of research paper or how to write research paper, are major hurdle, while writing manuscript. The research articles and research letters should be fewer than three thousand words, the structure original research paper; sometime review paper should be as follows:
Papers: These are reports of significant research (typically less than 7000 words equivalent, including tables, figures, references), and comprise:
(a)Title should be relevant and commensurate with the theme of the paper.
(b) A brief Summary, “Abstract” (less than 150 words) containing the major results and conclusions.
(c) Up to ten keywords, that precisely identifies the paper's subject, purpose, and focus.
(d) An Introduction, giving necessary background excluding subheadings; objectives must be clearly declared.
(e) Resources and techniques with sufficient complete experimental details (wherever possible by reference) to permit repetition; sources of information must be given and numerical methods must be specified by reference, unless non-standard.
(f) Results should be presented concisely, by well-designed tables and/or figures; the same data may not be used in both; suitable statistical data should be given. All data must be obtained with attention to numerical detail in the planning stage. As reproduced design has been recognized to be important to experiments for a considerable time, the Editor has decided that any paper that appears not to have adequate numerical treatments of the data will be returned un-refereed;
(g) Discussion should cover the implications and consequences, not just recapitulating the results; conclusions should be summarizing.
(h) Brief Acknowledgements.
(i) References in the proper form.
Authors should very cautiously consider the preparation of papers to ensure that they communicate efficiently. Papers are much more likely to be accepted, if they are cautiously designed and laid out, contain few or no errors, are summarizing, and be conventional to the approach and instructions. They will in addition, be published with much less delays than those that require much technical and editorial correction.
© Copyright by Global Journals Inc.(US) | Guidelines Handbook
XI
The Editorial Board reserves the right to make literary corrections and to make suggestions to improve briefness.
It is vital, that authors take care in submitting a manuscript that is written in simple language and adheres to published guidelines.
Format
Language: The language of publication is UK English. Authors, for whom English is a second language, must have their manuscript efficiently edited by an English-speaking person before submission to make sure that, the English is of high excellence. It is preferable, that manuscripts should be professionally edited.
Standard Usage, Abbreviations, and Units: Spelling and hyphenation should be conventional to The Concise Oxford English Dictionary. Statistics and measurements should at all times be given in figures, e.g. 16 min, except for when the number begins a sentence. When the number does not refer to a unit of measurement it should be spelt in full unless, it is 160 or greater.
Abbreviations supposed to be used carefully. The abbreviated name or expression is supposed to be cited in full at first usage, followed by the conventional abbreviation in parentheses.
Metric SI units are supposed to generally be used excluding where they conflict with current practice or are confusing. For illustration, 1.4 l rather than 1.4 × 10⁻³ m3, or 4 mm somewhat than 4 × 10⁻³ m. Chemical formula and solutions must identify the form used, e.g. anhydrous or hydrated, and the concentration must be in clearly defined units. Common species names should be followed by underlines at the first mention. For following use the generic name should be constricted to a single letter, if it is clear.
Structure
All manuscripts submitted to Global Journals Inc. (US), ought to include:
Title: The title page must carry an instructive title that reflects the content, a running title (less than 45 characters together with spaces), names of the authors and co-authors, and the place(s) wherever the work was carried out. The full postal address in addition with the e-mail address of related author must be given. Up to eleven keywords or very brief phrases have to be given to help data retrieval, mining and indexing.
Abstract, used in Original Papers and Reviews:
Optimizing Abstract for Search Engines
Many researchers searching for information online will use search engines such as Google, Yahoo or similar. By optimizing your paper for search engines, you will amplify the chance of someone finding it. This in turn will make it more likely to be viewed and/or cited in a further work. Global Journals Inc. (US) have compiled these guidelines to facilitate you to maximize the web-friendliness of the most public part of your paper.
Key Words
A major linchpin in research work for the writing research paper is the keyword search, which one will employ to find both library and Internet resources.
One must be persistent and creative in using keywords. An effective keyword search requires a strategy and planning a list of possible keywords and phrases to try.
Search engines for most searches, use Boolean searching, which is somewhat different from Internet searches. The Boolean search uses "operators," words (and, or, not, and near) that enable you to expand or narrow your affords. Tips for research paper while preparing research paper are very helpful guideline of research paper.
Choice of key words is first tool of tips to write research paper. Research paper writing is an art.A few tips for deciding as strategically as possible about keyword search:
© Copyright by Global Journals Inc.(US)| Guidelines Handbook
XII
• One should start brainstorming lists of possible keywords before even begin searching. Think about the most important concepts related to research work. Ask, "What words would a source have to include to be truly valuable in research paper?" Then consider synonyms for the important words.
• It may take the discovery of only one relevant paper to let steer in the right keyword direction because in most databases, the keywords under which a research paper is abstracted are listed with the paper.
• One should avoid outdated words.
Keywords are the key that opens a door to research work sources. Keyword searching is an art in which researcher's skills are bound to improve with experience and time.
Numerical Methods: Numerical methods used should be clear and, where appropriate, supported by references.
Acknowledgements: Please make these as concise as possible.
References
References follow the Harvard scheme of referencing. References in the text should cite the authors' names followed by the time of their publication, unless there are three or more authors when simply the first author's name is quoted followed by et al. unpublished work has to only be cited where necessary, and only in the text. Copies of references in press in other journals have to be supplied with submitted typescripts. It is necessary that all citations and references be carefully checked before submission, as mistakes or omissions will cause delays.
References to information on the World Wide Web can be given, but only if the information is available without charge to readers on an official site. Wikipedia and Similar websites are not allowed where anyone can change the information. Authors will be asked to make available electronic copies of the cited information for inclusion on the Global Journals Inc. (US) homepage at the judgment of the Editorial Board.
The Editorial Board and Global Journals Inc. (US) recommend that, citation of online-published papers and other material should be done via a DOI (digital object identifier). If an author cites anything, which does not have a DOI, they run the risk of the cited material not being noticeable.
The Editorial Board and Global Journals Inc. (US) recommend the use of a tool such as Reference Manager for reference management and formatting.
Tables, Figures and Figure Legends
Tables: Tables should be few in number, cautiously designed, uncrowned, and include only essential data. Each must have an Arabic number, e.g. Table 4, a self-explanatory caption and be on a separate sheet. Vertical lines should not be used.
Figures: Figures are supposed to be submitted as separate files. Always take in a citation in the text for each figure using Arabic numbers, e.g. Fig. 4. Artwork must be submitted online in electronic form by e-mailing them.
Preparation of Electronic Figures for Publication
Even though low quality images are sufficient for review purposes, print publication requires high quality images to prevent the final product being blurred or fuzzy. Submit (or e-mail) EPS (line art) or TIFF (halftone/photographs) files only. MS PowerPoint and Word Graphics are unsuitable for printed pictures. Do not use pixel-oriented software. Scans (TIFF only) should have a resolution of at least 350 dpi (halftone) or 700 to 1100 dpi (line drawings) in relation to the imitation size. Please give the data for figures in black and white or submit a Color Work Agreement Form. EPS files must be saved with fonts embedded (and with a TIFF preview, if possible).
For scanned images, the scanning resolution (at final image size) ought to be as follows to ensure good reproduction: line art: >650 dpi; halftones (including gel photographs) : >350 dpi; figures containing both halftone and line images: >650 dpi.
© Copyright by Global Journals Inc.(US) | Guidelines Handbook
XIII

Color Charges: It is the rule of the Global Journals Inc. (US) for authors to pay the full cost for the reproduction of their color artwork. Hence, please note that, if there is color artwork in your manuscript when it is accepted for publication, we would require you to complete and return a color work agreement form before your paper can be published.
Figure Legends: Self-explanatory legends of all figures should be incorporated separately under the heading 'Legends to Figures'. In the full-text online edition of the journal, figure legends may possibly be truncated in abbreviated links to the full screen version. Therefore, the first 100 characters of any legend should notify the reader, about the key aspects of the figure.
6. AFTER ACCEPTANCE
Upon approval of a paper for publication, the manuscript will be forwarded to the dean, who is responsible for the publication of the Global Journals Inc. (US).
6.1 Proof Corrections
The corresponding author will receive an e-mail alert containing a link to a website or will be attached. A working e-mail address must therefore be provided for the related author.
Acrobat Reader will be required in order to read this file. This software can be downloaded
(Free of charge) from the following website:
www.adobe.com/products/acrobat/readstep2.html. This will facilitate the file to be opened, read on screen, and printed out in order for any corrections to be added. Further instructions will be sent with the proof.
Proofs must be returned to the dean at [email protected] within three days of receipt.
As changes to proofs are costly, we inquire that you only correct typesetting errors. All illustrations are retained by the publisher. Please note that the authors are responsible for all statements made in their work, including changes made by the copy editor.
6.2 Early View of Global Journals Inc. (US) (Publication Prior to Print)
The Global Journals Inc. (US) are enclosed by our publishing's Early View service. Early View articles are complete full-text articles sent in advance of their publication. Early View articles are absolute and final. They have been completely reviewed, revised and edited for publication, and the authors' final corrections have been incorporated. Because they are in final form, no changes can be made after sending them. The nature of Early View articles means that they do not yet have volume, issue or page numbers, so Early View articles cannot be cited in the conventional way.
6.3 Author Services
Online production tracking is available for your article through Author Services. Author Services enables authors to track their article - once it has been accepted - through the production process to publication online and in print. Authors can check the status of their articles online and choose to receive automated e-mails at key stages of production. The authors will receive an e-mail with a unique link that enables them to register and have their article automatically added to the system. Please ensure that a complete e-mail address is provided when submitting the manuscript.
6.4 Author Material Archive Policy
Please note that if not specifically requested, publisher will dispose off hardcopy & electronic information submitted, after the two months of publication. If you require the return of any information submitted, please inform the Editorial Board or dean as soon as possible.
6.5 Offprint and Extra Copies
A PDF offprint of the online-published article will be provided free of charge to the related author, and may be distributed according to the Publisher's terms and conditions. Additional paper offprint may be ordered by emailing us at: [email protected] .
© Copyright by Global Journals Inc.(US)| Guidelines Handbook
XIV

2. Evaluators are human: First thing to remember that evaluators are also human being. They are not only meant for rejecting a paper. They are here to evaluate your paper. So, present your Best.
3. Think Like Evaluators: If you are in a confusion or getting demotivated that your paper will be accepted by evaluators or not, then think and try to evaluate your paper like an Evaluator. Try to understand that what an evaluator wants in your research paper and automatically you will have your answer.
4. Make blueprints of paper: The outline is the plan or framework that will help you to arrange your thoughts. It will make your paper logical. But remember that all points of your outline must be related to the topic you have chosen.
5. Ask your Guides: If you are having any difficulty in your research, then do not hesitate to share your difficulty to your guide (if you have any). They will surely help you out and resolve your doubts. If you can't clarify what exactly you require for your work then ask the supervisor to help you with the alternative. He might also provide you the list of essential readings.
6. Use of computer is recommended: As you are doing research in the field of Computer Science, then this point is quite obvious.
7. Use right software: Always use good quality software packages. If you are not capable to judge good software then you can lose quality of your paper unknowingly. There are various software programs available to help you, which you can get through Internet.
8. Use the Internet for help: An excellent start for your paper can be by using the Google. It is an excellent search engine, where you can have your doubts resolved. You may also read some answers for the frequent question how to write my research paper or find model research paper. From the internet library you can download books. If you have all required books make important reading selecting and analyzing the specified information. Then put together research paper sketch out.
9. Use and get big pictures: Always use encyclopedias, Wikipedia to get pictures so that you can go into the depth.
10. Bookmarks are useful: When you read any book or magazine, you generally use bookmarks, right! It is a good habit, which helps to not to lose your continuity. You should always use bookmarks while searching on Internet also, which will make your search easier.
Before start writing a good quality Computer Science Research Paper, let us first understand what is Computer Science Research Paper? So, Computer Science Research Paper is the paper which is written by professionals or scientists who are associated to Computer Science and Information Technology, or doing research study in these areas. If you are novel to this field then you can consult about
this field
from your supervisor or guide.
TECHNIQUES FOR WRITING A GOOD QUALITY RESEARCH PAPER:
1. Choosing the topic: In most cases, the topic is searched by the interest of author but it can be also suggested by the guides. You can
have several topics and then you can judge that in which topic or subject you are finding yourself most comfortable. This can be done by
asking several questions to yourself, like Will I be able to carry our search in this area? Will I find all necessary recourses to accomplish the search? Will I be able to find all information in this field area? If the answer of these types of questions will be "Yes" then you can choose that topic. In most of the cases, you may have to conduct the surveys and have to visit several places because this field is related to Computer Science and Information Technology. Also, you may have to do a lot of work to find all rise and falls regarding the various data of that subject. Sometimes, detailed information plays a vital role, instead of short information.
11. Revise what you wrote: When you write anything, always read it, summarize it and then finalize it.
© Copyright by Global Journals Inc.(US) | Guidelines Handbook
XV

16. Use proper verb tense: Use proper verb tenses in your paper. Use past tense, to present those events that happened. Use present tense to indicate events that are going on. Use future tense to indicate future happening events. Use of improper and wrong tenses will confuse the evaluator. Avoid the sentences that are incomplete.
17. Never use online paper: If you are getting any paper on Internet, then never use it as your research paper because it might be possible that evaluator has already seen it or maybe it is outdated version.
18. Pick a good study spot: To do your research studies always try to pick a spot, which is quiet. Every spot is not for studies. Spot that suits you choose it and proceed further.
19. Know what you know: Always try to know, what you know by making objectives. Else, you will be confused and cannot achieve your target.
20. Use good quality grammar: Always use a good quality grammar and use words that will throw positive impact on evaluator. Use of good quality grammar does not mean to use tough words, that for each word the evaluator has to go through dictionary. Do not start sentence with a conjunction. Do not fragment sentences. Eliminate one-word sentences. Ignore passive voice. Do not ever use a big word when a diminutive one would suffice. Verbs have to be in agreement with their subjects. Prepositions are not expressions to finish sentences with. It is incorrect to ever divide an infinitive. Avoid clichés like the disease. Also, always shun irritating alliteration. Use language that is simple and straight forward. put together a neat summary.
21. Arrangement of information: Each section of the main body should start with an opening sentence and there should be a changeover at the end of the section. Give only valid and powerful arguments to your topic. You may also maintain your arguments with records.
22. Never start in last minute: Always start at right time and give enough time to research work. Leaving everything to the last minute will degrade your paper and spoil your work.
23. Multitasking in research is not good: Doing several things at the same time proves bad habit in case of research activity. Research is an area, where everything has a particular time slot. Divide your research work in parts and do particular part in particular time slot.
24. Never copy others' work: Never copy others' work and give it your name because if evaluator has seen it anywhere you will be in trouble.
25. Take proper rest and food: No matter how many hours you spend for your research activity, if you are not taking care of your health then all your efforts will be in vain. For a quality research, study is must, and this can be done by taking proper rest and food.
26. Go for seminars: Attend seminars if the topic is relevant to your research area. Utilize all your resources.
12. Make all efforts: Make all efforts to mention what you are going to write in your paper. That means always have a good start. Try to mention everything in introduction, that what is the need of a particular research paper. Polish your work by good skill of writing and always give an evaluator, what he wants.
13. Have backups: When you are going to do any important thing like making research paper, you should always have backup copies of it either in your computer or in paper. This will help you to not to lose any of your important.
14. Produce good diagrams of your own: Always try to include good charts or diagrams in your paper to improve quality. Using several and unnecessary diagrams will degrade the quality of your paper by creating "hotchpotch." So always, try to make and include those diagrams, which are made by your own to improve readability and understandability of your paper.
15. Use of direct quotes: When you do research relevant to literature, history or current affairs then use of quotes become essential but if study is relevant to science then use of quotes is not preferable.
© Copyright by Global Journals Inc.(US)| Guidelines Handbook
XVI
sufficient. Use words properly, regardless of how others use them. Remove quotations. Puns are for kids, not grunt readers. Amplification is a billion times of inferior quality than sarcasm.
32. Never oversimplify everything: To add material in your research paper, never go for oversimplification. This will definitely irritate the evaluator. Be more or less specific. Also too, by no means, ever use rhythmic redundancies. Contractions aren't essential and shouldn't be there used. Comparisons are as terrible as clichés. Give up ampersands and abbreviations, and so on. Remove commas, that are, not necessary. Parenthetical words however should be together with this in commas. Understatement is all the time the complete best way to put onward earth-shaking thoughts. Give a detailed literary review.
33. Report concluded results: Use concluded results. From raw data, filter the results and then conclude your studies based on measurements and observations taken. Significant figures and appropriate number of decimal places should be used. Parenthetical
remarks are prohibitive. Proofread carefully at final stage. In the end give outline to your arguments. Spot out perspectives of further study of this subject. Justify your conclusion by at the bottom of them with sufficient justifications and examples.
34. After conclusion: Once you have concluded your research, the next most important step is to present your findings. Presentation is extremely important as it is the definite medium though which your research is going to be in print to the rest of the crowd. Care should be taken to categorize your thoughts well and present them in a logical and neat manner. A good quality research paper format is essential because it serves to highlight your research paper and bring to light all necessary aspects in your research.
Key points to remember:
Submit all work in its final form. Write your paper in the form, which is presented in the guidelines using the template. Please note the criterion for grading the final paper by peer-reviewers.
Final Points:
A purpose of organizing a research paper is to let people to interpret your effort selectively. The journal requires the following sections, submitted in the order listed, each section to start on a new page.
The introduction will be compiled from reference matter and will reflect the design processes or outline of basis that direct you to make study. As you will carry out the process of study, the method and process section will be constructed as like that. The result segment will show related statistics in nearly sequential order and will direct the reviewers next to the similar intellectual paths throughout the data that you took to carry out your study. The discussion section will provide understanding of the data and projections as to the implication of the results. The use of good quality references all through the paper will give the effort trustworthiness by representing an alertness of prior workings.
27. Refresh your mind after intervals: Try to give rest to your mind by listening to soft music or by sleeping in intervals. This will also improve your memory.
28. Make colleagues: Always try to make colleagues. No matter how sharper or intelligent you are, if you make colleagues you can have several ideas, which will be helpful for your research.
Think technically: Always think technically. If anything happens, then search its reasons, its benefits, and demerits.
30. Think and then print: When you will go to print your paper, notice that tables are not be split, headings are not detached from their descriptions, and page sequence is maintained.
31. Adding unnecessary information: Do not add unnecessary information, like, I have used MS Excel to draw graph. Do not add irrelevant and inappropriate material. These all will create superfluous. Foreign terminology and phrases are not apropos. One should NEVER take a broad view. Analogy in script is like feathers on a snake. Not at all use a large word when a very small one would be
29.
© Copyright by Global Journals Inc.(US) | Guidelines Handbook
XVII
Separating a table/chart or figure - impound each figure/table to a single page Submitting a manuscript with pages out of sequence
In every sections of your document
· Use standard writing style including articles ("a", "the," etc.)
· Keep on paying attention on the research topic of the paper
· Use paragraphs to split each significant point (excluding for the abstract)
· Align the primary line of each section
· Present your points in sound order
· Use present tense to report well accepted
· Use past tense to describe specific results
· Shun familiar wording, don't address the reviewer directly, and don't use slang, slang language, or superlatives
· Shun use of extra pictures - include only those figures essential to presenting results
Title Page:
Choose a revealing title. It should be short. It should not have non-standard acronyms or abbreviations. It should not exceed two printed lines. It should include the name(s) and address (es) of all authors.
Writing a research paper is not an easy job no matter how trouble-free the actual research or concept. Practice, excellent preparation, and controlled record keeping are the only means to make straightforward the progression.
General style:
Specific editorial column necessities for compliance of a manuscript will always take over from directions in these general guidelines.
To make a paper clear
· Adhere to recommended page limits
Mistakes to evade
Insertion a title at the foot of a page with the subsequent text on the next page
© Copyright by Global Journals Inc.(US)| Guidelines Handbook
XVIII
shortening the outcome. Sum up the study, with the subsequent elements in any summary. Try to maintain the initial two items to no more than one ruling each.
Reason of the study - theory, overall issue, purpose Fundamental goal To the point depiction of the research Consequences, including definite statistics - if the consequences are quantitative in nature, account quantitative data; results of any numerical analysis should be reported Significant conclusions or questions that track from the research(es)
Approach:
Single section, and succinct
As a outline of job done, it is always written in past tense
A conceptual should situate on its own, and not submit to any other part of the paper such as a form or table Center on shortening results - bound background information to a verdict or two, if completely necessary What you account in an conceptual must be regular with what you reported in the manuscript Exact spelling, clearness of sentences and phrases, and appropriate reporting of quantities (proper units, important statistics) are just as significant in an abstract as they are anywhere else
Introduction:
The Introduction should "introduce" the manuscript. The reviewer should be presented with sufficient background information to be capable to comprehend and calculate the purpose of your study without having to submit to other works. The basis for the study should be offered. Give most important references but shun difficult to make a comprehensive appraisal of the topic. In the introduction, describe the problem visibly. If the problem is not acknowledged in a logical, reasonable way, the reviewer will have no attention in your result. Speak in common terms about techniques used to explain the problem, if needed, but do not present any particulars about the protocols here. Following approach can create a valuable beginning:
Explain the value (significance) of the study Shield the model - why did you employ this particular system or method? What is its compensation? You strength remark on its appropriateness from a abstract point of vision as well as point out sensible reasons for using it. Present a justification. Status your particular theory (es) or aim(s), and describe the logic that led you to choose them. Very for a short time explain the tentative propose and how it skilled the declared objectives.
Approach:
Use past tense except for when referring to recognized facts. After all, the manuscript will be submitted after the entire job is done. Sort out your thoughts; manufacture one key point with every section. If you make the four points listed above, you will need a
least of four paragraphs.
Abstract:
The summary should be two hundred words or less. It should briefly and clearly explain the key findings reported in the manuscript--must have precise statistics. It should not have abnormal acronyms or abbreviations. It should be logical in itself. Shun citing references at this point.
An abstract is a brief distinct paragraph summary of finished work or work in development. In a minute or less a reviewer can be taught the foundation behind the study, common approach to the problem, relevant results, and significant conclusions or new questions.
Write your summary when your paper is completed because how can you write the summary of anything which is not yet written? Wealth of terminology is very essential in abstract. Yet, use comprehensive sentences and do not let go readability for briefness. You can maintain it succinct by phrasing sentences so that they provide more than lone rationale. The author can at this moment go straight to
© Copyright by Global Journals Inc.(US) | Guidelines Handbook
XIX
principle while stating the situation. The purpose is to text all particular resources and broad procedures, so that another person may use some or all of the methods in one more study or referee the scientific value of your work. It is not to be a step by step report of the whole thing you did, nor is a methods section a set of orders.
Materials:
Explain materials individually only if the study is so complex that it saves liberty this way. Embrace particular materials, and any tools or provisions that are not frequently found in laboratories. Do not take in frequently found. If use of a definite type of tools. Materials may be reported in a part section or else they may be recognized along with your measures.
Methods:
Report the method (not particulars of each process that engaged the same methodology) Describe the method entirely
To be succinct, present methods under headings dedicated to specific dealings or groups of measures Simplify - details how procedures were completed not how they were exclusively performed on a particular day. If well known procedures were used, account the procedure by name, possibly with reference, and that's all.
Approach:
It is embarrassed or not possible to use vigorous voice when documenting methods with no using first person, which would focus the reviewer's interest on the researcher rather than the job. As a result when script up the methods most authors use third person passive voice. Use standard style in this and in every other part of the paper - avoid familiar lists, and use full sentences.
What to keep away from
Resources and methods are not a set of information. Skip all descriptive information and surroundings - save it for the argument. Leave out information that is immaterial to a third party.
Results:
The principle of a results segment is to present and demonstrate your conclusion. Create this part a entirely objective details of the outcome, and save all understanding for the discussion.
The page length of this segment is set by the sum and types of data to be reported. Carry on to be to the point, by means of statistics and tables, if suitable, to present consequences most efficiently.You must obviously differentiate material that would usually be incorporated in a study editorial from any unprocessed data or additional appendix matter that would not be available. In fact, such matter should not be submitted at all except requested by the instructor.
Present surroundings information only as desirable in order hold up a situation. The reviewer does not desire to read the whole thing you know about a topic. Shape the theory/purpose specifically - do not take a broad view. As always, give awareness to spelling, simplicity and correctness of sentences and phrases.
Procedures (Methods and Materials):
This part is supposed to be the easiest to carve if you have good skills. A sound written Procedures segment allows a capable scientist to replacement your results. Present precise information about your supplies. The suppliers and clarity of reagents can be helpful bits of information. Present methods in sequential order but linked methodologies can be grouped as a segment. Be concise when relating the protocols. Attempt for the least amount of information that would permit another capable scientist to spare your outcome but becautious that vital information is integrated. The use of subheadings is suggested and ought to be synchronized with the results section. When a technique is used that has been well described in another object, mention the specific item describing a way but draw the basic
© Copyright by Global Journals Inc.(US)| Guidelines Handbook
XX
Do not present the similar data more than once. Manuscript should complement any figures or tables, not duplicate the identical information. Never confuse figures with tables - there is a difference.
Approach As forever, use past tense when you submit to your results, and put the whole thing in a reasonable order.Put figures and tables, appropriately numbered, in order at the end of the report If you desire, you may place your figures and tables properly within the text of your results part.
Figures and tables If you put figures and tables at the end of the details, make certain that they are visibly distinguished from any attach appendix materials, such as raw facts Despite of position, each figure must be numbered one after the other and complete with subtitle In spite of position, each table must be titled, numbered one after the other and complete with heading All figure and table must be adequately complete that it could situate on its own, divide from text
Discussion:
The Discussion is expected the trickiest segment to write and describe. A lot of papers submitted for journal are discarded based onproblems with the Discussion. There is no head of state for how long a argument should be. Position your understanding of the outcomevisibly to lead the reviewer through your conclusions, and then finish the paper with a summing up of the implication of the study. Thepurpose here is to offer an understanding of your results and hold up for all of your conclusions, using facts from your research andgenerally accepted information, if suitable. The implication of result should be visibly described. Infer your data in the conversation in suitable depth. This means that when you clarify an observable fact you must explain mechanismsthat may account for the observation. If your results vary from your prospect, make clear why that may have happened. If your resultsagree, then explain the theory that the proof supported. It is never suitable to just state that the data approved with prospect, and let itdrop at that.
Make a decision if each premise is supported, discarded, or if you cannot make a conclusion with assurance. Do not just dismissa study or part of a study as "uncertain." Research papers are not acknowledged if the work is imperfect. Draw what conclusions you can based upon the results thatyou have, and take care of the study as a finished work You may propose future guidelines, such as how the experiment might be personalized to accomplish a new idea. Give details all of your remarks as much as possible, focus on mechanisms. Make a decision if the tentative design sufficiently addressed the theory, and whether or not it was correctly restricted. Try to present substitute explanations if sensible alternatives be present. One research will not counter an overall question, so maintain the large picture in mind, where do you go next? The beststudies unlock new avenues of study. What questions remain? Recommendations for detailed papers will offer supplementary suggestions.
Approach:
When you refer to information, differentiate data generated by your own studies from available information Submit to work done by specific persons (including you) in past tense. Submit to generally acknowledged facts and main beliefs in present tense.
Content
Sum up your conclusion in text and demonstrate them, if suitable, with figures and tables. In manuscript, explain each of your consequences, point the reader to remarks that are most appropriate. Present a background, such as by describing the question that was addressed by creation an exacting study. Explain results of control experiments and comprise remarks that are not accessible in a prescribed figure or table, if appropriate. Examine your data, then prepare the analyzed (transformed) data in the form of a figure (graph), table, or in manuscript form.
What to stay away from Do not discuss or infer your outcome, report surroundings information, or try to explain anything. Not at all, take in raw data or intermediate calculations in a research manuscript.
© Copyright by Global Journals Inc.(US) | Guidelines Handbook
XXI

Do not give permission to anyone else to "PROOFREAD" your manuscript.
Methods to avoid Plagiarism is applied by us on every paper, if found guilty, you will be blacklisted by all of our collaboratedresearch groups, your institution will be informed for this and strict legal actions will be taken immediately.) To guard yourself and others from possible illegal use please do not permit anyone right to use to your paper and files.
The major constraint is that you must independently make all content, tables, graphs, and facts that are offered in the paper.You must write each part of the paper wholly on your own. The Peer-reviewers need to identify your own perceptive of theconcepts in your own terms. NEVER extract straight from any foundation, and never rephrase someone else's analysis.
Please carefully note down following rules and regulation before submitting your Research Paper to Global Journals Inc. (US):
Segment Draft and Final Research Paper: You have to strictly follow the template of research paper. If it is not done your paper may getrejected.
© Copyright by Global Journals Inc.(US)| Guidelines Handbook
XXII
THE
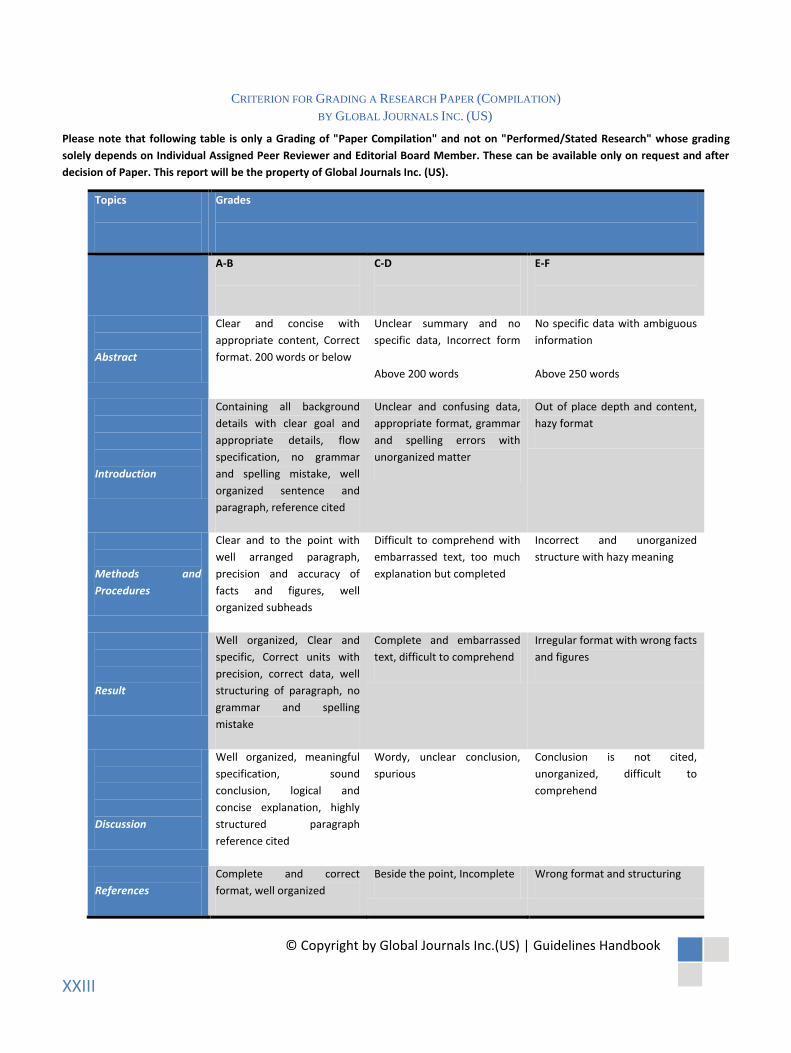
CRITERION FOR GRADING A RESEARCH PAPER (COMPILATION)BY GLOBAL JOURNALS INC. (US)
Please note that following table is only a Grading of "Paper Compilation" and not on "Performed/Stated Research" whose grading
solely depends on Individual Assigned Peer Reviewer and Editorial Board Member. These can be available only on request and after
decision of Paper. This report will be the property of Global Journals Inc. (US).
Topics Grades
A-B C-D E-F
Abstract
Clear and concise with
appropriate content, Correct
format. 200 words or below
Unclear summary and no
specific data, Incorrect form
Above 200 words
No specific data with ambiguous
information
Above 250 words
Introduction
Containing all background
details with clear goal and
appropriate details, flow
specification, no grammar
and spelling mistake, well
organized sentence and
paragraph, reference cited
Unclear and confusing data,
appropriate format, grammar
and spelling errors with
unorganized matter
Out of place depth and content,
hazy format
Methods and
Procedures
Clear and to the point with
well arranged paragraph,
precision and accuracy of
facts and figures, well
organized subheads
Difficult to comprehend with
embarrassed text, too much
explanation but completed
Incorrect and unorganized
structure with hazy meaning
Result
Well organized, Clear and
specific, Correct units with
precision, correct data, well
structuring of paragraph, no
grammar and spelling
mistake
Complete and embarrassed
text, difficult to comprehend
Irregular format with wrong facts
and figures
Discussion
Well organized, meaningful
specification, sound
conclusion, logical and
concise explanation, highly
structured paragraph
reference cited
Wordy, unclear conclusion,
spurious
Conclusion is not cited,
unorganized, difficult to
comprehend
References
Complete and correct
format, well organized
Beside the point, Incomplete Wrong format and structuring
© Copyright by Global Journals Inc.(US) | Guidelines Handbook
XXIII
Index
A
Aqueous · 59
C
Canyons · 4Credence · 38
E
Elevates · 1
F
Furnaces · 52
I
Insulation · 47, 49, 61, 64Inundation · 25, 26, 29, 40
M
Meteorological · 36
R
Reputes · 36