Life Science Journal
158
MARSLAND PRESS Multidisciplinary Academic Journal Publisher http://www.lifesciencesite.com Emails: [email protected] [email protected] Website: Life Science Journal Volume 10, Number 1, Part 10 ISSN: March 25, 2013 1097-8135 9 771097 813002 ISSN 1097-8135 Life Science Journal Volume 10, Number 1 ISSN: (Cumulative No.32) Part 10 March 25, 2013 1097-8135 Copyright © 2013 Marsland Press / Zhengzhou University Marsland Press PO Box 180432 Richmond Hill, New York 11418, USA Website: http://www.lifesciencesite.com Emails: [email protected] [email protected] Phone: (347) 321-7172 Life Science Journal 2013 Volume 10, Number 1 ISSN:1097-8135 , Part 10 Acta Zhengzhou University Overseas Edition Cover design: CAO, Zhaolong Photograph: YANG, Yizhong; YOUNG, Mary
-
Upload
khangminh22 -
Category
Documents
-
view
0 -
download
0
Transcript of Life Science Journal

MARSLAND PRESSMultidisciplinary Academic Journal Publisher
http://www.lifesciencesite.com
Emails:[email protected]@gmail.com
Website:
Life Science Journal
Volume 10, Number 1, Par t 10 ISSN:March 25, 2013 1097-8135
9 771097 813002
ISSN 1097-8135
Life Science Journal
Volume 10, Number 1 ISSN:(Cumulative No.32) Part 10 March 25, 2013 1097-8135
Copyright © 2013 Marsland Press / Zhengzhou University
Marsland PressPO Box 180432Richmond Hill, New York 11418, USA
Website:http://www.lifesciencesite.com
Emails:[email protected]@gmail.com
Phone: (347) 321-7172
Life Science Journal 2013 Volume 10, N
umber 1
ISSN:1097-8135
, Part 10
Acta Zhengzhou University Overseas Edition
Cover design: CAO, Zhaolong
Photograph: YANG, Yizhong; YOUNG, Mary

MARSLAND PRESSMultidisciplinary Academic Journal Publisher
http://www.lifesciencesite.com
Emails:[email protected]@gmail.com
Website:
Life Science Journal
Volume 10, Number 1, Par t 10 ISSN:March 25, 2013 1097-8135
Life Science Journal ISSN: 1097-8135 http://www.lifesciencesite.com
Life Science Journal - Acta Zhengzhou University Oversea Version ISSN: 1097-8135
Life Science Journal, the Acta Zhengzhou University Oversea Version, is an international journal with the purpose to enhance our natural and scientific knowledge dissemination in the world under the free publication principle. The journal is calling for papers from all who are associated with Zhengzhou University-home and abroad. Any valuable papers or reports that are related to life science - in their broadest sense - are welcome. Other academic articles that are less relevant but are of high quality will also be considered and published. Papers submitted could be reviews, objective descriptions, research reports, opinions/debates, news, letters, and other types of writings. Let's work together to disseminate our research results and our opinions. Editor-in-Chief: Shen, Changyu, Ph.D., Professor, Chinese Academy of Sciences Associate Editors-in-Chief: Ma, Hongbao; Cherng, Shen; Xin, Shijun Editorial Boards: Aghdam, Hashemi; An, Xiuli; Cao, Zhaolong; Chandra, Avinash; Chen, George; Dong, Ziming; Duan, uangcai; Edmondson, Jingjing; Fu, Qiang; Fu, Xianzhen; Gao, Danying; Han, Quancheng; Han, Zhijiang; Hosseini, Seyyed Mousa; Huang, Shuan-Yu; Kan, Quancheng; Lang, Jinghe; Li, Hui; Li, Xinhua; Li, Yan; Li, Yuhua; Li, Yusheng; Li, Zhen; Lindley, Mark; Liu, Hongmin; Liu, Hua; Liu, Xinjing; Ma, Changsheng; Ma, Margret; Ma, Yongsheng; Maio, Zhongrong; Ming, Gongguang; Mousavi, Amin; Nie, Wei; Qi, Yuanming; Qiao, Nancy X; Qin, Jie; Qin, Qin; Qin, Yuhua; Ouyang, Da; Sabyasachi Chatterjee; Seryasat, Omid Rahmani; Shang, Fude; Shi, Lifeng; Song, Chunpeng; Song, Yongping; Spurr, Lydia; Sun, Yan; Sun, Yingpu; Sun, Yiwu; Tan, Song; Venkatesh, Jaganathan; Wang, Jianliu; Wang, Lidong; Wang, Longde; Wang, Xiaoying; Wang, Yilong; Wang, Yongjun; Wang, Zhonggao; Wen, Jianguo; Wu, Ziying; Xu, Cunshuan; Xu, Yuming; Xue, Changgui; Yang, Qian; Young, Jenny; Zaki, Mona; Zhang, Guangxian; Zhang, Hong; Zhang, Jianying; Zhang, Kehao; Zhang, Liusuo; Zhang, Mingzhi; Zhang, Rui; Zhang, Shengjun; Zhang, Shuijun; Zhang, Suming; Zhang, Wei; Zhang, Xueguo; Zhang, Yanzhou; Zhang, Zhan; Zhang, Zhao; Zhang, Zhenxiang; Zhu, Huaijie.
Introductions to Authors 1. General Information: (1) Goals: As an international journal published both in print and on internet, Life Science Journal is dedicated to the dissemination of fundamental knowledge in all areas of nature and science. The main purpose of Life Science Journal is to enhance our knowledge spreading in the world under the free publication principle. It publishes full-length papers (original contributions), reviews, rapid communications, and any debates and opinions in all the fields of nature and science. (2) What to Do: The Life Science Journal provides a place for discussion of scientific news, research, theory, philosophy, profession and technology - that will drive scientific progress. Research reports and regular manuscripts that contain new and significant information of general interest are welcome. (3) Who: All people are welcome to submit manuscripts in life science fields. Papers of other fields are also considered. (4) Copyright and Responsibility of Authors to their Articles: When the manuscript(s) is submitted to the journal, the authors agree the following: All the authors have participated sufficiently in this work; The article is not published elsewhere; Authors are responsibility on the contents of the article; The journal and author(s) have same right for the copyright of the article and either of the journal or author(s) can use it by anyway without noting the other party. (5) Publication Costs: US$640 per article to defray costs of the publication will be paid by the authors when it is received. (6) Advertisements: The price will be US$400/page, and we normally accept one advertisement for one page. Other size of the advertisement please contact with our editorial office through email. 2. Manuscript Preparation - Each manuscript is suggested to include the following components but authors can do their own ways: (1) Title: including the complete article title; each author’s full name; institution(s) with which each author is affiliated, with city, state/province, zip code, and country; and the name, complete mailing address, telephone number, facsimile number (if available), and at least one email address for author(s). (2) Abstract: including Background, Materials and Methods, Results, and Discussions. (3) Key Words. (4) Introduction. (5) Materials and Methods. (6) Results. (7) Discussions. (8) Acknowledgments. (9) References. 3. Manuscripts Submission: (1) Submission Methods: Submission through email ([email protected] or [email protected]) is encouraged. (2) Software: The Microsoft Word file. (3) Font: Normal, Times New Roman, 10 pt, single space. (4) Page Setup: Paper-Letter size; Margins-2.54 cm each side; Header/Footer-1.27 cm. (5) Indent: Type 8 spaces in the beginning of each new paragraph. (6) Manuscript: Don’t use “Footnote” or “Header and Footer”. (7) Email: At least one author’s email must be put under title. (8) Title: Use Title Case in the title and subtitles, e.g. “Molecular Study of Stem Cell”. (9) Figures and Tables: Use full word of figure and table, e.g. Figure 1. Annul Income of Different Groups, Table 1. Annual Increase of Investment. (10) References: Cite references by “last name, year”, e.g. “(Smith, 2003)”. References should include all the authors’ last names and initials, title, journal, year, volume, issue, and pages etc. Reference Examples: Journal Article: Hacker J, Hentschel U, Dobrindt U. Prokaryotic chromosomes and disease. Science 2003;301(34):790-3. Book: Berkowitz BA, Katzung BG. Basic and clinical evaluation of new drugs. In: Katzung BG, ed. Basic and clinical pharmacology. Appleton & Lance Publisher. Norwalk, Connecticut, USA. 1995:60-9. (11) Submission Address: [email protected] or [email protected], Marsland Press, PO Box 180432, Richmond Hill, New York 11418, USA, 347-321-7172.
Life Science Journal - Acta Zhengzhou University Overseas Edition (Life Sci J), ISSN: 1097-8135
PO Box 180432, Richmond Hill, New York 11418, USA http://www.lifesciencesite.com; http://www.sciencepub.net; [email protected]; [email protected]
© 2013 Marsland Press / Zhengzhou University

CONTENTS
204 Online Communication: The Implementation of the Collaborative mLearning Science Module in a Malaysian Secondary School Dorothy DeWitt, Norlidah Alias, Saedah Siraj
1352-1363
205 Brucellosis-Induced Pancytopenia in Children: A Prospective Study Mona Afify, Salha H Al-Zahrani, and Mohamad A El-Koumi
1364-1368
206 The effect of intrauterine instillation of E-Aminocaproeic Acid during hysteroscopic operations in the management of intractable uterine hemorrhage:A Randomized Clinical Trial Sayyah-melli Manizheh, Ouladehsahebmadarek Elaheh, Taghavi Simin, Jafary Shobeiry Mehry, Mostafa Garabaghi Parvin, Nabipoure Bahareh, Arash Khaki
1369-1374
207 Globalisation and Labour Supply in Malaysia Poo Bee Tin, Rahmah Ismail
1375-1385
208 Role of Bank Credits in Development of Agriculture Sector Hassan Azimi
1386-1391
209 Surveying of degrees of manifesting of god from point of view of kabbala mysticism. Masoumeh- Azizi khadem
1392-1401
210 Morphometric Study of Anterior Cruciate Ligament and Histological Comparison with the Patellar and Hamstring Tendons and a Unique Case ofPes Anserinus Variant Mohamed Atif Ahmed Said Ahmed
1402-1411
211 The Protective Effect of Ginger (Zingiber Officinale) Against Adriamycin- Induced Hepatotoxicity in Rats: Histological Study Mohamed Atif Ahmed Said Ahmed
1412-1422
212 Experimental Studies in Japanese Quail Exposed to a recently used pesticide Mona S. Zaki; Osfor M. H.and Nagwa S. Ata
1423-1426
213 Prognostic Assessment of P-Glycoprotein over Expression in Refractory and / or Relapsed Acute Myeloid Leukemia and Response to Cyclosporine A Ashraf M. El Hefni, Fouad M. Abu Taleb, Khaled M.Hadhoud, Mahmoud A. Ashour and Amal Ahmed Zidan
1427-1436
214 Studies on an Actinomycete Producing a Melanin Pigment Inhibiting AflatoxinB1Production byAspergillusflavus Mohamed Tawfiek Shaaban, Sabha Mahmoud Mabrouk El-Sabbagh, and Asmaa Alam
1437-1448
215 Genetic Diversity and Phylogenetic Relationship among Some Rabbit Breeds Using Random AmplifiedPolymorphic DNA Markers El-Bayomi Kh. M., Awad A. and Saleh A. A.
1449-1457
216 Effect of Feeding on Diets Supplemented by Some Vegetable Oils on Blood Lipids and Bone Mineral Content in Osteoporotic Rats
1458-1465
I

Hala, M.A. Wahba and Magbolah, S. H. Al-Zahrany
217 Self concept and academic achievements among nursing students Essmat Gemeay, Sahar Behilak, Amal Kanona& Essmat A. Mansour
1466-1470
218 Thegenetic diversity and relatedness of eight rice (Oryza sativaL.) cultivars as revealed by AFLP and SSRs markers Haddad El Rabey, Khaled F. Salem and Magdy Z. Mattar
1471-1479
219 Effect of saffron on liver development in mouse embryo AmalAyedh and Fatma Al-Qudsi
1480-1495
220 A comparative study on Petri Nets in manufacturing applications Sayed Taha Mohamed,Mohamed Abdel Gawad Mostafa,Ahmed Fathi Mohamed
1496-1502
II

Life Science Journal 2013;10(1) http://www.lifesciencesite.com
http://www.lifesciencesite.com [email protected] 1352
Online Communication: The Implementation of the Collaborative mLearning Science Module in a Malaysian Secondary School
Dorothy DeWitt, Norlidah Alias, Saedah Siraj
Department of Curriculum and Instructional Technology, Faculty of Education, University of Malaya
50603 Kuala Lumpur, Malaysia. [email protected]
Abstract: Communication skills are required for collaborative discussions among scientists in constructing science knowledge. A collaborative mLearning (CmL) module with online communication tools (discussion forum, wiki, and text messaging) can enable authentic discussions for learning of science outside the classroom. This study seeks to determine whether online communication and collaboration is effective for learning. A developmental research approach with three phases of needs analysis, design, and implementation was employed. An urban school with a multiracial composition was selected for this study. In the Needs Analysis phase, a survey of 158 learners’ background in the use of technology was conducted to determine the types of tools which can be used in the CmL module. The module was implemented with twenty (20) selected Form 2 students to determine the types of interactions in their online discussions. Transcripts of their online communications were analyzed according to the types of interactions and processes; the learners were interviewed to verify if learning was effective in the CmL module. The findings showed that learners interacted with the content, instructor, and other learners in the discussion forum. However, only learner-content interaction was detected in the wiki, and learner-instructor in the text messaging SMS Quiz. Findings from interviews verified that learning was effective in the CmL module. In addition, the discussion forum allowed for argumentation to challenge the dualism of science knowledge. This study is significant as it shows that online communication tools force collaboration and are effective for teaching science. [DeWitt D, Norlidah A, Saedah S. Online Communication: The Implementation of the Collaborative mLearning Science Module in a Malaysian Secondary School. Life Sci J 2013;10(1):1352-1363] (ISSN:1097-8135). http://www.lifesciencesite.com. 204 Keywords: Communication in science; online communication; collaborative learning; mobile learning 1. Introduction
Scientists need to have good communication skills. Communication is important for making meaning out of scientific discussions arising from experimental findings. Communication skills are required in order to debate and defend scientific arguments (Nielsen 2012). Communication and collaboration are skills required in the real world of science. This is because scientific discovery does not occur in isolation with one scientist making conclusions, but with interactions among other scientists, within a community of peers (Sharma & Anderson 2009). In reality, scientific processes occur when there is collaborative communication among scientists (Hogan & Fisherkeller 2005). As scientists defend the case from their research perspective and try to convince their peers, they require specialized communication skills (Sharma and Anderson 2009).
In order to write convincing reports to argue their viewpoint, scientists need to have good writing skills. Written communications forms an important resource for reference among other scientists (Kubli 2005). However, it is noted that written scientific documents in the original form are not popular for reading even among scientists (Goodney and Long 2003). Hence, science learners should have both reading and writing skills for effective communication
in order to contribute to building knowledge in the scientific community (Dodick, Argamon and Chase 2009).
Communication in science should be emphasized in order to teach the nature of science. Teachers seem to have a dualistic perception of the nature of science knowledge (Emdin 2010). In Malaysia, teachers seem to encourage students to memorize the facts of science as they perceive there is insufficient time for science instruction in the classroom (Lee 1991; Sopia 2002; Tan 2002). There is also little time for communication and collaboration in the classroom, and social interactions are conducted at a lower cognitive level. This situation seems to be similar some urban schools in America (Emdin 2010).
Very few studies have been done on communications in science instruction, and even less on using online communications. However, online communications can be employed to address this problem of limited time for collaboration and communication, and to enable science learners to experience the nature of science in their communications as they contribute to the body of knowledge. Science learning is optimized and thinking skills are enhanced while motivation increases with online communication tools (Driscoll 2007; Guzdial and Turns 2000; Kaye 1992; Jonassen,

Life Science Journal 2013;10(1) http://www.lifesciencesite.com
http://www.lifesciencesite.com [email protected] 1353
2000; Jonassen, Lee, Yang, and Laffey 2005; Osbourne and Hennessy, 2003; Slotta and Linn 2000).
This study seeks to determine if collaboration using online communication tools such as test messaging, discussion forums and a collaborative online workspace, wiki, is effective for learning science. A collaborative mobile learning (CmL) module would be developed based on the survey of technology tools accessed by the learners in the context. This module would be implemented with a group of learners to determine the type of interactions and processes occurring. It is believed that online communication tools enable interactions for collaboration which allows the nature of science to be observed during the construction of knowledge, in an authentic manner similar to the processes encountered by actual scientists. This study is different from other studies as firstly it focuses on online communications for teaching the topic of nutrition in science which attempts to depict the nature of science through an argumentative approach using written communications. Secondly, it uses online collaborative communication in an environment natural to the younger learners who are already engaged with these tools. Thirdly, the online communication interactions are investigated to determine if they encouraged higher level cognitive processes which contribute to knowledge-building during the given tasks.
Furthermore, this study is significant as it would determine whether online communications can be used for teaching science infused with the elements of the nature of science. Science teachers can use the findings of this study to design instruction which enable teaching for the nature of science while allowing for communication among peers. As scientists may already be using online communications in the written form in communities of practice, researchers in science education need to be aware of the types of online communications taking place among scientists.
In this study, a collaborative mLearning (CmL) module was designed to teach science to address the need for collaborative communication in the science classroom. The problem of insufficient time for collaboration, communication and other interactions in the science classroom can be resolved using online communication tools as science tasks can be completed out of the formal classroom. In addition, the CmL module employed tools such as discussion forums, wikis, and text messaging, to allow for written communication and collaboration. This also addresses the need for improving science learners’ skills in written communication in science.
This study is aimed at determining if the CmL module developed using collaborative and
mobile learning is effective for learning science among students. A developmental approach was employed (Ritchey 1997; Wang and Hanafin 2005) in which the module was developed based on learners’ background in using technology. During the module implementation, the types of interactions and processes in the online communications among the students in the context of the study were recorded and analyzed to determine the cognitive processes occurring.
As the CmL module employed three types of tools, the types of written interaction in each tool were identified. This is important as it would determine if written communications enabled learning in science to occur. The research questions are: Need Analysis Phase
What are the communications equipment which the learners in the context of the study have access to?
What is the frequency of use of the technology communication tools among the learners in the context of the study? Implementation
What are the types of interaction in the technology communication tools in the CmL module? What are the processes (cognitive, social, teaching, attitude and noise) during the interactions in the online communications in the CmL module?
Is the CmL module effective for learning? 2. Communication for Learning Science
Communication is important in the process of acquiring scientific knowledge. Communications in science requires a language structure with vocabulary and rules to make meaning (Nielsen 2012). The vocabulary of science is the scientific verbal knowledge which may be specific to the discipline of science. The scientific verbal knowledge is the first aspect required for making meaning out of the experiences in science (Goodney and Long 2003; Hoyle & Stone 2000; Karpov and Haywood 1998; Nielsen 2012). The scientific verbal knowledge in combination with language structures enable learners to construct meaningful phrases and sentences to communicate their thoughts, develop science concepts and give feedback (Hogan and Fishkeller 2005; Hoyle and Stone 2000; Karpov and Haywood 1998).
Discussions based on higher level interactions enable learners to better recall and transfer these concepts (Emdin 2010). Hence, discussion on science concepts, activities and experiences will enhance learning, However, Emdin (2010) noted that different levels of discussions can occur in classrooms. Higher level interactions involve explanation and meaning-making of the science processes while low level interactions involve little
Life Science Journal 2013;10(1) http://www.lifesciencesite.com
http://www.lifesciencesite.com [email protected] 1354
discussion about science, but include lots of gestures and noise. His study of the interactions in a science classroom in an urban school showed that higher level interactions improve learning but low level interactions among learners do not enhance learning and recall (Emdin 2010). This study verifies the findings from other research that discussions and communications in science improves the quality of learning compared to the memorization of science facts (Kubli 2005; Sharma and Anderson 2009).
On the other hand, discussions with higher level interactions, which attempt to interpret and analyze findings of experiments, contribute to new scientific facts. There is no specific rule for deriving these scientific facts but the discussions during the attempt of making meaning of the information in the natural world contributes to the construction of scientific knowledge (Sharma and Anderson 2009). Hence, interactions during discussions such as questioning, arguments and debates encourage the construction of science knowledge. These forms of interactions develop critical thinking skills as differences of opinions are resolved in reaching mutual understanding (Hoyle and Stone 2000; Kampourakis 2010; Karpov and Haywood 1998; Kim & Song 2005).
The nature of science indicates that scientific knowledge is theory-laden, yet tentative. Science is part of human culture and is influenced by elements in the culture it resides in (Lederman 2007). Hence, the nature of science knowledge should be exposed to learners through the processes of discovery of new knowledge. However, the new knowledge may be in conflict with the existing knowledge, which will then require reinterpretation of the knowledge (Emdin 2010). This interpretation of knowledge is dependent on the learners’ perception of the nature of science knowledge.
The four stages of the nature of science knowledge are: dualism, multiplicity, relativism, and contextual relativism (Oliveira, Akerson, Colak, Pongsanon, and Genel 2011). In dualism, knowledge is absolute and is viewed as a collection of facts; while the multiplicity approach treats knowledge as being diverse yet uncertain with accuracy determined by an authority. The relativism approach sees knowledge as being tentative and truth as relative as everyone is entitled to an opinion whether right or wrong while the contextual relativism approach treats knowledge as complex, contextual, and open to reevaluation where the accuracy, right or wrong, depends on specified contexts, and adequacy judgments.
The reality in Malaysian classrooms indicates the teachers’ perception of the nature of science knowledge is in the dualism stage. Teachers prefer to teach the facts of science, stressing on memory work
among the learners rather than allowing them to communicate and collaborate to develop hypotheses and conclusions through experimentation (Lee 1991; Sopia 2002; Tan 2002). Science knowledge is not dualistic but relativistic in nature as science knowledge is not absolute and there is no correct and wrong answer (Oliveira et al. 2011; Sharma and Anderson 2009). Hence, instruction should be designed to take into consideration and correct the science teachers’ misconceptions of the nature of science (Oliveira et al. 2011)
In conclusion, scientific knowledge constructed through discussions among peers in order to draw conclusions from scientific discoveries needs higher level communicative skills for argumentation and persuasion of a scientific proposition to defend ones’ claims (Emdin 2010; Kampourakis 2010; Sharma and Anderson 2009). Learners of science should be aware of the relativism in the nature of science and be able to practice presenting and defending their findings as a process of communicating in a culture of science. This is required because scientists in the real world work in a social context and interact with communities of other scientists, communicating within a culture of science (Emdin 2010; Sharma & Anderson 2009). Hence, Science learners should also be understanding and practicing in a similar culture of scientific discovery, communicating and collaborating with their peers as part of the building of scientific knowledge (Emdin 2010; Nielsen 2012). The component of scientific communication as a nature of science should be included in science instruction to avoid the misconception that science is only knowledge and processes (Nielsen 2012).
3. Communicating Science in the Classroom In science, communication is not taught formally in the classroom. Learners acquire scientific verbal knowledge (vocabulary) and language structures of science by observing patterns and models during social interactions (Karpov and Haywood 1998; Sharma and Anderson 2009). The collaborative communications during these social interactions assist learners in identifying patterns of science language to model and build their personal scientific verbal knowledge (Hogan and Fishkeller 2005; Hoyle and Stone 2000). At the same time, their peers scaffold as they assist each other in understanding the task during their interactions (DeWitt and Siraj 2008; Karpov and Haywood 1998).
Science instruction in the classroom should consider the importance of developing communication skills in teaching for the nature of science. A structured form of science instruction should be designed to incorporate collaborative communication
Life Science Journal 2013;10(1) http://www.lifesciencesite.com
http://www.lifesciencesite.com [email protected] 1355
in the science classroom. Vygostsky believed that learners should be taught scientific concepts in the same way as in foreign language instruction (Kubli 2005). This is because words are “tools of thought” (Kubli 2005) which are manipulated to make meaning. Instruction should enable interactions with other learners, the tutor and learning materials (Kim & Song 2005; Sharma & Anderson 2009).
Collaborative communication approaches such as Socratic dialogue and problem solving make learning meaningful (Kubli 2005; Sharma and Anderson 2009). Problem-solving tasks have been shown to be effective for student-centered learning where learners take responsibility for their own learning (Johnson and Johnson, 2004) Meaningful and authentic tasks ensure that enriching and creative ideas can be shared in the group during problem-solving activities (Jonassen et al. 2005; Kaye, 1992; Palloff and Pratt, 1999; Puntambekar 2006; Siraj and Norman 2012; Vaughan, 2010; Woo and Reeves, 2007). Interactions can enhance the learners’ current understandings of science concepts and principles as learning becomes meaningful.
In this study, Socratic dialogue and problem solving will be conducted online, respectively, on a discussion forum and a wiki, which is accessed through the class web page. These online interactions will be permanent in a written form for all learners to view and model their interactions. Written communication is also important in developing learners’ writing skills. Resources such as textbooks have been used to provide information to scaffold and motivate the learner (Kubli 2005). In this study, web resources through information and links on the web page will be used as a resource to scaffold the learner. Science instruction in a context and culture which the learner is familiar and engaged with enhances learning. A study which integrated the hip-hop culture, focused on communication, increased participation in the science classroom (Emdin 2010). Online communication tools have been employed in science for collaborative learning. Studies have shown that online tools such as wikis and discussion forums can scaffold science learning (Guzdial and Turns 2000; Slotta and Linn 2000). Learners are able to improve upon their task, give feedback and have authentic discussions (Osbourne and Hennessy, 2003). This enables a higher level of reflective and constructive thinking for critical thinking (Jonassen, 2000; Jonassen et al. 2005), and increases motivation in learning (Driscoll 2007; Kaye 1992).
Collaborative learning is the acquisition of new knowledge, skills and attitudes occurring as a result of interactions in a group (Jonassen, Lee, Yang, and Laffey 2005; Kaye 1992) while mobile learning,
or mLearning, is the acquisition of new knowledge and skills anywhere and anytime (Geddes 2004; Saedah 2005). mLearning can take place using either mobile phones, or networked computers to access the internet from not only school, but from the home, library, access centers, or cybercafé at any time of the day. When collaborative and mobile learning are combined, Collaborative mLearning (CmL) is the acquisition of new knowledge and skills anywhere and anytime as a result of interactions through communications in a community and culture of learners. These interactions include postings on wikis, discussion forums and text messages online or through the mobile phone.
The culture of participatory learning in a collaborative environment for social interactions is afforded by online tools (Bonk et al., 2009; Pifarré and Li 2012). Learners gradually become experts as they participate in the active learning process while they build knowledge (Bonk et al. 2009; Pifarré and Li 2012; Zhang et al. 2007). As they gather and evaluate the information and knowledge, learners assimilate and apply the knowledge in solving problems (Biasutti and El-Deghaidy 2012). At the same time their peers and instructors scaffold the learners to help them achieve expert status (Whipp and Lorentz 2009; Pifarré and Li, 2012; Zhang et al., 2007).
Using online communications in learning has many advantages. Reading and writing skills as well as conceptual understanding improve (Imperatore, 2009; Lee, 1999; Shihab, 2009); learners also develop reasoning abilities and critical thinking (Bonk et al. 2009; Biasutti and El-Deghaidy 2012; Higdon and Topaz 2009; Zhang et al. 2007); gain confidence in using online tools effectively (Ertmer et al. 2011) and become more creative as they interpret and reorganize the information gathered to be presented in a different way, and collaborate with others (Biasutti and El-Deghaidy, 2012; Pifarré and Li, 2012).
The full potential of online communications for teaching science needs to be investigated further to study the impact of online communication on social and cognitive processes in learning (Ertmer et al. 2011). The type and quality of interaction in different web-based tools may also differ and will need to be investigated (Huang, 2010). For example, wikis have been used in secondary schools science for collaboration work and communication to document the process of scientific inquiry (DeWitt 2010; Hannafin et al. 2009). A wiki is a public web page that can be accessed and edited by anyone. Learners can post information, and their peers can add on to the document and edit it. The wiki enables collaboration to be designed in the instruction for construction of knowledge, and this information can be shared with an audience in an online portal (Bonk et al. 2009). This

Life Science Journal 2013;10(1) http://www.lifesciencesite.com
http://www.lifesciencesite.com [email protected] 1356
asynchronous communication tool allows not only the sharing of knowledge and information on a webpage, but also transforms knowledge as the learners involved in creating the web page generate, share and reshape knowledge on the wiki (Bonk et al. 2009). These interactions resemble the processes of generating knowledge which scientists go through.
However, lack of interaction between learners involved in online communication activities has been shown to be attributed to lack of motivation to contribute in the wiki, mainly due to learners’ lack of knowledge in the subject matter (Ertmer et al. 2011; Huang, 2010). Learners perceived that they would be judged negatively for giving the wrong answer (Ertmer et al. 2011).
Discussion forums are similar to bulletin boards which are platforms for sharing information. Forum comments can be viewed by everyone and the questions posted can be answered by anyone. Some forums restrict access to registered members only. The Knowledge Integration Environment (KIE) is a platform with an online asynchronous discussion forum for social and collaborative learning in science (Slotta and Linn 2000); it allows the storage of web resources, and provides scaffolding in the form of tips and guidance for the activities. The participating learners found the system useful for learning science as they were able to evaluate web pages effectively and ask relevant science questions (Slotta and Linn 2000). Another discussion forum, CaMILE, was effective for learning science as it encouraged learners to communicate and collaborate on science inquiry projects (Guzdial and Turns, 2000). However, both platforms did not use have any text messaging feature.
Text messages sent through the mobile phone Short Messaging System (SMS) can also be used for teaching science. Text messaging has been used for language instruction (Capuano, Gaeta, Miranda, and Pappacena 2004); when combined with other tools, text messaging is effective for learning (Arrigo, Gentile, Taibi, Chiappone and Tegolo 2004; Rau, Gao and Wu 2008). Hence it is possible to use text messaging with other online tools such as wiki and discussion forum.
Collaborative mLearning has been successfully implemented for inquiry-based teaching approach in science with the use of social media tools such as wikis and discussion forums (Guzdial and Turns, 2000; Slotta and Linn, 2000; Spa, 2004; Turcotte, 2012; Zhang et al. 2007). Socratic dialogue, authentic problem-solving and project-based learning approaches are best used with collaborative workspaces for interaction in a social context as they encourage reflection and critical thinking in learning (Jonassen et al. 2005; Osbourne and Hennessy 2003; Siraj and Norman 2012) and increase learners’
motivation (Driscoll, 2007; Kaye, 1992; Mayer, 2011).
In the Malaysian context, research is lacking on the use of a combination of online tools on a CmL platform for teaching science. It is hoped that this study will provide insights in this new area of science education. The relativism in the nature of science can be promoted in the discussion forum to encourage different opinions and views among the learners to show the many possibilities and answers to a problem, and not the dualistic nature of having only one correct answer.
Designed based on social constructivist learning theories the CmL module encourages communication and collaboration (Schunk 2000). Firstly, there must be sufficient activities for discussion to assist learners in building their personal understanding of scientific concepts and principles (Hoyle and Stone 2000). Secondly, opportunities for patterning and modeling should be provided with individualized support. The scaffolding will assist learners who have difficulties with the language of science (Ellerton 2003; Hoyle and Stone 2000; Merrill 2002). Opportunities should also be given for learners to link the science knowledge with their own personal experience (Ellerton 2003, Merrill 2002). Finally, there should be social interactions to motivate and engage learners in carrying out activities successfully and build meaningful science knowledge (Brown 2006).
The CmL module has problem tasks and allows for online group discussion. Modeling can occur from the artifacts such as the instructional material, tasks on wiki and comments on the forum and text messages while scaffolding is provided through interactions with peers and the tutor.
In distance learning, the theory of transactional distance explains the reason for the need for interactions. A shorter transactional distance (TD) means better communication between learner and instructor. In online communication, the gap can be reduced through dialogs between the learner and instructor in the form of interaction (D), structure of the course content and delivery (S), and the instructor enabling and learner exercising autonomy (A) (Moore 1993). The interactions in the online environment will be observed to determine whether learning occurs. Three types of interactions can occur: between the learner and content, between the learner and other learners, as well as between the learner and the instructor (Moore and Kearsley 2005). In this research the framework of these three types of interaction was used to determine the interactions in the CmL module. These interactions were further analyzed to determine the cognitive, social, teaching and attitudes processes.

Life Science Journal 2013;10(1) http://www.lifesciencesite.com
http://www.lifesciencesite.com [email protected] 1357
4. Material and Methods This research takes on a developmental
research approach in which a CmL module was developed based on the data from the first phase, the needs analysis (Ritchey, 1997; Wang and Hanafin, 2005). Based on the input on the communication tools the learners were familiar with, the module was developed and then implemented with a smaller group of learners for data collection. a. Needs Analysis
In this first phase, a survey was conducted on the ownership and access to communication tools among students in a selected urban secondary school in the Klang Valley in Malaysia. The school was selected based on the enrolment which reflected the proportion of the multiracial student community in Malaysia. A total of 158 fourteen-year-old Form 2 students were surveyed to determine the types of technology tools they could access. The CmL module on the topic of Nutrition in science was designed based on The First Principles of Instruction (Merrill 2002) and the social constructivist learning theory (Schunk 2000). The module consists of five online lessons, an initial face-to-face orientation meeting to the module, and a final face-to-face meeting (Table 1).
The findings of the first phase were taken into account to develop the CmL module. The three communication tools were chosen based on the findings of the needs analysis phase: wiki, discussion forum and text messaging. The CmL module would have a main problem task as group work on the wiki. Discussion questions which were smaller problems related to the main problem task would be posted on the discussion forum and answered individually on the forum. In addition, SMS Quiz, through text messaging, was pushed to learners’ mobile phones. Feedback could be given during the learning process in all the tools by both peers and the instructor.
Table 1. List of lessons in the CmL Module Lessons Title Initiala Orientation to module
1 The classes of food 2 Special diets (balanced meals) 3 Tests for food classes 4 Counting calories 5 Food in customs and cultures
Finala Summary
a. Implementation
The CmL science module was implemented with a group of 20 student volunteers, comprising
equal numbers of high, medium and low achievers in science. Laptops with internet access were made available to participants to access the CmL module during school hours while text messaging would only be sent to mobile phones after school hours as mobile phones were not allowed in schools. During the implementation, data were collected from the records of communication on the tools used and personal journals, as well as interviews with the learners. The written communications were coded for the types of online interactions (Moore & Kearsley, 2005) which were further analyzed to determine cognitive, social, teaching processes, and attitude. The coding and analysis was verified and validated by a second reviewer.
The Community of Inquiry (COI) Framework uses social, cognitive and teaching presence to investigate online discourse and collaboration (Garrison et al., 2010). Shedletsky (2010) included an additional category, discourse, to the original three presences of cognitive, social, and teaching processes. Attitudes enabled the affective aspect to be captured, while noise, was any communications which could not be identified. The complete list of interactions is in Table 2.
Later studies included attitudes and noise as interaction (Pinzon-Salcedo, Barros, Zarama, de Meza, Carulla, and Bejarano 2008). While some researchers indicate there is little evidence of cognitive processes like critical thinking in students’ online communications (Garrison, Anderson and Archer, 2010), others have found more evidence of critical thinking in the online communications as compared to face-to-face communications using this framework (Heckman and Annabi, 2005; Shedletsky, 2010).
Interviews were conducted after the module implementation to evaluate the effectiveness of using the usability evaluation method framework (Chai and Chen, 2004; Norlidah, Saedah and Vanitha, 2011). The final-user evaluation in retrospective was conducted through interviews and analyzed to determine user reactions to the effectiveness of the CmL module for learning.
Table 2. Categories for analysis of online
communications (Shedletsky 2010) Category Explanation
Cognitive Process Components of critical thinking as follows:
Triggering Messages encourage thinking about issues, posing a problem
Exploration Messages relate and connect but are not supported, a search for information
Integration Messages are supported and
Life Science Journal 2013;10(1) http://www.lifesciencesite.com
http://www.lifesciencesite.com [email protected] 1358
build on previous messages; construction of a possible solution
Resolution Messages develop a hypothesis and suggest ways to test and defend the hypothesis – an assessment to the solution
Social Process Characteristics of social interaction such as cohesiveness.
Teaching Process Design of the learning experience, delivery and facilitation of students
Discourse Process Responses between learners, and learners and instructors
In this study the types of interactions and the
level of cognitive processes occurring in the online communications were investigated. Verification of the effectiveness of the CmL module using online communications for learning science was done through usability evaluation. 5. Results
The findings are described according to developmental research, according to phases. The findings of the needs analysis would contribute to the design of the CmL module. During the implementation phase, the transcript of the online communications, journals and interviews were coded and analysed according to the categories. a. Needs Analysis
In the needs analysis phase the survey of the tools and frequency of tool usage was done to answer the following research questions: What are the communication equipment which the learners in the context of the study have access to? What is the frequency of use of the technology communication tools among the learners in the context of the study?
The findings indicate the majority of the students in the context of the study had access to simple mobile phones (81.6%) while more than half the respondents owned or had access to computers (63.9%). However, fewer (44.3%) could access the internet with computers. The equipment most of the respondents had access to was the mobile phone, followed by computers and video players.
The CmL module is effective for learning as there were cognitive processes in all the communication tools. The highest level of cognitive process, resolution, was recorded in the discussion forum (38.4%) while integration for the construction of solutions was recorded in the wiki (37.9%) and SMS Quiz (51.3%).
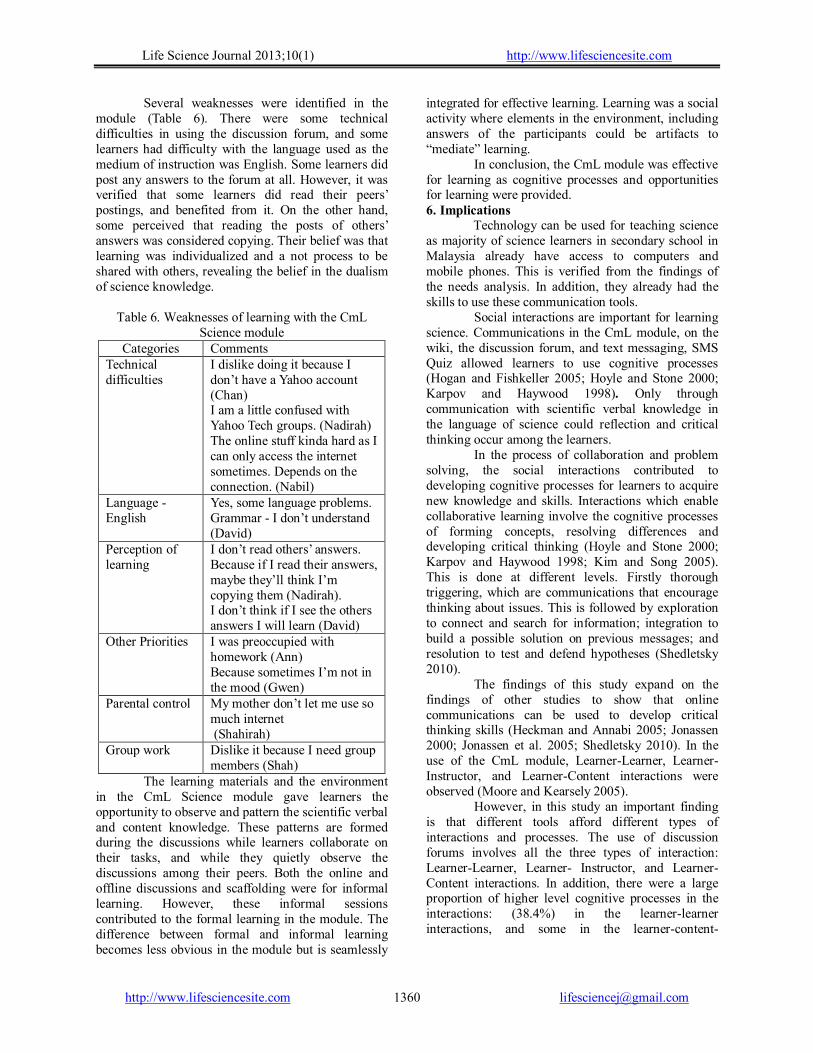
Most learners (84.3%) believed their understanding in science improved after completing
the module, while the rest were undecided. The CmL module encouraged learning as it improved understanding and encouraged learning (Table 5). When learners searched for information and made references either online or to print materials, they were formally modeling their answers. In addition, the informal discussions in the search for knowledge contributed to learning. There was interaction with peers and with the content in using the language of science and learners are able to recall the knowledge constructed better and could model their answers in quizzes and tests.
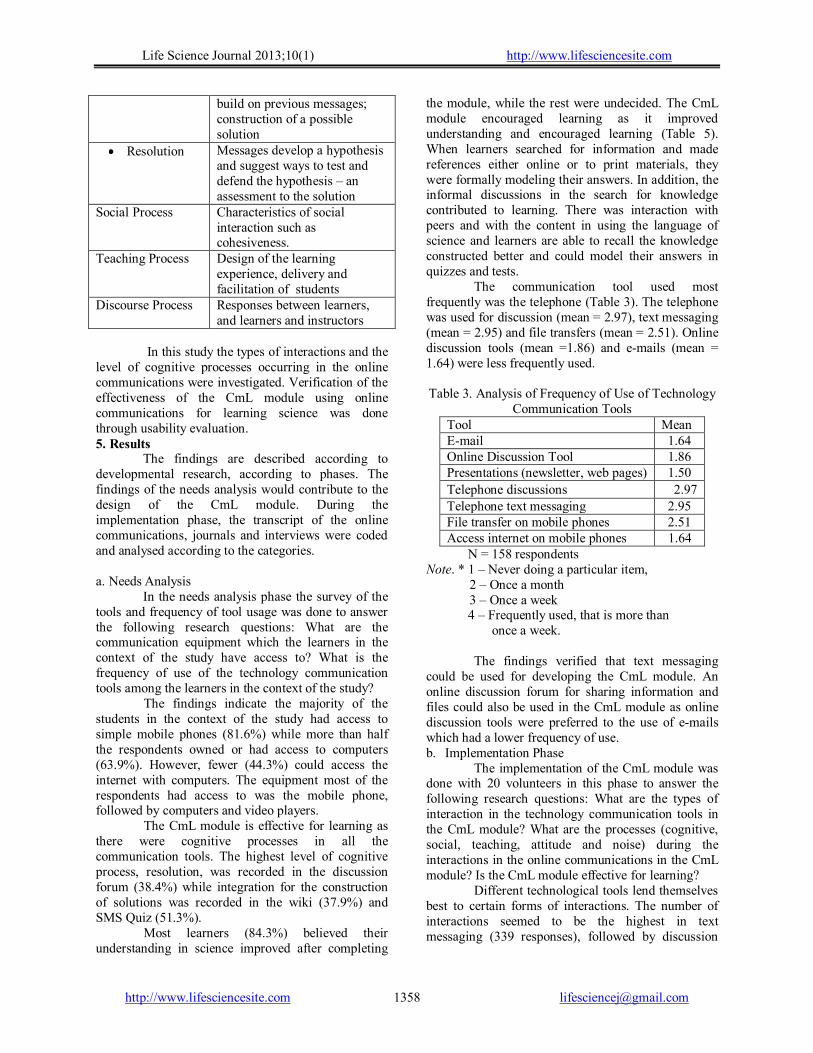
The communication tool used most frequently was the telephone (Table 3). The telephone was used for discussion (mean = 2.97), text messaging (mean = 2.95) and file transfers (mean = 2.51). Online discussion tools (mean =1.86) and e-mails (mean = 1.64) were less frequently used.
Table 3. Analysis of Frequency of Use of Technology
Communication Tools Tool Mean E-mail 1.64 Online Discussion Tool 1.86 Presentations (newsletter, web pages) 1.50
Telephone discussions 2.97 Telephone text messaging 2.95 File transfer on mobile phones 2.51 Access internet on mobile phones 1.64
N = 158 respondents Note. * 1 – Never doing a particular item, 2 – Once a month 3 – Once a week
4 – Frequently used, that is more than once a week.
The findings verified that text messaging
could be used for developing the CmL module. An online discussion forum for sharing information and files could also be used in the CmL module as online discussion tools were preferred to the use of e-mails which had a lower frequency of use. b. Implementation Phase
The implementation of the CmL module was done with 20 volunteers in this phase to answer the following research questions: What are the types of interaction in the technology communication tools in the CmL module? What are the processes (cognitive, social, teaching, attitude and noise) during the interactions in the online communications in the CmL module? Is the CmL module effective for learning?
Different technological tools lend themselves best to certain forms of interactions. The number of interactions seemed to be the highest in text messaging (339 responses), followed by discussion
Life Science Journal 2013;10(1) http://www.lifesciencesite.com
http://www.lifesciencesite.com [email protected] 1359
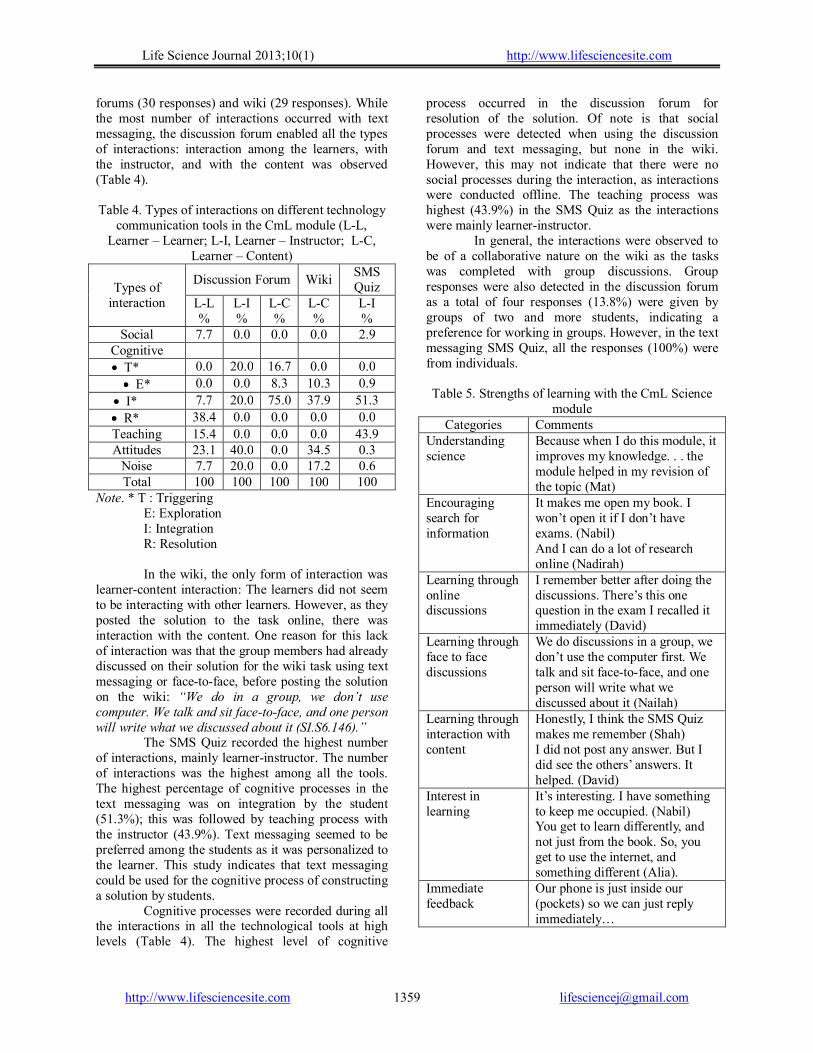
forums (30 responses) and wiki (29 responses). While the most number of interactions occurred with text messaging, the discussion forum enabled all the types of interactions: interaction among the learners, with the instructor, and with the content was observed (Table 4).
Table 4. Types of interactions on different technology
communication tools in the CmL module (L-L, Learner – Learner; L-I, Learner – Instructor; L-C,
Learner – Content)
Types of interaction
Discussion Forum Wiki SMS Quiz
L-L %
L-I %
L-C %
L-C %
L-I %
Social 7.7 0.0 0.0 0.0 2.9 Cognitive
T* 0.0 20.0 16.7 0.0 0.0
E* 0.0 0.0 8.3 10.3 0.9
I* 7.7 20.0 75.0 37.9 51.3
R* 38.4 0.0 0.0 0.0 0.0
Teaching 15.4 0.0 0.0 0.0 43.9 Attitudes 23.1 40.0 0.0 34.5 0.3
Noise 7.7 20.0 0.0 17.2 0.6 Total 100 100 100 100 100
Note. * T : Triggering E: Exploration I: Integration R: Resolution In the wiki, the only form of interaction was
learner-content interaction: The learners did not seem to be interacting with other learners. However, as they posted the solution to the task online, there was interaction with the content. One reason for this lack of interaction was that the group members had already discussed on their solution for the wiki task using text messaging or face-to-face, before posting the solution on the wiki: “We do in a group, we don’t use computer. We talk and sit face-to-face, and one person will write what we discussed about it (SI.S6.146).”
The SMS Quiz recorded the highest number of interactions, mainly learner-instructor. The number of interactions was the highest among all the tools. The highest percentage of cognitive processes in the text messaging was on integration by the student (51.3%); this was followed by teaching process with the instructor (43.9%). Text messaging seemed to be preferred among the students as it was personalized to the learner. This study indicates that text messaging could be used for the cognitive process of constructing a solution by students.
Cognitive processes were recorded during all the interactions in all the technological tools at high levels (Table 4). The highest level of cognitive
process occurred in the discussion forum for resolution of the solution. Of note is that social processes were detected when using the discussion forum and text messaging, but none in the wiki. However, this may not indicate that there were no social processes during the interaction, as interactions were conducted offline. The teaching process was highest (43.9%) in the SMS Quiz as the interactions were mainly learner-instructor.
In general, the interactions were observed to be of a collaborative nature on the wiki as the tasks was completed with group discussions. Group responses were also detected in the discussion forum as a total of four responses (13.8%) were given by groups of two and more students, indicating a preference for working in groups. However, in the text messaging SMS Quiz, all the responses (100%) were from individuals.
Table 5. Strengths of learning with the CmL Science
module Categories Comments
Understanding science
Because when I do this module, it improves my knowledge. . . the module helped in my revision of the topic (Mat)
Encouraging search for information
It makes me open my book. I won’t open it if I don’t have exams. (Nabil) And I can do a lot of research online (Nadirah)
Learning through online discussions
I remember better after doing the discussions. There’s this one question in the exam I recalled it immediately (David)
Learning through face to face discussions
We do discussions in a group, we don’t use the computer first. We talk and sit face-to-face, and one person will write what we discussed about it (Nailah)
Learning through interaction with content
Honestly, I think the SMS Quiz makes me remember (Shah) I did not post any answer. But I did see the others’ answers. It helped. (David)
Interest in learning
It’s interesting. I have something to keep me occupied. (Nabil) You get to learn differently, and not just from the book. So, you get to use the internet, and something different (Alia).
Immediate feedback
Our phone is just inside our (pockets) so we can just reply immediately…
Life Science Journal 2013;10(1) http://www.lifesciencesite.com
http://www.lifesciencesite.com [email protected] 1360
Several weaknesses were identified in the module (Table 6). There were some technical difficulties in using the discussion forum, and some learners had difficulty with the language used as the medium of instruction was English. Some learners did post any answers to the forum at all. However, it was verified that some learners did read their peers’ postings, and benefited from it. On the other hand, some perceived that reading the posts of others’ answers was considered copying. Their belief was that learning was individualized and a not process to be shared with others, revealing the belief in the dualism of science knowledge.
Table 6. Weaknesses of learning with the CmL
Science module Categories Comments
Technical difficulties
I dislike doing it because I don’t have a Yahoo account (Chan) I am a little confused with Yahoo Tech groups. (Nadirah) The online stuff kinda hard as I can only access the internet sometimes. Depends on the connection. (Nabil)
Language - English
Yes, some language problems. Grammar - I don’t understand (David)
Perception of learning
I don’t read others’ answers. Because if I read their answers, maybe they’ll think I’m copying them (Nadirah). I don’t think if I see the others answers I will learn (David)
Other Priorities I was preoccupied with homework (Ann) Because sometimes I’m not in the mood (Gwen)
Parental control My mother don’t let me use so much internet (Shahirah)
Group work Dislike it because I need group members (Shah)
The learning materials and the environment in the CmL Science module gave learners the opportunity to observe and pattern the scientific verbal and content knowledge. These patterns are formed during the discussions while learners collaborate on their tasks, and while they quietly observe the discussions among their peers. Both the online and offline discussions and scaffolding were for informal learning. However, these informal sessions contributed to the formal learning in the module. The difference between formal and informal learning becomes less obvious in the module but is seamlessly
integrated for effective learning. Learning was a social activity where elements in the environment, including answers of the participants could be artifacts to “mediate” learning.
In conclusion, the CmL module was effective for learning as cognitive processes and opportunities for learning were provided. 6. Implications
Technology can be used for teaching science as majority of science learners in secondary school in Malaysia already have access to computers and mobile phones. This is verified from the findings of the needs analysis. In addition, they already had the skills to use these communication tools.
Social interactions are important for learning science. Communications in the CmL module, on the wiki, the discussion forum, and text messaging, SMS Quiz allowed learners to use cognitive processes (Hogan and Fishkeller 2005; Hoyle and Stone 2000; Karpov and Haywood 1998). Only through communication with scientific verbal knowledge in the language of science could reflection and critical thinking occur among the learners.
In the process of collaboration and problem solving, the social interactions contributed to developing cognitive processes for learners to acquire new knowledge and skills. Interactions which enable collaborative learning involve the cognitive processes of forming concepts, resolving differences and developing critical thinking (Hoyle and Stone 2000; Karpov and Haywood 1998; Kim and Song 2005). This is done at different levels. Firstly thorough triggering, which are communications that encourage thinking about issues. This is followed by exploration to connect and search for information; integration to build a possible solution on previous messages; and resolution to test and defend hypotheses (Shedletsky 2010).
The findings of this study expand on the findings of other studies to show that online communications can be used to develop critical thinking skills (Heckman and Annabi 2005; Jonassen 2000; Jonassen et al. 2005; Shedletsky 2010). In the use of the CmL module, Learner-Learner, Learner-Instructor, and Learner-Content interactions were observed (Moore and Kearsely 2005).
However, in this study an important finding is that different tools afford different types of interactions and processes. The use of discussion forums involves all the three types of interaction: Learner-Learner, Learner- Instructor, and Learner-Content interactions. In addition, there were a large proportion of higher level cognitive processes in the interactions: (38.4%) in the learner-learner interactions, and some in the learner-content-

Life Science Journal 2013;10(1) http://www.lifesciencesite.com
http://www.lifesciencesite.com [email protected] 1361
interactions (75.0%). This indicates that it is effective for learning.
There were also higher level cognitive processes in the text messaging SMS Quiz (51.3%). In addition, the frequency of use was the highest among all the tools (339 responses). The text messaging SMS Quiz has a lot of potential for future use because of its popularity and the level of cognitive processes. Text messaging appears to be the most effective tool to reduce transactional distance (Moore 1993) as learners would not feel the online distance of the instructor as they are able to interact fully in personal dialogue with the instructor, and have autonomy over their learning.
The wiki was also frequently used and allowed for some high level interaction (37.9%). Its collaborative nature enabled learners to collaborate on solving meaningful problems as they knew their work was being published. However, not all the group members would contribute to the writing on the wiki. This was because group work was conducted face-to-face prior to posting on the wiki. There might be more cognitive and social processes which were captured in the data.
The discussion forum allowed for interaction to determine opinions related to the nature of science. Most of the learners stated that a question which had been answered need not be responded to. This reflected their perception of the dualism in the nature of science knowledge (Oliveira, Akerson, Colak, Pongsanon and Genel 2011). The instructor had to facilitate the forum to encourage members to give other opinions and to elicit responses from others.
The CmL module and the tools for communication can be used for developing cognitive processes through social interactions and communications among Form 2 science learners. There were also social and teaching processes and some noise during the communications. Of note is that the attitude was high in the wiki as the learners were able to show their creativity and personalize the page they were working on. The module allowed for written communications for exploring the nature of science knowledge by giving the learners authentic and meaningful tasks. The learners noted that they understood science better and had to search for information. They also admitted that the online discussions and face-to-face discussions enabled learning in the CmL module. Of note is the learners’ belief in the dualism of science knowledge; they expected that there was only one accurate answer in science, and were challenged in the discussion questions as they were continuously requested for more diverse answers.
However, the limitation of the study is that it was carried out in an urban school. Further research would be required to determine if the findings will be
similar in rural schools. A measure of the communication skills in science should be developed to determine if the CmL module could improve written scientific communications as well as cognitive processes. In addition to communication and cognitive processes, future studies may be conducted to determine the effectiveness of teaching the nature of science through individual technology tools or a combination of the tools. Acknowledgements: The authors wish to thank the Faculty of Education, University of Malaya, and the Ministry of Education Malaysia. This work was supported by a grant from the UMRG, University of Malaya, Kuala Lumpur. Corresponding Author: Dr. Norlidah Alias Department of Curriculum and Instructional Technology, Faculty of Education, University of Malaya, 50603 Kuala Lumpur, Malaysia E-mail: [email protected] References 1. Arrigo M, Gentile M, Taibi D, Chiappone G, Tegolo
D. mCLT: An application for collaborative learning on a mobile telephone. In Attewell J, Savill-Smith C (Eds.), Mobile learning anytime everywhere: A book of papers from MLEARN 2004. London: Learning and Skills Development Agency. 2004:11-15.
2. Biasutti M, El-Deghaidy H. Using Wiki in teacher education: Impact on knowledge management processes and student satisfaction. Computers and Education 2012;59:861–872.
3. Bonk CJ, Lee M, Kim N, Lin, M-FG. The tensions of transformation in three cross-institutional wikibook projects, The Internet and Higher Education, 2009; 12:126–135.
4. Brown BA. “It isn’t no slang that can be said about this stuff”: Language identity and appropriating science discourse. Journal of Research in Science Teaching 2006; 43(1):96 – 126.
5. Capuano N, Gaeta M., Miranda S, Pappacena L. A system for adaptive platform-independent mobile learning. In J. Attewell, & C. Savill-Smith (Eds.), Mobile learning anytime everywhere: A book of papers from MLEARN 2004. London: Learning and Skills Development Agency. 2004:15-19.
6. Chai CS, Chen, D. A review on usability evaluation methods for instructional multimedia: an analytical framework. Instructional Journal of Multimedia 2004, 31(3): 231.
7. DeWitt D, Saedah S (2008, May 6-8). Designing a collaborative mLearning environment for form two science. Proceeding, Working Paper, and Power Point delivered at International Conference on Educational Innovation (ICEI '08). The University of Malaya, Malaysian National Commission for UNESCO, and UNESCO Regional Office Jakarta. Legend Hotel, Kuala Lumpur.
Life Science Journal 2013;10(1) http://www.lifesciencesite.com
http://www.lifesciencesite.com [email protected] 1362
(http://www.unescoapceiu.org/bbs/board.php?bo_table=events&wr_id=397&page=5)
8. Driscoll K. (2007). Collaboration in today’s classrooms: New web tools change the game. Multimedia & Internet@Schools, 14(3), 9-12. Retrieved from the Proquest database.
9. Dodick J, Argamon S, Chase P. (2009). Understanding Scientific Methodology in the Historical and Experimental Sciences via Language Analysis. Science & Education, 18, 985–1004, DOI 10.1007/s11191-008-9146-6
10. Ertmer PA, Newby TJ, Liu W, Tomory A, Yu JH, Lee YM. Students’ confidence and perceived value for participating in cross-cultural wiki-based collaborations. Educational Technology Research and Development 2011; 59:213-228.
11. Emdin C. Dimensions of communication in urban Science education: Interactions and transactions Science Education 2011. doi: 10.1002/sce.20411
12. Garrison DR, Anderson T, Archer W. The first decade of the community of inquiry framework: A retrospective. The Internet and Higher Education 2010;13:5-9. doi: 10.1016/j.iheduc. 2009.10.003
13. Goodney, D.E & Long. C.S. (2003). The collective classic: A case for the reading of Science. Science & Education 12, 167–184, 2003.
14. Guzdial M, Turns J. Computer-supported collaborative learning in Engineering: The challenge of scaling-up assessment. In Jacobson M, Kozma R. B. (Eds.), Innovations in science and mathematics education: Advance design for technologies of learning. Mahwah, NJ: Erlbaum. 2000:227-257.
15. Heckman R, Annabi H. A content analytic comparison of learning processes in online and face-to-face case study discussions. [Online]. Journal of Computer-Mediated Communication 2005, 10(2).
16. Hannafin M, Hannafin K, Gabbitas B. Re-examining cognition during student-centered, Web-based learning. Educational Technology Research and Development 2009;57:767–785.
17. Higdon J, Topaz C. Blogs and Wikis as Instructional Tools: A Social Software Adaptation Of Just-In-Time Teaching. College Teaching 2009, 57, 105-109.
18. Hogan K, Fisherkeller J. (2005). Dialogue as data: Assessing students’ scientific reasoning with interactive protocols. In J. J. Mintzes, J. H. Wandersee, & J. D. Novak (Eds.), Assessing science understanding: A human constructivist view. London: Elsevier. 2005:95-127.
19. Hoyle P, Stone C. Developing the literate scientist. In J. Sears, & P. Sorensen (Eds.), Issues in science teaching. London: RoutledgeFalmer. 2000: 88-99.
20. Huang, W-H D. (2010). A case study of wikis’ effects on online transactional interactions, MERLOT Journal of Online Learning and Teaching 2010; 6(1):1-12.
21. Imperatore, C. (2009). Wikis and Blogs: Your keys to student collaboration and engagement. Today’s
Classroom Teacher: Techniques. March 2009 ed. Alexandria, VA ACTE: Association for Career and Technical Education.
22. Jonassen DH. (1999). Designing constructivist learning environments. In C. M. Reigeluth (Ed.), Instructional-design theories and models: Vol. 2. A new paradigm of instructional theory (pp. 215-268). Mahwah, NJ: Erlbaum.
23. Jonassen DH, Lee CB, Yang CC, Laffey J. (2005). The collaborative principle in multimedia learning. In R. E. Mayer (Ed.), The Cambridge handbook of multimedia learning (pp. 247-270). New York, NY: Cambridge University Press.
24. Kampourakis, K. (2010). Mendel and the Path to Genetics: Portraying Science as a Social Process. Science & Education DOI:10.1007/ s11191-010-9323-2
25. Karpov YV, Haywood HC. (1998). Two ways to elaborate Vygotsky’s concept of mediation: Implications for instruction. American Psychologist, 53(1), 27-36.
26. Kaye AR. (1992). Learning together apart. In A. R. Kaye (Ed.), Collaborative learning through computer conferencing: The Najaden Papers, F90. Nato ASI Series. Proceedings of the NATO Advanced Research Workshop on Collaborative Learning and Computer Conferencing, Copenhagen, Denmark, July 29-August 3, 1991 (pp. 1-24). Heidelberg, Germany: Springer-Verlag.
27. Kim H., Song J. The features of peer argumentation in middle school students’ scientific inquiry. Research In Science Education 2005; 36(3):211-233.
28. Kubli F. Science Teaching as a Dialogue – Bakhtin,Vygotsky and some Applications in the Classroom. Science & Education 2005;14: 501–534 DOI 10.1007/s11191-004-8046-7
29. Lederman NG. Nature of science: Past, present, and future. In Abell SK, Lederman NG (Eds.), Handbook of research on science education. Mahwah, NJ: Erlbaum. 2007:831–879.
30. Lee, LL.Acquisition of science process skills and its relationship to cognitive development. Unpublished M. Ed. dissertation, University Malaya, Kuala Lumpur. 1999
31. Merrill MD. First principles of instruction. Educational Technology Research and Development 2002; 50(3):43 - 60.
32. Moore MG. (1993). Theory of transactional distance. In Keegan D. (Ed.), Theoretical principles of Distance Education. London: Routeledge. 1993:22-38.
33. Moore MG, Kearsley G. Distance Education: A systems view (2nd ed). Belmont, CA: Thomson Wadsworth. 2005.
34. Nielsen KH. Scientific Communication and the Nature of Science, Science & Education, 2012 DOI 10.1007/s11191-012-9475-3
35. Norlidah A., Saedah S., & T. Vanitha Thanabalan, An Evaluation on the Usability of Physics Module:

Life Science Journal 2013;10(1) http://www.lifesciencesite.com
http://www.lifesciencesite.com [email protected] 1363
Teachers’ Retrospective. Jurnal Pendidikan (Edisi Khas). Universiti Malaya. 2011: 167-181.
36. Oliveira AW, Akerson VL., Colak H., Pongsanon K., Genel, A. The Implicit Communication of Nature of Science and Epistemology During Inquiry Discussion. Science Education. 2011. DOI 10.1002/sce.21005
37. Osbourne J., Hennessy S. (2003). Literature review in science education and the role of ICT: Promise, problems and future directions. Bristol, UK: Futurelab. Retrieved from http://www.futurelab.org.uk
38. Palloff RM, Pratt K. Building learning communities in cyberspace: Effective strategies for the online classroom. San Franscisco, CA: Jossey-Bass. 1999.
39. Pifarré M, Li L. Teaching how to learn with a wiki in primary education: What classroom interaction can tell us. Learning, Culture and Social Interaction. 2012.
40. Puntambekar S. Analyzing collaborative interactions: Divergence, shared understanding and construction of knowledge. Computers and Education 2006; 47:332–51.
41. Rau PLP, Gao Q, Wu, LM. Using mobile communication technology in high school education: Motivation, pressure and learning performance. Computers and Education, 2008. Retrieved from the Science Direct database.
42. Saedah S. mLearning dalam pembangunan sekolah berteknologi di Malaysia: Prospek pelaksanaan. (mLearning in the development for schools with technology in Malaysia: Implementation prospects). Paper presented at National Seminar on ICT in Education 2005, Tanjung Malim, 17-19th November.
43. Sharma A, Anderson CW. Recontextualization of Science from Lab to School: Implications for Science Literacy. Science & Education 2009,18:1253–1275, DOI 10.1007/s11191-007-9112-8
44. Shihab MM. Web 2.0 Tools Improve Teaching and Collaboration in High School English Language Classes. Doctor of Philosophy, Nova Southeastern University. UMI Microform. 2009.
45. Shedletsky, S. Critical Thinking in Discussions; Online verses face to face. In Russell D, Cases on Collaboration in Virtual Learning Environments: Processes & interactions. Hershey: Information Science Reference. 2010.
46. Schunk DH. Learning theories: An educational perspective (3rd ed.). Upper Saddle River, NJ: Merrill Prentice Hall. 2000.
47. Slotta JD, Linn MC. The Knowledge Integration Environment: Helping students use the internet
effectively. In Jacobson MJ., Kozma RB. (Eds.) Innovations in science and mathematics education: Advance design for technologies of learning Mahwah, NJ: Erlbaum. 2000:193-226.
48. Sopia Mohd. Yasin. Teachers’ perceptions of technology and its relationship with science in Malaysian schools. (Doctoral dissertation, University of Queensland, Australia., 1999). Koleksi abstrak disertasi kedoktoran mengenai pendidikan di Malaysia. Bahagian Perancangan Dan Penyelidikan Dasar Pendidikan, KPM [Doctoral dissertation abstracts on education in Malaysia. Educational Planning and Research Division, Ministry of Education] 2002.
49. Tan JN. The development and implementation if the primary school science curriculum in Malaysia. (Doctoral dissertation, University of East Anglia, U.K., 1999). Koleksi abstrak disertasi kedoktoran mengenai pendidikan di Malaysia. Bahagian Perancangan Dan Penyelidikan Dasar Pendidikan, KPM [Doctoral dissertation abstracts on education in Malaysia. Educational Planning and Research Division, Ministry of Education. 2002
50. Pinzon-Salcedo L, Barros R, Zarama R, de Meza M, Carulla C, Bejarano A. Using systems thinking and social network theory to improve children’s mathematical problem solving skills. Proceedings of the 52nd Annual Meeting of the International Society for the Systems Sciences (ISSS).University of Wisconsin, Madison, Wisconsin, USA -- July 13th - 18th 2008. Retrieved from http://journals.isss.org/index.php/ proceedings52nd
51. Vaughan ND. A blended community of inquiry approach: Linking student engagenment and course redesign. The Internet and Higher Education 2010;13:60-65.
52. Wang F, Hanafin MJ. Design-based research and technology enhanced learning environments. Educational Technology Research and Development 2005;53(4): 5-23.
53. Whipp JL, Lorentz RA. Cognitive and social help giving in online teaching: an exploratory study. Educational Technology Research and Development 2009;57:169–192.
54. Woo Y, Reeves TC. Meaningful interaction in web-based learning: A social constructivist interpretation. The Internet and Higher Education 2007;10:15-25.
55. Zhang J, Scardamalia M, Lamon M, Messina R, Reeve R. Socio-cognitive dynamics of knowledge-building in the work of 9- and 10-year-olds. Educational Technology Research and Development 2007, 55: 117-145.
1/9/2013
te.comhttp://www.lifesciencesi) 113;10(20Journal Science Life
1364
Brucellosis-Induced Pancytopenia in Children: A Prospective Study
Mona Afify1, Salha H Al-Zahrani1 , and Mohamad A El-Koumi2
1Department of Biology, Science College for Girls, King AbdulAziz University. 2Department of Pediatrics, Al-Khafji Joint Operation Hospital*, Kingdom of Saudi Arabia.
ABSTRACT: Brucellosis, a zoonotic infection, constitutes a major health and economic problem in many parts of the world, including countries of the Mediterranean Basin, The Middle East and The Arabian Gulf. Hematological complications in brucellosis are common and can be multi-factorial due to the pathogen's tropism for central (bone marrow) and peripheral (spleen) organs of the reticuloendothelial system (RES). Pancytopenia, although mainly reported in adults has also been described in children with brucellosis. This investigation was conducted to estimate the relative frequency of pancytopenia in children with brucellosis. The study was carried out in Al-Khafji region. All children suffering from fever of more than 5 days without clinically evident cause and associated with symptoms suggestive of brucellosis were screened by a rapid slide serum agglutination test for presence of brucellosis. Sixty patients who had tube agglutination titre > 1: 160 or had positive blood and/or bone marrow (BM) culture for brucellosis, were enrolled in the study. At enrollment, the following investigations were performed: CBC, blood culture and BM, aspiration was carried out in all patients with pancytopenia, to exclude malignancy. Obtained results revealed that: out of 60 children with brucellosis, 50 (83%) ingested raw animal milk and 45% had a positive family history of brucellosis. The commonly presenting symptoms and signs included; excessive sweating (68%), bone aches (62%), chills (55%), arthritis (32%), and hepatosplenomegaly. The most commonly detected hematological manifestations included; anemia (in 43%), leukopenia (in 38%) and leukocytosis (in 20%). Meanwhile, pancytopenia was detected in 11 patients (18%). Positive blood culture for brucella was seen in 38% (23 patients). melitensis from 21 patients was cultured in vitro.. Out of 9 BM cultures, 3 were positive for B. melitensis and 6 cultures were negative. Out of 11 patients with pancytopenia, 9 patients (82%) presented with bone aches and weakness, 7(64%) presented with sweating and chills, 6(55%) of patients had petechiea and purpura, 5 (46%) had splenomegaly and 5 (46%) had hepatomegaly. The majority of patients with brucella-induced pancytopenia had agglutination titres of > 1: 320 and all of them had positive blood culture for B. melitensis. In conclusion in a patient with fever, arthalgia, chills and hematological abnormalities such as anemia, leukopenia, thrombocytopenia or pancytopenia, brucellosis should be kept in mind, especially in geographical areas where the disease is still endemic, as in our region. [Mona Afify, SalhaHAl-Zahrani,and Mohamad A El-Koumi. Brucellosis-Induced Pancytopenia in Children:AProspective Study. Life Sci J 2013;10(1):1364-1368] (ISSN:1097-8135). http://www.lifesciencesite.com. 205 Key words: Pancytopenia-endemic brucellosis- fever of unknown origin. 1. Introduction Brucellosis, a primarily contagious disease of domestic animals, is caused by small, fastidious gram-negative coccobacilli of the genus Brucella. There are four important species pathogenic to humans; B. melitensis, found primarily in goats, sheep and camels; B. abortus in cows; B. suis in pigs; and B. canis in dogs. The Brucella species differ in degree of virulence and invasiveness, B. melitensis being the most invasive and produces the most severe disease and B. abortus is the least invasive (Al-Eissam, 1999). In Saudi Arabia, human infection with B. melitensis is commonly encountered (80%-100%), and infection with B. abortus is less frequent, but infection with other species has not been reported (Bilal et al., 1991). Humans are commonly infected through ingestion of raw milk, cheese or meat, or through direct contact with infected animals, products of conception or
animal discharges (e.g., among shepherds, farmers and veterinarians), and through inhalation of infectious aerosols (e.g., by workers in abattoirs and microbiology laboratories) (Young, 2000). Human brucellosis can be an acute or a chronic febrile illness and presents with a variety of manifestations after an incubation period, which can vary from 1 to 6 weeks or several months. Brucellosis may be difficult to distinguish clinically from a number of other infections such as typhoid fever, tuberculosis, infective endocarditis, and acute rheumatic fever (Sari et al., 2008). The symptoms of acute illness are fever, chills, headache, muscle and joint pains, malaise, nausea, night sweats and loss of appetite persisting 3 to 6 weeks. Brucellosis shows multisystem involvement (Dilek et al., 2008). The disease also produces a variety of nonspecific hematological abnormalities. The BM and the spleen

te.comhttp://www.lifesciencesi) 113;10(20Journal Science Life
1365
are commonly involved, and such involvement may result in a hypoplastic pattern on the peripheral blood smear (Sari et al., 2008). Hematological complications in brucellosis are common and can be multifactorial due to the pathogen's tropism for central (BM) and peripheral (spleen) organs of the RES. Changes in the hematological parameters are observed in most patients, but pancytopenia is rare (Lambros et al., 2010). Hemo-phagocytosis, hypersplenism or granulomatous changes in the BM may be responsible for pancytopenia occurring during brucellosis. Additionally, BM involvement due to simultaneous presentation of malignant diseases with brucellosis rarely lead to pancytopenia (Eser et al., 2006). Incidence of pancytopenia is 3-21% among adult patients affected by brucellosis (Omidi et al., 2009). Meanwhile, although the presentation of acute brucellosis with mesenteric lymphadenitis and pancytopenia is rare, it must be considered in patients such in endemic areas (Dag et al., 2011). On other hand, although brucellosis is a rare cause of pancytopenia, it should be considered in differential diagnosis with pancytopenia of children (Sen et al., 2010). 2.PATIENTS AND METHODS
This study was carried out at Al-Khafji Joint Operation Hospital during years 2010 through 2011. All children suffering from fever of more than 5 days, without clinically evident cause of fever and associated with symptoms suggestive of brucellosis such as weight loss, weakness, anorexia and arthalgia were screened for brucellosis by a rapid slide serum agglutination test using plasmatic stained febrile antigens reagent code number FA/018 for B. abortus and FA/020 for B. melitensis. In case of a positive result, tube agglutination test was performed. Titre of 1/20 up to 1/360 was done for each serum to avoid prozone effects. Titre above 1/160 and rising antibody titre was considered to be positive. From positive cases of slide agglutination test, ten ml of blood samples and/or bone marrow aspirates were taken under complete aseptic procedures, inoculated and mixed on Hemoline Performance Diphasique, BioMerieux blood culture system and Oxoid signal blood culture system code: BC0100. The medium was designed to create pressure in the sealed bottle when organisms were growing. A positive result is indicated when the blood/broth mixture rises above the green locking sleeve of the growth indicator device. Positive growth was subcultured on blood, chocolate and MacConkey's agar media aerobic in 5% CO2 atmosphere and anaerobically. Gram stain, oxidase, catalase, urease and other biochemical reactions were performed for identification of brucella organisms.
All children with positive tube agglutination test or positive blood or BM cultures were enrolled in the study. All the enrollment, baseline data were collected including demographic data, documented family history of brucellosis, ingestion of raw milk, cheese or meat or contact with infected animals or their products, and history of hematological disorders. After that a through clinical examination was performed. At enrollment, beside the laboratory diagnosis of brucellosis, the following investigations were performed complete blood count (CBC), erythrocyte sedimentation rate (ESR), and C-reactive protein (CRP). As required, coagulation parameters such as prothrombin time (PT), activated partial thromboplastin time (APTT) and plasma fibrinogen level were measured. Fibrinogen assay was performed by using kit (Diagnostica Stago, France). All investigations were considered abnormal according to the established reference values in childhood (Pesce, 2011). Pancytopnia was considered if white blood cells, platelets count and hemoglobin values are low according to age (Pesce, 2011). In cases with bicytopenia, severe cytopenia and pancytopenia, BM aspiration/biopsy was also performed. When results are abnormal or when needed, the CBC was repeated (Dilek et al., 2008). Data entry and statistical analysis were performed by application of the SPSS (version 15) statistical package. P-values <0.05 were considered significant. 3.RESULTS One hundred thirty-three patients were screened for brucellosis and 84 were positive by rapid slide test. Non of screened children with titre < 1: 160 had positive blood or BM culture for brucellosis. Sixty children, diagnosed as brucellosis by titre > 1:160 of tube agglutination method, were enrolled. Their ages ranged from 5 to 16 years (mean±SD: 7.6±1.8), 43 (71.7%) of them were males. Fifty patients (83.3%) ingested raw milk and 27 (45%) had a positive family history of brucellosis. Excessive sweating was present in 41 patients (68.3%), bone aches in 37 patients (61.7%), and chills were present in 33 patients (55%). Nineteen patients (32%), 11 patients (18%), 9 patients (15%) and 4 patients (7%) were found to have arthritis, hepatomegaly, spleno-megaly and hepatosplenomegaly, respectively (Table 1). Table (2) summarizes hematological manifestations, cultures and agglutination titres among 60 children suffering brucellosis. Twenty-six patients (43.3%) had anemia, 23 (38.3%) had leukopenia, 12 (20%) had leukocytosis and 11 patients (18.3%) had pancytopenia. Among 23 patients (38.3%) with positive blood culture, B. melitensis was isolated from 21 (35%) and B. abortus from 2 (3.3%). BM culture was carried out for 9 patients (15%), 3 of them (5%)

te.comhttp://www.lifesciencesi) 113;10(20Journal Science Life
1366
was positive for B. melitensis. Thirty-eight patients (63.3%) had an agglutination titre of 1/160-1/320, and 22 (36.7%) had an agglutination titres of 1/320-1/640 or more. Out of 60 patients with brucellosis, 11 patients (18.3%), 7 males and 4 females, with age ranging from 5 to 13 years, had pancytopenia at diagnosis. Among these 11 patients, 9 patients (81.8%) had bone aches and weakness, 6 patients (55%) had petechiae, pupura and/or bleeding and 5 patients (45.5%) had hepatomegaly and/or splenomegaly. The mean±SD of hemoglobin, WBCs counts and platelet counts accounted for 5.9±2.8, 3.12±1.3 and 32.7±4.7, respectively. The majority of patients with pancytopenia (72.7%) had an agglutination titre of 1/320-1/640 more. Blood culture was positive for B. melitensis in all patients with pancytopenia (Table 3). 4.DISCUSSION Brucellosis is primarily an infectious disease of domestic animals that is transmissible to humans. The source of infection is likely to fresh unpasteurized milk or milk products, or by direct contact with infected animal tissues (Soker et al., 2001). The World Health Organization estimates the number of new cases of brucellosis at more than 500,000 per year in the world. Although brucellosis has been controlled in many developed countries, it remains an important health problem in developing countries, particularly in Mediterranean region, Middle East and West Asian countries (Afscharpaiman and Mamishi, 2008). Hematological complications such as anemia and leukopenia are more frequently seen in acute brucellosis cases. However, acute brucellosis should also be considered in the differential diagnosis in the presence of other hematological abnormalities such as severe thrombocytopenia, pancytopenia, acute hemolytic anemia, and disseminated intravascular coagulation (Dilek et al., 2008). In this study, out of 133 patients with fever of more than 5 days, 60 children were diagnosed as acute brucellosis by titre of > 1:160 of tube agglutination method. The majority of patients (83%) ingested raw animal milk and 45% of them had a positive family history of brucellosis. Al-Eissa, (1999) reported that in Saudi population, brucellosis presents in both sexes and in all ages, and that the main form of acquiring disease is through ingestion of raw milk and milk products obtained mainly from infected goats or camels, a traditional custom fostered by the normadic heritage and dietary habits of the people. Patients with brucellosis usually present with fever, chills, malaise, weight loss, joint involvement hepatosplenomegaly and lymphadenopathy (Dilek et al., 2008). In this study, the main symptoms at presentation in 60 children with brucellosis were excessive sweating (in 68%), bone aches (in 62%) and
chills (in 55%). The main signs in these patients were arthritis (in 32%), and hepatosplenomegaly. Nearly similar results were obtained by other studies (Eser et al., 2006; Al-Anzi & Asma, 2007 and Dilek et al., 2008; Koura & Mohammed, 2009), both in children and adult patients. In this study, hematological laboratory investigations detected in 60 children with brucellosis included anemia (in 43%), leukopenia (in 38%), leukocytosis (in 20%) and pancytopenia (in 18%). In South-Western Saudi Arabia, Benjamin and Annobil, (1992) reported leucopenia (in 38%), anemia (in 64%), and thrombocytopenia (in 28%). Other studies of hematological changes during the active course of brucellosis showed that leukopenia occurred in 33% of patients, anemia in 44%, thrombocytopenia in 5% and pancytopenia in 14% (Al-Eissa & Al-Nasser, 1993 and Issa & Jamal, 1999 ;Koura & Mohammed, 2009). Furthermore, Koura and Mohammed (2009) detected pancytopenia in 10% of children suffering brucellosis. The relative frequency of pancytopenia with brucellosis varies from 3% to 21% in the previous studies, being highly relative in adults but low relative in children (Aysha & Shayib, 1986; Al-Eissa & Assuhaimi, 1993 and Yildirmak et al., 2003). The possible mechanisms suggested for pancytopenia include hypersplenism, granuloma formation in the BM, phagocytosis of formed elements by reticuloendothelial cells or BM depression due to the associated septicemia (Dilek, 2008). Although anemia in brucellosis is expected to be due to BM involvement, numerous other pathogenetic mechanisms can be (and have been) implicated. Lambros et al. (2010) reported that brucellosis induced an autoimmune process, culminating in autoimmune hemolysis. In this study, blood culture was positive for brucellosis in 23 children (21 for B. melitensis and 2 for B.abortus). BM culture was done for 9 children, 3 of them was positive and isolated B. melitensis. The majority of children with brucellosis (63%) had serum agglutination titres of 1/160-1/320. In this study, the most common symptoms and signs, in 11 children with pancytopenia, included bone aches and weakness (in 82%), sweating and chills (in 64%), petechiea and purpura (in 55%), hepatomegaly and splenomegaly (in 46%). The majority of children with pancytopenia (73%) have an agglutination titres of 1:320-1:640 or more. Furthermore, all cases with pancytopenia had positive blood culture. Nearly similar results were obtained by other studies (Bilal et al., 1991; and Al-Eissa & Al-Nasser, 1993;Sari et al., 2008; Dilek et al., 2008; Omidi et al., 2009; Koura & Mohammed, 2009). Recommendations:

te.comhttp://www.lifesciencesi) 113;10(20Journal Science Life
1367
1) Surveillance, testing and massive immunization of animals in areas of Saudi Arabia with high infection rate.
2) An organized national brucellosis control program to eradicate the disease.
Table 1: Demographic and clinical characteristics of 60 children diagnosed as having brucellosis, presented as number (n) and percentage (%).
Table 2: Hematological manifestations, cultures and agglutination titres among 60 study children, presented as number (n) and percentage (%).
Characteristic(s) n %
Age (years): Mean ± SD
Range
7.6±1.8
5-16 Males 43 71.7 Duration of fever (days), X±SD 9.6±5.3 History of raw milk ingestion 50 83.3 Family history of brucellosis 27 45 Symptoms :
Excessive sweating Bone ache
Chills Painful or swollen joints
Weakness
41 37 33 22 21
68.3 61.7 55
36.7 35
Signs : Arthritis
Hepatomegaly Splenomegaly
Hepatosplenomegaly Lymphadenopathy
Petechiae and purpura
19 11 9 4 4 3
31.7 18.3 15 6.7 6.7 5
* positive for B.melitensis
Table 3: Clinical and laboratory findings of 11 children suffering pancytopenia.
Finding n=11 %=18-31
Symptoms, no (%) Bone aches & weakness Sweating & chills Painful & swollen joints
9 7 5
81.8 63.6 45.5
Signs, no (%) Petechiae & purpura Hepatomegaly Splenomegaly Hepatosplenomegaly Arthritis Generalized lymphadenopathy
6 5 5 3 3 3
54.5 45.5 45.5 27.3 27.3 27.3
CBC, X±SD Hemoglobin (g/dl) WBC x 109/ml Platelets x 109 /ml
5.9±2.8 3.12±1.3 32.7±4.7
Agglutaination titres, n(%): 1:160 – 1:320 1:320 – 1:640 & more
3 8
27.3 72.7
Positive blood culture*, n(%) 11 100
* positive for B.melitensis.
n %
Hematological manifestations: Anemia Leucopenia Leucocytosis Pancytopenia Lymphocytosis
26 23 12 11 5
43.3 38.3 20.0 18.3 8.3
Cultures : Positive blood culture B.melitensis B.abortus
23 21 2
38.3 35 3.3
Positive bone marrow culture* 3 5 Negative bone marrow culture 6 10 Agglutination titres 1/160-1/320 1/320-1/640 & more
38 22
63.3 36.7
te.comhttp://www.lifesciencesi) 113;10(20Journal Science Life
1368
5-References 1- Afscharpaiman S, Mamishi S (2008).
Brucellosis: review of clinical and laboratory features and therapeutic regimens in 44 children. Acta Medica Iranica; 46(6): 489-94.
2- Al-Anazi KH, Asma M Al Jasser (2007). Brucella bacteremia in patients with acute leukemia: a case series. J Med Case Reports; 1: 144.
3- Al-Eissa YA (1999). Brucellosis in Saudi Arabia: Past, present and future. Annals of Saudi Medicine; 19(5):403-405.
4- Al-Eissa Y, Al-Nasser M (1993). Haematological changes in brucellosis. Infection; 21(1): 23-6.
5- Al-Eissa YA, Assuhaimi SA, AL-Fawaz IM, et al. (1993). Pancytopenia in children with brucellosis: clinical manifestations and bone marrow findings. Acta Haematol; 89: 132-6.
6- Alpay F (2010). Two unusual presentations of childhood brucella cases. J Curr Pediatr; 8: 39-43.
7- Aysha MH, Shayib MA (1986). Pancytopenia and other haematological findings in brucellosis. Scand J Hematol; 36: 335-8.
8- Benjamin B, Annobil SH (1992). Childhood brucellosis in South-Western-Saudia Arabia: a 5-year experience. J Trop Pediatr; 38(4): 167-72.
9- Bilal NE. Jamjoom GA, Bobo RA, Aly OFM, El-Nashar NM (1991). Brucellosis in the Asir region of Saudi Arabia. Saudi Med J; 12:37-41.
10- Dag MS, Turkbeler I, Gokhan A, et al. (2011). Mesenteric lymphadenitis, pancytopenia, and acute brucellosis Gaziantep Med J; 17(3): 153-54.
11- Dilek I, Durmus A, Karahocagil MK, et al. (2008). Hematological complications in 787 cases of acute brucellosis in Eastern Turkey. Turk J Med Sci; 38(5): 421-424.
12- Eser B, Altuntas F, Soyuer I, et al. (2006). Acute lymphoplastic leukemia associated with
brucellosis in two patients with fever and pancytopenia. Yonsei Med J; 47(5): 741-44.
13- Issa H, Jamal M (1999). Brucellosis in children in South Jordan. East Mediterrnean Health J; 5(5): 895-902.
14- Koura H, Mohammed A (2009). Pancytopenia in children with brucellosis. Sci J Azhar Med Fac (Girls); 30(2): 725-33.
15- Lambros K Bourantas, Pappas G, Kapsali E, et al. (2010). Brucellosis induced autoimmune hemolytic anemia treated with Rituximab. Annals Pharmacotherapy; 44:1677-680.
16- Omidi A, Jafarian AH, Erfanian M, Yazadanpanah MJ, Sharifian M (2009). Acute brucellosis with pancytopenia and maculopapular rash. Iranian J Pathol.; 4(3): 133-36.
17- Sari I, Altuntas F, Hacioglu S, et al (2008). A multicenter retrospective study defining the clinical and hematological manifestations of brucellosis and pancytopenia in a large series: hematological malignancies, the usual causes of pancytopenia in patients with brucellosis. Am J Hematol; 83: 334-9.
18- Sen TA, Demir T, Koken R, Kundak AA, Pesce MA (2011). Reference ranges for laboratory tests and procedures. In: Kliegman RM, Behrman RE, Jenson HB, Stanton BE (eds). Nelson textbook of pediatrics 19th ed., Saunders Co., Philadelphia, 2959-69.
19- Soker M, Devecioglu C, Yaramis A, et al. (2001). Microgangiopathic hemolytic anemia, thrombocytopenia and acute renal failure associated with acute brucellosis. Int Pediatrics; 16(2): 105-8.
20- Yildirmak Y, Palanduz A, Leyla Telhan, Arapoglu M, Kayaalap N (2003). Bone marrow hypoplasia during brucella infection. J Pediatr Hematol Oncol; 25(1): 63-4.
21- Young EJ (2004). Brucellosis. In: Feigin RD, Cherry JD, Demmler GJ, Kaplan SL (eds). Textbook of pediatric infectious diseases, 5th ed., Philadelphia. Saunders Co. 1582-87.
12/22/2012

mhttp://www.lifesciencesite.co )12013;10( Life Science Journal
1369
The effect of intrauterine instillation of E-Aminocaproeic Acid during hysteroscopic operations in the management of intractable uterine hemorrhage:A Randomized Clinical Trial
Sayyah-melli Manizheh1, Ouladehsahebmadarek Elaheh1, Taghavi Simin1, Jafary Shobeiry Mehry1, Mostafa
Garabaghi Parvin1, Nabipoure Bahareh2, Arash Khaki3
1- Women’s Reproductive Health Research Center, Tabriz University of Medical Sciences, Tabriz, Iran 2- Faculty of Medicine, Tabriz University of Medical Sciences, Tabriz, Iran
3- Department of Pathology, Tabriz Branch, Islamic Azad University,Tabriz-Iran Abstact: The main objective of this study is to determine the effect of intrauterine instillation of ε-aminocaproic acid (EACA) during hysteroscopic operations in the management of uterine bleeding. Seventy participants have been considered for each group in a double blind, RCT in a teaching hospital in Tabriz University of Medical Sciences from Oct. 2010 to Dec. 2012. Patients with a history of abnormal uterine bleeding accompanied submucous myoma less than 4 cm in diameters, were included. Both groups received dextrose 5% as a distending media. Only in group 1, EACA acid added to injected media. Intrauterine bleeding during hysteroscopic surgery was determined by visual scale. Intraoperative bleeding, duration of surgery, the volume of injected media, and success in completion of operation were considered as primary outcomes and postoperative complication including gastrointestinal side effects, uterine bleeding, and duration of hospital stay are considered as secondary outcomes. Of 140 patients, 120 of them completed the study. Patients in group 1 had less intraoperative intrauterine bleeding compared to group 2 (p =0.02). There was no statistically significant at the mean operation time (P=0.45). Statistically significant differences were found between the two groups to create a very clear operative field.[RR= 2.82 95%CI (1.76 – 4.5) (P<0.001)]. There was no significant intraoperative and postoperative complications in both groups (p>0.05). The results showed that EACA is effective in reducing hysterocopic intraoperative uterine bleeding. EACA makes a clear and un-blurred environment to achieve good surgical results. EACA is suggested for other uterine endoscopic surgeries. Sayyah-melli Manizheh, Ouladehsahebmadarek Elaheh, Taghavi Simin, Jafary Shobeiry Mehry, Mostafa Garabaghi Parvin, Nabipoure Bahareh, Arash Khaki. The effect of intrauterine instillation of E-Aminocaproeic Acid during hysteroscopic operations in the management of intractable uterine hemorrhage:A Randomized Clinical Trial. Life Sci J 2013;10(1):1369-1374] (ISSN:1097-8135). http://www.lifesciencesite.com. 206 Key words: E-Aminocaproeic Acid, hysteroscopy, uterine bleeding 1. Introduction
Abnormal uterine bleeding (AUB) is a common health complaint of women and up to 14 percent of women experience irregular or excessively heavy menstrual bleeding (1). It can be caused by a wide variety of problems. In premenopausal women AUB could have anovulatory and ovulatory patterns. Ovulatory abnormal bleeding may emanate from definable pathologic entities in the endometrial cavity such as polyps and submucous leiomyomas (2). When clear structural causes are identified, the decision will be hysterectomy (1). However, this intervention is not an ideal option during a woman’s reproductive years and submucous myomata no longer require hysterectomy because they can be satisfactorily managed conservatively by operative hysteroscopy (3). Operative hysteroscopy obtains a good environment to see and treat the uterine pathology (4). Although, hysteroscopy is an effective method for examining the uterine cavity but limited space inside the uterine cavity, inability to achieve a bright view and a satisfactory haemostasis are its potencial limitations. Several options have been carried out to overcome the
problem, including instillation of viscid media. The major disadvantages of most types of distending media is absorption of the irrigation fluid and susquent resuls such as life-threatening fluid overload and electrolyte disturbances if the duration of operation is long (5). To make a facilitation in performing hysteroscopic procedure, accurate fluid balancing, limiting the operation time and to create a bright view inside the uterine cavity, several strategies have been advocated. Some authors advocated preoperative use of danazol (6) and GnRH analogues (7,8), to reduce bleeding and the amount of fluid absorbed into the systemic circulation. The use of intrauterine prostaglandin F2α has also been described to facilitate extrusion of type 2 myomas (9). These medications have resulted to less intraoperative complications but they could not control bleeding episode during surgery. Antifibrinolytic tranexamic acid (ɛ-Aminocaproeic Acid, EACA), is one of the most effective medical therapy to treat heavy menstrual bleeding (10, 11). It is also used to treat or prevent excessive blood loss during surgery and in various other medical and surgical conditions such as elective cesarean section (12), postpartum haemorrhage
mhttp://www.lifesciencesite.co )12013;10( Life Science Journal
1370
(13), and hemorrhagic cystitis (14). It has also been shown that tranexamic acid reduces blood transfusion in surgery and is effective and safe for the reduction of blood loss (15). In contrast, some investigators has not recommended it for routine use (16), and others showed an uncertain effects (17), or no additional benefit for intravenous infusion of tranexamic acid (18). So we decided to use the agent directly to the surgical site to obtain good surgical results. Satisfactory distension of the uterine cavity to obtain clear visualization of the space and sustain the view bright without bleeding during procedure is an important outcome. This study was planned to determine the effect of intrauterine instillation of EACA during hysteroscopic operations in the management of uterine bleeding during hysteroscopic surgeries, making a bright view during operation, reduce duration of surgery, intraoperative and postoperative complcationas during and after hysteroscopic resectoscopic surgery and successfully performing the procedure. 2. Methods
A double-blind RCT was conducted at Alzahra University-affiliated Teaching Hospital in Tabriz University of Medical Sciences from Oct. 2010 to Sept.2012. Seventy participants have been considered for each group. The initial sample size with the probability (power) of 0.08, was caculated to be 60 patient for each and the sample size was increased to 70 number for each group to enhance the validity of study. Participants were allocated to intervention (group 1) and control (group 2) groups according to the RandList (RandList version 1.2, DatIng GmbH, Tübingen, Deutschland; seed number: 1901365632). Each participant gave written consent to participate. Patients with the history of persistent moderate uterine bleeding accompanied submucous myoma less than 4 cm in diameters; type 0 or type 1, and patients' willing to participate were included. Patients with cardiopulmonary, hepatic, and renal diseases, hypertension, metabolic disorders including diabetes, and high serum lipids, who had genital infections, uterine septum or structural abnormality, history of cervical and uterine cancer and history of thrombophilia or who were taking anticoagolants, pregnant women, and patients who had severe bleeding were excluded. Preoperative assessment of the fibroid was based on transvaginal ultrasound. Preoperatively, official endometrial biopsy and pap smear were performed for all patients to rule out malignancy. Pre and post-operative evaluation was made according to the routine control of patients in addition to checking of hemoglobin and hematocrit, plasma sodium and potassium levels before and 6 hours after the surgery. In addition, Misoprostol 200μg administrated vaginally
on cervical priming 12 hours before the procedure. All procedures were performed under general anesthesia and all patients received saline normal during surgery. Mean time for cervical dilatation by Hegar series was omitted from total time. A monopolar resectoscope was used and dextrose 5%, was selected as a distending media. In cases (group 1), one gram of E-Aminocaproeic Acid (TRANEXIP; Caspian Tamin Pharmaceutical Co. Iran), for every one liter of dextrose 5% and in controls (group 2), placebo i.e., dextrose 5% in the same form inside every one liter of the dextrose 5%, was used. The operative room temperature was used for instillation of the serums. Intrauterine bleeding during hysteroscopic surgery was determined by visual Likert scale between surgeon and circulate nurse in agreement, to estimate the amount of bleeding as no bleeding, mild, moderate and severe. The surgeon was not aware from the medication type which was used inside the serum. The need for transfusion, anesthetic compilations, and decide to not continuing operation was made during surgery. Accurate measurment of the absorbed volume was made by a closed system. Interaoperative bleeding, the quality of view, duration of surgery, the volume of injected media, intraoperative complications includig anesthetic side effects such as hypotension and bradycardia and success in completion of operation are considered as primary outcomes and documented. Levels of hematocrit, plasma sodium and potassium, 6 hours afer surgery, length of hospital stay, postoperative complications including gastrointestinal side effects, headache, postoperative uterine bleeding, leg muscles crump and duration of hospital stay are considered as secondary outcomes and were filled in data sheet. The study protocol was reviewed and approved by the Tabriz Research Affairs Review Board. Data were analyzed using both descriptive and analytic statistics. Values were given as the Means ± SD and N and (%). The chi squared (χ2) test, independent sample t- tests, and a repeated measurement ANOVA were performed on data. For all measurement parameters, differences were considered statistically significant at a p-value less than 0.05. All statistical analyses were performed using SPSS version 17.0 statistical software for Windows. The analyses was blind. 3. Results
One hundred and forty patients entered and 120 of them completed the study. In 20 patients (10 in each group) (28.4%), the procedure could not be proceeded because the uterine cavity did not distend at all. The patients'characteristics are shown in the table 1. There were no differences in demographic characteristics variable between the two groups.

mhttp://www.lifesciencesite.co )12013;10( Life Science Journal
1371
Table 1. Demographic characteristics of participants P value Group 2
mean±SD Group 1 mean±SD
0.39 40.9±9 39.6±7.8 Age 0.85 3.3±0.3 2.5±0.3 Gravity 0.13 2.8±0.2 2.1±0.2 Parity
Instillation of EACA was resulted to complete removal of the myoma in 56.6% (N=34) (grade 0) and 33.3% (N=20) (grade 1) of myomas in group 1 compared to 26.6% (n=16) (grade 0) and 25% (n=15) of myomas in group 2, which the difference was significant (p<0.001). Two groups were compared in terms of blood loss. Overall women in group 1 had less intraoperative intrauterine bleeding compared to group 2 (table 2)(p < 0.022).
Table 2. Amount of intraoperative intrauterine
bleeding P
value* No
bleeding N(%)
Mild N(%)
Moderate N(%)
Severe N(%)
0.022 26 (43.3%)
24(40%) 9 (15%) 1 (1.7%)
Group 1
14 (23.7%)
21 (35.6%)
21 (35.6%)
3 (5.1%)
Group 2
*P value< 0.05 was considered significant The mean operating time was 11±0.8 min and 10.8±0.9min for group 1 and 2, respectively which was not statistically significant (p=0.45). The results of χ2 analysis showed that a very clear operative field was found in 43 (71.6%) of group 1 compared to 15 (25%) of group 2, which the difference was statistically significant [RR= 2.82 95%CI (1.76 – 4.5)]( P<0.001). The results of instillated media volume, uterine size and myoma size are shown in table 3.
Table 3.The results of instilled media during hysteroscopy and uterus characteristics
P value*
Group 2 mean±SD
Group 1 mean±SD
0.01 2.4±0.2 1.8±0.2 Media volum used
0.51 11.1±0.9 10.0±0.7 Endometrial thikness
0.10 94.7±3.5 88.3±2.5 Uterin size 0.30 34.6±6.7 23.7±4.1 Myoma size
*P value< 0.05 was considered significant
Independent samples T test showed that the difference betweem the means of the injected media volume between groups was significant and in group 2 was higher (1800±200 cc vs. 2400±200cc) (P=0.01). But there was no difference at the mean size of the fibroid (23.7±4.1 cm vs. 34.6±67 cm) (P=0.30) and
uterine size (88.3±2.5cm vs. 94.7±3.5 cm) (P=0.51), between groups. The mean of EACA was 2.8g (0.5-4). There was no difference at the location of myomas inside the uterine cavity. In most patients of both groups (58% vs 60%, respectively), the myoma was located at the fundal - anterior surface of the uterus. The results of χ2 test showed that in 8.5% of group 1(n=5) and 8.3% of group 2 (n=5), the final results of pathology was endometrial polyp and two cases of endometrial hyperplesia was reported in group 2. There were no procedure-related complications in either group. There was also no significant postoperative complications in both groups. Only one case of nausia was reported in group 2. The levels of Hct before and 6 hours after the surgery was 37.2±6.4 and 34.5±5.3 in group 1 and 36.7±5.3 and 33.9±7.9 in group 2, respectively, which the difference between groups was not significant (p=0.95). In addition, there was no significant diferrence at the levels of Na+ and K+ between groups 6 hours after gurgery (p=0.45). There was no difference between groups at discharge time and more than 50% of them discharged on operation day.
4. Discussion
The results of our study show that women who received EACA, met all two primary efficacy end points, first; a significantly greater reduction in intrauterine blood loss compared to women who received dexterose (table 2) (P<0.001) and higher bright view [RR= 2.82 95%CI (1.76 – 4.5)]; second, lower infusion volume (p=0.01), and a higher surgical satisfaction (p<0.001). The duration of surgery in EACA group was shorter than in dexterose group, however, it was not significant. There was also no significant adverse events including gastrointestinal adverse effects such as nausia and vomiting. There was no potential complications such as venous air and gas embolism, uterine rupture which need for cancelling of the procedure. In 10 patients in each group the uterine cavity had a restricted space, so the procedure abandoned.
In recent years hysteroscopy is performed extensively for both to view and treat the pathology within the uterine cavity. Although hysteroscopic resection of submucous myomas is considered a safe procedure, but absorption of the irrigation fluid and intraoperative bleeding may result in life-threatening complications (19). Accurate fluid balancing and limiting the operation time may prevent these complications (5). Selection of a distending media requires consideration of the advantages, disadvantages, and risks associated with various media as well as their compatibility with electrosurgical or laser energy (20). The most common perioperative complications associated with operative hysteroscopy
mhttp://www.lifesciencesite.co )12013;10( Life Science Journal
1372
are hemorrhage (21). The walls of uterine cavity are so richly endowed with blood vessels that touching it with the sheath of the hysteroscope may invariably produces bleeding and for keeping the field clean, the clots need pushed apart or implement a strategy to reduce bleeding. To improve the procedure safty and minimize invasion some studies investigated preoperative administeration of medications to overcome the intraoperative complications. The preoperative use of danazol (6) or GnRH analogues (8), may reduce operating time, bleeding and the amount of fluid absorbed into the systemic circulation and difficulty of the procedure.Endometrial thinning prior to hysteroscopic surgery in the early proliferative phase of the menstrual cycle improves both the operating conditions for the surgeon and short term post-operative outcome. Despite both agents produce satisfactory results, but the effect of these agents on longer term post-operative outcomes such as amenorrhoea and the need for further surgical intervention reduces with time (22).On the other hand, the value of pre-operative GnRH analogues to facilitate resection of myoma is uncertain and the reports show no benefit (23).In addition, intrauterine prostaglandin F2α has been used to facilitate extrusion of type 2 myomas (9), but the effects of these medications during surgery is also unpredictable.
A variety of distending media have been used to achieve good visualization within the uterine cavity, but each one has some limitations and disadvantages such as vascular uptake, allergic reaction (5, 24, 25). Most complications could be avoided by closely monitoring fluid balance intraoperatively. In this study, we used dextrose 5%, because we were using a monopolar system. However, there was no hazard of this media relates to its vascular absorption and creation of an acute hyponatremic or hypo-osmolar state and the levels of Na+ and K+ were not changed after surgery. In addition, intraoperative intrauterine control of bleeding reduced both media over load and intrauterine bleeding , hence, gave opportuinity to complete the procedure and prevented unpleasant outcomes. EACA which was used in this study, is a plasminogen activator inhibitors and approved by the U.S. Food and Drug Administration for the treatment of ovulatory bleeding. Plasminogen activators are a group of enzymes that cause fibrinolysis and the dissolution of clots. An increase in the levels of plasminogen activators has been found in the endometrium of women with heavy menstrual bleeding. Plasminogen activator inhibitors such as EACA and tranexamic acid have therefore been promoted as a treatment for heavy menstrual bleeding in oral form or paraentrally (26, 27). It is also used during surgery to prevent clot breakdown (fibrinolysis) in order to reduce surgical blood loss (15, 28-30). In contrast, according to
Cochrane Database System Review , tranexamic acid has not been recommended for routine use (16). Raviraj and colleagues in their study showed that tranexamic acid reduces blood transfusion in surgical patients while its effects on thromboembolic events and mortality are uncertain (17). Caglar and co-workers in their study to define the effect of tranexamic acid use on perioperative and postoperative bleeding and blood transfusion requirements in women undergoing myomectomy, did not found any additional benefit for intravenous infusion of tranexamic acid (18). Although there has been a reluctance to prescribe tranexamic acid due to possible side effects of the drugs such as an increased risk of thrombogenic disease (deep venous thrombosis), long term studies in Sweden, however, have shown that the rate of incidence of thrombosis in women treated with tranexamic acid is comparable with the spontaneous frequency of thrombosis in women (10, 11,26). Therefore, EACA can be used to obtain good results without side effects.EACA is administerated intraoperativly and affect directly on bleeding from the uterine wall and myoma bed, reduce operating time and systemic absorption of distension media, facilitate complete removal of myoma and more importantly, they make a bright view to follow the procedure completely .The limitation of this study was the small sample size, and different myoma size. These promising findings need to be confirmed by well-designed and adequately powered prospective study with large sample size using patient-related outcomes and by carefully examine the safety and efficacy of these agents.
5. Conclusion
This study confirms that hysteroscopic resectoscopy with instillation of EACA is a safe, and rapid surgical procedure with no complications, which is peculiar to a good patients’ outcome. Addition of EACA to the fluid medium resulted to create a very clear operative field, bright and un-blurred environment to achieve good surgical results, which allowed the operator to see operative site continusely without interuption of the procedure. EACA was effective in reducing intraoperative and postoperative bleeding, operative duration, intraoperative and postoperative complications. This approach could be used in other uterine endoscopic surgeries and with other distending media or bipolar instruments.
Acknowledgment
We thank and fully acknowledge the staff of Alzahra Teaching Hospital for their help, Research affair of Tabriz Faculty of Medicine for supporting the proposal. Finally thanks from, Dr. Morteza Ghojazadeh for his contribution for data analysis. References , Irct registration number was: IRCT201105235283N2.this
mhttp://www.lifesciencesite.co )12013;10( Life Science Journal
1373
manuscript was obtained of medical thesis in M.D degree. Coresponding author: Arash Khaki email:[email protected] Tel:0098-914313-8399 Department of Pathology, Tabriz Branch, Islamic Azad University, Tabriz-Iran. Conflict of interest: Authors declare that they have no conflict of iterest. References 1. Sweet MG, Schmidt-Dalton TA, Weiss PM,
Madsen KP.Evaluation and management of abnormal uterine bleeding in premenopausal women. Am Fam Physician. 2012 Jan 1;85 (1):35-43.
2. Munro MG, Critchley HO, Fraser IS. The FIGO systems for nomenclature and classification of causes of abnormal uterine bleeding in the reproductive years: who needs them? Am J Obstet Gynecol. 2012 Oct;207 (4):259-65.
3. Marret H, Fritel X, Ouldamer L, Bendifallah S, Brun JL, De Jesus I, Derrien J, Giraudet G, Kahn V, Koskas M, Legendre G, Lucot JP, Niro J, Panel P, Pelage JP, Fernandez H.Therapeutic management of uterine fibroid tumors: updated French guidelines. Eur J Obstet Gynecol Reprod Biol. 2012 Aug 29.
4. van Dongen H, Emanuel MH, Wolterbeek R, Trimbos JB, Jansen FW.Hysteroscopic morcellator for removal of intrauterine polyps and myomas: a randomized controlled pilot study among residents in training.J Minim Invasive Gynecol. 2008;15(4):466.
5. Wegmüller B, Hug K, Meier Buenzli C, Yuen B, Maggiorini M, Rudiger A.Life-Threatening Laryngeal Edema and Hyponatremia during Hysteroscopy.Crit Care Res Pract. 2011;2011:140381.
6. Florio P, Filippeschi M, Imperatore A, Mereu L, Franchini M, Calzolari S, Mencaglia L, Litta P. The practicability and surgeons' subjective experiences with vaginal danazol before an operative hysteroscopy. Steroids. 2012 Apr;77 (5):528-33.
7. Sabry M, Al-Hendy A. Medical treatment of uterine leiomyoma.Reprod Sci. 2013 Apr;19 (4):339-53.
8. Muzii L, Boni T, Bellati F, Marana R, Ruggiero A, Zullo MA, Angioli R, Panici PB. GnRH analogue treatment before hysteroscopic resection of submucous myomas: a prospective, randomized, multicenter study. Fertil Steril. 2010 Sep;94 (4):1496-9.
9. Murakami T, Tachibana M, Hoshiai T, Ozawa Y, Terada Y, Okamura K. Successful strategy for the hysteroscopic myomectomy of a submucous
myoma arising from the uterine fundus. Fertil Steril. 2006 Nov;86(5):1513.e19-22.
10. Lukes AS, Moore KA, Muse KN, Gersten JK, Hecht BR, Edlund M, Richter HE, Eder SE, Attia GR, Patrick DL, Rubin A, Shangold.Tranexamic acid treatment for heavy menstrual bleeding: a randomized controlled trial. GASO Obstet Gynecol. 2010;116(4):865.
11. Leminen H, Hurskainen R. Tranexamic acid for the treatment of heavy menstrual bleeding: efficacy and safety. Int J Womens Health. 2012; 4:413-21.
12. Gungorduk K, Yıldırım G, Asıcıoğlu O, Gungorduk OC, Sudolmus S, Ark C.Efficacy of intravenous tranexamic acid in reducing blood loss after elective cesarean section: a prospective, randomized, double-blind, placebo-controlled study. Am J Perinatol. 2011 Mar;28(3):233-40.
13. Shakur H, Elbourne D, Gülmezoglu M, Alfirevic Z, Ronsmans C, Allen E, Roberts I. The WOMAN Trial (World Maternal Antifibrinolytic Trial): tranexamic acid for the treatment of postpartum haemorrhage: an international randomised, double blind placebo controlled trial. Trials. 2010 Apr 16; 11:40.
14. Lakhani A, Raptis A, Frame D, Simpson D, Berkahn L, Mellon-Reppen S, Klingemann H. Intravesicular instillation of E-aminocaproic acid for patients with adenovirus-induced hemorrhagic cystitis. Bone Marrow Transplant. 1999 Dec; 24(11):1259-60.
15. Ker K, Edwards P, Perel P, Shakur H, Roberts I. Effect of tranexamic acid on surgical bleeding: systematic review and cumulative meta-analysis. BMJ. 2012 May 17;344:e3054.
16. Gluud LL, Klingenberg SL, Langholz E. Tranexamic acid for upper gastrointestinal bleeding. Cochrane Database Syst Rev. 2012 Jan 18;1:CD006640.
17. Raviraj Raveendran, Jean Wong. Tranexamic acid reduces blood transfusion in surgical patients while its effects on thromboembolic events and mortality are uncertain. Evid Based Med doi:10.1136/eb-2012-100872.
18. Caglar GS, Tasci Y, Kayikcioglu F, Haberal A. Intravenous tranexamic acid use in myomectomy: a prospective randomized double-blind placebo controlled study. Eur J Obstet Gynecol Reprod Biol. 2008 Apr;137(2):227-31.
19. Van Kruchten PM, Vermelis JM, Herold I, Van Zundert AA.Hypotonic and isotonic fluid overload as a complication of hysteroscopic procedures: two case reports. Minerva Anestesiol. 2010 May;76(5):373-7.
20. Kucera E.Distension media in hysteroscopy--use and complications CeskaGynekol. 2003 May;68(3):191-5.
mhttp://www.lifesciencesite.co )12013;10( Life Science Journal
1374
21. American Association of Gynecologic Laparoscopists (AAGL): Advancing Minimally Invasive Gynecology WorldwideAAGL practice report: practice guidelines for the diagnosis and management of submucous leiomyomas. J Minim Invasive Gynecol. 2012 Mar-Apr;19(2):152-71.
22. Sowter MC, Lethaby A, Singla AA. Pre-operative endometrial thinning agents before endometrial destruction for heavy menstrual bleeding. Cochrane Database Syst Rev. 2002;(3):CD001124.
23. Mavrelos D, Ben-Nagi J, Davies A, Lee C, Salim R, Jurkovic D. The value of pre-operative treatment with GnRH analogues in women with submucous fibroids: a double-blind, placebo-controlled randomized trial. Hum Reprod. 2010 Sep;25(9):2264-9.
24. Paul D. Indman, Philip G. Brooks, Jay M. Cooper, Franklin D. Loffer, Rafael F. Valle, and Thierry G. Vancaillie. Complications of Fluid Overload from Resectoscopic Surgery. June 22, 2011.
25. Van Kruchten PM, Vermelis JM, Herold I, Van Zundert AA .Hypotonic and isotonic fluid overload as a complication of hysteroscopic procedures: two case reports. Minerva Anestesiol. 2010 May;76(5):373-7.
26. Lethaby A, Farquhar C, Cooke I. Antifibrinolytics for heavy menstrual bleeding.Cochrane Database Syst Rev. 2000;(4):CD000249.
27. Lakhani KP, Marsh MS, Purcell W, Hardiman P. Uterine artery blood flow parameters in women with dysfunctional uterine bleeding and uterine fibroids: the effects of tranexamic acid. Ultrasound Obstet Gynecol. 1998 Apr;11(4):283-5.
28. MacGillivray RG, Tarabichi SB, Hawari MF, Raoof NT. Tranexamic acid to reduce blood loss after bilateral total knee arthroplasty: a prospective, randomized double blind study. J Arthroplasty. 2011 Jan;26(1):24-8.
29. Perel P, Al-Shahi Salman R, Kawahara T, Morris Z, Prieto-Merino D, Roberts I, Sandercock P, Shakur H, Wardlaw J. Clinical Randomisation of an Antifibrinolytic in Significant Haemorrhage) intracranial bleeding study: the effect of tranexamic acid in traumatic brain injury--a nested randomised, placebo-controlled trial. Health Technol Assess. 2012;16(13):iii-xii, 1-54.
30. Abrishami A, Chung F, Wong J. Topical application of antifibrinolytic drugs for on-pump cardiac surgery: a systematic review and meta-analysis. Can J Anaesth. 2009 Mar;56(3):202-12.
1/25/2013

Life Science Journal 2013;10(1) http://www.lifesciencesite.com
http://www.lifesciencesite.com [email protected] 1375
Globalisation and Labour Supply in Malaysia
Poo Bee Tin, Rahmah Ismail
School of Economics, Faculty of Economics and Management, University Kebangsaan, Malaysia, 43600 Bangi,
Selangor, Malaysia. [email protected] Abstract: Globalisation opens the economy, moves goods, services, capital, labour and technology physically. In the context of labour market, the inflow of labour input is more relevant, because it gives implication on local labour especially in terms of job opportunities. Individual perception on the impact of globalization may change their attitude towards being working, but on the other hand, the labour supply may increase to cope with increasing cost of living due to globalization. Consequently, examine the determinants of labour supply is crucial in understanding the structure of labour market in the new era of globalization. The objective of this article is to examine labour supply by taking into account the globalisation effect. The study covers 3885 households in Peninsular Malaysia who are chosen using stratified random sampling. The basic labour supply determinants are own wage and non-
labour income. Though, the extended labour supply model includes other factors like spouse wage,number of children and individuals characteristics like education level and age. Likewise, the globalization indicator will also be integrated as another independent variable. The logistic regression is used to measure the functional relationship between the dependent variable and the independent variables. The results from the both logistic labour supply models demonstrate an expected sign for coefficient of age, which is negative and significant. Another interesting finding is that non-labour income is positive and significantly affects the labour supply, which means that non-labour income is one of the main concerns for the head of the household on the working decision. Globalisation is not significantly affecting the head of household labour supply, which mean that globalisation process is not a main concern of the head of household in securing their jobs. [Poo Bee Tin, Rahmah Ismail. Globalisation and Labour Supply in Malaysia. Life Sci J 2013;10(1):1375-1385] (ISSN:1097-8135). http://www.lifesciencesite.com. 207 Keywords: Globalisation,; head of households; labour supply; wage; non-labour income. 1. Introduction
Globalisation has occurred at different speeds in different countries and has often been an uneven but cumulative process. Multinational corporations are one of the main actors in this globalisation drama. A relatively small number of these companies have a disproportionate share in world trade and world production and, together with large financial corporations, are deeply involved in international short- and long-term capital flows (Epstein, 2005).
Globalisation is a process where interlink between countries in the world becomes more intense and flow of inputs between one country to another will be much easier. In the context of labour market, the inflow of labour input is more relevant, because it gives implication on local labour especially in terms of job opportunities. Individual perception on the impact of globalization may change their attitude towards being working, but on the other hand, the labour supply may increase to cope with increasing cost of living due to globalization. As globalization allows the free flow of input, including labour, it may affect job opportunities for the locals, as they face stiffer completion in securing jobs and may end up being unemployed, especially females who are less preferred by employers ( Rahmah and Poo, 2012).
From the economic perspective, Lairson and Skidmore (1997) view globalisation as the expansion of companies through national boundaries. Globalisation of trade linked with liberalisation in the trade policy has changed the way people work, think and consume, and reduces barriers to free trade. The negative impact of globalisation towards developing countries is the widespread effect of poverty, unemployment and human resource development crisis.
Our starting point is the traditional view of labour supply determinants such as own wage, spouse wage, non labour income, number of children, age and education level. Nowadays, it is important to take into account effect of globalization because globalization allowed free flow of inputs including labour, which may affect job opportunities for the locals. Consequently, investigate the determinants of labour supply is essential in understanding the structure of labour market in the new era of globalization. This study contributes to the literature by investigating the traditional determinants of labour supply as well as the effect of globalization to labour supply. In addition, studying the behavior of labour market can give rise to important policy implications.
Therefore, the objective of this article is to examine determinants of heads of household labour
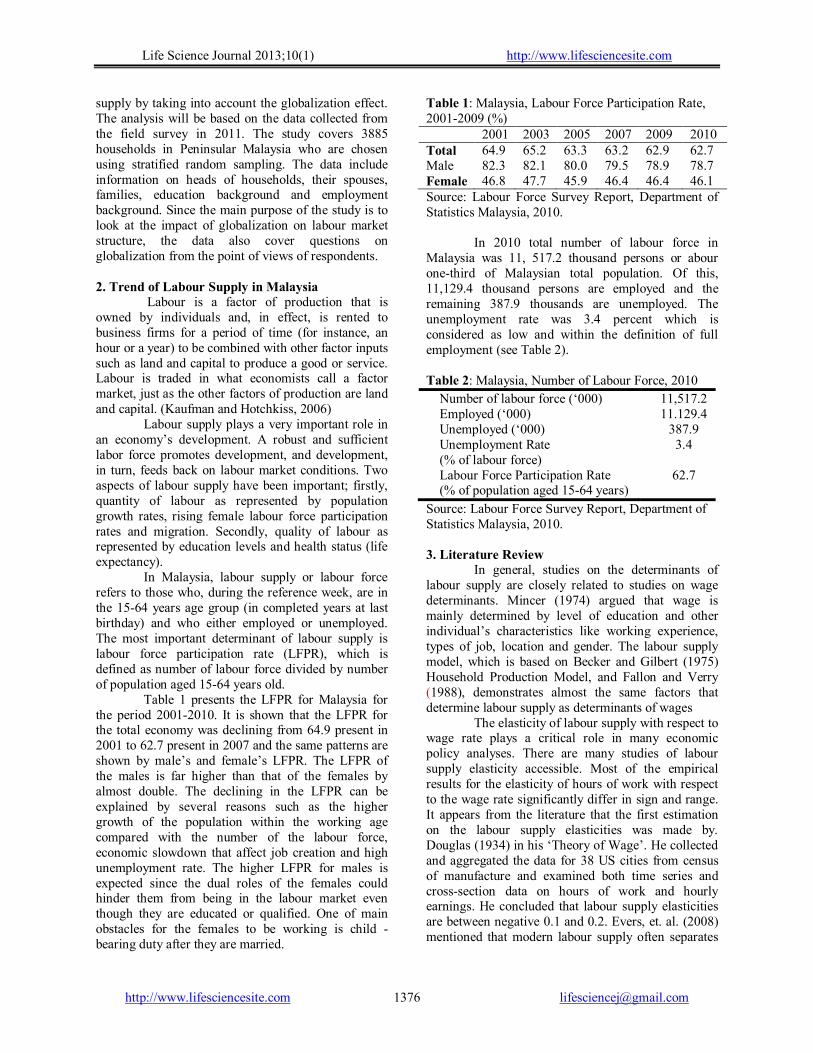
Life Science Journal 2013;10(1) http://www.lifesciencesite.com
http://www.lifesciencesite.com [email protected] 1376
supply by taking into account the globalization effect. The analysis will be based on the data collected from the field survey in 2011. The study covers 3885 households in Peninsular Malaysia who are chosen using stratified random sampling. The data include information on heads of households, their spouses, families, education background and employment background. Since the main purpose of the study is to look at the impact of globalization on labour market structure, the data also cover questions on globalization from the point of views of respondents. 2. Trend of Labour Supply in Malaysia
Labour is a factor of production that is owned by individuals and, in effect, is rented to business firms for a period of time (for instance, an hour or a year) to be combined with other factor inputs such as land and capital to produce a good or service. Labour is traded in what economists call a factor market, just as the other factors of production are land and capital. (Kaufman and Hotchkiss, 2006)
Labour supply plays a very important role in an economy’s development. A robust and sufficient labor force promotes development, and development, in turn, feeds back on labour market conditions. Two aspects of labour supply have been important; firstly, quantity of labour as represented by population growth rates, rising female labour force participation rates and migration. Secondly, quality of labour as represented by education levels and health status (life expectancy).
In Malaysia, labour supply or labour force refers to those who, during the reference week, are in the 15-64 years age group (in completed years at last birthday) and who either employed or unemployed. The most important determinant of labour supply is labour force participation rate (LFPR), which is defined as number of labour force divided by number of population aged 15-64 years old.
Table 1 presents the LFPR for Malaysia for the period 2001-2010. It is shown that the LFPR for the total economy was declining from 64.9 present in 2001 to 62.7 present in 2007 and the same patterns are shown by male’s and female’s LFPR. The LFPR of the males is far higher than that of the females by almost double. The declining in the LFPR can be explained by several reasons such as the higher growth of the population within the working age compared with the number of the labour force, economic slowdown that affect job creation and high unemployment rate. The higher LFPR for males is expected since the dual roles of the females could hinder them from being in the labour market even though they are educated or qualified. One of main obstacles for the females to be working is child -bearing duty after they are married.
Table 1: Malaysia, Labour Force Participation Rate, 2001-2009 (%)
2001 2003 2005 2007 2009 2010 Total 64.9 65.2 63.3 63.2 62.9 62.7 Male 82.3 82.1 80.0 79.5 78.9 78.7 Female 46.8 47.7 45.9 46.4 46.4 46.1 Source: Labour Force Survey Report, Department of Statistics Malaysia, 2010.
In 2010 total number of labour force in
Malaysia was 11, 517.2 thousand persons or abour one-third of Malaysian total population. Of this, 11,129.4 thousand persons are employed and the remaining 387.9 thousands are unemployed. The unemployment rate was 3.4 percent which is considered as low and within the definition of full employment (see Table 2). Table 2: Malaysia, Number of Labour Force, 2010
Number of labour force (‘000) 11,517.2 Employed (‘000) 11.129.4 Unemployed (‘000) 387.9 Unemployment Rate (% of labour force)
3.4
Labour Force Participation Rate (% of population aged 15-64 years)
62.7
Source: Labour Force Survey Report, Department of Statistics Malaysia, 2010. 3. Literature Review
In general, studies on the determinants of labour supply are closely related to studies on wage determinants. Mincer (1974) argued that wage is mainly determined by level of education and other individual’s characteristics like working experience, types of job, location and gender. The labour supply model, which is based on Becker and Gilbert (1975) Household Production Model, and Fallon and Verry (1988), demonstrates almost the same factors that determine labour supply as determinants of wages
The elasticity of labour supply with respect to wage rate plays a critical role in many economic policy analyses. There are many studies of labour supply elasticity accessible. Most of the empirical results for the elasticity of hours of work with respect to the wage rate significantly differ in sign and range. It appears from the literature that the first estimation on the labour supply elasticities was made by. Douglas (1934) in his ‘Theory of Wage’. He collected and aggregated the data for 38 US cities from census of manufacture and examined both time series and cross-section data on hours of work and hourly earnings. He concluded that labour supply elasticities are between negative 0.1 and 0.2. Evers, et. al. (2008) mentioned that modern labour supply often separates
Life Science Journal 2013;10(1) http://www.lifesciencesite.com
http://www.lifesciencesite.com [email protected] 1377
the income and substitution effects and make use of micro data instead of aggregated data. Using data from US coal mining in the first decades of the 20th century, Boal and Ransom (1997) finds the labor supply elasticity to be in the range 1.9–6.8 in the short run and infinite in the long run. However, Manning (2003) shows that the quantitative relationship between employment and wages depends crucially on whether wages are regressed on employment or the other way around, and indicates that the reason is measurement error. He concludes that even though it is reasonable to interpret this relationship as evidence of upward sloping supply curves, such regressions ‘are just not very informative’ on the supply elasticity.
Blundekk and Macurddy (1999) report that across 18-20 estimates of own wage labor supply elasticities in various studies; the median elasticity was 0.08 for men and 0.78 for married women. For cross wage elasticities, Killingsworth (1983) point out that a median spouse wage elasticity of 0.13 for married men’s labor supply and -0.08 for married women’s labor supply, although study of the 1980s by Devereux (2003) analyzing labor supply conditional on having positive hours, reports a cross elasticity of roughly -0.4 to -0.5 for women and -0.001 to -0.06 for men. These surveys indicate that women’s labor supply is considerably more sensitive to their own wages than is men’s. This difference is usually explained by the traditional division of labor in the family, in which women are seen as substituting among market work, home production and leisure, while men are viewed as substituting only or primarily between market work and leisure(Mincer,1962).
Most of the studies about effect of spouse’s wages to labour supply focus on labour supply of wives respond to husbands’ wages. Since, given traditional gender roles, women are perceived as secondary earners within the family, their labor supply is likely to be more negatively affected by their spouse’s wages. Saget (1999) examined the effect on a married woman’s labour supply decision of non-labour income and of her own wage rate in Hungary. The micro analysis showed that total montly household non-labour income has been defined as the sum of two different income components, first, the sum of sosial transfers that are received by any member of the household and second, the montly share of yearly profits. Firstly, the empirical results indicated that wage elasticity for married woman is estimated to be significant positive. Secondly, household earnings other than the wive’s (alternatively, earnings of husband when he is head of the household) were estimated to have no significant negative effect on probability of supplying labour). These imply that Hungarian women take their labour supply decisions independently of their husband’s or
other members of the household’s earning. Finally, the non-labour income effect is consistent with lesuire being a normal good. On the other hand, Morissette and Hou(2008) demostrated that the labour supply of Canadian wives responded strongly changes in husband’s wages during the 1980s.
Generally, as workers age, they may prefer to decrease their number of working hours due to health constraints or care obligations. As a result, one may expect to observe a steady drop in working hours before full retirement. Penner, et.al. (2002) concludes that among older American workers who left their job between 1992 and 2000 about 13% would have stayed in their job if they could have reduced their number of working hours. In Sweden, about 7 percent of the workers aged 50 years and above claim to have physical problems which restrict them from continuing work in the present occupation until the official retirement age, but that shortening working hours would solve the problem Wadensjo (2008).
Education is significantly correlated with economic growth, which, in turn, affects the labour supply patern. Maglad(1998) found a significant positive effect of education on the female labour supply to the urban labour markets in Sudan. Conversely, Jolloffe (2004) showed that increases education levels are associated with decreases in household’s labour supply and increases in their off-farm labour supply in rural Ghana. Babikir and Babiker (2007), who studied labour supply in Sudan, found a negative and significant relationship between education and labour supply in the agriculture sector.
Fajimi and Omonona (2010) examined the impact of women participation in agro-allied small and medium scale enterprises (SME) on poverty alleviation in Nigeria. They found that the poverty level of the women will be decreased by 0.3823 when the education status increased, while for the status of women as either household head or not the poverty level of women will be increased by 2.2319 if there is a unit change in the status. Therefore the process of acquiring good education should be made available because participation of women will be limited to their level of education also with the adoption of new technology for the expansion of the small and medium scale enterprise activities. Also poverty decreases as the level of education increases therefore women should be given the opportunities to education. Although the empirical findings are rather varied, a strong research tradition supports human capital theory as a theoretical framework to clarify and predict the relationship between education and labour supply. Supposedly, labours with higher educational levels are more likely to be active in the labour force since education is an investment that is positively correlated with earnings’ potential.
Life Science Journal 2013;10(1) http://www.lifesciencesite.com
http://www.lifesciencesite.com [email protected] 1378
Most of the literatures on labour supply give special attention on females because of their different characteristics compared with males especially when dealing with house chores. Most studies mentioned about a strong relationship between females labour supply and family size including the age structure of the children. The relationship between children’s age and female labour supply was the main focus in the studies by Gronau (1973), Rosenzweig and Wolpin (1980) and Schultz (1990). All of them demonstrated that children’s age structure has significant impact on female labour supply with negative effect for younger age children (<6 years old) and positive effect for the older age (>12 years old). The study by Wong and Levine (1992) in Mexico and Tienda and Glass (1985) in the United States supported that mother substitute raised female LFPR. In a more specific study, Schultz (1978) found that when number of children increased by three folds, female LFPR would decrease by 8-10 percentage points. The first child is shown to give a greater impact on female labour supply due to higher attention given to him/her by the parent. For example, Rosenzweig and Wolpin (1980) found that the twin first birth reduced female labour supply by 37 percentage points for 15-24 age group and 10 percentage points for the 25-34 age group.
The present of children aged less than 6 years old has greater negative impact on female labour supply (see for example, Lehrer (1992). Carlin and Flood (1997) compared estimates of male labour supply from time-use data with those from conventional survey data using a so called double-hurdle model. Referring to previous studies they noted that the presence of young children normally decreases work hours for women while the effect for males has typically become nonsignificant or weakly positive. In Malaysia, Rahmah and Fatimah (1999) found that number of children aged below 6 years old and 7-19 years old have negative impact on female hours of work in the handicraft industry.
A traditional subject in the analysis of migration focuses on its impact on labour markets variables such as unemployment levels and real wages of native workers in host countries. The effects of foreign workers are traditionally viewed in terms of complementarity or substitutability with natives in the production of household service. In the literature review, most of the simple theoretical models of labour supply suggest that an increase of foreign workers in the native labour market may result in lower wages and/or higher unemployment of natives if they are perfect substitutes to immigrants. In addition, empirical studies typically conclude that immigration has economically irrelevant or no effects on wages and employment of natives, see Borjas, (1994) for survey, is that foreign workers do not have a sizeable
and significant effect on employment and wages of natives in the same segment of the labour market, even when the foreign workers supply shock is large Card (2001) uses 1990 census data to study the effects of immigrant inflows on United State labour market. He found that immigrant inflows over the 1980s reduced wages and employment rates of low-skilled natives in Miami and Los Angeles by 1-3 percentage points. These finding imply that massive expansion of immigrant may have significantly reduced employment rates for younger and less-educated natives in both cities.
Borjas, (2005) analysis indicates that immigration lowers the wage of competing workers: a 10 percent increase in supply reduces wages by 3 to 4 percent. Using German data for the period 1975-1997, Honin (2005) concluded that the direct impact of immigration on native wages is small as a ten percent increase in labor supply stemming from immigration is predicted to reduce wages by less than one percent, with a stronger negative impact for low-skilled natives. In recent work based on US census data, Ottavino and Peri (2008) extends the structural modeling approach of Borjas (2005) to assess the overall impact of immigration on wages while allowing for imperfect substitutability between native and immigrant workers. Their empirical estimates point to a negative, but small, direct partial effect: an immigration shock that increases the labor force in a particular skill cell by ten percent reduces wages of natives of the same group by approximately one percent. However, Peri and Sparker (2008) argued that increased specialization might explain why many empirical analyses of the impact of foreign workers on wages and employment for less-educated native born find small effects. They found that foreign workers specialized in occupations that required manual and physical labour skills while natives specialized in jobs more intensive in communication and language tasks. While Mocetti and Porello (2010) showed that immigration in Italy had a displacement effect on low educated natives (both for male and females).
According to Okkerse (2008), theoretical aspects of labour market effects of immigration are usually described using a neo-classical competitive model of supply and demand in the market for labour services. In general, immigrants lower the price of factors with which they are perfect substitutes and raise the price of factors with which they are complements. Nevertheless, the impact of immigration on labour market outcomes of natives stays theoretically uncertain. Sizing up the enormous amount of research results produced in this field, the author concluded that immigration negatively affects wages of less-skilled labourers and earlier immigrants. 4. Theoritical Framework and Methodology

Life Science Journal 2013;10(1) http://www.lifesciencesite.com
http://www.lifesciencesite.com [email protected] 1379
Households are suppliers of labour. Individuals are assumed to be rational and seeking to maximize their utility function. The static labour supply theory assumes each individual has a quasi-concave utility function (Blundell and Macurddy(1997) and Killingsworth, (1983):
),( LCfU (1)
Where C is the consumption and L is the leisure hours, however, individuals are constrained by the working hours available to them. Therefore, hours of work (H) are H = T – L, T is the total time available. Suppose P is the price of goods and service, W is hourly wages rate and non-labour income, Y. The individual budget constraint is:
YWHPC
YLTWPC )( YWTWLPC (2)
In static model, non labour income, Y is typically the sum of two components: asset income and other unearned income. The right side of equation 2 often defined as “full income” from which consumer purchases consumption goods and leisure (Blundell and MaCurdy, 1999). Derivation of individual’s labour supply function is derive by maximize utility function subject to the budget constraint. The indirect utility representation of preferences is given by:
),(),,( HTCMaxUYWPV s.t.
YWHPC Set the Lagragian expression;
)(),(),,;,,( YWHPCHTCUYWPHCL
The first order conditions are;
0),(
PHTC
C
LU C
0),(
WHTC
H
LU L
0
WHPC
L
Or simply the first two conditions take the familiar form;
P
W
HTC
HTC
UU
C
L
),(
),(
Marginal Rate of
Substitution Therefore, the individuals labour supply
equation is obtained as below;
),,( YWPHH Or
),( YP
WHH
),( YHSWHH (3)
Where
P
W = HSW .
We assumed that P is constant, thus
nominal wage W s equal to the real
wage )(HSW . Besides these two basic
variables, there are other factors that could determine individuals labour supply such as spouse wage, number of children and individuals characteristics like education, age, and so forth that can be summarized as Zi. Therefore, equations (3) can be written as,
),,,( 21 ZZYHSWHHSW (4)
The analysis will be based on the data collected from the field survey in 2011. The study covers 3885 households in Peninsular Malaysia who are chosen using stratified random sampling. The data include information on heads of households, their spouses, families, education background and employment background. Since the main purpose of the study is to look at the impact of globalisation on labour market structure, the data also cover questions on globalisations from the point of views of respondents. Table 3 shows results of the reliability test for Pilot study data. The questions cover some statements to measure globalisation indicators. All values of Cronbach Alpha are above 0.8, which are considered as very good. This indiçâtes that all constructs are appropriate in measuring globalisation. Therefore, no modification were made on the questionnaires after the pilot test. 5. Model Specification
In order to achieve the objective of this paper, the study uses the logistic regression model for labour supply equation to capture head of households and does not go to work and who go to work. In general, logistic regression is used to measure the functional relationship between the qualitative dependent variable and the quantitative and qualitative independent variables. The dependent variable with a dichotomous character is used, whereby, the value 1 denotes if a head of household is working y and 0 values denotes if a head of household is not working. Therefore, the model is estimated in logistic binomial form.
Model used is as follows:
)1(1 zi eP (5)
with iP as the probability of workers having been
mobile ( 1Y ). Probability to choose the other is ( 0Y ) written as;
)1/(1)1( zi eP
(6)
Source: Pilot Survey 2011 Therefore, the probability of a worker
changing jobs is;
)1/( iiz PPe (7)

Life Science Journal 2013;10(1) http://www.lifesciencesite.com
http://www.lifesciencesite.com [email protected] 1380
The model is then transformed to a logarithm model to produce the equation;
)1/(ln( iii PPz =
= nn XXX ....22110
(8)
The estimation of the logistic model utilises likelihood ratio test (LRT) as indicator for fitness of the model and t-test for identifying the significant of
the parameters. The estimation model for this study is as follows,
iiii HEDUSWHSWLS 3210
iii NUMCNLYHAGE 654
iiii HWEGHFLGLOB 987 (9)
Table 3: Reliability Tests From Pilot Survey
Globalisation Indicators Cronbach Alpha (N=30) Determinants of Choices for Children’s Education Before 1995 (23 constructs) After 1995 (23 constructs)
0.895 0.942
Trend of Demand for Higher Education Before 1995 (12 constructs) After 1995 (12 constructs)
0.920 0.937
Importance of Field of Children’s Education Before 1995 (11 constructs) After 1995 (11 constructs)
0.933 0.969
Importance of Children’s Educational Institutions Before 1995 (19 constructs) After 1995 (19 constructs)
0.603 0.970
Influence of Globalisation on Children’s Aquired Skills Before 1995 (10 constructs) After 1995 (10 constructs)
0.941 0.912
Glabalisation Effect on Career Development Before 1995 (6 constructs) After 1995 (6 constructs)
0.953 0.961
Impact of Globalisation on wages and employment 0.971 Where, LS is head of households labour supply denote 1 if working and 0 otherwise, HSW is head of
households monthly wages, SW is is spouse monthly wages, HEDU is head of households level of education, HAGE is head of households age, NLY is household non- labour income, NUMC is household number of children, GLOB is effect of globalization measured by household’s min score based on perception, HFL is dummy variable for the present of foreign labour in head of households job place, HWEG is head of household perception of wage effect from the present of foreign labour, µ is error term and I is household. The level of education is categorized into two measures, year of schooling and level of educational attainment (secondary and tertiary).
6. Results and Discussion
Table 4 presents head of households profile from the survey data. In total, 3885 head of households were interviewed. In terms of demography profile, expectedly, the majority of the heads of the household are men (67.0 percent). Malay make up the largest population of the sample (69.5 percent), follow by Chinese (27.1 per cent), India (2.2 percent) and other races (0.6 percent). The majority of the head of the households who are in the range between 46-55 year of age, which represents 33.4 percent of the sample. Very small percentage of the households is aged above 56. A greater proportion of the head of the households are attaining secondary level of education (48.5 percent), than are attaining degree (19.1 percent), diploma (18.7 percent) and primary level of education (12.6 percent). As shown in Table 1, more than half of the respondents (55.2 percent) work in the domestic private sector, 32.7 percent in public sector and only 6 percent in multinational private sector. In 2011 (year of data collection), sector breakdown of respondents was as follows : services 64.8 percent, manufacturing 11.3 percent, agriculture 10.9 percent, construction 6.5 percent and mining 0.3 percent. The majority of them are service and sales workers (22.7 percent), professional (16.9 percent) and clerical support workers (9.4 percent). The respondents were also asked to choose among seven ranges of monthly income. Of the total number of 3885 respondents, the majority (36.9 percent) of the respondents indicated monthly income of RM1001-RM2500, 28.3 percent receive monthly income of RM2501-RM4000. The head of households who receive monthly income RM8001-RM10000 and more than RM 10001 are very few with the percentage of about 2.5 percent and 2.3 percent respectively. In terms of non-labour income, majority of the head of the households (98.2 percent) receive less than RM1000 per month.
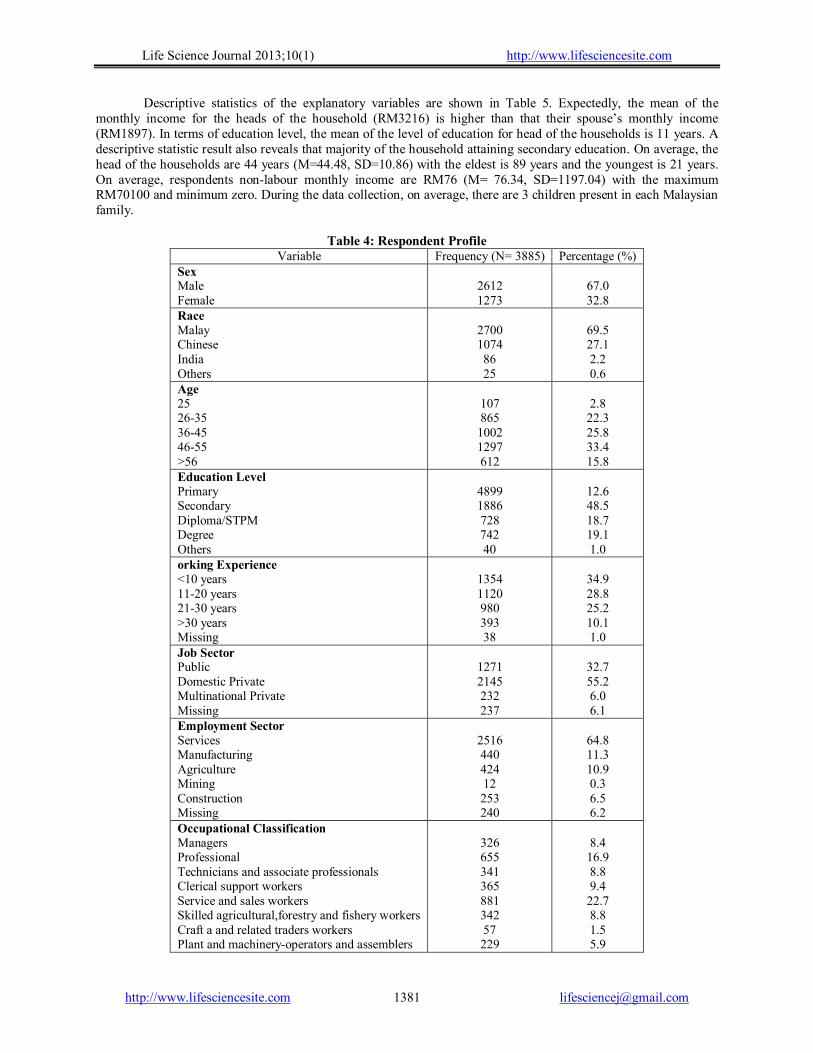
Life Science Journal 2013;10(1) http://www.lifesciencesite.com
http://www.lifesciencesite.com [email protected] 1381
Descriptive statistics of the explanatory variables are shown in Table 5. Expectedly, the mean of the monthly income for the heads of the household (RM3216) is higher than that their spouse’s monthly income (RM1897). In terms of education level, the mean of the level of education for head of the households is 11 years. A descriptive statistic result also reveals that majority of the household attaining secondary education. On average, the head of the households are 44 years (M=44.48, SD=10.86) with the eldest is 89 years and the youngest is 21 years. On average, respondents non-labour monthly income are RM76 (M= 76.34, SD=1197.04) with the maximum RM70100 and minimum zero. During the data collection, on average, there are 3 children present in each Malaysian family.
Table 4: Respondent Profile
Variable Frequency (N= 3885) Percentage (%) Sex Male Female
2612 1273
67.0 32.8
Race Malay Chinese India Others
2700 1074 86 25
69.5 27.1 2.2 0.6
Age 25 26-35 36-45 46-55 >56
107 865 1002 1297 612
2.8 22.3 25.8 33.4 15.8
Education Level Primary Secondary Diploma/STPM Degree Others
4899 1886 728 742 40
12.6 48.5 18.7 19.1 1.0
orking Experience <10 years 11-20 years 21-30 years >30 years Missing
1354 1120 980 393 38
34.9 28.8 25.2 10.1 1.0
Job Sector Public Domestic Private Multinational Private Missing
1271 2145 232 237
32.7 55.2 6.0 6.1
Employment Sector Services Manufacturing Agriculture Mining Construction Missing
2516 440 424 12 253 240
64.8 11.3 10.9 0.3 6.5 6.2
Occupational Classification Managers Professional Technicians and associate professionals Clerical support workers Service and sales workers Skilled agricultural,forestry and fishery workers Craft a and related traders workers Plant and machinery-operators and assemblers
326 655 341 365 881 342 57 229
8.4 16.9 8.8 9.4 22.7 8.8 1.5 5.9
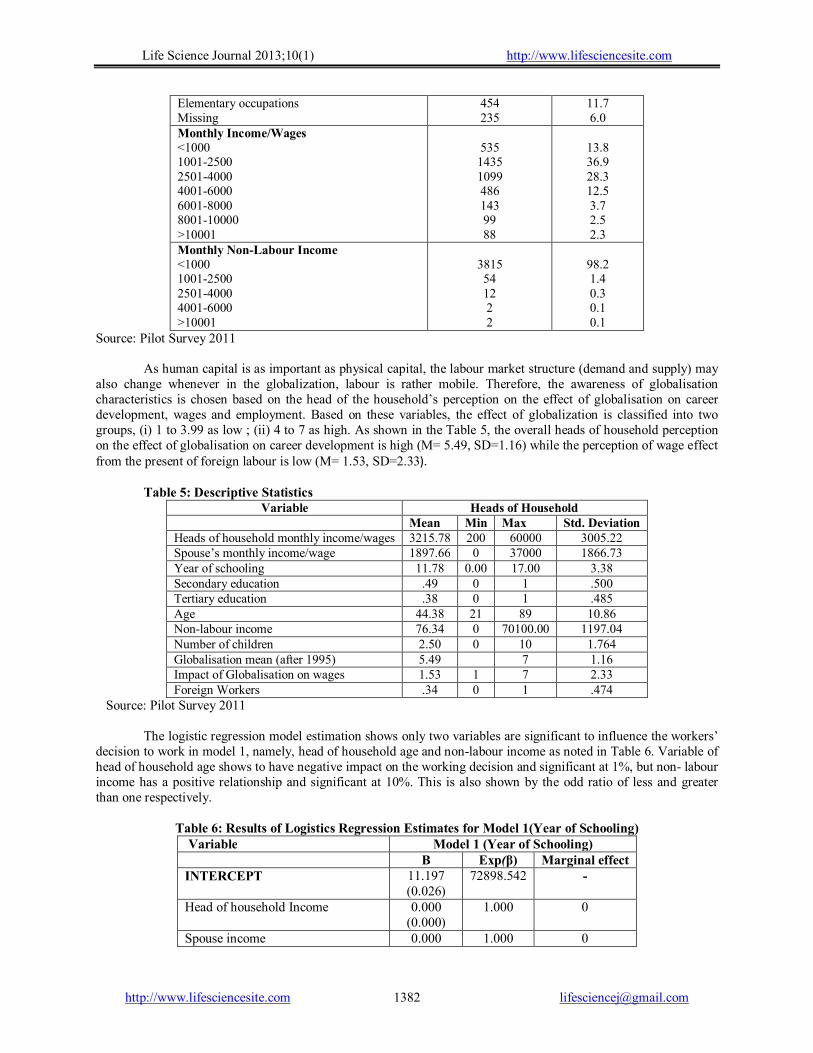
Life Science Journal 2013;10(1) http://www.lifesciencesite.com
http://www.lifesciencesite.com [email protected] 1382
Elementary occupations Missing
454 235
11.7 6.0
Monthly Income/Wages <1000 1001-2500 2501-4000 4001-6000 6001-8000 8001-10000 >10001
535 1435 1099 486 143 99 88
13.8 36.9 28.3 12.5 3.7 2.5 2.3
Monthly Non-Labour Income <1000 1001-2500 2501-4000 4001-6000 >10001
3815 54 12 2 2
98.2 1.4 0.3 0.1 0.1
Source: Pilot Survey 2011 As human capital is as important as physical capital, the labour market structure (demand and supply) may
also change whenever in the globalization, labour is rather mobile. Therefore, the awareness of globalisation characteristics is chosen based on the head of the household’s perception on the effect of globalisation on career development, wages and employment. Based on these variables, the effect of globalization is classified into two groups, (i) 1 to 3.99 as low ; (ii) 4 to 7 as high. As shown in the Table 5, the overall heads of household perception on the effect of globalisation on career development is high (M= 5.49, SD=1.16) while the perception of wage effect from the present of foreign labour is low (M= 1.53, SD=2.33).
Table 5: Descriptive Statistics Variable Heads of Household
Mean Min Max Std. Deviation Heads of household monthly income/wages 3215.78 200 60000 3005.22 Spouse’s monthly income/wage 1897.66 0 37000 1866.73 Year of schooling 11.78 0.00 17.00 3.38 Secondary education .49 0 1 .500 Tertiary education .38 0 1 .485 Age 44.38 21 89 10.86 Non-labour income 76.34 0 70100.00 1197.04 Number of children 2.50 0 10 1.764 Globalisation mean (after 1995) 5.49 7 1.16 Impact of Globalisation on wages 1.53 1 7 2.33 Foreign Workers .34 0 1 .474
Source: Pilot Survey 2011
The logistic regression model estimation shows only two variables are significant to influence the workers’ decision to work in model 1, namely, head of household age and non-labour income as noted in Table 6. Variable of head of household age shows to have negative impact on the working decision and significant at 1%, but non- labour income has a positive relationship and significant at 10%. This is also shown by the odd ratio of less and greater than one respectively.
Table 6: Results of Logistics Regression Estimates for Model 1(Year of Schooling)
Variable Model 1 (Year of Schooling) Β Exp(β) Marginal effect INTERCEPT 11.197
(0.026) 72898.542 -
Head of household Income 0.000 (0.000)
1.000 0
Spouse income 0.000 1.000 0
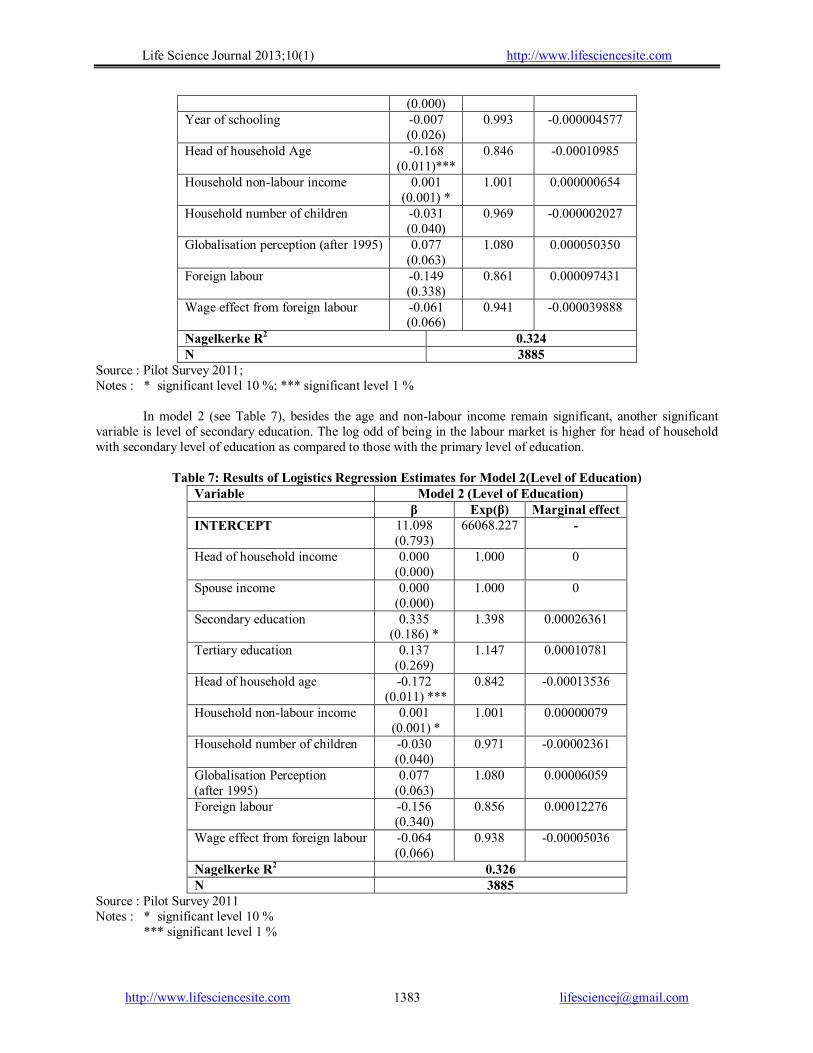
Life Science Journal 2013;10(1) http://www.lifesciencesite.com
http://www.lifesciencesite.com [email protected] 1383
(0.000) Year of schooling -0.007
(0.026) 0.993 -0.000004577
Head of household Age -0.168 (0.011)***
0.846 -0.00010985
Household non-labour income 0.001 (0.001) *
1.001 0.000000654
Household number of children -0.031 (0.040)
0.969 -0.000002027
Globalisation perception (after 1995) 0.077 (0.063)
1.080 0.000050350
Foreign labour -0.149 (0.338)
0.861 0.000097431
Wage effect from foreign labour -0.061 (0.066)
0.941 -0.000039888
Nagelkerke R2 0.324 N 3885
Source : Pilot Survey 2011 ; Notes : * significant level 10 %; *** significant level 1 %
In model 2 (see Table 7), besides the age and non-labour income remain significant, another significant
variable is level of secondary education. The log odd of being in the labour market is higher for head of household with secondary level of education as compared to those with the primary level of education.
Table 7: Results of Logistics Regression Estimates for Model 2(Level of Education)
Variable Model 2 (Level of Education) β Exp(β) Marginal effect INTERCEPT 11.098
(0.793) 66068.227 -
Head of household income 0.000 (0.000)
1.000 0
Spouse income 0.000 (0.000)
1.000 0
Secondary education 0.335 (0.186) *
1.398 0.00026361
Tertiary education 0.137 (0.269)
1.147 0.00010781
Head of household age -0.172 (0.011) ***
0.842 -0.00013536
Household non-labour income 0.001 (0.001) *
1.001 0.00000079
Household number of children -0.030 (0.040)
0.971 -0.00002361
Globalisation Perception (after 1995)
0.077 (0.063)
1.080 0.00006059
Foreign labour -0.156 (0.340)
0.856 0.00012276
Wage effect from foreign labour -0.064 (0.066)
0.938 -0.00005036
Nagelkerke R2 0.326 N 3885
Source : Pilot Survey 2011 Notes : * significant level 10 %
*** significant level 1 %
Life Science Journal 2013;10(1) http://www.lifesciencesite.com
http://www.lifesciencesite.com [email protected] 1384
7. Conclusions The results from the both logistic labour
supply models demonstrate an expected sign for coefficient of age, which is negative and significant. These imply that the older is the head of the household, the decision to work is less and this finding accord with the theory. Another interesting finding is that non-labour income is positive and significantly affects the labour supply, which means that non-labour income is one of the main concerns for the head of the household on the working decision. But the unexpected results derived from the own wage, which demonstrates that the decision to work among the head of households are less when wages increase. These findings contradict with the theory and one explanation for the contradiction is that backward labour supply curve. However, the year of schooling variable, which is assumed to be positively related to labour supply, is not statistically significant. But the higher is the level of education for the head of the household, the higher would be their labour supply, which demonstrates that the decision to work among the head of households with secondary level of education are more than that those who attain only primary level.
Globalisation is not significantly affecting the head of household labour supply, which mean that globalisation process is not a main concern of the head of household in securing their jobs. This finding support our hypothesis that globalisation will play a minor role since the intensity of globalization in Malaysia is still at the moderate level. Other variables seem not significantly affecting head of household labour supply in the sample. Acknowledgements: The authors wish to acknowledge the financial support provided through the Research University Grant Scheme (UKM-AP-CMNB-20-2009-4), by Universiti Kebangsaan Malaysia. Corresponding Author: Dr. Poo Bee Tin School of Economics Faculty of Economics and Management University Kebangsaan Malaysia 43600 Bangi, Selangor, Malaysia E-mail: [email protected] References 1. Epstein, G.A. Financialization and the World
Economy, Edward Elgar,Cheltenham, UK. 2005 2. Rahmah Ismail and Poo Bee Tin. Globalisation
and labour supply of single female heads of households in Malaysia. Life Science Journal 2012; 9(4);2751-9.
3. Lairson, T. and D. Skidmore. International political economy : The struggle for power and wealth, 2nd Edition. Fort Worth, TX: Harcourt Brace College Publishers. 1997.
4. Kaufman BE, Hotchkiss JL. The Economics of Labour Market. Thomson South-Western. 7th Edition 2006.
5. Labour force survey report, Department of Statistics, 2010.
6. Mincer, J. Schooling, experience and earning. New York: Columbia University.1974.
7. Becker, G.S. and Gilbert, G. The allocation of time and goods over the life cycle. New York: Columbia University Press.1975.
8. Fallon, P. and Verry, D. The economics of labour markets. Oxford: Philip Allan Publishers. 1988.
9. Douglas, P. Theory of wages. Macmillan. New York .1934.
10. Evers M, Moojj RD, Vuuren DV. The wage elasticity of labour supply: A synthesis of empirical estimates. De Economist 2008; 156; 25-43.
11. Boal WM, Ransom MR. Monopsony in the labor market. Journal of Economic Literature 1997; 35; 86-112.
12. Manning A. Monosony in motion: Imperfect competition in labour market. Princeton, NJ: Princeton University Press, 2003.
13. Blundell R, Macurddy T. Labour supply: A review of alternative approaches. In: Ashenfelter O, Card D. eds. Handbook of labor economics. vol. 3A, Chapter 27, Amsterdam, North Holland, 1999.
14. Killingsworth MR. Labour supply. Cambridge University Press. New York. 1983.
15. Devereux PJ. Changes in male labour supply and wages, Industrial and Labour Relations Review 2003; 56(3): 409-427.
16. Mincer J. Labor force participation of married women: A study of labour supply. In: Gregg H, Lewis H.G., eds. Aspects of labor economics. Princeton NJ: Princeton University Press. 1962.
17. Saget C. The determinants of female labour supply in Hungary. Economics Transition 1999; 7( 3): 575-591.
18. Morissette R, Hou F. Does the labour supply of wives respond to husbands’ wages? Canadian evidence from micro data and grouped data. Canadian Journal of Economics 2008; 41(4): 1186-1210.
19. Penner RG, Perun P, Steurle E. Legal and institutional impediments to partial retirement and part-time work by older workers. Washington D.C.: The Urban Institute, 2002.

Life Science Journal 2013;10(1) http://www.lifesciencesite.com
http://www.lifesciencesite.com [email protected] 1385
20. Wadensjo E. Work and pension in Sweden. European Papers on the New Welfare: The counter-ageing society. Milan. The Risk Institute 2008; 9;104-112.
21. Maglad NA. Female labour supply in Sudan Nairobi: African Economic Research Consortium, 1998, Special Paper 30.
22. Jolliffe D.The impact of education in rural Ghana: Examining household labour allocation and returns on and off the farm. Journal of Developing Economics 2004; 73; 287-314.
23. Babikir OM, Babiker BI. The determinants of labour supply and demand in irrigate agriculture: A case study of the Gezira Scheme in Sudan. African Development Review 2007; 19; 335-349.
24. Fajimi FO and Omonona BT . Women participation in agro-allied small and medium scale enterprise and its impact on poverty alleviation in Oyo State Nigeria. Journal of American Science 2010; 6(12); 771-780.
25. Gronau R. The effect of children on the housewife’s value of time. Journal of Political Economy 1973; 81(2); 168-199.
26. Rosenzweig M, Wolpin KI. Life cycle labour supply and fertility: Evidence from household models. Journal of Political Economy 1980; 88; 328-348.
27. Schults TP. Testing the neoclassical model of family labour supply and fertility. Journal of Human Resources 1990; 25; 599-634.
28. Wong R, Levine R. The effect of household structure on women’s economic activity and fertility: Evidence from recent mother in urban Mexico. Economic Development and Cultural Change 1992; 41; 89-102.
29. Tienda M, Glass J. Household structure and labour force participation of Black, Hispanics and White mothers. Demography 1985; 22; 381-394.
30. Schultz TP. The Influence of fertility in labour supply of married women: Simultaneous equation estimates. In: Erenberg RG, ed. Research in labour Economics. Greenwich. CT: JAI Press, 1978.
31. Lehrer EL. The impact of children on married women’s labour supply: Black-White differentials revisited. Journal of Human Resources 1992; 27(3); pp. 422-444.
32. Carlin PS, Flood L. Do children affect the labour supply of Swedish men? Time diary vs. survey data. Labour Economics 1997; 2; 167-183.
33. Rahmah Ismail, Fatimah Said. Women’s education and household activities, in women and work, challenges. In: Maimunah Ismail, Aminah Ahmad, eds. Industrializing nations. London: Asian Academic Press, 1999.
34. Borjas G. The economics of immigration. Journal of Economic Literature 1994; 32; 1667–1717.
35. Card D. Immigrant inflows, native outflows and the local labour market impacts of higher immigration, Journal of Labor Economics 2001; 19; 22–61.
36. G. Borjas, The labour demand curve is downward sloping: Re-examining the impact of immigration on the labour market, Quarterly Journal of Economics, vol.118, pp.1335–1374, 2003.
37. Bonin H. Wage and employment effects of immigration to Germany: Evidence from a skill group approach. IZA Discussion Paper No.1875, 2005.
38. Ottaviano GI, Peri G. Immigration and national wages: clarifying the theory and the empirics. NBER Working Paper 14188. National Bureau of Economic Research, 2008.
39. Peri G, Sparber C. Task specialization, immigration, and wages. American Economic Journal 2009; 1(3); 135-69.
40. Mocetti S, Porello C. How does immigration affect native internal mobility? New evidence from Italy. Regional Science and Urban Economics 2010;40(6); 427-439.
41. Okkerse Liesbet. 2008. How to measure labor market effects of migration: A review Journal of Economic Surveys 2008; 22(1); 1–30.
2/6/2013

Life Science Journal 2013;10(1) http://www.lifesciencesite.com
1386
Role of Bank Credits in Development of Agriculture Sector
Hassan Azimi
PhD Student of Economics and Management in Tajikistan ABSTRACT: The purpose of implementing current work was to determine the role of banking services in development and progress of agriculture in Iran. For this purpose, variables associated with bank facilities including long-term, mid-term and current facilities were used as conceptual model of the current research. On the other hand, existing indications and evidences indicate that in the process of development and growth, employment in the agriculture sector has been usually descending due to several reasons such as capital-intensive production and using modern technologies, while this trend has been ascending in two other sectors, namely industry and services. This paper demonstrates that the agriculture sector in Iran has not optimally used all its existing facilities and thus it seems that some employment opportunities have been lost there. This issue was investigated by looking at the agriculture sector and using statistics of time series from 1980 to 2010 as well as econometric models. In this regard, the required information and data were collected in terms of library and field studies, while SPSSwin software was utilized to run statistical tests in addition to a comprehensive review on the existing literature related to agricultural development. Thereby, the role of banking services was assessed in development of progress of agriculture in Iran. The results of this research demonstrated that the credits of Agriculture Bank have positively influences employment and short-term and investment in long-term. Therefore, application of a credit regime at least in short-term can develop employment opportunities in this sector. [Hassan Azimi. Role of Bank Credits in Development of Agriculture Sector. Life Sci J 2013;10(1):1386-1391] (ISSN:1097-8135). http://www.lifesciencesite.com. 208 Keywords: employment in agriculture sector, credits of Agriculture Bank Introduction
It is well known that employment and its rate are influenced by various factors like any other economic and social variable. Some of these factors are production rate, investment rate, level of wages and prices, monetary policies, financial policies, foreign trade and etc. By changing each variable, employment rate is directly or indirectly influenced with both employment and unemployment rates being determined in the market. Each variable might have positive or negative effects on the market process. As a result, consequences and effects of each variable must be studied in order to positively influence the employment rate and provide more job opportunities through identification of the barriers and mitigating or resolving them. In this regard, bank credits are known as an important and influential factor on employment, which develop job opportunities for job seekers by providing investment opportunities for the manufacturers.
Bank credits are allocated to various economic activities in terms of priorities of development goals, while the agriculture sector also benefits from these credits for development of production, investment and finally employment. Most of the bank credits for the agriculture sector (more than 50% of it) are financially supplied by Agriculture Bank (Table 1), which plays a significant role in financing options of the farmer. Therefore, it can have positive and important effects on this economic sector in terms of
production, income, investment and employment. However it has been frequently mentioned in the development literature that employment in the agriculture sector is decreased with its excess labor force being shifted to the sectors of industry and services during the development process, it must be noted that this case is satisfied just when all the existing facilities are completely used (Gharabaghian, 2002, pp. 554-556).
Unfortunately in Iran, land, water, different climates, technology and etc. are not completely and optimally used. Thus, it is still possible to develop employment alternatives in the agriculture sector by proper planning and by using the existing resources or creation of new ones. When believed that the existing agricultural resources are not completely and optimally exploited and there is loss of resources or it is possible to create new facilities for development of the activities in this sector just by small investment, one can expect development of the job opportunities in this sector. So, since the employment is the agriculture sector is not saturated in Iran, this study aims to investigate one of the effective factors on employment in this sector, i.e. credits, in order to evaluate the effect of this factor on employment and development of the agriculture sector and suggest some solutions by analysis of the results. Importance and Necessity
Agriculture is one of the most important sectors of economy in Iran and a considerable contribution of

Life Science Journal 2013;10(1) http://www.lifesciencesite.com
1387
the employed people is allocated to it, such that today near one-fourth of the employed population of Iran belongs to the agriculture sector. Therefore, it is inevitably necessary to pay attention to this sector and the large population of employed people in it, as well as development and improvement of its current status. Agricultural development is only possible by material and immaterial supports of the government and other involved parties, because most of the employed people in the great family of agriculture are of low-income classes (Soleimanipour & Nikouyi, 2004). Strategy of the agricultural development is in fact a road map which contributes to government officials, policy makers, society members, and also private sector and public sector investors to achieve
critical and key goals of the agriculture sector, usually including improved productivity and competitiveness, reduction of rural poverty, enhanced food security of families, increased capital savings of rural families, improved management and sustainable management of the natural resources, for proper selection of its way (Azimi, 1994). Problem Definition
The problem here is indeed the difference between existing situation and desired situation. In other words, this problem means the distance between where the agriculture is located now and where wished to be. The problem is solved when current situation could be transformed to the desired situation (Huber, 1980).
Fig. 1. Problem definition
Conceptual Framework of Research
Each conceptual model is supposed as an onset and base for implementation of studies and researches such that describes the variables under study and the correlations between them (Edwards et al., 2000). In other words, it can be declared that the conceptual model or mental map (Maastricht School of Management, 2001) and analytical instrument (Mirzayi, 1996, p.10) is ideally defined as a strategy to initiate and implement research. Thereby, it is expected that the variables, correlations and interactions between them are examined well, while some modifications are done with some of their factors being added or removed when necessary (Sautter & Leisen, 1999). The following conceptual framework variables are introduced courtesy of Agriculture Bank (Maleki, 2009).
This study will benefit from extraction procedure of component variables under
measurement from the relevant existing literature as well as deeds and documents of Agriculture Bank. It will also use expert survey for finalizing the variables.
Variables: Independent variables (bank facilities including long-term, mid-term and current facilities) - Dependent variable (agricultural development). Research Objectives: Primary objective (determination of effect and role of banking services on the agricultural development of Mazandaran province) - Secondary objectives (determination of effect and role of long-term bank facilities on the agricultural development of Mazandaran province, determination of effect and role of mid-term bank facilities on the agricultural development of Mazandaran province, determination of effect and role of current bank facilities on the agricultural development of Mazandaran province).
Desired and Potential Situation
role of the bank services is known in development and progress of Iranian agriculture
Current and Actual Situation
role of the bank services is unknown in development and progress of Iranian agriculture
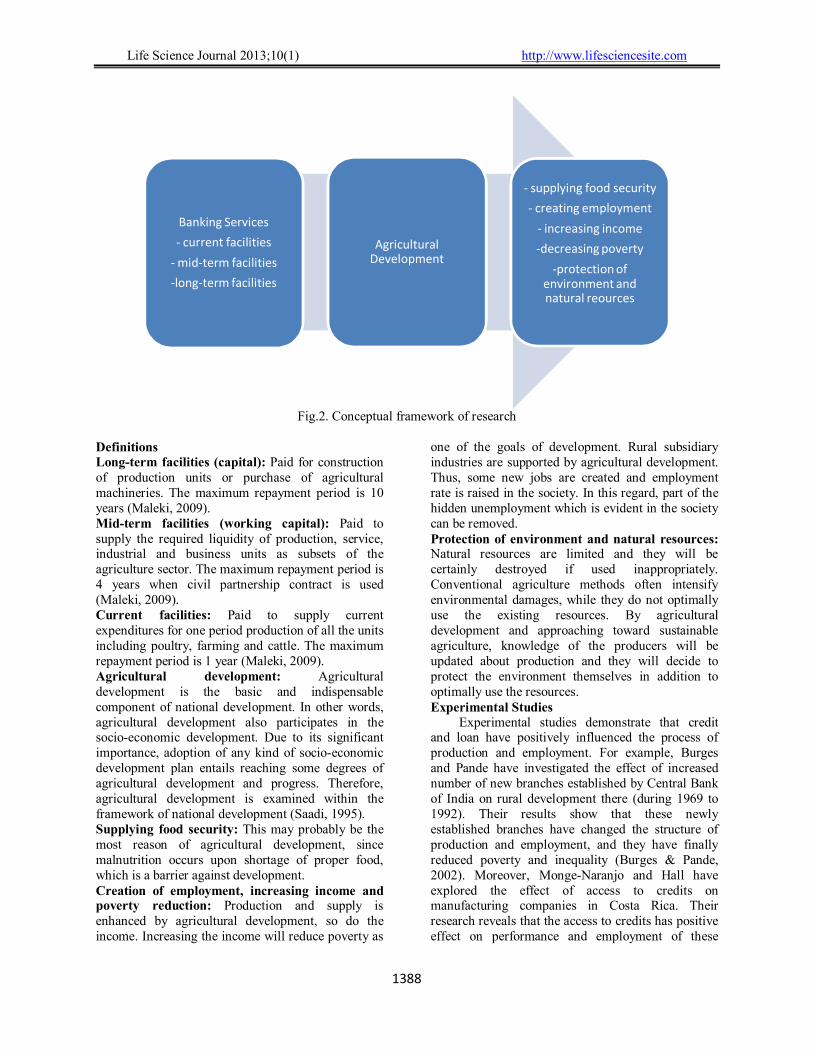
Life Science Journal 2013;10(1) http://www.lifesciencesite.com
1388
Fig.2. Conceptual framework of research
Definitions Long-term facilities (capital): Paid for construction of production units or purchase of agricultural machineries. The maximum repayment period is 10 years (Maleki, 2009). Mid-term facilities (working capital): Paid to supply the required liquidity of production, service, industrial and business units as subsets of the agriculture sector. The maximum repayment period is 4 years when civil partnership contract is used (Maleki, 2009). Current facilities: Paid to supply current expenditures for one period production of all the units including poultry, farming and cattle. The maximum repayment period is 1 year (Maleki, 2009). Agricultural development: Agricultural development is the basic and indispensable component of national development. In other words, agricultural development also participates in the socio-economic development. Due to its significant importance, adoption of any kind of socio-economic development plan entails reaching some degrees of agricultural development and progress. Therefore, agricultural development is examined within the framework of national development (Saadi, 1995). Supplying food security: This may probably be the most reason of agricultural development, since malnutrition occurs upon shortage of proper food, which is a barrier against development. Creation of employment, increasing income and poverty reduction: Production and supply is enhanced by agricultural development, so do the income. Increasing the income will reduce poverty as
one of the goals of development. Rural subsidiary industries are supported by agricultural development. Thus, some new jobs are created and employment rate is raised in the society. In this regard, part of the hidden unemployment which is evident in the society can be removed. Protection of environment and natural resources: Natural resources are limited and they will be certainly destroyed if used inappropriately. Conventional agriculture methods often intensify environmental damages, while they do not optimally use the existing resources. By agricultural development and approaching toward sustainable agriculture, knowledge of the producers will be updated about production and they will decide to protect the environment themselves in addition to optimally use the resources. Experimental Studies
Experimental studies demonstrate that credit and loan have positively influenced the process of production and employment. For example, Burges and Pande have investigated the effect of increased number of new branches established by Central Bank of India on rural development there (during 1969 to 1992). Their results show that these newly established branches have changed the structure of production and employment, and they have finally reduced poverty and inequality (Burges & Pande, 2002). Moreover, Monge-Naranjo and Hall have explored the effect of access to credits on manufacturing companies in Costa Rica. Their research reveals that the access to credits has positive effect on performance and employment of these
Banking Services
- current facilities
- mid-term facilities
-long-term facilities
Agricultural Development
- supplying food security
- creating employment
- increasing income
-decreasing poverty
-protection of environment and natural reources

Life Science Journal 2013;10(1) http://www.lifesciencesite.com
1389
manufacturing companies (Monge-Naranjo & Hall, 2003). Furthermore, in Iran a similar research conducted by Ghavam in 1992 indicates that the agricultural credits have not satisfied the expected potential changes in spite of their successes and production growth reported so far (Ghavam, 1992).
Thus, it is observed that production and employment effects of the credits are different among various countries due to their dissimilar social and economic structures, so each country must emphasize it adequately according to its existing conditions. The necessity of this issue is better understood when considering that the first solution to solve production and unemployment problems is always allocation of some credits that is to say investment. Particularly in Iran, where some budgets in terms of imposed facilities, construction credits and bank credits are used to increase production and employment every year. However, there have been just a few researches which have addressed the following questions: What is the effects of these monetary and bank policies in terms of economic sectors? Where are problems and barriers and how they can be resolved? How these policy tools can be improved by offering proper solutions?
Attention to these issues and studying them are of higher importance and position nowadays when unemployment and production crises are major problems of Iran. For this purpose, current paper aims to study the effect of credits provided by Agriculture Bank on employment of the agriculture sector. Thereby, this could be an introduction to future works and optimal policy making for solving the existing problems. Source of Agricultural Credits in Iran
Farmers have two finance options to increase their profit and production, in addition to improve performance and productivity of their products: (1) using their savings, (2) using credits (Duru et al., 1993, p.9). Rural families in developing countries do not have significant savings to finance their activities due to their insufficient annual income. Then, they must supply part of their financial needs from official and unofficial sources. There are three official credit sources in rural economy:
1) Commercial banks: Banks which have special criteria for giving collateral and secured loans. In most cases this makes some problems for the farmers to get their needed credit or loan timely, so they would refer to other official or unofficial sources to supply their financial need.
2) Specialized agriculture banks: These banks are established to compensate for inability of the commercial banks in providing adequate services to the farmers. They can thus significantly influence the agriculture either in positive or negative manner.
3) Public sector: Includes Funds loan which help the farmers to supply their financial needs (Taleb, 1993, p. 68).
Unofficial sources of loans mainly include the followings: urban shopkeepers or local traders, self buyers, owners, owners of tangible assets such as tractors and etc., friends and relatives, other rich people (Taleb, 1993, pp. 62-66). Statistically, the existing information demonstrates that Agriculture Bank has a considerable contribution of the credits allocated to the agriculture sector. Table 1 shows that during the period under study, contribution of Agriculture Bank in the facilities devoted to the agriculture sector was in average more than 50%. For example the amount of these facilities has reached from 563.1 trillion Rials in 2001 to 6785 trillion Rials in 2010. Figure 1 shows the importance of Agriculture Bank in financing the agriculture sector. It can be observed that the greatest and smallest contributions of Agriculture Bank are associated with years 2010 (63.6%) and 2005 (38.3%), respectively. In recent years, stocks of Agriculture Bank have been ascending according to the initial goals of establishing it, i.e. financing the agriculture sector. However, evaluation of these credits needs individual scientific research on any field of activity in the agriculture sector.
Table1. Contribution of agriculture bank in total facilities all banks have devoted to the agriculture
sector* Year All Banks Agriculture Bank Contribution 2001 956.9 563.1 58.8 2002 1076.4 546.3 51.0 2003 1725.1 825.9 47.1 2004 2364 1036.1 43.8 2005 3362 1286.8 38.3 2006 3695.2 1585.7 42.9 2007 5288.2 2359.4 44.6 2008 6791.1 3579.6 52.6 2009 8055.1 4235.5 52.6 2010 10664 6785.0 63.6 *References: Balance sheets from central bank of
the Islamic Republic of Iran from2001 to 2010
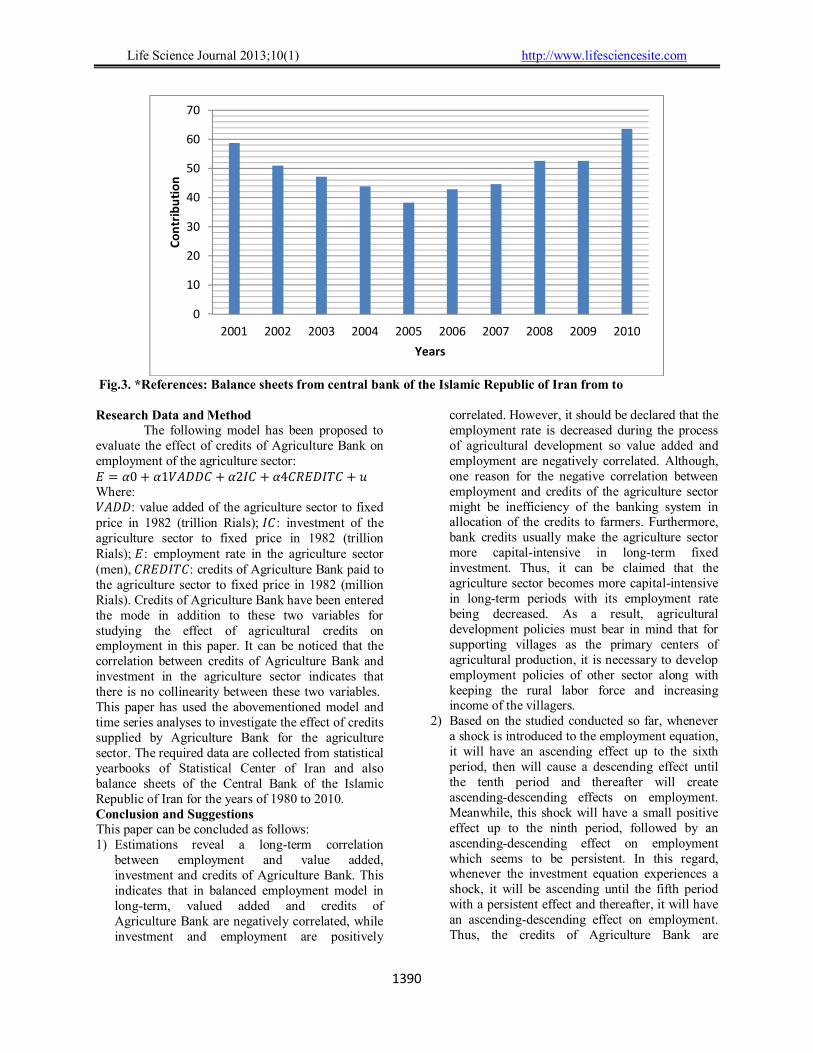
Life Science Journal 2013;10(1) http://www.lifesciencesite.com
1390
Fig.3. *References: Balance sheets from central bank of the Islamic Republic of Iran from to Research Data and Method
The following model has been proposed to evaluate the effect of credits of Agriculture Bank on employment of the agriculture sector: � = �0 + �1����� + �2�� + �4������� + � Where: ����: value added of the agriculture sector to fixed price in 1982 (trillion Rials); ��: investment of the agriculture sector to fixed price in 1982 (trillion Rials); �: employment rate in the agriculture sector (men), �������: credits of Agriculture Bank paid to the agriculture sector to fixed price in 1982 (million Rials). Credits of Agriculture Bank have been entered the mode in addition to these two variables for studying the effect of agricultural credits on employment in this paper. It can be noticed that the correlation between credits of Agriculture Bank and investment in the agriculture sector indicates that there is no collinearity between these two variables. This paper has used the abovementioned model and time series analyses to investigate the effect of credits supplied by Agriculture Bank for the agriculture sector. The required data are collected from statistical yearbooks of Statistical Center of Iran and also balance sheets of the Central Bank of the Islamic Republic of Iran for the years of 1980 to 2010. Conclusion and Suggestions
This paper can be concluded as follows: 1) Estimations reveal a long-term correlation
between employment and value added, investment and credits of Agriculture Bank. This indicates that in balanced employment model in long-term, valued added and credits of Agriculture Bank are negatively correlated, while investment and employment are positively
correlated. However, it should be declared that the employment rate is decreased during the process of agricultural development so value added and employment are negatively correlated. Although, one reason for the negative correlation between employment and credits of the agriculture sector might be inefficiency of the banking system in allocation of the credits to farmers. Furthermore, bank credits usually make the agriculture sector more capital-intensive in long-term fixed investment. Thus, it can be claimed that the agriculture sector becomes more capital-intensive in long-term periods with its employment rate being decreased. As a result, agricultural development policies must bear in mind that for supporting villages as the primary centers of agricultural production, it is necessary to develop employment policies of other sector along with keeping the rural labor force and increasing income of the villagers.
2) Based on the studied conducted so far, whenever a shock is introduced to the employment equation, it will have an ascending effect up to the sixth period, then will cause a descending effect until the tenth period and thereafter will create ascending-descending effects on employment. Meanwhile, this shock will have a small positive effect up to the ninth period, followed by an ascending-descending effect on employment which seems to be persistent. In this regard, whenever the investment equation experiences a shock, it will be ascending until the fifth period with a persistent effect and thereafter, it will have an ascending-descending effect on employment. Thus, the credits of Agriculture Bank are
0
10
20
30
40
50
60
70
2001 2002 2003 2004 2005 2006 2007 2008 2009 2010
Contribution
Years

Life Science Journal 2013;10(1) http://www.lifesciencesite.com
1391
negatively influenced by the shock applied more significantly which confirms the abovementioned finding. Since the results demonstrated that the effect of credits on employment is positive in short-term and negative in long-term (due to the balanced correlation in long-term for the agriculture sector being capital intensive), this issue must be emphasized during planning and policy making for employment. Thus, in short-term it is possible to devote credits timely and quickly and support employment growth in this sector via executive and supervisory systems. Nevertheless, the agriculture sector becomes capital-intensive in long-term due to using credits for investment and technology changes. This will not obviously cause positive effects on the employment rate, while it must also be considered in development plans of the country. Consequently, adoption of proper monetary and credit policies by the government as well as accurate and optimal executive, managerial and supervisory mechanisms can at least in short-term develop job opportunities in this section. Thus, the following recommendations can be made:
A) Supervision and control on allocation of credits to farmers,
B) Development of rural banking and crediting systems,
C) Mitigate dominant bureaucracy in crediting systems of Iran,
D) Organization of unofficial credit sector in villages,
E) Study on proper job opportunities in villages and allocation of required credits to them,
F ) Pay attention to production issues including market and marketing, price stability and etc., along with distribution and consumption issues (reducing the number of dealers for making rural employment sustainable, However, the development trend of agriculture sector in long-term is such that the employment rate is decreased and the process becomes more capital-intensive. Therefore, it is required to exclusively take into account non-agricultural employment in the development policies of agriculture and rural sectors for keeping the rural labor force and protecting the production centers (i.e. villages). References 1. Central Bank of the Islamic Republic of Iran,
economic reports and balance sheets of various years, Department of Economic Studies, (in Persian).
2. Central Bank of the Islamic Republic of Iran, 2003, “Role of Financial Institutions on Economic Development: Performance and Perspective an
Experience in Iran”, Monetary and Bank Research Center, Tehran, (in Persian).
3. Pasban, F., 1998, “Economic Evaluation of Imposed Credits in Poultry industries of Khorasan Province, Center for Rural Researches of Ministry of Jihad-e-Agriculture, (in Persian).
4. Duru et al., 1993, “Credit and Savings for Development”, Translated by Jamidi Younesi, H., Oktayi, N., Center of Research and Study on Rural Affairs, (in Persian).
5. Taleb, M., 1993, “Rural Credits in Iran”, Promotion Department of Jihad Miniistry, Tehran, (in Persian).
6. Gharabaghian, M., 1992, “Economics of Growth and Development”, 2nd Edition, Ney Pub., Tehran, (in Persian).
7. Ghavam, H., 1992, “Studying Agriculture Credits in Iran”, Master of Science Thesis, Tehran University.
8. Statistical Center of Iran, Statistics Yearbook for various years, (in Persian).
9. Baker, C. B.(1968), Credit in the production organization of the firm, American Journal of Agricultural Economics, Vol. 50(3), 507-520.
10. Betancourt, Roger and Barbara Robles (1989), Credit, money and production: Empirical evidence, Review of Economics and Statistics, Vol. 71(4), 712-717.
11. Burges, Robin and Rohini Pande (2002) , Do rural banks matter? evidence from the Indian Social Banking experiment , March , Internet.
12. Kochar, Anjini (1997), Does lack of access to formal credit constrain agricultural production?American Journal of Agricultural Economics, Vol. 79(3,Aug), 754-763.
13. Monge-Naranjo, Alexander and Luis J. Hall U (2003), Access to the effect of credit constraints on Costa Rican manufacturing firms, Working Paper #R-471
14. Mortikov, V. V. and V. M. Volonkin (1999), Money, credit, in a transition economy, East European Finance and Trade, Vol. 35(2,Mar-Apr), 83-92.
15. Taylor, Timothy G. and J. Scott Shonkwiler (1982), Alternative stochastic specifications of the frontier production function in the agricultural credit programs efficiency, Journal of Development Economics, Vol.21(1),149-160.
16. Taylor, Timothy G., H. Evan Drummond and Aloisio T. Gomes (1986), Agricultural credit programs and production efficiency: An analysis of traditional farming in southeastern Minas Gerais, Brazil,American Journal of Agricultural Economics, Vol. 68(1), 110-119.
12/22/2012
http://www.lifesciencesite.com2013;10(1) Life Science Journal
1392
Surveying of degrees of manifesting of god from point of view of kabbala mysticism.
Masoumeh- Azizi khadem
PhD Religions and Denominalions university, Qom branch , Qom , iran Abstract: Manifestation is one of important theology arguments in theorical mysticism. It mans the appearance of essence in attributes and names. Manifestation theory has been regarded by different schools. Jewish kabbala traditional mysticism is among these schools. In this school, the god has two aspects: 1) Transcendental aspect 2)existential aspect (name and attributes). The existential aspect is derived from transcendental aspect and it shows the degrees of manifesting of god from top to down. These decuple degrees of manifestation are called safira or safirut. safiruts are shown , in the shape of human , tree or geranium with seven branches and three knots . Tenth and last safirut is divine kingdom or shakheyna. And it is referred and mentioned as god's glory or presence of god in universe. in this article , degrees of manifesting of god from point of view of kabbbala mysticism , which is most important school in Jewish mysticism has been investigated to prove the monotheism in this school. According to this point which kabbalian, believe in a inductor or mediator to maintain the ascendancies of god. And in result, this mediator is the first degree of manifesting of god. And they explain the creation according to degrees of manifesting of god, mean special manifestation. [Masoumeh- Azizi khadem. Surveying of degrees of manifesting of god from point of view of kabbala
mysticism. Life Sci J 2013;10(1):1392-1401] (ISSN:1097-8135). http://www.lifesciencesite.com. 209 Key Words: God-Monotheism-Manifestation –Names and attributes And kabbala. Introduction:
Mysticism is an internal wisdom that we cant estimate a date for its appearance or assume it specific to a particular his recognition of himself, origin, aim and his peripheral world. Even though this attention, throughout the time, has been got fade or has been forgotten because of various, never eliminates entirely. Mysticism lexicaly means recognition and idiomatically is a maner that the truth s seekers choose it for achieving and recognizing God. Each of monotheistic religions has its particular mystic tradition with common and distinct points. At First vogued in the form of oral tradition and then in the from of internal religion. Jewery mysticism at first appeared among a few and particular group and until the second era of temple, (A.D 70 that the temple was distrojed by the Romans) was being taught secretly just to few individuals. Jewery mystic in centuries 12 and 13 of A.D tended to extension in Europe, and in addition to Germany, created plenty texts in provans and spain and promoted the kabbala religion, specially in theoretical part. In jewery mysticism there were 3 important events that finaly one of them has reached to development and in flore scence apex. These 3 events are distinctive by the names of "merkava", "kabbalah" and "Hasidim". Experience and perfection era of jewery mysticism should be researched in holy book and moses tradition. In addition to the holy book , in "Talmod" also there are hints about cosmology and recognition of existence, on the base of internal wisdom that has been accompanied with wizardry and black magic. Some people beliere that the start point collection, near the end of the second century of A.D.
Researchers emphasize on Grecian lessons, Indian Joga and also Iranian religion in second era of temple. Jewery mysticism is on the base of mysterious description and interpretation of torah as divine word, and wises have been searching the divine paths by obligating the holy book. Even though this religion has origin in appearance of jewish from tenth century, and reached to its apex and inflorescence in thirteen the century. Jewery mysticism similary to theoretical. "merkava" mysticism as early and empyrean mysyicism of jewery, has been debated on the base of Goods presence intuition on the empyrean (not Goods reality). This religion emphasize on recognition of name and in this religion , the "sheyoor Ghoomas" the word "merkava" has been debated by the meaning of chariot in Hazghiyal book. This mysticism s documents are in "Hakhalot" letters or their description and "khanokh". The wayfarer after self- vigilance and passing some steged, should pass from seven "Heikhal" (salon) that have guard in each direction. In each stage he should bring with the pass stamp that is Gods hidden names. (sholam, 1389 : 93). Kabbalah religion, realy is jewery Sufism and the most important mystic tradition of them. Its two main stages are prophetic kabbalah or "Zohary" and "mashihany" kabbalah (Jewish promised redeemer) or "Loryany". This mystic disposition opens the path of conduct and deportment for the wise and is firm on theology, cosmology and recognition of creation and angele. Abdolvahab meysari has written that "kabbalah is from a Hebrew word that means sequence and acceptance of the past generations heritage. Kabbalah originally means oral

http://www.lifesciencesite.com2013;10(1) Life Science Journal
1393
and from generation to generation heritage of jewish and is by the name of oral religion.
This word got a new meaning near the end of twerfth. Century and was used by the meaning of kind of "khakhamy" changed knowledge and Sufism. Individuals who are conversant and familiar with secrets and mysteries of kabbalah (Hebrew maghobalim) mention theirselves as individuals who are familiar with divine benefit. Kabbalah is one of the terms that alludes that means torahs mysteries. The Sufis were being mentioned as phrases like "yordi merkava" that meons people who came down on ship imona" that means devout men, and "Bani hikhlay milk" that 5, p175). The most important mystic opus in this age id "Zohar" that has been written about 1280 of A.D and kabbalah religion has been stabilized by this book. "Zohar" is a description and an interpretation on the holy book. Zohar shows that the creation has a divine inside and describes the "sefirahs" (manifestation stages) theory. Kabbalah mysticism in 1429 sfter the exile of jews from spain, conrinued to its life in palestin and was sffected by "attitude to mashih(appearance of redeemer) lessons.
In this age, german loriyai Isaac taught a group of followers until that his lessons became famous as "loriyai kabbalah". Loriya said "the first work of God in creation process is "Tzimtzum" act or pluck and constringe. In seventeenth century of A.D, the mysticism lessons of loriayi kabbalah, had spreaded among jewish society and the promised anticipation and attitude to Christianity had developed on the base of that. Some people belive the jews holocausts in Europe as the plat of such thought. The news of Christianity appearance was heard among the lavan (a city in southern border of frence) jews and was spread throughout the jewery society. This person was "shabetta savi" (1626-1676 of A.D) that many people were advertising for him. The most of his followers had inhabited in east of Europe. One of the significant mystic attitude is "Hasidi" movement. Samoel Hasidi and his son, Juda and his student, Aliazerben Juda are individuals who organized the german Hasidi movement. In this school, piety, asceticism, bearing aspersion and malison, being inattentive to laud Gloria, fondness and love to serviceing people and its most importart principle, the Gods love and kindness is visible. In Germany jewery mysticism (Hasid) has been distin guished by rely on pirty and morality. Hasidy Gnostics in order to seeing "kavd" (divine glory) had to have a life joint with pietism, hesitation and self-vigilance and in social relations had to pay attention to altruism, even with non- jew people. This life was yesulting to true love to God finaly, that was leading to his satisfaction. Fmong hasidy people, there are magical ingredient that are Gnostics swampeding result and mysteries of script mixture. Divine attitude to
immanence that is similar to all, there is among hasidy peoples opuses that is their mystic theologh reflection. In century 18 of A.D, hasidi religious bustle appeared in Ukraine. This bustle concentrate on sensations and emotions, and freed the people from jewish religious zeals, limitation. Israel originator of this movement. Bal sham Toors teachings are theoretically derived from "Tzimtzum loria" theory.
Reby Davo Baer that is a hasidy preacher of mezeich Baer, is one of the fallowers of Ball shem Tooy. He propagated the term of :truthful" or "perfect man". God's essence
Jewish religion, pride itself because of extension of God's essence concept. Jewish Gnostics also believe that God's essence is indescribable, while "Merkava" mysticism describe a human like God but at the same time express his essence, like a king; high, holy and ungetatable.
1-High, essential and internal or infinite (Ensof) aspect that they were describing it with a term which has been barrowed from new-platonic philosophy or with the intermediator of anthroplogical concepts.
2-Empyrean aspect that originates from divinity's inside and essence and includes ten aspects, that is by the names of qualities (middot), powers (kohot) and heavens (sefirot). These divine powers are imagined in shape of supernatural human or tree that God is contemporary in two aspect: the appearance and the insde.(kaviyani, 1389:35-36)
In kabbalah mysticism, God has two aspects: the existential (qualities and names) and the non-existential (EnSof). The existential aspect is issued from the non-existential one. The existential aspect that is universe of divine qualities and names, is God's creative words and creation aspect and is the same old time human shape that is God reveal shape and the Sefiroth is organs of his body. (Shariatmadari, 1379: 72). Many fonds of appearance, were delating the kabbalahians to attitude to duality in theology, because of these two aspects.
But because they didn't want to involve in God's likening cases in the holy book, and furthermore in order to show God's loftiness from these cases, believed in these aspects for God.
Intermediator in creation:
In jewish mysticism, in order to keeping God's loftiness from the creatures, and at the same time elimating the distance between God and the creatures, they believed in an intermediator in creation.
http://www.lifesciencesite.com2013;10(1) Life Science Journal
1394
Filon Eskandarani (a Grecian jewish philosopher) used this term in jewish tradition. In "kabbalah" and "Hasidim" school, the equivalentof this term is called "Shakhina "(the presence of God in the universe) and "kard". According to teaching of jewish theology, God is individual and at the same time, is straight to essence, absolute and extensive pure existence; He doesn’t occupy and space or place, but he has a command of all of objects and in spite of that, he is an undescribable and super-thought existence and is comprehensible just through intuition. Filon, was guided to concept of intermediator creatures, because of affects of this belief and emphasis on God's loftiness, in order to fill the distance between God's essence and materialist universe. The highest of these creatures is mind (Nous) or logos that is primary, primordial and old time dispatch. Logos, in the opinion of filon is absolutely lower than God and must sorted in group of creatures, but includes many other creatures and has priorship and superiority on them and is the intermediator and medium of God in creation of this universe. Filon believed that the logos is a non-physical essence and God's non-physical word or God's speech and at the same time internal and high and in form of an obedient and intermediator creature which God reveals himself through it and it is doer. (Shariatmadari, 1379: 68).
Shakhina:
"Shakhina" means God's shining and magnificence or his presence in universe, specially in holy places. From the first day that seely sacrosanct's essence created the universe, was always wishful that in habits amonge his creatures in worldly universe, but he did not perform it. But when "Mishan" was inaugurated, and seely sacrosanct's essence manifested his "shakhina" within it, he said" write that universe has been created today". (Bemid Barreba, 13:6). "Shakhina" or empyream in kabbalah religion is girl's female origin and queen of divine sources universe (sefiroth). Indeed shakhina, the last sefiroth, is in shape of a girl that although her birthplace is a phase of light, she must be wondered of far lands, that is symbol of her separating from her divine origin. Not only she is always in affliction, but also in shape of God's bride, girl or queen, is mother of every Israeli person.
Abraham Helvi, who is Loria's student, in 1571 has been "shakhina", in shape of a crying and wearing black woman, beside the Nobeh wall in Jerusalem that is crying for her youth day's spouse. (Sholam, 1389: 298). In kabbalah, other empyream or shakhina's bynames are divine king's wife and queen. She is israel's virgin and underside mother
(versus bina or eminent mother) and because is carrier of divine message directly, they know her as God's manifestation. And at the same time she also forms mystic skeleton of Israel society. She is a mirror and on the other hand, is the prism of divine manifestation. She reflects the lights which she has received from "Teifareh" or kind by "Yasod", to it and on the other hand by breaking those lights which are result of sefirehs' unity, brings out them and creates the universe. (shaya, universalmeaning, 1971; P, 57). "shakhinah" is called "kard" by "Hasidim". Kard means that in the opinion of Hasidim, that phase of God which is sent down by his honor. For human, is not creator God, but is his first creature or first emanation. This kard is the major sting ray that is called "shakhina" and is like ruahha-kadesh or holy spirit. (sholam, 1389, p170). Shakhina is God or his visible magnificence, not the God himself. Because God has two form: the visible and the invisible or the existential and the nonexistential. In Hasidim school, "shakhina" has other concepts such as "korob" (adducent angel that is visible magnificene) or holiness or magnificence which these two concepts are divine eqstern and western concepts which defend God's majesty and empyream. (Shankai, 1388, P206). God has revealed this light or divine magnificence for all of prophets and according to time's condition, always has manifested himself in various forms for Gnostics of later centuries. The seeing of "kard" was end of german jewish Gnostics wish. (Epstain, 1388, P278). This school has emphasized on appearance and manifestation mysteries more than creation mysteries and God manifests through "kard".
Manifestation:
Jewish Gnostics thought of manifestation, name and qualities in order to recognition of God. They never believe that God's essence is describable and recognizable. They believe that it is uncomprehensible and undescribable like islam and more over they believe that God is alive. One of the complex topics of jewish mysticism is sefiroth topic. Sefiroths are God's qualities that creatures has been created according to those. The sefiroths are also called God's manifestation. There are ten sefiroths and often are showed like a tree, concentricity figures or like a candlestick with seven branches and three ties. (Boker, 1389, P136).
In kabbalah, creation has manifestation and appearance concept. God's manifestation is realize from up to down stages unit it reach to creation stage. These manifestation stages are called "Sefiroth" or "Sefiroth". These ten sefiroths are not enumerated as some stages in order to reaching to God, but they show the divine manifestation stages

http://www.lifesciencesite.com2013;10(1) Life Science Journal
1395
which have cooperation together and are complement of each other. They are ten names of God which altogether form the divine major name and are not separated from God."God is their essence and they are God's essence. (Zohar, V1, 70A, 11B). The existence of these sefiroths is from Ensofe and they are simulated to human. Because the essence of God is undescribable and because one can reachs to a description of it just through symbol, the Ensof has communicated with the world through names and qualities and at the same time is like and similar to the Sefiroths. Word Sefiroth is accult world of language, the world of divine names. Sefiroths are creative names which God's honor appropriates them to himself. (Sholam, 1389, P283).
These ten Sefiroths are God's manifestations which various schools have expressed them in different forms. But all of these school have agreement on torah. Sholam, (a scholar and professor in jewish mysticism field) has written that "Torah in the opinion of them is a alive poem which revives in its mysterious life that beats and gurgles among unlimited superficial cortex, during its vivific meanings, unit reachs to deep and spiritual meaning of torah that is also accommodation of indigenous religion with novel mystery of torah. (Sholam, 1389, P61).
List of the Sefiroths:
1. keter: crown 2. Hokhmah: wisdom 3. Bina: Foresight 4. Gedullah: magnificence or Hesed: love 5. Gerurah: dignity or din: mercy 6.Tifrtet: beuty or Rahamim: mercy 7. Nezah: immortality 8. Hod: glory 9. Yesod: truthful man or yesod olam: the basis
of universe. 10. malkut: empyream or Atarah: Tarek From century 13 and after it, a Sefiroth that its
name was "Dat" or "Shenakht" was placed between the "Hokhmah" and "Bina" that is not a separate Sefiroth but has a coordinator role. (Daghighian, 1376, P370). Sefiroths are showed in form of human or tree and a candlestich with seven branches and three ties. According to exit travel (25: 31), the details of making of seven branches –condlestich in Sina mountain, has been showed to mosed by God. This candlestich is made from a piece of gold. Its seven branches and three ties in kabbalah tradition are symbol of single universe of ten Sefiroths. The left branches of this candlestich is symbol of divine anger qualities and the right branches show the divine mercy qualities. Both of them are centralized
in central pillar and balance position. The quality of each of these qualities, adjusts the other. (Boker, 1389, P136)
The stages of the Sefiroths:
Sefiroths are divided in 3 group in "Zohar"; "the first group forms a triple set that strengthing as divine thought manifestation. The first Sefiroth is called "keter" and is the demonstrator of the first stage of divine creation, similar to volition in Ben Jebron's philosophy.
Keter became the appearance cockle of two parallel Sefiroths, the Hokhmah (wisdom) and the Bina (understanding). With these two Sefiroths we are looker of duality principle influx, that according to kabbalah view point, is running throughout the word. And kabbala mentions it on the basis of the man and woman's sexual relationship. With predicat of this principle to the first triple set, we can say that Hokhman father is male element and active principle in world, because he has plan and map of the universe with its all boundless phases and movements, in himself, hiddenly. On the other hand, Bina is passive obtained and receptive mother or dissociation and separation principle". (Epstain, 1388, P285).
"The second triple set of God is interpreted as the moral power of universe essence inside that is originated from the first triple set that introduces it as thinker power of the universe's essence inside. These Sefiroths are the divine major names or the mystic crowns of the holy king. The tenth and the last "sefireh" is called "empyream" or "shakhinah" that is explanatory of the all Sefiroths' coordination and implys to the presence of God in the universe. This "sefireh" also is called "shakhinah" or "internal presence" (Epstain, 1388, P286).
The definition of the Sefiroths:
Ensof: This term is not in the holy book and "Talmod" but in jew mystic religion it is mentioned as the God unknown essence.
"This is when God has not created the universe but it has been in shape of "Ensof" which then explicated itself by the name of "Yehreh" in the form of "sefiroth" or "Adam kaddamon" in order to other its names and qualities, such as "sheday" and "Elohim" and …, remain unknown. According to kabbalah's view, these name are originated from its nature not a humanely thought.
Because a God who is hidden in himself, could be named just through metaphor, by the help of words and in mystrical way, which they never are his real names. (Shankayi, 1388, P196).
http://www.lifesciencesite.com2013;10(1) Life Science Journal
1396
Keter: keter and other nine Sefireh are Ensof's existence phase. Keter is not explainable but through declaring.
Because it has not any shape and form and introduces itself in "exit travel", part 3, verse 14 "Ehieh, Eshe, Ehieh" (I am that I am).
In this case, meane in "Ehieh" phase which is the unchangeable and absolute essence and is called "In", keter dosen't accept multipicty, but it is Single and the other nine "Sefiroths" manifest from it like nine flames of a luminous lamp.In this position which is single, there is not subtraction between existence, super existence or inexistence; and there is not any revot and chaos. Keter is a principle which concurrently is recognized through both "In" and "Ehieh". It means that "keter" is "Ensof" which concurrently has existence and inexistence, while each of the possibilities also has its specifications. (schaya.l, universalmeaning, 1971, PP36-38). While each of these possibilities also names its specifications, the keter (crown), this " Sefirah" is the first unveiling of God and stater of his divine name. This "sefirah" includes whatever that there was, there is and whatever that continues to live.
Wisdom (Hokhmah): wisdom is divine existence shine which everything is created from the rays of its sparks. Each spark is the initial sample of nature and essence of everything which are united with God's existence and this existence is the same initial wordly sample and each spark is as its endless sun. In wisdom, God knows himself as all of creatures. Because wisdom is end of dualities and oppositions. (Shnkayi, 1388, P, 199). Wisdom is of God's mercy qualities. This " Sefirah" is the divine wisdom and tact and intelligence shine in human.
This quality is equilibrated by anger quality in adverse direction of itself, means "Bina". (Boker, 1389, P137).
Bina: Wisdom is manifested through "Bina" or foresight in universe. Bina, not only could be as rationality, but also, could be as a task which has divided among the objects and is cause of distinction. She is the heavenly mother that is by the name of mere totality of all separation, and all of phases was formed in it but they are still safe and immune in divine wisdom's unity which in they think of that. (Shalam, 1389, P287). Bina is the first quality of anger qualities. This concept is a symbol of divine intuition and it means the resistence and durability in accepting the tradition and using wisdom in human. (Boker, 1389, P137).
Hesed: This sefirah is the result of marital of the father (wisdom) and the mather (Bina). This is the first God's cosmic radiate that he awards it to creatures on the base of their need level.
He is bound up to limiting the creatures in order to manifesting his kindness in them and he performs this work through wordly adjudication tool or the "religion". This power or "religion" is derived from "Bina" or distinction and fore sight. He keeps the religion like a dark seed in his luminous inside and during the growth, this seed gets a shape of the special sefireh. Although it seems anomalous apparently, at the same time is its complement. (shankayi, 1388, P202). Hesed is of mercy qualities.
This sefirah is the symbol of divine and humanely circumstantiality such as laxity, heedlessness, boon and love which is equilibrated by "Gerurah", a anger qualities. (Boker, 1389, P137).
Gerurah (anger): Anger is indeed the denegation of his single reality refusal which at first manifested in form of comic darkness or vacuum and placed in all scattered creatures which its opposite point is the "Single" without any peer. But God's kindness and boon which is divine infiniteness confirmation, and is running in all finite creatures, dominants the anger exclusive action, and fills out and lightens the dark and empty cosmic space with its radiate and spiritual presence in everywhere. Therefore the static anger of creatures is finite so they are distinctive; and if the creatures are classified according to infiniteness and limits, this anger changes to kindness and benefice. Indeed God's anger is negative aspect of his kindness and benefice in appearance and because everything is recognized by its opposite, so anger is the opposite of kingness and kabbalah says "in everywhere that there is God's anger, there is also his kindness and vice versa. Because both of them are united". (schaya. Luniversul meaning 1971 P.48). "Gerurah" shows the divine bale and also humanely universe order and his flair and the provisions and rules. (Boker, 1389, P136) "Tifrtet" (mercy), "Nezah", "Hod" and "Yesod":
Tifrtet or God's mercy, Forms the boundless and beatific coordination in possibilities. This coordination is potential in "keter" and outcrops in tifrtet in shape of prime and special samples, while the qualities of each of them combine with each other. Nezah or victory is a creator and absolute power that by enlivening the creatures, creates the revaled universes. This sefireh is male. Hod or magne ficence and glory of God that is female is originated from victory in order to while she creates the multiplicity universe, shows that among all numerous and superficial phases, a unity is hidden. And these phases have origin in a unit. (Shankayi, 1388, PP202-204).
About 6th and 9th safirehs it has mentioned that "Tifrtet means beauty and wellness and yesod means origin and basis … Tifrtet, that the holy spirit flys
http://www.lifesciencesite.com2013;10(1) Life Science Journal
1397
over it, is the heart of hearts that the essence of objects in habit in it. Yesod is the base and basis of everything which exists. This concept means "ego" in humans; the same thing which is base and basis of awareness. (Bokey, 1389, P136). The 9th sefirah, Yesod, outside of all upper sefiroths which all intertwine with king's phantasic face, when breaks down in "Shakhinah", is interpretated as life breeding powers which they act dynamicly in total world.
The divine vita runs in mystic breeding act, out of indigenous depths of this sefiroth. (Sholam, 1389, P295).
Adam Kadmon:
In the opinion of jewish scientists, this principle that human has been created like God, is indicative of human's has been created like God, is indicative of human's preponderance than the rest of creatures. "because God has created the man like himself. (appearance travel, g, P6). Jewish mystic religion simulates the sefiroths which are issued from God, as tree and human and simulating to human is derivative from the holy book and is mentioned as primordial human (Adamkadmon).
Sefiroths are imaged in a particular order, in shape of human, means the Adamkadmon (the prime man), with passive circumstantiality which lie in left hand, while the creatures which are the result of alliance of both sefiroths, have a position along the central vertical line. Keter (dihim) is in head and is dominant on total organism, while malkut (majesty) locates in below. The sefiroth's domain is Asilot (issuance) world. Nevertheless, their influence domain spreads to 3 other worlds, where they start their real activity (Epstain, 1388, P, 286). Adam Kadmon technically means perfect and general man of the sefiroths. Moses D.Leon says "Yes, he is the collector of all divine powers that is in creation book. (Sholam, 1389, P299). So like the world is full of weal and evil, he also is the basis of weal, evil and sin. In his alive organism, he is reflector of God's hidden vita. Man is a merely spiritual creature basically. His ethereal form and shape which covers him and thereafter transformed his body's vital order, places in contrast of visible and evident and a nature which his body performs it now. Sin was cause of his acquiescing to materialist existence, and because of sin's poison he was born in pollution of materialist vita. (Sholam, 1389, P299). In the opinion of jewish gonstics, unity in initial of creation, was abiding between Ensof and Shakhin but because of the initial sin the unity was discreted, shakhina was deported and the divine grace was cutted from the world. Rejoining of shakhinah to Ensof, restoration of the damaged initial unity and
then renewal of without obstacles grace of divine love and mercy are goals that man was created for realization of them. (Epstain, 1388, P288). Adam has not spoken about the first sin clearly in zohar.
Because he doesn't want to disclose the secret which torah didn't reveal. But "Shamon Ben Yohay", says ironical in this book that "Sefiroth plummeted on Adam in shape of vita tree and wisdom tree, means the first and the last sefiroth. Adam, inested of try to keeping their basic and original unity and in result, the wisdom and vita domain unity and gifting the salvation to the world, separated them and located worship of shakhinah in his mind without understanding their unity with the rest of sefiroths. Thus he became the abstacle of running of a vita which is running from a domain to another and instead of it, brought the distinction, separation, dissociation and soleness to the world. (Sholam, 1389, P301).Eeach person is bound that by reaching to God and moral and spiritual perfection, trys to restore and renewal this lost unity (yihod). But the highest ration in realization of this desirable perfection must be performed in processional form and by Israel society. This is a responsibility which made responsible for them through electing them. (Epstain, 1388, P289).
Names and qualities:
In jew religion, God has many names: such as Niglot (appearance), Nistarot (inside), Abot (father), Ral Taghamot (vengeful God), El Gheno (zeal God), El Ela (high God), Elo kino pa Rahamim va Haslihot (moon God who has mercies and beneficence), Noseh Aven vayshe va khata a (sin and offense forgiver) (Exit, 3417, P6), Memit (God who gets the creatures' life) mazmor, 33, P11), Eni yeshon lef eni ehron (I'm the first and the last) (Ashia, 12: 48), Hegavel (great God), Hekipor (powerful), Sibet Hasibot (the causer of causes) Elat ha Elot (the first cause), Miokhad (immortal God), Zakh (sublim-ate). Kabbalah followers know torah as an explanation about God's name whose structure is stable on the unspeakable name of God or a name with 4 letters (y, h, v, h). This lookout has been declared in zohar the mystic book. (Shankayi, 1388, P165).
Yahovah, the major name:
The major name, in islam is general of all divine names and qualities some people believe that nobody knows that, even the prophets and saints and just God know that and some people also believe that term "Allah" is the major name and their intention is not just the terms. Jews also believe that God has reverence this name specificly. Although the recent jews do not permit using of the major name, except to special individuals, it seems that
http://www.lifesciencesite.com2013;10(1) Life Science Journal
1398
using this name in only book era, had not the embargo of the next era. Adding "Ya-h" or "Ya-ho" as suffix to the individuals' names such as (Yashiah-Yashiyaho-Hezghiah-Hezghiyaho) wich even after the Babylon bondage, was usual and widespread among jews, is the sign of that the using and pronouncing of the name with 4 letters, was not forbidden. But in beginning of jewish scientist's work, we see that this name just was being pronounced in prayer and worship ceremony in "Beit Hamighdash" temple and it seems that such law has been enacted in that time: "In "Beit Hamighdash",the major name, in way that is written, is pronounced too, but in out of "Beit Hamighdash" it is performed in different way.(Kohan, 1382. P, 49). From "Mishnay" era and after that, God's name was not mentioned frankly, except in the temple. One of the jewish erudites of 3th century of A.D, has issued such a fatwa: "Anyone who pronounce the major name which have 4 letters, in way that is being written, Frankly he has perpetrated a mortal sin." (Pasighya, A 148).
The root of Yahova:
Buber believes that: maybe this name is the expansion of word "hova" which it means "he", because the arab tribes were using it for God in religious revival era and it had meaning of single.
The sufies also use word "yahova" in meaning of "he" in their recitation. "hova" means "he" in Arabic and Hebrew and in this culture it is used when word "he" has became understandable. (Buber, 1993, P50).
The meaning of "Yahova":
"Yahova", the God's name, when is sent down on moses said "Ahiya, Eshe, Ahia" means "I am that I am, but jews nation knew it with meaning of "he is" which also have meaning of the unchangeable and absolute. Birth travel, part 33 shows that when the name "Yahova" is mentioned, the intention is God's mercy quality. (shankayi, 1388, P171).
In pointing to israel's God, Elohim accompanys with Suffix (ha-Elohim) and plural verb and adjective and iot means the "real God" (Peydayesh 13:20 and khoroj 4: 32). This name which is numerated from major names after "Yahova", benefits the same "Yahova's holiness" and points to God's justice and judgement aspects, while "Yahova" bodes to to God's mercy. (Talmod, Briosht Reba, 3/33)
Rashi Believes that God has raised the universe on basis of justice which is raised from mercy. Other wise of that and on basis of mere mercy, was impossible. (means on basis of two name, "Yahova" and "Elohim") (Encyclopedaijudaica, vol 5, P1059).
"Elohim" is a name which is attributed to God and it has happened after the separation of eye from mind, but a bridge has been formed on this terrible abysm. (Sholam, 1389, P289).
Accommodation of prophets with the sefiroth :
The kabbalahians who are the followers of God's appearance in the sefiroths' manifestations, believe that each prophet is the symbol of appearance of one sefiroth which forms their prophecy and mission. Indeed in historic dimension, each of the prophets was responsible for imparting of divine message's mission and maner, by the name of that sefireh for his nation. For example Honor Moses was embodiment of "Bina" that its cosmology wisdom, at the same time is universes' law mother.
Honor Abraham is embodiment of "Hesed" which is universe' kindness, Isaac is embodiment of religion which is his power and Jacop is embodiment of "Tifrtet" which is beauty and coordination among all phases and possibilities and is illustrator of God's presence in everywhere and Messiah is embodiment of God's wisdom that shows his rescuer presence. Other prophets also are the weaker manifestations of the sefiroth. (Shaya, universal…, 1971, P. 87).
Accommodation of God's name with Sefiroth:
Name "Yahova" is formed from 4 letters (Y, h, v, h) and each letter is the explanatory of one of the divine reality stages. This major name is general of all names. Realization of God's holy names such as "Yahova" and "Adonay" (patron and lord) depend on sefiroth's wisdom.Because sefiroth is explanatory of God's names for mention, of course each name alongside its concept has one letter of that 4 letters of "Yahova". For example "Ehieh" is proportional with "keter" and "Yah" and points to the wisdom. Elohim if be general, is Bina name, because in this name all the realities of name "Yahova" turn up in god's wonderful manifestation. "Al" means "single God" or "Elohi" means "my God" which point to the far and high gods, mean absolute single manifestation in distinctive symbols is religion and means bale, and shows "Yahova" shafieh, "Tifrtet" or beauty than not only includes God's presence in every where, but also assimilates his high from with his form which is present in everywhere. Means Y, h tv, h. (Shankay, 1388, P. 211).
Conditionality of the God's names:
As some qualities have been metioned for God in Quran which imply to similing him to human, these ,(God's face) وجھ هللا ,(God's hand) یدهللا)qualities also there are in jewish religion and holy

http://www.lifesciencesite.com2013;10(1) Life Science Journal
1399
book. In attributing these qualities to God, there is difference of opinion among jewish wises. Some wises believe they are allowable and some say they are forbidden. For example:
-Seeing God by his eyes and ears. (khoroj 24, 10-24 and numbers 8: 12)
- Spiritual states such as love, detestation, happiness, anger and joy.
(Talmod, Bershit Reba and Hagiga, 5b and Makhilta 18:19).
- Yad in meaning of hand or right hand (Ashia 12:49)
- His sitting on the heaven. - His descenting for knowing that
what is happening on the earth or revealing himself (khoroj 18:19).
Moses Ben Meymon believes that, the terms which have been used in the holy book must not be attributed to their superficial meaning.
For example "Rokob" is common with "Rakb" literally but they are different in meaning: One meaning is ridding of human on animals. "and he was ridding on his donkey".
He believes that using "ridding" of God on the heaven as a metaphor is a strange and interesting simile because "Rakeb" is supreme than "Markob" and is not form its type. And "Rakeb" moves the "Markob" in any form which he want and "Rakeb" is apart from "Markob" and is not conneceted to it. God is such it. Because he is the motive of high heaven that each locomotor moves by its movement and in addition, God is also apart from heaven. This simile is not without. (Ebn meymon, 1924 A.D, V1, PP32-34). Or the 3 terms of "Ra'y", "Nazar" and "Hezy" which have been used in meaning of seeing with eye. But each of them is used as a metaphor for wisdom percetpition. "Ra'y" means seeing with eye. For example "and Jacop saw that there is a well in the desert." (Khoroj, 10: 24). In the opinion of "Ebn meymon" the intention is wisdom perception, not seeing with eye. Because eye just realizes the material in its speciall specifications such as color and in speciall direction, but god is superior than that be realized through this tools. "Nazar" sometimes means Seeing with eye. For example "and if somebody look at the earth" (numbers 8:12). "Hazy" also means seeing with eye; but this meaning is used as a metaphor for heart perception too. For example "God's word to Abraham was in the dream". (Ebn Meymon, 1924. A. D. V1 PP32 and 34).
All religion trepan to believe that "the absolute" is free of qualities, because he is high and superior than every things and because of it, human is created from him. According to it, the jewish tradition prefers to approximates God to man by metaphor
and qualities in order to be cause of recognition of him, although it has in mind the back wash of this mentalist. Many verses of the Koran, at the same time, kithe the sublimity of God's essence. (Shankayi, 1388, P167). Recognition of God is not possible except through his names.
Azrael (the pupil of the blind Isaac) describes God as the hidden of hiddens. And knows him as the general of the creatures. Because all of creatures are within him and he is within them. He is visible and hidden too. He is visible because the resurrection of all creatures is from him and he is hidden because no one can finds him in anywhere. (Epstain, 1388, P284). We should not attribute the descriptions to God likewise attributing them to man. Because he is a super human reality. Isaac Ben latif says: "All of the names and descriptions are as metaphor to us not to God." (Sholam, 1389, P. 274).
Jewish Gnostics, against some philosophers who believe that the recognition of God is limited to apophatic qualities, believe the affirmative qualities.
For example Gos is alive, wise, capable and bountiful. They in addition of affirmative qualities, attribute the moral qualities to God, such as the clement, merciful, powerful, … Then is developed a theory among the thinkers that they believed that should not use the metaphorical qualities about God, but they prefer to express the main qualities such as vita, wisdom, and power of God in declaring1 shape. Any type of the metaphorical quality kithes that what he is not. For example God is wise, it kithes that he is not unwise. (shankayi, 1388; P. 166). Moses Ben Meymon divides the believers of God's qualities in 2 group and says both of them are wrong. The first group believe that God is material and recount face, hand ear and eye for him, and the second group believe in God's declaring from any type of moral a material qualities but they have proved the affirmative and essence qualities for God and know him as axcess to essence or exact of essence. This group also are not into declaring any way. But the real declaring is believing that God is sublimate and absolved from and quality and denying every quality. (Ebn Meymon, 1924.A. D, P 126). As mentioned before, he believes that God has not any name except "Yahova". It means that the other names become nobler and superior than this name.
Because God who is unique and single and without accessory, has all the pure perefection, names and qualities. In zohar, in cantation of Elyahonabi (prophet Elyas or khezr) has been mentioned that "God"! in every world you are single, not like a number which comes in
1 Declatation of incomparability
http://www.lifesciencesite.com2013;10(1) Life Science Journal
1400
accounting." (Shankayi, 1388, P, 165). Espinoza in his book which its name is morality, knows the Gods qualities (knowledge, power, vita,…) as selfsame of his essence. He has mentioned that "God's power is selfsame of his essence" (Espinoza, 1364, P. 55), and also knows the God's existence as selfsame of his essence and has mentioned that "God's existence and essence is one thing and are the same" (Haman, 36). He knows the God's essence and all of his qualities as eternal. As he has mentioned about this case that "God and all of his qualities are eternal" and explains that "his purpose of these qualities, is the affairs which are indicative of God's essence. Means that they belong to essence quiddity of God. So the qualities theirselves requiring the quiddity, and because the quiddity is eternal, the qualities are eternal too.
Concluding:
Among gnostics, specially who rely on particular religion, with relinquishing from some disagree ments, there are many common points. As in Islamic teachings. That man has the khalif and deputy position of God on the earth, in mystic anothropology, in order to reaching to that position, the prefect man hermeutic is expressed which is particular to prophets and saints. Man in order to reaching to the highest degree of recognition, means monotheism, must pass some states and positions. Entering to this path without any quide which is mentioned as "Khezr or Morshed" in practical mysticism, is accompany with risk of misdirection. In jewish mystic school (Hasidim) also the term of "sadigh" (truthful) is prevalent. Sadigh (truthful) or the perfect man, because of concentration on God's essence, in addition to himself can help the other in order to adduction to god too. Sadigh or Tzaddik has been a honest and upright man who is as a holy and luminous person, one of the ten light's' manifestations (sefiroth). In jewish mysticism, because of the first sin of man, Shakhinah has been deported and God's grace, has been wasted. Jewish Gnostics also know the man as a sinful because of the first sin, but in Islamic mysticism man is not a sinful but also is as he general of all divine names and qualities and even position is higher than the angels.
The jews know their selves and their religion as the God's chosen but t he Islamic Gnostics such as "Ebn Arabi" knows the islam as such and the rest of the religions as stars. In kabbalain mysticism, God has two form: The existential (names and qualities) and the inexistential (En sof). The kabbalaians in order to keeping the God's ascendancy from the creatures, believe in a inductor in creation. In the kabbalah and Hasidim school, the equivalent of this
term is called shakinah or kavd. Creation, in kabbalah, has the appearance and manifestation concept. God's manifestation is realized from up to bottom until reach to the creation stage. These manifestation stages are called Sefirah or sefiroth.
The Sefiroths are divided in anger and mercy qualities which adjust each other. In Islamic mysticism also the manifestation justifys the multiplicity of the names and qualities. "In man's aspect, the manifestation has 2 dimension: outside and inside. The outside is testament world and the inside is the invisible world. (Wiliam chitic, 1389. P117). Islam believes that the recognition of God is possible through acts and qualities and by their manifestation of course God's essence is innocent of be understanded by human' limited wisdom, then many grandee believe that it is not understandable. They divide God to affirmative and apophatic qualities, essence and act. Islam believes that God is innocent from alliance and incarnation. The kabbalahians who are the followers of God's appearance in Sefiroths' manifestations, believe that each prophet is appearance symbol of one of the Sefiroths which forms their prophecy and mission too. Indeed, in historic dimension, each prophet was responsible for mission and manner of God' divine message signification by the name of that sefireh, for his people. In accommodation of the sefiroths, of the religion and the holy Abraham as symbol of Hesed.
In Islamic mysticism, in Ebn Arabi's look out in Fosous Alhekam, in accommodation of divine names on the prophets, the perfect man is the general of the divine names and "Mohamadiyeh reality" that is the lord of all external creatures;
By the name of divinity, is the divine general name and the symbol of the major name "Allah". Adam is the symbol of wisdom, Noah is the symbol of declaring and Abraham is the symbol of sincere friendship of God. The most important issue which in jewish gnostics' theology, is caused by the holy book is a attitude depend on assimilation. Although the Moslem Gnostics also offer a metaphoricall picture from God, they contemporary stress on declaring too, and finally express the summation theology between the assimilation and declaring. References and resources: 1. Holy book, by holy book distribution assembly. 2. -Keren Armestrang, 1383, the theology from
Abraham up to now, translation by Mohsen Sepehr, Markaz press, 5th edition, Tehran.
3. -Epstain, Izidor, 1388, Jewerj, translation by Behzad Salaki, philosophy and wisdom research institution of Iran. 2th edition, Tehran.

http://www.lifesciencesite.com2013;10(1) Life Science Journal
1401
4. -Moses Ebn Meymon, 1874, A.D,Delaleh Alhaerin, Dr. Atay's research, Ankara university press, Ankara.
5. -Barokh Espinoza, 1364 A.H, Akhlagh (morality), translation by Mohsen Jahangiri, Tehran.
6. -V.T. Estis, 1361. A.H, the mysticism and philosophy, Bahaodin khoramshahi, Sorosh press, 2th edition, Tehran.
7. -John vester Dil Boker, 1389, the world' religions, translation by Nima orazany and Elahe Hoseiny Parvar, Sayegostar press, Ghazvin.
8. -Abdol vahab Almeysari, 1383, Zionism and jewish encyclopedia translation by ovservation and researchs of Middle East. 7 volumes Tehran.
9. -Shirindokht Daghighan, 1379, A ladder to adoration heaven in jewish history and philosophy, translation by vida, Tehran.
10. -Marziyeh shankayi, 1388, the accommodating study of the divine names, sorosh press, 2th edition, Tehran.
11. -Garshom, sholam, 1389, the Great events in jesish mysticism, translation by Faridodin Radmehr, Niloofar press, 2th edition, Tehran.
12. -Abraham kohn, 1382, A treasury from Talmod, the English translation by Amir. Fereidon Gorgani, the herbrew translation by Yehoshogh Neten Eli, and Amir Hosein Sadri pour, Asatir press, Tehran.
13. -Shiva karyani, 1389, The kabbalah religion the jewish mysticism and philosophy, Fararavan press, 3th edition, Tehran.
14. -John Nas Bayer, 1385, The religions' general history, translation by Asghar Hekmat, The scientific and culture press, 16th edition, Tehran.
12/22/2012

Life Science Journal 2013;10(1) http://www.lifesciencesite.com
1402
Morphometric Study of Anterior Cruciate Ligament and Histological Comparison with the Patellar and Hamstring Tendons and a Unique Case of Pes Anserinus Variant
Mohamed Atif Ahmed Said Ahmed
Anatomy Department, College of Medicine, Zagazig University, Egypt.
[email protected] Abstract: Tendons are being used as grafts for the ACL reconstruction. Their microscopic structure has not been sufficiently studied and compared to the ACL. Aim: The present study focused on the anatomy of the anterior cruciate ligament as well as microscopic structure of patellar tendon, semitendinosus and gracilis tendons. It investigated also the crimping patterns and the tensile strength of these tendons and ligaments. Methods. length and width of ACL were measured by MRI software program for 15 patients. Twenty six lower limbs from formalin fixed cadavers were used in the present study. Measurement of tibial and femoral attachment of ACL were determined with the help of digital caliper. Samples from four different human tendons (ACL, Patellar tendon, semitendinosus and gracilis)were studied by light and scanning electron microscopy. The number, angle and length of wave crimps of the collagen fibers were analyzed by scanning electron microscopy and fibril/interstitum ratio and density of fibroblasts were also analyzed. Results. The length of the anteromedial and posterolateral bundles were 32±3.5mm and 23±3mm respectively with nearly the same width. The mean length and width of the femoral attachment of ACL were 17.3±1.7 mm and 9.3 ± 1.1 mm respectively, while, the mean length and width of the tibial attachment were 18.3 ± 2.9 mm and 12.1 ± 2.8 mm respectively. The crimp angle of the collagen fibers varied greatly between the four different tendons. Crimp top angle in ACL and PT (88 ± 8.6º and 130 ± 9.7 º respectively) was significantly lower than in semitendinosus and gracilis (148 ± 10 º and 159 ± 10.5 º respectively). Morphometric analysis confirmed that crimp number was highest in ACL and PT (6.2 ± 0.7and 5.4 ± 0.6 respectively). The crimp base length was more longer in gracilis (22 ± 4.1µm) and semitendinosus (20 ± 4.1 µm) than in ACL (15 ± 3.2 µm). The semitendinosus showed the highest number of fibroblasts, while the gracilis showed the highest fibril/interstitium ratio. No significant differences regarding the diameter of the collagen fibrils were found between all groups. The tensile strength was highest in PL (2905 ± 127 N) compared to other groups. A unique case of pes anserinus variant is reported that had implications for tendon harvesting and have an impact on the outcome of surgery. CONCLUSIONS: The present study will be useful for enhancing the knowledge of anatomy of ACL. Both semitendinous and gracilis tendons provide significantly more density of collagen fibrils and fibroblasts in comparison with patellar tendons. These findings provide a potential advantage of the hamstrings group on better remodelling and regeneration of the tissue. [Mohamed Atif Ahmed Said Ahmed. Morphometric Study of Anterior Cruciate Ligament and Histological Comparison with the Patellar and Hamstring Tendons and a Unique Case of Pes Anserinus Variant. Life Sci J 2013;10(1):1402-1411] (ISSN:1097-8135). http://www.lifesciencesite.com. 210 Keywords: anterior cruciate ligament – patellar tendon – semitendinosus – gracilis – pes anserinus variant. 1. Introduction
The integrity of the anterior cruciate ligament (ACL) is important to athletes who participate in running and jumping sports.(1) The incidence of ACL ruptures has risen during the last years. Currently, a large number of ACL reconstructions are performed each year.(2) To achieve a satisfying surgical outcome after ACL reconstruction, a basic knowledge of the anatomy of the ACL is essential. The ACL origin is from the medial surface of the lateral femoral condyle to be inserted into an area on the tibia between the medial intercondylar eminence and the anterior horns of the menisci.(3) Length and diameter of the ACL play an important role for selection and preparation of the graft. Little is known about the length and diameter of the ACL. There is also
disagreement on the actual anatomic division of the ACL.(4,5,6)
Currently, most ACL reconstructions are performed with patellar tendon or hamstrings autograft. However, there has been recent interest in the use of allograft.(7)
Ligaments and tendons have often been considered as similar tissues with no marked difference due to their similar composition and role in transmitting mechanical forces. (8,9) Others suggest that they may be structurally different from each other so that one tendon is not like another.(10,11) The histological structure of the tendons used as grafts for the ACL reconstruction has not been sufficiently studied in the human being and compared to the ACL.(12)

Life Science Journal 2013;10(1) http://www.lifesciencesite.com
1403
The material properties of ligament and tendon published in the literature vary considerably. Tensile tests are commonly used to characterize the structural and material properties of tendons and ligaments.(13)
These tests provide important data on the function of tissues and the mechanisms of injury and healing.(10,14) Graft tension can aid clinicians in graft selection and is an important factor in achieving a successful outcome after ACL reconstruction.(15)
The pes anserinus is composed of a combination of tendinous insertions of the sartorius (SA), gracilis (GL) and semitendinosus (ST) muscles.(16) Precise anatomical knowledge of the structures on the medial side of the knee and the relationships between tendons is critical for diagnosis, surgery, and the development of improved operative procedures of the knee.
The SA is the longest muscle in the body. It is used as a reconstructive flap for the abdominal wall, the inguinal zone and the distal third of the thigh.(17,18) The ST tendon curves around the medial condyle of the tibia to be inserted into the upper part of the medial surface of the body of the tibia with the GL muscle at the Gerdy tubercle behind the tendon of the ST, where it contributes to the pes anserinus.(3) The semimembranosus muscle (SM) is inserted mainly into the horizontal groove on the posterior medial aspect of the medial condyle of the tibia.(3)
The ST and GL tendon are commonly used for ligament reconstruction. Inaccurate incision may cause complications such as cutting the main tendon, inadequate graft length and tibial nerve injury.(19) The harvesting of ST and GL is still met with certain anxiety by many surgeons, as it is a closed, blind procedure. Pes anserinus variations may predispose certain patients to injury that may lead to a decrease in the normal glide and flexibility of the muscles.(20) The variant of the pes anserinus is dangerous as it can potentially divert the course of the tendon stripper and divide the main tendon resulting in a short inadequate graft. Little has been reported concerning the anatomy of these variant.
This study will be focused on the anatomy of the ACL as well as microscopic structure of the ACL, PT, ST and GL tendons. It will also investigate the crimping patterns and the tensile strength of these tendons and ligaments. Unique case of a variant of the pes anserinus and semimemranosus muscle will be discussed. 2. Material and Methods
Magnetic resonance images of the knee were prospectively collected as part of routine diagnostic workups for 26 consecutive adult patients visiting the department of radiology, Faculty of Medical Sciences, King Khaled University. The knee
positioned in full extension and the images were collected using 6-mm section thickness by (General Electric Machine). Standard sagittal and coronal images were used. Eleven patients were excluded due to ACL pathology leaving a total of 15 images for review. Ten males and five females with mean age (41.6 ± 6.5 years). Basic data were collected for each patient.
The intact ACL was measured. The images were independently measured in a blinded fashion by 2 specialists. The measurements were obtained by using the ruler function on a digital radiology viewing program. The average length and width of the bundles were calculated for each examiner and for both examiners combined.
The anatomical and histological parts of the present study was conducted in the Anatomy Department at King Khaled University, College of Medicine. Twenty six human cadaveric lower limbs were studied. There were 8 males and 5 females, with a mean age of (59.6 ± 8.1 years). No trauma or any other pathological condition was recorded in the joints studied. A careful dissection of the knee joint was made and the cruciate ligament was explored. The morphometric characteristics of both tibial and femoral attachments of the ACL were measured by digital caliber. During the present study a careful deep dissection of the ST, SA and GL tendons was made starting from the insertion of the pes anserinus and extending proximally to the musculo-tendinous junction. All tendons of ST, GL and SA were carefully identified and their insertions at the pes anserinus were recorded.
Data were analyzed using Statistical Product and Service Solutions (SPSS). The mean was calculated with the standard of deviation. Differences between examiners were evaluated with a paired t-test. Light microscopy
Specimens including the ACL, PT, ST and GL tendons were fixed in 10% neutral buffered formalin for 24 h, decalcified in 5% nitric acid for 5hours, dehydrated in graded alcohols and embedded in paraffin. Longitudinal sections of 10 μm were cut and then stained with Massonʼs trichrome to enhance the collagen under the light microscope (Nikon Eclipse E-200). These sections were used for comparative analysis of tissue structure.
The technique of point-counting morphometry was used to assess the ratio of fibril to interstatium. A sampling grid of points was used.(21) Four randomly selected fields per field were counted on each micrograph.(22) Assessment was made of whether each point was positioned on a fibril or interstatium.

Life Science Journal 2013;10(1) http://www.lifesciencesite.com
1404
The ratio of fibrils to interstatium was calculated for the tendons in each group. SEM
The specimens for scanning electron microscopy were prepared as described previously.(23)
Briefly, the specimens for scanning electron microscopy were fixed in 2% glutaraldehyde buffered with cacodylate, pH (7.4), dehydrated in graded alcohols and coated with gold. These specimens were examined and photographed with a 6390 LV Jeol SEM scanning electron microscope, College of Medicine, King Khaled University. Photomicrographs were obtained from randomly chosen areas. Morphometry
Crimp number, crimp top angle, the corresponding crimp base length and the diameter of collagen fibrils were measured from the images obtained by scanning electron microscopy. Microscopic images obtained from each tendon or ligament were randomly chosen for analysis. For each image the total number of crimps, the angle width at the top of three randomly selected crimps and the corresponding base lengths were recorded. An ANOVA test was used to evaluate for a difference among the four groups. All analyses were carried out using Prism program for Windows. Differences were considered to be significant at P < 0.05. Values were means ± S.D.
The fibril/interstitum ratio and density of fibroblasts per field were recorded from the light microscopy trichrome slides and analyzed. Tensile strength
Sixteen tendons of ACL, PT, ST and GL, four tendons per each group, were harvested from four human cadavers. Samples were cut transverse to the tendon long-axis from the middle part of the tendon. The specimens were wrapped in moistened gauze (0.9% saline) . Samples were fixed to the device. The specimens were used for immediate ultimate failure loading. Failure loading was obtained with uniaxial loading parallel to the fiber axis at a deformation rate of 1 mm/s. A universal testing machine (Wp 300.20- PC measurement data recording system) (Fig. 1) was used at College of Engineering, King Khaled University, Abha, KSA. Ultimate tensile strength was recorded for each specimen according to Noyes et al.(24) Each measurement was performed by the same technician and repeated three times. 3. Results
The ACL, by MRI study, is divided into 2 parallel bundles, namely the anteromedial (AM) and posterolateral (PL) bundle (Fig.2). The length of the AM bundle is 32 ± 3.5mm and the width is 6.9 ± 0.9 mm. The length of the PL bundle is 23 ± 3mm and
the width is 6.9 ± 0.9 mm. The width of the two bundles of the ACL bundles were the same. The width was measured at the upper, middle and lower thirds of the ligament. The middle third of the ligament was the most narrow portion.
The ACL ligament, in cadaveric study, is attached to the femur over an oval area with a mean length of 17.3 ± 1.7 mm and a width of 9.3 ± 1.1 mm with mean surface area of 130 ± 12.6 mm2. The insertion site for the ACL on the tibia is also oval area covering a mean surface area of 148 ± 17.1 mm2, 18.3 ± 2.9 mm length and 12.1 ± 2.8 mm width.
The ACL consists of collagen fiber bundles which forms multiple fascicles separated by septa of loose connective tissue. A bunch of collagen fibrils forms a collagen fiber, which is the basic unit of a tendon. Collagen fibers showed a longitudinal arrangement along the ligaments. Some of the individual fibrils and fibril groups form spiral-type plaits. Collagen fiber bundles were separated often by thin spaces. The major cell type of the cruciate ligament is the elongated fibroblast, lying solitarily between the parallel collagen fibrils and appear elongated and frequently has cytoplasmic processes. Histological sections also reveal the presence of chondrocytes-like cells (Fig. 3).
The anterior cruciate ligament by SEM showed collagen fiber bundles running parallel in a helical and planar wave pattern. ACL was appeared to be a thick multilayer cell sheet. Each layer included densely packed large collagen fibrils coursing parallel with periodic crimps (Fig. 4). Inside these tendon crimps some of the parallelly coursing fibrils changed their direction showing knots considered as fibril crimps. Tendon crimps appeared smaller, more numerous and closer to each other (Fig. 4).
PT in longitudinal sections appeared to be composed of high densely packed collagen fibrils. Collagen fiber bundles running parallel and arranged in crimps. Crimps are clearly large and flatten in longitudinal sections. Fibril crimps are also appeared. Collagen fiber bundles in the PT appear separated by large spaces in comparison to other tendons studied and the cellular material is rare (Fig. 5).
The PT at SEM showed high densely packed fibrils coursing parallel, but interrupted by irregular crimps. Tendon crimps appeared wider, less numerous and not closer to one other (Fig. 6).
ST in longitudinal sections appeared to be composed of densely packed collagen fibrils. Collagen fiber bundles running parallel and arranged in crimps. Crimps were wide in longitudinal sections. Fibril crimps are also appeared. More fibroblasts appear in the histological section and the interstitial spaces is moderate in size in comparison to other
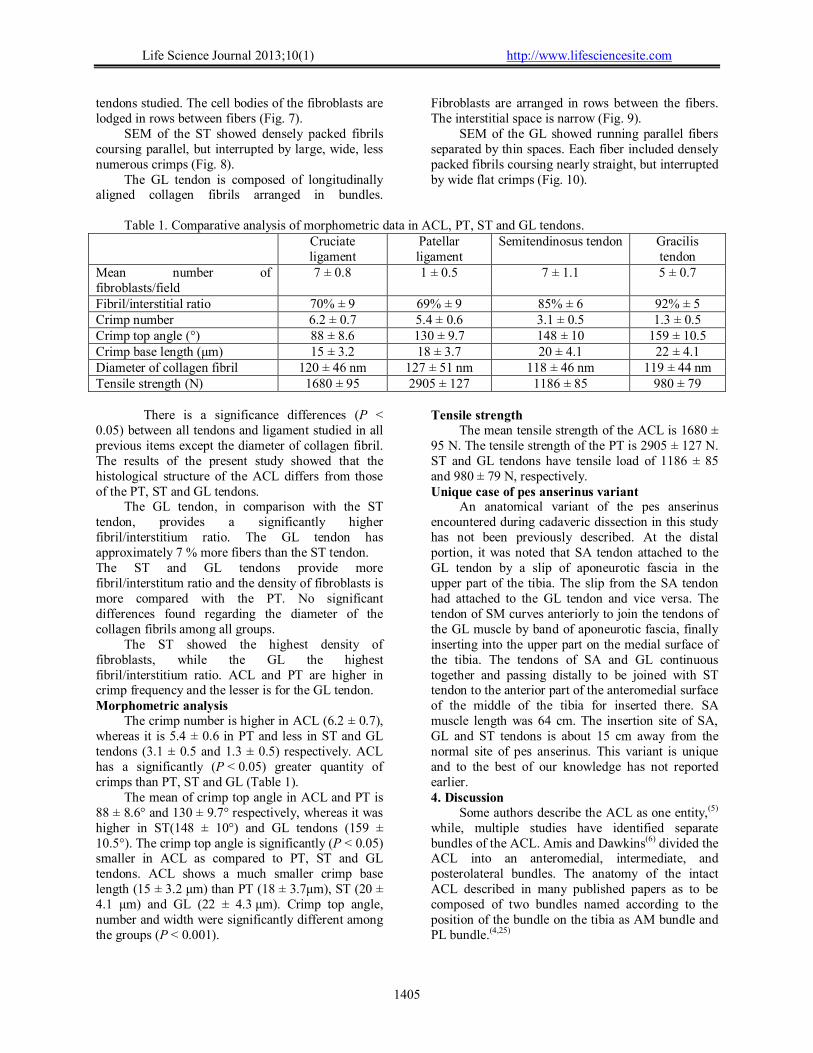
Life Science Journal 2013;10(1) http://www.lifesciencesite.com
1405
tendons studied. The cell bodies of the fibroblasts are lodged in rows between fibers (Fig. 7).
SEM of the ST showed densely packed fibrils coursing parallel, but interrupted by large, wide, less numerous crimps (Fig. 8).
The GL tendon is composed of longitudinally aligned collagen fibrils arranged in bundles.
Fibroblasts are arranged in rows between the fibers. The interstitial space is narrow (Fig. 9).
SEM of the GL showed running parallel fibers separated by thin spaces. Each fiber included densely packed fibrils coursing nearly straight, but interrupted by wide flat crimps (Fig. 10).
Table 1. Comparative analysis of morphometric data in ACL, PT, ST and GL tendons.
Cruciate ligament
Patellar ligament
Semitendinosus tendon Gracilis tendon
Mean number of fibroblasts/field
7 ± 0.8 1 ± 0.5 7 ± 1.1 5 ± 0.7
Fibril/interstitial ratio 70% ± 9 69% ± 9 85% ± 6 92% ± 5 Crimp number 6.2 ± 0.7 5.4 ± 0.6 3.1 ± 0.5 1.3 ± 0.5 Crimp top angle (°) 88 ± 8.6 130 ± 9.7 148 ± 10 159 ± 10.5 Crimp base length (μm) 15 ± 3.2 18 ± 3.7 20 ± 4.1 22 ± 4.1 Diameter of collagen fibril 120 ± 46 nm 127 ± 51 nm 118 ± 46 nm 119 ± 44 nm Tensile strength (N) 1680 ± 95 2905 ± 127 1186 ± 85 980 ± 79 There is a significance differences (P < 0.05) between all tendons and ligament studied in all previous items except the diameter of collagen fibril. The results of the present study showed that the histological structure of the ACL differs from those of the PT, ST and GL tendons.
The GL tendon, in comparison with the ST tendon, provides a significantly higher fibril/interstitium ratio. The GL tendon has approximately 7 % more fibers than the ST tendon. The ST and GL tendons provide more fibril/interstitum ratio and the density of fibroblasts is more compared with the PT. No significant differences found regarding the diameter of the collagen fibrils among all groups.
The ST showed the highest density of fibroblasts, while the GL the highest fibril/interstitium ratio. ACL and PT are higher in crimp frequency and the lesser is for the GL tendon. Morphometric analysis
The crimp number is higher in ACL (6.2 ± 0.7), whereas it is 5.4 ± 0.6 in PT and less in ST and GL tendons (3.1 ± 0.5 and 1.3 ± 0.5) respectively. ACL has a significantly (P < 0.05) greater quantity of crimps than PT, ST and GL (Table 1).
The mean of crimp top angle in ACL and PT is 88 ± 8.6° and 130 ± 9.7° respectively, whereas it was higher in ST(148 ± 10°) and GL tendons (159 ± 10.5°). The crimp top angle is significantly (P < 0.05) smaller in ACL as compared to PT, ST and GL tendons. ACL shows a much smaller crimp base length (15 ± 3.2 μm) than PT (18 ± 3.7μm), ST (20 ± 4.1 μm) and GL (22 ± 4.3 μm). Crimp top angle, number and width were significantly different among the groups (P < 0.001).
Tensile strength The mean tensile strength of the ACL is 1680 ±
95 N. The tensile strength of the PT is 2905 ± 127 N. ST and GL tendons have tensile load of 1186 ± 85 and 980 ± 79 N, respectively. Unique case of pes anserinus variant
An anatomical variant of the pes anserinus encountered during cadaveric dissection in this study has not been previously described. At the distal portion, it was noted that SA tendon attached to the GL tendon by a slip of aponeurotic fascia in the upper part of the tibia. The slip from the SA tendon had attached to the GL tendon and vice versa. The tendon of SM curves anteriorly to join the tendons of the GL muscle by band of aponeurotic fascia, finally inserting into the upper part on the medial surface of the tibia. The tendons of SA and GL continuous together and passing distally to be joined with ST tendon to the anterior part of the anteromedial surface of the middle of the tibia for inserted there. SA muscle length was 64 cm. The insertion site of SA, GL and ST tendons is about 15 cm away from the normal site of pes anserinus. This variant is unique and to the best of our knowledge has not reported earlier. 4. Discussion
Some authors describe the ACL as one entity,(5) while, multiple studies have identified separate bundles of the ACL. Amis and Dawkins(6) divided the ACL into an anteromedial, intermediate, and posterolateral bundles. The anatomy of the intact ACL described in many published papers as to be composed of two bundles named according to the position of the bundle on the tibia as AM bundle and PL bundle.(4,25)

Life Science Journal 2013;10(1) http://www.lifesciencesite.com
1406
Fig. 1. Photograph of tensile strength machine (Wp 300.20- PC measurement data recording system for universal machine).
Fig. 2. MRI of Knee joint showing the anteromedial (AM) and posterolateral (PL) bundles of the anterior cruciate ligament
Fig. 3. A photomicrograph of section of the anterior cruciate ligament showing fibre (F) with their fibroblasts (f) and chondrocyte like cells (c). Notice the interstitial space (I) lying between the fibres. (Masson´s trichrome X 1000)
Fig. 4. SEM micrograph of the anterior cruciate ligament showing the collagen fibre bundles (F) running parallel and appear separated by thin interstitial space (I). Inside each bundle densely packed collagen fibrils run parallel showing tendon crimps. The crimb base (cb) and the crimb angle (a) are noticed. Bar = 10 μm.
Fig. 5. A photomicrograph of a section in the patellar ligament showing high densely packed collagen fibrils. Fibre crimps appeared wider. Notice the fibre (F), the interstitial space (I) between the fibres and the fibril crimp (*). (Masson´s trichrome X 1000)
Fig. 6. SEM micrograph of the Patellar ligament showing the collagen fibre bundles (F) running parallel. Inside each bundle highly densely packed collagen fibrils run parallel showing fibre crimps. The crimp base (cb), crimp angle (a) and the wide interstitial space (I) are noticed. Bar = 5 μm.
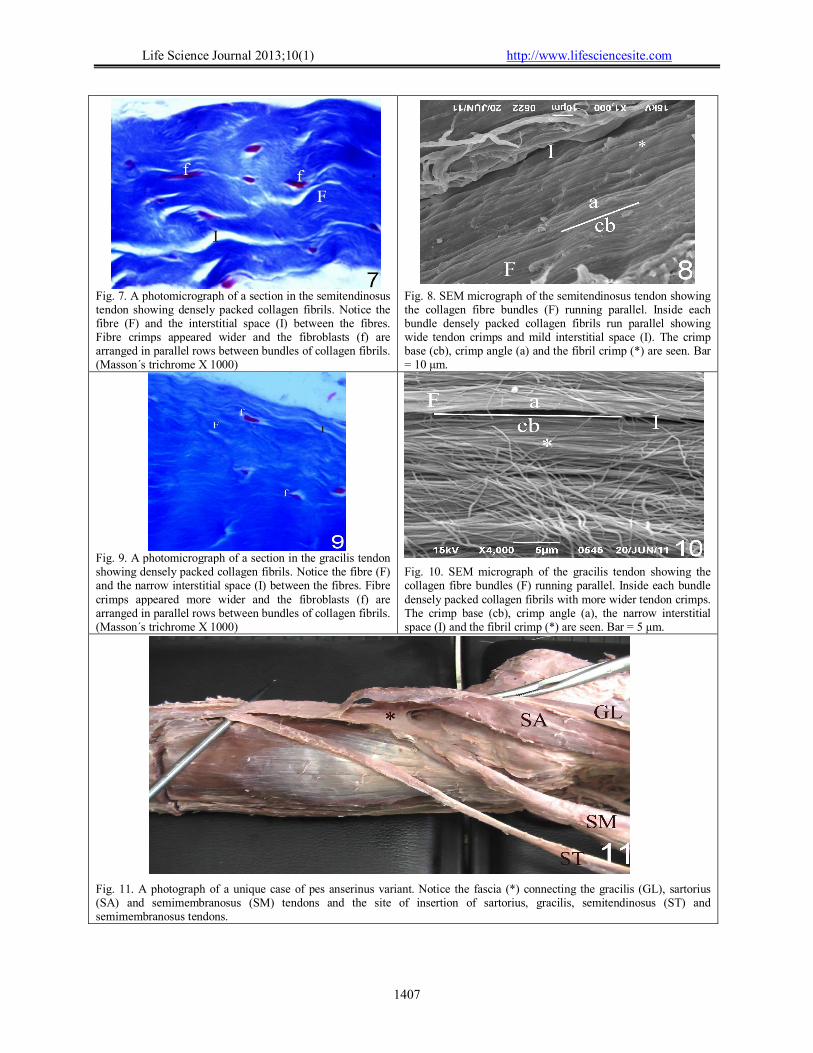
Life Science Journal 2013;10(1) http://www.lifesciencesite.com
1407
Fig. 7. A photomicrograph of a section in the semitendinosus tendon showing densely packed collagen fibrils. Notice the fibre (F) and the interstitial space (I) between the fibres. Fibre crimps appeared wider and the fibroblasts (f) are arranged in parallel rows between bundles of collagen fibrils. (Masson´s trichrome X 1000)
Fig. 8. SEM micrograph of the semitendinosus tendon showing the collagen fibre bundles (F) running parallel. Inside each bundle densely packed collagen fibrils run parallel showing wide tendon crimps and mild interstitial space (I). The crimp base (cb), crimp angle (a) and the fibril crimp (*) are seen. Bar = 10 μm.
Fig. 9. A photomicrograph of a section in the gracilis tendon showing densely packed collagen fibrils. Notice the fibre (F) and the narrow interstitial space (I) between the fibres. Fibre crimps appeared more wider and the fibroblasts (f) are arranged in parallel rows between bundles of collagen fibrils. (Masson´s trichrome X 1000)
Fig. 10. SEM micrograph of the gracilis tendon showing the collagen fibre bundles (F) running parallel. Inside each bundle densely packed collagen fibrils with more wider tendon crimps. The crimp base (cb), crimp angle (a), the narrow interstitial space (I) and the fibril crimp (*) are seen. Bar = 5 μm.
Fig. 11. A photograph of a unique case of pes anserinus variant. Notice the fascia (*) connecting the gracilis (GL), sartorius (SA) and semimembranosus (SM) tendons and the site of insertion of sartorius, gracilis, semitendinosus (ST) and semimembranosus tendons.

Life Science Journal 2013;10(1) http://www.lifesciencesite.com
1408
In agreement with the anatomical studies and recent data,(26) the present study showed that the ACL in MRI is divided into two parallel bundles, namely the AM bundle and the PL bundle. The AM bundle responsible for controlling the anteroposterior stability of the knee, and the PL bundle is responsible for controlling the internal rotation of the lateral tibial plateau.(27)
The length of the AM bundle in the present study was 32±3.5 mm and of the PL bundle was 23±3 mm by MRI. The width of each bundle is the same 6.9 ± 0.9 mm. The middle third of the ligament is the most narrow portion. The present result is in agreement with Takahashi et al.(28) and Smith et al.(29)
Hollis et al.(30) measured the individual bundle lengths in dissected cadavers to be, on average, 34 mm for the AM bundle and 22.5 mm for the PL bundle. Similar results were found by Steckel et al. (31) in a cadaveric model, in which the average length and width of the AM and PL bundles were 37.7 and 8.5 mm and 20.7 and 7.7 mm, respectively. The present data obtained by MRI demonstrate nearly the same trend, in which the AM bundle was longer than the PL bundle. Several studies have shown that the length of the ACL fibers vary with motion of the knee. The distance for the AM bundle increases with flexion and the length of the PL bundle decreases with flexion.(30, 32) Length and diameter of the ACL play an important role in ACL reconstruction.
Grossly, the femoral attachment is oval in shape with surface area of 130 ± 12.6 mm2. Authors using laser-digitizing methods described the insertion site to be circular (25) or oval(5) with a mean length of 18 mm and a width of 11 mm. The tibial attachment of ACL consists of oval area with surface area of 148 ± 17.1 mm2, 18.3 ± 2.9 mm length and 12.1 ± 2.8 mm width. Harner et al.(25) found the tibial insertion of the ACL to be approximately 120% of the femoral insertion site.
Morphological differences between ligaments and tendons or among different ligaments or different tendons have not been investigated in depth.(11) Fibrils group into fibers, fibers into fiber bundles.(11) All these structures are mainly oriented in their axial direction to strongly resist tensile load.(11,33) ACL should be histological and morphologically different from the tendons used for ACL reconstruction.(12) The present study showed that the ACL has a unique and complex histological structure.
The fibers in the present study are arranged in a wavy manner. The wavy shape is likely to allow the tendon to have its spring-like behavior. Tendons working with gravity are more flattened than those working against gravity.(34) The absence of mechanical loading leads to the straightening of crimps in the same tendon.(23) For this reason the
present study evaluated crimp number, crimp top angle and crimp base length in ACL, PT, ST and GL tendons to understand their elastic recoil properties and mechanical functions. Morphological observations and statistically significant morphometric analysis demonstrated that crimp number was high in ACL and PT, but it was less in GL and ST tendons. The mean crimp top angle in GL and ST tendons was significantly higher than in ACL and PT. The crimp base length was longer in GL and ST tendons than in ACL and PT. The smallest base length, top angle and most crimped pattern in ACL vs. PT, ST and GL tendons. Crimps in GL and ST tendons are larger, flatter and fewer than in ACL and PT suggesting ST and GL tendons acts as the major agonistic. The structure and crimping pattern observed in ST tendon were nearly similar to those of GL tendon suggesting that these tissues may have a similar recoiling property and biomechanical function. Crimps are involved in transferring and absorbing forces and recoiling of tendons and ligaments.(11) There is a correlation between the collagen fiber angle distribution and tendon mechanics in response to tensile loading.(35)
Collagen fibrils show crimps in the tendons and ligaments.(36) The single collagen fibrils within each tendon crimp change their direction showing fibril crimps.(37) The fibril crimps correspond to particular molecular arrangements of fibrils. They act as an elastic recoiling complex when a stretching force is removed.(11,33) The presence of fibril crimps in each collagen fibril inside crimps indicates a higher elastic recoil property and mechanical strength.
The cell bodies of the fibroblasts were lodged in rows between fibers and appeared elongated and frequently had cytoplasmic processes. Fibroblastic cells in tensile load have cytoplasmic processes which may be long and extend through collagen fibers.(38) The fibroblasts maintain the extracellular matrix.(39) The tendon fibroblasts proliferated faster than the ACL fibroblasts regardless of the material and geometry.(40) Myofibroblasts has been identified in fibroblastic cells and they might be involved in crimp formation and transmit tensile forces to the extracellular matrix in normal tendon and ligament.(41) Histological sections of ACL reveal the presence of chondrocytes-like cells. The presence of chondrocytes considered as a functional adaptation of the ligament to the occurring compressive stress .(42)
Fibril diameter is nearly the same in ACL, PT, ST and GL. The difference in tensile strength is not associated with fibril diameter, but with increase in collagen fibril lengths,(43) which can be related to the viscoelastic properties of tendons.(44) Other investigation has shown that collagen fibril diameter distribution alone cannot predict the material and
Life Science Journal 2013;10(1) http://www.lifesciencesite.com
1409
structural properties of a tendon.(8) Mechanical properties, soft tissue healing, cell proliferation, matrix production, and differentiation are regulated by changes in the fiber diameter.(45)
PT is widely considered a tendon. The biochemical extracellular matrix composition of human PT differs from that of other knee ligaments and is similar to other tendons.(46) All investigated tendons, excluding the patellar tendon, showed a higher fibril/interstitium ratio in comparison with ACL. A high percentage of the collagen fibrils in tendons can be important for the biomechanical capacity and the strength of tendon grafts.(47) Both ST and GL tendons provide significantly more density of collagen fibrils as well as density of fibroblasts in comparison with patellar tendons. These findings provide a potential advantage of the hamstrings group on better remodeling and regeneration of the tissue. The GL tendon showed the highest concentration of fibril/interstitium ratio. The GL tendon has approximately 7 % more fibers than the ST tendon. More fibers can play an important role for better biomechanical stability of the GL tendon. Hadjicostas et al.(12) reported that ligaments and tendons are similar in composition but differ in proportion and arrangement.
Tensile tests have been used to quantify the material properties of ligaments and tendons.(13,48) The tensile strength of the ACL, PT, ST, GL in the present research are 1680±95 N, 2905±127 N, 1186±85 N, 980±79 N, respectively. PT is the only ligament of the study that exceed ACL tensile strength value. The PT tensile strength is 173% greater than the ACL. The tensile strength of the ST represents 70% of the ACL tensile strength. The functional anatomy and biomechanics of the ST, GL and PT tendons explains the difference in their tensile strength. The PT functionally differs from the other knee ligaments as its load-related properties are significantly greater than the corresponding values of the ACL.(49) Younger specimens exhibited greater tensile load.(50)
Noyes et al reported the mean tensile strength of the normal ACL to be 1725 N.(24) The tensile strength of the ACL has been reported to be up to 2195 N.(51) Various investigation have demonstrated the tensile strength of the patellar tendon graft to be stronger than the original ACL.(52) Whereas, hamstring tendon grafts have been found to be inferior in strength to the normal ACL.(52)
The ST show the highest density of fibroblasts, while the GL the highest fibril/interstitium ratio. The highest fibroblasts and fibrils can play an important role in the better strength of the ST and GL tendons. The semitendinosus/gracilis combination is said to be stronger than the original ACL.(51,52) The technique of
coupling/doubling the semitendinosus and gracilis tendons is a more commonly established procedure.(53)
It is rarity in finding variations of the pes anserinus. Ivey and Prud’homme(54) classified the anatomical variants of the pes anserinus into seven groups: 1- Semicircular fascial slips extending from the first layer to the posterior aspect of the medial collateral ligament. 2- Splitting of the ST tendon with one end joining the GL and the other joining the crural fascia. 3- Overlap between the tendons in their distal attachment. 4- Thickened SA fascia inserting either as a separate tendon, or joining the GL or ST. 5- Tendinous slips arising from SA or GL running perpendicular and superficial to the ST. 6- A thickened band of SM running parallel to the medial collateral ligament adherent to the GL and ST. 7- A slip of ST splitting prior to fusion with the GL and inserting directly into the medial collateral ligament or tibia.
Koulouris and Connell(20) reported have that the SM muscle has multiple insertions. One inserted along the posterior aspect of the lateral condyle of the femur, the posterior joint capsule and the arcuate ligament. A second is attached to the fascia which covers the popliteus muscle and the posterior oblique ligament; while a few fibers inserted to the medial tibial condyle.(55) The SM muscle may be doubled and giving a slip to the femur or adductor magnus muscle.(56,57) An accessory SM has also been described.(56) A common accessory insertion of ST to the gastrocnemius fascia and a fascial sling have been found that commonly invests ST as it emerges under the SM tendon.(3)
Slips between the hamstring muscles may result in variations in the extent of insertion sites, causing a decrease in flexibility.(20) The insertion of SM to the upper medial part of the tibia and the slip between it, and SA and GL in the present study is rare and not reported before.
SA muscle length in the presenting case is 64 cm. This measurement is comparable to those published earlier.(58,59) In summary, this case is a unique variation in the insertion of the SA, GL, ST and SM tendons with a very long tendon of the SA and ST. Surgeons should be aware of the present findings during the tendon harvesting procedure. Conclusions:
The results of the present study revealed essential differences between ACL and tendons used as grafts for ACL reconstruction in regard of fibril–interstitium ratio and fibroblast . In terms of clinical relevance all the mentioned tendons can be used as auto or allografts for ACL reconstruction. Both ST and GL tendons provide significantly more density of

Life Science Journal 2013;10(1) http://www.lifesciencesite.com
1410
collagen fibrils as well as density of fibroblasts in comparison with patellar tendons. These findings provide a potential advantage of the hamstrings group on better remodeling and regeneration of the tissue. Patellar ligament has highest tensile load and more crimps than ST and GL tendons but with poor fibroblasts and less density of fibrils leading to less remodeling and regeneration. ST tendon has the highest number of fibroblasts between the tendons studied, while GL has the highest density of collagen fibrils. The present study recommends the use of coupling the ST and GL tendons for good remodeling and regeneration. The present study reports a case of a previously undescribed anatomical variant of the pes anserinus that have implications for tendon harvesting, preparation at ACL reconstruction and have an impact on the outcome of surgery. References 1. Zantop T, Petersen W, Sekiya JK, Musahl V, Fu FH.
Anterior cruciate ligament anatomy and function relating to anatomical reconstruction. Knee Surg Sports Traumatol Arthrosc. 2006;14(10):982-92.
2. Janssen KW, Orchard JW, Driscoll TR, van Mechelen W. High incidence and costs for anterior cruciate ligament reconstructions performed in Australia from 2003–2004 to 2007–2008: time for an anterior cruciate ligament register by Scandinavian model?. Scand J Med Sci Sports. 2012;22(4):495-501.
3. Standring S, editor. Gray’s anatomy: the anatomical basis of clinical practice. 3. Edinburgh: Elsevier Churchill Livingstone; 2005: 1461.
4. Girgis FG, Marshall JL, Monajem A. The cruciate ligaments of the knee joint. Anatomical, functional and experimental analysis, Clin Orthop. 1975;106:216–31.
5. Odensten M and Gillquist J. Functional anatomy of the anterior cruciate ligament and a rationale for reconstruction, J Bone Joint Surg Am. 1985;67:257–62.
6. Amis AA and Dawkins GP. Functional anatomy of the anterior cruciate ligament. Fiber bundle actions related to ligament replacements and injuries. J Bone Joint Surg Br. 1991;73:260–67.
7. Indelli PF, Dillingham MF, Fanton GS. Anterior cruciate ligament reconstruction using cryo preserved allografts. Clin Orthop. 2004; 420:268–75.
8. Provenzano PP and Vanderby Jr R. Collagen fibril morphology and organization: implications for force transmission in ligament and tendon, Matrix Biology. 2006;25:71–84.
9. Hoffmann A and Gross G. Tendons and ligaments engineering in the adult organism: mesenchymal stem cells and gene-therapeutic approaches, International Orthopaedics. 2007;31:791–97.
10. Haraldsson BT, Aagaard P, Krogsgaard M, Alkjaer T, Kjaer M, Magnusson SP. Region specific mechanical properties of the human patella tendon, Journal of Applied Physiology. 2005;98(3):1006–12.
11. Benjamin M, Kaiser E, Milz S. Structure-function relationships in tendons: a review, Journal of Anatomy. 2008;212:211–28.
12. Hadjicostas PT, Soucacos PN, Koleganova N, Krohmer G, Berger I. Comparative and morphological analysis of
commonly used autografts for anterior cruciate ligament reconstruction with the native ACL: an electron, microscopic and morphologic study. Knee Surg Sports Traumatol Arthrosc. 2008;16(12):1099-107.
13. Wren TA, Yerby SA, Beaupre GS, Carter DR. Mechanical properties of the human Achilles tendon, Clinical Biomechanics (Bristol, Avon). 2001;16:245–51.
14. Abramowitch SD, Woo SL, Clineff TD, Debski RE. An evaluation of the quasi-linear viscoelastic properties of the healing medial collateral ligament in a goat model, Annals of Biomedical Engineering. 2004; 32:329–35.
15. Beasley L, Weiland D, Vidal A, Chhabra A, Herzka A, Feng M, West R. Anterior cruciate ligament reconstruction: A literature review of the anatomy, biomechanics, surgical considerations, and clinical outcomes. Operative Techniques in Orthopaedics. 2005; 15(1): 5-19.
16. Mochizuki T, Akita K, Muneta T, Sato T. Pes anserinus: layered supportive structure on the medial side of the knee. Clin Anat. 2004;17(1):50-4.
17. Gu B, Fan Q, Lu Y, Goldenberg B. Repair of a huge defect of the gluteal region by rotation of a combined tensor fasciae latae sartorius myocutaneous flap. Plast Reconstr Surg. 1990;86:983-6.
18. Koshima I, Soeda S, Ohno A. Combined tensor fasciae latae musculocutaneous flap and sartorius musculocutaneous flap for the repair of wide defects of the lower leg. Plast Reconstr Surg. 1990;86:1198-201.
19. Kijkunasathian C, Limitlaohaphan C, Saengpetch N, Saitongdee P, Woratanarat P. The location of pes anserinus insertion in Thai people. J Med Assoc Thai. 2009;92 (6):S189-92.
20. Koulouris G and Connell D. Hamstring muscle complex: an imaging review. Radiographics. 2005;25(3):571-86.
21. Aherne WA and Dunhill MS. Point counting and the estimation of volume fraction. In: Aherne WA, Dunhill MS, eds. Morphometry. 3rd Edn. London, Edward Arnold Publishers, 1987: 33–44.
22. Howard CV and Reed MG. Estimation of component volume and volume fraction. In: Howard CV, Reed MG, eds. Unbiased Stereology. Three-Dimensional Measurement in Microscopy. 1st Edn. Oxford, BIOS Scientific Publishers, 1998: 55–65.
23. Järvinen TAH, Jozsa L, Kannus P, Järvinen TLN, Järvinen M. Organization and distribution of intramuscular connective tissue in normal and immobilized muscles. J Muscle Res Cell Mot. 2002; 23: 245-254.
24. Noyes F, Butler D, Grood E, Zernicke R, Hefti M. Biomechanical analysis of human ligament grafts used in knee-ligament repairs and reconstructions. Journal of Bone and Joint Surgery. 1984;66A:344-52.
25. Harner CD, Baek GH, Vogrin TM, Carlin GJ, Kashiwaguchi S, Woo SL. Quantitative analysis of human cruciate ligament insertions. Arthroscopy. 1999;15:741-49.
26. Jordan SS, DeFrate LE, Nha KW, Papannagari R, Gill TJ, Li G. The in-vivo kinematics of the anteromedial and posterolateral bundles of the anterior cruciate ligament during weight bearing knee flexion. Am J Sports Med. 2007;35:547‐54.
27. Komzák M, Hart R, Okál F, Safi A. Does the posterolateral bundle influence rotational movement more than the anteromedial bundle in anterior cruciate ligament reconstruction?: A clinical study. J Bone Joint Surg Br. 2012;94(10):1372-6.

Life Science Journal 2013;10(1) http://www.lifesciencesite.com
1411
28. Takahashi M, Doi M, Abe M, Suzuki D, Nagano A. Anatomical study of the femoral and tibial insertions of the anteromedial and posterolateral bundles of human anterior cruciate ligament. Am J Sports Med. 2006;34:787–92.
29. Smith BA, Livesay GA, Woo SL. Biology and biomechanics of the anterior cruciate ligament. Clin Sports Med. 1993;12:637–70.
30. Hollis JM, Takai S, Adams DJ. The effects of knee motion and external loading on the length of the anterior cruciate ligament (ACL): A kinematic study. J Biomech Eng. 1991; 3:208-14.
31. Steckel H, Starman JS, Baums MH, Klinger HM, Schultz W, Fu FH. Anatomy of the anterior cruciate ligament double bundle structure: a macroscopic evaluation. Scand J Med Sci Sports. 2007; 17(4):387-92.
32. Takai S, Woo SL, Livesay GA: Determination of the in-situ loads on the human anterior cruciate ligament. J Orthop Res. 1993;11:686-95.
33. Franchi M, Quaranta M, De Pasquale V, Macciocca M, Orsini E, Trirè A, Ottani V, Ruggeri A. Tendon crimps and peritendinous tissues responding to tensional forces. Eur J Histochem. 2007;51(1):9-14.
34. Järvinen TA, Järvinen TL, Kannus P, Józsa L, Järvinen M. Collagen fibers of the spontaneously ruptured human tendons display decreased thickness and crimp angle. J Orthop Res. 2004;22(6):1303-9.
35. Szczesny SE, Peloquin JM, Cortes DH, Kadlowec JA, Soslowsky LJ, Elliott DM. Biaxial tensile testing and constitutive modeling of human supraspinatus tendon. J Biomech Eng. 2012; 134(2): 021004.
36. De Campos Vidal B. Image analysis of tendon helical superstructure using interference and polarized light microscopy, Micron. 2003; 34:423–32.
37. Raspanti M, Manelli A, Franchi M, Ruggeri A. The 3D structure of crimps in the rat Achilles tendon. Matrix Biol. 2005;24(7):503-7.
38. Bruehlmann SB, Rattner JB, Matyas JR, Duncan NA. Regional variations in the cellular matrix of the annulus fibrosus of the intervertebral disc.J Anat. 2002; 201(2): 159-71.
39. Frank CB. Ligament structure, physiology and function. J Musculoskelet Neuronal Interact. 2004; 4(2):199-201.
40. Cooper JA, Lu HH, Ko FK, Freeman JW, Laurencin CT. Fiber-based tissue-engineering scaffold for ligament replacement: design considerations and in vitro evaluation. Biomaterials. 2005; 26:1523–32.
41. Weiss M, Unterhauser FN, Weiler A. Crimp frequency is strongly correlated to myofibroblast density in the human anterior cruciate ligament and its autologous tendon grafts. Knee Surgery, Sports Traumatology, Arthroscopy. 2012; 20 (5): 889-95.
42. Petersen W and Tillmann B. Anatomy and function of the anterior cruciate ligament. Orthopade. 2002;31:710-8.
43. McBride DJ, Trelstad RL, Silver FH. Structural and mechanical assessment of developing chick tendon. International Journal of Biological Macromolecules. 1988;10: 194–200.
44. Silver FH, Christiansen DL, Snowhill PB, Chen Y, Landis WJ. The role of mineral in the viscoelasticity of turkey tendons. Biomacromolecules. 2000;1: 180–5.
45. Erisken C, Zhang X, Moffat KL, Levine WN, Lu HH. Scaffold fiber diameter regulates human tendon fibroblast growth and differentiation. Tissue Eng Part A. 2012. Abstract.
46. Rumian AP, Wallace AL, Birch HL. Tendons and ligaments are anatomically distinct but overlap in molecular and morphological features—a comparative study in an ovine model, Journal of Orthopaedic Research. 2007;25:458–64.
47. Chandrashekar N, Mansouri H, Slanterbeck J, Hashemi J. Sex-based differences in the tensile properties of human anterior cruciate ligament. J Biomech. 2006; 39:2943–50.
48. Yin L and Elliott DM. A biphasic and transversely isotropic mechanical model for tendon: application to mouse tail fascicles in uniaxial tension. J Biomech. 2004;37(6):907-16.
49. Butler DL, Kay MD, Stouffer DC. Comparison of material properties in fascicle-bone units from human patellar tendon and knee ligaments. J Biomech. 1986;19(6):425-32.
50. Woo SL, Wu C, Dede O, Vercillo F, Noorani S. Biomechanics and anterior cruciate ligament reconstruction. J Orthop Surg Res. 2006;1: 2.
51. Mologne TS and Friedman MJ. Graft options for ACL reconstruction. American Journal of Orthopedics. 2000; 29: 845-53.
52. Brown CH and Sklar JH. Graft selection: Nonpatellar alternatives gain popularity. Biomechanics. 1998:21-25.
53. Barrett, GR, Boojin FK, Hartzog CW, Nash CR. Reconstruction of the anterior cruciate ligament in females: A comparison of hamstring versus patellar tendon autograft. Arthroscopy: Journal of Arthroscopic and Related Surgery. 2002;18: 46-54.
54. Ivey M and Prud’homme J. Anatomic variations of the pes anserinus: a cadaver study. Orthopedics. 1993;16:601–6.
55. Beltran J, Matityahu A, Hwang K, Jbara M, Maimon R, Padron M, Mota J, Beltran L, Sundaram M. The distal semimembranosus complex: normal MR anatomy, variants, biomechanics and pathology. Skeletal Radiol. 2003;32(8):435-45.
56. Stoane J M and Gordon D H. MRI of an accessory semimembranosus muscle. J Comput Assist Tomogr.1995;19(1):161–2.
57. Cattrysse E, Barbaix E, Janssens V, Alewaeters K, Van Roy P, Clarijs JP. Observation of a supernumerary hamstring muscle: a state of the art on its incidence and clinical relevance.Morphologie. 2002; 86(274):17-21.
58. Tang ML, Liu XY, Ren JW, Zhang DC, Li RS, Wen YM, Ge BF. The sartorius myocutaneous island flap. Surg Radiol Anat. 1993;15(4):259-63.
59. Clavert P, Cognet JM, Baley S, Stussi D, Prevost P, Babin SR, Simon P, Kahn JL. Anatomical basis for distal sartorius muscle flap for reconstructive surgery below the knee. Anatomical study and case report. J Plast Reconstr Aesthet Surg. 2008;61(1):50-4.
12/26/2012
Life Science Journal 2013;10(1) http://www.lifesciencesite.com
1412
The Protective Effect of Ginger (Zingiber Officinale) Against Adriamycin- Induced Hepatotoxicity in Rats: Histological Study
Mohamed Atif Ahmed Said Ahmed
Anatomy Department, College of Medicine, Zagazig University, Egypt
Abstract: Aim: The present study aimed to show the histopathological and ultrastructural changes occurred in the rat liver post-application of adriamycin and to evaluate the possible protection of ginger against adriamycin induced hepatic toxicity. Material And Methods: Animals were divided into four groups. The first group was given saline orally. The second group was given ginger extract orally with a single daily dose 250 mg/kg b.wt. for two weeks. The third group was treated with adriamycin in six intraperitoneal injections (each containing 2.5 mg/kg/b.wt) over a period of two weeks. The fourth group was treated with adriamycin at the same dose level as those of group III and by oral administration of ginger extract (250 mg/kg/b.wt) daily for two weeks. Livers specimens from all groups were examined by light and electron microscopies. Results: Adriamycin treated group revealed destruction of the hepatic cords, cytoplasmic vacuolization, cellular degeneration, pyknotic and atrophic nuclei, damaged mitochondria and accumulation of lipid droplets in the hepatocytes and deposition of a collagen-like fibrous material in the blood sinusoids and space of Disse with dilated intercellular spaces. Dilated blood sinusoids and dilated bile canaliculi with atrophy of its microvilli were also noticed. Damaged Kupffer cells with vacuoles were prominent. The hepatotoxic effect of adriamycin was ameliorated with partial disappearance of pathological hepatic damage when treatment was combined with ginger. The results of the present work indicated that ginger had protective effect against liver damage induced by adriamycin.Conclusion: The present results provide in vivo evidence of direct chemotherapeutic hepatotoxicity caused by adriamycin. Appropriate protective measures as ginger must be applied with anticancer treatment for improving liver structure. The results can further suggest the possible use of ginger against oxidative stress induced organ toxicities. [Mohamed Atif Ahmed Said Ahmed. The Protective Effect of Ginger (Zingiber Officinale) Against Adriamycin- Induced Hepatotoxicity in Rats: Histological Study. Life Sci J 2013;10(1):1412-1422] (ISSN:1097-8135). http://www.lifesciencesite.com. 211 Key words: Ginger – adriamycin – hepatotoxicity – protection – histology- ultrastructure - liver 1. Introduction
Adriamycin is an anthracyclic antibiotic with broad spectrum of anti-neoplastic activity that has been found to be highly effective against tumors.(1) The clinical usefulness of adriamycin is limited by its cardiotoxicity and hepatotoxicity.(2) Adriamycin can have serious side effects in liver.(2) Some researchers proposed that adriamycin-induced toxicity is most likely mediated by diverse oxidative damage on cellular components like membrane lipids in the plasma membranes and mitochondria.(3) Oxidative damage occurs in a cell when the concentration of reactive oxygen species generated, exceeds the antioxidant capability of the cell.
Research on ginger, the spice from rhizomes of Zingiber officinale reveals a number of analeptic properties as an antioxidant, anti-lipidemic, anti-hyperglycemic, anti-inflammatory and anti-cancer agent.(4,5,6) This medicinal herb is excellent for oral therapy as it is effective, non-toxic and without serious side effects.
Free radicals scavengers are known to reduce adriamycin-induced toxic effects.(7) Ginger extracts scavenge superoxide anion and hydroxyl radicals. It
reveals significant inhibitory properties against free radical attack and lipid peroxidation in mouse liver microsomes, as well as potent protective effects on primary rat hepatocytes against oxidative damage.(8) Ginger offer palliative and curative properties via an antioxidant effect. Though, the antioxidant activity of ginger is well known. Its hepatoprotective effect of ginger against ethanol, carbon tetrachloride and acetaminophen-induced hepatotoxicity in rats are also previously documented.(9,10,11)
Hepatic metabolism converts drugs into products that are more easily excreted.(12) The central role of liver in drug metabolism predisposes them to toxic injury.
For the previous mentioned reasons, the liver was choosen to focus in the present study of the pathological effects of adriamycin. Combination of phytochemicals and dietary supplements with anticancer drugs offers some promise.(13) To the best our knowledge, the possible modulating structure effect of ginger extract in the presence of adriamycin has not been yet investigated. Hence, the present study aimed to show the histopathological with ultrastructural changes occurred post-application of
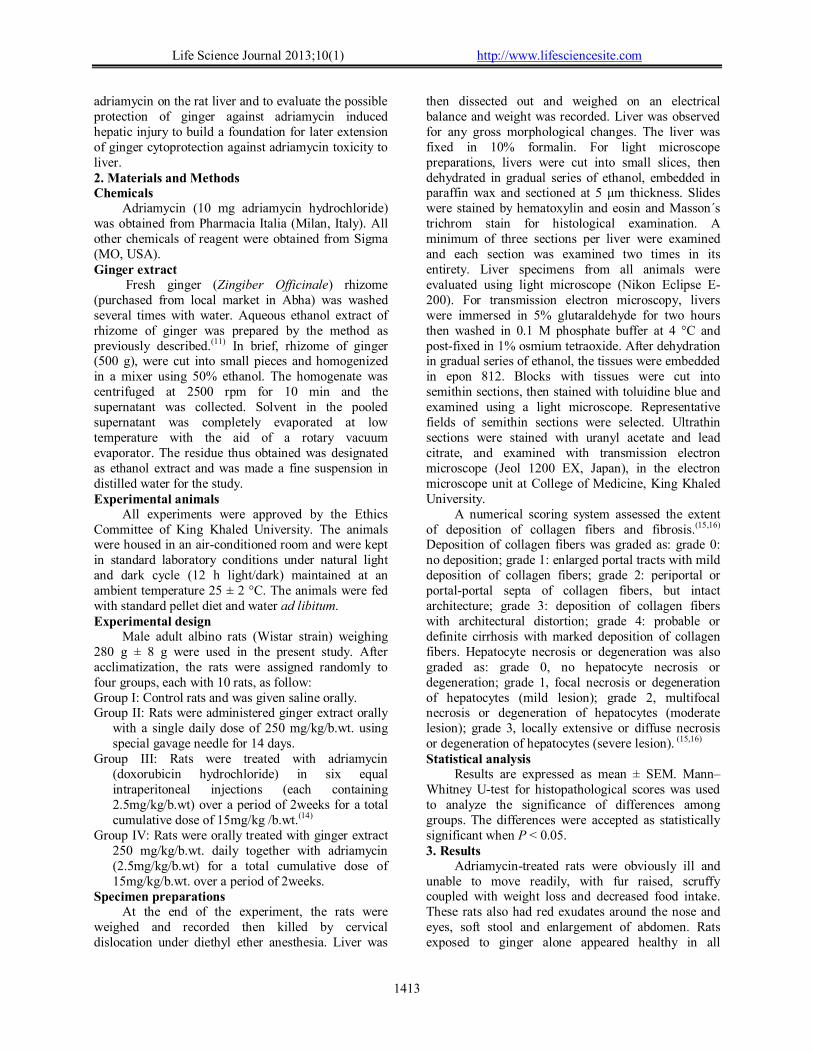
Life Science Journal 2013;10(1) http://www.lifesciencesite.com
1413
adriamycin on the rat liver and to evaluate the possible protection of ginger against adriamycin induced hepatic injury to build a foundation for later extension of ginger cytoprotection against adriamycin toxicity to liver. 2. Materials and Methods Chemicals
Adriamycin (10 mg adriamycin hydrochloride) was obtained from Pharmacia Italia (Milan, Italy). All other chemicals of reagent were obtained from Sigma (MO, USA). Ginger extract
Fresh ginger (Zingiber Officinale) rhizome (purchased from local market in Abha) was washed several times with water. Aqueous ethanol extract of rhizome of ginger was prepared by the method as previously described.(11) In brief, rhizome of ginger (500 g), were cut into small pieces and homogenized in a mixer using 50% ethanol. The homogenate was centrifuged at 2500 rpm for 10 min and the supernatant was collected. Solvent in the pooled supernatant was completely evaporated at low temperature with the aid of a rotary vacuum evaporator. The residue thus obtained was designated as ethanol extract and was made a fine suspension in distilled water for the study. Experimental animals
All experiments were approved by the Ethics Committee of King Khaled University. The animals were housed in an air-conditioned room and were kept in standard laboratory conditions under natural light and dark cycle (12 h light/dark) maintained at an ambient temperature 25 ± 2 °C. The animals were fed with standard pellet diet and water ad libitum. Experimental design
Male adult albino rats (Wistar strain) weighing 280 g ± 8 g were used in the present study. After acclimatization, the rats were assigned randomly to four groups, each with 10 rats, as follow: Group I: Control rats and was given saline orally. Group II: Rats were administered ginger extract orally
with a single daily dose of 250 mg/kg/b.wt. using special gavage needle for 14 days.
Group III: Rats were treated with adriamycin (doxorubicin hydrochloride) in six equal intraperitoneal injections (each containing 2.5mg/kg/b.wt) over a period of 2weeks for a total cumulative dose of 15mg/kg /b.wt.(14)
Group IV: Rats were orally treated with ginger extract 250 mg/kg/b.wt. daily together with adriamycin (2.5mg/kg/b.wt) for a total cumulative dose of 15mg/kg/b.wt. over a period of 2weeks.
Specimen preparations At the end of the experiment, the rats were
weighed and recorded then killed by cervical dislocation under diethyl ether anesthesia. Liver was
then dissected out and weighed on an electrical balance and weight was recorded. Liver was observed for any gross morphological changes. The liver was fixed in 10% formalin. For light microscope preparations, livers were cut into small slices, then dehydrated in gradual series of ethanol, embedded in paraffin wax and sectioned at 5 μm thickness. Slides were stained by hematoxylin and eosin and Masson´s trichrom stain for histological examination. A minimum of three sections per liver were examined and each section was examined two times in its entirety. Liver specimens from all animals were evaluated using light microscope (Nikon Eclipse E-200). For transmission electron microscopy, livers were immersed in 5% glutaraldehyde for two hours then washed in 0.1 M phosphate buffer at 4 °C and post-fixed in 1% osmium tetraoxide. After dehydration in gradual series of ethanol, the tissues were embedded in epon 812. Blocks with tissues were cut into semithin sections, then stained with toluidine blue and examined using a light microscope. Representative fields of semithin sections were selected. Ultrathin sections were stained with uranyl acetate and lead citrate, and examined with transmission electron microscope (Jeol 1200 EX, Japan), in the electron microscope unit at College of Medicine, King Khaled University.
A numerical scoring system assessed the extent of deposition of collagen fibers and fibrosis.(15,16) Deposition of collagen fibers was graded as: grade 0: no deposition; grade 1: enlarged portal tracts with mild deposition of collagen fibers; grade 2: periportal or portal-portal septa of collagen fibers, but intact architecture; grade 3: deposition of collagen fibers with architectural distortion; grade 4: probable or definite cirrhosis with marked deposition of collagen fibers. Hepatocyte necrosis or degeneration was also graded as: grade 0, no hepatocyte necrosis or degeneration; grade 1, focal necrosis or degeneration of hepatocytes (mild lesion); grade 2, multifocal necrosis or degeneration of hepatocytes (moderate lesion); grade 3, locally extensive or diffuse necrosis or degeneration of hepatocytes (severe lesion). (15,16) Statistical analysis
Results are expressed as mean ± SEM. Mann–Whitney U-test for histopathological scores was used to analyze the significance of differences among groups. The differences were accepted as statistically significant when P < 0.05. 3. Results
Adriamycin-treated rats were obviously ill and unable to move readily, with fur raised, scruffy coupled with weight loss and decreased food intake. These rats also had red exudates around the nose and eyes, soft stool and enlargement of abdomen. Rats exposed to ginger alone appeared healthy in all
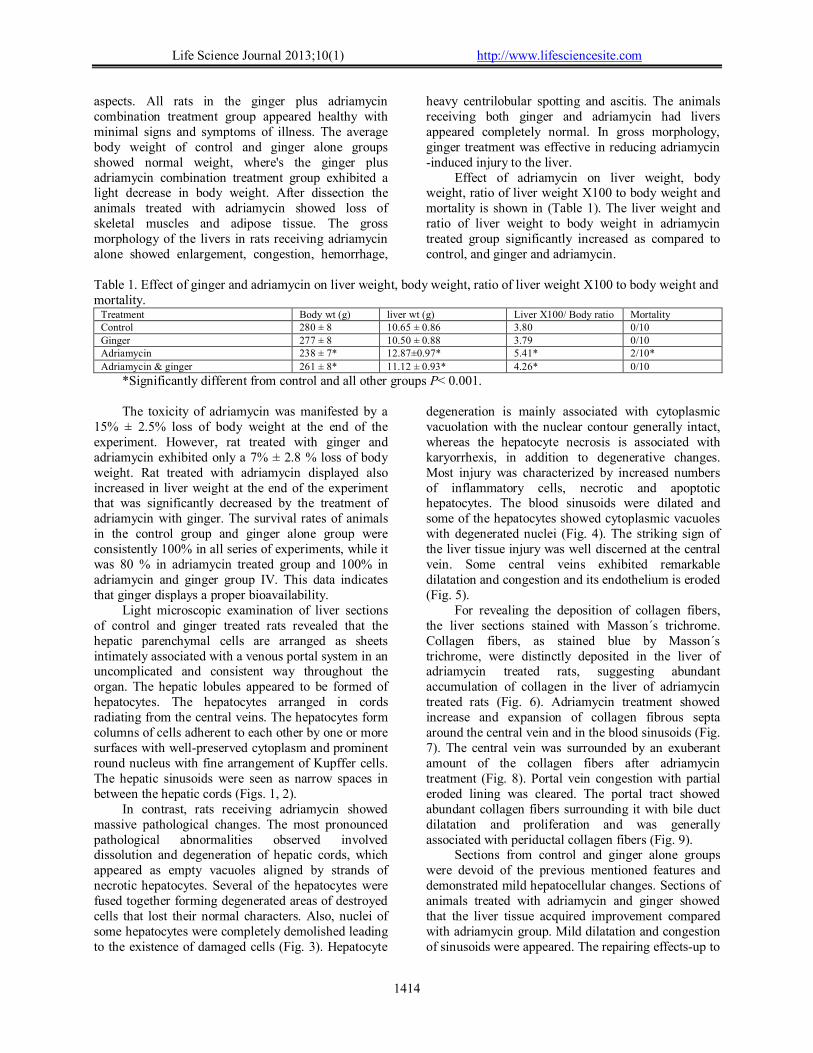
Life Science Journal 2013;10(1) http://www.lifesciencesite.com
1414
aspects. All rats in the ginger plus adriamycin combination treatment group appeared healthy with minimal signs and symptoms of illness. The average body weight of control and ginger alone groups showed normal weight, where's the ginger plus adriamycin combination treatment group exhibited a light decrease in body weight. After dissection the animals treated with adriamycin showed loss of skeletal muscles and adipose tissue. The gross morphology of the livers in rats receiving adriamycin alone showed enlargement, congestion, hemorrhage,
heavy centrilobular spotting and ascitis. The animals receiving both ginger and adriamycin had livers appeared completely normal. In gross morphology, ginger treatment was effective in reducing adriamycin -induced injury to the liver.
Effect of adriamycin on liver weight, body weight, ratio of liver weight X100 to body weight and mortality is shown in (Table 1). The liver weight and ratio of liver weight to body weight in adriamycin treated group significantly increased as compared to control, and ginger and adriamycin.
Table 1. Effect of ginger and adriamycin on liver weight, body weight, ratio of liver weight X100 to body weight and mortality.
Treatment Body wt (g) liver wt (g) Liver X100/ Body ratio Mortality Control 280 ± 8 10.65 ± 0.86 3.80 0/10 Ginger 277 ± 8 10.50 ± 0.88 3.79 0/10 Adriamycin 238 ± 7* 12.87±0.97* 5.41* 2/10*
Adriamycin & ginger 261 ± 8* 11.12 ± 0.93* 4.26* 0/10
*Significantly different from control and all other groups P< 0.001.
The toxicity of adriamycin was manifested by a 15% ± 2.5% loss of body weight at the end of the experiment. However, rat treated with ginger and adriamycin exhibited only a 7% ± 2.8 % loss of body weight. Rat treated with adriamycin displayed also increased in liver weight at the end of the experiment that was significantly decreased by the treatment of adriamycin with ginger. The survival rates of animals in the control group and ginger alone group were consistently 100% in all series of experiments, while it was 80 % in adriamycin treated group and 100% in adriamycin and ginger group IV. This data indicates that ginger displays a proper bioavailability.
Light microscopic examination of liver sections of control and ginger treated rats revealed that the hepatic parenchymal cells are arranged as sheets intimately associated with a venous portal system in an uncomplicated and consistent way throughout the organ. The hepatic lobules appeared to be formed of hepatocytes. The hepatocytes arranged in cords radiating from the central veins. The hepatocytes form columns of cells adherent to each other by one or more surfaces with well-preserved cytoplasm and prominent round nucleus with fine arrangement of Kupffer cells. The hepatic sinusoids were seen as narrow spaces in between the hepatic cords (Figs. 1, 2).
In contrast, rats receiving adriamycin showed massive pathological changes. The most pronounced pathological abnormalities observed involved dissolution and degeneration of hepatic cords, which appeared as empty vacuoles aligned by strands of necrotic hepatocytes. Several of the hepatocytes were fused together forming degenerated areas of destroyed cells that lost their normal characters. Also, nuclei of some hepatocytes were completely demolished leading to the existence of damaged cells (Fig. 3). Hepatocyte
degeneration is mainly associated with cytoplasmic vacuolation with the nuclear contour generally intact, whereas the hepatocyte necrosis is associated with karyorrhexis, in addition to degenerative changes. Most injury was characterized by increased numbers of inflammatory cells, necrotic and apoptotic hepatocytes. The blood sinusoids were dilated and some of the hepatocytes showed cytoplasmic vacuoles with degenerated nuclei (Fig. 4). The striking sign of the liver tissue injury was well discerned at the central vein. Some central veins exhibited remarkable dilatation and congestion and its endothelium is eroded (Fig. 5).
For revealing the deposition of collagen fibers, the liver sections stained with Masson´s trichrome. Collagen fibers, as stained blue by Masson´s trichrome, were distinctly deposited in the liver of adriamycin treated rats, suggesting abundant accumulation of collagen in the liver of adriamycin treated rats (Fig. 6). Adriamycin treatment showed increase and expansion of collagen fibrous septa around the central vein and in the blood sinusoids (Fig. 7). The central vein was surrounded by an exuberant amount of the collagen fibers after adriamycin treatment (Fig. 8). Portal vein congestion with partial eroded lining was cleared. The portal tract showed abundant collagen fibers surrounding it with bile duct dilatation and proliferation and was generally associated with periductal collagen fibers (Fig. 9).
Sections from control and ginger alone groups were devoid of the previous mentioned features and demonstrated mild hepatocellular changes. Sections of animals treated with adriamycin and ginger showed that the liver tissue acquired improvement compared with adriamycin group. Mild dilatation and congestion of sinusoids were appeared. The repairing effects-up to

Life Science Journal 2013;10(1) http://www.lifesciencesite.com
1415
certain limits were noticed. Hepatocytes showed much improvement with large number of binucleated hepatocytes (Figure 10). There is reduction in deposition of collagen fibers around the portal tract, central veins (Fig. 11) and in between hepatocytes and sinusoids (Fig. 12).
Ultrastructure of sections of groups I and II were normal with nearly rounded nuclei with regular structural organization. The cytoplasm crowded with organelles, particularly rough endoplasmic reticulum, smooth endoplasmic reticulum, golgi apparatus, ribosome and mitochondria (Fig. 13).
In contrast, the hepatocytes of liver sections from group treated with adriamycin showed irregularity and degenerative changes in the nuclear membrane. Shrunken and pyknotic nucleus in the degenerated hepatocyte is seen. The cytoplasm was condensed and contained degenerative changes such as condensed, atrophied and damaged mitochondria losing its cristae (Fig.14). Dilated intercellular spaces observed between hepatocyes (Fig. 14). Early phases of apoptosis and atrophic nuclei were also detected (Fig. 15). Disrupted rough endoplasmic reticulum and numerous of different sizes lysosome were also seen (Fig. 15).
Cytoplasmic vacuolization (Fig.15), accumulation of lipid droplets and cytoplasmic inclusion bodies were observed (Fig. 16).
Vacuoles were also seen in the heterochromain of the hepatocyte nucleus. Collagen-like fibrous septa deposition was seen in the space of Disse of blood sinusoid in between hepatocytes (Fig. 17). Dilated bile canaliculi with damage and atrophy of its microvilli were also seen (Fig. 18). Swollen and damaged Kupffer cell with irregular nuclear membrane. large autophagic vacuole was also seen (Fig. 19 ).
Cytoplasmic vacuolization, cristae loss in mitochondria, collagen fibers deposition and other degenerative changes were markedly attenuated in adriamycin with ginger treated group (Figs. 20 & 21). Most of the Hepatocytes nucleus, cytoplasmic organelles, Intercellular space, bile canaliculi and Kupffer cells are more or less normal in group IV (Figs. 20 & 21). Morphometric studies
Histopathological evaluation was performed in three liver sections per rat from all rats in each group (Table 2).
Table 2. Histopathological scoring of liver sections from all groups (mean ± S.D.).
Treatment Degeneration and necrosis Deposition of collagen fibers Group 1 control 0.2 ± 0.08 0.15 ± 0.07 Group 11 ginger 0.23 ± 0.08 0.19 ± 0.08 Group 111 Adriamycin 2.25 ± 0.23* 3.09 ± 0.25* Group 1V Ginger & adriamycin 0.85 ± 0.16* 1.11 ± 0.18*
*= Significant different from others P < 0.05
Concurrent treatment with adriamycin and ginger significantly attenuated the extent and severity of the histological features of liver damage induced by adriamycin alone. Degeneration and necrosis scores in the liver sections from adriamycin treated rats group III were significantly reduced in rats treated with ginger and adriamycin group IV (Table 2). The degeneration and necrosis
scores were reduced to about 62% by adding ginger. Hepatic collagen deposition were significantly decreased in group IV compared to group III (p < 0.05), suggesting that ginger ameliorated hepatic collagen deposition in adriamycin treated rats. The collagen fibers deposition scores were reduced to nearly 64% when the rats treated with ginger.
Figure (1): A photomicrograph of a section in the liver of the control rat showing radially arranged hepatocytes (h) around the central vein (cv) and blood sinusoids (s) clearly seen in between them. Notice the presence of kupffer cells (k). (H&E X 400).
Figure (2): A photomicrograph of a section in the liver of the ginger treated rat showing radially arranged hepatocytes (h) around the central vein (cv) and blood sinusoids (s) clearly seen in between them. Notice the presence of kupffer cells (k). (H&E X 400).

Life Science Journal 2013;10(1) http://www.lifesciencesite.com
1416
Figure (3): A photomicrograph of a section in the liver of adriamycin treated rat showing degenerated hepatocytes (h), destructed hepatic cords and in between them wide and dilated blood sinusoids (s). Notice the presence of many inflammatory cells (I) and kupffer cells (k). (H&E X 400).
Figure (4): A photomicrograph of a section in the liver of adriamycin treated rat showing the central vein (cv) with degenerated hepatocytes (h) and many inflammatory cells (I) with dilated blood sinusoids (s) full by red blood corpuscles (rc) are clearly seen. Notice the presence of vacuoles (v) and kupfer cells (k). (H&E X 400).
Figure (5): A photomicrograph of a section in the liver of adriamycin treated rat showing many degenerated and vacuolated hepatocytes (h). Notice the central vein (cv) is wide and dilated and its endothelium is eroded (thick arrow). (H&E X 400).
Figure (6): A photomicrograph of a section in the liver of adriamycin treated rat showing the central vein (cv) and portal tract (P) with marked deposition of collagen fibres surrounding them and dilated blood sinusoids (s) are clearly seen. (Masson´s trichrome X 100).
Figure (7): A photomicrograph of a section in the liver of adriamycin treated rat showing degenerated hepatocytes (h) with deposition of collagen fibres (f) around the central vein (cv) and in the dilated blood sinusoids (s). (Masson´s trichrome X 400).
Figure (8): A photomicrograph of a section in the liver of adriamycin treated rat showing remarkable dilatation of the central vein (cv) with deposition of collagen fibres (f) around it . (Masson´s trichrome X 400).
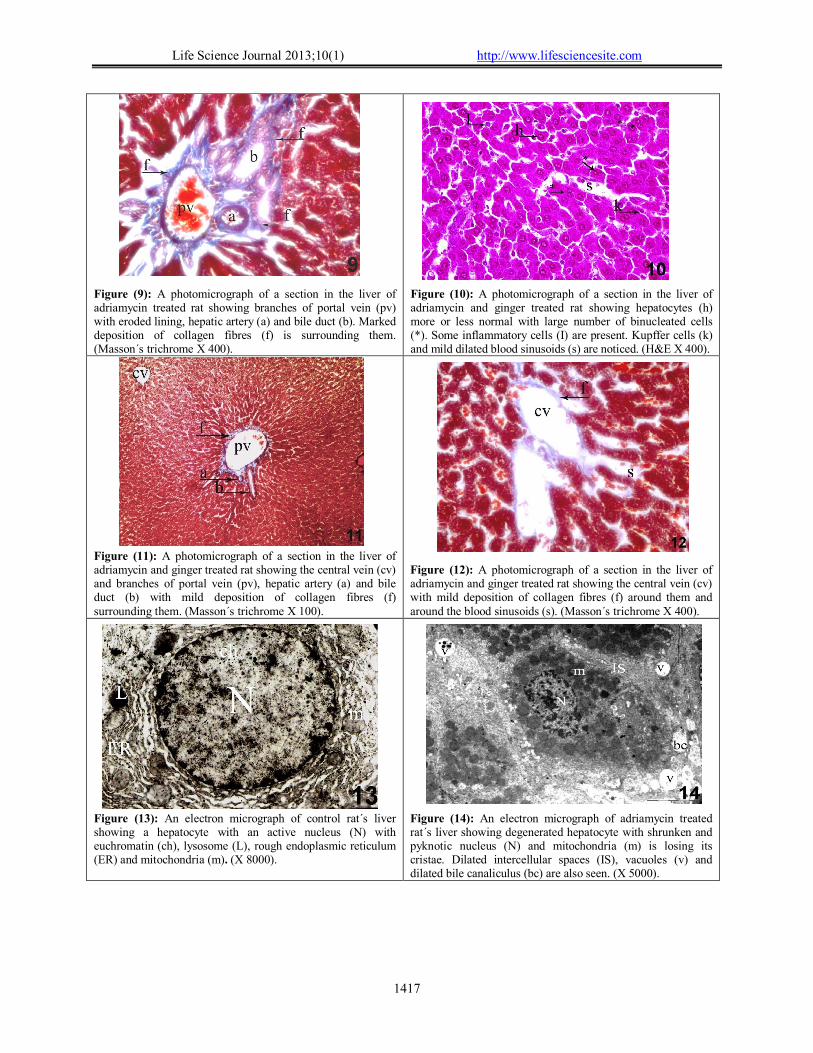
Life Science Journal 2013;10(1) http://www.lifesciencesite.com
1417
Figure (9): A photomicrograph of a section in the liver of adriamycin treated rat showing branches of portal vein (pv) with eroded lining, hepatic artery (a) and bile duct (b). Marked deposition of collagen fibres (f) is surrounding them. (Masson´s trichrome X 400).
Figure (10): A photomicrograph of a section in the liver of adriamycin and ginger treated rat showing hepatocytes (h) more or less normal with large number of binucleated cells (*). Some inflammatory cells (I) are present. Kupffer cells (k) and mild dilated blood sinusoids (s) are noticed. (H&E X 400).
Figure (11): A photomicrograph of a section in the liver of adriamycin and ginger treated rat showing the central vein (cv) and branches of portal vein (pv), hepatic artery (a) and bile duct (b) with mild deposition of collagen fibres (f) surrounding them. (Masson´s trichrome X 100).
Figure (12): A photomicrograph of a section in the liver of adriamycin and ginger treated rat showing the central vein (cv) with mild deposition of collagen fibres (f) around them and around the blood sinusoids (s). (Masson´s trichrome X 400).
Figure (13): An electron micrograph of control rat´s liver showing a hepatocyte with an active nucleus (N) with euchromatin (ch), lysosome (L), rough endoplasmic reticulum (ER) and mitochondria (m). (X 8000).
Figure (14): An electron micrograph of adriamycin treated rat´s liver showing degenerated hepatocyte with shrunken and pyknotic nucleus (N) and mitochondria (m) is losing its cristae. Dilated intercellular spaces (IS), vacuoles (v) and dilated bile canaliculus (bc) are also seen. (X 5000).

Life Science Journal 2013;10(1) http://www.lifesciencesite.com
1418
Figure (15): An electron micrograph of adriamycin treated rat´s liver showing degenerated hepatocytes with numerous lysosome (L) of different sizes, damaged mitochondria (m), vacuoles (v), atrophic nucleus (N) and disrupted rough endoplasmic reticulum (ER) are seen. Blood sinusoid (s) is dilated. (X 6000).
Figure (16): An electron micrograph of adriamycin treated rat´s liver showing degenerated hepatocytes with cytoplasmic inclusion body (ci). Lipid vacuoles (v) and mitochondria (m) losing its cristae are also seen. Notice the irregular nuclear membrane of the nucleus (N). There is also degenerated Kupffer cell (k) with a pyknotic and atrophic nucleus (N) . (X5000).
Figure (17): An electron micrograph of adriamycin treated rat´s liver showing degenerated hepatocyte (h) Mitochondria (m) losing its cristae and hepatocyte nucleus (N) with vacuoles in the heterochromatin (arrow). Deposition of collagen fibres (f), vacuoles (v) and red blood corpuscle (rc) in blood sinusoid (s) between hepatocytes (h) are also seen. (X 8000).
Figure (18): An electron micrograph of adriamycin treated rat´s liver showing hepatocyte with more or less normal nucleus (N) is seen. Dilated bile canaliculi (bc) with damaged and atrophy of its microvilli (mv). Deposition of collagen fibres (f) is observed. Large vacuole (v) and mitochondria (m) losing its cristae are also seen. (X 8000).
Figure (19): An electron micrograph of adriamycin treated rat´s liver showing swollen and damaged Kupffer cell (k) which contains large vacuole (v) and damaged cytoplasm with destructed of most organs. Red blood cell (rc) is seen in the blood sinusoid (s). (X 5000)
Figure (20): An electron micrograph of adriamycin and ginger treated rat´s liver showing more or less normal intercellular space (IS), bile canaliculi (bc) with some vacuoles (v). Notice the mitochondria (m) with normal cristae is present. (X 12000
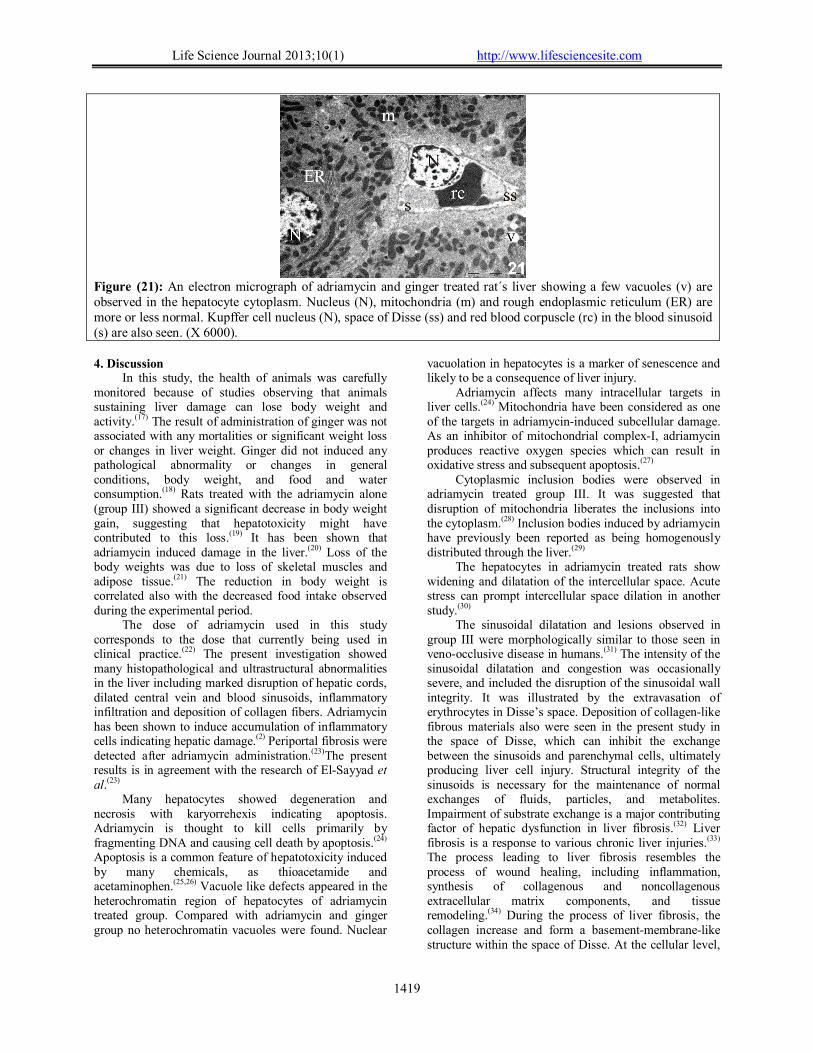
Life Science Journal 2013;10(1) http://www.lifesciencesite.com
1419
Figure (21): An electron micrograph of adriamycin and ginger treated rat´s liver showing a few vacuoles (v) are observed in the hepatocyte cytoplasm. Nucleus (N), mitochondria (m) and rough endoplasmic reticulum (ER) are more or less normal. Kupffer cell nucleus (N), space of Disse (ss) and red blood corpuscle (rc) in the blood sinusoid (s) are also seen. (X 6000). 4. Discussion
In this study, the health of animals was carefully monitored because of studies observing that animals sustaining liver damage can lose body weight and activity.(17) The result of administration of ginger was not associated with any mortalities or significant weight loss or changes in liver weight. Ginger did not induced any pathological abnormality or changes in general conditions, body weight, and food and water consumption.(18) Rats treated with the adriamycin alone (group III) showed a significant decrease in body weight gain, suggesting that hepatotoxicity might have contributed to this loss.(19) It has been shown that adriamycin induced damage in the liver.(20) Loss of the body weights was due to loss of skeletal muscles and adipose tissue.(21) The reduction in body weight is correlated also with the decreased food intake observed during the experimental period.
The dose of adriamycin used in this study corresponds to the dose that currently being used in clinical practice.(22) The present investigation showed many histopathological and ultrastructural abnormalities in the liver including marked disruption of hepatic cords, dilated central vein and blood sinusoids, inflammatory infiltration and deposition of collagen fibers. Adriamycin has been shown to induce accumulation of inflammatory cells indicating hepatic damage.(2) Periportal fibrosis were detected after adriamycin administration.(23)The present results is in agreement with the research of El-Sayyad et al.(23)
Many hepatocytes showed degeneration and necrosis with karyorrehexis indicating apoptosis. Adriamycin is thought to kill cells primarily by fragmenting DNA and causing cell death by apoptosis.(24) Apoptosis is a common feature of hepatotoxicity induced by many chemicals, as thioacetamide and acetaminophen.(25,26) Vacuole like defects appeared in the heterochromatin region of hepatocytes of adriamycin treated group. Compared with adriamycin and ginger group no heterochromatin vacuoles were found. Nuclear
vacuolation in hepatocytes is a marker of senescence and likely to be a consequence of liver injury.
Adriamycin affects many intracellular targets in liver cells.(24) Mitochondria have been considered as one of the targets in adriamycin-induced subcellular damage. As an inhibitor of mitochondrial complex-I, adriamycin produces reactive oxygen species which can result in oxidative stress and subsequent apoptosis.(27)
Cytoplasmic inclusion bodies were observed in adriamycin treated group III. It was suggested that disruption of mitochondria liberates the inclusions into the cytoplasm.(28) Inclusion bodies induced by adriamycin have previously been reported as being homogenously distributed through the liver.(29)
The hepatocytes in adriamycin treated rats show widening and dilatation of the intercellular space. Acute stress can prompt intercellular space dilation in another study.(30)
The sinusoidal dilatation and lesions observed in group III were morphologically similar to those seen in veno-occlusive disease in humans.(31) The intensity of the sinusoidal dilatation and congestion was occasionally severe, and included the disruption of the sinusoidal wall integrity. It was illustrated by the extravasation of erythrocytes in Disse’s space. Deposition of collagen-like fibrous materials also were seen in the present study in the space of Disse, which can inhibit the exchange between the sinusoids and parenchymal cells, ultimately producing liver cell injury. Structural integrity of the sinusoids is necessary for the maintenance of normal exchanges of fluids, particles, and metabolites. Impairment of substrate exchange is a major contributing factor of hepatic dysfunction in liver fibrosis.(32) Liver fibrosis is a response to various chronic liver injuries.(33) The process leading to liver fibrosis resembles the process of wound healing, including inflammation, synthesis of collagenous and noncollagenous extracellular matrix components, and tissue remodeling.(34) During the process of liver fibrosis, the collagen increase and form a basement-membrane-like structure within the space of Disse. At the cellular level,

Life Science Journal 2013;10(1) http://www.lifesciencesite.com
1420
origin of liver fibrogenesis is initiated by the damage of hepatocytes, resulting in the recruitment of inflammatory cells and platelets, and activation of Kupffer cells, with subsequent release of cytokines and growth factors.(34)
Electron microscopy study done by Kannan et al ,(35) as in the present study revealed the presence of lipid vacuoles in the liver of desethylaminodarone-treated rats. The clear cytoplasmic vacuoles contain predominantly electron-lucent material consistent with phospholipid.(36) Lysosomes are the primary site for phospholipid accumulation,(37) which results from an inability of the cell to catabolize this substrate.(38) Damaged Kupffer cells which contains large vacuole were demonstrated in the present study. The liver is known to be a major immunological organ affecting systemic responses in animals because of the abundance of mononuclear phagocytes.(39) The Kupffer cells and liver phagocytic system produces an array of mediators which protect the body against invasion by xenobiotic chemicals and materials.(40)
Liver is the main site of adriamycin metabolism. A number of studies indicate that enzyme activation of adriamycin begins with the drug conversion to a semiquinone free radical.(41) Reduction of side chain carbonyl group yields a more toxic metabolite. Such metabolite accumulates in the heart and contributes to heart failure.(42) The liver may play an essential role in heart damage. Also the improvement of liver toxicity may prevent cardiac damage.
Some side-effects of the adriamycin in this study reveals drastic pathological features at both structural and ultrastructural levels, which could be used as the basis for determining the appropriate way to reduce their hepatotoxic effects.
The production of free radicals by adriamycin is proposed to be critical for cytotoxicity. Adriamycin metabolism triggered production of reactive oxygen species and reactive intermediates in liver resulting in oxidative stress followed by cell death.(43) Antioxidants prevent the adriamycin-induced toxicity in experimental animals as well as in human.(44,45) The study using ginger had reported the significant antioxidant activities.(46) It is likely that the preventive effects of ginger in adriamycin toxicity are based on its antioxidant activity. Ginger also inhibits NO synthesis in activated macrophages and prevents oxidation and nitration reactions induced by peroxynitrite.(47) Moreover, a recent study by El-Sharaky et al.(48) showed that treatment with ginger decreased the hepatic tissue content of NO induced by administration of bromobenzene.
Recent experimental observations reported that ginger is an effective anticancer agent.(6) Further, ginger can relieve the chemotherapy associated nausea and vomiting in patients.(49) The present study proved that the hepatic pathology caused by administration of adriamycin ameliorated by combined treatment with ginger.
Mitochondria are nearly normal in adriamycin and ginger treated group. Mitochondria are natural targets of
phytochemical antioxidant protection.(27) Ginger could protect against adriamycin toxicity through a number of mitochondrial actions including up-regulation of specific anti-reactive oxygen species proteins, prevention of mtDNA damage, stimulation of replication, inhibition of membrane-active lipases, and protection of the electron transport chain.(50)
Recently, there are some interesting reports of plant-derived antifibrotic agent in experimental animals.(51) The percentage reduction in deposition of collagen fibers scores was about 64% in coadministration of ginger and adriamycin. Salvia miltiorrhiza, silymarin and Curcumin have been shown respectively to reduce the severity of hepatic fibrosis in treated rats.(52,53,54) The present study suggests the potential of ginger as anti-fibrotic agents.
In the present findings, the hepatotoxic pathological effect of adriamycin was ameliorated with partial disappearance of hepatic damage when treatment was combined with ginger. Degeneration and necrosis were decreased by 62% when ginger was combined with adriamycin. Thus, ginger appears to play a key role in the attenuation of hepatic injury, and then preserve the structural integrity of the hepatocellular structures.
More effective approaches are needed for increasing the therapeutic activity of anticancer drugs and decreasing systemic toxicity, with considerable interest focused on improvements through combination chemotherapy.(55,56) Ginger treatment afforded substantial protection against adriamycin liver damage, and merits careful evaluation for hepatoprotective potential. Combination chemo-therapy with this phytochemical would have the potential of expanding the therapeutic efficacy and possibly broaden the applications of adriamycin treatments. Appropriate protective measures as using ginger must be applied with anticancer treatment for improving liver structure. Conclusion:
The present results provide in vivo evidence of direct chemotherapeutic hepatotoxicity caused by adriamycin. Histopathological evaluations showed that ginger protects and reduces most of the damage caused by adriamycin in the liver. The protective properties of ginger and the fact that ginger has been used by humans in food, makes it a potential therapy for adriamycin-induced hepatic toxicity. The results can further suggest the possible use of ginger against oxidative stress induced organ toxicities. References 1. Booser DJ and Hortobagyi GN. Anthracycline
antibiotics in cancer therapy. Focus on drug resistance. Drugs. 1994;47(2):223-58.
2. Saad SY, Najja TA, Al-Rikabi AC. The preventive role of deferoxamine against acute doxorubicin-induced cardiac, renal and hepatic toxicity in rats. Pharmacol Res. 2001;43: 211-8.
3. DeGraff W, Hahn SM, Mitchell JB, Krishna MC. Free radical modes of cytotoxicity of adriamycin and
Life Science Journal 2013;10(1) http://www.lifesciencesite.com
1421
streptonigrin. Biochem Pharmacol. 1994; 48(7):1427-35.
4. Chrubasik S, Pittler M, Roufogalis B. Zingiberis rhizoma: a comprehensive review on the ginger effect and efficacy profiles Phytomedicine. 2005; 12: 684–701.
5. Ali BH, Blunden G, Tanira MO. Nemmar A. Some phytochemical, pharmacological and toxicological properties of ginger (Zingiberofficinale Roscoe): a review of recent research Food Chem Toxicol. 2008; 46: 409–20.
6. Habib SH, Makpol S, Abdul Hamid N, Das S, Wan Ngah W, Yusof YA. Ginger extract (Zingiber Officinale) has anti-cancer and anti-inflammatory effects on ethionine-induced hepatoma rats Clinics. 2008; 63(6): 807–13.
7. DeAtley SM, Aksenov MY, Aksenova MV, Harris B, Hadley R, Cole Harper P, Carney JM, Butterfield DA. Antioxidants protect against reactive oxygen species associated with adriamycin-treated cardiomyocytes. Cancer Lett. 1999;136(1):41-6.
8. Tao QF, Xu Y, Lam RY, Schneider B, Dou H, Leung PS. Diarylheptanoids and a monoterpenoid from the rhizomes of Zingiber officinale: antioxidant and cytoprotective properties J Nat Prod. 2008;71:12–17.
9. Mallikarjuna K, Sahitya Chetan P, Sathyavelu Reddy K, Rajendra W. Ethanol toxicity: rehabilitation of hepatic antioxidant defense system with dietary ginger. Fitoterapia. 2008 ; 79(3):174-8.
10. Yemitan OK, Izegbu MC. Protective effects of Zingiber officinale (Zingiberaceae) against carbon tetrachloride and acetaminophen-induced hepatotoxicity in rats. Phytother Res. 2006 ; 20(11):997-1002.
11. Ajith TA, Hema U, Aswathy MS. Zingiber officinale Roscoe prevents acetaminophen-induced acute hepatotoxicity by enhancing hepatic antioxidant status. Food Chem Toxicol. 2007; 45(11):2267-72.
12. Tolman KG. Hepatotoxicity of non-narcotic analgesics. Am J Med. 1998; 105(1B):13S-19S.
13. Russo M, Spagnuolo C, Tedesco I. Phyto-chemicals in Cancer Prevention and Therapy: Truth or Dare? Toxins. 2010; 2: 517-51.
14. Siveski-Iliskovic N, Kaul N, Singal PK. Probucol promotes endogenous antioxidants and provides protection against adriamycin-induced cardiomyopathy in rats. Circulation. 1994; 89(6):2829-35.
15. Scheuer PJ. Scoring of liver biopsies: are we doing it right? Eur J Gastroenterol Hepatol. 1996; 8(12):1141-3.
16. Hernández-Muñoz R, Díaz-Muñoz M, López V, López-Barrera F, Yáñez L, Vidrio S, Aranda-Fraustro A, Chagoya de Sánchez V. Balance between oxidative damage and proliferative potential in an experimental rat model of CCl4-induced cirrhosis: protective role of adenosine administration. Hepatology. 1997; 26(5):1100-10.
17. Ray SD and Mehendale HM. Potentiation of CCl4 and CHCl3 hepatotoxicity and lethality by various alcohols. Fundam Appl Toxicol. 1990;15(3):429-40.
18. Rong X, Peng G, Suzuki T, Yang Q, Yamahara J, Lic
Y. A 35-day gavage safety assessment of ginger in
rats. Regul Toxicol Pharmacol. 2009 ; 54(2): 118–23.
19. King PD and Perry MC. Hepatotoxicity of chemotherapy. Oncologist. 2001;6:162–76.
20. Agapito MT, Antolín Y, del Brio MT, López-Burillo S, Pablos MI, Recio JM. Protective effect of melatonin against adriamycin toxicity in the rat. J Pineal Res. 2001; 31(1):23-30.
21. Tisdale MJ. Mechanisms of cancer cachexia. Physiol Rev. 2009; 89(2):381-410.
22. Chabner BA, Ryan DP, Paz-Ares L, Garcia-Carbonevo R, Calabresi P. Antineoplastic Agents (Chapter 52). In Goodman and Gilman’s the Pharmacological Basis of Therapeutics, Hardman JG, Limbird LE, Gilman AG, 10th ed., McGraw-Hill, New York, NY, USA, 2001: 1389–459.
23. El-Sayyad HI, Ismail MF, Shalaby FM, Abou-El-Magd RF, Gaur RL, Fernando A, Raj MH, Ouhtit A. Histopathological effects of cisplatin, doxorubicin and 5-flurouracil (5-FU) on the liver of male albino rats. Int J Biol Sci. 2009;5(5):466-73.
24. Ray SD and Jena N. A hepatotoxic dose of acetaminophen modulates expression of BCL-2, BCL-X(L), and BCL-X(S) during apoptotic and necrotic death of mouse liver cells in vivo. Arch Toxicol. 2000 ;73(10-11):594-606.
25. Ledda-Columbano GM, Coni P, Curto M, Giacomini L, Faa G, Oliverio S, Piacentini M, Columbano A. Induction of two different modes of cell death, apoptosis and necrosis, in rat liver after a single dose of thioacetamide. Am J Pathol 1991;139:1099-109.
26. Knight TR, Fariss MW, Farhood A, Jaeschke H. Role of lipid peroxidation as a mechanism of liver injury after acetaminophen overdose in mice. Toxicol Sci. 2003;76:229-36.
27. Danz ED, Skramsted J, Henry N, Bennett JA, Keller RS. Resveratrol prevents doxorubicin cardiotoxicity through mitochondrial stabilization and the Sirt1 pathway. Free Radic Biol Med. 2009;46(12):1589-97.
28. Schaff Z, Lapis K, Andre J. Effect of proteolytic digestion of mitochondrial crystalline inclusions in Gilbert's syndrome. Journal of Microscopy.1974; 20 (3): 265–70.
29. Guillen FJ and Vazquez JJ. Cyanamide-induced liver
cell injury. Experimental study in the rat. Lab Invest.
1984 Apr;50(4):385-93.
30. Farré R, De Vos R, Geboes K, Verbecke K, Vanden Berghe P, Depoortere I, Blondeau K, Tack J, Sifrim D. Critical role of stress in increased oesophageal mucosa permeability and dilated intercellular spaces. Gut. 2007;56:1191–97.
31. Sato Y, Asada Y, Hara S, Tamura K, Hayashi T,
Sumiyoshi A. Hepatic stellate cells (Ito cells) in veno-
occlusive disease of the liver after allogeneic bone
marrow transplantation. Histopathology1999; 34: 66–
70.
32. Babbs C, Haboubi NY, Mellor JM, Smith A, Rowan BP, Warnes TW. Endothelial cell transformation in primary biliary cirrhosis: a morphological and biochemical study. Hepatology. 1990;11(5):723-9.

Life Science Journal 2013;10(1) http://www.lifesciencesite.com
1422
33. Friedman SL. Mechanisms of hepatic fibrogenesis. Gastroenterology. 2008; 134:1655-69.
34. Neubauer K, Saile B, Ramadori G. Liver fibrosis and altered matrix synthesis. Can J Gastroenterol. 2001;15(3):187-93.
35. Kannan R, Sarma JS, Guha M, Venkataraman K. Amiodarone toxicity, II. Desethylamiodarone-induced phospholipidosis and ultrastructural changes during repeated administration in rats. Fundam Appl Toxicol. 1990;16:103-9.
36. Obert AL, Sobocinski PG, Bobrowski FW, Metz LA, Rolsma DM., Altrogge MD, Dunstan WR. An immunohistochemical approach to differentiate hepatic lipidosis from hepatic phospholipidosis in rats. Toxicol Pathol. 2007; 35: 728-34.
37. Kacew S. Cationic amphiphilic drug-induced renal cortical lysosomal phospholipidosis: an in vivo comparative study with gentamicin and chlorphentermine.Toxicol Appl Pharmacol. 1987; 91:469–76.
38. Hostetler KY. Molecular studies of the induction of cellular phospholipidosis by cationic amphiphilic drugs. Fed Proc. 1984; 43:2582–5.
39. Si-Tayeb K, Lemaigre FP, Duncan SA. Organogenesis and development of the liver. Dev Cell. 2010; 18(2):175-89.
40. Sadauskas E, Danscher G, Stoltenberg M, Vogel U, Larsen A, Wallin H. Protracted elimination of gold nanoparticles from mouse liver. Nanomedicine. 2009; 5(2):162-9.
41. Bartoszek A. Metabolic activation of adriamycin by NADPH-cytochrome P450 reductase; overview of its biological and biochemical effects. Acta Biochim Pol. 2002; 49: 323-31.
42. Olson RD, Mushlin PS, Brenner DE, Fleischer C, Change BK and Baucek RJ. Doxorubicin cardiotixicity may be caused by its metabolite, doxorubicinol. Proc. Natl Acad Sci USA. 1988; 85: 3585-9.
43. Patel N, Joseph C, Corcoran GB, Ray SD. Silymarin modulates doxorubicin-induced oxidative stress, Bcl-xL and p53 expression while preventing apoptotic and necrotic cell death in the liver. Toxicol Appl Pharmacol. 2010;245(2):143-52.
44. Mohamed HE, El-Swefy SE, Hagar HH. The protective effect of glutathione administration on adriamycin-induced acute cardiac toxicity in rats. Pharmacol Res. 2000;42(2):115-21.
45. Cole MP, Chaiswing L, Oberley TD, Edelmann SE, Piascik MT, Lin SM, Kiningham KK, St Clair DK.The
protective roles of nitric oxide and superoxide dismutase in adriamycin-induced cardiotoxicity. Cardiovasc Res. 2006;69(1):186-97.
46. Masuda Y, Kikuzaki H, Hisamoto M, Nakatani N. Antioxidant properties of gingerol related compounds from ginger. Biofactors. 2004;21(1-4):293-6.
47. Ippoushi K, Azuma K, Ito H, Horie H, Higashio H. [6]-Gingerol inhibits nitric oxide synthesis in activated J774.1 mouse macrophages and prevents peroxynitrite-induced oxidation and nitration reactions. Life Sci. 2003;73(26):3427-37.
48. El-Sharaky AS, Newairy AA, Kamel MA, Eweda SM. Protective effect of ginger extract against bromobenzene-induced hepatotoxicity in male rats. Food Chem Toxicol. 2009;47(7): 1584-90.
49. Ernst E and Pittler MH. Efficacy of ginger for nausea and vomiting: a systematic review of randomized clinical trials. Br J Anaesth. 2000; 84(3):367-71.
50. Devasagayam TP, Tilak JC, Boloor KK, Sane KS, Ghaskadbi SS, Lele RD. Free radicals and antioxidants in human health: current status and future prospects. J Assoc Physicians India. 2004;52:794-804.
51. Gebhardt R. Oxidative stress, plant-derived antioxidants and liver fibrosis. Planta Med. 2002; 68:289-96.
52. Wasser S, Ho JMS, Ang HK, Tan CEL. Salvia miltiorrhiza reduced experimentally-induced hepatic fibrosis in rats. J Hepatol. 1998;29:760-71.
53. Jia JD, Bauer M, Cho JJ, Ruehl M, Milani S, Boigk G, Riecken EO, Schuppan D. Anti-fibrotic effect of silymarin in rat secondary biliary fibrosis is mediated by down regulation of procollagen alpha1(I) and TIMP-1. J Hepatol. 2001; 35:392-8.
54. Fu Y, Zheng S, Lin J, Ryerse J, Chen A. Curcumin protects the rat liver from CCl4-caused injury and fibrogenesis by attenuating oxidative stress and suppressing inflammation. Mol Pharmacol. 2008; 73:399-409.
55. Nabekura T, Yamaki T, Kitagawa S. Effects of chemopreventive citrus phytochemicals on human P-glycoprotein and multidrug resistance protein 1. Eur J Pharmacol. 2008;600(1-3):45-9.
56. Siegelin MD, Reuss DE, Habel A, Rami A, von Deimling A. Quercetin promotes degradation of survivin and thereby enhances death-receptor-mediated apoptosis in glioma cells. Neuro Oncol. 2009 ;11(2):122-31.
12/29/2012
Life Science Journal 2013;10(1) http://www.lifesciencesite.com
1423
Experimental Studies in Japanese Quail Exposed to a recently used pesticide
Mona S. Zaki1 ; Osfor M. H.2 and Nagwa S. Ata3
1 Hydrobiology Department, National Research Center, Egypt. 2 Animal Nutrition and Food Science, National Research Center, Egypt.
3 Microbiology and immunology Department, National Research Center, Egypt. [email protected]
Abstract: Thirty quails (80 – 100 gm B.wt) were divided into 2 equal groups to determine the nutritional and clinicopathological changes induced by 1% copper oxychloride. Blood samples were collected for determination of hemoglobin, PCV and some biochemical blood parameters. Liver and kidney weight increased and were associated with clinicopathological changes. A significant decrease was detected in the value of lib, PCV and iron. On the other hand, there was significant increase in the levels of ALT. AST, urea, creatinine, sodium, potassium. glucose, copper. cortisol hormone and insulin in treated groups in comparison with control ingroup untreated. Microbiological examination, revealed presence of strept pyogens, klebsiella, E.coli and anthracoids. Post Mortem examination of scarified quails revealed hi peremia of internal organs (kidney and liver). [Mona S. Zaki; Osfor M. H. and Nagwa S. Ata.. Experimental Studies in Japanese Quail Exposed to a recently used pesticide. Life Sci J 2013;10(1):1423-1426] (ISSN:1097-8135). http://www.lifesciencesite.com. 212
Keywords: quail, pesticide, copper oxychloride, liver, kidney function, cortisol. insulin hormone.
1. Introduction
Organic chemicals and pesticides are capable of depressing the immune, rig to increased susceptibility to diseases (Asztalos et al., 1990). The depression emphasizes dysfunction of adaptive immunity which differs from compromise of innate defenses that serves as the first line of defence against invading microorganisms. Also, it can behave as stress factor, acting through the neuro-endocrine immune axis (hypothalamus-hypophysisadrenal system) on the immune response. Chronic stress is responsible for the Copper is an essential trace element for many biological processes. However, at high concentrations it is highly toxic. The use of copper in industry and agriculture polutes natural water and may cause significant tissue damage in fish (Barham et al., 1972) . This tissue damage can be demonstrated by changes in activity of the cellular enzymes in sera. The increase in activity of these enzymes depends primarily on the magnitude and severity of cell damage (Bartels et al., 1972). The rise in blood glucose level has been used for detection of metabolic stress (Blaxhall, 1972) and hemogram as an index of health status in quails (Blaxhall, 1972). In recent years pesticide has been widely used in agriculture and their residue in the environment have increased. These chemical compound have been found in many natural products as green food, water, even man, animal and birds. Many clinicopathalogical disturbances in man and animal were observed. The important toxicological, aspects of pesticide effect on animal cells remain
unknown (EI-Hennawy et al., 1980; Jacobs and Gerstein, 1982; Mostafa et al., 1992 and Nebbia et al., 1993). In addition, pesticides such as copper oxychloride have not been investigated in birds as experimental animals. So the present investigation is conducted to study the effect of new pesticides, such as copper oxychloride on some nutritional and clinicopathalogical changes in experimental birds such as Japanese quails. 2. Material and Methods Experimental Design: Copper oxychloride was obtained from the pesticide Central laboratory. Cairo, Egypt. Thirty quails weight 80-100gm used in this study being obtained from the National Research Center farm of El-Noubaria. The birds were divided into equal groups. The first group (15 quails) were fed on ration containg I% copper oxychloride, for 30 days as shown in Table (1). The 2nd group (15 quails) were kept as untreated control. Blood samples from quails (at 3, 15 and 30 days) were taken on heparinized tube to study P.C.V, hamoglobin and non-heparinized tubes were centrifuged at 3000 r.p.m for 10 min, serum was separated and stored at - 20°C until analysed. Determination of serum Alanin aminotransferase (ALT), and Aspartate aminotransferase (AST) were done by commercial kits from Alkan Company (Reitman and Frankel, 1957). Serum glucose. was assessed according to Trinder, (1969). Blood hemoglobin was assessed by
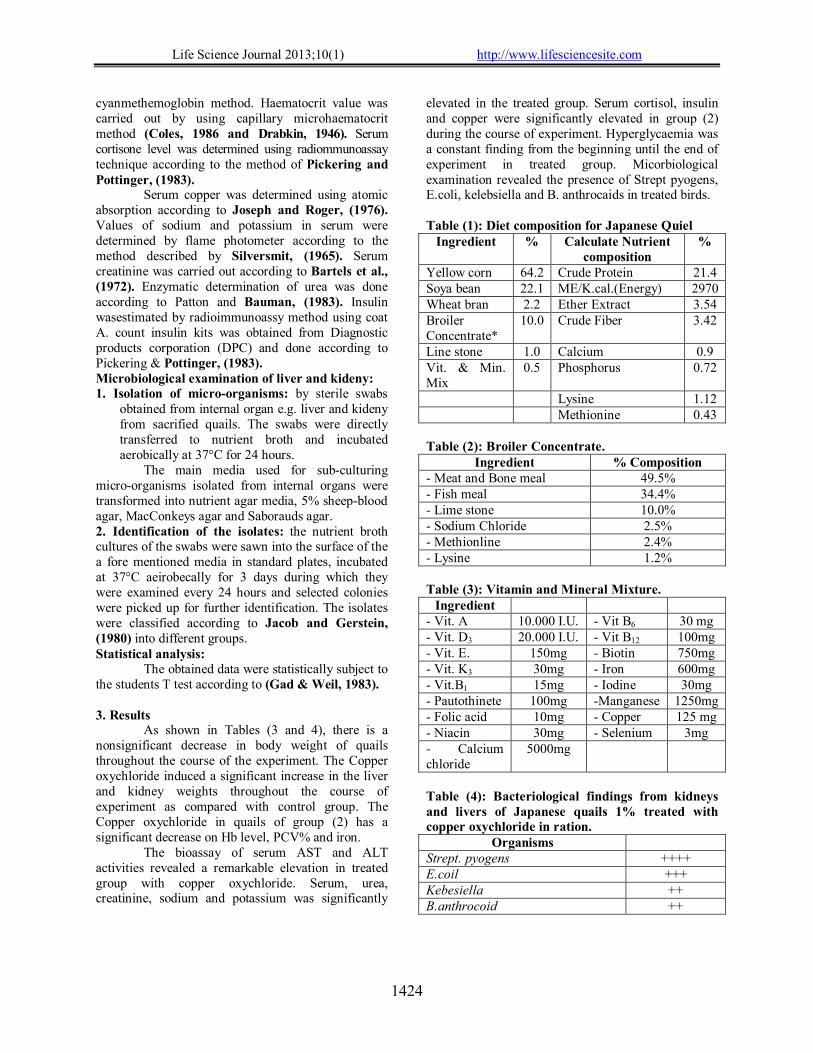
Life Science Journal 2013;10(1) http://www.lifesciencesite.com
1424
cyanmethemoglobin method. Haematocrit value was carried out by using capillary microhaematocrit method (Coles, 1986 and Drabkin, 1946). Serum cortisone level was determined using radiommunoassay technique according to the method of Pickering and Pottinger, (1983). Serum copper was determined using atomic absorption according to Joseph and Roger, (1976). Values of sodium and potassium in serum were determined by flame photometer according to the method described by Silversmit, (1965). Serum creatinine was carried out according to Bartels et al., (1972). Enzymatic determination of urea was done according to Patton and Bauman, (1983). Insulin wasestimated by radioimmunoassy method using coat A. count insulin kits was obtained from Diagnostic products corporation (DPC) and done according to Pickering & Pottinger, (1983). Microbiological examination of liver and kideny: 1. Isolation of micro-organisms: by sterile swabs
obtained from internal organ e.g. liver and kideny from sacrified quails. The swabs were directly transferred to nutrient broth and incubated aerobically at 37°C for 24 hours.
The main media used for sub-culturing micro-organisms isolated from internal organs were transformed into nutrient agar media, 5% sheep-blood agar, MacConkeys agar and Saborauds agar. 2. Identification of the isolates: the nutrient broth cultures of the swabs were sawn into the surface of the a fore mentioned media in standard plates, incubated at 37°C aeirobecally for 3 days during which they were examined every 24 hours and selected colonies were picked up for further identification. The isolates were classified according to Jacob and Gerstein, (1980) into different groups. Statistical analysis: The obtained data were statistically subject to the students T test according to (Gad & Weil, 1983). 3. Results As shown in Tables (3 and 4), there is a nonsignificant decrease in body weight of quails throughout the course of the experiment. The Copper oxychloride induced a significant increase in the liver and kidney weights throughout the course of experiment as compared with control group. The Copper oxychloride in quails of group (2) has a significant decrease on Hb level, PCV% and iron. The bioassay of serum AST and ALT activities revealed a remarkable elevation in treated group with copper oxychloride. Serum, urea, creatinine, sodium and potassium was significantly
elevated in the treated group. Serum cortisol, insulin and copper were significantly elevated in group (2) during the course of experiment. Hyperglycaemia was a constant finding from the beginning until the end of experiment in treated group. Micorbiological examination revealed the presence of Strept pyogens, E.coli, kelebsiella and B. anthrocaids in treated birds. Table (1): Diet composition for Japanese Quiel
Ingredient % Calculate Nutrient composition
%
Yellow corn 64.2 Crude Protein 21.4 Soya bean 22.1 ME/K.cal.(Energy) 2970 Wheat bran 2.2 Ether Extract 3.54 Broiler Concentrate*
10.0 Crude Fiber 3.42
Line stone 1.0 Calcium 0.9 Vit. & Min. Mix
0.5 Phosphorus 0.72
Lysine 1.12 Methionine 0.43 Table (2): Broiler Concentrate.
Ingredient % Composition - Meat and Bone meal 49.5% - Fish meal 34.4% - Lime stone 10.0% - Sodium Chloride 2.5% - Methionline 2.4% - Lysine 1.2% Table (3): Vitamin and Mineral Mixture.
Ingredient - Vit. A 10.000 I.U. - Vit B6 30 mg - Vit. D3 20.000 I.U. - Vit B12 100mg - Vit. E. 150mg - Biotin 750mg - Vit. K3 30mg - Iron 600mg - Vit.B1 15mg - Iodine 30mg - Pautothinete 100mg -Manganese 1250mg - Folic acid 10mg - Copper 125 mg - Niacin 30mg - Selenium 3mg - Calcium chloride
5000mg
Table (4): Bacteriological findings from kidneys and livers of Japanese quails 1% treated with copper oxychloride in ration.
Organisms Strept. pyogens ++++ E.coil +++ Kebesiella ++ B.anthrocoid ++
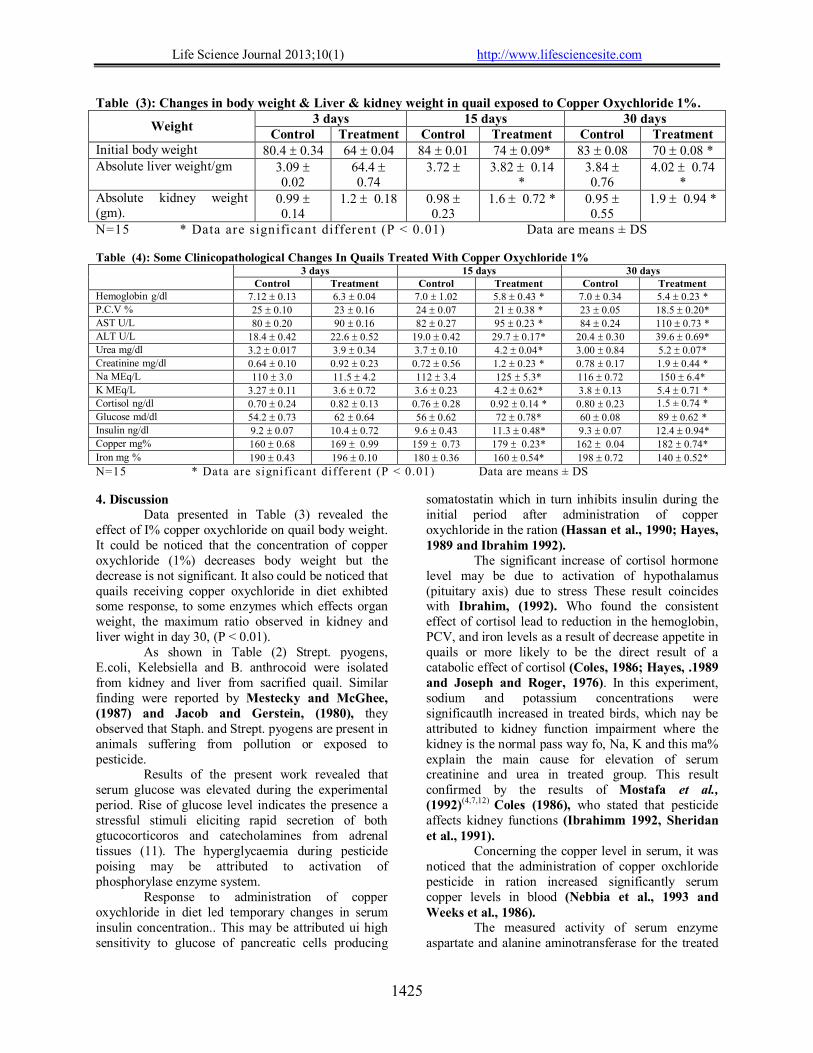
Life Science Journal 2013;10(1) http://www.lifesciencesite.com
1425
Table (3): Changes in body weight & Liver & kidney weight in quail exposed to Copper Oxychloride 1%.
Weight 3 days 15 days 30 days
Control Treatment Control Treatment Control Treatment Initial body weight 80.4 0.34 64 0.04 84 0.01 74 0.09* 83 0.08 70 0.08 * Absolute liver weight/gm 3.09
0.02 64.4 0.74
3.72 3.82 0.14 *
3.84 0.76
4.02 0.74 *
Absolute kidney weight (gm).
0.99 0.14
1.2 0.18 0.98 0.23
1.6 0.72 * 0.95 0.55
1.9 0.94 *
N=15 * Data are significant different (P < 0.01) Data are means ± DS Table (4): Some Clinicopathological Changes In Quails Treated With Copper Oxychloride 1%
3 days 15 days 30 days
Control Treatment Control Treatment Control Treatment Hemoglobin g/dl 7.12 0.13 6.3 0.04 7.0 1.02 5.8 0.43 * 7.0 0.34 5.4 0.23 * P.C.V % 25 0.10 23 0.16 24 0.07 21 0.38 * 23 0.05 18.5 0.20* AST U/L 80 0.20 90 0.16 82 0.27 95 0.23 * 84 0.24 110 0.73 * ALT U/L 18.4 0.42 22.6 0.52 19.0 0.42 29.7 0.17* 20.4 0.30 39.6 0.69* Urea mg/dl 3.2 0.017 3.9 0.34 3.7 0.10 4.2 0.04* 3.00 0.84 5.2 0.07* Creatinine mg/dl 0.64 0.10 0.92 0.23 0.72 0.56 1.2 0.23 * 0.78 0.17 1.9 0.44 * Na MEq/L 110 3.0 11.5 4.2 112 3.4 125 5.3* 116 0.72 150 6.4* K MEq/L 3.27 0.11 3.6 0.72 3.6 0.23 4.2 0.62* 3.8 0.13 5.4 0.71 * Cortisol ng/dl 0.70 0.24 0.82 0.13 0.76 0.28 0.92 0.14 * 0.80 0.23 1.5 ± 0.74 *
Glucose md/dl 54.2 0.73 62 0.64 56 0.62 72 0.78* 60 0.08 89 0.62 * Insulin ng/dl 9.2 0.07 10.4 0.72 9.6 0.43 11.3 0.48* 9.3 0.07 12.4 0.94* Copper mg% 160 0.68 169 0.99 159 0.73 179 0.23* 162 0.04 182 0.74* Iron mg % 190 0.43 196 0.10 180 0.36 160 0.54* 198 0.72 140 0.52*
N=15 * Data are significant different (P < 0.01) Data are means ± DS 4. Discussion Data presented in Table (3) revealed the effect of I% copper oxychloride on quail body weight. It could be noticed that the concentration of copper oxychloride (1%) decreases body weight but the decrease is not significant. It also could be noticed that quails receiving copper oxychloride in diet exhibted some response, to some enzymes which effects organ weight, the maximum ratio observed in kidney and liver wight in day 30, (P < 0.01). As shown in Table (2) Strept. pyogens, E.coli, Kelebsiella and B. anthrocoid were isolated from kidney and liver from sacrified quail. Similar finding were reported by Mestecky and McGhee, (1987) and Jacob and Gerstein, (1980), they observed that Staph. and Strept. pyogens are present in animals suffering from pollution or exposed to pesticide. Results of the present work revealed that serum glucose was elevated during the experimental period. Rise of glucose level indicates the presence a stressful stimuli eliciting rapid secretion of both gtucocorticoros and catecholamines from adrenal tissues (11). The hyperglycaemia during pesticide poising may be attributed to activation of phosphorylase enzyme system. Response to administration of copper oxychloride in diet led temporary changes in serum insulin concentration.. This may be attributed ui high sensitivity to glucose of pancreatic cells producing
somatostatin which in turn inhibits insulin during the initial period after administration of copper oxychloride in the ration (Hassan et al., 1990; Hayes, 1989 and Ibrahim 1992). The significant increase of cortisol hormone level may be due to activation of hypothalamus (pituitary axis) due to stress These result coincides with Ibrahim, (1992). Who found the consistent effect of cortisol lead to reduction in the hemoglobin, PCV, and iron levels as a result of decrease appetite in quails or more likely to be the direct result of a catabolic effect of cortisol (Coles, 1986; Hayes, .1989 and Joseph and Roger, 1976). In this experiment, sodium and potassium concentrations were significautlh increased in treated birds, which nay be attributed to kidney function impairment where the kidney is the normal pass way fo, Na, K and this ma% explain the main cause for elevation of serum creatinine and urea in treated group. This result confirmed by the results of Mostafa et al., (1992)(4,7,12) Coles (1986), who stated that pesticide affects kidney functions (Ibrahimm 1992, Sheridan et al., 1991). Concerning the copper level in serum, it was noticed that the administration of copper oxchloride pesticide in ration increased significantly serum copper levels in blood (Nebbia et al., 1993 and Weeks et al., 1986). The measured activity of serum enzyme aspartate and alanine aminotransferase for the treated
Life Science Journal 2013;10(1) http://www.lifesciencesite.com
1426
and control quail during the whole experiment showed a noticable increase of ALT & AST of quails treated with the pesticides. Such finding most probably denotes liver cell affection (toxic hepatitis). Also this increase was attributed to the distruction of the cells of liver, since the liver is the primary organ of detoxification as well as a major site for detoxifications reactions. Therefore, a significant increase in liver enzymes suggest an explanation for the presence of toxin in the liver cells (Hennawy, 1980). Our results agree with Nebbia et al., (1993), who observed the damage of liver and skeletal muscle in rabbits exposed to pesticide that caused liver and kideny disfunction. The significant increase in urea and creatinine, sodium and potassium could be attributed to the observed degeneration within some renal tubules in quails recieving l % copper oxychloride. Data agree with (Blaxhall, 1972; Husain et al., 1987 and Neskovi et al., 1992) In conclusion 1% pesticide copper oxychloride is not safe sine affects liver and kidney dysfunctions and its use should be restricted. This works is supported by a internal project National Research Center Lab of animal Nutrition, poultry, the first Reasearcher of this project is A Tohamy El-Yamani. The authors thanks Dr. Mohamed Aly Saud associate prof. of Microbiology, Animal Reproductive Instute, E1-Elaram for his kind assistant in the part of microbiology. References 1. Asztalos B.; Nemesok .1.; Benedeezky L;
Gabriel R.: Szabo A. and Refaie O.J. (1990): Arch. Environ. Contarn. Toxicol., 19: 275-282.
2. Barham W. T.; Smit, G.J. and Shoobee, H. J. J. (1972): Fish. Biology., 17: 275.
3. Bartels, H.; Bohnzer, M. and Heierli, C. (1972): Clinical chemistry Acta, 37: 193.
4. Blaxhall (1972): Journal of Bio. Chem.,4: 593-605.
5. Coles, E.T. (1986): Veterinary Clinical Pathology.4th Ed. W.S. saunders. Company, Philadelphia, London, Retman S. and Frankel S. Am. J. Clin.Pathol. 28,56 (1997)
6. Drabkin, D.J. (1946): Biol. Chem., 164, 703,. 7. El-Hennawy, S.L.; Shama, A.I.; Geabah, N.E.
and Sadek, M. (1980): Research Bull, (1274) 1-15, Faculty of Agriculture Ain Shams University.
8. Gad, S.C. and Well, C.S. (1983): Raven Press, New York, pp. 237-320.
9. Hassan, A.A.M.; El-Sewedy , S. M.; Minatogawa , Y. and kido, R. (1990): Journal of Environment of Science and Health Part B, B 25: 333-346. Hayes, WA. (1989): principles and techniches 2nd Edition, Haper and Row. P. 525.
10. Husain, R.; Ashari, R. A. and Gupta, P.C. (1987): Journal or Environmental Biology, 8: 137-142.
11. Ibrahim, Th. A. (1992): Proc. Of 2'd Cong Faculty Verterinary Medicine Cairo University, 47 : 51.
12. Jacobs, M.B. and Gerstein M.J. (1982): Hand-book of Microbiology. B. Van Nastrand company Inc. Toronto, New York & London.
13. Joseph, A. and Roger, W. G. (1976): Clinical chemistry principles and procedures forth ed. Boston , pp 186-197.
14. Linman, J. W. (1975): Haematology, Physiologyic, publish Company, Inc, New york 119 pp.
15. Mostafa, I. Y.; Zayed, S.M.A.D. and Farghaly, M. (1992 a): Journal of Environmental Science and Health, B., (27)4:399-405.
16. Mestecky, J. and McGhee, J.R. (1987): Advanced Immunology, 40:153-245 (510 ref.).
17. Nebbia, C.; Dacasto, M.; Gennaro Soffietti, M.; Rasero, R. and Copenhag (1993): 73:233-239.
18. Neskovic, N.K.; Karan, V.; Budimir, M.; Vojionvic, V.; Gasic, S. and Silij-Vitorivic. (1992): Journal of Environmental Science and Health, B (27) 4: 387-397.
19. Patton, CJ. and Bauman, WA. (1983): Rifking Excerpta Medica, NewYork , pp. 119-150.
20. Pickering, A.D. and Pottinger, P. (1983): Gen. Corn. Endocrinol. 49, 232.
21. Reitman, S. and Frankel, S. (1957): Am. J. Clin. Pathol., 28: 56.
22. Sheridan, M.A.; Eilertson, C.D. and Pisetskaya, E.M. (1991): Endocrinol. 81, 365.
23. Silversmit, A.B. (1965): Med 45, 175. 24. Trinder, P. (1969): Ann, Clim biochem. 6, 24. 25. Weeks, B.A.; Warinn2r, J.E.; Mason, P.L. and
Mc Ginnis, D.S. (1986): Journal of Fish Biol., 28: 635.
12/25/2012
Life Science Journal 2013;10(1) http://www.lifesciencesite.com
1427
Prognostic Assessment of P-Glycoprotein over Expression in Refractory and / or Relapsed Acute Myeloid Leukemia and Response to Cyclosporine A
Ashraf M. El Hefni1, Fouad M. Abu Taleb1, Khaled M.Hadhoud1, Mahmoud A. Ashour1 and Amal Ahmed Zidan2
1Hematology &Medical Oncology Unit, Internal Medicine Department
2ClinicalPathology Department, Faculty of Medicine, Zagazig University [email protected]
Abstract: Acute myeloid leukemia (AML) is a malignant hematopoietic neoplasm characterized by clonal proliferation of tumor cells that arise from the hematopoietic stem/progenitor population within the bone marrow. Objectives our study was enrolled to assess p-glycoprotein overexpression in refractory and /or relapsed acute myeloid leukemia and response to addition of cyclosporine A to chemotherapy. Patients and Methods this study was carried out at Hematology and Medical Oncology Unit, Internal Medicine Department, Zagazig University hospital during the period between July 2010 and July 2011. Forty patients with refractory or relapsed acute myeloid leukemia were classified into two groups, group (A): included 20 adult patients, their ages ranged from 18 to 60 years with median age 39 years, and they were treated with chemotherapy alone, group (B) included 20 adult patients with, their ages ranged from 20 to 61 years with median 40 years, they were treated with oral cyclosporine A in addition to the same chemotherapy protocol given in group A. All patients subjected to thorough medical history, physical examination, routine laboratory and radiological investigations and flowcytometry to assess p-glycoprotein overexpression. All patients had severe cardiac, pulmonary, hepatic, renal, neurological, metabolic disease, concomitant malignancies or uncontrolled infections were excluded from the study .Results P-glycoprotein was overexpressed in 22 patients with refractory or relapsed AML (55%), when the unpaired (t) test was applied to test the significance of difference between the mean value ± S.D of percentage of bone marrow blasts and Pglycoprotein overexpression, there was not any significant difference detected (t=0.08 and p=0.91). Chi square test (χ2) test was applied to test the significance of difference among different variables and P-glycoprotein overexpression. A statistically significant difference was found with cytogenetic study (Χ2 =8.5 and P=0.03) and response to treatment (Χ2 =8.02 and P=0.018). 13 patients were achieved CR (33%), 8 patients with PR (20%) and 19 patients with NR (47%) and when Chi square (χ2) test was applied to test the significance of difference among variables associated with response to treatment, a high significant difference was found with cytogenetic study (Χ2 =33.93 and P= 0.001) The mean overall survival in group B was more than group A but wasn't significantly different (P= 0.25) also no significant difference between overall survival and P-glycoprotein overexpression (P= 0.15), but there was highly significant difference between overall survival and response to treatment (P= 0.0014), also Chi square (χ2) test was applied to test the significance of difference among different toxicities which were occurred during therapy with patient groups, there is no significant difference was found conclusion P-glycoprotein was overexpressed in 55% of patients with refractory or relapsed acute myeloid leukemia and provide prognostic indicator for response to treatment and addition of oral cyclosporine as P-glycoprotein modulator doesn't improve response to chemotherapy or overall survival. [Ashraf M. El Hefni, Fouad M. Abu Taleb, Khaled M.Hadhoud, Mahmoud A. Ashour and Amal Ahmed Zidan. Prognostic Assessment of P-Glycoprotein over Expression in Refractory and / or Relapsed Acute Myeloid Leukemia and Response to Cyclosporine A. Life Sci J 2013;10(1):1427-1436] (ISSN:1097-8135). http://www.lifesciencesite.com. 213 Key words:- Acute myeloid leukemia (AML), P-glycoprotein (Pgp),Treatment response. 1. Introduction
Cancer is a major public health problem in many parts of the world (1) and advancements in early detection and cancer treatments have yielded significant progress (2). Multidrug resistance (MDR) represents a major obstacle in successful therapy of neoplastic diseases so, despite of treatment with invasive chemotherapy, a considerable number of patients with acute myeloid leukemia die because of occurrence of resistance (3). P-glycoprotein (Pgp) is a 170 kDa plasma protein, belongs to the ATP-binding
Cassette (ABC) transporters, which are associated with several (in excess of 40) family members that share sequence and structural homology protecting cancer cells from apoptosis and they use the energy that is released when they hydrolyze ATP to derive the movement of various (exogenous and endogenous) molecules across the cell membrane (4, 5). Since the discovery of P-glycoprotein (Pgp) there had been an enormous effort to generate clinically applicable inhibitors to restore sensitivity of cancer cells to chemotherapy (6) and many agents that modulate the
Life Science Journal 2013;10(1) http://www.lifesciencesite.com
1428
Pgp transporter were identified in the 1980s, including Cyclosporine A (7). Cyclosporine A is a widely used immunosuppressant drug who’s therapeutic and toxic actions are mediated through inhibition of calcineurin, a calcium and calmodulin-dependant phosphatase(8). The clinical efficacy of Cyclosporine A as a modulator in AML might in part reflect a broad spectrum of activity against the MDR proteins expressed in AML cells(9). In addition to broad spectrum modulation, CsA has been reported to have other effects that may be beneficial, including induction of apoptosis in at least some cell types as well as anti-angiogenic effects (10). So our study had been enrolled to evaluate p-glycoprotein over expression in patients with refractory or relapsed acute myeloid leukemia and response to cyclosporine A in addition to chemotherapy. 2. Patients and methods:-
This study was carried out at Hematology and Medical Oncology Unit, Internal Medicine Department, Zagazig University Hospital during the period between July 2010 and July 2011. It was included 40 patients with refractory or relapsed acute myeloid leukemia and was classified into two groups. Group (A) included 20 adult patients, their ages ranged from 18 to 60 years with median age 39 years and they were treated with chemotherapy alone (Ara-
C 1 gm/ m2/12 hour, 3 hours Intravenous infusion
from day 1 to day 3 and Novantron 10 mg/ m2 intravenous infusion from day 3 to day 5) (11). Group (B) included 20 adult patients their ages ranged from 20 to 61 years with median age 40 years, they were treated with oral Cyclosporine A (5 mg/kg/d orally for 5 successive days) in addition to the chemotherapy given in the same protocol as in group A . Well informed consent was obtained , also the protocol of therapy was reviewed and accepted by our institutional board. All patients had severe cardiac, pulmonary, hepatic, renal, neurological, metabolic disease, concomitant malignancies or uncontrolled infections were excluded from the study and all patients were subjected to complete clinical history and physical examination, routine laboratory investigations includes (complete blood picture, liver & kidney functions, PT, PTT/ INR and ESR). Virology studies including ( HBs Ag, HCV Ab, HIV Ab), bone marrow aspiration and biopsy with immunophenotyping and Cytogenetic study, routine radiology (chest X-ray and CT chest if indicated, pelvi-abdominal ultrasonography and CT abdomen & pelvis if indicated and echocardiography). while detection of P-glycoprotein expression level was done by anti-P-glycoprotein monoclonal antibody which was used to detect the mean fluorescence intensity
(MFI) of Pgp on blast cells using Becton Dickinson FAC scan flowcytometery and the intensity of staining of mean fluorescence index (MFI) was used in the detection of the Pgp expression level which represents the ratio between the mean fluorescence intensity of cells stained with the specific antibody and that of cells stained with the isotype matched control antibody(12) and the response to treatment was evaluated according to revised recommendations of the international working group for standardization of response criteria, the complete remission (CR), when the cellularity of the bone marrow (BM) after regeneration was near normal with <5% blast cells, the peripheral blood recovered completely, and no extra-medullary leukemic infiltrates were present. When the BM blast cell count remained between 5 and 25% but was reduced by at least 50% in comparison to the initial value, and the peripheral blood levels recovered completely, a patient was be considered to be in partial remission (PR) and failure to attain CR or PR will be consistent with failure or non response (NR) (13) as well as toxicity of treatment was evaluated according to WHO common toxicity Criteria.
Statistical Analysis
Data were collected, entered and checked to a SPSS version 15. Data were expressed as mean ± standard deviation in quantitative variables, number and percentage for qualitative variables, Chi square and correlation coefficient were used for analysis of data and for all above mentioned statistical test, the threshold of significance is fixed at 5% level (P-value).Kaplan-Meier used mainly in survival studies of patients and confidence intervals were calculated using Greenwood's estimate of the standard error and differences in overall survival were tested for significance using the log-rank statistic (14). 3. Results
Patient characteristics of study are showed in table (1) and P-glycoprotein was overexpressed in 22 patients with refractory or relapsed AML (55%) in figures: 1, 2, and 3).
Chi square test (χ2) test was applied to test the significance of difference among different variables and Pgp overexpression. A statically significant difference was found with cytogenetic study (Χ2 =8.5 and P=0.03) and response to treatment (Χ2 =8.02 and P=0.018) Table (3) Figure (4).
The patient response to treatment was as follow: 13 patients achieved CR (33%), 8 patients with PR (20%) and 19 patients with NR (47%) and when Chi square (χ2) test was applied to test the significance of difference among variables associated with response to treatment, a high significant
Life Science Journal 2013;10(1) http://www.lifesciencesite.com
1429
difference was found with cytogenetic study (Χ2 =33.93 and P= 0.001) Table (4) Figure (5).
Kaplan-Meier method was used to estimate one year over all survival of patients of the study. The mean overall survival in group B was more than group A but there wasn't significant difference (P= 0.25) also no significant difference between overall survival and Pgp over expression (P= 0.15), but there was highly significant difference between overall survival and response to treatment (P= 0.0014) Tables (5, 6, 7) Figures (6, 7, 8).
Chi square (χ2) test was applied to test the significance of difference among different toxicities which were occurred during therapy and patient groups, there was no significant difference was found (Table 8). Table (1)
% No. Character
100
40
Age(in years): Range(18-61) Median (41)
45 55
18 22
Sex: Male Female
7.5 20 25 15 15 2.5 2.5 7.5 5
3 8 10 6 6 1 1 3 2
Clinical presentation: CNS infiltration Pallor Fever Gum hypertrophy Purpura Lymphadenopathy Spleenomegaly Hepatomegaly Chloroma
35 7.5 57
14 3 23
Virology: Hcv Ab +ve HBsAg +ve Hcv/Hbv -ve
100
40
Bone Marrow (B.M) Blasts (%): Range (48-95) X± SD (74.87±13.85)
100
40
Immunophenotyping: +ve myeloid markers
7.5 10 15 25 45
3 4 6 10 17
FAB classification: M0 M1 M2 M4 M5
33 27 20 20
13 11 8 8
Cytogenetic study: Unfavorable Intermediate Favorable Unknown
Figure (1): Histogram of patient showing –ve Pgp
expression.
Figure (2): Histogram of patient showing +ve Pgp
expression.
Figure (3): Distribution of cases according to Pgp over expression. Table (2):Comparison between PgP overexpression and percentage of Bone Marrow blasts:
P T Pgp +ve Pgp -ve
0.91
0.08
74.95±15.61
71.77±11.79 B.M blasts X± SD

Life Science Journal 2013;10(1) http://www.lifesciencesite.com
1430
Table (3): Comparison between PgP overexpression with FAB classification, cytogenetic study and response to treatment: P Χ2 Pgp +ve
% No. Pgp –ve
No. %
0.41
3.92
2 66.7 2 50 2 33.3 4 40 12 70.5
1 33.3 2 50 4 66.6 6 60 5 29.4
FAB: M0 M1 M2 M4 M5
0.03*
8.5
11 84.7 6 54.6 2 25 3 37.5
2 15.3 5 45.4 6 75 5 62.5
Cytogenetic: Unfavorable Intermediate Favorable Unknown
0.018*
8.02
3 23.1 6 75 13 68.4
10 76.9 2 25 6 31.5
Response: CR PR NR
Significant*
Figure (4): Comparison between Pgp overexpression with FAB classification, cytogenetic study and response to treatment
Figure (5): Comparison between treatment response with studied groups, FAB classification and cytogenetic study. Table (4): Comparison between response to treatment with studied group, FAB classification and cytogenetic study:
P
Χ2
NR NO. %
PR NO. %
CR NO. %
0.93
0.13
10 50 9 45
4 20 4 20
6 30 7 35
Patient group: A B
0.57 6.62
2 66.6 1 25 3 50 4 40
9 52.9
0 0 0 0
1 16.7 2 20 5 29.4
1 33.3 3 75 2 33.3 4 40 3 17.6
FAB: M0 M1 M2 M4 M5
0.001** 33.93
12 92.3 5 45.5 0 0 2 25
0 0 4 36.4 0 0 4 50
1 7.7 2 18.2 8 100 2 25
Cytogenetic: Unfavorable Intermediate Favorable Unknown

Life Science Journal 2013;10(1) http://www.lifesciencesite.com
1431
Table (5): Comparison between overall survival and patient groups:
Log rank
Group B No. %
Group A No. %
1.3 0.25
10 50 6 30 Censored 10 50 14 70 Event
6.83 ± 0.88 4.90 ± 0.46 Mean survival ±SD 5.10 – 8.57 4.00 – 5.81 95% confidence interval
Table (6): Comparison between overall survival and Pgp over expression:
Log rank
Pgp +ve No. %
Pgp –ve No. %
2.04 0.15
7 31.82 9 50 Censored 15 68.18 9 50 Event
5.08 ± 0.59 7.31 ± 0.87 Mean survival ± SD 3.92- 6.23 5.60 – 9.01 95% confidence interval
Table (7):Comparison between overall survival and response to treatment:
Log rank NR
No. % PR
No. % CR
No. %
13.3 0.0014**
0 0 1 25 5 83.33 Censored 10 100 3 75 1 16.76 Event
3.5 ± 0.40 5.25 ± 1.09 7.33 ± 0.54 Mean survival ± SD 2.7 – 4.29 3.11 – 7.39 6.27 – 8.40 95 % confidence interval
** Highly significant
Figure (6): comparison between overall survival and patient groups
Figure (7): Comparison between overall survival and PgP over expression.
Figure (8):comparison between overall survival and response to treatment.
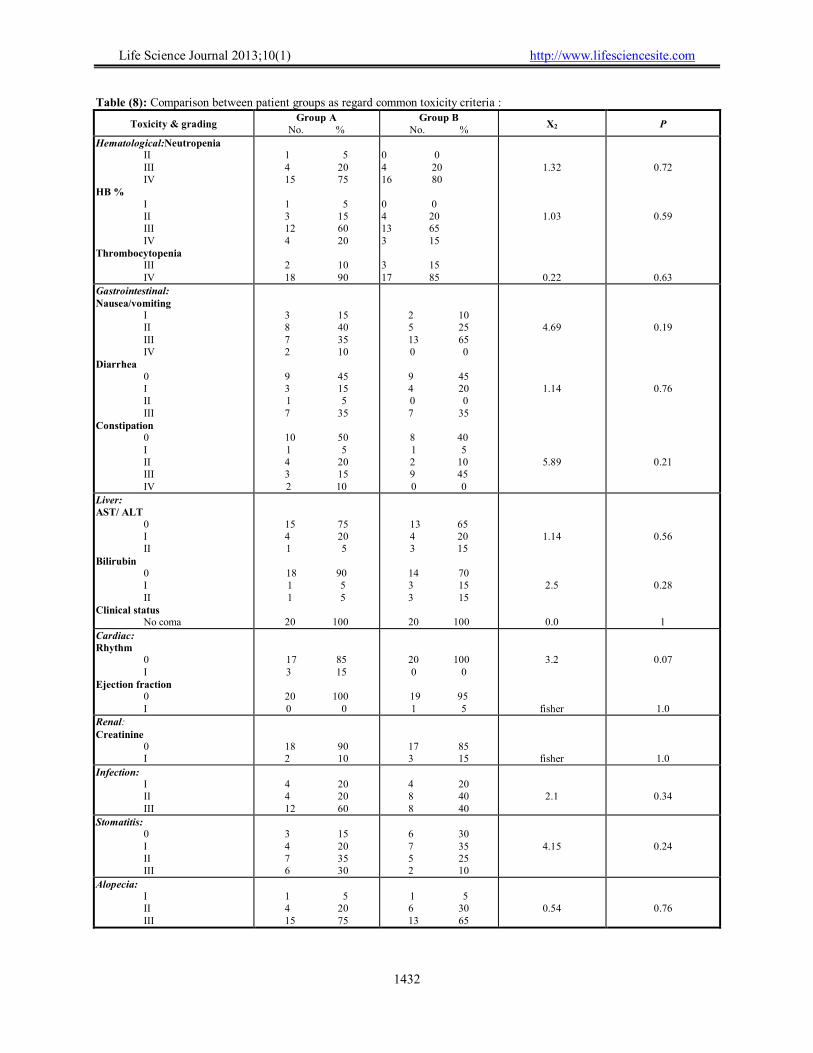
Life Science Journal 2013;10(1) http://www.lifesciencesite.com
1432
Table (8): Comparison between patient groups as regard common toxicity criteria :
P Χ2 Group B
No. % Group A
No. % Toxicity & grading
0.72
0.59
0.63
1.32
1.03
0.22
0 0 4 20 16 80 0 0 4 20 13 65 3 15 3 15 17 85
1 5 4 20 15 75
1 5 3 15 12 60 4 20
2 10 18 90
Hematological:Neutropenia II III IV HB % I II III IV Thrombocytopenia III IV
0.19
0.76
0.21
4.69
1.14
5.89
2 10 5 25 13 65 0 0
9 45 4 20 0 0 7 35
8 40 1 5 2 10 9 45 0 0
3 15 8 40 7 35 2 10
9 45 3 15 1 5 7 35
10 50 1 5 4 20 3 15 2 10
Gastrointestinal: Nausea/vomiting I II III IV Diarrhea 0 I II III Constipation 0 I II III IV
0.56
0.28
1
1.14
2.5
0.0
13 65 4 20 3 15
14 70 3 15 3 15
20 100
15 75 4 20 1 5
18 90 1 5 1 5
20 100
Liver: AST/ ALT 0 I II Bilirubin 0 I II Clinical status No coma
0.07
1.0
3.2
fisher
20 100 0 0
19 95 1 5
17 85 3 15
20 100 0 0
Cardiac: Rhythm 0 I Ejection fraction 0 I
1.0
fisher
17 85 3 15
18 90 2 10
Renal: Creatinine 0 I
0.34
2.1
4 20 8 40 8 40
4 20 4 20 12 60
Infection: I II III
0.24
4.15
6 30 7 35 5 25 2 10
3 15 4 20 7 35 6 30
Stomatitis: 0 I II III
0.76
0.54
1 5 6 30 13 65
1 5 4 20 15 75
Alopecia: I II III
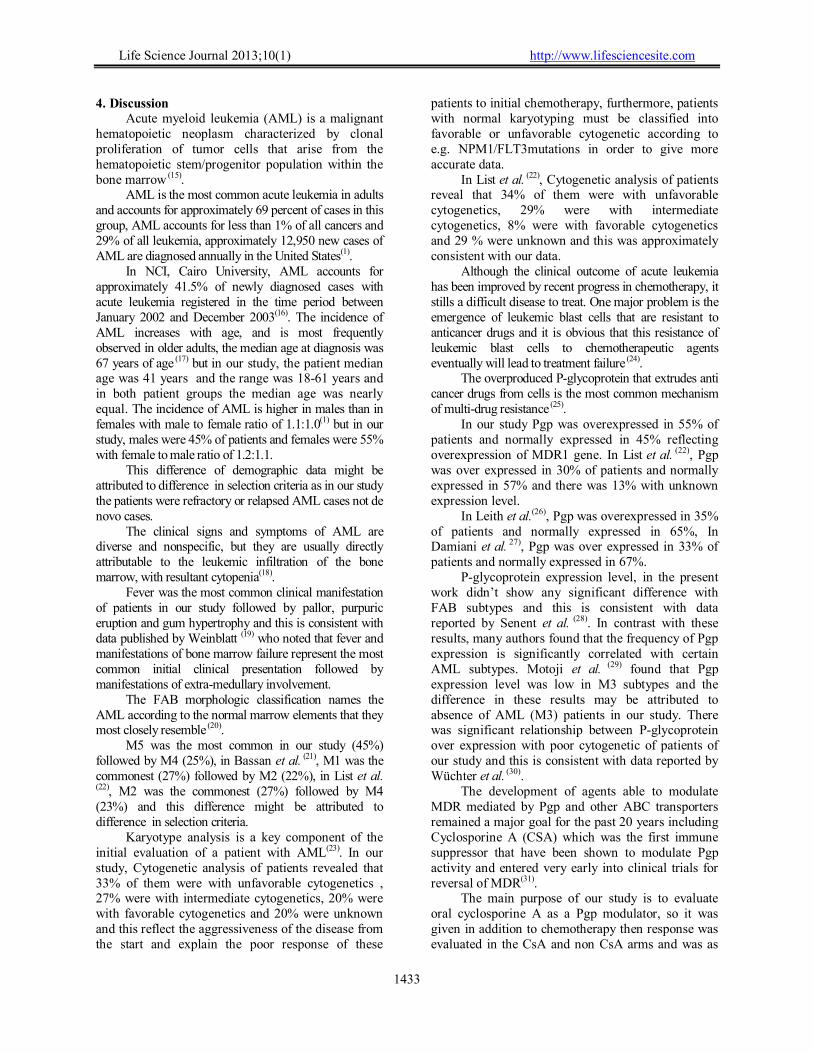
Life Science Journal 2013;10(1) http://www.lifesciencesite.com
1433
4. Discussion Acute myeloid leukemia (AML) is a malignant
hematopoietic neoplasm characterized by clonal proliferation of tumor cells that arise from the hematopoietic stem/progenitor population within the bone marrow (15).
AML is the most common acute leukemia in adults and accounts for approximately 69 percent of cases in this group, AML accounts for less than 1% of all cancers and 29% of all leukemia, approximately 12,950 new cases of AML are diagnosed annually in the United States(1).
In NCI, Cairo University, AML accounts for approximately 41.5% of newly diagnosed cases with acute leukemia registered in the time period between January 2002 and December 2003(16). The incidence of AML increases with age, and is most frequently observed in older adults, the median age at diagnosis was 67 years of age (17) but in our study, the patient median age was 41 years and the range was 18-61 years and in both patient groups the median age was nearly equal. The incidence of AML is higher in males than in females with male to female ratio of 1.1:1.0(1) but in our study, males were 45% of patients and females were 55% with female to male ratio of 1.2:1.1.
This difference of demographic data might be attributed to difference in selection criteria as in our study the patients were refractory or relapsed AML cases not de novo cases.
The clinical signs and symptoms of AML are diverse and nonspecific, but they are usually directly attributable to the leukemic infiltration of the bone marrow, with resultant cytopenia(18).
Fever was the most common clinical manifestation of patients in our study followed by pallor, purpuric eruption and gum hypertrophy and this is consistent with data published by Weinblatt (19) who noted that fever and manifestations of bone marrow failure represent the most common initial clinical presentation followed by manifestations of extra-medullary involvement.
The FAB morphologic classification names the AML according to the normal marrow elements that they most closely resemble (20).
M5 was the most common in our study (45%) followed by M4 (25%), in Bassan et al. (21), M1 was the commonest (27%) followed by M2 (22%), in List et al. (22), M2 was the commonest (27%) followed by M4 (23%) and this difference might be attributed to difference in selection criteria.
Karyotype analysis is a key component of the initial evaluation of a patient with AML(23). In our study, Cytogenetic analysis of patients revealed that 33% of them were with unfavorable cytogenetics , 27% were with intermediate cytogenetics, 20% were with favorable cytogenetics and 20% were unknown and this reflect the aggressiveness of the disease from the start and explain the poor response of these
patients to initial chemotherapy, furthermore, patients with normal karyotyping must be classified into favorable or unfavorable cytogenetic according to e.g. NPM1/FLT3mutations in order to give more accurate data.
In List et al. (22), Cytogenetic analysis of patients reveal that 34% of them were with unfavorable cytogenetics, 29% were with intermediate cytogenetics, 8% were with favorable cytogenetics and 29 % were unknown and this was approximately consistent with our data.
Although the clinical outcome of acute leukemia has been improved by recent progress in chemotherapy, it stills a difficult disease to treat. One major problem is the emergence of leukemic blast cells that are resistant to anticancer drugs and it is obvious that this resistance of leukemic blast cells to chemotherapeutic agents eventually will lead to treatment failure (24).
The overproduced P-glycoprotein that extrudes anti cancer drugs from cells is the most common mechanism of multi-drug resistance (25).
In our study Pgp was overexpressed in 55% of patients and normally expressed in 45% reflecting overexpression of MDR1 gene. In List et al. (22), Pgp was over expressed in 30% of patients and normally expressed in 57% and there was 13% with unknown expression level.
In Leith et al.(26), Pgp was overexpressed in 35% of patients and normally expressed in 65%, In Damiani et al. 27), Pgp was over expressed in 33% of patients and normally expressed in 67%.
P-glycoprotein expression level, in the present work didn’t show any significant difference with FAB subtypes and this is consistent with data reported by Senent et al. (28). In contrast with these results, many authors found that the frequency of Pgp expression is significantly correlated with certain AML subtypes. Motoji et al. (29) found that Pgp expression level was low in M3 subtypes and the difference in these results may be attributed to absence of AML (M3) patients in our study. There was significant relationship between P-glycoprotein over expression with poor cytogenetic of patients of our study and this is consistent with data reported by Wüchter et al. (30).
The development of agents able to modulate MDR mediated by Pgp and other ABC transporters remained a major goal for the past 20 years including Cyclosporine A (CSA) which was the first immune suppressor that have been shown to modulate Pgp activity and entered very early into clinical trials for reversal of MDR(31).
The main purpose of our study is to evaluate oral cyclosporine A as a Pgp modulator, so it was given in addition to chemotherapy then response was evaluated in the CsA and non CsA arms and was as
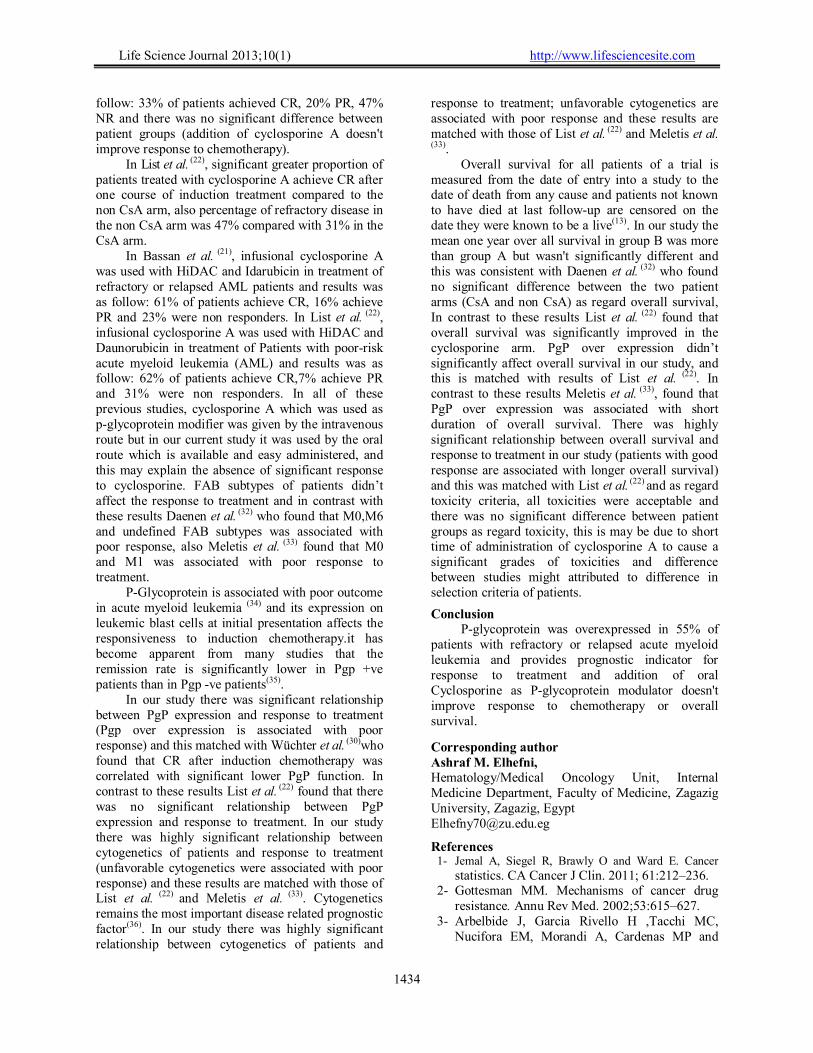
Life Science Journal 2013;10(1) http://www.lifesciencesite.com
1434
follow: 33% of patients achieved CR, 20% PR, 47% NR and there was no significant difference between patient groups (addition of cyclosporine A doesn't improve response to chemotherapy).
In List et al. (22), significant greater proportion of patients treated with cyclosporine A achieve CR after one course of induction treatment compared to the non CsA arm, also percentage of refractory disease in the non CsA arm was 47% compared with 31% in the CsA arm.
In Bassan et al. (21), infusional cyclosporine A was used with HiDAC and Idarubicin in treatment of refractory or relapsed AML patients and results was as follow: 61% of patients achieve CR, 16% achieve PR and 23% were non responders. In List et al. (22), infusional cyclosporine A was used with HiDAC and Daunorubicin in treatment of Patients with poor-risk acute myeloid leukemia (AML) and results was as follow: 62% of patients achieve CR,7% achieve PR and 31% were non responders. In all of these previous studies, cyclosporine A which was used as p-glycoprotein modifier was given by the intravenous route but in our current study it was used by the oral route which is available and easy administered, and this may explain the absence of significant response to cyclosporine. FAB subtypes of patients didn’t affect the response to treatment and in contrast with these results Daenen et al. (32) who found that M0,M6 and undefined FAB subtypes was associated with poor response, also Meletis et al. (33) found that M0 and M1 was associated with poor response to treatment.
P-Glycoprotein is associated with poor outcome in acute myeloid leukemia (34) and its expression on leukemic blast cells at initial presentation affects the responsiveness to induction chemotherapy.it has become apparent from many studies that the remission rate is significantly lower in Pgp +ve patients than in Pgp -ve patients(35).
In our study there was significant relationship between PgP expression and response to treatment (Pgp over expression is associated with poor response) and this matched with Wüchter et al. (30)who found that CR after induction chemotherapy was correlated with significant lower PgP function. In contrast to these results List et al. (22) found that there was no significant relationship between PgP expression and response to treatment. In our study there was highly significant relationship between cytogenetics of patients and response to treatment (unfavorable cytogenetics were associated with poor response) and these results are matched with those of List et al. (22) and Meletis et al. (33). Cytogenetics remains the most important disease related prognostic factor(36). In our study there was highly significant relationship between cytogenetics of patients and
response to treatment; unfavorable cytogenetics are associated with poor response and these results are matched with those of List et al. (22) and Meletis et al. (33).
Overall survival for all patients of a trial is measured from the date of entry into a study to the date of death from any cause and patients not known to have died at last follow-up are censored on the date they were known to be a live(13). In our study the mean one year over all survival in group B was more than group A but wasn't significantly different and this was consistent with Daenen et al. (32) who found no significant difference between the two patient arms (CsA and non CsA) as regard overall survival, In contrast to these results List et al. (22) found that overall survival was significantly improved in the cyclosporine arm. PgP over expression didn’t significantly affect overall survival in our study, and this is matched with results of List et al. (22). In contrast to these results Meletis et al. (33), found that PgP over expression was associated with short duration of overall survival. There was highly significant relationship between overall survival and response to treatment in our study (patients with good response are associated with longer overall survival) and this was matched with List et al. (22) and as regard toxicity criteria, all toxicities were acceptable and there was no significant difference between patient groups as regard toxicity, this is may be due to short time of administration of cyclosporine A to cause a significant grades of toxicities and difference between studies might attributed to difference in selection criteria of patients.
Conclusion P-glycoprotein was overexpressed in 55% of
patients with refractory or relapsed acute myeloid leukemia and provides prognostic indicator for response to treatment and addition of oral Cyclosporine as P-glycoprotein modulator doesn't improve response to chemotherapy or overall survival.
Corresponding author Ashraf M. Elhefni, Hematology/Medical Oncology Unit, Internal Medicine Department, Faculty of Medicine, Zagazig University, Zagazig, Egypt [email protected]
References 1- Jemal A, Siegel R, Brawly O and Ward E. Cancer
statistics. CA Cancer J Clin. 2011; 61:212–236. 2- Gottesman MM. Mechanisms of cancer drug
resistance. Annu Rev Med. 2002;53:615–627. 3- Arbelbide J, Garcia Rivello H ,Tacchi MC,
Nucifora EM, Morandi A, Cardenas MP and
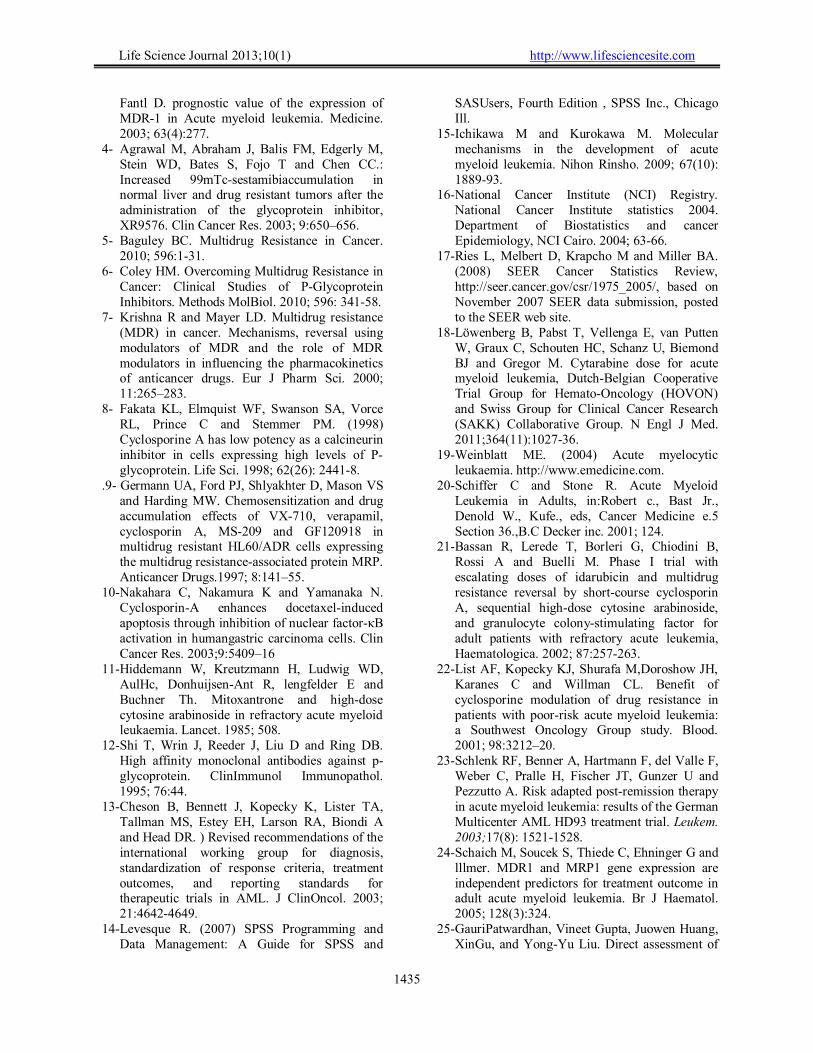
Life Science Journal 2013;10(1) http://www.lifesciencesite.com
1435
Fantl D. prognostic value of the expression of MDR-1 in Acute myeloid leukemia. Medicine. 2003; 63(4):277.
4- Agrawal M, Abraham J, Balis FM, Edgerly M, Stein WD, Bates S, Fojo T and Chen CC.: Increased 99mTc-sestamibiaccumulation in normal liver and drug resistant tumors after the administration of the glycoprotein inhibitor, XR9576. Clin Cancer Res. 2003; 9:650–656.
5- Baguley BC. Multidrug Resistance in Cancer. 2010; 596:1-31.
6- Coley HM. Overcoming Multidrug Resistance in Cancer: Clinical Studies of P-Glycoprotein Inhibitors. Methods MolBiol. 2010; 596: 341-58.
7- Krishna R and Mayer LD. Multidrug resistance (MDR) in cancer. Mechanisms, reversal using modulators of MDR and the role of MDR modulators in influencing the pharmacokinetics of anticancer drugs. Eur J Pharm Sci. 2000; 11:265–283.
8- Fakata KL, Elmquist WF, Swanson SA, Vorce RL, Prince C and Stemmer PM. (1998) Cyclosporine A has low potency as a calcineurin inhibitor in cells expressing high levels of P-glycoprotein. Life Sci. 1998; 62(26): 2441-8.
.9- Germann UA, Ford PJ, Shlyakhter D, Mason VS and Harding MW. Chemosensitization and drug accumulation effects of VX-710, verapamil, cyclosporin A, MS-209 and GF120918 in multidrug resistant HL60/ADR cells expressing the multidrug resistance-associated protein MRP. Anticancer Drugs.1997; 8:141–55.
10-Nakahara C, Nakamura K and Yamanaka N. Cyclosporin-A enhances docetaxel-induced apoptosis through inhibition of nuclear factor-κB activation in humangastric carcinoma cells. Clin Cancer Res. 2003;9:5409–16
11-Hiddemann W, Kreutzmann H, Ludwig WD, AulHc, Donhuijsen-Ant R, lengfelder E and Buchner Th. Mitoxantrone and high-dose cytosine arabinoside in refractory acute myeloid leukaemia. Lancet. 1985; 508.
12-Shi T, Wrin J, Reeder J, Liu D and Ring DB. High affinity monoclonal antibodies against p-glycoprotein. ClinImmunol Immunopathol. 1995; 76:44.
13-Cheson B, Bennett J, Kopecky K, Lister TA, Tallman MS, Estey EH, Larson RA, Biondi A and Head DR. ) Revised recommendations of the international working group for diagnosis, standardization of response criteria, treatment outcomes, and reporting standards for therapeutic trials in AML. J ClinOncol. 2003; 21:4642-4649.
14-Levesque R. (2007) SPSS Programming and Data Management: A Guide for SPSS and
SASUsers, Fourth Edition , SPSS Inc., Chicago Ill.
15-Ichikawa M and Kurokawa M. Molecular mechanisms in the development of acute myeloid leukemia. Nihon Rinsho. 2009; 67(10): 1889-93.
16-National Cancer Institute (NCI) Registry. National Cancer Institute statistics 2004. Department of Biostatistics and cancer Epidemiology, NCI Cairo. 2004; 63-66.
17-Ries L, Melbert D, Krapcho M and Miller BA. (2008) SEER Cancer Statistics Review, http://seer.cancer.gov/csr/1975_2005/, based on November 2007 SEER data submission, posted to the SEER web site.
18-Löwenberg B, Pabst T, Vellenga E, van Putten W, Graux C, Schouten HC, Schanz U, Biemond BJ and Gregor M. Cytarabine dose for acute myeloid leukemia, Dutch-Belgian Cooperative Trial Group for Hemato-Oncology (HOVON) and Swiss Group for Clinical Cancer Research (SAKK) Collaborative Group. N Engl J Med. 2011;364(11):1027-36.
19-Weinblatt ME. (2004) Acute myelocytic leukaemia. http://www.emedicine.com.
20-Schiffer C and Stone R. Acute Myeloid Leukemia in Adults, in:Robert c., Bast Jr., Denold W., Kufe., eds, Cancer Medicine e.5 Section 36.,B.C Decker inc. 2001; 124.
21-Bassan R, Lerede T, Borleri G, Chiodini B, Rossi A and Buelli M. Phase I trial with escalating doses of idarubicin and multidrug resistance reversal by short-course cyclosporin A, sequential high-dose cytosine arabinoside, and granulocyte colony-stimulating factor for adult patients with refractory acute leukemia, Haematologica. 2002; 87:257-263.
22-List AF, Kopecky KJ, Shurafa M,Doroshow JH, Karanes C and Willman CL. Benefit of cyclosporine modulation of drug resistance in patients with poor-risk acute myeloid leukemia: a Southwest Oncology Group study. Blood. 2001; 98:3212–20.
23-Schlenk RF, Benner A, Hartmann F, del Valle F, Weber C, Pralle H, Fischer JT, Gunzer U and Pezzutto A. Risk adapted post-remission therapy in acute myeloid leukemia: results of the German Multicenter AML HD93 treatment trial. Leukem. 2003;17(8): 1521-1528.
24-Schaich M, Soucek S, Thiede C, Ehninger G and lllmer. MDR1 and MRP1 gene expression are independent predictors for treatment outcome in adult acute myeloid leukemia. Br J Haematol. 2005; 128(3):324.
25-GauriPatwardhan, Vineet Gupta, Juowen Huang, XinGu, and Yong-Yu Liu. Direct assessment of

Life Science Journal 2013;10(1) http://www.lifesciencesite.com
1436
P-glycoprotein efflux to determine tumor response to chemotherapy. Biochem Pharmacol. 2010; 80(1): 72–79.
26-Leith CP, Kopecky KJ, Eijdems L, Weick J, Grever MR and Willman CL. Frequency and Clinical Significance of the Expression of the Multidrug Resistance Proteins MDR1/P-Glycoprotein, MRP1 and LRP in Acute Myeloid Leukemia. A Southwest Oncology Group Study, Blood. 1999; 49:1086-1099.
27-Damiani D, Tiribelli M, Calistri E,Geromin A, Chiarvesio A and Fanin R. The prognostic value of P-glycoprotein (ABCB) and breast cancer resistance protein (ABCG2) in adults with de novo acute myeloid leukemia with normal karyotype, Haematologica. 2006; 91:825-828
28-Senent L, Jarque I, Martin G, Sempere A, González-García Y, Gomis F and Sanz MA. P-glycoprotein expression and prognostic value in acute myeloid leukemia, Haematologica. 1998; 83:783.
29-Motoji T, Motomura S and Wang YH. Multidrug resistance and a strategy to overcome it .Int J Haematol. 2000; 72:418.
30-Wüchter C, Karawajew L, Ruppert V,Schrappe M,Harbott J and Schoch C. clinical significance of p-glycoprotein expression and function for response to induction chemotherapy, relapse rate and overall survival in acute leukemia. Haematologica. 2000; 85:711.
31-Morjani Hand Madoulet C. Immunosuppressors as multidrug resistance reversalagents. Methods MolBiol. 2010; 596:433-46.
32-Daenen S, van der holt B, Verhoef GEG, Löwenberg B, Huijgens PC and Verdonck LF. addition of CsA to the combination of mitoxantrone and etoposide to overcome resistance to chemotherapy in refractory or relapsed acute myeloid leukemia: a randomized phase II trial from HOVON,the Dutch-Belgian Hemato-Oncology working group for adults, leukemia research. 2004; 28:1057-1067.
33-Meletis J, Tsimberidou AM, Paterakis G, Androutsos G and Symeonidis A. Evaluayion of the clinical relevance of the expression and function of p-glycoprotein,multi drug resistance protein and lung resistance protein in patients with primary acute myeloid leukemia, leukemia research. 2002; 26:143-154.
34-Benderra Z, Faussat AM, Sayada L, Perrot JY, Tang R, Chaoui D, Morjani H, Marzac C, Marie JP and Legrand O. MRP3, BCRP, and P-glycoprotein activities are prognostic factors in adult acute myeloid leukemia. Clin Cancer Res. 2005; 1;11(21):7764-72.
35-Norgaard J and Hokland P. Biology of multiple drug resistance in acute leukemia .Int J Haematol. 2005;72:290.
36-Dühner H, Estey EH, Amadori S, Appelbaum FR, Büchner T, Burnett AK, Dombret H, Fenaux P, Grimwade D and Larson RA. Diagnosis and management of acute myeloid leukemia in adult. Blood. 2010; 115:453-474.
1/8/2013

Life Science Journal 2013;10(1) http://www.lifesciencesite.com
1437
Studies on an Actinomycete Producing a Melanin Pigment Inhibiting Aflatoxin B1 Production by Aspergillus flavus
Mohamed Tawfiek Shaaban, Sabha Mahmoud Mabrouk El-Sabbagh, and Asmaa Alam
Botany Department, Faculty of Science, Menoufia University, Egypt
[email protected] Abstract: Thirty different isolates of actinomycetes collected from different localities in Gharbia Governorate, Egypt were tested for melanin pigment production. Only one isolate produced melanin and identified as Streptomyces torulosus. The selected actinomycete isolate was grown under different cultural conditions and it was found that starch-nitrate medium was the optimum for the growth of selected isolate at pH 7.0 after 10 days of incubation at 30˚C. Increasing the L-tyrosine concentration in tyrosine liquid medium induced tyrosinase and enhanced the growth of the isolate and the ability of pigment production. The pigment was purified, characterized by physical and chemical properties and identified as melanin. In vitro aflatoxin B1 production by Aspergillus flavus was reduced with the increase of pure melanin pigment concentration up to 0.1g/100 ml culture (0.1%), after that the aflatoxin B1 production was completely inhibited with the increase of pure melanin pigment concentrations as compared with the control. In Vivo studies, the aflatoxin B1 concentration in wheat grains reduced with the increase of pure melanin pigment as compared with control. [Mohamed Tawfiek Shaaban, Sabha Mahmoud Mabrouk El-Sabbagh and Asmaa Alam. Studies on an Actinomycete Producing a Melanin Pigment Inhibiting Aflatoxin B1 Production by Aspergillus flavus. Life Sci J 2013; 10(1):1437-1448]. (ISSN: 1097-8135). http://www.lifesciencesite.com. 214 Keywords: Streptomyces torulosus, melanin pigment, physical analysis, aflatoxin B1 inhibition. 1. Introduction
Some actinomycetes are capable of producing dark-brown substances in the culture media, generally referred to as melanin or melanoid pigments. These brown-black metabolic polymers are important as a useful criterion in taxonomic studies (Dastager et al., 2006). Melanins are negatively charged composed of multi-functional polymers and polyphenolic compounds that are produced by various microorganisms by fermentative oxidation. They have also radio protective and antioxidant properties that can effectively protect the living organisms from ultraviolet radiation (Dastager et al., 2006; Frases et al., 2007). Melanins are frequently used in medicine, pharmacology and cosmetic preparations. Melanin’s ability to undergo polymerization is interesting in industry for its nano-technology uses in bio-plastics and biopolymers (Nakato, 2006).
The biosynthesis of melanin pigment in microorganisms takes place through different pathways, similarly to higher organisms. Melanin pigment can be made using L-tyrosine as precursor through the action of tyrosinase. Tyrosinase is a copper protein that belongs to the group of polyphenol oxidases. Tyrosinase transform the tyrosine into L-DOPA (3, 4-dihydroxyphenyl-L-alanine), which is further converted into dopachrome and autooxidized to indol-5, 6-quinone. The later is spontaneously polymerized into DOPA-melanin
which gives dark brown (Mencher and Heim, 1962; Margalith, 1992).
Melanin is an amorphous, dark-colored pigment, insoluble in most solvents, bleached by oxidizing agents, and soluble in alkali and phenols (Krysciak, 1985).
The aflatoxins are secondary metabolites produced by Aspergillus flavus, A. parasiticus, and A. nomius (Heathcote and Hibbert, 1978; Cotty et al., 1994). The first two species are widely distributed in nature and are able to grow on a wide variety of natural substances including foodstuffs and animal feeds causing serious economic losses. Among the major known types of aflatoxins are aflatoxin B1; aflatoxin B2, aflatoxin G1 and aflatoxin G2 (Nesbitt et al., 1962; Betina, 1989).
Aflatoxins are most noteworthy of all mycotoxins due to their association with liver cancer in man (Purchase, 1971). The inhibition of aflatoxin B1 (AFB1) biosynthesis by A. flavus by phenolic compounds acetosyringone, syringaldehyde, and sinapinic acid was studied by Hua et al. (1999).
Melanin was degraded by white rot fungi (Sporotrichum pruinosum) and the enzyme responsible for melanin degradation by P. chrysosporium was manganese peroxidase, which is one of the ligninolytic enzymes (Butler and Day, 1998).
The aim of this work was: to investigate the production and purification of melanin pigment by some actinomycetes isolates, to characterize the
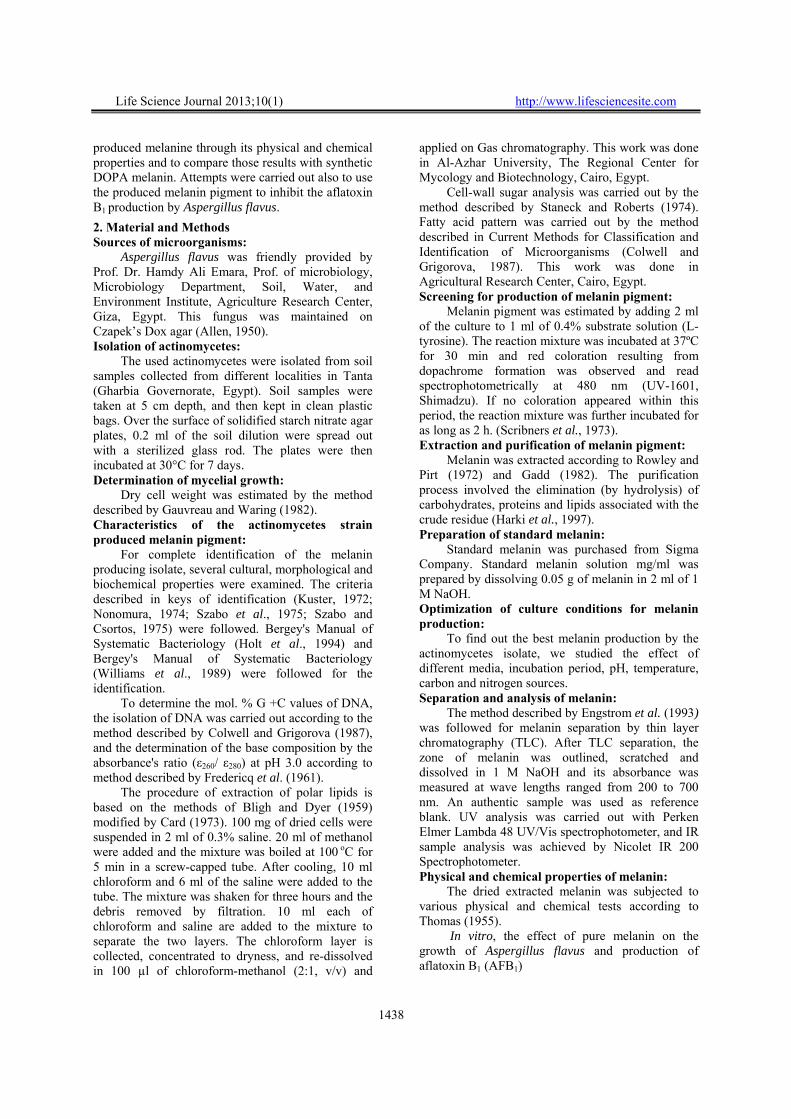
Life Science Journal 2013;10(1) http://www.lifesciencesite.com
1438
produced melanine through its physical and chemical properties and to compare those results with synthetic DOPA melanin. Attempts were carried out also to use the produced melanin pigment to inhibit the aflatoxin B1 production by Aspergillus flavus. 2. Material and Methods Sources of microorganisms:
Aspergillus flavus was friendly provided by Prof. Dr. Hamdy Ali Emara, Prof. of microbiology, Microbiology Department, Soil, Water, and Environment Institute, Agriculture Research Center, Giza, Egypt. This fungus was maintained on Czapek’s Dox agar (Allen, 1950). Isolation of actinomycetes:
The used actinomycetes were isolated from soil samples collected from different localities in Tanta (Gharbia Governorate, Egypt). Soil samples were taken at 5 cm depth, and then kept in clean plastic bags. Over the surface of solidified starch nitrate agar plates, 0.2 ml of the soil dilution were spread out with a sterilized glass rod. The plates were then incubated at 30°C for 7 days. Determination of mycelial growth:
Dry cell weight was estimated by the method described by Gauvreau and Waring (1982). Characteristics of the actinomycetes strain produced melanin pigment:
For complete identification of the melanin producing isolate, several cultural, morphological and biochemical properties were examined. The criteria described in keys of identification (Kuster, 1972; Nonomura, 1974; Szabo et al., 1975; Szabo and Csortos, 1975) were followed. Bergey's Manual of Systematic Bacteriology (Holt et al., 1994) and Bergey's Manual of Systematic Bacteriology (Williams et al., 1989) were followed for the identification.
To determine the mol. % G +C values of DNA, the isolation of DNA was carried out according to the method described by Colwell and Grigorova (1987), and the determination of the base composition by the absorbance's ratio (ε260/ ε280) at pH 3.0 according to method described by Fredericq et al. (1961).
The procedure of extraction of polar lipids is based on the methods of Bligh and Dyer (1959) modified by Card (1973). 100 mg of dried cells were suspended in 2 ml of 0.3% saline. 20 ml of methanol were added and the mixture was boiled at 100 oC for 5 min in a screw-capped tube. After cooling, 10 ml chloroform and 6 ml of the saline were added to the tube. The mixture was shaken for three hours and the debris removed by filtration. 10 ml each of chloroform and saline are added to the mixture to separate the two layers. The chloroform layer is collected, concentrated to dryness, and re-dissolved in 100 µl of chloroform-methanol (2:1, v/v) and
applied on Gas chromatography. This work was done in Al-Azhar University, The Regional Center for Mycology and Biotechnology, Cairo, Egypt.
Cell-wall sugar analysis was carried out by the method described by Staneck and Roberts (1974). Fatty acid pattern was carried out by the method described in Current Methods for Classification and Identification of Microorganisms (Colwell and Grigorova, 1987). This work was done in Agricultural Research Center, Cairo, Egypt. Screening for production of melanin pigment:
Melanin pigment was estimated by adding 2 ml of the culture to 1 ml of 0.4% substrate solution (L-tyrosine). The reaction mixture was incubated at 37ºC for 30 min and red coloration resulting from dopachrome formation was observed and read spectrophotometrically at 480 nm (UV-1601, Shimadzu). If no coloration appeared within this period, the reaction mixture was further incubated for as long as 2 h. (Scribners et al., 1973). Extraction and purification of melanin pigment:
Melanin was extracted according to Rowley and Pirt (1972) and Gadd (1982). The purification process involved the elimination (by hydrolysis) of carbohydrates, proteins and lipids associated with the crude residue (Harki et al., 1997). Preparation of standard melanin:
Standard melanin was purchased from Sigma Company. Standard melanin solution mg/ml was prepared by dissolving 0.05 g of melanin in 2 ml of 1 M NaOH. Optimization of culture conditions for melanin production:
To find out the best melanin production by the actinomycetes isolate, we studied the effect of different media, incubation period, pH, temperature, carbon and nitrogen sources. Separation and analysis of melanin:
The method described by Engstrom et al. (1993) was followed for melanin separation by thin layer chromatography (TLC). After TLC separation, the zone of melanin was outlined, scratched and dissolved in 1 M NaOH and its absorbance was measured at wave lengths ranged from 200 to 700 nm. An authentic sample was used as reference blank. UV analysis was carried out with Perken Elmer Lambda 48 UV/Vis spectrophotometer, and IR sample analysis was achieved by Nicolet IR 200 Spectrophotometer. Physical and chemical properties of melanin:
The dried extracted melanin was subjected to various physical and chemical tests according to Thomas (1955).
In vitro, the effect of pure melanin on the growth of Aspergillus flavus and production of aflatoxin B1 (AFB1)

Life Science Journal 2013;10(1) http://www.lifesciencesite.com
1439
Different concentrations of pure melanin pigment (0.05, 0.1, 0.2, 0.3, 0.4 and 0.5 g) were added to 250 ml Elenmeyer flasks containing 100 ml of Czapek’s Dox medium, each flask was inoculated with 1 ml spore suspension (containing 1×10⁶ spore/ml) of Aspergillus flavus. After incubation at 25°C for 10 days, the culture media were centrifuged at 10.000 rpm for 30 min, mycelia were harvested and the filtrate was assayed for aflatoxin B1. Production and growth of Aspergillus flavus were also measured by the method adopted from Kane and Mullins (1973). In Vivo, the effect of pure melanin on cereals aflatoxin B1 :
Grains of wheat were soaked in water for approximately 2 hours. Portions of 15 g of the soaked wheat were introduced into Erlenmeyer's flasks followed by sterilization at 121°C for 15 min in an autoclave. Different concentrations of pure melanin pigment [0.05, 0.1, 0.3, 0.5, 1.0, 2.0, 3.0 and 4.0 g (w/w)] were added to 15 g of the sterilized wheat grains which were inoculated by 106 spores/g of the Aspergillus flavus (a control group was not inoculated). The amount of aflatoxin B1 in the wheat was determined after 10 days of incubation at 25°C.
The Extraction of aflatoxin B1 from Aspergillus flavus was carried out according to Schuller et al. (1983) and A.O.A.C (1984). Purification of the final extracts were carried out according to Takeda et al. (1979). Detection and determination of aflatoxin B1
Thin layer chromatography (TLC) was used for identifying and estimating aflatoxin B1 in the extract as described by FAO and UNEP (1989) and FAO (1990). The quantities of aflatoxin B1 was determined by reading the silica gel plates quantitatively by fluorodensitometer (TLD-100 vitatron), following the method described by Shannon et al. (1983) and FAO (1990).
Standard aflatoxin B1 was purchased from Sigma Company. Standard solutions (10 µg/ml) was prepared by dissolving 1mg in a small volume of Benzene: Acetonitrile (98: 2, v/v) then completed to 100 ml with the same solvent mixture. 3. Results Isolation of actinomycetes and screening for production of melanin pigment:
Thirty isolates of actinomycetes were isolated form agricultural soils collected from different
localities in Gharbia Governorate, Egypt, grown on starch nitrate agar and screened for the production of melanin pigment. One strain only produced melanin. Characterization and identification of the selected isolate:
The results obtained in tables (1, 2, 3 and 4) show that the selected isolate was in the grey series on the tested media, the colonies showed good growth on yeast extract-malt extract agar (ISP 2) and oatmeal agar (ISP 3) with white aerial mycelium, yellow substrate mycelium, and no diffusible pigment produced. Inorganic salts-starch agar (ISP 4) showed good growth, grey aerial mycelium, yellow substrate mycelium and no diffusible pigment. On glycerol-asparagine agar (ISP 5) the growth was good with grey aerial mycelium, yellow substrate mycelium and no diffusible pigment. The dark brown melanoid pigments were formed in peptone yeast iron agar, starch nitrate agar and tyrosine agar. The isolate utilized various carbon sources for growth as glucose, arabinose, xylose, inositol, mannose and fructose, while sucrose, rhamnose, rhafinnose and cellulose were not utilized. The isolate utilized various nitrogen sources for growth [L-asparagine, KNO3, NaNO3, peptone, (NH4)2SO4 and NH4Cl]. Degradation of starch, casein, xanthine, tyrosine and urea were observed but the selected isolate does not degrade gelatine. The isolate tolerated up to 2.5 NaCl, produced H2S, and reduced nitrate and was able to inhibit B. subtilus, E. coli and C. albicans.
Light microscopic examination showed dichotomously branched and coiled spore chains (Photo 1). Scanning electron microscope (Photo 2) showed knobby spore surface (spiny and warty). Sensitivity to antibiotics and growth inhibitors were shown in table (2) A whole cell hydrolysate analysis revealed the presence of LL-diaminopimelic acid with Rf value of 0.29. The spore chains were in spiral form with10 to 20 spores or more per chain. Cells are aerobic, Gram positive, non acid fast, the wall have a type PII phospholipid pattern containing phosphatidylethanolamine. The culture was susceptible to streptomycin (10 µg/ml). Growth was best on starch nitrate medium at 30°C. The fatty acid profiles revealed that tetradecanoic acid (14:0), and hexadecanoic acid (16:0) were the predominant fatty acids. No diagnostic sugars detected in whole cell hydrolysate. Mol % G+C was 71.0.
Table (1): Cultural characteristics of the actinomycetes isolate grown on different agar media for 14 days at 30 oC. Media used Growth Aerial mycelium Substrate mycelium Soluble pigment Yeast extract-malt extract agar Good White Yellow None Inorganic salt starch agar Good Grey Yellow None Oat meal agar Good White Yellow None Glycerol-asparagine agar Good Grey Yellow None

Life Science Journal 2013;10(1) http://www.lifesciencesite.com
1440
Table (2): physiological characteristics of the selected isolate. Test Reaction Test Reaction Melanin pigment. Nitrate reduction. H2S production. Gelatin hydrolysis. Starch hydrolysis. Xanthine degradation. L-Tyrosin degradation. Casein degradation. Acid fast stain
+ ve + ve + ve - ve + ve + ve + ve + ve - ve
Growth at 45oC NaCl-tolerance (2-5 %w/v) Sensitivity to growth inhibitors: a-Sodium-azide 0.01% b-Phenol 0.1% Resistance to Streptomycin (25µg ml-1) Urea hydrolysis
- ve 2.5 %
+ ve + ve - ve + ve
Table (3): Biochemical characteristics of the selected isolate.
Tested material Reaction Cell wall chemotype. Whole cell sugar pattern. Phospholipids. PE (phosphatidylethanolamine) Pl (phosphatidylinositol) PIM (phosphatidylinositolmonoside) DPG(diphoshatidylgycerol) PG (phosphatidylglycerol) PS (phosphaditylserine Fatty acids pattern:- Dodecanoic acid (C12:0) Tetradecanoic acid (C14:0) Pentadecenoic acid (C15:0) Hexadecanoic acid (C16:0) Hexadecenoic acid (C16:l) Heptadecanoic acid (C17:0) Octadecanoic acid (C18:0) Octadecadienoic acid (C18:1)
I (LL-Diaminopimelic acid). No diagnostic sugar. + - - - - - 2.0 % 19.2 % 2.8 % 40.1 % 2.7 % 1.6 % 7.6 % 3.0%
(+): detected and (-): not detected. Table (4): Utilization of different carbon and nitrogen sources by the selected isolate. Source Utilization D- Glucose D- Xylose Sucrose L- Arabinose L-Rhmonose Raffinose Soluble starch Cellulose Mannose Inositol D-Fructose K NO3 L- asparagine Na NO3 Peptone (NH4)2SO4 NH4Cl
+ + - + - - + - + + + + + + + + +
Photo (1): Spore chains of the selected isolate examined by light microscope from 7 days old culture on starch nitrate agar (× 400).
Photo (2): Spore view of the selected isolate under scanning electron microscope from 14 days old culture on starch nitrate agar (× 15.000).

Life Science Journal 2013;10(1) http://www.lifesciencesite.com
1441
Effect of different media on growth and melanin production:
As shown in figure (1), starch nitrate medium was the most suitable medium followed by tyrosine medium, glucose-peptone medium and glycerol-asparagine medium respectively after incubation at 30°C for 10 days in dark on a shaker at 160 rpm.
0
0.5
1
1.5
2
2.5
Tyrosine medium
Starch-nitrate medium
Glycerol-aspargine medium
Glucose-peptone medium
Media
Melanin production (O. D. at 480 nm) Dry weight
Figure (1): Effect of different media on the dry weight (mg/ml) and melanin pigment production (O.D. at 480 nm) by the selected isolate.
Effect of incubation period on growth and melanin production:
The results showed that the pigment production was greatly affected by different incubation periods (3, 7, 10, 12 days) at 30°C on rotary shaker at 160 rpm. There was a clear gradual increasing in pigment production with increasing the incubation period. Also the growth of the selected strain, increased with increasing the incubation period up to10 days which proved to be the optimum incubation period for growth (Figure 2).
0
0,5
1
1,5
2
2,5
3 7 10 12Days
Melanin production (O. D. at 480 nm) Dry weight
Figure (2): Effect of different incubation periods on the dry weight (mg/ml) and melanin pigment production (O.D. at 480 nm) by the selected isolate. Effect of different pH values on growth and melanin production:
The effect of pH on melanin production by tested isolate was studied using buffered starch nitrate. Citrate phosphate buffer pH 4.0, phosphate
buffer pH 6.0 and, pH 7.0, Tris-HCl buffer pH 8.0 and pH 9.0 were used. After inoculation and incubation at 30°C on rotary shaker at 160 rpm for 10 days, the melanin pigment production and growth were measured. The results showed that the growth and pigment production of the experimental organism increased with the increasing of pH value up to pH 7.0 which represented the optimum pH value for melanin production after which the pigment production decreased. The growth increased with increasing the pH value up to pH 8.0 after which growth decreased (Figure 3).
00.5
11.5
22.5
pH5 pH6 pH7 pH8 pH9pH Values
Melanin production (O. D. at 480 nm) Dry weight
Figure (3): Effect of various pH values on the dry weight and the melanin pigment production (O.D. at 480 nm) by the selected isolate. Effect of different temperatures on growth and melanin production:
The results showed that the optimum temperature for the growth and the melanin production was 30˚C (Figure 4).
0
0.5
1
1.5
2
2.5
25 30 40
Temperature (˚C)
Melanin production (O. D. at 480 nm) Dry weight
Figure (4): Effect of different temperature on the dry weight (mg/ml) and the melanin pigment production (O.D. at 480 nm) by the selected isolate. Effect of different carbon sources on growth and melanin production:
Starch, in starch nitrate medium pH 7.0, was substituted with 20g ⁄ L of other carbon sources: fructose, glycerol, sucrose, and glucose. The results presented in (Figure 5) showed that the starch was the
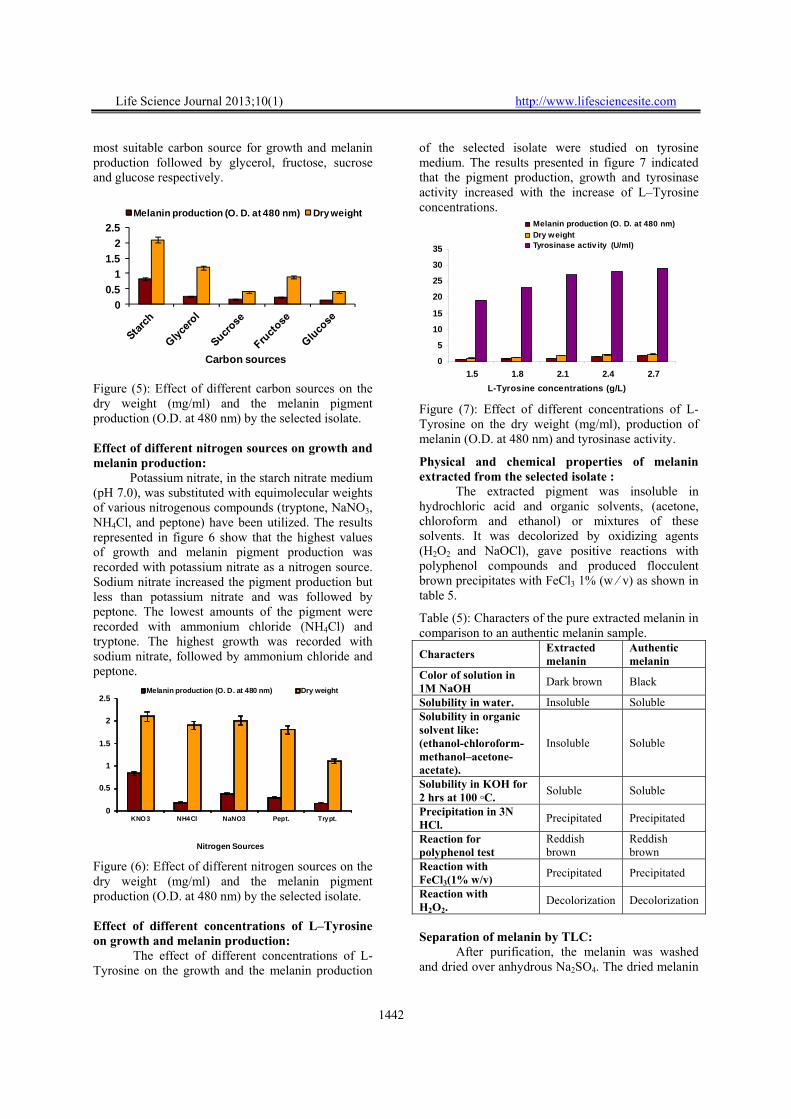
Life Science Journal 2013;10(1) http://www.lifesciencesite.com
1442
most suitable carbon source for growth and melanin production followed by glycerol, fructose, sucrose and glucose respectively.
00.5
11.5
22.5
Carbon sources
Melanin production (O. D. at 480 nm) Dry weight
Figure (5): Effect of different carbon sources on the dry weight (mg/ml) and the melanin pigment production (O.D. at 480 nm) by the selected isolate. Effect of different nitrogen sources on growth and melanin production:
Potassium nitrate, in the starch nitrate medium (pH 7.0), was substituted with equimolecular weights of various nitrogenous compounds (tryptone, NaNO3, NH4Cl, and peptone) have been utilized. The results represented in figure 6 show that the highest values of growth and melanin pigment production was recorded with potassium nitrate as a nitrogen source. Sodium nitrate increased the pigment production but less than potassium nitrate and was followed by peptone. The lowest amounts of the pigment were recorded with ammonium chloride (NH4Cl) and tryptone. The highest growth was recorded with sodium nitrate, followed by ammonium chloride and peptone.
0
0.5
1
1.5
2
2.5
KNO3 NH4Cl NaNO3 Pept. Trypt.
Nitrogen Sources
Melanin production (O. D. at 480 nm) Dry weight
Figure (6): Effect of different nitrogen sources on the dry weight (mg/ml) and the melanin pigment production (O.D. at 480 nm) by the selected isolate. Effect of different concentrations of L–Tyrosine on growth and melanin production:
The effect of different concentrations of L-Tyrosine on the growth and the melanin production
of the selected isolate were studied on tyrosine medium. The results presented in figure 7 indicated that the pigment production, growth and tyrosinase activity increased with the increase of L–Tyrosine concentrations.
0
5
10
15
20
25
30
35
1.5 1.8 2.1 2.4 2.7L-Tyrosine concentrations (g/L)
Melanin production (O. D. at 480 nm)Dry weightTyrosinase activ ity (U/ml)
Figure (7): Effect of different concentrations of L-Tyrosine on the dry weight (mg/ml), production of melanin (O.D. at 480 nm) and tyrosinase activity. Physical and chemical properties of melanin extracted from the selected isolate :
The extracted pigment was insoluble in hydrochloric acid and organic solvents, (acetone, chloroform and ethanol) or mixtures of these solvents. It was decolorized by oxidizing agents (H2O2 and NaOCl), gave positive reactions with polyphenol compounds and produced flocculent brown precipitates with FeCl3 1% (w ⁄ v) as shown in table 5. Table (5): Characters of the pure extracted melanin in comparison to an authentic melanin sample.
Authentic melanin
Extracted melanin Characters
Black Dark brown Color of solution in 1M NaOH
SolubleInsoluble Solubility in water.
Soluble Insoluble
Solubility in organic solvent like: (ethanol-chloroform-methanol–acetone-acetate).
Soluble Soluble Solubility in KOH for 2 hrs at 100 ◦C.
Precipitated Precipitated Precipitation in 3N HCl.
Reddish brown
Reddish brown
Reaction for polyphenol test
Precipitated Precipitated Reaction with FeCl3(1% w/v)
Decolorization Decolorization Reaction with H2O2. Separation of melanin by TLC:
After purification, the melanin was washed and dried over anhydrous Na2SO4. The dried melanin
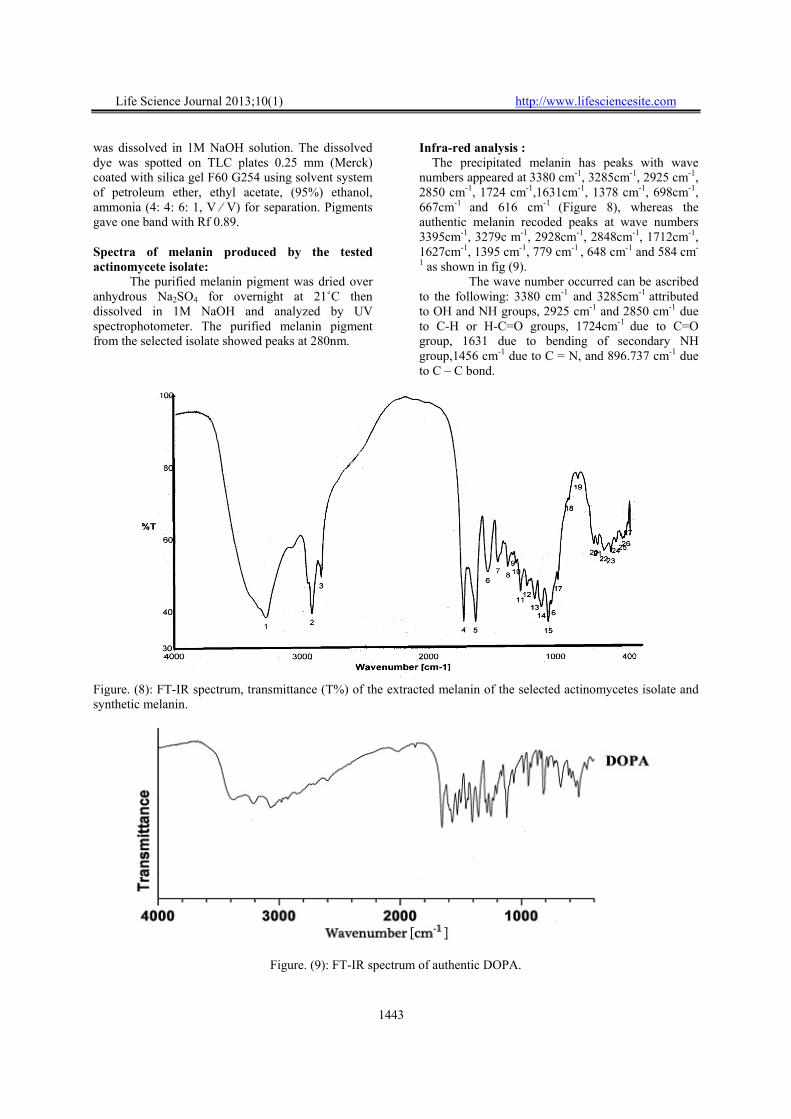
Life Science Journal 2013;10(1) http://www.lifesciencesite.com
1443
was dissolved in 1M NaOH solution. The dissolved dye was spotted on TLC plates 0.25 mm (Merck) coated with silica gel F60 G254 using solvent system of petroleum ether, ethyl acetate, (95%) ethanol, ammonia (4: 4: 6: 1, V ⁄ V) for separation. Pigments gave one band with Rf 0.89. Spectra of melanin produced by the tested actinomycete isolate:
The purified melanin pigment was dried over anhydrous Na2SO4 for overnight at 21˚C then dissolved in 1M NaOH and analyzed by UV spectrophotometer. The purified melanin pigment from the selected isolate showed peaks at 280nm.
Infra-red analysis : The precipitated melanin has peaks with wave numbers appeared at 3380 cm-1, 3285cm-1, 2925 cm-1, 2850 cm-1, 1724 cm-1,1631cm-1, 1378 cm-1, 698cm-1, 667cm-1 and 616 cm-1 (Figure 8), whereas the authentic melanin recoded peaks at wave numbers 3395cm-1, 3279c m-1, 2928cm-1, 2848cm-1, 1712cm-1, 1627cm-1, 1395 cm-1, 779 cm-1 , 648 cm-1 and 584 cm-
1 as shown in fig (9). The wave number occurred can be ascribed
to the following: 3380 cm-1 and 3285cm-1 attributed to OH and NH groups, 2925 cm-1 and 2850 cm-1 due to C-H or H-C=O groups, 1724cm-1 due to C=O group, 1631 due to bending of secondary NH group,1456 cm-1 due to C = N, and 896.737 cm-1 due to C – C bond.
Figure. (8): FT-IR spectrum, transmittance (T%) of the extracted melanin of the selected actinomycetes isolate and synthetic melanin.
Figure. (9): FT-IR spectrum of authentic DOPA.
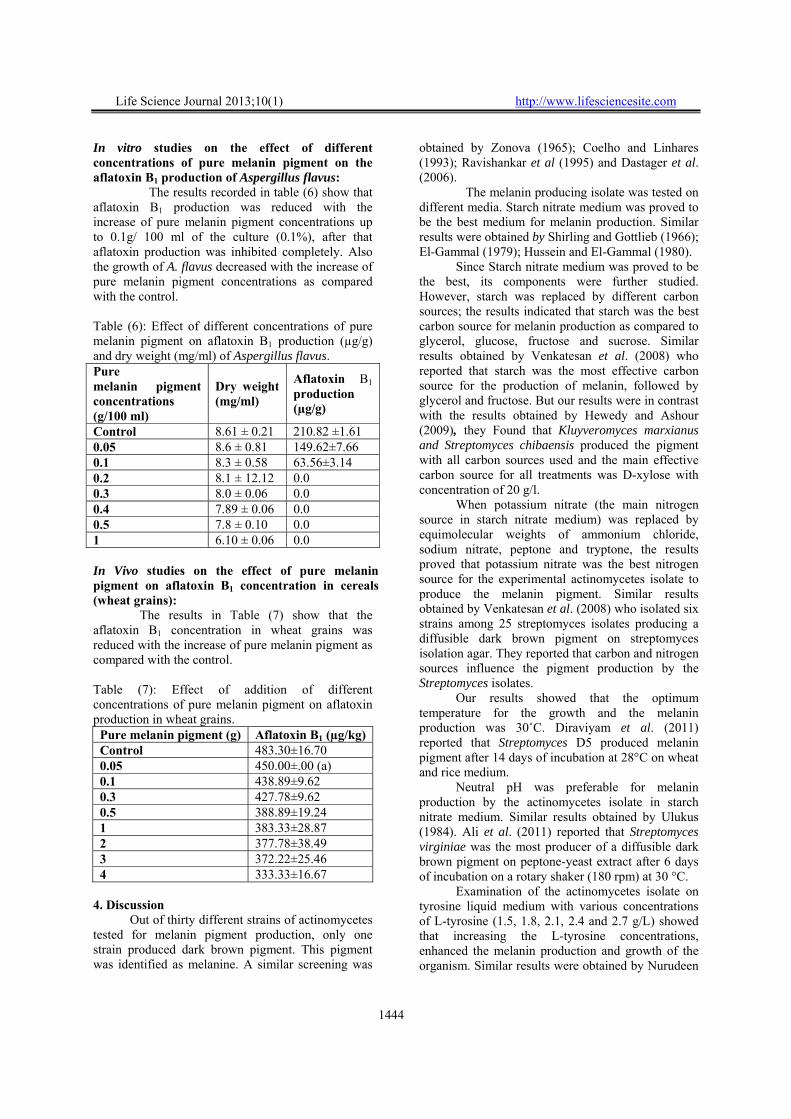
Life Science Journal 2013;10(1) http://www.lifesciencesite.com
1444
In vitro studies on the effect of different concentrations of pure melanin pigment on the aflatoxin B1 production of Aspergillus flavus:
The results recorded in table (6) show that aflatoxin B1 production was reduced with the increase of pure melanin pigment concentrations up to 0.1g/ 100 ml of the culture (0.1%), after that aflatoxin production was inhibited completely. Also the growth of A. flavus decreased with the increase of pure melanin pigment concentrations as compared with the control.
Table (6): Effect of different concentrations of pure melanin pigment on aflatoxin B1 production (µg/g) and dry weight (mg/ml) of Aspergillus flavus. Pure melanin pigment concentrations (g/100 ml)
Dry weight (mg/ml)
Aflatoxin B1 production (µg/g)
Control 8.61 ± 0.21 210.82 ±1.61 0.05 8.6 ± 0.81 149.62±7.66 0.1 8.3 ± 0.58 63.56±3.14 0.2 8.1 ± 12.12 0.0 0.3 8.0 ± 0.06 0.0 0.4 7.89 ± 0.06 0.0 0.5 7.8 ± 0.10 0.0 1 6.10 ± 0.06 0.0 In Vivo studies on the effect of pure melanin pigment on aflatoxin B1 concentration in cereals (wheat grains):
The results in Table (7) show that the aflatoxin B1 concentration in wheat grains was reduced with the increase of pure melanin pigment as compared with the control. Table (7): Effect of addition of different concentrations of pure melanin pigment on aflatoxin production in wheat grains.
Pure melanin pigment (g) Aflatoxin B1 (µg/kg) Control 483.30±16.70 0.05 450.00±.00 (a) 0.1 438.89±9.62 0.3 427.78±9.62 0.5 388.89±19.24 1 383.33±28.87 2 377.78±38.49 3 372.22±25.46 4 333.33±16.67
4. Discussion
Out of thirty different strains of actinomycetes tested for melanin pigment production, only one strain produced dark brown pigment. This pigment was identified as melanine. A similar screening was
obtained by Zonova (1965); Coelho and Linhares (1993); Ravishankar et al (1995) and Dastager et al. (2006). The melanin producing isolate was tested on different media. Starch nitrate medium was proved to be the best medium for melanin production. Similar results were obtained by Shirling and Gottlieb (1966); El-Gammal (1979); Hussein and El-Gammal (1980).
Since Starch nitrate medium was proved to be the best, its components were further studied. However, starch was replaced by different carbon sources; the results indicated that starch was the best carbon source for melanin production as compared to glycerol, glucose, fructose and sucrose. Similar results obtained by Venkatesan et al. (2008) who reported that starch was the most effective carbon source for the production of melanin, followed by glycerol and fructose. But our results were in contrast with the results obtained by Hewedy and Ashour (2009), they Found that Kluyveromyces marxianus and Streptomyces chibaensis produced the pigment with all carbon sources used and the main effective carbon source for all treatments was D-xylose with concentration of 20 g/l.
When potassium nitrate (the main nitrogen source in starch nitrate medium) was replaced by equimolecular weights of ammonium chloride, sodium nitrate, peptone and tryptone, the results proved that potassium nitrate was the best nitrogen source for the experimental actinomycetes isolate to produce the melanin pigment. Similar results obtained by Venkatesan et al. (2008) who isolated six strains among 25 streptomyces isolates producing a diffusible dark brown pigment on streptomyces isolation agar. They reported that carbon and nitrogen sources influence the pigment production by the Streptomyces isolates.
Our results showed that the optimum temperature for the growth and the melanin production was 30˚C. Diraviyam et al. (2011) reported that Streptomyces D5 produced melanin pigment after 14 days of incubation at 28°C on wheat and rice medium.
Neutral pH was preferable for melanin production by the actinomycetes isolate in starch nitrate medium. Similar results obtained by Ulukus (1984). Ali et al. (2011) reported that Streptomyces virginiae was the most producer of a diffusible dark brown pigment on peptone-yeast extract after 6 days of incubation on a rotary shaker (180 rpm) at 30 °C.
Examination of the actinomycetes isolate on tyrosine liquid medium with various concentrations of L-tyrosine (1.5, 1.8, 2.1, 2.4 and 2.7 g/L) showed that increasing the L-tyrosine concentrations, enhanced the melanin production and growth of the organism. Similar results were obtained by Nurudeen
Life Science Journal 2013;10(1) http://www.lifesciencesite.com
1445
and Ahern (1979) who noted that the production of extracellular melanins in some organisms increased as the concentration of tyrosine increased up to 0.1 % tyrosine.
Quadri and Agsar (2012) isolated thermo-alkaliphilic Streptomyces strains, able to produce melanin from limestone quarries of the Deccan traps and the maximum synthesis of melanin was recorded by utilizing starch (2.98µg/ml) and tyrosine (3.12µg/ml) as the carbon and nitrogen sources respectively in Shinobu's synthetic tyrosine medium.
The study of Bell and Wheeler (1986) described melanins as dark-brown to black pigments found in animals, plants, bacterial and fungal species and reported that tyrosinase is the key enzyme for producing melanin.
In the present study the obtained pigment responded positively to all physical and chemical tests that are diagnostic for the standard melanin (Thomas, 1955; Sussman et al., 1963; Ellis and Griffitts, 1974; Krysciak, 1985; Butler and Day 1998; Shrishailnath et al., 2010).
The melanin produced by the isolated actinomycetes isolate showed peaks in the UV region of the wave length ranging from 200-260 nm but none in the visible region as reported by Bell and Wheeler(1986) and Shrishailnath et al. (2010).
In the present study, the Infra red (IR) absorption spectra of the melanin produced by the actinomycetes isolate showed that the characteristic absorption bands that would be expected from an aromatic substance and their wave number was similar to the wave number of the melanin precursors. These results agree with the results obtained by Bonner and Duncan (1962); Ellis and Griffitts (1974).
In the present investigation, the UV, visible IR spectra and chemical properties were similar to that of the melanin precursor. So, it could be concluded that the studied structure of melanin produced from the studied actinomycetes isolate was similar to the biosynthesis of dihydroxyphenylalanin (DOPA) melanin from tyrosine.
Through the in vitro studies, we noted that aflatoxin production was reduced with the increase of pure melanin pigment concentrations up to 0.1g/ 100 ml culture, after that aflatoxin production was completely inhibited with the increase of pure melanin pigment concentration as compared with control. Also the growth of A. flavus decreased with the increase of concentration of pure melanin pigment as compared with control.
Melanins are negatively charged composed of multi-functional polymers and polyphenolic compounds. Phenolic compounds are known for their antimicrobial and antifungal activity (Friend, 1979)
and their inhibitory effect on aflatoxin production has also been reported (Sinha and Singh 1981; Bilgrami et al., 1982). Phenolic compounds reduce aflatoxin production by A. flavus and A. parasiticus (Fajardo et al. 1995; Aziz et al., 1998; Hua et al 1999). These compounds inhibited one or more early rather than late steps in the pathway, so accumulation of toxic intermediate formed in the later steps will not occur. Similar results obtained in our in vivo studies where the aflatoxin B1 concentration in wheat has been reduced with the increase of pure melanin pigment as compared with control.
Agricultural crops, especially corn, wheat, cotton, peanuts, and tree nuts infected by Aspergillus flavus and Aspergillus parasiticus, may contaminate by aflatoxins which can present a risk of hepatic carcinogenicity to humans. Inhibition of aflatoxin production is correlated with the amount of phenolic compound as (Gallic acids, tannins and melanin pigment) present. The evidence indicated that phenolic compounds are capable of inhibition of growth of A. flavus and that aflatoxigenicity is phytochemicaly inhibited by biosynthesis and maintenance of high levels of phenolic compounds (Molyneux et al., 2004). Aflatoxin B1 (AFB1) is the most toxic and is usually produced in the greatest quantity, also found in most foods, e.g. cereal grains (maize, wheat, oats, rice), ground nuts, peanut butter, mung beans, Brazil nuts, almonds, cotton seed and meal, cayenne paper, Indian chili powder, bread, eggs, and meat (Halt, 1994; Tseng, 1994; Hafez, 1996).
A comparison of the description of the selected isolate with the descriptions of Streptomyces in Bergey's Manual of Systematic Bacteriology (1989) showed that the selected strain had chemotaxonomic properties, cultural characteristics and morphological criteria that was consistent with the genus Streptomyces. There are 3 species have spiral spore chain, produce melanin pigment and a knobby spore surface that is intermediate between warty and spiny. These are Streptomyces torulosus, Streptomyces lomondensis and S. spinoverrucosus. The Streptomyces lomondensis with blue spore mass, S. spinoverrucosus with green, yellow, red or grey spore mass depending on the medium but S. torulosus is the only one has grey spore mass like our isolate. Comparing fatty acid pattern of our strain with the same fatty acid patterns of some Streptomyces species like S. albus (McNabb et al., 1997), we show similarities in the (14: 0), (16:0), (17:0) that were about 19.2, 40.1and 1.6 % as compared with the S. albus that were about 18.1, 33.1 and 1.5% .
The mol % G + C of the DNA was 71.0, positive Gram stain, acid fast negative, phospholipids was PII, no diagnostic sugar in the whole cell, the
Life Science Journal 2013;10(1) http://www.lifesciencesite.com
1446
cell wall chemotype I contain L-DAP acid. Most of the physiological, biochemical and morphological studies showed similarities between this strain and Streptomyces torulosus, so this isolate was identified as S. torulosus. Corresponding author Mohamed Tawfiek Shaaban Botany Department, Faculty of Science, Menoufia University , Egypt [email protected] References Allen, O. N. (1950). Experiments in soil
bacteriology. Burgess publishing Co., U S A Alexander, M. and Kuo, M. J. (1967). Inhibition of
the lysis of fungi by Melanins. J. Bacteriol., 94(3): 624-629.
Ali, M. A.; Keera, A. A.; Helmy, M. S.; Abd El-Nasser, H. N.; Ahmed, K. A. and El-Hennawi, H. M. (2011). Selection of Pigment (Melanin) production in Streptomyces and their application in Printing and Dyeing of Wool Fabrics. Research Journal of Chemical Science, 1(5): 22-28.
A. O. A. C. (1984). Official Methods of Analysis of Association of Official Analytical Chemists. 14th ed., AOAC, Washington VA., Chapter 26, "Natural Poisons". pp. 480-494.
Aziz, N. H.; Farag, S. E.; Mousa, L. A. A. and Abo-Zaid, M. A. (1998). Comparative antibacterial and antifungal effects of some phenolic compounds. Microbios, 93: 43-54.
Bell, A. and Wheeler, M. M. H. (1986). Biosynthesis and function of fungal melanins. Ann. Rev. Phytopathol, 24: 411-451.
Bergey,s Manual of Systematic Bacteriology. (1989). Edited by Williams, S. T., Sharp E. and Holt, J.G. Baltimore, Hongkong, Sydney. William and Wilkins, 4 pp. 2452-2492.
Betina, V. (1989). Mycotoxins: Chemical, Biological and Environmental Aspects. Elsevier, Amsterdam, pp. 75-79.
Bligh, E. G. and Dyer, W. J. (1959). A rapid method of total lipid extraction and purification. Can. J. Biochem. Physiol., 37: 911- 917.
Bilgrami, K. S.; Sinha, K. K. and Premlata, S. (1982). Prevention of aflatoxin production on some cereals and oil seeds by o-vanillin. Current Science, 51: 138.
Bonner, T. G. and Duncan, A. (1962). Infrared spectra of some melanins. Nature, 194: 1078-1079.
Butler, M. J. and Day, A. W. (1998). Fungal melanins: a review. Can. J. Microbiol., 44: 1115-1136.
Card, G. L. (1973). Metabolism of phosphatidylglycerol, phosphatidylethanolamine, and cardiolipin of Bacillus stearothermophilus. J. Bacteriol., 114 (3): 1125-1137.
Coelho, R. R. R. and Linhares, L. F. (1993). Melanogenic actinomycetes (Streptomyces sp.) from Brazilian soils. Biology and Fertility of Soils, 15(3): 220-224.
Colwell, R. R. and Grigorova, R. (1987). Identification of microorganisms by rapid DNA-DNA hybridization (Tourova TP, Antonov AS. eds). In: Methods in Microbiology. Academic Press Limited, 19: 335-336.
Cotty, P. J.; Bayman, P.; Egel, D.S. and Elias, D. S. (1994). Agriculture, aflatoxins, and Aspergillus. In: Powell, K. A., Fenwick, A., and Peberdy, J. F. (Eds.). The genus Aspergillus. New York. Plenum Press, pp. 1-27.
Dastager, S. G.; Li, W. J.; Dayanand, A.; Tang, S. K.; Tian, X. P.; Zhi, X. Y.; Xu L. H. and Jiang C. L. (2006). Separation, identification and analysis of pigment (melanin) production in Streptomyces. African J. of Biotechnology, 5: 1131-1134.
Diraviyam, T.; Radhakrishnan, M. and Balagurunathan, R. (2011). Antioxidant activity of melanin pigment from Streptomyces species D5 isolated from Desertsoil, Rajasthan, India. Drug Invention Today, 3(3),12-13.
El-Gammal, A. A. (1979). Studies on neomycin produced by Streptomyces fradiae. Egyptian Journal of Microbiology, 14: 103-105.
Ellis, P. H. and Griffitts, D. A. (1974). The location and analysis of melanins in the cell walls of some soil fungi. Can. J. Microbiol., 20: 1379-1386.
Engstrom, K.; Bishammar, S.; Svensson, C.; Bengtsson, M. and Andersson, R. (1993). Anthraquinones from Drechslera species and Bipolaris sorokiniana. Mycol. Res., 97(3): 381-384.
Fajardo, J. E.; Waniska, R. D.; Cuero, R. G. and Pettit, R. E. (1995). Phenolic compounds in peanut seeds: enhanced elicitation by chitosan and effects on growth and aflatoxin B1 production by A. flavus. Food Biotechnol., 9: 59-78.
Food and Agriculture Organization of the United Nations (FAO) and UNEP. (1989). Sampling of Agricultural products and their Analysis for Aflatoxin Determination. Center of International Projects, the USSR State Committee for Environment Protection, Moscow.
FAO. (1990). Manuals of Food Quality Control. 10. Training in Mycotoxins Analysis FAO Food and Nutrition paper 14/10. FAO, Rome.
Frases, S.; Salazar, A.; Dadachova, E. and Casadevall, A. (2007). Cryptococcus neoformans

Life Science Journal 2013;10(1) http://www.lifesciencesite.com
1447
of applied and can utilize the bacterial melanin precursor homogentisic acid for fungal melanogenesis. J. Environ. Microbiol., 73(2): 615-621.
Fredericq, E.; Oth, A. and Fontaine, F. (1961). The ultraviolet spectrum of deoxyribonucleic acids and their constituents. J. Mol. Biol., 3: 11-17.
Friend, J. (1979). Phenolic substances and plant disease. In Biochemistry of Plant Phenolics ed. Swain, T., Harbonne, J. B. and Van Sumere, C. F. New York: Plenum Press. pp. 557-588.
Gadd, G. M. (1982). Effect of media composition and light on colony differentiation and melanin synthesis in Microdochium bolleyi. Trans. Br. Mycol. Soc., 78(1): 115-122.
Gauvreau, D. and Waring, M. J. (1982). Quantitative determination of echinomycin by disc agar diffusion assay. European. J. Appl. Microbiol. Biotechnol., 15: 104-110.
Hafez, A. S. (1996). Ist Inter. Conf. on Environ. Pollution & Health. King Fahd Hospital, Jeddah, Saudi Arabia. 8th-11 January, 1996 (Abstract).
Halt, M. (1994). Aspergillus flavus and aflatoxin B1 in flour production. European J. of Epidemiology, 10: 555-558.
Harki, E.; Talou, T. and Dargent, R. (1997). Purification, characterization and analysis of melanin extracted from Tuber melanosporum vitt., Food Chem., 58: 69-73.
Heathcote, J. G. and Hibbert, J. P. (1978). Aflatoxins: Chemical and Biological Aspects. Elsevier Science Publishing, Inc., New York.
Hewedy, M. A. and Ashour, S. M. (2009). Production of a Melanin like Pigment by Kluyveromyces marxianus and Streptomyces Chibaensis. Australian Journal of Basic and Applied Sciences, 3(2): 920-927.
Holt, J. G.; Krieg, N. R.; Sneath, P. H. A.; Staley, J. T. and Williams, S.T. (1994). Genus Streptomyces. (eds). Bergey’s Manual of Determinative Bacteriology. 9th ed. Williams and Wilkins Baltimore. USA., pp.668-675.
Hua, S. S. T.; Grosjean, O. K. and Baker, J. L. (1999). Inhibition of aflatoxin biosynthesis by phenolic compounds. Letters in Applied Microbiology., 29: 289-291.
Hussein, A. M. and El-Gammal, A. (1980). An antibiotic produced by Streptomyces violaceoniger. Egyptian Journal of Botany, 23(3): 187-190.
Kane, B. E. and Mullins, J. T. (1973). Thermophilic fungi in a municipal waste compost system Mycologia, 65(5): 1087-1100.
Krysciak, J. (1985). Solubility of melanin and humin preparations in polar aromatic solvents. Folia Biol., 33: 195-214.
Kuster, E. (1972). Simple working key for the classification and identification of named taxa included in the international Streptomyces Project. Int. J. Syst. Bacteriol., 22: 139-148.
Margalith, P. (1992). Pigment Microbiology. Chapman and Hall, London.
McNabb, A.; Shutteworth, R.; Bechme, R. and ColBy, W. D. (1997). Fatty acid characterization of rapidly growing pathogenic aerobic actinomycetes as a mean of identification. Journal of Clinical Microbiology, 1361-1368.
Mencher, J. R. and Heim, A. H. (1962). Melanin biosynthesis by Streptomyces lavendulae. J. Gen. Microbiol., 28: 665-670.
Molyneux, R. J.; Mahoney, N. E.; Kim, J. H. and Campbell, B. C. (2004). Inhibition of aflatoxin biosynthesis in Aspergillus flavus by phenolic natural products. United States Department of Agriculture.
Nakato, L. (2006). Melanin and Bio/Nanotechnology. Blackherbals at the Source of the Nile, UG Ltd.
Nesbitt, B. F.; Kelly, J. O.; Sargeant , K. and Sheridan, A. (1962). Aspergillus flavus and turkey X disease. Toxic metabolites of Aspergillus flavus. Nature, 195: 1062-1063.
Nonomura, H. (1974): Key for classification and identification of 458 species of Streptomycetes included in ISP project. J. Ferm. Technol., 52: 78-92.
Nurudeen, T. A. and Ahern, D. G. (1979). Regulation of melanin production by Cryptocccus neoformans. Journal of clinical Microbiology, 10: 724-729.
Purchase, I. F. H. (1971). Symposium on mycotoxins inhuman health. The Macmillan Press, Let., London and Basingstoke.
Quadri, S. R and Agsar, D. (2012). Detection of melanin producing thermo-alkaliphilic Streptomyces from limestone quarries of the Deccan traps. World Journal of Science and Technology., 2(2):08-12.
Ravishankar, J. P.; Muruganandam, V. and Suryanarayanann, T. S. (1995). Isolation and characterization of melanin from a marine fungus. Bot. Mar., 38 (5): 413-416.
Rowley, B. I. and Pirt, S. J. (1972). Melanin production by Aspergillus nidulans in Batch and chemostat culture, Journal of Gen. Microbiol., 72: 553-563.
Schuller, S.P. and Van Egmond, V.H.P. (1983). Proc. Int. Symp. Mycotoxins, Cairo, Egypt, pp. 111-131.
Scribner’s, E.; Terry, T. and Bradley, S. G. (1973). Production of a sporulation pigment by
Life Science Journal 2013;10(1) http://www.lifesciencesite.com
1448
Streptomyces venezuelae. Appl. Microbiol. 25 (6): 873-879.
Shannon, G. M.; Shotwell, O. L. and Kwolek, W. F. (1983): Extraction and thin-layer chromatography of aflatoxin B1 in mixed feeds. J. Assoc. Offic. Anal. Chem., 66: 582-586.
Shirling, E. B. and Gottlieb, D. (1966). Methods for characterization of Streptomyces species. Int. J. of Syst. Bacteriol., 16: 313-340.
Shrishailnath, S.; Kulkarni, G.; Yaligara, V.; Kyoun, L. and Karegoudar, T. B. J. (2010). Purification and Physiochemical Characterization of Melanin Pigment from Klebsiella sp. Microbiol, Biotechnol., Department of Microbiology, Changwon National University, Korea, 20(11): 1513-1520.
Sinha, K. and Singh, P. (1981): Effects of some phenolics on aflatoxin production and growth of Aspergillus parasiticus. Ind. Phytopathol., 34: 530-531.
Staneck, J. L. and Roberts, G. D. (1974). Simplified approach to identification of aerobic actinomycetes by thin layer chromatography. Appl. Microbiol., 28: 226-231.
Sussman, A. S.; Lingappa, Y. and Bernstein, L. A. (1963): Effect of light and media upon growth and melanin formation in Cladosporium mansoni. Mycopathol. Mycol. App., 10: 809-810..
Szabo, I. M. and Csortos, C. S. (1975). A study of the nutrient content of canopy through fall in an Oak forest (Quercetum petraeae-cerris) measured for one year. Acta. Bot. Acad. Sci. Hung., 21: 419-432.
Szabo, I.; Marton, M.; Buti, M. and Fernandez, C. (1975). A diagnostic key for the identification of “species” of the Streptomyces and Streptoverticillium included in the international Streptomyces Project. Acta Bot. Acad. Sci. Hung., 21: 387-418.
Takeda, Y.; Isohata, E.; Amono, R. and Uchiyama, M. (1979). Simultaneous extraction and fractionation and thin layer chromatographic determination of 14 mycotoxins in grains. J. Assoc. Off. Anual. Chem., 62: 573-578.
Thomas, M. (1955): Melanins. (Paech, K. and Tracey. M. U., eds) Modern Methods of plant analysis. 4 springer Verlag-Berlin, 661-675.
Tseng , T. C. (1994). Recent aspects of aflatoxin research in Taiwan J. Toxicology - Toxin Rev, 13: 229-241.
Ulukus, I. (1984). A suitable medium for production of soluble red pigment by some strains of Macrophomin phaseoli (Maub1.). Ashby. J. Turkish-phytopathol., 13: 2-3: 53-61.
Venkatesan, S.; Ganesan, R. and Muthuchelian, K. (2008). Isolation, Identification and Characterization of Melanin Pigment Production in Streptomyces from Megamalai Forest Soil. Ethnobotanical Leaflets, 12: 827-831.
Williams, S. T.; Goodfellow, M. and Alderson, G. (1989). Genus streptomyces, Waksman and Henrici. (1943), In Bergey,s Manual of systematic Bacteriology. Edited by: Williams, S. T., Sharp, M. E., and Holt, J. G. Baltimore Hongkong Sydney. William and Wilkins, 4. pp. 2452-2492.
Zonova, G. M. (1965). Melanoid pigments of Actinomycetes. Mikrobiologiya, 34: 278-283.
Life Science Journal, 2013; 10 (1) http://www.lifesciencesite.com
1449
Genetic Diversity and Phylogenetic Relationship among Some Rabbit Breeds Using Random Amplified
Polymorphic DNA Markers
El-Bayomi Kh. M.1, Awad A.1* and Saleh A. A.1
1 Department of Animal Wealth Development, Faculty of Veterinary Medicine, Zagazig University [email protected]
Abstract: Random Amplified Polymorphic DNA (RAPD) marker was employed to assess the genetic variation and
phylogenetic relationship among three rabbit breeds viz. New Zealand White, Californian and Flander reared in
Egypt. Initially, a total of 20 random primers of arbitrary sequence were used but 14 of them generated reproducible,
scoreable and polymorphic bands. Out of 120 bands scored using these primers, 39 (33%) were recognized as
polymorphic and 81 (67%) as monomorphic bands. The highest percentage of polymorphic bands was recognized
for primers OPA-10 and OPA-06 (56%) while the lowest percentage of polymorphic bands was recognized for
primers OPE-19 (7%) and OPF-12 (14%). The band sharing frequencies (BSF) was found higher between New
Zealand White-Californian (0.88±0.029), followed by Californian-Flander (0.87±0.024) and New Zealand White-
Flander (0.84±0.034). Overall, there was no significant difference (P>0.05) in BSF values between breeds. The
highest genetic distance was found between New Zealand White-Flander (5.568) followed by Californian-Flander (5.000) and New Zealand White-Californian (4.690). One primer (OPE-11) in New Zealand White, three primers
(OPA-10, OPC-02, OPF-09) in Californian, five primers (OPA-01, OPA-06, OPA-10, OPB-14, OPF-09) in Flander
were found to be specific for these breeds. The study suggests that RAPD can be successfully utilized for detecting
genetic variation among the studied rabbit breeds.
[El-Bayomi Kh. M., Awad A. and Saleh A. A. Genetic Diversity and Phylogenetic Relationship among Some
Rabbit Breeds Using Random Amplified Polymorphic DNA Markers. Life Sci J 2013;10(1):1449-1457]. (ISSN:
1097-8135). http://www.lifesciencesite.com. 215
Key words: Rabbit, breed, RAPD markers, genetic diversity, phylogenetic.
1. Introduction In the last decade, popular meat breeds (New
Zealand White and Californian) of rabbit were
introduced in Egypt, being used in large scale
commercial production throughout Egypt. They
exhibit outstanding maternal abilities as related to
maternal behavior, fecundity, lactation, and
preweaning growth and survival (Khalil, 1993).
Recently, the rabbit has attracted more attention from
the biotechnology community. Several features make
it an attractive model for transgenic, cloning, and an
ideal choice for genomic analysis including; the rapid
onset of sexual maturity, a short gestation period, a relatively larger number of offspring per litter, year-
round reproductive capacity, and an average life-span
of 9 years. Also, the rabbit genome is estimated to be
3 billion base pairs long, almost equal to the size of
the human genome. In addition, rabbits have similar
lipid metabolism to humans, making them good
models of atherosclerosis (Dove, 2000).
Characterization at the molecular level is
undertaken mainly to explore genetic diversity within
and between animal populations, and to determine
genetic relationships among such populations. The estimation of genetic variability of a species is an
important criterion for its conservation and further
genetic improvement (Rahimi et al., 2005).
Molecular markers derived from polymerase chain reaction (PCR) amplification of genomic DNA
are an important part of the toolkit of evolutionary
geneticists (Holsinger et al., 2002). By detecting
genetic variation, genetic markers may provide useful
information at different levels; population structure,
levels of gene flow, phylogenetic relationships,
patterns of historical biogeography and the analysis
of parentage and relatedness (Feral, 2002). PCR-
based multi-locus DNA fingerprints represent one of
the most informative and cost-effective measures of
genetic diversity (Bagley et al., 2001).
Randomly Amplified Polymorphic DNA (RAPD) technique, described firstly by Williams et al.,
(1990), is a simple, fast and comparatively low cost
assay that uses short oligonucleotide primers of
arbitrary sequences to amplify anonymous fragments
of genomic DNA (Stepniak et al., 2002), and no
prior knowledge of the genome under investigation is
necessary to perform the assay (Bowditch et al.,
1993). Due to those features, the RAPD analysis has
found many uses in different fields of study in both
plants and animals. Polymorphism of RAPD
fragments is detected as a band’s presence or absence and may result from deletion, insertion or differences
in the nucleotide sequences in or between the priming
regions (Clark and Lanigan, 1993). RAPD markers
are the randomly amplified target regions of less
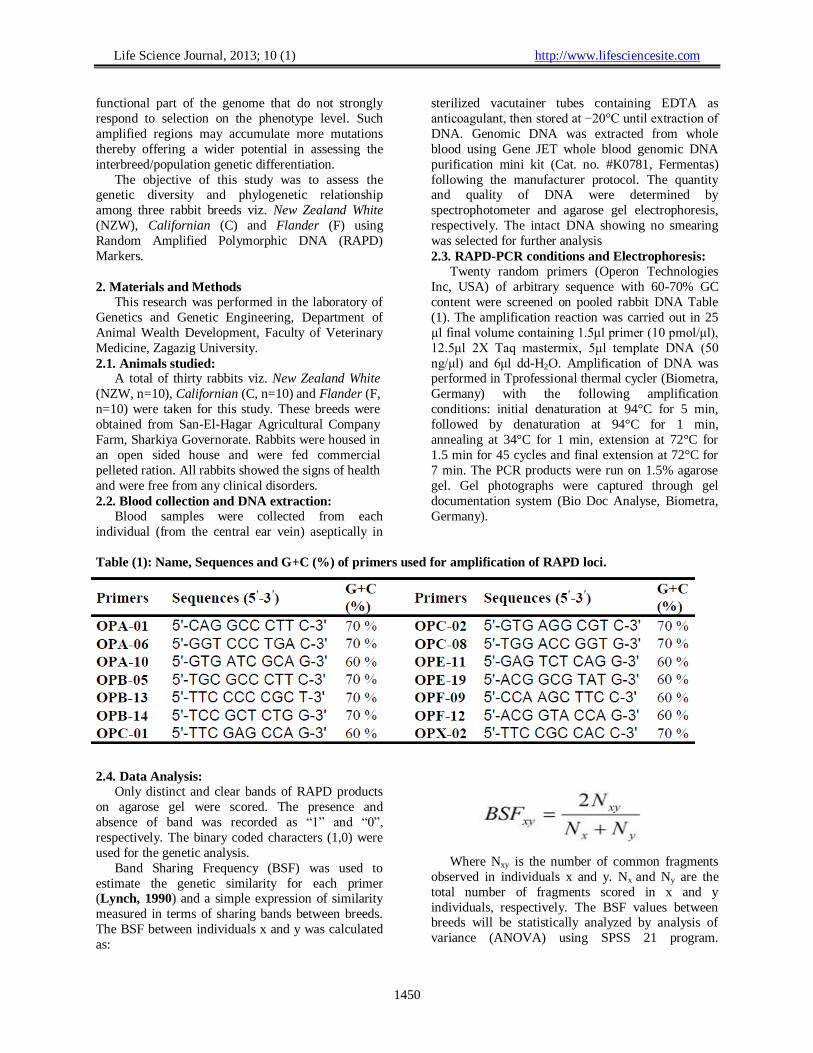
Life Science Journal, 2013; 10 (1) http://www.lifesciencesite.com
1450
functional part of the genome that do not strongly
respond to selection on the phenotype level. Such
amplified regions may accumulate more mutations
thereby offering a wider potential in assessing the
interbreed/population genetic differentiation.
The objective of this study was to assess the genetic diversity and phylogenetic relationship
among three rabbit breeds viz. New Zealand White
(NZW), Californian (C) and Flander (F) using
Random Amplified Polymorphic DNA (RAPD)
Markers.
2. Materials and Methods
This research was performed in the laboratory of
Genetics and Genetic Engineering, Department of
Animal Wealth Development, Faculty of Veterinary
Medicine, Zagazig University.
2.1. Animals studied: A total of thirty rabbits viz. New Zealand White
(NZW, n=10), Californian (C, n=10) and Flander (F,
n=10) were taken for this study. These breeds were
obtained from San-El-Hagar Agricultural Company
Farm, Sharkiya Governorate. Rabbits were housed in
an open sided house and were fed commercial
pelleted ration. All rabbits showed the signs of health
and were free from any clinical disorders.
2.2. Blood collection and DNA extraction:
Blood samples were collected from each
individual (from the central ear vein) aseptically in
sterilized vacutainer tubes containing EDTA as
anticoagulant, then stored at −20°C until extraction of
DNA. Genomic DNA was extracted from whole
blood using Gene JET whole blood genomic DNA
purification mini kit (Cat. no. #K0781, Fermentas)
following the manufacturer protocol. The quantity and quality of DNA were determined by
spectrophotometer and agarose gel electrophoresis,
respectively. The intact DNA showing no smearing
was selected for further analysis
2.3. RAPD-PCR conditions and Electrophoresis:
Twenty random primers (Operon Technologies
Inc, USA) of arbitrary sequence with 60-70% GC
content were screened on pooled rabbit DNA Table
(1). The amplification reaction was carried out in 25
µl final volume containing 1.5μl primer (10 pmol/μl),
12.5μl 2X Taq mastermix, 5μl template DNA (50
ng/μl( and 6μl dd-H2O. Amplification of DNA was performed in Tprofessional thermal cycler (Biometra,
Germany) with the following amplification
conditions: initial denaturation at 94°C for 5 min,
followed by denaturation at 94°C for 1 min,
annealing at 34°C for 1 min, extension at 72°C for
1.5 min for 45 cycles and final extension at 72°C for
7 min. The PCR products were run on 1.5% agarose
gel. Gel photographs were captured through gel
documentation system (Bio Doc Analyse, Biometra,
Germany).
Table (1): Name, Sequences and G+C (%) of primers used for amplification of RAPD loci.
2.4. Data Analysis:
Only distinct and clear bands of RAPD products
on agarose gel were scored. The presence and
absence of band was recorded as “1” and “0”,
respectively. The binary coded characters (1,0) were
used for the genetic analysis.
Band Sharing Frequency (BSF) was used to
estimate the genetic similarity for each primer (Lynch, 1990) and a simple expression of similarity
measured in terms of sharing bands between breeds.
The BSF between individuals x and y was calculated
as:
Where Nxy is the number of common fragments
observed in individuals x and y. Nx and Ny are the
total number of fragments scored in x and y
individuals, respectively. The BSF values between breeds will be statistically analyzed by analysis of
variance (ANOVA) using SPSS 21 program.
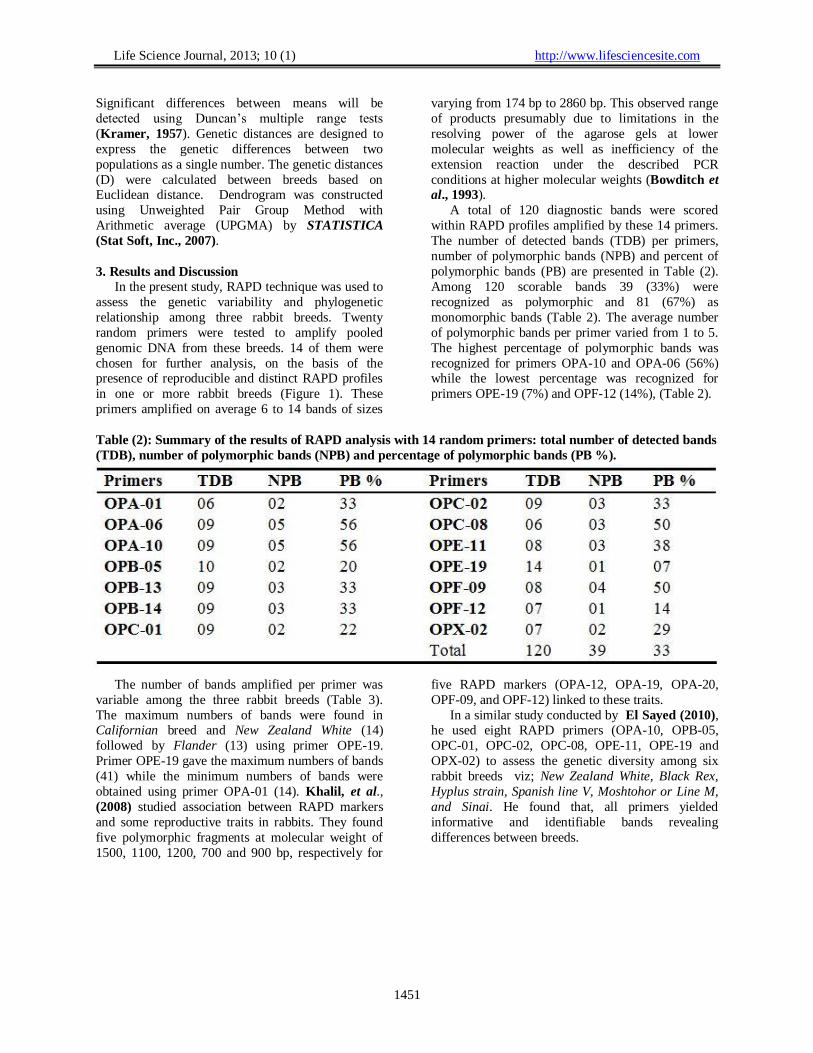
Life Science Journal, 2013; 10 (1) http://www.lifesciencesite.com
1451
Significant differences between means will be
detected using Duncan’s multiple range tests
(Kramer, 1957). Genetic distances are designed to
express the genetic differences between two
populations as a single number. The genetic distances
(D) were calculated between breeds based on Euclidean distance. Dendrogram was constructed
using Unweighted Pair Group Method with
Arithmetic average (UPGMA) by STATISTICA
(Stat Soft, Inc., 2007).
3. Results and Discussion
In the present study, RAPD technique was used to
assess the genetic variability and phylogenetic
relationship among three rabbit breeds. Twenty
random primers were tested to amplify pooled
genomic DNA from these breeds. 14 of them were
chosen for further analysis, on the basis of the presence of reproducible and distinct RAPD profiles
in one or more rabbit breeds (Figure 1). These
primers amplified on average 6 to 14 bands of sizes
varying from 174 bp to 2860 bp. This observed range
of products presumably due to limitations in the
resolving power of the agarose gels at lower
molecular weights as well as inefficiency of the
extension reaction under the described PCR
conditions at higher molecular weights (Bowditch et
al., 1993).
A total of 120 diagnostic bands were scored
within RAPD profiles amplified by these 14 primers.
The number of detected bands (TDB) per primers,
number of polymorphic bands (NPB) and percent of
polymorphic bands (PB) are presented in Table (2).
Among 120 scorable bands 39 (33%) were
recognized as polymorphic and 81 (67%) as
monomorphic bands (Table 2). The average number
of polymorphic bands per primer varied from 1 to 5.
The highest percentage of polymorphic bands was
recognized for primers OPA-10 and OPA-06 (56%) while the lowest percentage was recognized for
primers OPE-19 (7%) and OPF-12 (14%), (Table 2).
Table (2): Summary of the results of RAPD analysis with 14 random primers: total number of detected bands
(TDB), number of polymorphic bands (NPB) and percentage of polymorphic bands (PB %).
The number of bands amplified per primer was
variable among the three rabbit breeds (Table 3).
The maximum numbers of bands were found in Californian breed and New Zealand White (14)
followed by Flander (13) using primer OPE-19.
Primer OPE-19 gave the maximum numbers of bands
(41) while the minimum numbers of bands were
obtained using primer OPA-01 (14). Khalil, et al.,
(2008) studied association between RAPD markers
and some reproductive traits in rabbits. They found
five polymorphic fragments at molecular weight of
1500, 1100, 1200, 700 and 900 bp, respectively for
five RAPD markers (OPA-12, OPA-19, OPA-20,
OPF-09, and OPF-12) linked to these traits.
In a similar study conducted by El Sayed (2010), he used eight RAPD primers (OPA-10, OPB-05,
OPC-01, OPC-02, OPC-08, OPE-11, OPE-19 and
OPX-02) to assess the genetic diversity among six
rabbit breeds viz; New Zealand White, Black Rex,
Hyplus strain, Spanish line V, Moshtohor or Line M,
and Sinai. He found that, all primers yielded
informative and identifiable bands revealing
differences between breeds.

Life Science Journal, 2013; 10 (1) http://www.lifesciencesite.com
1452
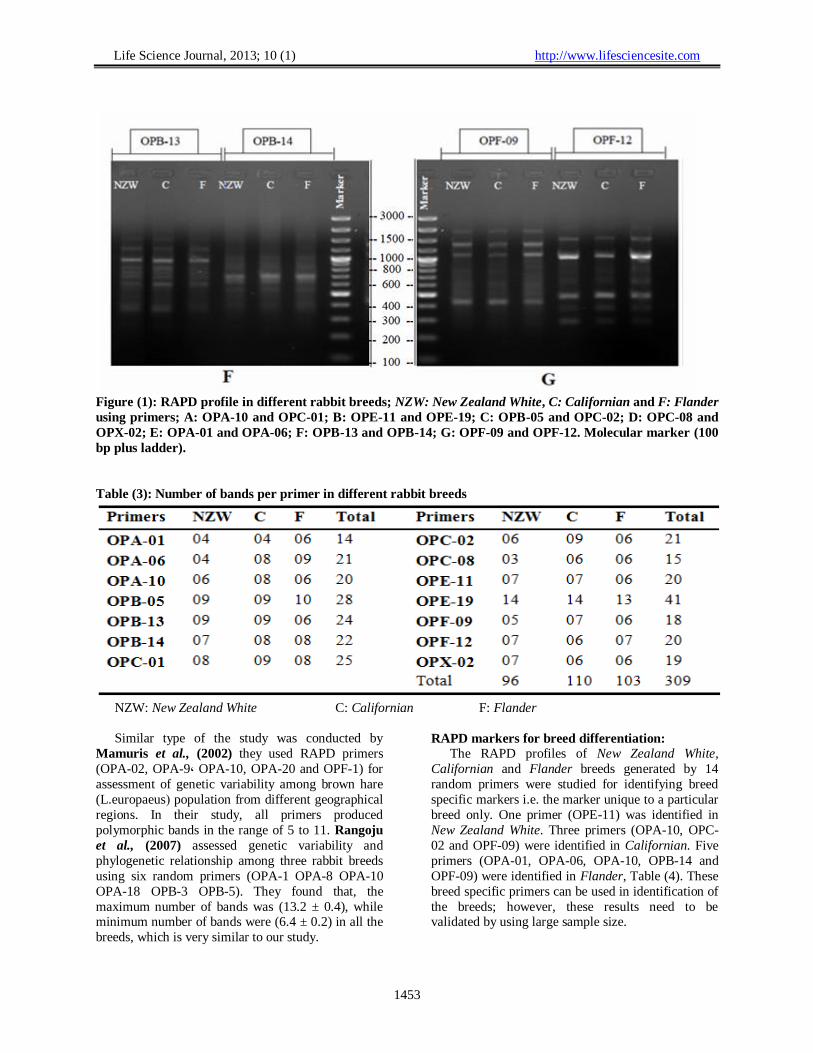
Life Science Journal, 2013; 10 (1) http://www.lifesciencesite.com
1453
Figure (1): RAPD profile in different rabbit breeds; NZW: New Zealand White, C: Californian and F: Flander
using primers; A: OPA-10 and OPC-01; B: OPE-11 and OPE-19; C: OPB-05 and OPC-02; D: OPC-08 and
OPX-02; E: OPA-01 and OPA-06; F: OPB-13 and OPB-14; G: OPF-09 and OPF-12. Molecular marker (100
bp plus ladder).
Table (3): Number of bands per primer in different rabbit breeds
NZW: New Zealand White C: Californian F: Flander
Similar type of the study was conducted by
Mamuris et al., (2002) they used RAPD primers
(OPA-02, OPA-9, OPA-10, OPA-20 and OPF-1) for
assessment of genetic variability among brown hare
(L.europaeus( population from different geographical
regions. In their study, all primers produced
polymorphic bands in the range of 5 to 11. Rangoju
et al., (2007) assessed genetic variability and
phylogenetic relationship among three rabbit breeds
using six random primers (OPA-1 OPA-8 OPA-10
OPA-18 OPB-3 OPB-5). They found that, the
maximum number of bands was (13.2 ± 0.4), while minimum number of bands were (6.4 ± 0.2) in all the
breeds, which is very similar to our study.
RAPD markers for breed differentiation:
The RAPD profiles of New Zealand White,
Californian and Flander breeds generated by 14
random primers were studied for identifying breed
specific markers i.e. the marker unique to a particular
breed only. One primer (OPE-11) was identified in
New Zealand White. Three primers (OPA-10, OPC-
02 and OPF-09) were identified in Californian. Five
primers (OPA-01, OPA-06, OPA-10, OPB-14 and
OPF-09) were identified in Flander, Table (4). These
breed specific primers can be used in identification of
the breeds; however, these results need to be validated by using large sample size.
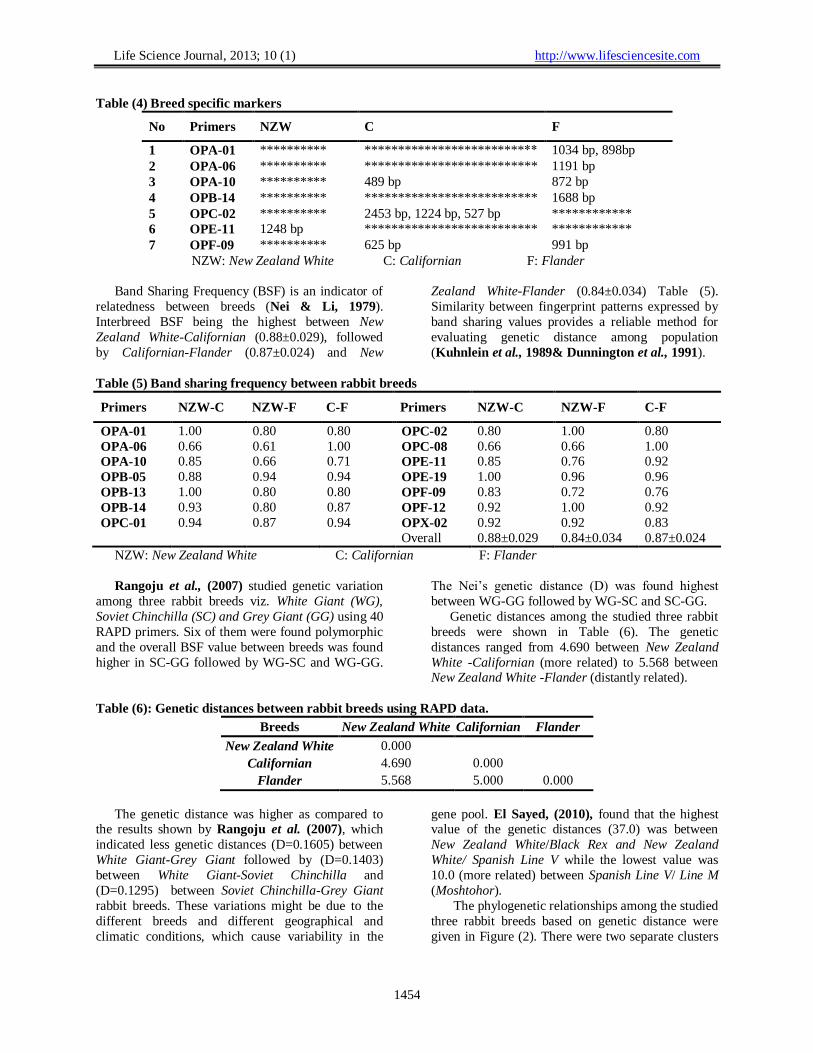
Life Science Journal, 2013; 10 (1) http://www.lifesciencesite.com
1454
Table (4) Breed specific markers
No Primers NZW C F
1 OPA-01 ********** ************************** 1034 bp, 898bp
2 OPA-06 ********** ************************** 1191 bp
3 OPA-10 ********** 489 bp 872 bp
4 OPB-14 ********** ************************** 1688 bp
5 OPC-02 ********** 2453 bp, 1224 bp, 527 bp ************
6 OPE-11 1248 bp ************************** ************
7 OPF-09 ********** 625 bp 991 bp
NZW: New Zealand White C: Californian F: Flander
Band Sharing Frequency (BSF) is an indicator of
relatedness between breeds (Nei & Li, 1979).
Interbreed BSF being the highest between New
Zealand White-Californian (0.88±0.029), followed
by Californian-Flander (0.87±0.024) and New
Zealand White-Flander (0.84±0.034) Table (5).
Similarity between fingerprint patterns expressed by
band sharing values provides a reliable method for
evaluating genetic distance among population
(Kuhnlein et al., 1989& Dunnington et al., 1991).
Table (5) Band sharing frequency between rabbit breeds
Primers NZW-C NZW-F C-F Primers NZW-C NZW-F C-F
OPA-01 1.00 0.80 0.80 OPC-02 0.80 1.00 0.80
OPA-06 0.66 0.61 1.00 OPC-08 0.66 0.66 1.00
OPA-10 0.85 0.66 0.71 OPE-11 0.85 0.76 0.92
OPB-05 0.88 0.94 0.94 OPE-19 1.00 0.96 0.96
OPB-13 1.00 0.80 0.80 OPF-09 0.83 0.72 0.76
OPB-14 0.93 0.80 0.87 OPF-12 0.92 1.00 0.92
OPC-01 0.94 0.87 0.94 OPX-02 0.92 0.92 0.83
Overall 0.88±0.029 0.84±0.034 0.87±0.024
NZW: New Zealand White C: Californian F: Flander
Rangoju et al., (2007) studied genetic variation
among three rabbit breeds viz. White Giant (WG),
Soviet Chinchilla (SC) and Grey Giant (GG) using 40
RAPD primers. Six of them were found polymorphic
and the overall BSF value between breeds was found
higher in SC-GG followed by WG-SC and WG-GG.
The Nei’s genetic distance (D) was found highest
between WG-GG followed by WG-SC and SC-GG.
Genetic distances among the studied three rabbit
breeds were shown in Table (6). The genetic
distances ranged from 4.690 between New Zealand
White -Californian (more related) to 5.568 between New Zealand White -Flander (distantly related).
Table (6): Genetic distances between rabbit breeds using RAPD data.
Breeds New Zealand White Californian Flander
New Zealand White 0.000
Californian 4.690 0.000
Flander 5.568 5.000 0.000
The genetic distance was higher as compared to the results shown by Rangoju et al. (2007), which
indicated less genetic distances (D=0.1605) between
White Giant-Grey Giant followed by (D=0.1403)
between White Giant-Soviet Chinchilla and
(D=0.1295) between Soviet Chinchilla-Grey Giant
rabbit breeds. These variations might be due to the
different breeds and different geographical and
climatic conditions, which cause variability in the
gene pool. El Sayed, (2010), found that the highest value of the genetic distances (37.0) was between
New Zealand White/Black Rex and New Zealand
White/ Spanish Line V while the lowest value was
10.0 (more related) between Spanish Line V/ Line M
(Moshtohor).
The phylogenetic relationships among the studied
three rabbit breeds based on genetic distance were
given in Figure (2). There were two separate clusters
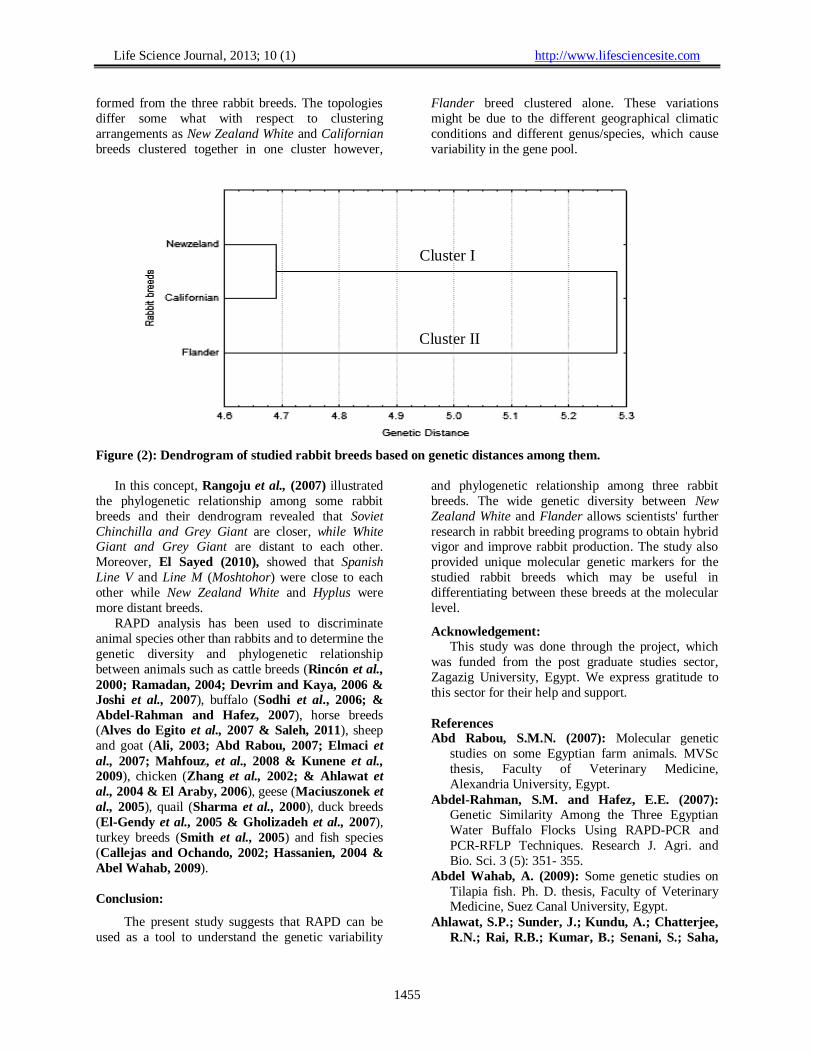
Life Science Journal, 2013; 10 (1) http://www.lifesciencesite.com
1455
formed from the three rabbit breeds. The topologies
differ some what with respect to clustering
arrangements as New Zealand White and Californian
breeds clustered together in one cluster however,
Flander breed clustered alone. These variations
might be due to the different geographical climatic
conditions and different genus/species, which cause
variability in the gene pool.
Figure (2): Dendrogram of studied rabbit breeds based on genetic distances among them.
In this concept, Rangoju et al., (2007) illustrated
the phylogenetic relationship among some rabbit
breeds and their dendrogram revealed that Soviet
Chinchilla and Grey Giant are closer, while White Giant and Grey Giant are distant to each other.
Moreover, El Sayed (2010), showed that Spanish
Line V and Line M (Moshtohor) were close to each
other while New Zealand White and Hyplus were
more distant breeds.
RAPD analysis has been used to discriminate
animal species other than rabbits and to determine the
genetic diversity and phylogenetic relationship
between animals such as cattle breeds (Rincón et al.,
2000; Ramadan, 2004; Devrim and Kaya, 2006 &
Joshi et al., 2007), buffalo (Sodhi et al., 2006; &
Abdel-Rahman and Hafez, 2007), horse breeds (Alves do Egito et al., 2007 & Saleh, 2011), sheep
and goat (Ali, 2003; Abd Rabou, 2007; Elmaci et
al., 2007; Mahfouz, et al., 2008 & Kunene et al.,
2009), chicken (Zhang et al., 2002; & Ahlawat et
al., 2004 & El Araby, 2006), geese (Maciuszonek et
al., 2005), quail (Sharma et al., 2000), duck breeds
(El-Gendy et al., 2005 & Gholizadeh et al., 2007),
turkey breeds (Smith et al., 2005) and fish species
(Callejas and Ochando, 2002; Hassanien, 2004 &
Abel Wahab, 2009).
Conclusion:
The present study suggests that RAPD can be
used as a tool to understand the genetic variability
and phylogenetic relationship among three rabbit
breeds. The wide genetic diversity between New
Zealand White and Flander allows scientists' further
research in rabbit breeding programs to obtain hybrid vigor and improve rabbit production. The study also
provided unique molecular genetic markers for the
studied rabbit breeds which may be useful in
differentiating between these breeds at the molecular
level.
Acknowledgement:
This study was done through the project, which
was funded from the post graduate studies sector,
Zagazig University, Egypt. We express gratitude to
this sector for their help and support.
References Abd Rabou, S.M.N. (2007): Molecular genetic
studies on some Egyptian farm animals. MVSc
thesis, Faculty of Veterinary Medicine,
Alexandria University, Egypt.
Abdel-Rahman, S.M. and Hafez, E.E. (2007):
Genetic Similarity Among the Three Egyptian
Water Buffalo Flocks Using RAPD-PCR and
PCR-RFLP Techniques. Research J. Agri. and
Bio. Sci. 3 (5): 351- 355.
Abdel Wahab, A. (2009): Some genetic studies on
Tilapia fish. Ph. D. thesis, Faculty of Veterinary Medicine, Suez Canal University, Egypt.
Ahlawat, S.P.; Sunder, J.; Kundu, A.; Chatterjee,
R.N.; Rai, R.B.; Kumar, B.; Senani, S.; Saha,
Cluster I
Cluster II
Life Science Journal, 2013; 10 (1) http://www.lifesciencesite.com
1456
S.K. and Yadav, S.P. (2004): Use of RAPD-PCR
for Genetic Analysis of Nicobari Fowl of
Andamans. British Poultry Science, 45(2): 194-
200.
Ali, B. (2003): Genetics similarity among four breeds
of sheep in Egypt detected by random amplified polymorphic DNA markers. Afric. J. Bio. 2: 194-
197.
Alves do Egito, A.; Fuck, B.H.; McManus, C.;
Paiva, S.R.; Albuquerque, M.M.; Santos, S.A.;
Pinto de Abreu, U.G.; Augusto da Silva, J.;
Sereno, F.T.P. and Mariante, A.S. (2007):
Genetic variability of Pantaneiro horse using
RAPD-PCR markers. Revista Brasileira de
Zootecnia, 36(4): 799-806.
Bagley, M.J.; Anderson, S.L.; and May, B. (2001) Choice of methodology for assessing genetic
impacts of environmental stressors: polymorphism and reproducibility of RAPD and
AFLP fingerprints. Ecotoxicology 10: 239-244.
Bowditch B.M., Albright D.G., Williams J.G. and
Braun M.J. (1993): Use of randomly amplified
polymorphic DNA markers in comparative
genome studies. Methos Enzymol. 224: 294-309.
Callejas, C. and Ochando, M.D. (2002): Phylogenetic relationships among Spanish barbus
species (Pisces, Cyprinidae) shown by RAPD
markers. Heredity, 89: 36–43.
Clark A.G. and Lanigan M.S. (1993): Prospects for estimating nucleotide divergence with RAPDs.
Mol Biol Evol. 10: 1096-1111
Devrim, A.K. and Kaya, N. (2006): An
investigation on DNA polymorphism of the cattle
breeds in the province of Kars by RAPD-PCR
technique. Revue de Médecine Vétérinaire,
157(2): 88-91.
Dove, A. (2000) Milking the genome for profit. Nat.
Biotechnol., 18 (10): 1045-1048.
Dunnington, E.A., Gal, O. and Siegel P.B. (1991)
Deoxyribonucleic acid fingerprint comparisons
between selected populations of chickens. Poult. Sci., 70: 463-470.
EL Araby, I. (2006): Assessment of genetic
diversity and phylogenetic relationships using
protein and DNA markers among some chicken
breeds in Egypt. Ph. D. thesis, Faculty of
Veterinary Medicine, Zagazig University, Egypt.
El-Gendy, E.A.; Helal, M.A.; Goher, N.H. and
Mostageer, A. (2005): Molecular
characterization of genetic biodiversity in ducks,
using RAPD-PCR analysis. Arab Journal of
Biotechnology, 8(2): 253-264.
Elmaci, C.; Oner, Y; Ozis, S. and Tuncel, E.
(2007): RAPD analysis of DNA polymorphism in
Turkish sheep breeds. Biochemical Genetics, 45:
691–696.
El Sayed, A.H. (2010): Assessment of Genetic
Variability among Some Rabbit Breeds by
Random Amplified Polymorphic DNA (RAPD) -
PCR. Master thesis, Faculty of Veterinary
Medicine, Suez Canal University, Egypt.
Feral, J.P. (2002): How useful is the genetic markers in attempts to understand and manage
marine biodiversity. J. Exp. Mar. Biol. Ecol., 268:
121-145.
Gholizadeh, M.; Mianji, Gh.R.; Ghobadi, A.;
Zadeh, H.S. and Montazami, Sh. (2007):
Measurement of within and between genetic
variability in duck breeds by RAPD markers.
Pakistan Journal of Biological Sciences, 10 (6):
982-985.
Hassanien, H.A. (2004): The genetic diversity of
Nile Tilapia Oreochromis niloticus based on
morphometric and molecular markers. Ph.D. Sc. Thesis, Department of Animal Production,
Faculty of Agriculture, Cairo University.
Holsinger, K.E.; Lewis, P.O. and Dey, D.K. (2002) A Bayesian approach to inferring population
structure from dominant markers. Mol. Ecol., 11:
1157-1164.
Joshi, J.; Patel, R.K.; Singh, K.M.; Soni, K.J.;
Chauhan, J.B.; Rank, D.N.; Joshi, C.G. and
Sambasiva Rao, K.R.S. (2007): Genome identity
and diversity study in Gir and Kankrej (Bos
indicus) cattle breeds using RAPD fingerprints. Biotechnology, 6 (3): 322-327.
Khalil, M.H. (1993): Diversity of repeatability
between parities for litter traits and reproductive
intervals in doe rabbits. World Rabbit Science, 1
(4): 147-154
Khalil, M.H.; Motawei, M.I.; Al-Saef, A.M.; Al-
Sobayil, K.A. and El-Zarei, M.F. (2008): RAPD
markers linked to litter, lactation and growth traits
in rabbits. 9th World Rabbit Congress, genetics,
p.143-148.
Kramer, C.Y. (1957) Extension of multiple range
tests to group correlated adjusted means. Biometrics, 13, 13-18.
Kuhnlein, U.; Dawe, Y.; Zadworny, D. and
Gavord, J.S. (1989) DNA fingerprinting: A tool
for determining genetic distances between strains
of poultry. Theor. Appl. Genet. 77: 669-672
Kunene, N.W.; Bezuidenhout, C.C. and Nsahlai,
I.V. (2009): Genetic and phenotypic diversity in
Zulu sheep populations: implications for
exploitation and conservation. Small Ruminant
Research, 84:100–107.
Lynch, M. (1990): The similarity index and DNA fingerprinting. Mol Biol Evol. 7: 478-484.
Maciuszonek, A.; Grajewski, B. and Bednarczyk,
M. (2005): RAPD-PCR analysis of various goose
populations. Folia Biol (Krakow), 53(2):83-85.
Life Science Journal, 2013; 10 (1) http://www.lifesciencesite.com
1457
Mahfouz, E.R.; Othman, O.E.; Soheir M.E. and El
Barody, M.A.A. (2008): Genetic variation
between some Egyptian sheep breeds using
RAPD-PCR. Research Journal of Cell and
Molecular Biology, 2 (2): 46-52.
Mamuris Z.; Sfougaris A.I.; Stamatis C. and Suchentrunk F. (2002( Assessment of genetic
structure of Greek brown hare (Lepus europaeus)
populations based on variation in random
amplified polymorphic DNA (RAPD). Biochem.
Genet., 40, 323-338.
Nei, M. and Li, W. H. (1979) Mathematical
modeling for studying genetic variations in terms
of restriction endonucleases. Proc. Natl Acad Sci
USA, 76: 5269-5273
Rahimi, G.; Khanahmadi, A.; Nejati-Javaremi, A.
and Smailkhanian, S. (2005) Evaluation of
genetic variability in a breeder flock of native chicken based on randomly amplified
polymorphic DNA markers. Iranian Journal of
Biotechnology, 3 (4): 231-234.
Ramadan, A.M. (2004): Biochemical studies on the
identification of meat species by the polymerase
chain reaction (PCR). M.Sc. thesis, Department of
Biochemistry, Faculty of Agriculture, Cairo
University.
Rangoju, P.K.; Kumar, S.; Kolte, A. P.; Gulyani,
R. and Singh, V.K. (2007): Assessment of
genetic variability among rabbit breeds by random amplified polymorphic DNA (RAPD) -
PCR. World Rabbit Sci., 15: 3 – 8.
Rincón, G.; D'Angelo, M.; Gagliardi, R.; Kelly,
L.; Llambí, S. and Postiglioni, A. (2000):
Genomic polymorphism in Uruguayan Creole
cattle using RAPD and microsatellite markers.
Research in Veterinary Science, 69 (2):171-4.
Saleh, A. (2011): Genetic Diversity and Phylogenetic
Relationships Among Some Breeds of Horses in
Egypt. Ph. D. thesis, Faculty of Veterinary
Medicine, Zagazig University, Egypt.
Sharma, D.; Appa Rao, K.B.C. and Totey, S.M.
(2000): Measurement of within and between population genetic variability in quails. British
Poultry Science, 41(1): 29-32.
Smith, E.J.; Geng, T.; Long, E.; Pierson, F.W.;
Sponenberg, D.P.; Larson, C. and Gogal, R.
(2005): Molecular analysis of the relatedness of
five domesticated turkey strains. Biochemical
Genetics, 43(2): 35-47.
Sodhi, M.; Mukesh, M.; Anand, A.; Bhatia, S. and
Mishra, B. P. (2006): Assessment of genetic
variability in two north Indian buffalo breeds
using random amplified polymorphic DNA
(RAPD) markers. Asian-Australasian Journal of Animal Sciences, 19:1234-1239.
Stepniak E.; Zagalska M. and Switonski M.
(2002): Use of RAPD technique in evolution
studies of four species in the family Canidae. J
Appl Genet. 43: 489-499.
Williams J.G.K.; Kubbelik A.R.; Livak K.J.;
Rafalski J.A. and Tingey S.V. (1990): DNA
polymorphisms amplified by arbitrary primers are
useful as genetic markers. Nucleic Acid Res., 18,
6531-6535.
Zhang, X.; Leung, F.C.; Chan, D.K.O.; Yang, G. and Wu, C. (2002): Genetic diversity of Chinese
native chicken breeds based on protein
polymorphism, randomly amplified polymorphic
DNA, and microsatellite polymorphism. Poultry
Science, 81:1463–1472.
12/22/2012

Life Science Journal 2013;10(1) http://www.lifesciencesite.com
1458
Effect of Feeding on Diets Supplemented by Some Vegetable Oils on Blood Lipids and Bone Mineral Content in Osteoporotic Rats
Hala, M.A. Wahba1 and Magbolah, S. H. Al-Zahrany2
1Home Economics Department, Faculty of Specific Education, Minufiya University
2 The Preparatory year, Al-baha University, KSA. [email protected]
Abstract: The effects of diets supplemented by soybean, flaxseed and sesame oils on blood lipids and bone mineral content in osteoporotic ovariectomized (OVX) rats were investigated. Fifty rats were randomly allocated into 5 equal groups and housed in metabolic metal cages. Rats of group (1) were sham operated (Sham) and of the other 4 groups were OVX and left for 8 weeks for induction of osteoporosis. Group (2) was fed on basal diet (OVX-control) and groups (3), (4) and (5) were fed on experimental diets containing either 5 % soybean, 5 %flaxseed or 5 % sesame oil, respectively for 6 weeks. Blood was collected for estimating serum levels of total cholesterol, triglycerides, phospholipids, calcium (Ca), phosphorous (P), bone - specific alkaline phosphatase (b-ALP) and osteocalcin (OC). Urine samples were collected for determination of Ca and P concentrations. Rats were euthanized, uteri were dissected out and weighed. Femur bones were removed and used for bone analyses. The results showed that feeding of diets supplemented with soybean, flaxseed and sesame oils to OVX rats reversed the decrease in uterine and femur weights and normalized the elevated serum levels of lipids, Ca, P, b-ALP and OC. These oils also decreased urinary Ca and P levels and increased femur bone density and calcium content in bone ash. In conclusion, dietary soybean, flaxseed and sesame oils cause hypolipidemic and anti-osteoporotic activities in osteoporotic rats. Intake of these vegetable oils in foods may be beneficial for the treatment of postmenopausal osteoporosis in women. [Hala, M.A. Wahba and Magbolah, S. H. Al-Zahrany. Effect of Feeding on Diets Supplemented by Some Vegetable Oils on Blood Lipids and Bone Mineral Content in Osteoporotic Rats. Life Sci J 2013;10(1):1458-1465] (ISSN:1097-8135). http://www.lifesciencesite.com. 216 Keywords: Vegetable oils; Osteoporosis; serum lipids; Calcium, Phosphorous; Osteocalcin; Ovariectomized rats. 1. Introduction
Bone is a connective tissue which continuously undergoes remodeling. Bone remodeling involves bone formation by osteoblasts and bone resorption by osteoclasts. Bone undergoes continuous remodeling with regular resorption and deposition of calcium into newly deposited bone. Osteoporosis is a bone disease characterized by bone mass reduction, deterioration of bone structure and decreased bone mineral density which leads to an increased risk of bone fractures. The bone matrix is composed of organic and inorganic components. The organic components include collagen and glycoprotein and the inorganic include minerals mainly calcium and phosphorus. Both organic and inorganic components provide strictness and strength to bones (Annemieke et al., 1997). Osteoporosis represents a major public health problem among general populations particularly in postmenopausal women due to loss in serum estrogen level (Vassilopoulou-Sellin, 2003). Adequate calcium intake is recommended for the development of high peak bone mass and for the prevention of osteoporosis (Kanis, 1999). Moreover, consideration should be given not only to the intake of adequate calcium, but also to the absorptive efficiency of the ingested calcium because intestinal calcium
absorption is influenced by many factors (Mjyazawa and Yoshida, 1991).
Dietary fats and oils are known as macronutrients which provide concentrated source of energy for the metabolic processes. In addition, fats are the main source of fat-soluble vitamins (Sanchez-Muniz and Bastida, 2006). Dietary fats are composed of different types of fatty acids (FA) which are saturated (SFA), monounsaturated (MUSFA) and polyunsaturated (PUSFA). Evidence has been shown that dietary fats can have important effects on bone health. Studies in animals indicated that high-fat diets could adversely affect bone (Hoffman et al., 1999). Saturated fatty acids may have adverse effects on bone health (Parhami, 2003). Long-chain polyunsaturated fatty acids could influence bone mass in various animal models. Dietary ratio of (n-6) to (n-3) polyunsaturated fatty acids altered biomarkers of bone formation (Watkins et al., 2000). A variety of mechanisms may account for the effects of dietary fats and oils on bone, including alterations in calcium absorption, prostaglandin synthesis, formation of osteoblasts and lipid oxidation (Haag et al., 2003).
Previous studies revealed that consumption of soybeans in foods has been linked to human health
Life Science Journal 2013;10(1) http://www.lifesciencesite.com
1459
benefits such as lowering serum cholesterol so inhibit the development of atherosclerosis (Nagata and Yamada, 2009) and protecting against breast and prostate cancer (Nagata, 2010). In addition, dietary soybeans may be beneficial in reducing the risk of osteoporosis (Byun and Lee, 2010).
It is known that the amount and type of fats and oils in the diet have important effects on blood lipids and bone health. Therefore, the objectives of the present study were to investigate the effects of supplemented diet by soybean, flaxseed and sesame oils on serum lipids and bone mineralization in ovariectomized osteoporotic rats. 2. Material and Methods 2.1. Vegetable oils Soybean, flaxseed and sesame oils were purchased from Agricultural Seeds, Medicinal Plants and Herbs Company, Cairo, Egypt. These oils were added at 5% concentration during preparation of experimental diets instead of fats of the basal diet. 2.2. Biochemical kits Kits for biochemical analysis of serum lipids, calcium, phosphorous, bone- specific alkaline phosphatase and osteocalcin were purchased from Gamma Trade Company for Pharmaceuticals and Diagnostic Chemicals, Dokki, Egypt, 2.3. Rats Fifty adult female rats of Sprague Dawley strain weighing 210-220 g body weight and 14-16 weeks old were used in this study. The rats were obtained from the Laboratory Animal Colony, Helwan, Egypt. The animals were housed individually under hygienic conditions in metabolic cages. The rats were kept at a room temperature of 25 ± 2 °C with relative humidity of 50–60% and on 12 hr light/12 hr dark cycles in the Animal House at the Agricultural Research Center, Giza, Egypt. 2.4. Preparation of basal and experimental diets Basal diet was prepared according to Reeves et al. (1993). It consists of 20 % protein (casein), 10 % sucrose, 5 % fat, 3.5 % salt mixture, 1% vitamin mixture, 2.5% choline chloride, and 5% fibers (cellulose). The remainder was maize starch up to 100 %. Three experimental diets were prepared by substituting the fat content in basal diet by 5% of soybean or flaxseed or sesame oil. 2.5. Ovariectomy procedure . Ovariectomy was performed in rats by bilateral incisions at both right and left flanks under ether anesthesia. The periovarian fatty tissue was identified and exteriorized. For prevention of subsequent hemorrhage, the arterial blood vessels were clamped by an artery forceps. Above the clamped area, both ovaries were removed out by cutting using a scalpel. Muscles and skin were stitched separately (Shalaby, 1977). Similarly, sham operation was performed in
rats where the ovaries were exposed but not removed. Povidone-iodine (antiseptic solution) was applied locally on the skin at both sites of the surgical operation. 2.6. Experiment and grouping of rats After complete surgical recovery, the operated rats (n = 50) were randomly distributed into 5 equal groups of 10 rats each. Group (1) was sham - operated (SHAM) and the other four groups were ovariectomized (OVX) and left after surgical operation for 8 weeks to induce osteoporosis as a result of estrogen hormone loss (Coxam, 2005). At start and end of the experiment, the rats were weighed and the changes in body weight gain were calculated. Group (2) was left as positive OVX control and fed on basal diet, while groups (3), (4) and (5) were fed on experimental diets containing 5% of soybean, flaxseed or sesame oil, respectively for 6 weeks. At end of the experiment, blood and urine samples were collected for biochemical analyses. Both uterine horns of each rat were removed and weighed. The femur bones were dissected out and taken for bone analyses. The experiment was carried out according to rules and guidelines for animal experimentation which approved by the Institutional Animal Care and Use Committee, NRC, Dokki, Egypt. 2.7. Biochemical analyses Blood samples were collected from portal hepatic vein into clean dry centrifuge tubes and centrifuged at 3000 rpm for 10 minutes to separate the serum which was stored in a refrigerator till biochemical analyses. Urine samples were collected then acidified with 12 Mol. HCL and stored in a refrigerator till analyses. Total cholesterol and triglycerides were estimated by the method of Zlatkis et al. (1953) and Foster and Dunn (1973) respectively. Phospholipids were analyzed by the method of Zilversmit and Davis (1950). Concentrations of calcium (Gindler and King, 1972) and phosphorus (Goodwin, 1970) in both serum and urine samples were determined spectrophotometrically using specific diagnostic reagent kits (BioMérieux, France). Serum bone-specific alkaline phosphate (Roy, 1970) was estimated by colorimetric assay using specific enzyme kits (Sigma Company, St. Louis, USA). Serum osteocalcin concentration was measured by an enzyme-linked immunosorbent assay (Rat Mid™, Osteocalcin ELISA kit, IDS Inc., Fountain Hills, Arizona, USA) according to the manufacturer's instructions. 2.8. Femur bone weight, length, volume and density The soft tissues around the right femur bone were removed and the femur was weighed. Femur length was measured with vernier caliper and femur volume
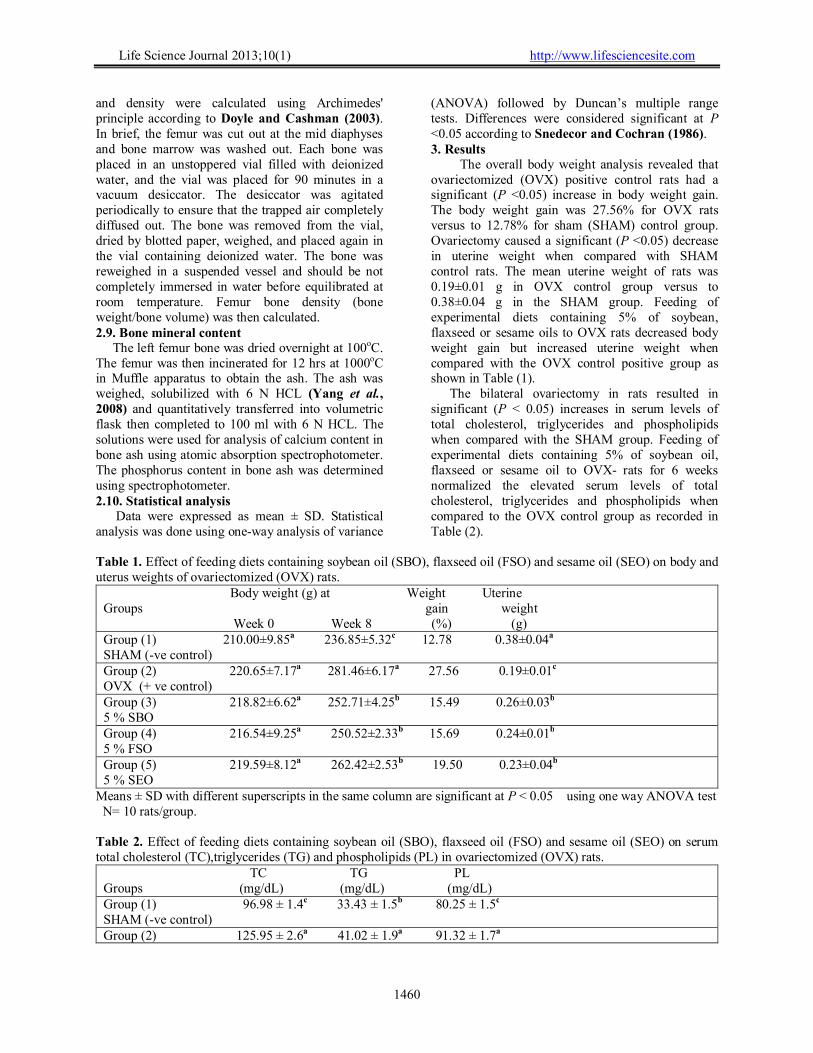
Life Science Journal 2013;10(1) http://www.lifesciencesite.com
1460
and density were calculated using Archimedes' principle according to Doyle and Cashman (2003). In brief, the femur was cut out at the mid diaphyses and bone marrow was washed out. Each bone was placed in an unstoppered vial filled with deionized water, and the vial was placed for 90 minutes in a vacuum desiccator. The desiccator was agitated periodically to ensure that the trapped air completely diffused out. The bone was removed from the vial, dried by blotted paper, weighed, and placed again in the vial containing deionized water. The bone was reweighed in a suspended vessel and should be not completely immersed in water before equilibrated at room temperature. Femur bone density (bone weight/bone volume) was then calculated. 2.9. Bone mineral content The left femur bone was dried overnight at 100oC. The femur was then incinerated for 12 hrs at 1000oC in Muffle apparatus to obtain the ash. The ash was weighed, solubilized with 6 N HCL (Yang et al., 2008) and quantitatively transferred into volumetric flask then completed to 100 ml with 6 N HCL. The solutions were used for analysis of calcium content in bone ash using atomic absorption spectrophotometer. The phosphorus content in bone ash was determined using spectrophotometer. 2.10. Statistical analysis Data were expressed as mean ± SD. Statistical analysis was done using one-way analysis of variance
(ANOVA) followed by Duncan’s multiple range tests. Differences were considered significant at P <0.05 according to Snedecor and Cochran (1986). 3. Results
The overall body weight analysis revealed that ovariectomized (OVX) positive control rats had a significant (P <0.05) increase in body weight gain. The body weight gain was 27.56% for OVX rats versus to 12.78% for sham (SHAM) control group. Ovariectomy caused a significant (P <0.05) decrease in uterine weight when compared with SHAM control rats. The mean uterine weight of rats was 0.19±0.01 g in OVX control group versus to 0.38±0.04 g in the SHAM group. Feeding of experimental diets containing 5% of soybean, flaxseed or sesame oils to OVX rats decreased body weight gain but increased uterine weight when compared with the OVX control positive group as shown in Table (1).
The bilateral ovariectomy in rats resulted in significant (P < 0.05) increases in serum levels of total cholesterol, triglycerides and phospholipids when compared with the SHAM group. Feeding of experimental diets containing 5% of soybean oil, flaxseed or sesame oil to OVX- rats for 6 weeks normalized the elevated serum levels of total cholesterol, triglycerides and phospholipids when compared to the OVX control group as recorded in Table (2).
Table 1. Effect of feeding diets containing soybean oil (SBO), flaxseed oil (FSO) and sesame oil (SEO) on body and uterus weights of ovariectomized (OVX) rats.
Body weight (g) at Weight Uterine Groups gain weight Week 0 Week 8 (%) (g) Group (1) 210.00±9.85a 236.85±5.32c 12.78 0.38±0.04a SHAM (-ve control) Group (2) 220.65±7.17a 281.46±6.17a 27.56 0.19±0.01c OVX (+ ve control) Group (3) 218.82±6.62a 252.71±4.25b 15.49 0.26±0.03b 5 % SBO Group (4) 216.54±9.25a 250.52±2.33b 15.69 0.24±0.01b 5 % FSO Group (5) 219.59±8.12a 262.42±2.53b 19.50 0.23±0.04b 5 % SEO
Means ± SD with different superscripts in the same column are significant at P < 0.05 using one way ANOVA test N= 10 rats/group. Table 2. Effect of feeding diets containing soybean oil (SBO), flaxseed oil (FSO) and sesame oil (SEO) on serum total cholesterol (TC),triglycerides (TG) and phospholipids (PL) in ovariectomized (OVX) rats.
TC TG PL Groups (mg/dL) (mg/dL) (mg/dL) Group (1) 96.98 ± 1.4c 33.43 ± 1.5b 80.25 ± 1.5c SHAM (-ve control) Group (2) 125.95 ± 2.6a 41.02 ± 1.9a 91.32 ± 1.7a
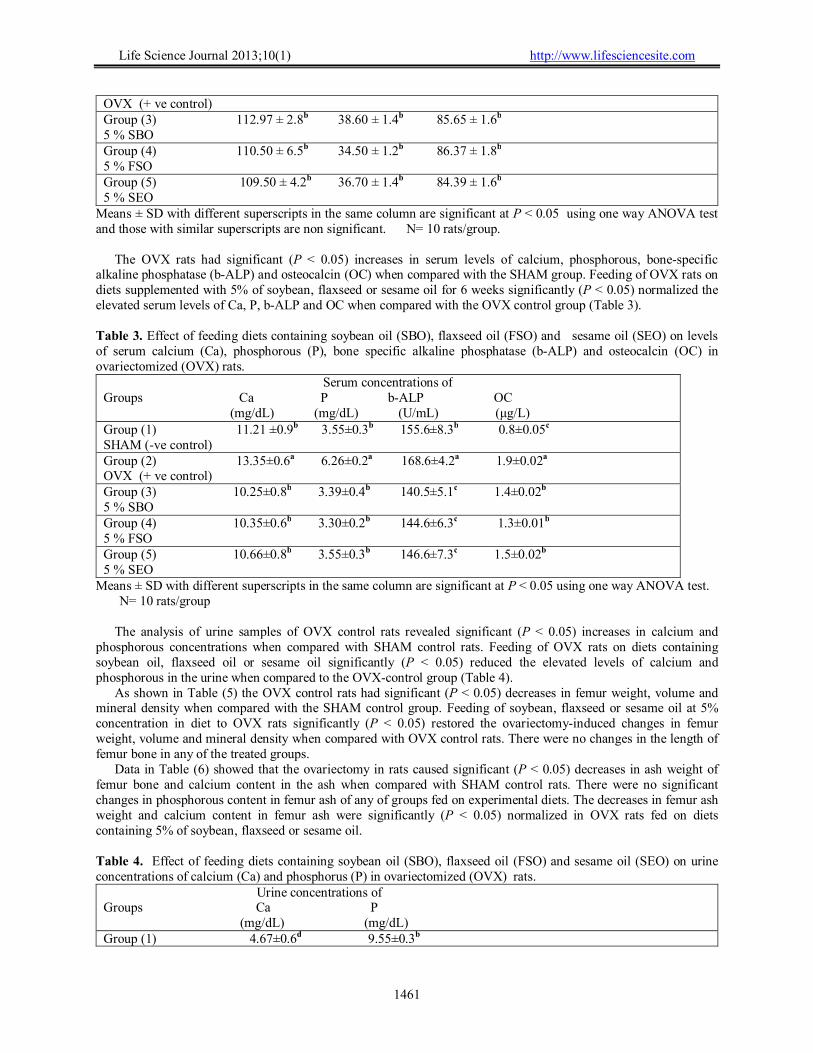
Life Science Journal 2013;10(1) http://www.lifesciencesite.com
1461
OVX (+ ve control) Group (3) 112.97 ± 2.8b 38.60 ± 1.4b 85.65 ± 1.6b 5 % SBO Group (4) 110.50 ± 6.5b 34.50 ± 1.2b 86.37 ± 1.8b 5 % FSO Group (5) 109.50 ± 4.2b 36.70 ± 1.4b 84.39 ± 1.6b 5 % SEO
Means ± SD with different superscripts in the same column are significant at P < 0.05 using one way ANOVA test and those with similar superscripts are non significant. N= 10 rats/group.
The OVX rats had significant (P < 0.05) increases in serum levels of calcium, phosphorous, bone-specific alkaline phosphatase (b-ALP) and osteocalcin (OC) when compared with the SHAM group. Feeding of OVX rats on diets supplemented with 5% of soybean, flaxseed or sesame oil for 6 weeks significantly (P < 0.05) normalized the elevated serum levels of Ca, P, b-ALP and OC when compared with the OVX control group (Table 3). Table 3. Effect of feeding diets containing soybean oil (SBO), flaxseed oil (FSO) and sesame oil (SEO) on levels of serum calcium (Ca), phosphorous (P), bone specific alkaline phosphatase (b-ALP) and osteocalcin (OC) in ovariectomized (OVX) rats.
Serum concentrations of Groups Ca P b-ALP OC (mg/dL) (mg/dL) (U/mL) (μg/L) Group (1) 11.21 ±0.9b 3.55±0.3b 155.6±8.3b 0.8±0.05c SHAM (-ve control) Group (2) 13.35±0.6a 6.26±0.2a 168.6±4.2a 1.9±0.02a OVX (+ ve control) Group (3) 10.25±0.8b 3.39±0.4b 140.5±5.1c 1.4±0.02b 5 % SBO Group (4) 10.35±0.6b 3.30±0.2b 144.6±6.3c 1.3±0.01b 5 % FSO Group (5) 10.66±0.8b 3.55±0.3b 146.6±7.3c 1.5±0.02b 5 % SEO
Means ± SD with different superscripts in the same column are significant at P < 0.05 using one way ANOVA test. N= 10 rats/group
The analysis of urine samples of OVX control rats revealed significant (P < 0.05) increases in calcium and
phosphorous concentrations when compared with SHAM control rats. Feeding of OVX rats on diets containing soybean oil, flaxseed oil or sesame oil significantly (P < 0.05) reduced the elevated levels of calcium and phosphorous in the urine when compared to the OVX-control group (Table 4).
As shown in Table (5) the OVX control rats had significant (P < 0.05) decreases in femur weight, volume and mineral density when compared with the SHAM control group. Feeding of soybean, flaxseed or sesame oil at 5% concentration in diet to OVX rats significantly (P < 0.05) restored the ovariectomy-induced changes in femur weight, volume and mineral density when compared with OVX control rats. There were no changes in the length of femur bone in any of the treated groups.
Data in Table (6) showed that the ovariectomy in rats caused significant (P < 0.05) decreases in ash weight of femur bone and calcium content in the ash when compared with SHAM control rats. There were no significant changes in phosphorous content in femur ash of any of groups fed on experimental diets. The decreases in femur ash weight and calcium content in femur ash were significantly (P < 0.05) normalized in OVX rats fed on diets containing 5% of soybean, flaxseed or sesame oil. Table 4. Effect of feeding diets containing soybean oil (SBO), flaxseed oil (FSO) and sesame oil (SEO) on urine concentrations of calcium (Ca) and phosphorus (P) in ovariectomized (OVX) rats.
Urine concentrations of Groups Ca P (mg/dL) (mg/dL) Group (1) 4.67±0.6d 9.55±0.3b
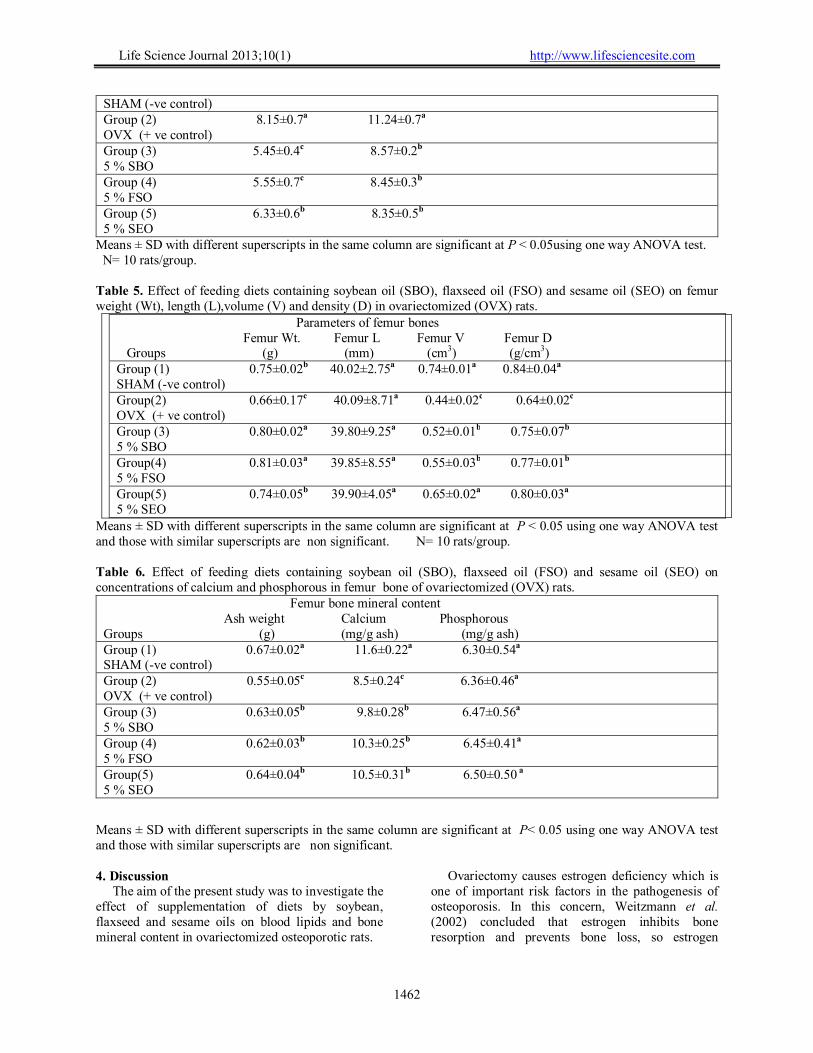
Life Science Journal 2013;10(1) http://www.lifesciencesite.com
1462
SHAM (-ve control) Group (2) 8.15±0.7a 11.24±0.7a OVX (+ ve control) Group (3) 5.45±0.4c 8.57±0.2b 5 % SBO Group (4) 5.55±0.7c 8.45±0.3b 5 % FSO Group (5) 6.33±0.6b 8.35±0.5b 5 % SEO
Means ± SD with different superscripts in the same column are significant at P < 0.05using one way ANOVA test. N= 10 rats/group. Table 5. Effect of feeding diets containing soybean oil (SBO), flaxseed oil (FSO) and sesame oil (SEO) on femur weight (Wt), length (L),volume (V) and density (D) in ovariectomized (OVX) rats.
Parameters of femur bones Femur Wt. Femur L Femur V Femur D Groups (g) (mm) (cm3) (g/cm3) Group (1) 0.75±0.02b 40.02±2.75a 0.74±0.01a 0.84±0.04a SHAM (-ve control) Group(2) 0.66±0.17c 40.09±8.71a 0.44±0.02c 0.64±0.02c OVX (+ ve control) Group (3) 0.80±0.02a 39.80±9.25a 0.52±0.01b 0.75±0.07b 5 % SBO Group(4) 0.81±0.03a 39.85±8.55a 0.55±0.03b 0.77±0.01b 5 % FSO Group(5) 0.74±0.05b 39.90±4.05a 0.65±0.02a 0.80±0.03a 5 % SEO
Means ± SD with different superscripts in the same column are significant at P < 0.05 using one way ANOVA test and those with similar superscripts are non significant. N= 10 rats/group. Table 6. Effect of feeding diets containing soybean oil (SBO), flaxseed oil (FSO) and sesame oil (SEO) on concentrations of calcium and phosphorous in femur bone of ovariectomized (OVX) rats.
Femur bone mineral content Ash weight Calcium Phosphorous Groups (g) (mg/g ash) (mg/g ash) Group (1) 0.67±0.02a 11.6±0.22a 6.30±0.54a SHAM (-ve control) Group (2) 0.55±0.05c 8.5±0.24c 6.36±0.46a OVX (+ ve control) Group (3) 0.63±0.05b 9.8±0.28b 6.47±0.56a 5 % SBO Group (4) 0.62±0.03b 10.3±0.25b 6.45±0.41a 5 % FSO Group(5) 0.64±0.04b 10.5±0.31b 6.50±0.50 a 5 % SEO
Means ± SD with different superscripts in the same column are significant at P< 0.05 using one way ANOVA test and those with similar superscripts are non significant. 4. Discussion The aim of the present study was to investigate the effect of supplementation of diets by soybean, flaxseed and sesame oils on blood lipids and bone mineral content in ovariectomized osteoporotic rats.
Ovariectomy causes estrogen deficiency which is one of important risk factors in the pathogenesis of osteoporosis. In this concern, Weitzmann et al. (2002) concluded that estrogen inhibits bone resorption and prevents bone loss, so estrogen
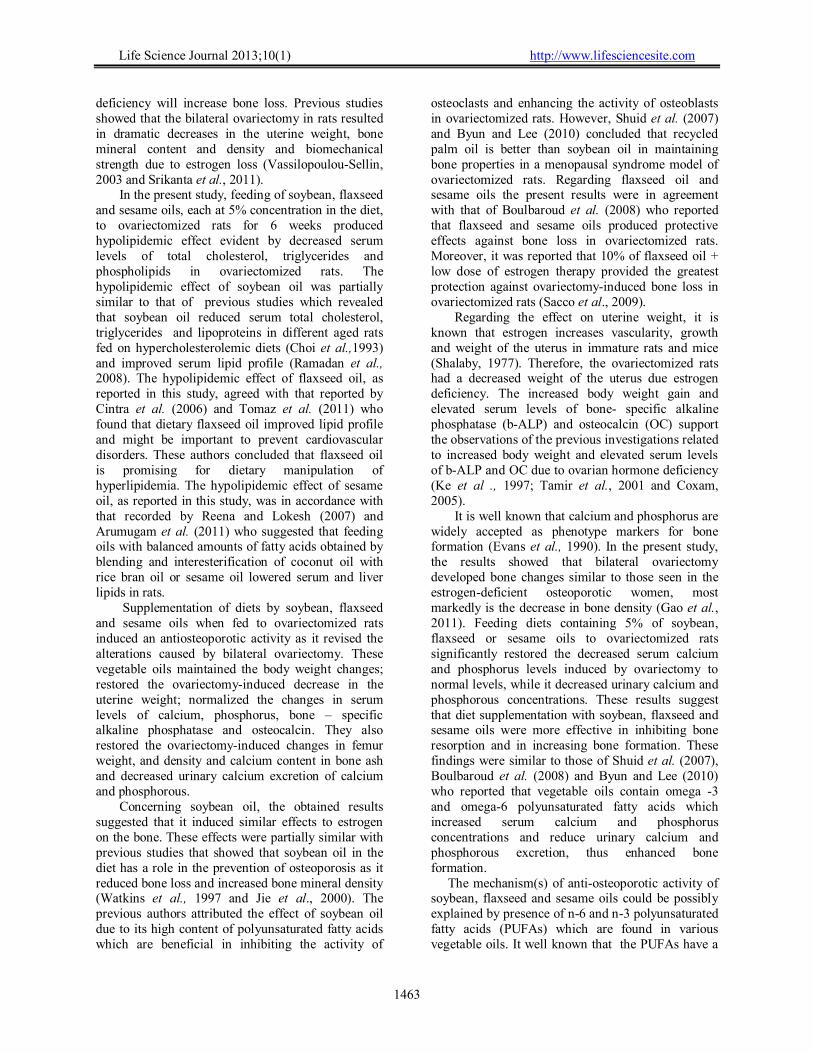
Life Science Journal 2013;10(1) http://www.lifesciencesite.com
1463
deficiency will increase bone loss. Previous studies showed that the bilateral ovariectomy in rats resulted in dramatic decreases in the uterine weight, bone mineral content and density and biomechanical strength due to estrogen loss (Vassilopoulou-Sellin, 2003 and Srikanta et al., 2011). In the present study, feeding of soybean, flaxseed and sesame oils, each at 5% concentration in the diet, to ovariectomized rats for 6 weeks produced hypolipidemic effect evident by decreased serum levels of total cholesterol, triglycerides and phospholipids in ovariectomized rats. The hypolipidemic effect of soybean oil was partially similar to that of previous studies which revealed that soybean oil reduced serum total cholesterol, triglycerides and lipoproteins in different aged rats fed on hypercholesterolemic diets (Choi et al.,1993) and improved serum lipid profile (Ramadan et al., 2008). The hypolipidemic effect of flaxseed oil, as reported in this study, agreed with that reported by Cintra et al. (2006) and Tomaz et al. (2011) who found that dietary flaxseed oil improved lipid profile and might be important to prevent cardiovascular disorders. These authors concluded that flaxseed oil is promising for dietary manipulation of hyperlipidemia. The hypolipidemic effect of sesame oil, as reported in this study, was in accordance with that recorded by Reena and Lokesh (2007) and Arumugam et al. (2011) who suggested that feeding oils with balanced amounts of fatty acids obtained by blending and interesterification of coconut oil with rice bran oil or sesame oil lowered serum and liver lipids in rats. Supplementation of diets by soybean, flaxseed and sesame oils when fed to ovariectomized rats induced an antiosteoporotic activity as it revised the alterations caused by bilateral ovariectomy. These vegetable oils maintained the body weight changes; restored the ovariectomy-induced decrease in the uterine weight; normalized the changes in serum levels of calcium, phosphorus, bone – specific alkaline phosphatase and osteocalcin. They also restored the ovariectomy-induced changes in femur weight, and density and calcium content in bone ash and decreased urinary calcium excretion of calcium and phosphorous. Concerning soybean oil, the obtained results suggested that it induced similar effects to estrogen on the bone. These effects were partially similar with previous studies that showed that soybean oil in the diet has a role in the prevention of osteoporosis as it reduced bone loss and increased bone mineral density (Watkins et al., 1997 and Jie et al., 2000). The previous authors attributed the effect of soybean oil due to its high content of polyunsaturated fatty acids which are beneficial in inhibiting the activity of
osteoclasts and enhancing the activity of osteoblasts in ovariectomized rats. However, Shuid et al. (2007) and Byun and Lee (2010) concluded that recycled palm oil is better than soybean oil in maintaining bone properties in a menopausal syndrome model of ovariectomized rats. Regarding flaxseed oil and sesame oils the present results were in agreement with that of Boulbaroud et al. (2008) who reported that flaxseed and sesame oils produced protective effects against bone loss in ovariectomized rats. Moreover, it was reported that 10% of flaxseed oil + low dose of estrogen therapy provided the greatest protection against ovariectomy-induced bone loss in ovariectomized rats (Sacco et al., 2009). Regarding the effect on uterine weight, it is known that estrogen increases vascularity, growth and weight of the uterus in immature rats and mice (Shalaby, 1977). Therefore, the ovariectomized rats had a decreased weight of the uterus due estrogen deficiency. The increased body weight gain and elevated serum levels of bone- specific alkaline phosphatase (b-ALP) and osteocalcin (OC) support the observations of the previous investigations related to increased body weight and elevated serum levels of b-ALP and OC due to ovarian hormone deficiency (Ke et al ., 1997; Tamir et al., 2001 and Coxam, 2005). It is well known that calcium and phosphorus are widely accepted as phenotype markers for bone formation (Evans et al., 1990). In the present study, the results showed that bilateral ovariectomy developed bone changes similar to those seen in the estrogen-deficient osteoporotic women, most markedly is the decrease in bone density (Gao et al., 2011). Feeding diets containing 5% of soybean, flaxseed or sesame oils to ovariectomized rats significantly restored the decreased serum calcium and phosphorus levels induced by ovariectomy to normal levels, while it decreased urinary calcium and phosphorous concentrations. These results suggest that diet supplementation with soybean, flaxseed and sesame oils were more effective in inhibiting bone resorption and in increasing bone formation. These findings were similar to those of Shuid et al. (2007), Boulbaroud et al. (2008) and Byun and Lee (2010) who reported that vegetable oils contain omega -3 and omega-6 polyunsaturated fatty acids which increased serum calcium and phosphorus concentrations and reduce urinary calcium and phosphorous excretion, thus enhanced bone formation. The mechanism(s) of anti-osteoporotic activity of soybean, flaxseed and sesame oils could be possibly explained by presence of n-6 and n-3 polyunsaturated fatty acids (PUFAs) which are found in various vegetable oils. It well known that the PUFAs have a
Life Science Journal 2013;10(1) http://www.lifesciencesite.com
1464
critical role in the regulation of a variety of biological processes including bone formation and metabolism (Maggio et al., 2009). In conclusion, the results suggest that dietary soybean, flaxseed and sesame oils induce hypocholesterolemic and anti-osteoporotic effects in ovariectomized rats. These vegetable oils can effectively ameliorate ovariectomy-induced osteoporosis in rats therefore they are considered promising natural dietary supplements for the treatment of postmenopausal osteoporosis in women. Further studies are needed to determine the mechanism(s) by which a diet supplemented by these oils can modulate bone tissue. References 1. Arumugam, P. and Ramesh, S. (2011): Protective
effects of sesame oil on 4-NQO-induced oxidative DNA damage and lipid peroxidation in rats. Drug Chem. Toxicol.; 34(2): 116-119.
2. Annemieke, M.B.; Melanie, A.M.; Engels, G.J.; Boerma, E.P. and Sabine, M.P. (1997): Changes in bone mineral density, body composition and lipid metabolism during growth hormone (GH) treatment in children with GH deficiency. J. Clin. Endocrinol. Metabol.; 82: 2423-2428.
3. Boulbaroud, S.; Mesfioui, A.; Arfaoui, A. Quichou, A. and El-Hessni, A. (2008): Preventive effects of flaxseed and sesame oils on bone loss in ovariectomized rats. Pakstaian J. Biol. Sci.; 11(13): 1696-1701.
4. Byun, J.S. and Lee, S.S. (2010): Effect of soybeans and sword beans on bone metabolism in a rat model of osteoporosis. Ann. Nutri. Metab.; 56(2): 106-112.
5. Cintra, D.E.; Costa, A.V.; Peluzio, M.C.; Matta, S.L.; Silva, M.T. and Costa, N.M. (2006): Lipid profile of rats fed high-fat diets based on flaxseed, peanut, trout, or chicken skin. Nutri.; 22(2):197-205.
6. Choi, Y.; Ahn, C.; Rhee, H.; Choe, M.; Kim C. and Kim J. (1993): Comparative effects of dietary palm oil, perilla oil and soybean oil on lipid profile in different aged rats fed on hypercholesterolemic diets. Biosci. Biotech. Biochem.; 57: 65-68.
7. Coxam, V. (2005): New advances in osteoporosis nutritional prevention. J. Med. Sci., 21(3): 297-301.
8. Doyle, L. and Cashman K.D. (2003): The effect of nutrient profiles of the dietary approaches to stop hypertension diets on blood pressure and bone metabolism and composition in normotensive and hypertensive rats. Br. J. Nutr.; 89: 713-724.
9. Evans, D.B.; Bunning, R.A. and Russell, R.G. (1990): The effects of recombinant human interleukin-1β on cellular proliferation and the production of prostaglandin E2, plasminogen activator, osteocalcin and alkaline phosphatase by osteoblast-like cells derived from human bone. Biochem. Biophys. Res. Commun.; 166: 208-216.
10. Foster, L.B. and Dunn, R.T. (1973): Stable reagents for determination of serum triglycerides by colorimetric method. Clin. Chem.; 19:338-340.
11. Gao, S.G.; Li, K.H.; Xu, M.; Jiang, W.; Shen, H.; Luo, W.; Tian, J. and Lei, G.H. (2011): Bone turnover in passive smoking female rat: relationships to change in bone mineral density. Musculoskelet., 12:131-139.
12. Gindler, E. M. and King, J. D. (1972): Rapid colorimetric determination of calcium in biologic fluid with Methyl thymol blue. Am. J. Clin. Pathol.; 58: 376-382.
13. Goodwin, J.F. (1970): Determination of serum phosphorus. Clin. Chem.; 16(9): 776-780.
14. Haag, M.; Magada, O.N.; Claassen, N.; Bohmer, L.H. and Kruger, M.C. (2003):= Omega-3 fatty acids modulate ATPases involved in duodenal calcium absorption. Prostagl. Leukot. Essent. Fatty Acids.; 68: 423- 429.
15. Hoffman, R. L.; Lawrence, D.; Kronfeld, W.; Cooper, D.; Sklan and J. Dascanio (1999): Dietary carbohydrates, and fat influence radiographic bone mineral content in growing foals. J. Animal Sci.; 77: 3330-3338.
16. Jie, M.Z.; Shimanuki, S.; Igarashi, A.; Kawasaki, Y. and Yamaguchi, M. (2000):Preventive effect of dietary soybean on bone loss in ovariectomized rats: Enhancement with isoflavone and zinc supplementation. J. Health Sci.; 46: 263- 268.
17. Kanis, J.A. (1999): The use of Ca in the management of osteoporosis. Bone; 24: 279- 290.
18. Ke, H.Z.; Chen, H.K.; Simmons, H.A.; Crawford. D.T.; Chidsey-Frink. K.L.; Jee, W.S. and Thompson, D.D. (1997): Comparative effects of droloxifene, tamoxifen and estrogen on bone, serum cholesterol, and uterine histology in the ovariectomized rat model. Bone; 20: 31-39.
19. Maggio, M.; Artoni, A.; Lauretani, F. Borghi, L.; Nouvenne, A.; Valenti, G. and Ceda, G.P. (2009): The impact of omega-3 fatty acids on osteoporosis. Curr. Pharmacol. Res.; 15: 4157-4164.
20. Mjyazawa, E.T. and Yoshida, I. (1991): Effect of dietary levels of phytate and inorganic phosphate on phytate breakdown and absorption of calcium and agnesium in rats. Nutri. Res.; 11: 797-806.
Life Science Journal 2013;10(1) http://www.lifesciencesite.com
1465
21. Nagata, C. (2010): Factors to consider in the association between soy isoflavone intake and breast cancer risk. J. Epidemiol.; 20(2): 83-89.
22. Nagata, J. and Yamada, K. (2009): Effects of simultaneous intake of soybean protein and diacylglycerol on lipid profiles and body fat accumulation in rats. Biosci. Biotechnol. Biochem.; 73(6): 1328-1332.
23. Parhami, F. (2003): Possible role of oxidized lipids in osteoporosis: could hyperlipidemia be a risk factor?. Prostagl. Leukot. Essent. Fatty Acids; 68: 373- 378.
24. Ramadan, M.A.; Amer, M.A. and Awad, A.E. (2008): Coriander seed and soybean oils improve plasma lipid profile in rats fed a diet containing cholesterol. Eur. Food Res. Technol.; 227: 1173-1182.
25. Reena, M.B. and Lokesh, B.R. (2007): Hypolipidemic effect of oils with balanced amounts of fatty acids obtained by blending and esterification of coconut oil with rice bran oil or sesame oil. J. Agric. Food Chem.; 55: 10461-10469.
26. Reeves, P.G.; Nielson, F.H. and Fahmy, G.C. (1993): Reports of the American Institute of Nutrition, adhoc willing committee on reformulation of the AIN 93, Rodent diet. J. Nutri.; 123: 1939-1951.
27. Roy, S.E. (1970): Colorimetric determination of serum bone-specific alkaline phosphatase. Clin. Chem.; 16:431-432.
28. Sacco, S.M.; Jiang, J.M.; Reza-Lopez, A.; Thompson, L.U. and Ward, W.E. (2009): Flaxseed combined with low-dose estrogen therapy preserves bone tissue in ovariectomized rats. Menopause; 16(3): 545-554.
29. Sanchez-Muniz, F.J. and Bastida, S. (2006): Effect of frying and thermal oxidation on olive oil and food quality. Cited in ''Olive Oil and Human Health'', International Publishing, Oxford shire, Page: 74-108.
30. Shalaby, M.A. (1977): Pharmacological studies on sex hormone- like effects of some Egyptian leguminous plants with their action on the uterus. M. V. Sc. Thesis Submitted to Pharmacology Department, Faculty of Veterinary Medicine, Cairo University, Egypt.
31. Shuid, A.N.; Chuan, L.H.; Mohamed, N. Jarin, K. Fong, Y.S. and Soliman, I.N. (2007): Recycled
palm oil is better than soy oil in maintaining bone properties in a menopausal syndrome model of ovariectomized rats. Asian J. Clin. Nutri.; 16: 393- 402.
32. Snedecor, G.W. and Cochran, W.G. (1986): Statistical Methods, 7th Edition, Iowa State University Press, Ames, USA, Page 90.
33. Srikanta, P.; Nagarajappa, S.H.; Viswanatha, G.L.; Handral, M.; Subbanna, R.; Srinath, R. and Hiremath, G. (2011): Anti-osteoporotic activity of methanolic extract of an Indian herbal formula (NR/CAL/06) in ovariectomized rats. J. Chinese Integr. Med.; 9(10): 1125-1132.
34. Tamir, S.; Eizenberg, M.; Somjen, D.; Izrael, S. and Vaya, J. (2001): Estrogen-like activity of glabrene and other constituents isolated from licorice root. J. Steroid Biochem. Mol. Biol.; 78(3): 291-298.
35. Tomaz, P.J.; Beltrame, D.J. and Teles, B.G. (2011): Impact of dietary flaxseed supplementation on biochemical profile in healthy rats. Nutri. Hosp.; 26(4): 798- 802.
36. Vassilopoulou-Sellin R. (2003): Breast cancer and hormonal replacement therapy. Ann. N.Y. Acad. Sci.; 997:341-350.
37. Watkins, B.A.; Li, Y.; Allen, K.G.; Hoffman, W.E. and Seifert M.F. (2000): Dietary ratio of (n-6) to (n-3) polyunsaturated fatty acids alter the fatty acid composition of bone compartments and biomarkers of bone formation in rats. J. Nutr., 130: 2274- 2284.
38. Weitzmann, M.N.; Roggia, C.; Toraldo, G.; Weitzmann, L. and Pacifi, R. (2002): Increased production of interleukin-7 uncouples bone formation from bone resorption during estrogen deficiency. J. Clin. Invest.; 110:1643-1650.
39. Yang, L.; Wu, J.; Ho, L.; Yang, G. S.; Hung, Y. and Lin, W. (2008): Effect of poly-(α glutamic acid on calcium absorption in rats. Biosci. Biotechonol. Biochem.; 72:3084-3090.
40. Zilversmit, D.B. and Davis, A.K. (1950): Micro determination of phospholipids by TCA precipitation method. J. Lab. Clin. Med.; 35:155-161.
41. Zlatkis A.; Zak, B. and Bogle, GJ. (1953): A method for the determination of serum total cholesterol. J. Clin. Med.; 41:486-492.
1/22/2013

Life Science Journal 2013;10(1) http://www.lifesciencesite.com
1466
Self concept and academic achievements among nursing students
Essmat Gemeay1, Sahar Behilak 2, Amal Kanona3 & Essmat A. Mansour 4
1 Psychiatric and Mental Health Nursing Dep.,College of Nursing ,King Saud University and Tanta University. 2 Psychiatric and Mental Health Nursing Dep. , Taibah University College of Applied Medical Sciences in
Yanbu and Mansoura University , Egypt 3 Medical Surgical Nursing Dep.,College of Nursing ,King Saud University
4 Medical Surgical Nursingdep. ,College of Nursing ,King Saud University and Tanta University [email protected]
Abstract: In teaching and learning, it is obviously observed that the students who have positive self concept; are actively involved in the learning process. While other students who are quite passive and quiet. This situation occurs because their action is influenced by the students’ self concept. Thus the aims of the current study are to investigate the self concept and its relation with the academic achievement among nursing students. Study design: A descriptive study Subject:A total subjects of 200 students were recruited in this study enrolled in first, second and third year at college of health science (Nursing). Setting:the current study conducted at college of health science –nursing department at Yanbu Cambous, Taibah University, Saudi Arabia during the 2nd semester of the academic year 1430-1431h. Tools :Structured interviewing questionnaire were designed by the researchers to collect the socio- demographic data as : age , educational level , marital status etc ..And ,Tennessee self- concept scale. It consists of 100 self descriptive statements.Results: Findings from the study show that statistically significant relation was found between students’ academic achievement and the self –concept level. Conclusion &recommendation: This study Strengthen the importance of enhancing the value of self concept as one of the most important requirements of the professional graduate nurse in all nursing educational institutions [Essmat Gemeay, Sahar Behilak, Amal Kanona and Essmat A. Mansour. Self concept and academic achievements among nursing students. Life Sci J 2013;10(1):1466-1470] (ISSN:1097-8135). http://www.lifesciencesite.com. 217 Key words: Self concept, Academic achievement 1. Introduction
Self concept is broadly seen as the image that the person hold about himself, It usually includes : attitudes , feelings and knowledge about abilities, skills appearance and social acceptability. It is a multi-dimensional construct that refers to an individual ‘s perception of self in relation to a number of academic and non academic characteristics ((1)), In which no characteristic exist in isolation as one’s self concept is a collection of beliefs about oneself( 1,2.) Despite differing opinions about the onset of self concept development, researchers, agree on the importance of one’s self concept, influencing people’s behaviors, cognitive and emotional outcomes including but not limited to academic achievements (3,4.) Previous studies has found that self concept has a significant influence on student’s outcome and achievements, in which student’s achievement is the outcome of education, it is the extent to which a student, teacher or institution has achieved their educational goals( 5.6) .There is no agreement on how the academic achievement is best tested or which aspects are most important, But, it is commonly measured by examination or continuous assessment(
6). In addition the student’s perception of the fit between their self concept and academic demand are
important for learning outcomes (2,5). Indeed self concept researcher have found a relationship between the students describe themselves and their academic performance (1). From an a practical view , it was founded that , both self concept and academic achievement can influence each other , Therefore , It can be stated that, self concept is critical and central variable in human behaviors . Individuals with positive self concept are expected to function more effectively, this is evident in interpersonal competence, intellectual efficiency and environmental mastery .In contrast, negative self concept is correlated with personal and social maladjustment 7. Self concept is mentioned frequently in nursing literature and there is a strong view emerging that one of the nursing future strengths lies in its ability to improve its self concept , It is believed that , nursing students usually face many issues that may foster the student’s self concept , this may be related to : nursing image , teaching program and teaching methods , as a consequence for the previous effect of self concept, a noticeable effect on academic achievement can be observed in nursing education (6) Regardless of the casual relation between self concept and student’s academic achievement , It is important in nursing education to keep in mind the

Life Science Journal 2013;10(1) http://www.lifesciencesite.com
1467
both .Nursing students often work with vulnerable clients who are in need of strong support persons to advocate and assist them to manage with their own health , and these students must be prepared and ready to assume their role with confidence and competence ,Moreover , positive teacher –students relationship inside and outside the classroom can improve student’s self concept and can facilitate learning processes. On the other hand , nursing instructor must provide learning experience and facilitate teaching skills that enhance the self esteem and concept which in part will affect the student’s academic achievements and will result in a future efficient nurse( 8,9). Therefore It is, important to investigate the relationship between self-concept and academic achievement in order to rescue those students who may be victims of their own negative beliefs about themselves. Aim of the study: The aims of the current study are to investigate the self concept and its relation with the academic achievement among nursing students. 2. Methodology The researchers' hypothesis that there is a relation between self concept and academic achievement. Research question : Does positive self concept improve student’s academic achievements? A total sample of 200 students were recruited in this study enrolled in first, second and third year at college of health science (Nursing).
A descriptive study was conducted at college of health science –nursing department at Yanbu Cambous, Taibah University ,Saudi Arabia during the 2nd semester of the academic year 1430-1431h.
Structured interviewing questionnaire were designed by the researchers to collect the socio- demographic data as : age , educational level , marital status etc …And ,Tennessee self- concept scale , A scale developed by Fitts and Warren 1969 (10)to measure self – concept . It consists of 100 self descriptive statements to which the subjects respond on a 5 point response, a scale ranging from completely agree to completely disagree statements . The one hundred statements contain 10 items for self criticism while the other 90 statements measure 5 aspects of self concept namely ; body image , social self , family self personal self and ethical self.
Data were collected by the researchers after obtaining an official consent from the dean of the college and also from the students participating in the study.
Students were interviewed on individual base, the time needed to fill out the questionnaire was 30 minutes .
Students performance and acheivemniets were collected from the students files from the student’s affaire department .
The data were organized , tabulated and statistically analyzed using SPSS soft ware statistical computer package version 12. The number and percent distribution of each observation was calculated , chi square and t test was performed . The study protocol was approved by pertinent research and ethical committees. Informed consent was taken from every the dean of college and student before inclusions in the study. No hazards were present. Participants were assured that all their data are highly confidential, anonymity was also assured through assigning a number for each student instead of names to protect their privacy .Data was only available to the researchers and participants. 3. Results Table (1) :Socio demographic Characteristics of the subjects
Variables Number Percent
Age 18- 20 22 < 24
61 99 36 4
30.5 49.5 18 2
Residency With Family Student’s Housing
182 18
91 9
Marital Status Marred Single Divorced
29 170 1
14.5 85 0.5
Family income Satisfying Not Satisfying
186 14
93 7
Table (2) : Academic data of the studied subjects
Number Percent
Academic year First year (freshmen) Second year (soft more) Third year (senior)
72 42 86
36 21 43
Academic Achievement Bad (late subjects) Satisfactory Good Very good Excellent
46 24 29 72 29
23 12 14.5 36 14.5
Program satisfaction Satisfied Not Satisfied
131 69
65.5 34.5
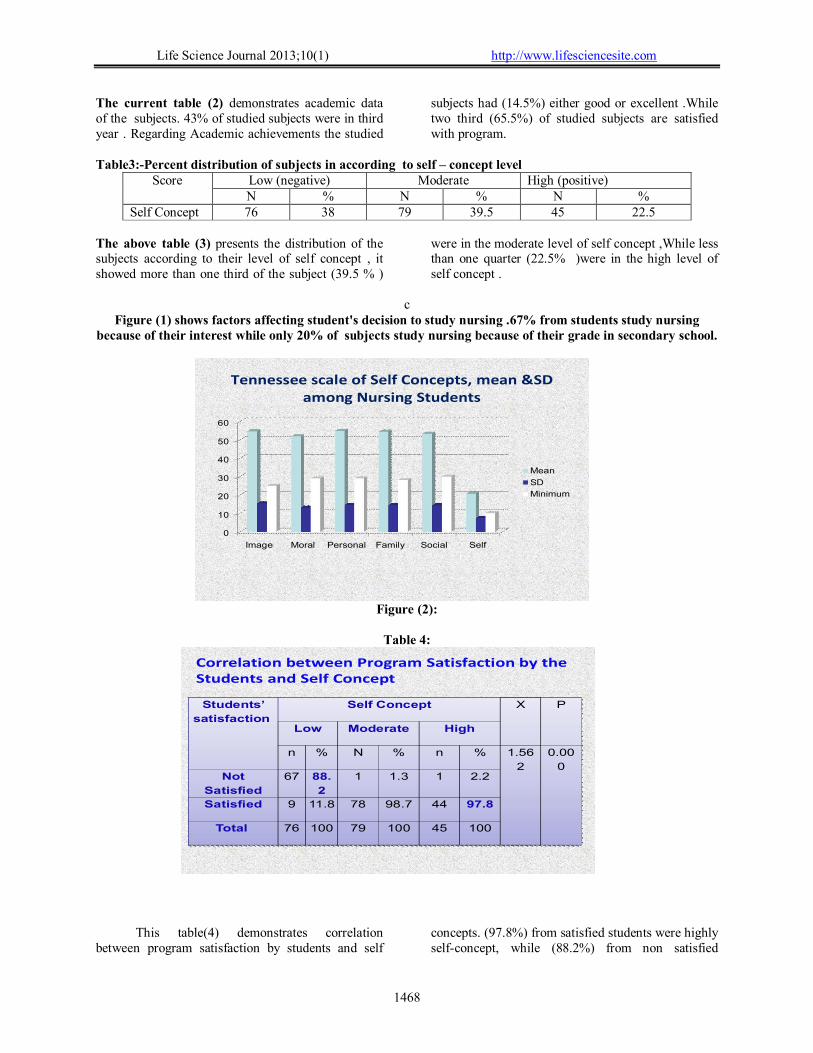
Life Science Journal 2013;10(1) http://www.lifesciencesite.com
1468
The current table (2) demonstrates academic data of the subjects. 43% of studied subjects were in third year . Regarding Academic achievements the studied
subjects had (14.5%) either good or excellent .While two third (65.5%) of studied subjects are satisfied with program.
Table3:-Percent distribution of subjects in according to self – concept level
Score Low (negative) Moderate High (positive) N % N % N %
Self Concept 76 38 79 39.5 45 22.5 The above table (3) presents the distribution of the subjects according to their level of self concept , it showed more than one third of the subject (39.5 % )
were in the moderate level of self concept ,While less than one quarter (22.5% )were in the high level of self concept .
c
Figure (1) shows factors affecting student's decision to study nursing .67% from students study nursing because of their interest while only 20% of subjects study nursing because of their grade in secondary school.
0
10
20
30
40
50
60
Image Moral Personal Family Social Self
Mean
SD
Minimum
Tennessee scale of Self Concepts, mean &SD among Nursing Students
Figure (2):
Table 4:
Students’
satisfaction
Self Concept X P
Low Moderate High
n % N % n % 1.56
2
0.00
0Not
Satisfied
67 88.
2
1 1.3 1 2.2
Satisfied 9 11.8 78 98.7 44 97.8
Total 76 100 79 100 45 100
Correlation between Program Satisfaction by the Students and Self Concept
This table(4) demonstrates correlation between program satisfaction by students and self
concepts. (97.8%) from satisfied students were highly self-concept, while (88.2%) from non satisfied
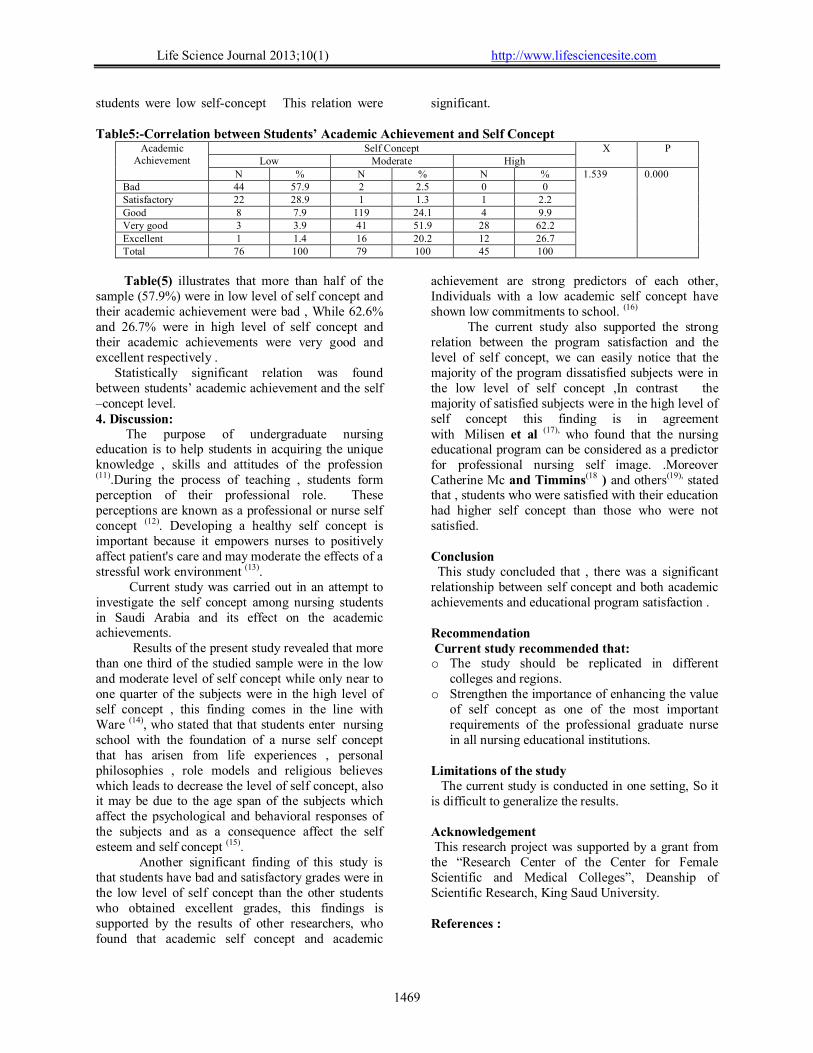
Life Science Journal 2013;10(1) http://www.lifesciencesite.com
1469
students were low self-concept This relation were significant. Table5:-Correlation between Students’ Academic Achievement and Self Concept
Academic Achievement
Self Concept X P Low Moderate High
N % N % N % 1.539 0.000 Bad 44 57.9 2 2.5 0 0 Satisfactory 22 28.9 1 1.3 1 2.2 Good 8 7.9 119 24.1 4 9.9 Very good 3 3.9 41 51.9 28 62.2 Excellent 1 1.4 16 20.2 12 26.7 Total 76 100 79 100 45 100
Table(5) illustrates that more than half of the
sample (57.9%) were in low level of self concept and their academic achievement were bad , While 62.6% and 26.7% were in high level of self concept and their academic achievements were very good and excellent respectively .
Statistically significant relation was found between students’ academic achievement and the self –concept level. 4. Discussion: The purpose of undergraduate nursing education is to help students in acquiring the unique knowledge , skills and attitudes of the profession (11).During the process of teaching , students form perception of their professional role. These perceptions are known as a professional or nurse self concept (12). Developing a healthy self concept is important because it empowers nurses to positively affect patient's care and may moderate the effects of a stressful work environment (13). Current study was carried out in an attempt to investigate the self concept among nursing students in Saudi Arabia and its effect on the academic achievements. Results of the present study revealed that more than one third of the studied sample were in the low and moderate level of self concept while only near to one quarter of the subjects were in the high level of self concept , this finding comes in the line with Ware (14), who stated that that students enter nursing school with the foundation of a nurse self concept that has arisen from life experiences , personal philosophies , role models and religious believes which leads to decrease the level of self concept, also it may be due to the age span of the subjects which affect the psychological and behavioral responses of the subjects and as a consequence affect the self esteem and self concept (15). Another significant finding of this study is that students have bad and satisfactory grades were in the low level of self concept than the other students who obtained excellent grades, this findings is supported by the results of other researchers, who found that academic self concept and academic
achievement are strong predictors of each other, Individuals with a low academic self concept have shown low commitments to school. (16) The current study also supported the strong relation between the program satisfaction and the level of self concept, we can easily notice that the majority of the program dissatisfied subjects were in the low level of self concept ,In contrast the majority of satisfied subjects were in the high level of self concept this finding is in agreement with Milisen et al (17), who found that the nursing educational program can be considered as a predictor for professional nursing self image. .Moreover Catherine Mc and Timmins(18 ) and others(19), stated that , students who were satisfied with their education had higher self concept than those who were not satisfied. Conclusion This study concluded that , there was a significant relationship between self concept and both academic achievements and educational program satisfaction . Recommendation Current study recommended that: o The study should be replicated in different
colleges and regions. o Strengthen the importance of enhancing the value
of self concept as one of the most important requirements of the professional graduate nurse in all nursing educational institutions.
Limitations of the study The current study is conducted in one setting, So it is difficult to generalize the results. Acknowledgement This research project was supported by a grant from the “Research Center of the Center for Female Scientific and Medical Colleges”, Deanship of Scientific Research, King Saud University. References :
Life Science Journal 2013;10(1) http://www.lifesciencesite.com
1470
1. SpaniathB,Spaniath F,Harlaar N &Plomin R .predicting school achievements from general cognitive ability ,self perceived ability and intrinsic value.Intell 2006;34, 363-374.
2. Breger K. the developing person through the life span .New York,NK worth published 2008; 288-2290.
3. Marsh H& Martin A.academic self concept and academic achievement .relation and casual ordering .British Journal of educational psychology 2011;81,59-77.
4. Trautwein U, Ludlke O, Nagy G & Marsh H. how students perceive the standing of their class predicts academic self concept .Journal of educational psychology 2009;101 (4 ): 853-866.
5. Preckel F,& Brull M .the benefits of being a fish in a big bond .controls and assimilation effects on academic self concept. Learning and individual differences 2010;20(5):522-531.
6. Van S, Bendekit H & Tomas C. The hunger mind .Intellectual curiosity is the third pillar of academic performance .perspective on psychology science 2011;6(6) :574-588.
7. Bossaret G & Doumen E. predicting student’s achievements during student’s middle childhood .developmental psychology 2011;34: 1497- 1512.
8. Rubie D .Teacher expectations and students self perception :Exploring relationship .psychology in the school 2006;43(5):537-552.
9. Euckay U & Chidozie E. construct validation of nurses self concept questionnaire in Nigeria .European journal of social science 2010;15(4)
10. Fitts, W. H., & Warren, W. L. (1996). Tennessee Self-Concept Scale, TSCS:2. Second edition. Manual. U.S.A: Western Psychological Services
11. Cronenwett L , Sherwood G, Barnsteiner J, Disch J& Mitchell P.Quality and safety education for nurses .Nursing Outlook 2007;55: 122-131.
12. Cowin L, Johnson M, Craven R & Marsh H. The professional self concept of nurses :A review of the literature from 1992- 2006. Australian journal of advanced nursing 2008; 24(3):60-64.
13. Azizy Y & Latif J .development of self concept .Pahang 2005; pts publishing sdn bhd.
14. Ware S. developing a self concept of nurse in baccalaureate nursing students. International journal of nursing education scholarship 2008;5(1):article 5.
15. Enju L& Stone S .Co- occurring Internalizing and externalizing behavioral problems: The mediating effect of negative self concept .Journal of youth and adolescence 2010; 41(6): 717-731.
16. Denise H & Mc Sharry P. Promoting self awareness in undergraduate nursing students in relation to their health status and personal behaviors .Nurse education in practice 2011;11(4):228-233
17. Milisen K, De Busser T, Kayaert A, Abraham I & Dierckx B. The evolving professional nursing self- image of students in baccalaureate program : A cross sectional survey .International journal of nursing studies 2010; 47(6):688-698.
18. Catherine Mc & Timmins F. Teaching assertiveness to undergraduate nursing students .Nursing education in practice 2003;3(1): 30-42.
19. Christiansen B & Jensen K. emotional learning within the framework of nursing education .Nurse education in practice 2008;8(5):328-334.
1/26/2013

Life Science Journal 2013;10(1) http://www.lifesciencesite.com
1471
The genetic diversity and relatedness of eight rice (Oryza sativa L.) cultivars as revealed by AFLP and SSRs markers
Haddad El Rabey*1&2, Khaled F. Salem3 and Magdy Z. Mattar4
1Biochemistry Department, Faculty of Science, King Abdulaziz University, Jeddah, Kingdom of Saudi Arabia.
2Bioinformatics Department, Genetic Engineering and Biotechnology Research Institute, Minufiya University, Sadat City PO Box 79, Egypt.
3Plant Biotechnology Department, Genetic Engineering and Biotechnology Research Institute, P. O. Box, 79, Sadat City, Minufiya University, Egypt.
4 Botany Department, Faculty of Science, Minufiya University, Shebin El-Kom, Egypt. [email protected]
Abstract: The amplified fragment length polymorphisms (AFLP) and simple sequence repeats (SSRs) markers were used in studying the genetic diversity of eight rice cultivars. The microsatellite markers were selected to fingerprint the eight rice cultivars under study. These markers were precisely selected in order to represent the entire rice genome. These SSR generated 46 markers, twelve out of them were polymorphic. The number of SSRs alleles per locus varied from 2 for RM133, RM 215 and RM433 to six for RM271, with a mean of 3.83 alleles per locus. Whereas, 245 polymorphic AFLP markers (nearly 87.21% of the total AFLP markers produced) were generated using five AFLP primer combinations. The polymorphism information content value for the two types of assays was 0.825 and 0.967 for SSR and AFLP markers, respectively. Pair-wise genetic similarity ranged from 0.393 to 0.783 and from 0.103 to 0.682 for AFLP and SSR, respectively. Cluster analysis was achieved based on SSRs and AFLP data and the relationship between the studied rice cultivars were addressed. [Haddad El Rabey, Khaled F. Salem and Magdy Z. Mattar. The genetic diversity and relatedness of eight rice (Oryza sativa L.) cultivars as revealed by AFLP and SSRs markers. Life Sci J 2013;10(1):1471-1479] (ISSN:1097-8135). http://www.lifesciencesite.com. 218 Key words: diversity, genetic distances, SSR, AFLP, Oryza sativa L. 1. Introduction
Rice (Oyrza sativa L.) is the second most important cereal crop in the world exceeded only by wheat (Poehlman & Sleper, 1995). It is grown in the temperate zone; (91%) in Asia, (5.8%) in North and South America, (2.8%) in Africa and (0.4%) in the southern part of Europe (Konokhova, 1985). The detection and characterization of genetic variation present in germplasm collections is important for plant breeding programs seeking to widen the genetic base of breeding populations.
Rice possesses the smallest genome size (400-500 Mbp) in monocotyledonous Gramineae, for this reason, it is considered the model system for studying Gramineae genome (Hartl & Jones, 2001). Based on comparative mapping with other Gramineae, the rice genome has extensive synteny with other Gramineae such as maize, Sorghum, wheat or barley (Moore et al., 1995; Saghai-Maroof et al., 1996; Gale & Devos, 1998 and Smilde et al., 2001). Dennis (2001) reported that genomics has led to a new paradigm for the study of biology and the research will focus on studying all the genes in an organism instead of studying individual genes. He added that in plants, genomics has been very dependent on the use of two model organisms, Arabidopsis as a general model for dicots and rice as model for cereals.
Molecular markers provide novel tools to differentiate among different plant genetic resources. Different marker systems are currently available for monitoring genetic diversity. Model markers with contrasting characteristics include amplified fragment length polymorphism (AFLP) as dominant and biallelic markers (Vos et al., 1995) and simple sequence repeat (SSR) as co-dominant markers that usually reveal a high number of alleles (Tautz, 1989). AFLP technique also provides many markers that randomly spread in the genome, whereas in a diversity study, the number of analyzed microsatellites is usually low. The comparative analysis between different markers is therefore intended to reveal the balance between different evolutionary forces contributing to genetic diversity.
Great efforts have been undertaken to obtain detailed genetic and physical maps of the rice genome (Ideta et al., 1994; Yano et al., 1996). Several scientists have interest to study and analyze the rice genome in order to localize the economic characters to their positions on the rice chromosomes (Mackill et al., 1995; Powell et al., 1996 and Lin et al., 2000). Caussa et al. (1994) and Kurata et al. (1994) developed RFLP maps for rice in Cornell and Japan respectively. These two maps form the basis of gene mapping research. The results derived from these two

Life Science Journal 2013;10(1) http://www.lifesciencesite.com
1472
maps clarified that polymorphism is very high between members of the Indica and Japonica subspecies and most mapping studies utilize Indica X Japonica crosses.
Gustafson and Yano (2000) generated DNA fingerprints for rice genome analysis utilizing several rice derived minisatellites containing different cone sequences and number of repeat units, followed by assessing their potential for use as genetic markers when mapped to rice recombinant inbred lines (RIL) population. Therefore, Sakata et al. (2000) established a new rice genome database in Japan called INE (integrated rice genome explorer) in order to integrate all the genomic information that has been accumulated so far and to correlate these data with the genome sequence.
Several studies concerning investigating the phenotypic and genetic variability linked to tolerance to biotic and abiotic stresses of the Egyptian rice cultivars (Sehly & Bastawisi, 1993; El Keredy et al., 1994 and Abdel Hafez et al., 1994), as well as studying the SDS- protein banding pattern and RAPD-based fingerprinting for discrimination between Egyptian rice cultivars and testing hybrid purity (Aly et al., 2000 and Wang et al., 2001). Mackill et al. (1995) compared the levels of polymorphism of 14 rice accessions as revealed by RAPD microsatellite loci and AFLP. They concluded that AFLPs are promising markers for mapping important genes. Powell et al. (1996) suggested that AFLPs provide high levels of delineation of complex genetic structures.
AFLPs fingerprinting technology was used in studying and mapping of rice economic traits such as submergence tolerance in rice (Kenong & Mackill, 1997) and studying the level of polymorphism in rice. It was also used in studying the comparative mapping of rice chromosome 1 and barley chromosome 3 (Saghai-Maroof et al., 1996; Smilde et al., 2001) and drought tolerant (Price et al., 2000). Ishimaru et al. (2001) constructed a rice function map by collating the results on quantitative trait loci (QTLs) for 23 important physiological and agronomic traits using EST (expressed sequence tags). Saini et al. (2004) assessed the genetic diversity within and among Basmati and non-Basmati rice varieties using AFLP, ISSR and SSR markers. They emphasized on the need for using a combination of different marker systems for a comprehensive genetic analysis of Basmati rice germplasm.
Saker et al. (2005) analyzed seven Egyptian rice genotypes using RAPD, SSR and AFLP markers. They concluded that each type of the three molecular approaches of DNA analysis could identify the different rice genotypes, and some of the Egyptian rice genotypes under investigation have probably
originated from closely related ancestors and possess high degree of genetic similarity. Kumagai et al. (2010) studied the genetic diversity and evolutionary relationships in genus Oryza using highly variable regions of chloroplast DNA.
Characterization of the genetic diversity and addressing cultivars relationships based on the genetic similarity are the major goals of the current research project. Both DNA fingerprinting using AFLP technology (Vos et al., 1995) and microsatellite loci (Litt & Luty, 1989) were used as genetic tools for fingerprinting rice cultivars under study. The present study was undertaken with the following objectives to (i) generate a comparative assessment of the potential of AFLP and SSRs markers to estimate genetic diversity among eight Egyptian rice genotypes; (ii) evaluate the application of AFLP and microsatellite markers as a tool for detecting genetic diversity among Egyptian rice genotypes and (iii) analyze the genetic structure of the Egyptian rice genotypes. 2.Materials and methods Plant materials
Eight rice genotypes were obtained from Rice Research Department, Field crop Research Institute, Agriculture Research Center (ARC), Ministry of Agriculture, Giza, Egypt. Details on these genotypes are given in Table (1). DNA isolation
Young leaves of 15 days-old seedling were harvested and immediately frozen in liquid nitrogen. DNA was extracted from the frozen leaves using a modified CTAB method as described by (Saghai-Maroof et al., 1984). Microsatellite assay
Twelve microsatellite markers were selected to represent the entire rice genome based on the published framework map (Akagi et al. 1996; Temnykh et al., 2000). The loci, chromosomal location, primer sequence, annealing temperature (Tm) and fragment size are presented in Table (2). DNA amplification was carried out in 25 μl reaction mixture, each containing 5 μl rice genomic DNA (50 ng), 2.5 μl 10X PCR buffer 1.5 μl mM MgCl2, 0.65 μl of each of the forward and reverse primers (250 nM), 2 μl 0.2 nM dNTPs and 0.3 μl Taq DNA polymerase and then completed to 25 μl with bidisttilled sterilized water. PCR amplification was carried out as described by Temnykh et al. (2000) as follows: 5 min at 94°C followed by 35 cycles (1 min at 94°C, 1 min at 55°C and 2 min at 72°C), with a final extension of 5 min at 72°C. The amplification product was resolved on 10% polyacrylamide gel electrophoresis (Chen et al., 1997 and Temnykh et al., 2000).

Life Science Journal 2013;10(1) http://www.lifesciencesite.com
1473
AFLP assay AFLP analysis was performed as described by
Vos et al. (1995). Briefly, 500 ng of rice genomic DNA was digested with EcoRI and MseI and double stranded adapters were ligated to the fragment ends. EcoRI adapters were ligated to the restricted fragments and preamplified with two primers (A18: 5-GACGATGAGTCCTGAG; A19: TACTCAGGACTCAT-5). MseI adapters were ligated to the restricted fragments and pre-amplified with two primers (M35: 5-bio-CTCGTAGACTGCGTACC; M36 CTGACGCATGGTTAA-5) containing one selective nucleotide. This was followed by pre-amplification step using non-selective primers. Selective amplification was performed on the pre-amplified fragment mixture using a total of five primer combinations. The reactions were performed in a Perkin-Elmer 9600 thermocycler Perkin-Elmer 9600 thermo cycler.
This was followed by pre-amplification step using non-selective primers. Selective amplification was performed on the pre-amplified fragment mixture using a total of five primer combinations namely, E36/M41, E37/M40, E40/M40, E40/M41, and E37/M41 were constructed by MWG-Biotech GmbH, Germany and used for PCR amplification. The sequence of these primers is as follows: (EcoRI primers: E36: 5-GAC TGC GTA CCA ATT C ACC-3, E37: 5-GAC TGC GTA CCA ATT C ACG-3, E40: 5-GAC TGC GTA CCA ATT C AGC-3, MseI primers: M40: 5-GAT GAG TCC TGA GTA A AGC-3, M41: 5-GAT GAG TCC TGA GTA A AGG-3).
3). The Amplified DNA product was separated in a 4.5% denaturing polyacrylamide gel electrophoresis, visualized by autoradiography using
P33-radiolabelled EcoRI primers and scored for the presence or absence of bands.
Data analyses
Diversity values were calculated for each locus as polymorphic information content (PIC)
k
1i
21PIC iP , where k is the total number of
alleles or polymorphic band detected for a locus of a marker and Pi is the frequency for each assay unit SSRs primer pairs (Botstein et al., 1980). For genetic similarity estimates and cluster analysis, the allelic data were converted to a binary format, with the presence of a specific allele (band) scored as unity and its absence as zero. For a subdivided sample, the total diversity of the sample can be partitioned into its components resulting from differentiation among populations and diversity within populations (Nei, 1973). Genetic similarities were estimated from the allele binary format dataset using the Dice method
(Nei & Li, 1979). The binary data were used to compute pair-wise similarity coefficients and the similarity matrix obtained was subjected to cluster analysis using the UPGMA (Un weighted Pair Group Method of Arithmetic Average) algorithm on NTSYS-pc version 2.1 software package (Rohlf, 1993). 3.Results SSR Analysis
Diversity of the twelve polymorphic SSR loci detected 46 alleles across the eight genotypes. The number of alleles per locus ranged from two for RM133, RM 215 and RM433 to six for RM271, with a mean of 3.83 alleles per locus (Table 3). The PPB is 100% for each SSR pair of primers. Thus, this marker type seems to be the most informative for assessment of diversity and for discrimination among genotypes. The PIC values for these markers in the examined genotypes ranged from 0.444 for RM 433 to 0.973 for RM 215 with an average of 0.825. The linear relationship between gene diversity and the number of alleles is shown in Figure (1). There is an increase in genetic diversity as the number of alleles increase. The correlation coefficient between gene diversity and the number of alleles was r = 0.309 (P < 0.01). The linear relationship between them is shown in Figure (1). Comparative utility of marker systems Polymorphic information content (PIC)
Gene diversity expressed as polymorphism information content (PIC) values for the 12 SSR loci varied from 0.444 for RM 433 to 0.973 for RM 215 with an average of 0.825. The linear relationship between gene diversity and the number of alleles is shown in Figure (1). The PIC values of assayed AFLP were observed in the range of 0.935 for the E40/E41 to 0.993 for E36/E41 with an average of 0.967 as shown in Table (4). Also, there is an increase in genetic diversity as the number of polymorphic band increase. The correlation coefficient between gene diversity and the number of alleles was, r = 0.861 (P < 0.01). The linear relationship between them is shown in Fig. 1.
SSR and AFLP markers showed high levels of polymorphism in the examined rice germplasm as the PIC value for the SSR and AFLP markers was calculated with an average of 0.825 and 0.967, respectively, across the germplasm lines assayed in Table (3). On the other hand, the 245 AFLPs and the 46 SSRs exhibited higher PIC values. Therefore, the data proved that these markers are efficient and powerful evidences in addressing the genetic diversity of rice genotypes as shown in Figure (1 and 2). Multiplex (n) and effective multiplex ratio (E)
Since SSR markers are usually locus specific, the twelve SSR markers analyzed are considered equal to twelve loci (as one locus per primer pair) in the present study. Thus, the SSR markers also provided the

Life Science Journal 2013;10(1) http://www.lifesciencesite.com
1474
multiplex or effective multiplex ratio as 1.0 per marker (Table 3). As a large number of fragments is detected using one AFLP primer combination, the AFLP markers have a higher multiplex ratio. Effective multiplex ratio of the AFLP, however, depends on the fraction of polymorphic markers (β) as many of the fragments obtained by one primer combination are polymorphic across the examined genotypes. In the present study, the n and E for the AFLP markers were calculated as 1.05 and 0.846, respectively as shown in Table (4). Marker index (MI)
For determining the overall utility of a given marker system, the MI was calculated for all the two marker systems examined. The AFLP markers showed the lowest MI (0.818), which is significantly lower than that estimated for the SSRs (0.825; Table 3). This analysis highlights the distinctive nature of the SSR assay. Genetic distances and relationships among genotypes AFLP polymorphisms AFLP analysis
A total of 245 polymorphic AFLP bands were obtained as a result of fingerprinting the eight genotypes under study using the five primer combinations. To estimate the genetic relatedness among the rice genotypes under study, pairwise distance matrix was obtained based on the formula of Nei and Li’s (1979). Based on the 245 AFLP markers, estimates of the genetic distance exhibited values ranged from 0.393 to 0.682 with a mean of 0.554 signifying that the genotypes studied are characterized by large divergence at the DNA level. The smallest genetic distance value of 0.393 was scored between the two short-grained Japonica type cultivars ‘Sakha
102’ [SK102] and ‘Giza 176’ [GZ176] as shown Table (5). However, ‘Sakha 101’ [SK101] and ‘Sakha 102’ [SK102] were most divergent, with the maximum genetic distance of 0.783. All others have displayed different middle levels of genetic similarity. The AFLP UPGMA dendrogram divided the eight tested genotypes into two main clusters as shown in Figure (3). The first main cluster included the two japonica rice cultivars Sakha 101 and Sakha 102. The second main cluster included two subclusters; the first includes two japonica rice cultivars namely; Giza171 and Giza176 and the other one includes four rice cultivars namely; Giza172, Giza 177, Giza 178 and Giza 181. The similarities ranged from 0.393 to 0.783. SSR Polymorphism
The genetic distance matrix among accessions ranged from 0.101 to 0.682 with a mean of 0.252. The smallest distance value was observed between ‘Sakha 101’ [SK101] and ‘Giza 181’ [GZ181] genotypes, which appear as the most similar accessions and closely related. The maximum distance value of 0.682 was obtained between ‘Giza 172’ [GZ172] and ‘Giza 171’ [GZ171] genotypes. The cluster analysis using UPGMA based on genetic distances from SSR marker analysis revealed that the eight genotypes were divided into two main clusters as shown in Figure (4). The first main cluster included the japonica rice cultivars and was divided into two subclusters. The first subcluster included two sub-subclusters. The first sub-subcluster includes one rice variety Sakha 101. The other sub-subcluster includes four rice varieties; Giza 172, Giza 171, Giza 177 and Giza 176. The second subcluster includes one variety Sakha 102. The other main cluster includes two indica rice varieties Giza 181 and Giza 178.
Table (1): List of rice genotypes used in the current study. Genotype Name Source Subspecies group Grain type
Giza 171 ARC, Egypt Japonica Short grain Giza 172 ARC, Egypt Japonica Short grain Giza 176 ARC, Egypt Japonica Short grain Giza 177 ARC, Egypt Japonica Short grain Sakha 101 ARC, Egypt Japonica Short grain Sakha 102 ARC, Egypt Japonica Short grain Giza 178 ARC, Egypt Indica/ Japonica Short grain Giza 181 ARC, Egypt Indica Long grain
Table (2): The 12 simple sequence repeats used in estimating the genetic similarity in rice cultivars under study. Primers Chromosome
number Relative distance from the centromere cM
Forward Primer sequence Reverse Primer sequence
Annealing Tm (ºC) Fragment size
RM 5 1 94.9 TGCAACTTCTAGCTGCTCGA GCATCCGATCTTGATGGG
55 113
RM 6 2 126 GTCCCCTCCACCCAATTC TCGTCTACTGTTGGCTGCAC
55 163
RM 11 7 47 TCTCCTCTTCCCCCGATC ATAGCGGGCGAGGCTTAG
55 140
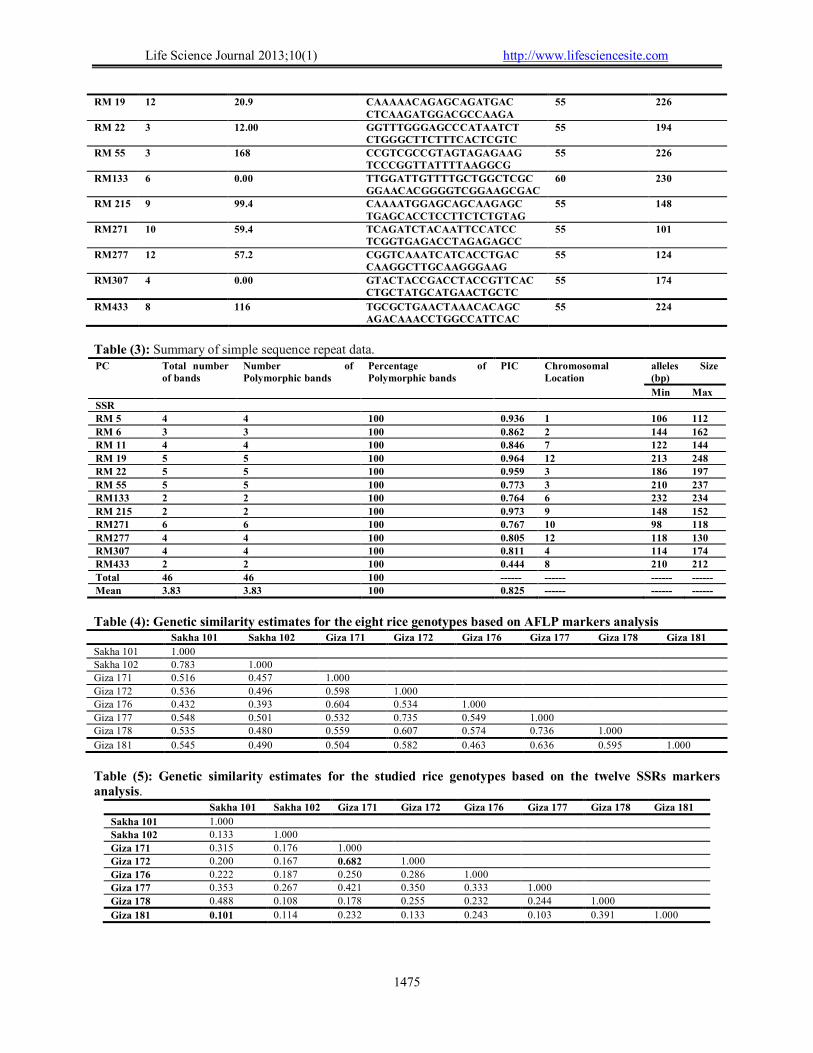
Life Science Journal 2013;10(1) http://www.lifesciencesite.com
1475
RM 19 12 20.9 CAAAAACAGAGCAGATGAC CTCAAGATGGACGCCAAGA
55 226
RM 22 3 12.00 GGTTTGGGAGCCCATAATCT CTGGGCTTCTTTCACTCGTC
55 194
RM 55 3 168 CCGTCGCCGTAGTAGAGAAG TCCCGGTTATTTTAAGGCG
55 226
RM133 6 0.00 TTGGATTGTTTTGCTGGCTCGC GGAACACGGGGTCGGAAGCGAC
60 230
RM 215 9 99.4 CAAAATGGAGCAGCAAGAGC TGAGCACCTCCTTCTCTGTAG
55 148
RM271 10 59.4 TCAGATCTACAATTCCATCC TCGGTGAGACCTAGAGAGCC
55 101
RM277 12 57.2 CGGTCAAATCATCACCTGAC CAAGGCTTGCAAGGGAAG
55 124
RM307 4 0.00 GTACTACCGACCTACCGTTCAC CTGCTATGCATGAACTGCTC
55 174
RM433 8 116 TGCGCTGAACTAAACACAGC AGACAAACCTGGCCATTCAC
55 224
Table (3): Summary of simple sequence repeat data. PC Total number
of bands Number of Polymorphic bands
Percentage of Polymorphic bands
PIC Chromosomal Location
alleles Size (bp)
Min Max SSR RM 5 4 4 100 0.936 1 106 112
RM 6 3 3 100 0.862 2 144 162 RM 11 4 4 100 0.846 7 122 144
RM 19 5 5 100 0.964 12 213 248 RM 22 5 5 100 0.959 3 186 197
RM 55 5 5 100 0.773 3 210 237 RM133 2 2 100 0.764 6 232 234
RM 215 2 2 100 0.973 9 148 152 RM271 6 6 100 0.767 10 98 118
RM277 4 4 100 0.805 12 118 130 RM307 4 4 100 0.811 4 114 174 RM433 2 2 100 0.444 8 210 212
Total 46 46 100 ------ ------ ------ ------ Mean 3.83 3.83 100 0.825 ------ ------ ------
Table (4): Genetic similarity estimates for the eight rice genotypes based on AFLP markers analysis Sakha 101 Sakha 102 Giza 171 Giza 172 Giza 176 Giza 177 Giza 178 Giza 181
Sakha 101 1.000 Sakha 102 0.783 1.000 Giza 171 0.516 0.457 1.000
Giza 172 0.536 0.496 0.598 1.000 Giza 176 0.432 0.393 0.604 0.534 1.000
Giza 177 0.548 0.501 0.532 0.735 0.549 1.000 Giza 178 0.535 0.480 0.559 0.607 0.574 0.736 1.000
Giza 181 0.545 0.490 0.504 0.582 0.463 0.636 0.595 1.000
Table (5): Genetic similarity estimates for the studied rice genotypes based on the twelve SSRs markers analysis.
Sakha 101 Sakha 102 Giza 171 Giza 172 Giza 176 Giza 177 Giza 178 Giza 181
Sakha 101 1.000
Sakha 102 0.133 1.000
Giza 171 0.315 0.176 1.000
Giza 172 0.200 0.167 0.682 1.000
Giza 176 0.222 0.187 0.250 0.286 1.000
Giza 177 0.353 0.267 0.421 0.350 0.333 1.000
Giza 178 0.488 0.108 0.178 0.255 0.232 0.244 1.000
Giza 181 0.101 0.114 0.232 0.133 0.243 0.103 0.391 1.000

Life Science Journal 2013;10(1) http://www.lifesciencesite.com
1476
y = 2.8693x + 1.4652 R2 = 0.0958
0
1
2
3
4
5
6
7
0 0.2 0.4 0.6 0.8 1 1.2
Fig. (1): Relationship between gene diversity and the number of alleles detected at 11 microsatellite loci.
Fig. (2): Dendrogram showing the genetic similarities among the studied rice cultivars based on using AFLP data analysis.
Fig. (3): Dendrogram showing the genetic similarities among the studied rice cultivars based twelve SSRs markers.
Life Science Journal 2013;10(1) http://www.lifesciencesite.com
1477
4. Discussion Given the proliferation of genetic markers,
comparisons between techniques are inevitable. However, there is a need for such comparisons in order to decide on which technique is best suited to the issues being examined. In this study, two of the polymerase chain reaction (PCR) based systems (SSRs and AFLPs) have been compared. Each technique not only differs in principal, but also in the type and amount of polymorphism. The two techniques varied widely, ranging from a maximum 100% (SSRs) to only 87.21% (AFLPs). Indeed, whenever SSRs have been compared to other systems, they have always revealed the highest levels of polymorphism (Wu & Tanksley, 1993; Saghai-Maroof et al., 1996; Powell et al., 1996 and Morgante et al., 2002). The average number of bands per lane or per PCR for AFLPs was 101.33, compared to 1.0 band per lane or PCR for SSRs. Thus, when the overall diversity indices of the two techniques were compared, AFLP was the highest (0.967). Powell et al. (1996) introduced the concept marker index as an overall measure of marker efficiency and they demonstrated that AFLPs had the highest marker index compared to other available marker systems. The high marker index is a reflection of the efficiency of AFLPs in simultaneous analysis of large number of bands rather than the levels of polymorphism detected (El Rabey et al., 2002).
Rice germplasm can be divided into four genepools, japonica, indica, indica/japonica and javanica, based on morphology distinctions and pedigree. Ni et al. (2002) using SSRs observed a clear separation between the indica and japonica types. In this study, similar results obtained with AFLPs and SSRs markers. With SSRs there is a clear separation between the indica and japonica types.
In the present study, the genetic diversity and cultivars relationship of eight Egyptian rice cultivars were characterized on the basis of the genetic affinity revealed by DNA fingerprinting using AFLP technique (Vos et al., 1995). The AFLP data provided high degrees of polymorphism that supports the value of AFLP in fingerprinting. The rice cultivars under study revealed by the 245 polymorphic bands that used efficiently in discriminating between various cultivars based on the genetic diversity and addressed the relationships among them. The studied cultivars were clustered into two principal groups. The first main cluster included the two cultivars Sakha 101 and Sakha 102. The second main cluster included two sub-subclusters. The first sub-subcluster includes two japonica rice cultivars Giza171 and Giza176. The other sub-subcluster includes four rice cultivars Giza172, Giza 177, Giza 178 and Giza 181. The most important phenomenon is the grouping of the two Indica lines with long grains (Giza 181 and Egyptian
Jasmine) together in one subgroup. This result is consistent with that based on proteins data analyses and that of Wang et al. (2001) and El Rabey (2003).
The structural changes (addition or deletion events) in rice genome may contribute to DNA variation detected by southern analysis (McCouch et al., 1988; Wang & Tanksley, 1989; Xu et al., 1998 and Morgante et al., 2002) or to point mutation (base substitution) (Ghareyazie et al., 1995). Yano et al. (1996) reported that collecting all rice genome data such as physical map, RAPD, SSR, AFLP and RFLP linkage maps and genetic map of phenotypic trait genes, including QTLs and the sequenced markers will generate an informative chromosome map as a comprehensive genome map. Once a fully integrated genome map is established, all the DNA clones such as plasmid, cosmid and YAC clones and all their data, will be very powerful tools not only for the analysis of rice genome structure and function , but also for practical rice breeding. Similar results were obtained by Huang et al. (2002) and Salem (2010). In the study herein, SSR was found highly polymorphic compared with AFLP markers. The high level of polymorphism linked with SSR is to be expected due to the unique mechanism responsible for generating SSR allelic diversity by replication slippage (Gupta & Varshney, 2000 and Varshney et al., 2005), whereas the basis of AFLP polymorphism are single nucleotide mutations and insertions/deletions (Ridout & Donini, 1999 and Rafalski, 2002). Regarding the detection of polymorphism, SSR markers are better than that of AFLP as SSR are co-dominant and multiallelic markers in contrast to the nature of AFLP markers.
In the present study the use of AFLP for DNA fingerprinting of the rice cultivars addressed the genetic relationships based on the homology of the genomic DNA of each cultivar. El Rabey et al. (2002) compared common bands isolated from different Hordeum species, 80.05% of these bands were found homologous in sequence. However, the intercultivars relationships based on AFLP data is considered a relationship based on sequence data.
So far, the genetic basis of several traits with economic and biological importance has been clarified by many rice geneticists and breeders. However, further analyses, at the molecular level, will be necessary for further improvement of rice varieties. Information generated from this study can be used to select parents for hybrid development to maximize the yield and development of segregating populations to map genes controlling yield and its components in rice.
Life Science Journal 2013;10(1) http://www.lifesciencesite.com
1478
Corresponding author Haddad El Rabey 1 & 2 1Biochemistry Department, Faculty of Science, King Abdulaziz University, Jeddah, Kingdom of Saudi Arabia. 2Bioinformatics Department, Genetic Engineering and Biotechnology Research Institute, Minufiya University, Sadat City PO Box 79, Egypt. [email protected]
References 1. Abdel Hafez, A.G., El Keredy M.S., El Hity M.A.,
El Mowafy H.F. (1994). Genetic analysis for salt tolerance traits in rice (Oryza sativa L.). J. Agric. Res. Tanta Univ. 20 (4): 666-677.
2. Akagi H., Yokozeki Y., Inagaki A., Fujimura T. (1996). Microsatellite DNA markers for the rice chromosomes. Theor Appl Genet. 93: 1071–1077.
3. Aly M., Rashed N., Hassan H. (2000). Genetic variability and assessment of relationships among some Egyptian rice (Oryza sativa L.) cultivars as revealed by SDS-protein and RAPD analyses. Egypt. J. Genet. Cytol. 29: 71-87.
4. Botstein D., White R.L., Skolnick M., Davis R.W. (1980). Construction of a genetic linkage map in man using restriction fragment length polymorphisms. Am J Hum Genet. 32:314–331.
5. Caussa M.A., Fulton T.M., Cho Y.G., Ahn S.N., Chunwongse J., WU K.S., Xiao J.H., Yu Z.H., Ronald P.C., Harington S.E., Second G., McCouch S.R., Tanksley S.D. (1994). Saturated molecular map of the rice genome based on interspecific backcross population. Genetics 138: 1251-1274.
6. Dennis E.S. (2001). Genomics and its relevance to barley. Proceedings of the 10th Australian Barley Technical Symposium.
7. El Keredy M.S., El Hity M.A., Abdel Hafez A.G., Mowafy H.F. (1994). Combining ability of major agronomic characters related to salt tolerance in rice (Oryza sativa L.). J. agric. Res. Tanta Univ. 20 (4): 650-665.
8. El Rabey H. (2003) DNA and seed protein fingerprinting of Egyptian crop plants. II. The relationships of 12 rice cultivars (Oryza sativa L.). Taeckholmia 23 (2): 35-49.
9. El Rabey H., Badr A., Schaefer-Pregl R., Martin W., Salamini F. (2002). Speciation and Species Separation in Hordeum L. (Poaceae) Resolved by Discontinuous Molecular Markers. Plant Biol. 4:1-9.
10. Gale M.D., Devos K.M. (1998). Plant comparative genetics after 10 years. Science 282: 656-659.
11. Ghareyazie B., Huang N., Second G., Bennett J., Khush G.S. (1995). Classification of rice germplasm: I. Analysis using AFLP and PCR-based RFLP. Theor. Appl. Genet. 91: 218-227.
12. Gupta P.K., Varshney R.K. (2000). The development and use of microsatellite markers for genetic analysis and plant breeding with emphasis on bread wheat. Euphytica 113: 163–185.
13. Gustafson J.P., Yano M. (2000). Genetic mapping of hypervariable minisatellite sequences in rice (Oryza sativa). The Appl. Gen. Abst. 100: 447-453.
14. Hartl D.L., Jones E.W. (2001). Genome evolution in the grass family. In, genetics and analysis of genes and genomes. Fifth edition, Jones and Bartlett publishers/Sudbury, Massachusetts, USA.
15. Huang Q, Börner A, Roder S, Ganal W. (2002). Assessing genetic diversity of wheat (Triticum aestivum L.) germplasm using microsatellite markers. Theor. Appl. Gen. 105: 699-707.
16. Ideta O., Yoshimura A., Ashikari M., Iwata N. (1994). Integration of conventional and RFLP linkage maps in rice. III. Chromosomes 5,7,8 and 12. Rice Genet. Newsl. 11: 116.
17. Ishimaru K., Yano M., Aokki N., Ono K., Hirose T., Lin S.Y., Monna L., Sasaki T., Ohsugi R. (2001). Toward the mapping of physiological and agronomic characters on a rice function map: QTL analysis and comparison between QTLs and expressed sequence tags. Theoritical and Applied Genetics 102 (6-7): 793-800.
18. Kenong X., Mackill D.J. (1997). AFLP markers closely linked to the rice submergence tolerance locus. Plant and Animal Genome V Conference, January 12-16: 148.
19. Konokhova V. (1985). Rice Growing. Translated from the Russian by V Kolykhmatov, Mir Publishers, Moscow.
20. Kumagai M., Wang L., Ueda S. (2010). Genetic diversity and evolutionary relationships in genus Oryza revealed by using highly variable regions of chloroplast DNA. Genetics 462: 44–51.
21. Kurata N., Nagamura Y., Yamamoto K. et al. (1994). A 300 Kilobase interval genetic map of rice including 883 expressed sequences. Nature Genetics 8: 365-372.
22. Lin H.X., Yamamoto T., Sasaki T., Yano M. (2000). Characterization and detection of epistatic interactions of 3 QTLs, HD1, Hd2, and Hd3, controlling heading date in rice using nearly isogenic lines. Theor and Appl Gen, 101 (7): 1021-1028.
23. Litt M., Luty J.A. (1989). A hypervariable microsatellite revealed by in vitro amplification of a dinucleotide repeat within the cardiac muscle actin gene. Am. J. Hum. Genet. 44: 397-401.
24. Mackill D., Zhang Z., Redona E., Colowit P. (1995). AFLP Markers for Rice Genetic Study. Plant Genome IV Conference, San Diego, California, USA, 71.
25. McCouch S.R., Kochert G., Yu Z.H., Wang Z.Y., Khush G.S., Coffman W.R., Tanksley S.D. (1988). Molecular mapping of rice chromosomes. Theor. Appl. Genet. 76: 815-829.
26. Moore G., Devos K.M., Wang Z., Gale M.D. (1995). Cereal genome evolution. Current Biology 5: 737-739.
27. Morgante M., Hanafey M., Powell W. (2002). Microsatellites are preferentially associated with

Life Science Journal 2013;10(1) http://www.lifesciencesite.com
1479
non-repetitive DNA in plant genomes. Nature Genetics 30: 194 -200.
28. Nei M. (1973). Analysis of gene diversity in subdivided populations. Proc. Natl. Acad. Sci. USA.
29. Nei M., Li W.H. (1979). Mathematical model for studying genetic variation in terms of restriction endonucleases. Proc. Natl. Acad. Sci. 76: 5269–5273.
30. Ni J., Colowit P.M. and Mackill D.J. 2002 Evaluation of genetic diversity in rice subspecies using microsatellite markers. Crop Sci 42: 601-607.
31. Poehlman J.M., Sleper D.A. (1995). Breeding field crops. Fourth edition, Iowa State Univ. press, Ames, Iowa, USA.
32. Powell W., Morgante M., Andre C., Hanafey M., Vogel M.J., Tingey S.V., Rafalski A. (1996). The comparison of RFLP, RAPD, AFLP and SSR (microsatellites) markers for germplasm analysis. Molecular Breeding 2: 225-235.
33. Price A.H., Steele K.A., Moore B.J., Barraclough P.P., Clark L.J. (2000). A combined RFLP and AFLP linkage map of upland rice (Oryza sativa L.) used to identify QTLs for root penetration ability. Th. App. Gen. 100 (1): 49-56.
34. Rafalski A. (2002). Applications of single nucleotide polymorphisms in crop genetics. Curr Opin Plant Biol. 5: 94–100.
35. Ridout C., Donini P. (1999). Use of AFLP in cereals research. Trends in Plant Science 4: 76-79.
36. Rohlf F.J. (1993). NTSYS-pc. Numerical Taxonomy and Multivariate Analysis System. Applied Biostatistics Inc, New York.
37. Saghai-Maroof M.A., Soliman K.M., Jorgensen R.A., Allard R.W. (1984). Ribosomal DNA spacer-length polymorphism in barley. Mendelian inheritance, chromosomal location, and population dynamics. Proc. Natl. Acad. Sci. USA 81: 8014-8018.
38. Saghai-Maroof M.A., Yang G.P., Biyashev R.M., Maughan P.J., Zhang Q. (1996). Analysis of the barley and rice genomes by comparative RFLP linkage mapping. Theo. Appl. Genet. 92: 541-551.
39. Saini N., Jain N., Jain S., R.K. (2004). Assessment of genetic diversity within and among Basmati and non-Basmati rice varieties using AFLP, ISSR and SSR markers. Euphytica 140: 133-146.
40. Sakata K., Antonio B.A., Mukai Y., Nagasaki H., Sakai Y., Makino K., Sasaki T. (2000). INE: a rice genome database with an integrated map view. Nucleic Acids Research 28 (1): 97-101.
41. Saker M., Youssef S., Abdallah N., Bashandy H., El Sharkawy A. (2005). Genetic analysis of some Egyptian rice genotypes using RAPD, SSR and
AFLP. African Journal of Biotechnology 4 (9): 882-890.
42. Salem K., Varshney RK, Röder M.S., Börner A. (2010). EST-SSR based estimates on functional genetic variation in a barley (Hordeum vulgare L.) collection from Egypt. Genet. Resour. Crop. Evol., 57: 515–521.
43. Sehly M.R., Bastawisi A.O. (1993). The present status of resistance to rice blast disease caused by Pyricularia oryzae under Egyptian conditions. Cahiers Options Mediterranean, 15, 3: 87-93.
44. Smilde W., Haluskova J., Sasaki T., Graner A. (2001). New evidence for the synteny of rice chromosome 1 and barley chromosome 3H from rice expressed sequence tags. Genome 44: 361-367.
45. Tautz D. (1989). Hypervariability of simple sequence as a general source for polymorphic DNA markers. Nuc. Acids Res., 17: 6463-6471.
46. Temnykh S., DeClerck G., Lukashuva A., Lipovich L., Cartinhour S., McCouch Susan (2000). Mapping and genome organization of microsatellite sequences in rice (Oryza sativa L.). Theor Appl Genet. 100: 697.
47. Varshney R.K., Nayak S.N., May G.D., Jackson S.A. (2005). Next-generation sequencing technologies and their implications for crop genetics and breeding. Trends in Biotechnology 27 (9): 522-530.
48. Vos P., Hogers R., Bleeker M., Reijans M. et al. (1995). AFLP: a new technique for DNA fingerprinting. Nucleic Acids Research 23 (21): 4407-4414.
49. Wu J., Tanksley S.D. (1993). Abundance, polymorphism and genetic mapping of microsatellites in rice. Mol Gen Genet. 241:225.
50. Wang XF, Knoblaunch R., Leist N. (2001). Identification of varieties and testing of hybrid purity of rice by ultrathin-layer isoelectric focusing of seed protein. Genetic Resources, April: 18-19.
51. Wang Z.Y., Tanksley S.D. (1989). Restriction fragment length polymorphism in Oryza sativa L. Genome 32: 1113-1118.
52. Xu J., Constantino S.V., Magpantay G., Bennett J. (1998). Classification of rice germplasm: II. Discrimination of indica from japonica via analysis of amplicon length polymorphisms. Plant Cell Reports, 17: 640-645.
53. Yano M., Nagamura Y., Kurata N., Sasaki T., Minobe Y. (1996). Toward the construction of an integrated genetic and physical map of rice. Genomes of plants and animals: 21st Stadler Genetics Symposium. Edited by P Gustafson and R B Flavell, Plenum Press, New York.
1/23/2013
Life Science Journal 2013;10(1) http://www.lifesciencesite.com
1480
Effect of saffron on liver development in mouse embryo
AmalAyedh and Fatma Al-Qudsi
Biology Department, Science Faculty, King AbdulAziz University, Jeddah, Saudi Arabia P.O. Box 42650, Jeddah 21551, Saudi Arabia
[email protected] Abstract: Saffron is internationally used as a food additive it is also used as an herbal medicine. The objective of this study was to assess the effect of everyday used doses of aqueous saffron extract on liver development in mice embryos. Forty five pregnant Swiss white Rodeless mice were divided into three groups. Group 1 received 10ml/kg body weight double distilled wateras control, group 2 received a high dose of aqueous saffron extract 100 mg saffron / kg body weight and group 3 received a low dose of aqueous saffron extract 2.5 mg saffron / kg body weight. Doses were administered orally for 5 days during the first and second weeks of gestation and for four days during the third week of gestation. Embryos were extracted on day 14, 18 of gestation and day 1 neonates. LPO, GSH and total protein content of liver at day 18 of gestation were measured. Histological structure of embryonic liver was studied. Significant decrease in LPO, significant increase in the GSH and a non-significant decrease in the total protein content of 18 day livers of embryos of treated mothers was seen compared to the control group. On the histological and ultra-structural level many deterioration were seen in the liver of embryos of treated mothers such as dilation and congestion of central veins and portal veins. It was concluded that oral administration of both doses of saffron caused deterioration of embryonic liver tissue. [AmalAyedh andFatma Al-Qudsi. Effect of saffron on liver development in mouse embryo. Life Sci J 2013;10(1):1480-1495] (ISSN:1097-8135). http://www.lifesciencesite.com. 219 Key words: Saffron, mouse embryo liver development, liver histology, apoptosis, hepatocytes. 1.Introduction
Saffron (Crocus sativus L. stigma) has been used since ancient times (Deo, 2003). Saffron is very usable in kitchen because of its color, taste and aroma. It is used for garnishing and coloring all kinds of rice and chicken, soup, seafood, desserts, drinks and home-baked sweets. In Arab countries, it is popular to make special tea and coffee with saffron. In India, a dish called Biryani is prepared with Saffron. In Italy and Switzerland, it is common to use saffron to cook rice. Cake is made with saffron in Germany and England, as well as many foods that are made with saffron from Spanish paella to French bouillabaisse (Abdullaev 1993, 2002; Negbi 1999; McGee 2004; Dharmananda 2005; Al-Moflehet al. 2006; Çavusoglu, et al., 2009; Verma and Middha 2010).
Saffron hasbeen used in folklore medicine,as well as in modern pharmacy. Saffron has been reputed to beuseful in the treatment of numerous human illnesses (Duke 1987;Zargari 1993; Abdullaev 2002). It can also be used topically to help clear up and cure sores and to reduce the discomfort of teething in infants. Furthermore, saffron contributes as an excellent stomach ailment and an antispasmodic as well. It helps digestion and increases appetite. It also relieves renal colic, reduces stomachaches and relieves tension. It’s essential oil is relaxant and could be useful in insomnia of nervous origin. Saffron as a medical
plant is considered as an excellent medicine in chronic bronchitis and lung diseases. In South Asia saffron is widely used for kidney, liver, vesica disease and for medication of cholera. External application of saffron tincture is useful for dermal disease such as impetigo (Abdullaev 1993; Khorasaniet al. 2008). Saffron has positive effects in lowering blood cholesterol and triglycerides (Arastehet al., 2010). The therapeutic function of saffron, included treatment of certain cancers, as in 1990's scientist reported for the first time the antitumor effect of Crocus sativus L. in mice.As well as cures for cerebrovascular and cardiovascular diseases has been well established (Nair et al.,1991; Negbi 1999; Abdullaev, 2002). Saffron is also considered as an anticonvulsant, antioxidant, anti-inflammatory , and is used to cure burns and treat depression (Salomi, 1991; Abdullaev, 2002; Hosseinzadeh and Younesi, 2002). Moreover, Crocus sativus is applicable for treatment of nervous disorders, anxiolytic, spasms, asthma (Abdullaev, 2002; Hosseinzadehet al. ,2005; Mohajeriet al., 2007; Hosseinzadeh and Noraei, 2009).
In modern pharmacy saffron has the reputation to be useful in treatment of many diseases including diabetes. In a study of diabetic male rats it was found that 50 mg/kg of hydromethanolic extract of saffron injected intraperitoneally decreased serum glucose, cholesterol levels and increased serum insulin
Life Science Journal 2013;10(1) http://www.lifesciencesite.com
1481
(Alarcon-Aguilaraet al., 1998; Mohajery et al.,2009; Arastehet al., 2010).
Saffron is used as an essential and natural colorant in industrial factories Dairy factories use saffron in making varied kinds of butter, cheese and ice cream. Products of drink, jelly, candy, cake and cookie factories benefit from saffron. The use of saffron in the cosmetic industry is now fairly widespread with the trend to use natural products and owing to its active substances. Saffron is also used as a perfume ingredient in many famous internationally brands and also as a dye or ink(Estilai, 1978; Basker and Negbi, 1983; Abdullaev, 2002; Hill, 2004; Aytekin and Acikgoz, 2008). Saffron extract given by oral administration to mice infected with cancer can inhibit the growth of cancer. It also increased the life of the treated mice (Chermahiniet al.,2010).
Adult rats having alcoholic and carbon tetrachloride (CCl4) liver toxicity were given saffronby intragastric feedingtubeto determine the therapeutic effectofsaffron. It was noted that saffron was usefulin the prevention ofliverinjury by alcoholic and CCl4, where the serum level of ALT decreased significantly in saffron groups as compared with rats treated with alcoholic and CCl4 only. However it was also notedthat saffron groups had obvious pathological changes (Anlinet al., 2000).
Adult liver metabolizes both beneficial and harmful substances. It stores nutrients and other useful substances, as well as detoxifying or breaking down harmful compounds. The liver regulates carbohydrate, lipid and protein metabolism and synthesis. Most of the water soluble minerals, vitamins and nutrients absorbed by the small intestine are transferred into the liver through the portal blood (Tso and McGill, 2003; Van Tellingen, 2003). Also liver also plays an important role in the storage and metabolism of iron and vitamins such as A, D, B12, synthesizes prothrombin, fibrinogen and clotting factors. Aged RBCs are destroyed primarily in spleen and liver. The liver also excrete calcium via the bile, breaks down toxic substances (Tso and McGill, 2003; Van Tellingen, 2003). The liver can be taken as the major source of hematopoietic cells during gestation at the age from 11.5 to 12.5 days (Sasaki and Matsumura 1986). Macrophages surround the erythroblasts to function as nurse cells during erythropoiesis and to phagocytize the expelled erythrocytic nuclei (Chasis, 2006; Isernet al., 2008). At the age of 12 days of gestation, the most abundant protein (albumin) is synthesized by mature hepatocytes and increases until adulthood (Tilghman and Belayew, 1982). The hepatocytes are involved in bile acids synthesis, bile formation, and absorption of nutrients and xenobiotics. Also they are able to maintain the homeostasis of glucose, amino acid,
ammonia and bicarbonate in the body(Tso and McGill, 2003). From age 12 to age 14 days of gestation stellate cells contain distinct fatty droplets in the cytoplasm that contain vitamin A. Megakaryocytes are found in the liver in large numbers at 13.5 day of gestation and produce platelets and store glycogen (Gibb and Stowell, 1949; Crawford, et al.,, 2010). Kupffer cells play an essential role in removing bacteria, virus particles and fibrin-fibrinogen complexes from the circulation. Kupffer cells in the liver can remove damaged RBCs. The RBCs are digested by secondary lysosomes in kupffer cells to release heme (Tso and McGill, 2003; Naito et al., 2004).
The usages of saffron in pregnant mice can have some complications on the embryo as giving rise to absorbed and abnormal embryos (Tafazoli et al.,2004). A study showed that oral administration of high and low doses of aqueous saffron extract to mice during pregnancy caused significant decrease in embryonic growth parameters and caused congenital malformations (AlQudsi and Ayedh, 2012). Studies on the effect of normally consumed saffron amounts on liver embryonic development are scarce and keeping in mind the importance of the liver during embryonic development and adult life therefore came the urgency to do such research.
2.Materials and Methods
All experimental procedure was approved by the Biology department at King Abdulaziz University. Forty five (45) mature female and 45 mature male SWR (Swiss White Rodeless mice) from King Saud University Animal house, were used. Weighing 25-30 grams. They were maintained at 22± 2ºC on 12 hours light: 12 hours dark daily in plastic cages, and fed on corn cob pellets with water bottle. Saffron, the dried stigmasof Crocus sativus flower were taken from Al-alawy market in Jeddah, and was identified by our Botany taxonomist, in the Biology Department at the Faculty of Science, King Abdulaziz University.
The estrus stage was determined according to the method described by (Walmeret al. 1992; Caligioni 2009). A male and a female (in estrus stage) were placed in one cage and left overnight. The presence of the vaginal plug, next morning was considered as fertilization evidence, and this was considered to be the first day of pregnancy therefore sexes were separated.
In this research two doses were used. (100 mg/kg body weight) as high dose (HD) taken from (Premkumaret al. 2003a). While the other dose (2.5 mg/kg body weight) as low dose (LD) used in everyday life, taken from (Al-Qudsi and Ayedh, 2012). The aqueous extract of saffron was prepared
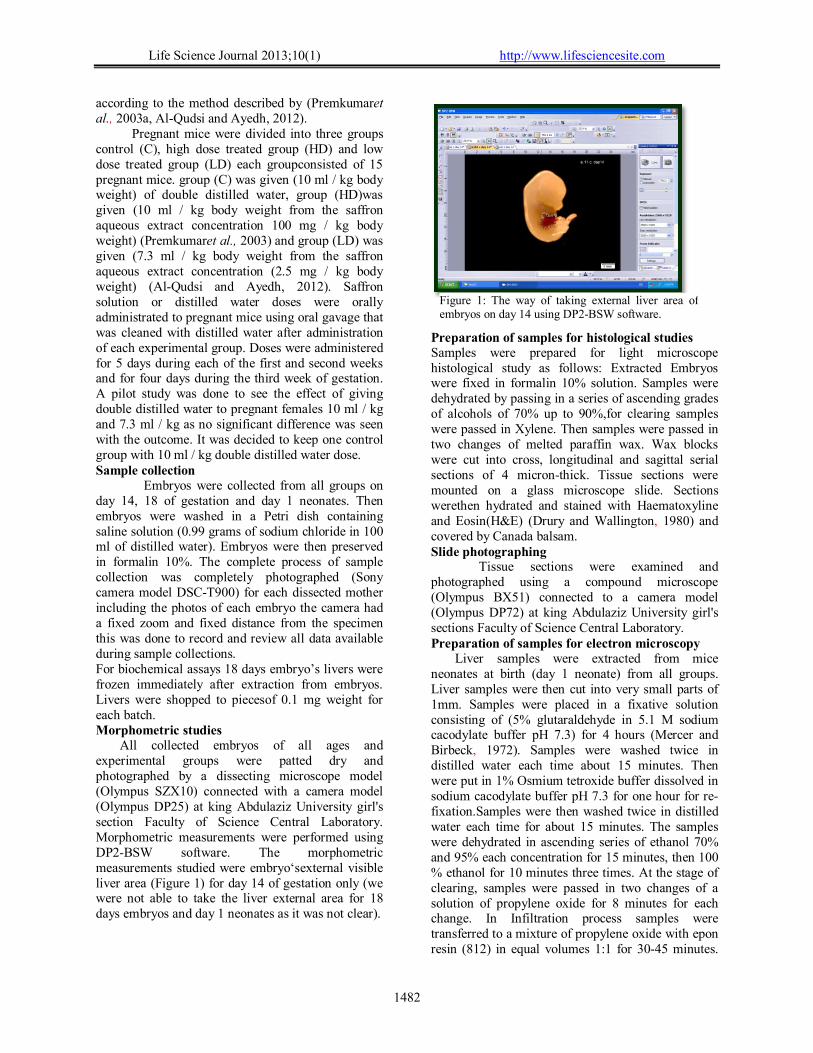
Life Science Journal 2013;10(1) http://www.lifesciencesite.com
1482
according to the method described by (Premkumaret al., 2003a, Al-Qudsi and Ayedh, 2012).
Pregnant mice were divided into three groups control (C), high dose treated group (HD) and low dose treated group (LD) each groupconsisted of 15 pregnant mice. group (C) was given (10 ml / kg body weight) of double distilled water, group (HD)was given (10 ml / kg body weight from the saffron aqueous extract concentration 100 mg / kg body weight) (Premkumaret al., 2003) and group (LD) was given (7.3 ml / kg body weight from the saffron aqueous extract concentration (2.5 mg / kg body weight) (Al-Qudsi and Ayedh, 2012). Saffron solution or distilled water doses were orally administrated to pregnant mice using oral gavage that was cleaned with distilled water after administration of each experimental group. Doses were administered for 5 days during each of the first and second weeks and for four days during the third week of gestation. A pilot study was done to see the effect of giving double distilled water to pregnant females 10 ml / kg and 7.3 ml / kg as no significant difference was seen with the outcome. It was decided to keep one control group with 10 ml / kg double distilled water dose. Sample collection Embryos were collected from all groups on day 14, 18 of gestation and day 1 neonates. Then embryos were washed in a Petri dish containing saline solution (0.99 grams of sodium chloride in 100 ml of distilled water). Embryos were then preserved in formalin 10%. The complete process of sample collection was completely photographed (Sony camera model DSC-T900) for each dissected mother including the photos of each embryo the camera had a fixed zoom and fixed distance from the specimen this was done to record and review all data available during sample collections. For biochemical assays 18 days embryo’s livers were frozen immediately after extraction from embryos. Livers were shopped to piecesof 0.1 mg weight for each batch. Morphometric studies
All collected embryos of all ages and experimental groups were patted dry and photographed by a dissecting microscope model (Olympus SZX10) connected with a camera model (Olympus DP25) at king Abdulaziz University girl's section Faculty of Science Central Laboratory. Morphometric measurements were performed using DP2-BSW software. The morphometric measurements studied were embryo‘sexternal visible liver area (Figure 1) for day 14 of gestation only (we were not able to take the liver external area for 18 days embryos and day 1 neonates as it was not clear).
Preparation of samples for histological studies Samples were prepared for light microscope histological study as follows: Extracted Embryos were fixed in formalin 10% solution. Samples were dehydrated by passing in a series of ascending grades of alcohols of 70% up to 90%,for clearing samples were passed in Xylene. Then samples were passed in two changes of melted paraffin wax. Wax blocks were cut into cross, longitudinal and sagittal serial sections of 4 micron-thick. Tissue sections were mounted on a glass microscope slide. Sections werethen hydrated and stained with Haematoxyline and Eosin(H&E) (Drury and Wallington, 1980) and covered by Canada balsam. Slide photographing
Tissue sections were examined and photographed using a compound microscope (Olympus BX51) connected to a camera model (Olympus DP72) at king Abdulaziz University girl's sections Faculty of Science Central Laboratory. Preparation of samples for electron microscopy
Liver samples were extracted from mice neonates at birth (day 1 neonate) from all groups. Liver samples were then cut into very small parts of 1mm. Samples were placed in a fixative solution consisting of (5% glutaraldehyde in 5.1 M sodium cacodylate buffer pH 7.3) for 4 hours (Mercer and Birbeck, 1972). Samples were washed twice in distilled water each time about 15 minutes. Then were put in 1% Osmium tetroxide buffer dissolved in sodium cacodylate buffer pH 7.3 for one hour for re-fixation.Samples were then washed twice in distilled water each time for about 15 minutes. The samples were dehydrated in ascending series of ethanol 70% and 95% each concentration for 15 minutes, then 100 % ethanol for 10 minutes three times. At the stage of clearing, samples were passed in two changes of a solution of propylene oxide for 8 minutes for each change. In Infiltration process samples were transferred to a mixture of propylene oxide with epon resin (812) in equal volumes 1:1 for 30-45 minutes.
Figure 1: The way of taking external liver area of embryos on day 14 using DP2-BSW software.
Life Science Journal 2013;10(1) http://www.lifesciencesite.com
1483
The samples were then embedded in pure epon resin and left for 30-45 minutes,then embedded in pure resin into blocks at 60ºC overnight. Samples were sectioned for light microscope by LKB ultramicrotome with glass knives to produce semi-thin sections (0.5 micron). Samples were stained for light microscope, by Toludin blue to determine the place to be examined by electron microscope. Samples were then cut into ultrathin sections of 50 nm by ultra-microtome with glass knives. Ultrathin sections were placed on mesh naked copper grids. For staining a drop of dye was put on the copper grid using uranil acetate for 30 minutes and lead citrate for 15 minutes (Reynold 1963, Mercer and Birbeck, 1972). Sections were examined and photographed by transmission electron microscope at King Fhad Medical Research Center in Jeddah. Lipid peroxidation (LPO) assay
The extent of LPO was estimated as the concentration of thiobarbituric acid (TBA) reactive product MDA by using the method of Ohkawaet al.,(1979). Two hundred fifty microliters of liver tissue homogenate were added to 1.5 ml of 1% phosphoric acid (pH 2.0) and 1 ml of 0.6% of TBA in air–light tubes and were placed in a boiling water bath for 25 min. After incubation, the sample was cooled to room temperature and MDATBA was extracted with 2.5 ml of butanol. Organic phase was separated by centrifugation for 5 min at 2000g and measured at 532 nm. MDA concentrations were determined using 1,1,3,3-tetraethoxypropane as standard and expressed as l mol/g liver tissue. Reduced glutathione (GSH) assay
Reduced GSH estimation was performed by the method of (Beutler et al.,1963). Livers were homogenized in 1 ml of 1.1% KCl cooled, then homogenate (100 µl) was mixed with 750 µl of precipitate solution (1.67 g of glacial metaphosphoric acid, 0.2 g of EDTA and 30 g of NaCl in 100 ml of distilled water) and 900 ml of distilled water. Homogenated tissues were centrifuged at 2000g for 15 min to precipitate proteins. Protein-free supernatant (250 ml) was added to 1 ml of Na² HPO4 (0.3 M) solution and the reaction was initiated by adding 125 ml of DTNB (6 mM) and the absorbance of 5-thio-2-nitrobenzoic acid (TNB) formed was measured at 412 nm. The level of GSH was obtained by standard curve and expressed as mmole per g liver tissue. Determination of total proteins content Principle
At an alkaline pH, the protein reacts with the copper in the biuret reagent causing an increase in
absorbance. The increase in absorbance at 550 nm due to the formation of the colored complex is directly proportional to the concentration of protein in the reaction (Gornallet al.,1949).
Protein + Cu++ blue-violet complex Reagents (1) Standard albumin (5 g/dL). (2) Biuret reagent consists of cupric sulfate (6 mmol/L), sodium potassium tartrate (21 mmol/L), sodium hydroxide (750 mmol/L) and potassium iodide (6 mmol/L). Procedure 1-The following volumes (mL) were pipetted into cuvettes and were mixed well:
Blank (mL)
Standard (mL)
Sample (mL)
Standard - 0.025 - Sample - - 0.025 Biuret reagent
1.0 1.0 1.0
2- All tubes were incubated at 37 °C for 10 min. 3- The absorbance of the sample (Asample) and standard (Astandard) against reagent blank was read at 550 nm. 4- Color stable for an hour, linearity up to 10 g/dL 5- The values were derived by the following equation: Total protein concentration (g/dL) = (Asample/ Astandard)x 5. Statistical analysis Data was analyzed using SPSS 16. The test used with normal distribution was Anova, Student-Neuman Keul test. In case of abnormal distribution Man-Whiteney U test was used from the non-parametrictest. Significance ( ٭( was at p˂0.05. 3.Results: Effect of saffron on external liver area: A non-significant decrease in the outer seen liver area of treated embryos (HD) and (LD) was seen on day 14 compared the control group. Effect of saffron on liver weight: A slight non-significant decrease in liver weight of treated (HD) and (LD) embryos was seen on day 18 compared the control group. Effect of saffron on liver peroxidation: A significant decrease in liver LPO of treated embryos (HD) and (LD) was seen on day 18 of gestation compared to the control group p= 0.046 for (HD) and p=0.041 for (LD)(Figure 2).

Life Science Journal 2013;10(1) http://www.lifesciencesite.com
1484
Figure 2 Graph showing the
effect of saffron on embryo’s
liver lipid peroxidation at day 18
of gestation. Values are M±SE
taken from 15 samples for each
age treatment (*) P˂ 0.05.
Figure 3 Graph showing the
effect of saffron on embryo’s
liver glutathione at day 18 of
gestation. Values are M±SE
taken from 15 samples for each
age treatment (*) P˂ 0.05.
Figure 4 Graph showing the effect
of saffron on embryo’s liver total
protein content at day 18 of
gestation. Values are M±SE taken
from 15 samples for each age
treatment (*) P˂ 0.05.
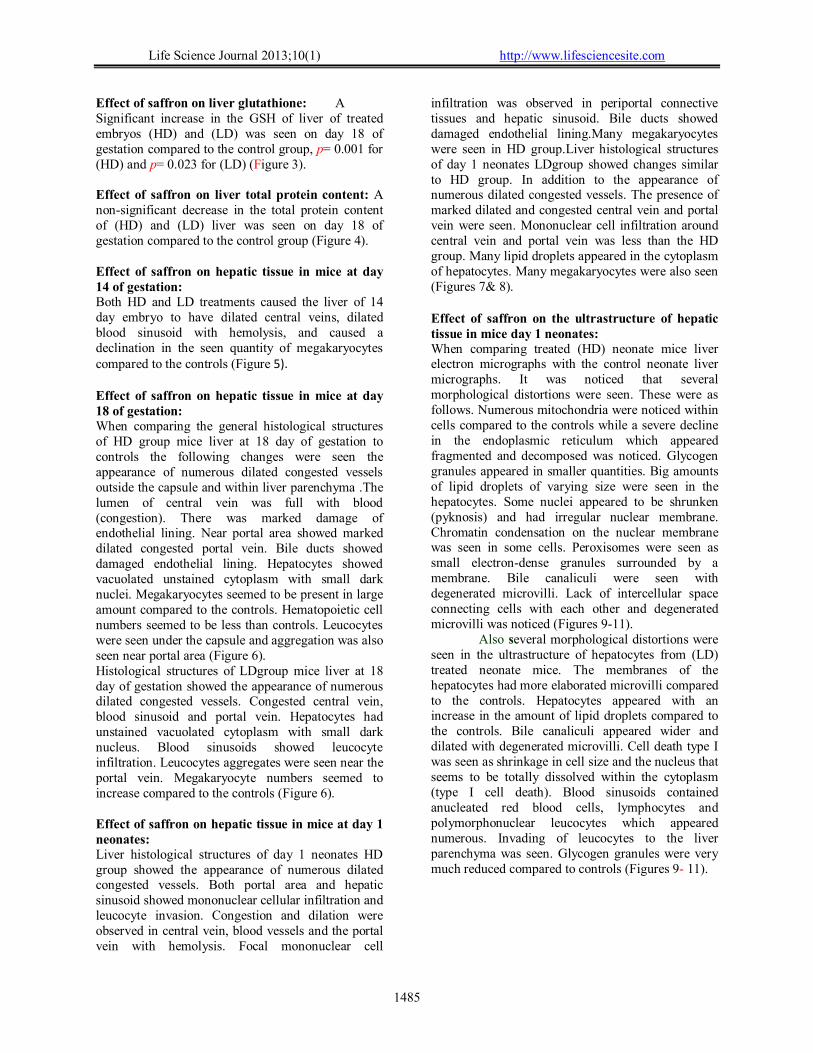
Life Science Journal 2013;10(1) http://www.lifesciencesite.com
1485
Effect of saffron on liver glutathione: A Significant increase in the GSH of liver of treated embryos (HD) and (LD) was seen on day 18 of gestation compared to the control group, p= 0.001 for (HD) and p= 0.023 for (LD) (Figure 3). Effect of saffron on liver total protein content: A non-significant decrease in the total protein content of (HD) and (LD) liver was seen on day 18 of gestation compared to the control group (Figure 4). Effect of saffron on hepatic tissue in mice at day 14 of gestation: Both HD and LD treatments caused the liver of 14 day embryo to have dilated central veins, dilated blood sinusoid with hemolysis, and caused a declination in the seen quantity of megakaryocytes compared to the controls (Figure 5). Effect of saffron on hepatic tissue in mice at day 18 of gestation: When comparing the general histological structures of HD group mice liver at 18 day of gestation to controls the following changes were seen the appearance of numerous dilated congested vessels outside the capsule and within liver parenchyma .The lumen of central vein was full with blood (congestion). There was marked damage of endothelial lining. Near portal area showed marked dilated congested portal vein. Bile ducts showed damaged endothelial lining. Hepatocytes showed vacuolated unstained cytoplasm with small dark nuclei. Megakaryocytes seemed to be present in large amount compared to the controls. Hematopoietic cell numbers seemed to be less than controls. Leucocytes were seen under the capsule and aggregation was also seen near portal area (Figure 6). Histological structures of LDgroup mice liver at 18 day of gestation showed the appearance of numerous dilated congested vessels. Congested central vein, blood sinusoid and portal vein. Hepatocytes had unstained vacuolated cytoplasm with small dark nucleus. Blood sinusoids showed leucocyte infiltration. Leucocytes aggregates were seen near the portal vein. Megakaryocyte numbers seemed to increase compared to the controls (Figure 6). Effect of saffron on hepatic tissue in mice at day 1 neonates: Liver histological structures of day 1 neonates HD group showed the appearance of numerous dilated congested vessels. Both portal area and hepatic sinusoid showed mononuclear cellular infiltration and leucocyte invasion. Congestion and dilation were observed in central vein, blood vessels and the portal vein with hemolysis. Focal mononuclear cell
infiltration was observed in periportal connective tissues and hepatic sinusoid. Bile ducts showed damaged endothelial lining.Many megakaryocytes were seen in HD group.Liver histological structures of day 1 neonates LDgroup showed changes similar to HD group. In addition to the appearance of numerous dilated congested vessels. The presence of marked dilated and congested central vein and portal vein were seen. Mononuclear cell infiltration around central vein and portal vein was less than the HD group. Many lipid droplets appeared in the cytoplasm of hepatocytes. Many megakaryocytes were also seen (Figures 7& 8). Effect of saffron on the ultrastructure of hepatic tissue in mice day 1 neonates: When comparing treated (HD) neonate mice liver electron micrographs with the control neonate liver micrographs. It was noticed that several morphological distortions were seen. These were as follows. Numerous mitochondria were noticed within cells compared to the controls while a severe decline in the endoplasmic reticulum which appeared fragmented and decomposed was noticed. Glycogen granules appeared in smaller quantities. Big amounts of lipid droplets of varying size were seen in the hepatocytes. Some nuclei appeared to be shrunken (pyknosis) and had irregular nuclear membrane. Chromatin condensation on the nuclear membrane was seen in some cells. Peroxisomes were seen as small electron-dense granules surrounded by a membrane. Bile canaliculi were seen with degenerated microvilli. Lack of intercellular space connecting cells with each other and degenerated microvilli was noticed (Figures 9-11). Also several morphological distortions were seen in the ultrastructure of hepatocytes from (LD) treated neonate mice. The membranes of the hepatocytes had more elaborated microvilli compared to the controls. Hepatocytes appeared with an increase in the amount of lipid droplets compared to the controls. Bile canaliculi appeared wider and dilated with degenerated microvilli. Cell death type I was seen as shrinkage in cell size and the nucleus that seems to be totally dissolved within the cytoplasm (type I cell death). Blood sinusoids contained anucleated red blood cells, lymphocytes and polymorphonuclear leucocytes which appeared numerous. Invading of leucocytes to the liver parenchyma was seen. Glycogen granules were very much reduced compared to controls (Figures 9- 11).

Life Science Journal 2013;10(1) http://www.lifesciencesite.com
1486
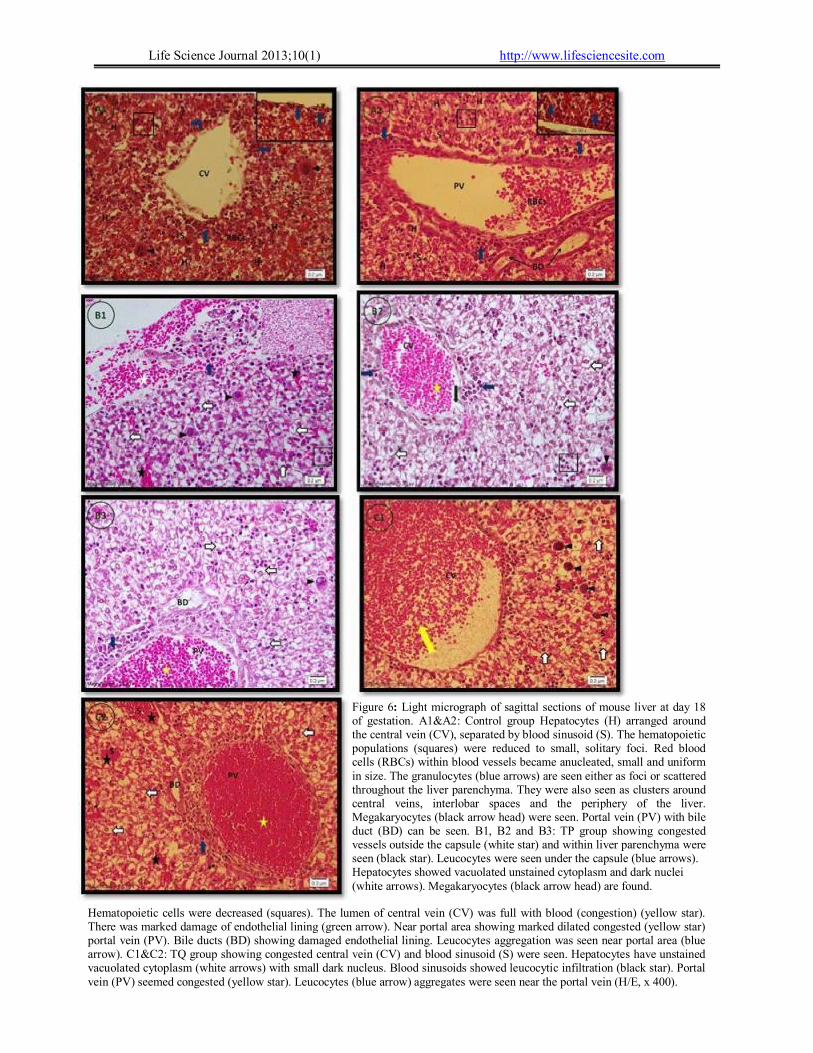
Life Science Journal 2013;10(1) http://www.lifesciencesite.com
1487
Figure 6: Light micrograph of sagittal sections of mouse liver at day 18 of gestation. A1&A2: Control group Hepatocytes (H) arranged around the central vein (CV), separated by blood sinusoid (S). The hematopoietic populations (squares) were reduced to small, solitary foci. Red blood cells (RBCs) within blood vessels became anucleated, small and uniform in size. The granulocytes (blue arrows) are seen either as foci or scattered throughout the liver parenchyma. They were also seen as clusters around central veins, interlobar spaces and the periphery of the liver. Megakaryocytes (black arrow head) were seen. Portal vein (PV) with bile duct (BD) can be seen. B1, B2 and B3: TP group showing congested vessels outside the capsule (white star) and within liver parenchyma were seen (black star). Leucocytes were seen under the capsule (blue arrows). Hepatocytes showed vacuolated unstained cytoplasm and dark nuclei (white arrows). Megakaryocytes (black arrow head) are found.
Hematopoietic cells were decreased (squares). The lumen of central vein (CV) was full with blood (congestion) (yellow star). There was marked damage of endothelial lining (green arrow). Near portal area showing marked dilated congested (yellow star) portal vein (PV). Bile ducts (BD) showing damaged endothelial lining. Leucocytes aggregation was seen near portal area (blue arrow). C1&C2: TQ group showing congested central vein (CV) and blood sinusoid (S) were seen. Hepatocytes have unstained vacuolated cytoplasm (white arrows) with small dark nucleus. Blood sinusoids showed leucocytic infiltration (black star). Portal vein (PV) seemed congested (yellow star). Leucocytes (blue arrow) aggregates were seen near the portal vein (H/E, x 400).
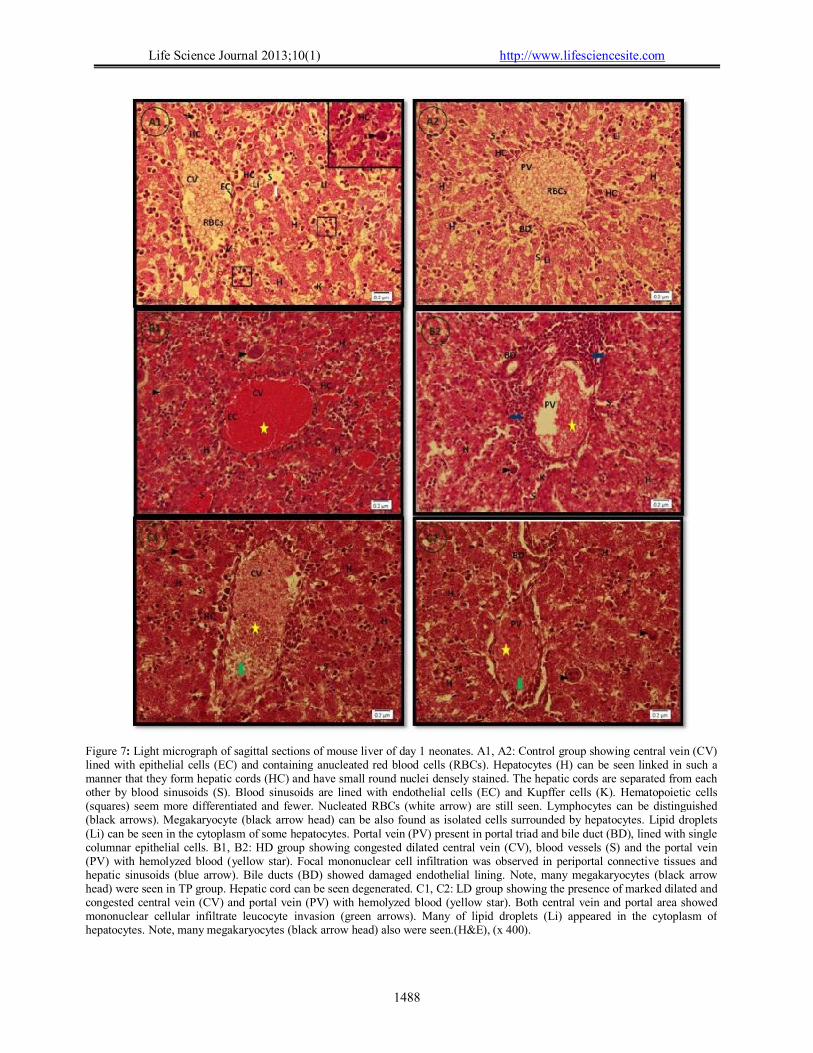
Life Science Journal 2013;10(1) http://www.lifesciencesite.com
1488
Figure 7: Light micrograph of sagittal sections of mouse liver of day 1 neonates. A1, A2: Control group showing central vein (CV) lined with epithelial cells (EC) and containing anucleated red blood cells (RBCs). Hepatocytes (H) can be seen linked in such a manner that they form hepatic cords (HC) and have small round nuclei densely stained. The hepatic cords are separated from each other by blood sinusoids (S). Blood sinusoids are lined with endothelial cells (EC) and Kupffer cells (K). Hematopoietic cells (squares) seem more differentiated and fewer. Nucleated RBCs (white arrow) are still seen. Lymphocytes can be distinguished (black arrows). Megakaryocyte (black arrow head) can be also found as isolated cells surrounded by hepatocytes. Lipid droplets (Li) can be seen in the cytoplasm of some hepatocytes. Portal vein (PV) present in portal triad and bile duct (BD), lined with single columnar epithelial cells. B1, B2: HD group showing congested dilated central vein (CV), blood vessels (S) and the portal vein (PV) with hemolyzed blood (yellow star). Focal mononuclear cell infiltration was observed in periportal connective tissues and hepatic sinusoids (blue arrow). Bile ducts (BD) showed damaged endothelial lining. Note, many megakaryocytes (black arrow head) were seen in TP group. Hepatic cord can be seen degenerated. C1, C2: LD group showing the presence of marked dilated and congested central vein (CV) and portal vein (PV) with hemolyzed blood (yellow star). Both central vein and portal area showedmononuclear cellular infiltrate leucocyte invasion (green arrows). Many of lipid droplets (Li) appeared in the cytoplasm of hepatocytes. Note, many megakaryocytes (black arrow head) also were seen.(H&E), (x 400).
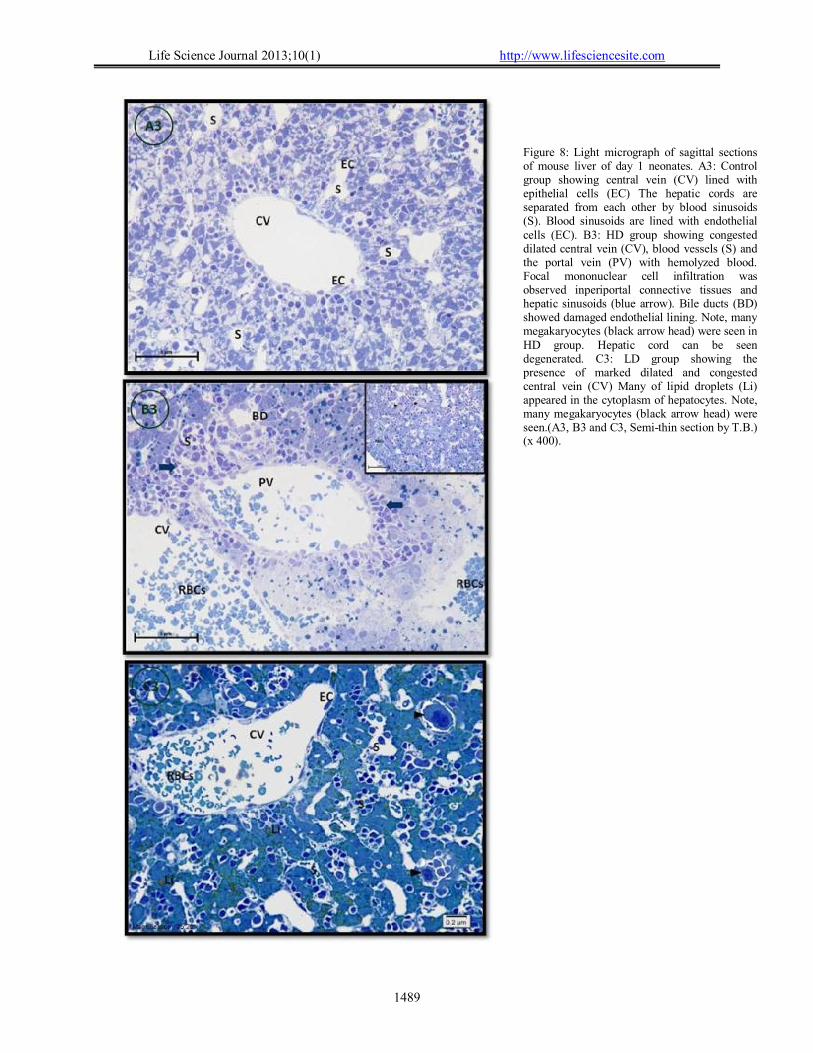
Life Science Journal 2013;10(1) http://www.lifesciencesite.com
1489
Figure 8: Light micrograph of sagittal sections of mouse liver of day 1 neonates. A3: Control group showing central vein (CV) lined with epithelial cells (EC) The hepatic cords are separated from each other by blood sinusoids (S). Blood sinusoids are lined with endothelial cells (EC). B3: HD group showing congested dilated central vein (CV), blood vessels (S) and the portal vein (PV) with hemolyzed blood. Focal mononuclear cell infiltration was observed inperiportal connective tissues and hepatic sinusoids (blue arrow). Bile ducts (BD) showed damaged endothelial lining. Note, many megakaryocytes (black arrow head) were seen in HD group. Hepatic cord can be seen degenerated. C3: LD group showing the presence of marked dilated and congested central vein (CV) Many of lipid droplets (Li) appeared in the cytoplasm of hepatocytes. Note, many megakaryocytes (black arrow head) were seen.(A3, B3 and C3, Semi-thin section by T.B.) (x 400).
Life Science Journal 2013;10(1) http://www.lifesciencesite.com
1490
4. Discussion The liver is the largest organ in the body
exhibiting both endocrine and exocrine properties. The liver can be taken as the major source of hematopoietic cells during gestation at the age from 11.5 to 12.5 days (Sasaki and Matsumura, 1986). In this study aqueous saffron extract (HD) 100 mg/kg, (LD) 2.5 mg/kg given to pregnant mothers for five daysinthefirsttrimesterofpregnancy, five days in the second trimester of pregnancy and two days in the third trimester of pregnancy caused a significant decrease in liver LPO of treated fetuses (HD) and (LD) and a non-significant decrease in the total protein content of liver. However, it caused a significant increase in liver GSH of treated embryos. The most important signs that indicate the presence of oxidative damage are the presence of LPO. It was found that LPO has an important role in the toxicity of many xenobiotics (Anane and Creppy,2001; Ali et al., 2010). It has been also reported that aqueous saffron extract decreased free radicals levels in mouse liver and has an antioxidant activity (Ali et al., 2010). Aqueous saffron extracts (40 and 80 mg/kg) given for five consecutive days protected mice from genotoxins-induced oxidative stress (Premkumaret al., 2003b). In this study, we observed that LPO in the embryos liver significantly decreased, while GSH significantly increased. Throughout the body oxidative stress might increase GSH synthesis rates (Cantinet al., 2007). It seems that saffron induced oxidative stress which increased GSH synthesis. Saffron plays an important role as an anti-cancer. Saffron also works on the inhibition of many cellular enzymes and for this reason it may lead to disabling the functions of these enzymes thus works as an antitumor (Chermahiniet al., 2010). Crocin an active constituents of saffron can induce apoptosis (Thatteet al.,2000). This study showed that aqueous saffron extract caused a non-significant decrease in liver weight of treated embryos at 18 day of gestation in (HD) and (LD).
A study reported that an increase in the numbers of leukocytesmay bearesult of the reaction of inflammation in thedamagedtissuein theliver aftertreated withsaffron (Mohajeryet al., 2009; Khayatnouriet al., 2011). Results of this study showed intensive invasion of monocytes and leucocytes in embryonic liver. In this study the aqueous saffron extractmight have been transferred from the treated mothers to the embryos
throughtheplacentaandthatmight haveledtoaninflammation of the embryonic liver tissue. Mohajeryet al. (2009) have reported that saffron induced normochromic-normocytic anemia and this may bedue tobonemarrow suppression. It was also reported that saffron has caused a significant increase ALT and AST that might cause damage to theliver tissue. Histopathological studies proved that the extractof saffron caused damagein the liver and kidneys tissues in miceasit causednecrosisand degeneration in thecentral areaof the hepatocytes. Thismaybedueto the reduction in the amount of oxygenreceived in this area(Mohajeryet al., 2009; Khayatnouriet al., 2011).Mohajeriet al. (2007) as well reported that giving rat (0.35 g/kg saffron extract) led to dilation and congestion of central veins, dilated sinusoids, necrosis and loss of the usual arrangement of hepatocytes. Similar results were seen in this study regarding embryonic liver sections where dilation and congestion was seen in the hepatic central and portal veins. When using (0.70 and 0.35 g/kg saffron extract) necrosis was seen in the central portions and infiltrations of lymphocytes and granulocytes in the portal areas. But when mice were given (1.05 g/kg saffron extract) more necrosis and degeneration of periportal area was seen. In addition to accumulation of Kupffer's cells with active phagocytosis in the periportal regions, bridging of inflamed portal tracts between different lobules, wide spread lytic necrosis and hemorrhages (Mohajeriet al., 2007). Similar results were seen in this study where apoptosis was also seen in hepatocytes. Necrosis and degeneration of hepatocytes occurs in the centrilobular when it receives less amount of oxygenized blood. As for necrosis and degeneration of periportalithappenedasaresultofexposuretotoxins from ethanolic extract of saffron (Crocus sativus) (Cullen, 2007; Mohajeriet al., 2007). This study indicated that oral administration of everyday used doses of saffron aqueous extract (2.5 mg saffron / kg body weight) to pregnant mice might have caused deterioration of the histological structure of 14 and 18 day embryonic liver and ultrastructure of the liver of day 1 neonate. It also caused a significant increase of LGH, significant decrease of LPO of 18 day embryo liver compared to the controls. More studies should be performed to assess the effect of low saffron doses on other embryonic organ development.

Life Science Journal 2013;10(1) http://www.lifesciencesite.com
1491
Figure 9: (A) TEM micrograph showing the ultrastructure of control neonate mouse liver (day 1). Normal hepatocytes (H) appeared polygonal and had distinct intercellular space (black arrows), they appeared arranged radially around the central vein (CV), that is lined by endothelial cells (EC). Hepatocytes appeared dark (DHC) and pale (PHC). The hepatocytesappearedcontaining a nucleus (N), with a nucleolus (Nu) or two nucleoli having euchromatin (yellow arrows). Rough endoplasmic reticulum (rER) could be seen throughout the cytoplasm intermixed with mitochondria (M). The normal abundance of glycogen rosettes (Gl) was also seen. (B) Enlarged portion of (A) shows hepatocytes (H) with euchromatic nuclei (N) and prominent nucleoli (Nu). The cytoplasm contains mitochondria (M) and glycogen (Gl). Large central vein (CV) can be seen. (S): a blood sinusoid. The blood vessels are separated from the hepatocytes by narrow spaces containing microvilli (Mv). Bile canaliculus (BC) can be seen between hepatocytes. (C) TEM micrograph showing the ultrastructure of (HD) neonate mouse liver (day 1). Hepatocytes (H) appeared around the central vein (CV) containing nuclei (N) of different sizes with dense chromatin (yellow arrows). Central vein lined by endothelial cells (EC). Lipid droplets (Li) could be seen in the cytoplasm. A narrow bile canaliculus (BC) could be seen between adjacent hepatocytesbounded by desmosome (D). Glycogen rosettes (Gl) appeared in smaller quantities compared to the control. (D): Enlarged portion of (C) where the hepatocytes (H) appeared containing a nucleus (N), nucleolus (Nu). Some hepatocytes appeared with pyknosis (Py) nuclei. Note chromatin (yellow arrows) condensation on the nuclear envelope. canaliculus (BC) can be seen with degenerated microvilli (Mv).(E):TEM micrograph showing the ultrastructure of (LD) neonate mouse liver (day 1). Hepatocytes (H) appear arranged radially around the central vein (CV). That is lined by endothelial cells (EC). Red blood cell (RBC) can be seen in the central vein. The hepatocytesappearedcontaining a nucleus (N), nucleolus (Nu). Elaborated microvilli can be seen between some hepatocytes (black arrows). Blood sinusoids (S) could be seen between the hepatocytes containing anucleated red blood cell (RBC) and lymphocyte (Lym).(F):TEM micrograph showing the ultrastructure of (LD) neonate mouse liver (day 1). The hepatocytesappearedcontaining a nucleus (N), nucleolus (Nu)with euchromatin (yellow arrows), mitochondria (M) and rough endoplasmic reticulum (rER). Glycogen (Gl) granules are very much reduced compared to control. Hepatocytes appeared to have an increase in the number of lipid droplets (Li). Bile canaliculi (BC) became much dilated with degenerated microvilli (Mv). Desmosome (De) was also seen. Blood sinusoids (S) can be seen containing lymphocyte (Lym).

Life Science Journal 2013;10(1) http://www.lifesciencesite.com
1492
Figure 10:(A) TEM micrograph showing the ultrastructure of control neonate mouse liver (day 1). Hepatocytes (H) appear around central vein (CV) with euchromatic nuclei (N). Central vein is lined by endothelial cell (EC). Glycogen (Gl) appearing as rosette shape in different cells. Lipid droplets (Li) can be seen in the cytoplasm. A narrow bile canaliculus (BC) can be seen between adjacent hepatocytes. The blood sinusoid (S) is separated from the hepatocytes by narrow spaces and contains Kupffer cell (K) (Uranayl acetate – lead citrate –1800x). (B) TEM micrograph showing the ultrastructure of (HD) neonate mouse liver (day 1). Shows hepatocytes with no clear plasma membrane (red arrows) only the nucleus (N) and nucleolus (Nu) are clear. However we can see very clear pale hepatocytes (PHC) with very clear plasma membrane and near it in the upper middle very clear dark hepatocyte (DHC). Small mitochondria (M) can be seen. Red blood cells can be seen free within the tissue (Uranayl acetate – lead citrate – 1400x). (C) TEM micrograph showing the ultrastructure of LD neonate mouse liver (day 1). Hepatocytes (H) with cell death type I can be seen. Type I cell death shrinkage in cell size and the nucleus might be totally dissolved within the cytoplasm (white star).Central vein (Cv). Red blood cell (RBC).Lipid droplets (Li) (Uranayl acetate – lead citrate – 1800x).

Life Science Journal 2013;10(1) http://www.lifesciencesite.com
1493
Figure 11: (A)TEM micrograph showing the ultrastructure of control neonate mouse liver (day 1). Polygonal hepatocytes (H) arranged radially around the central vein (CV) that is lined by endothelial cells (EC). The hepatocytes appearedcontaining a nucleus (N), nucleolus (Nu), glycogen rosettes (Gl) and lipid droplets (Li). The blood sinusoid (S) can be seen between the hepatocytes. The megakaryocytes (Me) can be observed with large and lobulated nucleus (N) (Uranayl acetate –lead citrate – 1800x). (B) TEM micrograph showing the ultrastructure of (HD) neonate mouse liver (day 1). Shows the change in the shape of hepatocytes (H) from its natural form with euchromatic nucleus (N), nucleolus (Nu). Small amount of glycogen (Gl) can be seen. Increasing numbers of lipid droplets in cytoplasm (Li). Two megakaryocytes can be observed (Me1) necrotic megakaryocyte with pyknotic nucleus, (Me2) with large nucleus (N) (Uranayl acetate – lead citrate – 1400x).
(C) TEM micrograph showing the ultrastructure of (LD) neonate mouse liver (day 1). Hepatocytes (H) had a crescent shape were pushed by invading leucocytes (white arrow). The hepatocytes appearedcontaining a nucleus (N), nucleolus (Nu), mitochondria (M) and an increase in the numerous of lipid droplets (Li) (Uranayl acetate – lead citrate – 2200x).
Life Science Journal 2013;10(1) http://www.lifesciencesite.com
1494
Acknowledgement The authors would like to thank King
Abdulaziz City for science and technology for funding this research, and King abdulaziz University for providing labs and apparatus. Special thanks to Dr. Najia Alzanbagi for providing the animal house in the girl’s campus at KAU.Dr. SawsanJalalah for helping with TEM, Dr. Suad Shaker for help with histology sections, Dr. Nahla El-shenawi for help with LPO, GSH and total protein essays. Corresponding author: Fatma Al-Qudsi, Biology Department, Science Faculty, KingAbdulaziz University, Jeddah, Saudi Arabia P.O. Box,42650, Jeddah 21551, Saudi Arabia [email protected] References
1. Abdullaev, F. I. (1993) Biological effects of saffron, Biofactors, vol. 4(2):83–86.
2. Abdullaev, F. I. (2002) Cancer chemopreventive and tumoricidal properties of saffron (Crocus sativusL.), Experimental Biology and Medicine, vol. 227(1):20-25.
3. Alarcon-Aguilara, F. J., Roman-Ramos, R., Perez-Gutierrez, S., Aguilar- Contreras, A., Contreras-Weber, C. C. and Flores-Saenz, J. L. (1998) Study of the anti- hyperglycemic effect of plants used as antidiabetics, Journal Ethnopharmacology, vol.61(2):101-110.
4. Ali, A., Shati, M. S. C., Saad, A. and Alamri, M. S. C. (2010) Role of saffron (Crocus sativus L.) and honey syrup on aluminum-induced hepatotoxicity, Saudi Medical Journal, vol. 31 (10): 1106-1113.
5. Al-Mofleh, L. A., Alhaider, A. A., Mosssa, J. S., Al- Sohaibani, M. O., Qureshi, S. and Rafatullah, S. (2006) Antigastric ulcer studies on 'saffron' Crocus sativus L. in rat, Pakistan Journal of Biological Sciences,vol. 9 (6):1009-1013.
6. Anane, R. and Creppy, E. E. (2001) Lipid peroxidation as pathway of aluminium cytotoxicity in human skin fibroblast cultures: prevention by superoxide dismutase+ catalase and vitamins E and C., Human & Experimental Toxicology, vol. 20: 477.
7. Anlin, M. A., Tieyong, W. U., Enyu, D. and et al. (2000) Prevention and Treatmentof Saffron on Experimental Alcoholic and CCI_4 Liver Injury in Wistar Rats, Chinese Journal of Integrated Traditional and Western Medicine on Liver Diseases, 06-019.
8. Arasteh, A., Aliyev, A., Khamnei, S., Delazar, A., Mesgari, M. and Mehmannavaz,Aytekin, A. and Acikgoz, A. O. (2008) Hormone and microorganism treatments in the cultivation of saffron (Crocus sativus L.) plants, Molecules, vol. 13: 1135-1146.
9. Basker, D. and Negbi, M. (1983) Uses of saffron Crocus sativus, Econ. Biol., vol. 37(2): 228-236.
10. Beutler, E., Duron, O. and Kefly, B. M. (1963) Improved method for determination of blood
glutathione, Journal Laboratory and Clinical Medicine, 61: 882-888.
11. Caligioni, C., (2009) Assessing reproductive status/stages in mice, Current Protocols in Neuroscienc A. 4I, 1–8.
12. Cantin, A. M., White, T. B., Cross, C. E., Forman d, H. J., Sokol, R. J. and Borowitz, D. (2007) Antioxidants in cystic fibrosis Conclusions from the CF Antioxidant Workshop, Bethesda, Maryland,Free Radical Biology & Medicine, vol. 42: 15 –31.
13. Çavusoglu, A., Erkel, I. E. and Sülüsoglu, M. (2009) Saffron (Crocus sativus L.) Studies with Two Mother Corm Dimensions on Yield and Harvest Period Under Greenhouse Condition, American-Eurasian Journal of Sustainable Agriculture, vol. 3(2): 126-129.
14. Chasis, J. A. (2006) Erythroblastic islands: Specialized microenvironmental niches for erythropoiesis, CurrOpinHematol, vol. 13: 137–41.
15. Chermahini, S. H., Abd. Majid, F. A., Sarmidi, M. R., Taghizadeh, E. and Salehnezhad, E. (2010) Impact of saffron as an anti-cancer and anti-tumor herb, African Journal of Pharmacy and Pharmacology,vol. 4(11), pp. 834-840.
16. Crawford, L. W., Foley, J. F. and Elmore, S. A. (2010) Histology atlas of the developing mouse hepatobiliary system with emphasis on embryonic days 9.5-18.5, Toxicologic Pathology, vol. 38: 872-906.
17. Cullen, J. M. (2007) Liver, Biliary system and Exocrine pancreas. In: Pathologic Basis of Veterinary Disease, 4th Edn., McGavin, M.D. and J.F. Zachary (Eds.). Mosby, London, pp: 403-406. http://www.elsevier.com/wps/find/bookdescription.
18. Deo, B. (2003) Growing saffron-the world's most expensive spice, Crop & Food Research Ltd, vol. 20: 11-23.
19. Dharmananda, S. (2005) Saffron: an anti-depressant herb, Institute for Traditional Medicine, from: http://www.itmonline.org/articles/saffron/ saffron.htm.
20. Drury, R. A. B. and Wallington, E. A. (1980) Carleton's histolgical technique, 5thm edition, Oxford,UK: Oxford University Press.
21. Duke, J. A. (1987) Handbook of medicinal herbs, KorasanJahadeKeshavarzi organization: CRC press.
22. Estilai, A. (1978) Variability in saffron (Crocus sativus L.), Experientia, vol. 34: 725.
23. Fatma Al-Qudsi and AmalAyedh. (2012) Effect of saffron on mouse embryo development. J Am Sci2012;8(12):1554-1568].(ISSN:1545-1003). http://www.jofamericanscience.org.
24. Gibb, R. P. and Stowell, R. E. (1949) Glycogen in human blood cells, Blood, vol. 4: 569– 79.
25. Gornall, A. G., Bardawill, C. J. and David, M. M. (1949) Determination of serum proteins by means of the biuret reaction,The Journal of Biological Chemistry, vol. 177(2): 751-766.
26. Hill, T. (2004) The contemporary encyclopedia of herbs and spices: Seasonings forthe global kitchen, 274, New Jersey: Wiley.
Life Science Journal 2013;10(1) http://www.lifesciencesite.com
1495
27. Hosseinzadeh, H. and Noraei, N. B. (2009) Anxiolytic and hypnotic effect of Crocus sativus aqueous extract and its constituents, crocin and safranal, in Mice, Phytother.Res., vol. 23: 768-774.
28. Hosseinzadeh, H., and Younesi, H. (2002) Antinociceptive and anti- inflammatory effects of Crocus sativus L. stigma and petal extracts in mice, BioMed Central Pharmacology, vol. 2: 7.
29. Hosseinzadeh, H., Sadeghnia, H. S., Ziaee, T. and Danaee, A. (2005) Protective effect of aqueous saffron extract (Crocus sativus L.) andcrocin, ischemia-reperfusion- induced oxidative damage in rats, Journal of Pharmacy & Pharmaceutical Sciences, vol. 8(3):387-393.
30. Isern, J., Fraser, S. T., He, Z., and Baron, M. H. (2008) The fetal liver is a niche for maturation of primitive erythroid cells, ProcNatlAcadSci U S A, vol. 105: 6662–6666.
31. Khayatnouri, M., Safavi, S. E., Safarmashaei, S. Babazadeh, D. and Mikailpourardabili, B (2011) The effect of Saffron Orally Administration on Spermatogenesis Index in Rat, Advances in Environmental Biology, vol. 5(7): 1514-1521.
32. Khorasani, G., Hosseinimehr, S. J. ,Zamzni, P. , Ghasemi, M. , and Ahmadi, A. (2008) The Effect of Saffron (Crocus sativus ) Extract for healing of second- degree burn wounds in rat, Keio Journal Med., vol. 57 (4):190-195.
33. McGee, H. (2004) On food and cooking: The science and lore of the kitchen, 422, New York: Scribner.
34. Mercer, E. H. and Birbeck, M. S. (1972) Electron microscopy; Microscopy, Electron; Technique, 3rd edition, Blacwell Scientific (Oxford): United Kingdom.
35. Mohajeri D., MesgariAbbasi M., Delazar A., Doustar Y., Mousavi, Gh. and Amouoghli Tabrizi B (2009) Histopathological study of subacute toxicity of Crocus sativus L. (Saffron) stigma total extract on liver and kidney tissues in the rat, Pharmaceutical Sciences Journal, 15(2): 115-124.
36. Mohajeri, D. ,Mousavi, G., Mesgari, M., Doustar, Y. and Nouri, M. H. K. (2007) Subacute toxicity of Crocus sativus L. (saffron) stigma ethanolic extract in rat, American Journal Of Pharmacology and Toxicology, vol. 2 (4):189-193.
37. Mohajery, D., Mousavi, G. and Doustar, Y. (2009) Antihyperglycemic and pancreas protective effects of Crocus sativus L. (saffron) stigma ethanolic extract on rats with alloxan-induce diabetes, Journal of Biological Sciences, vol. 9(4): 302-310.
38. Nair, S. C., Pannikar, B. and Panikkar K. R. (1991) Antitimour activity of saffron (Crocus sativus), Cancer Letters, vol. 57(2):109-114.
39. Naito, M., Hasegawa, G., Ebe, Y. andYamamoto, T. (2004) Differentiation an function of Kupffer cells, Med Electron Microsc, vol. 37(1):16-28.
40. Negbi, M. (1999) Saffron Crocus sativus L., 1-59, Amesterdam: Harwood academic publishers.
41. Ohkawa, H., Ohishi, N. and Yagi, K. (1979) Assay for lipid peroxides in animal tissues by thiobarbituric acid reaction, Analytical Biochemistry, vol. 95(2): 351–358.
42. Premkumar, K. , Abraham, S. K. , Santhiya, S. T. and Ramesh, A. (2003a) Inhibitory effects of aqueous crude extract of saffron (Crocus sativus L.) on chemical-induced genotoxicity in mice, Asia Pacific Journal of Clinical Nutrition,12 (4):474-476.
43. Premkumar, K., Abraham, S. K., Santhiya, S. T. and Ramesh, A. (2003b) Protective effects of saffron (Crocus sativusL.)on genotoxins-induced oxidative stress in Swiss albino mice, Phytotherapy Research, 17:614-617.
44. Reynold, E. S. (1963) Theuse of lead citrate at high phase an electronopaque stain in electron microscopy, Journal Cell Biology, (17): 208-212.
45. Salomi, M. J. (1991) Inhibitory effects of Nigella sativa and saffron (Crocus sativus) on chemical carcinogenesis in mice, Nutr. Cancer, vol. 16(1):67-72.
46. Sasaki, K. and Matsumura, G. (1986) Haemopoietic cells of yolk sac and liver in the mouse embryo: A light and electron microscopical study, J Anat, vol. 148: 87–97.
47. Tafazoli, M. , Kermani, T. and Sadat Jou, S. A. R. (2004) Effect of saffron on abnormal and its side effect on mice balb/c, Ofogh-E-Danesh Fall, vol. 10(3):53-56.
48. Thatte, U., Bagadey, S. and Dahanukar, S. (2000) Modulation of programmed cell death by medicinal plants, Cellular and Molecular Biology (Noisy-le-grand), vol. 46:199-214.
49. Tilghman, S. M., and Belayew, A. (1982) Transcriptional control of the murine albumin/alpha-fetoprotein locus during development, Proc. Natl Acad. Sci. USA, vol. 79: 5254–5257.
50. Tso, P. and McGill, J. (2003) "The Physiology of the Liver", In, A. George, Tanner and A. Rodney Rhoades Medical Physiology, Second edition, Lippincott, Williams & Wilkins: (in press), 514-523.
51. Walmer, D. K., Wrona, M. A., Hughes, C. L., Nelson, K. G. (1992) Lactoferrin expression in the mouse reproductive tract during the natural estrous cycle: correlation with circulating estradiol and progesterone, Endocrinology, 131:1458–1466.
52. Van Tellingen, C. (2003) Physiology: organ physiology from a phenomenological point of view, 28-38, Driebergen: Louis Bolk Institute.
53. Verma, R. S. and Middha, D. (2010) Analysis of Saffron (Crocus sativus L. Stigma) Components by LC–MS–MS, Chromatographia, vol. 71: 117–123.
54. Zargari, A. (1993) Medicinal plants, 574–578, Tehran: Tehran University Press.
12/22/2012
Science Journal 2013;10(1) http://www.lifesciencesite.com
1496
A comparative study on Petri Nets in manufacturing applications
1 Sayed Taha Mohamed, 2 Mohamed Abdel Gawad Mostafa, 3 Ahmed Fathi Mohamed
1Production Engineering and Mechanical Design Dept., Faculty of Engineering, Minia University, Egypt 2 Industrial Engineering Dept., faculty of Engineering, Zagazig University, Egypt
3 Mechanical Engineering Dept., College of Engineering and Islamic Architecture, Umm Al-Qura University, KSA. [email protected]
Abstract: The main aim of this paper is to show the Petri Nets facilities as a comprehensive approach to manufacturing applications for design, specification, simulation and verification of systems. So, a comparison study between the traditional Petri Net (PN) and Colored Petri Net (CPN) as a graphical and mathematical modeling tool was considered for systems that exhibit properties such as sequencing, concurrency merging and synchronization. We can observe that, by using CPN the description and analysis is more compact and the data manipulations can be described in much more direct way. In tern, CPN is a very useful tool for manufacturing systems of large size and high complexity. Petri net is involved to make the implementation of the job shop scheduling specially in any automation system. the effectiveness and efficiency of the proposed approach is illustrated in case study. [Sayed Taha Mohamed, Mohamed Abdel Gawad Mostafa, Ahmed Fathi Mohamed. A comparative study on Petri Nets in manufacturing applications. Life Sci J 2013;10(1):1496-1502] (ISSN:1097-8135). http://www.lifesciencesite.com. 20 Key words: Manufacturing modelling; Petri net; Colored Petri net. 1. Introduction
Petri Nets were devised in Germany 1962 by Petri, as a tool for modeling and analyzing processes assistance in the field of automata [1]. One of the strengths of this tool is the fact that it enables processes to be described graphically. Despite the fact that Petri Nets are graphical, they have a strong mathematical basis [2]. Unlike many other schematic techniques, they are entirely formalized [3]. So, it is often possible to make strong statements about the properties of the process being modeled. There are also several analysis techniques and tools available which can be applied to analyze a given Petri Net [4].
In tern, Petri Nets were recognized as an appropriate tool for modeling and analysis of manufacturing systems that exhibited properties such as sequencing, conflict, concurrency and synchronization [5, 6, and 7]. Over the years, the model proposed by Carl Adam Petri has been expanded upon in many different ways. So, it is possible to model complex processes in an accessible way. Since the late of 1970s, the European have been very active in organizing workshops, advanced courses and publishing conference proceedings on Petri Net. From July 1985 to June 1997 a global interest were focused in the advancements of timed and stochastic Petri Nets and their applications in the design and performance evaluation of systems [8]. However, in modeling a practical system using PN, one of the problems normally encountered is the rapid growth in the net size. So several PN classes have been proposed to reduce the net complexity, e.g. the introduction of object oriented PNs (OOPNs) [9],
colored PNs (CPNs) [10, 11 and 12] and hierarchical PNs [6]. Several authors have extended the traditional PN model with color in other words typed tokens [10] in these models; tokens have a value often referred to as color. There are several reasons for such an extension. One of these reasons is the fact that uncolored PN tend to become too large to handle. Another reason is the fact that tokens often represent objects or resources in the modeled system. As such these objects may have attributes, which are not easily represented by a simple PN token. These CPNs allow the modeler to make much more succinct and manageable descriptions.
The purpose of this paper is to present a comparison between traditional PN and CPN that is the field which can reduce the complexity of the management problems in manufacturing systems. The second section of the paper is devoted to the definitions, concepts and properties to be used in traditional PN. CPN definitions, concepts and properties are presented in the third section. The fourth section introduces a case study to compare the two categories of Petri Nets. Finally, section five presents the concluding remarks.
2. Traditional Petri net (PN)
A Petri net consists of places and transitions. We indicate a place using a circle. A transition is shown as a rectangle or bar. Figure 1 shows a simple Petri net, consisting of three places (P1, P2, and P3) and three transitions (T1, T2, and T3). Places and transitions in a Petri net can be linked by means of directed arcs. These arcs maybe weighted, this weight
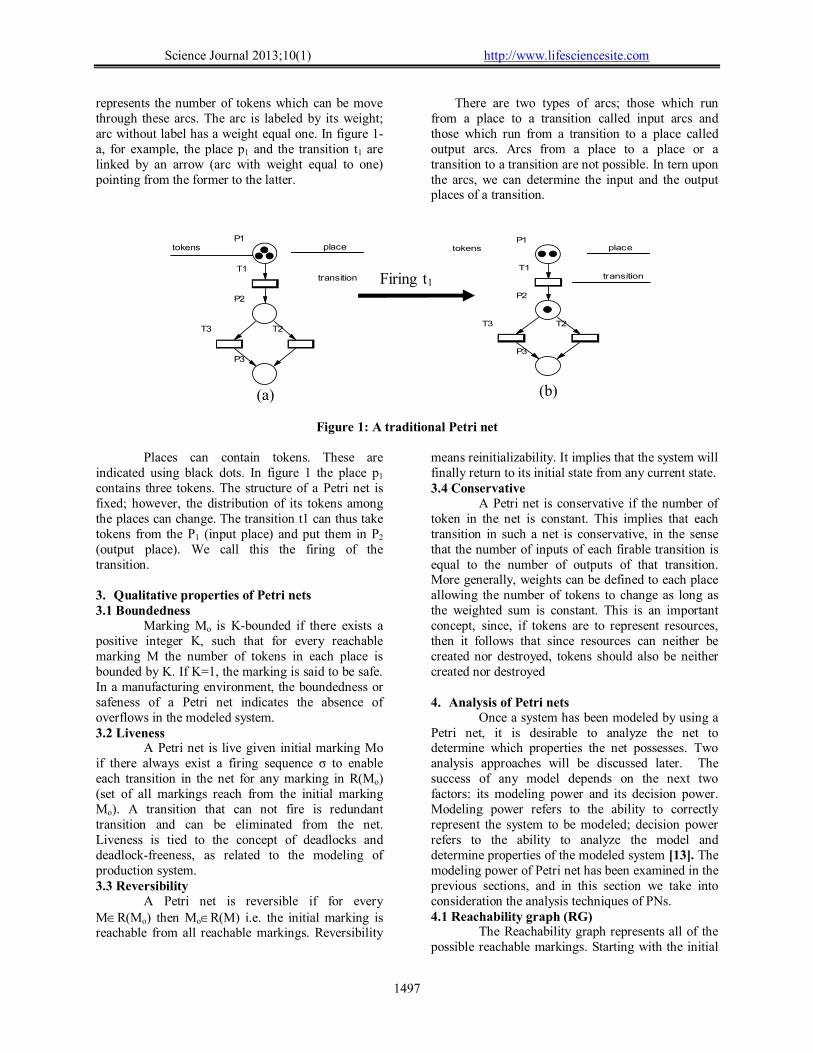
Science Journal 2013;10(1) http://www.lifesciencesite.com
1497
represents the number of tokens which can be move through these arcs. The arc is labeled by its weight; arc without label has a weight equal one. In figure 1-a, for example, the place p1 and the transition t1 are linked by an arrow (arc with weight equal to one) pointing from the former to the latter.
There are two types of arcs; those which run from a place to a transition called input arcs and those which run from a transition to a place called output arcs. Arcs from a place to a place or a transition to a transition are not possible. In tern upon the arcs, we can determine the input and the output places of a transition.
P1
T1
P2
T2
P3
placetokens
transition
T3
(a)
P1
T1
P2
T2
P3
placetokens
transition
T3
(b)
Figure 1: A traditional Petri net
Places can contain tokens. These are
indicated using black dots. In figure 1 the place p1 contains three tokens. The structure of a Petri net is fixed; however, the distribution of its tokens among the places can change. The transition t1 can thus take tokens from the P1 (input place) and put them in P2 (output place). We call this the firing of the transition.
3. Qualitative properties of Petri nets 3.1 Boundedness
Marking Mo is K-bounded if there exists a positive integer K, such that for every reachable marking M the number of tokens in each place is bounded by K. If K=1, the marking is said to be safe. In a manufacturing environment, the boundedness or safeness of a Petri net indicates the absence of overflows in the modeled system. 3.2 Liveness
A Petri net is live given initial marking Mo if there always exist a firing sequence σ to enable each transition in the net for any marking in R(Mo) (set of all markings reach from the initial marking Mo). A transition that can not fire is redundant transition and can be eliminated from the net. Liveness is tied to the concept of deadlocks and deadlock-freeness, as related to the modeling of production system. 3.3 Reversibility
A Petri net is reversible if for every MR(Mo) then MoR(M) i.e. the initial marking is reachable from all reachable markings. Reversibility
means reinitializability. It implies that the system will finally return to its initial state from any current state. 3.4 Conservative
A Petri net is conservative if the number of token in the net is constant. This implies that each transition in such a net is conservative, in the sense that the number of inputs of each firable transition is equal to the number of outputs of that transition. More generally, weights can be defined to each place allowing the number of tokens to change as long as the weighted sum is constant. This is an important concept, since, if tokens are to represent resources, then it follows that since resources can neither be created nor destroyed, tokens should also be neither created nor destroyed 4. Analysis of Petri nets
Once a system has been modeled by using a Petri net, it is desirable to analyze the net to determine which properties the net possesses. Two analysis approaches will be discussed later. The success of any model depends on the next two factors: its modeling power and its decision power. Modeling power refers to the ability to correctly represent the system to be modeled; decision power refers to the ability to analyze the model and determine properties of the modeled system [13]. The modeling power of Petri net has been examined in the previous sections, and in this section we take into consideration the analysis techniques of PNs. 4.1 Reachability graph (RG)
The Reachability graph represents all of the possible reachable markings. Starting with the initial
Firing t1
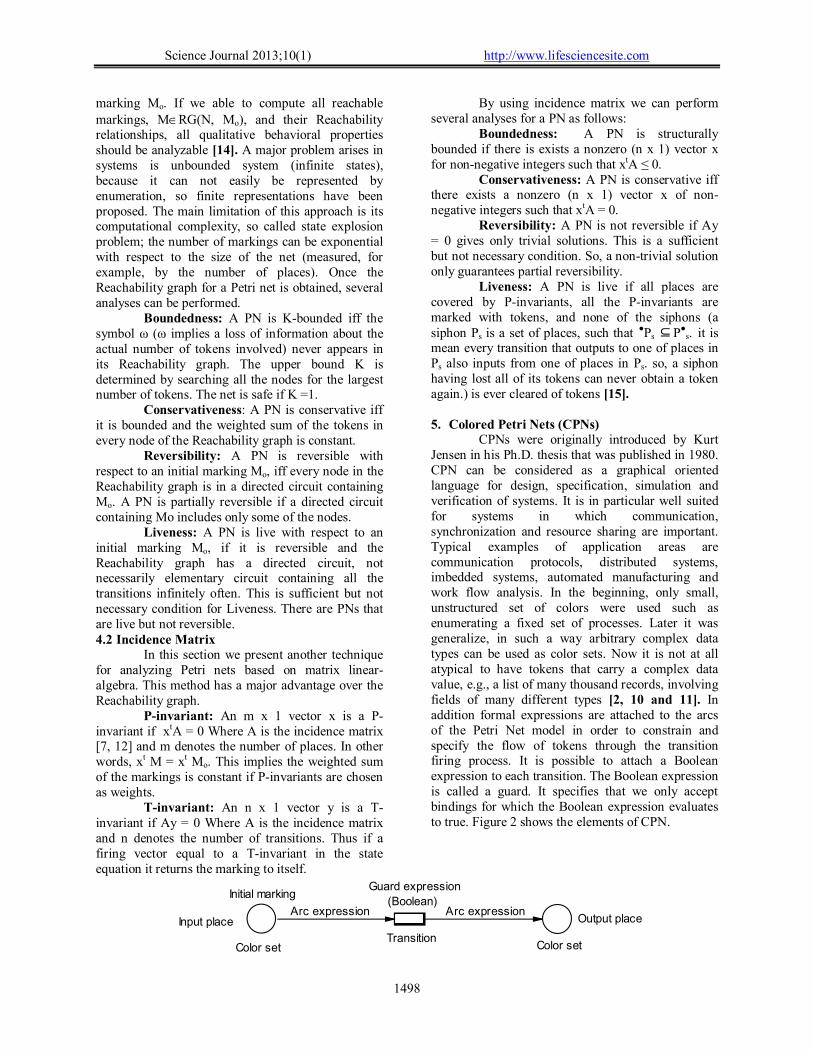
Science Journal 2013;10(1) http://www.lifesciencesite.com
1498
marking Mo. If we able to compute all reachable markings, MRG(N, Mo), and their Reachability relationships, all qualitative behavioral properties should be analyzable [14]. A major problem arises in systems is unbounded system (infinite states), because it can not easily be represented by enumeration, so finite representations have been proposed. The main limitation of this approach is its computational complexity, so called state explosion problem; the number of markings can be exponential with respect to the size of the net (measured, for example, by the number of places). Once the Reachability graph for a Petri net is obtained, several analyses can be performed.
Boundedness: A PN is K-bounded iff the symbol ω (ω implies a loss of information about the actual number of tokens involved) never appears in its Reachability graph. The upper bound K is determined by searching all the nodes for the largest number of tokens. The net is safe if K =1.
Conservativeness: A PN is conservative iff it is bounded and the weighted sum of the tokens in every node of the Reachability graph is constant.
Reversibility: A PN is reversible with respect to an initial marking Mo, iff every node in the Reachability graph is in a directed circuit containing Mo. A PN is partially reversible if a directed circuit containing Mo includes only some of the nodes.
Liveness: A PN is live with respect to an initial marking Mo, if it is reversible and the Reachability graph has a directed circuit, not necessarily elementary circuit containing all the transitions infinitely often. This is sufficient but not necessary condition for Liveness. There are PNs that are live but not reversible. 4.2 Incidence Matrix
In this section we present another technique for analyzing Petri nets based on matrix linear-algebra. This method has a major advantage over the Reachability graph.
P-invariant: An m x 1 vector x is a P-invariant if xtA = 0 Where A is the incidence matrix [7, 12] and m denotes the number of places. In other words, xt M = xt Mo. This implies the weighted sum of the markings is constant if P-invariants are chosen as weights.
T-invariant: An n x 1 vector y is a T-invariant if Ay = 0 Where A is the incidence matrix and n denotes the number of transitions. Thus if a firing vector equal to a T-invariant in the state equation it returns the marking to itself.
By using incidence matrix we can perform several analyses for a PN as follows:
Boundedness: A PN is structurally bounded if there is exists a nonzero (n x 1) vector x for non-negative integers such that xtA ≤ 0.
Conservativeness: A PN is conservative iff there exists a nonzero (n x 1) vector x of non-negative integers such that xtA = 0.
Reversibility: A PN is not reversible if Ay = 0 gives only trivial solutions. This is a sufficient but not necessary condition. So, a non-trivial solution only guarantees partial reversibility.
Liveness: A PN is live if all places are covered by P-invariants, all the P-invariants are marked with tokens, and none of the siphons (a siphon Ps is a set of places, such that ●Ps ⊆ P●
s. it is mean every transition that outputs to one of places in Ps also inputs from one of places in Ps. so, a siphon having lost all of its tokens can never obtain a token again.) is ever cleared of tokens [15]. 5. Colored Petri Nets (CPNs)
CPNs were originally introduced by Kurt Jensen in his Ph.D. thesis that was published in 1980. CPN can be considered as a graphical oriented language for design, specification, simulation and verification of systems. It is in particular well suited for systems in which communication, synchronization and resource sharing are important. Typical examples of application areas are communication protocols, distributed systems, imbedded systems, automated manufacturing and work flow analysis. In the beginning, only small, unstructured set of colors were used such as enumerating a fixed set of processes. Later it was generalize, in such a way arbitrary complex data types can be used as color sets. Now it is not at all atypical to have tokens that carry a complex data value, e.g., a list of many thousand records, involving fields of many different types [2, 10 and 11]. In addition formal expressions are attached to the arcs of the Petri Net model in order to constrain and specify the flow of tokens through the transition firing process. It is possible to attach a Boolean expression to each transition. The Boolean expression is called a guard. It specifies that we only accept bindings for which the Boolean expression evaluates to true. Figure 2 shows the elements of CPN.
Initial markingGuard expression
(Boolean)
Transition
Color set Color set
Input placeArc expressionArc expression
Output place
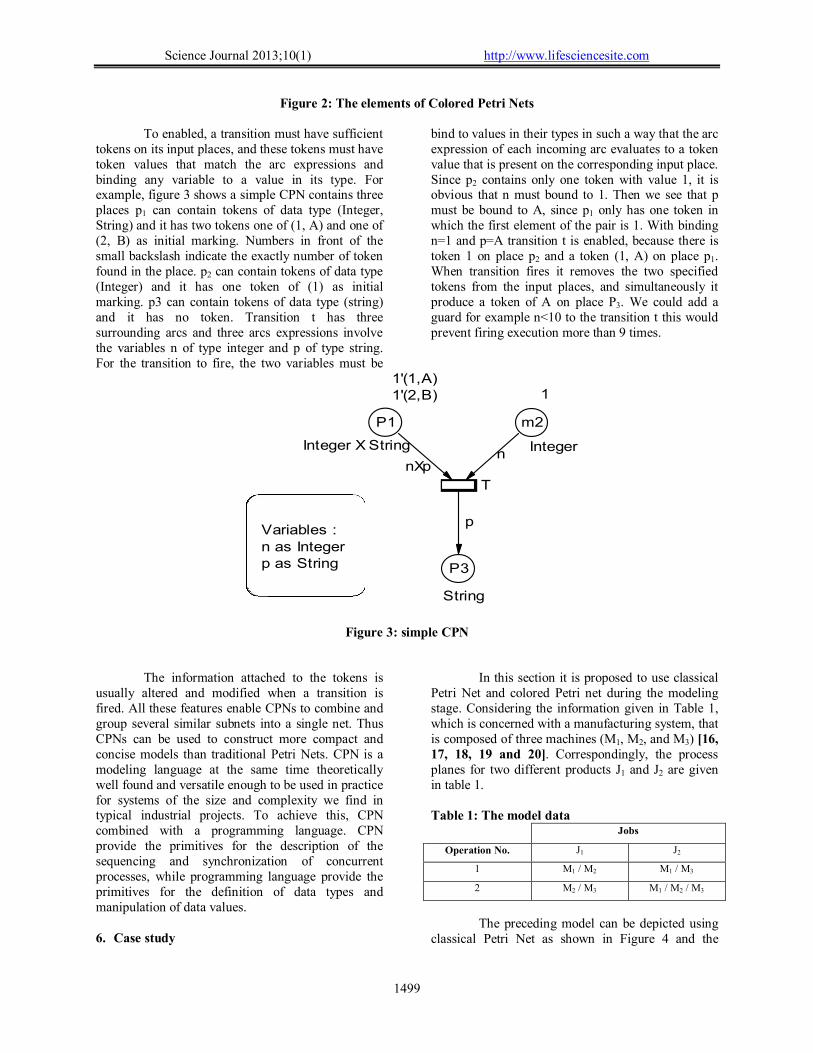
Science Journal 2013;10(1) http://www.lifesciencesite.com
1499
Figure 2: The elements of Colored Petri Nets
To enabled, a transition must have sufficient tokens on its input places, and these tokens must have token values that match the arc expressions and binding any variable to a value in its type. For example, figure 3 shows a simple CPN contains three places p1 can contain tokens of data type (Integer, String) and it has two tokens one of (1, A) and one of (2, B) as initial marking. Numbers in front of the small backslash indicate the exactly number of token found in the place. p2 can contain tokens of data type (Integer) and it has one token of (1) as initial marking. p3 can contain tokens of data type (string) and it has no token. Transition t has three surrounding arcs and three arcs expressions involve the variables n of type integer and p of type string. For the transition to fire, the two variables must be
bind to values in their types in such a way that the arc expression of each incoming arc evaluates to a token value that is present on the corresponding input place. Since p2 contains only one token with value 1, it is obvious that n must bound to 1. Then we see that p must be bound to A, since p1 only has one token in which the first element of the pair is 1. With binding n=1 and p=A transition t is enabled, because there is token 1 on place p2 and a token (1, A) on place p1. When transition fires it removes the two specified tokens from the input places, and simultaneously it produce a token of A on place P3. We could add a guard for example n<10 to the transition t this would prevent firing execution more than 9 times.
P1
1'(1,A) 1'(2,B)
m2
1
P3
String
T
Integer X String Integern
nXp
pVariables : n as Integer p as String
Figure 3: simple CPN
The information attached to the tokens is
usually altered and modified when a transition is fired. All these features enable CPNs to combine and group several similar subnets into a single net. Thus CPNs can be used to construct more compact and concise models than traditional Petri Nets. CPN is a modeling language at the same time theoretically well found and versatile enough to be used in practice for systems of the size and complexity we find in typical industrial projects. To achieve this, CPN combined with a programming language. CPN provide the primitives for the description of the sequencing and synchronization of concurrent processes, while programming language provide the primitives for the definition of data types and manipulation of data values.
6. Case study
In this section it is proposed to use classical Petri Net and colored Petri net during the modeling stage. Considering the information given in Table 1, which is concerned with a manufacturing system, that is composed of three machines (M1, M2, and M3) [16, 17, 18, 19 and 20]. Correspondingly, the process planes for two different products J1 and J2 are given in table 1.
Table 1: The model data Jobs
Operation No. J1 J2
1 M1 / M2 M1 / M3
2 M2 / M3 M1 / M2 / M3
The preceding model can be depicted using
classical Petri Net as shown in Figure 4 and the
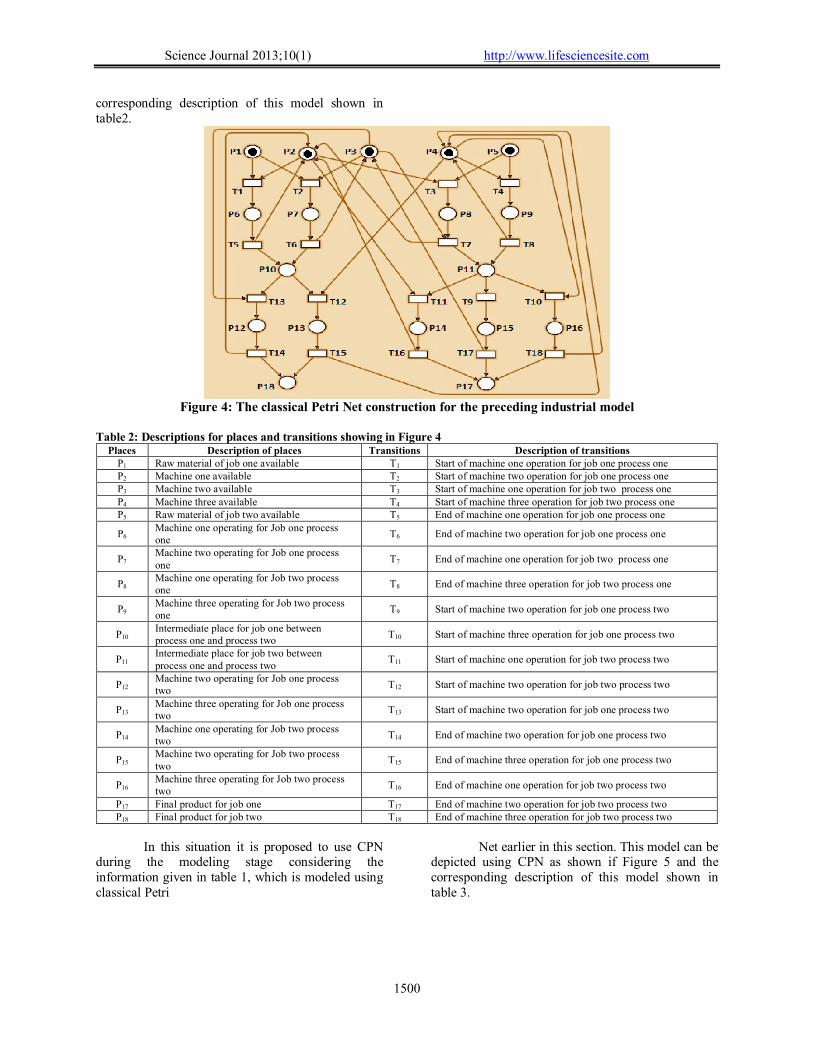
Science Journal 2013;10(1) http://www.lifesciencesite.com
1500
corresponding description of this model shown in table2.
Figure 4: The classical Petri Net construction for the preceding industrial model
Table 2: Descriptions for places and transitions showing in Figure 4
Places Description of places Transitions Description of transitions P1 Raw material of job one available T1 Start of machine one operation for job one process one P2 Machine one available T2 Start of machine two operation for job one process one P3 Machine two available T3 Start of machine one operation for job two process one P4 Machine three available T4 Start of machine three operation for job two process one P5 Raw material of job two available T5 End of machine one operation for job one process one
P6 Machine one operating for Job one process one
T6 End of machine two operation for job one process one
P7 Machine two operating for Job one process one
T7 End of machine one operation for job two process one
P8 Machine one operating for Job two process one
T8 End of machine three operation for job two process one
P9 Machine three operating for Job two process one
T9 Start of machine two operation for job one process two
P10 Intermediate place for job one between process one and process two
T10 Start of machine three operation for job one process two
P11 Intermediate place for job two between process one and process two
T11 Start of machine one operation for job two process two
P12 Machine two operating for Job one process two
T12 Start of machine two operation for job two process two
P13 Machine three operating for Job one process two
T13 Start of machine two operation for job one process two
P14 Machine one operating for Job two process two
T14 End of machine two operation for job one process two
P15 Machine two operating for Job two process two
T15 End of machine three operation for job one process two
P16 Machine three operating for Job two process two
T16 End of machine one operation for job two process two
P17 Final product for job one T17 End of machine two operation for job two process two P18 Final product for job two T18 End of machine three operation for job two process two
In this situation it is proposed to use CPN
during the modeling stage considering the information given in table 1, which is modeled using classical Petri
Net earlier in this section. This model can be depicted using CPN as shown if Figure 5 and the corresponding description of this model shown in table 3.
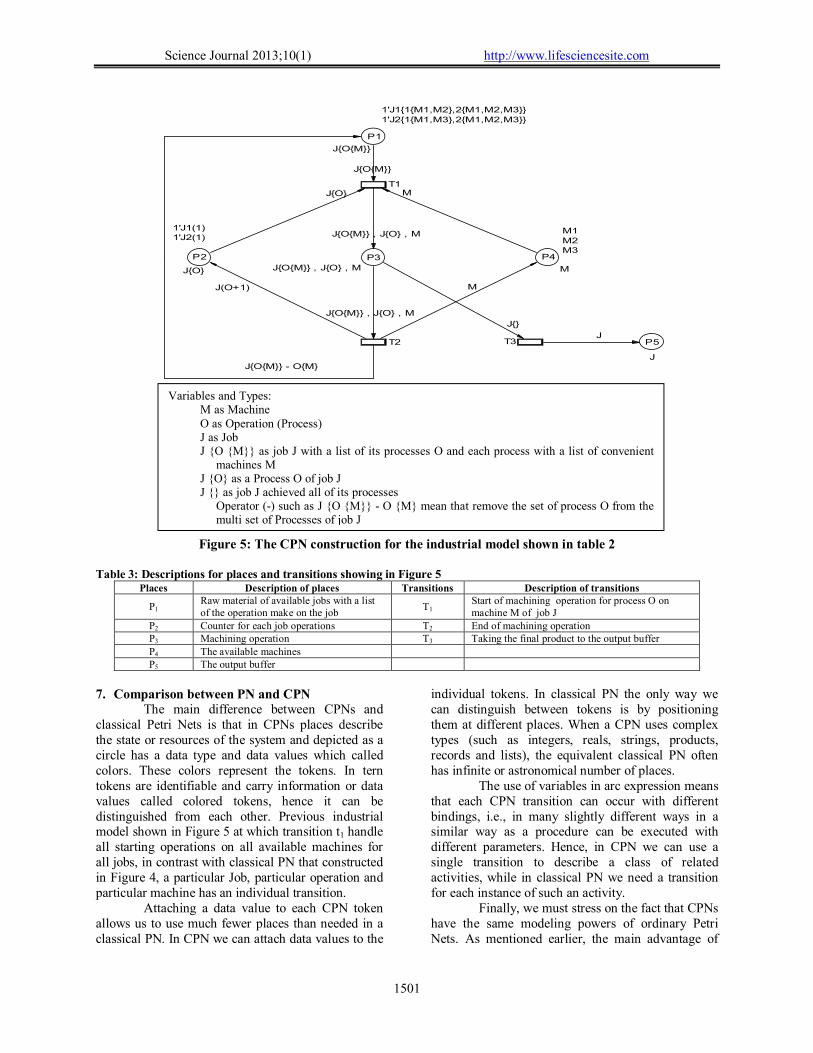
Science Journal 2013;10(1) http://www.lifesciencesite.com
1501
P1
P3 P2 P4
T1
T2 T3
1'J1{1{M1,M2},2{M1,M2,M3}}
1'J2{1{M1,M3},2{M1,M2,M3}}
J{O{M}}
M
M1
M2 M3
1'J1(1)1'J2(1)
J{O}
J{O{M}} , J{O} , M
J{O{M}}
J{O{M}} - O{M}
J(O+1)
J{}
J{O{M}} , J{O} , M
M
J
J{O{M}} , J{O} , M MJ{O}
J
P5
Figure 5: The CPN construction for the industrial model shown in table 2 Table 3: Descriptions for places and transitions showing in Figure 5
Places Description of places Transitions Description of transitions
P1 Raw material of available jobs with a list of the operation make on the job
T1 Start of machining operation for process O on machine M of job J
P2 Counter for each job operations T2 End of machining operation P3 Machining operation T3 Taking the final product to the output buffer P4 The available machines P5 The output buffer
7. Comparison between PN and CPN
The main difference between CPNs and classical Petri Nets is that in CPNs places describe the state or resources of the system and depicted as a circle has a data type and data values which called colors. These colors represent the tokens. In tern tokens are identifiable and carry information or data values called colored tokens, hence it can be distinguished from each other. Previous industrial model shown in Figure 5 at which transition t1 handle all starting operations on all available machines for all jobs, in contrast with classical PN that constructed in Figure 4, a particular Job, particular operation and particular machine has an individual transition.
Attaching a data value to each CPN token allows us to use much fewer places than needed in a classical PN. In CPN we can attach data values to the
individual tokens. In classical PN the only way we can distinguish between tokens is by positioning them at different places. When a CPN uses complex types (such as integers, reals, strings, products, records and lists), the equivalent classical PN often has infinite or astronomical number of places.
The use of variables in arc expression means that each CPN transition can occur with different bindings, i.e., in many slightly different ways in a similar way as a procedure can be executed with different parameters. Hence, in CPN we can use a single transition to describe a class of related activities, while in classical PN we need a transition for each instance of such an activity.
Finally, we must stress on the fact that CPNs have the same modeling powers of ordinary Petri Nets. As mentioned earlier, the main advantage of
Variables and Types: M as Machine O as Operation (Process) J as Job J {O {M}} as job J with a list of its processes O and each process with a list of convenient
machines M J {O} as a Process O of job J J {} as job J achieved all of its processes
Operator (-) such as J {O {M}} - O {M} mean that remove the set of process O from the multi set of Processes of job J
Science Journal 2013;10(1) http://www.lifesciencesite.com
1502
CPNs is that their formalism assists in constructing more compact Petri Net models which in turn help in simplifying the analysis process.
8. Conclusion
Petri nets are a general graphical tool very well suited to the description of distributed, sequencing and concurrent systems which exhibit synchronization and contention for share resources. In tern Petri nets have been claimed to be an ideal modeling tool for manufacturing systems. We can observe from the previous discussion that the main problem that hinders the use of classical Petri Net, as modeling tool, to model complex systems is usually a tedious task due to the large size of the resulting Petri Net model. Moreover, the huge size of the final Petri Net model increases the difficulty of analyzing and validating the model. Therefore, an important extension has been proposed to facilitate the modeling of complex systems. Typical extension is the addition of color that makes classical Petri net suitable for the representation and study of the complex manufacturing systems and called colored Petri net. Colored Petri nets inherit all the advantages of the classical Petri nets, such as the graphical and precise nature, the mathematical foundation and the analysis methods. References [1] Petri, C. A. "Communication with automata", English
Translation, New York: Griffiss Air Force Base. Tech. Rep. RADC-TR-65-377, Vol. 1, 1962.
[2] Peterson J. L., "Petri nets.", ACM Computing Surveys, vol. 9, no. 3, pp. 223-252, 1977.
[3] Viswanadham, N. and Narahari, Y., "Performance modeling of Automated Manufacturing Systems", Prentice Hall, Englewood Cliffs, NJ 07632, 1992.
[4] Zuberek W. M., "Application of timed Petri nets to modeling and analysis of flexible manufacturing cells", Technical report 9503, Dept. of Computer science, Memorial University of Newfoundland, Canada, 1995.
[5] Sun, T. H., Cheng, C. W. & Fu, L.C. "A Petri net based approach to modeling and scheduling for an FMS and a case study.", IEEE Transactions on Industrial Electronics, pp 593-601, 1994.
[6] Zuberek W. M., "Scheduling of flexible manufacturing cells and their timed color Petri net models.", Proceeding of 1995 IEEE international conference on systems, pp 2142-2147, 1995.
[7] Zuberek W. M., "hierarchical derivation of schedules for manufacturing cells.", 9th Symp. On information control in manufacturing, France, pp 423-428, 1998.
[8] Murata T., "Petri nets: properties, analysis and applications.", Proceedings of the IEEE, vol. 77, no. 4, 1989.
[9] Jiang Z., Zuo M. J. and Fung R. Y. K. "Stochastic Object-Oriented Petri nets (SOPNs) for reliability modeling of manufacturing systems.", Proceeding of the 1999 IEEE Canadian Conference on Electrical Computer Engineering, 1999.
[10] Jensen K., "An introduction to the theoretical aspects of coloured Petri nets.", Lecture Notes in Computer Science, Vol. 803, pp 230-272. Springer-Verlag, 1993.
[11] Jensen K., "A Brief Introduction to Coloured Petri Nets.", Lecture Notes in Computer Science, Vol. 1217: Tools and Algorithms for the Construction and Analysis of Systems. Proceedings of the TACAS'97 Workshop, Enschede, The Netherlands 1997, pp 201-208. Springer-Verlag, 1997.
[12] Jensen K., "An Introduction to the Practical Use of Coloured Petri Nets.", Lecture Notes in Computer Science, Vol. 1492: Lectures on Petri Nets II: Applications. Springer-Verlag, 1998.
[13] Zuberek W. M., "Cluster Tools With Chamber Revisiting-Modeling and Analysis Using Timed Petri Nets", IEEE transactions on semiconductor manufacturing, vol. 17, No. 3, August 2004.
[14] Mahsa G., Parisa A. B., Peter L. and Tianlong G., "Petri-net based formulation and algorithm for short-term scheduling of batch plants", Elsevier Ltd., Computers and Chemical Engineering 29 pg. 249–259, 2005.
[15] Bobbio, A., "System modeling with Petri nets", System Reliability Assessment, Kluwer P.C., pp 102-143, 1990.
[16] Hatono, I., Yarnagata, K., & Tamura, H. "Modeling and on-line Scheduling of flexible manufacturing systems using stochastic Petri nets.", IEEE Transactions on Software Engineering pp. 126-132, 1991.
[17] Lee, D.Y. & DiCesare, F. "Scheduling flexible manufacturing systems using Petri nets and heuristic search". IEEE Transactions on Robotics and Automation, pp. 123-132, (1994a April).
[18] Lee, D.Y. & DiCesare, F. "Integrated scheduling of flexible manufacturing systems employing automated guided vehicles", IEEE Transactions on Industrial Electronics, pp, 602-610, (1994b December).
[19] Lee, D.Y. & DiCesare, F. "Scheduling flexible manufacturing systems with the consideration of setup times", Proceedings of the 32nd Conference on Decision and Control. San Antonio, TX, pp. 3264-3269, (1993 December).
[20] Lee, D.Y. & DiCesare, F. "FMS scheduling using Petri nets and Heuristic Search" Proceedings of the 1992 IEEE International Conference on Robotics and Automation. Nice, France, pp. 1057-1062, (1992 May).
1/8/2013
Life Science Journal ISSN: 1097-8135 http://www.lifesciencesite.com
Life Science Journal
Acta Zhengzhou University Overseas Edition
(Life Sci J)
ISSN: 1097-8135
Call for Papers
The academic journal “Life Science Journal” (ISSN: 1097-8135) is inviting you to publish your papers. Life Science Journal, the Acta Zhengzhou University Oversea Version registered in the United States, is an international journal with the purpose to enhance our natural and scientific knowledge dissemination in the world under the free publication principle. The journal is calling for papers from all of the world. Any valuable papers or reports that are related to life science - in their broadest sense - are welcome. Other academic articles that are less relevant but are of high quality will also be considered and published. Papers submitted could be reviews, objective descriptions, research reports, opinions/debates, news, letters, and other types of writings. Let's work together to disseminate our research results and our opinions. Please send your manuscript to [email protected]; [email protected] Address: Life Science Journal - Acta Zhengzhou University Overseas Edition Marsland Press PO Box 180432, Richmond Hill, New York 11418, USA Telephone: (347) 321-7172 Emails: [email protected]; [email protected]; [email protected] Websites: http://www.lifesciencesite.com; http://www.sciencepub.net

9 771097 813002
ISSN 1097-8135
Life Science Journal
Volume 10, Number 1 ISSN:(Cumulative No.32) Part 10 March 25, 2013 1097-8135
Copyright © 2013 Marsland Press / Zhengzhou University
Marsland PressPO Box 180432Richmond Hill, New York 11418, USA
Website:http://www.lifesciencesite.com
Emails:[email protected]@gmail.com
Phone: (347) 321-7172
Acta Zhengzhou University Overseas Edition