605_pdf.pdf - International Journal of Life science and Pharma ...
16
10.22376/ijpbs/lpr.2020.10.4.P44-59 ijlpr 2020; doi Revised On 14 February 2020 Accepted On 26 May 2020 Published On 02 October 2020 Funding This research did not receive any specific grant from any funding agencies in the public, commercial or not for profit sectors. Copyright @ International Journal of Life Science and Pharma Research, available at www.ijlpr.com Int J Life Sci Pharma Res., Volume10., No 4 (October) 2020, pp P44-59 This article is under the CC BY- NC-ND Licence (https://creativecommons.org/licenses/by-nc-nd/4.0) Citation Mohanrao Tammi setty, Balasekhara Reddy Challa and Srinivasa Babu Puttagunta , Method Development for the Simultaneous Estimation of Etamsylate and Tranexamic Acid by UPLC/Pda in Bulk and Formulation..(2020).Int. J. Life Sci. Pharma Res.10(4), P44- 59 http://dx.doi.org/10.22376/ijpbs/lpr.2020.10.4.P44-59 Recieved On 22 January 2020 Mohanrao Tammi setty , Jawaharlal Nehru Technological University, Kakinada–533003, Andhra Pradesh, India. *Corresponding Author Research Article Pharmacy for Better Health International Journal of Life science and Pharma Research Method Development for the Simultaneous Estimation of Etamsylate and Tranexamic Acid by UPLC/Pda in Bulk and Formulation. Mohanrao Tammi setty 1 *, Balasekhara Reddy Challa 2 And Srinivasa Babu Puttagunta 3 1 Jawaharlal Nehru Technological University, Kakinada–533003, Andhra Pradesh, India. 2 Vagdevi college of Pharmacy, Gurajala-526415, Guntur (Dt.), Andhra Pradesh, India. 3 Vignan Pharmacy college, Vadlamudi, Guntur (Dt.), Andhra Pradesh, India. Abstract: Selective and novel method has been optimized for evaluation of Ethamsylate and Tranexamic acid in bulk, formulation and equipment cleaning samples by UPLC-PDA. The method was developed with the Buffer (pH: 7.0): Acetonitrile, (75:25%, v/v) using the Acquity BEH C 18 ,1.7µ.m,2.1mmX50mm analytical column with analysis time of five minutes. The flow of mobile phase through column was 0.8ml/min.The sample volume was 5 µL. The detection was carried at 260nm in a photodiode array detector. The retention times of Ethamsylate and Tranexamic acid were 1.121 min and 2.122 min respectively. The correlation coefficient (r 2 ) was 0.9997 with linear range of 2.5-30.0 µg/ml for EtamsylateFor Tranexamic acid 5µg/ml-60.0 µg/ml .The correlation coefficient (r 2 ) for Tranexamic acid was found to be 1.000. The LOQ for the Ethamsylate and Tranexamic acid was 25ng/ml and 50ng/ml respectively. The developed method was applied for the bulk,formulation and equipment cleaning samples.The results were found satisfactory.Hence the developed method was proved more accurate and sensitive.It can be used at all the stages in pharmaceutical manufacturing and quality control for evaluating of Ethamsylate and Tranexamic acid. Keywords: Selective, accurate,linear methodEthamsylate,Tranexamicacid,Bulk drug,Formulation, equipment Cleaning sample,UPLC,PDA. P-44
-
Upload
khangminh22 -
Category
Documents
-
view
0 -
download
0
Transcript of 605_pdf.pdf - International Journal of Life science and Pharma ...

10.22376/ijpbs/lpr.2020.10.4.P44-59ijlpr 2020; doi
Revised On 14 February 2020
Accepted On 26 May 2020
Published On 02 October 2020
Funding This research did not receive any specific grant from any funding agencies in the public, commercial or not for profit sectors.
Copyright @ International Journal of Life Science and Pharma Research, available at www.ijlpr.com
Int J Life Sci Pharma Res., Volume10., No 4 (October) 2020, pp P44-59
This article is under the CC BY- NC-ND Licence (https://creativecommons.org/licenses/by-nc-nd/4.0)
Citation Mohanrao Tammi setty, Balasekhara Reddy Challa and Srinivasa Babu Puttagunta , Method Development for the Simultaneous
Estimation of Etamsylate and Tranexamic Acid by UPLC/Pda in Bulk and Formulation..(2020).Int. J. Life Sci. Pharma Res.10(4), P44-
59 http://dx.doi.org/10.22376/ijpbs/lpr.2020.10.4.P44-59
Recieved On 22 January 2020
Mohanrao Tammi setty , Jawaharlal Nehru Technological
University, Kakinada–533003, Andhra Pradesh, India.
*Corresponding Author
Research Article Pharmacy for Better Health
International Journal of Life science and Pharma Research
Method Development for the Simultaneous Estimation of Etamsylate and Tranexamic Acid by UPLC/Pda in Bulk and Formulation.
Mohanrao Tammi setty1*, Balasekhara Reddy Challa2 And Srinivasa Babu Puttagunta3
1Jawaharlal Nehru Technological University, Kakinada–533003, Andhra Pradesh, India.
2Vagdevi college of Pharmacy, Gurajala-526415, Guntur (Dt.), Andhra Pradesh, India.
3Vignan Pharmacy college, Vadlamudi, Guntur (Dt.), Andhra Pradesh, India.
Abstract: Selective and novel method has been optimized for evaluation of Ethamsylate and Tranexamic acid in bulk, formulation and equipment cleaning samples by UPLC-PDA. The method was developed with the Buffer (pH: 7.0): Acetonitrile, (75:25%, v/v) using the Acquity BEH C18,1.7µ.m,2.1mmX50mm analytical column with analysis time of five minutes. The flow of mobile phase through column was 0.8ml/min.The sample volume was 5 µL. The detection was carried at 260nm in a photodiode array detector. The retention times of Ethamsylate and Tranexamic acid were 1.121 min and 2.122 min respectively. The correlation coefficient (r2) was 0.9997 with linear range of 2.5-30.0 µg/ml for EtamsylateFor Tranexamic acid 5µg/ml-60.0 µg/ml .The correlation coefficient (r2) for Tranexamic acid was found to be 1.000. The LOQ for the Ethamsylate and Tranexamic acid was 25ng/ml and 50ng/ml respectively. The developed method was applied for the bulk,formulation and equipment cleaning samples.The results were found satisfactory.Hence the developed method was proved more accurate and sensitive.It can be used at all the stages in pharmaceutical manufacturing and quality control for evaluating of Ethamsylate and Tranexamic acid. Keywords: Selective, accurate,linear methodEthamsylate,Tranexamicacid,Bulk drug,Formulation, equipment Cleaning sample,UPLC,PDA.
P-44

ijlpr 2020; doi 10.22376/ijpbs/lpr.2020.10.4.P44-59 Pharmacy
P-45
1. INTRODUCTION Based on the literature survey for this particular combination, there were no methods with good resolution and sensitivity to identify and to quantify Ethamsylate,Tranexamic acidin formulation, bulk and in equipment cleaning samples. Our developed method can quantify those drugs within a short period of time with good accuracy without any interferences at the lower concentration and with less sample. Etamsylate (Figure-1and 2) is (2, 5-dihydroxybenzenesulfonic acid; N-ethylethanamine) belongs to Anti haemorrhagic category. Basically, it is a haemostatic agent and act by stimulating the thromboplastin formation and decreasing the prostacyclin I2.It is used for the capillary haemorrhage and haemostasis, haematuria, epistaxis, menorrhagia and postpartum hemorrhagic conditions1-
2.Tranexamic acid is (Trans-4-(amino methyl) cyclohexane carboxylic acidbelonging to the class anti fibrinolytic category.It restricts the conversion of plasminogen to plasmin controls the blood loss during haemophilia, orthopaedic surgery’s, dental extraction procedures and menstrual blood loss.1-3A through literature survey revealed that various analytical and few bioanalytical methods were published to describe the quantification of Ethamsylate and Tranexamic acid in active pharmaceutical ingredient and pharmaceutical dosage forms to study the purity, degradation products by UV-Spectrophotometric method.5-8 and RP-HPLC09-15. Our literature survey also revealed that there was no method till date reported using UPLC at nanogram level of lower quantification and identification concentration for these principle components within the short period of time with the good resolution and peak shape. We attempted to develop a method with all those prerequisites and validated our method .The developed method succeeded in the quantification and identification in ng/ml range of concentration. 2. MATERIALS AND METHODS Etamsylate,Tranexamic acid with high purity(provided by the Yountus Life sciences), Acetonitrile(J.T.Baker, Phillipsburg, NJ, USA), Water(Milli - Q system, Millipore, Bedford, MA, USA),Tetrabutylammonium hydrogen sulphate (Sigma Aldrich), Sodium dihydrogen phosphate (Merck Pvt. Ltd, Worli, Mumbai) ,Triethylamine (Merck Pvt. Ltd, Worli, Mumbai)were obtained and of analytical grade. 2.3 Preparation of standard solution Ethamsylate and Tranexamic acid prepared at a concentration of 0.025mg/ml and 0.05 mg/ml respectively by taking 25.05 mg of Etamsylate standard having the assay value of 99.9% in 100ml volumetric flask and dissolved in diluent having water: acetonitrile 50:50ratio.From the stock 100ml taken 1ml to 10 volumetric flask and make up with the diluent to get final concentration of 0.025mg/ml of Etamsylate. For the tranexamic acid taken 50.21 mg having the potency 99.6 % in 1000 ml volumetric flask and dissolved in the diluent and makeup to 100ml.From the stock 100 ml taken 1ml and to 10ml volumetric flask and make up with diluent to get 0.05mg/ml of tranexamic acid. 2.2 Preparation of mobile-phase8
Mobile phase is prepared by mixing 750 ml Buffer: Acetonitrile 250 ml for 1000 ml mobile phase.
2.3 Calibration curve standards From the stock solutions of Etamsylate (0.025mg/ml) prepared,2.5µg/ml,5µg/ml,20 µg/ml,25µg/ml,30µg/ml dilutions were prepared by taking 2.5mg,5mg,20mg,25 mg,30 mg respectively in 100 ml volumetric flask and diluted with the diluent. From the stock solution, 1ml is diluted to 10mlwith the diluent. Similarly, from the stock solutions of Tranexamic Acid (0.05mg/ml) 5 µg/ml,25 µg/ml,40 µg/ml,50 µg/ml,60 µg/ml by taking 5.21mg,25.10mg,40.18 mg,50.21 mg,60.25 mg in 100 ml volumetric flask and make up to the mark with the diluent. From the stock taken 1ml and transferred to 10 ml volumetric flask and make up to the mark with the diluent. 2.4 Method optimization Consideration
For the optimization of instrument method, different buffer compositions with the solvent variations, column compartment temperatures,sample temperature,Wavelength extraction in mosaic form of detector were tried and verified by experimental design with the standard preparations in preliminary stage for identification. Optimization of the instrument method was done for the good elution for the separation in combinational formulation and also in bulk and equipment cleaning samples. 2.5 Optimizationof Chromatographic conditions After series of trials, the chromatographic conditions was accomplished with the buffer having the pH of 7.0.and Acetonitrile (75:25% v/v) by using the stationary phase Acquity BEH C18, 1.7 µ.m, 2.1 mm X 50 mm which gave the best peak shape. The Ethamsylate and Tranexamic acid separation was good at 265nm at the column temperature 25°C and sample compartment temperature 10° C with the flow0.8 ml/min. 2.6 Assay Sample Preparation
About 10 tablets of the brand Sylate : 500 mg were taken and powdered in mortar with the help of pestle. 750 mg of the sample was transferred in a 1000 ml volumetric flask and dissolved in the diluent and made up to the mark. From the stock, 1 ml is diluted to 10ml with diluent to get the final and desired concentration. 2.7 Method Validation The method showed linear and good accuracy in the concentration range of 2.5 µg/ml to 30 µg/ml of Etamsylate and 5 µg/ml to 60 µg/ml of Tranexamic Acid, 2.8 Selectivity and Specificity
To demonstrate the developed method for its specific and selective response, the diluent is injected as blank , the standard solution is prepared as per the section 3.1 prepared individually and injected individually in the volume of5µL in triplicate. 2.9 System suitability
For the verification of instrument suitability, sample identification and quantification, the standard preparation is injected six times at the concentration of 0.025mg/ml and 0.05mg/ml combination as per the section 3.1 prepared and

ijlpr 2020; doi 10.22376/ijpbs/lpr.2020.10.4.P44-59 Pharmacy
P-46
injected with the aim of %RSD of area NMT (not more than) 2.0% and theoretical plates NLT(Not Less Than)2000 plates and the tailing factor NMT 1.5 and resolution NLT 4. 2.10 Precision After method optimization the method was subjected for the method precision to prove the closeness between the series of measurements from the homogeneous sample as per the section 3.1 preparedand injected with the limit of % RSD for the area NMT 2%.The intermediate precision was verified on the next day with the same limit as % RSD for the area NMT 2%. 2.11 Accuracy and Recovery Quality control standards were prepared in the four levels as 80%, 100% and 120% in the combined standard solution as per the section 3.1 prepared and injected with the limit of % Recovery of NLT98% to prove the good accuracy. 2.12 Linearity The optimized method was calibrated with standards of 2.5 µg/ml,5 µg/ml,20 µg/ml,25 µg/ml,30 µg/ml for Etamsylate and 5 µg/ml,25 µg/ml,40 µg/ml,50 µg/ml,60 µg/ml for the tranexamic acid with the limit of regression coefficient(R2)NLT 0.99 (Figure: 10 and 11). 2.13 Robustness The developed method was evaluated for its robustness using small changes in the mobile phase composition , column temperature, flow and buffer PH .The sample was prepared as per the section 3.1 prepared and injected into the system. 2.14 Limit of Quantification Six Lower level of quantification standards were prepared to quantify the components with the criteria S/N ratio NLT10 for the LOQ and S/N ratio 3:1 for the LOD. 2.15 Assessment of stability of standard and Mobile
phase
The prepared standards having the concentration(25 µg/ml of Etamsylate and 50µg/ml of Tranexamic acid) were prepared from the preparations as per the section 3.1 prepared and injected up to 72 hours to access the stability of the standard and mobile phase with the same limit i.e% RSD for the area NMT 2%.
2.16 Degradation Behavior Inorder to prove that the method was stable, this method was used to analyze the drug samples after chemical,thermal ,photo and peroxide stress conditions and then calculatedfor its assay content. In chemical method,acid degradation was performedusing 0.1NHcl by taking one tablet powder in 1000 ml volumetric flask and 2 ml of 0.1NHcl acid was added and from 1000 ml solution taken 1 ml into 10 volumetric flask and make up was done with the diluent then injected into the system. Base degradation was carried by treating with 2 ml 1N NaoH and prepared as per the procedure followed in the acid degradationthen injected into the system. In thermal degradation the drug product powder was kept in oven for three hours at 105°C.Then prepared the sample as per the procedure followed earlier and injected into the system. In peroxide degradation added H2O2 2 ml to the tablet powder and prepared the final sample. 2.17 Filter Compatibility To verify the filter compatibility, the assay was calculated for the samples prepared as per the section 3.6 and undergone through the PVDF and Nylon filters. 2.18 Recovery of the swabs from the SS and Glass and
Epoxy plate
Taken 25.05 mg of etamsylate and 50.22 mg of tranexamic acid in 100 volumetric flask .After dissolving the components in the diluent taken 1 ml to 10 ml further 1 ml to 100 ml dilution was performed .From this taken 01 ml through the micro pipette. And kept drop wise in 10x10 plates individually and kept for air dry. After drying the plate, taken one sterile swab and wetted with the diluent and swabbed from the left side corner to the right side corner. Then the swab dipped into the tube having the 10 ml of diluent. Then the solution passed through 0.22 µ PVDF filter and collected the sample into the vial. Then evaluated the results with the limit not less than 95% of recovery. 3. STATISTICAL ANALYSIS The data was processed through the Q Sight software and the results were calculated as mean and ± SD for the accuracy and relative standard deviation was calculated for the precision.The co efficient of regression also calculated in the linearity parameter.
4. RESULTS AND DISCUSSION
Table 1: SpecificityData
S.NO Injection Etamsylate RT AREA Tranexamic Acid
RT AREA
01 Blank Not Detected NA NA Not Detected NA NA
02 01 Detected 1.121 425698 Detected 2.122 7578653
03 02 Detected 1.120 425816 Detected 2.121 7578862
04 03 Detected 1.122 425821 Detected 2.122 7579581
In the specificity study,there was no interference observed. The analytes were detected with good response. There was no carryover problem with this method.Because after
analytes injection blank injection was injected.Post blank analytes were not detected (Table: 1and Figure: 3 to 5).

ijlpr 2020; doi 10.22376/ijpbs/lpr.2020.10.4.P44-59 Pharmacy
P-47
Table 2: System Suitability Data
Parameter Etamsylate Tranexamic Acid
Peak Shape Good Good
Retention Time 1.121 2.122
Area 425958 75769583
Asymmetry 1.01 1.10
Theoritical Plates 4500 6500
Resolution 4.5
%RSD of Six Injections 0.14 0.06
The system suitability parameters results were showing that the method was acceptable to validate and it can be used for the regular analysis (Table: 2).
Table 3: System PrecisionData
Drug Name Etamsylate Tranexamic Acid
Injection RT Area RT Area
01 1.121 425482 2.124 7585421
02 1.121 424380 2.122 7586732
03 1.122 426481 2.123 7576471
04 1.121 425687 2.124 7586454
05 1.122 425982 2.123 7589465
06 1.122 424781 2.123 7589678
Average 1.122 425465.5 2.123 7585703.5
SD 0.00055 773.8472 0.000752773 4834.986194
%RSD 0.05 0.18 0.04 0.06
Table 4: Method Precision Data
Drug Name Etamsylate Tranexamic Acid
Injection RT Area RT Area
01 1.121 424427 2.124 757691
02 1.121 426277 2.122 756575
03 1.122 425321 2.123 758214
04 1.121 423485 2.124 757785
05 1.122 424722 2.123 759258
06 1.122 423658 2.123 758524
Average 1.122 424648.3 2.123 758007.8
SD 0.00055 1048.194 0.000753 902.7623
%RSD 0.05 0.25 0.04 0.12
The system precision and method precision results were found satisfactory as per the predefined limit(%RSD for RT and Ares NMT 2.0%) (Table: 3 and 4).
Table 5: Accuracy and RecoveryData
S.NO Drug Name % level spiking
Spiked amount(ng)
area Recovered amount(ng)
%Recovery %CV
1
Etamsylate
80
20.02 339941 20.00 99.9
0.11 20.03 340052 20.00 99.9
20.03 340612 20.03 100.0
2 100
25.03 424984 25.00 99.9
0.15 25.02 424998 25.00 99.9
25.03 425285 25.02 99.9
3 120
30.032 511020 30.003 99.9
0.02 30.022 512685 30.013 100.0
30.002 511625 30.015 100.0
1
Tranexamic Acid
80
40.00 6068617 40.00 100.0 0.01 40.00 6067514 40.00 100.0
40.00 6068524 40.00 100.0
2 100
50.00 7576584 49.95 99.9 0.09 50.01 7586524 50.01 100.0
50.01 7589658 50.03 100.0
3 120 60.01 9101925 60.00 100
ijlpr 2020; doi 10.22376/ijpbs/lpr.2020.10.4.P44-59 Pharmacy
P-48
60.02 9102065 60.01 100 0.02
60.03 9104652 60.02 100
The percentage recovery of the analytes in this method achieved more than 99% at all three levels. Hence this method was found to be more accurate (Table: 5 and Figure: 7to 9).
Table 6: Robustness Data
Condition Value Etamsylate Tranexamic Acid
RT AREA Asymmetry Resolution RT AREA Asymmetry
Flow
0.7 ml/min 1.212 412658 1.051 4.1 2.233 7495621 1.123
0.8 ml/min 1.121 425465 1.012 4.2 2.122 7585612 1.102
0.9 ml/min 1.112 418542 1.011 4.0 2.012 7695425 1.101
Mobile Phase Composition (Buffer: Acetonitrile)
80/20v/v 1.251 421365 1.048 4.1 2.312 7536254 1.131
75/25 v/v 1.121 425632 1.012 4.2 2.121 7586321 1.101
70/30v/v 1.101 413521 1.001 4.0 2.101 7423542 1.100
PH
6.8 1.212 418958 1.21 4.1 2.210 746258 1.121
7.0 1.121 425325 1.01 4.2 2.121 7586311 1.101
7.2 1.212 412359 1.05 4.1 2.231 7469521 1.102
Column Temperature
23 1.119 421575 1.031 4.1 2.118 7498521 1.130
25 1.122 425625 1.012 4.2 2.122 7581351 1.010
27 1.118 421325 1.001 4.0 2.012 7513528 1.110
The method was more capable with the minor alterations of instrument parameters.Based on the data of Table No:6 it was evident that when mobile phase composition ,PH and column temperature changes about 10% there
was no system suitability and there was no abnormality in pattern of the elution and its capability of repeatability (Table: 6).
Table 7: Filter Compatibility
Drug Name 0.2µm PVDF Filter Assay 0.2µm Nylon Filter Assay
Etamsylate 100.0 99.3
Tranexamic Acid 99.8 99.0
Difference 0.7% For Etamsylate
0.8% For Tranexamic Acid
Suitability PVDF 0.2µM Filter
Based on the filter compatibility results, the PVDF filter was more efficient for the analysis because there was no decrease
of drug when subjected to the filtration through the PVDF filter (Table: 7).
Table 8: Limit of Quantitation
Drug Name Area LOQ S/N ratio
Etamsylate 4261 25ng/ml 11.5
Tranexamic Acid 75681 50ng/ml 12.1
The LOQ for the Etamsylte found to be 25ng/ml and for the tranexamic acid was 50ng/ml.The obtained results showed that this method was more sensitive (Table: 8, Figur: 17)).
Table 9: LOQ Precision
Drug Name Etamsylate Tranexamic Acid
Injection RT Area RT Area
01 1.122 4215 2.123 75685
02 1.121 4265 2.121 75982
03 1.123 4263 2.122 75432
04 1.121 4215 2.121 76813
05 1.122 4269 2.122 76923
06 1.122 4312 2.123 75695
Average 1.122 4256.5 2.122 76088.33
SD 0.00075 36.86597 0.000894 629.4886
%RSD 0.07 0.87 0.04 0.83
The LOQ precision resultsproved that at this stage, the method was more consistent.Because at lower level quantification the %RSD was 0.87% for Etamsylate and 0.83%
for Tranexamicacid.The obtained %RSD was very less as the developed method was more sensitive (Table: 9).

ijlpr 2020; doi 10.22376/ijpbs/lpr.2020.10.4.P44-59 Pharmacy
P-49
Table 10: Limit of Detection
Drug Name Area LOD S/N ratio
Etamsylate 865 2.5ng/ml 3.4
Tranexamic Acid 7200 5.0ng/ml 3.1
The LOD for the Etamsylte found 2.5ng/ml and for the tranexamic acid was found 5.0ng/ml.The obtained results
were proving that this method was more sensitive in detection (Table: 10 and Figure: 18).
Table 11: Ruggedness Data
Drug Name Injection Day-1 Day-2 Drug Name Day-1 Day-2
Etamsylate
01 424865 424568
Tranexamic Acid
7596911 7582354
02 425985 424981 7556754 7556685
03 424368 426525 7558143 7557652
04 425856 426827 7576858 7574651
05 426399 425985 7592588 7559858
06 424589 425234 7585242 7556981
Average 425344 425687 7577749 7564697
Standard Deviation 841.2005 899.6058 17143.53 11023.87
%RSD 0.20 0.21 0.23 0.15
Based on the results shown in the table, the method was more rugged.Because when the samples analysed on the next day also there was no deviation from the first day result as per the predefined limit(%RSD for the Area
NMT2.0%).There was no change of retention time of main actives.Hence the method can be considered as rugged (Table: 11).
Table 12: Standard and Mobile Phase Stability
Drug Name Etamsylate Tranexamic Acid
Injection RT Area RT Area
Initial 1.122 425482 2.122 7585421
12 1.122 424185 2.123 7583685
24 1.122 426265 2.123 7579585
36 1.122 425361 2.124 7576385
48 1.121 425965 2.122 7585391
72 1.122 424637 2.122 7576594
Average 1.122 425315.8 2.123 7581177
SD 0.00041 786.3313 0.000816 4208.587
%RSD 0.04 0.18 0.04 0.06
The solution and mobile phase was stable up to 72 hours. The %RSD for the area and retention time below 0.2% .The result showed that the method was developed with good
stability. Hence the prepared samples can be analyzed with this method upto 72 hours. This method was helpful at the time of out of specification investigation also (Table: 12).
Table 13: Degradation Study on drug productData
Drug name Condition Peak area %Recovery %Degradation Purity Angle PurityThreshold
Etamsylate
Un Degraded 424912 100 - - -
Acid 414912 97.6 2.4 0.521 1.621
Base 411912 96.9 3.1 0.621 1.852
Thermal 409912 97.2 2.8 0.725 2.132
Photo 412912 96.5 3.5 0.685 1.921
Peroxide 410712 96.6 3.4 0.656 1.911
Tranexamic Acid
Un Degraded 7599958 99.8 - - -
Acid 7566958 99.4 0.4 0.212 0.951
Base 7331958 97.5 1.9 0.421 1.251
Thermal 7416958 97.4 2.0 0.435 1.285
Photo 7331958 96.3 3.5 0.465 1.454
Peroxide 7326958 96.7 3.1 0.510 1.621
The method was stable indicating because the degradants also detected with this method. The method was capable in detecting the degradants when the sample subjected to different stress conditions like chemical and thermal
degradations. As the method having the degradant detection capability, the method can be useful in out of trend results in shelf life study of the product. Table 14: Recovery on SS Plate of 100% spiking (Table: 13, Figure: 12-16)

ijlpr 2020; doi 10.22376/ijpbs/lpr.2020.10.4.P44-59 Pharmacy
P-50
Table 14. Recovery on SS Plate of 100% spiking
Drug Name Amount spiked(ng/ml)
Recovery (ng/ml)
%Recovery
Etamsylate 25 24 96.3
Tranexamic Acid 50 49 97.5
The recovery found good on SS plate. The percentage recovery was more than 95 %.Hence the method can be used to quantify the cleaning samples of manufacturing. Because most of the equipment used in manufacturing will be having SS as a material of construction. When the product change
over condition, the cleaning sample will be submitted to quality control to know the percentage of product traces were present in final rinse of the equipment. After confirming there were no previous product traces only the next product manufacturing will be start (Table: 14).
Table 15: Recovery on Glass Plate of 100% spiking
Drug Name Amount spiked(ng/ml)
Recovery (ng/ml)
%Recovery
Etamsylate 25 24 96.9
Tranexamic Acid 50 48 96.3
The recovery found good on Glass plate,For glass plate the percentage recovery was more than 95 %.Hence the method can be used to quantify the cleaning samples of manufacturing. Because in the manufacturing area, active components traces will stick to the glass panels used in the manufacturing area.The production chemist will take the
swab from the glass panel and submit to the quality control to identify the traces. After confirming there was no product traces the clearance will be given for the next product manufacturing (Table: 15).
Table 16: Recovery on Epoxy Plate of 100% spiking
Drug Name Amount spiked(ng/ml)
Recovery (ng/ml)
%Recovery
Etamsylate 25 24 95.3
Tranexamic Acid 50 48 96.2
The recovery found good on Epoxy plate. For Epoxy plate the percentage recovery was more than 95 %.Hence the method can be used to quantify the cleaning samples of manufacturing.During the manufacturing the spills will happened. Most of the floors will be designed with the epoxy
materials. Before manufacturing the next products the manufacturing chemist will take the swabs from the epoxy floor and will submitted to the quality control.After confirming the cleanliness only the product manufacturing clearance will be given (Table: 16, Figure: 7 to 9).
Fig 1. Chemical Structure Etamsylate Fig 2. Chemical Structure Tranexamic acid

ijlpr 2020; doi 10.22376/ijpbs/lpr.2020.10.4.P44-59 Pharmacy
P-51
Fig 3. Blank Chromatogram
Fig 4. Specificity Chromatogram of Etamsylate The Etamsylte eluted with good response and peak shape at RT 1.121.
Fig 5.Specificity Chromatogram of Tranexamic Acid The Tranexamic Acid eluted with good response and peak shape at RT 2.122.

ijlpr 2020; doi 10.22376/ijpbs/lpr.2020.10.4.P44-59 Pharmacy
P-52
Fig 6.System Suitability Chromatogram of Ethamsylate and Tranexamic Acid. The two analytes eluted with good resolution and symmetry.There was no tailing and other peaks interference at the main analytes elution.
Fig 7.80% Accuracy Level Chromatogram of Ethamsylate and Tranexamic Acid.

ijlpr 2020; doi 10.22376/ijpbs/lpr.2020.10.4.P44-59 Pharmacy
P-53
Fig 8.100% Accuracy Level Chromatogram of Ethamsylate and Tranexamic Acid.
Fig 9.120% Accuracy Level Chromatogram of Ethamsylate and Tranexamic Acid.
Fig10. Linearity Graph of Etamsylate The correlation co efficient obtained for the Etamsylate is 0.9997 against the predefined limit NLT 0.99.
ijlpr 2020; doi 10.22376/ijpbs/lpr.2020.10.4.P44-59 Pharmacy
P-54
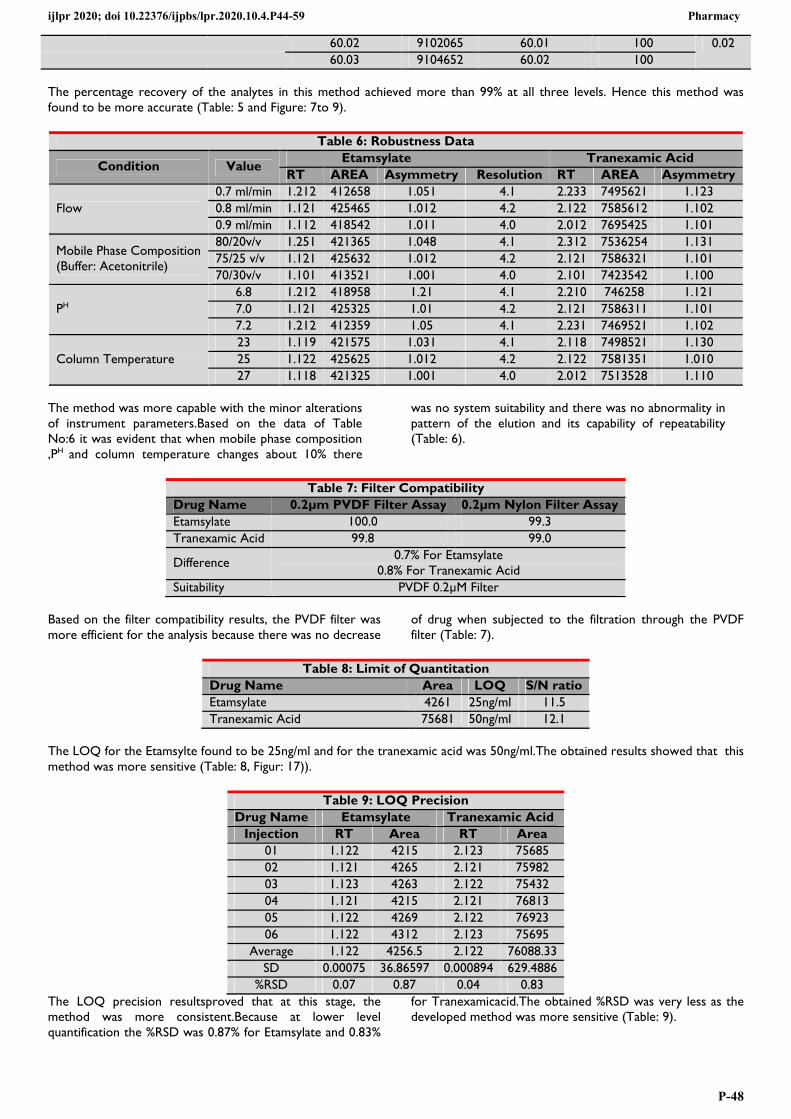
Fig 11. Linearity Graph of Tranexamic Acid The correlation co efficeient obtained for the Tranexamic Acidis 1.000 against the predefined limit NLT 0.99
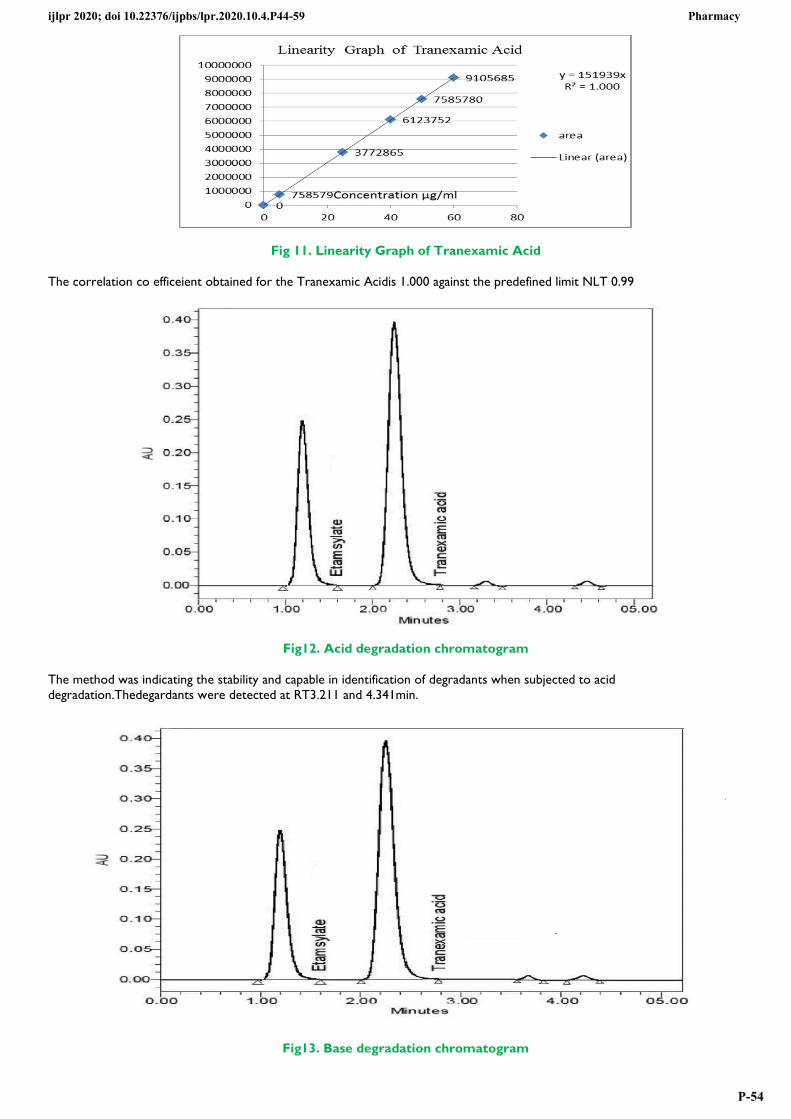
Fig12. Acid degradation chromatogram
The method was indicating the stability and capable in identification of degradants when subjected to acid degradation.Thedegardants were detected at RT3.211 and 4.341min.
Fig13. Base degradation chromatogram

ijlpr 2020; doi 10.22376/ijpbs/lpr.2020.10.4.P44-59 Pharmacy
P-55
The method was capable in identification of degradants when subjected to base degradation as shown in the figure. The degardants were detected at RT3.521 and 4.122min.
Fig 14.Thermal degradation chromatogram
The method was capable in identification of degradants when subjected to thermal degradation. The degardants were detected at RT3.312 min and 3.812 min,4.381 min.
Fig15. Photo degradation chromatogram The method was capable in identification of degradants when subjected to photo degradation. The degardants were detected at RT 2.821 min and 3.451 min,3.921 min.

ijlpr 2020; doi 10.22376/ijpbs/lpr.2020.10.4.P44-59 Pharmacy
P-56
Fig16. Peroxide degradation chromatogram
The method was capable in identification of degradants when subjected to peroxide degradation. The degardants were detected at RT 2.912 min and 3.412 min,4.521 min.
Fig17. LOQ chromatogram
The figure showing that at the lower concentration also the analytes eluted with good shape and resolution.This was proving that at lower level also the method will give good results.

ijlpr 2020; doi 10.22376/ijpbs/lpr.2020.10.4.P44-59 Pharmacy
P-57
Fig18. LOD chromatogram
The figure showing the limit of detection which is having lowest concentration which can be detected with this method. This was evident that method was more sensitive. 4.1 Method development and optimization In order to develop a good method for the qualitative and quantitative analysis, different trials were performed and observed some peak disturbances and retention time with different buffers like ammonium acetate and methanol. But finally the method was developed and optimized with the following conditions. The optimized method was mobile phase having the buffer pH of 7.0and Acetonitrile (75:25% v/v) by utilizing the stationary phase Acquity BEH C18, 1.7 µ.m,2.1 mm X 50 mm gave the best peak shape and resolution. The Ethamsylate and Tranexamic acid separation was good at 265nm with the column temperature 25°C and sample compartment temperature 10° C with the flow 0.8 ml.Then the Etamsylate peak was observed at 1.122 min and tranexamic acid at 2.122 min of total run time 5min. 4.2 Method validation No interference was observed at the time of main component elution times of Ethamsylate and Tranexamic acid The detectable level concentration was found to be 2.5 ng/ml for Etamsylate and 5.0 ng/ml as shown in the. The developed method repeatability was verified as system and method precision. The obtained % RSD of area and retention time for the system precision of Etamsylate was 0.18% and 0.05. The obtained % RSD of area and retention time for the system precision of tranexamic acid was 0.06% and 0.04. The obtained % RSD of area and retention time for the method precision of Etamsylate was 0.25% and 0.05%. The obtained % RSD of area and retention time for the method precision of tranexamic acid was 0.12% and 0.04 as shown in the The Linearity parameter was quantified by peak area vs concentration methodology. Different concentrations from 2.5µg/ml to 30 µg/ml standard solutions for Etamsylate and 5 µg/ml to 60 µg/ml were prepared and injected into the system. Then we calculated the regression coefficient. The
obtained regression coefficient for Etamsylate is 0.9997 and for the tranexamic acid it was 1.000 as shown in the .The %CV was lower than 5% and mean % recovery varied from 98 –102% as shown in the To prove the method stability,the method was verified with the minor variations of flow,mobile phase composition,PH,Column temperature variations for the robustness. The results shown in the proved that the method was able to produce accurate and consistent results with the minor variation of the method parameters. To show the method was stable, the method was applied to the formulation subjected to acid degradation as shown in ) were two degradant peaks were detected at 3.211min and 4.341 min, degradation behavior with base was shown in the chromatogram two degradants were detected at 3.521 min and 4.122 min and the degradation behavior of drug products if exposed to heat at 105°C showz in the ) three degradants were detected at 3.312min and 3.812 and 4.381min,The drug behavior when exposed to the light for 6 hours under the luminous light having lux more than2500 the degradants were detected at 2.821and 3.451min and 3.921min as shown in ) and three degradants were detected at 2.912 min and 3.412min and 4.521min with the peroxide degradation effect as shown in .The obtained chromatograms showedthat the method was successful in identifying the degradants and same was reflected in the quantification of the assay as shown in the . The method was verified for the ruggedness as interday and intraday precision. The obtained results were % RSD of area for the day-1andday-2 as 0.20and0.21 observed for the Etamsylate. The obtained results were % RSD of area for the day-1andday-2 as 0.23and0.15 for the tranexamic acid as shown in the . The LOQ and LOD were identified by injecting the lower concentrations with the S/N ratio criteria. The LOQ for the Etamsylate was 25ng/ml and 50ng/ml with the S/N ratio 11.5 and 12.1 as shown in the . The LOD for the Etamsylate was 2.5ng/ml and 5.0ng/ml with the S/N ratio 2.8 and 3.2 as shown in the (Table :10). The LOQ precision also performed to evaluate the repeatability at the lower quantification range .The obtained % RSD of the area for the Ethamsylate and tranexamic acid was 0.87 and 0.83% as shown in the ). The obtained %RSD showed the developed method was more selective , sensitive and accurate for the

ijlpr 2020; doi 10.22376/ijpbs/lpr.2020.10.4.P44-59 Pharmacy
P-58
quantification of the components. The ability of the method to the cleaning samples was verified by considering the recovery from the stainless steel plate,glass plate.epoxy plate with the aim of recovery NLT90%.The obtained recovery was more than 95% as shown in the . The methodology was utilized for the quantification of ethamsylate and tranexamic aid in the commercially available brand (Sylate-500mg). The obtained assay was 100% for the Etamsylate and 99.8% for the tranexamic acid. And the method was already proved in quantification of bulk in the above mention parameters as the accuracy and linearity. The same method was applied to the cleaning samples to identify the product traces in the lower quantification concentration range. The obtained results were proved that the method was good for quantification of the product traces in cleaning samples.The proposed method showed good performance in terms of linearity, accuracy, precision, recovery, robustness and stability forEtamsylate and Tranexamic acid in bulk, unit dose and equipment surface cleaning samples. It also showed appreciable resolution in separation and shape of the peak.After minor alteration of method parameters,we found good separation of the components without area abnormalities. 4.3 Abbreviations ET: Etamsylate, TA: Tranexamic acid, mg: Milligram, µg: Microgram, h: Hours, min: Minutes, mM: Milli molar, ml: Milliliter, C18: Octadecylsilane, mm: Millimeter,g: Grams, µm: Micro meter,L.O.Q: Lower limit of quantification,UPLC: Ultra Performance Liquid chromatography, AU: Atomic mass
units, LOQ: Limit of Quantification, LOD: Limit of detection, NLT :Not less than, NMT :Not more than,
5. CONCLUSION This technique contains a short run timeof analysis to get rapid results in critical situations.. The proposedmethod development for the simultaneous estimation of etamsylate and tranexamic acid by UPLC/ PDA would be much usefulfor routine analysis of bulk samples and finished dosage forms and for process equipment cleaning samples.
6. ACKNOWLEDGEMENTS The authors are grateful to Yontus Life Sciences Pvt. Ltd, Guntur, India for providing support to carry out analysis work 7. AUTHORS CONTRIBUTION STATEMENT T.MohanRao gathered the data related to this work,Dr.CH.Balasekhara Reddy and Dr.P.Srinivasababu guided ininterpretation of the results and completionof the work. All authors contributed equally to the manuscript completion.
8. CONFLICT OF INTEREST Conflict of interest declared none.
9. REFERENCES 1) Validation of analytical procedures: Text and
Methodology. In ICH Harmonized Tripartite Guidelines (2005) Q2 (R1).
https://database.ich.org/sites/default/files/Q2_R1__Gui
deline.pdf. 2) Snyder, L.R., Kirkland, J.J. and Glajch, J.L. Practical
HPLC Method Development. 1997, 2nd Edition, John Wiley and Sons, Inc., Hoboken.
3) Validation of analytical procedures: Text and Methodology. In ICH Harmonized Tripartite Guidelines (2005) Q2 (R1).
https://database.ich.org/sites/default/files/Q2_R1__Gui
deline.pdf 4) Roshan Issarani, Kaushik Kumar Vankar, Diptish
Kumar Nayak.Spectrophotometric Methods for Simultaneous Estimation of Etamsylate and Tranexamic Acidfrom Combined Tablet Dosage Form.Int.J. ChemTech Res.2010,2(1).
5) Naik RY, Dedania Z. Development and Validation of Spectrophotometric Method for Simultaneous Estimation of Etamsylate and Tranexamic Acid in Tablet Dosage Form. IJPRS.V4.2015(149-156).
http://sphinxsai.com/sphinxsaiVol_2No.1/ChemTech_
Vol_2No.1/ChemTech_Vol_2No.1PDF/CT=14%20(7
4-78).pdf. 6) Gehad G. Mohamed, Eman Y.Z. Frag and Abeer A.
Sedeek.Spectrophotometric Methods for Determination of Tranexamic Acid and Ethamsylate in Pure Form and Pharmaceutical Formulation.Insight Pharmaceutical Sciences 5 (1): 1-7, 2015.
https://insightknowledge.org/fulltext/?doi=IPHARMA-
IK.2015.1.7.
7) Arshad, M.D, Karadi,A.B Darak ,V.R., Raju, S.A.; Development and validation of visible spectrophotometric methods for the estimation of ethamsylate in pharmaceutical dosage forms.Journal of Chromatographic Science, 2017, Vol. 55, No. 1, 23–29.
https://www.semanticscholar.org/paper/Development-
and-Validation-of-Visible-Methods-for-Karadi-
Raju/46a9d992f0d0ce2da626377d17963f75a9468125. 8) Rajani Kaibada and Mukthinuthalapati Mathrusri
Annapurna.Analytical Methods for the Determination of Thrombolytics.Acta Scientific Pharmaceutical Sciences 3.4 (2019): 14-18.
https://www.actascientific.com/ASPS/pdf/ASPS-03-
0227.pdf, 9) Dr. G. Pratap Kumar, D. Manjeera and T. Murali
Krishna.Hplc method development and validation for simultaneous estimation of tranexamic acid and ethamsylate pharmaceutical dosage forms.wjpls, 2017, Vol. 3, Issue 6, 268-273. https://www.wjpls.org/download/article/17072017/1502882772.pdf.
10) Swati sahani, Vandana Jain .A Novel reversed-phase high-performance liquid chromatography method for simultaneous estimation of drotaverine hydrochloride, Etamsylate, and tranexamic acid in tablet dosage form.Asian J Pharm Clin Res. Vol 11, Issue 6, 2018, 121-125. DOI:10.22159/ajpcr.2018.v11i6.24777.
11) Yogini Jaiswal, Gokul Talale, sanjay surana.Determination of Etamsylate and Mefenamic Acid in Bulk Drugs and Tablets.Journal of planar chromatography V18(106),2005.
DOI: 10.1556/JPC.18.2005.6.11 12) Fawzia Ibrahim, Mohie K. Sharaf El-Din, Asmaa Kamal
El-Deenand Kuniyoshi Shimizu.Micellar HPLC Method

ijlpr 2020; doi 10.22376/ijpbs/lpr.2020.10.4.P44-59 Pharmacy
P-59
for Simultaneous Determination of Ethamsylate and Mefenamic Acid in Presence of Their Main Impurities and Degradation Products.J Chromatogr Sci. 2017 Jan;55(1):23-29. Epub 2016 Sep 27.
doi: 10.1093/chromsci/bmw143. 13) Chandrsekhara S, Good anavar. A New Stability-
Indicating RP-HPLC Method to Determine Etamsylate in Injection Formulation. International Journal of Pharmaceutical and Biological Archives. IJPBA, June – July, 2010, Vol. 1, Issue, 2.
https://www.ijpba.info/ijpba/index.php/ijpba/article/vie
w/46/26 14) Nageswara Rao R., Nagaraju P, Reddy V.
S.,Krishnamurthy P. R., Bhaskar S. U., GopalP.Determination of Etamsylate in pharmaceutical preparations. Asian J. Chem. / 2006 / 18(2) / pp 783-787.
http://www.asianjournalofchemistry.co.in/user/journal/
viewarticle.aspx?ArticleID=18_2_3.