Ontology-based methods for analyzing life science data
174
HAL Id: tel-01403371 https://hal.inria.fr/tel-01403371 Submitted on 25 Nov 2016 HAL is a multi-disciplinary open access archive for the deposit and dissemination of sci- entific research documents, whether they are pub- lished or not. The documents may come from teaching and research institutions in France or abroad, or from public or private research centers. L’archive ouverte pluridisciplinaire HAL, est destinée au dépôt et à la diffusion de documents scientifiques de niveau recherche, publiés ou non, émanant des établissements d’enseignement et de recherche français ou étrangers, des laboratoires publics ou privés. Ontology-based methods for analyzing life science data Olivier Dameron To cite this version: Olivier Dameron. Ontology-based methods for analyzing life science data. Bioinformatics [q-bio.QM]. Univ. Rennes 1, 2016. tel-01403371
-
Upload
khangminh22 -
Category
Documents
-
view
1 -
download
0
Transcript of Ontology-based methods for analyzing life science data

HAL Id: tel-01403371https://hal.inria.fr/tel-01403371
Submitted on 25 Nov 2016
HAL is a multi-disciplinary open accessarchive for the deposit and dissemination of sci-entific research documents, whether they are pub-lished or not. The documents may come fromteaching and research institutions in France orabroad, or from public or private research centers.
L’archive ouverte pluridisciplinaire HAL, estdestinée au dépôt et à la diffusion de documentsscientifiques de niveau recherche, publiés ou non,émanant des établissements d’enseignement et derecherche français ou étrangers, des laboratoirespublics ou privés.
Ontology-based methods for analyzing life science dataOlivier Dameron
To cite this version:Olivier Dameron. Ontology-based methods for analyzing life science data. Bioinformatics [q-bio.QM].Univ. Rennes 1, 2016. �tel-01403371�

Habilitation a Diriger des Recherches
presentee par
Olivier Dameron
Ontology-based methodsfor analyzing life science data
Soutenue publiquement le 11 janvier 2016
devant le jury compose de
Anita Burgun Professeur, Universite Rene Descartes Paris Examinatrice
Marie-Dominique Devignes Chargee de recherches CNRS, LORIA Nancy Examinatrice
Michel Dumontier Associate professor, Stanford University USA Rapporteur
Christine Froidevaux Professeur, Universite Paris Sud Rapporteure
Fabien Gandon Directeur de recherches, Inria Sophia-Antipolis Rapporteur
Anne Siegel Directrice de recherches CNRS, IRISA Rennes Examinatrice
Alexandre Termier Professeur, Universite de Rennes 1 Examinateur

2

Contents
1 Introduction 9
1.1 Context . . . . . . . . . . . . . . . . . . . . . . . . . . . . . . . . . . . . . . . . . 10
1.2 Challenges . . . . . . . . . . . . . . . . . . . . . . . . . . . . . . . . . . . . . . . . 11
1.3 Summary of the contributions . . . . . . . . . . . . . . . . . . . . . . . . . . . . . 14
1.4 Organization of the manuscript . . . . . . . . . . . . . . . . . . . . . . . . . . . . 18
2 Reasoning based on hierarchies 21
2.1 Principle . . . . . . . . . . . . . . . . . . . . . . . . . . . . . . . . . . . . . . . . . 21
2.1.1 RDF for describing data . . . . . . . . . . . . . . . . . . . . . . . . . . . . 21
2.1.2 RDFS for describing types . . . . . . . . . . . . . . . . . . . . . . . . . . . 24
2.1.3 RDFS entailments . . . . . . . . . . . . . . . . . . . . . . . . . . . . . . . 26
2.1.4 Typical uses of RDFS entailments in life science . . . . . . . . . . . . . . 26
2.1.5 Synthesis . . . . . . . . . . . . . . . . . . . . . . . . . . . . . . . . . . . . 30
2.2 Case study: integrating diseases and pathways . . . . . . . . . . . . . . . . . . . 31
2.2.1 Context . . . . . . . . . . . . . . . . . . . . . . . . . . . . . . . . . . . . . 31
2.2.2 Objective . . . . . . . . . . . . . . . . . . . . . . . . . . . . . . . . . . . . 32
2.2.3 Linking pathways and diseases using GO, KO and SNOMED-CT . . . . . 32
2.2.4 Querying associated diseases and pathways . . . . . . . . . . . . . . . . . 33
2.3 Methodology: Web services composition . . . . . . . . . . . . . . . . . . . . . . . 39
2.3.1 Context . . . . . . . . . . . . . . . . . . . . . . . . . . . . . . . . . . . . . 39
2.3.2 Objective . . . . . . . . . . . . . . . . . . . . . . . . . . . . . . . . . . . . 40
2.3.3 Semantic compatibility of services parameters . . . . . . . . . . . . . . . . 40
2.3.4 Algorithm for pairing services parameters . . . . . . . . . . . . . . . . . . 40
2.4 Application: ontology-based query expansion with GO2PUB . . . . . . . . . . . 43
2.4.1 Context . . . . . . . . . . . . . . . . . . . . . . . . . . . . . . . . . . . . . 43
2.4.2 Objective . . . . . . . . . . . . . . . . . . . . . . . . . . . . . . . . . . . . 44
2.4.3 Semantic expansion . . . . . . . . . . . . . . . . . . . . . . . . . . . . . . 45
2.4.4 Query generation . . . . . . . . . . . . . . . . . . . . . . . . . . . . . . . . 45
2.5 Synthesis . . . . . . . . . . . . . . . . . . . . . . . . . . . . . . . . . . . . . . . . 47
3 Reasoning based on classification 51
3.1 Principle . . . . . . . . . . . . . . . . . . . . . . . . . . . . . . . . . . . . . . . . . 51
3.1.1 OWL Classes . . . . . . . . . . . . . . . . . . . . . . . . . . . . . . . . . . 52
3.1.2 Union and intersection of classes . . . . . . . . . . . . . . . . . . . . . . . 53
3.1.3 Disjoint classes . . . . . . . . . . . . . . . . . . . . . . . . . . . . . . . . . 53
3.1.4 Negation: complement of a class . . . . . . . . . . . . . . . . . . . . . . . 54
3.1.5 Existential and universal restrictions . . . . . . . . . . . . . . . . . . . . . 54
3.1.6 Cardinality restrictions . . . . . . . . . . . . . . . . . . . . . . . . . . . . 55
3.1.7 Property chains . . . . . . . . . . . . . . . . . . . . . . . . . . . . . . . . . 55
3

3.1.8 Synthesis . . . . . . . . . . . . . . . . . . . . . . . . . . . . . . . . . . . . 553.2 Methodology: Description-logics representation of anatomy . . . . . . . . . . . . 57
3.2.1 Context . . . . . . . . . . . . . . . . . . . . . . . . . . . . . . . . . . . . . 573.2.2 Objective . . . . . . . . . . . . . . . . . . . . . . . . . . . . . . . . . . . . 583.2.3 Converting the FMA into OWL-DL . . . . . . . . . . . . . . . . . . . . . 583.2.4 Addressing expressiveness and application-independence: OWL-Full . . . 603.2.5 Pattern-based generation of consistency constraints . . . . . . . . . . . . . 61
3.3 Methodology: diagnosis of heart-related injuries . . . . . . . . . . . . . . . . . . . 643.3.1 Context . . . . . . . . . . . . . . . . . . . . . . . . . . . . . . . . . . . . . 643.3.2 Objective . . . . . . . . . . . . . . . . . . . . . . . . . . . . . . . . . . . . 653.3.3 Reasoning about coronary artery ischemia . . . . . . . . . . . . . . . . . . 653.3.4 Reasoning about pericardial effusion . . . . . . . . . . . . . . . . . . . . . 68
3.4 Optimization: modeling strategies for estimating pacemaker alerts severity . . . . 733.4.1 Context . . . . . . . . . . . . . . . . . . . . . . . . . . . . . . . . . . . . . 733.4.2 Objective . . . . . . . . . . . . . . . . . . . . . . . . . . . . . . . . . . . . 743.4.3 CHA2DS2VASc score . . . . . . . . . . . . . . . . . . . . . . . . . . . . . 743.4.4 Modeling strategies . . . . . . . . . . . . . . . . . . . . . . . . . . . . . . . 763.4.5 Comparison of the strategies’ performances . . . . . . . . . . . . . . . . . 77
3.5 Synthesis . . . . . . . . . . . . . . . . . . . . . . . . . . . . . . . . . . . . . . . . 80
4 Reasoning with incomplete information 834.1 Principle . . . . . . . . . . . . . . . . . . . . . . . . . . . . . . . . . . . . . . . . . 844.2 Methodology: grading tumors . . . . . . . . . . . . . . . . . . . . . . . . . . . . . 84
4.2.1 Context . . . . . . . . . . . . . . . . . . . . . . . . . . . . . . . . . . . . . 844.2.2 Objective . . . . . . . . . . . . . . . . . . . . . . . . . . . . . . . . . . . . 854.2.3 Why the NCIT is not up to the task . . . . . . . . . . . . . . . . . . . . . 854.2.4 An ontology of glioblastoma based on the NCIT . . . . . . . . . . . . . . 864.2.5 Narrowing the possible grades in case of incomplete information . . . . . 89
4.3 Methodology: clinical trials recruitment . . . . . . . . . . . . . . . . . . . . . . . 914.3.1 Context . . . . . . . . . . . . . . . . . . . . . . . . . . . . . . . . . . . . . 914.3.2 Objective . . . . . . . . . . . . . . . . . . . . . . . . . . . . . . . . . . . . 924.3.3 The problem of missing information . . . . . . . . . . . . . . . . . . . . . 924.3.4 Eligibility criteria design pattern . . . . . . . . . . . . . . . . . . . . . . . 954.3.5 Reasoning . . . . . . . . . . . . . . . . . . . . . . . . . . . . . . . . . . . . 96
4.4 Synthesis . . . . . . . . . . . . . . . . . . . . . . . . . . . . . . . . . . . . . . . . 98
5 Reasoning with similarity and particularity 1015.1 Principle . . . . . . . . . . . . . . . . . . . . . . . . . . . . . . . . . . . . . . . . . 101
5.1.1 Comparing elements with independent annotations . . . . . . . . . . . . . 1025.1.2 Taking the annotations underlying structure into account . . . . . . . . . 1035.1.3 Synthesis . . . . . . . . . . . . . . . . . . . . . . . . . . . . . . . . . . . . 108
5.2 Methodology: semantic particularity measure . . . . . . . . . . . . . . . . . . . . 1095.2.1 Context . . . . . . . . . . . . . . . . . . . . . . . . . . . . . . . . . . . . . 1095.2.2 Objective . . . . . . . . . . . . . . . . . . . . . . . . . . . . . . . . . . . . 1105.2.3 Definition of semantic particularity . . . . . . . . . . . . . . . . . . . . . . 1115.2.4 Formal properties of semantic particularity . . . . . . . . . . . . . . . . . 1115.2.5 Measure of semantic particularity . . . . . . . . . . . . . . . . . . . . . . . 1125.2.6 Use case: Homo sapiens aquaporin-mediated transport . . . . . . . . . . 113
5.3 Methodology: threshold determination for similarity and particularity . . . . . . 1165.3.1 Context . . . . . . . . . . . . . . . . . . . . . . . . . . . . . . . . . . . . . 117
4

5.3.2 Objective . . . . . . . . . . . . . . . . . . . . . . . . . . . . . . . . . . . . 1185.3.3 Similarity threshold . . . . . . . . . . . . . . . . . . . . . . . . . . . . . . 1185.3.4 Particularity threshold . . . . . . . . . . . . . . . . . . . . . . . . . . . . . 1255.3.5 Evaluation of the impact of the new threshold on HolomoGene . . . . . . 126
5.4 Synthesis . . . . . . . . . . . . . . . . . . . . . . . . . . . . . . . . . . . . . . . . 128
6 Conclusion and research perspectives 1296.1 Producing and querying linked data . . . . . . . . . . . . . . . . . . . . . . . . . 130
6.1.1 Representing our data as linked data . . . . . . . . . . . . . . . . . . . . . 1316.1.2 Querying linked data . . . . . . . . . . . . . . . . . . . . . . . . . . . . . . 134
6.2 Analyzing data . . . . . . . . . . . . . . . . . . . . . . . . . . . . . . . . . . . . . 1356.2.1 Selecting relevant candidates when reconstructing metabolic pathways . . 1366.2.2 Analyzing TGF-β signaling pathways . . . . . . . . . . . . . . . . . . . . 1366.2.3 Data analysis method combining ontologies and formal concept analysis . 137
Bibliography 139
Curriculum Vitæ 163
5

Acknowledgments
I and indebted to Mark Musen, Anita Burgun and Anne Siegel for allowing me to join their team,for their help and their encouragement, as well as for setting up such exciting environments.
I am most grateful to Michel Dumontier, Christine Froidevaux and Fabien Gandon for kindlyaccepting to review this document, and also to Anita Burgun, Marie-Dominique Devignes, AnneSiegel and Alexandre Termier for accepting to be parts of the committee.
I am thankful to all my colleagues for all the work we have accomplished together, assummarized by Figure 1 on the facing page. The PhD students I co-supervised have broughtsignificant contributions to most of the works presented in this manuscript: Nicolas Lebreton,Elodie Roques, Charles Bettembourg, Philippe Finet, Jean Coquet and Yann Rivault.
Close collaborations with colleagues from whom I learnt a lot were very stimulating: DanielRubin, Natasha Noy, Anita Burgun, Julie Chabalier, Andrea Splendiani, Paolo Besana, LyndaTemal, Pierre Zweigenbaum, Cyril Grouin, Annabel Bourde, Oussama Zekri, Pascal van Hille,Jean-Francois Ethier, Bernard Gibaud, Regine Le Bouquin-Jeannes, Anne Siegel, Jacques Nico-las, Guillaume Collet, Sylvain Prigent, Geoffroy Andrieux, Nathalie Theret, Fabrice Legeai,Anthony Bretaudeau, Olivier Filangi and again Charles Bettembourg.
Collaborating with colleagues from INRA was a great opportunity to tackle “real problems”and gave a great perspective on what this is all about: Christian Diot, Frederic Herault, DenisTagu, Melanie Jubault, Aurelie Evrard, Cyril Falentin Pierre-Yves Lebail and all the ATOLcurators: Jerome Bugeon, Alice Fatet, Isabelle Hue, Catherine Hurtaud, Matthieu Reichstadt,Marie-Christine Salaun, Jean Vernet, Lea Joret. Similarly, collaborations with colleagues fromEHESP provided the “human” counterpart: Nolwenn Le Meur, Yann Rivault.
More broadly, I benefited from the interactions with many other colleagues: GwenaelleMarquet, Fleur Mougin, Ammar Mechouche, Mikael Roussel, as well as the whole Symbiosegroup at IRISA, and particularly Pierre Peterlongo.
Working on workflows with Olivier Collin, Yvan Le Bras, Alban Gaignard and AudreyBihouee has been fun and I am eager to see what will come out of it.
In addition to research all these years were also the occasion of great teaching-related en-counters: Christian Delamarche, Emmanuelle Becker, Emmanuel Giudice, Annabelle Monnier,Yann le Cunff, Cedric Wolf.
Thank you all, I enjoyed all of it.
6

Figure 1: Graph of my co-authors. Two authors are linked if they share at least one publication.Node size is proportional to the number of articles.
7

8

Chapter 1
Introduction
This document summarizes my research activities since the defense of my PhD in Decem-ber 2003. This work has been carried initially as a postdoctoral fellow at Stanford Universitywith Mark Musen’s Stanford Medical Informatics group (now BMIR1), and then as an associateprofessor at University of Rennes 1, first with the UPRES-EA 3888 (which became UMR 936INSERM – University of Rennes 1 in 2009) from 2005 to 2012, and then with the Dyliss teamat IRISA since 2013.
First, I will present the context in which my research takes place. We will see that thetraditional approaches for analyzing life science data do not scale up and cannot handle theirincreasing quantity, complexity and connectivity. It has become necessary to develop automatictools not only for performing the analyses, but also for helping the experts do it. Yet, processingthe raw data is so difficult to automate that these tools usually hinge on annotations andmetadata as machine-processable proxies that describe the data and the relations between them.
Second, I will identify the main challenges. While generating these metadata is a challengeof its own that I will not tackle here, it is only the first step. Even if metadata tend to be morecompact than the original data, each piece of data is typically associated with many metadata,so the problem of data quantity remains. These metadata have to be reused and combined,even if they have been generated by different people, in different places, in different contexts,so we also have a problem of integration. Eventually, the analyses require some reasoning onthese metadata. Most of these analyses were not possible before the data deluge, so we areinventing and improving them now. This also means that we have to design new reasoningmethods for answering life science questions using the opportunities created bythe data deluge while not drowning in it. Arguably, biology has become an informationscience.
Third, I will summarize the contributions presented in the document. Some of the reasoningmethods that we develop rely on life science background knowledge. Ontologies are the formalrepresentations of the symbolic part of this knowledge. The Semantic Web is a more generaleffort that provides an unified framework of technologies and associated tools for representing,sharing, combining metadata and pairing them with ontologies. I developed knowledge-based reasoning methods for life science data.
Finally, I will describe the organization of the manuscript.
1http://bmir.stanford.edu/
9

1.1 Context: integrative analysis of life science data
Life sciences are intrinsically complicated and complex [1, 2]. Until a few years ago, both thescarcity of available information and the limited processing power imposed the double con-straints that work had to be performed on fragmented areas (either precise but narrow or broadbut shallow) as well as using simplifying hypotheses [3].
The recent joint evolution of data acquisition capabilities in the biomedical field, and ofthe methods and infrastructures supporting data analysis (grids, the Internet...) resulted inan explosion of data production in complementary domains (*omics, phenotypes and traits,pathologies, micro and macro environment...) [3, 4, 5]. For example, the BioMart communityportal provides a unified interface to more than 800 biological datasets distributed worldwideand spanning genomics, proteomics and cancer data [6], and the 2015 Nucleic Acids ResearchDatabase issue refers to more than 1500 biological databases [7]. Making data reusable hasbeen widely advocated [8]. This “data deluge” is the life-science version of the more general “bigdata” phenomenon, with the specificities that the proportion of generated data is much higher,and that these data are highly connected [9].
In addition to the breakthrough in each of these domains, majors efforts have been un-dertaken for developing the links between them: systems biology2 [10, 11, 12, 13, 14] at thefundamental level, translational medicine3 [15, 16] for the link between the fundamental andclinical levels, and more recently translational bioinformatics4 [17, 18, 19, 20] for the link betweenwhat happens at the molecular and cellular levels and what happens at the organ and individ-ual levels. These links between domains are obviously useful for performing better analysesof data, but conversely these new connections can sometimes reshape the domains themselves.For example, translational bioinformatics modifies the definitions of the fundamental notion ofwhat constitutes a disease by considering sequencing of genes or quantitating panels of RNA inaddition to the traditional nosology [21].
We are witnessing the transition from a world of isolated islands of expertise to a network ofinter-related domains [4, 22]. This is supported by another transition from a world where we hada small quantity of informations on a lot of people to a world where we have a lot of informationsin related domains (genetics, pathology, physiology, environment) for a small but increasingnumber of people. Storage capabilities kept pace with the increasing data generation. However,the bottleneck that once was data scarcity now lies in the lack of adequate dataprocessing and data analysis methods. This increasing data quantity and connectivity wasthe origin of new challenges.
The stake of data integration consists in establishing and then using systematically the linksbetween elements from different domains (e.g. from *omics to pathologies, from pathologies to*omics, or between *omics or pathologies of different species) having potentially different lev-els of precision [5]. For example, meta-analysis of heterogeneous annotations and pre-existingknowledge often lead to novel insights undetectable by individual analyses [23, 24]. Systems
2Systems biology aims at modeling the interactions between the elements of a biological system and theiremergent properties. These elements can themselves be composed of sub-elements that can interact among themor with other elements.
3Translational medicine aims at providing the best treatment for each patient by using the most recentdiscoveries in biology, drug discovery and epidemiology (bench to bedside), and conversely to reuse medical datawhen performing research (bedside to bench).
4Translational bioinformatics derives from translational medicine and focuses on integrating informationon clinical and molecular entities. It aims at improving the analysis and affect clinical care.
10

biology, translational medicine and translational bioinformatics all focus on the systematic or-ganization of these links.
The systematic exploitation of data permitted by integration requires some kindof automation. Because of life sciences intrinsic complexity, vast quantities of elements as wellas the numerous links between them that represent their inter-dependencies have to be takeninto account [25, 26].
This systematic exploitation of data is not only massive, it is also complex [4, 27]. Thesystematic analysis of the integrated data requires to perform some interpretation,which hinges on background knowledge [3]. Expertise or domain knowledge can be seenas the set of rules representing in what conditions data can be used or can be combined forinferring new data or new links between data (Levesque also provided an excellent more generalarticle on knowledge representation for artificial intelligence [28]).
The remainder of this document focuses on the third challenge of using knowledge for auto-matically integrating and analyzing biomedical data in a context covering translational medicineand translational bioinformatics.
1.2 Challenges: using domain knowledge to integrate and ana-lyze life science data
Several bottlenecks hamper the automated systematic exploitation of biomedical data:
• it has to take expertise or knowledge into account [29]. This entails both torepresent such knowledge in a formalism supporting its use in an automatic setting, andthat the conditions determining knowledge validity are themselves formally represented.
• it relies on data and knowledge that are obviously incomplete [3, 30]. We aretherefore in the intermediate state where we must develop automatic methods for pro-cessing vast amount of heterogeneous and inter-dependent data while being limited by theincomplete and fragmentary aspect of these data.
• it produces results that are so big and so complex that their biological in-terpretation is at best difficult. Dentler et al. showed that “Today, clinical data isroutinely recorded in vast amounts, but its reuse can be challenging” [31]. Moreover, itis not only the quantity of data that is increasing, but also the associated metadata thatdescribe and connect these data. Rho et al. point out that “One important issue in thefield is the growing complexity of annotation data themselves” and that “Major difficultiestowards meaningful biological interpretation are integrating diverse types of annotationsand at the same time, handling the complexities for efficient exploration of annotationrelationships” [24].
As Stevens et al. noted, “Much of biology works by applying prior knowledge [...] to anunknown entity, rather than the application of a set of axioms that will elicit knowledge. In ad-dition, the complex biological data stored in bioinformatics databases often require the additionof knowledge to specify and constrain the values held in that database” [29]. The same holdsfor the biomedical domain, e.g. to identify patient subgroups in clinical data repositories [32].
The knowledge we are focusing on is mostly symbolic, as opposed to other kinds of biomedicalknowledge (probabilistic, related to chemical kinetics, 3D models of anatomical entities or 4Dmodels of processes...). It should typically support generalization, association and deduction.
11

There is a long tradition of works in order to come up with an explicit and formal representa-tion of this knowledge that would support automatic processing. Cimino identified the followingkey requirements: “vocabulary content, concept orientation, concept permanence, non-semanticconcept identifiers, polyhierarchy, formal definitions, rejection of ‘not elsewhere classified’ terms,multiple granularities, multiple consistent views, context representation, graceful evolution, andrecognized redundancy” [33, 34, 35].
This line of work resulted in the now widespread acceptance of ontologies [29, 36] to representthe biomedical entities, their properties and the relations between these entities. Bard et al.defined ontologies as “formal representations of knowledge in which the essential terms arecombined with structuring rules that describe the relationships between the terms” [37]. Thiscovers the main points and encompasses alternative definitions [38, 39].
Ontologies range from fairly simple hierarchies to semantically-rich organization supportingcomplex reasoning [36]. There is also a distinction depending on their scope. Top-level ontologies(or upper ontologies) such as DOLCE or BFO are domain-independent and represent generalnotions such as things and processes. Domain ontologies cover a specific domain (e.g. normalhuman anatomy for the FMA of the description of gene products for GO) [40].
Ontologies are now a well established field [36, 2] that evolved from concept representa-tion [41]. In May 2015, there were 442 ontologies referenced by BioPortal, and 10,768 PubMedarticles mentioning “ontology” (Figure 1.1 on the next page). They cover the creation of newontologies, data annotation [2], data integration [3, 42], data analysis [5], or ontology as aproper research field [43]. There are many applications for bio-ontologies themselves, for exam-ple analysis of cancer *omics data [44], integration and analysis of quantitative biology data forhypothesis generation [45], biobanks [42], interpretation of complex biological networks [46] oreven analysis of research funding by diseases [47]. Hoehndorf et al. recently performed a reviewof the importance of bio-ontologies and their main application domains [48]. Among the mainontologies are the Gene Ontology (GO; for an analysis of its becoming the most cited ontol-ogy, see [45]), that provides a species-independent vocabulary for describing gene products, theNCI thesaurus for describing cancer-related entities, the International Classification of Diseases(ICD), OMIM for human genetic disorders, SNOMED Clinical Terms, the US National DrugFile (NDF-RT), ChEBI for describing small chemical molecules and UNIPROT for describingproteins, the Medical Subject Headings (MeSH) for annotating PubMed articles [36].
As noted previously, there are now numerous ontologies that are used in various contexts.These ontologies can overlap, which hampers data integration as some resources refer to someentity in an ontology whereas other resources can refer to the corresponding entity in anotherontology. The Unified Medical Language System (UMLS) provides some unifying architecturebetween the major biomedical ontologies and terminologies. The problems of ontology dispersionand overlap found a solution with BioPortal5 [49]. It is an open repository of biomedicalontologies that offers the possibility to browse, search and visualize ontologies, as well as tocreate, to store and to use mappings between these ontologies (i.e. relations between entitiesfrom different ontologies). Bioportal also supports the annotation of data from Gene Omnibus,clinical trials and ArrayExpress. It should be noted that BioPortal also provides some API andWeb services, so it can also be used by programs.
5http://bioportal.bioontology.org/
12
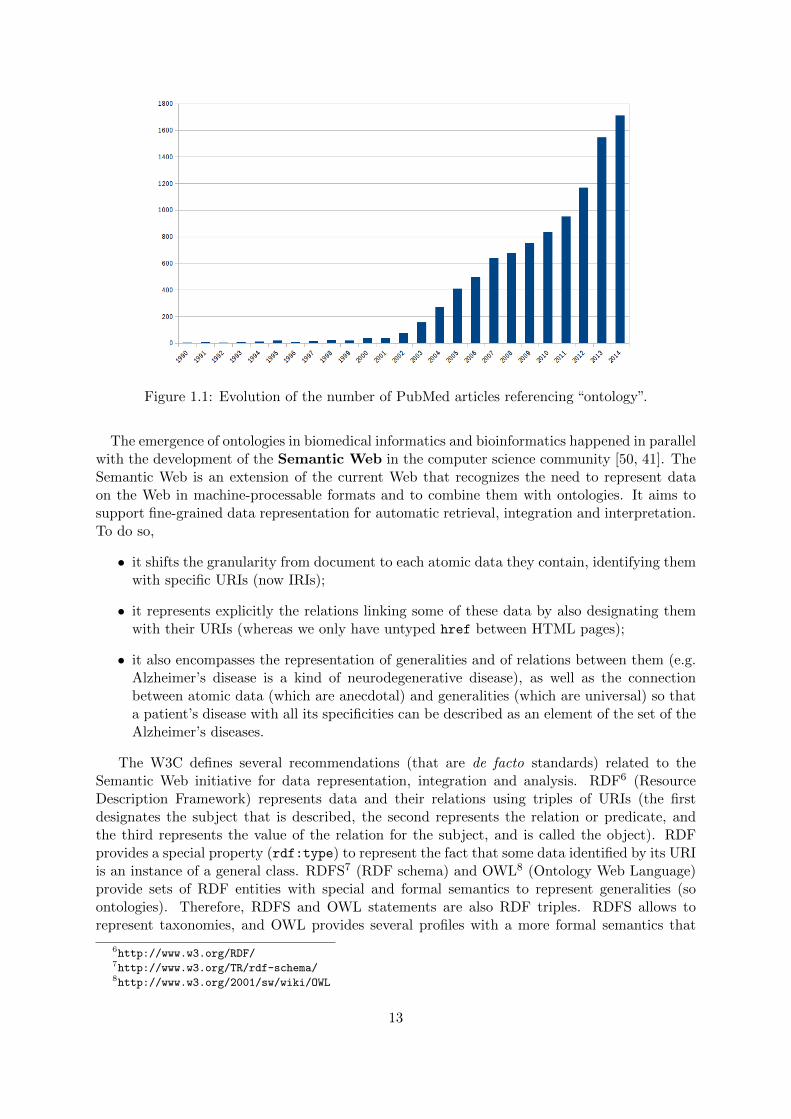
Figure 1.1: Evolution of the number of PubMed articles referencing “ontology”.
The emergence of ontologies in biomedical informatics and bioinformatics happened in parallelwith the development of the Semantic Web in the computer science community [50, 41]. TheSemantic Web is an extension of the current Web that recognizes the need to represent dataon the Web in machine-processable formats and to combine them with ontologies. It aims tosupport fine-grained data representation for automatic retrieval, integration and interpretation.To do so,
• it shifts the granularity from document to each atomic data they contain, identifying themwith specific URIs (now IRIs);
• it represents explicitly the relations linking some of these data by also designating themwith their URIs (whereas we only have untyped href between HTML pages);
• it also encompasses the representation of generalities and of relations between them (e.g.Alzheimer’s disease is a kind of neurodegenerative disease), as well as the connectionbetween atomic data (which are anecdotal) and generalities (which are universal) so thata patient’s disease with all its specificities can be described as an element of the set of theAlzheimer’s diseases.
The W3C defines several recommendations (that are de facto standards) related to theSemantic Web initiative for data representation, integration and analysis. RDF6 (ResourceDescription Framework) represents data and their relations using triples of URIs (the firstdesignates the subject that is described, the second represents the relation or predicate, andthe third represents the value of the relation for the subject, and is called the object). RDFprovides a special property (rdf:type) to represent the fact that some data identified by its URIis an instance of a general class. RDFS7 (RDF schema) and OWL8 (Ontology Web Language)provide sets of RDF entities with special and formal semantics to represent generalities (soontologies). Therefore, RDFS and OWL statements are also RDF triples. RDFS allows torepresent taxonomies, and OWL provides several profiles with a more formal semantics that
6http://www.w3.org/RDF/7http://www.w3.org/TR/rdf-schema/8http://www.w3.org/2001/sw/wiki/OWL
13

support richer reasoning. RDFS is well adapted to simple reasoning over large data sets, whereasOWL is adapted to more complex reasoning, at the cost of potentially longer computationtimes. These reasoning tasks are supported by several other recommendations. SPARQL9
(SPARQL Protocol and RDF Query Language) is an SQL-like query language for RDF. Notethat SPARQL1.1 can take most of RDFS semantics into account. OWL does not have a querylanguage but it does not really need one either because OWL inferences consists mostly indetermining whether a piece of data is an instance of a class, or whether a class is a subclassof another one. Additionally, SWRL10 (Semantic Web Rule Language) allows to representinference rules with variables. It should be noted that even if most bio-ontologies are representedin OWL, very few take advantage of the language expressivity. Most are RDFS ontologiesdisguised in OWL (which is possible because OWL is built on top of RDFS, e.g. all OWLclasses are RDFS classes), even if it has been demonstrated that they would benefit from usingOWL’s additional semantics [51, 52, 53]
Life sciences are a great application domain for the Semantic Web [54, 55, 56] and sev-eral major teams are involved in both, particularly at the W3C Semantic Web Health Careand Life Sciences interest group (HCLSIG)11. Since 2008, the Semantic Web Applications andTools for Life Sciences (SWAT4LS) workshop12 (co-organized by Andrea Splendiani, who wasa postdoc at U936) is an active event, along with conferences such as DILS, ISWC and ESWC.Semantic Web technologies have become an integral part of translational medicine and trans-lational bioinformatics [5, 14]. Several works have showed how these technologies can be usedto integrate genotype and phenotype informations and perform queries [57, 58]. More recently,Holford et al. proposed a Semantic Web framework to integrate cancer omics data and biologicalknowledge [44]. The Linked Data initiative [59] and particularly the Linked Open Data projectpromotes the integration of data sources in machine-processable formats compatible with theSemantic Web. Figure 1.2 on the facing page shows the importance of life sciences. In thepast few years, this proved instrumental for addressing the problem of data integration [53, 60].In this context, the Bio2RDF project13 promotes simple conventions to integrate biologicaldata from various origins [61, 62, 63]. Moreover, Semantic Web technologies support federatedqueries that gather and combine informations from several data sources [62]. The reconciliationof identifiers is further facilitated by initiatives such as identifiers.org [64].
1.3 Summary of the contributions
My contributions focused on methods for automatic analysis of biomedical data, based on on-tologies and Semantic Web technologies. This section is organized chronologically for presentinghow the various themes evolved and were applied to different projects. The remainder of thedocument is organized thematically.
My PhD dissertation consisted in the creation of an ontology of brain cortex anatomy [65, 66].At this point, the added value of ontologies for data integration and for reasoning had beendemonstrated by several major projects for many years. However, it was clear that developingontologies was a difficult endeavor with a part of craftsmanship. Particularly, one had to keeptrack of multiple dependencies between classes [67, 68, 69]. There was also the perception thatthe automatic reasoning based on ontologies all too often had to be completed by ad-hoc pro-
9http://www.w3.org/TR/sparql11-overview/10http://www.w3.org/Submission/SWRL/11http://www.w3.org/wiki/HCLSIG12http://www.swat4ls.org/13https://github.com/bio2rdf
14

Figure 1.2: Linked Open Data cloud in August 2014. Nodes are resources. Edges are cross-references between resources. Life science resources constitute the purple portion in the lowerright corner.(http://lod-cloud.net/).
gramming extensions either as pre-processing for making the data amenable to reasoning, or aspost-processing. There was no widespread agreement on the format to use for representing on-tologies at the time: frames were the dominant paradigm but multiple implementations existedin addition to the Protege editor [70]; interesting solutions like XML were advocated by theWorld Wide Web Consortium (W3C); Description Logics (DL) were gaining acceptance in thebiomedical community thanks to the reasoning capability and the DAML+OIL format beingassociated with an open source editor and a reasoner [71].
By the time I started my post-doc at Mark Musen’s Stanford Medical Informatics lab inStanford University, DAML+OIL had evolved into the OWL effort, which became a formalW3C recommendation on February 2004. Holger Knublauch, also post-doc at SMI, had juststarted developing an OWL plugin for Protege [72]. During my stay, I participated in theVirtual Soldier project.
My main contribution was to develop the symbolic reasoning mechanism for inferring theconsequences of penetrating bullet injuries based on both anatomical knowledge and patient-specific data [73, 74]. This made extensive use of Description Logics expressiveness to leveragereasoning capabilities based on classes (generic reasoning for inferring that a class is a subclassof another one) as well as on instances (data-specific reasoning for inferring that an individualis an instance of a class). The reasoning relied on rich anatomical knowledge. The Founda-tional Model of Anatomy (FMA) was the reference ontology but was originally developed andmaintained in frames, fortunately using Protege.
My second contribution was on ontology modeling and representation. I studied the theo-
15

retical aspects of the conversion of the frame-based FMA into an OWL version by preservingas much as possible of its original semantic richness and by automatically adding features thatwere beyond frames expressivity such as necessary and sufficient definitions or disjointness con-straints [75, 76]. Recognizing that different applications using the FMA may have differentexpressivity requirements and that some features may be useful in some context, but may addan unnecessary computational burden in other contexts, I proposed a modular approach so thatusers could import only the features they needed.
My third contribution addressed the need to automate certain operations during ontologydevelopment and ontology usage. For assisting both the development of the reasoning capabilityand the conversion of the FMA into OWL, I developed the ProtegeScript plugin [77] (stillincluded in the distribution of Protege 3) that added scripting capabilities (mainly Python,Ruby and BeanShell) to Protege and was compatible with both the original frames setting andthe OWL plugin. Eventually, I helped organize and teach the first versions of the Protege ShortCourse and Protege OWL Short Course in 2005, and have been invited back to Stanford to doso until 2011.
Since I joined Anita Burgun’s team as an associate professor at Rennes 1 university, I con-tinued working on ontology-based reasoning. Together with Gwenaelle Marquet, we devel-oped a semantically-rich reasoning application performing automatic classification of gliomatumors [78, 79]. This was in direct continuation of the line of work initiated in the VirtualSoldier project. In both cases, we demonstrated that if the relevant domain ontologies are richenough, developing an application-specific reasoning module only requires the creation of a fewclasses. In both cases though, this assumption was optimistic. Many works by other teamsfocused on improving existing ontologies[2] such as GO [52] or the NCI Thesaurus [80, 81].
As Jim Hendler pointed out, even a little semantics goes a long way [82], and I extended mywork to simpler forms of reasoning. With Julie Chabalier, we created a knowledge source relatingdiseases and pathways by integrating the Gene Ontology, KEGG orthology and SNOMEDCT [83, 84, 85, 86]. We proposed an approach combining mapping and alignment techniques.We used OWL-DL as the common representation formalism and demonstrated that RDFSqueries were expressive enough with acceptable computational performances. From 2008 to2010, I supervised Nicolas Lebreton’s PhD thesis with Anita Burgun on Web services parameterscompatibility for semi-automatic Web Service composition [87, 88, 89]. The context was thatbiologists typically conduct the analysis of their results by building workflows of atomic programsthat run on bioinformatics platforms and grids. They devote a great deal of efforts to buildingand maintaining (ad-hoc) scripts that execute these workflow and ensure the necessary dataformat conversions. We showed that the WSDL descriptions of Web services only provide aview on the structure of the services’ input and output parameters, whereas a view on theirnature was necessary for Web services composition. We proposed an algorithm using classestaxonomic hierarchies of Web services OWL-S semantic descriptions for checking the semanticcompatibility of services parameters and for suggesting compatible parameters pairings betweentwo Web services semi-automatically. We generated Taverna Xscufl files whenever possible.Lately, Charles Bettembourg developed GO2PUB as a part of his PhD thesis [90]. GO2PUB isa tool that uses the knowledge from the Gene Ontology (GO) and its annotations for enrichingPubMed queries with gene names, symbols and synonyms. We used the GO classes hierarchy forretrieving the genes annotated by a GO term of interest, or one of its more precise descendants.We demonstrated that the use of genes annotated by either GO terms of interest or a descendantof these GO terms yields some relevant articles ignored by other tools. The comparison ofGO2PUB, based on semantic expansion, with GoPubMed, based on text-mining techniques,showed that both tools are complementary.
16

With my participation to the Akenaton project, work on semantically-rich reasoning resumedand shifted to the optimization of symbolic knowledge modeling [91, 92]. The context is theautomatic triage of atrial fibrillation alerts generated by implantable cardioverter defibrillatorsaccording to their severity. There can be up to twenty alerts per patient per day, with around500,000 current patients en Europe, and an estimation of 10,000 new patients every year inEurope. Alerts severity depend on the CHA2DS2VASc score, which evaluation requires domainknowledge for reasoning about the patient’s clinical context. Several modeling strategies arepossible for reasoning on this knowledge. A first work compared ten strategies emphasizing allthe possible combinations of Java, OWL-DL and SWRL to compute the CHA2DS2VASc score.A second work compared the best of these ten strategies with a Drools rules implementation [93].The results showed that their limitations are the number and complexity of Drools rules and theperformances of ontology-based reasoning, which suggested using the ontology for automaticallygenerating a part of the Drools rules.
Together with the previous work on glioma tumor classification, the Akenaton project openeda new perspective on symbolic reasoning with incomplete information. When we were designingthe reasoning module for grading glioma tumors, we observed that some information weremissing for several patients, and that the module (rightfully) prevented the system from reachinga conclusion. We showed however that it was possible to narrow the number of possibilities byexcluding the situations that we inferred to be impossible. In the Akenaton project, similarly,the CHA2DS2VASc score is computed by summing points for each criterion met by the patient.Missing information can result in under-estimating the real value of the CHA2DS2VASc score.We proposed as a complementary approach to start from the maximum possible CHA2DS2VAScscore value and to subtract points for each criterion not met by the patient This in turn resultedin a over-estimation of the score. For a patient, combining the two values allowed us to determinethe range of the possible scores, instead of the false sense of security provided by a value thatmay be under-estimated. Building on the experience, my contribution to the Astec project in2012 was an OWL design pattern for modeling eligibility criteria that leveraged the open worldassumption to address the missing information problem of prostate cancer clinical trial patientrecruitment [94, 95].
Over the years, my interest in bioinformatics grew. In parallel with the previous works, Istarted in 2010 a collaboration with Christian Diot at UMR1348 PEGASE (INRA and Agro-campus Ouest) on knowledge-based cross-species metabolic pathway comparison in order tostudy how lipid metabolism was different in chicken human and mouse [96, 97]. Together, wesupervised Charles Bettembourg’s master in 2010 degree and ongoing PhD thesis since 2011.Our collaboration originated from the observation that when overfed, chicken do not developliver steatosis, whereas other animals such as geese, mice and humans do. Liver steatosis canfurther evolve into fatty liver disease and cancers, so analyzing the specificities of chicken’s lipidmetabolism is of both agricultural and medical interest. Our approach is based on metabolicpathways structural comparison in order to identify common and species-specific reactions, andmore importantly on functional comparison in order to quantify how much a metabolic processis common and species-specific. We improved a semantic similarity measure based on GeneOntology and created another metric measuring semantic specificity. This work opened the op-portunity of another collaboration with Frederic Herault on functional analysis and comparisonof gene sets, where we demonstrated the benefits of using semantic similarity for post-processingand clustering DAVID results [98].
In 2013, I joined the Dyliss team at IRISA. I contributed to the analysis of the candidatemetabolic networks for Ectocarpus siliculosus generated by Sylvain Prigent in the Idealg projectduring his PhD [99]. I am also working with Nathalie Theret, Geoffroy Andrieux and Jean
17

Coquet (whom I co-supervise) on the analysis of TGF-β signaling pathways and their role inhuman cancer [100]. Additionally, I collaborate with Fabrice Legeai, Anthony Bretaudeau,Charles Bettembourg and Denis Tagu, as well as with Melanie Jubault and Aurelie Evrard onrepresenting, storing and querying aphids [101] and Brassicaceae data in RDF. I co-supervisewith Regine Le Bouquin-Jeannes and Bernard Gibaud from LTSI the PhD thesis of PhilippeFinet on the integration and analysis of telemedicine data for monitoring patients with multiplechronic diseases [102, 103, 104]. I will co-supervise with Nolwenn Le Meur from EHESP thePhD thesis of Yann Rivault on the analysis of patients’ care trajectories [105]. These works arestill in progress and are further developed in my research perspectives in Chapter 6.
Over the years, the biomedical data and ontologies I have been using evolved from a medi-cal/clinical context to more general biological one. However, the reasoning primitives remainedthe same, so the distinction is not really relevant. From this point, I will refer to life sciencedata in general.
1.4 Organization of the manuscript
My various contributions belonged to different zones in the reasoning continuum ranging fromthe simple exploitation of a taxonomy to sophisticated reasoning involving intricate necessaryand sufficient definitions and the open world assumption.
Chapter 2 presents reasoning based on hierarchy, which is valuable in spite of its simplicity asa way to circumvent computational limitations and because the task at hand does not requiremore elaborate features. Section 2.1 is a summary of RDF and RDFS principles and of theassociated entailments. Section 2.2 emphasizes constraints due to ontologies’ size and presentsan early case study for inferring candidate associations between biological pathways from KEGGand diseases from SNOMED-CT using the Gene Ontology as a pivot. Section 2.3 focuses on amethod for performing semi-automatic pairing of Web services parameters. Section 2.4 showshow computation performances support performing on the fly semantic expansion of PubMedqueries.
Chapter 3 presents reasoning based on classification for inferring whether an individual is aninstance of a class or whether a class is a subclass of another one. Section 3.1 is a summary ofOWL main principles and the associated inferences. Section 3.2 shows that OWL both allowsto achieve a higher level of expressivity for representing an ontology of human anatomy, andsimplifies the process of building and maintaining complex ontologies by supporting consistencyconstraints. Section 3.3 shows the expressivity of this anatomy ontology supports the complexreasoning required to infer the consequences of bullet injuries in the region of the heart. Sec-tion 3.4 focuses on the comparison of OWL and SWRL respective advantages for optimizingthe classification of pacemaker alerts. In all the situations, we showed that if the domain on-tologies are available and rich enough, combining them and designing the reasoning portion ofthe application required a very small amount of work. Unfortunately, we also found repeatedlythat such domain ontologies rarely existed.
Chapter 4 presents how classification can be performed when the available informationsare incomplete. Section 4.1 is a summary of the open world assumption. Section 4.2 presentsa preliminary method for inferring the grade of a tumor according to its description. If thedescription is incomplete, a classical classification approach may fail because none of the gradesrequirements are filled. Our method then narrows the range of possible grades by ruling outthose incompatible with the information available. Section 4.3 improves the previous method
18

and proposes a design pattern for modeling clinical trials’ eligibility criteria in order to increasepatient recruitment.
Chapter 5 presents how ontology can also be used performing semantic similarity-basedreasoning. Section 5.1 summarizes the principles of semantic similarity for comparing elementsor sets of elements. Section 5.2 proposes a method for computing a generic semantic particularitymeasure that can be combined with any similarity for a finer interpretation. Section 5.3 presentsa method for determining optimal thresholds for semantic similarity and particularity measures.
Chapter 6 presents my research perspectives for producing, querying and analyzing lifescience data.
19

20

Chapter 2
Reasoning based on hierarchies
Outline
Taxonomy-based reasoning is arguably the simplest form of reasoning on an ontology. Neverthe-less, this simplicity can also be valuable. It is appropriate whenever the ontology is semanticallypoor (i.e. a taxonomy or an RDFS hierarchy or polyhierarchy) or when performances are im-portant (i.e. when short answer time possibly over large hierarchies is required). This chapterpresents the general principles of taxonomy-based reasoning, and three situations where it wasrelevant. It demonstrates that even simple reasoning brings added value in situations whereusing more elaborate tools would be overkill. Section 2.2 emphasizes constraints due to ontol-ogy size: it is a use case for generating candidate associations between diseases and pathwaysusing simple ontologies at a time when OWL reasoners could not load them. Section 2.3 is moremethod-oriented for performing semi-automatic pairing of Web services parameters. Section 2.4focuses on computation performances of an application providing on the fly semantic expansionof PubMed queries.
2.1 Principle
This section presents why using symbolic data descriptions is a good strategy for analyzing largeinterdependent datasets, and provides an overview of the associated requirements. We show thatthe situation we are facing in life sciences is a part of a more general problem. Eventually, weshow how RDF and RDFS supports the representation and the analysis of these descriptions.
2.1.1 RDF for describing data
2.1.1.1 Describing data: a generic problem
Annotations as proxies to data Analyzing data can be difficult or time-consuming (usuallyboth), and the problem is even worse if we have to deal with large quantities of data. Moreover,for interdependent data, analyzing some of the data can require the prior analysis of other data.Therefore, saving the result of the interpretation or of the analysis as annotations or metadatais a good strategy so that the next time we need to retrieve some information we do not needto perform the analysis all over again. These annotations can then be used as proxies for fasteror more accurate access to results. Naturally, when dealing with large data sets or in order topromote sharing, saving these annotations in a machine-processable format rather than in plaintext is desirable.
21

Data annotation requirements Ideally, these machine-processable data annotations shouldsupport the following requirements:
• describe their nature (i.e. a binary relation between the data and a set of things sharingsome common features): “TGFB1” is a gene, “TGF-β1” is a protein, “apoptosis” is a bio-logical process, “diabetes” is a disease, “The use and misuse of Gene Ontology annotations”is an article,
• describe their properties (i.e. a binary relation between a data and some datatype valuesuch as a string, a number, a date, etc.): “TGF-β1” is 390 amino acids-long, “The use andmisuse of Gene Ontology annotations” was published in 2008,
• describe the relations between them (i.e. a binary relation between two data elements):“TGFB1” is associated to “Homo sapiens”, it is located in “chromosome 19” and encodes“TGF-β1”, which interacts with the“LTBP1”protein and is involved in“apoptosis”,“SeungYon Rhee” is an author of “The use and misuse of Gene Ontology annotations” which hasfor subject the “Gene Ontology”.
• combine the descriptions from different sources either because these sources partiallycover the same topic (e.g. metabolic pathways from Reactome and from HumanCYC) orbecause these sources cover complementary topics (e.g. the genes associated to a diseaseof interest and the pathways these genes are involved in).
In the previous examples, the resources are typically identified by a string issued by somede facto or de jure “authoritative source”: the human gene “TGFB1” is preferentially referredto by “ENSG00000105329” in Ensembl, “Homo sapiens” by “9606” in the NCBI taxonomy ofspecies, the human proteins “TGF-β1” and “LTBP1” respectively by “P01137” and “Q14766” inUniprot, the article “The use and misuse of Gene Ontology annotations” by “PMID:18475267”in PubMed, and the Gene Ontology by“http://purl.bioontology.org/ontology/GO” in BioPortal. There is an obvious heterogene-ity of the identifier patterns among these authorities.
Moreover, what constitutes an“authoritative source”is not always well defined. For example,apoptosis is described among others as a biological process in the Gene Ontology (GO:0006915),as a cellular process in KEGG (ko04210), or as pathway in Reactome (REACT 578). Similarly,“glioma” is identified by “C71” in the 10th version of the International Classification of DiseasesICD10 (but it was “191” in the 9th version), “DI-02566” in Uniprot, “ko05214” in KEGG...
Eventually, some resources may not have been assigned an identifier: as of today, Seung YonRhee (the author of PMID:18475267) does not appear to have an ORCID1 identifier.
Although all the examples we gave are related to life sciences, the problem is more generic.
2.1.1.2 RDF
The Resource Description Framework2 (RDF) is a W3C recommendation providing a standardmodel for data interchange on the Web.
Identify resources using IRIs In RDF, a resource is anything that can be identified. Iden-tification is performed using Internationalized Resource Identifiers (IRIs), which generalize Uni-form Resource Identifiers (URIs) to non-ASCII character sets such as kanji, devanagari, cyrillic...In the remainder of this document we will only use URIs.
1http://orcid.org/2http://www.w3.org/RDF/
22

URIs syntax follows the pattern:<scheme name>:<hierarchical part>[?<query>][#<fragment>] where <scheme name> is typ-ically “http” or “urn”.
Note that although URIs having an http scheme name look like URLs, they actually forma superset of URLs as they may not be dereferenced (i.e. they are identifiers, not addressesand there is not necessarily an Internet resource at this address). For example, Uniprot generatesURIs for proteins by appending their Uniprot identifier to http://purl.uniprot.org/uniprot/and these are URLs (and by transitivity, also URIs and IRIs) so thathttp://purl.uniprot.org/uniprot/P01137 is dereferenced either to a Web page or to someRDF description of TGF-β1 depending on the header of the request. Likewise, Gene Ontologygenerates URIs for its terms by replacing the colon in their identifiers by an underscore, andby appending the result to http://purl.obolibrary.org/obo/GO_, but these are not derefer-enceable: http://purl.obolibrary.org/obo/GO_0006915 is an URI that is not an URL.
Also note that URIs specify how to represent a resource identifier but does guarantee unique-ness so that anyone is free to forge as many URIs as wanted to identify something (e.g. bio2rdfuses http://bio2rdf.org/go:0006915 for referring to GO:0006915 whereas the Gene Ontologyuses http://purl.obolibrary.org/obo/GO_0006915). Of course, interoperability encouragesto reuse existing identifiers whenever possible.
As URIs are cumbersome to deal with by humans, we often use the more convenient pre-fixed version (e.g. uniprot:P01137 ), but this still requires to specify somewhere that the“uniprot:” prefix is actually associated to “http://purl.uniprot.org/uniprot/”. PrefixedURIs are always unambiguously expanded into full URIs before being processed.
Describe resources with triples In RDF, resources are described using statements thatare triples composed of a subject, a predicate and an object(noted <subject> <predicate> <object> . ). The subject is the URI of the described re-source. The predicate is the URI of the relation (called a property). The object is a value of therelation for the described resource. This value can be either some URI identifying a resource,or a literal (i.e. a string with an optional indication of a datatype and an optional indication oflanguage). Figure 2.1 on the next page presents two RDF triples sharing the same subject; oneof the triples’ object is a resource and the other’s is a literal. These two triples illustrate howRDF meets respectively the third and the second requirements mentioned in section 2.1.1.1 onpage 21. The subject or the object may also be blank nodes, which we will not cover here asit has no impact on RDF expressivity. Note that if the relation can have several values for aresource, this requires as many statements as values.
The fact that some statements can share the same subject (Figure 2.1 on the next page),the same object or that the object of a statement can be the subject of another statement(Figure 2.2 on page 25) result in a directed graph structure connecting resources. As mentionedin the fourth requirement, statements coming from different sources can be combined in a singleexpanded graph, provided these sources use the same URIs to identify the same things. Forexample, Figure 2.2 on page 25 combine statements from Uniprot and from Reactome.
RDF specifies a special predicate rdf:type3 for describing the nature of a resource (i.e. aclass the resource is a member of). For example the statementuniprot:P01137 rdf:type uniprotCore:Protein indicates that TGF-β1 (P01137) is an in-stance of the class Protein. This rdf:type property allows RDF to address the first require-ment.
Figure 2.2 on page 25 also shows how the use of an unique URI across different datasources promotes interoperability and allows to combine complementary descriptions. Here,
3http://www.w3.org/1999/02/22-rdf-syntax-ns#type
23

Figure 2.1: Two RDF triples describing the same resource (uniprot:P01137). Resources arerepresented with ellipses, and literals by strings. Properties linking a subject to an object arerepresented with arrows. URI prefixes are the usual ones (http://prefix.cc is your friend).
Uniprot has a triple uniprot:P01137 rdfs:seeAlso reactome:REACT_120727.4 where theobject is the URI corresponding to the “Downregulation of TGF-β receptor signaling” path-way of Reactome, which in turn allows us to retrieve some additional information about thispathway. However, in the same example, Uniprot uses the uniprotCore:organism prop-erty linking to taxo:9606 whereas Reactome uses the biopax3:organism property linkingto http://identifiers.org/taxonomy/9606. This unfortunate use of different propertiesfor representing the species associated to a protein or a pathway, and of different URIs toidentify Homo sapiens prevents us twice to combine Uniprot and Reactome (e.g. for con-trolling that Uniprot proteins and the associated Reactome pathways are consistently anno-tated by the same species or for assisting during this annotation process). Also rememberthe part about authoritative sources issuing URIs: in this case, both Uniprot and Reactomecould have used the URI by the NCBI Taxonomy Database (either the Web page or the corre-sponding BioPortal resource http://purl.bioontology.org/ontology/NCBITAXON/9606). Inthis particular case, though, Reactome relies on the identifiers.org service by the NCBIto provide an additional level of indirection which actually allows to reconcile the Uniprotand the NCBI taxonomy [106]: the identifiers.org service lists several URIs associated tohttp://identifiers.org/taxonomy/9606, includinghttp://purl.bioontology.org/ontology/NCBITAXON/9606 as the primary one, as well as theUniprot one.
2.1.2 RDFS for describing types
While RDF is adapted for describing resources and relations between resources, RDF Schema4
(RDFS) provides a vocabulary for describing resources that are classes or predicates. Thisvocabulary is represented in RDF so that any RDFS statement is also a valid RDF statement.
2.1.2.1 RDFS classes
In RDFS, a class is a group of resources, which are its instances (the set of the instances of aclass is called the extension of the class). Instances and their classes are associated with therdf:type predicate we have seen in the previous section. Classes are themselves resources, sothey can be identified by some URI, and described by some properties. Note that two differentclasses can share the same set of instances (but classes having different sets of instances arenecessarily different).
4http://www.w3.org/TR/rdf-schema/
24

In RDFS, rdfs:Class is the class of all the RDFS classes (and is therefore a metaclass). Itis an instance of itself.
RDFS defines the rdfs:subClassOf property between two classes to represent the fact thatthe extension of the subject (i.e. the subclass) is a subset of the extension of the object (i.e.the superclass). A hierarchy of subclasses–superclasses is called a taxonomy.
Figure 2.2 shows some examples of associations between instances and their classes us-ing rdf:type (e.g. between uniprot:P01137 and uniprotCore:Protein for Uniprot or be-tween reactome:REACT_120727.4 or reactome:REACT_318.7 and reactome:Pathway). It alsoshows an example of taxonomy using rdfs:subClassOf between taxo:9606, taxo:9605 andtaxo:207598. Note that uniprotCore:Taxon is a metaclass as its instances are classes.
Figure 2.2: Graph of RDF triples describing the same resource (uniprot:P01137). Green nodescome from Uniprot and blue nodes from Reactome. Instances and classes are represented byellipses and boxes respectively. This graph shows typical use of RDF relations between instancesor between an instance and a class (rdf:type ), as well as RDFS relations (rdfs:subClassOfbetween classes.
2.1.2.2 RDF properties
In RDF, a property is a binary relation from one resource (the subject) to another resource (theobject). The set of the possible subjects (hence a class) for a property is its domain. The set ofthe possible objects (hence a class too) for a property is its range. The extension of a propertyis a subset of the Cartesian product of its domain and its range.
In RDFS, rdf:Property is the class of all the RDF properties (i.e. the relations betweenresources). It is an instance of rdfs:Class.
RDFS defines two properties rdfs:domain and rdfs:range for defining the domain andthe range of RDFS properties (the domain of rdfs:domain and rdfs:range is rdf:Property
25
and their range is rdfs:Class).RDFS defines the rdfs:subPropertyOf property between two properties to represent the
fact that the extension of the subject (i.e. the subproperty) is a subset of the extension of theobject (i.e. the superproperty). Naturally, declaring that a property is a subproperty of anotherproperty implies some additional constraints on their respective domains and ranges.
2.1.3 RDFS entailments
RDF and RDFS support some well-defined entailments which are supported by reasoners andthe SPARQL query language. This section provides a simplified overview, please refer to theW3C RDF1.1 semantics5 for the normative document and particularly to the chapter 9.26.
RDFS entailment 1 The object of an rdf:type property is an rdfs:Class:
If x rdf:type y then y rdf:type rdfs:Class .
RDFS entailment 2 The instances of a class are also instances of its superclass:
If x rdf:type y and y rdfs:subClassOf z then x rdf:type z .
RDFS entailment 3 rdfs:subClassOf is reflexive:
If x rdf:type rdfs:Class then x rdfs:subClassOf x .
RDFS entailment 4 rdfs:subClassOf is transitive:
If x rdfs:subClassOf y and y rdfs:subClassOf z then x rdfs:subClassOf z .
RDFS entailment 5 The relations of a property also hold for its superproperties:
If x R1 y and r1 rdfs:subPropertyOf r2 then x r2 y .
RDFS entailment 6 rdfs:subPropertyOf is reflexive:
If r rdf:type rdf:Property then r rdfs:subPropertyOf r .
RDFS entailment 7 rdfs:subPropertyOf is transitive:
If r1 rdfs:subPropertyOf r2 and r2 rdfs:subPropertyOf r3 then r1 rdfs:subPropertyOf r3 .
Note that by combining RDFS entailments 2 and 4, the instances of a class are also instancesof all its ancestors. Similarly, by combining RDFS entailments 5 and 7, a property between asubject and an object can be generalized to all the ancestors of the property.
2.1.4 Typical uses of RDFS entailments in life science
2.1.4.1 Classes hierarchies
Classes hierarchies are the most common structure of ontologies, not only in life sciences. Anotable example is Linnaeus’ taxonomy of species and the related NCBI taxonomy7 of all theorganisms in the public sequence databases (Figure 2.3 on the facing page). Similarly, life scienceontologies from the major repositories OBO Foundry8 and Bioportal9 are typically organizedas classes hierarchies.
5http://www.w3.org/TR/rdf11-mt/6http://www.w3.org/TR/rdf11-mt/#rdfs-entailment7http://www.ncbi.nlm.nih.gov/taxonomy8http://www.obofoundry.org/9http://bioportal.bioontology.org/
26

Figure 2.3: The NCBI Taxonomy of species is a (deep) tree-like hierarchy.
Most ontologies are polyhierarchies (i.e. a class can have zero or several direct superclassessuch as in Figure 2.4), and few have a tree structure (i.e. all the classes but the root haveexactly one superclass such as in Figure 2.3).
Figure 2.4: The superclasses of acetoin in ChEBI show a polyhierarchy.
Most ontologies have an intricate and deep taxonomy. Some exceptions are“flat”hierarchies,
27

such as the Online Mendelian Inheritance in Man10 (OMIM) with a maximal depth of 2, theEnzyme Commission number11 (EC number) classifies enzymes according to the reactions theycatalyze and is organized in 4 levels, or the KEGG Orthology with the first two levels describingpathways categories and the third level pathways (c.f. section 2.2.3.1).
Taxonomy-based reasoning with these ontologies typically involves RDFS entailment rules 2and 4. Both are used for reconciling the granularity differences between precise annotations andmore general queries.
2.1.4.2 Properties hierarchies
Property hierarchies are more seldom used in life science ontologies than classes hierarchies.A typical example is the Gene Ontology (GO) that specifies a regulates property with twosubproperties negatively regulates and positively regulates . These three propertiesare used in a pattern with rdfs:subClassOf . The regulates property associates a GO class“Regulation of X” with the corresponding GO class “X” (using an OWL existential restrictioncovered in section 3.1.5). The class “Regulation of X” has two subclasses “Positive regula-
tion of X” and “Negative regulation of X”, respectively associated to “X” by negatively
regulates and positively regulates (Figure 2.5).
Figure 2.5: Usage of the negatively regulates and positively regulates subpropertiesof regulates in the Gene Ontology.
Reasoning based on properties hierarchy typically involves RDFS entailment rules 5 and7. Like classes hierarchies, both are used for handling different levels of precision in the datadescriptions. Figure 2.6 on the facing page shows the possible generalizations of “Positiveregulation of leukocyte migrations” and of ‘Leukocyte migrations” as well as the cor-responding regulation relations.
2.1.4.3 Application to annotations
Reasoning based on classes and properties hierarchies is often used for reconciling annota-tions with different granularities [45]. Because of the definitions of rdfs:subClassOf andof rdfs:subPropertyOf , if a data element is annotated by a class, then we can infer thatthis data element is also annotated by the superclasses. Because of the transitive nature ofrdfs:subClassOf and of rdfs:subPropertyOf , we can also infer that the data element is alsoannotated by all the ancestors. In the Gene Ontology, this principle is known as the “True pathrule”. For example, the gene product uniprot:P55008 (AIF1, Allograft inflammatory factor
10http://bioportal.bioontology.org/ontologies/OMIM11http://www.chem.qmul.ac.uk/iubmb/enzyme/
28

Figure 2.6: Complex mix of rdfs:subClassOf hierarchies and of rdfs:subPropertyOf
hierarchies based on regulates , positively regulates and negatively regulates as-sociating the GO class Positive regulation of leukocyte migration and its ances-tors to the GO class Leukocyte migration and its ancestors (Image by QuickGOhttp://www.ebi.ac.uk/QuickGO/).
29

1) is annotated (among others) by GO:0002687 (Positive regulation of leukocyte migration) inHomo sapiens. The GO hierarchy (cf. Figure 2.6 on the previous page) allows us to infer thatAIF1 is also involved in “cell migration” and in “immune system process”. Several articles pro-vide more information on the GO annotations and the related inferences[107, 108]. Livingstonet al. also provided an interesting work on the representation of annotations [109].
The “True path rule”-like reasoning is useful in two situations: for analyzing the annotationsof data elements, and for querying the data elements annotated by some ontology class. In thefirst case, we proceed from the data element to its annotations, and in the second case from theannotations to the data elements. To comply with the semantics, reasoning consists in movingup along the hierarchy in the first case, and moving down in the second case.
A typical first case scenario consists in comparing two gene products by analyzing thecommon GO terms or the ones specific to one of the gene products: comparing their listsof direct annotations is likely to miss some common terms due to the granularity differences,and one should compare the lists of indirect annotations (i.e. the direct annotations and theirancestors).
A typical second case scenario consists in performing some query expansion for retrievingthe data elements annotated directly or indirectly by some annotation of interest (e.g. thegene products involved in “immune system process” with GO, or the articles about “infectiousdiseases” with the MeSH). Retrieving the data elements directly annotated is a trivial databasequery. However, we should also look for the data elements annotated by some descendant ofthese annotations, as the true path rule indicates that the annotation of interest is also validfor them.
2.1.5 Synthesis
As we have seen, RDFS-compliant reasoning consists mainly in computing the transitive closureof rdfs:subClassOf and rdfs:subPropertyOf . Of course, typical reasoning patterns usuallyinvolve combining both. Dedicated RDFS reasoners and query engines have been perfectedover the years. The simplicity of the task have allowed them to gain far better performancesthan ad-hoc solutions based on classic programming languages, or relational engines that arenotoriously bad at handling transitive closures.
In the remainder of this chapter, section 2.2 shows how an RDF(S) query engine allowsto combine multiple ontologies and to query them whereas each of these ontologies was toolarge to be loaded by an OWL reasoner (even if these ontologies were merely polyhierarchies).This demonstrated that not all tasks on ontologies require an OWL reasoner... and using onecan even be counter-productive. Section 2.3 focuses on a reasoning method that fully exploitssubclasses and subproperties for pairing Web services parameters. Section 2.4 shows that evenfor a large ontology such as the Gene Ontology, RDFS reasoning is compatible with on the flyPubMed query enrichment as the time spent enriching the query is negligible compared to thetime spent by PubMed for answering the query.
Overall, this chapter shows that RDFS reasoning is valuable even if the medical ontologycommunity was mostly focusing on OWL reasoners (on semantically-simple ontologies).
30

2.2 Case study: integrating diseases and pathways
This case study focuses on the integration of overlapping ontologies covering differentaspects of life science. We created a biomedical ontology associating diseases and path-ways using mapping and alignment techniques over KEGG Orthology, Gene Ontologyand SNOMED-CT. We represented this ontology in OWL and demonstrated thatRDFS queries were expressive enough with acceptable computational performances.In retrospect, this work is interesting because it identified the need for a posterioriresource integration (the linked open data initiative originated around 2007, and ontol-ogy alignment and mapping became a very active field in this period), and highlightedthe need for using reasoning tools adapted to the task at hand (in those days, DLreasoners could hardly load an ontology, so loading several ontologies was out of ques-tion; it would have been overkill anyway because these ontologies are mostly simpletaxonomies that hardly use DL features).
This work was a collaboration with Julie Chabalier who was a postdoctoral fellow. It was sup-ported by a grant from Region Bretagne (PRIR) and was originally published in Julie Chabalier,Olivier Dameron, and Anita Burgun. Integrating and querying disease and pathway ontologies:building an OWL model and using RDFS queries. In Bio-Ontologies Special Interest Group,Intelligent Systems for Molecular Biology conference (ISMB’07), 2007 [85].
2.2.1 Context
Use of ontologies within the biomedical domain is currently mainstream (e.g. the Gene Ontol-ogy GO [110]). Within a few years, the success of bio-ontologies has resulted in a considerableincrease in their number (e.g Open Biological Ontologies12). While some of these bio-ontologiescontain overlapping information, most of them cover different aspects of life science. How-ever, an application may require a domain ontology which spans several ontologies.Rather than to create a new ontology, an alternate approach consists of reusing, combining andaugmenting these bio-ontologies in order to cover the specific domain [111].
Associations between classes of genes and diseases as well as associations be-tween pathways and diseases are key components in the characterization of dis-eases. Different phenotypes may share common pathways and different biological processesmay explain the different grades of a given disease. However, this information remains absent inmost existing disease ontologies, such as SNOMED CT. Pathway-related information is presentin other knowledge sources. The KEGG PATHWAY database is a collection of pathways mapsrepresenting our knowledge on the molecular interaction and reaction networks for metabolismand cellular processes [112]. As the GO does not provide direct association with pathways,Mao et al. have proposed to use the KEGG Orthology (KO) as a controlled vocabulary forautomated gene annotation and pathway identification [113]. At that time, information aboutthe pathways involved in human diseases has been added to KO.
A major step for addressing this issue is “ontology integration”, which sets up relationsbetween concepts belonging to different ontologies. It encompasses several notions: mergingconsists in building a single, coherent ontology from two or more different ontologies coveringsimilar or overlapping domains, aligning is achieved by defining the relationships between someof the terms of these ontologies [114] and mapping corresponds to identifying similar conceptsor relations in different sources [115].
12http://obofoundry.org/
31

The automatic exploitation of the knowledge represented in integrated ontologies requires anexplicit and formal representation. Description Logics, and OWL (Web Ontology Language) inparticular, offer a compromise between expressivity and computational constraints [116]. How-ever, for leveraging its expressivity, ontologies should contain features such as necessary and suf-ficient definitions for classes whenever possible, as well as disjointness constraints. While recentworks put forward a set of modeling requirements to improve the representation of biomedicalknowledge [117, 51], current biomedical ontologies are mostly taxonomic hierarchies with sparserelationships. Even though, dedicated reasoners are hardly able to cope with them.
2.2.2 Objective
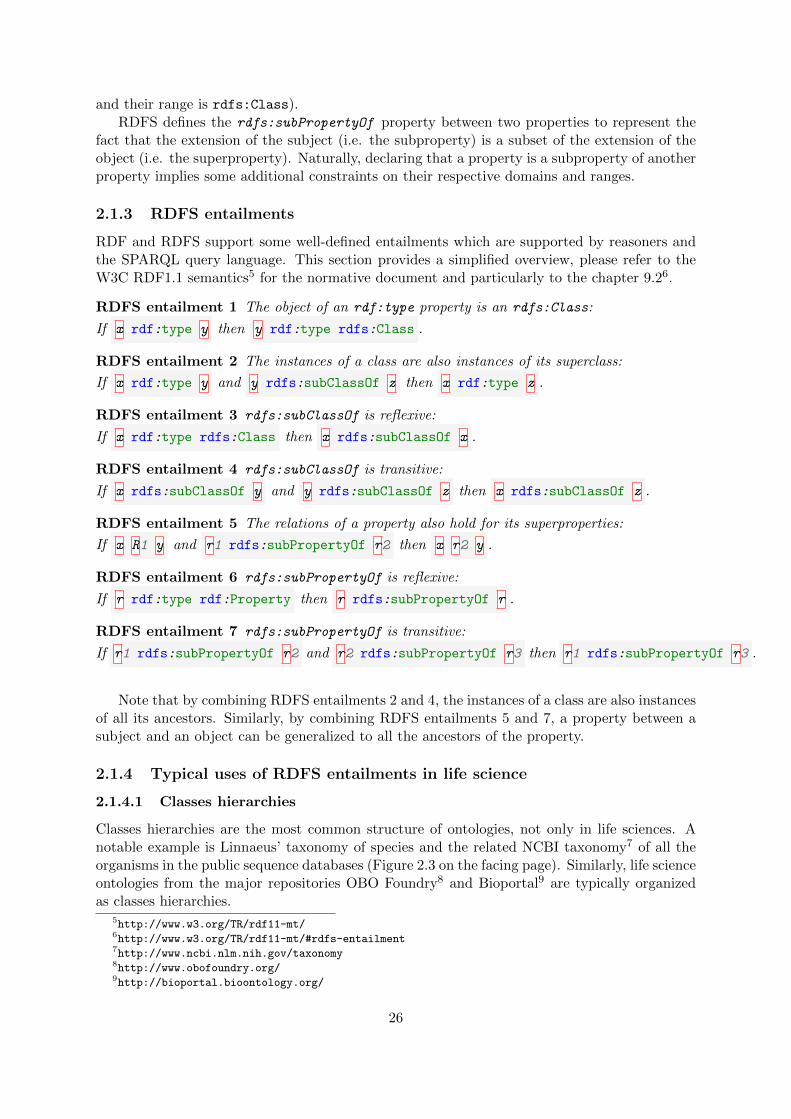
The objective of this study was to infer new knowledge about diseases by first inte-grating biological and medical ontologies and finally querying the resulting biomed-ical ontology. We hypothesized that most typical queries do not need the full ex-pressivity of OWL and that RDFS is enough for them. In this study, we used the term’pathway’ for metabolic pathways, regulatory pathways and biological processes. The approachpresented here consisted in developing a disease ontology using knowledge about pathways asan organizing principle for diseases. We represented this disease ontology in OWL. Followingan integration ontology methodology, pathway and disease ontologies have been integrated fromthree sources: SNOMED CT, KO, and GO. To investigate how information about pathways canserve disease classification purposes, we compared, as a use case, glioma to other neurologicaldiseases, including Alzheimer’s disease, and other cancers, including chronic myeloid leukemia.
2.2.3 Linking pathways and diseases using GO, KO and SNOMED-CT
2.2.3.1 KEGG Orthology
The KEGG PATHWAY database was used as the reference database for biochemical pathways.It contains most of the known metabolic pathways and some regulatory pathways. KO is afurther extension of the ortholog identifiers, and is structured as a directed acyclic graph (DAG)hierarchy of four flat levels. The top level consists in the following five categories: metabolism,genetic information processing, environmental information processing, cellular processes andhuman diseases. The second level divides the five functional categories into finer sub-categories.The third level corresponds to the pathway maps, and the fourth level consists in the genesinvolved in the pathways. The first three levels of this hierarchy were integrated in the diseaseontology.
KO hierarchy is provided in HTML format. We extracted the three upper levels of this hier-archy. Each KO class was represented by an OWL class respecting the subsumption hierarchy.
2.2.3.2 Gene Ontology
Gene Ontology is composed of three independent hierarchies representing biological processes(BP), molecular functions (MF) and cellular components (CC). A biological process is an orderedset of events accomplished by one or more ordered assemblies of molecular functions (e.g. cellularphysiological process or pyrimidine metabolism). Since we consider all pathways as biologicalprocesses, the biological process hierarchy was used to enrich the pathway definitions. The GOBP hierarchy is more detailed than that of KO. It is composed of 27,127 terms spanning 16levels; for more details about GO structure see [118].
We retrieved the OWL version of GO from the Gene Ontology website13.
13http://geneontology.org/page/download-ontology
32
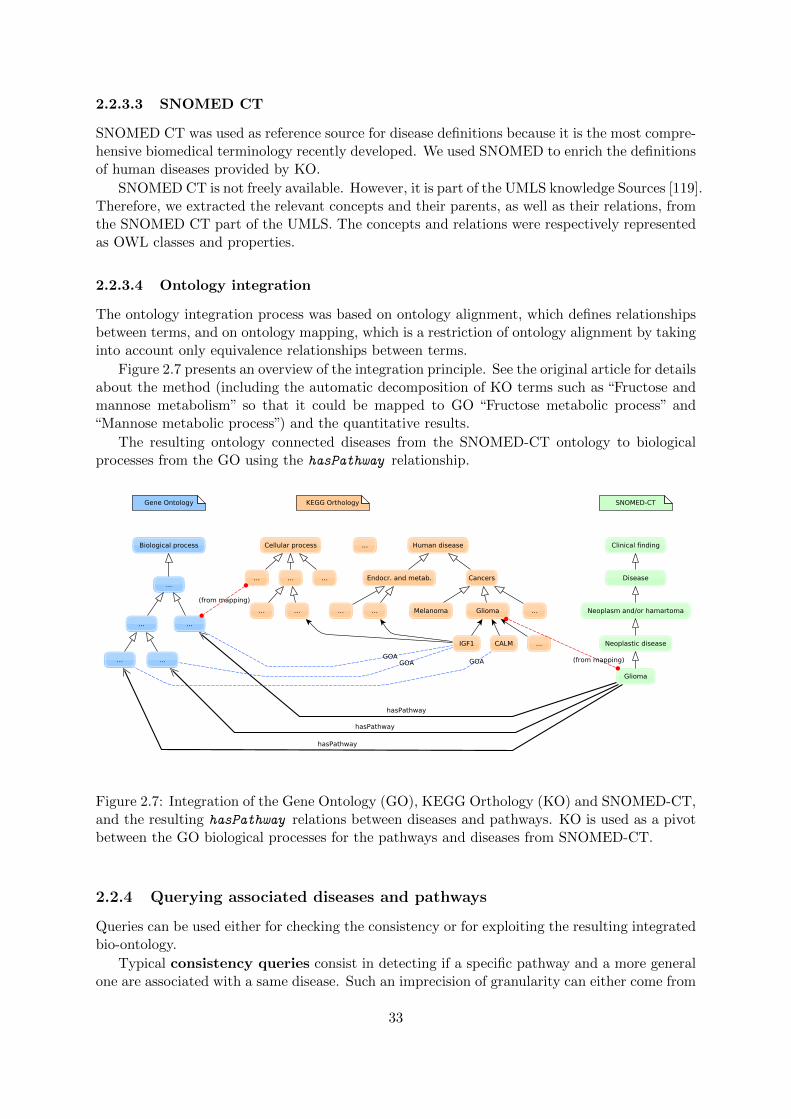
2.2.3.3 SNOMED CT
SNOMED CT was used as reference source for disease definitions because it is the most compre-hensive biomedical terminology recently developed. We used SNOMED to enrich the definitionsof human diseases provided by KO.
SNOMED CT is not freely available. However, it is part of the UMLS knowledge Sources [119].Therefore, we extracted the relevant concepts and their parents, as well as their relations, fromthe SNOMED CT part of the UMLS. The concepts and relations were respectively representedas OWL classes and properties.
2.2.3.4 Ontology integration
The ontology integration process was based on ontology alignment, which defines relationshipsbetween terms, and on ontology mapping, which is a restriction of ontology alignment by takinginto account only equivalence relationships between terms.
Figure 2.7 presents an overview of the integration principle. See the original article for detailsabout the method (including the automatic decomposition of KO terms such as “Fructose andmannose metabolism” so that it could be mapped to GO “Fructose metabolic process” and“Mannose metabolic process”) and the quantitative results.
The resulting ontology connected diseases from the SNOMED-CT ontology to biologicalprocesses from the GO using the hasPathway relationship.
Figure 2.7: Integration of the Gene Ontology (GO), KEGG Orthology (KO) and SNOMED-CT,and the resulting hasPathway relations between diseases and pathways. KO is used as a pivotbetween the GO biological processes for the pathways and diseases from SNOMED-CT.
2.2.4 Querying associated diseases and pathways
Queries can be used either for checking the consistency or for exploiting the resulting integratedbio-ontology.
Typical consistency queries consist in detecting if a specific pathway and a more generalone are associated with a same disease. Such an imprecision of granularity can either come from
33

one faulty ontology or from the integration of the knowledge from two ontologies with differentgranularity.
Typical queries for exploiting the ontology involve 1) retrieving the pathways commonto several diseases, 2) retrieving the pathways associated with one disease but not with anotherone, or 3) retrieving the diseases associated with the pathways associated with one class ofdiseases.
Computing the solutions for both kinds of queries only requires following explicit relations.It does not require OWL-based classification, and can be performed using only the RDFSsemantics. RDF repository, and represented the queries using the SeRQL language.
At the time of this study in 2007, we loaded the ontology in a Sesame RDF repository andused SeRQL which was the query language designed by Aduna for the Sesame triplestore [120].SeRQL advantages over SPARQL (which became a W3C recommendation in 2008) were thatit was the query language for the popular Sesame, and that it supported RDFS. Nowadays,SPARQL would be the query language of choice. RDFS support in SPARQL is achieved usingproperty path (e.g. rdfs:subClassOf+ indicates“follow one or more rdfs:subClassOf ”) whichappeared in 2013 when SPARQL1.1 became a W3C recommendation. We present the SPARQLequivalent of the original SeRQL queries.
2.2.4.1 Redundant disease–pathway associations
When a disease is associated with a pathway, we can infer automatically that it is also associatedwith all the superclasses subsuming (directly or indirectly) this pathway (Figure 2.8).
Figure 2.8: The association between SomeDisease and Pathway2 can be inferred using thepathway hierarchy and therefore does not need to be stated explicitly.
The following query retrieves the (disease, pathway) couples linked by a redundant has-
Pathway relation.
1 SELECT DISTINCT ?disease ?redundantPathway
2 WHERE {
3 ?disease dp:hasPathway ?precisePathway .
4 ?disease dp:hasPathway ?redundantPathway .
5 ?precisePathway rdfs:subClassOf+ ?redundantPathway .
6 }
2.2.4.2 Pathways common to two diseases
The following query retrieves the pathways directly associated to two diseases :
34

1 SELECT DISTINCT ?commonDirectPathway
2 WHERE {
3 ?disease1 dp:hasPathway ?commonDirectPathway .
4 ?disease2 dp:hasPathway ?commonDirectPathway .
5
6 BIND ( snomed:393564001 as ?disease1) # Glioma
7 BIND ( snomed:44054006 as ?disease2) # Type 2 diabetes mellitus
8 }
Figure 2.9: None of the three diseases share any direct pathway. However, considering theGO hierarchy allows to recognize that Disease1 is associated with a pathway more specificthan that of Disease3, and therefore Monosaccharide metabolic process and its ancestorsare all common to both diseases (idem for Disease2 and Disease3). Similarly, Disease1 andDisease2 are associated with Hexose metabolic process and its ancestors.
The previous query is similar to what we could do using a relational database. However, itfails to take the pathway hierarchy into account. If the two diseases are associated with differentpathways (e.g. “Fructose metabolic process” for the first and “Mannose metabolic process” forthe second) they do not have any direct pathway in common, whereas we could infer fromGO that both diseases are associated with the common ancestors of these two terms (in thisexample “Hexose metabolic process” and its ancestors), as seen in Figure 2.9. The followingquery retrieves the pathways directly or indirectly associated to two diseases (lines 3 and 4 couldhave been simplified to ?disease1 dp:hasPathway/rdfs:subClassOf* ?commonPathway butI kept the verbose version for the sake of clarity; idem for lines 6 and 7):
35

1 SELECT DISTINCT ?commonPathway
2 WHERE {
3 ?disease1 dp:hasPathway ?pathway1 .
4 ?pathway1 rdfs:subClassOf* ?commonPathway .
5
6 ?disease2 dp:hasPathway ?pathway2 .
7 ?pathway2 rdfs:subClassOf* ?commonPathway .
8
9 BIND ( snomed:393564001 as ?disease1) # Glioma
10 BIND ( snomed:44054006 as ?disease2) # Type 2 diabetes mellitus
11 }
The same principle allows to take the hierarchy of diseases into account in order to retrievethe pathways directly or indirectly associated with a class of diseases. Note that in this case weconsider the pathways associated with the disease class or at least one of its subclasses (and notthe pathways common to all the diseases of the class). This is mostly because the associationsbetween diseases and pathways are far from being exhaustive, and if one of the diseases is notassociated with any pathway, then the entire class would not be either (see chapter 4 for furtherdetails about reasoning with incomplete information).
The following query retrieves the pathways directly or indirectly associated with two classesof diseases or one of their subclasses:
1 SELECT DISTINCT ?commonPathway
2 WHERE {
3 ?disease1 rdfs:subClassOf* ?diseaseClass1 .
4 ?disease1 dp:hasPathway ?pathway1 .
5 ?pathway1 rdfs:subClassOf* ?commonPathway .
6
7 ?disease2 rdfs:subClassOf* ?diseaseClass2 .
8 ?disease2 dp:hasPathway ?pathway2 .
9 ?pathway2 rdfs:subClassOf* ?commonPathway .
10
11 BIND ( snomed:55342001 as ?diseaseClass1) # Neoplastic disease
12 BIND ( snomed:126877002 as ?diseaseClass2) # Disorder of glucose metabolism
13 }
2.2.4.3 Pathways specific to a disease
The following SPARQL query retrieves the pathways directly or indirectly associated with adisease (glioma) but not with another disease (type 2 diabetes mellitus):
36

1 SELECT DISTINCT ?disease1SpecificPathway
2 WHERE {
3 ?disease1 dp:hasPathway ?pathway1 .
4 ?pathway1 rdfs:subClassOf* ?disease1SpecificPathway .
5
6 FILTER NOT EXISTS {
7 ?disease2 dp:hasPathway ?pathway2 .
8 ?pathway2 rdfs:subClassOf* ?disease1SpecificPathway .
9 }
10
11 BIND ( snomed:393564001 as ?disease1) # Glioma
12 BIND ( snomed:44054006 as ?disease2) # Type 2 diabetes mellitus
13 }
Note that this query can be modified like we did for the common pathways in order toretrieve the pathways directly or indirectly associated with a class of diseases but not withanother class of diseases.
2.2.4.4 Pathways connecting a disease and a class of diseases
The following query retrieves the diseases associated directly or indirectly with the pathwaysassociated with one class of diseases. Note that in this case it is important to consider onlythe pathways directly associated with the class of diseases or at least on of its subclasses, butthat the pathways hierarchy should still be exploited to analyze the pathways associated withrelatedDisease.
1 SELECT DISTINCT ?relatedDisease
2 WHERE {
3 ?disease rdfs:subClassOf* ?diseaseClass .
4 ?disease dp:hasPathway ?pathway .
5
6 ?relatedDisease dp:hasPathway ?pathway2 .
7 ?pathway2 rdfs:subClassOf* ?pathway .
8
9 BIND ( snomed:55342001 as ?diseaseClass) # Neoplastic disease
10 }
2.2.4.5 Leukemia, glioma and Alzheimer’s disease use-case
For being able to manually check that our queries returned correct results, we considered threediseases: chronic myeloid leukemia, glioma, and Alzheimer’ disease. First, we performed someRDFS queries for checking the consistency of the integrated ontology. Among the pathwaysassociated with one disease, 87 are more general than some other pathway associated withthis disease (47 for leukemia, 29 for glioma and 10 for Alzheimer’s disease). We removed theleast specific pathways. We then performed some RDFS queries for comparing diseases bytheir associated pathways. First, we compared two neurological disorders, namely glioma andAlzheimer’s disease (Figure 2.10 on the next page). 8 direct pathway classes involved in gliomawere also associated to Alzheimer’s disease (86 indirect classes). Then we compared glioma andleukemia; 44 direct pathway classes were shared by these two cancers (165 indirect classes).Finally, 37 pathways are specific to these two cancers (97 indirect classes). Furthermore, thethree diseases are associated with pathways themselves associated with glioma.
37

Figure 2.10: Pathways (red ellipses) associated with diseases (blue rectangles): Alzheimer’sdisease (bottom left) and glioma (center top).
38

2.3 Methodology: Web services composition
This study focuses on using semantic annotations for helping a user pairing Webservices parameters for creating a workflow. From our experience, biologists usuallyhave a rather precise idea of the goal they want to achieve and of the services touse, but they can use some help for the technical aspect of service orchestration. Weassumed that the services composing the workflow are known, as well as their relativeorder. We demonstrated that parameter pairing should not only rely on the type ofthe parameters (e.g. a string or a date), but also on their nature (e.g. a family name,a city or a creation date as opposed to a validation date). We determined whetherpairs of parameters are semantically compatible by examining if they have the samenature or if the output parameter of a service is subsumed by the input parameter ofthe next service.In retrospect, this work is interesting because while at that time most of the otherworks on this domain focused on determining the succession of Web services, we fo-cused on the “next step”, i.e. pairing the parameters once this succession is known.Although we made a clear distinction between determining the succession of Web ser-vices and pairing the parameters in order to differentiate our work from the others,parameters semantic compatibility could provide some relevant information for guidingthe proposition of a succession of Web services.
This work was carried out by Nicolas Lebreton, who I supervised with Anita Burgun. Itwas originally published in Nicolas Lebreton, Christophe Blanchet, Daniela Barreiro Claro,Julie Chabalier, Anita Burgun, and Olivier Dameron. Verification of parameters semanticcompatibility for semi-automatic Web service composition: a generic case study. In Proceedingsof the 12th International Conference on Information Integration and Web-based Applicationsand Services (iiWAS2010), pages 845–848, 2010 [89].
2.3.1 Context
Creating a workflow of Web services is a difficult task [121]. Currently, this is a manual andtime-consuming process requiring different expertises. The first step is the selection of the Webservices and their arrangement in a sensible order. It requires domain expertise and is typicallydone by end-users who have an idea of the succession of tasks to perform. Service selectionrelies on the notion of goal, which is typically represented in task ontologies. The second stepconsists in pairing the output of a service with one of the inputs of the next one in the workflow.It requires technical expertise for connecting each service input parameters to data or to theoutput of some other service. Parameter pairing relies on the nature of the parameters, whichis typically represented in domain ontologies.
Annotations help automating this tedious process. When present, the WSDL (Web ServicesDescription Language) description of the service is useful, but it only addresses the syntacticlevel of interoperability (e.g. the input parameter is a string). Parameter pairing based on theirtype (not their nature) is prone to two kinds of errors:
• it misses correct pairings when the parameters are in different formats and would onlyrequire a conversion (e.g. the first service output is of type xsd:date whereas the secondservice input is a xsd:string);
• it generates incorrect pairings when the parameters are of different natures but representedin the same format (e.g. the first service output is family name of type xsd:string andthe second service input is a city of type xsd:string).
39

Recognizing the two previous kinds of errors from the correct situations requires some com-bined reasoning on the type of the parameters (e.g. using XML schemas) and on the nature ofthe parameters independently from the way they are represented (e.g. a date, a name, a city).OWL-S [122] is the de facto standard to represent semantic descriptions of the various Webservices. Semantic Web services composition is the act of taking several semantically-annotatedWeb services and binding them together to meet the needs of the user.
However, semantic description of Web services are scarce and are not really exploited byapplications. A well-known tool for multi-domain data analysis is currently Taverna [123] andits workflow language Xscufl (XML Simple Conceptual Unified Flow Language). Taverna allowsthe user to configure and combine the relevant Web services in a workflow. The Xscufl syntaxis used by the Taverna project to store and retrieve workflow definitions. Setting all Taverna’sparameters requires a significant knowledge of the Web services and this information is generallynot accessible in a software-compatible format that would support automatic assistance. Theservices combination and the pairing of parameters have to be performed manually, only theexecution of the workflow is automated.
2.3.2 Objective
We focused on the use of the semantic annotations to check the compatibility of Web servicesparameters in a workflow where the order of execution of the Web service is already known.
We demonstrated that OWL-S is expressive enough to support these pairings, and that oncethe pairings have been decided, an Xscufl file representing the workflow can be automaticallygenerated so that Taverna can execute the workflow.
2.3.3 Semantic compatibility of services parameters
During workflow composition, we assume that the user has already defined the Web servicesordering. During each transition from one Web service to the next, we examine all the possiblecombinations of an output of the first Web service with an input of the next one. Four situationscan arise (Figure 2.11 on the facing page):
• Identical match: the input and the output have exactly the same kind;
• Generalization match: the input is more general than the output of the previous service;
• Specialization match: the input is more specific than the output of the previous service.It is up to the user to make sure that in his conditions of use, the first service will alwaysreturn results that are semantically compatible with the next service input;
• Incompatibility : the input cannot be reconciled with the output of the previous service.This is either because the pairing has to be ruled out, or because the ontology is incomplete.
Compatibility is inferred in case of identical match or generalization match.
Compatibility is possible but not guaranteed in case of specialization match. In this case,the type of the output is more general than the type of the next service’s input. As the outputmay not be compatible with the required input type, it is up to the user to determine whetherthe particular conditions of application guarantee a safe execution.
2.3.4 Algorithm for pairing services parameters
We assumed that the order of the Web services in the workflow is known. We proposed analgorithm for semi-automatically determining which output parameter of a Web service can be
40

Figure 2.11: Semantic compatibility of a Web service output with the next Web service inputdepending on the parameters’ nature. Compatibility is inferred in case of identical match orgeneralization match. Compatibility is possible but not guaranteed in case of specializationmatch. Otherwise, compatibility is ruled out.
41

paired with which input parameter of the next service. For each input parameter, the algorithmreturns a set (possibly empty) of semantically-compatible output parameters, and a set (possiblyempty) of potentially-compatible output parameters. Optionally, both sets can be converted tolists if the difference of granularity between the output and the input parameter is considered.
For each pair of connected services, we determine all the pairwise semantic compatibilities ofan input parameter of the second service with an output parameter of the first services. Threeconfigurations can arise (Table 2.1 summarizes the possible actions):
• the Web service input is semantically compatible with exactly one output of a previousWeb service (either through identical match or through generalization match), and nospecialization match was detected. The correct pairing can be validated by the user.
• the Web service input is either semantically compatible with more than one output of aprevious Web service (either through identical match or through generalization match),or at least one specialization match was detected. Both lists of candidate pairings arepresented to the user who can reject them all or select one ;
• the Web service input is not semantically compatible with any of the outputs of a previousWeb service (either through identical match or through generalization match), and nospecialization match was detected. The situation cannot be resolved automatically andthe user should decide if the problem lies in the workflow itself or in the ontology used todescribe the parameters.
Nb semantically-compatible parameters0 1 >1
Specialization 0 No compatibility Validation required Reject or select onematch >= 1 Reject or select one Reject or select one Reject or select one
Table 2.1: Pairing services parameters.
Note that it is important to focus on the input parameters. Parameter pairing consists inchoosing one of the outputs of a previous service as the value for the input parameter (and thisvalue is obviously unique, whereas the output of a service can be paired with several inputs offollowing services). Figure 2.12 on the facing page shows a situation where the input of service S3is semantically-compatible with the output of service S1 and in a specialization match with theoutput of service S2. In this case, the user will have to make a choice between the semantically-compatible pair < O1, I3 > and a potentially-compatible pair < O2, I3 > (the former being themost likely candidate). If we had focused on output parameters, we would have determinedthat O1 was most likely paired with I3, and independently that O2 was most likely paired withI3 without realizing that both pairs are concurrent; moreover, in addition to I3, O1 could alsobe paired with the input of another service in addition to S3.
42

Figure 2.12: Pairing services parameters is performed by considering all the combinations lead-ing to an input parameter and applying Table 2.1 on the facing page.
2.4 Application: ontology-based query expansion with GO2PUB
This application automatically enriches PubMed queries with gene names, symbolsand synonyms annotated by a Gene Ontology (GO) term of interest or one of itsdescendants. GO2PUB is based on a semantic expansion of PubMed queries usingthe semantic inheritance between GO terms. We demonstrated that this approachyields some relevant articles ignored by the other tools and can be generalized to anybiological processes.In retrospect, this work is interesting because even if the MeSH and the Gene Ontologyare arguably the two ontologies that had the greatest impact on the life science com-munity, their integration was original and provided some added value. It should alsobe noted that the current implementation relies on the GOA databases in a relationalformat, as they were provided by the EBI. Now that the bio2rdf project released someRDF versions of GOA, the semantic expansion part of GO2PUB could be elegantlyrewritten as much simpler SPARQL queries.
This work was initiated and carried out by Charles Bettembourg during his Master’s degreeinternship and then at the beginning of his PhD thesis because he needed to perform PubMedqueries on lipid metabolism but found serious limitations with PubMed.
It was originally published in Charles Bettembourg, Christian Diot, Anita Burgun andOlivier Dameron. GO2PUB: Querying PubMed with semantic expansion of gene ontologyterms. In Journal of Biomedical Semantics 2012, 3:7 [90].
GO2PUB is available at http://go2pub.genouest.org/.
2.4.1 Context
The development of high-throughput methods of gene analysis requires to deal with lists ofthousands of genes while researchers were used to search the literature only for a few genes at atime. The information retrieval process becomes an increasingly difficult task and needs to beredesigned to provide literature concerning biological problems raised by the gene analyses.
PubMed is the most comprehensive public database of biomedical literature. It comprisesmore than 21 million entries for biomedical literature from MEDLINE, life science journals, andonline books14. The typical PubMed user has to read several dozens to hundreds of abstracts
14http://www.ncbi.nlm.nih.gov/pubmed
43

to select the relevant ones. More than 4 million articles were added in the last 5 years 15.
A well defined query is important to retrieve as many relevant articles as possible with asfew irrelevant ones as possible. Such a query is often more complex than the few loosely-coupledkeywords used by most users. There is a need for automatic tools helping the users to buildsuch complex queries that minimize silence and noise [124, 125].
Although PubMed supports MeSH-based query expansion [126], other literature search toolshave been developed [127, 128, 129, 130] and evaluated [131]. These can be classified into threemajor approaches. The first approach, exemplified by tools like SLIM [132], is based on anintuitive interface to set some filters on PubMed queries in order to obtain a better precisionthan with the basic PubMed querying system. A good proficiency with PubMed advanced searchbrings similar results.
The second approach developed in SEGOPubMed uses a Latent Semantic Analysis (LSA)framework. It is based on a semantic similarity measure between the user query and PubMedabstracts [133]. The authors of SEGOPubMed state that the LSA approach outperforms theother approaches when using well-referenced keywords. Unfortunately, no implementation ofSEGOPubMed is currently available. Moreover, this method requires that a corpus of well-referenced keywords be constituted and maintained before the search. Such a corpus is notavailable (in the biomedical domain) either.
The third approach is based on query enrichment using controlled vocabularies and ontolo-gies. An ontology is a knowledge representation in which concepts are described both by theirmeaning and their relations to each other [37]. Ontologies are useful to find information relevantto a given topic, particularly through a query expansion process[134]. The automatic handlingof the query complexity facilitates query formulation. Expanded queries applied to the Webinformation retrieval show a systematic improvement over the unexpanded ones [135]. QuExTperforms a concept-oriented query expansion to retrieve articles associated with a given list ofgenes symbols from PubMed and to prioritize them [136].
A frequent goal of gene-related analyses (e.g. transcriptomics) is to identify the genes withdifferent expression across samples analyzed. Thereafter, scientists link their list of genes tomore synthetic keywords and functions using Gene Ontology (GO) terms [137] associated togenes thanks to the Gene Ontology Annotation database [138]. At this stage of the gene-relatedanalyses, the keywords to search the literature are not gene names anymore but GO terms.Therefore, tools querying literature with GO terms seem appropriate. GoPubMed [139] usesa text extraction algorithm to mine PubMed abstracts with GO terms. It relies on a localstring alignment to compare the GO terms and the abstracts. GoPubMed selects the abstractscontaining at least a significant part of the semantic of the GO terms. However, GoPubMeddoes not follow GO strict rules conveying the semantics of terms. If the annotation of a geneproduct gp by a Gene Ontology term t is true, then the annotation of gp by any parent oft is equally true [138]. All transitive relation (is a, part of) have to be followed to retrievethese parents. As GoPubMed does not follow this rule, its recall decreases whenever inferencesabout gene annotations yield new relevant results [140]. None of the existing tools supports acombination of semantics-based and of synonym-based PubMed query enrichment.
2.4.2 Objective
In this study, we hypothesized that the name of the genes annotated by a GO term of interestor one of its descendants can be used as keyword in gene-oriented PubMed queries. The descen-dants of a GO term are defined according to the Gene Ontology specifications of reasoning about
15http://www.nlm.nih.gov/bsd/licensee/baselinestats.html
44

relations. The genes annotated with GO terms are provided by the Gene Ontology Annotationdatabase.
In our system GO2PUB, we propose a new approach that considers not only the genesannotated with a GO term of interest, but also those annotated by a descendant of this GOterm, complying with the semantic inheritance properties of GO. GO2PUB’s user inputs a listof GO terms of interest, one or more species, and a list of keywords. It generates a PubMedquery with the names, symbols and synonyms or aliases of these genes, the species and thekeywords and processes PubMed results.
We also performed a qualitative relevance study on our domain of expertise using threequeries related to lipid metabolism. In this manuscript, I focus on GO2PUB query expansion.Please refer to [90] for details on the relevance study.
2.4.3 Semantic expansion
Semantic expansion consists in following the semantic inheritance through the GO graph inorder to also consider all the descendants of the GO terms specified by the users. Then, theprocess retrieves the gene names annotated with these terms.
GO2PUB uses these gene names and their synonyms as additional keywords for PubMedqueries. Figure 2.13 shows that the expansion identifies five genes associated with the regulationof fatty acid metabolic process, instead of two if the semantic inheritance is ignored.
Regulation of fatty acid metabolic process (GO:0019217)
Regulation of fatty acid biosynthetic process(GO:0042304)
Negative regulation of fatty acid biosynthetic process (GO:0045717)
Positive regulation of fatty acid biosynthetic process (GO:0045723)
PPAR
CAV1
BRCA1 ChREBP APOA1
Figure 2.13: Keyword semantic enrichment. For a literature search about the regulation offatty acid metabolic process, we want to enrich the query with the associated genes. Thetwo genes PPAR and CAV1 are directly annotated by the GO term “Regulation of fatty acidmetabolic process” (GO:0019217). However, Gene Ontology inheritance properties say thatevery term inherits the meaning of all its ancestors. Consequently, genes annotated by at leastone descendant of the original term (BRCA1, ChREBP and APOA1) should also be considered.
2.4.4 Query generation
GO2PUB creates an expanded PubMed query with the name, symbol and synonyms of genesannotated by one or several GO terms provided by the users, for one or several species. Fig-ure 2.14 on the following page presents the process. The users provide one or several GO termsand species. To further restrict their query, they can also provide as many MeSH terms key-
45

words as wanted. Furthermore, a “free text” field supports the use of all the other PubMed tags,like [Author], [Journal], etc., and keywords from MeSH terms or free text.
(G1 U G2 U G3 U ...................... Gw U Gx U GyU U Gz)
GO1
GO11
Other terms
and their
descendants
GOα
GOα
GOα
GOα1 2
3
U
β species
(S1 U ... U Sβ)U
γ keywords
(K1 U ... U Kγ)
Figure 2.14: GO2PUB Query composition process using the parameters provided by the user.(1) the initial α GO terms (purple boxes) are enriched by their descendants. (2) the genes (herenoted G1 to Gz) annotated by the GO terms are retrieved. (3) the query is composed using thenames, symbols and synonyms of the genes, the β species (S) and the γ MeSH or free keywords(K).
The first part of each query involves one or more GO terms. The users can enter either thename or the identifier of the GO terms. These terms are suggested when the users start to fillthe field. The exact GO term is suggested if the users provide one of its GO synonyms. Forexample, GO2PUB will search for “lipid biosynthetic process” if the users provide “lipogenesis”.When two or more GO terms are entered, GO2PUB makes the union of them (“OR” connector).
Then, the users select one or several species using a name (common or scientific names andtheir synonyms are allowed) or a NCBI taxon code16. In this case, the users can choose tojoin them (using “OR”) or intersect them (using “AND”). Logical connectors “AND” and “OR”are set by default to make the union of species and intersection of keywords, but this can bemodified.
Next, the users can enter additional MeSH terms to specify their query. MeSH terms asso-ciated to the articles by PubMed are not all of same importance, some of them being classifiedas “Major topic” (MAJR). We can qualify each keyword as a simple MeSH term or a Majortopic. Again, the users can specify the connector between keywords.
GO2PUB retrieves all gene names annotated by each GO term, directly or indirectly throughthe semantic inheritance properties. It then builds a query on the model“(n gene names, symbolsor synonyms separated by OR) AND (m species) AND (p MeSH terms)”. The name, symboland synonyms of each gene compose the first part of the query. They will be searched in titleand abstract. Species and keywords chosen by the users make up the second part of the query.Finally, GO2PUB submits to PubMed a query composed of gene names annotated directly orindirectly by the GO terms chosen by the users (name OR symbol OR Synonym), at least onespecies and some MeSH terms and free keywords. This big query is split into several smallerones if it exceeds PubMed server URL length limitation. GO2PUB compiles the results anddisplays all citations numbered and sorted by date.
Figure 2.15 on the next page shows the respective results of PubMed, GoPubMed andGO2PUB for a query about“Lipogenesis in chicken liver”. Overall, the comparison of GO2PUB,based on semantic expansion with GoPubMed, based on text mining techniques showed thatboth tools are complementary.
16http://www.ncbi.nlm.nih.gov/Taxonomy
46

2
1
5
4
2
2
10
10
13
16
3
2
Lipogenesis in chicken liver
PubMed
GoPubMed (exp)
GO2PUB
(a) Repartition of all results for Q1
(b) Repartition of the resultsconsidered as relevant
among (a)
Figure 2.15: Comparison of the PubMed, GoPubMed and GO2PUB results for query “Lipogen-esis in chicken liver”. (a) displays the repartition and intersections of these results. (b) displaysthe repartition and intersections of the results considered as relevant.
2.5 Synthesis
What the three studies have in common All three studies require simple taxonomy-basedreasoning on OWL ontologies. However, in these cases, this simplicity was well adapted to thesituation.
It should be noted that in the first half of the 2000’s, OWL reasoners were perceived as thepreferred solution for querying OWL ontologies even if (1) most ontologies were essentially RDFStaxonomies represented in OWL, (2) the reasoners could hardly manage to load medium-size on-tologies and (3) classification was extremely slow if it successfully terminated (even consideringthe ontologies simplicities). This can be explained by the fact that unfortunately, few connec-tions existed within the semantic Web community between the people focusing on biomedicalontologies who were mostly DL-oriented, and the people developing RDF and SPARQL. Opensource ontology editors such as OILed and Protege have been coupled with DL reasoners sincethe early 2000’s, but have not supported simple and efficient connections with query languagesfrom the triplestore community until recently (contrary to TopBraid composer). Nowadays,ontologies have mostly evolved in size but not in semantic complexity [118].
Therefore, even if the topics of the first two studies seem outdated now, the principle is stillall the more relevant that major life science data sources such as Uniprot17 or the EBI18 areproviding their data as RDF and offer dedicated SPARQL endpoints, and initiatives such asbio2rdf[61] and the NCBO BioPortal[49, 141, 142] provide an integrated access in RDF to lifescience datasets and ontologies. Other initiatives such as purl19 and identifiers.org20 providesolutions for perennial and location-independent identifiers [106, 64].
17http://beta.sparql.uniprot.org/18https://www.ebi.ac.uk/rdf/19htts://purl.org20http://identifiers.org/
47

Integration of diseases and pathways Using SNOMED-CT and the Gene Ontology forintegrating diseases and pathways combined the hierarchies of these two ontologies. It wasthen possible to identify pathways or families of pathways shared by two diseases even if thesediseases are directly associated to different pathways, provided the pathways have some commonancestor. Conversely, two pathways may be associated to different but similar diseases.
Current analysis techniques go beyond the simple detection of shared common elementsand focus on whether the number of shared elements is greater than what we could expect byrandom selection [143].
If all the resources had existed in RDFS or OWL, the current version of this work wouldhave consisted in producing an OWL version of the mappings between SNOMED-CT diseasesand GO biological processes, and in performing SPARQL federated queries over SNOMED-CT,GO and the mappings.
Composition of Web services We proposed a simple generic algorithm compatible withany annotation framework such as WSMO, OWL-S or SAWSDL. The major limitations for itsdeployment were the lack of appropriate domain ontology, as well as (understandably given thelack of ontologies) the lack of semantic annotations for Web services and particularly for theirparameters [144].
Our semantic compatibility algorithm was only tested on linear workflow. Its generalizationto more complex control structures remains to be studied.
Semantic query expansion with GO2PUB GO2PUB performs a semantic expansion ofthe GO terms of interest complying with the semantic inheritance through the GO graph beforeretrieving the corresponding genes to enrich the query. Using the semantic inheritance propertiesof the GO graph was useful, as the more descendants a GO term has, the more relevant resultsGO2PUB yields.
GoPubMed does not follow the semantic inheritance properties of GO. We manually ex-panded GoPubMed queries and compared it to GO2PUB. This showed that query expansionwould be a valuable extension for GoPubMed.
Both GO2PUB and GoPubMed retrieved relevant articles ignored by PubMed. As most ofthe results obtained by GO2PUB and GoPubMed are relevant in the qualitative study and inthe generalization study, the intersection of GoPubMed and GO2PUB results decreases noise.As each tool yields relevant articles ignored by the other, the union of their results also decreasessilence.
GO2PUB seems less suited for queries involving either general GO terms or GO terms withfew or no descendants. Indeed, with general GO terms, GO2PUB considers a lot of descendants,and therefore a lot of genes. We expect this to increase the noise as some of the genes will beirrelevant. Conversely, GO terms having few or no descendants are associated with few genes.We do not expect semantic expansion to benefit these highly specific queries yielding only a fewPubMed results.
Overall, GO2PUB performed better than GoPubMed and PubMed. GO2PUB brought rele-vant results ignored by GoPubMed even when adding a manual query expansion for GoPubMed.Conversely GoPubMed text mining approach found relevant articles ignored by GO2PUB. Thisdemonstrates GO2PUB relevance and its complementarity with GoPubMed.
What we learned
• Ontologies are getting bigger much more than they are becoming semantically richer(see [118] for the Gene Ontology). Even though, DL-based reasoners can hardly keep upwith the size, so reasoning on rich ontologies is still prohibitive nowadays.
48

• OWL-based reasoning is not necessary in all situations.
• SPARQL is increasingly well adapted in terms of expressivity and of capability of dealingwith large quantities of information (the linked data initiative is soaring).
• The fact that SPARQL is well adapted is a good news in the short term as it obviouslyfills a need but it may also be a bad news in the longer term as it may turn people awayfrom the endeavor of producing semantically-richer ontologies (which may or may not bea bad thing).
49

50

Chapter 3
Reasoning based on classification
Outline
RDFS requires to explicitly state that a resource is an instance of a class or that a class is asubclass of another class. However, we should be able to recognize both situations from theclass characteristics. This then brings the need to formalize class characteristics. This formalrepresentation of class characteristics can even be used during the the ontology maintenanceprocess for ensuring completeness and internal consistency (like some non-regression tests) [145].I proposed a rule-based solution for maintaining the internal consistency of the brain cortexanatomy ontology I developed during my PhD [69]; as this was before the availability of OWL,it was not included in this manuscript.
Description Logics (DL) provides semantically-rich constructs such as disjointness, existen-tial and universal restrictions as well as necessary and sufficient definitions necessary for per-forming inferences beyond simple taxonomy-based reasoning [38, 71, 116, 146, 147, 51, 43, 54].
All these reasoning capabilities require that ontologies actually implement these various fea-tures, which was not the case in the early days of OWL. Section 3.2 shows the difficulty ofgenerating an OWL version of the ontology of human anatomy from a frame-based represen-tation (which fortunately for us was the result of an elaborate and rigorous modeling effort byCornelius Rosse and his team).
Section 3.3 shows that a portion of this OWL version of the human anatomy ontology wasinstrumental in the Virtual Soldier project for inferring the consequences of bullet injuries inthe region of the heart.
Section 3.4 focuses on the comparison of OWL and SWRL-based reasoning for optimizingthe classification of pacemaker alerts.
3.1 Principle
Description Logics (DL) are formal languages allowing to represent characteristics for sets ofobjects [146, 147]. They were created to remedy semantic networks and frame languages lackof formally-defined semantics [148]. There are several DL languages with different expressivity.This section focuses on the OWL language, which was developed in the Semantic Web context.OWL1.0-DL was based on SHOIN (D) [116] (OWL1.0 also defined OWL-Full, which did notbelong to the DL family in order to support metaclasses ; except when specified otherwise, wefocus on DL). Its limitations led to the development of OWL2.0, which extends OWL1.0-DL andis based on SROIQ(D) [149]. This section presents an overview of OWL main characteristics
51

that were used for biomedical data analysis. It is a summary of “OWL2 direct semantics”1 and“OWL2 RDF-based semantics”2.
3.1.1 OWL Classes
DL represent “concepts” or “classes” as sets of individuals defined in intension. The functionthat associates a class and a set of individuals is the interpretation function, noted I.
∆ is the set of all individuals for a particular domain. For a set of classes, there can be many∆, and therefore many interpretation functions. Neither ∆ nor I are usually completely known.As the notion of genericity is a key aspect of ontologies, ontologies specify characteristics ofclasses and relations between them that are valid for all sets of individuals and all interpretationfunctions.
Note that two classes can be associated to the same set of individuals by an interpretationfunction I1 in a particular domain, but to different sets by an interpretation function I2 in an-other domain. Classes that are associated to the same set of individuals for all the interpretationfunctions are equivalent (but each retains its identity). Similarly, a class can be associated toan empty set of individuals according to I1 but not according to I2. A class that is associatedto an empty set of individuals for all interpretation functions is unsatisfiable or inconsistent.
Having a set-based definition for DL classes allows to define a semantics based on set op-erations on their interpretation. This formally-defined semantics is useful because it supportsreasoning. On counterpart, this means that we will focuses on the classes that comply with thissemantics. Because rdfs:Class was loosely defined as the range of the rdf:type property,OWL introduces the notion of owl:Class (note how prefixes are useful for distinguishing thetwo) for designating classes that are sets of individuals (so metaclasses are not allowed, contraryto RDFS).
owl:Class rdfs:subClassOf rdfs:Class
OWL also defines two special classes: owl:Thing (also noted top or >) and owl:Nothing
(also noted bottom or ⊥).
owl:Thing rdf:type owl:Class
>I = ∆
owl:Nothing rdf:type owl:Class
⊥I = ∅
Of course, the RDFS definition of rdfs:subClassOf (noted v between classes) remainsvalid for OWL classes. In this case, for all interpretation function, the set of instances of thesubclass is a subset of the set of instances of the superclass. This is used in ontologies forrepresenting the characteristics shared by all the instances of the class by making the class asubclass of some logical expression combining the instances of other classes.
C1 rdfs:subClassOf C2
⇔C1I ⊆ C2I
1http://www.w3.org/TR/owl2-direct-semantics/2http://www.w3.org/TR/owl2-rdf-based-semantics/
52

OWL also provides an owl:equivalentClass property (noted ≡ between classes) to specifythat for all interpretation function, the two classes have the same set of instances. This is usedextensively in (semantically-rich) ontologies to provide at least one necessary and sufficientdefinition for a class by making it equivalent to some logical expression combining the instancesof other classes. A class with a necessary and sufficient definition is called a “defined class” byopposition to “primitive classes”.
C1 owl:equivalentClass C2
⇔C1I = C2I
3.1.2 Union and intersection of classes
The union (resp. intersection) of two classes, noted t (resp. u) is a class which set of instancesis the union (resp. intersection) of the sets of instances of the two classes.
owl:unionOf(C1, C2) rdfs:subClassOf owl:Class
⇔(C1 t C2)I = (C1I ∪ C2I)
owl:intersectionOf(C1, C2) rdfs:subClassOf owl:Class
⇔(C1 u C2)I = (C1I ∩ C2I)
For example, this can be used to define the class Finger by making it an equivalent class tothe union of Thumb, Index, etc. Similarly, we can define the class LeftThumb as the intersectionof Thumb and LeftSideOrgan.
3.1.3 Disjoint classes
OWL relies on the open world assumption (cf. Section 4.1), so by default, two classes can sharesome instance with an interpretation function, and not have any instance in common with an-other interpretation function. The disjointWith property specifies that two classes can neverhave any instance in common. When designing ontologies, sibling classes are usually disjoint(e.g. the five subclasses of Finger: Thumb, , MiddleFinger, RingFinger and LittleFinger arepairwise disjoint) but not always (e.g. if we also consider the two other subclasses LeftFingerand RightFinger, which are also pairwise disjoint but should not be assumed to be disjointfrom the five others).
Stating explicitly that two classes are disjoint is useful both for avoiding logical inferencesthat would not be consistent with the domain knowledge and for ruling out options in case ofpartially-known information. Several examples are presented in Chapter 4
C1 owl:disjointWith C2
⇔(C1I ∩ C2I) = ∅
53

3.1.4 Negation: complement of a class
The negation of a class (noted ¬) is a class which set of instances is the complement of the setof instances of the original class (i.e. the set of individuals that are not instances of the class).By definition, a class and its negation are disjoint.
owl:complementOf(C) rdfs:subClassOf owl:Class
⇔(¬C)I = (∆ \ CI)
For example, the intersection of the class Patient and of the negation of its subclass Di-
abeticPatient represents the non-diabetic patients (we will see in section 3.1.5 how to defineDiabeticPatient as the patients suffering from diabetes)
3.1.5 Existential and universal restrictions
An existential restriction (noted ∃ property . Class) is the class which instances are theindividuals related to at least an instance of Class (direct or indirect) through property (ora subproperty). For example ∃ suffersFrom Diabetes is the set of the individuals being thesubject of a triple which predicate is suffersFrom and which object is an instance of Diabetes.
(∃property .Class)I = {i ∈ ∆|∃j ∈ ClassI , (property I)(i, j)}
An universal restriction (noted ∀ property . Class) is the class which instances are theindividuals for which property (or a subproperty) only leads to instances of Class (direct orindirect), i.e. the individuals not related through property to anything that is not an instanceof Class. Individuals not related to anything through property also qualify as instances of theuniversal restriction. For example, ∀ hasMedication Anticoagulant is the set of individualswhose only medications are anticoagulant, including those who do not have any medication.
(∀property .Class)I = {i ∈ ∆|∀j ∈ ∆, (property I)(i, j)⇒ j ∈ ClassI}
Existential and universal restrictions are typically used:
• as superclasses for representing characteristics shared by all the instances of a class. Inthis case, the reasoning is “if you are an instance of the class, then you match the condi-tion”. For example, all the ventricular cavities are filled with blood (and other anatomicalstructures can also be filled with blood) VentricularCavity @ (∃ filledWith . Blood).If you are an instance of VentricularCavity, then you are related to at least one instanceof Blood through filledWith . Even if the relation is not explicitly stated, we know thatthere must be at least one.
• as equivalent classes for representing characteristics that define a class. In this case, thereasoning can be either“if you are an instance of the class, then you match the condition”or“if you match the condition, then you are an instance of the class”. For example, a diabeticpatient is an individual who suffers from diabetes DiabeticPatient ≡ (∃ suffersFrom .Diabetes).
54
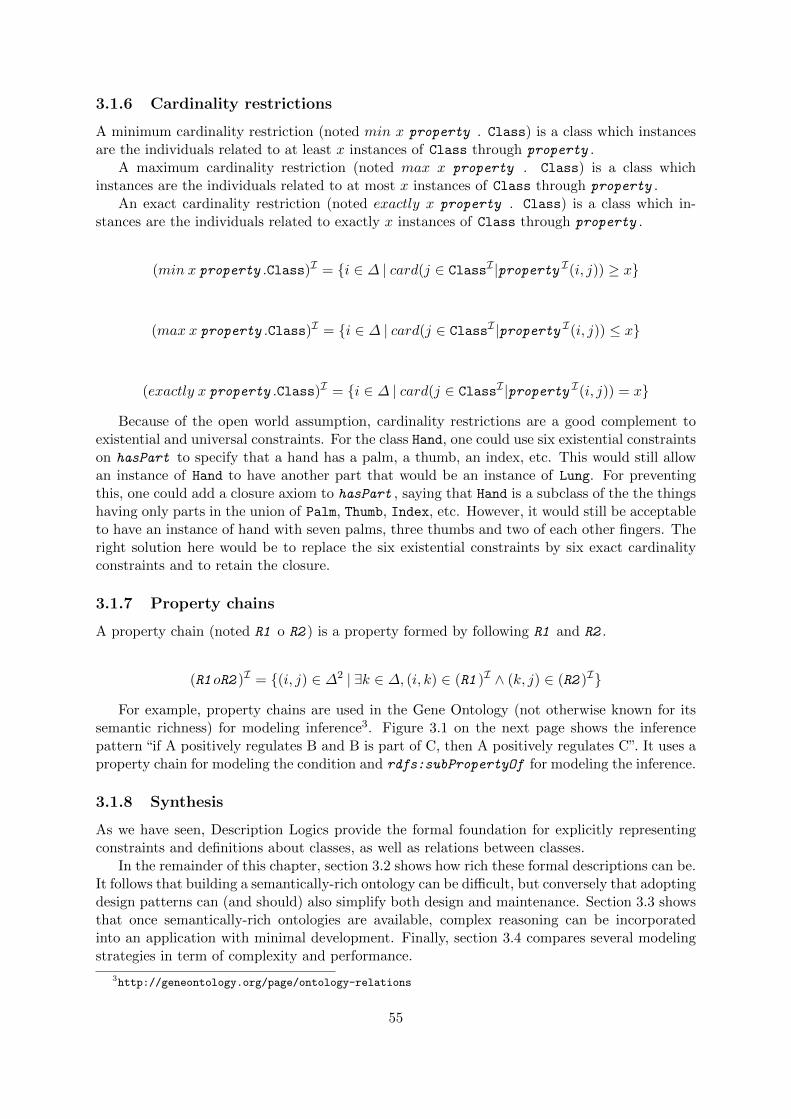
3.1.6 Cardinality restrictions
A minimum cardinality restriction (noted min x property . Class) is a class which instancesare the individuals related to at least x instances of Class through property .
A maximum cardinality restriction (noted max x property . Class) is a class whichinstances are the individuals related to at most x instances of Class through property .
An exact cardinality restriction (noted exactly x property . Class) is a class which in-stances are the individuals related to exactly x instances of Class through property .
(min x property .Class)I = {i ∈ ∆ | card(j ∈ ClassI |property I(i, j)) ≥ x}
(max x property .Class)I = {i ∈ ∆ | card(j ∈ ClassI |property I(i, j)) ≤ x}
(exactly x property .Class)I = {i ∈ ∆ | card(j ∈ ClassI |property I(i, j)) = x}
Because of the open world assumption, cardinality restrictions are a good complement toexistential and universal constraints. For the class Hand, one could use six existential constraintson hasPart to specify that a hand has a palm, a thumb, an index, etc. This would still allowan instance of Hand to have another part that would be an instance of Lung. For preventingthis, one could add a closure axiom to hasPart , saying that Hand is a subclass of the the thingshaving only parts in the union of Palm, Thumb, Index, etc. However, it would still be acceptableto have an instance of hand with seven palms, three thumbs and two of each other fingers. Theright solution here would be to replace the six existential constraints by six exact cardinalityconstraints and to retain the closure.
3.1.7 Property chains
A property chain (noted R1 o R2 ) is a property formed by following R1 and R2 .
(R1 oR2 )I = {(i, j) ∈ ∆2 | ∃k ∈ ∆, (i, k) ∈ (R1 )I ∧ (k, j) ∈ (R2 )I}
For example, property chains are used in the Gene Ontology (not otherwise known for itssemantic richness) for modeling inference3. Figure 3.1 on the next page shows the inferencepattern “if A positively regulates B and B is part of C, then A positively regulates C”. It uses aproperty chain for modeling the condition and rdfs:subPropertyOf for modeling the inference.
3.1.8 Synthesis
As we have seen, Description Logics provide the formal foundation for explicitly representingconstraints and definitions about classes, as well as relations between classes.
In the remainder of this chapter, section 3.2 shows how rich these formal descriptions can be.It follows that building a semantically-rich ontology can be difficult, but conversely that adoptingdesign patterns can (and should) also simplify both design and maintenance. Section 3.3 showsthat once semantically-rich ontologies are available, complex reasoning can be incorporatedinto an application with minimal development. Finally, section 3.4 compares several modelingstrategies in term of complexity and performance.
3http://geneontology.org/page/ontology-relations
55

Figure 3.1: Property chain in the Gene Ontology: if x positively regulates y and y part
of z, then we can infer that x positively regulates z.
56

3.2 Methodology: Description-logics representation of anatomy
This study focuses on converting the frame-based representation of the ontology ofnormal human anatomy (the FMA) into OWL, which is more adapted to the reasoningtask we envisioned (c.f. section 3.3). The challenges were (1) preserving and possiblyextending the semantic richness of the original ontology (contrasting with the otherontologies we have seen previously that were mostly taxonomies) and (2) dealing withthe large size of the ontology, which placed it out of reach for the reasoners. Weshowed that perfect conversion was impossible: we had to forgo some the the frame-specific aspects, but on the other hand we could add some OWL-specific ones such asdisjointness or coverage. We recognized that the computational constraints requiredsome simplification for the resulting ontology to be usable by applications, but thatthese simplifications were application-specific. We proposed a solution that deliversan OWL-Full representation as expressive as possible, and a “Virtual FMA-OWL”mechanism (detailed in the original article) providing access to the FMA on a concept-by-concept basis for further simplifications and adaptations.In retrospect, this work is interesting because it showed that even if Description Log-ics offer some highly desirable knowledge modeling primitives, using these primitivesconsistently and systematically during ontology design is difficult and in turn requiressome automation. At that time I mostly used dedicated ad hoc scripts on the FMA [76]or on the ontology of brain cortex anatomy I developed during my PhD [69], but thisproblem was later addressed by others in more principled approaches such as ontol-ogy design patterns[43] or more recently the SPINa and Shape Expressionb (ShEx)languages for expressing constraints on RDF(S) graphs.
ahttp://spinrdf.org/bhttp://www.w3.org/2001/sw/wiki/ShEx
This work was originally published in: Olivier Dameron, Daniel L. Rubin, and Mark A. Musen.Challenges in converting frame-based ontology into OWL: the Foundational Model of Anatomycase-study. In American Medical Informatics Association Conference AMIA05, pages 181–185,2005 [75] and later extended in: Olivier Dameron and Julie Chabalier. Automatic generation ofconsistency constraints for an OWL representation of the FMA. In 10th International ProtegeConference, 2007 [76].
3.2.1 Context
In the medical domain, anatomy is a fundamental discipline that underlies most medical fields [150].The Foundational Model of Anatomy (FMA) is the most complete ontology of canonical (i.e.healthy) human anatomy [151]. It strictly follows a principled modeling approach and includedmore than 70,000 concepts and 1.5 million relationships at the time of the study in 2004.
The FMA is represented in a frame language [152]. However, for some applications it isdesirable to use an OWL representation of the FMA, either for reasoning purposes [73] orfor integrating it with other OWL ontologies, such as the NCI thesaurus [153]. The problemis that frames’ semantics is not as precisely defined as Description Logics’ one. Moreover,although superficially similar, these two approaches rely on fundamentally different modelingassumptions, and there is no direct mapping between them. Protege4, the ontology editingplatform that was used to build the FMA supports both formalisms. The frame-based mode hasan “export to OWL” option. However, this option only performs a straightforward translation
4http://protege.stanford.edu/
57

that ignores all the features that do not have a direct equivalent. Moreover, it does not takeadvantage of all the OWL-specific features that are the basis of the language strength. For thesetwo reasons, the resulting translation would not be usable for reasoning.
3.2.2 Objective
We analyze some theoretical and computational issues of representing the FMA in OWL-DL. Toaddress the expressiveness limitation, we propose to use a more expressive formalism ensuringapplication independence while meeting the expressiveness requirements. To address the com-putational limitations, we propose a “Virtual FMA-OWL” architecture based on a Web Servicethat returns the OWL-Full representation of a concept given its identifier. Eventually, we advo-cate the use of this architecture for continuing to maintain the FMA in the current frame-basedform while making it accessible to the Semantic Web. Note that the intention of this article isnot to discuss the modeling of the FMA [151], but rather to examine different representationformalisms considering the computational requirements of the applications that use them.
3.2.3 Converting the FMA into OWL-DL
The FMA is currently composed of more than 70,000 anatomical items called concepts, hav-ing more than 1.5 million relationships (such as composition, neighborhood or blood supply)between them. The concepts are identified by a unique number called the FMAID, and areassociated with one or more designation (e.g. the string “Heart” for the concept 7088 corre-sponding to the heart), which allows to handle synonyms or multiple languages. The conceptsare strictly organized in a principled specialization hierarchy [152].
3.2.3.1 Basic concept representation: identifiers and designations
We represented the FMA concepts as OWL classes, and relationships as OWL properties.Classes were identified by their FMAID, relative to the FMA namespace5. This allows usto avoid any potential ambiguity with another ontology having a concept with the same iden-tifier, as different ontologies have different namespaces. We used RDF labels to represent theconcept designation, explicitly mentioning the language. This is illustrated by the Figure 3.2,in which the identifier is interpreted against the default namespace, which is declared at theontology level to be the FMA one).
1 <owl:Class rdf:ID="7088">
2 <rdfs:label xml:lang="en">Heart</rdfs:label>
3 <rdfs:label xml:lang="fr">Coeur</rfds:label>
4 ...
5 </owl:Class>
Figure 3.2: Representation of the FMA identifiers and designations in OWL-DL.
3.2.3.2 Taxonomy and metaclasses
The FMA features a complex structure of superclasses and subclasses [152]. For example,“Physical anatomical entity” is an instance of “Anatomical entity template”, and a subclass ofboth “Anatomical entity template” and “Anatomical entity”.
5http://sig.biostr.washington.edu/fma#
58

The representation of the original FMA taxonomy in OWL was straightforward. Thesubclasses—superclass relation between frames was represented by the rdfs:subClassOf rela-tion. The resulting hierarchy is homologous to the original FMA one (see Figure 3.3).
OWL-DL does not support metaclasses, so we needed to remove them.
Figure 3.3: Taxonomy of the OWL-DL representation of the FMA.
3.2.3.3 Disjointness
Description Logics’ modeling principles are slightly different from those of frames. These differ-ences have to be taken into account during conversion. Particularly, the FMA is organized ina hierarchy of mutually-disjoint concepts. However, in Description Logics (hence in OWL-DL),classes are not disjoint by default (i.e. there can exist an individual that is an instance of bothclasses). Therefore, in order to respect the FMA modeling principles, we assume that unlessspecified otherwise by multiple inheritance, all the direct subclasses of a class are mutuallydisjoint. For example, Esophagus and Stomach are two direct subclasses of “Organ with organcavity” and they are disjoint (an instance of “Esophagus” cannot be also an instance of “Stom-ach”). However, “Left breast”, “Right breast”, “Male breast” and “Female breast” should notbe specified as disjoint (although they are automatically because “Left female breast” is onlydescribed as a subclass of “Female breast”, and not also of “Left breast”). This point will befurther discussed in section 3.2.5.
Note that this knowledge was implicit in the frames version of the FMA and is made explicitin its OWL version.
3.2.3.4 Closure
Another difference between frames and Description Logics is that the latter relies on the “openworld assumption” [146] whereas the former assumes a closed world. In a closed world, every-thing that is not explicitly stated is assumed to be false.
Consequently, when the FMA describes the parts of an anatomical structure such as thehand, the fact that the structures other than the palm or the finger are not said to be partsof the hand is interpreted as “they are not part of the hand”. However, in Description Logics,providing a list of the possible parts of the hand does not prevent other structures to be alsoparts of the hand. Therefore, we have to add an extra constraint saying that the structures inthe list are the only possible parts of the hand. This is called introducing a closure axiom [154],and it has to be done for all the relationships (for an example see [73]).
However, generating closures is much more complicated than it may seem at first sight. Forexample, the possible parts of the hand are the palm and the five fingers. Now, we have to
59

take overloading by subclasses into account so that the possible parts of the “Left hand” are“Left palm”, “Left thumb”, . . . , “Left little finger” (note that the closure does not mention non-lateralized concepts such as “Thumb” anymore). However, the same approach cannot be appliedto the lungs: a lung has an upper lobe and a lower lobe as parts. Its subclass “Right lung” notonly has parts “Upper lobe of right lung” and “Lower lobe of right lung” (same approach as forthe hand), but also a middle lobe that does not exist for the left lung. As a consequence, itwould be incorrect to generate a closure for the lung based on its parts, whereas it should bedone for the hand. The first situation occurs when the child overloads its parent. The secondone occurs when subclasses introduce new properties. Unfortunately, real world situations canmix these two situations.
In order to automate the systematic generation of closures, we have to check if all the classesthat define the range of a relation for a concept are subclasses of the range of this relation forthe superclasses of the concept. This point will be further discussed in section 3.2.5.
3.2.3.5 N-ary and attributed relationships
N-ary relationships associate more than two entities. Particularly, this is extensively used inthe FMA to qualify a relation between two entities. Those attributed relationships are usedto qualify part or continuity relationships for example (the lung is continuous medially to thepulmonary veinous tree).
The modeling in Description Logics of such relationships has been studied by the W3CSemantic Web Best Practice working group, and we followed their recommendation [155].
3.2.4 Addressing expressiveness and application-independence: OWL-Full
From the previous section, we have seen that some of the FMA features are simply out of thescope of OWL-DL. We propose a two-layered approach. The first layer consists of a genericconversion tool that generates a representation of the FMA in OWL-Full. The second layerconsists of several application-specific optimization tools that simplify the OWL-Full represen-tation of concepts into OWL-DL ones by removing all the features unnecessary according to theapplication context.
OWL-Full does not suffer from the expressiveness limitations of OWL-DL. For example, itsupports metaclasses. Figure 3.4 shows that the “Heart” (FMAID: 7088) can be represented inOWL-Full both as a subclass and as an instance of“Organ with cavitated organ parts” (FMAID:55673), which complies with the original FMA structure.
1 <owl:Class rdf:ID="7088">
2 <rdfs:label xml:lang="en">Heart</rdfs:label>
3 <rdfs:label xml:lang="fr">Coeur</rfds:label>
4 <rdfs:subClassOf rdf:resource=
5 "http://sig.biostr.washington.edu/fma#55673"/>
6 <rdfs:type rdf:resource=
7 "http://sig.biostr.washington.edu/fma#55673"/>
8 ...
9 </owl:Class>
Figure 3.4: Representing the original FMA metaclasses and subclasses structure in OWL-Full(concept 7088 is the heart; concept 55673 is “Organ with cavitated organ part”).
OWL-Full allows us to generate a layer that has all the expressiveness we may need and that
60

is application-independent. Moreover, this approach promotes interoperability: any applicationthat requests the concept 7088 gets the same description in OWL-Full. The application is thenfree to modify this description internally according to its specific needs (namely simplify it tomeet its computational requirements), but at least, the communication between applicationsrefers to a shared representation.
3.2.5 Pattern-based generation of consistency constraints
This section summarizes a collaboration with Julie Chabalier between 2006 and 2007, and istherefore posterior to the initial work from 2004. Previous works showed that some featuresare implicit or cannot be represented in frames but are crucial for leveraging the specificities ofOWL [75, 156, 157, 158]. It would be possible to address this point by manual processing, but thetask is likely to be cumbersome, error-prone, and would increase the workload of maintaining theoriginal FMA. Moreover, the organization of the FMA follows a strict and principled approachthat could be exploited.
We identified in the original FMA a set of patterns reflecting situations with an underlyingmodeling principle that could not be partially or totally represented in frames, and is thereforemissing. We wrote a set of Python scripts for detecting these patterns among the classes of theoriginal FMA and generating the corresponding OWL constraints.
3.2.5.1 Representing multiple inheritance
The FMA taxonomy follows a very principled approach. We duplicated this taxonomy in OWL(cf. section 3.2.3.2). However, because the original FMA only uses single inheritance andbecause the distinction between single and multiple inheritance is not relevant in OWL, wegenerated some additional taxonomic relationships.
Due to the single inheritance constraint, the following situations incompletely account forthe subclass—superclass structure:
• left/right and male/female: 3 classes (Breast, Areola, Nipple)
• left/right and enumeration: 65 classes (e.g. Left first cervical nerve)
• upper/lower and enumeration: 5 classes (e.g. Upper first molar socket)
For example, Breast has four direct subclasses: Left breast, Right breast, Male breast
and Female breast. Each of Male breast and Female breast have one left and one rightdirect subclass. Consequently, Left male breast is a subclass of Male breast, but not of Leftbreast. Moreover, classes such as Intercostal lymph node combine the last two patterns.
3.2.5.2 Disjointness
In the original FMA, by default, all the sibling classes are disjoint. For example, the directsubclasses of Cell are Nucleated cell and Non-nucleated cell, and it is clear that a cellcannot be at the same time nucleated and non-nucleated. This feature can be made explicit inOWL with disjointness constraints.
However, systematically making all the sibling classes mutually disjoints requires to rule outsituations where all the direct subclasses of a class are not mutually exclusive. In the previousexample, Left breast and Right breast, as well as Male breast and Female breast aredisjoint, but Left breast and Male breast are not. Similarly, the class Region of chest
wall has seven direct subclasses, including Anterior chest wall, Superficial chest wall,Anterior superficial chest wall, Lateral chest wall and Lateral superficial chest
61

wall. The problem was then to distinguish among the siblings the pairs of disjoint classes fromthose that are not.
Rather than risking some inconsistency or some trivial satisfiability of the ontology, we chosethe conservative approach of only generating the disjointness constraints we are certain of. Thislead us to the identification of some other patterns among sibling classes:
• Left X/Right X: 3736 classes (e.g. Left lung)
• X left Y/X right Y: 13989 classes (e.g. Skin of right breast)
• Male X/Female X: 25 classes (e.g. Male breast)
• X male Y/X female Y: 75 classes (e.g. Right side of male chest)
• enumeration: XX classes (e.g. First cervical nerve)
• upper/(middle)/lower: YY classes (e.g. Upper lobe of lung)
Figure 3.5: Disjointness axiom for LeftBreast stating that it is disjoint from RightBreast. Itwas generated with the Left X/Right X pattern.
3.2.5.3 Necessary and sufficient definition
Coverage The FMA aims at completeness. It is assumed that for each class, its subclassesprovide a complete decomposition (i.e. there are no X-Other nor X-Unspecified subclasses ofthe X class). For example, the two direct subclasses of Organ are Solid organ and Cavitated
organ. The intended meaning is that each organ is either solid or cavitated, and that there isno third possibility. In OWL, this can be made explicit by a coverage definition. In the previousexample, Organ would be defined as the union of Solid organ and Cavitated organ.
62

A naive approach would consist in generating a coverage definition for each class using theunion of its direct subclasses. This would successfully generate the definition that a lobe oflung is either an upper lobe of lung or a middle lobe of lung or a lower lobe of lung. The resultwould always be correct from a logical point of view. However, in some situations, it can stillbe refined. If we return to the class Breast, we could further specify that a breast is either aleft breast or a right one, and also that it is either a male breast or a female one.
In order to generate coverage definitions as specific as possible, we reused the patternsidentified for generating multiple inheritance (Section 3.2.5.1) and disjointness (Section 3.2.5.2).For each of the matching pattern, we generated the corresponding coverage (this is what allowsus to generate two definitions for Breast, cf. Figure 3.6). We also generated a coverage definitionwith the classes matching none of the patterns (e.g. for Lobe of lung).
Figure 3.6: Two coverage axioms for Breast represented as necessary and sufficient definitionsfor Breast. They were generated with the Left X/Right X and the Male X/Female X patterns.
63

3.3 Methodology: diagnosis of heart-related injuries
This study aims at improving diagnosis and prognosis of battlefield injuries in theregion of the heart. It focuses on a reasoning method based on the FMA for (1)determining which parts of the heart muscle will become partially or totally ischemic incase of an injury involving a coronary artery, and (2) determining whether a perforationof the wall of the heart will lead to massive bleeding or will be (temporarily) containedby the surrounding cavity. Both scenarios perform some semantically-rich reasoning.The first one involves class-based reasoning, and the second one involves instance-basedreasoning. Together, they cover most of OWL1.0 constructs.In retrospect, this work is interesting because it demonstrated that semantically-richontologies represented in Description Logics actually support advanced reasoning. Italso showed that once the ontologies are available (which is a critical limitation, wehave covered some of the related difficulties in section 3.2), developing the application-specific part does not require a large amount of work (it was a matter of hours).Eventually, the encapsulation of the symbolic reasoning into a Web service was relevantin terms of software architecture and showed that the end user does not have to operatean ontology editor.
This work was a contribution to DARPA’s Virtual Solder project6 during my postdoc withMark Musen. It was originally published in: Daniel L. Rubin, Olivier Dameron, and MarkA. Musen. Use of Description Logic classification to reason about consequences of penetratinginjuries. In American Medical Informatics Association Conference AMIA05, pages 649–653,2005 [73]. It was also a contribution to: Daniel L. Rubin, Olivier Dameron, Yasser Bashir,David Grossman, Parvati Dev, and Mark A. Musen. Using ontologies linked with geometricmodels to reason about penetrating injuries. Artificial Intelligence in Medicine, 37(3):167–176,2006 [74].
3.3.1 Context
The Virtual Soldier project developed complex mathematical models to create physiologicalrepresentations of individual soldiers that can be used to improve medical diagnosis on and offthe battlefield. Soldiers would be equipped with “P tags” that are USB-like storage devicescontaining their 3D anatomical information, as well as physiological and biological parameters,their genetic information and their medical record. They would also be typically equipped with“intelligent” battledress and sensors that monitor their vital signs and physiological parametersand would also be able to record the location of a bullet entry and exit points as well as someassociated parameters such as bullet velocity. All these informations can be collected by medicalteams in the field and provided to some remote diagnosis and prognosis decision support system.
Primary penetrating injuries concern the anatomical structures directly impaired by theinternal trajectory of a bullet. They can be determined with spatial geometric models of in-jured subjects by computing the intersection of the bullet’s cone of damage with the organs.Secondary injuries are consequences of primary injuries. Typically, if the cone of damage im-pairs an artery, the organs perfused by the artery will experience ischemia. The determinationof secondary injuries relies on background knowledge about anatomy (e.g. the FoundationalModel of Anatomy [151]) and physiology (e.g. The Foundational Model of Physiology [159]).
A challenge in creating new decision support systems is to incorporate medical knowledge andto apply that knowledge in flexible ways [160]. In most reasoning systems that use ontologies, the
6http://www.virtualsoldier.us/
64

knowledge used to guide reasoning (control knowledge) is embedded in the application code orin rules used in conjunction with the domain ontology [161]. We believe that it is advantageousto use Description Logics in biomedical applications to represent both the domain knowledgeand the control knowledge needed for reasoning. Thus, we construe the reasoning problems inthe domain as classification tasks.
3.3.2 Objective
Given a set of anatomic structures that are directly injured by a projectile, we want to create areasoning application that deduces secondary injuries of two types: (1) regions of myocardiumthat will be ischemic if a coronary artery is injured, and (2) propagation of injury as bleedingoccurs into damaged anatomic compartments that surround the heart.
We modeled these tasks as classification problems. We describe our approach to creatingreasoning services that fulfill the above desiderata using OWL. In this work we exploit theautomated reasoning capability provided by OWL.
3.3.3 Reasoning about coronary artery ischemia
We created a reasoning service to infer the myocardial ischemic consequences of coronary arteryinjury (“Cardiac Ischemia Reasoner”). This service relied on class-based reasoning, i.e. wemodeled the query as a set of defined classes, and we checked which anatomical entities wereinferred to be subclasses of these defined classes.
3.3.3.1 Modeling blood vessels
We added necessary and sufficient conditions to classes in our base OWL ontology of anatomyto encode the dependency of downstream arterial branches on the upstream arteries, and torepresent the regions of the heart myocardium supplied by the coronary artery branches (Fig-ure 3.7 on the following page). For example, we represented the composition of the coronaryarteries using the hasSegment relation , and the tree-like structure of the blood vessels withthe isContinuousWithOutputOf .
We created a new primitive class SeveredBloodVessel as a subclass of BloodVessel. Thisclass will serve as an input for the reasoning service: when the geometric analysis detects thata primary injury involves a blood vessel, we declare that the corresponding class is a subclassof SeveredBloodVessel (therefore it remains an indirect subclass of BloodVessel).
SeveredBloodVessel @ BloodVessel
We created a new defined class FunctionallyImpairedBloodVessel to infer that all theblood vessels downstream a severed blood vessels are also affected. Figure 3.8 on the next pageshows that after declaring that the second segment of the right coronary artery was injured, allits downstream branches are inferred to be functionally impaired.
FunctionallyImpairedBloodVessel ≡
SeveredBloodVessel
t(∃isContinuousWithOutputOfFunctionallyImpairedBloodVessel)
65
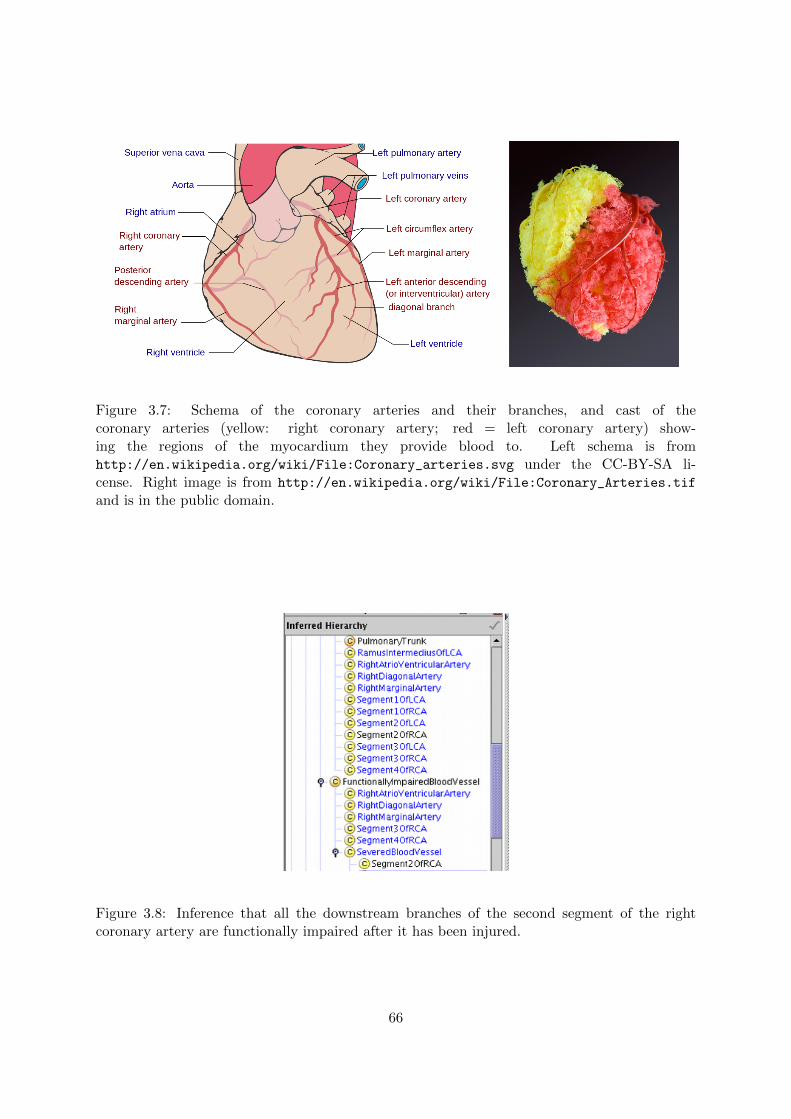
Figure 3.7: Schema of the coronary arteries and their branches, and cast of thecoronary arteries (yellow: right coronary artery; red = left coronary artery) show-ing the regions of the myocardium they provide blood to. Left schema is fromhttp://en.wikipedia.org/wiki/File:Coronary_arteries.svg under the CC-BY-SA li-cense. Right image is from http://en.wikipedia.org/wiki/File:Coronary_Arteries.tif
and is in the public domain.
Figure 3.8: Inference that all the downstream branches of the second segment of the rightcoronary artery are functionally impaired after it has been injured.
66
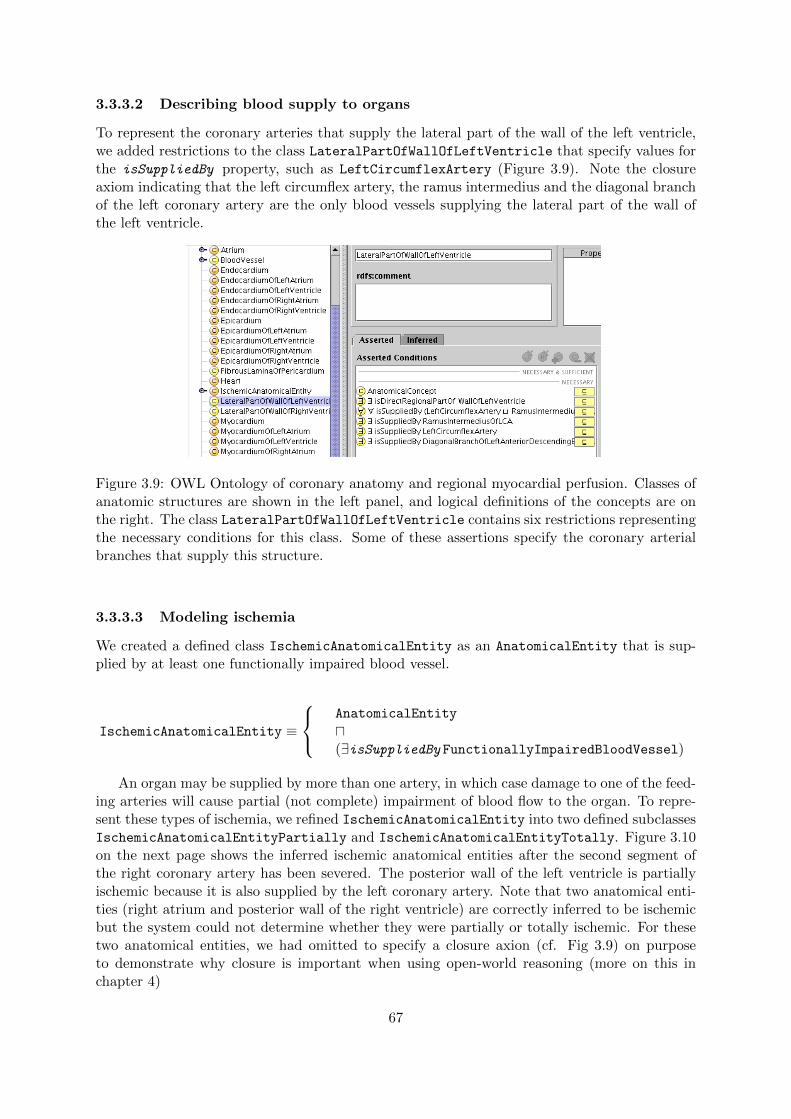
3.3.3.2 Describing blood supply to organs
To represent the coronary arteries that supply the lateral part of the wall of the left ventricle,we added restrictions to the class LateralPartOfWallOfLeftVentricle that specify values forthe isSuppliedBy property, such as LeftCircumflexArtery (Figure 3.9). Note the closureaxiom indicating that the left circumflex artery, the ramus intermedius and the diagonal branchof the left coronary artery are the only blood vessels supplying the lateral part of the wall ofthe left ventricle.
Figure 3.9: OWL Ontology of coronary anatomy and regional myocardial perfusion. Classes ofanatomic structures are shown in the left panel, and logical definitions of the concepts are onthe right. The class LateralPartOfWallOfLeftVentricle contains six restrictions representingthe necessary conditions for this class. Some of these assertions specify the coronary arterialbranches that supply this structure.
3.3.3.3 Modeling ischemia
We created a defined class IschemicAnatomicalEntity as an AnatomicalEntity that is sup-plied by at least one functionally impaired blood vessel.
IschemicAnatomicalEntity ≡
AnatomicalEntity
u(∃isSuppliedBy FunctionallyImpairedBloodVessel)
An organ may be supplied by more than one artery, in which case damage to one of the feed-ing arteries will cause partial (not complete) impairment of blood flow to the organ. To repre-sent these types of ischemia, we refined IschemicAnatomicalEntity into two defined subclassesIschemicAnatomicalEntityPartially and IschemicAnatomicalEntityTotally. Figure 3.10on the next page shows the inferred ischemic anatomical entities after the second segment ofthe right coronary artery has been severed. The posterior wall of the left ventricle is partiallyischemic because it is also supplied by the left coronary artery. Note that two anatomical enti-ties (right atrium and posterior wall of the right ventricle) are correctly inferred to be ischemicbut the system could not determine whether they were partially or totally ischemic. For thesetwo anatomical entities, we had omitted to specify a closure axion (cf. Fig 3.9) on purposeto demonstrate why closure is important when using open-world reasoning (more on this inchapter 4)
67

IschemicAnatomicalEntityPartially ≡
IschemicAnatomicalEntity
u(∃isSuppliedBy FunctionallyNonImpairedBloodVessel)
IschemicAnatomicalEntityTotally ≡
IschemicAnatomicalEntity
u(∀isSuppliedBy FunctionallyImpairedBloodVessel)
Figure 3.10: Cardiac Ischemia OWL ontology updated with the knowledge that the secondsegment of the right coronary artery has been injured. After automatic classification, particularanatomic classes (circled) are reclassified, suggesting the ischemic regions of myocardium thatoccur as a consequence of the right coronary artery injury.
3.3.4 Reasoning about pericardial effusion
We created a second reasoning service to infer the cavities affected by bleeding after an injury(“Injury Propagation Reasoner”). The heart is surrounded by two membranes – the pericardiumand the pleura, that determine two cavities enclosed inside each other (the heart is enclosedin the pericardial cavity, which is enclosed in the pleural cavity) and are normally filled withserous fluid. The (abnormal) presence of blood in these cavities is known as hemopericardiumand hemothorax (Figure 3.11 on the next page). In certain cases, the increased pressure canlimit hemorrhage.
This service relied on instance-based reasoning, i.e. we modeled the patient’s condition bycreating instances of all the relevant anatomical structures and by linking these instances withthe appropriate relations. We modeled the query as a set of defined classes, and we checkedwhich anatomical entities were inferred to be instances of these defined classes.
We first indicated in the ontology that blood vessels and cardiac cavities (the left and rightatrium and ventricles) are filled with blood (Figure 3.12 on the facing page).
In order to represent a perforation in the wall of the heart, we created an instance of the classAddedConduit, and added values to the continuousWith property to describe that this conduit
68

Figure 3.11: Blood loss through a punctured cardiac membrane fillsthe pericardial cavity. This can lead to a massive hemorrhage oron the contrary provide some temporarily containment. Schema fromhttp://en.wikipedia.org/wiki/File:Blausen_0164_CardiacTamponade_02.png underCC-BY license.
Figure 3.12: Blood vessels and cardiac cavities are filled with blood (and this is normal).
69

connects the cavity of the left ventricle and the pericardial space (Figure 3.13). The contin-
uousWith property represents spatial continuity between adjacent hollow anatomic structuresthat have been injured. It is symmetric and transitive. These two property characteristics areneeded to infer that, given a perforation in the wall of the left ventricle (HoleInWallOfHeart)and pericardium (HoleInPericardium) creating conduits that connect the surrounding cavities,the conduits, pericardial cavity, and pleural cavity will be in continuity with the cavity of theleft ventricle (Figure 3.14).
Figure 3.13: Knowledge representation in OWL of a hole in the heart wall. An instance of theAddedConduit class is created, having values of the continuousWith property specifying theanatomic compartments connected by this conduit.
Figure 3.14: Inferred knowledge after asserting a cardiac injury comprising a hole in the leftventricle and classifying the Injury Propagation OWL ontology. The pericardial cavity andpleural cavity are inferred to be in continuity with the left ventricle.
We created a defined class BloodFlow (Figure 3.15 on the next page). The necessary andsufficient condition of the BloodFlow class defines that any anatomical cavity continuous withsomething filled with blood is an instance of BloodFlow. The necessary condition indicates thatif an individual is an instance of BloodFlow, then it is itself filled with blood. The combinationof these two conditions models the rule “if a cavity is continuous with something filled withblood, then it is itself filled with blood”. In order to check that the reasoning was correct, we
70

created a defined probe class to retrieve the anatomical entities filled with blood (Figure 3.16).For the cardiac cavities, being filled with blood is a good thing, whereas for the pericardial andthe pleural cavities, this is abnormal. In order to detect cavities abnormally filled with blood,we defined the class Hemopericardium as a pericardial cavity that happens to be filled withblood, and we make it a subclass of the things abnormally filled with blood (Figure 3.17 onthe next page). We repeated the process with the pleural cavity and created a Hemothorax
class. Note that we used the same rule pattern as with BloodFlow. Eventually, we created theclass AnatomicalConceptWithEctopicBlood to retrieve the places abnormally filled with blood(Figure 3.18 on the following page).
Figure 3.15: The BloodFlow class uses a necessary and sufficient definition and a necessarycondition to model the rule “if a cavity is continuous with something filled with blood, then itis itself filled with blood”.
Figure 3.16: A probe class indicates the anatomical entities filled with blood. Note that thesystem inferred correctly that after the injury the pericardial and the pleural cavities are filledwith blood.
71

Figure 3.17: Hemopericardium is defined as a pericardial cavity filled with blood. The necessarycondition ensures that any instance of this class is then inferred to be abnormally filled withblood.
Figure 3.18: The AnatomicalConceptWithEctopicBlood retrieves the anatomical entities ab-normally filled with blood.
72

3.4 Optimization: modeling strategies for estimating pacemakeralerts severity
This study focuses on the determination of the best modeling strategy (in terms ofcorrectness and performances) for predicting the severity level of a pacemaker alert.Contrary to the previous studies, this application potentially involved processing alarge number of alerts, so performances became important. The previous sectionwith the Virtual Soldier project already demonstrated that some problems can bemodeled with class-based or instance-based OWL reasoning, but provided no hint onwhether one of them is better than the other. It is not even clear that statements suchas “class-based reasoning is faster than instance-based reasoning” actually make anysense, as the outcome may depend on the problem at hand. This empirical study wentone step further by considering SWRL rules in addition to OWL, and by exploringsystematically all the combinations of modeling strategies. The results showed thatboth OWL and SWRL-based ontology modeling techniques can reliably perform thereasoning necessary to propose a severity level associated with pacemaker alerts. Thebest performances were not obtained by using exclusively OWL nor SWRL but bycombining their respective advantages, using OWL to reduce the number of SWRLrules and making them simpler.In retrospect, this work is interesting because it was the first hands-on systematic eval-uation of modeling strategies. While applications usually use exclusively SPARQL,OWL or SWRL, optimizing performances suggests to combine their various strength.By extrapolation, this suggests a more formal approach for designing complex reason-ing tasks as workflows instead of monolithic entities, which allows to choose the besttechnology for each module and to promote their reuse.
This study was a contribution to the Akenaton7 project (ANR-07-TECS-0001). It was orig-inally published in: Olivier Dameron, Pascal van Hille, Lynda Temal, Arnaud Rosier, LouiseDeleger, Cyril Grouin, Pierre Zweigenbaum, and Anita Burgun. Comparison of OWL andSWRL-based ontology modeling strategies for the determination of pacemaker alerts severity.In Proceedings of the American Medical Informatics Association Conference AMIA, page 284,2011 [92], where it was shortlisted for the best article award.
It was later extended in: Pascal van Hille, Julie Jacques, Julien Taillard, Arnaud Rosier,David Delerue, Anita Burgun, and Olivier Dameron. Comparing Drools and ontology-basedreasoning approaches for telecardiology decision support. Studies in health technology and in-formatics, 180:300–304, 2012 [93] where we also considered Drools rules. Drools rules are notcapable of handling the granularity gap between precise patients data and more general crite-ria, so I do not present this later work here. We had to generate Drools rules that mimickedontology-based reasoning. The conclusion was that the limitations of ontology-based reasoningwere the reasoner’s performances, whereas the limitations of Drools were the number and com-plexity of rules. This suggested using ontology for automatically generating some of the Droolsrules.
3.4.1 Context
Patients suffering from heart failure are increasingly treated with implantable cardioverter de-fibrillators (ICD) and benefit from home monitoring [162]. In this context of telecardiology,ICDs send remote alerts about arrhythmic episodes to physicians, who have to determine their
7http://www.agence-nationale-recherche.fr/?Project=ANR-07-TECS-0001
73

emergency level and potentially take the required actions [163, 164]. Some automatic triage ofthe alerts according to their emergency level is instrumental to keep up with this overwhelm-ing flow of alerts (from zero most of the time up to as many as twenty alerts per patient perday; with an estimation of 500.000 new patients every year) efficiently. However, this is anintrinsically difficult task because the risk associated with an alert depends on multiple inter-dependent factors such as the patient’s medical history, his current pathologies and his currenttreatment [165]. For example, in case of atrial fibrillation (AF), the risk of thrombo-embolismis estimated by the CHA2DS2VASc score as well as by additional parameters that can eitherincrease the risk (e.g., if the patient is a smoker or is obese) or lower it (e.g., if the patient iscurrently treated with an anticoagulant) [166, 167].
The goal of the AKENATON project is to improve ICD alert management by automaticallyassociating each alert with a severity level [91]. This requires (i) to extract the relevant data fromthe alerts transmitted by ICDs and from the patient’s clinical context, (ii) to integrate them, (iii)to reconcile them with the severity criteria, and (iv) to compute the alert severity. Extractingdata relies on queries on the hospital patient database as well as on Natural Language Processingtechniques for mining free text and structured documents. Integrating data and reconcilingthe granularity gap with more general severity criteria requires symbolic domain knowledgerepresented as ontologies (e.g., in order to automatically recognize that a patient suffering froma right iliac artery stenosis will match the vascular disease CHA2DS2VASc criterion). Deducingthe alert severity from the various criteria is a combination of ontology-based and rule-basedinferences. The ontology model plays a central role in several steps and ensures the generalcoherence. It can be represented using different combinations of OWL [168] and SWRL [169].Each combination implies specific modeling decisions which may have consequences on theperformance of the system. Currently, no guideline exists to decide which strategy best fits ourparticular problem.
3.4.2 Objective
This study focuses on the determination of the best ontology modeling strategy to integratedata and to fill the granularity gap between data and the CHA2DS2VASc score criteria forpatients with an atrial fibrillation alert.
First, we identified the CHA2DS2VASc criteria that potentially require reference to domainknowledge to be reconciled with patient data. Second, we identified ten modeling strategiescovering all the possible combinations of Java, OWL-DL and SWRL. For each strategy, weassessed the modeling effort by counting the number of OWL classes, properties and SWRLrules. Third, we validated each strategy by verifying that they computed the correct score forall of the 192 possible combinations of criteria. Fourth, we compared the performances of theten strategies by measuring the computation time for each 192 cases of the validation set. Fifth,we evaluated all the strategies over a corpus of 62 actual patients by repeating steps three andfour.
3.4.3 CHA2DS2VASc score
CHA2DS2VASc is a new recommendation of the European Society of Cardiology to deter-mine stroke risk for patients with non-valvular fibrillation [166, 167, 170]. The higher theCHA2DS2VASc score, the higher the risk of thrombo-embolism [166, 167]. It is a major deter-minant for deciding whether or not an anticoagulation therapy is required in order to preventpotential stroke caused by stasis of blood in the heart, which may lead to the formation of athrombus that can dislodge into the blood flow. A CHA2DS2VASc score of zero is associatedwith a low risk, a score of one is associated with an intermediate risk, and a score of two or
74

more is associated with a high risk [167]. Table 3.1 presents the criteria required to compute theCHA2DS2VASc score. Some of them such as age or sex category can be directly computed fromthe patient’s administrative data. Medical criteria such as congestive heart failure or vasculardisease are more general. They encompass several diseases and are therefore unlikely to bepresent as such in the patient’s data. Reconciling the patient’s data with the CHA2DS2VASccriteria consists in interpreting the data according to some domain-specific knowledge, typicallyrepresented in ontologies.
Criterion Points
Congestive heart failure / left ventricular dysfunction 1Hypertension 1Age ≥ 75 y.o. 2Diabetes mellitus 1Stroke / transient ischemic attack / thromboembolism 2Vascular disease 165 ≤ Age < 75 1Sex category (ie, female gender) 1
Total 0 ≤ score ≤ 9
Table 3.1: CHA2DS2VASc score criteria (from [167]).
Computing the value of each criterion and adding these values into the global CHA2DS2VAScscore can both be achieved with different combinations of Java, OWL-DL 2.0 and SWRL. First,accessing the value of each criterion associated to a patient requires to follow several properties(typically dolce:has-quality from the patient to the CHA2DS2VASc score, then dolce:has-
quale from the score to each criterion, then has-integer-value from each criterion to itsvalue). Following the properties can be done either explicitly, or by using OWL-DL propertychains. Second, some criteria values such as gender or the age thresholds can either be com-puted by a rather simple Java function, or using the ontology, which in turn can be achievedusing OWL-DL features (e.g., a necessary and sufficient condition on a datatype property forthe age) or SWRL (using built-ins). Third, adding the criteria values to compute the globalCHA2DS2VASc score can also be performed by a Java function or by the swrlb:add() SWRLbuilt-in. Some choice for one of the three previous steps may exclude some other choices in an-other step. For example, using Java to compute the age and gender criteria values only makessense if the addition of the eight criteria values is itself done in Java. We systematically com-bined the Java, OWL and SWRL features for the three previous steps and derived ten possiblestrategies (cf. section 3.4.4 on the following page).
For each CHA2DS2VASc criterion, we manually determined whether reference to domainknowledge was necessary to reconcile the granularity gap with patient data (Table 3.2 on thenext page).
We generated a validation set of 192 dummy patients representing all the combinationsof values for the CHA2DS2VASc criteria. We validated each strategy by having it computethe CHA2DS2VASc score of each patient and comparing it to the solution. The solution isstraightforward to compute separately by a program because when creating each patient fromthe validation set, the value of each criterion is known. For each strategy, we also measuredthe number of OWL classes, properties and SWRL rules used, as well as the CPU usage foreach dummy patient. For each strategy, we measured the computing time on the evaluationset 50 times. Measurements were performed on a Dell Precision T3400 workstation with anIntel core 2 quad Q6600 64 bits 2,4 GHZ processor, 4 Gb RAM and Hitachi Ultrastar disk
75
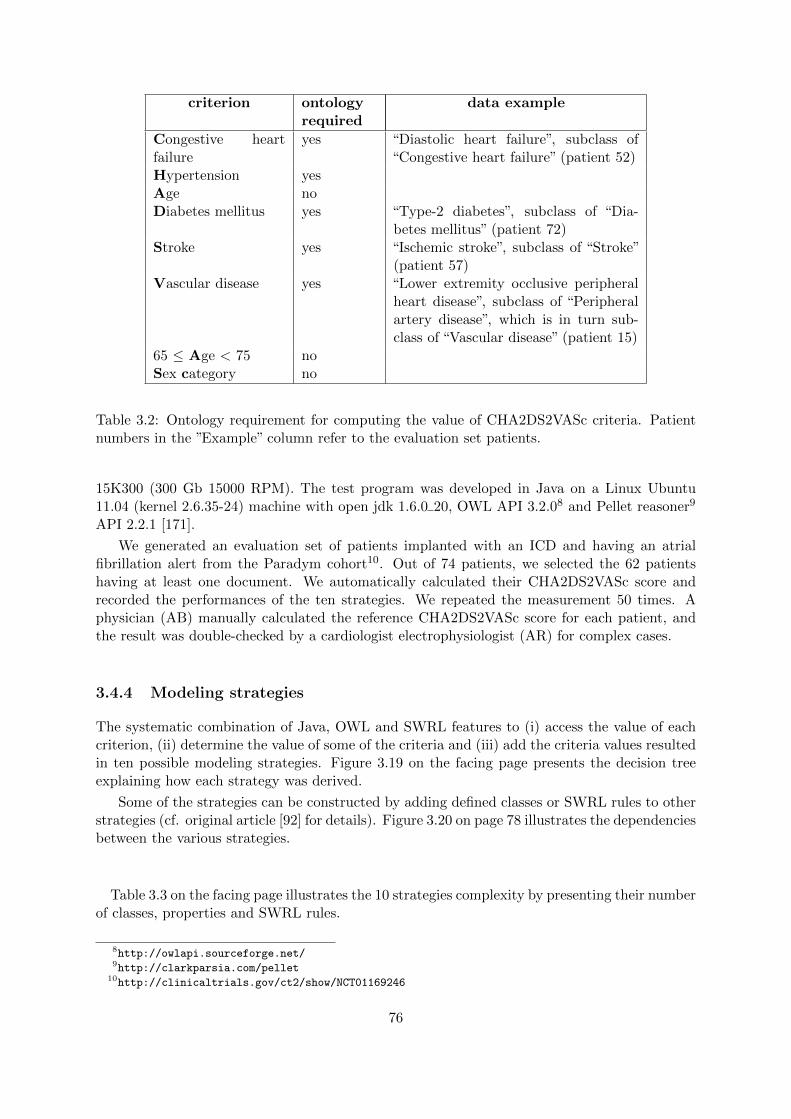
criterion ontologyrequired
data example
Congestive heartfailure
yes “Diastolic heart failure”, subclass of“Congestive heart failure” (patient 52)
Hypertension yesAge noDiabetes mellitus yes “Type-2 diabetes”, subclass of “Dia-
betes mellitus” (patient 72)Stroke yes “Ischemic stroke”, subclass of “Stroke”
(patient 57)Vascular disease yes “Lower extremity occlusive peripheral
heart disease”, subclass of “Peripheralartery disease”, which is in turn sub-class of “Vascular disease” (patient 15)
65 ≤ Age < 75 noSex category no
Table 3.2: Ontology requirement for computing the value of CHA2DS2VASc criteria. Patientnumbers in the ”Example” column refer to the evaluation set patients.
15K300 (300 Gb 15000 RPM). The test program was developed in Java on a Linux Ubuntu11.04 (kernel 2.6.35-24) machine with open jdk 1.6.0 20, OWL API 3.2.08 and Pellet reasoner9
API 2.2.1 [171].
We generated an evaluation set of patients implanted with an ICD and having an atrialfibrillation alert from the Paradym cohort10. Out of 74 patients, we selected the 62 patientshaving at least one document. We automatically calculated their CHA2DS2VASc score andrecorded the performances of the ten strategies. We repeated the measurement 50 times. Aphysician (AB) manually calculated the reference CHA2DS2VASc score for each patient, andthe result was double-checked by a cardiologist electrophysiologist (AR) for complex cases.
3.4.4 Modeling strategies
The systematic combination of Java, OWL and SWRL features to (i) access the value of eachcriterion, (ii) determine the value of some of the criteria and (iii) add the criteria values resultedin ten possible modeling strategies. Figure 3.19 on the facing page presents the decision treeexplaining how each strategy was derived.
Some of the strategies can be constructed by adding defined classes or SWRL rules to otherstrategies (cf. original article [92] for details). Figure 3.20 on page 78 illustrates the dependenciesbetween the various strategies.
Table 3.3 on the facing page illustrates the 10 strategies complexity by presenting their numberof classes, properties and SWRL rules.
8http://owlapi.sourceforge.net/9http://clarkparsia.com/pellet
10http://clinicaltrials.gov/ct2/show/NCT01169246
76

yes yes yesyesyes nono no no no
Java OWL SWRL OWL SWRL
Java SWRL
CHA2DS2VASc
total score
age and gender
criteria evaluation
age and gender
criteria evaluation
Property chainsProperty chains Property chains Property chains Property chains
Str 6
(j,j,p)
Str 5
(j,j,-)
Str 4
(j,o,p)
Str 10
(j,o,-)
Str 9
(j,s,p)
Str 3
(j,s,-)
Str 2
(s,o,p)
Str 8
(s,o,-)
Str 1
(s,s,-)
Str 7
(s,s,p)
Figure 3.19: Decision tree combining the 10 possible strategies for modeling the CHA2DS2VASccriteria.
Strategy Classes Obj. prop. datatype prop. SWRL rules1 0 0 3 122 2 1 0 93 0 0 0 84 2 1 0 85 0 0 0 56 0 1 0 57 0 1 0 98 2 0 3 129 0 1 0 810 2 0 0 8
Table 3.3: Complexity of the ten strategies in terms of number of additional classes, propertiesand SWRL rules over the base patient.owl model.
3.4.5 Comparison of the strategies’ performances
On the validation set, all ten strategies computed the correct CHA2DS2VASc score for each192 possible combination of criteria values. For each strategy, we computed the total time toprocess the 192 patients from the validation set. We then divided this total by 192 to determinethe average computation time by patient so that it can be compared with the measures on theevaluation set, which is smaller. We repeated the operation 50 times. Figure 3.21 on page 79shows the average computation time of a patient’s CHA2DS2VASc score for each strategy.
On the evaluation set, all ten strategies computed the correct CHA2DS2VASc score foreach of the 62 patients. Figure 3.22 on page 79 shows the average computation time of apatient’s CHA2DS2VASc score for each strategy. Figure 3.23 on page 80 compares the averageperformance of each modeling strategy over the validation and evaluation sets.
All strategies computed the correct CHA2DS2VASc score for all the patients from the val-idation and evaluation sets. This demonstrates that both OWL and SWRL-based ontologymodeling techniques can reliably perform the reasoning necessary to propose a severity levelassociated with ICD alerts.
77

patient.owl
A BLegend:
B extends A
SWRL
SWRL
SWRL
SWRL
SWRL
SWRL
SWRL
SWRL
OWL
OWL
strategy 5
(j,j,-)
strategy 6
(j,j,p)
strategy 10
(j,o,-)
strategy 4
(j,o,p)
strategy 3
(j,s,-)
strategy 9
(j,s,p)
strategy 8
(s,o,-)
strategy 2
(s,o,p)
strategy 1
(s,s,-)
strategy 7
(s,s,p)
Set criteria value
if criteria verified
Determine if
age and gender
criteria verified
Compute CHA2DS2VASc
= sum of criteria values
Figure 3.20: Dependencies between the common model (patient.owl) and the various strategies.
Table 3.3 on the preceding page and Figure 3.23 on page 80 show that the number of classes,properties and rules is not a good prediction of a strategy’s performance, so this systematic studywas relevant.
The comparison of the ten strategies showed that the best performances were not obtainedby using exclusively OWL nor SWRL but by combining their respective advantages, using OWLto reduce the number of SWRL rules and making them simpler. Figure 3.23 on page 80 showsthat the ranking of the strategies according to their performance is identical on the validationand evaluation set. For each strategy, the performance on the validation set was always betterthan on the evaluation set. This can be explained by the fact that there was no granularity-related reasoning involved in the validation set, whereas some patients from the evaluation setwere associated with data more precise than the CHA2DS2VASc criteria. For example, patient72 from the evaluation set had type 2 diabetes; a similar patient in the validation set wouldhave been described as having diabetes. Another factor explaining the difference could be thatthe distributions of patients for each CHA2DS2VASc score were different for the validation andevaluation sets (cf. original article).
The modeling approach presented in this article potentially under-estimates a patient’sCHA2DS2VASc score. If no information concerning a criterion is available, the criterion wasassigned the value 0. We could have used a dual approach that over-estimates the score byassigning an initial value of 1 or 2 to each criterion and then setting it to 0 when there is someevidence that the criterion is not met. However, this would have had several drawbacks. First,clinical records typically mention what the patient has, and seldom mention what he has not, soexcept for the age and gender criteria, this lack of explicit information would result in assumingthat almost all the criteria are met for all the patients. Second, the risk of thrombo-embolismis low for a CHA2DS2VASc score of 0, moderate for a score of 1 and high for a score between2 and 9. The previous point would then result in important false positives, with almost all thepatients being associated with a high risk. Eventually, combining the two approaches wouldprovide an interval of validity for the CHA2DS2VASc score.
78

0
50
100
150
200
250
300
350
400
450
500
model1 model2 model3 model4 model5 model6 model7 model8 model9 model10
ms
max.
median3Q
average1Q.min.
Figure 3.21: Boxplots representing the average computation time of the CHA2DS2VASc scoreof patients from the validation set. The boxplots were generated by repeating the measure 50times.
0
50
100
150
200
250
300
350
400
450
500
model1 model2 model3 model4 model5 model6 model7 model8 model9 model10
msmax.
median3Q
average1Q.min.
Figure 3.22: Boxplots representing the average computation time of the CHA2DS2VASc scoreof patients from the evaluation set. The boxplots were generated by repeating the measure 50times.
79

1 2 3 4 5 6 7 8 9 10
0
50
100
150
200
250
300
350
400
450
validation
evaluation
Modeling strategy
Co
mp
uta
tio
ntim
e(m
s)
Figure 3.23: Average computation time of the CHA2DS2VASc score of the patients from thevalidation and evaluation sets.
3.5 Synthesis
What the three studies have in common In all three studies, we found that the lackof semantically-rich ontologies was a major limitation for building applications that involvereasoning more complex than retrieving the ancestors or the descendants of a class. Even ifmost biomedical ontologies from repositories such as BioPortal are available in OWL format,they are basically mere RDFS taxonomies. Few of them contain disjointness, existential oruniversal constraints, or even (correctly) defined classes as we will see in section 4.2.3.
This is all the more regrettable that all three studies also repeatedly demonstrated thatonce semantically-rich ontologies are available, developing the application-specific part of thereasoning only required the addition or the modification of a limited number of classes andcould be done in a matter of hours.
Representation of anatomy The effort for converting the FMA in OWL was part of asubsequent larger research effort involving several teams [156, 158, 172]. Overall, this experimenttriggers several observations. First it confirmed that the OWL language was well designed, as allits constructs found an application for modeling anatomy. Second and somehow paradoxically,it showed that the additional effort required for using more expressive constraints contributedto make the job easier as it supported using design patterns and integrity constraints. Third,new initiatives such as SPIN and ShEx offer new research perspectives for representing theseconstraints and using them during ontology development and maintenance.
Diagnosis of injuries Using the anatomy ontology to perform some automatic inference ofindirect injuries showed that provided the semantically-rich ontologies are available, developingsome application-specific reasoning can be quite simple.
It was also a first attempt at comparing class-based and instance-based reasoning for amore principled modeling approach. It showed that both worked equally well. Instance-basedreasoning was more appealing from a modeling point of view but was also more difficult toimplement whenever closure were required.
This work is also interesting because it marked the transition to reasoning with incompleteinformation, which will be covered in chapter 4.
80

Modeling strategies of pacemaker alerts severity This study compared OWL and SWRL-based reasoning for classifying pacemaker alerts. It showed that the optimal modeling strategycombined features of OWL and of SWRL. Nowadays, this study should also cover SPARQL andSPIN11.
As we mentioned, our approach potentially under-estimates a patient’s CHA2DS2VAScscore. Conversely, assuming the worse case scenario and decrementing the CHA2DS2VAScscore when we find evidence that a criterion is not met would over-estimate the score. Combin-ing both approaches would provide a confidence interval. This typically raises the problem ofreasoning with incomplete information, which will be further discussed in chapter 4.
What we learned
• Formalizing knowledge is difficult.
• It is useful for maintaining large ontologies; we have seen it for the FMA, and the GeneOntology Next Generation is another example.
• It is useful for performing rich queries [173].
This lack of available semantically-rich ontologies can be partially explained by the factthat to a certain extent, ontology editing tools such as Protege or TopBraid and the associatedtutorials have succeeded too well. Domain experts are able to create and maintain their on-tologies (which is good) with a minimal understanding of knowledge representation principlesand of Semantic Web technologies. The latter point would not be so bad if people from theknowledge representation community (myself included) had not been less and less involved inontology development over the last decade. I observed this trend in all the research teams Ihave been involved in since my PhD (included), as more recently when I contributed to thedevelopment of the ATOL livestock ontology [174, 175, 176]. Contributing to ontology develop-ment is highly time consuming, and extremely difficult to convert into high impact publications.Moreover, the large part of craftsmanship and informatics skills involved in the design patterns,the consistency constraints and grasping DL are understandably perceived as too difficult bythe domain experts. This is strikingly the case for the Gene Ontology consortium that for yearskeep on using their idiosyncratic OBO formalism which is suboptimal in terms of interoperabil-ity, expressivity, maintenance and reasoning [177], and that chose to ignore efforts such as theOWL-based Gene Ontology Next Generation [52]. I have the feeling that when ontologies gaineda mainstream status in life science in the second half of the 2000’s (cf. Figure 1.1 on page 13),the knowledge representation community failed to create a pool of “knowledge representationengineers” who would have been recognized as key partners and could have taken over whenthe “knowledge representation researchers” gradually shifted their research efforts. Now theseengineers are sorely missed and even if their input is valuable, few perceive it as such. The datadeluge may be our next opportunity to patch things up if we (as researchers) both succeed indeveloping in time sound data management plans for E-Science (cf. my research perspectives insection 6.1.1.2), and if we succeed to avoid the previous mistake by having these plans adoptedby the life science community. Ontologies will probably be key components for handling thelarge quantities of data and metadata. I am eager to see whether these will be mere taxonomiesor semantically-rich ontologies.
11http://spinrdf.org/
81

82

Chapter 4
Reasoning with incompleteinformation
Outline
This chapter elaborates on situations we have encountered earlier where an incomplete descrip-tion lead to imprecise or biased results. In the Virtual Project, we had intentionally failedto provide a closure axiom for some anatomical entities in oder to demonstrate that (cf. sec-tion 3.3.3.3 on page 67). These entities were correctly inferred to be ischemic when necessary,but the system could not decide whether they were partially or totally ischemic. The VirtualSoldier project demonstrated that the reasoning system can gracefully handle missing informa-tion by using more general superclasses as a kind of “degraded mode”.
Subsequent works went one step further and sought to restrict the set of solutions by focusingon the things that can be inferred to be false when no conclusion can be reached concerningthe things that can be inferred to be true. When the description of the world is exhaustive, thereasoner will always be able to recognize the situations where a condition is satisfied. Whenthe description of the world is incomplete however, we may not be able to make the distinctionbetween the situations where we do not know whether the condition is true, and the situationswhere we know that the condition is not true. Therefore, the general idea was to generateautomatically negated versions of conditions of interest, with necessary and sufficient definitionsreferring to the original condition, and then to check whether data are classified as instance oras subclasses of the conditions or of their negated version.
Section 4.2 shows how this principle was first applied to the problem of grading tumors. Atumor grade is either 1, 2, 3 or 4, so each grade was a distinct condition. In case of incompleteinformation, we may not be able to reach a conclusion as to which grade qualifies, so none ofthem is proposed. However, even if it is incomplete, the available information may be sufficientto rule out some of the grades, and we can therefore narrow the possible solutions.
With tumor grades, the only constraints were that the conditions are mutually-exclusiveand that each tumor has a grade (even if we do not know which one). Section 4.3 focuses ondetermining the clinical trials a patient may be eligible to. In this case, conditions were thetrials eligibility criteria and a patient’s eligibility is defined by a conjunction of criteria or theirnegation, so the overall outcome is more complex to infer. We showed that not taking incompleteinformation into account leads to over-estimating patients rejection, and we proposed a designpattern for modeling clinical trial that addresses this issue.
83

4.1 Principle
As we have seen in section 3.1, OWL constraints must hold for any interpretation function.Therefore, during knowledge modeling, one not only has to specify the constraints that mustbe met (e.g. a hand has to have a thumb, an index, etc.), but also the relations that cannotexist (e.g. a heart can never be a part of the hand). As we have seen in section 3.2.3.4, this istypically done with closure constraints representing “the only possible values for this propertymust be instances of these classes”.
Although the open world assumption imposes an additional burden, it has two major benefitsover the closed world assumption [28]. First, it supports a finer description, with the possibilityto distinguish mandatory values from optional values. For example, an individual hand may nothave a thumb in case of amputation or of abnormality, or it may even have additional fingersin case of polydactily, but it has to have exactly one palm. Second, as we will see throughoutthis chapter, it supports correct reasoning even if the domain is not described exhaustively.
4.2 Methodology: grading tumors
This study focuses on determining the grade of brain tumors. This was motivated bythe need to reuse the patients data from one study in order to compare them with datafrom another study, with the two studies relying on slightly different grading systems.We applied the classification techniques seen in the previous chapter to automatethe process. However, as often, the patients data were sometimes incomplete, whichintroduced a bias if we use closed world reasoning, and lead OWL-based reasoningunable to propose any grade for these patients. We proposed a method based onthe logical negation of each tumor grade in order to determine the grades that wereincompatible with what we knew of the patients, thus narrowing the set of possiblegrades.In retrospect, this work is interesting because in addition to another example of howsemantically-rich ontologies can be reused by applications, it shows that semantically-rich ontologies can handle gracefully incomplete data, which are ubiquitous in lifesciences.
This study was originally published in: Gwenaelle Marquet, Olivier Dameron, Stephan Saikali,Jean Mosser, and Anita Burgun. Grading glioma tumors using OWL-DL and NCI thesaurus.In Proceedings of the American Medical Informatics Association Conference AMIA’07, pages508–512, 2007 [79]. It elaborates on a previous work on grading lung tumors: Olivier Dameron,Elodie Roques, Daniel L. Rubin, Gwenaelle Marquet, and Anita Burgun. Grading lung tumorsusing OWL-DL based reasoning. In 9th International Protege Conference, 2006 [78].
4.2.1 Context
Brain tumors represent 2.4 percent of all cancer deaths. Among tumor variables, tumor gradeand histology appear to have the greatest effect on survival. Glioblastoma, with median survivalshorter than twelve months, is a highly malignant (grade IV) glioma, which has the propensity toinfiltrate throughout the brain in contrast to pilocytic astrocytoma of the posterior fossa, whichdoes not spread and can be cured by surgery [178]. Traditionally, the grading (classification) ofa tumor is determined by the evaluation of tumor characteristics by a pathologist.
The process of determining the grade of a tumor consists in checking if it meets a setof requirements. There are numerous systems for grading the glioma tumors. The reference
84

grading system is the World Health Organization (WHO) grading system [179]. This systemassigns a grade from 1 to 4 to glioma, grade 1 being the least aggressive and grade 4 being themost aggressive. This classification is based on five histopathology criteria that are related tothe degree of anaplasia: cellular density, nuclear atypia, mitosis, endothelial proliferation andnecrosis. The WHO malignant grades are described as follows:
• WHO Grade IV: cellular density high, nuclear atypia marked, high mitotic activity,necrosis present, endothelial proliferation present.
• WHO Grade III: cellular density increased, distinct nuclear atypia, mitotic activitymarked, necrosis absent, endothelial proliferation absent.
• WHO Grade II: cellular density moderately increased, occasional nuclear atypia, mi-totic activity absent or 1 mitosis, necrosis absent, endothelial proliferation absent.
Grading tumors is typically a classification task. The grading system requires domain knowl-edge in order to fill the granularity gap between the tumor descriptions and the grade descrip-tions. However, applications such as decision support for pathologists or integration of datagraded using different systems require some formal representations of the grade definitions andthe background knowledge. Such representations are typically achieved using ontologies. Forthe past years, a lot of biomedical ontologies have been developed including NCI thesaurus [153](NCIT) a major resource in the cancer research domain. The NCIT provides descriptions for thebrain tumors. It also has classes for the grades. However, those classes have neither proper de-scriptions nor definitions. Therefore, they can not be used for the automatic grading of tumors,which requires an explicit and formal representation.
4.2.2 Objective
The goal of this study is to show how the version of the NCIT in OWL (Web Ontology Language)can be extended to automatically perform classification of glioma using histological descriptions.We have focused our study on the malignant grade. For that, we have developed an ontology ofthe glioma tumors based on the World Health Organization grading system [179]. In this study,we focus on the reasoning tasks. We provide an overview of the TNM grading system. We thenanalyze the NCIT and conclude that it has to be extended in order to perform automatic tumorgrading. We present the method that we used and the results obtained during the classificationof a set of tests generated and the classification of eleven reports provided by a pathologydepartment.
4.2.3 Why the NCIT is not up to the task
The NCI Thesaurus is a public domain Description Logic-based terminology to meet the needsof the cancer research community[153]. Its goal is to provide unambiguous codes and definitionsfor concepts used in cancer research. The NCIT has been converted into OWL-Lite [81]. Thecurrent version (07 01d) is composed of 55,458 named classes and 113 OWL properties. Amongthese classes, 18 % are defined classes, i.e. they have at least one necessary and sufficientconstraint, and 82 % are primitive classes, i.e. they can have constraints, but do not have anynecessary and sufficient definitions.
The classes representing the grades according to the WHO system have no restriction andare not semantically defined (Figure 4.1 on the next page). Therefore, they are just placehold-ers as nothing can be inferred to be a subclass or an instance of these classes. Because of theopen-world-assumption underlying the OWL semantics, if the grade of a tumor cannot be un-equivocally inferred, the tumor will not be classified under any grade. For example, tumors that
85

could be grade I or grade II tumors are not classified anywhere. There is no explicit differencebetween the grades the tumor belongs to (here I and II) and those it cannot belong to (here IIIand IV).
Figure 4.1: The WHO grades in the NCIT are primitive subclasses ofncit:Disease_Grade_Modifier. The intermediate classes Grade_1 to Grade_4 are placehold-ers allowing to take the multiple grading systems into account.
In the NCIT, the glioma tumors have been described as Central Nervous System Neoplasms.Each kind of tumors has been defined by necessary and sufficient conditions. For example,glioblastoma has been defined by the intersection of 17 restrictions. In Figure 4.2 on the facingpage we present some conditions used to define the glioblastoma class.
Such definitions cannot be logically exploited to achieve any reasoning for several reasons.First, we see that being a grade 4 tumor is one of the conditions of the definition. Since theNCIT does not provide any definition for the grades, the grade cannot be inferred from thedescription of the tumor, which leaves to the user the task of stating the grade when describingthe tumor... and if he knows the grade at this point, he probably does not need a reasoner tofigure whether the tumor is a glioblastoma. Second, the constraint concerning the grade is auniversal constraint (∀), and again, leaves it to the user to make sure that the tumor is neithera grade 1, nor 2, nor 3. Moreover, such a restriction is difficult to represent with instanceswhen describing a tumor. Third, the extensive use of “Disease_May_Have_... in existentialconstraints of the definition is deeply disturbing.
4.2.4 An ontology of glioblastoma based on the NCIT
The ontology we developed is based on the NCIT. A specific relevant part of the NCIT has beenextracted using eleven terms corresponding to the names of the glioma tumors and nine termsthat correspond to subclasses of atypia and mitotic activities. We first retrieved the NCITclasses corresponding to these terms and all their parents. For each of these classes, we followedall their relations and recursively retrieved the fillers and their parents.
Several operations have been necessary to address the issues mentioned in the previoussections and enhance the extracted portion of the NCIT. First we provided definitions for allWHO grades. Second, we added new classes (and new properties) for filling the granularity gapbetween the histologic features described in the WHO and the classes present in the NCIT. Forhandling the open-world-assumption, we also introduced the negations of each grade (namelynograde, cf. section 4.2.5 on page 89).
86

Figure 4.2: The ncit:Glioblastoma class has a necessary and sufficient definition. However,this definition cannot be logically exploited.
87

WHO_CNS_GRADE_II ≡
nci:Disease_Grade_Modifier
u(∃hasCellularDensity Moderate_Increased_Cellularity_Present)u(∃hasAtypia (Occas._Nucl._Atypia_Present t Dist._Nucl._Atypia_Present))u(∀hasMitoticActivity Low_Mitotic_Activity)u(hasNecrosisActivity = 0)u(hasVascularProliferation = 0)
WHO_CNS_GRADE_III ≡
nci:Disease_Grade_Modifier
u(∃hasCellularDensity Increased_Cellularity_Present)u(∃hasAtypia (Occas._Nucl._Atypia_Present t Dist._Nucl._Atypia_Present))u(∃hasMitoticActivity Marked_Mitotic_Activity)u(hasNecrosisActivity = 0)u(hasVascularProliferation = 0)
WHO_CNS_GRADE_IV ≡
nci:Disease_Grade_Modifier
u(∃hasCellularDensity High_Cellularity_Present)u(∃hasAtypia Marked_Nuclear_Atypia_Present)u(∃hasMitoticActivity High_Mitotic_Activity)u(∃hasNecrosisActivity Necrotic_Change)u(∃hasVascularProliferation Vascular_Proliferation)
The generated ontology is composed of 243 classes, among which 33 are defined. Among the243 classes, 234 classes correspond to NCIT classes, 5 classes have been added for the descriptionof the histologic criteria and 4 classes have been added for the description of nogrades. We reused24 class definitions from the NCIT and created the remaining 9.
Two sets of classification tests have been created. The validation set (15 tests) has been gen-erated for representing plausible combinations of the histologic criteria. Each test correspondsto a prototypical tumor. The evaluation set corresponds to eleven pathologic reports providedby the pathology department of the Rennes hospital. Each report was represented as a subclassof Disease_Grade_Modifier. This step was performed manually. Each report is read and thecorresponding Tumor class has been built manually. For each test, the description of its histo-logic criteria was done by existential restrictions for indicating the presence of a criterion, and
88

by cardinality restriction to zero for indicating the absence of a criterion. Figures 4.3 and 4.4show the case of Tumor10, which is correctly inferred to be a grade IV tumor. All tumors fromthe validation set were correctly graded. Ten of the eleven tumors from the evaluation set werecorrectly graded. The remaining tumor’s description only mentioned four of the five WHOcriteria, so it was not classified as a subclass of any of the four grades.
Figure 4.3: The Tumor10 from the evaluation set is defined according to its characteristics.
Figure 4.4: The Tumor10 from the evaluation set is correctly inferred to be a grade IV tumor.
4.2.5 Narrowing the possible grades in case of incomplete information
We completed the ontology by making WHO_CNS_GRADE_I, WHO_CNS_GRADE_II, WHO_CNS_GRADE_IIIand WHO_CNS_GRADE_IV mutually-disjoint and by adding a coverage axiom to Disease_Grade_Modifier:
89

Disease_Grade_Modifier ≡
WHO_CNS_GRADE_I
tWHO_CNS_GRADE_II
tWHO_CNS_GRADE_III
tWHO_CNS_GRADE_IV
Eventually, we added the four NoGrade classes according to the template:
NO_WHO_CNS_GRADE_I ≡
Disease_Grade_Modifier
u¬WHO_CNS_GRADE_I
Figure 4.5 shows that Tumeur4, which grade could not be determined because of its incom-plete description, was (correctly) classified as a subclass of both NO_WHO_CNS_GRADE_III andNO_WHO_CNS_GRADE_IV. This shows that even incomplete information can be valuable becauseit can be exploited to reduce the space of solutions. Here we could not infer the grade of thetumor, but the nograde classes allowed us to rule out grades 3 and 4 (the worse).
Figure 4.5: The Tumor4 from the evaluation set only has a partial description that covers 4 outof 5 WHO grade criteria (A). This prevents the reasoner to infer its grade (B). However, theNO_WHO_CNS_Grade classes are useful for ruling out grades 3 and 4 (C).
90

4.3 Methodology: clinical trials recruitment
This study focuses on patient recruitment in clinical trials. This task requires thematching of a large volume of information about the patient with numerous eligibilitycriteria, in a logically-complex combination. Moreover, some of the patient’s informa-tion necessary to determine the status of the eligibility criteria may not be availableat the time of pre-screening. We showed that the classic approach based on negationas failure over-estimates rejection when confronted with partially-known informationabout the eligibility criteria because it ignores the distinction between a trial for whichpatient eligibility should be rejected and trials for which patient eligibility cannot beasserted. We have also shown that 58.64% of the values were unknown in the 286prostate cancer cases examined during the weekly urology multidisciplinary meetingsat Rennes’ university hospital between October 2008 and March 2009. We proposedan OWL design pattern for modeling eligibility criteria based on the open world as-sumption to address the missing information problem.In retrospect, this work is interesting because it shows that the approach we developedfor the grade of brain tumors is actually more general and can be adapted to othersituations.
This study was a contribution to the Astec1 project (ANR-08-TECS-0002) and was relatedto the EHR4CR2 project (IMI 115189). It was originally published in: Olivier Dameron, PaoloBesana, Oussama Zekri, Annabel Bourde, Anita Burgun, and Marc Cuggia. OWL model of clin-ical trial eligibility criteria compatible with partially-known information. Journal of BiomedicalSemantics, 4(1), 2013 [95].
4.3.1 Context
Patient recruitment is a major focus in all clinical trials. Adequate enrollment provides abase for projected participant retention, resulting in evaluative patient data. Identification ofeligible patients for clinical trials (from the principal investigator’s perspective) or identificationof clinical trials in which the patient can be enrolled (from the patient’s perspective) is anessential phase of clinical research and an active area of medical informatics research. TheNational Cancer Institute has identified several barriers that health care professionals claim inregard to clinical trial participation3. Among those barriers, lack of awareness of appropriateclinical trials is frequently mentioned.
Automated tools that help perform a systematic screening either of the potential clinicaltrials for a patient, or of the potential patients for a clinical trial could overcome this barrier [180].The ASTEC (Automatic Selection of clinical Trials based on Eligibility Criteria) project aimsat automating the search of prostate cancer clinical trials to which patients could be enrolledto [181]. It features syntactic and semantic interoperability between the oncologic electronicmedical records and the recruitment decision system using a set of international standards(HL7 and NCIT), and the inference method is based on ERGO [182]. The EHR4CR projectaims at facilitating clinical trial design and patient recruitment by developing tools and servicesthat reuse data from heterogeneous electronic health records. The TRANSFoRm project hassimilar objectives for primary care [183, 184].
All these studies on data and criteria representation, integration and reasoning are moti-vated by the requirement to have the necessary information available at the time of processing
1http://www.agence-nationale-recherche.fr/?Project=ANR-08-TECS-00022http://www.ehr4cr.eu/3http://www.cancer.gov/clinicaltrials/learningabout/in-depth-program/page7
91

the patient’s data, and assume that somehow, that will be the case. Missing information thatis required for deciding whether a criterion is met leads to recruitment being underestimated.Solutions for circumventing this difficulty consist either in making assumptions about the unde-cided criteria, or in having a pre-screening phase considering a subset of the criteria for whichpatient’s data are assumed to be available. Bayesian belief networks have been used to addressthe former [185] but require a sensible choice of probability values and may lead to the wrongassumption in particular cases. The latter leaves most of the decision task to human expertise,which provides little added value (if an expert has to handle the difficult criteria, automaticallyprocessing the simple pre-screening ones is only a little weight off his shoulders) and is stillsusceptible to the problem of missing information for the pre-screening criteria.
4.3.2 Objective
We propose an OWL design pattern for modeling clinical trial eligibility criteria. This designpattern is based on the open world assumption for handling missing information. It inferswhether a patient is eligible or not for a clinical trial, or if no definitive conclusion can bereached.
4.3.3 The problem of missing information
4.3.3.1 Modeling clinical trial eligibility
A clinical trial can be modeled as a pair < (Ii)ni=0, (Ej)
mj=0 > where (Ii)
ni=0 is the set of the
inclusion criteria, and (Ej)mj=0 is the set of the exclusion criteria. All the eligibility criteria from
(Ii)ni=0 ∪ (Ej)
mj=0 are supposed to be independent from one another (at least in the weak sense:
the value of criterion Ck cannot be inferred from the combined values of other criteria). Eachcriterion can be modeled as an unary predicate C(p), where the variable p represents all theinformation available for the patient. C(p) is true if and only if the criterion is met.
A patient is deemed eligible for a clinical trial if all the inclusion criteria and none of theexclusion criteria are met.
patient eligible⇔n∧i=0Ii(p) ∧ ¬(
m∨j=0
Ej(p)) (4.1)
Before making the final decision on the list of clinical trials for which a patient is eligiblefor, there are intermediate pre-screening phases where only the main eligibility criteria of eachclinical trial are considered. Such pre-screening sessions rely on subsets of (Ii)
ni=0 and (Ej)
mj=0,
but the decision process remains the same.
For the sake of clarity, in addition to the general case, we will consider a simple clinical trialwith two inclusion criteria I0 and I1, and two exclusion criteria E0 and E1.
patient eligible⇔ I0(p) ∧ I1(p) ∧ ¬(E0(p) ∨ E1(p)) (4.2)
For example, these criteria could be:
• I0: evidence of a prostate adenocarcinoma;
• I1: absence of metastasis;
• E0: patient older than 70 years old;
• E1: evidence of diabetes.
92

According to equation 4.2, a patient would be eligible for the clinical trial if and only if he hasa prostate adenocarcinoma and has no metastasis and is neither older than 70 years old norsuffers from diabetes.
Because of De Morgan’s laws, equation 4.1 is equivalent to:
patient eligible⇔ (n∧i=0Ii(p)) ∧ (
m∧j=0¬Ej(p)) (4.3)
Even though equation 4.1 and equation 4.3 are logically equivalent, the latter is often pre-ferred because it is an uniform conjunction of criteria. Note that the negations in front of theexclusion criteria are purely formal, as both inclusion and exclusion criteria can represent anasserted presence (e.g. prostate adenocarcinoma for I0 or of diabetes for E1) or an assertedabsence (e.g. metastasis for I1).
For our example:
patient eligible⇔ I0(p) ∧ I1(p) ∧ (¬E0(p)) ∧ (¬E1(p)) (4.4)
According to equation 4.3, a patient would be eligible for the clinical trial if and only if hehas a prostate adenocarcinoma and has no metastasis and is not older than 70 years old anddoes not suffer from diabetes.
4.3.3.2 Patients who we know are not eligible and those who we do not knowwhether they are eligible
When a part of the information necessary for determining if at least one criterion is met isunknown, the conjunction of equation 4.3 can never be true. This necessarily makes the patientnot eligible for the clinical trial, whereas the correct interpretation of the situation is that thepatient cannot be proven to be eligible. This is different from proving that the patient is noteligible, and indeed, in reality the patient can sometimes be included by assuming the missingvalues (cf. next section).
For our fictitious clinical trial, we consider a population of nine patients covering all thecombinations of “True”, “False” or “Unknown” for the inclusion criterion I1 and the exclusioncriterion E1. Table 4.1 on the next page presents the value of equation 4.4 and correct inclusiondecision for the nine combinations. Among the five patients (p2, p5, p6, p7 and p8) for which atleast a part of the information is unknown, three (p2, p7 and p8) illustrate a conflict betweenthe value of equation 4.4 and expected inclusion decision. A strict interpretation of equation 4.4leads to the exclusion of the eight patients:
• for three of them (p0, p3 and p4), all the information is available;
• for two of them (p5 and p6), some information is unknown, but the available informationis sufficient to conclude that the patients are not eligible;
• for the three others (p2, p7 and p8), however, the cause of rejection is either because one ofthe inclusion criteria cannot be proven (I1 for p7 and p8) or because one of the exclusioncriteria cannot be proven to be false (E1 for p2 and p8).
In the case of unknown information, equation 4.3 alone is not enough to make the distinctionbetween the patients we know are not eligible (the first two categories, so this also includespatients for whom a part of the information is unknown) and those we do not know if they areeligible (the third category). This is a problem because patients from the first two categoriesshould be excluded from the clinical trial, whereas those from the third category should beconsidered for inclusion.
93

Patient I0 I1 E0 E1 I0 ∧ I1 ∧ ¬E0 ∧ ¬E1 Decision
p0 T T F T F Exclude(E1)
p1 T T F F T Include
p2 T T F ? F Proposecannot assert ¬E1 (assume ¬E1)
p3 T F F T F Exclude(both ¬I1 and E1)
p4 T F F F F Exclude(¬I1)
p5 T F F ? F Exclude(¬I1)
p6 T ? F T F Exclude(E1)
p7 T ? F F F Proposecannot assert I1 (assume I1)
Fp8 T ? F ? cannot assert I1 Propose
cannot assert ¬E1 (assume both I1 and ¬E1)
Table 4.1: Evaluation of equation 4.4 and correct inclusion decision for all the possible valuesof I1 and E1, with possibly unknown information.
94

One solution could be to assume the values of the unknown criteria in order to go back toa situation where inclusion or exclusion could be computed using equation 4.3. In this case:
• inclusion criteria for which the available information is not sufficient to compute the statusare considered to be met;
• exclusion criteria for which the available information is not sufficient to compute the statusare considered not to be met.
Therefore, in the case where the available information is not sufficient to compute the status of acriterion, a different status is assumed depending on whether the criterion determines inclusionor exclusion. Referring to our fictitious clinical trial, the lack of information about the absenceof metastasis would lead to the assumption that I1 is true, whereas the lack of informationabout diabetes would lead to the assumption that E1 is false.
This situation raises several issues:
• a different status is assumed depending on whether the criterion determines inclusion orexclusion;
• the assumed status depends on the nature of the criterion (i.e. inclusion or exclusion) andnot on its probability;
• one has to remember that the value for at least a criterion has been assumed in order toqualify the inferred eligibility (adamant for p0 or p1 vs “under the assumption that...” forp2, p7 and p8);
• this qualification can be difficult to compute (the status of E1 is unknown for both p2 andp5, but p5 can be confidently excluded whereas p2 can be included assuming E1).
4.3.4 Eligibility criteria design pattern
• for each criterion, create a class C_i (at this point, we do not care if it is an inclusionor an exclusion criterion, or both) and possibly add a necessary and sufficient definitionrepresenting the criterion itself (or use SWRL);
• for each criterion, create a class Not_C_i defined asNot_C_i ≡ Criterion u¬ C_i.This process can be automated;
• for each clinical trial, create a class Ct_k (placeholder);
• for each clinical trial, create a class Ct_k_include as a subclass of Ct_k with a necessaryand sufficient definition representing the conjunction of the inclusion criteria and of the
exclusion criteria (cf. equation 4.3) (Ct_k_include ≡nui=0
I_i umuj=0
Not_E_j);
• for each clinical trial, create a class Ct_k_exclude (placeholder) as a subclass of Ct_k;
• for each clinical trial, create a classCt_k_exclude_at_least_one_exclusion_criterion as a subclass ofCt_k_exclude with a necessary and sufficient definition representing the disjunction ofthe exclusion criteria(Ct_k_exclude_at_least_one_exclusion_criterion ≡
mtj=0
E_j );
95

• for each clinical trial, create a classCt_k_exclude_at_least_one_failed_inclusion_criterion as a subclass of Ct_k_excludewith a necessary and sufficient definition representing the disjunction of the negated in-clusion criteria(Ct_k_exclude_at_least_one_failed_incl_criterion ≡
nti=0
Not_I_i );
• represent the patient’s data with instances (Figure 4.6 and 4.7). For the sake of simplicity,we will make the patient an instance of as many C_i as we know he matches criteria, and asmany Not_C_j classes as we know he does not match criteria, even if this is ontologicallyquestionable (a patient is not an instance of a criterion). How the patient’s data arereconciled with the criteria by making the patient an instance of the criteria is not specifiedhere: it can be manually, or automatically with OWL necessary and sufficient definitionsor SWRL rules for the C_i and Not_C_j classes.
Figure 4.6: A patient for who all the information is available.
4.3.5 Reasoning
If all the required information is available, after classification, for each criterion the patientwill be an instance of each C_i or Not_C_i, and therefore will also be instantiated as eitherCt_k_include (like p1 in Figure 4.8 on the facing page),Ct_k_exclude_at_least_one_exclusion_criterion orCt_k_exclude_at_least_one_failed_inclusion_criterion (so at least we are doing as wellas the other systems).
If not all the information is available, because of the open world assumption, there will besome criteria for which the patient will neither be classified as an instance of C_i nor of Not_C_i(e.g. in Figure 4.7 on the next page, p2 is neither an instance of E_1 nor of Not_E_1), so he willnot be classified as an instance of Ct_k_include either. However, the patient may be classified
96

Figure 4.7: A patient for who some information is unknown (here about E1).
Figure 4.8: The class modeling clinical trial inclusion after classification (here patient p1 can beincluded).
97

as an instance ofCt_k_exclude_at_least_one_exclusion_criterion or ofCt_k_exclude_at_least_one_failed_inclusion_criterion. As both are subclasses of Ct_k_exclude,we will conclude that the patient is not eligible for the clinical trial. We will even know if it isbecause he matched an exclusion criterion (like p0, p3 and p6 in Figure 4.9), because he failedto match an inclusion criterion (like p3, p4 and p5 in Figure 4.10), or both (like p3).
Figure 4.9: The class modeling clinical trial exclusion because at least one of the exclusioncriteria has been met after classification (here patients p0, p3 and p6 match the definition).
Figure 4.10: The class modeling clinical trial exclusion because at least one of the inclusioncriteria failed to be met after classification (here patients p3, p4 and p5 match the definition).
If the patient is neither classified as an instance of Ct_k_include nor of Ct_k_exclude (orits subclasses), then we will conclude that the patient can be considered for the clinical trial,assuming the missing information will not prevent it (like p2, p7 and p8, who do not appear inFigs. 4.8, 4.9 and 4.10, consistently with Table 4.1 on page 94). By retrieving the criteria forwhich the patient is neither an instance of C_i nor of Not_C_i, we will know which informationis missing.
4.4 Synthesis
What the two examples have in common The approach developed in this chapter andexemplified by the two reasoning applications could certainly be applied to many other contexts.Missing or incomplete information is pervasive in life sciences, and this is an inner characteristics.The study on clinical trials demonstrated the extent of the phenomenon, with about 68 % ofpatients data not specified, and none of the 286 patients having all the required fields for anyof the four clinical trials we considered. I do not expect this trend to decrease, as we willkeep on needing to combine patches of informations from different natures and different origins.However, part of what is causing the problem is also the solution: this integration endeavoris supported by new technologies that inherently take missing information into account. As
98

we are making the transition from the information silo paradigm to the linked data paradigm,we are switching from query languages such as SQL that rely on the closed-world assumptionover well groomed and exhaustive data to reasoners capable of making the distinction betweenassertions that we know are false and assertions that are undecided (e.g. with “MINUS” and“NOT EXISTS” in SPARQL) or supporting the open-world assumption (OWL). I have theimpression that these features are not exploited to their full potential yet, but insisting on usingthe former query languages on data that do not fulfill the exhaustivity requirement anymoredoes not seem sensible.
A conclusion of the chapter on reasoning based on classification was that modeling thedomain-specific part of the reasoning task required a very little amount of work, provided thatsemantically-rich ontologies are available. Again, the availability of these ontologies turned outto be a limiting factor and we had to fix manually the imperfections of the NCIT.
Eventually, in both examples of grading tumors and of determining patients eligibility, theextra amount of work dedicated to handle missing information was again minimal. Moreover,both examples suggest that this additional work can be automated at least partially: the gen-eration of the NO_WHO_GRADE classes and their definitions followed a simple pattern that wasindependent from the definitions of the grades. Similarly, the generation of the Ct_exclude andof the negated criteria classes as well as their definition were only formal manipulations relyingon the definition of the corresponding Ct_include.
Grading tumors This application elaborates on a situation encountered in the Virtual Soldierproject. It took me several years before I realized that what I considered then to be a concreteexample of why closure axioms are useful in OWL (explaining the open world assumption inOWL was a major point during the Protege Short Course and on the mailing list) was actuallya part of a more general topic that proved to be valuable for modeling and reasoning overbiomedical data.
Assessing patients eligibility to clinical trials This application is in turn a transpositionof the tumor grading method. It could have implications in the more general efforts to formalizeand standardize the representation of clinical trials eligibility criteria.
However, even if the solution I developed was adequate, I have since then replicated thereasoning mechanism using SPARQL instead of OWL. However, this mechanism only focuses oncombining the status of the various eligibility criteria. Determining the status of each criteriontypically remains a classification task for which OWL is best suited. Comparing the originalsolution with an approach relying on OWL for determining each criterion status and on SPARQLfor combining the criteria remains to be done. It would be along the line of the optimizationstudy from section 3.4.
What we learned
• Failing to explicitly address incomplete information may lead to biased results.
• The modeling overhead for taking incomplete information into account was marginal inboth examples, and so was the additional computing cost.
• Just because some piece of information is incomplete does not mean that it is useless, asit can be exploited to reduce the space of solutions.
• The problem of incomplete information is pervasive in life science; however so far datasources and applications seldom take it into account, which make it a relevant field of
99

research. Primmer et al. made an in depth analysis of the Gene Ontology and its relevancefor analyzing non-annotated genomes using what is known on model species [30]. It shouldbe noted that Chen et al. developed a similarity measure among genes with shallowannotations [186]. Moreover, the Gene Ontology supports a NOT modifier for stating thata gene product was proved to be not associated with a GO term (e.g. for Homo sapiens,APOA1 (uniprot:P02647) is not associated to “transforming growth factor beta receptorsignaling pathway” (go:0007179)). This modifier allows to make the distinction betweenthe situations where we do not know whether a gene product is annotated to a GO term(absence of annotation) and the situations where we know that a gene product is notassociated to the GO term (annotation with the NOT modifier). Even if such modifiersshould be taken into account [140], I do not know of any widespread application that usethem (which of course does not mean that there are no such applications).
• The question of confidence is also related to missing information. The Gene Ontologyevidence codes4 and the associated decision tree5 were exploited by the IntelliGO semanticsimilarity measure [187]. GO evidence codes were later extended to the Evidence Ontology(ECO) [188] and inspired the Confidence Information Ontology [189].
4http://geneontology.org/page/guide-go-evidence-codes5http://geneontology.org/page/evidence-code-decision-tree
100
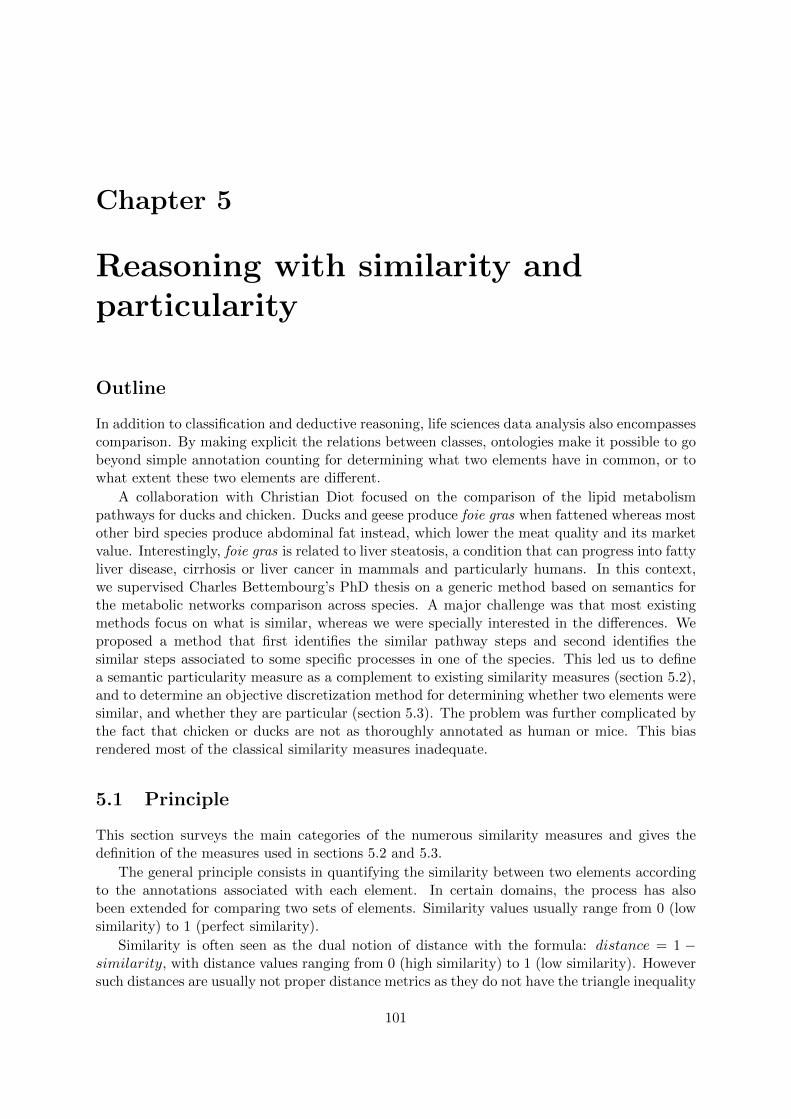
Chapter 5
Reasoning with similarity andparticularity
Outline
In addition to classification and deductive reasoning, life sciences data analysis also encompassescomparison. By making explicit the relations between classes, ontologies make it possible to gobeyond simple annotation counting for determining what two elements have in common, or towhat extent these two elements are different.
A collaboration with Christian Diot focused on the comparison of the lipid metabolismpathways for ducks and chicken. Ducks and geese produce foie gras when fattened whereas mostother bird species produce abdominal fat instead, which lower the meat quality and its marketvalue. Interestingly, foie gras is related to liver steatosis, a condition that can progress into fattyliver disease, cirrhosis or liver cancer in mammals and particularly humans. In this context,we supervised Charles Bettembourg’s PhD thesis on a generic method based on semantics forthe metabolic networks comparison across species. A major challenge was that most existingmethods focus on what is similar, whereas we were specially interested in the differences. Weproposed a method that first identifies the similar pathway steps and second identifies thesimilar steps associated to some specific processes in one of the species. This led us to definea semantic particularity measure as a complement to existing similarity measures (section 5.2),and to determine an objective discretization method for determining whether two elements weresimilar, and whether they are particular (section 5.3). The problem was further complicated bythe fact that chicken or ducks are not as thoroughly annotated as human or mice. This biasrendered most of the classical similarity measures inadequate.
5.1 Principle
This section surveys the main categories of the numerous similarity measures and gives thedefinition of the measures used in sections 5.2 and 5.3.
The general principle consists in quantifying the similarity between two elements accordingto the annotations associated with each element. In certain domains, the process has alsobeen extended for comparing two sets of elements. Similarity values usually range from 0 (lowsimilarity) to 1 (perfect similarity).
Similarity is often seen as the dual notion of distance with the formula: distance = 1 −similarity, with distance values ranging from 0 (high similarity) to 1 (low similarity). Howeversuch distances are usually not proper distance metrics as they do not have the triangle inequality
101

property. Note also that the perspectives are different as similarity focuses on what is commonbetween two elements, whereas distance focuses on what makes them different, so the connectionbetween similarity and distance may not be straightforward and the previous formula shouldbe seen as an approximation.
5.1.1 Comparing elements with independent annotations
5.1.1.1 Independent annotations with the same weight
Classic similarity measures are based on set operations over the annotations of two elements. IfA and B are the sets of annotations of the first and the second element respectively, the Jaccardindex is defined as :
J(A,B) =|A ∩B||A ∪B|
A similar notion is the Dice–Sørensen coefficient :
D(A,B) =2.|A ∩B||A|+ |B|
There is a correspondence between the Jaccard index and the Dice–Sørensen coefficient :J =
D
2−D
D =2J
1 + JThe Jaccard index and Dice–Sørensen coefficient both rely on two main assumptions: all the
annotations have the same weight, and all the annotations have the same frequency. These twonotions are different but not independent. Weight focus on the contribution of the annotationfor determining the similarity between two elements. This is related to informativeness orgranularity (a precise annotation conveys more information than a general or vague one). Itis an intrinsic property of the annotation. Frequency is corpus-dependent, and is therefore anextrinsic property of annotations. Even if all the annotations had the same granularity, anannotation that annotates most of the elements of a corpus would be considered to be lessinformative than a rarer annotation. Of course, with annotations of different granularities, themore general annotations tend to be also the most frequent.
5.1.1.2 Independent annotations with different weights
The cosine similarity is a simple measure where the elements A and B to be compared arerepresented as vectors of n annotations. Each annotation has a fixed position in the vectors sothat the ith element of the vector of A refers to the same annotation as the ith element of thevector of B.
similaritycosine(A,B) =A.B
||A|| × ||B||=
n∑i=1
(Ai ×Bi)√n∑
i=1(Ai)2 ×
√n∑
i=1(Bi)2
Although the ith element of the annotation vector can be any real number (so cosine simi-larity is in the [−1; 1] range), it is usually a positive number (so cosine similarity is in the [0; 1]range). There are several classical strategies for determining the values of the annotation vector.
102

A binary vector representing the absence or the presence of annotations makes the cosinesimilarity applicable when all the annotations have the same weight (cf. section 5.1.1.1).
A more elaborate weighting scheme such as the“term frequency – inverse document frequency”(tf-idf) allows to take into account both the importance of the annotation (possibly differentvalues for A and B), and the relative weights of each annotation (same value for A and B).
Term frequency indicates how important the annotation is to the element being compared.There are several weighting variants such as binary, raw frequency or log-normalization. For atext, this is typically the number of occurrences of a word divided by the number of words (forbeing able to compare texts of different lengths). For a gene, this is typically 1 or 0, dependingon whether the gene is annotated or not. For a set of genes, this is typically the proportion ofthe genes in the set annotated by the term (for being able to compare sets of different sizes).
Inverse document frequency indicates how important the annotation is in general, accordingto a reference corpus. As mentioned previously, an annotation present in few documents ismore informative than a common annotation. There are also several weighting variants suchas the logarithm of the inverse frequency, i.e. the logarithm of the inverse of the proportion ofdocuments in the corpus annotated by the term.
tf-idf is simply the product of the two previous aspects, which emphasizes an over-representationof rare annotations.
tf(annotation, document) =Nb of occurrences of annotation in document
Nb of annotations of document
idf(annotation, Corpus) = −log |{d ∈ Corpus : annotation ∈ d}||Corpus|
tfidf(annotation, document, Corpus) = tf(annotation, document)× idf(annotation, Corpus)
5.1.2 Taking the annotations underlying structure into account
All the previous similarity measures assume that the annotations are independent. However, theanalysis can be further refined by using ontologies to also consider the relations between someof the annotations. Figure 5.1 on the next page presents the Gene Ontology hierarchy betweenthree GO terms. This section shows how this hierarchy can be exploited by semantic similaritymeasures to infer that the first two are biologically close (their similarity is 0.57), whereas theyare biologically different from the third (their similarity are respectively 0.08 and 0.11). Lee etal. performed a comparison of three families of similarity based respectively on IC, ontologystructure and expert opinion on the SNOMED-CT ontology and found a poor agreement be-tween IC-based metrics, whereas the metric based on ontology structure correlated best withexpert opinion [190]. This suggests that taking the ontology structure into account improves theanalysis, although whether this can be generalized to other ontologies and application contextsremains an open question.
Within a given gene set, the genes sharing identical or similar GO annotations can begrouped into clusters using two approaches [191]. The GSEA approach computes these clustersconsidering the GO terms over-representation. The semantic similarity approach takes intoaccount GO properties to cluster genes considering the quantity and the importance of theirshared annotations [192, 193, 194, 195]. Both approaches are not exclusive, as semantic mea-sures can be involved in GSEA in order to improve the analysis [196]. If the GO terms wereindependent, the gene set characterization could be performed by a straightforward set-based
103

Figure 5.1: Gene Ontology hierarchy between “protein ADP-ribosylation”, “translational initi-ation” and “ion transport”. This hierarchy can be exploited by semantic similarity measuresto infer that the first two are biologically close, whereas they are biologically further from thethird. Dark blue edges represent “is a” and light blue edges represent “part of” relations (graphgenerated by Amigo).
104

approach such as the Jaccard index or Dice’s coefficient. However, GO terms are hierarchically-linked. Consequently, the characterization needs to take into account the underlying ontologicalstructure of the GO annotations [140].
Semantic similarity measures rely on ontologies to systematically quantify the weight of theshared elements. They exploit the formal representation of the meaning of the terms by con-sidering the relations between the terms (e.g. for inferring new annotations that were implicitas each term inherits all the properties of its ancestors) and by attributing different weights toeach term depending on how much information they convey. When working with annotationdatabases, it should be routine practice to use the ontology hierarchy to infer implicit anno-tation [140]. Gentleman developed a graph-based measure for the R package GOstats calledsimUI [197]. simUI defines the semantic similarity between two sets of terms corresponding totwo sub-graphs of the ontology as the ratio of the number of terms in the intersection of thosegraphs to the number of GO terms in their union, which corresponds to a simple adaptation ofthe Jaccard index. However, with simUI, all the terms have the same weight, which introduces abias emphasizing the intersection as the more general terms tend to annotate more genes. Othermeasures adopt different strategies to weight the terms. Pesquita et al. performed an extensivereview of the main semantic similarity measures [198] and identified two main categories, i.e.node-based methods and edge-based methods, as well as a handful of hybrid methods. Blan-chard et al. also performed an in-depth comparison of semantic similarities on subsumptionhierarchies without multiple inference [199].
5.1.2.1 Node-based semantic similarity
Node-based semantic similarity measures rely on how informative the terms are. Typically, theyconsider that two terms sharing an informative lowest common ancestor are more similar thantwo terms with a less informative lowest common ancestor, as seen in Fig. 5.1 on the facingpage.
Historically, Information Content (IC) value was used to quantify how informative a term is,with the least frequent terms having the highest IC value. Terms frequencies were determinedusing a reference corpus. The IC of a term t is its negative log probability P (t). When theannotations are organized in an ontology such as GO, it is necessary to take into accountthe subsumption hierarchy when computing this frequency in order to also consider implicitannotations to the terms descendants [140].
IC(t) = −log(P (t))
This concept, borrowed from Shannon’s Information Theory, was used to measure similaritiesusing ontologies [200, 201, 202] such as WordNet [203]. To compare two terms, these methodsrely on their most informative common ancestor (MICA). For Resnik, the similarity of two termsis simply the information content of their MICA. Lin also takes into account how far these twoterms are from their MICA. Pesquita et al. proposed to combine the graph-based simUI metricwith the IC of the terms involved in the computation [204]. In simGIC, each term is weightedby its IC.
similarityResnik(A,B) = maxt∈(ancestors(A)∩ancestors(B))(IC(t))
similarityLin(A,B) =2×maxt∈(ancestors(A)∩ancestors(B))(IC(t))
IC(A) + IC(B)
Ontologies are used twice when computing node-based semantic similarities: for determin-ing the correct information content of annotations and for determining the most informative
105

common ancestor. These methods developed in linguistics have been applied to GO [205, 206]using the frequency with which a term annotates a gene as a marker of its rarity. Consequently,the IC of a GO term is inversely proportional to the frequency with which it annotates a geneusing the Gene Ontology Annotations (GOA) database [138]. GOA specifies also how eachannotation has be attributed through Evidence Codes (EC). In their method called “IntelliGO”,Benabderrahmane et al. use a weighting corresponding to each GO term EC in addition totheir IC [187].
Retrieving only the most informative common ancestor to compute a semantic similarityignores the possibility that two GO terms can share several common ancestors. These situationsresult in a loss of information. A possible solution has been proposed that consists in using theaverage of the IC values of all disjoint common ancestors (DCA) instead of the maximum IC ofthis common set [207].
For the node-based methods relying on IC, the terms’ frequencies used to compute theIC values depend on the corpus of reference. In the context of genes comparison, IC-basedmethods have three main limits related to their dependence on a GOA-based corpus. First,it can prove difficult or even impossible to obtain a relevant corpus. GOA provides singleand multi-species annotation tables. Although using a species-specific table is well-suited tointra-species comparisons, it becomes problematic for cross-species comparisons. Second, usinga multi-species table (like the UniprotKB table) in these cases is biased towards the mostextensively annotated species such as human or mice. Third, the well-studied areas of biologyhave high annotation frequencies and are therefore less informative and see their importancedowngraded, whereas the less-studied areas are artificially upgraded [208, 209, 210].
5.1.2.2 Edge-based semantic similarity
Edge-based semantic similarity measures use the directed graph topology to compute distancesbetween the terms to compare. Among the simplest, Rada distance is based on the shortestpath between the two terms [211], with extensions that rely on the average path among multiplepaths [198]. Other approaches take into account the length of the path between the root of theontology and the least common ancestor (LCA) of the terms, with the result that terms witha deep common ancestor are more similar than terms with a common ancestor close to theroot [212, 213, 214, 215, 216]. The edge-based methods using depth as a proxy for precision arenot dependent on a particular corpus. This can be a strength when it is difficult or impossibleto determine a representative corpus, or a weakness when corpus-dependent frequencies arerelevant. Moreover, another constraint to consider is that in most ontologies, granularity is notuniform so terms at the same depth can have different precisions; this is typically the case forGO [217].
5.1.2.3 Hybrid semantic similarity
Pesquita et al. also identified“hybrid”methods that combine different aspects of node-based andedge-based methods. In Wang’s method [193], each term has a “semantic value” that representshow informative the term is, conforming to the node-based approach. However, the semanticvalue of a term is obtained by following the path from this term to the root and summing thesemantic contributions of all the ancestors of this term. As the semantic value depends onthe ontology topology, it also conforms to the edge-based approach. Note that this alternativeapproach is corpus-independent, so it is applicable when a relevant corpus cannot be computed(for comparing elements from several species) or does not exist (for poorly studied species). Therelevance of the results obtained by this approach has previously been demonstrated [193, 198].
106

For computing a term’s semantic value (SV), Wang first computes the semantic contributionsof the ancestors of the term. In the following formulas, SA(t) is the semantic contribution ofthe term t to the term A and we is the semantic contribution factor for edge e linking a term twith its child term t’. According to Wang, we use a semantic contribution factor of 0.8 for the“is a” relations and 0.6 for the “part of” relations, and we added a 0.7 factor for the “[positively][negatively] regulates” relations. An additional study not presented here showed that the valueof the regulation factor had minimal impact (+/- 0.01) on the overall value.
{SA(A) = 1SA(t) = max{we ∗ SA(t′) | t′ ∈ children of (t)} if t 6= A
Then, for each target term to compare, the semantic value is the sum of the semanticcontributions of all its ancestors. Figure 5.2 shows an example of the semantic contributionsof the ancestors of GO:0043231 allowing to determine its semantic value: SV(GO:0043231) =5.5952. The same operation for GO:0005622 gives SV(GO:0005622) = 2.92 (Fig 5.3 on thefollowing page). The more general a term (i.e. the less informative), the smaller its semanticvalue.
1
0.8 0.8
0.64 0.64
0.384
0.512
0.3072
0.4096
Figure 5.2: Semantic contributions of the ancestors of GO:0043231. The terms closerto GO:0043231 contribute more. The farther the ancestor, the smaller its contribution to theterm of interest. The semantic value of GO:0043231 is the sum of its ancestors’ semantic con-tribution,here SV(GO:0043231) = 5.5952.
107

1
0.8
0.64
0.48
Figure 5.3: Semantic contributions of the ancestors of GO:0005622; here SV(GO:0005622) =2.92.
SV (A) =∑t∈TA
SA(t)
The terms semantic values and their ancestors’ semantic contributions are used to computethe semantic similarity of two GO terms A and B:
similarityWang(A,B) =
∑t∈(TA∩TB)
(SA(t) + SB(t))
SV (A) + SV (B)
The semantic similarity of a GO term A and a set of GO terms G is the highest similaritybetween A and each element of G:
similarityWang(A,G) = maxt∈G(similarityWang(A, t))
The semantic similarity of two sets of GO terms G1 and G2 is:
similarityWang(G1, G2) =
(∑
t1∈G1
similarityWang(t1, G2)) + (∑
t2∈G2
similarityWang(t2, G1))
|G1|+ |G2|
Pesquita et al. do not single out any particular semantic similarity measure as the best one,as the optimal measure will depend on the data to compare and the level of detail expected inthe results. The main advantage of Wang’s method compared to purely node-based methods isthat the semantic value is not GOA-dependent, unlike information content. It is thus well-suitedto cross-species comparisons. As cross-species comparison is one of the key stakes in biology,further development in the domain of semantic comparison should support such comparisons.
5.1.3 Synthesis
As we have seen, assessing the similarity of two elements can be greatly improved by usingontologies in order to take into account their annotations underlying structure. However, sim-ilarity alone is not enough for comparing biological pathways between non-model species. We
108

also need to identify the pathway steps that are similar between the two species but for whichat least one of the two has some additional function. This sets up two challenges: being able toquantify similarity and particularity, and being able to determine both whether two elementsare similar, and whether one of them has some particular function.
In the remainder of this chapter, section 5.2 presents a semantic particularity measure de-signed to be combined with any semantic similarity measure. The joint use of similarity andparticularity allows to refine the comparison of sets based on the annotations of their elements.We show how the two sets similarity and their respective particularity determine comparisonpatterns (e.g. the two sets are similar and the second set presents a high particularity).
Section 5.3 presents a generic method for determining the optimal similarity and particularitythresholds minimizing the proportions of false positive and false negative as well as the abnormalcomparison patterns.
5.2 Methodology: semantic particularity measure
This study focuses on the definition of a semantic particularity measure for comparingsets of elements annotated by an ontology. We propose to combine our particularitymeasure with a similarity measure to first identify the similar sets, and second identifysets with additional functions from among the similar ones. This particularity measureis initially applied to gene sets comparison according to the genes’ GO annotations.We then show that the principle is generalizable to other ontologies.In retrospect, this work is interesting because whereas semantic similarity has beenan active research domain over the last decade with countless measures and not asingle one outperforming the others, our approach allows to refine the analysis by alsoconsidering the specificities that are inherently ignored by similarity. Our semanticparticularity measure is based on the general notion of informativeness, which canbe derived from any semantic similarity measure, so combining similarity and theassociated particularity can be performed with any similarity measure.
This study was originally published in: Charles Bettembourg, Christian Diot, and OlivierDameron. Semantic particularity measure for functional characterization of gene sets usingGene Ontology. PLoS ONE, 9(1):e86525, 2014 [96].
5.2.1 Context
With the continued advance of high-throughput technologies, genetic and genomics data analy-ses are outputting large sets of genes. The amount of data involved requires automated compar-ison methods [4]. The characterization of these sets typically consists in a combination of thefollowing three operations [218, 219]: first, synthesize the over- and under-represented functionsof these genes [220, 221]; second, identify how these genes interact with each other [222]; third,identify and quantify the common shared features and the differentiating features [223, 224].A widely used method for genes sets study called “Gene Set Enrichment Analysis” (GSEA)determines which gene features are over-represented in a gene set [225]. Numerous tools havebeen developed in this purpose: BiNGO [226], GOEAST [227], ClueGO [228], DAVID [229], Ge-neWeaver [230], GOTM [231]. See Hung et al. recent work for a review [232]. GSEA is useful forclustering a set of genes into subsets sharing over-represented features. Among these features,the biological processes (BP), molecular functions (MF) and cellular components (CC) annotat-ing each gene are represented using the Gene Ontology (GO) [233]. GO is species-independent,
109

and thus supports cross-species comparison [30]. The GO graph itself is also widely used forgenes semantic similarity analysis [234].
All the semantic similarity measures appear appropriate for identifying and quantifyingcommon features. However, as these measures are focusing on common features, they maylead to an incomplete analysis when comparing genes having particular features along sidesimilar ones [235]. For example, parts A and B of Figure 5.4 respectively present the molecularfunctions annotating the Exportin-5 orthologs of human (hsa) and rat (rno) and the Exportin-5 orthologs of human and drosophila (dme). Wang’s method allows to compute cross-speciessemantic similarity. The results on MF annotations are: Sim(hsa, rno) = 0.797 and Sim(hsa,dme) = 0.726. This is consistent with the fact that globally, the Exportin-5 orthologs share thesame functions between hsa, rno and dme. However, there are also five times as many human-specific MF terms compared to drosophila as compared to rats. It has been demonstratedthat Exportin-5 orthologs are functionally divergent among species [236]. The tiny differenceof semantic similarity (0.071) correctly reflects the fact that the orthologs share the same mainfunction, but is not sufficient to identify that some species also have additional functions.
protein
binding
binding
protein
transporter
activity
substrate-specific
transporter
activity
tRNA binding
RNA binding
organic cyclic
compound binding
transporter
activity
molecular function
nucleic acid
binding
heterocyclic
compound binding
protein
binding
binding
protein
transporter
activity
substrate-specific
transporter
activity
tRNA binding
RNA binding
organic cyclic
compound binding
transporter
activity
molecular function
nucleic acid
binding
heterocyclic
compound binding
A B
Human only annotation
Common annotation between human and rat
Human only annotation
Common annotation between human and drosophila
Exportin-5 MF annotations
for Homo sapiens
and Rattus norvegicus
Exportin-5 MF annotations
for Homo sapiens
and Drosophila melanogaster
Figure 5.4: Representation of Exportin-5 orthologs annotations. Common terms between speciesare displayed in blue. The terms annotating only the human ortholog are displayed in red. PartA of this figure displays the MF annotations of the human and rat orthologs of Exportin-5. PartB displays the MF annotations of the human and drosophila orthologs of Exportin-5. In thisexample, there is no rat nor drosophila-specific term. The semantic similarity values obtainedin these cases do not reflect the difference of human particularity between each part.
5.2.2 Objective
We assume that considering only similarity measures is not enough to compare sets of annota-tions. This analysis is valid for any set of annotations that refer to an ontology. We hypothesizethat gene set analysis can be improved by considering gene particularities in addition to genesimilarities. We propose a general definition and some associated formal properties. We pro-pose also a new approach based on the notion of GO term informativeness to compute gene setparticularities.
The original study was composed of three use cases. Section 5.2.6 on page 113 summarizesthe second one.
• The first use case replicated Wang’s study on Saccharomyces cerevisiae tryptophan degra-
110

dation when he defined his semantic similarity measure on GO. Our results showed thatWang’s results are still valid. We also identified a benefit of using a particularity measurein addition to a similarity measure for identifying particular functions between similargenes.
• The second use case covered a larger dataset composed of 51 well annotated human genesrelated to aquaporin-mediated transport in order to determine whether similar genes withparticular functions were a frequent situation. Our results showed that among similargenes, some also have some particular function and that this situation can be observedthroughout the full range of similarity values.
• The third use case compared homolog genes across different species. Our results shows thatortholog genes were, as expected, mostly similar. Again, we also identified some of themhaving high particularity values that denote specific functions. Eventually, we identifiedsome orthologs that have diverged and present a low similarity and high particularities.
5.2.3 Definition of semantic particularity
The semantic particularity of a set compared to another is the value that reflects the importanceof the features that belong to the first set but not the second. To compare two genes, we rely onthe similarity and the respective particularities of their sets of annotations. The particularityof a gene g1 annotated by the set Sg1 compared to a gene g2 annotated by the set Sg2 dependson the annotations of Sg1 that are not related to any annotation of Sg2.
5.2.4 Formal properties of semantic particularity
Like for semantic similarity, we compute a value bounded by 0 (least particular) and 1 (mostparticular). Four important properties arise from the semantic particularity definition:
• The semantic particularity is non-symmetric:
Par(Sg1, Sg2) = x ; Par(Sg2, Sg1) = x (Prop 1)
• Compared to itself, a set of annotations has no semantic particularity:
Par(Sg1, Sg1) = 0 (Prop 2)
If Sg1 = ∅, this comparison is meaningless.
• The semantic particularity of a set of annotations Sg1 (6= ∅) is maximal when it is com-pared to an empty set of annotations:
Par(Sg1, ∅) = 1 (Prop 3.1)
And conversely:
Par(∅, Sg1) = 0 (Prop 3.2)
• The particularity of a set Sg1 of annotations compared to a set Sg2 does not depend onthe elements of Sg2 that do not belong to Sg1:
111

Sg3 ∩ Sg1 = ∅ ⇒ Par(Sg1, Sg2) = Par(Sg1, Sg2 ∪ Sg3) (Prop 4)
5.2.5 Measure of semantic particularity
In order to compute the particularity of Sg1 compared to Sg2, we focus on the terms of Sg1 thatare not members of Sg2. This requires to address two problems: the terms are not independent,and they do not convey the same amount of information.
Some of the terms of Sg1 that are not members of Sg2 may be linked in the graph. Takingseveral linked terms into account would result in considering them several times. For example,in Figure 5.4B, considering both “RNA binding” and “tRNA binding” would result in countingtwice the contribution of “RNA binding”. Therefore, we should only focus on the terms of Sg1that do not have any descendant in Sg1 and that are not members of Sg2. Some of these termsmight be ancestors of terms of Sg2 and should be considered as common to Sg1 and Sg2. Wecall Sg∗ the union of Sg and the sets of ancestors of each element of Sg. We call MPT(Sg1,Sg2) the set of most particular terms of Sg1 compared to Sg2. MPT(Sg1, Sg2) is the set ofterms of Sg1 that do not have any descendant in Sg1 and that are not members of Sg2∗. In theFigure 5.4B, MPT(hsa, dme) = {“tRNA binding”}. Note that MPT(hsa, dme) is composed ofone term and not five.
Using the set theory, we could define Par(Sg1, Sg2) as the proportion of elements of Sg1 thatbelong to MPT(Sg1, Sg2). When computing card(MPT(Sg1, Sg2)), all the elements have thesame weight. However, considering the semantics underlying these elements, some of them maybe more informative than others and should ideally be emphasized. Different strategies, similarto those already proposed for the computation of the semantic similarity, can be applied.
We then define PI(Sg1, Sg2), the particular informativeness of a set of GO terms Sg1 com-pared to another set of GO terms Sg2, as the sum of the differences between the informativeness(I) of each term tp of MPT(Sg1, Sg2) and the informativeness of the most informative commonancestor (MICA) between tp and Sg2. The PI of a set of terms is the information that is notshared with the other set.
PI(Sg1, Sg2) =∑
tp∈MPT (Sg1,Sg2)
I(tp)− I(MICA(tp, Sg2)) (5.1)
In the Figure 5.4B, PI(hsa, dme) = I(tRNA binding) - I(binding). We have no sum in thisexample since MPT(Sg1, Sg2) only contains one term.
We last normalize PI to compute Par(Sg1, Sg2), the semantic particularity of the set ofGO terms Sg1 compared to the set of GO terms Sg2. We define MCT(Sg1, Sg2), the set ofthe most informative common terms of Sg1 and Sg2, as the set of the terms belonging to theintersection of Sg1∗ and Sg2∗ that do not have any descendant either in Sg1∗ or in Sg2∗. In theFigure 5.4B, MCT(hsa, dme) = {“protein transporter activity”, “protein binding”}. Par(Sg1,Sg2) is the ratio of PI(Sg1, Sg2) and the sum of the informativeness of Sg1 most informativeterms (i.e. those Sg1-specific and those common with Sg2; the MICA in the PI formula for theSg1-specific guarantees that the informativeness of common terms is not counted twice).
Par(Sg1, Sg2) =PI(Sg1, Sg2)
PI(Sg1, Sg2) +∑
tc∈MCT (Sg1,Sg2) I(tc)(5.2)
For the example of the Figure 5.4B, this formula becomes:
Par(hsa, dme) =I(tRNA binding)− I(binding)
(I(tRNA binding)− I(binding)) + (I(p. trsp. activity) + I(protein binding))(5.3)
112

Several measures of informativeness have been proposed. The widely used Information Con-tent (IC) family is based on annotations frequencies determined with an appropriate corpussuch as the GOA database. The most frequent terms are considered to be the least informative.When considering Gene Ontology annotations, it is necessary to take the GO subsumption hi-erarchy into account in order to also consider implicit annotations to the terms ancestors [140].The alternative approach is corpus-independent. A term informativeness is a function of its dis-tance to the root. It is typically used when a relevant corpus cannot be computed (for comparingelements from several species) or does not exist (for poorly studied species). Wang’s SemanticValue (SV) computes this type of informativeness. The relevance of the results obtained by thisapproach has previously been demonstrated [193, 198].
As shown in the equation 5.3, four terms are involved in the calculation of the MF par-ticularity of the human Exportin-5 ortholog compared to the drosophila Exportin-5 ortholog.This comparison is cross-species, so a semantic value-based informativeness measure is relevant.According to the previous formula, the semantic values of the terms involved in the equation 5.3are: SV(tRNA binding) = 4.201, SV(binding) = 1.8, SV(protein transporter activity) = 2.952and SV(protein binding) = 2.44. Consequently, we can compute: Par(hsa, dme) = 0.308.Likewise, for Figure 5.4A, Par(hsa, rno) = 0.082.
5.2.6 Use case: Homo sapiens aquaporin-mediated transport
We aimed to study a large dataset in order to determine the frequency and the importanceof pairs of similar genes where (at least) one of them also has a high particularity value. Weused a dataset composed by 51 well-annotated human genes involved in the aquaporin-mediatedtransport pathway for Homo sapiens. We used the list of all involved genes provided by theReactome database [237]. We computed the Wang similarity and S-Value-based particularitiesfor each pair of genes of this list. As the Human annotation database is one of the mostcomprehensive, we also duplicated the study using Lin’s measure as an IC-based similarity, andIC as a value of GO term informativeness for our specificity. Tables 5.1, 5.2 and 5.3 present theaverage, standard deviation, minimum and maximum values of particularity measured in thisstudy for each branch of GO. We classified these statistics in 20 similarity categories containingall the comparison results ranging from sim = 0.5 to sim = 0.999 with steps of sim = 0.025.
As similarity increases, particularity tends to decrease, as expected. In each 20 categoriesin the human aquaporin-mediated transport pathway, some of the genes have an importantparticularity compared to the others. This demonstrates that our method combining semanticsimilarity and particularity identifies genes that cannot be identified using only a similaritymeasure.
Figure 5.5 on page 115 illustrates this case giving the MF annotation graph of two couplesof genes: AQP8 and AQP5 in part A and AQP6 and AQP3 in part B. The correspondingsimilarity and particularity values are presented in table 5.4 on page 116. Both pairs of genesshare the same set of common annotations (in blue), and their respective similarity valueswere close (0.704 for AQP8 and AQP5; 0.696 for AQP6 and AQP3). As AQP8 has no specificannotation, Par(AQP8, AQP5) = 0. Conversely, AQP5 only has two general specific annotationsand Par(AQP5, AQP8) = 0.19. However, AQP6 and AQP3 each has several precise specificannotations:Par(AQP6, AQP3) = 0.247 and Par(AQP3, AQP6) = 0.415. The two couples have closesimilarity values regardless the method used but they show a very different particularity profile,with much higher particularities between AQP6 and AQP3 than between AQP8 and AQP5.The two distinct informativeness measures used to compute the particularity led to the sameconclusion.
These results confirm that among similar genes, some also have some particular functions,
113

BP S-value-based particularity IC-based particularitySimilarity Average Std dev. Min Max Average Std dev. Min Max
[0.5-0.524] 0.401 0.2 0.013 0.844 0.562 0.223 0 0.904[0.525-0.549] 0.386 0.174 0 0.794 0.532 0.284 0 0.89[0.55-0.574] 0.347 0.199 0 0.707 0.497 0.244 0 0.886[0.575-0.599] 0.352 0.198 0 0.798 0.502 0.241 0 0.895[0.6-0.624] 0.315 0.203 0 0.671 0.495 0.208 0 0.794
[0.625-0.649] 0.292 0.145 0 0.629 0.437 0.25 0 0.882[0.65-0.674] 0.299 0.162 0 0.615 0.439 0.258 0 0.876[0.675-0.699] 0.229 0.15 0 0.529 0.451 0.216 0.039 0.839[0.7-0.724] 0.228 0.166 0 0.631 0.403 0.239 0 0.859
[0.725-0.749] 0.22 0.145 0 0.501 0.35 0.233 0 0.727[0.75-0.774] 0.202 0.108 0 0.482 0.403 0.207 0 0.775[0.775-0.799] 0.178 0.118 0 0.563 0.319 0.222 0 0.671[0.8-0.824] 0.177 0.106 0 0.418 0.31 0.209 0.043 0.646
[0.825-0.849] 0.125 0.071 0 0.327 0.258 0.184 0 0.589[0.85-0.874] 0.105 0.131 0 0.418 0.201 0.136 0 0.625[0.875-0.899] 0.061 0.066 0 0.248 0.179 0.123 0 0.651[0.9-0.924] 0.039 0.061 0 0.211 0.207 0.156 0 0.614
[0.925-0.949] 0.041 0.067 0 0.248 0.193 0.181 0 0.572[0.95-0.974] 0.032 0.041 0 0.111 0.099 0.076 0 0.196[0.975-0.999] 0.005 0.006 0 0.015 0.077 0.152 0 0.519
Table 5.1: Particularity value statistics in 20 similarity values ranges from case 2 – BP measures.
and show that this situation can be observed throughout the full range of similarity values.Therefore, a particularity measure is a relevant complement to a similarity measure in order toidentify similar elements that also present some particular trait.
114

CC S-value-based particularity IC-based particularitySimilarity Average Std dev. Min Max Average Std dev. Min Max
[0.5-0.524] 0.353 0.233 0 0.846 0.621 0.244 0 0.911[0.525-0.549] 0.36 0.214 0 0.819 0.707 0.15 0.185 0.977[0.55-0.574] 0.33 0.187 0 0.799 0.64 0.202 0 0.897[0.575-0.599] 0.341 0.185 0 0.752 0.613 0.194 0 0.896[0.6-0.624] 0.317 0.183 0 0.754 0.621 0.165 0 0.888
[0.625-0.649] 0.268 0.18 0 0.706 0.592 0.207 0 0.852[0.65-0.674] 0.28 0.177 0 0.656 0.553 0.227 0 0.888[0.675-0.699] 0.24 0.177 0 0.583 0.495 0.241 0 0.845[0.7-0.724] 0.13 0.159 0 0.543 0.466 0.24 0 0.825
[0.725-0.749] 0.196 0.151 0 0.579 0.428 0.268 0 0.82[0.75-0.774] 0.134 0.122 0 0.484 0.383 0.246 0 0.819[0.775-0.799] 0.15 0.127 0 0.489 0.391 0.267 0 0.768[0.8-0.824] 0.144 0.093 0 0.269 0.19 0.187 0 0.625
[0.825-0.849] 0.133 0.123 0 0.421 0.352 0.231 0 0.73[0.85-0.874] 0.146 0.152 0 0.373 0.255 0.216 0 0.624[0.875-0.899] 0.051 0.051 0 0.11 0.145 0.152 0 0.381[0.9-0.924] 0.067 0.085 0 0.269 0.095 0.095 0 0.189
[0.925-0.949] - - - - - - - -[0.95-0.974] - - - - 0.131 0.131 0 0.262[0.975-0.999] 0.012 0.012 0 0.024 0.049 0.049 0 0.098
Table 5.2: Particularity value statistics in 20 similarity values ranges from case 2 – CC measures.
binding
molecular_function
protein binding
substrate-specific
transmembrane
transporter activity
substrate-specific
transporter activity
transmembrane
transporter activity
transporter activity
water channel activity
substrate-specific
channel activity
water transmembrane
transporter activity
channel activity
passive transmembrane
transporter activity
ion channel activity
ion transmembrane
transporter activity
substrate-specific
channel activity
nitrate transmembrane
transporter activity
inorganic anion
transmembrane
transporter activity
substrate-specific
transmembrane
transporter activity
anion transmembrane
transporter activity
anion channel activity
alcohol transmembrane
transporter activity
organic hydroxy
compound transmembrane
transporter activity
carbohydrate transporter
activity
transporter activity
transmembrane
transporter activity
carbohydrate transmembrane
transporter activity
polyol transmembrane
transporter activity
glycerol transmembrane
transporter activity
glycerol channel
activity
channel activity
substrate-specific
transporter activity
molecular_function
water transmembrane
transporter activity
water channel activity
passive transmembrane
transporter activity
A B
AQP5 only
Common to AQP5 and AQP8
AQP3 only
AQP6 only
Common to AQP3 and AQP6
Figure 5.5: MF annotations of two couples of human aquaporins. Part A: AQP8 and AQP5 sharemost of their annotations. Part B: AQP6 and AQP3 share numerous molecular functions, buteach gene also have particular functions. Note that the sets of common annotations are the samein both situation, leading to close similarity values. The respective semantic particularity valuesreflects AQP3 and AQP6 specific functions, enabling the identification of different patterns.
115

MF S-value-based particularity IC-based particularitySimilarity Average Std dev. Min Max Average Std dev. Min Max
[0.5-0.524] 0.341 0.26 0 0.798 0.494 0.162 0.296 0.701[0.525-0.549] 0.35 0.219 0 0.818 0.429 0.212 0 0.703[0.55-0.574] 0.364 0.32 0 0.731 0.422 0.265 0 0.849[0.575-0.599] 0.382 0.265 0 0.694 0.378 0.148 0.125 0.591[0.6-0.624] 0.242 0.079 0.132 0.47 0.397 0.205 0 0.81
[0.625-0.649] 0.207 0.113 0 0.531 0.302 0.145 0.158 0.475[0.65-0.674] 0.281 0.106 0.117 0.482 0.609 0.137 0.13 0.806[0.675-0.699] 0.223 0.181 0 0.562 0.453 0.249 0 0.763[0.7-0.724] 0.26 0.267 0 0.564 0.389 0.248 0 0.806
[0.725-0.749] 0.179 0.176 0 0.482 0.419 0.211 0 0.763[0.75-0.774] 0.171 0.177 0 0.371 0.315 0.216 0 0.643[0.775-0.799] 0.125 0.167 0 0.482 0.33 0.241 0 0.777[0.8-0.824] 0.063 0.056 0 0.137 0.239 0.218 0 0.574
[0.825-0.849] 0.119 0.13 0 0.415 0.316 0.222 0 0.574[0.85-0.874] 0.041 0.036 0 0.116 0.266 0.175 0 0.531[0.875-0.899] 0.045 0.05 0 0.126 0.179 0.093 0.086 0.272[0.9-0.924] 0.024 0.025 0 0.055 0.163 0.153 0 0.388
[0.925-0.949] 0.02 0.026 0 0.086 0.09 0.107 0 0.272[0.95-0.974] 0.005 0.007 0 0.023 - - - -[0.975-0.999] - - - - - - - -
Table 5.3: Particularity value statistics in 20 similarity values ranges from case 2 – MF measures.
SV-based AQP6 AQP3 IC-based AQP6 AQP3
SimAQP6 1 0.696
SimAQP6 1 0.81
AQP3 1 AQP3 1
ParAQP6 0 0.247
ParAQP6 0 0.531
AQP3 0.415 0 AQP3 0.388 0
SV-based AQP8 AQP5 IC-based AQP8 AQP5
SimAQP8 1 0.704
SimAQP8 1 0.8
AQP5 1 AQP5 1
ParAQP8 0 0
ParAQP8 0 0
AQP5 0.19 0 AQP5 0.13 0
Table 5.4: Similarity and particularity values of two couples of genes from case 2. The similaritybetween AQP6 and AQP3 is very close to the similarity between AQP8 and AQP5 regardlessthe method used (SV or IC-based). However, the particularity profile obtained for each coupleis very different. Again, the SV-based and IC-based methods led to the same conclusion.
5.3 Methodology: threshold determination for similarity andparticularity
As we have seen in Figure 5.5 on the previous page, AQP5 and AQP8 are similar, and so areAQP3 and AQP6. However, AQP3 and AQP6 each exhibits some specific function, contraryto AQP5 and AQP8. This interpretation is supported by the numeric values of their respective
116

semantic semantic similarities and particularities, as shown in table 5.4 on the facing page.
In order to be able to automatize the interpretation of these values, we have to determinethe value above which two entities can be considered similar or particular.
This study focuses on a method for determining semantic similarity and particularitythresholds for the interpretation of semantic comparisons. As we have seen in theprevious section, this interpretation consists in associating the similarity and partic-ularity values to some similarity and particularity pattern (e.g. two genes are similarand the second gene has a particular function). This section presents the generalprinciple for determining similarity thresholds on the Gene Ontology, and studies thethreshold robustness. We then show how this principle is also applicable for deter-mining particularity thresholds on the Gene Ontology. Eventually, we performed anextensive systematic comparison of the thresholds we computed with the traditional0.5 over the HomoloGene database. This showed that in 5.4% of the comparisons, thethresholds resulted in different patterns. Overall, the new thresholds increased thedetection of the “similar with some particularity” pattern, and decreased the numberof the inconsistent “similar and both particular” and “neither similar nor particular”patterns. We then focused on the PPAR multigene family and showed that the simi-larity and particularity patterns obtained with our thresholds discriminated orthologsand paralogs better than those obtained using default thresholds.In retrospect, this work is interesting because the interpretation of similarity mea-sures usually hinges on implicit thresholds (e.g. “a similarity of 0.83 is high enoughto consider that two genes are similar”) or arbitrary ones (e.g. 0.5 for measures in[0;1]). However, no systematic study had been carried on for determining what thesethresholds should be. This study proposes a generic method for determining the opti-mal threshold for semantic similarity measures and their associated particularity. It isapplicable to any ontology and any semantic similarity and particularity measure. Ina previous study, we had shown that the ongoing evolution of ontologies such as GOmodifies their structure, which in turn can affect the threshold value [118]. Therefore,the thresholds obtained by our method should be regularly updated.
This study was originally published in: Charles Bettembourg, Christian Diot, and OlivierDameron. Optimal threshold determination for interpreting semantic similarity and particular-ity: Application to the comparison of gene sets and metabolic pathways using GO and ChEBI.PloS ONE, 10(7):e0133579, 2015.
The original article performed the study on the three axis of the Gene Ontology: BiologicalProcess (BP), Cellular Component (CC) and Molecular Function (MF). Only BP is detailedhere.
The original article also shows that our threshold determination method is applicable toother ontologies such as the Chemical Entities of Biological Interest ontology (ChEBI) [238].This is not detailed here.
5.3.1 Context
In the previous section, we proposed to combine semantic similarity measures and a new seman-tic particularity measure to improve the results of gene set analysis [96]. Data analysis oftenhinges on a qualitative interpretation of the similarity values in order to contrast similar anddissimilar pairs of genes. This discretization of the similarity and particularity values makes the
117

interpretation easier. It determines whether a functional difference between two genes is or isnot marginal.
The main focus of studies to date has been on defining the measures, but there is noextensive study on the interpretation of the values obtained with these measures.There has neither been any systematic analysis of the optimal threshold value separating similarfrom dissimilar. As a result, interpretation is frequently based on either an implicit threshold(for example: “a similarity of 0.83 is high enough to consider that two genes are similar” withoutmentioning when a value reaches this point) or an arbitrary one (typically 0.5 for measures in[0;1] even though no mathematical property of the measures supports this choice).
There are cases where a threshold of 0.5 may be ill-adapted. For example, the similarityvalue between protein tyrosine kinase 2 (PTK2) and Ubiquitin B (UBB) is 0.502 using Wang’ssimilarity measure on their Biological Processes (BP) annotations. This value is just above theintuitive mid-interval threshold. These two genes are well annotated, with 73 and 79 distinctBP annotations, respectively. According to Entrez Gene, PTK2 is involved in cell growthand intracellular signal transduction pathways triggered in response to certain neural peptidesor cell interactions with the extracellular matrix while UBB is required for ATP-dependent,nonlysosomal intracellular protein degradation of abnormal proteins and normal proteins withrapid turnover. These processes cannot be considered “similar”. Consequently, the 0.502 valueof similarity should not lead to consider PTK2 and UBB as similar genes according to the BPthey participate in.
The main factors influencing the similarity values are: granularity differences in GO, GOtopology differences between BP, MF and CC, quantity and “quality” of gene annotations, GOtemporal evolution [118]. There is a need for a systematic study of semantic measure valuesin order to determine optimal similarity and particularity thresholds for the qualitative part offunctional gene set analysis. Note that the method for determining these thresholds should alsobe applicable to all semantic similarity categories as well on other ontologies outside GO.
5.3.2 Objective
We propose a generic method to define suitable thresholds based on analysis of the distributionsof similarity values. We then extend this method to the semantic particularity measure. Weshow that our method is applicable to a node-based and a hybrid semantic similarity measure onthe Gene Ontology as well as to the corresponding semantic particularity measures. We studythe robustness of our method by applying it to multiple sets of genes. We evaluate our methodby determining whether the new thresholds lead to different interpretations, and whether thesenew interpretations are biologically relevant.
5.3.3 Similarity threshold
5.3.3.1 Method for determining similarity thresholds
We first present the general process. We then provide more details about steps two and three.
General process Figure 5.6 on page 120 illustrates the process for determining a similaritythreshold. This process is composed of three steps:
1. Define at least two different groups of genes for species of interest. Within a group, thegenes should share some common characteristics. Genes from different groups should shareas few characteristics as possible.
118

2. (a) In each group, compute the similarities between each pair of genes (i.e. the intra-group similarities). Gather all the similarity results to obtain an S distribution ofsimilar genes.
(b) Compute the similarities between each combination of a gene from the first groupand a gene from a second group (i.e. the inter-group similarities). Gather all thesimilarity results to obtain an N distribution of non-similar genes.
3. If the S and N distributions have no overlap between the ranges (min, max), define thethreshold τsim using any value between τS (the lowest value of S) and τN (the highestvalue of N). Else, there are some false negatives (FN) and some false positives (FP):
(a) Compute the proportion of FN in the S distribution for all samples of the similaritythreshold between τN to τS . In this step, consider every value under the similaritythreshold as a FN.
(b) Compute the proportion of FP in the N distribution for all samples of the similaritythreshold between τN to τS . In this step, consider every value above the similaritythreshold as a FP.
(c) For each possible threshold value, sum the FN and FP proportions obtained in steps3a and 3b. The similarity threshold τsim is the threshold that minimizes this sum.
Constitution of the S and N distributions We ran a statistical test to determine whetherthe S and N distributions obtained at step 2 are significantly different. As we cannot considerthat the S and N variances are similar, we used an unequal variance t-test (Welch’s t-test) whichis the recommended test when considering different-sized distributions like S and N. Welch’st-test performs better than Student’s t-test when the variances are unequal yet still performson a par with the Student’s t-test when the variances are equal [239]. If the test concludes thatthe S and N distributions are non significantly different, the process has to be restarted at itsfirst step.
Overlap of the S and N distribution The minimization at step 3c has to be done on FNand FP proportions as the N and S distributions have different sizes.
When comparing the distributions of similar genes (S) to non-similar genes (N), if theminimum value of S is smaller than the maximum value of N, then the S and N distributionsoverlap and any threshold would lead to FPs or FNs.
Figure 5.7 on page 121 illustrates the case without overlap, where min(S) = a, max(N) = band a > b. A similarity value greater than a means that the genes compared are similar. Asimilarity value lower than b means that the genes compared are non-similar. A similarity valuebetween a and b means that the genes compared are nearly similar and thus require expertopinion to interpret the result.
Figure 5.8 on page 121 illustrates the case where the S and N distributions overlap, meaningthat there are some FPs (i.e. pairs of genes from N that are non-similar but that have a similarityvalue greater than a) and FNs (i.e. pairs of genes from S that are similar but have a similarityvalue lower than b). In this case, a similarity value lower than a means that the genes comparedare non-similar. A similarity value greater than b means that the genes compared are similar.Again, expert opinion would be required to interpret the result in this interval. However, inthis case, it is possible to determine the threshold value that minimizes both FP and FN.
We established a general framework that defines three thresholds values:
119
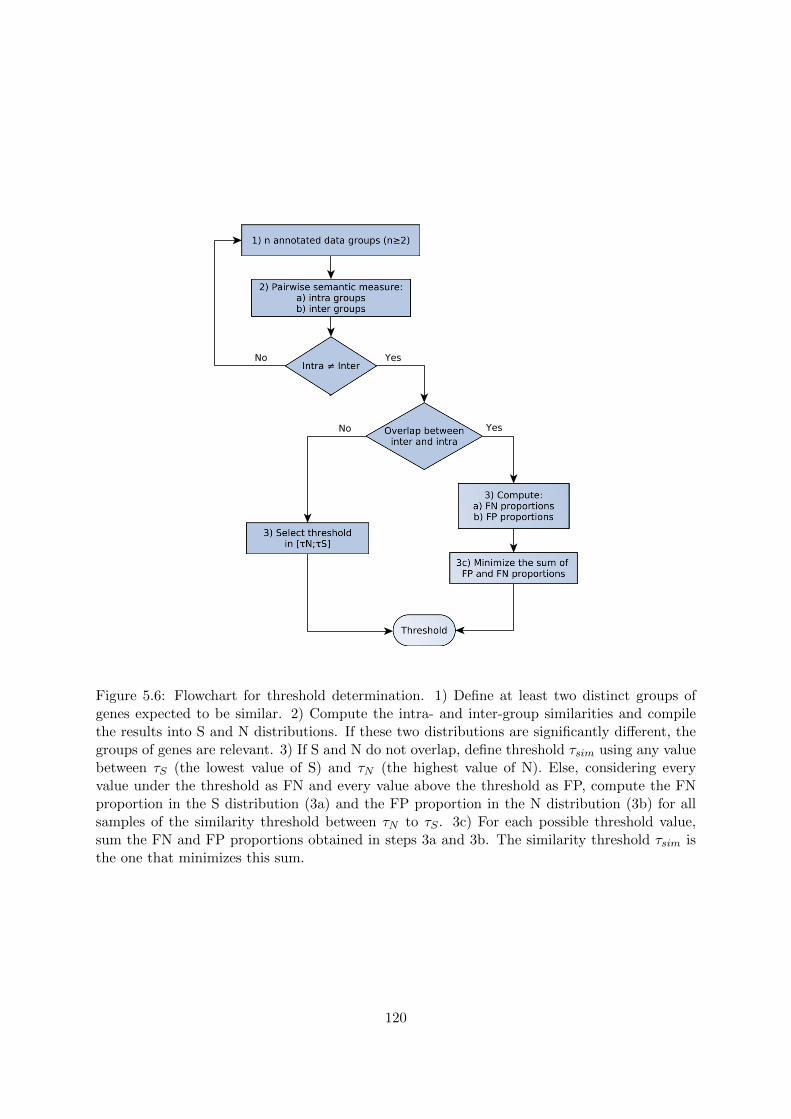
Figure 5.6: Flowchart for threshold determination. 1) Define at least two distinct groups ofgenes expected to be similar. 2) Compute the intra- and inter-group similarities and compilethe results into S and N distributions. If these two distributions are significantly different, thegroups of genes are relevant. 3) If S and N do not overlap, define threshold τsim using any valuebetween τS (the lowest value of S) and τN (the highest value of N). Else, considering everyvalue under the threshold as FN and every value above the threshold as FP, compute the FNproportion in the S distribution (3a) and the FP proportion in the N distribution (3b) for allsamples of the similarity threshold between τN to τS . 3c) For each possible threshold value,sum the FN and FP proportions obtained in steps 3a and 3b. The similarity threshold τsim isthe one that minimizes this sum.
120

• τS = max(a, b) is the threshold value above which the two compared genes are similar.There can not be any FP above τS , but there may be some FN below τS if a < b.
• τN = min(a, b) is the threshold value under which the two compared genes are non-similar.There cannot be any FN below τN , but there may be some FP above τN if a < b.
• τsim is the threshold value located between τS and τN that that minimizes the proportionof FP and FN. As τsim gets closer to τS , there will be more FN and fewer FP. Conversely,as τsim gets closer to τN , there will be more FP and fewer FN. τsim has to be computedusing the proportions of FP and FN as the S and N distributions have different sizes.
Similar Non-similar
0
0.25
0.5
0.75
1
Threshold
range
a
b
Figure 5.7: Ideal case of threshold determination. The threshold should be located betweenthe lowest whisker of the similar distribution (a) and the upmost whisker of the non-similardistribution (b).
Similar Non-similar
0
0.25
0.5
0.75
1
a
b
Figure 5.8: Overlap case of threshold determination. The similar and non-similar boxes overlap.In this case, there are false-positive and false-negative results between the lowest whisker of thesimilar distribution (a) and the upmost whisker of the non-similar distribution (b).
We applied this method to compute Lin’s and Wang’s semantic similarity thresholds on GO,as well as the corresponding IC-based and SV-based semantic particularity thresholds on GO.For all the pairs of genes compared, we used the GO annotations from the August 2013 version
121

of GOA. We computed Lin’s similarity with the GOSemSim R package [240] (version 1.18.0)using its GO and IC tables and the best-match average approach to compare genes. Pesquitaet al. showed that the best-match average approach performs best [198]. We computed Wang’ssimilarity, IC-based particularity and SV-based particularity using an in-house implementationof each measure and the August 2013 version of GO.
5.3.3.2 BP similarity threshold using two groups of similar genes
We studied the similarity values obtained when comparing genes known to be functionally closeand genes without functional proximity. This study was performed using a hybrid semanticsimilarity measure (Wang) and a node-based measure (Lin).
Figure 5.9 on the facing page presents the distribution of the BP similarity values obtained fortwo intra-family comparisons and the corresponding inter-family comparisons. The two PAN-THER families were “neurotransmitter gated ion channel” (pthr18945) and “tyrosine-proteinkinase receptor” (pthr24416).
As expected, similarity values obtained using either Wang’s (Figure 5.9A) or Lin’s measure(Figure 5.9B) were significantly higher in the intra-family comparisons than the inter-familycomparisons (Welch’s t-tests). We observed an overlap between the S and N distributions,which corresponds to the situation shown in Figure 5.8 on the previous page. τN was locatedat the lowest whisker of the intra-family S blue box, i.e. 0.096 with Wang’s measure and 0.364with Lin’s measure. τS was located at the upmost whisker of the inter-family N yellow box, i.e.0.519 with Wang’s measure and 0.588 with Lin’s measure.
We also determined the optimal similarity threshold value τsim that minimizes the sum ofFP and FN proportions. Figure 5.10 on page 124 reports the results for Wang’s and Lin’smeasures. The minimum ordinate value of the curves gives the threshold for BP using Wang’s(0.42) and the Lin’s (0.49) measures, respectively.
We used a similar approach for CC and MF; see original article.
5.3.3.3 Robustness of threshold determination
The more groups we build to constitute the S and N distributions, the more reliable the thresh-olds obtained become. We generalized the above-described process using six groups of similargenes for BP in order to determine τS , τN and τsim for Wang’s and Lin’s measures.
We computed the S distribution gathering the similarity values of each pair of genes insidesix different PANTHER families. These families were “histone h1/h5 (pthr11467)”, “g-proteincoupled receptor” (pthr12011), “neurotransmitter gated ion channel” (pthr18945), “tyrosine-protein kinase receptor” (pthr24416), “phosphatidylinositol kinase” (pthr10048) and “sulfatetransporter” (pthr11814). We computed the fifteen distributions corresponding to all the com-binations of genes similarity values from two of the previous six families. Each of these distri-butions is composed of the similarity values between each gene from the first family and eachgene from the second family. We combined all these inter-family similarity values into a globalN distribution.
In each previous case, the S and N distributions overlapped so defining a threshold inthis interval yields some FPs and some FNs. We determined the optimal similarity thresholdvalue that minimizes the sum of FP and FN proportions. Figure 5.11 on page 124 reports theresults for Wang’s SV-based measure and for Lin’s IC-based measure. The minimum ordinatevalue of each curve gives the threshold for BP, MF and CC using Wang’s and Lin’s measures,respectively. These similarity thresholds differed according to similarity measure used. Theyalso differed between BP, MF and CC. This can be explained by the different level of complexitybetween these three branches [118]. It is possible to use one of the three proposed thresholds
122
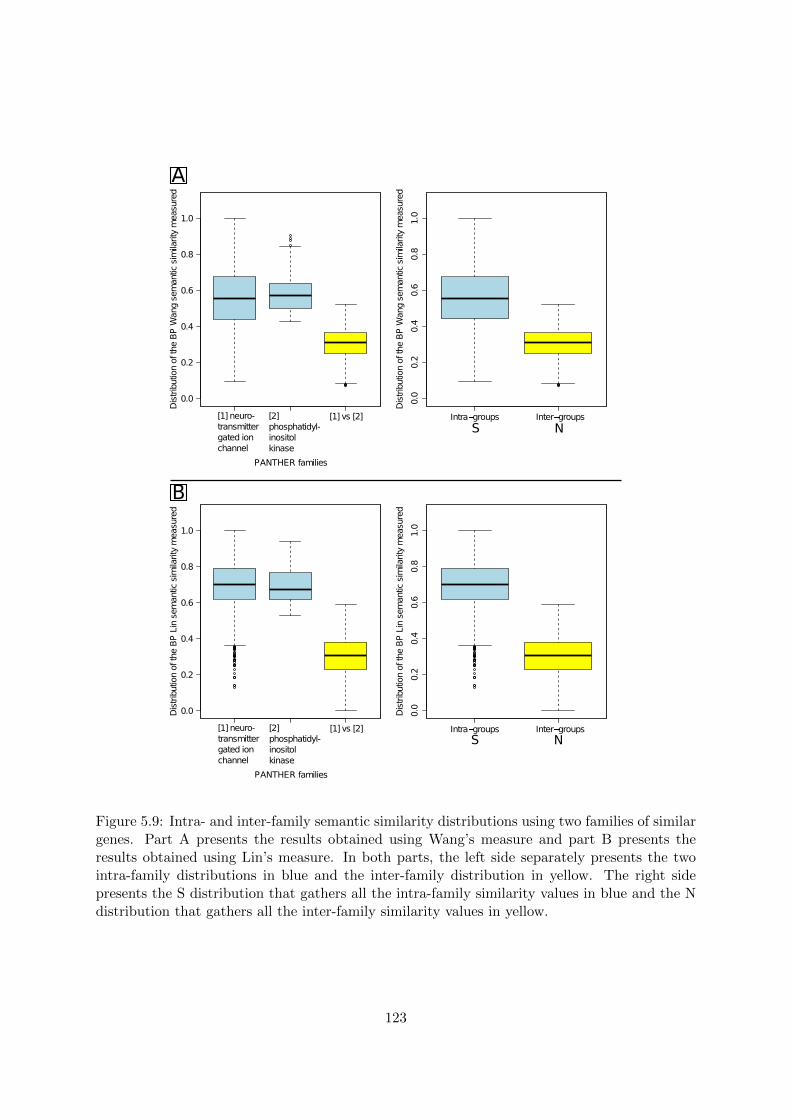
0.0
0.2
0.4
0.6
0.8
1.0
[1] neuro-
transmitter
gated ion
channel
[2]
phosphatidyl-
inositol
kinase
[1] vs [2]
PANTHER families
Dis
trib
ution o
f th
e B
P W
ang s
em
antic s
imila
rity
measure
d
Intra groups Inter groups0.0
0.2
0.4
0.6
0.8
1.0
Dis
trib
ution o
f th
e B
P W
ang s
em
antic s
imila
rity
measure
d
0.0
0.2
0.4
0.6
0.8
1.0
Dis
trib
ution o
f th
e B
P L
in s
em
antic s
imila
rity
measure
d
Intra groups Inter groups
0.0
0.2
0.4
0.6
0.8
1.0
Dis
trib
ution o
f th
e B
P L
in s
em
antic s
imila
rity
measure
d
[1] neuro-
transmitter
gated ion
channel
[2]
phosphatidyl-
inositol
kinase
[1] vs [2]
PANTHER families
A
B
S N
S N
Figure 5.9: Intra- and inter-family semantic similarity distributions using two families of similargenes. Part A presents the results obtained using Wang’s measure and part B presents theresults obtained using Lin’s measure. In both parts, the left side separately presents the twointra-family distributions in blue and the inter-family distribution in yellow. The right sidepresents the S distribution that gathers all the intra-family similarity values in blue and the Ndistribution that gathers all the inter-family similarity values in yellow.
123

0,095 0,115 0,135 0,155 0,175 0,195 0,215 0,235 0,255 0,275 0,295 0,315 0,335 0,355 0,375 0,395 0,415 0,435 0,455 0,475 0,495 0,515
0
10
20
30
40
50
60
70
80
90
100
BPSimilarity threshold
Sum
of
FP a
nd F
N p
roport
ions o
f SV-b
ased s
imilari
ty v
alu
e
0,42
0,13 0,15 0,17 0,19 0,21 0,23 0,25 0,27 0,29 0,31 0,33 0,35 0,37 0,39 0,41 0,43 0,45 0,47 0,49 0,51 0,53 0,55 0,57
0
10
20
30
40
50
60
70
80
90
100
Similarity threshold
Sum
of
FP a
nd F
N p
roport
ions o
f IC
-based s
imilari
ty v
alu
e
BP
0,49
Figure 5.10: Determination of Wang’s similarity threshold (left) and Lin’s similarity threshold(right) using two families of similar genes. The minimum of false-positive and false-negativeproportions gives the similarity threshold (τsim).
(τN , τS and τsim) depending on the accuracy needed to interpret the semantic similarity results.None of these thresholds is equal to the intuitive “default” threshold of 0.5.
0,165 0,19 0,215 0,24 0,265 0,29 0,315 0,34 0,365 0,39 0,415 0,44 0,465 0,49 0,515 0,54 0,565 0,59 0,615 0,64 0,665 0,69 0,715 0,74 0,7650
10
20
30
40
50
60
70
80
90
100
BP
MF
CC
Similarity threshold
Su
m o
f F
P a
nd
FN
pro
po
rtio
ns
of
SV
-bas
ed s
imil
arit
y v
alu
e
0,4 0,475
0,41
0,28 0,305 0,33 0,355 0,38 0,405 0,43 0,455 0,48 0,505 0,53 0,555 0,58 0,605 0,63 0,655 0,68 0,705 0,73 0,755 0,78 0,805 0,83 0,855 0,88 0,905 0,930
10
20
30
40
50
60
70
80
90
100
Similarity threshold
Sum
of
FP
and F
N p
ropo
rtio
ns
of
IC-b
ased
sim
ilar
ity v
alue
0,540,52
0,535
BP
MF
CC
Figure 5.11: Determination of Wang’s similarity threshold (left) and Lin’s similarity thresh-old (right). The minimum of false-positive and false-negative proportions gives the similaritythreshold (τsim). The overlapping parts of the boxplots (between τN and τS) are shown in thelower part of the figure. The thresholds are located between the similar and non-similar boxes.
We validated our study using a leave-one-out approach that consisted in successively re-computing the thresholds using all the sets but one. This approach provides an evaluation ofthreshold stability.
The thresholds varied slightly over the different datasets. BP similarity threshold variedbetween 0.4 and 0.435. MF similarity threshold remained stable at 0.41, except when nottaking into account the family of genes related to neurotransmitter gated ion channels (0.49).CC similarity threshold was between 0.475 and 0.515.
124

5.3.4 Particularity threshold
5.3.4.1 Method for determining particularity thresholds
In addition to the similarity thresholds determination, we used the same approach to computesemantic particularity thresholds on BP, CC and MF in order to determine the comparisonprofile of two genes G1 and G2. The procedure consisted in comparing each value of the triple(Similarity(G1,G2); Particularity(G1,G2); Particularity(G2,G1)) with its respective threshold(noted“+”if the value is greater than the threshold, and“-”otherwise). The results of comparingtwo genes on their similarity and particularity values can be classified into eight distinct patternsdescribed in Table 5.5. A comparison should not result in a “+ + +” nor a “- - -” pattern.Indeed, a “+ + +” pattern would mean that the two genes compared share enough features tobe considered similar yet, at the same time, that each have enough particular features to bothbe considered particular. Conversely, a “- - -” pattern would mean that the two genes comparedare neither similar nor particular.
Notation sim(A, B) par(A, B) par(B, A)
+ + + > τsim > τpar > τpar+ + - > τsim > τpar < τpar+ - + > τsim < τpar > τpar+ - - > τsim < τpar < τpar- + + < τsim > τpar > τpar- + - < τsim > τpar < τpar- - + < τsim < τpar > τpar- - - < τsim < τpar < τpar
Table 5.5: Patterns of similarity and particularity. The results of a semantic comparison of geneannotations can be classed into eight macro-patterns according to similarity and particularityvalues. The first sign is a “+” if the similarity is greater than or equal to the similarity thresholdτsim, or a “-” otherwise. The two other signs depends on the two particularity values, a “+” fora particularity greater than the particularity threshold τpar or a “-” otherwise.
We applied the threshold determination process described in Figure 5.6 on page 120 toobtain a particularity threshold. For the first step, we composed the same gene groups as thoseused to compute the similarity threshold. For the second step, we computed all the intra-groupand inter-group particularity values between all possible pairs of genes. At the third step, wedid not consider any FPs nor FNs as genes belonging to the same group can have some degree ofparticularity even if they are similar. However, knowing the similarity threshold, we computedthe proportion of “+ + +” and “- - -” patterns found in the results while particularity thresholdvaried. We computed the particularity threshold τpar using the similarity threshold τsim. Forstep 3c, we summed the “+ + +” and “- - -” proportions for each possible particularity thresholdvalue. The particularity threshold τpar was the one that minimized this sum.
5.3.4.2 Computation of particularity thresholds
The variation of the “+ + +” and “- - -” profiles in our datasets was studied using the similaritythreshold τsim obtained in the previous section and sampling the value of τpar, the particularitythreshold. Table 5.6 on the following page gives the particularity thresholds (τpar) minimizingthe sum of “+ + +” and “- - -” patterns for SV-based and IC-based approaches.
These thresholds differed between BP, MF and CC and between approaches (Figure 5.12).
125

SV-based particularity threshold IC-based particularity threshold
BP 0.515 0.68
MF 0.485 0.66
CC 0.335 0.6
Table 5.6: Semantic SV-based and IC-based particularity thresholds. These thresholds minimizethe proportions of non-informative “+ + +” or “- - -” patterns according to Table 5.5.
We performed the leave-one-out study in order to assess stability of the particularity thresholdby removing one gene set from our datasets and re-computing the particularity threshold. Thisanalysis was performed on BP, MF and CC. The thresholds varied slightly among the differentdatasets:
• BP particularity threshold was between 0.49 and 0.515 ;
• MF particularity threshold was between 0.35 and 0.485 ;
• CC particularity threshold was between 0.28 and 0.335.
0 0,025 0,050,075 0,1 0,1250,150,175 0,2 0,2250,250,275 0,3 0,3250,350,375 0,4 0,4250,450,475 0,5 0,525 0,550,575 0,6 0,6250,650,675 0,7 0,7250,750,775 0,8 0,8250,850,875 0,9 0,9250,950,9750
10
20
30
40
50
60
70
80
90
100
Particularity threshold
Sum
of
++
+ a
nd -
-- p
atte
rns
pro
port
ions
of
SV
-bas
ed s
imil
arit
y a
nd p
arti
cula
rity
val
ues
BP MF CC
1
0,515
0,335
0,4850 0,025 0,050,075 0,1 0,1250,150,175 0,2 0,2250,250,275 0,3 0,3250,350,375 0,4 0,4250,450,475 0,5 0,525 0,550,575 0,6 0,6250,650,675 0,7 0,7250,750,775 0,8 0,8250,850,875 0,9 0,9250,950,975
0
10
20
30
40
50
60
70
80
90
100
Particularity threshold
Sum
of
++
+ a
nd -
-- p
atte
rns
pro
port
ions
of
IC-b
ased
sim
ilar
ity a
nd p
arti
cula
rity
val
ues
BP MF CC
1
0,68
0,6
0,66
Figure 5.12: Determination of the SV-based particularity threshold (left) and the IC-basedparticularity threshold (right). The minimum of “+ + +” and “- - -” pattern proportions givesthe particularity threshold.
5.3.5 Evaluation of the impact of the new threshold on HolomoGene
The evaluation study involved first quantifying the extent of the changes resulting from usingthe threshold computed by our method instead of the default 0.5 and then determining whetherthese changes are biologically relevant.
5.3.5.1 Large-scale evaluation of the impact of threshold changes
We evaluated the impact of our new GO similarity and particularity thresholds over the wholeHomoloGene database intra-group gene comparisons. HomoloGene is a system that automati-cally detects homologs, including paralogs and orthologs, among the genes of 21 fully-sequencedeukaryotic genomes [241].
126

Table 5.7 summarizes the results for BP. It provides the number of pairs of genes changingfrom one pattern of Table 5.5 to another using τsim and τpar instead of the default value of0.5. We have not distinguished the “+ + -” and “+ - +” categories nor the “- + -” and “- - +”categories as the order of particularity values in the results of this study is meaningless. Allcategories of the pattern described in Table 5.5 were impacted by the change of threshold. Thegreatest size increase concerned the “+ + - or + - +” category (+26.2% for BP). The numberof “+ + +” and “- - -” cases, that are the least-informative cases, decreased (-11.2% for BP).
BP. �
+ - - + + - or+ - +
+ + + - + + - + - or- - +
- - - Total using0.5 thresholds
+ - - 268,471 0 0 0 0 0 268,471
+ + - or + - + 1,780 54,168 0 0 0 0 55,948
+ + + 7 270 2,623 0 0 0 2,900
- + + 2 154 2,254 10,374 304 1 13,089
- + - or - - + 177 16,027 0 0 32,578 102 48,884
- - - 2,883 0 0 0 0 1,401 4,284
Total usingnew thresholds
273,320 70,619 4,877 10,374 32,882 1,504 T= 393,576
Table 5.7: Evolution in patterns in results on HomoloGene intra-group BP compar-isons. Numbers of pairs of genes changing from one pattern to another when considering ouroptimal similarity and particularity thresholds instead of the default value of 0.5. The mostimportant transition consists in 16,027 results moving from the “- + - or - - +” category (sizedecreased by 32.7%) to the “+ + - or + - +” category (size increased by 26.2%). The newthresholds give more “+ + +” results but fewer “- - -” results. Globally, the sum of the numbersof the “+ + +” and “- - -” patterns has decreased (-11.2%).
Overall, on BP, CC and MF, the change of thresholds:
• deeply impacted the distribution the HomoloGene intra-group comparison results betweenthe different patterns;
• resulted in important transition from the “- + - or - - +” to the “+ + - or + - +” patterns;
• resulted in fewer “+ + +” and “- - -” cases.
Analysis of relevance on the PPAR multigene family
We measured similarity and particularity values of PPARα, PPARβ and PPARγ between sixspecies. Each gene was only annotated by one or two CC terms, so we kept CC results out ofthis study. All our similarity values were greater than τsim (which is not surprising as we areconsidering genes from the same family). Consequently, in order to emerge similarity differencesbetween orthologs and paralogs, we had to use the more stringent τS . This threshold guaranteesthat the results above it indicate two similar genes. However, the only conclusion that can beinferred for the gene comparisons resulting in values between τsim and τS is that there is doubtover whether these genes are similar. The results of inter-orthologs comparisons systematicallymatched a “+ - -” pattern, as expected. In contrast, the results of inter-paralog comparisonsincluded some values lower than τS and greater than τpar, resulting in“+ + -”, “- + -”and“- - +”patterns. Consequently, the thresholds we computed for similarity and particularity measuresresulted in patterns consistent with the ortholog conjecture for the PPAR gene family.
127

5.4 Synthesis
What we learned
• Similarity and particularity metrics allow to provide an objective measure for the com-parison of two elements.
• This process can be improved by using ontologies in order to take existing knowledge intoaccount.
• Using semantic particularity as a complement to semantic similarity further refine theanalysis when peculiarities are also of biological interest.
• Having a numeric value for similarity and particularity is good because it supports rankingthe elements to compare. In our study, we were interested in sorting the pathway stepsfrom the most similar to the least, and among the similar ones, from the most particularto the least.
• Surprisingly, the next step in analysis involved a coarse discretization in order to dis-tinguish the similar elements from the dissimilar ones, and the particular from the non-particular. Although this is done on a regular basis in life science articles, no sound methodexisted to determine how similar (resp. particular) two elements should be for being con-sidered similar (resp. particular). We proposed an empirical method applicable to anysimilarity and particularity metrics, over any ontology. This method generated thresholdthat are different from the usual implicit thresholds, biologically-relevant, rather robust(i.e. choosing a slightly different threshold only has a small impact on the performances)and that can be recomputed when ontologies evolve.
128

Chapter 6
Conclusion and research perspectives
Since 2003, my research interests have gradually evolved from the representation of symbolicknowledge in semantically-rich formalisms and the associated reasoning to the development ofsimilarity and particularity-based reasoning on semantically simpler ontologies. This transitionresulted from both my growing interest in bioinformatics, and from the fortunate conjunctionat that time of biological data becoming increasingly available as part of the (open) linked datainitiative (which is more difficult in the medical domain), and of the release of SPARQL1.1.Indeed, in bioinformatics answering biologically-relevant questions involves data integrationand comparison rather than classification, and, as we have seen, SPARQL1.1 supports most ofthe needs for querying and integrating data annotated with simple ontologies.
In this context, the reasoning methods I developed gave encouraging preliminary resultson several projects Dyliss is currently involved in. However, both our production and usageof linked data is still fragmentary, ad hoc and incomplete. It is becoming clear that in eachproject, we are facing the same limitations.
129

My research perspectives build on my previous works to tackle the challenges of pro-ducing and querying linked data, as well as developing semantic-based methods foranalyzing complex life science data.The first strategic requirement consists in setting up an environment for representingour research data as linked data, ideally with the support of the GenOuest platform.This task encompasses the conversion of data as well as the development of a virtualresearch environment. Beyond the engineering aspect, the open research challenge liesin the development of a consistent data and metadata management methodology.The second strategic requirement consists in querying these data. Again, we expectthat some data analysis patterns are common to several projects, which requires tostore and share them, independently from the datasets. Moreover, we should be ableto formulate new relevant biological questions that used to be out of reach when datawere more scarce and when combining and processing data was more difficult than itcurrently is (and will be as we make progress on the first requirement). Eventually,the combination of structurally and semantically-rich data becoming available and ofcomplex queries call for tools capable of abstracting this complexity for the user.The third strategic requirement focuses on methods for analyzing the data uncoveredby the complex queries of the previous requirement. The results of such queries aretypically so large and complex that they are themselves useless, until we develop ded-icated analysis methods. Again, this is a general problem, so I expect these methodsto hinge on a core of generic reasoning primitives that will probably involve domainknowledge for interpretation and will be applicable to multiple projects, at least formetabolic network analysis.
6.1 Producing and querying linked data
Over the last few years, most of the major life science data and knowledge consortia have pro-vided access to some RDF version of their data: pathway databases such as Reactome [237],Wikipathway [242], *CYC [243] are available in the BioPAX format [244, 245, 246] (as they re-main incomplete, their integration is desirable but remains a challenge of its own [247, 248, 249]).Others are even providing dedicated SPARQL endpoints that will support federated queries:Uniprot1 [250], resources from the EBI2 [251] (currently BioModels, BioSamples, ChEMBL, Ex-pression Atlas and Reactome and others are in preparation) or PubChemRDF [252]. Moreover,initiatives such as identifiers.org3 simplify the integration of life science data identifiers fromdifferent sources [64]. Eventually, repositories such as bio2rdf4 [61, 63] and BioPortal5 [49] offersome uniform access to respectively 35 datasets and 442 ontologies.
However, all these are typically resources that we use when analyzing our data, but noneour data themselves are currently in RDF. This makes the analysis cumbersome as we have todevelop ad hoc conversion scripts that hamper exploratory work.
I intend to address the following two challenges that we encounter repeatedly:
• incorporate the data we work with into the linked data framework for our directbenefit (analyzing our data better and giving them a better visibility) as well as for the
1http://sparql.uniprot.org/2https://www.ebi.ac.uk/rdf/platform3http://identifiers.org/4https://github.com/bio2rdf5http://bioportal.bioontology.org/
130

benefit of the community [8]
• when (linked) data are here, we still have to invent the querying that takes fulladvantage of the linked data framework. This encompasses two problems: (1) abioinformatics one about formulating new biological questions that are relevant but usedto be out of reach for lack of available data and querying capabilities [253], and (2) acomputer science one about providing an infrastructure for representing these data andfor supporting their new querying (which will most probably involve the Semantic Web).I expect to focus on the first one but will rely extensively rely on the second one, withsome possible marginal contributions.
6.1.1 Representing our data as linked data
Incorporating our data in the linked data framework consists in storing and sharing our dataas well as linking them to other resources such as genes, pathways, RNA fragments, taxons,molecules or proteins. While data storage will consist in using available technical solutions suchas Virtuoso6 or Fuseki7, making explicit the relations to other resources and integrating every-thing into an E-Science context that remains to be developed goes beyond simple engineering.
As we see below, this challenge is common to many projects.
6.1.1.1 Converting data into RDF
MiRNAdapt on aphids The MiRNAdapt project8 led by Denis Tagu from INRA aims atstudying how aphids’ gene expression adapt to changes of the local environment such as sea-sons, and particularly genic regulation during pea aphid embryogenesis. The project producedlarge quantities of data about messenger RNA, microRNA, piRNA and long non-coding RNAexpression levels as well as epigenetic marks such as histone and DNA methylation. These dataare stored in 16 tabulated flat files totaling 6,160,765 lines. Analyzing these data requires tobe able to query them uniformly even if they were obtained separately, as well as connectingthen with external resources [254]. Currently, the biologists import the files as spreadsheets forbeing able to process them. The processing must be manually adapted and repeated for eachnew query, which usually takes between two and three hours each time before computation cantake place.
Since 2014, with Fabrice Legeai, Anthony Bretaudeau and Charles Bettembourg, we im-ported the information in RDF (45,278,179 triples) and stored it in a triplestore [101]. Thisprocess only needs to be done once. We were then able to write SPARQL queries for each 6 usecases, which demonstrated that SPARQL has the necessary expressivity. Writing each querytook only a few minutes, and the queries can be reused and adapted, which simplifies analysis,particularly exploratory hypotheses. For this proof of concept, the flat file conversion in RDFwas performed with ad hoc scripts. We are investigating how to streamline this process, e.g.using tarql9 or directly in the triplestore10.
EPICLUB on Brassicaceae The EPICLUB project led by Melanie Jubault from INRAaims to determine the respective parts of epigenetics and genetics in Brassicaceae (cabbages,broccoli, cauliflower, Brussels sprouts, radishes,...) response to clubroot, a common disease
6http://virtuoso.openlinksw.com/7https://jena.apache.org/documentation/fuseki2/8http://www6.rennes.inra.fr/igepp_eng/RESEARCH-TEAMS/Ecology-and-Genetics-of-
Insects/Projects/MiRNAdapt29http://tarql.github.io/
10http://virtuoso.openlinksw.com/dataspace/doc/dav/wiki/Main/VirtCsvFileBulkLoader
131

caused by a protist called Plasmodiophora brassicae. The project requires an infrastructure formanaging and integrating a large quantity of data including Brassicaceae genome sequences withtheir orthology and synteny relations, resistance major genes and QTL, and transcriptomics,metabolomics and epigenomics data. Currently, the data are available as text and csv files aswell as spreadsheets. With Aurelie Evrard and Melanie Jubault, we will follow an approachsimilar to the MiRNAdapt project.
Patient care trajectories The PEPS platform (plateforme pharmaco-epidemiologie des pro-duits de sante) led by Emmanuel Oger (CHU Rennes) aims at providing an infrastructurefor performing large scale pharmacoepidemiology studies based on French national medico-administrative databases such as SNIIRAM (Systeme National d’Information Inter-Regime del’Assurance Maladie, the French equivalent to National Health Insurance Cross-Schemes In-formation System NHI-CIS) for healthcare reimbursement (e.g. drug prescriptions, medicaltransports) and PMSI (Programme de Medicalisation des Systemes d’Information) from hos-pital discharge information systems (e.g. diagnosis and procedures). In collaboration withNolwenn Le Meur and Yann Rivault (EHESP), we focused on detecting complications for pa-tients having an day surgery (i.e. a surgery that does not require an overnight hospital stay)between January and December 2012, and their follow-up data over 2013. The dataset con-cerned 1,389,271 patients and 1,636,445 instances of procedure. We wanted to determine whichpatients had an outpatient surgery, and among them which ones had a pattern suggesting apossible complication (for example an antibiotics prescription or another hospitalization in thefollowing days). The data were too big for being handled by R (which was not a surprise),and our need to use ontologies about procedures, drugs or diseases made the use of a relationaldatabase impractical.
We converted the data in RDF and linked with ontologies such as ATC for drugs, CCAMfor procedures and ICD10 for diagnosis. We wrote SPARQL queries to retrieve the patients ofinterest and their related information [105]. We used R to perform the statistical analysis inorder to identify determinants of complications. As in the two previous projects, this turnedout to be a relevant solution that supported the need for data integration and data analysis onlarge datasets. Further work will continue on data representation and on data analysis withthe beginning of Yann Rivault’s PhD thesis that will focus on the analysis of patients’ caretrajectories. This will expand a previous work with Gautier Defossez and Alexandre Rolleton the temporal representation of care trajectories of breast cancer patients using data from aregional information system [255], and will benefit from a collaboration with Thomas Guyet,David Gross-Amblard and Yann Dauxais (IRISA).
Synthesis These projects require some graph querying and traversal capabilities, as well assome integration with other resources, for which RDF is well adapted [22]. Some of the analysismethods in use or in development also require some graph topology functions such as finding themaximal cliques, or involve Answer Set Programming, for which RDF may not be the optimaldata representation format. Determining whether the data should be stored natively in RDFand exported to other formalisms, or the other way around remains to be investigated for thedefinition of Dyliss data management plan.
With the help of the GenOuest11 engineers, these data should be deployed on the GenOuestplatform.
11http://www.genouest.org/
132

6.1.1.2 Incorporating linked (meta)data into a Virtual Research Environment
All the efforts presented in the previous section are not specific to our team. As we have seenin sections 1.1 and 1.2, life sciences is one of the many domains concerned with the data deluge.Researchers are generating increasing quantities of data in data silos and we are all tryingas hard as we can to make things even worse by interconnecting these silos. In translationalresearch, accessing and combining data is a challenge as important as the biological questions wetry to answer. We have seen throughout this manuscript that the Semantic Web is valuable forautomatically processing the data in order to answer biological questions [50]. All the efforts formanaging the data of the projects presented in the previous sections also suggest that manualdata management specific to each project will fail globally because of both thequantity and the complexity. Tending the scientific information ecosystem shouldbe done systematically.
E-Science is “both the pursuit of global, collaborative in silico science and the computa-tional infra-structure to support it.” [256]. In this context, systematic data management relieson metadata associated to the raw data as well as the data produced along the processingsteps of the analysis. This is typically supported by Virtual Research Environments (VRE). Inbioinformatics, the data processing steps are usually handled by a workflow engine associatedwith the VRE, such as the Taverna [257] engine with myExperiment [258], or more recentlyGalaxy12 [259] and its data manager [260] with HubZero13.
With the VRE providing an integrated framework for storing the data and the associatedmetadata, as well as workflow descriptions that can be executed on the data, the next challengelies in metadata generation. Currently, these metadata are optional: they are not required byany step of the analysis and except for the most simple ones such as the date or the creator, itis up to the user to provide them to the VRE for meeting traceability requirements of for aneasier data retrieval. However, this will never scale-up for handling large quantities of data.
With Yvan Le Bras (plateforme GenOuest), Alban Gaignard (institut du thorax Nantes),Audrey Bihouee (plateforme bioinformatique BiRD Nantes), Francois Moreews (INRA Rennes)and Olivier Collin (plateforme GenOuest), we are working on integrating a semantically-richmetadata (typically based on PROV14, ISA [261] and EDAM [262]) generation capability intothe VRE data management. We hypothesize that the metadata associated with the result ofthe execution of a workflow can be automatically determined from the annotations of the inputdata and of the workflow and we propose to embed this capability into the workflow engineitself [263].
Among the strategies we are considering, I propose to:
• create a generic “semantic metadata wrapper” service taking as parameters (1) the iden-tifier of a “regular service”, (2) a semantic description of this regular service (the serviceidentifier can be a part of the semantic description) and of its parameters and (3) a se-mantic description of the workflow invoking the regular service. The semantic wrapperservice is responsible for invoking the regular service, and for generating the metadataassociated with the result.
• create a service converting a “regular” workflow into a “semantic metadata-enabled” work-flow by embedding each service of the original workflow into its semantic metadata wrappercounterpart.
This solution is compatible with any workflow engine, and does not require to hack into theinternals of the engine. It requires a minimal amount of manual annotation: once for each
12https://galaxyproject.org/13https://hubzero.org/14http://www.w3.org/TR/prov-o/
133

service and once for each workflow. Moreover, a user can use the regular version of the serviceswhen creating a new workflow and then generate the semantically-enabled version for productionpurpose once he is satisfied. Eventually, the generic wrapper that can possibly be refined usingan approach similar to inheritance by creating as many specific wrappers generating specialannotations and calling the generic wrapper for handling the general annotations.
6.1.2 Querying linked data
In all the projects mentioned in Section 6.1.1.1, writing SPARQL queries greatly simplifies theanalysis. However, in spite of the benefits, this in turn suffers from two main limitations: (1)writing these queries requires a mental representation of the data underlying structure, i.e. whatkinds of entities are present and what are the typical relations between them, and (2) not allend-users are willing to take up learning SPARQL, and find it all the more difficult to do sobecause they also lack (1).
Representations of the structure of the data available at SPARQL end-points are typicallyprovided by additional diagrams (e.g. for Uniprot15, Reactome16 or ChEMBL17). However,these diagrams are hand-crafted and not always available, which makes the manual explorationof an endpoint cumbersome.
When a diagram is available, the user still has to write SPARQL queries, which (s)he maynot be familiar with. This typically consists in writing the SPARQL code in the text area of awebsite. The most user-friendly solutions feature syntax-highlighting but are still regarded as“too technical”, even if some typical example queries and templates are provided. Initiatives suchas Sparklis18 aim at making exploration easier [264]. Sparklis allows the user to build a querystep by step by iteratively selecting the relation and the neighbor of a node of interest It wasstill perceived as lacking ergonomy. Moreover, because of performance constraints, infrequentproperties and neighbors may not be presented for a node of interest, which may give themisleading impression that some information is not present in the data.
I propose an unified solution to both problems based on the representation of the data presenton a triplestore as a graph, and on a query-building principle using paths on the abstractiongraph. Of course this solution should be generic, and will be applicable (among others) to allthe projects mentioned in Section 6.1.1.1.
6.1.2.1 RDFmap: building an abstraction graph of data
RDFmap aims at building automatically a graph-based abstraction of a dataset that would besimilar to the hand-crafted diagrams used currently.
The general principle consists in identifying the main classes, and in creating a link betweentwo classes if an instance of the first class is associated to an instance of the second class. Thewhole process can be performed as a SPARQL query. The first results are encouraging. Somework is still required for improving identification of the main classes and for determining whichrelations between them should be represented.
6.1.2.2 AskOmics: building SPARQL queries as paths on the abstraction graph
AskOmics is being developed by Charles Bettembourg and Fabrice Legeai as a contribution tothe MiRNAdapt project [101], but should be applicable to any RDF dataset.
15http://sparql.uniprot.org/images/diagrams/uniprot.jpg16https://www.ebi.ac.uk/rdf/sites/ebi.ac.uk.rdf/files/documents/reactome_simplified.png17https://www.ebi.ac.uk/chembl/extra/RDF/chembl_18_rdf_summary.png18http://www.irisa.fr/LIS/ferre/sparklis/
134

It is based on an abstract representation of the MiRNAdapt data which was created manuallybut should be replaced by the result of RDFmap in the future. AskOmics uses D3.js19 to providea visual representation of the abstraction as a graph. By starting from a node of interest anditeratively selecting its neighbors, the user creates a path on the abstraction graph. This pathcan then be transformed into a SPARQL query that can be executed on the original dataset.
This approach presents several benefits. First, the abstraction graph only needs to begenerated once and does not need to be computed on-the-fly for each node, contrary to Sparklis.Second, the whole query building only takes place on the abstraction graph, which is muchsmaller than a typical RDF dataset. Third, intermediate count() queries can be executed onthe dataset to provide on-the-fly hints to the user (or for debugging assistance). Fourth, thesame principle can be applied on an optional (manually-generated) “interface layer” on top theabstraction graph in order to hide parts of the abstraction that may not be relevant to the useror to provide “shortcuts” in order to avoid property paths (i.e. composition of relations) ; therecan be different interface layers depending on the types of users.
6.2 Analyzing data
I joined the Dyliss team at IRISA in 2013. The team focuses on bioinformatics and systemsbiology. The main goal in biology is to characterize groups of genetic actors that control thephenotypic answer of non-model species when challenged by their environment. Unlike modelspecies, only a limited prior-knowledge is available for these organisms [30] together with a smallrange of experimental studies (culture conditions, genetic transformations). To accommodatethese limitations, the team explores methods in the field of formal systems, more precisely inknowledge representation, constraints programming, multi-scale analysis of dynamical systems,and machine learning. Our goal is to take into account both the information on physiologicalresponses of the studied species under various constraints and the genetic information from theirlong-distant cousins.
The challenge to face is thus incompleteness: the limited range of physiological or geneticknown perturbations is combined with an incomplete knowledge of living mechanisms involved.We favor the construction and study of a “space of feasible models or hypotheses” includingknown constraints and facts on a living system rather than searching for a single optimizedmodel. We develop methods allowing a precise investigation of this space of hypotheses. There-fore, the biologist will be in position of developing experimental strategies to progressively shrinkthe space of hypotheses and gain in the understanding of the system. This refinement approachis particularly suited to non-model organisms, which have specific and little known survivalmechanisms. It is also required in the framework of an increasing automation of experimenta-tions in biology.
By exploring the complete space of models, our approach typically produces numerous can-didate models compatible with the observations. My contribution consists in investigatingto what extent domain knowledge can further refine the analysis of the set of mod-els by identifying classes of similar models, or by selecting the models that best fitbiological knowledge. We anticipate that this will be particularly relevant when studyingnon-model species for which little is known but valuable information from other species can betransposed or adapted.
Sections 6.2.1 and 6.2.2 present ongoing works on the selection of relevant candidates whenreconstructing metabolic pathways and on the analysis of TGF-β signaling pathways. Althoughthe application domains are different, the reasoning method is strikingly similar in both cases.
19http://d3js.org/
135

Section 6.2.3 presents my medium to long range main research goal, that consists in defining amore generic analysis framework combining topological and semantics information.
6.2.1 Selecting relevant candidates when reconstructing metabolic pathways
This work is a contribution to the Idealg project20 (investissement d’avenir). It is a collaborationwith Sylvain Prigent, Anne Siegel and Pierre Vignet. The idealg project aims at having a betteroverall understanding of the three groups of macroalgae (green, red and brown) in order todevelop the algae sector in Brittany. This includes especially the study of species specific toeach of the three major groups of algae, Ectocarpus siliculosus in the case of brown algae.
A part of this projects consists in proposing a complete metabolic network for Ectocarpussiliculosus. A metabolic network is the complete set of physical and physiological reactions thatexplain the overall functioning of a cell. This metabolic network has to have a good qualityand has to be compatible with biological observations. It must especially be able to explainthe presence of 56 compounds of interest for biologists. Reconstructing metabolic networks isa labor-intensive task requiring numerous biological experiments. Most current efforts reliedmassively on experts manual intervention either in plants [265, 266, 267] or in animals [268].
Ectocarpus siliculosus not being a “model species”, numerous portions of metabolic path-ways are unknown [30]. The traditional approach is not applicable in this context because thedata are too scarce, would take too long to produce and lack a large-enough community tovalidate. A classic strategy consists in completing the pathways using reactions observed inother species. However, there are many reactions from many species, spread in several com-plementary databases [247]. Determining the best candidates from a biological point of viewrequires incorporating prior knowledge [269] but remains an open challenge, specially for largescale networks [270, 271, 272, 273]. Existing symbolic knowledge represented in ontologies cancontribute to address the problem of missing information [274, 275] and the problem of pro-cessing large quantities of interdependent data [45]. A previous study used MetaCyc [276] asa source of candidate reactions to complete the metabolic network [99]. The smallest set ofMetaCyc reactions to be added to the reconstructed network in order to produce the 56 targetproteins of interest is composed of 42 reactions. However, a systematic exploration produced2400 possible minimal sets that are all structurally equivalent. Together, these 2400 candidatesets cover 70 reactions, so they have a large overlap.
We have developed a knowledge-based method that reduces the number of candidate setsfrom 2400 to 48. It consists in creating a graph of mutually-exclusive reactions (i.e. couplesof reactions that do not belong to any candidate metabolic network) in order to retrieve themaximal cliques. Composing a candidate network requires to select one of the reactions foreach clique. We then developed a reasoning method based on ontologies in order to determinefor each clique a subset of the reactions that fit best with biological knowledge. Eventually, weonly select the candidate networks composed of these reactions. We are currently performinga formal evaluation of this strategy on Escherichia coli by artificially degrading metabolicnetworks before reconstructing them (i.e. to assess whether we selected the relevant candidatesand discarded the not-so relevant ones) and investigating further enhancements.
6.2.2 Analyzing TGF-β signaling pathways
This project is a collaboration with Nathalie Theret with whom I supervise Jean Coquet’s PhDthesis, Geoffroy Andrieux, Anne Siegel and Jacques Nicolas. The transforming growth factorbeta 1 (TGF-β1) protein plays a major role in immune response and in tumor development, as an
20http://www.idealg.ueb.eu/
136
antagonist in the early stages and as a promoter in the advanced stages [277]. TGF-β pleiotropiceffects are linked to the complex mechanisms regulating its activity. These mechanisms aretherefore potential therapeutic targets.
Geoffroy Andrieux developed the most exhaustive discrete model of TGF-β signaling path-ways. It contains 9,248 reactions composed of 9,177 components. This model allowed him toidentify 15,934 sets of influence composed of chemical reactions and activating some of the 145genes influenced by TGF-β [278]. The size and the internal complexity of this network preventits exploitation by biologists.
We are conducting a systematic analysis in order to identify:
• sets of genes activated by similar sets of influence. The relevance of these gene sets willdepend on the biological processes of the diseases associated with the genes.
• families of similar sets of influence (i.e. activating the same genes or genes involved insimilar processes).
• genes or sets of influence common to several sets and playing the role of interface. Suchelements are of potential interest for understanding the transition of TGF-β role fromtumor antagonist to tumor promoter.
This analysis consists in a systematic search of associations, and also relies on external domainknowledge such as biological processes or diseases. This knowledge is used both in the searchof association and on the interpretation of results.
The analysis consists in determining cliques of genes activated by the same sets of influence,and cliques of sets of influence activating the same genes. We then determine the cliqueshomogeneity according to biological processes or diseases, and select the most interesting forfurther analysis by biologists.
6.2.3 Data analysis method combining ontologies and formal concept analy-sis
The method for selecting candidates after metabolic pathways reconstruction (section 6.2.1) andthe method for analyzing signaling pathways (section 6.2.2) both consist of a topological analysisof a domain-dependent graph, followed by a semantic-based method for grouping solutions of forreducing their number. I intend to develop a refined and unified analysis method. The Confocalproject (PEPS CNRS FaSciDo 2015) with Anne Siegel, Jacques Nicolas et Nathalie Theret,Jean Coquet, Amedeo Napoli (LORIA Nancy) and Elisabeth Remy (Institut de Mathematiquesde Luminy) is a first step in this direction.
In the biomedical domain, the classical approaches for analyzing annotated elements rely ondomain knowledge and semantic similarity values in oder to perform hierarchical clustering [279,280, 22]. Because data are noisy and incomplete, as mentioned previously, special approacheshave been developed [281, 282].
Limitation 1: classical biclustering methods do not permit partial overlap of clusters, whichis not compatible with the pleiotropic nature of some genes.
Formal concept analysis (FCA) performs an exhaustive search of maximal sets of elementssharing the same attributes [283]. It addresses the previous limitation and is a relevant alterna-tive because the lattice represents several levels of precision from numerous small sets of geneshaving many influence sets in common, to fewer larger gene sets sharing fewer influence sets.Contrary to biclustering, the lattice also supports the identification of partially overlapping clus-ters. Compared to the maximal cliques, it allows us to perform a finer-grain analysis. FCA hasalready been successfully applied to the analysis of gene expression data [284] and to signaling
137

networks modeling [285]. Eren et al. have shown that clustering algorithms capable of findingmore than one model are more likely to find biologically-relevant clusters [279]. However, FCAalso suffers from the following limitations, even if recent breakthrough in the Orpailleur teamconcerned the combination of biclustering and FCA [286, 287] and a concept stability measurefor identifying relevant concepts [288, 289].
Limitation 2: FCA assumes that the elements are independent, whereas we would like totake relations extracted from ontologies into account.
Limitation 3: FCA’s exhaustive search generates numerous formal concepts, not all ofthem being informative (specially the large and the small ones) or biologically-relevant [290].
Limitation 4: FCA is sensitive to noisy and incomplete data. Pensa and Boulicaut devel-oped a fault-tolerant technique that they applied to gene expression analysis [291].
I will focus on using ontologies to guide formal concept analysis for identifying relevantassociations among data. This will involve using ontologies (1) before FCA for enriching anno-tations, and (2) after FCA for identifying semantically-homogeneous clusters that either matchexisting knowledge (for validation purpose), or do not (for discovery purpose).
138

Bibliography
[1] Carol J. Bult. From information to understanding: the role of model organism databasesin comparative and functional genomics. Animal Genetics, 37(suppl. 1):28–40, 2006.
[2] Olivier Bodenreider and Robert Stevens. Bio-ontologies: current trends and future direc-tions. Briefings in Bioinformatics, 7(3):256–274, 2006.
[3] Judith A. Blake and Carol J. Bult. Beyond the data deluge: Data integration and bio-ontologies. Journal of Biomedical Informatics, 39(3):314–320, 2006.
[4] Nicola Cannata, Emanuela Merelli, and Russ B. Altman. Time to organize the bioinfor-matics resourceome. PLoS Computational Biology, 1(7):0531–0533, 2005.
[5] R Bellazzi, M Diomidous, I N Sarkar, K Takabayashi, A Ziegler, and A T McCray. Dataanalysis and data mining: current issues in biomedical informatics. Methods of informationin medicine, 50(6):536–544, 2011.
[6] Damian Smedley, Syed Haider, Steffen Durinck, Luca Pandini, Paolo Provero, JamesAllen, Olivier Arnaiz, Mohammad Hamza Awedh, Richard Baldock, Giulia Barbiera,Philippe Bardou, Tim Beck, Andrew Blake, Merideth Bonierbale, Anthony J Brookes,Gabriele Bucci, Iwan Buetti, Sarah Burge, Cedric Cabau, Joseph W Carlson, ClaudeChelala, Charalambos Chrysostomou, Davide Cittaro, Olivier Collin, Raul Cordova, Ros-alind J Cutts, Erik Dassi, Alex Di Genova, Anis Djari, Anthony Esposito, Heather Es-trella, Eduardo Eyras, Julio Fernandez-Banet, Simon Forbes, Robert C Free, TakatomoFujisawa, Emanuela Gadaleta, Jose M Garcia-Manteiga, David Goodstein, Kristian Gray,Jose Afonso Guerra-Assuncao, Bernard Haggarty, Dong-Jin Han, Byung Woo Han, ToddHarris, Jayson Harshbarger, Robert K Hastings, Richard D Hayes, Claire Hoede, ShenHu, Zhi-Liang Hu, Lucie Hutchins, Zhengyan Kan, Hideya Kawaji, Aminah Keliet, Ar-naud Kerhornou, Sunghoon Kim, Rhoda Kinsella, Christophe Klopp, Lei Kong, DanielLawson, Dejan Lazarevic, Ji-Hyun Lee, Thomas Letellier, Chuan-Yun Li, Pietro Lio, Chu-Jun Liu, Jie Luo, Alejandro Maass, Jerome Mariette, Thomas Maurel, Stefania Merella,Azza Mostafa Mohamed, Francois Moreews, Ibounyamine Nabihoudine, Nelson Ndegwa,Celine Noirot, Cristian Perez-Llamas, Michael Primig, Alessandro Quattrone, Hadi Ques-neville, Davide Rambaldi, James Reecy, Michela Riba, Steven Rosanoff, Amna Ali Saddiq,Elisa Salas, Olivier Sallou, Rebecca Shepherd, Reinhard Simon, Linda Sperling, WilliamSpooner, Daniel M Staines, Delphine Steinbach, Kevin Stone, Elia Stupka, Jon W Teague,Abu Z Dayem Ullah, Jun Wang, Doreen Ware, Marie Wong-Erasmus, Ken Youens-Clark,Amonida Zadissa, Shi-Jian Zhang, and Arek Kasprzyk. The BioMart community portal:an innovative alternative to large, centralized data repositories. Nucleic acids research,43(W1):W589–W598, 2015.
139

[7] Michael Y Galperin, Daniel J Rigden, and Xose M Fernandez-Suarez. The 2015 nucleicacids research database issue and molecular biology database collection. Nucleic acidsresearch, 43(Database issue):D1–D5, 2015.
[8] Alyssa Goodman, Alberto Pepe, Alexander W Blocker, Christine L Borgman, Kyle Cran-mer, Merce Crosas, Rosanne Di Stefano, Yolanda Gil, Paul Groth, Margaret Hedstrom,David W Hogg, Vinay Kashyap, Ashish Mahabal, Aneta Siemiginowska, and AleksandraSlavkovic. Ten simple rules for the care and feeding of scientific data. PLoS computationalbiology, 10(4):e1003542, 2014.
[9] Zachary D Stephens, Skylar Y Lee, Faraz Faghri, Roy H Campbell, Chengxiang Zhai,Miles J Efron, Ravishankar Iyer, Michael C Schatz, Saurabh Sinha, and Gene E Robinson.Big data: Astronomical or genomical? PLoS biology, 13(7):e1002195, 2015.
[10] Hiroaki Kitano. Computational systems biology. Nature, 420(6912):206–210, 2002.
[11] Marvalee H Wake. What is ”integrative biology”? Integrative and comparative biology,43(2):239–241, 2003.
[12] Jennifer R Tisoncik and Michael G Katze. What is systems biology? Future microbiology,5(2):139–141, 2010.
[13] Bas Teusink, Hans V Westerhoff, and Frank J Bruggeman. Comparative systems biology:from bacteria to man. Wiley interdisciplinary reviews. Systems biology and medicine,2(5):518–532, 2010.
[14] Huajun Chen, Tong Yu, and Jake Y Chen. Semantic web meets integrative biology: asurvey. Briefings in bioinformatics, 14(1):109–125, 2012.
[15] Francesco M Marincola. Translational medicine: A two-way road. Journal of translationalmedicine, 1(1):1, 2003.
[16] Indra Neil Sarkar. Biomedical informatics and translational medicine. Journal of trans-lational medicine, 8:22, 2010.
[17] Atul J Butte. Translational bioinformatics: coming of age. Journal of the AmericanMedical Informatics Association : JAMIA, 15(6):709–714, 2008.
[18] Nigam H Shah, Clement Jonquet, Annie P Chiang, Atul J Butte, Rong Chen, and Mark AMusen. Ontology-driven indexing of public datasets for translational bioinformatics. BMCbioinformatics, 10 Suppl 2:S1, 2009.
[19] Qing Yan. Translational bioinformatics and systems biology approaches for personalizedmedicine. Methods in molecular biology (Clifton, N.J.), 662:167–178, 2010.
[20] R B Altman. Translational bioinformatics: Linking the molecular world to the clinicalworld. Clinical pharmacology and therapeutics, 2012. In press.
[21] Atul J Butte and Lucila Ohno-Machado. Making it personal: translational bioinformatics.Journal of the American Medical Informatics Association : JAMIA, 20(4):595–596, 2013.
[22] Atsushi Fukushima, Shigehiko Kanaya, and Kozo Nishida. Integrated network analysisand effective tools in plant systems biology. Frontiers in plant science, 5:598, 2014.
140

[23] Yonqing Zhang, Supriyo De, John R Garner, Kirstin Smith, S Alex Wang, and Kevin GBecker. Systematic analysis, comparison, and integration of disease based human geneticassociation data and mouse genetic phenotypic information. BMC medical genomics, 3:1,2010.
[24] Kyoohyoung Rho, Bumjin Kim, Youngjun Jang, Sanghyun Lee, Taejeong Bae, Jihae Seo,Chaehwa Seo, Jihyun Lee, Hyunjung Kang, Ungsik Yu, Sunghoon Kim, Sanghyuk Lee,and Wan Kyu Kim. GARNET - gene set analysis with exploration of annotation relations.BMC bioinformatics, 12 Suppl 1:S25, 2011.
[25] William A Baumgartner, K Bretonnel Cohen, Lynne M Fox, George Acquaah-Mensah,and Lawrence Hunter. Manual curation is not sufficient for annotation of genomicdatabases. Bioinformatics (Oxford, England), 23(13):i41–i48, 2007.
[26] Carole Goble and Robert Stevens. State of the nation in data integration for bioinformat-ics. Journal of biomedical informatics, 41(5):687–693, 2008.
[27] Sean Bechhofer, Iain Buchan, David De Roure, Paolo Missier, John Ainsworth, JitenBhagat, Philip Couch, Don Cruickshank, Mark Delderfield, Ian Dunlop, Matthew Gamble,Danius Michaelides, Stuart Owen, David Newman, Shoaib Sufi, and Carole Goble. Whylinked data is not enough for scientists. Future Generation Computer Systems, 29(2):599–611, 2013.
[28] Hector J. Levesque. On our best behaviour. In Proceedings of IJCAI2013 conference,2013.
[29] Robert Stevens, Carole A. Goble, and Sean Bechhofer. Ontology-based knowledge repre-sentation for bioinformatics. Briefings in bioinformatics, 1(4):398–416, 2000.
[30] C R Primmer, S Papakostas, E H Leder, M J Davis, and M A Ragan. Annotated genesand nonannotated genomes: cross-species use of gene ontology in ecology and evolutionresearch. Molecular ecology, 22(12):3216–3241, 2013.
[31] Kathrin Dentler, Annette ten Teije, Nicolette de Keizer, and Ronald Cornet. Barriers tothe reuse of routinely recorded clinical data: a field report. Studies in health technologyand informatics, 192:313–317, 2013.
[32] G F Cooper, B G Buchanan, M Kayaalp, M Saul, and J K Vries. Using computer modelingto help identify patient subgroups in clinical data repositories. Proceedings / AMIA ...Annual Symposium. AMIA Symposium, pages 180–184, 1998.
[33] J J Cimino. Desiderata for controlled medical vocabularies in the twenty-first century.Methods of information in medicine, 37(4–5):394–403, 1998.
[34] James J Cimino. In defense of the desiderata. Journal of biomedical informatics,39(3):299–306, 2005.
[35] Barry Smith. New desiderata for biomedical terminologies. In Ontologies and BiomedicalInformatics, Conference of the International Medical Informatics Association, 2005.
[36] J. J. Cimino and X. Zhu. The practical impact of ontologies on biomedical informatics.Methods of information in medicine, 2006.
[37] Jonathan B L Bard and Seung Y Rhee. Ontologies in biology: design, applications andfuture challenges. Nature reviews. Genetics, 5(3):213–222, 2004.
141

[38] Thomas R. Gruber. Formal Ontology in Conceptual Analysis and Knowledge Representa-tion, chapter Toward Principles for the Design of Ontologies used for Knowledge Sharing.Kluwer Academic Publishers, 1993.
[39] B Chandrasekaran, JR Josephson, and VR Benjamins. What are ontologies and why dowe need them ? IEEE Intelligent Systems, 14(1):20–26, 1999.
[40] Anita Burgun. Desiderata for domain reference ontologies in biomedicine. Journal ofBiomedical Informatics, 39:307–313, 2006.
[41] Stefan Schulz, Laszlo Balkanyi, Ronald Cornet, and Olivier Bodenreider. From conceptrepresentations to ontologies: A paradigm shift in health informatics? Healthcare infor-matics research, 19(4):235–242, 2013.
[42] Andre Q Andrade, Markus Kreuzthaler, Janna Hastings, Maria Krestyaninova, and StefanSchulz. Requirements for semantic biobanks. Studies in health technology and informatics,180:569–573, 2012.
[43] Mikel Egana Aranguren, Erick Antezana, Martin Kuiper, and Robert Stevens. Ontol-ogy design patterns for bio-ontologies: a case study on the cell cycle ontology. BMCBioinformatics, 9(Suppl 5):S1, 2008.
[44] Matthew E Holford, James P McCusker, Kei-Hoi Cheung, and Michael Krauthammer. Asemantic web framework to integrate cancer omics data with biological knowledge. BMCbioinformatics, 13 Suppl 1:S10, 2012.
[45] Lars J Jensen and Peer Bork. Ontologies in quantitative biology: a basis for comparison,integration, and discovery. PLoS biology, 8(5):e1000374, 2010.
[46] Frank Emmert-Streib, Matthias Dehmer, and Benjamin Haibe-Kains. Untangling sta-tistical and biological models to understand network inference: the need for a genomicsnetwork ontology. Frontiers in genetics, 5:299, 2014.
[47] Yi Liu, Adrien Coulet, Paea LePendu, and Nigam H Shah. Using ontology-based annota-tion to profile disease research. Journal of the American Medical Informatics Association: JAMIA, 19(e1):e177–e186, 2012.
[48] Robert Hoehndorf, Michel Dumontier, and Georgios V Gkoutos. Evaluation of researchin biomedical ontologies. Briefings in bioinformatics, 2012. In press.
[49] Natalya F Noy, Nigam H Shah, Patricia L Whetzel, Benjamin Dai, Michael Dorf, NicholasGriffith, Clement Jonquet, Daniel L Rubin, Margaret-Anne Storey, Christopher G Chute,and Mark A Musen. Bioportal: ontologies and integrated data resources at the click of amouse. Nucleic acids research, 37(Web Server issue):W170–W173, 2009.
[50] Alan Ruttenberg, Tim Clark, William Bug, Matthias Samwald, Olivier Bodenreider, He-len Chen, Donald Doherty, Kerstin Forsberg, Yong Gao, Vipul Kashyap, June Kinoshita,Joanne Luciano, M. Scott Marshall, Chimezie Ogbuji, Jonathan Rees, Susie Stephens,Gwendolyn T. Wong, Elizabeth Wu, Davide Zaccagnini, Tonya Hongsermeier, Eric Neu-mann, Ivan Herman, and Kei-Hoi Cheung. Advancing translational research with thesemantic web. BMC Bioinformatics, 8(3), 2007.
[51] Robert Stevens, Mikel Egana Aranguren, Katy Wolstencroft, Ulrike Sattler, Nick Drum-mond, Matthew Horridge, and Alan Rector. Using OWL to model biological knowledge.International Journal of Human Computer Studies, 65(7):583–594, 2007.
142

[52] Mikel Egana Aranguren, Sean Bechhofer, Phillip Lord, Ulrike Sattler, and Robert Stevens.Understanding and using the meaning of statements in a bio-ontology: recasting the geneontology in OWL. BMC bioinformatics, 8:57, 2007.
[53] David P Hill, Nico Adams, Mike Bada, Colin Batchelor, Tanya Z Berardini, Heiko Dietze,Harold J Drabkin, Marcus Ennis, Rebecca E Foulger, Midori A Harris, Janna Hastings,Namrata S Kale, Paula de Matos, Christopher J Mungall, Gareth Owen, Paola Roncaglia,Christoph Steinbeck, Steve Turner, and Jane Lomax. Dovetailing biology and chemistry:integrating the Gene Ontology with the ChEBI chemical ontology. BMC genomics, 14:513,2013.
[54] Nicola Cannata, Michael Schroder, Roberto Marangoni, and Paolo Romano. A semanticweb for bioinformatics: goals, tools, systems, applications. BMC bioinformatics, 9 Suppl4:S1, 2008.
[55] Lennart J G Post, Marco Roos, M Scott Marshall, Roel van Driel, and Timo M Breit. Asemantic web approach applied to integrative bioinformatics experimentation: a biologicaluse case with genomics data. Bioinformatics (Oxford, England), 23(22):3080–3087, 2007.
[56] R Bellazzi. Big data and biomedical informatics: A challenging opportunity. Yearbook ofmedical informatics, 9(1), 2014. In press.
[57] Satya S. Sahoo, Olivier Bodenreider, Kelly Zeng, and Amit Sheth. An experiment inintegrating large biomedical knowledge resources with RDF: Application to associatinggenotype and phenotype information. In Proceedings of the WWW2007 Workshop onHealth Care and Life Sciences Data Integration for the Semantic Web, 2007.
[58] Marıa Taboada, Diego Martınez, Belen Pilo, Adriano Jimenez-Escrig, Peter N Robinson,and Marıa J Sobrido. Querying phenotype-genotype relationships on patient datasetsusing semantic web technology: the example of cerebrotendinous xanthomatosis. BMCmedical informatics and decision making, 12:78, 2012.
[59] Christian Bizer, Tom Heath, and Tim Berners Lee. Linked data–the story so far. Inter-national Journal on Semantic Web and Information Systems, 5(3):1–22, 2009.
[60] Kevin M Livingston, Michael Bada, William A Baumgartner, and Lawrence E Hunter.Kabob: ontology-based semantic integration of biomedical databases. BMC bioinformat-ics, 16:126, 2015.
[61] Francois Belleau, Marc-Alexandre Nolin, Nicole Tourigny, Philippe Rigault, and JeanMorissette. Bio2RDF: towards a mashup to build bioinformatics knowledge systems.Journal of biomedical informatics, 41(5):706–716, 2008.
[62] Kei-Hoi Cheung, H Robert Frost, M Scott Marshall, Eric Prud’hommeaux, MatthiasSamwald, Jun Zhao, and Adrian Paschke. A journey to semantic web query federation inthe life sciences. BMC bioinformatics, 10 Suppl 10:S10, 2009.
[63] Alison Callahan, Jose Cruz-Toledo, and Michel Dumontier. Ontology-based querying withBio2RDF’s linked open data. Journal of biomedical semantics, 4 Suppl 1:S1, 2013.
[64] Sarala M Wimalaratne, Jerven Bolleman, Nick Juty, Toshiaki Katayama, Michel Du-montier, Nicole Redaschi, Nicolas Le Novere, Henning Hermjakob, and Camille Laibe.SPARQL-enabled identifier conversion with identifiers.org. Bioinformatics (Oxford, Eng-land), 31(11):1875–1877, 2015.
143

[65] Olivier Dameron, Bernard Gibaud, Anita Burgun, and Xavier Morandi. Towards asharable numeric and symbolic knowledge base on cerebral cortex anatomy: lessons froma prototype. In American Medical Informatics Association AMIA, pages 185–189, 2002.
[66] Olivier Dameron, Bernard Gibaud, and Xavier Morandi. Numeric and symbolic repre-sentation of the cerebral cortex anatomy: Methods and preliminary results. Surgical andRadiologic Anatomy, 26(3):191–197, 2004.
[67] Olivier Dameron, Anita Burgun, Xavier Morandi, and Bernard Gibaud. Modelling depen-dencies between relations to insure consistency of a cerebral cortex anatomy knowledgebase. In Studies in Health technology and informatics, pages 403–408, 2003.
[68] Olivier Dameron, Bernard Gibaud, and Mark Musen. Using semantic dependencies forconsistency management of an ontology of brain-cortex anatomy. In First InternationalWorkshop on Formal Biomedical Knowledge Representation KRMED04, pages 30–38,2004.
[69] Olivier Dameron, Mark A. Musen, and Bernard Gibaud. Using semantic dependencies forconsistency management of an ontology of brain-cortex anatomy. Artificial Intelligence inMedicine, 39(3):217–225, 2007.
[70] Patrick Lambrix, Manal Habbouche, and Marta Perez. Evaluation of ontology develop-ment tools for bioinformatics. Bioinformatics (Oxford, England), 19(12):1564–1571, 2003.
[71] Robert Stevens, Chris Wroe, Sean Bechhofer, Phillip Lord, Alan Rector, and Carole Goble.Building ontologies in daml + oil. Comparative and functional genomics, 4(1):133–141,2003.
[72] Holger Knublauch, Ray W. Fergerson, Natalya F. Noy, and Mark A. Musen. The protegeOWL plugin: An open development environment for semantic web applications. In Pro-ceeding of the Third International Semantic Web Conference (ISWC2004), volume 3298of Lecture Notes in Computer Science, pages 229–243. Springer Berlin Heidelberg, 2004.
[73] Daniel L. Rubin, Olivier Dameron, and Mark A. Musen. Use of description logic clas-sification to reason about consequences of penetrating injuries. In American MedicalInformatics Association Conference AMIA05, pages 649–653, 2005.
[74] Daniel L. Rubin, Olivier Dameron, Yasser Bashir, David Grossman, Parvati Dev, andMark A. Musen. Using ontologies linked with geometric models to reason about penetrat-ing injuries. Artificial Intelligence in Medicine, 37(3):167–176, 2006.
[75] Olivier Dameron, Daniel L. Rubin, and Mark A. Musen. Challenges in converting frame-based ontology into OWL: the Foundational Model of Anatomy case-study. In AmericanMedical Informatics Association Conference AMIA05, pages 181–185, 2005.
[76] Olivier Dameron and Julie Chabalier. Automatic generation of consistency constraintsfor an OWL representation of the FMA. In 10th International Protege Conference, 2007.
[77] Olivier Dameron. JOT: a scripting environment for creating and managing ontologies. In7th International Protege Conference, 2004.
[78] Olivier Dameron, Elodie Roques, Daniel L. Rubin, Gwenaelle Marquet, and Anita Bur-gun. Grading lung tumors using OWL-DL based reasoning. In 9th International ProtegeConference, 2006.
144

[79] Gwenaelle Marquet, Olivier Dameron, Stephan Saikali, Jean Mosser, and Anita Burgun.Grading glioma tumors using OWL-DL and NCI thesaurus. In Proceedings of the Amer-ican Medical Informatics Association Conference AMIA’07, pages 508–512, 2007.
[80] Anand Kumar, Yum Lina Yip, Barry Smith, and Pierre Grenon. Bridging the gap betweenmedical and bioinformatics: an ontological case study in colon carcinoma. Computers inbiology and medicine, 36(7-8):694–711, 2005.
[81] Franck W. Hartel, Sherri de Corronado, Robert Dionne, Gilberto Fragoso, and JenniferGolbeck. Modeling a description logic vocabulary for cancer research. Journal of Biomed-ical Informatics, 38:114–129, 2005.
[82] Julian Seidenberg and Alan Rector. Web ontology segmentation: analysis, classificationand use. In Proceedings of the World Wide Web Conference (WWW’06), pages 13–22,2006.
[83] Julie Chabalier, Gwenaelle Marquet, Olivier Dameron, and Anita Burgun. Enrichisse-ment de la hierarchie KEGG par l’exploitation de Gene Ontology. In Workshop OGSB,JOBIM’06, 2006.
[84] Julie Chabalier, Olivier Dameron, and Anita Burgun. Integrating disease and pathwayontologies. In Proceedings of the ISMB conference, Poster Session, 2007.
[85] Julie Chabalier, Olivier Dameron, and Anita Burgun. Integrating and querying disease andpathway ontologies: building an OWL model and using RDFS queries. In Bio-OntologiesSpecial Interest Group, Intelligent Systems for Molecular Biology conference (ISMB’07),2007.
[86] Julie Chabalier, Olivier Dameron, and Anita Burgun. Using knowledge about pathways asan organizing principle for disease ontologies. In Journees Ouvertes Biologie, Informatiqueet Mathematiques (JOBIM’07), 2007.
[87] Nicolas Lebreton, Olivier Dameron, Christophe Blanchet, and Julie Chabalier. Utilisationd’ontologies de taches et de domaine pour la composition semi-automatique de servicesweb bioinformatiques. In Proceedings of the Journees Ouvertes de Biologie, Informatiqueet Mathematiques (Jobim 2008), 2008.
[88] Nicolas Lebreton, Christophe Blanchet, Julie Chabalier, and Olivier Dameron. Utilisationd’ontologies de taches et de domaine pour la composition semi-automatique de servicesweb bioinformatiques. In Journees Ouvertes Biologie, Informatique et Mathematiques(JOBIM 2009), 2009.
[89] Nicolas Lebreton, Christophe Blanchet, Daniela Barreiro Claro, Julie Chabalier, AnitaBurgun, and Olivier Dameron. Verification of parameters semantic compatibility for semi-automatic web service composition: a generic case study. In 12th International Conferenceon Information Integration and Web-based Applications and Services (iiWAS2010), pages845–848, 2010.
[90] Charles Bettembourg, Christian Diot, Anita Burgun, and Olivier Dameron. GO2PUB:Querying PubMed with semantic expansion of gene ontology terms. Journal of biomedicalsemantics, 3(1):7, 2012.
145

[91] Anita Burgun, Lynda Temal, Arnaud Rosier, Olivier Dameron, Philippe Mabo, PierreZweigenbaum, Regis Beuscart, David Delerue, and Henry Christine. Integrating clini-cal data with information transmitted by implantable cardiac defibrillators to supportmedical decision in telecardiology: the application ontology of the AKENATON project.In Proceedings of the American Medical Informatics Association Conference AMIA, page992, 2010.
[92] Olivier Dameron, Pascal van Hille, Lynda Temal, Arnaud Rosier, Louise Deleger, CyrilGrouin, Pierre Zweigenbaum, and Anita Burgun. Comparison of OWL and SWRL-basedontology modeling strategies for the determination of pacemaker alerts severity. In Pro-ceedings of the American Medical Informatics Association Conference AMIA, page 284,2011.
[93] Pascal van Hille, Julie Jacques, Julien Taillard, Arnaud Rosier, David Delerue, Anita Bur-gun, and Olivier Dameron. Comparing Drools and ontology-based reasoning approachesfor telecardiology decision support. Studies in health technology and informatics, 180:300–304, 2012.
[94] Olivier Dameron, Paolo Besana, Oussama Zekri, Annabel Bourde, Anita Burgun, andMarc Cuggia. OWL model of clinical trial eligibility criteria compatible with partially-known information. In Proceedings of the Semantic Web for Life Sciences workshopSWAT4LS2012, 2012.
[95] Olivier Dameron, Paolo Besana, Oussama Zekri, Annabel Bourde, Anita Burgun, andMarc Cuggia. OWL model of clinical trial eligibility criteria compatible with partially-known information. Journal of Biomedical Semantics, 4(1), 2013.
[96] Charles Bettembourg, Christian Diot, and Olivier Dameron. Semantic particularitymeasure for functional characterization of gene sets using Gene Ontology. PLoS ONE,9(1):e86525, 2014.
[97] Charles Bettembourg, Christian Diot, and Olivier Dameron. Optimal threshold determi-nation for interpreting semantic similarity and particularity: Application to the compari-son of gene sets and metabolic pathways using GO and ChEBI. PloS one, 10(7):e0133579,2015.
[98] Frederic Herault, Annie Vincent, Olivier Dameron, Pascale Le Roy, Pierre Cherel, andMarie Damon. The longissimus and semimembranosus muscles display marked differencesin their gene expression profiles in pig. PloS one, 9(5):e96491, 2014.
[99] Sylvain Prigent, Guillaume Collet, Simon M Dittami, Ludovic Delage, Floriane Ethis deCorny, Olivier Dameron, Damien Eveillard, Sven Thiele, Jeanne Cambefort, CatherineBoyen, Anne Siegel, and Thierry Tonon. The genome-scale metabolic network of ectocar-pus siliculosus (EctoGEM): a resource to study brown algal physiology and beyond. ThePlant journal : for cell and molecular biology, 80(2):367–381, 2014.
[100] Jean Coquet, Geoffroy Andrieux, Jacques Nicolas, Olivier Dameron, and Nathalie Theret.Analysis of tgf-beta signalization pathway thanks to topological and semantic web meth-ods. In Journees Ouvertes Biologie, Informatique et Mathematiques (JOBIM 2015), postersession, 2015.
[101] Charles Bettembourg, Olivier Dameron, Anthony Bretaudeau, and Fabrice Legeai. Inte-gration et interrogation de reseaux de regulation genomique et post-genomique. In Proceed-ings of the IN-OVIVE workshop (INtegration de sources/masses de donnees heterogenes
146
et Ontologies, dans le domaine des sciences du VIVant et de l’Environnement), conferenceIC (Ingenierie des Connaissances) PFIA, 2015.
[102] Philippe Finet, Regine Le Bouquin-Jeannes, and Olivier Dameron. La telemedecine dansla prise en charge des maladies chroniques [in french]. Techniques Hospitalieres, (740),2013.
[103] Philippe Finet, Regine Le Bouquin-Jeannes, Olivier Dameron, and Bernard Gibaud. Re-view of current telemedicine applications for chronic diseases: Toward a more integratedsystem? IRBM, 2015. In press.
[104] Philippe Finet, Bernard Gibaud, Olivier Dameron, and Regine Le Bouquin-Jeannes. In-teroperabilite d’un systeme de capteurs en telemedecine. In Proceedings of the Journeesd’etude sur la Telesante, UTC Compiegne, 2015.
[105] Yann Rivault, Olivier Dameron, and Nolwenn Le Meur. Une infrastructure generiquebasee sur les apports du web semantique pour l’analyse des bases medico-administratives.In Proceedings of the IN-OVIVE workshop (INtegration de sources/masses de donneesheterogenes et Ontologies, dans le domaine des sciences du VIVant et de l’Environnement),conference IC (Ingenierie des Connaissances) PFIA, 2015.
[106] Nick Juty, Nicolas Le Novere, and Camille Laibe. Identifiers.org and miriam registry: com-munity resources to provide persistent identification. Nucleic acids research, 40(Databaseissue):D580–D586, 2012.
[107] David P Hill, Barry Smith, Monica S McAndrews-Hill, and Judith A Blake. Gene ontologyannotations: what they mean and where they come from. BMC bioinformatics, 9 Suppl5:S2, 2008.
[108] Judith A Blake. Ten quick tips for using the gene ontology. PLoS computational biology,9(11):e1003343, 2013.
[109] Kevin M Livingston, Michael Bada, Lawrence E Hunter, and Karin Verspoor. Repre-senting annotation compositionality and provenance for the semantic web. Journal ofbiomedical semantics, 4:38, 2013.
[110] Gene Ontology Consortium. The gene ontology (GO)project in 2006. Nucleic acidsresearch, 34(Database issue):D322–D326, 2006.
[111] Gwenaelle Marquet, Jean Mosser, and Anita Burgun. Aligning biomedical ontologies usinglexical methods and the UMLS: the case of disease ontologies. Studies in health technologyand informatics, 124:781–786, 2006.
[112] Minoru Kanehisa, Susumu Goto, Shuichi Kawashima, Yasushi Okuno, and Masahiro Hat-tori. The KEGG resource for deciphering the genome. Nucleic acids research, 32(Databaseissue):D277–D280, 2004.
[113] Xizeng Mao, Tao Cai, John G. Olyarchuk, and Liping Wei. Automated genome annotationand pathway identification using the KEGG Orthology (KO) as a controlled vocabulary.Bioinformatics, 21(19):3787–3793, 2005.
[114] Michel Klein. Combining and relating ontologies : an analysis of problems and solutions.In International Joint Conference on Artificial Intelligence IJCAI01, 2001.
147

[115] Patrick Lambrix and He Tan. Sambo – a system for aligning and merging biomedicalontologies. Journal of Web Semantics, 4(3), 2006.
[116] I. Horrocks, P.F. Patel-Schneider, and F. van Harmelen. From SHIQ and RDF to OWL:The making of a web ontology language. Journal of Web Semantics, 1(1):7–26, 2003.
[117] Cornelius Rosse, Anand Kumar, Jose L V Mejino, Daniel L Cook, Landon T Detwiler,and Barry Smith. A strategy for improving and integrating biomedical ontologies. In Pro-ceedings, American Medical Informatics Association Fall Symposium AMIA2005, pages639–643, 2005.
[118] Olivier Dameron, Charles Bettembourg, and Nolwenn Le Meur. Measuring the evolutionof ontology complexity: the Gene Ontology case study. PLoS ONE, 8(10):e75993, 2013.
[119] Olivier Bodenreider. The unified medical language system (umls): integrating biomedicalterminology. Nucleic acids research, 32(Database issue):D267–D270, 2004.
[120] Peter Haase, Jeen Broekstra, Andreas Eberhart, and Raphael Volz. A comparison of RDFquery languages. In Proceedings of the Third International Semantic Web Conference(ISWC2004), pages 502–517, 2004.
[121] Chris Wroe, Carole Goble, Antoon Goderis, Phillip Lord, and al. Recycling workflows andservices through discovery and reuse: Research articles. In Concurrency Computation :Practice and Experience, volume 19, pages 181–194, 2007.
[122] Roman Vaculin and Katia Sycara. Monitoring execution of OWL-S web services. Proceed-ings of OWL-S: Experiences and Directions Workshop, European Semantic Web Confer-ence, 2007.
[123] Duncan Hull, Katy Wolstencroft, Robert Stevens, Carole Goble, and al. Taverna: a toolfor building and running workflows of services. In Nucleic Acids Research, volume 34,pages W729–32, 2006.
[124] Sooyoung Yoo and Jinwook Choi. On the query reformulation technique for effectiveMEDLINE document retrieval. Journal of biomedical informatics, 43(5):686–693, 2010.
[125] Nicolas Griffon, Wiem Chebil, Laetitia Rollin, Gaetan Kerdelhue, Benoit Thirion, Jean-Francois Gehanno, and Stefan Jacques Darmoni. Performance evaluation of unified med-ical language system’s synonyms expansion to query PubMed. BMC medical informaticsand decision making, 12:12, 2012.
[126] Zhiyong Lu, Won Kim, and W John Wilbur. Evaluation of query expansion using MeSHin PubMed. Information retrieval, 12(1):69–80, 2009.
[127] Zhiyong Lu. PubMed and beyond: a survey of web tools for searching biomedical litera-ture. Database : the journal of biological databases and curation, 2011:baq036, 2011.
[128] Dietrich Rebholz-Schuhmann, Harald Kirsch, Miguel Arregui, Sylvain Gaudan, Mark Ri-ethoven, and Peter Stoehr. EBIMed–text crunching to gather facts for proteins frommedline. Bioinformatics (Oxford, England), 23(2):e237–e244, 2007.
[129] Yasunori Yamamoto and Toshihisa Takagi. Biomedical knowledge navigation by literatureclustering. Journal of biomedical informatics, 40(2):114–130, 2006.
148

[130] Yoshimasa Tsuruoka, Makoto Miwa, Kaisei Hamamoto, Jun’ichi Tsujii, and Sophia Ana-niadou. Discovering and visualizing indirect associations between biomedical concepts.Bioinformatics (Oxford, England), 27(13):i111–i119, 2011.
[131] A Bajpai, S Davuluri, H Haridas, G Kasliwal, H Deepti, KS Sreelakshmi, DS Chan-drashekar, P Bora, M Farouk, N Chitturi, V Samudyata, KP ArunNehru, andK Acharya. In search of the right literature search engine(s). Nature precedings, pagehttp://dx.doi.org/10.1038/npre.2011.2101.3, 2011.
[132] Michael Muin, Paul Fontelo, Fang Liu, and Michael Ackerman. SLIM: an alternative webinterface for MEDLINE/PubMed searches - a preliminary study. BMC medical informaticsand decision making, 5:37, 2005.
[133] Bhanu C Vanteru, Jahangheer S Shaik, and Mohammed Yeasin. Semantically linking andbrowsing PubMed abstracts with gene ontology. BMC genomics, 9 Suppl 1:S10, 2008.
[134] J Bhogal, A Macfarlane, and P Smith. A review of ontology-based query expansion.Information Processing and Management, 43(4):866–886, 2007.
[135] Roberto Navigli and Paola Velardi. An analysis of ontology-based query expansion strate-gies. In Proceedings of the 14th European Conference on Machine Learning, Workshop onAdaptive Text Extraction and Mining, Cavtat-Dubrovnik, Croatia, 2003.
[136] Sergio Matos, Joel P Arrais, Joao Maia-Rodrigues, and Jose Luis Oliveira. Concept-based query expansion for retrieving gene related publications from MEDLINE. BMCbioinformatics, 11:212, 2010.
[137] M A Harris, J Clark, A Ireland, J Lomax, M Ashburner, R Foulger, K Eilbeck, S Lewis,B Marshall, C Mungall, J Richter, G M Rubin, J A Blake, C Bult, M Dolan, H Drabkin,J T Eppig, D P Hill, L Ni, M Ringwald, R Balakrishnan, J M Cherry, K R Christie, M CCostanzo, S S Dwight, S Engel, D G Fisk, J E Hirschman, E L Hong, R S Nash, A Sethu-raman, C L Theesfeld, D Botstein, K Dolinski, B Feierbach, T Berardini, S Mundodi,S Y Rhee, R Apweiler, D Barrell, E Camon, E Dimmer, V Lee, R Chisholm, P Gaudet,W Kibbe, R Kishore, E M Schwarz, P Sternberg, M Gwinn, L Hannick, J Wortman,M Berriman, V Wood, N de la Cruz, P Tonellato, P Jaiswal, T Seigfried, R White, andGene Ontology Consortium. The gene ontology (GO) database and informatics resource.Nucleic acids research, 32(Database issue):D258–D261, 2004.
[138] Evelyn Camon, Michele Magrane, Daniel Barrell, Vivian Lee, Emily Dimmer, JohnMaslen, David Binns, Nicola Harte, Rodrigo Lopez, and Rolf Apweiler. The gene ontol-ogy annotation (goa) database: sharing knowledge in uniprot with gene ontology. Nucleicacids research, 32(Database issue):D262–D266, 2004.
[139] Andreas Doms and Michael Schroeder. Gopubmed: exploring pubmed with the geneontology. Nucleic acids research, 33(Web Server issue):W783–W786, 2005.
[140] Seung Yon Rhee, Valerie Wood, Kara Dolinski, and Sorin Draghici. Use and misuse ofthe gene ontology annotations. Nature Reviews Genetics, 9(7):509–515, 2008.
[141] Patricia L Whetzel, Natalya F Noy, Nigam H Shah, Paul R Alexander, Csongor Nyulas,Tania Tudorache, and Mark A Musen. BioPortal: enhanced functionality via new webservices from the national center for biomedical ontology to access and use ontologies insoftware applications. Nucleic acids research, 39(Web Server issue):W541–W545, 2011.
149

[142] Manuel Salvadores, Matthew Horridge, Paul R Alexander, Ray W Fergerson, Mark AMusen, and Natalya F Noy. Using SPARQL to query Bioportal ontologies and metadata.In Proceedings of the International Semantic Web Conference ISWC 2012, volume 7650of Lecture Notes in Computer Science, pages 180–195, 2012.
[143] Nigam H Shah, Tyler Cole, and Mark A Musen. Chapter 9: Analyses using diseaseontologies. PLoS computational biology, 8(12):e1002827, 2012.
[144] Andreas Heßand Nicholas Kushmerick. Learning to attach metadata to web services. InD. et al. Fensel, editor, Proceedings of the Second International Semantic Web Conference(ISWC2003), pages 258–273, 2003.
[145] Sherri de Coronado, Margaret W Haber, Nicholas Sioutos, Mark S Tuttle, and Lawrence WWright. Nci thesaurus: using science-based terminology to integrate cancer research re-sults. Studies in health technology and informatics, 107(Pt 1):33–37, 2004.
[146] D. Nardi, R. J. Brachman, F. Baader, W. Nutt, F. M. Donini, U. Sattler, D. Cal-vanese, R. Molitor, G. De Giacomo, R. Kusters, F. Wolter, D. L. McGuinness, P. F.Patel-Schneider, R. Moller, V. Haarslev, I. Horrocks, A. Borgida, C. Welty, A. Rector,E. Franconi, M. Lenzerini, and R. Rosati. The Description Logics Handbook : Theory,Implementation and Applications. Cambridge University Press, 2003.
[147] Franz Baader, Ian Horrocks, and Ulrike Sattler. Description logics as ontology languagesfor the semantic web. In Dieter Hutter and Werner Stephan, editors, Festschrift in honorof Jorg Siekmann, Lecture Notes in Artificial Intelligence, 2003.
[148] Dieter Fensel, Ian Horrocks, Franck van Harmelen, Stefan Decker, Michael Erdmann, andMichel Klein. OIL in a nutshell. In Knowledge Acquisition, Modeling and Management,pages 1–16, 2000.
[149] Bernardo Cuenca Grau, Ian Horrocks, Boris Motik, Bijan Parsia, Peter Patel-Schneider,and Ulrike Sattler. OWL 2: the next step for OWL. Journal of Web Semantics, 6(4):309–322, 2008.
[150] C. Rosse, J.L. Mejino, R. Modayur, B.R.and Jakobovits, K.P. Hinshaw, and J.F. Brinkley.Motivation and organizational principles for anatomical knowledge representation: Thedigital anatomist symbolic knowledge base. Journal of the American Medical InformaticsAssociation, 5(1):17–40, Jan/Feb 1998.
[151] C. Rosse and J.L.V Mejino. A reference ontology for bioinformatics: the foundationalmodel of anatomy. Journal of Biomedical Informatics, 36:478–500, 2003.
[152] N.F. Noy, M.A. Musen, J.L.V. Mejino, and C. Rosse. Pushing the envelope: Challengesin a frame-based representation of human anatomy. Data and Knowledge EngineeringJournal, 48(3):335–359, 2004.
[153] Jennifer Golbeck, Gilberto Fragoso, Franck Hartel, Jim Hendler, Jim Oberthaler, andBijan Parsia. The national cancer institute’s thesaurus and ontology. Journal of WebSemantics, 1(1):75–80, 2003.
[154] A. Rector, N. Drummond, M. Horridge, J. Rogers, H. Knublauch, R. Stevens, H. Wang,and C. Wroe. Owl pizzas: Practical experience in teaching owl-dl: Common errors andcommon patterns. In Proceedings of the European Conference on Knowledge Acquisition(EKAW-2004), pages 63–81, 2004.
150
[155] N. Noy and A. Rector. Defining n-ary relations on the semantic web: Use with individuals.In W3C Techn. Report., 2004. http://www.w3.org/TR/swbp-n-aryRelations/.
[156] Christine Golbreich, Songmao Zhang, and Olivier Bodenreider. The foundational modelof anatomy in OWL: Experience and perspectives. Web Semantics, 4(3):181–195, 2006.
[157] Songmao Zhang, Olivier Bodenreider, and Christine Golbreich. Experience in reasoningwith the foundational model of anatomy in OWL DL. In Proceedings of the PacificSymposium on Biocomputing, number 11, pages 200–211, 2006.
[158] Natalya F. Noy and Daniel L. Rubin. Translating the foundational model of anatomy intoowl. Technical report, Stanford Medical Informatics, 2007.
[159] Daniel L. Cook, Jose L.V. Mejino, and Cornelius Rosse. Evolution of a foundational modelof physiology: Symbolic representation for functional bioinformatics. In Proceedings of theMEDINFO’04 Conference, pages 336–340, 2004.
[160] IJ Haimowitz, RS Patil, and Szolovits P. Representing medical knowledge in a termi-nological language is difficult. In Proceedings of Annual Symposium on ComputationalApplications in Medical Care, pages 101–105, 1988.
[161] Christine Golbreich. Combining rule and ontology reasoners for the semantic web. InProceedings of Rules and Rule Markup Languages for the Semantic Web, number 3323,pages 6–22, 2004.
[162] W Backman, D Bendel, and R Rakhit. The telecardiology revolution: improving themanagement of cardiac disease in primary care. J R Soc Med., 103(11):442–6, 2010.
[163] K Nikus, J Lahteenmaki, P Lehto, and M Eskola. The role of continuous monitoring in a24/7 telecardiology consultation service–a feasibility study. J Electrocardiol., 42(6):473–80,2009.
[164] CT Lin, KC Chang, CL Lin, CC Chiang, SW Lu, SS Chang, BS Lin, HY Liang, RJ Chen,YT Lee, and LW Ko. An intelligent telecardiology system using a wearable and wirelessecg to detect atrial fibrillation. IEEE Trans Inf Technol Biomed., 14(3):726–33, 2010.
[165] P Rubel, J Fayn, G Nollo, D Assanelli, B Li, L Restier, S Adami, S Arod, H Atoui, M Ohls-son, L Simon-Chautemps, D Telisson, C Malossi, GL Ziliani, A Galassi, L Edenbrandt,and P Chevalier. Toward personal eHealth in cardiology. results from the EPI-MEDICStelemedicine project. J Electrocardiol., 38(4 suppl):100–6, 2005.
[166] GY Lip, R Nieuwlaat, R Pisters, DA Lane, and HJ Crijns. Refining clinical risk stratifi-cation for predicting stroke and thromboembolism in atrial fibrillation using a novel riskfactor-based approach: the euro heart survey on atrial fibrillation. Chest, 137(2):263–72,2010.
[167] European Heart Rhythm Association and European Association for Cardio-ThoracicSurgery, AJ Camm, P Kirchhof, GY Lip, U Schotten, I Savelieva, S Ernst, IC Van Gelder,N Al-Attar, G Hindricks, B Prendergast, H Heidbuchel, O Alfieri, A Angelini, D Atar,P Colonna, R De Caterina, J De Sutter, A Goette, B Gorenek, M Heldal, SH Hohloser,P Kolh, JY Le Heuzey, P Ponikowski, and FH Rutten. Guidelines for the management ofatrial fibrillation: the task force for the management of atrial fibrillation of the europeansociety of cardiology (ESC). Eur Heart J., 31(19):2369–429, 2010.
151

[168] BC Grau, I Horrocks, B Motik, B Parsia, P Patel-Schneider, and U Sattler. OWL 2: Thenext step for OWL. Journal of Web Semantics, 6:309–22, 2008.
[169] I Horrocks, PF Patel-Schneider, H Boley, S Tabet, B Grosof, and M Dean. SWRL:A semantic web rule language combining OWL and RuleML. Technical report, W3Csubmission, 2004.
[170] GY Lip and JL Halperin. Improving stroke risk stratification in atrial fibrillation. Am JMed., 3(6):484–8, 2010.
[171] E Sirin, B Parsia, BC Grau, A Kalyanpur, and Y Katz. Pellet: A practical OWL-DLreasoner. Journal of Web Semantics, 5:51–3, 2007.
[172] Huanying Helen Gu, Duo Wei, Jose L V Mejino, and Gai Elhanan. Relationship auditingof the fma ontology. Journal of biomedical informatics, 42(3):550–557, 2009.
[173] Simon Jupp, Robert Stevens, and Robert Hoehndorf. Logical gene ontology annotations(GOAL): exploring gene ontology annotations with owl. Journal of biomedical semantics,3 Suppl 1:S3, 2012.
[174] Wiktoria Golik, Olivier Dameron, Jerome Bugeon, Alice Fatet, Isabelle Hue, CatherineHurtaud, Matthieu Reichstadt, Marie-Christine Salaun, Jean Vernet, Lea Joret, FredericPapazian, Claire Nedellec, and Pierre-Yves Le Bail. ATOL: the multi-species livestocktrait ontology. In Proceedings of the 6th Metadata and Semantics Research ConferenceMTSR, 2012.
[175] Isabelle Hue, Jerome Bugeon, Olivier Dameron, Alice Fatet, Catherine Hurtaud, LeaJoret, Marie-Christine Meunier-Salaun, Claire Nedellec, Matthieu Reichstadt, Jean Ver-net, and Pierre-Yves Le Bail. ATOL and EOL ontologies, steps towards embryonic pheno-types shared worldwide? In Proceedings of the 4th Mammalian Embryo Genomics Meet-ing, October 2013, Quebec City, volume 149 of Animal Reproduction Science, page 99,2014.
[176] Pierre-Yves Le Bail, Jerome Bugeon, Olivier Dameron, Alice Fatet, Wiktoria Golik, Jean-Francois Hocquette, Catherine Hurtaud, Isabelle Hue, Catherine Jondreville, Lea Joret,Marie-Christine Meunier-Salaun, Jean Vernet, Claire Nedellec, Matthieu Reichstadt, andPhilippe Chemineau. Un langage de reference pour le phenotypage des animaux d’elevage :l’ontologie ATOL. Production Animale, 27(3):195–208, 2014.
[177] Christine Golbreich, Matthew Horridge, Ian Horrocks, Boris Motik, and Rob Shearer.OBO and OWL: Leveraging semantic web technologies for the life sciences. In Proceedingsof the 6th International Semantic Web Conference (ISWC 2007), volume 4825 of LectureNotes in Computer Science, pages 169–182, 2007.
[178] FG David and BJ Mc Carthy. Epidemiology of brain tumors. Curr Opin Neurol., 13:635–640, 2000.
[179] P Kleihues, DN Louis, BW Scheithauer, LB Rorke, G Reifenberger, PC Burger, andWK Cavenee. The WHO classification of tumors of the nervous system. J NeuropatholExp Neurol., 61(3):215–225, 2002.
[180] Marc Cuggia, Paolo Besana, and David Glasspool. Comparing semi-automatic systemsfor recruitment of patients to clinical trials. International journal of medical informatics,80(6):371–388, 2011.
152

[181] Marc Cuggia, Jean-Charles Dufour, Paolo Besana, Olivier Dameron, Regis Duvauferrier,Dominique Fieschi, Catherine Bohec, Annabel Bourde, Laurent Charlois, Cyril Garde,Isabelle Gibaud, Jean-Francois Laurent, Oussama Zekri, and Marius Fieschi. ASTEC: Asystem for automatic selection of clinical trials. In Proceedings of the American MedicalInformatics Association Conference AMIA, page 1729, 2011.
[182] Paolo Besana, Marc Cuggia, Oussama Zekri, Annabel Bourde, and Anita Burgun. Usingsemantic web technologies for clinical trial recruitment. In 9th International SemanticWeb Conference (ISWC2010), 2010.
[183] Derek Corrigan, Adel Taweel, Tom Fahey, Theodoras Arvanitis, and Brendan Delaney.An ontolological treatment of clinical prediction rules implementing the alvarado score.Studies in health technology and informatics, 186:103–107, 2013.
[184] Jean-Francois Ethier, Olivier Dameron, Vasa Curcin, Mark M. McGilchrist, Robert A.Verheij, Theodoros N. Arvanitis, Adel Taweel, Brendan C. Delaney, and Anita Burgun.A unified structural/terminological framework based on LexEVS: application to TRANS-FoRm. Journal of the American Medical Informatics Association, 20(5):986–994, 2013.
[185] L Ohno-Machado, E Parra, S B Henry, S W Tu, and M A Musen. AIDS2: a decision-support tool for decreasing physicians’ uncertainty regarding patient eligibility for HIVtreatment protocols. Proceedings Symposium on Computer Applications in Medical Care,pages 429–433, 1993.
[186] Xiujie Chen, Ruizhi Yang, Jiankai Xu, Hongzhe Ma, Sheng Chen, Xiusen Bian, and LeiLiu. A sensitive method for computing go-based functional similarities among genes with’shallow annotation’. Gene, 509(1):131–135, 2012.
[187] Sidahmed Benabderrahmane, Malika Smail-Tabbone, Olivier Poch, Amedeo Napoli, andMarie-Dominique Devignes. Intelligo: a new vector-based semantic similarity measureincluding annotation origin. BMC bioinformatics, 11(1):588, 2010.
[188] Marcus C Chibucos, Christopher J Mungall, Rama Balakrishnan, Karen R Christie,Rachael P Huntley, Owen White, Judith A Blake, Suzanna E Lewis, and Michelle Giglio.Standardized description of scientific evidence using the evidence ontology (eco). Database: the journal of biological databases and curation, 2014, 2014. In press.
[189] Frederic B Bastian, Marcus C Chibucos, Pascale Gaudet, Michelle Giglio, Gemma LHolliday, Hong Huang, Suzanna E Lewis, Anne Niknejad, Sandra Orchard, Sylvain Poux,Nives Skunca, and Marc Robinson-Rechavi. The confidence information ontology: a steptowards a standard for asserting confidence in annotations. Database : the journal ofbiological databases and curation, 2015, 2015. In press.
[190] Wei-Nchih Lee, Nigam Shah, Karanjot Sundlass, and Mark Musen. Comparison ofontology-based semantic-similarity measures. AMIA ... Annual Symposium proceedings/ AMIA Symposium. AMIA Symposium, pages 384–388, 2008.
[191] Michael F Ochs, Aidan J Peterson, Andrew Kossenkov, and Ghislain Bidaut. Incorpo-ration of gene ontology annotations to enhance microarray data analysis. Methods inmolecular biology (Clifton, N.J.), 377:243–254, 2007.
[192] Kristian Ovaska, Marko Laakso, and Sampsa Hautaniemi. Fast gene ontology basedclustering for microarray experiments. BioData mining, 1(1):11, 2008.
153

[193] James Z Wang, Zhidian Du, Rapeeporn Payattakool, Philip S Yu, and Chin-Fu Chen. Anew method to measure the semantic similarity of GO terms. Bioinformatics (Oxford,England), 23(10):1274–1281, 2007.
[194] Rafal Kustra and Adam Zagdanski. Incorporating gene ontology in clustering gene ex-pression data. In CBMS, pages 555–563. IEEE Computer Society, 2006.
[195] Nadia Bolshakova, Francisco Azuaje, and Padraig Cunningham. A knowledge-drivenapproach to cluster validity assessment. Bioinformatics (Oxford, England), 21(10):2546–2547, 2005.
[196] Billy Chang, Rafal Kustra, and Weidong Tian. Functional-network-based gene set analysisusing gene-ontology. PloS one, 8(2):e55635, 2013.
[197] Catia Pesquita, Daniel Faria, Hugo Bastos, Antonio EN Ferreira, Falcaon Andre O, andFrancisco M Couto. Metrics for go based protein semantic similarity: a systematic evalu-ation. BMC Bioinformatics, 9(Suppl 5):S4, 2008.
[198] Catia Pesquita, Daniel Faria, Andre O Falcao, Phillip Lord, and Francisco M Couto.Semantic similarity in biomedical ontologies. PLoS computational biology, 5(7):e1000443,2009.
[199] Emmanuel Blanchard, Mounira Harzallah, and Pascale Kuntz. A generic framework forcomparing semantic similarities on a subsumption hierarchy. In ECAI2008 - 18th EuropeanConference on Artificial Intelligence, pages 20–24, 2008.
[200] Philip Resnik. Semantic similarity in a taxonomy: An information-based measure and itsapplication to problems of ambiguity in natural language. Journal of Artificial IntelligenceResearch, 11:95–130, 1999.
[201] Dekang Lin. An information-theoric definition of similarity. In Proceedings of the 15thInternational Conference on Machine Learning, pages 296–304, 1998.
[202] Jay J Jiang and David W Conrath. Semantic similarity based on corpus statistics andlexical taxonomy. In International Conference Research on Computational Linguistics(ROCLING X), page 9008, 1997.
[203] G. Miller. WordNet: A lexical database for english. Communications of the ACM,38(1):39–41, 1995.
[204] Catia Pesquita, Daniel Faria, Hugo Bastos, Andre O Falcao, and Francisco M Couto.Evaluating go-based semantic similarity measures. In Proc. 10th Annual Bio-OntologiesMeeting, pages 37–40, 2007.
[205] P.W. Lord, R.D. Stevens, A. Brass, and C.A. Goble. Investigating semantic similaritymeasures across the gene ontology: the relationship between sequence and annotation.Bioinformatics, 19(10):1275–1283, 2003.
[206] Brendan Sheehan, Aaron Quigley, Benoit Gaudin, and Simon Dobson. A relation basedmeasure of semantic similarity for gene ontology annotations. BMC Bioinformatics,9(1):468, 2008.
[207] Francisco M Couto, Mario J Silva, and Pedro M Coutinho. Measuring semantic similaritybetween gene ontology terms. Data and Knowledge Engineering, 61(1):137–152, 2007.
154

[208] Bo Jin and Xinghua Lu. Identifying informative subsets of the gene ontology with infor-mation bottleneck methods. Bioinformatics (Oxford, England), 26(19):2445–2451, 2010.
[209] Jesse Gillis and Paul Pavlidis. Assessing identity, redundancy and confounds in geneontology annotations over time. Bioinformatics (Oxford, England), 2013. In press.
[210] Gang Chen, Jianhuang Li, and Jianxin Wang. Evaluation of gene ontology semantic sim-ilarities on protein interaction datasets. International journal of bioinformatics researchand applications, 9(2):173–183, 2013.
[211] R Rada, H Mili, E Bicknell, and M Blettner. Development and application of a metric onsemantic nets. IEEE Transaction on Systems, Man, and Cybernetics, 19(1):17–30, 1989.
[212] Viktor Pekar and Steffen Staab. Taxonomy learning - factoring the structure of a taxonomyinto a semantic classification decision. In Proceedings of COLING, 2002.
[213] Zhibiao Wu and Martha Palmer. Verb semantics and lexical selection. In Proc. of the32nd annual meeting on Association for Computational Linguistics, pages 133–138, 1994.
[214] Jill Cheng, Melissa Cline, John Martin, David Finkelstein, Tarif Awad, David Kulp, andMichael A Siani-Rose. A knowledge-based clustering algorithm driven by Gene Ontology.Journal of biopharmaceutical statistics, 14(3):687–700, 2004.
[215] Marco A Alvarez and Changhui Yan. A graph-based semantic similarity measure for thegene ontology. Journal of bioinformatics and computational biology, 9(6):681–695, 2011.
[216] Norberto Dıaz-Dıaz and Jesus S Aguilar-Ruiz. Go-based functional dissimilarity of genesets. BMC bioinformatics, 12:360, 2011.
[217] Gaston K Mazandu and Nicola J Mulder. Dago-fun: tool for gene ontology-based func-tional analysis using term information content measures. BMC bioinformatics, 14(1):284,2013.
[218] Steffen Grossmann, Sebastian Bauer, Peter N Robinson, and Martin Vingron. Improveddetection of overrepresentation of gene-ontology annotations with parent child analysis.Bioinformatics (Oxford, England), 23(22):3024–3031, 2007.
[219] Sebastian Klie, Marek Mutwil, Staffan Persson, and Zoran Nikoloski. Inferring gene func-tions through dissection of relevance networks: interleaving the intra- and inter-speciesviews. Molecular bioSystems, 8(9):2233–2241, 2012.
[220] Da Wei Huang, Brad T Sherman, and Richard A Lempicki. Bioinformatics enrichmenttools: paths toward the comprehensive functional analysis of large gene lists. Nucleicacids research, 37(1):1–13, 2008.
[221] Roland Barriot, David J Sherman, and Isabelle Dutour. How to decide which are themost pertinent overly-represented features during gene set enrichment analysis. BMCbioinformatics, 8:332, 2007.
[222] Miranda D Stobbe, Gerbert A Jansen, Perry D Moerland, and Antoine H C van Kampen.Knowledge representation in metabolic pathway databases. Briefings in bioinformatics,2012. In press.
[223] Troy Hawkins, Meghana Chitale, and Daisuke Kihara. Functional enrichment analysesand construction of functional similarity networks with high confidence function predictionby pfp. BMC bioinformatics, 11:265, 2010.
155

[224] Zhixia Teng, Maozu Guo, Xiaoyan Liu, Qiguo Dai, Chunyu Wang, and Ping Xuan. Mea-suring gene functional similarity based on group-wise comparison of go terms. Bioinfor-matics (Oxford, England), 2013. In press.
[225] Aravind Subramanian, Pablo Tamayo, Vamsi K Mootha, Sayan Mukherjee, Benjamin LEbert, Michael A Gillette, Amanda Paulovich, Scott L Pomeroy, Todd R Golub, Eric SLander, and Jill P Mesirov. Gene set enrichment analysis: a knowledge-based approachfor interpreting genome-wide expression profiles. Proceedings of the National Academy ofSciences of the United States of America, 102(43):15545–15550, 2005.
[226] Steven Maere, Karel Heymans, and Martin Kuiper. BiNGO: a cytoscape plugin to as-sess overrepresentation of gene ontology categories in biological networks. Bioinformatics(Oxford, England), 21(16):3448–3449, 2005.
[227] Qi Zheng and Xiu-Jie Wang. GOEAST: a web-based software toolkit for gene ontologyenrichment analysis. Nucleic acids research, 36(Web Server issue):W358–W363, 2008.
[228] Gabriela Bindea, Bernhard Mlecnik, Hubert Hackl, Pornpimol Charoentong, MarieTosolini, Amos Kirilovsky, Wolf-Herman Fridman, Franck Pages, Zlatko Trajanoski, andJerome Galon. ClueGO: a Cytoscape plug-in to decipher functionally grouped gene on-tology and pathway annotation networks. Bioinformatics (Oxford, England), 25(8):1091–1093, 2009.
[229] Da Wei Huang, Brad T Sherman, Qina Tan, Jack R Collins, W Gregory Alvord, JeanRoayaei, Robert Stephens, Michael W Baseler, H Clifford Lane, and Richard A Lempicki.The david gene functional classification tool: a novel biological module-centric algorithmto functionally analyze large gene lists. Genome biology, 8(9):R183, 2007.
[230] Erich J Baker, Jeremy J Jay, Jason A Bubier, Michael A Langston, and Elissa J Chesler.GeneWeaver: a web-based system for integrative functional genomics. Nucleic acids re-search, 40(Database issue):D1067–D1076, 2011.
[231] Bing Zhang, Denise Schmoyer, Stefan Kirov, and Jay Snoddy. Gotree machine (gotm): aweb-based platform for interpreting sets of interesting genes using gene ontology hierar-chies. BMC bioinformatics, 5:16, 2004.
[232] Jui-Hung Hung, Tun-Hsiang Yang, Zhenjun Hu, Zhiping Weng, and Charles DeLisi. Geneset enrichment analysis: performance evaluation and usage guidelines. Briefings in bioin-formatics, 13(3):281–291, 2011.
[233] M Ashburner, C A Ball, J A Blake, D Botstein, H Butler, J M Cherry, A P Davis,K Dolinski, S S Dwight, J T Eppig, M A Harris, D P Hill, L Issel-Tarver, A Kasarskis,S Lewis, J C Matese, J E Richardson, M Ringwald, G M Rubin, and G Sherlock. Geneontology: tool for the unification of biology. the gene ontology consortium. Nature genetics,25(1):25–29, 2000.
[234] Jing Wang, Xianxiao Zhou, Jing Zhu, Yunyan Gu, Wenyuan Zhao, Jinfeng Zou, and ZhengGuo. Go-function: deriving biologically relevant functions from statistically significantfunctions. Briefings in bioinformatics, 13(2):216–227, 2011.
[235] Wyatt T Clark and Predrag Radivojac. Information-theoretic evaluation of predictedontological annotations. Bioinformatics (Oxford, England), 29(13):i53–i61, 2013.
156

[236] Satoshi Shibata, Mitsuho Sasaki, Takashi Miki, Akira Shimamoto, Yasuhiro Furuichi, JunKatahira, and Yoshihiro Yoneda. Exportin-5 orthologues are functionally divergent amongspecies. Nucleic acids research, 34(17):4711–4721, 2006.
[237] David Croft, Gavin O’Kelly, Guanming Wu, Robin Haw, Marc Gillespie, Lisa Matthews,Michael Caudy, Phani Garapati, Gopal Gopinath, Bijay Jassal, Steven Jupe, IrinaKalatskaya, Shahana Mahajan, Bruce May, Nelson Ndegwa, Esther Schmidt, VeronicaShamovsky, Christina Yung, Ewan Birney, Henning Hermjakob, Peter D’Eustachio, andLincoln Stein. Reactome: a database of reactions, pathways and biological processes.Nucleic acids research, 39(Database issue):D691–D697, 2010.
[238] Kirill Degtyarenko, Paula de Matos, Marcus Ennis, Janna Hastings, Martin Zbinden, AlanMcNaught, Rafael Alcantara, Michael Darsow, Mickael Guedj, and Michael Ashburner.ChEBI: a database and ontology for chemical entities of biological interest. Nucleic acidsresearch, 36(Database issue):D344–D350, 2007.
[239] Graeme D Ruxton. The unequal variance t-test is an underused alternative to student’st-test and the mann-whitney u test. Behavioral Ecology, 17(4):688–690, 2006.
[240] Guangchuang Yu, Fei Li, Yide Qin, Xiaochen Bo, Yibo Wu, and Shengqi Wang. GOSem-Sim: an R package for measuring semantic similarity among GO terms and gene products.Bioinformatics, 26(7):976–978, 2010.
[241] NCBI Resource Coordinators. Database resources of the national center for biotechnologyinformation. Nucleic acids research, 41(Database issue):D8–D20, 2012.
[242] Thomas Kelder, Martijn P van Iersel, Kristina Hanspers, Martina Kutmon, Bruce R Con-klin, Chris T Evelo, and Alexander R Pico. Wikipathways: building research communitieson biological pathways. Nucleic acids research, 2011. In press.
[243] Ron Caspi, Hartmut Foerster, Carol A. Fulcher, Rebecca Hopkinson, John Ingraham,Pallavi Kaipa, Markus Krummenacker, Suzanne Paley, John Pick, Seung Y. Rhee,Christophe Tissier, Peifen Zhang, and Peter D. Karp. MetaCyc: a multiorganism databaseof metabolic pathways and enzymes. Nucleic Acids Research, 35:D511–D516, 2006.
[244] Lean Stromback and Patrick Lambrix. Representations of molecular pathways: an evalu-ation of SBML, PSI MI and BioPAX. Bioinformatics, 21(24):4401–4407, 2005.
[245] Alan Ruttenberg, Jonathan Rees, and Jeremy Zucker. What biopax communicates andhow to extend owl to help it. In Bernardo Cuenca Grau, Pascal Hitzler, Conor Shankey,and Evan Wallace, editors, Proceedings of the OWLED-06 Workshop on OWL: Experi-ences and Directions, volume 216. CEUR-WS.org, 2006.
[246] Emek Demir, Michael P Cary, Suzanne Paley, Ken Fukuda, Christian Lemer, Imre Vas-trik, Guanming Wu, Peter D’Eustachio, Carl andoanne Schaefer, Frank Schacherer, IrmaMartinez-Flores, Zhenjun Hu, Veronica Jimenez-Jacinto, Geeta Joshi-Tope, KumaranKandasamy, Alejandra C Lopez-Fuentes, Elgar Mi, Huchler, Igor Rodchenkov, AndreaSplendiani, Sasha Tkachev, Jeremy Zucker, Gopal Gopinath, Harsha Rajasimha, Ran-jani Ramakrishnan, Imran Shah, Nadia Syeand Anwar, Ozgun Babur, Michael Blinov,Erik Brauner, Dan Corwin, Sylva Donaldson, Frank Gibbons, Robert Goldberg, Pe-ter Hornbeck, Peter Luna, Augustiy-Rust, Eric Neumann, Oliver Ruebenacker, OliverReubenacker, Matthias Samwald, Martijn van Iersel, Sarala Wimalaratne, Keith Allen,Michelle Braun, Burk andillo, Kei-Hoi Cheung, Kam Dahlquist, Andrew Finney, Marc
157

Gillespie, Elizabeth Glass, Li Gong, Robin Haw, Michael Honig, Olivier Hubaut, ShivaKand Krupa, Martina Kutmon, Julie Leonard, Debbie Marks, David Merberg, VictoriaPetri, Alex Pico, Dean Ravenscroft, Liya Ren, Nigam Shah, Sugot, Rebecca Tang, RyanWhaley, Stan Letovksy, Kenneth H Buetow, Andrey Rzhetsky, Vincent Schachter, Bruno SSobral, Ugur Dogrusoz, Shannon a Mirit McWeeney, Ewan Birney, Julio Collado-Vides,Susumu Goto, Michael Hucka, Nicolas Le Novere, Natalia Maltsev, Akhilesh Pandey, PaulThomas, Edga Peter D Wingender, Chris Sander, and Gary D Bader. The BioPAX com-munity standard for pathway data sharing. Nature biotechnology, 28(9):935–942, 2010.
[247] Donny Soh, Difeng Dong, Yike Guo, and Limsoon Wong. Consistency, comprehensiveness,and compatibility of pathway databases. BMC bioinformatics, 11:449, 2010.
[248] Tomer Altman, Michael Travers, Anamika Kothari, Ron Caspi, and Peter D Karp. Asystematic comparison of the metacyc and kegg pathway databases. BMC bioinformatics,14:112, 2013.
[249] Liam G Fearnley, Melissa J Davis, Mark A Ragan, and Lars K Nielsen. Extracting reactionnetworks from databases-opening pandora’s box. Briefings in bioinformatics, 15(6):973–983, 2014.
[250] Nicole Redaschi and Consortium UniProt. UniProt in RDF: Tackling dataintegration and distributed annotation with the semantic web. In 3rd In-ternational Biocuration Conference, 2009. Available from Nature Precedingshttp://dx.doi.org/10.1038/npre.2009.3193.1.
[251] Simon Jupp, James Malone, Jerven Bolleman, Marco Brandizi, Mark Davies, LeylaGarcia, Anna Gaulton, Sebastien Gehant, Camille Laibe, Nicole Redaschi, Sarala MWimalaratne, Maria Martin, Nicolas Le Novere, Helen Parkinson, Ewan Birney, andAndrew M Jenkinson. The ebi rdf platform: linked open data for the life sciences. Bioin-formatics (Oxford, England), 30(9):1338–1339, 2014.
[252] Gang Fu, Colin Batchelor, Michel Dumontier, Janna Hastings, Egon Willighagen, andEvan Bolton. PubChemRDF: towards the semantic annotation of pubchem compoundand substance databases. Journal of cheminformatics, 7:34, 2015.
[253] Thomas Kelder, Bruce R Conklin, Chris T Evelo, and Alexander R Pico. Finding the rightquestions: exploratory pathway analysis to enhance biological discovery in large datasets.PLoS biology, 8(8):e1000472, 2010.
[254] David Gomez-Cabrero, Imad Abugessaisa, Dieter Maier, Andrew Teschendorff, MatthiasMerkenschlager, Andreas Gisel, Esteban Ballestar, Erik Bongcam-Rudloff, Ana Conesa,and Jesper Tegner. Data integration in the era of omics: current and future challenges.BMC systems biology, 8 Suppl 2:I1, 2014.
[255] Gautier Defossez, Alexandre Rollet, Olivier Dameron, and Pierre Ingrand. Temporalrepresentation of care trajectories of cancer patients using data from a regional informationsystem: an application in breast cancer. BMC Medical Informatics and Decision Making,14(1):24, 2014.
[256] Joanne S. Luciano and Robert D. Stevens. e-Science and biological pathway semantics.BMC Bioinformatics, 8(Suppl 3):S3, 2007.
158

[257] Duncan Hull, Katy Wolstencroft, Robert Stevens, Carole Goble, Mathew R Pocock, PeterLi, and Tom Oinn. Taverna: a tool for building and running workflows of services. Nucleicacids research, 34(Web Server issue):W729–W732, 2006.
[258] Carole A Goble, Jiten Bhagat, Sergejs Aleksejevs, Don Cruickshank, Danius Michaelides,David Newman, Mark Borkum, Sean Bechhofer, Marco Roos, Peter Li, and DavidDe Roure. myExperiment: a repository and social network for the sharing of bioin-formatics workflows. Nucleic acids research, 38(Web Server issue):W677–W682, 2010.
[259] Jeremy Goecks, Anton Nekrutenko, James Taylor, and Galaxy Team. Galaxy: a compre-hensive approach for supporting accessible, reproducible, and transparent computationalresearch in the life sciences. Genome biology, 11(8):R86, 2010.
[260] Daniel Blankenberg, James E Johnson, Galaxy Team, James Taylor, and AntonNekrutenko. Wrangling galaxy’s reference data. Bioinformatics (Oxford, England),30(13):1917–1919, 2014.
[261] Alejandra Gonzalez-Beltran, Eamonn Maguire, Susanna-Assunta Sansone, and PhilippeRocca-Serra. linkedISA: semantic representation of ISA-Tab experimental metadata. BMCbioinformatics, 15 Suppl 14:S4, 2014.
[262] Jon Ison, Matus Kalas, Inge Jonassen, Dan Bolser, Mahmut Uludag, Hamish McWilliam,James Malone, Rodrigo Lopez, Steve Pettifer, and Peter Rice. Edam: An ontology ofbioinformatics operations, types of data and identifiers, topics, and formats. Bioinformat-ics (Oxford, England), 2013. In press.
[263] Francois Moreews, Yvan Le Bras, Olivier Dameron, Cyril Monjeaud, and Olivier Collin.Integrating galaxy workflows in a metadata management environment. In Galaxy Com-munity Conference GCC2014, Proceedings, 2014.
[264] Sebastien Ferre. Expressive and scalable query-based faceted search over SPARQL end-points. In International Semantic Web Conference (ISWC), pages 438–453, 2014.
[265] Samuel M D Seaver, Christopher S Henry, and Andrew D Hanson. Frontiers inmetabolic reconstruction and modeling of plant genomes. Journal of experimental botany,63(6):2247–2258, 2012.
[266] Cristiana Gomes de Oliveira Dal’Molin and Lars Keld Nielsen. Plant genome-scalemetabolic reconstruction and modelling. Current opinion in biotechnology, 24(2):271–277, 2012.
[267] Shira Mintz-Oron, Sagit Meir, Sergey Malitsky, Eytan Ruppin, Asaph Aharoni, and TomerShlomi. Reconstruction of arabidopsis metabolic network models accounting for subcellu-lar compartmentalization and tissue-specificity. Proceedings of the National Academy ofSciences of the United States of America, 109(1):339–344, 2011.
[268] Seongwon Seo and Harris A Lewin. Reconstruction of metabolic pathways for the cattlegenome. BMC systems biology, 3:33, 2009.
[269] Baikang Pei and Dong-Guk Shin. Reconstruction of biological networks by incorporat-ing prior knowledge into bayesian network models. Journal of computational biology,19(12):1324–1334, 2012.
159

[270] Seyedsasan Hashemikhabir, Eyup Serdar Ayaz, Yusuf Kavurucu, Tolga Can, and TamerKahveci. Large-scale signaling network reconstruction. IEEE/ACM transactions on com-putational biology and bioinformatics / IEEE, ACM, 9(6):1696–1708, 2012.
[271] Chen Li, Maria Liakata, and Dietrich Rebholz-Schuhmann. Biological network extractionfrom scientific literature: state of the art and challenges. Briefings in bioinformatics,15(5):856–877, 2013.
[272] Purvesh Khatri, Marina Sirota, and Atul J Butte. Ten years of pathway analysis: currentapproaches and outstanding challenges. PLoS computational biology, 8(2):e1002375, 2012.
[273] Ron Caspi, Kate Dreher, and Peter D Karp. The challenge of constructing, classifyingand representing metabolic pathways. FEMS microbiology letters, 345(2):85–93, 2013.
[274] John P Rooney, Ashish Patil, Fraulin Joseph, Lauren Endres, Ulrike Begley, Maria RZappala, Richard P Cunningham, and Thomas J Begley. Cross-species functionome anal-ysis identifies proteins associated with dna repair, translation and aerobic respiration asconserved modulators of uv-toxicity. Genomics, 97(3):133–147, 2010.
[275] Gamze Abaka, Turker Biyikoglu, and Cesim Erten. CAMPways: constrained alignmentframework for the comparative analysis of a pair of metabolic pathways. Bioinformatics(Oxford, England), 29(13):i145–i153, 2013.
[276] Ron Caspi, Tomer Altman, Kate Dreher, Carol A Fulcher, Pallavi Subhraveti, Ingrid MKeseler, Anamika Kothari, Markus Krummenacker, Mario Latendresse, Lukas A Mueller,Quang Ong, Suzanne Paley, Anuradha Pujar, Alexander G Shearer, Michael Travers,Deepika Weerasinghe, Peifen Zhang, and Peter D Karp. The MetaCyc database ofmetabolic pathways and enzymes and the BioCyc collection of pathway/genome databases.Nucleic acids research, 40(Database issue):D742–D753, 2011.
[277] Joan Massague. Tgfbeta signalling in context. Nature reviews. Molecular cell biology,13(10):616–630, 2012.
[278] Geoffroy Andrieux, Michel Le Borgne, and Nathalie Theret. An integrative modelingframework reveals plasticity of tgf-beta signaling. BMC systems biology, 8(1):30, 2014.
[279] Kemal Eren, Mehmet Deveci, Onur Kucuktunc, and Umit V Catalyurek. A comparativeanalysis of biclustering algorithms for gene expression data. Briefings in bioinformatics,14(3):279–292, 2013.
[280] Alessia Visconti, Francesca Cordero, and Ruggero G Pensa. Leveraging additional knowl-edge to support coherent bicluster discovery in gene expression data. Intelligent DataAnalysis, 18(5):837–855, 2014.
[281] Rohit Gupta, Navneet Rao, and Vipin Kumar. Discovery of error-tolerant biclusters fromnoisy gene expression data. BMC bioinformatics, 12 Suppl 12:S1, 2011.
[282] Rui Henriques and Sara C Madeira. Bicpam: Pattern-based biclustering for biomedicaldata analysis. Algorithms for molecular biology : AMB, 9(1):27, 2014.
[283] Rudolf Wille. Restructuring lattice theory: An approach based on hierarchies of concepts.In I Rival, editor, Ordered sets, volume 83 of NATO Advanced Study Institutes Series,pages 445–470. Springer Netherlands, 1982.
160

[284] Sylvain Blachon, Ruggero G Pensa, Jeremy Besson, Celine Robardet, Jean-Francois Bouli-caut, and Olivier Gandrillon. Clustering formal concepts to discover biologically relevantknowledge from gene expression data. In silico biology, 7(4-5):467–483, 2007.
[285] Santiago Videla, Carito Guziolowski, Federica Eduati, Sven Thiele, martin Gebser,Jacques Nicolas, Julio Saez-Rodriguez, Torsten Schaub, and Anne Siegel. Learningboolean logic models of signaling networks with ASP. Theoretical Computer Science,2014. In press.
[286] Mehdi Kaytoue, Sergei O. Kuznetsov, Juraj Macko, and Amedeo Napoli. Biclusteringmeets triadic concept analysis. Annals of Mathematics and Artificial Intelligence, SpecialIssue Post-proceedings of CLA 2011, 70(1–2):55–79, 2014.
[287] Mehdi Kaytoue, Victor Codocedo, Jaume Baixeries, and Amedeo Napoli. Three interre-lated fca methods for mining biclusters of similar values on columns. In Karell Bertet andSebastian Rudolph, editors, The Eleventh International Conference on Concept Latticesand their Applications (CLA 2014), Kosice Slovakia, pages 243–254. CEUR WorkshopProceedings 1252, 2014.
[288] Aleksey Buzmakov, Sergei O. Kuznetsov, and Amedeo Napoli. Scalable estimates ofstability. In Cynthia Vera Glodeanu, Mehdi Kaytoue, and Christian Sacarea, editors,12th International Conference on Formal Concept Analysis (ICFCA 2014), Lecture Notesin Artificial Intelligence LNAI 8478, pages 157–172. Springer, 2014.
[289] Aleksey Buzmakov, Sergei O. Kuznetsov, and Amedeo Napoli. On evaluating interest-ingness measures for closed itemsets. In 7th European Starting AI Researcher Symposium(STAIRS-2014), Prague, pages 71–80. IOS Press, 2014.
[290] Simon Andrews and Constantinos Orphanides. Analysis of large data sets using formalconcept lattices. In Marzena Kryszkiewicz and Sergei Obiedkov, editors, Proceedings ofthe 7th International Conference on Concept Lattices and Their Applications, volume 672of CEUR Workshop Proceedings, 2010.
[291] Ruggero G Pensa and Jean-Francois Boulicaut. Towards fault-tolerant formal conceptanalysis. In Proceedings of AI*IA 2005: Advances in Artificial Intelligence, volume 3673of Lecture Notes in Computer Science, pages 212–223, 2005.
161

162

Olivier Dameron
Curriculum Vitæ
Identification
Nom patronymique : DameronNom usuel : DameronPrenom : OlivierDate de naissance : 23 octobre 1974Grade : Maıtre de conferences – classe normaleEtablissement : Universite de Rennes 1Section CNU : 65ORCID 0000-0001-8959-7189
Domaine de recherche
Je developpe des methodes basees sur les ontologies pour analyser des donnees biomedicales.Cela fait intervenir des competences en representation des connaissances et en bioinformatique.
Mon approche consiste a exploiter des connaissances symboliques du domaine d’etude afin d’ameliorerl’analyse de donnees qui sont en grandes quantites, complexes, fortement interdependantes et incompletes.Pour cela, j’utilise les technologies du Web Semantique pour integrer ces donnees qui sont souventdistribuees, et pour combiner differents types de raisonnement : deduction, classification, comparaison...
L’application principales concerne la caracterisation fonctionnelle et la comparaison de voies meta-boliques et de voies de signalisation.
Deroulement de carriere
depuis septembre 2005 : Maıtre de conferences, Universite de Rennes 1.
janvier 2004 – juin 2005 : Postdoctorant. Stanford Medical Informatics group, Universite de Stanford(Californie, Etats-Unis d’Amerique). Responsable : Mark Musen.
octobre 2000 – decembre 2003 : Doctorat Modelisation, representation et partage de connaissances ana-tomiques sur le cortex cerebral – Universite de Rennes 1, directeur : Bernard Gibaud.
1999 – 2000 DEA informatique medicale, Universite de Rennes 1. 1er/14.
1998 – 1999 Service militaire.
1995 – 1998 Eleve ingenieur INSA Rennes, departement informatique.
Activites de responsabilites (administratives et en recherche sur toutela carriere)
Recherche
2015–present : Membre nomme de la section 65 du CNU
2015 : Responsable du PEPS CNRS Fondements et applications de la science des donnees« confocal » (concepts formels, connaissances ontologies et etude de liaisons).
2014–present : Coordinateur du theme « Biologie-sante » de l’IRISA.

2007 : Jury de these de Sandrine Pawlicki (Approche bioinformatique des mecanismes d’agre-gation et de polymerisation des proteines amyloıdes).
2005–2013 : Creation et co-responsabilite du theme « Reseaux d’Expression Genetique : in vivo,in vitro et in silico » au sein de l’IFR 140.
2005 : Comite d’organisation 8eme conf. internationale Protege.
2004 : Comite d’organisation 7eme conf. internationale Protege.
Enseignement
Responsabilites de formations
depuis septembre 2012 : Co-responsable du master 2 « Bioinformatique et genomique ».
2008–2012 : Co-responsable du parcours « Bioinformatique » du master 2 « Modelisation dessystemes biologiques ».
2007–2012 : Responsable du master 1 recherche « Methodes et Traitements de l’Information Bio-medicale et Hospitaliere ».
2010–2012 : Co-responsable du master 2 « Methodes et Traitements de l’Information Biomedicaleet Hospitaliere ».
Responsabilites d’UE
depuis septembre 2005 : Responsable des UE « Bases de mathematiques et probabilite » et « Methodesen informatique » du master 1 « Sante publique ».
depuis septembre 2006 : Responsable de l’UE « Methodes Web avance en biomedical » du master 2recherche « Sante publique ».
depuis septembre 2006 : Responsable de l’UE « Principes de programmation et algorithmique » dumaster 1 « Bioinformatique et genomique ».
depuis septembre 2008 : Responsable de l’UE « Standardisation des connaissances et bio-ontologies »du master 2 « sante publique ».
depuis septembre 2011 : Responsable du module « eSante » en troisieme annee de cycle ingenieur ESIR.
depuis septembre 2012 : Responsable de l’UE « Gestion de projet informatique » du master 1 « Bioin-formatique et genomique ».
depuis septembre 2015 : Co-responsable de l’UE « Bioinformatique » ENS Rennes.
Fig. 1 – Volume des enseignements annuels. La charge normale est de 192h equivalent TD. J’etais endemi-delegation a l’INRIA en 2014–2015 et 2015–2016 et ne devait donc que 96h equivalent TD lors decette periode.
Encadrement
– Doctorats : 5 (dont 3 en cours)

– Stages ingenieurs : 1
– Stages master2 : 7
– Stages master1 : 9
mars – juin 2006 : Stage master 1 Bioinformatique : Elodie Roques.
janvier – juin 2006 : Stage master 2 recherche Informatique medicale : Ihssene Belhadj.
fevrier – juin 2006 : Stage master 2 professionnel Traitement de l’information medicale et hospitaliere :Nicolas Cottais
janvier – juin 2007 : Stage master 2 recherche Bioinformatique : Elodie Roques.
2007–2010 : Doctorat Nicolas Lebreton (bourse MENRT) : « Realisation d’ontologies de tacheset de domaine en bioinformatique et utilisation de la semantique pour l’appariementsemi-automatique de Services Web ». Co-encadrement avec Anita Burgun.
avril – juin 2008 : Stage master 1 bioinformatique : Lea Joret.
janvier – juin 2009 : Stage master 2 recherche bioinformatique : Lea Joret.
avril – juin 2009 : Stage master 1 bioinformatique : Charles Bettembourg.
janvier – juin 2010 : Stage master 2 recherche bioinformatique : Charles Bettembourg.
juillet 2010 – mai 2011 : Stage ingenieur CNAM : Pascal van Hille.
2010 – 2013 : Doctorat Charles Bettembourg (bourse MENRT) : « Comparaison inter-especes devoies metaboliques : application a l’etude du metabolisme des lipides chez le poulet,la souris et l’homme ». Co-encadrement avec Christian Diot (INRA).
avril – juin 2011 : Stage master 1 bioinformatique : Walid Bedhiafi.
avril – septembre 2011 : Stage master 2 CCI : Nicolas Schnell.
avril – juin 2012 : Stage master 1 Bioinformatique et genomique : Jeremy Rio.
avril – juin 2013 : Stage master 1 Bioinformatique et genomique : Ayite Kougbeadjo.
octobre 2013 – Doctorat Philippe Finet (ingenieur en CDI a la DSI du CHU Alencon-Mamers) :« Production et transmission des donnees de suivi des patients dans un contexte detelemedecine et integration dans un systeme d’information pour l’aide a la decision ».Co-encadrement avec Regine Le Bouquin-Jeannes du LTSI.
avril – juin 2014 : Stage master 1 Bioinformatique et genomique : Dominique Mias-Lucquin.
avril – juin 2014 : Stage master 1 Bioinformatique et genomique : Loıc Bourgeois.
octobre 2014 – Doctorat Jean Coquet (bourse MENRT) : « Semantic-based reasoning for biologicalpathways analysis ». Co-encadrement avec Jacques Nicolas
mars – aout 2015 : Stage master 2 Statistiques pour l’entreprise : Yann Rivault (co-encadre avec NolwennLe Meur, EHESP).
avril – juin 2015 : Stage master 1 Bioinformatique et genomique : Pierre Vignet.
octobre 2015 – Doctorat Yann Rivault (contrat ANSM) : « ». Co-encadrement avec Nolwenn LeMeur (EHESP)
Distinctions, rayonnement scientifique et relation avec le monde indus-triel
Distinctions
janvier – decembre 2004 : Laureat bourse INRIA de stage postdoctoral a l’etranger.
2011 : L’article « Comparison of OWL and SWRL-based ontology modeling strategies for thedetermination of pacemaker alerts severity » a ete selectionne pour le Best paper awardde la conference AMIA (American Medical Informatics Association). Une versionetendue a ete soumise a un journal.
2014 – 2015 : demi delegation INRIA.
2015 – 2016 : demi delegation INRIA.

Rayonnement scientifique
2005–2011 : Participation a l’animation des « Protege Short Course » et « Protege-OWL ShortCourse ». Il s’agit de sessions payantes de formation a destination d’un public d’in-dustriels et d’academiques, organisees par le Stanford Medical Informatics group. J’aiparticipe a leur creation leur de mon stage postdoctoral et j’ai ensuite ete reguliere-ment invite pour animer une partie de ces formations jusqu’en 2011.
avril 2009 : Seminaire invite LRI, Orsay.
mai 2010 : Presentation BreizhJUG : Introduction to the semantic Web
octobre 2011 : Journee de la plateforme bioinformatique GenOuest – Presentation Contributions ofontologies to life sciences
novembre 2011 : Ecole thematique biologie integrative BioGenOuest – Presentation caracterisation etcomparaison fonctionnelles de listes de genes : apport de la semantique.
aout 2014 article « La bioinformatique avec biopython » dans le hors-serie Python de GNU/Linuxmagazine
decembre 2014 : Seminaire invite LINA, Nantes.
fevrier 2015 : Seminaire invite Institut de recherche sur les maladies genetiques Imagine, Paris
mars 2015 : Seminaire invite ENS Rennes
2014–2015 : Blog bioinfo-fr.net : articles « Gephi pour la visualisation et l’analyse de graphes » 1,« Gerer les versions de vos fichiers : premiers pas avec git » 2 et « Git : cloner unprojet, travailler a plusieurs et creer des branches » 3
Fig. 2 – Nombre et type de publications par annees
1. http://bioinfo-fr.net/gephi-pour-la-visualisation-et-lanalyse-de-graphes2. http://bioinfo-fr.net/git-premiers-pas3. http://bioinfo-fr.net/git-usage-collaboratif

Fig. 3 – Evolution des publications
Publications parues ou acceptees : liste exhaustive
Bilan :– H-index : 15
– 18 articles dans des journaux indexes par PubMed ou Web of science
– 4 en premier auteur
– 5 en dernier auteur
– 21 articles longs dans des conferences internationales indexes par PubMed ou Web of science aveccomite de lecture
– 6 en premier auteur
– 1 en dernier auteur
Articles indexes dans PubMed ou Web of science
[1] Olivier Dameron, Bernard Gibaud, and Xavier Morandi. “Numeric and Symbolic Representationof the Cerebral Cortex Anatomy: Methods and preliminary results”. In: Surgical and RadiologicAnatomy 26.3 (2004), pp. 191–197.
[2] Daniel L. Rubin, Olivier Dameron, Yasser Bashir, David Grossman, Parvati Dev, and Mark A.Musen. “Using ontologies linked with geometric models to reason about penetrating injuries”. In:Artificial Intelligence in Medicine 37.3 (2006), pp. 167–176.
[3] Olivier Dameron, Mark A. Musen, and Bernard Gibaud. “Using semantic dependencies for consis-tency management of an ontology of brain-cortex anatomy”. In: Artificial Intelligence in Medicine39.3 (2007), pp. 217–225.
[4] Amrapali Zaveri, Luciana Cofiel, Jatin Shah, Shreyasee Pradhan, Edwin Chan, Olivier Dameron,Ricardo Pietrobon, and Beng Ti Ang. “Achieving High Research Reporting Quality Through theUse of Computational Ontologies”. In: Neuroinformatics 8.4 (2010), pp. 261–271.
[5] A Burgun, A Rosier, L Temal, J Jacques, R Messai, L Duchemin, L Deleger, C Grouin, P Van Hille,P Zweigenbaum, R Beuscart, D Delerue, O Dameron, P Mabo, and C Henry. “Decision support intelecardiology: An ontology-based patient-centered approach”. In: IRBM 32.3 (2011), pp. 191–194.
[6] Charles Bettembourg, Christian Diot, Anita Burgun, and Olivier Dameron. “GO2PUB: QueryingPubMed with Semantic Expansion of Gene Ontology Terms”. In: Journal of biomedical semantics3.1 (2012), p. 7.
[7] Marc Cuggia, Jean-Charles Dufour, Oussama Zekri, Isabelle Gibaud, Cyril Garde, Catherine Bohec,Regis Duvauferrier, Dominique Fieschi, Paolo Besana, Laurent Charlois, Annabel Bourde, Nico-las Garcelon, Jean-Francois Laurent, Marius Fieschi, and Olivier Dameron. “ASTEC AutomaticSelection of clinical Trials based on Eligibility Criteria”. In: IRBM (2012).

[8] Olivier Dameron, Charles Bettembourg, and Nolwenn Le Meur. “Measuring the Evolution of On-tology Complexity: the Gene Ontology Case Study”. In: PLoS ONE 8.10 (2013), e75993.
[9] Olivier Dameron, Paolo Besana, Oussama Zekri, Annabel Bourde, Anita Burgun, and Marc Cuggia.“OWL Model of Clinical Trial Eligibility Criteria Compatible with Partially-known Information”.In: Journal of Biomedical Semantics 4.1 (2013).
[10] Jean-Francois Ethier, Olivier Dameron, Vasa Curcin, Mark M. McGilchrist, Robert A. Verheij,Theodoros N. Arvanitis, Adel Taweel, Brendan C. Delaney, and Anita Burgun. “A Unified Struc-tural/Terminological Framework based on LexEVS: application to TRANSFoRm”. In: Journal ofthe American Medical Informatics Association 20.5 (2013), pp. 986–994.
[11] Charles Bettembourg, Christian Diot, and Olivier Dameron. “Semantic particularity measure forfunctional characterization of gene sets using Gene Ontology”. In: PLoS ONE 9.1 (2014), e86525.
[12] Gautier Defossez, Alexandre Rollet, Olivier Dameron, and Pierre Ingrand. “Temporal represen-tation of care trajectories of cancer patients using data from a regional information system: anapplication in breast cancer”. In: BMC Medical Informatics and Decision Making 14.1 (2014),p. 24.
[13] Frederic Herault, Annie Vincent, Olivier Dameron, Pascale Le Roy, Pierre Cherel, and Marie Da-mon. “The longissimus and semimembranosus muscles display marked differences in their geneexpression profiles in pig”. In: PloS one 9.5 (2014), e96491.
[14] Sylvain Prigent, Guillaume Collet, Simon M Dittami, Ludovic Delage, Floriane Ethis de Corny,Olivier Dameron, Damien Eveillard, Sven Thiele, Jeanne Cambefort, Catherine Boyen, Anne Siegel,and Thierry Tonon. “The genome-scale metabolic network of Ectocarpus siliculosus (EctoGEM): aresource to study brown algal physiology and beyond”. In: The Plant journal : for cell and molecularbiology 80.2 (2014), pp. 367–381.
[15] Charles Bettembourg, Christian Diot, and Olivier Dameron. “Optimal Threshold Determinationfor Interpreting Semantic Similarity and Particularity: Application to the Comparison of Gene Setsand Metabolic Pathways Using GO and ChEBI”. In: PloS one 10.7 (2015), e0133579.
[16] Philippe Finet, Regine Le Bouquin-Jeannes, Olivier Dameron, and Bernard Gibaud. “Review ofcurrent telemedicine applications for chronic diseases: Toward a more integrated system?”In: IRBM(2015). In press.
[17] Andrej Machno, Pierre Jannin, Olivier Dameron, Werner Korb, Gerik Scheuermann, and JurgenMeixensberger. “Ontology for assessment studies of human-computer-interaction in surgery”. In:Artificial intelligence in medicine 63.2 (2015), pp. 73–84.
[18] Arnaud Rosier, Philippe Mabo, Lynda Temal, Pascal Van Hille, Olivier Dameron, Louise Deleger,Cyril Grouin, Pierre Zweigenbaum, Julie Jacques, Emmanuel Chazard, Laure Laporte, ChristineHenry, and Anita Burgun. “Personalized and automated remote monitoring of atrial fibrillation”.In: Europace : European pacing, arrhythmias, and cardiac electrophysiology : journal of the wor-king groups on cardiac pacing, arrhythmias, and cardiac cellular electrophysiology of the EuropeanSociety of Cardiology (2015). In press.
Conferences internationales indexees dans PubMed ou Web of science
[1] Olivier Dameron, Bernard Gibaud, and Xavier Morandi. “Numeric and Symbolic Knowledge Re-presentation of Cortex Anatomy Using Web Technologies”. In: Artificial Intelligence Medicine, 8thConference on AI in Medicine in Europe, AIME 2001, Cascais, Portugal, July 1-4, 2001, Procee-dings. Ed. by Silvana Quaglini, Pedro Barahona, and Steen Andreassen. Vol. 2101. Lecture Notesin Computer Science. Springer, 2001, pp. 359–68. isbn: 3-540-42294-3.
[2] Bernard Gibaud, Olivier Dameron, and Xavier Morandi. “Representation and sharing of numericand symbolic knowledge about brain cortex anatomy using web technology”. In: Computer AssistedRadiology and Surgery 2001. Ed. by HU Lemke, MW Vannier, K Inamura, AG Farman, and K Doi.Elsevier, 2001, pp. 356–361.
[3] Olivier Dameron, Bernard Gibaud, Anita Burgun, and Xavier Morandi. “Towards a sharable nu-meric and symbolic knowledge base on cerebral cortex anatomy: lessons from a prototype”. In:American Medical Informatics Association AMIA. 2002, pp. 185–189.

[4] Olivier Dameron, Anita Burgun, Xavier Morandi, and Bernard Gibaud. “Modelling dependenciesbetween relations to insure consistency of a cerebral cortex anatomy knowledge base”. In: Studiesin Health technology and informatics. 2003, pp. 403–408.
[5] Bernard Gibaud, Olivier Dameron, and Xavier Morandi. “Re-use of a multi-purpose knowledge cor-pus on cortex anatomy for educational purposes”. In: Studies in Health technology and informatics.2003, pp. 439–444.
[6] Christine Golbreich, Olivier Dameron, Bernard Gibaud, and Anita Burgun. “How to representontologies in view of a Medical Semantic Web ?” In: AIME 03 Conference Proceedings. 2003,pp. 51–60.
[7] Christine Golbreich, Olivier Dameron, Bernard Gibaud, and Anita Burgun. “Web ontology lan-guage requirements w.r.t expressiveness of taxononomy and axioms in medecine”. In: InternationalSemantic Web Conference ISWC03 proceedings. Vol. 2870. Lecture Notes in Computer Science.Springer, 2003.
[8] Olivier Dameron, Natalya F. Noy, Holger Knublauch, and Mark A. Musen. “Accessing and Mani-pulating Ontologies Using Web Services”. In: Proceeding of the Third International Semantic WebConference (ISWC2004), Semantic Web Services workshop. 2004.
[9] Olivier Dameron, Daniel L. Rubin, and Mark A. Musen. “Challenges in Converting Frame-BasedOntology into OWL: the Foundational Model of Anatomy Case-Study”. In: American MedicalInformatics Association Conference AMIA05. 2005, pp. 181–185.
[10] Bernard Gibaud, Olivier Dameron, Eric Poiseau, and Pierre Jannin. “Implementation of atlas-matching capabilities using Web Services technology: lessons learned from the development of ademonstrator”. In: Computer Assisted Radiology and Surgery 2005. 2005.
[11] Daniel L. Rubin, Olivier Dameron, and Mark A. Musen. “Use of Description Logic Classification toReason about Consequences of Penetrating Injuries”. In: American Medical Informatics AssociationConference AMIA05. 2005, pp. 649–653.
[12] Gwenaelle Marquet, Olivier Dameron, Stephan Saikali, Jean Mosser, and Anita Burgun. “Gradingglioma tumors using OWL-DL and NCI Thesaurus”. In: Proceedings of the American MedicalInformatics Association Conference AMIA’07. 2007, pp. 508–512.
[13] Elena Beisswanger, Vivian Lee, Jung-Jae Kim, Dietrich Rebholz-Schuhmann, Andrea Splendiani,Olivier Dameron, Stefan Schulz, and Udo Hahn. “Gene Regulation Ontology (GRO): design prin-ciples and use cases”. In: Studies in Health technology and informatics - Proceedings of the MedicalInformatics in Europe conference (MIE’08). Vol. 136. 2008, pp. 9–14.
[14] Cyril Grouin, Arnaud Rosier, Olivier Dameron, and Pierre Zweigenbaum.“Testing tactics to localizede-identification”. In: Studies in health technology and informatics 150 (2009), pp. 735–739.
[15] Anita Burgun, Lynda Temal, Arnaud Rosier, Olivier Dameron, Philippe Mabo, Pierre Zweigen-baum, Regis Beuscart, David Delerue, and Henry Christine.“Integrating clinical data with informa-tion transmitted by implantable cardiac defibrillators to support medical decision in telecardiology:the application ontology of the AKENATON project”. In: Proceedings of the American Medical In-formatics Association Conference AMIA. 2010, p. 992.
[16] Lynda Temal, Arnaud Rosier, Olivier Dameron, and Anita Burgun. “Mapping BFO and DOLCE”.In: Studies in health technology and informatics 160 (2010), pp. 1065–1069.
[17] Marc Cuggia, Jean-Charles Dufour, Paolo Besana, Olivier Dameron, Regis Duvauferrier, DominiqueFieschi, Catherine Bohec, Annabel Bourde, Laurent Charlois, Cyril Garde, Isabelle Gibaud, Jean-Francois Laurent, Oussama Zekri, and Marius Fieschi. “ASTEC: A System for Automatic Selectionof Clinical Trials”. In: Proceedings of the American Medical Informatics Association ConferenceAMIA. 2011, p. 1729.
[18] Olivier Dameron, Pascal van Hille, Lynda Temal, Arnaud Rosier, Louise Deleger, Cyril Grouin,Pierre Zweigenbaum, and Anita Burgun. “Comparison of OWL and SWRL-Based Ontology Mode-ling Strategies for the Determination of Pacemaker Alerts Severity”. In: Proceedings of the AmericanMedical Informatics Association Conference AMIA. 2011, p. 284.
[19] Cyril Grouin, Louise Deleger, Arnaud Rosier, Lynda Temal, Olivier Dameron, Pascal van Hille,Anita Burgun, and Pierre Zweigenbaum. “Automatic computation of CHA2DS2-VASc score: In-formation extraction from clinical texts for thromboembolism risk assessment”. In: Proceedings ofthe American Medical Informatics Association Conference AMIA. 2011, pp. 501–510.

[20] Pascal van Hille, Julie Jacques, Julien Taillard, Arnaud Rosier, David Delerue, Anita Burgun, andOlivier Dameron. “Comparing Drools and Ontology-based reasoning approaches for telecardiologydecision support”. In: Studies in health technology and informatics 180 (2012), pp. 300–304.
[21] A Machno, P Jannin, O Dameron, W Korb, G Scheuermann, and J Meixensberger. “Analysis ofMCI evaluation studies in surgery”. In: Proceedings of the Computer Assisted Radiology and Surgeryconference CARS2012. In press. 2012.
Conferences internationales avec comite non indexees
[1] Christian Barillot, Romain Valabregue, Jean-Pierre Matsumoto, Florent Aubry, Habib Benali, YannCointepas, Olivier Dameron, Michel Dojat, E. Duchesnay, Bernard Gibaud, Serge Kinkingnehun,Dimitri Papadopoulos, Melanie Pellegrini-Issac, and Eric Simon. “Neurobase: Management of Dis-tributed and Heterogeneous Information Sources in Neuroimaging”. In: MICCAI 2004 Conference.Ed. by M. Dojat and B. Gibaud. 2004, pp. 85–94.
[2] Olivier Dameron. “JOT: a Scripting Environment for creating and managing ontologies”. In: 7thInternational Protege Conference. 2004.
[3] Olivier Dameron. “Using the JOT plugin for reasoning with Protege”. In: Workshop on Protegeand Reasoning – 7th International Protege Conference. 2004.
[4] Olivier Dameron, Bernard Gibaud, and Mark Musen. “Using semantic dependencies for consistencymanagement of an ontology of brain-cortex anatomy”. In: First International Workshop on FormalBiomedical Knowledge Representation KRMED04. 2004, pp. 30–38.
[5] Olivier Dameron and Mark A. Musen. “Accessing and manipulating Life-Sciences Ontologies UsingWeb Services”. In: W3C Workshop on Semantic Web for Life Sciences. 2004.
[6] Bernard Gibaud, Michel Dojat, Habib Benali, Olivier Dameron, Jean-Pierre Matsumoto, Mela-nie Pellegrini-Issac, Romain Valabregue, and Christian Barillot. “Toward an Ontology for SharingNeuroimaging Data and Processing Methods: Experience Learned from the Development of a De-monstrator”. In: MICCAI 2004 Conference. Ed. by M. Dojat and B. Gibaud. 2004, pp. 15–23.
[7] Holger Knublauch, Olivier Dameron, and Mark Musen. “Weaving the Biomedical Semantic Webwith the Protege OWL Plugin”. In: First International Workshop on Formal Biomedical KnowledgeRepresentation KRMED04. 2004, pp. 39–47.
[8] D.L. Rubin, O. Dameron, Y. Bashir, D. Grossman, P. Dev, and M.A. Musen. “Using ontologieslinked with geometric models to reason about penetrating injuries”. In: Intelligent Data Analysisin Medicine and Pharmacology IDAMAP04. 2004.
[9] Olivier Dameron. “Keeping modular and platform-independent software up-to-date: benefits fromthe Semantic Web”. In: 8th International Protege Conference. 2005.
[10] Christine Golbreich, Olivier Bierlaire, Olivier Dameron, and Bernard Gibaud. “Use Case: Ontologywith Rules for identifying brain anatomical structures”. In: W3C Workshop on Rule Languages forInteroperability. 2005.
[11] Christine Golbreich, Olivier Bierlaire, Olivier Dameron, and Bernard Gibaud. “What reasoningsupport for ontology and rules? the brain anatomy case study”. In: 8th International ProtegeConference. 2005.
[12] Daniel L. Rubin, Olivier Dameron, and Mark A. Musen.“Using OWL and Description Logics BasedClassification for Reasoning in Biomedical Applications”. In: 8th International Protege Conference.2005.
[13] Olivier Dameron, Elodie Roques, Daniel L. Rubin, Gwenaelle Marquet, and Anita Burgun. “Gra-ding lung tumors using OWL-DL based reasoning”. In: 9th International Protege Conference. 2006.
[14] Julie Chabalier, Olivier Dameron, and Anita Burgun. “Integrating and querying disease and pa-thway ontologies: building an OWL model and using RDFS queries”. In: Bio-Ontologies SpecialInterest Group, Intelligent Systems for Molecular Biology conference (ISMB’07). 2007.
[15] Julie Chabalier, Olivier Dameron, and Anita Burgun.“Integrating disease and pathway ontologies”.In: Proceedings of the ISMB conference, Poster Session. 2007.

[16] Olivier Dameron and Julie Chabalier.“Automatic generation of consistency constraints for an OWLrepresentation of the FMA”. In: 10th International Protege Conference. 2007.
[17] Andrea Splendiani, Elena Beisswanger, Jung-Jae Kim, Vivian Lee, Olivier Dameron, and DietrichRebholz-Schuhmann. “Bio-Ontologies in the context of the BOOTStrep project”. In: Proceedingsof the Bio-Ontologies SIG Workshop ISMB, (poster). 2007.
[18] Olivier Dameron and Julie Chabalier. “Bio-ontologies Tutorial”. In: Proceedings of the Data Inte-gration In Life Science conference DILS. Ed. by A. Bairoch, S. Cohen-Boulakia, and Froidevaux C.Vol. 5109. LNBI. 2008, p. 208.
[19] Olivier Dameron, Charles Bettembourg, and Lea Joret. “Quantitative cross-species comparison ofGO annotations: advantages and limitations of semantic similarity measure”. In: 11th InternationalProtege Conference. 2009.
[20] Lynda Temal, Arnaud Rosier, Olivier Dameron, and Anita Burgun. “Modeling cardiac rhythm andheart rate using BFO and DOLCE”. In: International Conference for Biomedical Ontologies. 2009.
[21] Anita Burgun, Arnaud Rosier, Lynda Temal, Olivier Dameron, Philippe Mabo, Pierre Zweigen-baum, Regis Beuscart, David Delerue, and Christine Henry. “Supporting medical decision in tele-cardiology: a patient-centered ontology-based approach”. In: Medinfo 2010. In press. 2010.
[22] Nicolas Lebreton, Christophe Blanchet, Daniela Barreiro Claro, Julie Chabalier, Anita Burgun,and Olivier Dameron. “Verification of parameters semantic compatibility for semi-automatic Webservice composition: a generic case study”. In: 12th International Conference on Information Inte-gration and Web-based Applications and Services (iiWAS2010). 2010, pp. 845–848.
[23] Olivier Dameron, Paolo Besana, Oussama Zekri, Annabel Bourde, Anita Burgun, and Marc Cuggia.“OWL Model of Clinical Trial Eligibility Criteria Compatible With Partially-known Information”.In: Proceedings of the Semantic Web for Life Sciences workshop SWAT4LS2012. 2012.
[24] Wiktoria Golik, Olivier Dameron, Jerome Bugeon, Alice Fatet, Isabelle Hue, Catherine Hurtaud,Matthieu Reichstadt, Marie-Christine Salaun, Jean Vernet, Lea Joret, Frederic Papazian, ClaireNedellec, and Pierre-Yves Le Bail. “ATOL: the multi-species livestock trait ontology”. In: Procee-dings of the 6th Metadata and Semantics Research Conference MTSR. 2012.
[25] Anthony Bretaudeau, Olivier Dameron, Fabrice Legeai, and Yvan Rahbe. “AphidAtlas : avanceesrecentes”. In: Proceedings of BAPOA 2013 MOP. INRA, CIRAD Lavalette Campus Montpellier,France. Ed. by M. Uzest. [In French]. 2013.
[26] Isabelle Hue, Jerome Bugeon, Olivier Dameron, Alice Fatet, Catherine Hurtaud, Lea Joret, Marie-Christine Meunier-Salaun, Claire Nedellec, Matthieu Reichstadt, Jean Vernet, and Pierre-YvesLe Bail. “ATOL and EOL ontologies, steps towards embryonic phenotypes shared worldwide?”In: Proceedings of the 4th Mammalian Embryo Genomics Meeting, October 2013, Quebec City.Vol. 149. Animal Reproduction Science 1–2. 2014, p. 99.
[27] Francois Moreews, Yvan Le Bras, Olivier Dameron, Cyril Monjeaud, and Olivier Collin. “Integra-ting GALAXY workflows in a metadata management environment”. In: Galaxy Community Confe-rence GCC2014, Proceedings. 2014. url: https://wiki.galaxyproject.org/Events/GCC2014/Abstracts/Posters#P28:_Integrating_GALAXY_workflows_in_a_metadata_management_
environment.
Articles de journaux nationaux avec comite
[1] JJ Levrel, B Carsin-Nicol, C Ouail-Tabourel, E Chabert, P Darnault, B Gibaud, O Dameron, andX Morandi.“Electronic imaging with photo-realistic rendering for neuroanatomy teaching: methodsand preliminary results”. In: Journal of Neuroradiology (2002).
[2] V Bertaud, I Belhadj, O Dameron, N Garcelon, L Hendaoui, F Marin, and R Duvauferrier. “L’in-formatisation du signe radiologique”. In: Journal de Radiologie 88.1 (2007), pp. 27–37.
[3] Philippe Finet, Regine Le Bouquin-Jeannes, and Olivier Dameron. “La telemedecine dans la priseen charge des maladies chroniques [in French]”. In: Techniques Hospitalieres 740 (2013).

[4] Pierre-Yves Le Bail, Jerome Bugeon, Olivier Dameron, Alice Fatet, Wiktoria Golik, Jean-FrancoisHocquette, Catherine Hurtaud, Isabelle Hue, Catherine Jondreville, Lea Joret, Marie-ChristineMeunier-Salaun, Jean Vernet, Claire Nedellec, Matthieu Reichstadt, and Philippe Chemineau. “Unlangage de reference pour le phenotypage des animaux d’elevage : l’ontologie ATOL”. In: ProductionAnimale 27.3 (2014), pp. 195–208.
Conferences nationales avec comite non indexees
[1] Olivier Dameron, Bernard Gibaud, and Xavier Morandi. “Representation de connaissances nume-riques et symboliques sur l’anatomie du cortex cerebral par des technologies du web”. In: Forumdu Jeune Chercheur Compiegne. 2001.
[2] Olivier Dameron, Anita Burgun, Xavier Morandi, and Bernard Gibaud. “Ontologie stratifiee del’anatomie du cortex cerebral : application au maintien de la coherence”. In: Journee Web Seman-tique, Rennes. 2003.
[3] Christine Golbreich, Olivier Dameron, Bernard Gibaud, and Anita Burgun. “Comment representerles ontologies pour tendre vers un Web Semantique Medical ?” In: Journees Fran caises de la Toile.2003.
[4] Julie Chabalier, Gwenaelle Marquet, Olivier Dameron, and Anita Burgun. “Enrichissement de lahierarchie KEGG par l’exploitation de Gene Ontology”. In: Workshop OGSB, JOBIM’06. 2006.
[5] Julie Chabalier, Olivier Dameron, and Anita Burgun. “Using knowledge about pathways as anorganizing principle for disease ontologies”. In: Journees Ouvertes Biologie, Informatique et Ma-thematiques (JOBIM’07). 2007.
[6] Nicolas Lebreton, Olivier Dameron, Christophe Blanchet, and Julie Chabalier. “Utilisation d’on-tologies de taches et de domaine pour la composition semi-automatique de services Web bioinfor-matiques”. In: Proceedings of the Journees Ouvertes de Biologie, Informatique et Mathematiques(Jobim 2008). 2008.
[7] Elodie Roques, Julie Chabalier, and Olivier Dameron. “Enrichissement semantique de patronssyntaxiques pour l’amelioration du mapping entre voies metaboliques et processus biologiques”. In:Proceedings of the Journees Ouvertes de Biologie, Informatique et mathematiques (Jobim 2008).2008.
[8] Cyril Grouin, Arnaud Rosier, Olivier Dameron, and Pierre Zweigenbaum. “Une procedure d’ano-nymisation a deux niveaux pour creer un corpus de comptes rendus hospitaliers”. In: JourneesFrancophones d’Informatique Medicale. 2009.
[9] Nicolas Lebreton, Christophe Blanchet, Julie Chabalier, and Olivier Dameron. “Utilisation d’onto-logies de taches et de domaine pour la composition semi-automatique de services Web bioinforma-tiques”. In: Journees Ouvertes Biologie, Informatique et Mathematiques (JOBIM 2009). 2009.
[10] Charles Bettembourg, Christian Diot, and Olivier Dameron. “Cross-Species Metabolic PathwaysComparison: Focus on Mouse, Human and Chicken Lipid Metabolism”. In: Journees OuvertesBiologie, Informatique et Mathematiques (JOBIM 2011). In press. 2011.
[11] Charles Bettembourg, Christian Diot, Anita Burgun, and Olivier Dameron. “GO2PUB: QueryingPubMed with Semantic Expansion of Gene Ontology Terms”. In: Journees Ouvertes Biologie, In-formatique et Mathematiques (JOBIM 2012). 2012.
[12] Alexandre Rollet, Gautier Defossez, Olivier Dameron, Poitou-Charentes CoRIM, Poitou-CharentesCRISAP, and Pierre Ingrand. “Developpement et evaluation d’un algorithme de representation desparcours de soins de patientes atteintes d’un cancer du sein a partir des donnees d’un systemed’information regional”. In: Proceedings of the conference Evaluation Management OrganisationInformation Sante (EMOIS2013, Nancy, France). [In French, short abstract]. 2013.
[13] Charles Bettembourg, Olivier Dameron, Anthony Bretaudeau, and Fabrice Legeai. “Integration etinterrogation de reseaux de regulation genomique et post-genomique”. In: Proceedings of the IN-OVIVE workshop (INtegration de sources/masses de donnees heterogenes et Ontologies, dans ledomaine des sciences du VIVant et de l’Environnement), conference IC (Ingenierie des Connais-sances) PFIA. 2015.

[14] Jean Coquet, Geoffroy Andrieux, Jacques Nicolas, Olivier Dameron, and Nathalie Theret.“Analysisof TGF-beta signalization pathway thanks to topological and Semantic Web methods”. In: JourneesOuvertes Biologie, Informatique et Mathematiques (JOBIM 2015), poster session. 2015.
[15] Philippe Finet, Bernard Gibaud, Olivier Dameron, and Regine Le Bouquin-Jeannes. “Interopera-bilite d’un systeme de capteurs en telemedecine”. In: Proceedings of the Journees d’etude sur laTelesante, UTC Compiegne. 2015.
[16] Yann Rivault, Olivier Dameron, and Nolwenn Le Meur. “Une infrastructure generique basee surles apports du Web Semantique pour l’analyse des bases medico-administratives”. In: Proceedingsof the IN-OVIVE workshop (INtegration de sources/masses de donnees heterogenes et Ontologies,dans le domaine des sciences du VIVant et de l’Environnement), conference IC (Ingenierie desConnaissances) PFIA. 2015.
[17] Yann Rivault, Olivier Dameron, and Nolwenn Le Meur.“La gestion de donnees medico-administratives
grace aux outils du Web Semantique”. In: Proceedings of the conference Evaluation ManagementOrganisation Information Sante (EMOIS2016, Dijon, France). [In French, short abstract]. 2016.
Divers
Voile : Moniteur federal de voile (catamaran). Participation au challenge CNRS en 2010,2011, 2012, 2013, 2014 et 2015.
Associations : President d’une creche parentale (fevrier 2010 – juin 2011) ;Tresorier de l’« association voile recherche-enseignement Rennes » (depuis 2012).
18 decembre 2015