Entertainment, Arts and Sports Law Journal - New York State ...
Upload
khangminh22Category
view
1download
0
Journal of Sports Science
Volume 3, Number 4, July-Aug. 2015 (Serial Number 9)
David
David Publishing Company
www.davidpublisher.com
PublishingDavid

Publication Information: Journal of Sports Science is published bimonthly in hard copy (ISSN 2332-7839) by David Publishing Company located at 1840 Industrial Drive, Suite 160, Libertyville, IL 60048, USA.
Aims and Scope: Journal of Sports Science, a professional academic journal, covers all sorts of papers related to various aspects of the sport sciences; the Journal aims to promote communication and development across all sub-disciplines of the sports
sciences.
Editorial Board Members: Jerzy Kosiewicz (Poland), Teet Seene (Estonia), Andreas N. Kavazis (Albania), Salvatore Cincimino (Italy), Gareth Irwin (UK), José Ramón Alvero Cruz (Spain), Vaclav Bunc (Czech Republic), Claudiu Avram (Romania), Marcio Luis Pinto Domingues (Lisbon), Daniel Memmert (Germany), Irena Valantine (Lithuanian), Daniel Mayorga-Vega (Spain), Jan Ove Tangen (Norway), Li Chen (USA), Jae-Pil Ha (USA).
Manuscripts and correspondence are invited for publication. You can submit your papers via Web Submission, or E-mail to [email protected] or [email protected]. Submission guidelines and Web Submission system are available at http://www.davidpublisher.com
Editorial Office: 1840 Industrial Drive, Suite 160, Libertyville, IL 60048, USA Tel: 1-323-984-7526, 323-410-1082
Fax: 1-323-984-7374, 323-908-0457 E-mail: [email protected]; [email protected].
Copyright©2015 by David Publishing Company and individual contributors. All rights reserved. David Publishing Company holds the exclusive copyright of all the contents of this journal. In accordance with the international convention, no part of this journal may be reproduced or transmitted by any media or publishing organs (including various websites) without the written permission of the copyright holder. Otherwise, any conduct would be considered as the violation of the copyright. The contents of this journal are available for any citation. However, all the citations should be clearly indicated with the title of this journal, serial number and the name of the author.
Abstracted/Indexed in: Google Scholar Database of EBSCO, Massachusetts, USA (Humanities Abstracts (H.W. Wilson)) LLBA Database of CSA Universe Digital Library S/B ProQuest, USA CrossRef Ulrich’s Periodicals Directory Summon Serials Solutions Chinese Database of CEPS, American Federal Computer Library center (OCLC), USA
Subscription Information: Price (per year): Print $520, Online $320, Print and Online $600
David Publishing Company 1840 Industrial Drive, Suite 160, Libertyville, IL 60048, USA Tel: 1-323-984-7526, 323-410-1082; Fax: 1-323-984-7374, 323-908-0457 E-mail: [email protected]
David Publishing Companywww.davidpublisher.com
DAVID PUBLISHING
D

Journal of Sports Science
Volume 3, Number 4, July–Aug. 2015 (Serial Number 9)
Contents
Technical Papers
155 Effects of Neuroticism on Partial and Whole Body Reactions under Stress
Kanaka Yatabe, Hiroto Fujiya, Naoko Yui, Keisuke Tateishi, Yuka Murofushi, Fumiko Terawaki, Koh
Terauchi, Hajime Kobayashi, Takaaki Kudo, Mahiro Ohno, Aya Uchino, Hisao Miyano, Tadasu Oyama
and Haruki Musha
165 Beach Handball and Beach Volleyball as Means Leading to Increasing Physical Activity of
Recreational Sportspeople—Pilot Study
Jan Bělka, Karel Hůlka, Michal Šafář, Radim Weisser and Julie Chadimova
171 Effect of an Acute Exercise Session on Body Composition Using Multi-Frequency Bioelectrical
Impedance Analysis in Adults
Kyle L. Romanowski, Andrea J. Fradkin, Curt B. Dixon and Joseph L. Andreacci
179 The Impact of the Techniques and Tactics Appropriate by the Athletes in Phase Triple Jump and
Their Relationships with the Finale Results
Zerf Mohammed, Mokkedes Moulay Idriss, Bengoua Ali, Bendahmane Med Nasreddin and Guebli
Abd-el-Kader
Technical Reports
186 Olympic Movement or Diplomatic Movement? The Role of Olympic Games on Development of
International Relations
Mahdi Shariati Feizabadi, Fernando Delgado, Mohammad Khabiri, Nasrollah Sajjadi and Ebrahim
Alidoust
195 Wrestling: Glory of India at the Olympics—A Brief History of Indian Wresting Team in the
Olympic Games
Naveen Singh Suhag


Journal of Sports Science 3 (2015) 155-164
doi: 10.17265/2332-7839/2015.04.001
Effects of Neuroticism on Partial and Whole Body
Reactions under Stress
Kanaka Yatabe1, Hiroto Fujiya
1, Naoko Yui
1, Keisuke Tateishi
1, Yuka Murofushi
1, Fumiko Terawaki
1, Atsuhiro
Yoshida2, Hirotaka Yoshioka
2, Koh Terauchi
2, Hajime Kobayashi
2, Takaaki Kudo
2, Mahiro Ohno
2, Aya Uchino
2,
Hisao Miyano3, Tadasu Oyama
4 and Haruki Musha
1
1. Department of Sports Medicine, St. Marianna University School of Medicine, Kawasaki 216-8511, Japan
2. Department of Sports Medicine, St. Marianna University Graduate School of Medicine, Kawasaki 216-8511, Japan
3. Research Division, National Center for University Entrance Examinations, Tokyo 153-8501, Japan
4. Department of Psychology, College of Humanities and Sciences, Nihon University, Tokyo 156-8550, Japan
Abstract: Effects of neuroticism on partial and whole body reaction times were investigated under stress, or choking conditions in
student participants (N = 127). We measured simple and choice reaction times of parts of the body and choice reaction times of the
whole body in the participants with high and low neuroticism such as depression, cyclic tendency, inferiority feelings, and
nervousness under the controlled stress scenario of being in front of people. Results indicated significant differences in reaction times
of partial body, discriminative decisions and choice reaction times of participants in the high neuroticism group. Results of whole
body reaction times were opposite to that of partial body reactions. However, a two-way factorial analysis of variance indicated
neither a significant main effect, nor interactions between reaction times and personality traits. Whole body reactions suggest that the
effects of stimulus transduction process from motor commands to motor outputs via motor neurons has a greater effect in the central
nervous system than recognition and decision-making. However, it is possible that changes in the intracortical mechanisms related to
cognitions and emotions could be correlated in partial body movements with nearly no muscular activity. Our findings suggested that
delays indiscrimination, decision-making, and choice times could affect the performance of individuals.
Key words: Personality traits, stress, reaction.
1. Introduction
Reactions times are important components of motor
movements. The movements of body parts in which
there is almost no muscular activity have been
evaluated during a target-tracking task, by using MEP
(motor evoked potential) involuntary finger
movements [1]. The authors concluded that increases
in excitability of the corticospinal tract were
determined by changes in intracortical mechanisms
related to cognitions and emotions. Also, in the case
of whole body reactions, the stimulus transduction
process from motor commands to motor outputs via
motor neurons might have a more significant effect in
Corresponding author: Kanaka Yatabe, M.A., assistant
professor, research fields: sports psychology, mood and
emotion. E-mail: [email protected].
the central nervous system than recognition and
decision-making. Reaction times are physiologically
significant, and are simple, noninvasive tests of
peripheral, as well as central neural structures [2].
Many processes involved inhuman mental activities,
such as information collection, learning, and thinking,
among others, are unconscious processes. This
characteristic is distinctively observed in athletics and
sports. For these reasons, it is possible that
unconscious self-awareness, rather than conscious
self-awareness, has a larger impact on individual
performance in sports [3, 4].
A previous study has suggested that unrecognizable
stimuli could increase the speed of simple movements
such as key-pressing reactions. Based on this finding,
we examined whether participants high in neuroticism,
D DAVID PUBLISHING

Effects of Neuroticism on Partial and Whole Body Reactions Under Stress
156
compared to those low in neuroticism, would show
differences in discrimination times between partial and
complete body movements in terms of psychological
and behavioral dimensions.
2. Purpose
Stress in sports consist of three dimensions [5]:
psychological, physiological and behavioral [6-10].
One of psychological stress is pressure, which is also
known as choking. In terms of behavioral dimensions,
a decline in the speed of movement resulting from
choking has been reported [11]. This study was
designed to examine whether differences in
psychological states decreased the speed of
movements, or increased reaction times, by measuring
partial body and whole body reaction times under a
stress scenario of being in front of people.
3. Participants and Method
Undergraduate students (N = 127) participated in an
experiment under the controlled stress of being
watched by people. We measured simple and choice
reaction times in a part of the participant’s body, the
finger, and the separate reaction times of the left and
right sides of the participants’ whole body, by using a
color detection task. Then, we measured partial and
whole body reaction times of the team, by using a
crossover design. After the measurement, we divided
participants according to their personality trait into
two groups, high and low neuroticism, based on their
neuroticism score, and conducted a comparative
analysis of SRT (simple reaction times), CRT (choice
reaction times) and DT (discrimination times) of the
two groups of participants.
We used the Japanese version of the Guilford
Personality Inventory [12, 13] and conducted
between-task comparisons of psychological stress
levels resulting from neuroticism. We first extracted
four scales of neuroticism: D (depression), C (cyclic
tendency), I (inferiority feelings), and N (nervousness).
Each scale had a maximum score of 20 points
resulting in a total score 80 points. Based on the mean
score of the present population (36.4 ± 2 SD points)
the participants were divided into two groups. The
group of the participants with the scores higher than
average was regarded as the unstable group, and the
other as the stable group [14, 15].
3.1 Ethical Considerations
This study was approved by the St. Marianna
University School of Medicine Clinical Research
Committee (No.1976). The Helsinki Declaration was
honored. The surveys were completed anonymously,
so that the participants’ identities were secured. The
survey responses have been maintained under careful
conditions. No results containing personal information
have been released, and the data will not be used for
other purposes.
3.2 Statistical Analysis
Of the 127 participants, the results of 120 (72 men
and 48 women) were analyzed using a Student’s t-test
for between-groups comparisons and a Paired t-test
for between-subjects comparison. We also conducted
two-way (neuroticism groups × times) repeated
measures ANOVA (analyses of variance) by means of
Tukey HSD (honestly significant difference).
Follow-up univariate analyses of variance (ANOVAs)
were used in cases of significant main effects and
interaction. Analyses were carried out using SPSS
Statistics (ver. 21.0) and a P-value was set P < 0.05 to
determine statistical significance. The criteria for
including reaction times in the analysis were reactions
exceeding the average reaction time ± 3SD, but not
exceeding 200 msec, which were considered to be
respectively indicative of reaction errors and reaction
failures and were regarded as missing values.
About the experimental condition in this study, to
measure partial body reaction times, we used a
reaction time assessment software developed for basic
experiments by Okamoto Y. (Response/Reaction
Time, Keiso Shobo, Tokyo, Japan) [16, 17] and

Effects of Neuroticism on Partial and Whole Body Reactions Under Stress
157
conducted a randomized signal-timing program with
approximately one minute duration of simple reaction
time measurement (separately for left and right for
fingers) and approximately two minutes duration of
choice reaction time testing (simultaneous for left and
right fingers). We calculated the median reaction
times for each condition. To assess SRT, participants
pressed the “J” key of a computer keyboard as quickly
as possible when the letter “J” appeared in white text
on a black computer screen. The time from the onset
of the presentation to participant’s key press was
regarded as their SRT. To assess CRT, participants
selected either the “F (left)” key, or the “J (right)” key
near the center of the keyboard, and quickly pressed
the selected key. The time from the onset of the
presentation to participants’ decision-making was
considered as their CRT.
To measure participants’ whole body reaction times,
we used a Multi Jump Tester (DKH, Tokyo, Japan).
We presented different colored lights to examine
differences in participants’ sensory DT
(discrimination time). Measurement time was
approximately one minute per leg. In this method,
participants moved their right or left leg from the front
of the mat to its top, as quickly as possible in response
to a color light that had been selected by the
participants from among three colors, which was
presented in a randomized order. The trials were
randomized three times each for the left and right legs.
Therefore, six measurements were conducted. First,
participants stood on the mat to which sensors were
attached, and one of the three colored lights was
randomly turned on in a random order. They
simultaneously lifted their leg from the front of the
mat and stepped on the mat when the instructed light
came on. We regarded the time from the light turning
on to participant jumping as the WBCRT (whole body
choice reaction time) of that participant; the time from
lifting the leg from the mat to landing on the mat was
considered their MT (movement time); and the time
required for making the decision to jump (decision
making time). The MTs could not measure
independently, so the WBDTs (whole body
discriminative times) were shown in Fig. 1.
(a) Partial body reaction (b) Whole body reaction
Fig. 1 Experimental condition.
DT: The time required for distinction and decision, as reaction start time.
MT: The time required for movement, as muscular contraction time.
WBDTs: The MTs could not measure independently, so the whole body discriminative times (DT + MT = WBDTs).

Effects of Neuroticism on Partial and Whole Body Reactions Under Stress
158
4. Results
Response times of all participants in the present
study indicated that the mean partial body SRT was
268.0 ± 33.1 msec. Similar to most Japanese people,
approximately about 90% of the participants were
right handed [18, 19], probably as the results of early
training of children’s chopsticks-handling in their
homes. Although the CRT and DT of the left finger
were slightly delayed (CRT: left; 398.1 ± 51.7, right;
390.9 ± 54.3 msec, DT: left; 130.1 ± 46.6, right; 122.9
± 47.7 msec), there were no statistically significant
differences either between the left and the right hands
or between men and women (Table 1).
Results also indicated that whole body CRTs were
evenly distributed for both the left and right sides of
the body and there were no significant differences
either in the side of the bodies or in gender.
4.1 Partial Body Scores of High and Low Neuroticism
Groups
Next partial body tasks were compared between the
high neuroticism group and the low neuroticism group.
Left CRTs were 389.2 ± 52.9 msec for the low
neuroticism group and 407.2 ± 49.7 msec for the high
neuroticism group. Right CRTs were 383.1 ± 50.0
msec for the low neuroticism group and 398.8 ± 58.1
msec for the high neuroticism group. Although the
high neuroticism group had slightly longer CRTs than
the low neuroticism group, there were no significant
differences in CRTs between the two groups for left or
right fingers as follows, left: t(116) = -1.908, P = 0.059,
right: t(116) = -1.575, P = 0.118.
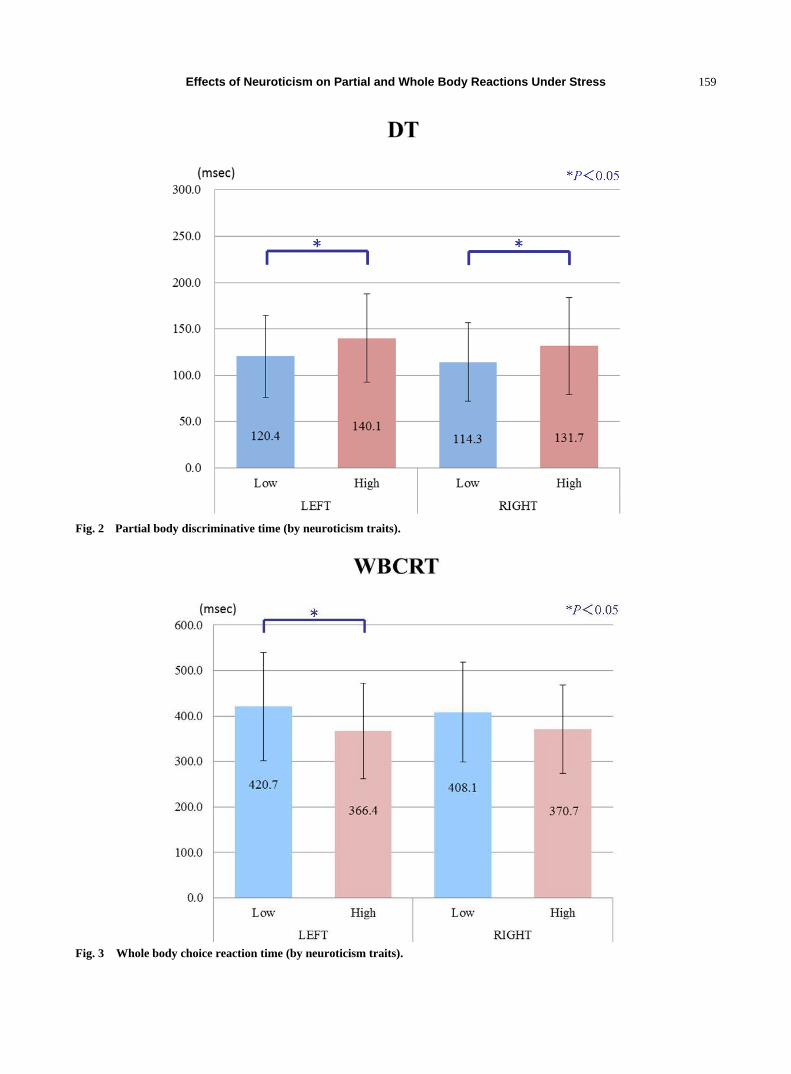
However, as can be seen in Fig. 2, there were
significant between-group differences (P < 0.05) in
partial body DTs. Left finger DTs were 120.4 ± 44.5
msec for the low neuroticism group and 140.1 ± 47.5
msec for the high neuroticism group, t(116) = -2.334,
P = 0.021. Right hand DTs were 114.3 ± 42.2 msec for
the low neuroticism group and 131.7 ± 52.0 msec for
the high neuroticism group, t(116) = -2.000, P = 0.048.
We found that high neuroticism group had slightly
longer DTs than the low neuroticism group, possible
indicative of reduced central processing in the brain.
4.2 Whole Body Scores of High and Low Neuroticism
Groups
Whole body CRTs of the high and low neuroticism
groups showed different trends to that of partial body
results (as shown in Fig. 3). There were differences
between the left and the right (left: the low
neuroticism group 420.7 ± 119.0 msec, the high
neuroticism group 366.4 ± 105.1 msec, right: the low
neuroticism group 408.1 ± 109.7 msec, the high
neuroticism group 370.7 ± 97.5 msec). We found that
the WBCRTs of the low neuroticism group were
shorter than those of the high neuroticism group; left:
Table 1 Partial and Whole body reaction times (average ± standard deviation).
Partial Body Reaction
SRT CRT DT CRT DT
(msec) (AV) (Left) (Left) (Right) (Right)
Average 268.0 398.1 130.1 390.9 122.9
±SD 33.3 51.7 46.6 54.3 47.7
Whole Body Reaction
Left sides 1st time 2nd time 3rd time WBCRT WBDT
(msec)
Average 392.0 406.7 393.6 393.3 156.1
±SD 133.6 133.8 120.8 114.5 93.1
Right sides
1st time 2nd time 3rd time WBCRT WBDT (msec)
Average 400.5 394.8 399.3 390.8 141.9
±SD 112.5 122.5 126.9 104.5 91.2
Effects of Neuroticism on Partial and Whole Body Reactions Under Stress
159
Fig. 2 Partial body discriminative time (by neuroticism traits).
Fig. 3 Whole body choice reaction time (by neuroticism traits).

Effects of Neuroticism on Partial and Whole Body Reactions Under Stress
160
t(113) = 2.594, P = 0.011, right: t(113) = 1.925, P =
0.057. This finding suggests opposite effects of
neuroticism traits on partial body and whole body
reactions.
We conducted two-way factorial ANOVA of whole
body reaction measurements, with measurement
period and personality traits to examine differences in
repeated measurement periods. Results indicated
neither a significant main effects nor interactions; left:
F(2, 168) = 0.082, right: F(2, 168) = 0.595, Ps > 0.05
(Fig. 4).
It is suggested that slight differences between the
left and the right sides of the body were probably
related to whether or not it was the dominant leg of
the participants. The high neuroticism group had a
shorter response time and their performance improved
as they repeated the task. The low neuroticism group
was more likely to decrease the speed of their
performances as the task was repeated. The results
were in line with the degrees of performance observed
in relation to introversion versus extroversion
personality traits [20, 21]. The high neuroticism group
was more likely to improve their performances as they
repeated a task and the low neuroticism group was
more likely to perform at their best the first time.
If we review whole body reactions by breaking
them down according to the four personality scales of
neuroticism (among the four scales), “D (Depression)”
and “N (Nervousness)” scales of the two neuroticism
group indicated significant differences by repeated
measures ANOVA. (N) scale of the high neuroticism
group, indicated a two factor interaction (emotional
groups × period) on the right leg of the body, which
was the dominant side of most participants, F(4, 280)
= 3.442, P = 0.035. Especially in (D) scales on both
sides and (N) scale on the right leg of the body, these
results indicated that the high neuroticism group
tended to be shorter at first time, but were longer at
the 2nd and the 3rd time on the estimated averages.
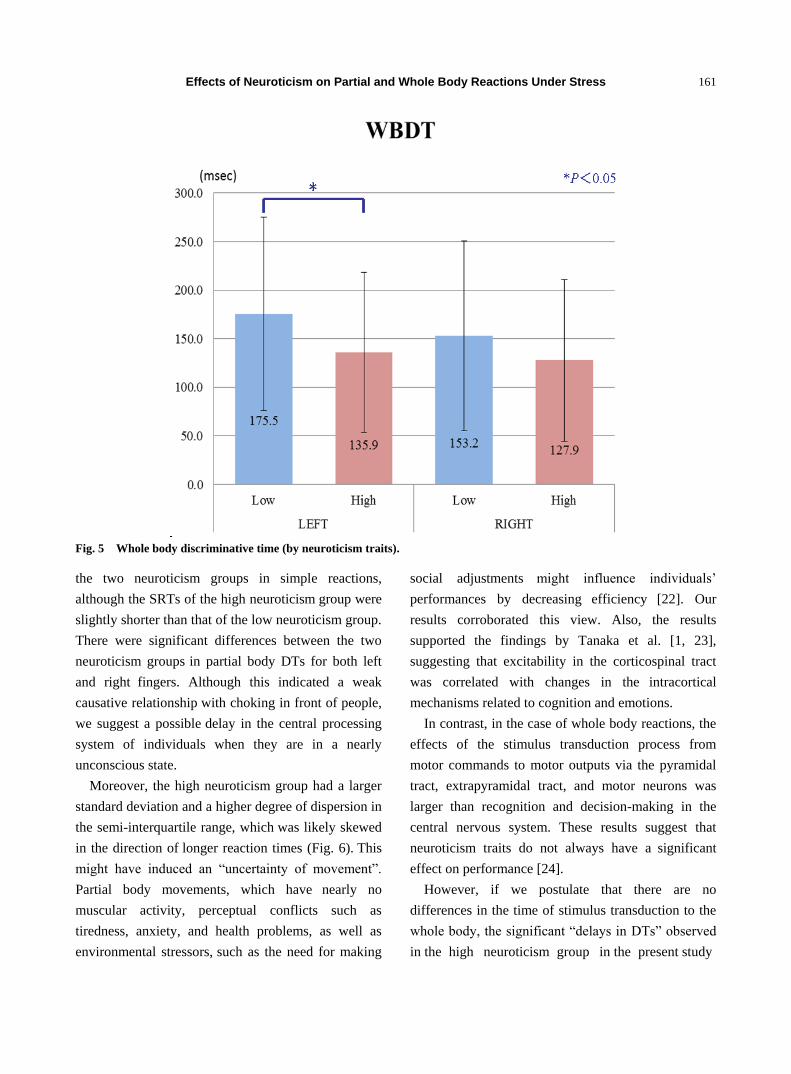
Differences between the left and the right sides
were also observed in whole body DTs (left: low
neuroticism group 175.5 ± 99.6 msec, high
neuroticism group 135.9 ± 82.6 msec, right: low
neuroticism group 153.2 ± 97.3 msec, high
neuroticism group 127.9 ± 83.3 msec) as see Fig. 5. A
Difference (P < 0.05) was also observed in the left leg
between the two groups, t(94) = 2.107, P = 0.038. We
also observed a difference in the same direction for the
right leg, which did not reach significance, t(102) =
1.408, P = 0.162. The whole body DTs tended to be
opposite of DTs in partial body reactions; the WBDTs
of high neuroticism group were shorter than those of
low neuroticism group on average.
5. Discussion
Results indicated no significant differences between
Fig. 4 Whole body choice reaction times (by neuroticism traits).
Effects of Neuroticism on Partial and Whole Body Reactions Under Stress
161
Fig. 5 Whole body discriminative time (by neuroticism traits).
the two neuroticism groups in simple reactions,
although the SRTs of the high neuroticism group were
slightly shorter than that of the low neuroticism group.
There were significant differences between the two
neuroticism groups in partial body DTs for both left
and right fingers. Although this indicated a weak
causative relationship with choking in front of people,
we suggest a possible delay in the central processing
system of individuals when they are in a nearly
unconscious state.
Moreover, the high neuroticism group had a larger
standard deviation and a higher degree of dispersion in
the semi-interquartile range, which was likely skewed
in the direction of longer reaction times (Fig. 6). This
might have induced an “uncertainty of movement”.
Partial body movements, which have nearly no
muscular activity, perceptual conflicts such as
tiredness, anxiety, and health problems, as well as
environmental stressors, such as the need for making
social adjustments might influence individuals’
performances by decreasing efficiency [22]. Our
results corroborated this view. Also, the results
supported the findings by Tanaka et al. [1, 23],
suggesting that excitability in the corticospinal tract
was correlated with changes in the intracortical
mechanisms related to cognition and emotions.
In contrast, in the case of whole body reactions, the
effects of the stimulus transduction process from
motor commands to motor outputs via the pyramidal
tract, extrapyramidal tract, and motor neurons was
larger than recognition and decision-making in the
central nervous system. These results suggest that
neuroticism traits do not always have a significant
effect on performance [24].
However, if we postulate that there are no
differences in the time of stimulus transduction to the
whole body, the significant “delays in DTs” observed
in the high neuroticism group in the present study

Effects of Neuroticism on Partial and Whole Body Reactions Under Stress
162
Fig. 6 Dispersion of discriminative time (by neuroticism traits).
might decrease individual performance. In particular,
children from 6 to 12 years of age are in a growth
period with ongoing development of their nervous
system. In the case of such children, the effects of a
delayed stimulus transduction time in the motor
command output system related to emotions, could
have significant effects on their performance.
6. Future Issues
It has been suggested with regard to whole body
reactions that “emotionally stable groups have a faster
whole body reaction time” under psychological stress
in the context of personality traits, and that “there is a
correlation between pressure and performance” [21,
25-28]. However, our results did not support these
findings, because individuals in the present study were
facing weak pressure, which might be correlated with
attention and concentration for particular types of
performance. This could be because an optimal level
of tension might have a facilitating effect on choking.
This experiment examined differences in participants’
whole body reactions under slight pressure, which
unlike under strong pressure, might have been
insufficient to generate differences in reaction
times.
In sports, it has been regarded that reaction time and
performance before and after official games differ
according to reaction times and neuroticism. However,
in the present experiment on whole body reactions, we
found the effects of motor control time, or the effects
of the stimulus transduction process from the motor
command to the motor output via the pyramidal tract,
extrapyramidal tract, and motor neurons may have a
larger effect. Our findings suggest that in the case of
partial body movements, in which there is almost no
muscular activity, changes in the intracortical
mechanisms related to unconscious cognitions and
emotions might be correlated.
Acknowledgements
This research was supported by a Grant-in-Aid for
Scientific Research (No.22700633 and 25350789)
from Ministry of Education, Culture, Sports, Science
and Technology in Japan and St. Marianna University
School of Medicine for helping with data collection
on this project.

Effects of Neuroticism on Partial and Whole Body Reactions Under Stress
163
Reference
[1] Tanaka, Y., Funase, K., Sekiya, H., Sasaki., J., and
Takemoto, T. 2011. “Multiple EMG Activity and
Intracortical Inhibition and Facilitation during a Fine
Finger Movement under Pressure.” Journal of Motor
Behavior 43 (1): 73-81.
[2] Mohan, M., Thombre, D. P., Das, A. K., and Subramanian,
N. 1984. “Reaction Time in Clinical Diabetes Mellitus.”
Indian Journal of Physiology and Pharmacology 28 (4):
311-4.
[3] Masters, R. S. W., Maxwell, J. P., and Eves, F. F. 2009.
“Marginally Perceptible Outcome Feedback, Motor
Learning and Implicit Processes.” Consciousness and
Cognition 18 (3): 639-45.
[4] Lewicki, P., Hill, T., and Czyzewska, M. 1992.
“Nonconscious Acquisition of Information.” American
Psychologist 47 (6): 796-801.
[5] Lang, P. J. 1971. “The Application of
Psychophysiological Methods to the Study of
Psychotherapy and Behavior Modification.” In Handbook
of Psychotherapy and Behavior Change, edited by Bergin,
A., and Grafield, S. New York, NY: Wiley, 75-125.
[6] Ichimura, S. 1965. “Factor Analytical Study on the Traits
of Stage Fright in Sports.” Japan Journal of Physical
Education, Health and Sport Sciences 9 (1): 18-22. (in
Japanese)
[7] Arimitsu, K., and Imada, H. 1999. “Situations and
Cognitive Appraisals in ‘Agari’ Experiences: Feature
Analyses of ‘Agari’ Experiences.” The Japanese Journal
of Psychology 70 (1): 31-7. (in Japanese)
[8] Wang, J., Marchant, D., and Morris, T. 2004.
“Self-consciousness and Trait Anxiety as Predictors of
Choking in Sport.” Journal of Science and Medicine in
Sport 7 (2): 174-85.
[9] Tanaka, Y., and Sekiya, H. 2010. “The Influence of
Audience and Monetary Reward on Putting Kinematics
of Expert and Novice Golfers.” Research Quarterly for
Exercise and Sport 81 (4): 416-24.
[10] Mullen, R., Hardy, L., and Tattersall, A. 2005. “The
Effects of Anxiety on Motor Performance: A Test of the
Conscious Processing Hypothesis.” Journal of Sport &
Exercise Psychology 27: 212-25.
[11] Tanaka, Y., and Sekiya, H. 2006. “The Influence of
Acute Psychological Stress on Golf Putting.” Japanese
Journal of Sport Psychology 33 (2): 1-18. (in Japanese)
[12] Guilford, J. P. 1975. “Factors and Factors of Personality.”
Psychological Bulletin 82 (5): 802-14.
[13] Tsujioka, Y. 1957. “A Factorial Study of the
Temperament of Japanese College Male Students by the
Yatabe-Guilford Personality Inventory.” Psychologia 1
(2): 110-9. (in Japanese)
[14] Luce, R. D. 1986. Response Times: Their Role in
Inferring Elementary Mental Organization. Oxford
Psychology Series 8. New York: Oxford University Press,
562.
[15] Welford, A. T. 1977. “Motor Performance.” Handbook of
the Psychology of Aging 2 (450): 95.
[16] Okamoto, Y. 1982. “A Test of the Fixed-point Property
of the Two-state Model for Simple Reaction Time.”
Japanese Psychological Research 24 (4): 222-4.
[17] Okamoto, Y. 2010. Response/Reaction Time: Psychology
VC++ for University Students, Introduction to Program.
Tokyo: KeisoShobo. (in Japanese)
[18] Hardyck, C., and Petrinovich, L. F. 1977.
“Left-handedness.” Psychological Bulletin 84 (3):
385-404.
[19] Maehara, K. 1989. Right-handed Person, Left-handed
Science, Handedness, Footedness, Work Eyes, Work Ear.
Tokyo: Kodansha. (in Japanese)
[20] Baumeister, R. F. 1984. “Choking under Pressure:
Self-consciousness and Paradoxical Effects of Incentives
on Skillful Performance.” Journal of Personality and
Social Psychology 46 (3): 610-20.
[21] Murayama, T., and Sekiya, H. 2012. “Factors Related to
Choking under Pressure in Sports and the Relationships
among Them.” Japan Journal Physical Education,
Health and Sport Sciences 57 (2): 595-611. (in
Japanese)
[22] O’Relly, and Joseph, P. 1977. “Hana Kai II. A 17-day
Dry Saturation Dive at 18.6 ATA: VI. Cognitive
Performance, Reaction Time, and Personality Changes.”
Undersea Biomedical Research 4 (3): 297-305.
[23] Tanaka, Y., and Sekiya, H. 2010. “The Influence of
Audience and Monetary Reward on the Putting
Kinematics of Expert and Novice Golfers.” Research
Quarterly for Exercise and Sport 81 (4): 416-24.
[24] Yavuz, H. U., and Oktem, F. 2012. “The Relationship
between Depression, Anxiety and Visual Reaction Times
in Athletes.” Biology of Sport 29 (3): 205-9.
[25] Lenzenweger, M. F. 2001. “Reaction Time Slowing
During High-load, Sustained-attention Task
Performance in Relation to Psychometrically Identified
Schizotypy.” Journal of Abnormal Psychology 110 (2):
290-6.
[26] Panayitou, G., and Vrana, S. R. 2004. “The Role of
Self-focus, Task Difficulty, Task Self-relevance, and
Evaluation Anxiety in Reaction Time Performance.”
Motivation and Emotion 28 (2): 171-96.
[27] Murayama, T., Tanaka, Y., and Sekiya, H. 2009.
“Qualitative Research on the Mechanism of Choking
under Pressure.” Japan Journal Physical Education,
Health and Sport Sciences 54 (2): 263-277. (in
Japanese)

Effects of Neuroticism on Partial and Whole Body Reactions Under Stress
164
[28] Ciucurel, M. M. 2012. “The Relation between Anxiety,
Reaction Time and Performance before and after Sport
Competitions.” Procedia-Social and Behavioral Sciences
33: 885-889. Accessed May 7, 2015.
http://www.sciencedirect.com/science/article/pii/S187704
2812002571
Journal of Sports Science 3 (2015) 165-170
doi: 10.17265/2332-7839/2015.04.002
Beach Handball and Beach Volleyball as Means Leading
to Increasing Physical Activity of Recreational
Sportspeople—Pilot Study
Jan Bělka1, Karel Hůlka
1, Michal Šafář
2, Radim Weisser
1 and Julie Chadimova
1
1. Department of Sport, Faculty of Physical Culture, Palacky University, Olomouc 77900, Czech Republic
2. Department of Natural Sciences in Kinanthropology, Faculty of Physical Culture, Palacky University, Olomouc 77900, Czech
Republic
Abstract: The sample consisted of sixteen man of aged average 24.5 year, average height 181.9 cm and weight 80.4 kg. The average of
static pulse rate was 56.4 beats min-1. The average heart rate max was 189.7 ± 7.8 beats min-1. For the calculation of HRmax (maximal
heart rate), a mathematical figure HRmax = 207 – (0.7 × age) was used. Probands have participated on the same day on a tournament in
beach and handball tournament. HR (heart rate) was monitored via Sport Tester Polar. The results were evaluated by Polar software.
The data was statistically compiled with the use of arithmetic average and standard deviation. The players played three matches in
beach volleyball on one set to 21 points (necessary difference of 2 points). One set lasted approximate 13.5 min. After a break, they
went to play three matches in beach handball. The average HR during beach volleyball was 149.5 ± 14.1 beats min-1 and 164.3 ± 14.5
beats min-1 in beach handball. In beach volleyball, we also focused on players’ intensity load differences 172 ± 14.1 beats min-1and
goalkeepers 156.5 ± 16.6 beats min-1. In the beach volleyball, players spend most of their playing time on the playing area in the zone
intensity load 80%-90% HRmax (36% playing time). In the beach handball, players spend most of their playing time on the playing area
in the zone intensity load 90%-100% HRmax (39% playing time).
Key words: Sport games, heart rate, physical activity, health.
1. Introduction
Man as a human being is both morphologically and
functionally adapted to the way of life of being able to
deal with a difficult physical activity which has always
been a part of basic attribution of living and surviving.
Health problems and diseases such as obesity, diabetes
mellitus II type, hypertension, metabolic
cardiovascular syndrome, ischaemic heart disease,
peripheral vascular disease, lower back pain,
osteoporosis and fractures are mostly connected with
the inactive way of living and sedentary jobs, and they
are said to be the cause of the mentioned chronic health
diseases. The intensified physical activity has a
beneficiary potential on better health state by evocating
Corresponding author: Jan Bělka, Ph.D., assistant of
professor, research field: sport training, sport condition, team
handball and small sided games. E-mail: [email protected].
adaptive changes in most of the organs and systems,
their function and regulation in the human body.
One of the most important things for physical
education is the human biological need for a physical
activity. Satisfying such a need comes with selection.
From the natural need for an activity is, as a
consequence, a new social need (a motive for social
contact) has developed. The actual needs related to
physical activity are based on stimulatory tendencies of
motivational cluster such as need for change, need for
activity repetition, health care need, etc. The necessary
condition for doing a sport is the joyful experience.
Presently, the joyful experience coming through a
physical activity is one of the most important motives
of it. We also speak here about an attractiveness of
sport in the means of offering a wide range of
unconventional, funny and socializing physical
D DAVID PUBLISHING
Beach Handball and Beach Volleyball as Means Leading to Increasing Physical Activity of Recreational Sportspeople—Pilot Study
166
activities such as co-educated forms of PA (physical
activity), meeting with friends, etc. Beach games have
become a big temptation not only for professional
athletes, but also for common recreational
sportspeople.
The basic point of beach games was the active way
of doing leisure time activities by the sea or on the
beach. The main idea was to relax, have fun, meet
friends, gain experience, and have better health
condition.
Beach volleyball combines all positive aspects of
team sports-ability to play theball, speed and accuracy
of movement, flexibility, deemed necessary to link
individual actions and thinking of the teammates, etc.
To these positive aspects, we can add multilateral
influence of the natural factors in outdoor sports [1].
The popularity of beach volleyball is increasing, but it
is a sport in the early stages of its development and it is
necessary to introduce quality materials to support the
development of players and coaches through practical
advice [2].
Beach handball is played in a 15 × 12 m sandfield.
Each equipment has one goalkeeper and three players
of field that compete during two halves of 10 minutes
each (2 × 10 min). They follow the applicable rules of
in door handball, with the exception of the zone of
change, which is an entire band for each team, and the
score of the goalkeepers, which counts double [3].
There are few authors dealing with topics such as
basketball, football, volleyball, beach football, indoor
football, rugby and who also deals with heart rate
monitoring during competition games [4-14]. All of
them by Cobos include a recording of heart rates by
telemetry, a valid system of measurement [15-17]. It
gives us information about heart response when
performing exercises that express a huge variability of
intensity [18] and, at the same time, it gives us an
energetice information about the performed exercise
[19].
There are only few surveys done on this topic in
beach volleyball [20, 21], beach football [7] and
beachhandball [22]. As a consequence to these facts,
we have done a research based on load intensity of
recreational players in beach volleyball and beach
handball.
Research of this study was a part of students’ granted
competition project nr. 43510007: “Analysis of players’
intensity during competitions in sport games
(basketball, football, handball and volleyball)” at
Palacky University in Olomouc.
The main goal of this research was to compare the
intensity load of recreational players in beach
volleyball and beach handball in competitions on the
basis of analysing heart rate monitoring and to analyse
the intensity load of recreational players in beach
volleyball and handball competition.
2. Methods
2.1 Participants
Participants were randomly chosen from students
studying physical education and sport in Faculty of
Physical Culture on Palacky Univerzity Olomouc,
Czech Republic. The research battery consisted of 16
men in the age average of 24.5 ± 3.74 years, of average
height 181.9 ± 6.02 cm and weight 80.4 ± 7.5 kg. The
players’ average HRrest was 56.4 ± 6.89 beats min-1
.
The average HRmax was 189.7 ± 7.8 beats min-1
.
Due to lack of financial and organizational support,
it was impossible to make exercise tests for getting the
HRmax. As a matter of fact the HRmax was figured out
from this formula: HRmax = 207 – (0.7 × age). The heart
rate monitoring was realized by the help of Team Polar
monitors. The results were evaluated by Polar
software.
2.2 Data Gathering Description
Posters informing about the participation on the
tournament were posted in advanced. The poster
informed about registration to this tournament for
men’s pairs in beach volleyball and a drawing lot
tournament in beach handball. There was an
informative meeting for all of the teams about the

Beach Handball and Beach Volleyball as Means Leading to Increasing Physical Activity of Recreational Sportspeople—Pilot Study
167
tournament system, rules for both sports and about
heart rate monitoring. The monitoring was held in TJ
Milo beach courts in Olomouc. The tournament in
volleyball was held on four beach courts, and the
handball tournament was held on just one court.
The beach volleyball tournament lasted from 9 to 11
o’clock and the drawing lot tournament of three teams
(two five-member teams and one six-member team)
lasted from 12 to 14 o’clock. Before beach volleyball
beginning, all of the probands received the heart rate
monitors which they put on their chests. The teams
received points from both tournaments to the final list.
The weather was sunny and windless; the temperature
was about 20 °C.
Each team/pair played three matches for one set to
21 points (two-point difference necessary). Then each
proband played two matches in beach handball.
2.3 Statistical Analysis
The data was with Software Statistica (9.0 version,
StatSoft, Inc., Tulsa, USA) processed by the
arithmetical average, percentage formulas, standard
deviation and statistical importance—Man-Whitney
test. There was a statistical significance P < 0.05. The
statistical calculations were based on the time data
received from sport testers (how many seconds the
players spent in each load intensity zone). All the
probands participated on beach volleyball and handball
tournament held in the same day.
3. Results
The players played in the beach volleyball
tournament three matches each for one set only (end by
receiving 21 points, but two-point difference
necessary). Each set lasted approx. 13.5 ± 5.3 minutes.
The players’ average HR was 149.5 ± 14.1 beats
min-1
.There is no significant difference between each
load intensity zones (Fig. 1) on the significance level P
< 0.05. The probands mostly, more than 50%,
respectively, appeared in the intensity below an
anaerobic threshold (< 85% HRmax). The motion on the
court was also influenced by the level of players’ skills.
After beach volleyball tournament (sixty-minute
break), the probands played tournament (three matches)
in beach handball. The average heart rate players was
164.3 ± 14.5 beats min-1
in matches beach handball.
The significant difference was while comparing load
intensity of in the load intensity zone 90%-100%
HRmax and 70%-80% HRmax (P = 0.0201) resp. < 70%
HRmax (P = 0.0455). The matches were interrupted
only minimally (imprecise ball passing, shooting out of
the goal, fouls etc.) and the level of the matches was
appropriate to recreational players. The load intensity
was more than 50% above the anaerobic threshold
Fig. 1 Load intensity of recreational players in beach volleyball matches.

Beach Handball and Beach Volleyball as Means Leading to Increasing Physical Activity of Recreational Sportspeople—Pilot Study
168
(> 85% HRmax). Even the load intensity of goalkeepers
was compared here. Due to the tactic and rules
specification, there was no statistically significant
difference between field players and goalkeepers. It
was due to the same game participation of goalkeepers.
When losing a ball, the goalkeeper had to leave the
court immediately, so the next goalkeeper could run
into the goal area. Each team had two goalkeepers.
The only one significant difference was while
comparing load intensity of beach handball and beach
volleyball matches only in the load intensity zone
90-100% HRmax (P = 0.0365). We consider higher load
intensity to be in the beach handball recreational
players. Playing beach handball should lead to
improving one’s physical ability and fitness factor.
Playing beach volleyball should result in weight
reduction. This fact is not in comparison with beach
football significantly important, but from the practical
point of view, it tells us about higher load intensity in
beach handball matches (Fig. 3).
Fig. 2 Load intensity of recreational players in beach handball matches.
Fig. 3 Comparison of recreational players’ intensity in beach handball matches and beach volleyball matches.

Beach Handball and Beach Volleyball as Means Leading to Increasing Physical Activity of Recreational Sportspeople—Pilot Study
169
4. Summary
The players spent 24 ± 20.9% playing time in load
low intensity zone (<70 % HRmax) in match beach
volleyball. Players beach volleyball spent most playing
time (36%) in load intensity 80%-90% HRmax. In the
match beach handball, players spent most playing time
(39%) in load intensity 90%-100% HRmax and little
playing time in load intensity 70%-80% HRmax.
In beach handball, we monitored the average HR of
the players that was 172 ± 14.1 beats min-1
and of the
goalkeepers it was 156.5 ± 16.6 beats min-1
. The
players’ average HR in volleyball match was 149.5 ±
14.1 beats·min-1
.Statistically important difference
between each zone was only in the beach handball
matches. In comparison with both sports, the
statistically important difference was not confirmed.
As a matter of fact, only the practical importance can
be evaluated. Beach handball recreational players spent
in the zone above anaerobic threshold more than 50%
of the whole time in comparison with beach volleyball
players, who spent there only 39%.
References
[1] Kuchukov, V., and Antonov, I. 2004.
Beachvolleyball-Management. Sofia: HCA-nPEC.
[2] Jones, H., and Dalanhese, D. 2011. Beach Volleyball
Drillbook. Lausanne: Federationinternational de
Volleyball.
[3] European Handball Federation. 2005. Beachhandball
Rules of the Game. Paper presented at the EHF Course n4
for EHF Beach Handball Referee Candidates,
Balatonboglar.
[4] Barbero, J. C., Soto, V. M., Barbero, V., and Granda, J.
2008. “Match Analysis and Heart Rate of Futsal Players
during Competition.” Journal of Sports Sciences 26 (1):
63-73.
[5] Beam, W. C., and Merill, T. L. 1994. “Analysis of Heart
Rates during Female Collegiate Basketball.” Medicine and
Science in Sports and Exersice 26 (3): 66.
[6] Capranica, L., Tessitore, A., Guidetti, L., and Figura, F.
2001. “Heart Rate and Match Analysis in pre-Pubescent
Soccer Players.” Journal of Sports Sciences 19 (6):
379-84.
[7] Castellano, J., and Casamichana, D. 2010. “Heart Rate and
Motion Analysis by GPS in Beach Soccer.” Journal of
Sports Science and Medicine 9 (1): 98-103.
[8] Cohen, M. 1980. “Contribution to the Physiological Study
of Basketball.” Ph.D. thesis, Faculte Xavier Bichat, París.
[9] Janeira, M. A., and Maia, J. 1998. “Game Intensity in
Basketball. An Interactionist View Linking Time-Motion
Analysis, Lactate Concentration and Heart Rate.”
Coaching & Sport Science 3 (2): 26-30.
[10] Matthew, D., and Delextrat, A. 2009. “Heart Rate, Blood
Lactate Concentration, and Time-Motion Analysis of
Female Basketball Players during Competition.” Journal
of Sports Sciences 27 (8): 813-21.
[11] Mc Innes, S. E., Carlson, J. S, Jones, C. J., and McKenna,
M. J. 1995. “The Physiological Load Imposed on
Basketball Players during Competition.” Journal of Sports
Sciences 13 (5): 89-93.
[12] Ramsey, J. D., Ayoub, M. M., Dudek, R. A., and Edgae, H.
S. 1970. “Heart Rate Recovery during a Collegue
Basketball Game.” Journal of Human Sport and Exercise
41 (4): 528-35.
[13] Rodriguez-Alonso, M., Fernández-Garcia, B.,
Pérezlanaluce, N., and Terrados, N. 2003. “Blood Lactate
and Heart Rate during National and International
Women’s Basketball.” The Journal of Sports Medicine
and Physical Fitness 43 (4): 432-6.
[14] Vaquera, A. 2008. “Heart Rate Response to Game-Play in
Professional Basketball Players.” Journal of Human Sport
and Exercise 3 (1): 1-9.
[15] Laukkanen, R. M. T., and Virtanen, P. K. 1998. “Heart
Rate Monitors: State of the Art.” Journal of Sports
Sciences 16 (1): 3-7.
[16] Noakes, T. D., Lambert, M. I., and Gleeson, M. 1998.
“Heartrate Monitoring and Exercise: Challenges for the
Future.” Journal of Sports Sciences 16 (1): 105-6.
[17] Terbizan, D. J., Dolezal, B. A., and Albano, C. 2002.
“Validity of Seven Commercially Available Heart Rate
Monitors.” Measurement in Physical Education &
Exercise Science 6 (4): 243-7.
[18] Moore, A. D., Jr., Lee, S. M., Greenisen, M. C., and
Bishop, P. 1997. “Validity of a Heart Rate Monitor during
Work in the Laboratory and on the Space Shuttle.”
American Industrial Hygiene Association Journal 58 (4):
299-301.
[19] Fudge, B. W., Wilson, J., Easton, C., Irwin, L., Clark, J.,
and Haddow, O. 2007. “Estimation of Oxygen Uptake
during Fast Running Using Accelerometry and Heart
Rate.” Medicine and Science in Sports and Exercise 39 (1):
192-8.
[20] Lorenz, R., Roll, C., Wiebke, D., and Jeschke, D. 2001.
“Cardiac and Metabolic Stress during the Beach
Volleyball.” Deutsche Zeitschrift für Sportmedizin 52 (2):
7-8.
[21] Michalec, T. 2008. “Analyses of the Load Intenzity

Beach Handball and Beach Volleyball as Means Leading to Increasing Physical Activity of Recreational Sportspeople—Pilot Study
170
Players during the of Beach Voleyball Match.” Master
thesis, Palacky Univerzity, Faculty of Physical Culture,
Olomouc.
[22] Karras, D., Chryssanthopoulous, C., and Diafas, V. 2007.
“Body Fluid Loss during Four Consecutive Beach
Handball Matches in High Humidity and Environmental
Temperatures.” Serbian Journal of Sport Sciences 1 (1):
8-13.
Journal of Sports Science 3 (2015) 171-178
doi: 10.17265/2332-7839/2015.04.003
Effect of an Acute Exercise Session on Body
Composition Using Multi-Frequency Bioelectrical
Impedance Analysis in Adults
Kyle L. Romanowski1, Andrea J. Fradkin
1, Curt B. Dixon
2 and Joseph L. Andreacci
1
1. Department of Exercise Science, Bloomsburg University, Bloomsburg, PA 17815, USA
2. Department of Health Science, Lock Haven University, Lock Haven, PA 17745, USA
Abstract: The purpose of this investigation was to examine the effect of an acute bout of aerobic exercise (AE) and resistance exercise
(RE) on body composition measured by multi-frequency bioelectrical impedance analysis (MBIA) in adults. Ninety-five recreationally
active young adults (46 women and 49 men) reported for testing on three occasions. After an initial MBIA assessment, subjects
performed 45 minutes of continuous AE, RE, or did nothing, which served as the control (CON). During the AE trial, subjects
performed an acute bout of treadmill exercise at 60%-75% of their age predicted maximal heart rate (APHRmax). The RE trial consisted
of an 8-exercise circuit consisting of; 3 sets of 10-12 repetitions at 65%-75% of their one-repetition max (1RM) for each exercise.
During the CON trial, subjects sat quietly in the laboratory. Body composition was reassessed immediately following the exercise bouts
for comparison. Mean percent body fat (%BF) decreased following the exercise bouts (AE = 0.7%, RE = 1.6%; P < 0.001) likely due to
significant (P < 0.001) reductions in impedance (AE: 40Ω, 32Ω, and 29Ω; RE: 45Ω, 29Ω, and 28Ω) measured at 5, 50 and 500 kHz.
Conversely, significant increases in %BF (0.7%, P < 0.05), body mass (0.2 kg, P < 0.001), and impedance at 5 and 50 kHz (15Ω and
16Ω; P <0.001) were observed following the CON trial. These findings support that MBIA assessments should be performed prior to
exercise in order to prevent exercise-induced reductions in %BF values.
Key words: BIA, bioimpedance, percent body fat, body mass.
1. Introduction
Obesity is a major public health problem in the
United States, which causes a wide range of serious
complications and increases the risk of illness and
premature death. According to the Center for Disease
Control and Prevention, health problems associated
with obesity include: increased risk of type 2 diabetes
[1], sleep apnea, asthma [2], joint problems and
musculoskeletal discomfort [3], gallstones [4], stroke
[5], and cancer [6]. In addition, obesity is also
associated with high blood pressure and high
cholesterol, both of which contribute to cardiovascular
disease which is the leading cause of death in the
United States [7]. Body mass index data indicates that
Corresponding author: Joseph L. Andreacci, Ph.D.,
FACSM, professor, research field: exercise physiology. E-mail:
obesity has been significantly increasing among the US
population over the past 30 years [8], with recent
estimates showing that nearly one-third of adults being
classified as obese (32.2% of men and 35.5% of
women) [9].
As awareness of the obesity epidemic has increased,
so too has the interest in effective weight management
programs designed to improve eating behaviors and
increase physical activity. To encourage participation,
employers often offer incentives to employees who
lose weight [10]. In order to track the effectiveness of
these intervention programs, accurate methods of
measuring body composition are necessary [11].
One popular method of assessing body composition
is bioelectrical impedance analysis (BIA). During the
assessment a small, undetectable electrical current is
passed through the body, and the resistance to the
D DAVID PUBLISHING

Effect of an Acute Exercise Session on Body Composition using Multi-Frequency Bioelectrical Impedance Analysis in Adults
172
current flow (impedance) is measured by the analyzer
[12, 13]. Lean body mass is highly conductive to the
current flow because of a high water and electrolyte
content (low impedance), while fat mass is a poor
conductor [11]. From the impedance measurement,
BIA devices estimate body composition [body mass
(BM), lean body mass (LBM), and total body water
(TBW)] [14]. Multiple BIA analyzers are currently
available including leg-to-leg (LBIA), segmental
(SBIA), and multi-frequency (MBIA) device.
Acute shifts in fluid and electrolyte balance which
occur throughout the day have been shown to alter BIA
body composition estimates by altering the impedance
measurement [15]. As such, several pretesting
guidelines have been designed to control for these
fluctuations in hydration [14]. For instance, avoiding
exercise 12 hours prior to testing is a common BIA
guideline. Previously, Dixon et al. in two separate
studies, examined the effect of aerobic exercise [13]
and resistance exercise [16] on body fat using LBIA
and SBIA devices. Following 40 minutes of aerobic
exercise at 60%-75% of the individual’s age predicted
heart rate maximum (APHRmax), they found a 1.5%
mean decrease in LBIA assessed percent body fat
(%BF), and a 1.2% mean decrease in SBIA in 63
recreationally active adults (31 women; 32 men) [13].
In another study [16], %BF reductions (LBIA = 0.4%;
SBIA = 1.2%) were also observed following an eight
exercise resistance training circuit in 86 young adults
(45 women; 41 men). Recently, Andreacci et al.
examined the impact that cycle ergometry exercise had
on %BF estimates using LBIA and SBIA [12].
Seventy-four college-aged adults performed two
30-minute exercise sessions, as well as a day which
served as the control. The subjects’ body composition
was measured pre and post exercise, it was found that
cycle ergometry altered mean %BF estimates of LBIA
0.5%, and SBIA 1.0% [12].
Although previous studies have explored the impact
of acute exercise on LBIA and SBIA body composition
measurements, to our knowledge, no studies have
examined MBIA technology. MBIA differs from the
majority of LBIA and SBIA devices by incorporating
three electrical frequencies (5, 50, and 500 kHz) into
the measurement rather than a single standard
frequency of 50 kHz [17]. The multiple frequencies
enable the determination of both extracellular and
intracellular water [18]. Extracellular water can be
determined using low frequencies (≤ 50 kHz), while
higher frequencies (≥ 200 kHz) are necessary to
penetrate cell membranes and determine intracellular
water [18]. This MBIA determination of intracellular
fluid is an assessment that previous single-frequency
BIA technology could not provide.
Previous research has shown changes in LBIA and
SBIA body composition measures following acute
bouts of exercise [12, 13, 16]. The impact that exercise
has on the more advanced MBIA technology is
currently unknown. Given that MBIA expands upon
this originally technology by determining both
intracellular and extracellular water, one may
anticipate greater exercise-induced alterations in body
composition measures. As such, the purpose of this
study was to examine the effect of an acute bout of
aerobic exercise (AE) and resistance exercise (RE) on
body composition measured by MBIA (InBody 520) in
adults.
2. Methods
2.1 Experimental Approach to the Problem
Each subject reported to the exercise physiology
laboratory on three separate occasions within a
seven-day period. In order to control for experimental
bias, the testing order was counterbalanced prior to the
first day.
On the initial visit, anthropometric data was
recorded for each subject. During each visit, subjects
underwent an initial MBIA assessment (PRE). Subjects
then performed 45 minutes of a RE, AE, or the control
(CON) trial. During the RE trial, each subject
completed an eight-exercise circuit protocol consisting
of three sets of 10-12 repetitions for each exercise.

Effect of an Acute Exercise Session on Body Composition using Multi-Frequency Bioelectrical Impedance Analysis in Adults
173
During the AE trial, all subjects were asked to complete
45 minutes of treadmill exercise at 60%-75% of their
APHRmax. During the CON trial, subjects were asked to
sit quietly for the duration of 45 minutes. Subjects were
provided with a bottle of water (500 mL) for
consumption during all three trials. A second MBIA
assessment was then performed immediately following
each trial (POST).
2.2 Subjects
Ninety-five (49 men, 46 women) recreationally
active college aged adults were recruited for the study,
subject characteristics can be observed in Table 1.
Subjects were recruited via flyers posted throughout
the campus. The Bloomsburg University Institutional
Review Board approved the study protocol and
methods. Each subject completed a Physical Activity
Readiness Questionnaire (PAR-Q), as well as an
informed consent form prior to participation.
2.3 Procedures
Prior to testing, subjects were asked to adhere to
strict pretesting guidelines: (1) no food or drink two
hours prior to testing; (2) no exercise 12 hours prior to
testing; (3) no alcohol consumption 48 hours prior to
testing; and (4) no diuretics seven days prior to testing.
Compliance to the guidelines was verbally confirmed
before each experimental trial. Urine specific gravity
(USG), was measured by a hand-held digital fiberoptic
refractometer (Misco Corp., Cleveland, OH, USA),
prior to the initial MBIA assessment, in order to
determine hydration state [19].
The AE exercise bout consisted of 45 minutes of
continuous walking/jogging on a treadmill. The
exercise intensity was determined as a percentage of
each individual’s APHRmax, and kept between
60%-75%. A polar heart monitor was used to ensure
that subjects remained within the desired target HR
range during the test. Subjects were permitted to adjust
speed and grade as needed during the test to remain
within the target HR zone.
The RE trial required each subject to complete an
eight-exercise circuit protocol consisting of three sets
of 8-12 repetitions at 65%-75% of their one repetition
max (1RM) for each exercise. The eight exercises
included; dumbbell chest press, lat pull-down, lunges,
abdominal crunches, seated row, shoulder press, bicep
curl, and triceps extension. Three full circuits were
performed within the 45 minutes, at their own pace. HR
was recorded after each circuit set using a polar heart
monitor.
The MBIA measurements were measured using the
InBody 520 (Biospace Co., Beverly Hills, CA, USA).
The InBody 520 measured the direct segmental
impedance across both legs, arms and trunk at multiple
frequencies (5, 50, and 500 kHz). The InBody system
has an 8-point electrode placement, which contacts the
body at two points in each hand and foot. Body mass,
and five segmental impedance measurements (right
arm, left arm, trunk, right leg, and left leg) are
automatically measured while the subject stood erect
holding the electrodes with their bare feet placed
properly on the contact electrodes on the MBIA
platform. As recommended by the manufacturer [18],
the subject’s arms were held straight-down without
touching the sides of their trunk.
2.4 Statistical Analysis
Data was analyzed using SPSS 22 for Windows
(SPSS, Inc., Chicago, IL). All values are expressed as
Table 1 Subject Characteristics.
Age Height Body mass BMI
(yrs) (cm) (kg) (kg/m2)
Women (n = 46) 21.2 ± 1.9 164.4 ± 5.2* 62.9 ± 7.8* 23.2 ± 2.4*
Men (n = 49) 22.1 ± 3.3 177.5 ± 6.8 81.8 ± 13.3 25.9 ± 3.8
Total (n = 95) 21.7 ± 2.6 170.9 ± 6.0 72.4 ± 10.6 24.6 ± 3.1
All values are mean ± SD. BMI = body mass index.
*P < 0.05 difference when compared to men.

Effect of an Acute Exercise Session on Body Composition using Multi-Frequency Bioelectrical Impedance Analysis in Adults
174
mean ± SD, if normally distributed. Paired samples
t-tests were used to detect significant differences (pre
vs. post) in the MBIA body composition for each of the
experimental trials. Statistical significance was
established a priori at P ≤ 0.05 for all analyses.
Bland-Altman plots [20] were used to assess individual
differences in %BF, plotted against BM pre- to post
exercise. The reliability (intraclass correlation
coefficient) of the body composition variables
determined by MBIA for each experimental trial
exceeded 0.843.
3. Results
The MBIA body composition data of the group for
the CON, RE, and AE trials are presented in Table 2.
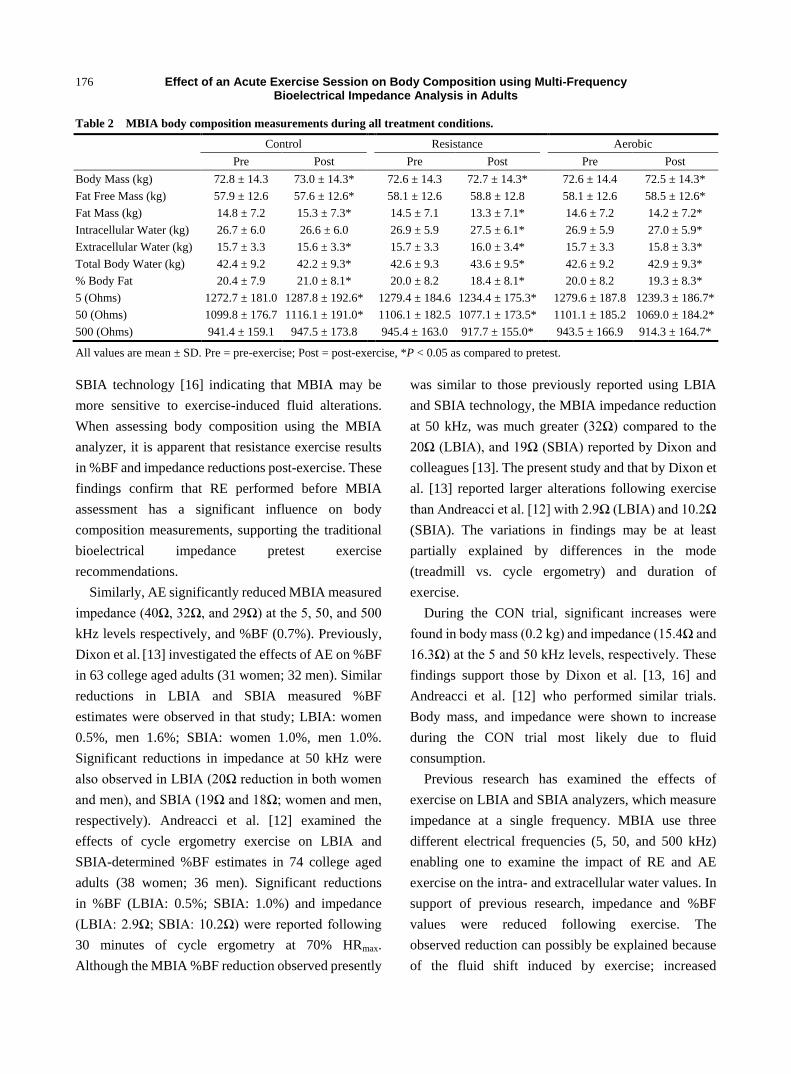
Following RE, significant (P < 0.05) reductions were
observed for fat mass (1.2 kg), %BF (1.6%), and
impedance (45Ω, 29 Ω, and 28Ω) at the levels of 5, 50,
and 500 kHz respectively (Table 2). Significant (P
<0.05) increases were also observed after RE in body
mass (0.1 kg), TBW (1.0 kg), intracellular water (0.6
kg), and extracellular water (0.3 kg). No significant
differences were observed post exercise in FFM in the
RE trial (Table 2). USG measured prior to exercise
averaged 1.02 g/ml. The average HR for all subjects
during the resistance trial was 139 ± 19 beats per
minute.
Following AE, significant (P < 0.05) reductions in
body mass (0.1 kg), FM (0.4 kg), %BF (0.7%), and
impedance (40Ω, 32Ω, and 29Ω) at the levels of 5, 50,
and 500 kHz respectively, were observed. Significant
(P < 0.05) increases were observed in FFM (0.4 kg),
TBW (0.3 kg), intracellular water (0.1 kg), and
extracellular water (0.1 kg; Table 2). Measured USG
averaged 1.02 g/ml. The average HR for all subjects
during the aerobic trial was 144 ± 19 beats per minute.
During the control (CON) trial significant (P < 0.05)
increases were observed in body mass (0.2 kg), fat
mass (0.5 kg), %BF (0.6%), and impedance at 5 kHz
(15Ω) and 50 kHz (16Ω). Significant (P < 0.05)
decreases were observed in FFM (0.3kg), TBW (0.2
kg), and extracellular water (0.1 kg). No changes were
observed in intracellular water, or impedance at the
level of 500 kHz (Table 2). The average measure of
USG was 1.02 g/ml.
Bland-Altman plots were used to show the
difference in %BF (pre – post) vs. body mass, for each
condition (Fig. 1A, 1B, 1C). There was no relation
between the magnitude of %BF change (pre-post) and
BM in any of the trials.
4. Discussion
Due to the prevalence of obesity, many people are
concerned with losing weight and keeping track of their
body fat, thus measuring body composition has become
popular in health and fitness facilities. A simple, fast
and noninvasive method of monitoring adiposity, such
as BIA, is needed by those that prescribe and monitor
exercise. When using BIA technology, specific
pretesting guidelines have been recommended in order
to increase the accuracy of the measurements,
including no exercise within 12 hours prior to the test
[14]. This investigation examined the effect of two
different exercise modalities (resistance and aerobic)
on body composition determined by the relatively new
MBIA technology. The primary finding of this
investigation was that impedance and %BF
measurements were significantly reduced following
both 45 minutes of RE and AE in the men and women.
RE resulted in significant reductions in MBIA
measured impedance (45Ω, 29Ω, and 28Ω) and %BF
(1.6%). These findings are consistent with previous
work that examined the effects of RE on single
frequency (50 kHz) BIA. Dixon et al. [16] assessed
eighty six recreationally active adults (45 women and
41 men) before and after a RE bout. Significant
reductions in SBIA measured %BF (women 0.9%; men
1.4%), impedance (women 22.2Ω; men 22.3Ω), and fat
mass (women 0.6kg; men 1.3kg) were observed
following RE. In the present study, the reductions in
the MBIA impedance at 50 kHz (29Ω) and %BF (1.6%)
were slightly larger than those previously reported using

Effect of an Acute Exercise Session on Body Composition using Multi-Frequency Bioelectrical Impedance Analysis in Adults
175
Dif
fere
nc
e in
%B
F (
Pre
-Po
st)
-4
-2
0
2
4
6
Total:
R2 = 0.00119
p = 0.730
A
Dif
fere
nc
e in
%B
F (
Pre
-Po
st)
-4
-2
0
2
4
6Total:
R2 = 0.00012
p = 0.916
B
Body Mass (kg)
40 60 80 100 120 140
Dif
fere
nc
e in
%B
F (
Pre
-Po
st)
-4
-2
0
2
4
6
Women
Men
Total:
R2 = 0.00212
p = 0.658
C
Fig. 1 Scatter plots exploring individual differences between pre and post exercise %BF is plotted against body mass for
women () and men (); A) Control, B) Resistance Exercise, and C) Aerobic Exercise. Values greater than 0 indicate a %BF
decrease from pre to post. The mean difference is represented by the solid line, and the dashed lines represent ± 2 SD from
the mean.
Effect of an Acute Exercise Session on Body Composition using Multi-Frequency Bioelectrical Impedance Analysis in Adults
176
Table 2 MBIA body composition measurements during all treatment conditions.
Control
Resistance
Aerobic
Pre Post
Pre Post
Pre Post
Body Mass (kg) 72.8 ± 14.3 73.0 ± 14.3*
72.6 ± 14.3 72.7 ± 14.3*
72.6 ± 14.4 72.5 ± 14.3*
Fat Free Mass (kg) 57.9 ± 12.6 57.6 ± 12.6*
58.1 ± 12.6 58.8 ± 12.8
58.1 ± 12.6 58.5 ± 12.6*
Fat Mass (kg) 14.8 ± 7.2 15.3 ± 7.3*
14.5 ± 7.1 13.3 ± 7.1*
14.6 ± 7.2 14.2 ± 7.2*
Intracellular Water (kg) 26.7 ± 6.0 26.6 ± 6.0
26.9 ± 5.9 27.5 ± 6.1*
26.9 ± 5.9 27.0 ± 5.9*
Extracellular Water (kg) 15.7 ± 3.3 15.6 ± 3.3*
15.7 ± 3.3 16.0 ± 3.4*
15.7 ± 3.3 15.8 ± 3.3*
Total Body Water (kg) 42.4 ± 9.2 42.2 ± 9.3*
42.6 ± 9.3 43.6 ± 9.5*
42.6 ± 9.2 42.9 ± 9.3*
% Body Fat 20.4 ± 7.9 21.0 ± 8.1*
20.0 ± 8.2 18.4 ± 8.1*
20.0 ± 8.2 19.3 ± 8.3*
5 (Ohms) 1272.7 ± 181.0 1287.8 ± 192.6*
1279.4 ± 184.6 1234.4 ± 175.3*
1279.6 ± 187.8 1239.3 ± 186.7*
50 (Ohms) 1099.8 ± 176.7 1116.1 ± 191.0*
1106.1 ± 182.5 1077.1 ± 173.5*
1101.1 ± 185.2 1069.0 ± 184.2*
500 (Ohms) 941.4 ± 159.1 947.5 ± 173.8
945.4 ± 163.0 917.7 ± 155.0*
943.5 ± 166.9 914.3 ± 164.7*
All values are mean ± SD. Pre = pre-exercise; Post = post-exercise, *P < 0.05 as compared to pretest.
SBIA technology [16] indicating that MBIA may be
more sensitive to exercise-induced fluid alterations.
When assessing body composition using the MBIA
analyzer, it is apparent that resistance exercise results
in %BF and impedance reductions post-exercise. These
findings confirm that RE performed before MBIA
assessment has a significant influence on body
composition measurements, supporting the traditional
bioelectrical impedance pretest exercise
recommendations.
Similarly, AE significantly reduced MBIA measured
impedance (40Ω, 32Ω, and 29Ω) at the 5, 50, and 500
kHz levels respectively, and %BF (0.7%). Previously,
Dixon et al. [13] investigated the effects of AE on %BF
in 63 college aged adults (31 women; 32 men). Similar
reductions in LBIA and SBIA measured %BF
estimates were observed in that study; LBIA: women
0.5%, men 1.6%; SBIA: women 1.0%, men 1.0%.
Significant reductions in impedance at 50 kHz were
also observed in LBIA (20Ω reduction in both women
and men), and SBIA (19Ω and 18Ω; women and men,
respectively). Andreacci et al. [12] examined the
effects of cycle ergometry exercise on LBIA and
SBIA-determined %BF estimates in 74 college aged
adults (38 women; 36 men). Significant reductions
in %BF (LBIA: 0.5%; SBIA: 1.0%) and impedance
(LBIA: 2.9Ω; SBIA: 10.2Ω) were reported following
30 minutes of cycle ergometry at 70% HRmax.
Although the MBIA %BF reduction observed presently
was similar to those previously reported using LBIA
and SBIA technology, the MBIA impedance reduction
at 50 kHz, was much greater (32Ω) compared to the
20Ω (LBIA), and 19Ω (SBIA) reported by Dixon and
colleagues [13]. The present study and that by Dixon et
al. [13] reported larger alterations following exercise
than Andreacci et al. [12] with 2.9Ω (LBIA) and 10.2Ω
(SBIA). The variations in findings may be at least
partially explained by differences in the mode
(treadmill vs. cycle ergometry) and duration of
exercise.
During the CON trial, significant increases were
found in body mass (0.2 kg) and impedance (15.4Ω and
16.3Ω) at the 5 and 50 kHz levels, respectively. These
findings support those by Dixon et al. [13, 16] and
Andreacci et al. [12] who performed similar trials.
Body mass, and impedance were shown to increase
during the CON trial most likely due to fluid
consumption.
Previous research has examined the effects of
exercise on LBIA and SBIA analyzers, which measure
impedance at a single frequency. MBIA use three
different electrical frequencies (5, 50, and 500 kHz)
enabling one to examine the impact of RE and AE
exercise on the intra- and extracellular water values. In
support of previous research, impedance and %BF
values were reduced following exercise. The
observed reduction can possibly be explained because
of the fluid shift induced by exercise; increased
Effect of an Acute Exercise Session on Body Composition using Multi-Frequency Bioelectrical Impedance Analysis in Adults
177
perfusion to the active muscle tissue during the
exercise.
5. Conclusion
The findings in the present study, should benefit
those currently assessing adiposity using MIBA
technology in fitness-wellness centers, where it may be
difficult and impractical for these people to adhere to
stringent pretesting guidelines, prior to having
their %BF assessed. Our findings indicate that the
observed change in %BF, while statistically significant,
may hold little practical significance in the field setting
when assessed using MBIA technology. Therefore,
restricting the client’s exercise behavior prior to the
assessment may not be needed, however these results
may be more significant in a clinical setting. However,
precision is critical, so MBIA assessments should be
performed prior to exercise to eliminate potential
exercise-induced alterations in body composition
measurements, caused by fluid shifts. This information
is important for coaches, personal trainers, athletic
trainers, as well as other health and fitness
professionals who may use this technology to monitor
body composition in the field.
Acknowledgements
The authors would like to gratefully acknowledge all
subjects for their participation in this investigation.
This investigation was supported by a Bloomsburg
University Graduate Thesis Award (KLR).
References
[1] Medalie, J. H., Papier, C., Goldbourt, U., and Herman, J. B.
1974. “Diabetes Mellitus among 10,000 Adult Men. I.
5-year Incidence and Associated Variables.” Israel
Journal of Medical Sciences 10 (7): 681-97.
[2] Shepard, J. W. Jr. 1992. “Hypertension, Cardiac
Arrhythmias, Myocardial Infarction, and Stroke in
Relation to Obstructive Sleep Apnea.” Clinics in Chest
Medicine 13 (3): 437-58.
[3] Hochberg, M. C., Lethbridge-Cejk, M., Scott, W. W.,
Reichle, R., Plato, C. C., and Tobin, J. D. 1995. “The
Association of Body Weight, Body Fatness and Body Fat
Distribution with Osteoarthritis of the Knee: Data from the
Baltimore Longitudinal Study of Aging.” Journal of
Rheumatology 22 (3): 488-93.
[4] Everhart, J. E., Khare, M., Hill, M. C. and Maurer, K. R.
1999. “Prevalence and Ethnic Differences in Gallbladder
Disease in the United States.” Gastroenterology 117 (3):
632-9.
[5] Rexrode, K. M., Hennekens, C. H., Willett, W. C., Colditz,
G. A., Stampfer, M. J., Rich-Edwards, J. W., Speizer, F. E.,
and Manson, J. E. 1997. “A Prospective Study of Body
Mass Index, Weight Change, and Risk of Stroke in
Women.” Journal of the American Medical Association
277 (19): 1539-45.
[6] Helmrich, S. P., Shapiro, S., Rosenberg, L., Kaufman, D.
W., Slone, D., Bain, C., Miettinen, O. S., Stolley, P. D.,
Rosenshein, N. B., Knapp, R. C., Leavitt, T. Jr,
Schottenfeld, D, Engle, R. L., and Levy, M. 1983. “Risk
Factors for Breast Cancer.” American Journal of
Epidemiology 117 (1): 35-45.
[7] Hoyert, D. L., and Xu, J. 2012. “Deaths: Preliminary Data
for 2011.” National Vital Statistics Reports: From the
Centers for Disease Control and Prevention, National
Center for Health Statistics, National Vital Statistics
System 61 (6): 1-51.
[8] Flegal, K. M., Carroll, M. D., Kit, B. K., and Ogden, C. L.
2012. “Prevalence of Obesity and Trends in the
Distribution of Body Mass Index among US Adults,
1999-2010.” Journal of the American Medical Association
307 (5): 491-7.
[9] Ogden, C., Carroll, M., Kit, B., and Flegal, K. 2012.
“Prevalence of Obesity in the United States, 2009-2010.”
National Center for Health and Statistics Data Brief 82:
1-8.
[10] Cawley, J., and Price, J. 2013. “A Case Study of a
Workplace Wellness Program that Offers Financial
Incentives for Weight Loss.” Journal of Health Economics
32 (5): 794-803.
[11] Kyle, U., Bosaeus, I., De Lorenzo, A., Deurenberg, P., Elia,
M., Gomez, J., Heitmann, B., and Kent-Smith, L. 2004.
“Bioelectrical Impedance Analysis- Part 1: Review of
Principles and Methods.” Clinical Nutrition 23 (5):
1226-43.
[12] Andreacci, J. L., Nagle, T., Fitzgerald, E., Rawson, E. S.,
and Dixon, C. B. 2013. “Effect of Exercise Intensity on
Percent Body Fat Determined by Leg-to-Leg and
Segmental Bioelectrical Impedance Analyses in Adults.”
Research Quarterly for Exercise and Sport 84 (1): 88-95.
[13] Dixon, C. B., Andreacci, J. L., and Ledezma, C. 2008.
“Effect of Aerobic Exercise on Percent Body Fat Using
Leg-to-Leg and Segmental Bioelectrical Impedance
Analysis in Adults.” International Journal of Body
Composition Research 6 (1): 27-34.
[14] Heyward, V. H., and Wagner, D. R. 2004. Applied Body
Effect of an Acute Exercise Session on Body Composition using Multi-Frequency Bioelectrical Impedance Analysis in Adults
178
Composition Assessment. Champaign: Human Kinetics,
87-98.
[15] Deurenberg, P., Weststrate, J., Paymans, I., and Van der
Kooy, K. 1988. “Factors Affecting Bioelectrical
Impedance Measurements in Humans.” European Journal
of Clinical Nutrition 42 (12): 1017-22.
[16] Dixon, C. B., and Andreacci, J. L. 2009. “Effect of
Resistance Exercise on Percent Body Fat Using
Leg-to-Leg and Segmental Bioelectrical Impedance
Analysis in Adults.” Journal of Strength and Conditioning
Research 23 (7): 2025-32.
[17] National Institutes of Health Technology Assessment
Conference Statement. 1996. “Bioelectrical Impedance
Analysis in Body Composition Measurement.” American
Journal of Clinical Nutrition 64 (3): S524-32.
[18] Biospace, Inc. 2006. InBody Results Interpretation.
Beverly Hill: CA.
[19] Shirreffs, S. 2003. “Markers of Hydration Status.”
European Journal of Clinical Nutrition 57 (2): 56-9.
[20] Bland, J. M., and Altman, D. G. 1986. “Statistical Methods
for Assessing Agreement between Two Methods of
Clinical Measurement.” Lancet 1 (8476): 307-10.

Journal of Sports Science 3 (2015) 179-185
doi: 10.17265/2332-7839/2015.04.004
The Impact of the Techniques and Tactics Appropriate
by the Athletes in Phase Triple Jump and Their
Relationships with the Finale Results
Zerf Mohammed, Mokkedes Moulay Idriss, Bengoua Ali, Bendahmane Med Nasreddin and Guebli Abd-el-Kader
Physical Education Institute Laboratory OPAPS, University Abdel Hamid Ibn Badis Mostaganem, Mostaganem 27000, Algeria
Abstract: The purposes of this study were to describe and compare the techniques used by elite world triple jumper and the Algerian
elite team to determine the impact of distribution modality phases allowing the elite to exceeds 17-meter. Our subjects were two
world elite 2009 and two Algerian national elite 2013. In the lack of new technology Modern measuring instruments kinematics or
kinetics, our study based in measure of the Phase distribution ratio as measure of Stride length Jump distance. That literature review
two schools, the Russian technique (which emphasizes the hop phase) and the Polish technique (which emphasizes the jump phase).
Our aims for this study are: Are there any statistically significant differences between the results of the samples in the distance
achieved? Are there any statistically significant differences between practical Ratio relative distances (world 2009-national 2013)?
Are there any statistically significant differences between Stride length phase distances (world 2009-national 2013)? For that, we
have chosen the analysis of variance and correlation of the distances achieved in each of the phases with the official distance of
jumper and “T” student to compare implementation distribution of phases (hop, step and jump) with the results accuses. Based on the
practices and weaknesses of elites in practice, we confirm: (1) All the samples practice the Russian technique as model in the
distribution of the phase ratio; (2) The problem of our elites is in the hop phase distribution and its relationship with other phases; (3)
Improve achieve horizontal vertical velocity in hop phase as solution.
Key words: The ratio phase, techniques, tactics appropriate, triple jump.
1. Introduction
The original triple jump as practiced by the Greeks
was no more than three long jumps. The regulated
triple jump was protected at the end of the XIX
century, first by the Irish and then by the Americans
[1].
The triple jump was inspired by the ancient
Olympic Games and has been a modern Olympics
event since the Games’ inception in 1896. According
to IAAF (International Association of Athletics
Federations) rules, the hop shall be made so that an
athlete lands first on the same foot as that from which
he has taken off in the step, he shall land on the other
foot, from which, subsequently, the jump is performed
Corresponding author: Zerf Mohammed, Ph.D., research
field: biomechanics sports evaluation training. E-mail:
[2]. The current male and female world record holders
are Jonathan Edwards of Great Britain, with a jump of
18.29 m (60 ft. 0 in), and Inessa Kravets of Ukraine,
with a jump of 15.50 m (50 ft. 10 in). Both records
were set during 1995 World Championships in
Gothenburg.
The current record male Africa 17.37 m (56 ft.
113⁄4 in) by Tarik Bouguetaïb (MAR) and female is
15.39 m (50 ft. 53⁄4 in) Françoise Mbango Etone
(CMR).
The best record of Algerian female is 14. 98 m (+
0.2 m/s) By Baya Rahouli in Meeting Almeria 1 Juliet
2005 the best record of male Algerian is 16.92 m by
Lotfi Khaïda Monaco Herculis games in August 7,
1993 [3].
The literature review reveals that the triple jump
consists of a running approach, 3 take-off phases in
which the athlete hops on one foot, lands on the same
D DAVID PUBLISHING

The Impact of the Techniques and Tactics Appropriate by the Athletes in Phase Triple Jump and Their Relationships with the Finale Results
180
foot, steps onto the opposite foot, and finally jumps
and lands in the sand pit [4].
The lengths of the three phases are typically about
39%, 30%, 31% of the total length of the jump for the
Russian technique, and 35%, 29%, 36% of the total
length for the Polish technique [5]. Allen et al.
reported that the world record performances from
1911 to 1985 a move away from a hop-dominated
technique with a small step phase
(40-41%:22%:36-38%), towards a hop-dominated
technique with a larger step phase
(37-39%:28-30%:31-33%), and latterly towards a
jump-dominated technique (34-35%:28-30%:36-37%)
[6].
Hiu confirmed that Phase ratio is a measure of
effort distribution in the triple jump [7].
Hop-dominant, balanced, and jump-dominant
techniques were three triple jump techniques defined
based on phase ratio.
For the reason that our elites does not exceed
17-meter, our goal is to introduce the biomechanics
evaluation before explaining the reason scientific of
the absence of the Algerian performance elite in world
festivals by discussing the importance of
maintaining the model distribution ratios applied in
the outcome.
In addition, our research analyzed the performance
of Algerian elites as first part and the second part was
to compare their results with the world’s elite 2009 to
illustrate the importance of the good contribution of
the phase jump on the results. Our motive is to
highlight the biomechanical assessment for Algerian
coaches to plan the choice of the right assessment
technique to their athletes.
2. Material and Methods
For the purposes of analysis, we have calculated the
distance of the hop phase (the distance of the hop),
and step phase (the distance of the step), and the phase
jump (the distance of the jump), in two-dimensional
[8].
The analysis of the present study was with the
software Kinovea, the capture and measured distance
of each phase of triple jump as Fig.1.
Fig. 1 The method chosen to calculate the Distance of phase [9].

The Impact of the Techniques and Tactics Appropriate by the Athletes in Phase Triple Jump and Their Relationships with the Finale Results
181
Sites of the three cameras that depicting the
distance triple jump
These cameras were placed at distances of 19.4 m
and 22.1 m from the midline of the triple jump runway,
with their optical axes at right angles to this line. The
first camera was placed 0.9 m forward (or on the pit
side) of the front edge of the board and was used to
record the subjects’ performances during the hop
phase of the triple jump. The second camera was
placed 13.0 m forward of the front edge of the board
and was used to record performances during the step
and jump phases [8]. To measure the real distance, a
series of markers was placed in carefully measured
locations along the inside, curb of the track between
the runway and each camera. These markers served as
reference measurement.
3. Data Collection
3.1 Subjects
The subjects were the two-world champions Berlin
2009 results from the German athletics federation [10]
and for Algerian; we have made analyses of their
performances in similar study [11].
3.2 Data Reduction
Our cameras were attached to our laptops to record
directly into folders prepare in advance for each
subject chosen for analysis. The distances of the
analyses tests are shown in Table1 (a-b) for all the
subjects and Table 1(b) for Algerian elite’s team. With
the software Kinovea, the films obtained for each
test were phase analysis for each variable and
participant.
3.3 Data Analysis
The data analysis procedures used in this study
consisted of the computation of the means, standard
deviations, the Pearson correlations and Independent
Samples Test of all the variables identified in based of
the theoretical model in the similar studies (Fig. 1).
4. Results
From Table 2, through the results of the paired T
student and Pearson correlation at the 0.05 level
(2-tailed) and Degrees of freedom (n-1) are not
significant at the 0.01 level (2-tailed) in all
comparisons except in the hop phase.
5. Conclusion
From this, we conclude that the tactics appropriate
used by nationalist elements remain far from the level
of application of the Champions world within this
technique (which emphasizes the hop phase) in hop
phase comparison.
Table 1 (a-b) Description of The Acquired Results of Our Samples.
The Results (a) Champions World 2009 [10]
Variables Real Stride length (m)
Distance Hop Step Jump
World Champion 17.92 6.49 5.41 6.02
Vice World 17.60 6.51 5.41 5.68
Mean 17.76 6.50 5.41 5.85
SD 0.23 0.01 0.00 0.24
The Results (b) Algerian Champions 2013 after the kinematics analysis [11]
Variables Real Stride length (m)
Distance Hop Step Jump
Champion Algeria 16.16 5.79 5.1 5.27
Vice Champion 16.15 5.72 5.02 5.41
Mean 16.16 5.76 5.06 5.34
SD 0.01 0.05 0.06 0.10

The Impact of the Techniques and Tactics Appropriate by the Athletes in Phase Triple Jump and Their Relationships with the Finale Results
182
Table 2 Deference statistical existed between the results of the samples obtained in the final distance.
variables Mean SD t df R Sig. (2-tailed)
Total distance World 17.76 0.23
10.36
01
+1 0.06 Algerian 16.16 0.01
Hop World 6.50 0.014
16.56 -1 0.038 Algerian 5.76 0.049
Step World 5.41 0.00
8.87 +1 0.071 Algerian 5.06 0.06
Jump World 5.85 0.24
2.13 -1 0.280 Algerian 5.34 0.09
Table 3 The connectivity relationships between variables in order to study.
Correlations length phase distance for our samples
variables Hop Step Jump
Hop
Pearson Correlation 1 0.995** 0.869*
Sig. (2-tailed) 0.005 0.131
N 4 4 4
Step
Pearson Correlation 0.995** 1 0.852*
Sig. (2-tailed) 0.005 0.148
N 4 4 4
Jump
Pearson Correlation 0.869* 0.852* 1
Sig. (2-tailed) 0.131 0.148
N 4 4 4
** Correlation is significant at the 0.01 level (2-tailed).
From Table 3, through the results of correlations
length phase distance for our samples at the 0.01 level
(2-tailed) and degrees of freedom (n = 4), the
correlations is strong positive significant in all the
comparisons except in the jump phase.
Since the differences are not statistically significant,
all our samples practice the Russian technique (which
emphasizes the hop phase).
From the Table 4 (a), through the results of the
mean of the Ratio World Jumpers, we conclude that
the dominant techniques is for the benefit of the
Hop-dominated technique with a length of three
phases are typically (36%, 31%, 33%). Based on the
results obtained, we referred to the practice of the
Russian technique (emphasizes the hop phase) [9, 12,
13].
Table 4 (b) shows the results of the correlations of
the ratio based on the relative distance for our
champion world. The simple correlation is significant
positive at the 0.01 level (2-tailed) in all comparisons,
except in the jump phase which is strong negative.
From that, we confirm that the dominant techniques is
in the benefit of the Hop-dominated. Based on the
results obtained, we referred to the practice of the
Russian technique (emphasizes the hop phase) [9, 12,
13].
Table 4 (c) shows the results of the mean of the
Ratio Algerians Jumpers, and we conclude that the
dominant techniques is for the benefit of the
Hop-dominated technique
Table 4 (d) shows the results of the correlations of
the ratio based on the relative distance of the Algerian
Champion 2013, the simple correlation is significant
positive at the 0.01 level (2-tailed) in all comparisons,
except in the jump phase which is strong negative; we
confirm that the dominant technique is in the benefit
of the Hop-dominated. Based on the results obtained,
we referred to the practice of the Russian technique
(emphasizes the hop phase) [9, 12, 13].
Table 5 (a) shows the results of the Independent
Samples Test for the Stride length phase distance
between our champions (world-national), which is

The Impact of the Techniques and Tactics Appropriate by the Athletes in Phase Triple Jump and Their Relationships with the Finale Results
183
Table 4 (a) The practical ratio relative distance for the World Champion 2009.
(a) Champion World 2009 based on the relative distance (%)
Variables Jump Relative Distance (%)
Distance (m) Hop Ratio (%) Step Ratio (%) Jump Ratio (%)
World champion 17.92 36.22 30.19 33.59
Vice World 17.60 36.99 30.74 32.27
Mean 16.96 36.60 30.46 32.93
SD 0.94 0.55 0.39 0.93
Table 4 (b) The correlations on the relative distance phase for the World Champion 2009.
(b) Champion World 2009 correlations on the relative distance (%)
Variables Hop Step Jump
Hop
Pearson Correlation 1 1** -1**
Sig. (2-tailed)
N 2 2 2
Step
Pearson Correlation 1** 1 -1**
Sig. (2-tailed)
N 2 2 2
Jump
Pearson Correlation -1** -1** 1
Sig. (2-tailed)
N 2 2 2
** Correlation is significant at the 0.01 level (2-tailed).
Table 4 (c) The practical ratio relative distance for the Algerian Champions 2013.
(c) Algerian Champions 2013 based on the relative distance (%)
Variables Distance (m) Hop ratio (%) Step ratio (%) Jump ratio (%)
World champion 16.16 35.83 31.56 32.61
Vice world 16.15 35.42 31.08 33.50
Mean 16.155 35.62 31.32 33.05
SD 0.01 0.29 0.34 0.63
Table 4 (d) The correlations on the relative distance phase for the Algerian Champion 2013.
(d) Algerian Champions 2013 correlations on the relative distance (%)
Variables Hop Step Jump
Hop
Pearson Correlation 1 1** -1**
Sig. (2-tailed)
N 2 2 2
Step
Pearson Correlation 1** 1 -1**
Sig. (2-tailed)
N 2 2 2
Jump
Pearson Correlation -1** -1** 1
Sig. (2-tailed)
N 2 2 2
** Correlation is significant at the 0.01 level (2-tailed).
significant at the 0.05 level (2-tailed) in all
comparisons, except in jump phase. From that, we
confirm the superiority hurt in the interest of world
champions in phases (hop and step).
Table 5 (b) show the results of the correlations the
Stride length phase distance between our champions
(world-national), which is significant at the 0.01 level
(2-tailed) in all comparisons, except in correlations

The Impact of the Techniques and Tactics Appropriate by the Athletes in Phase Triple Jump and Their Relationships with the Finale Results
184
Table 5 (a) Independent samples test of the stride length phase distance between our champions (world-national).
Independent Samples Test M SD T df Sig. (2-tailed)
Hop World 6.50 0.015
20.467
2
0.002 Algerian 5.76 0.049
Step World 5.41 0.00
8.750 0.013 Algerian 5.06 0.056
Jump World 5.85 0.24
2.774 0.109 Algerian 5.34 0.099
Table 5 (b) Correlations of the stride length phase distance between our champions (world-national).
(b) Correlations the Stride length phase distance
variables Hop ALG Step ALG Jump ALG
Hop CW
Pearson Correlation -1** -1** 1**
Sig. (2-tailed)
N 2 2 2
Step CW
Pearson Correlation 1** 1** -1**
Sig. (2-tailed)
N 2 2 2
Jump CW
Pearson Correlation 1** 1** -1**
Sig. (2-tailed)
N 2 2 2
** Correlation is significant at the 0.01 level (2-tailed).
phase (hop (CW)*hop (Alg), hop (CW)* step
(ALG),step(CW)*jump(ALG) and jump (CW)-jump
(ALG)). Based on the synthesis of Ed Jacoby [14] ,
the triple jump good coach understands that good
mechanics in the transition phases leads to a good
performance and that any error in any phase will be
related to another. For this reason, we confirm that the
strength of our world champions is in the correct
practice of this technique that requires good
mechanical and physical control in the transition
between phases.
6. Discussion
The study showed that the Russian technique
(which emphasizes the hop phase) most used by our
samples was the technique hop. The most difference
between the world champions and our elites are in hop
phase. Paul [15] explained the objective of this phase
is to achieve horizontal vertical velocity (going
forward and up) of the takeoff board, not vertical
horizontal velocity (up and forward as in the long
jump) and any change should minimally in the step
phase change the angular momentum created by hop
[16].
For our research, we explain that difference in the
level of optimum phase practiced by our champion
world in the transition of the advantage hop phase that
any error in achieve horizontal vertical velocity are
related in the other phases. For that, we advise our
coach and their elites the recommendation of K.
Dziewiecki, Z. Mazur [17] . The phase’s ratios
distances must be learned measured and practiced as
effort distribution in their techniques (Hop-dominant,
balanced, and jump-dominant). The technique is based
on phase ratio [7] and the improving final speed
horizontal ideal for the athlete [6] and condition and
not to lose control of the technique and influence in
achievement
7. Conclusion
From the purposes of this study, we recommend our
coaches and their athletes the mean most used in
assessment in the triple jump, because the phase ratio
allows us not only to measure the effort distribution in

The Impact of the Techniques and Tactics Appropriate by the Athletes in Phase Triple Jump and Their Relationships with the Finale Results
185
the triple jump but also define the techniques and
errors of practice. The comparisons guide us to
determine the technique practiced and weaknesses of
our elites in practice.
Our results and recommendations:
1. All the samples practice the Russian technique as
model in the distribution of the phase ratio.
2. The problem of our elites is in the hop phase
distribution and its relationship with other phases.
3. Improve achieve horizontal vertical velocity in
hop phase as solution.
Our aims:
For the national elites and their technical steps:
Using the biomechanics to determine the errors
practice in models theoretical.
Integrated the modern scientific methods into the
program monitoring sports.
Respect the modality distribution of efforts in
Russian technique to improve the performances.
References
[1] Koski, R. T. 2004. The Sports of Antiquity. From the
Fields of Olympia to Roman Arenas. Jyväskylä: Atena
Kustannus Oy, 6.
[2] International Association of Atlithics Fedration. 2002.
“Triple-Jump-Introduction.” IAAF. Accessed January 1,
2015. www.iaaf.org/news/news/triple-jump-introduction.
[3] Algérienne, F. 2014. “Records Athletics Algeria.”
Accessed April 19, 2014.
https://en.wikipedia.org/wiki/Records_d%27Alg%C3%A
9rie_d%27athl%C3%A9tisme
[4] Allen, S. J., King, M. A., and Yeadon, M. R. 2013.
“Trade-offs between Horizontal and Vertical Velocities
during Triple Jumping and the Effect on Phase
Distances.” Journal of Biomechanics 46 (5): 979-83.
[5] Miladinov, O., and Bonov, P. 2004. “Individual
Approach in Improving the Technique of Triple
Jump for Women.” New Studies in Athletics 4 (19):
27-36.
[6] Samuel, J. A. 2009. “Optimisation of Performance in the
Triple Jump Using Computer Simulation.” Ph.D. thesis,
Loughborough University, 2.
[7] Hui, L. 2012. “Effects of Phase Ratio and Velocity
Conversion Coefficient on the Performance of the Triple
Jump.” Journal of Sports Sciences 30 (14): 36.
[8] Nelia, A. M., Tania, F. P. M., and Joao, P. B. 2005.
“Approach Speed and Performance in the Horizontal
Jumps.” IAAF 20 (3): 43-8.
[9] Bing, Y. 1982. “Biomechanics of Triple Jump.” Ph.D.
thesis, Center for Human Movement Science, The
University of North Carolina at Chapel Hill, USA.
[10] Project by the German Atletecs. 2009. Biomechanics
Report WC Berlin 2009 Triple Jump. German Atletecs
Federration, German.
[11] Ahcenne, A., and Zerf, M. 2015. “A Study of Some
Mechanical Focal Stages in the Triple Jump and Their
Relationship with Performance.” Presented at the 1st
International Congress of I3SAW, Algeria.
[12] McNab, T. 1968. Triple Jump. London: Amateur Athletic
Association London UK.
[13] Irving, S. 2006. “Mechanics of the Jump Approach.”
Journal Modern Athlete and Practical Coaching: 14.
[14] Jacoby, E. 2009. Winning Jumps and Pole Vault. USA:
Human Kinetics, 43.
[15] Paul, B. “Using Quintic Biomechanics to Calculate
Centre of Mass.” Q4E Case Study 22, UK: Athletics.
[16] Gordon, R., Graham, C., Joseph, H., Gary, K., and
Saunders, W. 2004. Research Methods in Biomechanics.
USA: Human Kinetics, 92.
[17] Dziewiecki, K., Mazur, Z., and Blajer, W. 2013.
“Assessment of External and Internal Loads in the Triple
Jump via Invese Dynamics Simulation.” Biol. Sport 2
(2083): 103-9.

Journal of Sports Science 3 (2015) 186-194
doi: 10.17265/2332-7839/2015.04.005
Olympic Movement or Diplomatic Movement? The Role
of Olympic Games on Development of International
Relations
Mahdi Shariati Feizabadi1, Fernando Delgado
1, Mohammad Khabiri
2, Nasrollah Sajjadi
2 and Ebrahim Alidoust
2
1. Department of Communication Studies and Theater Arts, University of Wisconsin River Falls, River Falls City, Wisconsin 54022,
USA
2. Department of Sport Management, University of Tehran, Tehran, Tehran 1438, Iran
Abstract: The Olympic Charter is categorized into three main sections: the IOC (International Olympic Committee), the IFs
(International Federations) and NOCs (National Olympic Committees). Since the 1980s, the prominent functions of sport and in
particular mega events such as the Olympic Games have been deeply analyzed by academic and political writers. Sporting mega
events like the Olympic Games can produce lots of advantages: international branding and prestige, economic development, unity
and cooperation, cultural exchanges and interactions, reduction in political isolation and sanctions, and so on. One of the most
important legacies of Olympic Games for the host country/city is social cohesion, national pride and patriotism. For example, the
success of Iran in the London 2012 Olympics resulted in heightened cultural identity and national prestige. Despite political and
economic isolation resulting from international sanctions, Iranian athletes and coaches overcame obstacles to win four Olympic gold
medals in “Mega Media Event” that is the summer Olympic Games. The present study demonstrates the interconnections between
success in the Olympic Games and the development of nations. The data to support the analysis and arguments were gathered
through public documents and interviews with sport diplomacy experts. At first, we investigated some international functions for
sport, then we had 13 interviews with 11 Iranian and 2 foreign experts who had international positions in different sport organizations
like IOC, Ifs, FIFA (Federation international the Football Association) and OCA (Olympic council of Asia). Finally, all information
was organized into the following factors: enhancing international branding and prestige, international image, number of sport tourists
as virtual industry in new millennium, national cohesion and identity, national patriotism, peacefulness, cultural exchanges among
nations and reduce political boycotts and economic sanctions.
Key words: Olympic, International Relations, Iran.
1. Introduction
Public diplomacy is a new diplomatic studies area.
Fisher describes public diplomacy as the result of
three components: cultural exchanges, cultural
diplomacy, and media casting. Because of the
intersecting phenomenon of international sporting
events—which traverses cultural exchanges,
diplomacy and transnational organizations, and the
prevalence and influence of the mass media on
sport—international sport can play an important role
Corresponding author: Mahdi Shariati Feizabadi, Ph.D.,
research field: sport management. E-mail:
in the entire public-private continuum at any point [1].
Fused together, sport diplomacy create a hybrid
concept, “sport diplomacy”, which has a critical role
in diplomatic history [2].
For centuries, sport has been a vital part of
community and nation building and its relationship
with the political sphere (especially diplomacy) has a
long tradition of cooperation and synergy. Although
sport diplomacy as a sub-branch of public diplomacy
has attracted much attention in recent years, the
relationship goes back to the 9th century BC. The
kings signed an “Olympic Truth” during the first
festival of the ancient Olympic Games. They agreed to
D DAVID PUBLISHING
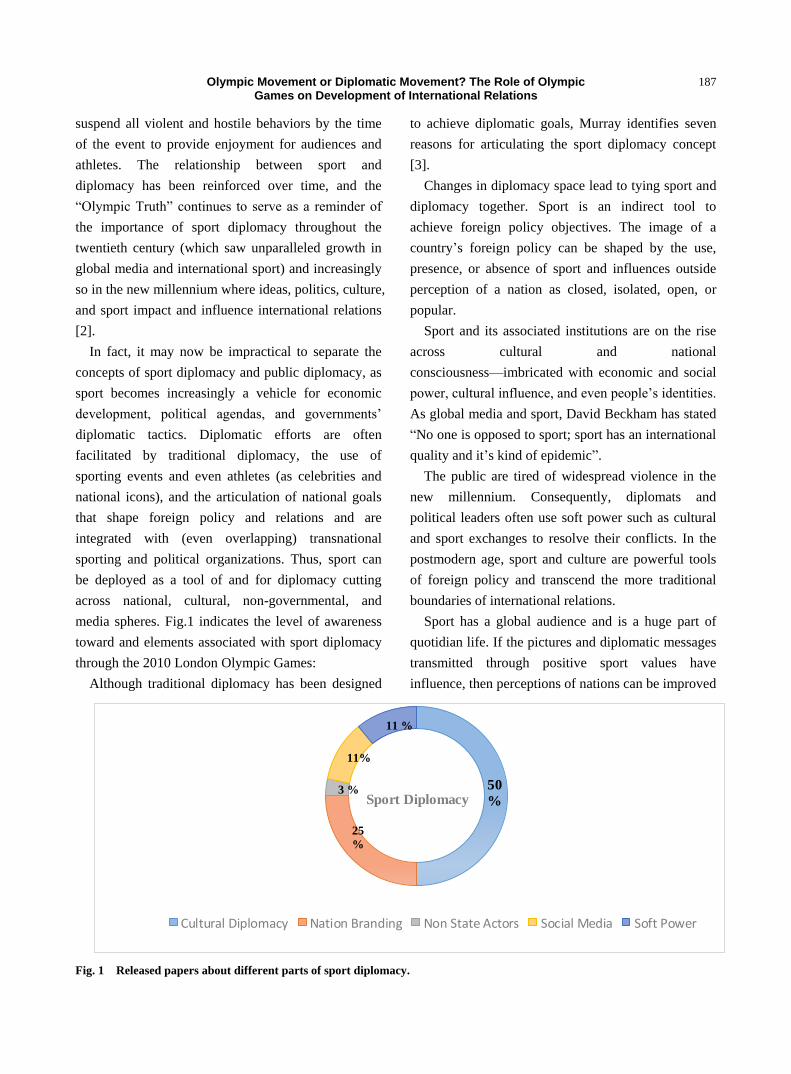
Olympic Movement or Diplomatic Movement? The Role of Olympic Games on Development of International Relations
187
suspend all violent and hostile behaviors by the time
of the event to provide enjoyment for audiences and
athletes. The relationship between sport and
diplomacy has been reinforced over time, and the
“Olympic Truth” continues to serve as a reminder of
the importance of sport diplomacy throughout the
twentieth century (which saw unparalleled growth in
global media and international sport) and increasingly
so in the new millennium where ideas, politics, culture,
and sport impact and influence international relations
[2].
In fact, it may now be impractical to separate the
concepts of sport diplomacy and public diplomacy, as
sport becomes increasingly a vehicle for economic
development, political agendas, and governments’
diplomatic tactics. Diplomatic efforts are often
facilitated by traditional diplomacy, the use of
sporting events and even athletes (as celebrities and
national icons), and the articulation of national goals
that shape foreign policy and relations and are
integrated with (even overlapping) transnational
sporting and political organizations. Thus, sport can
be deployed as a tool of and for diplomacy cutting
across national, cultural, non-governmental, and
media spheres. Fig.1 indicates the level of awareness
toward and elements associated with sport diplomacy
through the 2010 London Olympic Games:
Although traditional diplomacy has been designed
to achieve diplomatic goals, Murray identifies seven
reasons for articulating the sport diplomacy concept
[3].
Changes in diplomacy space lead to tying sport and
diplomacy together. Sport is an indirect tool to
achieve foreign policy objectives. The image of a
country’s foreign policy can be shaped by the use,
presence, or absence of sport and influences outside
perception of a nation as closed, isolated, open, or
popular.
Sport and its associated institutions are on the rise
across cultural and national
consciousness—imbricated with economic and social
power, cultural influence, and even people’s identities.
As global media and sport, David Beckham has stated
“No one is opposed to sport; sport has an international
quality and it’s kind of epidemic”.
The public are tired of widespread violence in the
new millennium. Consequently, diplomats and
political leaders often use soft power such as cultural
and sport exchanges to resolve their conflicts. In the
postmodern age, sport and culture are powerful tools
of foreign policy and transcend the more traditional
boundaries of international relations.
Sport has a global audience and is a huge part of
quotidian life. If the pictures and diplomatic messages
transmitted through positive sport values have
influence, then perceptions of nations can be improved
Fig. 1 Released papers about different parts of sport diplomacy.
Sport Diplomacy
Cultural Diplomacy Nation Branding Non State Actors Social Media Soft Power
50
%
11%
25
%
11 %
3 %
Olympic Movement or Diplomatic Movement? The Role of Olympic Games on Development of International Relations
188
and the strategies of foreign policy changed. For
instance, the Beijing 2008 Summer Olympic Games
provided an opportunity for China to introduce itself
as an economy, culture, and people to an international
community.
Convergence and increasing proximity of sport and
diplomacy to each other. Jim Cain, former U.S.
ambassador to Denmark, observes “Sports can be a
powerful tool for achieving the relationships among
the governments”. Sport carries a positive message in
the context of common values such as mutual respect,
tolerance, compassion, discipline. These values, in
turn, can positively influence the presence of racism,
the experience of xenophobia, and bridge cultural and
political divisions. In this way, sport can support and
extend effective foreign policy toward oriented toward
positive international relations. After Black September
(September 11, 2011), USA applied sport as a way to
attract Muslim youth in Africa and the Middle East.
Sport provided a vehicle for the US to connect with
people across broad national, ethnic, and religious
difference. This tactic reinforced, across even
disparate tribal and ethnic groups, commonalities and
orientations toward human rights and mutual respect.
Thus, while respecting differences in language, local
traditions, customs, etc., the use of sport reinforces a
more universal experience and a space for
intercultural contact and awareness.
Globalization is another reason and resource to
interact and integrate diplomacy and sport together.
As Markovits and Rensmann note “political
campaigning, governing, and symbolic politics often
entail references to sport”, perhaps this is so because
athletes and politicians travel in a space of public
awareness focused on each group’s roles and
responsibilities within cultural and political spheres.
Consequently, sport and diplomacy are drawn toward
each other like magnets—each having their force but
often attracted to one another via their import and
influence on citizens, voters, and consumers. Perhaps
the affinity is primordial—both the athlete and the
diplomat compete is races where winning and losing
is eminently observable and measurable and the drama
draws an audience irrespective of the competition’s
locale—racing oval or meeting room table [4].
Lastly, sport diplomacy provides a soft path to
reveal a significant change in a nation’s foreign policy
agenda. The best example of this is perhaps the Ping
Pong diplomacy between China and the US in 1971 or,
more recently, the 2011 if cricket diplomacy between
India and Pakistan, where Gilani (Pakistan Prime
Minister) invited his Hindi counterpart Singh to attend
and watch the semifinal match of cricket world cup in
south Asian countries [3].
Over the past three decades, hosting sport mega
events (like the summer or winter Olympics or the
FIFA World Cup) has emerged as a prominent
political phenomenon and it is one of the emerging
economic resources for governments [5]. The mega
events are important in the international arena—they
provide a venue for global public attention and create
a powerful platform for a nation desiring to articulate
a particular image of itself (as developed,
cosmopolitan, friendly, safe, etc.). Mega events have
many determinant features like: the increased number
of tourists, trade, reputation of host city/country in the
world, and the development of infrastructure in the
host country/city [6]. Numerous studies in relation to
each of terms “Mega Event”, “Major Event”,
“Hallmark Event”, “Wide Scale Event” and “Special
Event” were presented. By considering all these
definitions, the term “Mega” is different due to effect
of event on host city/country [2]. Politicians run the
political processes at community and influence large
non-governmental organizations such as the IOC or
FIFA [7].
The Olympic Games, as an example of a huge
cultural event, reminds us the potential for “Sport
Diplomacy”. The IOC prepared an appropriate space
for gathering disparate nations in a calm place and
remove conflicts and governmental enmity. This
happens by athletic heroism, the competitive spirit,

Olympic Movement or Diplomatic Movement? The Role of Olympic Games on Development of International Relations
189
and the values of the Olympic charter even for a short
period of time [8]. The concept of “Olympic
Diplomacy” has two main vectors: the first one is the
intrinsic value of sport, even if experience in the
transient manner of a match or competition, for
diplomatic dialogue and safe space for competition
between nations. The other is that sport can highlight
the space of conflict and facilitate friendship or very
visibly offer an opportunity for protest. The reaction
of many nations to the Soviet invasion to Afghanistan
in December 1979 and subsequent boycott is but one
example where a mega event, and the attention is
draws globally, serves as a space for nations to
articulate the state of their diplomatic relations [3].
1.1 Media Roles, International Relations and Sport
The increase presence and value television are
interconnected with the Olympic Games, each
influencing each other in the mutual goal of
generating larger audiences and more revenue.
Technological advances in the mass media have
enabled the Olympic Games to become more
accessible to audiences throughout the globe. While
the IOC sees the media broadcasting rights as the
main source of its revenue, sport is the most important
source programming, from a commercial perspective,
for the media [9]. The Rome 1960 Summer Olympic
Games was the first the time television broadcast
Olympic events live casting. In the fifty years since
then, media conglomerates have competed for the
broadcasting rights, with the costs spiraling upward
from the slightly more than $1.2 million paid in 1960
to over one billion dollars spent on recent
broadcasting rights. The introduction of broadcasting
provided a brilliant opportunity for home audiences to
watch games like the stadium spectators and to expand
the fan experience—redefining the Olympics as global
mega event. People in 18 countries, including Japan,
Canada and USA watched those 1960 Olympic Games.
Shariati Feizabadi explained the number of territories
covered by Olympic Games in Table 1 [10].
Since the 1984 Los Angeles, broadcasting rights
have exploded and their relevance and import has
reinforced and grown the Olympic Games—there is
now a symbiosis between broadcasters and the
Olympics. This in turn has fueled greater
opportunities for sponsorship and associated revenue,
driven ticket sales (thought this uneven), created
larger opportunities for merchandising, and
encouraged competition for hosting the games because
of the perception of prestige and direct or indirect
benefits of having millions of people come to the host
city and billions able to see the host city through their
televisions and computer screens. Indeed the
commercialization of the Olympics has grown
dramatically since the 1984 summer games and the
IOC has seen the opportunity to increase sponsorships
and the expansion of broadcast rights sales. One of the
beneficial outcomes for political, community, and
economic boosters within a host city is the potential
for investment and development of infrastructure to
secure hosting rights as the scale of the event has grown.
Table 1 Number of territories covered by Olympic broadcasting.
Year Host No. of Territories
Year Host No. of Territories
1980 Moscow 11 1936 Berlin 1
1984 Los Angeles 156 1948 London 1
1988 Seoul 160 1952 Helsinki 2
1992 Barcelona 193 1956 Melbourne 1
1996 Atlanta 214 1960 Rome 21
2000 Sydney 220 1964 Tokyo 40
2004 Athena 220 1968 Mexico city Na
2008 Beijing 220 1972 Munich 98
2012 London 220 1976 Montreal 124

Olympic Movement or Diplomatic Movement? The Role of Olympic Games on Development of International Relations
190
Thus local leaders can often secure private and public
investment in projects, while other local sectors
related to tourism and hospitality profit from sponsors,
tourists, and ticket sales [12].
During this period of expansion of the broadcasting
and commercialization, there has been a growth in the
territories and region where the games are covered.
The Sydney 2000 Olympic Games were the first to
broadcast to 220 different countries and regions. On
the other hand, Beijing 2008 Summer Olympic Games
was the first fully digital games in the world’s biggest
sport event history that 63% of the global population
(4.3 out of 6.7 billion people) had access to watch the
games live. This tournament was the biggest “Media
Event” in the world [10].
1.2 Sport Functions in International Relations
Across the historical place of sport, today sport has
become the focal point of community.
Bainvel summarized the functions of sport in the
following [13]:
A tool for promotion of power and domination
A phenomenon to strengthen political ideology
A tool to destroy peacefulness
A way for provoking enmities
A tool to estimate and out graded nations
A tool for damaging the neutralized relations
A tool for revenge
Kind of easy business
A way to hide doping
A tool for tampering
A tool for racism
A tool for physical and verbal violence
A way to increase patriotism
A tool for integrating the minorities and tribes
Contributing tool for peace
A tool for encouraging the nationalism
A way to improve international relations
A way for strengthening peacefulness
A tool for nation's friendship
A way for increasing tolerance and kindness
A tool for reducing conflicts
A way for creating chivalry spirit
A tool for analyzing an especial
A way for explaining the opposes situation
1.3 International Branding, Prestige and Image
Sport is a way to influence the image of a nation,
and producing what is called “Soft Power” or “Social
Capital”. The foundational elements of public
diplomacy are listening or engaging a foreign public
by collecting and analyzing its opinions and feeding
that to the formation of policy; Advocacy through
direct representation of information and policy;
cultural diplomacy through the participation in and
facilitated export of culture exchange; diplomacy as
the mutual exchanges of personnel with foreign
partner; international broadcasting engaging foreign
audiences through direct delivery of news. All these
elements, which Joseph Nye famously labeled as
“Soft Power,” work together with policies and cultural
values of society [23].This is especially true for newly
founded countries that are faced with financial
constraints and where sport can be a precious
alternative for other symbolic or raw materials [2].
“National Branding” is a new form of public
diplomacy among the countries where sport is the
easiest way to achieve that goal [14]. Sport as national
brand can facilitate governments in their pursuit of
achieving their commercial or political goals [2]. For
instance, “Sport Nation” was one of the Australian
images before, during and after Sydney 2000 Summer
Olympic Games. According to Australian tourist
Commission report, the successful outcome of Games
leaded to improving Australia’s image as much as 10
years, and it shows the correct management of image
by organizers [14].
1.4 Sport Tourism: “Virtual Industry” in New
Millennium
Besides cultural and archaeological tourism, many
tourism attraction types have come into existence and
Olympic Movement or Diplomatic Movement? The Role of Olympic Games on Development of International Relations
191
addressed broader segments of tourists across the
world, including recreational tourism, beaches tourism,
religious tourism, therapeutic tourism, eco-tourism,
sports tourism, golf tourism, safari tourism, desert
tourism, yacht tourism, and maritime tourism in
addition to festivals tourism, and cultural events and
finally conferences and exhibitions tourism. Sport
tourism can be seen as like the fine arts and theater:
players are akin to artists, spectators become the
audience, and stadiums are the theaters [15]. Small
countries can benefit from hosting sport events
proportionally. The Cook Islands, with a population of
13,000, are near New Zealand and hosted 100
thousand tourisms annually. Over the past decade, the
islands have several projects for the construction of
sport facilities and infrastructures such as 3000-seat
national stadium. The islands hosted “Pacific Mini
Games” where 22 islands competed in 15 sport
disciplines. The other sport event was “World Youth
Netball” championship where 20 countries
participated in those games. These islands have hosted
the “Bowl” tournament in 2009. It was one of the
seventh major events in rugby field that resulted in
34500 tourists to islands [1].
1.5 Sport, National Identity, Cohesion and Patriotism
Sport is frequently a vehicle for the expression of
nationalist sentiment to the extent that politicians are
all too willing to harness it for such disparate, even
unethical purposes as nation building, promoting the
nation or giving cultural power to separatist
movements [24]. The integrative role of sport for a
nation is similar to its structured functional role that
can be been found in classical and social science
studies. Sport can allow for local, regional, or even
national differences and still provide a space to deal
with diversity, racism, tribal and regional conflicts
within a country. Indeed, this safe zone for disparate
peoples to come together is a central reason that
causes people to participate in sport events and, on a
larger scale, undergirds the value of the Olympic
movement [16]. For example, a country tried to
employ players from other nationalities to use sport as
a national pride tool. As Qatar did by employing
Bulgaria’s weightlifters [8]. As former IOC president
Avery Brundage1 has stated “Sport as well as music
and fine arts can be paled the political and ethnical
boundaries; we can stay together through sport, and
politic or business never be realized this cohesion,
lonely” [8].
1.6 Sport, Political Boycotts and Economic Sanctions
Isolation and sanctions can be placed in the context
of development. Politicians and policy makers talked
about “political development” phenomenon at first,
then the economists, sociologists and political
scientists focused on the importance role of policy.
The collocation “political development” has a precise
definition. This refers to several studies from the
perspective of inter disciplinary studies of “growth”,
“modernization” and “development” in the Third
World [17].
Sport as an arena for diplomatic strife arena can
occur, and isolation and global development are the
double-edged sword of sport. The cold war opponents
boycotted each other’s games in 1980 and 1984. USA
plus 64 other countries boycotted Moscow 1980
Summer Olympic Games because of Soviet invasion
to Afghanistan. This led to only 80 countries
participating in those games. Since 1956, this was the
lowest number of nations in the Olympic Games. On
the other hand, Soviet Union and 14 other countries
from East Bloc (except Romania) refused to
participate in 1984 Los Angeles with the excuse of
unsafety [18].
1.7 Sport and Its Peacefulness Role
Many authors have suggested that sport has
potential to reduce tension among competitors in
international arena, and it can integrate diversity and
inequality in a country. Regardless of language, race,
1 Former President of IOC during 1952-72

Olympic Movement or Diplomatic Movement? The Role of Olympic Games on Development of International Relations
192
ideology or culture, sport is capable to gather all
people for creating and exciting humanitarian scene.
For instance, Olympic rings symbolized the five
continents and its white flag represent purity [19].
Sport cannot impose or maintain peace, but it can
inspire it. Sport has a vital role to play as it continues
to demonstrate that it can facilitate dialogue between
different communities and be a catalyst for mutual
understanding in global society [24].
1.8 Sport Fields: An Arena for Cultural Exchanges
Many experts talk about the common aspects of
cultural relations and sport diplomacy, however, we
can clarify this similarity by exploring some indicators.
For example, cultural relations between nations and
their peoples can be facilitated by political structuring
of offices and ministries. A nation could create a
special organization with the task of implementing
strategy that could include establishing cultural
centers, friendship associations, scientific and
academic cooperation, cooperation between Radio and
TV, sports, tourism and the other kinds of cultural
activities that can be helpful both to economic
development and easing international tensions by
encouraging contact and understanding [20]. Sport can
therefore be a part of a government’s public
diplomacy strategy. Although sport is not the only
form of diplomacy, it is an important part of cultural
diplomacy (along with food, education, science, etc.)
[8]. As compared to the other types of cultural
exchanges like science, language, art and so on, sport
is a vital part of cultural soft power which bring
greater unity and national cohesion and expand a
nation’s space in the international sphere of diplomacy
and relations [14].
It might properly be said that sport is
“schizophrenic” because of its association with
frivolous or leisure activity and its very serious role in
terms of domestic and international politics. For sure
people with different interest utilize sport for
amusement and to pass the time, but it has also been
part of important diplomatic positions (for example,
the ping pong diplomacy between the US and China,
1980 Summer Olympics boycott; and, in an
anticipatory vein, the 2022 Qatar World Cup). From
our vantage point, sport ought to be considered as a
suitable basis for presenting culture and encouraging
positive international relations. Although some people
believe that sport should be kept clean and free from
political issue, perhaps it is better consider it as a part
of political life and a tool for diplomacy [8].
1.9 International Sport Organizations
International society has many diverse
organizations that operate in different contexts. The
global society without international organizations and
mutually international organizations without global
society never substantialize each other, there needs to
be structure to connect and facilitate the work of both
elements. International organizations are a significant
reason for global solidarity and an effective means for
international diplomacy and the pursuit of more
perfect solutions among nations as they seek to make
effective decisions in and for the world [21].
Sajjadi categorized the sport international
organizations into two main categories [20]:
(1) IOC (International Olympic Committee);
(2) IFs (International Sport Federations).
The Olympic movement includes the IOC and the
hundreds of NOCs (National Olympic Committees).
As well within sports and events associated with the
Olympics, there are international federations, and the
OCOGs (Organizational Committee of the Games), as
well as national associations and clubs that are parts of
this huge executive sport organization [16].
Mega events like the Summer Olympic Games,
Asian Games and the other kinds of hallmark events
play a critical role in placing a city or country on a
global map. Increasing the number of tourists and the
associated increase in revenue, as well as the
increased reputation of host country and host city, are
the most important advantages that provoke a

Olympic Movement or Diplomatic Movement? The Role of Olympic Games on Development of International Relations
193
government to support hosting. As the largest and
most popular global event, the Olympic Games play
an important role in developing and expanding
international communications. The Olympic Games
have a critical impact on national pride. Different
countries, by investing on this mega event, try to
maintain and develop their national pride by
presenting themselves on a world stage [13].
Of course, the Olympic Games are not the only tool
or opportunity for such building an international
profile. The OCA is the most important sport
organization in Asia which holds Summer Asian
Games every four years. In addition to the biggest
continental event, it is in charge of some other events
[1]: (1) Asian Winter Games; (2) Asian Indoor Games;
(3) Asian Beach Games; (4) Asian Martial—Art
Games; (5) AYG (Asian Youth Games).
Likewise, FIFA plays a critical role in international
relations. A giant organization with 209 members
(more than United Nations Organization), FIFA was
founded by seven European footballing nations in
1904. The story of this growth, first at a continental
level and then moving into its transcontinental reality,
is that association football itself was coterminous with
the rise of industrial society and nations and now
associated with the transnational reality of media and
multinational corporate sponsorships [25].
2. Conclusion
The first question that we need to ask ourselves
before explaining how to get involved with diplomacy
is: What actually constitutes diplomacy? Public
diplomacy is, at its core, the sharing of diplomatic
messages between political entities that improve the
relationship between nations. Public diplomacy was
used as a vehicle to promote nation’s soft power for
winning the Cold War. In this space, sport is an ideal
vehicle, capable of fomenting a domestic and perhaps
even international collective culture and a safe space
for nations to countries symbolize their prowess and
challenge each other. By sending delegations of
athletes abroad, nations can promulgate international
relations through a foundation built upon sporting
exchanges and related tourism. Correspondingly, the
suspension of a proposed sport visit to another nation
can be used by states as means to safely engage in
public conflict with specific government and its policy
makers.
The significance of the phenomenon of sport is not
inherent but manifests itself in the uses to which it is
put in society. In fact, sport symbolizes the
international environment while also being a
pragmatic tool of that environment. Its manifold uses
serve a variety interests in international relations, a
usefulness that can only increase as the effect of sport
becomes more widely recognized and understood. The
additional presence and symbiosis with the mass
media will simply enhance the centrality and import of
sport to diplomacy in the new millennium.
Currently, the ability of a country or international
actor to present an appropriate and attractive image,
via sport, to the international community can provide
great opportunities for political and economic
development. On the other hand, ignoring this fact can
lead to a country’s isolation.
Increased international attention to soft power and
public diplomacy can be considered the most
important component of creating positive image in
international society. Sport organizations as main
actors of NGOs can promote or decreased the image
of a nation. Even the impact for a city awarded
hosting rights for the Summer Olympic Games is
considerable, as people admire their ability to be
successful actors across different political, social,
economy and cultural domains. Further elevation to
the IOC or FIFA can serve as a kind of verification
sign for a nation’s importance or superiority. All in all,
the assumption that mega events such as the Summer
Olympic Games are good for states and their citizens
rests on a number of conjectures that also serve as an
event’s legacy. The most five prominent legacies are:
(1) Success of elite athletes can inspire most of

Olympic Movement or Diplomatic Movement? The Role of Olympic Games on Development of International Relations
194
youth to take part in sport to improve their
healthiness;
(2) In comparison with the other forms of tourism,
Olympic Games are economically lucrative and
bringing a huge revenue for hosting nation/city;
(3) Olympic Games engendered a “feel cool” factor
among citizens of the host nation;
(4) Urban and rural regeneration accelerated;
(5) Nations benefits by casting themselves
internationally that introduce their culture and pursue
national interest in international relations.
References
[1] Pigman, G. A. 2014. “International Sport and Public
Dimension; Governments, Sport Federations and the
Global Audience.” Diplomacy & State Craft 25 (1):
94-116.
[2] Deos, A. 2013. “Sport and Relational Public Diplomacy;
the Case of Newzealand and Rugby World Cup 2011.”
Sport in Society 17 (9): 1170-86.
[3] Murray, S. 2012. Sport Diplomacy: A Hybrid of Two
Halves. Brisbane: Diplomatic Studies Section of
Intrernational Studies Association Press.
[4] Markovits, A. S., and Rensmann, L. 2010. Gaming the
World: How Sports Are Reshaping Global Politics and
Culture. Princeton, NJ: Princeton University Press.
[5] Grix, J. 2013. Sport Politics and Olympic. Political
Studies Review 8 (11) 15-25.
[6] Shariati, M., Goudarzi, M., and Azari, A. 2013. “An
Investigation of the Relationship between the Success of
Countries at the Shenzhen 2011 Summer Universiade
with Educational and Demo-Economic.” Social and
Behavioral Sciences 22 (11): 803-7.
[7] Doosti, M. 2012. Explanation and Analyses of the Causes
and Consequences of Involvement of Politicians to Sport
of Iran. Ph.D. thesis, University of Tehran.
[8] Jackson, S. 2013. “The Contested Terrain of Sport
Diplomacy in a Globalizing World.” International Area
Studies Review 4 (6): 274-84.
[9] Preuss, H. 2004. The Economics of Staging the Olympics.
London: Palgrave Press.
[10] Feizabadi, M. S., Bakhtiari, M., Rashidzade, H., and Nik,
F. 2013. “The Evolution of Television Broadcasting
Rights during the Summer Olympic Games.”
International Research Journal of Applied and Basic
Sciences 4 (3): 613-6.
[11] IOC, Fact Sheet. 2014. IOC Media Factsheet. Athen:
IOC Press.
[12] Preuss, H. 2002. Economic Dimensions of Olympic
Games. Barcelona: International Chair in Olympism.
[13] Bainvel, S. 2005. Sport and Politics: A Study of the
Relationship between International Relationship and
Football. M.A. thesis, Linkopings University.
[14] Grix, J., and Houlihan, B. 2013. “Sport Mega Events as
Part of a Nation’s Soft Power Strategy; the Cases of
Germany (2006) and UK (2012).” The British Journal of
Politics and International Relations 22 (3): 125-39.
[15] Greenwell, C., Bussel, L. A., and Shonk, D. 2014.
Managing Sport Events. New York: Human Kinetics Press.
[16] Beacom, A. 2012. International Diplomacy and the
Olympic Movement. London: Palgrave Press.
[17] Aalam, A. 2014. Principles of Politics (Persian). Tehran:
Ney Press.
[18] Hosseini, A. 2010. The Sport Perception of Presidents.
Tehran: Iranian Students’ News Agency.
[19] Rezaee, H. 2013. Football and Political Conditions in
Iran. Tehran: Official Website of Iran’s Football
Federation.
[20] Jan, S. A. 2013. The Effect of Supportive Behaviors in
Iran Public Diplomacy. Tehran: University of Tehran
Press.
[21] Qafoori, M. 2013. International Organizations. Tehran:
SAMT Press.
[22] Sajjadi, N. 2014. Sport & International Relations. Tehran:
Hatmi Press.
[23] Nye, J. S. 2004. Soft Power: The Means to Success in
World Politics. Public Affairs Press.
[24] Bairner, A. 2001. Sport, Nationalism, and Globalization:
European and North American Perspectives. Suny Press.
[25] Millward, P., and Parnell, D. 2014. “FIFA: The Men, the
Myths and the Money.” Leisure/Loisir 38 (2): 199-202.

Journal of Sports Science 3 (2015) 195-202 doi: 10.17265/2332-7839/2015.04.006
Wrestling: Glory of India at the Olympics—A Brief
History of Indian Wresting Team in the Olympic Games
Naveen Singh Suhag
Department of Physical Education, Maharishi Dayanand University, Rohtak, Haryana 124001, India
Abstract: Wrestling as an Olympic sport has been around since the dawn of modern Olympic games and India is a participating nation in it. Wrestling has unique position among Olympic disciplines in India, from being provider of first individual medal to newly independent nation to lately becoming most significant contributor in medal tally. This coming of age of Indian wrestling team with double medal tally in the last Olympics has been outcome of long and steady journey of Indian wrestling team over a period of 40-50 years and numerous Summer Olympic Games. However, this journey of Indian wrestling team in the Olympics is also a story of significant twist and turn, near misses and also of glory. So this article covers the entire saga of Indian wrestlers at highest sporting event of world—Olympic Games, from inception of first Indian team of mere three grapplers to latest Olympics with debut of first Indian female grappler in Olympic arena. This history is written by sweat and hard work of Indian grapplers with its own highs and lows. Key words: Indian wrestling team, the Olympics, wrestlers of India in Olympic Games, freestyle and Greco Roman Wrestling.
1. Introduction
As a participating nation, India has a long history in
the modern Olympic Games with debut of Indian
contingent in 2nd Olympic Games organized at Paris in
1900. After a gap, India has registered its continuous
presence in the games since 1920 Olympics[ 1 ] and
Indian Wrestling Team also has remained important
part of the nation’s Olympic delegation. Till now, India
as a nation has 26 medals at the Olympics to its credit,
majority being in team event of Field Hockey with 11
different medals, leading the whole world in this sport.
However, when it comes to individual events, it is the
Wrestling Team of India which has set many records in
Olympic History of the nation. Wrestling gave the first
individual medal of independent India at 1952
Olympics[2] and brought feeling of pride, honour and
hope not only for the newly established republic, in
comity of nations, but also to the millions toiling under
Corresponding author: Naveen Singh Suhag, Ph.D.,
research field: Indo-Russian wrestling style. E-mail: [email protected]. 1Organized at Antwerp, Belgium 2Ibid
colonialism in third world countries. Wrestling along
with shooting, as a discipline, share the second highest
number of medal haul in the Olympics for India. Along
with this Wrestling as a sport is only discipline, in India,
which gave double Olympic medalist for the nation.
Not only has wrestling registered its presence on medal
tally of India at the Olympics in an impressive fashion,
but also there are numerous instances of dominance of
Indian Wrestling Team in the Olympics with many
near miss opportunities. Hence the exploits of the
Indian Wrestling Team at the various Olympics are
worth analysis to understand the current direction of
Sports in the nation and also to predict the future trends
and pattern.
2. The Beginning
The sojourn of Indian Wrestling Team at the
Olympics initiated from the 1920 Olympics[3] itself
where two member steam represented India. Out of two
disciplines in which the new nation participated,
Wrestling was one of main event apart from Athletics.
3Organized at London, the UK
D DAVID PUBLISHING

Wrestling: Glory of India at the Olympics—A Brief History of Indian Wresting Team in the Olympic Games
196
This team comprised of Kumar Navale and Randhir
Shindes in middleweight[ 4 ] and featherweight[ 5 ]
categories respectively. This debut of Indian Wrestling
Team was indeed impressive as wrestler Randhir
Shindes not only reached up to semifinal but also on his
way defeated a famous Great Britain wrestler of that
time, Henry Inman in quarter final. This was a great
feat given that India was under colonial British Raj and
its people were held to be inferior to British lot.
However, after going down in semifinal, Randhir
Shindes could only secure 4th Rank in final tally.
Despite being one step short of a podium finish, this
debut Indian Wrestling Team laid a proper foundation
to the India’s Olympic dream which encouraged and
inspired the coming generations of wrestlers and
sportspersons in the nation.
2.1 First Wrestling Team of India as Sovereign Nation
in the Olympics
After a log gap, the next Olympics for Indian
wrestlers came in 1948[6], in the post war era when for
the first time India participated as an independent
nation. The new nation sent 6 members strong team for
a of total 8 weight disciplines in freestyle category.
This team had future stalwart of Indian wrestling, K.D.
Jadhav, a boy only of 21 years in a new weight
category introduced as Fly Weight. He was best
performer of team and stood 6 in final standings of his
weight category, after being defeated by much senior
Iran’s M. Raisi, who stood 4th.
However, the other members of 1948 Wrestling
Team were not that impressive in their performance.
Most of team went down in 2nd round of elimination,
Nirmal Bose in Bantam Weight, S. Suryavanshi in
Feather Weight, Banta Singh in Light Weight and
Keshav Roy in Middle Weight. Only Anant Bhargava
in Welter Weight reached 3rd round but still he failed
to get a final ranking. Another important feature worth
noticing here is that there is lack of representation in 4Up to 75 kg 5Up to 60 kg being lightest Weight category in 1920 Olympics. 6Organized at London, the UK
higher weight categories by Indians and also in
Greco-Roman Style. Despite all this, the Indian
Wrestling Team had made its presence felt.
3. The First Podium Finish, 1952 Olympic Games
The 1952 Olympic Games[ 7 ] have a special
significance in general as well as from perspective of
India. These games witnessed a paradigm shift with the
coming of Soviet Union and other East European
players in competition. This entry of Soviet Union in
the games was most profoundly felt in Wrestling
Discipline as they come to dominate this sports right
from beginning. In this background, India sent 4
members strong team with K. D. Jadhav as senior of
the earlier Olympic Games. This Indian Wrestling
Team had dream run and had rendezvous with history.
Out of total 4 wrestlers in this team, one came very
close to podium finish, Keshav D. Mangawai in
freestyle Featherweight category securing 4th position,
while his other teammate, K. D. Jadhav made history
by becoming first Indian individual to win a medal at
the Olympics. The gravity of this achievement can be
gauged by the fact that for matching this feat by an
Indian, it took 44 long years and 11 editions of the
Olympics. Thus in this edition of the Olympic Games,
Indian Wrestling Team achieved a hall mark which was
no thought of earlier.
This staller performance by Mr K. D. Jadhav needs
to bit explained. After migrating to higher Bantam
weight category[8] from earlier Fly weight[9], Jadhav
had to face tough pool with 6 rounds to cross before
final round. In first two rounds, Jadhav defeated his
Canadian and Mexican opponents, decisively by fall,
respectively. In 3rd Round, Jadhav met tough opponent
Schmitz whom he defeated by 2-1 difference of points.
The final round came down to Japan’s Shohachi Ishii,
Soviet Azerbaijani Rashid Mamedbekov, and Indian K.
D. Jadhav. Mamedbekov had beaten Jhadav in round 7Organized at Helsinki, Finland 857 kg 952kg

Wrestling: Glory of India at the Olympics—A Brief History of Indian Wresting Team in the Olympic Games
197
five, so Ishii fought Jhadav in the first final match,
winning by unanimous decision. Ishii then defeated
Mamedbekov, also by unanimous decision, to win the
gold medal, with the Soviet taking silver. However,
despite his loss in final round, it was by his stupendous
performance that Indian wrestler impressed the
wrestling fraternity of world and entered into annals of
the Olympic Games history and that of a proud nation.
4. The Period of Long Wait 1956-2004
4.1 Stage of Ascendency 1956-1976
In next edition of the summer Olympics[10] in 1956,
India sent 5 members contingent; however it failed to
make the mark. None of wrestlers get beyond 3rd round
and hence failed to secure final ranking. However, the
situation changed in next summer games[11] as India
Wrestling Team performed better. The commendable
performer of this team in Freestyle category were
MadhoSingh contesting in Middle Weight securing 5th
position, Sajan Singh got 7th position in Light Heavy
Weight. Uday Chand and Gian Prakash got 14th and
15th position in Welter and Light Weight categories,
respectively.
The 1964 Summer Olympic Games[12] were special
for India as well as other Asian countries, as these were
organized for first time in Asian Continent. India sent 7
members strong Wrestling Team for various weight
categories. However, except Bishamber Singh in
Bantam Weight category who secured 6th rank,
nobody could get any ranking, failing majorly in 2nd or
3rd round. However, this edition of the Olympic game
witnessed the first participation by Indian Wrestlers in
Greco-Roman Style. Mostly, the freestyle wrestlers of
India participated in Greco-Roman category also and
India was represented in 5 different weight categories
of Greco-Roman Style, highest till now, though none
succeeded beyond elimination round.
The Indian Wrestling Team in 1968 Olympic
10Organised at Melbourne, Australia 11 1960 Summer Olympics were organized at Rome, Italy 12Organised at Tokyo, Japan
Games[13] achieved a unique feat, as its Light Weight
Freestyle Wrestler Uday Chand went on to represent
India in three consequent Summer Olympic Games of
1960, 1964 and 1968 at age of 33 years. In his last
Olympics, Uday Chand gave his best and got 6th Rank.
Apart from him another wrestler in Freestyle Light
Weight Category, Sudesh Kumar achieved same
position in ranking, but he failed during elimination
round in same weight category at Greco-Roman event.
Their other team mates failed to get a ranking position
after failing in elimination rounds.
Munich Olympics[14] though has been infamous for
terrorist attack, witnessed the strong performance of
Indian Wrestlers in different weight categories. It has
been especially a close call for two Indian grapplers
Sudesh Kumar and surprisingly young 17 years old
Prem Nath, both of them missing podium finish by
whisker and ending as 4th in their respective weight
categories.
The senior of two, Sudesh Kumar using his previous
Olympic experience performed well in his Fly Weight
category, and remained unbeaten till final round,
winning his all but one bout by fall. However, in last
round, he was beaten by eventual Gold and Silver
Medalists in closely contested matches. The young 17
years old Prem Nath had dream run in Bantam Weight,
winning all his bouts in decisively. In end, he was
defeated by mature USA wrestler Rich Sanders who
was silver medalist in 1968 and also in 1972 Olympics.
For Bronze medal, Prem Nath was unlucky, as he lost it
on basis of bad points rather than a bout. He had more
bad points than the 3rd adjudged Hungarian Wrestler,
hence another close miss for medal hope.
In 1976 Olympics[15]Indian Wrestling Team did not
participate and it was only Olympics since 1948 where
no Indian grappler took part. However, 1980’s decade
saw strong performance by Indian wrestlers in the
Olympic arena.
13Organised at Mexico City, Mexico 14 1972 Summer Olympics were organized at Munich, Germany. 15Organised at Montreal, Canada

Wrestling: Glory of India at the Olympics—A Brief History of Indian Wresting Team in the Olympic Games
198
4.2 The Stage of Plateau 1980-1992
In 1980[16] Olympics among the 5 member team, two
finished in top 6 positions. In Lightweight Freestyle
Jagminder Singh displayed splendid wrestling and
reached till 5th round and finally placed at 4th Rank,
missing podium finish. Likewise in Welterweight
Freestyle category, Rajinder Singh had dominant
performance but been unlucky in third round when he
lost to Italian Wrestler on criteria basis despite having
tie in score. Eventually Rajinder Singh was placed 6th
in his weight category.
The Los Angeles Olympics[ 17 ]were interesting as
USSR (Union of Soviet Socialist Republics) led East
Bloc countries boycotted the games and hence
competition in Wrestling was comparatively eased than
previous editions. India entered one of most
experienced team and was considered strong
contenders for medals in wrestling, which was also
proved by performance of its wrestlers. India
participated in most of Freestyle Weight categories and
out of these 4 of its wrestler got into final ranking
bracket.
The best performer was Welterweight wrestler
Rajinder Singh who reached up to final round and been
placed 4th after losing to eventual silver and bronze
medalist of his weight. But Rajinder Singh was first
Indian wrestler since K. D. Jadhav to improve upon his
performance in subsequent Olympics and finishing in
ranking table, despite that fact that Singh could not
repeat feat of Jadhav. Similarly, Rohtas Singh in
Bantamweight got 5th rank in final standing, Mahavir
Singh got 6th Rank in Flyweight category and Kartar
Singh got 7th rank in Heavyweight category which was
also best performance for an Indian wrestler in this
particular weight category.
The Seoul Olympics[ 18 ]saw a team of 4 Indian
wrestlers competing in different weight categories of
Freestyle event. However, none of team members
16Organised at Moscow, erstwhile USSR 171984 181988
could get beyond the elimination rounds and hence
could not get final ranking. Kartar Singh in
Heavyweight Category became the 2nd Indian wrestler
to participate in three consequent Olympics, that is,
1980, 1984 and 1988, after Uday Chand in 1960’s.
The 1992 Olympic Games[19] were also unique for
Indian Wrestling Team for two main events. One of
them was the performance on PappuYadav in Light Fly
Weight of Greco-Roman Category, in which after long
gap since 1968, an Indian participated and that too
secured decent 8th rank. Along with that Subash
Verma in Heavyweight of Freestyle category landed
6th Rank, improving over that of his team mate same
category in last edition of the Games. These events are
significant as Indian Wrestlers were now venturing into
areas earlier not touched upon like Greco-Roman style
and heavier weight categories of Freestyle.
4.3 Stage of Decline 1996-2000
In Atlanta Olympics[20] lone Indian grappler was
Pappu Yadav, who now migrated to higher weight
category of Flyweight in Greco-Roman style of
wrestling. However, he could not repeat his
performance and got 17th rank tied with another
grappler. Similar situation continued in next edition of
Summer Olympics in 2000[ 21 ] where lone Indian
Wrestler representing India was Gurbinder Singh in
Lightweight category of Greco-Roman Style, finishing
at low rank of 13th. These two editions of games saw
the nadir of this sport in Olympic History of India.
However, things took dramatic turn since then onwards
for better and better.
The Athens Olympic Games[22] proved to be another
watershed in history of Wrestling at Olympics, as it
saw the introduction of women events for first since
1904 Olympics and also that too for India, as it saw the
debut of rising Indian wrestler who later made India
proud by putting India again in medal tally of wrestling
19Organized at Barcelona, Spain 201996 21Organized at Sydney, Australia 222004

Wrestling: Glory of India at the Olympics—A Brief History of Indian Wresting Team in the Olympic Games
199
at Olympics. Indian wrestling team was comprised of
total 7 wrestlers, one in Greco-Roman and six in
Freestyle. The best performance in this team was that
of Ramesh Kumar in Men’s Welterweight category,
where he secured 10th rank. However, it was the
experience gained by young wrestlers of 21 years of
age both, namely Yogeshwar Dutt and Sushil Kumar in
Featherweight and Lightweight categories of Freestyle,
respectively, that proved crucial for golden
performance by these grapplers in later edition of the
Olympic Games. Another first for Indian Wrestling
Team at the Olympics was the entry of Palwinder
Singh Cheema in Super Heavyweight[23] category of
Freestyle as this weight category was untouched by
Indian wrestlers prior to that, though he finished 15th
in final ranking yet this was a feat for Indian Wrestling
Team.
5. The Golden Era of Indian wrestling in the Olympics 2008-onwards
5.1 Repeat of History and Second Ever Medal in
Wrestling 2008
The new dawn of Indian wrestling came up
unexpectedly in 2008 Olympics[ 24 ] when the long
draught of medals was quenched and in fact new flood
gates were opened. Post these games, wrestling became
a household name and it drew huge public as well as
institutional support to Indian Wrestlers which went on
to reshape the map of wrestling in India and manifested
into more stellar performance by Indian Wrestlers in
next Olympics.
In 2008, India sent a small contingent of three
wrestlers; two experienced Yogeshwar Dutt in Men’s
Lightweight[ 25 ] Category and Sushil Kumar in
Welterweight[26] Category, along with Rajeev Tomar in
Super Heavyweight[27]. It is worth discussing about the
format of these freestyle competitions in the 2008
23120kg 24Organized at Beijing, China 2560kg 2666kg 27See supra note 23
Olympics. This freestyle wrestling competition
consisted of a single-elimination tournament, with a
repechage[ 28 ] used to determine the winner of two
bronze medals. The two finalists faced off for gold and
silver medals. Each wrestler who lost to one of the two
finalists moved into the repechage, culminating in a
pair of bronze medal matches featuring the semifinal
losers each facing the remaining repechage opponent
from their half of the bracket. Each bout consisted of up
to three rounds, lasting two minutes apiece. The
wrestler who scored more points in each round was the
winner of that rounds; the bout finished when one
wrestler had won two rounds (and thus the match).
Unfortunately for India, its Super Heavyweight
grappler was ousted in round one of competition itself.
In Men’s Lightweight category, Dutt gave sturdy
performance, after getting bye in initial round, he
outclassed his Kazak competitor in dominant way.
However, in quarterfinals, he met Japanese wrestler
and both had a closely contested bout. After winning
first round, Dutt conceded the second round to his
competitor and it came to final and penultimate round.
In this decisive final round, the Indian wrestler again
seized the initiative early, going ahead 1-0 but failed to
hold on to the lead in the last 10 seconds and gave away
two match winning points to his opponent to lose 2-1.
And in semifinal, this Japanese Wrestler lost out to
eventual silver medalist Ukrainian Wrestler, closing
even the possibility of a chance for Dutt in repechage
round. This dented the moral of not only the individual
but whole Indian Team.
However, the journey of Sushil Kumar in 2008
Olympics is albeit full of twist and turns which can
even motivate a commercial sports thriller. He not only
created history by equating the feat of K. D. Jadhav[29],
grand old man of Indian Wrestling at Olympics after 56
years by bagging bronze medal but also rewritten the
28Repechage means literally “fishing out, rescuing” and is a practice in series competitions that allows participants who failed to meet qualifying standards by a small margin to continue to the next round. 29Wrestling Bronze Medalist in Helsinki Olympics 1952

Wrestling: Glory of India at the Olympics—A Brief History of Indian Wresting Team in the Olympic Games
200
chronicles of Indian Wrestling for all the time to come
by repeating his feat in next Olympics with
improvement in metal of his medal to silver. This
elevation of Kumar into history books is in fact
manifestation of coming of age of Indian Wrestling
Traditions at international arena, seeds of which were
sown long ago.
After getting a bye to the 1/8 round, Kumar lost to
Ukrainian Wrestler A. Stadnikin the first round of the
66 kg freestyle wrestling event in straight two rounds
leaving, his medal hopes hinging on the repechage
round, provided that Ukrainian wrestler reaches final.
Stadnik reached in final round providing a chance to
Kumar at repechage. There Kumar defeated American
Doug Schwab, who was 5th in last world
championships in which Kumar was seventh, in the
first repechage round and Belarusian Albert Batyrov in
the second repechage round. In the bronze medal match
on 20 August 2008, Kumar faced the tough opponent
Kazak wrestler L. Spiridonov, who reached up to
semifinal round and there losing to finalist A. Stadnik.
This bronze medal match was so intense and had
proved to harbinger of a positive change to Indian
wrestling which nobody could have thought. In first
round, Kumar got better of his opponent by score of 2-1
in close contest between both wrestlers. In second
round, however, Kazak wrestler beat Kumar with score
of 0-1. It came down to decisive final round and a
hallowed medal of the Olympics at stake. Within
stipulated time of 2 minutes, none of wrestler could
score a point and match went on to be decided by a
technique called clinch rule. In this scenario, one of the
wrestlers is randomly chosen to take his opponent’s leg
for a final 30 seconds that decides the round. The
positions are chosen at random by the official. He uses
a bag containing two balls—one red, one blue; each
representing a wrestler. The ball that is pulled by the
official decides which wrestler starts in the offensive
position. Even in this case, luck run out on Sushil and
his opponent won the draw thus Kazak wrestler was in
better position.
However, as it is said in folklores fortune favors the
bold, Indian wrestler brought his opponent down from
a seemingly disadvantaged position and winning this
round with 2-0 score in his favor and thus bronze medal
of the Olympics and an assured position in history
books.
5.2 The First Ever Double Medal Haul for Indian
Wrestling 2012
The latest 30th Olympic Games in London[30] saw
the zenith of Indian Wrestling Team where it returned
with two Olympic medals, rare first in Indian sports
that too of different colors-one silver and one bronze.
And Sushil Kumar became first sports person to
achieve distinct feat of being first sportsperson to
achieve double Olympic medal. Along with that, in
Geeta Phogat India found its first women grappler to
compete in Olympics.
In London Olympic Games, India sent a team of 5
wrestlers, one woman and rest men in Freestyle
category. Out of these, Geeta Phogat secured 13th rank
in Women Lightweight category and become first
woman wrestler from India to compete at Olympics
since inception of woman wrestling events in 2004
Olympics onwards. Other two young wrestlers, Amit
Kumar and Narsingh P. Yadav secured 10th and 13th
ranks in Men’s Featherweight and Middleweight,
respectively.
It was feat of two veterans[31] Yogeshwar Dutt and
Sushil Kumar which took wrestling to its peak in this
edition of Olympic Games. Competing in Men’s
Lightweight Freestyle category, Dutt defeated
Bulgarian wrestler in Qualification round in three
rounds. But he got defeated by eventual Silver medalist
Russian B. Kudukhov in second round, allowing an
attempt in repechage round. Dutt’s performance in
repechage round was decisive in all three rounds. In
first round, he dismissed the Puerto Rican wrestler in
straight two rounds. In second round, he dispatched
30In 2012 31Both played in three Olympics 2004, 2008 and 2012

Wrestling: Glory of India at the Olympics—A Brief History of Indian Wresting Team in the Olympic Games
201
then Junior world and Asian champion and promising
wrestler of Iran Masoud Esmaeilpour in closely
contested match with score of 0-3-4 in his favour,
coming from behind. In final bronze medal match,
again coming from behind, Dutt defeated North Korean
wrestler Ri Jong-myoung with score of 0-1-6 in favour
of Dutt. In final round of this bronze medal match, he
out classed his opponent with full minute remaining by
scoring straight 6 points to his opponents none. This
was India’s third Bronze Medal at Olympics in
Wrestling.
Sushil Kumar’s journey to maiden Olympic Finals,
in Men’s Welterweight Freestyle category, for that
matter, first by any Indian Wrestler, is rather
manifestation of dominance now been associated with
Indian Wrestling Team at international events
including at the Olympics. After getting a bye in first
round, Kumar sent packing then defending Olympic
Champion Ramazan Sahin[ 32 ] of Turkey in second
round itself. In quarterfinals, Kumar defeated the
Uzbek wrestler in tough three rounds match. The
semifinal was also keenly contested bout between
Indian and Kazak Wrestler A. Tanatarov. First period
was won by Kumar in dominant way with score of 3-0
in his favour. However, second period was won by
Kazak wrestler with similar score line. This led to the
final round of bout being decisive as both wrestlers
were at tie after winning one round each. In this final
round, Sushil got better of his opponent in last minute
of contest as he was rallying behind by 3 points during
initial duration. Thus he won this semifinal with
amazing display of writ and willpower. And with a
final score of 3-6 in his favour, he entered the Olympic
final, first for any Indian Wrestler ever.
In final, however, Sushil Kumar suffering from
fatigue and possible food poisoning lost to Japanese
Wrestler in straight two rounds and settled for the
Silver Medal. This is 4th medal of Indian
Wrestling Team ever and only 2nd individual Silver
322008 Beijing Gold Medalist in Men’s Welterweight Freestyle category
medal[33] for India ever at Olympics till date.
6. Conclusion
Thus there are few things that become apparent on
analysis of history of Indian Wrestling Team in
Olympics. It is beyond doubt that Freestyle Wrestling
has been backbone of India at the Olympic Games as
compared to Greco-Roman Style of Wrestling. Though
there been a presence of Indian wrestler in
Greco-Roman Style at Olympics but largely it has been
nominal in nature. It is the Freestyle Wrestling which is
deeply rooted in cultural fabric of Indian society
especially in its northern and western region that has
produced numerous formidable competitors of this
sport at Olympics for India.
Another factor which distinguishes Wrestling as
Olympic sports in India Sporting History is its long and
continuous presence at numerous the Olympic Games.
Apart from sports like Hockey, none other discipline
can boast of such long and strong presence in Indian
Contingent at various Olympic Venues. However, the
sheer tally of medals in wrestling discipline is low if we
compare it in proportion to the players competing at the
Olympics for India. But when we take into account the
closely missed chances and stellar performance by
various Indian grapplers at the Olympics then, it would
be safe to say that no other sports in India, especially, in
individual category has displayed such formidable
performance at this highest sporting platform. Indian
Wrestlers are now better off under severe levels of
stress and anxiety to perform well at highest levels
mainly on account of new found success of their
colleagues at the Olympics. It has been proven too as a
positive impact on mental toughness of Indian
Wrestlers.
Hence this journey of Indian Wrestling Team at
Olympics will continue and it is expected to get rich
haul of medals for nation in coming games. As now
especially the current generation of wrestlers in India 33First Silver Medal for India was won by Maj. Rajyavardhan Singh Rathore in Men’s Double Trap Shooting at 2004 Athens Olympic Games.

Wrestling: Glory of India at the Olympics—A Brief History of Indian Wresting Team in the Olympic Games
202
has seen first-hand experience of converting
opportunities into medals, as for previous generations,
the medals were eluding for long gap. Hope this good
harvest of medals by Indian grappler continues for time
to come in annals of the Olympic Games.
References
Periodical
[1] Rana, M. S. 2009. “Assessment of Mental Toughness
among High and Low Achievers Indian Wrestlers: A
Comparative Study.” Research Journal of Physical
Education and Sports Science. 4 (1): 60-70.
Books
[2] Majumdar, B., and Mehta, N. 2012. Olympics: The India
Story. New Delhi India: Harper Collins India Ltd. 20-50.
[3] Bill, M., and Hejmans, J. 2011. Historical Dictionary of
the Olympics Movement. Plymouth UK: The Scarecrow
Press, Inc, 90-110.
[4] Barbara, M. L. 2007. Great Moments in Olympic History
Olympic Wrestling. New York: The Rosen Publishing
Group, Inc, 33-40.
[5] Coulon, P., and Sten, S. 1962. 1912-1962—Fifty Years of
Greco-Roman and Freestyle Wrestling in the FILA/IAWF.
Lausanne: FILA, 110-50.
Internet Sources
[6] The Wrestling Federation of India. 2015. “Olympians in Wrestling in India.” WFI Database. Accessed on March 10, 2015. http://www.wrestlingfederationofindia.com/awards.php?id=26&p=1
[7] The United World Wrestling. 2015. “History of Wrestling.” Accessed on March 12, 2015. https://unitedworldwrestling.org/organization/history
[8] The United World Wrestling. 2015. “The Wrestling at Olympics.” Accessed on March 12, 2015. https://unitedworldwrestling.org/database
[9] Sports-Reference. 2015. “Olympic Sports Participating Countries Database- India.” Accessed on March 28, 2015. http://www.sports-reference.com/olympics/countries/IND/
[10] The Wikipedia free encyclopedia. 2015. “India at the Olympics.” Wikipedia Database. Accessed on March 15, 2015. http://en.wikipedia.org/wiki/India_at_the_Olympics
Thesis
[11] Navin, K. 2013. “Wrestling and Its Promotion in India. A Case Study of Arjun Awardee Ashok Kumar.” Ph.D. thesis, The M.D. University Rohtak.
[12] Indrasan, R. 1994. “Wrestling in India since Ancient Times.” Ph.D. thesis, Banaras Hindu University Varanasi. (In Hindi)
Copyright © 2022 FDOKUMEN