Quaternary Science Journal - EGQSJ - Copernicus.org
88
E & G Quaternary Science Journal Eiszeitalter und Gegenwart issn 0424-7116 An open-access journal by the German Quaternary Association Editor-in-chief: Margot Böse Volume 67 No. 1 & 2 2018
-
Upload
khangminh22 -
Category
Documents
-
view
0 -
download
0
Transcript of Quaternary Science Journal - EGQSJ - Copernicus.org
E&GQuaternary Science Journal Eiszeitalter und Gegenwart
issn 0424-7116An open-access journal by
the German Quaternary AssociationEditor-in-chief: Margot Böse
Volume 67No. 1 & 2
2018

E&G Quaternary Science JournalAn open-access journal of the German Quaternary Association
E&G Quaternary Science Journal (EGQSJ) is an interdisciplinary open-access journal published by the German Quaternary Association (DEUQUA) since 1951, and it is one of the longest-running journals relat-ed to Quaternary research. EGQSJ publishes peer-reviewed articles and express reports, as well as thesis abstracts related to Quaternary geology, paleo-environments, paleo-ecology, soil science, paleo-clima-tology, geomorphology, geochronology, archaeology, and geoarchaeology focussing on, but not limited to, research from central Europe.
Copernicus Publications Bahnhofsallee 1e 37081 Göttingen Germany
Phone: +49 551 90 03 39 0 Fax: +49 551 90 03 39 70
[email protected] http://publications.copernicus.org
Printed in Germany. Schaltungsdienst Lange o.H.G.
ISSN 0424-7116
Published by Copernicus GmbH (Copernicus Publications) on behalf of the German Quaternary Association (DEUQUA).
https://www.eg-quaternary-science-journal.net/
All EGQSJ articles have been distributed under the
Creative Commons Attribution 4.0 International License.
Image credit: Middle Waimakariri River Valley, eastern-central Southern Alps, New Zealand. The image depicts a view from Late Glacial (17.5 ka ago) terminal moraines near the confluence of Poulter River (inner “Poulter moraine”) downvalley towards the entry of Waimakariri Gorge and Puketeraki Range (far distance). Different levels of lower (young fluvial) and upper (old glaciofluvial) terraces are visible especially on the true right. Stefan Winkler, 2018, all rights reserved.

Editor-in-chief
Margot Böse Freie Universität Berlin, Germany [email protected]
Assistant editors
Christopher Lüthgens University of Natural Resources and Life Sciences, Vienna, Austria [email protected]
Daniela Sauer University of Goettingen, Germany [email protected]
Guest editors
Special Issue “Geoarchaeology and past human–environment interactions”
Hans von Suchodoletz University of Leipzig, Germany
Stefanie Berg Bavarian State Office for Monument Conservation, Germany
Lukas Werther Friedrich Schiller University Jena, Germany
Christoph Zielhofer University of Leipzig, Germany
Eileen Eckmeier Ludwig-Maximilians-University Munich, Germany
Associate editors
Pierre Antoine CNRS, Laboratoire de Géographie Physique, France
Jürgen Ehlers Witzeeze, Germany
Markus Fuchs Justus-Liebig-University Giessen, Germany
Ralf-Dietrich Kahlke Forschungsstation für Quartärpaläontologie, Weimar, Germany
Thomas Litt University of Bonn, Germany
Leszek Marks University of Warsaw, Poland
Henk Weerts Cultural Heritage Agency, The Netherlands
Advisory board
Flavio Anselmetti University of Bern, Switzerland Karl-Ernst Behre Niedersächsisches Institut für historische Küstenforschung, Germany
Philip Gibbard University of Cambridge, UK
Volli E. Kalm † University of Tartu, Estonia
Cesare Ravazzi CNR, IDPA, Italy
James Rose Royal Holloway University of London, UK
Christian Schlüchter University of Bern, Switzerland
Dirk van Husen Gmunden, Austria
Jef Vandenberghe Vrije Universiteit, Amsterdam, Netherlands
Andreas Vött Johannes Gutenberg-Universität Mainz, Germany
Editorial Support
Natascha Töpfer [email protected]
Publication Production
Sarah Schneemann [email protected]
E&G Quaternary Science Journal An open-access journal of the German Quaternary Associationhttps://www.eg-quaternary-science-journal.net/

E&G Quaternary Sci. J., 67, 85–86, 2019https://doi.org/10.5194/egqsj-67-85-2019© Author(s) 2019. This work is distributed underthe Creative Commons Attribution 4.0 License.
Editorial
Editorial E&G Quaternary Science Journal, Vol. 67 (2018)Christopher Lüthgens1 and Margot Böse2
1University of Natural Resources and Life Sciences (BOKU), Institute of Applied Geology,Peter-Jordan-Str. 82, 1190 Vienna, Austria2Freie Universität Berlin, Institute of Geographical Sciences, Physical Geography, Malteserstr. 74–100,12249 Berlin, Germany
Correspondence: Christopher Lüthgens ([email protected])
Relevant dates: Published: 24 January 2019
How to cite: Lüthgens, C., and Böse, M.: Editorial E&G Quaternary Science Journal, Vol. 67 (2018), E&G Qua-ternary Sci. J., 67, 85–86, https://doi.org/10.5194/egqsj-67-85-2019, 2019.
With the finalisation of volume 67 of E&G QuaternaryScience Journal (EGQSJ), it seems fitting to have a shortlook back at the past 1.5 years, which may have markedone of the most eventful periods in the history of Eiszeital-ter und Gegenwart – Quaternary Science Journal and itstransformation to EGQSJ, but even more importantly tohave a glance at the future development of the journal. Thetransfer of EGQSJ to Copernicus Publications in late 2017paved the way for a successful relaunch, which was cele-brated at 2018’s EGU (European Geosciences Union) confer-ence in Vienna, Austria, and attracted interested parties fromvarious fields of geoscientific research. The relaunch wasalso highly supported by the Quaternary and geomorpho-logical research community during last year’s Central Eu-ropean Conference on Geomorphology and Quaternary Sci-ences held in Giessen, Germany. In August 2018, EGQSJwas accepted into the Directory of Open Access Journals(DOAJ) and thus received the DOAJ Seal, which recognisesjournals that adhere to an exceptionally high level of publish-ing standards and best practice. This was an important mile-stone because a growing number of funding agencies requirethe DOAJ Seal as a prerequisite for applying for fundingwhich is exclusively dedicated to supporting the open accesspublication of scientific results. Backed up by the unprece-dented publication infrastructure in the history of the journalprovided by Copernicus Publications, a significant increasein submissions of all manuscript types eligible for publica-tion in EGQSJ – full research papers, express reports, and
thesis abstracts – was recorded. Some of these submissionscould already be published in Vol. 67, highlighting our effortsin minimising turnaround times from submission to publica-tion, notwithstanding the strict application of our peer reviewsystem, the latter also being responsible for a recent increaseof the rejection rate.
Vol. 67 also includes an innovation with regard to thetreatment of special issues. Two special issues were initi-ated in 2018, both resulting from the initiative and effort ofteams of guest editors promoting EGQSJ at different con-ferences. The first special issue Geoarchaeology and pasthuman–environment interactions is edited by Hans von Su-chodoletz, Stefanie Berg, Lukas Werther, Christoph Ziel-hofer, and Eileen Eckmeier, and the second special issueConnecting disciplines – Quaternary archives and geomor-phological processes in a changing environment is edited byJohanna Lomax, Thomas Kolb, and Markus Fuchs. Paperssubmitted to these and all upcoming special issues undergothe same review process as those submitted to regular issuesof EGQSJ. In contrast to traditional special issues, each ar-ticle, once accepted, is immediately published online in theregular EGQSJ volume, but will clearly be assigned to a spe-cial issue. Publications as contributions to special issues willalso be included in the regular printed version of EGQSJ. Inaddition, a compilation of all papers of a certain special issuewill be available online via a dedicated section of the EGQSJwebsite. This reduces the turnaround times for publication ofspecial issues, and at the same time enables DEUQUA (Ger-
Published by Copernicus Publications on behalf of the Deutsche Quartärvereinigung (DEUQUA) e.V.

86 C. Lüthgens and M. Böse: Editorial
man Quaternary Association) to offer the coverage of the ar-ticle processing charges for papers to be published not onlyin the regular series, but also in EGQSJ special issues.
At the last DEUQUA general meeting in Giessen inSeptember 2018, Christopher Lüthgens was elected newchief editor for EGQSJ, and will take over the respective du-ties from Margot Böse from Vol. 68 onwards. Building onthe solid foundation of EGQSJ established during the lastyear, the new editorial team consisting of more than 30 Qua-ternary scientists is looking forward to facing the challengeof helping EGQSJ become an indispensable journal for thepublication of Quaternary-related research in central Europe(and beyond). To fulfil that aim in the near future, we relyon you, the members of the Quaternary research commu-nity, to support EGQSJ by promoting the journal, and lastbut not least, by submitting your high-quality manuscripts toEGQSJ. You are also cordially invited to join DEUQUA asthe parent organisation of EGQSJ, and support the journaland benefit from all other activities of the association.
E&G Quaternary Sci. J., 67, 85–86, 2019 www.eg-quaternary-sci-j.net/67/85/2019/

E&G Quaternary Sci. J., 67, 1–6, 2018https://doi.org/10.5194/egqsj-67-1-2018© Author(s) 2018. This work is distributed underthe Creative Commons Attribution 4.0 License.
Express
report
Middle to Late Holocene mobilization of DOC-bound Pb andY in the Magellanic moorlands (53◦ S) as a function of seaspray fertilization, climate variations and volcanic fallout?A preliminary reportBjörn Klaes1, Rolf Kilian1, Gerhard Wörner2, Sören Thiele-Bruhn3, and Helge W. Arz4
1Department of Geology, University of Trier, Campus II, Geozentrum, Behringstraße 21, 54296 Trier, Germany2Geochemistry Division, University of Göttingen, Goldschmidtstraße 1, 37077 Göttingen, Germany3Soil Science Department, University of Trier, Campus II, Geozentrum, Behringstraße 21, 54296 Trier, Germany4Department of Marine Geology, IOW Warnemünde, Seestraße 15, 18119 Rostock, Germany
Correspondence: Björn Klaes ([email protected])
Relevant dates: Published: 31 January 2018
How to cite: Klaes, B., Kilian, R., Wörner, G., Thiele-Bruhn, S., and Arz, H. W.: Middle to Late Holocene mo-bilization of DOC-bound Pb and Y in the Magellanic moorlands (53◦ S) as a function of sea sprayfertilization, climate variations and volcanic fallout? A preliminary report, E&G Quaternary Sci. J.,67, 1–6, https://doi.org/10.5194/egqsj-67-1-2018, 2018.
1 Introduction
In the course of previously reconstructed paleoclimate, theyttrium (Y) content of the MA1 stalagmite from the MarceloArévalo (MA) cave at 53◦ S has been used as proxy for rain-fall intensity-related transport of siliciclastic detritus ontothe speleothem (Schimpf et al., 2011). Due to the fact thatlater works (e.g., Hartland et al., 2012; Birkel et al., 2017)highlight organic complexation as the dominant transportpathway of Y and other hardly soluble trace elements inDOC-rich waters, a reconsideration of the MA1 stalagmite’sY record was necessary, including an investigation on localsoil formation as well as rock weathering.
In southernmost Patagonia, the Magellanic moorlandscover an extended area at the windward side of the Andes(Kilian et al., 2006; Whittle and Gallego-Sala, 2016), but pe-dogenetic processes of the dominantly occurring soil typesin this region (Podsols and Histosols) are still poorly stud-ied (Casanova et al., 2013). Such peatlands are one of theworld’s most important terrestrial carbon sinks, but they alsorelease large amounts of dissolved organic carbon (DOC)
into nearby aquatic systems (Birkel et al., 2017). Besidesparticulate organic carbon (POC), this flux may contributeto an organic carbon burial in fjord sediments from southern-most Patagonia that is up to hundred times higher than theglobal ocean average (Smith et al., 2015). DOC releases frompeatland ecosystems are mainly controlled by rainfall inten-sity, water table fluctuations, temperature, soil pH and peataccumulation–degradation cycles (e.g., Broder et al., 2015;Birkel et al., 2017). Here, the transport of typically moreinsoluble trace elements, such as lead (Pb) and yttrium, isstrongly linked to the solute export of carbon (Birkel et al.,2017). Due to the fact that complexation of Pb and Y in soilsolutions and surface and drip waters is more susceptible toorganic substances than to pedogenic (hydr)oxides, they rep-resent suitable proxies to determine paleo-fluxes of DOC inthe course of speleothem trace element analysis (e.g., Hart-land et al., 2012).
Sea spray has been considered as the most important nutri-ent source for ombrotrophic peatlands in westerly dominatedcoastal mountain belts, such as the superhumid southernmostAndes (Kilian et al., 2013; Whittle and Gallego-Sala, 2016),
Published by Copernicus Publications on behalf of the Deutsche Quartärvereinigung (DEUQUA) e.V.

2 B. Klaes et al.: Mobilization of DOC-bound Pb and Y in the Magellanic moorlands (53◦ S)
in particular during periods with an increasing strength of thesouthern westerly wind belt (SWW; Lamy et al., 2010). It hasa significant control on peat accumulation and decompositionrates as well as on the hydrochemistry of surface waters andchemical leaching of soils and bedrock (e.g., Kilian et al.,2013; Broder et al., 2015): sea-salt aerosols introduce variousbasic ions, micro-nutrients and sulfate into terrestrial ecosys-tems. Moreover, they are suggested to be the major contribu-tor to the natural deposition of selenium (Se) at coastal sites(Wen and Carignan, 2009). For that reason, Se concentra-tions in a stalagmite from the southernmost Andes have beenpreviously used as a valuable paleoenvironmental proxy forsea spray deposition to the Magellanic moorlands (Kilian etal., 2013), especially since Se pollution by regional anthro-pogenic sources (e.g., industry, Wen and Carignan, 2009) islimited in such a remote study area. In soils characterized byhigh OC contents and acidic pore water, e.g., in peat soils,Se mobilization/immobilization is rather controlled by plantuptake and the adsorption onto organic substances than byadsorption onto Fe/Al (hydr)oxides (Li et al., 2017). Nev-ertheless, a certain amount of Se remains dissolved in soilsolutions of acid environments (Li et al., 2017).
Previous investigations in the study area highlighted thatregional climate variations (wind velocities, precipitation andtemperature) during distinct Holocene phases are closely re-lated to changes in SWW intensities (Lamy et al., 2010). Fur-thermore, large centennial to millennium-scale modificationsof aquatic as well as terrestrial ecosystems of the superhumidsouthernmost Andes have been interpreted as a consequenceof (1) climate variations (e.g., the global cooling-phenomenaduring the Little Ice Age, LIA; Schimpf et al., 2011; Kilianet al., 2013) and (2) local tephra fallout, in particular afterthe Plinian 4.15 kyr cal BP Mt. Burney eruption (Kilian et al.,2006).
Here we present first insights into Middle to LateHolocene peat formation–degradation cycles in the Magel-lanic moorlands as revealed by a revaluation of trace ele-ment concentrations detected in the MA1 stalagmite, basedon newly gathered Pb, Y and Se data from the MA cave’shost rocks as well as distinguished soil horizons and weath-ered parent rocks from its peat-vegetated catchment.
2 Setting
The MA cave from where the stalagmite MA1 has been re-covered is located in the core zone of the SWW in the west-ern Strait of Magellan (52◦41.7′ S, 73◦23.3′W; Schimpf etal., 2011; Fig. 1a). It was formed by fjord coastal erosionin a fracture zone at 20 m a.s.l. during a period with moreelevated coastlines. Next to the site, the automatic weatherstation Arévalo (Fig. 1b) recorded during the last decade anannual precipitation of up to 4500 mm a−1 and mean tem-peratures at 5.3 ◦C (Schimpf et al., 2011, and unpublisheddata). The small catchment (ca. 25 m× 25 m at 80 m a.s.l.) is
situated on top of a relatively flat ridge (Fig. 1b), which ischaracterized by peat vegetation and bare rock surfaces. It isconnected by drainage pathways along the fracture zone withthe interior of the cave.
The cave’s walls and rock lithology of the catchmentare composed of granitoid rocks and mylonitic orthogneisswhich are cross-cut by some mafic dykes. The soils of thepeat catchment (Histic Podsols, termed according to FAO,2015) reach a solum thickness of 50 cm on average and havea sandy loam texture. Its pore water is characterized by a dis-tinct acidity (pH between 3.9 and 5.7). Within the four soilprofiles, a spodic horizon underlies the histic epipedon (om-brotrophic peat). An up to 10 cm thick tephra layer of theMt. Burney volcano (4.15 kyr cal BP; Kilian et al., 2013) isembedded in the stagnic subsoils. The sampling position ofthe MA1 stalagmite inside the cave and other details of thesite are described in detail by Schimpf et al. (2011).
3 Methods
A representative sampling from soil horizons and rocklithologies in and around the cave and its catchment was con-ducted during the austral winter expedition with RV GranCampo II in 2015. Samples include the distinguished hori-zons of four peat soil profiles from the catchment, weath-ered rock fragments obtained from the lowermost peat soilhorizons, and unweathered rocks derived from the cave’swalls. Representative samples were prepared, e.g., by crush-ing and milling, at the Geology Department of the Universityof Trier. Trace element analysis (Pb, Y and Se) of pulverizedbulk samples was realized with ICP-MS (Perkin Elmer DRCII Q-ICP-MS) at the Geochemistry Division of the Universityof Göttingen after using a ultra-pure HF/HClO4-HF/HNO3mixture in a pressurized Teflon apparatus (Picotrace®) foracid digestion. The international standard JA-2 was appliedto calibrate these ICP-MS measurements. The pH values ofsoil horizons were detected in CaCl2 solution using a dig-ital pH meter at the University of Trier (Soil Science De-partment). Detailed information concerning previously ob-tained ICP-MS/OES measurements of drilled samples alongthe growth axis of the MA1 stalagmite as well as U/Th dat-ing and the age–depth model has been presented in Schimpfet al. (2011). Already published trace element concentrationsof the MA1 speleothem used here are Y, Se and U (Schimpfet al., 2011; Kilian et al., 2013).
4 Results and discussion
As shown in Fig. 2a and b the majority of upper soil hori-zons from the MA catchment, including the histic epipedons(H) and the spodic mineral horizons (B), show up to 2 timeshigher Se concentrations than underlying unaltered parentrocks (between 16 and 23 ppm). This indicates that leachingof selenium from such rock sources was limited during soil
E&G Quaternary Sci. J., 67, 1–6, 2018 www.eg-quaternary-sci-j.net/67/1/2018/

B. Klaes et al.: Mobilization of DOC-bound Pb and Y in the Magellanic moorlands (53◦ S) 3
Figure 1. (a) The southernmost Patagonian Andes with the study site in the northwest of the Gran Campo Nevado ice field (GCN), thelocation of the Mt. Burney volcano and isolines for annual precipitation (Lamy et al., 2010). (b) The MA cave system and the associatedcatchment in a small bay of a fjord arm connected to the Strait of Magellan with the drainage pathways (blue arrows) and the automaticweather station (AWS) Arévalo.
formation. The significant top-to-bottom difference of Se en-richment in soils and its decoupling from lithogenic Se bud-gets suggests that the deposition by sea-salt aerosols to theombrotrophic peat of the H horizon represent an importantSe source (Wen and Carignan, 2009; Broder et al., 2015), es-pecially during frequent storm events with strong westerlywinds (Lamy et al., 2010; Schimpf et al., 2011). However,the fixation of Se to organic materials and its uptake by peatvegetation seem to be an important process here, which alsocontrols the Se retention in comparable soil types (Li et al.,2017, Fig. 2a, b and d).
The high Se contents (20 ppm) detected in tephra are mostlikely to be explained by illuviation of Se complexed to soilorganic matter (Li et al., 2017) due to prevailing podsoliza-tion processes (Vermeire et al., 2016). The vesicular structureof pumice particles promotes the accumulation of plant resid-uals (e.g., Hughes et al., 2013), in particular as Se in bulksamples of tephra-containing subsoils is reduced (Fig. 2a, b).
In contrast to Se, the trace elements Pb and Y are mainlyof a lithogenic origin and leached from source rocks (gran-ites and granodiorite, mylonitic orthogneiss and mafic dykes;see Fig. 2a–c) as a consequence of strong mineral dissolu-tion under acid conditions, which is a common characteris-tic of podsolic soils (Vermeire et al., 2016). Due to distincthost minerals (e.g., allanites for Y and certain heavy min-erals for Pb; unpublished data), leaching intensities of bothmore lithogenic trace elements are not equal (Fig. 2a–c): inthe case of Y, strongly decreased concentrations in weath-ered rock samples may indicate such a pronounced feedbackto meteoric weathering (up to ∼ 15 ppm loss in gneisses,Fig. 2b). Furthermore, mafic dykes could represent a poten-tial source for Y release. With regard to Pb, greater leaching
tendencies can be assumed for gneisses, whereas weatheredand unweathered samples of granitoid rocks exhibit a diffuseloss–gain pattern. Mafic dykes seem to be of minor impor-tance for Pb leaching compared to that of Y (Fig. 2a, b).
However, despite a possible slightly different behaviorduring chemical weathering in source rocks, Pb and Y show avery high correlation (R2
= 0.89 for all investigated soil hori-zons and R2
= 0.65 for the narrow grouped field excludingthe subsoil horizon that shows elevated Y and Pb contents;Fig. 2c) with respect to their concentrations in soil horizonsand tephra, which separates pedogenic processes triggeredby a high OC availability from weathering of parent rocks.Both show a loss of up to ∼ 20 ppm compared to lithogenicsources. According to, for example, Hartland et al. (2012),Vermeire et al. (2016) and Birkel et al. (2017), the particularand uniform behavior of Pb and Y is controlled by a sim-ilar binding affinity to organic substances (preferred), e.g.,DOC, and the formation of mineral–organic complexes withFe/Al hydroxides (subordinate); see Fig. 2d. Consequently, itcan be argued that they share the same transport mechanismin DOC-rich drainage and drip waters during their transportfrom the MA catchment to the MA1 speleothem. This trans-port mechanism and eluviation is further accelerated by theextraordinarily high precipitation. Thus, Pb and Y can beused as proxies for tracing past DOC fluxes onto the MA1stalagmite which depend on the past climate, environmen-tal changes and its influences on the peat ecosystem in theMA catchment as described for comparable hydrological en-vironments (e.g., Hartland et al., 2012). The high Y contentof the MA1 stalagmite (1 to 16 ppm) is most likely stronglycontrolled by DOC flux and only to a minor extent by the
www.eg-quaternary-sci-j.net/67/1/2018/ E&G Quaternary Sci. J., 67, 1–6, 2018

4 B. Klaes et al.: Mobilization of DOC-bound Pb and Y in the Magellanic moorlands (53◦ S)
Figure 2. Selenium, yttrium and lead concentrations detected in representative samples of the three different lithological features as well asof the distinguished soil horizons and Mt. Burney tephra deposits from four peat soil profiles (Histic Podsols) of the MA catchment (a, b, c).For the interpretation of the shown correlation coefficients shown in panel (c), the reader is referred to the text. (d) The processual linkage ofsea spray deposition and related fixation of selenium in ombrotrophic peat is displayed schematically in combination with leaching/transportof lead and yttrium due to podsolization (according to Wen and Carignan, 2009; Broder et al., 2015; Vermeire et al., 2016; and Li et al.,2017).
incorporation of detrital minerals in the stalagmite’s laminaeas previously suggested by Schimpf et al. (2011).
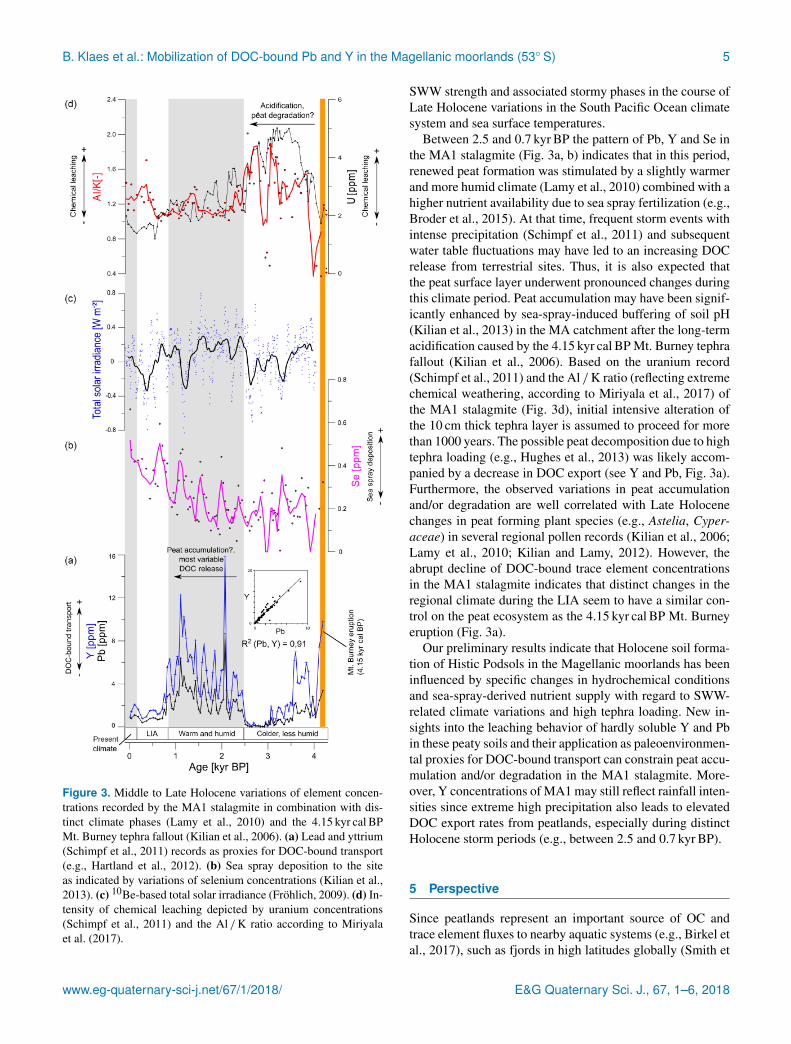
The MA1 stalagmite record presented in Fig. 3a shows thatthe concentrations of DOC-bound Pb and Y are highly corre-lated during the last four millennia since the 4.15 kyr cal BPMt. Burney eruption (R2
= 0.91; up to 16 ppm Y and up to9 ppm Pb were measured). In particular, during an assumedwarmer and more humid phase between 2.5 and 0.7 kyr BP(e.g., Lamy et al., 2010) with an estimated annual mean pre-cipitation of up to 6500 mm a−1 for the cave site (Schimpfet al., 2011), the trace elements Pb and Y show generally in-creasing concentrations in the MA1 stalagmite, but also pro-
nounced centennial-scale variations following a significantmillennium-scale decline since the Mt. Burney tephra fall-out (Kilian et al., 2006). At the beginning of the LIA (cool-ing of ∼ 1.5 ◦C and reduced precipitation, e.g., Kilian andLamy, 2012; Schimpf et al., 2011), the peak intensities ofPb and Y decrease abruptly and then persist with very lowconcentrations throughout this cold phase. Se shows peak in-tensities with periodicities of 500 years that coincide withphases of elevated global solar irradiance (Fig. 3b, c). Thisis consistent with findings of Lamy et al. (2010) and Kil-ian and Lamy (2012), who have argued that this wind-drivenvariability of sea spray input is closely linked to changes in
E&G Quaternary Sci. J., 67, 1–6, 2018 www.eg-quaternary-sci-j.net/67/1/2018/
B. Klaes et al.: Mobilization of DOC-bound Pb and Y in the Magellanic moorlands (53◦ S) 5
Figure 3. Middle to Late Holocene variations of element concen-trations recorded by the MA1 stalagmite in combination with dis-tinct climate phases (Lamy et al., 2010) and the 4.15 kyr cal BPMt. Burney tephra fallout (Kilian et al., 2006). (a) Lead and yttrium(Schimpf et al., 2011) records as proxies for DOC-bound transport(e.g., Hartland et al., 2012). (b) Sea spray deposition to the siteas indicated by variations of selenium concentrations (Kilian et al.,2013). (c) 10Be-based total solar irradiance (Fröhlich, 2009). (d) In-tensity of chemical leaching depicted by uranium concentrations(Schimpf et al., 2011) and the Al /K ratio according to Miriyalaet al. (2017).
SWW strength and associated stormy phases in the course ofLate Holocene variations in the South Pacific Ocean climatesystem and sea surface temperatures.
Between 2.5 and 0.7 kyr BP the pattern of Pb, Y and Se inthe MA1 stalagmite (Fig. 3a, b) indicates that in this period,renewed peat formation was stimulated by a slightly warmerand more humid climate (Lamy et al., 2010) combined with ahigher nutrient availability due to sea spray fertilization (e.g.,Broder et al., 2015). At that time, frequent storm events withintense precipitation (Schimpf et al., 2011) and subsequentwater table fluctuations may have led to an increasing DOCrelease from terrestrial sites. Thus, it is also expected thatthe peat surface layer underwent pronounced changes duringthis climate period. Peat accumulation may have been signif-icantly enhanced by sea-spray-induced buffering of soil pH(Kilian et al., 2013) in the MA catchment after the long-termacidification caused by the 4.15 kyr cal BP Mt. Burney tephrafallout (Kilian et al., 2006). Based on the uranium record(Schimpf et al., 2011) and the Al /K ratio (reflecting extremechemical weathering, according to Miriyala et al., 2017) ofthe MA1 stalagmite (Fig. 3d), initial intensive alteration ofthe 10 cm thick tephra layer is assumed to proceed for morethan 1000 years. The possible peat decomposition due to hightephra loading (e.g., Hughes et al., 2013) was likely accom-panied by a decrease in DOC export (see Y and Pb, Fig. 3a).Furthermore, the observed variations in peat accumulationand/or degradation are well correlated with Late Holocenechanges in peat forming plant species (e.g., Astelia, Cyper-aceae) in several regional pollen records (Kilian et al., 2006;Lamy et al., 2010; Kilian and Lamy, 2012). However, theabrupt decline of DOC-bound trace element concentrationsin the MA1 stalagmite indicates that distinct changes in theregional climate during the LIA seem to have a similar con-trol on the peat ecosystem as the 4.15 kyr cal BP Mt. Burneyeruption (Fig. 3a).
Our preliminary results indicate that Holocene soil forma-tion of Histic Podsols in the Magellanic moorlands has beeninfluenced by specific changes in hydrochemical conditionsand sea-spray-derived nutrient supply with regard to SWW-related climate variations and high tephra loading. New in-sights into the leaching behavior of hardly soluble Y and Pbin these peaty soils and their application as paleoenvironmen-tal proxies for DOC-bound transport can constrain peat accu-mulation and/or degradation in the MA1 stalagmite. More-over, Y concentrations of MA1 may still reflect rainfall inten-sities since extreme high precipitation also leads to elevatedDOC export rates from peatlands, especially during distinctHolocene storm periods (e.g., between 2.5 and 0.7 kyr BP).
5 Perspective
Since peatlands represent an important source of OC andtrace element fluxes to nearby aquatic systems (e.g., Birkel etal., 2017), such as fjords in high latitudes globally (Smith et
www.eg-quaternary-sci-j.net/67/1/2018/ E&G Quaternary Sci. J., 67, 1–6, 2018

6 B. Klaes et al.: Mobilization of DOC-bound Pb and Y in the Magellanic moorlands (53◦ S)
al., 2015), the sensitivity of these highly vulnerable ecosys-tems (e.g., Whittle and Gallego-Sala, 2016) to exogenic forc-ing factors (e.g., climate impacts and volcanic fallout) shouldbe investigated further in superhumid southernmost Patag-onia. This includes the quantification of past and presentorganic fluxes from peatlands to estuarine environments incombination with its linkage to the cyclic behavior of ele-ment transport to understand the implications of these pro-cesses for the terrestrial nutrient supply to marine biochemi-cal cycles in fjords (e.g., Ríos et al., 2016).
Data availability. The data presented here are archived in thePANGAEA database (https://pangaea.de).
Competing interests. The authors declare that they have no con-flict of interest.
Acknowledgements. Francisco Ríos (University of Trier) andTobias Sauter (University of Erlangen-Nuremberg) are acknowl-edged for their participation in field work during the 2015 aus-tral winter expedition with RV Gran Campo II. Oscar Baeza-Urrea(University of Trier), Petra Ziegler (University of Trier), Klaus Si-mon and Jakob Rauscher (both University of Göttingen) are thankedfor technical assistance and analytical support. Furthermore, theanonymous reviewers are thanked for their comments that helpedto improve the quality of the manuscript.
References
Birkel, C., Broder, T., and Biester, H.: Nonlinear and threshold-dominated runoff generation controls DOC export in a smallpeat catchment, J. Geophys. Res.-Biogeo., 122, 498–513,https://doi.org/10.1002/2016JG003621, 2017.
Broder, T., Blodau, C., Biester, H., and Knorr, K. H.: Sea spray,trace elements, and decomposition patterns as possible con-straints on the evolution of CH4 and CO2 concentrations andisotopic signatures in oceanic ombrotrophic bogs, Biogeochem-istry, 122, 327–342, https://doi.org/10.1007/s10533-014-0044-5,2015.
Casanova, M., Salazar, O., Seguel, O., and Luzio, W.: The Soils ofChile, Springer World Soils Book Series, Dordrecht, the Nether-lands, https://doi.org/10.1007/978-94-007-5949-7, 2013.
FAO: World reference base for soil resources 2014: Internationalclassification system for naming soils and creating legends forsoil maps, World Soil Resources Reports, 106, Rome, Italy, 2015.
Fröhlich, C.: Evidence of a long-term trend in total so-lar irradiance, Astron. Astrophys., 501, L28–L30,https://doi.org/10.1051/0004-6361/200912318, 2009.
Hartland, A., Fairchild, I. J., Lead, J. R., Borsato, A.,Baker, A., Frisia, S., and Baalousha, M.: From soil tocave: Transport of trace metals by natural organic mat-ter in karst dripwaters, Chem. Geol., 304–305, 68–82,https://doi.org/10.1016/j.chemgeo.2012.01.032, 2012.
Hughes, P. D. M., Mallon, G., Brown, A., Essex, H. J., Stan-ford, J. D., and Hotes, S.: The impact of high tephra loadingon late-Holocene carbon accumulation and vegetation succes-sion in peatland ecosystems, Quaternary Sci. Rev., 67, 160–175,https://doi.org/10.1016/j.quascirev.2013.01.015, 2013.
Kilian, R. and Lamy, F.: A review of Glacial andHolocene paleoclimate records from southernmost Patag-onia 1 (49-55◦ S), Quaternary Sci. Rev., 53, 1–23,https://doi.org/10.1016/j.quascirev.2012.07.017, 2012.
Kilian, R., Biester, H., Behrmann, J., Baeza, O., Fesq-Martin, M., Hohner, M., Schimpf, D., Friedmann, A., andMangini, A.: Millennial-scale volcanic impact on a su-perhumid and pristine ecosystem, Geology, 34, 609–612,https://doi.org/10.1130/G22605.1, 2006.
Kilian, R., Lamy, F., and Arz, H.: Late Quaternary variations of thesouthern westerly wind belt and its influences on glacier extend,denudation as well as terrestrial and aquatic ecosystems withinthe southernmost Andes, German Journal of Geosciences, 164,279–294, https://doi.org/10.1127/1860-1804/2013/0027, 2013.
Lamy, F., Kilian, R., Arz, H., Francois, J., Kaiser, J., Prange, M.,and Steinke, T.: Holocene changes in the position and intensityof the southern westerly wind belt, Nat. Geosci., 3, 695–699,https://doi.org/10.1038/NGEO959, 2010.
Li, Z., Liang, D., Peng, Q., Cui, Z., Huang, J., and Lin, Z.: Interac-tion between selenium and soil organic matter and its impact onsoil selenium bioavailability: A review, Geoderma, 295, 69–79,https://doi.org/10.1016/j.geoderma.2017.02.019, 2017.
Miriyala, P., Sukumaran, N. P., Nagender Nath, B., Ramamurty, P.B., Sijinkumar, A. V., Vijayagopal, B., Ramaswamy, V., and Se-bastian, T.: Increased chemical weathering during the deglacialto mid-Holocene summer monsoon intensification, Nature Scien-tific Reports, 7, 44310, https://doi.org/10.1038/srep44310, 2017.
Ríos, F., Kilian, R., and Mutschke, E.: Chlorophyll-α thinlayers in the Magellan fjord system: The role of thewater column stratification, Cont. Shelf Res., 124, 1–12,https://doi.org/10.1016/j.csr.2016.04.011, 2016.
Schimpf, D., Kilian, R., Kronz, A., Simon, K., Spötl, C., Wörner,G., Deininger, M., and Mangini, A.: The significance of chem-ical, isotopic, and detrital components in three coeval stalag-mites from the superhumid southernmost Andes (53◦ S) as high-resolution palaeo-climate proxies, Quaternary Sci. Rev., 30, 443–459, https://doi.org/10.1016/j.quascirev.2010.12.006, 2011.
Smith, R. W., Bianchi, T. S., Allison, M., Savage, C., and Galy,V.: High rates of organic carbon burial in fjord sediments glob-ally, Nat. Geosci., 8, 450–454, https://doi.org/10.1038/ngeo2421,2015.
Vermeire, M.-L., Cornu, S., Fekiacova, Z., Detienne, M., Delvaux,B., and Cornélis, J.-T.: Rare earth dynamics along pedogenesis ina chronosequence of podzolic soils, Chem. Geol., 446, 163–174,https://doi.org/10.1016/j.chemgeo.2016.06.008, 2016.
Wen, H. and Carignan, J.: Ocean to continent transfer of atmo-spheric Se as revealed by epiphytic lichens, Environ. Pollut., 157,2790–2797, https://doi.org/10.1016/j.envpol.2009.04.021, 2009.
Whittle, A. and Gallego-Sala, A. V.: Vulnerability of the peat-land carbon sink to sea level rise, Sci. Rep., 6, 28758,https://doi.org/10.1038/srep28758, 2016.
E&G Quaternary Sci. J., 67, 1–6, 2018 www.eg-quaternary-sci-j.net/67/1/2018/

E&G Quaternary Sci. J., 67, 7–16, 2018https://doi.org/10.5194/egqsj-67-7-2018© Author(s) 2018. This work is distributed underthe Creative Commons Attribution 4.0 License.
Research
article
Capability of U–Pb dating of zircons from Quaternary tephra:Jemez Mountains, NM, and La Sal Mountains, UT, USAJana Krautz1, Mandy Hofmann2, Andreas Gärtner2, Ulf Linnemann2, and Arno Kleber1
1Institute of Geography, Technische Universität Dresden, Helmholtzstr. 10, 01690 Dresden, Germany2Senckenberg Naturhistorische Sammlungen Dresden, Museum für Mineralogie und Geologie, Sektion Geochronologie,GeoPlasma Lab, Königsbrücker Landstraße 159, 01109 Dresden, Germany
Correspondence: Jana Krautz ([email protected])
Relevant dates: Published: 31 January 2018
How to cite: Krautz, J., Hofmann, M., Gärtner, A., Linnemann, U., and Kleber, A.: Capability of U–Pb datingof zircons from Quaternary tephra: Jemez Mountains, NM, and La Sal Mountains, UT, USA, E&GQuaternary Sci. J., 67, 7–16, https://doi.org/10.5194/egqsj-67-7-2018, 2018.
Abstract: Two Quaternary tephras derived from the Jemez Mountains, New Mexico – the Guaje andTsankawi tephras – are difficult to distinguish due to their similar glass-shard chemical composi-tion. Differences in bulk chemical composition are small as well. Here we examine the feasibilityto assign an age to a distal tephra layer in the La Sal Mountains, Utah, by U–Pb dating of zirconsand to correlate it with one of the two Jemez eruptions. We also dated original Jemez tephras forcomparison. Even though the tephras are very young, we obtained reasonable age determinations us-ing the youngest cluster of zircon grains overlapping in age at 2σ . Thereafter, the Guaje tephra is1.513± 0.021 Myr old. The La Sal Mountains tephra is correlated with the Tsankawi tephra. Threesamples yielded a common age range of 1.31–1.40 Myr. All ages are in slight disagreement with pub-lished age determinations obtained by 40Ar / 39Ar dating. These findings indicate that distal Jemeztephras can be distinguished by U–Pb dating. Furthermore, we encourage giving this method a try forage assignments even of Quaternary volcanic material.
Kurzfassung: Zwei quartäre Tephren aus den Jemez Mountains, New Mexico, – Guaje- und Tsankawi-Tephra –sind durch die ähnliche chemische Zusammensetzung ihrer Gläser nur schwer zu unterscheiden. Diesgilt auch, bis auf geringfügige Unterschiede, für die Totalanalyse. Wir haben die Möglichkeit unter-sucht, das Alter einer distalen Tephralage in den La Sal Mountains, Utah, zu bestimmen und einer derTephren aus den Jemez Mountains zuzuordnen. Zur Vergleichbarkeit haben wir auch die Zirkone derTephren aus den Jemez Mountains U–Pb datiert. Obwohl die Tephren alle sehr jung sind, haben wirreliable Alter durch das Cluster der jüngsten, im 2σ Fehler überlappenden Zirkone erhalten. Demzu-folge ist die Guaje-Tephra 1.513± 0.021 Myr alt. Die Tephra aus den La Sal Mountains wurde mitder Tsankawi-Tephra korreliert: Drei Proben aus den Jemez Mountains (1×) und den La Sal Moun-tains (2×) ergaben eine Altersspanne von 1.31–1.40 Myr. Alle Alter weichen etwas von bereits pub-lizierten 40Ar / 39Ar ab. Die Ergebnisse deuten darauf hin, dass die distalen Jemez-Tephren durchU–Pb Datierung unterschieden werden können. Wir wollen dazu ermutigen, diese Methode der Al-tersbestimmung auch für quartäres vulkanisches Material in Erwägung zu ziehen.
Published by Copernicus Publications on behalf of the Deutsche Quartärvereinigung (DEUQUA) e.V.

8 J. Krautz et al.: Capability of U–Pb dating of zircons from Quaternary tephra
1 Introduction
Tephra is eruptive rock material deposited as airborne falloutoften quite distant from its source volcano. Because of itschemical composition – usually obtained from glass shards– it often may be related to a particular volcanic eruption(Westgate et al., 1994). Therefore, tephrochronology has be-come an established method, using tephra intercalated be-tween other deposits as a stratigraphic marker bed, providedthe original eruption is well dated (Lowe, 2011).
There are a lot of reliable methods for dating Quaternarytephra (Dickinson and Gehrels, 2009). Most commonly the40Ar / 39Ar method is applied using K-rich minerals (Lowe,2011). This utilizes the fact that embedded argon completelyleaves the mineral lattice by disturbances such as a volcaniceruption. After this the enrichment by radioactive decay ofK re-starts, and thenceforward the accrued isotopes may bemeasured. So ages can be calculated via the half-life of theisotopes (Worsley, 1998).
A distal tephra layer discovered in the La Sal Moun-tains, Utah, was linked to the volcanic province of the JemezMountains, New Mexico, based on glass-shard chemistry.However, correlation with a particular eruption remained am-biguous (Kleber, 2013), because two tephras derived fromthere have closely similar chemical compositions (Slate etal., 2007) – one of the major threads of tephrochronology(Lowe, 2011). Zimmerer et al. (2016) state that both tephrasare difficult to date by Ar–Ar dating, asking for elaboratesample preparation and calculation of the results. Thoughstill not done very often on such young zircons (Lee, 2012),there have been a few successful applications of U–Pb dat-ing of zircons to young material in recent years (e.g., Ito etal., 2016; Sakata et al., 2017). Zircons have the advantage ofbeing outstandingly chemically and physically robust. Theyare unsusceptible to alteration and weathering even under ex-treme conditions (Wilson et al., 2008). Thus, we tried datingthe tephra layer using zircon dating.
Here we demonstrate reasonable age determinations of zir-cons from the La Sal Mountains tephra layer and of the twosuspect tephras in the Jemez Mountains. Through this, the Je-mez tephra layers may be discriminated with high certainty.Furthermore, we encourage giving the U–Pb method – whichis available in a variety of labs worldwide – a try for datingvolcanic material of undisclosed age even if the assumed ageis as young as 1 Myr, after having tested the total uraniumcontents.
2 Geological setting
2.1 Jemez Mountains, New Mexico
The Jemez Mountains (Fig. 1) are calderas of various vol-canic eruptions, among which the Valles, Antonio, andToledo calderas are still recognizable as concentric moun-
tain ranges. Their eruptive products, mainly basalt–andesite–dacite–rhyolite associations, range from about 15 Myr (mid-Miocene) to < 2 Myr (Pleistocene) (Kues et al., 2007). TheNeogene and Quaternary formations are divided into threegroups, named after Indian nations, from oldest to youngest:the Keres, the Polvadera, and the Tewa group (Bailey et al.,1969). We took our samples from the Tewa group. This com-prises the Bandelier Tuff, which is mainly the result of twolarge ignimbrite- and caldera-forming eruptions. The lowerOtowi (including the Guaje tephra) and the upper Tshirege(including the Tsankawi tephra) sequences were depositedapproximately 1.6 and 1.2 Ma, respectively (Self et al., 1996;Slate et al., 2007). Today large parts of these ignimbrite andtephra sequences belong to the Bandelier National Monu-ment.
The Jemez Mountains are known to be the source areaof the La Sal Mountains tephra layer. We took samples ap-proximately 8 km southeast of Los Alamos, New Mexico,from a slope along New Mexico State Road 502 (Guaje andTsankawi tephras, located at 35◦52′05′′ N, 106◦11′59′′Wand at 35◦52′05′′ N, 106◦12′00′′W, respectively). The site isdepicted in Goff (2009) and in Fig. 2a.
2.2 La Sal Mountains, Utah
The chain of the La Sal Mountains lies at the eastern bor-der of Utah (Fig. 1). Like the Jemez Mountains, it is partof the Colorado Plateau Province and together with MountPeale (3877 m a.s.l.) is the highest peak of the plateau (Hen-ning, 1975; Grahame and Sisk, 2002). The La Sal Moun-tains are remnants of laccoliths and mainly consist of gran-itoid rocks (Henning, 1975; Ross, 2006). The Precambrianbasement is unconformably overlain by Paleozoic and Meso-zoic sedimentary rocks, which were intruded by monzoniteand diorite porphyry during the Paleogene (K–Ar ages are25–28 Myr; Ross, 2006). The laccolithic structures preserveMesozoic rocks at the mountain flanks, mainly clays andsandstones (Richmond, 1962; Henning, 1975). Within theadjacent Paradox Basin, the Mesozoic rock sequence isunderlain by marine sediments, which include limestone,dolomite, slate, and a several-hundreds-of-meters-thick di-apiric layer of salt and gypsum (Henning, 1975).
A distal tephra layer was found in the northwest-ern La Sal Mountains, Utah, USA (located 38◦34′33′′ N,109◦17′32′′W), approximately 20 km linear distance fromMoab, Utah, at 2130 m a.s.l., on a 22◦ steep slope, exposedby a road cut of the Manti-La Sal Circuit (Kleber, 2013 andFig. 2b). The tephra was identified by the US Geological Sur-vey, Tephrochronology Laboratory, Menlo Park, CA, via thechemical composition of its glass shards. It was correlatedwith either the approximately 1.25 Myr old (Phillips et al.,2007) Tsankawi tephra or – because of the Fe contents some-what more likely – the approximately 1.65 Myr old (Spell
E&G Quaternary Sci. J., 67, 7–16, 2018 www.eg-quaternary-sci-j.net/67/7/2018/

J. Krautz et al.: Capability of U–Pb dating of zircons from Quaternary tephra 9
Figure 1. Areas under study. Source of maps: Google Maps 2016 (http://maps.google.com).
and Harrison, 1993) Guaje tephra, both derived from the Je-mez Mountains, New Mexico (Kleber, 2013).
3 Methods
We took two samples from the deposition area in the LaSal Mountains, UT, USA, and one from each original tephralayer, derived from the Toledo Caldera (Guaje tephra) andfrom the Valles Caldera (Tsankawi tephra). The latter two– taken from well-known tephra locations – were mainlymeasured to disclose whether the results of the U–Pb de-terminations are consistent with the aforementioned earlier40Ar / 39Ar datings and may, thus, yield reliable ages of dis-tal tephra layers.
We performed sample preparation for cathodolumines-cence (CL) images, LA-ICP-MS (laser ablation with induc-tively coupled plasma mass spectrometry) U–Pb analyses,and age calculations at the Geochronology Department ofSenckenberg Naturhistorische Sammlungen Dresden, Ger-many. Circa 1 kg of material was collected for each sample.After crushing in a jaw crusher, the samples were sieved forthe fraction 36 to 400 µm. Density separation of this fractionwas accomplished with LST (solution of lithium heteropoly-tungstates in water). We used a Frantz isodynamic separa-tor for the magnetic separation of the extracted heavy miner-als. Single zircon grains of all grain sizes, colors, and mor-
phological types were randomly picked under a binocularmicroscope and subsequently analyzed regarding their mor-phology based on backscatter electron (BSE) images of theunmounted zircon grain surfaces using a Zeiss EVO50SEMat 20 kV and a spot size of 300 nm. Then the grains weremounted in resin blocks and polished to approximately halftheir thickness, in order to expose their internal structure. Weobtained CL images using a Zeiss EVO50SEM coupled to aCL detector system at 20 kV and a spot size of 500 nm. Zir-cons were analyzed for U, Th, and Pb isotopes by LA-ICP-MS, utilizing a Thermo Scientific ELEMENT 2 XR sectorfield ICP-MS coupled to a New Wave UP-193 excimer lasersystem with laser spot sizes of 20 to 35 µm. Fifteen secondsof background acquisition was followed by 25 s of data ac-quisition during each analysis. The signal was tuned for amaximum sensitivity for Pb and U, whereas oxide produc-tion (235UO vs. 238U) was kept well below 1 %. Raw datawere corrected for background signal, common Pb, laser-induced elemental fractionation, instrumental mass discrim-ination, and time- and depth-dependent elemental fraction-ation of Pb / Th and Pb / U using an Excel® macro devel-oped by Axel Gerdes (Geosciences Inst., Goethe Univer-sity Frankfurt, Germany). Reported uncertainties were prop-agated by quadratic addition of the external reproducibil-ity obtained from the standard zircon GJ-1 (∼ 0.6 and 0.5–1 % for 207Pb / 206Pb and 206Pb / 238U, respectively) dur-
www.eg-quaternary-sci-j.net/67/7/2018/ E&G Quaternary Sci. J., 67, 7–16, 2018

10 J. Krautz et al.: Capability of U–Pb dating of zircons from Quaternary tephra
Figure 2. (a) Sampling sites of tephras in the Jemez Mountains.All visible rocks are volcanic in origin. Photo: Jana Krautz (22 Au-gust 2014). (b) Sampling site in the La Sal Mountains. The whitishtephra intercalates between periglacial cover beds and is to the leftof the picture cut by a gully fill. Photo: Arno Kleber (27 July 2009).The sampling spot visible in the La Sal Mountains tephra was forradiofluorescence dating, not for the present dating.
ing individual analytical sessions and the within-run preci-sion of each analysis. Concordia diagrams (2σ error ellipses)and concordia ages (95 % confidence level) were created us-ing Isoplot/Ex 2.49 (Ludwig, 2001). 207Pb / 206Pb ages wereused for concordant analyses of zircons above 1.0 Ga, and206Pb / 238U ages for younger ones. For ages younger than10 Myr, we corrected for 230Th disequilibrium using the for-mula of Simon et al. (2008).
Geochemical analyses of bulk samples were performed atActivation Laboratories Ltd. (Ancaster, Ontario, Canada) us-ing their standard protocols RX4 for sample preparation and4LITHO-Quant Major Elements Fusion ICP (WRA)/TraceElements Fusion ICP-MS (WRA4B2) for the analyses as de-scribed on their website (ActLabs, 2014). The samples fromthe La Sal Mountains were contaminated with pedogenic
Table1.E
lectronm
icroprobeanalyses
ofglassshards
fromtephra
layers.±
:standarddeviation.V
aluesare
weight-percentoxide,re-calculated
tobe
100%
fluid-free.Norm
alizeddata
(rawdata
areavailable
inSupplem
ent).
sourcephase
nSiO
2TiO
2A
l2 O3
Fe2 O3
MnO
MgO
CaO
Na2 O
K2 O
P2 O
5Total
2014-NM
-Gu
glassshards
3177.12
±0.84
0.05±
0.0212.29
±0.31
1.42±
0.070.09±
0.020.02±
0.040.26±
0.033.84±
0.284.90±
0.310.01±
0.01100.00
2014-LSM
-Tglass
shards22
77.44±
0.730.08±
0.0212.24
±0.10
1.50±
0.140.07±
0.020.03±
0.010.29±
0.034.03±
0.184.30±
0.250.01±
0.0199.99
2013-LSM
-Tglass
shards44
77.41±
0.740.09±
0.0312.21
±0.12
1.47±
0.160.07±
0.020.03±
0.010.28±
0.023.92±
0.244.51±
0.230.01±
0.01100.00
E&G Quaternary Sci. J., 67, 7–16, 2018 www.eg-quaternary-sci-j.net/67/7/2018/

J. Krautz et al.: Capability of U–Pb dating of zircons from Quaternary tephra 11
Figure 3. Ages of tephra layers as derived from the youngest cluster of grain ages overlapping at the 2σ level. (a) Guaje tephra, (b) Tsankawitephra, (c) La Sal Mountains tephra sampled in 2013, (d) same but sampled in 2014.
carbonates, whereas the samples from the Jemez Mountainswere not, or at least not to the same degree. Therefore, themajor elements (and the total percentages) were re-calculatedon a carbonate-free basis, i.e., without considering MgO,CaO, and loss on ignition (LOI), though the original val-ues of these three measurements are given so that one couldre-assemble all original quantities. In addition to the afore-mentioned samples, we analyzed a confirmed Guaje tephrasample provided by David B. Dethier (Slate et al., 2007).
Microprobe analyses were conducted aided by aCAMECA SX51 electron microprobe with five wavelength-dispersive spectrometers at the Earth Sciences Institute atHeidelberg University. The standard operating conditionswere 15 kV accelerating voltage, 20 nA beam current, and abeam diameter of ca. 20 µm. Counting times during analyseswere 10 s for Na and K; 20 s for Fe; 30 s for Mn and P;and 50 s for Si, Ti, Al, Mg, and Ca. Detection limits were0.02 wt % for Si, Al, and Ca, 0.001 wt % for Ti and Mn,0.08 wt % for Fe, and 0.09 wt % for K and Na. Calibrationwas performed using natural and synthetic oxide andsilicate standards. Values given are weight-percent oxide,re-calculated to be 100 % fluid-free.
4 Results and discussion
The microprobe analyses of glass shards corroborate thegreat similarity of the Guaje and the La Sal Mountainstephras (Table 1; cf. Supplement for raw data). Even thedifferences in Fe contents, typically acknowledged as theonly clue to distinguish Guaje from Tsankawi tephras (An-drei M. Sarna-Wojcicki, personal communication, 1990), arewithin the standard deviations of the analyses.
Table 2 shows that the major and especially the trace ele-ment concentrations from bulk samples of the La Sal Moun-tains tephra are very close to the Tsankawi tephra fromthe Jemez Mountains but somewhat dissimilar to the Guajetephra sample as well as to the Guaje sample DN-97-117 sub-mitted by David B. Dethier. This holds especially true forthe elements shaded in yellow in Table 2, with the most re-markable being Cr, Rb, Nb, and Th. The differences in theSr and Ba contents between the La Sal Mountains and JemezMountains samples may be explained by eolian contamina-tion, as both elements are frequent components of eolian de-posits (Jones, 1986). Similar differences in Tl contents maybe due to different durations of sample materials being ex-
www.eg-quaternary-sci-j.net/67/7/2018/ E&G Quaternary Sci. J., 67, 7–16, 2018

12 J. Krautz et al.: Capability of U–Pb dating of zircons from Quaternary tephra
Table2.
Major
andtrace
element
concentrationsof
tephrasam
ples.The
tabledisplays
analysesfrom
bulksam
ples.Major
element
percentagesare
calculatedcarbonate-free,i.e.,
withoutconsidering
thecolum
nsin
italicfont.Trace
elements
which
showrem
arkabledifferences
between
Guaje
andT
sankawitephras
areidentified
inbold
font.Source:Actlab
reportnum
berA14-07544;reportdate:24
October2014.
Analyte
symbol
SiO2
Al2 O
3Fe2 O
3M
nOM
gOC
aON
a2 OK
2 OTiO
2P
2 O5
LO
ITotal
ScB
eV
Cr
Co
Ni
Cu
Unitsym
bol%
%%
%%
%%
%%
%%
%ppm
ppmppm
ppmppm
ppmppm
Detection
limit
0.010.01
0.010.001
0.010.01
0.010.01
0.0010.01
––
11
520
120
10A
nalysism
ethodIC
PIC
PIC
PIC
PIC
PIC
PIC
PIC
PIC
PIC
PIC
P–
ICP
ICP
ICP
MS
MS
MS
MS
2013L
SM-T
75.5312.92
2.790.07
0.221.06
3.434.42
0.130.03
6.9599.33
25
830
1<
20<
102014
LSM
-T74.67
13.812.56
0.080.29
2.483.46
4.220.14
0.048.07
98.992
712
301
<20
<10
2014N
M-G
U76.56
12.652.47
0.090.39
0.483.14
4.840.06
<0.01
6.8499.82
113
7160
1<
2020
DN
-97-11774.52
13.783.09
0.100.19
0.472.70
5.390.11
0.025.9
99.702
1113
2302
<20
202014
NM
-TS
76.1211.77
2.540.07
0.080.39
4.004.26
0.09<
0.010.78
98.871
56
301
<20
<10
Analyte
symbol
Zn
Ga
Ge
As
Rb
SrY
Zr
Nb
Mo
Ag
InSn
SbC
sB
aB
iL
aC
eU
nitsymbol
ppmppm
ppmppm
ppmppm
ppmppm
ppmppm
ppmppm
ppmppm
ppmppm
ppmppm
ppm
Detection
limit
301
15
22
24
12
0.50.2
10.5
0.53
0.40.1
0.1A
nalysism
ethodM
SM
SM
SM
SM
SIC
PIC
PIC
PM
SM
SM
SM
SM
SM
SM
SIC
PM
SM
SM
S2013
LSM
-T80
232
<5
14990
55244
596
0.9<
0.25
0.63.9
216<
0.467.8
1332014
LSM
-T100
252
<5
164151
76272
806
1.1<
0.26
0.64.8
411<
0.471.6
1352014
NM
-GU
13029
2<
5335
1793
245150
80.8
<0.2
110.7
8.939
<0.4
40.693.3
DN
-97-117120
312
<5
30529
92243
1448
0.8<
0.210
0.710.2
125<
0.443.1
1052014
NM
-TS
9023
2<
5160
2359
20057
20.7
<0.2
3<
0.52.9
78<
0.458.6
116
Analyte
symbol
PrN
dSm
Eu
Gd
Tb
Dy
Ho
Er
Tm
Yb
Lu
Hf
TaW
Tl
PbT
hU
Unitsym
bolppm
ppmppm
ppmppm
ppmppm
ppmppm
ppmppm
ppmppm
ppmppm
ppmppm
ppmppm
Detection
limit
0.050.1
0.10.05
0.10.1
0.10.1
0.10.05
0.10.04
0.20.1
10.1
50.1
0.1A
nalysism
ethodM
SM
SM
SM
SM
SM
SM
SM
SM
SM
SM
SM
SM
SM
SM
SM
SM
SM
SM
S2013
LSM
-T14
48.89.9
0.248.3
1.59
1.85.4
0.875.2
0.727.3
4.74
0.628
19.95.6
2014L
SM-T
15.256
120.55
10.51.9
122.4
7.11.2
7.51.12
9.36.5
40.7
3724.9
6.82014
NM
-GU
10.839.9
11.4<
0.0510.9
2.113.7
2.98.5
1.459.3
1.310.9
146
0.942
43.416
DN
-97-11711.2
4211.4
0.1510.9
213.6
2.88.2
1.349.1
1.2310.8
13.45
144
43.413.9
2014N
M-T
S12.6
44.19.8
0.138.6
1.59.7
1.95.6
0.925.7
0.86.7
4.93
0.219
19.66.1
E&G Quaternary Sci. J., 67, 7–16, 2018 www.eg-quaternary-sci-j.net/67/7/2018/

J. Krautz et al.: Capability of U–Pb dating of zircons from Quaternary tephra 13
Figure 4. Weighted average ages of tephra layers to compare with the age displays. (a) Guaje tephra, (b) Tsankawi tephra, (c) La SalMountains tephra sampled in 2013, (d) same but sampled in 2014.
posed to oxidation. These findings render the La Sal Moun-tains tephra correlative to the Tsankawi rather than the Guajetephra.
In all samples, primary uranium contents in zircons weresufficiently high to allow reliable age determinations. Giventhe apparently young ages of the tephras, 207Pb could notbe accumulated in quantities remarkably above the detec-tion limit of the instrument due to the extremely long half-life of 235U and/or insufficiently high U contents to pro-duce enough Pb in such short intervals of time (compareyoung grains in the Supplement). Thus, we could use onlythe 206Pb / 238U for age estimations (cf. Gehrels, 2014).Therefore, 207Pb / 235U and 207Pb / 206Pb ratios for cross-validation are not available; the degree of concordance can-not be calculated for these young zircon grains, and thosedata are left blank (Supplement). Accordingly, the ages wereport are regarded as model ages.
To establish the age of each tephra sample, we used theyoungest cluster of zircon-derived U–Pb ages overlappingat 2σ . The mean age of the youngest cluster of grain agesthat overlap in age at 2σ is regarded as the most conserva-
tive measure of age (Dickinson and Gehrels, 2009). Theseclusters may be seen as groups of analyses resulting in agesclose together, thereby validating each other even without areliable Pb–Pb age. Grains with younger 238U / 206Pb agesthan the ones used for the calculation of the concordia ages(cf. Supplement) are not part of such a cluster in the concor-dia plot and, thus, cannot be cross-validated. Accordingly,they were not considered sufficiently reliable.
The grains used for age determination are accentuatedin tables in the Supplement. The clusters are sufficientlylarge for the ages to be constrained to small confidence in-tervals (2σ ); see also Figs. 3 and 4: we assigned an ageof 1.513± 0.021 Myr to the Guaje tephra from the JemezMountains, which is somewhat younger than the publishedAr–Ar-derived ages of 1.651± 0.011 Myr (Zimmerer et al.,2016) or 1.613± 0.011 Myr (Izett and Obradovich, 1994).The other three samples yielded ages incompatible with theGuaje tephra: the Tsankawi tephra from the Jemez Moun-tains was determined to be as old as 1.316± 0.012 Myr.The two samples from the La Sal Mountains yielded agesof 1.327± 0.017 Myr (sample from the year 2013) and
www.eg-quaternary-sci-j.net/67/7/2018/ E&G Quaternary Sci. J., 67, 7–16, 2018

14 J. Krautz et al.: Capability of U–Pb dating of zircons from Quaternary tephra
Figure 5. CL images of selected zircons which have been included in the age displays (including laser ablation mark). (a) La Sal Mountainstephra sampled in 2013: c13; (b) same but sampled in 2014: a22; (c) Tsankawi tephra: a38; (d) Guaje tephra: a36.
1.341± 0.059 Myr (2014 sample, which had the smallestnumber of zircon ages within the overlapping cluster). Theconfidence intervals of the latter three samples do all over-lap within errors. Therefore, we correlate these tephra-layersamples with the same, the Tsankawi eruption. The commonage range within 2σ of both samples is 1.31–1.40 Myr. Weassume this is the most likely age array. Zoning of zirconsindicates steady growth. If there is a core depicted in the CLimages, the measuring spot may not be located at a core’sedge (Fig. 5).
The ages derived via Ar–Ar dating are 1.264± 0.010 Myr(Phillips et al., 2007; recalculated by Zimmerer et al., 2016)and 1.223± 0.018 Myr (Izett and Obradovich, 1994); i.e.,they are slightly younger than ours. Though being very closeto each other, the U–Pb ages are slightly older. The com-mon notion is that Ar–Ar ages approximate the eruption agesand U–Pb ages indicate the (earlier) time of crystal closure(Simon et al., 2008). However, this does not work for theGuaje tephra. Zimmerer et al. (2016) observed similar dif-ferences between 40Ar / 39Ar and uranium-series (U /Th)ages for other tephras of the Jemez Mountains. They explain
their findings with a complicated crystallization history of themagma, leading to disequilibrium between the uranium iso-topes in the melt. Another explanation could be that the zir-con crystal lattices of the Guaje tephra were not completelyclosed during eruption, as our sample was taken close to anunderlying mafic lava bed which still could have been hotenough to achieve this effect. Or there still are problems withthe Ar–Ar dating of some Jemez tephras not yet understood.
Older zircons (cf. Supplement for raw data) are assumed tobe inherited from rocks melted during magma rise, with thosezircons being their most temperature-resistant components.
5 Conclusions
Our findings demonstrate that U–Pb dating of zircons fromQuaternary volcanic material may result in valuable age de-termination. U–Pb dating of zircons seems to allow – at leastcombined with bulk geochemical analyses – confident dis-tinction between the two tephras derived from the JemezMountains, which are too similar to be clearly kept apartby glass-shard chemistry alone. This approach avoids the
E&G Quaternary Sci. J., 67, 7–16, 2018 www.eg-quaternary-sci-j.net/67/7/2018/

J. Krautz et al.: Capability of U–Pb dating of zircons from Quaternary tephra 15
complications accompanying the Ar–Ar dating of Bandeliertephras (Phillips et al., 2007; Zimmerer et al., 2016).
We recommend considering U–Pb dating as a possible ap-proach to identifying rather young tephras or to distinguishsuch tephras, as in our study. However, before application,we recommend measuring total uranium contents in zirconminerals, which might indicate whether this dating methodwill be applicable.
In Quaternary research, dating of zircons as young as1 Myr may well become a tool for better defining age mod-els of sedimentary archives – such as loesses, cover beds, orpaleosols – with interbedded or admixed tephra layers.
Data availability. All underlying data can be found in the Supple-ment.
Supplement. The supplement related to this article is availableonline at: https://doi.org/10.5194/egqsj-67-7-2018-supplement.
Competing interests. The authors declare that they have no con-flict of interest.
Acknowledgements. We thank David B. Dethier, Williamstown,MA, USA, for sending samples from Jemez tephras and Hans-Peter Meyer, Heidelberg, Germany, for the electron-microprobeanalyses. We also thank Rita Krause (Senckenberg NaturhistorischeSammlungen Dresden) for her invaluable support of our lab work.We are grateful to the San Ildefonso Indian Nation for allowing ac-cess to the Tsankawi sampling site. We thank two anonymous re-viewers and Ludwig Zöller for their critical comments and helpfuladvice. Our work was supported by the German Research Founda-tion (DFG, KL 701/12-0).
References
Actlabs: Geochemistry/Assay Overview, available at:http://www.actlabs.com/Page.Aspx?Menu=64&App=210&Cat1=499&Tp=2&Lk=No, last access: 22 December2014.
Bailey, R. A., Smith, R. L., and Ross, C. S.: Stratigraphic nomen-clature of volcanic rocks in the Jemez Mountains, New Mexico,Geological Survey Bulletin, 1274-P, U.S. Government PrintingOffice, Washington, USA, 1969.
Dickinson, W. R. and Gehrels, G. E.: Use of U-Pb Ages of detri-tal zircons to infer maximum depositional ages of strata. A testagainst a Colorado Plateau Mesozoic database, Earth Planet. Sc.Lett., 288, 115–125, https://doi.org/10.1016/J.Epsl.2009.09.013,2009.
Gehrels, G. E.: Detrital zircon U-Pb geochronology appliedto tectonics, Annu. Rev. Earth Pl. Sc., 42, 127–149,https://doi.org/10.1146/Annurev-Earth-050212-124012, 2014.
Goff, F.: Valles Caldera. A geologic history, University of NewMexico Press, Albuquerque, USA, 2009.
Grahame, J. D. and Sisk, T. D.: La Sal Mountains, Utah,available at: https://web.archive.org/web/20060208054415/http://www.cpluhna.nau.edu/index.htm (last access: 10 December2014), 2002.
Henning, I.: Die La Sal Mountains, Utah. Ein Beitrag zurGeoökologie der Colorado-Plateau-Provinz und zur vergleichen-den Hochgebirgsgeographie, Akademie der Wissenschaften undder Literatur, Mainz, Germany, 88 pp., 1975.
Ito, H., Nanayama, F., and Nakazato, H.: Zircon U-Pb dating using LA-ICP-MS. Quaternary tephras inBoso Peninsula, Japan, Quat. Geochronol., 40, 12–22,https://doi.org/10.1016/j.quageo.2016.07.002, 2016.
Izett, G. A. and Obradovich, J. D.: 40Ar / 39Ar age constraintsfor the Jaramillo Normal subchron and the Matuyama-Brunhesgeomagnetic boundary, J. Geophys. Res., 99, 2925–2934,https://doi.org/10.1029/93JB03085, 1994.
Jones, R. L.: Barium in Illinois surface soils, Soil Sci. Soc. Am. J.,50, 1085–1087, 1986.
Kleber, A.: Heavy-mineral analysis as a tool in tephrochronology,with an example from the La Sal Mountains, Utah, USA, Geolo-gos, 19, 87–94, https://doi.org/10.2478/logos-2013-0006, 2013.
Kues, B. S., Kelley, S. A., and Lueth, V. W. (Eds.): Geology ofthe Jemez region II. New Mexico Geological Society 58th An-nual Field Conference, New Mexico Geological Society, 19–22 September 2007, Socorro, NM, USA, 499 pp., 2007.
Lee, M. S. (Ed.): Mass Spectrometry Handbook, John Wiley andSons, Inc, Hoboken, NJ, USA, 2012.
Lowe, D. J.: Tephrochronology and its applica-tion: a review, Quat. Geochronol., 6, 107–153,https://doi.org/10.1016/J.Quageo.2010.08.003, 2011.
Ludwig, R. K.: User manual for Isoplot. Ex Rev. 2.49, Berke-ley Geochronology Center Special Publication, 1a, 1–58,https://doi.org/10.1016/S1471-3918(01)80062-9, 2001.
Phillips, E. H., Goff, F., Kyle, P. R., Mcintosh, W. C.,Dunbar, N. W., and Gardner, J. N.: The 40Ar / 39Ar ageconstraints on the duration of resurgence at the VallesCaldera, New Mexico, J. Geophys. Res., 112, 2925–2934,https://doi.org/10.1029/2006JB004511, 2007.
Richmond, G. M.: Quaternary stratigraphy of the La Sal Mountains,Geological Survey, Professional Paper 450-D, United StatesGovernment Printing Office, Washington, USA, 1962.
Ross, M. L.: Preliminary geologic map of the Warner Lake Quad-rangle, Grand County, Utah, Utah Department of Natural Re-sources, Salt Lake City, USA, 18 pp., 2006.
Sakata, S., Hirakawa, S., Iwano, H., Danhara, T., Guillong, M., andHirata, T.: A new approach for constraining the magnitude ofinitial disequilibrium in Quaternary zircons by coupled uraniumand thorium decay series dating, Quat. Geochronol., 38, 1–12,https://doi.org/10.1016/j.quageo.2016.11.002, 2017.
Self, S., Heiken, G., Sykes, M. L., Wohletz, K., Fisher, R. V., andDethier, D. P. (Eds.): Field excursions to the Jemez Mountains,New Mexico, New Mexico Bureau of Mines and Mineral Re-sources, Socorro, NM, USA, 1996.
Simon, J. I., Renne, P. R., and Mundil, R.: Implications of pre-eruptive magmatic histories of zircons for U-Pb geochronol-ogy of silicic extrusions, Earth Planet. Sc. Lett., 266, 182–194,https://doi.org/10.1016/j.epsl.2007.11.014, 2008.
Slate, J. L., Sarna-Wojcicki, A. M., Wan, E., Dethier, D. P., Wahl, D.B., and Lavine, A.: A chronostratigraphic reference set of tephra
www.eg-quaternary-sci-j.net/67/7/2018/ E&G Quaternary Sci. J., 67, 7–16, 2018
16 J. Krautz et al.: Capability of U–Pb dating of zircons from Quaternary tephra
layers from the Jemez Mountains volcanic source, New Mex-ico, in: Geology of the Jemez region II. New Mexico GeologicalSociety 58th Annual Field Conference, New Mexico GeologicalSociety, edited by: Kues, B. S., Kelley, S. A., and Lueth, V. W.,19–22 September 2007, Socorro, NM, USA, 239–247, 2007.
Spell, T. L. and Harrison, T. M.: 40Ar / 39Ar geochronol-ogy of post-Valles Caldera rhyolites, Jemez volcanicfield, New Mexico, J. Geophys. Res., 98, 8031–8051,https://doi.org/10.1029/92JB01786, 1993.
Westgate, J. A., Perkins, W. T., Fuge, R., Pearce, N., and Wintle,A. G.: Trace-element analysis of volcanic glass shards by laserablation inductively coupled plasma mass spectrometry. Appli-cation to tephrochronological studies, Appl. Geochem., 9, 323–335, https://doi.org/10.1016/0883-2927(94)90042-6, 1994.
Wilson, C. J. N., Charlier, B. L. A., Fagan, C. J., Spinks, K. D.,Gravley, D. M., Simmons, S. F., and Browne, P. R. L.: U–Pbdating of zircon in hydrothermally altered rocks as a correla-tion tool: application to the Mangakino geothermal field, NewZealand, J. Volcanol. Geoth. Res., 176, 191–198, 2008.
Worsley, P.: Altersbestimmung, in: Geomorphologie. Ein Metho-denhandbuch für Studium und Praxis, edited by: Goudie, A.,Springer, Berlin, Germany, 447–558, 1998.
Zimmerer, M. J., Lafferty, J., and Coble, M. A.: The eruptiveand magmatic history of the youngest pulse of volcanism atthe Valles Caldera. Implications for successfully dating LateQuaternary eruptions, J. Volcanol. Geoth. Res., 310, 50–57,https://doi.org/10.1016/J.Jvolgeores.2015.11.021, 2016.
E&G Quaternary Sci. J., 67, 7–16, 2018 www.eg-quaternary-sci-j.net/67/7/2018/

E&G Quaternary Sci. J., 67, 17–23, 2018https://doi.org/10.5194/egqsj-67-17-2018© Author(s) 2018. This work is distributed underthe Creative Commons Attribution 4.0 License.
Express
report
Reconsidering the origin of the Sedrun fans(Graubünden, Switzerland)Catharina Dieleman1, Susan Ivy-Ochs2, Kristina Hippe2, Olivia Kronig2, Florian Kober3, and Marcus Christl21Institute of Geology, ETH Zurich, 8093 Zurich, Switzerland2Laboratory of Ion Beam Physics, ETH Zurich, 8092 Zurich, Switzerland3NAGRA, Hardstrasse 73, 5430 Wettingen, Switzerland
Correspondence: Susan Ivy-Ochs ([email protected])
Relevant dates: Published: 20 April 2018
How to cite: Dieleman, C., Ivy-Ochs, S., Hippe, K., Kronig, O., Kober, F., and Christl, M.: Reconsideringthe origin of the Sedrun fans (Graubünden, Switzerland), E&G Quaternary Sci. J., 67, 17–23,https://doi.org/10.5194/egqsj-67-17-2018, 2018.
1 Introduction
Four alluvial fans, Pulanera, L’Ondadusa, Drun and Bugnei,located near the town of Sedrun in the upper VorderrheinValley (Fig. 1), are striking in that they have a commonaggradation surface (∼ 1◦ slope oriented along the mainvalley axis) and distinct coterminous cut-off toes. Similarcoalesced fans with marked incised toes occur just down-stream at Disentis (Fig. 2a). These geomorphological char-acteristics suggest that the fans built up for a limited periodof time and then were abruptly incised by the VorderrheinRiver. Switching between aggradation, fan abandonment andchannel entrenchment can be a response to (1) variation indischarge due to climate changes or extreme precipitationevents, (2) decreases in sediment supply reflecting waning(e.g. paraglacial) sediment availability, (3) tectonic uplift, or(4) changes in base level (Harvey et al., 2005; Hornung etal., 2010, and references therein). Inside a mountain range,change in local base level can be caused by large-scale down-stream blockage by a glacier, a landslide or a man-made dam(Korup and Tweed, 2007).
Previous work in the study area was focused on thebedrock (Huber, 1948), especially for characterization of theNEAT Gotthard basis tunnel site below Sedrun (Schneider,1992, and references therein). In the northern tributary val-leys (Val Giuv, Val Mila, Val Strem; Fig. 2a) Aar granite
dominates, while strongly sheared metamorphic rocks of theTavetscher Zwischenmassif underlie the Vorderrhein Valleyitself. Along the trough shoulder, especially at Cuolm daVi (Fig. 2a), active deep-seated slope degradation is presentas evidenced by abundant trenches and uphill facing scarps(Amann et al., 2006).
The aim of this study is to determine what caused thisabrupt and apparently brief period of fan aggradation in theupper Vorderrhein. Previous researchers have interpreted theSedrun and Disentis fans as kame terraces (Scapozza, 2012)or as Lateglacial outwash fans (Hantke, 1983). For the latterto be true the valley fill at Sedrun would have to be dom-inated by tributary valley sediment rather than Vorderrheinfluvial sediments. Both of these hypotheses require that thefans formed between about 17 and 11.7 kyr ago.
2 Methods
To decipher the evolution of the upper Vorderrhein regionand the origin of the Sedrun fans, we did detailed geomor-phologic mapping supported by ArcGIS landscape analy-sis, as well as cosmogenic 10Be exposure dating of boul-ders on moraines at the mouths of the three tributary val-leys. No boulders suitable for exposure dating were foundon any of the fan surfaces. Debris-flow sediments of the fansbury several of these moraines; thus the moraine dates pro-
Published by Copernicus Publications on behalf of the Deutsche Quartärvereinigung (DEUQUA) e.V.

18 C. Dieleman et al.: Reconsidering the origin of the Sedrun fans
Figure 1. Panorama photograph (looking E) showing the coalesced-fan surface and the distinct cut-off toes of the fans in the upper Vorder-rhein area near Sedrun. Fans and associated catchments are labelled P, Pulanera; O, L’Ondadusa; D, Drun; and B, Bugnei.
Figure 2. (a) Slope map based on 2 ± 0.5 m resolution DEM (swissAlti3D, swisstopo JA100120) of the oversize fans near Sedrun andDisentis. Catchments (encircled with dashed line) connected to the Sedrun fans are labelled P, Pulanera; O, L’Ondadusa; D, Drun; and B,Bugnei. The 14 March 2016 debris avalanche release and deposit area are shown. Squares indicate locations of Fig. 2b and c. (b) Close-upof the moraines in Val Giuv with 10Be-dated boulder locations (dates shown in Fig. 4). (c) Close-up of the aspect map of the upper Drunfan. Note morphology of debris-flow levees on upper fan surface; arrow points to left-lateral moraines of the Val Strem paleoglacier that arepartly buried by the upper Drun fan sediment.
vide maximum ages for aggradation of the fans. Sampling,sample preparation and age calculations for 10Be exposuredating followed established procedures (Ivy-Ochs and Kober,2008). Based on the mapped lateral and frontal moraines,paleoglaciers were reconstructed and the associated equilib-rium line altitudes (ELAs) were calculated using the ArcGISGlaRe tool (Pellitero et al., 2015, 2016). Knowledge of theELA depression with respect to the Little Ice Age ELA is an-
other means of estimating the timing of the glacier advanceand associated moraine construction. We reconstructed thesedimentary fill of the upper Vorderrhein Valley based onour own outcrop descriptions combined with the informa-tion gleaned from the published NEAT core logs (Schneider,1992).
E&G Quaternary Sci. J., 67, 17–23, 2018 www.eg-quaternary-sci-j.net/67/17/2018/

C. Dieleman et al.: Reconsidering the origin of the Sedrun fans 19
Figure 3. (a) Sediment of the upper Drun fan exposed in the Drun stream incision just south of Valtgeva (location shown in Fig. 2a). Theoutcrop is dominated by debris-flow deposits made up of crudely bedded, angular to subangular gneiss and schist cobbles and boulders (inpart imbricated) in a silty, sandy matrix. Close to the top of the section, ∼ 0.75 m of interbedded laminated sands is visible, which is in turnoverlain by another block layer. (b) View up into Val Giuv along the dated inner left-lateral moraine. Boulder Giuv1 is in the right foreground(age 10 880 ± 430 years).
3 Geomorphology of the upper Vorderrhein Valley
3.1 Fan morphology and valley fill
The four fans studied here have a common, coalesced aggra-dation surface (∼ 1380 m a.s.l.) that once must have extendedall the way across the valley to the southern slope. Althoughthe Pulanera fan is located at the mouth of Val Mila, thefan emanates from the small erosional-collapse catchmentnamed Val Pulanera (Fig. 2a). At the toe of the Pulanera fan,incision by the Vorderrhein created a sequence of nine ter-races. Riser height of the oldest terrace is 20 m. The mostrecent terrace is 1 m above today’s active channel. Just tothe west at Val Giuv numerous lateral and frontal morainesmark past glacier positions (Fig. 2b), but there is very lit-tle outwash downstream of the moraines and no fan, andthe Giuv stream enters a bedrock canyon before joining theVorderrhein. The lower part of the canyon is filled withand draped by sediment of the neighbouring Pulanera fan.The L’Ondadusa fan is built up of material from the smallcatchment L’Ondadusa, which lies between Val Mila and ValStrem. Both the Pulanera and L’Ondadusa fans are largelyinactive with little material being delivered to the fan today.Only tiny streams, which lack incised channels, traverse thetwo fans. The erosion escarpment along the Vorderrhein isabout 50 m at L’Ondadusa and 70 m at the toe of the Drunfan. The Strem torrent, which separates the L’Ondadusa andDrun fans (Fig. 2a), has incised about 30 m into the topo-graphically contiguous fan surface.
The Drun fan, which lies at the mouth of Val Strem,consists of a lower main fan and an upper fan to thenortheast. Surface morphology shows that the fan itselfdoes not emanate from Val Strem, but instead the upperfan sediment is sourced in the Drun catchment (Fig. 2c).The fan is a ski area and both the lower and upper fanswere cleaned of large boulders. The upper Drun fan bearsscattered boulders (< 0.5 m in height) and faint levees ofabandoned channels. Outcrops of the upper fan deposit
along the incised Drun channel (∼ 35 m) near Valtgevareveal several-metre-thick, matrix-supported block layerswith infrequent interbedded laminated sands (Fig. 3a). Theformer are dominated by angular to subangular schist andgneiss blocks in a matrix of silty sand. The Drun catchmentlies at the foot of the Cuolm da Vi, the site of activegravitational collapse and toppling with reported movementrates of some tens of centimetres per year (Amann et al.,2006). Several-metre-thick debris-flow deposits within thechannel itself attest to recent deposition by the Drun torrent.Left lateral moraines present in Val Strem at Valtgeva arepartially buried by the debris-flow sediments of the upperDrun fan (Fig. 2c). The most upvalley moraine was buriedin part by the 14 March 2016 Val Strem debris avalanche(Fig. 2a). During this event the western flank of Cuolmda Vi collapsed and ∼ 200 000 m3 of rock debris mixedwith snow detached and ran up tens of metres on theopposite valley slope to eventually form a ∼ 1 km debristongue (https://www.nzz.ch/panorama/ungluecksfaelle-und-verbrechen/felssturz-in-sedrun-geroell-verschuettet-wasser–und-stromversorgung-1.18712845, last access: 17 January2018).
Two of the NEAT cores (Schneider, 1992) were takenclose to the middle of the valley (locations shown in Fig. 2a).Examination of the published core log data allowed us aglimpse into the valley fill beneath the L’Ondadusa and Drunfans. Core SBA at 1342 m a.s.l. (2701381/1170326) lies inthe Vorderrhein channel, while core SBB at 1358 m a.s.l.(2701314/1170165) lies in the Strem channel ∼ 240 m northof the Vorderrhein. Both cores traversed bedrock (Schnei-der, 1992), in SBA at 55 m depth (1288 m a.s.l.) and inSBB at 89 m depth (1269 m a.s.l.). This reach of the Vorder-rhein Valley is overdeepened as shown by the top bedrocksurface at 1269 m a.s.l. (core SBB), which is tens of me-tres lower than the bedrock threshold in the canyon nearBugnei at 1340 m a.s.l. The first 5–10 m of sediment on topof bedrock was interpreted by Schneider (1992) as sub-
www.eg-quaternary-sci-j.net/67/17/2018/ E&G Quaternary Sci. J., 67, 17–23, 2018

20 C. Dieleman et al.: Reconsidering the origin of the Sedrun fans
Table 1. Sample information, measured 10Be concentrations and calculated surface exposure ages; all errors are 1σ .
Sample Latitude Longitude Elevation Sample Topographic 10Be concentration ExposureID (m a.s.l.) thickness (cm) shielding factor (104 at g−1)a ageb
Mila1 46.6835 8.7412 1672 2.0 0.966 15.36 ± 0.67 10 120 ± 440Mila2 46.6782 8.7472 1532 2.3 0.985 18.64 ± 0.93 13 430 ± 670Mila3 46.6790 8.7509 1512 2.4 0.987 18.62 ± 0.79 13 600 ± 580
Giuv1 46.6741 8.7209 1841 4.0 0.979 18.64 ± 0.73 10 880 ± 430Giuv2 46.6738 8.7213 1831 3.5 0.980 33.45 ± 1.43 19 610 ± 840Giuv3 46.6734 8.7227 1795 2.5 0.982 20.31 ± 0.76 12 070 ± 450
a Analyses were normalized to the ETH AMS (accelerator mass spectrometry) standard S2007N (Christl et al., 2013). b Calculated with the online calculator ofBalco et al. (2008) using the northeast North America calibration data set, a rock density of 2.65 g cm−3, and no erosion. Errors include the statisticaluncertainties of the AMS measurement and the error on the subtracted blank (3.5 ± 2.5 × 10⁻¹⁵).
glacial till (overconsolidated diamicton). This is overlain byglaciofluvial gravels, rare interbedded glacigenic sediments(“tills”) and lake sediments. The glaciofluvial deposits con-tain a broad spectrum of lithologies attesting to both local andVorderrhein contributions. Starting at an elevation of about1300 m a.s.l., Vorderrhein gravels with well-rounded clastsbegin to dominate both cores. Schneider (1992) interpretedthis as signalling the onset of the Holocene. No 14C datesare reported for any of the NEAT cores in the valley. In coreSBB, the presence of clean, well-sorted and at times cross-bedded sands between elevations of 1330 and 1340 m a.s.l.was interpreted to indicate the presence of a lake (Schnei-der, 1992). Starting at elevation 1350 m a.s.l. and continu-ing to the top of core SBB poorly sorted, locally sourceddebris-flow sediments with subangular gneiss blocks rang-ing up to 1 m3 in diameter were logged. The elevation of the(abandoned) Drun fan surface just adjacent to core SBB isat 1385–1390 m a.s.l., allowing 35–40 m of debris-flow sedi-ments, which comprise the fan topography visible today.
Topographically, the abandoned Drun fan surface contin-ues to the east to coalesce with the Bugnei fan, where theVorderrhein has incised more than 120 m at the fan toe. Fanoutcrops along the northern canyon wall indicate the pres-ence of a pre-existing canyon that was filled by Bugnei de-bris. The canyon is contiguous with the Cavorgia bedrockcanyon that separates the Sedrun fan surface from the Disen-tis fan surface (Fig. 2a). The rather uniform 7◦ radial angleof the Bugnei fan surface on both the west and east side un-derscores the idea that during fan aggradation the (former)Cavorgia canyon must have been already completely filledup.
3.2 Moraines and paleoglacier reconstruction
Results of 10Be exposure dating of moraine boulders aregiven in Table 1 and shown in Fig. 4. In Val Giuv,the prominent left-lateral moraine (Fig. 2b) is an accre-tionary moraine with the outermost left-lateral moraine (age12 070 ± 450 years, Giuv3) having been partially buried bythe larger more prominent inner left-lateral moraine (age
10 880 ± 430 years, Giuv1, Fig. 3b). The apparently tooold age of Giuv2 19 610 ± 840 years (also on outermostmoraine) reflects cosmogenic nuclide inheritance and is notdiscussed further. Sub-parallel latero-frontal moraines at themouth of Val Mila indicate that, 13 430 ± 670 years ago(Mila2), the local glacier had just reached the main val-ley. The upvalley left-lateral moraine records stabilization ofthe glacier at a recessional position 10 120 ± 440 years ago(Mila1). From a boulder on the left flank of the VorderrheinValley an age of 13 600 ± 580 years (Mila3) was obtained.This gives a minimum age for the timing of an ice-free mainvalley. Pollen data indicate ice-free conditions around Sedrunby the beginning of the Bølling interstadial (ca. 14.6 kyr ago;Burga, 1987).
Comparison of the ELAs of the paleoglaciers provides anindependent means of assessing contemporaneity of moraineformation in the three tributary valleys. Determined ELAsfor the reconstructed paleoglaciers are 2300, 2230, and2240 m a.s.l. (accumulation area ratio, AAR) for Val Giuv,Mila and Strem, respectively (Fig. 4). All three valleys hostedglaciers during the Little Ice Age. ELA depressions with re-spect to the Little Ice Age ELAs, which were 2700, 2570and 2650 m a.s.l. (Maisch, 1992), are 400, 340 and 410 m, re-spectively. ELA depression during the Egesen stadial acrossthe Alps varies between 250 and 350 m (Ivy-Ochs, 2015, andreferences therein). Both the 10Be ages and ELA depressionssupport the hypothesis that the studied moraines record ad-vance of Val Giuv, Mila, and Strem glaciers during the Ege-sen stadial, which was between about 13 and 11.5 kyr ago(Ivy-Ochs, 2015).
4 Discussion and conclusions
The dated left-lateral moraine at the mouth of Val Mila(Mila2) is buried along its downstream end by fan sedimentssourced in the small basin Val Pulanera. In Val Strem threeleft-lateral moraines are partially buried by the Drun up-per fan deposits (Fig. 2c). Although those moraines are un-dated, the similarity of the paleoglacier ELAs and 1ELAs
E&G Quaternary Sci. J., 67, 17–23, 2018 www.eg-quaternary-sci-j.net/67/17/2018/

C. Dieleman et al.: Reconsidering the origin of the Sedrun fans 21
Figure 4. Reconstructed paleoglaciers in the three tributary valleys. Pink lines show the AAR ELAs calculated with the ArcGIS tool GlaRe(Pellitero et al., 2015, 2016). Yellow dots indicate the locations of 10Be-dated boulders. The corresponding 10Be ages and their uncertaintiesare given. The coherence of the ELAs and 1ELAs with respect to the Little Ice Age ELAs (see text) in concert with the 10Be ages suggestthat these glaciers advanced during the Alpine Lateglacial Egesen stadial.
with respect to Little Ice Age ELAs point to contemporane-ity of moraine formation with the dated moraines in ValGiuv (12.9–10.9 kyr ago). As the footprint of the paleoglaciersnout associated with the dated moraines (Fig. 4) was down-stream of the Drun–Strem confluence, debris-flow activitypost-dates the Egesen stadial. Similarly, the core data showthat only the top 35–40 m of valley fill is actually debris-flowsediments; most is fluvial and glaciofluvial deposits of theVorderrhein River, which accumulated in the overdeepeningupstream of Bugnei. In sum, our data indicate that fan sedi-ments built up after the end of the Lateglacial and that aggra-dation only took place for a few tens to at most hundreds ofyears (deposit thickness 30–40 m), when one considers thattens of metres of debris-flow sediment can accumulate in asingle event (Harvey et al., 2005).
If the fans did not build up due to evacuation of Lateglacialglacial deposits from the tributary valleys, then why didthey aggrade and why did aggradation stop and give wayto toe incision so abruptly? We propose that the build-up of the Sedrun and Disentis fans was related to thedamming of the Vorderrhein River by the Flims landslide.The Flims landslide (volume 9–12 km3) has been dated to9400 cal yr BP with radiocarbon (Deplazes et al., 2007) and8900 ± 700 years with cosmogenic 10Be and 36Cl (Ivy-Ochset al., 2009). The Vorderrhein was completely blocked by amore than 600 m-thick landslide dam and a lake, Ilanzersee,formed upstream (Wassmer et al., 2004; von Poschinger,2005). This would have led to marked upstream aggradationfor as long as the lake existed. Interestingly, in 1882 Heimmentioned that the Flims landslide-dammed lake had an im-
pact on the landscape all the way up to Disentis, without giv-ing details (Heim, 1882). The highest elevation of the lake isdifficult to assess, especially as it may not have been at thatelevation for very long. Wassmer et al. (2004) suggest a lakelevel of 1150 m a.s.l. but geomorphological evidence showsthat a lake that high would have overflowed the landslide atnumerous locations (cf. von Poschinger, 2005). It seems thatthe lake could have attained a level of around 940 m a.s.l.without overflowing (Fig. 5). Von Poschinger (2005) esti-mated a highest level of 936 m a.s.l. and a level that was heldfor fairly long at about 830 m a.s.l. As soon as the lake hadfilled with water (taking many years, disregarding seepage),a new higher local base level for all torrents upstream of thelake was established. The marked flattening of the river gra-dient and reduction in stream power led to immediate andrapid aggradation upstream. First to aggrade were the fansnear Disentis whose fan toes were closest to the western endof the lake. At present, there is no evidence that the Disentisfans were deltas. As these fans grew they blocked the Cavor-gia canyon (Fig. 2). Vorderrhein sediment choked the canyonand the Bugnei fan began to build up. This led to formation ofaccommodation space around Sedrun. As shown by the coredata, first a lake formed west of Bugnei (recorded by sandlayers between 1330 and 1340 m a.s.l. in core SBB), then thethree fans, Pulanera, L’Ondadusa and Drun, aggraded and co-alesced to form a continuous surface with an elevation ofabout 1380 m a.s.l. Ilanzersee never filled completely withsediment but emptied (likely stepwise) due to breaches in thelandslide deposit where the present Vorderrhein channel is.The uniformity of the marked cut-off toes of the Disentis and
www.eg-quaternary-sci-j.net/67/17/2018/ E&G Quaternary Sci. J., 67, 17–23, 2018

22 C. Dieleman et al.: Reconsidering the origin of the Sedrun fans
Figure 5. Coloured elevation overlain on hillshade map of the area between Disentis and Flims (swisstopo JA100120). The dark grey arearepresents the Flims landslide deposits. The black thick dashed line indicates the location of the blockage of the Vorderrhein River by thelandslide dam (von Poschinger, 2005). The proposed Ilanzersee shoreline at an elevation of 1150 m a.s.l. (Wassmer et al., 2004) is outlinedin grey dots. This reconstruction shows that a lake with surface at 1150 m a.s.l would have overflowed the landslide dam at several pointsboth north and south of the location of the blockage and subsequent final breach. The white and light blue areas show extents of Ilanzerseewith shorelines of 940 and 830 m a.s.l., respectively, as proposed by von Poschinger (2005). Lower panel: longitudinal ESE–WNW profilealong the Vorderrhein River down to the Flims landslide deposits. The two lake levels, 940 and 830 m a.s.l., are shown. In the backgroundthe mountain peaks to the north are illustrated. Vertical exaggeration 2.5×.
Sedrun fans suggests coherent response to an abrupt down-stream change in base level, which we suggest was the drain-ing of Ilanzersee. As the lake level decreased suddenly, theVorderrhein was able to clear out the Cavorgia canyon (thereis no evidence for formation of a new bedrock canyon epi-genetically), base level dropped and fan aggradation ceased.The fan toes were incised. The associated knickpoint is nowlocated near the outlet of the Drun torrent just west of theBugnei fan, as attested by the bedrock outcrops in the chan-nel at elevation 1340 m a.s.l. This is also the approximate el-evation of the present floodplain upstream of this point. Thebroad floodplain (200 m wide) and the nine cut terraces re-flect meandering of the Vorderrhein near Pulanera and pointto the river being in a stable state at present along this reach.
Data availability. All primary data for this paper are given in thetables. Data are archived in the expage database (http://expage.github.io/, last access: 17 April 2018).
Competing interests. The authors declare that they have no con-flict of interest.
Acknowledgements. AlpTransit Gotthard AG and swisstopo arethanked for allowing access to drill core data for the Gotthard basistunnel site. We are grateful for support of fieldwork, sample prepa-ration and AMS measurements provided by the Ion Beam Physicsgroup at ETH Zurich. Constructive reviews and comments by ananonymous reviewer and Christopher Lüthgens helped us to im-prove the manuscript.
References
Amann, F., Donatsch, G., Bonanomi, Y., and Moser, M.: Kine-matik und Bewegungsmechanismus der tiefgründigen InstabilitätCuolm Da Vi (Graubünden, Schweiz), Bulletin für angewandteGeologie, 11, 117–131, 2006.
Balco, G., Stone, J. O., Lifton, N. A., and Dunai, T. J.:A complete and easily accessible means of calculatingsurface exposure ages or erosion rates from 10Be and
E&G Quaternary Sci. J., 67, 17–23, 2018 www.eg-quaternary-sci-j.net/67/17/2018/

C. Dieleman et al.: Reconsidering the origin of the Sedrun fans 23
26Al measurements, Quaternary Geochronology, 3, 174–195,https://doi.org/10.1016/j.quageo.2007.12.001, 2008.
Burga, C. A.: Das alpine Spät- und Postglazial in Graubünden auf-grund geomorphologischer und pollenanalytischer Untersuchun-gen, Vierteljahresschrift der Naturforschenden Gesellschaft inZürich, 132, 26–44, 1987.
Christl, M., Vockenhuber, C., Kubik, P. W., Wacker, L.,Lachner, J., Alfimov, V., and Synal, H.-A.: The ETHZurich AMS facilities: Performance parameters and ref-erence materials, Nucl. Instrum. Meth. B, 294, 29–38,https://doi.org/10.1016/j.nimb.2012.03.004, 2013.
Deplazes, G., Anselmetti, F. S., and Hajdas, I.: Lake sedimentsdeposited on the Flims rockslide mass: the key to date thelargest mass movement of the Alps, Terra Nova, 19, 252–258,https://doi.org/10.1111/j.1365-3121.2007.00743.x, 2007.
Hantke, R.: Eiszeitalter: Die jüngste Erdgeschichte der Alpen undihrer Nachbargebiete, Ott, Thun, Switzerland, 1983.
Harvey, A. M. Mather, A. E., and Stokes, M.: AlluvialFans: Geomorphology, Sedimentology, Dynamics GeologicalSociety, London, UK, Special Publications, 251, 248 pp.,https://doi.org/10.1144/GSL.SP.2005.251.01.16, 2005.
Heim, A.: Der alte Bergsturz von Flims, Jahrbuch des SchweizerAlpenclub, Bern, Switzerland, 18, 295–309, 1882.
Hornung, J., Pflanz, D., Hechler, A., Beer, A., Hinderer, M.,Maisch, M., and Bieg, U.: 3-D architecture, depositional pat-terns and climate triggered sediment fluxes of an alpine allu-vial fan (Samedan, Switzerland), Geomorphology, 115, 202–214,https://doi.org/10.1016/j.geomorph.2009.09.001, 2010.
Huber, W.: Petrographisch-mineralogische Untersuchungen imsüdöstlichen Aarmassiv, Schweiz. Miner. Petrog., 2, 557–642,1948.
Ivy-Ochs, S.: Glacier variations in the European Alps at the endof the last glaciation, Cuadernos de investigación geográfica, 41,295–315, https://doi.org/10.18172/cig.2750, 2015.
Ivy-Ochs, S. and Kober, F.: Surface exposure dating with cos-mogenic nuclides, E&G Quaternary Sci. J., 57, 179–209,https://doi.org/10.3285/eg.57.1-2.7, 2008.
Ivy-Ochs, S., Poschinger, A. V., Synal, H. A., and Maisch,M.: Surface exposure dating of the Flims landslide,Graubünden, Switzerland, Geomorphology, 103, 104–112,https://doi.org/10.1016/j.geomorph.2007.10.024, 2009.
Korup, O. and Tweed, F.: Ice, moraine, and landslide dams inmountainous terrain, Quaternary Sci. Rev., 26, 3406–3422,https://doi.org/10.1016/j.quascirev.2007.10.012, 2007.
Maisch, M.: Die Gletscher Graubündens, Part B, GeographischesInstitut Universität Zürich, Zürich, Switzerland, 1992.
Pellitero, R., Rea, B. R., Spagnolo, M., Bakke, J., Hughes, P.,Ivy-Ochs, S., Lukas, S., and Ribolini, A.: A GIS tool for auto-matic calculation of glacier equilibrium-line altitudes, Comput.Geosci., 82, 55–62, https://doi.org/10.1016/j.cageo.2015.05.005,2015.
Pellitero, R., Rea, B. R., Spagnolo, M., Bakke, J., Ivy-Ochs, S., Frew, C. R., Hughes, P., Ribolini, A., Lukas,S., and Renssen, H.: GlaRe, a GIS tool to reconstruct the3D surface of palaeoglaciers, Comput. Geosci., 94, 77–85,https://doi.org/10.1016/j.cageo.2016.06.008, 2016.
Scapozza, C.: Kame Terrassen Camischolas (Disentis, Sedrun, GR),Géotope Suisse, no. 284 (GR), Bern, Switzerland, 2012.
Schneider, T.: Geologische Auswertung (Schlussbericht) Sondier-bohrungen Tujetsch, NNE Rueras, Bundesamt für Verkehr undAlpTransit, Bern, Switzerland, 1992.
Von Poschinger, A.: Der Flimser Bergsturz als Stau-damm, Bulletin für angewandte Geologie, 10, 33–47,https://doi.org/10.5169/seals-225564, 2005.
Wassmer, P., Schneider, J. L., Pollet, N., and Schmitter-Voirin, C.:Effects of the internal structure of a rock-avalanche dam onthe drainage mechanism of its impoundment, Flims sturzstromand Ilanz paleo-lake, Swiss Alps, Geomorphology, 61, 3–17,https://doi.org/10.1016/j.geomorph.2003.11.003, 2004.
www.eg-quaternary-sci-j.net/67/17/2018/ E&G Quaternary Sci. J., 67, 17–23, 2018

E&G Quaternary Sci. J., 67, 25–31, 2018https://doi.org/10.5194/egqsj-67-25-2018© Author(s) 2018. This work is distributed underthe Creative Commons Attribution 4.0 License.
Express
report
Disestablishing “Glacial Lake Speight”, New Zealand? Anexample for the validity of detailed geomorphologicalassessment with the study of mountain glaciationsStefan Winkler1, David Bell2, Maree Hemmingsen3, Kate Pedley2, and Anna Schoch4
1Department of Geography and Geology, University of Würzburg, Am Hubland, 97074 Würzburg, Germany2Department of Geological Sciences, University of Canterbury, Private Bag 4800, Christchurch 8140, New Zealand3Primary Science Solutions Ltd., Woodbury Street 75, Russley, Christchurch 8042, New Zealand4Department of Geography, University of Bonn, Meckenheimer Allee 166, 53115 Bonn, Germany
Correspondence: Stefan Winkler ([email protected])
Relevant dates: Received: 30 May 2018 – Revised: 10 August 2018 – Accepted: 21 August 2018 –Published: 28 August 2018
How to cite: Winkler, S., Bell, D., Hemmingsen, M., Pedley, K., and Schoch, A.: Disestablishing “Glacial LakeSpeight”, New Zealand? An example for the validity of detailed geomorphological assessment withthe study of mountain glaciations, E&G Quaternary Sci. J., 67, 25–31, https://doi.org/10.5194/egqsj-67-25-2018, 2018.
1 Introduction
The middle Waimakariri River catchment in the SouthernAlps of New Zealand, informally defined here as its reach up-stream of Waimakariri Gorge to the junction of Bealey River(Fig. 1), is characterised by an outstanding assemblage ofvarious landforms representing different processes of forma-tion and ages. It offers ideal conditions for studying the sedi-ment budget of a major New Zealand braided river within itsmountain catchment. Such research has, however, not beencarried out yet. It seems to be a legitimate hypothesis consid-ering this catchment as part of a complex sediment cascade.Its numerous voluminous fans, impressive terrace sequences,and wide braided river floodplains are efficient sedimentsinks. This would infer that substantial and efficient evacu-ation of sediment would rather take place under full glacialconditions during glaciations or in their wake, intensified byparaglacial processes, than under current (Holocene) condi-tions. Detailed studies on the sediment budget may revealvaluable insights into the successive build-up of the Canter-bury Plains and their modification by Holocene fluvial actionconnected to major braided rivers. Additionally, they bear
implications beyond these fluvial aspects. Palaeoseismolog-ical studies claim to have detected signals of major AlpineFault earthquakes in coastal environments along the easternseaboard of the South Island (McFadgen and Goff, 2005).This requires high connectivity between the lower reaches ofmajor braided rivers and their mountain catchments to gener-ate immediate significant sediment pulses. It would be con-tradictory to the abovementioned hypothesis though. Obtain-ing better control on sediment budgets of braided rivers likethe Waimakariri River will finally add significant value tomultiple scientific and applied topics like regional resourcemanagement.
An essential first step of sediment budget studies is to sys-tematically map the geomorphology, conventionally in thefield and/or using remote-sensing applications, to localise,genetically identify, and classify landforms or entire topose-quences of the area being investigated. In formerly glaciatedmountain environments it is also indispensable to obtainall available chronological information supporting subse-quent investigations. In our case, only limited chronologicaland geomorphological information has previously been pub-lished. The first major geomorphological mapping was con-
Published by Copernicus Publications on behalf of the Deutsche Quartärvereinigung (DEUQUA) e.V.

26 S. Winkler et al.: Validity of detailed geomorphological assessment
Figure 1. Elevation map of the study area (based on NZ Topo50 map data, Land Information New Zealand, https://www.linz.govt.nz/land/maps/topographic-maps, last access: 9 August 2018). The small insert shows its location within New Zealand and the red frame denotes thearea covered by Fig. 3 (i.e. the potential damming site). The approximate outlines of “Glacial Lake Speight” are indicated by a stippled lineand based on existing morphological evidence and the figure published in Gage (1958). Please note that the maximum lake level Gage quotesin his text (1550 ft or ∼ 472.5 m a.s.l.) matches neither the lake extent indicated in his own figures nor modern topographic data. Even ifsome inaccuracy may result from the topographic information Gage used at his time, the difference is quite considerable and “1550 ft” ispotentially a printing error (1750 or 1850 ft (∼ 533 or ∼ 564 m would result in a much better match).
ducted by Gage (1958), who introduced a regional stratigra-phy that is still in use today despite its lack of numerical agecontrol (see Barrell et al., 2011). Rother et al. (2015) pub-lished new numerical (cosmogenic radionuclide) ages andimproved our knowledge about Last Glacial Maximum iceextent and subsequent deglaciation. They, however, made noattempt to thoroughly assess Gage’s geomorphological map.Except from a few studies merely addressing local topics, nowork on a wider regional scale relevant for sediment budgetstudies has been published. The study area is covered in theglacial geomorphological map of Barrell et al. (2011), whichprimarily focuses on the chronological aspects of glaciallandforms and lacks details due to its scale (1:100 000).
In his study, Gage (1958) introduced the so-called “GlacialLake Speight” that temporarily occupied a large section ofthe middle Waimakariri River during deglaciation (Fig. 1).He named it after Robert Speight, a prominent Christchurch-based geologist who investigated glacial landforms and de-posits of the region during the first part of the 20th cen-tury. Gage’s concept of Glacial Lake Speight has been re-
tained since (see Forsyth et al., 2008; Barrell et al., 2011;Rother et al., 2015). Geomorphological evidence in the formof palaeolake shorelines is evident, for example on the largealluvial fans (Fig. 2a, b, Supplement Sect. 3.8). Whereasthe existence of this former lake remains unchallenged, al-ready in early preparatory stages of our study the originalconcept of Glacial Lake Speight comes into conflict withour geomorphological analysis and mapping. We concludethat Glacial Lake Speight potentially has to become dises-tablished as a temporal lake formed during deglaciation andcausally connected to it. Establishing a logical succession oflandforms and related processes during landscape evolutionreveals that the temporary lake that once occupied the val-ley must be younger, even without new chronological data.This inevitably requires revisiting statements of Gage (1958)regarding the lifespan of the temporary lake and proposedmechanism of its damming. Glacial Lake Speight and itschronological status is not a major focus of our general study;instead we aim to share our conclusions and put them upfor discussion because (a) Glacial Lake Speight is a well-
E&G Quaternary Sci. J., 67, 25–31, 2018 www.eg-quaternary-sci-j.net/67/25/2018/

S. Winkler et al.: Validity of detailed geomorphological assessment 27
Figure 2. Ground images of selected geomorphological features inthe study area: (a) Binser Fan as seen from the opposite side of thevalley; a sequence of shorelines related to the former lake is visibleon its lower part to the right; (b) sequence of shorelines formed onthe lower part of the prominent fan downstream from Binser Fan asseen from the opposite side of the valley; (c) overview of the pro-posed damming site (see text and Fig. 3) as seen towards the east;(d) slump at the confluence of Waimakariri River and Poulter River(entering from the left back) immediately downstream from the pro-posed damming site (all images Stefan Winkler: a 11 March 2018,b–d 13 March 2018).
known concept within the regional Quaternary communitythat surely needs further reassessment, (b) it constitutes an-other example for apparently universally accepted key local-ities that might not hold up under detailed re-evaluation, andimportantly (c) it demonstrates the unchanged value of basicgeomorphological analysis and mapping despite recent tech-nical and methodological progress.
2 Reassessing Glacial Lake Speight
2.1 Original concept and its difficulty
Because of missing shorelines or lake sediments founddownstream of the confluence of Poulter Valley, Gage (1958)concluded that the lake existed during deglaciation whenthe glacier retreated subsequent to the last major advancethat formed terminal moraines in this section of the val-ley, the two-phased “Poulter advance” (ca. 17.5 ka accord-ing to Rother et al., 2015, using terrestrial cosmogenic nu-clides). The inner of the Poulter moraines is located justupstream the abovementioned confluence (Figs. 1 and 3and Fig. S4d, e in the Supplement). Gage (1958) suggestedthat this moraine and debris-covered stagnant ice dammedGlacial Lake Speight but provided no detailed mechanism ortimeline. It extended up-valley as far as the Hawdon Riverconfluence (Fig. 1). Among a few other sites, the promi-nent Binser Fan shows evidence in the form of palaeolakeshorelines best described as wave-cut benches (Figs. 2a,
S3.8d). Binser Fan and an adjacent fan to the east (Goose-berry Stream Fan; see Figs. S3.8a, b, c) should have beenbuilt up to their present height during the highest lake levelaccording to Gage. This interpretation was repeated by Bar-rell et al. (2011) mapping this particular fan to be of (Latest)Late Otiran age (∼ 20–14.5 ka), whereas almost all other fansin the area are mapped as Holocene. Gage (1958) interpretsthe shorelines as signs of an intermittent lake level loweringand states that Glacial Lake Speight existed for hundreds ofyears. Draining to at least the present floodplain level shouldhave been completed prior to final wastage of early Poulteradvance stagnant ice downstream of the lake because the lat-ter protected, according to Gage, glacial sediments east ofthe Poulter moraine from destruction during drainage (seeGage, 1958, and Fig. 2 therein). Finally, he sees a lower fanintersecting one of the abovementioned fans formed duringlower lake levels and consequently judges post-deglaciationfan activity as insignificant.
This original concept immediately creates difficulties witha chronological sequencing of the landforms present in thestudy area (see below and see Fig. 3). It seems unlikely thatthe massive Binser Fan fully developed in the short timeframe between the former glacier retreating from this partof the valley and the palaeolake reaching its maximum waterlevel. Furthermore, it infers that Binser Fan has been pre-dominately inactive during the subsequent Late Glacial andthe entire Holocene. This would be unusual in comparison tomost other fans in the wider region. The large extent of thelake and its inferred period of existence would, furthermore,require a rather stable natural dam, somehow difficult to com-prehend if stagnant ice was involved. To tackle these andother emerging discrepancies, several questions need to beaddressed. (a) Where was the lake’s “dam” located? (b) Howdid it form and what material did it consisted of? (c) Whendid the lake form and how long did it exist? (d) What was themechanism of its outburst?
2.2 Geomorphological assessment
Some of the questions raised above are easily solved. Thereare no features related to the palaeolake located downstreamfrom the confluence of Poulter River. Although there is morethan one suitable scar that could be related to potential mas-sive landslides blocking the narrow Waimakariri Gorge fur-ther downstream (Figs. S2, S4f), the lack of any morphologi-cal evidence at the mouth and within the lower reach of bothmajor tributaries, the Poulter and Esk rivers, rejects this hy-pothesis. Furthermore, the well-developed terrace sequencesalong Waimakariri River downstream of the Poulter Riverconfluence (Fig. S3.4a) show no signs of influence by a tem-porary lake. The feature that once dammed the palaeolakeneeds, therefore, to be at the location Gage (1958) originallyproposed.
Because this location of the former natural dam cannot beseparated from its origin and properties, the issue starts to
www.eg-quaternary-sci-j.net/67/25/2018/ E&G Quaternary Sci. J., 67, 25–31, 2018

28 S. Winkler et al.: Validity of detailed geomorphological assessment
Figure 3. (a) Orthorectified aerial photo of the proposed damming site (modified after Land Information New Zealand, https://data.linz.govt.nz/data/category/aerial-photos, last access: 9 August 2018). A few features mentioned in the text are indicated and set into a proposedchronosequence. (b) Preliminary geomorphological map of the proposed damming site covering the same area as the upper panel. The maphas been prepared following the slightly modified mapping key of GMK 25 (see Leser and Stäblein, 1985) and some layers (including activeprocesses) have been omitted for clarity. The two different signatures for glacial process area account for landforms of defined origin (e.g.moraine ridges) vs. areas that have merely been overprinted/modified. Different signatures for scarps, ridges, and channels highlight differentdimensions (listed small to large here) as outlined in detail in the abovementioned mapping key (contours based on NZ Topo50 map data,Land Information New Zealand, https://www.linz.govt.nz/land/maps/topographic-maps, last access: 9 August 2018).
become quite complex. There is no bedrock structure nearthe site in the Waimakariri Valley that could have acted as adam (see S3.4). Given the glacial history of the valley andits occupancy by a large valley glacier during most of MIS2, it would be hard to assume that a bedrock structure suit-able to act as a dam during deglaciation would have sur-vived many thousands of years of glacial erosion and thencompletely eroded since. Unlike large foreland lakes in the
Southern Alps east of the Main Divide like Lake Ohau orLake Pukaki, Glacial Lake Speight would not have occu-pied a glacial foreland depression supporting a permanentlake. While Gage (1958) draws such a comparison, bothabovementioned lakes have natural outlets and are actuallydammed by massive glaciofluvial fanheads and not any ter-minal moraine sequences. This is a fundamental differencefrom the Waimakariri River valley because such settings gen-
E&G Quaternary Sci. J., 67, 25–31, 2018 www.eg-quaternary-sci-j.net/67/25/2018/

S. Winkler et al.: Validity of detailed geomorphological assessment 29
erally facilitate the occurrence of stable dams with estab-lished outlets. There is neither evidence for a postglacially in-filled huge overdeepened basin in this part of the WaimakaririRiver valley nor does the setup of glacial, glaciofluvial, orfluvial landforms suggest such a basin existed. This requiresany potential lake dam to be sufficiently stable to persist un-til the lake reached its maximum extent before it graduallycollapsed or became incised and subsequently eroded.
With the original timeline of Gage (1958), the natural damneeded to allow the lake to exist over many centuries, anassumption that sounds unrealistic for the terminal morainehe proposed, especially if debris-covered stagnant ice shouldhave been involved. If the moraine actually constituted thedam, lake formation must have started immediately duringthe initial withdrawal of the glacier. It may theoretically in-clude parts of the glacier tongue becoming separated fromthe active glacier and successively wasting down. But themoraine could only have acted as a dam if no efficient over-flow existed from the onset. Increasing hydrological pres-sure by an enlarging proglacial lake is usually sufficient towiden and incise any meltwater overflow channel (in partic-ular if stagnant ice becomes exposed) and thereby preventany blockage upstream. With the distance of glacier retreatbetween the potential damming site and the confluence ofHawdon Valley of ca. 15 km (Fig. 1), it must have taken manycenturies if compared to reported concurrent glacier retreat insimilar valleys (Rother et al., 2014; Shulmeister et al., 2018).It seems, therefore, doubtful that the Poulter moraine anddebris-covered stagnant ice could have provided a stable lakedam over such a long period without an existing depressionand a supportive massive fanhead or similar feature.
If the conclusions of Gage (1958) regarding Glacial LakeSpeight are accepted, the Waimakariri River needs to havebeen incised at least a few metres below the lowest palaeo-lake shorelines prior to its formation. As soon as lake forma-tion commenced and the former valley glacier left its positionat the Poulter moraine, no further incision would have beenpossible. This theoretically could reintroduce the abovemen-tioned hypothesis of an overdeepened basin upstream fromthe Poulter River confluence, but it becomes easily contra-dicted by the outline and profile of (glacio)fluvial terraces incomparison with the modern floodplain (see Figs. 3, S4c, d,e) and other geomorphological evidence up- and downstreamof the damming site (e.g. truncated fans). Furthermore, theposition of the Poulter moraine itself (Figs. 3, S3.1) wouldnot match such a low valley floor level as two prominent ter-races immediately proximal in high elevation (Figs. 3, S3.2)must have formed shortly after the glacier retreated. The ter-races are located above the highest lake shoreline and thusneed to be older.
Binser Fan is a typical outsize fan (Jarman et al., 2011)characterised by an anomalous relationship between fan area(ca. 2.2 km2) and catchment area (ca. 3.4 km2). There is stilldiscussion whether these fans are formed during rather catas-trophic events or by gradual processes over longer periods
of time. According to Gage (1958), the fan has been com-pletely built up into the lake during its maximum extension.The palaeolake shorelines on the fan show an erosional char-acter (S3.8) and are likely formed by wave action related topredominant westerly wind directions. The fan seems to beadjusted to a base level below the lowest lake shorelines closeor identical to the modern valley floor. Erosion at the baseof Binser Fan indicates subsequent shifting of Waimakariri’sactive river channel towards the east in this section of the val-ley (see S4c). Binser Fan and its two neighbours cover glacialfeatures (kame terraces, glacially sculptured bedrock ledges)at their lateral upper margins (Figs. 3, S3.8e, S4c). From thismorphological age relationship and process sequence, thefans presumably post-date any major glacial activity in thevalley including initial deglaciation. Judging by comparisonwith other formerly glaciated mountain valleys worldwide,morphology and setting of the fans in the study area clearlyindicate a postglacial formation, perhaps (but not necessar-ily) related to the paraglacial process system (Brardinoni etal., 2018). A Late Glacial build-up during the short timeframe of the maximum lake level followed mainly by inac-tivity to allow preservation of the shorelines seems unlikely.The sedimentary architecture of the fan could be investigatedusing geophysical methods (e.g. ground-penetrating radar) toprove its non-deltaic formation into a lake.
2.3 An alternative model for a non-glacial Lake Speight
Barrell et al. (2011) mapped parts of the area north of theactive river channel where Gage (1958) located the Poul-ter moraines as landslide. A landslide origin for the palae-olake, not necessarily related to deglaciation, would solvesome of the abovementioned inconsistencies. Ground inspec-tion reveals, however, that only a part of the terminal morainecomplex has been post-depositionally covered by slope ma-terial (angular, clast-supported sediment mainly up to pebblegrain size; see S3.3). There is no defined source area/scarof a larger landslide at the proposed damming site (S3.2)and both surface material and morphology of the terminalmoraine complex are comparable to contemporary ones inother valleys (e.g. Borsellino et al., 2017). Even if we re-ject its capacity to act as a lake dam we have no doubt thatthe area constitutes a moraine system subsequently modifiedby glaciofluvial erosion and slope processes (Figs. 3, S3.1).However, its outline in relation to surrounding geomorpho-logical features (in particular the two major proximal ter-races; see S3.6) underlines our conclusion that the moraineitself cannot be considered a lake dam.
Mass movements are very frequent in the Southern Alps.Many are supposed to be coseismically triggered (Davies,2016) and the proposed damming site is in proximity to anactive fault (Esk River Fault; see Forsyth et al., 2008). Massmovements have, of course, many various triggers and with-out a prominent landslide scar (see S3.2), the narrow ac-tive river channel enclosed by steep erosion scars cut into
www.eg-quaternary-sci-j.net/67/25/2018/ E&G Quaternary Sci. J., 67, 25–31, 2018

30 S. Winkler et al.: Validity of detailed geomorphological assessment
terrace flights itself moves into the focus. A major slumpcould easily mobilise enough material to block the narrowcourse of the Waimakariri River at this site. Successive in-cision during the latest late glacial or Holocene could haveformed a steep-sided channel cut into glacial and glacioflu-vial sediment of various origin and properties (see S3.10).Such sediment may not persistently support high cliffs if ex-posed to some form of external or internal forcing. A slumpsome hundred metres downstream of the proposed dammingsite (Fig. 2d) may constitute a miniature analogue for whathappened at a larger scale at the narrowing. The proposeddamming site is, furthermore, the only stretch within the val-ley where (glacio)fluvial terraces are not well developed (seeS3.4a, 3.5a), instead cut by the abovementioned high ero-sional scarp (see Figs. 2c, 3, S3.7).
How long would such a slump theoretically need to blockthe channel in order to dam the palaeolake to its mappedmaximum size? Whereas the lake area can be estimated toca. 24.5 km2 using existing morphological evidence and con-tours (Fig. 1), a detailed estimate of its volume is impos-sible. A generous estimate of 100 m average water depthwould yield 2.45 × 10⁹ m3 for its maximum level. The long-term annual average runoff for the Waimakariri River is∼ 120 m3 s−1 near its mouth and ∼ 90 % of this runoff is es-timated for it at the Waimakariri Gorge, which represents themountain catchment (online data: https://www.niwa.co.nzand https://www.ecan.govt.nz, last access: 20 May 2018).Reducing the ratio to 60 % in accounting for three major trib-utaries (Poulter, Esk, Kowai) entering downstream from theproposed damming site, the modern annual average runoffvolume would total 2.27 × 10⁹ m3. Even if modern runoffdata show high annual variability and are not representa-tive for the past, the comparison reveals that filling the tem-porary lake to its maximum level would only take severalyears, even if its volume is hugely underestimated. The lakecould, therefore, have been a short-lived feature that lasted asshort as ∼ 10 or fewer years, quite comparable to landslide-dammed lakes that have been observed in the wake of recentearthquakes (Kaikoura, New Zealand). Consequently, aftera comparatively short time an outlet could have formed andthe lake successively drained. The multiple palaeolake shore-lines show that drainage was not catastrophic but more grad-ual. Such a gradual process also argues for more coherentmaterial of the lake dam and excludes, for example, debris-covered stagnant ice that may have been present in the valleyduring deglaciation. The latter would, once exposed, causea sudden drainage. Recent experience at artificially dammedlakes (e.g. Lake Pukaki) demonstrates that shorelines formquite quickly in glacial and glaciofluvial sediments compara-ble to the ones at Waimakariri River (Bunting, 1977; obser-vations by the authors). The likely short time frame providesanother argument against Lake Speight’s glacial origin.
3 Conclusions and outlook
Geomorphological mapping and analysis conducted as aninitial step towards a sediment budget study of the middleWaimakariri River has revealed serious doubts that a palaeo-lake that formed in the study area was temporally or causallyrelated to the last deglaciation. Unless a convincing, detailedmodel of how the Poulter moraine and debris-covered stag-nant ice could dam a lake of significant dimensions for manyhundreds of years in the specific setting (i.e. without a mas-sive fanhead and pre-existing basin) is developed, the previ-ous concept of Glacial Lake Speight that stood unchallengedwithin the regional Quaternary geology for 70 years shouldconsequently be disestablished. Any such model seriouslyconsidered requires, furthermore, to fit with the chronose-quence and timescales of para- and postglacial landform de-velopment both locally and regionally, in particular with thedominating fans. We propose an alternative model for a com-paratively short-lived temporary lake due to blockage by amajor mass movement event during the latest late glacial orHolocene. Future detailed work on possible mechanisms andage constraints is highly encouraged. This is inevitably nec-essary to obtain better control on landscape evolution andeffective process systems.
Disestablishing the glacial context of former Lake Speighthas implications beyond regional scale. It is an ostensive ex-ample that vigorous geomorphological analysis and mappinghas inalterable value especially for the study of late Qua-ternary mountain glaciations. It reveals again that even ap-parently “established” concepts of key landforms or type lo-calities occasionally have to be challenged. One has to ac-cept that recent scientific progress within the field of datingtechniques and palaeoglaciological modelling cannot com-pensate for what sometimes seems to be the gradual replace-ment of traditional geomorphology by “big data”. Ultimately,Glacial Lake Speight joins an increasing number of key lo-calities that deserve to be re-evaluated and may no longer becarried on in their original interpretation.
Data availability. All data sources are publicly accessible online;supporting ground imagery can be found in the Supplement.
Supplement. The supplement related to this article is availableonline at: https://doi.org/10.5194/egqsj-67-25-2018-supplement.
Competing interests. The authors declare that they have no con-flict of interest.
E&G Quaternary Sci. J., 67, 25–31, 2018 www.eg-quaternary-sci-j.net/67/25/2018/

S. Winkler et al.: Validity of detailed geomorphological assessment 31
References
Barrell, D. J. A., Andersen, B. G., and Denton, G. H.: Glacial ge-omorphology of the Central South Island, GNS Science Mono-graphs, 27, Lower Hutt, New Zealand, 2011.
Borsellino, R., Shulmeister, J., and Winkler, S.: Glacial ge-omorphology of the Brabazon and Butler Downs in theRangitata Valley, New Zealand. J. Maps, 13, 502–510,https://doi.org/10.1080/17445647.2017.1336122, 2017.
Brardinoni, F., Picotti, V., Maraio, S., Bruno P. P., Cucato, M.,Morelli, C., and Mair, V.: Postglacial evolution of a formerlyglaciated valley: Reconstructing sediment supply, fan building,and confluence effects at the millennial time scale, online first,Geol. Soc. Am. B., https://doi.org/10.1130/B31924.1, 2018.
Bunting, D. G.: Lake Pukaki shore-line stability: a preliminary engi-neering geological investigation, Unpublished MSc thesis, Uni-versity of Canterbury, Christchurch, New Zealand, 1977.
Davies, T. R. H.: Mountain process geomorphology: Conceptualprogress in the Southern Alps, in: Landscape and Quaternary En-vironmental Change in New Zealand, edited by: Shulmeister, J.,Atlantis Press, 205–233, 2016.
Forsyth, P. J., Barrell, D. J. A., and Jongens, R.: Geology of theChristchurch area, GNS 1:250 000 Geological Maps, 16, LowerHutt, New Zealand, 2008.
Gage, M.: Late Pleistocene glaciations of the Waimakariri Valley,Canterbury, New Zealand, N. Z. J. Geol. Geophys., 1, 123–155,https://doi.org/10.1080/00288306.1958.10422800, 1958.
Jarman, D., Agliardi, F., and Crosta, G. B.: Megafans and outsizefans from catastrophic slope failures in Alpine glacial troughs:the Malser Haide and the Val Venosta cluster, Italy. Geol. Soc.Spec. Publ., 351, 253–277, https://doi.org/10.1144/SP351.14,2011.
Leser, H. and Stäblein, G.: Legend of the geomorphological map1:25.000 (GMK 25) – fifth version in the GMK priority pro-gramm of the Deutsche Forschungsgemeinschaft, Berliner Ge-ographische Abhandlungen, 39, 61–89, Berlin, Germany, 1985.
McFadgen, B. G. and Goff, J. R.: An earth systems approach to un-derstanding the tectonic and cultural landscapes of linked ma-rine embayments: Avon-Heathcote Estuary (Ihutai) and LakeEllesmere (Waihora), New Zealand, J. Quaternary Sci. 20, 227–237, https://doi.org/10.1002/jqs.907, 2005.
Rother, H., Fink, D., Shulmeister, J., Mifsud, C., Evans, M., andPugh, J.: The early rise and late demise of New Zealand’s lastglacial maximum, P. Natl. Acad. Sci. USA ,111, 11630–11635,https://doi.org/10.1073/pnas.1401547111, 2014.
Rother, H., Shulmeister, J., Fink, D., Alexander, D., and Bell, D.:Surface exposure chronbology for the Waimakariri glacial se-quence in the Southern Alps of New Zealand: Implications forMIS-2 ice extent and LGM glacial mass balance, Earth Planet.Sc. Lett., 429, 69–81, https://doi.org/10.1016/j.epsl.2015.07.033,2015.
Shulmeister, J., Fink, D., Winkler, S., Thackray, G., Borsellino,R., Hemmingsen, M., and Rittenour, T.: Evidence for slowlate-glacial ice retreat in the upper Rangitata Valley, SouthIsland, New Zealand, J. Quaternary Sci. 185, 102–112,https://doi.org/10.1016/j.quascirev.2018.01.006, 2015.
www.eg-quaternary-sci-j.net/67/25/2018/ E&G Quaternary Sci. J., 67, 25–31, 2018

E&G Quaternary Sci. J., 67, 33–36, 2018https://doi.org/10.5194/egqsj-67-33-2018© Author(s) 2018. This work is distributed underthe Creative Commons Attribution 4.0 License.
Thesisabstract
Proglacial streams and their chronology in the glacierforefields of the HimalayasGerrit TombrinkInstitute of Geography, University of Göttingen, Goldschmidtstrasse 5, 37077 Göttingen, Germany
Correspondence: Gerrit Tombrink ([email protected])
Relevant dates: Published: 10 September 2018
How to cite: Tombrink, G.: Proglacial streams and their chronology in the glacier forefields of the Himalayas, E&GQuaternary Sci. J., 67, 33–36, https://doi.org/10.5194/egqsj-67-33-2018, 2018.
Supervisors: Matthias Kuhle †, Daniela Sauer, Jürgen EhlersDissertation online:http://hdl.handle.net/11858/00-1735-0000-002E-E317-A
The aim of this investigation was to develop a classifi-cation of glaciofluvial landforms and to identify a generalsequence of these forms in the glacier forefields of the Hi-malayas. The intention behind this effort was to providea standard sequence of typical glaciofluvial landforms thatcan serve as a tool for establishing relative chronologicalframeworks of fluctuations of glaciers in cases in which thepreservation of moraines does not allow for direct determina-tion of the former extents of glaciations. Thus, this researchaimed at establishing a standard sequence of landforms thatshows a climatic–genetic dependence on recent and histori-cal glacier fluctuations during the Holocene in the study ar-eas of Khumbu Himal (central Eastern Himalayas; Fig. 1a)and Pangong Tso (Western Himalayas; Fig. 1b). An empir-ical approach, including systematic analyses at the micro-,meso-, and macroscale (Schumm, 1991) of the main studyarea in Khumbu Himal, allowed such a standard sequenceto be identified. This systematic multi-scale approach alsoproved suitable for the proglacial streams in the semi-arid re-gion near the Pangong Tso southwest shore, which was usedto identify convergences and divergences of landforms.
The methods that finally allowed for the establishment ofthe standard sequence of glaciofluvial landforms includedgeomorphological field techniques that were applied in twofield campaigns in 2012 and 2013, sedimentological analy-
sis, satellite image studies, and photo-panorama evaluations.Combination of these methods allowed for the distinguish-ing of divergent channel-reach morphologies (Montgomeryand Buffington, 1997), glaciofluvial terraces, gravel deposits(sandur), sequences of proglacial stream landforms, and lon-gitudinal stream profiles in the study areas of the Himalayas.The influencing factors of the streams, such as geologicalprocesses (e.g., tectonic deformation), slope processes (e.g.,avalanches, debris flows), climatic processes (e.g., precipita-tion), and fluvial processes (e.g., glacial lake outburst floods(GLOFs), river inflows), were considered. The roles of thesefactors were clarified using additional field surveys in tribu-tary valleys.
Microanalysis. In the glacier forefields, proglacialstreambed morphologies show a downstream change fromcascades into step-pool sequences. Based on these chang-ing morphologies, early and late stages of streambed evo-lution were reconstructed. This approach allowed for rela-tive classification of the beds of the proglacial streams inKhumbu Himal into early and late stages of streambed evo-lution. The basal tills underneath the streambeds were rarelydeposited during Late Glacial to Neoglacial stages (IV–‘VII),but mostly during historical glacier stages (VII–XI) to the re-cent (XII) glacier stage (glacial stages according to Kuhle,2005), and stages from 1980 onwards (glacial stages accord-ing to Racoviteanu and Bajracharya, 2008). In the proglacialstreams at Pangong Tso, the streambed was relatively classi-fied into several late stages of streambed evolution. In thesestudy areas, the basal tills underneath the streambeds were
Published by Copernicus Publications on behalf of the Deutsche Quartärvereinigung (DEUQUA) e.V.
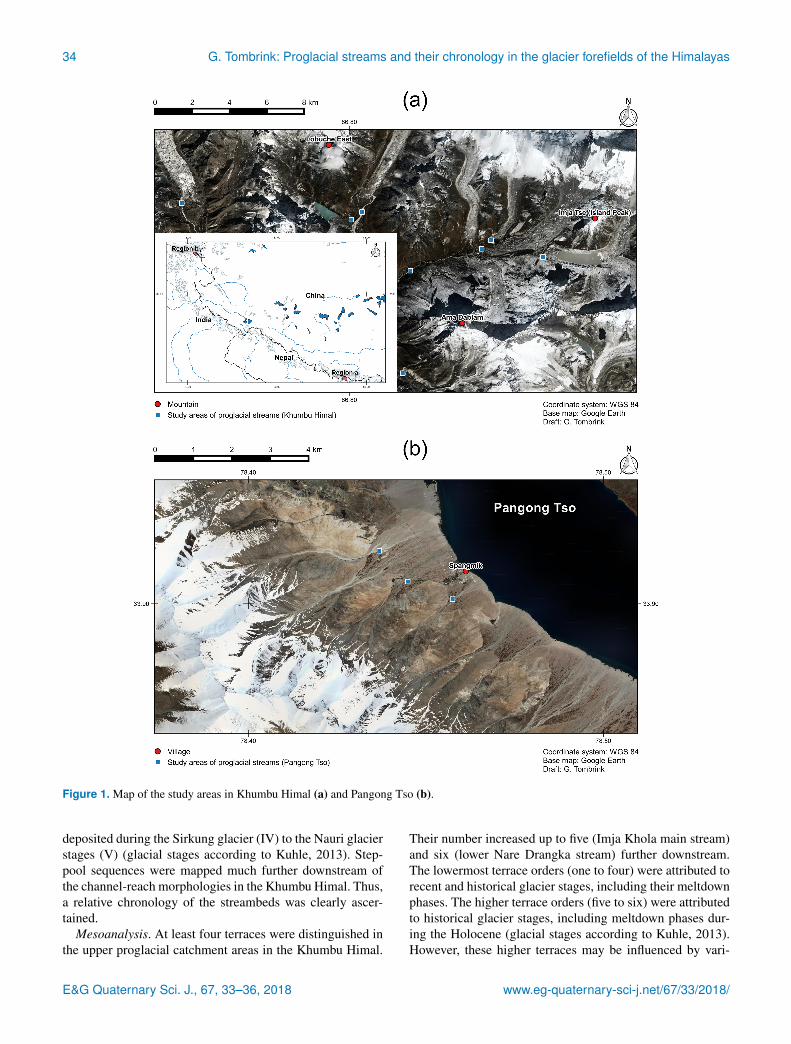
34 G. Tombrink: Proglacial streams and their chronology in the glacier forefields of the Himalayas
Figure 1. Map of the study areas in Khumbu Himal (a) and Pangong Tso (b).
deposited during the Sirkung glacier (IV) to the Nauri glacierstages (V) (glacial stages according to Kuhle, 2013). Step-pool sequences were mapped much further downstream ofthe channel-reach morphologies in the Khumbu Himal. Thus,a relative chronology of the streambeds was clearly ascer-tained.
Mesoanalysis. At least four terraces were distinguished inthe upper proglacial catchment areas in the Khumbu Himal.
Their number increased up to five (Imja Khola main stream)and six (lower Nare Drangka stream) further downstream.The lowermost terrace orders (one to four) were attributed torecent and historical glacier stages, including their meltdownphases. The higher terrace orders (five to six) were attributedto historical glacier stages, including meltdown phases dur-ing the Holocene (glacial stages according to Kuhle, 2013).However, these higher terraces may be influenced by vari-
E&G Quaternary Sci. J., 67, 33–36, 2018 www.eg-quaternary-sci-j.net/67/33/2018/
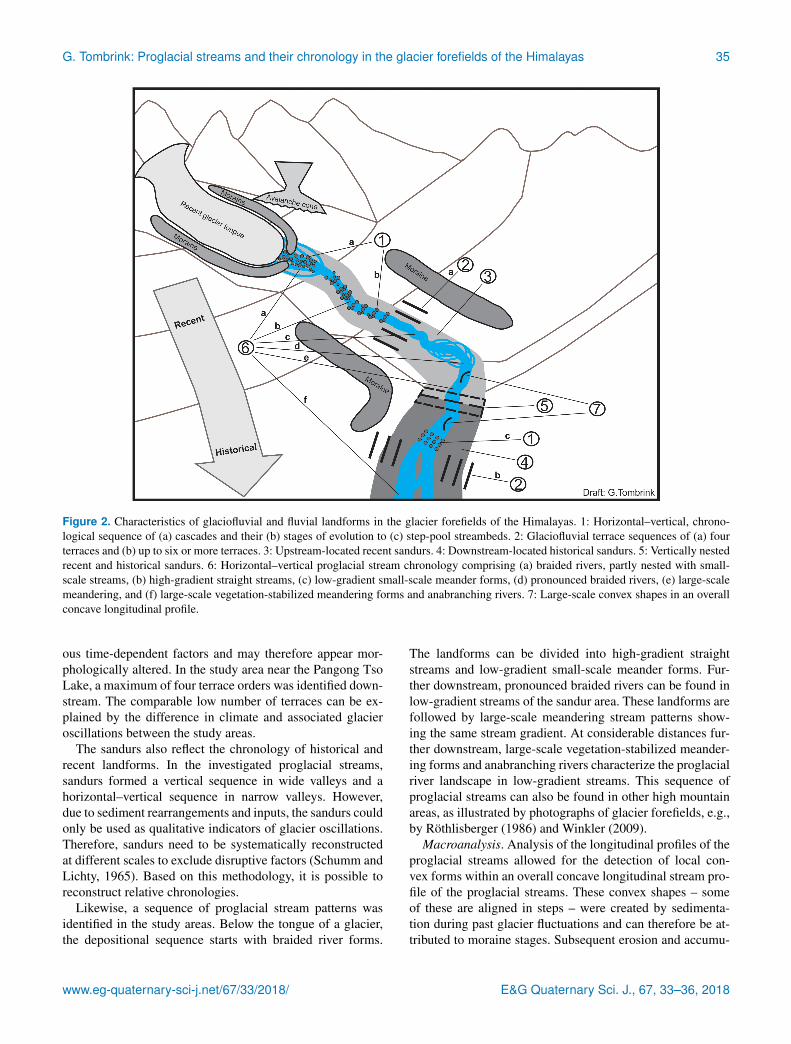
G. Tombrink: Proglacial streams and their chronology in the glacier forefields of the Himalayas 35
Figure 2. Characteristics of glaciofluvial and fluvial landforms in the glacier forefields of the Himalayas. 1: Horizontal–vertical, chrono-logical sequence of (a) cascades and their (b) stages of evolution to (c) step-pool streambeds. 2: Glaciofluvial terrace sequences of (a) fourterraces and (b) up to six or more terraces. 3: Upstream-located recent sandurs. 4: Downstream-located historical sandurs. 5: Vertically nestedrecent and historical sandurs. 6: Horizontal–vertical proglacial stream chronology comprising (a) braided rivers, partly nested with small-scale streams, (b) high-gradient straight streams, (c) low-gradient small-scale meander forms, (d) pronounced braided rivers, (e) large-scalemeandering, and (f) large-scale vegetation-stabilized meandering forms and anabranching rivers. 7: Large-scale convex shapes in an overallconcave longitudinal profile.
ous time-dependent factors and may therefore appear mor-phologically altered. In the study area near the Pangong TsoLake, a maximum of four terrace orders was identified down-stream. The comparable low number of terraces can be ex-plained by the difference in climate and associated glacieroscillations between the study areas.
The sandurs also reflect the chronology of historical andrecent landforms. In the investigated proglacial streams,sandurs formed a vertical sequence in wide valleys and ahorizontal–vertical sequence in narrow valleys. However,due to sediment rearrangements and inputs, the sandurs couldonly be used as qualitative indicators of glacier oscillations.Therefore, sandurs need to be systematically reconstructedat different scales to exclude disruptive factors (Schumm andLichty, 1965). Based on this methodology, it is possible toreconstruct relative chronologies.
Likewise, a sequence of proglacial stream patterns wasidentified in the study areas. Below the tongue of a glacier,the depositional sequence starts with braided river forms.
The landforms can be divided into high-gradient straightstreams and low-gradient small-scale meander forms. Fur-ther downstream, pronounced braided rivers can be found inlow-gradient streams of the sandur area. These landforms arefollowed by large-scale meandering stream patterns show-ing the same stream gradient. At considerable distances fur-ther downstream, large-scale vegetation-stabilized meander-ing forms and anabranching rivers characterize the proglacialriver landscape in low-gradient streams. This sequence ofproglacial streams can also be found in other high mountainareas, as illustrated by photographs of glacier forefields, e.g.,by Röthlisberger (1986) and Winkler (2009).
Macroanalysis. Analysis of the longitudinal profiles of theproglacial streams allowed for the detection of local con-vex forms within an overall concave longitudinal stream pro-file of the proglacial streams. These convex shapes – someof these are aligned in steps – were created by sedimenta-tion during past glacier fluctuations and can therefore be at-tributed to moraine stages. Subsequent erosion and accumu-
www.eg-quaternary-sci-j.net/67/33/2018/ E&G Quaternary Sci. J., 67, 33–36, 2018

36 G. Tombrink: Proglacial streams and their chronology in the glacier forefields of the Himalayas
lation processes influence the formation and rearrangementof these shapes in the longitudinal proglacial stream profile.
All of the morphological forms described above provedsuitable to characterize the glaciofluvial and fluvial sequenceof landforms in the glacier forefields of the Himalayas(Fig. 2). In summary, the aim of this work to develop a toolfor establishing relative chronologies of glacier fluctuationswas achieved through the detailed geomorphological analy-sis at the micro-, meso-, and macroscale that was carried outin this study. This new tool complements the conventionalglacial indicators found in the Himalayas (Kuhle, 1990). Itcan be used to locate glacier forefields and distinguish differ-ent glacial stages in high mountain areas of the Himalayas,where conventional indicators are not well preserved. In ad-dition, the geomorphological indicators used here can serveto compare the intensity of glacier-melting processes. In thisway, they also allow for the detection of climatic changes inthe proglacial streams of the high mountain areas under in-vestigation. Thus, the outcomes of this study contribute tothe understanding of streams in the Himalayas, which alsohas practical implications, as changes in their total runoff(Tombrink, 2017) may affect landscapes and irrigation sys-tems.
Data availability. All data are publicly accessible via the thesis(dissertation online) and the references therein.
Competing interests. The author declares that there is noconflict of interest.
This open-access publication was fundedby the University of Göttingen.
References
Kuhle, M.: The Probability of Proof in Geomorphology – an Ex-ample of the Application of Information Theory to a new Kindof Glacigenetic Morphological Type, the Ice-Marginal Ramp(Bortensander), GeoJ., 21.3, 195–222, 1990.
Kuhle, M.: The maximum Ice Age (Würmian, Last Ice Age, LGM)glaciation of the Himalaya – a glaciogeomorphological investi-gation of glacier trim-lines, ice thicknesses and lowest former icemargin positions in the Mt. Everest–Makalu–Cho Oyu massifs(Khumbu and Khumbakarna Himal) including informations onlate-glacial, neoglacial, and historical glacier stages, their snow-line depressions and ages, GeoJ., 62, 193–650, 2005.
Kuhle, M.: The Uplift of High Asia above the Snowline and itsGlaciation as an Albedo-Dependent Cause of the Quaternary IceAges, Earth sciences in the 21st Century, Nova science publ.,New York, USA, 2013.
Montgomery, D. R. and Buffington, J. M.: Channel-reach morphol-ogy in mountain drainage basins, Geol. Soc. Am. Bull., 109,596–611, 1997.
Racoviteanu, A. and Bajracharya, S.: GLIMS Glacier Database,Boulder, CO, USA, National Snow and Ice Data Center,https://doi.org/10.7265/N5V98602, 2008.
Röthlisberger, F.: 10 000 Jahre Gletschergeschichte der Erde: EinVergleich zwischen Nord- und Südhemisphäre Alpen, Skandi-navien, Himalaya, Alaska, Südamerika, Neuseeland, Sauerlän-der, Aarau, Switzerland, 1986.
Schumm, S. A.: To interpret the earth: Ten ways to be wrong, Cam-bridge Univ. Press, Cambridge, UK, 1991.
Schumm, S. A. and Lichty, R. W.: Time, Space, and Causality inGeomorphology, Am. J. Sci., 263, 110–119, 1965.
Tombrink, G.: Flood events and their effects in a Himalayan moun-tain river: Geomorphological examples from the Buri GandakiValley, Nepal, J. Mt. Sci., 14, 1303–1316, 2017.
Winkler, S.: Gletscher und ihre Landschaften: Eine illustrierte Ein-führung, Wiss. Buchges., Darmstadt, Germany, 2009.
E&G Quaternary Sci. J., 67, 33–36, 2018 www.eg-quaternary-sci-j.net/67/33/2018/

E&G Quaternary Sci. J., 67, 37–40, 2018https://doi.org/10.5194/egqsj-67-37-2018© Author(s) 2018. This work is distributed underthe Creative Commons Attribution 4.0 License.
Thesisabstract
Glacial history of the upper Drac Blanc catchment(Écrins massif, French Alps)Felix Martin HofmannDepartment of Geology, Lund University, Sölvegatan 12, 22362 Lund, Sweden
Correspondence: Felix Martin Hofmann ([email protected])
Relevant dates: Published: 23 November 2018
How to cite: Hofmann, F. M.: Glacial history of the upper Drac Blanc catchment (Écrins massif, French Alps),E&G Quaternary Sci. J., 67, 37–40, https://doi.org/10.5194/egqsj-67-37-2018, 2018.
Supervisors: Helena Alexanderson (Lund University) &Philippe Schoeneich (Université Grenoble-Alpes)
Numerous studies dealing with Late Glacial and earlyHolocene glacier variability have been carried out in theAustrian and Swiss Alps. The advent of cosmic ray exposure(CRE) dating, based on the concentration of in situ producedcosmogenic nuclides in the quartz fraction of boulderson moraines, has, since then, enabled the chronology ofglacier fluctuations in these regions during this period tobe refined (see references in Ivy-Ochs, 2015). However,this holds partly true for the French (Western) Alps. Thefew available CRE ages from boulders on moraines in thisregion (e.g. Chenet et al., 2016) indicate glacier fluctuationsconcomitant with the cooling at 12.7 ka b2k (kiloyears before∼ 2000 CE; Heiri et al., 2014). Further glacier fluctuationsin the French Alps occurred until the early Holocene (e.g.Le Roy, 2012), thereby suggesting a similar pattern as in theAustrian and Swiss Alps where glaciers shaped morainesduring the Egesen and Kartell stadials (Ivy-Ochs, 2015).However, precise palaeogeographic and palaeoclimaticreconstructions require additional chronological constraintson Late Glacial and early Holocene glacier variability in theFrench Alps. The latter application of glacier records is ofparticular interest, as the lack of biological proxies from theLate Glacial hampers detailed reconstructions of climaticvariations in this region.
Considering that a sequence of well-preserved moraines inthe Rougnoux valley in the southern Écrins massif (Fig. 1; Di
Costanzo and Hofmann, 2016) has been assigned to glacierfluctuations at the end of the Late Glacial or in the earlyHolocene, this set of moraines and prominent moraines attwo nearby locations (Fig. 1) were considered suitable targetsto obtain additional chronological constraints on the relatedglacier variability. Hence, this study not only contributes toa better understanding of the chronology of Late Glacial andearly Holocene glacier fluctuations in the French Alps butalso provides a solid base for future palaeogeographic andpalaeoclimatic reconstructions.
Based on freely available aerial photographs taken by theFrench National Institute of Geographic and Forest Informa-tion (IGN), an orthophoto and a high-resolution digital eleva-tion model (DEM) were established using the structure-frommotion technique. The use of a combination of a DEM-basedhillshade, the orthophoto and photographs as well as exten-sive field surveys enabled the establishment of geomorpho-logical maps of the study area using the mapping system ofLausanne University. The identification of pre-Little Ice Age(LIA) moraines in the study area was based on a two-fold ap-proach. Firstly, it was assessed whether the ridges in questionare characterised by an asymmetric shape and a steeper prox-imal side. Secondly, it was verified whether the landformsare composed of a diamicton, if outcrops were available. Allmoraines, even small ones, which are indicative for the ex-tent of the two palaeoglaciers in the study area, were thenassigned to former positions of the glaciers based on theirrelative position in the field to finally establish a morphos-tratigraphy.
Published by Copernicus Publications on behalf of the Deutsche Quartärvereinigung (DEUQUA) e.V.

38 F. M. Hofmann: Glacial history of the upper Drac Blanc catchment
Figure 1. Moraines in the upper Drac Blanc catchment.
Due to the lack of organic material in the moraines suit-able for radiocarbon dating, the measurement of the concen-tration of the in situ accumulated cosmogenic nuclide 10Bein the quartz fraction of samples from boulders on selectedmoraines was deemed the only solution to overcome this lim-itation and to be able to constrain their ages. The 10Be pro-duction rate of Young et al. (2013) was chosen for the de-termination of the CRE ages. Considering that the CRE ageswith a snow shielding correction are believed to be most re-alistic, they are presented below. Given that, in most cases,three CRE ages were obtained from each moraine, landformages were computed (Fig. 2). First, reduced χ2 statistics wasapplied. If reduced χ2 turned out to be roughly 1, the averageCRE age was chosen as landform age to eliminate the scat-ter due to analytical uncertainties, whereas the oldest CREage from a moraine was considered the landform age if re-duced χ2 was significantly larger than 1, as most sampledboulders were small, thereby increasing the likelihood forpost-depositional exhumation. The computed CRE ages werecompared with previously published 10Be CRE ages fromboulders on moraines at key sites in the Alps, recalculated ac-cording to a recent 10Be production rate (Young et al., 2013),and data from palaeoclimatic proxies other than glaciers.
Thirdly, DEMs of the palaeoglaciers during the depositionof their outermost LIA moraines and the further down-valleymoraines were established using the GlaRe ArcGIS toolbox(Pellitero et al., 2016). Generally, the basal shear stress asprimary input of the GlaRe toolbox was adjusted to fit theDEMs of the palaeoglaciers to the preserved moraines. Asecond ArcGIS toolbox enabled the equilibrium line altitudes(ELAs) of the palaeoglaciers to be determined, whereby themost common accumulation area ratio of 0.67 was assumed.This ratio is believed to be appropriate for Alpine glaciersbeing in equilibrium with the climate (Gross et al., 1977).Lastly, ELA depressions with respect to the end of the LIAwere computed to allow for stratigraphical correlations be-tween sampled and not-sampled moraines.
In total, 10 and 8 pre-LIA positions of the Rougnouxand Prelles palaeoglaciers were identified, respectively. Anenigmatic 10Be CRE age of a boulder on the lowermostsampled moraine (PdC M10-11) indicates that it may havestabilised after a period of stable ice margins at or before17.2 ± 1.8 ka b2k (Fig. 2). Given its location at the conflu-ence of two valleys, the moraine was probably deposited atthe common margin of the glaciers from both valleys. Dur-ing this potential event, the ELA of the palaeoglacier from
E&G Quaternary Sci. J., 67, 37–40, 2018 www.eg-quaternary-sci-j.net/67/37/2018/
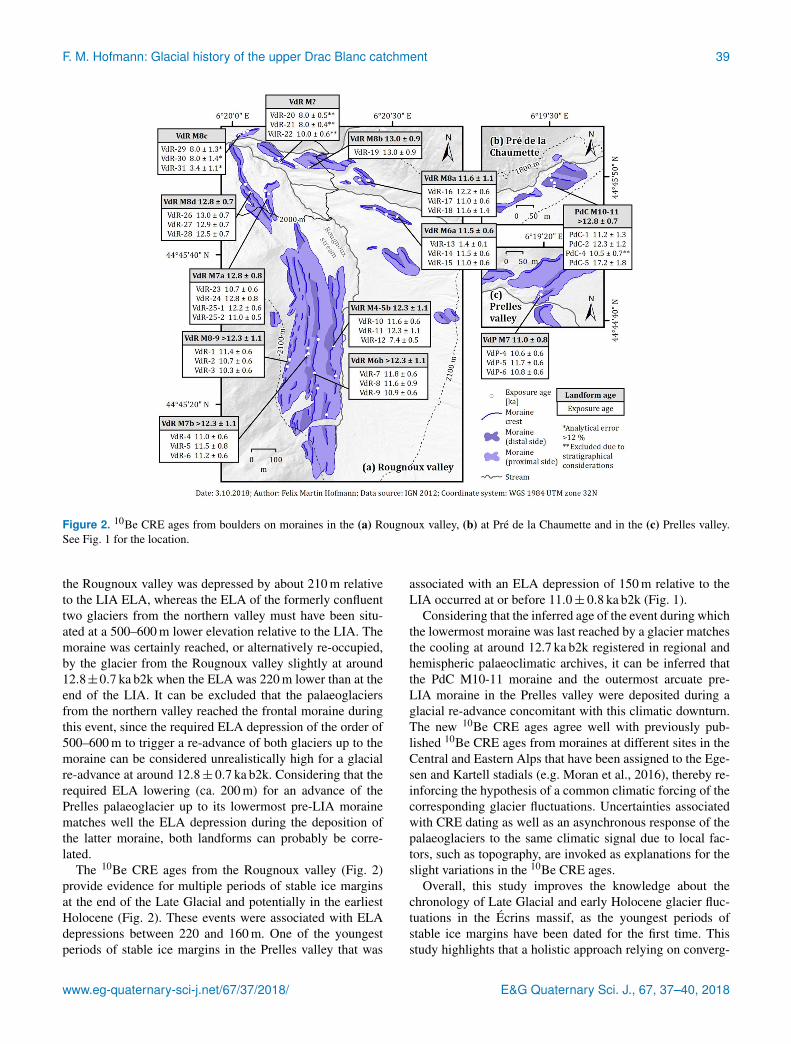
F. M. Hofmann: Glacial history of the upper Drac Blanc catchment 39
Figure 2. 10Be CRE ages from boulders on moraines in the (a) Rougnoux valley, (b) at Pré de la Chaumette and in the (c) Prelles valley.See Fig. 1 for the location.
the Rougnoux valley was depressed by about 210 m relativeto the LIA ELA, whereas the ELA of the formerly confluenttwo glaciers from the northern valley must have been situ-ated at a 500–600 m lower elevation relative to the LIA. Themoraine was certainly reached, or alternatively re-occupied,by the glacier from the Rougnoux valley slightly at around12.8±0.7 ka b2k when the ELA was 220 m lower than at theend of the LIA. It can be excluded that the palaeoglaciersfrom the northern valley reached the frontal moraine duringthis event, since the required ELA depression of the order of500–600 m to trigger a re-advance of both glaciers up to themoraine can be considered unrealistically high for a glacialre-advance at around 12.8 ± 0.7 ka b2k. Considering that therequired ELA lowering (ca. 200 m) for an advance of thePrelles palaeoglacier up to its lowermost pre-LIA morainematches well the ELA depression during the deposition ofthe latter moraine, both landforms can probably be corre-lated.
The 10Be CRE ages from the Rougnoux valley (Fig. 2)provide evidence for multiple periods of stable ice marginsat the end of the Late Glacial and potentially in the earliestHolocene (Fig. 2). These events were associated with ELAdepressions between 220 and 160 m. One of the youngestperiods of stable ice margins in the Prelles valley that was
associated with an ELA depression of 150 m relative to theLIA occurred at or before 11.0 ± 0.8 ka b2k (Fig. 1).
Considering that the inferred age of the event during whichthe lowermost moraine was last reached by a glacier matchesthe cooling at around 12.7 ka b2k registered in regional andhemispheric palaeoclimatic archives, it can be inferred thatthe PdC M10-11 moraine and the outermost arcuate pre-LIA moraine in the Prelles valley were deposited during aglacial re-advance concomitant with this climatic downturn.The new 10Be CRE ages agree well with previously pub-lished 10Be CRE ages from moraines at different sites in theCentral and Eastern Alps that have been assigned to the Ege-sen and Kartell stadials (e.g. Moran et al., 2016), thereby re-inforcing the hypothesis of a common climatic forcing of thecorresponding glacier fluctuations. Uncertainties associatedwith CRE dating as well as an asynchronous response of thepalaeoglaciers to the same climatic signal due to local fac-tors, such as topography, are invoked as explanations for theslight variations in the 10Be CRE ages.
Overall, this study improves the knowledge about thechronology of Late Glacial and early Holocene glacier fluc-tuations in the Écrins massif, as the youngest periods ofstable ice margins have been dated for the first time. Thisstudy highlights that a holistic approach relying on converg-
www.eg-quaternary-sci-j.net/67/37/2018/ E&G Quaternary Sci. J., 67, 37–40, 2018

40 F. M. Hofmann: Glacial history of the upper Drac Blanc catchment
ing lines of evidence, such as geomorphological mapping,CRE dating and ELA reconstructions, should be applied todecipher the glacial history of a region with the greatest pos-sible accuracy.
Data availability. Details on the samples for 10Be CRE dating canbe found in a global database of glacial 10Be and 26Al data avail-able at http://expage.github.io/data/txt/Hofmann-2018.txt (last ac-cess: 16 November 2018). All other data are available from the au-thor upon request.
Author contributions. This study was mostly undertaken duringthe master thesis project of FMH. PS carried out geomorphologicalfield mapping and supported FMH together with HA during the es-tablishment of the geomorphological maps. The samples for 10BeCRE dating were taken by FMH and PS. The preparation of therock samples for 10Be CRE dating in the Laboratoire Nationale desNucléides Cosmogéniques in Aix-en-Provence (France) was per-formed by FMH. HA and PS provided FMH support during the in-terpretation of the results of CRE dating and the ELA reconstruc-tions. The manuscript was written by FMH.
Competing interests. The author declares that there is no con-flict of interest.
Acknowledgements. Firstly, Helena Alexanderson andPhilippe Schoeneich are thanked for their excellent supervision.The project was financially supported by the German AcademicExchange Service (DAAD) through a one-year scholarship forgraduate students to Felix Martin Hofmann. The administrationof the Écrins national park is acknowledged for the authorisationfor sampling (authorisation no. 472/2017). Sébastien Bolbenes andMelaine Le Roy are thanked for their dedication during field work.Jordan R. Mertes is acknowledged for his help during the establish-ment of the DEM and the orthophoto. This study would have beenimpossible without the unanimous support of Didier L. Bourlès,Laëtitia Léanni, Régis Braucher and Valéry Guillou during thelab work. This paper benefitted from insightful discussions withLena Håkansson, Per Möller, Melaine Le Roy, Irene Schim-melpfennig, Max Boxleitner, Sven Lukas, Susan Ivy-Ochs andJürgen M. Reitner and other colleagues. The comments of thereviewers are gratefully appreciated.
References
Chenet, M., Brunstein, D., Jomelli, V., Roussel, E., Rinterknecht,V., Mokadem, F., Biette, M., Robert, V., Léanni, L., andASTER Team: 10Be cosmic-ray exposure dating of morainesand rock avalanches in the Upper Romanche valley (FrenchAlps): Evidence of two glacial advances during the LateGlacial/Holocene transition, Quaternary Sci. Rev., 148, 209–221,https://doi.org/10.1016/j.quascirev.2016.07.025, 2016.
Di Costanzo, H. and Hofmann, F. M.: Le retrait du glacierdu Drac Blanc (massif des Écrins, Alpes françaises),Méditerranée, Revue géographique des pays méditer-ranéens, Paléo-environnements, géoarchéologie, géohistoire, 5,https://doi.org/10.15496/publikation-13788, 2016.
Gross, G., Kerschner, H., and Patzelt, G.: Methodische Unter-suchungen über die Schneegrenze in alpinen Gletschergebieten,Zeitschrift für Gletscherkunde und Glazialgeologie, 12, 223–251, 1977.
Heiri, O., Koinig, K. A., Sp.tl, C., Barrett, S., Brauer, A., Drescher-Schneider, R., Gaar, D., Ivy-Ochs, S., Kerschner, H., Luetscher,M., Moran, A., Nicolussi, K., Preusser, F., Schmidt, R., Schoene-ich, P., Schwörer, C., Sprafke, T., Terhorst, B., and Tinner,W.: Palaeoclimate records 60–8 ka in the Austrian and SwissAlps and their forelands, Quaternary Sci. Rev., 106, 186–205,https://doi.org/10.1016/j.quascirev.2014.05.021, 2014.
Ivy-Ochs, S.: Glacier variations in the European Alps at the endof the last glaciation, Cuadernos de investigación geográfica, 41,295–315, https://doi.org/10.18172/cig.2750, 2015.
Le Roy, M.: Reconstitution des fluctuations glaciaires holocènesdans les Alpes occidentales – Apports de la dendrochronologie etde la datation par isotopes cosmogéniques produits in situ, PhDthesis, Grenoble University, Grenoble, 363 pp., 2012.
Moran, A. P., Ivy-Ochs, S., Schuh, M., Christl, M., and Ker-schner, H.: Evidence of central Alpine glacier advances duringthe Younger Dryas–early Holocene transition period, Boreas, 45,398–410, https://doi.org/10.1111/bor.12170, 2016.
Pellitero, R., Rea, B. R., Spagnolo, M., Bakke, J., Ivy-Ochs, S., Frew, C. R., Hughes, P., Ribolini, A., Lukas,S., and Renssen, H.: GlaRe, a GIS tool to reconstruct the3D surface of palaeoglaciers, Comput. Geosci., 94, 77–85,https://doi.org/10.1016/j.cageo.2016.06.008, 2016.
Young, N. E., Schaefer, J. M., Briner, J. P., and Goehring, B. M.:A 10Be production-rate calibration for the Arctic, J. QuaternarySci., 28, 515–526, https://doi.org/10.1002/jqs.2642, 2013.
E&G Quaternary Sci. J., 67, 37–40, 2018 www.eg-quaternary-sci-j.net/67/37/2018/

E&G Quaternary Sci. J., 67, 41–72, 2019https://doi.org/10.5194/egqsj-67-41-2019© Author(s) 2019. This work is distributed underthe Creative Commons Attribution 4.0 License.
Research
article
New data from the Middle Palaeolithic Cotencher cave (SwissJura): site formation, environment, and chronologyJudit Deák1, Frank Preusser2, Marie-Isabelle Cattin1, Jean-Christophe Castel3, and François-Xavier Chauvière1
1Office du patrimoine et d’archéologie Neuchâtel (OPAN), section Archéologie, Hauterive, Switzerland2Institute of Earth and Environmental Sciences, University of Freiburg, Freiburg, Germany3Muséum d’histoire naturelle Genève, Département d’archéozoologie, Genève, Switzerland
Correspondence: Judit Deák ([email protected])
Relevant dates: Received: 17 September 2018 – Revised: 6 December 2018 – Accepted: 10 December 2018 –Published: 10 January 2019
How to cite: Deák, J., Preusser, F., Cattin, M.-I., Castel, J.-C., and Chauvière, F.-X.: New data from the MiddlePalaeolithic Cotencher cave (Swiss Jura): site formation, environment, and chronology, E&G Quater-nary Sci. J., 67, 41–72, https://doi.org/10.5194/egqsj-67-41-2019, 2019.
Abstract: Cotencher cave is one of the oldest Palaeolithic sites of Switzerland and is known for its rich faunaland Mousterian artefacts, the latter suggesting one or several passages of Neanderthal hunter–gatherertribes. This interdisciplinary study summarises novel data concerning site formation processes and an-thropic attendance of the site. While the lithic artefacts indicate tool production at the site, the faunalremains do not yield any evidence of a link to human occupation. The sedimentary sequence permitsus to unravel several important environmental changes that occurred during the Late Pleistocene. Thepresence of a local glacier around 70 ka (Marine Isotope Stage, MIS 4) is revealed followed by ice-freeconditions characterised by alternating soil formation processes and landscape destabilisation duringMIS 3. Solifluction processes suggesting recurrent frozen ground were responsible for the displace-ments of part of the artefacts and faunal remains. Evidence of local glacier development around 36 kais related to the particular geomorphological conditions of the studied region and shed new light onthe complexity of glacier dynamics. The recognition and dating of recurrent hostile glacier landscapesmight contribute to understanding the reasons for the Middle and Upper Palaeolithic attendance hia-tuses known in the studied region.
Kurzfassung: Die Cotencher-Höhle ist eine der ältesten paläolithischen Fundstätten der Schweiz und bekannt fürihre reiche Fauna und mousterischen Artefakte. Letztere weisen darauf hin, dass Neanderthaler-Sippen aus Jägern und Sammlern die Region einmal oder mehrere Male durchstreift haben könnten.Diese interdisziplinäre Studie fasst neue Daten zu Standortbildungsprozessen und zu Aufenthaltenvon Menschen zusammen. Während die Steinartefakte eine Werkzeugproduktion an der Fundstelleanzeigen, geben die Faunenreste keine Hinweise auf eine Anwesenheit von Menschen. Die Sedi-mentabfolge erlaubt es, einige wichtige Umweltveränderungen während des späten Pleistozäns zuentschlüsseln. Die Präszenz eines lokalen Gletschers vor etwa 70 ka (Marines Isotopen Stadium,MIS 4) ist erkennbar, gefolgt von eisfreien Bedingungen, die durch sich abwechselnde Bodenbil-dungsprozesse und Landschaftsdestabilisierung während des MIS 3 charakterisiert sind. Solifluktion-sprozesse, die auf wiederkehrend gefrorene Böden schließen lassen, waren verantwortlich für die Ver-lagerung eines Teils der Artefakte und Faunenreste. Die Bildung eines Lokalgletschers vor etwa 36 ka
Published by Copernicus Publications on behalf of the Deutsche Quartärvereinigung (DEUQUA) e.V.

42 J. Deák et al.: New data from the Middle Palaeolithic Cotencher cave
ist bedingt durch die speziellen geomorphologischen Gegebenheiten der untersuchten Region undgeben neue Befunde über die Komplexität der Gletscherdynamik. Die Identifikation wiederkehren-der lebensfeindlicher glazialer Landschaften könnte einen Beitrag dazu leisten, die phasenweise Ab-wesenheit von Menschen im Untersuchungsgebiet während des Mittel- und Oberpaläolithikums zuerklären.
1 Introduction
While Alpine glaciers extended several times onto theSwiss Plateau during the Pleistocene (Ivy-Ochs et al., 2008;Preusser et al., 2011), the Jura Mountains were also recur-rently covered by local and sometimes Alpine ice bodies(Campy, 1992; Graf et al., 2007; Buoncristiani and Campy,2011). During the Last Glacial Maximum (LGM), the icecover reached up to 1200 m in the western part of the SwissPlateau (Campy, 1992; Bini et al., 2009; Cupillard et al.,2015) and most sediments and soils previously covering thelandscape as well as their archaeological content were re-moved by glacial erosion. As a consequence, Lower andMiddle Palaeolithic sites are scarce in the region and theMiddle Palaeolithic is documented at only about 20 open air,rock shelter, and cave sites (Le Tensorer, 1993, 1998; Tillet,2001; Crotti, 2008; Detrey, 2010, 2013). Among these, Co-tencher cave is the first Middle Palaeolithic site ever discov-ered in the Jura Mountains of Switzerland (Egloff, 1989).
Only a few records of Pleistocene environmental changeare available from the Swiss Alpine foreland and in the JuraMountains for the time before the LGM (Ivy-Ochs et al.,2008; Preusser et al., 2011; Heiri et al., 2014; Cupillard etal., 2015). Cave and rock shelter deposits have the poten-tial to provide valuable additional information in this contextdue to their relatively protected setting compared to poten-tially more easily eroding open-air sites. These landscape el-ements were also places of human activity, and geoarchae-ological studies aim at understanding the processes behindsite formation (Goldberg and Macphail, 2006). Cave depositsare subdivided into clastic and chemical sediments (Gold-berg and Macphail, 2006; White, 2007). The clastic sedi-ments originate from either inside (autochthonous) or outside(allochthonous) of the cave and comprise weathering detri-tus, rock breakdown, entrance talus, infiltrates, and fluvial,glacial, and aeolian deposits. In addition, biogenic debrisand anthropogenic layers may occur. Chemical deposits areconsidered to be in situ formed (autochthonous) and includespeleothems, evaporates, ice, and phosphate and nitrate min-erals originating from guano and bone alteration. Thus, cavesand rock shelters are locations of numerous simultaneous orsuperposed depositional processes. Understanding these pro-cesses and their environmental causes is particularly chal-lenging and often performed within interdisciplinary inves-tigations (e.g. Goldberg et al., 2003; Angelucci et al., 2013;Boschian et al., 2017).
The most common approach to determine the age of cavedeposits is radiocarbon dating of organic remains, in particu-lar charcoal and bones, incorporated into sediments (Hajdas,2008; Taylor and Bar-Yosef, 2014). Usually, this method isconsidered reliable despite potential problems related to re-working that may lead to radiocarbon ages older than thetime of sediment deposition (e.g. Lee et al., 2011). Further-more, radiocarbon ages ≥ 30000 14C yr tend to underesti-mate the real age, and ages beyond 50 000 14C yr are gener-ally not considered reliable (e.g. Hajdas et al., 2007; Higham,2015). Other approaches include the dating of speleothemformation with the U-series methodology, in particular whenapplied to flow stones (St Pierre et al., 2009). An importantimprovement was the introduction of luminescence dating todate cave deposits (Feathers, 1996; Roberts, 1997; Robertset al., 2015). Using optical stimulation, this approach allowsus to directly date the deposition age of quartz and feldspargrains from sediments found in caves. However, the methodis also affected by several potential problems that need care-ful consideration (Jacobs and Roberts, 2008). First, the lu-minescence signal might not have been fully reset prior todeposition (partial bleaching), which will lead to overesti-mation of ages. As grains have individual light exposure his-tories, measuring very few or even individual grains allowsthe detection of and correction for this effect using statisticalapproaches (e.g. Duller, 2008). Indication for partial bleach-ing is a wide-spread and positively skewed distribution, incombination with high overdispersion values (e.g. Rittenour,2008). Second, while quartz is mainly the preferred mineralin luminescence dating, quartz from certain regions includingthe Alps is problematic with regard to its signal properties(e.g. Preusser et al., 2006). At the same time the lumines-cence signal in feldspar can be affected by unstable signalcomponents that may lead to age underestimation. While thesignal loss can be monitored in the laboratory and approacheshave been suggested to correct for it (Huntley and Lamothe,2001), these procedures have been shown to often be prob-lematic (e.g. Wallinga et al., 2007; Lowick et al., 2012). Analternative might be to use more stable signal componentsfrom feldspar (Thomsen et al., 2008), but at the cost of aslower resetting by daylight (Buylaert et al., 2012), whichmight be problematic in settings with short-distance trans-port. Third, reconstructing annual dose rate can be complexin cave settings (e.g. Guérin et al., 2017) and radioactive dis-equilibrium in the uranium decay chain may occur (e.g. Olleyet al., 1997).
E&G Quaternary Sci. J., 67, 41–72, 2019 www.eg-quaternary-sci-j.net/67/41/2019/

J. Deák et al.: New data from the Middle Palaeolithic Cotencher cave 43
Sediments of Cotencher cave have delivered rich faunalassemblages and more than 400 artefacts that were found intwo distinct stratigraphical units. Already Dubois and Stehlin(1932/1933) discussed the relationship between the sedimen-tary sequence and past glaciations. More recent geoarchaeo-logical studies define and characterise several stratigraphicunits positioned between the Eemian and the Holocene(Adatte et al., 1991; Rentzel, 1990). The dating of the se-quence is based on techno-typological elements, variation inthe mineralogy, and a few charcoal radiocarbon ages. The lat-ter, originating from two individual archaeological find lay-ers, are at the upper dating limit and suggest a minimumage of 40 ka for the lower part of the site. The youngestfind layer was interpreted as being deposited during the LatePleistocene (Marine Isotope Stage – MIS 3, cited as Inter-pleniglacial in Adatte et al., 1991). Based on clay mineral-ogy, the oldest archaeological layer is interpreted as last in-terglacial soil redeposited during the early Late Pleistocene(Adatte et al., 1991). According to the most favoured hypoth-esis the lithic artefacts represent Mousterian Charentian oforiental Quina type originating from a single archaeologi-cal level situated originally at the entrance of the cave andredeposited during the two time intervals mentioned above(Bernard-Guelle, 2004).
As part of a regional landscape and natural resource co-ordination plan (Chauvière et al., 2018b, c; Deák, 2018a, b)two sections close to the entrance of the cavity were inves-tigated. Establishing a more precise and detailed chronologyof the sedimentary sequence was the main target, as the ra-diometric and archaeologic dating available so far were im-precise and incomplete. The present study focuses on thepre-Holocene sedimentary sequence hosting numerous Pleis-tocene faunal remains and Palaeolithic artefacts. We presentthe results of an interdisciplinary approach that provides notonly a more detailed chronological framework but also com-pletes our knowledge concerning the environmental changesrecorded in the sediment fill. Furthermore, the archaeologi-cal finds are discussed in the larger context of Middle Palae-olithic occupations in Switzerland and neighbouring France.
2 Research context
2.1 Regional setting
Cotencher cave is located in the Areuse canyon, which ispart of the Travers Valley (Canton Neuchâtel, Switzerland;Fig. 1). The entrance is at 660 m in altitude and situated140 m above the present-day valley bottom. The cave is about18 m long and consists of a 7 m long and 13 m wide rockshelter as well as an 11 m long underground gallery (Gigon,1976; Fig. 2a and b). There is no evidence of recent orpast karst springs or underground river activity. The caveis formed in Upper Jurassic limestones (Méia and Becker,1976), more precisely at the interface between Kimmerid-gian and Thitonian (Portlandian) strata (Dubois and Stehlin,
1932/1933). Late Quaternary undifferentiated glacial andglaciofluvial deposits interpreted as being of penultimateglacial (Rissian) age are present discontinuously on theneighbouring slopes (Méia and Becker, 1976); sediments at-tributed to the last interglacial and early phases of the lastglacial cycle are apparently absent in the valley (Pasquier etal., 2013). Prior to previous archaeological excavations thecave was almost fully filled with sediment and one could en-ter it only by crawling (Gigon, 1976; Fig. 2b). Indeed, themaximum height of the internal gallery is about 5 m (Gigon,1976, Miéville, 2005), where the sedimentary fill reachedthicknesses of up to 4 m.
2.2 Research history
Cotencher cave has been mentioned as early as 1523 CE(Miéville, 2005), but the first excavations inside the cav-ity only date back to the second half of the 19th century(Otz, 1867; Desor, 1868, 1872). The latter permitted re-searchers to unravel the presence of old bones mainly at-tributed to cave bears (Ursus spelaeus). A high variety offaunal remains were confirmed by subsequent excavationsthat took place in 1915 and between 1916 and 1918 (Stehlinand Dubois, 1916; Dubois, 1917, 1918, 1920; Dubois andStehlin, 1932/1933). The 1916–1918 excavations have abenchmark value and the results published in a monography(Dubois and Stehlin, 1932/1933) were the first to describe thecomplete stratigraphic sequence and defined (from youngestto oldest) the following stratigraphic units: (i) cryoclasticsediment (éboulis) containing Holocene archaeological re-mains (Dubois and Stehlin, 1932/1933; Vouga, 1943; DeRougemont, 1982); (ii) sterile white clay (argiles blanches);(iii) “gravelly layer” (couche à galets); (iv) “brown layer”(couche brune); and (v) a yellow basal clay (argile dufond). Detailed investigation of the sedimentary sequenceand study of the various finds permitted scholars to recog-nise the changing environmental conditions recorded in thecave. Thousands of animal bones (belonging to about 60species and sometimes burnt), dismantled fire places, andmore than 400 lithic Mousterian artefacts attest to the pres-ence of Neanderthal people during the time when the gravellylayer and the brown layer were formed (Dubois and Stehlin,1932/1933; Egloff, 1976; Le Tensorer, 1998). This rich ar-chaeological assemblage was further completed by illegaldigs outside the cave in the 1950s. In 1964, a mandible frag-ment attributed to a ca. 40-year-old Neanderthal woman wasdiscovered in the brown layer in the innermost part of thecave (Moll, 1971, 1974, 1977; Bay, 1981).
The first sedimentological analyses were performed in the1950s (Schmid, 1958). Between 1988 and 1990, new exca-vations were accompanied by detailed sedimentological andmineralogical studies, permitting researchers to complete theunderstanding of the stratigraphic and environmental his-tory (Fig. 3) (Rentzel, 1990, 1992; Adatte et al., 1991). Ac-cording to these data the sedimentary record of the cave in-
www.eg-quaternary-sci-j.net/67/41/2019/ E&G Quaternary Sci. J., 67, 41–72, 2019

44 J. Deák et al.: New data from the Middle Palaeolithic Cotencher cave
Figure 1. Location of Cotencher cave and of mentioned sites.
Figure 2. Map of the cavity with the localisation of the various interventions and sections mentioned in this paper (a) and longitudinalsection of it based on Dubois and Stehlin (1932/1933) (b).
cludes (i) Holocene cryoclastic deposit (Layer I), (ii) twopost-glacial finely textured layers (II and III), (iii) an In-terpleniglacial gravelly layer (V), and (iv) sediment (brownlayer or VI) interpreted as reworked Eemian soil. Three char-coal fragments found in the archaeological layers (two inthe gravelly layer, one in the brown layer) gave radiocarbonages of around 40 000 14C yr BP, considered minimum ages.
These results together with palaeontological and palynolog-ical data have been included in the synthetic work dedicatedto the Palaeolithic in Switzerland by Le Tensorer (1998), whoattributed the lowest archaeological find layer to the final partof the Odderade interstadial, while the gravelly layer was cor-related with the Dürnten (Hengelo) phase.
E&G Quaternary Sci. J., 67, 41–72, 2019 www.eg-quaternary-sci-j.net/67/41/2019/

J. Deák et al.: New data from the Middle Palaeolithic Cotencher cave 45
Figure 3. Synthetic overview of the stratigraphy of the site as recorded by the various studies. (a) Dubois and Stehlin excavations (Duboisand Stehlin, 1932/1933); (b) study by Renzel 1988 (Rentzel, 1990); (c) 2016 intervention presented in this paper and the dates obtained.Legend: on the right side of the columns the stratigraphic nomenclature used by the various authors is indicated.
2.3 Climate and environment
Present-day climate in the study region is characterised bymean annual temperatures of 9.4 ◦C (Neuchâtel 485 m a.s.l.)and 6.3–6.4 ◦C (La Chaux-de-Fonds 1018 m a.s.l.; Chaumont1136 m a.s.l.). For the same stations mean annual precipita-tions are 987, 1468 and 1289 mm (Météosuisse, 2016). Themean annual evaporation for the Neuchâtel station is 573 mm(Météosuisse, 2005); thus on an annual basis leaching condi-tions prevail.
Reconstruction of the Late Pleistocene terrestrial environ-mental history of the northern Alpine foreland and the JuraMountains is based on discontinuously dated evidence from(i) lake pollen records, glacier melt-out and outwash de-posits, and a few cave sites – all of them covered by the iceduring the LGM, and (ii) some dolina deposits and loess–palaeosol sequences described in localities situated outsideof the reach of LGM glaciers (Preusser et al., 2003, 2011;Preusser, 2004; Blant and Deriaz, 2007; Ivy-Ochs et al.,2008; Gaar and Preusser, 2012; Becker et al., 2013; Leeschet al., 2013; Heiri et al., 2014; Bichet et al., 2016). Accordingto Preusser (2004), five rather cool to cold periods (stadials,S1–5) are delimited from warmer phases. The first marked
cooling (S1/MIS 5d) after the last interglacial was possiblyaccompanied by a first glacier advance into the major alpinevalleys, but its extension is not defined. It was followed bya period of rather warm conditions with boreal forest andsome deciduous trees. This phase is usually correlated withthe Brørup interstadial and MIS 5c. The geographical exten-sion of the S2 glacier advance (MIS 5b) cannot be delimiteddue to subsequent erosion (Ivy-Ochs et al., 2008). The sec-ond interstadial of the Early Würmian (MIS 5a) was againcharacterised by boreal forest with some temperate taxa. ForS3 (equivalent of MIS 4), glacial outwash deposits are docu-mented relatively close to the studied site (Fig. 1), at Finster-hennen (Preusser et al., 2007) and at Arçon (Cupillard et al.,2015; Bichet et al., 2016). For the subsequent period (MiddleWürmian, corresponding to MIS 3) a succession of more orless mild interstadials has been recognised at Gossau in theLake Zürich area (Preusser et al., 2003). Its first phase, theDürnten Interstadial of Welten (1981), featured open wood-land vegetation with pine and spruce and likely dates to about55 ka (Wegmüller et al., 2002). Sites with faunal remainsfound both inside and outside the LGM limits indicate opentundra–steppe environment but temporarily with patches of
www.eg-quaternary-sci-j.net/67/41/2019/ E&G Quaternary Sci. J., 67, 41–72, 2019

46 J. Deák et al.: New data from the Middle Palaeolithic Cotencher cave
boreal vegetation (Becker et al., 2013). The site of Nieder-weningen, dating to ca. 45 ka (Hajdas et al., 2007; Preusserand Degering, 2007), has been particularly well investigated,with detailed reconstructions pointing towards open wood-land conditions (Drescher-Schneider et al., 2007) and a richfauna (Furrer et al., 2007). During the Late Würmian (MIS 2,LGM) all the alpine valleys and the surrounding lowlandswere largely covered by ice (Ivy-Ochs et al., 2008) and thenorthern lobe of the Valais (Rhone) Glacier started to de-posit proglacial sediments at Finsterhennen just after 30 ka(Preusser et al., 2007). In the Jura Mountains local glaciersspread over substantial parts of the landscape (Campy, 1992;Buoncristiani and Campy, 2011). On its eastern flanks, dur-ing the most extensive phase of the LGM, local glaciers weresubjugated by the Valais Glacier (Campy, 1992; Pasquier etal., 2013) and Cotencher cave was buried under about 500–600 m of ice (Campy, 1992).
3 Methods
3.1 Excavation and documentation of archaeologicalfinds
Two almost perpendicular sections, situated close to the en-trance of the cave (2.5 and 2 m high, respectively), have beencleaned for this study (Figs. 4 and 5). The sections have beendivided into 50 cm large vertical bands and along each bandthe profiles were successively cleaned by horizontal seg-ments. In the upper parts of the sections, the horizontal clean-ing and sampling segments were 10 cm, while in the lowerparts, containing the archaeological find layers, the segmentswere 5 cm thick. All sediments originating from this cleaningprocess have been collected to be sieved and analysed. Sam-ples for luminescence dating were taken by forcing metaltubes into the sediment exposure and additional material wastaken for high-resolution gamma spectrometry. Undisturbedblocks were taken for thin section preparation and they areused here to estimate porosity. Detailed micromorphologicalstudies are planned for a subsequent phase of this project.
All samples and the lithic and faunal finds discoveredduring the cleaning process were three-dimensionally posi-tioned. The bulk samples were wet sieved (see below) andall bones and archaeological lithic fragments were carefullycollected and documented. The sediments in the lower partof the studied sections are leftovers of former excavationsor result from natural collapse of the cave walls. These havebeen 2 mm dry-sieved in front of the cavity and artefacts werecollected. A detailed photographic documentation of the suc-cessive stages of field work was also performed (Fig. 4).
The entire collection of lithic artefacts (457), including thefinds of the 2016 excavation, has been re-examined accord-ing to standard procedures. So far, only the bone assemblageof the 1916–1918 excavations has been assessed in detailwith the purpose of verification of the identified bone frag-ments and their thorough examination, according the current
standards with regard to the presence or absence of traces ofhuman activity (Castel, 2010; Castel et al., 2017). The bonefragments found during the 2016 intervention will be anal-ysed during a later phase of this project.
3.2 Sedimentology and soil science
Sedimentological and pedological observations were madeon both sections to record the morphology, the nature andlateral variability in the soil, and the sediment characteristics.These observations were completed during infrastructure in-stallation works in 2017. Although former studies (Duboisand Stehlin, 1932/1933, Rentzel, 1990) already proposed anomenclature of the layers (Fig. 3), we observed a moredetailed stratigraphy and renumbered layers starting fromLayer 1 (L.1) at the upper part of the sequence. In order toassure the representativeness of derived data, samples had aweight between 1.1 and 15 kg, the heavier samples being thegravelly layers. The bulk samples were air-dried, weighed,and subsampled for subsequent analyses. The remains werewet-sieved (8 mm, 4 mm, 2 mm, and 500 µm sieves) in or-der to recover archaeological material and to characterisethe quantity and nature of the coarse fraction of the vari-ous layers. The material left on each sieve was air-dried andweighed. It is important to restate that for preservation issuessampling was restricted to a thin external part of the sections.As a consequence the granulometric values of the coarsefraction calculated here should be considered only as indica-tive. For detailed analyses of the fine fraction, we rely onRentzel (1990). The organic carbon content was determinedusing the Walkley and Black method, while the CaCO3 con-tent was measured with a calcimeter; both methods are ex-plained in Mathieu and Pieltain (2003).
Petrographic and morphological investigation of the frac-tion > 8 mm of a set of selected samples, representative foreach stratigraphic unit, was performed according to a pro-tocol set up for this study. As the first screening revealedmarked difference in size, petrography, and morphology ofthe pebbles from different layers, it was attempted to iden-tify the stratigraphic origin of the calcareous rock fragments.As the available petrographic collections did not permit aclear stratigraphic attribution of the facies recognised, a site-specific catalogue was established. Based on petrographiccomposition and morphology, different groups of gravel fa-cies (GF1, GF2, etc.) were defined (Table 6). For all selectedsamples, weight, size, and morphology (roundness, surfaceroughness; Bullock et al., 1985) of the components of eachgroup was recorded. Limestone banks enclosing the cavityon both the outside and inside were sampled as local lime-stone reference material (Ref. I, Ref. II., Table 6).
Based on the comparison with the reference materialand morphological observations, five major coarse fractiongroups have been defined (Table 6 and Fig. 9). Group A in-cludes fresh rock fragments originating from the limestonelayers hosting the cave. Group B includes rock fragments
E&G Quaternary Sci. J., 67, 41–72, 2019 www.eg-quaternary-sci-j.net/67/41/2019/

J. Deák et al.: New data from the Middle Palaeolithic Cotencher cave 47
Figure 4. Field view of the observed and sampled sections. (a) Section 1 (ST1 location; see Fig. 2). Note the ice wedge cast at the contactbetween layers L.5 and L.7 and filled up with the gravels of L.6. (b) Section 2 (ST2 – location; see Fig. 2). Note the gully eroding the gravellydeposit L.12. (Photos: Marc Juillard, Laténium).
similar to limestone strata enclosing the cave but at leastshortly transported. Group C includes rock fragments sim-ilar to the limestone strata enclosing the cave, but stronglyrounded. Group D includes rock fragments not present in thestrata enclosing the cave. Group E includes particular fea-tures. The rock fragments of groups A and B are consid-ered to be autochthonous, originating from either the break-down of limestone banks enclosing the cave or those form-ing the rock shelter. Rock fragments of groups C and D areclearly allochthonous as they either bear evidence of signifi-cant transport and/or their petrography is not present aroundthe cave. The few rock fragments belonging to group E mightbe related with some human activity, but their quantity is toosmall to allow further interpretation.
3.3 Luminescence dating
Sample preparation for equivalent dose (De) determinationwas carried out in a red-light laboratory and included wet-sieving (100–150 µm) followed by removal of carbonates(20 % HCl) and organic matter (30 % H2O2). Clay particleswere dispersed during combined Na oxalate and ultrasonictreatment. K feldspar and quartz fractions were separated us-ing heavy liquids (Na polytungstate). The latter fraction wasetched in 40 % HF for 1 h, followed by> 1 h HCl (10 %) andre-sieving (to remove feldspar grains). Infrared (IR) screen-ing revealed strong contamination of the quartz fraction withfeldspar that could not be removed by further HF etching andall further work focused on K feldspar. It has to be noted
that the amount of feldspar received during preparation wasquite small due its low presence in the samples, and this lim-ited the number of experiments and replicate measurements.Feldspar extracts were fixed on stainless steel discs using a1 mm stamped spot of silicone oil, which will represent ca. 60individual grains per disc.
Measurements for De determination were performed us-ing a Freiberg Instruments Lexsyg Smart device (Richter etal., 2015), equipped with a Hamamatsu H7360-02 photomul-tiplier and using a combination of a Schott BG39 (3 mm)and a Brightline HC 414/46 interference (3.5 mm) filter. Weapplied the post-IR (pIR) infrared stimulated luminescence(IRSL) (Buylaert et al., 2009), with a preheat at 250 ◦C for60 s, a first IR stimulation at 50 ◦C for 90 s (IR-50), and asubsequent second IR stimulation at 225 ◦C for 100 s (pIR-225), both with a power of 130 mWcm−2.
The performance of the protocol was monitored in doserecovery tests and we received recovery ratios of 0.90 forIR-50 and 1.12 for pIR-225, which are at the limits of therecommendations given by Wintle and Murray (2006) forsuch tests. To investigate potential residuals, six aliquotswere exposed to the light of the inbuilt blue diodes subse-quently three times for 30 s (100 mWcm−2), followed byDedetermination using the pIR protocol. This shall exemplar-ily mimic repeated exposures of samples suspended in wa-ter (UV cut-off) to daylight. However, due to the complex-ity in nature with regard to light level, spectrum, and ex-posure times, this gives only a very rough idea of the dif-
www.eg-quaternary-sci-j.net/67/41/2019/ E&G Quaternary Sci. J., 67, 41–72, 2019
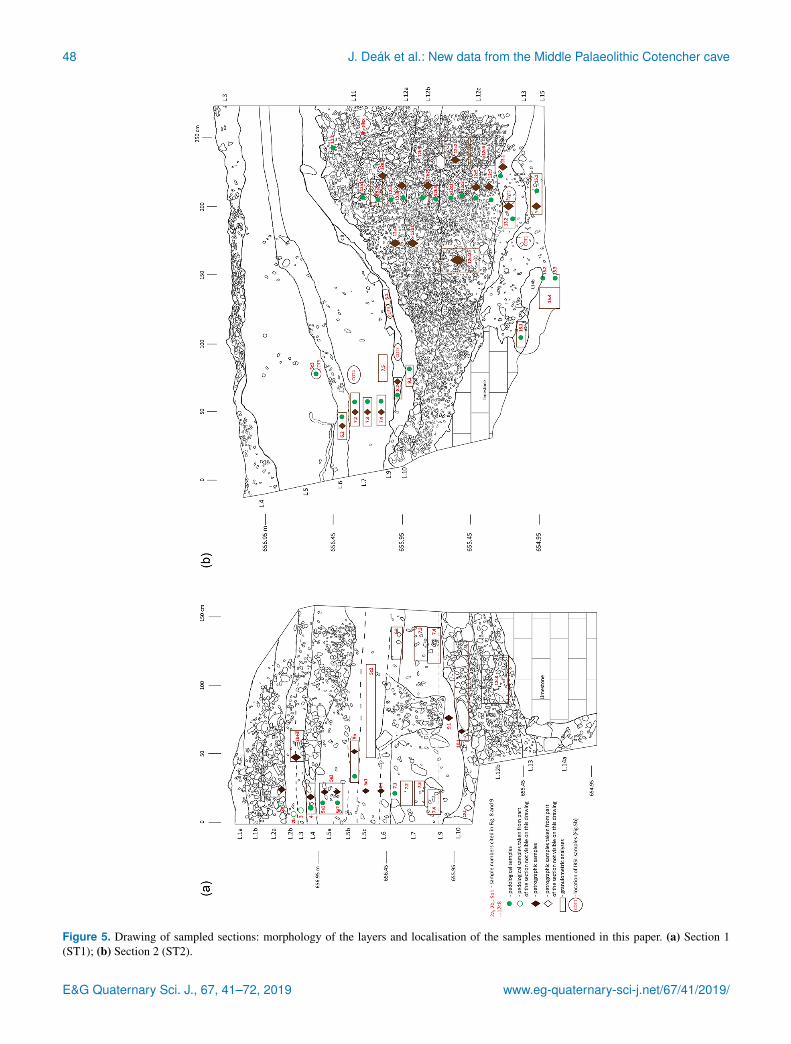
48 J. Deák et al.: New data from the Middle Palaeolithic Cotencher cave
Figure 5. Drawing of sampled sections: morphology of the layers and localisation of the samples mentioned in this paper. (a) Section 1(ST1); (b) Section 2 (ST2).
E&G Quaternary Sci. J., 67, 41–72, 2019 www.eg-quaternary-sci-j.net/67/41/2019/

J. Deák et al.: New data from the Middle Palaeolithic Cotencher cave 49
Figure 6. Example of a normalised dose response curve for analiquot of sample COT-3 IR-50.
Figure 7. Dose distribution plots exemplified for IR-50 of two sam-ples.
ferent behaviour of IR-50 and pIR-225. For sample COT-3, we received average values of 5.99± 1.39 Gy (IR-50)and 54.25± 18.03 Gy (pIR-225), and this represents appar-ent residual ages of ca. 3 and 27 ka, respectively. The thirdtest aims at investigating the stability of different signalswith time. For this, four previously measured aliquots wereused and the normalised luminescence signal (Lx/Tx) wasmonitored with different time intervals between irradiationand measurement (Auclair et al., 2003), with a maximum of5500 s. This results in average g values of 1.5± 0.7 % perdecade for IR-50 and of 0.5± 0.3 % per decade for pIR-225,based on four replicate measurements for COT-3.
Material for dose rate determination was taken around theposition sampled for measuring De. During sampling it wasattempted to collect material representative for the deposi-tional context by taking between 500 and 1000 g. The ma-
terial was dried, crushed, and homogenised. High-resolutiongamma spectrometry was carried out at VKTA Rossendorfe.V. (by Detlev Degering). To investigate for radioactivedisequilibrium different decay products in the uranium de-cay chain are compared (cf. Zander et al., 2007). Dose rateand ages were calculated using Adele software (designedby Detlev Degering). Average sediment moisture was esti-mated on the measurement of the present-day water contentand the geological setting (Table 4). These values roughlycorrespond to the porosity evaluated through the observa-tion of undisturbed samples in thin sections. Nevertheless,as discussed below, a wide range of environmental and de-positional changes occurred during the sedimentation and insitu evolution of the analysed sequence. In addition to thehumidity inherent to the karstic environment, the water con-tent of samples was affected by (i) COT1 evolved mostly indry conditions; although during its own deposition there wassurely some water flow. Moreover, during deposition of theoverlying sediments (L.14 and L.13) it was subject to some(1000 years?) years of water/ice saturation. (ii) COT2 wasdeposited by water (Figs. 4b, 5b and Table 5), but it is impos-sible to estimate how long it was water saturated; the over-lying deposit (L.12) was mainly deposited by solifluction onfrozen ground with no evidence of water flow and was thusmostly dry. (iii) COT.3, COT.4, and COT.5 are water-laid de-posits and they were affected by freeze–thaw processes prob-ably for several thousand years. Conversely, water saturationwas absent after deglaciation. Taking all these elements intoconsideration and in order to avoid circular reasoning, the lu-minescence age was calculated including a large uncertainty(Table 4) to account for potential moisture changes in thepast.
Cosmic dose rate calculation follows Prescott and Hut-ton (1994) corrected for geographic position and using arock cover of 10 m. For feldspar, an internal K content of12.5± 1.0 % was used (Huntley and Baril, 1997), supportedby measurements from the Swiss Plateau (Gaar et al., 2014).The efficiency of alpha particles in causing radiation damage(alpha efficiency, a value) was assumed to be 0.05± 0.01,following Preusser (1999) and Preusser and Kasper (2001)as the geographically closest a value assessments.
4 Results
4.1 Lithic artefacts
The lithic assemblage studied so far (flint and flakedquartzite) is composed of 457 pieces, most of them foundin the gravelly layer (L.12), while only a few have beengathered from the brown layer (L.15) (Table 1). The ma-jority of these finds (428 objects) originate from excava-tions performed between 1916 and 1918 (Dubois and Stehlin,1932/1933,) but data regarding the vertical and horizontaldistribution of these artefacts have not been processed so far.During the 2016 excavations in addition to the chips (see be-
www.eg-quaternary-sci-j.net/67/41/2019/ E&G Quaternary Sci. J., 67, 41–72, 2019

50 J. Deák et al.: New data from the Middle Palaeolithic Cotencher cave
Table1.O
verviewofthe
lithicartefacts
foundin
thecavity
bythe
successiveinterventions.B
asedon
modified
Bernard-G
uelle(2004).
Dubois-Stehlin
(1916–1918)Pittard’s
seriesM
oll’sseries
Friedli’sseries
1988excavation
2016intervention
Total(1926–1936)
(1964)(1966)
Stratigraphicunit
Brow
nlayer
Gravelly
layerV
L.11
L.2
to13
(L.15/16)
(L.12)
Lithic
artefacts
1.Tools
Lim
ace1
1Straightside
scraper2
13
Convex
scraper1
1314
Concave
scraper3
3D
oubleconvex
sidescraper
33
Double
concave–convexside
scraper1
1C
onvergentstraightscraper1
12
Convergentconvex
scraper1
1011
Convergentconcave
scraper1
45
Offset(side)scraper
121
21
16Straighttransverse
scraper2
2C
onvextransverse
scraper3
14
Concave
transversescraper
11
Atypicalend
scraper2
2N
otch4
37
Denticulate
21
3B
iface1
1V
arious2
2Subtotaltools
466
19
181
2.Flakingby-products
Knapping
waste
products34
2871
134
339C
ore1
1819
Knapping
waste
products(offstratigraphy)
1818
Total39
3892
913
41
457
3.Flakesand
fragments
lessthan
1cm
long
Chips
2020
Note
that(i)severaloftheinterventions
(Pittard,Friedli,Moll)w
ereoriented
solelyforarchaeologicalm
aterialcollectionand
theydo
notgiveinform
ationconcerning
thestratigraphic
positionofthe
finds;(ii)theflacking
by-productsdocum
entedduring
the1988
excavationcontain
onechip.
E&G Quaternary Sci. J., 67, 41–72, 2019 www.eg-quaternary-sci-j.net/67/41/2019/

J. Deák et al.: New data from the Middle Palaeolithic Cotencher cave 51
low) only one flint object was found, a canted scraper witha thinned base (Chauvière et al., 2018a). The 1988 and 2016operations revealed the presence of 1–2 cm long chips (flakesand fragments of flakes, Table 1). These artefacts were ab-sent in the inventories compiled before 1988, when no siev-ing was performed. These chips indicate that flaking opera-tions and manufacturing and sharpening of tools were proba-bly conducted in the cave and/or close to its entrance. More-over, some chips have a curved profile and their distal partconserves a portion of the dorsal surface of the original flake.These two observations constitute diagnostic criteria to iden-tify them as retouch flakes. The 20 chips of 2016 excava-tions were found in layers 10, 12b, 12c, and 13 of sections 1and 2 (Figs. 4a, b, 5a, b), but also in layers 2, 3, 4, and 5of section 1. For L.2 to L.5 these chips possibly originatefrom overlaying deposit due to pedoturbation processes. In-deed, L.1 is known to contain Holocene archaeological re-mains (Dubois and Stehlin, 1932/1933). Thus, based on theavailable data we suggest that these are likely related toTardiglacial or Holocene use of the site. Finally, it is worth-while to mention that the layer enclosing the scraper foundin 2016 (L.11) contained only a few bone fragments and noflint chips.
To summarise, the lithic industry of Cotencher cave withits numerous scrapers (63 of 83 tools) can be classified asMousterian Charentian of oriental Quina type, characterisedby a discoidal debitage (non-Quina) (Bernard-Guelle, 2004).Nevertheless the scarcity of “scalariform” retouches and thehigh number of canted scrapers (16), some of them withthinned bases, indicate a certain distinction compared withthe typical Charentian sites (ibid).
4.2 Faunal remains
The assemblage of faunal remains discussed here concernsthe finds collected during the 1916–1918 excavations andoriginates from the two main archaeological find layers (L.15and L.12), with a high number of pieces and rich in species(Table 2). It is composed of herbivores, carnivores, and om-nivores that indicate a wide variety and sometimes diver-gent ecological background, from temperate to severely cold.The simultaneous presence of reindeer and wild boar, for ex-ample, two species with very contrasting ecological back-grounds, suggests a complex environmental and sedimentaryhistory (Le Tensorer, 1998). The interpretation of the envi-ronmental significance of this assemblage is still incomplete,as the data processing concerning their horizontal and verti-cal distribution is still in progress. Nevertheless, the availableinformation already indicates a polygenetic depositional his-tory. A closer look at the rodent species gives some moredetails, as L.15 (brown layer) contains both arctic–steppicand forest species, while L.12 (gravelly layer) only containsheliophile and forest species (Table 3).
Noteworthy is the fact that the studied bone assemblagesdid not yield any faunal remains with undeniable cut marks.
Indeed, the long bone fracture surfaces are typical dry bonefractures that are characteristic for bones whose breaking isnot interesting for nutrition or those that are frequently foundin natural accumulations (in open-air sites or in caves) forwhich the question of anthropogenic contribution does notarise. In the current state of research, the main criteria foridentifying human activity (Castel et al., 2012) appear to beabsent from the Cotencher bone assemblages. As a conse-quence, with the available data there are no arguments to in-fer a synchronous accumulation of the silex and the bonefinds. Similar conclusions have been obtained for severalother Mousterian sites situated in mountain environmentsand raise the question of the reasons for human passage inthese areas marginal to the main occupation territories. Theabsence of hunting and food consumption evidence has beenexplained as an indication of sites preferentially used for toolpreparation (Castel et al., 2012).
4.3 Luminescence dating
The performance of IR-50 and pIR-225 is generally good(e.g. low recuperation, recycling values close to unity), andeven for the oldest samples signal levels do not approachsaturation (Fig. 6). In most samples, the distribution of Devalues is skewed and overdispersion exceeds 0.20, implyingthe presence of at least some partial bleaching. This is il-lustrated in Fig. 7, showing a tight distribution for IR-50 ofsample COT5, with one prominent outlier at the upper edge.For IRSL of sample COT1, an overdispersion of 0.15 and aGaussian-like distribution are interpreted to represent com-plete resetting of the IR-50 signal prior to deposition in thisparticular sample. As this represents the only well-bleachedsample in the data set, its value was used as input parame-ter sigma_b when applying the minimum age model (MAM;Galbraith et al., 1999) to all other samples. Even after ap-plying MAM, mean De values of pIR-225 are much highercompared to IR-50 and not in agreement with radiocarbondating available for the upper part of the sequence (Table 4).The pIR-225 ages are also internally inconsistent. This isinterpreted to represent high residual levels in the pIR-225signal at the time of deposition that are masked by aver-aging effects in the multigrain feldspar aliquots. With re-spect to incompletely bleached samples, this may result inage overestimation even when the MAM is applied becausesignals from incompletely bleached grains mask the signalsof well-bleached grains on the aliquots. Such an observationis not unexpected considering the literature (e.g. Buylaertet al., 2012; Lowick et al., 2012, 2015) and the results ofthe bleaching experiment carried out here. The pIR-225 esti-mates are hence not considered in further discussion. Whilesignal instability could affect the IR-50, the measured g val-ues are rather small, at the lower edge of values reported byLowick et al. (2012). As these authors observe uncorrectedIR-50 ages in good agreement with independent dating con-trol, we also refrain from carrying out fading corrections.
www.eg-quaternary-sci-j.net/67/41/2019/ E&G Quaternary Sci. J., 67, 41–72, 2019

52 J. Deák et al.: New data from the Middle Palaeolithic Cotencher cave
Table 2. Overview of the vertebrate faunal remains according to their stratigraphic position, based on the material documented by Duboisand Stehlin (1932/1933). Based on Le Tensorer (1998, p. 103–106).
Taxonomy Brown layer (L.15/16) Gravelly layer (L.12)
Order Family or species
Carnivora
Ursus arctos × ×
Ursus spelaeus × ×
Panthera spelaea × ×
Panthera pardus × ×
Lupus lupus × ×
Cuon alpinus × ×
Gulo gulo ×
Lynx cf. pardina × ×
Lynx lynx ×
Alopex lagopus ×
Vulpes corsac × ×
Vulpes vulpes × ×
Felis sylvaticus ×
Mustela putorius ×
Mustela nivalis ×
Martes martes × ×
PerissodactylaEquus sp. × ×
Dicerorhinus kirchbergensis ×
Coelodonta antiquitatis ×
Artiodactyla
Sus scrofa × ×
Cervus elaphus × ×
Rangifer tarandus × ×
Bovidae × ×
Capra ibex × ×
Rupicapra rupicapra × ×
Lagomorphs Lepus timidus × ×
Rodentia
Marmota marmota × ×
Arvicola sp. ×
Arvicola terrestris ×
Microtus gregalis ×
Microtus nivalis × ×
Microtus raticeps ×
Microtus arvalis ×
Clethrionomys rutilus ×
Dicrostonyx torquatus × ×
Sciurus vulgaris ×
Martes ermina × ×
Cricetus cricetus ×
Allocricetus bursae ×
Eliomis quercinus × ×
Glis glis × ×
Apodemus sylvaticus × ×
Soricidae ×
Chiroptera
Miniopterus schreibersi ×
Plecotus auritus ×
Myotis myotis × ×
Rhynolophus ferrum equinum ×
E&G Quaternary Sci. J., 67, 41–72, 2019 www.eg-quaternary-sci-j.net/67/41/2019/
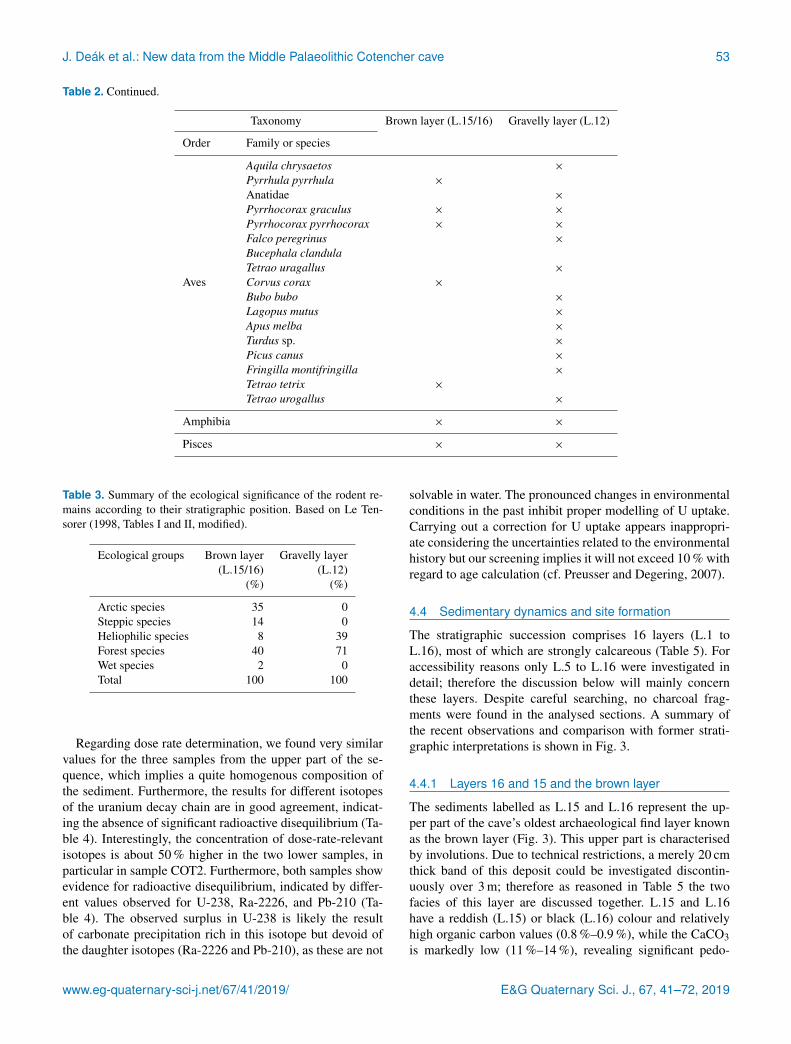
J. Deák et al.: New data from the Middle Palaeolithic Cotencher cave 53
Table 2. Continued.
Taxonomy Brown layer (L.15/16) Gravelly layer (L.12)
Order Family or species
Aves
Aquila chrysaetos ×
Pyrrhula pyrrhula ×
Anatidae ×
Pyrrhocorax graculus × ×
Pyrrhocorax pyrrhocorax × ×
Falco peregrinus ×
Bucephala clandulaTetrao uragallus ×
Corvus corax ×
Bubo bubo ×
Lagopus mutus ×
Apus melba ×
Turdus sp. ×
Picus canus ×
Fringilla montifringilla ×
Tetrao tetrix ×
Tetrao urogallus ×
Amphibia × ×
Pisces × ×
Table 3. Summary of the ecological significance of the rodent re-mains according to their stratigraphic position. Based on Le Ten-sorer (1998, Tables I and II, modified).
Ecological groups Brown layer Gravelly layer(L.15/16) (L.12)
(%) (%)
Arctic species 35 0Steppic species 14 0Heliophilic species 8 39Forest species 40 71Wet species 2 0Total 100 100
Regarding dose rate determination, we found very similarvalues for the three samples from the upper part of the se-quence, which implies a quite homogenous composition ofthe sediment. Furthermore, the results for different isotopesof the uranium decay chain are in good agreement, indicat-ing the absence of significant radioactive disequilibrium (Ta-ble 4). Interestingly, the concentration of dose-rate-relevantisotopes is about 50 % higher in the two lower samples, inparticular in sample COT2. Furthermore, both samples showevidence for radioactive disequilibrium, indicated by differ-ent values observed for U-238, Ra-2226, and Pb-210 (Ta-ble 4). The observed surplus in U-238 is likely the resultof carbonate precipitation rich in this isotope but devoid ofthe daughter isotopes (Ra-2226 and Pb-210), as these are not
solvable in water. The pronounced changes in environmentalconditions in the past inhibit proper modelling of U uptake.Carrying out a correction for U uptake appears inappropri-ate considering the uncertainties related to the environmentalhistory but our screening implies it will not exceed 10 % withregard to age calculation (cf. Preusser and Degering, 2007).
4.4 Sedimentary dynamics and site formation
The stratigraphic succession comprises 16 layers (L.1 toL.16), most of which are strongly calcareous (Table 5). Foraccessibility reasons only L.5 to L.16 were investigated indetail; therefore the discussion below will mainly concernthese layers. Despite careful searching, no charcoal frag-ments were found in the analysed sections. A summary ofthe recent observations and comparison with former strati-graphic interpretations is shown in Fig. 3.
4.4.1 Layers 16 and 15 and the brown layer
The sediments labelled as L.15 and L.16 represent the up-per part of the cave’s oldest archaeological find layer knownas the brown layer (Fig. 3). This upper part is characterisedby involutions. Due to technical restrictions, a merely 20 cmthick band of this deposit could be investigated discontin-uously over 3 m; therefore as reasoned in Table 5 the twofacies of this layer are discussed together. L.15 and L.16have a reddish (L.15) or black (L.16) colour and relativelyhigh organic carbon values (0.8 %–0.9 %), while the CaCO3is markedly low (11 %–14 %), revealing significant pedo-
www.eg-quaternary-sci-j.net/67/41/2019/ E&G Quaternary Sci. J., 67, 41–72, 2019

54 J. Deák et al.: New data from the Middle Palaeolithic Cotencher cave
Table4.R
esultsoflum
inescencedating
with
theaverage
activityofK
andT
h(the
lattergivenas
anaverage
ofdifferentisotopes;cf.PreusserandK
asper,2001)andassum
edaverage
sedimentm
oistureduring
burialandresulting
doserate
(D).T
henum
berof
replicatem
easurements
(n)is
giventogether
with
therelative
overdispersion(od)
forIR
-50and
pIR-225,
equivalentdose(D
e ),andage
forthetow
differentapproaches.
Lab
codeK
Th
U-238
Ra-226
Pb-210M
oistureD
nod
De
De
Age
Age
(Bq
kg−
1)(B
qkg−
1)(B
qkg−
1)(B
qkg−
1)(B
qkg−
1)(%
)(G
yka−
1)IR
-50pIR
-225IR
-50pIR
-225(G
y)(G
y)(ka)
(ka)
CO
T5
237±
2516.7±
1.1
24.8±
3.9
21.2±
1.4
19.9±
4.2
10±
51.87±
0.11
240.30/0.17
49.1±
4.3
161.1±
15.0
26.5±
2.8
87.0±
9.5
CO
T4
297±
3120.2±
1.3
22.9±
4.0
26.0±
1.7
25.8±
3.7
10±
52.19±
0.12
240.21/0.17
66.4±
5.4
164.5±
15.2
30.6±
3.0
75.7±
8.2
CO
T3
267±
2718.0±
1.2
21.1±
3.2
24.1±
1.4
24.1±
2.9
10±
52.03±
0.11
240.30/0.36
73.8±
6.4
133.4±
17.9
36.6±
3.8
66.2±
9.6
CO
T2
401±
4229.4±
1.9
102±
979.2±
5.1
43.8±
4.8
15±
53.51±
0.17
240.37/0.20
250.8±
30.3
468.7±
61.1
72.5±
9.4
135±
11C
OT
1177±
1614.1±
1.0
83.2±
7.0
65.9±
3.9
41.1±
4.9
15±
53.27±
0.13
240.15/0.49
217.6±
7.1
313.1±
16.1
67.8±
3.4
97.6±
6.3
genetic processes (Fig. 8b and Table 5). The fine materialis fluffy. Our study of the > 8 mm fraction indicates thatit is composed of weathered bedrock limestone with some(ca. 8 %) rolled limestone gravel (Fig. 8a).
The underlying brown layer is present all over the caveand fills up the natural depressions inside the cavity, with amaximal thickness of 1.5 m (Fig. 2). The coarse fraction isabsent in its lower part and varies between 10 % and 50 %in its upper part (Rentzel, 1990, and Table 5). Locally largelimestone blocks probably originating from the ceiling arealso present (Dubois and Stehlin, 1932/1933, Rentzel, 1990).A few small (ca. 1 cm) alpine pebbles and a notable amountof sand grains of alpine origin are attributed to reworking ofolder glacier deposits (Dubois and Stehlin, 1932/1933). Thefine material is characterised, at least locally, by traces ofstratification (Dubois and Stehlin, 1932/1933). X-ray miner-alogy reveals some calcite and quartz grains in the bulk sam-ples, while the clay fraction is characterised by the markedpresence of mica, kaolinite, and pedogenetic phyllosilicates.The later data are interpreted as an indication of a relation-ship to previous Eemian soil cover that occurred in the sur-roundings (Rentzel, 1990; Adatte et al., 1991). The fine mate-rial contains common phosphate-rich impregnations or nod-ules with values of ca. 12 % to 74 % CaCO3(PO4)2 (Duboisand Stehlin 1932/1933; Rentzel, 1990). Rare occurrences ofcharcoal fragments were mentioned by Rentzel (1990).
All these data suggest that the layer is the result ofcompound accumulation processes: (i) deposition inside thecave of a soil formed under and in front of the rock shel-ter, (ii) breakdown and in situ weathering of bedrock, and(iii) important input of biogenic phosphorus-rich organic ma-terial (decomposed faunal remains and coprolites and/or batguano). The significant quantity of weathered, but not rolled,cave bear bones scattered throughout the layer (Dubois andStehlin, 1932/1933) and the high amount of faunal remains(Table 2) argues for in situ phosphorus accumulation. TheIRSL age for the upper part of this deposit is 67.8± 3.4 ka(COT1, Table 4).
4.4.2 Layer 14
This stratified sediment, composed of alternating sandy,clayey, or heterometric gravelly strata, has been observed byRentzel (1990) both close to the entrance of the cavity and inits inward side. During the 2016 work we distinguish only afew thin discontinuous lenses of this layer, while towards theinner part of the cavity, explored in 2017, a stratified depositup to 57 cm thick was observed (Table 5). In this inward part,large limestone blocks (at least 40 or 20 cm) are present at theupper part of this deposit. X-ray mineralogy of the bulk sam-ples indicates a high amount of quartz and feldspar, while in-terstratified phyllosilicates and kaolinite in the clay fractionare less common compared to the underlying layer (Adatte etal., 1991). The sedimentological characteristics suggest de-position by running water.
E&G Quaternary Sci. J., 67, 41–72, 2019 www.eg-quaternary-sci-j.net/67/41/2019/

J. Deák et al.: New data from the Middle Palaeolithic Cotencher cave 55
Table 5. Brief descriptions of the sediments.
Layer Brief description Coarse Thickness HClno. fraction (cm)
1 Angular and more or less platy limestone fragments (2–14 cm diameter)in a granular humiferous silty matrix. The lower part of the layer thefine material is less humiferous and there are travertine- and stalagmite-like concretion fragments. Common present-day roots. Lower boundaryis sharp.
u.p. 40 %; l.p. 50 % 38 ±±±
2 White (5Y 8/1.5) strongly porous granular silt with common angularlimestone fragments (5–12 cm diameter) in its upper layer and a fewsmall (2–3 cm diameter) limestone fragments in its lower part. Abundantpresent-day roots in its lower part. Lower boundary is gradual.
u.p. 30 %–40 %;l.p. 2 %–5 %
20 +++
3 Grey homogeneous clayey–sandy silt. Observed only in section 1. Lowerboundary is gradual.
8–10 ++
4 Slightly brownish clayey–sandy silt with common angular rock frag-ments (3–5 cm diameter). Lower boundary is gradual but laterally showspocket-like morphology.
30 % 10–30
5 Light grey to white (5Y 7.5/2) sandy, slightly clayey silt. Separated inthree layers based on the coarse material. From up down: for L.5a theupper part has a few angular limestone gravels more or less verticallyoriented; for L.5b the middle part has almost no coarse fraction and ismore sandy with small (0.2–0.6 cm diameter) stratified gravel; L.5c hasa homogenous lower part with rare calcareous gravel (2–3 cm diameter).Its lower part fills up the gully that erodes L.12 and that is partially filledby L.7 to L.10. Compact, brittle, and fine (1 mm thick) lamellar structurein the upper part, with coarser lamellar (up to 1 cm) in depth. Lowerboundary is sharp.
u.p. 10 %; m.p. < 1 %;l.p. 2 %–3 %
20–70 +++
6 Former gravel level: 0.5–11 cm in depth angular or sub-rounded lime-stone gravels. A few of the gravels are still at this contact. Most of themare situated along vertical fissures until the deeper part of the layer. Onecluster of them suggests an ice wedge cast. Lower boundary is sharp.
10
7 Homogeneous, light grey (5Y 7.5/3) silty to clayey silty sediment. Moreand more clayey in depth. Compact and brittle. Large platy structurewhich becomes angular blocky in depth. Partially fills up the channelmarked by the underlying layers. Lower boundary is sharp with involu-tions of the underlying layer.
20 %–30 % 20–60 +++
8 White, well-sorted, fine bleached sand. Upper limit with involutions.Lower boundary is sharp.
0 5–10 +++
9 Grey-brownish (2.5Y 7/2) clayey sediment. Stratified with involutionsand angular clayey soil fragments incorporated. Former studies describea chaotic related distribution of these fragments. Plugs the lower part ofa depression created by the deposition L.10, while it eroded L.12. Lowerboundary is sharp.
0 10–15 +++
10 Angular calcareous boulders (10–20 cm diameter) and rounded/sub-rounded calcareous gravels present in the lower part of the depressioneroding the underlying layer 12. Lower boundary is sharp.
100 % 15
www.eg-quaternary-sci-j.net/67/41/2019/ E&G Quaternary Sci. J., 67, 41–72, 2019
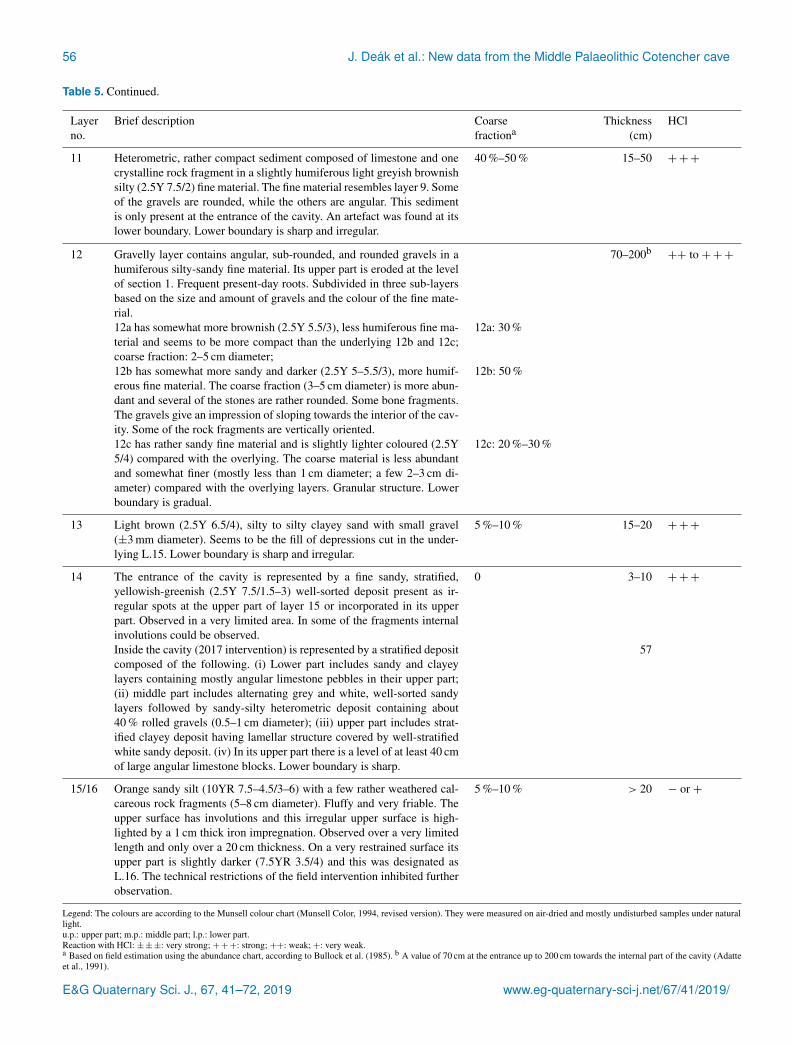
56 J. Deák et al.: New data from the Middle Palaeolithic Cotencher cave
Table 5. Continued.
Layer Brief description Coarse Thickness HClno. fractiona (cm)
11 Heterometric, rather compact sediment composed of limestone and onecrystalline rock fragment in a slightly humiferous light greyish brownishsilty (2.5Y 7.5/2) fine material. The fine material resembles layer 9. Someof the gravels are rounded, while the others are angular. This sedimentis only present at the entrance of the cavity. An artefact was found at itslower boundary. Lower boundary is sharp and irregular.
40 %–50 % 15–50 +++
12 Gravelly layer contains angular, sub-rounded, and rounded gravels in ahumiferous silty-sandy fine material. Its upper part is eroded at the levelof section 1. Frequent present-day roots. Subdivided in three sub-layersbased on the size and amount of gravels and the colour of the fine mate-rial.
70–200b++ to +++
12a has somewhat more brownish (2.5Y 5.5/3), less humiferous fine ma-terial and seems to be more compact than the underlying 12b and 12c;coarse fraction: 2–5 cm diameter;
12a: 30 %
12b has somewhat more sandy and darker (2.5Y 5–5.5/3), more humif-erous fine material. The coarse fraction (3–5 cm diameter) is more abun-dant and several of the stones are rather rounded. Some bone fragments.The gravels give an impression of sloping towards the interior of the cav-ity. Some of the rock fragments are vertically oriented.
12b: 50 %
12c has rather sandy fine material and is slightly lighter coloured (2.5Y5/4) compared with the overlying. The coarse material is less abundantand somewhat finer (mostly less than 1 cm diameter; a few 2–3 cm di-ameter) compared with the overlying layers. Granular structure. Lowerboundary is gradual.
12c: 20 %–30 %
13 Light brown (2.5Y 6.5/4), silty to silty clayey sand with small gravel(±3 mm diameter). Seems to be the fill of depressions cut in the under-lying L.15. Lower boundary is sharp and irregular.
5 %–10 % 15–20 +++
14 The entrance of the cavity is represented by a fine sandy, stratified,yellowish-greenish (2.5Y 7.5/1.5–3) well-sorted deposit present as ir-regular spots at the upper part of layer 15 or incorporated in its upperpart. Observed in a very limited area. In some of the fragments internalinvolutions could be observed.
0 3–10 +++
Inside the cavity (2017 intervention) is represented by a stratified depositcomposed of the following. (i) Lower part includes sandy and clayeylayers containing mostly angular limestone pebbles in their upper part;(ii) middle part includes alternating grey and white, well-sorted sandylayers followed by sandy-silty heterometric deposit containing about40 % rolled gravels (0.5–1 cm diameter); (iii) upper part includes strat-ified clayey deposit having lamellar structure covered by well-stratifiedwhite sandy deposit. (iv) In its upper part there is a level of at least 40 cmof large angular limestone blocks. Lower boundary is sharp.
57
15/16 Orange sandy silt (10YR 7.5–4.5/3–6) with a few rather weathered cal-careous rock fragments (5–8 cm diameter). Fluffy and very friable. Theupper surface has involutions and this irregular upper surface is high-lighted by a 1 cm thick iron impregnation. Observed over a very limitedlength and only over a 20 cm thickness. On a very restrained surface itsupper part is slightly darker (7.5YR 3.5/4) and this was designated asL.16. The technical restrictions of the field intervention inhibited furtherobservation.
5 %–10 % > 20 − or +
Legend: The colours are according to the Munsell colour chart (Munsell Color, 1994, revised version). They were measured on air-dried and mostly undisturbed samples under naturallight.u.p.: upper part; m.p.: middle part; l.p.: lower part.Reaction with HCl: ±±±: very strong; +++: strong; ++: weak; +: very weak.a Based on field estimation using the abundance chart, according to Bullock et al. (1985). b A value of 70 cm at the entrance up to 200 cm towards the internal part of the cavity (Adatteet al., 1991).
E&G Quaternary Sci. J., 67, 41–72, 2019 www.eg-quaternary-sci-j.net/67/41/2019/

J. Deák et al.: New data from the Middle Palaeolithic Cotencher cave 57
Table 6. Petrographic and morphologic descriptions of the various rock fragment groups.
Code* Brief description Comments Coarse fraction group*
Ref. I Light grey to slightly beige, very compact,indurated, fine crystalline limestone. Undulat-ing to rough (microkarst-like) external surfaceswith a thin discontinuous white, slightly pow-dery coating. Locally thin hard, hard, and gran-ular crust. Cutting external edges.
Sampled outside of the cavity: limestone bankforming the ceiling of the rock shelter. Upperstrata.
Ref. II Brownish grey, very compact, indurated, finecrystalline limestone. Undulating to smooth ex-ternal surfaces with thin white crust. Cutting ex-ternal edges.
As above: upper part of the middle strata.
Ref. III Dark grey, compact, indurated, finely crys-talline limestone. Undulating external surfaceswith a very thin white crust. Cutting externaledges.
As above: lower part of the middle strata.
Ref. IV Light grey, slightly yellow beige, very compact,indurated fine crystalline limestone. Undulatingto smooth external surfaces with bright whitecoating on surfaces and along fissures. On somesides more granular crust resembling a lichenmat and providing a rough surface.
As above: lowest strata.
Ref. V Light grey to yellowish whitish, very compact,indurated, fine crystalline limestone. Rough ex-ternal surfaces covered by a slight powderywhite crust and organic matter.
Isolated limestone block situated in front of thecavity, covered my mosses and litter.
Ref. VI Brownish grey, very compact, indurated, finecrystalline limestone. Rough external surfacescovered by a white, irregular, rather hard crust.Some Fe impregnations towards its externalrim.
Sampled inside the cavity: limestone outcropsituated on the floor of the cavity, at the levelof sections 1 and 2.
Ref. VII Light grey to white compact limestone or finesandstone with some internal holes (former fos-sils?). Globally rather powdery aspect, with amore pronounced trend toward the external partof the fragment. Irregular, rough external sur-faces.
Sampled inside the cavity: limestone from thelateral wall, 2–3 m inward from section 2.
Ref. VIII Beige to yellowish grey, very compact, in-durated, fine crystalline limestone. Undulatingto smooth external surfaces with an irregularthin white crust. Resembling to Ref. IV(3)
Sampled inside the cavity: limestone outcropon the floor situated towards the inner third ofthe cavity.
GF1 Strongly porous, tuff-like CaCO3 nodules andplaty, rather angular, compact CaCO3 crustfragments.
A
GF2 Light grey to dark grey, very compact, in-durated finely crystallised angular to subangu-lar rock fragments. Undulating surfaces cov-ered by a thin indurated CaCO3 crust. Rathersharp edges.
Resemble Ref. II and III. A
www.eg-quaternary-sci-j.net/67/41/2019/ E&G Quaternary Sci. J., 67, 41–72, 2019

58 J. Deák et al.: New data from the Middle Palaeolithic Cotencher cave
Table 6. Continued.
Code Brief description Comments Coarse fraction group
GF3 Light grey to whitish, very compact, indurated,fine crystallised angular to subangular rockfragments. Undulating external surfaces cov-ered by thin, indurated, white CaCO3 crust.
Resemble Ref. I. A
GF4 Very compact, indurated, sub-rounded to sub-angular limestone rock fragments. Rough andporous external surfaces (alteration, dissolutionof fossils) covered by thin, hard, white crust.Under this crust: brownish grey, fine crystalline.Locally more brownish hard precipitations.
Resemble Ref. VI. A
GF5 Rather porous weathered rock fragments atleast partially covered by orange-brownish(phosphorus?) precipitation crust. Sometimessandy aspect. Sometimes part of them iswhitish, suggesting a least weathered lime-stone. Weak to moderate reaction with HCl.
Weathered and phosphorus impregnated rockfragments (Ref. VIII).
A
GF6 Subangular to sub-rounded limestone frag-ments having a rough white external surfacewith partially preserved microkarst features. In-side compact light grey.
Might correspond to Ref. I B
GF7 Subangular to sub-rounded, polished surfaced,indurated, strongly compact limestone frag-ments. White at the surface, yellow-brownishgrey fine crystallisation inside.
Resemble Ref. IV and VIII. C
GF8 Sub-rounded light grey yellowish limestonefragment with smooth surfaces suggestingrolling processes.
Resemble Ref. I. C
GF9 Bright white rounded fine sandstone gravels. Might be rolled fragments of Ref. VII. C
GF10 Brownish grey, rounded limestone gravel withsmooth/polished surfaces.
D
GF11 Grey to dark grey, rounded to sub-roundedlimestone or fine sandstone gravels with smoothsurfaces.
D
GF12 Greyish white, laminated fine sandstone grav-els.
D
GF13 Rounded Alpine rock fragments. D
GF14 Strongly rolled 1–2 cm diameter gravels.Mostly limestones, but rare alpine rockfragments.
D
GF15 Small (±1 cm) irregular CaCO3 concretions,resembling loess dolls.
D
GF16 Dark grey to black angular limestone. ThinCaCO3 crust.
Might correspond to Ref. III, but it might be afragment of a black limestone.
E? or D?
GF17 1–2 cm large, angular calcite crystals. E
GF18 Angular yellowish small limestone fragments. Might be lithic artefacts. E
Legend:Ref. I to VIII: limestones hosting the cavity or blocks situated inside and outside of it;GF1 to GF18: site-specific gravel facies defined for this study.See explication in Sect. 3.2.
E&G Quaternary Sci. J., 67, 41–72, 2019 www.eg-quaternary-sci-j.net/67/41/2019/

J. Deák et al.: New data from the Middle Palaeolithic Cotencher cave 59
Figure 8. Variation in granulometric and chemical soil characteristics throughout the studied layers. (a) Granulometry. (b) Variation inorganic carbon and CaCO3 content. Legend: 2a to 15.4 – sample numbers; their location is presented in Figs. 4a, b and 5a, b.
4.4.3 Layer 13
This heterometric relatively finely textured sediment hasbeen observed in a gully-like depression in section 2, to-wards the entrance of the cave. The 8 mm fraction is mainlycomposed of slightly reworked local limestone fragments,but in the fine gravel fraction (1–2 cm) small quantitiesof rounded limestone pebbles of various origins and onerounded quartzite were detected (Figs. 8a and 9). Field andlaboratory observations and the analytical data (organic car-bon and CaCO3 content, Fig. 8b) suggest that it is a par-tial reworking of the underlying L.15 and L.16 with somefresh sediment input. The latter is suggested by the roundedsmall gravels and the relatively higher CaCO3 content com-pared to the underlying L.15 and L.16. The morphology in
the channel-like depression suggests torrential flows at thisexternal part of the cavity. The sections examined do not per-mit us to state whether L.13 and L.14 are the result of twoclearly distinct sedimentary events or if they are the differentsediment facies deposited during the same landscape desta-bilisation phase. This layer has been dated to 72.5± 9.4 ka(COT-2, Table 4) but this sample shows a high overdisper-sion, implying the presence of partial bleaching. This is incontrast to COT-1, which appears to be well bleached. Alto-gether, the environmental proxy data and IRSL dating of thislower part of the studied sequence imply correlation to theperiods of severe cooling of the S3 stadial (MIS 4).
www.eg-quaternary-sci-j.net/67/41/2019/ E&G Quaternary Sci. J., 67, 41–72, 2019

60 J. Deák et al.: New data from the Middle Palaeolithic Cotencher cave
Figure 9. Petrographic composition of the more than 8 m fraction of selected samples. Legend: 2a to 15.1 – sample numbers; their location ispresented in Fig. 5a and b. GF: gravel fractions as described in the methods and Table 6. GF1 to GF5: fresh rock fragments originating fromthe limestone layers hosting the cave (group A); GF6: pebbles similar to limestone strata enclosing the cave but at least shortly transported(group B); GF7 to GF9: pebbles similar to the limestone strata enclosing the cave, but strongly rounded (group C); GF10 to GF16: pebblesnot present in the strata enclosing the cave (group D). Note the presence of non-calcareous gravels of GF14 is indicated by a cross as theirquantity is too small to be visible on the graph.
4.4.4 Layer 12
This rich coarse material, up to 180 cm thick, sediment(Figs. 4a, b, 5a, b, 8a; Table 5) is present all over the cavity(Dubois and Stehlin, 1932/1933; Rentzel, 1990). The coarsefraction varies between 50 % and 92 % and the > 8 mm frac-tion, composed mainly of 3–8 cm large pebbles, dominates inthis deposit (Fig. 8a). Petrographic observations (Fig. 9) indi-cate that throughout this deposit the coarse material is com-posed of (i) more or less rolled limestone fragments similar
to the limestone banks hosting the cavity and (ii) rolled lime-stone and sandstone pebbles that are allochthonous. Part ofthe gravel has a powdery, and thus weathered, external part,while others are more polished and little weathered. Non-calcareous components are very rare and are represented byone ca. 3 cm large rolled schist or gneiss fragment (sp.12.5)and a few rolled ca. 5–10 mm pebbles. The variability inpetrography and morphology of the calcareous coarse frac-tion has already been highlighted by Dubois and Stehlin
E&G Quaternary Sci. J., 67, 41–72, 2019 www.eg-quaternary-sci-j.net/67/41/2019/

J. Deák et al.: New data from the Middle Palaeolithic Cotencher cave 61
(1932/1933). They also stated that the alpine components arevery rare, all rounded, and dominated by quartzite, with a fewgneiss pebbles.
The< 2 mm fraction is more important in the lower part ofthe deposit (30 %–40 % in L.12c and L.12b) and it decreasesin the upper part (less than 20 % in L.12a). Throughout L.12this fine material is rather rich in CaCO3, but except in theupper part of the layer (L.12a), values are less than 40 %.The organic carbon values show some variability, but gener-ally they are rather high (Fig. 8b). In the lower part of the de-posit (L.12c and L.12b) organic contents are highest and in-creases upward (L.12b), while in the uppermost part (L.12a)these values are generally lower, although certain variabilityis present. The CaCO3 content, on the contrary, is markedlylower in the lower part of the deposit (L.12c and L.12b) andincreases towards the top (L.12a). All this suggests that thefine material constituting this unit has undergone noticeablepedogenetic processes that had a more important fingerprintin the lower part of the deposit (L.12c and L.12b).
The clay and silt fractions are dominated by mica (Adatteet al., 1991). Weathered clay minerals (interstratified phyl-losilicates) are present mainly in the lower part of the depositwhile in the upper part chlorite increases in parallel to thequasi-fading of the interstratified constituents.
Bone fragments are present all over the layer and allthrough the cavity; some of them are strongly rolled, partof them are clearly reworked, and part of them seem tobe rather fresh (Dubois and Stehlin, 1932/1933). Althoughformer studies mention the presence of charcoal (Rentzel,1990), we did not find any despite the large number of sam-ples sieved. No in situ fireplaces have been observed so farbut sieving revealed pebbles bearing traces of heating. A con-centration of burned rock fragments, associated with a freshlithic tool, has been documented towards the upper part ofthis deposit, during the 2017 campaign. This feature will bestudied during a later phase of this project.
To summarise, all these data suggest a complex environ-mental history recorded in this deposit. The heterogeneousand allochthonous coarse fractions indicate that part of thesediment source was originally situated outside the cavity.The traces of pedogenetic processes all over this layer in-dicate that this sediment evolved as a soil outside the cav-ity. Eventually the heterometric soil and its faunal and arte-fact constituents were deposited inside the cavity during sev-eral depositional phases. The chronological setting of theseprocesses is specified by the stratigraphic position of L.12(Fig. 3) and will be discussed below.
4.4.5 Layer 11
This heterometric coarse-material-rich (Table 5), rather com-pact sediment is present only towards the entrance of the cav-ity and it wedges out towards the inside. Due to technicalreasons it was only briefly examined and sampled during the2016 operations. The fine material is moderately humifer-
ous and rather strongly calcareous (Fig. 8b), while the coarsefraction is composed of rounded and angular limestone frag-ments and at least one rounded pebble of alpine origin (Ta-ble 5). The poorly sorted nature of this deposit suggests de-position by mass movement. Similarly to L.12, the origin ofthe sediment is most probably related to a deposit situatedearlier at the cavity entrance, but as indicated by the chemi-cal soil characteristics this deposit was little affected by thepedogenetic processes. The presence of the alpine rock frag-ment can be explained as either originating from reworkedglacial sediment or it could be related to human activity.
4.4.6 Layer 10
This sediment is composed of mostly rolled, but also angular,coarse gravel, blocks of autochthonous and allochthonouslimestone, and a few alpine pebbles (Table 5 and Figs. 8a,9). Earlier studies also described a more heterometric faciesof this deposit with an irregularly surfaced gravelly layercomposed of rounded limestone and alpine pebbles, rich inbone fragments, and having a sandy-silty matrix (Rentzel,1990). As for the non-calcareous components, the largestrounded pebble (9 cm) found in L.10 (sp.10.1) is proven tobe a stone tool, while the others are 2–4 cm large rounded tosub-rounded quartzite and angular schist fragments account-ing for 3 % of the coarse material of sample 10.2 (Figs. 8a, 9).As argued for L.12 and L.11 above, the few non-calcareouscomponents are most likely reworked from sediments that al-ready existed in the region. The clay mineralogy of the finesediment is similar to L.12, but no interstratified, pedogeneticminerals are present in the clay fraction (Adatte et al., 1991).L.10 has been observed at the bottom of the depression cutin the L.12. This gully – traversing the rock shelter parallelwith the main valley – removed, at its deepest part, at least40 cm of the gravel-rich L.12 (Fig. 4b).
These elements indicate that an important water flow tra-versed this landscape position and reworked and disturbedsediments towards the entrance of the cavity. It eroded thefine material of L.12 and rolled and re-sedimented part ofits coarser fraction, including the bone fragments. Limestonefragments from the cavity fallen due to frost shattering com-pleted the sediment body accumulated.
4.4.7 Layer 9
This layer is a highly calcareous, stratified, finely texturedclayey, silty sediment. The few coarse components found bysieving (Fig. 8a) are probably related to underlying L.10. Insome parts the clayey band is discontinuous and chaoticallyoriented. The layer partially fills the channel cut before thedeposition of L.10 (Figs. 4b, 5a, b), but it is also present inthe inner parts of the cavity (Rentzel, 1990). These sedimen-tary features indicate fine material deposition by low energyflow and decantation in a pond environment. The presenceof standing water in highly porous rock and at this landscape
www.eg-quaternary-sci-j.net/67/41/2019/ E&G Quaternary Sci. J., 67, 41–72, 2019

62 J. Deák et al.: New data from the Middle Palaeolithic Cotencher cave
position further argues for a frozen landscape. The chaoti-cally oriented clayey bands indicate freeze–thaw processesaffecting this layer. The absence of pollen in the test sam-ples (Bezat, 1990), the low organic carbon content, and theabsence of the organic layers in the sequence are in goodagreement with a vegetation-free glacial environment.
4.4.8 Layer 8
This strongly calcareous, stratified, well-sorted, fine sandylayer with some gravels (Figs. 4b, 8a; Table 5) indicates anepisode of significant water flow. The size and morphologyof the coarse fraction (Fig. 8a) indicate episodes of more en-ergetic water flow and also some cryoclastic rock fall fromthe ceiling during the deposition of this layer. The invo-lutions observed at its surface are related to freeze–thawprocesses occurring during and/or after the deposition oflayer 7. The IRSL age of this layer indicates depositionaround 36.6± 3.8 ka (COT3, Table 4).
4.4.9 Layer 7
This strongly calcareous, lightly coloured, clayey silty de-posit (Table 5 and Figs. 4a, b, 8a, b) has been described atthe entrance of the cavity, but earlier studies suggest that itis probably present all over the cave (Dubois and Stehlin,1932/1933; Rentzel, 1990). It coarsens upward. Traces ofstratifications have been reported by Rentzel (1990). It is arather compact and brittle sediment with platy structure. Inthe sections investigated it can be up to 40 cm thick and rep-resents the upper fill of the gully eroding the upper part ofthe L.12. The coarse fraction, except its lowest part, repre-sents less than 10 % (Fig. 8a) and is mainly composed of an-gular rock fragments similar to the limestone strata hostingthe cavity. A low abundance (a few grains per sample), butsystematic presence, of small (ca. 5 mm) rounded alpine peb-bles was observed (Fig. 9). These are probably related to thepresence of older alpine material in the surroundings. The or-ganic carbon content is very low, among the lowest measuredin this stratigraphic sequence (Fig. 8b). Screening for palyno-logical content revealed an absence of pollen (Bezat, 1990),whereas mineralogical analyses document the lack of weath-ered minerals (Adatte et al., 1991). In former studies this andthe overlying layer (L.5) have been described as one singledeposit (Dubois and Stehlin1932/1933; Rentzel, 1990). Oursubdivision is based on the occurrence of a gravel layer (L.6)on top of L.7 and an ice wedge cast filled with these gravels(Figs. 4a, 5a). The IRSL age of the upper part of the layer is30.6± 3.0 ka (COT4, Table 4).
4.4.10 Layer 6
This layer is composed of mostly angular limestone peb-bles and some smaller blocks resembling the limestone stratahosting the cavity. It is present as (i) a discontinuous gravellayer occurring on top of L.7 and (ii) dispersed or concen-
trated vertical stones inside the underlying L.7 (Figs. 4a, 5a).The morphology of the latter is interpreted as a former icewedge cast and fill of the former cryodesiccation features.All these elements indicate the absence of fine sedimentinput, strong freezing conditions favourable of permafrost,ice wedge formation, and cryoclastic breakdown of the sur-rounding limestone walls.
4.4.11 Layer 5
This strongly calcareous sandy, slightly clayey silt is presentall over the cavity (Table 5 and Rentzel, 1990), with its max-imal thickness of about 60 cm towards the entrance (Fig. 2b).It appears rather homogeneous but shows some stratificationand a distinct platy structure (Table 5 and Rentzel, 1990). Inaddition some faint vertical cryodesiccation features couldalso be observed. Except for the upper part, coarse material isscarce (Fig. 8a) and composed of almost exclusively angular,local limestone fragments (Fig. 9). The organic carbon con-tent is low except for the uppermost sample (Fig. 8b), whichis likely contaminated by present-day roots. Mineralogicalanalyses indicate the absence of weathered minerals (Adatteet al., 1991).
Sedimentation of this layer indicates that water-flow pro-cesses were regularly active again at this landscape position.The texture suggests that part of the fine material might be ofaeolian origin. The platy structure, the cryodesiccation fis-sures and the cryoclasted rock fragments incorporated in thesediment witness a particular cold environment during theaccumulation of this deposit. IRLS dating of the sample fromthe lower part of the layer indicates an age of 26.5± 2.8 ka(COT5, Table 4).
4.4.12 Layers 3 and 4
These strongly calcareous heterometric sediments, withabundant angular limestone fragments in L.4 (Figs. 4a, 5a,9), were found only at the entrance of the cavity. The com-mon angular limestone fragments in L.4 suggest importantcryoclastic breakdown of the cavity roof that possibly indi-cates cold climatic phases. The lack of chronological, field,and analytical data does not permit a discussion of the de-position processes and environmental significance of theselayers.
5 Discussion
As recognised already by former scholars in the first quarterof the twentieth century (Dubois and Stehlin, 1932/1933) thesedimentary sequence of the Cotencher cave is an outstand-ing record of the environmental changes that occurred duringthe Late Pleistocene. Regional climatic fluctuations (Fig. 10)are also documented in different sections of the alpine fore-land (Preusser, 2004) and in the Jura Mountains (Cupillardet al., 2015). The deposits of the Cotencher cave reinforce
E&G Quaternary Sci. J., 67, 41–72, 2019 www.eg-quaternary-sci-j.net/67/41/2019/

J. Deák et al.: New data from the Middle Palaeolithic Cotencher cave 63
Figure 10. Syntheses of the Cotencher data in comparison with the regional chronological and palaeoenvironmental record. 1 based onLisiecki and Raymo (2005). 2 based on Preusser (2004), Ivy-Ochs et al. (2008), Cupillard et al. (2015), and Bichet et al. (2016).
some of the former environmental records and permit us tofurther decipher the complexity of Jura and Alpine glacierdynamics.
5.1 Early last glacial: evidence of landscapedestabilisation
Based on mineralogical arguments, the brown layer presentin the lower part of the stratigraphic sequence has been in-terpreted as sediment originating from Eemian soil (Adatteet al., 1991). Its spatial (vertical and horizontal) distribu-tion (Fig. 2b) suggests the presence of a reasonably largesediment platform in front of the cave and under the rockshelter. Pedogenetic processes transformed this sediment andthe resulting rather weathered soil has been subsequently re-worked into the cave. The observations available so far donot permit an exhaustive discussion about the deposition pro-cesses, but the stratified sandy layer described by Duboisand Stehlin (1932/1933) clearly suggests at least some wa-ter flow towards the cavity, while the large limestone blockswitness gravitational accumulations. The important quan-tity of biogenic phosphorus (Dubois and Stehlin, 1932/1933;Rentzel, 1990) and the presence of numerous cave bear (Ur-
sus speleous) bones together with the presence of animalbones indicating both steppe and forest vegetation cover (seeSect. 4.2) suggest slow sediment build-up over a long timespan and sediment accumulation during several depositionalphases. Involutions in the upper part of this layer may reflectcryoturbation processes but could also be related to faunalturbation, such as digging by bears in order to prepare hiber-nation dens (e.g. at the rock shelter of Tanay Sur-les-Creux;Braillard et al., 2004). Larger sections would be needed toformulate a trustworthy interpretation.
The L.15 observed and analysed in this work representsonly the uppermost part of this stratigraphic unit known asthe brown layer (Fig. 3). For this part of the sequence theIRSL chronology suggests reworking processes around 67 ka(see discussion below). As a result we can only deduce thatthe accumulation of the brown layer containing part of theMousterian artefacts occurred during several phases of theearly Last Glacial, but this can be detailed only through moresuitable sections and further dating.
www.eg-quaternary-sci-j.net/67/41/2019/ E&G Quaternary Sci. J., 67, 41–72, 2019
64 J. Deák et al.: New data from the Middle Palaeolithic Cotencher cave
5.2 Evidence of glacier processes around 70 ka
In the lower part of the studied sequence several convergingsedimentary and chronological facts indicate the presence ofa glacier environment in the surroundings of Cotencher cave.First of all, layers L.14 and L.13 suggest water flow pro-cesses both at the entrance and towards inner parts of thecavity. The presence of running water despite the steep slopesand strongly permeable environment both inside cavity andunder the rock shelter at about 140 m above the river val-ley bottom implies that something kept up the water. Thegeomorphological context as described above suggests thepresence of a neighbouring glacier during the deposition ofthese sediments. The high CaCO3 content of the various sub-layers, their low organic carbon content, and the cyroclastedcoarse components (Table 5) further sustain the hypothesisof a cold environment characterised by sparse or absent veg-etation cover. Altogether, the environmental proxy data andIRSL dating of this lower part of the studied sequence (COT1and COT2, Table 4) imply correlation to the periods of severecooling with the S3 stadial (MIS 4). This evidence is furthercompleted by the information provided by the sedimentarydata recorded in L.12. Indeed the coarse fraction of this layerreveals that the sediment source of this deposit is not onlylimited to physical breakdown of the limestone hosting thecavity. As such, the thickness of this layer, the wide varietyof stone fragments, their morphology, and particularly the al-lochthonous and rolled pebbles (Fig. 9) reveal the presenceof a rather thick and heterometric sediment outside the cav-ity that was originally deposited, at least partially, by wa-ter. Once more, the evidence of water flow, depositing coarsematerial in the studied geomorphological context, strength-ens the hypothesis of the presence of a glacier. Layer L.12was deposited after 67 ka. Moreover, before its deposition ithas undergone pedogenetic processes. Therefore we can con-clude that the deposition of the sediment source of L.12 inthe surroundings of the cavity also occurred during the se-vere cold period of S3 stadial (MIS 4).
To summarise, during the S3 stadial the studied landscapewas occupied by ice masses and thick associated deposits.In this environment the seasonal meltwater deposited thefiner sediments of L.14 and L.13 inside the cavity and pos-sibly reworked the upper part of the brown layer, sampledas L.15 here. Similarly accumulation of heterometric sedi-ment (source of L.12) at the entrance of the cave and on thesurrounding slopes was related to ice-marginal debris sup-ply resulting in the deposition of lateral moraine or kameterraces. The petrographic data suggest that this glacier wasof local (Jura Mountains) origin. The very few alpine ele-ments can be well explained as reworking of deposits of olderglacial material, which extended westward beyond the LGM(Campy, 1992) and were also mapped in the neighbourhoodof the studied region (Méia and Becker, 1976; Pasquier et al.,2013).
This climatic cooling of MIS 4 is rarely evidenced in theregional terrestrial record. Two sites witnessing glacier ad-vances have been reported: in the northern Alpine forelandat Finsterhennen glacier-outwash deposits have been dated toabout 70 ka (Preusser et al., 2007), while in the Jura Moun-tains recent studies of an outcrop at Arçon also describedglacio-fluviatile sediments situated under organic sedimentsdated to ca. 48 ka and interpreted as possibly deposited dur-ing this period (Bichet et al., 2016). As such the Cotenchersedimentary record represents additional evidence for thisrarely recorded climatic event in terrestrial context and itsimportance lies also in its geographical position, situated be-tween the above-mentioned locations (Fig. 1).
It is interesting to mention that the hypothesis of glacialsedimentation in front of the cavity has already been formu-lated by Dubois and Stehlin (1932/1933). Similar to our rea-soning, they tried to understand the presence of the wide va-riety gravels in the couche à galets. They concluded that onlythe presence of a glacier, different from the one known for themain Würmian with an alpine source, could explain water-laid deposits high above the valley bottom. Based on the sci-entific data of their time, they interpreted this glacier activity(“Areuse precursor glaciation”) as representing a cooling thatoccurred before the LGM-dated Rhone glacier conquered theAlpine foreland and the slope of the Jura Mountains (Duboisand Stehlin, 1932/1933).
5.3 Alternation of pedogenetic and cryogenic processesduring MIS 3
Layers L.12 and L.11 witness evolution outside and recur-rent sediment transport towards the cavity. The organic mat-ter accumulation and the associated CaCO3 content trends,the slight weathering of the limestone fragments, and thenotable presence of pedogenetic minerals, particularly in itslower part, indicate that the sediment generating L.12 was af-fected by pedogenetic processes; thus it evolved outside thecavity. As indicated by CaCO3 and organic carbon content,the soil-forming processes affected the lower part of the de-posit more strongly than its upper part (particularly L.12b,but also L12c). The same chemical soil properties suggest aperceptible weakening of the impact of the pedogenetic pro-cesses in the upper part of the deposit (L.12a) as well as inL.11.
Subsequently the heterometric soil sediments were trans-ported into the cavity. As explored earlier (Dubois andStehlin, 1932/1933) the karstic chimneys of the cavity arecompletely plugged by metres of limestones; therefore thecoarse deposit must have been transferred by horizontaltransport. Although some fine material might have been de-posited by water seepage through karstic fissures of the cav-ity roof, the morphology of the deposits (intermixed coarseand granular fine fraction, absence of stratification, homo-geneous presence of granular, humiferous fine material) in-dicate deposition by mass movement, in which the fine and
E&G Quaternary Sci. J., 67, 41–72, 2019 www.eg-quaternary-sci-j.net/67/41/2019/

J. Deák et al.: New data from the Middle Palaeolithic Cotencher cave 65
coarse materials were transported together. In addition, thedistinct layering (L.12c to L.12a,) observed both in 2016 andby former studies (Dubois and Stehlin, 1932/1933; Rentzel,1990) and the presence of a considerable amount of organicmatter clearly indicate that deposition of this sediment oc-curred in several phases. Solifluction processes and soil creeptriggered by repeated intensive freezing conditions and thepresence of frozen ground (Bertran et al., 1997) can best ex-plain the morphology of the L.12 and its characteristics, suchas (i) the heterometric nature of the deposit, (ii) roundedallochthonous gravels associated with more angular, moreor less polished local limestone fragments, and (iii) homo-geneous distribution of the organic material throughout a180 cm thickness. The L.11, occurring only at the entranceof the cavity, might be a solifluction deposit.
To conclude, L.12 and L.11 are the result of combined de-position of heterometric soil sediments stemming from thecavity entrance and of fragments resulting from the physicalbreakdown of the limestone hosting the cavity. They recordmultiple cycles of alternation of soil formation processes andfrost-related sedimentation that occurred after ca. 67 ka andbefore ca. 36 ka. This period corresponds to the time spanof Gossau PAZ2 to Gossau PAZ5 (Preusser et al., 2003),i.e. roughly to the major part of MIS 3 (Fig. 10). For this pe-riod, environmental archives support an ice-free but fluctuat-ing cold and milder climate with changing ecosystems alter-nating among coniferous forest, steppe, and tundra (Preusseret al., 2003; Drescher-Schneider et al., 2007; Becker et al.,2013; Bichet et al., 2016).
The sediment and soil characteristics of L.12 and L.11 arein good agreement with these environmental trends, show-ing regular organic matter accumulation and some decarbon-atation outside the cavity during milder climatic conditions.This was followed by destabilisation of vegetation cover andof soils and physical breakdown of the ceiling during coolerphases. The reworking of these pedosediments towards thecavity suggests repeated periods of frozen subsoils enablingsoil creep processes. The numerous faunal remains found allover this layer (Dubois and Stehlin, 1932/1933) also con-firm the hypothesis of cyclic soil formation processes andrecurrent deposition over a long time span. Whereas the largemammal remains indicate a wide variety of ecosystems (Ta-ble 2), the rodent remains are heliophile and forest species(Table 3). A brief pollen study (Bezat, 1990) revealing thedominance of the arboreal and shrub pollen in one sample ofL.12 further confirms at least one phase of interstadial cli-matic conditions.
Based on their stratigraphic position, the soils generatingL.12c and L.12b, characterised by marked pedogenetic trans-formations, can be possibly correlated to the phases GossauPZ2 and PZ4, respectively. Their transport in the cavity couldbe related to the colder conditions that are known as GossauPZ3 and PZ5 (Fig. 10). The upper part of L.12 (L12a) andL.11 show less distinct pedogenetic processes (significantorganic matter decrease, the noteworthy CaCO3 and coarse
fraction augmentation). This can be best explained by themore and more important cooling that occurred during thepassage towards the LGM. The soil formation and sedimen-tation trends described here present strong similarities withthose described for the Ferrassie rock shelter record in SWFrance (Bertran et al., 2008) and this highlights the potentialof terrestrial sediments to document gradual environmentalchanges.
5.4 Glacier processes during the Last Glacial Maximum
In the sedimentary record of Cotencher cave the advent ofthe LGM is marked by the gully incision towards the en-trance of the cavity that erodes the upper part of the porousand heterometric sediments of L.12 and deposits the coarsesediment of L.10. Torrential flow at this landscape position(ca. 140 m above the valley bottom) can only be explained bythe presence of a glacier that was accompanied by meltwa-ter at its margin and frozen ground in the surroundings. Theincision process was followed by the formation of a pondwith fine material sedimentation (L.9) and this is a furtherindication of frozen grounds. This slow deposition was fol-lowed by more or less dynamic overland or concentrated wa-ter flow (L.8). All these deposits underwent severe and re-peated freeze–thaw processes as indicated by the cryoturba-tion features. This cluster of sedimentary and morphologicalevidence reveals severe climatic deterioration, the quasi ab-sence of vegetation, and the presence of a glacier in the sur-roundings. Petrographic data (Table 6, Fig. 9) suggest that alocal glacier occupied parts of the Areuse canyon. Our dataare in good agreement with Pasquier et al. (2013), who doc-umented till deposits composed of gravels of local origin un-derlying fine sediments and tills of alpine origin. The tim-ing of these events triggered by the local glacier is about36.6±3.8 ka (COT-3) and gives a novel and valuable chrono-logical indication for an early onset of a glacial environmentin the Jura Mountains, more precisely in the Travers Valley.This date is several thousand years older than those known inthe lowlands of the northern Alpine foreland. At Finsterhen-nen (ca. 40 km from the site), the northern lobe of the Rhoneglacier started to deposit proglacial sediments at about 30 ka(Preusser et al., 2007). Similarly, higher up in the Jura Moun-tains, the landscape was also not yet covered by ice, as is in-dicated by dates provided by various faunal records. Indeed,at the Baume de Longaigue (820–920 m), situated higher upin the studied valley, an ibex bone has been accelerator massspectrometry (AMS) dated to 34840± 340 BP (Leesch etal., 2013) and an open landscape suggesting faunal assem-blage found in a cave at La Chaux-de-Fond (1020 m, Fig. 1)has been AMS dated to 32590± 630 BP (Oppliger, 2010, inLeesch et al., 2013).
This apparent relatively early formation of a local glacierin the Areuse canyon was possibly due to its particular ge-omorphological, climatic, and microclimatic conditions in aseverely cooling regional climate. As highlighted by Buon-
www.eg-quaternary-sci-j.net/67/41/2019/ E&G Quaternary Sci. J., 67, 41–72, 2019

66 J. Deák et al.: New data from the Middle Palaeolithic Cotencher cave
cristiani and Campy (2011), the morphology of some of thevalleys in the Jura Mountains, the average cool conditions,and the exposure to northeast winds created sufficiently arc-tic conditions for local glacier development. The importanceof the local geomorphological factors is still evident in thepresent-day climatic conditions. Indeed, higher up in the val-ley the sunshine-sheltered “Creux-du-Van” setting is a placewhere a ca. 20 m thick permafrost still exists in the screesituated under the mountain cliff at about 1200 m (Pancza,1988/1989; Delaloy and Reynard, 2001). This location couldhave been the place of birth of the local glacier that invadedthe valley downstream and caused sediment deposition at thelevel of the studied site. Furthermore, the Jura Mountainsare a geomorphological barrier for the Atlantic humid airmasses, and the high precipitation associated with low evap-otranspiration was probably an additional factors triggeringearly local glacier development.
The first phase of erosion–sedimentation processes reveal-ing the existence and closeness of a local glacier was fol-lowed by the deposition of L.7. The transition from the un-derlying pond environment is gradual and reveals a glaciola-custrine setting. The analytical data further support an envi-ronment with no or scarce vegetation cover. The stratigraphicposition and the dating performed indicate that this sedimen-tation took place between ca. 36.6± 3.8 and 30.0± 3.0 ka(COT3, COT4), thus just prior to the LGM and in continuityof sedimentary processes discussed for L.10 to L.8. The deepfreeze–thaw processes were probably very active and the cry-oturbation processes recorded by the underlying L.8 and L.9are probably related at least partially to this period. The de-position of L.7 corresponds to the expansion of glaciers ofthe LGM in both the Jura and the northern Alpine foreland(Preusser, 2004; Preusser et al., 2011). However the contin-uous fine sediment accumulation indicates that the surround-ings of the cave were not yet completely covered by ice, buttorrential water flow associated with its margins was replacedby calmer overland and lateral water flow processes.
A break in the fine sediment input is recorded by theL.6. This period, which lasted from about 30.0± 3.0 to26.5± 2.8 ka (COT4, COT5) was characterised inside thecave by intensive (cryo)shattering of the cave roof and theformation of ice wedge in the already existing sediments. Thesedimentary hiatus unravelled here can be interpreted as anindication that the cavity entrance was plugged by ice and/orsediment.
The next sedimentary phase materialised by L.5 indicatesrenewed overland water flow possibly accompanied by ae-olian sediment input in an environment with absent or littlevegetation cover. The accumulation of this sediment was alsoaccompanied by frost shattering of the limestones hostingthe cavity and deep freeze–thaw processes. These processesstarted at about 26.5±2.8 ka (COT5) but we do not have datato further constrain the time span of this sediment accumu-lation. The onset of sedimentary processes and the absenceof vegetation cover might be interpreted as (i) evidences of
deglaciation at the level of the cave or (ii) the sedimentaryfingerprint of the complex processes associated with the pas-sage between the local glacier and the alpine glacier. Thisdate is consistent with existing chronological evidences thatexpect the start of deglaciation at the maximum extent of theRhone glacier not later than 24±2 ka (Ivy-Ochs, 2015). Firstvegetation re-colonisation in the lowlands around NeuchâtelLake is estimated at around 19 ka (Thew et al., 2009).
The sediments of L.10, L.9, L.7, L.8, L.6, and L.5 thusshow some important phases of the sedimentary dynamicsthat occurred in the studied region and at the level of the siteduring the LGM: (i) presence of a local glacier at the alti-tudes close to Cotencher cave at about 36.6± 3.8 ka trigger-ing erosion processes and sediment deposition, (ii) followedby the growth of the ice body, filling up the valley at thelevel of the cavity entrance accompanied by a sediment hia-tus that lasted from ca. 30.6±3.0 to 26.5±2.8 ka and (iii) finematerial sedimentation in an environment with no vegetationcover post 26.5± 2.8 ka. A succession of a local till over-laid by glaciolacustrine sediments followed by till of alpineorigin covered by glaciolacustrine sediments is documentedin cores and outcrops situated upstream of the site (Pasquieret al., 2013; Mojon et al., 2015). The sedimentary evidencesand chronological data provided here complete this geologi-cal record and bring novel elements into the knowledge andtiming of the regional glaciation history.
5.5 Dynamics of human activities
The new chronological and environmental information com-bined with available archaeological data permit us to re-address the question of the nature, location, and timing ofhuman presence at Cotencher cave and its surroundings. Thissubject concerns three aspects: the nature of this activity, itslocation, and its timing.
In the review of Mousterian occupation of the Jura Moun-tains, Detrey (2013) concludes that the Travers Valley wasused not only as passage for Palaeolithic people, but thisinternal part of the mountain chain was also a place of ex-ploitation of lithic resources and rich in potential prey. Thetechno-economic analyses of the lithic assemblage of Co-tencher cave have been interpreted as indicating temporarydwelling under the rock shelter, with a mixed economic voca-tion (production and consumption of blanks) that was possi-bly frequented on several occasions (Bernard-Guelle, 2004).Our study confirms that the tools found in earlier excava-tions can be characterised as Charentian Mousterian of ori-ental Quina type. Moreover, the study of the material col-lected in 2016 unravels the presence of numerous chips wit-nessing debitage (or flaking) operations, the manufacturingand sharpening of tools at the level of the site. The faunal re-mains analysed so far could not reveal any unequivocal traceof anthropic action; thus the bone assemblage does not per-mit further discussion of the nature of human activity.
E&G Quaternary Sci. J., 67, 41–72, 2019 www.eg-quaternary-sci-j.net/67/41/2019/
J. Deák et al.: New data from the Middle Palaeolithic Cotencher cave 67
The location of the human activity remains difficult toassess. Dubois and Stehlin (1932/1933, p. 189) mentionedcharcoal and burned stones without lithic tools at the bot-tom of the cave in the lower part of the brown layer. Theyinterpret these finds as the remains of two fireplaces and ifthis assumption was correct it would imply an occupationpre-dating 67 ka. The lithic artefacts are present in the de-posits situated under L.15 (brown layer) and in L.12 (gravellylayer). The brown layer contains only a minor amount of thisfind (Table 1) and according to the available data it is mostlysituated in the upper part of it. This imprecise informationdoes not permit us to assert the timing of the human activitymaterialised by the tools found in this stratigraphic unit. In-deed several hypotheses can be formulated, but none of themcan be eliminated: (i) they could have been reworked fromoutside during the deposition of the brown layer or of theL.15 and L.16, and thus might be older than 67 ka; (ii) theymight be the results of in situ activity inside the cavity duringor by the end of the accumulation of this layer but before thedeposition of L.14 and L.13, thus once more reflecting hu-man activity older than 67 ka; (iii) they could be stemmingfrom the overlying L.12 due to bioturbation or cryoturbationprocesses and in this case they would be the reworked tracesof the seasonal anthropic activity, which took place at thelevel of the rock shelter between ca. 67 and 36 ka. As for theL.12, although burned stones and bones were regularly ob-served in this layer, so far there are no elements clearly sup-porting in situ human activity inside the cavity. In absenceof these features, we can only formulate that the lithic toolswere used at the external rock shelter part of the site andthey were deposited as part of L.12 during multiple processesof soil creep that occurred over a time span of some 10 000years, i.e. after the deposition of the sediment source of L.12at around 72 ka and before 36 ka. The study of vestiges foundin 2017 might give arguments to complete this interpretation.
Based on the study of the lithic industry, Bernard-Guelle(2004) concludes that the lithic artefacts that are spread allover the two find layers (red and gravelly layer) are pos-sibly related to the reworking of one single archaeologicallevel, located initially at the entrance of the cavity. The sed-imentological study performed here contests this interpre-tation. First of all, these two layers have considerably dif-ferent sedimentological and pedological characteristics andthey have been deposited during distinct and rather distanttime frames. In addition, sediments supporting the develop-ment of a glacier, reaching more or less the level of the cav-ity, separate the two layers that contain the lithic and faunalfinds. As developed here above, the brown layer has beendeposited and evolved inside the cavity after the last inter-glacial and before ca. 67 ka. The sedimentation of L.12 inthe cavity post-dates the marked cooling at about 67 ka and itoccurred during multiple phases up to about 36 ka. The soilcharacteristics of this reworked sediment suggest several dis-tinct phases of pedogenetic evolution outside the cavity. As aconsequence the artefacts reworked inside the cavity through
the successive mass movements are, at least partially, relatedto recurrent human activity on the soil surface at the entranceof the cavity, over a time span of several thousands of years.
The climatic fluctuations unravelled here also permit us tomodestly complete the already existing considerations con-cerning the relationship between the succeeding climates anddistribution of the Palaeolithic sites in the studied region.The Mousterian sites, although not numerous, are presenton both sides of the Jura Mountains (Le Tensorer, 1998;Tillet, 2000, 2001; Detrey, 2013). The marked dissymme-try in the frequency of sites between the northwester slopes(more abundant) and southeaster flanks (scarce) has been ex-plained (i) by the erosion processes more active on the Hel-vetic side due to the glacier passage during the LGM and(ii) by the more abundant silex outcrop on the French side.Moreover, Detrey (2013) highlights the fact that among thesites post-dating MIS 5, there is a hiatus corresponding toMIS 4 and the early part of MIS 3. The Cotencher data ac-quired here might at least partially explain this fact. As dis-cussed above, around 67 ka a local glacier developed at thelevel of the cave, but likely also in some other parts of theJura Mountains (Bichet et al., 2016). The erosion triggeredby this glacier passage, as well as the hostile landscape, non-suitable for anthropic activity, could be the cause of this hia-tus. As for the early Upper Palaeolithic sites (Aurignacian,Gravettian), they are completely absent in the Jura Moun-tains (Leesch et al., 2013) and in Switzerland (Cattin et al.,2009; Leesch and Bullinger, 2013). In addition to the ero-sion processes induced by the glaciers of the LGM, the rela-tively limited prospection and research programs are thoughtto be possibly responsible for this lack (ibid). Neverthelessit seems that the Jura Mountains represented a barrier regionthat the people preferred to avoid during the Upper Palae-olithic in the Jura Mountains (Leesch and Bullinger, 2013).Once more the sedimentary and chronological evidences ofthe deposits accumulated in Cotencher cave support this fact.The local glacier was active at the level of the cavity as earlyas ca. 36.1± 3.5 ka (COT3) and a glacio-lacustrine type ofsedimentation was active at least up to 26.5±2.8 ka (COT1).This environmental setting was once more not attractive forthe hunter–gatherer populations.
6 Conclusions
The interdisciplinary study of the sedimentary fill of Co-tencher cave permitted us to unravel and date several signif-icant environmental changes encoded in these deposits. Ac-cording to this, two periods of glacier development are doc-umented for the Late Pleistocene. Compared to the chronol-ogy known for alpine glaciers advancing into the lowlands, aparticular early development of a local glacier is apparentlyrevealed for the LGM. These data imply new elements for theunderstanding of the dynamics of this major climatic change.As for the climatic deterioration of MIS 4, the Cotencher sed-
www.eg-quaternary-sci-j.net/67/41/2019/ E&G Quaternary Sci. J., 67, 41–72, 2019

68 J. Deák et al.: New data from the Middle Palaeolithic Cotencher cave
iments support a local glacier build-up and these data com-plete the scarce regional terrestrial record. The new archaeo-logical information clearly reveals manufacturing and sharp-ening activities of Mousterian tools at the level of the site.Although it is still not possible to delimit the precise loca-tion of the various occupations, this study points out two oftheir characteristics: (i) at least part of them occurred at theentrance rock shelter part of the cavity and (ii) a repeatedvisiting of the site occurred over a long time span. The inte-gration of the sedimentological and chronological data alsopermitted us to formulate a hypothesis concerning some ofthe questions raised about the dynamics of human passage inthe studied region. According to our data the particular hos-tile glacier landscape explains, at least partially, the absenceof traces of human activity for both the period of MIS 4–earlyMIS 3 and the early Late Palaeolithic.
Data availability. Most of the underlying data are included in thepaper. Our site is still under study as part of a larger project of theNeuchâtel Archaeological Service. For this reason part of our un-derlying data are not yet publicly available.
Author contributions. JD carried out the field work (observa-tions, descriptions, sampling) and the selection of samples for anal-yses; she interpreted the analytical data, drew the graphs, and cre-ated the sedimentological tables; she set up the sieving protocol andsupervised the sieving; she set up the petrographic analyses protocoland performed petrographic study; she wrote the paper in collabo-ration with FP, MIC, and FXC. FP carried out the IRSL sampling,processing, and analyses; MIC carried out the field work (diggingand sampling), examined and interpreted the lithic collections, andcreated the table concerning the lithic artefacts; JCC studied and in-terpreted the bone collection; FXC conceived and coordinated thisproject; he led and carried out the field work (digging and sam-pling), handled the various archaeological collections, and createdthe tables concerning the faunal remains.
Competing interests. The authors declare that they have no con-flict of interest.
Acknowledgements. We express our gratitude to So-nia Wüthrich, head of the archaeology section of Neuchâtelcanton, Frédéric Cuche, president of the association of “Maisonde la Nature Neuchâteloise”, and Marc-Antoine Kaeser, directorof Laténium, Parc et musée d’archéologie de Neuchâtel, for theopportunity and support to perform this research.
We sincerely acknowledge our colleagues of the Office dupatrimoine et de l’archéologie de Neuchâtel for their help:Frédéric Brenet contributed substantially to the excavation work,performed the sieving, and drew the figures; Marc Juillard,Julien Spielmann, and Philippe Zuppinger helped us with the photo-graphic documentation, the topographic measures, and the illustra-tions. We are greatly indebted to Vincent Bichet, Michel Campy
(Université de Franche-Comté), Stéphane Gogniat (Hydrogeos),Thierry Malvésy, and Bernard Claude (Muséum d’histoire na-turelle de Neuchâtel) for the helpful and stimulating discussions.Philippe Rentzel (IPNA, Basel), Stéphanie Wirth (CHYN, Univer-sité de Neuchâtel), and François Pasquier kindly helped to find dataand reference material. The pedological analyses were performedin the LAS (EOST, Université de Strasbourg) and we are grateful toMartine Trautmann for the efficient handling of our samples.
Sébastien Bernard-Guelle, the anonymous reviewer, and Christo-pher Lüthgens are sincerely acknowledged for their constructiveand helpful comments and suggestions.
This study is part of a regional landscape and natural coordi-nation “Cotencher project”, coordinated by François-Xavier Chau-vière. We would like to thank Loterie romande, Fondation ErnestDubois, Fondation Göhner, Fondation Sophie et Karl Binding, Fon-dation du Casino de Neuchâtel, La Migros Neuchâtel-Fribourg,ECOFORUM, and Société d’histoire et d’archéologie du canton deNeuchâtel for the financial support. We express our appreciation ofall the participants and partner institutions for their collaboration.
References
Adatte, T., Rentzel, P., and Kübler, B.: Etude minéralogique et sédi-mentologique du remplissage de la grotte de Cotencher (Juraneuchâtelois, Suisse), Eclogae Geol. Helv., 84, 671–688, 1991.
Angelucci, D. E., Anesin, D., Susini, D., Villaverde, V., Zapata, J.,and Zilhão, J.: Formation processes at a high resolution MiddlePaleolithic site: Cueva Antón (Murcia, Spain), Quaternary Int.,315, 24–41, 2013.
Auclair, M., Lamothe, M., and Huot, S.: Measurement of anoma-lous fading for feldspar IRSL using SAR, Radiat. Meas., 37,487–492, 2003.
Bay, R.: Der menschliche Oberkiefer aus der Grotte de Cotencher(Rochefort, Neuchâtel, Suisse), Archives suisses d’anthropologiegénérale, 451, 57–101, 1981.
Becker, D., Oppliger, J., Thew, N., Scherler, L., Aubry, D., andBraillard, L.: Climat et écologie en Ajoie durant la second par-tie du Pleniglaciaire moyen weichsélien: apport des remplissagedes dolines de Courtedoux-Vâ Tche Tchâ (Jura, CH), in: Le pe-uplement de l’Arc jurassien de la Préhistoire au Moyen Âge.Actes des deuxièmes journées archéologiques frontalières del’Arc jurassien, Delle (F) -Boncourt (CH), edited by: Richard, A.,Schifferdeccker, F., Mazimann J.-P., and Bélet-Gonda, C., 16–18November 2007, Presses Universitaire de Franche-Compté, Be-sançon, 13–23, 2013.
Bernard-Guelle, S.: Un site moustérien dans le Jura suisse: la grottede Cotencher (Rochefort, Neuchâtel) revisitée, Bulletin de la So-ciété préhistorique Française, 101, 741–769, 2004.
Bertran, P., Hétu, B., Texier, J.P. and Steijn, H.: Fabric characteris-tics of subaerial slope deposits, Sedimentology, 44, 1–16, 1997.
Bertran, P., Caner, L., Langohr, R., Lemée, L., and d’Errico, F.: Con-tinental palaeoenvironments during MIS 2 and 3 in southwesternFrance: the La Ferrassie rockshelter record, Quaternary Sci. Rev.,27, 2048–2063, 2008.
Bezat, E.: Analyse pollinique, Cotencher Sondage 1988 – P1,in: Neue quatärgeologische Untersuchungen an den Höh-lensediementen von Cotencher (Kt. NE), edited by: Renztel, P.,
E&G Quaternary Sci. J., 67, 41–72, 2019 www.eg-quaternary-sci-j.net/67/41/2019/

J. Deák et al.: New data from the Middle Palaeolithic Cotencher cave 69
Labor für Ur- und Frühgeschichte der Universität Basel, 76–81,1990.
Bichet, V., Buoncristiani, J.-F., and Ravier, É.: Identification desédiments du stade isotopique 3 (OIS-3) dans les formationsproglaciaires du haut Jura, in: De la reconstitution des paysagesà l’histoire des sociétés, edited by: Barral, P. M. M. and RavierE., 10 000 d’archives sédimentaires en zones humides, Infolio,Gollion, Switzerland, 19–27, 2016.
Bini, A., Buoncristiani, J. F., Coutterand, S., Ellwanger, D., Fel-ber, M., Florineth, D., Graf, H. R., Keller, O., Kelly, M.,Schlüchter, C., and Schoeneich, P.: Die Schweiz während desletzteiszeitlichen Maximum (LGM) 1 : 500000, Carte et notice,Bundesamt für Landestopografie Swisstopo, Wabern, 2009.
Blant, M. and Deriaz, P.: Le gisement paléontologique du Pléis-tocène supérieur de la grotte du Balai (Saint-Croix, Vaud), Sta-lactite supplément, 16, 155–158, 2007.
Boschian, G., Gerometta, K., Ellwood, B. B., and Karavanic, I.:Late Neandertals in Dalmatia: Site formation processes, chronol-ogy, climate change and human activity at Mujina Pecina, Croa-tia, Quaternary Int., 450, 12–35, 2017.
Braillard, L., Guélat, M., and Rentzel, P.: Effects of bears on rock-shelter sediments at Tanay Sur-les-Creux, southwestern Switzer-land, Geoarchaeology, 19, 343–367, 2004.
Bullock, P., Fedoroff, N., Jongerius, A., Stoops, G., and Tursina,T.: Handbook for soil thin section description, Waine Research,Wolverhampton, 1985.
Buoncristiani, J.-F. and Campy, M.: Quaternary Glaciations in theFrench Alps and Jura, in: Ehlers, J., Gibbard, P. L., and Hughes,P. D., Developments in Quaternary Science. Quaternary glacia-tions – extent and chronology, Elsevier, Amsterdam, the Nether-lands, 117–126, 2011.
Buylaert, J. P., Murray, A. S., Thomsen, K. J., and Jain, M.: Test-ing the potential of an elevated temperature IRSL signal fromK-feldspar, Radiat. Meas., 44, 560–565, 2009.
Buylaert, J. P., Jain, M., Murray, A. S., Thomsen, K. J., Thiel, C.,and Sohbati, R.: A robust feldspar luminescence dating methodfor Middle and Late Pleistocene sediments, Boreas, 41, 435–451,2012.
Campy, M.: Palaeogeographical relationship between Alpine andJura glaciers during the two last Pleistocene glaciation, Palaeo-geogr. Palaeocl., 93, 1–12, 1992.
Castel, J.-C.: The faunal remains at Roc-de-Marsal and game ex-ploitation in the Mousterian of Southwest France, Variability inHuman Hunting Behavior during Oxygen Isotope Stages 4/3:Implications for Understanding Modern Human Origins. ICAZParis 2010, S5, 4, 2010.
Castel, J.-C., Luret, M., and Chaix, L.: Hommes et bêtes auMoustérien, in: La Haute-Savoie durant la Préhistoire, edited by:Serralongue, J., Culture 74/08, Haute-Savoie, 60–64, 2012.
Castel, J.-C., Discamps, E., Soulier, M.-C., Sandgathe, D., Dibble,H. L., McPherron, S. J. P., Goldberg, P., and Turq, A.: Neander-tal subsistence strategies during the Quina Mousterian at Roc deMarsal (France), Quaternary Int., 433, 140–156, 2017.
Cattin, M.-I., Affolter, J., and Thew, N.: Provenance de diversesmatières premières: un indice pour définir circulations et terri-toires au Magdalénien supérieur en Suisse, in: Le concept deterritoires dans le Paléolithique supérieur européen, edited by:Djindjian F., Kozlowski, J., and Bicho, N., actes 15e Congrès
UISPP, Lisbonne, September 2006, Oxford BAR S1938, Lis-bonne, 157–165, 2009.
Chauvière, F.-X., Cattin, M.-I., Deák, J., and Brenet, F.: Le petitracloir moustérien: un retour à la grotte paléolithique de Co-tencher (Rochefort, NE), Nike-Bulletin, 1, 32–35, 2018a.
Chauvière, F.-X., Deák, J., Cattin, M.-I., Brenet, F., Juillard, M.,Castel, J.-C., Oppliger, J., and Preusser, F.: La grotte de Co-tencher: une (pré)histoire humaine et naturelle. Archéologie Su-isse: Neuchâtel les nouvelles voies de l‘archéologie, Archéoloo-gie Suisse, 41, 16–20, 80, 2018b.
Chauvière, F.-X., Deák, J., Cattin, M.-I., Brenet, F., Juillard, M.,Castel, J.-C., Oppliger, J., and Preusser, F.: Die Höhle vonCotencher: eine menschliche und natürliche (Vor-)Geschichte,Archäologie Schweiz: Neuenbourg, neue Wege der Archäologie,Archäologie Schweiz, 41, 16–20, 80, 2018c.
Crotti, P.: Le peuplement paléolithique et mésolithique de la Su-isse: la question de l’utilisation des étages montagnards dans lesAlpes, Geogr. Helv., 63, 167–175, https://doi.org/10.5194/gh-63-167-2008, 2008.
Cupillard, C., Magny, M., Bocherens, H., Bridault, A., Bégeot, C.,Bichet, V., Bossuet, G., Drucker, D. G., Gauthier, E., Jouannic,G., Millet, L., Richard, H., Rius, D., Ruffaldi, P., and Walter-Simonnet, A.-V.: Changes in ecosystems, climate and societiesin the Jura Mountains between 40 and 8 ka cal BP, QuaternaryInt., 378, 40–72, 2015.
Deák, J.: Geoarchäologie oder das „Gedächtnis der Böden“,Archäologie Schweiz: Neuenbourg, neue Wege der Archäologie,Archéologie Suisse, 41, 36–40, 80, 2018a.
Deák, J.: La géoarchéologie ou la mémoire des „sols“, ArchéologieSuisse: Neuchâtel les nouvelles voies de l‘archéologie, AS, 41,36–40, 80, 2018b.
Delaloy, R. and Reynard, E.: Les éboulis gelés du Creux du Van(Chaîne du Jura, Suisse), Environnements Périglaciaire, 8, 118–129, 2001.
De Rougemont, D.: Monnaies trouvées lors des fouilles de 1917 àCotencher NE, Gazette numismatique suisse, 28–32, 100–104,1982.
Desor, E.: Théorie de l’époque glaciaire, Congrès Internationald’Anthrolpologie et d’archéologie préhistorique, Compte rendude la 2eme session, Paris, 1867, Paris C. Reinwald, Libraire-éditeur, 275–276, 1868.
Desor, E.: Essai d’une classification des cavernes du Jura, Bulletinde la Société des Sciences Naturelles de Neuchâtel, 9, 69–87,1872.
Detrey, J.: Nouvelles données sur le Paléolithique moyen dans lecanton du Jura (Suisse), Revue Archéologique de l’Est, 59, 7–45, 2010.
Detrey, J.: Présence moustérienne dans l’arc jurassien: un état dela question, in: Deuxièmes journées archéologiques frontalièresde l’Arc jurassien. Actes, Le peuplement de l’Arc jurassien dela Préhistoire au Moyen Âge. Besançon, edited by: Richard,A., Schifferdeccker, F., Mazimann J.-P., and Bélet-Gonda, C.,Presses Universitaires de Franche-Comté et Porrentruy, Officede la culture et Société jurassienne d’émulation, Delle, France– Boncourt, Switzerland, 16–18 November 2007, 41–70, 2013.
Drescher-Schneider, R., Jacquat, C., and Schoch, W.: Palaeobotani-cal investigations at the mammoth site of Niederweningen (Kan-ton Zürich), Switzerland, Quaternary Int., 164–165, 113–129,2007.
www.eg-quaternary-sci-j.net/67/41/2019/ E&G Quaternary Sci. J., 67, 41–72, 2019

70 J. Deák et al.: New data from the Middle Palaeolithic Cotencher cave
Dubois, A.: Note sur les fouilles exécutées en 1916 dans la grottede Cotencher, Le Rameau de sapin, IIème série, 14–15, 1917.
Dubois, A.: Les fouilles de la grotte de Cotencher, Le véritable mes-sager boiteux de Neuchâtel, 72–74, 1918.
Dubois, A.: Les Fouilles de la Grotte de Cotencher, Actes de laSociété Helvétique des Sciences, 101, 99–122, 1920.
Dubois, A. and Stehlin, H. G.: La grotte de Cotencher: stationmoustérienne, Emil Birkhaeuser&Cie, Bâle, 1932/1933.
Duller, G. A. T.: Single-grain optical dating of Quaternary sedi-ments: why aliquot size matters in luminescence dating, Boreas,37, 589–612, 2008.
Egloff, M.: Musée cantonal d’archéologie, Ville de Neuchâtel, Bib-liothèques et musées, 1975, 91–95, 1976.
Egloff, M.: Des premiers chasseurs au début du christianisme His-toire du Pays de Neuchâtel, 1. De la préhistoire au Moyen-Age,Attinger, Neuchâtel, 9–160, 1989.
Feathers, J. K.: Luminescence dating and modern human origins,Evol. Anthropol.-Issues, News, and Reviews, 5, 25–36, 1996.
Furrer, H., Graf, H. R., and Mäder, A.: The mammoth site of Nieder-weningen, Switzerland, Quaternary Int., 164–165, 85–97, 2007.
Gaar, D. and Preusser, F.: Luminescence dating of mammoth re-mains from northern Switzerland, Quaternary Geochronol., 10,257–263, 2012.
Gaar, D., Lowick, S. E., and Preusser, F.: Performance of differentluminescence approaches for the dating of known-age glacioflu-vial deposits from northern Switzerland, Geochronometria, 41,65–80, 2014.
Galbraith, R. F., Roberts, R. G., Laslett, G. M., Yoshida, H., and Ol-ley, J. M.: Optical dating of single and multiple grains of quartzfrom Jinmium rock shelter, Northern Australia: part I, experi-mental design and statistical models, Archaeometry, 41, 339–364, 1999.
Gigon, R.: Inventaire Spéléologique de la Suisse, tome 1: Canton deNeuchâtel, Commission de Spéléologie de la Société helvétiquedes Sciences Naturelles, Neuchâtel, 1976.
Goldberg, P. and Macphail, R. I.: Caves and rockshelters, in: Prac-tical and theoretical geoarchaeology, edited by: Goldberg, P. andMacphail, R., Blackwell Publishing, Malden, 169–187, 2006.
Goldberg, P., Schiegl, S., Meligne, K., Dayton, C., and Conard,N. J.: Micromorphology and site formation at Hohle Fels Cave,Swabian Jura, Germany, Eiszeitalter und Gegenwart, 53, 1–25,2003.
Graf, A. A., Strasky, S., Ivy-Ochs, S., Akçar, N., Kubik, P. W.,Burkhard, M., and Schluchter, C.: First results of cosmogenicdated pre-Last Glaciation erratics from the Montoz area, JuraMountains, Switzerland, Quaternary Int., 164–165, 43–52, 2007.
Guérin, G., Valladas, H., Joron, J.-L., Mercier, N., Reyss, J.-L.,and Zaidner, Y.: Apports de la datation par la luminescence dessites du Proche-Orient et résultats préliminaires du site de NesherRamla (Israël), L’Anthropologie, 121, 35–45, 2017.
Hajdas, I.: Radiocarbon dating and its applications in Qua-ternary studies, E&G Quaternary Sci. J., 57, 2–24,https://doi.org/10.3285/eg.57.1-2.1, 2008.
Hajdas, I., Bonani, G., Furrer, H., Mäder, A., and Schoch, W.: Ra-diocarbon chronology of the mammoth site at Niederweningen,Switzerland: Results from dating bones, teeth, wood, and peat,Quaternary Int., 164–165, 98–105, 2007.
Heiri, O., Koinig, K. A., Spötl, C., Barrett, S., Brauer, A., Drescher-Schneider, R., Gaar, D., Ivy-Ochs, S., Kerschner, H., Luetscher,
M., Moran, A., Nicolussi, K., Preusser, F., Schmidt, R., Schoene-ich, P., Schwörer, C., Sprafke, T., Terhorst, B., and Tinner, W.:Palaeoclimate records 60–8 ka in the Austrian and Swiss Alpsand their forelands, Quaternary Sci. Rev., 106, 186–205, 2014.
Higham, T.: European Middle and Upper Palaeolithic radiocarbondates are often older than they look: problems with previous datesand some remedies, Antiquity, 85, 235–249, 2015.
Huntley, D. J. and Baril, M. R.: The K content of the K-feldspars be-ing measured in optical dating or in thermoluminescence dating,Ancient TL, 15, 11–13, 1997.
Huntley, D. J. and Lamothe, M.: Ubiquity of anomalous fading inK-feldspars and the measurement and correction for it in opticaldating, Can. J. Earth Sci., 38, 1093–1106, 2001.
Ivy-Ochs, S.: Glacier variations in the European Alps at the endof the last glaciation, Cuadernos de investigación geográfica, 41,295–315, 2015.
Ivy-Ochs, S., Kerschner, H., Reuther, A., Preusser, F., Heine, K.,Maisch, M., Kubik, P. W., and Schlüchter, C.: Chronology of thelast glacial cycle in the European Alps, J. Quaternary Sci., 23,559–573, 2008.
Jacobs, Z. and Roberts, R. G.: Advances in optically stimulated lu-minescence dating of individual grains of quartz from archeolog-ical deposits, Evol. Anthropol.-Issues, News, and Reviews, 16,210–223, 2008.
Lee, M. K., Lee, Y. I., Lim, H. S., Lee, J. I., Choi, J. H., and Yoon,H. I.: Comparison of radiocarbon and OSL dating methods fora Late Quaternary sediment core from Lake Ulaan, Mongolia, J.Paleolimnol., 45, 127–135, 2011.
Leesch, D. and Bullinger, J.: Le Plateau suisse et le massif du Jurapendant le Paléolithique supérieure ancien: paléoenvironnmentet indices d’occupation humaine, Mémoire LVI de la Sociétépréhistorique française, Le Paléolithique supérieure ancien del’Europe du Nord-Ouest, 385–394, 2013.
Leesch, D., Bullinger, J., and Cupillard, C.: Le peuplement de l’arcjurassien au Paléolithique supérieur, Le peuplemenr de l’Arcjurassien de la Préhistoire au Moyen Âge, Actes des deux-ièmes journées archéologiques frontalières de l’Arc jurassien,Delle, France – Boncourt, Switzerland, 16–18 November 2007,Presses universitaire de Franche-Compté., Annales Littéraires del’Université de Franche-Compté, série Environnement, sociétéset archéologie 17, Cahier d’archéologie jurassienne, 21, 71–84,2013.
Le Tensorer, J.-M.: Méthodologie et chronologie La Suisse duPaléolithique à l’aube du Moyen-Age. De l’Homme de Néan-dertal à Charlemagne, 1. Paléolithique et Mésolithique, Sociétésuisse de préhistoire et d’archéologie, Bâle, 15–38, 1993.
Le Tensorer, J.-M.: Le Paléolitique en Suisse, Jérôme Millon,Grenoble, 1998.
Lisiecki, L. E. and Raymo, M. E.: A Pliocene-Pleistocene stack of57 globally distributed benthic δ18O records, Paleoceanography,20, 1–17, 2005.
Lowick, S. E., Trauerstein, M., and Preusser, F.: Testing the appli-cation of post IR-IRSL dating to fine grain waterlain sediments,Quaternary Geochronol., 8, 33–40, 2012.
Lowick, S. E., Buechi, M. W., Gaar, D., Graf, H. R., and Preusser,F.: Luminescence dating of Middle Pleistocene proglacial de-posits from northern Switzerland: methodological aspects andstratigraphical conclusions, Boreas, 44, 459–482, 2015.
E&G Quaternary Sci. J., 67, 41–72, 2019 www.eg-quaternary-sci-j.net/67/41/2019/

J. Deák et al.: New data from the Middle Palaeolithic Cotencher cave 71
Mathieu, C. and Pieltain, F.: Analyse chimique des sols, Méthodeschoisies, Edition Tec and Doc Paris, 2003.
Méia, J. and Becker, F.: Notice explicative et feuille 1164, Neuchâ-tel, Commission géologique suisse, 1976.
Météosuisse: Evapotranspiration nach Primault. Neuchâtel, 485 m.1996–2005, Météosuisse, Geneve, Switzerland, 2005.
Météosuisse: Normes climatologique La Brévine (1961–1990),Chaumon (1961–1990), Neuchâtel (1961–1990), La Chaux-deFonds (1901–1980), Météosuisse, Genève, Switzerland, 2016.
Miéville, H.: Cotencher. Dictionnaire historique de la Suisse (DHS),available at: http://www.hls-dhs-dss.ch/textes/f/F12556.php (lastaccess: 1 December 2018), 2005.
Mojon, P.-O., Pasquier, F., and Emery-Barbier, A.: Micropaléon-tologie des dépôts lacustres Tardiglaciaires à Holocènes duVal-de-Travers et de la Vallée des ponts (Jura Suisse Nord-Occidental), Bulletin de la Société Neuchâteloise des SciencesNaturelles, 135, 51–77, 2015.
Moll, H. F.: Rochefort NE. Grotte de Cotencher, Annuaire de laSociété Suisse de Préhistoire et d’Archéologie, 56, 177, 1971.
Moll, H. F.: Die Paläolitische Station von Cotencher (RochefortNE), Kolloquium: Der fossile Mensch im schweizerischenPalaolithicum, Verhandlungen der Schweizerischen Natur-forschenden Gesellschaft, Sektion Anthropologie, 6, 48–49,1974.
Moll, H. F.: Découverte d’un maxillaire supérieur humain à la grottede Cotencher (commune de Rochefort, canton de Neuchâtel, Su-isse), Bulletin de la Société d’Etudes et de Recherches Préhis-toriques des Eyzies, 26, 1–15, 1977.
Munsell Color: Munsell soil color charts, 1994, New Windsor,1994.
Olley, J. M., Roberts, R. G., and Murray, A. S.: Disequilibria inthe uranium decay series in sedimentary deposits at Allen’s cave,nullarbor plain, Australia: Implications for dose rate determina-tions, Radiat. Meas., 27, 433–443, 1997.
Otz, H.-L.: Communication à la séance du 4 avril 1867, Bulletinde la société neuchâteloise des sciences naturelles, 7, 534–536,1867.
Pancza, A.: Un pergélisol actuel dans le Jura Neuchâtelois, Bul-letin de la Société neuchâteloise de géographie, 32–33, 129–140,1988/1989.
Pasquier, F., Burkhard, M., Mojon, P.-O., and Gogniat, S.: Feuille1163 Travers-Atlas géol. Suisse 1 : 25000, Notice expl. 162, Of-fice fédérale de topographie, Wabern, Switzerland, 2013.
Prescott, J. R. and Hutton, J. T.: Cosmic ray contributions to doserates for luminescence and ESR dating: Large depths and long-term time variations, Radiat. Meas., 23, 497–500, 1994.
Preusser, F.: Luminescence dating of fluvial sediments and over-bank deposits from Gossau, Switzerland: fine grain dating, Qua-ternary Sci. Rev., 18, 217–222, 1999.
Preusser, F.: Towards a chronology of the Late Pleistocene in thenorthern Alpine Foreland, Boreas, 33, 195–210, 2004.
Preusser, F. and Degering, D.: Luminescence dating of the Nieder-weningen mammoth site, Switzerland, Quaternary Int., 164–165,106–112, 2007.
Preusser, F. and Kasper, H. U.: Comparison of dose rate determina-tion using high-resolution gamma spectrometry and inductivelycoupled plasma-mass spectrometry, Ancient TL, 19, 1–24, 2001.
Preusser, F., Geyh, M. A., and Schlüchter, C.: Timing of Late Pleis-tocene climate change in lowland Switzerland, Quaternary Sci.Rev., 22, 1435–1445, 2003.
Preusser, F., Ramseyer, K., and Schlüchter, C.: Characterisation oflow OSL intensity quartz from the New Zealand Alps, Radiat.Meas., 41, 871–877, 2006.
Preusser, F., Blei, A., Graf, H., and Schlüchter, C.: Luminescencedating of Würmian (Weichselian) proglacial sediments fromSwitzerland: methodological aspects and stratigraphical conclu-sions, Boreas, 36, 130–142, 2007.
Preusser, F., Graf, H. R., Keller, O., Krayss, E., and Schlüchter,C.: Quaternary glaciation history of northern Switzerland, E&GQuaternary Sci. J., 60, 21, https://doi.org/10.3285/eg.60.2-3.06,2011.
Rentzel, P.: Neue quatärgeologische Untersuchungen an den Höh-lensediementen von Cotencher (Kt. NE), Diplomarbeit, Laborfür Ur- und Frühgeschichte der Universität Basel, 131 pp., 1990.
Rentzel, P.: Lithostratigraphie und Geochronologie der Höh-lensediemente von Cotencher (Schweiz, Kt. NE), 9e Congrès na-tional de spéléologie, Société Suisse de Spléléologie et Comis-sion de Spéléologie ASSN, 109–112, 1992.
Richter, D., Richter, A., and Dornich, K.: Lexsyg Smart – a lumi-nescence detection system for dosimetry, material research anddating application, Geochronometria, 42, 202–209, 2015.
Rittenour, T. M.: Luminescence dating of fluvial deposits: applica-tions to geomorphic, palaeoseismic and archaeological research,Boreas, 37, 613–635, 2008.
Roberts, R. G.: Luminescence dating in archaeology:from originsto optical, Radiat. Meas., 27, 819–892, 1997.
Roberts, R. G., Jacobs, Z., Li, B., Jankowski, N. R., Cunningham,A. C., and Rosenfeld, A. B.: Optical dating in archaeology: thirtyyears in retrospect and grand challenges for the future, J. Ar-chaeol. Sci., 56, 41–60, 2015.
Schmid, E.: Höhlenforschung und sedimentanalyse. Ein Beitrag zurDatierung des Alpinen Paläolithikums, Verlag des Institutes fürUr- und Frühgeschichte der Schweiz, Basel, 1958.
Stehlin, H.-G. and Dubois, A.: Notes préliminaires sur les fouillesentreprises dans la Grotte de Cotencher (canton de Neuchâtel),Eclogae Geol. Helv., 14, 240–242, 1916.
St Pierre, E., Zhao, J.-X., and Reed, E.: Expanding the utility ofUranium-series dating of speleothems for archaeological andpalaeontological applications, J. Archaeol. Sci., 36, 1416–1423,2009.
Taylor, R. and Bar-Yosef, O.: Radiocarbon Dating, Walnut Creek,California, Left Coast Press, Walnut Creek, California, 2014.
Thew, N., Hadorn, P., and Coope, G. R.: Hauterive/Rouges-Terres.Reconstruction of Upper Palaeolithic and Early Mesolithic nat-ural environments, Office et musée cantonal d’archéologie,Neuchâtel, 2009.
Thomsen, K. J., Murray, A. S., Jain, M., and Bøtter-Jensen, L.:Laboratory fading rates of various luminescence signals fromfeldspar-rich sediment extracts, Radiat. Meas., 43, 1474–1486,2008.
Tillet, T.: Le Moustérien dans l’arc alpin: complémentarité entresites en grotte et sites en plein-air, in: Les Paléoalpins, hom-mage à Pierre Bintz, edited by: Tillet, T., Université de Grenoble,Grenoble, 99–106, 2000.
Tillet, T.: Le Paléolithique moyen dans les Alpes et le Jura: exploita-tion de milieux de contraintes d’altitude, in: Settlement dynam-
www.eg-quaternary-sci-j.net/67/41/2019/ E&G Quaternary Sci. J., 67, 41–72, 2019

72 J. Deák et al.: New data from the Middle Palaeolithic Cotencher cave
ics of the middle Palaeolithic and Middle Stone Age, edited by:Conard, N. J., Kerns Verlag, Tübingen, 421–446, 2001.
Vouga, D.: Le Paléolitique, Mémoires de la Société Neuchâteloisedes Sciences Naturelles, 7, 18–28, 1943.
Wallinga, J., Bos, A. J. J., Dorenbos, P., Murray, A. S., andSchokker, J.: A test case for anomalous fading correction in IRSLdating, Quaternary Geochronol., 2, 216–221, 2007.
Wegmüller, S., Preusser, F., and Müller, B. U.: Palynostratigraphis-che Untersuchung und Lumineszenzdatierung des Profils Gal-genmoos und Implikationen für die Chronologie des letztenGlazialzyklus im nördlichen Alpenvorland der Schweiz, EclogaeGeol. Helv., 95, 115–126, 2002.
Welten, M.: Verdrängung und Vernichtung der anspruchsvollenGehölze am Beginn der letzten Eiszeit und die Korrelation derFrühwürm- Interstadiale in Mittel- und Nordeuropa, Eiszeitalterund Gegenwart, 31, 187–202, 1991.
White, W. B.: Cave sediments and paleoclimate, J. Cave KarstStud., 69, 76–93, 2007.
Wintle, A. G. and Murray, A. S.: A review of quartz optically stim-ulated luminescence characteristics and their relevance in single-aliquot regeneration dating protocols, Radiat. Meas., 41, 369–391, 2006.
Zander, A., Degering, D., Preusser, F., Kasper, H. U., and Brückner,H.: Optically stimulated luminescence dating of sublittoral andintertidal sediments from Dubai, UAE: Radioactive disequilibriain the uranium decay series, Quaternary Geochronol., 2, 123–128, 2007.
E&G Quaternary Sci. J., 67, 41–72, 2019 www.eg-quaternary-sci-j.net/67/41/2019/

E&G Quaternary Sci. J., 67, 73–84, 2019https://doi.org/10.5194/egqsj-67-73-2019© Author(s) 2019. This work is distributed underthe Creative Commons Attribution 4.0 License.
Research
article
Fortification, mining, and charcoal production: landscapehistory at the abandoned medieval settlement of Hohenwalde atthe Faule Pfütze (Saxony, Eastern Ore Mountains)Johann Friedrich Tolksdorf1, Matthias Schubert2, Frank Schröder2, Libor Petr3, Christoph Herbig4, Petr Kocár5,Mathias Bertuch2, and Christiane Hemker2
1Praktische Denkmalpflege: Bodendenkmalpflege, Bayerisches Landesamt für Denkmalpflege, Thierhaupten, Germany2ArchaeoMontan Research Group, Landesamt für Archäologie Sachsen, Dresden, Germany3Department of Botany and Zoology, Masaryk University, Brno, Czech Republic4Institut für Archäologische Wissenschaften, Goethe-Universität Frankfurt am Main, Frankfurt, Germany5Institute of Archaeology, Czech Academy of Sciences, Prague, Czech Republic
Correspondence: Johann Friedrich Tolksdorf ([email protected])
Relevant dates: Received: 8 October 2018 – Revised: 3 December 2018 – Accepted: 10 December 2018 –Published: 15 January 2019
How to cite: Tolksdorf, J. F., Schubert, M., Schröder, F., Petr, L., Herbig, C., Kocár, P., Bertuch, M., and Hemker,C.: Fortification, mining, and charcoal production: landscape history at the abandoned medieval set-tlement of Hohenwalde at the Faule Pfütze (Saxony, Eastern Ore Mountains), E&G Quaternary Sci.J., 67, 73–84, https://doi.org/10.5194/egqsj-67-73-2019, 2019.
Abstract: Geoarchaeological reconstructions of land-use changes may help to reveal driving cultural factorsand incentives behind these processes and relate them to supra-regional economic and political devel-opments. This is particularly true in the context of complete abandonment of a settlement. Here wepresent a case study from the site of Faule Pfütze, a small catchment in the Eastern Ore Mountains(Saxony). The historical record of this site is confined to the report of a settlement called Hohenwaldein 1404 CE and two later references to the then-abandoned settlement in 1492 and 1524 CE in thisarea. Combined geoarchaeological studies allowed for the reconstruction of several phases of landuse. While a first phase of alluvial sedimentation occurred during the late 12th century, archaeologi-cal evidence for a permanent settlement is absent during this period. The onset of settlement activityis identified during the late 14th century and included a hitherto unknown massive stone building.Mining features are present nearby and are dated to the early 15th century. The local palynologicalrecord shows evidence for reforestation during the mid 15th century and thereby corroborates the timeof abandonment indicated by written sources. These processes are discussed in the context of a lo-cal political conflict (Dohna Feud) leading to the redistribution of properties and the development of amining economy during this time. Later land use from the mid 16th century onwards appears restrictedto charcoal production, probably in the context of smelting works operating in nearby Schmiedebergas indicated by rising lead concentrations in the alluvial record.
Kurzfassung: Geoarchäologische Rekonstruktionen der Landschaftsgeschichte können dazu dienen, die hinterdiesen Prozessen liegenden kulturellen Triebkräfte und Motivationen offenzulegen und diese mit über-regionalen ökonomischen und politischen Entwicklungen in Beziehung zu setzen. In besonders hohem
Published by Copernicus Publications on behalf of the Deutsche Quartärvereinigung (DEUQUA) e.V.

74 J. F. Tolksdorf et al.: Landscape history at the abandoned medieval settlement of Hohenwalde
Maße trifft dieses im Umfeld von vollständigen Wüstungsprozessen zu. Im Rahmen einer Fallstudiewird hier die Fundstelle an der “Faulen Pfütze”, einer kleinen Siedlungskammer im Osterzgebirge(Sachsen), vorgestellt. Die historische Überlieferung zu dieser Fundstelle beschränkt sich auf die Nen-nung einer Siedlung “Hohenwalde” im Jahr 1404 sowie zwei spätere Nennungen aus dem Jahr 1492und 1524, die sich bereits auf eine Wüstung in diesem Gebiet beziehen. Nur durch geoarchäologis-che Ansätze war es daher möglich, unterschiedliche Phasen der Landnutzungsgeschichte zu rekon-struieren. Während eine erste Phase der alluvialen Sedimentation bereits im späten 12. Jahrhundertfestzustellen ist, fehlen archäologische Belege für eine dauerhafte Siedlung zu diesem Zeitpunkt nochvöllig. Der Beginn der Siedlungsaktivitäten setzt im späten 14. Jahrhundert ein und umfasst dabei auchein bislang unbekanntes massives Steingebäude. In unmittelbarer Nähe treten Bergbauspuren auf, diein das frühe 15. Jahrhundert datieren. Die palynologischen Analysen zeigen eine lokale Wiederbewal-dungsdynamik ab der Mitte des 15. Jahrhunderts und bestätigen dabei den durch historische Quellengenannten Zeitpunkt der Siedlungsaufgabe. Diese Entwicklung wird vor dem Hintergrund eine re-gionalen Auseinandersetzung (Dohnaischen Fehde) diskutiert, die vor Ort nicht nur eine territorialeNeuverteilung sondern auch Bergbauaktivitäten zur Folge hatte. Spätere Landnutzung ab der Mittedes 16. Jahrhunderts scheint dann auf die Produktion von Holzkohle beschränkt gewesen zu sein,wahrscheinlich zur Versorgung der Hüttenwerke im nahen Schmiedeberg, was sich auch in steigen-den Bleieinträgen in den alluvialen Sedimenten abzeichnet.
1 Introduction
A number of regional case studies have highlighted the influ-ence of mining activities and related timber and charcoal pro-duction on central European mountain ranges (e.g. Stolz andGrunert, 2010; Hrubý et al., 2014; Knapp et al., 2015). In theOre Mountains region silver and tin mining has been presentat least since the mid 12th century based on historical sources(Wagenbreth, 1990), but archaeological and palaeoenviron-mental investigations on this time period have been scarcecompared to other regions. Due to the establishment of aborder zone between East Germany and the Czechoslovakiafrom 1945 to 1990 and low construction activities, this areahas not been in the focus of the heritage authorities on bothsides of the border for decades. Moreover, the intensive min-ing activities in later centuries were expected to have de-stroyed most of the medieval structures. Palaeoenvironmen-tal studies were restricted to pollen profiles from mires in theupper reaches of the Ore Mountains (Stebich, 1995; Schlöf-fel, 2010). Research activity in this area only resumed afterthe discovery of well-preserved mining features from the late12th and 13th century in Dippoldiswalde in 2008 and ledto the establishment of two German–Czech ArchaeoMon-tan research projects (Ziel-3 ArchaeoMontan from 2012 to2015 and ArchaeoMontan 2018 from 2016 to 2018). In thecourse of these projects, local studies focussed on the me-dieval human impact around the town of Freiberg that haveflourished as a silver mining centre since the mid 12th cen-tury (Tolksdorf et al., 2018) and the effects of mining activ-ities together with timber and charcoal production since thelate 12th century in the small mining district of Niederpöbelnear Schmiedeberg in the Eastern Ore Mountains (Schröder,2015; Tolksdorf et al., 2015). The results have indicated a
strong impact in the form of deforestation, a sharp decline oftree species like Abies alba and changes in forest composi-tion during ongoing land use. This case study addresses theland-use history of a comparatively short-lived village in theOre Mountains in the context of local mining activities andthe regional political history.
2 Site topography and sampling
The site of Faule Pfütze is located in the Eastern Ore Moun-tains (Osterzgebirge in German) about 30 km south of Dres-den (Fig. 1a) in a mountain ridge east of Schmiedeberg(Fig. 1b) and was investigated by the ArchaeoMontan 2018team in 2016 and 2017. Local geology is dominated byquartz porphyries and porphyroid granites (GK 25, 1915;Reinisch, 1915). In the study area the small valley of theBrießnitzbach river opens to the east, and the modern sitename “Faule Pfütze” (meaning “brackish pool” in German)relates to the wetlands around the spring area of this river.Microtopographical assessment of lidar data reveals severalsunken roads that converge in the area of a modern dam usedfor the road, creating a small pond. Some mining features(shafts, mining heaps) can be recognized by their specific to-pography to the southeast. Additional charcoal kilns in theform of round platforms are visible on the surrounding slopes(Fig. 2a).
Immediately downstream of the modern dam, the upper110 cm of alluvial sediments was accessible in an outcrop cutby the river and sampled as profile 1 for macro-botanical, pa-lynological, geochemical, and 14C analyses. A dense layer ofrubble just a few metres upstream of profile 1 was noted as anarchaeological feature and labelled profile 3. To substantiatethe age of the mining features, profile 2 was situated beside
E&G Quaternary Sci. J., 67, 73–84, 2019 www.eg-quaternary-sci-j.net/67/73/2019/

J. F. Tolksdorf et al.: Landscape history at the abandoned medieval settlement of Hohenwalde 75
Figure 1. (a) Location of the site of Faule Pfütze in the Ore Mountains (data: SRTM), (b) regional topography (data: GeoSN). Historicalmining features are mapped according to historical maps (Ur–Oder and Oeder–Zimmermann from early 17th century) and written sources(Müller, 1964) using the symbols and time periods from Göhler and Wehmeyer (2013).
a mining heap in order to sample the palaeo-surface coveredby mining waste for botanical (BOT-36) and 14C analyses(MAMS-30882).
The valley bottom above profile 1 yielded numerous ce-ramic fragments on the surface. Here, profile 4 was recordedto document the relation of settlement layers to alluvialand colluvial sediments, while profile 5 was situated at thetransition from the southern hillslope to the alluvial plain.A prominent feature visible in the digital elevation model(DEM) derived from lidar scan is a stone heap with a squarelayout rising more than 1 m above the valley floor. Pro-file 6 was used to record a profile in this feature and pro-file 7 was used for archaeological investigation of the valleyfloor nearby. Sedimentation history on the valley floor was
recorded using a transect consisting of six cores and profiles1 and 3 (Fig. 2b) from the southeast to the northwest.
3 Methods and material
Botanical macro-remains were retrieved from sediment sam-ples by wet sieving with mesh widths of 2, 1, 0.5, and0.25 mm and determined according to standard literature(Cappers et al., 2012) and a reference collection of wildand domestic plants. Their attribution to ecological groupsis based on the classification by Oberdorfer (2001). Sam-ple preparation for pollen analysis followed standard acetoly-sis procedure, and a minimum number of 500 palynomorphswere identified according to literature (Beug, 2004) in everysample. A portable X-ray fluorescence (XRF) unit (Olympus
www.eg-quaternary-sci-j.net/67/73/2019/ E&G Quaternary Sci. J., 67, 73–84, 2019

76 J. F. Tolksdorf et al.: Landscape history at the abandoned medieval settlement of Hohenwalde
Figure 2. (a) Site topography, sampled records, and results of anthracological analysis of charcoal kilns from this area; (b) stratigraphic logsof the core transect through the valley floor.
Innov-X DELTA 50) was used to measure geochemical prop-erties on dried samples from the grain-size fraction < 0.8 mm(CGS Prague Laboratories). Changing concentrations of theelements Pb, As, and Zn were used as potential environmen-tal proxies for metallurgical activities (Hürkamp et al., 2009;Schmidt-Wygaasch et al., 2010). The 14C analyses were per-formed by the Curt-Engelhorn-Zentrum Archäometrie (CEZ)in Mannheim, and calibrated using IntCal13 (Table 1) andthe Bayesian model implemented in OxCal. Samples of 30charred particles were extracted from three charcoal kilns for
an anthracological assessment. Determination of the taxa isbased on wood-anatomical features on fresh cuts with differ-ent orientations (Schweingruber, 1990). Due to their anatom-ical similarity Populus and Salix were grouped together. Thedating of ceramics was based on typological and technologi-cal parallels with well-dated archaeological assemblages inthe region (Mechelk, 1981). A series of overlapping pho-tos was used to process 3-D models for larger archaeologicalfeatures by structure from motion (SfM). Consequently, the
E&G Quaternary Sci. J., 67, 73–84, 2019 www.eg-quaternary-sci-j.net/67/73/2019/

J. F. Tolksdorf et al.: Landscape history at the abandoned medieval settlement of Hohenwalde 77
Table 1. Results of 14C analyses.
Lab no. Profile Material and 14C 14C 14C δ13Ccontext (calibrated; (calibrated; (‰)
IntCal13, 1σ ) IntCal13, 2σ )
(BP) (cal CE) (cal CE)
MAMS- profile 1 charcoal from 282± 16 1528–1544 1522–1573 −23.630884 alluvial layer 18–25 cm 1634–1650 1630–1657
below surfaceMAMS- profile 1 charcoal 333± 17 1499–1504 1487–1638 −23.930883 from alluvial layer 49–55 cm 1512–1527
below surface 1555–16011617–1633
MAMS- profile 1 charcoal from 401± 19 1447–1479 1441–1498 −17.632962 alluvial layer 75 cm 1601–1616
below surfaceMAMS- profile 2 charcoal below 510± 17 1414–1430 1408–1437 −23.130882 mining heapMAMS- profile 4 charcoal concentration 953± 22 1029–1049 1023–1059 −25.733862 below alluvial layers, 1086–1124 1065–1155
55 cm below surface 1137–1150 1065–1155MAMS- profile 6 charcoal, under 593± 24 1315–1356 1300–1369 −29.233861 embankment 80 cm 1389–1400 1381–1410
below surfaceMAMS- core 4 charcoal from 857± 23 1167–1214 1058–1075 −29.034614 base of alluvial 1154–1250
sedimentsMAMS- charcoal kiln charcoal kiln 311± 21 1522–1575 1495–1602 −23.932530 423 1586–1590 1616–1646
1625–1642
structures were mapped in a local coordinate system with thesurrounding surface as the vertical reference level.
4 Results
The auger transect through the valley floor around profile 1shows a complex sequence of coarse fluvial sands and al-luvial silt that partly cover the periglacial cover beds dom-inated by gravels (Fig. 2b). Fine layers of organic detrituswere preserved within some of the alluvial silt units. Collu-vial layers appear at the northern slope covering the alluviallayers. A 14C sample from the lowermost alluvial layer incore 4 yielded an age of 1058–1075 or 1154–1250 cal CE(MAMS-34614).
Profile 1 was recorded at a location where the river at theoutlet of the modern dam incised into the valley floor. Thesequence exposed along the bank consists of alluvial lay-ers with organic detritus and coarse fluvial sands (Fig. 3).Based on three 14C analyses (MAMS-30883, MAMS-30884,MAMS-32962), these layers have been deposited from theearly 15th century to the early 17th century. The content ofbotanical macro-remains differs between the alluvial layersbut is consistently dominated by wetland taxa. The ratio of
arboreal to non-arboreal pollen within the three lowermostpollen samples shows recovering forest vegetation up to adepth of 61 cm. The sample at 55 cm is characterized bya high percentage of micro-charcoal and declining arborealpollen. Geochemical analyses show a relatively stable con-centration of zinc and arsenic but a distinct rise in lead con-centrations at a depth of about 50 cm. Based on the chrono-logical model, both the drop of arboreal pollen and the riseof lead content are ascribed to the 15th to 16th century.
The detailed analysis of the pollen spectra (Fig. 4) re-veals a very high percentage of Corylus avellana pollen inthe lowermost sample at 90 cm. The subsequent samples at75 cm show a sharp decline of Corylus but increasing per-centages of Abies, Pinus, and Picea pollen. At a depth of61 cm the share of Abies pollen declined again while Pinusand Picea are still expanding. Although pollen from Secalecereale and Centaurea cyanus as well as ruderal taxa likePlantago lanceolata or Rumex acetosella are present in theselower three samples, their low number indicates that perma-nent settlement and arable land could have existed only atsome distance. Additional information about the local veg-etation is provided by the macro-botanical spectra at 75,67, and 61 cm depth. These present a dominance of wetland
www.eg-quaternary-sci-j.net/67/73/2019/ E&G Quaternary Sci. J., 67, 73–84, 2019

78 J. F. Tolksdorf et al.: Landscape history at the abandoned medieval settlement of Hohenwalde
Table 2. Macro-botanical and anthracological results.
Sample (BOT: macro-remains; HK: anthracology) BOT-53 BOT-54 BOT-62 BOT-63 BOT-64 BOT-65 BOT-36 BOT-79 BOT-80 BOT-85 HK-14 HK-15 HK-16cf. Figs. 2 and 3 for sample location
Sample size (litres or 0.1l 0.1l 0.1l 0.1l 0.1l 0.1l 0.2l 0.1l 0.1l 0.1l 30 30 30pieces (pcs.)) pcs. pcs. pcs.
Depth (cm) 75 47 51 56 61 67 120 14–29 29–49 200 10 10 10
Profile 1 1 1 1 1 1 2 4 4 4 kiln kiln kiln423 424 529
Taxonomy Anatomy Preser-vation
Fore
stco
mm
unity
Abies alba ND u 5 9 4 9 2ND ch 21 500 36 180W ch 3 14 17
Picea abies ND u 9 11 11 23 7ND ch 4W ch 7
Abies and Picea indet. W ch 3Pinus ND ch 5
W ch 6 11Populus sp. FS u 1 1
W ch 1Populus and Salix indet. W ch 1Carpinus betulus FS ch 1Fagus sylvatica W ch 15 1Quercus robur W ch 1Oxalis acetosella FS u 1 1
Fore
sted
ges
and
clea
ranc
es
Arctium sp. FS u 1Betula pendula and FS u 11 1 6pubescens W c 2 2Carex ovalis FS u 1 1 1Hypericum hirsutum FS u 1Sambucus nigra FS ch 2Rubus fructicosus agg. FS u 1
Mea
dow
s Cerastium fontanum R u 4 1 5 1 3Luzula campestris FS u 2 1and L. multifloraOriganum vulgare FS u 1Prunella vulgaris FS u 1Rumex acetosella agg. FS u 1 1
Wet
land
san
driv
erba
nks
Carex sp. FS u 13 1000 300 359 195 480Glyceria fluitans FS u 114 32 50 4 115Montia fontana s.l. FS u 41 8 4Potamogeton sp. FS u 2Ranunculus flammula FS u 1 4 8 17 8 8Scirpus sylvaticus FS u 1 10 33 10 10Sparganium emersum FS u 1Sphagnum FS u +
Var
ia
Chenopodium album type FS u 1Carduus and Cirsium FS u 1Juncus sp. FS u 5 7 9 7 1 2 36 31 60Lamiaceae FS u 1Myosotis sp. FS u 1Pinaceae FS u 1Poa sp. FS u 5 1Polygonum aviculare agg. FS u 2Sagina procumbens FS u 1Viola sp. FS u 18 1 5 1Rumex crispus FS ch 1or R. obtusifoliusIndeterminate FS u 1Indeterminate W u + + + +
Indeterminate W ch + + + + + +
Indeterminate R u 4 4 6
taxa like Glyceria fluitans or Montia fontana with increas-ing numbers of Carex species. Remains of taxa which tendto occur on more open areas such as meadows or clearanceslike Cerastium fontanum, Betula, or Carex ovalis are seldomfound and even show a decline that is in good accordancewith the expansion of forest vegetation visible in the pollen.
However, direct evidence of forest species like fir or pine israre in these samples.
The trend towards a recovery of the forest vegetationseems to be interrupted at a depth of 55 cm with decliningpercentages of Pinus, Picea, and Abies pollen accompaniedby rising values of Corylus and species related to open ar-
E&G Quaternary Sci. J., 67, 73–84, 2019 www.eg-quaternary-sci-j.net/67/73/2019/

J. F. Tolksdorf et al.: Landscape history at the abandoned medieval settlement of Hohenwalde 79
Figure 3. Stratigraphy, chronology, and key results of palynological, macro-botanical, and geochemical analyses in profile 1.
eas, especially Poaceae and Cyperaceae together with Rumexacetosella and Artemisia. The macro-botanical samples fromthis layer show a complete absence of taxa related to forestvegetation. While evidence for forest species is visible againin the macro-botanical spectrum at a 51 cm depth, the macroremains at a 47 cm depth and a pollen spectrum at a 45 cmdepth are consistent with a reduction of forest taxa. Partic-ularly, the very high number of Rumex acetosella pollen inthe uppermost sample might indicate the permanent estab-lishment of open areas, perhaps meadows.
Mining activity in this area is proven by profile 2 (Fig. 5a),which revealed a layer of charred material below a miningheap. Abies alba needles dominated the charred material byfar (BOT-36) and prove that it results from the burning oflocal vegetation rather than technological processes like fire-setting or smelting. The material yielded an age of 1408–1437 cal CE (MAMS-30882) providing a minimum age forthe mining activities.
The square stone heap was investigated at profile 6(Fig. 5b) and revealed a stone wall construction coveredby an embankment. Residues of the former topsoil belowthe embankment contained ceramic fragments, an iron nail,and charred material, yielding a 14C age of 1300–1369 or1381–1410 cal CE. It is in very good accordance with thetypochronological dating of the ceramic material discoveredbelow the layers of relocated rubble in profile 7 (Fig. 5d).This was assigned to the end of the 14th century and laterbased on the presence of high- and undercut-shaped collar
rims (hohe und unterschnittene Kragenränder) and reddishhigh-fired earthenware (rotscherbige hochgebrannte Irden-ware; Mechelk, 1981).
While profile 5 at the transition from the slope to the al-luvial plain only yielded relocated coarse material, nearbyprofile 4 showed intercalating layers of alluvial sedimenta-tion and colluvial material (Fig. 5c). At a depth of 50 cm adense layer of charred material was covered by alluvial sed-iments. This material (BOT-85) was dominated by charredAbies alba needles but also contained remains of local Jun-cus species. Remains of Sambucus nigra could indicate theexistence of clearances. A 14C analysis provided an age of1023–1155 cal CE for this layer. It was covered by collu-vial sediments that contained charred remains of Abies andJuncus but also Picea needles (BOT-80). The subsequent al-luvial layer from a 30 to 12 cm depth contained charred anduncharred botanical remains (Picea together with Juncus andCarex species) together with ceramic fragments dating to the14th century by means of typochronology. Remains of firwere absent in this younger layer.
Some small plateaus visible in the DEM were identified ascharcoal kilns (Fig. 2a). While kiln 549 only contained re-mains of Abies and Picea, the fuel spectra of the kilns 423and 424 were very broad and contained Fagus, Abies, Picea,Betula, Populus/Salix (indiff), and Quercus of differing pro-portions. A 14C analysis of kiln 423 provided an age of 1495–1646 cal CE.
www.eg-quaternary-sci-j.net/67/73/2019/ E&G Quaternary Sci. J., 67, 73–84, 2019

80 J. F. Tolksdorf et al.: Landscape history at the abandoned medieval settlement of Hohenwalde
Figure 4. Palynological and macro-botanical spectra from profile 1 (cf. Fig. 3).
5 Discussion
The onset of alluvial sedimentation dates back to the12th century based on 14C ages from charcoal taken fromprofile 4 and core 4. Although catastrophic events like wild-fires could theoretically trigger local soil erosion (Shakesbyand Doerr, 2006), human impact is a more likely cause. Fromthe regional perspective, the 12th century is known as a timeperiod with intensive rural colonization and mining in theOre Mountains (Billig and Geupel, 1992; Kenzler, 2013).The earliest timber from the nearby medieval mines of Dip-poldiswalde (about 7 km NNW) could indicate the start ofmining in the region at the turn of the 12th to the 13th century(Hoffmann, 2011; Westphal et al., 2014). However, at the siteof Faule Pfütze, the artefact assemblage and archaeologicalfeatures suggest permanent human activity to have occurredfrom the 14th century onwards. It may be possible that thissettlement phase was preceded by phases of ephemeral landuse with low archaeological visibility, e.g. logging or pas-ture. Botanical spectra from this time preceding the settle-ment (BOT-80, BOT-85) contain high shares of Abies alba(fir) needles compared to other taxa like Picea abies (spruce)
or Pinus sylvestris (pine) and may indicate the dominance offir in the forest composition. However, such evidence neithersupport nor preclude earlier human activities in the area.
Human settlement on this site during the 14th centuryis undisputed and included the construction of the massivebuilding recorded in profiles 6 and 7. Based on the construc-tion technique, the ground plan, and the archaeological ma-terial, this feature represents the remains of what is possi-bly some sort of fortification (cf. Schwabenicky, 1996), butdefinitely a solid stone-built structure. The onset of miningmay have occurred later as indicated by the 14C age fromprofile 2 (Fig. 6, phase 1). Identifying the political and eco-nomic context of the strong building and the mining activ-ities is problematic as major territorial changes took placein the region after the Dohna Feud (1385–1402 CE) (Er-misch, 1902; Hoffmann, 2011). Eventually, the first histori-cal record concerning the village of Hohenwalde in 1404 CEappears in the aftermath of these events when land owner-ship had changed (Müller, 1964). It is possible that miningactivities have been fostered in this region by the new owner.Another aspect worth discussing is the function of the mas-sive building. It may have either protected the settlement and
E&G Quaternary Sci. J., 67, 73–84, 2019 www.eg-quaternary-sci-j.net/67/73/2019/

J. F. Tolksdorf et al.: Landscape history at the abandoned medieval settlement of Hohenwalde 81
Figure 5. (a) Layer of burnt material (yellow arrow) below mining heap; (b) topography of the fortified building with profile recorded inprofile 6; (c) profile 4 with macro-botanical analyses and chronological results; (d) selected artefacts from the site dating to the 14th century.
the road or been related to the protection of older mining fa-cilities as discussed for other regions of the Ore Mountains(Schwabenicky, 1996; Kenzler, 2009). However, no histori-cal record from this area ever refers to a fortification or min-ing activities, highlighting the incompleteness of this typeof source. Botanical spectra from the settlement period de-rive from the burnt material below the mining heap (BOT-36)with abundant charred Abies alba needles and the upper partof profile 4 (BOT-79), where the dominance of Picea abiesprobably mirrors the local vegetation on the wet valley floor.
No cultivated plants or weeds have been detected in any sam-ple.
The abandonment of the settlement can be narrowed downby combining the historical sources mentioning an aban-doned village in 1492 CE and the 14C time depth model inprofile 1. Here the beginning of the ecological succession isdated to the mid 15th century (Fig. 6, phase 2), marked by ahigh share of pioneer taxa like Corylus avellana (hazel) andthe absence of settlement indicators. During later decades,Abies, followed by Picea and Pinus, established in the area.Layers dated to the mid 16th century in profile 1 reveal a de-
www.eg-quaternary-sci-j.net/67/73/2019/ E&G Quaternary Sci. J., 67, 73–84, 2019
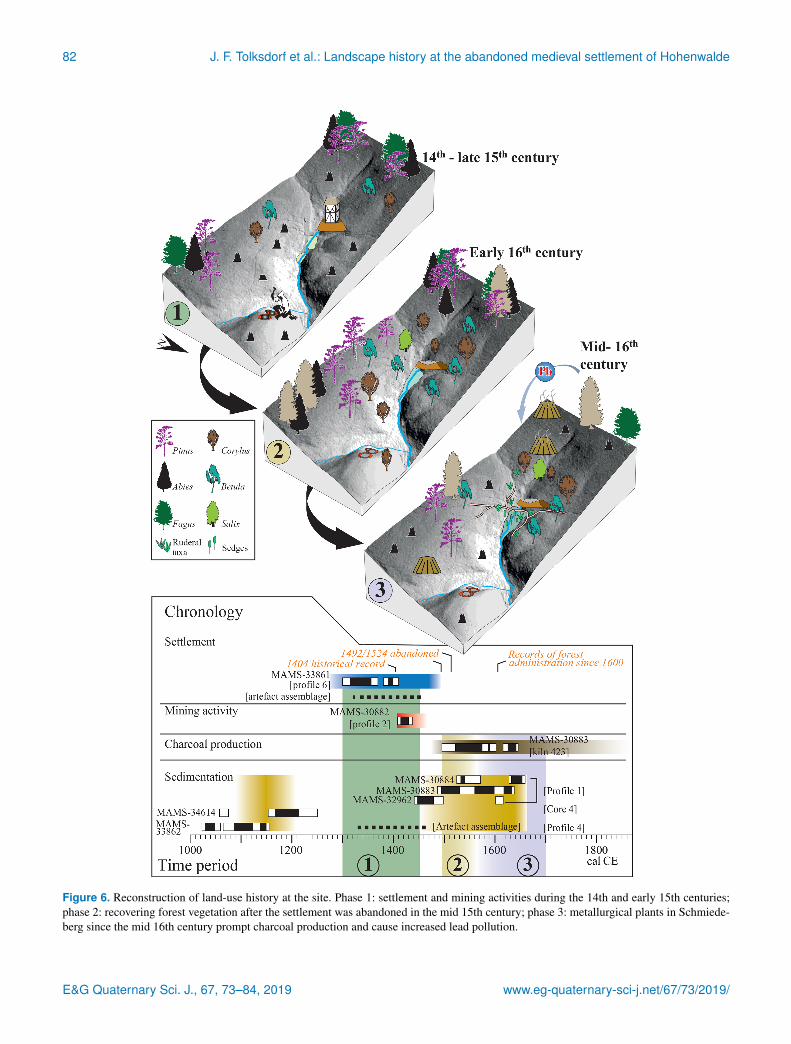
82 J. F. Tolksdorf et al.: Landscape history at the abandoned medieval settlement of Hohenwalde
Figure 6. Reconstruction of land-use history at the site. Phase 1: settlement and mining activities during the 14th and early 15th centuries;phase 2: recovering forest vegetation after the settlement was abandoned in the mid 15th century; phase 3: metallurgical plants in Schmiede-berg since the mid 16th century prompt charcoal production and cause increased lead pollution.
E&G Quaternary Sci. J., 67, 73–84, 2019 www.eg-quaternary-sci-j.net/67/73/2019/

J. F. Tolksdorf et al.: Landscape history at the abandoned medieval settlement of Hohenwalde 83
clining share of arboreal pollen and rising contents of char-coal particles (Fig. 6, phase 3). This suggests resuming landuse in this area, probably for the purpose of charcoal pro-duction. It is supported by a 14C date of 1495–1602 or 1616–1646 cal CE (MAMS-32530) from charcoal kiln 423 and his-torical sources from the late 16th century (Reinhold, 1942).Rising lead concentrations in the upper part of profile 1 prob-ably result from intensified metallurgical activities in nearbySchmiedeberg (2 km E) where smelting works were estab-lished during this period (Müller, 1964). While the pollenspectra capture a rising percentage of spruce in this area, thespectra from the charcoal kilns are more diverse, with pio-neer taxa like Betula on the one hand and forest taxa likeFagus sylvatica and Abies alba on the other hand, and maysimply reflect the natural local vegetation variety. The use ofthis area for logging and charcoal production continued un-til modern times; today the area is mainly covered by Piceaplantations.
6 Conclusions
Our results indicate local settlement activities at least since14th century CE and the existence of a strong building inthis settlement may point towards the need to secure the areaand its resources during this time period. It is likely thatthis area was affected by political reorganization followinga feud in 1402 CE, and mining activities dating to the early15th century may relate to a changed political and organi-zational background of the settlement that must have failedsince the mid 15th century as indicated by reforestation andhistorical sources. Land use shifted to charcoal productionto supply the striving metallurgical activities in the nearbySchmiedeberg area since the 16th century CE.
Data availability. All raw data and artefacts are stored at the Lan-desamt für Archäologie Sachsen (dataset code: OFD-01) and canobtained upon reasonable request.
Author contributions. Fieldwork was performed by JFT, MS,FS, and MB under the project supervision of CH. Pollen analysiswas done by LP, anthracological analyses by PK, and analysis ofbotanical remains by CH. JFT prepared the manuscript and figures.
Competing interests. The authors declare that they have no con-flict of interest.
Special issue statement. This article is part of the special issues“Geoarchaeology and past human–environment interactions”. It isnot associated with a conference.
Acknowledgements. This research was part of the project “Ar-chaeoMontan – Mittelalterlicher Bergbau in Sachsen und Böhmen”funded by the EU programme INTERREG VA. We thank Chris-tian Tinapp and an anonymous reviewer as well as the guest editor,Hans von Suchodoletz, who made very helpful comments on an ear-lier version of the manuscript.
References
Beug, H.-J.: Leitfaden der Pollenbestimmung für Mitteleuropa undangrenzende Gebiete, Pfeil, München, 2004.
Billig, G. and Geupel, V.: Entwicklung, Form und Datierungender Siedlungen in der Kammregion des Erzgebirges, Siedlungs-forschung, Archäologie, Geschichte, Geographie, 10, 173–194,1992.
Cappers, R. T. J., Bekker, R. M., and Jans, J. E. A.: Digital zadenat-las van Nederland/Digital seed atlas of the Netherlands, Eelde:Barkhuis, 2012.
Ermisch, H.: Dohna und die Dohnaische Fehde, Die Grenzboten,61, 77–86, 1902.
GK 25: Geologische Karte von Sachsen, 1:25000, Blatt 101Dippoldiswalde-Glashütte, 1915.
Göhler, M. and Wehmeyer M.: Montanarchäologisch Kartierungen,in: ArchaeoMontan 2012, edited by: Smolnik, R., Erkunden – Er-fassen – Erforschen, Arbeits- und Forschungsberichte zur säch-sischen Bodendenkmalpflege, Beiheft 26, LfA Sachsen, Dres-den, 197–203, 2013.
Hoffmann, Y.: Die Geschichte von Dippoldiswalde bis zum Endeder ersten Bergbauperiode um 1400. Arbeits- und Forschungs-berichte zur sächsischen Bodendenkmalpflege, 51/52, 391–421,2011.
Hrubý, P., Hejhal, P., Malý, K., Kocár, P., and Petr, L.: CentrálníCeskomoravská vrchovina na prahu vrcholného stredoveku:archeologie, geochemie a rozbory sedimentárních výplní niv[Central Bohemian-Moravian highlands on the threshold of thehigh middle ages: archaeology, geochemistry and the analyses ofalluvial sediments] Opera Universitatis Masarykianae Brunensis,Facultas Philosophica, 422, Masaryk Univ., Brno, 2014.
Hürkamp, K., Raab, T., and Völkel, J.: Two and three-dimensionalquantification of lead contamination in alluvial soils of a historicmining area using field portable X-ray fluorescence (FPXRF)analysis, Geomorphology, 110, 28–36, 2009.
Kenzler, H.: The medieval settlement of the Ore Mountains, Thedevelopment of the settlement structure, in: Medieval Rural Set-tlement in Marginal Landscapes, edited by: Klápšte, J. and Som-mer, P., Brepolis, Turnhout, 379–392, 2009.
Kenzler, H.: Bergbau und Kolonisation, Die Rolle des Montanwe-sens innerhalb der mittelalterlichen Besiedlungsgeschichte desErzgebirges, in: ArchaeoMontan 201, edited by: Smolnik, R.,Erkunden – Erfassen – Erforschen, LfA Sachsen, Dresden, 157–163, 2013.
Knapp, H., Nelle, O., and Kirleis, W.: Charcoal usage in medievaland modern times in the Harz Mountains Area, Central Ger-many: Wood selection and fast overexploitation of the wood-lands, Quatern. Int., 366, 51–69, 2015.
Mechelk, H.: Zur Frühgeschichte der Stadt Dresden und zur Heraus-bildung einer spätmittelalterlichen Keramikproduktion im säch-
www.eg-quaternary-sci-j.net/67/73/2019/ E&G Quaternary Sci. J., 67, 73–84, 2019

84 J. F. Tolksdorf et al.: Landscape history at the abandoned medieval settlement of Hohenwalde
sischen Elbgebiet aufgrund archäologischer Befunde, Dt. Verl.Wissenschaft, Berlin, 1981.
Müller, G.: Zwischen Müglitz und Weißeritz. Ergebnisse derheimatkundlichen Bestandsaufnahme im Gebiet Dippoldis-walde/Glashütte, Akademie-Verlag, Berlin, 1964.
Oberdorfer, E.: Pflanzensoziologische Exkursionsflora für Deutsch-land und angrenzende Gebiete, Ulmer, Stuttgart, 2001.
Reinhold, F.: Die Bestockung der kursächsischen Wälder im 16.Jahrhundert, Baensch, Dresden, 1942.
Reinisch, R.: Erläuterungen zur Geologischen Karte von Sachsen1:25000. Nr. 101 Blatt Dippoldiswalde-Glashütte, Kauffmanns,Leipzig, 1915.
Schlöffel, M.: Die postglaziale Waldgeschichte der Lehmhaide.Rekonstruktion spät- und postglazialer Umweltbedingungen aneinem Torfprofil aus dem Erzgebirge, Arbeits- und Forschungs-berichte zur sächsischen Bodendenkmalpflege, 51/52, 9–27,2010.
Schmidt-Wygasch, C., Schamuhn, S., Meurers-Balke, J.,Lehmkuhl, F., and Gerlach, R.: Indirect dating of historicalland use through mining: Linking heavy metal analyses offluvial deposits to archaeobotanical data and written accounts,Geoarchaeology, 25, 837–856, 2010.
Schröder, F.: Die montanarchäologischen Ausgrabungen in Nieder-pöbel (2011–2013) – Befunde und Ergebnisse, in: ArchaeoMon-tan 2015, edited by: Smolnik, R., Montanarchäologie im Erzge-birge, LfA Sachsen, Dresden, 23–166, 2015.
Schwabenicky, W.: Beziehungen zwischen Burgen und Bergbau imsächsischen Erzgebirge, Burgenforschung in Sachsen, 9, 9–29,1996.
Schweingruber, F. H.: Anatomie europäischer Hölzer, Haupt, Bern,1990.
Shakesby, R. A. and Doerr, S. H.: Wildfire as a hydrological andgeomorphological agent, Earth-Sci. Rev., 74, 269–307, 2006.
Stebich, M.: Beiträge zur Vegetationsgeschichte des GeorgenfelderHochmoores, Dissertation Universität Leipzig, Leipzig, 1995.
Stolz, C. and Grunert, J.: Late Pleistocene and Holocene land-scape history of the central Palatinate forest (Pfälzerwald, south-western Germany), Quatern. Int., 222, 129–142, 2010.
Tolksdorf, J. F., Elburg, R., Schröder, F., Knapp, H., Herbig, C.,Westphal, T., Schneider, B., Fülling, A., and Hemker, C.: Forestexploitation for charcoal production and timber since the 12thcentury in an intact medieval mining site in the Niederpöbel Val-ley (Erzgebirge, Eastern Germany), J. Archaeol. Sci., 4, 487–500, 2015.
Tolksdorf, J. F., Petr, L., Schubert, M., Herbig, C., Kaltofen, A.,Matson, S., and Hemker, C.: Palaeoenvironmental reconstruc-tion in the mining town of Freiberg (Lkr. Mittelsachsen) in Sax-ony, from the 12th century onwards, Archaol. Korresponden., 48,281–296, 2018.
Wagenbreth, O.: Bergbau im Erzgebirge: technische Denkmale undGeschichte, Dt. Verl. für Grundstoffindustrie, Leipzig, 1990.
Westphal, T., Heußner, K.-U., and Herbig, C.: Holz am Berg – Holzim Bergwerk, in: ArchaeoMontan 2014, edited by: Smolnik, R.,Ergebnisse und Perspektiven, LfA Sachsen, Dresden, 243–256,2014.
E&G Quaternary Sci. J., 67, 73–84, 2019 www.eg-quaternary-sci-j.net/67/73/2019/

https://www.eg-quaternary-science-journal.net/ ISSN 0424-7116
C. Lüthgens Editorial E&G Quaternary Science Journal, Vol. 67 (2018) and M. Böse Editorial
Issue no. 1
B. Klaes et al. Middle to Late Holocene mobilization of DOC-bound Pb and Y in the Magellanic moorlands (53° S) as a function of seaspray fertilization, climate variations and volcanic fallout? A preliminary report 1 | Express report
J. Krautz et al. Capability of U–Pb dating of zircons from Quaternary tephra: Jemez Mountains, NM, and La Sal Mountains, UT, USA 7 | Research article
C. Dieleman et al. Reconsidering the origin of the Sedrun fans (Graubünden, Switzerland) 17 | Express report
S. Winkler et al. Disestablishing “Glacial Lake Speight”, New Zealand? An example for the validity of detailed geomorphological assessment with the study of mountain glaciations 25 | Express report
G. Tombrink Proglacial streams and their chronology in the glacier forefields of the Himalayas 33 | Thesis abstract
Issue no. 2
F. M. Hofmann Glacial history of the upper Drac Blanc catchment (Écrins massif, French Alps) 37 | Thesis abstract
J. Deák et al. New data from the Middle Palaeolithic Cotencher cave (Swiss Jura): site formation, environment, and chronology 41 | Research article
J. F. Tolksdorf et al. Fortification, mining, and charcoal production: landscape history at the abandoned medieval settlement of Hohenwalde at the Faule Pfütze (Saxony, Eastern Ore Mountains) 73 | Research article | Special issue article
CONTENTS