5124_pdf.pdf - International Journal of Engineering, Science ...
227
International Journal of Engineering, Science and Mathematics Vol.7 Issue 4, April 2018, ISSN: 2320-0294 Impact Factor: 6.765 Journal Homepage: http://www.ijesm.co.in , Email: [email protected] Double-Blind Peer Reviewed Refereed Open Access International Journal - Included in the International Serial Directories Indexed & Listed at: Ulrich's Periodicals Directory ©, U.S.A., Open J-Gage as well as in Cabell’s Directories of Publishing Opportunities, U.S.A 2 International Journal of Engineering, Science and Mathematics http://www.ijesm.co.in , Email: [email protected] International Journal of Engineering, Science and Mathematics Vol.7, Issue 4, April2018(special issue) ISSN: 2320-0294 Impact Factor: 6.765 Journal Homepage: http://www.ijesm.co.in , Email: [email protected] Agricultural Sustainability by Cultivation of Medicinal and Aromatic Plant ASCMAP 2017 Supported and funded by Department of Science and Technology Editors Dr. Kanchan Deoli Bahukhandi Dr. Nihal Anwar Siddiqui Dr. Syed.Mohammad Tauseef
-
Upload
khangminh22 -
Category
Documents
-
view
2 -
download
0
Transcript of 5124_pdf.pdf - International Journal of Engineering, Science ...

International Journal of Engineering, Science and Mathematics Vol.7 Issue 4, April 2018, ISSN: 2320-0294 Impact Factor: 6.765 Journal Homepage: http://www.ijesm.co.in, Email: [email protected] Double-Blind Peer Reviewed Refereed Open Access International Journal - Included in the International Serial Directories Indexed & Listed at: Ulrich's Periodicals Directory ©, U.S.A., Open J-Gage as well as in Cabell’s Directories of Publishing Opportunities, U.S.A
2 International Journal of Engineering, Science and Mathematics
http://www.ijesm.co.in, Email: [email protected]
International Journal of Engineering, Science and Mathematics
Vol.7, Issue 4, April2018(special issue)
ISSN: 2320-0294 Impact Factor: 6.765
Journal Homepage: http://www.ijesm.co.in, Email: [email protected]
Agricultural Sustainability by Cultivation of Medicinal and Aromatic Plant
ASCMAP 2017
Supported and funded by Department of Science and Technology
Editors
Dr. Kanchan Deoli Bahukhandi
Dr. Nihal Anwar Siddiqui
Dr. Syed.Mohammad Tauseef

International Journal of Engineering, Science and Mathematics Vol.7 Issue 4, April 2018, ISSN: 2320-0294 Impact Factor: 6.765 Journal Homepage: http://www.ijesm.co.in, Email: [email protected] Double-Blind Peer Reviewed Refereed Open Access International Journal - Included in the International Serial Directories Indexed & Listed at: Ulrich's Periodicals Directory ©, U.S.A., Open J-Gage as well as in Cabell’s Directories of Publishing Opportunities, U.S.A
3 International Journal of Engineering, Science and Mathematics
http://www.ijesm.co.in, Email: [email protected]
International Journal of Engineering, Science and Mathematics Vol.7 Issue 4, April 2018, ISSN: 2320-0294 Impact Factor: 6.765 Journal Homepage: http://www.ijesm.co.in, Email: [email protected] Double-Blind Peer Reviewed Refereed Open Access International Journal - Included in the International Serial Directories Indexed & Listed at: Ulrich's Periodicals Directory ©, U.S.A., Open J-Gage as well as in Cabell’s Directories of Publishing Opportunities, U.S.A
4 International Journal of Engineering, Science and Mathematics
http://www.ijesm.co.in, Email: [email protected]
Preface
Since time immemorial India has lead the world by demonstrating the use of herbal drugs in
curing ailments. Most of the jadi buti(s) (medicinal herbs) used in Ayurveda, Siddha, Unani and
Homoeopathy systems of medicines come from natural forests - which are fast disappearing.
Disappearance of forests has been accelerated by the conversion of forests into agricultural
fields, to feed the growing population, and the climate change triggered by global warming.
Medicinal plants are very sensitive to climate change and therefore there is an immediate need
for conservation and sustainable use of medicinal plants. While efforts should be made to
conserve the natural sources of jadi buti(s), cultivation of medicinal plants should be encouraged
with participation of all the stake holders - growers, collectors, traders, manufacturers, exporters,
etc. This objective to ensure availability of medicinal plants in a sustainable way requires steps to
acquire and develop know-how of growing medicinal plants and understand various factors that
affect growth of such plants.
In order to cater to this need University of Petroleum and Energy Studies (UPES), with support
from Department of Science & Technology, seed division, Government of India, New Delhi, has
organized a one day National Conference on Agricultural Sustainability by Cultivation of
Medicinal and Aromatic Plants (ASCMAP 2017), December 18, 2017. The conference aims to
provide an interdisciplinary forum to researchers, consultants, industries, academicians,
entrepreneurs and professionals for dissemination of information, results, innovations and
improvisations in the broad area of environment based on agricultural diversification,
conservation and sustainable development through cultivation of Medicinal & Aromatic Plants.
Dr. Kanchan Deoli Bahukhandi
Dr. Nihal Anwar Siddiqui
Dr. Syed.Mohammad Tauseef
International Journal of Engineering, Science and Mathematics Vol.7 Issue 4, April 2018, ISSN: 2320-0294 Impact Factor: 6.765 Journal Homepage: http://www.ijesm.co.in, Email: [email protected] Double-Blind Peer Reviewed Refereed Open Access International Journal - Included in the International Serial Directories Indexed & Listed at: Ulrich's Periodicals Directory ©, U.S.A., Open J-Gage as well as in Cabell’s Directories of Publishing Opportunities, U.S.A
5 International Journal of Engineering, Science and Mathematics
http://www.ijesm.co.in, Email: [email protected]
National Conference
Agricultural Sustainability by Cultivation of Medicinal and Aromatic Plant
ASCMAP 2017
Supported and funded by Department of Science and Technology
Patron Chief Patron
Dr. S J Chopra, Chancellor UPES Dr. Deependra Kumar Jha, Vice Chancellor
Chair Person Convener Conference Secretary
Dr. Nihal Anwar Siddiqui Dr. Kanchan Deoli Bahukhandi Tanuja Uniyal Sati
Professor and Head
HSE Department
1. Advisory Committee
Dr. Kamal Bansal
Dr. Suresh Kumar
Dr. Suresh Kumar
Dr. S.K. Banerjee
Dr. Manish Prateek
Dr. Jitendra Kumar Pandey
Dr. Neelu Jyoti Ahuja
2. Registration Committee :
i) Ms. Madhuben Sharma
ii) Dr. Pratibha Joshi
iii) Venkata Krishnakanth
3. Comparing Committee
i) Ms. Madhuben Sharma
ii) Dr. Sweta Sachdeva
4. Certificate and Prize Distribution
Committee
i) Mr. Prasenjit Mondal
ii) Dr. Shefali Arora
5. Session Coordinator
i. Dr. SM Tauseef
ii. Dr. Mandira Aggrawal
iii. S Arun P.A
iv. Dr. Maheshwar Pathak
v. Mr. V.Venkata Krishnakanth (Skype)
vi. Akshi Singh
6. Media and News
i) Dr. S.M Tauseef
ii) Mr. Dharani Kumar. K
iii) Dr. N.A. Siddiqui
7. Conference Kit
i. Mr. Prasenjit Mondal
ii. Mr. Abhishek Nandan
8. Refreshment/Lunch Committee
i) Dr. Bikrama Prasad
ii) Mr. Abhinav Srivastava
9. Photography
i) Abhinav Srivastava
ii) Mr. Venkata Krishnakanth

International Journal of Engineering, Science and Mathematics Vol.7 Issue 4, April 2018, ISSN: 2320-0294 Impact Factor: 6.765 Journal Homepage: http://www.ijesm.co.in, Email: [email protected] Double-Blind Peer Reviewed Refereed Open Access International Journal - Included in the International Serial Directories Indexed & Listed at: Ulrich's Periodicals Directory ©, U.S.A., Open J-Gage as well as in Cabell’s Directories of Publishing Opportunities, U.S.A
3 International Journal of Engineering, Science and Mathematics
http://www.ijesm.co.in, Email: [email protected]
Contents
SN Title of the Paper Page No
1 Density Functional Theory (DFT) Study of Structural and Electronic Properties of
Crystalline 2,3-benzanthracene, Elloh V. W.a, b
, Yaya A.b , Abhishek K. Mishra*.
4-8
2 Workplace Hazards and its Management A review paper on Analyis of risks and its
control measures, Aditya Sharma, Ashish Maindolia, Akshi Kunwar Singh
9-14
3 Developing mechanism for awareness and monitoring Health, Safety in Farming sector,
Bhaskar Tichkule
15-23
4 Lock Out Tag Out – A Step towards proactive Culture, Akshi Kunwar Singh , Arun
P.A. Deepak, Mamgain
24-28
5 Seed output and Seed protein content – Quantitative analysis, Dr . Lalit Singh 29-34
6 Horizontal well Plugging and Abandonment, Mohammed Junaid Khan 35-41
7 Assessment of Major Hazards in Plastic Indsutry and the Safety Assessement of injection
moulding machine using FMEA, (Bahukhandi Kanchan Deoli)
(Kumar Sooraj), Siddiqui N.A
42-46
8 Estemates of variability, heriitability and genetic advance in garlic. (Alliumsativum L.)
Genotypes, Nrmala Koranga
47-49
9 Insight into the structural analysis of the MAP Kinase Protein Family in Arabidopsis
thaliana (Linn.) Heynh. A. B Bajpai, Vibha, Vibha, Nitin Kumar Verma
50-57
10 Conversion of waste plastic to Valuable Hydrocarbon Prodcuts, Patil, P.P.1,Agarwal,
M.**
,Mohammed, S.***
, Mandal, C.****
58-69
11 Accident Prevention and Control an Overview of Literature, N .N. Pisharodya2
, Kanchan
D. Bahukhandib, Prashant S Rawat
c, R. K. Elangovan
d
70-82
12 Leadership: Predictors of Safe Behaviors and Performance, Govindan
Pradeep Nair, Dr. Kanchan Deoli Bahukhandi
83-92
13 Management of HSE Risk and Implementation of Safe Work Practices in
Electrical Installations, Jayant Mukerjee, Prasenjit Mondal, Akshi Singh, Abhishek
Nandan
93-100
14 Sustaianble options for E-Waste Management,Gautam Priti, Bahukhandi Kanchan Deoli 101-106

International Journal of Engineering, Science and Mathematics Vol.7 Issue 4, April 2018, ISSN: 2320-0294 Impact Factor: 6.765 Journal Homepage: http://www.ijesm.co.in, Email: [email protected] Double-Blind Peer Reviewed Refereed Open Access International Journal - Included in the International Serial Directories Indexed & Listed at: Ulrich's Periodicals Directory ©, U.S.A., Open J-Gage as well as in Cabell’s Directories of Publishing Opportunities, U.S.A
4 International Journal of Engineering, Science and Mathematics
http://www.ijesm.co.in, Email: [email protected]
15 In-vitro regeneration and callus induction of Pseudarthria viscida(L.)Wight & ARN,
Priya P S
107-110
16 111-119
17 Assessment of air quality in Dehradun city of Uttarakhand (Impact of Vehicular
pollution in Doon Valley) Bahukhandi Kanchan Deoli, Siddarth, Siddiqui NA, Mohini
120-126
18 A review on Phytopharmacological Activity of Plumeria species, Shefali Arora,
Kanchan Deoli Bhaukhandi, Shailey Singhal, Mamta Latwal, Tanuja Uniyal Sati,
Deepak Kumar
127-131
19 Developing a Geospatial based based approach to locate wind farm in Meluar Taluk ,
Tamil Nadu, India, Sparsh Jain, Ayush Yadav, Dr. Saurabh Mittal)
132-138
20 River Water Quality Analysis and Wastewater Utilization Techniques for Uttarakhand -
A Review Paper , Anshul Kestwal, Latika Sharma, Mukesh Chandra Kestwal, Ravi
Kumar Patel, Surajit Mondal
139-145
21 Structured Risk Review Techniques in HSE Impact Assessment, and their design
impact , Velmurugan Renganathan, Dr. Nihal Anwar Siddiqui, Dr. Kanchan Deoli
Bahukhandi
146-152
22 A study on post combustion carbon carbon capture (PCCC) retrofit option for coal based
power plant in India, Praveen Kumar ML1a
, V. Venkata Krishnakanth1b
, Nihal Anwar
Siddiqui
153-161
23 Using solar thermal technonolofy seebesk as an Auxiliary for power generation
Mayank Rautela, Saransh Vijayvargiya, Sagar Prajapat, Surajit Mondal**
162-176
24 Disaster Management: A critical insight with special emphasis on Canadian Disaster
management, Dharani Kumar K, Dr.Nihal Anwar Siddiqui, Abhinav Srivastava
177-183
25 Saussurea costus: Boon for the Himalayan communities (A review), Tanuja Uniyal,
Dr. Manisha Chaudhary, Dr. Kanchan D. Bahukhandi, Dr. Shefali Arora
184-187
26 Assessment of Human Behaviour during accidental fire Hazards,
(Bahukhandi Kanchan Deoli), (Sharma Madhuben), (Sagarkumar Vaghasia )
188-197

International Journal of Engineering, Science and Mathematics Vol.7 Issue 4, April 2018, ISSN: 2320-0294 Impact Factor: 6.765 Journal Homepage: http://www.ijesm.co.in, Email: [email protected] Double-Blind Peer Reviewed Refereed Open Access International Journal - Included in the International Serial Directories Indexed & Listed at: Ulrich's Periodicals Directory ©, U.S.A., Open J-Gage as well as in Cabell’s Directories of Publishing Opportunities, U.S.A
5 International Journal of Engineering, Science and Mathematics
http://www.ijesm.co.in, Email: [email protected]
DENSITY FUNCTIONAL THEORY (DFT) STUDY OF STRUCTURAL AND ELECTRONIC
PROPERTIES OF CRYSTALLINE 2,3-BENZANTHRACENE
ELLOH V. W.A, B
, YAYA A.B
, ABHISHEK K. MISHRA*.A,
aDepartment of Physics, University of Petroleum and Energy Studies (UPES), Dehradun, India.
bDepartment of Materials Science and Engineering, University of Ghana, Legon, Ghana.
Abstract
We have carried out first principles calculations to investigate various
ground state properties, e.g. the structural, electronic band structure,
density of states, the projected density of states and dispersion forces
of the title molecule. Our first principles calculations reveal that the
title molecule exhibits promising high charge carrier mobility nature.
The calculated structural lattice parameters are in excellent
agreement with available experimental data. The band structure
calculations reveal that the direct and indirect band gaps are 2.00981
eV and 2.10785 eV respectively in perfect agreement with
experimental values.
Keywords:
Density Functional
Theory (DFT)
calculations;
Benzanthracene;
Dispersion correction. Copyright © 2018 International Journals of Multidisciplinary
Research Academy. All rights reserved.
Author correspondence:
Dr. Abhishek K. Mishra,
Department of Physics, University of Petroleum and Energy Studies (UPES), Bidholi, Dehradun, India
1. Introduction It is well known that organic semiconductors have great potential as active materials in optoelectronic devices.
Among these materials, molecular semiconductors of the oligomers of the acene family have attracted attention due
to their promising high charge carrier mobilities, which enable them to be incorporated in functional devices such as

International Journal of Engineering, Science and Mathematics Vol.7 Issue 4, April 2018, ISSN: 2320-0294 Impact Factor: 6.765 Journal Homepage: http://www.ijesm.co.in, Email: [email protected] Double-Blind Peer Reviewed Refereed Open Access International Journal - Included in the International Serial Directories Indexed & Listed at: Ulrich's Periodicals Directory ©, U.S.A., Open J-Gage as well as in Cabell’s Directories of Publishing Opportunities, U.S.A
6 International Journal of Engineering, Science and Mathematics
http://www.ijesm.co.in, Email: [email protected]
light-emitting diodes [1, 2], field effect transistors [3–8] and photovoltaic cells [9–12]. The molecules within the
oligomer crystals are bound together by van der Waals (vdW) dispersion forces. Therefore, the crystal is compliant,
in that the application of a small external perturbations such as pressure, temperature, can significantly alter
structural, vibrational and electronic properties whilst preserving the chemical structure of the molecule. The interest
in molecular crystals along with the temperature and pressure dependence of their properties dictate the need to
correctly predict the properties of the crystal under ambient temperature and pressure conditions and when subjected
to external conditions.
Density-functional theory (DFT) is by far the most popular method for performing first-principles quantum-
mechanical simulations of materials because it balances a sufficiently accurate treatment of exchange and
correlation for many purposes with a moderate computational cost. However, the usual approximations employed to
describe exchange and correlation—the generalized gradient approximations (GGAs)— lack any account of vdW
dispersion forces that play an important role in carbon-based conjugated semiconductors. A recent DFT study
performed on other molecular crystals containing a correction for the vdW interactions correctly predicts the
structural, vibrational, electronic and optical properties of the crystals [13, 14]. In the present study, using Quantum
Espresso Modelling Techniques and applying the dispersion correction term as implemented in the Quantum
Espresso suite which is important in such a study, we will present a detailed first-principles study of the 2,3-
benzanthracene molecular crystal under ambient temperature and pressure conditions.
Among the oligomers of the acene crystals, 2,3-benzanthracene is a good choice for such a study due to the
availability in the literature of experimental results under ambient and external conditions.
2. Our Method and Computational Details The first principles calculations were performed within density functional theory approach using the plane wave
basis sets implemented in Quantum Espresso code [15]. The exchange correlation functional is approximated with
generalized gradient approximation parameterized by the Perdew-Burke-Ernzerhof (PBE) scheme [16]. The plane
wave ultra-soft pseudo potential method is adopted to describe the interaction between electrons and ions. The
Monkhorst-Pack has been adopted to generate special k-points within 6x6x6 grid throughout the Brillouin zone. The
calculations are done with a plane wave function and charge density cut-offs of 60 Ryd and 600 Ryd, respectively
and obtained quite accurate values of in-plane and out-of-plane lattice constant a and c, respectively by the process
of the total energy minimization. A Broyden–Fletcher–Goldfarb–Shanno (BFGS) algorithm was used to relax
electrons, ions and cell parameters in the unit cell with full degree of freedom. The atomic positions and cell
parameters were fully relaxed in all cases, until an energy convergence of 10−7
eV and a force convergence of 0.04
eV/˚A is reached.
After getting the relaxed structures, we performed self-consistent calculations with a Monkhorst-Pack [17] 8×8×8 k-
mesh followed by the non-self-consistent calculations for band structures, DOS/PDOS and charge density
separately. We have used 12×12×12 k-points mesh along the path Γ−H−X−Γ in the irreducible Brillouin zone to
obtain the band structure with very fine mesh points.
Tables and Figures are presented center, as shown below and cited in the manuscript.
Table: Optimized Lattice Parameters of Title Molecule
Title Molecule Lattice Lattice Lattice
Constant Constant Constant
a(Å) b(Å) c(Å)
Present Work 7.372 8.752 11.866
Experimental 6.055 7.872 13.420
(a) (b)

International Journal of Engineering, Science and Mathematics Vol.7 Issue 4, April 2018, ISSN: 2320-0294 Impact Factor: 6.765 Journal Homepage: http://www.ijesm.co.in, Email: [email protected] Double-Blind Peer Reviewed Refereed Open Access International Journal - Included in the International Serial Directories Indexed & Listed at: Ulrich's Periodicals Directory ©, U.S.A., Open J-Gage as well as in Cabell’s Directories of Publishing Opportunities, U.S.A
7 International Journal of Engineering, Science and Mathematics
http://www.ijesm.co.in, Email: [email protected]
Fig.1 The super cell structure of title molecule: (a) front view, (b) side view.
International Journal of Engineering, Science and Mathematics Vol.7 Issue 4, April 2018, ISSN: 2320-0294 Impact Factor: 6.765 Journal Homepage: http://www.ijesm.co.in, Email: [email protected] Double-Blind Peer Reviewed Refereed Open Access International Journal - Included in the International Serial Directories Indexed & Listed at: Ulrich's Periodicals Directory ©, U.S.A., Open J-Gage as well as in Cabell’s Directories of Publishing Opportunities, U.S.A
8 International Journal of Engineering, Science and Mathematics
http://www.ijesm.co.in, Email: [email protected]
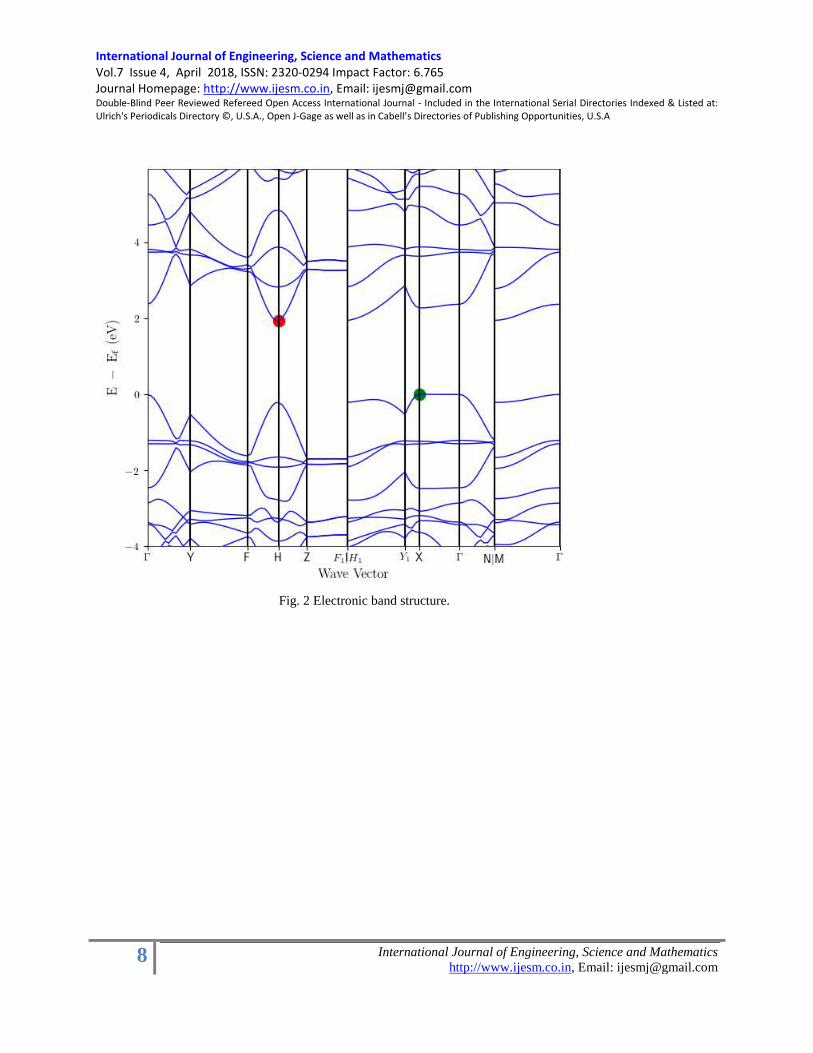
Fig. 2 Electronic band structure.
International Journal of Engineering, Science and Mathematics Vol.7 Issue 4, April 2018, ISSN: 2320-0294 Impact Factor: 6.765 Journal Homepage: http://www.ijesm.co.in, Email: [email protected] Double-Blind Peer Reviewed Refereed Open Access International Journal - Included in the International Serial Directories Indexed & Listed at: Ulrich's Periodicals Directory ©, U.S.A., Open J-Gage as well as in Cabell’s Directories of Publishing Opportunities, U.S.A
9 International Journal of Engineering, Science and Mathematics
http://www.ijesm.co.in, Email: [email protected]
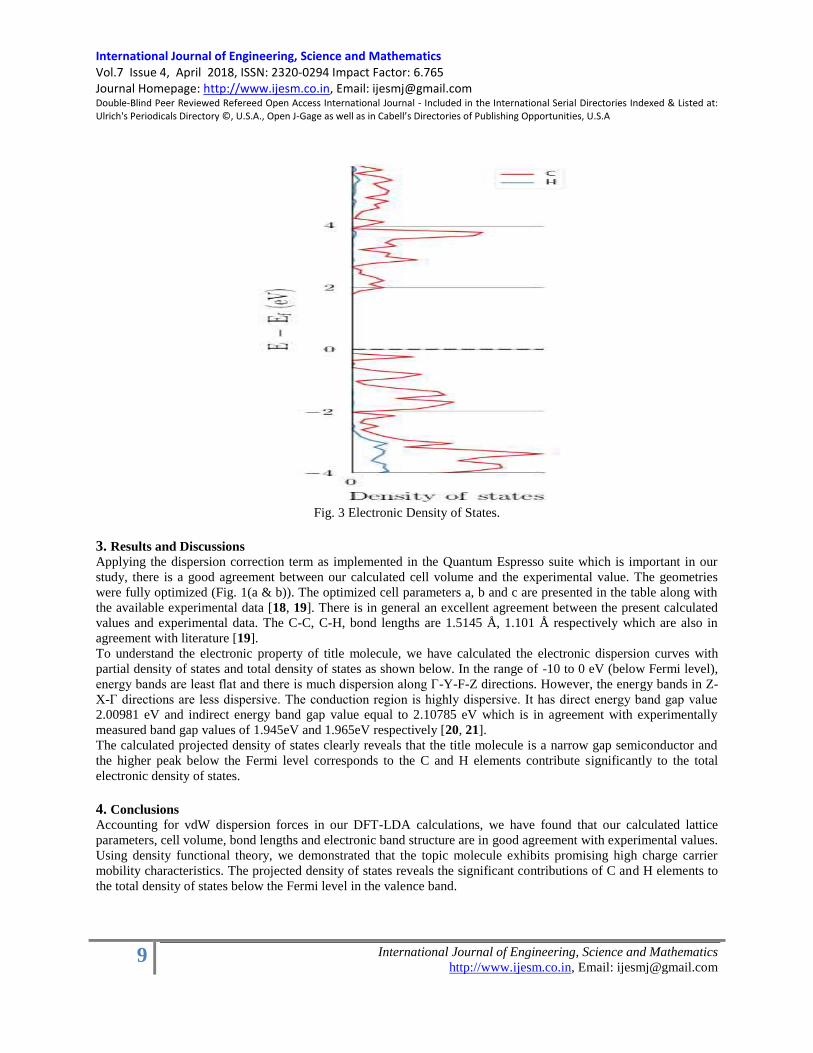
Fig. 3 Electronic Density of States.
3. Results and Discussions Applying the dispersion correction term as implemented in the Quantum Espresso suite which is important in our
study, there is a good agreement between our calculated cell volume and the experimental value. The geometries
were fully optimized (Fig. 1(a & b)). The optimized cell parameters a, b and c are presented in the table along with
the available experimental data [18, 19]. There is in general an excellent agreement between the present calculated
values and experimental data. The C-C, C-H, bond lengths are 1.5145 Å, 1.101 Å respectively which are also in
agreement with literature [19].
To understand the electronic property of title molecule, we have calculated the electronic dispersion curves with
partial density of states and total density of states as shown below. In the range of -10 to 0 eV (below Fermi level),
energy bands are least flat and there is much dispersion along Γ-Y-F-Z directions. However, the energy bands in Z-
X-Γ directions are less dispersive. The conduction region is highly dispersive. It has direct energy band gap value
2.00981 eV and indirect energy band gap value equal to 2.10785 eV which is in agreement with experimentally
measured band gap values of 1.945eV and 1.965eV respectively [20, 21].
The calculated projected density of states clearly reveals that the title molecule is a narrow gap semiconductor and
the higher peak below the Fermi level corresponds to the C and H elements contribute significantly to the total
electronic density of states.
4. Conclusions Accounting for vdW dispersion forces in our DFT-LDA calculations, we have found that our calculated lattice
parameters, cell volume, bond lengths and electronic band structure are in good agreement with experimental values.
Using density functional theory, we demonstrated that the topic molecule exhibits promising high charge carrier
mobility characteristics. The projected density of states reveals the significant contributions of C and H elements to
the total density of states below the Fermi level in the valence band.

International Journal of Engineering, Science and Mathematics Vol.7 Issue 4, April 2018, ISSN: 2320-0294 Impact Factor: 6.765 Journal Homepage: http://www.ijesm.co.in, Email: [email protected] Double-Blind Peer Reviewed Refereed Open Access International Journal - Included in the International Serial Directories Indexed & Listed at: Ulrich's Periodicals Directory ©, U.S.A., Open J-Gage as well as in Cabell’s Directories of Publishing Opportunities, U.S.A
10 International Journal of Engineering, Science and Mathematics
http://www.ijesm.co.in, Email: [email protected]
Acknowledgments
The authors, VWE and AKM acknowledge the use of University of Petroleum and Energy Studies (UPES) High
Performance Computing Service and the computational resources. VWE thanks the Ministry of Science and
Technology for the grant of FICCI of New Delhi for C V Raman fellowship.
References [1] Choi H. J., Park Y. W., Choi J. H., Park T. H., Song E. H. and Ju B. K.; 2010 Improved electroluminescent
efficiency of OLEDs by pentacene as HIL/HTL and plasma treatment on ITO anode 10th Int. Meeting on
Information Display and International Display Manufacturing Conference and Asia Display (IMID/IDMC/ASIA
Display) (Seoul, Korea).
[2] F. Zhang et al, Improved performance of organic light emitting diodes by pentacene as hole transporting layer
Appl. Surf. Sci. 255 1942–5, 2008.
[3] H. Klauk et al, High-mobility polymer gate dielectric pentacene thin film transistors J. Appl. Phys. 92 5259–63,
2002.
[4] C. Fang-Chung, et al Morphological study on pentacene thin-film transistors: the influence of grain boundary on
the electrical properties J. Phys. D: Appl. Phys. 43 405103, 2010.
[5] J. M. Choi, et al, Comparative study of the photo-response from tetracene-based and pentacene-based thin-film
transistors, Appl. Phys. Lett. 88 043508, 2006.
[6] D. J. Gundlach, et al, Thin-film transistors based on well-ordered thermally evaporated naphthacene films Appl.
Phys. Lett. 80 2925–7, 2002.
[7] D. J. Yun and S. W. Rhee, Pentacene thin-film transistor with niox as a source/drain electrode deposited with
sputtering J. Electrochem. Soc. 155 H899–902, 2008.
[8] C. Santato, F. Cicoira and S. Bertolazzi, Tetracene films for light-emitting transistors: chemical and physical
effects of the organic dielectric substrates APS March Meeting, American Physical Society, 15–19, 2010.
[9] J. C. Nolasco et al, Relation between the barrier interface and the built-in potential in pentacene/C60 solar cell
Appl. Phys. Lett. 97 013305, 2010.
[10] Y. Shao, et al, Enhancement of tetracene photovoltaic devices with heat treatment Appl. Phys. Lett. 90 103501,
2007.
[11] D. M. Dissanayake et al, Charge transfer between acenes and PbS nanocrystals Nanotechnology 20 195205,
2009.
[12] B. Ehrler et al, In situ measurement of exciton energy in hybrid singlet-fission solar cells Nat. Commun.
3 1019, 2012.
[13] B. Schatschneider, et al Understanding the structure and electronic properties of molecular crystals under
pressure: application of dispersion corrected DFT to oligoacenes, J. Phys. Chem. A 117 8323–31, 2013.
[14] A. M. Reilly and A. Tkatchenko, Understanding the role of vibrations, exact exchange, and many-body van der
Waals interactions in the cohesive properties of molecular crystals, J. Chem. Phys. 139 024705, 2013.
[15] P. Giannozzi, et al., http://www.quantum-espresso.org.
[16] J. P. Perdew, K. Burke and M. Ernzerhof, Phys. Rev. Lett. 77, 3865–3868, 1996.
[17] C. W. Bunn, Nature 161, 929-930, 1948.
[18] R. C. L. Mooney, Journal of the American Chem. Soc. 63, 2828-2832, 1941.
[19] H. J. Monkhorst and J. D. Pack, Special points for Brillouin-zone integrations. Phys. Rev. B Solid State 13
5188S, 1976.
[20] C. U. Devi, A.K. Sharma and V. V. R. N. Rao, Materials Letters 56, 167– 174, 2002.
[21] G. Hirankumara, S. Selvasekarapandian, N. Kuwata, J. Kawamura, T. Hattori, Journal of Power Sources 114,
262 – 267, 2005.

International Journal of Engineering, Science and Mathematics Vol.7 Issue 4, April 2018, ISSN: 2320-0294 Impact Factor: 6.765 Journal Homepage: http://www.ijesm.co.in, Email: [email protected] Double-Blind Peer Reviewed Refereed Open Access International Journal - Included in the International Serial Directories Indexed & Listed at: Ulrich's Periodicals Directory ©, U.S.A., Open J-Gage as well as in Cabell’s Directories of Publishing Opportunities, U.S.A
11 International Journal of Engineering, Science and Mathematics
http://www.ijesm.co.in, Email: [email protected]
WORKPLACE HAZARDS AND ITS MANAGEMENT: A REVIEW PAPER ON ANALYSIS OF RISKS
AND ITS CONTROL MEASURES
Aditya Sharma
Ashish Maindolia
Akshi Kunwar Singh
Abstract
Research Scholar, University Of Petroleum & energy Studies,Dehradun Research Scholar, University Of Petroleum & energy Studies,Dehradun Asst Professor, University Of Petroleum & energy Studies,Dehradun

International Journal of Engineering, Science and Mathematics Vol.7 Issue 4, April 2018, ISSN: 2320-0294 Impact Factor: 6.765 Journal Homepage: http://www.ijesm.co.in, Email: [email protected] Double-Blind Peer Reviewed Refereed Open Access International Journal - Included in the International Serial Directories Indexed & Listed at: Ulrich's Periodicals Directory ©, U.S.A., Open J-Gage as well as in Cabell’s Directories of Publishing Opportunities, U.S.A
12 International Journal of Engineering, Science and Mathematics
http://www.ijesm.co.in, Email: [email protected]
Working in industry is not safe as it sounds. Every single work
activity is associated with some major health hazards. Occupational
health hazards are major concern nowadays and many studies has
been done to analyze and manage the risks associated with work. In
spite of the fact that many technologies and techniques have evolved
to resolve the issue, still some of the major issues stays in the
workplace environment. Noise, being the major issue, creates
permanent Noise Induced Hearing Loss (NIHL), heat stress cause
heat cramps, exhaustion and heat stroke, vibration cause hand arm
vibration syndrome and chemicals like silica, asbestos and chromium
cause major lung and heart diseases. Ergonomics hazards are also a
topic of concern as wrong posture causes musculoskeletal disorders.
In today‘s scenario, owner of the workplace is focused on generating
profits and employees are focused on their salaries and this attitude
gives rise to workplace accidents and health hazards. Workers
negligence on their health results in rise of occupational diseases like
NIHL, HAVS, asthma, cancer, lungs disorder etc. This paper focuses
on the major hazards which results in various occupational diseases
and also some of the management methods to reduce the hazards and
make the workplace much less hazardous.
Keywords:
Musculoskeleton disorder;
NIHL;
HAVS;
Copyright © 2018International Journals of Multidisciplinary
Research Academy. All rights reserved.
Author correspondence:
Aditya Sharma,
Research Scholar, University of Petroleum & energy Studies
Dehradun-India
1. Introduction
In the past years many researchers have studied and identified various occupational and workplace hazards. They
have categorized the occupational hazards as follows:
1. Physical hazards which includes noise, vibration, heat stress and radiation
2. Chemical hazards which includes fumes, dusts, metals, chemicals
3. Biological hazards which includes fungus, algae etc
4. Ergonomic hazards such as musculoskeletal disorder
5. Psychological hazards leading mental stress, lack of motivation. [5]
These hazards have led to many occupational accidents and injuries. Working in unsafe workplace leads to danger to
life to workers and staff turnover happens. Occupation accidents and injuries not only hamper the workers faith in
workplace but also the reputation of industry.
The major workplace problem includes noise, vibration, heat stress, chromium toxicity, musculoskeletal disorder,
dust, fumes, asbestos and silica. Noise being the top issue of concern as one in six adults are suffering from
physiological hearing impairment. [1] Vibration causes hand arm vibration syndrome to those workers involved in
drilling activities. Working in wrong or lifting heavy load manually leads to musculoskeletal disorders. [2] Exposure
to silica and asbestos dusts leads to lung disorders, asthma, silicosis and asbestosis. [3][4]

International Journal of Engineering, Science and Mathematics Vol.7 Issue 4, April 2018, ISSN: 2320-0294 Impact Factor: 6.765 Journal Homepage: http://www.ijesm.co.in, Email: [email protected] Double-Blind Peer Reviewed Refereed Open Access International Journal - Included in the International Serial Directories Indexed & Listed at: Ulrich's Periodicals Directory ©, U.S.A., Open J-Gage as well as in Cabell’s Directories of Publishing Opportunities, U.S.A
13 International Journal of Engineering, Science and Mathematics
http://www.ijesm.co.in, Email: [email protected]
Categorization of each hazard and their consequences is very important as it helps in assessment of risk related to
any activity. Assessment of risk is an effective technique in workplace which helps in control of workplace hazards
and accidents at very initial stage.
Assessment of risk is performed as:
1. Identification of hazards related to activity.
2. Identification of workers at risk.
3. Evaluation of risk and assigning control measures.
4. Recording the findings.
5. Reviewing the control measures. [5]
This paper reviews the workplace related hazards and their management along with some standard values assigned
with each parameter.
2. Literature Review
NOISE
Noise is workplace is of prime concern as it damages the cochlea. Acute effects are ringing of ear, tingling effect,
less concentration, threshold shift and irritation. Due to irreversible damage to sensory hair cells of the cochlea
NIHL causes the reduction of a progressive, sensorineural, hearing deficit. [1] Worldwide, the disability percentage
occurred due to noise has reached to 16% and raging 7-21% in various sub regions. The assigned value of safe
sound level at workplace is 85dB. [13]
Noise can be reduced by the following methods:
1) Sound proofing of the work zone.
2) Providing job rotation.
3) Providing rest between the tasks.
4) By providing the ear muffs and ear plugs.
5) By medical check-ups.
6) Providing training and knowledge about the occupational noise induced disease.

International Journal of Engineering, Science and Mathematics Vol.7 Issue 4, April 2018, ISSN: 2320-0294 Impact Factor: 6.765 Journal Homepage: http://www.ijesm.co.in, Email: [email protected] Double-Blind Peer Reviewed Refereed Open Access International Journal - Included in the International Serial Directories Indexed & Listed at: Ulrich's Periodicals Directory ©, U.S.A., Open J-Gage as well as in Cabell’s Directories of Publishing Opportunities, U.S.A
14 International Journal of Engineering, Science and Mathematics
http://www.ijesm.co.in, Email: [email protected]
Fig-1: Noise and risk criteria. [5]
Muscoskeletal Disorder
While lifting a load of weight more than the worker‘s capability or doing any physical work with wrong posture can
lead to ergonomic injury. Musculoskeletal disorder and upper limb disorder are main disorders related to ergonomic
injuries. Musculoskeletal disorder is associated with back bone and spinal cord effecting muscles, spine, and
ligaments, joint and supporting blood vessels causing inflammatory and degenerative conditions. [2]
Chemical Exposure
Chemical exposures like exposure to dust, fumes and metallic particles lead to severe issues to lungs, hearts and
brains. Respiratory diseases like silicosis, asbestosis, pulmonary oedema, asthma and lung cancer can occur due to
inhalation of metal dusts.
Chromium toxicity is one issue as the hexavalent chromium is carcinogenic. Chromium enter the cells through
anionic transport system. Once the chromium is entered in cells, it reduces various intercellular reductants and due
to cellular activities the hexavalent chromium is converted into trivalent chromium which reacts with proteins to
produce toxicity. [6] The trivalent chromium is also lethal when exposed to it directly. Exposure to chromium fumes
can occur due to hot works like welding, forging, melting of aluminum.
Silica dust is another issue at workplace since it can cause silicosis, pulmonary oedema and other lung related
diseases. Silica is found in crystalline form mainly in crytobalite or quartz form which have tendency to cause
cancer. Silica dusts are mostly generated from blast activities, molding, and cement industries and even in paint
industries. [4]
Third most toxic and generally used material is Asbestos as it is also carcinogenic and causes asbestosis. The most
toxic form of asbestos is chrysotile which causes lung, larynx and gastrointestinal cancer and pleura malignant
mesothelioma. [3]
Vibration and heat stress
International Journal of Engineering, Science and Mathematics Vol.7 Issue 4, April 2018, ISSN: 2320-0294 Impact Factor: 6.765 Journal Homepage: http://www.ijesm.co.in, Email: [email protected] Double-Blind Peer Reviewed Refereed Open Access International Journal - Included in the International Serial Directories Indexed & Listed at: Ulrich's Periodicals Directory ©, U.S.A., Open J-Gage as well as in Cabell’s Directories of Publishing Opportunities, U.S.A
15 International Journal of Engineering, Science and Mathematics
http://www.ijesm.co.in, Email: [email protected]
Vibration is rapid reciprocating motion of any device which leads to interaction of low frequencies with blood
vessels. Work activities like drilling, chipping, grinding leads to vibration exposure to worker. Exposure to vibration
causes Hand Arm Vibration Syndrome. Hand Arm Vibration Syndrome is caused by the activities which involves
low frequency vibration and refers to signs and symptoms of vascular, neurological and musculoskeletal. [9]
The people who are exposed to HAVS are drillers, grinders, moulders, electric welders, forklift operators, polishers,
sheet metal operators, chainsaw operators, power tools operators, etc. can suffer from cold intolerance, blanched
finger, tingling of fingers, pain and swelling in fingers and forearms, etc.
Heat stress is another main concern which has causes many fatalities at the workplace. The temperature at which
humans can work safely is 370c above this temperature dehydration causes which leads to heat stress.
Heat stress is classified into heat cramps (loss of body fluids), heat exhaustion (depletion of body fluids) and heat
stroke (damage to the temperature regulatory functioning of body). Occupational heat stress is calculates as Wet
Bulb Globe Temperature.
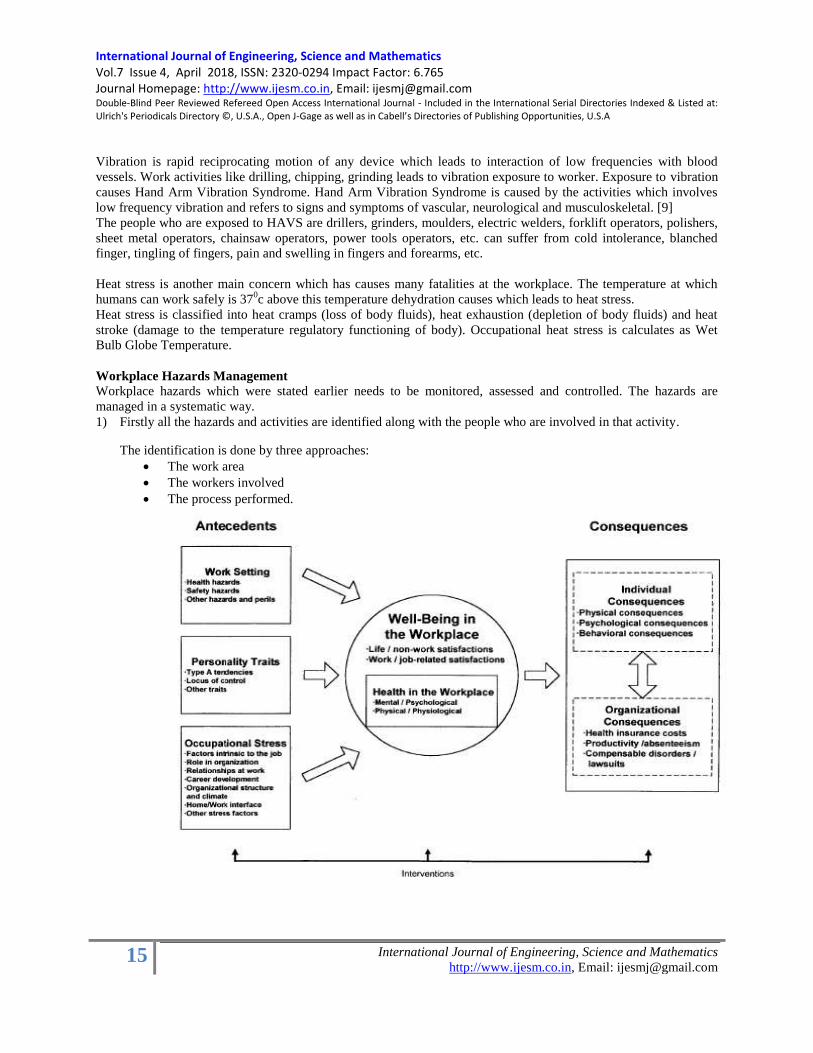
Workplace Hazards Management
Workplace hazards which were stated earlier needs to be monitored, assessed and controlled. The hazards are
managed in a systematic way.
1) Firstly all the hazards and activities are identified along with the people who are involved in that activity.
The identification is done by three approaches:
The work area
The workers involved
The process performed.

International Journal of Engineering, Science and Mathematics Vol.7 Issue 4, April 2018, ISSN: 2320-0294 Impact Factor: 6.765 Journal Homepage: http://www.ijesm.co.in, Email: [email protected] Double-Blind Peer Reviewed Refereed Open Access International Journal - Included in the International Serial Directories Indexed & Listed at: Ulrich's Periodicals Directory ©, U.S.A., Open J-Gage as well as in Cabell’s Directories of Publishing Opportunities, U.S.A
16 International Journal of Engineering, Science and Mathematics
http://www.ijesm.co.in, Email: [email protected]
Fig-2: A Framework for Organizing and Directing Future Theory, Research, and Practice Regarding Health
and Well-Being in the Workplace. [7]
2) Risk assessment is another tool to reduce the risk involved with workplace. Assessment of risk is performed as:
Identification of hazards related to activity.
Identification of workers at risk.
Evaluation of risk and assigning control measures.
Recording the findings.
Reviewing the control measures. [5]
3) The hierarchy of controls which are assigned as per risk assessment are:
Elimination of the hazards by either stopping the process or by removing the element which causes harm.
Isolating the process by creating partitions or shifting of the process machineries to separate section.
By the application of engineering techniques such as local exhaust systems, fan, sound proofing, etc.
Application of administrative controls like job rotation, jobs in shifts, rest etc.
The last resort is the application of personal protective equipments. Although they are not that effective but
they provide protection up to some level.
4) Monitor and reviewing of the whole process for better control measures and its sustainable application. [11]
Along with these management techniques, some advanced tools are also used to reduce and identify the hazards at
initial and in running phase of any work. These techniques are as follows:
Hazard Identification and Risk Assessment
Hazard Operability Studies
Failure Mode Effect Analysis
Fault Tress Analysis
Event Tree Analysis
Bowtie Analysis
What-if Analysis
Brain storming
Use of models and software like CFD, ALOHA, PHAST which do simulations. [12]
Proper training and awareness should also be provided to each and every employee especially at the time of joining.
Premedical checkups should be performed and records should be kept at the workplace.
3. Conclusion
Occupational health hazards are increasing with the increase of technology as not a single process or machinery is
completely safe. Machines are working with electricity or fuels which give rise to fumes and electrocution along
with noisy environment which increases threat to life to workers. According to HAZAWA act it is the duty of the
employer to take care of his employee‘s ad it is the duty of employees to take care of themselves as well as their
subordinates. Occupational diseases might not be identified soon in the workers as they take 15-20 years of time
after the worker has started working to be diagnosed. The worker is affected slowly but the effect is permanent and
cannot be reversed. Even though workers are aware of the fact that workplace is full on dangers, still they have
negligence in their attitude which needs to be changed. Proper training and awareness should also be provided to
each and every employee especially at the time of joining. Premedical checkups should be performed and records
should be kept at the workplace.
Advanced techniques are now available which helps in identifying the hazards in every early stages and the
government is banning the use of most of the toxic substances like asbestos which again is the good approach

International Journal of Engineering, Science and Mathematics Vol.7 Issue 4, April 2018, ISSN: 2320-0294 Impact Factor: 6.765 Journal Homepage: http://www.ijesm.co.in, Email: [email protected] Double-Blind Peer Reviewed Refereed Open Access International Journal - Included in the International Serial Directories Indexed & Listed at: Ulrich's Periodicals Directory ©, U.S.A., Open J-Gage as well as in Cabell’s Directories of Publishing Opportunities, U.S.A
17 International Journal of Engineering, Science and Mathematics
http://www.ijesm.co.in, Email: [email protected]
towards enhancing the workplace‘s safety culture. But one thing that should be remembered all the time is that
safety comes from inside and one should consider safety as value not as priority.
References
1. Kurmis, A., & Apps, S. (2007). Occupationally-acquired noise-induced hearing loss: a senseless workplace
hazard. International journal of occupational medicine and environmental health, 20(2), 127-136.
2. Punnett, L., & Wegman, D. H. (2004). Work-related musculoskeletal disorders: the epidemiologic evidence and
the debate. Journal of electromyography and kinesiology, 14(1), 13-23.
3. Landrigan, P. J., Nicholson, W. J., Suzuki, Y., & LaDou, J. (1999). The hazards of chrysotile asbestos: a critical
review. Industrial Health, 37(3), 271-280.
4. Rice, F. L., Park, R., Stayner, L., Smith, R., Gilbert, S., & Checkoway, H. (2001). Crystalline silica exposure and
lung cancer mortality in diatomaceous earth industry workers: a quantitative risk assessment. Occupational and
environmental medicine, 58(1), 38-45.
5. Reinhold, K., & Tint, P. (2009). Hazard profile in manufacturing: determination of risk levels towards enhancing
the workplace safety. Journal of environmental engineering and landscape management, 17(2), 69-80.
6.Carbone M, Rizzo P, Pass H. Simian (2000) Virus 40: The link with human malignant mesothelioma is well
established,20(2A), 875–877.
7. Danna, K., & Griffin, R. W. (1999). Health and well-being in the workplace: A review and synthesis of the
literature. Journal of management, 25(3), 357-384.
8. Kjellstrom, T., & Crowe, J. (2011). Climate change, workplace heat exposure, and occupational health and
productivity in Central America. International Journal of Occupational and Environmental Health, 17(3), 270-281.
9. Pelmear, P. L., & Taylor, W. (1994). Hand-arm vibration syndrome. Journal of family practice, 38(2), 180-186.
10. Kjellstrom, T., Holmer, I., & Lemke, B. (2009). Workplace heat stress, health and productivity–an increasing
challenge for low and middle-income countries during climate change. Global Health Action, 2(1), 2047.
11. Manuele, F. A. (2005). Risk assessment & hierarchies of control. Professional Safety, 50(5), 33.
12. Kletz, T. (1992) Hazop and Hazan. Identifying and Assessing Process Industry Hazards , 3rd edn, The
Institution of Chemical Engineers, Rugby
13.Nelson DI, Nelson RY, Concha-Barrientos M, Fingeruhut M. the global burden of occupational noise induced
hearing loss. Am J Ind Med 2005;48:446-58.
14. Fetoni, A. R., De Bartolo, P., Eramo, S. L. M., Rolesi, R., Paciello, F., Bergamini, C., ... & Troiani, D. (2013).
Noise-induced hearing loss (NIHL) as a target of oxidative stress-mediated damage: cochlear and cortical responses
after an increase in antioxidant defense. Journal of Neuroscience, 33(9), 4011-4023.
15. Ramsey JD. Task performance in heat: a review. Ergonomics 1995; 38: 154-65.
16. Degan, G. A.; Lippiello, D.; Pinzari, M. 2003. Dust propagation: A method in risk analysis, in The 3-rd Safety
and Reliability International Conference KONBIN‘03. Monograph Series 3. Warszawa: Air Force Institute of
Technology, 45–53.
17. Resolution of the Estonian Government. 2007b. No. 223 of 23 October 2007 on the exposure limits of chemical
agents in the work environment. State Gazette in Estonia, RTL 2007, 55, 369.
18. Salminen, S.; Saari, J.; Saarela, K.-L.; Rasanen, T. 1993. Organizational factors influencing serious occupational
accidents, Scandinavian Journal of Work, Environment and Health 19: 257–352.
19. Evenson, E. T. 2002. Cold Environments. Physical and Biological Hazards of the Workplace. 2nd Edition. New
York: John Wiley & Sons, Inc.
20. Bernard, B. P., & Putz-Anderson, V. (1997). Musculoskeletal disorders and workplace factors; a critical review
of epidemiologic evidence for work-related musculoskeletal disorders of the neck, upper extremity, and low back.

International Journal of Engineering, Science and Mathematics Vol.7 Issue 4, April 2018, ISSN: 2320-0294 Impact Factor: 6.765 Journal Homepage: http://www.ijesm.co.in, Email: [email protected] Double-Blind Peer Reviewed Refereed Open Access International Journal - Included in the International Serial Directories Indexed & Listed at: Ulrich's Periodicals Directory ©, U.S.A., Open J-Gage as well as in Cabell’s Directories of Publishing Opportunities, U.S.A
18 International Journal of Engineering, Science and Mathematics
http://www.ijesm.co.in, Email: [email protected]
DEVELOPING MECHANISM FOR AWARENESS & MONITORING HEALTH & SAFETY IN
FARMING SECTOR
Bhaskar Tichkule
Abstract
India, a growing economy and world‘s largest democracy, has
population exceeding 1.2 billion. More than 90% work in the
informal economy, mainly agriculture and services. Less than 10%
work in the organized sector; mainly industry, mining and some
services. Agricultural works are associated with a variety of unique
occupational health and safety hazards in the form of physical factors
like extreme weather conditions, sunrays, etc; chemical and
toxicological hazards in the form of pesticides/fertilizers, etc,
including different forms of biological and mechanical hazards. But
unluckily there is no mechanism with government to establish the
required data about health and safety in forming sector where, our 70
% countrymen working on daily basis.
The focus of the project was developing a mechanism for regular
monitoring of accidents and occupational health issues in farming
through the involvement of various government admistrative bodies.
Also as a beginning in farm sector, let realize some system to spread
awareness about hazards to the rural large population for their
welfare and financial benefits and health. The data collected by
choosing a zone of one taluka in Maharashtra to identify hazards,
activities, their effects on health, any existing system to collect data
through farmers, government administration on village level; through
survey, checklists, interviews and by other means.
The survey conducted for data collection of health and safety
problems reached on conclusion that it required awareness about
OSH risks among all farm workers and farmers. The very important
finding which needs immediate attention that, there is no system for
any data collection from government side for agricultural safety
injuries and health related problems. Present situation demand in
OSH needed to acquire National policy, legislation; awareness
program and development of OHS infrastructure in farming sector.
Keywords:
India;
Physical Factors;
Chemical & toxicological
hazards;
Occupational Safety & Health;
Survey for Data Collection;
Prevention & Control.

International Journal of Engineering, Science and Mathematics Vol.7 Issue 4, April 2018, ISSN: 2320-0294 Impact Factor: 6.765 Journal Homepage: http://www.ijesm.co.in, Email: [email protected] Double-Blind Peer Reviewed Refereed Open Access International Journal - Included in the International Serial Directories Indexed & Listed at: Ulrich's Periodicals Directory ©, U.S.A., Open J-Gage as well as in Cabell’s Directories of Publishing Opportunities, U.S.A
19 International Journal of Engineering, Science and Mathematics
http://www.ijesm.co.in, Email: [email protected]
Copyright © 2018International Journals of Multidisciplinary
Research Academy. All rights reserved.
Author correspondence:
Bhaskar Tichkule,
HSE Manager,
Nexans, Abu Dhabi, UAE
1. INTRODUCTION:
Agriculture is one of the most hazardous occupations worldwide. In several countries the fatal accident rate in
agriculture is double the average for all other industries. According to ILO estimates, workers suffer 250 million
accidents every year. Out of a total of 335,000 fatal workplace accidents worldwide, there are some 170,000 deaths
among agricultural workers. The intensive use of machinery and of pesticides and other agrochemicals has raised the
risks. Machinery such as tractors and harvesters has the highest frequency and fatality rates of injury. Available data
from developing countries shows that there has been an increase in the accident rate in agriculture.
If we see the demographical area of India, it covers 328 million hectors total area. Out of this figure, 140 million
hector is net cultivated land. Average size of land holding is 1.16 ha for land holders. In India 263 million
agriculture workers depends on the land. It is also important to quote here that 37 % are female workers contribution
of human power to the total power used in agriculture is about 5%. It is estimated that out of total farmers, about 84
% are small and marginal farmers (having less than 2 hector land). There are different cropping patterns with
different practices vary depending on the crops. Also level of mechanization, we can see in varied levels.
The use of variety of equipments, fertilizers, pesticides, terrains, atmospheric conditions creates various types of
safety and health hazards for the farmers and farm workers. Some of them like excessive vibration dose, noise
exposure, respiratory problems due to dust, chemical exposure ill effect due to pesticides spray, musculoskeletal
disorders, extreme weather conditions etc.
1.1 Aim:
The aim of the project is developing a mechanism for regular monitoring of accidents and occupational health issues
in agriculture through the involvement of various government administrative bodies. Also as a beginning in farm
sector, let realize some system to spread awareness about hazards of farm sector to the rural large population for
their welfare and financial benefits and their health.
1.2 Objective of Study:
Objective of the project is to identify level of awareness in rural area farming sector.
To know the existing system for health and safety in place for farming sector.
To know the legal system or code of conducts for best practices to minimize the farm risks in farming
sector.
To find the different means for spreading awareness about health and safety in rural sector farming to
spread all over the country.
To develop a constructive mechanism for collection of useful incident/ injury data from the rural farming
area.
1.3 Case Study Area:

International Journal of Engineering, Science and Mathematics Vol.7 Issue 4, April 2018, ISSN: 2320-0294 Impact Factor: 6.765 Journal Homepage: http://www.ijesm.co.in, Email: [email protected] Double-Blind Peer Reviewed Refereed Open Access International Journal - Included in the International Serial Directories Indexed & Listed at: Ulrich's Periodicals Directory ©, U.S.A., Open J-Gage as well as in Cabell’s Directories of Publishing Opportunities, U.S.A
20 International Journal of Engineering, Science and Mathematics
http://www.ijesm.co.in, Email: [email protected]
It is obvious to select a rural area where farming is a main business. I have selected a block where farming is 80 %
people business and the main cultivation is paddy. For interviews and checklist and survey, the study has provided
in depth of problems and the obvious health and safety hazards. Also it helps to identify any system available to
notification of incident or injury related with agriculture sector. The known farmers enthusiastically participated in
whole study and provided the required data for study.
1.4 Significance of Study:
Study is significant to locate the existing system of collecting data which was very poorly found.
To develop the mechanism which can benefit for collection of health and safety data for future.
To identify the hazards in farming sector.
What can be the means for dissipation of awareness about health and safety in rural area?
Government lagging behind the code of practices, acts, rules with refers to farming sector.
2. RESEARCH METHOD:
As we see our rural area in India is wide spread, survey and observation is suitable method by selecting certain area.
Our large population is depending on agriculture sector, we can choose a part of it only for survey and observation.
It is known that many type of farm machines and tools, equipments, various types of fertilizers, pesticides used in
agriculture sector which generate some obvious hazards. The methodology used here by conducting interviews, talk
in groups, collecting data which little available on internet, talk with various organizations, associations and
government entities. This subject is wide spread which allow taking samples easy.
2.1 Targeted Population and Sample Size:
Obviously target population is the cluster of farmers which cultivating paddy fields on block level. We have taken
200 farmers samples for collecting relevant information and data for this study. Its inclusion is located with farmers,
gramsewaks, NGO‘s, PHC physicians, Village Talathi, Agriculture Supervisor & officer, Police station Authorities,
Various farmers associations head, etc.
Quistionnaire used for Farmers
Interview with PHC physician
Interview with Local Police station Authority
Interview with Gramsewak in village Grampanchayat
Interview with NGO in Agriculture sector
Interview with Agriculture Supervisors
Interview with Private Physician in that Area
Data collection from Internet from various website internationally and nationally also. It is difficult to get data about
health and safety in agriculture on National level. Our government have no policy about the farming sector health
and safety. Secondly it came to picture, very few people has done research in this subject about data collection as
there no existing system. In such a vast country, and 60% dependency on agriculture, people are not looking for
their welfare and health and safety, it is very sorry state for our country.
3. RESULTS AND DICUSSIONS:
The evaluation of agriculture hazards is important based on that anybody can design various awareness planning and
program about health and safety for farmers. Based on the observations, collection of farm hazards are prescribed as
further:
International Journal of Engineering, Science and Mathematics Vol.7 Issue 4, April 2018, ISSN: 2320-0294 Impact Factor: 6.765 Journal Homepage: http://www.ijesm.co.in, Email: [email protected] Double-Blind Peer Reviewed Refereed Open Access International Journal - Included in the International Serial Directories Indexed & Listed at: Ulrich's Periodicals Directory ©, U.S.A., Open J-Gage as well as in Cabell’s Directories of Publishing Opportunities, U.S.A
21 International Journal of Engineering, Science and Mathematics
http://www.ijesm.co.in, Email: [email protected]
Mechanical, chemical and environmental hazards may increase the risk of accidents for agricultural workers. The
principle risks to the health and safety of agricultural workers stem from the nature of the work, the condition of
tools or equipment and exposure to chemicals.
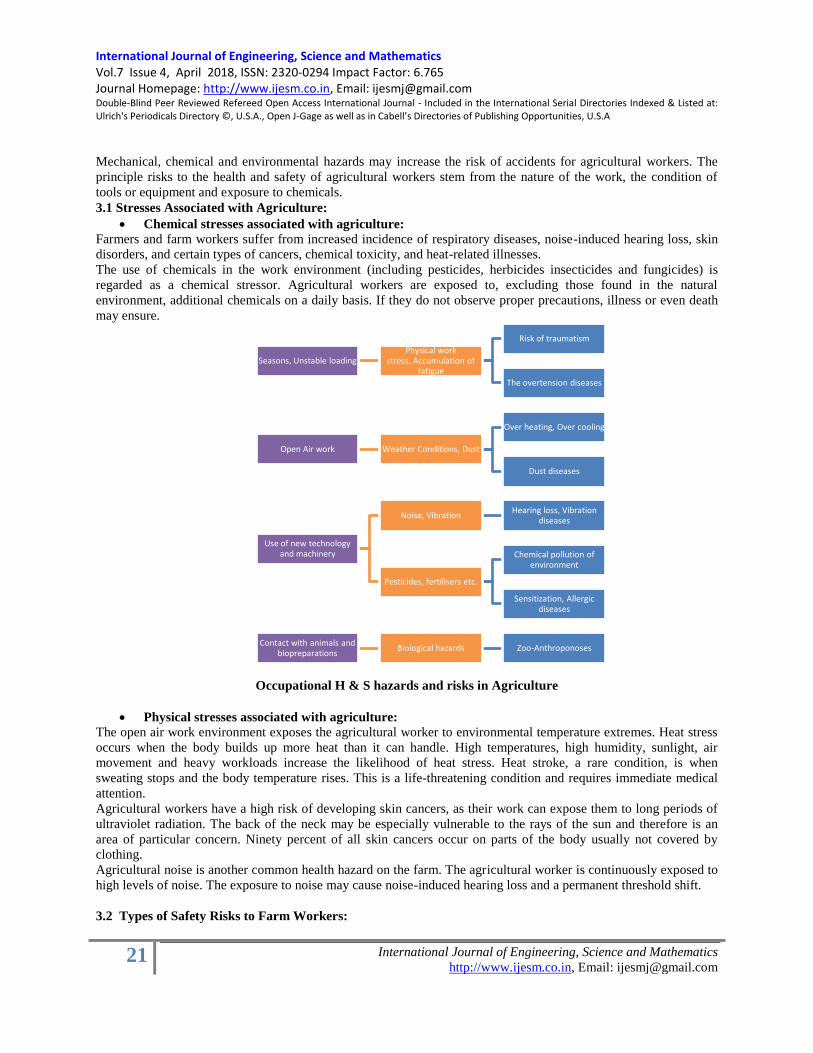
3.1 Stresses Associated with Agriculture:
Chemical stresses associated with agriculture:
Farmers and farm workers suffer from increased incidence of respiratory diseases, noise-induced hearing loss, skin
disorders, and certain types of cancers, chemical toxicity, and heat-related illnesses.
The use of chemicals in the work environment (including pesticides, herbicides insecticides and fungicides) is
regarded as a chemical stressor. Agricultural workers are exposed to, excluding those found in the natural
environment, additional chemicals on a daily basis. If they do not observe proper precautions, illness or even death
may ensure.
Occupational H & S hazards and risks in Agriculture
Physical stresses associated with agriculture:
The open air work environment exposes the agricultural worker to environmental temperature extremes. Heat stress
occurs when the body builds up more heat than it can handle. High temperatures, high humidity, sunlight, air
movement and heavy workloads increase the likelihood of heat stress. Heat stroke, a rare condition, is when
sweating stops and the body temperature rises. This is a life-threatening condition and requires immediate medical
attention.
Agricultural workers have a high risk of developing skin cancers, as their work can expose them to long periods of
ultraviolet radiation. The back of the neck may be especially vulnerable to the rays of the sun and therefore is an
area of particular concern. Ninety percent of all skin cancers occur on parts of the body usually not covered by
clothing.
Agricultural noise is another common health hazard on the farm. The agricultural worker is continuously exposed to
high levels of noise. The exposure to noise may cause noise-induced hearing loss and a permanent threshold shift.
3.2 Types of Safety Risks to Farm Workers:
Seasons, Unstable loadingPhysical work
stress, Accumulation of fatigue
Risk of traumatism
The overtension diseases
Open Air work Weather Conditions, Dust
Over heating, Over cooling
Dust diseases
Use of new technology and machinery
Noise, VibrationHearing loss, Vibration
diseases
Pesticides, fertilisers etc.
Chemical pollution of environment
Sensitization, Allergic diseases
Contact with animals and biopreparations
Biological hazards Zoo-Anthroponoses

International Journal of Engineering, Science and Mathematics Vol.7 Issue 4, April 2018, ISSN: 2320-0294 Impact Factor: 6.765 Journal Homepage: http://www.ijesm.co.in, Email: [email protected] Double-Blind Peer Reviewed Refereed Open Access International Journal - Included in the International Serial Directories Indexed & Listed at: Ulrich's Periodicals Directory ©, U.S.A., Open J-Gage as well as in Cabell’s Directories of Publishing Opportunities, U.S.A
22 International Journal of Engineering, Science and Mathematics
http://www.ijesm.co.in, Email: [email protected]
High health and safety risks of farm workers Inhalation of inorganic dust
Inhalation of organic dust
Inhalation of ammonium nitrate
Exposure to excessive noise
Exposure to whole body vibration
Inhalation of exhaust gases
Tractor roll-overs
Caught in or between objects Inhalation of organophosphates
Ingestion of organophosphates
Skin absorption of organophosphates
Pesticide Consumption by different Crops in India.
Moderate health and safety risks of farm workers: Exposure to high temperatures
Exposure to ultraviolet radiation
Skin contact with fertilizers
Skin burns from fertilisers
Poor ergonomic design
Trips and slips
Contact dermatitis
Low health and safety risks of farm workers
Farmers exposed to arsenic pesticides are at risk of skin cancer, multiple cell carcinomas and squamous cell
carcinoma.
3.3 Analysis of Collected Data:
Following is the analysis based on the various interviews:
90 % of farmers not aware about the health and safety hazards from their job
It is difficult for farmers to guess the hazards related with health or illness from their work.
25 % educated farmers are able to tell few hazards which come out of tools and equipment which they
used.

International Journal of Engineering, Science and Mathematics Vol.7 Issue 4, April 2018, ISSN: 2320-0294 Impact Factor: 6.765 Journal Homepage: http://www.ijesm.co.in, Email: [email protected] Double-Blind Peer Reviewed Refereed Open Access International Journal - Included in the International Serial Directories Indexed & Listed at: Ulrich's Periodicals Directory ©, U.S.A., Open J-Gage as well as in Cabell’s Directories of Publishing Opportunities, U.S.A
23 International Journal of Engineering, Science and Mathematics
http://www.ijesm.co.in, Email: [email protected]
Out off 200 people interview, 165 farmers were educated up to 5th
standard. Education is important
requirement for farmers which enable them to think about their job.
As age old procedure they are following for farming, their think is ―show must go on at any cost‖.
But it is glad to say all 100 % farmers were agreeing to take part in health and safety programs as it is
related with them.
They were very keen to know safety and health hazards for them from their farm land.
They want me to teach them how to identify the hazards from the job.
As observed, if government or other parties plan to implement health and safety program, they are excited
to participate in that than any educated one.
In Interview with Gramsewak, he was not aware about health and safety and hazards in farm land.
Gramsewak agreed for participation in awareness program and maintaining a data for future health and
safety plans.
Gramsewak suggested, if government instruct to all villager to notify the small injuries and illnecess in
grampanchayayt, it is easy to prepare a record for the year on village level.
At presents, there is some existing NGO‘s working in farming sector. They are doing best also. But they
don‘t have any program for health and safety for farming sector.
No government instruction has been provided to them to prepare the plans for health and safety of farmers.
NGO‘s don‘t have any communications with HSE specialists.
But we can say, if government plan for the new small awareness program, NGO‘s can help immensely.
Local Police stations were not aware about the health and safety incidents in particular.
Police authority does not keep any record separately for farm incidents or injuries.
Agriculture associations don‘t have any role about health and safety of farmers.
Government still today don‘t have any health and safety policy for farmers and farm workers.
Trade Unions are not formed yet for farmers which can play important role in health and safety of farmers.
Agriculture universities don‘t play much role in relation with health and safety subject.
Even manufacturers of machines do not care about the farmers who is doing near about 50000 crore rs
business every year in India.
Fatality rate for farmers due poor health problems, nobody care them. No policy for occupational health
which emerge from farming work.
PHC (Public Health Centres) which located for village service, do not participate for collection of any data
with refer to health and safety in agriculture sector.
Private physicians don‘t have any role for producing any record for farm injuries and ill heaths from
farming sector.
Very poor treatment for farmers gets for their health problems year on year.
Repetitive occupational health problems are coming on often basis but no arrangement to record it.
International Journal of Engineering, Science and Mathematics Vol.7 Issue 4, April 2018, ISSN: 2320-0294 Impact Factor: 6.765 Journal Homepage: http://www.ijesm.co.in, Email: [email protected] Double-Blind Peer Reviewed Refereed Open Access International Journal - Included in the International Serial Directories Indexed & Listed at: Ulrich's Periodicals Directory ©, U.S.A., Open J-Gage as well as in Cabell’s Directories of Publishing Opportunities, U.S.A
24 International Journal of Engineering, Science and Mathematics
http://www.ijesm.co.in, Email: [email protected]
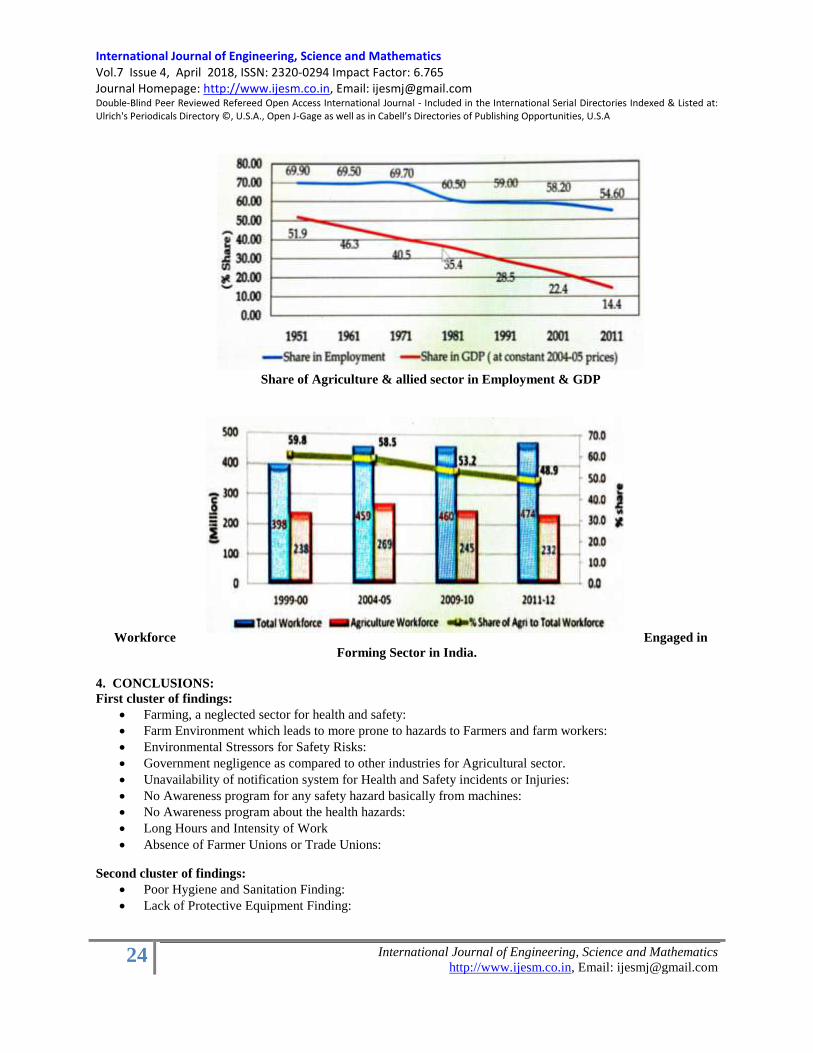
Share of Agriculture & allied sector in Employment & GDP
Workforce Engaged in
Forming Sector in India.
4. CONCLUSIONS:
First cluster of findings:
Farming, a neglected sector for health and safety:
Farm Environment which leads to more prone to hazards to Farmers and farm workers:
Environmental Stressors for Safety Risks:
Government negligence as compared to other industries for Agricultural sector.
Unavailability of notification system for Health and Safety incidents or Injuries:
No Awareness program for any safety hazard basically from machines:
No Awareness program about the health hazards:
Long Hours and Intensity of Work
Absence of Farmer Unions or Trade Unions:
Second cluster of findings:
Poor Hygiene and Sanitation Finding:
Lack of Protective Equipment Finding:

International Journal of Engineering, Science and Mathematics Vol.7 Issue 4, April 2018, ISSN: 2320-0294 Impact Factor: 6.765 Journal Homepage: http://www.ijesm.co.in, Email: [email protected] Double-Blind Peer Reviewed Refereed Open Access International Journal - Included in the International Serial Directories Indexed & Listed at: Ulrich's Periodicals Directory ©, U.S.A., Open J-Gage as well as in Cabell’s Directories of Publishing Opportunities, U.S.A
25 International Journal of Engineering, Science and Mathematics
http://www.ijesm.co.in, Email: [email protected]
Poor Housing Finding:
Lack of adequate health and safety training:
Rural Location and lack of availability and quality medical assistance:
Cost of Medical Treatment:
4.1 Recommendations:
4.1.1 Developing Mechanisam for Health and Safety:
Throughout the study, it is found that there is no health and safety culture in Farming sector where we can go ahead
and say improvement. In very first place, we are lacking for the mechanism for health and safety implementation.
Mechanism is the important base on which we can expect implementation like a vast country of us.
International
ILO Convention No. 184 concerning safety & Health in Agriculture Recommendations of DGFASLI to take care of
this convention, it was suggested to rename The Plantation Labour Act, 1951 as the Agriculture Workers (Safety,
Health and Welfare) Act.
Central Government:
Central government still doesn‘t have policy for farming sector health and safety. It is need of hour to welfare,
health and safety of our farmers who feed the complete nation.The Promotional Framework for Occupational Safety
and Health Convention, 2006 (No. 187), and its accompanying Recommendation (No. 197), also promote such
broader approaches.
State government:
Actually main role of state government should be for implementation of the various health and safety programs in
all the over the state through various administrative branches. State Government can establish a Directorate General
for the state to administer the various health and safety programs all over the state. Safety Inspectors can do the
pertinent role if their strength increases district wise. If a District collector has given some responsibility of health
and safety of farmers and farm workers, he can collect a necessary data from the available resources on district level
which can be analyse further for the reviewing the health and safety policies and programs.
Block level Agricultural Administration Department:
During our survey it is found that agriculture assistance and officers having a better communication and direct
coming in contact with the farmers. It‘s a valuable source which can used as implementation of various health and
safety programs in rural farm work areas.
Public Health Centre ( PHC):
Usually in India, we can find one PHC among the 7-8 villages. Whenever farmers or farm workers get ill or any
other medical help, they are visiting to PHC. Recommendation is that, Health Ministry should insist them to keep
the record of farm injuries and illness caused due to farming for the year. PHC is a very valuable source to gather the
exact information occupational health diseases. They can help to do occupational health surveillance in rural areas
farmers which can use as a data to consider various factors for health and safety programs.
Local Police Stations:
Suppose any tractor incident happened, department notifying it as a tractor incident only. But if a record notify it as
a Farm related tractor fatality, then it will help to get exact data for incidents in farming sector. State government
should utilize this small concept for collection of genuine data to prepare the policy and programs for health and
safety.
NGO (Non Governmental Organizations):

International Journal of Engineering, Science and Mathematics Vol.7 Issue 4, April 2018, ISSN: 2320-0294 Impact Factor: 6.765 Journal Homepage: http://www.ijesm.co.in, Email: [email protected] Double-Blind Peer Reviewed Refereed Open Access International Journal - Included in the International Serial Directories Indexed & Listed at: Ulrich's Periodicals Directory ©, U.S.A., Open J-Gage as well as in Cabell’s Directories of Publishing Opportunities, U.S.A
26 International Journal of Engineering, Science and Mathematics
http://www.ijesm.co.in, Email: [email protected]
In our country many nongovernmental organizations are working in agricultural sector but no one has yet taken
interest in health and safety of farmers. NGO can be utilized for the health and safety programs in a fruitful way.
They can easily establish and implement health and safety programs in large extent.
Trade Unions or Farmers Associations:
In our country trade unions are found in factory side only and more political involvement diminishes their values
also. It is the need of hour that farmers also should gather under the trade unions. Trade unions can be more valuable
for taking care of farmer‘s welfare by providing health and safety shelter to them in rural areas.
Registered Farmers Associations They should be directed with health and safety initiatives for its implementation throughout their members during
meetings. They can keep collect some information about the hazards and risks what their members are facing during
cultivation and suggest some remedies to avoid them or reduces them.
State Agriculture Universities:
The agriculture universities can develop a program for health and safety in agriculture and study it well through
students throughout the curricular for its future implementations. They can play important role in coming future.
Even we can say, why not include one separate subject for hazards and risk treatments for agriculture out comings as
they are having knowledge of pesticides and inorganic fertilizers. Because most of the hazards are related with them
which affects the health and safety of farmers.
Private Physicians practicing in rural areas:
It is necessary of government directives to educate and enforce them to keep the record of patients who are coming
from farmers families with refer to farming hazards and ill health.
Manufactures ofFarm Machines:
As we all aware, most of the incidents happened due to farm machines utilized in farming sector, Make necessary
for manufacturers to provide the training to farmers how to operate machine safely. Let manufacturer prepare a
gadgets how to operate their machines in safe manner to avoid the injury/incidents.
Gramsewaks:
Gramsewaks are deployed in every grampanchayat in India at village level who helps to keep the record of spending
on various works, agricultural data, mediator for communication between government and village administration.
Government can utilize him for distribution of various safety related matters on village level. Even it is possible that
the system can generate to notify incidents or accidents or ill health of villagers in village grampanchayat with him.
He can play a detailed role to collect useful data of safety and health which emerge in relation with farming.
Talathi( Village Revenue Officer):
Talathi is appointed by land revenue department to keep the record of lands on village level basis. Most of the
farmers are visiting him often for their land problems. He is having the authority to issue various required
documents with refer to land owners. He can be the focal point for notification of various hazards which realized in
farm sectors. Talathi can become a reality collector of genuine problems of the farmers in relation with health and
safety.
4.1.2 Awareness about Hazards and Health Problems in Farming Sector:
We can a say there is no awareness about health and safety in farming sector at all. It is immense requirement to
spread awareness about health and safety in farming sector. Government and various sources can help to create the
atmosphere of health and safety culture among the farmers and farm workers. National programmes for agriculture
should seek to promote a preventive OSH culture that addresses the particular needs of men and women and to
progressively improve OSH throughout the sector.
There should be time-bound and have clear targets and indicators.
target OSH risks that concern small family farms, the self employed and seasonal and migrant workers; and

International Journal of Engineering, Science and Mathematics Vol.7 Issue 4, April 2018, ISSN: 2320-0294 Impact Factor: 6.765 Journal Homepage: http://www.ijesm.co.in, Email: [email protected] Double-Blind Peer Reviewed Refereed Open Access International Journal - Included in the International Serial Directories Indexed & Listed at: Ulrich's Periodicals Directory ©, U.S.A., Open J-Gage as well as in Cabell’s Directories of Publishing Opportunities, U.S.A
27 International Journal of Engineering, Science and Mathematics
http://www.ijesm.co.in, Email: [email protected]
Involve a range of different activities at both national and local levels, including high-level conferences,
seminars and meetings to maintain focus on the issues, targeted inspection and enforcement, educational
and promotional activities, media coverage, widespread publicity and information through websites, etc.
TV and radio programs may be targeted at specific types of farms, the self-employed and/or vulnerable
workers, including seasonal and migrant workers, highlighting any safety and health risks they may face.
Provide workers with language suitable resources concerning the details of their healthcare and insurance
coverage as well as guidelines to any registration requirements in accessible formats such as radio spots,
photo novellas, etc.
Fund community organizations and agencies that are active in working with farm workers. These groups
will play an important role in supporting farm workers, have extensive ties to their communities
Provide training courses for medical professionals practicing in areas of high farm worker concentration to
ensure that they have a proper understanding of immigrant and migrant worker issues,
Include interviews with farm workers in workplace health and safety assessments to obtain a
comprehensive understanding workplace conditions
Provide first aid training to workers in relation with small health problems and small injuries.
Developing safety guidelines/ good practices documentation for various operations/ areas in agriculture.
Manufacturers of machinery, equipment, chemicals and other products intended for use in agriculture
should as far as reasonably practicable, ensure that their products are designed and manufactured so that
they present minimal OSH risks to those who use them correctly and provide instructions in the language of
the user for the safe installation, storage, use and maintenance of those products.
Competent authorities should consider how to engage other partners, such as farmers‘ associations,
agricultural development organizations, financial institutions, insurance companies, NGOs, community-
based organizations and others in promoting OSH more widely within the agricultural sector.
Competent authorities and Safety inspectors should consider how to make best use of agricultural trade
fairs and exhibitions, through displays of information and promotional material, film shows and other
activities
On primary school level, various types of farming hazards competition may help to teach the parents about
the unknown hazards as kids or innovative always in their ideas.
4.2 Future Research:
This report has opened a number of avenues for future research on form worker health and safety. It would be useful
to extend the study for other agricultural sectors like animal husbandry, chicken form etc. or to conduct in depth
comparative research on particular crop and / or commodities. However my suggestion is for further paddy field
farmers and farm workers study with refer to health and safety issue. The way observe data said, and the population
involved in farming sector in India, it is the need of hour to participate in health and safety program enhancement for
our poor and always neglected farmers.
REFERENCES:
1. Sweden by Nieuwenhuijsen and Schenker ―during most operations on farms, and in particular during
ground preparation operations‖.
2. Occupational health problems among agricultural and plantation workers. Available
from‖:https://www.researchgate.net/publication/12040393_Occupational_health_problems_among_agricult
ural_and_plantation_workers [accessed Aug 14, 2017]‖.
3. BOHS. a response to the Joint ILO/WHO Committee on Occupational Health priority area for
ILO/WHO/ICOH collaboration, with support of the Finnish Institute of Occupational Health (FIOH).
Author: Professor Jorma Rantanen. 3rd, revised edition, Helsinki 28 September 2007

International Journal of Engineering, Science and Mathematics Vol.7 Issue 4, April 2018, ISSN: 2320-0294 Impact Factor: 6.765 Journal Homepage: http://www.ijesm.co.in, Email: [email protected] Double-Blind Peer Reviewed Refereed Open Access International Journal - Included in the International Serial Directories Indexed & Listed at: Ulrich's Periodicals Directory ©, U.S.A., Open J-Gage as well as in Cabell’s Directories of Publishing Opportunities, U.S.A
28 International Journal of Engineering, Science and Mathematics
http://www.ijesm.co.in, Email: [email protected]
4. ―Safety and health in agriculture. Programme on safety, health and the environment. Labour Protection
Department‖. Internatinal Labour Organisation.
5. ―Code of practice on safety and health in agriculture 2010.‖ International Lobour Office , Geneva.
6. ―Top on the agenda: Health and safety in agriculture. Labour Education 2000/ 1-2 Nos. 118/119. ILO ―
7. ―Health, Safety and Environment: A Series of Trade Union Education Manuals for Agricultural Workers‖
Written by: Peter Hurst & Peter Kirby. ILO.
8. Agricultural Research Centre of Finland and The Tampere University of Technology (2006)
9. World Health Organisation. World Health Report 2002 statistical annex. Available from: http. [accessed on
2008 Apr 5]
10. World Health Organisation. Review document of WHO Regional Office for South-East Asia, and India
Country Team. South-East Asia, Online Resources: WHO; Country cooperation strategy: India. Available
from:http://www.who.int/countries/en/cooperation_strategy_ind_en.pdf. [accessed on 2008 May 16; cited
on 2000 Nov 7]
11. Directorate General, Factory Advice Service and Labour Institutes (DGFASLI) Safety and Health Info:
Standard Reference Note 2008. Online resources. [Accessed on 2009 Jun 12]. Available from:
http://www.dgfasli.nic.in/info1.htm.
12. Gupta MN. Technical Report Series No. 4. New Delhi: ICMR; 1970. Technical Review on Pneumoconiosis
in India; p. 19.
13. Banerjee SR‖. Agricultural child labour in West Bengal. Indian Pediatr. 1993; 30:1425–9.‖
14. Qadeer I, Roy D.‖ Work, wealth and health: Sociology of workers' health in India. Soc Sci. 1989;1:45–92.‖
15. GOI. Final Report. New Delhi: GOI Ministry of Labour; 1963-65. Rural Labour Enquiry; p. 151.
16. Dr. L. P. Gite, Emeritus Scientist (Ex-Project Coordinator ,AICRP on Ergonomics and Safety in
Agriculture) Central Institute of Agricultural Engineering (Indian Council of Agricultural Research) Bhopal
17. ―Occupational Safety and Health in Agriculture- The BOHS Approach‖; Prepared in Public Interest By
Indian Association of Occupational Health April, 2013
18. The Agricultural Research Centre of Finland and The Tampere University of Technology (2006)
LOCK OUT TAG OUT - A STEP TOWARDS PROACTIVE CULTURE
Akshi Kunwar Singh
Asst Professor, Health,Safety & environment Departmnent, University of Petroleum & energy Studies,Dehradun- India

International Journal of Engineering, Science and Mathematics Vol.7 Issue 4, April 2018, ISSN: 2320-0294 Impact Factor: 6.765 Journal Homepage: http://www.ijesm.co.in, Email: [email protected] Double-Blind Peer Reviewed Refereed Open Access International Journal - Included in the International Serial Directories Indexed & Listed at: Ulrich's Periodicals Directory ©, U.S.A., Open J-Gage as well as in Cabell’s Directories of Publishing Opportunities, U.S.A
29 International Journal of Engineering, Science and Mathematics
http://www.ijesm.co.in, Email: [email protected]
Arun P.A.**
Deepak Mamgain***
Abstract
This paper gives an overview of the entire safe LOTO Procedure for
Transformer maintenance. The main purpose for doing the research
was rectifying the shortcomings and problem faced by workers and
employees while performing LOTO. This paper tells you the exact
and practical procedure, which is a path forward towards ―Zero
Incident‖. The problems faced while performing LOTO are that all
the persons, who are working inside, under or above the equipment,
which has been isolated, are not providing locks. It means that those
persons are not taken in to consideration. That means if no one told
them about completion of job and unintentionally de-isolate the
equipment their life will come in danger. Another problem, which
they face while applying LOTO, occurs when the keys transfer in
shift changes and making an LOTO for more than one day. This
paper discusses about the solution of these problems for achieving
safe LOTO.
Keywords:
LOTO;
PDB;
PCC;
MCC;
Copyright © 2018International Journals of Multidisciplinary
Research Academy. All rights reserved.
Author correspondence:
Akshi Kunwar Singh,
Asst Professor, Health,Safety & envrionement Departmnent
University of Petroleum & energy Studies,Dehradun- India
1. Introduction
In an organization, two workers were clearing jam in the de-dusting suction of pipe at Shuttle Conveyor platform,
Conveyor started accidently and one worker fell to his death from 15-20 meters height. In an another incident
which happened during maintenance while starting Control Board 1, a flash over happened resulting in 60%-70%
burns to one of the workers and minor burns to the two others. The probable cause are the lack of awareness
regarding the isolation procedures and isolation sources. It becomes necessary to ensure a formal approach for
managing risk to personnel from hazardous energy. It is required as to reduce the number and frequency of
incidents related to hazardous energy. These key elements have been subsequently further modified and developed
into a series of practices or procedures. These practices or procedures shown below are equally applicable across all
locations in an Industry whatever type it may be. This would help in bringing out a consistency in the process
throughout the industry location.
What can happen without LOTO [4]?

International Journal of Engineering, Science and Mathematics Vol.7 Issue 4, April 2018, ISSN: 2320-0294 Impact Factor: 6.765 Journal Homepage: http://www.ijesm.co.in, Email: [email protected] Double-Blind Peer Reviewed Refereed Open Access International Journal - Included in the International Serial Directories Indexed & Listed at: Ulrich's Periodicals Directory ©, U.S.A., Open J-Gage as well as in Cabell’s Directories of Publishing Opportunities, U.S.A
30 International Journal of Engineering, Science and Mathematics
http://www.ijesm.co.in, Email: [email protected]
The scope and filed of application which has been discussed in the paper complies -
i) To achieve and maintain safely the isolation made and
ii) Releasing the equipment from lockout.
As to achieve and maintain safely the isolation separate Isolation procedures have to be made for separate
equipments with Isolation points and mechanism.
Second points deals with the releasinf of the equipment from the Lock Out safely.
2. Methodology & Artwork
The basic requiremnet for performing a Lock out & Tag out is described below ,the following steps are to be
followed for safe operation.
Lock out Tag out Procedure for Electrical Isolation of Transformers Step Down/Step Up
-Persons authorized to lock must be an Employee or Associate Employee fulfilling the following criterion:
i) Qualified and trained in the Lockout and Tag out.
ii) Should have minimum of 2 year experience in Power Distribution equipment
Steps to follow while doing Lock Out /Tag Out for the working of the personnel‘s.
First to identify the type & intensity of the energy that the machine or equipment uses. (By Authorized Person) Prior
to starting any defined job. All possible sources of electrical energy must be determined (33/11/6.6/0.690/0.433 kV)
using up-to-date information such as drawings and diagrams. All electrical circuits, conductors and other live parts
are in energized state until the LOTO [4] procedure is completed.
Hazards:
• Electric shock leading to severe burn injury / fatality.
• While working in Circuit Breaker [10] mechanism, care taken for De-Energizing the springs as to avoid
injury to fingers and hands.
Personal Protecting Equipment
• Insulated Hand Gloves
• Face Shield,
• Arc Flash suit
Second is too aware all affected Employees (Persons who are going to work in that equipment) and associate
employees about the machine or equipment, which will be down and locked out for service or maintenance.
Electrocution Arc Flashover Fire

International Journal of Engineering, Science and Mathematics Vol.7 Issue 4, April 2018, ISSN: 2320-0294 Impact Factor: 6.765 Journal Homepage: http://www.ijesm.co.in, Email: [email protected] Double-Blind Peer Reviewed Refereed Open Access International Journal - Included in the International Serial Directories Indexed & Listed at: Ulrich's Periodicals Directory ©, U.S.A., Open J-Gage as well as in Cabell’s Directories of Publishing Opportunities, U.S.A
31 International Journal of Engineering, Science and Mathematics
http://www.ijesm.co.in, Email: [email protected]
-Third step is to cut off power of the machine or equipment
LV (Secondary) Side Isolation
The responsible qualified person should ensure un-interrupted power to connected loads prior to switching off the
LV (Secondary) side breaker by complying with the following procedure:
• Switch ON Bus-coupler [9]
• Switch OFF the identified Incomer
• Switch OFF Control supply of LT [11]Circuit Breaker [10]
• Drawing Out LT [11] Circuit Breaker [10]
• Place Isolation Tag
Fourth step is to make machine or equipment to be isolated from energy sources, by means of appropriate energy-
isolating devices.
HV (Primary) Side Isolation
• Switch OFF the identified Circuit Breaker [10]
• Switch OFF Control supply
• Draw Out HT [11] Circuit Breaker [10]
• Place Isolation Tag
Cordon Off the area, and then Switch On the isolation of the equipment by doing the following:
1. If the circuit breaker [10] is in Test position, try to energize the transformer by switching ON the breaker
(as per procedure). The circuit breaker should not close in such circumstances.
2. If the circuit breaker [10] is indrawn out position, the above-mentioned step not required.
Drain the stored energy, like in capacitors, springs, elevated machine members, rotating flywheels, hydraulic
systems, and air, gas, steam, or water pressure, using methods such as grounding, blocking or bleeding down.
Residual energy from the HT [11] cable has to be dis charged and properly earthed as mentioned below:
Procedure for discharging:
1. Open the back cover using suitable tools
2. Use HV Tester [1] to ensure absence of voltage. (HV Tester [1] tested periodically for its healthiness.)
3. Open the grill (if provided).
4. Discharge the stored energy of the cable by using a Discharge Rod[12] as per the following steps:
Fix the Earthing [3] clamp of the Discharge Rod [12] rigidly to the nearby earth point/bus.
Stand on a rubber mat [7]
Use the Discharge Rod [12] one after the other in all the three phases till the residual energy is
completely discharged
Procedure for Earthing [5] outgoing cables using Earthing [5] clamps:
Earth the cables as per the following steps:
The Earthing [5] cable and clamps should be designed such so as to handle the system fault [6] current
Stand on a rubber mat [7].
Fix the earth lead of the Earthing [5] clamp rigidly to the nearby earth point/bus.

International Journal of Engineering, Science and Mathematics Vol.7 Issue 4, April 2018, ISSN: 2320-0294 Impact Factor: 6.765 Journal Homepage: http://www.ijesm.co.in, Email: [email protected] Double-Blind Peer Reviewed Refereed Open Access International Journal - Included in the International Serial Directories Indexed & Listed at: Ulrich's Periodicals Directory ©, U.S.A., Open J-Gage as well as in Cabell’s Directories of Publishing Opportunities, U.S.A
32 International Journal of Engineering, Science and Mathematics
http://www.ijesm.co.in, Email: [email protected]
With the Discharge Rod [12] connected to the R-phase, connect one of the Earthing [5] leads of the
Earthing [5] clamp on to the R-phase [8].
Repeat the same procedure for Y and B phases [8].
Remove the Discharge Rod [12].
Earthing [5] should remain intact until end of work
Procedure of Earthing [5] outgoing cable using Earthing [5] Truck-
Draw out the Circuit breaker [10]
1. Identify the cable chamber Earthing [5] truck

International Journal of Engineering, Science and Mathematics Vol.7 Issue 4, April 2018, ISSN: 2320-0294 Impact Factor: 6.765 Journal Homepage: http://www.ijesm.co.in, Email: [email protected] Double-Blind Peer Reviewed Refereed Open Access International Journal - Included in the International Serial Directories Indexed & Listed at: Ulrich's Periodicals Directory ©, U.S.A., Open J-Gage as well as in Cabell’s Directories of Publishing Opportunities, U.S.A
33 International Journal of Engineering, Science and Mathematics
http://www.ijesm.co.in, Email: [email protected]
3. Clean Earth Truck and connect the earth bus of the Earthing [5] truck in its specified location.
4. Rack In Earth Truck to Service position
-LOCK OUT the energy isolating devices with assigned individual locks and tags.
Apply Lockout device along with Lock out Tag at the following isolation points:
LT Circuit Breaker [10]
HT Circuit Breaker [10]
Removing the source of hazardous energy and materials
Addressing exposure to hazards while performing the
Lockout/Tagout
Installing Lockout devices
Verify that hazardous energy material has been removed
Trying the equipment to determine that the hazardous energy
is under control
Developing a method for checking the continuity of Lockouts
across shifts
Releasing the equipment from Lockout
Isolation procedures
Identifying and listing Lockout points for task with multiple
lockouts
Review and assess periodically Lockout/Tagout completion
in the areas

International Journal of Engineering, Science and Mathematics Vol.7 Issue 4, April 2018, ISSN: 2320-0294 Impact Factor: 6.765 Journal Homepage: http://www.ijesm.co.in, Email: [email protected] Double-Blind Peer Reviewed Refereed Open Access International Journal - Included in the International Serial Directories Indexed & Listed at: Ulrich's Periodicals Directory ©, U.S.A., Open J-Gage as well as in Cabell’s Directories of Publishing Opportunities, U.S.A
34 International Journal of Engineering, Science and Mathematics
http://www.ijesm.co.in, Email: [email protected]
Note: A Tag without the use of lock can be use in a place where the equipment does not have the facility to
provide a lock. In that case, the LOTO [4] Keeper should ensure enhanced monitoring.
-Check that no employees is or are subjected towards the hazardous energy, ―VERIFY‖ [2] the isolation of the
equipment through the following methods:
Equipment is isolated from its energy sources.
CONTINUITY OF LOCKOUTS ACROSS SHIFTS
It is essential that a method for helping ensure the continuity of lockouts across shifts be developed and made clear
to all affected persons. Provide and maintain a register in which the transactions of Lockout devices keys
interchanged with next shift in charges with mentioning of date, time etc.
Conclusion
The above article states about the relevance of safe workplace practice i.e. lock out Tag out and the importance of it
in our day-to-day life. The procedure for making an isolation for Mechanical, Electrical and Operation as well.
Therefore, the main objective is to follow these practices in your respective fields. By following these procedures
and practices, it is certain that some improvement will sure happen.
Acknowledgement
I want to thank all the officials and staff of Steel industry, with their help and support the research was completed.
Thank you very much all the officials and Staff Electrical Department.
References
[1] Ahmed, A., Shadrokh, Y., Coulbeck, L., Castellazzi, A., Johnson, C.M., 2012. A closed-loop IGBT non-
destructive tester. Microelectron. Reliab. 52, 2358–2362. doi:10.1016/j.microrel.2012.06.108
[2] Allen, P.B., 2013. Productively safer lock-out tag-out procedure with Permanent Electrical Safety Devices,
in: IEEE Conference Record of Annual Pulp and Paper Industry Technical Conference. pp. 101–106.
doi:10.1109/PPIC.2013.6656050
[3] Chevalier, G., Sinatra, S.T., Oschman, J.L., Sokal, K., Sokal, P., 2012. Earthing: Health implications of
reconnecting the human body to the Earth‘s surface electrons. J. Environ. Public Health.
doi:10.1155/2012/291541
[4]Craven, B., 2001. LOCK OUT TAG OUT. Mobil. Forum J. Air Mobil. Command. Mag. 10, 10.
[5]Cronshaw, G., 2005. Earthing: Your Questions Answered. IET Wiring Matters 16, 7.
[6]Dusang, L. V., 2008. A ground fault protection method for ungrounded systems, in: 2008 IEEE Electrical
Power and Energy Conference - Energy Innovation. doi:10.1109/EPC.2008.4763332
[7]Electrical Installation Standard, 2007. . J. Chem. Heal. Saf. doi:10.1016/j.jchas.2007.03.012
[8] Lo Calzo, G., Lidozzi, A., Solero, L., Crescimbini, F., 2011. Three-phase Z-source power supply design and
dynamic modeling, in: IEEE Energy Conversion Congress and Exposition: Energy Conversion Innovation for
a Clean Energy Future, ECCE 2011, Proceedings. pp. 1339–1345. doi:10.1109/ECCE.2011.6063934
[9]Lorenz, L., Nieweglowski, K., Wolter, K.J., Bock, K., 2016. Analysis of Bending Effects for Optical-Bus-
Couplers, in: Proceedings - Electronic Components and Technology Conference. pp. 2523–2528.
doi:10.1109/ECTC.2016.96
[10] Pinnekamp, F., 2007. The circuit breaker. ABB Rev.
[11]Tadmor, R., 2008. Line energy, line tension and drop size. Surf. Sci. 602. doi:10.1016/j.susc.2008.05.018

International Journal of Engineering, Science and Mathematics Vol.7 Issue 4, April 2018, ISSN: 2320-0294 Impact Factor: 6.765 Journal Homepage: http://www.ijesm.co.in, Email: [email protected] Double-Blind Peer Reviewed Refereed Open Access International Journal - Included in the International Serial Directories Indexed & Listed at: Ulrich's Periodicals Directory ©, U.S.A., Open J-Gage as well as in Cabell’s Directories of Publishing Opportunities, U.S.A
35 International Journal of Engineering, Science and Mathematics
http://www.ijesm.co.in, Email: [email protected]
SEED OUTPUT AND SEED PROTEIN CONTENT – QUANTITATIVE ANALYSIS
Dr . Lalit Singh Dr .Lalit Singh
Assistant Professor
DBS (P.G)College Dehradun (U.K) India.
Abstract (10pt)
Man being rich in protein content mainly consumes the
seeds of legumes. The name pulse is derived from the Latin word
―puls‖ meaning thick soup or potage. Quantitative analysis of seed
output and seed protein content of vigna radiata and Vigna mungo
was done on per plant basis by treating the plants with two pesticides
rogor and nuvan. Pods of the plants were collected and carefully the
seeds were separated from pods, weighed and then protein content
analysis was done. Protein estimation was done by the method of
Bradford (1976). The data are recorded as mg/gm fresh weight of
seeds. It has been observed that in pesticide treated plants, the seed
output and protein contents show variability as against the control
plants.
Seed output and protein content of the seed is the measure of
plant yield and its food value and in the present investigation, seed
output and protein content of the seeds of Vigna radiata and Vigna
mungo were analyzed at different concentrations of rogor and nuvan
to find the effect of these chemical pesticides on legume plants. The
data showed that at low concentration, i.e., 0.5% and 1.0%, the effect
of these chemical pesticides was very less on seed yield and protein
content but when the concentration of pesticide is increased, there
was gradual decrease in seed yield and protein content and at higher
concentration and at 10.0% pesticide concentration and above no
results were obtaine
Key words:
Vigna , Pesticides , Rogor ,
Nuvan.
1. Introduction (10pt)
The seeds of legumes are mainly consumed by man being rich in protein content. The name pulse is
derived from the Latin word ―puls‖ meaning thick soup or potage. The edible seeds of legumes are ―pulses‖, e.g.
lentils, bean, pea, chick pea, mung bean and urd bean. Each of these pulse crops has wide range of colors and sizes.
Pulse crops are grown for food and feed in countries around the world and hold significant cultural and historical
importance too. In addition to their food value, pulses also play an important role in cropping system because of
their ability to fix nitrogen and biologically enrich the soil. Pulses contain proteins, including essential amino acids
(18-25%) much higher than cereals.

International Journal of Engineering, Science and Mathematics Vol.7 Issue 4, April 2018, ISSN: 2320-0294 Impact Factor: 6.765 Journal Homepage: http://www.ijesm.co.in, Email: [email protected] Double-Blind Peer Reviewed Refereed Open Access International Journal - Included in the International Serial Directories Indexed & Listed at: Ulrich's Periodicals Directory ©, U.S.A., Open J-Gage as well as in Cabell’s Directories of Publishing Opportunities, U.S.A
36 International Journal of Engineering, Science and Mathematics
http://www.ijesm.co.in, Email: [email protected]
Review of Literature:
Maguire, J. D in the year 1973 studied the Physiological disorders in germination of seeds induced by the
environment.Mehta A R and Johri S N (1985) Studied the tolerance of saline water irrigation on germination of
oilseed crops. Singh, Tejbir and Kumar, Y in the year 1988 carried out qualitative and quantitative analysis of
soluble nodular proteins under influence of growth hormones in mung bean (Vigna radiata L).
2. Research Method (10pt)
Quantitative analysis of seed output and seed protein content was done on per plant basis in control as well
as treated plant. Pods of the plants were collected and carefully the seeds were separated from pods, weighed and
then protein content analysis was done.Protein estimation was done by the method of Bradford (1976). The data are
recorded as mg/gm fresh weight of seeds.
3. Results and Analysis (10pt)
It has been observed that in pesticide treated plants, the seed output and protein contents show variability as against
the control plants. The data for these parameters as observed in Vigna radiata and Vigna mungo are shown in table
9.1 to 9.8 for sample I and II respectively.
The results (table 1 and figure 1 A and B) for Vigna radiata show that the seed output was 3.50, 3.48, 3.15
gm, and 2.66, 2.25, 1.99 gm, and 1.64, 1.26 gm while protein content was 249, 231, 215 mg/gm, and 198, 172, 124
mg/gm, and 82, 52 mg/gm for different increasing concentrations of rogor, i.e., 0.0%, 0.5%, 1.0%, 1.5%, 2.0%,
2.5%, 5.0% and 7.5% respectively. No results were obtained at 10.0% rogor concentration.
The results for the effect of nuvan on seed output and protein content of Vigna radiata are shown
in table 2 and figure 2A, B). The result showed that the seed output was 3.20, 2.98, 2.65 gm, and 2.15, 1.91, 1.54
gm, and 1.42, 1.05 gm/plant and protein content was 247.00, 227.00, 215.00 mg/gm, and 189.00, 162.00, 121.00
mg/gm, and 78.00, 48.00 mg/gm of fresh weight of seed.
The result for the effect of Rogor on seed output and protein content of Vigna mungo are shown in
table 3 and fig. 3A, B). The results indicated that the seed output were 3.80, 3.40, 2.88 gm, and 2.78, 2.53, 1.95 gm,
and 1.81, 1.42 gm and protein content were 231.00, 214.00, 187.00 mg/gm, and 161.00, 143.00, 114.00 mg/gm, and
65.00, 38.00 mg/gm for 0.0%, 0.5%, 1.0%, 1.5%, 2.0%, 2.5%, 5.0% and 7.5% rogor concentration respectively. No
results were obtained for 10.0% rogor concentration.
Table 4 and fig. 4 A, B shows the results for the effect of various concentrations of nuvan on seed
output and protein content of Vigna mungo (sample I). The result showed that the seed output was 3.42, 3.15, 2.88
gm, and 2.51, 2.26, 1.77 gm, and 1.26, 1.05 gm per plant and the protein content was 248.00, 230.00, 214.00, and
197.00, 174.00, 125.00, and 84.00, 53.00 mg/gm for increasing concentration of nuvan, i.e., 0.5%, 1.0%, 1.5%,
2.0%, 2.5%, 5.0%, 7.5%, respectively. No results were obtained at 10.0% nuvan concentration.
Table 1 Effect of various concentration of Rogor on Seed output and protein content of Vigna radiata .
S/N Treatment Seed output
(gm)
Protein content (mg/gm)
1 0.0% 3.500.17 249.00 3.97
2 0.5% 3.480.16 231.003.57
3 1.0% 3.150.14 215.003.40
4 1.5% 2.660.12 198.003.17
5 2.0% 2.250.12 172.003.04
6 2.5% 1.990.10 124.002.15
7 5.0% 1.640.08 82.002.11
8 7.5% 1.260..06 52.002.08
9 10.0% 0.00 0.00
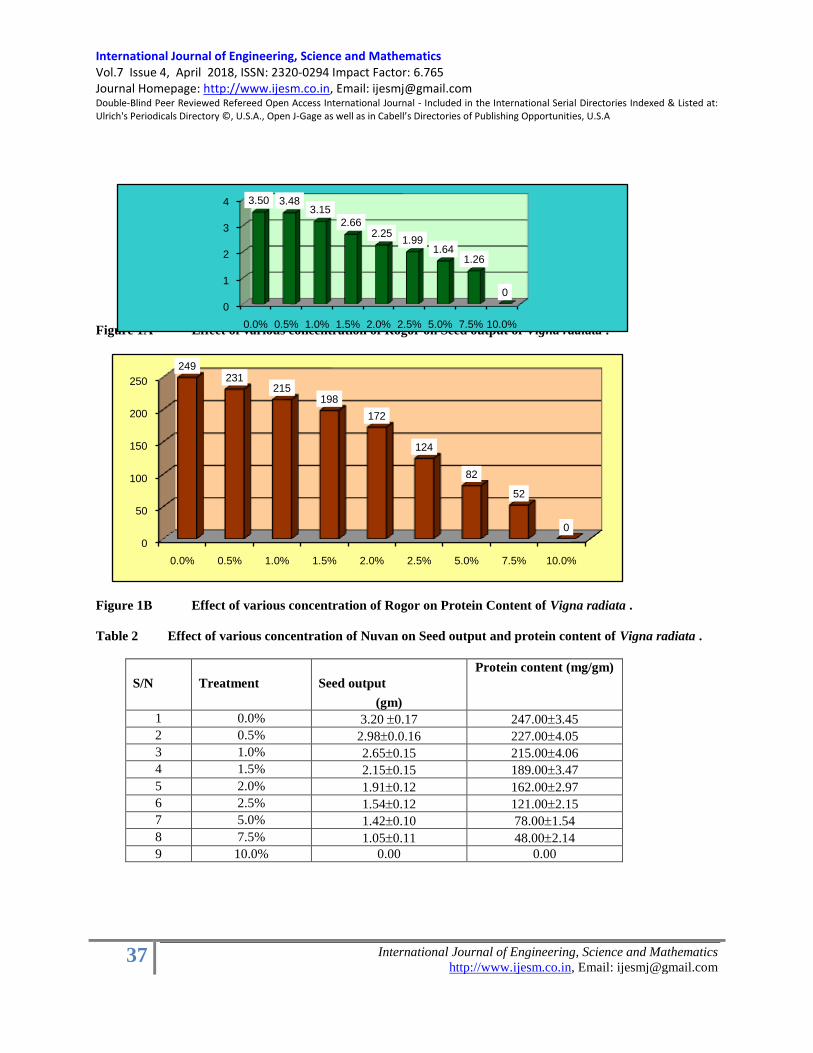
International Journal of Engineering, Science and Mathematics Vol.7 Issue 4, April 2018, ISSN: 2320-0294 Impact Factor: 6.765 Journal Homepage: http://www.ijesm.co.in, Email: [email protected] Double-Blind Peer Reviewed Refereed Open Access International Journal - Included in the International Serial Directories Indexed & Listed at: Ulrich's Periodicals Directory ©, U.S.A., Open J-Gage as well as in Cabell’s Directories of Publishing Opportunities, U.S.A
37 International Journal of Engineering, Science and Mathematics
http://www.ijesm.co.in, Email: [email protected]
Figure 1A Effect of various concentration of Rogor on Seed output of Vigna radiata .
Figure 1B Effect of various concentration of Rogor on Protein Content of Vigna radiata .
Table 2 Effect of various concentration of Nuvan on Seed output and protein content of Vigna radiata .
S/N Treatment Seed output
(gm)
Protein content (mg/gm)
1 0.0% 3.20 0.17 247.003.45
2 0.5% 2.980.0.16 227.004.05
3 1.0% 2.650.15 215.004.06
4 1.5% 2.150.15 189.003.47
5 2.0% 1.910.12 162.002.97
6 2.5% 1.540.12 121.002.15
7 5.0% 1.420.10 78.001.54
8 7.5% 1.050.11 48.002.14
9 10.0% 0.00 0.00
0
1
2
3
4
0.0% 0.5% 1.0% 1.5% 2.0% 2.5% 5.0% 7.5% 10.0%
3.50 3.483.15
2.662.25
1.991.64
1.26
0
0
50
100
150
200
250
0.0% 0.5% 1.0% 1.5% 2.0% 2.5% 5.0% 7.5% 10.0%
249231
215198
172
124
82
52
0
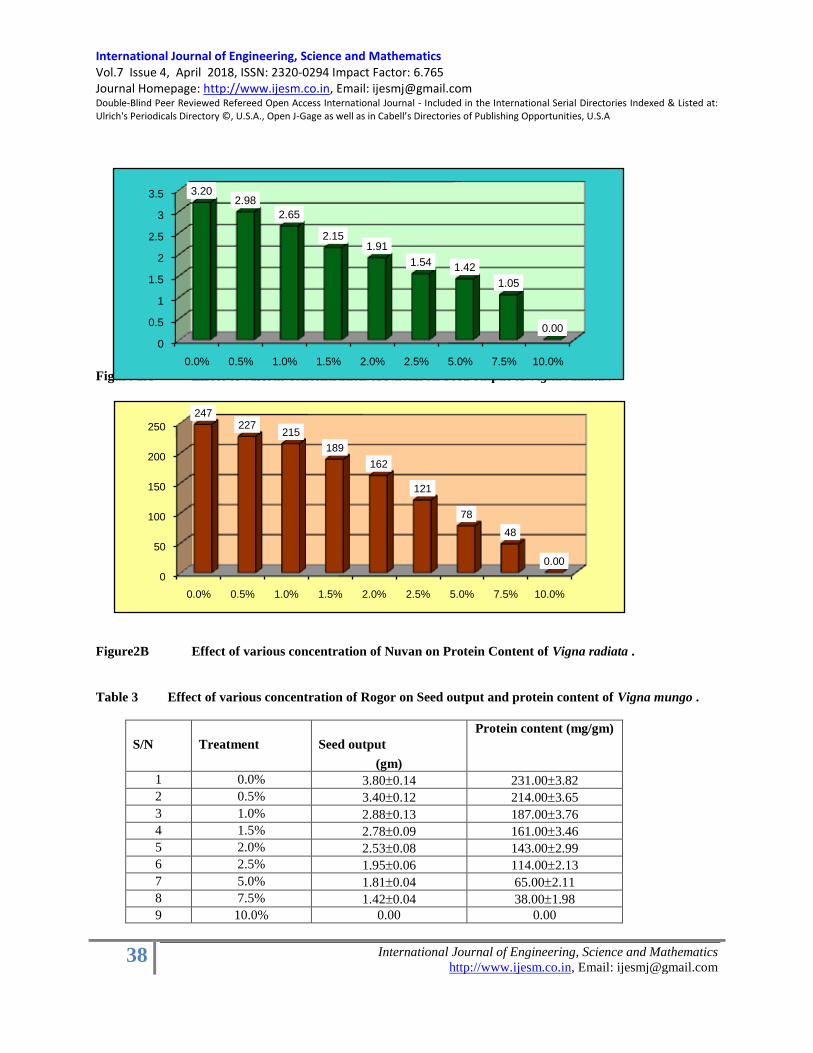
International Journal of Engineering, Science and Mathematics Vol.7 Issue 4, April 2018, ISSN: 2320-0294 Impact Factor: 6.765 Journal Homepage: http://www.ijesm.co.in, Email: [email protected] Double-Blind Peer Reviewed Refereed Open Access International Journal - Included in the International Serial Directories Indexed & Listed at: Ulrich's Periodicals Directory ©, U.S.A., Open J-Gage as well as in Cabell’s Directories of Publishing Opportunities, U.S.A
38 International Journal of Engineering, Science and Mathematics
http://www.ijesm.co.in, Email: [email protected]
Figure 2A Effect of various concentration of Nuvan on Seed output of Vigna radiata .
Figure2B Effect of various concentration of Nuvan on Protein Content of Vigna radiata .
Table 3 Effect of various concentration of Rogor on Seed output and protein content of Vigna mungo .
S/N Treatment Seed output
(gm)
Protein content (mg/gm)
1 0.0% 3.800.14 231.003.82
2 0.5% 3.400.12 214.003.65
3 1.0% 2.880.13 187.003.76
4 1.5% 2.780.09 161.003.46
5 2.0% 2.530.08 143.002.99
6 2.5% 1.950.06 114.002.13
7 5.0% 1.810.04 65.002.11
8 7.5% 1.420.04 38.001.98
9 10.0% 0.00 0.00
0
0.5
1
1.5
2
2.5
3
3.5
0.0% 0.5% 1.0% 1.5% 2.0% 2.5% 5.0% 7.5% 10.0%
3.202.98
2.65
2.151.91
1.54 1.42
1.05
0.00
0
50
100
150
200
250
0.0% 0.5% 1.0% 1.5% 2.0% 2.5% 5.0% 7.5% 10.0%
247227
215
189
162
121
78
48
0.00
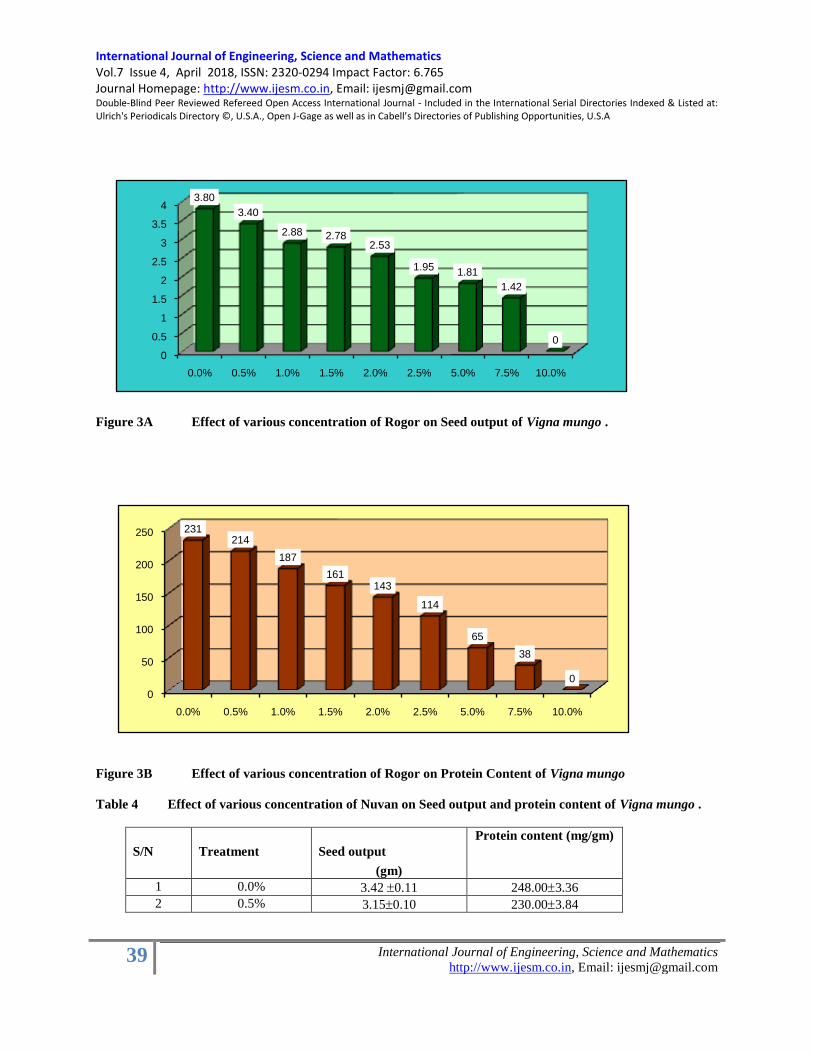
International Journal of Engineering, Science and Mathematics Vol.7 Issue 4, April 2018, ISSN: 2320-0294 Impact Factor: 6.765 Journal Homepage: http://www.ijesm.co.in, Email: [email protected] Double-Blind Peer Reviewed Refereed Open Access International Journal - Included in the International Serial Directories Indexed & Listed at: Ulrich's Periodicals Directory ©, U.S.A., Open J-Gage as well as in Cabell’s Directories of Publishing Opportunities, U.S.A
39 International Journal of Engineering, Science and Mathematics
http://www.ijesm.co.in, Email: [email protected]
Figure 3A Effect of various concentration of Rogor on Seed output of Vigna mungo .
Figure 3B Effect of various concentration of Rogor on Protein Content of Vigna mungo
Table 4 Effect of various concentration of Nuvan on Seed output and protein content of Vigna mungo .
S/N Treatment Seed output
(gm)
Protein content (mg/gm)
1 0.0% 3.42 0.11 248.003.36
2 0.5% 3.150.10 230.003.84
0
0.5
1
1.5
2
2.5
3
3.5
4
0.0% 0.5% 1.0% 1.5% 2.0% 2.5% 5.0% 7.5% 10.0%
3.80
3.40
2.88 2.782.53
1.951.81
1.42
0
0
50
100
150
200
250
0.0% 0.5% 1.0% 1.5% 2.0% 2.5% 5.0% 7.5% 10.0%
231214
187
161143
114
65
38
0

International Journal of Engineering, Science and Mathematics Vol.7 Issue 4, April 2018, ISSN: 2320-0294 Impact Factor: 6.765 Journal Homepage: http://www.ijesm.co.in, Email: [email protected] Double-Blind Peer Reviewed Refereed Open Access International Journal - Included in the International Serial Directories Indexed & Listed at: Ulrich's Periodicals Directory ©, U.S.A., Open J-Gage as well as in Cabell’s Directories of Publishing Opportunities, U.S.A
40 International Journal of Engineering, Science and Mathematics
http://www.ijesm.co.in, Email: [email protected]
3 1.0% 2.880.09 214.003.79
4 1.5% 2.510.07 197.003.81
5 2.0% 2.260.06 174.003.43
6 2.5% 1.770.04 125.002.65
7 5.0% 1.260.05 84.002.56
8 7.5% 1.050.03 53.002.48
9 10.0% 0.00 0.00
Figure 4A Effect of various concentration of Nuvan on Seed output of Vigna mungo.
Figure 4B Effect of various concentration of Nuvan on Protein Content of Vigna mungo .
4. Conclusion (10pt)
Seed output and protein content of the seed is the measure of plant yield and its food value and in the present
investigation, seed output and protein content of the seeds of Vigna radiata and Vigna mungo were analyzed at
different concentrations of rogor and nuvan to find the effect of these chemical pesticides on legume plants. The data
showed that at low concentration, i.e., 0.5% and 1.0%, the effect of these chemical pesticides was very less on seed
yield and protein content but when the concentration of pesticide is increased, there was gradual decrease in seed
yield and protein content and at higher concentration and at 10.0% pesticide concentration and above no results were
obtained. The present results coincide with the observations made by Asgar Ali et al. (2006).
0
0.5
1
1.5
2
2.5
3
3.5
0.0%0.5%1.0%1.5%2.0%2.5%5.0%7.5%10.0%
3.42 3.152.88
2.512.26
1.77
1.261.05
0
0
50
100
150
200
250
0.0% 0.5% 1.0% 1.5% 2.0% 2.5% 5.0% 7.5% 10.0%
248230
214197
174
125
84
53
0

International Journal of Engineering, Science and Mathematics Vol.7 Issue 4, April 2018, ISSN: 2320-0294 Impact Factor: 6.765 Journal Homepage: http://www.ijesm.co.in, Email: [email protected] Double-Blind Peer Reviewed Refereed Open Access International Journal - Included in the International Serial Directories Indexed & Listed at: Ulrich's Periodicals Directory ©, U.S.A., Open J-Gage as well as in Cabell’s Directories of Publishing Opportunities, U.S.A
41 International Journal of Engineering, Science and Mathematics
http://www.ijesm.co.in, Email: [email protected]
References(10pt)
Maguire, J. D. (1973), Physiological disorders in germination of seeds induced by the environment. Seed
Eco. Proc. 19th
Ester School, Agri. Sci. Uni. Nottingham Ed. :H. Heydeuker.
Mehta A R and Johri S N (1985) Studies on tolerance of saline water irrigation on germination of oilseed
crops, Ookoassay, 2 : 37-39.
Singh, Tejbir and Kumar, Y. (1988), Qualitative and quantitative analysis of soluble nodular proteins under
influence of growth hormones in mung bean (Vigna radiata L). Ad. Pl. Sci. 1 : (2 Suppl.) 361-376.
International Journal of Engineering, Science and Mathematics Vol.7 Issue 4, April 2018, ISSN: 2320-0294 Impact Factor: 6.765 Journal Homepage: http://www.ijesm.co.in, Email: [email protected] Double-Blind Peer Reviewed Refereed Open Access International Journal - Included in the International Serial Directories Indexed & Listed at: Ulrich's Periodicals Directory ©, U.S.A., Open J-Gage as well as in Cabell’s Directories of Publishing Opportunities, U.S.A
42 International Journal of Engineering, Science and Mathematics
http://www.ijesm.co.in, Email: [email protected]
HORIZONTAL WELL PLUGGING AND
ABANDONMENT
Mohammed Junaid Khan
Abstract
Plugging and abandoning of oil and gas
wells those are no longer economically
viable or reached to final phase of
production. Dry wells and other wells
which have wellbore issue need to close
and abandoned. In oil and gas industries
a number of wells drilled, the average
ratio of exploratory and drive well in
proved region is 1:3. Production wells
when passed their production stage
require more maintenance/investment
and are rapidly approaching their end of
life. This final stage of well is cessation
and next step is to plug and abandoned
the wells. It is also necessary in order to
protect the environment, fresh water
aquifer, rivers ecosystem and minerals
deposition bed from contamination of
hydrocarbons.
This paper focused on general review of
abandoning, feasible methods and
techniques of horizontal well plugging
and abandoning and addressed the
economic challenges related to it and
challenges of protection of environment
and rehabilitation of land. Technically
sound abandoning practices are
essential for long term environment
protections and rehabilitation of land to
return it owner.
The regulatory bodies‘ involvement in
plugging and abandoning are given for
just as a reference. Rigless techniques of
plugging and abandonment are
discussed which are most optimal and
effective methods especially for onshoar
Keywords:
Horizontal, P&A;
mD; TOC;HSE,
OISD-STD.
International Journal of Engineering, Science and Mathematics Vol.7 Issue 4, April 2018, ISSN: 2320-0294 Impact Factor: 6.765 Journal Homepage: http://www.ijesm.co.in, Email: [email protected] Double-Blind Peer Reviewed Refereed Open Access International Journal - Included in the International Serial Directories Indexed & Listed at: Ulrich's Periodicals Directory ©, U.S.A., Open J-Gage as well as in Cabell’s Directories of Publishing Opportunities, U.S.A
43 International Journal of Engineering, Science and Mathematics
http://www.ijesm.co.in, Email: [email protected]
1. Introduction
The plugging and abndonment of oil and gas wells is a big challenge for the servicing companies because of the
P&A phase is not for yielding money but it‘s performed mainly for environment protection desires. As the cost of
P&A in onshoare field is much lesser than the cost of P&A of offshoare wells so the P&A phase has big care and
costwise must be optimum. The 1956, ―oil gas and coal mining act required‖, ‗wells to be permitted‘ and upon
completion and abandonment, wells has to be placed on record with the department of the environment resources.
Because there were no previous requirements, there are problems with locating the abandoned oil and gas wells
drilled before January 30, 1956(D.G. Calvert et. al). Before implementing this act in Pennsylvania alone there may
be thousands of unplugged abandoned wells since the industries drilled without regularity requirement.
The drack well, drill in Pennsylvania in 1859 is acknowledged start of drilling industries in the United States.
Drilling equipment began with hand digging tools, followed by spring pole, cable-tools and rotary rig equipment in
the late of 1800s. Early ―Churn‖ drilling used a cable or flexible line so that holes were mainly vertical.By earlier
methods all well are drilled vertically downward. Directional drilling evolved from the need to drill the hole in other
direction. Special drilling tool and procedure are used to change the direction of the well bore from vertical to
directional or horizontal in order to penetrate the target location or zone where can‘t be reached by conventional
vertical drilling. Directional and vertical drilling serves mainly for the drilling of exploration and development wells.
Horizontal drilling creates the development wells with increase sometimes very high production rate. There are
various well patterns under directional and horizontal classifications depending upon types of wells.
The purpose of horizontal well is to increase the productivity by increasing drainage area at the well bore.
Horizontal well can be defined as extension of highly deviated well or drilling a well parallel to horizontal bed plane
or drilling in order to increase the length of completion zone through the reservoir borehole inclination approaching
90 degree from vertical.
hydrocarbon fields. Offsoare field
plugging and abandonment is also
briefly discussed. Howevre, either
permanent or temporary plugging and
abandonment would be suitable for oil
and gas field is discussed too.
Some tables and figures are mentioned
for purpose of easy comprehension and
source from which these are taken are
also mentioned along with.
Copyright © 2018International Journals
of Multidisciplinary Research
Academy. All rights reserved.
Author correspondence:
First Author, Mohammed Junaid Khan
Masters‘ Program, Petroleum Exploration
University of Petroleum Energy and Studies,Energy Acres, Bidholi, Dehradun, 248007, Uttarakhand, India,

International Journal of Engineering, Science and Mathematics Vol.7 Issue 4, April 2018, ISSN: 2320-0294 Impact Factor: 6.765 Journal Homepage: http://www.ijesm.co.in, Email: [email protected] Double-Blind Peer Reviewed Refereed Open Access International Journal - Included in the International Serial Directories Indexed & Listed at: Ulrich's Periodicals Directory ©, U.S.A., Open J-Gage as well as in Cabell’s Directories of Publishing Opportunities, U.S.A
44 International Journal of Engineering, Science and Mathematics
http://www.ijesm.co.in, Email: [email protected]
By passing the time a stage comes when all types of wells has lost their productivity and use required partially or
permanently, to plug and abandon the well following guidelines assigned by existing regulatory body in that
particular state or country. The regulation body has described what standard has to maintain during closing the wells
in their guidelines.it may be different area to area on the basis of formations zone and stratigraphic records.
Whatever situation is existing we have to follow guidelines according to that particular norms.
Table 1: Petroleum Field Regulatory Authorities‘ Names
General Review:
Holes or wells have been dug and drilled for various purposes.
Table 2: Drilling scope and purposes.
Industrial Purposes Domestic purposes Others
Industrial and Municipal
application
Oil and Gas
Mine drainage
Testing
Seismic purpose
Solution mining
Measurment of physiacal
roperties of downholes
• Drinking water wells
• Irrigation purose
Specific purpose
Plugging and Abandonment
Plugging
The principal technique applied to prevent cross flow between permeable formations is plugging of the well,
creating an impermeable barrier between two zones. Beside this the Well plugs are being used for several different
operations in oil and gas industry, such as lost circulation control, formation testing, directional/sidetrack drilling,
zonal isolation and well abandonment. The scope of this study is restricted to the latter two applications. Well plugs
can be either cement or mechanical plugs. Specifications of well plugs and abandonment are prescribed by
regulatory authorities.
In the oil and gas industry the most common material used for plugging wells is Portland cement, which is placed in
the well as slurry that hardens under influence of the in-situ temperature and pressure. A cement plug consists of a
S/N Country‘s Name Regulatory body guidelines.
1 India OISD-STD-175, OMR 1984/others
2 USA Texas Railroad commission
3 Canada AER(Alberta Energy Regulation)
4 Norway ―Act 29 November 1996 No. 72 relating to
petroleum activities‖

International Journal of Engineering, Science and Mathematics Vol.7 Issue 4, April 2018, ISSN: 2320-0294 Impact Factor: 6.765 Journal Homepage: http://www.ijesm.co.in, Email: [email protected] Double-Blind Peer Reviewed Refereed Open Access International Journal - Included in the International Serial Directories Indexed & Listed at: Ulrich's Periodicals Directory ©, U.S.A., Open J-Gage as well as in Cabell’s Directories of Publishing Opportunities, U.S.A
45 International Journal of Engineering, Science and Mathematics
http://www.ijesm.co.in, Email: [email protected]
volume of cement that fills a certain length of casing or open hole to prevent vertical migration of fluids. Cement
satisfies the essential criteria of an adequate plug; it is durable, low-permeable (mD) and relatively inexpensive. API
has set the specific stander of cement to be used for specific depth interes zon and working conditions. Single
cement could not be used for all intrest depth and temperature. Generally the cement s are used in P&A because, it is
easy to pump in place, has a reasonable setting time and is capable of tight bonding to the formation and well casing
surface preventing fluid flow along these interfaces.
Abandonment
The purpose of permanent well abandonment is to isolate permeable and hydrocarbon bearing formation from fresh
water aquifers and minerals deposition, protecting underground resources and gas seepage from thin zone into
aquifer and lateral migration. The intention of abandonment is to restore the natural integrity of the formation that
was penetrated by the wellbore. Abandonment procedures were developed in the oil and gas industry where several
techniques were designed to prevent inter-zonal communication and fluid migration. If a well is not properly
abandoned, it may provide pathways for brines, hydrocarbons or other fluids to migrate up the well and into shallow
drinking water aquifers or to surface. Identify the well to be abandoning and plug is the primary task for abandoned
processes and defining the each zone which need to plug, identified its characteristics and physical and chemical
behavior of formation zone. A whole study of wells which to be plugged is thoroughly completed then we go to
further for planning of well abandonment
Classification of Abandonment
There are two types of well abandonment (1) Temporary Abandonment (2) Permanent Abandonment
Temporary Abandonment: temporary abandonment is applied to that wells of field which need to be reintered into
the well for reprodusing the well. Temporary abandonment need to apply where the wells can‘t be used for
production prospects but wells can be used water injection wells or disposals or other such porposes, due to
uncontrolled flow of fluids could leed to the well integrity failure and environmental hazards, indication of
irrepareble the well intigrity failures‘ and the production and other activities can not possible to environmental
reasons. In the oil and gas field many wells rest as dummy and subsquentlyapplicable niether for production nor for
injection or other‘s purposes that‘s need to be closed temporarly so the pressure of wells are controlled and stable as
per requairments, the decision of abandon or shut the well is taken by the Field Head Quarter (FHQ) levels, While
approval of permanent abandonment the wells is granted by Corporate office.
Permanent Abandonment: when the wells has no fruther prospects and completely got dry no indication of
producing hydrocarbons, and can‘t be used as water injection wells, identifies as permanent abandonment. Now a
days the most effective and optimal techniques are requaire to plugging and abandonment because of liablity to
environment protection such as to protect fresh water aquifer, minerals depositions and biogradients etc. CO2 gas is
very hamful for the natural resourses and the water aquifer. Substitutes of cement or best quality of cement to
abandoning especially horizontal wells are need to introduse. A large scope of research is exists herebacausemostaly
companies are intreste in the production of oil and gas but gives less attention to plugginf and abandonment of wells.
Plans to wells Plugging and Abandonment
Any work has their effectiveness and acceptance as much how smartly and perfectly as planned it.
Because the abandonment and plugging segment has no economical add in production plan so the expenditure for
abandoning and adapted techniques should be planned prior to drilling or can say it is the course of action under
initial plans.
Initial plan of plugging and abandoning of horizontal well is to define the well first and identify the zone of interest

International Journal of Engineering, Science and Mathematics Vol.7 Issue 4, April 2018, ISSN: 2320-0294 Impact Factor: 6.765 Journal Homepage: http://www.ijesm.co.in, Email: [email protected] Double-Blind Peer Reviewed Refereed Open Access International Journal - Included in the International Serial Directories Indexed & Listed at: Ulrich's Periodicals Directory ©, U.S.A., Open J-Gage as well as in Cabell’s Directories of Publishing Opportunities, U.S.A
46 International Journal of Engineering, Science and Mathematics
http://www.ijesm.co.in, Email: [email protected]
and designing the well abandoning course of area as well as total capital cost, techniques and procedure is required
for this course of action. After planning defining and designing the course of horizontal wells follows the guidelines
of state or country regulatory bodies whose has written guidelines and procedure has to be adapted by abandoning
service providing companies.Final plan of abandonment is to check durability and inspection of work and desire.
Activities Involved in Plugging and Abandonment:
General Steps in abandoning
Remove salvageable equipment,
Isolation of open hole,
Isolation of perforations,
Isolation of lap joints or liner tops,
Finding and replacing channels in cements
Identification the channels in cement sheath.
Repair of channels-cement squeeze. Cement slurries.
Materials used
Gelled pills (Betonites and others).
Portland cement.
Spacers to protect cement slurries.
Mechanical plug (incl. cement retainers).
Inflatable plug.
Pre Abandon Activities
1. Disassembled and remove all well equipment:
Before abandoning and plugging the well drilling rig and work- over tools are utilized to pull out of all
down-hole‘s equipment previously used in production by operators, such as production tubing, down-hole
pumps and packers. Casing is also removed if it would be possible. If the tools removal is not possible to
come out due to stuck and lost equipment the whole abandonment strategies have to revised and approved
by concerned authorities.
2. Cleaning the well:
After the removal all bore hole‘s equipment and completing the operation, the wellbore needs to be cleaned
from fill, scale and other debris. To this purpose the wellbore is flushed by a circulation fluid with
sufficient density to control pressure and with the physical properties that enable the removal of debris. Air
with high pressure is circulated to clean the well less accessible corners. Dependent on the specific
conditions additional tools or additives may be required to successfully clean the hole.
Currently Plugs Practices
Licensee must use the log from the well to determine the exact plug positions through the well. All leaking and
interested zone must be identified which to be plugged. P&A has different processors to different country base on
local and state regulation imposed by regulatory authorities.

International Journal of Engineering, Science and Mathematics Vol.7 Issue 4, April 2018, ISSN: 2320-0294 Impact Factor: 6.765 Journal Homepage: http://www.ijesm.co.in, Email: [email protected] Double-Blind Peer Reviewed Refereed Open Access International Journal - Included in the International Serial Directories Indexed & Listed at: Ulrich's Periodicals Directory ©, U.S.A., Open J-Gage as well as in Cabell’s Directories of Publishing Opportunities, U.S.A
47 International Journal of Engineering, Science and Mathematics
http://www.ijesm.co.in, Email: [email protected]
The plugging and abandoning (P&A) has different methods, there are four methods for well plugging and
abandonment are discussed, these are the balanced plug method, the dump bailer method, the two-plug method and
rigless method. API recommends the abandonment to be chosen after an analysis of the well for probable risks and
potential problems with respect to the different abandonment techniques. However, in reality ideal practices are not
always successfully achieved. Here only rigless technique is explained.
Rig less method
The key fact of this rig less abandonment program would be the coordination of the all well services to maximize
efficiency.
There are five main performance criteria-
Super-mobile, all equipment, including a mobile camp should be mounted on the wheel so it can be transported to
new location quickly.
Self-supporting, as the name implies that the contract can take care of nearly all activities likes, material supply,
transport and sub conductor service with minimal operator involvement. The main hydrocarbon producing
companies need only to provide programming, air transport, communication facilities, some mud and chemicals and
site representatives.
Dry location concept, well site is dry because water or fluid would not be drain near the working site. This
eliminates the necessity of the repairing and rebuilding the waste pits near the abandonment location. Although the
circulation and dumping is inevitable during the job process, all fluid is stored into a tank. Dry locations speed up
abandonment and restoration job by approximately about ten days per well because no time is spent in cleaning the
waste pit or waiting for the location to dry. In previous techniques this required several months.
One-stop job, each well-site is visited once and entire abandonment process must complete at this time. Any return
to the site subsequently delays the operations and increases the logistical costs and associated HSE exposers.
Minimum mileage, the total process is optimized to reduce move time by unit moves and optimized transport too.
HSE concern need to be also maintained and limited the night driving to an absolute minimum (12/12 hr.) working
schedule to optimize camp moves.

International Journal of Engineering, Science and Mathematics Vol.7 Issue 4, April 2018, ISSN: 2320-0294 Impact Factor: 6.765 Journal Homepage: http://www.ijesm.co.in, Email: [email protected] Double-Blind Peer Reviewed Refereed Open Access International Journal - Included in the International Serial Directories Indexed & Listed at: Ulrich's Periodicals Directory ©, U.S.A., Open J-Gage as well as in Cabell’s Directories of Publishing Opportunities, U.S.A
48 International Journal of Engineering, Science and Mathematics
http://www.ijesm.co.in, Email: [email protected]
Figure 2.Rig lessHorizontal well Plugging and Abandonment (Self-made)
Cement plug evaluation
After the well is plugged, testing is required to ensure that the plug is a placed at the proper level and provides zonal
isolation. The plug can be verified by tagging its top, pump pressure testing or swab testing.
Tagging the top of cement (TOC) can be done through the employment of a drill pipe, wire line, work string or
tubing. The procedure, recommended by API, is a very straightforward operation with the benefit that no additional
pressure needs to be put on the wellbore. It enables exact determination of the top of the plug. Tagging the plug with
open-ended pipe can also be applied for testing the cement plug‘s integrity. However, disadvantages of this method
comprise the concentration of the load on the area where the pipe hits the cement, the required incorporation of
corrections for buoyancy and friction when using the pipe weight, and potential weight insufficiency for shallow
plugs.
Secoundly, pressure test can be executed using pump pressure. In this case the pressure is exerted uniformly on the
plug and no corrections are required. The application of pump pressure provides more accurate data on the pressure,
which could also be monitored over time. However, the associated changes in pressure itself could initiate casing
integrity problems if the well cannot sustain the enforced pressure changes.due to this, it could lead to loss of
wellbore control.Another pressure testing method is swab testing or swabbing. This technique involves running of a
swabbing tool that reduces the pressure in the wellbore above the plug to levels below the pressure gradient from the
Perforation Zone
Cement Plug
Rigless P&A setups

International Journal of Engineering, Science and Mathematics Vol.7 Issue 4, April 2018, ISSN: 2320-0294 Impact Factor: 6.765 Journal Homepage: http://www.ijesm.co.in, Email: [email protected] Double-Blind Peer Reviewed Refereed Open Access International Journal - Included in the International Serial Directories Indexed & Listed at: Ulrich's Periodicals Directory ©, U.S.A., Open J-Gage as well as in Cabell’s Directories of Publishing Opportunities, U.S.A
49 International Journal of Engineering, Science and Mathematics
http://www.ijesm.co.in, Email: [email protected]
isolated reservoir below the plug.Subsequently fluid levels and pressure are monitored to ensure adequate isolation.
Swabbing is more time-consuming relative to the other methods.By evaluating the cement plugs through these
methods it could be assure to safe plugging of wells.
HSE- Health, Safety and Environment
Environment and natural resources protection such as (soil, greenery and water aquifer) is primary concern of any
firm or industries. HSE subject has become most important to world nowadays. Many international conventions are
organized by UN and different observatory institute time to time on international platform.As oil and gas exploration
field consume a large amount of natural resources and land, subsequently have effect on the natural resource as
discussed very beginning at this chapter. OSHA the international regulatory authority and other local and national
regulatory bodies release advisory to companies about HSE.
As horizontal oil and gas well can affect the environment is shown in the above figure. How oil and gas seepages
and leakages could affect the nearby soil and water aquifer bed through passage in form of fractures, faults and
permeable channels into amongst different subsurface strata. In order to develop a comprehensive overview of
applied well abandonment techniques, common practice of well drilling, plugging and abandonment needs to be
evaluated in different regions throughout the world. To this purpose, a questionnaire was developed and distributed
amongst experts active in operating and service companies, consultancies, regulator bodies and research institutes
involved in oil well drilling and abandonment activities worldwide. This section comprises a concise description of
the results of the well abandonment survey. However, the collected amount of data proved to be insufficient to
extrapolate and investigate regional differences.
Rehabilitation of land: after completing the plugging and abandoning the wells of exploration field by the licensee
the producer company has to rehabilitate the field as much possible as was before and returned to that person(s) who
is the real owner of the land.Rehabiliation is done only when it has been confermedthat the hydrocarbon field will
not be going to fruther production in future. No bypassed oil are there, no infill drilling could be possible there.
After rehabilitation the land it can be converting into farm land for agricultural purpose or others.
Refrences:
[1] D.G. Calvert, D.K. Smithet al.,‖ Issues and Techniques of Plugging and Abandonment of Oil and Gas
Wells‖,Society of Petroleum Engineers (SPE); doi: 10.2118/28349-MS, September 28 1994.
[2] Jim Ellis, President and Chief Executive Officer, ―Directive 020 AER (Alberta Energy Regulator)”
CANADA; March 15, 2016
[3] Shah, S. and Sublette, K. (2004),‖ Development of an Environmentally Friendly and Economical Process
for Plugging Abandoned Wells‖ (EPA Grant No. R827015C024). University of Oklahoma.
[4] Plugging and Abandoning Oil and Gas Wells Page 20 of 21 Pennsylvania DEP (2000) ―Pennsylvania‘s
Plan for Addressing Problem Abandoned Wells and Orphaned Wells‖ (DEP Document No. 550-0800-001),
Pennsylvania Department of Environmental Protection - Bureau of Oil and Gas Management, April 2010.
p. 4.
http://www.elibrary.dep.state.pa.us/dsweb/Get/Version-48262/550-0800-001.pdf
[5] George E. King, R.L. Valecia,‖Environmental Risk and well integrity of Plugged and Abandoned wells‖,
SPE, doi: 10.2118/170949-MS, 27-29 October 2014.
[6] Handal_ Cristian,‖Abandonment of obsolete wells and installations on the Norwegian continental shelf‖
University of Stavanger, June 2014.

International Journal of Engineering, Science and Mathematics Vol.7 Issue 4, April 2018, ISSN: 2320-0294 Impact Factor: 6.765 Journal Homepage: http://www.ijesm.co.in, Email: [email protected] Double-Blind Peer Reviewed Refereed Open Access International Journal - Included in the International Serial Directories Indexed & Listed at: Ulrich's Periodicals Directory ©, U.S.A., Open J-Gage as well as in Cabell’s Directories of Publishing Opportunities, U.S.A
50 International Journal of Engineering, Science and Mathematics
http://www.ijesm.co.in, Email: [email protected]
[7] ―Plugging and abandonment of Oil and Gas wells ―by the technology subgroup of the Operations and
Environment task group;Working documents of the NPC North American Resource Development Study,
Paper#2-25 September 15, 2011.
[8] France tettero, Ian Barclay; Optimising Integrated Rig less Plug and Abandonment –A 60 well Case study;
Petroleum development Oman, TimoStaal- Schlumberger oilfield services; doi:10.2118/89636-MS
[9] NaveedArif, G. Mahmoud et al.,‖Multiple water zone isolation techniques in Horizontal Open Hole Case
Study‖;SPEdoi: 10.2118/182980-MS.
[10] Halliburton (1981) Halliburton Cementing Tables, ―Technical Data Oil Well Cements and Cement
Additives‖. Halliburton Company, Duncan OK, 1981.
[11] Book,‖Introduction to directional and horizontal drilling‖, by J.A.‖Jim‖Short, Penn Well publication
Company Tulsa Oklahoma- pdf. TN 871.23.S48 1993.
ASSESSMENT OF MAJOR HAZARDS IN PLASTIC INDSUTRY AND THE SAFETY
ASSESSEMENT OF INJECTION MOULDING MACHINE USING FMEA
International Journal of Engineering, Science and Mathematics Vol.7 Issue 4, April 2018, ISSN: 2320-0294 Impact Factor: 6.765 Journal Homepage: http://www.ijesm.co.in, Email: [email protected] Double-Blind Peer Reviewed Refereed Open Access International Journal - Included in the International Serial Directories Indexed & Listed at: Ulrich's Periodicals Directory ©, U.S.A., Open J-Gage as well as in Cabell’s Directories of Publishing Opportunities, U.S.A
51 International Journal of Engineering, Science and Mathematics
http://www.ijesm.co.in, Email: [email protected]
Kumar Sooraj,
Bahukhandi Kanchan Deoli
Siddiqui N.A
Abstract
Safety at work is one of the very esstential part for which
commitment isrequired from both the site management as well as
from employees site. In order to implement the safety at
workstations, it must be measured and this measurement can be
achieved by an appropriate safety indices. This study used Failure
Mode Effective Analysis (FMEA) concepts and proposed a new
safety index. This new index is a general index and can be used in all
fields of industries. The FMEA standard tables were changed and
safety can be measured based on three criteria: severity, occurrence,
and detection. These three criteria led us to do final calculation risk
priority number (RPN)
This paper will give an awareness to the plastics workers ( men and
women) to understand the nature and extent of toxic exposures in the
production of plastics and required measures which should be taken
for a cleaner and healthier workplace. The assessment of the
injection moulding machine using FMEA(Failure Mode Effective
Analysis) has been carried out to identify various hazards and risk
associated with plastic products manufacturing equipments and
measures which were required to reduce the level of risk. FMEA had
also helped in assessing various control measures. An index has been
developed using FMEA (Failure Mode Effective Analysis). The
methodology consists of collection of primary data to find out the
severity, occurence and detection number, which enabled to develop
RPN( Risk Priority Number) number.The tool is implemented on
injection moulding machine. It was found that with the help of
various RPN numbers the identification of various risks and
recommended methods to reduce the risk, a proper assessment of
major hazards in the plastic industry can be obtained. The result
indicated that majority 47% comes under moderate level of
occurence.
(9 pt).
Keywords:
Hazards and Risk associated
with plastic products;
FMEA(Failure Mode Effective
Analysis) ; Safety, Safety
Index; RPN(Risk Priority
Number)
Copyright © 2018International Journals of Multidisciplinary
Research Academy. All rights reserved.
Author correspondence:
First Author,
Doctorate Program, Linguistics Program Studies
Udayana University,Jalan P.B.Sudirman, Denpasar, Bali-Indonesia

International Journal of Engineering, Science and Mathematics Vol.7 Issue 4, April 2018, ISSN: 2320-0294 Impact Factor: 6.765 Journal Homepage: http://www.ijesm.co.in, Email: [email protected] Double-Blind Peer Reviewed Refereed Open Access International Journal - Included in the International Serial Directories Indexed & Listed at: Ulrich's Periodicals Directory ©, U.S.A., Open J-Gage as well as in Cabell’s Directories of Publishing Opportunities, U.S.A
52 International Journal of Engineering, Science and Mathematics
http://www.ijesm.co.in, Email: [email protected]
1. Introdcition
The hazard assessment will help the plastics workers to understand the nature and extent of toxic exposures during
various process of plastics manufacturing in plastic industry. Plastics are extremely diverse in terms of chemical
composition, properties and possible applications, and are widely distributed in the society and the environment.
[1](Lithner Delilah 2001). In the last 20 years the global annual production has doubled, reaching 345 million tons
in 2015. Most of the chemicals which are used to produce plastics are hazardous for human health and for other
living organism in our environment. The plastic polymers are not considered as toxic, but in plastic products there
may be non-bound residual monomers, polymerization chemicals, degradation products, and additives which have
toxic properties.
Different FMEA calculations are defined in different fields such as industries [2] [3] [4] [5] [6] [7] [8]. Different
methodologies such as reliability and FMEA (Failure mode and effects analysis) were cpndcuted by number of
researchers in the past [9] [10][11] [12]. FMEA is one of the most well-known techniques to assess the failure of a
process or a product. FMEA has been used in safety topics to increase the safety at work [13]. This index has been
useful for predicting the safety of foods. Husain et al used FMEA and probabilistic counter examples for airbag
system. Moreover FMEA can be used to increase the safety of patients in hospitals. Chiozza and Ponzetti [14] have
been used FMEA to reduce the medical errors. They showed a significant reduction of the risk priority number
(RPN). Adachi and Lodolce [15] [16].
2. Research Method
The methodology includes literature survey about the various steps involving in the plastic product manufacturing.
Various steps involved in the manufacturing of plastic products are Injection moulding , Extrusion, Blow moulding
, Compression moulding, Calendering, Finishing process and purging. FMEA is a systematic tool that has been
used in industries to analyze the reliability. The performance of a production in the point of view of risk can be
measured using FMEA. By the by the risk and the probability of getting accident can be reduced and analyzed. The
initial step is to find out the failure modes. Any kind of errors or defects in a process or design is called failure
modes. Here 45 failure modes are identified. In next step all the failure modes are ranked with the help of Severity
table, Occurrence Table and Detection table.
At last the risk priority number (RPN) is identified based on the above estimation of the severity, occurrence, and
detection. This index is the main index which shows the priority of corrective action on the failure modes. Based on
Equation 1, the RPN is calculated by multiplying the severity (1–10), occurrence (1–10) and detection ranking (1–
10) levels resulting in a scale from 1 to 1000.
RPN = Severity ×Occurrence × Detection.
3. Results and Analysis (10pt)
3.1.Assessment for plastic injection molding machine using FMEA
The ranking of FMEA was based on three main criteria: severity, probability, and detection. In this study also we
use these three criteria. Severity,Occurrence,Detection. Table 1 shows the ranking of different accidents in
workstations in the point of view of severity. The next item to the ranking of accidents is based on the occurrence
of ranking. Occurrence criteria for classification as indicated is the probability of a failure during the expected life
of the system. In this part also means occurrence probability of an accident of a worker. Therefore , the
occurrence of description is similar , only the rank is formed vice versa. Detection classification criteria is the last
criteria to be evaluated for classification of accidents in jobs. As detection ranking said it helps to sort based on an
assessment of the probability of failure . Similar to previous parts detection classification criteria is also formed
by an accident on workstations. Tables 1, 2, and 3 develops to assess the safety of plastic injection molding
machine. These tables have been derived from the original FMEA concepts and with some modifications they are
used for assessing the safety of plastic injection moulding machine.

International Journal of Engineering, Science and Mathematics Vol.7 Issue 4, April 2018, ISSN: 2320-0294 Impact Factor: 6.765 Journal Homepage: http://www.ijesm.co.in, Email: [email protected] Double-Blind Peer Reviewed Refereed Open Access International Journal - Included in the International Serial Directories Indexed & Listed at: Ulrich's Periodicals Directory ©, U.S.A., Open J-Gage as well as in Cabell’s Directories of Publishing Opportunities, U.S.A
53 International Journal of Engineering, Science and Mathematics
http://www.ijesm.co.in, Email: [email protected]
3.2. Assessing the safety ofplastic injection molding machine at ESS PLAST PVT LTD
Manufacturing processes which have two cases thermoplastic and thermosetting is called injection moulding. Raw
materials are inserted into a heated barrel, mixed and forced into a mold cavity where it cools and hardens to the
configuration of the mould cavity. ESS PLAST PVT LTD. is a factory producing plastic products in Kerala, India.
This product has 2 main parts, First is the body and Second is the cap. Each part is produced by an injection process
and in each process there is a specific rate of rejection. Finally in last process these two parts will be assembled. ESS
PLAST PVT LTD wants to increase the safety at workstations. Therefore the proposed method was implemented in
this organization and the results were mentioned using FMEA (Table 4). All failures are categorized in 3 categories:
- Appearance, Dimensional, and Performance.
In order to increase the safe level of working in injectionmoulding machines Failure Mode Effects Analysis has
been carried out with several potential failure modes based on performance, appearance and dimension. Based on
Tables 1. (severity), Table 2. (occurrence), and Table 3.(detection,) the problems were detected and then RPN
has been calculated. By referring the RPN chart the various recommend measures are identified. RPN
interpretation indicated that 47% failure category comes under RPN between 451-650 that shows moderate
probability that the defect will be detected. 31%failure category comes under RPN between 301-450 that shows
low probability of occurrence.
Figure 1 RPN interpretation chart
Table 1 Severity Ranking Criteria
Rank Title Description
10 Lethal The injuries are non-survivable even with immediate medical attention.
0
5
10
15
20
25
30
35
40
45
50
800-1000 (Very High
Probability)
651-800(High Probaility)
451-650 (More Probability)
301-450 (Low Probability)
216-300 (very low)
Pro
bal
ity
(%)
Probability

International Journal of Engineering, Science and Mathematics Vol.7 Issue 4, April 2018, ISSN: 2320-0294 Impact Factor: 6.765 Journal Homepage: http://www.ijesm.co.in, Email: [email protected] Double-Blind Peer Reviewed Refereed Open Access International Journal - Included in the International Serial Directories Indexed & Listed at: Ulrich's Periodicals Directory ©, U.S.A., Open J-Gage as well as in Cabell’s Directories of Publishing Opportunities, U.S.A
54 International Journal of Engineering, Science and Mathematics
http://www.ijesm.co.in, Email: [email protected]
9 Serious The injuries pose a serious threat to the individuals life and require
immediate medical attention. 8 Severe Those are dangerous in life term periods such as high volume for
Hearing system.
7 Moderate Injuries are survivable,but may require medical attention. Without
medical attention the injuries could be come severe.
6 Mild Fatigues or injuries pose no serious threat to life if complications are
prevented (such as infection of wounds)
Source (Rakesh R, Bobin Cherian Jos, George Mathew March 2013)
Table 2 Occurrence ranking criteria
Rank Probability of
Failure
Description
10 Very High,
An unlikely probability of occurrence during the item operating.
9 Highly repeated
A remote probability of occurrence during the item operating
time. 8 Moderate
failures
An occasional probability of occurrence during the item operating.
7 Few failures A moderate probability of occurrence during the item operating.
6 Very less A high probability of occurrence during the item operating time.
Source (Rakesh R, Bobin Cherian Jos, George Mathew March 2013)
Table 3 Detection ranking criteria
Rank Description
10 Very high probability that the defect is detected
9 High probability that the defect will be detected.
8 Moderate probability that the defect will be detected.
7 Low probability that the defect will be detected.
6 Very low (or zero) probability that the defect will be detected.
Source (Rakesh R, Bobin Cherian Jos, George Mathew March 2013)
Table 4 Assessment for plastic injection molding machine using FMEA
4. Conclusion
The assessment carried out by FMEA consist of 45 failure category out of 45 % lies in moderate occurrence 31%
lies is low occurrence 13 % high probability of occurrence and 5 % very high occurrence so proper measures have
to be taken to reduce the probability of occurrence to very low in between 215 to 350. Controlling at the source,
Substitution, Isolation, Re- engineering controlling along the path should be implemented
References

International Journal of Engineering, Science and Mathematics Vol.7 Issue 4, April 2018, ISSN: 2320-0294 Impact Factor: 6.765 Journal Homepage: http://www.ijesm.co.in, Email: [email protected] Double-Blind Peer Reviewed Refereed Open Access International Journal - Included in the International Serial Directories Indexed & Listed at: Ulrich's Periodicals Directory ©, U.S.A., Open J-Gage as well as in Cabell’s Directories of Publishing Opportunities, U.S.A
55 International Journal of Engineering, Science and Mathematics
http://www.ijesm.co.in, Email: [email protected]
[1] Lithner, Delilah ―Environmental and health hazards of chemicals in plastic polymers and products,‖ Sweden
Printed pub Intellect Infol, 2011.
[2] Oldenhof MT, van Leeuwen JF, Nauta MJ, de Kaste D, Odekerken-Rombouts YM, Vredenbregt MJ, Weda M,
Barends DM.Consistency of FMEA used in the validation of analytical procedures, J Pharm Biomed Anal, Feb
2011.
[3] Shahrami A, Rahmati F, Kariman H, Hashemi B, Rahmati M, Baratloo A, Forouzanfar MM, Safari S.
Emerg, ―Utilization of Failure Mode and Effects Analysis (FMEA) Method in Increasing the Revenue of Emergency
Department; a Prospective Cohort Study, ―Emerq Tehran, 2013.
[4] Leong and Shariff 2008, "Inherent safety index module (ISIM) to assess inherent safety level during preliminary
design stage." Process Safety and Environmental Protection 86(2): 113-119; 2008.
[5] Gitelman, V., E. Doveh, et al. "Designing a composite indicator for road safety." Safety Science 48(9): 1212-
1224. 9. Goddard, P.
[6] Hermans, E., F. Van den Bossche, et al. "Combining road safety information in a performance index." Accident
Analysis & Prevention 40(4): 1337-1344. 11. Hermans, E. 2008.
[7] Van den Bossche, et al, "Uncertainty assessment of the road safety index." Reliability Engineering & System
Safety 94(7): 1220-1228, 2009.
[8] Chang, Y.H. and Yeh .C. H. A, ―New Airline Safety Index, ―International Journal of Engineering and
Technology (IJET), 2004.
[9] Theodoros H. Varzakas and Ioannis S. Arvanitoyyannis, ―Application of Failure Mode and Effect Analysis
(FMEA), Cause and Effect Analysis, and Pareto Diagram in Conjunction with HACCP to a Corn Curl
Manufacturing Plant‖ Critical revivew in Food Sciecne and Nuttrition, Vlolume 47, 2007, Issue -4, 2007.
[10] Yonas Mitiku Degu , Srinivasa Moorthy R , ―Implementation of Machinery Failure Mode and Effect Analysis
in Amhara Pipe Factory P.L.C., Bahir Dar, Ethiopia‖. American Journal of Engineering Research, 2014.
[11] Thakore Riddhish, Dave Rajat , Tejas Parsana, ―Process FMEA Tool to Enhance Quality and Efficiency of
Bearing Manufacturing Industr‖ Scholars Journal of Engineering and Technology (SJET), 2015
[12] Adachi W. and A. E. Lodolce, Use of failure mode and effects analysis in improving the safety of drug
administration. Am J Health Syst Pharm. 1;62(9):917-20, 2005.
[13] Chang, Y.H. and Yeh .C. H. A, New Airline Safety Index. International Journal of Engineering and
Technology (IJET), 2004.
[14] Dale, B. G. and Shaw P. Failure mode and effects analysis in the U.K. motor industry IEEE Explore, 1990.
[15] Dudek-Burlikowska M, ―Application of FMEA method in enterprise focused on quality‖ Journal of
achievements in materials and manufacturing engineering, 2011.
[16] Rakesh R, Bobin Cherian Jos, Mathew George, ―FMEA Analysis for Reducing breakdowns of a Sub System in
the Life Care Product Manufacturing Industry‖ International Journal of Engineering Science and Innovative
Technology (IJESIT) Volume 2, Issue 2, 2013.
[17] Rajesh MG, Latha MS, ―Preliminary evaluation of the antihepato protective activity of Kamilari, a polyherbal
formulation. J Ethnopharmacol‖ 91; 99-104, 2004.
[18] Husain, T.; Hussain, A.; Ahmed, M, ―Studies of vegetative behavior and climatic effects on some pasture
grasses growing wild in Pakistan‖ Pakistan J. Bot.; 41 (5): 2379-2386, 2009
[19] Chiozza, M. L. and Ponzetti C, FMEA, ―A model for reducing error, Clin Chim Acta Jun;404(1):75-8. 2009.
[20] Adachi W, Lodolce AE, ―Use of Failure mode and effects analysis in improving the safety of i.v. drug
administration, Am J Health Syst Pharm, May 1;62(9):917-2, 2005[21] Thivel, P. X., Y. Bultel, et al, "Risk analysis
of a biomass combustion process using MOSAR and FMEA methods." Journal of Hazardous Materials 151(1): 221-
231, 2008
International Journal of Engineering, Science and Mathematics Vol.7 Issue 4, April 2018, ISSN: 2320-0294 Impact Factor: 6.765 Journal Homepage: http://www.ijesm.co.in, Email: [email protected] Double-Blind Peer Reviewed Refereed Open Access International Journal - Included in the International Serial Directories Indexed & Listed at: Ulrich's Periodicals Directory ©, U.S.A., Open J-Gage as well as in Cabell’s Directories of Publishing Opportunities, U.S.A
56 International Journal of Engineering, Science and Mathematics
http://www.ijesm.co.in, Email: [email protected]
ESTEMATES OF VARIABILITY, HERIITABILITY AND GENETIC ADVANCE IN
GARLIC. (ALLIUM SATIVUM L.)GENOTYPES
NIRMALA KORANGA
Abstract
The Spice Garlic is an important leading medicinal and remunerative
crop in our economy. Garlic (Allium sativum L.) is an important
condiment which is a most remunerative crop is an indian agriculture.
It is a perinial bulbs crops. Generally grown as annual crop. Its grown
in moderate temperature winter and summer are suitable for its
cultivation. It is also used for getting relief from gastric troubles,
paralysis etc.. The paper cover heritability and genetic advance
amount traits of 15 diverse genotypes for two seasons. Objectives of
the paper are Evaluative variability in garlic genotypes and to find
out heritability and genetic advance in garlic genotype.
Keywords:
Genotype;
Heritability;
Variability;
Remunerative;
Condiment;
Allicium.
Author correspondence:
Nirmala Koranga,
Asst Professor
DBS PG College, Dehradun, Uttarakhand.
1. Introduction
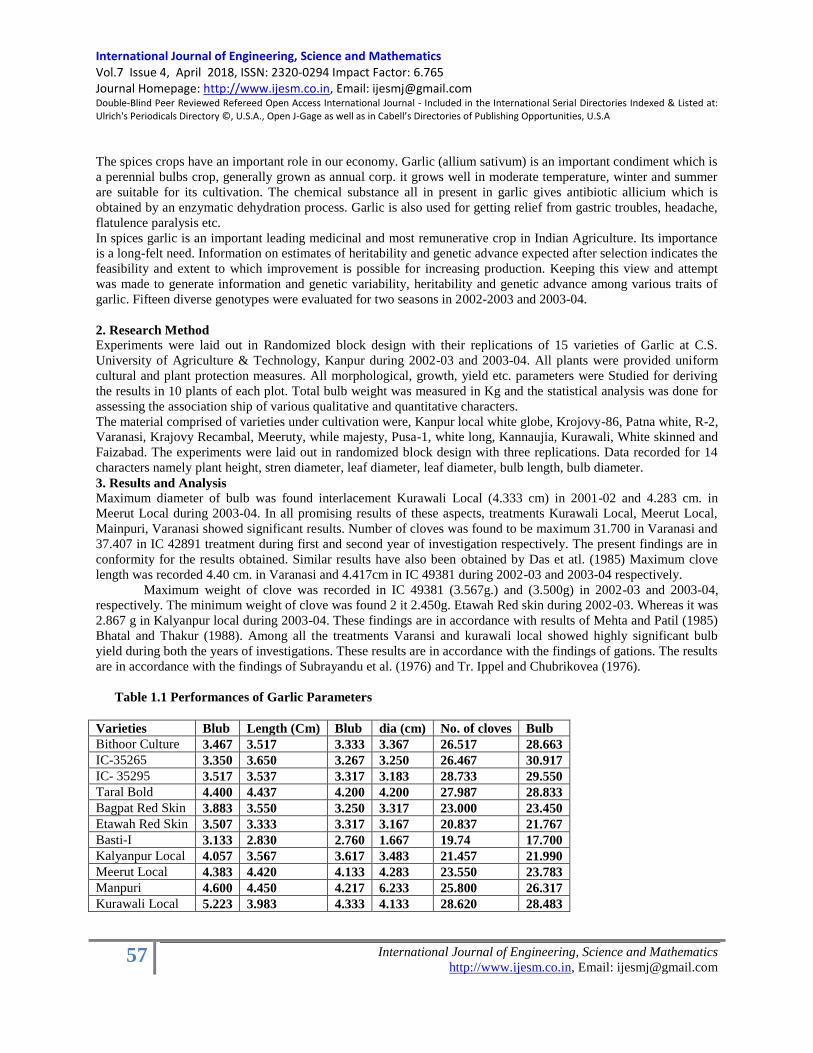
International Journal of Engineering, Science and Mathematics Vol.7 Issue 4, April 2018, ISSN: 2320-0294 Impact Factor: 6.765 Journal Homepage: http://www.ijesm.co.in, Email: [email protected] Double-Blind Peer Reviewed Refereed Open Access International Journal - Included in the International Serial Directories Indexed & Listed at: Ulrich's Periodicals Directory ©, U.S.A., Open J-Gage as well as in Cabell’s Directories of Publishing Opportunities, U.S.A
57 International Journal of Engineering, Science and Mathematics
http://www.ijesm.co.in, Email: [email protected]
The spices crops have an important role in our economy. Garlic (allium sativum) is an important condiment which is
a perennial bulbs crop, generally grown as annual corp. it grows well in moderate temperature, winter and summer
are suitable for its cultivation. The chemical substance all in present in garlic gives antibiotic allicium which is
obtained by an enzymatic dehydration process. Garlic is also used for getting relief from gastric troubles, headache,
flatulence paralysis etc.
In spices garlic is an important leading medicinal and most remunerative crop in Indian Agriculture. Its importance
is a long-felt need. Information on estimates of heritability and genetic advance expected after selection indicates the
feasibility and extent to which improvement is possible for increasing production. Keeping this view and attempt
was made to generate information and genetic variability, heritability and genetic advance among various traits of
garlic. Fifteen diverse genotypes were evaluated for two seasons in 2002-2003 and 2003-04.
2. Research Method
Experiments were laid out in Randomized block design with their replications of 15 varieties of Garlic at C.S.
University of Agriculture & Technology, Kanpur during 2002-03 and 2003-04. All plants were provided uniform
cultural and plant protection measures. All morphological, growth, yield etc. parameters were Studied for deriving
the results in 10 plants of each plot. Total bulb weight was measured in Kg and the statistical analysis was done for
assessing the association ship of various qualitative and quantitative characters.
The material comprised of varieties under cultivation were, Kanpur local white globe, Krojovy-86, Patna white, R-2,
Varanasi, Krajovy Recambal, Meeruty, while majesty, Pusa-1, white long, Kannaujia, Kurawali, White skinned and
Faizabad. The experiments were laid out in randomized block design with three replications. Data recorded for 14
characters namely plant height, stren diameter, leaf diameter, leaf diameter, bulb length, bulb diameter.
3. Results and Analysis Maximum diameter of bulb was found interlacement Kurawali Local (4.333 cm) in 2001-02 and 4.283 cm. in
Meerut Local during 2003-04. In all promising results of these aspects, treatments Kurawali Local, Meerut Local,
Mainpuri, Varanasi showed significant results. Number of cloves was found to be maximum 31.700 in Varanasi and
37.407 in IC 42891 treatment during first and second year of investigation respectively. The present findings are in
conformity for the results obtained. Similar results have also been obtained by Das et atl. (1985) Maximum clove
length was recorded 4.40 cm. in Varanasi and 4.417cm in IC 49381 during 2002-03 and 2003-04 respectively.
Maximum weight of clove was recorded in IC 49381 (3.567g.) and (3.500g) in 2002-03 and 2003-04,
respectively. The minimum weight of clove was found 2 it 2.450g. Etawah Red skin during 2002-03. Whereas it was
2.867 g in Kalyanpur local during 2003-04. These findings are in accordance with results of Mehta and Patil (1985)
Bhatal and Thakur (1988). Among all the treatments Varansi and kurawali local showed highly significant bulb
yield during both the years of investigations. These results are in accordance with the findings of gations. The results
are in accordance with the findings of Subrayandu et al. (1976) and Tr. Ippel and Chubrikovea (1976).
Table 1.1 Performances of Garlic Parameters
Varieties Blub Length (Cm) Blub dia (cm) No. of cloves Bulb
Bithoor Culture 3.467 3.517 3.333 3.367 26.517 28.663
IC-35265 3.350 3.650 3.267 3.250 26.467 30.917
IC- 35295 3.517 3.537 3.317 3.183 28.733 29.550
Taral Bold 4.400 4.437 4.200 4.200 27.987 28.833
Bagpat Red Skin 3.883 3.550 3.250 3.317 23.000 23.450
Etawah Red Skin 3.507 3.333 3.317 3.167 20.837 21.767
Basti-I 3.133 2.830 2.760 1.667 19.74 17.700
Kalyanpur Local 4.057 3.567 3.617 3.483 21.457 21.990
Meerut Local 4.383 4.420 4.133 4.283 23.550 23.783
Manpuri 4.600 4.450 4.217 6.233 25.800 26.317
Kurawali Local 5.223 3.983 4.333 4.133 28.620 28.483
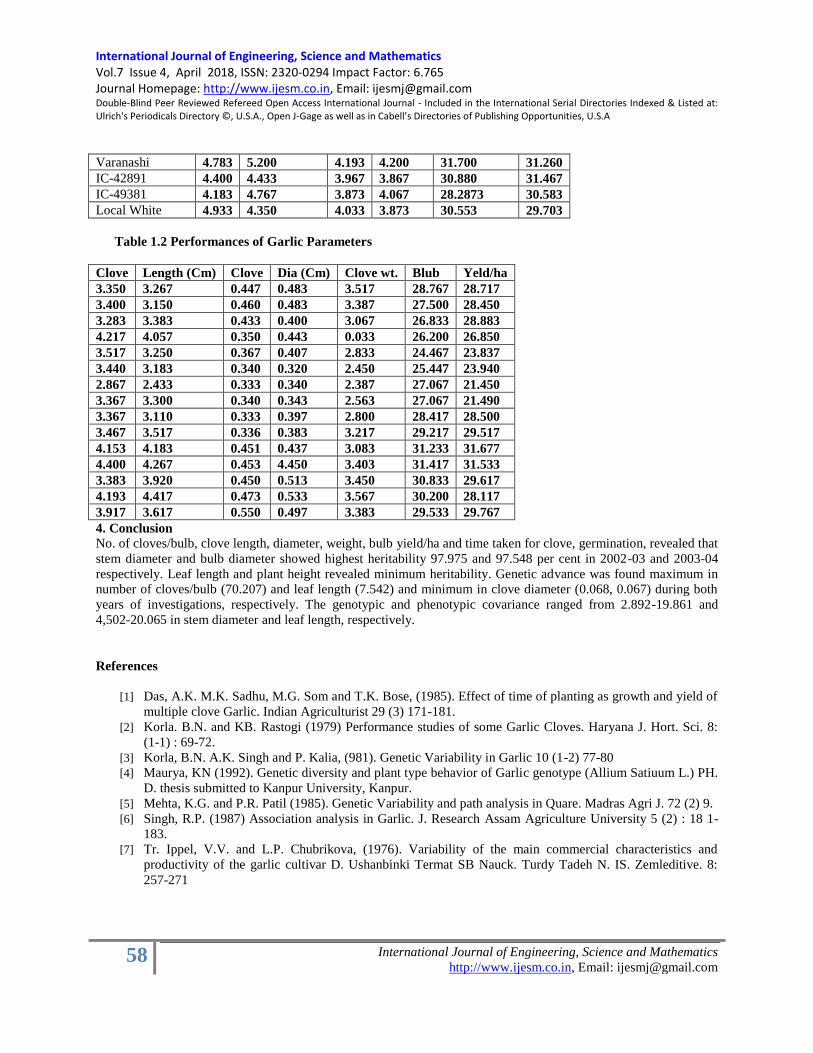
International Journal of Engineering, Science and Mathematics Vol.7 Issue 4, April 2018, ISSN: 2320-0294 Impact Factor: 6.765 Journal Homepage: http://www.ijesm.co.in, Email: [email protected] Double-Blind Peer Reviewed Refereed Open Access International Journal - Included in the International Serial Directories Indexed & Listed at: Ulrich's Periodicals Directory ©, U.S.A., Open J-Gage as well as in Cabell’s Directories of Publishing Opportunities, U.S.A
58 International Journal of Engineering, Science and Mathematics
http://www.ijesm.co.in, Email: [email protected]
Varanashi 4.783 5.200 4.193 4.200 31.700 31.260
IC-42891 4.400 4.433 3.967 3.867 30.880 31.467
IC-49381 4.183 4.767 3.873 4.067 28.2873 30.583
Local White 4.933 4.350 4.033 3.873 30.553 29.703
Table 1.2 Performances of Garlic Parameters
Clove Length (Cm) Clove Dia (Cm) Clove wt. Blub Yeld/ha
3.350 3.267 0.447 0.483 3.517 28.767 28.717
3.400 3.150 0.460 0.483 3.387 27.500 28.450
3.283 3.383 0.433 0.400 3.067 26.833 28.883
4.217 4.057 0.350 0.443 0.033 26.200 26.850
3.517 3.250 0.367 0.407 2.833 24.467 23.837
3.440 3.183 0.340 0.320 2.450 25.447 23.940
2.867 2.433 0.333 0.340 2.387 27.067 21.450
3.367 3.300 0.340 0.343 2.563 27.067 21.490
3.367 3.110 0.333 0.397 2.800 28.417 28.500
3.467 3.517 0.336 0.383 3.217 29.217 29.517
4.153 4.183 0.451 0.437 3.083 31.233 31.677
4.400 4.267 0.453 4.450 3.403 31.417 31.533
3.383 3.920 0.450 0.513 3.450 30.833 29.617
4.193 4.417 0.473 0.533 3.567 30.200 28.117
3.917 3.617 0.550 0.497 3.383 29.533 29.767
4. Conclusion
No. of cloves/bulb, clove length, diameter, weight, bulb yield/ha and time taken for clove, germination, revealed that
stem diameter and bulb diameter showed highest heritability 97.975 and 97.548 per cent in 2002-03 and 2003-04
respectively. Leaf length and plant height revealed minimum heritability. Genetic advance was found maximum in
number of cloves/bulb (70.207) and leaf length (7.542) and minimum in clove diameter (0.068, 0.067) during both
years of investigations, respectively. The genotypic and phenotypic covariance ranged from 2.892-19.861 and
4,502-20.065 in stem diameter and leaf length, respectively.
References
[1] Das, A.K. M.K. Sadhu, M.G. Som and T.K. Bose, (1985). Effect of time of planting as growth and yield of
multiple clove Garlic. Indian Agriculturist 29 (3) 171-181.
[2] Korla. B.N. and KB. Rastogi (1979) Performance studies of some Garlic Cloves. Haryana J. Hort. Sci. 8:
(1-1) : 69-72.
[3] Korla, B.N. A.K. Singh and P. Kalia, (981). Genetic Variability in Garlic 10 (1-2) 77-80
[4] Maurya, KN (1992). Genetic diversity and plant type behavior of Garlic genotype (Allium Satiuum L.) PH.
D. thesis submitted to Kanpur University, Kanpur.
[5] Mehta, K.G. and P.R. Patil (1985). Genetic Variability and path analysis in Quare. Madras Agri J. 72 (2) 9.
[6] Singh, R.P. (1987) Association analysis in Garlic. J. Research Assam Agriculture University 5 (2) : 18 1-
183.
[7] Tr. Ippel, V.V. and L.P. Chubrikova, (1976). Variability of the main commercial characteristics and
productivity of the garlic cultivar D. Ushanbinki Termat SB Nauck. Turdy Tadeh N. IS. Zemleditive. 8:
257-271

International Journal of Engineering, Science and Mathematics Vol.7 Issue 4, April 2018, ISSN: 2320-0294 Impact Factor: 6.765 Journal Homepage: http://www.ijesm.co.in, Email: [email protected] Double-Blind Peer Reviewed Refereed Open Access International Journal - Included in the International Serial Directories Indexed & Listed at: Ulrich's Periodicals Directory ©, U.S.A., Open J-Gage as well as in Cabell’s Directories of Publishing Opportunities, U.S.A
59 International Journal of Engineering, Science and Mathematics
http://www.ijesm.co.in, Email: [email protected]
INSIGHT INTO THE STRUCTURAL ANALYSIS OF THE MAP KINASE PROTEIN FAMILY IN
ARABIDOPSIS THALIANA (LINN.) HEYNH.
A. B Bajpai
B. Vibha
Nitin Kumar Verma
Abstract
Mitogen-activated protein kinases are important signaling tools in all
eukaryotes, and function in mediating an enormous variety of
external signals to appropriate cellular responses. In the present
study, ten full-length amino acid sequences of MAP kinase from
Doctorate Program, Linguistics Program Studies, Udayana University Denpasar, Bali-Indonesia (9 pt) STIMIK STIKOM-Bali, Renon, Depasar, Bali-Indonesia English Language Specialist, Oller Center, Carriage House, 2nd Floor, California, USA
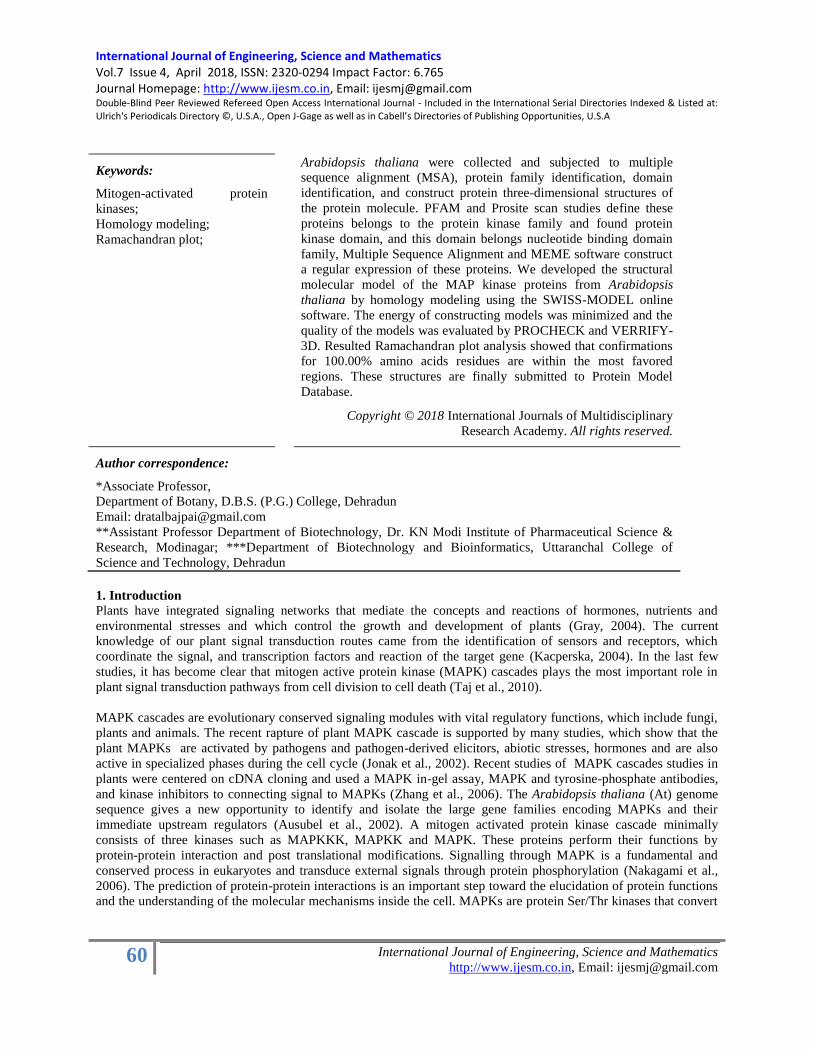
International Journal of Engineering, Science and Mathematics Vol.7 Issue 4, April 2018, ISSN: 2320-0294 Impact Factor: 6.765 Journal Homepage: http://www.ijesm.co.in, Email: [email protected] Double-Blind Peer Reviewed Refereed Open Access International Journal - Included in the International Serial Directories Indexed & Listed at: Ulrich's Periodicals Directory ©, U.S.A., Open J-Gage as well as in Cabell’s Directories of Publishing Opportunities, U.S.A
60 International Journal of Engineering, Science and Mathematics
http://www.ijesm.co.in, Email: [email protected]
Keywords:
Mitogen-activated protein
kinases;
Homology modeling;
Ramachandran plot;
Arabidopsis thaliana were collected and subjected to multiple
sequence alignment (MSA), protein family identification, domain
identification, and construct protein three-dimensional structures of
the protein molecule. PFAM and Prosite scan studies define these
proteins belongs to the protein kinase family and found protein
kinase domain, and this domain belongs nucleotide binding domain
family, Multiple Sequence Alignment and MEME software construct
a regular expression of these proteins. We developed the structural
molecular model of the MAP kinase proteins from Arabidopsis
thaliana by homology modeling using the SWISS-MODEL online
software. The energy of constructing models was minimized and the
quality of the models was evaluated by PROCHECK and VERRIFY-
3D. Resulted Ramachandran plot analysis showed that confirmations
for 100.00% amino acids residues are within the most favored
regions. These structures are finally submitted to Protein Model
Database.
Copyright © 2018 International Journals of Multidisciplinary
Research Academy. All rights reserved.
Author correspondence:
*Associate Professor,
Department of Botany, D.B.S. (P.G.) College, Dehradun
Email: [email protected]
**Assistant Professor Department of Biotechnology, Dr. KN Modi Institute of Pharmaceutical Science &
Research, Modinagar; ***Department of Biotechnology and Bioinformatics, Uttaranchal College of
Science and Technology, Dehradun
1. Introduction
Plants have integrated signaling networks that mediate the concepts and reactions of hormones, nutrients and
environmental stresses and which control the growth and development of plants (Gray, 2004). The current
knowledge of our plant signal transduction routes came from the identification of sensors and receptors, which
coordinate the signal, and transcription factors and reaction of the target gene (Kacperska, 2004). In the last few
studies, it has become clear that mitogen active protein kinase (MAPK) cascades plays the most important role in
plant signal transduction pathways from cell division to cell death (Taj et al., 2010).
MAPK cascades are evolutionary conserved signaling modules with vital regulatory functions, which include fungi,
plants and animals. The recent rapture of plant MAPK cascade is supported by many studies, which show that the
plant MAPKs are activated by pathogens and pathogen-derived elicitors, abiotic stresses, hormones and are also
active in specialized phases during the cell cycle (Jonak et al., 2002). Recent studies of MAPK cascades studies in
plants were centered on cDNA cloning and used a MAPK in-gel assay, MAPK and tyrosine-phosphate antibodies,
and kinase inhibitors to connecting signal to MAPKs (Zhang et al., 2006). The Arabidopsis thaliana (At) genome
sequence gives a new opportunity to identify and isolate the large gene families encoding MAPKs and their
immediate upstream regulators (Ausubel et al., 2002). A mitogen activated protein kinase cascade minimally
consists of three kinases such as MAPKKK, MAPKK and MAPK. These proteins perform their functions by
protein-protein interaction and post translational modifications. Signalling through MAPK is a fundamental and
conserved process in eukaryotes and transduce external signals through protein phosphorylation (Nakagami et al.,
2006). The prediction of protein-protein interactions is an important step toward the elucidation of protein functions
and the understanding of the molecular mechanisms inside the cell. MAPKs are protein Ser/Thr kinases that convert

International Journal of Engineering, Science and Mathematics Vol.7 Issue 4, April 2018, ISSN: 2320-0294 Impact Factor: 6.765 Journal Homepage: http://www.ijesm.co.in, Email: [email protected] Double-Blind Peer Reviewed Refereed Open Access International Journal - Included in the International Serial Directories Indexed & Listed at: Ulrich's Periodicals Directory ©, U.S.A., Open J-Gage as well as in Cabell’s Directories of Publishing Opportunities, U.S.A
61 International Journal of Engineering, Science and Mathematics
http://www.ijesm.co.in, Email: [email protected]
extracellular stimuli into a wide range of cellular responses (Cargnello and Roux, 2011). Earlier studies suggested
that, MAPKs regulate different types of processes including abscission, stomatal and ovuled evelopment, signals for
various abiotic stresses, and defense responses against bacterial and fungal pathogens (Pitzschke et al., 2009).
2. Research Method
Sequences of MAP kinase proteins of Arabidopsis thaliana were retrieved from the SWISSPROT, a public domain
protein database (Bairoch, 2000). Table 1 shows the protein sequences considered in this study. The MAP kinase
amino acid sequences were retrieved in FASTA format and used for further analysis.
Table 1. Protein sequences considered for the study
S.No. Accession no. MAP Kinase Length
1 Q39021 MAPK-1 370
2 Q39022 MAPK-2 376
3 Q39023 MAPK-3 370
4 Q39024 MAPK-4 376
5 Q39025 MAPK-5 376
6 Q39026 MAPK-6 395
7 Q39027 MAPK-7 368
8 Q9LM33 MAPK-8 589
9 Q9LV37 MAPK-9 510
10 Q9M1Z5 MAPK-10 393
Sequence analysis of the considered protein sequences
A set of ten potential protein sequences from Arabidopsis thaliana was used as the preliminary data. An
initial alignment generated by CLUSTRAL W and functional characterization was of all ten protein was done
through PFAM and PROSITE Scan.
Comparative Modeling:
The method of comparative modeling requires for the identification of homologous sequences with known structure.
The first step of comparative modeling is scanning and selection of template protein structure using the target
sequence as query (Berman et al., 2000). BLASTp is generally used for template selection procedure (Johnson et al.,
2008). The output of BLASTp for potential templates was showing in Table 2. Ten models were constructed through
MODELLER 9v10 (John and Sali, 2003) for each protein sequence. MODELLER implements comparative protein
modeling by satisfaction of spatial restraints.
Analysis of the model: The several models generated through Modeller for the same target and the best model selected for further analysis.
We evaluated the model with the lowest value of the Modeller objective function and PROCHECK statistics
(Laskowski et al., 1993). The overall stereo-chemical quality of the models for MAP kinase checked through
Ramachandran‘s map calculation it was computed through the Structure Analysis and Verification Server
(PROCHECK and VERIFY-3D) program that is available on National Institute of Health (NIH) server
(http://services.mbi.ucla.edu/SAVES/) (Eisenberg et al., 1997).
Table 2: Summary of the best template sequence profile that was generated through BLASTp

International Journal of Engineering, Science and Mathematics Vol.7 Issue 4, April 2018, ISSN: 2320-0294 Impact Factor: 6.765 Journal Homepage: http://www.ijesm.co.in, Email: [email protected] Double-Blind Peer Reviewed Refereed Open Access International Journal - Included in the International Serial Directories Indexed & Listed at: Ulrich's Periodicals Directory ©, U.S.A., Open J-Gage as well as in Cabell’s Directories of Publishing Opportunities, U.S.A
62 International Journal of Engineering, Science and Mathematics
http://www.ijesm.co.in, Email: [email protected]
S.No Name of
Protein PDB ID Identities E. Value Score
1 MPK-1 pdb|3TEI|A 172/341(50%) 3e-114 341bits(857)
2 MPK-2 pdb|3TEI|A 173/336(51%) 2e-114 341bits(857)
3 MPK-3 pdb|4IC7|A 179/343(52%) 7e-119 355bits(912)
4 MPK-4 pdb|4IC7|A 188/366(51%) 1e-124 370bits(951)
5 MPK-5 pdb|3TEI|A 177/346(51%) 3e-117 349bits(895)
6 MPK-6 pdb|289F|A 167/304(55%) 7e-117 333bits(854)
7 MPK-7 pdb|3TEI|A 163/341(48%) 7e-117 332bits(852)
8 MPK-8 pdb|4IC7|A 169/348(49%) 3e-106 331bits(848)
9 MPK-9 pdb|4IC7|A 165/348(47%) 1e-103 322bits(824)
10 MPK-10 pdb|3TEI|A 177/346(51%) 1e-115 345bits(886)
Visualization and structural analysis Visualization and Structural analysis of the final protein model was carried out through PyMol software (DeLano,
2002). 3dSS (Sumathi et al., 2006) and CHIMERA (Pettersen et al., 2004) were used for the structural alignment
and RMSD calculation with model and template protein structure.
Table 3: Ramachandran Plot Results
Regions MAPK-
1
MAPK-
2
MAPK-
3
MAPK-
4
MAPK-
5
MAPK-
6
MAPK-
7
MAPK-
8
MAPK-
9
MAPK-
10
Fully
Allowed
Region
81.52% 80.48% 77.99% 77.01% 80.48% 79.64% 81.42% 72.40% 67.72% 81.33%
Additionally
Allowed
Region
14.13% 13.64% 15.76% 16.84% 14.44% 15.27% 13.66% 18.23% 20.08% 14.07%
Generously
Allowed
Region
3.26% 4.28% 4.08% 3.74% 3.21% 03.56% 03.28% 6.67% 6.50% 02.30%
Outside
Region 1.09% 1.60% 02.17% 2.41% 1.87% 01.53% 01.64% 2.90% 5.71% 02.30%
Total 100% 100% 100% 100% 100% 100% 100% 100% 100% 100%
Table 4: Comparison of model validation from different server
MAPK-
1
MAPK-
2
MAPK-
3
MAPK-
4
MAPK-
5
MAPK-
6
MAPK-
7
MAPK-
8
MAPK-
9
MAPK-
10
Prosa
(z-score) -7.77 -7.93 -8.7 -8.26 -8.40 -7.95 -7.91 -6.64 -5.02 -8.59
Verify 3D 82.70% 84.04% 82.70% 87.23% 82.98% 70.00% 72.55% 69.61% 74.71% 84.22%
Physico-chemical characterization
For physio-chemical characterization theoretical pI (isoelectric point), molecular weight, -R and +R (total number of
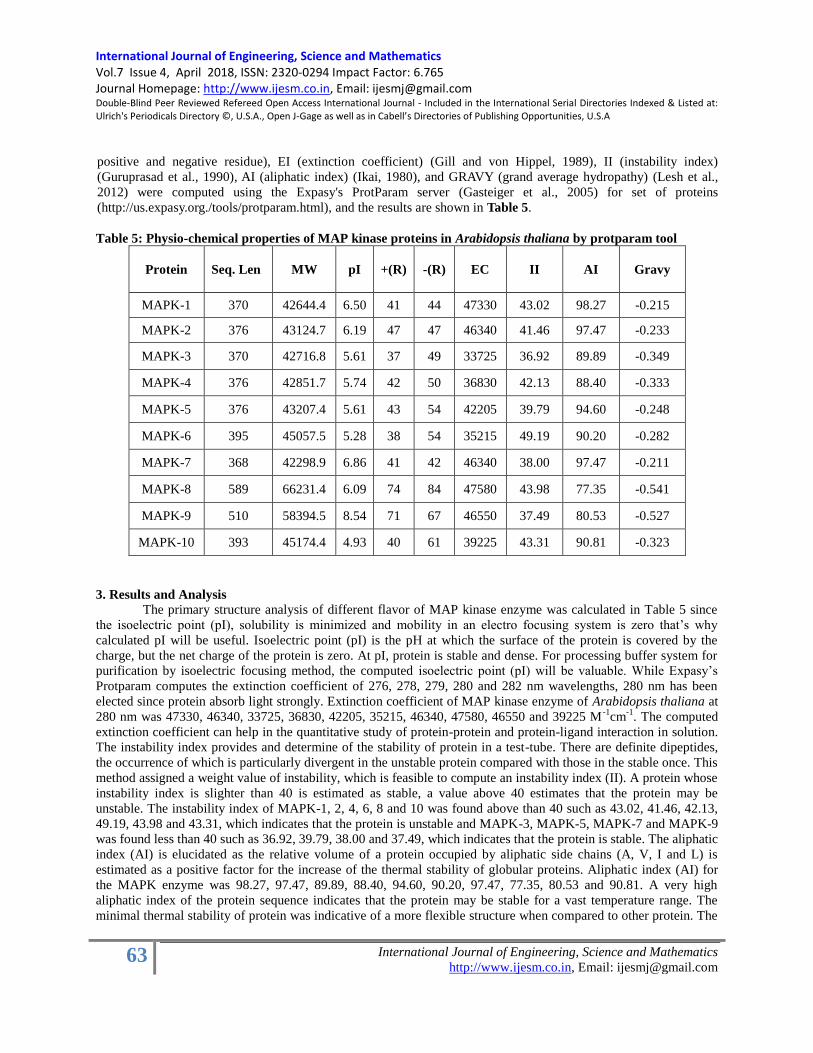
International Journal of Engineering, Science and Mathematics Vol.7 Issue 4, April 2018, ISSN: 2320-0294 Impact Factor: 6.765 Journal Homepage: http://www.ijesm.co.in, Email: [email protected] Double-Blind Peer Reviewed Refereed Open Access International Journal - Included in the International Serial Directories Indexed & Listed at: Ulrich's Periodicals Directory ©, U.S.A., Open J-Gage as well as in Cabell’s Directories of Publishing Opportunities, U.S.A
63 International Journal of Engineering, Science and Mathematics
http://www.ijesm.co.in, Email: [email protected]
positive and negative residue), EI (extinction coefficient) (Gill and von Hippel, 1989), II (instability index)
(Guruprasad et al., 1990), AI (aliphatic index) (Ikai, 1980), and GRAVY (grand average hydropathy) (Lesh et al.,
2012) were computed using the Expasy's ProtParam server (Gasteiger et al., 2005) for set of proteins
(http://us.expasy.org./tools/protparam.html), and the results are shown in Table 5.
Table 5: Physio-chemical properties of MAP kinase proteins in Arabidopsis thaliana by protparam tool
Protein
Seq. Len MW pI +(R) -(R) EC II AI Gravy
MAPK-1 370 42644.4 6.50 41 44 47330 43.02 98.27 -0.215
MAPK-2 376 43124.7 6.19 47 47 46340 41.46 97.47 -0.233
MAPK-3 370 42716.8 5.61 37 49 33725 36.92 89.89 -0.349
MAPK-4 376 42851.7 5.74 42 50 36830 42.13 88.40 -0.333
MAPK-5 376 43207.4 5.61 43 54 42205 39.79 94.60 -0.248
MAPK-6 395 45057.5 5.28 38 54 35215 49.19 90.20 -0.282
MAPK-7 368 42298.9 6.86 41 42 46340 38.00 97.47 -0.211
MAPK-8 589 66231.4 6.09 74 84 47580 43.98 77.35 -0.541
MAPK-9 510 58394.5 8.54 71 67 46550 37.49 80.53 -0.527
MAPK-10 393 45174.4 4.93 40 61 39225 43.31 90.81 -0.323
3. Results and Analysis
The primary structure analysis of different flavor of MAP kinase enzyme was calculated in Table 5 since
the isoelectric point (pI), solubility is minimized and mobility in an electro focusing system is zero that‘s why
calculated pI will be useful. Isoelectric point (pI) is the pH at which the surface of the protein is covered by the
charge, but the net charge of the protein is zero. At pI, protein is stable and dense. For processing buffer system for
purification by isoelectric focusing method, the computed isoelectric point (pI) will be valuable. While Expasy‘s
Protparam computes the extinction coefficient of 276, 278, 279, 280 and 282 nm wavelengths, 280 nm has been
elected since protein absorb light strongly. Extinction coefficient of MAP kinase enzyme of Arabidopsis thaliana at
280 nm was 47330, 46340, 33725, 36830, 42205, 35215, 46340, 47580, 46550 and 39225 M-1
cm-1
. The computed
extinction coefficient can help in the quantitative study of protein-protein and protein-ligand interaction in solution.
The instability index provides and determine of the stability of protein in a test-tube. There are definite dipeptides,
the occurrence of which is particularly divergent in the unstable protein compared with those in the stable once. This
method assigned a weight value of instability, which is feasible to compute an instability index (II). A protein whose
instability index is slighter than 40 is estimated as stable, a value above 40 estimates that the protein may be
unstable. The instability index of MAPK-1, 2, 4, 6, 8 and 10 was found above than 40 such as 43.02, 41.46, 42.13,
49.19, 43.98 and 43.31, which indicates that the protein is unstable and MAPK-3, MAPK-5, MAPK-7 and MAPK-9
was found less than 40 such as 36.92, 39.79, 38.00 and 37.49, which indicates that the protein is stable. The aliphatic
index (AI) is elucidated as the relative volume of a protein occupied by aliphatic side chains (A, V, I and L) is
estimated as a positive factor for the increase of the thermal stability of globular proteins. Aliphatic index (AI) for
the MAPK enzyme was 98.27, 97.47, 89.89, 88.40, 94.60, 90.20, 97.47, 77.35, 80.53 and 90.81. A very high
aliphatic index of the protein sequence indicates that the protein may be stable for a vast temperature range. The
minimal thermal stability of protein was indicative of a more flexible structure when compared to other protein. The

International Journal of Engineering, Science and Mathematics Vol.7 Issue 4, April 2018, ISSN: 2320-0294 Impact Factor: 6.765 Journal Homepage: http://www.ijesm.co.in, Email: [email protected] Double-Blind Peer Reviewed Refereed Open Access International Journal - Included in the International Serial Directories Indexed & Listed at: Ulrich's Periodicals Directory ©, U.S.A., Open J-Gage as well as in Cabell’s Directories of Publishing Opportunities, U.S.A
64 International Journal of Engineering, Science and Mathematics
http://www.ijesm.co.in, Email: [email protected]
Grand Average hydropathy (GRAVY) value for a peptide or protein is calculated as the sum of hydropathy values of
all the amino acids, divided by the number of residues in the sequence. A GRAVY index of different MAPK
enzyme was calculated such as -0.215, -0.233, -0.349, -0.333, -0.248, -0.282, -0.211, -0.541, -0.527 and -0.323. This
low value shows the probability of better interaction with water.
Comparative Modeling is a very effective method of generating the 3D structure of a protein for which
experimental (X-rays crystallographic or NMR) structure is not available but the crystal structure of homologue is
available. Then by making use of this template the 3D structure of the protein of interest was generated
through homology modeling based method (Kumar Verma et al., 2013). For homology modeling of MAPK from
Arabidopsis thaliana, BLAST (Basic Local Alignment Search Tool) scanning results had revealed identical with
crystallographic structure showing in Table 2, while the template was determined based on higher sequence identity.
Comparative modeling predicts the three dimensional structure of hypothetical model of a given protein sequence
(target), based primarily on this alignment to the template. The resulting 3-D structure of MAP kinase was sorted
according to the score calculated from discrete optimization, protein (DOPE) scoring function. The final model,
which has lowest root mean square deviation (RMSD), relative to the trace of the crystal structure, was selected for
further study.
(a) (b)
(d) (d)

International Journal of Engineering, Science and Mathematics Vol.7 Issue 4, April 2018, ISSN: 2320-0294 Impact Factor: 6.765 Journal Homepage: http://www.ijesm.co.in, Email: [email protected] Double-Blind Peer Reviewed Refereed Open Access International Journal - Included in the International Serial Directories Indexed & Listed at: Ulrich's Periodicals Directory ©, U.S.A., Open J-Gage as well as in Cabell’s Directories of Publishing Opportunities, U.S.A
65 International Journal of Engineering, Science and Mathematics
http://www.ijesm.co.in, Email: [email protected]
(e) (f)
(g) (h)
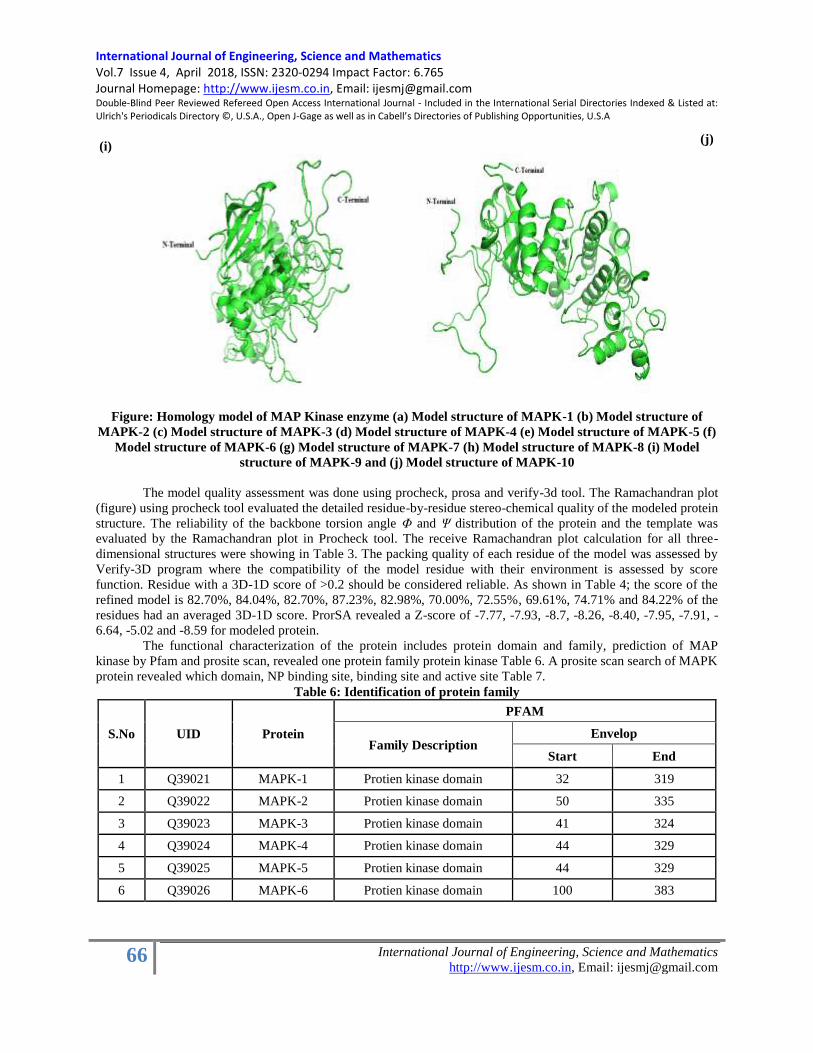
International Journal of Engineering, Science and Mathematics Vol.7 Issue 4, April 2018, ISSN: 2320-0294 Impact Factor: 6.765 Journal Homepage: http://www.ijesm.co.in, Email: [email protected] Double-Blind Peer Reviewed Refereed Open Access International Journal - Included in the International Serial Directories Indexed & Listed at: Ulrich's Periodicals Directory ©, U.S.A., Open J-Gage as well as in Cabell’s Directories of Publishing Opportunities, U.S.A
66 International Journal of Engineering, Science and Mathematics
http://www.ijesm.co.in, Email: [email protected]
Figure: Homology model of MAP Kinase enzyme (a) Model structure of MAPK-1 (b) Model structure of
MAPK-2 (c) Model structure of MAPK-3 (d) Model structure of MAPK-4 (e) Model structure of MAPK-5 (f)
Model structure of MAPK-6 (g) Model structure of MAPK-7 (h) Model structure of MAPK-8 (i) Model
structure of MAPK-9 and (j) Model structure of MAPK-10
The model quality assessment was done using procheck, prosa and verify-3d tool. The Ramachandran plot
(figure) using procheck tool evaluated the detailed residue-by-residue stereo-chemical quality of the modeled protein
structure. The reliability of the backbone torsion angle Φ and Ψ distribution of the protein and the template was
evaluated by the Ramachandran plot in Procheck tool. The receive Ramachandran plot calculation for all three-
dimensional structures were showing in Table 3. The packing quality of each residue of the model was assessed by
Verify-3D program where the compatibility of the model residue with their environment is assessed by score
function. Residue with a 3D-1D score of >0.2 should be considered reliable. As shown in Table 4; the score of the
refined model is 82.70%, 84.04%, 82.70%, 87.23%, 82.98%, 70.00%, 72.55%, 69.61%, 74.71% and 84.22% of the
residues had an averaged 3D-1D score. ProrSA revealed a Z-score of -7.77, -7.93, -8.7, -8.26, -8.40, -7.95, -7.91, -
6.64, -5.02 and -8.59 for modeled protein.
The functional characterization of the protein includes protein domain and family, prediction of MAP
kinase by Pfam and prosite scan, revealed one protein family protein kinase Table 6. A prosite scan search of MAPK
protein revealed which domain, NP binding site, binding site and active site Table 7.
Table 6: Identification of protein family
S.No UID Protein
PFAM
Family Description Envelop
Start End
1 Q39021 MAPK-1 Protien kinase domain 32 319
2 Q39022 MAPK-2 Protien kinase domain 50 335
3 Q39023 MAPK-3 Protien kinase domain 41 324
4 Q39024 MAPK-4 Protien kinase domain 44 329
5 Q39025 MAPK-5 Protien kinase domain 44 329
6 Q39026 MAPK-6 Protien kinase domain 100 383
(i) (j)
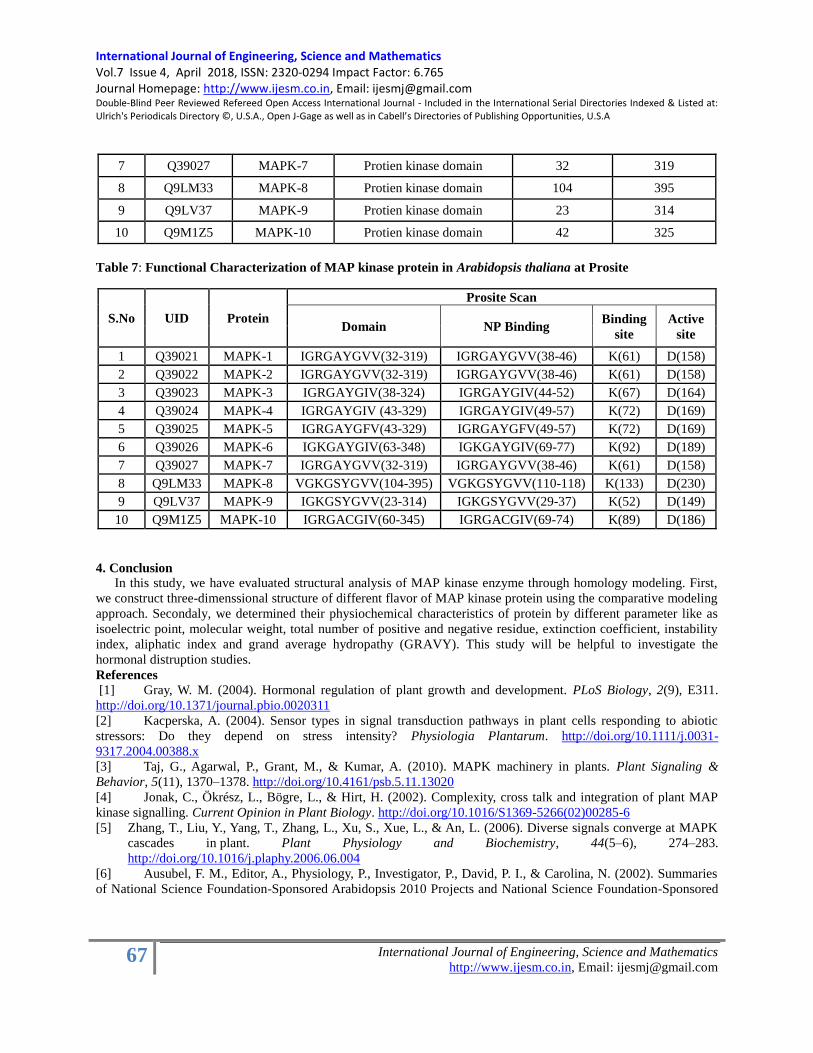
International Journal of Engineering, Science and Mathematics Vol.7 Issue 4, April 2018, ISSN: 2320-0294 Impact Factor: 6.765 Journal Homepage: http://www.ijesm.co.in, Email: [email protected] Double-Blind Peer Reviewed Refereed Open Access International Journal - Included in the International Serial Directories Indexed & Listed at: Ulrich's Periodicals Directory ©, U.S.A., Open J-Gage as well as in Cabell’s Directories of Publishing Opportunities, U.S.A
67 International Journal of Engineering, Science and Mathematics
http://www.ijesm.co.in, Email: [email protected]
7 Q39027 MAPK-7 Protien kinase domain 32 319
8 Q9LM33 MAPK-8 Protien kinase domain 104 395
9 Q9LV37 MAPK-9 Protien kinase domain 23 314
10 Q9M1Z5 MAPK-10 Protien kinase domain 42 325
Table 7: Functional Characterization of MAP kinase protein in Arabidopsis thaliana at Prosite
S.No UID Protein
Prosite Scan
Domain NP Binding Binding
site
Active
site
1 Q39021 MAPK-1 IGRGAYGVV(32-319) IGRGAYGVV(38-46) K(61) D(158)
2 Q39022 MAPK-2 IGRGAYGVV(32-319) IGRGAYGVV(38-46) K(61) D(158)
3 Q39023 MAPK-3 IGRGAYGIV(38-324) IGRGAYGIV(44-52) K(67) D(164)
4 Q39024 MAPK-4 IGRGAYGIV (43-329) IGRGAYGIV(49-57) K(72) D(169)
5 Q39025 MAPK-5 IGRGAYGFV(43-329) IGRGAYGFV(49-57) K(72) D(169)
6 Q39026 MAPK-6 IGKGAYGIV(63-348) IGKGAYGIV(69-77) K(92) D(189)
7 Q39027 MAPK-7 IGRGAYGVV(32-319) IGRGAYGVV(38-46) K(61) D(158)
8 Q9LM33 MAPK-8 VGKGSYGVV(104-395) VGKGSYGVV(110-118) K(133) D(230)
9 Q9LV37 MAPK-9 IGKGSYGVV(23-314) IGKGSYGVV(29-37) K(52) D(149)
10 Q9M1Z5 MAPK-10 IGRGACGIV(60-345) IGRGACGIV(69-74) K(89) D(186)
4. Conclusion
In this study, we have evaluated structural analysis of MAP kinase enzyme through homology modeling. First,
we construct three-dimenssional structure of different flavor of MAP kinase protein using the comparative modeling
approach. Secondaly, we determined their physiochemical characteristics of protein by different parameter like as
isoelectric point, molecular weight, total number of positive and negative residue, extinction coefficient, instability
index, aliphatic index and grand average hydropathy (GRAVY). This study will be helpful to investigate the
hormonal distruption studies.
References [1] Gray, W. M. (2004). Hormonal regulation of plant growth and development. PLoS Biology, 2(9), E311.
http://doi.org/10.1371/journal.pbio.0020311
[2] Kacperska, A. (2004). Sensor types in signal transduction pathways in plant cells responding to abiotic
stressors: Do they depend on stress intensity? Physiologia Plantarum. http://doi.org/10.1111/j.0031-
9317.2004.00388.x
[3] Taj, G., Agarwal, P., Grant, M., & Kumar, A. (2010). MAPK machinery in plants. Plant Signaling &
Behavior, 5(11), 1370–1378. http://doi.org/10.4161/psb.5.11.13020
[4] Jonak, C., Ökrész, L., Bögre, L., & Hirt, H. (2002). Complexity, cross talk and integration of plant MAP
kinase signalling. Current Opinion in Plant Biology. http://doi.org/10.1016/S1369-5266(02)00285-6
[5] Zhang, T., Liu, Y., Yang, T., Zhang, L., Xu, S., Xue, L., & An, L. (2006). Diverse signals converge at MAPK
cascades in plant. Plant Physiology and Biochemistry, 44(5–6), 274–283.
http://doi.org/10.1016/j.plaphy.2006.06.004
[6] Ausubel, F. M., Editor, A., Physiology, P., Investigator, P., David, P. I., & Carolina, N. (2002). Summaries
of National Science Foundation-Sponsored Arabidopsis 2010 Projects and National Science Foundation-Sponsored

International Journal of Engineering, Science and Mathematics Vol.7 Issue 4, April 2018, ISSN: 2320-0294 Impact Factor: 6.765 Journal Homepage: http://www.ijesm.co.in, Email: [email protected] Double-Blind Peer Reviewed Refereed Open Access International Journal - Included in the International Serial Directories Indexed & Listed at: Ulrich's Periodicals Directory ©, U.S.A., Open J-Gage as well as in Cabell’s Directories of Publishing Opportunities, U.S.A
68 International Journal of Engineering, Science and Mathematics
http://www.ijesm.co.in, Email: [email protected]
Plant Genome Projects That Are Generating Arabidopsis Resources for the Community. Plant Physiology, 129(2),
394–437. http://doi.org/10.1104/pp.900034
[7] Nakagami, H., Soukupová, H., Schikora, A., Zárský, V., & Hirt, H. (2006). A Mitogen-activated protein
kinase kinase kinase mediates reactive oxygen species homeostasis in Arabidopsis. The Journal of Biological
Chemistry, 281(50), 38697–38704. http://doi.org/10.1074/jbc.M605293200
[8] Cargnello, M., & Roux, P. P. (2011). Activation and Function of the MAPKs and Their Substrates, the
MAPK-Activated Protein Kinases. Microbiology and Molecular Biology Reviews, 75(1), 50–83.
http://doi.org/10.1128/MMBR.00031-10
[9] Pitzschke, A., Schikora, A., & Hirt, H. (2009). MAPK cascade signalling networks in plant defence.
Current Opinion in Plant Biology. http://doi.org/10.1016/j.pbi.2009.06.008
[10] Bairoch, A. (2000). The SWISS-PROT protein sequence database and its supplement TrEMBL in 2000.
Nucleic Acids Research, 28(1), 45–48. http://doi.org/10.1093/nar/28.1.45
[11] Bateman, A. (2007). ClustalW and ClustalX version 2.0. Bioinformatics, 21(23), 2947–8. Retrieved from
http://www.ebi.ac.uk/tools/clustalw2
[12] Finn, R. D., Mistry, J., Tate, J., Coggill, P., Heger, A., Pollington, J. E., … Bateman, A. (2010). The Pfam
protein families database. Nucleic Acids Research, 38(Database issue), D211–D222.
[13] de Castro, E., Sigrist, C. J. A., Gattiker, A., Bulliard, V., Langendijk-Genevaux, P. S., Gasteiger, E., …
Hulo, N. (2006). ScanProsite: Detection of PROSITE signature matches and ProRule-associated functional and
structural residues in proteins. Nucleic Acids Research, 34(WEB. SERV. ISS.).
[14] Berman, H. M., Westbrook, J., Feng, Z., Gilliland, G., Bhat, T. N., Weissig, H., … Bourne, P. E. (2000).
The Protein Data Bank. Nucleic Acids Research, 28(1), 235–242. http://doi.org/10.1093/nar/28.1.235
[15] Johnson, M., Zaretskaya, I., Raytselis, Y., Merezhuk, Y., McGinnis, S., & Madden, T. L. (2008). NCBI
BLAST: a better web interface. Nucleic Acids Research, 36(Web Server issue), W5–W9.
[16] John, B., & Sali, A. (2003). Comparative protein structure modeling by iterative alignment, model building
and model assessment. Nucleic Acids Research, 31(14), 3982–3992.
[17] Laskowski, R. A., MacArthur, M. W., Moss, D. S., & Thornton, J. M. (1993). PROCHECK: a program to
check the stereochemical quality of protein structures. Journal of Applied Crystallography.
http://doi.org/10.1107/S0021889892009944
[18] Eisenberg, D., Luthy, R., & Bowie, J. U. (1997). VERIFY3D: Assessment of protein models with three-
dimensional profiles. Methods in Enzymology, 277, 396–406.
[19] DeLano, W. (2002). Pymol Molecular Graphics System: An open-source molecular graphics tool. CCP4
Newsletter On Protein Crystallography.
[20] Sumathi, K., Ananthalakshmi, P., Roshan, M. N. A. M., & Sekar, K. (2006). 3dSS: 3D structural
superposition. Nucleic Acids Research, 34(WEB. SERV. ISS.).
[21] Pettersen, E. F., Goddard, T. D., Huang, C. C., Couch, G. S., Greenblatt, D. M., Meng, E. C., & Ferrin, T. E.
(2004). UCSF Chimera--a visualization system for exploratory research and analysis. Journal of Computational
Chemistry, 25(13), 1605–12. http://doi.org/10.1002/jcc.20084
[22] Gill, S. C., & von Hippel, P. H. (1989). Calculation of protein extinction coefficients from amino acid
sequence data. Analytical Biochemistry. http://doi.org/10.1016/0003-2697(89)90602-7
[23] Guruprasad, K., Reddy, B. V. B., & Pandit, M. W. (1990). Correlation between stability of a protein and its
dipeptide composition: A novel approach for predicting in vivo stability of a protein from its primary sequence.
Protein Engineering, Design and Selection, 4(2), 155–161. http://doi.org/10.1093/protein/4.2.155
[24] Ikai, A. (1980). Thermostability and aliphatic index of globular proteins. Journal of Biochemistry, 1898(6),
1895–1898. http://doi.org/10.1017/CBO9781107415324.004
[25] Lesh, N., Mitzenmacher, M., Whitesides, S., Vanetten, C. H., Nielsen, H. C., Peters, J. E., … Grassberger,
P. (2012). A simple method for displaying the hydropathic character of a protein. Journal of Chemical Physics,
90(1), 3682–3693. http://doi.org/10.1103/PhysRevE.56.3682
[26] Gasteiger, E., Hoogland, C., Gattiker, A., Duvaud, S., Wilkins, M. R., Appel, R. D., & Bairoch, A. (2005).
Protein Identification and Analysis Tools on the ExPASy Server. The Proteomics Protocols Handbook, 571–607.
http://doi.org/10.1385/1-59259-890-0:571
International Journal of Engineering, Science and Mathematics Vol.7 Issue 4, April 2018, ISSN: 2320-0294 Impact Factor: 6.765 Journal Homepage: http://www.ijesm.co.in, Email: [email protected] Double-Blind Peer Reviewed Refereed Open Access International Journal - Included in the International Serial Directories Indexed & Listed at: Ulrich's Periodicals Directory ©, U.S.A., Open J-Gage as well as in Cabell’s Directories of Publishing Opportunities, U.S.A
69 International Journal of Engineering, Science and Mathematics
http://www.ijesm.co.in, Email: [email protected]
[27] Kumar Verma, A., Arjun, J., & Chillawar, R. (2013). Homology Modeling and characterization of
Phosphoenolpyruvate Carboxykinase (PEPCK) from Schistosoma japonicum. IOSR Journal of Pharmacy and
Biological Sciences (IOSR-JPBS), 8(5), 82–93.
CONVERSION OF WASTE PLASTICS TO VALUABLE HYDROCARBON PRODUCTS
Patil, P.P.3
Agarwal, M.**
Mohammed, S.***
Mandal, C.****
Abstract
Plastics have though entwined their way into our everyday lives
nonetheless posing a tremendous threat to the environment. The
MoEF and Climate Change report of 2016 stresses that in India
15000 tons of plastic waste is engendered every year. This paper
emphasizes the conversion of waste plastic into value added fuels,
3M. Tech. Petroleum Exploration Student, University of Petroleum and Energy Studies, Dehradun
** Senior Associate Professor, Department of Petroleum Engineering and Earth Sciences, University of Petroleum and Energy
Studies, Dehradun
*** M. Tech. Petroleum Exploration Student, University of Petroleum and Energy Studies, Dehradun
**** M. Tech. Petroleum Exploration Student, University of Petroleum and Energy Studies, Dehradun
International Journal of Engineering, Science and Mathematics Vol.7 Issue 4, April 2018, ISSN: 2320-0294 Impact Factor: 6.765 Journal Homepage: http://www.ijesm.co.in, Email: [email protected] Double-Blind Peer Reviewed Refereed Open Access International Journal - Included in the International Serial Directories Indexed & Listed at: Ulrich's Periodicals Directory ©, U.S.A., Open J-Gage as well as in Cabell’s Directories of Publishing Opportunities, U.S.A
70 International Journal of Engineering, Science and Mathematics
http://www.ijesm.co.in, Email: [email protected]
Keywords:
Cracking;
HDPE;
LDPE;
Pyrolysis;
Economic development.
which is being elucidated as a practical solution for reutilizing of
plastics. Under anaerobic cracking process, plastic can be
decomposed into 3 fractions: gas, liquid & solid residue. The present
paper describes the pyrolysis method for conversion of plastic waste
into useful gasoline and gas-oil range hydrocarbons containing more
of olefins, aromatics and naphthenes than paraffins. The products
obtained from catalytic cracking resulted better overall yields,
characteristics & more stability than the products by thermal
cracking. The waste plastic feed mixture consisting of High-Density
Polyethylene (HDPE) and Low-Density Polyethylene (LDPE) was
cracked for the study. The conversion of plastic waste to liquid
hydrocarbons can be used as a source of energy and/or as a feedstock
for petrochemicals. The present work will also play a significant role
in enhancing social, environment & health benefits and also in
economic development in the energy sector of 21st century.
Copyright © 201 International Journals of Multidisciplinary Research
Academy. All rights reserved.
Author correspondence:
Dr.Mandira Agarwal
Senior Associate Professor
Department of Petroleum Engineering and Earth Sciences
University of Petroleum and Energy Studies, Dehradun
1. INTRODUCTION
Pyrolysis is a chemical reaction involving molecular breakdown of larger molecules into smaller molecules in the
presence of high temperature. Pyrolysis has been derived from two Greek words ―pyro‖ meaning fire and ―lysis‖
meaning separating. Pyrolysis, a type of thermolysis, is a high temperature reaction that involves irreversible
simultaneous change of chemical composition and physical phase of organic material. It is one of the processes
involved in charring wood, in absence of oxygen for the synthesis of coal, starting at 200–300°C (390–570°F).[1][3]
The synthetic plastic made from a wide range of organic polymers such as polyethylene, poly vinyl chloride, nylon,
etc., can be precast into various shapes, in softer state, and then set into a rigid or slightly elastic state. An important
property attributed to plastics is plasticity, which is the general property of the materials to irreversibly deform
without breaking. Polymers of plastic are often made up of carbon and hydrogen and sometimes of oxygen,
nitrogen, sulfur, chlorine, fluorine, phosphorous, or silicon. [2]
Thermoplastics, thermosets and bio-plastics are the 3 forms of plastic, among which thermoplastic gets soften when
heated and harden on cooling. Greater than 80 % of plastics are thermoplastics that include: High density
polyethylene (HDPE), Low density polyethylene (LDPE), Polyethylene terephthalate (PET), Polypropylene (PP),
Polyvinyl chloride (PVC). [2]
Thermosets are hardened through curing process and cannot be re-melted or re-molded.
Thermosets includes: Polyurethane (PU), Epoxy, Phenolics and Unsaturated polyesters. [2]
Bio-plastics can be
produced by conversion of plant sugar and from plastics grown in micro-organisms, corn and other crops [2]
Central Pollution Control Board (CPCB) in 2016 reported that the packaging and polyvinyl chloride (PVC) pipe
industry is growing at the rate of 16-18% per year. We use different kind of plastics goods in our daily life and its
demand is rapidly increasing from domestic to industrial use. The demand for the plastic goods is rising at the rate of
22% per year. According to the plastic production data of 2014-15, 6533.157 thousand metric tons was produced.

International Journal of Engineering, Science and Mathematics Vol.7 Issue 4, April 2018, ISSN: 2320-0294 Impact Factor: 6.765 Journal Homepage: http://www.ijesm.co.in, Email: [email protected] Double-Blind Peer Reviewed Refereed Open Access International Journal - Included in the International Serial Directories Indexed & Listed at: Ulrich's Periodicals Directory ©, U.S.A., Open J-Gage as well as in Cabell’s Directories of Publishing Opportunities, U.S.A
71 International Journal of Engineering, Science and Mathematics
http://www.ijesm.co.in, Email: [email protected]
The National consumption of plastic is as shown in Table 1 from the year 1996 to 2007. The domestic consumption
is expected to touch 20 million Metric tons by 2020. [5], [8]
Table 1
S. No. Year Consumption (Tons)
1. 1996 61,000
2. 2000 3,00,000
3. 2001 4,00,000
4. 2007 8,500,000
Source: Central Pollution Control Board
According to plastic and polymers industry, the per capita consumption of plastic in India doubled from 4 kg in
2006 to 8 kg in 2008 and 12 kg in 2016, and globally it would touch an average of 27 kg per person by 2020.
Among the factors driving the consumption growth of plastics is increasing in packaging, infrastructure, agriculture,
automotive, healthcare and FMCG segments. [6], [8]
Although plastics have become increadible commodities in our daily life providing enormous economic benefits to
the society, the non-biodegradability of it has made their disposal a serious environmental concern. The littering of
these wastes has resulted in a general deterioration of hygiene in urban areas as well as threat to the biodiversity
both on land and marine region.
The present paper highlights the method by which waste plastics like polyethylene and polypropylene accounting 60
% of the plastics being consumed can be converted into gasoline, diesel or aromatics. The method is totally
environment friendly as there is no formation of toxic substances. The method has the potential of supplementing
the high value petroleum products as well as providing an environment friendly disposal method and the adoption of
this method can help in keeping the urban and semi-urban areas free from plastics. [7
2.
EXPERIMENTAL PROCEDURE

International Journal of Engineering, Science and Mathematics Vol.7 Issue 4, April 2018, ISSN: 2320-0294 Impact Factor: 6.765 Journal Homepage: http://www.ijesm.co.in, Email: [email protected] Double-Blind Peer Reviewed Refereed Open Access International Journal - Included in the International Serial Directories Indexed & Listed at: Ulrich's Periodicals Directory ©, U.S.A., Open J-Gage as well as in Cabell’s Directories of Publishing Opportunities, U.S.A
72 International Journal of Engineering, Science and Mathematics
http://www.ijesm.co.in, Email: [email protected]
Figure 1: Fabricated Reactor (Photo Captured In Lab)
Firstly, the reactor was assembled, insulated properly with asbestos sheets and insulation ropes to minimize the heat
losses as shown in Figure 1. Initially, the temperatures profile was worked out to set the maximum temperature of
the reactor to 500°C by regulating the voltage from the dimmer stat at 160 V. Thus, the maximum temperature of
reactor under different conditions of voltage and time was obtained. The data obtained during this calibration was
utilized for controlling the reactor temperature and maintaining it during the actual operation run. The reactor was
then subjected to trial runs for optimizing the process parameters.
Three sets of experiments were performed at 4800C temperature with mixed plastic feed consisting of HDPE and
LDPE as shown in Figure 5. The first set was carried out without any catalyst, the second set was carried in the
presence of porcelain beads as shown in Figure 6 and the third set with copper mesh as shown in Figure 7. It was
observed that the condenser did not require low temperature cooling, as the vapours started solidifying at room
temperature by itself in the first two experimental sets except the third experimental set. As a result, water
condensers were used for cooling the vapour products from the third set of experiment. The 1st air condenser was
maintained at higher temperature while the 2nd
condenser was maintained at room temperature which was followed
by an optional water condenser. This type of cooling arrangement helps in collecting the products properly. The
experimental setup is as shown in Figure 2.
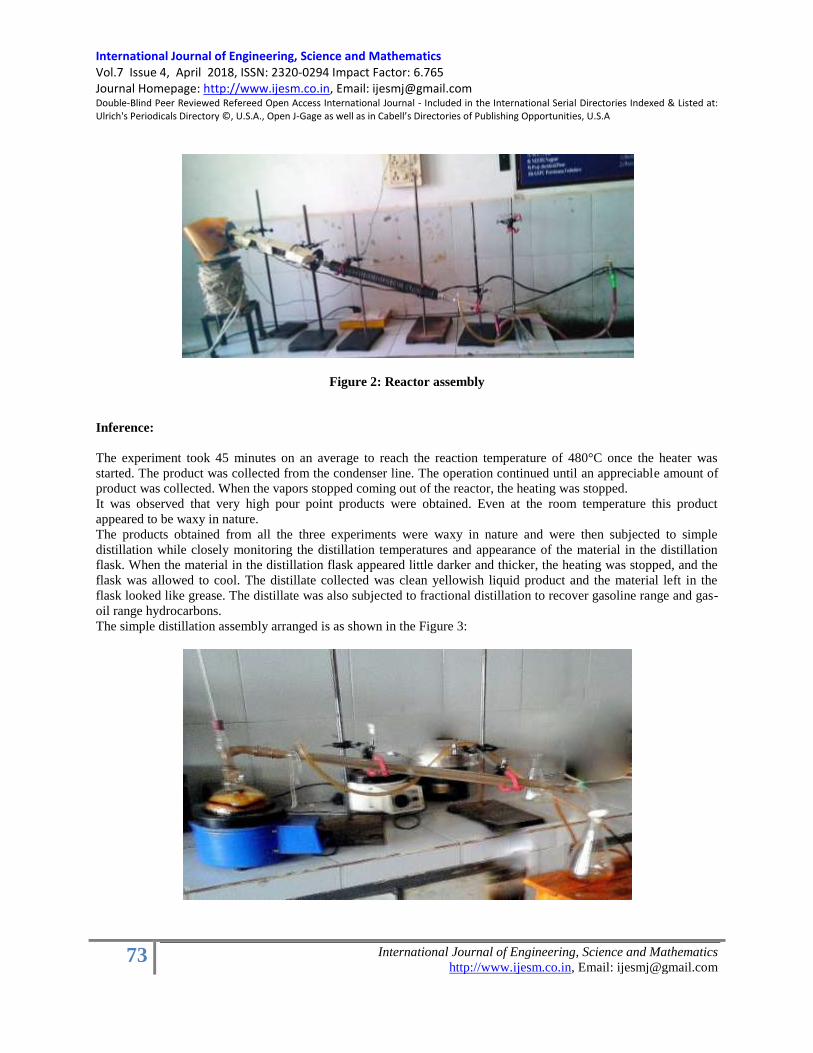
International Journal of Engineering, Science and Mathematics Vol.7 Issue 4, April 2018, ISSN: 2320-0294 Impact Factor: 6.765 Journal Homepage: http://www.ijesm.co.in, Email: [email protected] Double-Blind Peer Reviewed Refereed Open Access International Journal - Included in the International Serial Directories Indexed & Listed at: Ulrich's Periodicals Directory ©, U.S.A., Open J-Gage as well as in Cabell’s Directories of Publishing Opportunities, U.S.A
73 International Journal of Engineering, Science and Mathematics
http://www.ijesm.co.in, Email: [email protected]
Figure 2: Reactor assembly
Inference:
The experiment took 45 minutes on an average to reach the reaction temperature of 480°C once the heater was
started. The product was collected from the condenser line. The operation continued until an appreciable amount of
product was collected. When the vapors stopped coming out of the reactor, the heating was stopped.
It was observed that very high pour point products were obtained. Even at the room temperature this product
appeared to be waxy in nature.
The products obtained from all the three experiments were waxy in nature and were then subjected to simple
distillation while closely monitoring the distillation temperatures and appearance of the material in the distillation
flask. When the material in the distillation flask appeared little darker and thicker, the heating was stopped, and the
flask was allowed to cool. The distillate collected was clean yellowish liquid product and the material left in the
flask looked like grease. The distillate was also subjected to fractional distillation to recover gasoline range and gas-
oil range hydrocarbons.
The simple distillation assembly arranged is as shown in the Figure 3:
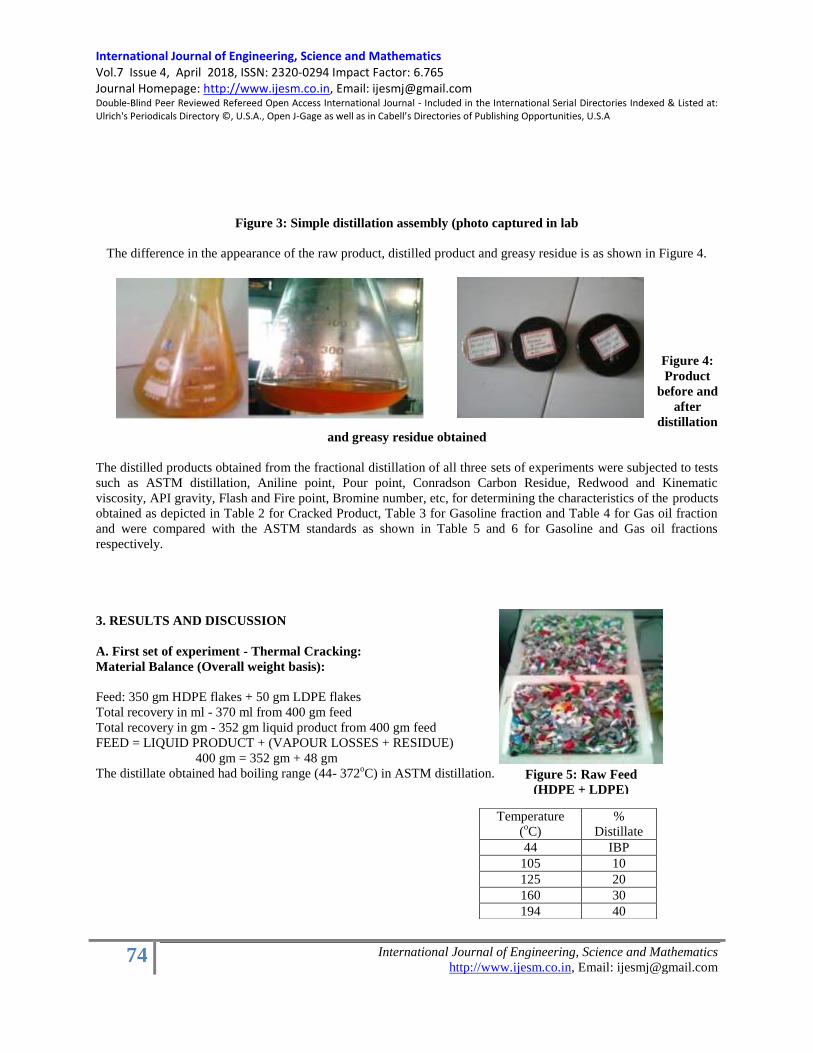
International Journal of Engineering, Science and Mathematics Vol.7 Issue 4, April 2018, ISSN: 2320-0294 Impact Factor: 6.765 Journal Homepage: http://www.ijesm.co.in, Email: [email protected] Double-Blind Peer Reviewed Refereed Open Access International Journal - Included in the International Serial Directories Indexed & Listed at: Ulrich's Periodicals Directory ©, U.S.A., Open J-Gage as well as in Cabell’s Directories of Publishing Opportunities, U.S.A
74 International Journal of Engineering, Science and Mathematics
http://www.ijesm.co.in, Email: [email protected]
Figure 3: Simple distillation assembly (photo captured in lab
The difference in the appearance of the raw product, distilled product and greasy residue is as shown in Figure 4.
Figure 4:
Product
before and
after
distillation
and greasy residue obtained
The distilled products obtained from the fractional distillation of all three sets of experiments were subjected to tests
such as ASTM distillation, Aniline point, Pour point, Conradson Carbon Residue, Redwood and Kinematic
viscosity, API gravity, Flash and Fire point, Bromine number, etc, for determining the characteristics of the products
obtained as depicted in Table 2 for Cracked Product, Table 3 for Gasoline fraction and Table 4 for Gas oil fraction
and were compared with the ASTM standards as shown in Table 5 and 6 for Gasoline and Gas oil fractions
respectively.
3. RESULTS AND DISCUSSION
A. First set of experiment - Thermal Cracking:
Material Balance (Overall weight basis):
Feed: 350 gm HDPE flakes + 50 gm LDPE flakes
Total recovery in ml - 370 ml from 400 gm feed
Total recovery in gm - 352 gm liquid product from 400 gm feed
FEED = LIQUID PRODUCT + (VAPOUR LOSSES + RESIDUE)
400 gm = 352 gm + 48 gm
The distillate obtained had boiling range (44- 372oC) in ASTM distillation.
Temperature
(oC)
%
Distillate
44 IBP
105 10
125 20
160 30
194 40
Figure 5: Raw Feed
(HDPE + LDPE)
(
H
D
P
E
+
L
D
P
E
)
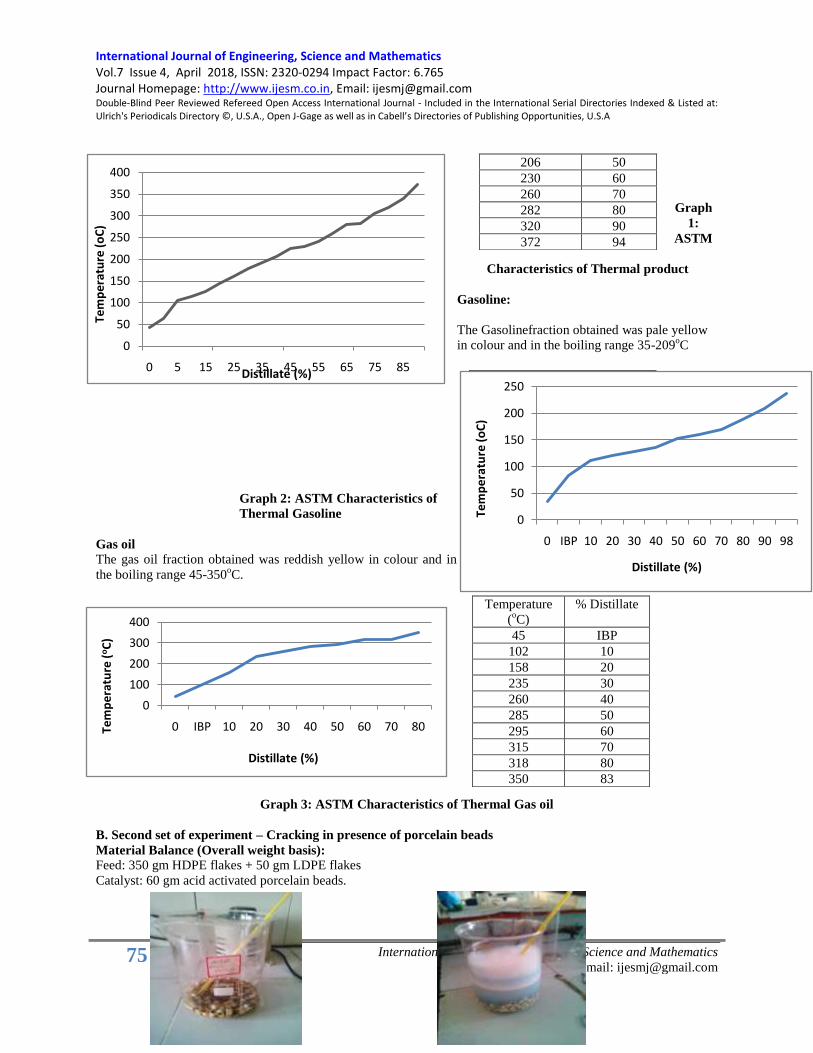
International Journal of Engineering, Science and Mathematics Vol.7 Issue 4, April 2018, ISSN: 2320-0294 Impact Factor: 6.765 Journal Homepage: http://www.ijesm.co.in, Email: [email protected] Double-Blind Peer Reviewed Refereed Open Access International Journal - Included in the International Serial Directories Indexed & Listed at: Ulrich's Periodicals Directory ©, U.S.A., Open J-Gage as well as in Cabell’s Directories of Publishing Opportunities, U.S.A
75 International Journal of Engineering, Science and Mathematics
http://www.ijesm.co.in, Email: [email protected]
0
50
100
150
200
250
300
350
400
0 5 15 25 35 45 55 65 75 85
Tem
pe
ratu
re (
oC
)
Distillate (%)
Graph
1:
ASTM
Characteristics of Thermal product
Gasoline:
The Gasolinefraction obtained was pale yellow
in colour and in the boiling range 35-209oC
Graph 2: ASTM Characteristics of
Thermal Gasoline
Gas oil
The gas oil fraction obtained was reddish yellow in colour and in
the boiling range 45-350oC.
Graph 3: ASTM Characteristics of Thermal Gas oil
B. Second set of experiment – Cracking in presence of porcelain beads
Material Balance (Overall weight basis):
Feed: 350 gm HDPE flakes + 50 gm LDPE flakes
Catalyst: 60 gm acid activated porcelain beads.
206 50
230 60
260 70
282 80
320 90
372 94
Temperature
(oC)
% Distillate
35 IBP
84 10
112 20
121 30
129 40
136 50
152 60
161 70
170 80
188 90
209 94
Temperature
(oC)
% Distillate
45 IBP
102 10
158 20
235 30
260 40
285 50
295 60
315 70
318 80
350 83
0
100
200
300
400
0 IBP 10 20 30 40 50 60 70 80Tem
pe
ratu
re (
oC
)
Distillate (%)
0
50
100
150
200
250
0 IBP 10 20 30 40 50 60 70 80 90 98
Tem
pe
ratu
re (
oC
)
Distillate (%)
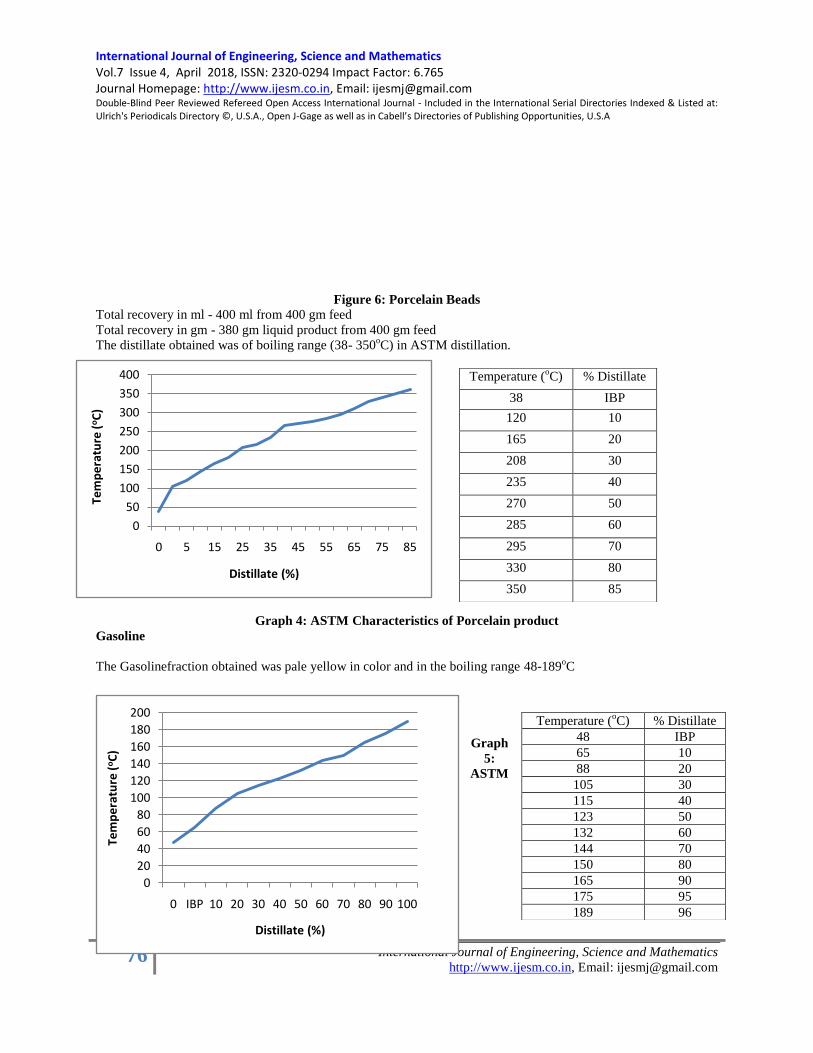
International Journal of Engineering, Science and Mathematics Vol.7 Issue 4, April 2018, ISSN: 2320-0294 Impact Factor: 6.765 Journal Homepage: http://www.ijesm.co.in, Email: [email protected] Double-Blind Peer Reviewed Refereed Open Access International Journal - Included in the International Serial Directories Indexed & Listed at: Ulrich's Periodicals Directory ©, U.S.A., Open J-Gage as well as in Cabell’s Directories of Publishing Opportunities, U.S.A
76 International Journal of Engineering, Science and Mathematics
http://www.ijesm.co.in, Email: [email protected]
Figure 6: Porcelain Beads
Total recovery in ml - 400 ml from 400 gm feed
Total recovery in gm - 380 gm liquid product from 400 gm feed
The distillate obtained was of boiling range (38- 350oC) in ASTM distillation.
Graph 4: ASTM Characteristics of Porcelain product
Gasoline
The Gasolinefraction obtained was pale yellow in color and in the boiling range 48-189oC
Graph
5:
ASTM
Temperature (oC) % Distillate
38 IBP
120 10
165 20
208 30
235 40
270 50
285 60
295 70
330 80
350 85
Temperature (oC) % Distillate
48 IBP
65 10
88 20
105 30
115 40
123 50
132 60
144 70
150 80
165 90
175 95
189 96
0
50
100
150
200
250
300
350
400
0 5 15 25 35 45 55 65 75 85
Tem
pe
ratu
re (
oC
)
Distillate (%)
0
20
40
60
80
100
120
140
160
180
200
0 IBP 10 20 30 40 50 60 70 80 90 100
Tem
pe
ratu
re (
oC
)
Distillate (%)
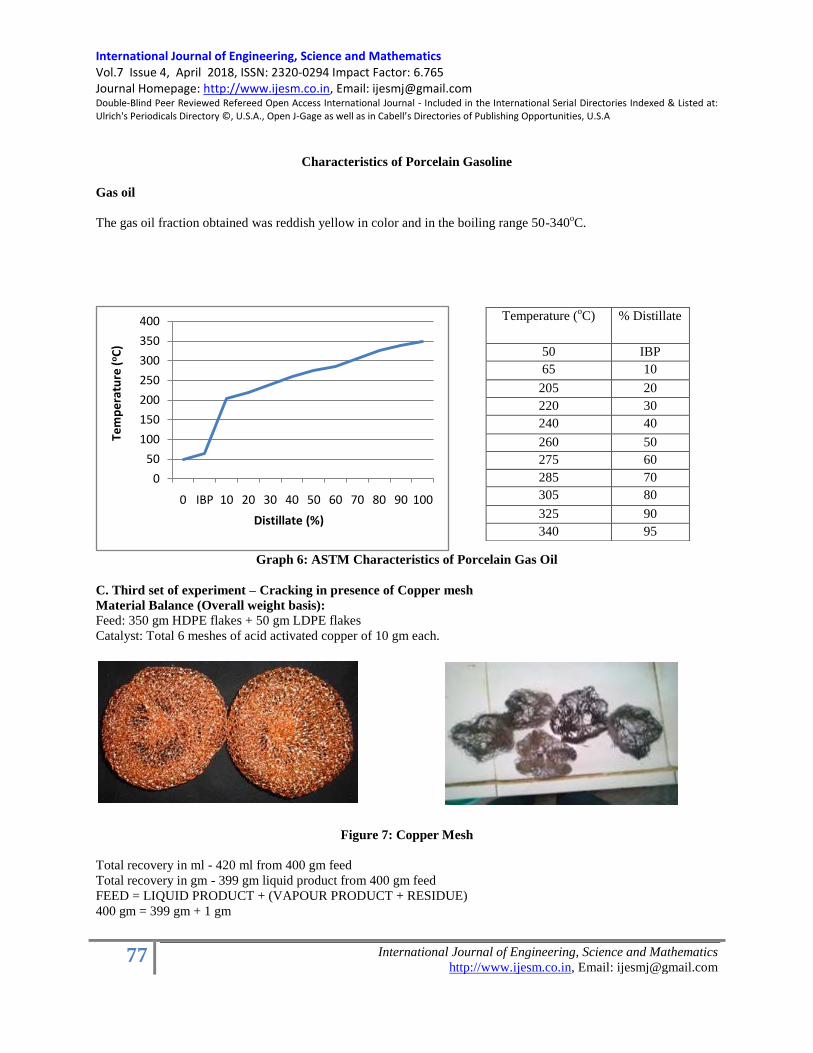
International Journal of Engineering, Science and Mathematics Vol.7 Issue 4, April 2018, ISSN: 2320-0294 Impact Factor: 6.765 Journal Homepage: http://www.ijesm.co.in, Email: [email protected] Double-Blind Peer Reviewed Refereed Open Access International Journal - Included in the International Serial Directories Indexed & Listed at: Ulrich's Periodicals Directory ©, U.S.A., Open J-Gage as well as in Cabell’s Directories of Publishing Opportunities, U.S.A
77 International Journal of Engineering, Science and Mathematics
http://www.ijesm.co.in, Email: [email protected]
Characteristics of Porcelain Gasoline
Gas oil
The gas oil fraction obtained was reddish yellow in color and in the boiling range 50-340oC.
Graph 6: ASTM Characteristics of Porcelain Gas Oil
C. Third set of experiment – Cracking in presence of Copper mesh
Material Balance (Overall weight basis):
Feed: 350 gm HDPE flakes + 50 gm LDPE flakes
Catalyst: Total 6 meshes of acid activated copper of 10 gm each.
Figure 7: Copper Mesh
Total recovery in ml - 420 ml from 400 gm feed
Total recovery in gm - 399 gm liquid product from 400 gm feed
FEED = LIQUID PRODUCT + (VAPOUR PRODUCT + RESIDUE)
400 gm = 399 gm + 1 gm
Temperature (oC) % Distillate
50 IBP
65 10
205 20
220 30
240 40
260 50
275 60
285 70
305 80
325 90
340 95
0
50
100
150
200
250
300
350
400
0 IBP 10 20 30 40 50 60 70 80 90 100
Tem
pe
ratu
re (
oC
)
Distillate (%)
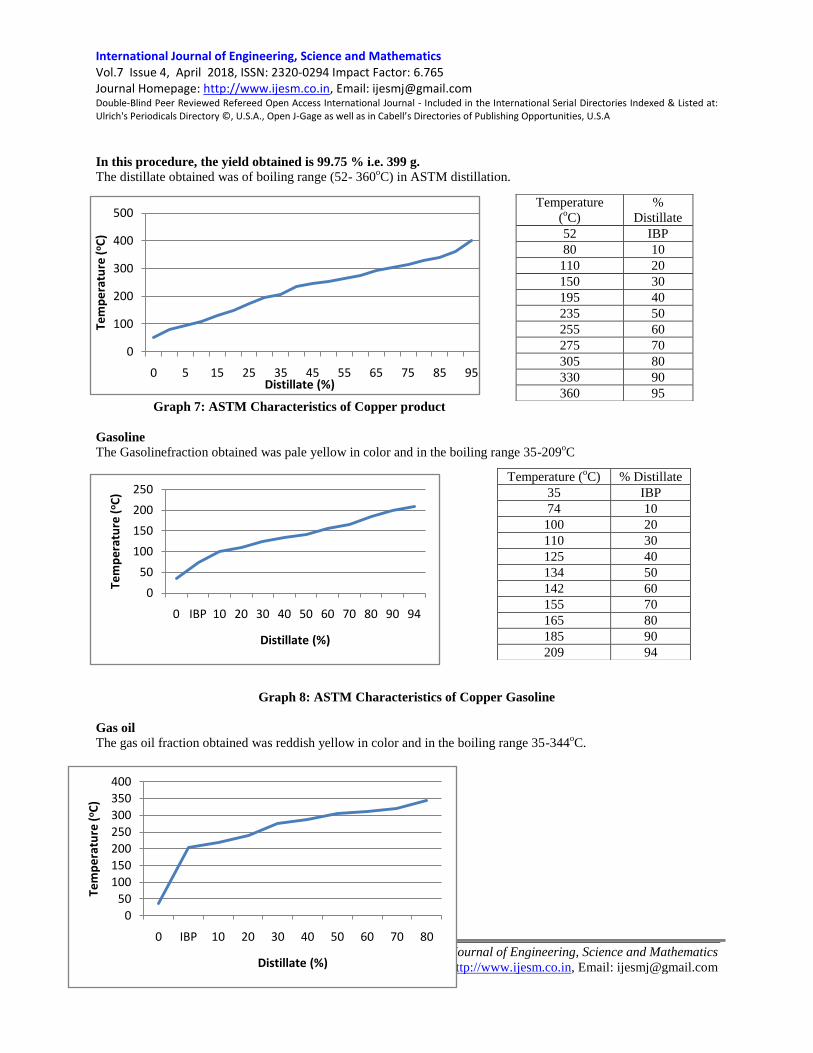
International Journal of Engineering, Science and Mathematics Vol.7 Issue 4, April 2018, ISSN: 2320-0294 Impact Factor: 6.765 Journal Homepage: http://www.ijesm.co.in, Email: [email protected] Double-Blind Peer Reviewed Refereed Open Access International Journal - Included in the International Serial Directories Indexed & Listed at: Ulrich's Periodicals Directory ©, U.S.A., Open J-Gage as well as in Cabell’s Directories of Publishing Opportunities, U.S.A
78 International Journal of Engineering, Science and Mathematics
http://www.ijesm.co.in, Email: [email protected]
In this procedure, the yield obtained is 99.75 % i.e. 399 g. The distillate obtained was of boiling range (52- 360
oC) in ASTM distillation.
Graph 7: ASTM Characteristics of Copper product
Gasoline
The Gasolinefraction obtained was pale yellow in color and in the boiling range 35-209oC
Graph 8: ASTM Characteristics of Copper Gasoline
Gas oil
The gas oil fraction obtained was reddish yellow in color and in the boiling range 35-344oC.
Temperature
(oC)
%
Distillate
52 IBP
80 10
110 20
150 30
195 40
235 50
255 60
275 70
305 80
330 90
360 95
Temperature (oC) % Distillate
35 IBP
74 10
100 20
110 30
125 40
134 50
142 60
155 70
165 80
185 90
209 94
0
100
200
300
400
500
0 5 15 25 35 45 55 65 75 85 95
Tem
pe
ratu
re (
oC
)
Distillate (%)
0
50
100
150
200
250
0 IBP 10 20 30 40 50 60 70 80 90 94
Tem
pe
ratu
re (
oC
)
Distillate (%)
0
50
100
150
200
250
300
350
400
0 IBP 10 20 30 40 50 60 70 80
Tem
pe
ratu
re (
oC
)
Distillate (%)
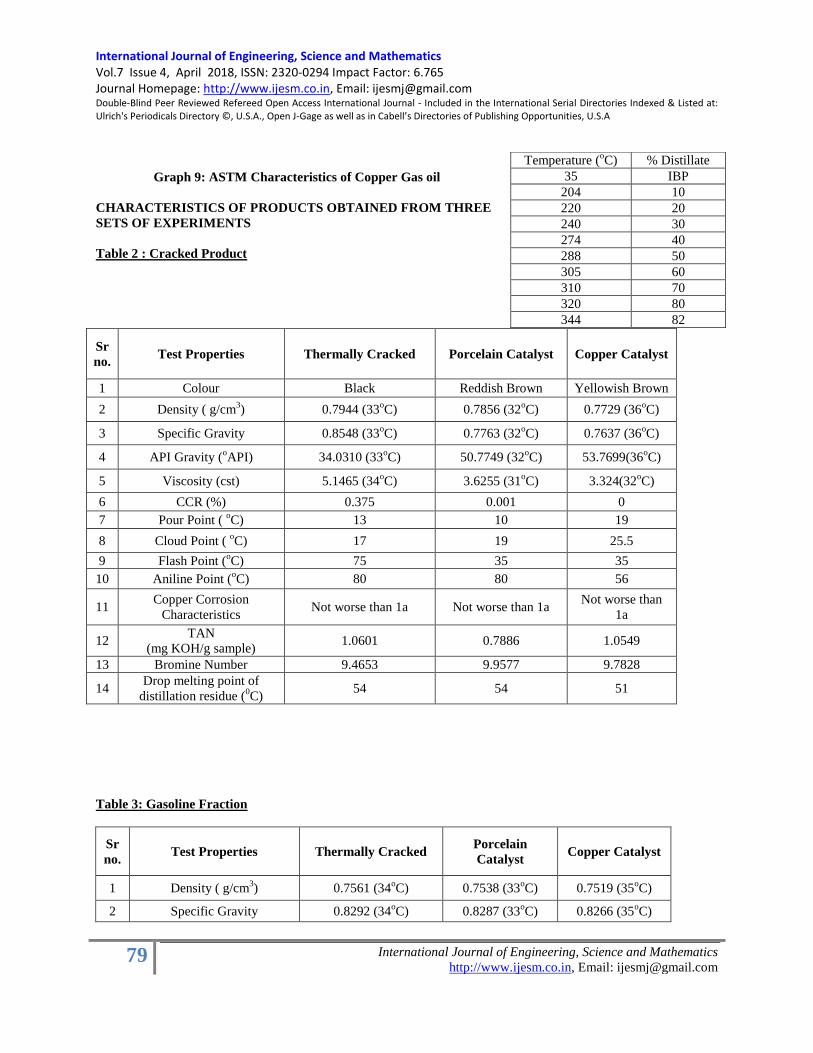
International Journal of Engineering, Science and Mathematics Vol.7 Issue 4, April 2018, ISSN: 2320-0294 Impact Factor: 6.765 Journal Homepage: http://www.ijesm.co.in, Email: [email protected] Double-Blind Peer Reviewed Refereed Open Access International Journal - Included in the International Serial Directories Indexed & Listed at: Ulrich's Periodicals Directory ©, U.S.A., Open J-Gage as well as in Cabell’s Directories of Publishing Opportunities, U.S.A
79 International Journal of Engineering, Science and Mathematics
http://www.ijesm.co.in, Email: [email protected]
Graph 9: ASTM Characteristics of Copper Gas oil
CHARACTERISTICS OF PRODUCTS OBTAINED FROM THREE
SETS OF EXPERIMENTS
Table 2 : Cracked Product
Sr
no. Test Properties Thermally Cracked Porcelain Catalyst Copper Catalyst
1 Colour Black Reddish Brown Yellowish Brown
2 Density ( g/cm3) 0.7944 (33
oC) 0.7856 (32
oC) 0.7729 (36
oC)
3 Specific Gravity 0.8548 (33oC) 0.7763 (32
oC) 0.7637 (36
oC)
4 API Gravity (oAPI) 34.0310 (33
oC) 50.7749 (32
oC) 53.7699(36
oC)
5 Viscosity (cst) 5.1465 (34oC) 3.6255 (31
oC) 3.324(32
oC)
6 CCR (%) 0.375 0.001 0
7 Pour Point ( oC) 13 10 19
8 Cloud Point ( oC) 17 19 25.5
9 Flash Point (oC) 75 35 35
10 Aniline Point (oC) 80 80 56
11 Copper Corrosion
Characteristics Not worse than 1a Not worse than 1a
Not worse than
1a
12 TAN
(mg KOH/g sample) 1.0601 0.7886 1.0549
13 Bromine Number 9.4653 9.9577 9.7828
14 Drop melting point of
distillation residue (0C)
54 54 51
Table 3: Gasoline Fraction
Sr
no. Test Properties Thermally Cracked
Porcelain
Catalyst Copper Catalyst
1 Density ( g/cm3) 0.7561 (34
oC) 0.7538 (33
oC) 0.7519 (35
oC)
2 Specific Gravity 0.8292 (34oC) 0.8287 (33
oC) 0.8266 (35
oC)
Temperature (oC) % Distillate
35 IBP
204 10
220 20
240 30
274 40
288 50
305 60
310 70
320 80
344 82

International Journal of Engineering, Science and Mathematics Vol.7 Issue 4, April 2018, ISSN: 2320-0294 Impact Factor: 6.765 Journal Homepage: http://www.ijesm.co.in, Email: [email protected] Double-Blind Peer Reviewed Refereed Open Access International Journal - Included in the International Serial Directories Indexed & Listed at: Ulrich's Periodicals Directory ©, U.S.A., Open J-Gage as well as in Cabell’s Directories of Publishing Opportunities, U.S.A
80 International Journal of Engineering, Science and Mathematics
http://www.ijesm.co.in, Email: [email protected]
3 API Gravity (oAPI) 39.1454 (34
oC) 39.2517 (33
oC) 39.6831(35
oC)
4 Viscosity (cst) 0.7215 (34oC) 0.7085 (32
oC) 0.6851 (35
oC)
5 Pour Point ( oC)
Not obtained upto
-25oC
Not obtained upto
-25oC
Not obtained upto
-25oC
6 Cloud Point ( oC) 5.4 3 2
7 Flash Point (oC) 35 35 35
8 Copper Corrosion
Characteristics Not worse than 1a Not worse than 1a Not worse than 1a
9 TAN
(mg KOH/g sample) 1.0617 0.7854 1.0511
10 Bromine Number 17.0762 16.6829 17.088
Table 4: Gas Oil Fraction
Sr
no. Test Properties Thermally Cracked Porcelain Catalyst
Copper
Catalyst
1 Density ( g/cm3) 0.8126 (34
oC) 0.8109 (33
oC) 0.8095 (35
oC)
2 Specific Gravity 0.8670 (34oC) 0.8666 (33
oC) 0.8651 (35
oC)
3 API Gravity (oAPI) 31.7194 (34
oC) 31.7825 (33
oC) 32.8023 (35
oC)
4 Viscosity (cst) 3.5335 (34oC) 3.3572 (33
oC) 3.2178 (35
oC)
5 CCR (%) 0.351 0.231 0.112
6 Pour Point ( oC) 25 19 17
7 Cloud Point ( oC) 32 25.5 24.7
8 Flash Point (oC) 35 39 39
9 Aniline Point (oC) 83 59 54
10 Copper Corrosion
Characteristics Not worse than 1a Not worse than 1a
Not worse than
1a
11 TAN
(mg KOH/g sample) 1.047 0.5257 1.065
12 Bromine Number 9.7721 9.3961 9.4463
Figure 8: Final products as obtained from the experiment
The figure above shows the following product (from left to right):

International Journal of Engineering, Science and Mathematics Vol.7 Issue 4, April 2018, ISSN: 2320-0294 Impact Factor: 6.765 Journal Homepage: http://www.ijesm.co.in, Email: [email protected] Double-Blind Peer Reviewed Refereed Open Access International Journal - Included in the International Serial Directories Indexed & Listed at: Ulrich's Periodicals Directory ©, U.S.A., Open J-Gage as well as in Cabell’s Directories of Publishing Opportunities, U.S.A
81 International Journal of Engineering, Science and Mathematics
http://www.ijesm.co.in, Email: [email protected]
Obtained from Copper Mesh
1. Crude oil
2. Gasoline
3. Gas oil
Obtained from
Porcelain Beads
1. Crude oil
2. Gasoline
3. Gas oil
Obtained from
Thermal
Cracking
1. Crude oil
2. Gasoline
3. Gas oil
ASTM Standard
Specifications:[4]
Table 5: Gasoline
Sr No. Test Properties Range
1 Density ( g/cm3) * 0.7-0.78
2 Specific Gravity* 0.7-0.8
3 API Gravity (oAPI) * 30-39
4 Viscosity (cst) * 0.37-0.44
5 Pour Point ( oC) -40
6 Cloud Point ( oC) 3
7 Flash Point (oC) 45
8 Copper Corrosion Characteristics Not worse than 1a
9 TAN (mg KOH/g sample) 0.5
(*Note: At 60oF)
Table 6: Diesel
Sr No. Test Properties Range
1 Density ( g/cm3) * 0.83-0.87

International Journal of Engineering, Science and Mathematics Vol.7 Issue 4, April 2018, ISSN: 2320-0294 Impact Factor: 6.765 Journal Homepage: http://www.ijesm.co.in, Email: [email protected] Double-Blind Peer Reviewed Refereed Open Access International Journal - Included in the International Serial Directories Indexed & Listed at: Ulrich's Periodicals Directory ©, U.S.A., Open J-Gage as well as in Cabell’s Directories of Publishing Opportunities, U.S.A
82 International Journal of Engineering, Science and Mathematics
http://www.ijesm.co.in, Email: [email protected]
2 Specific Gravity* 0.81-0.89
3 API Gravity (oAPI) * 30-42
4 Viscosity (cst) * 2.6-4.1
5 CCR (%) 0.2
6 Pour Point ( oC) -6
7 Cloud Point ( oC) 6
8 Flash Point (oC) 165
9 Aniline Point (oC) 65-70
10 Copper Corrosion Characteristics Not worse than 1a
11 TAN (mg KOH/gsample) 0.5
(*Note: At 60oF)
4. CONCLUSION
Based on the results obtained from the three sets of experiments performed it can be concluded that the cracking of
plastics is a viable way for the disposal of plastic wastes, considering the environmental hazards posed by the
generation and consumption of huge amount of plastic waste. Since plastic is a petroleum product and the energy
lost in the form of plastic waste can be recovered back to the energy contained as hydrocarbon liquids and gases by
pyrolysis process. This way the environment can be saved from the threat due to plastic wastes and at the same time,
to some extent, non-renewable source of energy (petroleum) can be conserved. Therefore the conversion of plastic
waste to liquid and gaseous hydrocarbons can be used as a source of energy and/or as a feedstock for petrochemicals
which seems to be an environmentally and economically best option available.
It is observed that the product obtained from the cracking of plastic waste in the presence of ceramic beads and
copper is more stable than the thermally cracked product. However, the product obtained from cracking of waste
plastic in the presence of ceramic beads is waxy in nature similar to the product that is obtained from the thermal
cracking of waste plastic. While the product obtained from the cracking of waste plastic in the presence of copper
mesh has higher yields, less waxy nature and color stability compared to the products obtained from the other two
sets of experiments.
From these observations, it appears that the cracking of plastic waste in presence of copper mesh is most efficient
process compared to thermal cracking and cracking in presence of porcelain beads.
REFERENCES:
1. Waste plastics to fuel: a sustainable method for waste reduction and energy generation, Department of
Chemistry, School of Engg. and Technology, Paralakhemundi, CUTM Odisha.pdf
2. http://www.ecozuri.com/skin/frontend/default/default/pdf/Plastic_101.pdf
3. http://www.pyrolysisplant.com/what-is-pyrolysis/
4. Book: B.K. Bhaskara,―Modern Petroleum Refining Processes‖, Page no.111,144,146,148, 195
5. http://www.wealthywaste.com/plastic-consumption-in-india
6. http://www.business-standard.com/article/companies/plastics-consumption-to-treble-in-10-years-
111032300076_1.html
7. http://www.iip.res.in/waste_plastic.php
8. https://community.data.gov.in/production-of-polymers-in-2014-15/
International Journal of Engineering, Science and Mathematics Vol.7 Issue 4, April 2018, ISSN: 2320-0294 Impact Factor: 6.765 Journal Homepage: http://www.ijesm.co.in, Email: [email protected] Double-Blind Peer Reviewed Refereed Open Access International Journal - Included in the International Serial Directories Indexed & Listed at: Ulrich's Periodicals Directory ©, U.S.A., Open J-Gage as well as in Cabell’s Directories of Publishing Opportunities, U.S.A
83 International Journal of Engineering, Science and Mathematics
http://www.ijesm.co.in, Email: [email protected]
Accident Prevention and Control - An Overview of Literature
(N .N. Pisharody)4
(Kanchan D. Bahukhandi)**
(Prashant S Rawat)***
(R. K. Elangovan)****
4 Nuclear Power Corporation of India Limited, Anushaktinagar, Mumbai, Maharashtra, India – 400094. **
University of Petroleum and Energy Studies, Dehradun, Uttarakhand, India – 248007 ***
University of Petroleum and Energy Studies, Dehradun, Uttarakhand, India – 248007
International Journal of Engineering, Science and Mathematics Vol.7 Issue 4, April 2018, ISSN: 2320-0294 Impact Factor: 6.765 Journal Homepage: http://www.ijesm.co.in, Email: [email protected] Double-Blind Peer Reviewed Refereed Open Access International Journal - Included in the International Serial Directories Indexed & Listed at: Ulrich's Periodicals Directory ©, U.S.A., Open J-Gage as well as in Cabell’s Directories of Publishing Opportunities, U.S.A
84 International Journal of Engineering, Science and Mathematics
http://www.ijesm.co.in, Email: [email protected]
Abstract
Injury can be intentional or unintentional. Intentional injuries occur due to
willful act of individuals and unintentional injuries occur due to accidents.
This paper looks into unintentional injuries and illustrates an overview of
literature on accident prevention and control. Hazards in combination with
favorable work place interfaces cause accidents and injuries. Since all
accidents are caused, all should be investigated to identify and correct causes.
Accident prediction models help to understand and analyze accident process.
Accident prevention and control measures should start from design and it
should continue throughout the life cycle. The paper refutes Heinrich‘s
theory of accident causation that 88% of accidents occur due to unsafe acts as
details of research methodology followed by him are not available. Similarly,
Heinrich‘s theory that in a group of 330 accidents of same kind, involving
same person, there is a constant ratio of 1:29:300 between major injuries,
minor injuries and near misses also has been disproved due to inconsistency
in the definition of accidents in different editions of his book. Modern
theories indicate that accidents occur due to organizational reasons, rather
than workers‘ fault. Approach of organization towards principles of human,
organization and technical factors affects accident prevention and control.
Studies also indicate that reporting of high frequency and low consequence
near misses should be imbibed into organizational safety culture as it gives
ample opportunities for preventing accidents of low frequency and high
consequence. The paper also emphasizes requirement of management
commitment and positive safety culture within the organization to foster an
accident prevention culture.
Keywords:
Accident Causation; Hazard
Identification; Near Miss; Risk
Assessment; Safety
Management
Copyright © 2018International Journals of Multidisciplinary
Research Academy. All rights reserved.
Author correspondence:
N. N. Pisharody
Nuclear Power Corporation of India Limited,
Anushaktinagar, Mumbai, Maharashtra,
India - 400094
1. Introduction
Hazard is a characteristic of a system or process that represents potential for an accident, causing injury to
people; or damage to property or environment [13]. In any system, risk cannot be eliminated fully; however it can be
reduced to acceptable level by additional corrective measures. Hazards in work environment are identified through
plant safety inspections or system features and corrected through Safety Related Deficiency Management System
(SRDMS). Despite this, there could be some residual hazards, which on interaction with external agencies can cause
near misses.
Near misses are relatively harmlessdisruptions from normal operation without any personal injury or property
loss. Near misses under different circumstances could cause accidents or events of serious consequences. Near
misses are prevented from escalating into accidents by providing safety barriers. Safety barriers may be physical i.e.
machine guards, protection systems etc or non-physical i.e. administrative controls, work permits etc. Accidents
occur due to a series of failures or errors occurring in a sequential path.Safety barriers break this sequential path and
prevent accidents. Failure of safety barriers may exacerbate near misses into accidents [19], [32].

International Journal of Engineering, Science and Mathematics Vol.7 Issue 4, April 2018, ISSN: 2320-0294 Impact Factor: 6.765 Journal Homepage: http://www.ijesm.co.in, Email: [email protected] Double-Blind Peer Reviewed Refereed Open Access International Journal - Included in the International Serial Directories Indexed & Listed at: Ulrich's Periodicals Directory ©, U.S.A., Open J-Gage as well as in Cabell’s Directories of Publishing Opportunities, U.S.A
85 International Journal of Engineering, Science and Mathematics
http://www.ijesm.co.in, Email: [email protected]
All accidents are investigated and additional safety barriers are provided to prevent recurrence. However, failure
of existing or additionally installed safety barriers may cause recurrence of accidents as shown in Figure-1 [26],
[30]. Whenever safety barriers are challenged, situation becomes closer to accidents. Even though multiple safety
barriers are deployed, maintenance of barriers is essential to prevent accidents. About 30-40% of accidents and
precursors occur due to shortfalls in barrier maintenance, introduction of new hazards during maintenance or due to
non-maintenance related causes [29].
Figure-1: Sequence of Escalation of Hazards to Accidents Ac
cidents
may or
may
not
cause
injury.
Injury
is
bodily
damage resulting from overexposure to energy in excess of threshold limit of physiological capacity [15]. Energy
can be mechanical, thermal, electrical, chemical or radiant energy. Injury can be intentional or unintentional.
Intentional injuries occur due to willful act of individuals i.e. homicide, violence, suicide etc. Unintentional injuries
occur due to accidents i.e. fall of persons, fall of objects, caught in objects, struck by moving objects, electric shock
etc.
This paper looks into unintentional injuries due to accidents and illustrates an overview of literature on accident
prevention and control.
2. Taxonomy of Literature Hazards in combination with favorable work place interfaces cause accidents and injuries. Since all accidents
are caused, all should be investigated to identify and correct causes. Approach of organization towards principles of
human, organization and technical factors also affects accident prevention and control. Accident prediction models
help analysis of accident.
Considering the above sequence, literature on industrial accident prevention and control can be categorized as
hazard control, accident causation, accident investigation, human, organizational and technical factors, accident
control and accident prediction. This paper comprises of nine sections. Section 1 presents introduction, Section 2
gives taxonomy. Section 3 deals with hazard control, Section 4 is on accident causation, Section 5 reviews accident
investigation, Section 6 gives an account of human, organizational and technical factors pertaining to accident
prevention, Section 7 is on accident control, Section 8 looks into accident prediction and Section 9 gives discussion
and conclusion of the review.
3. Hazard Control
Hazard control is a function, directed towards recognizing, evaluating and eliminating or reducing destructive
effects of hazards to protect workers from injuries [27]. Hazard control involves following six essential processes:
1. Hazard identification
2. Hazard ranking
3. Management decision making
4. Establishing preventive and corrective measures
5. Monitoring, and
6. Evaluating programme effectiveness
3.1 Hazard Identification:-
A person working in the neighborhood of hazards is vulnerable to the risk of accident and injury. Severity of
injury depends up on the amount of energy transferred to victim‘s body during the accident. A systematic method
for hazard identification is the first step towards accident prevention and control.

International Journal of Engineering, Science and Mathematics Vol.7 Issue 4, April 2018, ISSN: 2320-0294 Impact Factor: 6.765 Journal Homepage: http://www.ijesm.co.in, Email: [email protected] Double-Blind Peer Reviewed Refereed Open Access International Journal - Included in the International Serial Directories Indexed & Listed at: Ulrich's Periodicals Directory ©, U.S.A., Open J-Gage as well as in Cabell’s Directories of Publishing Opportunities, U.S.A
86 International Journal of Engineering, Science and Mathematics
http://www.ijesm.co.in, Email: [email protected]
Hazard identification methods are categorized as comparative methods and fundamental methods. Comparative
methods involve comparison of plant conditions by checklist, safety audit, hazard indices etc.Fundamental methods
of hazard identification involve stimulating a group of people for identifying hazards by raising a series of questions
by What-if Analysis, Failure Modes and Effects Analysis and Hazard and Operability Study etc [13], [20].
Khanzode et al.[18] propose following approaches for hazard identification:
Biased reactive approach, where hazards are identified based on information after an accident.
Biased proactive approach, where hazards are identified based on historical data before the accident.
Unbiased proactive approach, where hazards are identified before the accident, without considering the
presence of historical data.
Results of biased reactive approach depend on expertise and professional competency of persons carrying out
the job. Biased proactive approach depends on prior information about processes and systems. Unbiased proactive
approach is not completely unbiased as historical data and previous work experience are essential in this approach.
Rathnayaka et al.propose System Hazard Identification, Prevention and Prediction (SHIPP) framework for
chemical processes hazards [32]. SHIPP framework considers safety barriers related to human, organizational and
technical aspects for hazard control. Depending on success or failure of safety barriers, it considers six consequences
for an event i.e. safe, near-miss, mishap, incident, accident and serious accident.
3.2 Hazard Ranking:-
Objective of hazard ranking is to prioritize corrective actions, based on risk assessment. Risk is determined
from the probability and severity of event with the help of risk matrix. Typical risk matrix and actions to be taken at
various risk levels aregiven in Table-1 in Table-2 respectively [12], [14], [23].
Major pit falls in risk assessment[43] are:
Risk assessment is carried out to justify decisions already taken.
Generic risk assessment is used when specific assessment is required.
All the hazards and risks in a particular activity are not identified.
Results of risk assessment are not used for implementing corrective measures.
Table-1
Risk Matrix
Severity
Slightly Harmful Harmful Extremely Harmful Probability
of
Occurrence
Highly Unlikely Trivial Risk Tolerable Risk Moderate Risk
Unlikely Tolerable Risk Moderate Risk Substantial Risk
Likely Moderate Risk Substantial Risk Intolerable Risk
Table-2
Risk Based Action Plan
Trivial Risk No action is required and no documentary record needs to be kept
Tolerable Risk No additional controls are required.
Monitoring is required to ensure that controls are maintained
Moderate Risk Risk reduction measures should be implemented
Substantial Risk Work should not be started until risk has been reduced.
Urgent action should be taken to reduce risk.
Intolerable Risk
Work should not be started or continued until risk has been reduced.
If it is not possible to reduce risk, work should remain prohibited.
3.3 Management Decision Making:-
Management decision making involves modification in design, work environment or procedures; repair or
replacement of equipment for eliminating or controlling hazards and risks.

International Journal of Engineering, Science and Mathematics Vol.7 Issue 4, April 2018, ISSN: 2320-0294 Impact Factor: 6.765 Journal Homepage: http://www.ijesm.co.in, Email: [email protected] Double-Blind Peer Reviewed Refereed Open Access International Journal - Included in the International Serial Directories Indexed & Listed at: Ulrich's Periodicals Directory ©, U.S.A., Open J-Gage as well as in Cabell’s Directories of Publishing Opportunities, U.S.A
87 International Journal of Engineering, Science and Mathematics
http://www.ijesm.co.in, Email: [email protected]
3.4 Establishing Preventive and Corrective Measures:-
Hazards can be eliminated or controlled at source, path and at receiverby design, administrative control or by
Personal Protective Equipment (PPE) [27], [20]. Methods of hazard control by design are elimination, substitution
and engineering controls; these are preventive actions. Administrative control and PPEs do not remove hazards, but
reduce exposure to hazards; these are contingent actions. Preventive actions do not rely on human performance,
hence are not prone to human errors. Contingent actions depend on human performance, hence are less effective.
Work places should be designed to avoid overly stressful work methods, by consideringhuman capabilities and
limitations. Design should consider probability of errors in human interactions with use of PPEs as low as
reasonably practicable [23]. In fact a multitier defense-in-depth approach with a combination of design,
administrative control and PPEs should be adopted for effective control of accidents.
3.5 Monitoring
Monitoring is essential to verify whether hazard control measures meet the objectives and to identify any new
hazards due to introduction of hazard control measures.
3.6 Evaluating Programme Effectiveness
Final process in hazard control process is evaluation of its effectiveness in terms of reduction in accidents and
injuries.
Despite the above, effectiveness of hazard control programme depends on organizational commitment and
competence to identify and remove potential hazards [33].
4. Accident Causation
Systems are reasonably well designed to provide automatic protection with minimum human intervention. In
case of any failure, some may get recovered; some may fail in safe manner and some others may escalate into minor
or major accidents. It is difficult to design a safe system, unless accidents are anticipated and understood. Accident
causation models are aimed at this objective; and for answering why and how do accidents occur [1].
Accident causation theories are evolved over five different ages. First age is closely associated with
technological aspects, where accidents were attributed to mechanical and structural failures. In the Second age,
human errors were considered to cause accidents. Third age is based on the premise that, if design of system is
human error prone, instead of human error reduction programmes, design modifications should be attempted first.
Third age realizes that humans are not the sole cause of accidents. Fourth age is associated with organizational
safety culture. Fifth age is related to resilience of people to adapt safe practices before the accident [31].
4.1 Factors Contributing Accidents and Injuries
Accidents and injuries occur due to individual factors, job factors and organizational factors [18].
Individual Factors:
Individual factors are age, work experience, living habits etc. Inadequate work experience, increase in age and
unhealthy living habits increase injury risk. Injury risk follows a bath tub curve with age. It is high during the initial
years of employment due to lack of awareness and work experience. It diminishes as individual acquires work
experience and rises again with age due to physiological weaknesses and lack of mental comprehension. There is
also another view thatinjury risk may increase with work experience as individual may become complacent and pay
less adherence to safe work practices [47]. This aspect can be addressed by deploying workers with different levels
of experience, varying from novice to highly experienced.
Negative traits such as absenteeism, lack of emotional stability, risk taking behavior, job dissatisfaction and
violations may reflect in individual‘s relationship within organization and also contribute accidents and injuries.
Living habits such as consumption of alcohol and tobacco also cause accidents and injuries [18].
Job Factors
Hazardous jobs performed at unsafe locations without requisite safety measures increase potential for accidents
and injuries. For example, machine related accidents in US had caused 8505 fatalities between 1980 and 1989 with
an average annual fatality rate of 0.8 per 100, 000 workers [5]. Manual material handling is one of the major causes
of workplace injuries due to musculoskeletal disorders, strains and sprains. Poor housekeeping, inadequate working
space, working in night shifts, high job stress, high job dissatisfaction, less job responsibility and poor work
execution also add to workplace injuries [18].
Organization Factors:

International Journal of Engineering, Science and Mathematics Vol.7 Issue 4, April 2018, ISSN: 2320-0294 Impact Factor: 6.765 Journal Homepage: http://www.ijesm.co.in, Email: [email protected] Double-Blind Peer Reviewed Refereed Open Access International Journal - Included in the International Serial Directories Indexed & Listed at: Ulrich's Periodicals Directory ©, U.S.A., Open J-Gage as well as in Cabell’s Directories of Publishing Opportunities, U.S.A
88 International Journal of Engineering, Science and Mathematics
http://www.ijesm.co.in, Email: [email protected]
Organizational factors which cause accidents are shown in Figure-2 [33]. Brief description of each factor is
given below:
Pathological-Reactive: Safety practices in industry are the barest minimum to meet regulatory requirements, with no
management commitment.
Incipient-Reactive: Safety practices are just above regulatory requirements and management shows some signs of
concern.
Worried-Reactive: Management is worried about continuing occurrence of accidents.
Repair-Routine-Reactive: Management gives reasonable sensitivity to accidents and takes corrective measures.
Conservative - Calculative - Reactive: Management emphasizes auditing and work place safety measures based on
technical and human error aspects.
Incipient-Proactive: Management begins to accept importance of organizational factors and actively finds
engineering solutions for accident prevention and control.
Generative-Proactive: Management is highly committed and takes many proactive measures. Organizational safety
and corrective measures are continuously reviewed and implemented.
Figure-2: Organizational Factors Contributing to Accidents Significant organizational factors considered for occurrence of accidents are safety climate, workgroup size,
management support, coworker support, supervisory support, workplace safety practices and management
commitment towards safety. Higher the support and commitment, the less will be the accidents.
4.2 Accident Causation Theories
Injury due to accident occurs due to unplanned or unwanted release of energy or hazardous materials above the
threshold limit of human structure. Severity of injury depends on the amount of energy or hazardous materials
transferred and vulnerability of body tissue to get damaged.
Accident causation theories can be categorized based on the themes i.e. person as cause, system as cause,
person and system as cause and system-person sequence as cause. Person as cause theme holds individual factors for
accident causation. System as cause theme states that accidents occur due to system failures and not due to
individuals. Person and System as cause theme considers that accidents occur due to individual factors and system
failures. System-person sequence as cause theme assumes that sequential interactions between system and person
cause accidents. Classification of accident causation theories is given in Table-3 [20], [18].
Person as Cause Theme:
Pure Chance Hypothesis states that everyone has equal chance for an accident. There are no specific patterns
for an accident and accident is considered as an act of God. This hypothesis is based on feelings.
Accident Proneness Theory suggests that certain groups within a population are more likely to meet accidents
due to some natural personality traits called accident proneness. Accident proneness could be due to stress and
socio-psychological behavior of individuals. An individual‘s accident proneness may change with age. At younger
age, high energy for taking risk may cause accidents; whereas at old age, low energy to overcome risk may cause

International Journal of Engineering, Science and Mathematics Vol.7 Issue 4, April 2018, ISSN: 2320-0294 Impact Factor: 6.765 Journal Homepage: http://www.ijesm.co.in, Email: [email protected] Double-Blind Peer Reviewed Refereed Open Access International Journal - Included in the International Serial Directories Indexed & Listed at: Ulrich's Periodicals Directory ©, U.S.A., Open J-Gage as well as in Cabell’s Directories of Publishing Opportunities, U.S.A
89 International Journal of Engineering, Science and Mathematics
http://www.ijesm.co.in, Email: [email protected]
accidents. These models blame individuals for accidents and recommend behavioral interventions for improving
safety performance.
Unconscious Motivation Theory is based on psycho-analytic theory. It believes that accidents are caused by
subconscious processes due to guilt, aggression, anxiety, ambition and conflict. The theory focuses on personality
traits and individual‘s perception about work environment. It suggests that low feeling about job and work place;
and withdrawal from work contribute accidents. The theory prompts behavioral interventions for improving safety
performance.
Adjustment-Stress Theory holds the view that, individuals who cannot adjust with their work and work place,
have more tendencies for accidents than who can adjust. Inability to adjust may be due to physical and psychological
stressors.
Goal Freedom Alertness Theory says that some individuals are accident prone due to lack of alertness on the job
and flexibility in setting objectives of the job.
Table-3
Classification of Accident Causation Theories
Accident Theme Accident Causation Theory
Person as Cause 1. Pure chance hypothesis
2. Accident proneness theory
3. Unconscious motivation theory
4. Adjustment stress theory
5. Goal freedom alertness theory
Person or System as Cause 1. Heinrich‘s domino sequential theory
2. Bird‘s domino sequential theory
System as Cause 1. Swiss cheese theory
2. Epidemiological theory
System - Person Sequence as Cause 1. Systems theory
2. Houston theory
3. Socio Technical System theory
Person and System as Cause Theme:
Heinrich‘s Domino Sequential Theory postulates that injury happens due to a series of events represented by fall of
five dominos i.e. ancestry and social environment, fault of persons, hazards, accident and injury as shown in Figure-
3[10].Removal of any one of the dominos breaks accident sequence and prevents injury [10]. The first two dominos
i.e. ancestry and social environment; and fault of persons are not within the control of organization; hence the third
domino i.e. hazards due to unsafe conditions and unsafe acts, are controlled to prevent accidents. Ancestry, social
environment and fault of persons and unsafe acts follow person as cause theme. Unsafe conditions are attributed to
system and follow system as cause theme. In combination, this theory adopts person and system as cause theme for
the accidents. Heinrich postulates that 88% of the accidents are due to unsafe acts, 10% due to unsafe mechanical or
physical conditions and balance 2% are not preventable.

International Journal of Engineering, Science and Mathematics Vol.7 Issue 4, April 2018, ISSN: 2320-0294 Impact Factor: 6.765 Journal Homepage: http://www.ijesm.co.in, Email: [email protected] Double-Blind Peer Reviewed Refereed Open Access International Journal - Included in the International Serial Directories Indexed & Listed at: Ulrich's Periodicals Directory ©, U.S.A., Open J-Gage as well as in Cabell’s Directories of Publishing Opportunities, U.S.A
90 International Journal of Engineering, Science and Mathematics
http://www.ijesm.co.in, Email: [email protected]
Figure-3: Heinrich’s Domino Theory of Accident Causation Bird and Loftus [2]replaced first three dominos of Heinrich by ―Lack of Control‖ due to inadequate
management programme, ―Basic Causes‖ of personal and job factors and ―Immediate Causes‖ of unsafe acts and
unsafe conditions.
Domino theories conclude that unsafe acts and unsafe conditions are the only causes of accidents, leaving apart
other causes due to organizational factors. Heinrich theory of 88% of accidents occurs due to unsafe acts is false as
information on data collection, survey documents, quality of information and analytical methods used by him is not
available. Modern theories on accident causation indicate that accidents occur due to organizational reasons, rather
than workers fault. Overemphasizing on unsafe acts and unsafe conditions as causes for accidents, may divert
attention to human errors and dilute essence of accident prevention [23].
System as Cause Theme:
Reason‘s Swiss Cheese Model comprises of a series of randomly holed Swiss cheeses arranged in series as
shown in Figure-4. Each slice represents a safety barrier and each hole represents a possible condition for barrier
failure. Whenever a failure mechanism makes it through all the holes, there will be accident. If there is deflection
from sequence, there will be anomaly. Anomaly in combination with favorable circumstances may cause accident.
Anomaly indicates a failure in system and hence follows system as cause theme [23],[25], [26], [28].
Gordon‘s Epidemiological theory
Gordon [7]compares injury as agency causing harm to human body similar to disease. While injuries damage
human body quickly, diseases do so at a slower pace. Epidemiological theoryassumes an equilibrium between host,
agent and environment to maintain healthy or injury free condition. Any disturbance to this equilibrium will make
the host unhealthy or cause injury.
System - Person Sequence as Cause Theme:
Systems model of accident causation assumes thatworker, equipment and environment interact with each other
to produce output. Worker senses hazards and takes appropriate control measures to bring back system into safe
state. Equipment must be designed, maintained and used to ensure safety of workers. Work place environment
should be designed to ensure health, safety and comfort of workers. An accident interrupts this process. Effective
management of interfaces between worker, equipment and environment will reduce likelihood and consequence of
accidents [27].
Houston theory of accident process envisages that an accident occurs due to sequential interaction between
target, driving force and trigger [20]. Principal driving force is energy. Target has threshold intensity, below which
driving force has no effect. Trigger also has threshold level, below which it does not operate. Trigger causes driving
force to injure the target. Accident can be prevented by reducing energy of driving force by safety barriers between
energy and target.

International Journal of Engineering, Science and Mathematics Vol.7 Issue 4, April 2018, ISSN: 2320-0294 Impact Factor: 6.765 Journal Homepage: http://www.ijesm.co.in, Email: [email protected] Double-Blind Peer Reviewed Refereed Open Access International Journal - Included in the International Serial Directories Indexed & Listed at: Ulrich's Periodicals Directory ©, U.S.A., Open J-Gage as well as in Cabell’s Directories of Publishing Opportunities, U.S.A
91 International Journal of Engineering, Science and Mathematics
http://www.ijesm.co.in, Email: [email protected]
Figure-4: Swiss Cheese Model of Accident Causation Brown et al. [3] opine that safety hazard, safety climate and production pressure influence safety efficacy and
cavalier attitude. Likelihood of accident increases during peak production period. High levels of production pressure
might weaken safety efficacy. Employees with cavalier attitude may violate safety requirements and become risk
seekers.
Manchester and Leiden Universities observe that deficiencies in hardware, design, maintenance management,
goals, housekeeping, communication, organization, training, safety defenses and introduction of error causing
conditions also cause accidents ([41], [42].
5. Accident Investigation
Accident investigation provides valuable information on accident causation and deep insight into accident
prevention and corrective action [25]. Depth of accident investigation is a measure of openness, safety culture and
management commitment to know and correct causes of accidents. Despite having outstanding safety performance,
accidents occur or recur if organizations do not learn from accidents and fail to correct root causes.
In organization with positive safety culture, management will be interested in knowing true causes. In such
organizations, accident investigations will be based on facts. Success of accident investigation depends on blame
free culture, freedom from fear of reprisals and faith that information collected will be used for the benefit of all. In
order to make an accident investigation unbiased, it should be carried out by an independent team not related to area
and job in which accident has occurred [23].
Barriers inhibiting true accident investigation are:
Inadequate training and knowledge of investigation team.
If supervisors investigate accidents, they may not indicate shortcomings for which they themselves are
responsible.
Detailed investigation is not possible, if management is not supportive.
In organizations with blaming culture, corrective actions may involve reprimanding of individuals.
Human error is not the only cause for an accident, but it is a symptom of systemic failures. A systemic accident
model focuses on the whole system comprising of design, development, operation and maintenance of system; not
on human errors alone. First step to address human errors is to examine the design of workplace and work methods
[23]. The aspects to be considered in design for safety are:
Risk should be within acceptable level
Failure of work systems and methods due to human errors should be low.
Hazards and risks during operation and maintenance should be low.
While performing job, need of personal protective equipment should be less.
Many serious injuries and fatalities are low probability events, with unique, multiple and complex contributing
factors; attributed to poor design, shortcomings in supervision, poorly made procedures, undetected manufacturing
defects, maintenance failures, inadequate training, inadequate tools or equipment and other technical, operational,
cultural or administrative issues [23]. Most of the serious injuries and fatalities occur:
During non-routine works and plant transients.
During plant shutdowns, maintenance and start-ups.
While working near high energy sources.
During construction and modifications.
Before any accident, there would be disruptions or anomalies. Recurrence of disruptions is a precursor for an
accident. Precursors are alerts or signals of an impending accident. Under alternative circumstances precursors may
escalate into accidents in presence of certain immediate factors. Immediate factors are exacerbating factors such as
failure in interaction between work team, hazardous workplace or equipment and materials [36]. Next to occurrence
of a precursor, accident will occur, if there are immediate factors without mitigating factors, i.e.
Accident = Precursor + Immediate Factors - Mitigating Factors.
If corrective measures are not taken, accident will recur in the absence of mitigating measures i.e.
Accident (n+1) = Accident (n) + No corrective measures + Time - Mitigating Factors.
International Journal of Engineering, Science and Mathematics Vol.7 Issue 4, April 2018, ISSN: 2320-0294 Impact Factor: 6.765 Journal Homepage: http://www.ijesm.co.in, Email: [email protected] Double-Blind Peer Reviewed Refereed Open Access International Journal - Included in the International Serial Directories Indexed & Listed at: Ulrich's Periodicals Directory ©, U.S.A., Open J-Gage as well as in Cabell’s Directories of Publishing Opportunities, U.S.A
92 International Journal of Engineering, Science and Mathematics
http://www.ijesm.co.in, Email: [email protected]
Identification and correction of causes of precursors provide opportunity to interrupt accident sequence from
escalating into a more severe incident [34]. Precursors and immediate factors occur more frequently than accidents.
Therefore, correcting causes of precursors and immediate factors will help in accident prevention. Safety at work
place can be improved by real-time tracking of precursors and immediate factors [35], [50].
Accident investigation involves finding answers to five Ws and one H, i.e. what? when? where? why? who? and
how? [33]. ‗How‘ of these involves identification of root causes by using ―Five Why Technique‖, in which, why is
asked five times to determine the root cause. Ideal accident investigation is based on the principle of ―what-you-
find-is-what-you-fix‖, which means that first identify causes of accident, then implement corrective measures to fix
the causes. Jonas et al. [17] say thatthough most of the investigations follow ―what-you-find-is-what-you-fix‖, many
constraints influence identification and implementation of effective remedial measures; hence ―what you find is not
always what you fix‖. Some of the constraints to achieve ―what-you-find-is-what-you-fix‖ are experience and
competency of investigators; resources, time, availability of data, management support, acceptance of investigation
results and lack of stop rule to decide the extent of investigation.The common issues with most of the
accidentsareineffective leadership, weak supervisory oversight and lack of organizational learning [37]. Accident
investigations should be aimed to prevent recurrence, to fix responsibility and to develop accident models for
theoretical understanding [9].
Accident investigation should be unbiased. However, some degree of bias creeps into accident investigation due
to author bias i.e. reluctance to accept findings of other investigations; confirmation bias i.e. tendency to confirm
preconceived causes; frequency bias i.e. tendency to classify causes in common categories; political bias, where
status of individual gives undue influence and sponsor bias, where causes are influenced by possible damage to the
reputation of organization [17]. Ingress of bias into accident investigation can be reduced by formation of
independent investigation committees with experts from heterogeneous fields relevant to accident.
Collection and analysis of accident data are important for risk assessment and taking risk informed decisions on
accident prevention. However, true and factual data with quality and depth of information are difficult to obtain due
to under reporting or non-reporting [9]. Incidents with less severity are either under reported or not reported due to
lack of impact in the media. If at all reported, available data will be just to meet regulatory requirements. This often
reduces accident investigations to mere checklist filling, without touching upon underlying causes [4].
6. Human, Organizational and Technical Factors
Human factors are environmental, organizational and job factors, which influence human behavior at work and
affect health and safety [46]. Overall objective of human factors is to design systems, jobs and organizations to
match with human capabilities and limitations. Nature of issues related to human factors varies according to the type
of systems. For example, issues of human factors in manual systems and automated systems will be different.
Human factors should be integrated in the design and development process by considering following aspects [39]:
Effective way to control hazards and risks associated with human factors is to address these at design stage and
continue it throughout the life cycle.
System design should support operators.
Addressing issues of human factors as afterthought will be ineffective.
Human factors activities must proceed in parallel with technical development.
Majority of accidents occur due to actions initiated bypeople and could have been prevented by correct actions
at right time. About 80% of the accidents attributed to human factors are due to either actions or omissions of people
[45]. Though modern controls, automated safety systems and structured documentation systems facilitate safe work
environment; human intervention is crucial in accident prevention and control; hence responsibility of operators for
ensuring safety shall not be ignored [32].
A study by the University of Aberdeen concludes that higher the management commitment to safety, lower the
rates of accident. Failures in decision making are one of the major causes of accidents. Errors in decision making
may remain dormant for many years and can cause accidents later on. The study recommends that benchmarking of
safety management strategy and safety climate among the companies at regular intervals will help in ensuring safer
work environment and improving safety climate [40], [42]. Many serious injuries occur due to less than adequate
conservative decision making and shortfalls in organizational safety culture. Latent weaknesses such as unsafe

International Journal of Engineering, Science and Mathematics Vol.7 Issue 4, April 2018, ISSN: 2320-0294 Impact Factor: 6.765 Journal Homepage: http://www.ijesm.co.in, Email: [email protected] Double-Blind Peer Reviewed Refereed Open Access International Journal - Included in the International Serial Directories Indexed & Listed at: Ulrich's Periodicals Directory ©, U.S.A., Open J-Gage as well as in Cabell’s Directories of Publishing Opportunities, U.S.A
93 International Journal of Engineering, Science and Mathematics
http://www.ijesm.co.in, Email: [email protected]
design, inadequate supervision and failure to identify and correct unsafe conditions, inadequate training and
improper tools; in combination with weak organizational safety culture may cause accidents and injuries.
In organizations where management commitment is strong, high priority is given to safety. Key characteristics
of these organizations are; active managerial involvement, delegation of authority, consistency in safety practices,
leadership to improve safety, supervisors serve as role models, effective personal communication and overwhelming
priority given to safety. Casual factors for accidents and injuries are largely systemic and are reflections of
organizational safety culture. Organizational safety culture comprises of basic values, norms, perceptions and
practices within the organization and among the individuals that safety related issues are received the importance as
warranted [23]. It is permanent in nature. Culture created by top management influences organizational safety
culture. As unsafe conditions in workplaces are easier to manage than human minds, top management shall become
a driver for fostering positive safety culture within organization to address human factors.
7. Accident Control
A process is always associated with transmission of energy in controlled environment. At some occasions,
control is lost and energy is released above the physiological tolerance of human body, cause accidents and
injuries.Three characteristics of accidents are; it occurs as a combination of circumstances, it is preceded by near
misses and there may be wide variations in the consequences of accidents, i.e. from near miss in one circumstance to
severe injury and loss of life or property in some other circumstance.Near misses are warning indicators of potential
accidents and act as pointers to alert organization that ―all is not well‖ with respect to safety [20], [26], [30].
Heinrich et al. say that in a group of 330 accidents of same kind, involving same person, there is a constant ratio
of 1:29:300 between major injuries, minor injuries and near misses. This implies that a person who suffers a major
injury had on an average 300 chances of narrow escapes without any injury [10].However, this theory is proved to
be false as there is no consistency in the definition of accidents in different editions of Heinrich‘s book. In the first
edition, accidents were considered to have ―same‖ cause. In the second edition, it was changed to ―similar‖ and ―of
the same kind‖ and in the third edition, accidents were considered to be ―of the same kind and involving same
person‖. Heinrich has not explained reason for the above changes. If the data based on the first assumption was
valid, how does the conclusion can change from edition to edition of same book [23]? However, studies also show
that high frequency and low consequence near misses give opportunities to correct causes of accidents; hence
prevent accidents of low frequency and high consequence. In orderto develop a strong accident prevention system;
reporting of near misses and correction of causes should be imbibed in organizational safety culture. Studies also
show that whenever line managers had shown increased focus in reporting and correcting of causes of near misses,
there were reductions in accidents. Since near misses give an overall picture of risks in the organization, not
considering near misses in risk assessment can lead to significantunder-estimation of ―true‖ risk. Major accidents
and injuries occur due to slow movement of human, organizational and technical systems towards a state of high
risk. This movement is indicated by near misses and corrective actions based on this movement will facilitate
accident prevention [6], [17], [21], [24], [26], [30], [32], [35], [36], [38], [48], [49].
Hovden et al. [11] categorize accident models as cause-consequence models, descriptive models, and system
models. All these models supplement to each other and rove around human, organizational and technical factors
associated with safety management. Accident models affect the way people think about safety. Accident models are
simplified representations of real-life accidents and are utilized for reactive and proactive safety management.
Accident models facilitate the followings:
To understand accident phenomena.
To prevent personal biases in accident causation.
To provide wider range of preventive measures.
To guide investigations regarding data collection and accident analyses.
To analyze interrelations between factors and conditions of accident causation.
Both individual and organizational factors contribute to accidents. Employees with better education demonstrate
better compliance to safety measures and are less susceptible to injuries. On the contrary, employees with high job
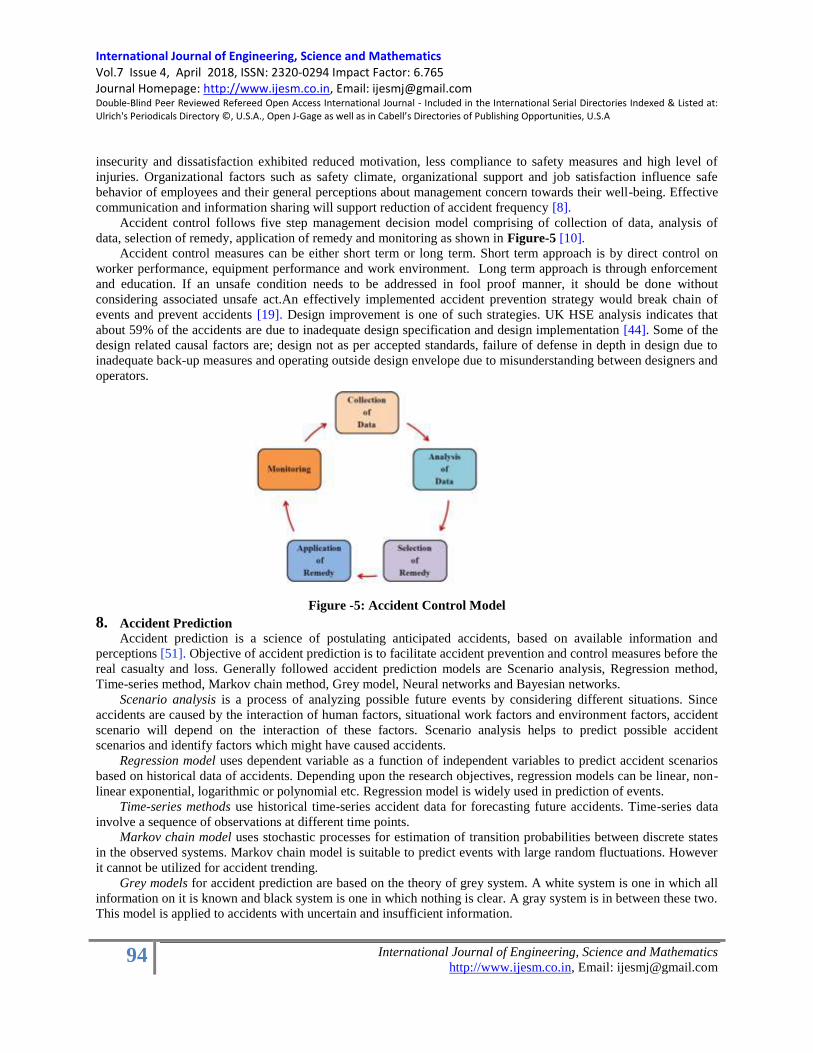
International Journal of Engineering, Science and Mathematics Vol.7 Issue 4, April 2018, ISSN: 2320-0294 Impact Factor: 6.765 Journal Homepage: http://www.ijesm.co.in, Email: [email protected] Double-Blind Peer Reviewed Refereed Open Access International Journal - Included in the International Serial Directories Indexed & Listed at: Ulrich's Periodicals Directory ©, U.S.A., Open J-Gage as well as in Cabell’s Directories of Publishing Opportunities, U.S.A
94 International Journal of Engineering, Science and Mathematics
http://www.ijesm.co.in, Email: [email protected]
insecurity and dissatisfaction exhibited reduced motivation, less compliance to safety measures and high level of
injuries. Organizational factors such as safety climate, organizational support and job satisfaction influence safe
behavior of employees and their general perceptions about management concern towards their well-being. Effective
communication and information sharing will support reduction of accident frequency [8].
Accident control follows five step management decision model comprising of collection of data, analysis of
data, selection of remedy, application of remedy and monitoring as shown in Figure-5 [10].
Accident control measures can be either short term or long term. Short term approach is by direct control on
worker performance, equipment performance and work environment. Long term approach is through enforcement
and education. If an unsafe condition needs to be addressed in fool proof manner, it should be done without
considering associated unsafe act.An effectively implemented accident prevention strategy would break chain of
events and prevent accidents [19]. Design improvement is one of such strategies. UK HSE analysis indicates that
about 59% of the accidents are due to inadequate design specification and design implementation [44]. Some of the
design related causal factors are; design not as per accepted standards, failure of defense in depth in design due to
inadequate back-up measures and operating outside design envelope due to misunderstanding between designers and
operators.
Figure -5: Accident Control Model
8. Accident Prediction
Accident prediction is a science of postulating anticipated accidents, based on available information and
perceptions [51]. Objective of accident prediction is to facilitate accident prevention and control measures before the
real casualty and loss. Generally followed accident prediction models are Scenario analysis, Regression method,
Time-series method, Markov chain method, Grey model, Neural networks and Bayesian networks.
Scenario analysis is a process of analyzing possible future events by considering different situations. Since
accidents are caused by the interaction of human factors, situational work factors and environment factors, accident
scenario will depend on the interaction of these factors. Scenario analysis helps to predict possible accident
scenarios and identify factors which might have caused accidents.
Regression model uses dependent variable as a function of independent variables to predict accident scenarios
based on historical data of accidents. Depending upon the research objectives, regression models can be linear, non-
linear exponential, logarithmic or polynomial etc. Regression model is widely used in prediction of events.
Time-series methods use historical time-series accident data for forecasting future accidents. Time-series data
involve a sequence of observations at different time points.
Markov chain model uses stochastic processes for estimation of transition probabilities between discrete states
in the observed systems. Markov chain model is suitable to predict events with large random fluctuations. However
it cannot be utilized for accident trending.
Grey models for accident prediction are based on the theory of grey system. A white system is one in which all
information on it is known and black system is one in which nothing is clear. A gray system is in between these two.
This model is applied to accidents with uncertain and insufficient information.

International Journal of Engineering, Science and Mathematics Vol.7 Issue 4, April 2018, ISSN: 2320-0294 Impact Factor: 6.765 Journal Homepage: http://www.ijesm.co.in, Email: [email protected] Double-Blind Peer Reviewed Refereed Open Access International Journal - Included in the International Serial Directories Indexed & Listed at: Ulrich's Periodicals Directory ©, U.S.A., Open J-Gage as well as in Cabell’s Directories of Publishing Opportunities, U.S.A
95 International Journal of Engineering, Science and Mathematics
http://www.ijesm.co.in, Email: [email protected]
Neural Networks isused to fit complex non-linear relationships between inputs and outputs. Applications of
Neural networks for accident prediction are divided into trend prediction and causality prediction. While inputs for
trend prediction are time-series data, inputs for causality prediction are a set of influencing factors related to
accidents.
Bayesian Networks are probabilistic graphical model to quantify cause-effect relationship between various
factors related to accidents. Bayesian Networks help to predict and identify causes of accidents.
Accident prediction models are selected based on nature of data, prediction accuracy and required information.
Each method has its own limitations, depending on the data. As one method alone may not be able to produce
realistic prediction, a combination of different methods is adopted to have a reasonable accuracy of prediction.
9. Discussion and Conclusion
Causes of accidents being multi-disciplinary in nature, prevention and control of accidents have always been a
big challenge. With the influence of human, organizational and technical factors, accident prevention has become
more complex and continual efforts are required to control or reduce probability and severity of accidents. Accident
prevention and control measures should be included in the design and subsequent operation to bring risk within the
acceptable limits. Engineering or administrative safety barriers can be provided to reduce risk; however maintenance
of these barriers is also essential to prevent accidents. Accidents may or may not cause injury. Injury can be
intentional or unintentional. Accidents cause unintentional injuries.
Accident prediction and causation models help to know why and how do accidents occur. Heinrich‘s theory that
88% of accidents occur due to unsafe acts by workers has been disproved as information on research methodology
used by Heinrich is not available. Modern theories on accident causation indicate that accidents occur due to
organizational reasons, rather than workers‘ faults. Hence, focus of accident prevention should be shifted from
workers‘ behavior to improving design of work systems and reducing complexity of work procedures.
All accidents should be investigated as it provides valuable information on the genesis of accidents and deep
insight on accident prevention. In order to make an accident investigation unbiased, it should be by an independent
team, not related to the area and job in which accident occurred. Accident investigation involves finding answers to
five Ws and one H, i.e. what? when? where? why? who? and how? Of these, How‘ involves identification of root
causes by using ―Five Why Technique‖, in which why is asked five times to determine root cause.
An accident is preceded by near misses or precursors, where most, but not all of the conditions for an accident
are met. Heinrich theory that in a group of 330 accidents of same kind, involving same person, there is a constant
ratio of 1:29:300 between major injuries, minor injuries and near misses is refuted under the premise that there is no
consistency in the definition of accidents in different editions of Heinrich‘s book. Despite this, other studies says
that high frequency and low consequence near misses give ample opportunities to correct causes of accidents,
hence to prevent accidents of low frequency and high consequence. Therefore, reporting of near misses and
correction of causes should be imbibed in to organizational safety culture. Accident models facilitate understanding
of accident phenomena. These are simplified representations of real-life accidents.
The paper also emphasizes requirement of management commitment, positive safety culture and supportive
safety climate to foster an accident prevention culture within the organization.
Conflicts of interest
None of the contributing authors have conflicts of interest to declare.
Acknowledgements
The article has been written as a voluntary effort and has not of received any funding. Opinions expressed are
those of authors and not of their organizations.
References
[1] Al-shanini, A., Ahmad, A., Khan, F., 2014. Accident Modeling and Analysis in Process Industries. Journal
of Loss Prevention in the Process Industries 32, 319-334.
[2] Bird, F., Loftus, R., 1976. Loss Control Management. Institute Press, Loganville, Georgia.
[3] Brown, K. A., Willis, P. G., Prussia, G. E., 2000. Predicting Safe Employee Behavior in the Steel Industry:
Development and Test of a Socio-Technical Model. Journal of Operations Management 18, 445-465.
[4] Carol, S., Vilchez, J. A., Casal, J., 2002. Study of the Severity of Industrial Accidents with Hazardous
Substances by Historical Analysis. Journal of Loss Prevention in the Process Industries 15, 517-524.

International Journal of Engineering, Science and Mathematics Vol.7 Issue 4, April 2018, ISSN: 2320-0294 Impact Factor: 6.765 Journal Homepage: http://www.ijesm.co.in, Email: [email protected] Double-Blind Peer Reviewed Refereed Open Access International Journal - Included in the International Serial Directories Indexed & Listed at: Ulrich's Periodicals Directory ©, U.S.A., Open J-Gage as well as in Cabell’s Directories of Publishing Opportunities, U.S.A
96 International Journal of Engineering, Science and Mathematics
http://www.ijesm.co.in, Email: [email protected]
[5] Chinniah, Y., 2015. Analysis and Prevention of Serious and Fatal Accidents Related to Moving Parts of
Machinery.Safety Science 75, 163-173.
[6] Geoffrey, I., 1991. Near Miss Reporting Pitfalls for Nuclear Power Plants. Near Miss Reporting as a Safety
Tool, Butterworth-Heinemann, Oxford.
[7] Gordon, J. E., 1949. The Epidemiology of Accidents.The American Journal of Public Health.
[8] Gyekye, S. A., Salminen, S., Ojajarvi, A, 2012.A theoretical model to ascertain determinates of
occupational accidents among Ghanaian industrial workers. International Journal of Industrial Ergonomics
42, 233-240.
[9] Hale, A. R., Karczewski, J., Koornneef, F., Otto, E., 1991. IDA: An Interactive Program for the Collection
and Processing of Accident Data. Near Miss Reporting as a Safety Tool, Butterworth-Heinemann, Oxford.
[10] Heinrich, H. W., Peterson, D., Roos, N., 1980. Industrial Accident Prevention (A Safety Management
Approach), 5th
Edition. McGraw-Hill Book Company.
[11] Hovden, J., Albrechtsen, E., Herrera, I. A., 2010. Is there a need for new theories, models and approaches
to occupational accident prevention?Safety Science 48, 950-956.
[12] IS-3786, 1983-Reaffirmed in 2002. Method for Computation of Frequency and Severity Rates for Industrial
Injuries and Classification of Industrial Accidents.Bureau of Indian Standard.
[13] IS-15656, 2006. Hazard Identification and Risk Analysis-Code of Practice. Bureau of Indian Standard.
[14] IS-18001, 2007. Occupational Health and Safety Management System-Requirements with guidance for use.
Bureau of Indian Standard.
[15] ICECI, 2004.International Classification of External Causes of Injuries. ICECI Coordination and
Maintenance Group, World Health Organization.
[16] Jones, S., Kirchsteiger, C., Bjerke, W., 1999. The Importance of Near Miss Reporting to Further Improve
Safety Performance.Journal of Loss Prevention in the Process Industries 12, 59-67.
[17] Jonas, L., Carl, R., Erik, H., 2010. What you find is not always what you fix-How other aspects than causes
of accidents decide recommendations for remedial actions.Accident Analysis and Prevention 42, 2132-
2139.
[18] Khanzode, V.V., Maiti, J., Ray, P. K., 2012. Occupational Injury and Accident Research: A
Comprehensive Review.Safety Science 50, 1355-1367.
[19] Kinnersley, S., Roelen, A., 2007. The Contribution of Design to Accidents.Safety Science 45, 31-60.
[20] Lees, F. P., 1996. Loss Prevention in the Process Industries, 2nd
Edition. Butterworth-Heinnemann.
[21] Lucas, D. A., 1991. Organizational Aspects of Near Miss Reporting. Near Miss Reporting as a Safety Tool,
Butterworth-Heinemann, Oxford.
[22] Manuele F.A., 2011. Reviewing Heinrich - Dislodging Two Myths from the Practice of Safety.
Professional Safety, www.asse.org.
[23] Manuele F.A., 2014. Advanced Safety Management – Focusing on Z10 and Serious Injury Prevention,
John Wiley & Sons, Inc, Hoboken, New Jersey, USA.
[24] Masson, M., 1991. Understanding, Reporting and Preventing Human Fixation Errors. Near Miss Reporting
as a Safety Tool, Butterworth-Heinemann, Oxford.
[25] Moura, R., Beer, M., Patelli, E., Lewis, J., Knoll, F., 2016. Learning from Major Accidents to Improve
System Design. Safety Science 84, 37-45.
[26] NASA, 2011. Accident Precursor Analysis Handbook. National Aeronautics and Space Administration
Office of Safety and Mission Assurance Washington, D.C. 2054.
[27] National Safety Council, 1981. Accident Prevention Manual for Industrial Operations-Administration and
Programmes, 8th
Edition.National Safety Council, USA.
[28] OHS Body of Knowledge, 2012. Models of Causation: Safety. Safety Institute of Australia Ltd,
Tullamarine, Victoria, Australia.
[29] Okoh, P., Haugen, S., 2013. Maintenance-Related Major Accidents: Classification of Causes and Case
Study. Journal of Loss Prevention in the Process Industries 26, 1060-1070.
[30] Phimister, J. R., Oktem, U., Kleindorfer, P. R., Kunreuther, H., 2003. Near Miss Incident Management in
Chemical Process Industry. Society of Risk Analysis, Risk Analysis Vol.23, No. 3, 445-459.

International Journal of Engineering, Science and Mathematics Vol.7 Issue 4, April 2018, ISSN: 2320-0294 Impact Factor: 6.765 Journal Homepage: http://www.ijesm.co.in, Email: [email protected] Double-Blind Peer Reviewed Refereed Open Access International Journal - Included in the International Serial Directories Indexed & Listed at: Ulrich's Periodicals Directory ©, U.S.A., Open J-Gage as well as in Cabell’s Directories of Publishing Opportunities, U.S.A
97 International Journal of Engineering, Science and Mathematics
http://www.ijesm.co.in, Email: [email protected]
[31] Pillay, M., 2015. Accident Causation, Prevention and Safety Management: A Review of the State-of-The-
Art. 6th International Conference on Applied Human Factors and Ergonomics and the Affiliated
Conferences, Procedia Manufacturing 3, 1838-1845.
[32] Rathnayaka, S., Khan, F., Amyotte, P., 2011. SHIPP Methodology: Predictive Accident Modeling
Approach. Part I: Methodology and Model Description. Process Safety and Environmental Protection
89,151-164.
[33] Reason, J., 1991. Too Little and Too Late: A Commentary on Accident and Incident Reporting Systems.
Near Miss Reporting as a Safety Tool, Butterworth-Heinemann, Oxford.
[34] Saleh, J. H., Saltmarsh, E. A., Favaro, F. M., Brevault, L., 2013. Accident Precursors, Near Misses and
Warning Signs: Critical Review and Formal Definitions within the Framework of Discrete Event Systems.
Reliability Engineering and System Safety 114, 148-154.
[35] Sonnemans, P. J. M., Korvers, P. M. W., 2006. Accidents in the Chemical Industry: Are They
Foreseeable?Journal of Loss Prevention in the Process Industries 19, 1-12.
[36] Sonnemans, P. J. M., Körvers, P. M. W., Pasman, H. J., 2010. Accidents in ―normal‖ operation - Can you
see them coming?Journal of Loss Prevention in the Process Industries 23, 351-366.
[37] Taylor, R. H., Van Wijk, L. G. A., May, J. H. M., Carhart, N. J., 2015. A Study of the Precursors Leading
To ‗Organizational‘ Accidents in Complex Industrial Settings.Process Safety and Environmental Protection
93, 50-67.
[38] Taylor, R. K., Lucas, D. A., 1991. Signals Passed at Danger: Near Miss Reporting from a Railway
Perspective. Near Miss Reporting as a Safety Tool, Butterworth-Heinemann, Oxford.
[39] UK HSE, 2002. Human Factors Integration: Implementation in the Onshore and Offshore Industries.
Research report 001, Prepared by BAE Systems Defense Consultancy for the HSE, UK.
[40] UK HSE, 2003a. Factoring the Human into Safety: Translating Research into Practice (Vol. 1)-
Benchmarking Human and Organizational Factors in Offshore Safety. Research report 059, Prepared by the
University of Aberdeen for the HSE, UK.
[41] UK HSE, 2003b. Factoring the Human into Safety: Translating Research into Practice (Vol. 2) - The
Development and Evaluation of A Human Factors Accident and Near Miss Reporting Form for the
Offshore Oil Industry.Research report 060, Prepared by the University of Aberdeen for the HSE, UK.
[42] UK HSE, 2003c. Factoring the Human into Safety: Translating Research into Practice (Vol. 3) - Crew
Resource Management. Research report 061, Prepared by the University of Aberdeen for the HSE, UK.
[43] UK HSE, 2003d. Good Practice and Pitfalls in Risk Assessment. Prepared by The Health and Safety
Laboratory for the HSE, UK.
[44] UK HSE, 2003e. Out of Control - Why Control Systems Go Wrong and How to Prevent Failure. HSE.
[45] UK HSE, 2007. Development of a working model of howhuman factors, safety management systemsand
wider organizational issues fit together. HSE, UK.
[46] UK HSE, 2009. Reducing error and influencing behavior.HSE, UK.
[47] US NRC, 2010. Regulatory Perspective. 55th Annual Meeting of the Health Physics Society, Salt Lake
City, Utah.
[48] Van der Schaaf, T. W., 1991a. Development of a Near Miss Management System at a Chemical Process
Plant. Near Miss Reporting as a Safety Tool, Butterworth-Heinemann, Oxford.
[49] Van der Schaaf, T. W., 1991b. A Framework for Designing Near Miss Management Systems. Near Miss
Reporting as a Safety Tool, Butterworth-Heinemann, Oxford.
[50] Wu, W., Alistair, G. F., Gibb, Qiming, Li, 2010. Accident precursors and near misses on construction sites:
An investigative tool to derive information from accident databases.Safety Science 48, 845-858.
[51] Zheng, X., Liu, M., 2009. An Overview of Accident Forecasting Methodologies. Journal of Loss
Prevention in Process Industries 22, 484-491.

International Journal of Engineering, Science and Mathematics Vol.7 Issue 4, April 2018, ISSN: 2320-0294 Impact Factor: 6.765 Journal Homepage: http://www.ijesm.co.in, Email: [email protected] Double-Blind Peer Reviewed Refereed Open Access International Journal - Included in the International Serial Directories Indexed & Listed at: Ulrich's Periodicals Directory ©, U.S.A., Open J-Gage as well as in Cabell’s Directories of Publishing Opportunities, U.S.A
98 International Journal of Engineering, Science and Mathematics
http://www.ijesm.co.in, Email: [email protected]
LEADERSHIP: PREDICTORS OF SAFE BEHAVIORS AND PERFORMANCE
Govindan Pradeep Nair 1
Dr. Kanchan Deoli Bahukhandi2

International Journal of Engineering, Science and Mathematics Vol.7 Issue 4, April 2018, ISSN: 2320-0294 Impact Factor: 6.765 Journal Homepage: http://www.ijesm.co.in, Email: [email protected] Double-Blind Peer Reviewed Refereed Open Access International Journal - Included in the International Serial Directories Indexed & Listed at: Ulrich's Periodicals Directory ©, U.S.A., Open J-Gage as well as in Cabell’s Directories of Publishing Opportunities, U.S.A
99 International Journal of Engineering, Science and Mathematics
http://www.ijesm.co.in, Email: [email protected]
Key Words:
Safety;
Leadership
UAE
Construction;
Culture;
Safety
Performance;
Abstract
The study sets out to explore the safety leadership factors and assessing their
application on sites within the UAE construction industry. The initial focus of the
study was to determine whether there was a consensus amongst the various experts
on the factors that constituted safety leadership. Following the analysis, the
researcher was able to identify some common ground. However, an overall
consensus was not possible to achieve within the timescale of the research
project.The study further explored whether factors of safety leadership were being
appliedto sites within the construction industry. Although responses from site
managers and subordinates were (on the whole) positive, statistically they were
unreliable and therefore a definite and consistent conclusion could not be derived.
Another objective of the study was to see whether site managers and subordinates
were in agreement on the factors that were ‗least‘ and ‗most‘ important for a site
manager to demonstrate safety leadership. The results supported that both groups
are having the same two factors in the top two positions and agreeing precisely on
the remaining seven.
The primary purpose of the study was to see whether there was enough evidence to
claim that sites reporting to be more active in the area of safety leadership had a
better safety performance. The results of the data analysis to this effect were not
conclusive, andthe link between leadership and performance was not established.
Further refinement of the principles used in this study could be undertakento
explore this in future. This report provides detail on the research context, the
methods selected for gathering the data, the results of the analysis and conclusions
drawn.
____________________________________________________________________________________
Author Correspondence: 1Govindan Pradeep Nair
HSE Manager,
P.O.Box 31487,
Abu Dhabi, UAE
2Dr. Kanchan Deoli Bahukhandi
Asst. Professor,
UPES, Dehradun (Uttarakhand),
1.0 Introduction
1.1 The Study Context
Effective leadership has been identified within previous studies into human factors as a critical factor in influencing
(both positively and negatively) the behaviour of workers (Miles, 1999). ‗Human Factors‘ is a complex issue and
much research has been conductedto understanding the subject in more detail.The context of this research was
behaviour-based, in that it aimed to develop and apply a series of subjective tests to measure the extent of current
understanding of the factors of safety leadership on some construction sites within major contractors in UAE. The
extent to which these factors were being efficiently applied on a day-to-day basis was also explored.The analysis
was carried out on data gathered, which sought to build on previous research into leadership within the construction
industry, provide further insights into the aspects that constituted good safety leadership and try to establish whether
there was a link between ‗safety leadership‘ and ‗safety performance.‘

International Journal of Engineering, Science and Mathematics Vol.7 Issue 4, April 2018, ISSN: 2320-0294 Impact Factor: 6.765 Journal Homepage: http://www.ijesm.co.in, Email: [email protected] Double-Blind Peer Reviewed Refereed Open Access International Journal - Included in the International Serial Directories Indexed & Listed at: Ulrich's Periodicals Directory ©, U.S.A., Open J-Gage as well as in Cabell’s Directories of Publishing Opportunities, U.S.A
100 International Journal of Engineering, Science and Mathematics
http://www.ijesm.co.in, Email: [email protected]
1.2 An expert’s view of Leadership
Leadership has been recognised in history for a variety of reasons. Sir Ernest Shackleton displayed great leadership
securing his expeditions escape from the South Pole. His country for very different reasons also considered Adolf
Hitler to be a great leader (Shackleton, 1999).
People will be dedicated to specific people who, on the organisation chart, have little authority, but instead have the
zest, dynamism, expertise and compassion for their teammates. On the other hand, non-leaders in management, but
they have little influence over others.Effective leaders convey firmness and coherence in their actions, in line with
the image of the future they paint. The result: clarity of purpose, the credibility of leadership, and integrity in the
organisation (Shackleton, 1999).
One of the best-known names in the leadership business is Warren Bennis. Bennis identified the following essential
ingredients of leadership as being: -
Guiding Vision
Passion
Integrity
Trust
Curiosity, and
Daring
1.3 Project Case Study
Building on previous research in the field of leadership the researcher sought to identify whether there was
agreement amongst today‘s ‗experts‘ on the factors that constituted safety leadership. The extent to which these
factors were being appliedto sites within the construction industry was then tested. The extent of application of
safety leadership factors was tested from two dimensions, one being the view of the site manager and the other being
that of subordinates – stated vs observed level.
Site managers and subordinates were asked to rank safety leadership factors in order of importance separately. A
comparison was sought to determine whether there was an agreement between these two groups on the factors of
safety leadership that were most (at least) important of a site manager when demonstrating safety leadership.Safety
performance data was calculated on a site-by-site basis to see whether a link could be found between site safety
performance and the application of factors of safety leadership.
1.4 Project Objectives
The objectives of this research were to: -
Build on earlier research conducted for ‗supervision‘ and ‗senior management‘ to identifying the safety
leadership behaviours of site managers.
Seek to identify associations between safety performance and safety leadership, (i.e. determine whether
safety leadership has a positive impact on health and safety or not).
Check the extent of agreement between site managers and subordinates on the factors of safety leadership
that are most (at least) significant when demonstrating safety leadership.
2.0 Research Methodology and Data Collection

International Journal of Engineering, Science and Mathematics Vol.7 Issue 4, April 2018, ISSN: 2320-0294 Impact Factor: 6.765 Journal Homepage: http://www.ijesm.co.in, Email: [email protected] Double-Blind Peer Reviewed Refereed Open Access International Journal - Included in the International Serial Directories Indexed & Listed at: Ulrich's Periodicals Directory ©, U.S.A., Open J-Gage as well as in Cabell’s Directories of Publishing Opportunities, U.S.A
101 International Journal of Engineering, Science and Mathematics
http://www.ijesm.co.in, Email: [email protected]
A range of literature and previous research in the field of leadership and how these views and opinions helped form
the context for this research project has been examined. This study sought to build upon the earlier work, provide
new perspectives in the field of safety leadership and provide a further source of reference for the future.This section
provides detail on the objectives to be achieved, the methods used to collect and then analyse the data, anticipated
errors and mitigation measures.
2.1 Study Methods (General)
To achieve the objectives a number of methods were selected. The study project required the use of both qualitative
and quantitative methods. The qualitative aspects included the development of two questionnaires, which provided
the primary source of data to study the objectives. Quantitative techniques were applied to score the response to the
questionnaires and during the data analysis phase.
A literature review was completed to understand the views of leadership ‗experts‘. This qualitative method was
requiredto achieve the first objective. Quantitative methods were used to obtain incident data from the participating
company to test whether there is a link between safety leadership and safety performance.
2.2 Company of study and demographics
For this study project, neither the company nor sites were directly identified. Where differentiation was required
from one site to another, this was achieved, by merely referring to the sites as A, B or C etc.
The company selected for the study project was a major construction company in the United Arab Emirates (UAE).
The Company has invested a significant amount of time, effort and money in the area of safety leadership.The
Company‘s operation involves the building and community development projects, roads bridges and infrastructure
construction and industrial turn-key projects.
6 Sites were chosen for the study project representing four building sites and two infrastructure construction sites.
The estimated sample population of these eight sites requested to participate in the study project is in the region of
168 personnel, representing subordinates and site managers, the more substantial population being that of the
subordinates.
2.3 Literature Review
The literature review phase of the project was undertakento establish the context of the study that current guidance
on the factors of safety leadership demonstrates a convergence of expert opinion.
2.4 Defining ‘Factors of Safety Leadership’
To verify the extent to which factors of safety leadership were being applied to sites within the construction industry
and in order to test the level of agreement between site managers and subordinates on which factors are most and
least significant when demonstrating safety leadership, there was a need first to determine just what the factors of
safety leadership were.
The literature review completed provided the primary source of data on which to establish the factors of safety
leadership for the study project. Each of the characteristics, traits, personalities and events discussed within these
(and other) documents was tabulated. From this table, the study then sought to group the issues to identify a number
ofkey headings on which to use for the study project.
The study concluded on nine ‗groups‘ or factors of safety leadership for the study project, being: -

International Journal of Engineering, Science and Mathematics Vol.7 Issue 4, April 2018, ISSN: 2320-0294 Impact Factor: 6.765 Journal Homepage: http://www.ijesm.co.in, Email: [email protected] Double-Blind Peer Reviewed Refereed Open Access International Journal - Included in the International Serial Directories Indexed & Listed at: Ulrich's Periodicals Directory ©, U.S.A., Open J-Gage as well as in Cabell’s Directories of Publishing Opportunities, U.S.A
102 International Journal of Engineering, Science and Mathematics
http://www.ijesm.co.in, Email: [email protected]
Factor 1 - Setting a personal example
Factor 2 - Involving and consulting people in decision making
Factor 3 - Rewarding safe behaviour
Factor 4 - Disciplining unsafe behaviour
Factor 5 - Trustworthy and open
Factor 6 - Demonstrating safety priorities over production
Factor 7 - Communication and feedback
Factor 8 - Personal involvement in safety initiatives
Factor 9 - Building relationships with people
2.6 Questionnaire design
Some publications on attitude survey‘s and questionnaire design were reviewedto ensure the questionnaires used
within this research project would be a reliable means to gather the necessary data.
One of these publications, in particular, Oppenheim‘s Questionnaire Design, Interviewing and Attitude
Measurement, proved valuable when considering the design of the questionnaires for this research project.
Oppenheim makes several recommendations including ‗not assuming that questionnaires used previously in the UK
will suit other projects‘ and ‗not use personal questions at the front of a questionnaire‘. Oppenheim also suggests: -
• Questions should not be too long (max 20 words)
• Avoiding double-barreled questions
• Avoid double negatives
• Don‘t know and not applicable categories are often left out.
• Need to stick to simple words
• Avoid acronyms, abbreviations, jargon and technical terms
• Beware of dangers of alternative usage – child‘s age next birthday.
• All closed questions should start their lives as open ones
• Beware of leading questions
• Beware of loaded words
• Don‘t overtax the respondents
• Pay attention to detail
Every effort has been made to ensure that these recommendations were considered in the design of the two
questionnaires used for the research project.
2.7 Questionnaire Scoring System (Likert Scale)
Following a review of the various means of scoring/answering used on previous questionnaires, the researcher opted
to use the Likert Scale as the method that respondents should use for answering each of the statements within the
two questionnaires.
Although the Likert procedure has its disadvantages, it is undoubtedly less laborious than other scales and is the
most popular scaling procedure in use today.
The Likert scoring system was applied in part 2 of the questionnaire as the means for scoring the extent of site
manager activity based on the statement being asked.

International Journal of Engineering, Science and Mathematics Vol.7 Issue 4, April 2018, ISSN: 2320-0294 Impact Factor: 6.765 Journal Homepage: http://www.ijesm.co.in, Email: [email protected] Double-Blind Peer Reviewed Refereed Open Access International Journal - Included in the International Serial Directories Indexed & Listed at: Ulrich's Periodicals Directory ©, U.S.A., Open J-Gage as well as in Cabell’s Directories of Publishing Opportunities, U.S.A
103 International Journal of Engineering, Science and Mathematics
http://www.ijesm.co.in, Email: [email protected]
The Likert scoring system involves a 5 point scale, requiring respondents to state whether they (1) strongly agree,
(2) agree, (3) neither agree nor disagree, (4) disagree or (5) strongly disagree with a statement being made.
2.8 Data Analysis
The study used some methods to analyse the data. These methods are covered in detail in Section 3.0. However, a
summary is provided here. SPSS (Statistical Package for the Social Sciences) was used as the basis for holding the
data collected for objective 2 and 3. This software package provided a range of data management and statistical
techniques (Norusis 1992). Frequency methods to determine the number of times a particular factor of safety
leadership was referenced from a range of sources. Comparing data from two sources, to see whether there was
enough evidence to support the study objective that sites that were more proactive in safety leadership had a better
safety performance.Every effort was made to ensure the validity and reliability of the statistical processes
undertaken.
3.0 Data Analysis and Conclusions
3.1 Analysis methods
The literature review process provided the primary source of information for studying the objective. A broad range
of publications, journals and previous studies into leadership (particularly safety leadership), were reviewed to
achieve the objective.The frequency that same factor was mentioned within the different reference sources provided
the evidence to support if there was a ‗consensus‘ among the experts on the factors that are most important in
demonstrating safety leadership.Responses to site manager and subordinate questionnaire were collected,and each of
the statements was entered into the SPSS software. SPSS was used to provide primary output for each of the 34
statements regarding the number (and percentage) of respondents selecting a particular category. The 34 statements
were then grouped under their assigned factor of safety leadership, using the code at the end of each statement.
The Likert scoring system (described below) was used to provide total scores for each of the nine factors. The factor
scores for the site manager and subordinate questionnaires were then compared, to see whether the two groups were
in agreement on the level of safety leadership is applied. The total Likert scores for each of the nine factors of
leadership were calculated for both site managers and subordinates. A further calculation was undertaken to
determine the ‗standard deviation‘, for each of the factors for both groups.
The construction industry uses a standard calculation to obtain an ‗incident frequency rate‘ (IFR) which is then used
to compare performance year on year. This calculation (detailed below) was used to obtain an IFR for each site
participating in the study project.
Number of incidents x 10,00,00 = incident rate
Number of hours worked
Note – the incidents selected for the calculation were only those that resulted in ‗injury‘ to personnel and did
not include near misses, damage to plant or environmental incidents.The overall total of the Likert scores for
site managers and subordinates were calculated on a site-by-site basis. This score was indicative of the level of
safety leadership activity being reported on each site.The site Likert scores for each site was then compared
with the IFR for each site to see whether those sites with the higher Likert scores had lower IRF's.
A scattergram was used to display the results (see section 3.2 below).
3.2 Results of analysis

International Journal of Engineering, Science and Mathematics Vol.7 Issue 4, April 2018, ISSN: 2320-0294 Impact Factor: 6.765 Journal Homepage: http://www.ijesm.co.in, Email: [email protected] Double-Blind Peer Reviewed Refereed Open Access International Journal - Included in the International Serial Directories Indexed & Listed at: Ulrich's Periodicals Directory ©, U.S.A., Open J-Gage as well as in Cabell’s Directories of Publishing Opportunities, U.S.A
104 International Journal of Engineering, Science and Mathematics
http://www.ijesm.co.in, Email: [email protected]
The three most frequently suggested factors of leadership from the range of sources referenced were: -
Building trust with subordinates (recorded 8 times)
o Reflecting the values and aspirations of your followers (O‘Toole)
o Leaders must be trusted (Bennis) (O‘Toole) (HSE)
o Need to win and hold trust (Gardner)
o Leaders must be approachable (Sefton)
o Leaders must be honest (Sefton) (Cacioppe)
Maintaining integrity, and (recorded nine times)
o Task-relevant knowledge (Kets De Vries)
o Expertise (Powell)
o High standards of integrity (Nanus)
o Leaders need integrity (HSE)(Sefton)(O‘Toole)
o Leaders demonstrate integrity in their behaviour (De Pree's)
o Competence (Cacioppe)
o Leaders need to know their strengths and their weaknesses ( (Bennis)
Listening to subordinates. (recorded five times)
o Workgroup participation in decision making (HSE) (Sefton)
o Listening to others (O‘Toole)
o Inclusion (O‘Toole)
o Workforce involvement (HSE)
Table 2 below summarizes the Likert ‗mean scores‘ for each of the nine factors of safety leadership.
Table 1: Application of Safety Leadership Factors
Mean Score Table
Factor
Number
Factor Description Site Managers
Mean Score
Subordinates
Mean Score
1 Setting a personal example 3.24 4.94
2 Involving and consulting people in decision making 4.11 3.75
3 Rewarding safe behaviour 4.09 3.68
4 Disciplining unsafe behaviour 4.00 3.31
5 Trustworthy and open 4.24 3.95
6 Demonstrating safety priorities over production 4.53 4.12
7 Communication and feedback 4.07 2.77
8 Personal involvement in safety initiatives 4.07 3.96
9 Building relationships 3.85 2.11
On the whole, the results for all factors reported positive results, to varying degrees, with upwards of 50% of the
Likert scores being either neutral or positive.
Factor 1 ‗Setting a personal example‟ resulted in an 88% positive score by the site managers and 73% by
subordinates. One of the main areas of disagreement was in statement 10 ‗people work safer when the site manager

International Journal of Engineering, Science and Mathematics Vol.7 Issue 4, April 2018, ISSN: 2320-0294 Impact Factor: 6.765 Journal Homepage: http://www.ijesm.co.in, Email: [email protected] Double-Blind Peer Reviewed Refereed Open Access International Journal - Included in the International Serial Directories Indexed & Listed at: Ulrich's Periodicals Directory ©, U.S.A., Open J-Gage as well as in Cabell’s Directories of Publishing Opportunities, U.S.A
105 International Journal of Engineering, Science and Mathematics
http://www.ijesm.co.in, Email: [email protected]
is walking about on site‘. 67% of site managers believed that they did have an influencing effect on subordinate
behaviour when they were on site, whereas only 36% of subordinates is agreeing and 40% disagreeing. Factor 2
‗Involving and consulting people in decision making‟ resulted in an 82% positive score by site managers and 75%
by subordinates. There was little disagreement on any of the four statements in this factor. Encouraging was the
closeness of the results for statement 31 ‗The site manager encourages the workforce to take on a more active role in
health and safety‘. The scores for this were almost identical, with 93.4% and 93.1% either agreeing or strongly
agreeing and the others are remaining neutral.Factor 3 ‗Rewarding safe behaviour‟ resulted in an 82% positive score
for the site managers and 74% for subordinates. The main area of disagreement was in statement 1 ‗people are
rewarded for taking on additional safety responsibilities‟. Subordinates scored much lower (only 54% positive) than
site managers (80%).
Factor 4 ‗Disciplining unsafe behaviour‘ resulted in an 80% positive score for the site managers and 66% for
subordinates. The main difference in opinion lay around statement 21 ‗people are appropriately disciplined on the
site for breaches of safe working practices‘. Subordinates scored this much lower than site managers (34% against
73%) with more subordinates remaining neutral (47%).
Factor 5 ‗Trustworthy and Open‘ resulted in an 84% positive score for the site managers and 79% for subordinates.
There were a number of areas of disagreement between site managers on this factor. For statement 16 ‗subordinates
trusted the site manager enough to approach them on any matter‘ scored well with only 10% between the scores
(subordinates scoring lower) and the negative scores for both groups being higher on the site manager side rather
than the subordinates. 100% of site managers agreed that there was ‗no reason why people should feel afraid to
report incidents on site‘ (statement 24), however, 41% of subordinates either disagreed or remained neutral (59%
positive). There was a very positive score by the subordinates for statement 32 ‗I feel I could tell the site manager if
I had a concern about safety on site‟, with 97% either agreeing or strongly agreeing with the statement.
Factor 6 ‗Demonstrating safety priorities over production‟ resulted in a 91% positive score for site managers and
82% for subordinates. The most significant finding in this factor was in statement 11 ‗there is no pressure to get the
job done at the expense of adhering to safe working practices‟. One of the site managers disagreed with this
statement.Factor 7 ‗Communication and feedback‘ resulted in an 83% positive score by the site managers and 78%
for subordinates. Statement 19 ‗the site manager talks more about safety than production‘ seemed to affect the
scores most significant, with site managers scoring only 46% and subordinates 22%, with many remaining neutral.
Factor 8 ‗Personal involvement in safety initiative‘ resulted in 76% positive by the site managers and 78% for
subordinates. There were no significant findings from this factor.Factor 9 ‗Building relationships‘ resulted in a 77%
positive score by the site managers and 75% for subordinates. The main observation was in statement 17 ‗the site
manager pushes the safety agenda purely to satisfy senior management‟. One of the site managers agreed with this
statement. It is evident that the results for factors 2 to 9 that there is a likelihood that the results could have occurred
by chance and therefore statistically they are not significant.
The results for factor 1, reported a significance score of 1.95, which means that there is only a 3% chance that the
results could have occurred by chance and therefore (statistically) there is evidence to suggest that the site managers
and subordinates are in fact not members of the same group and that some confidence can be placed on the
results.Table 3 summarizes the mean scores obtained following the calculation of points from the ranking exercise,
described in section 3.1 above. A column is included in the table to show where the factor ranked for subordinates
and site managers.
Table 2: Factors of Safety Leadership
Mean Score Ranking Table
Site Managers Subordinates
Factor Mean Score Final Rank Factor Mean Score Final Rank

International Journal of Engineering, Science and Mathematics Vol.7 Issue 4, April 2018, ISSN: 2320-0294 Impact Factor: 6.765 Journal Homepage: http://www.ijesm.co.in, Email: [email protected] Double-Blind Peer Reviewed Refereed Open Access International Journal - Included in the International Serial Directories Indexed & Listed at: Ulrich's Periodicals Directory ©, U.S.A., Open J-Gage as well as in Cabell’s Directories of Publishing Opportunities, U.S.A
106 International Journal of Engineering, Science and Mathematics
http://www.ijesm.co.in, Email: [email protected]
Number Number
1 8.73 1 1 6.54 2
2 5.06 5 2 5.00 5
3 3.20 8 3 3.25 8
4 1.93 9 4 3.16 9
5 6.20 2 5 7.01 1
6 5.40 3 6 5.27 3
7 5.13 4 7 5.17 4
8 4.27 7 8 4.69 7
9 4.80 6 9 4.80 6
Interesting to observe that subordinates view factor 5 ‗Trustworthy and open‟ as their most important factor, above
‗setting a personal example‟ with site managers ranking these in reverse order.
Table 4 below provides a summary of the injury frequency rates for each site along with the combined Likert scores
for site managers and subordinates.
Table 3: Injury Frequency Rates
Site Injury frequency
rate (IFR)
Site rank by IFR score Likert score for site managers
and subordinates
Site rank by Likert
score
A 0.00 1 268.9 4
B 3.25 6 289.0 2
C 2.66 5 298.2 1
D 0.00 1 284.8 3
E 0.58 2 256.0 5
F 1.05 4 252.6 6
G 0.00 1 243.4 7
H 0.89 3 Excluded – no SM quest
returned
Excluded – no SM
quest returned
A scattergram was used to plot the results for each site and identify whether there was anyapparent association
between Likert scores and Incident Frequency Rates (IFR‘s). Thisis shown in figure 2 below.
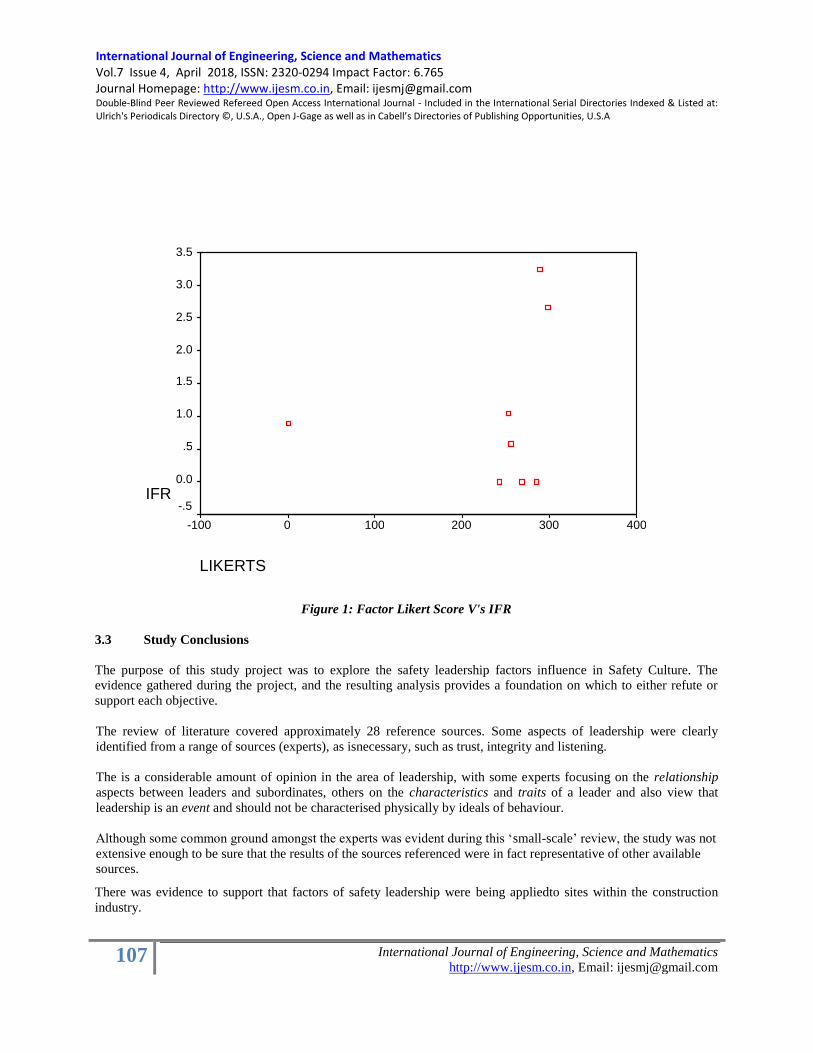
International Journal of Engineering, Science and Mathematics Vol.7 Issue 4, April 2018, ISSN: 2320-0294 Impact Factor: 6.765 Journal Homepage: http://www.ijesm.co.in, Email: [email protected] Double-Blind Peer Reviewed Refereed Open Access International Journal - Included in the International Serial Directories Indexed & Listed at: Ulrich's Periodicals Directory ©, U.S.A., Open J-Gage as well as in Cabell’s Directories of Publishing Opportunities, U.S.A
107 International Journal of Engineering, Science and Mathematics
http://www.ijesm.co.in, Email: [email protected]
LIKERTS
400 300 200 100 0 -100
IFR
3.5
3.0
2.5
2.0
1.5
1.0
.5
0.0
-.5
Figure 1: Factor Likert Score V's IFR
3.3 Study Conclusions
The purpose of this study project was to explore the safety leadership factors influence in Safety Culture. The
evidence gathered during the project, and the resulting analysis provides a foundation on which to either refute or
support each objective.
The review of literature covered approximately 28 reference sources. Some aspects of leadership were clearly
identified from a range of sources (experts), as isnecessary, such as trust, integrity and listening.
The is a considerable amount of opinion in the area of leadership, with some experts focusing on the relationship
aspects between leaders and subordinates, others on the characteristics and traits of a leader and also view that
leadership is an event and should not be characterised physically by ideals of behaviour.
Although some common ground amongst the experts was evident during this ‗small-scale‘ review, the study was not
extensive enough to be sure that the results of the sources referenced were in fact representative of other available
sources.
There was evidence to support that factors of safety leadership were being appliedto sites within the construction
industry.

International Journal of Engineering, Science and Mathematics Vol.7 Issue 4, April 2018, ISSN: 2320-0294 Impact Factor: 6.765 Journal Homepage: http://www.ijesm.co.in, Email: [email protected] Double-Blind Peer Reviewed Refereed Open Access International Journal - Included in the International Serial Directories Indexed & Listed at: Ulrich's Periodicals Directory ©, U.S.A., Open J-Gage as well as in Cabell’s Directories of Publishing Opportunities, U.S.A
108 International Journal of Engineering, Science and Mathematics
http://www.ijesm.co.in, Email: [email protected]
The study highlighted some areas of disagreement in that subordinates suggested they did not alter their behaviour
when the site manager was on site, that people were not always rewarded for taking on additional safety
responsibilities and that some incidents may not be reported through fear of victimisation. Both groups seemed
unsure whether disciplinary action was used appropriately.Only factor 1 scored highly on the significance test with
some level of confidence reported that the results for factor 1 were in fact from two distinct groups. Based on this it
can be inferred that the factors of safety leadership are not actively appliedto sites within the Construction industry
in UAE. Although site managers and subordinates did not agree on the order of the first two factors of safety
leadership, both groups had the same factors as their top two most crucial safety leadership factors. More
surprisingly, was the order in which site managers and subordinates placed the remaining seven factors of safety
leadership. Results show that both groups ranked the remaining seven factors of safety leadership in precisely the
same order.
Given the significance test results for factor 1 ‗setting a personal example‟ and the evidence presented in Table 3
above, it can be concluded that there is aconsensus between subordinates and site managers on the factors that are
most important when demonstrating safety leadership.In order for this objective to be confirmed a number of factors
needed to be present in that firstly, incident data was required on which to complete the calculation to determine the
incident frequency rate (IRF) and secondly that the Likert scores were available for each of the sites. Looking at
Table 4 in section 3.2 above is evident that some sites reported no incidents during the review period, which
although very positive concerning the sites safety performance meant that those sites could not be included in the
study of the objective.
The final issue was about the data available and its association with the objective being tested. It was evident from
the data that there was little association between those sites reporting low IFR‘s and those sites scoring highly within
the questionnaires. Thisis shown in Figure 2 above.Although the relationship between attitude and behaviour has
been shown in some studies to have a relationship to accident rates in the chemical, automotive, steel and
construction industries (Boyett et al., 1998; Whittington et al., 1992), the results of this study project proved to be
inconclusive.
3.4 The need for further study
The study was unable to define precisely what the factors of safety leadership were from the range of expert opinion
available. Although some areas of common ground were identified, the available range of opinion on safety
leadership proved to be too extensive to be covered satisfactorily within the timescale of this study project and
therefore more extensive study is needed.There was little statistical evidence to support the application of factors of
safety leadership on sites within the construction industry. A more substantial population of site managers may have
provided very different results, and therefore an opportunity exists to undertake this in the future.The study has
provided evidence that site managers and subordinates are aligned on factors of safety leadership that are important
for a site manager to demonstrate safety leadership. The consensus that ‗Trustworthy and Openness‟ and „Setting a
Personal Example‟ featured as the two most important factors for both site managers and subordinates helps to
support earlier study conducted on supervisors (HSE, 1999). The link between safety leadership behaviour and
accident rates was not established. Further refinement of the principles used in this study project could be
undertakento test this objective in the future.
4.0 Summary
The study has provided further insights into the application of safety leadership factors within the construction
industry, with some of the findings reported in an earlier studybeing supported, i.e. the importance that ‗setting a
personal example‟ and ‗openness and trust‟ have to play when demonstrating safety leadership. The importance of
consultation had also been recorded in an earlier study (Whittington et al., 1992) and there was evidence to support
this earlier study within this project.

International Journal of Engineering, Science and Mathematics Vol.7 Issue 4, April 2018, ISSN: 2320-0294 Impact Factor: 6.765 Journal Homepage: http://www.ijesm.co.in, Email: [email protected] Double-Blind Peer Reviewed Refereed Open Access International Journal - Included in the International Serial Directories Indexed & Listed at: Ulrich's Periodicals Directory ©, U.S.A., Open J-Gage as well as in Cabell’s Directories of Publishing Opportunities, U.S.A
109 International Journal of Engineering, Science and Mathematics
http://www.ijesm.co.in, Email: [email protected]
The alignment between site managers and subordinates on the ranking of safety leadership factors was
unpredictable, however also very encouraging, highlighting that management and the subordinates may be more
closely aligned than previously thought – if this population sample reflects the broader population.
The ability to identify the ‗key‘ factors of ‗safety leadership‟ from the literature review was unsuccessful. The
difficulties in identifying common ground amongst the experts on the factors of safety leadership (and leadership in
general) have been identified by Kits de Vrie's (1995). He concluded that, although most studies would agree that
traits such as conscientiousness, energy, intelligence, dominance, self-confidence, sociability, and openness to
experience, task-relevant knowledge, and emotional stability are important, beyond that limited area of agreement,
‗the myriad theories diverge, and it is easy to lose oneself in the academic hair-splitting Kits De Vrie‘s (1995).The
study failed to identify a link between safety leadership behaviour and accident rates. The reasons for this could be
many, however further study in this area may prove to be useful in understanding the role that safety leadership has
to play in the overall ‗organisational factors‘ affecting today‘s workplaces.
Opportunities to further enhance safety leadership factors have been provided by this study, with regards to ensuring
appropriate disciplinary action is being used. The study also provided some areas for an address in that there were
still views that subordinates may not be reporting all incidents through fear of retribution.
One last observation related to whether the subordinate behaviour was influenced positively when the site manager
was on site. Readers could make two interpretations of these results. Either site managers are not positively
influencing subordinate behaviour, or the subordinates are working safely irrespective of whether the site manager is
on site or not.
6.0 Bibliography
1. Miles, B, HSE OSD, HSG 48 Presentation Health and Safety Executive, 1999, Reducing Error and
Influencing Behaviour, HS(G)48, HSE Books, ISBN 0-7176-2452-8
2. 1998, Boyett, J & Boyett, J, The Guru Guide – The best ideas of the top management thinkers, John Wiley
& Sons Ltd, ISBN 0471380547
3. Shackleton, E, South, 1999
4. Powell, Gnr C, A Leadership Primer, Department of the Army, United States of America
5. Bernard, 1926; Blake, Shepard and Mouton, 1964; Drath and Palus, 1994; Fiedler, 1967; and House and
Mitchell, 1974
6. Bhagawati B (2015). Basics of occupational safety and health. IOSR J Environ Sci Toxicol Food Technol.
PP91–94.
7. Amponsah-Tawiah K.and Dartey-Baah K (2011). Occupational health and safety: key issues and concerns
in Ghana. Int J Bus Soc Sci, PP 120–126.
8. National Safety Council. NSC; Itasca (IL): 2004. Injury facts.
9. International Labour Organization ( 2014). Safety and health at work: a vision for sustainable prevention
[Online] Available at http://www.ilo.org/wcmsp5/groups/public/-ed_protect/-protrav/-
safework/documents/publication/wcms_301214.pdf [Accessed on 11 October 2016].
10. Seo D.C., Torabi M.R., Blair E.H.and Ellis N.T(2004). A cross-validation of safety climate scale using
confirmatory factor analytic approach. J Safety Res. PP 427–445.]
11. Gyekye S.A. Workers' perceptions of workplace safety: an African perspective. Int J Occup Saf Ergon.
2006;12:31–42.
12. Musonda, I. & Smallwood, J. (2008). Client Commitment and Attitude to Construction Health and Safety
in Botswana, In Proceedings of People in Construction, TG59 (Port Elizabeth (12-14 July), SouthAfrica,
231-347.
13. Okorie, V.N(2014).Behaviour-based health and safety management in construction: A leadership-focused
approach. Unpublished PhD Thesis: Nelson Mandela Metropolitan University, Port Elizabeth, Department
of Construction Management, South Africa.

International Journal of Engineering, Science and Mathematics Vol.7 Issue 4, April 2018, ISSN: 2320-0294 Impact Factor: 6.765 Journal Homepage: http://www.ijesm.co.in, Email: [email protected] Double-Blind Peer Reviewed Refereed Open Access International Journal - Included in the International Serial Directories Indexed & Listed at: Ulrich's Periodicals Directory ©, U.S.A., Open J-Gage as well as in Cabell’s Directories of Publishing Opportunities, U.S.A
110 International Journal of Engineering, Science and Mathematics
http://www.ijesm.co.in, Email: [email protected]
14. Lu, C.S. & Yang, C.S. (2010). Safety leadership and safety behaviour in container terminal operation:
Safety Science, 48(2), 123-134.Cooper, M.D. (2010). Safety leadership in construction: a case study. Indian
Journal of Occupational Medicine and Ergonomics: Suppl. A Psychology: 32(1), A15-17.
15. Lees, H. & Austin, J. (2011).The case for behavior-based safety in construction. Proceedings of the
Institution of Civil Engineers: Management, Procurement and Law, 164(1), 3-7.
16. Oloke, A.O. (2010). Responsibility of Key Duty Holders in Construction Design and Management. In
McAleenan, C. &Oloke, D. ed. ICE annual of Health and Safety in Construction, London: Thomas Telford,
29-37.
17. Zou, P. X. (2011). Fostering a strong safety culture. Leadership and Management in Engineering,
11(10);11-22.
18. Yoon, S., Lin, H., Chen, G., Yi, S., Choi, J. and Rui, Z. (2013). Effect of Occupational Health and Safety
Management System on Work-Related Accident Rate and Differences of Occupational Health and Safety
Management System Awareness between Managers in South Korea's Construction Industry. Safety and
Health at Work, 4(4), pp.201-209.
19. Zanko, M. and Dawson, P. (2011). Occupational Health and Safety Management in Organizations: A
Review. International Journal of Management Reviews, 14(3), pp.328-344.
20. Stewart, JM., 2002. Managing for World Class Safety. A Wiley Interscience Publication, pp.1-31.

International Journal of Engineering, Science and Mathematics Vol.7 Issue 4, April 2018, ISSN: 2320-0294 Impact Factor: 6.765 Journal Homepage: http://www.ijesm.co.in, Email: [email protected] Double-Blind Peer Reviewed Refereed Open Access International Journal - Included in the International Serial Directories Indexed & Listed at: Ulrich's Periodicals Directory ©, U.S.A., Open J-Gage as well as in Cabell’s Directories of Publishing Opportunities, U.S.A
111 International Journal of Engineering, Science and Mathematics
http://www.ijesm.co.in, Email: [email protected]
MANAGEMENT OF HSE RISK AND IMPLEMENTATION OF SAFE WORK PRACTICES IN
ELECTRICAL INSTALLATIONS
Jayant Mukerjee
Prasenjit Mondal
Akshi Singh
Abhishek Nandan
Abstract
The chance of fatality increases when a person comes into the contact
of substantial electric current. As it passes through the body
(following low resistance path)to ground causes skin lesion,
fibrillation, organ damage or death etc., nature of these fatalities are
almost accidental but, most of it occurred due to unsafe working
condition and unsafe acts which, in terms can be predicted as an
electrical safety issue in the working procedure of an organization.
Electrical accident follows the pattern and extensive burns with
charring cloths were being depicted in cases of high tension
electrocution. There is a very high possibility of fatality when the
person remains unattended after electrocution. Seeing the industrial
accidents in order to manage HSE risks and implementation of safe
work practices there is a need to transform the electrical power
industry in terms of generic risk assessments and electrical safety
checklist at any working voltage.
This paper gives the importance of generic risk assessment and
electrical safety checklist for managing HSE risks with the help of
some relevant case studies based on electrical accidents.
Keywords:
HSE risks;
Safe work practices;
electrocution,
working voltage;
industrial accidents;
power industry
Copyright © 2018 International Journals of Multidisciplinary
Research Academy. All rights reserved.
Author correspondence:
Jayant Mukerjee,
M.tech, Health Safety and Environment
University of Petroleum and Energy Studies, Dehradun
1. Introduction
Electrical installations are the group of equipments installed from a common electrical supply in order to serve and
fulfill the required task of conveying electricity to a point of consumption or used to generate or store electricity. All
the fittings are combined to form as a part of the system. There is a story which makes no sense at all but very
famous as it leads towards the adaptation of electrical safety procedure, in the late 1800s, it was evident that hotels

International Journal of Engineering, Science and Mathematics Vol.7 Issue 4, April 2018, ISSN: 2320-0294 Impact Factor: 6.765 Journal Homepage: http://www.ijesm.co.in, Email: [email protected] Double-Blind Peer Reviewed Refereed Open Access International Journal - Included in the International Serial Directories Indexed & Listed at: Ulrich's Periodicals Directory ©, U.S.A., Open J-Gage as well as in Cabell’s Directories of Publishing Opportunities, U.S.A
112 International Journal of Engineering, Science and Mathematics
http://www.ijesm.co.in, Email: [email protected]
had to place signs and posters for assuring their guests that electricity is harmless in order to increase their guest list.
By the late 1900s, the scenario got changed totally and now, signs had to be hung to remind everyone that electricity
is a hazard for and to maintain a safe distance from it. In fact, the transition of electricity from a silent and casual
interpretation to a deadly hazard is a change that many cannot understand until it happens to them in order to affect
their well being. Because of these facts, the total acceptance of an electrical safety procedure became a requirement
for the health and welfare of workers.(Kumar, Verma et al. 2014)Electricity is an inherent part of present generation
and its unsafe handling increases the probability of getting minute electric shock to electrocution which is normally
preventable with the implementation of safety measures. In industries many workers are daily exposed to electrical
energy while performing their general duties but, only few understands that even a small amount of electrical energy
can lead to electrocution. For an e.g. electric current from 7.5W/120V incandescent lamp when passed through our
body (hand to hand or hand to foot) through chest is sufficient to cause fibrillation. It is evident that normal
household appliance also imposes very high risk in case someone operating it in an unsafe manner or breakdown of
insulation. The end result i.e. Electrocution may happen from 7.5W electrical bulb or overhead electrical power
lines. So, electricity is always treated as a hazard irrespective of its intensity and person while working with
electricity online must wear an appropriate personal protection accordingly. There is no country remained unaffected
by occupational accidents and power sector is most critical in the sense that, even though one can try to reduce the
probability of accidents by applying control measures but, most of the times severity remains unchanged. Many
efforts are aggravated in terms of continual improvement and up-gradation of safety precautions and legal
regulations but, it seems not a single country can negate the outcome of electrical accidents. Of course, there is a
vast difference in the safety precaution and significant controls when we compare countries in terms of
implementation, which is solely depends its own economic capacity, strength and vigilance of enforcement agencies.
(Bastian, Carman et al. 2015)To capture ground potential rise during ground fault there exist an electronic recording
system. When a distribution network is supplied by wye-transformer subjected to ground fault, the fault current
returns back to transformer wye point via earth, local grounding grid as well as any metallic parts and there is a rise
in ground potential leads to creation of touch and step potentials inside and within the surrounding areas of
substation until the operation of protective devices or self clearance of fault. So, if the grounding system is not
working properly there is a chance of electric shock to employees and public in the vicinity of substation. Therefore,
substation grounding system should be regularly accessed via. Visual inspection, ground continuity testing, low
current injection testing etc. with specified time frames as recommended by different regulatory standards.
Factors Affecting the Severity of Electric Shock
Physical Condition: A good physical condition tends to cause less trauma for a given amount of electrical current
flow whereas, a person with any medical problem (e.g. heart or lung ailments) are severely affected by the effect of
electric shock.
Current Duration: We know that,
J= I2RT
Where,
J: energy; Joules
I: current; Amperes
R: resistance; Ohms
T: time of current flow; Seconds
As the energy delivered by current through our body is directly proportional to the time duration therefore is
increase in the duration of flow of current, increases the severity or trauma.
Since, the frequency of current flow does not match with the frequency of heart beat per minute. Therefore, even
shorter duration current leads from minute electric shock and fibrillation to electrocution as this current tends to
overlap the body‘s cardiac cycle.
Frequency of Current Flowing: For higher frequency currents, Joule heating effect (J= I2RT) become less
momentousas there is an increase in capacitive current flow in higher frequency. It is also evident that there is

International Journal of Engineering, Science and Mathematics Vol.7 Issue 4, April 2018, ISSN: 2320-0294 Impact Factor: 6.765 Journal Homepage: http://www.ijesm.co.in, Email: [email protected] Double-Blind Peer Reviewed Refereed Open Access International Journal - Included in the International Serial Directories Indexed & Listed at: Ulrich's Periodicals Directory ©, U.S.A., Open J-Gage as well as in Cabell’s Directories of Publishing Opportunities, U.S.A
113 International Journal of Engineering, Science and Mathematics
http://www.ijesm.co.in, Email: [email protected]
apparent difference between DC (zero Hz) and power line frequency (50Hz) at equal magnitude of current in terms
of the phenomenon of ―let-go‖ threshold, which is higher in case of DC than that of AC.
Voltage Magnitude: Initially it was assumed that at same magnitude of electric current 200V source would create
the same effect as 2000V source. But, practically higher voltage is more lethal for these reasons:
1. Electrical pressure above 400 volts may be sufficient to puncture epidermis as there is a significant
amount of resistance provided by epidermis to current flow, here current magnitude dramatically
increases.
2. For greater cellular voltage gradient, the degree of electroporation is higher as severity of
electroporation increases at higher fields.
3. There is an increased chance of electric arcing with higher voltage at the point of contact with the
electrical conductor.
Power Generation, Transmission and Distribution System in India
In India Power sector is ever growing at very fast speed. Within year 2017-18 (till 30.09.2017), the Peak Demand
(Pd) is aproximately 164.1 GW & it is increasing day by day and the Installed Capacity (Ic) is 329.3 GW at present
with the mix generation of Nuclear (2.1%), Renewable (17.7%), Hydro (13.6%) & Thermal (66.6%). Power
generation, transmission and distribution sources in India is totally unbalanced and are unevenly dispersed as, it is
concentrated within few pockets but spread throughout the country. The natural resource of hydro power is located
in the foothills of Himalayas and in the North East. Coal reserves are particularly centered in Jhadkhand, Kolkata,
Orissa, Chhattisgarh belt and certain segments of Madhya Pradesh whereas Tamil Nadu and Gujrat are the sources
of lignite. Over the years a wide-ranging network of Transmission lines has been build and developed as the power
is produced by various power generating stations, transmitting to substations and distributing the same to the
consumers in order fulfill their load demands. Subjected to the amount of power and the distance involved, there
have been electrical lines laid down. The ostensible EHV (Extra High Voltage) lines in particular are ± 800 kV
HVDC & 765kV, 400 kV, 230/220 kV, 110 kV and 66kV/33KV, 11KV AC voltages ect. All the SEBs (State
Electricity Boards) and those including in central sectors have been installed these lines.
Total of 12,551 circuit km of lines have been commisioned in 2017-18 (April toSeptember 2017 quarter) and the
annual target of 54.4% is already achieved which is of 23,086 ckm for 2017-18 and in addition to this the
transformation capacity of 42,065 MVA substations has also been supplemented during 2017-18 (April to
September 2017) which constitutes to 77.9% of the 53,978 MVA total annual target for the year 2017-18.
As on 23-10-2017
Source: OM SECTION
Total Installed Capacity (As on 31.09.2017) : Central Electricity Authority (CEA)
Sector MW % Of Total
State Segment 81,102 24.6%
Central Segment 103,033 31.3%
Private Segment 145,165 44.1%
Total 3,29,298

International Journal of Engineering, Science and Mathematics Vol.7 Issue 4, April 2018, ISSN: 2320-0294 Impact Factor: 6.765 Journal Homepage: http://www.ijesm.co.in, Email: [email protected] Double-Blind Peer Reviewed Refereed Open Access International Journal - Included in the International Serial Directories Indexed & Listed at: Ulrich's Periodicals Directory ©, U.S.A., Open J-Gage as well as in Cabell’s Directories of Publishing Opportunities, U.S.A
114 International Journal of Engineering, Science and Mathematics
http://www.ijesm.co.in, Email: [email protected]
Fuel MW % Of Total
Total Thermal
Oil 1,93,427 66.60%
Gas 25,185 58.70%
Coal 838 7.60%
Hydro (Renewable) 44,653 13.60%
Nuclear 6780 2.10%
RES *(MNRE) 58,303 17.70%
Total 3,29,226
Growth in conventional generation of power in India - between 2009-17, URL: (http://powermin.nic.in)

International Journal of Engineering, Science and Mathematics Vol.7 Issue 4, April 2018, ISSN: 2320-0294 Impact Factor: 6.765 Journal Homepage: http://www.ijesm.co.in, Email: [email protected] Double-Blind Peer Reviewed Refereed Open Access International Journal - Included in the International Serial Directories Indexed & Listed at: Ulrich's Periodicals Directory ©, U.S.A., Open J-Gage as well as in Cabell’s Directories of Publishing Opportunities, U.S.A
115 International Journal of Engineering, Science and Mathematics
http://www.ijesm.co.in, Email: [email protected]
Risk- Evaluation, Assessment and Management
Hazard: It is basically, source or situation that has is likely to cause harm in terms of injury or ill health of a person,
defect/harm to machine or equipment, property, environment etc. and depends on nature and position. For example,
in electrical industries: poor wire insulation, unauthorized working, unprotected electrical parts, loose electrical
connection, over voltage or short circuit or over current due to any electrical fault, gradual phase changing,
maintenance without control of hazardous energy via. LOTO, inappropriate PPEs etc. which can lead to the risk
(combination of severity of injury and likelihood of occurrence of hazardous event) of electrocution.
(Luko 2014)Risk Assessment techniques-There is a lot of deviation in understanding the notion and utilization of
principles of risk management and ANSI Z690.3-2011 is most useful for mid management and quality engineers but
not as useful for technical specialists.
(Aven 2016)Risk assessment and management plays very important role in decision making process and are
established as a scientific field of study and made to continual improvements in order to meet with new challenges
every now and then.
It is very important to distinguish between risk management and risk assessment.
The phenomenon of risk assessment provides us with the answer to: How risky the situation is?
Whereas its management provides us with the answer to: what should we do about it?
The phenomenon of Risk management provides us with the systematic function of management policies, practices
and procedures so as to analyze access & control risks and associated identified hazards in order to protect
employees, general public of the vicinity as well as local/global environment as well as company assets while
avoiding business discontinuity. We can also define Risk Management as the continual process of identification,
evaluation, selection, and implementation of actions plans to turn down health risk and to ecosystems. The risk
management is having a goal which is dependably sound and economic by preventing risks taking integrated actions
that reduce while taking into account of civil, cultural, ethical, political, and legal legislations. Risk management is a
step by step and logical process to identify, reduce and control the workplace hazards. This process includes any or
all of the following steps:
Identify the hazards
Define risks levels
Define risk reduction measures through control measures
Obtain signature of approval form authourity (generally CEO)
Implement risk reduction measures through control measures
Risk assessment is defined to be, identification of hazards and its associated risk analysis and evaluation in order to
analyze the form, characteristics and dimension of the risk. Here the formulation of risk assessment sheet is done by
the process of collection of data of respective processes and operations from appropriate sources and used to
estimate probability and severity of occurrence in order to provide its control measures and reduce the estimated
probability and severity indices as a result of brain storming sessions. A risk assessment is an estimation and
evaluation of the potential health effects on workers who are continuously exposed to hazardous materials or
situations. It should consider all pertinent, veracious, and reasonably available information, and must explain the
criteria for selecting all the relied informations. Risk assessment steps:
Identification of hazard (area by area basis)
Decide who is getting affected
Evaluate risk and decide its precaution in terms if control measures
Record finding and implement them
Review risk assessment sheets and update for continual improvement
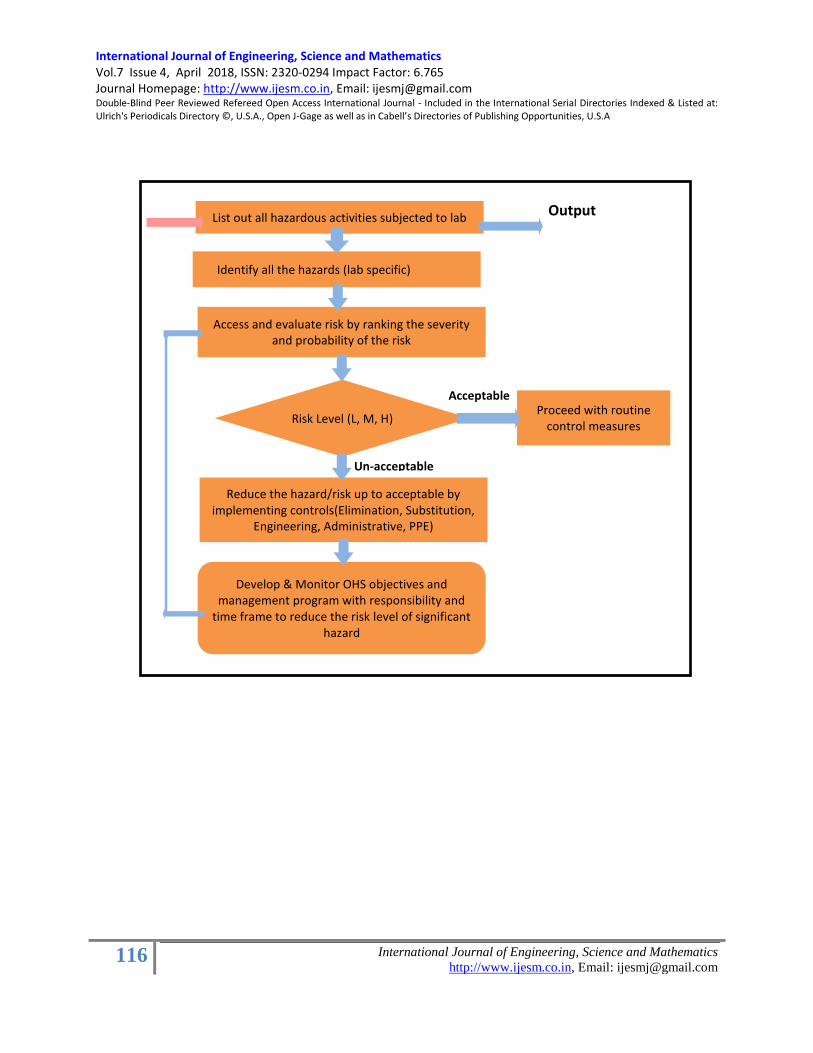
International Journal of Engineering, Science and Mathematics Vol.7 Issue 4, April 2018, ISSN: 2320-0294 Impact Factor: 6.765 Journal Homepage: http://www.ijesm.co.in, Email: [email protected] Double-Blind Peer Reviewed Refereed Open Access International Journal - Included in the International Serial Directories Indexed & Listed at: Ulrich's Periodicals Directory ©, U.S.A., Open J-Gage as well as in Cabell’s Directories of Publishing Opportunities, U.S.A
116 International Journal of Engineering, Science and Mathematics
http://www.ijesm.co.in, Email: [email protected]
List out all hazardous activities subjected to lab
Identify all the hazards (lab specific)
Access and evaluate risk by ranking the severity and probability of the risk
Risk Level (L, M, H)
Develop & Monitor OHS objectives and management program with responsibility and
time frame to reduce the risk level of significant hazard
Proceed with routine control measures
Reduce the hazard/risk up to acceptable by implementing controls(Elimination, Substitution,
Engineering, Administrative, PPE)
Output
Acceptable
Un-acceptable
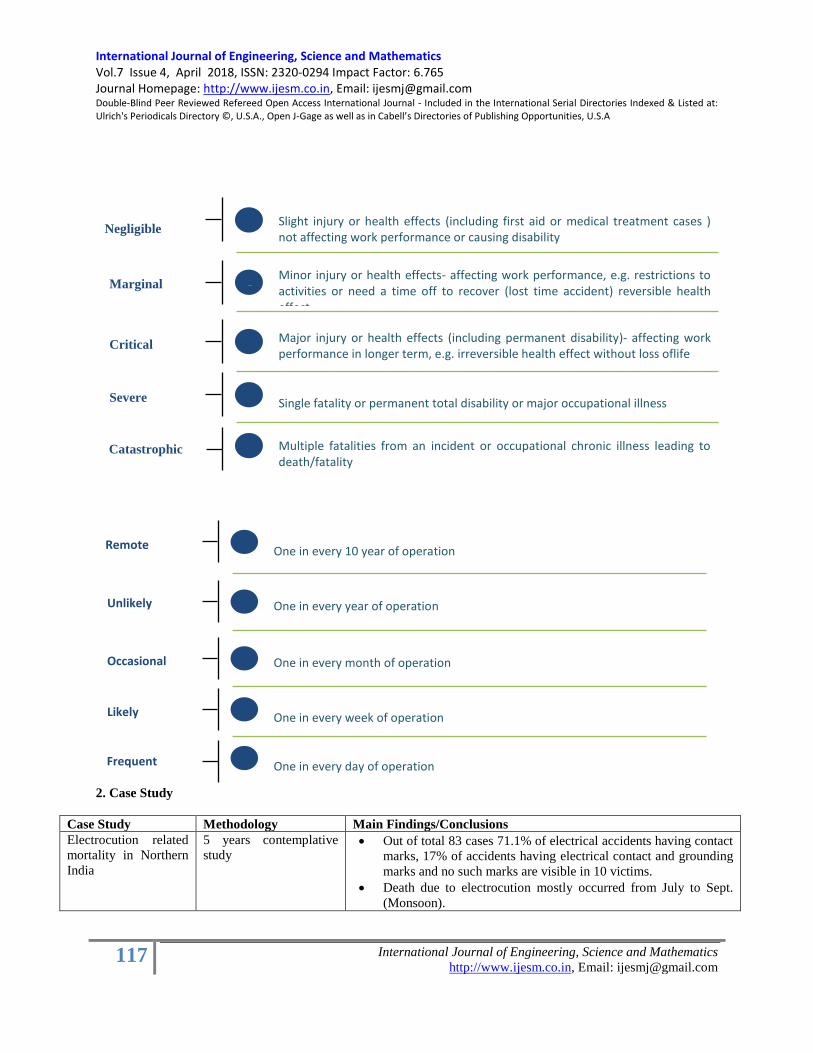
International Journal of Engineering, Science and Mathematics Vol.7 Issue 4, April 2018, ISSN: 2320-0294 Impact Factor: 6.765 Journal Homepage: http://www.ijesm.co.in, Email: [email protected] Double-Blind Peer Reviewed Refereed Open Access International Journal - Included in the International Serial Directories Indexed & Listed at: Ulrich's Periodicals Directory ©, U.S.A., Open J-Gage as well as in Cabell’s Directories of Publishing Opportunities, U.S.A
117 International Journal of Engineering, Science and Mathematics
http://www.ijesm.co.in, Email: [email protected]
2. Case Study
Case Study Methodology Main Findings/Conclusions
Electrocution related
mortality in Northern
India
5 years contemplative
study Out of total 83 cases 71.1% of electrical accidents having contact
marks, 17% of accidents having electrical contact and grounding
marks and no such marks are visible in 10 victims.
Death due to electrocution mostly occurred from July to Sept.
(Monsoon).
Unlikely
Likely
2
4
Remote
One in every month of operation
1
Occasional 3
One in every week of operation
One in every 10 year of operation
One in every year of operation
Frequent 5
One in every day of operation
Marginal
Severe
2
4
Negligible
Major injury or health effects (including permanent disability)- affecting work performance in longer term, e.g. irreversible health effect without loss oflife
1
Critical
3
Single fatality or permanent total disability or major occupational illness
Slight injury or health effects (including first aid or medical treatment cases ) not affecting work performance or causing disability
Minor injury or health effects- affecting work performance, e.g. restrictions to activities or need a time off to recover (lost time accident) reversible health effect
Catastrophic
5 Multiple fatalities from an incident or occupational chronic illness leading to death/fatality

International Journal of Engineering, Science and Mathematics Vol.7 Issue 4, April 2018, ISSN: 2320-0294 Impact Factor: 6.765 Journal Homepage: http://www.ijesm.co.in, Email: [email protected] Double-Blind Peer Reviewed Refereed Open Access International Journal - Included in the International Serial Directories Indexed & Listed at: Ulrich's Periodicals Directory ©, U.S.A., Open J-Gage as well as in Cabell’s Directories of Publishing Opportunities, U.S.A
118 International Journal of Engineering, Science and Mathematics
http://www.ijesm.co.in, Email: [email protected]
These accidents signify that workers do not have any elementary
knowledge of risks from electric shocks and most of the
accidents were preventable.
Maintenance Method
based on Risk
Estimation for 170kV
Gas Insulated
Switchgear (GIS)
FMEA and risk analysis
for pneumatic type GIS
based on collected
historical data of failures
and surveys of experts
Defined sub systems of failures and functional failures by
classifying historical data.
Estimation of frequency by classifying failure types using
Analytical Hierarchy Process (AHP).
Risk estimation
By doing condition assessment test, disassembling and
examination the GIS operable on outdoor substation for more
than 20 years, it is founded that operational performance of the
parts of pneumatic system got degraded with time and its risk
priority is high.
(Tuyou, Jiekang et al.
2016)Power supply
risk assessment
method for relay
protection system
faults
Relay protection
system, hidden faults
of reduced power
supply load power-
A Probability
analysis
Calculation of risk
value due to relay
protection system
sudden faults.
The hidden fault is the cause of all the occurrences of over-load,
reduced power supply load or outage of the relay protection
systems.
Reduced power supply load power probability is proportional to
the risk value due to hidden faults of relay protection system.
Risk assessment
techniques as decision
support tools for
military operations
Qualitative and
Quantitative risk analysis Both the analysis techniques for risk assessment can be applied
as decision support tools.
Qualitative risk assessment identifies all the possible events
which impacts transportation and Quantitative RA estimates
good relevance of the time duration in much precise form.
(Ünsar and Süt
2015)Occupational
accidents in energy
sectors in Turkey
between 2002-2010
Study of work accidents
statistics (Turkey
Electricity Generation
Corporation website)
between 2002 to 2010
Trends shows that number of accidents every year is more than
100 accept 2005, 2006 and 2009.
Number of deaths increases 2.5 times as on 2009 compared to
2002.
Percentage of accidents is higher when workers are not wearing
PPEs, unsafe materials, personal faults and insufficiency in these
plants.
Work accidents mostly occurred while workers are doing
maintenance.
More emphasis must be given to incident investigation and
employee training with the formation of work security culture.
(Jia, Qi et al.
2015)Hierarchical risk
assessment of
transmission system
considering the
influence of active
distribution network
Case study depicting
Distributed
generation capacity
influence on system
risk.
System risk due
influence to DGs‘
capacity proportion.
As distributed generation capacity increases, expected energy not
supplied (EENS)-MWh/y and Severity Index- system min/y,
decreases smoothly. When the generation capacity is 40% of
maximum load maximum power is observed.
The effectiveness of Power support from micro turbine is better
than wind generation and photovoltaic generation because these
two are having random power output and cannot be maintained
rated.

International Journal of Engineering, Science and Mathematics Vol.7 Issue 4, April 2018, ISSN: 2320-0294 Impact Factor: 6.765 Journal Homepage: http://www.ijesm.co.in, Email: [email protected] Double-Blind Peer Reviewed Refereed Open Access International Journal - Included in the International Serial Directories Indexed & Listed at: Ulrich's Periodicals Directory ©, U.S.A., Open J-Gage as well as in Cabell’s Directories of Publishing Opportunities, U.S.A
119 International Journal of Engineering, Science and Mathematics
http://www.ijesm.co.in, Email: [email protected]
DGs‘ dispersion
influence on system
risk.
System risk due to
component outage
probability.
DGs‘ location
influence on system
risk.
EENS (expected energy not supplied), PLC (probability of load
curtailment), EFLC (expected frequency of load curtailment), SI
(severity index) all indices is inversely proportional to dispersion
degree.
EENS & SI increases with increase in outage probability
therefore it is evident that DGs cannot able to generate sufficient
power generation in order to transform from abnormal to normal
condition.
DGs to be located in order to maintain balance between DGs
capacity and local load.
(Mukherjee, Farooqui
et al.
2015)Retrospective
study of fatal
electrocution in rural
region of western
Maharashtra, India
Investigation of deaths,
autopsied in different
hospitals of Maharashtra
due to electrocution via.
Medico logical records
and subjective analysis
of postmortem reports.
Out of 2292 autopsies, 2.31% of deaths are fatality due to
electrocution and are accidental in nature where majority is for
males nearly 79.25%.
Highest number to fatalities is observed during June to sept. And
in 90.57 % of cases are having electric mark or burn.
Majority of deaths occurred before even brought the victims to
hospital.
3. Conclusion
It is very evident that from the review that for all workers (whether electrical or non electrical) in an industry,
electricity is somehow the part of their work what they are performing and majority of electrical accidents had
occurred because of the reasons: Improper knowledge, Inappropriate use of materials while working on line,
Inappropriate protective equipments, Personal faults, Lack of training and Lack of risk management
So, in order to manage the risk from electrical energy and implementation of safe work practices, every task must
where there is a requirement of working with electrical energy directly or indirectly should have Generic risk
assessment sheet , Electrical safety checklist.
These two should be the minimum requirement to check any indicative potential hazard before starting any work.
These RA sheets and checklist should be updated and modified time to time in order to provide continual
improvement.
References
1. Athanasios C Karmpreis (2014) "Risk Assessment techniques as decision support tools for military
operations" Journal of Computations & Modelling, vol.4, no.1, 2014, 67-81
2. Y.M. Kim (2015) "Maintenance Method based on Risk Estimation for 170kV Gas Insulated Switchgear."
21, rue d‘Artois, F-75008 PARIS
3. Sachil Kumar (2013) "Electrocution-related_mortality_in_northern_India." Egyptian Journal of Forensic
Sciences
4. Peter A. Smith (2001) "A Preliminary Study of the Application of Probabilistic Risk Assessment
Techniques to High-Energy Laser Safety" United States Air Force Research Laboratory
5. Aven, T. (2016). "Risk assessment and risk management: Review of recent advances on their foundation."
European Journal of Operational Research253(1): 1-13.
6. Bastian, M. B., W. D. Carman, et al. (2015). "Real-Time Monitoring of Substation Ground Potential Rise
and Grounding System Impedance Using Power System Faults." IEEE Transactions on Industry
Applications51(6): 5298-5304.
7. Jia, H., W. Qi, et al. (2015). "Hierarchical Risk Assessment of Transmission System Considering the
Influence of Active Distribution Network." IEEE Transactions on Power Systems30(2): 1084-1093.

International Journal of Engineering, Science and Mathematics Vol.7 Issue 4, April 2018, ISSN: 2320-0294 Impact Factor: 6.765 Journal Homepage: http://www.ijesm.co.in, Email: [email protected] Double-Blind Peer Reviewed Refereed Open Access International Journal - Included in the International Serial Directories Indexed & Listed at: Ulrich's Periodicals Directory ©, U.S.A., Open J-Gage as well as in Cabell’s Directories of Publishing Opportunities, U.S.A
120 International Journal of Engineering, Science and Mathematics
http://www.ijesm.co.in, Email: [email protected]
8. Kumar, S., A. K. Verma, et al. (2014). "Electrocution-related mortality in northern India – A 5-year
retrospective study." Egyptian Journal of Forensic Sciences4(1): 1-6.
9. Luko, S. N. (2014). "Risk Assessment Techniques." Quality Engineering26(3): 379-382.
10. Mukherjee, B., J. M. Farooqui, et al. (2015). "Retrospective study of fatal electrocution in a rural region of
western Maharashtra, India." J Forensic Leg Med32: 1-3.
11. Tuyou, S., W. Jiekang, et al. (2016). "Power supply risk assessment method for relay protection system
faults." Archives of Electrical Engineering65(4).
12. Ünsar, A. S. and N. Süt (2015). "Occupational Accidents in the Energy Sector: Analysis of Occupational
Accidents that Occurred in Thermal and Hydroelectric Centrals Between 2002 and 2010 in Turkey."
Procedia - Social and Behavioral Sciences181: 388-397.
SUSTAINABLE OPTIONS FOR E-WASTE MANAGEMENT
Gautam Priti
Bahukhandi Kanhan Deoli
Abstract
―E-waste" is a popular jargon for electronic products nearing the end
of their useful life. E-wastes are considered dangerous, as certain
components of some electronic products contain materials that are
hazardous, destined for reuse, resale, salvage, recycling, or disposal
depending on their condition and density. The hazardous content of
these materials pose a threat to human health and environment.
Discarded computers, televisions, Laptops, servers, stereos, copiers,
fax machines, electric lamps, cell phones, severs, audio equipment
and batteries if inappropriately disposed can leach lead and other
substances into soil and groundwater. Many of these products can be
reused, refurbished, or recycled in appropriate options so that they
are less harmful to the ecosystem. This paper is
basedonsecondarydatathat study the e-waste composition, Global and
Indian E-waste scenarios and the hazards of e-wastes, the need for its
appropriate management, public awareness and environment friendly
technological sound options that can be implemented.
Keywords:
E-Waste;
Environmentally sound
management ;
Sustainabile development ;
Extended Producer
Responsibility;
Copyright © 2018 International Journals of Multidisciplinary
Research Academy. All rights reserved.
Author correspondence:
Gautam Priti,
Environment Science Lab. Deptt. Of Botany
Dr. Priti Gautam,Environment Science Lab. Deptt. of Botany, Kisan (P.G.) College, Simbhaoli Ghaziabad - INDIA

International Journal of Engineering, Science and Mathematics Vol.7 Issue 4, April 2018, ISSN: 2320-0294 Impact Factor: 6.765 Journal Homepage: http://www.ijesm.co.in, Email: [email protected] Double-Blind Peer Reviewed Refereed Open Access International Journal - Included in the International Serial Directories Indexed & Listed at: Ulrich's Periodicals Directory ©, U.S.A., Open J-Gage as well as in Cabell’s Directories of Publishing Opportunities, U.S.A
121 International Journal of Engineering, Science and Mathematics
http://www.ijesm.co.in, Email: [email protected]
Kisan (P.G.) College , Simbhaoli Ghaziabad
1. Introduction
Electronic waste or e-waste is the term given to describe any electronic product, or product containing electrical
components, that has reached the end of its usable life cycle [1]. We are constantly confromusnted with
environmental changes across the world, ranging from mismanagement of wastes, contamination and industrial
revolution followed by the advances in information technology during the last century has radically changed
people's lifestyle. In recent time, waste electrical & Electronic equipment(WEEE) or electronic waste (e-waste)
generation, trans-boundary movement and disposal are becoming issues of concern to solid waste management
professionals, environmentalists, international agencies and governments around the world [2] ,[3].Electronic waste
contain toxic substances such as lead, mercury, cadmium and lithium [4]. These Toxic materials can be released
upon disposal posing a threat to human health and the environment. For example, Laptops contain certain
components, which are highly toxic, such as chlorinated and brominated substances, toxic gases, toxic metals,
plastics and plastic additives. These days computer has become most common and widely used gadget in all kinds of
activities ranging from schools, residences, offices to manufacturing industries. Basel Action Network (BAN)
estimates that the 500 million computers in the world contain 2.87 billion kgs of plastics, 716.7 million kgs of lead
and 286,700 kgs of mercury. E-waste is becoming a crucial waste stream in terms of both quantity and toxicity [5].
The total amount of e-waste produced has reached approximately 41 million ton in 2014 and increasing at a rate of
3-5% every year [6]. However electronic waste also contain precious metals such as gold ,silver which offer
opportunities for economic extraction. Recycling of WEEE is significant not only for the recovery aspect of valuable
materials there are also significant energy savings when recycled materials are used in place of virgin materials [7].
2. Toxic effects on environment and human health
Disposal of e-wastes is a particular problem faced in many regions across the globe. E-Wastes that are landfilled
produces contaminated leachates, which eventually pollute the groundwater. Acids and sludge obtained from
melting computer chips, if disposed on the ground causes acidification of soil. Incineration of e-wastes can emit
toxic fumes and gases, thereby polluting the surrounding air. Improperly monitored landfills can cause
environmental hazards. Mercury & other heavy metals will leach when certain electronic devices, such as circuit
breakers are destroyed. The same is true for polychlorinated biphenyls (PCBs) from condensers. In addition,
burning e-waste is the open-air burning of plastics in order to recover copper and other metals. The toxic fall-out
from open air burning affects both the local environment and broader global air currents, depositing highly toxic by
products in many places throughout the world. The World Health Organization states that heavy metals such as lead
and cadmium, even at low levels, can threaten child development and cause neurological damage [8].
Table I summarizes the health effects of certain constituents in e-wastes. If these electronic items are discarded with
other household garbage, the toxics pose a threat to both health and vital components of the ecosystem. In view of
the ill-effects of hazardous wastes to both environment and health, several countries exhorted the need for a global
agreement to address the problems and challenges posed by hazardous waste. International outrage following these
irresponsible activities led to the drafting and adoption of strategic plans and regulations at the Basel Convention.
The Convention secretariat, in Geneva, Switzerland, facilitates and implementation of the Convention and related
agreements. It also provides assistance and guidelines on legal and technical issues, gathers statistical data, and
conducts training on the proper management of hazardous waste.
Table I: Toxic Effects of E-Waste components on health
Source of e-wastes Components Health effects

International Journal of Engineering, Science and Mathematics Vol.7 Issue 4, April 2018, ISSN: 2320-0294 Impact Factor: 6.765 Journal Homepage: http://www.ijesm.co.in, Email: [email protected] Double-Blind Peer Reviewed Refereed Open Access International Journal - Included in the International Serial Directories Indexed & Listed at: Ulrich's Periodicals Directory ©, U.S.A., Open J-Gage as well as in Cabell’s Directories of Publishing Opportunities, U.S.A
122 International Journal of Engineering, Science and Mathematics
http://www.ijesm.co.in, Email: [email protected]
Relays and switches, printed
circuit boards Mercury (Hg)
Chronic damage to the brain.
Respiratory and skin disorders due to bioaccumulation in
fishes.
Solder in printed circuit boards,
glass panels and gaskets in
computer monitors
Lead (PB)
Damage to central and peripheral nervous systems, blood
systems and kidney damage.
Affects brain development of children.
Chip resistors and semiconductors Cadmium (CD)
Toxic irreversible effects on human health.
Accumulates in kidney and liver.
Causes neural damage.
Teratogenic.
Corrosion protection of untreated
and galvanized steel plates,
decorator or hardner for steel
housings
Hexavalent
chromium (Cr) VI
Asthmatic bronchitis.
DNA damage.
Cabling and computer housing Plastics including
PVC
Burning produces dioxin. It causes
Reproductive and developmental problems;
Immune system damage;
Interfere with regulatory hormones
Plastic housing of electronic
equipment and circuit boards.
Brominated flame
retardants (BFR) Disrupts endocrine system functions
Front panel of CRTs Barium (Ba) Muscle weakness;
Damage to heart, liver and spleen.
Motherboard Beryllium (Be)
Carcinogenic (lung cancer)
Inhalation of fumes and dust. Causes chronic beryllium
disease or beryllicosis.
Rubber ----- Phthalate plasticizer, BFR
Batteries ----- Lead,Lithium,Cadmium,Mercury
3. Results and Analysis
3.1 Basel Convention
The fundamental aims of the Basel Convention are the control and reduction of trans-boundary movements of
hazardous and other wastes including WEEEDirectivesandRestrictionofuseofCertain
HazardousSubstances(RoHS),whicharealsoimplementedbyother countries.According to EU directives, itis
mandatoryforall27countriesofEuropeanUniontorecycletheire-waste [9],[10] . The increasing number of
environmental regulations like EU‘s Restriction of Hazardous substances Directive(RoHS), the Registration,
Evaluation, Authorization and Restriction of Chemicals(REACH) regulation and the Waste Electrical and Electronic
Equipment (WEEE) directives makes it imperative for companies to engage in sustainability and good
environmental practices.
3.2 Mnagement of E - Waste
It is estimated that 75% of electronic items are stored due to uncertainty of how to manage it. These electronic junk
lie unattended in houses, offices, warehouses etc. and normally mixed with household wastes, which are finally
disposed off at landfills. This necessitates implementable management measures.

International Journal of Engineering, Science and Mathematics Vol.7 Issue 4, April 2018, ISSN: 2320-0294 Impact Factor: 6.765 Journal Homepage: http://www.ijesm.co.in, Email: [email protected] Double-Blind Peer Reviewed Refereed Open Access International Journal - Included in the International Serial Directories Indexed & Listed at: Ulrich's Periodicals Directory ©, U.S.A., Open J-Gage as well as in Cabell’s Directories of Publishing Opportunities, U.S.A
123 International Journal of Engineering, Science and Mathematics
http://www.ijesm.co.in, Email: [email protected]
In industries management of e-waste should begin at the point of generation. This can be done by waste
minimization techniques and by sustainable product design. Waste minimization in industries involves adopting:
Eco Design
Volume Reduction
Extended Producer Responsibility
Recovery and reuse.
Awareness and Communication
3.4 Eco Design
Eco design is state of art to the actions during product development to minimize its environmental impact during its
life cycle (cradle to grave) approach. It is an important consideration since it forms the basis of most of the
environmental impacts during production, consumption and disposal of a product. Eco design activities include
design for reduction or elimination of environmentally hazardous materials, design for re-use, design for recycling
design for remanufacturing and design for resource efficiency.
3.5 Volume reduction
Volume reduction includes those techniques that remove the hazardous portion of a waste from a non-hazardous
portion. These practices are usually to reduce the volume, and thus the cost of disposing of a waste material.
Segregation of wastes is in many cases a simple and economical technique for waste diminution. Wastes containing
different types of metals can be treated separately so that the metal value in the sludge can be recovered.
Concentration of a waste stream may increase the likelihood that the material can be recycled or reused. Methods
include gravity and vacuum filtration, ultra filtration, reverse osmosis, freeze vaporization etc.
3.6 Extended Producer Responsibility:
One of the important features of the e-waste (Management and Handling) rules 2011 & e E-Waste (Management)
Rules, 2016 are the inclusion of extended producer responsibility (EPR) under the provisions of these rules thus
making EPR mandatory. In particular, the producer is entrusting with financial and physical responsibility of their
product, once the consumer discards them. This extends the responsibility of the producer for a product‘s life cycle.
The main concept is that the responsibility and costs of managing, recycling, and disposing of a particular product is
to be borne by the producer of that product, rather than society [11].
The rules state that EPR can be implemented by the producers either individually or collectively. Individual
Producer Responsibility (IPR) means the responsibility of producers for its products through the entire cycle
including the collection and end of life management. Collective Producer Responsibility (CPR) implies that
consortium of producer takes responsibility for end of life management of products of all the members of the
consortium. According to these rules the producers have to ensure e waste is collected through authorized collection
agencies and channelized to a registered dismantler or recycler. The EPR suggests that the producer (manufacturer
or importer) of the product is responsible for the management of product through the life cycle of the product
including the end of life management of products. This could be done by means of increase in use of recycled
constituents in the products, enhancing the ease of product disassembly and by considering other ways to reduce the
overall environmental footprints of a product.
3.7 Recovery and reuse

International Journal of Engineering, Science and Mathematics Vol.7 Issue 4, April 2018, ISSN: 2320-0294 Impact Factor: 6.765 Journal Homepage: http://www.ijesm.co.in, Email: [email protected] Double-Blind Peer Reviewed Refereed Open Access International Journal - Included in the International Serial Directories Indexed & Listed at: Ulrich's Periodicals Directory ©, U.S.A., Open J-Gage as well as in Cabell’s Directories of Publishing Opportunities, U.S.A
124 International Journal of Engineering, Science and Mathematics
http://www.ijesm.co.in, Email: [email protected]
This technique could eliminate waste disposal costs, reduce raw material costs and provide income from a saleable
waste. Waste can be recovered on-site, or at an off-site recovery facility, or through inter industry exchange. A
number of physical and chemical techniques are available to reclaim a waste material such as reverse osmosis,
electrolysis, condensation, electrolytic recovery, filtration, centrifugation etc. However recycling of hazardous
products has little environmental benefit if it simply moves the hazards into secondary products that eventually have
to be disposed of. Unless the goal is to redesign the product to use non-hazardous materials, such recycling is a
mirage.
3.8 Awareness and Communication:
An essential aspect in the process of compliance of any rule is the creation of awareness among the stakeholders on
the various aspects of the products, including the requirements for the environmentally sound management of the
product at the end of life. The awareness creation can also be done through educational institutions. Awareness is
also essential regarding the hazardous constituents present in the equipment as well as the safe handling and disposal
of the product after its use. The producers should provide information on safe handling of the product to ensure its
safe delivery and installation for use. In the same manner the producers should also provide information for safe
handling of the end of life product.
3.9 Indian Scenario
While the world is manifesting at the technological revolution, countries like India are facing an imminent danger.
The high rate of reuse and refurbishment of electrical and electronic products in India has enable the growth of the
secondary market there are extending the life of product and only small quantity of e-waste are destined for
recycling. In fact, it is estimated that by 2017, global e-waste production will increase by 33%, which is
approximately 72 million tons. E-waste of developed countries, such as the US, dispose their wastes to India and
other Asian countries.India has become a major destination for E-waste exports from the developed nations[12].
Moreover, Indians have been generating rapidly increasing amounts of E waste domestically [13], [14]. A recent
investigation revealed that much of the electronics turned over for recycling in the United States ends up in Asia,
where they are either disposed of or recycled with little or no regard for environmental or worker health and safety.
India‘s rate of PC obsolescence is growing dangerously. As up gradation beyond a point become uneconomical and
incompatible with new software, a vast amount of hardware will soon be added to the waste stream [15].
It is imperative that developing countries and India in particular wake up to the domination of the developed
countries and set up appropriate management measures to prevent the hazards and mishap due to mismanagement of
e-wastes.
3.10 Management Option
Considering the severity of the problem, it is imperative that certain management options be adopted to handle the
bulk e-wastes. Following are some of the management options suggested for the government, industries and the
public.
3.11 Responsibilities of the Government:
At the Government level regulatory agencies should be set up. Government ought to enforce stringent laws and
administrative procedures[16].The Ministry of Environment and forests, Government of India has notified the e E-
Waste (Management) Rules, 2016 under the Environment (Protection) Act, 1986. These rules are applicable to the
producers of electrical and electronic equipments, the consumers, collection centres, dismantlers, and recyclers
handling e-waste. According to these rules every stakeholders in the e waste value chain is responsible for
environmentally sound management of e-waste.Under this law, the agency concerned should

International Journal of Engineering, Science and Mathematics Vol.7 Issue 4, April 2018, ISSN: 2320-0294 Impact Factor: 6.765 Journal Homepage: http://www.ijesm.co.in, Email: [email protected] Double-Blind Peer Reviewed Refereed Open Access International Journal - Included in the International Serial Directories Indexed & Listed at: Ulrich's Periodicals Directory ©, U.S.A., Open J-Gage as well as in Cabell’s Directories of Publishing Opportunities, U.S.A
125 International Journal of Engineering, Science and Mathematics
http://www.ijesm.co.in, Email: [email protected]
o Collect basic information on the materials from manufacturers, processors and importers and to
maintain an inventory of these materials. The information should include toxicity and potential
harmful effects.
o Identify potentially harmful substances and require the industry to test them for adverse health and
environmental effects.
o Control risks from manufacture, processing, distribution, use and disposal of electronic wastes.
o Encourage beneficial reuse of "e-waste" and encouraging business activities that use waste".
o Set up programs so as to promote recycling among citizens and businesses.
o Educate e-waste generators on reuse/recycling options and producers should also provide
information for safe handling of the end of life product.
o Governments should encourage and support NGOs and other organizations to involve actively in
solving the nation's e-waste problems.
o Governments should explore opportunities to partner with manufacturers and retailers to provide
recycling services.
o Polluter pays principle and extended producer responsibility should be adopted.
3.12 Role of industries
1. Generators of wastes should take responsibility to determine the output characteristics of wastes and if
hazardous, should provide management options.
2. Companies can adopt their own policies while handling e-wastes. Some are given below:
Use label materials to assist in recycling.
Standardize components for easy disassembly.
Create computer components and peripherals of biodegradable materials.
Utilize technology sharing particularly for manufacturing and de manufacturing.
Encourage or promote for green supply chain.
3. At the production level the industries can reduce the quantity of hazardous materials by reviewing the
material purchase procedures and the inventory tracking system.[17].Companies should adopt waste
minimization techniques, which will make a significant reduction in the quantity of e-waste generated and
thereby lessening the impact on the environment. It is a "reverse logistics" system that designs
infrastructure to recover and reuse every material contained within e-wastes metals such as copper, gold,
and various plastics. These practices can lead to considerable gains in efficiencies, competitive advantage
and deliver significant benefits to the bottom line.
4. Manufacturers, distributors, and retailers should undertake the responsibility of recycling/disposal of
their own products.
5. Manufacturers of computer monitors, television sets and other electronic devices containing hazardous
materials must be responsible for educating consumers and the general public regarding the potential threat
to public health and the environment posed by their products.
3.14 Individual Effort
Waste prevention is perhaps more preferred to any other waste management option including recycling. Electronic
waste collection among the recyclers should be extended to household rather than focusing on industries and
commercial organizations [18] Donating electronics for reuse extends the lives of valuable products and keeps them
out of the waste management system for a longer time. But care should be taken while donating such items i.e. the
items should be in working condition. Reuse, in addition to being an environmentally preferable alternative, also
benefits society. By donating used electronics, schools, non-profit organizations, and lower-income families can
afford to use equipment that they otherwise could not afford.

International Journal of Engineering, Science and Mathematics Vol.7 Issue 4, April 2018, ISSN: 2320-0294 Impact Factor: 6.765 Journal Homepage: http://www.ijesm.co.in, Email: [email protected] Double-Blind Peer Reviewed Refereed Open Access International Journal - Included in the International Serial Directories Indexed & Listed at: Ulrich's Periodicals Directory ©, U.S.A., Open J-Gage as well as in Cabell’s Directories of Publishing Opportunities, U.S.A
126 International Journal of Engineering, Science and Mathematics
http://www.ijesm.co.in, Email: [email protected]
E-wastes should never be disposed with garbage and other household wastes. This should be segregated at the site
and sold or donated to various organizations. NGOs should also adopt a participatory approach in management of e-
wastes.
4. Conclusion
Manufacturers, retailers, users, and disposers should share responsibility for reducing the environmental impacts of
products. Adopt product stewardship approach i.e. a product-cantered approach should be adopted to preserve and
protect environment. Thus E- waste management initiatives are valuable for the environment as well for the
industries. They play an important role in achieving the ―triple bottom line‖ of social, environmental and economic
benefits leading to sustainable development.
References:
1. Sthiannopkao S, Wong MH (2013) Handling e-waste in developed and developing countries: Initiatives,
practices, and consequences. Sci of the Tot Environ 463: 1147-1153.
2. Musson, S.E., Jang, Y.C., Townsend, T.G., Chung, I.H., 2000.Characterization
of lead leachability fromcathode ray tubes using the toxicitycharacterization leaching procedure.Environme
ntal Science & Technology 34, 43764381.
3. Cui, J., Forsberg, E. (2003). Mechanical recycling of waste electric and electronic
Equipment: a review. Journal of Hazardous Materials B99, 243263.
4. Cui, J. & Zhang, L. (2008) Metallurgical recovery of metals from electronic waste: A review, Journal of
hazardous hazardous materials, 158 (2-3) 228-256.
5. Dwivedy,M. Mittal RK.(2010) Future trends in computer waste generation in India. Waste Manage.
30,2265-2277.
6. Kumar A, Holuszko M, Espinosa DCR (2017) E-waste: An overview on generation, collection, legislation
and recycling practices. Res Conser and Recyc 122: 32-42.
7. Nnorom,I.C.,Osibanjo.O.,(2007) Electronic waste (e-waste): Material flows and management practices in
Nigeria. Waste Management, 28,1472-1479.
8. Acaroglu L .(2013). Where Do Old Cellphones Go to Die? Нe New York Times.
9. Rakesh Johri ,‖E-Waste Implications, regulations and management in India and current global best
practices,‖ The energy and Resources Institute 2008.
10. Khetriwal, D. S., Kraeuchi, P., & Schwaninger, M. (2005). A comparison of electronic waste recycling in
Switzerland and in India. Journal of Environmental Impact Assessment Review, 25, 492–504.
11. Song Q, Li J (2014) A systematic review of the human body burden of e waste exposure in China. Environ
Int 68: 82-93.
12. Sepulveda,A.,Schluep.M.,Renauda,FG.,Striecher.M.,Ruediger.Kuehr.R.,Hagelu,C., Gerecke, AC.,(2010) A
review of the environmental fate and effects of hazardous substances released from electrical and
electronic equipments during recycling :Examples from China and India. Environment impact assessment
review.30,28-41.
13. Skinner,A.,Dinter,Y.,Liyod,A.,Strothmann,P.,(2010) The challenges of E-Waste management in India:
Can India draw lessons from the EU and USA?ASIEN,117,7-26.
14. Needhidasan S, Samuel M, Chidambaram R (2014) Electronic waste-an emerging threat to the environment
of urban India. J of Environ Health Sci and Eng 12: 36.
15. Toxics Link (2014) Impact of E-Waste Recycling on Water and Soil report 732.
16. Third World Network. (1991). Toxic Terror: Dumping of Hazardous Wastes in the Third World, Third
World Network, Malaysia
17. Freeman M. H. 1989. Standard Handbook of Hazardous Waste Treatment and Disposal, McGraw-Hill
Company, USA.

International Journal of Engineering, Science and Mathematics Vol.7 Issue 4, April 2018, ISSN: 2320-0294 Impact Factor: 6.765 Journal Homepage: http://www.ijesm.co.in, Email: [email protected] Double-Blind Peer Reviewed Refereed Open Access International Journal - Included in the International Serial Directories Indexed & Listed at: Ulrich's Periodicals Directory ©, U.S.A., Open J-Gage as well as in Cabell’s Directories of Publishing Opportunities, U.S.A
127 International Journal of Engineering, Science and Mathematics
http://www.ijesm.co.in, Email: [email protected]
18. John, B.C., Chamhuri Siwar, Ahmad Fariz M, Rawshan Ara B.,(2010)Bridging the Gaps: An Ewaste man
agement and recycling assessment of material recycling facilities in
Selangor and Penang.International Journal of Environmental Sciences,(3) 383-391.
IN-VITRO REGENERATION AND CALLUS INDUCTION OF
International Journal of Engineering, Science and Mathematics Vol.7 Issue 4, April 2018, ISSN: 2320-0294 Impact Factor: 6.765 Journal Homepage: http://www.ijesm.co.in, Email: [email protected] Double-Blind Peer Reviewed Refereed Open Access International Journal - Included in the International Serial Directories Indexed & Listed at: Ulrich's Periodicals Directory ©, U.S.A., Open J-Gage as well as in Cabell’s Directories of Publishing Opportunities, U.S.A
128 International Journal of Engineering, Science and Mathematics
http://www.ijesm.co.in, Email: [email protected]
PSEUDARTHRIA VISCIDA(L.)WIGHT& ARN.
Priya P S
Abstract
Ayurveda is a traditional medicinal system in India and an alternate
system practiced in other parts of world. Trade data indicates that the
demand for many ingredients in Ayurvedic medicines has exceeded
the supply and the species of many medicinal plants are not available
in the required quantities. This leads the un-scientific plant collection
and the destruction of valuable medicinal plant species. In this
context, designing the protocol for in-vitro propagation of such
species becomes more relevant. Micro propagation of
Pseudarthriaviscida (L.) WIGHT & ARN. among dasamula has
been attempted. It is extensively used in the preparation of Ayurvedic
formulations to soothe tridosha, pain, arthritis, intermittent fever,
respiratory diseases etc. The results indicate that most suitable and
appropriate medium for callus induction in Pseudarthria is MS with
3.5mg/L BAP and 1mg/L NAA. Best callus response is shown by
the leaf explant in Pseudarthria. Best explant for bud proliferation is
axillary bud. MS medium with 0.5 mg/L of NAA and 0.5 mg/L of
BAP was the best suited medium for lengthening of axillary bud.
Root formation occurs when axillary bud is inoculated in the MS
medium with 4mg/L IAA and 0.5mg/L BAP.
Keywords:
Pseudarthria viscida;
Callus;
Medicinal plant;
In-vitro.
Author correspondence:
Priya P S
Faculty, Department of Botany,
Alpine Institute of Management and Technology, Dehradun, Utharakhand
1. Introduction
Pseudarthria viscida is a shrub having thin branches and trifoliated leaves.It is an important ethno medicinal
plant of Fabaceae and one among the ―Dasamoola‖ (ten roots). Its medicinal importances were indicated in the
ancient Ayurvedic manuscripts. It is an inevitable ingredient in many Ayurvedic medicines like
Dasamoolarasayanam, Dasamoolarishtam, Agastyaharitakirasayana, Anuthaila, Brahma rasayana,
Sudarshanachurna, Narayanathaila, Dhanuantharaghrita, etc [12].The whole plant is a panacea for an extensive
range of diseases like rheumatism, fever, bronchial asthma, haemorrhoids and diabetes mellitus. It is an effective
medicine for bleeding, oedema, heart diseases and blood disorders. Other properties like antihypertensive,
antioxidant [11], antiulcer, antifungal, antidiarrheal and antitumor have also been reported from P. Viscida[1].
Faculty, Department of Botany, Alpine Institute of Management and Technology, Dehradun, Utharakhand
International Journal of Engineering, Science and Mathematics Vol.7 Issue 4, April 2018, ISSN: 2320-0294 Impact Factor: 6.765 Journal Homepage: http://www.ijesm.co.in, Email: [email protected] Double-Blind Peer Reviewed Refereed Open Access International Journal - Included in the International Serial Directories Indexed & Listed at: Ulrich's Periodicals Directory ©, U.S.A., Open J-Gage as well as in Cabell’s Directories of Publishing Opportunities, U.S.A
129 International Journal of Engineering, Science and Mathematics
http://www.ijesm.co.in, Email: [email protected]
In Indian Ayurvedic industrial scenario, turnover of the industry is estimated to be around Rs 650 crore [4]. The
large market for medicinal plants has resulted in unscientific over harvesting and depleted at a much faster rate than
it is being replenished. India is exporting the medicinal plants as raw materials like roots stem, wood, Bark, flower,
whole plant etc in a large scale. The plant collections involve the destructive harvesting and over exploitation. And
most of the medicinal plants are habitat specific slow growing with limited distribution and habitat requirement [6],
[10].
P. viscida has high trade value as its pharmaceutical value goes on. It has been incorporated in the Red listed (it is
vulnerable with high trade status) medical plants and it comes under high conservation concern [8]. It is one among
the major group of extensive trading medicinal plants. The un-scientific collection resulted in successive depletion
of this medicinal plant from wild. At present, its population is highly reduced in the nature.In contempt with its huge
pharmaceutical and economic potential, this plant could not been cultivated in large scale as it has low viability rate
of seeds, germination rate and seedling establishment ability in younger stages. For conservational and commercial
strategy, the in-vitro method of plant regeneration can be utilized successfully from a single shoot tip or axillary
bud. A huge number of uniform, healthy plants with sound genetic qualities can be created within a short span of
time. [3], [6], [10]. In many plants there are reports of successful callus induction and plantlets regeneration:
Ocimum basilicum[7], Enicostemmaaxillare[9] , Desmodium gangeticum[5] , etc
2. Research Method
The selected plant Pseudarthria viscida(L.) Wight &Arn. collected from wild has been grown in the green
house. The explants to be inoculated were collected from green house. The culture medium used was Murashige and
Skoog (MS, 1962) [2]. Sucrose 4% (Analytical grade, Hamedia, India), agar-0.8 percentage (Bacteriological grade,
Hamedia, India) were also added. Some growth regulators like cytokinin and auxin were used. Cytokinin used was
6- Benzyl aminopurine (BAP) and auxin was Indole acetic acid (IAA), Naphthalein acetic acid (NAA).
Concentrated stock solutions were prepared. Then culture medium was made by adding required quantities of all
constituents from the stock solution. Then hormones were fortified to the basal medium either as alone or in various
combinations. Then, pH of culture medium was adjusted to 5.8(by using 1N KOH or 1N HCl) prior to autoclaving at
1200C. Then 300 ml tissue culture tube was filled with 50 ml culture medium and then autoclaved. The explants that
used for inoculation were node, leaf, internode, axillary bud and shoot tip. The explants collected were sterilized
with 0.1 % Mercuric chloride. The sterilized explants were inoculated in the medium and incubated for16-hour
photo period with light intensity of 2000 to 2500 lux and temperature of 25 ± 1 0C. The light intensity provided by
cool white fluorescent tubes.
Maximum callus growth in terms of weight was recorded after 60 days of inoculation. Direct organogenesis was
also recorded. The data was recorded in10 to 15 days duration. After shoot proliferation, newly formed shoots were
transferred to rooting medium. And after rhizogenesis, the plantlets were acclimatized and planted in the field. The
photographs were taken at appropriate time by using a Digital Camera (Nikon D50).
3. Results and Analysis
3.1. Surface sterilization of explants
For eliminating the microorganisms that causes future contamination, sterilization processes were carried out.
The collected explants were thoroughly washed under running tape water for 15-20 minutes following by a wetting
agent teepol and then thoroughly washed with distilled water. Then dipped in ethyl alcohol (70 %) for 1 minute and
washed gently using sterile distilled water for three rounds. It was then treated with 0.1% Mercuric chloride for
different time intervals. After the treatment explants were dipped in autoclaved distilled water to wash-off even the
traces of sterilants. In Pseudarthria, optimum exposure time in 0.1% Mercuric chloride for all the explants was 4
minutes .The average culture establishment of explants after 7 days of inoculation was 53.62% when it was exposed
to Mercuric chloride for 4 minutes.
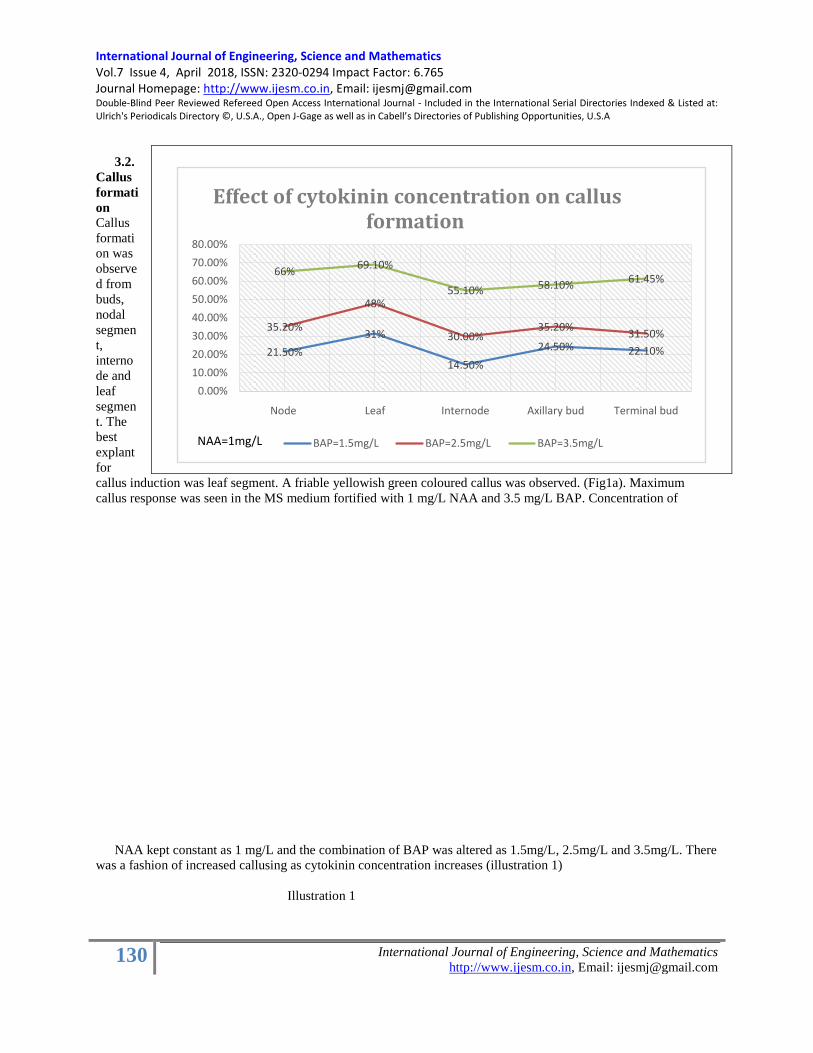
International Journal of Engineering, Science and Mathematics Vol.7 Issue 4, April 2018, ISSN: 2320-0294 Impact Factor: 6.765 Journal Homepage: http://www.ijesm.co.in, Email: [email protected] Double-Blind Peer Reviewed Refereed Open Access International Journal - Included in the International Serial Directories Indexed & Listed at: Ulrich's Periodicals Directory ©, U.S.A., Open J-Gage as well as in Cabell’s Directories of Publishing Opportunities, U.S.A
130 International Journal of Engineering, Science and Mathematics
http://www.ijesm.co.in, Email: [email protected]
3.2.
Callus
formati
on
Callus
formati
on was
observe
d from
buds,
nodal
segmen
t,
interno
de and
leaf
segmen
t. The
best
explant
for
callus induction was leaf segment. A friable yellowish green coloured callus was observed. (Fig1a). Maximum
callus response was seen in the MS medium fortified with 1 mg/L NAA and 3.5 mg/L BAP. Concentration of
NAA kept constant as 1 mg/L and the combination of BAP was altered as 1.5mg/L, 2.5mg/L and 3.5mg/L. There
was a fashion of increased callusing as cytokinin concentration increases (illustration 1)
Illustration 1
21.50%
31%
14.50%
24.50% 22.10%
35.20%
48%
30.00%35.20%
31.50%
66%69.10%
55.10% 58.10%61.45%
0.00%
10.00%
20.00%
30.00%
40.00%
50.00%
60.00%
70.00%
80.00%
Node Leaf Internode Axillary bud Terminal bud
Effect of cytokinin concentration on callus formation
BAP=1.5mg/L BAP=2.5mg/L BAP=3.5mg/LNAA=1mg/L
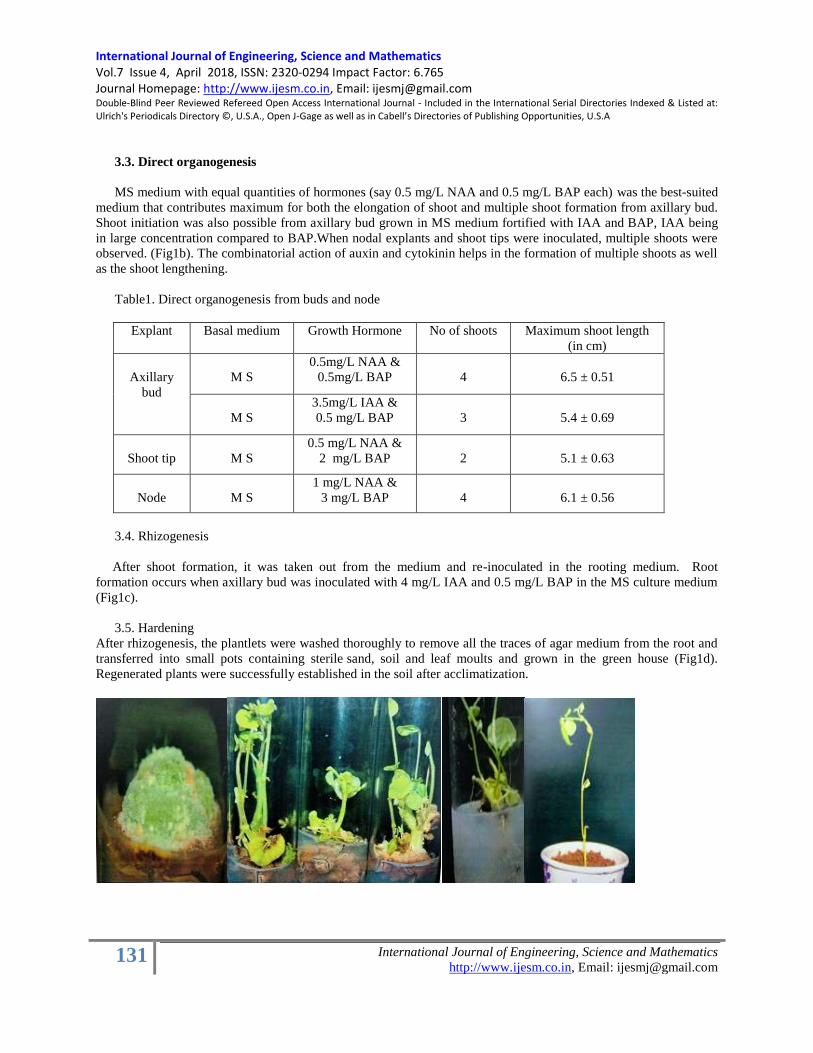
International Journal of Engineering, Science and Mathematics Vol.7 Issue 4, April 2018, ISSN: 2320-0294 Impact Factor: 6.765 Journal Homepage: http://www.ijesm.co.in, Email: [email protected] Double-Blind Peer Reviewed Refereed Open Access International Journal - Included in the International Serial Directories Indexed & Listed at: Ulrich's Periodicals Directory ©, U.S.A., Open J-Gage as well as in Cabell’s Directories of Publishing Opportunities, U.S.A
131 International Journal of Engineering, Science and Mathematics
http://www.ijesm.co.in, Email: [email protected]
3.3. Direct organogenesis
MS medium with equal quantities of hormones (say 0.5 mg/L NAA and 0.5 mg/L BAP each) was the best-suited
medium that contributes maximum for both the elongation of shoot and multiple shoot formation from axillary bud.
Shoot initiation was also possible from axillary bud grown in MS medium fortified with IAA and BAP, IAA being
in large concentration compared to BAP.When nodal explants and shoot tips were inoculated, multiple shoots were
observed. (Fig1b). The combinatorial action of auxin and cytokinin helps in the formation of multiple shoots as well
as the shoot lengthening.
Table1. Direct organogenesis from buds and node
Explant Basal medium Growth Hormone
No of shoots Maximum shoot length
(in cm)
Axillary
bud
M S
0.5mg/L NAA &
0.5mg/L BAP
4
6.5 ± 0.51
M S
3.5mg/L IAA &
0.5 mg/L BAP
3
5.4 ± 0.69
Shoot tip
M S
0.5 mg/L NAA &
2 mg/L BAP
2
5.1 ± 0.63
Node
M S
1 mg/L NAA &
3 mg/L BAP
4
6.1 ± 0.56
3.4. Rhizogenesis
After shoot formation, it was taken out from the medium and re-inoculated in the rooting medium. Root
formation occurs when axillary bud was inoculated with 4 mg/L IAA and 0.5 mg/L BAP in the MS culture medium
(Fig1c).
3.5. Hardening
After rhizogenesis, the plantlets were washed thoroughly to remove all the traces of agar medium from the root and
transferred into small pots containing sterile sand, soil and leaf moults and grown in the green house (Fig1d).
Regenerated plants were successfully established in the soil after acclimatization.

International Journal of Engineering, Science and Mathematics Vol.7 Issue 4, April 2018, ISSN: 2320-0294 Impact Factor: 6.765 Journal Homepage: http://www.ijesm.co.in, Email: [email protected] Double-Blind Peer Reviewed Refereed Open Access International Journal - Included in the International Serial Directories Indexed & Listed at: Ulrich's Periodicals Directory ©, U.S.A., Open J-Gage as well as in Cabell’s Directories of Publishing Opportunities, U.S.A
132 International Journal of Engineering, Science and Mathematics
http://www.ijesm.co.in, Email: [email protected]
Fig 1a: Callus from leaf Fig 1b: Multiple shoots Fig. 1c: Root formation Fig.
1d: A newly formed explant (from node shoot tip and axillary bud)
plantlet
4. Conclusion
Through this study, it was attempted to frame up a protocol for the in-vitro regeneration of a vulnerable
medicinal plant. In a combination of auxin and cytokinin, callus induction was observed more as the cytokinin
concentration increases. Shoot regeneration and multiple shoots were observed from buds, nodes and internodes
when auxin and cytokinin mixed up in different proportions. Root formation was induced when auxins were used in
increased concentration. Leaves were the best explants for callusing.
Around 50% of approved drugs produced during last three decades are from either directly or indirectly from
natural products. Plant in-vitro techniques help the propagation of plant or plant tissues under aseptic atmosphere
totally independent of geographical and climatic factors. It offers an alternative technology for producing plant
metabolites as well as the cultivation of whole plant as such. If this is possible majority of our threatened plants and
natural resources will be conserved.
Reference [1] Meena K. Cheruvathur , T. Dennis Thomas., An efficient plant regeneration system through callus for
Pseudarthria viscida (L.) Wright and Arn., a rare ethnomedicinal herb, Physiology and Molecular Biology of
Plant, pp-395–401,Oct,2011.
[2] Murashige T, Skoog F. A revised medium for rapid growth and bioassays with tobacco cultures. Physiologia
Plantarum. 1962; Vol 15, pp 473–497, July 1962.
[3] Oommen S, Ved DK, Krishnan R., Tropical Indian medicinal plants: propagation methods. Foundation for
Revitalisation of Local Health Traditions (FRLHT). pp 232–235, 2000.
[4] Preetha. N, Laladhas K. p and and Oommen V Oommen., Stratagem for Sustainable utilization of Medicinal
Plant Resources,Proceedings of Research conference on sustainabirity and Management strategy ,TIM-csMS-
2015
[5] Puspashree Puhan and Shiba Prasad Rath,. In vitro Micropropagation of Desmodium gangeticum (L.) DC
(Fam-Fabaceae): A Medicinal Legume through Axillary Bud Multiplication. Pakistan Journal of Biological
Sciences, pp- 477-483, 2012.
[6] Shi-Lin Chen, Hua Yu, Hong-Mei Luo, Qiong Wu, Chun-Fang Li, and André Steinmetz.,Conservation and
sustainable use of medicinal plants: problems, progress, and prospects, Chinese Medicine, 11.37,July,2016.
[7] Sudhakaran, S and V. Sivasankari., A protocol for in-vitro plant regeneration in Ocimumbasilicum ,Plant cell
biotechnology and molecular biology, pp-185-188,4-2003
[8] The IUCN Red list of threatened species, IUCN, Gland, 2000
[9] Thomas,S. and A.Gangaprasad,.,Rapid clonal multiplication through invitro axillary shoot proliferation of
Enicostemmaaxillare (Lam) Ranyal-A rare medicinal plant, Ind.J.of.Biol.Res.pp-115-120,1-2005
[10] Ved DK, Goraya G.S., Demand and supply of medicinal plants in India. Bangalore: FRLHT. pp. 1–18, 2007
[11] Vijayabaskaran M, Venkatesaramurthy N, Babu G, Perumal P, Jayakar B., In vitro antioxidant evaluation of
Pseudarthria viscida Linn. Int J Curr Pharmaceut Res.Vol 2,pp-21–23, 2010.
[12] Warrier PK, Nambiar VPD, Ramankutty C., Indian medicinal plants: a compendium of 500 species.
Hyderabad: Orient Longman Ltd. pp. 336, 1996.

International Journal of Engineering, Science and Mathematics Vol.7 Issue 4, April 2018, ISSN: 2320-0294 Impact Factor: 6.765 Journal Homepage: http://www.ijesm.co.in, Email: [email protected] Double-Blind Peer Reviewed Refereed Open Access International Journal - Included in the International Serial Directories Indexed & Listed at: Ulrich's Periodicals Directory ©, U.S.A., Open J-Gage as well as in Cabell’s Directories of Publishing Opportunities, U.S.A
133 International Journal of Engineering, Science and Mathematics
http://www.ijesm.co.in, Email: [email protected]
IMPROVEMENT OF SITE SAFETY CULTURE IN CONSTRUCTION
INDUSTRY; A CASE STUDY ON METRO CONSTRUCTION INDUSTRY Srivalli K.
Madhuben Sharma
Dr.Kanchan Deoli Bahukhandi
Abstract
M.TechHSE Program, UPES, Bidholi, Dehradun, Uttarakhand-India. UPES,Bidholi, Dehradun, Uttarakhand-India. UPES,Bidholi, Dehradun, Uttarakhand-India.
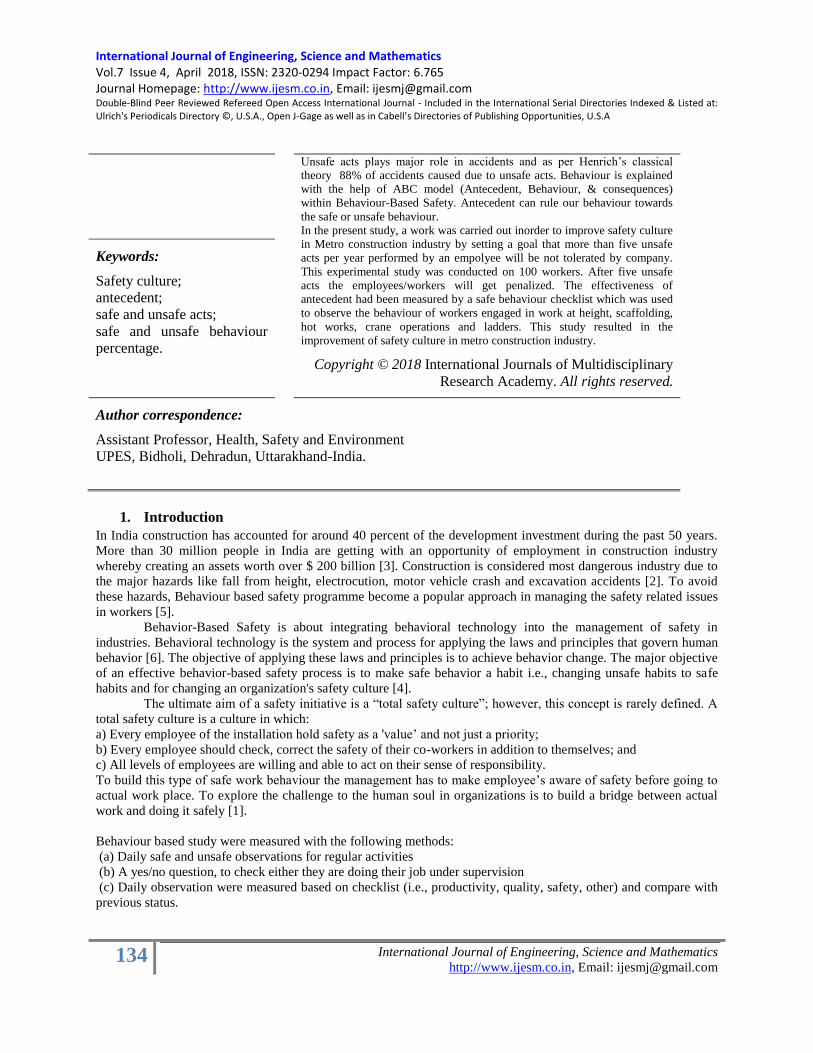
International Journal of Engineering, Science and Mathematics Vol.7 Issue 4, April 2018, ISSN: 2320-0294 Impact Factor: 6.765 Journal Homepage: http://www.ijesm.co.in, Email: [email protected] Double-Blind Peer Reviewed Refereed Open Access International Journal - Included in the International Serial Directories Indexed & Listed at: Ulrich's Periodicals Directory ©, U.S.A., Open J-Gage as well as in Cabell’s Directories of Publishing Opportunities, U.S.A
134 International Journal of Engineering, Science and Mathematics
http://www.ijesm.co.in, Email: [email protected]
Unsafe acts plays major role in accidents and as per Henrich‘s classical
theory 88% of accidents caused due to unsafe acts. Behaviour is explained
with the help of ABC model (Antecedent, Behaviour, & consequences)
within Behaviour-Based Safety. Antecedent can rule our behaviour towards
the safe or unsafe behaviour.
In the present study, a work was carried out inorder to improve safety culture
in Metro construction industry by setting a goal that more than five unsafe
acts per year performed by an empolyee will be not tolerated by company.
This experimental study was conducted on 100 workers. After five unsafe
acts the employees/workers will get penalized. The effectiveness of
antecedent had been measured by a safe behaviour checklist which was used
to observe the behaviour of workers engaged in work at height, scaffolding,
hot works, crane operations and ladders. This study resulted in the
improvement of safety culture in metro construction industry.
Keywords:
Safety culture;
antecedent;
safe and unsafe acts;
safe and unsafe behaviour
percentage.
Copyright © 2018 International Journals of Multidisciplinary
Research Academy. All rights reserved.
Author correspondence:
Assistant Professor, Health, Safety and Environment
UPES, Bidholi, Dehradun, Uttarakhand-India.
1. Introduction
In India construction has accounted for around 40 percent of the development investment during the past 50 years.
More than 30 million people in India are getting with an opportunity of employment in construction industry
whereby creating an assets worth over $ 200 billion [3]. Construction is considered most dangerous industry due to
the major hazards like fall from height, electrocution, motor vehicle crash and excavation accidents [2]. To avoid
these hazards, Behaviour based safety programme become a popular approach in managing the safety related issues
in workers [5].
Behavior-Based Safety is about integrating behavioral technology into the management of safety in
industries. Behavioral technology is the system and process for applying the laws and principles that govern human
behavior [6]. The objective of applying these laws and principles is to achieve behavior change. The major objective
of an effective behavior-based safety process is to make safe behavior a habit i.e., changing unsafe habits to safe
habits and for changing an organization's safety culture [4].
The ultimate aim of a safety initiative is a ―total safety culture‖; however, this concept is rarely defined. A
total safety culture is a culture in which:
a) Every employee of the installation hold safety as a 'value‘ and not just a priority;
b) Every employee should check, correct the safety of their co-workers in addition to themselves; and
c) All levels of employees are willing and able to act on their sense of responsibility.
To build this type of safe work behaviour the management has to make employee‘s aware of safety before going to
actual work place. To explore the challenge to the human soul in organizations is to build a bridge between actual
work and doing it safely [1].
Behaviour based study were measured with the following methods:
(a) Daily safe and unsafe observations for regular activities
(b) A yes/no question, to check either they are doing their job under supervision
(c) Daily observation were measured based on checklist (i.e., productivity, quality, safety, other) and compare with
previous status.

International Journal of Engineering, Science and Mathematics Vol.7 Issue 4, April 2018, ISSN: 2320-0294 Impact Factor: 6.765 Journal Homepage: http://www.ijesm.co.in, Email: [email protected] Double-Blind Peer Reviewed Refereed Open Access International Journal - Included in the International Serial Directories Indexed & Listed at: Ulrich's Periodicals Directory ©, U.S.A., Open J-Gage as well as in Cabell’s Directories of Publishing Opportunities, U.S.A
135 International Journal of Engineering, Science and Mathematics
http://www.ijesm.co.in, Email: [email protected]
The present study was conducted in the Metro construction industry and the objective of the study is to.
a) Study of behavior pattern of workers pre and post after providing HSE training.
b) Study the effectiveness of safe work behaviour (SWB) license as an antecedent.
c) Calculation of safe act index.
2. Material and Methodology
Study area and data collection
The study area of present research was Metro construction area in India.Sample size of the workers for the present
study was100. The workers behaviour was assessed on primary data collection, check list analysis and SWB license
card. The primary data was collected with the help of checklist. Primary data belongs to a particular project, so
company details and documents were kept confidential. Checklist (Table No.1) was a questionnaire used to record
the workers behaviour. The checklist consist two options yes and no where ‗Yes‘ means safe behaviour and ‗No‘
means unsafe behaviour. Another management tool used by the study area was SWB license. SWB license is a card
which contains five warning indicators which indicate the severity level from low to high. The level is classified by
the consequences that may result from the unsafe acts. In those five warnings, three warnings are circle with ‗D‘,
one warning is circle with ‗A‘ & another is circle with ‗AF‘.
Circle with ‗D‘ – Chances of occurring accident Damage to property without human injury
Circle with ‗A‘ – Chances of occurring accident, which may cause human injury and
damage to property or only human injury.
Circle with ‗AF‘ – Chances of occurring accident, which may results Fatality
SWB Guidelines are
1. Warnings will be given when card-holder performs any unsafe act
2. If the person didn‘t get any mark in a span of year will be awarded in such a way people have goal towards safety
3. If worker is working unsafely under supervision of supervisor, both of them get the warnings in their respective
SWB license
4. If worker is working unsafely before same skilled workers, then those workers should correct him to safe work. If
they not correcting then they will also get the warning along with the worker who is doing unsafe act
5. If supervisor is forcing worker to do unsafe work, then he can feedback to HSE department (This system will
increase the safety culture from reactive to interdependent as per Bradley curve)
6. If the person receives warnings with combination of 2D‘s, A & AF or all the five are filled in case all are near
misses, then the person will get the punishment by the company like, financial penalties, removal from the site and
cancelation of license.
7. If the person‘s unsafe acts which leaded to an Accident of A or AF type, then the person should leave the
company and also license will be cancelled.
8. If license get cancelled then the person can‘t join in any company due to the Aadhar link who are following this
same system until he/she renew the card.
9. To renew the card he/she should gone through preferred training by company or authorized persons and get
renewed the card with apologies letter.
Table 1: Checklist for observation
S.No. Checklist Questions Yes
(Y)
No
(N)
Work at height

International Journal of Engineering, Science and Mathematics Vol.7 Issue 4, April 2018, ISSN: 2320-0294 Impact Factor: 6.765 Journal Homepage: http://www.ijesm.co.in, Email: [email protected] Double-Blind Peer Reviewed Refereed Open Access International Journal - Included in the International Serial Directories Indexed & Listed at: Ulrich's Periodicals Directory ©, U.S.A., Open J-Gage as well as in Cabell’s Directories of Publishing Opportunities, U.S.A
136 International Journal of Engineering, Science and Mathematics
http://www.ijesm.co.in, Email: [email protected]
1 Does worker prefer proper and secure working platform and access to perform
work?
2 Effective guard rail/ life lines provided for workers to anchor their safety
belt/Harness?
3 Workers are under the direct supervision of a supervisor?
4 Workers are using safety belt/harness/fall arrester?
5 Are workers using life line?
6 Anchor anchored in effective position?
7 Proper access & aggress are using by workers?
Hot works
1 Is worker performing Hot work under the supervision of supervisor?
2 Is worker checked that no combustible or flammable materials around the area
where Hot Work is performing?
3 Is worker kept fire extinguisher nearby?
4 Is worker checked the Gas cylinders flashback arrestors?
5 Is worker protected DTL Cable with Fire Blankets/Sheets?
6 Is there proper equipment earthling provided by worker?
7 Using proper PPE?
8 Does worker using equipment with all cables free from wear & tear?
Scaffolds
• Is the surrounding area and in the vicinity of the basis for scaffold no water
logged checked by worker before working on that scaffold?
• Is worker working in the platform where easy access to climb?
• Is there sign boards provided? (safe/ unsafe)
• Are ladders giving access to working platforms securely fixed top and bottom,
complete and undamaged in every way?
• Are all working platform completely decked out and toe board fitted?
Lifting and crane operations
• Is operator using Audible alarm / warning horns when needed?
• Is rigger present?
• Is taglines are using properly?
• Operator is experienced and competent?

International Journal of Engineering, Science and Mathematics Vol.7 Issue 4, April 2018, ISSN: 2320-0294 Impact Factor: 6.765 Journal Homepage: http://www.ijesm.co.in, Email: [email protected] Double-Blind Peer Reviewed Refereed Open Access International Journal - Included in the International Serial Directories Indexed & Listed at: Ulrich's Periodicals Directory ©, U.S.A., Open J-Gage as well as in Cabell’s Directories of Publishing Opportunities, U.S.A
137 International Journal of Engineering, Science and Mathematics
http://www.ijesm.co.in, Email: [email protected]
Stairways & Ladders
• Is worker checking that ladder position for 4:1 ratio before using it?
• Is worker checking that ladder kept 3ft above the platform before working on it?
• Is person checking ladder either it is in good condition or not before using?
• While climbing ladders & stairways, is every worker wearing shoes and helmet?
• Are workers holding hand-rails while climbing?
• Are workers wearing chin-strip properly?
Total Safe and Unsafe observations respectively ∑Y ∑N
Total no. of observations ∑Y + ∑N
Methodology
To find the effectiveness of SWB license 100 workers engaged in five different activities before and after HSE
training had been interviewed using checklist. The checklist was used for recording the Pre and post observations.
With the help of this checklist, overall safe behaviour percentage and unsafe behaviour percentage was calculated by
using formula 1&2 (according to Safe Act Index):
Safe Behaviour % = (Total no. of ―Yes‖ observation‘s/ Total observations) *100
= (∑Y/∑Y + ∑N) *100 ……………………………………….. (1)
Unsafe Behaviour % = (Total no. of ―No‖ observation‘s / Total observations) *100
= (∑N/∑Y + ∑N) *100 ……………………………..………….. (2)
3. Results and Analysis Pre-observations and post-observations (after providing HSE training) for 100 workers were recorded with the help
of checklist for five activities (height at work, hot-works, scaffolds, lifting & crane operations and stairways &
ladders).Table No 2,3,4,5 and 6 recorded the pre and post observation of the workers engaged in different activties.
Activity 1: Work at Height
Table 2: Observed Checklist for work at Height
S.No. Questioners Pre Post
Yes No Yes No
1 Does worker prefer proper and secure working platform and
access to perform work?
54 36 80 10
2 Effective guard rail/ life lines provided for workers to anchor
their safety belt/Harness?
15 75 50 40
3 Workers are under the direct supervision of a supervisor? 50 50 90 10
4 Workers are using safety belt/harness/fall arrester? 100 0 100 0
5 Are workers using life line? 12 88 99 1
6 Anchor anchored in effective position? 2 98 85 15
7 Proper access & aggress are using by workers? 68 12 80 0
TOTAL =660 301 359 584 76
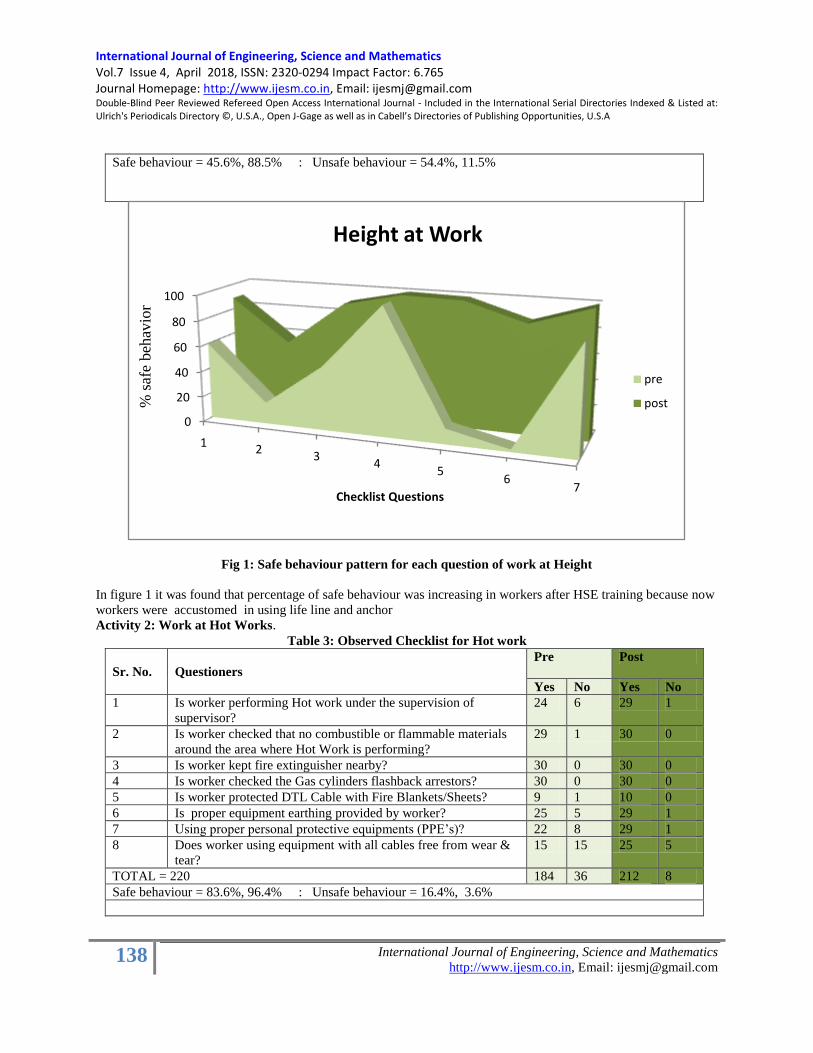
International Journal of Engineering, Science and Mathematics Vol.7 Issue 4, April 2018, ISSN: 2320-0294 Impact Factor: 6.765 Journal Homepage: http://www.ijesm.co.in, Email: [email protected] Double-Blind Peer Reviewed Refereed Open Access International Journal - Included in the International Serial Directories Indexed & Listed at: Ulrich's Periodicals Directory ©, U.S.A., Open J-Gage as well as in Cabell’s Directories of Publishing Opportunities, U.S.A
138 International Journal of Engineering, Science and Mathematics
http://www.ijesm.co.in, Email: [email protected]
Safe behaviour = 45.6%, 88.5% : Unsafe behaviour = 54.4%, 11.5%
Fig 1: Safe behaviour pattern for each question of work at Height
In figure 1 it was found that percentage of safe behaviour was increasing in workers after HSE training because now
workers were accustomed in using life line and anchor
Activity 2: Work at Hot Works.
Table 3: Observed Checklist for Hot work
Sr. No. Questioners
Pre Post
Yes No Yes No
1 Is worker performing Hot work under the supervision of
supervisor?
24 6 29 1
2 Is worker checked that no combustible or flammable materials
around the area where Hot Work is performing?
29 1 30 0
3 Is worker kept fire extinguisher nearby? 30 0 30 0
4 Is worker checked the Gas cylinders flashback arrestors? 30 0 30 0
5 Is worker protected DTL Cable with Fire Blankets/Sheets? 9 1 10 0
6 Is proper equipment earthing provided by worker? 25 5 29 1
7 Using proper personal protective equipments (PPE‘s)? 22 8 29 1
8 Does worker using equipment with all cables free from wear &
tear?
15 15 25 5
TOTAL = 220 184 36 212 8
Safe behaviour = 83.6%, 96.4% : Unsafe behaviour = 16.4%, 3.6%
0
20
40
60
80
100
12
34
56
7
% s
afe
beh
avio
r
Checklist Questions
Height at Work
pre
post

International Journal of Engineering, Science and Mathematics Vol.7 Issue 4, April 2018, ISSN: 2320-0294 Impact Factor: 6.765 Journal Homepage: http://www.ijesm.co.in, Email: [email protected] Double-Blind Peer Reviewed Refereed Open Access International Journal - Included in the International Serial Directories Indexed & Listed at: Ulrich's Periodicals Directory ©, U.S.A., Open J-Gage as well as in Cabell’s Directories of Publishing Opportunities, U.S.A
139 International Journal of Engineering, Science and Mathematics
http://www.ijesm.co.in, Email: [email protected]
Fig 2: Safe behaviour pattern for each question of Hot Work
Post HSE training, the change in workers safety behaviour was visible and is depicted in figure 2. During working,
workers were using proper cables and PPE‘s. Due to the presence of 24kV live cables in entire working area
creating it a high risk area, so all the necessary precautions were carried from initial stages of hot work.
Activity 3: Scaffolds
Table 4: Observed Checklist for Scaffolds
Sr.No Questions Pre Post
Yes No Yes No
1. Is the surrounding area and in the vicinity of the basis for
scaffold no water logged checked by worker before working on
that scaffold?
50 10 58 2
2. Is worker working in the platform where easy access to climb? 35 30 60 5
3. Is there sign boards provided? (safe/unsafe) 15 45 59 1
4. Are ladders giving access to working platforms securely fixed
top and bottom, complete and undamaged in every way?
8 12 18 2
5. Are all working platform completely decked out and toe board
fitted?
43 17 55 5
TOTAL= 275 151 124 250 15
Safe behaviour = 54.9%, 90.9% : Unsafe behaviour = 45.1%, 5.45%
0
50
100
1 2 3 4 5 6 7 8
% s
afe
be
hav
ior
questions
Hot Works
pre
post
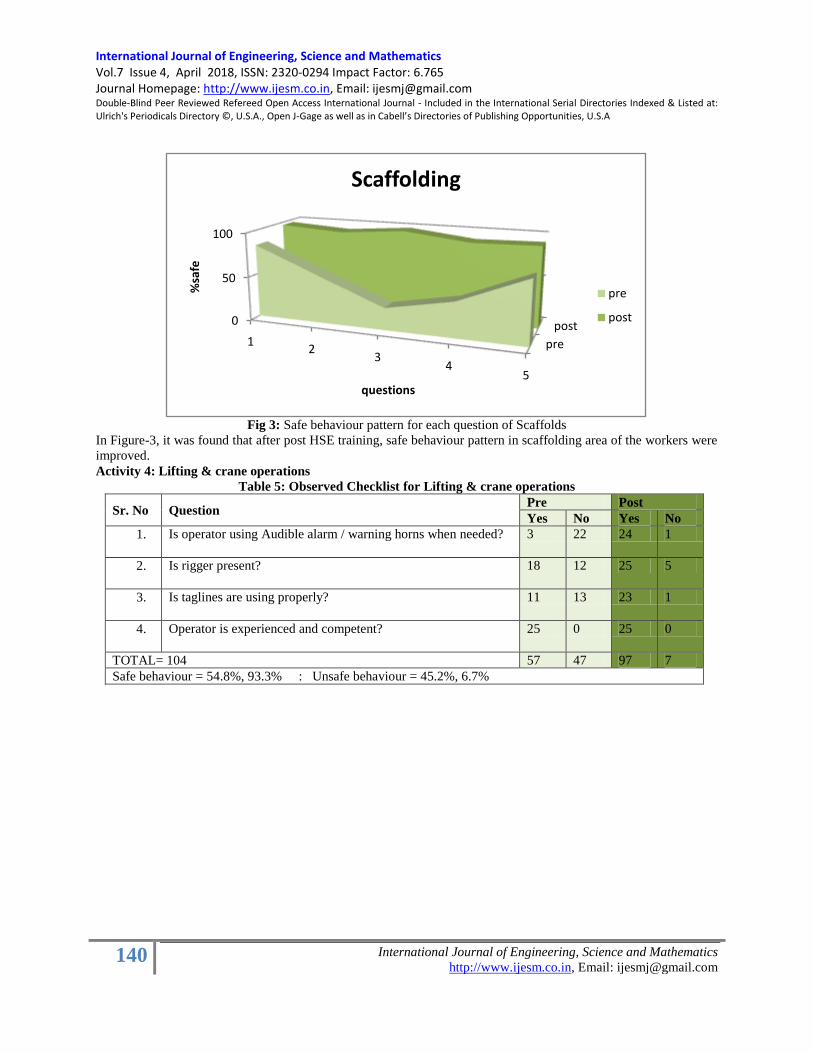
International Journal of Engineering, Science and Mathematics Vol.7 Issue 4, April 2018, ISSN: 2320-0294 Impact Factor: 6.765 Journal Homepage: http://www.ijesm.co.in, Email: [email protected] Double-Blind Peer Reviewed Refereed Open Access International Journal - Included in the International Serial Directories Indexed & Listed at: Ulrich's Periodicals Directory ©, U.S.A., Open J-Gage as well as in Cabell’s Directories of Publishing Opportunities, U.S.A
140 International Journal of Engineering, Science and Mathematics
http://www.ijesm.co.in, Email: [email protected]
Fig 3: Safe behaviour pattern for each question of Scaffolds
In Figure-3, it was found that after post HSE training, safe behaviour pattern in scaffolding area of the workers were
improved.
Activity 4: Lifting & crane operations
Table 5: Observed Checklist for Lifting & crane operations
Sr. No Question Pre Post
Yes No Yes No
1. Is operator using Audible alarm / warning horns when needed? 3 22 24 1
2. Is rigger present? 18 12 25 5
3. Is taglines are using properly? 11 13 23 1
4. Operator is experienced and competent? 25 0 25 0
TOTAL= 104 57 47 97 7
Safe behaviour = 54.8%, 93.3% : Unsafe behaviour = 45.2%, 6.7%
pre
post0
50
100
12
34
5
%sa
fe
questions
Scaffolding
pre
post
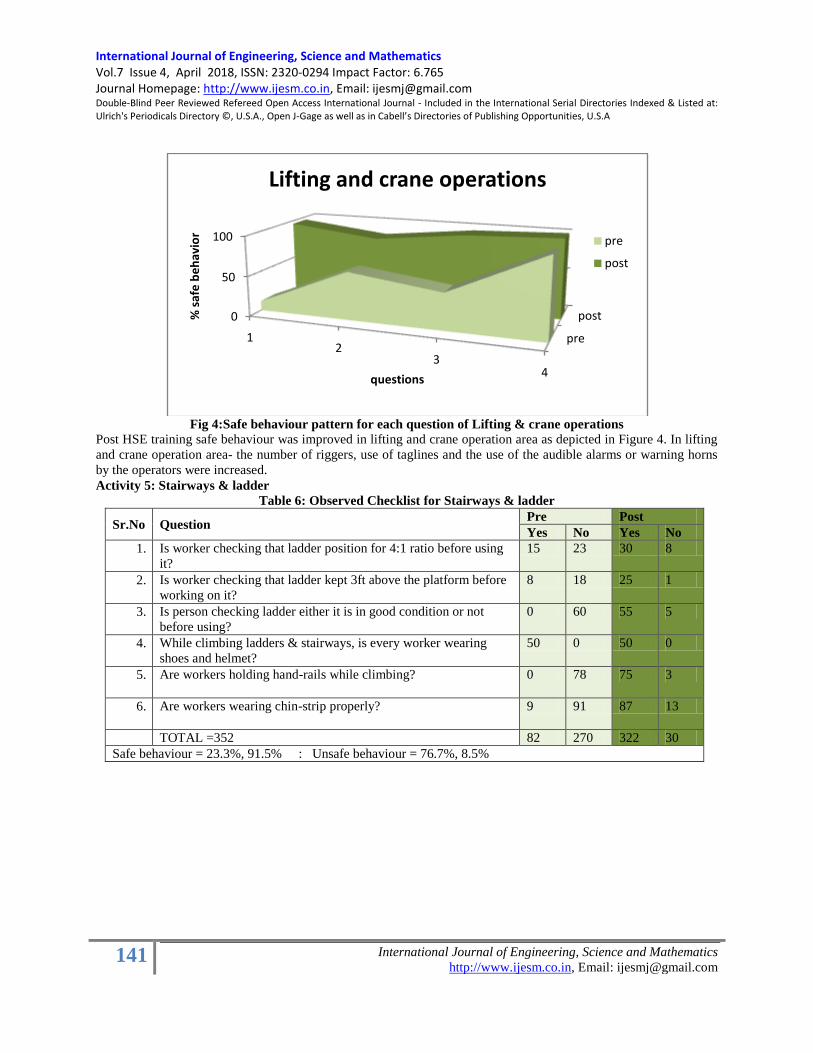
International Journal of Engineering, Science and Mathematics Vol.7 Issue 4, April 2018, ISSN: 2320-0294 Impact Factor: 6.765 Journal Homepage: http://www.ijesm.co.in, Email: [email protected] Double-Blind Peer Reviewed Refereed Open Access International Journal - Included in the International Serial Directories Indexed & Listed at: Ulrich's Periodicals Directory ©, U.S.A., Open J-Gage as well as in Cabell’s Directories of Publishing Opportunities, U.S.A
141 International Journal of Engineering, Science and Mathematics
http://www.ijesm.co.in, Email: [email protected]
Fig 4:Safe behaviour pattern for each question of Lifting & crane operations
Post HSE training safe behaviour was improved in lifting and crane operation area as depicted in Figure 4. In lifting
and crane operation area- the number of riggers, use of taglines and the use of the audible alarms or warning horns
by the operators were increased.
Activity 5: Stairways & ladder
Table 6: Observed Checklist for Stairways & ladder
Sr.No Question Pre Post
Yes No Yes No
1. Is worker checking that ladder position for 4:1 ratio before using
it?
15 23 30 8
2. Is worker checking that ladder kept 3ft above the platform before
working on it?
8 18 25 1
3. Is person checking ladder either it is in good condition or not
before using?
0 60 55 5
4. While climbing ladders & stairways, is every worker wearing
shoes and helmet?
50 0 50 0
5. Are workers holding hand-rails while climbing? 0 78 75 3
6. Are workers wearing chin-strip properly? 9 91 87 13
TOTAL =352 82 270 322 30
Safe behaviour = 23.3%, 91.5% : Unsafe behaviour = 76.7%, 8.5%
pre
post0
50
100
12
34
% s
afe
be
hav
ior
questions
Lifting and crane operations
pre
post
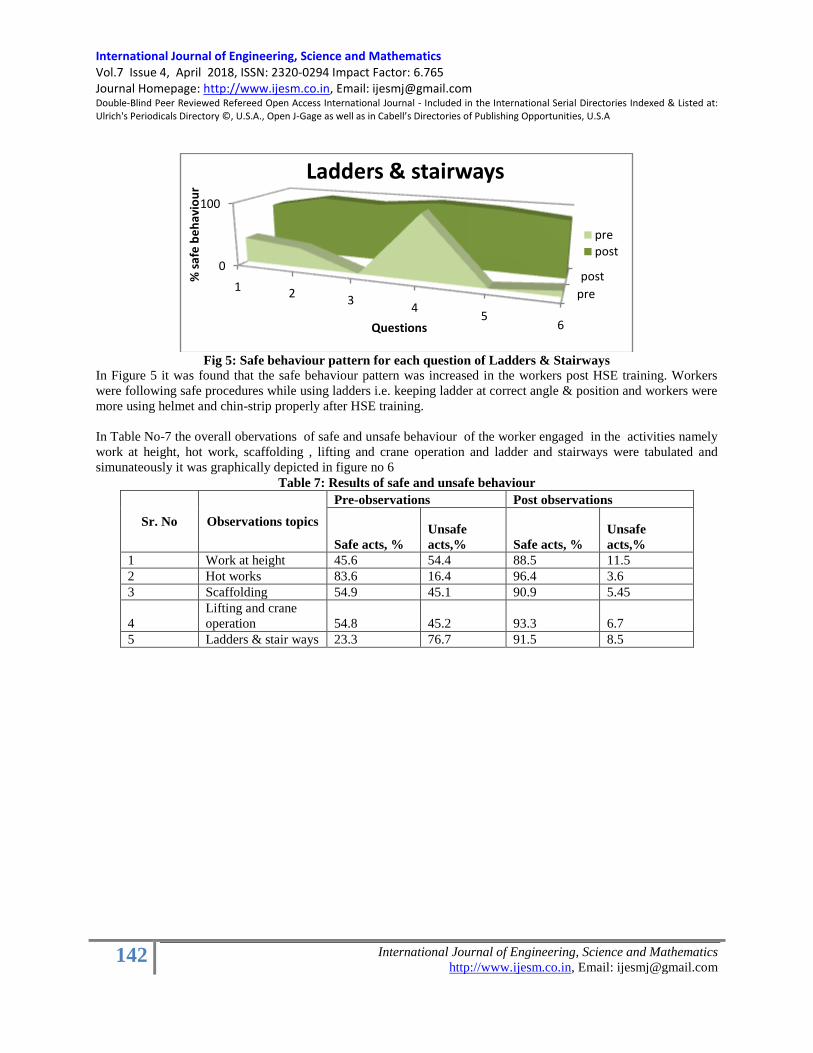
International Journal of Engineering, Science and Mathematics Vol.7 Issue 4, April 2018, ISSN: 2320-0294 Impact Factor: 6.765 Journal Homepage: http://www.ijesm.co.in, Email: [email protected] Double-Blind Peer Reviewed Refereed Open Access International Journal - Included in the International Serial Directories Indexed & Listed at: Ulrich's Periodicals Directory ©, U.S.A., Open J-Gage as well as in Cabell’s Directories of Publishing Opportunities, U.S.A
142 International Journal of Engineering, Science and Mathematics
http://www.ijesm.co.in, Email: [email protected]
Fig 5: Safe behaviour pattern for each question of Ladders & Stairways
In Figure 5 it was found that the safe behaviour pattern was increased in the workers post HSE training. Workers
were following safe procedures while using ladders i.e. keeping ladder at correct angle & position and workers were
more using helmet and chin-strip properly after HSE training.
In Table No-7 the overall obervations of safe and unsafe behaviour of the worker engaged in the activities namely
work at height, hot work, scaffolding , lifting and crane operation and ladder and stairways were tabulated and
simunateously it was graphically depicted in figure no 6
Table 7: Results of safe and unsafe behaviour
Sr. No Observations topics
Pre-observations Post observations
Safe acts, %
Unsafe
acts,% Safe acts, %
Unsafe
acts,%
1 Work at height 45.6 54.4 88.5 11.5
2 Hot works 83.6 16.4 96.4 3.6
3 Scaffolding 54.9 45.1 90.9 5.45
4
Lifting and crane
operation 54.8 45.2 93.3 6.7
5 Ladders & stair ways 23.3 76.7 91.5 8.5
pre
post0
100
1 23
45
6
% s
afe
be
hav
iou
r
Questions
Ladders & stairways
pre
post
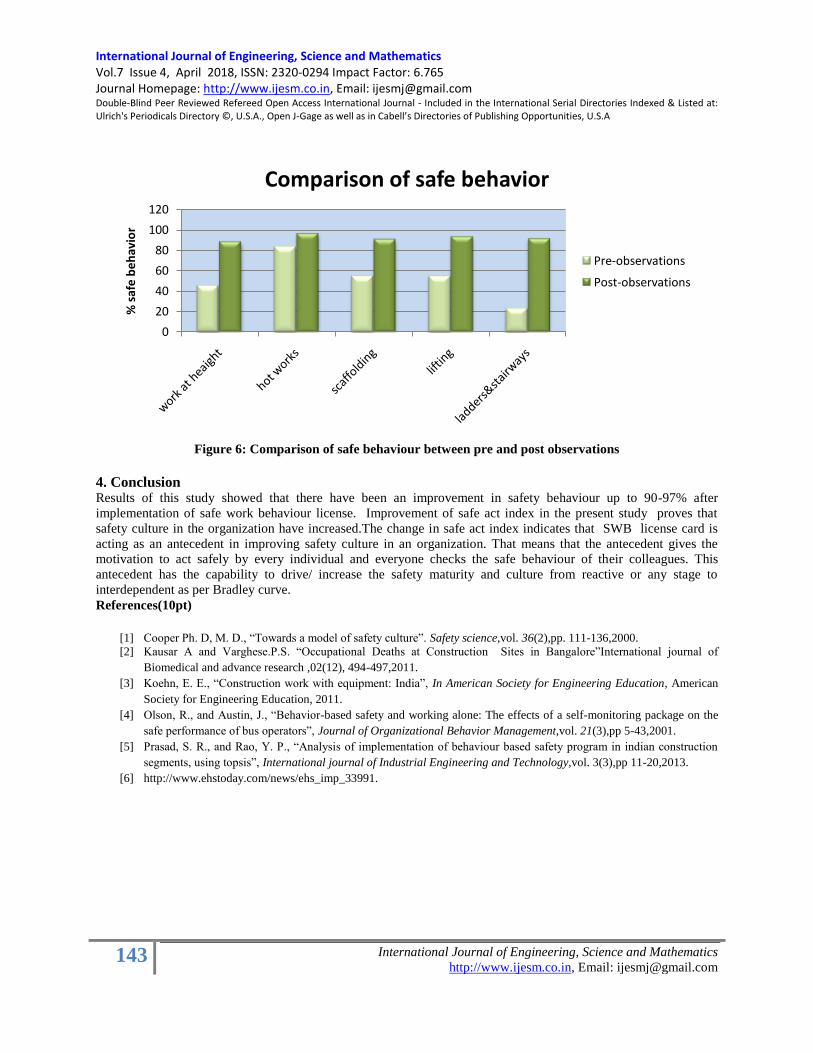
International Journal of Engineering, Science and Mathematics Vol.7 Issue 4, April 2018, ISSN: 2320-0294 Impact Factor: 6.765 Journal Homepage: http://www.ijesm.co.in, Email: [email protected] Double-Blind Peer Reviewed Refereed Open Access International Journal - Included in the International Serial Directories Indexed & Listed at: Ulrich's Periodicals Directory ©, U.S.A., Open J-Gage as well as in Cabell’s Directories of Publishing Opportunities, U.S.A
143 International Journal of Engineering, Science and Mathematics
http://www.ijesm.co.in, Email: [email protected]
Figure 6: Comparison of safe behaviour between pre and post observations
4. Conclusion Results of this study showed that there have been an improvement in safety behaviour up to 90-97% after
implementation of safe work behaviour license. Improvement of safe act index in the present study proves that
safety culture in the organization have increased.The change in safe act index indicates that SWB license card is
acting as an antecedent in improving safety culture in an organization. That means that the antecedent gives the
motivation to act safely by every individual and everyone checks the safe behaviour of their colleagues. This
antecedent has the capability to drive/ increase the safety maturity and culture from reactive or any stage to
interdependent as per Bradley curve.
References(10pt)
[1] Cooper Ph. D, M. D., ―Towards a model of safety culture‖. Safety science,vol. 36(2),pp. 111-136,2000.
[2] Kausar A and Varghese.P.S. ―Occupational Deaths at Construction Sites in Bangalore‖International journal of
Biomedical and advance research ,02(12), 494-497,2011.
[3] Koehn, E. E., ―Construction work with equipment: India‖, In American Society for Engineering Education, American
Society for Engineering Education, 2011.
[4] Olson, R., and Austin, J., ―Behavior-based safety and working alone: The effects of a self-monitoring package on the
safe performance of bus operators‖, Journal of Organizational Behavior Management,vol. 21(3),pp 5-43,2001.
[5] Prasad, S. R., and Rao, Y. P., ―Analysis of implementation of behaviour based safety program in indian construction
segments, using topsis‖, International journal of Industrial Engineering and Technology,vol. 3(3),pp 11-20,2013.
[6] http://www.ehstoday.com/news/ehs_imp_33991.
0
20
40
60
80
100
120
% s
afe
be
hav
ior
Comparison of safe behavior
Pre-observations
Post-observations
International Journal of Engineering, Science and Mathematics Vol.7 Issue 4, April 2018, ISSN: 2320-0294 Impact Factor: 6.765 Journal Homepage: http://www.ijesm.co.in, Email: [email protected] Double-Blind Peer Reviewed Refereed Open Access International Journal - Included in the International Serial Directories Indexed & Listed at: Ulrich's Periodicals Directory ©, U.S.A., Open J-Gage as well as in Cabell’s Directories of Publishing Opportunities, U.S.A
144 International Journal of Engineering, Science and Mathematics
http://www.ijesm.co.in, Email: [email protected]
ASSESSMENT OF AIR QUALITY IN DEHRADUN CITY OF UTTARAKHAND (IMPACT OF
VEHICULAR POLLUTION IN DOON VALLEY
Bahukhandi Kanchan Deoli, Siddarth
Siddiqui NA & Singh Mohini
Air pollutants are added in the atmosphere from variety of sources
that change the composition of air and affect the biotic environment.
The concentration of air pollutants depend not only on the quantities
that are emitted from air pollution sources but also on the ability of
the atmosphere to either absorb or disperse these emission. The
pollution concentration vary spatially and temporarily causing the air
pollution pattern to change with different locations and time due to
changes in meteorological and topographical condition. The sources
of air pollutants include vehicles, industries, domestic and natural
sources. The presence of air pollutants in the ambient air adversely
affects the health of the population. Automobile emissions, industrial
emission and burning of fossil fuels are adding large amount of air
pollution in the Dehradun city of Uttarakhand. These emission
deteriorating the ambient air quality and which further causing lot of
health problem. In this research paper an assessment of air pollution
has been conducted in order to assess the ambient air quality of
Dehradun city. The ambient air quality has been measured at ten
different sampling location during winter season in Dehradun city.
The parameter like SPM, RSPM, SOx and NOx and metrological
parameter like temperature, humidity and rainfall were monitored.
Total ten sampling locations were selected and samples ranging
across different seasons were collected and then analyzed in
Dehradun city. The high concentration of pollution were found in
various sampling location which was mainly due to vehicular
pollution in Dehradun city and due increased urbanization and
industrialization over the past decade.
Air Pollution, Ambient air
quality,
Copyright © 2018 International Journals of Multidisciplinary
Research Academy. All rights reserved.
Author correspondence:
Bahukhandi Kanchan Deoli
HSE Department, UPES
1. Introduction Environmental pollution is one of the major problem in all over the world including developed, underdeveloped and
developing countries (Ghose et al, 2005). The effect of air pollution is very much severe on human including as

International Journal of Engineering, Science and Mathematics Vol.7 Issue 4, April 2018, ISSN: 2320-0294 Impact Factor: 6.765 Journal Homepage: http://www.ijesm.co.in, Email: [email protected] Double-Blind Peer Reviewed Refereed Open Access International Journal - Included in the International Serial Directories Indexed & Listed at: Ulrich's Periodicals Directory ©, U.S.A., Open J-Gage as well as in Cabell’s Directories of Publishing Opportunities, U.S.A
145 International Journal of Engineering, Science and Mathematics
http://www.ijesm.co.in, Email: [email protected]
well on plants and animals and on our surrounding (Nagdene 2004, Samoli et al 2012). Air pollution causes harmful
diseases and cause various environmental problem at regional and global level (Barman et al., 2010). Air pollution
causes acute and chronic effects on human being (Afroz et al. 2003). It is estimated that 60 % of air pollution in
India mainly caused by automobile emissions ( Johansson O 1997, Kathuria, V 2002, Krawack, S. 199, Nylund et al
2003, Pundir 2001).
The pollution caused by automobile emissions are more harmful because they emit in lower level of troposphere
hence directly inhaled by human being during respiration process. The pollutant like SOx, NOx, SPM and RSPM,
inorganic, organic and metal pollution are mainly generated from automobile emissions and considered major air
pollutant. (Agarwal and Singh 2000). According to Global Health Report of 2014 on Air Pollution published by
World Health Organization it has estimated that Indian has become 9th
largest industrial nation but at the same time
it has become the most polluted nation in the world (Vijay Kumar 2015). The ambient air quality of Dehradun
district is deteriorating at alarming rate (Kumar Vijay 2015). Vehicular pollution is one of the major cause of air
pollution in Dehradun district. The study conducted by ( Singh Pooja et al 2014 and 2012 DF Report 2012)
estimated the growth of registered vehicle was 11 % during the past 12 years, growth of car constitute 14 % and
two wheeler was 75% . It estimated that the present transportation system was mainly operated by private operator
by temp and buses. Around 1300 tempo were operating in different route of Dehradun city (Singh Pooja et al. 2014).
It is difficult to control vehicular emission because it emitted directly on lower level of troposphere, since dehradun
is a valley where dilution and dispersion of pollution takes a very long time especially during winter season and this
causes several health impact headache, nausea, irritation of eyes, various bronchial problems and visibility. The
study conducted by USPCB (Uttarakhand State Pollution Control Board ) in 2017 found that the concentration of
PM 10 (Particulate matter ) were increased up to 330.42 µg/m3
in various locations (USPCB 2017). In order to
prevent and control air pollution, the Air (Prevention and Control of Pollution) Act was enacted in 1981. The
responsibility has been further emphasized under Evironment(Protection) Act, 1986. It is necessary to assess the
present and anticipated air pollution through air quality survey/monitoring programs.
Physiography of Doon valley
The Doon Valley has the Himalayas to its north, the Shivalik range to its south, the sacred river Ganga to its east and
the river Yamuna to its west. The city of Dehradun is surrounded by river Song on the east, river Tons on the west,
Himalaya ranges on the north and Sal forests in the south. The Doon Valley is situated between the two most
important rivers of India. i.e. Ganga and Yamuna, located in a picturesque setting. Dehradun is surrounded by dense
forest all around and number of streams and canals dissect the city in the north-south direction. The high hills in the
east and north and Sivaliks in the south give an interesting topographical setting to the city.
2. Material and Method
The methodology consist of field survey, collection of primary and secondary data, identification of sampling sites,
monitoring and analysis of the samples and compilation of data and report. The air quality monitoring had been
done by using sophisticated, standard instrument i.e. respirable dust sampler manufactured by envirotech, the high
volume sampler and the Fugitive Monitoring Kit. The air quality monitoring had been done by using sophisticated,
standard instrument i.e. respirable dust sampler manufactured by envirotech, the high volume sampler and the
Fugitive Monitoring Kit. The parameter SPM (suspended particulate matter) and RSPM (Respirbale Particulate
matter) were monitored and analysed by gravimetric methods by using instrument Respirbale dust sampler and
fugitive monitoring kit. The determination of RSPM is by gravimetric method. For the determination of RSPM
glass micro fiber paper were used as filter. These filters are having low resistance to air flow, low affinity for
moisture and 98 % collection efficiency for particulate less than 10 micron in size. and for the parameter SOx and
NOx , the samples were collected in pre cleaned/ sterile container. The filter paper were equilibrated in
environmental condition average between 200 C and 30
0 C and hot varying more than +- 3
0 C with relative
humidity less than 50% without varying more than 5% for 24 hour before weighing. The actual and measured
weights were found. Monitoring was done at 3 meter (10 feet) above the ground level. Meteorology plays a vital
role in effecting the dispersion of pollutants. Once discharged into the atmosphere i.e. their transport, dispersion and

International Journal of Engineering, Science and Mathematics Vol.7 Issue 4, April 2018, ISSN: 2320-0294 Impact Factor: 6.765 Journal Homepage: http://www.ijesm.co.in, Email: [email protected] Double-Blind Peer Reviewed Refereed Open Access International Journal - Included in the International Serial Directories Indexed & Listed at: Ulrich's Periodicals Directory ©, U.S.A., Open J-Gage as well as in Cabell’s Directories of Publishing Opportunities, U.S.A
146 International Journal of Engineering, Science and Mathematics
http://www.ijesm.co.in, Email: [email protected]
diffusion into the environment The metrological parameter like temperature, relative humidity, rainfall and wind
speed were also monitored.
Following Calculation were used for the estimation of SPM and RSPM
RSPM = W X 10 6/
V
SPM = W x 10 6 / v
Volume of air sampled V = Q x T
3. Reesult and Discussion
3.1. Meteorological Parameter :
The maximum temperature recorded during the entire study period was 300C in the month of March and where as
the minimum temperature recorded was 3.20C in the month of January (Table 1). The relative humidity during
varied from a maximum of 98% in the month of November to minimum of 32 % in the month of March. The
maximum rainfall was 27.8 mm in August and the minimum recorded was nil. The highest wind speed recorded was
7.2 km/hr in the month of February, while the predominant wind direction is noted as SW (Southwest) (Table 1).
Table 1. Meteorological Data for Dehradun City
Date Temperature(0C)
Relative Humidity
(%) Rainfall
Bright
Sunshine
Mean
Wind
Velocity
Direction
Hours
Max Min Mean 07:19 14:19
(mm) Total
Rainfall (Hours) (Km/hr) 07:19 14:19
Oct 31.8 10.2 20.7 93 47 27.8 7.6 1.8
C NW/
SW/
W
Jan 25 -2.4 10.8 94 45 14.7 4.9 1.7 C W
Feb 26.3 -0.5 13.7 8.2 1.5 C N
March 32.9 7.5 20 88 32 2.2 2.9
C NW/
SSW
3.2 Air Quality Index
As per AQI standard the AQI index of SO2 were ranged from 120 to 175 which indicated sensitive group of people
sufferering with asthma were at risk. The health effect of SOx had increased ncreased respiratory symptoms, such as
chest tightness and wheezing in people with asthma, possible aggravation of heart or lung disease. It is suggested to
Children, asthmatics, and people with heart or lung disease should limit outdoor exertion. The AQI index for RSPM
(Particulate matter size less then (10 µg/m3) were ranged between 74 to 166 , sensitive group are the people with
respiratory disease were the group most at risk. The health effect AQI RSPM include increased respiratory
symptoms and aggravation of lung disease, such as asthma; possible respiratory effects in general population.
(Source AQI calculator, Air Now https://www.airnow.gov/index.cfm?action=airnow.calculator

International Journal of Engineering, Science and Mathematics Vol.7 Issue 4, April 2018, ISSN: 2320-0294 Impact Factor: 6.765 Journal Homepage: http://www.ijesm.co.in, Email: [email protected] Double-Blind Peer Reviewed Refereed Open Access International Journal - Included in the International Serial Directories Indexed & Listed at: Ulrich's Periodicals Directory ©, U.S.A., Open J-Gage as well as in Cabell’s Directories of Publishing Opportunities, U.S.A
147 International Journal of Engineering, Science and Mathematics
http://www.ijesm.co.in, Email: [email protected]
Table 2. National AMBIENT AIR QUALITY STANDARDS, Central Pollution Control Board
Notification, 18th
November 2009, Gazette of India
Pollutant
Time Weighted
Average
Industrial
Area,
Residential,
Rural and
Other area
Ecological
Sensitive area
notified by
Central
government
Method of Measurement
Sulphur
Dioxide
Annual
Average* 24
hours**
50µgN/m3
80 µgN/m3
20µgN/m3
80 µgN/m3
Improved West and Geeks
method
Ultraviolet Fluorescence
Oxides of
Nitrogen
Annual
Average* 24
hours**
40µgN/m3
80 µgN/m3
30µgN/m3
80 µgN/m3
Jacob and Hochhwiser
modified (Na-arsenite)
method-Gas-Phase
Chemilusence
SPM
(Suspended
Particulate
Matter) As
per IS 1994
Std
Annual
Average* 24
hours**
360µgN/m3
500 µgN/m3
140µgN/m3
200 µgN/m3
High Volume Sampling
[Average flow rate not less
than 1.1 m3/ minute]
Particulate
Matter (Size
less then 10
µm or PM 10
µg/ m3
Annual
Average* 24
hours**
60µgN/m3
100 µgN/m3
60µgN/m3
100 µgN/m3
Gravimetric TOEM, Beta
attenuation
Sources : Gazette of India, NAAQ, CPCB, 18th
November 2009
Table 3. Ambinet air quality data in Dehradun City
S.N
.
Locations Parameters in µgN/m3
SPM RSPM SOx NOx
1. Bajaj service center Premnagar
chowk.
350
111.11
27.8
26.80
2. Hundai service center Prince chowk. 270
166
30.45 28.00
3. Oberoi motor workshop majra. 416.66
166.6
35.00
30.00
4. Chevrolet Workshop Transport
nagar.
166.6
83.33
24.00
23.85
5. Mohit auto service center Rajpur
road.
138.88
83.33
25.75
20.50
6. Rohan motors, Chakrata road. 100.00
66.66
23.85
23.55

International Journal of Engineering, Science and Mathematics Vol.7 Issue 4, April 2018, ISSN: 2320-0294 Impact Factor: 6.765 Journal Homepage: http://www.ijesm.co.in, Email: [email protected] Double-Blind Peer Reviewed Refereed Open Access International Journal - Included in the International Serial Directories Indexed & Listed at: Ulrich's Periodicals Directory ©, U.S.A., Open J-Gage as well as in Cabell’s Directories of Publishing Opportunities, U.S.A
148 International Journal of Engineering, Science and Mathematics
http://www.ijesm.co.in, Email: [email protected]
7. Mahindra & Mahindra Kargi
Chowk.
416.6
125.0
22.65 26.25
8. Roadways workshop Haridwar road. 138.88
74.18
26.95
26.35
9. Hyundai motors, Haridwar road. 160.11
76.9
26.97 27.80
10. Mayur auto Rajpur road. 146.88
91.21
25.8
21.80
3.3. Spatial and Seasonal variation in aminet air quality
The SPM concentration in the various workshop were ranged from 100 Nµg/m3
to 416 Nµg/m3
with a mean value
of 230.4 Nµg/m3
. The RSM concentration ranged from 66.66 Nµg/m3
to 166 Nµg/m3
with mean value of 104.3
Nµg/m3
in various location of Dehradun city. The concentration of RSPM was found very high and crossed the
maximum permissible limit (RSPM 60 Nµg/m3) as per NAAQ standards (Table 1) in all sampling locations.
The SPM & RSPM were found maximum in the month of December with a mean value of 167.1 µg/Nm3& 63.5
µg/Nm3 and minimum was found in the month of October with the mean value of 101.62 µg/Nm
3& 35.68
µg/Nm3respectively in Ballupur crossing chowk. The concentration of NOx& SO2 were recorded high i.e 36.33
µg/Nm3& 24.85 µg/Nm
3 in the month of February respectively. Similarly concentration of SPM was recorded in the
month of February as highest i.e. 393.69 µg/Nm3and month of October as lowest i.e. 306 µg/Nm
3 .While the high
concentration of NOx was recorded as 38.65 µg/Nm3 and for SO2 as 34.02 µg/Nm
3 in the month of December in
Astley Hall. Alarming concentration of both SPM and RSPM was recorded in the month of February & December
with value of 454.3 µg/Nm3& 180.86 µg/Nm
3 respectively. Simultaneously high concentration was found for NOx
in the month of February at GMS road.
Vasant Vihar has range of concentration for SPM between 241.64 µg/Nm3 – 340.86 µg/Nm
3 and range of RSPM
was between 102.45 µg/Nm3 – 156.32 µg/Nm
3 .In case of NOx& SO2 range was find between 10.43 µg/Nm
3 – 23.82
µg/Nm3& 3.48 µg/Nm
3 – 14.28 µg/Nm
3 respectively. The high concentration of SPM & RSPM was notice due to
movement of heavy vechile in this area having maximum value of 367.19 µg/Nm3& 170.33 µg/Nm
3 respectively at
premnager. Also due to vechicular emission level of NOx & SO2 was high about 38.93 µg/Nm3&36.31 µg/Nm
3
respectively at Premnager while in Kanwali Road the concentration of SPM was between 147.65 µg/Nm3 – 232.22
µg/Nm3 , while RSPM was between 67.56 µg/Nm
3 – 110.33 µg/Nm
3 .Value recorded for NOx are between 34.32
µg/Nm3 – 39.92 µg/Nm
3 for SO2 was between 25.14 µg/Nm
3 – 34.76 µg/Nm
3. While Haridwar are in outskirt of
Dehradun and the maximums value recorded for SPM is 145.44 µg/Nm3, RSPM is 71.45 µg/Nm
3 , NOx is 27.23
µg/Nm3& SO2 is 19.26 µg/. Air level maximum recorded for SPM, RSPM, NOx & SO2 are 165.89 µg/Nm
3, 75.45
µg/Nm3, 24.09 µg/Nm
3& 16.51 µg/Nm
3 respectively. Minimum level recorded are 80.76 µg/Nm
3,
30.66µg/Nm3,14.5 µg/Nm
3& 11.79 µg/Nm
3 respectively in Rajpur Road
Prince Chock is a commercial area and the maximum level of SPM, RSPM, NOx & SO2 are 376.57 µg/Nm3, 170.55
µg/Nm3, 45.88 µg/Nm
3& 41.33 µg/Nm
3 respectively. Clock Tower is the center point of the City with major
commercial market and high density of people so the concentration observed was found between range of 323.78
µg/Nm3-395.17 µg/Nm
3& 116.32 µg/Nm
3 – 187.36 µg/Nm
3 respectively for SPM and RSPM. Concentration of
SPM was recorded high in month of February with value of about 430.69 µg/Nm3 .While concentration of SO2 was

International Journal of Engineering, Science and Mathematics Vol.7 Issue 4, April 2018, ISSN: 2320-0294 Impact Factor: 6.765 Journal Homepage: http://www.ijesm.co.in, Email: [email protected] Double-Blind Peer Reviewed Refereed Open Access International Journal - Included in the International Serial Directories Indexed & Listed at: Ulrich's Periodicals Directory ©, U.S.A., Open J-Gage as well as in Cabell’s Directories of Publishing Opportunities, U.S.A
149 International Journal of Engineering, Science and Mathematics
http://www.ijesm.co.in, Email: [email protected]
observed high in month of February with a value of 36.45 µg/Nm3 at Selaqui Inustrial area of Dehradun. Unusual
level of SPM and RSPM was recorded with a value of 520.46 µg/Nm3& 270.55 µg/Nm
3 respectively Rispana
Bridge. The first reading was before the other bridge came and second value is the clear indication of advantage
with two way road. While concentration of NOx and SO2 was with in the normal range and the maximum value
recorded was 43.68 µg/Nm3& 36.53 µg/Nm
3 respectively at Rispana Bridge. Saharanpur Chowk has found to have
the maximum concentration of SPM with a value of about 657.34 µg/Nm3 and RSPM with a value of
320.67µg/Nm3. While NOx and SO2 was found between the range of 43.56 µg/Nm
3 – 51.74 µg/Nm
3& 39.76
µg/Nm3 – 44.67 µg/Nm
3 respectively.
Figure 1. SPM cocnetration at different place of Dehradun city
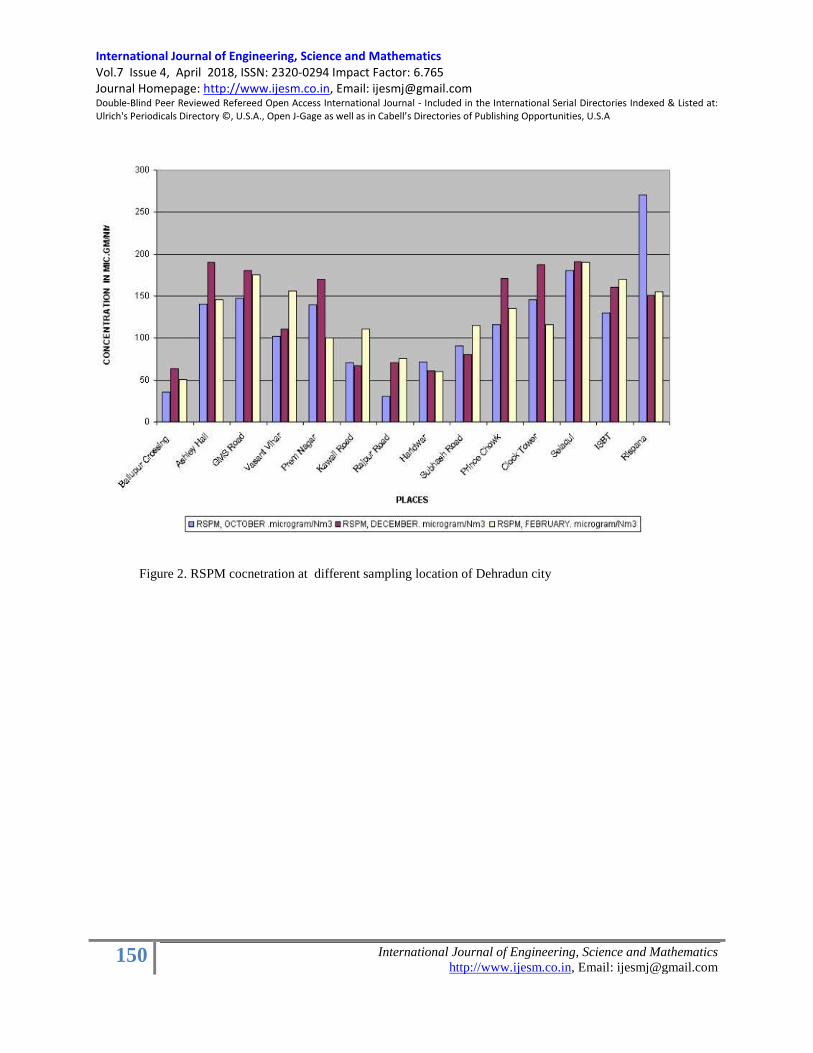
International Journal of Engineering, Science and Mathematics Vol.7 Issue 4, April 2018, ISSN: 2320-0294 Impact Factor: 6.765 Journal Homepage: http://www.ijesm.co.in, Email: [email protected] Double-Blind Peer Reviewed Refereed Open Access International Journal - Included in the International Serial Directories Indexed & Listed at: Ulrich's Periodicals Directory ©, U.S.A., Open J-Gage as well as in Cabell’s Directories of Publishing Opportunities, U.S.A
150 International Journal of Engineering, Science and Mathematics
http://www.ijesm.co.in, Email: [email protected]
Figure 2. RSPM cocnetration at different sampling location of Dehradun city
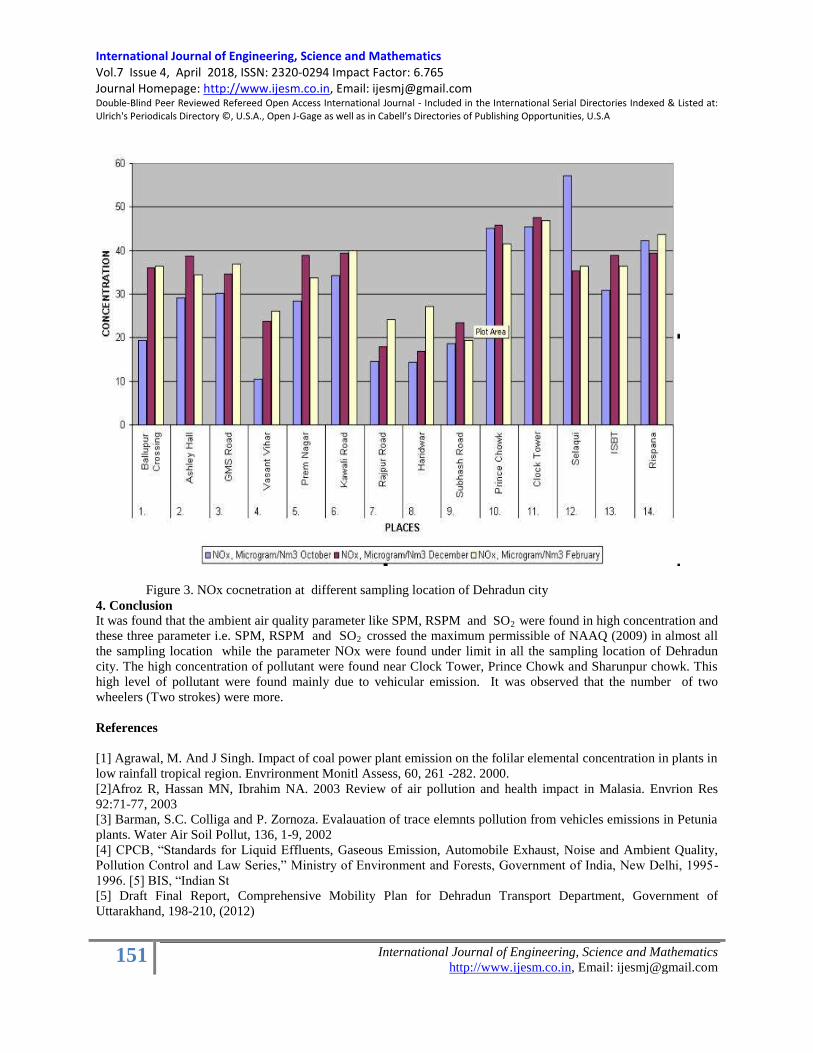
International Journal of Engineering, Science and Mathematics Vol.7 Issue 4, April 2018, ISSN: 2320-0294 Impact Factor: 6.765 Journal Homepage: http://www.ijesm.co.in, Email: [email protected] Double-Blind Peer Reviewed Refereed Open Access International Journal - Included in the International Serial Directories Indexed & Listed at: Ulrich's Periodicals Directory ©, U.S.A., Open J-Gage as well as in Cabell’s Directories of Publishing Opportunities, U.S.A
151 International Journal of Engineering, Science and Mathematics
http://www.ijesm.co.in, Email: [email protected]
Figure 3. NOx cocnetration at different sampling location of Dehradun city
4. Conclusion
It was found that the ambient air quality parameter like SPM, RSPM and SO2 were found in high concentration and
these three parameter i.e. SPM, RSPM and SO2 crossed the maximum permissible of NAAQ (2009) in almost all
the sampling location while the parameter NOx were found under limit in all the sampling location of Dehradun
city. The high concentration of pollutant were found near Clock Tower, Prince Chowk and Sharunpur chowk. This
high level of pollutant were found mainly due to vehicular emission. It was observed that the number of two
wheelers (Two strokes) were more.
References
[1] Agrawal, M. And J Singh. Impact of coal power plant emission on the folilar elemental concentration in plants in
low rainfall tropical region. Envrironment Monitl Assess, 60, 261 -282. 2000.
[2]Afroz R, Hassan MN, Ibrahim NA. 2003 Review of air pollution and health impact in Malasia. Envrion Res
92:71-77, 2003
[3] Barman, S.C. Colliga and P. Zornoza. Evalauation of trace elemnts pollution from vehicles emissions in Petunia
plants. Water Air Soil Pollut, 136, 1-9, 2002
[4] CPCB, ―Standards for Liquid Effluents, Gaseous Emission, Automobile Exhaust, Noise and Ambient Quality,
Pollution Control and Law Series,‖ Ministry of Environment and Forests, Government of India, New Delhi, 1995-
1996. [5] BIS, ―Indian St
[5] Draft Final Report, Comprehensive Mobility Plan for Dehradun Transport Department, Government of
Uttarakhand, 198-210, (2012)

International Journal of Engineering, Science and Mathematics Vol.7 Issue 4, April 2018, ISSN: 2320-0294 Impact Factor: 6.765 Journal Homepage: http://www.ijesm.co.in, Email: [email protected] Double-Blind Peer Reviewed Refereed Open Access International Journal - Included in the International Serial Directories Indexed & Listed at: Ulrich's Periodicals Directory ©, U.S.A., Open J-Gage as well as in Cabell’s Directories of Publishing Opportunities, U.S.A
152 International Journal of Engineering, Science and Mathematics
http://www.ijesm.co.in, Email: [email protected]
[6] Uttarakhand State Pollution Control Board, Report 2017, http://cpcbenvis.nic.in/
National Ambient Air Quality Standard, Central Pollution Control Board, Notification, 18th
November 2009,
Gazette of India, http://home.iitk.ac.in/~anubha/H5.pdf
[7]Johansson, O. (1997) ―Optimal Road Pricing: Simultaneous Treatment of Time Losses, Increased fuel
consumption, and Emissions‖, Transportation Research – Part D, Vol. 2(2), 77-87.
[8]Kumar Vijay. Ambient air quality and noise status for Dehadun, Uttarakahnd, India. J. Envrion. Res. Develop.
2015
[9] Kathuria, V. Vehicular Pollution Control in Delhi. India. Transportation Research – Part D, 7(5): 373-87, 2002
[10] Krawack, S. Traffic Management and Emissions. The Science of the Total Environment, 134: 305-14. 1993
[11] Nylund, N.O., Lawson, A. Exhaust emissions from natural gas vehicles. International Association of natural gas
Vehicles, VTT Energy. 2000
[12] Pundir, B.P. Vehicular Air Pollution in India: Recent Control Measures and Related Issues‘, in India
Infrastructure Report 2001, Oxford University Press, Delhi. 2001
[13] Sadhana Chaurasia, Pragya Dwivedi, Ravindra Singh and Anand Dev Gupta. Assessment of ambient air quality
status and air quality index of Bhopal City (Madhya Pradesh). India, 2013
[14] Singh Pooja, Chani P.S. and Parida M. Assessing the performance of public transport operation in Dehradun
Uttarakhand, India, Journal of Envrionmental Research and Development, Vol.8 No. 04, April.-June. 2014
[15] Vijay Kumar. Ambient Air Quality and Noise Status for Dehradun, Uttarakhand, India. J. Environmental Res.
Develop., Vol.10 No. 01. July – September 2015
[16] Faiz, A., C.S. Weaver, and M.P. Walsh (1996) Air Pollution from Motor Vehicles, International Bank for
Reconstruction and Development/World Bank.
[17] Environmental Science and Engineering (2nd
Edition) by J. Glynn Henry and Gary W. Heinke pg 492-565.
[18] Central Pollution Control Board (1999) Parivesh: Newsletter, CPCB, Ministry of Environment and Forests,
Delhi. Website-- www.cpcb.nic.in
[19] United States Environmental Protection Agency, Air Quality Criteria for Particulate matter Chapter 1 ,
Executive Summary, EPA 600/P-95/001aF, April 1996, Website -
http://www.epa.gov/ORD/WebPubs/execsum.html.
[20] Ministry of Env. And Forest (MOEF), Govt. Of India.
[21] http://www.epa.gov/air/urbanair/pm/hlth1.html
[22] http://www.epa.gov/oar/particlepollution/health.html
[23] http://www.epa.gov/air/airtrends/aqtrnd01/pmatter.htm
[24] https://www.airnow.gov/index.cfm?action=airnow.calculator
International Journal of Engineering, Science and Mathematics Vol.7 Issue 4, April 2018, ISSN: 2320-0294 Impact Factor: 6.765 Journal Homepage: http://www.ijesm.co.in, Email: [email protected] Double-Blind Peer Reviewed Refereed Open Access International Journal - Included in the International Serial Directories Indexed & Listed at: Ulrich's Periodicals Directory ©, U.S.A., Open J-Gage as well as in Cabell’s Directories of Publishing Opportunities, U.S.A
153 International Journal of Engineering, Science and Mathematics
http://www.ijesm.co.in, Email: [email protected]
A REVIEW ON PHYTOPHARMACOLOGICAL ACTIVITY OF
PLUMERIA SPECIES
Shefali Arora
Kanchan Deoli Bhaukhandi**
Shailey Singhal***
Mamta Latwal****
Tanuja Uniyal Sati*****
Deepak Kumar******
Abstract
―Green medicines are safer and healthier than synthetic ones‖ with
this code, the plants are widely exploited in the tradition medicines.
Due to greater advances in understanding the mechanism of action of
herbs, plants gain the acceptance from the medical profession for the
positive influence on health and quality of life. Phtyopharmacological
studies from plant origin have tremendous therapeutic values. Natural
products are effective in the treatment of various infectious diseases
while simultaneously regulates many of the side effects. Therefore
the present review was undertaken to validate scientifically the
therapeutic role of all the species of Plumeria.
Keywords:
Plumeria;
Phytochemical activity;
Pharmacological value;
Plants
Copyright © 2018International Journals of Multidisciplinary
Research Academy. All rights reserved.
Author correspondence:
Shefali Arora,
Assisstant Professor, Department of Chemistry
University Of Petroleum and Energy Studies, Dehradun-India
1. Introduction Natures play a very important roles as medicinal agents for thousands of years and renowned as one of the important
systems of alternative and complementary medicines. Herbs or higher plants offers vital and appreciable roles in the
*Assisstant Professor, Department of Health Safety and Environment, University Of Petroleum and Energy Studies, Dehradun-
India, Email: [email protected]
***Associate Professor, Department of Chemistry, University Of Petroleum and Energy Studies, Dehradun-India, Email:
****Assisstant Professor, Department of Chemistry, University Of Petroleum and Energy Studies, Dehradun-India, Email:
*****Junior research fellow, Department of Health Safety and Environment, University Of Petroleum and Energy Studies,
Dehradun-India,
****** Assisstant Professor, Department of Pharmaceutical Chemistry, Dolphin Institute of Biomedical and Natural Sciences,
Dehradun-India,

International Journal of Engineering, Science and Mathematics Vol.7 Issue 4, April 2018, ISSN: 2320-0294 Impact Factor: 6.765 Journal Homepage: http://www.ijesm.co.in, Email: [email protected] Double-Blind Peer Reviewed Refereed Open Access International Journal - Included in the International Serial Directories Indexed & Listed at: Ulrich's Periodicals Directory ©, U.S.A., Open J-Gage as well as in Cabell’s Directories of Publishing Opportunities, U.S.A
154 International Journal of Engineering, Science and Mathematics
http://www.ijesm.co.in, Email: [email protected]
modern system of medicine and serve as extremely useful natural drugs [1]. Basic compounds that provides by
plants affording less toxic and more effective drug molecules. To avoid the various side effects of drugs prepared by
chemical methods, indigenous plants are given priority because of their cheap, easily available and harmless
condition [2]. Natural product chemistry is helpful for the exploration of biologically active prototypes for the newer
and better drug synthesis. Modification of inactive natural products by biological/chemical means into potent drugs
is a vital role of natural drug substances [3-5]. Various bioactive metabolites like alkaloids, terpenoids, flavonoids,
steroids, glycosides etc. are present in plants and have their therapeutic value for the cure of diseases. Thus emphasis
is given on the biological screening of medicinal plants for the proper exploration of their active constituents present
in various parts of the plants. Apart from this, people from India have taken this work very seriously because of our
excellent Ayurveda past. In our country (India) more than 75% of total population relies on traditional medicines
based on plant product [6].
General Discription
Genus Plumeria belongs to Apocyanaceae family and widely cultivated in the tropical and subtropical region.
Plumeria species are widely used as purgative, remedy of diarrhea, bronchitis, asthama, dysentery, cough, fever,
bleeding piles, blood disorders and tumors etc. [7]. Plumeria species are commonly found as ornamental plants and
due to its ease of propagation through cutting, various species of Plumeria are now widely cultivated and distributed
in different part of the world [8]. As a ornamental plants, it si often seen in parks, gardens, graveyards and premises
with their attractive fragrant flowers of various colour and size. This plant is grown for their aesthetic features but
also have nutritive and medicinal properties. The tree of Plumeria genus were introduced to Malaysia and three most
common species are found all over the world viz. P. obtuse, P. rubra and P. acuminate [9]. Although numerous
hybrids and varities have also appeared and scientist recognize more than sixty species, that may reduced to seven or
eight and rest are hybrids and varieties [10].
Taxonomical classification of Plumeria species are
Kingdom Plantae
Subkingdom Spermatophyta
Division Magnoliophyta
Class Magnoliopsida
Subclass Asteridae
Order Gentianales
Family Apocynaceae
Genus Plumeria
Various species of Plumeria is well known for its lovely strong fragrant. Its spiral shaped blooms grow
from June through November. The tree is 20 inches long, coarse, blunt, deciduous leaves clustered only at the tips of
the rough, thick and grey green branches. Basically it is an ornamental plant and sometime used to make necklaces
which decorates coffins. Its flower give no nectar and trick their pollinators. The milky latex of Plumeria species
contains poisonous compounds that irritates the eyes and skin. The leaves are spirally arranged near the ends of the
swollen branches and flowers are large, waxy, very fragrant, in terminal or lateral stalked cluster [11]. Overall
Plumeria is genus of laticiferous trees and shrubs and about eight species are reported from India but it is very
difficult to fix their identity because of overlapping character of some species.
Chemical Constituents of various Plumeria species
Varoius research papers have proved that the first medicinally active compound isolated from the species of
Plumeria were Iridoid glycosides. The other medicinally active constituents in the latex and oil of some of these
species were alkaloids, tanins, carbohydrates and triterpenoids. The same components were also isolated from the
different extract of roots and the other areal parts of Plumeria plant. The following some lines describe the bioactive
chemical constituents of some of the Plumeria species.
1) Plumeria acuminate: The active constituents present in P. acuminate species are steroids, alkaloids,
glycosides, flavonoids and tanins. Phytochemical studies have shown that the stigmast-7-enol, lupeol
carboxylic acid, lupeol acetate and ursolic acid are present in the leaves of this species. The roots of P.
acuminate also contain Fulvoplumierin along with three new components viz. isoplumericin, β-

International Journal of Engineering, Science and Mathematics Vol.7 Issue 4, April 2018, ISSN: 2320-0294 Impact Factor: 6.765 Journal Homepage: http://www.ijesm.co.in, Email: [email protected] Double-Blind Peer Reviewed Refereed Open Access International Journal - Included in the International Serial Directories Indexed & Listed at: Ulrich's Periodicals Directory ©, U.S.A., Open J-Gage as well as in Cabell’s Directories of Publishing Opportunities, U.S.A
155 International Journal of Engineering, Science and Mathematics
http://www.ijesm.co.in, Email: [email protected]
dihydroplumericin and β-dihydroplumericinic acid. An essential oil from Plumeria acuminate after steam
distillation contain primary alcohols, citronellol geraniol, farnesol and phenylethyl alcohol with small
amount of aldehyde and ketones (6.8%). These oil have saponification value (123) and acid value(20.2)
[12,13]
2) Plumeria rubra: The bark of the plant contain plumieride coumarylplumieride, protoplumericine,
Rubrinol:an antibacterial triterpenoid together with teraxastery acetate, lupeol, stigmasterol, oleanolic acid
[14]. Its flower contain essential oil, 1-diethoxyethane, benzaldehyde, geraniol, citral, methylbenzoate,
methyl salicylate and linalool [15-17].
3) Plumeria alba: Various alkaloids, carbohydrates, flavonoids, phenolic compounds, sterols, tanins and
iridoid glycosides are isolated from the bark of Plumeria alba. The researchers have successfully reported
its medicinal values with the components of amyrinacetate, β-sitosterols, mixtures of amyrins,
plumeridecoumertae and plumeridecomerateglycosides [18-19]. Essential oil from its flower contain
primary alcohol, geraniol, citronellol, farnesol and some linalol with quercetin and kaompferol.
4) Plumeria obtuse: The fresh leaves of P. obtuse contain two new and three known iridoids. The new
iridoids have been isolated and characterized as 6-O-acetylplumieride-p-E-coumarate[20,21] and 6-O-
acetylplumieride-p-Z-coumarate [22]. The oil, isolated from P. obtuse mainly consist of benzyl salicylate
(45.4%) and benzyl benzoate (17.2%), with minute concentration of alkanoic acid [23].
Medicinal value of Plumeria species
The seeential oil and fragrance contain the flower of various Plumeria species and used in perfume and cosmetic
industry and aromatherapy. Plumeria species have been investigated to have antimicrobial, anticancer, antipyretic
and antioxidant activities[24-31]. Different part of Plumeria also have their medicinal values and can be used for the
treatment of skin cancer, antifilarial and other affliction [32]. The following few lines will summarized some recent
pharmacological activities of Plumeria species.
1) Antioxidant properties: Plumeria alba leaves are the promising source of antioxidant activity. The
methanol extract was found to have the free medical scavenging activity even more than that of ascorbic
acid at the test concentration with the minor activity in chloroform and petroleum ether extract [33]. In
other studies, an antioxidant activity was confirmed by invitro studies in P. rubra and a flavone glycoside
was isolated and a significant reduction of serum triglycerides in alloxan-induced hyperglycemic rats was
reported [34].
2) Antipyretic properties: Several experimental studies have investigate the antipyretic and antinociceptive
activity of methanol extract of P. acuminate leaves. A significant reduction in brewer‘s yeast induced
administration of P. acuminate leaves extract with different doses (100,250 and 500mg/kg) [35]. Ethanolic
extract of the leaf of Plumeria rubra was reported for their antipyretic activity. It is useful in maintaining
normal body temperature and reducing boiled milk induced elevatal rectal temperature in rabbits. An
standard antipyretic drug e.g. aspirin were taken as standard [36].
3) Antimicrobial properties: Various extract of Plumeria rubra leaves were studied for their
antimicrobial activities against eleven human pathogenic bacteria. Chloroform and ethyl acetate extract
showed moderate to good antimicrobial activity against all the tested pathogens. The ethyl acetate extracts
showed the largest zone of inhibition (25mm in diameter with 2000mg/disc extract) against E. coli and with
fungal radial mycelial growth (62.00% with 100mg extract /ml medium) in A. ustus ethyl acetate extract
[37]. The ethanolic extract from the stem bark of Plumeria acutifolia was tested for antimicrobial activity
against both gram positive and gram negative bacteria and fungi by disc diffusion method. Results have

International Journal of Engineering, Science and Mathematics Vol.7 Issue 4, April 2018, ISSN: 2320-0294 Impact Factor: 6.765 Journal Homepage: http://www.ijesm.co.in, Email: [email protected] Double-Blind Peer Reviewed Refereed Open Access International Journal - Included in the International Serial Directories Indexed & Listed at: Ulrich's Periodicals Directory ©, U.S.A., Open J-Gage as well as in Cabell’s Directories of Publishing Opportunities, U.S.A
156 International Journal of Engineering, Science and Mathematics
http://www.ijesm.co.in, Email: [email protected]
shown that the extract have very strong antimicrobial activity against E. faecalis, B. subtilis, S. aureus, P.
aeruginosa, S. typhimurium, A. niger and C. albicans [38].
4) Antitumor properties: In indonesia, the bark of Plumeria rubra was investigated for their cytotoxic
constituents. 2,5-dimethoxy-p-benzoquinone and three iridoids viz fulvoplumierin, allamcin and
allamandin were active phytoconstituents of the petroleum ether and chloroform and the iridoid plumerian
and the lignin liriodendrin were isolated from the aqueous extract [39]. Methanolic extract of P. alba was
also investigated for antitumor using invitro cytotoxic and mean survival time[40]. Researcher have noticed
a decrease in the tumor volume and viable ell count in the DLA tumor hosts. Kardono et. al. reported the
three cytotoxic iridoidsfulvo plumierin, allamcin and allamandin from the bark of P. rubra.
Conclusion
The present review describes the phytochemical and pharmacological screening of various Plumeria species.
Studies have shown that there is a vast scope of pharmaceutical activities for the plant of genus Plumera. The
evaluation needs to be carried out for their clinical application for the betterment of the man kind.
Reference
[1] Farombi, E.O., ―African indigenous plants with chemotherapeutic potentials and biotechnological approach
to the production of bioactive prophylactic agents,‖ African Journal of Biotechnology, vol. 2, pp. 662-671,
2003.
[2] Leswar, N.D. and Widjata R., ―Medicinal and aromatic plant,‖ CSIR Delhi publication and information
directorates, New Delhi, 1992.
[3] Kokate, C.K., Purohit, A.P. and Gokhale, S.B. (Eds), ―Pharmacognosy,‖ 42nd edition, Nirali prakashan,
Pune, vol. 8.1(8.5), pp. 1.1-1.6, 2008.
[4] Ashutosh kar, ―Pharmacognosy and pharmacobiotechnology,‖ new age international, second edition, Vol.
5.
[5] Trease, G.E. and Evans, M.C., ―Text book of Pharmacognosy,‖ 12th edition, Balliere, Tindall, London, pp.
343-83, 1983.
[6] Organization WH, ―WHO traditional medicine strategy 2002-2005‖ Geneva, World Health Organization,
2002
[7] Nadkarni, K.M., ―Indian Materia Medica,‖ Popular Prakashan, Bombay, vol. 1, pp. 561, 993, 1976.
[8] Omata, A., Yomogida, K., Nakamura, S., Hashimoto, S., Arai, T. and Furukawa, K., ―Volatile Components
of Plumeria Flowers. Part 1. Plumeria rubra forma acutifolia (Poir) Woodson cv. 'Common yellow',‖
Flavour and Fragrance Journal, vol. 6, pp. 277-279, 1991.
[9] Corner, E.J.H., ―Wayside Trees Of Malaya,‖ vol. 1, pp. 147-148, 1952.
[10] Krishanmirthi, A., ―The Wealth of India,‖ Council of Scientific and Industrial Research, New Delhi, Vol.
7, pp. 164.
[11] Chin, H.F., ―Malaysian Flowers in Colour Tropical Press,‖ Kuala Lumpur, Malaysia, pp. 15-23, 1993.
[12] Pand R.R. and Mehrotra, B.N., ―Compendium of Indian Medicinal Plants,‖ CDRI, Lucknow & NISCAIR
New Delhi, vol. 1, pp. 320-322.5, 1960-1969.
[13] Mahajan, R.T. and Badgujar, S.B., ―Phytochemical investigation of some laticiferous plants belonging to
Khandesh region of Maharashtra,‖ Ethnobotanical Leaflets, vol. 12, pp. 1145-1152, 2008.
[14] Chen, Y.H. and Zang, S., ―In anonymus: Xinhua Bencao Gangyao,‖ Shanghi science and technology
Press, Shanghai, pp. 418-419, 1991.
[15] Zhu, L.F., Li, Y.H., Li, B.L., Lu, B.Y. and Zang, W.L., ―Aromatic Plants and essential constituents,‖ South
China Institute of Botany, Chinese Academic science, pp. 89, 1983.

International Journal of Engineering, Science and Mathematics Vol.7 Issue 4, April 2018, ISSN: 2320-0294 Impact Factor: 6.765 Journal Homepage: http://www.ijesm.co.in, Email: [email protected] Double-Blind Peer Reviewed Refereed Open Access International Journal - Included in the International Serial Directories Indexed & Listed at: Ulrich's Periodicals Directory ©, U.S.A., Open J-Gage as well as in Cabell’s Directories of Publishing Opportunities, U.S.A
157 International Journal of Engineering, Science and Mathematics
http://www.ijesm.co.in, Email: [email protected]
[16] Pino, J.A., Ferres, A., Alvarez, D. and Rosado, ―Volatiles of an alcoholic extract Flowers from Plumeria
rubra L. var. acutifolia,‖ Flavour and Fragrance Journal, vol. 9(6), pp. 343-345, 1994.
[17] Gopi, J., Khatri, P., Singh, N., Gaud, H. and Patel, R., ―Phytochemical and Pharmacological potential of
Plumeria rubra Linn. (Apocyanaceae): A Review,‖ International Journal of Pharmaceutical Science, vol.
3(1), pp. 1162-1168, 2011.
[18] Rengaswami, S. and Venkatarao, E., ―Chemical Components of Plumeria alba.,‖ Proc. Indian Academic
Science, vol. 52(A), pp. 173-181, 1960.
[19] Coppen, J.J.W. and Cobb, A.L., ―The occurrence of iridoids in Plumeria and Allamanda,‖ Phytochemistry,
vol. 22(1), pp. 125, 1983.
[20] Siddiqui, S., Siddiqui, B.S., Naeed, A. and Begum, S., ―Isolation and structure elucidation obtusililin, a
new triterpenoid and 27-p-Z caumaroyloxyursolic acid from the leaves of Plumeria obtuse‖ Pakistan
Journal of Scientific and Industrial Research, Vol. 13(2), pp. 115-119, 1991.
[21] Siddiqui, B.S., Naeed, A., Begum, S. and Siddiqui, S., ―Minor Iridoids From The Leaves Of
PlumeriaObtusa,‖ Phytochemistry, vol. 37(3), pp. 769, 1994.
[22] Walker, J., ―The Subtropical Garden,‖ 83, 1992.
[23] Gopi, J., Khatri, P., Singh, N., Gaud, H. and Patel, R., ―Phytochemical and Pharmacological Potential of
Plumeria rubra Linn. (Apocyanaceae): A Review,‖ International Journal of Pharmaceutical Sciences, vol.
3(1), pp. 1162-1168, 2011.
[24] Sibi, G., Awasthi, S., Dhananjaya, K., Mallesha, H. and Ravikumar, K.R., ―Comparative studies of
Plumeria species for their phytochemical and antifungal properties against Citrus sinensis pathogens,‖
International Journal of Agricultural Research, vol. 7, pp. 324-331, 2012.
[25] Rasool, S.N., Jaheerunnisa, S., Chitta, S.K. and Jayaveera, K.N., ―Antimicrobial activities of Plumeria
acutifolia,‖ Journal of Medicinal Plants Research, vol. 2, pp. 77-80, 2008.
[26] Radha, R. and Sivakumar, T., ―In vitro and in vivo anti-cancer activity of leaves of Plumeria alba Linn,‖
Journal of Pharmaceutical Research, vol. 2, pp. 203-207, 2009.
[27] Radha, R., Kavimani, S. and Ravichandran, V., ―Antitumor activity of methanolic extract of Plumeria alba
L. leaves against Dalton lymphoma ascites in mice,‖ International Journal of Health Research, vol. 1, pp.
79-85, 2009.
[28] Rekha, J.B. and Jayakar, B., ―Anticancer activity of ethanolic extract of leaves of Plumeria rubra (Linn.),‖
Current issue Pharmaceutical Technology, CPR1, vol. (2), pp. 175-179, 2011.
[29] Dobhal, M.P., Li, G., Gryshuk, A., Graham, A., Bhatanager, A.K., Khaja, S.D., Joshi, Y.C., Sharma, M.C.,
Oseroff, A. and Pandey, R.K., ―Structural modifications of plumieride isolated from Plumeria bicolor and
the effect of these modifications on in vitro anticancer activity,‖ The Journal of Organic Chemistry, vol.
69, pp. 6165-6172, 2004.
[30] Gupta, M., Mazumder, U.K. and Gomathi, P., ―Evaluation of antipyretic and antiociceptive activities of
Plumeria accuminata leaves,‖ Journal of Medical Science, vol. 7, pp. 835-839, 2007.
[31] Merina, A.J., Sivanesan, D., Begum, V.H. and Sulochana, N., ―Antioxidant and hypolipidemic effect of
Plumeria rubra L. in alloxan induced hyperglycemic rats,‖ E-Journal of Chemistry, vol. 7, pp. 1-5, 2010.
[32] Rizvi, W., Kumar, A., Kumar, R. and Haider, N., ―Evaluation of Anti filarial activity in roots of Plumeria
alba.,‖ Proceedings of the 6th
Conference of Medicinal and Aromatic Plants of Southeast European
countries, pp. 132, 2010.
International Journal of Engineering, Science and Mathematics Vol.7 Issue 4, April 2018, ISSN: 2320-0294 Impact Factor: 6.765 Journal Homepage: http://www.ijesm.co.in, Email: [email protected] Double-Blind Peer Reviewed Refereed Open Access International Journal - Included in the International Serial Directories Indexed & Listed at: Ulrich's Periodicals Directory ©, U.S.A., Open J-Gage as well as in Cabell’s Directories of Publishing Opportunities, U.S.A
158 International Journal of Engineering, Science and Mathematics
http://www.ijesm.co.in, Email: [email protected]
[33] Chaudhuri, S., Bakshi, S., Pande, J.N. and Biswas, M., ―Screening of in-vitro Antioxidant Profile of
Different Extracts of the Leaves of Plumeria alba Linn,‖ Journal of Advanced Pharmacy Education &
Research, Vol. 5 (2), pp. 98, 2015.
[34] Merinda, J., Sinanesan, D., Begum, V.H. and Sulochana, N., ―Antioxidant and Hypolipidemic Effect of
Plumeria Rubra L. in Alloxan Induced Hyperglycermic Rats,‖ Journal of Chemistry, vol. 7(1), pp. 1-5,
2010.
[35] Muir, C.K. and Hoe, K.F., ―Pharmacological action of leaves of Plumeria acuminate,‖ Planta Medica, vol.
44 (1), pp. 61-63, 1982.
[36] Misra, V., Uddin, S.M., Srivastava, V. and Sharma, U., ―Antipyretic activity of the plumeria rubra leaves
extract,‖ International Journal of Pharmaceutics, vol. 2(2), pp. 330-33, 2012.
[37] Jarin, L., Rahman, Md. S. and Anwar, M.N., ―Antibacterial and antifungal activity of crude extracts of
Plumeria rubra L.,‖ Chittagong University Journal of Biological Sciences, Vol. 3, pp. 1-2, 2008.
[38] Rasool, S.N., Jaheerunnisa, S., Kumar, S. and Jayaveera, K.N., ―Antimicrobial activities of Plumeria
acutifolia,‖ Journal of Medicinal Plant Research, vol. 2(4), pp. 077-080, 2008.
[39] Kardono, L.B., Tsauri, S., Padmawinata, K., Pezzuto, J.M. and Kinghorn, A.D., ―Cytotoxic Constituents of
the Bark of Plumeria rubra Collected in Indonesia,‖ Journal of Natural Product, vol. 53 (6), pp. 1447-1455,
1990.
[40] Banu, R.K., and Jayakar B., ―Anti cancer activity of ethanolic extract of leaves of Plumeria rubra (Linn.),‖
Current Pharma Research, vol. 1(2), pp.175-179, 2011.
DEVELOPING A GEOSPATIAL BASED APPROACH TO LOCATE WINDFARM IN MELUR TALUK,
TAMIL NADU, INDIA
(Sparsh Jain)
(Ayush Yadav)
(Dr. Saurabh Mittal)
Abstract
Wind Energy technologies transform the kinetic energy of the wind
into useful electrical power. Wind energy is renewable, inexhaustible
and it generates clean and climate-friendly energy, which can cut
down fossil fuel dependency. Among the renewable energy resources
wind energy has been the most popular for the investors. In India,
Tamil Nadu has a very large potential for wind power. Selecting the
location for wind farm is byzantine that involves not only technical
aspect, but also physical, economic and environmental requirements
that may results in ambivalence objectives. The most favorable
locations for wind farm will be acted based on environmental Land
Keywords:
Keywords- Kinetic Energy,
Geospatial, GIS, MCA
(Multicriteria Approach),
Bachelor of Technology (Geosciences), College of Engineering Studies, University of Petroleum and Energy Studies, Bidholi
Campus, Energy Acres, Dehradun-India. *Bachelor of Technology (Geosciences), College of Engineering Studies, University of Petroleum and Energy Studies, Bidholi
Campus, Energy Acres, Dehradun-India. **Associate Professor, Department of Petroleum Engineering and Earth Sciences, University of Petroleum and Energy Studies,
Dehradun-India.
International Journal of Engineering, Science and Mathematics Vol.7 Issue 4, April 2018, ISSN: 2320-0294 Impact Factor: 6.765 Journal Homepage: http://www.ijesm.co.in, Email: [email protected] Double-Blind Peer Reviewed Refereed Open Access International Journal - Included in the International Serial Directories Indexed & Listed at: Ulrich's Periodicals Directory ©, U.S.A., Open J-Gage as well as in Cabell’s Directories of Publishing Opportunities, U.S.A
159 International Journal of Engineering, Science and Mathematics
http://www.ijesm.co.in, Email: [email protected]
Weighted Overlay
use factors, wind resources and water treatment. The performance of
wind farms depends on location-based variables, implying the need
for geospatial information analysis to find the best fit for each
segment. Geospatial technology means collection of tools that
contributes to the geographical & location component and analysis of
earth. Geospatial information technology is therefore proving to be
an essential component of decision making process in wind energy.
The main benefit of using Geographical Information System (GIS) is
not merely the user-friendly visual access the display, but it has better
decision-making capabilities & also featured with data collection and
integration capabilities, management, analysis and presentation of
geographic and other spatially defined data. So an integrated model
will be developed to evaluate the potential locations of wind in Melur
Taluk, Tamilnadu. For predicting the best locations, we adopt the
multi-criteria approach utilizes the Weighted Overlay method to
determine the weightage of sitting criteria (factors and constraints),
and to develop the best describable map from single-factor maps to
represent these criteria.
Copyright © 2018 International Journals of Multidisciplinary
Research Academy. All rights reserved.
Author correspondence:
First Author,
Bachelor of Technology (Geociences), College of Engineering Studies
University of Petroleum and Energy Studies, Bidholi Campus, Energy Acres, Dehradun-India
1. Introduction
Wind is a form of Solar energy that cause by uneven heating of the atmosphere by the radiation of Sun, unevenness
of earth‘s surface and off course rotation & their flow pattern is govern by earth‘s terrain, water bodies & vegetation
cover[1]. When these factors are harvested and subjected to modern technology then this source can be used to
generate mechanical power of electricity and illuminate by converting from kinetic energy of wind. Its free, clean,
fresh, renewable source and a good prospect for future unlike fossil fuel dependency on large scale in present.
Believing on stats, by today‘s technology wind energy could provide 20% of America‘s electricity with turbines
installed in less than 1% of its land[2]. Taking an edge over fossil dependency, wind energy is now the world‘s
fastest growing energy resource and expanding rapidly across industries worldwide. Nonetheless accessing the wind
farm location is cumbersome as it holds several factors that restrains for wind power generation. Mainly three
factors include Physical, Social & Economical factors set the benchmark for predicting best locations and rejecting
unfavourable sites to possibly extract maximum energy efficiency[3].
Physical factor includes the wind farm location is best develop by of Geospatial technology that inhibits the
advancements of modern tools for geographical locations benefit for settling up project by Multi Criteria Decision
Making approach use for weighted overlay of all undertaking parameters and analyse the best pick up location for
Wind farm installation. Social factors hinders the public acceptance & project approval of protected areas whereas
economics include site accessibility, proximity of grid and availability of installation equipment. In India, Tamil
Nadu has very large potential for wind power. Several wind power companies that participated in RENERGY 2012,
a renewable energy event organised by the Tamil Nadu Energy Development Agency, have said that despite having

International Journal of Engineering, Science and Mathematics Vol.7 Issue 4, April 2018, ISSN: 2320-0294 Impact Factor: 6.765 Journal Homepage: http://www.ijesm.co.in, Email: [email protected] Double-Blind Peer Reviewed Refereed Open Access International Journal - Included in the International Serial Directories Indexed & Listed at: Ulrich's Periodicals Directory ©, U.S.A., Open J-Gage as well as in Cabell’s Directories of Publishing Opportunities, U.S.A
160 International Journal of Engineering, Science and Mathematics
http://www.ijesm.co.in, Email: [email protected]
6,300 MW of wind power capacity – about 40 per cent of the total installed capacity in the country – Tamil Nadu
has a lot of good sites to offer. [4][5].
2. Methodology
The methodology for the proposed area is explained comprehensively for best site selection for Wind Turbine. The
entire methodology is summarized pictorially in Fig. 1
Tables and Figures
are presented center, as shown below and
cited in the manuscript.
3. Study Area
Melur is a town and a municipality in the Madurai East in the Indian state of Tamil Nadu (Fig. 2). The name Melur
name comes from "Mela Nadu". Melur is called Thaikramam ('Mother of Villages')[6]. Melur Taluk is bounded by
Siaganga Taluk towards South, Kottampatti Taluk towards North, Singampunari Taluk towards North, and
Tiruppuvanam Taluk towards South. Thirupuvanam City, Sivaganga City, Natham City, Madurai City are the
nearby Cities to Melur. It is the biggest taluk within the Madurai District. Melur is one of the largest populations of
Madurai district (Fig. 3). The chief occupation of this area people is Agriculture. It is located 31 Km towards East
from District headquarters Madurai. It is a Taluk head quarter. Geographic location of Melur Taluk (Table 1)[7].

International Journal of Engineering, Science and Mathematics Vol.7 Issue 4, April 2018, ISSN: 2320-0294 Impact Factor: 6.765 Journal Homepage: http://www.ijesm.co.in, Email: [email protected] Double-Blind Peer Reviewed Refereed Open Access International Journal - Included in the International Serial Directories Indexed & Listed at: Ulrich's Periodicals Directory ©, U.S.A., Open J-Gage as well as in Cabell’s Directories of Publishing Opportunities, U.S.A
161 International Journal of Engineering, Science and Mathematics
http://www.ijesm.co.in, Email: [email protected]
4. Softwares Used
The remote sensing and GIS software used in this
study were ArcGIS (a product by ESRI) & Erdas
Imagine (a product by Hexagon Geospatial Pvt.
Ltd. Earlier by Intergraph).
ArcGIS is a Licensed based GIS tool for working
with maps, it also includes creating, compiling,
analyzing, sharing and many more with the
data[8].
Erdas Imagine is a Remote sensing application with main focus on geospatial raster processing that allows the user
to prepare, display and enhance the digital images for mapping. Its an image processing software [9].
5. Data Collection & Preparation
According to the workflows for the criteria, the datasets were obtained from different organizations such as
International Renewable Energy Agency (IRENA) for Average windspeed, Survey of India for topological sheets
(Sheet no. 58K_2, 58G_6, 58G_9 & 58G_13) & US Geological Survey for Satellite Imagery and Elevation
information.
The Average windspeed at 1Km resolution was collected from Global Atlas for Renewable energy of IRENA. The
Global Atlas for Renewable energy was sponsored by a 3 TIER organization. Slope map has been prepared by using
Digital Elevation Model of NASA Shuttle Radar Topographic Mission at free of cost from USGS Explorer Website
(Fig. 3)[10].
The proposed methodology of study involved various activities such as base map preparation, LULC map
preparation, digitization and image processing using software and interpretation of the outputs.
First stage includes development of spatial data base with a definite scale and with help of satellite data.
GIS and remote sensing technology is applied to prepare various thematic maps. Land use and terrain data
use to eliminate geographical areas not suitable for wind developments. Multiple databases with land use
and elevation data are evaluate for resolution, format, quality, and ease of use.
The second stage involved preparation of digital elevation model (DEM) by interpolating contour map.
DEM is use to prepare slope, aspect, flow accumulation and stream order.
The third stage is the representation of environmental objectives as Boolean sets for vector layers and fuzzy
sets for raster layers. At the end of the Multi-criteria Decision-making process, an overall index for wind
energy potential will calculate by raster multiplication.

International Journal of Engineering, Science and Mathematics Vol.7 Issue 4, April 2018, ISSN: 2320-0294 Impact Factor: 6.765 Journal Homepage: http://www.ijesm.co.in, Email: [email protected] Double-Blind Peer Reviewed Refereed Open Access International Journal - Included in the International Serial Directories Indexed & Listed at: Ulrich's Periodicals Directory ©, U.S.A., Open J-Gage as well as in Cabell’s Directories of Publishing Opportunities, U.S.A
162 International Journal of Engineering, Science and Mathematics
http://www.ijesm.co.in, Email: [email protected]
Fig. 3:From upper left: Landuse map; Color composition for Image processing; Slope map (in degree);
Wind speed data (in m/s) of study area.
6. Identification of Criteria
Provide a statement that what is expected, as stated in the "Introduction" chapter can ultimately result in "Results
and Discussion" chapter, so there is compatibility. Moreover, it can also be added the prospect of the development
of research results and application prospects of further studies into the next (based on result and discussion).
The developed criteria for the study area consisted of constraint factors including; Average Wind velocity,
Terrain slope, Settlements, Transmission line access, Road access, hydrography and environmental science
[11].
So, these parameters were used for identifying suitable sites for wind farms in Melur Taluk. The constraint
factors and their corresponding criteria were highlighted as being a Physical, Social and Economical. Areas
containing settlements were excluded because of environmental concerns such as noise that might disturb
of humans.
7. Boolean Logic
Other excluded areas are Streams, Lakes, and Rivers. In the case of single-objective, a decision set contains
two subsets: suitable (for allocation), and not suitable (for allocation). For that, the vector layers were geo-
processed by Boolean operators (AND, OR, NOR), in order to perform such functions as, Buffer,
intersection, union and clip within the ArcGIS software environment (Fig. 4).
Buffer zones were created and the distance scores (assigned ‗1‘ for suitable and ‗0‘ not suitable) then added
in the attribute table, thereby creating layers for each of the constraint criteria. Then, the buffer layers were
integrated by OR operator or UNION tool of QGIS software environment.
The product of the Boolean operations was used to convert the resultant layer into a binary raster format
of 0 (excluded) and 1 (not excluded). The constraints for siting a wind farm, the accuracy in finding the

International Journal of Engineering, Science and Mathematics Vol.7 Issue 4, April 2018, ISSN: 2320-0294 Impact Factor: 6.765 Journal Homepage: http://www.ijesm.co.in, Email: [email protected] Double-Blind Peer Reviewed Refereed Open Access International Journal - Included in the International Serial Directories Indexed & Listed at: Ulrich's Periodicals Directory ©, U.S.A., Open J-Gage as well as in Cabell’s Directories of Publishing Opportunities, U.S.A
163 International Journal of Engineering, Science and Mathematics
http://www.ijesm.co.in, Email: [email protected]
most and the least suitable locations is dependent on how the information from all the constraint layers is
combined to produce a single index of evaluation.
This can be realized by assuming that all the layers are of different importance and therefore carry the same
weight or Overall Average Weighting procedure. This is achieved by multiplying the attribute scores, by
map layer weights, on a cell by cell basis.
In ArcGIS, this is attained using the RECLASS and RASTER CALCULATOR function of the RASTER
module. In order for the resultant map to be meaningful and consistent, map
Weights had to add up to 100% and the attribute scores had to be chosen using a scheme that was the same
for each map.
Results

International Journal of Engineering, Science and Mathematics Vol.7 Issue 4, April 2018, ISSN: 2320-0294 Impact Factor: 6.765 Journal Homepage: http://www.ijesm.co.in, Email: [email protected] Double-Blind Peer Reviewed Refereed Open Access International Journal - Included in the International Serial Directories Indexed & Listed at: Ulrich's Periodicals Directory ©, U.S.A., Open J-Gage as well as in Cabell’s Directories of Publishing Opportunities, U.S.A
164 International Journal of Engineering, Science and Mathematics
http://www.ijesm.co.in, Email: [email protected]
The five criteria that are used in the study are the inputs to the Multi Criteria Decision Making in the open
source GIS Software environment, which computes the suitability index (Fig. 5) shows the calculation
results of the land suitability index at 80 m above the ground. The classification is done only for the ―highly
suitable‖ region as shown in the figure. The most suitable areas are occupying 15.79 percent of total studied
area.
Suitability area- 107.472 km2 (Table. 3.)
Fig. 5 Suitability Index map (Resultant) of Study Area
International Journal of Engineering, Science and Mathematics Vol.7 Issue 4, April 2018, ISSN: 2320-0294 Impact Factor: 6.765 Journal Homepage: http://www.ijesm.co.in, Email: [email protected] Double-Blind Peer Reviewed Refereed Open Access International Journal - Included in the International Serial Directories Indexed & Listed at: Ulrich's Periodicals Directory ©, U.S.A., Open J-Gage as well as in Cabell’s Directories of Publishing Opportunities, U.S.A
165 International Journal of Engineering, Science and Mathematics
http://www.ijesm.co.in, Email: [email protected]
Conclusion
The study established to determine the efficiency of geographic analysis tools in ArcGIS to identify the
suitable sites for wind farm development in Melur Taluk, Tamil Nadu, India. The paper adopts the concept
of weighted overlay to Multi Criteria Decision Making process.
In this study, the suitability index map will be technical support to the investors of wind farm development.
This study indicates that 15.79% of the study area is identified as most suitable for wind farm
establishments.
8. References
[1] Wind Energy Development Programmatic EIS, ―Wind Energy Guide‖ (An online Public `
Information and Involvement Resource) [Online], Available
http://windeis.anl.gov/guide/basics/index.cfm
[Accessed 15-Dec.-2014].
[2] Energy Information Administration, International Energy Annual 1999, DOE/EIA-0219(99) (Washington,
DC, January 2001.)
[3] Yeh, Tsu M., L. Huang, Factors in determining wind farm location: integrating GQM, fuzzy, DEMATEL
and ANP (2014), Renewable Energy, 66, 159-169.
[4] Blachowski, J., A. Nowacka and M. Szurek. GIS-Based method for Wind Farm location Multi Criteria
Analysis, Wroclaw. International Journal of Mining Science, 21, 65-81.
[5] Tamil Nadu still a big draw for wind power developers. Chennai (2012, March 13). Retrieved from
http://www.thehindubusinessline.com/economy/tamil-nadu-still-a-big-draw-for-wind-power-
developers/article2991751.ece
[6] Melur, Wikipedia the free encyclopaedia, last edited (2017, November 03).
[7] Census Info 2011 Final Population totals Office of The Registrar General and Census Commissioner,
Ministry of Home Affairs, Government of India. 2013. Retrieved 26 January 2014.
[8] Environmental Systems Research Institute (ESRI) home page [online], Available
https://www.arcgis.com
[9] Erdas Imagine offered by Hexagon Geospatial product‘s page [online],
https://www.hexagongeospatial.com/products/power-portfolio/erdas-imagine
[10] Iyappan, L., P. Kasinatha Pandian (2015). Developing a Geospatial approach to locate Wind Farms in
Pollachi Taluk, Tamil Nadu, India. International Journal of Technical Research and Applications, 12, 30-
34.
[11] Yasin, S., H. Tim, H. Siddique, ―A GIS-based Decision Support System for the optimal siting of wind
Farm projects – 2009, volume 7, Issue 2, 11-14.
[12] C. Wind Resource Assessment Unit, ―Geographical Information System for Identifying Wind Potential
Sites,‖ 2006.
RIVER WATER QUALITY ANALYSIS AND WASTEWATER
UTILIZATION TECHNIQUES FOR UTTARAKHAND - A REVIEW
Anshul Kestwal*
Latika Sharma*
Mukesh Chandra Kestwal**
Ravi Kumar Patel**
Surajit Mondal**
International Journal of Engineering, Science and Mathematics Vol.7 Issue 4, April 2018, ISSN: 2320-0294 Impact Factor: 6.765 Journal Homepage: http://www.ijesm.co.in, Email: [email protected] Double-Blind Peer Reviewed Refereed Open Access International Journal - Included in the International Serial Directories Indexed & Listed at: Ulrich's Periodicals Directory ©, U.S.A., Open J-Gage as well as in Cabell’s Directories of Publishing Opportunities, U.S.A
166 International Journal of Engineering, Science and Mathematics
http://www.ijesm.co.in, Email: [email protected]
Abstract
A sanitation or sewerage system can be defined as the water treatment unit
applied before dumping the waste water in water bodies. The need of
sanitation system is not only for water treatment before final dumping but
also to keep the urban areas neat and hygienic, waste water has to be
transported out of urban areas because waste water containing organic waste
may act as an invitation to epidemics due to presence of harmful pathogens.
Moreover,the results of Water Quality Index (WQI) also reflect the excellent
water quality with ‗A-Grade‘ of all river water samples obtained after RBF
process in comparison to normal river water samples having good water
quality with ‗BGrade‘ except the Srinagar site, where the river water sample
was found to be unsuitable for drinking purpose with ‗E-Grade‘
Keywords:
Sanitation;
Water Quality;
Grey Water;
Waste Water; Copyright © 2018 International Journals of Multidisciplinary
Research Academy. All rights reserved.
Author correspondence:
Surajit Mondal
Research Scientist
Department of Research and Development
University of Petroleum & Energy Studies, Bidholi, Dehradun, Uttrakhand (248007)
1. Introduction (10pt)
Importance of water is very well defined for human survival, river water is an important source of
surface water which is being used directly for irrigation and domestic purposes (washing, bathing,
cleaning etc.) since a very long time ago. After being completely used for human purposes, waste water
(both organic and inorganic) from all the areas of use is collected and the liquid based waste products
(i.e., human excrete, industrial waste, domestic waste) are unceremoniously dumped into the surface
water bodies.
For at first it did not seem like much of a problem, as the ratio of volume of waste being disposed
to the volume of water bodies was quite low, but as the human population has grown drastically over a
period of time, so has the need for proper sanitation systems and waste disposal systems in this
urbanization process.
A sanitation or sewerage system can be defined as the water treatment unit applied before
dumping the waste water in water bodies.
The need of sanitation system is not only for water treatment before final dumping but also to
keep the urban areas neat and hygienic, waste water has to be transported out of urban areas because
waste water containing organic waste may act as an invitation to epidemics due to presence of harmful
pathogens. By the early 19th century sewerage system became an important part of the urban areas. At
first it was a major belief that the waste water containing human excrete is fit only for disposal sand that
the natural environment was itself capable of consuming the waste but as the population increased natural
methods were of no use.
Also, water contamination is a major issue in India as practically 70 for every penny of its surface
water assets and a developing level of its groundwater saves are defiled by natural, lethal, natural, and

International Journal of Engineering, Science and Mathematics Vol.7 Issue 4, April 2018, ISSN: 2320-0294 Impact Factor: 6.765 Journal Homepage: http://www.ijesm.co.in, Email: [email protected] Double-Blind Peer Reviewed Refereed Open Access International Journal - Included in the International Serial Directories Indexed & Listed at: Ulrich's Periodicals Directory ©, U.S.A., Open J-Gage as well as in Cabell’s Directories of Publishing Opportunities, U.S.A
167 International Journal of Engineering, Science and Mathematics
http://www.ijesm.co.in, Email: [email protected]
inorganic toxins. By and large, these sources have been rendered perilous for human utilization and
additionally for different exercises, for example, water system and modern needs. This demonstrates that
corrupted water quality can add to water shortage as it restricts its accessibility for both human utilize and
for the biological community. Family borne effluents contribute a generous extent of water contamination
in India. Untreated effluents from families dirty surface and groundwater sources. Neighborhood
governments (city organizations, districts, furthermore, panchayats) have the duty of water supply and
sanitation and should treat the effluents according to national water contamination models or insignificant
national norms (MINAS) However, about 70 for each penny of the effluents are not treated and arranged
off into the natural media untreated. Table 19.1 gives the synopsis insights of wastewater age what's
more, treatment in India in 2008. Given below is a table demonstrates that urban areas, which have a
populace of more than one lakh (Class-I), treat just around 32 for every penny of the wastewater
produced. Note that out of the aggregate effluent treatment limit of 11554 MLD in the nation, around 70
per penny (8040 MLD) has been made in 35 metropolitan urban communities. Metropolitan urban
communities treat around 52 for every penny of their wastewater. Delhi and Mumbai represent about 69
for every penny of the treatment limit of metropolitan urban areas. This shows that littler towns and urban
communities have almost no wastewater treatment limit. Then, just 3.15 for each penny of the provincial
populace approaches to sanitation administrations and 115 million homes have no access to toilets of any
sort. As per CPCB report 2008 following percentage of water is being ejected and following is being
treated. The numerical values are given below in table1:
Table 1: Classification of Class 1 and Class 2 cities as per CPCB 2008
Category Number of Cities Total Water
Supply (MLD)
Wastewater
Generation
(MLD)
Treatment
Capacity (MLD)
Class 1 city 498 44796.05 35,558.12 11,553.68(32%)
Class 2 city 410 3324.83 2,696.7 233.7(8%)
Total 908 48,093.88 38,254 11787.38(31%)
2. Wastewater: Treatment and Applications
A water treatment unit uses various chemical reactions and mechanical separation methods to
remove harmful components present in waste water such that it harms the ecosystem in least amount
possible when disposed into natures.
2.1 Wastewater treatment systems
2.1.1 Bio-refineries wastewater treatment
Ther are a very few processes for waste-water treatment. In any case, natural treatment forms
alone are not adequate to meet fixing ecological directions (Pant and Adholeya, 2007). A legitimate
decision of tertiary treatment can additionally lessen shading and leftover COD.
However, another approach is to utilize green growth. The upside of wastewater treatment
utilizing green growth is that one can diminish the natural and inorganic burdens, increment disintegrated
oxygen levels, alleviate CO2 contamination and create profitable biomass by successive utilization of
heterotrophic and autotrophic algal species and the produced biomass can be an amazing wellspring of
'natural' manures. As reported in examines on eutrophication, green growth are known to flourish under

International Journal of Engineering, Science and Mathematics Vol.7 Issue 4, April 2018, ISSN: 2320-0294 Impact Factor: 6.765 Journal Homepage: http://www.ijesm.co.in, Email: [email protected] Double-Blind Peer Reviewed Refereed Open Access International Journal - Included in the International Serial Directories Indexed & Listed at: Ulrich's Periodicals Directory ©, U.S.A., Open J-Gage as well as in Cabell’s Directories of Publishing Opportunities, U.S.A
168 International Journal of Engineering, Science and Mathematics
http://www.ijesm.co.in, Email: [email protected]
high centralizations of inorganic nitrates and phosphates that are generally dangerous to different life
forms. This specific part of green growth can help remediate exceptionally contaminated wastewaters.
2.1.2 Municipal wastewater treatment using constructed wetlands
Developed wetlands (CWs) are a practical treatment elective for city wastewater, and various
investigations on their execution in civil water treatment have been led. A decent outline built wetland
ought to have the capacity to keep up the wetland water power, to be specific the pressure driven stacking
rates (HLR) and the water powered maintenance time (HRT), as it influences the treatment execution of a
wetland (Kadlec and Wallace, 2009). Indian involvement with built wetland frameworks is generally on a
trial scale, treating various types of wastewater. One of the real imperatives to handle scale built wetland
frameworks in creating nations like India is the prerequisite of a moderately substantial land zone that
isn't promptly accessible. Subsurface (even/vertical) stream frameworks, by and large connected with
around a 100 times littler size range and 3 times littler HRTs (by and large 2.9 days) than the surface
stream frameworks (with around 9.3 days HRT, Kadlec, 2009), are along these lines being thought to be
the more appropriate alternatives for the creating nations. Shorter HRTs by and large convert into littler
land prerequisite. Bunch stream frameworks, with diminished detainment time, have been accounted for
to be related with bring down treatment region and higher toxin expulsion effectiveness (Kaur et al.,
2012a, b). Accordingly, cluster encouraged vertical sub-surface stream wetlands appear to have a
suggestion for better adequacy under Indian conditions.
2.2 Wastewater application methods
Homestead laborers and their families honing wrinkle or surge squander water system methods
are at the most elevated hazard. Splash/sprinkler water system prompts the most astounding potential
store of the salts, pathogens and different toxins on the yield surfaces and influences adjacent groups.
Dribble water system is the most secure water system strategy however experiences stopping up of the
producers, contingent upon the wastewater add up to suspended strong focuses. Utilization of fitting
channels, for example, rock, screen and plate channels in blend with trickle frameworks has been seen to
hugely diminish the obstructing and coliform rate (Tripathi et al., 2011).
2.2.1 Post harvest interventions
Post-reap intercessions are a critical segment for wellbeing hazard diminishment of wastewater-
flooded products and are of specific significance to address conceivable on-cultivate pre-defilement, and
furthermore pollution that may happen after the harvests leave the ranch. The wellbeing dangers could be
particularly brought down with appropriation of a portion of the minimal effort practices, for example,
rehashed washings, presentation of the deliver to daylight and raising the harvests on beds, expelling the
two outmost leaves of cabbage and furthermore, cutting over some range from ground level.
2.3 Grey Water: Source and Concepts
Waste water from urban areas can be classified into three main categories as: yellow water, grey
water & brown water.
Yellow water consists mainly of urine from toilets, yellow water is considered as nutrient rich
fluid (yellow water has high levels of nitrogen and phosphorus i.e., about 80% and 50% respectively of
total nitrogen and phosphorus content in municipal wastewater which are afterward extracted for further
use). Brown water mainly consist of feces, urine, solid and semisolid waste from toilets which are

International Journal of Engineering, Science and Mathematics Vol.7 Issue 4, April 2018, ISSN: 2320-0294 Impact Factor: 6.765 Journal Homepage: http://www.ijesm.co.in, Email: [email protected] Double-Blind Peer Reviewed Refereed Open Access International Journal - Included in the International Serial Directories Indexed & Listed at: Ulrich's Periodicals Directory ©, U.S.A., Open J-Gage as well as in Cabell’s Directories of Publishing Opportunities, U.S.A
169 International Journal of Engineering, Science and Mathematics
http://www.ijesm.co.in, Email: [email protected]
obviously of organic nature. Grey water which is least contaminated with pathogens consisting of waste
water after bathing, dish washing, laundry etc., with a very low content of organic matter grey water
mainly contains components of soap, detergents etc. which wash away along with water.
Grey waste water can be recycled and reused for purposes like irrigation, toilet flushing, car
washing etc. (for purposes that does not include direct contact or intake by humans) after various
biological, chemical and mechanical treatment therefore it has to be kept separate from brown and yellow
water to delete the risk of contamination. During last decades number of technologies called ―ecological
sanitation ―techniques have been developed in order to make use of waste water and to control the
wastage of clean water by reusing waste water after treatment , this has shown visible reduction in usage
of fresh water supplied into urban areas .The goal is ―sustainable sanitation ―which refers to sanitation
system that protect and promote human health , do not degrade the environment, is technically and
institutionally appropriate , economically viable and most importantly socially acceptable (vacuumed
toilets were introduced to completely stop use of water for flushing purpose but became socially
unacceptable because people thought they were not hygienic enough also some complained that they
made unpleasant voice while flushing and also they were expensive to be implemented over large area).
2.4 Grey Water: Treatment Techniques and Applications
The objective of grey water treatment and reuse varies as the area changes , some require to
reduce the fresh water consumption and hence need to reuse grey water , some objectives are based on
environmental concerns while some objectives are primarily based on hygiene, therefore various pilot
project have been introduced and are being introduced based on priority of the particular area (e.g., the
main drivers of grey water separation in Netherlands were reduction of water use & reduction of sewer
overflow whereas in Sweden main objectives were nutrient recycling and reduction of emissions
therefore they used urine separation systems). The problem with developing a required sanitation or
sewerage and treatment system is that a number of factors have to be kept in mind such as if the project is
practically applicable or not, economical factors, geographical factors etc. which makes the process quite
complicated. One of the pilot projects introduced the idea of a ―grey water dam‖ to store the grey water
and further use it for electricity production.
Some methods of treatment of grey water are listed below-
1. Aerobic pre-treatment technique (suitable for waste water from bathrooms and laundry i.e., waste
water not containing organic components.
2. Anaerobic treatment followed by aerobic pre- treatment (suitable for waste water from kitchens i.e.,
waste water containing organic waste)
3. Physical treatment (old treatment technique coarse filtration or membrane often coupled with
disinfectant)
3. Acceptable Water Quality Standards and River Water Quality Analysis
3.1 Drinking Water
Uttarakhand rivers Gola, Kosi, Ramganga, Saryu and Lohavati rivers flows mainly in the region
of Kumaon district, were analyzed. They are the main source of water for drinking and irrigation purposes
the following data was obtained pre and post monsoon by the report in 2012 water was found to be unfit
for drinking. Various hydro chemical feces also with reference to water quality index it was found
unsuitable for drinking purposes. Moreover, when we look at irrigation purposes water system water
nature of all the waterway water was discovered appropriate in both the seasons as indicated by the
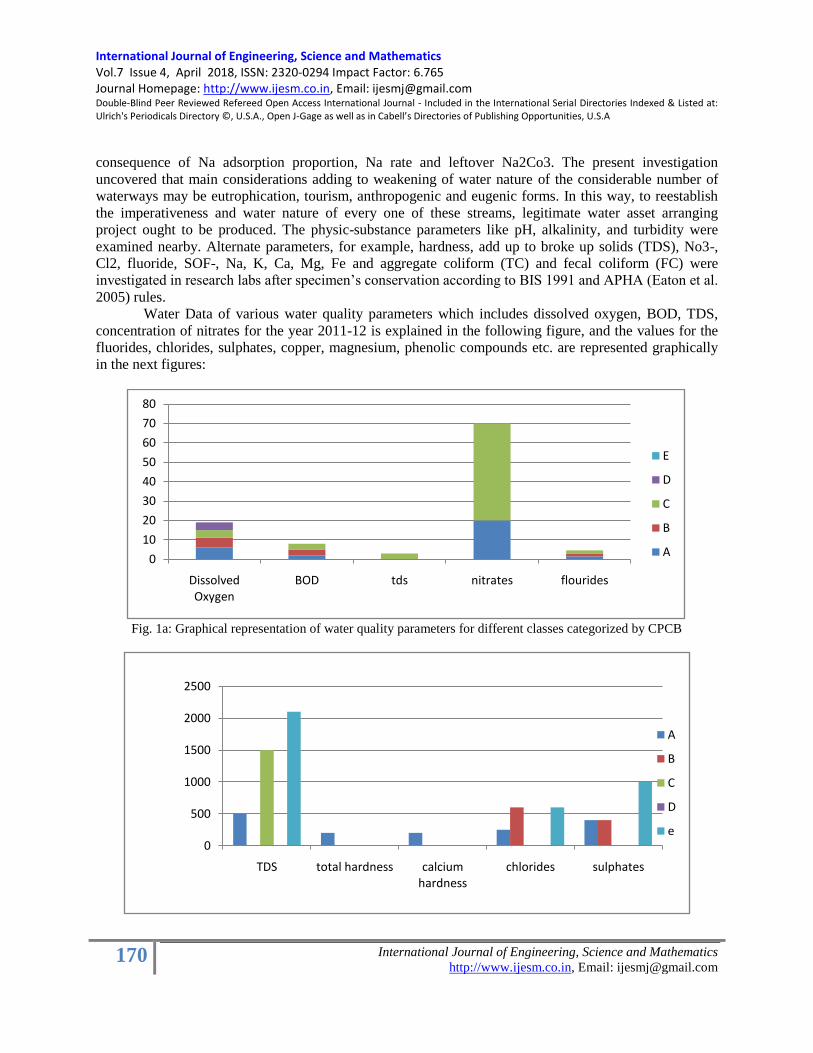
International Journal of Engineering, Science and Mathematics Vol.7 Issue 4, April 2018, ISSN: 2320-0294 Impact Factor: 6.765 Journal Homepage: http://www.ijesm.co.in, Email: [email protected] Double-Blind Peer Reviewed Refereed Open Access International Journal - Included in the International Serial Directories Indexed & Listed at: Ulrich's Periodicals Directory ©, U.S.A., Open J-Gage as well as in Cabell’s Directories of Publishing Opportunities, U.S.A
170 International Journal of Engineering, Science and Mathematics
http://www.ijesm.co.in, Email: [email protected]
consequence of Na adsorption proportion, Na rate and leftover Na2Co3. The present investigation
uncovered that main considerations adding to weakening of water nature of the considerable number of
waterways may be eutrophication, tourism, anthropogenic and eugenic forms. In this way, to reestablish
the imperativeness and water nature of every one of these streams, legitimate water asset arranging
project ought to be produced. The physic-substance parameters like pH, alkalinity, and turbidity were
examined nearby. Alternate parameters, for example, hardness, add up to broke up solids (TDS), No3-,
Cl2, fluoride, SOF-, Na, K, Ca, Mg, Fe and aggregate coliform (TC) and fecal coliform (FC) were
investigated in research labs after specimen‘s conservation according to BIS 1991 and APHA (Eaton et al.
2005) rules.
Water Data of various water quality parameters which includes dissolved oxygen, BOD, TDS,
concentration of nitrates for the year 2011-12 is explained in the following figure, and the values for the
fluorides, chlorides, sulphates, copper, magnesium, phenolic compounds etc. are represented graphically
in the next figures:
Fig. 1a: Graphical representation of water quality parameters for different classes categorized by CPCB
0
10
20
30
40
50
60
70
80
Dissolved Oxygen
BOD tds nitrates flourides
E
D
C
B
A
0
500
1000
1500
2000
2500
TDS total hardness calcium hardness
chlorides sulphates
A
B
C
D
e
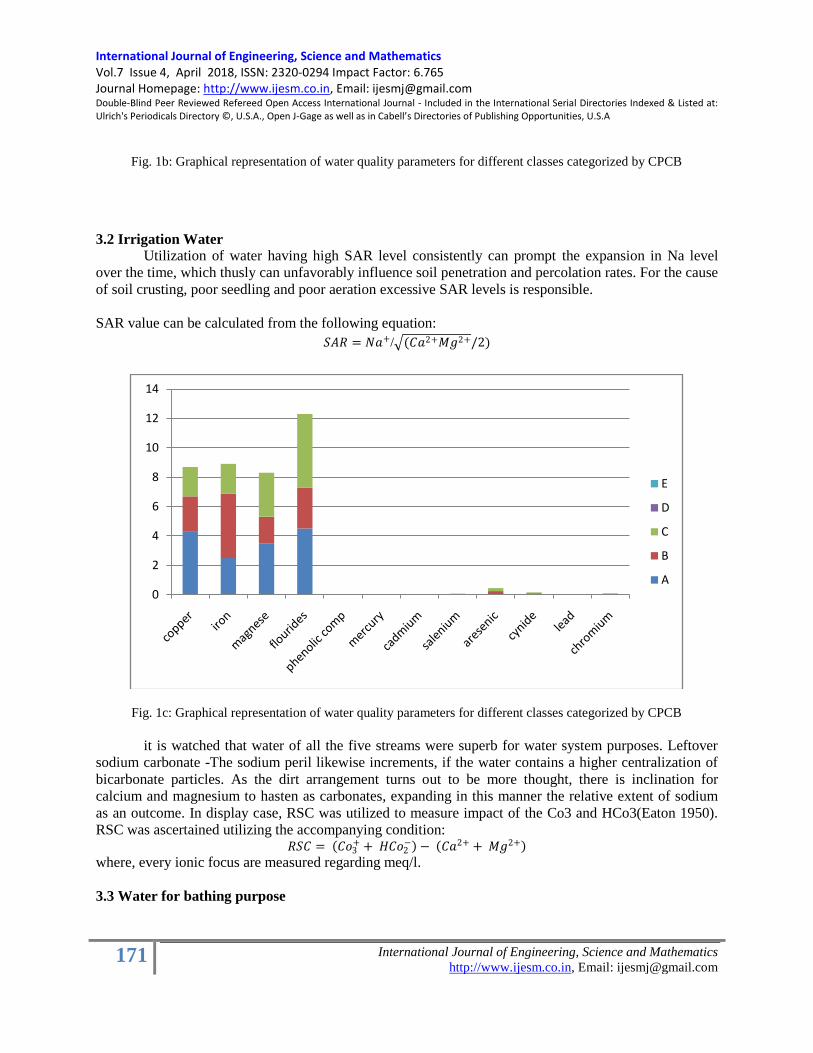
International Journal of Engineering, Science and Mathematics Vol.7 Issue 4, April 2018, ISSN: 2320-0294 Impact Factor: 6.765 Journal Homepage: http://www.ijesm.co.in, Email: [email protected] Double-Blind Peer Reviewed Refereed Open Access International Journal - Included in the International Serial Directories Indexed & Listed at: Ulrich's Periodicals Directory ©, U.S.A., Open J-Gage as well as in Cabell’s Directories of Publishing Opportunities, U.S.A
171 International Journal of Engineering, Science and Mathematics
http://www.ijesm.co.in, Email: [email protected]
Fig. 1b: Graphical representation of water quality parameters for different classes categorized by CPCB
3.2 Irrigation Water
Utilization of water having high SAR level consistently can prompt the expansion in Na level
over the time, which thusly can unfavorably influence soil penetration and percolation rates. For the cause
of soil crusting, poor seedling and poor aeration excessive SAR levels is responsible.
SAR value can be calculated from the following equation:
𝑆𝐴𝑅 = 𝑁𝑎+/ (𝐶𝑎2+𝑀𝑔2+/2)
Fig. 1c: Graphical representation of water quality parameters for different classes categorized by CPCB
it is watched that water of all the five streams were superb for water system purposes. Leftover
sodium carbonate -The sodium peril likewise increments, if the water contains a higher centralization of
bicarbonate particles. As the dirt arrangement turns out to be more thought, there is inclination for
calcium and magnesium to hasten as carbonates, expanding in this manner the relative extent of sodium
as an outcome. In display case, RSC was utilized to measure impact of the Co3 and HCo3(Eaton 1950).
RSC was ascertained utilizing the accompanying condition: 𝑅𝑆𝐶 = 𝐶𝑜3
+ + 𝐻𝐶𝑜2− − 𝐶𝑎2+ + 𝑀𝑔2+
where, every ionic focus are measured regarding meq/l.
3.3 Water for bathing purpose
0
2
4
6
8
10
12
14
E
D
C
B
A
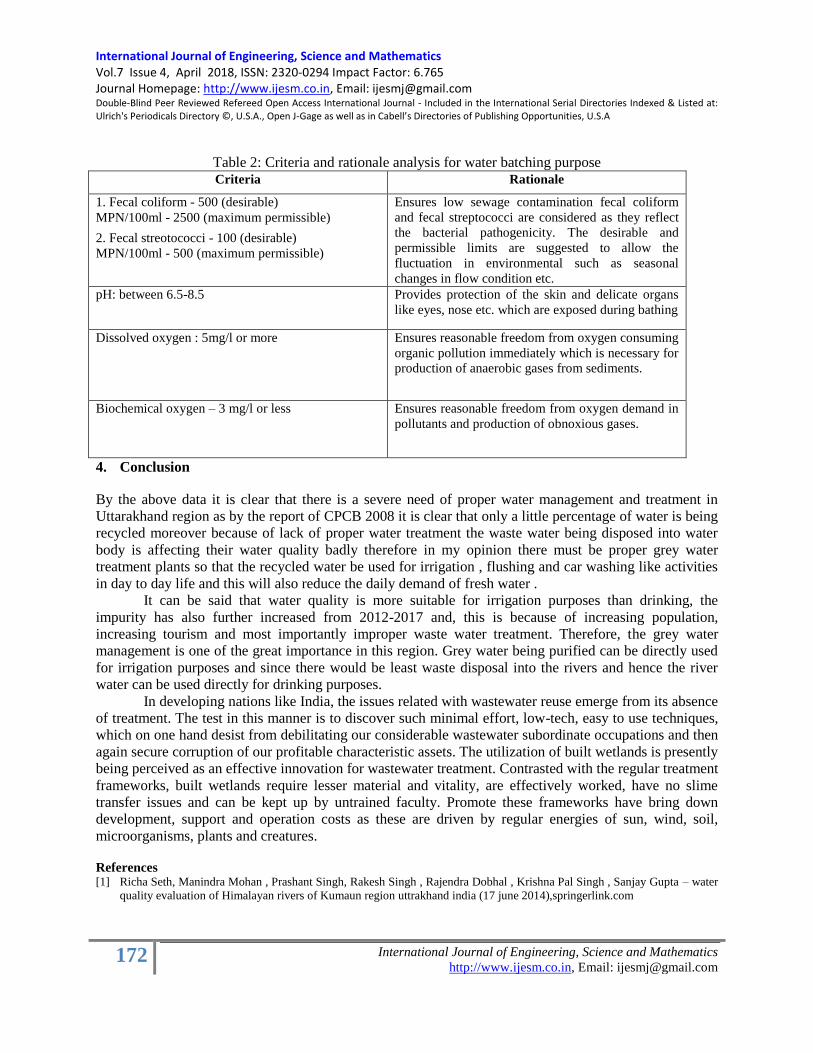
International Journal of Engineering, Science and Mathematics Vol.7 Issue 4, April 2018, ISSN: 2320-0294 Impact Factor: 6.765 Journal Homepage: http://www.ijesm.co.in, Email: [email protected] Double-Blind Peer Reviewed Refereed Open Access International Journal - Included in the International Serial Directories Indexed & Listed at: Ulrich's Periodicals Directory ©, U.S.A., Open J-Gage as well as in Cabell’s Directories of Publishing Opportunities, U.S.A
172 International Journal of Engineering, Science and Mathematics
http://www.ijesm.co.in, Email: [email protected]
Table 2: Criteria and rationale analysis for water batching purpose Criteria Rationale
1. Fecal coliform - 500 (desirable)
MPN/100ml - 2500 (maximum permissible)
2. Fecal streotococci - 100 (desirable)
MPN/100ml - 500 (maximum permissible)
Ensures low sewage contamination fecal coliform
and fecal streptococci are considered as they reflect
the bacterial pathogenicity. The desirable and
permissible limits are suggested to allow the
fluctuation in environmental such as seasonal
changes in flow condition etc.
pH: between 6.5-8.5 Provides protection of the skin and delicate organs
like eyes, nose etc. which are exposed during bathing
Dissolved oxygen : 5mg/l or more Ensures reasonable freedom from oxygen consuming
organic pollution immediately which is necessary for
production of anaerobic gases from sediments.
Biochemical oxygen – 3 mg/l or less Ensures reasonable freedom from oxygen demand in
pollutants and production of obnoxious gases.
4. Conclusion
By the above data it is clear that there is a severe need of proper water management and treatment in
Uttarakhand region as by the report of CPCB 2008 it is clear that only a little percentage of water is being
recycled moreover because of lack of proper water treatment the waste water being disposed into water
body is affecting their water quality badly therefore in my opinion there must be proper grey water
treatment plants so that the recycled water be used for irrigation , flushing and car washing like activities
in day to day life and this will also reduce the daily demand of fresh water .
It can be said that water quality is more suitable for irrigation purposes than drinking, the
impurity has also further increased from 2012-2017 and, this is because of increasing population,
increasing tourism and most importantly improper waste water treatment. Therefore, the grey water
management is one of the great importance in this region. Grey water being purified can be directly used
for irrigation purposes and since there would be least waste disposal into the rivers and hence the river
water can be used directly for drinking purposes.
In developing nations like India, the issues related with wastewater reuse emerge from its absence
of treatment. The test in this manner is to discover such minimal effort, low-tech, easy to use techniques,
which on one hand desist from debilitating our considerable wastewater subordinate occupations and then
again secure corruption of our profitable characteristic assets. The utilization of built wetlands is presently
being perceived as an effective innovation for wastewater treatment. Contrasted with the regular treatment
frameworks, built wetlands require lesser material and vitality, are effectively worked, have no slime
transfer issues and can be kept up by untrained faculty. Promote these frameworks have bring down
development, support and operation costs as these are driven by regular energies of sun, wind, soil,
microorganisms, plants and creatures.
References [1] Richa Seth, Manindra Mohan , Prashant Singh, Rakesh Singh , Rajendra Dobhal , Krishna Pal Singh , Sanjay Gupta – water
quality evaluation of Himalayan rivers of Kumaun region uttrakhand india (17 june 2014),springerlink.com

International Journal of Engineering, Science and Mathematics Vol.7 Issue 4, April 2018, ISSN: 2320-0294 Impact Factor: 6.765 Journal Homepage: http://www.ijesm.co.in, Email: [email protected] Double-Blind Peer Reviewed Refereed Open Access International Journal - Included in the International Serial Directories Indexed & Listed at: Ulrich's Periodicals Directory ©, U.S.A., Open J-Gage as well as in Cabell’s Directories of Publishing Opportunities, U.S.A
173 International Journal of Engineering, Science and Mathematics
http://www.ijesm.co.in, Email: [email protected]
[2] Strauss M, Blumenthal U. 1990. Human Waste Use in agriculture and Aquaculture: Utilization Practice and Health
Perspectives. IRCWD Report 09/90. International Reference Centre for Waste Disposal, Duebendorf, Germany.
[3] Thawale P R, Juwarkar A A, Singh S K. 2006. Resource conservation through land treatment of municipal wastewater. Current Science 90: 704-11.
[4] Tripathi VK, Rajput TBS, Patel N,. Lata Rao AR, Chandrasekharan H. 2011. Dynamics of microorganisms under micro-
irrigation system with municipal wastewater. pp. 95.In: International Symposium on Water for Agriculture, 17-19 January 2011, Nagpur, India.
[5] Trivedy RK, Nakate SS. 2001. Treatment of hospital waste and sewage in hyacinth ponds. pp. 132–163. In: Trivedy, R.K., Kaul, S. (Eds.). Low Cost Wastewater Treatment Technologies. ABD, Jaipur, India.
[6] Van-Rooijen DJ, Turral H, Biggs TW. 2008. Urban and Industrial Water Use in the Krishna Basin‘, Irrigation and Drainage,
DOI: 10.1002/ird.439.
STRUCTURED RISK REVIEW TECHNIQUES IN HSE IMPACT
ASSESSMENT, AND THEIR DESIGN IMPACT
Velmurugan Renganathan
Dr. Nihal Anwar Siddiqui
Dr. Kanchan Deoli Bahukhandi
Keywords:
Health Safety and Environmental Impact Assessment; HSEIA; Structured Risk Review Techniques; HSE Studies;
Risk Reduction Measures; RRM; Front End Engineering Design; FEED.
Abstract
Establishing respective management systems are important aspect to address Health Safety and Environmental
(HSE) issues of the major expansion and/or modification works undertaken by Companies in their hydrocarbon
processing facilities. Aim of this study is to understand the benefits and limitations of applying the Structured Risk
Review Techniques as part of HSE Impact Assessment (HSEIA) in early design phase, interpreting how it enhances
the design integrity in subsequent phases, and consequently to decide the way forward for next phase HSEIA
process. To achieve this, a Case Study approach has been adopted in expansion of an Offshore Oil & Gas processing
facility. A detailed review of identifying HSE risks using proven techniques, and associated HSE Studies have been
performed; All preventive & mitigative measures derived as an outcome were incorporated in Front End Engineering
Design (FEED) phase. Obviously, introduction of Risk Reduction Measures was achieved which in turn reduced the
probability of occurrence & limit the extent and duration of hazardous events, further mitigated the undesired
effects. Preventive measures such as inherently safer design in early stage of the project and asset integrity
management as part of Loss Prevention principles were also been emphasized.
Copyright©2018 The Authors & International Journal of Engineering, Science and Mathematics
(IJESM).Allrightsreserved.
Authorcorrespondence:

International Journal of Engineering, Science and Mathematics Vol.7 Issue 4, April 2018, ISSN: 2320-0294 Impact Factor: 6.765 Journal Homepage: http://www.ijesm.co.in, Email: [email protected] Double-Blind Peer Reviewed Refereed Open Access International Journal - Included in the International Serial Directories Indexed & Listed at: Ulrich's Periodicals Directory ©, U.S.A., Open J-Gage as well as in Cabell’s Directories of Publishing Opportunities, U.S.A
174 International Journal of Engineering, Science and Mathematics
http://www.ijesm.co.in, Email: [email protected]
Velmurugan Renganathan,
PO Box # 4032, Khalidiya, Abu Dhabi, United Arab Emirates.
1 Introduction Establishing respective management systems [15] are important aspect to address Health Safety and
Environmental (HSE) issues of the major expansion and/or modification works undertaken by Companies in their hydrocarbon processing facilities. HSE Impact Assessment [10], [12], [14] using structured review techniques & applicable HSE Studies [6] across all stages of project life cycle to identify the hazards, and the assessment of associated risks will help us to introduce Risk Reduction Measures (RRM).
Student of M. Tech (HSE) 2016-18 Batch, University of Petroleum and Energy Studies, Dehradun, Uttarakhand,
India.
** Professor & Head of Department, Department of Health, Safety and Environment, University of Petroleum and
Energy Studies, Dehradun, Uttarakhand, India.
*** Assistant Professor, Department of Health, Safety and Environment, University of Petroleum and Energy Studies,
Dehradun, Uttarakhand, India. Risk Reduction Measures should include those items/aspects to reduce the probability of occurrence [1]
& restrictiing the time of hazardous events, and mitigating its effects. Preventive measures such as inherently safer design in earlier stage of the project and asset integrity management [17] as a part of Loss Prevention [3], [4] activities shall also be emphasized.
1.1 Case Selection An Oilfield COMPANY situated in Abu Dhabi (United Arab Emirates) Offshore is Exploring,
Developing & Producing Crude Oil. To achieve additional production by developing a new Oil field and increasing output from existing oil fields, COMPANY (otherwise called as ‗Facility Operator‘ herein) is proceeding with installation of new Crude Oil Heater. Additionally, to cater the future electrical power demand resulting from the field expansion, COMPANY is installing the fuel gas supply system in their existing facilities which includes:
Fuel Gas Holder for Gas Turbine Generator
Fuel Gas Compressors The above-mentioned facilities as part of COMPANY‘s expansion are chosen as a Case Study. These
facilities are subjected to HSE Impact Assessment by using structured risk review techniques & other HSE Studies, and discussions held on how the study recommendations were implemented in FEED.
COMPANY has outsourced the Engineering Contractor to carry out the Design, and arranged Project Management Consultant (PMC) to oversee the project. Approved Third party consultant and COMPANY‘s in-house team are deployed to carry out the HSE Impact Assessment (HSEIA) and other HSE Studies.
1.2 Objectives of the Study
Aim of this study is to understand the benefits and limitations of applying the structured risk review techniques in early design phase based on the impact assessment carried out, interpreting how it enhances the design integrity in subsequent phases, and consequently to decide the way forward for next stage HSEIA process. Hence, the following sequential approach is adopted for the Case Study:
1. Carrying out HSE Impact using appropriately selected Structured Risk Review and associated
HSE Studies
2. Analyzing and implementing the preventive & mitigative measures identified as an outcome of
HSEIA into FEED
3. Discussing the benefits and limitations of applying the Structured Risk Review Techniques
4. Deciding the way forward for the subsequent phase HSEIA process i.e., for Detailed
Engineering, and Operations.
2 Methodology

International Journal of Engineering, Science and Mathematics Vol.7 Issue 4, April 2018, ISSN: 2320-0294 Impact Factor: 6.765 Journal Homepage: http://www.ijesm.co.in, Email: [email protected] Double-Blind Peer Reviewed Refereed Open Access International Journal - Included in the International Serial Directories Indexed & Listed at: Ulrich's Periodicals Directory ©, U.S.A., Open J-Gage as well as in Cabell’s Directories of Publishing Opportunities, U.S.A
175 International Journal of Engineering, Science and Mathematics
http://www.ijesm.co.in, Email: [email protected]
For the chosen scope of this Case Study, it is significant to identify hazards [1], [2] in early stages, so that adequate time shall be given to analyze & evaluate the risks to determine the counter measures for managing them in FEED. Selection of structured review techniques is the key for achieving it. Identification of Major Accident Hazards is vital in early stage for concluding cost-effective Risk Reduction Measure (RRM). HAZID/ENVID/OHID (Occupational Safety Hazards Identification/ Environmental Aspects & Impacts Idenfication/ Occupational Health Risks Idenfication), and Hazard and Operability (HAZOP) Study (to find out process related hazards) are believed to be useful to achieve this objective.
At FEED stage, risk evaluation techniques such as QRA [5], [7], [9], [13], Bow-Tie (combination of FTA & ETA), FERA [8], [11], etc. are scheduled. With interpretation of International Standards and Code of Practices, the outcome of risk identification & review techniques, other HSE Studies are dealt as HSE Impact Assessment (HSEIA) in this context.
The outcome/ recommendations from the HSE Impact Assessment are implemented in FEED Phase of the project facilities. Site Visits are carried out to interact with Operations Team to validate the critical data/ inputs (pertinent to the existing facilities) used for FEED and to ensure that interpretation of those by Project Team are right.
The evaluation techniques [1], [2] are anticipated to provide outcomes which are themselves possesing uncertainities, and subject to the review of experienced design professionals consequently.
Face to face interaction sessions (study workshops, review & progress meetings, etc.), Desktop Reviews are administered with the multi-disciplinary team members (from COMPANY including Corporate HSE Team/ Technical Safety Team, Project Management Consultant, Engineering Contractor, Third Party HSEIA Consultant), Operations Team as they are perceived to be more skilled and experienced in applying these techniques.
Software applications such as PHA Pro 8.5 (for preliminary/ process hazards identification), Bow Tie XP, PHAST/ PHAST Risk 6.7 (QRA & FERA), ExSILentia (SIL) etc., are used for carrying out the relevant studies.
2.1 HSE Impact Assessment & its outcome
HSE & Loss Prevention Philosophy establishes the HSE/ Loss prevention [3], [4]requirements for the project scope and defines the HSE activities comprising of various risk review techniques [1], [2]to help reduce the risks associated with the project.
2.1.1 Overview of HSEIA Process
HSE Impact Assessment [10], [12], [13], [14]ensured that all hazards identified are assessed through HSEIA process (Environmental Impact Assessment, Ocuupation Health Risk Assessment, Control of Major Aaccident Hazards, HSE Management System review, etc.) and risk reduction measures are specified and HSE Critical Equipment and Systems (HSECES) are identified.
The following hazard assessments studies are carried out for the project scope aiming to identify the main hazards and to evaluate the associated risk levels are acceptable when compared with set risk acceptance criteria. COMPANY standards and Regulatory body‘s COPs & study methodologies are used to identify all hazards.
o Preliminary Hazard Identification using HAZID/ENVID/OHID Studies [1], [2]:Hazard Identification
studies are performed qualitatively utilizing Management criteria to identify all Health, Safety and
Environmental hazards and threats related to the project scope.
o Process Hazard Identification using HAZOP [1], [2]:Hazard and Operability Study is performed to identify
in a systematic manner all hazards and operability issues of the design and operation of the expansion
facilities.
o The following Major Accident Hazards (MAHs) are identified based on HAZID workshop:
MAH-01 Hydrocarbon liquid under pressure (oil heater)
MAH-02 Hydrocarbon Gas under pressure (Fuel gas system)

International Journal of Engineering, Science and Mathematics Vol.7 Issue 4, April 2018, ISSN: 2320-0294 Impact Factor: 6.765 Journal Homepage: http://www.ijesm.co.in, Email: [email protected] Double-Blind Peer Reviewed Refereed Open Access International Journal - Included in the International Serial Directories Indexed & Listed at: Ulrich's Periodicals Directory ©, U.S.A., Open J-Gage as well as in Cabell’s Directories of Publishing Opportunities, U.S.A
176 International Journal of Engineering, Science and Mathematics
http://www.ijesm.co.in, Email: [email protected]
However, no additional Major Accident Hazards are identified through HAZOP process.
o Quantitative Risk Assessment (QRA) [5], [7], [9], [13]:QRA study is carried out quantitatively to assess and
establish incremental risk levels for the proposed facilities in terms of Location Specific Individual Risk
(LSIR), Individual Risk Per Annum (IRPA) and Societal Risk.
o Fire and Explosion Risk Assessment (FERA) [8], [11]: Outcome of the consequence analysis are used to
perform FERA, which defined the Active Fire Protection, Passive Fire Protection, Fire Zone and
Overpressure requirements.
o Escape Evacuation and Rescue Assessment (EERA): Based on the consequence assessment results, the
requirements for personnel to escape are evaluated in case of an emergency.
o Design Review is conducted to evaluate the integrity of design of the systems from the possibility of
delivery of performance with respect to capacity, quality, operability issues, maintainability issues,
facilities for emergency shutdowns, and HSE.
o Safety Integrity Level (SIL) Assessment [6] is performed based on IEC 61508 & IEC 61511 guidelines,
and identified the required SIL rating of Safety Instrument Functions based on layers of protection
available.
2.1.2 Outcome of HSEIA
The outcome of HSE Impact Assessment [10], [12], [13], [14]is briefed hereunder:
All HSE hazards/impacts/aspects are systematically identified, inclusive of relevant risk / impact
classification (e.g. High, Medium and Low) in accordance with regulatory requirements/practices
that are agreed upon prior to the studies.
It is demonstrated that all Major Accident Hazards have been identified and relevant control,
mitigation and recovery measures are incorporated into the FEED design.
It is demonstrated that significant environmental impacts have been identified, analysed and
assessed [14]. The impacts are justified as ‗de-minimus‘. Suitable inputs are taken forward to be
implemented in design.
It is demonstrated that Occupational Health Risks have been identified and the aspects pertinent to
the scope are found to be ‗de-minimus‟ [14].
The identified Medium and Low Risk Hazards/ Impacts/ Aspects are managed and controlled via
the HSE Management System [15] and associated Procedures/ Work Instructions.
Implementation plan developed that shows how the control, mitigation and recovery measures for
Significant Environmental Impacts, Major Accident Hazards and High Occupational Health Risks
will be implemented and managed throughout the remaining lifecycle of the expansion facilities
(Detailed Engineering/ Construction/ Comissioning, Operations).
Update of Emergency Preparedness and Response Plan [15] in Construction Phase with respect to
the identified Major Accident Hazards.
The HSEIA outcome provides guidance in the selection of equipment and design of the facilities to achieve
its objectives. Recognizing that all accidental losses are preventable, the adopted philosophy focussed on
avoiding damage to the human, environment, asset, and security. Following are the main hazards accounted
in the FEED:
Presence of sour gas in the installation
High pressure hydrocarbon releases
High pressure toxic gas releases
Jet and pool fires
Explosion
FEED design adopts the following methods of risk reduction to ensure basic HSE requirements are inherent
[3], [4] in the design of the facilities, which included:
Minimizing hazardous inventories
Minimizing equipment, flanges and fittings

International Journal of Engineering, Science and Mathematics Vol.7 Issue 4, April 2018, ISSN: 2320-0294 Impact Factor: 6.765 Journal Homepage: http://www.ijesm.co.in, Email: [email protected] Double-Blind Peer Reviewed Refereed Open Access International Journal - Included in the International Serial Directories Indexed & Listed at: Ulrich's Periodicals Directory ©, U.S.A., Open J-Gage as well as in Cabell’s Directories of Publishing Opportunities, U.S.A
177 International Journal of Engineering, Science and Mathematics
http://www.ijesm.co.in, Email: [email protected]
Segregating hazardous and non-hazardous areas
Optimization of plan layout
Keeping the design and intended operating activities simple
Using well proven technology and techniques
Minimizing intervention requirements Project Health, Safety & Environmental Review (PHSER) is performed to provide assurance to the
COMPANY that HSE hazards have been identified, assessed and appropriate controls have been or will be implemented to reduce the identified HSE risks to a level that is acceptable or ‗As Low As Reasonably Practicable‘ (ALARP) in design.
2.2 Implementation of Study outcome in FEED
Based on the outcomes of different HSE studies, the recommendations are incorporated in FEED stage deliverables/drawings and selected actions implemented are outlined as below:
Evaluation of mitigation measures on Loss of Containment scenarios: QRA assessed the toxic & sweet fuel
gas releases on loss of containment from Oil Heater & Fuel Gas supply systems. All necessary
recommendations relevant to mitigate the toxic and hydrocarbon gas release are implemented in the design
stage. QRA recommendations are closed appropriatelyin HSE Action tracking register.
Compliance to project design specifications on Hydrogen Sulphide (H2S) requirements: It is ensured that
the design practice complies with the COMPANY‘s Management of H2S procedure [15], in line with local
regulating body requirements [14]. Based on the H2S concentration in process stream indicated in the
Piping & Instrumentation Diagrams (P&IDs) and Heat & Mass Balance (HMB), fixed toxic gas detectors
are provided in H2S prone areas (Fire & Gas (F&G) detector layout drawing).
ESD (Emergency Shutdown) based isolation is provided for the heater to limit the inventory in LOC (Loss
of Containment) case.
Compressor discharge piping is provided with personal protection.
F&G detectors are updated in 2D orientation layouts. F&G Philosophy accounts early alarms to personnel
in process areas and buildings to facilitate safe escape, muster & evacuation. F&G Detector Layout, Cause
and Effect Chart are developed.
Fire Zoning concept [3], [4] is adopted for new Oil heater, Fuel Gas Supply System and referred in the Fire
Zone Layouts. FERA assessment reconfirmed the requirement of the new Fire Zone and accordingly the
facility is designed.
Fire Water Demand Calculation and Adequacy Study Report is confirmed that the existing Fire water
system is adequate to cater the firewater requirement of the expansion facility.
Passive fire protection layouts are updated with the outcome/requirement of the FERA assessment.
ESDVs (Emergency Shutdown Valves) are located outside the Fire Zone impact distance of 12.5 kW/m2
thermal radiation effect zone as possible. However, BDVs (Blow Down Vavlves) & ESDVs, which are not
possible to keep outside the Fire Zone impact distance and hence provided with suitable Passive Fire
Protection.
Fire Hydrant and Monitor Location layout is developed with sufficient inter distance to operate the
firefighting equipment in case of fire.
For Fuel Gas Supply System, Primary Fire Protection for compressor area is achieved by Deluge water
spray protection for all the three compressors simultaneously.
Requirement of Hydrocarbon gas detection at existing gas turbines enclosures ventilation air intake are
included in the design.
H2S Toxic gas & Hydrocarbon gas detectors are considered in process buildings‘ HVAC air intake with
sufficient voting logics, accordingly automatic shutdown is considered.
All relevant outcomes and logics are incorporated in the F&G layouts for buildings, and F&G Cause &
Effect charts.

International Journal of Engineering, Science and Mathematics Vol.7 Issue 4, April 2018, ISSN: 2320-0294 Impact Factor: 6.765 Journal Homepage: http://www.ijesm.co.in, Email: [email protected] Double-Blind Peer Reviewed Refereed Open Access International Journal - Included in the International Serial Directories Indexed & Listed at: Ulrich's Periodicals Directory ©, U.S.A., Open J-Gage as well as in Cabell’s Directories of Publishing Opportunities, U.S.A
178 International Journal of Engineering, Science and Mathematics
http://www.ijesm.co.in, Email: [email protected]
3 Results and Discussion Identification of Major Accident Hazards is vital in early stage for concluding cost-effective Risk
Reduction Measure (RRM). HAZID and HAZOP [1], [2] are deemed useful to achieve this objective. The evaluation techniques [1], [2] are anticipated to provide outcomes which are themselves possesing
uncertainities, and subject to the review of experienced design professionals consequently. QRA [5], [7], [9], [13] shall be performed when adequate valid data available in order to get good
results. In early stages of project lifecycle, there will be uncertainities in input data (and hence in model also), in general. In the subsequent phases of design, these uncertainintes need be validated to conclude the firm design. Otherwise, the feasibility of adapting alternative techniques to be optioned for validating the outcomes.
3.1 Benefits of structured review techniques
The following key benefits are obtained in view of applying the structured risk identification & review techniques:
Systematic process of identifying HSE impacts, and establishing prevention & mitigation measures.
Identification of critical risk controls and an assessment of their effectiveness.
Graphical depiction of the risks by means of contours which gives easy understanding and interpretation.
Closing the loops between outcome of Risk Assessments carried out in FEED Phase and the existing
Management Systems.
Balanced risk overview for the Facility Operator‘s system between internal & external stakeholders.
Simple and straightforward methodology and demands only minimal trainings for involved multi-
disciplinary team members.
Increased awareness and understanding of the safety risk existing within organization.
Flexibility to adopt this methodology across wide range of industries and at any phase of project lifecycle.
3.2 Enhancement of Design Integrity through structured review techniques
The following are the learning outcomes of the subject Study pertinent to the enhancement of Design Integrity through structured risk reviews:
It is obvious from this Study that the structured risk review techniques are most suitable for the projects
following the standard lifecycle process, however all the projects are not necessarily required to undergo all
the risk reviews / HSE studies especially the projects with minimal HSE impact, i.e. ‗de-minimis‘ projects
supported with justification.
Providing clarity on careful selection of structured review techniques & associated HSE studies (such as
SIL, etc.) for next phases of project lifecycle (Detailed Engineering, Operations, etc.).
Integrating the incremental risk from the expansion facilities with the existing facility‘s risks [16] while
moving into Operations Phase will give clear picture to Facility Operator for further proceedings. For
example, Integrated QRA study will help in proper future land use planning (to locate the accommodations,
fabrication shops, warehouses, etc.).
The results of QRA & FERA study results will facilitate COMPANY to site the process buildings within
the existing facilities [16] in such a way those are protected from potential vapor cloud explosion (with the
rated overpressure and phase duration) hazards from current expansion facilities.
Construction & Commissioning nodes of HAZID/ENVID/OHID workshops (conducted in early stages)
provide primary inputs for framing tendering requirements for subsequent phase of the project.
Outcomes from HSE Studies/ Reviews & associated activities emphasize Facility Operator to focus more
on ‗HSE in procurement‘ during EPC (Engineering, Procurement & Construction) Phase. A review of all
items (especially HSE critical equipment to be procured during EPC Phase) must comply with HSE
requirements with respect to fabrication, certification, installation and operation.
During EPC Phase, performance standards shall be developed for identified HSECES to ensure continued
integrity of the HSECESs through appropriate task related to design, construction, commissioning, pre-
commissioning etc.

International Journal of Engineering, Science and Mathematics Vol.7 Issue 4, April 2018, ISSN: 2320-0294 Impact Factor: 6.765 Journal Homepage: http://www.ijesm.co.in, Email: [email protected] Double-Blind Peer Reviewed Refereed Open Access International Journal - Included in the International Serial Directories Indexed & Listed at: Ulrich's Periodicals Directory ©, U.S.A., Open J-Gage as well as in Cabell’s Directories of Publishing Opportunities, U.S.A
179 International Journal of Engineering, Science and Mathematics
http://www.ijesm.co.in, Email: [email protected]
The importance of documenting the potential risk escalation scenarios to avoid ‗design sleepers‘ as part of
deviation management. This is mainly to support ALARP demonstration, and helps project team to manage
the risks especially during Commissioning phase.
This Case Study emphasizes the significance of selection of competent team members, and their various
roles, experience and good engineering judgement for FEED and detailed engineering phases, in specific.
Importance of allowing sufficient time for closing out the actions before the subsequent phase of the
project, and proper cascading of the items related to subsequent phases of the project are of paramount
importance to enhance the integrity of the facility.
3.3 The Way Forward – Subsequent phases of HSEIA process
Apart from above discussions, this Study gives us the ‘the way forward‘ for the subsequent phases of HSEIAs (particularly for Detailed Engineering & Operations) as follows:
When moving into subsequent phase, HAZID/ENVID/OHID screening shall be conducted as a review. If
no major hazards/ impacts and aspects are introduced, detailed studies like COMAH, EIA, OHRA may not
be required.
This Case Study accentuating on importance of updating the FEED HSEIA [10], [12], [13], [14] report
during Detailed Engineering especially when engineered facilities are undergoing "substantive changes"
such as:
o Changes to the types or quantities of hazardous materials.
o Process changes, particularly changes in HSE Critical Equipment & Systems (HSECES).
o Changes to the nature of hazards and threats that could initiate a major accident.
o Changes that would result in additions to or subtractions from the list of identified major accident
scenarios.
To avoid duplication of application of the risk review techniques and impact assessment across various
phases, and to improve the implementation of its outcome in workable manner, the following options shall
be taken into consideration with involvement of Facility Operator‘s Technical Safety Team members:
o One time full-fledged EIA can be decided based on the ENVID Screening carried out earlier
stages of the project. The same approach may have to be extended to OHRA with careful
consideration. If no major changes are anticipated in the impacts and aspects of subsequent phases,
then a comprehensive Occupational Exposure Monitoring & Health Surveillance Plan, and
Environmental Management & Monitoring Plan would suffice to manage the risk to ALARP (‗As
Low As Reasonably Practicable‘).
o To ensure effectiveness of HSECES during Operations phase, the Bow-Ties shall have to detail
the tag level information, whereas the Performance Standards generated for the mentioned phase
shall detail Testing, Inspection and Maintenance task required during Operations, and hence those
are grouped by Type/ Make.
If the expansions/ modifications are similar type of earlier installations, then re-evaluation of installations‘
original design may be adequate enough to determine the Risk Reduction Measures (RRM).
In the case of usage of complex risk reviews, the uncertain data have to be subjected to validation for
deciding the Risk Reducion Measures (RRM).
Though the Hazard Identification and Risk Asessment (HIRA) related activities depends on scale of the
expansions and/ or modifications the COMPANY is undergoing, the design phase (FEED, Detailed
Engineering) of the project shall have to review the Risk Reduction Measures (RRM) in accordance with
the significace of identified (new) issues.
The conclusions, recommendations, close-outs of various studies/ reviews and activities adapted during
design phases (FEED, Detailed Engineering) shall have to be reviewed, verified and approved by
Independent Competent Person for assuring the effectiveness of the controls implemented.

International Journal of Engineering, Science and Mathematics Vol.7 Issue 4, April 2018, ISSN: 2320-0294 Impact Factor: 6.765 Journal Homepage: http://www.ijesm.co.in, Email: [email protected] Double-Blind Peer Reviewed Refereed Open Access International Journal - Included in the International Serial Directories Indexed & Listed at: Ulrich's Periodicals Directory ©, U.S.A., Open J-Gage as well as in Cabell’s Directories of Publishing Opportunities, U.S.A
180 International Journal of Engineering, Science and Mathematics
http://www.ijesm.co.in, Email: [email protected]
A comprehensive Tracking register comprising of all study outcomes/ recommendations (including the
actions carrying forward for next phases) shall be maintained, close-outs to be done with the evidence of
supporting documents.
The need for written ‗Fitness Statement‘ shall have to be established as a commitment from the Project
Management that all hazards, impact and aspects have been identified, assessed and mitigated through the
adopted structured risk review techniques and other safety studies without any significant pending items.
4 Conclusions This Case Study constitutes a detailed structured risk review framework [1], [2], [14], [15] that
contributed in identifying/assessing all HSE risks associated with the hydrocarbon process facilities falling under the chosen scope. Preventive & Mitigative measures [3], [4] identified as an outcome of various hazard identification & review methodologies are implemented in the FEED phase of the project. The recommendations are definitive, affirmative with clear directions for the FEED stage project to progress. A dedicated Project Health Safety Environmental Review (PHSER)has been conducted and found that all the recommendations have been adequately closed with supporting evidences. The Deliverables & Documents impacted due to the outcome of the reviews during the FEED stage of the projects are also discussed in brief denoting how the study recommendations are absorbed into the design of the facility with suitable samples. It is of great significance to note that suitable and sufficient risk reduction measures [3], [4] are mostly achieved during the FEED phase of project lifecycle.
From this study, the benefits and limitations of applying the Structured Risk Review Techniques [1], [2] in early design, interpretions on how the review techniques enhance the design integrity [17] in subsequent phases, and the approach for consequent phase HSEIA process [10], [12], [13], [14], [15] are attained as valuable outcomes.
References
[1] Paolo Pittiglio, Paolo Bragatto, CorradoDelle Site., ―Updated failure rates and risk management in process
industries‖, Elsevier, Volume 1, 2013
[2] ISO 17776:2002 International Standard, ―Petroleum and natural gas industries - Offshore production
installations – Guidelines on tools and techniques for hazard identification and risk assessment‖, Annex-B
Structured review techniques, pp. 20-30
[3] Mannan, Sam, ed. Lees' ―Loss prevention in the process industries‖, Hazard identification, assessment and
control. Butterworth-Heinemann, 2004.
[4] F.P. Lees, ―Loss prevention in the process industries‖, 2nd edn., Institution of Chemical Engineers
[5] Institute of Petroleum (IP) Research Report, Ignition Probability Review, Model Development and Look-Up
Correlations, Energy Institute, January 2006.
[6] International Electrotechnical Commission (IEC):
IEC 61508 ―Functional Safety of Electrical/Electronic/Programmable Electronic Safety-related
Systems‖
IEC 61511 ―Functional safety - Safety instrumented systems for the process industry sector‖
[7] ―A Guide to Quantitative Risk assessment for offshore installations‖, CMPT 1999
[8] Fire& Blast Information Group (FABIG), Technical Note 8 – ―Protection of Piping Systems Subject to Fires
and Explosions‖.
[9] TNOCPR 18E, ―Guideline for quantitative risk assessment‖, Purple book
[10] UK Offshore Operators Association (UKOOA), http://www.ukooa.co.uk/
[11] Research to Improve Guidance on Separation distance for the multi-energy method (RIGOS), Research Report
No. 369
[12] UK HSE, http://www.hse.gov.uk/
[13] Risk Assessment Data Directories of International Association of Oil & Gas Producers (OGP)
[14] Codes of Practices of Regulating Body - Abu Dhabi National Oil Company (ADNOC)
[15] COMPANY‘s HSE Policy, HSEMS Apex Manual, General System Procedures, Operation Control Procedures,

International Journal of Engineering, Science and Mathematics Vol.7 Issue 4, April 2018, ISSN: 2320-0294 Impact Factor: 6.765 Journal Homepage: http://www.ijesm.co.in, Email: [email protected] Double-Blind Peer Reviewed Refereed Open Access International Journal - Included in the International Serial Directories Indexed & Listed at: Ulrich's Periodicals Directory ©, U.S.A., Open J-Gage as well as in Cabell’s Directories of Publishing Opportunities, U.S.A
181 International Journal of Engineering, Science and Mathematics
http://www.ijesm.co.in, Email: [email protected]
Guidelines
[16] COMPANY‘s Operations Phase HSEIA Report for existing facilities
[17] COMPANY‘s Asset Integrity Management System (AIMS) Manual
A STUDY ON POST COMBUSTION CARBON CAPTURE (PCCC) RETROFIT OPTION FOR COAL
BASED POWER PLANTS IN INDIA
Praveen Kumar ML1a
, V. Venkata Krishnakanth1b
, Nihal Anwar Siddiqui2
1a- M. Tech student, University of Petroleum and Energy Studies, 1b- Assistant Professor, Dept. of Health, Safety
and Environment, University of Petroleum and Energy Studies,
2- Professor & Head-Dept. of Health, Safety and Environment, University of Petroleum and Energy Studies
__________________________________________________________________________
ABSTRACT: Beingthe prime source of Indian Electric Power, Coal based electrical power is giving rise to increase
ingreenhouse emissions and thus imposed with the emission control targets from international protocols and
nation/state level legislations, posing a challenge to its sustainability. In this paper, an effort made to address the

International Journal of Engineering, Science and Mathematics Vol.7 Issue 4, April 2018, ISSN: 2320-0294 Impact Factor: 6.765 Journal Homepage: http://www.ijesm.co.in, Email: [email protected] Double-Blind Peer Reviewed Refereed Open Access International Journal - Included in the International Serial Directories Indexed & Listed at: Ulrich's Periodicals Directory ©, U.S.A., Open J-Gage as well as in Cabell’s Directories of Publishing Opportunities, U.S.A
182 International Journal of Engineering, Science and Mathematics
http://www.ijesm.co.in, Email: [email protected]
issue of ‗Sustainable Thermal Power Generation‘ as per global norms developed within United Nations Framework
Convention on Climate Change etc. Best retrofit is investigatedfor hypothetical 200MW coal based thermal power
plant. Feasibility of ‗Post combustion retrofit measures‘ in Coal based power plants along with the CBM (Coal Bed
Methane), ECBMR (Enhanced Coal Bed Methane Recovery) and EOR (Enhanced Oil Recovery) options with a
viable business model are suggested for coal and oil rigging sites, if present, near power plant.
Keywords: Post combustion CDM, pollution, global warming, Coal based thermal power plant.
1.0. Introduction: It has been one of the prevailing challenges for the human kind, to sustain energy surplus
derived from various energy resources. Development of modern societies have been very rampant and harnessing of
resources like coal and other fossil fuels for power generation is disturbing the tradeoff between the actual benefits
derived from Power and the aftermath of environmental effects like pollution and global warming due to greenhouse
gas emissions.. Intergovernmental Panel on Climate Change (IPCC)[14]
under United Nations Environment Program
(UNEP) prepared ‗Special Report on Emissions Scenarios‘ (SRES) in the year 2000, regarding the futuristic climate
change of the world from 1990 to 2100. It was predicted that global warming might result in increase of energy
demand for space cooling and in decreased energy use for space heating under working group-II. It further predicts
the dare difficulties in power transmission and distribution to meet huge energy demands under adverse climatic
changes introduced by constant feeding of global warming gases mainly carbon dioxide and methane from vehicles
and Coal based thermal powers. Global warming would wipe out millions of the humans by 2050 and affect the
health of the surviving population. In contrast, India‘s coal energy generation has been raised by 11% (from 33% to
44%) between years 2000-2013 and is predicted to see 5% rise (44%-to-49%) by 2040[39] [43]
. These give a clear
indication of energy demand rise and have direct relation with carbon emissions, thus with global warming.
To cope up with this inevitable rise in carbon emissions in relation to fossil fuel usage, various international
protocols such as Kyoto Protocol, The Paris Agreement, etc., have recently been revised and accepted by various
countries across the globe. By signing the Paris Agreement, adapted with COP21 (Conference Of Parties) in October
2016, India marked the new beginning of the Environmental laws like the Environment Amendment Rules 2015 and
the taxes that would affect all in the boundaries of the country to meet the International level of reducing global
temperature by 2oC pre industrialization level (1750 AD). The same lead for series of legislative reforms with regard
to pollution control and would mean future cap on day-to-day generation schedule as a Power Generator.
1.1. The Problem:Following are the challenges faced by Indian coal based power sector:
a. From the perspective of a power producer, excessive pressure of the government to run the established
plants at higher PLF and set up new plants to reach the power target given by the government, however
by meeting extreme stringent norms of emission again enforced by the same, has put the thermal power
sector perplexed by contradiction of expectations by the government. [8] [39]
b. Another serious issue is the availability of the Scheduled Generation (SG) on daily basis from RLDC,
based on which daily generation targets are set. Due to the increased expectation of the government, many
public and private companies are setting up power plants in and around the region of the established
power plants. Imagine a case where the coal producer itself declares setting up of thermal plants! The
Power Purchase Agreement (PPA) of the established power project versus a newly set up plant are in a
jinx due to this. Deviation settlement mechanism (earlier called as Unscheduled Interchange) signed by
ISGS (Inter State Generating Stations) with CERC (Central Electricity Regulatory Commission), in an
effort to maintain grid discipline has furthered worsened the operating load of the plants. This rule
induces parity with those who have not signed the accord.[40]
c. In addition to already existing confusion, the tariff rates are also revised to the extent that they are based
on the Heat rates and as received coal. Calorific values at the coal stack yard which is boggling the
already troubled and confused economy of power sector. Availability of imported coal and Indian coal is
another issue. Duty and CESS are adding burden to the existing power costs. Allocation of coal blocks to
captive power plants and private parties are adding further problems. [29] [30]

International Journal of Engineering, Science and Mathematics Vol.7 Issue 4, April 2018, ISSN: 2320-0294 Impact Factor: 6.765 Journal Homepage: http://www.ijesm.co.in, Email: [email protected] Double-Blind Peer Reviewed Refereed Open Access International Journal - Included in the International Serial Directories Indexed & Listed at: Ulrich's Periodicals Directory ©, U.S.A., Open J-Gage as well as in Cabell’s Directories of Publishing Opportunities, U.S.A
183 International Journal of Engineering, Science and Mathematics
http://www.ijesm.co.in, Email: [email protected]
d. Renewal energy sources as alternatives with tax sops, have come to the crushing extent, the very survival
of the existing power plant has been the major issue. [41]
e. Confusion to Maximize or minimize Plant Load Factor(PLF): Increasing PLF, leads to continuous
operation of boiler set at maximum rated output, which leads to increase in carbon emissions. Reduction
of PLF leads to power scarcity. Thus, power producers have no other options than diversifying capital
investments in new ventures to meet the target. Hence, this lead the power producers are provoked to
import more amounts of coal, as Indian coal consumption has already been signed surpassed PPA. As-
received coal criteria, envisaged by the new PAT rules of government has further thronged the sector to
abyss. When coal is received in the coal yard it cannot be directly fired in to the boiler, it has to be stored
to be used up gradually. The loss in calorific value due to storage is not accounted for. This has added to
already existing problem. [42] [43]
f. Initiative by Ministry of Environment, Forest and Climate change which came up with an Environment
amendment rules 2015 aimed at protecting environment and hence enforce new limits for release of
pollutants from industries. [8]
g. With the outlay of IPCC under UNEP which stressed the requirement of increased power requirement to
meet future targets and implications of post Kyoto regime, Government of India had given by 2032, a
total outlay of 128000 MW power requirement from 56% coal ,16% gas ,11% nuclear, 17% renewal
source. [39]
All these legislations and Initiations on the renewable energy front, have threatened the very survival of the existing
thermal power plants. This raises question of survival of thermal power stations. However, the fact that we can
coexist propels us to come up with new technologies like Clean Development Mechanisms (CDM) like Post
Combustion Carbon Capture (PCCC) and reap the benefits of it. It further helps us to utilize the captured Carbon
dioxide to be used for ECBMR at Coal mining and EOR at Oilrigs. This further helps us to go for Carbon trading
and come up with a business model for the coal based thermal plant. In this paper, comparative study of various
Carbon capture technologies (Wyoming Institute, Canada) have been done and concluded with best retrofits. A
suitable business model for a coal-based plant proposed based on PCCC retrofit as an option.
2.0 Material and Methods: IPCC WG3 Technical Report 2014 was studied as the first hand reference to the
issues related to Pollution and global warming. Primary approximate data of Indian Coal specifications and
emissions were collected from various other sources and partly from authors. Case studies of different PCCC
technologies with carbon dioxide sequestration techniques were derived from various sources. Exclusive survey of
New papers like Economic Times [30]
and current affairs on CDM and CBM policies of government have been
probed with implications from Renewable energy scenario of our country. Tariff calculations have been applied to a
hypothetical 200 MW plant based on petition filing by Power companies [29] [30]
and findings available on CERC
website and studies of Reference [35]
Table 1: Fixed cost calculations
A. Fixed Cost Calculations
1.Return on Equity:
Capital cost= 200*1.0979 Cr/MW = 219.58 Cr INR
Debt/Equity = (70%/30%)

International Journal of Engineering, Science and Mathematics Vol.7 Issue 4, April 2018, ISSN: 2320-0294 Impact Factor: 6.765 Journal Homepage: http://www.ijesm.co.in, Email: [email protected] Double-Blind Peer Reviewed Refereed Open Access International Journal - Included in the International Serial Directories Indexed & Listed at: Ulrich's Periodicals Directory ©, U.S.A., Open J-Gage as well as in Cabell’s Directories of Publishing Opportunities, U.S.A
184 International Journal of Engineering, Science and Mathematics
http://www.ijesm.co.in, Email: [email protected]
Equity = 219.58 *0.30= 65.874 Cr INR
Debt = 0.7*219.58 = 153.706 Cr INR
ROE= 15.50*65.87 / 100= 10.21047 Cr INR
2. Interest on Loan: 13.5*153.706 /100 = 20.75031 Cr INR
3. Interest on Working Capital:
Working capital = 0.1*219.58 =21.958 Cr INR
Int on capital= 0.1* 21.985=2.1958Cr INR
4.Depreciation: 5.28% =0 (as fixed by commission)
5.O&M Cost: ( INR 22.581 lakh/MW) = 22.581*200 = 45.162 Cr INR
6. Total fixed cost (1+2+3+4+5) = 78.31858 Cr INR
7. Total Power Generation=200*365*24*0.85*1000/1000000 =1489.2 MU
8.Fixed Cost per Unit = 78.31858 /1489.2 = 0.052591 INR/KWhr
Table 2: Variable cost Calculations
B. Variable Cost Calculations
1.Cost of oil consumption:
= specific oil consumption*cost of oil/litre
= 0.5*43934/1000 = 0.021967 INR/KWhr
2. Heat Contribution of oil :
= GCV*Sp oil consumption
= 9078*0.5*0.001=4.5 Kcal/Kwhr
3. Heat rate of Coal
= Station HR-HR of oil
= 2396.43-4.5 =2391.93 Kcal/Kwhr
4. Specific coal consumption
=Heat combustion of Coal/GCV
=2391.93/4565 = 0.523 Kg/KWhr.
5.Cost of Special Coal consumption:
= special coal * cost of coal
=0.523971* 3025.73/1000 = 1.58539 INR/KWhr
6. Total Variable Cost:
= Cost of Sp.Oil consumption + Cost of sp.Coal consumption
= 0.021967+ 1.58539 = 1.6073 INR/KWhr
7.Variable cost/unit at bus bar
=Total Variable cost /(1-APC)

International Journal of Engineering, Science and Mathematics Vol.7 Issue 4, April 2018, ISSN: 2320-0294 Impact Factor: 6.765 Journal Homepage: http://www.ijesm.co.in, Email: [email protected] Double-Blind Peer Reviewed Refereed Open Access International Journal - Included in the International Serial Directories Indexed & Listed at: Ulrich's Periodicals Directory ©, U.S.A., Open J-Gage as well as in Cabell’s Directories of Publishing Opportunities, U.S.A
185 International Journal of Engineering, Science and Mathematics
http://www.ijesm.co.in, Email: [email protected]
=1.6073 /(1-0.0668) =1.722 INR/KWhr
C. Total Cost /Unit
Nominal Tariff = A(8) + B (7)
= 0.052591+1.722 = 1.774591 INR/KWhr
Sorbent selection studies and secondary data have been compared with studies done by Juan C. Abanades et.al
(2004) with that of Maciej Radosz et.al (2008) [12] [13]
.
3. Parameters of model sorbents [12]
:
i. Cost of sorbent/kg of CO2 removed: COS
COS =𝐹0
𝐹𝑅
×𝐹𝑅
𝐹𝐶𝑂2
× 𝑏 × 𝑀𝑆 ×𝐶𝑆
𝑀𝐶𝑂2
COScapture avoided = COS × R𝑎𝑐
Whereas: Ra/c = ratio of $/tonne avoided to $/tonne captured
F0=Make up rate of the sorbent ($/mol of CO2)
FR= Recirculation rate of sorbent.
F0/FR =Sorbent Recycle ratio ($/mol of CO2)
FCO2=Removal rate of CO2
b= cost per mole of CO2 absorbed.
MS= mass of sorbent required to absorb 1 mol of CO2 in kg/Mol
CS= Cost per kg of CO2 captured in $/kg
M CO2= Molar value of CO2
Final selection criterion is : (COS)any sorbent < (COS)MEA
ii. Yield fraction of sorbent r N or Cycling sorbent fraction SN:
SN=1- rN = 1
F0
FR+1
N
Table 3 Parameters of Model sorbents
Material COS $/ton F0/FR $/mol of CO2 N $/mol of CO2 CS $/kg FR/FCO2 $/mol of CO2
MEA 2 0.000 152 4561 1.25 3.57
CaCO3 2 0.0552 13 0.005 3
K2O 1.88 0.001 89 367 0.155 3
Na2CO3 1.88 0.002 48 280 0.105 3

International Journal of Engineering, Science and Mathematics Vol.7 Issue 4, April 2018, ISSN: 2320-0294 Impact Factor: 6.765 Journal Homepage: http://www.ijesm.co.in, Email: [email protected] Double-Blind Peer Reviewed Refereed Open Access International Journal - Included in the International Serial Directories Indexed & Listed at: Ulrich's Periodicals Directory ©, U.S.A., Open J-Gage as well as in Cabell’s Directories of Publishing Opportunities, U.S.A
186 International Journal of Engineering, Science and Mathematics
http://www.ijesm.co.in, Email: [email protected]
Li2CO3 5.588 0.000 0835 8299 4.47 3
Active carbon 4.2 0.000 75 925 0.5 1
Zeolites 1.7 0.000 375 1849 1.0 1
Hydrotalcites 1.88 0.000 020 7 33505 2.0 1
Fe2O3 1.88 0.003 32 209 0.026 3
Cobalt 1.89 0.000 010 5 66001 33.43 2
Copper 3.76 0.000 18 3858 1.812 2
Nickle 1.89 0.000 040 8 16986 8.636 2
Manganese 1.90 0.000 21 3270 0.592 2
iii. Vessel dimensions of Activated filter PCCC filters and DP across filters (Maciej Radosz et.al (2008)) [13]
a. Vessel dimension calculation: Q = ρ × A × 𝑣
𝐷 = 4 × 𝑄
3.14 × 𝑣 × ρ
Q = flue gas flow Kmol/s
A= Area of the vessel head on the flow m2
D= Diameter of the vessel m
ѵ = flue gas superficial velocity m/s
b. Differential Pressure across filter:
∆𝑝 × ρ
ε × 𝑣 × ρ 2×
𝐷𝑝
∆𝐿×
ε3
1 − ε =
150
𝑁𝑅𝑒
+ 175
Dp = Sorbent Particle diameter
Δp =Differential Pressure across the bed in Pa
ρ = Density of flue gas in kg/m3.
ε = void fraction of bed.
ѵ = superficial velocity in m/s
ΔL= length in m.
µ =flue gas viscosity in Pa-s
where Reynolds Number NRe is 𝑁𝑅𝑒 =𝐷𝑝×ε ×𝑣×ρ
1−ε ×µ
iv. Economics: Tertiary data of Economics of PCCC, its specification parameters and effects on tariff cost
change are calculated based on application of primary and secondary data. Economics and ROI calculations
have also been partly from intuition and the studies of Maciej Radosz et.al (2008). [13]

International Journal of Engineering, Science and Mathematics Vol.7 Issue 4, April 2018, ISSN: 2320-0294 Impact Factor: 6.765 Journal Homepage: http://www.ijesm.co.in, Email: [email protected] Double-Blind Peer Reviewed Refereed Open Access International Journal - Included in the International Serial Directories Indexed & Listed at: Ulrich's Periodicals Directory ©, U.S.A., Open J-Gage as well as in Cabell’s Directories of Publishing Opportunities, U.S.A
187 International Journal of Engineering, Science and Mathematics
http://www.ijesm.co.in, Email: [email protected]
a. PCCC filter effect on Electricity cost change: Change in electricity charges% is given by
CO2 emission rate per yr × recovery × purity × (Capture cost − credits)
power plant capacity × 8760 × electricity selling price
b. Gain based on CDM:
CO2 credits earned per year = CO2 captured per year*recovery* 1 CO2 Credit in INR Sale of CO2
to ECMBR Project
at nearby Coal
Mines
Additional Profit from sale of CO2 = (CO2 captured per year*recovery) * 1 CO2 Credit in INR
If CO2 is supplied to self-funded ECBMR projects, then additional credits obtained by CH4 capture at mines per
year.
Special credits for CH4 capture = 21* CH4 captured per year*1 CO2 Credit in INR
Total gain would be sum of all 3 above:
I. Cost based on CDM: Total Cost on CO2 captured = (CO2 captured per year*recovery) * cost/ton
captured in INR.
II. Total Profit/Loss based on CDM: Total Profit or gain = (2) – (3)
III. Return on Investment: ROI= Total Gain/Investment Cost
The following inferences can be drawn-out from afore said cost estimation methodologies:
A: Well established coal based Electrical power generation company can easily abide by present
Environmental laws and regulations to sustain a business
B: CDM with Activated charcoal is the best sorbent for PCCC. AGREEMENT between studies of Juan C.
Abanades et.al (2004) and Maciej Radosz et.al (2008) [12] [13]
(COS) ANY SORBENT < COS MEA
C: Monetary aspects and impacts of PCCC on unit electricity cost is the least if B is applied
D: Business portfolio in the form of Coal bed methane and Enhanced Oil recovery methodology is viable
E: Coal based power with CDR (Carbon di oxide Reduction) can coexist with Renewable energy power
The unit electricity charge found is 1.774591INR/KWhr for hypothetical 200MW. CO2 released per year
estimated as 1.205595 Million tons for 100% loading and plant operating continuously for 1 year for 30% carbon
in Indian coal. Sorbents for PCCC may be selected based on less COS value, low F0/FR ratio and high N values
(Juan C. Abanades et.al (2004)) [12]
. 1% change in electricity charges is introduced if net difference between the
capture cost and credits is 40.4 INR /ton (C).750 tons of activated charcoal is estimated in 75 vessels with 25
vessels each in adsorption, heating and cooling modes of 2 minutes each and total cycle of 6 minutes. This
provides for 90% CO2 capture with N2 selectivity as with references from Maciej Radosz et.al (2008) [13]
Vessel
dimensions are calculated as diameter 3.702 m and length 2 m. Differential pressure of 0.01476 ksc has been
calculated as per Ergun equation (Maciej Radosz et.al (2008))[13]
.This is the additional load across Induced draft
fans if these are retrofitted. Accordingly rerating of fans can be done. IPCC WG3 Technical summary 2014, TS
3.2.2, page 69clearly demarcates this statement: ―De-carbonization is easy to achieve in energy sector
/electricity than in buildings, transport and industry sectors‖. Hence, the drive for study and the time is too short
for Power sector to act. It is surely going to have impact on India and could shake the monolithic empire of coal
based power sector.

International Journal of Engineering, Science and Mathematics Vol.7 Issue 4, April 2018, ISSN: 2320-0294 Impact Factor: 6.765 Journal Homepage: http://www.ijesm.co.in, Email: [email protected] Double-Blind Peer Reviewed Refereed Open Access International Journal - Included in the International Serial Directories Indexed & Listed at: Ulrich's Periodicals Directory ©, U.S.A., Open J-Gage as well as in Cabell’s Directories of Publishing Opportunities, U.S.A
188 International Journal of Engineering, Science and Mathematics
http://www.ijesm.co.in, Email: [email protected]
The study, thus done from the global context of pollution, greenhouse effects and its mitigating strategies has
wide implications for a country like India and its backbone of economy mainly the Power sector and Energy
sector. By 2030, the coal based Power companies would need to implement Carbon Dioxide Reduction (CDR)
methodologies to meet the global requirement of 450ppm of Equivalent Carbon dioxide concentration and 2oC
(pre-industrial limits viz.1750 AD) global surface temperature rise by 2100 AD. One such mitigating measure is
by implementing PCCC technologies like the activated charcoal PCCC as elaborated in this study.
3.2. Challenges and Solution: The limitation of this study are the issues like operational safety, integrity of
carbon dioxide storage, risks of transportation, scaling up of infrastructure, low rate of return on investment vis a
vis high carbon investment. More needs to be done in this area with further research as per IPCC WG3 Technical
Summary 2014. The implementation of this concept is the dire need of the hour and initial pilot plants in power
sector is yet to be taken up on the mass scale. Though EMA (Ethyl Amine Absorption) has proven its worth and
has acted as benchmark process (Juan C. Abanades et.al, 2004) [12]
and case studies donehere, it is still costly as
per studies done as per (Maciej Radosz et.al , 2008)[13]
(B). Hence, with thorough investigation, given Indian
context, it is envisaged that activated charcoal filter with low pressure low temperature selective capture of CO2
with N2 is a viable option given the replacement time of 10 yrs. and can act as best retrofit and satisfying the
criterion set as per B.
3.3. The Business Model:All these necessitates business model integration and coming up with a sustainable
business model (A and E). This idea is represented pictorially for better comprehension. The costs that are thus
tabulated in this study, indicate that carbon capture alone would not be useful for the Coal based power
company. This needs to be clubbed with ECBMR options with 33 captive coal blocks or EOR to earn the special
credits. Joint Venture with coal India limited and Equipment manufacturing for PCCC technologies are
necessary, given the cost of technology, which foreign companies would like to lavish upon. This could also
have a huge bearing on the ―cheap power per unit and to all ―dream of our government. Mere reduction in tax on
CDM earning from 30% to 10% [30]
would not help the cause.
Figure
1 Cash Flow Wagon
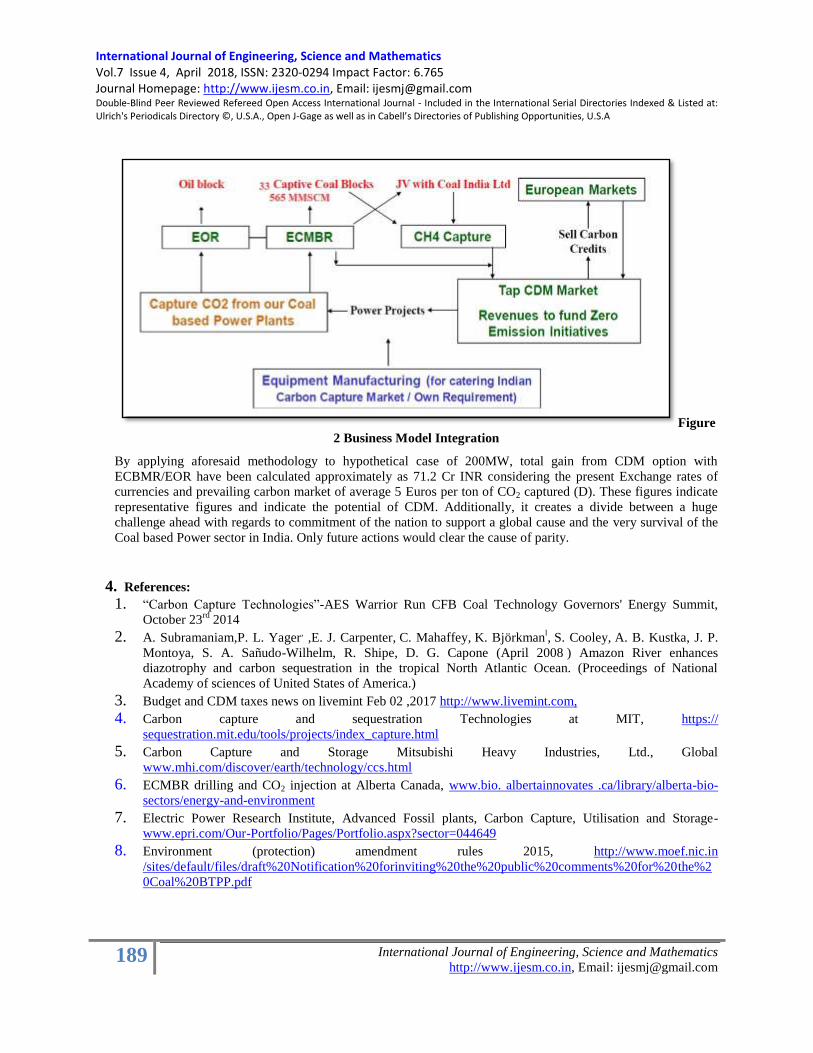
International Journal of Engineering, Science and Mathematics Vol.7 Issue 4, April 2018, ISSN: 2320-0294 Impact Factor: 6.765 Journal Homepage: http://www.ijesm.co.in, Email: [email protected] Double-Blind Peer Reviewed Refereed Open Access International Journal - Included in the International Serial Directories Indexed & Listed at: Ulrich's Periodicals Directory ©, U.S.A., Open J-Gage as well as in Cabell’s Directories of Publishing Opportunities, U.S.A
189 International Journal of Engineering, Science and Mathematics
http://www.ijesm.co.in, Email: [email protected]
Figure
2 Business Model Integration
By applying aforesaid methodology to hypothetical case of 200MW, total gain from CDM option with
ECBMR/EOR have been calculated approximately as 71.2 Cr INR considering the present Exchange rates of
currencies and prevailing carbon market of average 5 Euros per ton of CO2 captured (D). These figures indicate
representative figures and indicate the potential of CDM. Additionally, it creates a divide between a huge
challenge ahead with regards to commitment of the nation to support a global cause and the very survival of the
Coal based Power sector in India. Only future actions would clear the cause of parity.
4. References:
1. ―Carbon Capture Technologies‖-AES Warrior Run CFB Coal Technology Governors' Energy Summit,
October 23rd
2014
2. A. Subramaniam,P. L. Yager, ,E. J. Carpenter, C. Mahaffey, K. Björkman
‖, S. Cooley, A. B. Kustka, J. P.
Montoya, S. A. Sañudo-Wilhelm, R. Shipe, D. G. Capone (April 2008 ) Amazon River enhances
diazotrophy and carbon sequestration in the tropical North Atlantic Ocean. (Proceedings of National
Academy of sciences of United States of America.)
3. Budget and CDM taxes news on livemint Feb 02 ,2017 http://www.livemint.com,
4. Carbon capture and sequestration Technologies at MIT, https://
sequestration.mit.edu/tools/projects/index_capture.html
5. Carbon Capture and Storage Mitsubishi Heavy Industries, Ltd., Global
www.mhi.com/discover/earth/technology/ccs.html
6. ECMBR drilling and CO2 injection at Alberta Canada, www.bio. albertainnovates .ca/library/alberta-bio-
sectors/energy-and-environment
7. Electric Power Research Institute, Advanced Fossil plants, Carbon Capture, Utilisation and Storage-
www.epri.com/Our-Portfolio/Pages/Portfolio.aspx?sector=044649
8. Environment (protection) amendment rules 2015, http://www.moef.nic.in
/sites/default/files/draft%20Notification%20forinviting%20the%20public%20comments%20for%20the%2
0Coal%20BTPP.pdf

International Journal of Engineering, Science and Mathematics Vol.7 Issue 4, April 2018, ISSN: 2320-0294 Impact Factor: 6.765 Journal Homepage: http://www.ijesm.co.in, Email: [email protected] Double-Blind Peer Reviewed Refereed Open Access International Journal - Included in the International Serial Directories Indexed & Listed at: Ulrich's Periodicals Directory ©, U.S.A., Open J-Gage as well as in Cabell’s Directories of Publishing Opportunities, U.S.A
190 International Journal of Engineering, Science and Mathematics
http://www.ijesm.co.in, Email: [email protected]
9. Exim India newspaper 'Exim Newsletter' from Mumbai, Western India and New Delhi, and Exim India -
'Shipping Times' from Kolkata, Chennai, Cochin and Tuticorin ,dated 01.08.17
http://www.eximin.net/forexdetails.aspx
10. Geochemical aspects of CO2 sequestration in deep saline aquifers: A review
byG.P.D.De,Silva,P.G,.M.S.A.Perera(2015) (Science direct FuelVolume 155, 1 September 2015, Pages
128-143)Central Pollution Control Board Report (2001), Water quality trends of different rivers, available
at www.cpcb.nic.in, accessed during July 2012.
11. Intergovernmental Panel on Climate Change ( IPCC) WG3 Technical summary 2014,IPCC
https://www.ipcc.ch/ pdf/ assessment-report/ ar5/wg3/ ipcc_wg3 _ ar5_technical-summary.pdf
12. Juan C. Abanades, Edward S. Rubin, and Edward J. Anthony (2004) Sorbent Cost and Performance in CO2
Capture Systems. Ind. Eng. Chem. Res. 2004, 43, 3462-3466
13. Maciej Radosz, Xudong Hu, Kaspars Krutkramelis, and Youqing Shen (2008) Flue-Gas Carbon Capture on
Carbonaceous Sorbents: Toward a Low-Cost Multifunctional Carbon Filter for “Green” Energy
Producers (Soft Materials Laboratory, Department of Chemical and Petroleum Engineering, UniVersity of
Wyoming,Laramie, Wyoming 82071) Ind. Eng. Chem. Res. 2008, 47, 3783-3794
14. MartinBlunt.F, JohnFayers, Franklin M.OrrJr.(1993)Carbon dioxide in enhanced oil recovery (Science
Direct /Energy Conversion and Management Volume 34, Issues 9–11, September–November 1993, Pages
1197-1204)
15. Masaki Iijima,Takahiko Endo,Daisuke Shimada (2010) CO2 Capture Technology for Mitigating Global
Warming and Climate Change by (Mitsubishi Heavy Industries Technical Review Vol. 47 No. 1 ,Mar. 2010
)
16. PCCC at Esbjerg Power Plant in Denmark. Final Publishable Executive Summary www.co2castor.com,
www.zeroco2.no/projects/esbjerg, www.co2cesar.eu/
17. PCCC at Petra Nova ,Unit 8 W.A.Parish Plant,Houston,Texas,USA https:// www
.globalccsinstitute.com/projects/petra-nova-carbon-capture-project
18. PCCC at Unit 3 Boundary Dam Power station ,Canada http:// www. saskpower.com/our-power-future/our-
electricity/our-electrical-system/boundary-dam-power-station/
19. PCCC at Peterhead Scottish and Southern Energy PCCC ,Scotland ,UK https://www.gov.uk/guidance/uk-
carbon-capture-and-storage-government-funding-and-support
20. PCCC at Sinopec Qilu Petrochemical (Unit 5 ,Shengli Power plant ) CCS Project, China
http://www.zeroco2.no/projects/sinopec-shengli-pcc
21. PCCC at AES Warrior Run Power Station ,Maryland USA at http:// mde.
maryland.gov/programs/regulations/air/Documents/AES_Letter_to_MDE_01-15-14.pdf
22. PCCC at Petronas Fertilizer Plant,Malysia http ://www. mhi.co.jp/ technology/ review
/pdf/e471/e471037.pdf
23. PCCC at Indian Farmers Fertilizers Company: Aonla and Phulpur,India
https://www.mhi.com/news/sec1/200504261059.html
24. PCCC at Nagrjuna Chemicals and fertilizers Ltd: Kakinada ,India http:// www.
mhi.com/news/story/0804081233.html
25. PCCC at Barry Electric generating Plant ,Alabama ,USA Crown Conference Centre, Melbourne, 22 - 23
June 2010 Policy, investment and partnership for government, technology and primary industries
26. Praveen kumar M.L., Suresh.P, Naresh Raju P (2009):Spectrum professional circle presentation at
National Professional Circle Convention at PMI Noida.
27. Richard Fabera, Moritz Köpckeb, Ole Biedec,Jacob Nygaard Knudsend, Jimmy Andersene (2011) Open-
loop step responses for the MEA post-combustion capture process: Experimental results from the Esbjerg
pilot plant.(Science Direct Energy Procedia 4 (2011) 1427–1434).

International Journal of Engineering, Science and Mathematics Vol.7 Issue 4, April 2018, ISSN: 2320-0294 Impact Factor: 6.765 Journal Homepage: http://www.ijesm.co.in, Email: [email protected] Double-Blind Peer Reviewed Refereed Open Access International Journal - Included in the International Serial Directories Indexed & Listed at: Ulrich's Periodicals Directory ©, U.S.A., Open J-Gage as well as in Cabell’s Directories of Publishing Opportunities, U.S.A
191 International Journal of Engineering, Science and Mathematics
http://www.ijesm.co.in, Email: [email protected]
28. T.D.Rathnaweera.,P.G.Ranjith,M.S.A.Perera,A.Lashin.N.Al Arifi (2015) Non-linear stress–strain
behaviour of reservoir rock under brine saturation: (Science Direct measurementVolume 71, July 2015,
Pages 56-72).
29. Tariff petitions under CERC order: Petition no 268/GT/2014 dated 08.11.16 (www.cercindia.gov.in)
30. Tariff petitions under CERC order: Petition no 292/GT/2014 dated 24.01.17 (www.cercindia.gov.in)
31. ―The carbon pricing watch 2017‖ (May) An advance brief from the ―State and Trends of Carbon pricing
2017 ‖ report by World bank Group and ECOFYS ,Washington, DC: World Bank. Doi: 10.1596/978- 1-
4648-1129-6
32. The Economic Times Energy world Exclusive on Issues related to Coal ,Power,Energy and Evironment.
April 25,2017Cheng, B. and Titterington, D. M., (1994), Neural Networks: A Review from a Statistical
Perspective, Statistical Science, 9(1), pp 2-54.
33. V. N. Choudhary ,Ravi Prakash Tripathi (2010) Strategic issues and challenges for coal for power
Generation in India.4th Thermal Power India 2010 conference, Delhi
34. Verdon.J.P. (2012) Chapter 2 The Wayburn CO2 Injection Project /Microsesmic Monitoring and
Geomechanical Modelling of CO2 storage in Suburface Reservoirs . Springer publications,2012
,XVII,183p.102 illus.,77 illus in color, hardcover ISBN 978-3-642-25387-4
35. Vilas S. Motghare , R. K. Cham (2014) Generation Cost Calculation for 660 MW Thermal Power Plants
(IJISET - International Journal of Innovative Science, Engineering & Technology, Vol. 1 Issue 10,
December 2014)
36. YongSun, VinayParikh, LianZhang (2012)Sequestration of carbon dioxide by indirect mineralization using
Victorian brown coal fly ash(Science Direct 2012,Journal of Hazardous MaterialsVolumes 209–210, 30
March 2012, Pages 458-466)
37. W.DGunter, TGentzis, B.ARottenfusser, R.J.HRichardson (1997) Deep coalbed methane in Alberta,
Canada: A fuel resource with the potential of zero greenhouse gas emissions (Science Direct 1997, Energy
Conversion and Management,Volume 38 ,Supplement1997, Pages S217-S222).
38. National Electricity Plan, Page 14, CEA, 2016, In fulfilment of CEA's obligation under section 3(4) of the
Electricity Act 2003. http://www.cea.nic.in/reports/committee/nep/nep_dec.pdf
39. Deviation settlement Mechanism, Gazette of India, 2014, http://www.cercind.gov.in/2016/regulation/14.pdf
40. Renewable energy Tax benefits and accelerated depreciation benefit, Section 32 of Income tax act, Budget
2016-17 www.energetica-
india.net/download.php?seccion=article&archivo.pdf,www.makeinindia.com/sector/renewable-energy
41. PAT mechanism and CERC, Bureau of Energy Efficiency, 2012 ,https://beeindia.gov.in/content/pat-3
42. Daily generation Declaration and SG scheduling by RLDCs, Power grid corporation of India Ltd,
www.powergridindia.com, www.srldc.in
43. India energy Outlook, World Energy Outlook special report, 2015 by IEA-
www.iea.org/publications/freepublications/publication/IndiaEnergyOutlook_WEO2015.pdf

International Journal of Engineering, Science and Mathematics Vol.7 Issue 4, April 2018, ISSN: 2320-0294 Impact Factor: 6.765 Journal Homepage: http://www.ijesm.co.in, Email: [email protected] Double-Blind Peer Reviewed Refereed Open Access International Journal - Included in the International Serial Directories Indexed & Listed at: Ulrich's Periodicals Directory ©, U.S.A., Open J-Gage as well as in Cabell’s Directories of Publishing Opportunities, U.S.A
192 International Journal of Engineering, Science and Mathematics
http://www.ijesm.co.in, Email: [email protected]
SING SOLAR THERMAL TECHNOLOGY: SEEBECK AS AN AUXILIARY FOR POWER
GENERATION
Mayank Rautela* Saransh Vijayvargiya*
Sagar Prajapat*
Surajit Mondal**
Abstract
The existing R&D project known as ―Solar Thermal Pyrolysis‖ is a
great success till the time focus is on extraction of oil from jathropa seeds
which is its main objective. But, this project lacks an insulator. So, majority
of the heat which could have been used was getting wasted. On calculating
heat loss, it was found that very high amount of heat was being given out. In
order to utilize this waste heat, an auxiliary was the first thought.Rather than
using a Waste Heat Recovery (WHR) equipment, production of current
seemed to be a better alternative. So, using the principle of the Seebeck
Effect was the first choice.It allows for generation of current through creation
of 2 junctions i.e. hot and cold. The surface of the receiver which was
emitting a lot of waste heat was used as the hot point and the ambient air was
used as the cold point. Due to the temperature difference the voltage is
generated and so, current is produced. Seebeck circuit can be made by using
various combinations of metals, therefore an experiment is performed in
order to use this waste heat to generate current.
Keywords:
Seebeck Effect;
Power Generation;
Solar Thermal Technology;
Copyright © 2018International Journals of Multidisciplinary
Research Academy. All rights reserved.
Author correspondence:
Surajit Mondal
Research Scientist
Department of Research and Development
University of Petroleum & Energy Studies, Bidholi, Dehradun, Uttrakhand (248007)
1. Introduction
Thermoelectric are based on the Peltier Effect. The Peltier Effect is one of the three thermoelectric effects;
the other two are known as the ―Seebeck Effect and Thomson Effect‖. Whereas the last two effects act on a single
conductor, the Peltier Effect is a typical junction phenomenon. Thermoelectric coolers are solid state heat pumps
used in applications where temperature stabilization, temperature cycling, or cooling below ambient are required.
There are many products using thermoelectric coolers, including CCD cameras (charge coupled device), laser
diodes, microprocessors, blood analyzers and portable picnic coolers. This article discusses the theory behind the
thermoelectric cooler, along with the thermal and electrical parameters involved.

International Journal of Engineering, Science and Mathematics Vol.7 Issue 4, April 2018, ISSN: 2320-0294 Impact Factor: 6.765 Journal Homepage: http://www.ijesm.co.in, Email: [email protected] Double-Blind Peer Reviewed Refereed Open Access International Journal - Included in the International Serial Directories Indexed & Listed at: Ulrich's Periodicals Directory ©, U.S.A., Open J-Gage as well as in Cabell’s Directories of Publishing Opportunities, U.S.A
193 International Journal of Engineering, Science and Mathematics
http://www.ijesm.co.in, Email: [email protected]
165
An experiment to produce bio-oil is being done on the premises of the UPES by providing heat using solar
concentrator and receiver system. The surface of the receiver gets heated upto around 300°C leading to large amount
of heat loss from the surface of the receiver. This waste heat may be trapped and be used for generating
current using the principle of Seebeck effect.5 So, by using the various seebeck materials the generation of current is
done.
THERMOELECTRIC EFFECT6
1. PELTIER EFFECT
When DC voltage is applied to the module, the positive and negative charge carriers in the pellet array
absorb heat energy from one substrate surface and release it to the substrate at the opposite side. The surface where
heat energy is absorbed becomes cold; the opposite surface where heat energy is released, becomes hot. Reversing
the polarity will result in reversed hot and cold sides.
2. SEEBECK EFFECT
The conductors are two dissimilar metals denoted as material A and material B. The junction temperature at
A is used as a reference and is maintained at a relatively cool temperature (Tc). The junction temperature at B is
used as temperature higher than temperature Tc. With heat applied to junction B, a voltage (E out) will appear across
terminals T1 and T2 and hence an electric current would flow continuously in this closed circuit. This voltage thus
derived is known as the Seebeck EMF, can be expressed as:
E out = α (Th – Tc)
Where:
• α = 𝒅𝑬
𝒅𝑻 = α (A – B)
• α is the differential Seebeck coefficient or (thermo electric power coefficient) between the two materials, A and B,
positive when the direction of electric current is same as the direction of thermal current, in micro-volts per degree
Kelvin.
• E out is the output voltage in micro-volts.
• Th and Tc are the hot and cold thermocouple temperatures, respectively, in degree Kelvin.
5Richard T.L, challenges in recovery of waste heat, science, Vol.32, pp. 736-9 (2010).
6Lehmann J.; Thermoelectric innovation: Science and technology Earth scan: London, UK, 2009.

International Journal of Engineering, Science and Mathematics Vol.7 Issue 4, April 2018, ISSN: 2320-0294 Impact Factor: 6.765 Journal Homepage: http://www.ijesm.co.in, Email: [email protected] Double-Blind Peer Reviewed Refereed Open Access International Journal - Included in the International Serial Directories Indexed & Listed at: Ulrich's Periodicals Directory ©, U.S.A., Open J-Gage as well as in Cabell’s Directories of Publishing Opportunities, U.S.A
194 International Journal of Engineering, Science and Mathematics
http://www.ijesm.co.in, Email: [email protected]
Fig. 2.1(a) Layout of Seebeck Effect7
The potential difference between the junctions is called the Seebeck voltage or the thermo electric emf which is
of the order of a few micro-volts per degree temperature difference (µV/ K).
Seebeck Series: The magnitude and direction of thermo emf in a thermocouple depends not only on the
temperature difference between the hot and cold junctions but also on the nature of metals constituting
the thermocouple.
(i) Seebeck arranged different metals in the decreasing order of their electron density. Few metals
forming the series are as below.
―Sb, Al, Fe, Cd, Zn, Ag, Au, Cr, Sn, Pb, Hg, Mn, Cu, Pt, Co, Ni, Bi‖89
(ii) Thermo electric emf is directly proportional to the distance between the two metals in series. Farther
the metals in the series forming the thermocouple greater is the thermo emf. Thus maximum thermo
emf is obtained for Sb-Bi thermo couple.
(iii) The current flow at the hot junction of the thermocouple is from the metal occurring later in the series
towards that occurring earlier, Thus, in the copper-iron thermocouple the current flows from copper
(Cu) to iron (Fe) at the hot junction.This may be remembered easily by the hot coffee.
3. THOMSON EFFECT
William Thomson, who described the relationship between the two phenomena, later issued a more
comprehensive explanation of the Seebeck and Peltier effects. When an electric current is passed through a
conductor having a temperature gradient over its length, heat will be either absorbed by or expelled from the
conductor. Whether heat is absorbed or expelled depends on the direction of both the electric current and
temperature gradient. This phenomenon is known as the Thomson Effect.
7Rowe D.M., Handbook of Thermoelectric , CRC press: Vol.1, pp55-75(1995)
8 Soltes E., Elder, Seebeck Effect, Thermoelectric processes, CRC Pres: pp63-95 (1996).
9Brown R., Holmgren J., Fast electron flow and heat loss upgrading, National Programme207; Energy
alternatives, Richland, WA, USA (2006).

International Journal of Engineering, Science and Mathematics Vol.7 Issue 4, April 2018, ISSN: 2320-0294 Impact Factor: 6.765 Journal Homepage: http://www.ijesm.co.in, Email: [email protected] Double-Blind Peer Reviewed Refereed Open Access International Journal - Included in the International Serial Directories Indexed & Listed at: Ulrich's Periodicals Directory ©, U.S.A., Open J-Gage as well as in Cabell’s Directories of Publishing Opportunities, U.S.A
195 International Journal of Engineering, Science and Mathematics
http://www.ijesm.co.in, Email: [email protected]
3.1 ESTIMATION OF OVERALL HEAT LOSS10
When sunlight falls on the concentrator it gets reflected on to the receiver where the Pyrolysis process takes
place. So due to absence of insulation or any other sort of insulation material on the surface because of which there
is significant heat loss from the surface.
We calculated the heat loss in order to find out the actual amount of heat which is feasible for the Seeback
effect.
Q Total = Q convection + Q radiation
Q convection = h × A × (𝑇𝑠 − 𝑇𝑎 )
= 60 × (𝜋
4) × 𝑑2 × (603 – 303)
= 14130 𝑑2 Watts.
Q radiation = 𝜀 × 𝜍 × 𝐴 × ( 𝑇𝑠4 − 𝑇𝑎
4 )
= 0.67 × 5.67 × 10−8 × (𝜋
4) × 𝑑2 × (603 – 303)
= 3691.36 𝑑2 Watts.
Q total = 14130 𝑑2 + 3691.36 𝑑2
= 17821.36 𝑑2
= 17821.36 × 3.85
= 264157.11 Watts
= 264.157 KW
Thus, we have 264 KW of heat loss from the surface of the receiver. This heat lost can be used for the
application for Seeback Effect as per our proposal.
10
Emmos H.W., Atreya, The science of heat and mass transfer, Indian academy of sciences, Vol.5, pp.259-
268 (1994).

International Journal of Engineering, Science and Mathematics Vol.7 Issue 4, April 2018, ISSN: 2320-0294 Impact Factor: 6.765 Journal Homepage: http://www.ijesm.co.in, Email: [email protected] Double-Blind Peer Reviewed Refereed Open Access International Journal - Included in the International Serial Directories Indexed & Listed at: Ulrich's Periodicals Directory ©, U.S.A., Open J-Gage as well as in Cabell’s Directories of Publishing Opportunities, U.S.A
196 International Journal of Engineering, Science and Mathematics
http://www.ijesm.co.in, Email: [email protected]
3.2 MOTT - JONES THERMOELECTRIC POWER EQUATION11
VAB = ΔVA - ΔVB = −𝜋2𝑘2
6𝑒
𝑥𝑎
𝐸𝐹𝐴𝑂−
𝑥𝑏
𝐸𝐹𝐵𝑂 𝑇2 − 𝑇0
2
Where, VAB = available emf, which is the difference in ΔV for the two metals.
k = Boltzmann‘s Constant = 1.3807 × 10⁻²³ J / K
e = Charge of electron = 1.6 × 10⁻¹⁹ Coulomb
x = a numerical factor in Mott – Jones thermoelectric power equation that represents the effect of the
energy dependence of electron scattering in metals.
EFO = Fermi Energy at 0 K.
3.3. OBSERVATION AND EXPERIMENTAL RESULTS
A. When Iron And Copper Wire Are Used As A Seebeck Combination
i. Single wires
Data for Iron Wire:-
Length of Iron Wire, LA = 1 m
Thickness of Iron Wire = 2.5 mm
Resistivity of Iron (Fe), 𝜌𝑎 = 9.71 × 10^-8 Ωm
Area of Iron Wire, AA = 𝜋×(2.5 ×10⁻³)2
4 = 4.90625 × 10⁻⁶ m2
Resistance of Iron Wire, RA = 𝜌𝑙
𝐴 =
9.71 × 10−8× 1
4.90625 × 10−6 = 0.019791082 Ω
xa = 0.99 and EFAO = 11.1 eV
Data for Copper Wire:-
Length of Copper Wire, LB = 1 m
Thickness of Copper Wire = 0.511mm
Resistivity of Copper (Cu), 𝜌𝑏 = 1.68 × 10^-8 Ωm
Area of Copper Wire, AB = 𝜋×(0.511 ×10⁻³)2
4 = 1.9625 × 10⁻⁷ m2
Resistance of Copper Wire, RB = 𝜌𝑙
𝐴 =
1.7×10−8×1
1.9625 × 10−7 = 0.081959221 Ω
𝑥𝑏= -1.7 and 𝐸𝐹𝐵𝑂= 7 eV
11
Kasap Safa, Thermoelectric Effects in Metals: Thermocouples, Special custom: p. 68, 2001.

International Journal of Engineering, Science and Mathematics Vol.7 Issue 4, April 2018, ISSN: 2320-0294 Impact Factor: 6.765 Journal Homepage: http://www.ijesm.co.in, Email: [email protected] Double-Blind Peer Reviewed Refereed Open Access International Journal - Included in the International Serial Directories Indexed & Listed at: Ulrich's Periodicals Directory ©, U.S.A., Open J-Gage as well as in Cabell’s Directories of Publishing Opportunities, U.S.A
197 International Journal of Engineering, Science and Mathematics
http://www.ijesm.co.in, Email: [email protected]
Total Resistance, R = RA + RB = 0.019+ 0.082 = 0.101 Ω
I. OBSERVATION TABLE A
S.NO TIME TEMPERATURE (K) OUTPUT
Surface
Temperature
(K)
Ambient
Temperature
(K)
Temperature
Difference (K)
Voltage
(µV)
Current
(mA)
Power
(× 10-6 W)
1. 10:00 – 10:15 433 304 129 400.82 3.34 1.343
2. 10:15 – 10:30 438 305 133 416.62 4.08 1.699
3. 10:30 – 10:45 446 305 141
446.44 4.35 1.942
4. 10:45 – 11:00 450 306 144 459 4.50 2.065
5. 11:00 – 11:15 456 307 149 479.30 4.70 2.252
6. 11:15 – 11:30 464 307 157 510.34 5.00 2.551
7. 11:30 – 11:45 470 308 162 530.4 5.20 2.758
8. 11:45 – 12:00 475 308 167 551.28 5.39 2.971
9. 12:00 – 12:15 481 309 172 572.6 5.61 3.212
10. 12:15 – 12:30 488 310 178 598.84 5.87 3.515
11. 12:30 – 12:45 492 311 181 612.75 6.01 3.682
12. 12:45 – 13:00 497 313 184 628.36 6.16 3.870
13. 13:00 – 13:15 504 313 191 657.90 6.45 4.243
14. 13:15 – 13:30 511 314 197 685.22 6.72 4.604
15. 13:30 – 13:45 521 315 206 726 7.11 5.161
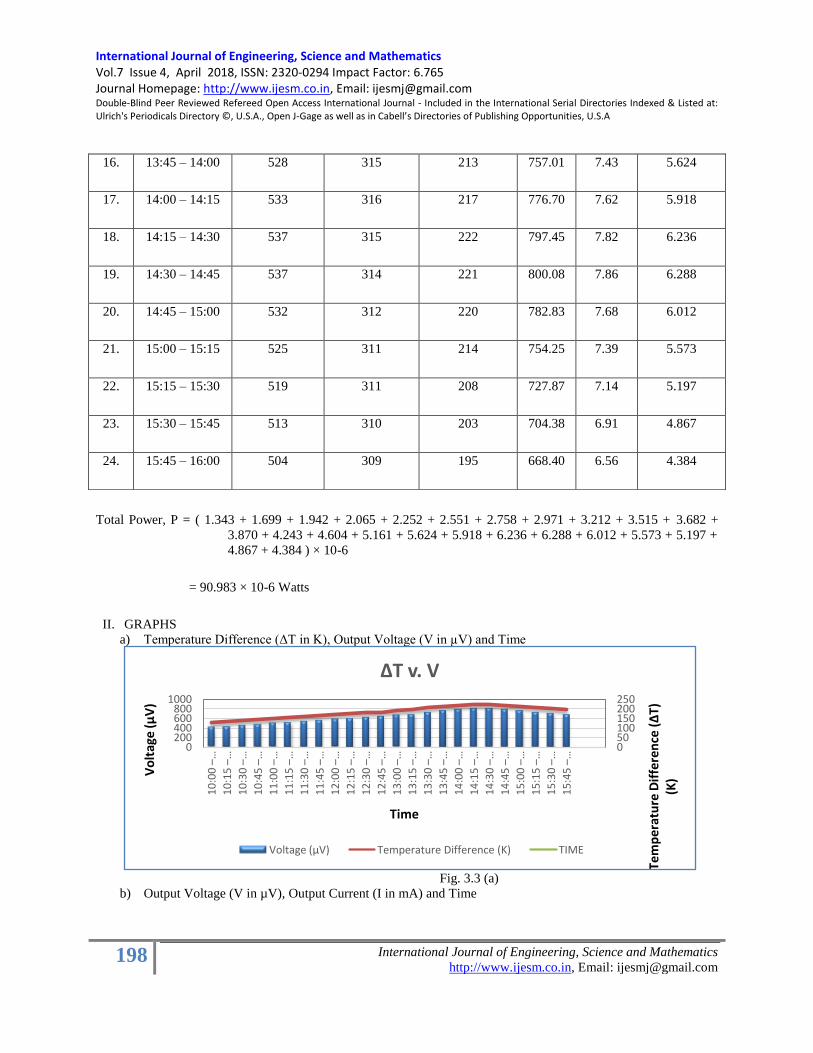
International Journal of Engineering, Science and Mathematics Vol.7 Issue 4, April 2018, ISSN: 2320-0294 Impact Factor: 6.765 Journal Homepage: http://www.ijesm.co.in, Email: [email protected] Double-Blind Peer Reviewed Refereed Open Access International Journal - Included in the International Serial Directories Indexed & Listed at: Ulrich's Periodicals Directory ©, U.S.A., Open J-Gage as well as in Cabell’s Directories of Publishing Opportunities, U.S.A
198 International Journal of Engineering, Science and Mathematics
http://www.ijesm.co.in, Email: [email protected]
Total Power, P = ( 1.343 + 1.699 + 1.942 + 2.065 + 2.252 + 2.551 + 2.758 + 2.971 + 3.212 + 3.515 + 3.682 +
3.870 + 4.243 + 4.604 + 5.161 + 5.624 + 5.918 + 6.236 + 6.288 + 6.012 + 5.573 + 5.197 +
4.867 + 4.384 ) × 10-6
= 90.983 × 10⁻⁶ Watts
II. GRAPHS
a) Temperature Difference (ΔT in K), Output Voltage (V in µV) and Time
Fig. 3.3 (a)
b) Output Voltage (V in µV), Output Current (I in mA) and Time
050100150200250
0200400600800
1000
10
:00
–…
10
:15
–…
10
:30
–…
10
:45
–…
11
:00
–…
11
:15
–…
11
:30
–…
11
:45
–…
12
:00
–…
12
:15
–…
12
:30
–…
12
:45
–…
13
:00
–…
13
:15
–…
13
:30
–…
13
:45
–…
14
:00
–…
14
:15
–…
14
:30
–…
14
:45
–…
15
:00
–…
15
:15
–…
15
:30
–…
15
:45
–…
Tem
per
atu
re D
iffe
ren
ce (
ΔT)
(K
)Vo
ltag
e (µ
V)
Time
ΔT v. V
Voltage (µV) Temperature Difference (K) TIME
16. 13:45 – 14:00 528 315 213 757.01 7.43 5.624
17. 14:00 – 14:15 533 316 217 776.70 7.62 5.918
18. 14:15 – 14:30 537 315 222 797.45 7.82 6.236
19. 14:30 – 14:45 537 314 221 800.08 7.86 6.288
20. 14:45 – 15:00 532 312 220 782.83 7.68 6.012
21. 15:00 – 15:15 525 311 214 754.25 7.39 5.573
22. 15:15 – 15:30 519 311 208 727.87 7.14 5.197
23. 15:30 – 15:45 513 310 203 704.38 6.91 4.867
24. 15:45 – 16:00 504 309 195 668.40 6.56 4.384

International Journal of Engineering, Science and Mathematics Vol.7 Issue 4, April 2018, ISSN: 2320-0294 Impact Factor: 6.765 Journal Homepage: http://www.ijesm.co.in, Email: [email protected] Double-Blind Peer Reviewed Refereed Open Access International Journal - Included in the International Serial Directories Indexed & Listed at: Ulrich's Periodicals Directory ©, U.S.A., Open J-Gage as well as in Cabell’s Directories of Publishing Opportunities, U.S.A
199 International Journal of Engineering, Science and Mathematics
http://www.ijesm.co.in, Email: [email protected]
Fig. 3.3 (b)
c) Output Voltage (V in µV), Output Power (P in Watts) and Time
Fig. 3.3 (c)
ii) Stacking of wires
Data for Iron Wire:-
Length of iron wire, LA = 1.5 m
Number of iron wires used for stacking = 15
Thickness of iron wire = 2.5 mm
0246810
0200400600800
10001
0:0
0 –
10
:15
10
:15
–1
0:3
0
10
:30
–1
0:4
5
10
:45
–1
1:0
0
11
:00
–1
1:1
5
11
:15
–1
1:3
0
11
:30
–1
1:4
5
11
:45
–1
2:0
0
12
:00
–1
2:1
5
12
:15
–1
2:3
0
12
:30
–1
2:4
5
12
:45
–1
3:0
0
13
:00
–1
3:1
5
13
:15
–1
3:3
0
13
:30
–1
3:4
5
13
:45
–1
4:0
0
14
:00
–1
4:1
5
14
:15
–1
4:3
0
14
:30
–1
4:4
5
14
:45
–1
5:0
0
15
:00
–1
5:1
5
15
:15
–1
5:3
0
15
:30
–1
5:4
5
15
:45
–1
6:0
0 Cu
rren
t (m
A)
Vo
ltag
e (
µV
)
Time
Voltage v. Current
Voltage (µV) Current (mA)
01234567
0100200300400500600700800900
10
:00
–1
0:1
5
10
:15
–1
0:3
0
10
:30
–1
0:4
5
10
:45
–1
1:0
0
11
:00
–1
1:1
5
11
:15
–1
1:3
0
11
:30
–1
1:4
5
11
:45
–1
2:0
0
12
:00
–1
2:1
5
12
:15
–1
2:3
0
12
:30
–1
2:4
5
12
:45
–1
3:0
0
13
:00
–1
3:1
5
13
:15
–1
3:3
0
13
:30
–1
3:4
5
13
:45
–1
4:0
0
14
:00
–1
4:1
5
14
:15
–1
4:3
0
14
:30
–1
4:4
5
14
:45
–1
5:0
0
15
:00
–1
5:1
5
15
:15
–1
5:3
0
15
:30
–1
5:4
5
15
:45
–1
6:0
0
Po
wer
(1
0^
-6 W
atts
)
Vo
ltag
e (µ
V)
Time
Voltage v. Power
Voltage (µV) Power (10^-6 Watts)
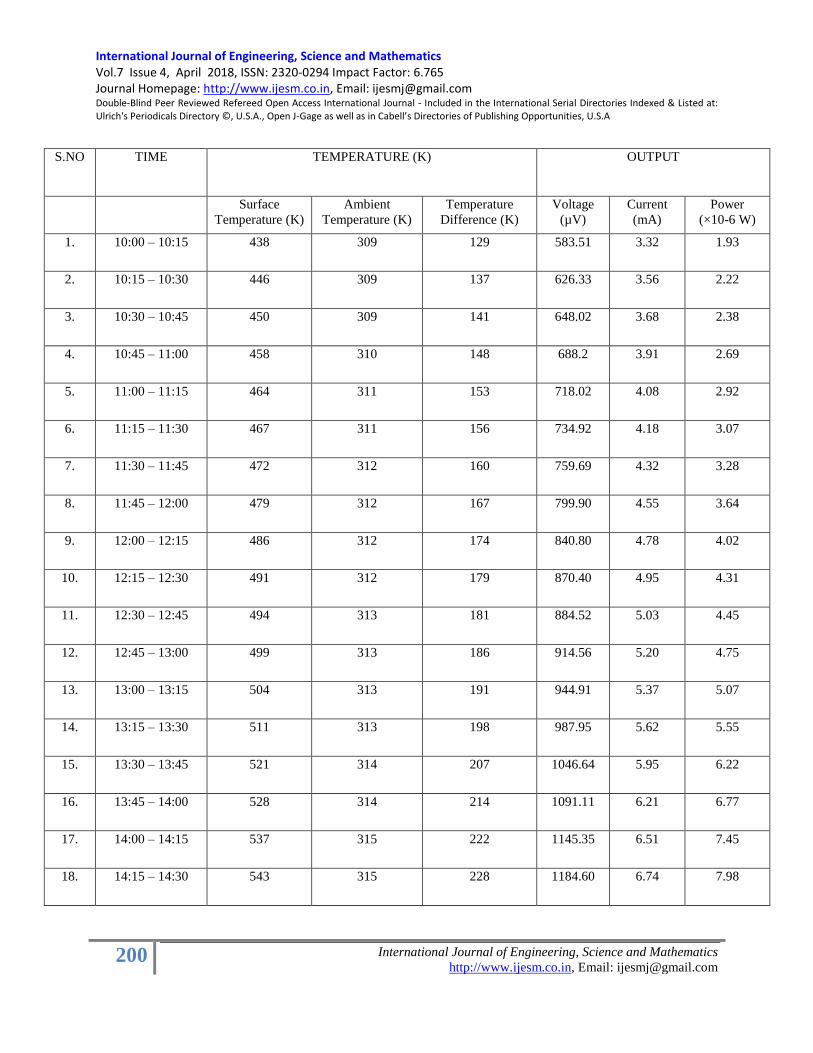
International Journal of Engineering, Science and Mathematics Vol.7 Issue 4, April 2018, ISSN: 2320-0294 Impact Factor: 6.765 Journal Homepage: http://www.ijesm.co.in, Email: [email protected] Double-Blind Peer Reviewed Refereed Open Access International Journal - Included in the International Serial Directories Indexed & Listed at: Ulrich's Periodicals Directory ©, U.S.A., Open J-Gage as well as in Cabell’s Directories of Publishing Opportunities, U.S.A
200 International Journal of Engineering, Science and Mathematics
http://www.ijesm.co.in, Email: [email protected]
S.NO TIME TEMPERATURE (K) OUTPUT
Surface
Temperature (K)
Ambient
Temperature (K)
Temperature
Difference (K)
Voltage
(µV)
Current
(mA)
Power
(×10-6 W)
1. 10:00 – 10:15 438 309 129 583.51 3.32 1.93
2. 10:15 – 10:30 446 309 137 626.33 3.56 2.22
3. 10:30 – 10:45 450 309 141
648.02 3.68 2.38
4. 10:45 – 11:00 458 310 148 688.2 3.91 2.69
5. 11:00 – 11:15 464 311 153 718.02 4.08 2.92
6. 11:15 – 11:30 467 311 156 734.92 4.18 3.07
7. 11:30 – 11:45 472 312 160 759.69 4.32 3.28
8. 11:45 – 12:00 479 312 167 799.90 4.55 3.64
9. 12:00 – 12:15 486 312 174 840.80 4.78 4.02
10. 12:15 – 12:30 491 312 179 870.40 4.95 4.31
11. 12:30 – 12:45 494 313 181 884.52 5.03 4.45
12. 12:45 – 13:00 499 313 186 914.56 5.20 4.75
13. 13:00 – 13:15 504 313 191 944.91 5.37 5.07
14. 13:15 – 13:30 511 313 198 987.95 5.62 5.55
15. 13:30 – 13:45 521 314 207 1046.64 5.95 6.22
16. 13:45 – 14:00 528 314 214 1091.11 6.21 6.77
17. 14:00 – 14:15 537 315 222 1145.35 6.51 7.45
18. 14:15 – 14:30 543 315 228 1184.60 6.74 7.98

International Journal of Engineering, Science and Mathematics Vol.7 Issue 4, April 2018, ISSN: 2320-0294 Impact Factor: 6.765 Journal Homepage: http://www.ijesm.co.in, Email: [email protected] Double-Blind Peer Reviewed Refereed Open Access International Journal - Included in the International Serial Directories Indexed & Listed at: Ulrich's Periodicals Directory ©, U.S.A., Open J-Gage as well as in Cabell’s Directories of Publishing Opportunities, U.S.A
201 International Journal of Engineering, Science and Mathematics
http://www.ijesm.co.in, Email: [email protected]
Resistivity of iron (Fe), 𝜌𝑎 = 9.71 × 10^-8 Ωm
Area of single iron wire, AA = 𝜋×(2.5 ×10⁻³)2
4 = 4.90625 × 10⁻⁶ m2
Resistance of single iron wire = 𝜌𝑙
𝐴 =
9.71 × 10−8× 1.5
4.90625 × 10−6 = 0.029686624 Ω
Total resistance of 15 stacked iron wire, RA = 1
15 ×0.029686624 = 2.246 Ω
xa = 0.99 and EFAO = 11.1 eV
Data for Copper Wire:-
Length of copper wire, LB = 1.5 m
Number of copper wires used for stacking = 30
Thickness of copper wire = 0.511mm
Resistivity of copper (Cu), 𝜌𝑏 = 1.68 × 10^-8 Ωm
Area of copper wire, AB = 𝜋×(0.511 ×10⁻³)2
4 = 1.9625 × 10⁻⁷ m2
Resistance of single copper wire = 𝜌𝑙
𝐴 =
1.7×10−8×1.5
1.9625 × 10−7 = 0.122938831 Ω
Total resistance of 30 stacked copper wire, RB = 1
30 ×0.122938831 = 0.271 Ω
𝑥𝑏= -1.7 and 𝐸𝐹𝐵𝑂= 7 eV
Total Resistance, R = RA + RB
= 2.246 + 0.271
= 2.517 Ω
I. OBSERVATION TABLE D
Total Power = (1.93 + 2.22 + 2.38 + 2.69 + 2.92 + 3.07 + 3.28 + 3.64 + 4.02 + 4.31 + 4.45 + 4.75 + 5.07 + 5.55 +
6.22 + 6.77 + 7.45 + 7.98 + 8.00 + 7.69 + 7.43 + 7.04 + 6.44 +5.92) × 10-6
= 114.69 × 10⁻⁶ Watts
II. GRAPHS
a) Temperature Difference (ΔT in K), Output Voltage (V in µV) and Time
19. 14:30 – 14:45 542 313 229 1185.61 6.75 8.00
20. 14:45 – 15:00 538 312 226 1163.25 6.61 7.69
21. 15:00 – 15:15 535 312 223 1143.75 6.50 7.43
22. 15:15 – 15:30 529 310 219 1112.63 6.33 7.04
23. 15:30 – 15:45 522 311 211 1064.34 6.05 6.44
24. 15:45 – 16:00 515 311 204 1020.33 5.80 5.92

International Journal of Engineering, Science and Mathematics Vol.7 Issue 4, April 2018, ISSN: 2320-0294 Impact Factor: 6.765 Journal Homepage: http://www.ijesm.co.in, Email: [email protected] Double-Blind Peer Reviewed Refereed Open Access International Journal - Included in the International Serial Directories Indexed & Listed at: Ulrich's Periodicals Directory ©, U.S.A., Open J-Gage as well as in Cabell’s Directories of Publishing Opportunities, U.S.A
202 International Journal of Engineering, Science and Mathematics
http://www.ijesm.co.in, Email: [email protected]
Fig. 3.3 (j)
b) Output Voltage (V in µV), Output Current (I in mA) and Time
Fig. 3.3 (k)
0
50
100
150
200
250
0
200
400
600
800
1000
1200
14001
0:0
0 –
10
:15
10
:15
–1
0:3
0
10
:30
–1
0:4
5
10
:45
–1
1:0
0
11
:00
–1
1:1
5
11
:15
–1
1:3
0
11
:30
–1
1:4
5
11
:45
–1
2:0
0
12
:00
–1
2:1
5
12
:15
–1
2:3
0
12
:30
–1
2:4
5
12
:45
–1
3:0
0
13
:00
–1
3:1
5
13
:15
–1
3:3
0
13
:30
–1
3:4
5
13
:45
–1
4:0
0
14
:00
–1
4:1
5
14
:15
–1
4:3
0
14
:30
–1
4:4
5
14
:45
–1
5:0
0
15
:00
–1
5:1
5
15
:15
–1
5:3
0
15
:30
–1
5:4
5
15
:45
–1
6:0
0 Tem
per
atu
re D
iffe
ren
ce (
ΔT)
(K
)
Vo
ltag
e (
µV
)
Time
ΔT v. V
Voltage (µV) Temperature Difference (K)
012345678
0200400600800
100012001400
10
:00
–1
0:1
5
10
:15
–1
0:3
0
10
:30
–1
0:4
5
10
:45
–1
1:0
0
11
:00
–1
1:1
5
11
:15
–1
1:3
0
11
:30
–1
1:4
5
11
:45
–1
2:0
0
12
:00
–1
2:1
5
12
:15
–1
2:3
0
12
:30
–1
2:4
5
12
:45
–1
3:0
0
13
:00
–1
3:1
5
13
:15
–1
3:3
0
13
:30
–1
3:4
5
13
:45
–1
4:0
0
14
:00
–1
4:1
5
14
:15
–1
4:3
0
14
:30
–1
4:4
5
14
:45
–1
5:0
0
15
:00
–1
5:1
5
15
:15
–1
5:3
0
15
:30
–1
5:4
5
15
:45
–1
6:0
0 Cu
rren
t (m
A)
Vo
ltag
e (µ
V)
Time
Voltage v. Current
Voltage (µV) TIME Current (mA)

International Journal of Engineering, Science and Mathematics Vol.7 Issue 4, April 2018, ISSN: 2320-0294 Impact Factor: 6.765 Journal Homepage: http://www.ijesm.co.in, Email: [email protected] Double-Blind Peer Reviewed Refereed Open Access International Journal - Included in the International Serial Directories Indexed & Listed at: Ulrich's Periodicals Directory ©, U.S.A., Open J-Gage as well as in Cabell’s Directories of Publishing Opportunities, U.S.A
203 International Journal of Engineering, Science and Mathematics
http://www.ijesm.co.in, Email: [email protected]
c) Output Voltage (V in µV), Output Power (P in Watts) and Time
Fig. 3.3 (l)
ii. Stacking of Wires
Data for Aluminium Wire:-
Length of aluminium wire, LA = 1.5 m
Number of aluminium wires used for stacking = 4
Thickness of aluminium wire = 0.6 mm
Resistivity of aluminium (Al), 𝜌𝑎 = 2.65 × 10⁻⁸ Ω-m
Area of aluminium wire, AA = 𝜋×(0.6 ×10⁻³)2
4 = 2.826 × 10⁻⁷ m2
Resistance of single aluminium Wire = 𝜌𝑙
𝐴 =
2.65 ×10−8×1.5
2.826 × 10−7 = 0.141 Ω
Total resistance of 4 stacked aluminium wire, RA= 1
4 ×0.141 = 1.773 Ω
xa = 2.78
EFAO = 11.6 eV
0123456789
0
200
400
600
800
1000
1200
1400
10
:00
–1
0:1
5
10
:15
–1
0:3
0
10
:30
–1
0:4
5
10
:45
–1
1:0
0
11
:00
–1
1:1
5
11
:15
–1
1:3
0
11
:30
–1
1:4
5
11
:45
–1
2:0
0
12
:00
–1
2:1
5
12
:15
–1
2:3
0
12
:30
–1
2:4
5
12
:45
–1
3:0
0
13
:00
–1
3:1
5
13
:15
–1
3:3
0
13
:30
–1
3:4
5
13
:45
–1
4:0
0
14
:00
–1
4:1
5
14
:15
–1
4:3
0
14
:30
–1
4:4
5
14
:45
–1
5:0
0
15
:00
–1
5:1
5
15
:15
–1
5:3
0
15
:30
–1
5:4
5
15
:45
–1
6:0
0
Po
we
r (1
0^
-6 W
atts
)
Vo
ltag
e (
µV
)
Time
Voltage v. Power
Voltage (µV) Power (10^-6 Watts)

International Journal of Engineering, Science and Mathematics Vol.7 Issue 4, April 2018, ISSN: 2320-0294 Impact Factor: 6.765 Journal Homepage: http://www.ijesm.co.in, Email: [email protected] Double-Blind Peer Reviewed Refereed Open Access International Journal - Included in the International Serial Directories Indexed & Listed at: Ulrich's Periodicals Directory ©, U.S.A., Open J-Gage as well as in Cabell’s Directories of Publishing Opportunities, U.S.A
204 International Journal of Engineering, Science and Mathematics
http://www.ijesm.co.in, Email: [email protected]
Data for Copper Wire:-
Length of copper wire, LB = 1.5 m
Number of copper wires used for stacking = 4
Thickness of copper wire = 0.511mm
Resistivity of copper (Cu), 𝜌𝑏 = 1.68 × 10^-8 Ωm
Area of copper wire, AB = 𝜋×(0.511 ×10⁻³)2
4 = 1.9625 × 10⁻⁷ m2
Resistance of single copper wire = 𝜌𝑙
𝐴 =
1.7×10−8×1.5
1.9625 × 10−7 = 0.122938831 Ω
Total resistance of 4 stacked copper wire, RB = 1
4 ×0.122938831 = 2.049 Ω
𝑥𝑏= -1.7
𝐸𝐹𝐵𝑂= 7 eV
Total Resistance, R = RA + RB
= 1.773 + 2.049= 3.822 Ω
CONCLUSION
The live project consists of bio-oil production using solar concentrator and receiver system. This system has a lot of
waste heat that is being given off. As per our calculations it is approximately equal to 264.16 KW. Before beginning
with any project the first step to it is, the feasibility study. So, we conducted the feasibility referred by various
parameters via this literature review and these have been thoroughly analyzed. So, we were of the opinion that our
proposed Seeback Effect will be actively extracting waste heat from the ongoing live project. The auxiliary that was
proposed by us which would be able to extract this and convert it into usable form, working on the principle of
Seeback Effect, has been successfully created and tested. So, the project has turned out to be successful as there is a
generation of current by using the waste heat.
BIBLIOGRAPHY
Articles
1. Lehmann J.; Thermoelectric innovation: Science and technology Earth scan: London, UK, 2009.
2. Brown R., Holmgren J., Fast electron flow and heat loss upgrading, National Programme207; Energy
alternatives, Richland, WA, USA (2006).
3. Soltes E., Elder, Seebeck Effect, Thermoelectric processes, CRC Pres: pp63-95 (1996).
4. Kasap Safa, Thermoelectric Effects in Metals: Thermocouples, Special custom: p. 68, 2001.
Books
1. Emmos H.W., Atreya, The science of heat and mass transfer, Indian academy of sciences, Vol.5, pp.259-
268 (1994).
2. Balat M.et al. Main routes for the thermo conversion, Alternative systems, Energy conversion and
Management, Vol.50, pp.3147-57 (2009).
3. Rowe D.M., Handbook of Thermoelectric , CRC press: Vol.1, pp55-75(1995)
4. Nolas G.S.,Thermoelectric: Basic Principles and New Materials Developments, Springer series, Vol. 4, pp.
567-79, 2010.
5. Mohan D.,Thermoelectric cooling Electronics, Cooling Methods in Industry, Vol. 2 ,pp. 45-55.
6. Richard T.L, challenges in recovery of waste heat, science, Vol.32, pp. 736-9 (2010).
International Journal of Engineering, Science and Mathematics Vol.7 Issue 4, April 2018, ISSN: 2320-0294 Impact Factor: 6.765 Journal Homepage: http://www.ijesm.co.in, Email: [email protected] Double-Blind Peer Reviewed Refereed Open Access International Journal - Included in the International Serial Directories Indexed & Listed at: Ulrich's Periodicals Directory ©, U.S.A., Open J-Gage as well as in Cabell’s Directories of Publishing Opportunities, U.S.A
205 International Journal of Engineering, Science and Mathematics
http://www.ijesm.co.in, Email: [email protected]
Disaster Management: A critical insight with special emphasis on Canadian
Disaster management Dharani Kumar K
Dr.Nihal Anwar Siddiqui
Abhinav Srivastava
Abstract (10pt)
This paper will diagram the issues and the most recent
experimental decisions about environmental change and
serious climate occasions. This paper will give data about
the connection between a shifting atmosphere and
recurrence and seriousness of compelling climate
occasions particularly in the northern scopes. It will
examine strategies, means, instruments which will lessen
the undesirable effect of great climate occasions and
connected characteristic catastrophes on mortal populaces
and base, with specific accentuation on the Global
circumstance. At last, it seems ahead at the proceeding
with requirement for exploratory, designing, radical and
authoritative activities and procedures that will encourage
moderation in a varying atmosphere.
Keywords:
Weather, Disaster loss,
Climate change,
Temperature
Copyright © 2018International Journals of Multidisciplinary
Research Academy. All rights reserved.
Author correspondence:
Dharni Kumar
Asst. Professor, HSE Department
UPES,
Introduction : Catastrophe mitigation and readiness in a climate change
Hotter temperatures will step by step cause glacial ice to liquefy [1]. Joined with development of
sea water because of hotter water hotness, ocean heights could rise to a level that will undermine
beach front ranges and little island countries [1]. Also, with more thermodynamic vitality in the
worldwide framework, there will probably be an expansion in events of great climate occasions,
prompting dangers to social security and belongings harm. Environmental variation can be
contended to be the maximum prevalent and sweeping ecological problem ever managed by the
global group.
International Journal of Engineering, Science and Mathematics Vol.7 Issue 4, April 2018, ISSN: 2320-0294 Impact Factor: 6.765 Journal Homepage: http://www.ijesm.co.in, Email: [email protected] Double-Blind Peer Reviewed Refereed Open Access International Journal - Included in the International Serial Directories Indexed & Listed at: Ulrich's Periodicals Directory ©, U.S.A., Open J-Gage as well as in Cabell’s Directories of Publishing Opportunities, U.S.A
206 International Journal of Engineering, Science and Mathematics
http://www.ijesm.co.in, Email: [email protected]
[3]In the year 1988, the Intergovernmental Panel on Climate Change (IPCC) was shaped by the
World Meteorological Organization (WMO) and the United Nations Environment Program
(UNEP). It united an expansive scope of government and non-government specialists to gather
and survey the latest accessible experimental learning and to figure out what is known and not
thought about the atmosphere framework and environmental change.
Somewhere in the range of 2000 researchers added to the latest report, the 1995n Second
assessment report, which reasoned that, "The equalization of proof recommends a perceptible
human impact on worldwide atmosphere [3].
1. Disaster management and its implications
[6]Debacle administration is the dedicated towards to diminishing nursery gas fixations
underneath 1990 stages with the point of moderating the degree of environmental alteration. Be
that as it may, along with the diminishments in nursery gas emanations consented to in Kyoto
there might keep on being changes in atmosphere under which Canada people will need to
adjust. For Canada's situation, in view of our high scope area, the effect of the progressions
might be especially serious [6].
Global powers have sorted out the residential science appraisal procedure round Canada's
Climate Program Board (CCPB). The CCPB has arranged information on the condition of the
knowledge, effects of environmental modification on Canada, and relief and adjustment reaction
alternatives. The four government regular assets divisions (Atmosphere, Regular Resources,
Cultivation and Agri-Food, and Fisheries and Oceans) consented to cooperate on combined
undertakings and execute a system for reasonable improvement learning and innovation in the
characteristic asset parts [2].
[10]An outline of the experimental data and information shows that Canada's normal temperature
is around 1°C hotter since 1885, and there has remained a perceivable increment in the
recurrence of wintertime tempests all through the twentieth period .In 1997, around 89%of
aggregate nursery gas emanations (GHGs) in Global were inferable from conveyance and fuel
generation and utilization [10]. [12]In Canada, 1999 is turning out to be the most sultry year on
top score: the normal nationwide hotness for the initial 6 months was 2.7°C overhead ordinary
and parts of the Northwest Territories experienced temperatures more than 5°C above typical
[12]. [14]On account of its size and high scope area, Global is anticipated to encounter more
prominent temperature fluctuates than maximum areas of the ecosphere. As a beach front and
northern state, and as a renewable strength maker in the ranger service, horticulture and fisheries
divisions, Global is added helpless than greatest to harm from environmental modification [14].
[8]During the Kyoto Protocol, Global consented to lessen discharges of nursery gasses to six
percent underneath 1991 levels by somewhere around 2009 and 2012. In next report in 1998, the
Commissioner of Environment and Sustainable Development inspected the government
International Journal of Engineering, Science and Mathematics Vol.7 Issue 4, April 2018, ISSN: 2320-0294 Impact Factor: 6.765 Journal Homepage: http://www.ijesm.co.in, Email: [email protected] Double-Blind Peer Reviewed Refereed Open Access International Journal - Included in the International Serial Directories Indexed & Listed at: Ulrich's Periodicals Directory ©, U.S.A., Open J-Gage as well as in Cabell’s Directories of Publishing Opportunities, U.S.A
207 International Journal of Engineering, Science and Mathematics
http://www.ijesm.co.in, Email: [email protected]
execution exertion on key worldwide natural understandings for the period between the Rio de
Janeiro (1992) and Kyoto (1997) gatherings [8]. [13] The review identified a deficient execution
exertion, described by an absence of co-appointment among government offices, an absence of
elected commonplace co-operation and a general administration structure that needed
responsibility. In a meeting promptly taking after Kyoto, government, commonplace and
regional pioneers consented to restore the execution exertion [13].
At that end, the national administration elucidated the particular parts of Environment Canada
and Natural Resources Canada, made a Federal Climate Change Secretariat and federations that
have approved the Pact (175 starting July 1999) and is the incomparable power of the Treaty.
Environment Global (EG) builds up the worldwide and provincial general course models in
Global and looks into environmental modification, counting environmental variation effects and
adjustment investigation. It additionally drove the effort on the Global Country Learning, the
primary nationwide evaluation on environmental modification effects and adjustment. Regular
Properties Global principals national administration study on vitality proficiency, elective
energizes, renewable vitality and the part of timberlands in environmental change. What's more,
the inter-departmental Program of Energy Research and Development organization assistances
coordinate the vitality Research projects of 12 divisions.Meanwhile April 1997, PERD has
expanded his backing for exploration identified with vitality effectiveness and environmental
change.
2. Disaster Losses
[14]Accumulation of dependable worldwide or even national debacle misfortune measurements
is a famously troublesome assignment to some degree on the grounds that there are no
institutionalized ways to deal with such gauges and Monetary misfortune Figures now and again
incorporate backhanded costs, for example, loss of exchange, while others incorporate just direct
harms[14]. What's more, some misfortune evaluations might be expanded to meet all
requirements for government monetary financial help. [4] While reservations about the
information ought to be remembered, there are great signs that aggregate worldwide financial
misfortunes have been ascending at an amazing rate following the mid 1960s. Normal direct
financial misfortunes in consistent moneys have ascended from around $ one billion US for
every one year in the 1960 to over fifty billion dollar every one year in the 1990 period.
Consolidated misfortunes because of characteristic and human-instigated calamities were
evaluated by Munnich Reinsurance for 1993 at sixty five billion dollar and for 1996 at 180
billion dollar [4].
[8] The tremendous 1996 misfortunes incorporated the Kobe city, Japan seismic tremor assessed
at about 80 billion dollar. Just two to five billion dollars of the sums were from humanoid
mischances, the rest from common debacles. Albeit just 20% of these financial misfortunes were
in low wage nations, the effect communicated as rate of their GNP was nearly 5 times that of
high salary nations [8].The Center for Research on Epidemiology of Disasters (CRED) evaluates
a sum of nearly 2 billion individuals were influenced by common risk catastrophes between
International Journal of Engineering, Science and Mathematics Vol.7 Issue 4, April 2018, ISSN: 2320-0294 Impact Factor: 6.765 Journal Homepage: http://www.ijesm.co.in, Email: [email protected] Double-Blind Peer Reviewed Refereed Open Access International Journal - Included in the International Serial Directories Indexed & Listed at: Ulrich's Periodicals Directory ©, U.S.A., Open J-Gage as well as in Cabell’s Directories of Publishing Opportunities, U.S.A
208 International Journal of Engineering, Science and Mathematics
http://www.ijesm.co.in, Email: [email protected]
1986-1995. This is around 33% of the present worldwide populace (albeit a portion of the
general population influenced may have been checked a rare times having been gone by
additional than one fiasco throughout the 10 years). Figures influenced have increased a normal
of six % every year in the course of recent decades, triples the worldwide populace development
rate
[5] Calamity passing above the previous decades were assessed by CED at 750,000 around the
world. While both monetary misfortunes and numbers influenced have been surging ever higher.
A sixty-fold increment in straight financial debacle misfortunes from 1966 to 1993 far
overwhelms the multiplying of aggregate worldwide GNP amid the identical time frame. It is
likewise a distant speedier rate of expansion than the development of the universe's populace
from around 3 billion to 5 billion amid the identical time frame [5].
On the off chance that it is viewed as that the expanded seismic tremor fiasco misfortunes is by
and large corresponding to the worldwide increment in populace and uncovered framework, why
are atmosphere related misfortunes expanding ordinarily all the more quickly? It is hard to figure
out if there is a more noteworthy rate of financial advancement in territories influenced by surges
and tempests, than those influenced by quakes in any case, in numerous portions of the earth,
these are fundamentally the equal areas, and also it is far-fetched that disparity improvement
could represent the huge contrasts in amount of progress. Along these lines, the substantially
more quickly expanding rate of misfortune from climatically related fiascos, for example, from
surges, tempests and dry seasons may without a doubt propose that these last perils might
increment in recurrence and seriousness.
3. Synopsis of Past Changes Worldwide misfortunes in climate related fiascos have risen immensely in the course of
recent decades, three times as quickly concerning seismic tremor debacles and a comparable
pattern is clear in worldwide scenario. Three variables seem to have created this expanding
calamity
a) Increased populace and development of manmade buildings, structures presented to the risks.
b) Changes in area use influencing surge and dry season recurrence.
c) Increases, at any rate territorially, in recurrence of substantial rainfall and extreme
extratropical storms.
The comparative significance of these 3 elements is hard to decide from accessible information.
Catastrophe relief measures, particularly cautioning and readiness frameworks for surges and
storms, and more secure building plan for seismic tremors, high winds and snow loads,
especially in monetarily created nations, have restricted the expansion in numbers.
4. Projections of extreme weather events for Canada. The northern topographical area of Canada and its tremendous outward zone casing cold
tundra, inside fields and broad shorelines will open the nation to dissipations of most sorts of
climate frameworks making a great likelihood of associated grievous occasions. [7] While
International Journal of Engineering, Science and Mathematics Vol.7 Issue 4, April 2018, ISSN: 2320-0294 Impact Factor: 6.765 Journal Homepage: http://www.ijesm.co.in, Email: [email protected] Double-Blind Peer Reviewed Refereed Open Access International Journal - Included in the International Serial Directories Indexed & Listed at: Ulrich's Periodicals Directory ©, U.S.A., Open J-Gage as well as in Cabell’s Directories of Publishing Opportunities, U.S.A
209 International Journal of Engineering, Science and Mathematics
http://www.ijesm.co.in, Email: [email protected]
predictions are famously troublesome, maximum studies have anticipated that Carbon dioxide
identical focuses in the environment will two fold from pre-mechanical times to the center of the
following century. Without real mediation under the UN Framework Convention on Climate
Change, the Second Assessment Report of the Intergovernmental Panel on Climate Change
(IPCC) demonstrated the accompanying projections for Canada [7].
[9]When all is said in done, for each 1degree C increment in worldwide temperature, around 5%
more precipitation will happen because of an accelerating of the vanishing procedure. Extremes
of the hydrological cycle (surges, dry seasons), ought to thusly turn out to be more regular.
Substantial precipitation occasions could increment in recurrence by additional than half and the
power by as much as half. What are currently twenty year return occasions could get to be 10-
year occurrences. A more prominent recurrence of substantial rainstorms and avalanches is
foreseen, particularly in western Canada [9].
[15]Late information demonstrate quite expanded backwoods flames, and dangers to numerous
timberland zone groups. As much as thirty half of the boreal timberland land range could be
influenced in the following fifty years. In Canada, the quantity of lightning flames could
increment by forty four %,and region smoldered by seventy eight % winters are prone to be
hotter and damper; summers hotter and drier [15].In a few districts, this could bring about
lessened snow packs to nourish streams and water stockpiling stores in summer, potentially
prompting force and water supply deficiencies, and in addition expanded woods fires, creepy
crawly infestations and harvest harm. In different districts, compelling winter snowfall occasions
are anticipated to increment in recurrence.
[11]Proof for watched changes in dry season recurrence is not predictable or persuading, but
rather dry season recurrence and seriousness in real grain developing locales of Canada could
increment later on. The mean ocean level has ascended somewhere around 10 and 25 cm over
the previous century. Projections of future rates of expansion in a warming world are 2 to 5 times
these past rates with a mid-range projection of a 0.5 meter ascend by 2100 [11]. [18]Appraisals
are that the world populace presented to beach front flooding would twofold from 46 to 92
million with a 0.5 meter ocean level ascent. In Canada, this would influence groups on every one
of the three coasts [18].
Conclusion-
Individuals are not by and large intrigued by "crises" in typical times what's more, have a
tendency to deny that there could be issues. In an emergency, governments see their part as
"rescuer" or "assistant". Promptly taking after a crisis or emergency, the political level is all the
more positively arranged to rolling out improvements to the crises or hazard administration
framework. Crisis readiness experts who wish to roll out improvements to the crises or hazard
administration framework ought to consider having all the foundation done for coveted changes
ahead of time with the expectation of acquiring endorsement from the political level when

International Journal of Engineering, Science and Mathematics Vol.7 Issue 4, April 2018, ISSN: 2320-0294 Impact Factor: 6.765 Journal Homepage: http://www.ijesm.co.in, Email: [email protected] Double-Blind Peer Reviewed Refereed Open Access International Journal - Included in the International Serial Directories Indexed & Listed at: Ulrich's Periodicals Directory ©, U.S.A., Open J-Gage as well as in Cabell’s Directories of Publishing Opportunities, U.S.A
210 International Journal of Engineering, Science and Mathematics
http://www.ijesm.co.in, Email: [email protected]
conditions are correct - that is, promptly taking after a debacle. There will be extensive financial
and social advantages in expanding and enhancing catastrophe readiness and alleviation
endeavors. As the rising pattern in the recurrence and seriousness of climate related occasions
and the related devastation, harm, damage and death toll unmistakably shows, enhanced
catastrophe readiness and moderation is a basic in a evolving atmosphere. It is currently by and
large acknowledged that some type of progress in our atmosphere is really happening and will
keep on occurring for various decades regardless of arrangements for decreases in nursery gas
outflows and levels. One angle to which we should adjust is the expanding recurrence and
seriousness of great climate occasions and the related characteristic fiascos. There are two
primary purposes behind the basic of adjustment. In the first place, the effects of environmental
change, and subsequently, its peril to society, can be adjusted by adjustments of different sorts.
Second, adjustment is thought to be a vital approach choice or reaction procedure to worries
about environmental change correlative to diminishing net outflow of nursery gases. Maybe now
the significance of the expression "moderate" or "relief" and a portion of the hazard
administration and fiasco administration terms ought to be cleared up, since they are utilized to
some degree diversely by the environmental change and the crisis readiness groups.
Reference
1. Alexander, D. (1993), Natural Disasters, Chapman & Hall, New York, NY.Anderson,
M.B. (1992), ``Metropolitan areas and disaster vulnerability: a consideration for
developing countries'', in Kreimer, A. and Munasinghe, M. (Eds), Environmental
Management and Urban Vulnerability, The World Bank, Washington, DC, pp. 77-92.
2. Aida Idris, Saiful Nizam Che Soh. 2014. Determinants of HADR mission success:
exploring the experience of the Malaysian army. Disaster Prevention and Management:
An International Journal 23:4, 455-468.
3. Burton, I., 1992. Regions and Resilience: An Essay on Global Warming. The Regions
and Global Warming: Impacts and Response Strategies. Schmandt, J., and Clarkson, J.,
eds. Oxford University Press, New York pp. 257-274
4. Comfort, L., Wisner, B., Cutter, S., Pulwarty, R., Hewitt, K., Oliver-Smith, A., Wiener,
J., Fordham, M., Peacock, W. and Krimgold, F. (1999), ``Reframing disaster policy: the
global evolution of vulnerable communities'', Environmental Hazards, No. 1,pp. 39-44.
5. Hulme, M., Raper, S.C.B., and Wigley, T.M.L., 1995. An Integrated Framework to
Address Climate Change (ESCAPE) and Further Developments of the Global and
Regional Climate Modules (MAGICC), Energy Policy 23(4/5), 347-355
6. Jepma, C.J., Asaduzzaman, M., Mintzer, I., Maya, R.S., and Al-Monef, M., 1996. A
Generic Assessment of Response Options, Climate change. 1995: Economic and social
dimensions of climate change. Contributions of Working Group III to the Second
Assessment Report of the Intergovernmental Panel on Climate Change. Bruce, J.P., Lee,
H., and Haites, E., eds., Cambridge University Press, Cambridge, pp. 225-262.
International Journal of Engineering, Science and Mathematics Vol.7 Issue 4, April 2018, ISSN: 2320-0294 Impact Factor: 6.765 Journal Homepage: http://www.ijesm.co.in, Email: [email protected] Double-Blind Peer Reviewed Refereed Open Access International Journal - Included in the International Serial Directories Indexed & Listed at: Ulrich's Periodicals Directory ©, U.S.A., Open J-Gage as well as in Cabell’s Directories of Publishing Opportunities, U.S.A
211 International Journal of Engineering, Science and Mathematics
http://www.ijesm.co.in, Email: [email protected]
7. Jaime Santos-Reyes, Alan N. Beard. 2013. Information Communication Technology and
a Systemic Disaster Management System Model. International Journal of Distributed
Systems and Technologies 2:1, 29-42.
8. Kates, R.W. (1985), ``The interaction of climate and society'', in Kates, R.W., Ausubel,
J.H. and Berberian, M. (Eds), Climate Impact Assessment, Wiley, New York, NY, pp. 3-
36.
9. Liverman, D. (1990), ``Vulnerability to global environmental change'', in Kasperson,
R.E., Dow, K., Golding, D. and Kasperson, J.X. (Eds), Understanding Global
Environmental Change: The Contributions of Risk Analysis and Management,Clark
University, Worcester, pp. 27-44.
10. Osamu Hiroi, Hanshin-Awaji Earthquake and disaster information, Chikyu, No. 13, 1995
11. Pauliina Palttala, Camillo Boano, Ragnhild Lund, Marita Vos. 2012. Communication
Gaps in Disaster Management: Perceptions by Experts from Governmental and Non-
Governmental Organizations. Journal of Contingencies and Crisis Management 20:1,2-12
12. Marcia Perry. 2007. Natural disaster management planning. International Journal of
Physical Distribution & Logistics Management 37:5, 409-433
13. Markham, A., and Malcolm, J.: 1996, ‗Biodiversity and Wildlife, Adapting to Climate
Change: An International Perspective. Smith, J.B., Bhatti, N., Gennady V., Menzhulin,
R., Benioff, M., Campos, B., Rijsberman, J., Budayko, F., M.I., Dixon R.K., eds.
Springer, New York pp. 384-401.
14. Sander Leeuw, Iris F. A. Vis, Sebastiaan N. Jonkman. 2012. Exploring Logistics Aspects
of Flood Emergency Measures. Journal of Contingencies and Crisis Management 20:3,
166-179.
15. S. Mohammad H. Mojtahedi, Bee Lan Oo. 2014. Stakeholders‘ approaches to disaster
risk reduction in built environment. Disaster Prevention and Management: An
International Journal 23:4, 356-369.
16. Vinnie Jauhari, Richa Malhotra, Umashankar Venkatesh. 2009. Pre‐crisis period
planning: lessons for hospitality and tourism. Worldwide Hospitality and Tourism
Themes 1:1, 66-74
17. Weichselgartner, J. and Bertens, J. (2000), ``Natural disasters: acts of God, nature or
society? ± On the social relation to natural hazards'', in Andretta, M.A. (Ed.), Risk
Analysis II, WIT Press, Southampton, pp. 3-12.
18. Zhang, J. et al., (2003), ―Flood disaster monitoring and evaluation in China‖,
Environmental Hazards., Vol. 4, pp. 33-43.

International Journal of Engineering, Science and Mathematics Vol.7 Issue 4, April 2018, ISSN: 2320-0294 Impact Factor: 6.765 Journal Homepage: http://www.ijesm.co.in, Email: [email protected] Double-Blind Peer Reviewed Refereed Open Access International Journal - Included in the International Serial Directories Indexed & Listed at: Ulrich's Periodicals Directory ©, U.S.A., Open J-Gage as well as in Cabell’s Directories of Publishing Opportunities, U.S.A
212 International Journal of Engineering, Science and Mathematics
http://www.ijesm.co.in, Email: [email protected]
SAUSSUREA COSTUS: BOON FOR THE HIMALAYAN COMMUNITIES
(A REVIEW) Tanuja Uniyal
Dr. Manisha Chaudhary
Dr. Kanchan D. Bahukhandi
Dr. Shefali Arora
Abstract Saussurea costus one of the important plant of saussurea genus known as a snow- lotus, from Asteraceae family reported as a
critically endangered species of sub-alpine zone of Himalaya. Mature plants rooted out for its highly precious roots which is in
great demand in local as well as in international market causing rapid deterioration by population number in wild habitat. In situ
and ex situ conservation of species required on front-foot by reserving the forest area in small patches and cultivation on gram
panchayat land. This review paper focusing on the identification to cultivation of the Saussurea costus.
Keywords: Saussurea costus; Asteracea; Endangered
Introduction
The Himalaya ―name of dignity‖. Geographical
position of the Himalaya itself like a bless for India
and due to known as ―six seasons‘ country‖. It covers
many secrets itself with snow very beautifully. It is a
habitat for number of floral and faunal species.
Altitudinally, the Himalaya can be divided into six
eco-climatic zone: Sub-tropical (below the 1500m),
warm temperate (1501-2500m), Cool temperate
(2501-3000m), Sub-Alpine (3001-3500m), Alpine
(3501-5500), Nival (above the 5500m). The
extremely cold climate of the Himalaya creates a
unique identity in each of its species. Due to the
dense forest cover, The Himalayan forest known for
the medicinally important plant varieties. Number of
species of Gymnosperms and Angiosperms reported
from this region. Many fabulous and rare plant
species endemic to the Himalaya and serves as the
crude drugs or as the parts of different health care
system. Extremely harsh conditions help in develop
secondary metabolites to survive in such conditions.
However, to fulfill the requirement of increased
human population, many species are going to be
demolish and under threatened category. One of the
endangered species of Himalayan forest is Saussurea
costus from Asteraceae Family.
About Asteraceae Family
The word Aster means ‗compact, flowering heads of
the plants contains florets vary from species to
species. This family also known as ‗Compositae‘.
The Asteraceae family (Sunflower family) is one of
the largest plant family found almost throughout the
world containing the greatest number of species with
about 24,000 – 30,000 species and 1000 genera out of
which approximately 177 genera and 1000 species
found in India. Every life forms found in this family
such as annual, biennial, perennial herbs, shrubs,
undershrubs, climber, trees and some aquatic also.
There are number of plants of this family found very
useful in traditional health care system.
Genus – Saussurea
Saussurea genus commonly known as saw-wort and
snow lotus. It is a genus with 250-300 species and
found in alpine region of Himalaya. Most of the
exotic species of Himalayan region come under this
genus such as- Saussurea obvallata commonly known
as brahmkamal, Saussurea abrormis, Saussurea
bhutkesh, Saussurea linearifolia, Saussurea
candolleana, Saussurea albescens etc.
Taxonomic Details
Kingdom :- Plantae
Phylum :- Tracheophyta
Class:- Magnoliopsida
Order:- Asterales
Family:- Asteraceae
Botanical/Scientific Name:- Saussurea costus
Synonyms:- Aucklandia costus
Vernacular name:- Kuth
Parts Used:- Root of the mature plants used in many
formulations or as a crude drug by different health
care system or by local inhabitants.
Distribution:- Native to India, Endemic to
Himalayan region such as Jammu and Kashmir,
Himachal Pradesh, Arunachal Pradesh, Sikkim,
Uttarakhand and Pakistan.
Habitat:-S. costus is a species of cool temperate-sub
alpine forest of Himalaya with altitudes ranging from
3001-3500m. It is found in slopes of mountains.
Flowering and Fruiting:- During August-
September
International Journal of Engineering, Science and Mathematics Vol.7 Issue 4, April 2018, ISSN: 2320-0294 Impact Factor: 6.765 Journal Homepage: http://www.ijesm.co.in, Email: [email protected] Double-Blind Peer Reviewed Refereed Open Access International Journal - Included in the International Serial Directories Indexed & Listed at: Ulrich's Periodicals Directory ©, U.S.A., Open J-Gage as well as in Cabell’s Directories of Publishing Opportunities, U.S.A
213 International Journal of Engineering, Science and Mathematics
http://www.ijesm.co.in, Email: [email protected]
Seed Collection:- During September- October
Population Structure
As the mature plant is taken out for its root, S. costus
is a critically endangered species in its natural habitat
and mentioned in Appendix I of CITES (the
Convention on International Trade in Endangered
Species of Wild Fauna and Flora) after the
amendments of 1985. It is a drug of export quality
and exported to china, japan and other European
countries. After the depletion in its wild habitat,
commercial cultivation had been started in 1930-40
in Jammu and Kashmir, lahul-spiti and Garhwal as its
natural habitat.
Botanical Description
S. costus is Herbaceous plant, 1-3m in height, erect,
robust, pubescent with a simple stem. Leaves thin
membranous, irregular margins, glabrate in lower
surface, basal leaves large while upper leaves small
with short petioled. Stalkless head of flower, axillary
or terminal; bluish-purple in color, hard and rounded,
flowers raise in cluster of 2-5; fimbriate anther tail.
Root stout, inverted cone shaped up to 40-60 cm
long, greyish brown with characteristic odour.
Ethnobotanical Description
The inhabitants of Himalayan region depend on the
forest products from the ancient time. The traditional
knowledge is inherited to cure different diseases.
Tribals of the Himalaya used the root of S. costus to
cure the asthma, cough, cholera, leprosy, rheumatism,
stomachache, toothache, typhoid fever, hair wash,
diarrhoea, dysentery, nervous disorders, irregular
menstrual problems etc. either as a single drug or in
combination with another drugs. It is also used as
deodorant, antiseptic, liver malfunctioning, high
blood pressure, leaves used to protect wollen clothes,
in some regions. Besides these, different Indian
system of medicine like Ayurveda, Siddha and Unani
and Chinese system used this plant as a main
composition of drugs.
Medicinal Properties
S. costus is used as an Anti-inflammatory,
Anticancer, Antimicrobial, Antiparasitic, Anti-ulcer,
Imunomodulator, Hepatoprotective etc. in traditional
as well as advance system of drug delivery. Roots of
S. costus contains ‗saussurine‘, a medicinally active
alkaloid. Essential oil of S. costus is in high demand
for different formulation and basic preparations.
Phyto-constituents of S. Costus
Phyto-constituents of any plants are the composition
of ingredients found in that plants. Saussurea costus
is rich in Costunolide, dehydrocostuslactone, costic,
palmitic, linoleic acids, β-sitosterol,
sesquiterpenoides, Saussureal, steroids,
pregnenolone, daucosterol, syrine, a lignin glycoside,
1-hydroxypinoresinol-1-β-d-glucopyranoside, 12-
octadecadienoic acid, (Z,Z)-9,12-octadienoic acid-2-
hydroxy1,3-propanedinyl ester, lappalone and 1, 6-
dihydroxycostic acid, Saussureamines A, B, C, D and
E, dihydrocostunolide and sesquiterpene aldehyde.
Cultivation of S.costus
Cultivation of S.costus required Sandy- loam soil
with high moisture % and rich in organic carbon.
Germination and survival of seedlings is best with the
climate of cool temperate to sub-alpine region of the
Himalaya. The planting can be done by direct and
nursery method but productivity is higher by nursery
preparation. The seeds aresown in April or May in
nursery. When the seedlings are almost 15 cm long, it
is transplanted in field. 5-6 irrigations are sufficient
between May-September. Although the land should
be irrigated, when seeds are sprouting. It is very
important in cultivation of S. costus that it should be
grow without chemical fertilizers and pesticides as
the species medicinally important in market.
Harvesting Usually done in 2-3 years until well-
grown mature root tubers are developed. However,
yield is obtained from 3 years old crop. Root is
harvested in early September or October or early
spring. The roots should be cleaned with waterand
dried for further processing. 2-3 quintal of dry
tuberous roots can be obtained after 2-3 years of
planting. The market rate is Rs.100-150 per kg of dry
roots orvaries accordingtoquality and market
availability. A marginal farmer can earn a good
income by cultivation of S. costus. Intercropping also
can be done with small duration crop.
Conclusion
The genus saussurea is endemic to the Himalayan
region. Species of this genus play vital role in
phytosociological attributes of Himalayan forest.
Extinction of this genus in wild habitat can show
severe effect on biodiversity of the Himalayan
region. To fulfill the requirement of increasing
population it is better to cultivate them in agricultural
land. Gram panchayat can play an important role in
Ex situ conservation of the S.costus. by identification
of the species, assessment of life cycle, patching in
adjacent forest.
International Journal of Engineering, Science and Mathematics Vol. 7 Issue 4, April 2018 ISSN: 2320-0294 Impact Factor: 6.765 Journal Homepage: http://www.ijesm.co.in, Email: [email protected] Double-Blind
Peer Reviewed Refereed Open Access International Journal - Included in the International Serial Directories Indexed & Listed at: Ulrich's Periodicals Directory ©, U.S.A., Open J-Gage as well as in Cabell’s Directories of Publishing Opportunities, U.S.A
214 International Journal of Engineering, Science and Mathematics
http://www.ijesm.co.in, Email: [email protected]
References Akhtar, M.S., Riffat, S., 1991. Field trail of Saussurea lappa roots against nematodes and Nigella sativa seeds against
cestodes in children. Journal of Pakistan Medical Association 41, 185–187.
Akshay KR; SudharaniN; Anjali K B; Deepak T M, 2014. Biodiversity and strategies for conservation of rare,
endangered and threatened medicinal plants. Research and Reviews: Journal of Pharmacognosy and Phytochemistry;
vol.2; Issue 3; July- September
Anonymous, 2000. Report of the Task Force on Conservation and Sustainable Use of Medicinal Plants. Planning
Commission, Government of India, New Delhi, India.
Bapalal, G., 1998. Nighantu Adarsh, vol. I. Chaukhambha Bharti Academy, Varanasi, pp.744–745.
Bork, P.M., Schmitz, L.M., Kuhnt, M., Escher, C., Heinrich, M., 1997. Sesquiterpene lactone containing Mexican Indian
medicinal plants and pure sesquiterpene lactones as potent inhibitors of transcription factor NF- B. FEBS Letters 402,
85–90.
Bose, B.C., Saifi, A.Q., Vijayvargiya, R., Sharma, S.K., 1961. Some aspects of phytochemical and pharmacological study
of Saussurea lappa. Journal of Pharmaceutical Science 50, 679–681.
Bremer, K., 1994. Asteraceae-Ladistic and Classification. Timber Press, Portland,Oregon, U.S.A.
Bremner, P., Heinrich, M., 2005. Natural products and their role as inhibitors of the pro-inflammatory transcription factor
NF- B. Phytochemistry Reviews 4, 27–37.
Bruchhausen, F.Y., Dannhardt, G., Ebel, S., Frahm, A.W., Hackenthal, E., Holzgrabe, U., 1994. Hagers Handbuch der
Pharmazeutischen Praxis. Band 9,
Chaudhary, H.J., Rao, R.R., 2000. Trans-Himalaya: a vast genetic resource centre of less known economic plants. Indian
Journal of Forestry 23, 446–456.
Cho, J.Y., Kim, A.R., Jung, J.H., Chun, T., Rhee, M.H., Yoo, E.S., 2004. Cytotoxic and pro-apoptotic activities of
cynaropicrin, a sesquiterpene lactone, on the viability of leukocyte cancer cell lines. European Journal of Pharmacology
92, 85–94.
Cho, J.Y., Baik, K.U., Jung, J.H., Park, M.H., 2000. In vitro anti-inflammatory effect of cynaropicrin, a serquiterpene
lactone, from Saussurea lappa. European Journal of Pharmacology 398, 399–407.
Chopra, R.N., Nayar, S.L., Chopra, I.C., 1956. Glossary of Indian Medicinal Plants. Publication and Information
Directorate, CSIR, New Delhi, India.
Clarke, C.B., 1876. Composite indica descriptae et secus genera Benthamii Ordinate. Thacker, Spink and Co., Calcutta,
India.
Dale, E., Davis, M., Faustman, D.L., 2006. A role for transcription factor NF B in autoimmunity: possible interactions of
genes, sex, and the immune response. Advances in Physiology Education 30, 152–158.
Damre, A.A., Damre, A.S., Saraf, M.N., 2003. Evaluation of sesquiterpene lactone fraction of Saussurea lappa on
transudative, exudative and proliferative phases of inflammation. Phytotherapy Research 17, 722–725.
Farooq, S., Pathak, G.K., 1998. A comparative study of in vivo antimicrobial activity of total solvent extracts of some
medicinal plants with Asawa and Arishta preparation. Journal of Non Timber Forest Products 5, 79–81.
Gokhale, A.B., Damre, A.S., Kulkarni, K.R., Saraf, M.N., 2002. Preliminary evaluation of anti-inflammatory and anti-
arthritic activity of S. lappa, A. speciosa and A. asoara. Phytomedicine 9, 433–437.
Harish Singh; Pushpi Singh; Tariq Husain. Medicinal Plant diversity in newly reported sacred grove Pithoragarh dist.,
Uttarakhand. Indian Forester. 2011;2: 1005-1008.
Huntose, Y., Pandey, K.K., Dwivedi, M., 1999. Response of herbal drug (kustha) on Psychological and neurobehavior
changes during labour. In: South-East Asian Seminar on Herbs and Herbal Medicines, Patna, India, January 16–19, pp.
63–68.
Jain, S.K., 1991. Dictionary of Indian Folk Medicine and Ethnobotany. Deep Publication, India, pp. 160–161.
Jeong, S.J., Itokawa, T., Shibuya, M., Kuwano, M., Ono, M., Higuchi, R.,Miyamoto, T., 2002. Costunolide, a
serquiterpene lactone from Saussurea lappa inhibits the VEGER KDR/FLK-1 signaling pathway. Cancer Letter 187, 129–
133.
Jin, M., Lee, H.J., Ryu, J.H., Chung, K.S., 2000. Inhibition of LPS-induced NO Productioon and NF-kappa B activation
by a serquiterpene from Saussurea lappa. Archives of Pharmacological Research 23, 54–58.
Jung, I.H., Kim, Y., Lee, Co., Kang, S.S., Park, J.H., Im, K.S., 1998. Cytotoxic constituents of Saussurea lappa. Archives
of Pharmacological Research 21, 153–156.
Kala, C.P., Dhyani, P.P., Sajwan, B.K., 2006. eveloping the medicinal plants sector in northern India: challenges-and
opportunities. Journal of Ethnobiology and Ethnomedicine 2, 32–47.
Kala, C.P., Manjerkar, N., 1999. Ethnomedicobotany of Indian Trans Himalaya. A case study from Spiti. Journal of
Econonomic and Taxonomic Botany 23, 177–183.
Kalsi, P.S., Kumar, S., Jawanda, G.S., Chhabra, B.R., 1995. Guaianolides from Saussurea lappa. Phytochemistry 40,
1713–1715.

International Journal of Engineering, Science and Mathematics Vol. 7 Issue 4, April 2018 ISSN: 2320-0294 Impact Factor: 6.765 Journal Homepage: http://www.ijesm.co.in, Email: [email protected] Double-Blind
Peer Reviewed Refereed Open Access International Journal - Included in the International Serial Directories Indexed & Listed at: Ulrich's Periodicals Directory ©, U.S.A., Open J-Gage as well as in Cabell’s Directories of Publishing Opportunities, U.S.A
215 International Journal of Engineering, Science and Mathematics
http://www.ijesm.co.in, Email: [email protected]
Kang, J.S., Yoon, Y.D., Lee, K.H., Park, S.K., Kim, H.M., 2004. Costunolide inhibits interleukin-1 expression by down-
regulation of AP-1 and MAPK activity in LPS-stimulated RAW 264.7 cells. Biochemical and Biophysical Research
Communications 313, 171–177.
Kang, S.S., Kim, J.S., Chi, H.J., Chang, S.Y., Ha, K.W., 1999. Isolation and quantitative determination of costunolide
from Saussurea root. Korean Journal of Pharmacognosy 30, 48–53.
Kapoor, L.D., 2001. Handbook of Ayurvedic Medicinal Plants. CRC Press, Washington, D.C, pp. 299–300.
Rajkumar MH; Sringeswara AN; Rajanna MD. 2011, Ex-situ conservation of medicinal plants at University of
Agricultural Sciences, Bangalore.
Uniyal; Uniyal RC; Jain MR; Jain P 2000. Cultivation of Medicinal Plants in India: A reference book. New Delhi:
TRAFFIC India and WWF India.
Vinod Kumar Bisht; Vineet Purohit, 2010 Medicinal and Aromatic Plants Diversity of Asteraceae in Uttarakhand; Nature
and Science
International Journal of Engineering, Science and Mathematics Vol. 7 Issue 4, April 2018 ISSN: 2320-0294 Impact Factor: 6.765 Journal Homepage: http://www.ijesm.co.in, Email: [email protected] Double-Blind
Peer Reviewed Refereed Open Access International Journal - Included in the International Serial Directories Indexed & Listed at: Ulrich's Periodicals Directory ©, U.S.A., Open J-Gage as well as in Cabell’s Directories of Publishing Opportunities, U.S.A
216 International Journal of Engineering, Science and Mathematics
http://www.ijesm.co.in, Email: [email protected]
Assessment of Human Behaviour during accidental fire Hazards
(Bahukhandi Kanchan Deoli)
(Sharma Madhuben)
(Sagarkumar Vaghasia )
Abstract
Fire has been affecting humans in various ways throughout the history but a
common person know very less about the actual nature of fire or in most of
the cases we had poor understanding about human behaviour in the
situations of fire. The objectives of this research paper is to study and to
characterise human behaviour in the situation of fire which will be helpful
in giving evacuation models.
The questionnaire have been prepared and primary data were analysed to
determine the characteristics of the group. It was found that the chances of
panic were high in situations of fire. Respondents who were having fire
safety training had taken more precaution during investigation phase but
after confirming the changes in fire trend more aggressiveness had been
shown by the people to fight against the fire. Sense of helping others in
situations of fire was predominant, but it was found relatively higher in
feminine gender, old people with fire who got appropriate fire safety
training.
Keywords:
Fire Safety, Hazards, Human Behaviour
Copyright © 2018 International Journals of Multidisciplinary Research Academy. All rights reserved.
Author correspondence:
Kanchan Deoli Bahukhandi Asst. Professor, HSE Department University of Petroleum and Energy Studies
1. Introduction (10pt) Fire have killed many people for centuries, destroying part or even whole cities. Studies in the field of human
behaviour in case of fire had started in a true sense during 1960-70 [1, 2, 3, 4, 5, 6, 7, 8]. Human behaviour
can be described as a manner in which a person conducts himself. It refers to the full range of physical and
emotional behaviours due to which humans engage socially, biologically, intellectually, etc. and are
influenced by authority, culture, emotions, values, attitudes, ethics, rapport, coercion, persuasion and/or
genetics (APA psychology glossary). Each human has a distinct behaviour, which affects the decisions taken
by individual in a particular situation. In situations of fire it is generally observed that all occupants of the
Doctorate Program, Linguistics Program Studies, Udayana University Denpasar, Bali-Indonesia (9 pt) STIMIK STIKOM-Bali, Renon, Depasar, Bali-Indonesia English Language Specialist, Oller Center, Carriage House, 2nd Floor, California, USA

International Journal of Engineering, Science and Mathematics Vol. 7 Issue 4, April 2018 ISSN: 2320-0294 Impact Factor: 6.765 Journal Homepage: http://www.ijesm.co.in, Email: [email protected] Double-Blind
Peer Reviewed Refereed Open Access International Journal - Included in the International Serial Directories Indexed & Listed at: Ulrich's Periodicals Directory ©, U.S.A., Open J-Gage as well as in Cabell’s Directories of Publishing Opportunities, U.S.A
217 International Journal of Engineering, Science and Mathematics
http://www.ijesm.co.in, Email: [email protected]
building decided to evacuate immediately. This behaviour is well known, but there is no significant research
done in the field of human behaviour and the type of choices taken in such situations.
Some of the evacuation models have tried to consider this delay in the evacuation time by allowing the
programmer to introduce the delay at the initiation of the evacuation simulation. The time delay introduced is
based on the understanding and assumptions of the programmer, not based on the scientific data and evidence
for a particular situation. For quantifying the time delay and incorporating it in the simulation models, it is
essential to understand behaviour of the occupants. These behavioural patterns need to be quantified and
incorporated in evacuation models for estimating the time delay. Researches in the field of human behaviour
has shown that the actions performed by any individual in a specific situation is based on his behavioural
decision making process, and not merely a coincidence or a result of change in environment by the situation
only [9]. This decision making process is unique for every individual as all the individuals have a different
behavioural pattern. The results can be same for many individual persons but the deduction to the decision by
the process will be unique. The process of the decision making can be broadly divided in four stages 1)
Perceiving the clues, 2) Interpreting the gathered information and risk evaluation, 3) Making the decision
about the actions based on the interpretations, and 4) performing the action [10].
The stages of the decision making are influenced by a numerous factors depending on the individual,
surrounding environment, past experience, type of emergency etc. Stage 1 of perceiving cues is basically
receiving of the information from various available sources. The receiving data has very limited option as the
modes of getting information of fire is limited e.g. smoke, rising temperature, alarm, instruction from other
people etc. Stage 2 of the process is interpreting the information and results in either ignoring which will
delay the process or exploring, which in result will give further information on the situation. As we move on
to the stage 3 the possibilities of the decision is dependent on the individual behaviour. The person make an
analysis of the situation which decide the future course of action depending on the situation. The person can
instruct others if he has adequate knowledge. Stage 4 of the process is how the person will perform the action
after he has come to a decision like evacuation procedure, help in fire fighting, warn other about the situation
or wait for others to rescue him.
2. Research Method The study consist of collection of primary data, collection and characterization of samples in the form of
questionnaire, compilation of data and report. The study of behaviour was done using a questionnaire which
was prepared in google-forms and was circulated on various social media platforms. The google form
included various questions in which people had responded. People replied to the questionnaire and the
responses were recorded in a excel sheet. The collected from these responses was segregated and analysed to
determine the characteristics and behaviour of the respondents.
3. Results and Analysis
3.1 Overall characterization
The study consist of collection of samples where questions were answered by the total 334 respondents
consisting 11% of women and 89% of men. They were between the age of 16 and 63 years with an average
of 30 years old. It was found that 34% person were having training in fire safety. More than 80% of the
respondents had university education which exceeded the national scenario. It was found that 34 % of the
respondents were unaware of the evacuation plans of the buildings where they work or live. Considering the
ability of the respondents to recognise the emergency exit was found that 91% state that they were capable
of identifying it, but that percentage drops considerably when they were asked about the buildings they
attend, because only 67% declare to have the information regarding the same.
3.2 Influence on the reactions of the relation of the respondents with the building
It was assumed that the behaviour of the occupants in a fire incident would have been different if they were
in other building except where they live or work, and the data collected verifies the assumption, as 27%

International Journal of Engineering, Science and Mathematics Vol. 7 Issue 4, April 2018 ISSN: 2320-0294 Impact Factor: 6.765 Journal Homepage: http://www.ijesm.co.in, Email: [email protected] Double-Blind
Peer Reviewed Refereed Open Access International Journal - Included in the International Serial Directories Indexed & Listed at: Ulrich's Periodicals Directory ©, U.S.A., Open J-Gage as well as in Cabell’s Directories of Publishing Opportunities, U.S.A
218 International Journal of Engineering, Science and Mathematics
http://www.ijesm.co.in, Email: [email protected]
(Figure 1) of the respondents said they would have the same behaviour, while only 67% (Figure 1) stated
that it would be different if they were in their own building.
3.3 Knowledge of the evacuation plans and emergency exitsIt was found that 211 (63%) (Figure 3) responded positively and were having the knowledge of the evacuation plans of the buildings that they live in or work
On the other hand it was found that 91% (Figure 3) said that in case of emergency respondent identify the
emergency exits, that percentage drops significantly when considering the knowledge of evacuation plan of
respondents in their building they attend, since only 63% declared to have this knowledge. Preference of exit
in situation of fire was asked and 90% (Figure 4) of the respondents spotted for the emergency exit while
only 5% choose for the regular path of access. Respondents were also asked to give preference of exits based
on the risk factor involved, during the fire situation. It was clearly observed that respondents preferred ―Exit
that are far and safe‖ with 83% in comparison to (Figure 5) ―Exits that are close but high risk‖ with only
13%, while 4% preferred to ―Stay where you are and wait for others‖.
3.4 Chance of panic referred by the respondents
Analysis of various incidents showed that the occurrence of panic is very common and the effects of panic
are widespread, but some researchers believe that is not the case in most of the situations [11]. According to
the data obtained from the survey, 79% (Figure 6) of the respondents believe that in a fire situation there will
be chances of panic.It was found that case of panic in such situation was always been present and ther
researches also support the chances of panic in case of fire, and that it is mostly irrelevant of other
characteristics of the human behaviour [12]
3.5. Spirit of helping others in a situation of emergency
In situations of fire helping others is very crucial. especially when considering. It was revealed that
81%emploee showed intrest in helping disabled and aged occupants (figure 7). This additional analysis
showed that 76% of the respondents with fire safety training consider that there was spirit of helping others in
case of fire situations. While 83.3% female respondents, and 76% of male respondents having fire training
considered the spirit of helping others. Considering the education qualification of respondents it can be seen
that 81% of the graduates and higher qualification believe in helping others.
3.7 Ways to know about the fire referred by the respondents
In consisted of recognizing how people come to know about the occurrence of fire, and how they become
alert about the presence of the fire. From the analysis it was found that the ―Smell of smoke‖ about 47%,
followed by the ―Alarm‖, with 26%, while the third was concerned with the ―Visualization of smoke‖, with
19%, the ―Strange noises‖ and ―Unusual movements of the occupants‖ were both with 3% and ―Others‖, with
2% (figure 8). Analysing the data collected from respondents about the three most common responses from
the overall analysis, based on various characteristics of the respondents. It came found that the most common
answers were same among masculine gender, but it differs for females as ―Smell of smoke‖, with 42.1%,
followed by the ―Visualization of smoke‖, with 39.4%, while the third was concerned ―Alarm‖, with 15.7%.
Also it is not verified when the analysis is done considering respondents having the training, revealing a
deviation in the results of the analysis in the number of people responding to ―Smell of smoke‖, decreased to
35%, followed by the ―Alarm‖, increasing to 35%, while ―Visualization of smoke‖, decreased to 13%, the
―Unusual movements of the occupants‖ and ―Strange noises‖, both had slight increase to 4.3%. It should also
be taken into account that even with changes in response there was no change of the sequence of the factors
when considering the trained people with rest of the group.
3.8. Action of the respondents to the alarm
Identifying the reactions of the occupants after being aware that something unusual is going on, not knowing
if it corresponds or not to a fire. From the analysis of the responses it was observed that 27% refer

International Journal of Engineering, Science and Mathematics Vol. 7 Issue 4, April 2018 ISSN: 2320-0294 Impact Factor: 6.765 Journal Homepage: http://www.ijesm.co.in, Email: [email protected] Double-Blind
Peer Reviewed Refereed Open Access International Journal - Included in the International Serial Directories Indexed & Listed at: Ulrich's Periodicals Directory ©, U.S.A., Open J-Gage as well as in Cabell’s Directories of Publishing Opportunities, U.S.A
219 International Journal of Engineering, Science and Mathematics
http://www.ijesm.co.in, Email: [email protected]
―Investigating what was happening‖; while 26% indicate ―Warn others‖ followed by ―leave the place on his
own initiative‖ with 25% and 18% preferred to ―Contact authorities like fire brigade‖, then finally to ―Wait to
be told what you should do‖ and ―Continue to do what he was doing‖ both with 2% (figure 9). Upon detailed
analysis of the data on the basis of age, it was verified that people above the average age of 29 years
preferred ―Investigating what was happening‖ with 29% followed by ―Warning others‖ with 23% and closely
followed by at the third position ―Leave the place on your own initiative‖ with 22%. 19% respondents
preferred to
―Contact authorities like Fire brigade‖ and ―Wait to be told what you should do‖ with 7%. No person in the
above average age group preferred to ―Continue to do what you were doing‖. In contrast to this people below
average age of 29 preferred to ―Warn others‖ and ―Leave the place on your own initiative‖ with 27%,
followed by ―Investigating what has happened‖ with 26% and ―Contact to authorities like Fire brigade‖ with
17%. ―Continue to do what you were doing‖ and ―Wait to be told what you should do‖ with 2% & 1%
respectively. It was observed that the respondents above average age, preferred to investigate the situation
due to long experience, but at the same time it was found that the percentage of people preferring to wait for
instruction to proceed further had also been increased.
Taking fire training into consideration it had verified that there was a considerable increase in the
respondents preferring to ―Leave the place on your own initiative‖ by 6% while ―Investigating what was
happening‖ decreased by 7%, and no significant difference in other choices. It was found that respondents
with fire training would leave the place and reduce casualties, instead of trying to investigate and put more
lives in danger, as generally instructed action to be taken upon hearing the alarm.
3.9 Interpretation of the alarm signal
From the general analysis of the data received from the respondents, it has been observed that 31% of the
respondents preferred ―In the uncertainty it‘s considered as fire‖ followed by ―Real fire‖ with 28% and
―Exercise of Evacuation‖ with 24%. ―False alarm‖ and ―Others‖ are both with 7% and 3% with ―Operations
of Maintenance‖ (figure 10). Evaluating the influence of age, when considering the respondents below the
average age of the group there was no considerable change in the responses. But in case of respondents above
the average age of group, it was found that ―Exercise of Evacuation‖ was first with 30%, followed by ―In the
uncertainty it‘s considered as fire‖ and ―Real fire‖ with 28% and 27% respectively. ―Other‖ with 6%,
―Operations of Maintenance‖ with 5% and lastly ―False Alarm‖ with 4%. It can be concluded that there is
significant change in the behaviour of respondents above average age of group, in interpreting the signal of
the alarm, but there is no significant change of interpretation of alarm signal when considering respondents
with age below the average age of group, in comparison with the general interpretation of the group.
Only taking into account respondents with fire training ―Exercise of Evacuation‖ and ―In the uncertainty it‘s
considered as fire‖ are both with 29%, but with increase of 5% and decrease of 2% respectively. Percentage
of respondents with ―False Alarm‖ increased by 4% to 11% while no significant change in the response was
observed for ―Operations of Maintenance‖ and ―Other‖.
3.10 Reactions of respondents due to the presence of smoke
To understand the effects of low visibility on behaviour of occupants, due to smoke, on the selection of
evacuation pathways it was found that 78% of respondents had most frequent reaction of ―Try another way
to get out of the building‖, followed by ―Investigate to fight the fire‖ was 26%, all other responses were
included in residual percentage (figure 11). Respondents having undergone fire safety training had different
reactions, when compared to the analysis of overall responses. 56% of those with fire safety training gave the
response that they will ―Try another way to get out of the building‖, while on second place with 32%
respondents chose to ―Investigate to fight the fire‖. When considering respondents without fire safety
training, the most given reply was to ―Try another way to get out of the building‖, with 70%, and in second
place ―Investigate to fight the fire‖, with 23%.
3.11 Reactions by respondents when faced with direct contact to the fire
To evaluate the difference in behaviour of respondents with respect to coming directly in contact with fire in
comparison to hearing an alarm, see smoke, or been warned by others, they were asked a question on the
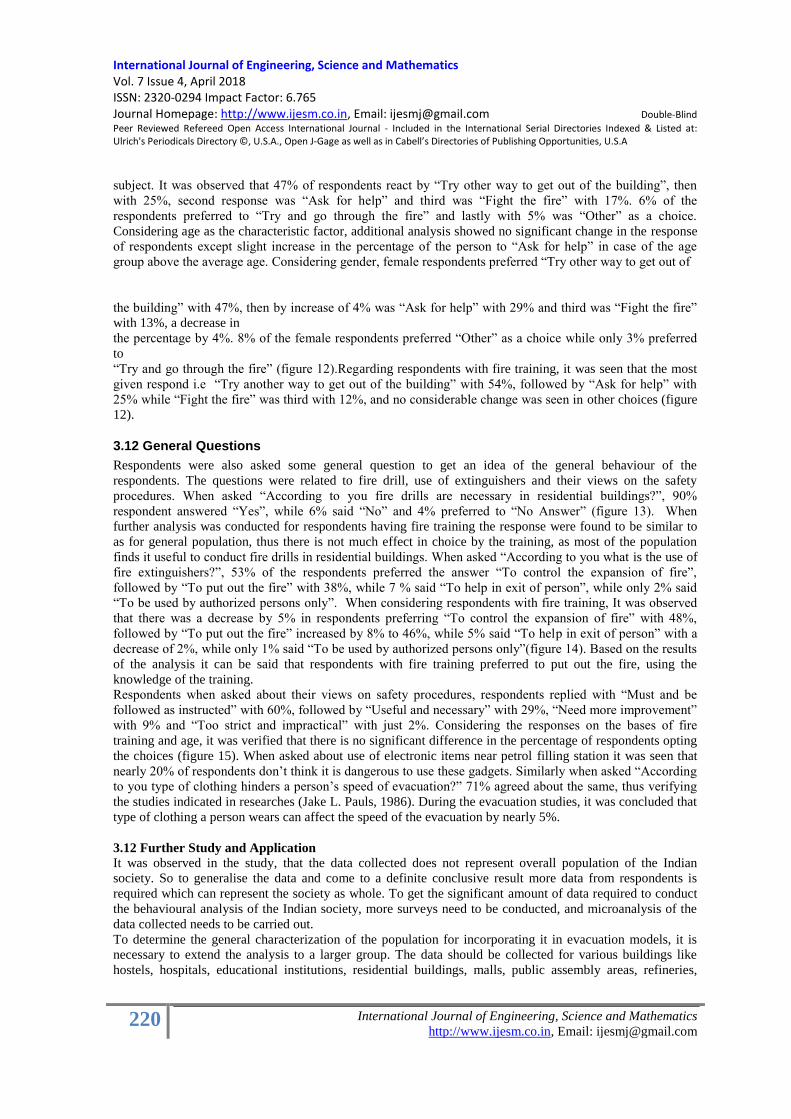
International Journal of Engineering, Science and Mathematics Vol. 7 Issue 4, April 2018 ISSN: 2320-0294 Impact Factor: 6.765 Journal Homepage: http://www.ijesm.co.in, Email: [email protected] Double-Blind
Peer Reviewed Refereed Open Access International Journal - Included in the International Serial Directories Indexed & Listed at: Ulrich's Periodicals Directory ©, U.S.A., Open J-Gage as well as in Cabell’s Directories of Publishing Opportunities, U.S.A
220 International Journal of Engineering, Science and Mathematics
http://www.ijesm.co.in, Email: [email protected]
subject. It was observed that 47% of respondents react by ―Try other way to get out of the building‖, then
with 25%, second response was ―Ask for help‖ and third was ―Fight the fire‖ with 17%. 6% of the
respondents preferred to ―Try and go through the fire‖ and lastly with 5% was ―Other‖ as a choice.
Considering age as the characteristic factor, additional analysis showed no significant change in the response
of respondents except slight increase in the percentage of the person to ―Ask for help‖ in case of the age
group above the average age. Considering gender, female respondents preferred ―Try other way to get out of
the building‖ with 47%, then by increase of 4% was ―Ask for help‖ with 29% and third was ―Fight the fire‖
with 13%, a decrease in
the percentage by 4%. 8% of the female respondents preferred ―Other‖ as a choice while only 3% preferred
to
―Try and go through the fire‖ (figure 12).Regarding respondents with fire training, it was seen that the most
given respond i.e ―Try another way to get out of the building‖ with 54%, followed by ―Ask for help‖ with
25% while ―Fight the fire‖ was third with 12%, and no considerable change was seen in other choices (figure
12).
3.12 General Questions
Respondents were also asked some general question to get an idea of the general behaviour of the
respondents. The questions were related to fire drill, use of extinguishers and their views on the safety
procedures. When asked ―According to you fire drills are necessary in residential buildings?‖, 90%
respondent answered ―Yes‖, while 6% said ―No‖ and 4% preferred to ―No Answer‖ (figure 13). When
further analysis was conducted for respondents having fire training the response were found to be similar to
as for general population, thus there is not much effect in choice by the training, as most of the population
finds it useful to conduct fire drills in residential buildings. When asked ―According to you what is the use of
fire extinguishers?‖, 53% of the respondents preferred the answer ―To control the expansion of fire‖,
followed by ―To put out the fire‖ with 38%, while 7 % said ―To help in exit of person‖, while only 2% said
―To be used by authorized persons only‖. When considering respondents with fire training, It was observed
that there was a decrease by 5% in respondents preferring ―To control the expansion of fire‖ with 48%,
followed by ―To put out the fire‖ increased by 8% to 46%, while 5% said ―To help in exit of person‖ with a
decrease of 2%, while only 1% said ―To be used by authorized persons only‖(figure 14). Based on the results
of the analysis it can be said that respondents with fire training preferred to put out the fire, using the
knowledge of the training.
Respondents when asked about their views on safety procedures, respondents replied with ―Must and be
followed as instructed‖ with 60%, followed by ―Useful and necessary‖ with 29%, ―Need more improvement‖
with 9% and ―Too strict and impractical‖ with just 2%. Considering the responses on the bases of fire
training and age, it was verified that there is no significant difference in the percentage of respondents opting
the choices (figure 15). When asked about use of electronic items near petrol filling station it was seen that
nearly 20% of respondents don‘t think it is dangerous to use these gadgets. Similarly when asked ―According
to you type of clothing hinders a person‘s speed of evacuation?‖ 71% agreed about the same, thus verifying
the studies indicated in researches (Jake L. Pauls, 1986). During the evacuation studies, it was concluded that
type of clothing a person wears can affect the speed of the evacuation by nearly 5%.
3.12 Further Study and Application
It was observed in the study, that the data collected does not represent overall population of the Indian
society. So to generalise the data and come to a definite conclusive result more data from respondents is
required which can represent the society as whole. To get the significant amount of data required to conduct
the behavioural analysis of the Indian society, more surveys need to be conducted, and microanalysis of the
data collected needs to be carried out.
To determine the general characterization of the population for incorporating it in evacuation models, it is
necessary to extend the analysis to a larger group. The data should be collected for various buildings like
hostels, hospitals, educational institutions, residential buildings, malls, public assembly areas, refineries,

International Journal of Engineering, Science and Mathematics Vol. 7 Issue 4, April 2018 ISSN: 2320-0294 Impact Factor: 6.765 Journal Homepage: http://www.ijesm.co.in, Email: [email protected] Double-Blind
Peer Reviewed Refereed Open Access International Journal - Included in the International Serial Directories Indexed & Listed at: Ulrich's Periodicals Directory ©, U.S.A., Open J-Gage as well as in Cabell’s Directories of Publishing Opportunities, U.S.A
221 International Journal of Engineering, Science and Mathematics
http://www.ijesm.co.in, Email: [email protected]
industries etc. The behavioural pattern of the any individual can vary depending on the location, mental state,
physical capabilities, previous exposure etc. The data required can be collected by conducted by surveying
occupants of various such buildings or facilities. To characterize the behavioural pattern of the occupants,
surveys, drills etc. should be conducted for various occupants in various buildings. The behaviour of different
occupants in similar buildings will be different even though type of work, layout etc. as same. Thus
collecting the data for various buildings and facilities with different occupants will provide a general
characterization of the occupants in that particular type of environment.The behaviour can be quantified in
various parameters as defined above. These parameters will act as input for the evacuation models for the
building, in the designing phase. This will help in optimization of resources required for safe evacuation of
the building, as well as estimation of the evacuation time including the time delay due to occupant behaviour.
Fig.1. Difference in reaction if in own building, Figure 1 Information of evacuation plan and emergency exits
Figure 2 : Identify the emergency exitsFigure 3 : Preference of exit in case of fire
Yes67%
No27%
No Answer
6%
Yes63%
No32%
No Answer
5%
Yes91%
No6%
No Answer
3%
90%
5% 5%Emergency Exit
Regular access and egress
Find another way out
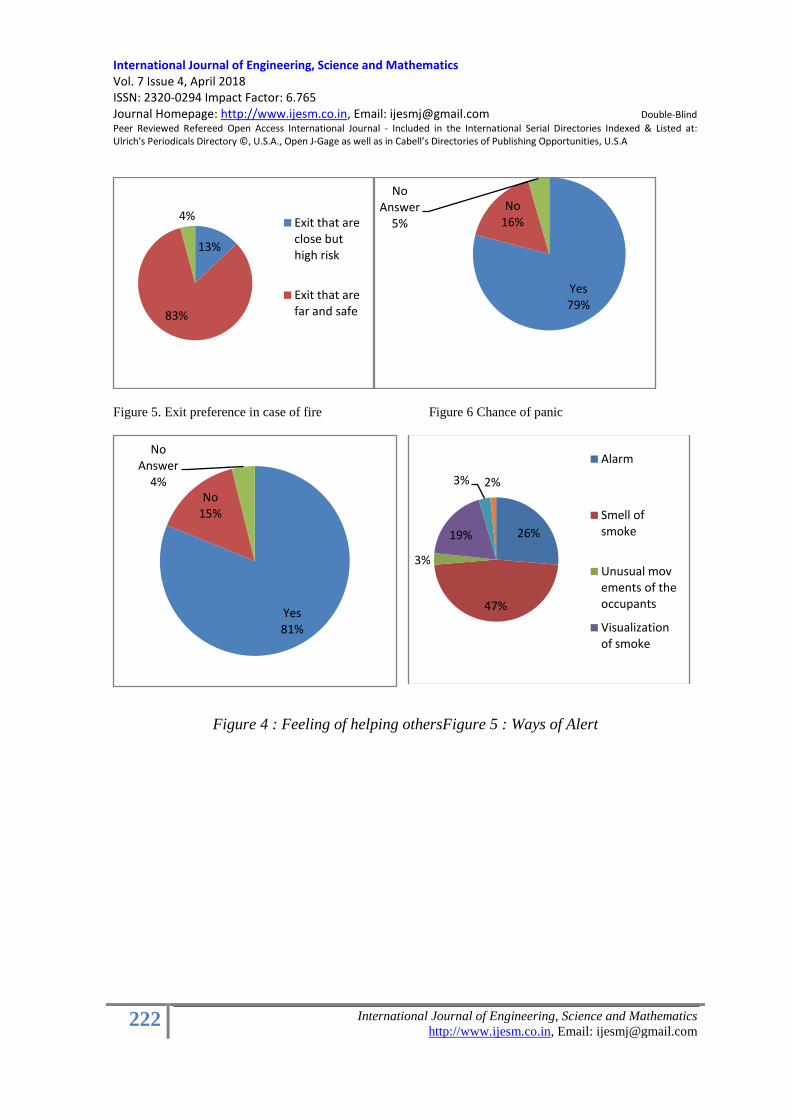
International Journal of Engineering, Science and Mathematics Vol. 7 Issue 4, April 2018 ISSN: 2320-0294 Impact Factor: 6.765 Journal Homepage: http://www.ijesm.co.in, Email: [email protected] Double-Blind
Peer Reviewed Refereed Open Access International Journal - Included in the International Serial Directories Indexed & Listed at: Ulrich's Periodicals Directory ©, U.S.A., Open J-Gage as well as in Cabell’s Directories of Publishing Opportunities, U.S.A
222 International Journal of Engineering, Science and Mathematics
http://www.ijesm.co.in, Email: [email protected]
Figure 5. Exit preference in case of fire Figure 6 Chance of panic
Figure 4 : Feeling of helping othersFigure 5 : Ways of Alert
13%
83%
4%Exit that are close but high risk
Exit that are far and safe
Yes79%
No16%
No Answer
5%
26%
47%
3%
19%
3% 2%
Alarm
Smell of smoke
Unusual movements of the occupants
Visualization of smoke
Yes81%
No15%
No Answer
4%
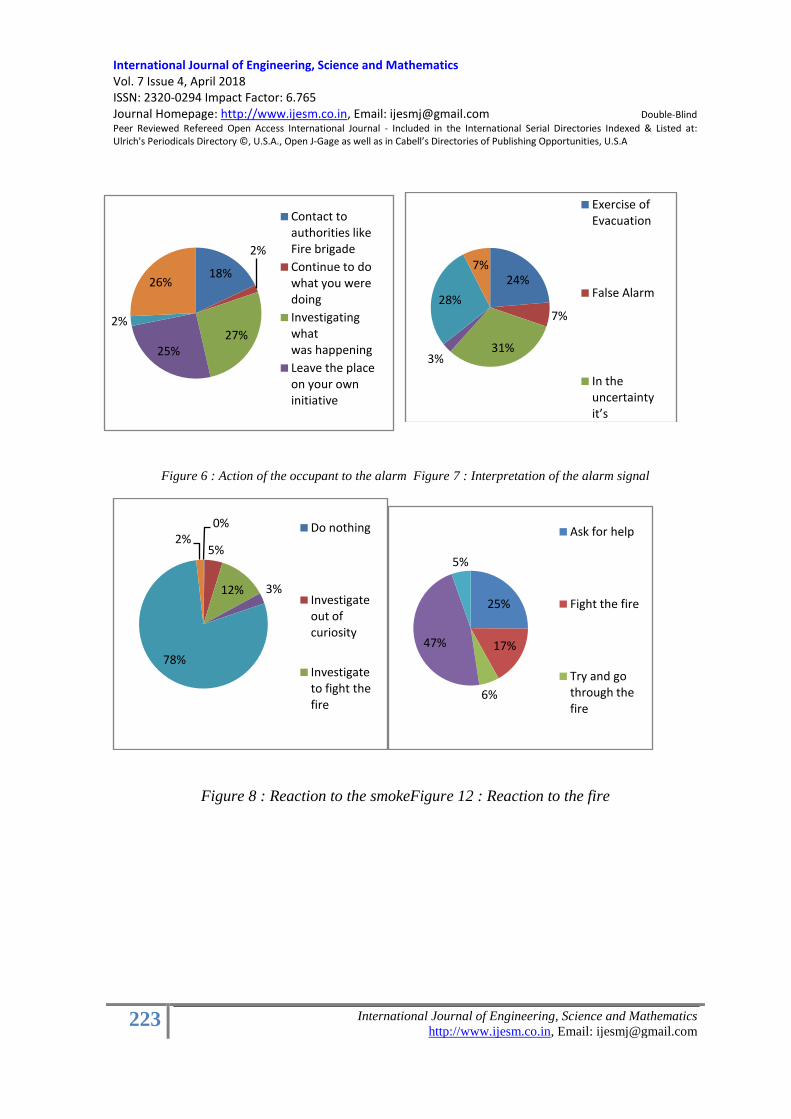
International Journal of Engineering, Science and Mathematics Vol. 7 Issue 4, April 2018 ISSN: 2320-0294 Impact Factor: 6.765 Journal Homepage: http://www.ijesm.co.in, Email: [email protected] Double-Blind
Peer Reviewed Refereed Open Access International Journal - Included in the International Serial Directories Indexed & Listed at: Ulrich's Periodicals Directory ©, U.S.A., Open J-Gage as well as in Cabell’s Directories of Publishing Opportunities, U.S.A
223 International Journal of Engineering, Science and Mathematics
http://www.ijesm.co.in, Email: [email protected]
Figure 6 : Action of the occupant to the alarm Figure 7 : Interpretation of the alarm signal
Figure 8 : Reaction to the smokeFigure 12 : Reaction to the fire
24%
7%
31%3%
28%
7%
Exercise of Evacuation
False Alarm
In the uncertainty it’s considered
0%
5%
12% 3%
78%
2%Do nothing
Investigate out of curiosity
Investigate to fight the fire
25%
17%
6%
47%
5%
Ask for help
Fight the fire
Try and go through the fire
18%
2%
27%25%
2%
26%
Contact to authorities like Fire brigade
Continue to do what you were doing
Investigating what was happening
Leave the place on your own initiative

International Journal of Engineering, Science and Mathematics Vol. 7 Issue 4, April 2018 ISSN: 2320-0294 Impact Factor: 6.765 Journal Homepage: http://www.ijesm.co.in, Email: [email protected] Double-Blind
Peer Reviewed Refereed Open Access International Journal - Included in the International Serial Directories Indexed & Listed at: Ulrich's Periodicals Directory ©, U.S.A., Open J-Gage as well as in Cabell’s Directories of Publishing Opportunities, U.S.A
224 International Journal of Engineering, Science and Mathematics
http://www.ijesm.co.in, Email: [email protected]
Figure 14 : Use of Fire extinguishers
Figure 159 : Views on safety procedures
4. Conclusion
The chances of occurrence of panic were high in situations of fire. Effect of age was considerably high in the
evacuation process. Respondents with fire safety training had taken more precaution during investigation
phase, whereas after having information of the situation their reactions become aggressive. Sense of helping
others was relatively higher in feminine gender, old people and respondents who attended fire safety
training. Gender of the occupants affects only in very few decisions during evacuations. There was little
relevance of the fact that the occupant knows the building or not and their reaction during a fire. Alarm was
not considered as the reliable source to be alerted for the fire. Assumption by respondents that alarm is not
the signal for evacuation but it was the signal for occurrence of fire. High influence on reactions towards
firefighting by occupants having fire safety training during a fire. The follow up of this study is to develop an
Artificial Intelligence (AI) which would collect the data of occupants in a building by image processing. The
53%38%
2%7% To control
the expansion of fire
To put out the fire
60%
9%
29%
2%
Must and be followed as instructed
Need more improvement
Useful and necessary
Too strict and impractical
90%
6% 4%
Yes
No
No Answer

International Journal of Engineering, Science and Mathematics Vol. 7 Issue 4, April 2018 ISSN: 2320-0294 Impact Factor: 6.765 Journal Homepage: http://www.ijesm.co.in, Email: [email protected] Double-Blind
Peer Reviewed Refereed Open Access International Journal - Included in the International Serial Directories Indexed & Listed at: Ulrich's Periodicals Directory ©, U.S.A., Open J-Gage as well as in Cabell’s Directories of Publishing Opportunities, U.S.A
225 International Journal of Engineering, Science and Mathematics
http://www.ijesm.co.in, Email: [email protected]
AI would determine the safest path for the occupants in the building using evacuation simulation, fire and
smoke progression in the building, and behaviour of the individual occupant. To make this model capable
enough for general use, study should be extended to various kinds of buildings like hotels, hospitals,
educational institutions, refineries, offices etc. so that significant data and information can be collected.
References(10pt)
[1] Proulx, G., Movement of People: The Evacuation Timing, SFPE Handbook of Fire Protection
Engineering, National Fire Protection Association, Quincy, MA, 2002.
[2] Proulx, G., ―Understanding human behaviour in stressful situations‖,Workshop to Identify Innovative
Research Needs to Foster Improved Fire Safety in the United States, National Academy of Sciences,
Delegate Binder Section 7, Washington, D.C., April 15-16, P 1-5. 2002.
[3] Erica D. Kuligowski, ―The Process of Human Behavior in Fires‖, National Institute of Standards and
Technology Technical Note 1632, May 2009.
[4] Jake L. Pauls, Brian K. Jones, ―Building Evacuation: Research Methods and Case studies‖, in David V.
Canter, ―Fires and Human Behaviour‖, J. Willeys, 1986
[5] Jake L. Pauls, ―Building Evacuation: Research Findings and Recommendations‖, in David V. Canter,
―Fires and Human Behaviour‖, J. Willeys, 1986.
[6] Jonathan D. Sime, ―The Concept of Panic‖, in David V. Canter, ―Fires and Human Behaviour‖, J.
Willeys, 1986.
[7] Peter G. Wood, ―A Survey of Behaviour in Fires‖, in David V. Canter, ―Fires and Human Behaviour‖, J.
Willeys, 1986.
[8] Janet Hall, ―Patient Evacuation in Hospitals‖ in David V. Canter, ―Fires and Human Behaviour‖, J.
Willeys, 1986.
[11] Blumer, Herbert, Symbolic Interactionism: Perspective and Method. Englewood Cliffs, NJ: Prentice-
Hall 1969
[12] Keating John P, ―The Myth of Panic‖, Fire Journal, 1992.