
JOURNAL OF ENGINEERING GEOLOGY - joegindia.com
143
Indian Society of Engineering Geology JOURNAL OF ENGINEERING GEOLOGY ISSN 0970-5317 VOLUME XLVI, NO 1 www.isegindia.org www.joegindia.com JUNE 2021 I N D I A N S O C I E T Y O F E NG I N E E R I N G G E O L O G Y 1 9 6 5 SPECIAL ISSUE : I-SYSTEM OF GROUND CHARACTERIZATION International Conference on Recent Advances in Geotechnics - EGCON 2021 9 th -11 th December 2021 For more details, please visit: www.egcon2021.com
-
Upload
khangminh22 -
Category
Documents
-
view
1 -
download
0
Transcript of JOURNAL OF ENGINEERING GEOLOGY - joegindia.com

Indian Society of Engineering Geology
JOURNAL OF ENGINEERING GEOLOGY
ISSN 0970-5317
VOLUME XLVI, NO 1
www.isegindia.org
www.joegindia.com
JUNE 2021
IN
D
IA
NS
OC
I
IE
TY
OF
E N G I N EE
R
IN
GG
EO
LO
G
Y
1 9 6 5
SPECIAL ISSUE : I-SYSTEM OF GROUND CHARACTERIZATION
International Conference on
Recent Advances in Geotechnics
- EGCON 2021
9th -11th December 2021
For more details, please visit:
www.egcon2021.com

Editorial Board
1. Er. A. K. Singh, CMD, NHPC Ltd., Faridabad, India
2. Mr. S.L. Kapil, ED, NHPC., Faridabad, India
3. Dr. Gopal Dhawan, Ex-CMD, MECL, Nagpur, India
4. Dr. Ranjit Rath, CMD, MECL, Nagpur, India
5. Mr. P.L. Narula, GSI(Retd.), New Delhi, India
6. Dr. Prabhas Pandey, GSI(Retd.), Lucknow, India
7. Er. R.N. Misra, Ex-CMD, SJVNL, Shimla, India
8. Er. A.K. Mishra, MD, MHPA, Bhutan
9. Dr. R. Chitra, Director, CSMRS, New Delhi, India
10. Dr. T. Fechner, MD, Geotomographie GmbH, Germany
11. Mr. Pradeep Singh, Director (Tech), MoM, New Delhi
12. Dr. Y.P. Sharda, SNC Lavlin, New Delhi, India
13. Mr. Y. Deva, Consultant (EG), Noida
14. Mr. M. Raju, Ex-DG, GSI, Hyderabad, India
15. Dr. Rajinder Bhasin, Expert Advisor, NGI, Norway
16. Mr. U.V. Hedge, Consultant ( EG), Bengaluru, India
17. Dr. V.K. Sharma, Advisor, GoB, Patna, India
18. Dr. Rajbal Singh, Expert, WAPCOS, New Delhi, India
19. Dr. Manoj Verman, RocScience, Gurugram, India
20. Er. Balraj Joshi, Ex CMD, NHPC, Faridabad
21. Prof. K.S. Rao, IIT-Delhi, New Delhi, India
22. Mr. M.J. Ahmed, ACES, Dubai
23. Dr. Bineshian Hoss, Amberg Engg. AG, Australia
24. Dr. Saibal Ghosh, Director, GSI, Kolkata, India
25. Mr. Imran Sayeed, Consultant, Faridabad, India
26. Dr. R. K. Goel, CIMFR-CBRI, Roorkee, India
27. Mr. N.K. Mathur, Ex GM, NHPC,, Faridabad, India
28. Prof. R. K. Dubey, ISM-IIT, Dhanbad, India
29. Dr. D.S. Subramnayam, NIRM, Bengaluru, India
30. Rahul Khanna, DGM, NHPC, Faridabad, India
(Editor/ Convener)
ISEG Council
ISEG, the Indian National Group of International Association of Engineering Geology and Environment (IAEG) is managed by an elected Governing Council. ISEG Council for the session 2020-21 is given below: President
A. K. Singh CMD, NHPC, Faridabad Vice-Presidents A. K. Mishra MD, MHPA, Bhutan Pradeep Singh Director (Tech), MoM, New Delhi Ramesh Chauhan AGM/Chief Geologist, SJVNL
Secretary S. L. Kapil ED, NHPC, Faridabad Joint Secretaries Nihar R. Bhattacharjee Director, GSI, Kolkata Vachaspati Pandey DGM (Geo), NHPC, Fbd. Treasurer Dr. Mridul Srivastava Director, GSI, Lucknow Editor Rahul Khanna DGM (Geo), NHPC, Kullu Joint Editor Vipul Nagar Sr. Manager (Geophy), NHPC Ltd. Past President Dr. K.S. Rao Professor, IIT, Delhi Past Secretary Dr. Saibal Ghosh Director, GSI, Kolkata Council Members M. Raju GSI, Hyderabad
Arindom Chakraborty CVPPL, Jammu
Akhouri Biswapriya GSI, Patna
Sunil J. Ganvir NHPC Ltd., Faridabad
Dr. Neelima Satyam IIT, Indore
Sebabrata Das GSI, Jammu
Dr. Asit Kr. Swain GSI, Bhubaneswar, Odisha
Amitabh Sharan CEO, EGE Consultants, Fbd.
Satish K. Goel MD, Spageo Infra, New Delhi
Dharmendra Kumar GSI, New Delhi
Address for Correspondence:
Rahul Khanna Editor, ISEG C/o DGM (Geo), Parbati HE Project, Stage-II, NHPC Ltd., Nagwain, District Mandi, Himachal Pradesh-175121 E-mail:[email protected]; [email protected]
The journal is available in electronic form at website: www.joegindia.com
Copies of journal (till Vol. XLI) can be obtained by book post if available. An amount of Rs 350/- has to be deposited through on-line bank transfer. Bank details are given below: Name: UCO Bank; Branch: GSI Branch, Aliganj, Lucknow; Name of account: “INDIAN.SOC.OF.ENG”; Account No.:90330200000045; IFSC Code: UCBA0002024 In case it is required by speed post please add Rs
90/-. International orders will cost $150 per copy
including postage.
Front Cover Photograph: Top Left: Indices and impact
factors as input for calculation of I-System; Top Right: (I)-
Class and (I)-GC’s output as I-System’s classification and characterization; Bottom: I-System’s rating chart for indices
and impact factors.
Indian Society of Engineering Geology
(IAEG India National Group) (Established 1965)
S. L. Kapil, Secretary, Indian Society of Engineering Geology, C/o Executive Director & HOD, Engineering Geology & Geotechnical Division. NHPC Office Complex, Sector-33, Faridabad, Haryana-121003.
Email: [email protected]; Mobile: +91-9911103790
Journal of Engineering Geology, Vol. XLVI, No. 1 for June 2021 published by ISEG includes peer reviewed papers submitted by authors.
(C) Indian Society of Engineering Geology 2021

JOURNAL
OF
ENGINEERING GEOLOGY
www.isegindia.org
www.joegindia.com
SPECIAL ISSUE:
I-SYSTEM OF GROUND CHARACTERIZATION
VOLUME XLVI, NO. 1
JUNE 2021

Journal of Engineering Geology (Volume XLVI, No. 1)
SPECIAL ISSUE: I-SYSTEM OF GROUND CHARACTERIZATION
Contents
Title
Authors
Page
No
Editorial
1. I-System: Index of Ground-Structure (2021 Edition) - Bineshian, H.
01
2. Ground Characterisation for Design using I-System Software : Case Studies
- Bineshian, H.
51
3. Chronology of Development of I-System: A Brief History
- Bineshian, H.
73
4. Long range underground prediction of ground behaviour/hazards at tunnel T13 in USBRL
project using TSP
- Choudhary, K., Bineshian, H., Dickmann, T., Gupta, S and Hegde, R.K.
78
5. Earthquake scenario selection of Tindharia landslide in India
- Neharika, G.N.S and Neelima Satyam, D.
91
6. Pull-out test of rock bolts: Analyzing the causes of failure
- Sahoo, R. N., Singh, Ajay and Dash, A. K.
106
7. Role of geotechnical monitoring instrumentation in Tehri Pumped Storage Plant (1000 MW)
– A case study -Prasad, Rajeev, Shukla, Atul Kumar and Kumar, Tarun
118
8. I-System Software
134
EGCON-2021: Virtual Conference

Editorial
“It may have been in pieces, but I gave you the best of me”
- Jim Morrison
Publication of journal for the society is not a one time job, the process is continues
and persistent efforts are required round the year to bring out each issue. Be it
collection of technical papers, sending them to our esteemed reviewers, forwarding
comments of the reviewers to authors, collecting finalized manuscript from them and
finally the acceptance of paper for publication in the journal. During last couple of
years, we had tried our best to reduce the publication time. I feel proud to announce
that in this issue, we had managed to accept few research papers within one month of
initial submission. The credit goes to the elite reviewers of the journal, members of
the editorial board and obviously to the authors who managed to submit the corrected
manuscripts within the stipulated time line.
This volume carries three very interesting papers by Dr. Bineshian Hoss, Principal,
Consultancy Head, Amberg Engineering AG, Australia and who is now an esteemed
member of the ISEG editorial board. In order to buttress his association with the
society, he had offered to publish the latest 2021 edition of I-System, an engineering
classification for ground characterization developed by him after a hard labour and
research of about 24 years. Beside, this issue also carries two more articles on
I-System, second article highlight the case histories and utility of the I-System
software while third one narrates the chronology of its development. Considering the
above, it has been decided to dedicate this issue of the Journal of Engineering
Geology especially for I-System of Ground Characterization.
It gives me immense pleasure to bring out Vol. XLVI, issue No. 1 for our readers
which carries four technical papers on variety of interesting aspects of Engineering
Geology and Geotechnics beside three dedicated papers on I-System. The credit for
the publication of this Special Issue of the Journal goes to Mr. S.L. Kapil, Secretary,
ISEG who has firm belief that innovative works should be eulogised and encouraged.
I offer my sincere gratitude to Er. A.K. Singh, President, ISEG also for his enormous
encouragement and support to the journal. Last but not the least; I’m deeply indebted
to all editorial board members for their cooperation and help without which timely
publication of this issue would not have been possible.
September 2021
With regards,
Rahul Khanna
Editor, ISEG

Journal of Engineering Geology Volume XLVI, No 1 A bi-annual Journal of ISEG June 2021
1
I-System: Index of Ground-Structure 2021 Edition
H Bineshian, PhD
Principal, Technical Director, Amberg Engineering AG, Australia [email protected]
Received December 2020, Accepted May 2021
Abstract
An optimised geotechnical/geomechanical design approach includes empirical, analytical, seismic, and observational stages. Empirical and observational parts of a design are vital in initiation of the approach and in finalisation of judgements for practice and design purposes containing the derivation of ground behaviour, identification of ground hazards, determination of support systems, and characterisation of ground’s mechanical properties. Engineering classifications are main part of empirical and observational stages of the design for human made structures in ground; though, they have limitations in application. I-System is a classification as well as a characterisation system for ground that is developed to cross the limitations involved with other classifications. It is comprehensively applicable for civil, mining, and oil & gas structures in ground including but not limited to abutments of bridges and dams, caverns, deep and shallow foundations, embankment and tailing dams, galleries, deep and shallow metro stations, mine stopes, open pits, shafts, slopes, trenches, tunnels, underground spaces and storages, wells, etc. It considers easily derivable geohydrological, geomechanical, geometrical, geophysical, geostructural, geotechnical, and dynamic properties and configuration of ground in relation to the structure together with the method of excavation and construction. It is first published in 2019 based on 22 years’ research and verification in design and construction of underground, semi-surface, and surface works in rock and soil; however, since then further developments as well as improvements and clarifications are made. This paper provides the latest edition of I-System (as a full package) and an introduction to I-System Software. Keywords: (I), (I)-Class, (I)-GC, blast-induced damage, characterisation, classification, Damage Indicator, GCD, GCef, Ground Conductivity Enhanced Factor, hydraulic conductivity, I-System, Index of Ground-Structure, intact rock, rock mass, soil, SRH, support system, vibration-induced damage, ViD 1. Introduction Design approach for structures in ground includes 4 important stages as shown in Figure 1 (Bineshian et al, 2019). The design methodology should pass empirical, analytical, seismic, and observational procedures to get the optimised design badge of “good for construction” while empirical and observational parts are playing very crucial role and determinative factors for this purpose. Both parts are quite depended on ground’s engineering classification and characterisation.
Figure 1. Design approach for structures in ground
Design procedure is presented in Figure 2 based on the design approach explained above. Figure 2a demonstrates a well-defined design procedure and Figure 2b shows the data requirements in a design setting. As a brief definition, Ground Zoning (GZ) is based on ground inherent properties that divides entire length of a tunnel to a group of limited numbers of zones or stretches with similar properties. It eases the identification of ground behaviour and related hazard/s, determination of required support system,
EmpiricalDesign Practicality
AnalyticalDesign Core
SeismicDynamic Design
ObservationalDesign Adequacy

Journal of Engineering Geology Volume XLVI, No 1 A bi-annual Journal of ISEG June 2021
2
procedure of structural dimensioning, and finally verification of the required measures for each zone. GZ is the first stage in design procedure, which is conducted after completion of initial geotechnical/geomechanical investigation in initial phase of study. Empirical classification systems are the important element in identification of GZs.
a. Design procedure diagram b. Design setting’s data requirements
Figure 2. Design procedure for structures in ground
Second and third stages in a healthy design procedure are identification of the Ground Behaviour (GB) and associated Ground Hazard/s (GH) respectively. Russo and Grasso (2007) proposed an approach to identify excavation behaviour based on continuum equivalent and equilibrium models; however, in this paper, it is produced for continuum and discontinuum media by combined analytical and empirical modelling as principal concept in identification of GB (Figure 3a). As can be seen in Figure 3a, classification systems are used in empirical analysis for identification of GB. Figure 3b represents the same by a fully empirical approach using I-System (Figure 3b) as a classification and characterisation system (Bineshian, 2019a, 2019b).
Ground Behaviour (GB)
a. Analytical/empirical stress analysis approach in identification of GB
b. I-System approach in determination of GB (Bineshian, 2019a, 2019b)
Figure 3. Flowcharts representing two ways to identify the GB; stress analysis and I-System
SVStructural Verifications: Relative Safety Margin for SD
SDStructural Dimensioning: Process for each SS
SSSupport Systems: Determination for each GB
GHGround Hazards: Failure Categorization
GBGround Behaviour: Mechanical Responses
GZGround Zoning: Ground Properties
Input
Geo-hydro
Geo-mechanical
Geo-metrical
Geo-physical
Geo-structural
Geo-technical
Stability Measures(Strength/Failure Capacity)
Empirical Analysis (Classifications and Characterisations)
Mechanical Responses(Deformation and Plastic Zone)
Analytical Analysis (Continuum/Discontinuum Modelling)
Data Collection
Geotech &Geomech
DataI-System
(I)-Class&
(I)-GCGB

Journal of Engineering Geology Volume XLVI, No 1 A bi-annual Journal of ISEG June 2021
3
Figure 4 represents most expected Ground Hazards (GH) from the identified GB that should be considered within the design procedure (Figure 2a).
Figure 4. Ground Hazards (GH) expected from the identified GB
In the fourth stage of a design procedure (Figure 2a), Support System/s (SS) should be selected from choices of solutions required for each GZ and related GB and GH. Again, the need for a comprehensive and suitable classification system is recognised to be vital to find the best solution/s for each mechanical response and associated hazard/s. Further to selection of suitable solution/s as SS for each GH, the measures (either primary or final SS) should be dimensioned (calculation part of design approach; fifth stage in Figure 2a) and verified (defining the relative safety margins; last stage of design approach in Figure 2a). Probabilistic Convergence-Confinement method (e.g., Carranza-Torres, 2004) can be used for Structural Dimensioning (SD). In Structural Verification (SV), Limit State Design (LSD) that known as Load and Resistance Factor Design (LRFD) method is used (McCormac, 2008). LSD itself has two procedures in design verification; Ultimate Limit State (ULS) and Serviceability Limit State (SLS). ULS includes checking against generated bending moment, axial forces, and shear forces (EN 1990:2002 E). On the other hand, SLS checks the generated crack width in the structure (e.g., crack width < 0.30 mm as per IS 456:2000). Figure 5 illustrates the SV procedure as the last stage in a design procedure (Figure 2a) required for plain or reinforced concrete structure (for primary or final SS).
Figure 5. Structural Verification (SV) check
GroundHazards
BlockFall Brittle
FailureCircularFailure
Creep
Exfoliation
GravityDriven
GroundBurst
HeavingLateral
DeformationPlaneFailure
PunchingFailure
ShearFailure
Sliding
Squeezing
Swelling
Toppling
VEP
WedgeFailure
ULS
Bending Moments
Axial Forces
Shear Forces
SLS
Width of Crack(w < 0.30 mm; IS 456:2000)

Journal of Engineering Geology Volume XLVI, No 1 A bi-annual Journal of ISEG June 2021
4
As per design procedure and requirement explained here, it is proved that engineering classifications are the main part of the empirical and observational design elements in a healthy design approach and design procedure shown in Figures 1 and 2 (Bineshian, 2012, Bineshian and Ghazvinian, 2012a and 2012b). Comprehensiveness and practicality of the engineering classifications are essential to make them appropriately applicable in NATM, NMT, SEM, SCL, etc.; however, existing engineering classifications come with limitations in use for both rock and soil. Limitations, inaccuracy, and imprecision involved with existing classifications make engineers uncertain in determination and dimensioning of structures specially when they encounter ground complications (Bineshian, 2014, Bineshian, 2017, Bineshian et al, 2019). RMR and Q are popular existing classifications developed by Bieniawski (1973) and Barton et al (1974) respectively. They are only applicable for rock medium. RMR is proposed for surface and underground works but its water pressure consideration is doubtful, quantification of joint orientation is uncertain, and the effect of water on rock mass is inattentive (Bineshian et al, 2013). Q is proposed for tunnels merely, which comes with several limits in input parameters including discontinuity’s aperture, orientation, persistency, size, and rock strength. Palmstrom and Broch (2006) stated that there is a shortcoming in most existing classifications when observed rock mass characteristics are used to estimate the conditions for design without including input of the excavation method. An excavation damage factor or similar should be applied, but none of the existing empirical or other tools in rock engineering makes use of this (Palmstrom and Broch, 2006). I-System is developed to be used as a comprehensive classification and characterisation system for ground (Bineshian, 2019b). It is verified against varieties of ground and scrutinised in several projects through 22 years research to address and resolve the aforesaid issues involved with existing classifications (Table 1). I-System provides prediction of ground behaviour together with recommendations on required Support System/s (SS), Excavation Technique/s (ET), Instrumentation Technique/s (IT), Prevention Technique/s (PT), and Forecast Technique/s (FT) followed by Design Remark/s (DR) as well as estimation for important mechanical properties of ground. Its output is optimised by analytical, numerical, and observational methods to compensate the demerits of existing classifications and strengthen its comprehensiveness.
Table 1. Application summary for popular existing engineering classifications compared to I-System Applications System
Media Structure (Civil, Mining, Oil and Gas)
Rock Soil Surface Underground
RMR (Bieniawski, 1973) a n/a c/a a
Q (Barton et al, 1974) a n/a n/a a
I-System (Bineshian, 2019b) a a a a
a Applicable c/a Conditionally Applicable n/a Not Applicable This paper is a 2021 edition of I-System in a full package, which is further developed by providing vibration-induced damage (ViD) assessment methods, pull length advisor, and systematic bolting calculator. It provides further illustrations, details, clarifications, and updates to I-System as well as introducing I-System Software as a design utility that eases the use of I-System while expected accuracy is obtained in calculation.

Journal of Engineering Geology Volume XLVI, No 1 A bi-annual Journal of ISEG June 2021
5
2. I-System: Definition Providing a solution to engineers in their challenges with complicated ground conditions is the key perception and approach in development of this all-in-one classification and characterisation system for ground in accord with real condition to deliver design parameters and practical recommendation/s. Also, it has been in mind to provide a trusted utility for empirical part of design. In development of this system, drawbacks and limitations of other classifications (e.g., RMR and Q) are properly addressed and consequently resolved (Bineshian, 2019a, 2019b). This comprehensive classification and characterisation system for ground (rock and soil) entitled “Index of Ground-Structure” or in short form “I-System”. It is conceptually different from any existing classifications due to its applicability for varieties of ground conditions and structures and its comprehensiveness in providing accurate and precise prediction of ground behaviour based on several geomechanical hazards (failure mechanisms) studied in course of development. Its range of application (Figure 6) in design and/or practice includes underground structures (caverns, deep or underground metro stations, exploration and grouting galleries, mine stopes, shafts, tunnels of any type or method, underground spaces, underground storages, wells, etc.), semi-surface structures (bridge abutments, dam abutments, deep foundations, shallow metro stations including open-cut and cut & cover, etc.), and surface structures (embankment dams, open pits, shallow foundations, slopes, tailing dams, trenches, etc.).
Figure 6. Range of application of I-System
It is the first ever classification, which is applicable for both rock and soil that considers ground’s problematical and structural configurations, opening’s scale effect, earthquake’s negative effect, and excavation technique’s impact (Figure 7a). Besides, it is the first ever classification that carefully provides prediction for special ground behaviour including but not limited to Squeezing, Swelling, and Heaving (SSH), Time Dependent (TD), Visco-elasto Plastic (VP), fully plastic, gravity driven (GD), and Burst Prone (BP) condition (Figure 7b).
a. First ever features covered by a classification system
b. Special ground behaviour covered by I-System
Figure 7. Most important features covered by I-System
I-System'sApplication
Rock
Soil
Civil
Mining
Oil & Gas
Underground Structures
Semi-surface Structures
Surface Structures
Problematical Configuration
Structural Configuration
Scale Effect
Earthquake Effect
Excavation Technique
Impact
Squeezing,Swelling,
and HeavingBehaviour
VEP Behaviour
Fully Plastic Behaviour
Time Dependent Behaviour
Burst Prone Ground
Behaviour

Journal of Engineering Geology Volume XLVI, No 1 A bi-annual Journal of ISEG June 2021
6
I-System is verified in a wide varieties of challenging ground conditions to ensure that a suitable estimation is obtained in classification and characterisation. It provides recommendations on determination of primary and final SS, required ET for encountered condition, proper IT for monitoring, appropriate PT against possible failures, verified FT to predict the ground condition ahead, and practical DR that is helpful in understanding of ground behaviour, failure mechanism, and load configuration (Section 4). Moreover, it characterises the ground by deriving the mechanical properties (Section 5) that can be used as input for SD in design procedure. It is intended that I-System to have key indices to enable an appropriate modelling of ground-structure behaviour to the full (Figure 8). It includes five indices to define the mechanical response of ground in relation to the structure. Furthermore, it has two impact factors to define the impact of Dynamic Forces (DF!) and Excavation Technique (ET!) on structure. Indices and impact factors in I-System (Figure 8) are based on easily derivable main properties (i.e., key geomechanical, geostructural, geohydrological, geotechnical, geophysical, and geometrical features; Figure 2b) and determinant seismic and excavation factors that affecting the ground-structure response (Figure 7a).
Figure 8. I-System calculation; indices and impact factors
Eq 1 represents I-System in a mathematical form entitled “(I)”. Eq 2 to 8 defines the indices and the impact factors for (I) as follows: (I) = (A! + C! +H! + P! + S!) × DF! × ET! (1) A! = (a"# + a"$ + a"!) × a"% × a"" × a"& × a"' (2) C! = c'( × c$( (3) H! = h)( × h)$ (4) P! = 3p(( + p"( + 5p'$ × p'*67 × p+,&p+, = 𝑓(V', V$) (5) S! = s($ × s$- (6) DF! = 𝑓(PGA./, ERZ,MSK)&PGA./ = 𝑓(PGA, SF,MSF) (7) ET! = 𝑓(ET, PPV) (8)
Copyright © Bineshian I-System 2019. All rights reserved.
Ai
Ci
Hi
Pi
Si
DFi ETi
I-System

Journal of Engineering Geology Volume XLVI, No 1 A bi-annual Journal of ISEG June 2021
7
where; (I) I-System’s value A! Armature Index C! Configuration Index H! Hydro Index P! Properties Index S! Strength Index DF! Dynamic Forces Impact ET! Excavation Technique Impact I-System’s value ranges between 100 – 0 and classifies the ground-structure interaction to 10 classes as (I)-01 to (I)-10 from best to worst class. The indices of A!, C!, H!, P!, and S! have 20 per cent share out of a total score of 100. DF! and ET! are factors ranging between 1 – 0.75 and 1 – 0.50 respectively, which impact the summation of indices (Figure 9). Indices are defined in the Section 3. Full definition of the parameters is available in Section 10.
Figure 9. I-System’s scoring diagram
I-System is applicable for estimation of quality of ground in relation to the structure at any scale and type. It assists with empirical and observational parts of the design approach (Figure 1). I-System is applicable in design procedure and/or in practice (Figures 2 and 3) for:
- categorizing the ground properties in relation to Ground Zoning (GZ), - discovering Ground Behaviour (GB), - identifying associated failure mechanism/s (Figure 4) as Ground Hazard/s (GH), - determining the required Support System/s (SS); Section 4, and - assisting in Structural Dimensioning and Verification (SD and SV) by
characterizing the most important mechanical properties of ground (Section 5). It is also applicable to (Tables 9 - 12 in Section 4):
- find the appropriate technique/s for excavation further to the determination of the required support system/s (ET),
- select suitable option for instrumentation/monitoring during construction (IT), - implement the proper technique for prevention of hazard/s (PT), and - designate the required technique for forecasting/prediction (FT).
I-System is developed to serve the above-stated purposes for underground, semi-surface, and surface structures in the field of civil, mining, and oil and gas.
DF!
𝐈100 − 0
A!20 − 0
C!20 − 0
H!20 − 0
P!20 − 0
S!20 − 0
ET!1.00 − 0.75
1.00 − 0.50

Journal of Engineering Geology Volume XLVI, No 1 A bi-annual Journal of ISEG June 2021
8
3. Indices and Impact Factors I-System (Eq 1) includes 5 indices and 2 impact factors (Figures 8 and 9) with mathematical form of Eq 2 to 8. In this section all associated parameters of each index are defined in details. Derivation of parameters from ground and their use in I-System is confusion-free; consequently, selection of the input data is certain, which makes the classification’s output accurate and credible. Section 10 provides a complete list of definitions for abbreviations, parameters, and short forms used in this paper. 3.1. Armature Index A! is the Armature Index (Eq 1 and 2) as ground’s skeleton armature, which is intended to model the most important geomechanical aspects of rock mass as a ground medium through the discontinuity properties of ground. A! has 20 score out of 100 (Figure 9). Table 2 defines parameters of A!.
Table 2. Armature Index (A!): adn, ads, adi, ada, add, adf, adp Discontinuity Number/s adn Discontinuity
Set/s ads Discontinuity Inclination adi
0 - 9 10.00 0 10.00 [IF (adn ≥ 2.50 & ads ≥ 4.00) THEN↓ ELSE 0] 10 - 14 7.50 1 9.00 n/a or Granular 0.00 15 - 19 5.00 2 7.00 0 - 10 -1.00 20 - 24 2.50 3 4.00 11 - 30 -1.50 ≥ 25 0.00 ≥ 4 0.00 31 - 60 -2.00 n/a or Granular 0.00 n/a or Granular 0.00 61 - 90 -2.50 Discontinuity Aperture ada Discontinuity
Disintegration add Discontinuity Friction adf Discontinuity
Persistency adp n/a or Granular 1.00 n/a or Granular 1.00 n/a or Granular 1.00 n/a or Granular 1.00
Tight 1.00 Unweathered/Unaltered 1.00 High Friction - Rough/Uneven
1.00 < 0.90 × D* 1.00
Semi-Tight 0.95 Semi-Integrated 0.95 Moderate Friction - Nonsmooth
0.95 ≥ 0.90 × D* 0.90
Open 0.90 Weathered/Altered 0.90 Low Friction - Smooth/Even
0.90 * For semi-surface and surface structure, “D” should be replaced with “B”, which is the Berm’s width in a slope or in a
trench ada Factor related to “Discontinuity Aperture” that is based on the most unfavourable opening of the discontinuities add Factor related to “Discontinuity Disintegration” that is based on the worst weathering or alteration of surface of the
discontinuity sets adf Factor related to “Discontinuity Friction” that is based on the least friction condition of discontinuity sets adi Score related to “Discontinuity Inclination” that is based on dip angle of the most unfavourable discontinuity set adn Score related to “Discontinuity Number/s” that is based on number of individual discontinuities per meter of a horizontal
or vertical scanline or average of number of discontinuities per meter of horizontal and vertical scanline adp Factor related to “Discontinuity Persistency” that is based on the most unfavourable discontinuity set ads Score related to “Discontinuity Set/s” reflecting the number of sets of discontinuities D Diameter, width, or height (mm) of underground opening (the greater value) Granular A definition describing the soil; a medium, which is not considered as discontinuum n/a Not Applicable It should be noted that, if “adn” and “ads” are zero, the score for “adi” to be assigned as zero; it happens when the number of discontinuities is ≥ 25 and number of discontinuity sets is ≥ 4. It means that the inclination for the most unfavourable or critical discontinuity set is not easily derivable. In this case, the medium tends to be homogeneous and isotropic due to generated uniform texture – by presence of high number of discontinuities as well as discontinuity sets – that is subject to mechanical response related to continuum mechanics’ principles. Moreover, if the medium is soil mass, “n/a or Granular” to be selected for each parameter from Table 2; otherwise, for rock (intact or mass) the suitable parameter other than “n/a or Granular” to be selected.

Journal of Engineering Geology Volume XLVI, No 1 A bi-annual Journal of ISEG June 2021
9
3.2. Configuration Index C! is the Configuration Index (Eq 1 and 3) as ground’s problematical and structural configuration that contains important problematical geostructural features of rock and/or soil. C! has 20 score out of 100 (Figure 9). Table 3 defines parameters of C!.
Table 3. Configuration Index (C!): cpc, csc Problematical Configuration of Ground cpc Homogeneous or Isotropic or Jointless or Granular* 1.00 Fractured - Slightly 0.95 Faulted - Brittle Single 0.90 Folded - Anticline/Syncline 0.85 Folded - Dome/Basin 0.80 Fractured - Moderately 0.75 Faulted - Graben/Horst 0.70 Folded - Complex/Plunging 0.65 Fractured - Highly 0.60 Faulted - Brittle/Ductile Multiple 0.55 Differed - Unconformities 0.50 BP - High Stress Zone; High Overburden - e.g., Rock Burst, Coal Burst 0.45 Tectonised - Complex of Geostructures 0.40 Sheared - High Shear Stresses - e.g., Mylonite 0.35 TD - Flaky/Micaceous/Cleated - Coals, Mudstone, Phyllite, Schist, Shale, Slate, Young Sandstones 0.30 VP - Incremental-Sudden Large Shear Movement, Cyclic Mobility-Flow Liquefaction, Limited-Continuous Debris Discharge - Flowing/Overrunning
0.25 Structural Configuration of Ground csc Continuum Massive Rock** 20.00 Layered Rock (> 100 cm) 17.00 Layered Rock (100 - 10 cm) 15.00 Clastic Breccia/Conglomerate 13.00 Layered Rock (< 10 cm) 11.00 Foliated/Laminar/Platy Rock 9.00 Coarse Grained Skeleton Soil 7.00 Cohesive Matrix Skeleton Soil 4.00 Single Grained Skeleton Soil - Dense Texture 2.00 Single Grained Skeleton Soil - Loose Texture 0.00
* “Homogeneous or Isotropic or Jointless or Granular” represents a ground condition that it is homogenous and/or isotropic, which is jointless like intact rock or granular like soil mass. Abstractly, this option to be selected when the ground is intact rock or soil mass.
** “Continuum Massive Rock” represents a ground, which is massive medium rather than layered one; e.g., intact rock or unlayered and structurally interlocked rock mass.
cpc Impacting factor related to “Problematical Configuration” of ground indicating ground's tectonic state csc Score of “Structural Configuration” of ground (an effect of ground's texture, fabric, and structure) BP Burst Prone - ground condition with rock burst or coal burst behaviour TD Time Dependent - ground condition with time dependent shearing behaviour such as squeezing/swelling/heaving
behaviour, or even creep VP Visco-elasto-Plastic - ground condition as visco-elasto-plastic to fully plastic behaviour that contains elastic
component/s together with viscous component/s, which makes ground strain rate time dependence; however, due to losing energy during static/dynamic loading cycle, its behaviour converts to fully plastic and may flows like a viscous substance.
In selection of right description for “Problematical Configuration” in Table 3, if the medium is jointless like intact rock or if it is granular like soil mass, “Homogeneous or Isotropic or Jointless or Granular” to be picked. Furthermore, to select “Structural Configuration” correctly, if ground contains unlayered and structurally interlocked rock mass rather than layered one or it contains intact rock, “Continuum Massive Rock” to be picked.

Journal of Engineering Geology Volume XLVI, No 1 A bi-annual Journal of ISEG June 2021
10
3.3. Hydro Index H! is the Hydro Index (Eq 1 and 4) as hydro effect on ground’s mechanical behaviour and its hydro related properties. It is a function of GCD (Ground Conductivity Designation; Appendix 1, Bineshian, 2020a) or Wetness diagram (Figure 10) and softness due to presence of water (in scale of Mohs). H! has 20 score out of 100 (Figure 9). Table 4 defines parameters of H!.
Table 4. Hydro Index (H!): hgc, hgs Ground Conductivity (GCD) or [Wetness] hgc Ground Softness
(Mohs) hgs (≤ 0.99) or [Dry] 20.00 ≥ 7 1.00
(1 - 1.99) or [Humid] 19.00 6 0.60
(2 - 2.99) or [Damp] 18.00 5 0.50
(3 - 4.99) or [Moist] 16.00 4 0.40
(5 - 6.99) or [Leak] 15.00 3 0.30
(7 - 9.99) or [Wet] 13.00 2 0.20
(10 - 14) or [Drip] 11.00 1 0.10
(15 - 24) or [Shower] 9.00 Moulded by Light Finger Pressure 0.05
(25 - 49) or [Flow] 6.00 Exuded between Fingers 0.00
(50 -99) or [Gush] 3.00 (≥ 100) or [Burst] 0.00
GCD Ground Conductivity Designation (Bineshian, 2020a; Appendix 1) as a criterion to score the hydraulic conductivity of ground; it is listed in the table inside parentheses – ( ); it is not mandatory to use GCD value to derive correct value for gc from Table 4; instead, Wetness diagram (Figure 10) can be considered for the same in conjunction with Table 4.
hgc Score assigned to “Ground Conductivity” that is measured using GCD or selected from Wetness diagram as criterion for hydropressure effect on ground
hgs Impact factor related to “Ground Softness” that is considered as an effect of water on medium or infilling material (Mohs)
Wetness A diagram defined here to categorise the ground’s water content, which is classifying the ground water condition (observational identification) in 11 ranges (Figure 10); it is listed in the table inside brackets – [ ]
Figure 10. Wetness diagram
GCD provides a quantitative measure for “Ground Conductivity”. If GCD test is not used then observational ground water condition to be considered as a criterion for scoring the “hgc” using the Wetness diagram (Figure 10) in conjunction with Table 4. GCD is listed in Table 4 inside the parenthesis “( )”. Wetness diagram provides a qualitative description for “Ground Conductivity” based on observational identification for ground’s hydraulic conductivity. It classifies the ground wetness into 11 ranges from dry to water burst. Wetness diagram is listed in Table 4 inside the brackets “[ ]”. It is the choice of designer, engineer, or geologist to use GCD or Wetness diagram as per site condition.
DryHumid
DampMoist
LeakWet
DripShower
FlowGush
Burst

Journal of Engineering Geology Volume XLVI, No 1 A bi-annual Journal of ISEG June 2021
11
3.4. Properties Index P! is the Properties Index (Eq 1 and 5) as ground shear properties by way of a definition as a function of texture, fabric, shape, and size of soil materials together with body wave velocity. P! is considered to be an important part of I-System to model essential geotechnical characteristics of ground as part of the comprehensiveness of the system in applicability for varieties of ground, which in this index, it is the soil medium. P! has 20 score out of 100 (Figure 9). Table 5 defines parameters of P!.
Table 5. Property Index (P!): pcc, pdc, pps, ppm, pbw Cohesiveness Consistency pcc Denseness
Consistency pdc Indurated 8.00 Never Indented by Thumbnail 6.00 Large Size Particles 6.50 Indented Hardly by Thumbnail 5.00 Picked Difficult 5.00 Indented by Thumbnail 4.00 Picked Easily 3.50 Indented by Thumb 3.00 Shovelled Difficult 2.00 Moulded by Strong Finger Pressure 2.00 Shovelled Easily 0.50 Moulded by Light Finger Pressure 1.00 Foot Imprint Easily 0.00 Exuded between Fingers when Squeezed in Hand 0.00 Particles’ Size pps Particles’
Morphology ppm Body Wave Velocity m/sec (Vp) or [Vs] pbw
n/a e.g., Rock 3.00 n/a e.g., Rock 2.00 (≥ 6000) or [≥ 3300] 1.00 Boulder 3.00 Angular 2.00 (5999 - 5000) or [3299 - 2900] 0.90 Cobble 2.50 Sub-angular 1.50 (4999 - 4500) or [2899 - 2600] 0.80 Pebble 2.00 Flat 0.75 (4499 - 4000) or [2599 - 2200] 0.70 Gravel 1.50 Rounded 0.00 (3999 - 3500) or [2199 - 2000] 0.65 Sand 1.00
(3499 - 3000) or [1999 - 1500] 0.60 Silt 0.50 (2999 - 2500) or [1499 - 1000] 0.55 Clay 0.00 (2499 - 2000) or [999 - 750] 0.50
(1999 - 1000) or [749 - 300] 0.45 (≤ 999) or [≤ 299] 0.40
n/a Not Applicable; it should be chosen when the ground is rock including intact rock or rock mass pbw Factor related to “Body Wave Velocity” including Vp or Vs as geophysical properties of ground that corrects P!; Body
Wave Velocity is derived either from reliable references (considering the type of materials of ground) or is measured using geophysical methods
pcc Score related to “Cohesiveness Consistency” that is an important shear property of soil (cohesion) pdc Score related to “Denseness Consistency” that is an important shear property of soil (non-cohesiveness; friction) ppm Influencing parameter related to “Particles’ Morphology” that is a function of shape of soil's grains/granules pps Influencing parameter related to “Particles’ Size” that is a function of size of soil's grains/granules” Rock Intact rock or rock mass Vp Primary Wave Velocity (m/sec); it is listed in the table inside parentheses – ( ) Vs Shear or Secondary Wave Velocity (m/sec); it is listed in the table inside brackets – [ ] As it is stated in the footnote of Table 5, “Body Wave Velocity” can be derived from reliable references or it can be measured using geophysical surveying method/s. It is recommended to use the geophysical technique/s to derive Vp and/or Vs; however, it is not compulsory to measure “Body Wave Velocity” by conducting geophysical surveys when conduction of measurement is not feasible or practicable. Besides, it should be noted that either Vp or Vs can be used in selection of proper value for “Pbw” in Table 5. Furthermore, to clarify the term “Rock” in Table 5, it should be selected if the ground is intact rock or rock mass, but if the medium contains conglomerate or breccia with poor matrix that stone pieces are easily detached from the matrix, options other than “n/a” and “Rock” to be chosen.

Journal of Engineering Geology Volume XLVI, No 1 A bi-annual Journal of ISEG June 2021
12
3.5. Strength Index S! is the Strength Index (Eq 1 and 6) representing ground’s strength behaviour under confining condition. Due to importance of this index in I-System, key parameters of both ground and structure are considered to define this index. In definition of S!, unconfined compressive strength of ground, scale effect, shape factor of the structure, and stress ratio between vertical and horizontal virgin stresses at the location or depth of placement of structure is considered. S! has 20 score out of 100 (Figure 9). Table 6 defines parameters of S!.
Table 6. Strength Index (S!): scs, sse Compressive Strength (UCS) scs Scale
Effect Shape sse ≥ 200 MPa 20.00 UndS - B/H σv ≥ σh σv < σh 199 - 150 MPa 19.00 ≥ 2.50 0.80 1.00 149 - 100 MPa 18.00 99 - 75 MPa 16.00 = 1.90 - 1.30 0.85 0.95 74 - 50 MPa 14.00 49 - 30 MPa 12.00 = 1.20 - 0.80 0.90 0.90 29 - 20 MPa 10.00 19 - 10 MPa 9.00 = 0.70 - 0.50 0.95 0.85 9 - 5 MPa 8.00 4.90 - 2 MPa 7.00 ≤ 0.40 1.00 0.80 1.90 - 1 MPa 6.00 999 - 400 KPa 5.00 SurS - B/H sse 399 - 200 KPa 4.00 ≥ 2.50 1.00 199 - 100 KPa 3.00 99 - 50 KPa 2.00 = 1.90 - 1.30 0.95 49 - 30 KPa 1.00 ≤ 29 KPa 0.00 = 1.20 - 0.80 0.90 = 0.70 - 0.50 0.85 ≤ 0.40 0.80
B/H Underground, semi-surface, or surface structures’ shape or scale factor as ratio of horizontal span to height of underground opening or ratio of width of berm to height of slope or trench
scs Score related to “Compressive Strength” as Unconfined Compressive Strength (UCS) of ground sse “Scale Effect” factor SurS Surface or Semi-surface Structure UCS Unconfined Compressive Strength UndS Underground Structure σh Horizontal Stresses at the location or at the depth of the placement of the structure σv Vertical Stresses at the location or at the depth of the placement of the structure In Table 6 a wide range of strength from below 29 KPa to over 200 MPa is considered to cover varieties of very weak soil to very strong rock. Higher range of strength is given in MPa while ranges below 1 MPa is given in KPa that makes the strength values more expressive. Derivation of “sse” for underground structure from Table 6 requires two steps:
1. Select matching shape or “Scale Effect” range based on B/H. 2. Pick the proper “sse” from either σv ≥ σh column or σv < σh column.
Derivation of “sse” for surface or semi-surface structure from Table 6 is as follows:
1. Select the proper range for “Scale Effect” based on B/H. 2. Pick the proper “sse” from the associated column.

Journal of Engineering Geology Volume XLVI, No 1 A bi-annual Journal of ISEG June 2021
13
3.6. Dynamic Forces Impact DF! is the Dynamic Forces Impact (Eq 1 and 7) on the ground-structure behaviour that represents effect of earthquake. Table 7 defines values of DF! as a function of Scaled Design Peak Ground Acceleration (PGASD), Earthquake Risk Zone (ERZ), or Medvedev-Sponheuer-Karnik (MSK) Scale (Medvedev and Sponheuer, 1969). If PGASD is selected to be used for derivation of DF!, it should be scaled by designer (Eq 9) that may require the ground motion time history data to produce the time-acceleration curve; consequently, scaling factor (SF) to be calculated using the PGA derived from the curve and the desired PGA; accordingly, the time-acceleration plot is scaled. This is a simple procedure that designers who performs dynamic response spectrum analysis are familiar with. Magnitude Scaling Factor (MSF) is another way for scaling the desired PGA; Eq 10 (Idriss, 1999) is an example that is derived for cohesionless soils; however, similar relationships (Idriss and Boulanger, 2008, 2010, Boulanger and Idriss, 2014) for cohesionless soils or any other reliable MSF relationships for cohesive soils may be used for derivation of MSF. When PGASD is produced, Table 7 to be used to pick the associated value of DF!; otherwise, if use of ERZ or MSK is preferred, subsequently the earthquake zoning map for project area from reliable references to be used for determination of ERZ or MSK and then related DF! to be picked from Table 7. ERZ is categorised in 7 classes of damage risk zones as shown in Table 7; EH (MSK XI-XII), VH (MSK IX-X), H (MSK VII-VIII), M (MSK V-VI), L (MSK IV), VL (MSK III), and EL (MSK I-II). DF! ranges between 1.00 to 0.75 (Figure 9). SF = PGASD ÷ PGA & PGASD = SF × PGA (9) MSF = 6.9 × e7
!"# 8 − 0.058 ≤ 1.8 & PGASD = MSF × PGA (10)
where; M Moment Magnitude of Earthquake MSF Magnitude Scaling Factor PGA Peak Ground Acceleration (g); maximum ground acceleration during earthquake PGASD Scaled Design Peak Ground Acceleration (g); scaled desired PGA SF Scaling Factor
Table 7. Dynamic Forces Impact (DF!) (PGASD) or [ERZ] or {MSK} DFi (< 0.05g) or [EL] or {I-II} 1.00
(0.06g - 0.10g) or [VL] or {III} 0.99
(0.11g - 0.15g) or [L] or {IV} 0.97
(0.16g - 0.25g) or [M] or {V-VI} 0.94
(0.26g - 0.35g) or [H] or {VII-VIII} 0.90
(0.36g - 0.50g) or [VH] or {IX-X} 0.85
(> 0.50g) or [EH] or {XI-XII} 0.75
DFi Dynamic Forces Impact ERZ Earthquake Risk Zone classifies seismicity to 7 grades as EH (Extremely High), VH (Very High), H (High), M
(Moderate), L (Low), VL (Very Low), and EL (Extremely Low); it is listed in the table inside brackets – [ ] g g-force or peak ground acceleration due to earth’s gravity (m/sec2); 1g = 9.81 m/sec2 MSK Medvedev-Sponheuer-Karnik Scale (Medvedev and Sponheuer, 1969) classifies seismicity to 12 grades as I to XII; it
is listed in the table inside braces – { } PGASD Scaled Design Peak Ground Acceleration; it is listed in the table inside parentheses – ( ) PGASD, ERZ, or MSK are the choices of designer, engineer, or geologist; their values are listed in Table 7 inside parentheses, brackets, and braces respectively.

Journal of Engineering Geology Volume XLVI, No 1 A bi-annual Journal of ISEG June 2021
14
3.7. Excavation Technique Impact ET! is the Excavation Technique Impact (Eq 1 and 8) on the ground-structure behaviour representing vibration impacts on structure during the excavation, which is designed to be a function of Excavation Technique (ET) or Peak Particle Velocity (PPV). ET! ranges between 1.00 to 0.50 (Figure 9). Table 8 defines values of ET!.
Table 8. Excavation Technique Impact (ET!) (ET) or [PPV mm/sec] ETi (ManDigg) 1.00
(ME/NonExBreak) or [< 2] 0.99
(ResiBlast) or [2 - 9] 0.98
(CommBlast) or [10 - 24] 0.97
(IndBlast) or [25 - 59] 0.96
(InfraBlast) or [60 - 119] 0.95
(CtldBlast) or [120 - 449] 0.90
(MineBlast) or [450 - 499] 0.80
(ProdBlast) or [500 - 599] 0.65
(UnCtldBlast) or [≥ 600] 0.50
CommBlast Commercial Blasting (Engineered blasting near commercial area) CtldBlast Controlled Blasting (An ordinary engineered blasting for civil works) ET Excavation Technique; it is listed in the table inside parentheses – ( ) ETi Excavation Technique Impact IndBlast Industrial Blasting (Engineered blasting near industrial area) InfraBlast Infrastructures Blasting (Engineered blasting for demolishing the infrastructures) ManDigg Manual Digging (Small scale excavation without use of explosives or NonExBreak) ME Mechanised Excavation (Medium-large scale excavation without use of explosives or NonExBreak) MineBlast Mining Blasting (Controlled blasting with underground/surface mining standards) NonExBreak Non-Explosive Breaking (Ground fragmentation using expansive materials) PPV Peak Particle Velocity (mm/sec) at the distance of 20 m from blast; listed in the table inside brackets – [ ] ProdBlast Production Blasting (Controlled blasting for rock production in large scale) ResiBlast Residential Blasting (Engineered blasting near residential area) UnCtldBlast Un-Controlled Blasting (Non-engineered blasting) Categorization provided in Table 8 for ET and PPV is based on the research and experience of author (Bineshian, 2019a, 2019b) in design and application of engineered blasting and fragmentation techniques in various strata and several projects; however, AS 2187.2 – 1993 is taken into consideration for PPV limits for engineered blasting near important structure/s. This is for the first time that impact of excavation technique is comprehensively considered in a classification and characterisation system. I-System considers it as an impact factor influencing the total value of (I). If PPV is used as criterion for scoring the ET!; therefore, it is recommended to measure it using seismographs; however, it can be estimated using empirical relation proposed by United States Bureau of Mines (Duvall and Fogelson, 1962), which is known as USBM PPV Predictor for estimation of blast-induced ground vibration (Appendix 2); otherwise, type of ET is the criterion to pick the proper score for ET! from Table 8. Vibration-induced Damage (Bineshian, 2021a, 2021b; Appendix 2) assessment is necessary when blasting is used for excavation. Use of ET or PPV in Table 8 for picking the right value for ET!, is the choice of the designer, engineer, or geologist; it can be used as per availability and condition. In Table 8, for better differentiation, ET values are listed inside parentheses while PPV values are listed inside brackets.
Journal of Engineering Geology Volume XLVI, No 1 A bi-annual Journal of ISEG June 2021
15
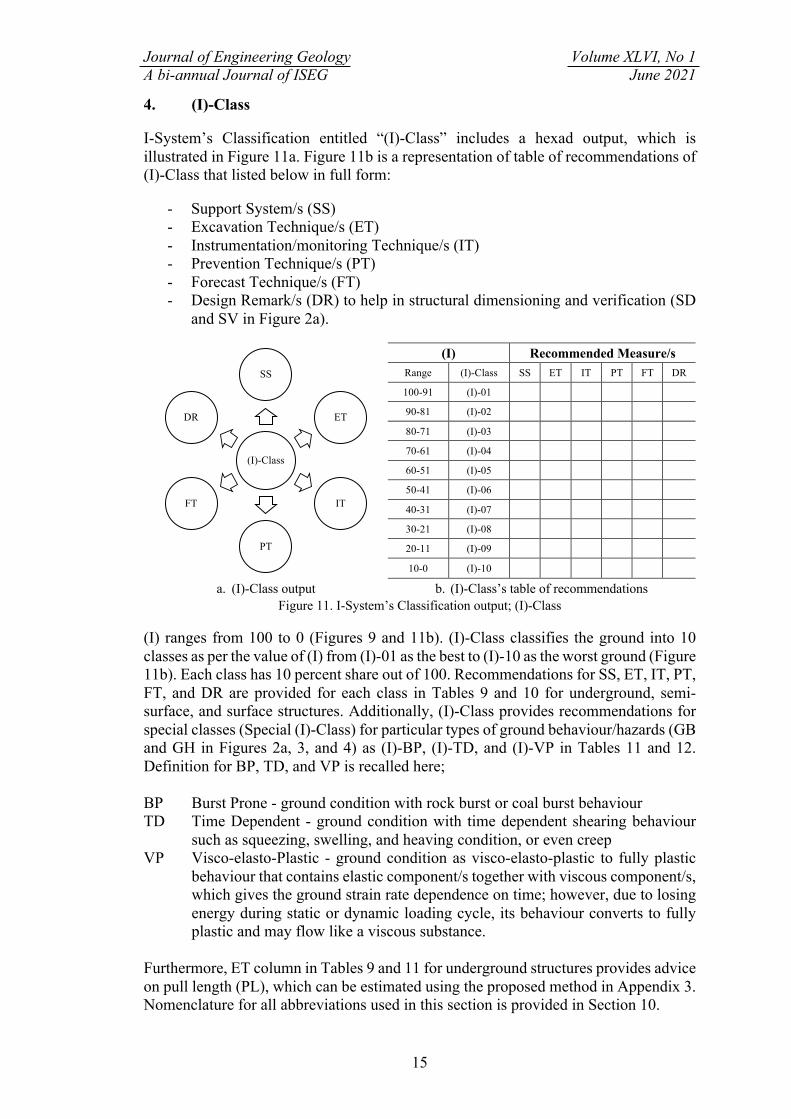
4. (I)-Class I-System’s Classification entitled “(I)-Class” includes a hexad output, which is illustrated in Figure 11a. Figure 11b is a representation of table of recommendations of (I)-Class that listed below in full form:
- Support System/s (SS) - Excavation Technique/s (ET) - Instrumentation/monitoring Technique/s (IT) - Prevention Technique/s (PT) - Forecast Technique/s (FT) - Design Remark/s (DR) to help in structural dimensioning and verification (SD
and SV in Figure 2a).
(I) Recommended Measure/s Range (I)-Class SS ET IT PT FT DR
100-91 (I)-01
90-81 (I)-02
80-71 (I)-03
70-61 (I)-04
60-51 (I)-05
50-41 (I)-06
40-31 (I)-07
30-21 (I)-08
20-11 (I)-09
10-0 (I)-10
a. (I)-Class output b. (I)-Class’s table of recommendations Figure 11. I-System’s Classification output; (I)-Class
(I) ranges from 100 to 0 (Figures 9 and 11b). (I)-Class classifies the ground into 10 classes as per the value of (I) from (I)-01 as the best to (I)-10 as the worst ground (Figure 11b). Each class has 10 percent share out of 100. Recommendations for SS, ET, IT, PT, FT, and DR are provided for each class in Tables 9 and 10 for underground, semi-surface, and surface structures. Additionally, (I)-Class provides recommendations for special classes (Special (I)-Class) for particular types of ground behaviour/hazards (GB and GH in Figures 2a, 3, and 4) as (I)-BP, (I)-TD, and (I)-VP in Tables 11 and 12. Definition for BP, TD, and VP is recalled here; BP Burst Prone - ground condition with rock burst or coal burst behaviour TD Time Dependent - ground condition with time dependent shearing behaviour
such as squeezing, swelling, and heaving condition, or even creep VP Visco-elasto-Plastic - ground condition as visco-elasto-plastic to fully plastic
behaviour that contains elastic component/s together with viscous component/s, which gives the ground strain rate dependence on time; however, due to losing energy during static or dynamic loading cycle, its behaviour converts to fully plastic and may flow like a viscous substance.
Furthermore, ET column in Tables 9 and 11 for underground structures provides advice on pull length (PL), which can be estimated using the proposed method in Appendix 3. Nomenclature for all abbreviations used in this section is provided in Section 10.
(I)-Class
SS
ET
IT
PT
FT
DR

Journal of Engineering Geology Volume XLVI, No 1 A bi-annual Journal of ISEG June 2021
16
Table 9. (I)-Class for Underground Structures: SS, ET, IT
(I) (I)-Class Recommended Measure/s
SS ET IT
100-91 (I)-01 Scaling FF, ME/DnB, PL Nil
90 - 81 (I)-02 Scaling, IndiB25 FF, ME/DnB, PL Nil
80 - 71 (I)-03 Scaling, SpotB25 FF, ME/DnB, PL Nil
70 - 61 (I)-04 Scaling, SpotB25, PatchPS50 FF, ME/DnB, PL 3DMS@400m
60 - 51 (I)-05 Scaling, SpotB32/SysHB25.LS, PS50, PSFS50, RDH54.L FF, ME/DnB, PL 3DMS@200m
50 - 41 (I)-06 Scaling, SysB32.L.S/SysHB32.L.S, FRS100, FRFS50, RDH54.L
HnB/(FF if ≤ 45 m2), ME/DnB, PL
3DMS@100m, StrainM@300m
40 - 31 (I)-07
Scaling, CPS32.L.S/FP32.250.L.X1, SysB32.L.S/SysHB32.L.S, LG25.20.150.1000-, FRS200, FRFS150, RDH54.L
HnB/(FF if ≤ 35 m2), ME/NonExBreak/ DnB, PL
3DMS@75m, StrainM@250m, PressC/LoadC@300m
30 - 21 (I)-08
FP32.200.L.X1/FP76.250.L.X1/ PR100.300.L.X1, SysLB32.L.S, LG32.25.180.1000/ RigidR150UC23.1000-, FRS225/FRC225, FaceButt.L, FRFS200, RDH54.L+CF
PSE, ME/NonExBreak, PL
3DMS@50m, StrainM@200m, PressC/LoadC@250m, SingleRodE@400m
20 - 11 (I)-09
PR100.250.L.X1/FP76.200.L.X1/ FP32.200.L.X2, FaceB25.L.S/ FaceP300-, FaceButt.L, PreG/I, RigidR150UC23.750-+RingC, SysN32.L.S, FRS225/FRC225, FRFS200, RDH54.L+CF
PSD, ME, PL
3DMS@25m, StrainM@150m, PressC/LoadC@200m, MultiRodE@400m, StrainG@500m
10 - 0 (I)-10
PR100.200.L.X1/FP76.200.L.X2, PreG/I, PostG/I, FaceB32.L.S/ FaceP300-, FaceButt.L, RigidR200UC46.500-+RingC, SysN32.L.S, FRS250/FRC250, FRFS225, (RDH54.L, WDH54.L)+CF
PSD, ME, PL
3DMS@15m, StrainM@100m, PressC/LoadC@150m, MultiRodE@300m, StrainG@400m, DIC@25m

Journal of Engineering Geology Volume XLVI, No 1 A bi-annual Journal of ISEG June 2021
17
Table 9. Continued; (I)-Class for Underground Structures: PT, FT, DR
(I) (I)-Class Recommended Measure/s
PT FT DR
100-91 (I)-01 Avoid: ‘UnCtldBlast’ TSP/PH100.BH.L Active load configuration, SPL
and/or SFL not required
90 - 81 (I)-02 Avoid: ‘UnCtldBlast’ TSP/PH100.BH.L Active load configuration, SPL
and/or SFL not required
80 - 71 (I)-03 Avoid: ‘UnCtldBlast’ TSP/PH100.BH.L Active load configuration, SPL
and/or SFL not required
70 - 61 (I)-04 Avoid: ‘ProdBlast/UnCtldBlast’ TSP/PH100.BH.L Active load configuration, SFL
not required
60 - 51 (I)-05 Avoid: ‘ProdBlast/UnCtldBlast’
TSP/PH100.BH.L/ PH54.EC.L
Load configuration to be maintained as active, SFL not required
50 - 41 (I)-06 Avoid: ‘ProdBlast/UnCtldBlast’
TSP/PH100.BH.L/ PH54.EC.L
Load configuration to be maintained as active
40 - 31 (I)-07
Apply: ‘CPS’, Avoid: ‘MineBlast/ProdBlast/ UnCtldBlast’
TSP/PH100.BH.L/ PH54.EC.L Critical load bearing capacity
30 - 21 (I)-08
Apply: ‘FP/PR, maintain buttress’, Avoid: ‘FF & DnB’
TSP/PH54.EC.L
Passive load configuration, Sensitive to: ‘scale, unsupported span, & stand-up time’
20 - 11 (I)-09
Apply: ‘PreG/I & PR/FP, maintain buttress’, Avoid: ‘FF, NonExBreak/DnB, & ductile SS’
TSP/PH54.EC.L
Passive load configuration, Sensitive to: ‘scale, unsupported span, & stand-up time’
10 - 0 (I)-10
Apply: ‘PreG/I & PR, maintain buttress’, Avoid: ‘FF, NonExBreak/DnB, & ductile SS’
TSP/PH54.EC.L
Passive load configuration, Sensitive to: ‘scale, unsupported span, & stand-up time’

Journal of Engineering Geology Volume XLVI, No 1 A bi-annual Journal of ISEG June 2021
18
Table 10. (I)-Class for Semi-surface and Surface Structures: SS, ET, IT
(I) (I)-Class Recommended Measure/s
SS ET IT
100-91 (I)-01 Scaling (PreS, DD12000-), (ProdBlast, PD6000-) Nil
90 - 81 (I)-02 Scaling, IndiB25 (PreS, DD12000-), (ProdBlast, PD4000-) Nil
80 - 71 (I)-03 Scaling, SpotB25 (PreS, DD9000-), (ProdBlast, PD4000-) Nil
70 - 61 (I)-04 Scaling, SpotB25/SpotA25, PatchHEAM/PatchWeldM, DH54.L
(PreS, DD9000-), (ProdBlast, PD3000-) 3DMS@200m
60 - 51 (I)-05 Scaling, SpotB32/SpotA32, HEAM/WeldM, DH54.L
(PreS, DD6000-), (ProdBlast, PD3000-) 3DMS@150m
50 - 41 (I)-06 Scaling, SysA25.L.S, FRS150, DH54.L
(PreS, DD6000-), (ProdBlast, PD2000-) 3DMS@75m, IncM@500m
40 - 31 (I)-07 Scaling, SysA32.L.S, FRS250, PostG/I, DH54.L ME/NonExBreak 3DMS@25m, IncM@400m
30 - 21 (I)-08 RWall-SolP/FRS300/FRC300, SysN32.L.S, WH54.L+CF PSE, ME 3DMS@10m, IncM@300m
20 - 11 (I)-09 DWall-TanP/FRS350/FRC350, SysN32.L.S, WH54.L+CF PSE/OC, ME 3DMS@10m, IncM@200m,
DIC
10 - 0 (I)-10 DWall-SecP/FRS400/FRC400, SysN32.L.S, WH54.L+CF PSE/OC, ME 3DMS@10m, IncM@150m,
DIC

Journal of Engineering Geology Volume XLVI, No 1 A bi-annual Journal of ISEG June 2021
19
Table 10. Continued; (I)-Class for Semi-surface and Surface Structures: PT, FT, DR
(I) (I)-Class Recommended Measure/s
PT FT DR
100-91 (I)-01 Avoid: ‘UnCtldBlast’ VPH54.L
Permanent stable condition, SPL and/or SFL not required
90 - 81 (I)-02 Avoid: ‘UnCtldBlast’ VPH54.L
Check against ‘plain failure criteria’, SPL and/or SFL not required
80 - 71 (I)-03 Avoid: ‘UnCtldBlast’ VPH54.L
Check against ‘plain/wedge failure criteria’, SPL and/or SFL not required
70 - 61 (I)-04 Avoid: ‘ProdBlast/UnCtldBlast’ VPH54.L
Check against ‘plain/wedge failure & rock fall criteria’, SPL and/or SFL not required
60 - 51 (I)-05
Protect crest with FRS to prevent increment in pore water pressure, Avoid: ‘ProdBlast/UnCtldBlast, & bulk removal of toe’
ERT/VPH54.L
Check against ‘plain/wedge/toppling failure & rock fall criteria’, SFL not required
50 - 41 (I)-06
Cover slope crest with WPM & FRS at a width equal to height to help prevention of tension crack generation, Avoid: ‘ProdBlast/UnCtldBlast, surcharge at crest, & toe lightening’
ERT/VPH54.L
Check against ‘plain/wedge/toppling failure & rock fall criteria’
40 - 31 (I)-07
Cover slope crest with WPM & FRS at a width equal to height to help prevention of tension crack generation, Avoid: ‘ProdBlast/UnCtldBlast, sharp/tall slope, short berm, surcharge at crest, & toe lightening’
ERT/SRT/VPH54.L
Check against ‘plain/wedge/toppling failure & rock fall criteria’
30 - 21 (I)-08
Cover slope crest with WPM & FRS at a width equal to height to help prevention of tension crack generation, Avoid: ‘NonExBreak/DnB, sharp/tall slope, short berm, & surcharge at crest’
MASW/SRT/ERT/ VPH54.L
Check against ‘circular failure criteria’
20 - 11 (I)-09
Avoid: ‘NonExBreak/DnB, unretained wall/s, & surcharge at crest’
MASW/SRT/ VPH54.L
Check against ‘circular failure criteria’
10 - 0 (I)-10
Avoid: ‘NonExBreak/DnB, unretained wall/s, & surcharge at crest’
MASW/SRT/ VPH54.L
Check against ‘circular failure criteria’

Journal of Engineering Geology Volume XLVI, No 1 A bi-annual Journal of ISEG June 2021
20
Table 11. Special (I)-Class for Underground Structures
(I)-Class Recommended Measure/s
SS ET IT PT FT DR
(I)-BP*
Scaling, SysDB25.L.S/ ConeB25.L.S/ YieldB25.L.S, FRS150, SRH100.L.S.X1, HEAM/CableL+ WeldM, FRFS50
HnB, ME/ DnB, PL
3DMS@25m, StrainM@100m, PressC/LoadC@ 300m, MultiRodE@ 600m
Avoid: ‘ProdBlast/ UnCtldBlast, rigid SS, & naked faces’
TSP/ PH100. BH.L
Bursting initiation time and depth of plastic zone around periphery to be measured
(I)-TD*
Mild-Severe SSH: YieldR1000+RingC, SRH100+.L.S.X2, YieldFRS200/ YieldFRC200, LSC, SysDB25.L.S Minor SSH: RigidR200UC46.1000-+RingC, FRS200/FRC200+ SRH100.L.S.X1+ SysLB32.L.S
HnB, ME, PL
3DMS@10m, StrainM@100m, PressC/LoadC@ 150m, MultiRodE@ 300m, StrainG@400m, DIC@25m
Apply: ‘SRH, SysLB for Minor SSH’ Avoid: ‘FF, DnB, rigid SS, & SysLB for Mild-Severe SSH’
TSP/ PH100. BH.L
Nonuniform deformation, load relaxation, scale sensitive
(I)-VP
BulkH300+, FaceP300-, PR100.150.L.X1, PreI/JetG/PreF, PostG/I, RigidR200UC46.500-+RingC, FRS300/FRC300, FRFS275, (RDH54.L, WDH54.L, ADH54.L)+CF
PSD, ME, PL
3DMS@10m, StrainM@100m, PressC/LoadC@ 150m, MultiRodE@ 400m, StrainG@400m, DIC@25m
Apply: ‘PreG/I & PR, maintain buttress’ Strictly Avoid: ‘FF, NonExBreak/ DnB, ductile SS, & build-up of hydrostatic pressure/thrust at face’
TSP/ PH54. EC.L
Passive load configuration, Sensitive to: ‘scale, unsupported span, & stand-up time’
* Appendix 4 for further information.
Table 12. Special (I)-Class for Semi-surface and Surface Structures
(I)-Class Recommended Measure/s
SS ET IT PT FT DR
(I)-VP JetG/PreG/I/PreF, DWall-SecP/TanP, WH54.L+CF
PSE/OC,ME
3DMS@10m, DIC
Apply PreG/I/Freezing Strictly Avoid: ‘NonExBreak/ DnB, unretained wall/s, & surcharge at crest’
MASW/VPH54.L
Liquefaction prone, vibration sensitive, high passive lateral load configuration in design of retaining structure, long term consideration in time dependent behaviour
Appendix 5 illustrates some of the measures recommended in the SS and FT columns in Tables 9 and 11, including ADH, BH, BulkH, ConeB, CPS, EC, FaceB, FaceButt, FaceP, FibreD, FP, PH, PR, RDH, SysB SysDB, SysHB, SysLB, SysN, WDH, and YieldB. Definition of these measures is presented in Section 10. Appendix 6 provides systematic bolting calculation method for bolting parameters (length and spacing) for measures proposed in the SS column in Tables 9 and 11, including ConeB, SysB, SysDB, SysLB, SysN, and YieldB. Definition of these measures is presented in Section 10.

Journal of Engineering Geology Volume XLVI, No 1 A bi-annual Journal of ISEG June 2021
21
5. (I)-GC I-System’s Ground Characterisation entitled “(I)-GC” characterizes the mechanical properties of ground (rock or soil mass) by quantifying most important ground properties including Modulus of Deformation (E"), Poisson’s Ratio (𝜈#), Unconfined Compressive Strength (σ$"), Uniaxial Tensile Strength (σ%"), Cohesion (φ"), and Internal Friction Angle (φ"). Quantified values provided as output of (I)-GC are estimations based on empirical correlations. Figure 12 is a representation of hexad output for (I)-GC.
Figure 12. I-System’s Ground Characterisation; (I)-GC
(I)-GC’s output (Figure 12) provides most important input values required in design approach and procedure (Figures 1 and 2a) for underground, semi-surface, and surface structures. The mathematical form of (I)-GC’s hexad output is presented in Eq 11 to 16 (Bineshian, 2019b), whereas the graphical form is presented in Figure 13. These empirical equations are developed and examined by author for several cases (Bineshian, 2019b); however, their accuracy may improve by study on further cases. E) = e9.9:×(=)-1 (11) ν) = 0.5 − 0.004 × (I) (12) σ() = 0.007 × σ( × e9.9:×(=) (13) σ?) = −σ() × e(9.9@×(=)A@) (14) C) = 0.002 × σ() × e9.9:×(=) (15) φ) = 15 + 0.55 × (I) (16)
where; (I) I-System’s Value E) Modulus of Deformation of ground – rock-/soil-mass (GPa) ν) Poisson’s Ratio of ground σ( Unconfined Compressive Strength of intact rock or soil (MPa) σ() Unconfined Compressive Strength of ground – rock-/soil-mass (MPa) σ?) Uniaxial Tensile Strength of ground – rock-/soil-mass (MPa) C) Cohesion of ground (KPa) φ) Internal Friction Angle of ground (degrees)
(I)-GC
E!
ν!
σ"!
σ#!
C!
φ!

Journal of Engineering Geology Volume XLVI, No 1 A bi-annual Journal of ISEG June 2021
22
a. (I) vs Modulus of Deformation
b. (I) vs Poisson’s Ratio
c. (I) vs Unconfined Compressive Strength
d. (I) vs Uniaxial Tensile Strength
e. (I) vs Cohesion f. (I) vs Internal Friction Angle
Figure 13. (I)-GC Chart
0
25
50
75
100
125
150
0 10 20 30 40 50 60 70 80 90 100
Eg(G
Pa)
(I)
0.1
0.15
0.2
0.25
0.3
0.35
0.4
0.45
0.5
0 10 20 30 40 50 60 70 80 90 100
νg
(I)
0
0.2
0.4
0.6
0.8
1
0 10 20 30 40 50 60 70 80 90 100
σcg/σc
(I)
-1
-0.8
-0.6
-0.4
-0.2
00 10 20 30 40 50 60 70 80 90 100
σtg/σc
g
(I)
0
0.05
0.1
0.15
0.2
0.25
0.3
0 10 20 30 40 50 60 70 80 90 100
Cg/σc
g
(I)
0
10
20
30
40
50
60
70
0 10 20 30 40 50 60 70 80 90 100
φg
(Deg
rees
)
(I)

Journal of Engineering Geology Volume XLVI, No 1 A bi-annual Journal of ISEG June 2021
23
6. Utilisation Guideline Utilisation approach of I-System is based on the following steps:
- Stage 1. Derivation of input parameters from a site visit or reference data. Figure 2b demonstrates the data group, which is used in I-System as input.
- Stage 2. Calculation of indices; A!, C!, H!, P!, S!, DF!, and ET! using the derived data in Stage 1, Eq 2 – 8, and Tables 2 – 8.
- Stage 3. Calculation of (I) using Eq 1 and calculated indices in Stage 2. - Stage 4. Determination of (I)-Class using the calculated (I) value in Stage 3 and
Tables 9 – 12. Recommendations for SS, ET, IT, PT, FT, and DR provided in Tables 9 – 12 are applicable in practice.
- Stage 5. Calculation of (I)-GC; E", 𝜈#, σ$", σ%", C", and φ" using Eq 11 to 16 or Figure 13, which is applicable for design.
Figure 14 summarises the utilisation approach explained above in a simple diagram.
Figure 14. Utilisation diagram of I-System An example of I-System calculation for a tunnel is provided in Appendix 7; input parameters for calculation of (I) in Figure 24a, (I)-Class as output of classification in Figure 24b, (I)-GC as characterisation output in Figure 24c, and (I)-GC Charts in Figure 24d. Below, a summary of (I)-Class for the same example is provided as a guide for decoding the recommendations’ script: (I) = 25 ⟹ (I)-08 ⟹ Table 9 ⟹ Derive recommendations for (I)-08 as follows:
SS - Support System FP32.200.L.X1/FP76.250.L.X1/PR100.300.L.X1, SysLB32.L.S, LG32.25.180.1000/RigidR150UC23.1000-, FRS225/FRC225, FaceButt.L, FRFS200, RDH54.L+CF ET - Excavation Technique/s PSE-ME/NonExBreak, PL IT - Instrumentation Technique/s 3DMS@50m, StrainM@200m, PressC/LoadC@250m, SingleRodE@400m PT - Prevention Technique/s Apply FP/PR, Maintain Buttress, Avoid: ‘FF & DnB’ FT - Forecast Technique/s TSP/PH54.EC.L Design Remark/s Passive load configuration, sensitive to ‘scale, unsupported span, & stand-up time’
Input(Stage 1)
Derive the prameters from a
site visit or available data
Indices(Stage 2)
Calculate the indices using Eq 2 - 8 and Tables 2 -8 and derived data
(I)(Stage 3)
Calculate I-System using Eq 1 and calculated
indices
(I)-Class(Stage 4)
Determine(I)-Class usingI-System value
and Tables 9 - 12 and utilise in
practice
(I)-GC(Stage 5)
Calculate Eg, νg, σcg, σtg,
Cg, φgusing Eq 11 - 16
and utilise for design
Output

Journal of Engineering Geology Volume XLVI, No 1 A bi-annual Journal of ISEG June 2021
24
Tunnel’s largest dimension in a cross section (diameter, width, or height) for above example is 8000 mm; therefore, D = 8000 mm. Section 10 provides a comprehensive nomenclature that is necessary to be used for decoding of the output of I-System’s classification. I-System’s classification output, namely, (I)-Class that is provided in Tables 9 – 12, should be decoded using Section 10. Accordingly, above output-example is decoded (using Section 10) and interpreted in details as follows:
- SS – Support System to be applied:
- PR100.300.L.X1 or FP76.250.L.X1 or FP32.200.L.X1 (Piperoofing 100 mm dia, 300 mm spacing, L = 0.7D to L = D then L = 5600 to 8000 mm in one row) or (Forepoling 76 mm dia, 250 mm spacing, L = 0.7D to L = D then L = 5600 to 8000 mm in one row) or (Forepoling 32 mm dia, 200 mm spacing, L = 0.7D to L = D then L = 5600 to 8000 mm in one row). Specified length (L) for the piperoofing or forepoling is a function of D (Diameter, width, or height (mm) of underground opening, the greater value), which can be derived from the empirical equation (L = 0.7D to L = D) proposed in Section 10 and Appendix 5. The length between 5600 to 8000 mm to be selected as per condition.
- SysLB32.L.S (Systematic Long Bolting 32 mm dia, L = 0.7D or L = D × D99A(=)
D99 then L = 5600 to
6000 mm, S = 0.3L = 1700 to 1800 mm). Specified length (L) and spacing (S) for systematic long bolting as a function of D (Diameter, width, or height (mm) of underground opening, the greater value) can be derived from empirical equations (L = 0.7D and S = 0.3L) proposed in Section 10 and Appendix 5 or using proposed equations in Appendix 6 (L = D × D99A(=)
D99 and S = 0.3L)
as a function of D and (I). The length between 5600 to 6000 mm to be selected as per condition.
- LG32.25.180.1000- or RigidR150UC23.1000- (Lattice Girder with 32 mm dia rebar at intrados and two 25 mm dia rebars at extrados with 180 mm spacing between the intrados and extrados and spacing between the LGs below 1000 mm) or (Rigid Rib made with Universal Column as per Australian Standard of 150UC23 and spacing of below 1000 mm).
- FRS225 or FRC225 (Fibre Reinforced Shotcrete with 225 mm thickness) or (Fibre Reinforced Concrete with 225 mm thickness).
- FaceButt.L (Face Buttress with L = 0.25D = 2000 mm if D ≥ 6000 mm). Specified length (L) for buttress as a function of D (Diameter, width, or height (mm) of underground opening, the greater value) can be derived from empirical equation (L ≥ 0.25D) proposed in Section 10 and Appendix 5.
- FRFS200 (Fibre Reinforced Face Sealing with 200 mm thickness).
- RDH54.L+CF (Radial Drainage Holes 54 mm dia, L ≤ D ≅ 8000 mm + Collar Filtration). Specified length (L) for radial drainage holes as a function of D (Diameter, width, or height (mm) of underground opening, the greater value) can be derived from empirical equation proposed in Section 10 and Appendix 5 (L ≤ D).

Journal of Engineering Geology Volume XLVI, No 1 A bi-annual Journal of ISEG June 2021
25
- ET – Excavation Technique/s to be implemented:
- PSE-ME/NonExBreak, PL (Partial Sequential Excavation using Mechanised Excavation or Non-Explosives Breaking with Pull Length as PL = 0.5D (=)
D99 then PL = 1000 mm).
Specified pull length (PL) for advance at face as a function of D (Diameter, width, or height (mm) of underground opening, the greater value) and (I) can be derived from empirical equation (PL = 0.5D (=)
D99) proposed in Appendix 3.
- IT – Instrumentation Technique/s to be used:
- 3DMS@50m (3D Monitoring Station at every 50 m).
- StrainM@200m (Strain Meter at every 200 m).
- PressC/LoadC@250m (Pressure Cell or Load Cell at every 250 m).
- SingleRodE@400m (Single-Rod Extensometer at every 400 m).
- PT – Prevention Technique/s to be considered:
- Apply PR/FP (Piperoofing or Forepoling). - Maintain Buttress. - Avoid ‘FF (Full Face Excavation) and DnB (Drill and Blast)’.
- FT – Forecast Technique/s to be utilised:
- TSP/PH54.EC.L (Tunnel Seismic Prediction) or (Probe Hole 54 mm dia using Exploratory Coring with L = 3D = 24000 mm). Specified length (L) for probe hole using exploratory coring as a function of D (Diameter, width, or height (mm) of underground opening, the greater value) can be derived from empirical equation (L = 3D) proposed in Section 10.
- DR – Design Remark/s to be taken into consideration:
- Passive load configuration, and - Sensitive to ‘scale, unsupported span, and stand-up time’.
Example provided here in this section is analysed with I-System Software (it is introduced in Section 7 and output of the same is presented in Appendix 7). Further case studies are available in reference number 8 for application of I-System for underground, semi-surface, and surface structures. Notably, two methods are used for calculation of the length of the Systematic Long Bolting (SysLB), which illustrated in Appendix 5 and fully explained in Appendix 6. It is the choice of designer, engineer, or geologist to select the method that is more compatible with site condition; however, it is recommended to take the greater value between the calculated ones (using illustrations in Appendix 5 or proposed equation in Appendix 6). Same logic is applicable for other calculations for the proposed measures.
Journal of Engineering Geology Volume XLVI, No 1 A bi-annual Journal of ISEG June 2021
26
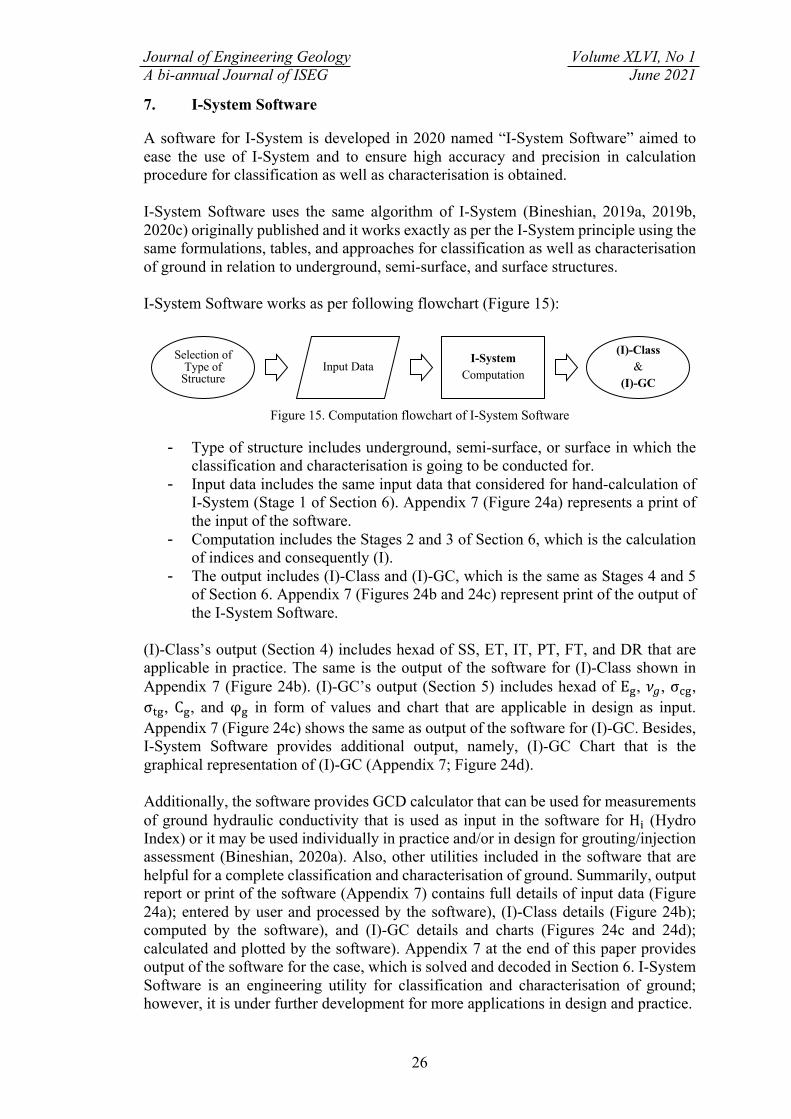
7. I-System Software A software for I-System is developed in 2020 named “I-System Software” aimed to ease the use of I-System and to ensure high accuracy and precision in calculation procedure for classification as well as characterisation is obtained. I-System Software uses the same algorithm of I-System (Bineshian, 2019a, 2019b, 2020c) originally published and it works exactly as per the I-System principle using the same formulations, tables, and approaches for classification as well as characterisation of ground in relation to underground, semi-surface, and surface structures. I-System Software works as per following flowchart (Figure 15):
Figure 15. Computation flowchart of I-System Software
- Type of structure includes underground, semi-surface, or surface in which the
classification and characterisation is going to be conducted for. - Input data includes the same input data that considered for hand-calculation of
I-System (Stage 1 of Section 6). Appendix 7 (Figure 24a) represents a print of the input of the software.
- Computation includes the Stages 2 and 3 of Section 6, which is the calculation of indices and consequently (I).
- The output includes (I)-Class and (I)-GC, which is the same as Stages 4 and 5 of Section 6. Appendix 7 (Figures 24b and 24c) represent print of the output of the I-System Software.
(I)-Class’s output (Section 4) includes hexad of SS, ET, IT, PT, FT, and DR that are applicable in practice. The same is the output of the software for (I)-Class shown in Appendix 7 (Figure 24b). (I)-GC’s output (Section 5) includes hexad of E", 𝜈#, σ$", σ%", C", and φ" in form of values and chart that are applicable in design as input. Appendix 7 (Figure 24c) shows the same as output of the software for (I)-GC. Besides, I-System Software provides additional output, namely, (I)-GC Chart that is the graphical representation of (I)-GC (Appendix 7; Figure 24d). Additionally, the software provides GCD calculator that can be used for measurements of ground hydraulic conductivity that is used as input in the software for H! (Hydro Index) or it may be used individually in practice and/or in design for grouting/injection assessment (Bineshian, 2020a). Also, other utilities included in the software that are helpful for a complete classification and characterisation of ground. Summarily, output report or print of the software (Appendix 7) contains full details of input data (Figure 24a); entered by user and processed by the software), (I)-Class details (Figure 24b); computed by the software), and (I)-GC details and charts (Figures 24c and 24d); calculated and plotted by the software). Appendix 7 at the end of this paper provides output of the software for the case, which is solved and decoded in Section 6. I-System Software is an engineering utility for classification and characterisation of ground; however, it is under further development for more applications in design and practice.
Selection of Type of
StructureInput Data
I-SystemComputation
(I)-Class&
(I)-GC

Journal of Engineering Geology Volume XLVI, No 1 A bi-annual Journal of ISEG June 2021
27
8. Conclusions I-System is developed to compensate demerits of existing engineering classifications including their limitations, drawbacks, impreciseness, and inaccuracy. It is applicable for rock and soil with acceptable precision and accuracy with simplicity in use and certainty in its approach for derivation of input parameters besides clarity and trust in the output data. It is developed in challenging projects in varieties of ground and verified for perfectness. There is no limitation/s in its application for any type of underground, semi-surface, and surface structures in rock and soil. It comes with a simple equation containing essential parameters, which can be derived from doubtless input tables, reliable references, or test results. It is based on certain key indices, which defines mechanical behaviour of surrounding ground of structure considering impact of dynamic forces as well as excavation technique impact. I-System contains two main parts; (I)-Class as classification system and (I)-GC as characterization system. (I)-Class classifies the ground to 10 classes from the best to the worst, which contains a hexad output as recommendations that is required in practice for execution including; Support System, Excavation Technique/s, Instrumentation Technique/s, Prevention Technique/s, Forecast Technique/s, and Design Remark/s. (I)-GC provides a hexad output, which is required for design as input including; E", 𝜈#, σ$", σ%", C", and φ". I-System practically takes into consideration the most important mechanical aspects of ground for an appropriate optimised design. It has the capacity to be a reliable comprehensive classification as well as characterisation system to be utilised in both practice and design for all ground related structures. 9. Future Research Recommendations Author recommends following additional researches for further development and improvement of I-System:
- Scrutinization of indices including their parameters as well as their scorings for a better modelling of each index of ground.
- Investigation on impact factors and their influence on total value of I-System to obtain better accuracy – if possible – in effect of influencing parameters on (I).
- Study on impact of important factors of shape, scale, in-situ stresses, and/or overburden, which are already considered in Strength Index to develop – if possible – a more effective method in consideration of these factors.
- Adding more recommendation/s on required SS, ET, IT, PT, FT, and DR as output of (I)-Class.
- Work on (I)-GC and their output in characterisation of mechanical aspects of ground for already proposed properties and more parameters by collecting further data in a comprehensive range and varieties of ground for obtaining best fit to derive more accurate correlations.

Journal of Engineering Geology Volume XLVI, No 1 A bi-annual Journal of ISEG June 2021
28
10. Nomenclature (I) I-System’s value (I)-Class I-System's Ground Classification, which provides recommendations on SS, ET, IT, PT,
FT, and DR that are applicable in practice as well as design for structures in ground (I)-GC I-System's Ground Characterisation, which provides hexad of E), 𝜈E, σ(), σ?), C), and
φ) that are applicable in design as input parameters for design of structures in ground
3DM 3D Monitoring - using Bi-Reflex Target 3DMS 3D Monitoring Station ada Factor related to “Discontinuity Aperture” that is based on the most unfavourable
opening of the discontinuities; a parameter of A! add Factor related to “Discontinuity Disintegration” that is based on the worst weathering or
alteration of surface of the discontinuity sets; a parameter of A! adf Factor related to “Discontinuity Friction” that is based on the least friction condition of
discontinuity sets; a parameter of A! ADH Axial Drainage Hole/s - NX hole/s (w/- or w/o casing), parallel to axis of tunnel,
perpendicular to face; L ≤ 1.5D, S as per site condition adi Score related to “Discontinuity Inclination” that is based on the dip angle of the most
critical/unfavourable discontinuity set; a parameter of A! adn Score related to “Discontinuity Number/s” that is based on number of individual
discontinuities per meter of a horizontal or vertical scanline or average of number of discontinuities per meter of horizontal and vertical scanline; a parameter of A!
adp Factor related to “Discontinuity Persistency” that is based on the most unfavourable discontinuity set; a parameter of A!
ads Score related to “Discontinuity Set/s” reflecting the number of sets of discontinuities; a parameter of A!
A! Armature Index B Width of a berm in a slope or trench or width or horizontal span of an underground space B/H Underground, semi-surface, or surface structures’ shape or scale factor as ratio of
horizontal span to height of underground opening or ratio of width of berm to height of slope or trench
BH Blind Hole - triangular patterned probing parallel to axis of underground space using blind hole/s; L = 2D and 100+ mm diameter
BP Burst Prone – highly stressed ground condition with rock burst or coal burst behaviour BRT Bi-Reflex Target - 3, 5, or 7 targets installed in a 3DMS based on severity of convergency BulkH Bulk Head - shotcrete/concrete plug at whole section of excavation at face to prevent the
ground from flowing; L ≤ 0.15D C Convergency (mm) c/a Conditionally Applicable cD Site constant in USBM PPV Predictor cF Site constant in USBM PPV Predictor CableL Cable Lacing - applicable for controlling rock burst in deep underground spaces CF Collar Filtration - filtration of drainage holes' outlet to stop debris/fines discharge Cg Cohesion of ground (MPa) C! Configuration Index CommBlast Commercial Blasting (engineered blast near commercial area) ConeB Cone Bolts - oriented/radial cone bolts; L = 0.5D, S = 0.3L

Journal of Engineering Geology Volume XLVI, No 1 A bi-annual Journal of ISEG June 2021
29
Continuum Massive Rock
A massive medium rather than layered one; e.g., intact rock or unlayered and structurally interlocked rock mass
cpc Impacting factor related to “Problematical Configuration” of ground indicating ground's tectonic state; a parameter of C!
CPD*%G Maximum charge per delay (kg) CPS Crown Periphery Spiling - SN umbrella at 5-30 deg; L = 0.7D csc Score of “Structural Configuration” of ground (an effect of ground's texture, fabric, and
structure); a parameter of C! CtldBlast Controlled Blasting (an ordinary engineered blast for civil works) CYSS Conventional Yield Support System - a conventional system of yield measures used in
tunnelling under SSH condition; it includes TH or H sliding ribs, LSC, and/or LCN d Depth of placement of the structure D Diameter, width, or height (mm) of underground opening (the greater value) DD Drilling Depth (mm) DF! Dynamic Forces Impact DH Drainage Hole/s - upward NX hole/s (w/- or w/o casing); L = 1.5H, S as per site condition Di Damage Indicator (%); Bineshian (2021a, 2021b) Di-Class Classification of ViD based on Di DIC Digital Image Correlation (Bineshian et al, 2021a, 2021b) Dist The distance between the blasting location and concerned structure (m) DL Drilling Length of blastholes (mm) DnB Drill and Blast - controlled blast using a designed drilling pattern DR Design Remark/s DWall Diaphragm Wall EC Exploratory Coring - single NX hole parallel to axis of tunnel; L = 3D Eg Deformation Modulus of ground - rock mass or soil mass's deformation modulus (GPa) ElFootR Elephant Foot Rib – a stiff/rigid rib applicable when vertical load above crown is high EN European Standard – Eurocode of practice ERT Electrical Resistivity Tomography - a non-destructive geophysical method for ground
characterisation ERZ Earthquake Risk Zone classifies seismicity to EH (Extremely High), VH (Very High), H
(High), M (Moderate), L (Low), VL (Very Low), EL (Extremely Low) ET Excavation Technique/s ET! Excavation Technique Impact FaceB Face Bolting – Fibreglass Dowel/s or SDA bolts drilled parallel to axis to support against
face pressure/thrust, perpendicular to face; L = D, S ≤ 0.3L FaceButt Face Buttress - keeping part of face in place as a buttress to absorb face pressure or thrust
as part of face stabilization; L ≥ 0.25D (Only if D ≥ 6 m) FaceP Face Plug - shotcrete at face to plug outlet of debris discharge; L ≤ 0.05D f+ Frequency of blast-induced vibration (Hz) FF Full Face excavation FibreD Fibreglass Dowel/s - used as FaceB; L = D, S ≤ 0.3L FP Fore Poling - umbrella using perforated/blind SDA; L = D FRC Fibre Reinforced Concrete Freezing A pre-excavation solidification for underground, semi-surface, and surface openings FRFS Fibre Reinforced Face Sealing

Journal of Engineering Geology Volume XLVI, No 1 A bi-annual Journal of ISEG June 2021
30
FRS Fibre Reinforced Shotcrete FT Forecast Technique/s g g-force or peak ground acceleration due to earth’s gravity (m/sec2); 1g = 9.81 m/sec2 GB Ground Behaviour based on mechanical response of ground GCD Ground Conductivity Designation (Bineshian, 2020a) GCDe Existing GCD; post-blast measured GCD GCDp Pre-existing GCD; pre-blast measured GCD GCef Ground Conductivity Enhanced Factor (Bineshian, 2021a, 2021b) GD Gravity Driven - flowing ground with fully plastic behaviour GH Ground Hazards based on failure categorisation Rock Intact rock or rock mass Granular Soil mass (conglomerate and breccia is excluded from this category) GRC Ground Reaction Curve GZ Ground Zoning based on ground properties H Height of a slope, trench, opening, or buttress HCF Half Cast Factor (%) HEAM High Energy Absorption Mesh - mesh over shotcrete; protective mesh against dynamic
or impact loads hgc Score assigned to “Ground Conductivity” that is measured using GCD or selected from
Wetness diagram as criterion for hydropressure effect on ground; a parameter of H! hgs Impact factor related to “Ground Softness” that is considered as an effect of water on
medium/infilling material (Mohs); a parameter of H! H! Hydro Index HnB Heading and Benching - an excavation method to control the scale effect on stability I-System Index of Ground-Structure; a comprehensive classification and characterisation system
for ground including both rock and soil media (Bineshian, 2019a, 2019b, 2020c) IncM Inclinometer/s IndBlast Industrial Blasting (engineered blast near industrial area) IndiB Individual Bolting - oriented and in very limited number InfraBlast Infrastructures Blasting (engineered blast for demolishing infrastructures) IS Indian Standard - code of practice IT Instrumentation Technique/s JetG Jet Grouting - applicable in construction of underground, semi-surface, and surface
metro station Jointless A definition describing an important feature of intact rock; a medium that does not have
any countable joint set L Length of ADH, BH, ConeB, CPS, DH, EC, FaceB, FaceButt, FaceP, FP, PH, PR, RDH,
SRH, SysA, SysB, SysDB, SysHB, SysLB, SysN, VPH, WDH, WH, and YieldB (mm) LCN Longitudinal Compression Niche; applicable in YSS for tunnelling under SSH condition
(Bineshian, 2020b) L(H Length of contour or periphery blasthole (m) LG Lattice Girder LH( Length of half-cast or half barrel (m) L! Length of water injected portion (packed length) of drilled hole (m) or length of casing
hole (m) or length of installed perforated SDA (m) in the GCD test procedure LoadC Load Cell/s LRFD Load and Resistance Factor Design method
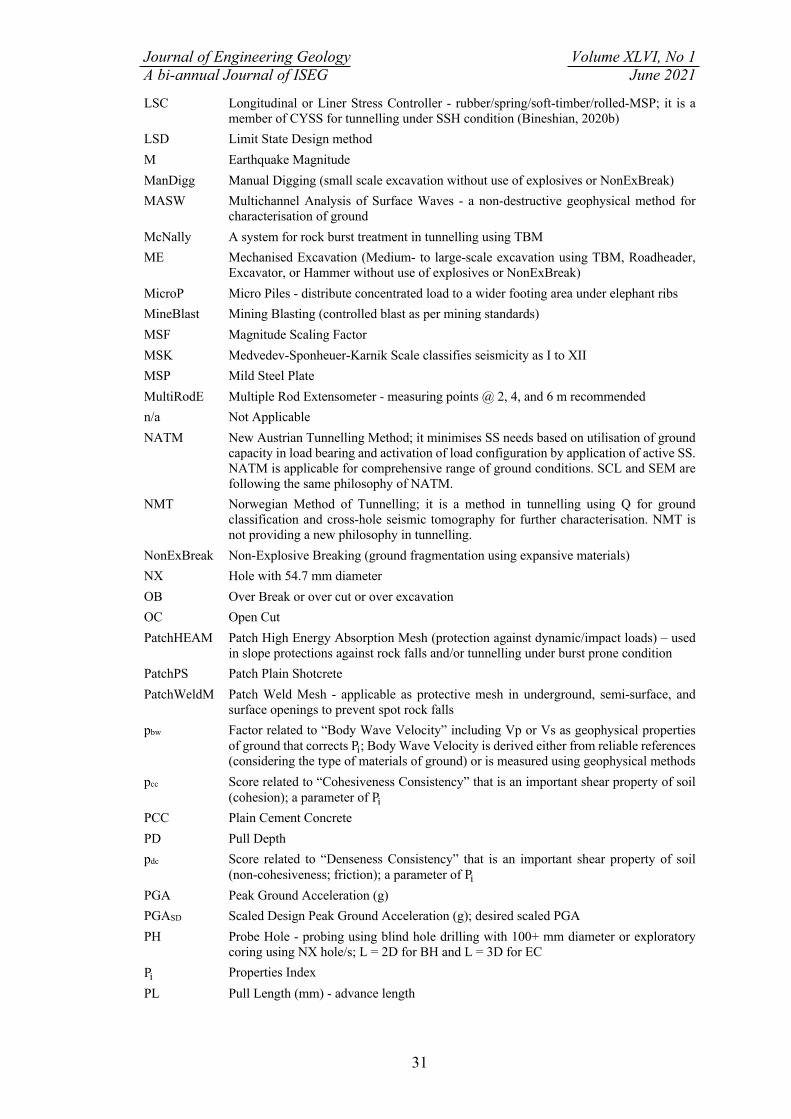
Journal of Engineering Geology Volume XLVI, No 1 A bi-annual Journal of ISEG June 2021
31
LSC Longitudinal or Liner Stress Controller - rubber/spring/soft-timber/rolled-MSP; it is a member of CYSS for tunnelling under SSH condition (Bineshian, 2020b)
LSD Limit State Design method M Earthquake Magnitude ManDigg Manual Digging (small scale excavation without use of explosives or NonExBreak) MASW Multichannel Analysis of Surface Waves - a non-destructive geophysical method for
characterisation of ground McNally A system for rock burst treatment in tunnelling using TBM ME Mechanised Excavation (Medium- to large-scale excavation using TBM, Roadheader,
Excavator, or Hammer without use of explosives or NonExBreak) MicroP Micro Piles - distribute concentrated load to a wider footing area under elephant ribs MineBlast Mining Blasting (controlled blast as per mining standards) MSF Magnitude Scaling Factor MSK Medvedev-Sponheuer-Karnik Scale classifies seismicity as I to XII MSP Mild Steel Plate MultiRodE Multiple Rod Extensometer - measuring points @ 2, 4, and 6 m recommended n/a Not Applicable NATM New Austrian Tunnelling Method; it minimises SS needs based on utilisation of ground
capacity in load bearing and activation of load configuration by application of active SS. NATM is applicable for comprehensive range of ground conditions. SCL and SEM are following the same philosophy of NATM.
NMT Norwegian Method of Tunnelling; it is a method in tunnelling using Q for ground classification and cross-hole seismic tomography for further characterisation. NMT is not providing a new philosophy in tunnelling.
NonExBreak Non-Explosive Breaking (ground fragmentation using expansive materials) NX Hole with 54.7 mm diameter OB Over Break or over cut or over excavation OC Open Cut PatchHEAM Patch High Energy Absorption Mesh (protection against dynamic/impact loads) – used
in slope protections against rock falls and/or tunnelling under burst prone condition PatchPS Patch Plain Shotcrete PatchWeldM Patch Weld Mesh - applicable as protective mesh in underground, semi-surface, and
surface openings to prevent spot rock falls pbw Factor related to “Body Wave Velocity” including Vp or Vs as geophysical properties
of ground that corrects P!; Body Wave Velocity is derived either from reliable references (considering the type of materials of ground) or is measured using geophysical methods
pcc Score related to “Cohesiveness Consistency” that is an important shear property of soil (cohesion); a parameter of P!
PCC Plain Cement Concrete PD Pull Depth pdc Score related to “Denseness Consistency” that is an important shear property of soil
(non-cohesiveness; friction); a parameter of P! PGA Peak Ground Acceleration (g) PGASD Scaled Design Peak Ground Acceleration (g); desired scaled PGA PH Probe Hole - probing using blind hole drilling with 100+ mm diameter or exploratory
coring using NX hole/s; L = 2D for BH and L = 3D for EC P! Properties Index PL Pull Length (mm) - advance length

Journal of Engineering Geology Volume XLVI, No 1 A bi-annual Journal of ISEG June 2021
32
P* Peak head (MPa) during injection period of T! in GCD test procedure; it is the measured water pressure before the first drop in peak is observed.
PostG/I Post-excavation Grouting/Injection - consolidation/solidification ppm Influencing parameter related to “Particles’ Morphology” that is a function of shape of
soil's grains/granules; a parameter of P! pps Influencing parameter related to “Particles’ Size” that is a function of size of soil's
grains/granules”; a parameter of P! PPV Peak Particle Velocity (mm/sec) PR Pipe Roofing - perforated/blind pipe (w/- or w/o grouting); L = D PreF Pre-Excavation Freezing of face or excavation line/periphery PreG/I Pre-excavation Grouting/Injection - cement/mineral/chemical-base PreS Pre-excavation Splitting PressC Pressure Cell/s ProdBlast Production Blasting (controlled blast for rock production in large scale) PS Plain Shotcrete PSD Partial-Sequential Digging - small scale partial digging in several sequences e.g., small
pilots, considering stand-up time and maximum unsupported span PSE Partial-Sequential Excavation - small scale partial excavation larger than digging scale
in several sequences e.g., pilot and enlargement, considering stand-up time and maximum unsupported span
PSFS Plane Shotcrete Face Sealing - application of 50 mm plain shotcrete at face to prevent hazards/disintegration
PT Prevention Technique/s PU-2C Polyurethane with two components Q Rock mass classification for tunnel supports (Barton et al, 1974) Q, Water intake rate (lit/min) in GCD test procedure RCC Reinforced Cement Concrete (Conventional) RDH Radial Drainage Hole/s - NX radial holes (w/- or w/o casing); L ≤ D, S as per site
condition ResiBlast Residential Blasting (engineered blast near residential area) RigidR Rigid Ribs – steel ribs made from H profile (heavy beam) or any equivalent profile/s
used for manufacturing rigid ribs to absorb entire dead/passive load from the ground RingC Ring Closure or invert closure RMR Rock Mass Rating (Bieniawski, 1973) RSS Rigid Support System RWall Retaining Wall including cladding wall and any other types S Spacing related to ConeB, CPS, FaceB, SRH, SysA, SysB, SysDB, SysHB, SysLB,
SysN, or YieldB; S ≤ 0.3L SCL Sprayed Concrete Lining; it is a tunnelling method using shotcrete (sprayed concrete) as
a primary liner as a member of SS for interaction with ground load configuration. SCL is almost the same as NATM with higher emphasis on shotcreting as primary SS.
scs Score related to “Compressive Strength” as Uniaxial Compressive Strength of ground; a parameter of S!
SD Structural Dimensioning for each SS SDA Self-Drilling Anchor SecP Secant Piling or equivalent driven or bored piles including friction or end bearing piles SEM Sequential Excavation Method; it is not a tunnelling method; instead, it is an excavation
method based on NATM principles for optimisation of load configuration.

Journal of Engineering Geology Volume XLVI, No 1 A bi-annual Journal of ISEG June 2021
33
SF Scaling Factor SFL Structural Final Liner S! Strength Index SingleRodE Single Rod Extensometer - measuring point @ 3 m recommended SLS Serviceability Limit State design check - a LSD method SN Store Norfors - a rigid system of bolts using steel rebars SolP Soldier Piling or equivalent driven or bored piles SPL Structural Primary Liner SpotA Spot Anchoring SpotB Spot Bolting - oriented with limited number SRH Stress Release Holes - long radial naked holes; 100 - 300 mm diameter; L = D
(Bineshian, 2020b) SRT Seismic Refraction Tomography - a non-destructive geophysical method SS Support System sse “Scale Effect” factor; a parameter of S! SSH Squeezing/Swelling/Heaving (Bineshian, 2020b) SSH-Class Classification for SSH ground based on severity of convergency (Bineshian, 2020b) StrainG Strain Gauge/s StrainM Strain Meter SurS Surface Structure including surface and semi-surface structure/s and mine/s in general
comprising of but not limited to bridge and dam abutments, cut & cover, deep and shallow foundations, embankment and tailing dams, open cuts, open pits, shallow metro stations (cut & cover or open cut), slopes, surface power house openings, trenches
SV Structural Verification based on the definition of relative safety margin for SD Swellex An expandable rock bolting system from Atlas Copco SysA Systematic Anchoring - anchors perpendicular to face of slope; L = 0.5H, S = 0.3L SysB Systematic Bolting - radial direction; L = 0.5D, S = 0.3L SysDB Systematic Dynamic Bolts - oriented/radial dynamic bolts; a system of ductile bolting,
which is applicable for tunnelling under stressed condition like burst prone and/or SSH ground (Bineshian, 2020b); L = 0.5D, S = 0.3L
SysHB Systematic Horn Bolting – a system of bolts oriented towards the direction of advancement at tunnel, which is used to prevent over-breaks and rock falls from crown in tunnelling with unfavourable orientation of discontinuities; to be used only above SPL of tunnel (crown) at 30 - 45 deg; L = 0.7D, S ≤ 0.3L
SysLB Systematic Long Bolting - radial long bolts; L = 0.7D, S = 0.3L SysN Systematic Nailing - radial bolts/anchors; L = D = H, S = 0.3L t Time period or duration of vibration in a blast (sec) TanP Tangent Piling or equivalent driven or bored piles including friction or end bearing piles TBM Tunnel Boring Machine TD Time Dependent - ground condition with time dependent shearing behaviour such as
squeezing/swelling/heaving condition, or even creep TH Toussaint-Heintzmann - steel profile used in fabrication of yield/sliding ribs T! Injection period (minutes) taken for injection of V, quantity of water in GCD test
procedure; it is the period of time from initial raise in pressure till the first drop in peak. TSP Tunnel Seismic Prediction UB Under Break or under cut or under excavation UC Universal Column as per Australian Standard (i.e., 150UC23 and 200UC46)

Journal of Engineering Geology Volume XLVI, No 1 A bi-annual Journal of ISEG June 2021
34
UCS Unconfined Compressive Strength ULS Ultimate Limit State design check - a LSD method UnCtldBlast Un-Controlled Blasting (Non-engineered blast) UndS Underground Structure/s including underground shallow and deep structures, openings,
and mines comprising of but not limited to caverns, deep metro stations, galleries, stopes, shafts, tunnels, underground power houses, stations, storages, wells
USBM The United States Bureau of Mines ViD Vibration-induced Damage or blast-induced damage (Bineshian, 2021a, 2021b) Vp Primary Wave Velocity (m/sec) VP Visco-elasto-Plastic - ground condition as visco-elasto- to fully plastic behaviour;
ground contains elastic component/s together with viscous component/s that causes strain rate dependence on time; however, due to losing energy during static or dynamic loading cycle, its behaviour converts to fully plastic and may flow like viscous substance.
VPH Vertical Probe Hole - vertical NX blind/coring exploration hole/s; L = 0.5H Vs Shear/Secondary Wave Velocity (m/sec) V, Injected quantity of water (lit) during injection period of T! in GCD test procedure; it is
measured from the moment that the pressure is started rising till the first drop in peak is observed.
w Width of crack in concrete (mm); as per IS 456:2000 permissible crack width in the SLS design check for SV must be as: w < 0.30 mm
WDH Wing Drainage Holes - NX wing shape (w/- or w/o casing) at 30 - 45 deg applicable in underground openings to drain water from sides and ahead of face to reduce the pore hydrostatic pressure; L ≤ 2D, S as per site condition
WeldM Weld Mesh - conventional weld mesh used over shotcrete in ground burst condition or used as reinforcement for shotcrete
Wetness A diagram defined here to clarify the ground's water content, which is classifying the ground water condition (observational identification) in 11 ranges
WH Weep Holes - upward angled NX weeps (w/- or w/o casing); L = H, S as per condition WPM Waterproofing Membrane - an elastic/flexible impermeable geotextile or fibre reinforced
geomembrane or composite to be used for sealing X1 One Row X2 Two Rows YieldB Yielding Bolts - oriented/radial ductile bolts for stressed condition including burst prone
and/or SSH ground (Bineshian, 2020b); L = 0.5D, S = 0.3L YieldFRC Yield Fibre Reinforced Concrete - FRC with embedded LSC and/or LCN, which is
applicable for tunnelling under SSH condition (Bineshian, 2020b) YieldFRS Yield Fibre Reinforced Shotcrete - FRS with embedded LSC and/or LCN, which is
applicable for tunnelling under SSH condition (Bineshian, 2020b) YieldR Yield Ribs - sliding ribs using TH or H yield/sliding steel profile; it is an important
member of CYSS for tunnelling under SSH condition (Bineshian, 2020b) YSS Yield Support System - a system of yield measures, which is used for tunnelling under
SSH condition; it includes CYSS and/or SRH System (Bineshian, 2020b) νg Poisson's Ratio of ground σc Unconfined Compressive Strength of intact rock or soil (MPa) σcg Unconfined Compressive Strength of ground - rock mass or soil mass (MPa) σh Horizontal Stresses (MPa) at the location or depth of placement of structure (d) σtg Uniaxial Tensile Strength of ground - rock mass or soil mass (MPa) σv Vertical Stresses (MPa) at the location or depth of placement of structure (d) φg Internal Friction Angle of ground (degrees)

Journal of Engineering Geology Volume XLVI, No 1 A bi-annual Journal of ISEG June 2021
35
11. References 1. AS 2187.2 1993. ‘Australian Standard – Explosives; Storage, transport, and use;
Part 2: Use of explosives’, Committee CE/5. 2. Barton, N, Lien, R, Lunde, J 1974. ‘Engineering classification of rock masses for
the design of tunnel support’, Rock Mechanics, 6: 4: 189 - 236. 3. Bieniawski, Z.T, 1973. ‘Engineering classification of jointed rock masses’, Civil
Engineer, South Africa, 15 (12). 4. Bineshian, H 2012. ‘Prediction of triaxial compressive strength of geomaterials
based on a failure criterion’, Proceedings of 31th International Conference OOAE, OMAE, Rio, Brazil, 1 - 6.
5. Bineshian, H 2014. ‘Stress non-uniformity in concrete and rock structures’, LAP Lambert Publishing, Germany, 333p.
6. Bineshian, H 2017. ‘Tunnelling in Visco-Elasto-Plastic ground in tunnel T05 of the Katra-Dharam Section of the Udhampur Srinagar Baramulla Rail Link Project’, Proceedings of Tunnelling in Himalayan Geology, Jammu, India.
7. Bineshian, H 2019a. ‘I-System; A quick introduction’, Proceedings of the 8th IndoRock-2019 Conference, Delhi, India, 254 - 271.
8. Bineshian, H 2019b. ‘I-System: Index of Ground-Structure; A Comprehensive Indexing System for Ground-Structure Behaviour; Classification and Characterization’, Journal of Engineering Geology (JOEG), XLIV (1 & 2), 73 - 109, ISSN 0970-5317.
9. Bineshian, H 2020a. ‘GCD – Ground Conductivity Designation; A testing method to quantify ground’s hydraulic conductivity and solidification quality’, Journal of Engineering Geology (JOEG), XLV (1 & 2), 17 - 23, ISSN 0970-5317.
10. Bineshian, H 2020b. ‘SRH System – Stress Release Hole/s; A substitution to conventional yield support system’, Journal of Engineering Geology (JOEG), XLV (1 & 2), 1 - 16, ISSN 0970-5317.
11. Bineshian, H 2020c. ‘I-System: Index of Ground-Structure; Definition, applications, and utilisation in design/practice’, TAI Journal, 9 (1): 42 - 64.
12. Bineshian, H 2021a. ‘Principles in blasting design for civil works; An introduction to design and control of underground blasting; Part 1: Fundamentals of blasting; Part 2: Blast impacts control’, Presentation of lectures delivered to National Hydroelectric Power Corporation (NHPC Limited), Delhi, India, 1 - 39.
13. Bineshian, H 2021b. ‘Vibration-induced Damage Assessment; New practical methods applicable for engineered blasting’, TAI Journal, 10 (1): 5 - 14.
14. Bineshian, H, Dyskin, A V, Pasternak, E 2021a. ‘QI Full-Field of View Strain Measurements in Concrete/Rock Structures – Precision and Accuracy’, ISRM Journal, 10 (1), 3 - 15, ISSN 2277-131X (Print), ISSN 2277-1328 (Online).
15. Bineshian, H, Dyskin, A V, Pasternak, E 2021b. ‘Effect of Bending Moment on Concrete/Rocks in Compression – A Study Based on Digital Image Correlation (DIC) ’, In press.
16. Bineshian, H, Ghazvinian, A 2012a. ‘A comprehensive nonlinear-linear compressive-tensile strength criterion for geomaterials’, JRMGE, 4 (2): 140 - 148.

Journal of Engineering Geology Volume XLVI, No 1 A bi-annual Journal of ISEG June 2021
36
17. Bineshian, H, Ghazvinian, A 2012b. ‘Applicability of a new strength criterion in comparison to failure criteria’, Ground Engineering in a Changing World, ANZ Conference, Melbourne, Australia, 1045 - 1050.
18. Bineshian, H, Gupta, S, Hegde, R K 2019. ‘NATM in Hazardous Condition – Challenging Visco-Elasto-Plastic Ground – T5 Tunnel – USBRL Project’, Proceedings of International Conference, Tunnelling Asia, Mumbai, India, 120 - 135.
19. Bineshian, H, Rasouli, V, Ghazvinian, A 2013. ‘Proposed constants for Bieniawski's strength criterion for rocks and coal’, IJRSG, 2 (3): 12 - 21.
20. Boulanger, R W, Idriss, I M 2014. ‘CPT and SPT-based liquefaction triggering procedures’, Rep UCD/CGM-14/01, Department of Civil and Environmental Engineering, University of California, Davis, 138p.
21. Carranza-Torres, C 2004. ‘Elasto-plastic solution of tunnel problems using the generalized form of the Hoek-Brown failure criterion’, Int J Rock Mech Min Sci 41 (Suppl 1): 629 - 639.
22. Duvall, W I, Fogelson, D E 1962. ‘Review of Criteria for Estimating Damage to Residences from Blasting Vibrations’, United States Bureau of Mines (USBM), RI5968.
23. Dyno Nobel 2010. ‘Blasting and Explosives Quick Reference Guide’, REF 0110/0210/AZZ AUS/2K.
24. EN 1990:2002 E 2001. ‘Eurocode - Basis of Structural Design’, CEN. 25. Idriss, I M 1999. ‘An update to the Seed-Idriss simplified procedure for evaluating
liquefaction potential’, In Proceedings, TRB Workshop on New Approaches to Liquefaction, Publication No FHWA-RD-99-165, Federal Highway Administration.
26. Idriss, I M, Boulanger, R W 2008. ‘Soil liquefaction during earthquakes’, Earthquake Engineering Research Institute, Oakland, 261p.
27. Idriss, I M, Boulanger, R W 2010. ‘SPT-based liquefaction triggering procedures’, Rep UCD/CGM-10/02, Department of Civil and Environmental Engineering, University of California, Davis, CA, 259p.
28. IS 456:2000. ‘Indian Standard – Plain and reinforced concrete’, Code of Practice, 4th Edition, BIS2000.
29. McCormac, J C 2008. ‘Structural Steel Design (4th ed)’, Upper Saddle River, NJ: Pearson Prentice Hall, ISBN 978-0-13-221816-0.
30. McKown, A F 1986. ‘Perimeter control blasting for underground excavations in fractured and weathered rock’, Bulletin of the Association of Engineering Geologists, 23 (4), 461 - 478.
31. Medvedev, S V, Sponheuer, W 1969. ’Scale of seismic intensity’, Proceedings of the 4th World Conference on the Earthquake Engineering, 1, A-2, 143 - 153.
32. Palmstrom, A, Broch, E 2006. ‘Use and misuse of rock mass classification system with particular reference to the Q system’, Tunnels and Underground Space Technology, Vol 21, 575 - 593.
33. Russo, G, Grasso, P 2007. ‘On the classification of the rock mass excavation behaviour’, Proceedings of the 11th Congress of International Society of Rock Mechanics, Lisbon, 9 - 13.
34. United States Patent 2002. ‘McNally et al (45)’, Date of Patent: 2002/10/22.

Journal of Engineering Geology Volume XLVI, No 1 A bi-annual Journal of ISEG June 2021
37
Appendix 1: GCD Ground Conductivity Designation (GCD) is a test method based on a simple single stage water injection procedure for examination of the ground’s hydraulic conductivity (Bineshian, 2020a). The output of GCD guides engineers and/or geologists to have a pre- and/or post-grouting/injection assessment on ground quality in terms of permeability, solidification, consolidation, water ingress reduction, or sealing quality. Eq 17 represents dimensionless empirical form of GCD. Eq 18 represents water intake rate in lit/min, which is used in Eq 17. Figure 16 demonstrates schematics for the GCD test setup. Table 13 provides classification for ground hydraulic conductivity as well as ground solidification quality. GCD = Q, (P* + L!)⁄ (17) Q, =
I$J%
(18) where; GCD Ground Conductivity Designation (dimensionless) L! Length of water injected portion (packed length) of hole or perforated SDA (m) P* Peak head (MPa) during injection period of T!; measured pressure before the first drop in peak Q, Water intake rate (lit/min); to be calculated using Eq 18 T! Injection period of time (min) taken to inject V, quantity of water; it is the period of time from
initial raise in pressure till the first drop in peak is observed. V, Injected quantity of water (lit) during injection period of T!; it is measured from the time that
pressure is started to raise till the first drop in peak pressure is observed.
a. Drilling orientation b. Top-Mech Packer c. GCD configuration during the test Figure 16. GCD setup (Bineshian, 2020a)
Table 13. Ground Conductivity Designation (Bineshian, 2020a)
Ground Hydraulic Conductivity GCD Ground Solidification Quality Very High - VH > 100 VP - Very Poor
High - H 100 - 51 P - Poor Medium - M+ 50 - 16 F - Fair
Moderate - M- 15 - 6 G - Good Low - L 5 - 1 VG - Very Good
Very Low - VL < 1 E - Excellent A proper conduction of GCD test method includes procedures as follows:
1. Select the location in which ground conductivity to be measured.
2. Drill a single naked hole in any direction or orientation in the chosen location including horizontal, vertical, or inclined at face, wall/s, crown, or invert (Figure 16a). Drilling can be conducted using a rotary-percussion or rotary drilling system; however, rotary drilling system is preferred.
�������
Injection Pump
Top/Mech Packer
Injection Hole (e.g., NX)
Li
Pm
Qw

Journal of Engineering Geology Volume XLVI, No 1 A bi-annual Journal of ISEG June 2021
38
3. Stabilise the drilled hole using casing; however, naked hole for GCD test is preferred. If hole is not sustained, casing can be applied or SDA can be used.
4. Flush the naked hole using clear water to remove fine debris and cuttings. If casing hole or SDA is used, the same flushing procedure to be applied.
5. Pack the collar of the naked drilled hole using a top/mechanical packer (Figure
16b). Packing must be conducted in a proper way that the collar is completely sealed and no leakage of water is observed. If casing or SDA is used, a proper packing inside casing or on the outlet of SDA is necessary to be conducted. The space between casing and ground and/or between the SDA and ground should be completely sealed only at collar using cement mortar or PU-2C or any method/material that may be applicable. It is important to note that only a short portion (maximum 300 mm length) at collar of the hole to be sealed.
6. Set up a suitable water pump and connections for injection of water to the hole
(Figure 16c). The water pump should have the capacity in providing enough pressure and be equipped with pressure gauge. Use of grouting pump unit in GCD test procedure is highly recommended.
7. Inject water to the hole and measure the V& in T! period of time.
8. Calculate Q& and consequently GCD.
9. Find the proper range of GCD in Table 13 based on the calculated value.
10. Classify the Ground Hydraulic Conductivity and Ground Solidification Quality
using Table 13 for further judgment and use in design and/or practice.
GCD ranges from below 1 to above 100 (Table 13) that classifies ground’s hydraulic conductivity into 6 categories; very low (VL), low (L), moderate (M-), medium (M+), high (H), and very high (VH). It also classifies solidification quality into 6 categories as excellent (E), very good (VG), good (G), fair (F), poor (P), and very poor (VP). Conduction of GCD test does not contain complicated procedure; however, there are some important notes that needs to be considered in measurements as follows: - It is recommended to repeat the test for 3 times and then making an average of
values to obtain a better precision and accuracy in GCD estimation.
- If during the water injection, pressure is not obtained, or it is lesser than 0.20 MPa, then the ground hydraulic conductivity would be considered as VH, which means that quality of grouting or injection executed at the location of the hole is classified as VP (Table 13). In this case the section should be further grouted/injected by a proper consolidation material/s and/or with a better configuration to obtain the targeted GCD value that designated in particular design.
- If the pressure is rapidly raised and exceeded 1 MPa, then the ground hydraulic
conductivity would be considered as VL, which means that quality of grouting or injection executed at the location of the hole is classified as E (Table 13).

Journal of Engineering Geology Volume XLVI, No 1 A bi-annual Journal of ISEG June 2021
39
Appendix 2: ViD Vibration-induced Damage (ViD) or in other words blast-induced damage includes deterioration of ground, further development of plastic zone beyond the excavation line, aggravation of overbreak, and damage to vicinity structure/s induced by vibration (Bineshian, 2021a). Peak Particle Velocity (PPV) is a suitable vibration parameter that is used to assess the ViD that is measured, calculated, or predicted using seismographs, mathematical formulas, or empirical equations respectively. In absence of measurement or calculation, empirical equations are developed. One of the first and most credible empirical PPV predictor (Eq 19) is proposed by USBM (Duvall and Fogelson, 1962). PPV = cD [
/!$?KL/&'(
).+ \(,
(19) where; cD Site constant; determined by regression analysis on (Dist, PPV) or empirical values to be used cF Site constant; determined by regression analysis on (Dist, PPV) or empirical values to be used CPD*%G Maximum charge per delay (kg) Dist The distance between the blasting location and concerned structure or transducer (m) PPV Peak Particle Velocity (mm/sec) “Dist” to be assumed as 20 m when Eq 19 is used for derivation of ET! value from Table 8 (Section 3.7). c' and c( can be derived from regression analysis; however, use of empirical values for site constants (e.g., Table 14) assists in prediction of PPV.
Table 14. Site constants for USBM PPV Predictor (Eq 19); constants from Dyno Nobel (2010)
Ground Strength Confinement Condition of Blast
Site Constants cD cF
Hard Free Face 500 -1.6 Average Free Face 1140 -1.6
Hard-Average Heavily Confined 5000 -1.6 Considering that I-System includes the ETi in its equation as a dependent variable on PPV, the same is used to define an indicator for ViD as a function of the same, which is expressed in a percentage (Bineshian, 2021b). Mathematical form of this indicator is defined in Eq 20 and the classification for ViD is shown in Table 15 (Bineshian, 2021b). Di = (1- ETi)×100 (20) where; Di Damage Indicator (%); indicator for ViD to the structure in ground ETi Excavation Technique’s Impact factor; part of I-System (Bineshian, 2019a, 2019b, 2020c)
Table 15. Damage Indicator’s classification (Bineshian, 2021a, 2021b) ET PPV (mm/sec)* ETi Di Range (%) Di-Class ViD ManDigg - 1.00 0 Di-01 Nil ME/NonExBreak < 2 0.99 0.1 - 1 Di-02 Unscathed ResiBlast 2 - 9 0.98 1.1 - 2 Di-03 Unnoticeable CommBlast 10 - 24 0.97 2.1 - 3 Di-04 Negligible IndBlast 25 - 59 0.96 3.1 - 4 Di-05 Minor InfraBlast 60 - 119 0.95 4.1 - 5 Di-06 Mild CtldBlast 120 - 449 0.90 5.1 - 10 Di-07 Moderate MineBlast 450 - 499 0.80 10.1 - 20 Di-08 Major ProdBlast 500 - 599 0.65 20.1 - 35 Di-09 Destructive UnCtldBlast ≥ 600 0.50 35.1 – 50 & 50+ Di-10 Catastrophic
* @ Dist = 20 m
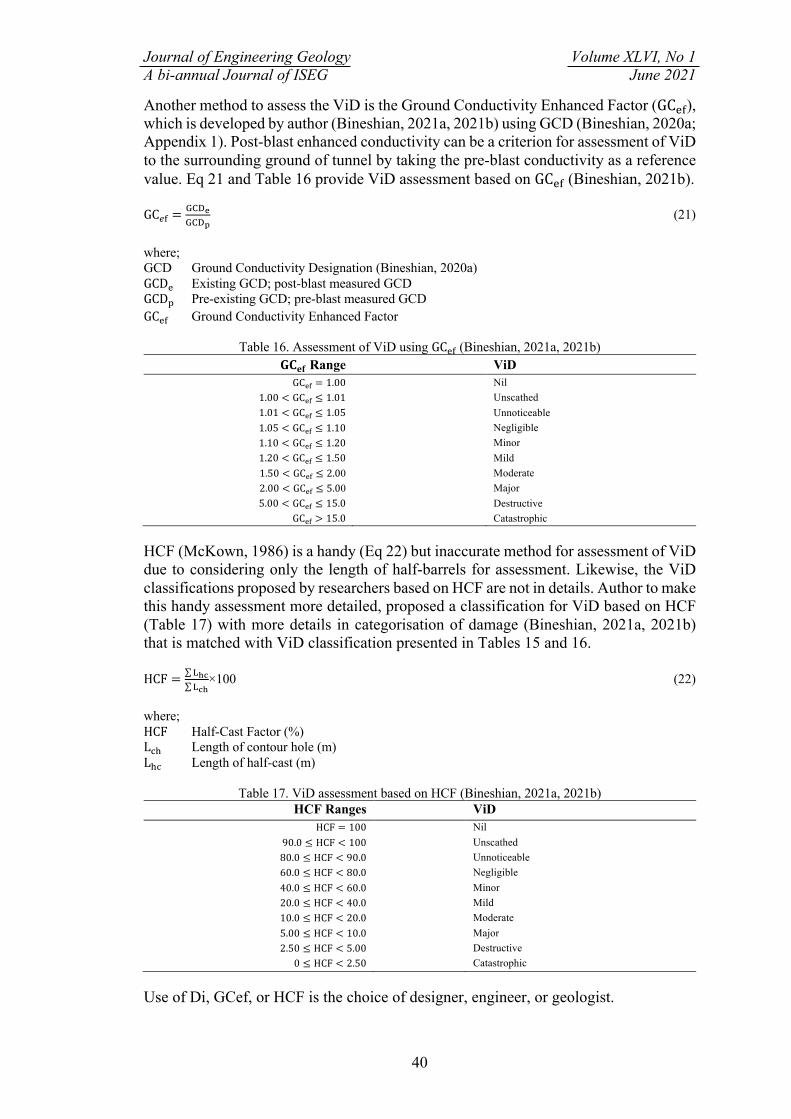
Journal of Engineering Geology Volume XLVI, No 1 A bi-annual Journal of ISEG June 2021
40
Another method to assess the ViD is the Ground Conductivity Enhanced Factor (GC)*), which is developed by author (Bineshian, 2021a, 2021b) using GCD (Bineshian, 2020a; Appendix 1). Post-blast enhanced conductivity can be a criterion for assessment of ViD to the surrounding ground of tunnel by taking the pre-blast conductivity as a reference value. Eq 21 and Table 16 provide ViD assessment based on GC)* (Bineshian, 2021b). GCM& =
NK/-NK/.
(21)
where; GCD Ground Conductivity Designation (Bineshian, 2020a) GCD- Existing GCD; post-blast measured GCD GCD' Pre-existing GCD; pre-blast measured GCD GC-& Ground Conductivity Enhanced Factor
Table 16. Assessment of ViD using GC-& (Bineshian, 2021a, 2021b) 𝐆𝐂𝐞𝐟 Range ViD GC"# = 1.00 Nil
1.00 < GC"# ≤ 1.01 Unscathed 1.01 < GC"# ≤ 1.05 Unnoticeable 1.05 < GC"# ≤ 1.10 Negligible 1.10 < GC"# ≤ 1.20 Minor 1.20 < GC"# ≤ 1.50 Mild 1.50 < GC"# ≤ 2.00 Moderate 2.00 < GC"# ≤ 5.00 Major 5.00 < GC"# ≤ 15.0 Destructive
GC"# > 15.0 Catastrophic HCF (McKown, 1986) is a handy (Eq 22) but inaccurate method for assessment of ViD due to considering only the length of half-barrels for assessment. Likewise, the ViD classifications proposed by researchers based on HCF are not in details. Author to make this handy assessment more detailed, proposed a classification for ViD based on HCF (Table 17) with more details in categorisation of damage (Bineshian, 2021a, 2021b) that is matched with ViD classification presented in Tables 15 and 16. HCF = ∑R/0
∑R0/×100 (22)
where; HCF Half-Cast Factor (%) L(H Length of contour hole (m) LH( Length of half-cast (m)
Table 17. ViD assessment based on HCF (Bineshian, 2021a, 2021b) HCF Ranges ViD
HCF = 100 Nil 90.0 ≤ HCF < 100 Unscathed 80.0 ≤ HCF < 90.0 Unnoticeable 60.0 ≤ HCF < 80.0 Negligible 40.0 ≤ HCF < 60.0 Minor 20.0 ≤ HCF < 40.0 Mild 10.0 ≤ HCF < 20.0 Moderate 5.00 ≤ HCF < 10.0 Major 2.50 ≤ HCF < 5.00 Destructive
0 ≤ HCF < 2.50 Catastrophic Use of Di, GCef, or HCF is the choice of designer, engineer, or geologist.

Journal of Engineering Geology Volume XLVI, No 1 A bi-annual Journal of ISEG June 2021
41
Appendix 3: Pull Length Advisor Implementation of suitable length for pull is crucial for stability of opening in tunnelling specially under challenging condition. I-System in its earlier edition (e.g., 2019, 2020) proposed values for pull length (PL) to be considered for each (I)-Class during excavation in underground spaces; however, in this edition an equation (Eq 23) is proposed (Bineshian, 2021b) – based on the best fit on empirical data – for calculation of PL as a function of D and (I) values, which provides a better advice for safe PL based on tunnel dimension and ground’s quality or condition. The “PL” recommendation that is reflected in (I)-Class in Tables 9 and 11 for underground structures should be calculated using Eq 23. The calculated value for PL should be further assessed by engineer as per site condition for the safe and efficient advance at face. When drill and blast technique (DnB) is used for excavation, Eq 24 provides an estimate for the drilling length (DL) for an optimised engineered blasting with a reasonable blasting efficiency.
PL = 0.5D (=)
D99 (23)
DL = 1.1PL (24)
where; (I) I-System’s value D Diameter, width, or height (mm) of underground opening (the greater value) DL Drilling Length (mm) when DnB is used for excavation PL Pull Length (mm) as an advice for advance in tunnel using DnB or ME Figure 17 is a graphical representation of Eq 23. Calculated PL from Eq 23 or derived from Figure 17 can be further reviewed by the engineer at site based on the actual condition of ground and structure. An example as a guide is also shown in Figure 17 for a tunnel with D = 8,000 mm and (I) = 75; the PL for DnB technique for tunnel’s face advance is derived from Figure 17 and DL is calculated using Eq 24: PL = 3000 mm DL = 3300 mm
Figure 17. PL graph; derivation of PL as a function of D and (I) for tunnels (Bineshian, 2021b)
D = 4,000
D = 5,000
D = 6,000
D = 7,000
D = 8,000
D = 9,000
D = 10,000
D = 11,000
D = 12,000
500
1000
1500
2000
2500
3000
3500
4000
4500
5000
5500
60000 10 20 30 40 50 60 70 80 90 100
PL (m
m)
(I)

Journal of Engineering Geology Volume XLVI, No 1 A bi-annual Journal of ISEG June 2021
42
Appendix 4: SRH SSH (squeezing, swelling, and heaving) behaviour is a complicated non-uniform time-dependent mechanical response of ductile ground to excavation; however, it is different in load configuration compared to creep as a typical time dependent behaviour. It is a post-excavation procedure of yield stress development that generates plastic zone around the opening, however; because of stimulation caused by micro-scale sliding failure of existing non-uniformly distributed weak planes, shear stresses further magnified that initiates non-uniform deformation toward free space in a plastification process. Convergence is occurred when excavated space is the only existing free space. Severity of SSH condition depends on ground properties and induced stresses (Bineshian, 2020b). An empirical identification criterion for distinguishing SSH from Non-SSH as well as a classification for severity of SSH is presented in Table 18.
Table 18. Identification criterion and classification for SSH condition (Bineshian, 2020b) Convergency (mm) SSH-Class
C ≤ $.&'($$
Non-SSH $.&'($$
< C ≤ )'($$
Minor )'($$
< C ≤ *'($$
Mild
C > *'($$
Severe
C Convergency (mm) D Diameter, width, or height (mm) of underground opening (the greater value) Support system used for SSH ground includes Rigid Support System (RSS), and Yield/Ductile Support System (YSS). RSS is a stiff system of measures to resist against induced deformation due to SSH behaviour by absorbing entire accumulative SSH stresses. RSS is applicable for passive load configuration in gravity driven and shallow depth overburden with less arch effect; it is not recommended to be applied for tunnelling in SSH ground. YSS is designed to accommodate deformations that is induced to periphery of tunnel in SSH ground by controlled yielding to prevent/terminate accumulation of load. Application of YSS in its conventional form (CYSS) includes reaming (Figure 18a), LCN (Figure 18b), LSC (Figure 18c), YieldR (Figures 18d and 18e), YieldB, convergency measurements, and instrumentation.
a. Typical reaming b. Typical LCN in FRS c. Schematic of LSC in FRS
d. TH sliding rib and clamp e. H sliding rib and clamp
Figure 18. CYSS elements (Bineshian, 2020b) Application of CYSS is a cost- and time-inefficient system, which includes several sequences as well as delay and hindrance in the tunnelling procedures. Consequently, SRH (Stress Release Hole/s) is developed for tunnelling under SSH condition (Bineshian, 2020b) to eliminate the hazards and challenges involved with tunnelling under SSH condition as well as lessening the hindrance and cost caused by application

Journal of Engineering Geology Volume XLVI, No 1 A bi-annual Journal of ISEG June 2021
43
of CYSS without compromise in safety. Key concept behind SRH is to divert the SSH stresses towards the uniformly distributed free spaces created by SRHs; therefore, non-uniform deformation caused by SSH behaviour is induced to the SRHs instead of their occurrence on periphery (Figure 19). Thus, further accumulation of SSH stresses also will be controlled and finally terminated. Table 19 offers requirements for application of SRH System for treatment of each class of SSH condition in tunnelling as well as requirements for CYSS. SRH System releases/terminates incremental non-uniform time-dependent shear stresses around the periphery, prevents/minimises convergency, eliminates repair or rework of primary SS, saves in cost and time and reduces hindrance compared to CYSS, and also improves efficiency of advancement (Bineshian, 2020b).
Minor-SSH Mild-SSH Severe-SSH
Figure 19. Illustration of observed patterns of induced deformation inside SRH (Bineshian, 2020b)
Table 19. Guideline for requirements in application of SRH and/or CYSS (Bineshian, 2020b)
Main Required Resources SSH-Class
Minor* Mild* Severe* CYSS SRH CYSS SRH CYSS SRH
Reaming n/a n/a a n/a a a YieldR ^ a n/a a n/a a a LG (If TH or H profile is not used) a n/a n/a c/a n/a c/a RingC< n/a n/a a n/a a c/a FRS a a a a a a LCN> a n/a a n/a a a LSC and laxation of clamps> a n/a a n/a a n/a YieldB using SysDB (L = 0.5D) n/a n/a a n/a a a YieldB using SN, SDA, Swellex (L = 0.5D) a n/a n/a a n/a n/a Drilling of 100 - 300 mm holes for SRH (L = 1D) n/a a n/a a n/a a 3DM or Chord Convergency Meter@ a a a a a a DIC# @ 25 m n/a n/a a a n/a n/a Strain Meter @ 100 m a n/a a n/a a a Pressure Cell or Load Cell @ 150 m a n/a a n/a a a Single-/Multi-Rod Extensometer @ 300 m n/a n/a a n/a a a Strain Gauge @ 400 m n/a n/a n/a n/a a a
* Table 18. ^ TH or H profile capable of sliding; Figures 18d and 18e. < Ring Closure or Invert Closure; It is recommended to be applied to prevent heaving; however, its applicability depends
on observations, SSH-Class, and (I)-Class to be decided by Engineer at site. > Figure17b; skilled team for installation and deformation control is required. # Bineshian et al (2021a, 2021b) @ Spacing between the measuring stations (Table 20) a Applicable c/a Conditionally Applicable; applicable for (I)-07; not applicable for (I)-05 and (I)-06 D Diameter, width, or height (mm) of underground opening (the greater value) L Length (mm) n/a Not Applicable SRH System is applied in a systematic pattern of large diameter drilled – using ordinary rotary percussion drilling system – holes (100 - 300 mm) in an individual system as shown in Figure 20 or combined with other measures (Table 19) depending on the severity of convergency. Continues monitoring of stresses is required when CYSS (e.g., sliding ribs and LSC) is applied, further to several periodical sequences of measurements and clamps laxation, which is time-consuming procedure that hinders the advancement. Contrastingly, SRH replaces all these sequences of CYSS with a simple systematic inexpensive drilling of holes. SRH works in a continuous no-
0° 45° 90° 135°

Journal of Engineering Geology Volume XLVI, No 1 A bi-annual Journal of ISEG June 2021
44
maintenance manner until it ends the accumulation of shear stresses and convergency. It is individually applicable for Minor to Mild-SSH condition with (I)-05 to (I)-07 without needs of CYSS. Moreover, it is applicable for Severe-SSH in combination with some elements of CYSS (Table 19). When LG is applied in combination with SRH in ground with (I)-07, it prevents occurrence of large deformation at periphery while SRH System absorbs the deformation beyond the periphery (Bineshian, 2020b).
Stage I ( ) for Minor-SSH, Stage II ( + ) for Mild-SSH, Stage III ( + + ) for Severe-SSH
Stage I for Minor-SSH Stage II for Mild-SSH Stage III for Severe-SSH
Figure 20. SRH drilling pattern – plan and cross section views; L = D, S = 2000 mm (Bineshian, 2020b) 3DM measures for tunnelling under SSH condition is provided in Table 20. Each 3DMS may contain 3, 5, or 7 BRTs depending on the SSH-Class (Figure 21) and the size of the underground space. It is not recommended to place the final liner before termination of convergency and earlier than ending of proposed minimum period of monitoring.
Table 20. 3DM; guideline for application in tunnelling under SSH condition (Bineshian, 2020b)
SSH-Class Number of BRTs at each 3DMS
Frequency of Reading
Minimum period of monitoring
(month)
Spacing of 3DMS (m)
Non-SSH Measures proposed at (I)-Class in I-System (Tables 9 – 12 in Section 4) is applicable; (I)-01 to (I)-10 Minor 3 Once a fortnight 6 15 Mild 5 Once a week 9 10
Severe 7 Twice a week 12 5
Minor SSH-Class Mild SSH-Class Severe SSH-Class
Figure 21. 3DM; illustration of configuration of 3DMS based on SSH-Class (Bineshian, 2020b) Similarly, SRH System is applicable for tunnelling in burst prone (BP) condition; however, if TBM is used application of McNally et al (2002) support system with HEAM/WeldM is an alternative choice. Use of SRH System to control the plastic zone around the tunnel in BP load configuration is recommended with use of CtldBlast (PPV ≤ 449 mm/sec), SysDB, FRS, and HEAM or WeldM (Bineshian, 2020b).
%.%.
����
%.
�������
���
���
%.
��������������
���
���
���
���
%.
���
���
���
���
S S S S S S
S S S S
2000
2000
1000
1000

Journal of Engineering Geology Volume XLVI, No 1 A bi-annual Journal of ISEG June 2021
45
Appendix 5: Schematic Illustrations of SS
a. BulkH
L ≤ 0.15D b. FaceButt
L ≥ 0.25D
c. FaceB, FibreD
L = D and S ≤ 0.3L d. FaceP
L ≤ 0.05D
e. CPS, FP, PR
L = 0.7D to L = D f. SysHB
L = 0.7D; S ≤ 0.3L
g. ConeB, SysB, SysDB, YieldB; L = 0.5D
SysLB; L = 0.7D, SysN; L= D; S = 0.3L h. ADH
L ≤ 1.5D
i. RDH
L ≤ D j. WDH
L ≤ 2D
k. BH, EC, PH
L = 2D to L = 3D Figure 22. Schematical illustration of some SS elements proposed in (I)-Class; Sections 4 and 10
���
L
L
L
L
L L
5 – 7° 30-45°
L L
L
S
S
L
L
S
L
30-45° 30-45°
L
PROFILE PROFILE
PROFILE PROFILE
PROFILE PROFILE
PROFILE PROFILE
PROFILE PLAN
PROFILE
S
S
S
64 – 114 mm diameter holes
64 – 114 mm diameter holes required for drilling for CPS, FP, PR 25 – 76 mm diameter rods required for CPS, FP 100+ mm diameter pipes required for PR
25 – 32 mm diameter bolts
25 – 32 mm diameter bolts
64 – 114 mm diameter holes
25 – 32 mm diameter bolts
64 – 114 mm diameter holes
64 – 114 mm diameter holes
FAC
E
FAC
E
FAC
E
FAC
E
FAC
E
FAC
E
FAC
E
FAC
E
FAC
E
FACE
FAC
E

Journal of Engineering Geology Volume XLVI, No 1 A bi-annual Journal of ISEG June 2021
46
Appendix 6: Systematic Bolting Calculator Estimation of the length of bolting system (Section 10) is summarised here in Table 21, which is proposed for (I) ≤ 50 (Tables 9 and 11) to provide an initial estimation for length and spacing of bolts as variables dependent on D; however, due to having only one independent variable without considering the ground quality, it gives less precision and accuracy in estimation of bolt parameters when ground condition varies. Table 21. Estimation of the length of systematic bolting proposed in I-System for underground works
Bolting Parameters
Systematic Bolting* ConeB SysB SysDB YieldB SysLB SysN
L 0.5D 0.7D D S 0.3L
* Using 25-32 mm diameter steel-bar/-pole including (e.g., SDA, SN, etc.) D Diameter, width, or height (mm) of underground opening (the greater value) L Length of ConeB, SysB, SysDB, SysLB, SysN, YieldB (mm) S Spacing of bolts along the both axis and transverse direction (mm)
Author proposed Eq 25 and 26 for calculation of length and spacing of aforementioned bolting systems as a function of D and (I). Eq 25 is valid for (I) ≤ 50. Systematic bolting for (I) > 50 is not recommended in I-System; instead, spot and/or individual bolting is recommended (if required). Neither to be conservative nor incautious, a comparison of output of Table 21 and Eq 25 and 26 may help to decide on bolting system’s parameters. L = D × D99A(=)
D99 (25)
S = 0.3L (26) where; (I) I-System’s value D Diameter, width, or height (mm) of underground opening (the greater value) L Length of ConeB, SysB, SysDB, SysLB, SysN, YieldB (mm) for 25-32 mm diameter bolts S Spacing of bolts along the both axis and transverse direction (mm) Figure 23 provides a graph based on Eq 25 for L when D and (I) are known. An example is also shown in Figure 23 for a tunnel with D = 10,000 mm and (I) = 30; the length of the bolting system is derived as L = 7000 mm.
Figure 23. L graph; derivation of length of bolting systems (25-32 mm diameter ConeB, SysB, SysDB,
SysLB, SysN, YieldB) as a function of D and (I) for underground spaces
D = 4,000
D = 5,000
D = 6,000
D = 7,000
D = 8,000
D = 9,000
D = 10,000
D = 11,000
D = 12,000
D = 13,000
D = 14,000
D = 15,000
D = 16,000
2000
3000
4000
5000
6000
7000
8000
9000
10000
11000
12000
13000
14000
15000
1600001020304050
L (m
m)
(I)

Journal of Engineering Geology Volume XLVI, No 1 A bi-annual Journal of ISEG June 2021
47
Appendix 7: I-System Software – Input and Output
Figure 24a. I-System Software’s output; Input
(I) = (Ai + Ci + Hi + Pi + Si) × DFi × ETi Bineshian (2019)
Calculation Sheet: Location:CH46598 JK
Project: Type of Structure:USBRL-T05 Underground
Country: Date:IN 2021/03/11
Ai - ARMATURE INDEX: 2.77
dn Discontinuity Number/s - per m ≥ 25
ds Discontinuity Set/s 3
di Discontinuity Inclination - ° 31 - 60
da Discontinuity Aperture Open
dd Discontinuity Disintegration Semi-Integrated
df Discontinuity Friction Low Friction - Smooth/Even
dp Discontinuity Persistency ≥ 0.90 x D
Ci - CONFIGURATION INDEX: 5.25
pc Problematical Configuration Sheared - High Shear Stresses - e.g. Mylonite
sc Structural Configuration Layered (100 - 10 cm)
Hi - HYDRO INDEX: 6.50
gc Ground Conductivity (GCD) || [Wetness] (7 - 9.99) || [Wet]
gs Ground Softness - Mohs 5
Pi - PROPERTIES INDEX: 6.60
cc Cohesiveness Consistency Picked Easily
dc Denseness Consistency Never Indented by Thumbnail
ps Particle Size Sand
pm Particle Morphology Sub-angular
bw Body Wave Velocity - m/sec (Vp) || [Vs] (3499 - 3000) || [1999 - 1500]
Si - STRENGTH INDEX: 8.10
cs UCS 19 - 10 MPa
se Scale Effect D/H = 1.20 - 0.80 & σv ≥ σh
DFi - DYNAMIC FORCES IMPACT: 0.85
(PGASD) || [ERZ] || {MSK} (0.36g - 0.50g) || [VH] || {IX-X}
ETi - EXCAVATION TECHNIQUE IMPACT: 0.99
(ET) || [PPV mm/sec] (ME/NonExBreak) || [< 2]
1/4
I-System
Version 1.7.2 B
ased on I-System
Bineshian (2019) C
opyright © I-S
ystem 2020. A
ll Rights R
eserved WorldW
ide. 20210311-22:04

Journal of Engineering Geology Volume XLVI, No 1 A bi-annual Journal of ISEG June 2021
48
Figure 24b. I-System Software’s output; (I)-Class Output
I-System - Index of Ground-Structure Bineshian (2019)
25%
(I)-Class
(I)-08
Recommended Measure/sSS - Support System
FP32.200.L.X1/FP76.250.L.X1/PR100.300.L.X1, SysLB32.L.S, LG32.25.180.1000-/RigidR150UC23.1000-, FRS225/FRC225, FaceButt.L, FRFS200, RDH54.L+CF
ET - Excavation Technique/s
PSE-ME/NonExBreak, PL1000-
IT - Instrumentation Technique/s
3DMS@50m, StrainM@200m, PressC/LoadC@250m, SingleRodE@400m
PT - Prevention Technique/s
Apply FP/PR, Maintain Buttress, Avoid: FF & DnB
FT - Forecast Technique/s
TSP/PH54.EC.L
Design Remark/s
Passive load configuration, sensitive to scale, unsupported span, & stand-up time
2/4
I-System
Version 1.7.2 B
ased on I-System
Bineshian (2019) C
opyright © I-S
ystem 2020. A
ll Rights R
eserved WorldW
ide. 20210311-22:04

Journal of Engineering Geology Volume XLVI, No 1 A bi-annual Journal of ISEG June 2021
49
Figure 24c. I-System Software’s output; (I)-GC Output
I-System - Index of Ground-Structure Bineshian (2019)
(I)-GC; I-System’s Ground Characterization
(I) = 25
Selected UCS range is 19 - 10 MPa.
Specified Value =σc 10 MPa
Modulus of Deformation
Eg = 2.490 GPa
Poisson's Ratio
νg = 0.400
Unconfined Compressive Strength
σcg = 0.244 MPa
Uniaxial Tensile Strength
σtg = -0.012 MPa
Cohesion
Cg = 1.706 KPa
Internal Friction Angle
ϕg = 28.750°
(I)-GC characterizes the ground based on (I);
however, it is recommended to scrutinise it
by deriving the mechanical properties of
ground by standardised in-situ testing
methods.
3/4
I-System
Version 1.7.2 B
ased on I-System
Bineshian (2019) C
opyright © I-S
ystem 2020. A
ll Rights R
eserved WorldW
ide. 20210311-22:04

Journal of Engineering Geology Volume XLVI, No 1 A bi-annual Journal of ISEG June 2021
50
Figure 24d. I-System Software’s output; (I)-GC Chart Output
I-System - Index of Ground-Structure Bineshian (2019)
(I)-GC ChartE g
0
25
50
75
100
125
150
(I)0 10 20 30 40 50 60 70 80 90 100
ν g
0.10.150.2
0.250.3
0.350.4
0.450.5
(I)0 10 20 30 40 50 60 70 80 90 100
σ cg/σ c
0
0.2
0.4
0.6
0.8
1
(I)0 10 20 30 40 50 60 70 80 90 100
σ tg/σ c
g
-1
-0.8
-0.6
-0.4
-0.2
0
(I)0 10 20 30 40 50 60 70 80 90 100
C g/σ
cg
0
0.05
0.1
0.15
0.2
0.25
0.3
(I)0 10 20 30 40 50 60 70 80 90 100
ϕg
0
10
20
30
40
50
60
70
(I)0 10 20 30 40 50 60 70 80 90 100
(25,2.49)
(25,0.4)
(25,0.024)
(25,-0.05)
(25,0.007)(25,28.75)
4/4
I-System
Version 1.7.2 B
ased on I-System
Bineshian (2019) C
opyright © I-S
ystem 2020. A
ll Rights R
eserved WorldW
ide. 20210311-22:04

Journal of Engineering Geology Volume XLVI, No 1 A bi-annual Journal of ISEG June 2021
51
Ground Characterisation for Design using I-System Software Case Studies
H Bineshian, PhD
Principal, Technical Director, Amberg Engineering AG, Australia [email protected]
Received January 2021, Accepted May 2021
Abstract
This article aims to provide case studies of recent use of I-System in underground, semi-surface, and surface projects in both rocks and soils. I-System is used for classification and characterisation of ground in the projects in India including USBRL and Teesta in design and/or for execution of the work. Recommendations obtained form (I)-Class including primary and final support system, required excavation technique/s for encountered condition, proper instrumentation technique/s for monitoring, appropriate prevention technique/s against possible failures, verified forecast technique/s to predict the ground condition ahead, and practical design recommendations for understanding of ground behaviour, failure mechanism, and load configuration ascertained to be practical and well optimised. Characterisation of ground’s mechanical properties by (I)-GC including modulus of deformation, Poisson’s ratio, unconfined compressive strength, uniaxial tensile strength, cohesion, and internal friction angle are found to be suitable to be used in design. Keywords: (I)-Class, (I)-GC, I-System Nomenclature (I) I-System’s value MSK Medvedev-Sponheuer-Karnik Scale (I)-Class I-System's Ground Classification NATM New Austrian Tunnelling Method (I)-GC I-System's Ground Characterisation NHPC National Hydroelectric Power Corporation Ai Armature Index NR Northern Railway of Indian Railway Cg Cohesion of ground PGASD Scaled Design Peak Ground Acceleration (g) Ci Configuration Index Pi Properties Index D Diameter/width/height of opening (the greater value) PPV Peak Particle Velocity DFi Dynamic Forces Impact PT Prevention Technique/s Eg Deformation Modulus of ground Si Strength Index ET Excavation Technique/s SS Support System ETi Excavation Technique Impact UCS Uniaxial Compressive Strength ERZ Earthquake Risk Zone USBRL Udhampur-Srinagar-Baramula Rail Link FT Forecast Technique/s νg Poisson's Ratio of ground Hi Hydro Index σcg Unconfined Compressive Strength of ground IT Instrumentation Technique/s σtg Uniaxial Tensile Strength of ground KRCL Konkan Railway Corporation Limited φg Internal Friction Angle of ground LTHPL Lanco Teesta Hydro Power Limited 1. Introduction I-System (Bineshian, 2019a, 2019b, 2020) has been verified in railway, metro, road, canal, hydropower, and mining projects during 22 years course of development. After it was first published in 2019, it is further applied in design of several projects in India including Tunnels T03, T05, T06, T35, T37, T44, T50, and T51 of Central Railway, Tunnels T05 wider section, T09 cut and cover, T40 wider section, T41-T47, and T14 twin tunnels of Northern Railway, Tunnels Pernem and Old Goa of Konkan Railway, and Teesta hydropower project. The results were quite satisfactory. Following sections provide a brief study on application of I-System in some of mentioned projects of recent cases. Calculation procedure is explained in details in I-System paper published in 2019 (Bineshian, 2019b); therefore, it is avoided here to repeat the calculation procedure.

Journal of Engineering Geology Volume XLVI, No 1 A bi-annual Journal of ISEG June 2021
52
2. Underground Rock Works – USBRL Project – Tunnel T05 NR is the client of the project. Work is being executed by KRCL. T05 is one of the most challenging NATM tunnels in USBRL in North India (Bineshian, 2017a, Bineshian et al, 2019). It is a 6 km twin tube tunnel in young Himalaya’s terrain in dolomite rock formation, which passes through several hazardous zones. Following case is related to an incident (2019/05/11) at main tunnel (D = 8000 mm) at CH46598. I-System is utilised to assess the condition and to provide a solution to overcome the challenge. I-System’s recommendations are applied and successful results obtained. Figure 1 represents the input and output data of analysis obtained from I-System Software.
Figure 1a. I-System Software output – USBRL – T05 Tunnel
(I) = (Ai + Ci + Hi + Pi + Si) × DFi × ETi Bineshian (2019)
Calculation Sheet: Location:CH46598 JK
Project: Type of Structure:USBRL-T05 Underground
Country: Date:IN 2021/03/11
Ai - ARMATURE INDEX: 2.77
dn Discontinuity Number/s - per m ≥ 25
ds Discontinuity Set/s 3
di Discontinuity Inclination - ° 31 - 60
da Discontinuity Aperture Open
dd Discontinuity Disintegration Semi-Integrated
df Discontinuity Friction Low Friction - Smooth/Even
dp Discontinuity Persistency ≥ 0.90 x D
Ci - CONFIGURATION INDEX: 5.25
pc Problematical Configuration Sheared - High Shear Stresses - e.g. Mylonite
sc Structural Configuration Layered (100 - 10 cm)
Hi - HYDRO INDEX: 6.50
gc Ground Conductivity (GCD) || [Wetness] (7 - 9.99) || [Wet]
gs Ground Softness - Mohs 5
Pi - PROPERTIES INDEX: 6.60
cc Cohesiveness Consistency Picked Easily
dc Denseness Consistency Never Indented by Thumbnail
ps Particle Size Sand
pm Particle Morphology Sub-angular
bw Body Wave Velocity - m/sec (Vp) || [Vs] (3499 - 3000) || [1999 - 1500]
Si - STRENGTH INDEX: 8.10
cs UCS 19 - 10 MPa
se Scale Effect D/H = 1.20 - 0.80 & σv ≥ σh
DFi - DYNAMIC FORCES IMPACT: 0.85
(PGASD) || [ERZ] || {MSK} (0.36g - 0.50g) || [VH] || {IX-X}
ETi - EXCAVATION TECHNIQUE IMPACT: 0.99
(ET) || [PPV mm/sec] (ME/NonExBreak) || [< 2]
1/4
I-System
Version 1.7.2 B
ased on I-System
Bineshian (2019) C
opyright © I-S
ystem 2020. A
ll Rights R
eserved WorldW
ide. 20210311-22:04

Journal of Engineering Geology Volume XLVI, No 1 A bi-annual Journal of ISEG June 2021
53
Figure 1b. I-System Software output – USBRL – T05 Tunnel
I-System - Index of Ground-Structure Bineshian (2019)
25%
(I)-Class
(I)-08
Recommended Measure/sSS - Support System
FP32.200.L.X1/FP76.250.L.X1/PR100.300.L.X1, SysLB32.L.S, LG32.25.180.1000-/RigidR150UC23.1000-, FRS225/FRC225, FaceButt.L, FRFS200, RDH54.L+CF
ET - Excavation Technique/s
PSE-ME/NonExBreak, PL1000-
IT - Instrumentation Technique/s
3DMS@50m, StrainM@200m, PressC/LoadC@250m, SingleRodE@400m
PT - Prevention Technique/s
Apply FP/PR, Maintain Buttress, Avoid: FF & DnB
FT - Forecast Technique/s
TSP/PH54.EC.L
Design Remark/s
Passive load configuration, sensitive to scale, unsupported span, & stand-up time
2/4
I-System
Version 1.7.2 B
ased on I-System
Bineshian (2019) C
opyright © I-S
ystem 2020. A
ll Rights R
eserved WorldW
ide. 20210311-22:04

Journal of Engineering Geology Volume XLVI, No 1 A bi-annual Journal of ISEG June 2021
54
Figure 1c. I-System Software output – USBRL – T05 Tunnel
I-System - Index of Ground-Structure Bineshian (2019)
(I)-GC; I-System’s Ground Characterization
(I) = 25
Selected UCS range is 19 - 10 MPa.
Specified Value =σc 10 MPa
Modulus of Deformation
Eg = 2.490 GPa
Poisson's Ratio
νg = 0.400
Unconfined Compressive Strength
σcg = 0.244 MPa
Uniaxial Tensile Strength
σtg = -0.012 MPa
Cohesion
Cg = 1.706 KPa
Internal Friction Angle
ϕg = 28.750°
(I)-GC characterizes the ground based on (I);
however, it is recommended to scrutinise it
by deriving the mechanical properties of
ground by standardised in-situ testing
methods.
3/4
I-System
Version 1.7.2 B
ased on I-System
Bineshian (2019) C
opyright © I-S
ystem 2020. A
ll Rights R
eserved WorldW
ide. 20210311-22:04
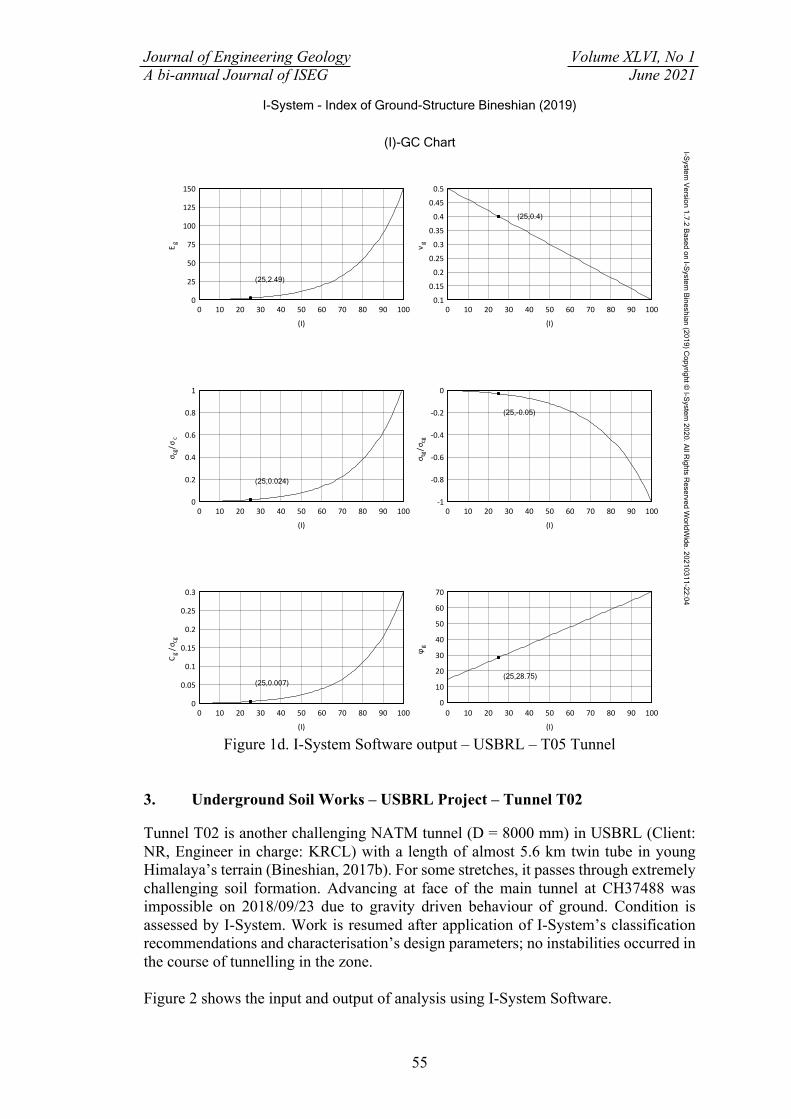
Journal of Engineering Geology Volume XLVI, No 1 A bi-annual Journal of ISEG June 2021
55
Figure 1d. I-System Software output – USBRL – T05 Tunnel
3. Underground Soil Works – USBRL Project – Tunnel T02 Tunnel T02 is another challenging NATM tunnel (D = 8000 mm) in USBRL (Client: NR, Engineer in charge: KRCL) with a length of almost 5.6 km twin tube in young Himalaya’s terrain (Bineshian, 2017b). For some stretches, it passes through extremely challenging soil formation. Advancing at face of the main tunnel at CH37488 was impossible on 2018/09/23 due to gravity driven behaviour of ground. Condition is assessed by I-System. Work is resumed after application of I-System’s classification recommendations and characterisation’s design parameters; no instabilities occurred in the course of tunnelling in the zone. Figure 2 shows the input and output of analysis using I-System Software.
I-System - Index of Ground-Structure Bineshian (2019)
(I)-GC Chart
E g
0
25
50
75
100
125
150
(I)0 10 20 30 40 50 60 70 80 90 100
ν g
0.10.150.2
0.250.3
0.350.4
0.450.5
(I)0 10 20 30 40 50 60 70 80 90 100
σ cg/σ c
0
0.2
0.4
0.6
0.8
1
(I)0 10 20 30 40 50 60 70 80 90 100
σ tg/σ c
g
-1
-0.8
-0.6
-0.4
-0.2
0
(I)0 10 20 30 40 50 60 70 80 90 100
C g/σ
cg
0
0.05
0.1
0.15
0.2
0.25
0.3
(I)0 10 20 30 40 50 60 70 80 90 100
ϕg
0
10
20
30
40
50
60
70
(I)0 10 20 30 40 50 60 70 80 90 100
(25,2.49)
(25,0.4)
(25,0.024)
(25,-0.05)
(25,0.007)(25,28.75)
4/4
I-System
Version 1.7.2 B
ased on I-System
Bineshian (2019) C
opyright © I-S
ystem 2020. A
ll Rights R
eserved WorldW
ide. 20210311-22:04

Journal of Engineering Geology Volume XLVI, No 1 A bi-annual Journal of ISEG June 2021
56
Figure 2a. I-System Software output – USBRL – T02 Tunnel
(I) = (Ai + Ci + Hi + Pi + Si) × DFi × ETi Bineshian (2019)
Calculation Sheet: Location:Failure JnK
Project: Type of Structure:USBRL - T02 Underground
Country: Date:IN 2021/06/03
Ai - ARMATURE INDEX: 0.00
dn Discontinuity Number/s - per m N/A || Jointless
ds Discontinuity Set/s N/A || Jointless
di Discontinuity Inclination - ° N/A || Jointless
da Discontinuity Aperture N/A || Jointless
dd Discontinuity Disintegration N/A || Jointless
df Discontinuity Friction N/A || Jointless
dp Discontinuity Persistency N/A || Jointless
Ci - CONFIGURATION INDEX: 4.00
pc Problematical Configuration Homogeneous || Isotropic || Jointless || Granular
sc Structural Configuration Cohesive Matrix Skeleton
Hi - HYDRO INDEX: 2.40
gc Ground Conductivity (GCD) || [Wetness] (25 - 49) || [Flow]
gs Ground Softness - Mohs 4
Pi - PROPERTIES INDEX: 8.12
cc Cohesiveness Consistency Picked Easily
dc Denseness Consistency Never Indented by Thumbnail
ps Particle Size Gravel
pm Particle Morphology Angular
bw Body Wave Velocity - m/sec (Vp) || [Vs] (3999 - 3500) || [2199 - 2000]
Si - STRENGTH INDEX: 7.20
cs UCS 9 - 5 MPa
se Scale Effect D/H = 1.20 - 0.80 & σv ≥ σh
DFi - DYNAMIC FORCES IMPACT: 0.85
(PGASD) || [ERZ] || {MSK} (0.36g - 0.50g) || [VH] || {IX-X}
ETi - EXCAVATION TECHNIQUE IMPACT: 0.90
(ET) || [PPV mm/sec] (CtldBlast) || [120 - 449]
1/4
I-System
Version 1.7.2 B
ased on I-System
Bineshian (2019) C
opyright © I-S
ystem 2020. A
ll Rights R
eserved WorldW
ide. 20210603-13:24

Journal of Engineering Geology Volume XLVI, No 1 A bi-annual Journal of ISEG June 2021
57
Figure 2b. I-System Software output – USBRL – T02 Tunnel
I-System - Index of Ground-Structure Bineshian (2019)
17%
(I)-Class
(I)-09
Recommended Measure/sSS - Support System
PR100.250.L.X1/FP76.200.L.X1/FP32.200.L.X2, FaceB25.L.S/FaceP300-, FaceButt.L, PreG/I, RigidR150UC23.750-+RingC, SysN32.L.S, FRS225/FRC225, FRFS200, RDH54.L+CF
ET - Excavation Technique/s
PSD-ME, PL750-
IT - Instrumentation Technique/s
3DMS@25m, StrainM@150m, PressC/LoadC@200m, MultiRodE@400m, StrainG@500m
PT - Prevention Technique/s
Apply PreG/I & PR/FP, Maintain Buttress, Avoid: FF, NonExBreak/DnB, & Ductile SS
FT - Forecast Technique/s
TSP/PH54.EC.L
Design Remark/s
Passive load configuration, sensitive to scale, unsupported span, & stand-up time
2/4
I-System
Version 1.7.2 B
ased on I-System
Bineshian (2019) C
opyright © I-S
ystem 2020. A
ll Rights R
eserved WorldW
ide. 20210603-13:24

Journal of Engineering Geology Volume XLVI, No 1 A bi-annual Journal of ISEG June 2021
58
Figure 2c. I-System Software output – USBRL – T02 Tunnel
I-System - Index of Ground-Structure Bineshian (2019)
(I)-GC; I-System’s Ground Characterization
(I) = 17
Selected UCS range is 9 - 5 MPa.
Specified Value =σc 5 MPa
Modulus of Deformation
Eg = 1.340 GPa
Poisson's Ratio
νg = 0.432
Unconfined Compressive Strength
σcg = 0.082 MPa
Uniaxial Tensile Strength
σtg = -0.003 MPa
Cohesion
Cg = 0.383 KPa
Internal Friction Angle
ϕg = 24.350°
(I)-GC characterizes the ground based on (I);
however, it is recommended to scrutinise it
by deriving the mechanical properties of
ground by standardised in-situ testing
methods.
3/4
I-System
Version 1.7.2 B
ased on I-System
Bineshian (2019) C
opyright © I-S
ystem 2020. A
ll Rights R
eserved WorldW
ide. 20210603-13:24

Journal of Engineering Geology Volume XLVI, No 1 A bi-annual Journal of ISEG June 2021
59
Figure 2d. I-System Software output – USBRL – T02 Tunnel
4. Surface Rock and Soil Works – USBRL Project – Tunnel Portal of T13 Portal works of both main and escape tunnels of T13 (one of the longest twin tunnels in USBRL with 9 km length in young Himalaya’s terrain) is designed using I-System. Following case represents the output for I-System evaluation on portal of the escape tunnel of T13. The slope of this portal is located in a ground with mix of sandstone fragments in soil matrix. (I)-Class output obtained from I-System for the slope of the T13’s portal is being applied. The portal is designed using (I)-GC output of I-System as design parameters. Input as well as output of the analysis conducted using I-System Software is presented in Figure 3.
I-System - Index of Ground-Structure Bineshian (2019)
(I)-GC Chart
E g
0
25
50
75
100
125
150
(I)0 10 20 30 40 50 60 70 80 90 100
ν g
0.10.150.2
0.250.3
0.350.4
0.450.5
(I)0 10 20 30 40 50 60 70 80 90 100
σ cg/σ c
0
0.2
0.4
0.6
0.8
1
(I)0 10 20 30 40 50 60 70 80 90 100
σ tg/σ c
g
-1
-0.8
-0.6
-0.4
-0.2
0
(I)0 10 20 30 40 50 60 70 80 90 100
C g/σ
cg
0
0.05
0.1
0.15
0.2
0.25
0.3
(I)0 10 20 30 40 50 60 70 80 90 100
ϕg
0
10
20
30
40
50
60
70
(I)0 10 20 30 40 50 60 70 80 90 100
(17,1.34)
(17,0.432)
(17,0.016)
(17,-0.036)
(17,0.005) (17,24.35)
4/4
I-System
Version 1.7.2 B
ased on I-System
Bineshian (2019) C
opyright © I-S
ystem 2020. A
ll Rights R
eserved WorldW
ide. 20210603-13:24

Journal of Engineering Geology Volume XLVI, No 1 A bi-annual Journal of ISEG June 2021
60
Figure 3a. I-System Software output – USBRL – T13 Tunnel
(I) = (Ai + Ci + Hi + Pi + Si) × DFi × ETi Bineshian (2019)
Calculation Sheet: Location:ET Portal JnK
Project: Type of Structure:USBRL - T13 Surface
Country: Date:IN 2021/06/03
Ai - ARMATURE INDEX: 5.48
dn Discontinuity Number/s - per m 15 - 19
ds Discontinuity Set/s 3
di Discontinuity Inclination - ° 11 - 30
da Discontinuity Aperture Semi-Tight
dd Discontinuity Disintegration Weathered/Altered
df Discontinuity Friction Moderate Friction - Nonsmooth
dp Discontinuity Persistency ≥ 0.90 x D
Ci - CONFIGURATION INDEX: 9.00
pc Problematical Configuration Fractured - Highly
sc Structural Configuration Layered (100 - 10 cm)
Hi - HYDRO INDEX: 12.00
gc Ground Conductivity (GCD) || [Wetness] (≤ 0.99) || [Dry]
gs Ground Softness - Mohs 6
Pi - PROPERTIES INDEX: 16.00
cc Cohesiveness Consistency Indurated
dc Denseness Consistency Never Indented by Thumbnail
ps Particle Size N/A (e.g. Grainless)
pm Particle Morphology N/A (e.g. Grainless)
bw Body Wave Velocity - m/sec (Vp) || [Vs] (4999 - 4500) || [2899 - 2600]
Si - STRENGTH INDEX: 12.60
cs UCS 74 - 50 MPa
se Scale Effect B/H = 1.20 - 0.80
DFi - DYNAMIC FORCES IMPACT: 0.85
(PGASD) || [ERZ] || {MSK} (0.36g - 0.50g) || [VH] || {IX-X}
ETi - EXCAVATION TECHNIQUE IMPACT: 0.99
(ET) || [PPV mm/sec] (ME/NonExBreak) || [< 2]
1/4
I-System
Version 1.7.2 B
ased on I-System
Bineshian (2019) C
opyright © I-S
ystem 2020. A
ll Rights R
eserved WorldW
ide. 20210603-13:37

Journal of Engineering Geology Volume XLVI, No 1 A bi-annual Journal of ISEG June 2021
61
Figure 3b. I-System Software output – USBRL – T13 Tunnel
I-System - Index of Ground-Structure Bineshian (2019)
46%
(I)-Class
(I)-06
Recommended Measure/sSS - Support System
Scng, SysA25.L.S, FRS150, DH54.L
ET - Excavation Technique/s
(PreS, DD6000-), (ProdBlast, PD2000-)
IT - Instrumentation Technique/s
3DMS@75m, IncM@500m
PT - Prevention Technique/s
Cover Slope Crest with WPM & FRS at a Width Equal to Height to Help Prevention of Tension Crack Generation, Avoid: ProdBlast/UnCtldBlast, Surcharge at Crest, & Toe Lightening
FT - Forecast Technique/s
ERT/VPH54.L
Design Remark/s
Check against plain/wedge/toppling failure & rock fall criteria
2/4
I-System
Version 1.7.2 B
ased on I-System
Bineshian (2019) C
opyright © I-S
ystem 2020. A
ll Rights R
eserved WorldW
ide. 20210603-13:37

Journal of Engineering Geology Volume XLVI, No 1 A bi-annual Journal of ISEG June 2021
62
Figure 3c. I-System Software output – USBRL – T13 Tunnel
I-System - Index of Ground-Structure Bineshian (2019)
(I)-GC; I-System’s Ground Characterization
(I) = 46
Selected UCS range is 74 - 50 MPa.
Specified Value =σc 50 MPa
Modulus of Deformation
Eg = 8.974 GPa
Poisson's Ratio
νg = 0.316
Unconfined Compressive Strength
σcg = 3.491 MPa
Uniaxial Tensile Strength
σtg = -0.403 MPa
Cohesion
Cg = 69.639 KPa
Internal Friction Angle
ϕg = 40.300°
(I)-GC characterizes the ground based on (I);
however, it is recommended to scrutinise it
by deriving the mechanical properties of
ground by standardised in-situ testing
methods.
3/4
I-System
Version 1.7.2 B
ased on I-System
Bineshian (2019) C
opyright © I-S
ystem 2020. A
ll Rights R
eserved WorldW
ide. 20210603-13:37

Journal of Engineering Geology Volume XLVI, No 1 A bi-annual Journal of ISEG June 2021
63
Figure 3d. I-System Software output – USBRL – T13 Tunnel
5. Semi-surface Unweathered Rock Works – Teesta HEP (Stage VI) NHPC is the client of the project. Work is being executed by LTHPL. Subject work is the characterisation of ground for slope stabilisation design for barrage and power intake pile wall and the desilting basin. I-System is used for derivation of ground parameters as well as prediction for required measures for stabilisation of the subject structures. Six parameters including Eg, σcg, σcg, Cg, and φg for the fresh rock mass for the semi-surface structure is estimated using (I)-GC. Analysis input and output of I-System Software is presented in Figure 4.
I-System - Index of Ground-Structure Bineshian (2019)
(I)-GC Chart
E g
0
25
50
75
100
125
150
(I)0 10 20 30 40 50 60 70 80 90 100
ν g
0.10.150.2
0.250.3
0.350.4
0.450.5
(I)0 10 20 30 40 50 60 70 80 90 100
σ cg/σ c
0
0.2
0.4
0.6
0.8
1
(I)0 10 20 30 40 50 60 70 80 90 100
σ tg/σ c
g
-1
-0.8
-0.6
-0.4
-0.2
0
(I)0 10 20 30 40 50 60 70 80 90 100
C g/σ
cg
0
0.05
0.1
0.15
0.2
0.25
0.3
(I)0 10 20 30 40 50 60 70 80 90 100
ϕg
0
10
20
30
40
50
60
70
(I)0 10 20 30 40 50 60 70 80 90 100
(46,8.974)
(46,0.316)
(46,0.07)
(46,-0.115)
(46,0.02)
(46,40.3)
4/4
I-System
Version 1.7.2 B
ased on I-System
Bineshian (2019) C
opyright © I-S
ystem 2020. A
ll Rights R
eserved WorldW
ide. 20210603-13:37

Journal of Engineering Geology Volume XLVI, No 1 A bi-annual Journal of ISEG June 2021
64
Figure 4a. I-System Software output – Teesta HEP – Barrage
(I) = (Ai + Ci + Hi + Pi + Si) × DFi × ETi Bineshian (2019)
Calculation Sheet: Location:Fresh Sikkim
Project: Type of Structure:TeestaHEP Semi-Surface
Country: Date:IN 2021/05/22
Ai - ARMATURE INDEX: 9.50
dn Discontinuity Number/s - per m 10 - 14
ds Discontinuity Set/s 3
di Discontinuity Inclination - ° 31 - 60
da Discontinuity Aperture Tight
dd Discontinuity Disintegration Unweathered/Unaltered
df Discontinuity Friction High Friction - Rough/Uneven
dp Discontinuity Persistency < 0.90 x D
Ci - CONFIGURATION INDEX: 12.75
pc Problematical Configuration Fractured - Moderately
sc Structural Configuration Layered (> 100 cm)
Hi - HYDRO INDEX: 16.00
gc Ground Conductivity (GCD) || [Wetness] (3 - 4.99) || [Moist]
gs Ground Softness - Mohs ≥ 7
Pi - PROPERTIES INDEX: 12.00
cc Cohesiveness Consistency Indurated
dc Denseness Consistency Never Indented by Thumbnail
ps Particle Size N/A (e.g. Grainless)
pm Particle Morphology N/A (e.g. Grainless)
bw Body Wave Velocity - m/sec (Vp) || [Vs] (3499 - 3000) || [1999 - 1500]
Si - STRENGTH INDEX: 12.60
cs UCS 74 - 50 MPa
se Scale Effect B/H = 1.20 - 0.80
DFi - DYNAMIC FORCES IMPACT: 0.90
(PGASD) || [ERZ] || {MSK} (0.26g - 0.35g) || [H] || {VII-VIII}
ETi - EXCAVATION TECHNIQUE IMPACT: 0.99
(ET) || [PPV mm/sec] (ME/NonExBreak) || [< 2]
1/4
I-System
Version 1.7.2 B
ased on I-System
Bineshian (2019) C
opyright © I-S
ystem 2020. A
ll Rights R
eserved WorldW
ide. 20210605-10:39

Journal of Engineering Geology Volume XLVI, No 1 A bi-annual Journal of ISEG June 2021
65
Figure 4b. I-System Software output – Teesta HEP – Barrage
I-System - Index of Ground-Structure Bineshian (2019)
56%
(I)-Class
(I)-05
Recommended Measure/sSS - Support System
Scng, SpotB32/SpotA32, HEAM/WeldM, DH54.L
ET - Excavation Technique/s
(PreS, DD6000-), (ProdBlast, PD3000-)
IT - Instrumentation Technique/s
3DMS@150m
PT - Prevention Technique/s
Protect Crest with FRS to Prevent Increment in Pore Water Pressure, Avoid: ProdBlast/UnCtldBlast, & Bulk Removal of Toe
FT - Forecast Technique/s
ERT/VPH54.L
Design Remark/s
Check against plain/wedge/toppling failure & rock fall criteria, SFL not required
2/4
I-System
Version 1.7.2 B
ased on I-System
Bineshian (2019) C
opyright © I-S
ystem 2020. A
ll Rights R
eserved WorldW
ide. 20210605-10:39

Journal of Engineering Geology Volume XLVI, No 1 A bi-annual Journal of ISEG June 2021
66
Figure 4c. I-System Software output – Teesta HEP – Barrage
I-System - Index of Ground-Structure Bineshian (2019)
(I)-GC; I-System’s Ground Characterization
(I) = 56
Selected UCS range is 74 - 50 MPa.
Specified Value =σc 50 MPa
Modulus of Deformation
Eg = 15.445 GPa
Poisson's Ratio
νg = 0.276
Unconfined Compressive Strength
σcg = 5.756 MPa
Uniaxial Tensile Strength
σtg = -0.990 MPa
Cohesion
Cg = 189.298 KPa
Internal Friction Angle
ϕg = 45.800°
(I)-GC characterizes the ground based on (I);
however, it is recommended to scrutinise it
by deriving the mechanical properties of
ground by standardised in-situ testing
methods.
3/4
I-System
Version 1.7.2 B
ased on I-System
Bineshian (2019) C
opyright © I-S
ystem 2020. A
ll Rights R
eserved WorldW
ide. 20210605-10:39

Journal of Engineering Geology Volume XLVI, No 1 A bi-annual Journal of ISEG June 2021
67
Figure 4d. I-System Software output – Teesta HEP – Barrage
6. Surface Highly Weathered Rock Work – Teesta HEP (Stage VI) Subject work is the characterisation of ground for slope stabilisation design for barrage and power intake pile wall and the desilting basin in a highly weathered rock mass as a surface structure. I-System is used for derivation of ground parameters as well as prediction for required measures for stabilisation of the subject structures. Similar to the Section 5, six parameters including Eg, σcg, σcg, Cg, and φg for the highly weathered rock mass for the surface structure is estimated using (I)-GC. Figure 5 provides the input and output of the analysis conducted using I-System Software.
I-System - Index of Ground-Structure Bineshian (2019)
(I)-GC Chart
E g
0
25
50
75
100
125
150
(I)0 10 20 30 40 50 60 70 80 90 100
ν g
0.10.150.2
0.250.3
0.350.4
0.450.5
(I)0 10 20 30 40 50 60 70 80 90 100
σ cg/σ c
0
0.2
0.4
0.6
0.8
1
(I)0 10 20 30 40 50 60 70 80 90 100
σ tg/σ c
g
-1
-0.8
-0.6
-0.4
-0.2
0
(I)0 10 20 30 40 50 60 70 80 90 100
C g/σ
cg
0
0.05
0.1
0.15
0.2
0.25
0.3
(I)0 10 20 30 40 50 60 70 80 90 100
ϕg
0
10
20
30
40
50
60
70
(I)0 10 20 30 40 50 60 70 80 90 100
(56,15.445)
(56,0.276)
(56,0.115)
(56,-0.172)
(56,0.033)
(56,45.8)
4/4
I-System
Version 1.7.2 B
ased on I-System
Bineshian (2019) C
opyright © I-S
ystem 2020. A
ll Rights R
eserved WorldW
ide. 20210605-10:39

Journal of Engineering Geology Volume XLVI, No 1 A bi-annual Journal of ISEG June 2021
68
Figure 5a. I-System Software output – Teesta HEP – Desilting basin
(I) = (Ai + Ci + Hi + Pi + Si) × DFi × ETi Bineshian (2019)
Calculation Sheet: Location:Weathered Sikkim
Project: Type of Structure:TeestaHEP Surface
Country: Date:IN 2021/05/22
Ai - ARMATURE INDEX: 2.03
dn Discontinuity Number/s - per m 20 - 24
ds Discontinuity Set/s ≥ 4
di Discontinuity Inclination - ° 31 - 60
da Discontinuity Aperture Semi-Tight
dd Discontinuity Disintegration Weathered/Altered
df Discontinuity Friction Moderate Friction - Nonsmooth
dp Discontinuity Persistency < 0.90 x D
Ci - CONFIGURATION INDEX: 9.00
pc Problematical Configuration Fractured - Highly
sc Structural Configuration Layered (100 - 10 cm)
Hi - HYDRO INDEX: 9.00
gc Ground Conductivity (GCD) || [Wetness] (5 - 6.99) || [Leak]
gs Ground Softness - Mohs 6
Pi - PROPERTIES INDEX: 10.00
cc Cohesiveness Consistency Indurated
dc Denseness Consistency Never Indented by Thumbnail
ps Particle Size N/A (e.g. Grainless)
pm Particle Morphology N/A (e.g. Grainless)
bw Body Wave Velocity - m/sec (Vp) || [Vs] (2499 - 2000) || [999 - 750]
Si - STRENGTH INDEX: 9.00
cs UCS 29 - 20 MPa
se Scale Effect B/H = 1.20 - 0.80
DFi - DYNAMIC FORCES IMPACT: 0.90
(PGASD) || [ERZ] || {MSK} (0.26g - 0.35g) || [H] || {VII-VIII}
ETi - EXCAVATION TECHNIQUE IMPACT: 0.99
(ET) || [PPV mm/sec] (ME/NonExBreak) || [< 2]
1/4
I-System
Version 1.7.2 B
ased on I-System
Bineshian (2019) C
opyright © I-S
ystem 2020. A
ll Rights R
eserved WorldW
ide. 20210605-10:42

Journal of Engineering Geology Volume XLVI, No 1 A bi-annual Journal of ISEG June 2021
69
Figure 5b. I-System Software output – Teesta HEP – Desilting basin
I-System - Index of Ground-Structure Bineshian (2019)
35%
(I)-Class
(I)-07
Recommended Measure/sSS - Support System
Scng, SysA32.L.S, FRS250, PostG/I, DH54.L
ET - Excavation Technique/s
ME/NonExBreak
IT - Instrumentation Technique/s
3DMS@25m, IncM@400m
PT - Prevention Technique/s
Cover Slope Crest with WPM & FRS at a Width Equal to Height to Help Prevention of Tension Crack Generation, Avoid: ProdBlast/UnCtldBlast, Sharp/Tall Slope, Short Berm, Surcharge at Crest, & Toe Lightening
FT - Forecast Technique/s
ERT/SRT/VPH54.L
Design Remark/s
Check against plain/wedge/toppling failure & rock fall criteria
2/4
I-System
Version 1.7.2 B
ased on I-System
Bineshian (2019) C
opyright © I-S
ystem 2020. A
ll Rights R
eserved WorldW
ide. 20210605-10:42

Journal of Engineering Geology Volume XLVI, No 1 A bi-annual Journal of ISEG June 2021
70
Figure 5c. I-System Software output – Teesta HEP – Desilting basin
I-System - Index of Ground-Structure Bineshian (2019)
(I)-GC; I-System’s Ground Characterization
(I) = 35
Selected UCS range is 29 - 20 MPa.
Specified Value =σc 25 MPa
Modulus of Deformation
Eg = 4.755 GPa
Poisson's Ratio
νg = 0.360
Unconfined Compressive Strength
σcg = 1.007 MPa
Uniaxial Tensile Strength
σtg = -0.075 MPa
Cohesion
Cg = 11.590 KPa
Internal Friction Angle
ϕg = 34.250°
(I)-GC characterizes the ground based on (I);
however, it is recommended to scrutinise it
by deriving the mechanical properties of
ground by standardised in-situ testing
methods.
3/4
I-System
Version 1.7.2 B
ased on I-System
Bineshian (2019) C
opyright © I-S
ystem 2020. A
ll Rights R
eserved WorldW
ide. 20210605-10:42

Journal of Engineering Geology Volume XLVI, No 1 A bi-annual Journal of ISEG June 2021
71
Figure 5d. I-System Software output – Teesta HEP – Desilting basin
7. Conclusions I-System is used for classification as well as characterisation of ground in several projects before it is first ever published in 2019 and after that till now. Five case studies are presented here in this paper for the above-stated purpose in underground structures (T02, and T05, USBRL), semi-surface structure (Teesta barrage and distilling basin), and surface structures (T13 portal and Teesta barrage). The results as output of I-System in both (I)-Class and (I)-GC is applied in both design as well as practice. Execution of some of these projects are already completed and some are being executed.
I-System - Index of Ground-Structure Bineshian (2019)
(I)-GC Chart
E g
0
25
50
75
100
125
150
(I)0 10 20 30 40 50 60 70 80 90 100
ν g
0.10.150.2
0.250.3
0.350.4
0.450.5
(I)0 10 20 30 40 50 60 70 80 90 100
σ cg/σ c
0
0.2
0.4
0.6
0.8
1
(I)0 10 20 30 40 50 60 70 80 90 100
σ tg/σ c
g
-1
-0.8
-0.6
-0.4
-0.2
0
(I)0 10 20 30 40 50 60 70 80 90 100
C g/σ
cg
0
0.05
0.1
0.15
0.2
0.25
0.3
(I)0 10 20 30 40 50 60 70 80 90 100
ϕg
0
10
20
30
40
50
60
70
(I)0 10 20 30 40 50 60 70 80 90 100
(35,4.755)
(35,0.36)
(35,0.04)
(35,-0.074)
(35,0.012)
(35,34.25)
4/4
I-System
Version 1.7.2 B
ased on I-System
Bineshian (2019) C
opyright © I-S
ystem 2020. A
ll Rights R
eserved WorldW
ide. 20210605-10:42

Journal of Engineering Geology Volume XLVI, No 1 A bi-annual Journal of ISEG June 2021
72
8. References 1. Bineshian, H 2017a. ‘Tunnelling in Visco-Elasto-Plastic ground in tunnel T05 of
the Katra-Dharam Section of the Udhampur Srinagar Baramulla Rail Link Project’, Proceedings of Tunnelling in Himalayan Geology, Jammu, India.
2. Bineshian, H 2017b. ‘Plastic ground at T02 tunnel; Method of treatment using SRH’, DDC Project Register, USBRL, KRCL.
3. Bineshian, H 2019a. ‘I-System; A quick introduction’, Proceedings of the 8th IndoRock-2019 Conference, Delhi, India, 254 - 271.
4. Bineshian, H 2019b. ‘I-System: Index of Ground-Structure; A Comprehensive Indexing System for Ground-Structure Behaviour; Classification and Characterization’, Journal of Engineering Geology (JOEG), XLIV (1 & 2), 73 - 109, ISSN 0970-5317.
5. Bineshian, H 2020. ‘I-System: Index of Ground-Structure; Definition, applications, and utilisation in design/practice’, TAI Journal, 9 (1): 42 - 64.
6. Bineshian, H, Gupta, S, Hegde, R K 2019. ‘NATM in Hazardous Condition – Challenging Visco-Elasto-Plastic Ground – T5 Tunnel – USBRL Project’, Proceedings of International Conference, Tunnelling Asia, Mumbai, India, 120 - 135.

Journal of Engineering Geology Volume XLVI, No 1 A bi-annual Journal of ISEG June 2021
73
Chronology of Development of I-System A Brief History
H Bineshian, PhD
Principal, Technical Director, Amberg Engineering AG, Australia [email protected]
Received May 2021, Accepted June 2021
Abstract
This article provides chronology of development of I-System. The purpose to develop a new classification is explained and the aim to develop a comprehensive characterisation is presented. The general shortcomings of the existing classifications are briefly addressed and the reason to use I-System is clarified. Importance of comprehensiveness of an engineering classification system for both rocks and soils as well as varieties of tunnelling methods is described and necessity of consideration of most important features of ground as well as structures is briefed. Keywords: (I)-Class, (I)-GC, I-System 1. Introduction Empirical and observational design elements in a healthy design procedure is based on a suitable engineering classification and ground characterisation as the main part in design of structures in ground (Bineshian, 2019a, 2019b, 2020). It is necessary that the engineering classification to be comprehensive enough to be applicable for both rocks and soils and to be appropriate for application in modern tunnelling methods (e.g., NATM, NMT, SEM, SCL, etc.). Existing engineering classifications come with limitations in use, imprecision in regular application, and inaccuracy in estimation, which make engineers uncertain in determination and dimensioning of structures specially when they encounter ground complications (Bineshian, 2014, Bineshian, 2017a, Bineshian et al, 2019). RMR by Bieniawski (1973) and Q by Barton et al (1974) are widely used existing classifications; however, they lag in applications, comprehensiveness, accuracy, and precision. They are only applicable for rock medium; RMR is proposed for surface and underground works and Q for tunnels only. They take few parameters of rocks as input for the classification while very important parameters of ground are ignored, which have great impact on the ground quality. None of them considering excavation methods or properly taking the structures specifications (Bineshian, 2019b). I-System is developed to be used as a comprehensive classification and characterisation system for ground; i.e., both rocks and soils (Bineshian, 2019b). It is verified against varieties of ground conditions and scrutinised in several projects through 22 years research to address and resolve the aforesaid issues involved with existing classifications. I-System provides prediction of ground behaviour together with recommendations on required support system/s, excavation technique/s, instrumentation technique/s, prevention technique/s, and forecast technique/s followed by design remark/s as well as estimation for important mechanical properties of ground. Its output is optimised by analytical, numerical, and observational methods to compensate the demerits of existing classifications and strengthen its comprehensiveness.

Journal of Engineering Geology Volume XLVI, No 1 A bi-annual Journal of ISEG June 2021
74
2. Chronology Table 1 represents a brief chronology of the development course of I-System. It is avoided to present all the details; however, main progress in research and the development is listed.
Table 1. Chronology and development procedure of I-System since 1999. Year Description
1999 - Initial form of (I) is developed as a function of uniaxial compressive strength, RQD, discontinuities’ dip effect, rocks and soils’ fabric, texture, and structure, and ground water condition.
2000 - Further development is attained by adding more important structural properties of rocks as armature index.
- RQD is removed from the system due to its inefficiency in designating the rock quality.
- Important easily derivable soils properties considering ground structural configurations is added to the system for better modelling of soils properties.
- Dynamic forces’ impact on the structure is added to the system for a better modelling of ground-structure reaction.
2001 - Further development is obtained by improvement of soil modelling in the system using morphology, cohesiveness consistency, and denseness consistency as some elements of properties index of the system.
2002 - Further development is achieved by adding the most important
seismic properties of ground to the system to describe better the properties of rocks and soils.
2003 - Further development is applied to the system by establishing the structural as well as problematical configurations of ground including the tectonic features and structural geological aspects of ground; this part is called configuration index of the system.
2004 - I-System was further developed by considering the negative effects of water on ground including the effects in softening of the ground materials as well as the pressure effect both as main elements of hydro index of the system.
- Excavation method’s impact is added to the system by considering the method of excavation and peak particle velocity.
2005 - Seismic as well as dynamic effects including peak ground acceleration’s effect on the structure is further developed as impact factor for proper modelling of the structure in relation to the ground.

Journal of Engineering Geology Volume XLVI, No 1 A bi-annual Journal of ISEG June 2021
75
2006 - Scale effect and consideration of shape and depth of placement of the structure is considered in the system as elements of the strength index.
2007 - Indices and impact factors are further assessed and the derivation
of parameters are tested in practice.
2008 - Hydraulic conductivity of ground is included in the system as part of hydro index and the system is further developed to approach its final form.
2009 - (I)-Class’s development is initiated as I-System’s classification system and its initial form for underground, semi-surface, and surface structures is prepared.
2010 - Special ground conditions including burst prone, squeezing, swelling, heaving, gravity driven, and time dependent grounds/behaviour are taken into consideration to be included in the (I)-Class.
- I-System is further verified in practice.
2011 - Development of Stress Release Holes (SRH) for squeezing, swelling, and heaving (SSH) ground is initiated.
- I-System is further verified in various ground conditions; consequently, corrections/amendments in scoring system is applied.
2012 - Further verification of I-System and its (I)-Class is conducted in practice.
- Scoring system is further assessed for the parameters of the indices and impact factors.
- Classification for SSH condition is initiated.
2013 - Development of Ground Conductivity Designation (GCD) is initiated as a criterion for assessment of ground conductivity as well as solidification quality.
- I-System is further verified in practice. - (I)-Class’s recommendations were assessed in details for different
structures and its recommendations were further improved. - Further development on SRH is obtained.
2014 - GCD is tested in practice and it is further assessed.
- I-System’s scoring system is further modified. - (I)-Class’s recommendations are further improved. - SRH research is reached to its final form to be applied in practice.
2015 - SRH is applied in practice and the results are assessed.
- Further work is conducted on I-System’s scoring system to form its final format.

Journal of Engineering Geology Volume XLVI, No 1 A bi-annual Journal of ISEG June 2021
76
- (I)-Class’s recommendations are verified for challenging tunnelling condition.
- GCD is further tested in practice.
2016 - Development of (I)-GC as I-System’s ground characterisation for estimation of mechanical properties of ground is initiated.
- I-System and (I)-Class are reached to their final form while they are further verified in practice.
- SRH is successfully applied in practice.
2017 - GCD’s results cited in publications (Bineshian, 2017a, 2017b, Bineshian, et al, 2019).
- Further researches on SRH are performed. - I-System is further verified in practice. - (I)-GC’s accuracy is further improved by derivation of best fit on
empirical data.
2018 - I-System is further verified; it is formally used in design. - GCD and SRH have obtained their final forms. - (I)-GC is further developed while it has obtained acceptable
accuracy in estimation of mechanical properties of ground.
2019 - I-System is first ever published (Bineshian, 2019a, 2019b) while it is further applied in design and its performance was verified systematically.
- GCD and SRH are further applied in practice and their suitability were verified.
- Research on ViD (vibration-induced damage) is initiated as a function of (I).
- Development of empirical equations/methods for estimation of pull length in underground works as well as rock bolting system calculation based on I-System is initiated.
- (I)-GC is included in I-System as a comprehensive characterisation system.
2020 - ViD, pull length advisor, and systematic bolting calculator are developed based on (I).
- GCD is published (Bineshian, 2020a). - SRH System is published (Bineshian, 2020b). - I-System is further verified. - I-System Software is developed (Bineshian, 2020c).
2021 - ViD is published (Bineshian, 2021).
- 2021 edition of I-System is in press containing further clarifications as well as added features; application of I-System is eased.
- I-System Software is further developed to include all added features of I-System.

Journal of Engineering Geology Volume XLVI, No 1 A bi-annual Journal of ISEG June 2021
77
3. References 1. Barton, N, Lien, R, Lunde, J 1974. ‘Engineering classification of rock masses for
the design of tunnel support’, Rock Mechanics, 6: 4: 189 - 236. 2. Bieniawski, Z.T, 1973. ‘Engineering classification of jointed rock masses’, Civil
Engineer, South Africa, 15 (12). 3. Bineshian, H 2014. ‘Stress non-uniformity in concrete and rock structures’, LAP
Lambert Publishing, Germany, 333p. 4. Bineshian, H 2017a. ‘Tunnelling in Visco-Elasto-Plastic ground in tunnel T05 of
the Katra-Dharam Section of the Udhampur Srinagar Baramulla Rail Link Project’, Proceedings of Tunnelling in Himalayan Geology, Jammu, India.
5. Bineshian, H 2017b. ‘Plastic ground at T02 tunnel; Method of treatment using SRH’, DDC Project Register, USBRL, KRCL.
6. Bineshian, H 2019a. ‘I-System; A quick introduction’, Proceedings of the 8th IndoRock-2019 Conference, Delhi, India, 254 - 271.
7. Bineshian, H 2019b. ‘I-System: Index of Ground-Structure; A Comprehensive Indexing System for Ground-Structure Behaviour; Classification and Characterization’, Journal of Engineering Geology (JOEG), XLIV (1 & 2), 73 - 109, ISSN 0970-5317.
8. Bineshian, H, Gupta, S, Hegde, R K 2019. ‘NATM in Hazardous Condition – Challenging Visco-Elasto-Plastic Ground – T5 Tunnel – USBRL Project’, Proceedings of International Conference, Tunnelling Asia, Mumbai, India, 120 - 135.
9. Bineshian, H 2020a. ‘GCD – Ground Conductivity Designation; A testing method to quantify ground’s hydraulic conductivity and solidification quality’, Journal of Engineering Geology (JOEG), XLV (1 & 2), 17 - 23, ISSN 0970-5317.
10. Bineshian, H 2020b. ‘SRH System – Stress Release Hole/s; A substitution to conventional yield support system’, Journal of Engineering Geology (JOEG), XLV (1 & 2), 1 - 16, ISSN 0970-5317.
11. Bineshian, H 2021. ‘Vibration-induced Damage Assessment; New practical methods applicable for engineered blasting’, TAI Journal, 10 (1): 5 - 14.
12. Bineshian, H 2020c. ‘I-System: Index of Ground-Structure; Definition, applications, and utilisation in design/practice’, TAI Journal, 9 (1): 42 - 64.
13. Bineshian, H 2021. ‘Vibration-induced Damage Assessment; New practical methods applicable for engineered blasting’, TAI Journal, 10 (1): 12 - 21.

Journal of Engineering Geology Volume XLVI, No 1 A bi-annual Journal of ISEG June 2021
78
Long Range Underground Prediction of Ground Behaviour/Hazards at Tunnel T13 in USBRL Project using TSP
K Choudhary1, H Bineshian2, T Dickmann3, S Gupta4, R K Hegde5
1Geophysicist, AMBERG Technologies, India 2Principal, Technical Director, AMBERG Engineering AG, Australia
3Principal, Amberg Technologies, Switzerland 4Chief Engineer, Northern Railway, India
5Chief Engineer, Konkan Railway Corporation Limited, India
Received June 2021, Accepted July 2021
Abstract
Estimates of uncertainties and its associated risk during the construction process are essential information for decision making in any stage of a tunnel project. Dealing with adverse ground condition at any depth can be problematic, which will lead to a significant delay and cost upsurge if it is not adequately predicted. The amount of information available for the ground can be increased by specialised geophysical technique, which provide indirect assessment of engineering properties. The aim of such type of geophysical investigation is to model the expected behaviour of the ground and thus to predict the scenarios indicating potential variations in the quality of the rock mass during underground excavation. Tunnel Seismic Prediction (TSP) as an advanced geophysical method for estimating ground condition ahead and around of unexcavated areas in tunnelling quantifies mechanical ground parameters based on body waves velocities (compression and shear wave velocities). Seismic velocities are sensitive to rock mass quality, porosity, stress state, and water condition. The method is widely accepted because of its long prediction range and high resolution. TSP 303 is used in tunnel T13 of Udhampur Srinagar Baramulla Rail Link (USBRL) Project in J & K, India and achieved a remarkably high prediction accuracy of 90 per cent. The prediction of ground condition at T13 helped to prevent potential failure/collapses to occur. In this article the use of seismic properties of ground to assess the geomechanical behaviour ahead of the face of the tunnel is illustrated. Keywords: GCD, I-System, SRH, tunnelling, TSP 1. Introduction Geophysical investigations in underground engineering imply a series of geophysical methods. The tunnelling industry has already identified the potential of these non-destructive methods that valuably contribute to the assessment of the ground condition and to the provision of an interpretative prediction guideline for advancement. Due to long range prediction and high resolution, seismic methods are classified as optimized methods in which they are usually preferred for the assessment of the ground condition/s. Many tunnels are located in areas with relatively weak access along the alignment and excavated/bored under extremely high overburden. These two factors often result in limited geological information. It would be reasonable to state that the deeper the tunnel, the greater the level of uncertainties due to less accurate geotechnical data available. The normal approach to assess the geomechanical condition is to obtain the geological section along the tunnel by observation, borehole drilling, and surface geophysical

Journal of Engineering Geology Volume XLVI, No 1 A bi-annual Journal of ISEG June 2021
79
survey. However, factors like overburden, thickness, and topography may limit the potential of these methods to obtain the precise and sufficient information. In excavation through inaccessible mountain even an extensive geotechnical baseline report can miss the critical ground surprises. This can create a big challenge for both drill and blast and TBM drive in terms of their performance and safety. The safe operation can be achieved by implementing the right method. The overall goal should be minimising the risk in such a way that it always is within acceptability (Dickmann, 2013, Dickman and Krueger, 2014, Dickmann et al, 2018). The only way to achieve the acceptability of risk is to control them. Knowing in advance where the significant geological boundaries intersect the tunnel axis can help to prevent hazards such as large failures, collapses, and extreme ground conditions. 2. Overview of Tunnel Seismic Prediction The TSP is based on the evaluation of elastic body waves, which are being excited by detonation charges providing the best signal to noise ratio and the least restrictive conditions for recording and processing (Figure 1).
Figure 1. Measurement layout of the 3D Tunnel Seismic Prediction technique (TSP 303) consisting of
usually 4 receivers (RCV) and 24 shot points
The body waves travel as compression or shear waves through the ground and are being reflected at interfaces with different mechanical properties like density or elasticity. Thus, by separation of the different wave types using three-component-sensors it is possible to derive information about the mechanical properties of the ground such as dynamic modulus of elasticity. Even in rather complex geomechanical hard rock condition, prediction ranges of 100 - 150 m can be achieved. Acoustic signals are produced by a series of 24 shots, containing 25 to 100 grams of explosives. Four sensor probes, consisting of highly sensitive tri-axial receivers, are contained in protection tubes whose tips are firmly cemented into boreholes of 45-50 mm in both side-walls (Figure 1). The 3-component receivers pick up the seismic signals, which have been reflected from any kind of discontinuity in the ground ahead. A highly sophisticated processing and evaluation software has been devised for ease of operation. The capability of the system to record the full wave field of compressional and shear waves in conjunction with the intelligent analysis software enables a determination of ground mechanical properties such as Poisson Ratio and Young’s Modulus within the prediction area.

Journal of Engineering Geology Volume XLVI, No 1 A bi-annual Journal of ISEG June 2021
80
3. Specific Aspect of Tunnel Seismic Operation The necessary operations to perform a tunnel seismic measurement in a typical TSP setup can be integrated into the construction operations without any interference with the excavation work. Boreholes for receivers can be prepared using ordinary drilling systems. Explosive charging can be conducted as simple as tamping of a single cartridge in a short hole. Installation of seismic receivers as well as charging and shooting of holes may take place during maintenance intervals or short excavation breaks of about one hour. This operation time can be further reduced by splitting the campaign into two parts that can be carried out on consecutive days. For advancing of a long and deep tunnel, the decision had been usually made for the use of a TBM. There is even a tendency to specify a shielded machine when in fact an open machine may do the job. Here, the use of precast segments will constitute a crucial point because it shall limit seismic surveys since the ground is not accessible at all. In order to avoid large-scale drilling measures through the precast segments, it would be very helpful to use the grouting and lifting inserts of the segments. For example, the hexagonal or honeycomb segmental lining provides a quick and easy layout of the seismic bore line. Regular grouting inserts every 1.5 meters fit perfectly to the regular spacing of the seismic layout (Figure 2). The stability, safety, and the serviceability of segmental elements are guaranteed using explosives for TSP measurements. In case of full backfilling of the segments the blasts could activate settlements with a maximum of 3 mm in worse ground strengths like weathered mudstone. The settlements become less with increasing ground strength. Damage-free blasts can be performed if the blowouts are canalized by installed tubes, while the blow out plane behind the segments is concurrently eliminated. It can be stated that TSP is applicable for TBM drive with segmental lining where any damage to lining elements due to the required explosive charges can be excluded.
Figure 2. Installation of TSP sensor into 2 m deep inside the side wall - NATM (left) and TBM (right)

Journal of Engineering Geology Volume XLVI, No 1 A bi-annual Journal of ISEG June 2021
81
4. Case Study Himalayan mountain range is arc-shaped, convex southwards with syntaxial bends at the western and eastern ends (Figure 3). The syntaxial western bend is parallel to a continental scale deep fault known as the Chaman Fault. The Himalayan Mountain range is subdivided into four principal tectonic zones, from south to north these are: Sub-Himalaya, Lesser Himalaya, Higher Himalayan Crystalline, and Tethyan Himalaya. Himalayas are known to be very seismically active and the number of earthquakes has been recorded in historical times. Tunnel T13 project is located in the state of J&K and alignment passes through highly undulating and steep hill slopes of the younger Himalayas.
Figure 3. Outline geological map of the Himalayan Mountain Belt (Ahmed, 1988)
Table 1. Chronological order of Geological formation of the USBRL project area.
Group/Formation Age Lithology
Quaternary Deposits Sub-recent to recent (Pleistocene to Holocene)
Terrace deposits, scree/ debris, slope wash, river borne material and alluvial soil.
Murree formation Eocene to Miocene Purple to reddish coloured sandstone, siltstone and claystone.
Sabathu Formation Paleocene to Eocene
Variegated shale of Khaki, olive green and pale/yellow colour interlayer with calcareous sandstone, shale and nummulitic limestone
Jangalgali Formation Crestaceous-Eocene
Chert/Quartz breccia, ferruginous sandstone/shale/ and pisolitic/non pisolitic bauxite
Sirban Group
Khairikot Formation
Meso-Proterozoic
Quartzite, dark grey slate and variegated shale with stromatolitic limestone/dolomite bands.
Trikuta Formation
Dark grey to light grey dolomite, stromatolitic dolomite, slate, quartzite and subordinate limestone

Journal of Engineering Geology Volume XLVI, No 1 A bi-annual Journal of ISEG June 2021
82
The area falls in Seismic zone V of the standard seismic zoning map of India. Present alignment passes through terrain of rugged morphology occupied by round or sub round crested ridges and hills. The project alignment for Tunnel T13 passes through the Lower Murree formation of Upper Eocene age. It comprises of purple, brown to greyish alternate bands of medium to fine grained sandstone, siltstone, and claystone. Rock mass is highly fractured, sheared, and jointed in nature with the presence of numerous bands of pseudo-conglomerate. These rocks are much prone to weathering and erosion. On account of high tectonic activities in Himalayas, the rocks along the alignment are folded, over-thrusted and faulted at many places, resulting into highly jointed and crushed rocks. In this regard, Figure 3 is representing the anticipated L-Profile of the project T13 including three main geological zones and project line. Government of India planned a 326 km railway line to provide an alternative and a reliable transportation system to state of Jammu & Kashmir (J&K) with the Indian Railway network from Jammu to Baramulla. The project has been declared as a Project of National Importance. Jammu-Udhampur-Katra-Quazigund-Baramulla Railway line is the largest project in the construction of a mountain railway since independence of India (Figure 4). Udhampur-Srinagar-Baramulla Rail Link (USBRL) is a mega project for construction of main part of above-mentioned railway line. It passes through young Himalayas with tectonised zones including major thrust faults.
Figure 4. USBRL Project Layout
The USBRL is in various stages of progress in the balance length from Katra to Banihal. The client for the project is Northern Railway (NR) as one of the 16 and of course largest route kilometres railway zone of Indian Railway (IR). Tunnel T13 is located in the state of J&K and alignment passes through highly undulating and steep hills of younger Himalaya and through the Murree formation of upper Eocene age. It includes twin tunnels comprising of Main Tunnel (MT) and Escape Tunnel (ET) together with 24 Cross Passages (CPs) as part of USBRL Project. The T13 has been assigned to Konkan Railway Corporation Limited (KRCL), which is a Union Government Company headquartered in Mumbai. Conduction of TSP is

Journal of Engineering Geology Volume XLVI, No 1 A bi-annual Journal of ISEG June 2021
83
awarded to AMBERG Engineering headquartered in Switzerland with an Indian branch in Gurgaon. This paper focuses on the TSP measurement on tunnel T13P1 ET between CH62898 to CH63076 as shown in Figure 5.
Sandstone Siltstone Claystone Tunnel
Figure 5. Location of TSP campaign & Geological L-Profile of Tunnel T13
Table 2 presents an overview of Tunnel T13’s features.
Table 2. Salient features of T13 Tunnel Type Twin (MT & ET)
Total Length (MT) 9.37 km
NATM Portion 9.37 km
Total Excavated Length 3.67 km
Water Inflow Dripping in most of the length
Lithology Sandstone, Siltstone & Claystone
Geo-structure Techtonised - Moderately to Highly Jointed
Geotechnical/geomechanical observations of measurements is summarised as follows:
- Surrounding ground’s main material: Siltstone - Overburden ≈ 150 m - No of JS: 3+ - RQD < 55 - UCS of Intact Rock ≈ 70 MPa - UCS of Rock Mass < 7 MPa - (I)-05 – (I)-06 (as per I-System; Bineshian (2019a, 2019b, 2020a)) - Water condition: Dripping (GCD = 6 – 15; Bineshian (2020b)) - Infilling of the discontinuities: Gouge comprising silt and clay - Orientation of discontinuities: Unfavourable
T13P
1 C
H61
001
T13P
2 C
H70
389
T13P
A C
H65
890
T13P
2 C
H70
389

Journal of Engineering Geology Volume XLVI, No 1 A bi-annual Journal of ISEG June 2021
84
- Vp: 4000 – 5600 m/sec (Primary Wave Velocity); Figure 5 - Vp: 2200 – 3100 m/sec (Primary Wave Velocity) - ERZ: VH with MSK IX-X (Earthquake Risk Zone) - SS: FRS (Fibre Reinforced Shotcrete), SysRB (Systematic Rock Bolting),
and SRH (Stress Release Holes; Bineshian (2020c)) - Mechanical behaviour of surrounding ground: Minor – mild squeezing - Excavation Technique (ET): Full face
Figure 6 shows the 2D rock property chart and plan view of dynamic young’s modulus along seismic axis. Red colour at chart of Dynamic Young’s Modulus generally indicates reduced rock stiffness whereas blue colour indicates enhanced rock stiffness.
Figure 6. Ground property chart and plan view of dynamic young’s mod along seismic axis
The estimated reference value of dynamic Young’s Modulus (Edyn) is 53 GPa and it varies between 33 GPa to 64 GPa along the tunnel axis. Directly ahead of tunnel face, Edyn decrease abruptly below the reference value. In addition to this, the distribution of P –wave velocity is shown on Figure 7. In some section ahead of face, P-wave velocity is below the reference value i.e., 4,433 m/s, which allows inferring that at some of these sections decrease in rock stiffness might be expected.

Journal of Engineering Geology Volume XLVI, No 1 A bi-annual Journal of ISEG June 2021
85
Figure 7. Top view of 3D P wave velocity model along MT as well as ET axis (top) and surface
rendering of 3D-P wave velocity lower than 4,350 m/s (bottom)
In addition to predict the behaviour of rock mass, it is also possible to explore the possibility of water bearing zones on the basis of variation in poison ratio which is being calculated from primary & shear wave velocity. Figure 8 shows the distribution of rendered Poisson’s ratio of σ ≥ 0.29 within the prediction range around & ahead of the tunnel axis. Depending on the seismic response at a given site, Poisson's ratio greater than equal to 0.29 are assumed as good indicators of these possible water bearing zone.

Journal of Engineering Geology Volume XLVI, No 1 A bi-annual Journal of ISEG June 2021
86
Figure 8. Distribution of poison ratio along MT as well as ET axis (top) and 3D view with surface
rendering value of 0.29 (bottom) TSP has been conducted at CH 62954 and a length of 122 m ahead was predicted. TSP has predicted the ground using I-System (Bineshian, 2019a, 2019b, 2020a) as weak to fair rock mass (including (I)-05 to (I)-08 as per I-System’s classification) ahead of above-said chainage. TSP results were compared with actual gathered data from site during excavation and a 90 per cent matching is obtained. Appendix 1 presents TSP results and Appendix 2 provides a comparison conducted by Client and Contractor’s Engineers/Geologists. As can be seen mismatching is only 10 per cent of the length, which is not also deviated

Journal of Engineering Geology Volume XLVI, No 1 A bi-annual Journal of ISEG June 2021
87
from the quality predicted; however, it has given more conservative info compared to the actual data obtained. On the basis of comparison of TSP prediction with actual ground condition encountered, calibration of seismic parameters for a given site can be initiated. A valid calibration will certainly increase the accuracy while doing data analysis in further measurements. So, it is always necessary to conduct the TSP measurements on a regular interval which enable Client/contractor to tackle any further ground surprises. TSP procedure consumed only 0.12 per cent of drive in such challenging condition in tunnel. Hindrance caused by TSP procedure is almost nothing (≈ 1 hr 35 mins for 122 m length of tunnel) while the prediction is tuned to have 90 per cent matching with actual condition encountered. Tunnelling in the initial stretch was an exceptionally challenging due to weak surrounding ground and water bearing zone; however, due to having high accuracy prediction no failure or collapse happened and therefore based on the prediction provided, prevention techniques are applied to prevent occurrence of any type of gravity or lateral failure or even caving. It is strongly recommended to tune the TSP results by conduction of GCD (Bineshian, 2020b), EC (Exploratory Coring), or BH (Blind Hole Probing) for a safe drive in tunnel. 5. Conclusions As per the stated comparison, TSP prognosis has close correlation with actual ground condition encountered including ground class and water condition. The prediction of the ground condition at T13 helped the client and contractor to prevent potential failure and collapses to occur in the tunnel with an accuracy of at least 90 percent. Geophysical methods are an essential part of modern tunnelling, which enables continuous risk assessment and management during construction. They are meaningful and necessary tools in modern tunnelling and it is well noted that the tunnelling community continuously overcomes its scepticism and doubts about the potential of these methods. When exactly realising the optimal use of them, tunnelling will become more predictable in both costs and risks. TSP can be the right way to turn the geomechanical risk/s and hazard/s into manageable condition/s. This advance technology can give a project the required support in overcoming the risk associated with geomechanical uncertainties. The TSP operation does not make any disturbance to tunnelling work if operated systematically. As it is presented in this paper, it only took 0.12 per cent of progress time for the length of prediction. To increase the accuracy, such type of geophysical techniques should be used in a regular manner. Globally, TSP is a well-established geophysical technique for ground prediction in NATM or conventional methods of tunnelling comprising of mechanized or drill and blast excavation technique/s including full face boring systems or partial sequential digging/excavation techniques.

Journal of Engineering Geology Volume XLVI, No 1 A bi-annual Journal of ISEG June 2021
88
6. References
1. Ahmad, T 1988. ‘Geological Review of Himalayan Mountain Belt’. 2. Bieniawski, Z T 1993. ‘Classification of rock masses for engineering: RMR
system and future trends’, Comprehensive rock engineering, J A Hudson ed 3: 553-573.
3. Bineshian, H 2017. ‘Tunnelling in Challenging Visco-Elasto-Plastic Ground - Tunnel T5 - Katra–Dharam Section - USBRL Project’, Int Conf Tunnelling, Jammu, India.
4. Bineshian, H 2019a. ‘I-System; A quick introduction’, Proceedings of the 8th IndoRock-2019 Conference, Delhi, India, 254 - 271.
5. Bineshian, H 2019b. ‘I-System: Index of Ground-Structure; A Comprehensive Indexing System for Ground-Structure Behaviour; Classification and Characterization’, Journal of Engineering Geology (JOEG), XLIV (1 & 2), 73 - 109, ISSN 0970-5317.
6. Bineshian, H 2020a. ‘I-System: Index of Ground-Structure; Definition, applications, and utilisation in design/practice’, TAI Journal, 9 (1): 42 - 64.
7. Bineshian, H 2020b. ‘GCD – Ground Conductivity Designation; A testing method to quantify ground’s hydraulic conductivity and solidification quality’, Journal of Engineering Geology (JOEG), XLV (1 & 2), 17 - 23, ISSN 0970-5317.
8. Bineshian, H 2020c. ‘SRH System – Stress Release Hole/s; A substitution to conventional yield support system’, Journal of Engineering Geology (JOEG), XLV (1 & 2), 1 - 16, ISSN 0970-5317.
9. Bineshian, H, Gupta, S, Hegde, R K 2019. ‘NATM in Hazardous Condition – Challenging Visco-Elasto-Plastic Ground – T5 Tunnel – USBRL Project’, TA, Mumbai, India.
10. Choudhary, K, Bineshian, H, Gupta, S, Hegde, R K, 2019. ‘Application of TSP for prediction of mechanical properties of surrounding ground of tunnel T5 in USBRL Project’, Proc 8th IndoRock-2019 Conference, Delhi, India, 229 – 235.
11. Cracknell, M J, Reading, A M 2014. ‘Geological mapping using remote sensing data: A com-parison of five machine learning algorithms, their response to variations in the spatial distribution of training data and the use of explicit spatial information’, Computers & Geosciences 63, 22–33.
12. Dickmann, T 2013. ‘3D Tunnel Seismic Prediction: A Next Generation Tool to Characterize Rock Mass Conditions Ahead of the Tunnel Face’ Journal of Rock Mechanics & Tunnelling Technology (JRMTT) 20 (1) 2014 pp 35-47.
13. Dickmann, T, Krueger, D 2014. ‘How to turn geological uncertainty into manageable risk of world tunnel congress 2014 - Tunnels for better Life, 9-15 Foz do Iguaçu, Brazil.
14. Dickmann, T, Krueger, D, Hecht-Méndez, J 2018. ‘Optimization of Tunnel Seismic operations for fast and continuous investigations ahead of the face’, Proceedings of World Tunnelling Congress, Dubai.
15. Schön, J H 2015. ‘Physical Properties of Rocks’, Fundamentals and principle Petrophysics, Volume 65, 2nd Edition, Amsterdam: Elsevier.
16. Svensson, M 2017. ‘GeoBIM for Infrastructure Planning’, Proceedings of the 23rd European Meeting of Environmental and Engineering Geophysics, 3-7 September, Malmö, Sweden.

Journal of Engineering Geology Volume XLVI, No 1 A bi-annual Journal of ISEG June 2021
89
Appendix 1. TSP Results for T13P1 ET
Table 3. Detailed results of TSP for T13P1 ET including measured physical and predicted mechanical properties
CH (m) VP (m/s)
VS (m/s) ν Ε
(GPa) TSP Interpretation
62898 – 62954 4,944 2,858 0.25 53 Reference rock stiffness (Siltstone, (I)-06 and water bearing)
62954 – 62971 4,234 2,279 0.30 33 Decrease in rock stiffness (I)-08 – (I)-09 and possible water bearing zone
62971 – 62978 4,105 2,343 0.26 33 Decrease in rock stiffness (I)-08 - (I)-09 and possible water bearing zone
62978 – 62984 4,092 2,465 0.22 36 Decrease in rock stiffness (I)-08 - (I)-09 and possible water bearing zone
62984– 62995 4,152 2,452 0.23 36 Decrease in rock stiffness (I)-08 - (I)-09 and possible water bearing zone
62995 – 63001 5,081 2,968 0.24 57 Almost similar to reference, (I)-06
63001 – 63007 5,075 2,868 0.27 54 Almost similar to reference, (I)-06
63007 – 63010 5,249 2,783 0.30 52 Similar stiffness to reference, (I)-06 – (I)-07 and possible water bearing zone
63010 – 63015 5,195 2,786 0.30 52 Similar stiffness to reference, (I)-06 – (I)-07 and possible water bearing zone
63015 – 63022 5,148 2,752 0.30 51 Similar stiffness to reference, (I)-06 – (I)-07 and possible water bearing zone
63022 – 63025 4,682 2,797 0.22 49 Decrease in rock stiffness, (I)-06 - (I)-07
63025 – 63050 5,406 2,934 0.29 59 Increase in rock stiffness, (I)-05 - (I)-06
63050 – 63055 5,014 2,945 0.24 56 Increase in rock stiffness, (I)-05 - (I)-06
63055 – 63058 5,401 2,947 0.29 59 Further increase in rock stiffness, (I)-05 - (I)-06
63058 – 63064 5,053 3,032 0.22 59 Increase in rock stiffness, (I)-05 - (I)-06
63064 – 63066 5,564 3,050 0.29 64 Increase in rock stiffness, (I)-05 - (I)-06 and possible water bearing zone
63066 – 63069 5,249 2,978 0.26 59 Increase in rock stiffness, (I)-05 - (I)-06
63069 – 63074 4,912 2,923 0.23 55 Slight decrease in rock stiffness, (I)-05 - (I)-06
63074 – 63076 5,303 2,943 0.28 58 Increase in rock stiffness, (I)-05 - (I)-06 [End of Prediction]
(I)-Class I-System’s Classification (Bineshian, 2019a, 2019b, 2020a) CH Tunnel Chainage VP Body Wave – Primary Wave Velocity VS Body Wave – Shear Wave Velocity ν Poisson’s Ratio E Dynamic Young’s Modulus
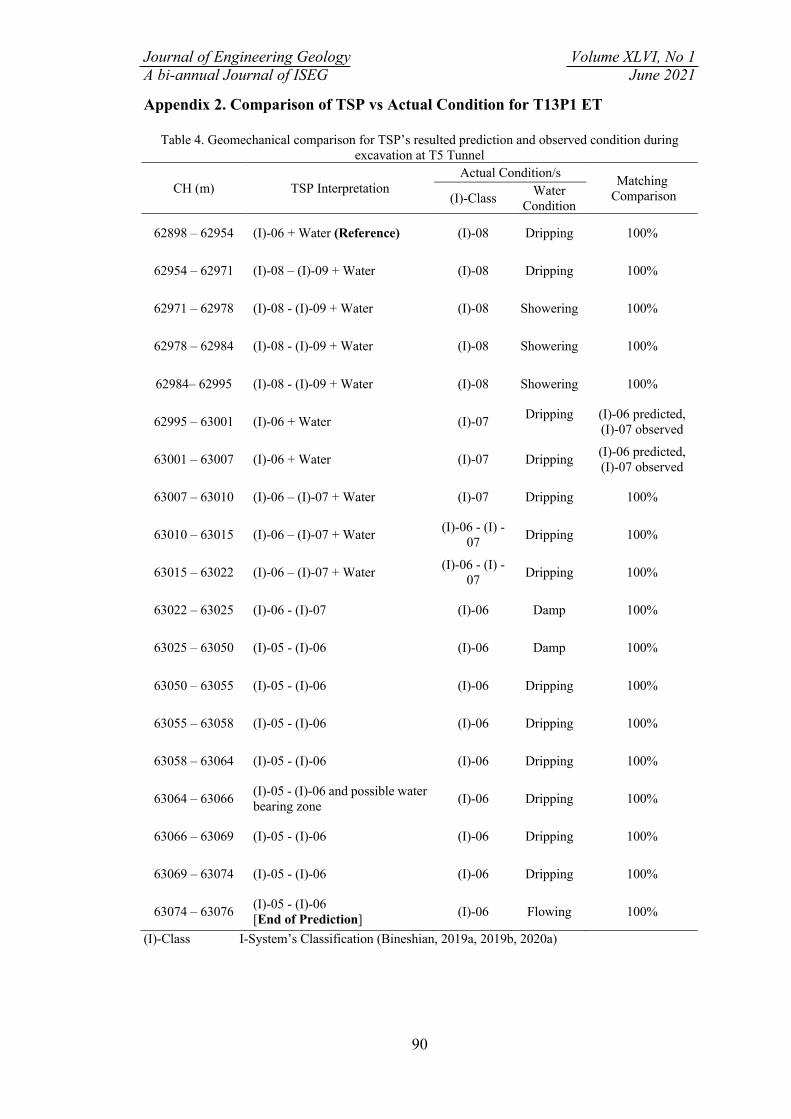
Journal of Engineering Geology Volume XLVI, No 1 A bi-annual Journal of ISEG June 2021
90
Appendix 2. Comparison of TSP vs Actual Condition for T13P1 ET
Table 4. Geomechanical comparison for TSP’s resulted prediction and observed condition during excavation at T5 Tunnel
CH (m) TSP Interpretation Actual Condition/s Matching
Comparison (I)-Class Water Condition
62898 – 62954 (I)-06 + Water (Reference) (I)-08 Dripping 100%
62954 – 62971 (I)-08 – (I)-09 + Water (I)-08 Dripping 100%
62971 – 62978 (I)-08 - (I)-09 + Water (I)-08 Showering 100%
62978 – 62984 (I)-08 - (I)-09 + Water (I)-08 Showering 100%
62984– 62995 (I)-08 - (I)-09 + Water (I)-08 Showering 100%
62995 – 63001 (I)-06 + Water (I)-07 Dripping
(I)-06 predicted, (I)-07 observed
63001 – 63007 (I)-06 + Water (I)-07 Dripping (I)-06 predicted, (I)-07 observed
63007 – 63010 (I)-06 – (I)-07 + Water (I)-07 Dripping 100%
63010 – 63015 (I)-06 – (I)-07 + Water (I)-06 - (I) -07 Dripping 100%
63015 – 63022 (I)-06 – (I)-07 + Water (I)-06 - (I) -07 Dripping 100%
63022 – 63025 (I)-06 - (I)-07 (I)-06 Damp 100%
63025 – 63050 (I)-05 - (I)-06 (I)-06 Damp 100%
63050 – 63055 (I)-05 - (I)-06 (I)-06 Dripping 100%
63055 – 63058 (I)-05 - (I)-06 (I)-06 Dripping 100%
63058 – 63064 (I)-05 - (I)-06 (I)-06 Dripping 100%
63064 – 63066 (I)-05 - (I)-06 and possible water bearing zone (I)-06 Dripping 100%
63066 – 63069 (I)-05 - (I)-06 (I)-06 Dripping 100%
63069 – 63074 (I)-05 - (I)-06 (I)-06 Dripping 100%
63074 – 63076 (I)-05 - (I)-06 [End of Prediction] (I)-06 Flowing 100%
(I)-Class I-System’s Classification (Bineshian, 2019a, 2019b, 2020a)
Journal of Engineering Geology Volume XLVI, No 1
A bi-annual Journal of ISEG June 2021
91
Earthquake scenario selection of Tindharia landslide in India
Neharika, G.N.S
Research Assistant, International Institute of Information Technology, Geotechnical
Research Laboratory, Gachibowli, Hyderabad-500008, Telangana, India
Neelima Satyam, D.
Associate Professor, Indian Institute of Technology, Discipline of Civil Engineering,
Simrol, Indore-453552, Madhya Pradesh, India
Received July 2021, Accepted August 2021
Abstract
Earthquake-induced landslides can affect people and structures as a result of significant ground shaking or
regardless of the intensity. A suitable design ground motion helps to mitigate the impact of such landslides.
The most commonly used design ground motion in slope stability analysis is based on probabilistic seismic
hazard maps. Uncertainties in the selection of expected ground motion levels have been ignored. The
present study is conducted based on improvised fully probabilistic approach, which provides the total
probability of slope failure in a particular period under seismic loading by addressing all possible scenarios.
This approach is applied to the seismically active Tindharia slope located in Darjeeling, India. The total
probability of seismic slope failure obtained in the next 50 years is 30% and the most probable peak-ground
acceleration that triggers a landslide is 0.12g. Design peak-ground acceleration predicted from the next
475-year probabilistic seismic hazard map is 1.02g. In the present study, the significant difference in the
design peak-ground acceleration from probabilistic seismic-hazard analysis and fully probabilistic approach
is observed. The study suggests that the seismic landslide hazard may be overestimated or underestimated
when used in the design of ground intensity obtained by conducting PSHA.
1. Introduction:
Earthquake-induced landslides pose major threats worldwide, especially in mountainous
zones (Liao and Lee, 2000). India has experienced several destructive earthquakes
(Mw≥8.0) that have caused deadly landslides, which have had an impact on the human
environment in many ways. In this country, 70% of highly vulnerable landslides have
been observed in the Himalayan region, Northeast India, Eastern Ghats, and Western
Ghats.
Several methods and evaluation studies are proposed to determine the landslide hazard
and conduct a susceptibility assessment (Guzzetti et al., 1999). The methods are either
quantitative or qualitative approaches based on knowledge, experience, numerical
expressions, methods, and computer-based models. Seismically induced landslide
analysis considers not only the well-measured material properties but also proper ground-
motion selection.
Many researchers have developed seismically induced hazard maps in terms of
susceptibility or probability on a regional or global scale. Most of the hazard maps are
developed by estimating slope parameters using a global information system that
provides the rough hazard level of the specific site. The statistical and deterministic

Journal of Engineering Geology Volume XLVI, No 1
A bi-annual Journal of ISEG June 2021
92
approaches focus on landslide susceptibility that helps determine where landslides are
likely to occur through the use of physically based models regardless of triggering
conditions (Van Westen et al. 2008; Lee et al., 2008). In current engineering practice, the
quantified risk levels of the regional or global scale have been identified using hazard
maps produced by probabilistic approach (Raghukanth and Iyenger, 2007). The triggering
peak ground acceleration (PGA) in the slope stability analysis has been computed from
probabilistic hazard maps. Most commonly, the PGA that initiates failure of the slope is
measured from 475 years of 10% probability seismic hazard maps (Wang et al., 2017).
The hazard maps developed based on an earthquake catalogue (EC) are not restricted to
the use of regional ground-motion prediction equation (GMPE) only. The pseudo
probabilistic, statistical, and deterministic approach provides a conservative estimation of
seismic landslide hazards. Most of the studies observed uncertainty regarding the
earthquake scenario.
The improvised fully probabilistic approach (Alexey et al., 2020) has been applied in the
present study to estimate the consistent earthquake scenario for seismic slope stability.
The method handles the uncertainties in the data and provides reasonable hazard
management. The framework of the approach aims to find the total probability of the
slope failure under various ground-shaking levels (Del Gaudio et al., 2003). Some
researchers have used this approach to develop the annual frequency of exceedance for
the given sliding displacements (Rathje etal., 2008; Martino et al., 2019; Del Gaudio et
al., 2003).
The present study aims to examine the impact of the Tindharia landslide, which occurred
because of the September 18, 2011 earthquake and destroyed the World Heritage Site in
the area. The landslide occurred in seismic zone IV in the Darjeeling region in West
Bengal, India. This zone is highly vulnerable to earthquakes and is seismically active due
to many seismic sources. Thus, considering the suitable selection of the earthquake
scenario is important for the seismically induced landslide hazard assessment.
2. Methodology:
Fully probabilistic approach
A fully probabilistic approach represents the entire probability chain of the seismically
induced landslide from strong motion prediction to mode of deformation. The approach
accounts for two essential stages of calculation: evaluation of probability of occurrence of
various PGA (yi) within a certain period and determination of conditional probability at
which the landslide triggers a given PGA. The total probability of the slope in the next T
years is calculated using the following equation:
( ) ∑ ∑ ( ) ( )
∑ ∑ (1)
where PT (PGA = yi) occurrence probability of PGA (yi) in a certain time interval and
P(SF yi, model j) is the probability of the slope failure under seismic loading (yi) for

Journal of Engineering Geology Volume XLVI, No 1
A bi-annual Journal of ISEG June 2021
93
slope model j. Geo-mechanical models of slope were ranked by weight wj, where∑
.
Probability of occurrence of PGA
PSHA is involved in the development of seismic hazard curves to address engineering
safety issues in specific hazard levels (Raghukanth and Iyengar, 2007). The main goal of
the analysis is to determine the probability of exceedance of a particular PGA in specified
time intervals of seismic hazard curves (Cornell, 1968). The analysis is based on all
possible sources in the site with all possible earthquake magnitudes, site-to-source
distance, and GMPE. The calculation of all the sources that exceed the acceleration a is
( ) ∑ ( )∑ ∑ ( )
(
) ( ), (2)
Where, nsources represent the potential earthquake sources, and nM and nR represent the
number of possible earthquakes and distances. P(Mi = mk) and P(Ri = rk) are the
probability of magnitudes and distances in source i. v, the average rate of the threshold
magnitude greater than the minimum magnitude, can be expressed as
(3)
Where a and b parameters are constants and mo is constant mean annual rate of
exceedance. These three parameters are obtained from the EC using Gutenberg–Richter
distribution.
The probability of magnitude is
( ) ( )
( ), (4)
Where FM (m) is the cumulative distribution function and mmax is the maximum
magnitude that the source produces.
The (PGA>yi mj, rk) is the probability of exceedance of the PGA for acceleration yi for
mj and rk. The probability of exceedance of any PGA value is derived as follows:
( ) ( ( ) ( )
) (5)
Where, σlnPGA is the standard deviation.
The probability of exceeding the PGA value (yi) in the next T years is
( ) ( ) ( )
The probability of occurrence of a discrete set of ground motions is as follows:

Journal of Engineering Geology Volume XLVI, No 1
A bi-annual Journal of ISEG June 2021
94
( ) ( ) ( ) ( )
Equation (7) is used to evaluate the total probability of slope failure in equation 1.
Conditional probability of Tindharia landslide
The second step in calculating the fully probabilistic analysis is to know the probability
of slope failure under seismic loading. The analysis is evaluated using Jibson
probabilistic model (Jibson et al., 2000), which corresponds to Weibull distribution
shown in the equation 8 The model calibrated with predicted sliding displacement (DN)
in cm, critical acceleration (ac) and peak ground acceleration (y) based on Newmark
approach (Newmark, 1965). The Newmarks approach assess the probability of slope
triggering given the critical slope acceleration (ac) and PGA value (y).
( | ) ( ) ( )
Where,
( ) (
) (
)
] (9)
Many empirical relations are combined with Newmark’s displacement (DN) and intensity.
However, in the present study, the predicted Newmark’s displacement of the slope is
evaluated with PGA using the above equation 9 (Romeo, 2000).
The critical acceleration (ac) is a function of slope geometry and static factor of safety
(Fs) and given as
( ) ( )
Where, Fs and g are the static factor of safety and factor of gravity, and α is the dip angle
of the sliding surface.
The static factor of safety is calculated using simplified limit equilibrium model of an
infinite slope under certain assumptions based on Newmark approach (1965). As per the
Newmarks approach, when some internal deformation accumulates the sliding mass the
failure of landslide starts. When the seismic acceleration exceeds the critical value the
accumulation of inner deformations takes place.
The approach considers the landslide mass sliding along planar surface. The assumptions
in the model considered are as follows: the slope is homogeneous, the effect of pore
pressure is negligible, the static safety factor is stress independent (constant), the sliding
mass of the slope is rigid solid, and coefficients of static and dynamic friction are equal
and constant. The static factor of safety (Fs) according to limit equilibrium theory is given
as follows (Jibson et al., 2000):

Journal of Engineering Geology Volume XLVI, No 1
A bi-annual Journal of ISEG June 2021
95
(11)
where c’ is cohesion, φ is friction angle, z is slope normal thickness, γ and γw are unit
weight of material and ground water, α is dip angle of the sliding surface, and m is the
saturated sliding mass thickness.
The soils in the area are saturated most of the year, so pore pressures are neglected from
the equation 11 and paid great attention on third term of the equation.
In the next T years, the total probability of seismically induced landslide is obtained by
substituting equations (8) and (7) in equation (1).
3. Details of study area:
The Tindharia slide is located at latitude and longitude of 26°51114.55
11N–
88°20113.12
11E in Darjeeling hills, West Bengal, India. The landslide is beneath the
century-old Darjeeling toy train used in tourism. The slope failed on September 18, 2011
after the earthquake in Sikkim, Nepal (Figure 1).
(a) (b)
Picture 1 Aerial photographs of study area: (a) front view and (b) side view
(Source: Save the Hills)
The triangular debris slide was trigged initially by the earthquake, and the debris is
widely spread over the entire site and deposited at the lower part of the slope. The upper
part of the slope consists of colluviums and residual soils with varying thickness of 0–8m
after the earthquake. After the initial earthquake-induced slope failure, the destabilization
and series of failures were observed in the study area because of heavy rainfall on

Journal of Engineering Geology Volume XLVI, No 1
A bi-annual Journal of ISEG June 2021
96
September 28th
, 2011. The debris had been eroded and washed away due to surface
runoff. Highly weathered sandstone was exposed in some areas on the slope, revealing
open cracks, especially at the top of the slope. Furthermore, destabilization and failure at
the toe of the slope was observed due to stream erosion. A stream of water flowed toward
the bottom of the slide and played a vital role in mass wasting and initiating further
instability on the slope.
Material properties
The Tindharia landslide altered at elevation ranges of 600–800m with 30°–45°slope.
According to the geological profile, the top layer of the study area is covered with
residual soils and colluviums mainly with coaly shale and sandstone from the Gondwana
group. A coal band is observed at the toe of the slope. The bottom layer of the slope is
covered with highly weathered sandstone. The slope parameters for the hazard
assessment were selected from the geological report of the study area by Kundu
(2019).The soil parameter cohesion (c’) and friction angle (φ) are 7.8 Kpa and 38°.The
unit weight of material (γ) and groundwater (γw) is 19 and 9.8kN/m3. The slope normal
thickness (z) and dip angle (α) are 4m and 28°. The saturated sliding mass thickness (m)
is considered as 1 in the present study.
4. Preparation of EC and seismo-tectonic map:
EC preparation is the most fundamental step in PSHA. To prepare the EC, the following
procedure is conducted: collection of earthquake data, homogenization of earthquake
magnitude, de-clustering of the catalogue, and checking for data completeness.
The present study area is in the Bengal basin, which was seismically stable before 1930
and vulnerable after several seismic sources around the site produced remarkable ground
motions. At a radius of approximately 300km from the site, magnitudes in the range of
4.0–8.0 were collected from 1932 to 2019 (91 years) and used in the present analysis. The
region included active thrusts, faults, and lineaments. A total of 1,227 point sources along
with 21 potential linear sources before declustering are collected along with magnitude
scales, focal depth, time, and date. The point sources are collected from historical and
instrumental records (USGS, ISC, and IRIS) and published literature. The linear sources
are collected from the Seismotectonic Atlas of India (SEISAT 2000). The collected
earthquake data are in different magnitude scales, so the homogenization of the collected
data to one moment magnitude scale was conducted based on the empirical relations
presented by Scordilis (2006) and Deniz and Yucemen (2010).
The de-clustering is necessary because the earthquake events collected from various
sources are the raw data with good possibility of dependent events such as foreshocks and
aftershocks. Furthermore, as we collected the data from various sources, the same events
that were repeated with the same magnitude or with slightly different magnitudes were
observed carefully and removed. The aftershocks and foreshocks from the
homogenization catalogue were de-clustered based on the window method of Gardner
and Knopoff (1974) using ZMAP software (Wiemer, 2001). After the removal of all

Journal of Engineering Geology Volume XLVI, No 1
A bi-annual Journal of ISEG June 2021
97
independent events, out of 1277 events a total of 189 main shock events (84.64% of total
records) were in the final catalogue. The before and after de-clustering of the events for
the present study are shown in the Figure 2 (a & b).
Picture 2 (a) Before and (b) after de-clustering of catalogue.
The complete catalogue with moment magnitudes of Mw>4 is summarized in Table 1.
The seismo-tectonic map for the present study area is shown in Figure 3.
Table 1
Summary of final earthquake catalogue
SI No. Moment magnitude (Mw) Number of events
1 4 ≤ Mw < 4.5 17
2 4.5 ≤ Mw < 5 60
3 5 ≤ Mw < 5.5 60
4 5.5 ≤ Mw < 6 33
5 6 ≤ Mw < 6.5 10
6 6.5 ≤ Mw < 7 5
7 Mw ≥ 7 3

Journal of Engineering Geology Volume XLVI, No 1
A bi-annual Journal of ISEG June 2021
98
Picture 3 Location of site along with seismic tectonic features and distribution of past
earthquakes (1932 to 2019) with in 300 km radius.
5. Analysis of Results and Discussion:
Data checking for completeness in terms of quality and quantity to ensure reliable results
was conducted using a statistical test proposed by Stepp (1973) as shown in Figure 4.
Picture 4 Data completeness based on Stepp’s method.
0.01
0.1
1
2 20 200
Annual
rat
e of
exce
edan
ce
Time (years)
4<M<4.9
5<M<5.9
6<M<6.9
>7.0

Journal of Engineering Geology Volume XLVI, No 1
A bi-annual Journal of ISEG June 2021
99
The seismicity parameters were evaluated using Gutenberg and Richter (G–R) model
(1944) for the improved EC. The distribution of the earthquake frequency in a region
with respect to magnitude is only frequency magnitude distribution estimated using the
G–Rrecurrence model expressed as
, (12)
where indicates the cumulative number of earthquakes with magnitudes greater than
or equal to . The ‘a’ parameter describes the background seismicity, i.e., mean yearly
number of earthquakes in a region, and ‘b’ describes the relative ratio of larger shocks to
smaller shocks.
From the seismic parameters, the level of seismicity of the region can be evaluated. Thus,
the G–R regional recurrence relationship for the study area is presented in Figure 5. The
magnitude of completeness (Mc) is minimum magnitude event, where 100% is detected
(Rydelek and Sacks, 1989) as estimated by Wiemer and Wyss (2000) method using the
ZMAP tool (Wiemer, 2001). The site is divided into (0.1° * 0.1°) grid size and Mc is
evaluated at the center of each grid within 300km radius.
Picture 5 Frequency magnitude distribution relation of entire study area.
In the present study, the seismic parameters ‘a’ and ‘b’ are estimated to be 3.228 and
0.631. The seismic parameters obtained are comparable with those from previous studies
conducted in the same region.
GMPE
The 189 seismic point sources within 300km radius from the site are distributed by one or
the other nearest dynamic potential active tectonic features such as thrust, faults, and
log (Nm) = 3.231-0.632Mw
-2
-1.5
-1
-0.5
0
0.5
1
4 4.5 5 5.5 6 6.5 7 7.5
log (
Cum
mula
tive
even
ts p
er y
ear)
Magnitude (Mw)

Journal of Engineering Geology Volume XLVI, No 1
A bi-annual Journal of ISEG June 2021
100
lineaments. Thus, in the present study, the 20 line-source combinations of active faults,
lineaments, and thrusts were selected for seismic hazard assessment of the study region
(Table 1). The different hypocentral depth is considered within the range of 1–70 km
depending on the faults for real hazard estimation.
Table 2
Details of seismic sources
SI.No Fault Name
Shortest
distance from
site (km)
(Rmin)
Mmax
1 East Patna Fault 190.478 7.1
2 Munger Sahastra Ridge Fault 130.129 7.2
3 Munger Sahastra Ridge 156.888 7
4 Rajmahal Fault 197.761 6.7
5 Malda Kishanganj Fault 79.037 5.3
6 Jangipur Fault 244.137 7.2
7 Gaibandha Fault 199.347 7.2
8 Debagram Bogra Fault 256.412 4.4
9 Dhubri Fault 171.615 7.8
10 Katihar Nailphamuri Fault 105.396 7
11 West Patna Fault 243.126 7.2
12 Sainthia Bahman Fault 229.488 6.4
13 GouriShankar Lineament 229.487 7
14 Everest Lineament 183.12 6.6
15 Arun Lineament 136.49 7.2
16 Kanchenjunga Lineament 89.844 5.5
17 Purnea Everest Lineament 99.734 5.7
18 Tista Lineament 10.981 7.1
19 Main Boundary Thrust 4.321 7.3
20 Main Central Thrust 8.214 8
Many researchers have developed different GMPEs for various regions of India
depending on the observed and available datasets to estimate PGA. The GMPE selection
among several available GMPEs is an important step because it greatly influences the
final hazard assessment. The present study area consists of two zones: Bengal basin zone
and northeastern Himalayan zone. The range of shear wave velocity is ranging from 100
to 3800 m/sec for Bengal Basin (Mitra et al. 2008 and Nath et al., 2010). The tectonic
features of the study area are mostly influenced by those of the most active Himalayan
region. Few GMPEs have been developed for the study area, but the best suited GMPE
was checked and selected for the present study area is of Anbazhagan et al. (2019) which
is performed with magnitude range Mw 4-9, hypo central distance range 10-750kms and
shear wave velocity Vs30 of 2000m/sec; and is expressed as follows:

Journal of Engineering Geology Volume XLVI, No 1
A bi-annual Journal of ISEG June 2021
101
( ) ( ) ( ) ( ) σ (12)
( ) or else is equal to ,
Where Y is the ground motion; a1, a2, a3, a4, am, a6, and a7 are the regression
coefficients; M is the moment magnitude; R is the hypocentral distance; and σ is the
standard deviation.
6. Results and discussion:
The PSHA study is performed for the evaluation of seismic hazard curves, which
represent the PGA against the mean annual rate of exceedance. The seismic hazard curve
shown in Figure 6 is computed using CRISIS (2007) software. The design PGA from the
seismic hazard curve corresponding to 10% probability of exceedance (475-year return
period) for the study area obtained is 1.02g. The PGA obtained from the seismic hazard
curve is compared with the previous research result in the study area. The obtained PGA
shows a good match with that provided by previous studies.
Picture 6 Cumulative hazard curve of 20 potential sources.10% exceedance probability
level in 475-year return period is indicated in red dotted lines.
The critical acceleration (ac) evaluated for the present slope model using Newmark’s
approach is 0.022g (equation 5). The obtained critical value (ac) is substituted in the
Jibson probabilistic model (equation 4), which provides the probability of landslide
occurrence (Pr (DN(yi)) in relation to ground shaking level (yi). The conditional
probability of slope failure (Pij) in the next 50 years with respect to PGA is shown in
Figure 7. The total probability of occurrence of the earthquake-induced landside in the
next 50 years is 30%.
0
0.1
0.2
0.3
0.4
0.5
0.6
0.7
0.8
0.9
1
1.1
1.2
0.01 0.1 1
P(P
GA
>y)
PGA (g)

Journal of Engineering Geology Volume XLVI, No 1
A bi-annual Journal of ISEG June 2021
102
Picture 7 Total probability in next 50 years (cumulative distribution).
The (Pij) obtained was multiplied by available ground scenario (ai) for the slope model.
For the considered slope model of critical acceleration (ac), 0.022g of the PGA observed
is approximately0.1–0.3g (Figure 8). The far variation in this PGA was observed for the
475-year probability.
Picture 8 PDF of slope failure in next 50years
-0.001
0
0.001
0.002
0.003
0.004
0.005
0.006
0.01 0.1 1 10
P(a
).P
(slo
pe
fail
ure
\a)
PGA (g)
-0.01
0
0.01
0.02
0.03
0.04
0.05
0.06
0.07
0.01 0.1 1 10
P(A
). P
(Slo
pe
fail
ure
|y)
PGA (g)

Journal of Engineering Geology Volume XLVI, No 1
A bi-annual Journal of ISEG June 2021
103
The PGA rates obtained from the 475-year shaking map intensity and fully probabilistic
approach are 1.02g and 0.12g. Thus, the sliding displacements obtained from PSHA are
much higher than those obtained by the fully probabilistic approach. The hazard
deaggregation for estimating the most probable magnitude and distance from site to
source has been performed in CRISIS software. The most probable earthquake scenario
that would trigger the landslide in the next 50 years is Mw = 6.53 at a distance of R =
58km.
Conclusion
Ground shaking is an important factor in earthquake disasters. The appropriate ground
motion is the key input in implementing risk mitigation measures and slope design. For
the hazard assessment in the site, the improvised fully probabilistic technique is
considered. The method is the multi-stage hazard approach that includes data selection,
probabilistic seismic hazard analysis, geological investigations, and landslide probability
calibration model.
The method is applied considering a Tindharia slope that is known asa seismically active
slide from the past. A30% total probability of slope failure is observed in the next 50
years. The most probable seismic event obtained from fully probabilistic technique that
would trigger the landslide in the next 50 years is PGA of 0.12g,Mw = 6.53, and R =
58km. The peak ground intensity predicted for the next 50 years from the probabilistic
seismic hazard analysis is 1.02g. The corresponding Newmark’s displacements predicted
from the fully probabilistic approach are almost four times less than the sliding
displacement obtained from the PGA of the 475-year return period.
The results depicted from the present study show that the significant difference in
ground-shaking intensity is observed between the two methods. The landslide hazard is
overestimated when considering the 475-year seismic hazard map obtained from the
PSHA analysis. The fully probabilistic approach can handle all possible ground-motion
scenarios and provide reasonable hazard management.
References:
1. Liao, H. W., and Lee, C. T. (2000). Landslides triggered by the Chi-Chi earthquake.
In Proceedings of the 21st Asian Conference on Remote Sensing, Taipei. Vol.1, 2p.
2. Guzzetti, F., and Cardinali, M. (1990). Landslide inventory map of the Umbria
region, Central Italy, In: Proceedings ALPS 90 6th International Conference and
Field Workshop on Landslides, edited by: Cancelli, A., Milan, 273–284.
3. Lee, C.T., Huang, C.C., Lee, J.F., Pan, K.L., Lin, M.L., and Dong, J.J. (2008).
Statistical approach to earthquake-induced landslide susceptibility. Eng. Geol. 100,
43–58.
4. Van Westen C.J., Castellanos, E., and Kuriakose, S.L. (2008). Spatial data for
landslide susceptibility, hazard, and vulnerability assessment: an overview. Eng.
Geol. 102 (3–4), 112-131.

Journal of Engineering Geology Volume XLVI, No 1
A bi-annual Journal of ISEG June 2021
104
5. Kanth, S. R., and Iyengar, R. N. (2007). Estimation of seismic spectral acceleration
in peninsular India. Journal of Earth System Science. 116(3), 199-214.
6. Wang, T., Liu, J., Shi, J., and Wu, S. (2017). The influence of DEM resolution on
seismic landslide hazard assessment based upon the Newmark displacement
method: A case study in the loess area of Tianshui, China. Environ. Earth Sci. 76,
604.
7. Rathje, E.M., and Saygili, G. (2011). Estimating Fully Probabilistic Seismic Sliding
Displacements of Slopes from a Pseudo probabilistic Approach. J. Geotech.
Geoenviron. Eng. 137, 208–217.
8. Martino, S., Battaglia, S., Delgado, J., Esposito, C., Martini, G., and Missori, C.
(2018). Probabilistic Approach to Provide Scenarios of Earthquake-Induced Slope
Failures (PARSIFAL) Applied to the Alcoy Basin (South Spain). Geosciences. 8,
57p.
9. Alexey, K., Yuriy, G., and Andrey, S. (2020). Hazard-Consistent Earthquake
Scenario Selection for Seismic Slope Stability Assessment. MDPI. Sustainability.
12, 4977p.
10. Del Gaudio, V., Wasowski, J., and Pierri, P. (2003). An Approach to Time-
Probabilistic Evaluation of Seismically Induced Landslide Hazard. Bull. Seismol.
Soc. Am. 93, 557–569.
11. Ketan Bajaj and Anbazhagan, P. (2019). Regional stochastic GMPE with available
recorded data for active region –Application to the Himalayan region. Soil
dynamics and earthquake engineering. 126, 105825.
12. Cornell, C.A. (1968). Engineering seismic risk analysis. Bull. Seismol. Soc. Am. 58,
1583–1606.
13. Newmark, N.M. (1965). Effects of earthquakes on dams and embankments.
Geotechnique. 15, 139–159.
14. Romeo, R. (2000). Seismically induced landslide displacements: A predictive
model. Eng. Geol. 58, 337–351.
15. Jibson, R.W., Harp, E.L., and Michael, J.A. (2000). A method for producing digital
probabilistic seismic landslide hazard maps. Eng. Geol. 58, 271–289.
16. SEISAT. (2000). Seismotectonic Atlas of India, Geological Survey of India. New
Delhi.
17. Scordilis, E. M. (2006). Empirical global relations converting Ms and Mb to
moment magnitude. Journal of seismology. 10(2), 225-236.
18. Deniz, A., and Yucemen, M. S. (2010). Magnitude conversion problem for the
Turkish earthquake data. Natural hazards. 55(2), 333-352.
19. Gardner, J. K., and Knopoff, L. (1974). Is the sequence of earthquakes in Southern
California, with aftershocks removed, Poissonian?. Bulletin of the Seismological
Society of America. 64(5), 1363-1367.
20. Stepp, J. C. (1973). Analysis of completeness of the earthquake sample in the Puget
Sound area. NOAA Tech. Report ERL 267-ESL30, Boulder, Colorado.
21. Wiemer, S. (2001). A software package to analyze seismicity: ZMAP. Seismol. Res.
Lett. 72(3) 373–382.
22. Kundu. (2019). Effect of rainfall and earthquake on landslides of Darjeeling
Himalayas. Ph.D thesis. IIT Delhi.

Journal of Engineering Geology Volume XLVI, No 1
A bi-annual Journal of ISEG June 2021
105
23. Gutenberg, B., and Richter, C. F. (1944). Frequency of earthquakes in California;
Bull. Seismol. Soc. Am. 34(4), 185–188.
24. Rydelek, P. A., and Sacks, I. S. (1989). Testing the completeness of earthquake
catalogues and the hypothesis of self-similarity. Nature. 337(6204), 251–253.
25. Wiemer, S., and Wyss, M. (2000). Minimum magnitude of completeness in
earthquake catalogs: examples from Alaska, the western US and Japan. Bull Seism
Soc A. 90, 859–869.
26. Mitra, S., Bhattacharya, S.N., Nath, S.K. (2008), Crustal structure of the Western
Bengal Basin from joint analysis of teleseismic receiver functions and Rayleigh-
wave dispersion, Bull Seism Soc Am 98, 2715–2723.
27. S.K. Nath, K.K.S. Thingbaijam, J.C. Vyas, P. Sengupta, S.M.S.P. Dev. (2010),
Macroseismic-driven site effects in the southern territory of West Bengal, India
Seismological Research Letters, 81 (3), 480-482.

Journal of Engineering Geology Volume XLVI, No 1
A bi-annual Journal of ISEG June 2021
106
Pull-out test of rock bolts: Analyzing the causes of failure
Sahoo, R. N.
Senior Manager (Geology),
CVPPL, Jammu-180012, J&K, India
Singh, Ajay
Deputy General Manager (Geology)
NHPC Ltd., Faridabad-121003, Haryana, India
Dash, A. K.
General Manager (Civil),
CVPPL, Jammu-180012, J&K, India
E-mail of the Corresponding Author: [email protected]
Received April 2021/Accepted August 2021
Abstract
To stabilize the roof and walls of the tunnels/caverns, tensioned rock bolts (Mechanical/Cement or Resin
grouted end anchorage type) are the modern support system used worldwide. These rock bolts (post-
stressed active anchors) installed in pattern create a stress field around the excavated area of tunnel. The
effectiveness of these rock bolts are evaluated through the well-known „Pull-out test‟ conducted as per IS
11309:1985 guidelines, wherein a rock bolt is considered to pass the test, if it registers a displacement of
<40mm with designated load applied. While conducting pull-out test, failure of the rock bolts is generally
attributed in the order of assertion to - (a) poor ground/geology, (b) poor material quality of rods, but hardly
attributing to (c) improper testing methodology and/or (d) poor workmanship. This paper discusses non-
geological reasons of failure for Pull-out tests conducted on 28 nos. in-situ rock bolts in the Powerhouse
Cavern, Pakal Dul HE Project, J&K (1000MW); out of which only 2 no. rock bolts passed. In this case,
inapt testing method/approach i.e. inadequate torque application on the bolt (for the purpose of
tightening/stressing); evincing ineffective end-anchorage at bolt head which caused failure of rock bolts
during Pull-out-test.
Keywords: Rock bolt, Pull-out Test, Torque
1. Introduction:
Rock bolt typically is a rod having (mechanical/cement grouted/resin grouted end
anchorage) and provisioned with a bearing plate and nut. It is a tensioned reinforcing
element to be stressed immediately after installation by torqueing or jacking, by means of
a calibrated stressing device. The rock bolt is synonym with active rock anchor. The
instant case confers mechanical end anchorage type expansion shell rock bolts installed in
Powerhouse Cavern, Pakal Dul HEP.
Pull-out test is the test of effective anchorage and bond strength between reinforcing
element (bolt) & the rockmass housing the bolt. This test in tunnels/caverns are typically
performed to assess the anchorage or pull-out capacity of rock bolts. The instant case
dealing with mechanically anchored bolts, Pull out test is done in un-grouted bolts. Pull-
out capacity becomes very much important because rock bolts are anchored into the

Journal of Engineering Geology Volume XLVI, No 1
A bi-annual Journal of ISEG June 2021
107
stable rock mass located beyond the plastic zone/zone of failure. Rock bolts reinforce and
mobilize the inherent strength of rockmass by offering confining pressure, increase the
stiffness of the rock and contribute shear resistance to the rock joints. The rock bolts are
tested by incremental loading until total extension of reinforcement from hole/rock face
reaches 40mm or till it yields/fractures, whichever is early.
The maximum load generally applied on the rock bolts (expansion shell type) during
pull-out test is 60% of Yield Strength of Bolt. The range of load for different bolt dia
with corresponding Torque range is shown in Table-1 below.
Table 1
Range of Load & Torque for different Bolt dia
S.
No.
Dia of rock bolt
(mm)
Max. Load applied
(Ton)
Corresponding torque
( Newton meter or N-m)
1. 25 15 750
2. 32 24 1536
3. 36 30 2160
Pakaldul HE Project (1000MW) is located in Kishtwar district of Jammu and Kashmir
state (UT) of India. It is a storage scheme on the river Marusudar, a tributary of Chenab.
The project envisages construction of 184m high CFRD near village Drangdhuran, two
nos. 9.6km long each having 7.2m dia HRTs and an underground power house (166m x
20.2m x 51m) located in the right bank hill of Dul Reservoir. Presently, project is under
construction by CVPP Ltd.
By the end of Nov‟2019, excavation of PH cavern for top heading part (from EL 1285 to
1278M) and benching up to EL 1259.5M was completed and further benching being in
progress. The results of pull out tests conducted on 7.5 m long and 32Ø rock bolts
installed in crown/top heading of power house cavern has been taken for this study.
2. Geological setup of Project area:
Geologically, the project area lies in inner Lesser Himalaya (Kishtwar window) under
Kishtwar group of rocks. Dam complex & part of HRT lie in Kibar gneisses whereas
power house complex is housed in Quartzite-Phyllite sequence of Dul formation.
As per geological data collected while excavation, the PH cavern heading zone
encompasses fresh to slightly weathered, moderately jointed and strong quartzite with
thin (<5cm) bands of weak phyllites at places. Rock mass is dissected by primarily 4 set
of joints including sub horizontal hill side dipping foliations (355°-030°/15°-20°). No
significant shear zone observed during excavation of the cavern. The rock class
encountered in the central gullet as 35 % Class-II and 65% Class-III.

Journal of Engineering Geology Volume XLVI, No 1
A bi-annual Journal of ISEG June 2021
108
3. Rock supports installed in PH crown:
After completion of the central heading and side slashing, the crown of the cavern has
been supported by 32Ø 7.5 m & 36Ø 9m long rock bolts (@ 3m c/c) & 200mm thick SFR
shotcrete. The excavation drawing of central heading (From EL 1285M to 1278M)
showing stages of excavation and details of rock supports is shown in sketch as under
(Figure-1):
Figure 1 View of PH Cavern from Top Adit to PH Crown towards Main Access Tunnel
4. Pull out tests:
Subsequent to installation of desired 440 nos. (365 nos. of expansion shell type and 75
nos. resin capsule type) 7.5 m long, 32Ø rock bolts in the PH cavern (heading part,
between EL 1278M to 1285m), Pull-out tests were carried out. It is to mention that
Project had previously conducted pull-out tests in 28 no. rock bolts in heading part of
cavern. Out of all the tested bolts, only 02 nos. expansion cell type rock bolts installed at
RDs 114 & 123 side slash wall portion i.e. confining to Stage-1B & Stage-2 passed,
showing less than 40mm displacement with the designated 24-ton load. Accordingly, few
permutation & combination of bolt assemblies of different makes/brands were also tried
by Project but registered failing results during pull-out test. Hence, it was apprehended by
the Project & Contractor that poor geology is responsible for the failures of majority of
the rock bolts.

Journal of Engineering Geology Volume XLVI, No 1
A bi-annual Journal of ISEG June 2021
109
In view of above, the geology encountered while excavation of PH cavern (heading part)
was reviewed and it was observed that the rock mass in the entire structure area falls
under fair to good category and devoid of any remarkable weak geological feature. So, to
understand the real cause of Rock bolt failure vis-à-vis material property of bolt & its
accessories/geology of the cavern or any other cause, two confirmatory pull-out tests with
the details given here under were carried out in PH cavern area (Refer Table-2).
Table 2
Details of 2 Nos. Confirmatory Pull-out Tests in Powerhouse Cavern
Test
No.
Location Type of
rock bolt
Load applied
(Ton)
Displacement
(mm)
Geology of the
Testing location
1. At RD 127m (R-8
hole-Right SPL, EL
1280M) in Stage-2
i.e. at rightmost
side slashing wall
heading portion of
PH Cavern
32mm dia.
7.5m long
Expansion
shell rock
bolt
4 6
Strong to very
strong Quartzite
with thin bands of
Phyllite having
Rock class III
(Fair) with RMR
value 58.
8 12
12 18
16 24
20 32
24 36
2. At RD 126m (R-1
hole-Left SPL, EL
1279.8M) in Stage-
1B i.e. at leftmost
side slashing wall
heading portion of
PH Cavern
4 7
8 14
12 23
16 34
20 46
24 53
Figure 2 Load Vs Displacement Graph for Confirmatory Pull-out Test No. 1&2
at RD 127m & 126m respectively

Journal of Engineering Geology Volume XLVI, No 1
A bi-annual Journal of ISEG June 2021
110
From the above Table-2 & Graph (Figure-2), it can be seen that despite being conducted
in similar geological environment, the pull-out Test no. 1 got passed registering 36mm
displacement with application of designated 24-ton load, whereas Test no. 2 failed
registering 46mm displacement at 20 ton load and subsequent 53mm displacement with
designated 24 ton load. From these test results, it could be conclusively inferred that local
geology was not responsible for the failure of said pull-out tests conducted in PH cavern.
Further, to analyse the real cause of rock bolt failures, another confirmatory test (Test
No.3) was done through re-tightening of nut & re-torqueing of the same bolt to go for
another round of Pull-out test. Re-testing of already tested rock bolt i.e. R-1 hole, EL
1279.8m at RD 126 (Stage-1B) of PH cavern was carried out. Results of the same are
shown as under in Table-3 & graphical representation of Load Vs Displacement in
Figure-3, as under:
Table 3
Details of Another Confirmatory Pull-out Test (Test No.3) on Previously Tested
Rock bolt at RD 126m (Stage-1B) in Powerhouse Cavern
Test
No.
Location Type of rock
bolt
Load applied
(Ton)
Displacement
(mm)
Geology of the
testing location
3. At RD 126m (R-1
hole-at Left SPL,
EL 1279.8M) in
Stage-1B i.e
leftmost side
slashing wall
heading portion
of PH Cavern
32mm dia.
7.5m long
Expansion
shell rock
bolt
4 2 Strong to very
strong Quartzite
with thin bands
of Phyllite having
Rock class III
(Fair) with RMR
value 58.
8 4
12 8
16 10
20 12
24 14
26 16
28 21
Figure 3 Load Vs Displacement Graph-Pull-out Test No.3 - RD126m (Stage-1B)

Journal of Engineering Geology Volume XLVI, No 1
A bi-annual Journal of ISEG June 2021
111
From the above observations in Table-3 & Figure-3, it could be understood that the rock
bolt that had previously failed at 20ton load registering 46mm displacement, after re-
tightening & re-torqueing showed passing value of 12mm displacement on the same load
& 14mm displacement at designated 24 ton load for 32mm dia bolt (as per Technical
specification). The results also indicate that these bolts could even take up further load
beyond this designated 24ton load (60% of Yield strength of Fe 500 bolt) registering
21mm (<40mm) displacement at 28ton load during Pull-out test.
The above discussion indicates that probably proper torqueing was not done during pull-
out testing of previous failed rock bolts. However, the 2 rock bolts (though under-
torqued) that had previously passed prior to experimentation; successful pull-out result
could be attributed to better bond strength of bolt (expansion shell) & rock due to higher
competency and/or mere coincidence.
In this regard the range of torque provided by the testing personnel in previous tests were
analysed and it was observed that the torque provided for 32mm dia rock bolts in the
previous test was 226N-m against the desired torque of 1536 N-m (Refer Table-1). It
means that the said rock bolt was torqued at quite lower value i.e. 15% of design stress
value. Though the torque value was too less than the required, but during testing the bolt
was being pulled out at its maximum/full designated stress value of 24 ton. Hence, it was
apprehended that lower range of torque application might be causing failure of rock bolts.
5. Experimental Pull-out tests:
Now to validate this theory/working concept of “Designated value of Torque” for bolts to
undergo stressing, prior to Pull-out test; the need for carrying out few additional
validating experiments in PH cavern was felt. Accordingly, two experimental Pull-out
tests were carried out with the available Torque wrench at site (Max. Capacity 540 N-m).
The details of these experiments are mentioned as under.
5. (a) Experiment-1:
Experimental pull-out test was conducted with a better quality (SAIL make) 25mm dia,
3m long rock bolt available at site. Testing was done in similar geology at RD 125m (R-1
hole, EL 1279.6m) in Stage-1B (left side wall heading portion) of PH cavern i.e. near
previously failed rock bolt which was installed and subjected to test (R-1 hole, EL
1279.8m at RD 126 of Stage-1B). This bolt was stressed with 540 N-m torque against the
designated 750N-m. Subsequently, Pull-out test was done and results are given in Table-4
and corresponding Figure-4, as under.

Journal of Engineering Geology Volume XLVI, No 1
A bi-annual Journal of ISEG June 2021
112
2 3
6
10
15
0
2
4
6
8
10
12
14
16
0 2 4 6 8 10 12 14
DIS
PLA
CEM
ENT(
IN M
M)
LOAD(IN TON)
Load Vs Displacement Graph ( Experimental Pull out Test-1)
Table 4
Details of Pull-out Test (Experiment-1) at RD 125m (Stage-1B) in PH Cavern
Figure 4 Load Vs Displacement Graph-Experiment-1 Pull-out Test
at RD 125m(Stage-1B) in Powerhouse Cavern
During testing, after applying 12 ton load, vibrations was observed in the testing element
and subsequently when load increased up to 13 ton, there was a sound of
slippage/breakage of rock bolt and could not take up further load. So, to see the mode of
failure in the bolt; the bolt assembly was removed from the hole. It was observed that
there was a slippage failure of shell/flange from the bolt thread.
From the above experiment, it could be clearly inferred that in similar geologic set up, the
rock bolt (at R-1 hole, RD 125m) showed better statistics i.e. lesser displacement under
higher torque application. It could easily take 13 ton load against designated 15 ton load
and even registered very less displacement of 10mm at 12 ton load as compared to the
bolt (at R1 hole, RD 126) that registered 23mm displacement at 12ton, which obviously
had failed previously with lower torque application (Refer Test No.2 in Table-2). Further,
it was observed that due to mechanical defect in the shell attached at bolt head, upon
higher load application slippage failure occurred at bolt threading.
Pull-out test set-up for Experiment-1 at RD 125m (Stage-1B) in PH Cavern is shown in
Picture-1 below:
Load Applied (Ton) Displacement (mm)
3 2
6 3
9 6
12 10
13 15

Journal of Engineering Geology Volume XLVI, No 1
A bi-annual Journal of ISEG June 2021
113
Picture 1 Showing Pull-out Testing Equipment & Experiment-1 Pull-out at RD125m
(R-1 hole, EL 1279.6m, Left SPL- Stage-1B heading portion of PH cavern) in sound
rock mass–View from Top Adit to PH Crown towards Main Access Tunnel
5. (b) Experiment-2:
After satisfactory and better test result registered with Experiment-1 in sound rock mass,
it was decided to do the same experiment in weaker rockmass (sheared/fractured zone) so
as to understand the behaviour of expansion shell rock bolt with similar installation
procedure, adopting similar testing methodology.
A thick sheared/fractured zone(±1m) was observed within Quartzite rockmass near Right
SPL at RD132m. The rockmass being fractured, a smaller dia hole (38mm) was preferred
therein for the experiment. Designated Hole dia being 38mm for 25mm dia bolt;
Experiment-2 was planned to be conducted on a 25mm dia, 3m long rock bolt with its
insertion in R-8 drill hole (Right SPL) at EL 1279M in Stage-2 (right side wall heading
portion) of PH cavern. During insertion of the rock bolt jamming was experienced,
probably due to partial collapse of hole or presence of drill cuttings due to drilling in
fractured zone.
Similar as that of Experiment-1, this expansion shell rock bolt (25mm dia, 3m long) was
stressed with the new Torque wrench made available at site thereby applying Torque
value of 540N-m subsequent to opening of the shell at bolt head inside the hole bottom.
Thereafter, Pull-out test was done on this 25mm dia 3m long bolt in presence of Senior
Officers & site representatives of Pakal Dul HEP, CVPP and Senior officials of M/s
Afcons (Power House Contractor)-Refer Picture-2 shown below. The results of Pull-out
test are shown below in Table-5&6 with their graphical presentations in Figure-5&6
respectively.
Previously failed
bolt-R1 hole
(RD 126m)
Pull-out Testing
Equipment- R1 hole
(RD 125m)

Journal of Engineering Geology Volume XLVI, No 1
A bi-annual Journal of ISEG June 2021
114
Picture 2 Showing Pull-out Testing Equipment & Experiment-2 (a,b) Pull-out
at RD132m (R-8 hole, EL 1279, Right SPL- Stage-2 heading portion of PH cavern)
in sheared & fractured weak rock mass–View from Top Adit to PH Crown towards
Main Access Tunnel
Table 5
Details of Pull-out Test (Experiment-2a) at RD 132m (Stage-2) in PH Cavern
Load (Ton) Displacement (mm)
3 3
6 7
7 27
Figure 5 Load Vs Displacement Graph-Experiment-2a
Pull-out Test (1st attempt) at RD 132m(Stage-2) in Powerhouse Cavern
(Exp-2a)

Journal of Engineering Geology Volume XLVI, No 1
A bi-annual Journal of ISEG June 2021
115
In the above Experiment-2a, the bolt couldn‟t take further load beyond 7 ton (Refer
Table-5 & Figure-5). Hence, it called for re-testing (Experiment-2b) to check and verify
the effectiveness of bolt. Results of Re-testing after releasing (zeroing) the hydraulic load
in the jack are represented as under at Table-6 & corresponding Figure-6.
Table 6
Details of Pull-out Test (Experiment-2b) at RD 132m (Stage-2) in PH Cavern
Load (Ton) Displacement (mm)
3 1
6 5
7 17
8 18
Figure 6 Load Vs Displacement Graph-Experiment-2b
Pull-out Test (2nd
attempt) at RD 132m (Stage-2) in Powerhouse Cavern
Even in this second attempt (Experiment-2b, Table-6& Figure-6), Rock bolt couldn‟t take
further load in Pull-out test beyond 7-8 ton, but showed better statistics with lesser
displacement in such fractured rockmass as compared to Experiment-2a (Refer Table-5).
Though effort was made to un-tighten the nut and remove the bolt from the hole to
understand the failure mechanism, however couldn‟t retrieve the bolt due to jamming.
Nevertheless, it could be inferred that the Rock bolt could take Avg. 7.5 ton (i.e. 50% of
the designated Load of 15 ton meant for 25mm dia) load registering an avg. satisfactory
displacement value of ~18-27mm (<40mm) in weak (fractured) rockmass.
Above experiments (Experiment-2a & 2b) clearly show the role of proper/adequate
torque application prior to pull-out testing of rock bolts that limits the displacement
below 40mm as specified in IS 11309-1985. Further, it could also be inferred that

Journal of Engineering Geology Volume XLVI, No 1
A bi-annual Journal of ISEG June 2021
116
geology should not be attributable for rock bolts‟ failure in pull-out tests executed in
Power House Cavern heading portion, rather designated application of torque range is
playing a key role.
The location plan of Rock bolts those have undergone Experimental-Pull-out testing at
RDs 125,126,127 & 132 in PH cavern heading portion have been demarcated on 3D
geological log, shown below at Figure-7.
Figure 7 3D-Geological log of Power House Cavern Heading between
EL 1285-1278m, showing location of Observed Confirmatory & Experimental
Pull-out tests carried out on Expansion shell Rock bolts.
6. Project’s Compliance & Final Results:
In view of the above experiments done in PH Cavern, conclusively inference was drawn
in attributing under-capacity torqueing of rock bolts as the primary cause of failure
during their pull-out tests. Accordingly, Project & Contractor were advised to avail 2 new
calibrated Torque Wrenches with higher designated capacity (as per Torque Range
mentioned in Table-1) on priority & re-torque the already installed un-grouted rock bolts
with the same & re-install new bolts near the failed ones in compliance to Technical
Specifications as dictated in Contracts. Consequent upon adoption of revised
methodology at site with higher Torque range as per designated capacity, the first phase
of pull-out tests done during Mid-November to 1st week of December 2019 showed
remarkable results with passing of 30 bolts out of 34 re-torqued/newly installed bolts.
The 4 no. bolts those still failed were due to end-anchorage flange & shell junction
slippage that in-turn owed to material defect of threading in the bolt head (i.e. non-
geological reason).
Subsequent compliance at site with higher-designated capacity torqueing of bolts &
dedicated installations, further benching excavation in PH Cavern below heading (i.e.

Journal of Engineering Geology Volume XLVI, No 1
A bi-annual Journal of ISEG June 2021
117
below EL 1278m) could be successfully resumed at site after a considerable hold &
delay.
7. Conclusion and Recommendations:
From the above discussed confirmatory Pull-out tests & Experimental Pull-out test
results, it could be inferred that geology/rockmass condition has no such pronounced
impact/attribute to failure of rock bolts during Pull-out tests conducted in heading part of
Power house cavern. Rather, improper/under-torqueing of bolts after installation was the
main causative factor behind the said failures.
As torqueing keeps the reinforcing element as well as surrounding rock in stressed
condition, it was also observed that, upon further stressing, the bolt was able to take up
higher load registering lower displacement value. Hence, the role of torqueing of rock
bolt to its design stress/tension value prior to Pull-out test is imperative & needs to be
done for effective support of underground structures. Further, it is pertinent to mention
here that Project executing representatives need to ensure availability of Torque
Wrench/testing equipment at site which should be capable of stressing the largest
diameter of rock bolt to the yield stress of the bolt. Based on the experiments conducted,
it is also suggested that stressing of bolts in fractured rockmass need to be done at lower
stress value (less than 50% of design value), as observed during experimentation at site.
Conclusively, it can be remarked that testing of rock support elements, their behaviour (in
addition to site geology), deficiencies (if any) in the material property, site executional
procedures & technical know-how of stressing/testing equipment vis-à-vis methodology
adopted at site; for rock support installation to be successful & effective, all these
parameters need to be comprehensibly looked into instead of having stereotype approach
at site.
References:
1. Pull-out Test results at PH cavern of Pakal Dul HE Project, J&K- Site visit of
Design Team, CVPP, CO, Jammu to Project during 04/11/2019 - 09/11/2019:
Design Tour Note No. CVPP/GM/Design/2019/1201dtd.23/11/2019; Office Note
No. CVPP/GM/Design/2021/325 dtd. 23/04/2021.
2. Ziping Huang, Einar Broch, Ming Lu (2002): Cavern roof stability-Mechanism of
arching and stabilization by rock bolting (Article)/Tunneling in underground and
Space technology, July 2002.

Journal of Engineering Geology Volume XLVI, No 1
A bi-annual Journal of ISEG June 2021
118
Role of geotechnical monitoring instrumentation in Tehri Pumped
Storage Plant (1000 MW) – A case study
*Prasad, Rajeev
Chief Geologist
Shukla, Atul K.,
Engineering Geologist
Kumar, Tarun
Manager (Geology)
Hindustan Construction Company Ltd.
Tehri Pumped Storage Plant, New Tehri, Uttarakhand, India.
*E-mail of the Corresponding Author: [email protected]
Received July 2021, Accepted August 2021
Abstract
Instrumentation and monitoring are an essential part of current tunnelling practice. For safe and economical
tunnelling in sensitive construction environments a continuous adaptation of excavation and support design
is required so that input parameters can be revised when the predictions deviate from measured values. To
understand the rock mass behaviour it is necessary to make a note of all parameters which needs to be
measure in pre and post construction stages. Systematic monitoring results can provide valuable
information pertaining to imminent collapse, thus making it possible to control the tunnel stability by
providing proper counter measures. Excavation of any underground openings results in the release and
readjustment of three dimensional stresses around the cavity. This results in displacements/deformations
which are time dependent. Extensometer is used to measure deformation of a section of rock mass and
adjacent surrounding strata with the help of anchors at different depths. The depth of anchors varies with
type of rock strata and the location of fix point with respect to which deformation are to be measured. More
importantly, it involves detailed planning to finalize the position of each monitoring instrument based on
location and orientation of geological features. The present geotechnical monitoring practices for
underground structures involve convergence monitoring with the help of optical targets and rock mass
displacement with help of bore hole extensometers. In addition to this load cells are also used for recording
and monitoring of loads in structural elements like rock bolts and cable anchors. This paper briefly
describes about the deformation of rock mass in underground structure of Tehri Pumped Storage Plant for
long term monitoring their results and conclusions.
Key Words: Underground Excavation, Geotechnical monitoring Instrumentation, Warning limits, MPBX,
BRT and Load cells.
1. Introduction:
The geotechnical instrumentation has a vital role in evaluating the structural performance
of an underground structure. The natural ground or rock mass tends to deform and
de-stress when subjected to excavations, foundation and other loadings etc. Activities like
squeezing, swelling and creep depend upon the mechanical characteristics of the material
and are responsible for the disturbances inside the underground rock mass.

Journal of Engineering Geology Volume XLVI, No 1
A bi-annual Journal of ISEG June 2021
119
The long term performance of an underground structure is monitored by installing the
structural instruments to predict and evaluate the safety of excavated openings. However,
the question on number, type and locations of instruments can only be addressed by
fortuitous combination of understanding of underground structural behaviour, experience
and judgement. The instrumentation design therefore needs to be conceived with care and
considerations of site specific conditions associated with the structures. (Kelllaway, M.,
Taylor, D. et.al.)
Various types of instruments are used for underground structures including system to
record by key monitoring parameters listed as under:
1) Convergence – Deformations of excavated surface and surrounding rock mass
2) Load developed in rock bolts after installation and tensioning
3) Pore water pressure in the rock mass
4) Earth Pressure developed due to excavation
Multiple underground structures are under excavation at Tehri Pumped Storage Plant
along with several adits, tunnels, shafts and cavern. The structural behaviour of these
openings has been monitored by instruments installed at respective location along the
length and cross section. Further, it is equally important to ensure proper recording of
monitoring data in order to analyze and take immediate action in case of any adverse
conditions observed.
2. Brief Description of Project:
As an integral part of Tehri Power House Complex located in the state of Uttarakhand in
Northern India; an underground 4 X 250 MW Tehri Pumped Storage Plant is under
construction based on the concept of upper and lower reservoir. The Tehri dam reservoir
will function as the upper reservoir and Koteshwar reservoir as the lower balancing
reservoir. On completion additional generating capacity 1000 MW (4 X 250 MW)
peaking power will be added to Northern grid. During non-peak hours, water from lower
reservoir would be pumped back to upper reservoir by utilizing the surplus available
power in the grid.
Tehri Pumped Storage Plant comprises construction of Power House, two nos. of
upstream Surge Shafts, Butterfly Valve Chamber, Penstock Assembly Chamber, two nos.
of downstream Surge Shafts, four nos. of Penstocks, Bus bar Chamber, Ventilation
tunnel, Drainage Galleries, two nos. Tail Race Tunnels and Outfall Structure located on
the left bank of Bhagirathi River.
3. Geology of the area:
Tehri Project area lies within the Main Himalayan Block (MHB), in the midlands of
Lesser Himalayas, bounded to the north and south by regional tectonic lineaments – the
Main Central Thrust (MCT) and Main Boundary Fault (MBF) respectively. The former,
to the north separates the meta-sedimentary sequence of Lesser Himalaya from the

Journal of Engineering Geology Volume XLVI, No 1
A bi-annual Journal of ISEG June 2021
120
crystalline rocks of Higher Himalaya and the latter marks boundary between lesser
Himalaya and tertiary sequence of Frontal Foothill Belt (FFB), in the south. The rock
stratigraphy of lesser Himalaya exposed around the Tehri Project area are broadly
classified into Garhwal, Shimla, Jaunsar, Bailana, Krol and Tal groups. The folded meta-
sedimentary rocks exposed around the project site form an uninterrupted sequence of
Chandpur Phyllites having a variable proportion of argillaceous and arenaceous
constituents. Considering the rhythmicity of intercalated bands and varied the degree of
tectonic effects in them, the Phyllites at project side have been classified into mainly four
lithological variants as described below.
Phyllitic Quartzite Massive (PQM)
Phyllitic Quartzite Thinly Bedded (PQT)
Quartzite Phyllite (QP)
Sheared/Schistose Phyllite (SP)
PQM and PQT are more quartzite (arenaceous) and rarely micaceous in composition and
are coarser in grain size. These rocks are grey, dark grey, brownish grey, greenish grey,
greyish grey and green in colour. It is mainly comprised of quartz, feldspar and oriented
leths of micaceous minerals. QP is more areno-argillaceous in composition, fine-grained
and dark coloured. SP comprises of argillaceous and deformed variants of PQM and PQT
rock, formed in sheared zone area which has weak rock mass characterististics.
4. Instrumentation and Monitoring:
The main objective of instrumentation and monitoring are very important for any
underground structure. Observations recorded through instruments installed at various
underground structures serves as guide for taking proactive remedial actions. If the
underground excavation encounters known or unexpected major geological features such
as fault, shear zone or a highly weathered rock mass, instrumentation can be used to
monitor its behaviour. The use of proper instrument at appropriate time can give very
valuable information, which can help to prevent a likely major mishap. This can provide
early warning of many conditions that could contribute any failure mechanism.
Type and selection of monitoring instruments based on geotechnical aspects and
surrounding rock mass. Various monitoring instruments installed in multiple adits,
tunnels, shafts and chambers at different cross sections as per approved drawings and in
consultation with designers.
1.1 Instrument Installed:
The monitoring instruments installed at various locations in the underground openings
are listed in Table 1 along with general specifications.

Journal of Engineering Geology Volume XLVI, No 1
A bi-annual Journal of ISEG June 2021
121
Table 1
Specifications of Monitoring Instruments installed at Tehri Pumped Storage Plant
S
No.
Instrument Type Parameter Unit Range Resolution Sign
Convention
1 Bi-reflex targets Optical Deformation
of Excavated
Surface
mm - 2.omm “+ve”
displacement indicate
Divergence in
cavern “-ve” displacement
indicate
Convergence in cavern
2 MPBX
(2m, 5m, 10m &
15m or 20m)
Vibrating
wire Deformation
s of rock
mass
mm 0.0
–
50 or
±25m
0.01 mm
for sensors
“+ve”
displacement
indicate separation of
anchors from
wall
“-ve”
displacement
indicate
convergence of
anchors towards
wall
3 Load cells
(in rock
bolts)
Vibrating
wire Load
developed in
rock bolts
tons 30m Accuracy
1%
“+ve” value
indicates
increase in rock
bolt load (Due
to convergence)
“-ve” value
indicates
decrease in rock
bolt load (due to
loosening or far field
convergence)
4 Load cells
(in cable
anchors)
Load
developed in
cable anchors
200m
The technical aspects of monitoring instruments installed at various components of
project are briefly described as follows:
a) Bi-Reflex Targets :
Bi-Reflex Targets consists of reflector plate mounted on a robust frame. The target has
reflectors on both sides and is mounted on a universal joint such that it can be oriented in
any direction as required. The target has cross mark to allow precise targeting. It is used
along with the convergence bolt and break off point as shown in Figure1 below:

Journal of Engineering Geology Volume XLVI, No 1
A bi-annual Journal of ISEG June 2021
122
Figure 1 A Bi-Reflex Target
The targets are generally installed in cross sections of underground openings at required
locations and monitor the absolute position of point on the excavated surface. For
monitoring the displacements in different type of roc class five, three and one bi-reflex
target installed at a given cross section of tunnel profile. Targets are designated as T1, T2,
T3, T4 and T5. The absolute displacement of each target is determined as displacement
vector in terms of its magnitude and direction. As the direction of all the appropriate
coordinates (i.e. Northing and Easting) are selected to determine the displacement
vectors. The magnitude of displacement vector between two consecutives date is plotted
with respect to time or date to analyze the behaviour of target. The continuous vector
diagram in plane of tunnel cross section is superimposed on the cross section of the
opening to analyze the movement of tunnel boundary.
Rate of movement is calculated as ratio of displacement magnitude in mm and number of
days elapsed since last date of measurement. All three layouts of installed BRT‟s are
shown in Figure 2a, 2b and 2c respectively along with indicative displacement vectors.
Figure 2a Five Target Section
Continuous Displacement
vectors
T3
T5

Journal of Engineering Geology Volume XLVI, No 1
A bi-annual Journal of ISEG June 2021
123
Figure 2b Three Target Section
Figure 2c Single target section
b) MPBX-Multiple Point Bore hole Extensometer:
Multiple Point Bore hole Extensometer is used to measure the deformation of a section of
rock mass with respect to deep anchor. MPBX can be either single point or multiple point
consists of sliding rod, anchored at selected points within bore hole and fitted with
vibrating wire sensors(Figure 3).The movement of the rock mass around bore hole is
transferred to the attached anchors and same is recorded by transducers placed on the top
of bore hole.
Figure 3 Collar Head at the Excavated Surface
Continuous Displacement
vectors

Journal of Engineering Geology Volume XLVI, No 1
A bi-annual Journal of ISEG June 2021
124
The maximum number of anchors possible to install in a bore hole depends on diameter
of bore hole and type of anchor used. The anchors can be attached to the surrounding
rock mass in two ways; either by grouting the bore hole or by mechanical attaching with
hydraulic anchors. For measurements of displacements the vibrating wire type sensors are
used for long term measurements of relative displacements at four anchor points.
MPBX installed at Tehri Pumped Storage Plant has four anchor points (2m, 5m, 10m,
15m and 20m) are grouted type in which the anchors are grouted in to bore hole while
keeping the movements transferring elements free with PVC pipe. Photograph of MPBX
before and after installation shown in Figure 4 below:
Figure 4a Anchors Figure 4b Rods with PVC Pipe
Figure 4c Collar Head
c) Load Cell in Rock bolts:
Vibrating wire load cells are used for recording and monitoring of loads in structural
elements like rock bolts, tie backs, foundation anchors tunnel supports and in
prestressing. It is installed at the time of the structural elements. A pretension force
induced in the rock bolt recorded in the load cell. The distressing of the rock mass takes
place due to any excavation or loading activity and the rock load is transferred to the rock

Journal of Engineering Geology Volume XLVI, No 1
A bi-annual Journal of ISEG June 2021
125
bolts. The axial load which is developed in rock bolts is reflected in load cells as an
increment to the initial installed load.
The vibrating wire load cell comprises of a set of three or six vibrating wire gauges,
mounted parallel to each other, equally spaced in a ring in an alloy steel cylinder. The
method of construction results in a very robust instrument suitable for use where high
performance, longevity and mechanical strength are important. Typical arrangement of
load cell installed along with rock bolt is shown in Figure 5.
Figure 5 Load Cells and its typical arrangement with rock bolts
The monitoring of load cell data is also carried out periodically and the data obtained is
analyzed with warning limits provided by designers. Generally the increase in rock bolt
loads indicates the convergence in openings and vice versa.
1.2 Instrumentation Scheme:
Adequate instrumentation scheme has been specified by the design consultant, in
particular the monitoring plan, frequency of readings, definition of threshold limits
adopted in case of ground movements exceeding prescribed conservative „trigger‟ limits
are indicated. The general procedure for the implementation of countermeasures should
be the movement exceeds the limit of displacement/stress established from design
calculation for the structural integrity and safety of workers during excavation.
Geotechnical monitoring instrument installed at various structure of project along with
their excavated width listed in Table 2.

Journal of Engineering Geology Volume XLVI, No 1
A bi-annual Journal of ISEG June 2021
126
Table2
List of Underground Structure monitored by Geotechnical Instrument
S.
No.
Structure Name Structure ID Orientation of
opening w.r.t. North
Maximum excavated
of opening (m)
1 Adit
AA-6 N30°
7.0 AA-10 N08°
AA-11 N30°
2 Butterfly Valve Chamber BVC N303° 10
3 Upper Penstock Assembly PAC N303° 13
4 Lower Penstock Assembly LPAC N71° 11.6
5 Tail Race Tunnel-3 TRT-3 D/S N185° 11.0
6 Tail Race Tunnel-4 TRT-4 D/S N185° 11.0
7 Ventilation Tunnel VT N102° 4.6
8 Bus Bar Chamber BBC N213° 10.0
9 Drainage Gallery DG around BVC N303° 4.4
10 D/S surge Shaft Chamber-3 D/S SSChamber-3 N30° 19.8
11 D/S Surge Shaft Chamber-4 D/S SSChamber-4 N30° 19.8
12 Link tunnel between D/S Surge
Shaft Chamber-3&4
D/S SSChamber-3
& 4
N30° 11.5
13 Lower Bus bar Tunnel-5 LBB-5 N300-335° 7.9
14 Lower Bus bar Tunnel-6 LBB-6 N300-335° 7.9
15 Lower Bus bar Tunnel-7 LBB-7 N300-335° 7.9
16 Lower Bus bar Tunnel-8 LBB-8 N300-325° 7.9
17 Upper Bus bar Tunnel-5 UBB-5 N120° 7.9
18 Upper Bus bar Tunnel-6 UBB-6 N120° 7.9
19
Adit
AA-1 N54°-90° 7.0
AA-2 N303° 7.0
AA-3 N303° 7.0
20 U/S Surge Shaft Chamber-3 U/S SSChamber-3 Vertical Direction 15.0
21 U/S Surge Shaft Chamber-4 U/S SSChamber-4 Vertical Direction 15.0
22 U/S Surge Shaft-3 U/S Shaft-3 Vertical Direction 20.8
23 U/S Surge Shaft-4 U/S Shaft-4 Vertical Direction 20.8
24 Drainage Gallery around
upstream Surge Shaft
DGUSSS N325° 4.4
25
Power House
Service Bay N30° 24.6
26 Crane Beam N30° 24.6
27 Pipe Gallery N210° 3.6
The type number and interval of readings are being finalized by the designer based on
evaluation of previous monitoring results, trend and warning limits. The tunnel
convergence monitoring is the predominant measure adopted for the all foreseen/
unforeseen roc mass condition. As earlier stated, the convergence readings are the main
parameter for evaluating the stability of any underground structure, while other measures
can be considered additional tool to know the behavior of rock mass.
1.3 Frequency of monitoring and warning limit:
The frequency of monitoring data is depended upon the warning limit of individual
structure provided by designers in approved instrumentation drawing for individual
project component. A pre determined or rate of change of a key indicator parameter that

Journal of Engineering Geology Volume XLVI, No 1
A bi-annual Journal of ISEG June 2021
127
is considered to indicate a potential problem, but not of sufficient severity to require
cessation of the works. Exceeding this trigger level will generally require a check on
instrument function, visual inspection of structure being monitored, increase in
monitoring frequency, review of the design and modification of construction process. The
warning limit of different engineering parameters obtained from monitoring data to check
the health of structure as under.
A) Deformation measurements:
Alarming limits for benching and heading activities for different structures obtained from
approved instrumentation drawing and readings are taken in same reference line as
mentioned in Table 3a and 3b respectively.
Table 3a
Maxm
allowable and warning limit of deformation in underground openings of Tehri PSP
Structure Warning limit (MM)
Heading Benching
I level II level I level II level
BVC (1st bench)
1% of the underground opening 50mm to 75mm More Than 75mm
UPAC 50mm to 75mm More Than 75mm
LPAC 1% of the underground opening
PH 1% of the underground opening
DSSS-3 50mm to 100mm More than 100mm 150mm to 200mm More than 200mm
DSSS-4 50mm to 100mm More than 100mm 150mm to 200mm More than 200mm
USSS-3 20mm to 40mm More than 40mm 50mm to 60mm More than 60mm
USSS-4 20mm to 40mm More than 40mm 50mm to 60mm More than 60mm
LINK TUNNEL 15 30 50mm to 100mm More than 100
ADITS 1% of the underground opening
DRAINAGE
GALLERY
1% of the underground opening
TRT-3 1% of the underground opening
TRT-4 1% of the underground opening
VENTELATION
TUNNEL
1% of the underground opening
TRT outfall 1% of the underground opening 30 40
DS SS
Rock Type-
PQM + PQT
PQT + QP
QP + SP
SP
50
120
150
200
100
150
200
250
US SS Rock Type-
Type-2
Type-3
Type-4
50
100
200
75
150
250

Journal of Engineering Geology Volume XLVI, No 1
A bi-annual Journal of ISEG June 2021
128
LOWER BUS
BAR TUNNEL
100 150
UPPER
HORIZONTAL
PENSTOCK
Rock class II
III
IV
V
30
50
100
200
VERTICAL
SHAFT
Rock class II
III
IV
V
30
50
100
200
Table 3b
Warning limit for rock bolt loads in UG Openings at PH Cavern of Tehri PSP
S. No. Rock bolt dia. (mm) Design load, D (Tons) Warning limit W = 80 % of D (Tons)
1 25 20.0 16.0
2 32 35.0 28.0
B) Rock Load Measurements:
The warning limits for the rock bolt loads monitored by load cells installed in the rock
bolts are suggested by 80% of the design capacity of the rock bolt. The design capacity of
rock bolts are different for different size of bolts installed and so shall be the warning
level for the rock load observed and recorded by instrument as shown in Table 3.
120 ton capacity of cable anchors locked at 80 ton installed in Power House, Butterfly
Valve Chamber, Penstock Assembly Chamber and presently installation is in progress at
the benches of Tail Race Tunnel outfall beyond El: 623.0m.
Regular monitoring data is taken based on the above warning limit considered for
different instruments and the behavior of underground openings observed from the
analysis of monitoring data in terms of correlation with major construction activities.
2. Regular Monitoring data processing and interpretation:
As stated earlier also monitoring data is regularly taken at site in consideration with their
warning limits and frequencies for individual structures. The deformation occurred after
the instrumentations are monitored regularly and interpretation work carried out
accordingly on monthly basis. Maximum rate of displacement observed by Bi-reflex
targets, MPBX and increment in load on rock bolts/cable anchors by load cells are
summarized in Table 4, 5 and 6 respectively.

Journal of Engineering Geology Volume XLVI, No 1
A bi-annual Journal of ISEG June 2021
129
Table 4
Maximum Rate of displacement observed by Bi-reflex target
SNo.
Component
RD (m)
Class
of
Rock
Target
ID
Maximum
movement
w.r.t. initial
Maximum
Rate of
Movement in
last month
(mm) (mm/month)
1 Adit AA-1 160 IV T-3 34.60 0.00
2 AA-2 Drainage
Gallery
25 IV T-2 37.68 1.19
3 U/S Surge Shaft
Chamber 3
16.3 IV T-5 17.63 2.07
4 Chamber-3
Cracking
23.32 IV Lower
Left
12.17 0.00
5 USSS-3 EL: 802.80 III OP-4 36.77 0.00
6 U/S Surge Shaft
Chamber 4
2.2 IV T-6 45.89 0.0
7 USSS-4 EL:802 III OP-8 67.82 12.38
8 BVC 35.6m VA T-4 133.5 0.00
9 DG-USS 82.00 IV T-2 40.59 0.00
10 PAC 30.32 IV T-2 49.75 0.00
1 PH 41.5 IV T-2 34.4 0.00
2 UDG-PH 0.00 III T-1 40.51 0.00
3 PH Service Bay 16.34 IV Left
OP-1
15.5 0.00
4 LBB-5 10 III OP-1 17.09 0.00
5 LBB-6 15 III T-3 25.67 0.00
6
LBB-7
35
III
T-3
10.8
Target damaged
in Jan'17
7
LBB-8
18
III
T-1
10.4
Target damaged in
August'17
8 UBB-5 7.5 III T-2 41.7 0.00
9 UBB-6 7.5 III T-2 7.5 0.00
10 Adit 3 15.9 IV T-4 15.3 2.01
11 AA-10 195.54 III T-1 17.54 2.00
12 AA-11 160 IV T-5 33.49 2.69
13 AA-8R 112.5 III T-2 30.27 0.00
14 Pipe gallery 22 III T 3 2.2 0.00
15 VT 310 IV T-4 38.64 0.00
16 BBC 81 III T-2 25.09 0.00
17 D/S Surge Shaft
Chamber 3
17.3 IV T-4 33.86 0.00
18 DSSS-3 EL:580 III OP-2 36.04 0.00

Journal of Engineering Geology Volume XLVI, No 1
A bi-annual Journal of ISEG June 2021
130
19 D/S Surge Shaft
UP Chamber 4
15 IV T-6 40.72 0.00
20 DSSS-4 EL:611 III OP-8 36.76 9.32
21 AA-6 (Link Adit) 6 IV T-4 31.64 0.00
22 TRT-3 D/s 500 III T-1 25.27 0.00
23 TRT-3 U/s 146 VA T-2 4.5 0.00
24 TRT-4 D/s 612 VA T-3 18.18 1.99
25 TRT-4 U/s 110 VA T-3 4.5 0.00
26 TRT Out Fall 70.00 IV SM-3 34.98 1.38
27 Vertical
Penstock-5
EL:
704.167
M-3 9.6 0.0
28 Vertical
Penstock-7
EL:
704.355
M-3 8.9 0.00
Table 5
Maximum displacement observed by MPBX
SNo. Component Maximum sensor displacement w.r.t. initial @ sensor depth , RD
Crown U/S wall D/S wall
1
U/S surge shaft
Chamber-3
1.51mm @ 10m,
RD 16.6m Cable Damaged Since Nov'18
-6.80mm @ 15m,
RD 16.6m, EL: 873m
11.01 mm @ 5m,
RD 16.6m,EL 862m
2
U/s Surge Shaft-3 Gallery Side
EL: 857m
Adit Side EL: 856m Adit Side, R/s EL: 856m
D/s Wall
-5.00mm @ 2m 3.55mm @ 10m 4.65mm @ 2m
Adit Side , L/s EL: 856.00m, U/s Wall
-0.98mm@5m Cable damaged since April'19
3 U/S surge shaft
Chamber-4
2.65 mm @ 2m,
RD 21m
2.21mm @ 2m, RD 21m,
EL: 873m
-4.13mm @ 2m, RD 21m
4
U/s Surge Shaft-4
Adit Side Wall,
EL: 857m
Gallery Side Wall
EL: 856m
Adit L/s EL: 855m, U/s Wall
3.94mm @ 10m 4.56mm @ 10m 2.04mm @ 5m
Adit Side Wall,
EL: 790m
U/s Wall EL: 790m D/s Wall, EL: 790m
-2.79mm @2m -1.60mm @ 10m -0.74mm @2m
5 BVC -22.66mm @ 2m,
RD 72.13m
-7.57mm @ 15m, RD
35.605m, El:722m
19.93mm @ 15 m, RD 35.60
m, El:722m
6 PAC -4.96mm @ 10m,
RD 80.69m
-5.62mm @10m,
RD 6.18 m
-9.66mm @ 10m, RD 6.18m
7 PH -0.60mm* @ 5m,
RD 87m
0.79mm @ 20m, RD 12m 5.32 mm @ 5m, RD 37m
8 PH-UDG -5.59mm @ 10m, RD 41m
9 D/S surge shaft
Chamber-3
-1.96 mm @ 10m,
RD 13.8m
-2.44mm @ 5m, RD 13.8m 16.72mm @ 2m, RD 13.8m,
EL 644.50m
Adit Side EL: 613.393 Link Tunnel Wall EL: 613.393m
1.58mm @ 5m 0.51mm@m

Journal of Engineering Geology Volume XLVI, No 1
A bi-annual Journal of ISEG June 2021
131
10 D/s Surge Shaft-3 Link Tunnel Side
Wall EL: 580M
D/s Wall EL: 580M U/s Wall EL: 580M
4.21mm @ 15m -1.13mm @15m -2.53mm @ 15m
11 D/S surge shaft
Chamber.4
1.77mm @ 10m, RD
13.8m Cable Damaged since July'17
-3.42mm @ 15m, RD 13.8m
EL 649 m
-6.78mm @ 5m, RD 13.8m,
EL: 649.50 m Cable Damaged since Jan‟18
12
D/S surge shaft-4
U/S wall EL:613.6m EL: 613.711m End wall EL: 613.650m D/S wall
-0.12mm @ 10m 1.77mm @ 5m 0.48mm @5m Cable Damaged since March'20
Link Tunnel wall EL:613.603 m,
-2.00mm @15m
13 Link Tunnel 7.16mm @ 15m
RD: 21.50m
1.37mm @ 10m
RD: 21.50m
-9.25mm @ 2m RD: 21.50m
Note: (-ve reading) Internal Convergence dominates, (+ve reading) Wall Convergence Dominates
Table 6
Rock bolt load increment w.r.t initial installed load
Component Maximum rock bolt load increments w.r.t. initial installed load (Tons)
Crown U/S wall D/S wall
U/S SURGE SHAFT-3 1.10 Tons @ EL: 812.25 1.60Tons @ EL:812.25
U/S SURGE SHAFT- 4,
EL: - 806.25
2.90 Tons @ EL:803.25 3.23 Tons @ EL:806.25m
EL: 790.650m Gallery Side Wall
2.33 @ EL:790.65m
BVC Load cell on Rock
Bolt 3.07 Tons @ RD: 18.93 1.07 Tons @ RD: 23.42
BVC Load cell on Cable
Anchor 47.65 Tons @ RD 74 m 67.99Tons @ RD 43 m
Rock Bolt Load Cell PH 9.55 Tons @
RD 138m
11.94 Tons @ RD 138m 9.33 Tons @ RD 38m
Cable Anchor
Load Cell PH Gallery
41.13Tons @ RD 3.15 m 16.79 Tons @ RD 135.5m
D/S SURGE SHAFT-3,
EL: 593.50m 3.40Tons @ EL: 593.50m
D/S SURGE SHAFT-4,
EL:602.60m
9.90@ EL: 602.60m
Cable Anchor Load Cell
Link Tunnel Between
DSSS Chamber 3 & 4
3.37@ RD: 10m,
EL: 645.5m
Cable Anchor
Load Cell Out Let
5.10Tons @ RD -5 m EL: 620m 20.01Tons @ RD -50 m
EL: 622m
Note:(-ve) reading indicates relaxation of load, (+ve) reading indicates accumulation of load
Journal of Engineering Geology Volume XLVI, No 1
A bi-annual Journal of ISEG June 2021
132
3. Conclusions:
The most important aspect of the interpretation part is the calculation of the expected
value of the parameters being monitored. The recorded values of various parameters are
being compared with the expected values to ensure collection of meaningful data.
Another effective way to validate instrument reading is through routine visual
observation. Observation of the monitored area can provide early warning signals, such
as tension crack or evident seepage, which may not be picked up by nearby field
monitoring instruments and can also guide remedial actions. The following conclusions
can be drawn from analyzing the instrumentation and monitoring records till date.
Based on the instrumentation work carried out in Tehri Pumped Storage Plant, significant
movements are being observed in BVC, PAC, Downstream Surge Shaft and Chambers.
These movements may be due to adverse geology encountered during excavation.
Considering the case of BVC and PAC which is very critical component of project
wherein at some locations first warning limit has been breached. Special precaution has
been taken during further excavation in this area by control blasting in various steps to
avoid any mishap. Additional rock supports is also suggested by designers and
implemented at site immediately. The monitoring data of other project components lies
within warning limit and considered to be safe. Further, it has also been proposed that the
monitoring shall be continued as per present frequency and if found any change in data
in terms of increment immediately frequency of reading should be increase and counter
measures to be taken without any delay for the safety of project component.
Acknowledgements:
Authors are very much thankful to the management of THDC India Limited and M/S
Hindustan Construction Company Limited for providing the necessary support to carry
out the work and overall guidance to write this paper.
References:
1. Construction Monitoring and Instrumentation. June-2010. SCDOT Geotechnical
Design Manual.
2. Kellaway, M., Taylor, D. et al. 2012. The use of Geotechnical Instrumentation to
Monitor Ground displacement during excavation of the Ingula Power Caverns for
Model Calibration and design verification purposes. South African tunneling
2012, pp. 1 to 23.
3. Sehra, R. S. and Gupta, S, L., 2017. Rock deformation by extensometer for
underground Power House of Sardar Sarovar Project, Gujarat, India .International
Journal for Innovative Research in Science and Technology,Volume-4/Issue-
6/November-2017,PP.57 to 61.
4. Selagini, Andrea, Carri, Andrea and Savi, Robero, 2017. Role of Geotechnical
Monitoring: State of the Art and New Perspectives, GEO-EXPO 2017. Sarajevo,
October 26th
and 27th
2017.

Journal of Engineering Geology Volume XLVI, No 1
A bi-annual Journal of ISEG June 2021
133
5. Sharma, H.K. and Manchanda, H., 2019. Instrumentation and Monitoring of
Tunnel T2 of Katra to Dharam Section of Udhampur-Srinagar Baramulla New
BG Railway Project. Journal of TAI, volume-8, pp. 37 to 53.
6. Sharma, V. M., 2011. Instrumentation and Interpretation of Monitoring data of
Dams. Proceedings of 3rd
Indian Young Geotechnical Engineering Conference,
March 25-26,2011,New Delhi, India
7. Sharma, V.M., 2011. Instrumentation and Monitoring of Underground
Excavations. Journal of Engineering Geology, vol. XXXVII, Nos. 1-4, pp.95-102.
8. International Tunneling and Underground Space Association (ITA). November-
2011. Report on Monitoring and Control in Tunnel Construction.
AITES/ITA/WG2-Research.

Journal of Engineering Geology Volume XLVI, No 1
A bi-annual Journal of ISEG June 2021
134
I-System Software
The I-System Software, developed by Terrene Technology Ltd (TTL), has been
developed by TTL's technical and software developer team based on the “I-System -
Index of Ground-Structure” Bineshian 2019, 2020, 2021.
The I-System Software developed over the last two years with extra modules and
special calculators very useful for the design and execution and monitoring phase of
civil and mining projects. The software has the capability to classify and characterise
the ground for design and execution purposes and support geotechnical,
geohydrological, geomechanical, geophysical, and earthquake assessment/s for
residential and industrial constructions, geostructural assessment for onshore and
offshore projects, and most recently under developing new geomechanical
applications for oil and gas industry for well bore stability and reservoir compaction
assessment. Geomechanical applications and more 4D applications of software will
come in near future but the current version covers most of geotechnical and
geomechanical aspects of projects from surface to underground, available to
customers worldwide just with a formal request to our support team.
From the starting of the software development till present when a commercial product
is ready to be offered to companies and research institutions, over 2000 projects have
been modelled and verified for different applications and confirmed the validity of
results in different geographical locations and conditions.
Our technical team can support all applications of software for the purposes of using
in surface, semi-surface, and underground structures in various industries. Also, our
software development team can adjust, and tailor made the new version and modules
based on your requirement if your dedicated case is in demand or may not exist in our
current software capabilities.
We have a dedicated technical support team for I-System Software. We will share all
news and guidelines related to software on the web and direct communication with
customers and will reply to users through email.
Should you have any queries related to the I-System Software, please do not hesitate
to email us your enquiries on following email ID and we will reply at the earliest
time: [email protected]
For existing customers, the technical support will be provided through following
email ID: [email protected]
For general enquiries related to I-System and sales please contact through:
+44 7725624172
Visit our website (www.terrenetechnology.co.uk) for update and news.

Journal of Engineering Geology Volume XLVI, No 1
A bi-annual Journal of ISEG June 2021
135
Terrene Technology Ltd is a consulting company active in Geoscience activities and
recently fully focused on Geomechanical studies and digitalisation, with headquarter
in UK, Registered in England and Wales - Reg No: 08639057.
Headquarter and trading address: 24 Rubislaw square, Aberdeen, Scotland, United
Kingdom, Ab15 4DG
Email: [email protected]
Phone: +447725624172
Registered Address: 320 Firecrest Court, Centre Park, Warrington, WA1 1RG, UK

KEYNOTE SPEAKERS
I Cnternational onference on ecent dvances in eotechnicsR A G
EGCON 2021
Organized by: Indian Society of Engineering Geology (Indian National Group of IAEG)
9 - 11 December, 2021 | (Virtual Conference)
Empowering Knowledge and Innovation
In association with: NHPC Limited (A Government of India Enterprise)
Dr. Martin WielandChairman Committee on
Seismic Aspects of Dam Design (ICOLD)AFRY Switzerland Ltd, Zurich, Switzerland
Dr. Wu FaquanSecretary General, IAEG
Shaoxing UniversityChina
Dr. M. H. LokeEditorial Board Member
Journal of Applied GeophysicsCEO, Geotomo Software Sdn Bhd.
Penag, Malaysia
Dr. Louis N.Y. WongBulletin Editor in Chief Ex officio member, IAEG
Associate Professor / DirectorThe University of Hong Kong, Hong Kong
Dr. Rajinder BhasinRegional Manager Asia
Norwegian Geotechnical Institute (NGI)Norway
Dr. Bineshian HossTechnical Director
Amberg Engineering AGSwitzerland
Dr. Thomas FechnerManaging Director, Geotomographie GmbH,
Germany
Dr. Praveen K. MalhotraPresident, Strong Motion Incorporation
Massachusetts, USA
Conference Manager
NITESH DOSHIEmail: [email protected]
Contact No.: 9871799152
Online Registration is now openOnline Registration is now openFor more details, please visit:
www.egcon2021.com
Contact For All CorrespondenceS L KAPILCHAIRMAN & CONVENERSecretary, ISEG
VACHASPATI PANDEYCO-CONVENERJoint Secretary, ISEG
VIPUL NAGARCO-CONVENERJoint Editor, ISEG
Engg. Geology & Geotech Division, NHPC Ltd., Sector-33, Faridabad-121003, Haryana
Email: [email protected] No.: 9454218451
Email: [email protected] No.: 7086071155
Email: [email protected] No.: 0129-2255805

Guidelines for Authors
It is strongly encouraged to produce original work however preliminary it may be. If it conveys even one single message, Journal of Engineering Geology will be happy to publish the same. However, all papers will be professionally or scholarly peer reviewed as the case may be. The journal lays great emphasis on scientific work ethics and moral values. Case studies, analysis, experimental studies related with engineering geology, geologic hazards, geo-engineering, soil and rock mechanics, geotechnology, geo-hydrology or geo-environment are all welcome. The ambit of engineering geology is ever increasing and the list of subjects is illustrative not exhaustive. Abstract Abstract should be limited to 200 words and covering the entire paper. Many authors give introduction in a brief manner in place of abstract which is discouraged. Abstract is actually a summary of the entire work carried out. The purpose of giving abstract is to allow researchers and other professional go through a bunch of papers to find the relevant work of their own interest. It is also understood that abstract may be able to stand alone and be able to communicate what the authors want. Yet so in 200 words many writers find it difficult to portray a true picture of their entire work. This is where the judicious choice of approach and use of minimal expressions to convey important messages is required. Figures, tables and pictures are not required in the abstract. Main Paper Full length papers are to be submitted according to the formatting given in template. Page margins, line spacing, paragraph spacing, title, sub-headings, table style and figures/ pictures are to be maintained as given in template. In case authors do not wish to give their designations they are free to give their name(s) and affiliations only. It is also optional to give email id for the authors. However, it is necessary to give email id to the editor for communication. If the authors want to hide their emails from publication they must make specific mention of the same. It may be noted that the pictures should be clear and captioned. The caption should be attached to the picture. The pictures should have been taken by authors themselves or if they are using other work, proper references need to be given. Just like pictures, figures should also be clear and legible with caption attached to the figure. References may be arranged alphabetically. Author(s) may submit abstract of 200 words, if desired, for our response which will be given within one month. However the option of submitting full length paper directly is also open. Comments/acceptance will be conveyed as soon as possible after review. The papers getting acceptance will be published in forthcoming issue based on availability of space. The responsibility of obtaining permissions, references or copyright violations if any shall solely rest with the author or jointly in case of two or more authors. The society will however correspond with the first author or as nominated by first author. It is advised to follow the guidelines and template for quick processing of the papers.
Editor
Journal of Engineering Geology
www.isegindia.org www.joegindia.com
A bi-annual journal of ISEG

www.isegindia.org
www.joegindia.com
Indian Society of Engineering Geology
(IAEG India National Group) (Established 1965)
S. L. Kapil Secretary
Indian Society of Engineering Geology,
C/o Executive Director (Geotech) Engineering Geology & Geotechnical Division
NHPC Office Complex, Sector-33, Faridabad, Haryana Email: [email protected];
Mobile: +91-9911103790
IN
D
IAN
SOC
I
IETY
OF
E N G I N EER
ING
GEOLO
G
Y
1 9 6 5