
International Journal of Computational and Engineering
169
International Journal of Computational and Engineering JUNE 2019 VOLUME4 NUMBER2 Publisher: ACADEMIC PUBLISHING HOUSE Address: Quastisky Building, Road Town, Tortola, British Virgin Islands UK Postal Code: VG1110 E-mail: [email protected] www.ij-ce.com
-
Upload
khangminh22 -
Category
Documents
-
view
1 -
download
0
Transcript of International Journal of Computational and Engineering

International Journal ofComputational and
EngineeringJUNE 2019 VOLUME4 NUMBER2
Publisher: ACADEMIC PUBLISHING HOUSEAddress: Quastisky Building, Road Town, Tortola, British Virgin IslandsUK Postal Code: VG1110
E-mail: [email protected]


CONTENTSDESIGN AND CONTROL STRATEGY OF CHANG’E-3 SOFT LANDING ORBIT..................................1
DESIGN AND IMPLEMENTATION OF INTELLIGENT CULTIVATION PLAN AND SYLLABUSARRANGEMENT SYSTEM................................................................................................................................ 6
RESEARCH ON HIGH PRECISION DETECTION SYSTEM BASED ON INFRARED SENSINGTECHNOLOGY................................................................................................................................................... 11
THE OPTIMIZATION SIMULATION OF CASTING PROCESS FOR COMPRESSOR CROSSHEAD14
DISCUSSION ON ANTI-JAMMING TECHNOLOGY OF INTELLIGENT MEDICAL PAGINGSYSTEM................................................................................................................................................................17
SIMULATION EXPERIMENT AND ANALYSIS OF OIL-WATER TWO-PHASE FLUID IMAGER INNEAR HORIZONTAL WELL........................................................................................................................... 20
DISCUSSION ON MINE HOIST VECTOR CONTROL SYSTEM BASED ON THREE-LEVELINVERTER........................................................................................................................................................... 23
DESIGN AND IMPLEMENTATION OF A BUILDING FOUNDATION CONSTRUCTION VIRTUALSIMULATION TRAINING SYSTEM............................................................................................................... 26
ELECTRICAL CONTROL OF TUNNEL KILN BASED ON INDUSTRIAL NETWORK....................... 29
CLASSIFICATION OF COLOR IMAGES BASED ON VGG16 NETWORK MODEL AND LIB -SVM32
ANALYSIS OF COLLEGE-LED COLLEGE STUDENT WORK MANAGEMENT MODE....................35
RESEARCH ON CHANNEL ESTIMATION TECHNOLOGY BASED ON OFDM IN WIRELESSCOMMUNICATION SYSTEMS........................................................................................................................38
QUANTUM PARTICLE SWARM OPTIMIZATION ALGORITHM BASED ON IMPROVEDMIGRATION IDEA.............................................................................................................................................41
ANALYSIS OF DRAGON MIGRATION BASED ON ANALOGY AND CLUSTER ANALYSIS............43
AN ALGORITHM FOR SEMANTIC MATCHING OF NATURAL LANGUAGE ENVIRONMENTPARAGRAPH.......................................................................................................................................................47
RESEARCH ON ENDOWMENT INSURANCE MANAGEMENT SYSTEM BASED ON BSARCHITECTURE............................................................................................................................................... 51
THE IMPACT OF CLIMATE CHANGE ON NATIONAL VULNERABILITY.........................................55
ENVIRONMENTAL COST ASSESSMENT BASED ON INVEST MODEL OPTIMIZATION............... 59
CHANGE-E-III SOFT LANDING TRACK DESIGN AND CONTROL STRATEGY................................65
ANALYSIS OF THE USE OF COLLEGE CAMPUS LOANS.......................................................................69
SHADOWMARKET SEGMENTATION BASED ON K-MEANS CLUSTERING.................................... 72
INTELLIGENT PROCESSING OF FLAME SPECTRUM BIG DATA IN CONVERTERSTEELMAKING FURNACE MOUTH.............................................................................................................75
BIG DATA DRIVEN BLAST FURNACE TEMPERATURE INTELLIGENT PREDICTION................. 81
DETERMINATION OF SEAT VOLUME BASED ON GREY PREDICTION............................................84

OPTIMIZATION MODEL OF TRAJECTORY DESIGN AND CONTROL STRATEGIES FORAIRCRAFT’ SOFT-LANDING.......................................................................................................................... 86
CHARACTERISTICS AND CAUSES OF OZONE CONCENTRATION IN BEIJING.............................91
APPLICATION OF MAS-CA MODEL IN STUDYING THE EVOLUTION OF WORLD LANGUAGEDISTRIBUTION...................................................................................................................................................96
FUZZY CLUSTERING ANALYSIS BASED ON PERFORMANCE-TO-PRICE RATIO OFDIFFERENT MOBILE ELECTRONIC PRODUCTS...................................................................................101
PHYSICAL BALANCE CHARACTERISTICS AND BALANCED RISK ASSESSMENT OF THEELDERLY...........................................................................................................................................................104
GROUNDWATER NUMERICAL SIMULATION AND ENVIRONMENTAL CAPACITY ANALYSISOF PETROLEUM INDUSTRY BASED ON MODFLOW............................................................................108
RESEARCH ON INFORMATION -BASED TEACHING PRACTICE OF ROAD AND BRIDGEENGINEERING MEASUREMENT COURSE...............................................................................................114
RESEARCH ON SECURITY PROCESSING METHOD OF DATA TIME TRANSFER PROCESS.... 120
APPLICATION OF SENSING TECHNOLOGY IN AUTOMATIC CONTROL SYSTEM OFAGRICULTURAL MACHINERY...................................................................................................................123
RESEARCH STATUS OF MASK PROJECTION STEREO LITHOGRAPHY APPARATUS ANDSELECTIVE LASER SINTERING................................................................................................................. 126
APPLICATION OF AUTOMATIC CONTROL TECHNOLOGY IN MACHINERY..............................129
OPTIMIZATION ANALYSIS OF AIR GAP MAGNETIC FIELD IN ELECTROMAGNETICHARMONIC MOVABLE TOOTH DRIVE SYSTEM.................................................................................. 132
DESIGN OF FAULT DIAGNOSIS MODULE BASED ON VIRTUAL INSTRUMENT ANDMULTI-SIGNAL MODEL FOR TARGET SEARCH COMBINATION OF CERTAIN EQUIPMENT136
COMBUSTION SIMULATION OF HIGH-CONCENTRATION ORGANIC LIQUID WASTES..........138
RESEARCH OF PHOTOELECTRIC COUNTING FOR ONLINE BARS................................................ 143
RESEARCH OF BICYCLE AUTOMATIC CONTROL SYSTEM BY USING LQR OPTIMAL THEORY.............................................................................................................................................................................. 147
CLASSIFICATION OF PLANTING STRUCTURE IN REMOTE SENSING IMAGES BASED ONSEMANTIC SEGMENTATION NETWORK MODELS..............................................................................151
DESIGN OF PLAYGROUND TICKETING SCHEME BASED ON LOGIT MODEL ALGORITHM..157ON THE ENGLISH TRANSLATION OF SONG OF A PIPA PLAYER FROM THE PERSPECTIVE OFTHREE BEAUTIES PRINCIPLE....................................................................................................................162

Design and Control Strategy of Chang’e-3 Soft
Landing Orbit
Ai-ai Wang 1,2, Zhi-li Liu 1,2, Xiao-zhen Shi1,3
1North China University of Science and Technology, Tangshan, 063210, Hebei, China 2Yisheng Innovation Education Base, Tangshan, 063210, Hebei, China 3College of Chemical Engineering, Tangshan, Hebei, China
*E-mail: [email protected]
Abstract: The core task of Chang’e-3 is to achieve a
high reliability and safety soft landing on the moon,
requiring the lander to have the ability of autonomous
obstacle identification and avoidance. In this paper,
the flight dynamics models of the main deceleration
stage, fast adjustment stage, obstacle avoidance stage
and slow descent stage of the lunar soft landing are
studied. According to the dynamic equation, the
guidance laws of each stage are optimized, and the
descent trajectory is optimized. Combining with
engineering practice, the control strategy of Chang’e
3 soft landing orbit is established.
The first step is to determine the position and velocity
of the near and far moons of the landing preparation
orbit. A fixed coordinate system (agreement lunar
coordinate system) centered on the lunar center is
established to analyze the forces on Chang’e 3 and
establish a two-dimensional dynamic model. Finally,
the position of the nearest point is (19.43 degrees W,
29.01 degrees N) and the far point is (160.57 degrees
E, 29.01 degrees S). The velocity of the perilunar
point is 1.692 km/s and that of the far point is 1.614
km/s. The results show that T = 530, Q has a
relatively small value of 1098.6 kg.
The second step is to optimize the fuel consumption
in the landing preparation stage and the main
deceleration stage. Take the nearest point to the center,
coordinate A (1149, 1153). In the fast adjustment
stage, the guidance law with linear variation of thrust
magnitude and direction is used. For the rough
obstacle avoidance section, the optimal switching
guidance law is adopted first, and then the optical
image-based rough obstacle detection algorithm is
adopted. Through the analysis and processing of the
image, the over-bright and over-dark obstacles are
judged, and the major obstacles in the current falling
area are identified, so as to determine the safe area.
For avoiding obstacles, the main task is to avoid
obstacles on the lunar surface. The method of obstacle
avoidance recognition and safe landing area selection
based on three-dimensional image is used to
determine the safe area. In the slow descent stage, the
main task is to achieve the relative rest of the moon at
a distance of 4 M. The vertical soft landing model and
the equivalent continuous variable thrust guidance
rate are used to analyze the free landing of Chang’e 3
to the precise landing point.
Keywords: Orbital optimization; Lunar soft landing;
Flight dynamics model; Two-dimensional analytical
dynamic model
1. RESTATEMENT OF THE PROBLEM 1.1. Background introduction
Soft landing on the lunar surface is an important step
in the lunar exploration program. The so-called lunar
soft landing means that the lander, under the action of
the braking system, landed at a small speed and
accurately in the designated area of the moon to
ensure the safety of test equipment and
astronauts[1-3]. Because there is no atmosphere on
the lunar surface, the entire soft landing process needs
to guide the engine. The flight dynamics model of the
lander is established correctly, and the descent
trajectory and guidance law of the lander are
optimized on this basis. It has important guiding
significance for the design of lander flight procedure
and fuel consumption[4-8].
1.2. Problems to be solved
According to the topic of information and the
attachment content, we need to analyze the goddess of
the moon landing number three six stages of the
process, and establish reasonable lander flight
dynamics equation, and then according to the
different characteristics of six stages in the process of
soft landing and declining trajectory of chang 3
requirements established and various stages of the
optimal control strategy, finally, the model for the
error analysis and sensitivity analysis.
2. PROBLEM ANALYSIS
Fuel consumption optimization is the main
optimization objective in the landing preparation
stage and the main deceleration stage. Quick
adjustment period, using the linear change of size and
direction of thrust guidance law, for coarse obstacle
avoidance, first using the optimal guidance law, and
then the coarse obstacle detection algorithm based on
optical image, the imaging based on optical image,
based on image analysis and processing, the judge
had bright and the dark obstacles, identify the current
decline in area of obstacle, to determine the safety
area[9]. For the fine obstacle avoidance segment, the
main task is to fine avoid obstacles on the lunar
surface. The method of obstacle avoidance
recognition and safe landing area selection based on
International Journal of Computational and Engineering 1
ACADEMIC PUBLISHING HOUSE

3D image is adopted to determine the safe area. The
main task of the slow descent stage is to achieve a
static position relative to the lunar surface at a
distance of 4m[10-12].The model of vertical soft
landing and the equivalent continuous variable thrust
guidance rate are used to analyze the chang’e-3 free
fall to the exact point of the moon.
Then, the error analysis of the engine thrust, initial
velocity and initial height in the designed landing
orbit and control strategy is required, and the
influence of the different terrain heights of the lunar
surface in the rough obstacle avoidance stage and the
fine obstacle avoidance stage on the required
adjustment probability of chang’e-3 landing is
called sensitivity analysis.
3. ASSUMPTIONS OF THE MODEL
1) The fuel consumption of attitude engine is not
considered.
2) All external forces acting on the detector pass
through its center of mass.
3) The influence of lunar oblateness on Chang’e-3
soft landing is not considered.2
Symbol Meaning
F Main thrust
Gm
The Moon’s Gravitation
a acceleration
ax
Horizontal acceleration
ay
Vertical acceleration
G Universal Gravitation Constant
n Fuel consumption per unit time
( kg)
v Specific impulse in m/s unit
θ Direction angle of main driving
force
φ Direction of acceleration
Q otal fuel consumption of
Chang’e-3 ( kg)
M0
Initial mass of Chang’e 3
mt Quality of Chang’e 3
4) The soft landing process of Chang’e-3 is only
affected by the general gravity of the moon, without
considering the influence of the sun, the earth
disturbance and the aspheric gravity disturbance of
the moon.
4. ESTABLISHMENT AND SOLUTION OF
MODEL
4.1 Model preparation
The flow chart of this question is shown fig.1 below.
4.2. Solution of model
4.2.1. Rapid adjustment phase
In order to meet the requirement of uniform transition
of thrust and attitude of the main engine, the thrust
model of the rapid adjustment stage is established as
follows
1 1
2 2
F k t b
k t b
(1)
In this expression, F is the thrust, λ is thrust direction
angle,that is, the angle between the thrust direction
and the local horizontal line.
Assume that the initial moment of the fast-tuning
phase is t2,Termination time is t3. The dynamic
equation of this stage is
2 2 2
3 3 3
= cos
= sin
x
y
v t v t t
v t v t t
( )( ) ( )
( )( ) ( ) (2)
Figure 1. Question 2 Flow chart
4.2.2. Rough obstacle avoidance section
4.2.3. Optimal switching conductivity
Assume that the initial moment of the rough
avoidance segment is t3, termination time is t4,
Based on Planar Moon Model[6] , the equation of
motion is as follows:
cos
cos
sin
m
m
h v
FSv g
m
g
v
m mS
(3)
Among h is the height of the moon, γ angle between
falling velocity v and vertical direction,Called drop
Angle,gm is the moon’s gravitational acceleration, S is
the switching value for braking force,It is defined as
follows
0 t 0,
1 t , f
St
(4)
The type (14) indicates that the lander in the coarse
avoidance section will first do a free fall motion and
then fall down to the near-segment terminal by means
of a starting mechanism.
In order to simplify the process, two simplification co
nditions are introduced within a certain range of error
s:
1) The lander approaches a vertical descent at this sta
ge, γ treated as a small quantity,so
International Journal of Computational and Engineering2
ACADEMIC PUBLISHING HOUSE
sin
cos 1
(5)
2) The duration of this phase is shorter, and the
assumption of quality invariance is introduced.
0 0( )Fa
a fa a
F Fa
m m t m
(6)
aindicates the initial state of the coarse avoidance seg
ment, f
indicates coarse avoidance segment termination statu.
Finally, we obtain the simplified equation of motion
as shown below.2
0 02 02( )( ) ( )2 Fa m a fa a faa
m Fa m
a g h h v vv
g a g
=0 (7)
4.2.4. Rough obstacle Detection algorithm based on
Optical Image
The features of the rock pit images on the lunar
surface are as follows:
1) the rock on the crater surface has a high brightness.
2) there are obvious shaded areas in the crater. 3)
there is a strong contrast between the bright areas and
the shadows, which are the targets of our elimination.
1. The Segmentation of Optical Image and the
recognition of obstacle area
The optical image will be divided into m×n equal
squares,The TIF diagram provided is 2300×2300
resolution,divide the gray value into 23×23,each
pixel is 100×100, and then count the gray values of
each grid.
There are 100×100 grayscale levels per cell,too large
a grayscale means too bright, that is, rock on the
surface of a rock pit, too small to represent a rock pit,
is a dark area, when the gray scale of a grid is too
large or too small points, this grid is identified as a
barrier area, can not land. You need to count points
that are too large and too small for grayscale, as
follows
Let the initial value of the number of obstacle are sum
as be 0 Barrier number threshold is threshold ,the
critical value of overdark grayscale is Dark, the
overlighted gray value is Light, within a lattice
100×100 of grayscale points x if,
x Dark or x Light
Indicates that the gray point x is a barrier point,sum the statistical value plus one, when a lattice of
statistics is complete, if
sum threshold That is, the number of obstacles exceeds the threshold,
and then the lattice is judged to be a barrier area. For
convenience, the mark barrier area is located in the
lattice 0, the non-barrier area is 1.
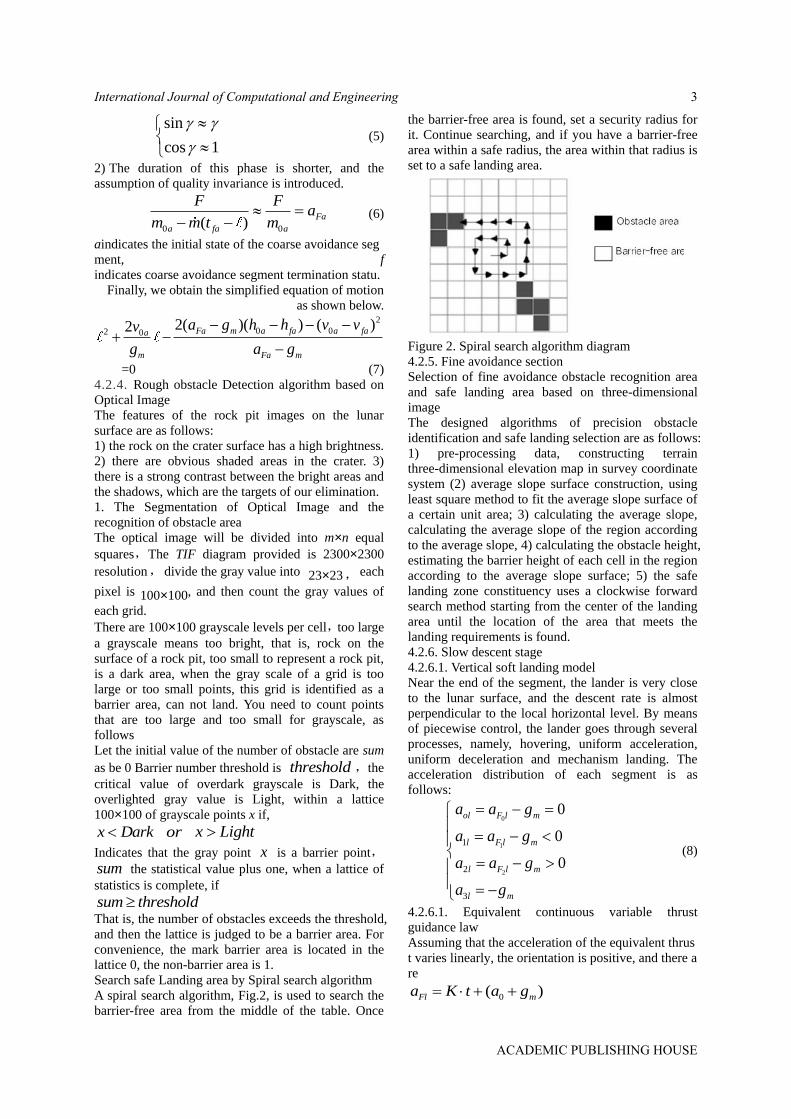
Search safe Landing area by Spiral search algorithm
A spiral search algorithm, Fig.2, is used to search the
barrier-free area from the middle of the table. Once
the barrier-free area is found, set a security radius for
it. Continue searching, and if you have a barrier-free
area within a safe radius, the area within that radius is
set to a safe landing area.
Figure 2. Spiral search algorithm diagram
4.2.5. Fine avoidance section
Selection of fine avoidance obstacle recognition area
and safe landing area based on three-dimensional
image
The designed algorithms of precision obstacle
identification and safe landing selection are as follows:
1) pre-processing data, constructing terrain
three-dimensional elevation map in survey coordinate
system (2) average slope surface construction, using
least square method to fit the average slope surface of
a certain unit area; 3) calculating the average slope,
calculating the average slope of the region according
to the average slope, 4) calculating the obstacle height,
estimating the barrier height of each cell in the region
according to the average slope surface; 5) the safe
landing zone constituency uses a clockwise forward
search method starting from the center of the landing
area until the location of the area that meets the
landing requirements is found.
4.2.6. Slow descent stage
4.2.6.1. Vertical soft landing model
Near the end of the segment, the lander is very close
to the lunar surface, and the descent rate is almost
perpendicular to the local horizontal level. By means
of piecewise control, the lander goes through several
processes, namely, hovering, uniform acceleration,
uniform deceleration and mechanism landing. The
acceleration distribution of each segment is as
follows:
0
1
2
1
2
3
0
0
0
ol F l m
l F l m
l F l m
l m
a a g
a a g
a a g
a g
(8)
4.2.6.1. Equivalent continuous variable thrust
guidance law
Assuming that the acceleration of the equivalent thrus
t varies linearly, the orientation is positive, and there a
re
0( )Fl ma K t a g
International Journal of Computational and Engineering 3
ACADEMIC PUBLISHING HOUSE
Among, K slope representing equivalent thrust
acceleration,K>0 indicates a gradual increase in
thrust,K<0 indicates a gradual decrease in thrust;a0
represents the equivalent thrust acceleration relative
to the lunar gravity acceleration gm initial offset. a0>0
indicates that the initial thrust acceleration is greater
than gm, a0<0, indicates that the initial thrust
acceleration is less than or equal to gm.
Combining shutdown conditions ( )
h( )
ft off
ft off
v t v
t h
(9)
For equation (19), two consecutive integrals on both
sides of equation (19) are obtained.
0 0
3 2
0 0
0 3
12 6
26 2
l off off
fl fl
off l off
fl fl
h h v vK
t t
h h v va
t t
(10)
Among them, subscript 0 and f denote the initial
landing and shutdown state respectively, subscript l
denotes the landing stage, subscript off denotes the
shutdown time.
4.3. Solution of model
4.3.1. Coarse obstacle avoidance optical image
segmentation and recognition of obstacle area
The imread function is obtained by MATLB, and the
gray image of the rough obstacle avoidance optical
image is read. Considering the gray scale image
element, it is rather slow to judge the obstacle area
with MATLB, so the gray scale image is input into
C++ to solve the model.
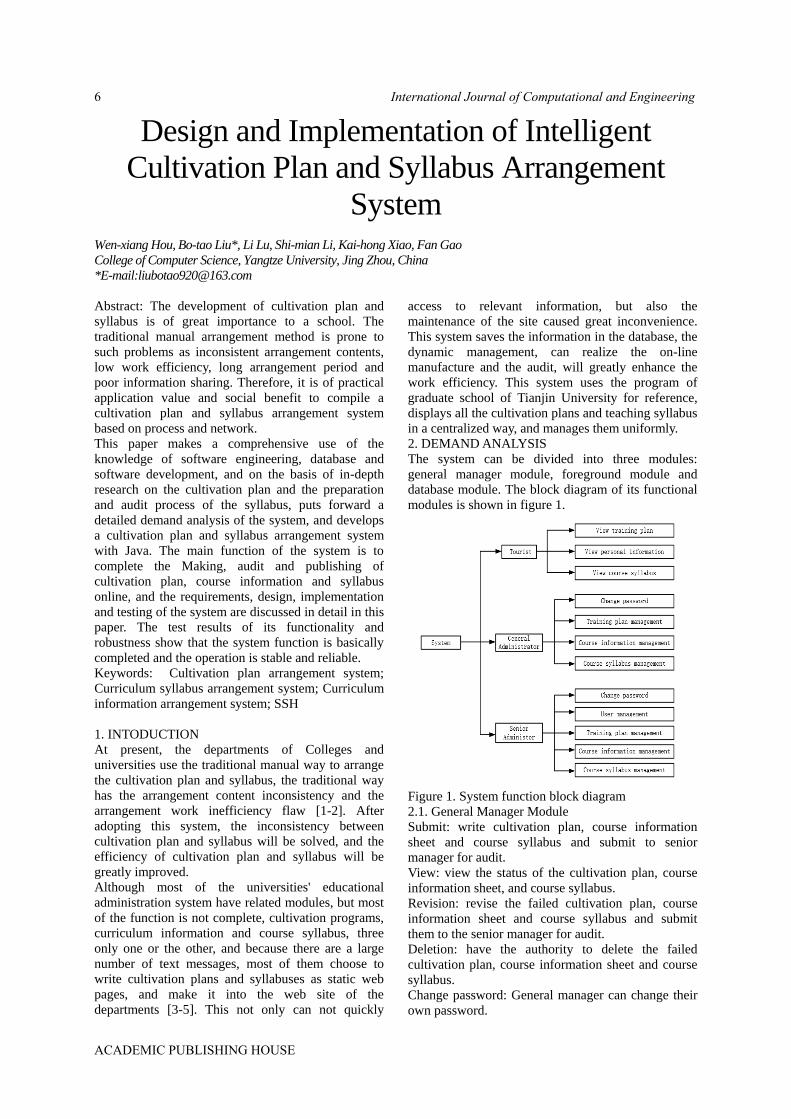
Figure 3. Comparison of obstacle area 0-1 with
original TIF map
When using C++ to partition and identify obstacle
areas, the values are set after many tests: The
threshold value is 80, the critical value of over-dark
gray level is 84, and the critical value of over-bright
gray level is 105. The 0-1 figure of obstacle area is
obtained as follows in fig.3 , and its correctness can
be verified by comparing with TIF in fig.4.
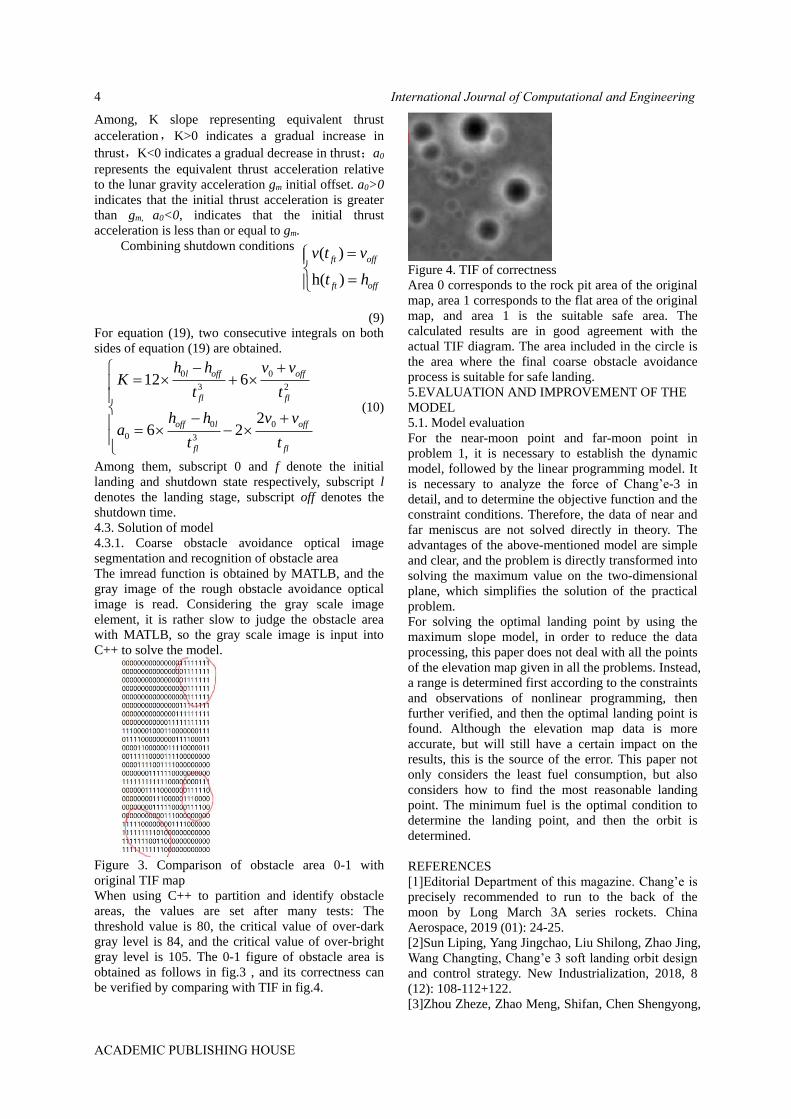
Figure 4. TIF of correctness
Area 0 corresponds to the rock pit area of the original
map, area 1 corresponds to the flat area of the original
map, and area 1 is the suitable safe area. The
calculated results are in good agreement with the
actual TIF diagram. The area included in the circle is
the area where the final coarse obstacle avoidance
process is suitable for safe landing.
5.EVALUATION AND IMPROVEMENT OF THE
MODEL
5.1. Model evaluation
For the near-moon point and far-moon point in
problem 1, it is necessary to establish the dynamic
model, followed by the linear programming model. It
is necessary to analyze the force of Chang’e-3 in
detail, and to determine the objective function and the
constraint conditions. Therefore, the data of near and
far meniscus are not solved directly in theory. The
advantages of the above-mentioned model are simple
and clear, and the problem is directly transformed into
solving the maximum value on the two-dimensional
plane, which simplifies the solution of the practical
problem.
For solving the optimal landing point by using the
maximum slope model, in order to reduce the data
processing, this paper does not deal with all the points
of the elevation map given in all the problems. Instead,
a range is determined first according to the constraints
and observations of nonlinear programming, then
further verified, and then the optimal landing point is
found. Although the elevation map data is more
accurate, but will still have a certain impact on the
results, this is the source of the error. This paper not
only considers the least fuel consumption, but also
considers how to find the most reasonable landing
point. The minimum fuel is the optimal condition to
determine the landing point, and then the orbit is
determined.
REFERENCES
[1]Editorial Department of this magazine. Chang’e is
precisely recommended to run to the back of the
moon by Long March 3A series rockets. China
Aerospace, 2019 (01): 24-25.
[2]Sun Liping, Yang Jingchao, Liu Shilong, Zhao Jing,
Wang Changting, Chang’e 3 soft landing orbit design
and control strategy. New Industrialization, 2018, 8
(12): 108-112+122.
[3]Zhou Zheze, Zhao Meng, Shifan, Chen Shengyong,
International Journal of Computational and Engineering4
ACADEMIC PUBLISHING HOUSE

Luan Hao. A method for estimating the elevation of
Chang’e 3. Journal of Xi’an University of Electronic
Science and Technology: 1-7 [2019-04-21].
http://kns.cnki.net/kcms/detail/61.1076.TN.20181217.
1102.004.html.
[4]Yan Jin, Xu Xinchao, Zhang Jichao. Research on
image matching method of descent sequence of
Chang’e-3 lander. Surveying and spatial geographic
information, 2018, 41(10): 140-144.
[5]Zhang Xiuzhi, Zhang Yumei, Zheng Cong, Liao
Wenkai-Chang’e-3 soft landing orbit design and
control strategy model. Science and technology
innovation, 2018, (25): 44-45.
[6]Han Puxia. Calculating the lunar elevation of
Chang’e-3 based on binocular vision. Tianjin
University of Technology, 2018.
[7]Analysis of Key Mechanics Problems in the
Release and Separation Process of Zou Huaiwu, Yang
Wenzhao, Liu Dianfu, Xiao Jie, Hu Zhenyu, Chang’e
3 Patrol-Lander. Journal of Astronautics, 2018, 39
(01): 9-16.
[8]Qin Jiayong, Pei Yifei, Wang Jing, Yin Xiaofang,
Gao Qinghua. Spacecraft Environmental Engineering,
2017, 34 (06): 656-661.
[9]Dingdan. Discussion on the design and control of
Chang’e 3 soft landing orbit. Science and Technology
Wind, 2017, (23): 7.
[10]Tong Shanshan, Niu Yujun, Chang’e 3 soft
landing trajectory model and optimal control strategy.
Journal of Nanyang Institute of Technology, 2017, 9
(04): 125-128.
[11]He Jinyang. Optimized Solution of Chang’e 3
Perigee Apogee Model. Enterprise Technology
Development, 2017, 36 (07): 30-31+35.
[12]Zhang Qiaoling. The mission of Chang’e 3 and its
preliminary scientific achievements. Journal of the
Chinese Academy of Sciences, 2017, 32 (01): 85-90.
International Journal of Computational and Engineering 5
ACADEMIC PUBLISHING HOUSE
Design and Implementation of Intelligent
Cultivation Plan and Syllabus Arrangement
System
Wen-xiang Hou, Bo-tao Liu*, Li Lu, Shi-mian Li, Kai-hong Xiao, Fan Gao
College of Computer Science, Yangtze University, Jing Zhou, China
*E-mail:[email protected]
Abstract: The development of cultivation plan and
syllabus is of great importance to a school. The
traditional manual arrangement method is prone to
such problems as inconsistent arrangement contents,
low work efficiency, long arrangement period and
poor information sharing. Therefore, it is of practical
application value and social benefit to compile a
cultivation plan and syllabus arrangement system
based on process and network.
This paper makes a comprehensive use of the
knowledge of software engineering, database and
software development, and on the basis of in-depth
research on the cultivation plan and the preparation
and audit process of the syllabus, puts forward a
detailed demand analysis of the system, and develops
a cultivation plan and syllabus arrangement system
with Java. The main function of the system is to
complete the Making, audit and publishing of
cultivation plan, course information and syllabus
online, and the requirements, design, implementation
and testing of the system are discussed in detail in this
paper. The test results of its functionality and
robustness show that the system function is basically
completed and the operation is stable and reliable.
Keywords: Cultivation plan arrangement system;
Curriculum syllabus arrangement system; Curriculum
information arrangement system; SSH
1. INTODUCTION
At present, the departments of Colleges and
universities use the traditional manual way to arrange
the cultivation plan and syllabus, the traditional way
has the arrangement content inconsistency and the
arrangement work inefficiency flaw [1-2]. After
adopting this system, the inconsistency between
cultivation plan and syllabus will be solved, and the
efficiency of cultivation plan and syllabus will be
greatly improved.
Although most of the universities' educational
administration system have related modules, but most
of the function is not complete, cultivation programs,
curriculum information and course syllabus, three
only one or the other, and because there are a large
number of text messages, most of them choose to
write cultivation plans and syllabuses as static web
pages, and make it into the web site of the
departments [3-5]. This not only can not quickly
access to relevant information, but also the
maintenance of the site caused great inconvenience.
This system saves the information in the database, the
dynamic management, can realize the on-line
manufacture and the audit, will greatly enhance the
work efficiency. This system uses the program of
graduate school of Tianjin University for reference,
displays all the cultivation plans and teaching syllabus
in a centralized way, and manages them uniformly.
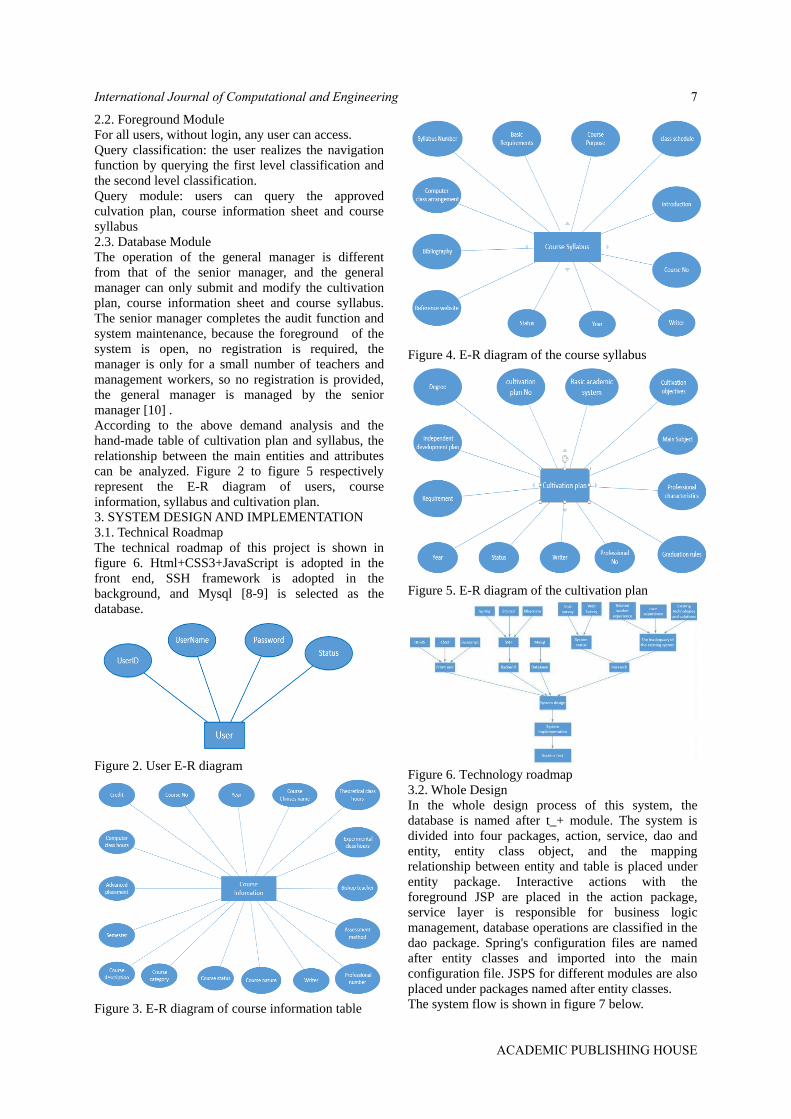
2. DEMAND ANALYSIS
The system can be divided into three modules:
general manager module, foreground module and
database module. The block diagram of its functional
modules is shown in figure 1.
Figure 1. System function block diagram
2.1. General Manager Module
Submit: write cultivation plan, course information
sheet and course syllabus and submit to senior
manager for audit.
View: view the status of the cultivation plan, course
information sheet, and course syllabus.
Revision: revise the failed cultivation plan, course
information sheet and course syllabus and submit
them to the senior manager for audit.
Deletion: have the authority to delete the failed
cultivation plan, course information sheet and course
syllabus.
Change password: General manager can change their
own password.
International Journal of Computational and Engineering6
ACADEMIC PUBLISHING HOUSE
2.2. Foreground Module
For all users, without login, any user can access.
Query classification: the user realizes the navigation
function by querying the first level classification and
the second level classification.
Query module: users can query the approved
culvation plan, course information sheet and course
syllabus
2.3. Database Module
The operation of the general manager is different
from that of the senior manager, and the general
manager can only submit and modify the cultivation
plan, course information sheet and course syllabus.
The senior manager completes the audit function and
system maintenance, because the foreground of the
system is open, no registration is required, the
manager is only for a small number of teachers and
management workers, so no registration is provided,
the general manager is managed by the senior
manager [10] .
According to the above demand analysis and the
hand-made table of cultivation plan and syllabus, the
relationship between the main entities and attributes
can be analyzed. Figure 2 to figure 5 respectively
represent the E-R diagram of users, course
information, syllabus and cultivation plan.
3. SYSTEM DESIGN AND IMPLEMENTATION
3.1. Technical Roadmap
The technical roadmap of this project is shown in
figure 6. Html+CSS3+JavaScript is adopted in the
front end, SSH framework is adopted in the
background, and Mysql [8-9] is selected as the
database.
Figure 2. User E-R diagram
Figure 3. E-R diagram of course information table
Figure 4. E-R diagram of the course syllabus
Figure 5. E-R diagram of the cultivation plan
Figure 6. Technology roadmap
3.2. Whole Design
In the whole design process of this system, the
database is named after t_+ module. The system is
divided into four packages, action, service, dao and
entity, entity class object, and the mapping
relationship between entity and table is placed under
entity package. Interactive actions with the
foreground JSP are placed in the action package,
service layer is responsible for business logic
management, database operations are classified in the
dao package. Spring's configuration files are named
after entity classes and imported into the main
configuration file. JSPS for different modules are also
placed under packages named after entity classes.
The system flow is shown in figure 7 below.
International Journal of Computational and Engineering 7
ACADEMIC PUBLISHING HOUSE
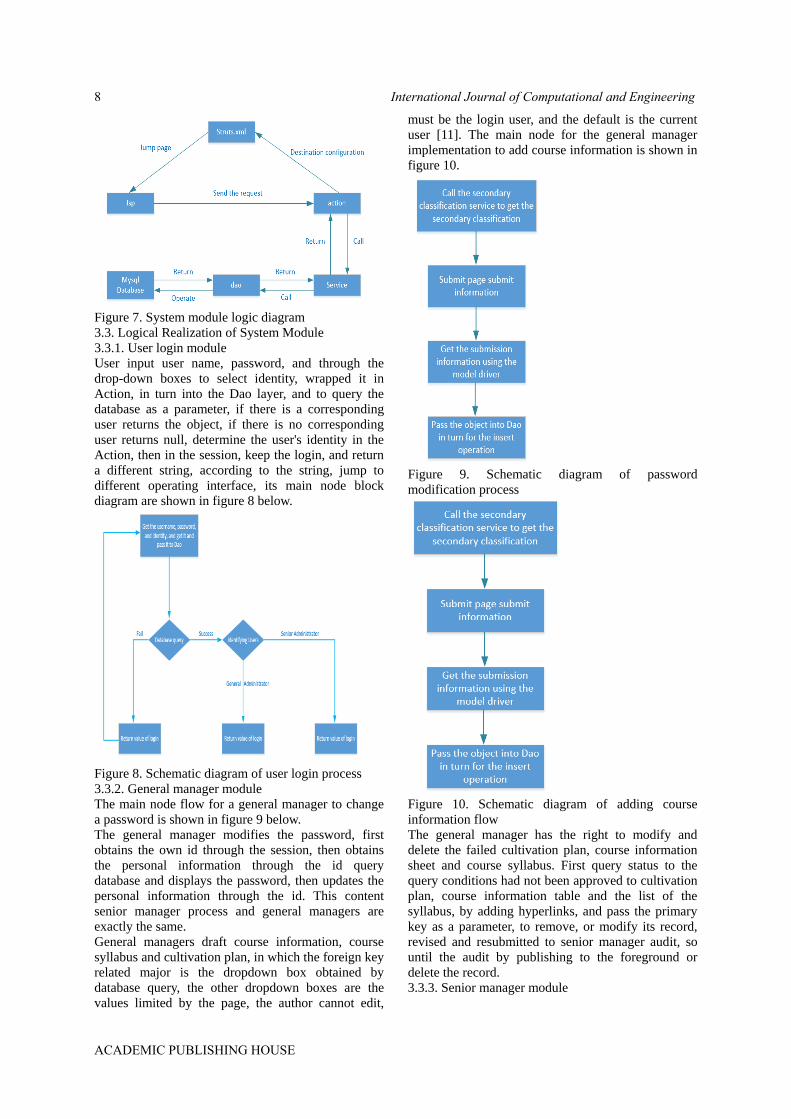
Figure 7. System module logic diagram
3.3. Logical Realization of System Module
3.3.1. User login module
User input user name, password, and through the
drop-down boxes to select identity, wrapped it in
Action, in turn into the Dao layer, and to query the
database as a parameter, if there is a corresponding
user returns the object, if there is no corresponding
user returns null, determine the user's identity in the
Action, then in the session, keep the login, and return
a different string, according to the string, jump to
different operating interface, its main node block
diagram are shown in figure 8 below.
Figure 8. Schematic diagram of user login process
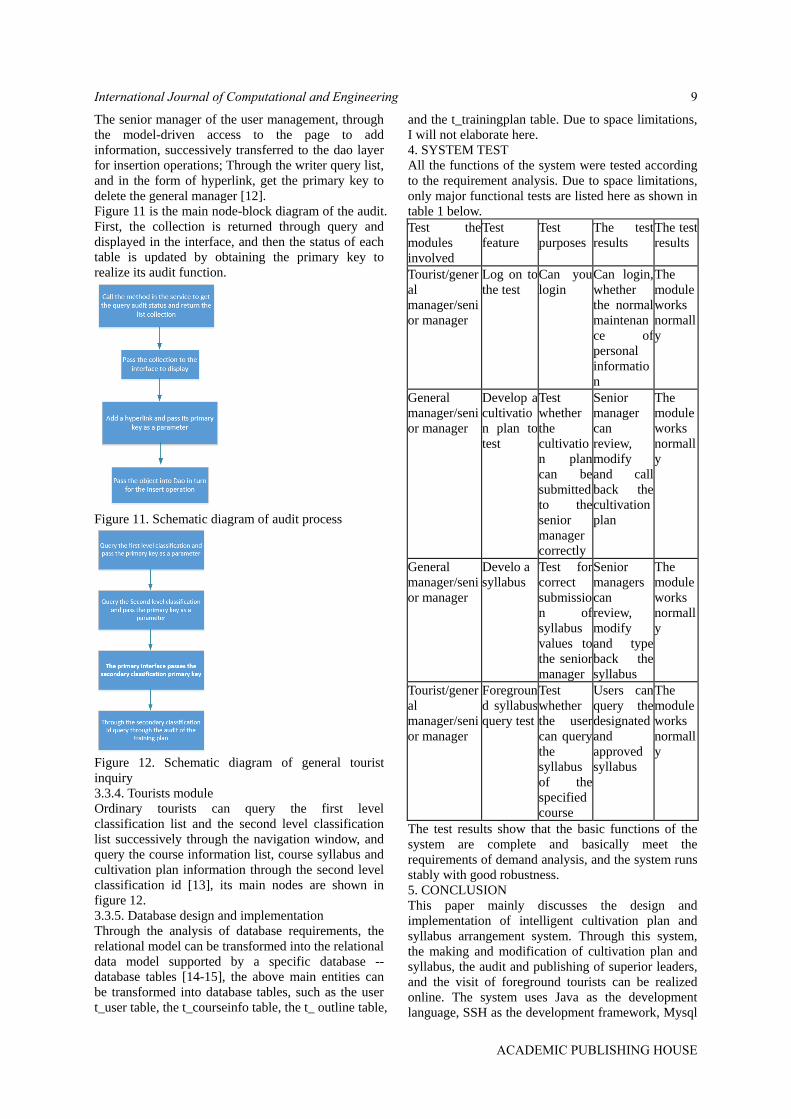
3.3.2. General manager module
The main node flow for a general manager to change
a password is shown in figure 9 below.
The general manager modifies the password, first
obtains the own id through the session, then obtains
the personal information through the id query
database and displays the password, then updates the
personal information through the id. This content
senior manager process and general managers are
exactly the same.
General managers draft course information, course
syllabus and cultivation plan, in which the foreign key
related major is the dropdown box obtained by
database query, the other dropdown boxes are the
values limited by the page, the author cannot edit,
must be the login user, and the default is the current
user [11]. The main node for the general manager
implementation to add course information is shown in
figure 10.
Figure 9. Schematic diagram of password
modification process
Figure 10. Schematic diagram of adding course
information flow
The general manager has the right to modify and
delete the failed cultivation plan, course information
sheet and course syllabus. First query status to the
query conditions had not been approved to cultivation
plan, course information table and the list of the
syllabus, by adding hyperlinks, and pass the primary
key as a parameter, to remove, or modify its record,
revised and resubmitted to senior manager audit, so
until the audit by publishing to the foreground or
delete the record.
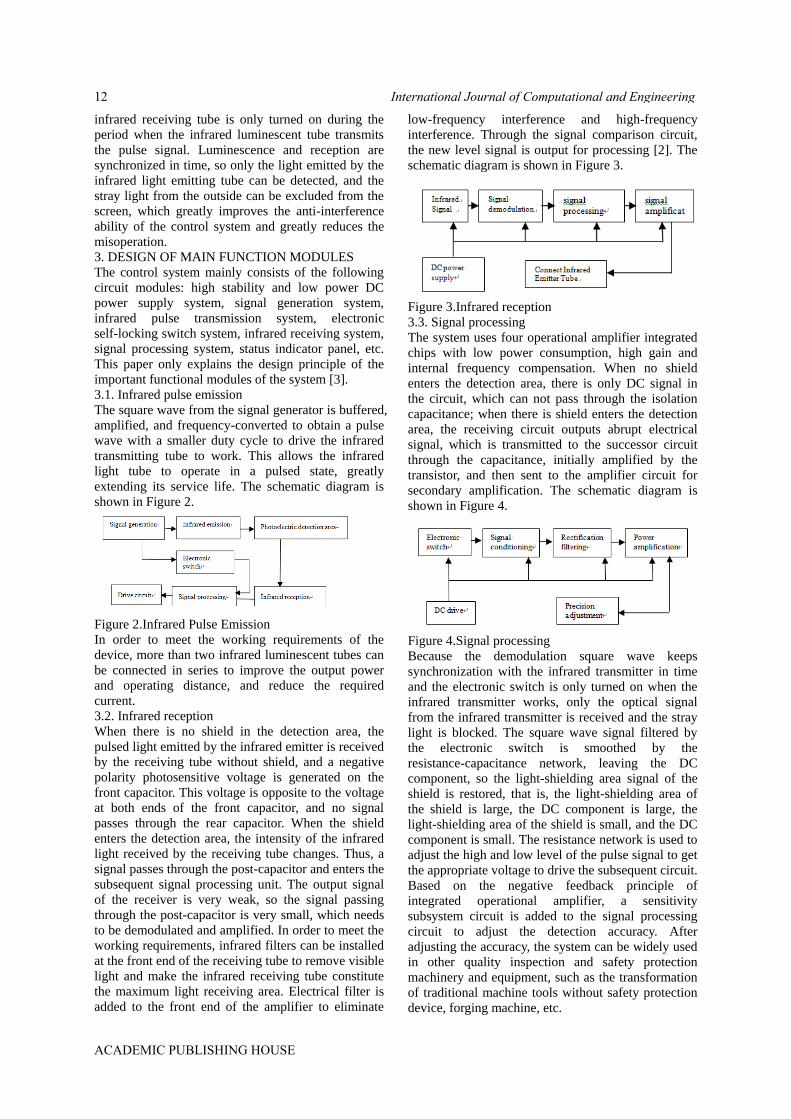
3.3.3. Senior manager module
International Journal of Computational and Engineering8
ACADEMIC PUBLISHING HOUSE
The senior manager of the user management, through
the model-driven access to the page to add
information, successively transferred to the dao layer
for insertion operations; Through the writer query list,
and in the form of hyperlink, get the primary key to
delete the general manager [12].
Figure 11 is the main node-block diagram of the audit.
First, the collection is returned through query and
displayed in the interface, and then the status of each
table is updated by obtaining the primary key to
realize its audit function.
Figure 11. Schematic diagram of audit process
Figure 12. Schematic diagram of general tourist
inquiry
3.3.4. Tourists module
Ordinary tourists can query the first level
classification list and the second level classification
list successively through the navigation window, and
query the course information list, course syllabus and
cultivation plan information through the second level
classification id [13], its main nodes are shown in
figure 12.
3.3.5. Database design and implementation
Through the analysis of database requirements, the
relational model can be transformed into the relational
data model supported by a specific database --
database tables [14-15], the above main entities can
be transformed into database tables, such as the user
t_user table, the t_courseinfo table, the t_ outline table,
and the t_trainingplan table. Due to space limitations,
I will not elaborate here.
4. SYSTEM TEST
All the functions of the system were tested according
to the requirement analysis. Due to space limitations,
only major functional tests are listed here as shown in
table 1 below.
Test the
modules
involved
Test
feature
Test
purposes
The test
results
The test
results
Tourist/gener
al
manager/seni
or manager
Log on to
the test
Can you
login
Can login,
whether
the normal
maintenan
ce of
personal
informatio
n
The
module
works
normall
y
General
manager/seni
or manager
Develop a
cultivatio
n plan to
test
Test
whether
the
cultivatio
n plan
can be
submitted
to the
senior
manager
correctly
Senior
manager
can
review,
modify
and call
back the
cultivation
plan
The
module
works
normall
y
General
manager/seni
or manager
Develo a
syllabus
Test for
correct
submissio
n of
syllabus
values to
the senior
manager
Senior
managers
can
review,
modify
and type
back the
syllabus
The
module
works
normall
y
Tourist/gener
al
manager/seni
or manager
Foregroun
d syllabus
query test
Test
whether
the user
can query
the
syllabus
of the
specified
course
Users can
query the
designated
and
approved
syllabus
The
module
works
normall
y
The test results show that the basic functions of the
system are complete and basically meet the
requirements of demand analysis, and the system runs
stably with good robustness.
5. CONCLUSION
This paper mainly discusses the design and
implementation of intelligent cultivation plan and
syllabus arrangement system. Through this system,
the making and modification of cultivation plan and
syllabus, the audit and publishing of superior leaders,
and the visit of foreground tourists can be realized
online. The system uses Java as the development
language, SSH as the development framework, Mysql
International Journal of Computational and Engineering 9
ACADEMIC PUBLISHING HOUSE

as the database [20]. Compared with the traditional
manual production method, this system can greatly
improve the work efficiency and data accuracy, and
compared with the current market equivalent system,
has the advantages of cross-platform, comprehensive
functions, system maintenance difficulty is small.
ACKNOWLEDGEMENTS
This paper was financially supported by four projects:
The project of young people in the Education Hall of
Hubei (No. Q20161311), The Yangtze Youth Fund
(No. 2015cqn53), Teaching and research project of
Yangtze University (No. JY2015038), the Yangtze
University Students’ Innovation and Entrepreneurship
Training Program Project (No. 2016081)
REFERENCES
[1]LI Hai-jian, TIAN Yue-xin, LI Wen-jie Mobile
Internet Thinking and Traditional Business
Reengineering. China Industrial Economics,
2014(10).
[2]ZHOU Hong-duo. I understand that the "Internet
+" - "Internet +" is a kind of fusion. Modern
Communication, 2015 (08).
[3]HU Wen, LI Yan. Analysis of MySQL DataBase
Storage Engine. Software Guide, 2012(12).
[4]XUE Zhi-liang. Configuration of JSP and Servlet
development environment under Tomcat. China
Science and Technology Information, 2006(20).
[5](Germany) Christian Bauer. Java Persistence
with Hibernate. People Post Press, 2007.
[6]ZHOU Hong-jing, YANG Jin-min. Object
persistence implementation based on Hibernate.
Computer Era, 2009(03).
[7](America)Rod Johnson etc. Professional Java
Development with the Spring Framework.
Mechanical industry press, 2006.
[8]ZOU Cun-jie. The researc and application of the
Spring framework which based on MVC pattern.
Dalian Maritime University, 2006.
[9]WANG Tao-tao, LI Xiao-yu, SHI Wei-li. Design
and Implementation of Authority by Struts 2 Intercept.
Computer and Modernization, 2009(01).
[10]LI Xiang. Design and Implementation of Web
Application System Among Struts2 Framework.
Southwestern University of Finance and Economics.
2010.
[11]Brown D, Davis c. Struts2 in Action, 2008.
[12]CHEN Hui-min, ZHANG Rui. Theory and
Application of Software Engineering. Journal of
Xi’an Petrdleum Institute (Social Sciences Edition),
2001(04).
[13]LIU Hong-mei. Development of Application
System Based on C/S and B/S Architecture.
Computer and Modernization, 2007(11)
[14]WU Wen. Analysis of Web Development
Techniques based on Java. Science Mosaic,
2013(05)
[15]CHANG Jin, ZHENG Ke, XU Yan-qun.
Research and Application of Lightweight Framework
Based on SSH. Coal Mine Machinery, 2010(08).
[16]LI Yang. Design and Implementation of SSMin
Web Application Development. Computer
Technology and Development, 2016(12).
[17]LIU Tian-yin. HTML5 and Web Application
Platform in the Future. Yinshan Academic
Journal (Natural Science Edition), 2010(02).
[18]Gong Yun-zhan. Software testing course.
Mechanical industry press, 2008.
[19]Wang Xiao-hua. Software Testing Technology
Application Research. Defence Science &
Technology Industry, 2012(03).
[20]Bruce Eckel. Thinking in Java. Mechanical
industry press, 2007.6.
International Journal of Computational and Engineering10
ACADEMIC PUBLISHING HOUSE

Research on High Precision Detection System
Based on Infrared Sensing Technology
Jing Zhao
Electric and Electronic Engineering Department, Zibo Vocational Institute, Zibo, 255314, China
E-mail: [email protected]
Abstract:The system is based on infrared sensing
technology and is used to detect the diameter of
objects. Through the debugging of the selection, the
system installation can achieve an impact distance of
5mm-30m.Adjusting the system accuracy, the system
can automatically detect the diameter ф ≥0.05mm.The article introduces the workflow of the
system and the design principles of the main
functional modules.
Keywords: Photoelectric control; Pulse
modulation/synchronous demodulation; Detection
system
1. INTRODUCTION
The detection control circuit is one of the core
technologies of the automation control system. Its
sensitivity, accuracy, service life, safety, stability and
other factors directly determine the advantages and
disadvantages of the automation control process.
Through the investigation of cotton textile enterprises,
it was found that some spinning equipment still uses
on-site manual quality inspection. Because manual
testing can not guarantee the timely splicing of cotton
sliver and the stability of cotton yarn diameter, it
causes problems such as product quality and low
production efficiency.
In order to ensure the improvement of product quality
and efficiency, a high-precision detection and control
system based on infrared sensing technology is
adopted. The system can be used not only in textile
machinery, but also in traditional forging machines
and machine tools by adjusting the system accuracy,
sensitivity and measuring range. It can also
effectively protect personal safety.
Because infrared has strong penetrating ability
andanti-interference ability, it is not easy to scatter
and is not easy to cause crosstalk. The system uses
infrared-based sensing and uses
modulation/demodulation technology to complete the
system signal transmission and reception design.
2. SIGNAL FLOW AND PRINCIPLE OF THE
SYSTEM
From the infrared emission tube to the relay control
device to stop and start, it is the main channel for
processing the unit signal.In the main channel,
electrical signals are transmitted in the order shown in
Figure 1.
Figure 1.Signal main channel
Infrared luminescent tube and infrared receiving tube
are separated on both sides of photoelectric detection
area, which need little maintenance. Infrared receiver
is a photosensitive current source. The photosensitive
current increases with the increase of light flux. When
the photosensitive current charges the capacitor, the
electrical signal changes with the change of light flux
can be obtained.
When there is no shield, the light path is unimpeded
and the photosensitive current is the largest; when
there is a shield passing through the detection area,
the part of the light path is blocked, the output
potential increases, and the larger the shading area,
the higher the output potential.
By adjusting the sensitivity of the detection system,
the principle can be used to measure and control the
diameter or area of the object to be measured, so as to
realize quality inspection or safety protection.
Multi-station monitoring can be realized through the
connector [1].
In this design, pulse modulation and synchronous
demodulation are used to generate and pick up
infrared light. Compared with dc light,
pulse-modulated light enhances the ability
towithstand stray light and electromechanical
interference in the workshop.On the other hand, the
life of the illuminating tube is relatively prolonged
due to the pulse state.When a shield enters the
detection area, the intensity of the light received by
the infrared receiver will change abruptly. Therefore,
the estimated value of the variable light is used as the
occlusion signal.
Traditional safety protectors are prone to
misoperation, such as when lighting is turned on or
off, signal processing unit will judge them as
occlusion signal and misoperation. In the design of
the system, pulse modulation/synchronous
demodulation is used to make the infrared
luminescent tube emit signal for a period of time and
turn off the signal for a period of time, that is, to emit
infrared light in the form of pulse. Similarly, the
International Journal of Computational and Engineering 11
ACADEMIC PUBLISHING HOUSE
infrared receiving tube is only turned on during the
period when the infrared luminescent tube transmits
the pulse signal. Luminescence and reception are
synchronized in time, so only the light emitted by the
infrared light emitting tube can be detected, and the
stray light from the outside can be excluded from the
screen, which greatly improves the anti-interference
ability of the control system and greatly reduces the
misoperation.
3. DESIGN OF MAIN FUNCTION MODULES
The control system mainly consists of the following
circuit modules: high stability and low power DC
power supply system, signal generation system,
infrared pulse transmission system, electronic
self-locking switch system, infrared receiving system,
signal processing system, status indicator panel, etc.
This paper only explains the design principle of the
important functional modules of the system [3].
3.1. Infrared pulse emission
The square wave from the signal generator is buffered,
amplified, and frequency-converted to obtain a pulse
wave with a smaller duty cycle to drive the infrared
transmitting tube to work. This allows the infrared
light tube to operate in a pulsed state, greatly
extending its service life. The schematic diagram is
shown in Figure 2.
Figure 2.Infrared Pulse Emission
In order to meet the working requirements of the
device, more than two infrared luminescent tubes can
be connected in series to improve the output power
and operating distance, and reduce the required
current.
3.2. Infrared reception
When there is no shield in the detection area, the
pulsed light emitted by the infrared emitter is received
by the receiving tube without shield, and a negative
polarity photosensitive voltage is generated on the
front capacitor. This voltage is opposite to the voltage
at both ends of the front capacitor, and no signal
passes through the rear capacitor. When the shield
enters the detection area, the intensity of the infrared
light received by the receiving tube changes. Thus, a
signal passes through the post-capacitor and enters the
subsequent signal processing unit. The output signal
of the receiver is very weak, so the signal passing
through the post-capacitor is very small, which needs
to be demodulated and amplified. In order to meet the
working requirements, infrared filters can be installed
at the front end of the receiving tube to remove visible
light and make the infrared receiving tube constitute
the maximum light receiving area. Electrical filter is
added to the front end of the amplifier to eliminate
low-frequency interference and high-frequency
interference. Through the signal comparison circuit,
the new level signal is output for processing [2]. The
schematic diagram is shown in Figure 3.
Figure 3.Infrared reception
3.3. Signal processing
The system uses four operational amplifier integrated
chips with low power consumption, high gain and
internal frequency compensation. When no shield
enters the detection area, there is only DC signal in
the circuit, which can not pass through the isolation
capacitance; when there is shield enters the detection
area, the receiving circuit outputs abrupt electrical
signal, which is transmitted to the successor circuit
through the capacitance, initially amplified by the
transistor, and then sent to the amplifier circuit for
secondary amplification. The schematic diagram is
shown in Figure 4.
Figure 4.Signal processing
Because the demodulation square wave keeps
synchronization with the infrared transmitter in time
and the electronic switch is only turned on when the
infrared transmitter works, only the optical signal
from the infrared transmitter is received and the stray
light is blocked. The square wave signal filtered by
the electronic switch is smoothed by the
resistance-capacitance network, leaving the DC
component, so the light-shielding area signal of the
shield is restored, that is, the light-shielding area of
the shield is large, the DC component is large, the
light-shielding area of the shield is small, and the DC
component is small. The resistance network is used to
adjust the high and low level of the pulse signal to get
the appropriate voltage to drive the subsequent circuit.
Based on the negative feedback principle of
integrated operational amplifier, a sensitivity
subsystem circuit is added to the signal processing
circuit to adjust the detection accuracy. After
adjusting the accuracy, the system can be widely used
in other quality inspection and safety protection
machinery and equipment, such as the transformation
of traditional machine tools without safety protection
device, forging machine, etc.
International Journal of Computational and Engineering12
ACADEMIC PUBLISHING HOUSE

4. TEST RESULTS AND DATA ANALYSIS
The schematic drawing, simulation debugging and
PCB board drawing of the testing system are all
designed by EDA (Protel) software. The parts are
selected, debugged and welded. Under normal
temperature, humidity and fluorescent lamp
environment, the infrared sensor is used to detect the
measured object. By changing the measuring distance
and the diameter of the measured object, several
groups of experimental data are obtained, as shown in
Table 1.
Table 1. Detection of automatic parking results under
different conditions Detection
distance/m
Diameter of
detector/m
m
Detection
Times/tim
es
Diameter change of
measured
object/mm
Stopping
times/times
0.05 0.05 20/20 d>0.05/d<0.05 20/20
0.5 0.05 20/20 d>0.05/d<0.05 20/20
1 0.05 20/20 d>0.05/d<0.05 20/19
1.5 0.05 50/50 d>0.05/d<0.05 47/49
3 0.1 20/20 d>0.1/d<0.1 20/20
10 0.25 20/20 d>0.25/d<0.25 20/18
15 0.5 20/20 d>0.5/d<0.5 20/19
15<L<30 0.5 50/50 d>2/d<2 40/38
15<L<30 2 50/50 d>2/d<2 48/49
From the experimental data, it can be seen that the
diameter of the test object decreases with the increase
of the test distance due to the divergence of the
infrared light emitted by the infrared emitter in the air
and other effects such as air flow, dust and density
difference. By increasing the transmitting power and
improving the demodulation and detection function of
the receiver, the detection distance is 30m, the
diameter of the test object is 2mm, and the detection
accuracy is 95%. However, the accurate detection rate
below 1 mm is low. Therefore, how to improve the
detection accuracy is the focus of this project in the
future, and also the key to continue to expand the
detection field [4].
Considering that the infrared sensor is greatly affected
by the environmental temperature, illumination,
humidity and other properties, the stability of the
environmental temperature, humidity, illumination,
light stroboscopic detection system is adjusted. In the
range of ambient illumination <20000LX, ambient
temperature-15-60 C, ambient humidity <90% RH,
stroboscopic <1500 RPM, the test detection rate
(correct parking percentage) is not less than 90%.
5. CONCLUSION
The detection system works with 380 or 220V,
50-60Hz AC. It has good universality with
mechanical equipment and does not need any other
power supply. The installation frame is easy to install.
It uses light display circuit to adjust the firing
accuracy of transmitter and receiver tubes, which is
simple and fast. The high precision detection system
is based on infrared sensing technology. It can be used
in the fields of textile, machinery, food production,
product quality monitoring and safety protection. It
effectively guarantees the improvement of product
quality and normal production. The system has wide
application prospects.
REFERENCES
[1]Liu Chuanqing. Wireless sensor
networktechnology. Electronic Industry Press2015.
[2]Sun Ting, Yang Yongtian, Li Lihong. The
Development Status of Wireless Sensor Network
Technology. Application of Electronic Technology,
2006-06.
[3]Zhao Bing, Yang Jifeng, Sun Shulin, Wang
Shuai.Laboratory Static Characteristics Calibration
System Based on LabVIEW. Instrument Technique
and Sensor, 2011-06.
[4]Yang Sanxu, Xu Shushan, Yin Baozhong. Study on
the stability of capacitive sensor measurement circuit.
Sensor and Microsystem, 2006-07
.
International Journal of Computational and Engineering 13
ACADEMIC PUBLISHING HOUSE
The Optimization Simulation of Casting
Process for Compressor Crosshead
Gaojian Li
Zibo Vocational Institute, Shandong, China
E-mail: [email protected]
Abstract: The casting process for compressor
crosshead of ductile cast iron was analyzed, and the
suitable pouring gate position gate position and
parting surface were chosen. The casting forming
process of the crosshead was simulated by procast
software and the casting process was optimized.
Finally, the self-forming riser which makes full use of
nodular cast iron eutectic expansion effect was
designed to improve the crosshead surface puality and
internal defects, and improve the casting efficiency of
the crosshead.
1. INTRODUCTION
Based on computer simulation technology, Procast
casting molding software is used to simulate the
casting process of spheroidal graphite crossheads,
analyze the existing problems of existing process
methods, and assist in finding out the causes and
solutions [1-2] to optimize the crosshead casting
process. Finally, the riser that makes full use of the
eutectic expansion of ductile iron to achieve
self-feeding is designed, which improves the surface
quality and internal defects of the crosshead and
greatly improves the casting efficiency of the
crosshead.
2. PROCESS PLAN DETERMINATION
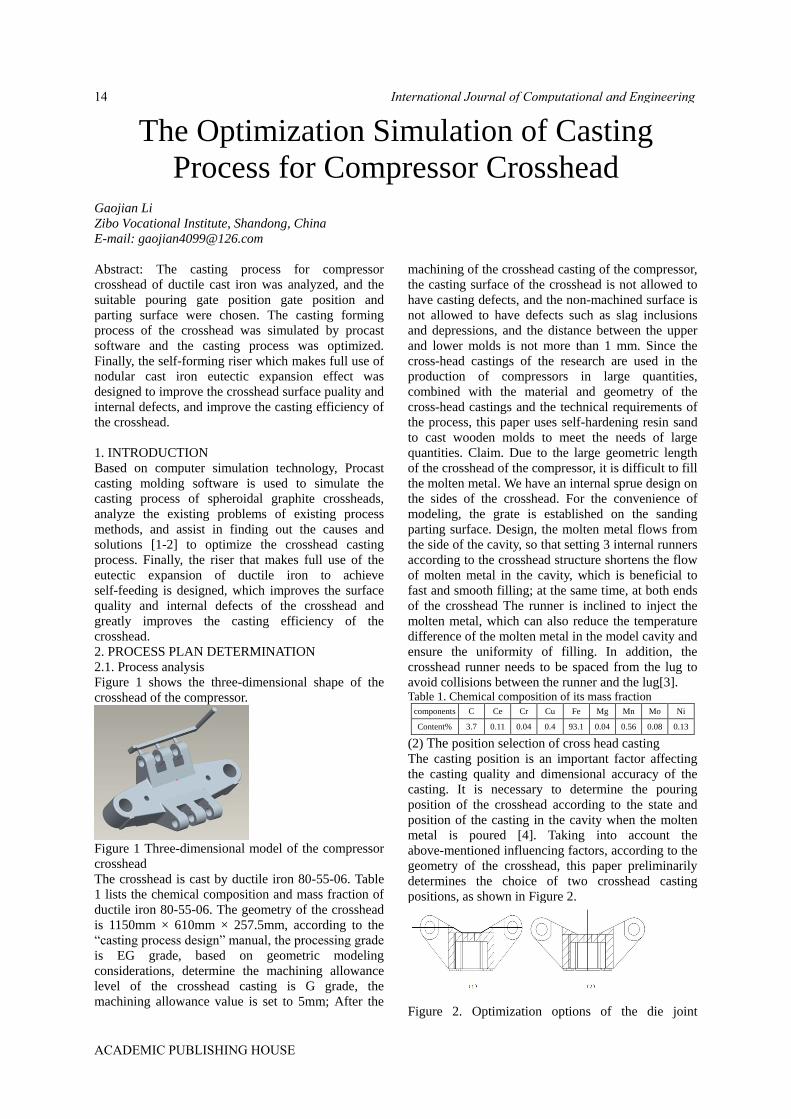
2.1. Process analysis
Figure 1 shows the three-dimensional shape of the
crosshead of the compressor.
Figure 1 Three-dimensional model of the compressor
crosshead
The crosshead is cast by ductile iron 80-55-06. Table
1 lists the chemical composition and mass fraction of
ductile iron 80-55-06. The geometry of the crosshead
is 1150mm × 610mm × 257.5mm, according to the
“casting process design” manual, the processing grade
is EG grade, based on geometric modeling
considerations, determine the machining allowance
level of the crosshead casting is G grade, the
machining allowance value is set to 5mm; After the
machining of the crosshead casting of the compressor,
the casting surface of the crosshead is not allowed to
have casting defects, and the non-machined surface is
not allowed to have defects such as slag inclusions
and depressions, and the distance between the upper
and lower molds is not more than 1 mm. Since the
cross-head castings of the research are used in the
production of compressors in large quantities,
combined with the material and geometry of the
cross-head castings and the technical requirements of
the process, this paper uses self-hardening resin sand
to cast wooden molds to meet the needs of large
quantities. Claim. Due to the large geometric length
of the crosshead of the compressor, it is difficult to fill
the molten metal. We have an internal sprue design on
the sides of the crosshead. For the convenience of
modeling, the grate is established on the sanding
parting surface. Design, the molten metal flows from
the side of the cavity, so that setting 3 internal runners
according to the crosshead structure shortens the flow
of molten metal in the cavity, which is beneficial to
fast and smooth filling; at the same time, at both ends
of the crosshead The runner is inclined to inject the
molten metal, which can also reduce the temperature
difference of the molten metal in the model cavity and
ensure the uniformity of filling. In addition, the
crosshead runner needs to be spaced from the lug to
avoid collisions between the runner and the lug[3]. Table 1. Chemical composition of its mass fraction
components C Ce Cr Cu Fe Mg Mn Mo Ni
Content% 3.7 0.11 0.04 0.4 93.1 0.04 0.56 0.08 0.13
(2) The position selection of cross head casting
The casting position is an important factor affecting
the casting quality and dimensional accuracy of the
casting. It is necessary to determine the pouring
position of the crosshead according to the state and
position of the casting in the cavity when the molten
metal is poured [4]. Taking into account the
above-mentioned influencing factors, according to the
geometry of the crosshead, this paper preliminarily
determines the choice of two crosshead casting
positions, as shown in Figure 2.
Figure 2. Optimization options of the die joint
International Journal of Computational and Engineering14
ACADEMIC PUBLISHING HOUSE
position
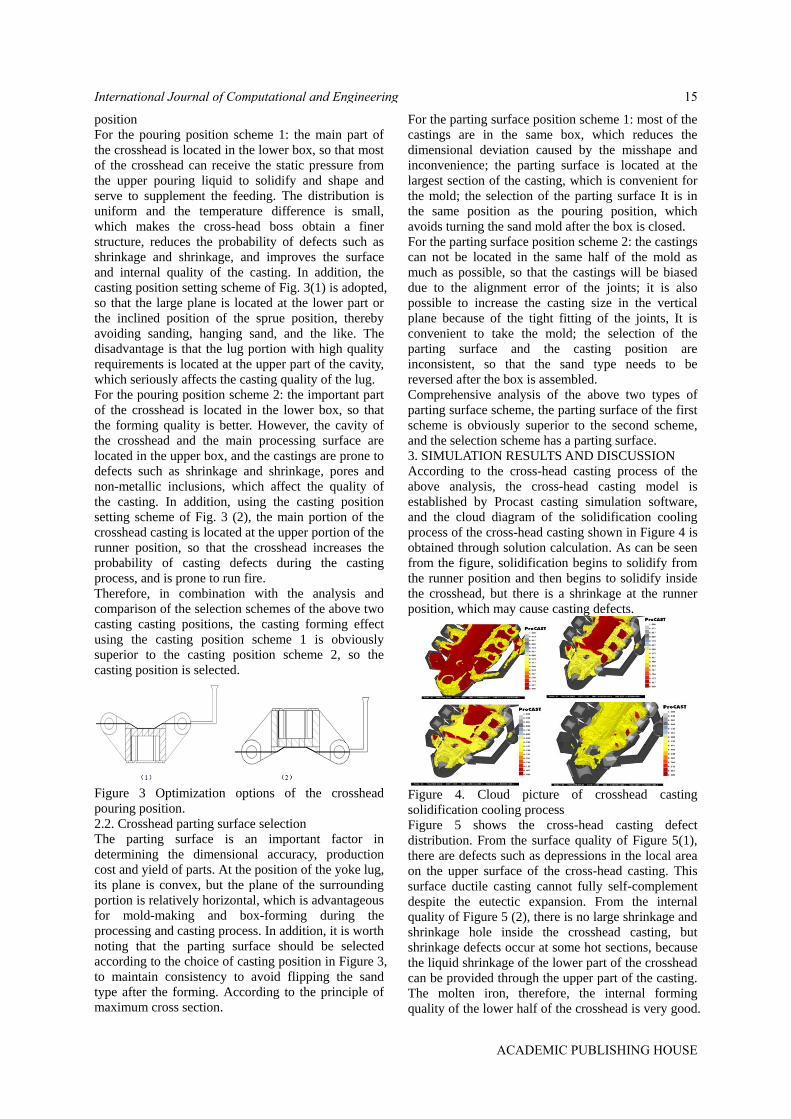
For the pouring position scheme 1: the main part of
the crosshead is located in the lower box, so that most
of the crosshead can receive the static pressure from
the upper pouring liquid to solidify and shape and
serve to supplement the feeding. The distribution is
uniform and the temperature difference is small,
which makes the cross-head boss obtain a finer
structure, reduces the probability of defects such as
shrinkage and shrinkage, and improves the surface
and internal quality of the casting. In addition, the
casting position setting scheme of Fig. 3(1) is adopted,
so that the large plane is located at the lower part or
the inclined position of the sprue position, thereby
avoiding sanding, hanging sand, and the like. The
disadvantage is that the lug portion with high quality
requirements is located at the upper part of the cavity,
which seriously affects the casting quality of the lug.
For the pouring position scheme 2: the important part
of the crosshead is located in the lower box, so that
the forming quality is better. However, the cavity of
the crosshead and the main processing surface are
located in the upper box, and the castings are prone to
defects such as shrinkage and shrinkage, pores and
non-metallic inclusions, which affect the quality of
the casting. In addition, using the casting position
setting scheme of Fig. 3 (2), the main portion of the
crosshead casting is located at the upper portion of the
runner position, so that the crosshead increases the
probability of casting defects during the casting
process, and is prone to run fire.
Therefore, in combination with the analysis and
comparison of the selection schemes of the above two
casting casting positions, the casting forming effect
using the casting position scheme 1 is obviously
superior to the casting position scheme 2, so the
casting position is selected.
Figure 3 Optimization options of the crosshead
pouring position.
2.2. Crosshead parting surface selection
The parting surface is an important factor in
determining the dimensional accuracy, production
cost and yield of parts. At the position of the yoke lug,
its plane is convex, but the plane of the surrounding
portion is relatively horizontal, which is advantageous
for mold-making and box-forming during the
processing and casting process. In addition, it is worth
noting that the parting surface should be selected
according to the choice of casting position in Figure 3,
to maintain consistency to avoid flipping the sand
type after the forming. According to the principle of
maximum cross section.
For the parting surface position scheme 1: most of the
castings are in the same box, which reduces the
dimensional deviation caused by the misshape and
inconvenience; the parting surface is located at the
largest section of the casting, which is convenient for
the mold; the selection of the parting surface It is in
the same position as the pouring position, which
avoids turning the sand mold after the box is closed.
For the parting surface position scheme 2: the castings
can not be located in the same half of the mold as
much as possible, so that the castings will be biased
due to the alignment error of the joints; it is also
possible to increase the casting size in the vertical
plane because of the tight fitting of the joints, It is
convenient to take the mold; the selection of the
parting surface and the casting position are
inconsistent, so that the sand type needs to be
reversed after the box is assembled.
Comprehensive analysis of the above two types of
parting surface scheme, the parting surface of the first
scheme is obviously superior to the second scheme,
and the selection scheme has a parting surface.
3. SIMULATION RESULTS AND DISCUSSION
According to the cross-head casting process of the
above analysis, the cross-head casting model is
established by Procast casting simulation software,
and the cloud diagram of the solidification cooling
process of the cross-head casting shown in Figure 4 is
obtained through solution calculation. As can be seen
from the figure, solidification begins to solidify from
the runner position and then begins to solidify inside
the crosshead, but there is a shrinkage at the runner
position, which may cause casting defects.
Figure 4. Cloud picture of crosshead casting
solidification cooling process
Figure 5 shows the cross-head casting defect
distribution. From the surface quality of Figure 5(1),
there are defects such as depressions in the local area
on the upper surface of the cross-head casting. This
surface ductile casting cannot fully self-complement
despite the eutectic expansion. From the internal
quality of Figure 5 (2), there is no large shrinkage and
shrinkage hole inside the crosshead casting, but
shrinkage defects occur at some hot sections, because
the liquid shrinkage of the lower part of the crosshead
can be provided through the upper part of the casting.
The molten iron, therefore, the internal forming
quality of the lower half of the crosshead is very good.
International Journal of Computational and Engineering 15
ACADEMIC PUBLISHING HOUSE
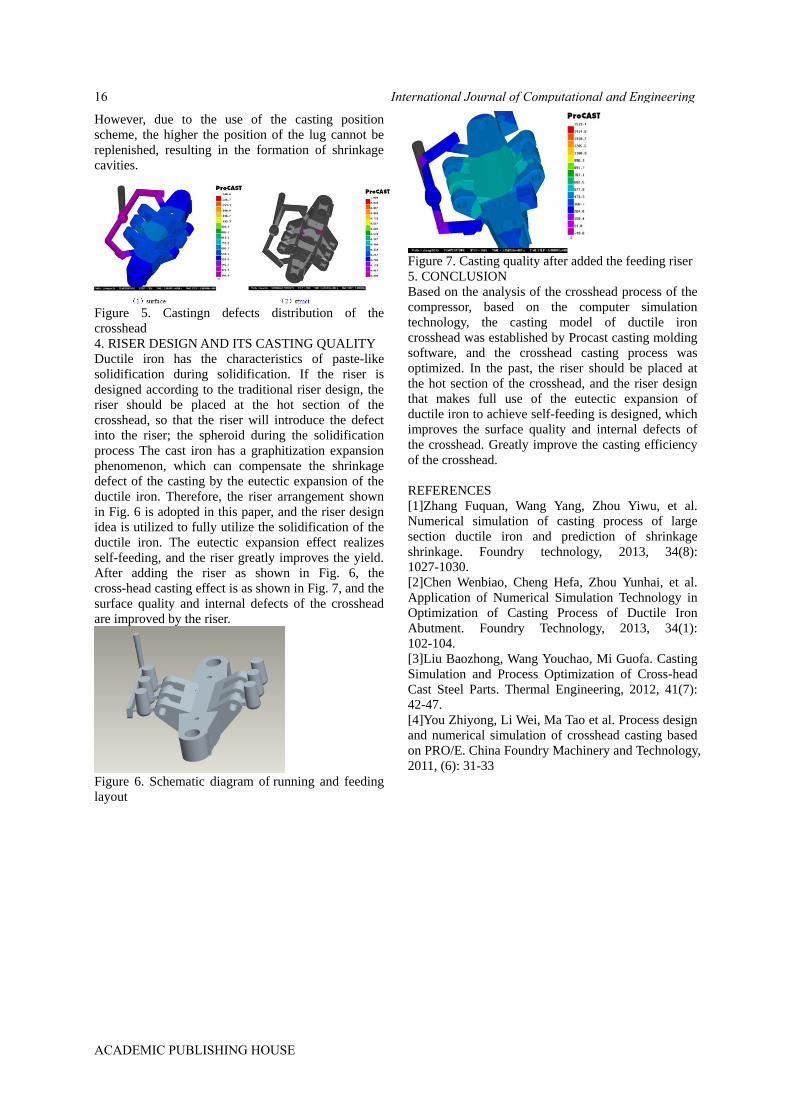
However, due to the use of the casting position
scheme, the higher the position of the lug cannot be
replenished, resulting in the formation of shrinkage
cavities.
Figure 5. Castingn defects distribution of the
crosshead
4. RISER DESIGN AND ITS CASTING QUALITY
Ductile iron has the characteristics of paste-like
solidification during solidification. If the riser is
designed according to the traditional riser design, the
riser should be placed at the hot section of the
crosshead, so that the riser will introduce the defect
into the riser; the spheroid during the solidification
process The cast iron has a graphitization expansion
phenomenon, which can compensate the shrinkage
defect of the casting by the eutectic expansion of the
ductile iron. Therefore, the riser arrangement shown
in Fig. 6 is adopted in this paper, and the riser design
idea is utilized to fully utilize the solidification of the
ductile iron. The eutectic expansion effect realizes
self-feeding, and the riser greatly improves the yield.
After adding the riser as shown in Fig. 6, the
cross-head casting effect is as shown in Fig. 7, and the
surface quality and internal defects of the crosshead
are improved by the riser.
Figure 6. Schematic diagram of running and feeding
layout
Figure 7. Casting quality after added the feeding riser
5. CONCLUSION
Based on the analysis of the crosshead process of the
compressor, based on the computer simulation
technology, the casting model of ductile iron
crosshead was established by Procast casting molding
software, and the crosshead casting process was
optimized. In the past, the riser should be placed at
the hot section of the crosshead, and the riser design
that makes full use of the eutectic expansion of
ductile iron to achieve self-feeding is designed, which
improves the surface quality and internal defects of
the crosshead. Greatly improve the casting efficiency
of the crosshead.
REFERENCES
[1]Zhang Fuquan, Wang Yang, Zhou Yiwu, et al.
Numerical simulation of casting process of large
section ductile iron and prediction of shrinkage
shrinkage. Foundry technology, 2013, 34(8):
1027-1030.
[2]Chen Wenbiao, Cheng Hefa, Zhou Yunhai, et al.
Application of Numerical Simulation Technology in
Optimization of Casting Process of Ductile Iron
Abutment. Foundry Technology, 2013, 34(1):
102-104.
[3]Liu Baozhong, Wang Youchao, Mi Guofa. Casting
Simulation and Process Optimization of Cross-head
Cast Steel Parts. Thermal Engineering, 2012, 41(7):
42-47.
[4]You Zhiyong, Li Wei, Ma Tao et al. Process design
and numerical simulation of crosshead casting based
on PRO/E. China Foundry Machinery and Technology,
2011, (6): 31-33
International Journal of Computational and Engineering16
ACADEMIC PUBLISHING HOUSE

Discussion on Anti-jamming Technology of
Intelligent Medical Paging System
Lingling Ding
Information Engineering Department, Zibo Vocational Institute, Zibo, Shandong Province, 255000, China
E-mail: [email protected]
Abstract: This paper first describes the source and
consequences of medical paging system interference,
and then gives solutions from both the host and the
extension. These methods can improve the stability
and reliability of the medical paging system.
Keywords: Medical paging system; Hardware;
Software; Anti-jamming technology
1. INTRODUCTION
With the development of society, intelligent medical
paging intercom system is applied to various fields,
such as hospital wards, nursing homes and other
occasions. At present, the general functions of the bus
two-wire products on the market are relatively simple,
and the anti-interference and reliability are poor. Due
to the limited design level and testing equipment, in
the complex electromagnetic environment of the
hospital, the products often fail, which affects the
normal use. The reliability of the intelligent medical
paging intercom system is determined by many
factors, and the system anti-interference performance
is one of the important indicators of system reliability.
Even the control system designed in the company’s
laboratory, after installation and commissioning, fully
meets the design requirements, but after entering the
site, the system is often unable to work stably for a
long time. The reason for this situation is that the site
environment is more complicated and there are
various electromagnetic interferences [1]. Therefore,
the reliability design of the paging intercom system
and the application of anti-interference technology are
more and more important.
2. SOURCES AND CONSEQUENCES OF
INTERFERENCE
Interference in the field environment enters the MCU
system in the form of pulses. There are three main
channels, namely, spatial interference, power supply
system interference, and process channel interference.
Consequences of interference: (1) Increased data
acquisition error. (2) The program runs out of order,
and the control state fails or crashes. (3) The system
controlled object is mishandled. (4) The state of the
controlled object is unstable. (5) Timing is not
allowed. (6) Changes in data [2].
In view of the above problems, this paper discusses
some methods to improve the anti-interference ability
of single-chip application system from hardware and
software.
3. HARDWARE ANTI-INTERFERENCE
3.1. Reasonable selection of components
The device is reasonably selected based on system
parameters to meet system performance requirements.
As far as possible, select components with high
integration, low temperature drift, good
anti-interference performance and low power
consumption, and choose a CPU with strong
anti-interference performance.
3.2. Suppress power interference
Connect the TVS or varistor at the incoming end of
the AC grid, Absorb surge voltage; use low-pass filter
to suppress high frequency noise introduced by power
grid. When designing filter, pay attention to make
resonance frequency much smaller than interference
frequency; use analog circuit and digital circuit power
supply separately, power supply floating technology,
use power supply Isolation transformer and power
supply filtering technology.
3.3. Suppress electromagnetic field interference
When the metal with good electrical conductivity is
used as the shielding box and grounded, the power
line inside the shielding box will not affect the outside,
and the external power line will not penetrate the
shielding box into the inside, which can suppress the
interference source and block the transmission path of
the interference. The role of electric field isolation.
The magnetic circuit shielding is made of a highly
magnetically conductive material and is enclosed in a
closed structure [3-4].
3.4. Good grounding
Good grounding can greatly inhibit the internal noise
coupling of the system, prevent the intrusion of
external interference, and improve the
anti-interference ability of the system.
3.5. Take isolation measures
Isolation of digital signals typically employs
optocouplers. In the specific circuit design, the
optocoupler is added after the ADC and before the
DAC. The power supply of the power supply and the
microcomputer must be independent, and the ground
line must be separated. For the isolation of analog
signals, an isolation amplifier is usually used, and the
signal is magnetically coupled by a transformer in the
isolation amplifier to block the line connection of the
path, thereby cutting off the interference source[5].
3.6. Overvoltage protection circuit
The overvoltage protection circuit is composed of a
current limiting resistor and a voltage stabilizing tube.
The current limiting resistor should be selected
International Journal of Computational and Engineering 17
ACADEMIC PUBLISHING HOUSE

appropriately. If it is too large, it will cause signal
attenuation. If it is too small, it will not protect the
regulator tube. The voltage regulator value of the
Zener is selected to be slightly higher than the highest
transmitted signal voltage. Too low will limit the
effective signal and make the signal distorted.
3.7. Wiring and process of printed circuit board
Design the printed circuit board and wiring in
accordance with the three principles of controlling the
noise source as much as possible, minimizing the
propagation and coupling of noise, and minimizing
the absorption of noise.
3.8. Improvement of host anti-interference
performance
Due to the complexity of the hospital’s
electromagnetic environment, this design uses several
measures to enhance its anti-interference ability, the
main means are as follows:
1) Shielding: the outer frame is made of aluminum
metal, the joints are tightly connected; the bus adopts
shielded twisted pair;
2) Grounding: the outer frame is connected to the
earth, and the bus shielding layer is connected to the
earth;
3) Filtering: 104 chip capacitors are added between all
digital IC power pins and ground, and placed close to
the chip;
4) Adopt chips and components with strong
anti-interference ability;
5) The external interface is separated and protected by
magnetic beads, TVS, varistor and other components;
6) The chip and the external input and output pins
plus TVS or fast diodes for limiting, or add
optocouplers, optical relays, etc. to isolate;
7) Reasonably arrange the devices on the circuit board,
following the principle of small electrical interference
between devices and easy to dissipate heat;
8) The layout of the circuit board is reasonably
divided. The analog circuit area, digital circuit area,
and power drive area are separated as much as
possible. The ground lines are not mixed and
connected to the ground of the power supply. The
ground and power lines are as thick as possible, and
many more;
9) Communication timeout automatic reset function:
If the communication between the CPU of the main
control board and the CPU of the display board times
out, it is considered that the other party is dead. At
this time, the automatic reset function is activated,
and the +5V power supply is cut off for about 1
second to make the voltage of the single-chip
microcomputer rapidly decrease, ensuring power
failure. After the automatic power-on restart [6].
After the instrument (all products of Shanghai Sanji
SANKI Electronics: electrostatic generator:
NS61000-2K, pulse group generator: NS61000-4K,
lightning surge generator: LSG-728), the
anti-interference ability of each test There has been a
substantial increase.
Electrostatic discharge ESD: from the original 2
(contact discharge 2KV, air gap discharge 4KV) to
level 4 (contact discharge 8KV, air gap discharge
15KV) [52];
Electric fast transient pulse group EFT: from the
original level 1 (500V/5KHz on the power line, 250
V/5KHz on the signal line) to level 3 (2KV/5KHz on
the power line, 1KV/5KHz on the signal line);
Lightning Surge: Increased from the original level 2
(line-line 0.5KV, line-ground 1KV) to level 3
(line-line 1.0KV, line-ground 2.0KV).
3.9. Improvement of anti-jamming performance of
extension and display
1) From the original single panel, the full plug-in is
changed to double-panel, patch technology, and the
chip STC12C2052 with strong anti-interference
ability is selected as the CPU;
2) Add anti-interference components at the input and
output port lines, such as input to increase TVS,
varistor, etc. to suppress the transient high-voltage
stringing; use optocoupler to isolate the external pins
connected to the CPU; extension, door light The input
is connected to the self-recovery fuse. When the
internal components of the extension are damaged
and the short circuit exceeds the critical operating
current of the fuse, the protection will be activated,
and the connection between the extension and the bus
will be disconnected to prevent the entire system from
being affected. , and can be automatically restored [7].
3)When the circuit board is typeset, place components
according to function, power, etc., rational layout and
wiring, thicken power and ground lines, and cover
copper on a large area, and so on.
4. SOFTWARE ANTI-INTERFERENCE
4.1. CPU anti-interference measures
The CPU anti-interference needs to be solved. The
following methods can be used.
1) Manual reset
2) Power failure protection
3) Sleep anti-interference
4.2. Instruction redundancy
Manually insert some single-byte instructions at key
locations, or rewrite valid single-byte instructions,
which is called “instruction redundancy”. Usually, a
two-byte or more empty operation instruction NOP is
inserted after a two-byte instruction and a three-byte
instruction, so that even if the random program flies
to the operand. Due to the existence of NOP, the
subsequent instructions are prevented from being
executed as operands, and the program is
automatically put on the track.
4.3. Setting Software Traps
When the random program enters the non-program
area, the redundant instructions will not work.
Through software traps, intercept the random program,
direct it to the specified location, and then handle the
error. A software trap is an instruction that directs the
captured random program to the reset entry address
0000H.
International Journal of Computational and Engineering18
ACADEMIC PUBLISHING HOUSE

4.4. “Watchdog” technology
The “watchdog” technology continuously monitors
the program cycle running time. If the time exceeds
the known cycle setting time, the system is considered
to be in an “infinite loop”, then the program is forced
to return to the 0000H entry, and an error is scheduled
at 0000H. Process the program to get the system
running on the right track.
4.5. Digital filtering
Digital filtering is to process the signal input to the
data acquisition part of the single-chip microcomputer
through program design to achieve anti-interference.
5. CONCLUSION
In engineering practice, several anti-interference
methods are usually used together and complement
each other to achieve good anti-interference effects.
Fundamentally, hardware anti-jamming is active, and
software anti-jamming is passive. Detailed analysis of
interference sources, hardware and software
anti-interference measures, improve system
monitoring procedures, you can ensure that the
system runs accurately and reliably.
REFERENCES
[1]Practical anti-jamming technology of single-chip
system. Beijing: People’s Posts and
Telecommunications Press, 2004.
[2]Jhong Sam Lee & Leonard E. Miller. CDMA
System Engineering Handbook. 2002, 56-65.
[3]Bingyun Qian, Jianping Wang. Anti-jamming
technology in single-chip application system. Modern
electronic technology, 2005, No. 2.
[4]Lal C. Godora. Application of Antenna Arrays to
Mobile Communication, Part 1: Performance
Improvement, Feasibility, and System Considerations.
Proc IEEE, 1997, 85: 1031-1060.
[5]Guojin Li, Xiaokui Ren. Anti-jamming technology
of single-chip microcomputer. Modern electronic
technology, No.15, 2003.
[6]Hoyoung Choi, Jaeseong Bae, Sangho lee, Sangjun
Lee. Simulation Results for Coverage and
Performance Improvements for CDMA2000 1X
Networking Using Smart Antenna System. VTC,
2002, 1574-1578.
[7]J.C. Liberti, T.S. Rappaport. Analytical Results for
Capacity Improvement in CDMA. IEEE Trans. On
Veh. Tech., August, 1994, 43(3).
International Journal of Computational and Engineering 19
ACADEMIC PUBLISHING HOUSE

Simulation Experiment and Analysis of
Oil-Water Two-Phase Fluid Imager in Near
Horizontal Well
Hang Chen1, Junfeng Liu1,2,*, Jinyu Meng1, Guoqiang Cheng1, Yu Xie1 1School of Geophysics and Oil Resources, Yangtze University (Wuhan Campus), Wuhan, Hubei, 430100, China 2Key Laboratory of Exploration Technologies for Oil & Gas Resources (Yangtze University), Ministry of
Education, Wuhan, Hubei, 430100, China
*E-mail: [email protected]
Abstract: The interpretation of multiphase flow in
horizontal wells is recognized as a difficult problem at
present. The measurement of single probe centering in
conventional instruments cannot reflect the true
situation of the well because of the uncertainty of the
measurements of the phase holdup and the velocity of
flow. In order to solve this problem, based on the flow
loop, a series of physical simulation experiments have
been carried out using the newly developed single
probe fluid imager, which consists of a single turbine
flowmeter and a single capacitance water holdup tool,
which is composed of a single turbine Flowmeter and
a single capacitance water holdup tool. Continuous
measurements can be made on the wellbore section.
First, the well deviation is 85 °, 88 °and 90 °, and the
total flow rate of oil and water is 50, 70, 100, 120,
160, 200, 250, 300 m³/d simulation experiments were
carried out and fixed-point measurements were
carried out at five different height positions on the
cross-section of the wellbore. Secondly, the counting
rate of the holdup probe at different positions and the
rotating speed of the turbine were collected under
different flow conditions. Then, (1) the Trallero flow
pattern classification method is used to divide the
flow pattern. (2) the local water holdup is calculated
according to the response value of the holdup probe in
pure oil and pure water, and the response coefficient
and start-up speed of the turbine are calculated
according to the response value of the turbine in pure
oil and pure water, and then the starting speed of the
turbine is calculated. Local velocity. Finally, the
holdup profile imaging is analyzed by using
MATLAB software. The results show that the simple
inverse range ratio algorithm is the best for smooth
stratified flow. For wavy stratified flow, Gaussian
Radial basis algorithm has the best imaging effect,
which provides a theoretical basis for the
interpretation of oil-water two-phase flow profile in
near horizontal wells.
Keywords: horizontal well; oil-water; flow pattern;
local water holdup; local velocity; flow imaging
1. INTRODUCTION
The oil-water two-phase flow pattern, local velocity
and local water holdup have complicated changes in
horizontal and high deviated wells due to gravity
differentiation and the influence of well deviation
[1-2], and the response characteristics of two-phase
flow pattern to the instrument have taken place.
Subsequent flowrate calculation, dynamic monitoring
and interpretation of production profile will have a
great impact. Therefore, the commercial multi-phase
flow logging tools for horizontal wells are mainly
measured by array probes. Schlumberger has
introduced the FSI fluid Imager [3], which consists of
six optical probes, six electric probes and five micro
flowmeters. The probe and flowmeter are distributed
on the triangle hydraulic arm, which can be achieved
by extending the hydraulic arm. Borehole coverage
measurement. In addition, Halliburton also introduced
the SONDEX-MAPS fluid imager. The instrument
consists of Capacitance Array Tool (CAT), Resistance
Array Tool (RAT), and Spinner Array Tool (SAT)
[4-5]. CAT is composed of 12 capacitance sensors,
which is used to distinguish the light phase from the
heavy oil and water. RAT is composed of 12
micro-resistivity sensors to distinguish
non-conductive hydrocarbon (oil and gas) and water
with good conductivity. SAT consists of 6
micro-rotors for measuring flow the velocity of the
body.
Different from the above-mentioned instruments, the
single probe fluid imager used in this experiment
consists of a single turbine flowmeter and a single
capacitance water holdup tool, which can be
continuously measured on the wellbore section. By
changing the position measurement of the single
probe on the wellbore cross-section, the coverage
measurement of the whole hole cross-section can be
realized, and then several local holdup and local
velocity can be obtained.
2. GENERAL SITUATION OF EXPERIMENT
As shown in figure 1, Yangtze University multiphase
flow simulation loop is used for this experiment. The
simulated well bore is 12m long and the inner
diameter is 124mm. The temperature is 5°C and 12°C,
the pressure is normal pressure. The medium is tap
water (density 1000kg/m3, viscosity 1.16mPa·s) and
white oil (density 842.5kg/m3, viscosity 9.26mPa·s).
The total flow rate of oil and water is 50, 70, 100, 120,
International Journal of Computational and Engineering20
ACADEMIC PUBLISHING HOUSE
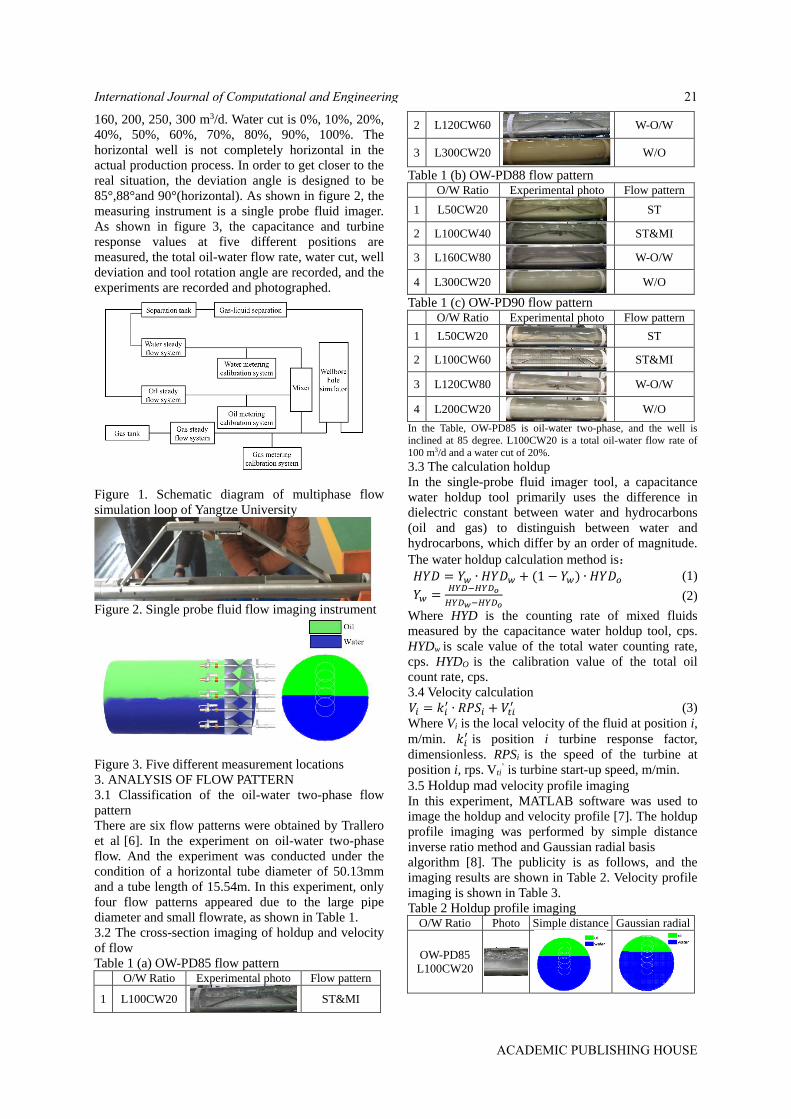
160, 200, 250, 300 m3/d. Water cut is 0%, 10%, 20%,
40%, 50%, 60%, 70%, 80%, 90%, 100%. The
horizontal well is not completely horizontal in the
actual production process. In order to get closer to the
real situation, the deviation angle is designed to be
85°,88°and 90°(horizontal). As shown in figure 2, the
measuring instrument is a single probe fluid imager.
As shown in figure 3, the capacitance and turbine
response values at five different positions are
measured, the total oil-water flow rate, water cut, well
deviation and tool rotation angle are recorded, and the
experiments are recorded and photographed.
Figure 1. Schematic diagram of multiphase flow
simulation loop of Yangtze University
Figure 2. Single probe fluid flow imaging instrument
Figure 3. Five different measurement locations
3. ANALYSIS OF FLOW PATTERN
3.1 Classification of the oil-water two-phase flow
pattern
There are six flow patterns were obtained by Trallero
et al [6]. In the experiment on oil-water two-phase
flow. And the experiment was conducted under the
condition of a horizontal tube diameter of 50.13mm
and a tube length of 15.54m. In this experiment, only
four flow patterns appeared due to the large pipe
diameter and small flowrate, as shown in Table 1.
3.2 The cross-section imaging of holdup and velocity
of flow
Table 1 (a) OW-PD85 flow pattern O/W Ratio Experimental photo Flow pattern
1 L100CW20
ST&MI
2 L120CW60
W-O/W
3 L300CW20
W/O
Table 1 (b) OW-PD88 flow pattern O/W Ratio Experimental photo Flow pattern
1 L50CW20
ST
2 L100CW40
ST&MI
3 L160CW80
W-O/W
4 L300CW20
W/O
Table 1 (c) OW-PD90 flow pattern O/W Ratio Experimental photo Flow pattern
1 L50CW20
ST
2 L100CW60
ST&MI
3 L120CW80
W-O/W
4 L200CW20
W/O
In the Table, OW-PD85 is oil-water two-phase, and the well is
inclined at 85 degree. L100CW20 is a total oil-water flow rate of
100 m3/d and a water cut of 20%.
3.3 The calculation holdup
In the single-probe fluid imager tool, a capacitance
water holdup tool primarily uses the difference in
dielectric constant between water and hydrocarbons
(oil and gas) to distinguish between water and
hydrocarbons, which differ by an order of magnitude.
The water holdup calculation method is:
𝐻𝑌𝐷 = 𝑌𝑤 ∙ 𝐻𝑌𝐷𝑤 + (1 − 𝑌𝑤) ∙ 𝐻𝑌𝐷𝑜 (1)
𝑌𝑤 =𝐻𝑌𝐷−𝐻𝑌𝐷𝑜
𝐻𝑌𝐷𝑤−𝐻𝑌𝐷𝑜 (2)
Where HYD is the counting rate of mixed fluids
measured by the capacitance water holdup tool, cps.
HYDw is scale value of the total water counting rate,
cps. HYDO is the calibration value of the total oil
count rate, cps.
3.4 Velocity calculation
𝑉𝑖 = 𝑘𝑖′ ∙ 𝑅𝑃𝑆𝑖 + 𝑉𝑡𝑖
′ (3)
Where Vi is the local velocity of the fluid at position i,
m/min. 𝑘𝑖′ is position i turbine response factor,
dimensionless. RPSi is the speed of the turbine at
position i, rps. Vti’ is turbine start-up speed, m/min.
3.5 Holdup mad velocity profile imaging
In this experiment, MATLAB software was used to
image the holdup and velocity profile [7]. The holdup
profile imaging was performed by simple distance
inverse ratio method and Gaussian radial basis
algorithm [8]. The publicity is as follows, and the
imaging results are shown in Table 2. Velocity profile
imaging is shown in Table 3.
Table 2 Holdup profile imaging O/W Ratio Photo Simple distance Gaussian radial
OW-PD85
L100CW20
International Journal of Computational and Engineering 21
ACADEMIC PUBLISHING HOUSE
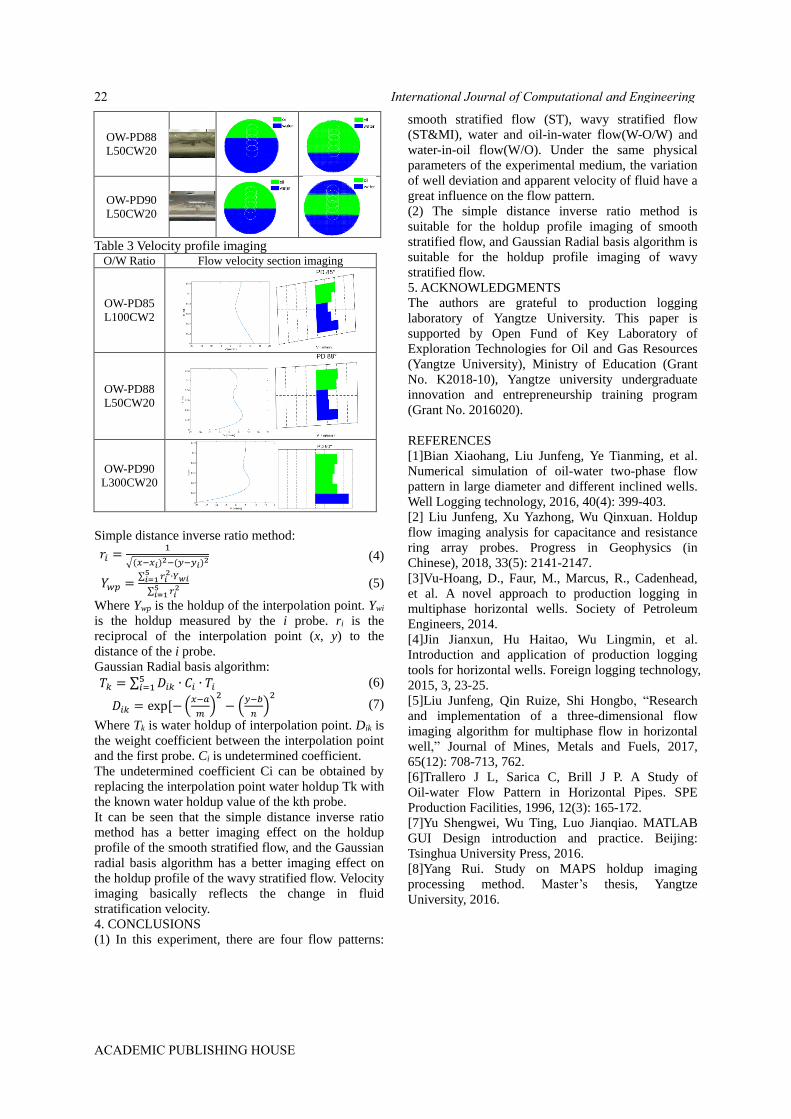
OW-PD88
L50CW20
OW-PD90
L50CW20
Table 3 Velocity profile imaging O/W Ratio Flow velocity section imaging
OW-PD85
L100CW2
OW-PD88
L50CW20
OW-PD90
L300CW20
Simple distance inverse ratio method:
𝑟𝑖 =1
√(𝑥−𝑥𝑖)2−(𝑦−𝑦𝑖)
2 (4)
𝑌𝑤𝑝 =∑ 𝑟𝑖
2∙5𝑖=1 𝑌𝑤𝑖
∑ 𝑟𝑖25
𝑖=1
(5)
Where Ywp is the holdup of the interpolation point. Ywi
is the holdup measured by the i probe. ri is the
reciprocal of the interpolation point (x, y) to the
distance of the i probe.
Gaussian Radial basis algorithm:
𝑇𝑘 = ∑ 𝐷𝑖𝑘 ∙ 𝐶𝑖 ∙ 𝑇𝑖5𝑖=1 (6)
𝐷𝑖𝑘 = exp[− (𝑥−𝑎
𝑚)2
− (𝑦−𝑏
𝑛)2 (7)
Where Tk is water holdup of interpolation point. Dik is
the weight coefficient between the interpolation point
and the first probe. Ci is undetermined coefficient.
The undetermined coefficient Ci can be obtained by
replacing the interpolation point water holdup Tk with
the known water holdup value of the kth probe.
It can be seen that the simple distance inverse ratio
method has a better imaging effect on the holdup
profile of the smooth stratified flow, and the Gaussian
radial basis algorithm has a better imaging effect on
the holdup profile of the wavy stratified flow. Velocity
imaging basically reflects the change in fluid
stratification velocity.
4. CONCLUSIONS
(1) In this experiment, there are four flow patterns:
smooth stratified flow (ST), wavy stratified flow
(ST&MI), water and oil-in-water flow(W-O/W) and
water-in-oil flow(W/O). Under the same physical
parameters of the experimental medium, the variation
of well deviation and apparent velocity of fluid have a
great influence on the flow pattern.
(2) The simple distance inverse ratio method is
suitable for the holdup profile imaging of smooth
stratified flow, and Gaussian Radial basis algorithm is
suitable for the holdup profile imaging of wavy
stratified flow.
5. ACKNOWLEDGMENTS
The authors are grateful to production logging
laboratory of Yangtze University. This paper is
supported by Open Fund of Key Laboratory of
Exploration Technologies for Oil and Gas Resources
(Yangtze University), Ministry of Education (Grant
No. K2018-10), Yangtze university undergraduate
innovation and entrepreneurship training program
(Grant No. 2016020).
REFERENCES
[1]Bian Xiaohang, Liu Junfeng, Ye Tianming, et al.
Numerical simulation of oil-water two-phase flow
pattern in large diameter and different inclined wells.
Well Logging technology, 2016, 40(4): 399-403.
[2] Liu Junfeng, Xu Yazhong, Wu Qinxuan. Holdup
flow imaging analysis for capacitance and resistance
ring array probes. Progress in Geophysics (in
Chinese), 2018, 33(5): 2141-2147.
[3]Vu-Hoang, D., Faur, M., Marcus, R., Cadenhead,
et al. A novel approach to production logging in
multiphase horizontal wells. Society of Petroleum
Engineers, 2014.
[4]Jin Jianxun, Hu Haitao, Wu Lingmin, et al.
Introduction and application of production logging
tools for horizontal wells. Foreign logging technology,
2015, 3, 23-25.
[5]Liu Junfeng, Qin Ruize, Shi Hongbo, “Research
and implementation of a three-dimensional flow
imaging algorithm for multiphase flow in horizontal
well,” Journal of Mines, Metals and Fuels, 2017,
65(12): 708-713, 762.
[6]Trallero J L, Sarica C, Brill J P. A Study of
Oil-water Flow Pattern in Horizontal Pipes. SPE
Production Facilities, 1996, 12(3): 165-172.
[7]Yu Shengwei, Wu Ting, Luo Jianqiao. MATLAB
GUI Design introduction and practice. Beijing:
Tsinghua University Press, 2016.
[8]Yang Rui. Study on MAPS holdup imaging
processing method. Master’s thesis, Yangtze
University, 2016.
International Journal of Computational and Engineering22
ACADEMIC PUBLISHING HOUSE

Discussion on Mine Hoist Vector Control
System Based on Three-Level Inverter
Yao Wang
Zibo Vocational Institute, ZiBo 255314, China
E-mail: [email protected]
Abstract: Mine hoist is an important transportation
equipment for mines.Mine hoisting is the most
important working procedure in mining. It is mainly
responsible for the connection between the
underground and the underground, as well as the
collection of good coal through the shaft hoisting, and
the release of materials and equipment needed
underground. The staff also uses this equipment to
achieve the connection between the wells and the
wells. Once such transportation equipment fails, it
will not only cause the mines to work normally, but
even endanger the lives of the workers.Therefore, the
requirements of the mine hoist for its own electrical
control devices are very strict, and the electric drive
equipment of the mine is also a research hotspot of
researchers today.This paper mainly analyzes the
application principle and mechanism of the new
inverter three-level inverter in the mine hoist, and
analyzes the function of the three-level inverter on the
mine hoist and the improvement of the hoist vector
control system.
Keywords: Mine hoist; Three-level inverter; Vector
control system
1. INTRODUCTION
Mine work is a large-scale equipment consisting of
various electromechanical equipment. The mine hoist
is not only the transmission equipment for mine work
but also the largest fixed equipment for mines. Its
power consumption accounts for 30% to 40% of the
total power consumption of the mine. The huge power
consumption makes the mine hoist have high
requirements for its own electrical control devices. In
addition, it has large inertia, high speed and complex
operation requirements [1]. Therefore, in order to
ensure the normal and efficient operation of coal mine
production, the electric drive of the mine hoist should
be further researched and improved to promote the
coal production efficiency of the entire mine.
2. THE CURRENT DEVELOPMENT STATUS OF
MINE HOIST
After 30 years of development, the mine hoist has
developed from the original motor through the
reducer drive reel system to the IGBT pulse width
modulation high-performance inverter with direct
torque control technology and the IGCTU_ level
high-voltage inverter. Large-capacity synchronous
motor variable frequency speed control system
[2].The development and application of this electric
transmission device enables high efficiency and low
accident rate in today’s mines. However, due to
China’s own national conditions, today’s mines have a
large gap with foreign countries in automation and
equipment manufacturing processes. Some
high-performance AC speed control systems are still
imported from abroad.
Therefore, this also puts strict requirements on the
development of electric drive equipment for mine
hoists in China.Strengthening the research on electric
drive equipment and developing its own first-class
electric drive technology has become the main subject
of today’s researchers. Here, the author combines the
development status of domestic and foreign hoisting
machines, and briefly analyzes the requirements and
improvements of electrical equipment required for
mine lifting equipment.
3. MINE HOIST REQUIREMENTS FOR
ELECTRIC DRIVES
The operating characteristics of the mine hoist and its
huge power consumption have placed great demands
on its own electric drive.In view of the important
position of mine hoist in mine production, in order to
ensure the normal operation of the hoist to ensure the
normal operation of the mine, the author puts forward
the following requirements for the electric drive unit
in combination with the operating characteristics of
the mine hoist:
3.1. Reliability
The normal operation of the mine hoist is not only
related to the normal operation of the mine but also
the life of each miner. Therefore, the electric drive
system of the hoist itself has high
reliability.Interference from external factors also has
certain exclusion functions, and the key equipment
needs to be redundantly protected.Only by
comprehensive consideration can we ensure the
normal operation of the mine [3-4].
3.2. Four quadrant operation
In the mine hoist’s drag system, both the bucket
lifting system and the cage lifting system must meet
the four-quadrant operation, and the four stages of
acceleration, constant speed, deceleration and
crawling are required in one cycle.The specific
working principle is to drive the driving wheel by
using the driving motor, and then to pull the lifting
container through the traction wire connected with the
driving wheel, and at the same time, use the speed
regulating system connected with the motor to play
International Journal of Computational and Engineering 23
ACADEMIC PUBLISHING HOUSE
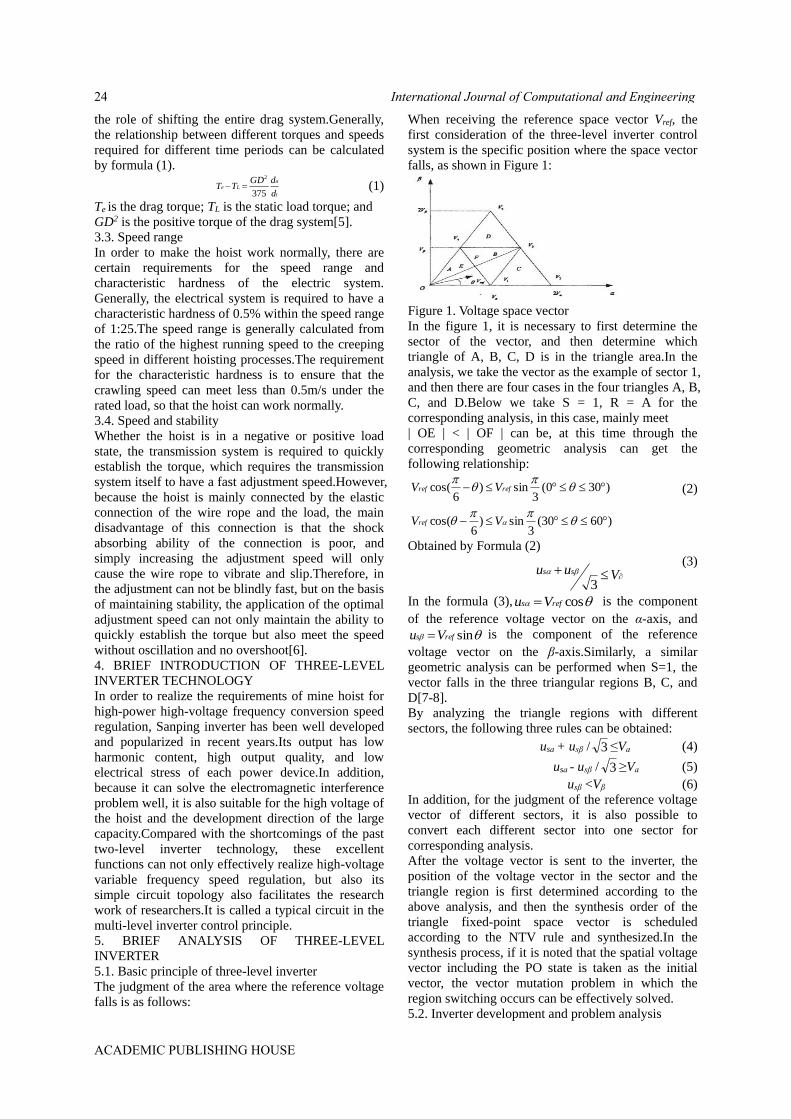
the role of shifting the entire drag system.Generally,
the relationship between different torques and speeds
required for different time periods can be calculated
by formula (1).
t
nLe
d
dGDTT
375
2
(1)
Te is the drag torque; TL is the static load torque; and
GD2 is the positive torque of the drag system[5].
3.3. Speed range
In order to make the hoist work normally, there are
certain requirements for the speed range and
characteristic hardness of the electric system.
Generally, the electrical system is required to have a
characteristic hardness of 0.5% within the speed range
of 1:25.The speed range is generally calculated from
the ratio of the highest running speed to the creeping
speed in different hoisting processes.The requirement
for the characteristic hardness is to ensure that the
crawling speed can meet less than 0.5m/s under the
rated load, so that the hoist can work normally.
3.4. Speed and stability
Whether the hoist is in a negative or positive load
state, the transmission system is required to quickly
establish the torque, which requires the transmission
system itself to have a fast adjustment speed.However,
because the hoist is mainly connected by the elastic
connection of the wire rope and the load, the main
disadvantage of this connection is that the shock
absorbing ability of the connection is poor, and
simply increasing the adjustment speed will only
cause the wire rope to vibrate and slip.Therefore, in
the adjustment can not be blindly fast, but on the basis
of maintaining stability, the application of the optimal
adjustment speed can not only maintain the ability to
quickly establish the torque but also meet the speed
without oscillation and no overshoot[6].
4. BRIEF INTRODUCTION OF THREE-LEVEL
INVERTER TECHNOLOGY
In order to realize the requirements of mine hoist for
high-power high-voltage frequency conversion speed
regulation, Sanping inverter has been well developed
and popularized in recent years.Its output has low
harmonic content, high output quality, and low
electrical stress of each power device.In addition,
because it can solve the electromagnetic interference
problem well, it is also suitable for the high voltage of
the hoist and the development direction of the large
capacity.Compared with the shortcomings of the past
two-level inverter technology, these excellent
functions can not only effectively realize high-voltage
variable frequency speed regulation, but also its
simple circuit topology also facilitates the research
work of researchers.It is called a typical circuit in the
multi-level inverter control principle.
5. BRIEF ANALYSIS OF THREE-LEVEL
INVERTER
5.1. Basic principle of three-level inverter
The judgment of the area where the reference voltage
falls is as follows:
When receiving the reference space vector Vref, the
first consideration of the three-level inverter control
system is the specific position where the space vector
falls, as shown in Figure 1:
Figure 1. Voltage space vector
In the figure 1, it is necessary to first determine the
sector of the vector, and then determine which
triangle of A, B, C, D is in the triangle area.In the
analysis, we take the vector as the example of sector 1,
and then there are four cases in the four triangles A, B,
C, and D.Below we take S = 1, R = A for the
corresponding analysis, in this case, mainly meet
| OE | < | OF | can be, at this time through the
corresponding geometric analysis can get the
following relationship:
)6030(3
sin)6
cos(
)300(3
sin)6
cos(
VV
VV
ref
refref (2)
Obtained by Formula (2)
Vuu ss
3
(3)
In the formula (3), cosrefs Vu is the component
of the reference voltage vector on the α-axis, and
sinrefs Vu is the component of the reference
voltage vector on the β-axis.Similarly, a similar
geometric analysis can be performed when S=1, the
vector falls in the three triangular regions B, C, and
D[7-8].
By analyzing the triangle regions with different
sectors, the following three rules can be obtained:
usɑ + usβ / 3 ≤Vɑ (4)
usɑ - usβ / 3 ≥Vɑ (5)
usβ <Vβ (6)
In addition, for the judgment of the reference voltage
vector of different sectors, it is also possible to
convert each different sector into one sector for
corresponding analysis.
After the voltage vector is sent to the inverter, the
position of the voltage vector in the sector and the
triangle region is first determined according to the
above analysis, and then the synthesis order of the
triangle fixed-point space vector is scheduled
according to the NTV rule and synthesized.In the
synthesis process, if it is noted that the spatial voltage
vector including the PO state is taken as the initial
vector, the vector mutation problem in which the
region switching occurs can be effectively solved.
5.2. Inverter development and problem analysis
International Journal of Computational and Engineering24
ACADEMIC PUBLISHING HOUSE

5.2.1. Development of three-level inverter
The three-level inverter has three level states, so that
its output harmonics are significantly less than the
two-level inverter, and its own asymmetric
bidirectional switch ensures the two-way flow of
energy, which largely guarantees The hoist is required
for four-quadrant operation in electric drive control.In
addition, the three-level inverter embedded in the
diode can also realize the function of converting the
medium-low voltage device into a high-capacity
converter. Based on the performance characteristics of
the three-level inverter itself, it has broad prospects in
medium and high voltage variable frequency speed
regulation and power system reactive power
compensation.
However, while seeing the advantages of the
three-level inverter itself, its own shortcomings have
also brought certain constraints to its development.
First of all, its topology uses 12 power tubes, which
brings inconvenience to the control of the three levels
itself. Secondly, the imbalance of the midpoint
potential on the DC side also restricts the
development of the topology.Nowadays, SVPMW is
the main control strategy for the three-level topology.
Three-level inverters have entered a practical stage
abroad, but their development and application in
China are still in the initial stage. Traditional DC
voltage source power supply and DC voltage source
power supply GT0 inverter is replaced by IGBT and
IGCT two-level or three-level PWM inverter. It is also
a development trend, which can meet high-power,
high-voltage AC frequency conversion control. The
system also certifies its important position in the
electrical equipment of the hoist.
5.2.2. Difficulty analysis of three-level inverter
The topology of the three-level inverter uses 12 power
tubes, and the topology itself has a variety of
structures. Therefore, the control strategy for the
topology is much more complicated than that of the
two-level inverter.Nowadays, the main influence on
the development of the topology is the imbalance of
the midpoint potential on the DC side. For this
problem, this paper also gives a corresponding
solution strategy.
The balance of the midpoint potential on the DC side
is related to the performance of the inverter. If the
effective regulation cannot be performed, it will not
only affect the efficiency of the inverter, but also the
speed regulation performance of the motor. Therefore,
the DC side focus potential balance effect directly
affects the entire production process.
5.3. Control Strategy of Space Vector for Three-Level
Inverter
The three-level control strategy for space vector is
currently the most widely used PWM.This control
strategy is mainly based on the synthesis of space
vectors. Firstly, the utilization of voltage is much
higher than other control strategies. Secondly, the
output waveform is of high quality, almost close to
sinusoidal. In addition, its control itself can make
rational use of space vectors to reduce the use of
switches. The effective control of the space vector by
the three-level inverter is almost perfect in line with
the high requirements of the mine hoist for electric
drive equipment.Therefore, the application of
three-level inverters in mine hoist equipment is also
the first choice of electrical equipment of mine hoist
nowadays.
6. CONCLUSION
Mine hoist is an important transmission equipment in
mine production. In order to complete mine work
with high quality, to ensure low mine operation and
high efficiency, mine hoist also needs certain
development.In order to improve the operation quality
of the hoist, controlling the electric drive equipment
of the hoist plays an indispensable role. Based on this,
this paper further analyzes the three-level inverter
suitable for high voltage and large capacity and low
harmonic at the output end. The working principle of
three-level inverter, how to solve the problem of
neutral-point potential balance which restricts the
development of its own topology, and the control
strategy of space vector are analyzed accordingly,
which effectively solves the performance requirement
of high voltage frequency conversion in electric drive
equipment of hoist.
REFERENCES
[1]Annette Von Jouance, Shaoan Dai, Haoran Zhang.
A Simple Method for Balancing the DC-link Voltage
of Three-level Inverters, 2001.
[2]Jae Hyeong Seo, Cang Ho Choi, Dong Seok Hyun.
A new simplified Space-Vector PWM Method for
Three-Level-Inverters, IEEE Transactions on Power
Electronics, 2001.
[3]Fang Xiang. Vector control system of mine hoist
based on three-level inverters. Anhui University of
Technology: Control Theory and Control Engineering,
2009.
[4]Zhang Li. Research and Application of Three-level
Inverter Synchronous Motor Speed Regulation
System. Anhui University of Technology: Power
Electronics and Power Drive, 2009.
[5]Lanyun, Zhangli. Application of IGCT Frequency
Converter in Speed Regulation System of Mine Hoist.
Electrical Drive, Nov 2008.
[6]Zhang Li, Li Shuangliu, Liu Fayun. Application of
IGCT in Frequency Conversion Speed Regulation
System of Mine Hoist. Coal mine machinery, Apr
2002.
[7]Li Chongjian. AC Synchronous Motor Speed
Regulation System. Science Press, 2006.
[8]Katsutoshi Yamanaka, AhmetM ava, HiroshiKirino,
YoshiyukiTanaka, NoritakaKoga, Tsuneo Kume. A
Novel Neutral Point Potential Stabilization Technique
Using the Information of Output Current Polarities
and Voltage vector. IEEE Transactions on Industry
Applications, 2002.
International Journal of Computational and Engineering 25
ACADEMIC PUBLISHING HOUSE
Design and Implementation of a Building
Foundation Construction Virtual Simulation
Training System
Wenzhen Wang
Zibo Vocational College, Zibo, Shandong 255314, China
E-mail: [email protected]
Abstract: Construction foundation construction is the
core knowledge that construction engineering
students should master. It has important significance
in the development of students’ professional ability.
The traditional on-site learning method is affected by
many factors such as time and cost, and it is difficult
to meet the needs of actual learning. The development
of a related virtual simulation training system can
simulate the actual situation of the construction site,
so that students can experience the experience similar
to the actual operation, making the teaching more
intuitive, improving the interest of learning and
deepening the mastery of relevant knowledge.
Keywords: building foundation construction; virtual
simulation; training system
1. INTRODUCTION
Virtual simulation is a new technology developed
after the 1980s. It forms a three-dimensional digital
graphical model through software programming to
generate a man-made virtual environment. It involves
disciplines such as artificial intelligence, sensing
technology, human-computer interaction, and
computer graphics. The application of virtual
simulation technology in education and teaching can
not only present the knowledge learned more
intuitively, mobilize the enthusiasm of students, but
also change the traditional teaching mode and
improve the students’ practical ability[1].
Construction foundation construction is the core
teaching content of civil engineering related majors,
and it has strong practical characteristics, especially
the main project, namely the construction of
reinforced concrete engineering. For the frontline
personnel at the construction site, mastering the craft
and method is also should have the basic qualities. At
present, the main problems in the construction of
building foundation construction are:
(1) The practical teaching link is difficult to meet the
actual teaching needs: due to the characteristics of the
architectural profession, the teaching plan is difficult
to correspond to the actual production time of the
enterprise; the period of infrastructure construction is
long, the amount of engineering is large, and the
short-term training cannot be truly comprehensive.
Understand the construction process.
(2) Students are difficult to actually operate, and the
learning effect is not good: internships at off-campus
construction sites, due to time and cost constraints,
and construction units for personal safety
considerations, students often cannot actually
complete construction operations. It is difficult to
achieve the expected learning effect.
(3) The assessment of academic performance is not
reasonable: the learning of infrastructure construction
content is generally through off-campus practice. The
academic performance is generally based on the
student’s attendance and relevant reports and
summary materials issued by the trainee, which is
subjective. Sex is not conducive to the development
of students’ enthusiasm for learning.
The development of building foundation construction
simulation teaching software can use the current
advanced virtual simulation technology to apply 3D
visualization technology to teaching, so that students
can simulate and post training in the learning process,
and can fully understand the whole construction
foundation. process. Through the construction of this
virtual simulation software, the practice and theory
can be combined with the actual situation of the
construction site, and the real working environment
can be simulated and developed by using software, so
that students can truly experience the technology and
skills of the construction site, thus reducing the
students. The unfamiliarity of the scene makes the
teaching more intuitive [2-3].
2. DOMESTIC AND FOREIGN RESEARCH
OVERVIEW AND DEVELOPMENT TREND
The application of virtual simulation technology in
architecture at home and abroad is mainly reflected in
the following two aspects:
2.1. Research on the theory of building construction
simulation
In 1991, American scholars proposed the definition of
virtual enterprise. Tsinghua University and Tongji
University had scholars in this area. In 1997, domestic
research on virtual enterprises received attention in
various aspects. At present, the relevant theoretical
framework has been formed, virtual enterprises have
also begun to expand from the manufacturing industry
to other industries. In terms of virtual construction,
from the first introduction of the concept by the
American Inventors Association in 1996 to the
emergence of the TFV (Transformation-Flow-Value)
International Journal of Computational and Engineering26
ACADEMIC PUBLISHING HOUSE
theory in 2000, the possibility of applying virtual
enterprise theory in the construction industry was
demonstrated. Domestic researchers’ research on
virtual construction is mostly at the organizational
management level, and less research on the realization
of specific technologies [4-5].
2.2. Research on simulation methods of building
construction
Building construction simulation technology is a
specific application in virtual construction, mainly
through virtual simulation and virtual reality
technology. Virtual simulation technology generally
describes the whole system by establishing a model,
and then obtains some regular data through some
repeated experiments. The domestic researcher Yu
Xinfu studied the dynamic simulation of super
high-rise building construction, and Zhang Zhengfeng
applied the graphic technology in visual simulation to
study the construction process of complex group
buildings [6]. Virtual reality is the transformation of
boring data into intuitive images in virtual
construction, which facilitates operations and
comparative analysis, and enables the study of deeper
content in the data. Zhao Lingjun studied the
identification of buildings and the extraction of
geometric dimensions. Wang Chenhui simulated the
working scene of hydraulic excavators. Zhong
Denghua and others analyzed the visual simulation of
hydropower projects, and their research results have
been successfully applied. Virtual reality technology
is widely used in building construction, and its
development direction is mainly event-driven
immersion and time-driven immersion.
3. RESEARCH AND ANALYSIS ON THE STATUS
QUO OF CONSTRUCTION TRAINING FOR
BUILDING FOUNDATION CONSTRUCTION
“Construction Engineering Construction Technology”
is the core course of civil engineering related majors.
The main project, that is, the construction of
reinforced concrete engineering, is even more
important. For the construction of this part of the
project, for the first-line personnel at the construction
site, master the process and method. It is the basic
quality that should be possessed, especially for the
construction workers. In the training of students, the
teaching hours and credits, teaching equipment and
training places, and the number of teachers are the
first in each course [7]. This course is also a
compulsory course for other civil engineering majors.
It plays a role in the formation of students’
professional ability. Decisive significance, in the
construction industry, the demand for talent skills is
getting higher and higher, its status and role is
increasingly prominent, so how to make students
more accurately master the skills of building
foundation is particularly important.
4. CONSTRUCTION AND DEVELOPMENT OF
VIRTUAL SIMULATION TRAINING SYSTEM
FOR BUILDING FOUNDATION CONSTRUCTION
The system uses Unity3D and 3ds Max as the
development platform to realize the system logic
function and 3D model design and production; use
SQL Server 2008 to realize the storage of identity
information and training progress information; the
specific virtual training system can support the above
technical support. Run on PCs, mobile devices, and
the web.
The design framework uses the classic MVC design
pattern to divide the entire system development into
three major modules: the model component, the view
component, and the controller component. The model
component is the communication bridge between the
view component and the controller component. The
specific operation information sent by the controller is
transmitted to the model component. After a series of
logical calculations, the model component sends a
calculated series of related information to the view. A
component that receives information from the view
component and ultimately presents it to the user. In
this system, the model component is implemented by
C# function script, the view component is jointly
completed by UGUI interface development
technology and 3ds Max, and the controller
component is responsible for hardware devices such
as mouse and keyboard. The MVC design pattern
reasonably divides the software development process
and abides by the principle of “low coupling and high
cohesion” of software development. The developer
can develop different system components in parallel
according to the interface mode of the overall design
of the system, effectively improving System
development efficiency.
The building foundation construction virtual
simulation training system consists of 6 modules, as
follows:
(1) Identity authentication module
Its main functions are: judging the identity of the
logged-in user, recalling the progress of the
corresponding learning module, and learning scores.
(2) Common module
Its main functions are: engineering drawings,
technical specifications, knowledge learning, video
library, test question bank, toolbox.
(3) Earthwork excavation engineering module
Its main functions are: site requirements, site cleaning,
line positioning, mechanical excavation, trimming
and inspection.
(4) Reinforcement engineering module
Its main functions are: elastic steel wire, placing steel
bars, tying steel bars, placing blocks, placing vertical
ribs, welding steel bars, and hoop binding.
(5) Template Engineering Module
Its main functions are: preparation work before
construction, formwork installation, quality inspection
and acceptance, formwork demolition, and project
acceptance.
(6) Concrete engineering module
Its main functions are: concrete preparation, concrete
International Journal of Computational and Engineering 27
ACADEMIC PUBLISHING HOUSE

transportation, pouring and compaction, concrete
maintenance, engineering acceptance.
In short, the virtual simulation training system of
building foundation construction has built a teaching
platform combining the theoretical study and
production practice of higher vocational building
majors, making up for the teaching methods, training
conditions, time and space constraints, and realizing
teaching in the classroom. Project and construction
projects, teaching process and construction process,
school learning and actual work consistency. However,
this kind of simulation teaching system also has
problems such as poor student’s on-site safety
production awareness and inability to perform on-site
operations, etc., which should be paid attention to.
Through the rational design of each teaching link, the
virtual simulation training combined with the
theoretical teaching and production practice can
improve the teaching efficiency, broaden the practical
teaching channels, and play an active role in
promoting the vocational school’s ability and
development.
REFERENCES
[1]Hua L.F., Adviser-Su, Jun C. The development of
intelligent virtual reality-based industrial training
systems. Hong Kong: Hong Kong University of
Science and Technology, 1998, 100-102.
[2]Hang Y.Y., Zhong L.Z., Li Z. Survey of virtual
maintenance. Acta Simulata Systematica Sinica, 2005,
9(15): 38-39.
[3]Fang Xiaofeng. 3D Simulation Design System for
Urban Planning Based on Virtual Reality. Computer
Simulation, 2007, 24(3): 230-235.
[4]Wang Jianjian, Zhang Xu, Wang Yong, et al.
Development status, policies and implications for
virtual reality technology in the United States.
Science and Technology Management Research, 2010,
30(14): 37-40, 56.
[5]Jiang Xuezhi, Li Zhonghua. Research Status of
Virtual Reality Technology at Home and Abroad[j].
Journal of Liaoning Technical University (Natural
Science Edition), 2004, 23(2): 238-240.
[6]Talking about the research status and development
trend of virtual reality technology [EB/OL].
http://blog.sina.com.cn/s/blog_5ddbd1060100ec6r.ht
ml, 2009-07-01.
[7]Grigore C. Burdea, Philippe Coiffet. Virtual
Reality Technology. 2nd ed. Wei Yingmei, Luan
Daodao, etc.. Beijing: Publishing House of
Electronics Industry, 2005.
International Journal of Computational and Engineering28
ACADEMIC PUBLISHING HOUSE

Electrical Control of Tunnel Kiln Based on
Industrial Network
Shisheng Zhang
Zibo vocational institute, Zibo, Shandong, 255314, China
E-mail: [email protected]
Abstract: According to the control technology of
zirconia zunnel ziln, it is proposed a solution of
remote control based on CC_Link bus. Configuration
via the substrate module,Configure network
parameters and inverter parameters,Using Q series
PLC to control system,GOT touch screen for
interactivecontrol.The network is stable and
reliable,stronganti-interference ability,Convenient
programming. The system is easy to operate,Kiln
atmosphere is easy to control.
Keywords: CC_Link; zunnel ziln;inverter
1. ANALYSIS OF ELECTRICAL CONTROL
TECHNOLOGY OF TUNNEL KILN
Tunnel kiln is a continuous firing equipment, which
has the advantages of continuity, short cycle, good
quality, high thermal efficiency, uniform temperature,
labor saving and long service life.This project uses a
tunnel kiln with a length of 41 meters and an annual
output of 3,000 tons of zirconia.It has 68 kiln cars and
its electrical control is divided into seven areas
(lines).The structural diagram is shown in figure 1.
Figure 1.The structural diagram
Area A (return line) is used for loading and unloading
of kiln trucks to ensure that there are trucks at the end
of the line.Area B ferry is used to transport zone A
kiln car to kiln head.The kiln in zone C is used for
sintering incoming materials, pushing a kiln truck
every 72 minutes.Zone D ferry is used to transfer the
sintering completion of zone C to the kiln car parked
at the end of the kiln to the F line for cooling.When
there is a call order, the kiln car cooled in zone E will
stop at the end of the line and be transported to line
A.E, F area return line for kiln car cooling, buffer
storage to ensure that there is a car at the end of the
line.G zone ferry is used to transport F zone kiln car
to E line for further cooling and storage [1].
2. MITSUBISHI CC-LINK BUS
In the industrial control system, data and control
information can be transmitted simultaneously in a 10
Mbps high-speed field network by CC-Link Bus.It
has outstanding advantages such as excellent
performance, strong anti-interference ability, simple
use and cost saving.
Its bottom layer follows RS485 communication
protocol and mainly uses broadcasting-polling
(circular transmission) mode to communicate.The
master station sends the refresh data (RY/RWw) to all
slave stations and polls slave stations at the same time;
the slave station responds to the master station's
polling (RX/RWr) and informs other slave stations of
the response; and then the master station polls other
slave stations (which do not send refresh data at this
time) and informs other slave stations of the response.
This project space does not exceed 100 meters,
according to its maximum data transmission speed of
10 Mbps, its performance is quite stable; and it can
also connect various local control stations as
intelligent equipment stations, using CC-Link can
form a simple PLC control network, the price is
extremely low.
3. HARDWARE CONFIGURATION
The control system uses Mitsubishi Q series PLC and
CC_Link module to configure on the base. Connect
stations on CC_Link network module as shown in
Table 1.
Table 1. CC-link Hardware Configuration
4.NET CONFIGURATION
After setting up the PLC project in GX-Work2, all the
modules on the board are configurated. Under the
monitoring of diagnosis_system, the installation
location and address distribution of each module can
be seen. The address of CC_Link module on the
Statio
n Modular Function
0 QJ61BT11N CC-Link Master
1 AJ65SBTB1-32D Input
2 AJ65SBTB2N-16R
D Output
3 AJ65SBTB1-32DR B Ferry
4 AJ65SBTB1-32DR D Ferry
5 AJ65SBTB1-32DR G Ferry
6 FR-A740-7.5K Preheating Fan
7 FR-A740-5.5K Combustion Supporting
Fan
8 FR-A740-22K Smoke Exhausting Fan
9 FR-A740-7.5K Cooling Fan
International Journal of Computational and Engineering 29
ACADEMIC PUBLISHING HOUSE

board is 80H.The netconfiguration is shown in figure
2.
Figure 2.The netconfiguration
Then set network parameters, in the project
parameters network parameters CC-link, indicate the
meaning of each parameter.
For the converter, it is necessary to install additional
CC-link interface board on the converter, wiring the
network on the interface board, and then setting the
parameters of the converter.
Select transmission speed of 156 kbps, other
parameters are default, click "Reflect Settings and
Close" to save information.
Pull out "X/Y Assignment Confirmation" and you can
see that the slave address is assigned as Table 4,
which is the mapping address to be used in
programming [1]. The X/Y initial address
assignmentis shown in Table 2.
Table 2. X/Y initial address assignment
5. COMMUNICATION CONTROL
The remote I/O module settings take the B area ferry
as an example. Its module model is
AJ65SBTB1-32DR, and its CC-link station is set to
No. 3. The module I/O address corresponds to the
actual programming address. The action of the
module Y00 can be controlled by controlling Y1050
in the program [2].
After the initialization of PLC, after a period of time,
ensure that the frequency converter is ready to start,
and then write frequency to enable the frequency
converter, otherwise the operation is complex or the
frequency converter can not carry out network
communication.
When the system is debugged, the converter controls
the fan to form the thermal atmosphere in the kiln,
which is operated by the thermal engineer to
determine the working frequency of each converter[3].
It can be configurated on touch screen, the interface
should have permission to avoid non-professional
operation and clear responsibility; the change of
frequency value can be increased or decreased by
buttons to meet the requirements of thermal engineers;
and the upper and lower limits of frequency should be
set to protect the thermal atmosphere of equipment
and kiln. If the control mode of the converter needs to
be changed, the mode button of the panel can be
directly operated without temporarily stopping the
work of the converter, so as to avoid the change of
gas concentration, insufficient oxygen supply and
danger during start-up and shutdown.
6.PROGRAM STRUCTURE
The system has three return lines, three ferry cars,
four frequency converters, 10 gas valves, three kiln
doors and one cylinder to be controlled. The program
structure is shown in Figure 11-20. In addition, there
are test procedures, alarm management, password
management and so on.
Each program block should be controlled sequentially
to avoid interaction. A unified resource allocation
library, equipment component library and alarm
information database are established to facilitate
adding and modifying and avoid resource conflicts.
Taking A return line as an example, the program flow
is analyzed. Initial state (M102) A car is waiting
between parking spaces 3 and 4, and the running
judgment is made to decide which process to enter
(waiting, manual delivery, regular delivery).
Manual delivery is the process of moving a parking
space from the kiln car with full material at the tail of
the return line to the first one (condition: there are
manual delivery signals and fewer than 26 kiln cars
on the return line (up to 26 on this line). The car goes
westward (M110) to position 3 and is automatically
crashed into the kiln car by mechanical device,
stopping westward. Start eastbound (M111), reach
position 4, delay eastbound (M112) 2 seconds, stop
eastbound. Start westbound (M113) (automatically
decoupled from kiln car by mechanical device) return,
westbound to position 4, stop westbound, enter the
waiting state (M102), ready for the next time.
Timing delivery is the process of sending a car to the
first car every 72 minutes: if there is no manual signal,
more than 10 kiln cars on the return line (less than 10
can not be delivered), B ferry is in a waiting state, and
there is no car at the exit of the return line, it can be
delivered; first, the car travels eastward (M120),
meets the kiln car's automatic loading, stops
eastbound when there is a car at the rear; and starts
westbound (M113) from the mechanical device.
Return to No. 4 westbound, stop westbound, enter the
Station X Y
1 1→X1000 1→Y1000
1 1→X1010 1→Y1010
2 2→X1020 2→Y1020
2 2→X1030 2→Y1030
3 3→X1040 3→Y1040
3 3→X1050 3→Y1050
4 4→X1060 4→Y1060
4 4→X1070 4→Y1070
5 5→X1080 5→Y1080
5 5→X1090 5→Y1090
6 6→X10A0 6→Y10A0
6 6→X10B0 6→Y10B0
7 7→X10C0 7→Y10C0
7 7→X10D0 7→Y10D0
8 8→X10E0 8→Y10E0
8 8→X10F0 8→Y10F0
9 9→X1100 9→Y1100
9 9→X1110 9→Y1110
International Journal of Computational and Engineering30
ACADEMIC PUBLISHING HOUSE

waiting state (M102), prepare for the next time.
In order to ensure the operation and maintenance of
the system, fault alarm is essential. The possible
failure states are: car override on return line,
inclination of kiln box, number saturation of kiln car,
alarm test, ferry override, unloading fault, kiln door
lifting override, cylinder expansion fault, temperature
abnormality, pressure abnormality, return line
overtime, ferry overtime, kiln head urgent need kiln
car, kiln tail urgent need to leave, a total of 61 failure
points.
When a fault occurs, the corresponding state is
positioned. On the one hand, the alarm is driven. On
the other hand, the state is configurated to the touch
screen alarm group, and the fault number, location
and treatment method are prompted on the touch
screen. When the staff has finished handling the
malfunction, press the reset button on the touch
screen, and the alarm will be released.
In addition, the duty personnel can inquire the fault
number, fault location and treatment methods in the
work manual to ensure the normal operation of the
system.
Through operation, it is found that most of the causes
of failure are caused by sensors or mechanical reasons,
and the PLC itself has no fault.
7. CONCLUSION
Based on the research and analysis of the control
technology of zirconia tunnel kiln, the solution of
long-distance control with CC_Link bus is put
forward. This requires the configuration of the
substrate, the configuration of network parameters,
the use of Q series PLC for system control, GOT
touch screen for interactive control. The actual results
show that the network is stable and reliable,
anti-interference ability is strong, simple and easy to
operate, the programming is convenient, the operation
is easy, the system runs well, the failure rate is very
low, the kiln atmosphere is easy to control, and the
product quality and output fully meet the design
requirements of the factory.
REFERENCES
[1]Zhang shisheng. PLC Applied Technology,
Xian:Xidian University Press,2018, 252-260.
[2]Qiao yuanfeng.CC-Link Communication
Technology between Mitsubishi PLC and Mitsubishi
Inverter.NanNing:Equipment Manufacturing
Technology, Phase 2, 2012, 82-83.
[3]Hou Lu. Design and Temperature Control of
Tunnel Kiln Control System, Phil. Trans. Roy.
Shenyang:Northeastern University, 2008.
International Journal of Computational and Engineering 31
ACADEMIC PUBLISHING HOUSE
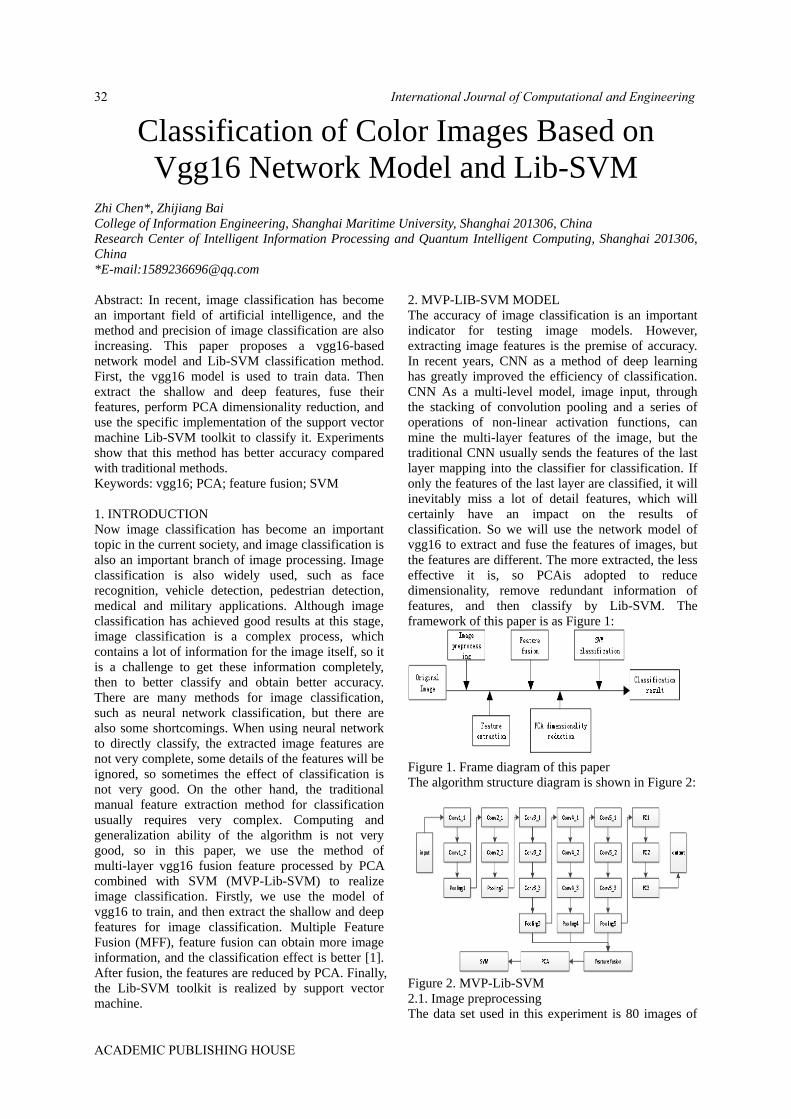
Classification of Color Images Based on
Vgg16 Network Model and Lib-SVM
Zhi Chen*, Zhijiang Bai
College of Information Engineering, Shanghai Maritime University, Shanghai 201306, China
Research Center of Intelligent Information Processing and Quantum Intelligent Computing, Shanghai 201306,
China
*E-mail:[email protected]
Abstract: In recent, image classification has become
an important field of artificial intelligence, and the
method and precision of image classification are also
increasing. This paper proposes a vgg16-based
network model and Lib-SVM classification method.
First, the vgg16 model is used to train data. Then
extract the shallow and deep features, fuse their
features, perform PCA dimensionality reduction, and
use the specific implementation of the support vector
machine Lib-SVM toolkit to classify it. Experiments
show that this method has better accuracy compared
with traditional methods.
Keywords: vgg16; PCA; feature fusion; SVM
1. INTRODUCTION
Now image classification has become an important
topic in the current society, and image classification is
also an important branch of image processing. Image
classification is also widely used, such as face
recognition, vehicle detection, pedestrian detection,
medical and military applications. Although image
classification has achieved good results at this stage,
image classification is a complex process, which
contains a lot of information for the image itself, so it
is a challenge to get these information completely,
then to better classify and obtain better accuracy.
There are many methods for image classification,
such as neural network classification, but there are
also some shortcomings. When using neural network
to directly classify, the extracted image features are
not very complete, some details of the features will be
ignored, so sometimes the effect of classification is
not very good. On the other hand, the traditional
manual feature extraction method for classification
usually requires very complex. Computing and
generalization ability of the algorithm is not very
good, so in this paper, we use the method of
multi-layer vgg16 fusion feature processed by PCA
combined with SVM (MVP-Lib-SVM) to realize
image classification. Firstly, we use the model of
vgg16 to train, and then extract the shallow and deep
features for image classification. Multiple Feature
Fusion (MFF), feature fusion can obtain more image
information, and the classification effect is better [1].
After fusion, the features are reduced by PCA. Finally,
the Lib-SVM toolkit is realized by support vector
machine.
2. MVP-LIB-SVM MODEL
The accuracy of image classification is an important
indicator for testing image models. However,
extracting image features is the premise of accuracy.
In recent years, CNN as a method of deep learning
has greatly improved the efficiency of classification.
CNN As a multi-level model, image input, through
the stacking of convolution pooling and a series of
operations of non-linear activation functions, can
mine the multi-layer features of the image, but the
traditional CNN usually sends the features of the last
layer mapping into the classifier for classification. If
only the features of the last layer are classified, it will
inevitably miss a lot of detail features, which will
certainly have an impact on the results of
classification. So we will use the network model of
vgg16 to extract and fuse the features of images, but
the features are different. The more extracted, the less
effective it is, so PCAis adopted to reduce
dimensionality, remove redundant information of
features, and then classify by Lib-SVM. The
framework of this paper is as Figure 1:
Figure 1. Frame diagram of this paper
The algorithm structure diagram is shown in Figure 2:
Figure 2. MVP-Lib-SVM
2.1. Image preprocessing
The data set used in this experiment is 80 images of
International Journal of Computational and Engineering32
ACADEMIC PUBLISHING HOUSE
flowers, food, buildings, animals and cars from the
Corel database, but because the image used by vgg16
is 224 X 224 input, the image is normalized to 224 X
224 image pixels as input.
In deep learning, a large number of experiments show
that the size of data sets directly affects the
performance of deep learning. If the data sets are too
small, it is easy to cause over-fitting. In order to get
more data, we will use data enhancement to expand
the size of the data set [2]. Data enhancement
methods include flipping, clipping, rotation, scaling
deformation, affine change, visual change and so on.
In this experiment, we will use rotation to enhance the
data, which can not only enhance the size of the data,
but also keep the pixels of the image unchanged. This
will preserve more information about the image.
Rotation enhancement will rotate the image as the
center, and the enhancement is as follows: rotate the
picture 90°, 180°, 270°, so that the number of
images will be 3 times, which are 240 sheets, and then
70% of the image will be used. The training set, the
remaining 30% as a test set.
2.2. Feature extraction
Because of the nature of convolution and pooling
computation, the translation part of the image has no
effect on the final eigenvector. From this point of
view, the extracted features are more difficult to
over-fit. Because of the invariance of translation, it is
meaningless to alter the translation character, which
eliminates the process of altering the sample. The
features extracted by CNN are more scientific than
simple projection and direction. Feature extraction
will not become the bottleneck of the final
improvement of accuracy. The ceiling can use
different convolution, pooling and the size of the final
output eigenvector to control the fitting ability of the
overall model. The dimension of eigenvectors can be
reduced in over-fitting, and the output dimension of
convolution layer can be increased in under-fitting.
Compared with other feature extraction methods,
vgg16 is more flexible. In this paper, we use vgg16 to
extract features [3]. We will extract features from pool
3, pool 4 and pool 5 layers [4]. The operation of pool
layer is image resize. The information removed
during image compression is only some insignificant
information, while the information left behind is a
scale invariant feature, which is the most capable of
expressing image features. Feature dimensionality
reduction, we know that an image contains a lot of
information and features, but some information for us
to do image tasks without too much use or duplication,
we can remove such redundant information, extract
the most important features, which is also a major role
of pooling operations. To a certain extent, it can
prevent over-fitting and is more convenient to
optimize. The pooling layer is to do some
optimization under the condition of feature
invariance.
2.3. Feature fusion
The model of convolution neural network will filter
the image features. If some valuable features are
ignored, it will affect the experimental results and
degrade its performance. The traditional convolution
neural network only considers the feature map of the
last layer after layer convolution, and does not fully
mine the information of each layer of convolution
neural network, which will be one. The neglect of the
shallow features of some images results in the
reduction of classification accuracy. Therefore,
combining the shallow features with the deep features
and using the fused features to classify will achieve
better results. In this paper, feature fusion will be
carried out by serial fusion. The fused feature vectors
can be expressed by the following expressions (1): 2 1Z , ,l l lX X X (1)
2.4. PCA dimension reduction
The feature is merged by serial fusion, and the
redundant information is increased. We need to
reduce the dimension of the fused feature vector. The
dimension reduction can remove noise and
unimportant features, making the data set easier to use
and reducing the calculation of the algorithm. There
are many dimension reduction algorithms, such as
singular value decomposition, principal component
analysis, factor analysis, etc. In this paper, PCA is
used to reduce the features [6], and a k-dimensional
image feature is obtained. The value of K is
determined by the cumulative contribution rate of the
principal component. Combining with the experiment,
the first k eigenvectors with cumulative contribution
rate of 0.85 are selected to form a new image feature
map to reduce the dimension without affecting the
classification accuracy.
2.5. Lib-SVM classifier
SVM can analyze objects from the characteristics of
samples. Support Vector can minimize the empirical
error and maximize the geometric edge, which is
characterized by solving the small sample size and
non-linear classification to a certain extent, solving
the problem of local minimum of classification model
and improving the accuracy of classification. This
article will use Lib-SVM instead of the output layer
of vgg16 to classify images [7]. Lib-SVM is a toolkit
designed and developed by Professor Lin Zhiren of
Taiwan University. Download the lib-svm package
first, then import the package into the python package
to use.
3. EXPERIMENT AND RESULT ANALYSIS
3.1. Experimental platform
The experimental environment used in this paper is
Windows operating system, using I5-6500 processor,
the main frequency is 3.20GHz, the memory is 16GB,
the deep learning framework is TensorFlow, and the
software programming environment is Python3.6.
3.2. Evaluation criteria
This experiment mainly verifies the results of the
experiment by the accuracy rate. The main formula is
International Journal of Computational and Engineering 33
ACADEMIC PUBLISHING HOUSE

as follows:
100%T ln of pictures
Identify he correct number of imagesAccuracy
ota umber
(2)
3.3. Comparison with other methods
In order to verify the effectiveness of the method, it
will be compared with the traditional method, the
results are shown below:
Table 1. MVP-Lib-SVM
Sample type Classification accuracy/%
flowers 93.6
food 90.7
building 93.3
animals 96.5
cars 89.6
Table 2. Manually extract-Lib-SVM
Sample type Classification accuracy/%
flowers 86.4
food 88.5
building 92.7
animals 95.6
cars 90.5
Table 3. Vgg16-Lib-SVM
Sample type Classification accuracy/%
flowers 89.5
food 89.3
building 90.1
animals 93.6
cars 90.8
Comparing the method of this paper with the above
two methods, the comparison of Table 1 and 2
experiments shows that the features extracted by
vgg16 are more complete than the features of manual
extraction. Table 1 and 3, the feature fusion makes the
information of the picture more specifically, the
accuracy of the classification is higher.
4. CONCLUSION
This paper combines neural network and multi-feature
fusion to classify images with support vector machine.
The accuracy has been improved to a certain extent.
After feature fusion, dimension reduction is carried
out, which effectively reduces the redundant
information of features and greatly improves the
operational efficiency. Some samples are not very
good when classifying, resulting in poor results. The
more types, the lower the classification efficiency.
The next step is to do so. Good samples can be
selected for further experiments, and different
classifiers can be selected for further experiments.
REFERENCES
[1]XuenaQiu. An adaptive kernel-based target
tracking method based on multiple features fusion.
Ieej Transactions on Electrical & Electronic
Engineering, 2011, 7(1):91-97.
[2]ShengDaoqing. Research on image enhancement
algorithm. Wuhan University of Science and
Technology.
[3]Liu B., Zhang X., Gao Z., et al. Weld Defect
Images Classification with VGG16-Based Neural
Network. 2017.
[4]Sun W., Du H.J., Zang X.R., et al. Traffic Sign
Recognition Based on CNN Multi-layer Feature and
ELM. Journal of University of Electronic Science and
Technology, 2018, 47(3): 343-349.
[5]QuanSen ZENG, Sheng Gen, et al. A new method
of feature fusion and its application in image
recognition. Pattern Recognition, 2005, 38(12):
2437-2448.
[6]LiLei. Method of SVM Face Detection Based on
PCA Dimensionality Reduction. Journal of Qingdao
University of Science and Technology (Natural
Science), 2010, 31(5).
[7]Anonymous. Application of Lib SVM in Color
Image Classification. Wireless Interconnect
Technology, 2018, v.15, No. 140(16): 140-142.
International Journal of Computational and Engineering34
ACADEMIC PUBLISHING HOUSE

Analysis of College-led College Student Work
Management Mode
Xingzhong Li
Zibo Vocational Institute, Shandong, China
E-mail: [email protected]
Abstract: The college-led college student work
management model is based on the school, with the
secondary colleges as the main force, with clear
powers and responsibilities, division of labor and
cooperation, management and service of college
students, and a new model of college students’ work
that highlights the functions of ideological and
political education. Under this model, the work of
college students presents a significant degree of
autonomy, and the autonomy of college students is
targeted, characteristic and educational.
Keywords: College student work; Education; X-ray
energy spectrum
1. INTRODUCTION
College student work has multiple functions of
management, service and education, and the function
of ideological and political education is increasingly
valued by people. For example, in 2004, the
“Opinions on Further Strengthening and Improving
College Students’ Ideological and Political Education”
jointly issued by the Central Committee of the
Communist Party of China and the State Council
required “putting the ideological and political
education of college students at the top of the
school’s work.” Counselors affiliated with colleges
and universities are regarded as the “backbone
strength” of college students’ ideological and political
education. The “study style construction”, “social
practice activities” and “solving the practical
problems of college students” mentioned in these
schools all depend on the work of college students.
carry out. At present, the role of college students’
work in the ideological and political education of
college students is further exerted. Can not be
separated from the optimization of its management.
The “College of the College” model is a new
exploration of the current development of student
work management in colleges and universities [1].
We intend to examine the concepts related to it.
Discuss the characteristics and value orientation of
this management model College-led college student
work management model connotation college-led
college student work management model,
It is based on the school. A new mode of college
student work management with colleges as the main
force, clear powers and responsibilities, division of
labor and cooperation, management and service of
college students, and highlighting the objectives of
ideological and political education.
2. THE MAIN TASKS OF COLLEGE STUDENTS’
WORK
Main Tasks of College Student Work The work of
college students in China is mainly composed of
college student affairs management and college
ideological and political education. The former mainly
includes management and service in terms of student
status, funding, class, employment, attendance,
logistics, etc.; the latter is guided by Marxism, Mao
Zedong Thought and the theory of socialism with
Chinese characteristics. The implementation of the
“student-oriented” value concept mainly includes
college students’ mental health education, situation
policy education, employment guidance education, as
well as organizing students to participate in party and
group life, participating in various activities sponsored
by colleges and schools, and participating in social
practice activities. And implemented as a carrier [2-3].
Although all colleges and universities in China have
set up special courses in ideological and political
theory, which are taught by full-time teachers, the
work teams of college students actually undertake the
functions of ideological and political education for
college students. Not only does it have courses related
to it, but it is also close to student life and is integrated
into education. The characteristics of education in
practice play an irreplaceable role. It has become an
important channel beyond the “main channel” of
ideological and political education in colleges and
universities.
3. COLLEGE STUDENT WORK MANAGEMENT
MODE
Student work management mode in colleges and
universities work management of college students is
the realization of the tasks of the relevant functional
departments around the work of college students. A
kind of adjustment and control activities for the
implementation of college students’ work management
of college students’ work discussed in this paper
mainly refers to the management implemented at the
school level, that is, within the school. The university
student work management mode is a set of relatively
fixed management standards and operating systems
formed in the management activities of college
students’ work [4].
It is precisely because of this relatively fixed and
standardized characteristics. The management model
has a tendency to become rigid. Directly affecting the
International Journal of Computational and Engineering 35
ACADEMIC PUBLISHING HOUSE
completion of organizational tasks and the realization
of goals. Some scholars pointed out that from the
perspective of organizational structure, the work of
college students in China has long adopted a
centralized and unified bureaucratic management
model. This management model is “theoretically; the
straight-line organizational structure”: the school
leader, the student work department, and the
first-class student work group. There are problems
such as excessive management functions, unclear
division of labor, low degree of specialization, weak
coordination and coordination, and poor
communication of organizational information. What
the king wants is that this management model makes
the student staff business complicated [5]. The main
function of student work has a negative impact on
ideological and political education. This student work
management model is school-led and innovation
needs to be promoted.
4. EMPHASIZING THE RELEVANCE OF
COLLEGE STUDENT WORK
Western modern management science that emerged in
the 1950s. Such as Peter Drucker’s epoch-making
“goal management” thinking, the behavioral school
advocates the human-centered “flexible management”
concept. All of the current college students’ work
management innovation can be used for reference.
The work management mode of college students is an
external condition for college students’ work and
operation, and can adapt to the current situation of
college students’ work. It will have an important
impact on the orderly and efficient development of
university students’ work. Based on the above
discussion. We try to put forward the “college-led
college student work management model”. And its
connotation is defined as follows: the college-led
college student work management mode is based on
the school, with the college as the main force, clear
powers and responsibilities, division of labor and
cooperation, management and service of college
students. A new mode of college student work
management that highlights the objectives of
ideological and political education.
College-led college student work management model
characteristics College-led work management model
for college students. In fact, the autonomy of student
work is clearly, fully and appropriately assigned to
colleges, further delineating the respective rights of
schools and colleges responsibility [6]. Make the two
work together and complement each other in student
work. Under the college-led model, the college fully
enjoys the autonomy of student work.
4.1. Emphasizing the pertinence of college students’
work
First of all, contemporary college students often have
distinct personalities in understanding problems,
feeling the world, and living in the world, pursuing a
different way: secondly, since the 1990s. China’s
higher education has become more popular from the
elite, and the colleges and universities have greatly
expanded their enrollment. The number of college
students has increased year by year. Therefore, many
new contradictions and new problems are faced. This
requires that the work of college students can be
carried out in a flexible and diverse manner. Can truly
respect the different choices of college students. Solve
the different types of difficulties it faces. In this case.
Traditional school-led student work management
model. It is often based on solving the problems of
general and universal existence among college
students. It is difficult to adapt to the needs of college
students’ personality development. The academic team
of colleges and universities directly contacts and
interacts with students. They leave students’ lives,
listen to students’ opinions, answer questions and
solve problems for students, and have unique
advantages in dealing with the above situations; in fact.
At present, the actual work of college students is more
borne by the academic teams of various colleges.
4.2. Reflecting the characteristics of the student work
of the college
Higher education in the world adopts a model of
sub-disciplinary training for students, in order to
enable the educational subjects to master certain
professional skills to adapt to the increasingly fine
social division of labor. Meet the needs of an
increasingly diverse market, or try to cultivate
specialized talents who are engaged in research in a
particular subject area. In this case. The profession
determines the future career direction of college
students to some extent. The life vision, value
orientation, thinking style and career ideals of college
students are often closely related to the majors they
are studying. Therefore, college students of different
majors often have significant differences in the above
aspects. College students with the same or similar
majors have some commonality in these aspects. This
objectively requires the university’s academic system
to manage and serve. When implementing ideological
and political education. Must meet the reality of
college students at different levels of professionalism.
5. CONCLUSION
As mentioned earlier, ideological and political
education should be placed at the top of all work in
colleges and universities, and this aspect of the work
of college students is increasingly valued by people in
the school-led mode. In all fairness. With the
increasing enrollment of colleges and universities in
recent years, the number of college academics is
limited to the large number of “hard” jobs that can be
investigated, and ideological and political education is
often due to its own ambiguity, long-term and
complexity. Ignored. Under the college-led model. It
will give them more time to strengthen and improve
the ideological and political education of the college,
such as the guidance of the extracurricular activities of
college students.
International Journal of Computational and Engineering36
ACADEMIC PUBLISHING HOUSE

REFERENCES
[1]Li Zhongyan, Zhang Furong. Student Management
and Thinking in Colleges and Universities in the New
Period. Urban Construction Theory Research
(electronic version), 2018, (24).
[2]Hu Jiangling. Reflections on doing a good job in
the management of college students in the new era.
Examination Weekly, 2009, (35), 181-182.
[3]Ye Chunqiao. Exploration and Reflection on
College Student Management in the New Period.
Journal of Ningbo University (Educational Science
Edition), 2018, 28(1) 46-48.
[4]Li Jianpo. Strategic Thinking on Improving the
Management Level of College Students in the New
Period. Journal of Henan Normal University
(Philosophy and Social Sciences), 2009, 36(5)
211-213.
[5]Zhang Xiaojun.Analysis of the Ideological and
Political Education Function of Student Management
Early Warning Mechanism in Private Colleges and
Universitie. Science and Technology Economics
Guide, 2016(18).
[6]Fan Wei. Analysis of ideological and political
education in the management of students in higher
vocational colleges. Cai Zhi, 2017(22).
International Journal of Computational and Engineering 37
ACADEMIC PUBLISHING HOUSE

Research on Channel Estimation Technology
Based on OFDM in Wireless Communication
Systems
Ke-jia Ji, Yi Sun
Institute of Information and Engineering, Zhengzhou University, Zhengzhou 450000, Henan, China
Abstract: Orthogonal frequency division multiplexing
(OFDM) modulation technology is widely used in the
fourth-generation mobile communication. It has
strong anti-multipath fading capability and high
spectrum utilization. However, OFDM system is very
sensitive to channel estimation errors.The channel
estimation accuracy is directly related to the detection,
demodulation and equalization at the receiving end.
Focus on OFDM channel estimation technology, the
traditional performance based on pilot is discussed.
And the channel estimation in high-speed mobile
communication is proposed. Besides, for OFDM
systems with different system uses, the parameters of
the channel are different.
Keywords: OFDM; Wireless communication system;
Channel estimation
1. INTRODUCTION
Orthogonal Frequency Division Multiplexing (OFDM)
converts high-speed serial data flow into low-speed
parallel data stream by dividing the channel into
several sub-channels in the frequency domain. And
each channel uses orthogonal sub-carriers to transmit
data, and the receiver uses correlation technology to
separate the data, which reduces the mutual
interference between sub-carriers and improves the
utilization of frequency band [1]. Therefore, OFDM is
widely used in wireless communication.
However, OFDM system is very sensitive to channel
estimation error and synchronization error, and
channel estimation plays an important role in signal
detection and coherent demodulation. Consequently,
channel estimation has become a key part of wireless
communication system. The accuracy of channel
estimation in OFDM system will directly affect the
performance of the whole wireless communication
system.
Channel estimation is to estimate the impact response
of the channel in order to study the impact of the
physical channel on the input signal. In orthogonal
frequency division multiplexing (OFDM) systems, the
design of channel estimation mainly considers two
factors: one is the complexity of the algorithm, the
other is the arrangement of pilot patterns. The suitable
channel estimation algorithm requires lower bit error
rate and less mean square error, and the complexity of
the algorithm should meet the requirements.
2. CONVENTIONAL CHANNEL ESTIMATION
ALGORITH
Traditional pilot-based algorithms include least
square method (LS), least mean square error method
(MMSE) and discrete Fourier transform method (DFT)
based on transform domain.
2.1. Least square method (LS)
The least squares algorithm is the basis of channel
estimation algorithms for all OFDM systems because
of its low complexity and simple computation.
However, it dose not take into account the influence
of noise so that it can only be used in the case of high
signal-to-noise ratio (SNR). When the SNR is low, the
influence of noise is great, and the accuracy of
channel estimation is quickly decreased.
2.2. Minimum mean square error method (MMSE)
Unlike the LS algorithm, the MMSE algorithm consid
ers the influence of noise. It makes full use of the
statistical characteristics of the channel to deal with
the noise, so it has a wider range of applications and
higher estimation accuracy. Nevertheless, a difficulty
is that the channel characteristics are often unknown
in practical application. In addition, the MMSE
algorithm requires the solution of the inverse matrix,
and the computation is complex when the dimension
of the matrix is large. Thus, its use is still limited to a
certain extent.
2.3. Discrete fourier transform method (DFT)
The estimation accuracy of DFT algorithm is higher
than that of LS algorithm, and the complexity of the
algorithm is lower than that of MMSE algorithm. The
algorithm is based on the feature that channel energy
is more concentrated in time domain than in
frequency domain. First, the LS algorithm is used to
estimate the signal, and then the frequency domain
value is converted to the time domain value by IDFT.
After removing the noise in the time domain, the time
domain is converted to the frequency domain by DFT,
and finally the frequency domain response of the
channel is estimated. Because DFT and IDFT can be
implemented quickly by digital signal processing
technology (DSP), the complexity of the algorithm is
not high.
In fact, the three traditional channel estimation
methods mentioned above show that pilot signals are
inserted serially, and the bandwidth utilization is low,
so they occupy valuable frequency band resources. In
this case, the channel estimation method based on
International Journal of Computational and Engineering38
ACADEMIC PUBLISHING HOUSE

decision feedback does not need pilot signal, and can
effectively improve the transmission efficiency and
band efficiency. However, due to the problem of error
accumulation, the performance of the system is
degraded and can not be realized quickly. In contrast,
the blind channel estimation method does not need
training sequence, and the transmission efficiency of
the system is higher. Of course, we can also use the
semi-blind channel estimation method with low
complexity, which uses both specific training
sequence and blind estimation method. This method
not only ensures the system performance, but also has
a good convergence rate [2].
3. CHANNEL ESTIMATION IN HIGH SPEED
MOBILE ENVIRONMENT
The high-speed transmission system adopts coherent
demodulation. In order to ensure the performance of
the system, it is necessary to rely on the channel
estimation to demodulate the signal at the starting end
of the transmission system. In the high-speed mobile
environment, the channel change speeds up and the
traditional channel estimation method is no longer
applicable. It is essential to design a method which
can effectively resist the channel change, track the
channel change quickly, improve the transmission
efficiency and reduce the complexity of the algorithm
[3]. Because DFT is an effective interpolation method
with simple implementation and good estimation
performance, we can interpolate the frequency
response of the channel in the process of time-domain
and frequency-domain transformation. Another
method is to perform MMSE filtering in frequency
domain and linear interpolation in time domain to
adapt to the high-speed changing channel by means of
MMSE algorithm. In a word, no matter which
algorithm is adopted, it is sagacious to consider the
channel change and the complexity of the algorithm
to realize the fast tracking ability of the estimation
algorithm according to the actual environment.
4. CHANNEL ESTIMATION FOR DIFFERENT
OFDM SYSTEM
4.1. Multi-input multi-output orthogonal frequency
division multiplexing system (MIMO-OFDM)
The MIMO-OFDM system has multiple transceiver
terminals, which can generate independent parallel
channels in space and transmit data simultaneously. It
improves the transmission efficiency and channel
capacity. The accurate estimation of the channel state
will directly affect the data processing of coherent
demodulation and channel equalization. Because the
received signal at the receiving end of the MIMO
system is the superposition of the multiple antenna
signals, and the signals of other antennas are
interference for the channel estimation of any pair of
antennas, the proposed channel estimation algorithm
should match the MIMO-OFDM channel model.
Based on common channel estimation methods, blind
estimation algorithm has high complexity, low
convergence and poor tracking ability. Therefore,
channel estimation is based on pilot insertion, that is,
non-blind channel estimation algorithm, which
requires not only the minimum number of pilots, but
also the real-time tracking of channel changes [4].
Different from OFDM system, the pilot frequency of
different antennas in MIMO-OFDM system should be
orthogonal in order to avoid the interference between
antennas.
4.2. Multi-band orthogonal frequency division
multiplexing ultra-wideband system
(MB-OFDM-UWB)
MB-OFDM-UWB system has the advantages of high
bandwidth in frequency domain and high transmission
rate. It can transmit data at high speed and is suitable
for short-range wireless communication. Because of
the sparse characteristics of UWB system, most of the
impact response values are near zero. We can reduce
the channel dimension by using compressed sensing
technology to achieve channel estimation [4-7]. If
compression sensing is carried out in the time domain,
it is indispensable to add a qualified training sequence
in the time domain and change the structure of the
system in order to realize the channel estimation more
accurately but the realization process is more
complicated. Based on the above situation,
compression sensing in frequency domain and
reconstruction of OMP algorithm can be used to
realize channel estimation. This method can obtain
high estimation accuracy without using all the known
training sequences.
4.3. Coherent Optical Orthogonal Frequency Division
Multiplexing System (CO-OFDM)
For CO-OFDM system, easy to carry on signal
processing and high-order modulation, it has become
the research hotspot in the field of optical
communication. Due to the dispersion of fiber,
frequency shift and phase noise caused by transceiver
laser, it is certainly worth considering the error rate
(BER) as an important index to evaluate the system
performance in the process of channel estimation [2].
In general, the above three different systems utilize
the OFDM technology, but also because of the
different system performance requirements, the
influence of its own factors needs to be taken into
account when the channel estimation is carried out,
and the appropriate parameters are selected as the best
index to measure the performance of the system.
5. CONCLUSION
Channel estimation has always been an important
research topic in the field of mobile communication,
and its accuracy will directly affect the results of
signal processing and thus affect the performance of
the system. OFDM technology is widely used in
mobile communication because of its high band
efficiency and high anti-jamming ability. For the three
traditional channel estimation methods of wireless
mobile communication: LS algorithm has low
complexity, but its application range is limited;
MMSE algorithm has high estimation precision, but
International Journal of Computational and Engineering 39
ACADEMIC PUBLISHING HOUSE

the algorithm is more complex; DFT is between the
two methods, and DSP technology can be used to
improve the computing speed. For high-speed
wireless mobile communication, the channel
estimation method needs to track the channel change
in real time. And for the wireless communication
system with different uses, it is necessary to find the
corresponding channel estimation algorithm
according to its unique system performance, and
improve the algorithm according to each performance
index.
REFERENCES
[1]Chen L. Research on Channel Estimation of Next
Generation Wireless Communication System. Beijing
University of Posts and Telecommunication, 2014
[2]Liu K, Liao S Y, Yin R M, Wang W. Research on
Pilot-symbol-aided Channel Estimation in OFDM
Wireless OFDM Wireless Communication system.
Journal of Henan Polytechnic University (Natural
Science), 2013, 32(4): 596-602.
[3]Jiang Z M. Key Technologies of OFDM Wireless
Mobile Communication System. Communication
design and application, 2015, 9: 16-16.
[4]Tian Q H, Research on key Technologies of High
Speed Mobile Wireless Communication system and
Broadband Satellite Communication system based on
OFDM. Beijing University of Posts and
Telecommunication, 2013.
[5]Shu S. Research on Pilot-Based Channel
Estimation Technologies for MIMO-OFDM Wireless
Communication System. Nanjing University of
Aeronautics and Astronautics, 2017.
[6]Wang X M. Research and Implementation of the
Channel Estimation in Wireless Communication
Systems. Nankai University, 2015.
[7]Cong J. Study of the Synchronization and Channel
Estimation Technique Incoherent Optical OFDM
Communication System, Harbin Institute of
Technology, 2014.
International Journal of Computational and Engineering40
ACADEMIC PUBLISHING HOUSE
Quantum Particle Swarm Optimization
Algorithm Based on Improved Migration Idea Qianyu Chen1, Yonglu Liu1, Yiwei Zhao1, Mingfang Wang2, Yuhao Dong3 1PLA Dalian Naval Academy 2Unit 93861 3PLA Air Force Engineering University, Xi’an, Shanxi, 710051
E-mail: [email protected]
Abstract: In PSO algorithm, the search space of
particles is the whole feasible solution space of the
problem, but because of the aggregation of particle
swarm, the loss of population diversity is inevitable.
At the later stage of the search, the particles are
clustered and the search space is very limited. Particle
swarm may fall into local extreme point. In order to
avoid falling into local extremum, an adaptive method
is introduced based on QPSO algorithm. When using
QPSO to solve practical problems, the parameters in
formula (5.5) are usually reduced linearly[1].
Keywords: PSO algorithm, QPSO algorithm,
convergence 1. INTRODUCTION
In order to make the standard particle swarm
optimization algorithm get rid of the local extremum,
this paper applies the migration strategy to the
standard particle swarm optimization algorithm. The
multi-generation population of the particle swarm
optimization algorithm does not appear the
phenomenon of individual gradually becoming better,
which proves that the particle swarm optimization
algorithm has been trapped in the local optimum.
Therefore, guided by the best fitness particle, a goal is
set as M, which is analyzed together with other
particles in the collective. Then, the worst individual
after migration is replaced by the best individual
Gbest before migration, thus the migration
quantum particle swarm optimization algorithm is
obtained.
2. MIGRATION THOUGHT
2.1. Particle swarm optimization (PSO) migration
idea
In the D-dimensional search space, a community is
composed of N particles, each particle contains a
D-dimensional position vector, which is denoted as Xi,
and is regarded as the group optimization, thus
producing a random target point Pbest, denoted as M.
Therefore, the migration strategy of PSO is to adjust
its own position according to the formula:
i
iinewi
PbestM
PbestMXX
)(2_ (1)
2.2. Algorithmic flow
The algorithmic flow is:
Step1: Initialize the position and velocity of particles
Step2: Calculate the fitness of each particle
Step3: The current position of the particle
Step4: Change the velocity and position of particles
Step5: Compare the fitness values. The current
position of particles is regarded as the best position in
the whole population.
Step6: Judging whether the PSO algorithm can fully
satisfy the convergence conditions
Step7: Global Optimal Particle Individual Output, this
is the end of the algorithm.
3. CONCLUSION
Power supply equipment optimization problem is a
complex non-linear optimization problem, and its
continuous and discrete variables are intermingled
with each other, which makes optimization very
difficult. Long-term research is based on traditional
optimization methods, such as non-linear
programming, linear programming and dynamic
programming, which have strong model dependence
and high requirements for the continuity of initial
points and variables. In recent years, intelligent
optimization algorithms widely used in academia can
better overcome the shortcomings of traditional
optimization algorithms. Particle swarm optimization
(PSO) algorithm is a heuristic algorithm based on
multi-point random search. It uses multi-point parallel
search method and information exchange among
particles. It can quickly converge to a point in the
solution space. There are fewer parameters to be
adjusted, and it is suitable for power supply
equipment optimization[2]. Firstly, the improved
particle swarm optimization (PSO) algorithm is used
to optimize the reactive power of power supply
equipment. Firstly, the optimization index is
determined to be the stability of static voltage, thus a
set of Multi-Objective Reactive power optimization
model is established. At the same time, the
comprehensive factors such as the minimum active
power loss, the optimization of voltage level and the
maximization of static voltage stability are considered.
Particle swarm optimization (PSO) is used to
optimize the model function. The experimental results
show that the particle swarm optimization algorithm
can realize the economic operation of power supply
equipment and improve the stability of power supply
equipment. Therefore, it proves that the particle
swarm optimization algorithm has its unique
International Journal of Computational and Engineering 41
ACADEMIC PUBLISHING HOUSE

advantages and effectiveness[3].
Secondly, the improved particle swarm optimization
algorithm is used to optimize the multi-objective
dispatching model of power supply equipment failure.
According to the relevant research, it is proved that
the improved particle swarm optimization algorithm
can greatly improve the feasibility of power supply
equipment decision-making, provide strong support
for decision-makers, and prove that the algorithm is
very suitable for multi-objective dispatching
optimization of power supply equipment.
Thirdly, according to the specific power loss problem
of power supply equipment, the variant improved
particle swarm optimization (PSO) algorithm is used
to optimize the reactive power of multi-objective.
Through a large number of related experiments, it is
proved that PSO algorithm can express the specific
relationship between voltage deviation and power loss
in power supply equipment, and at the same time,
provide users with a very uniform distribution of
diverse alternatives. By stacking the results several
times, it can be shown that the algorithm has reliable
stability. Moreover, numerical experiments on the
improved particle swarm optimization algorithm
prove that the algorithm has strong search ability and
convergence ability, and overcomes many
shortcomings of the particle swarm optimization
algorithm.
In summary, the improved particle swarm
optimization (PSO) algorithm is applied to the power
supply equipment fault problem, which can reduce the
number of parameter settings and has strong
operability in optimization. Therefore, this paper uses
the PSO algorithm to optimize the parameters of the
wide area damping controller.
REFERENCES
[1]Roman Lysecky, Frank Vahid. A Configurable
Logic Architecture for Dynamic Hardware/ Software
Partitioning. Proceedings of the Design, Automation
and testing in Europe Conference and Exhibition
(DATE04), 2004, IEEE, 01-06.
[2]William B. Andrew, Glenn Cart, Ravi K, Charath,
James F.Hoff, Ron Modo,Hung Nguyen, William
Smith, David Rhein, Joe Schulingkamp, Carolyn W.
Spivak, James P. Steward, Akila Subramaniam. A
Field Programmable System Chip which combines
FPGA and ASIC circuitry. IEEE 1999 CUSTOM
INTEGRATED CIRCUITS CONFERENCE,
183-186.
[3]Quartus II Installation & Licensing for PCs, Altera
Corporation 101 Innovation Drive San Jose, CA
95134(408)544-7000, www.altera.com
International Journal of Computational and Engineering42
ACADEMIC PUBLISHING HOUSE

Analysis of dragon migration based on
Analogy and cluster Analysis
Suyun Wang, Yajun Zhang, Chongrun Wu, Yu Gao, Chunli Wang
Institute of Information Technology of Guilin University of Electronic Technology, Guilin, 541004, China
E-mail: [email protected]
Abstract: Firstly, it is supposed that there are many
factors , which means overall ecological impact
requirements, food, environment and the
community and so on. After calculation, we can
finally find that food is main factor. Secondly, our
team establishes the transfer diagram of the external
environment and energy of dragons. Then we find
basic energy consumed by the three dragons. Thirdly,we use the way of analogy to calculate the body
surface area of each dragon. That is equal to the
coefficient multiplied by the height plus the
coefficient multiplied by the weight. Then we use the
figure of calculation subtracts the coefficient to get
the area of three dragons. Fourthly, suppose that if the
animal body is analogized with a flexible beam
(cylinder), which is supported at the end of the
extremities. Base on the elastic theory, we get the
final calculated heat. Regarding question 5, we
compare the living community of the Siberian Tigers
to the dragon. Then get the communities supporting
three dragon are 24,000 square kilometers. Finally, we
analyze energy consumption of the dragon in different
climates and areas, and then find the basic energy
consumption of the dragon .
Keywords: The energy consumption of dragon;
Analogy calculation; Cluster analysis; Principal
component analysis; Nonlinear regression equation
1. THE RESTATEMENT OF PROBLEM
1.1. The background of problem
In “Game of Thrones”, the weight of three dragons
was about 10 kg when they hatched, and their weight
increased about 30-40 kg per year. They continued to
grow throughout life, depending on the characteristics,
behavior, habits, diet, and interaction with the
environment.
1.2. The requirements of problem
Question 1: What are the ecological impacts and
requirements of the dragon?
Question 2: What is the energy consumption of the
dragon?
Question 3: How much area does it take to support the
three dragons?
Question 4: What are their calorie intake
requirements?
Question 5: How much community is needed to
support the dragon to get different levels of
assistance?
Question 6: Like other migratory animals, dragons
may travel to different parts of the world in different
climates?
Question 7: In arid regions, does dragons moving
between warm temperate regions and the Arctic
region have a major impact on the resources needed
to sustain and grow dragons?
2. THE ASSUMPTIONS OF MODEL AND THE
DESCRIPTION OF SYMBOL
1). Assume that the dragon's basic biology is accurate
and obey the laws of conservation of energy in nature.
2). Assume that the ecological impact of the dragon is
determined by four factors: food, environment,
community, and geography.
3). Assume that the dragon is a warm-blooded animal
and the environment has less impact on the dragon.
4). Assume that each dragon has the same habits,
behavioral characteristics, and eating habits.
5). Assume that each dragon's intake is one percent of
its own and the food is sufficient.
6). Assume that dragons live in the community and
receive feeding.
7).
Symbol The Meaning of Symbol
Individual ecological impact
and requirements of dragon
Influencing factors The daily calorie needed
The energy that dragons need
to basal metabolism
The energy that dragons need
to digest food
The energy that dragons need
to physical activity
3. THE ANALYSIS OF PROBLEM
3.1. Analysis of question 1
In order to know and solve the ecological impact and
requirements of the dragon and we can assume that
the ecological impact of the dragon is determined by
many factors such as food, environment, community,
geography, humanities, space, and time.[1]
3.2. Analysis of question 2
We can use Figure 1, in which the three dragons
absorb the external energy for growth, and the excess
energy is excluded from the external energy. The
amount of heat each dragon needs per day is equal to
the basic energy required for each dragon's basal
metabolism. Then, use the figure of calculation plus
the calories needed for the physical activity of the
dragon.[2] Finally use the results plus the energy
Y
(i 1.2.3 )ix n
MY
JY
XY
TY
International Journal of Computational and Engineering 43
ACADEMIC PUBLISHING HOUSE
needed to digest the food.
The energy required for each dragon to digest food is
equal to 10% multiplied by the amount of heat
required for basal metabolism plus the amount of heat
required for physical activity. The heat required for
each dragon per day is equal to 1.1 times the basic
energy required for basal metabolism plus the amount
of heat required for each dragon's physical activity.[3]
3.3. Analysis of question 3
Regarding the question 3, we can calculate the body
surface area of the dragon analogously to the surface
area of human beings.[4] The analog surface
calculation method is used to calculate the body
surface area of each dragon.
The body surface area of each dragon is equal to the
coefficient multiplied by the height of the dragon plus
the coefficient multiplied by the weight of the dragon
and finally subtracted from the coefficient.[5] The
adult dragon can swallow a long mammoth in one bite,
so we can know the height and volume of the dragon.
It is known that area needed to support each dragon.
3.4. Analysis of question 4
For the calculation of the intake of the three dragons,
we must first calculate the volume of each dragon.
Besides, we have calculated how much energy is
needed for the three dragons to maintain daily
growth.[6] As long as the model changes, we can
calculate the maximum basic intake per dragon and
get the basic intake of the three dragons. .
3.5. Analysis of question 5
We refer to the current Siberian tiger, and analogy to
the size and range of activities to calculate how large
the active community of each dragon is. Then, we
calculate how many areas of the three dragons require
community giving activities.[7]
3.6. Analysis of questions 6 and 7
We refer to the current migratory birds, analogous to
the migratory range of migratory birds to calculate the
migration of dragons. As the species migrates, the
resources also change. Considering the subsequent
conditions, cluster analysis method in multivariate
analysis is used to analyze the influence of different
pairs on the dragon.[8]
4. THE ESTABLISH AND SOLUTION OF MODEL
4.1. The establish and solution of the problem one
model
We can use the nonlinear programming to assume that
the overall ecological impact and requirements of the
dragon are , and many other influencing factors are
.
Then there are:
So the total obtained is:
Because of
only values 0 or1,thus
,we have
Principal component analysis is used to further
optimize the model and the results are obtained. The
overall ecological impact and requirements of the
dragon are . The other influencing factors including:
food , environment , community , geography
, humanity , space ,and time and so on.
So get:
It is possible to get that the main factor is food, and
the environmental, community and geographical are
assistant.
4.2. The establish and solution of the problem two
model
The amount of heat that each dragon needing per day
is equal to the basic energy required for each dragon's
basal metabolism plus the amount of heat required for
each dragon's physical activity plus the energy needed
to digest food, namely:
The energy required for each dragon must be greater
than the daily basic calories needed to grow, namely:
The energy required for each dragon to digest food is
equal to 10% multiplied by the amount of heat
required for each dragon's basal metabolism plus the
amount of heat required for physical activity, namely:
The heat required for each dragon per day is equal to
1.1 times the basic energy required for each dragon's
basal metabolism plus the heat required for each
dragon's physical activity, namely:
From the above, we can know that if each adult
dragon need to maintain growth, the basic energy
every day are .The basic energy consumed
by three dragons every day are .
4.3. The establish and solution of the problem three
model
We use the analogy calculation method to calculate
the body surface area of each dragon. It is equal to the
coefficient multiplied by the dragon's height plus the
Y
ix
1 Determining ecological impacts and requirements
0 Not determining ecological impacts and requirementsix
1
n
i
i
x Y
1ix i n
1- =0 1i ix x i n
1
0n
i
i
x Y
Y
1x 2x 3x
4x 5x 6x 7x
1 1 2 2 3 3 n nY a x a x a x a x
11 12 1
21 22 2
1 2
n
n
n n nn
x x x
x x xx
x x x
11
21
1
1n
a
aa
a
12
22
2
2n
a
aa
a
13
23
3
3n
a
aa
a
'
i iY a x
M J X TY Y Y Y
C MY Y
10%X J TY Y Y
1.1M J TY Y Y
62.5 10 KJ67.5 10 KJ
International Journal of Computational and Engineering44
ACADEMIC PUBLISHING HOUSE
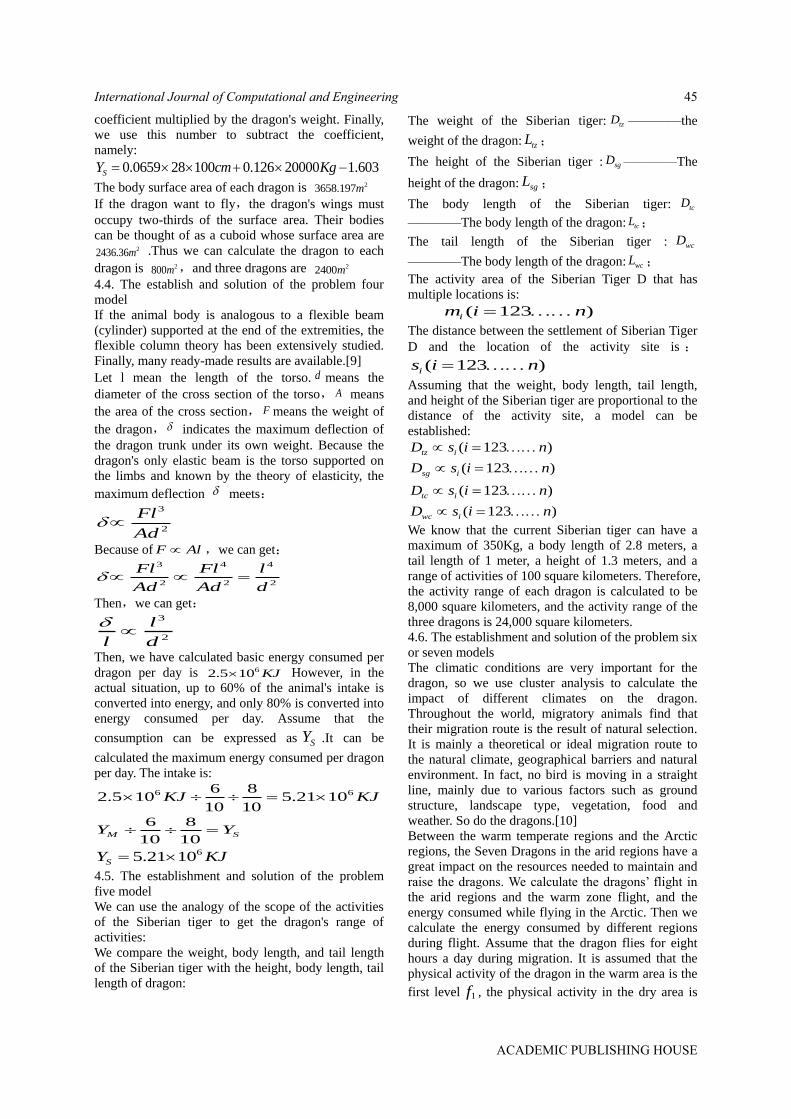
coefficient multiplied by the dragon's weight. Finally,
we use this number to subtract the coefficient,
namely:
The body surface area of each dragon is If the dragon want to fly,the dragon's wings must
occupy two-thirds of the surface area. Their bodies
can be thought of as a cuboid whose surface area are
.Thus we can calculate the dragon to each
dragon is ,and three dragons are
4.4. The establish and solution of the problem four
model
If the animal body is analogous to a flexible beam
(cylinder) supported at the end of the extremities, the
flexible column theory has been extensively studied.
Finally, many ready-made results are available.[9]
Let l mean the length of the torso. means the
diameter of the cross section of the torso, means
the area of the cross section, means the weight of
the dragon, indicates the maximum deflection of
the dragon trunk under its own weight. Because the
dragon's only elastic beam is the torso supported on
the limbs and known by the theory of elasticity, the
maximum deflection meets:
Because of ,we can get:
Then,we can get:
Then, we have calculated basic energy consumed per
dragon per day is However, in the
actual situation, up to 60% of the animal's intake is
converted into energy, and only 80% is converted into
energy consumed per day. Assume that the
consumption can be expressed as .It can be
calculated the maximum energy consumed per dragon
per day. The intake is:
4.5. The establishment and solution of the problem
five model
We can use the analogy of the scope of the activities
of the Siberian tiger to get the dragon's range of
activities:
We compare the weight, body length, and tail length
of the Siberian tiger with the height, body length, tail
length of dragon:
The weight of the Siberian tiger: ————the
weight of the dragon: ;
The height of the Siberian tiger : ————The
height of the dragon: ;
The body length of the Siberian tiger:
————The body length of the dragon: ;
The tail length of the Siberian tiger :
————The body length of the dragon: ;
The activity area of the Siberian Tiger D that has
multiple locations is:
The distance between the settlement of Siberian Tiger
D and the location of the activity site is :
Assuming that the weight, body length, tail length,
and height of the Siberian tiger are proportional to the
distance of the activity site, a model can be
established:
We know that the current Siberian tiger can have a
maximum of 350Kg, a body length of 2.8 meters, a
tail length of 1 meter, a height of 1.3 meters, and a
range of activities of 100 square kilometers. Therefore,
the activity range of each dragon is calculated to be
8,000 square kilometers, and the activity range of the
three dragons is 24,000 square kilometers.
4.6. The establishment and solution of the problem six
or seven models
The climatic conditions are very important for the
dragon, so we use cluster analysis to calculate the
impact of different climates on the dragon.
Throughout the world, migratory animals find that
their migration route is the result of natural selection.
It is mainly a theoretical or ideal migration route to
the natural climate, geographical barriers and natural
environment. In fact, no bird is moving in a straight
line, mainly due to various factors such as ground
structure, landscape type, vegetation, food and
weather. So do the dragons.[10]
Between the warm temperate regions and the Arctic
regions, the Seven Dragons in the arid regions have a
great impact on the resources needed to maintain and
raise the dragons. We calculate the dragons’ flight in
the arid regions and the warm zone flight, and the
energy consumed while flying in the Arctic. Then we
calculate the energy consumed by different regions
during flight. Assume that the dragon flies for eight
hours a day during migration. It is assumed that the
physical activity of the dragon in the warm area is the
first level , the physical activity in the dry area is
0.0659 28 100 0.126 20000 1.603SY cm Kg 23658.197m
22436.36m2800m 22400m
d
A
F
3
2
Fl
Ad
F Al3 4 4
2 2 2
Fl Fl l
Ad Ad d
3
2
l
l d
62.5 10 KJ
SY
6 66 82.5 10 5.21 10
10 10KJ KJ
6 8
10 10M SY Y
65.21 10S KY J
tzD
tzL
sgD
sgL
tcD
tcL
wcD
wcL
123( )im i n
123( )is i n
123( )
( )
( )
(
123
)
123
123
tz
sg
tc
wc
i
i
i
i
D
D
D
s i n
s i n
s i n
D s i n
1f
International Journal of Computational and Engineering 45
ACADEMIC PUBLISHING HOUSE

the second level , and the level of physical activity
in the Arctic is .
Then there are:
The basal metabolic rate (BMR) is:
The effect of food heat is:
The total energy that the dragon needed to fly every
day in the warm zone is:
The total energy that the dragon required to fly daily in arid areas is:
The total energy that the dragon needed to fly every day in the Arctic is:
Because 、 、 mean that physical
consumption of the dragon in different levels of
environment, it is calculated that basic flight
consumption is .
5. EVALUATION AND PROMOTION OF THE
MODEL
Because the analogy model method in the text
belongs to the category of reasonable reasoning.
Besides, there is the property of contingency, and the
mathematical model established by the analogy
method lacks reliability. The reliability depends on
the similarity and the similarity of the two things and
the degree of correlation between them. Therefore,
this method requires a wealth of information, and
requires some experience or a large number of
experiments, as well as the correctness of the
mathematical model built according to statistics. A
practice test is also required. However, there is
insufficient information in the text, and there are also
contingent characteristics.[11]
Because the dragon is a virtual species in the novel, it
is the most feasible way to combine the results of
animals in real life.
6. ACKNOWLEDGMENT
The authors wish to thank Chunli Wang. This word
was supported in part by a grant from the project of
fund of teaching reform project of higher education
undergraduate in Guangxi in 2018: research and
practice of “handwriting pad +the teaching plan of
PDF + MeiPai” hybrid teaching method for
mathematics courses in independent colleges
(2018JGA335).
REFERENCES
[1]Jiang Qiyuan, Xie Jinxing. Mathematical Model
(Third Edition). Beijing: Higher Education Press,
2003.
[2]Li Mingzhen, Qi Jianhua. Establishing
Mathematical Model by Analogy Method. Journal of
Henan Institute of Education, 2003.
[3]Zhang Fuyun, Yang Ruoli. Chinese Bird Migration
Research. China Forestry Publishing House, 1997.
[4]Chen Jun. Research on the relationship between
urban rail transit and regional economic development
based on cluster analysis. Science and Technology
Economic Market, 2018.
[5]Wang Nanqi, Jiang Weibing. Comparison and
Cluster Analysis of Photosynthetic Efficiency and
Seasonal Changes of Different Li Resources. Journal
of Nanjing Agricultural University, 2019.
[6]Hou Yuanwei. A new clustering analysis algorithm
based on deep learning. Journal of Xinxian University,
2018.
[7]Xiang Yuyu, Liang Shu. Study on the relationship
between wintering migratory birds and environmental
factors in the East Dongting Lake wetland. Journal of
Zhongnan University of Science and Technology,
2017.
[8]Li Huan, Xiong Mengying. Random forest analysis
of fusion factor analysis. Computer Engineering and
Applications: 2019.
[9]Yu Lei, Zhu Wenzhao. Research on Innovation
Capability of High-tech Industry Based on Factor
Analysis. Journal of Changchun University of Science
and Technology, 2019.
[10]Zhang Yumeng. Research on Environmental
Protection Evaluation of Anhui Province Based on
Factor Analysis and Cluster Analysis. Modern
Business & Trade, 2019.
[11]LIU Che. The Geographical Pattern of Bird
Species Richness in China and Its Relationship with
Environmental Factors. Journal of Peking University
(Natural Science), 2014.
2f
3f
weight 24MBMR Y h
The effect of food heat 10%BMR
18 12 + 10%W M MY Y BMR h f Y BMR h BMR 6 6 6
12.5 10 3.72 8 2.5 10 3.72 12 2.5 10 10%WY h f h 8
11.86 10WY f
28 12 + 10%g M MY Y BMR h f Y BMR h BMR
6 6 622.5 10 3.72 8 2.5 10 3.72 12 2.5 10 10%gY h f h 8
21.86 10WY f
38 12 + 10%b M MY Y BMR h f Y BMR h BMR 6 6 6
12.5 10 3.72 8 2.5 10 3.72 12 2.5 10 10%WY h f h 8
31.86 10WY f
1f 2f 3f
81.86 10WY
International Journal of Computational and Engineering46
ACADEMIC PUBLISHING HOUSE
An Algorithm for Semantic Matching of
Natural Language Environment Paragraph
Ying Li1,*, Yinghong Cai2, Huijuan Liu 1
1China Comservice Public Information Industry Co. Ltd., Xinjiang, 830000, China
2Guilin University of Electronic Technology, Guilin, 541004, China
*E-mail:[email protected]
Abstract: Aiming at the problem that traditional text
retrieval can only match texts by keywords, but not
semantic matching, an algorithm for natural language
environment paragraphs semantic matching with
subject description sentences is proposed. Firstly, a
method for quickly calculating semantic similarity is
proposed. The Euclidean distance calculation is
performed on the word vector of the topic sentence and
the article so that the similarity is obtained efficiently.
Secondly, a method of dimensionality learning to
compare the loss of different features is proposed,
which can keep the acquired sample features
unchanged while the number of dimensions is reduced,
so that the learned spatial features are more conducive
for sentence matching. Experimental results show that
the concatenated long Short-Term Memory (LSTM)
framework provides promising results on the Sohu
news dataset with an accuracy rate of 95%.
Keywords: Text retrieval; Semantic matching;
Euclidean distance; Contrast loss
Semantic matching is an important research field in
information retrieval. It has been in the application in
the field of natural language. Compared with basic
keyword matching, semantic matching is more
challenging because of the different semantic
information between different sentences. The problem
that semantic matching needs to deal with is the
similarity between sentences and sentences or between
sentences and articles. The challenge of this problem
mainly includes the influence of redundant information,
the context of the sentence in which the sentence is
located, the multi-sense of part of speech and the
connotation of multiple words and other factors.
The text search that was first introduced and put into
use is the index of the books used by the library.
Readers can quickly find the book and its specific
location in the library through the index. With the
invention and emergence of computers, document
matching is performed on a computer basis, and
documents for retrieving keywords appear to be
presented to the user as final retrieval results. The work
[1] uses a keyword and a logical relationship (including
“and”, “or”, “non”) to form a Boolean expression. A
document is a collection of index words. The criterion
for judging whether the query is related to the
document is whether the document satisfies the
Boolean expression of the query. In [2], a VSM
(vector space models) model is proposed, it uses the
vocabulary to multiply the word frequency in the text
and the reverse document frequency of the vocabulary
to calculate the weight, and the search term is obtained.
With the development of deep learning, Long Short-
Term Memory Networks (LSTM) has been proven to
have made breakthroughs in many aspects like
sentence matching, information retrieval and machine
translation. Deep learning does not require manual
design of feature extractors, but is learned by computer
autonomously. It is suitable for complex and changing
data. It is robust and provides generalization ability.
The cross-language automatic retrieval method based
on semantic extension proposed in [3]. It is to complete
the semantic retrieval by the original search instruction
input by the user. In fact, many users express the
retrieval requirements in this way, resulting in the
decline of retrieval quality.
In [4], a document retrieval design method is proposed
based on latent semantic analysis. This method solves
the problem like multiple words and one meaning.
Besides , it can effectively cluster documents in
semantics and complete the similarity calculation
between query statements and document sets.
Reference [5] proposes a semantic retrieval method
based on process ontology, which improves the fit of
search results by using the content matching principle
of reserved semantics in PQL statements.
Aiming at the method in [3-5], an algorithm for quickly
calculating the similarity of sentences is proposed. By
calculating the Euclidean distance between sentence
vectors, the rate of sentence matching is effectively
improved. At the same time, this paper also proposes a
contrast loss method based on Euclidean distance,
which adds the Euclidean distance and the threshold.
In the process of network training, the learned feature
class distance can better express the paired sentences
and the degree of matching. In the end, the method can
effectively improve the accuracy of sentence semantic
matching.
1. THE OVERALL FRAMEWORK DESIGN
1.1. The designed scheme of LSTM sentence semantic
based on euclidean diatance
The Euclidean distance method is usually used in
similar layers. This paper uses the Manhanttan LSTM
Model [6] proposed by Jonas Mueller and Aditya
Thyagarajan to improve the connected LSTM
backbone network. The Siamese LSTM structure
International Journal of Computational and Engineering 47
ACADEMIC PUBLISHING HOUSE
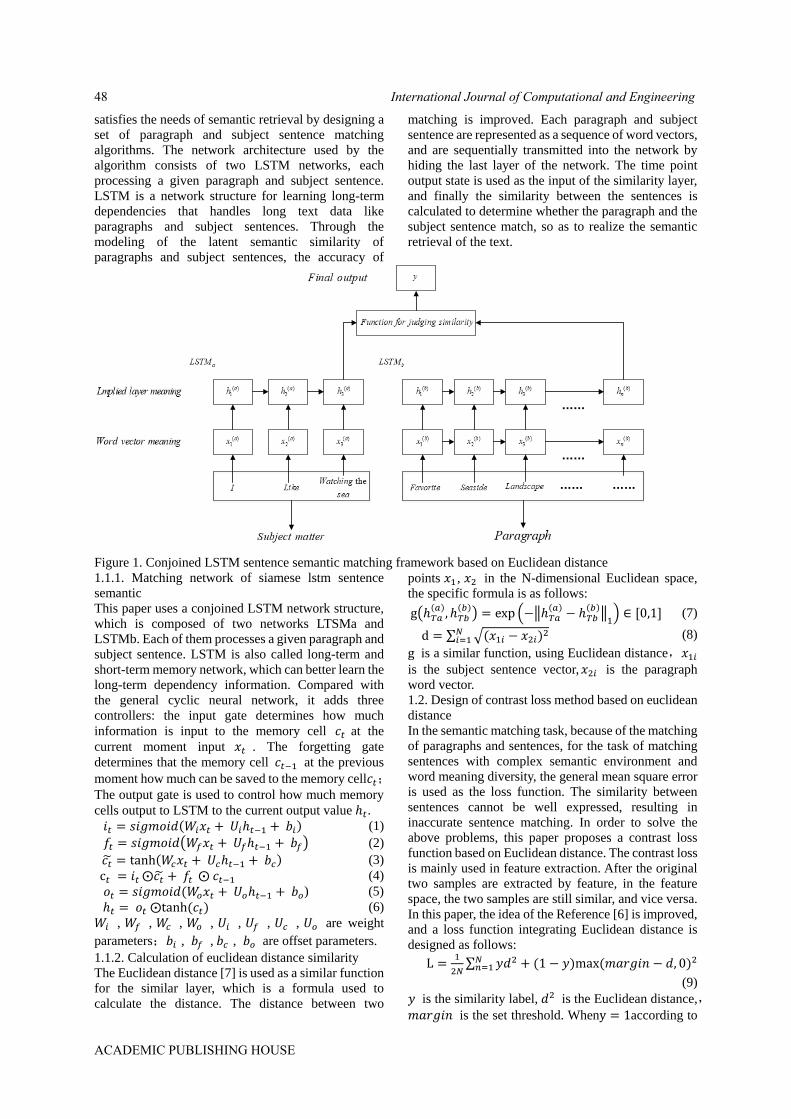
satisfies the needs of semantic retrieval by designing a
set of paragraph and subject sentence matching
algorithms. The network architecture used by the
algorithm consists of two LSTM networks, each
processing a given paragraph and subject sentence.
LSTM is a network structure for learning long-term
dependencies that handles long text data like
paragraphs and subject sentences. Through the
modeling of the latent semantic similarity of
paragraphs and subject sentences, the accuracy of
matching is improved. Each paragraph and subject
sentence are represented as a sequence of word vectors,
and are sequentially transmitted into the network by
hiding the last layer of the network. The time point
output state is used as the input of the similarity layer,
and finally the similarity between the sentences is
calculated to determine whether the paragraph and the
subject sentence match, so as to realize the semantic
retrieval of the text.
Figure 1. Conjoined LSTM sentence semantic matching framework based on Euclidean distance
1.1.1. Matching network of siamese lstm sentence
semantic
This paper uses a conjoined LSTM network structure,
which is composed of two networks LTSMa and
LSTMb. Each of them processes a given paragraph and
subject sentence. LSTM is also called long-term and
short-term memory network, which can better learn the
long-term dependency information. Compared with
the general cyclic neural network, it adds three
controllers: the input gate determines how much
information is input to the memory cell 𝑐𝑡 at the
current moment input 𝑥𝑡 . The forgetting gate
determines that the memory cell 𝑐𝑡−1 at the previous
moment how much can be saved to the memory cell𝑐𝑡;The output gate is used to control how much memory
cells output to LSTM to the current output value ℎ𝑡.
𝑖𝑡 = 𝑠𝑖𝑔𝑚𝑜𝑖𝑑(𝑊𝑖𝑥𝑡 + 𝑈𝑖ℎ𝑡−1 + 𝑏𝑖) (1)
𝑓𝑡 = 𝑠𝑖𝑔𝑚𝑜𝑖𝑑(𝑊𝑓𝑥𝑡 + 𝑈𝑓ℎ𝑡−1 + 𝑏𝑓) (2)
𝑐�̃� = tanh(𝑊𝑐𝑥𝑡 + 𝑈𝑐ℎ𝑡−1 + 𝑏𝑐) (3)
c𝑡 = 𝑖𝑡 ⨀𝑐�̃� + 𝑓𝑡 ⨀ 𝑐𝑡−1 (4)
𝑜𝑡 = 𝑠𝑖𝑔𝑚𝑜𝑖𝑑(𝑊𝑜𝑥𝑡 + 𝑈𝑜ℎ𝑡−1 + 𝑏𝑜) (5)
ℎ𝑡 = 𝑜𝑡 ⨀tanh (𝑐𝑡) (6)
𝑊𝑖 , 𝑊𝑓 , 𝑊𝑐 , 𝑊𝑜 , 𝑈𝑖 , 𝑈𝑓 , 𝑈𝑐 , 𝑈𝑜 are weight
parameters;𝑏𝑖 , 𝑏𝑓 , 𝑏𝑐 , 𝑏𝑜 are offset parameters.
1.1.2. Calculation of euclidean distance similarity
The Euclidean distance [7] is used as a similar function
for the similar layer, which is a formula used to
calculate the distance. The distance between two
points 𝑥1 , 𝑥2 in the N-dimensional Euclidean space,
the specific formula is as follows:
g(ℎ𝑇𝑎(𝑎)
, ℎ𝑇𝑏(𝑏)
) = exp (−‖ℎ𝑇𝑎(𝑎)
− ℎ𝑇𝑏(𝑏)
‖1
) ∈ [0,1] (7)
d = ∑ √(𝑥1𝑖 − 𝑥2𝑖)2𝑁
𝑖=1 (8)
g is a similar function, using Euclidean distance,𝑥1𝑖
is the subject sentence vector, 𝑥2𝑖 is the paragraph
word vector.
1.2. Design of contrast loss method based on euclidean
distance
In the semantic matching task, because of the matching
of paragraphs and sentences, for the task of matching
sentences with complex semantic environment and
word meaning diversity, the general mean square error
is used as the loss function. The similarity between
sentences cannot be well expressed, resulting in
inaccurate sentence matching. In order to solve the
above problems, this paper proposes a contrast loss
function based on Euclidean distance. The contrast loss
is mainly used in feature extraction. After the original
two samples are extracted by feature, in the feature
space, the two samples are still similar, and vice versa.
In this paper, the idea of the Reference [6] is improved,
and a loss function integrating Euclidean distance is
designed as follows:
L =1
2𝑁∑ 𝑦𝑑2𝑁
𝑛=1 + (1 − 𝑦)max (𝑚𝑎𝑟𝑔𝑖𝑛 − 𝑑, 0)2
(9)
𝑦 is the similarity label, 𝑑2 is the Euclidean distance,,𝑚𝑎𝑟𝑔𝑖𝑛 is the set threshold. Wheny = 1according to
International Journal of Computational and Engineering48
ACADEMIC PUBLISHING HOUSE

the formula, the contrast loss function only
leaves ∑ 𝑦𝑑2𝑁𝑛=1 , their Euclidean distance of the
original two samples in the feature space is relatively
large. It shows that the current model is not good, so it
should increase the loss. However, for y = 0,if the
Euclidean distance of the sample in the feature space is
small, the corresponding loss value will become larger.
In this paper, we use the Adadalta [8] gradient
optimization method for feedback learning. The
formula is as follows:
E[𝑔2]𝑡 = 𝜌E[𝑔2]𝑡−1 + (1 − 𝜌)𝑔𝑡2
(10)
RMS(𝑔𝑡) = √E[𝑔2]𝑡 + 𝜖 (11)
∆𝑥𝑡 = −𝜂
RMS(𝑔𝑡) 𝑔𝑡 (12)
g is the similarity function , ρ is the attenuation
coefficient, RMS is value , ∆𝑥𝑡 is the attenuation
coefficient after each update iteration, 𝜖 is the
minimum value to avoid the denominator zero added,𝑔𝑡 is the iterative gradient.
2. EXPERIMENTAL RESULTS AND ANALYSIS
The experimental platform configuration includes Intel
i5-4460 quad-core 3.4GHZ processor, 8GB memory,
GTX980Ti graphics card and Ubuntu14.04 operating
system, and uses TensorFlow deep learning framework
based on Python programming language.
2.1. The data of experimental; thesetting of parameter
setting
2.1.1. Training database and test database
In order to obtain the network training of semantic
sentence matching corpus, it is needed of the segment-
sentence form data of paragraphs and subject sentences
[9] . Considering the format of the news data “title and
content”, Sohu News is used as the data set.
2.1.2. The preprocessing of data
First, the title and content of each news item used
should be extracted, and remove the information that
only has the title but the content is empty. Besides, it
should remove the content that has no title and does not
meet the data format requirements. Secondly, the jieba
word segmentation tool is used to accurately extract the
extracted data [10] . In the format: subject
(corresponding to the news headline) \t the paragraph
described in the subject matter (corresponding to the
content of the news) \ t tag, artificially mark the
matching result of the paragraph and the subject, 1 is
similar to 0 is not similar. The title and narrative
content of news must be matched, then the tag value is
set to 1; for the tag value 0, the total number of news
lines is divided into two parts. For the number of lines
greater than fifty, the content and the title are randomly
selected in the number of lines less than fifty from the
front. Otherwise, the 50 numbers of the following
numbers are randomly selected for matching, and
finally the processed data set is divided into a training
set and a test set.
2.2. Experimental results and analysis
This experiment used three different sets of data to
conduct experiments and analysis and comparison,
shown in Table 1.
Table 1. Comparison of three sets of data sets
Dataset
Label
value 1
and 0
ratio
Number of
trained data
sets
Experimental
results
1 1:4 15965 TOP1:
50.27%
2 1:1 6386 TOP1:
71.96%
3 1:1 519263 TOP1:
95.12%
2.2.1. A data set with a ratio of 1 to 0 with a label value
of 1:4
Data set 1: The ratio is that 1 means right and 4 means
errors. That is, the data with a ratio of “1” and “0” of
1:4, and a total of 15,965 are trained. The accuracy of
the experimental results is TOP1: 50.2%.
Analysis of experimental results: The reason why the
accuracy after analysis is low is that the proportion of
data with a tag value of “0” in the dataset is too large,
which leads to the fact that the conjoined LSTM
structure does not learn the semantics of paragraphs
and subject description sentences well match [11] .
2.2.2. Small data with a ratio of 1 to 0 with a label value
of 1:1
Data set 2: Based on the data 1, the data is improved,
and the ratio is that 1 means right and 1means error.
That is, the data with the label value of “1” and “0” is
1:1, and a total of 6386 pieces of data are used for
training. The accuracy of the experimental results is
TOP1: 71.9%.
Analysis of experimental results: The experimental
results prove the correctness of the improved ideas.
When the data set contains a small value of “0”, the
accuracy will be significantly improved [12] . However,
the amount of data in this data set is too small, only
6386 pieces of data. After analysis, the reason why the
current accuracy is not high is that the trained data set
is too small and the concatenated LSTM structure
cannot learn more semantic similarity [13] .
2.2.3. Big data with a ratio of 1 to 0 with a label value
of 1:1
Data set 3: The Sohu news data is used in a one-to-one
error, that is, the data with a label value of “1” and “0”
is 1:1. A total of 519,263 pieces are trained, and the test
data set is 510,000. The accuracy of the experimental
results is TOP1: 95%.
Analysis of experimental results: This experimental
result proves the correctness of the improved thinking.
Experiments show that when the data set contains a
small value of “0” and the data set is large enough, the
concatenated LSTM structure can capture the
similarity between the semantics of the paragraph and
the subject description sentence. The accuracy rate will
be greatly improved [14] .
2.2.4. Comparison results of three different sets of data
Through the analysis of the training results of data set
1 and data set 2, the conclusion is that when the data
International Journal of Computational and Engineering 49
ACADEMIC PUBLISHING HOUSE

set contains a large proportion of data with a label
value of “0”, the trained model is not satisfactory.
When the proportion of data with a tag value of “0” in
the data set is large, the concatenated LSTM structure
does not well learn the matching of the paragraph and
the subject description sentence. The Sohu News Big
Data Set uses data with label values of “1 and 0” to be
processed in a ratio of 1:1. The data set is divided into
training data sets with 519,263 and test data sets with
510,000. The accuracy of the experiment is accurate.
The rate reaches TOP1: 95%. The results show that the
conjoined LSTM structure has achieved good results in
dealing with natural language environment paragraphs
and subject description sentence matching. The
concatenated LSTM based on word embedding can
well learn the potential semantic similarity between the
input paragraph and the subject description sentence.
This result depends on the acquisition of a large
amount of data and training, so that the Siamese LSTM
structure can be fully learned, and a good predictive
matching result can be obtained.
3. CONCLUTION
This paper proposes an matching algorithm for natural
language environments paragraph semantic. The
Euclidean distance is used as a similar function to
calculate the degree of matching between the
paragraph and the subject sentence. The degree of
calculation is also improved while obtaining the
similarity. Using the contrast loss function, the network
can learn the matching features between sentences
during the training process, and better express the
consistency of sentence pairs. The experimental results
of this method on Sohu news data matching task show
that the accuracy of this method is as high as 95%.
Further research can extract the subtle features of
sentences through deep semantic analysis techniques
to improve the accuracy of sentence semantic matching.
ACKNOWLEDGMENT
The authors wish to thank Cai Xiaodong. This word
was supported in part by a grant from Cai Xiaodong.
REFERENCES
[1]Liu H.Q., Zhang L.F. Analysis of Boolean Logic
Retrieval Model. Modern Information, 2004, 24(9): 4-
6.
[2]Zhuang X.Y. Research and implementation of
Chinese text classification system based on SVM. Jilin
University, 2007.
[3]Mikolov T., Sutskever I., Chen K., et al. Distributed
Representations of Words and Phrases and their
Compositionality. Advances in Neural Information
Processing Systems, 2013, 26:3111-3119.
[4]Ning L. A Design of Cross-Language Automatic
Retrieval Method Based on Semantic Extension.
Modern Information, 2014, 34(1): 155-158.
[5]Zhang Expo, Liu Boai, Liu Chaoyang, et al.
Document retrieval design method based on latent
semantic analysis. Journal of Beijing Institute of
Petrochemical Technology, 2015, 23(2): 37-42. Jonas
Mueller and Aditya Thyagarajan. 2016. Siamese
recurrent architectures for learning sentence similarity.
In Thirtieth AAAI Conference on Artificial
Intelligence.
[6]Zhou Z.H. Machine Learning: Machine learning.
Tsinghua University Press, 2016.
[7]Zeiler M.D. ADADELTA: An Adaptive Learning
Rate Method. Computer Science, 2012.
[8]Graves A. Supervised Sequence Labelling with
Recurrent Neural Networks. Springer Berlin
Heidelberg, 2012.
[9]Bjerva J., Bos J., Goot R.V.D, et al. The Meaning
Factory: Formal Semantics for Recognizing Textual
Entailment and Determining Semantic Similarity.
SemEval-2014 Workshop. 2014.
[10]He H., Gimpel K., Lin J. Multi-Perspective
Sentence Similarity Modeling with Convolutional
Neural Networks. Conference on Empirical Methods
in Natural Language Processing. 2015: 1576-1586.
[11]Le Q.V., Mikolov T. Distributed Representations
of Sentences and Documents. 2014, 4: II-1188.
[12]Li Y., Xu L., Tian F., et al. Word embedding
revisited: a new representation learning and explicit
matrix factorization perspective. International
Conference on Artificial Intelligence. AAAI Press,
2015: 3650-3656.
[13]Lien E., Kouylekov M. Semantic Parsing for
Textual Entailment. International Conference on
Parsing Technologies. 2015: 40-49.
[14]Tai, K. S., Socher, R., and Manning, C.D.
Improved Semantic Representations from Tree-
Structured Long Short-Term Memory Networks, 2015,
ACL 1556-1566.
International Journal of Computational and Engineering50
ACADEMIC PUBLISHING HOUSE
Research on Endowment Insurance
Management System Based on BS
Architecture
Jiaqi Huo1,*, Tianyu Zhang2, Jiahao Wang3 1Yisheng College, North China University of Science and Technology, Tangshan, Hebei, China 2College of Metallurgy and Energy, North China University of Science and Technology, Tangshan, Hebei, China 3College of Science, North China University of Science and Technology, Tangshan, Hebei, China
*E-mail: [email protected]
Abstract: This paper studies the design and test of
insurance business management system based on BS
framework. First, the functional requirements of
customer management, contract management,
insurance category management and other
nonfunctional requirements such as security and
system environment are analyzed. Then, on the basis
of BS technology framework, to meet the needs of
endowment insurance management, the system
design of endowment insurance management system
is realized. Finally, the white box testing method is
used to test the function and performance of the
pension insurance management system, and
determine whether the test results are consistent with
the expected results of the software.
Keywords: BS framework; Functional requirement;
White box testing
1. INTRODUCTION
When the traditional endowment insurance enterprise
business management, the business data are recorded
on the paper, the management efficiency is low [1-3].
Design and implementation of the pension insurance
business management system based on BS
framework, can help the old-age insurance
enterprises a better understanding of customer needs,
so as to formulate the corresponding pension
insurance business plan better, laid the foundation for
the first to occupy the market opportunities, through
the implementation of the pension insurance business
management system, through the network sharing all
the better the pension insurance business resources,
and thus laid the foundation for collaborative work,
improve work efficiency and better.
Analysis of the pension insurance business
management needs in the pension insurance business
management system function, need to provide the
main function of customer management [2-7],
contract management, category management, pension
insurance pension insurance business management,
customer complaint management, user management
and permissions management requirements and the
system safety, environment and other nonfunctional
requirements, to ensure that the endowment insurance
business management system can satisfy the actual
demand of pension insurance business management
system, management organization structure specific
figure endowment insurance business management
system structure diagram, shown in Figure 1. Endowment insurance management system
functional requirement Non functional requirements
cu
stom
er m
an
ag
em
en
t
co
ntra
ct m
an
ag
em
en
t
co
ntra
ct m
an
ag
em
en
t
Serv
ice man
agem
ent
Co
mp
lain
t man
ag
em
en
t
use
r man
ag
em
en
t
Perm
ission
man
ag
em
en
t
Perm
ission
man
ag
em
en
t
Perm
ission
man
agem
ent
Figure 1. Organization chart of endowment insurance
management system
2. DESIGN OF ENDOWMENT INSURANCE
MANAGEMENT SYSTEM BASED ON BS
FRAMEWORK
2.1. Logical structure
In the design and implementation of BS architecture
[3] based on the insurance business management
system, application framework is mainly used in the
J2EE technology of Struts2, Spring and JDBC to build
the system, guided by MVC, the system is divided
into presentation layer, business logic layer and data
access object domain, five different from the house,
and then in the background data storage using SQL
inch Server2005 as a data storage device. The specific
technical route and implementation plan are shown in
Figure 2.
Clie
nt
(BS
Bro
wse
r
)
Pag
e re
qu
irem
en
tsP
ag
e re
spo
nse
Web
presentation layer
Web forms
project jsp
project jsp
project jsp
...
...
... Spring
Spring DI
Business
logic layer
...
entity
...
Spring IOC
...
Connection
pool
Jav
a
data
base
Core
interface
SqlHelper
SqlHelper
JDBC
APISQL Server
table
table
......
......
Domain
object layer
Data access layer Database layer
Figure 2. Insurance management system technology
roadmap and implementation plan
2.2. System architecture design
Design and implementation of insurance business
management system based on BS architecture, the
International Journal of Computational and Engineering 51
ACADEMIC PUBLISHING HOUSE
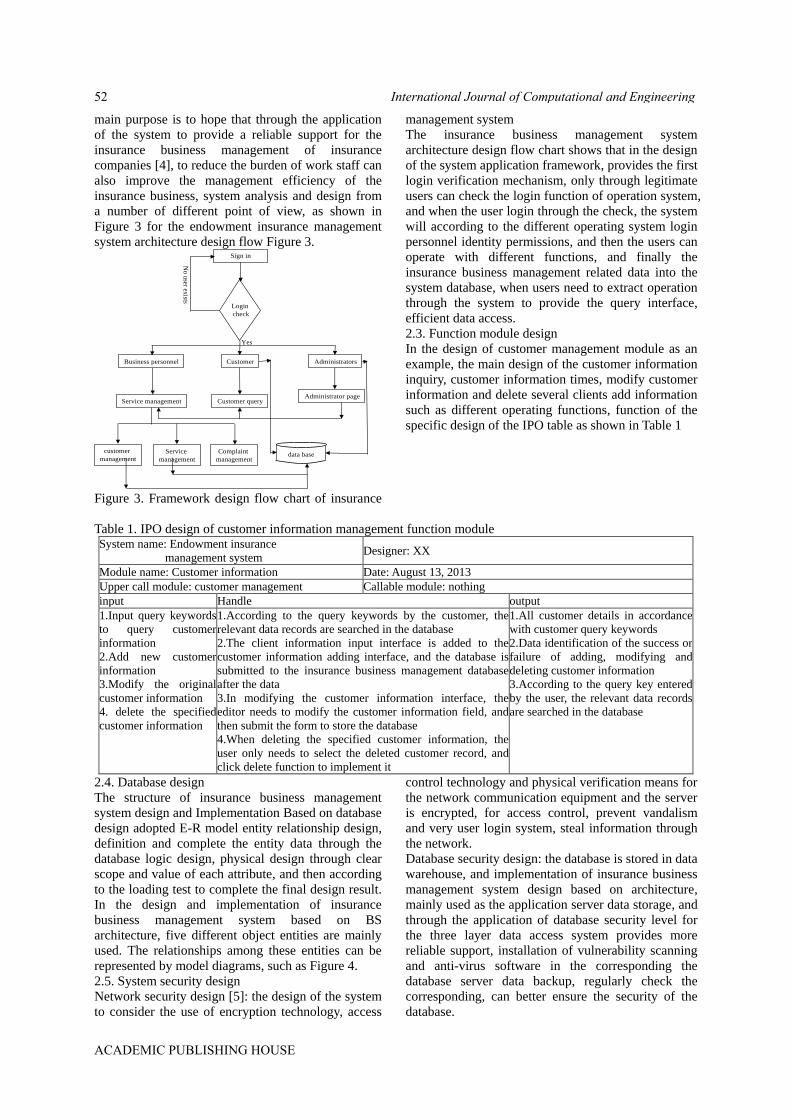
main purpose is to hope that through the application
of the system to provide a reliable support for the
insurance business management of insurance
companies [4], to reduce the burden of work staff can
also improve the management efficiency of the
insurance business, system analysis and design from
a number of different point of view, as shown in
Figure 3 for the endowment insurance management
system architecture design flow Figure 3. Sign in
Business personnel Customer Administrators
Yes
Service management Customer queryAdministrator page
customer
management
Service
management
Complaint
managementdata base
Login
check
No
user ex
ists
Figure 3. Framework design flow chart of insurance
management system
The insurance business management system
architecture design flow chart shows that in the design
of the system application framework, provides the first
login verification mechanism, only through legitimate
users can check the login function of operation system,
and when the user login through the check, the system
will according to the different operating system login
personnel identity permissions, and then the users can
operate with different functions, and finally the
insurance business management related data into the
system database, when users need to extract operation
through the system to provide the query interface,
efficient data access.
2.3. Function module design
In the design of customer management module as an
example, the main design of the customer information
inquiry, customer information times, modify customer
information and delete several clients add information
such as different operating functions, function of the
specific design of the IPO table as shown in Table 1
Table 1. IPO design of customer information management function module System name: Endowment insurance
management system Designer: XX
Module name: Customer information Date: August 13, 2013
Upper call module: customer management Callable module: nothing
input Handle output
1.Input query keywords
to query customer
information
2.Add new customer
information
3.Modify the original
customer information
4. delete the specified
customer information
1.According to the query keywords by the customer, the
relevant data records are searched in the database
2.The client information input interface is added to the
customer information adding interface, and the database is
submitted to the insurance business management database
after the data
3.In modifying the customer information interface, the
editor needs to modify the customer information field, and
then submit the form to store the database
4.When deleting the specified customer information, the
user only needs to select the deleted customer record, and
click delete function to implement it
1.All customer details in accordance
with customer query keywords
2.Data identification of the success or
failure of adding, modifying and
deleting customer information
3.According to the query key entered
by the user, the relevant data records
are searched in the database
2.4. Database design
The structure of insurance business management
system design and Implementation Based on database
design adopted E-R model entity relationship design,
definition and complete the entity data through the
database logic design, physical design through clear
scope and value of each attribute, and then according
to the loading test to complete the final design result.
In the design and implementation of insurance
business management system based on BS
architecture, five different object entities are mainly
used. The relationships among these entities can be
represented by model diagrams, such as Figure 4.
2.5. System security design
Network security design [5]: the design of the system
to consider the use of encryption technology, access
control technology and physical verification means for
the network communication equipment and the server
is encrypted, for access control, prevent vandalism
and very user login system, steal information through
the network.
Database security design: the database is stored in data
warehouse, and implementation of insurance business
management system design based on architecture,
mainly used as the application server data storage, and
through the application of database security level for
the three layer data access system provides more
reliable support, installation of vulnerability scanning
and anti-virus software in the corresponding the
database server data backup, regularly check the
corresponding, can better ensure the security of the
database.
International Journal of Computational and Engineering52
ACADEMIC PUBLISHING HOUSE

Business
information
Service identifier
Business category
Business theme
Detailed description
Business characteristics
Sales crowd`
Customer
information
Customer address
Income level
Contact information
Work unit
Customer identification
name
Gender
Administration
Administration
Administration
Administration
System userComplaint
information
Insurance
category
role
subjection
User identification
User name
Contact information
Account passwordPrivilege level
Tracking personnel
Detailed description
Reasons for
complaints
Complaints clients
Identification of
complaints
Identification
Class name
comment
Adding time
ID
describe Figure 4. E-R model diagram of insurance
management system database
3. TEST OF ENDOWMENT INSURANCE
SYSTEM BASED ON WHITE BOX METHOD
White box testing is also called structural testing,
transparent box testing, logic driven testing or
code-based testing. In the test of insurance business
management system based on BS architecture, white
box testing is used mainly.
3.1. The basic principle of white box testing
According to the directed graph between modules,
the importance of the module can be defined. The
importance of a module is defined as the importance
of a module.
X
XC
XCxim
(1)
In the formula, XC is the number of paths that
arrive from the top node and pass through the X[6].
The McCabe metric in the module: McCabe
considers that the complexity of the program is
determined by the number of loops in the control
flow graph corresponding to the program, and the
more the number of loops, the more complicated the
program is. And the loop cardinality in the program
can be given below.
Definition: the cardinality of a strongly connected
graph is equal to the number of linearly independent
loops in a graph, which can be calculated by formula
2
lneGV (2)
In the formula, e is the number of edges in G , N
is the number of nodes in G [7].
Variable self-instance Ad , the formula is:
VdLALAd (3)
In the formula, AL is the place where the absolute
variables of time and space are located, VdL is a
recently defined row.
Definition: complexity of variable relation Vm , the
formula is:
AdTmVm (4)
In the formula, Tm is aggregation deficiency, Ad
is the variable self-distance
With the above definition, the calculation formula of
variable metric complexity can be given now:
iVmMVm \ (5)
In the formula, iVm is the complexity of the variable
relation of the i element in Dset .
Without considering other factors, the more complex
the system is, the higher the defect density will be.
3.2. White box testing process
The endowment insurance management system based
on BS as a white box, using the process tree
transformation and map the unconstrained edges
covering theorem combined with the proposed white
box testing process model based on tree, through the
cycle calculation process tree is not selected in the
path contains no restriction of the number of edges are
not covered, choose the best test path. Until the
unconstrained edges are covered, selected to achieve
the best coverage path of the white box testing.
Specific procedures such as Figure 5:
Test start
Importance evaluation
and program segmentation
Program flow graph construction
Generation of
DD diagram
Process tree
acquisition
Optimal coverage
path selection
End of test
Procedure judgment
Program flow graph
Unconstrained edge set
Independent path set
Test path set
Figure 5. Test process chart
In white box testing, it is not in the software as an
available internal structure of the box, the internal
structure is studied logic instead of the box, to test the
specific process and logic structure details, test results
and determine whether the software expected results,
through the white box testing method can determine
the application to meet the requirements of the
business management of insurance enterprise
endowment insurance management system BS
framework can be better based on.
4. CONCLUSION
By using the framework of BS technology combined
with the application of software architecture, improve
the access efficiency of data storage, but also reduce
the cost of the system resource, not only improve the
response efficiency of data operation, but also reduce
the pressure of the server and client data processing,
which laid the foundation for the improvement of
system performance.
International Journal of Computational and Engineering 53
ACADEMIC PUBLISHING HOUSE

REFERENCE
[1]Liu Jie. Talking about the development of personal
account information management system of basic
endowment insurance. Labour World, 2001, (01):
39-40.
[2]Yu Liqun. Problems and suggestions on the overall
management system of the endowment insurance for
the people. Times Finance, 2008, (05):160.
[3]Liao Xu. Research on SAP development
technology based on BS architecture. China Strategic
Emerging Industry, 2017, (20):133-134.
[4]Si Yu. Design and implementation of endowment
insurance information management system in
Weifang. University of Electronic Science and
technology of China, 2014.
[5]Gao Miao. Design of security architecture for
tobacco enterprise information network system.
Science and Technology of West China, 2010, 9(13):
30-32.
[6]Allen Haley, Stuart Zweben. Development and
application of a white box approach to integration
testing. Journal of Systems and Software, 2004, 4(4):
309-316.
[7]A reliability assessment tool for distributed
software development environment based on java and
J/Link. European Journal of Operational Research,
2006, 175(1): 435-445.
International Journal of Computational and Engineering54
ACADEMIC PUBLISHING HOUSE

The Impact of Climate Change on National
Vulnerability
Liyan Dong1, 2, ChenShuai Liu1, 3, Liuye Zhang1, 4, Aimin Yang3, * 1Engineering Computing and Simulation Innovation Lab, North China University of Science and Technology,
Tangshan 063210, Hebei, China 2College of Metallurgy and Energy, North China University of Science and Technology, Tangshan 063210,
Hebei, China 3College of Science, North China University of Science and Technology, Tangshan 063210, Hebei, China 4College of Mechanical Engineering, North China University of Science and Technology, Tangshan 063210,
Hebei, China
*E-mail: [email protected]
Abstract: Climate change not only has effects on
ecological environment, but also greatly changes
humans’ life style, which even, due to the
weakening and collapse of social and government
structures, causes the emergency of fragile states.
According to the World Vulnerability Index Table,
selecting Senegal to analyze the vulnerability
thermal map in 2012, and get the vulnerability
mutation node and mutation characteristics.
Through the maximum membership function in
fuzzy mathematics, define the transitional period of
national vulnerability as [0.423, 0.531].
Keywords: National vulnerability; Hierarchical
fuzzy evaluation; IAHP; climate change; sensitivity
analysis
1. INTRODUCTION
Climate change refers to the change of climate
status in a long period of time, such as climate
averaging, climate change rate, etc. Its
characterization properties are mainly the changes
of temperature and precipitation. Changes in
climate directly or indirectly change human
lifestyles, increase national vulnerability and even
lead to the weakening and collapse of social and
governmental structures. Vulnerable countries have
increased the vulnerability of a country's population
to climate shocks such as natural disasters, reduced
arable land, unpredictable weather and rising
temperatures. Unsustainable environmental
practices, immigration and resource shortages that
prevail in developing countries may further
exacerbate ineffective governance [1-3].
2. SIGNAL ACQUISITION
2.1. Verify the accuracy
To determining the accuracy of the model, we chose
Senegal in 2012 for the fuzzy analysis. Through
numerical simulations of average food production,
the average freshwater person, the number of
refugees in the country and total GDP in Senegal in
2012, we get a fuzzy comprehensive matrix of
target levels (social, political, economic and
cohesive) targeting Senegal [2].
0354.00236.00874.0
0146.00646.01290.0
1108.00321.0236.0
5616.00054.0012.0
A
(1)
Then we use the weight vector B of the quasi-target
layer to the target obtained by the AHP in the
original model to carry out weight analysis on the
ambiguity in the fuzzy comprehensive matrix A.
Then we use MATLAB to calculate and finally
determine the fuzzy vector C of Senegal's national
vulnerability in 2012[3], among them,
0321.05536.00134.0C (2)
Finally, basing on the principle of maximum
ambiguity given, it is clear that Senegal was a
vulnerable country in 2012.This result is consistent
with the results of the country’s fragility
Temperature heat picture given by the FFP. The
2012 Temperature heat picture is shown in Figure 1.
2.2. Verify fragile stability
In order to verify the stability of the model, we
selected Senegal from 2000 to 2012 to carry out
fuzzy analysis to conduct numerical simulation of
Senegal's indicators of average grain yield, per
capita fresh water volume, domestic refugees and
total GDP in 2012.The first guideline layer Aim at
the fuzzy comprehensive matrix of the target level
(social, political, economic and cohesive).
Then we use the weight vector B of the quasi-target
layer to the target obtained by AHP in the original
model to carry on the weight analysis to the fuzzy
degree in the fuzzy comprehensive matrix and
finally get the fuzzy vector C of Senegal's national
vulnerability from 2000 to 2008 [4]. We find that
Senegal's assessment of 2000-2008 has been more
vulnerable. Use MATLAB to draw the tendency of
vulnerable membership over time.
Figure 1 shows that Senegal has been in a more
vulnerable state for the period 2000-2008, and the
results of our model calculations are about the same
as the actual results.
International Journal of Computational and Engineering 55
ACADEMIC PUBLISHING HOUSE
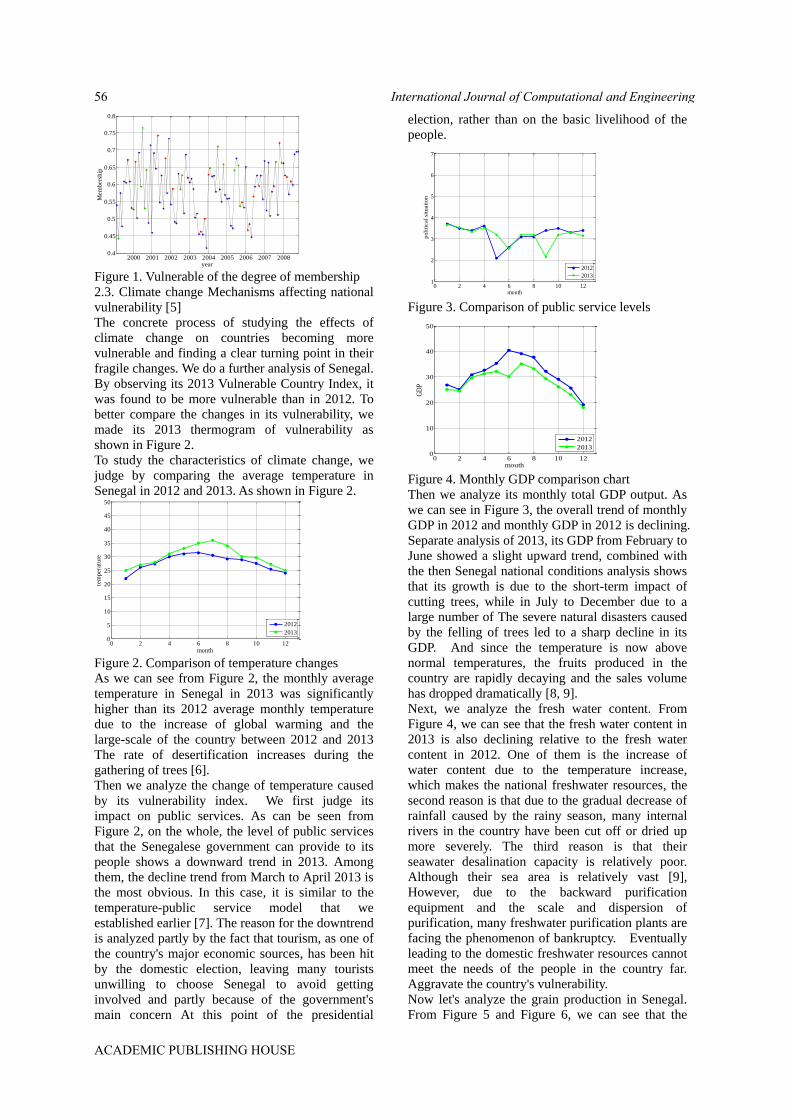
2000 2001 2002 2003 2004 2005 2006 2007 20080.4
0.45
0.5
0.55
0.6
0.65
0.7
0.75
0.8
Mem
bers
hip
year
Figure 1. Vulnerable of the degree of membership
2.3. Climate change Mechanisms affecting national
vulnerability [5]
The concrete process of studying the effects of
climate change on countries becoming more
vulnerable and finding a clear turning point in their
fragile changes. We do a further analysis of Senegal.
By observing its 2013 Vulnerable Country Index, it
was found to be more vulnerable than in 2012. To
better compare the changes in its vulnerability, we
made its 2013 thermogram of vulnerability as
shown in Figure 2.
To study the characteristics of climate change, we
judge by comparing the average temperature in
Senegal in 2012 and 2013. As shown in Figure 2.
0 2 4 6 8 10 120
5
10
15
20
25
30
35
40
45
50
month
tem
pera
ture
2012
2013
Figure 2. Comparison of temperature changes
As we can see from Figure 2, the monthly average
temperature in Senegal in 2013 was significantly
higher than its 2012 average monthly temperature
due to the increase of global warming and the
large-scale of the country between 2012 and 2013
The rate of desertification increases during the
gathering of trees [6].
Then we analyze the change of temperature caused
by its vulnerability index. We first judge its
impact on public services. As can be seen from
Figure 2, on the whole, the level of public services
that the Senegalese government can provide to its
people shows a downward trend in 2013. Among
them, the decline trend from March to April 2013 is
the most obvious. In this case, it is similar to the
temperature-public service model that we
established earlier [7]. The reason for the downtrend
is analyzed partly by the fact that tourism, as one of
the country's major economic sources, has been hit
by the domestic election, leaving many tourists
unwilling to choose Senegal to avoid getting
involved and partly because of the government's
main concern At this point of the presidential
election, rather than on the basic livelihood of the
people.
0 2 4 6 8 10 121
2
3
4
5
6
7
month
poli
tical
situ
ati
on
2012
2013
Figure 3. Comparison of public service levels
0 2 4 6 8 10 120
10
20
30
40
50
mouth
GD
P
2012
2013
Figure 4. Monthly GDP comparison chart
Then we analyze its monthly total GDP output. As
we can see in Figure 3, the overall trend of monthly
GDP in 2012 and monthly GDP in 2012 is declining.
Separate analysis of 2013, its GDP from February to
June showed a slight upward trend, combined with
the then Senegal national conditions analysis shows
that its growth is due to the short-term impact of
cutting trees, while in July to December due to a
large number of The severe natural disasters caused
by the felling of trees led to a sharp decline in its
GDP. And since the temperature is now above
normal temperatures, the fruits produced in the
country are rapidly decaying and the sales volume
has dropped dramatically [8, 9].
Next, we analyze the fresh water content. From
Figure 4, we can see that the fresh water content in
2013 is also declining relative to the fresh water
content in 2012. One of them is the increase of
water content due to the temperature increase,
which makes the national freshwater resources, the
second reason is that due to the gradual decrease of
rainfall caused by the rainy season, many internal
rivers in the country have been cut off or dried up
more severely. The third reason is that their
seawater desalination capacity is relatively poor.
Although their sea area is relatively vast [9],
However, due to the backward purification
equipment and the scale and dispersion of
purification, many freshwater purification plants are
facing the phenomenon of bankruptcy. Eventually
leading to the domestic freshwater resources cannot
meet the needs of the people in the country far.
Aggravate the country's vulnerability.
Now let's analyze the grain production in Senegal.
From Figure 5 and Figure 6, we can see that the
International Journal of Computational and Engineering56
ACADEMIC PUBLISHING HOUSE
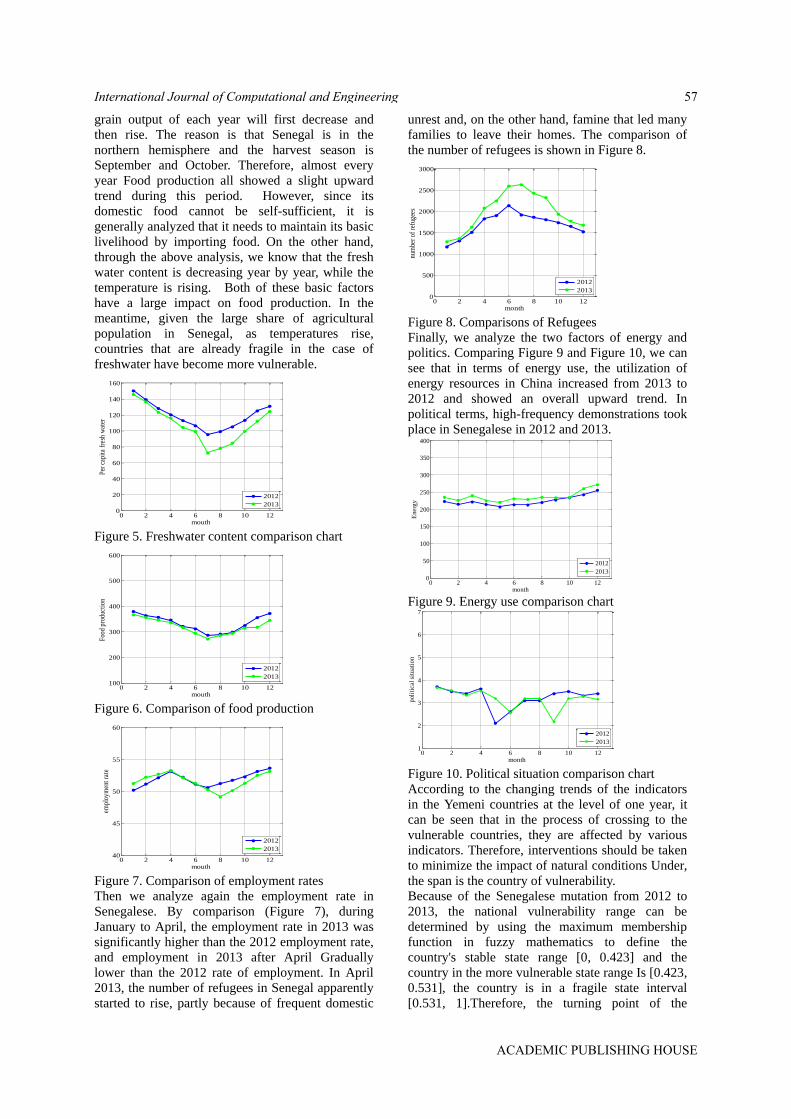
grain output of each year will first decrease and
then rise. The reason is that Senegal is in the
northern hemisphere and the harvest season is
September and October. Therefore, almost every
year Food production all showed a slight upward
trend during this period. However, since its
domestic food cannot be self-sufficient, it is
generally analyzed that it needs to maintain its basic
livelihood by importing food. On the other hand,
through the above analysis, we know that the fresh
water content is decreasing year by year, while the
temperature is rising. Both of these basic factors
have a large impact on food production. In the
meantime, given the large share of agricultural
population in Senegal, as temperatures rise,
countries that are already fragile in the case of
freshwater have become more vulnerable.
0 2 4 6 8 10 120
20
40
60
80
100
120
140
160
mouth
Per
cap
ita
fres
h w
ater
2012
2013
Figure 5. Freshwater content comparison chart
0 2 4 6 8 10 12100
200
300
400
500
600
mouth
Foo
d pr
oduc
tion
2012
2013
Figure 6. Comparison of food production
0 2 4 6 8 10 1240
45
50
55
60
mouth
empl
oym
ent
rate
2012
2013
Figure 7. Comparison of employment rates
Then we analyze again the employment rate in
Senegalese. By comparison (Figure 7), during
January to April, the employment rate in 2013 was
significantly higher than the 2012 employment rate,
and employment in 2013 after April Gradually
lower than the 2012 rate of employment. In April
2013, the number of refugees in Senegal apparently
started to rise, partly because of frequent domestic
unrest and, on the other hand, famine that led many
families to leave their homes. The comparison of
the number of refugees is shown in Figure 8.
0 2 4 6 8 10 120
500
1000
1500
2000
2500
3000
month
num
ber
of r
efug
ees
2012
2013
Figure 8. Comparisons of Refugees
Finally, we analyze the two factors of energy and
politics. Comparing Figure 9 and Figure 10, we can
see that in terms of energy use, the utilization of
energy resources in China increased from 2013 to
2012 and showed an overall upward trend. In
political terms, high-frequency demonstrations took
place in Senegalese in 2012 and 2013.
0 2 4 6 8 10 120
50
100
150
200
250
300
350
400
month
Energ
y
2012
2013
Figure 9. Energy use comparison chart
0 2 4 6 8 10 121
2
3
4
5
6
7
month
pol
itic
al s
itu
atio
n
2012
2013
Figure 10. Political situation comparison chart
According to the changing trends of the indicators
in the Yemeni countries at the level of one year, it
can be seen that in the process of crossing to the
vulnerable countries, they are affected by various
indicators. Therefore, interventions should be taken
to minimize the impact of natural conditions Under,
the span is the country of vulnerability.
Because of the Senegalese mutation from 2012 to
2013, the national vulnerability range can be
determined by using the maximum membership
function in fuzzy mathematics to define the
country's stable state range [0, 0.423] and the
country in the more vulnerable state range Is [0.423,
0.531], the country is in a fragile state interval
[0.531, 1].Therefore, the turning point of the
International Journal of Computational and Engineering 57
ACADEMIC PUBLISHING HOUSE

national vulnerability from stability to vulnerability
is [0.423, 0.531].
REFERENCES
[1]Krakowka, A.R., Heimel, N., and Galgano, F.
Modeling Environmenal Security in Sub-Sharan
Africa – ProQuest. The Geographical Bulletin, 2012,
53(1): 21-38.
[2]Schwartz, P. and Randall, D. An Abrupt Climate
Change Scenario and Its Implications for United
States National Security, October 2003.
[3]Nick Brooks and W. Neil Adger. Country level
risk measures of climate-related natural disasters
and implications for adaptation to climate change”,
January 2003:4-9
[4]Li Zhong Han, Jin Quan Zhang, Yun Yang.
Comprehensive Fuzzy Assessment on the
Life-Cycle Environment Impact of Bridges. Applied
Mechanics and Materials, 2014, 3013(522).
[5]Theisen, O.M., Gleditsch, N.P., and Buhaug, H.
Is climate change a driver of armed conflict Climate
Change, 2013, 117 (3): 613-625.
[6]M. Stiehm, M. Brede, D. Quosdorf, H. Martin, A.
Leder. A Sensitivity Analysis of Stent Design
Parameters using CFD. Biomedical Engineering /
Biomedizinische Technik, 2013.
[7]Sulaimon Olanrewaju Adebiyi, Emmanuel
Olateju Oyatoye, Owolabi Lateef Kuye. An
Analytic Hierarchy Process Analysis: Application to
Subscriber Retention Decisions in the Nigerian
Mobile Telecommunications. International Journal
of Management and Economics, 2015, 48(1).
[8]Luyuan Chen, Xinyi Zhou, Fuyuan Xiao, Yong
Deng, Sankaran Mahadevan. Evidential Analytic
Hierarchy Process Dependence Assessment
Methodology in Human Reliability Analysis.
Nuclear Engineering and Technology, 2017, 49(1).
[9]Marie Ivanco, Gene Hou, Jennifer Michaeli.
Sensitivity analysis method to address user
disparities in the analytic hierarchy process. Expert
Systems with Applications, 2017, 90.
International Journal of Computational and Engineering58
ACADEMIC PUBLISHING HOUSE

Environmental Cost Assessment Based on
Invest Model Optimization
Yashuai An1, Shuai Wang2, Yuliang Guo2,* 1 Hebei University of Engineering, Handan City 056000, Hebei, China 2 College of Science and Letters, Hebei University of Engineering, Handan 056000, Hebei, China
*Email: [email protected]
Abstract: Based on the InVEST model, we firstly
propose the impact factors of the ecosystem service
system, namely land use change, vegetation damage,
soil erosion and biodiversity. And we establish the
criteria for economic loss to measure the impact of
each factor on ecosystem services. And then we
obtain the weights of each factor to perform logistic
regression analysis. Secondly, we use the LELAM
model to monetize the economic loss assessment
factor and obtain the actual environmental costs.
Based on the real benefit of the land use project =
project benefit - environmental cost model, we
conduct a comprehensive assessment for the true cost
of the land use project. Secondly, based on the model
established above, we carry out cost assessment for
specific examples. Example 1: Estimating the
environmental cost of a section of highway
construction. First, according to the economic loss
standard, we determine the weight of the economic
loss assessment factor, bring the data into the
ecosystem service evaluation model and obtain the
environmental cost of 2, 0205, 600 Dollar for the two
years; Example 2: We perform an environmental cost
assessment for all land use projects in Sichuan
Province for 10 Dollar. The model seeks the final
environmental cost of 300 billion Dollar. Finally,
based on the genetic algorithm, we optimize the
above model to obtain the real benefits of the two
examples of land use projects are 1.065 billion yuan
and 11.365 trillion Dollar, respectively. By the query
data, we conclude that the error is less than 4% to
verify the effectiveness of the model.
Keywords: Environmental cost; InVEST model;
Logistic regression; LELAM model; Genetic
optimization
1. INTRODUCTION
Classical economic theories often ignore the impact
of their decisions on the biosphere or assume
unlimited resources or capabilities to meet the needs
of their economic construction, and even pursue
economic construction as a result of environmental
damage. The current environmental situation is grim.
The biosphere provides many natural conditions for
human life to maintain a healthy and sustainable
environment, which is called ecosystem services.
However, whenever humans change ecosystems, we
may limit or remove ecosystem services. As they
accumulate, they will directly affect biodiversity and
cause environmental degradation, which in turn will
result in environmental costs.
In recent years, with the deepening of sustainable
development research, it is increasingly recognized
that human sustainable development must be based on
the protection of the Earth’s life support system to
maintain the sustainability of the biosphere and
maintain the sustainability of ecosystem services. The
sustainable development of human society depends
fundamentally on the sustainability of ecosystems and
their services. Therefore, it is necessary to study the
economic value of ecosystem services and incorporate
them into the economic accounting system of land use
projects in order to promote rational decision-making
of natural capital development, avoid short-term
economic behaviors that damage ecosystem services,
and contribute to the protection of ecosystems.
Ultimately, it is conducive to the sustainable
development of human beings themselves. The theory
and method of quantitative evaluation of ecosystem
services and economic value of natural capital have
become an important content and focus of sustainable
development assessment research at home and abroad.
Become the frontier of environmental economics and
ecological economics research in current ecology and
resource economics [1-5].
2. MODEL ESTABLISHMENT AND SOLUTION
2.1. Model establishment
2.1.1 Identification and screening of environmental
impact economic loss assessment factors
We need to establish an environmental impact
economic loss assessment model. First, we need to
identify and predict environmental impact factors.
Project environmental impact factor screening is a
reasonable ranking of environmental impact factors.
Evaluate project selection
From the current situation of global environmental
assessment, different projects have different degrees
of environmental economic losses. Therefore, when
we do environmental economic loss assessment, we
must first screen the project. We divide the project
into four categories, as Table 1:
In summary, first determine the area where the project
construction may have an impact based on the
boundary of the assessment scope. According to the
requirements of assessment depth and breadth, further
determine the scope of economic impact assessment
International Journal of Computational and Engineering 59
ACADEMIC PUBLISHING HOUSE
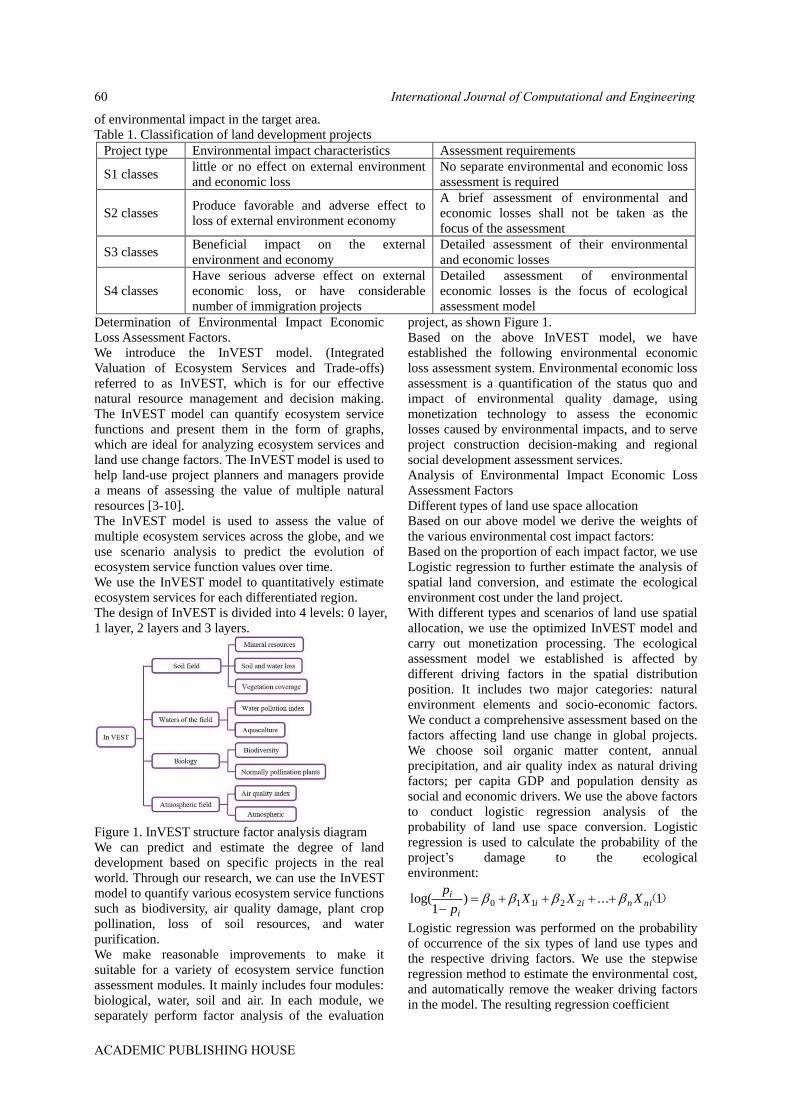
of environmental impact in the target area.
Table 1. Classification of land development projects
Project type Environmental impact characteristics Assessment requirements
S1 classes little or no effect on external environment
and economic loss
No separate environmental and economic loss
assessment is required
S2 classes Produce favorable and adverse effect to
loss of external environment economy
A brief assessment of environmental and
economic losses shall not be taken as the
focus of the assessment
S3 classes Beneficial impact on the external
environment and economy
Detailed assessment of their environmental
and economic losses
S4 classes
Have serious adverse effect on external
economic loss, or have considerable
number of immigration projects
Detailed assessment of environmental
economic losses is the focus of ecological
assessment model
Determination of Environmental Impact Economic
Loss Assessment Factors.
We introduce the InVEST model. (Integrated
Valuation of Ecosystem Services and Trade-offs)
referred to as InVEST, which is for our effective
natural resource management and decision making.
The InVEST model can quantify ecosystem service
functions and present them in the form of graphs,
which are ideal for analyzing ecosystem services and
land use change factors. The InVEST model is used to
help land-use project planners and managers provide
a means of assessing the value of multiple natural
resources [3-10].
The InVEST model is used to assess the value of
multiple ecosystem services across the globe, and we
use scenario analysis to predict the evolution of
ecosystem service function values over time.
We use the InVEST model to quantitatively estimate
ecosystem services for each differentiated region.
The design of InVEST is divided into 4 levels: 0 layer,
1 layer, 2 layers and 3 layers.
Figure 1. InVEST structure factor analysis diagram
We can predict and estimate the degree of land
development based on specific projects in the real
world. Through our research, we can use the InVEST
model to quantify various ecosystem service functions
such as biodiversity, air quality damage, plant crop
pollination, loss of soil resources, and water
purification.
We make reasonable improvements to make it
suitable for a variety of ecosystem service function
assessment modules. It mainly includes four modules:
biological, water, soil and air. In each module, we
separately perform factor analysis of the evaluation
project, as shown Figure 1.
Based on the above InVEST model, we have
established the following environmental economic
loss assessment system. Environmental economic loss
assessment is a quantification of the status quo and
impact of environmental quality damage, using
monetization technology to assess the economic
losses caused by environmental impacts, and to serve
project construction decision-making and regional
social development assessment services.
Analysis of Environmental Impact Economic Loss
Assessment Factors
Different types of land use space allocation
Based on our above model we derive the weights of
the various environmental cost impact factors:
Based on the proportion of each impact factor, we use
Logistic regression to further estimate the analysis of
spatial land conversion, and estimate the ecological
environment cost under the land project.
With different types and scenarios of land use spatial
allocation, we use the optimized InVEST model and
carry out monetization processing. The ecological
assessment model we established is affected by
different driving factors in the spatial distribution
position. It includes two major categories: natural
environment elements and socio-economic factors.
We conduct a comprehensive assessment based on the
factors affecting land use change in global projects.
We choose soil organic matter content, annual
precipitation, and air quality index as natural driving
factors; per capita GDP and population density as
social and economic drivers. We use the above factors
to conduct logistic regression analysis of the
probability of land use space conversion. Logistic
regression is used to calculate the probability of the
project’s damage to the ecological
environment:
)(1...)1
log( 22110 niniii
i XXXp
p
Logistic regression was performed on the probability
of occurrence of the six types of land use types and
the respective driving factors. We use the stepwise
regression method to estimate the environmental cost,
and automatically remove the weaker driving factors
in the model. The resulting regression coefficient
International Journal of Computational and Engineering60
ACADEMIC PUBLISHING HOUSE
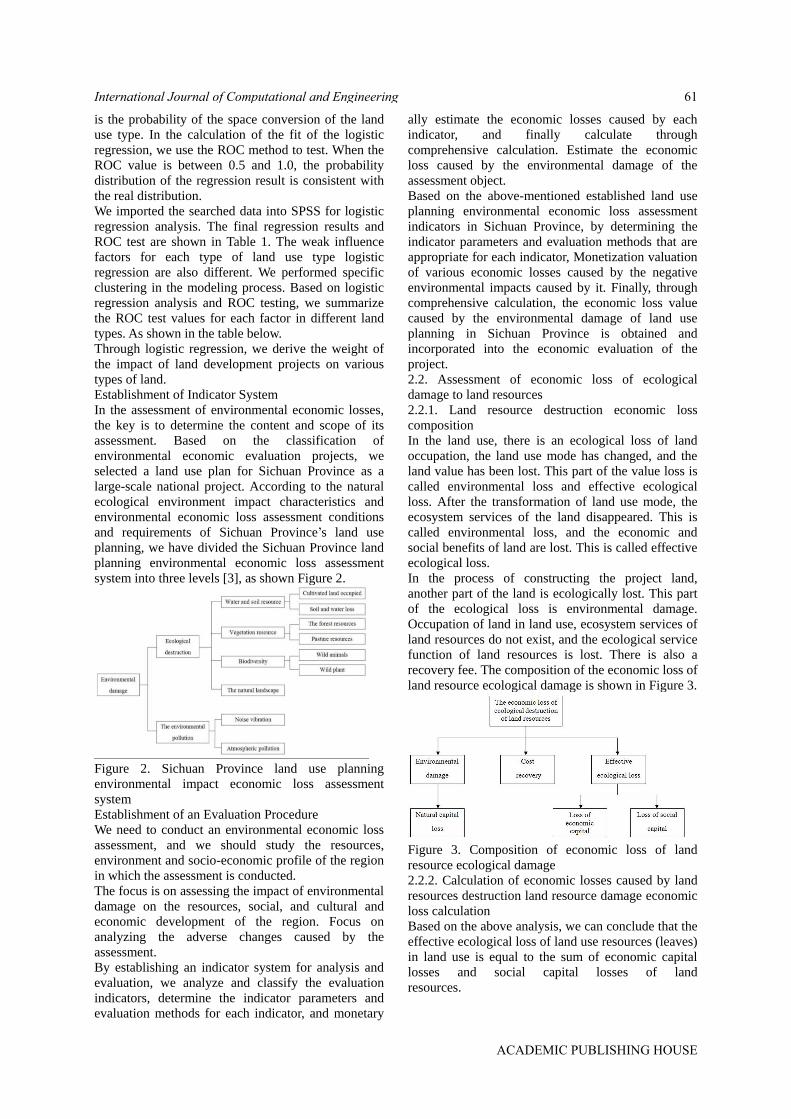
is the probability of the space conversion of the land
use type. In the calculation of the fit of the logistic
regression, we use the ROC method to test. When the
ROC value is between 0.5 and 1.0, the probability
distribution of the regression result is consistent with
the real distribution.
We imported the searched data into SPSS for logistic
regression analysis. The final regression results and
ROC test are shown in Table 1. The weak influence
factors for each type of land use type logistic
regression are also different. We performed specific
clustering in the modeling process. Based on logistic
regression analysis and ROC testing, we summarize
the ROC test values for each factor in different land
types. As shown in the table below.
Through logistic regression, we derive the weight of
the impact of land development projects on various
types of land.
Establishment of Indicator System
In the assessment of environmental economic losses,
the key is to determine the content and scope of its
assessment. Based on the classification of
environmental economic evaluation projects, we
selected a land use plan for Sichuan Province as a
large-scale national project. According to the natural
ecological environment impact characteristics and
environmental economic loss assessment conditions
and requirements of Sichuan Province’s land use
planning, we have divided the Sichuan Province land
planning environmental economic loss assessment
system into three levels [3], as shown Figure 2.
Figure 2. Sichuan Province land use planning
environmental impact economic loss assessment
system
Establishment of an Evaluation Procedure
We need to conduct an environmental economic loss
assessment, and we should study the resources,
environment and socio-economic profile of the region
in which the assessment is conducted.
The focus is on assessing the impact of environmental
damage on the resources, social, and cultural and
economic development of the region. Focus on
analyzing the adverse changes caused by the
assessment.
By establishing an indicator system for analysis and
evaluation, we analyze and classify the evaluation
indicators, determine the indicator parameters and
evaluation methods for each indicator, and monetary
ally estimate the economic losses caused by each
indicator, and finally calculate through
comprehensive calculation. Estimate the economic
loss caused by the environmental damage of the
assessment object.
Based on the above-mentioned established land use
planning environmental economic loss assessment
indicators in Sichuan Province, by determining the
indicator parameters and evaluation methods that are
appropriate for each indicator, Monetization valuation
of various economic losses caused by the negative
environmental impacts caused by it. Finally, through
comprehensive calculation, the economic loss value
caused by the environmental damage of land use
planning in Sichuan Province is obtained and
incorporated into the economic evaluation of the
project.
2.2. Assessment of economic loss of ecological
damage to land resources
2.2.1. Land resource destruction economic loss
composition
In the land use, there is an ecological loss of land
occupation, the land use mode has changed, and the
land value has been lost. This part of the value loss is
called environmental loss and effective ecological
loss. After the transformation of land use mode, the
ecosystem services of the land disappeared. This is
called environmental loss, and the economic and
social benefits of land are lost. This is called effective
ecological loss.
In the process of constructing the project land,
another part of the land is ecologically lost. This part
of the ecological loss is environmental damage.
Occupation of land in land use, ecosystem services of
land resources do not exist, and the ecological service
function of land resources is lost. There is also a
recovery fee. The composition of the economic loss of
land resource ecological damage is shown in Figure 3.
Figure 3. Composition of economic loss of land
resource ecological damage
2.2.2. Calculation of economic losses caused by land
resources destruction land resource damage economic
loss calculation
Based on the above analysis, we can conclude that the
effective ecological loss of land use resources (leaves)
in land use is equal to the sum of economic capital
losses and social capital losses of land
resources.
International Journal of Computational and Engineering 61
ACADEMIC PUBLISHING HOUSE

)2]()()([)(e
m
ij
ej
m
ij
ej jSZjKZSKY
Note: Negative sign indicates loss,in the formula:Zj is
the area occupied by the j-th land type for a certain
type of construction project; Ke(j)is the unit value of
the economic capital of the jth class ecosystem;
Se(j)is the unit value of the social capital of the jth
class land ecosystem.
The environmental loss of land resources occupied by
a certain type of construction project in land use is
equal to the loss of natural capital of land resources.
)3)](([1
e jNZNm
j
ej
In the formula: Ne(j) is the unit value of the natural
capital of the j-type land ecosystem; Zj is the same as
above.
The land occupied by the construction project is
basically occupied permanently, so it is necessary to
reopen a piece of land to compensate the occupied
land. The cost of restoration involved here includes
the cost of occupying another land, the cost of soil
improvement, replanting, fertilization, watering,
de-worming, cultivation, fire prevention and
management. The recovery cost of land resources
occupied by a certain type of construction project in
land use (indicated by De).
)4()(1
e j
m
j
ZjDD
In the formula: D(j)is the unit land restoration cost of
the category j land ecosystem; Zj is the same as
above.
The total ecological loss He of the land occupied by a
certain type of construction project is equal to the sum
of the effective ecological loss, environmental loss
and recovery cost of the land.
)5()()()()(e eeeee DNSKYDNH
)6)(()(
)()(
11
11
e
jDZjNZ
jSZjKZH
m
j
je
m
j
j
e
m
j
je
m
j
j
)7()}()]([)]([)({1j
m
jejejej jDZjNZjSZjKZ
The negative sign is removed, and only the numerical
value indicates the amount of ecological loss, so the
above formula becomes:
)9)(()()()()(
)8()}()()()({
1
1
e
jDZjNZjSZjKZjX
jDZjNZjSZjKZH
jejejej
N
I
I
m
j
jejejej
In the formula: A indicates the types of ecological
losses caused by occupation of land resources in land
use, namely economic capital loss, social capital loss,
natural capital loss, and recovery costs.
2.2.3. Building a LELAM model
The land ecological loss assessment (LELAM) model
is an ecological damage economic loss assessment
model that occupies land use land resources [6].
Assume that in the land, the ecological loss of a
certain type of construction project land at a certain
point is composed of the ecological loss of m land
types, then the ecological loss hI of the first part of
the m land type is:
)10)(()(...)2()1(h mXjXXX IIIII
In the formula: hI is the ecological loss of Part I of m
land types; XI(j) is the ecological loss of Part A of j
species;I=1, 2 , …, N, j=l, 2, …, m.
At a certain point in time, the total ecological loss He
of the M land types is:
)12)((...
)2()1(,
)11)((
1
11
1 11
e
mX
XXHSo
jXhH
N
I
I
N
I
I
N
I
Ie
N
I
m
j
I
N
I
I
2.3. Model solution
The model is solved by an example. We do case
studies by using the eco-efficiency costs of land use
development projects in Sichuan Province.
2.3.1. Natural environment and socio-economic
generalization
Figure 4. Land use project change rate after 2001
The natural characteristics of Sichuan Province are
diverse, and basically include various ecological
service functions around the world. It is conducive to
the rationalization of the model of the environmental
degradation cost of global land development.
The topography and geomorphology form the
characteristics of gully vertical and horizontal and
various types of landforms. There are many kinds of
soils in Sichuan Province, and the distribution is
complex, mainly purple soil, followed by yellow soil;
Wanzhou District is a subtropical monsoon humid
zone with four distinct climates. The average annual
temperature is 17.7 °C, and the highest annual
average temperature is 19.0 °C. 1243 mm [8].
The rate of change of land use projects after 2001 is
shown in Figure 4.
2.3.2. Evaluation of land use conversion in Sichuan
province using remote sensing technology
Economic loss assessment of occupational land
ecological damage in the process of urbanization in
International Journal of Computational and Engineering62
ACADEMIC PUBLISHING HOUSE

Sichuan Province.
We use TM data and OLI remote sensing images for
data analysis to study the impact of land use projects
in the Sichuan region on landscape class flowers.
When selecting the influence of remote sensing, in
order to avoid the influence of disturbance factors
such as seasonal factors and clouds. When selecting
remote sensing areas, we should select the remote
sensing data with good vegetation growth in June
2010 and January 2019. Remote sensing images are
shown in Figures 5-6.
Figure 5. Schematic diagram of Sichuan remote
sensing in 2010
Figure 6. Schematic diagram of Sichuan remote
sensing in 2019
The above picture shows the remote sensing images
of Sichuan Province in 2010 and 2019. By
comparison, it has been found that its topography,
waters and vegetation have undergone tremendous
changes. First, the land use increased from 10.21% to
60.87%; the coverage of forest grassland decreased
from 50.634% to 13.231%; the waters changed little
but the water content decreased by nearly 50%.
Among them, urban planning, roads and railways are
the main land use projects. By searching for the use of
land resources for two years, they are substituted into
the ecosystem service evaluation model to obtain
environmental costs for two years.
We have occupied 724, 737 mu of various types of
land in the process of urbanization in Sichuan
Province from 2010 to 2019. The most occupied land
is cultivated land, accounting for 57.81% of the total
land area, followed by occupation of unused land.
26.22% of the area, as shown in Figure 4. In 2010, the
urbanization of Sichuan Province has expanded on a
large scale, and the urban area has increased by 306.6
square kilometers. It has established a large-scale
development in the form of encroaching on a large
amount of cultivated land.
Sichuan’s total environmental losses are recorded as
N=496 million US dollars
Sichuan’s total environmental losses are recorded as
N=496 million US dollars
4.396(One hundred million U.S. dollars)
The total effective ecological loss in Sichuan Province
is recorded as
Y=3.30599.2 (billion USD)
0.81023
The total ecosystem restoration cost of Sichuan
Province is recorded as
D=1.32077 billion US dollars
(One hundred million U.S. dollars) (One hundred
million U.S. dollars)
2.4. Model role analysis
Firstly, the ecological service system evaluation
model we established has effectively solved the
problem of estimating the value of environmental
costs. When planning the land use project, we bring
the data into the model pair by predicting the area and
type of land resource utilization. The environmental
cost of the project is estimated. Then based on the real
benefit of the land use project = project benefit -
environmental cost model, we can get the real project
benefit. Through our query of the network data, we
found that if the environmental cost exceeds 3% of
the total cost, the environmental cost of the project is
too high. And the impact on the environment is too
large.
3. CONCLUSION
Therefore, when planning the project, the land use
project planner can use our model to evaluate the
actual benefits of the project, and then improve the
plan according to the proportion of environmental
cost to reduce the environmental cost and reduce the
impact of the project on the environment. For the
management personnel, the company’s projects and
plans can be properly arranged according to the
environmental costs, and the direction of the company
can be controlled more rationally to avoid project
risks.
REFERENCES
[1]Liu Zifeng. The economic loss caused by land
occupation in Liu Zifeng’s urbanization process.
Chongqing University, 2003.
[2]Liu Gengyuan, Yang Qing. Ecosystem Service
Value Non-monetary Quantity Accoun ting:
Theoretical Framework and Methodology. China
Environmental Management, 2018, 10 (04): 10-20.
[3]Xu Lingyun, Ding Ling. Water quality risk
assessment of the Heishui River Basin based on the
INVEST model. Pearl River, 2019, (01): 146-152.
[4]Yuan Xianqiang. Dynamic change of land use
International Journal of Computational and Engineering 63
ACADEMIC PUBLISHING HOUSE

landscape pattern and ecological envi ronment
assessment in Yingkou City based on remote sensing.
Liaoning Normal University, 2017.
[5]Su Qing. Railway Green Line Selection
Environmental Impact Economic Impact Asses sment.
Central South University, 2009.
[6]Costanza R. the Value of the Worlds Ecosystem
Service sand Natural Capital. Nat ure. 1997, 387:
253-260
[7]Dai Yongli, Shi Dezhen. Research on road
environment cost monetization model. Environmental
Science, 2012, 38 (02): 69-72.
[8]Yang Yuanyuan, De Wei, Fu Hua. Research
framework for ecosystem service function value
evaluation based on InVEST model. Journal of
Capital Normal University (Natural Science Edition),
2012, 33(03): 41-47.
[9]Qi Wei. Comprehensive evaluation of township
ecological environment based on CPS GA-BP neural
network. Nanjing Normal University, 2016.
[10]Zhang Zhiqiang, Xu Zhongmin, Cheng Guodong.
Evaluation of ecosystem service value and natural
capital value. Journal of Ecology, 2001, (11):
1918-1926.
International Journal of Computational and Engineering64
ACADEMIC PUBLISHING HOUSE

Change-E-III Soft Landing Track Design and
Control Strategy
Yu Bi1,2, Hanying Li1, Ruishan Li1,*, Aimin Yang3 1 Mathematical Modeling Innovation Lab, North China University of Science and Technology, Tangshan 063210,
Hebei, China 2 North China University of Science and Technology, Tangshan 063210, Hebei, China 3 College of Science, North China University of Science and Technology, Tangshan 063210, Hebei, China
*E-mail: [email protected]
Abstract: The moon is the closest celestial body to the
earth. Chang 'E III launched by China has
successfully achieved a soft landing on the surface of
the moon. How to achieve a soft landing has become
the focus of attention. First, according to Kepler’s law,
the speed relationship between the nearest moon and
the far moon point is obtained, and the process of
Chang ‘E III from the far moon point to the near
moon point is analyzed. The speed is obtained from
the law of mechanical energy conservation. Finally,
the space spherical coordinate system of the moon is
established, and the position in the lunar fixed
coordinate system is obtained by combining the
number of orbital roots. The position of the recent
moon point can be obtained by the transformation of
the coordinate system(19.51°W, 43.82°N), and the
altitude is 15km., The location of the far moon
is(160.49°E, 43.82°S) and the altitude is 100km. A
lunar inertial coordinate system is established. For the
plane of landing trajectory, the trajectory equation is
obtained by fitting the landing orbit at the
deceleration stage as a standard parabola. Since the
control law is the same, the main deceleration section
is used to replace the fast adjustment phase. The
elevation map of the rough obstacle avoidance and
fine obstacle avoidance section was used to obtain the
best safe landing site. During the slow speed drop
phase, do uniform deceleration until the speed is
reduced to zero. For the optimal control strategy, the
state equation of soft-landing orbit is simplified, then
the terminal constraints of soft-landing orbit are dealt
with by the multiplication sub method, the joint choke
gradient method and the constraint operator are
introduced to optimize the iterative solution of
soft-landing orbit. For error analysis, because the
shape of the moon is 1/963.7256, the moon is
approximated as a circular sphere. In the lunar fixed
coordinate system, the radius of the moon is
uniformly used as the average radius; When the
Chang ‘E III detector flies around the moon, Chang’ E
III moves in the gravitational field in the center of the
moon, ignoring various photodynamic factors; The
various types of speeds sought are all relative speeds.
The scope is limited to the two-body system category,
regardless of whether the detector orbits with the
moon. Then the sensitivity analysis is carried out, the
parameters in the model are analyzed one by one, and
the changes in a certain range are simulated and the
results are compared.
Keywords: kepler’s law; orbital optimization; image
processing; multiplication
1. INTRODUCTION
Chang ‘E III successfully launched and reached the
lunar orbit. The mass of Chang ‘E III is 2.4 T, and the
main deceleration engine can produce adjustable
thrust from 1500N to 7500N, and the specific impulse
is 2940m/s, which satisfies the control requirements
for speed adjustment. The four sides are equipped
with small attitude adjustment engines. After the
thrust direction is given, various attitude adjustment
controls can be automatically implemented. The
scheduled landing point of Chang ‘E III in Hongwan
District is 19.51 W, 44.12 N, and the altitude is
-2641m. In the case of high-speed flight, Chang ‘E III
must ensure the accurate realization of a soft landing
in the scheduled area of the moon [1-4]. The focus is
on designing a landing orbit and an optimal control
strategy. For the landing track design, the basic
requirements are the following three points: the
landing preparation track is 15km in the near month
and 100km in the far month; From the landing orbit
from the recent month to the landing point, the soft
landing process can be divided into six stages, and the
state of each stage at the key point should be satisfied
[5-7]. And the fuel consumption during the
soft-landing process is minimized.
2. THE POSITION OF THE NEAREST AND
DISTANT MOON AND THE CORRESPONDING
SPEED
According to Kepler’s second law, the product of the
rate of Chang ‘E III at a certain point and the distance
from that point to the center of the moon is a fixed
value. When the longitude is one degree, the actual
ground distance is:360/2 cR
.When the Latitude is
one degree, the actual ground distance is: 90/jR .
2.1. Recent Moon, Far Moon Speed
According to Kepler’s second law and the law of
mechanical energy conservation:
)(
22
ABA
BA
RRR
GMRV
(1)
International Journal of Computational and Engineering 65
ACADEMIC PUBLISHING HOUSE

It is known that the distance from the moon to the
surface of the moon is R1 = 15km, the distance from
the far moon to the surface of the moon is R2 = 100km,
and the average radius of the moon is R= 1737.013
km, so there is: RRRA 1, RRRB 2
,
Substituting to formula(1) yields: skmVA /6925.1 ,
Similarly, the far month speed can be:
skmVB /6529.1 . The speed direction of Chang ‘E
III at the near and far moon points is along the track
tangent direction.
2.2. Location of Recent and Distant Months
The spherical surface of three-dimensional space can
be used to define the space spherical coordinate
system on the moon, describing the position of the
near and far moon points and the position of the
satellite on the moon. Show in Figure 1.
Figure 1. Space spherical coordinate system of the
Moon
By Kaipulefangcheng:
EeME sin1 (2)
)1(1 tnM (3)
Find the relationship between E and f:
)cos1(0 Eear (4)
e
r
ea
f 0
2
1
)1(1
cos (5)
From the coordinates of the satellite in the elliptical
orbital plane, the coordinates of the satellite in the
space spherical coordinate system of the moon can be
obtained.
32an (6)
It is known that the T moment satellite is near the
moon, and the formula(3) can be used to find the time
of the satellite at the recent month M0.
From formulas(4) and(5) can be derived:
Eeay
eEax
sin1'
)(cos'2
(7)
Assuming that Chang ‘E III moves in the gravitational
field in the center of the moon and ignores various
photodynamic factors, the moon is regarded as a
circular sphere at this time. Then the position of
Chang’ E III in the lunar fixed coordinate system is:
if
iff
iff
fe
ea
z
y
x
sin)sin(
cos)sin(cos)cos(sin
cos)sin(sin)cos(cos
cos1
)1( 2
(8)
In the calculation of Chang ‘E III elliptical orbit, this
article introduces a kind of Walker [1]. It is proposed
to eliminate singular improved orbital roots. The
number of orbital roots in this group will only
produce singularity when the orbital angle i=180°,
but the probability of occurrence in the Chang ‘E III
transfer orbit can be ignored. Its basic form is: )1( 2eap (9)
)cos( ef (10)
When Chang ‘E III is at the point of the month, the
number of orbital roots is: i=90°, the right ascension
of the ascending node B =353.9°, M1=0°, f=0,
Ω=37.9°, ω=52.1°
The position of Chang ‘E III in the fixed coordinate
system is:
067520.1
063480.1
060358.1
ez
ey
ex
From the definition of the latitude and longitude of
the moon, it can be found that the position of the
recent moon point is(19.51°W,43.82°N), the altitude is
15km, and the same is found: the location of the far
moon point is(160.49°E,43.82°S), elevation is 100km.
3. EXPRESSION AND OPTIMAL CONTROL
STRATEGY OF LANDING ORBIT
The plane of landing trajectory is taken out separately
as the x’oy’ coordinate system. The landing orbit of
the main deceleration stage can be fitted as part of the
standard parabola, and the expression of its running
trajectory can be considered.
From the near monthly point coordinates (15,0) and
the end point coordinates (37,3) of the main
deceleration phase, the expression of the winner’s
deceleration phase landing orbit is:
1567.192 yx (11)
3.1. Landing Prep Track
At this stage, the main engine of Chang ‘E III was
shut down and was affected by the gravity of the
moon and flew in an elliptical orbit.
3.2. Establishment of Soft-Landing Dynamics Model
for Landing Orbit in Main Deceleration Stage
At this stage, the parabola was reduced from 15km in
recent months to 3km from the lunar surface, and the
relative speed dropped from 1.7 km/s to 57m/s.
The inertial coordinate system of the lunar center and
the Chang ‘E III orbital coordinate system are
established, as shown in Figures 2-3, respectively.
International Journal of Computational and Engineering66
ACADEMIC PUBLISHING HOUSE

Figure 2. Moon surface inertial coordinate system
Figure 3. Chang ‘E 3 orbital coordinate system
Influential factors such as non-ball items of lunar
gravity, solar and lunar gravitational perturbation, etc.
can be ignored [4] and at the same time, the influence
of Coriolis force and traction caused by the rotation of
the moon can also be ignored[5] And A soft landing
mass cardio dynamics equation is established for the
main deceleration section:
Ee gv
Fm
r
u
r
v
wr
r
vu
rm
Fw
r
uv
r
vw
m
Fv
r
v
r
uv
m
Fu
sin
)(sin
tancoscos
tancoscos
22
2
1
2
(12)
From the characteristics of the moon and soft landing
process, the terminal constraints of soft landing orbit
are dealt with by the multiplication submethod, and
then the joint choke gradient method is used to solve
the soft landing orbit.
The optimization of the Chang ‘E III soft landing
orbit can be converted into a nonlinear optimal
control strategy problem with control constraints and
terminal constraints, that is, within the time [ 0t , ft ],
the optimal control function u(t) is determined to
satisfy the differential equation:
)),(),(( ttutxfx (13)
Introduce the costate variable λ(t) to form the
Hamilton function[4]
ftuxLH r ),,( (14)
The equations of motion for the soft landing of Chang
‘E III are:
)),(),(( ttutxfx (15)
In this paper, we use the multiplication submethod to
deal with the terminal constraints of orbital optimal
control, namely[6]
m
j
jjjj
m
j
ffjff ttxvttxttx11
2 )),(()),((2
)),((
(16)
The terminal time of the soft landing orbit is free, so
each time the integral orbital state equation is
integrated, the terminal time ft must be determined
[7] and take the time when a terminal condition
reaches satisfaction as terminal time ft .
The simulation curve is shown in Figure 4.
Figure 4. Simulation graph
It can be seen from the thrust angle of attack curve
that the control quantity changes smoothly, without
mutation, easy to control, and satisfies the control
quantity constraints. The speed change curve and
height change curve of the lander are smooth and
converge well to the terminal constraints.
3.3. Quick Adjustment Phase
The main requirement at this stage is to adjust the
attitude of the aircraft using a small attitude
adjustment engine, and the horizontal speed is
reduced to 0m/s, so that the engine thrust direction of
the winner is downward.
1222 umtF (17)
3.4. Crude Barrier Avoidance Phase
The main purpose of this stage is to avoid large
craters, so it is first necessary to determine the
location of the crater. Find a three-dimensional map
(as shown in Figure 5) and a grayscale enhancement
map(as shown in Figure 6) at 2400m from the surface
of the moon. Grayscale can be used to measure the
level of terrain.
International Journal of Computational and Engineering 67
ACADEMIC PUBLISHING HOUSE

Figure 5. Three-dimensional map at 2400m
Figure 6. Grayscale enhancement
Through observation, the crater distribution area in
the area can be drawn in the grayscale map, which is
not suitable for landing area, and the estimated
landing area can be found. In order to obtain the exact
point of existence of the crater, Figure 7 can be
obtained by using Matlab and the altitude of the crater
can be obtained from Figure 8.
Figure 7. Grayscale enhancement of coarse barrier
avoidance
3.5. Fine Obstacle Avoidance Phase
By determining the crater distribution, the
displacement of the landing trajectory is analyzed,
and the optimal control strategy is found.
Figure 8. Grayscale enhancement of fine barrier
avoidance
4. ERROR ANALYSIS
For the transfer orbit of Chang ‘E III, there are two
main types of errors, one is the system error; The
second is to assume the estimation error and
Jisuanwucha.
In the second type of error, because the shape of the
moon is 1/963.7256, the moon is approximated as a
circular sphere, and the radius of the moon in the
lunar fixed coordinate system is uniformly used as the
average radius; Chang ‘E III moves in the
gravitational field in the center of the moon, ignoring
the influence of various photodynamic factors; The
various types of speeds sought are all relative speeds,
regardless of whether the detector orbits with the
moon.
Assume that the mechanical model used to calculate
Chang ‘E III’s operation is: (X F X,t) The mechanical model of the landing preparation
orbit is: ( ( (X F X,t) F X,t) F X,t)
Among them, for the mechanical model error, that is,
a class of errors, as long as it is small enough, the
error caused by the landing preparation orbit of Chang
‘E III is negligible.
5. SENSITIVITY ANALYSIS
This paper mainly analyzes the sensitivity of the
parameter specific impulse ve, and focuses on the
main deceleration stage. The results are as follows:
Table 1. Table of relations between specific impulse
and time
ve(m/s) t(s)
2939.97 615
2939.98 617
2939.99 619
2940.01 623
2940.02 625
From the Table 1, it can be seen that for each increase
or decrease of a percentage, the range of time t
changes is within 2s, about 0.03 %, and it can be
concluded that it is less sensitive than Chong ve.
REFERENCES
[1]Walker M.J.H, Ireland B, Owens J. A Set of
Modified Equinoctial Orbit Elements. Celestial
Mechanics, 1985, 36(1):409-419. [2]Walker M.J.H. A set of modified equinoctial orbit
elements. Celestial Mechanics, 1986, 38(4):391-392. [3]Beauty Curtis. Orbital mechanics. Beijing: Science
Press, 2009, 25-59.
[4]Cai Y.F. Research on the guidance control method
of lunar probe soft landing. Northwestern Institute of
Technology, 2006.
[5]Ceng Y. Spacecraft flight mechanics. Northwestern
Industrial University Press, 1993.
[6]Wang M.G, Yuan jianping, Luo jianjun. RLV
re-entry trajectory airborne rapid optimization.
Astronautical Journal, 2005, 26(3): 253-256.
[7]Tang Q. Moon soft landing orbit rapid optimization.
Computer Simulation, 2007, 24(12): 24-27.
International Journal of Computational and Engineering68
ACADEMIC PUBLISHING HOUSE

Analysis of The Use of College Campus Loans
Xuebing Chen1,2, Yi Yang3, Xiaoqing Meng1,4, Aimin Yang1,2,*
1 Engineering Computing and Simulation Innovation Lab, Tangshan, 063210, Hebei, China 2 College of Science, North China University of Science and Technology, Tangshan, 063210, Hebei, China 3Agriculture and Forestry Economic Management College, Henan University of Animal Husbandry and
Economy, Zhengzhou, 450000, Henan, China 4 College management, North China University of Science and Technology, Tangshan, 063210, Hebei, China
*Email: [email protected]
Abstract: China’s Internet finance has developed
rapidly, with more and more campus loans for college
students as loans, and some negative impacts.
Through the investigation of the use of campus loans
in colleges and universities, the reasons for students
using campus loans are analyzed, and corresponding
countermeasures are given. Combined with the
survey data, logit regression is used to explore the
reasons why students use campus loans. It is
concluded that men are more likely to use campus
loans than women, and the subjective attitude
towards campus loans also affects students’ attitudes
toward using campus loans. Some related suggestions
are given by describing the statistics.
Keywords: logit regression; questionnaire analysis;
campus loan; description statistics
1. INTRODUCTION
The growing development of Internet finance in
China has led to the formation and development of a
large number of online loan companies. Only when
there is demand, there is a market. Based on the
effective support of the Internet platform, the online
loan company has effectively solved the urgent need
for funds for the shortage of funds in the market [1].
At present, Internet finance exists in different forms,
but with the help of the Internet platform, the idle
funds in the market are loaned to the capital
demanders at a certain loan interest rate. In recent
years, in the concentration of many online loan
clouds, campus loans with college students as the
mainstay have mushroomed and developed. [2-3]
Campus loans, which are campus network loans, are
a platform for borrowing to help students solve
economic difficulties and start a business. However,
in recent years, news of college students who have
been burdened with huge amounts of money due to
loans to the campus have been repeatedly exposed,
and incidents of suicide due to absenteeism have also
occurred from time to time [4]. For a time, campus
lending has become one of the hot topics of
sensational campus and society [5]. This survey
mainly hopes to understand the main problems of the
existing regulatory measures of campus loans through
the status of campus loans of college students and the
recognition and evaluation of relevant regulatory
measures, and propose targeted improvement
measures according to relevant theories. Regulate the
college students’ campus loan ideas.
2. CAUSE ANALYSIS
With "personal basic information" (gender, grade,
living expenses, emergency money selection),
"attitude on campus loans", "use around the people"
as independent variables, "campus loan use" as a
dependent variable, study students choose campus.
The reason for the loan is to establish a logistic
regression model.
2.1. Selection of Variables
The dependent variable of the model is whether the
student surveyed uses campus loans. It is a
dichotomous variable. Its two levels are “used” and
“never used”, which are coded as 1 and 0 respectively,
and select the students to be investigated. The six
variables of “grade”, “gender”, “living expenses”,
“whether to choose online lending platform
borrowing when urgently using money”, “use of
surrounding people” and “attitude to campus loans”
are added to the model. The five variables are all
discrete variables, so they are all converted into
virtual variables introduced into the model, and the
forward selection method is used for logistic
regression, as Table 1.
Table 1. variable assignment table
Variable name Assignment
Campus loan use 1: used 0: Never used
Grade (x1)
1: Freshman 2:
Sophomore 3: Junior
4: Senior
Gender (x2) 1: male 0: Female
Living expenses (x3)
1: Less than 1,000 yuan
2: 1000-1500 yuan
3:1500-2000 yuan 4:
More than 2,000 yuan
Choose online lending
platform to borrow
when you are in a
hurry (x4)
1: selected 0: not selected
Attitude towards
campus lending (x5)
1: Benefits outweigh the
disadvantages 0: Do more
harm than good
Surroundings use (x6) 1: Yes 2: No
2.2. Result Analysis
Table 2. Overall situation of the significance test of
the regression equation
Omnibus test of model coefficients
International Journal of Computational and Engineering 69
ACADEMIC PUBLISHING HOUSE
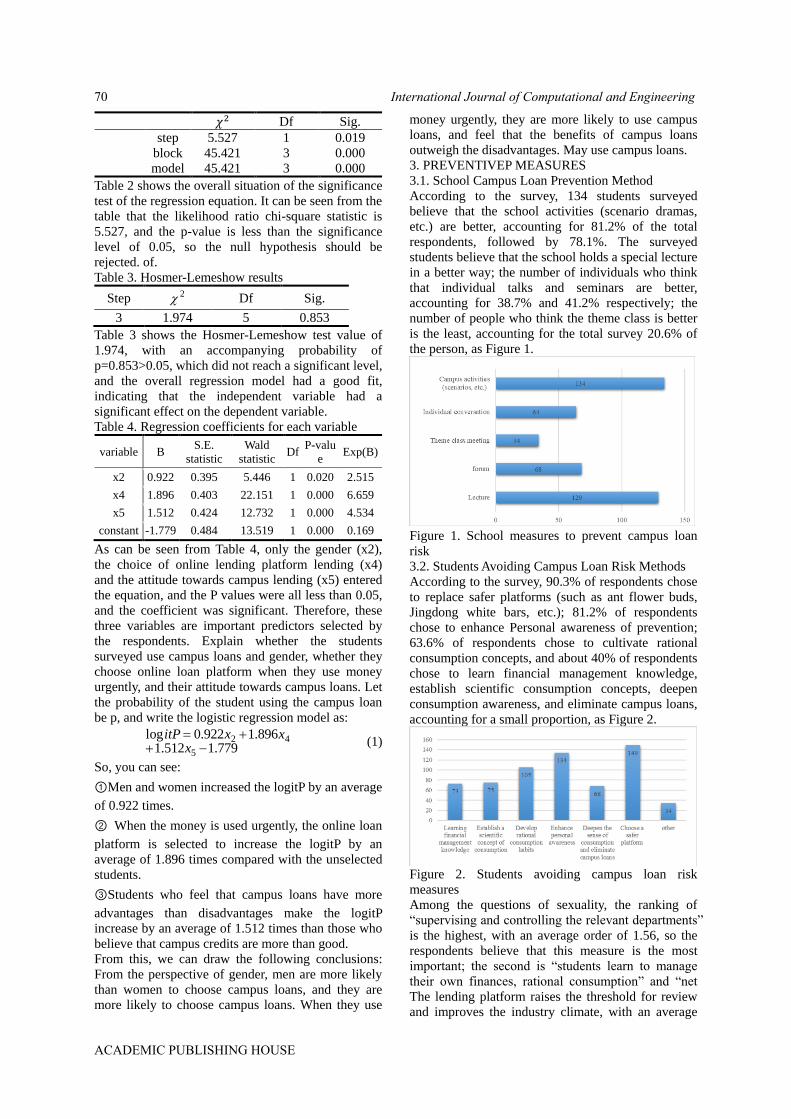
𝜒2 Df Sig.
step 5.527 1 0.019
block 45.421 3 0.000
model 45.421 3 0.000
Table 2 shows the overall situation of the significance
test of the regression equation. It can be seen from the
table that the likelihood ratio chi-square statistic is
5.527, and the p-value is less than the significance
level of 0.05, so the null hypothesis should be
rejected. of.
Table 3. Hosmer-Lemeshow results
Step 2 Df Sig.
3 1.974 5 0.853
Table 3 shows the Hosmer-Lemeshow test value of
1.974, with an accompanying probability of
p=0.853>0.05, which did not reach a significant level,
and the overall regression model had a good fit,
indicating that the independent variable had a
significant effect on the dependent variable.
Table 4. Regression coefficients for each variable
variable B S.E.
statistic
Wald
statistic Df
P-valu
e Exp(B)
x2 0.922 0.395 5.446 1 0.020 2.515
x4 1.896 0.403 22.151 1 0.000 6.659
x5 1.512 0.424 12.732 1 0.000 4.534
constant -1.779 0.484 13.519 1 0.000 0.169
As can be seen from Table 4, only the gender (x2),
the choice of online lending platform lending (x4)
and the attitude towards campus lending (x5) entered
the equation, and the P values were all less than 0.05,
and the coefficient was significant. Therefore, these
three variables are important predictors selected by
the respondents. Explain whether the students
surveyed use campus loans and gender, whether they
choose online loan platform when they use money
urgently, and their attitude towards campus loans. Let
the probability of the student using the campus loan
be p, and write the logistic regression model as:
779.1512.1896.1922.0log
5
42
x
xxitP (1)
So, you can see:
①Men and women increased the logitP by an average
of 0.922 times.
② When the money is used urgently, the online loan
platform is selected to increase the logitP by an
average of 1.896 times compared with the unselected
students.
③Students who feel that campus loans have more
advantages than disadvantages make the logitP
increase by an average of 1.512 times than those who
believe that campus credits are more than good.
From this, we can draw the following conclusions:
From the perspective of gender, men are more likely
than women to choose campus loans, and they are
more likely to choose campus loans. When they use
money urgently, they are more likely to use campus
loans, and feel that the benefits of campus loans
outweigh the disadvantages. May use campus loans.
3. PREVENTIVEP MEASURES
3.1. School Campus Loan Prevention Method
According to the survey, 134 students surveyed
believe that the school activities (scenario dramas,
etc.) are better, accounting for 81.2% of the total
respondents, followed by 78.1%. The surveyed
students believe that the school holds a special lecture
in a better way; the number of individuals who think
that individual talks and seminars are better,
accounting for 38.7% and 41.2% respectively; the
number of people who think the theme class is better
is the least, accounting for the total survey 20.6% of
the person, as Figure 1.
Figure 1. School measures to prevent campus loan
risk
3.2. Students Avoiding Campus Loan Risk Methods
According to the survey, 90.3% of respondents chose
to replace safer platforms (such as ant flower buds,
Jingdong white bars, etc.); 81.2% of respondents
chose to enhance Personal awareness of prevention;
63.6% of respondents chose to cultivate rational
consumption concepts, and about 40% of respondents
chose to learn financial management knowledge,
establish scientific consumption concepts, deepen
consumption awareness, and eliminate campus loans,
accounting for a small proportion, as Figure 2.
Figure 2. Students avoiding campus loan risk
measures
Among the questions of sexuality, the ranking of
“supervising and controlling the relevant departments”
is the highest, with an average order of 1.56, so the
respondents believe that this measure is the most
important; the second is “students learn to manage
their own finances, rational consumption” and “net
The lending platform raises the threshold for review
and improves the industry climate, with an average
International Journal of Computational and Engineering70
ACADEMIC PUBLISHING HOUSE
order of 2.46 and 2.15; the average ranking of parents
and school measures is lower, at 4.46 and 4.37
respectively, as Figure 3.
Figure 3. Ranking of the importance of preventing
campus credit risk measures
4. CONCLUSION
(1) Men are more likely to use campus loans than
women. When they use money, they are more likely
to use campus loans. The attitude towards campus
loans is also an important factor affecting students’
use of campus loans.
(2) When studying the reasons for students using
campus loans, it was found that men and women
increased the logitP by an average of 0.922 times
compared with women. When the money was used
urgently, the online loan platform was selected to
increase the logitP by an average of 1.896 times
compared with the unselected students. Students are
more likely to increase logitP by an average of 1.512
times compared to students who believe that campus
credits are greater than profit.
(3) The school organizes campus activities, and the
special lectures are welcomed by the students. The
theme class meeting is not feasible.
When studying the school’s measures to prevent
campus loan risk, about 80% of the students surveyed
thought that organizing campus activities and
conducting special lectures were better. Among the
165 valid questionnaires, only 34 people thought that
individual conversations were more effective,
accounting for 20.6%, and it is more troublesome to
implement, so the feasibility is not high. It is
recommended that schools can regularly carry out
college activities on campus credit risk prevention
and control, or lectures on related topics, and
strengthen the promotion of campus loan risk
protection measures.
(4) More than 80% of respondents believe that the
“choose a safer platform” and “enhance personal
awareness” measures can avoid the risk of campus
loans.
In the study of students’ measures to avoid campus
loan risk, 90.3% of the students believe that "choose a
safer platform (such as ant flower bud, Jingdong
white strip, etc.)" can better avoid campus loan risk
measures; 81.2% of students It is considered that
“enhancing personal prevention awareness” can
better avoid the risk of campus loans. Only 41.1% of
the students chose to “deepen the sense of
consumption and eliminate the campus loan”,
indicating that the feasibility of eliminating the
campus loan is low. Therefore, students can use a
safer loan platform when they are in a state of
emergency, and enhance their awareness of financial
management in their daily lives.
(5) The relevant departments should strengthen
supervision and the platform should raise the
threshold for review.
In the study of effective measures to avoid campus
loan risk measures, it is found that the relevant
departments have the highest ranking and the highest
importance. The state has already introduced relevant
policies, but there are some problems in supervision.
There is a phenomenon of “714 high-altitude” in the
online loan platform, so the relevant departments
Strengthening supervision of campus loans can
effectively reduce the risk of campus loans; secondly,
the platform itself has made a difference. The current
online lending platform is to attract users and
promote misleading advertising information such as
“0 interest rate, 7 days interest-free”, resulting in
Vicious competition, the platform should raise the
threshold for review, reduce the bad debt rate, to
increase revenue rather than raise interest rates at a
glance; students should also learn to manage their
own finances, to achieve rational consumption, the
high consumption of most students is Because of the
comparison psychology and herd mentality,
contemporary college students should learn financial
management knowledge and achieve rational
consumption in order to fundamentally prevent the
risk of campus loans.
REFERENCES
[1]Zhao L. On the prevention and rectification of
campus loans. Journal of Liaoning Teachers College
(Social Science Edition), 2018, (2): 133-134.
[2]Gu H.L. Eliminating the "Campus Lending" Trap
to Build a Harmonious Campus in Colleges and
Universities. Industry and Technology Forum, 2016,
15(19): 264-265.
[3]Li W, Yuan Q, Zheng W, et al. Investigation and
research on the status quo and influencing factors of
“campus loan”. Journal of North China University of
Technology(Social Science Edition), 2018, 18(1):
11-14 .
[4]Mo C.C. The Harm, Causes and Avoiding
Strategies of College Campus Loan Chaos. Journal of
Shenyang University (Social Science Edition), 2018,
(1).
[5]Zheng C.M, Jia S.S. Comparison of domestic and
international campus loan platforms and regulation
analysis. Finance and Economics: Academic Edition,
2016, (17).
International Journal of Computational and Engineering 71
ACADEMIC PUBLISHING HOUSE

Shadow Market Segmentation Based On
K-means Clustering
Xuebing Chen1,2,*, Yi Yang3, Xinjia Yang4, Yang Han1,2 1 Engineering Computing and Simulation Innovation Lab, Tangshan 063210, Hebei, China 2 College of Science, North China University of Science and Technology, Tangshan, 063210, Hebei, China 3 Agriculture and Forestry Economic Management College, Henan University of Animal Husbandry and
Economy, Zhengzhou, 450000, Henan, China 4 Zhengzhou University of Light Industry, College of Electrical Information Engineering, Zhengzhou, 450000,
Henan, China
*Email: [email protected]
Abstract: Shadow play is one of the oldest dramas in
China. It is a must for Chinese folk art. The research
on the market of shadow culture derivatives has
far-reaching significance for the development of
shadow play. Through a questionnaire survey, this
paper investigates the residents’ willingness to
purchase shadow-shadow derivatives in some cities
in Tangshan City, Hebei Province, and their
sensitivity to the price of derivatives. Finally, based
on the questionnaire data, the K-means clustering
method was used to segment the respondents, and
finally the four types of consumers, price-sensitive,
shadow-like, price-sensitive and insignificant, were
given. The characteristics of the four types of
consumers. At the end of the article, we present some
development suggestions for the shadow film
derivatives market.
Keywords: k-means clustering; chinese shadow play;
derivative market
1. INTRODUCTION
The shadow play also called “shadow drama” “light
shadow drama” “tu ying xi” is a silhouette of a
character made of light or animal skin or cardboard to
perform a story [1]. The repertoire and the aria are
influenced by the local opera, and the artist is
manipulating. Singing and matching music [2].
Tangshan Phi Phi is also called “Le Ting Ying” and
“Zhangzhou Shadow”. It is popular in Tangshan,
Hebei, Chengde, Langfang and other cities and
counties in the three northeastern provinces. It has a
major influence in Chinese shadow play. Status.
However, with the acceleration of the modernization
process, the audience of Shadow Play has plummeted
and the crisis of survival has intensified.
“Derivatives” refers to things derived from native
things [3]. Art derivatives are art peripheral products
developed on the basis of original works of art [4,5].
Shadow Derivatives refers to products that are used
by all the elements related to the shadow play to
produce economic benefits in all aspects of life [5].
Nowadays, the shadow derivative has been extended
to all aspects of people’s daily life such as toys,
handicrafts, souvenirs, daily necessities, clothing,
home, audio and video, books, online games, food
and beverage.
In addition, due to the long time-consuming
production of Tangshan Shadows, the sensitivity of
manuals is extremely high, and many of them are
passed on to the children, and the family inheritance
of the children is not passed down. It is necessary to
protect them and develop them.
In recent years, China’s enthusiasm for the protection
of intangible cultural heritage has been
unprecedentedly high, and the protection of
intangible cultural heritage has been increasing. The
“One Belt, One Road” interconnection project aims to
explore the potential of the regional market, promote
investment and consumption, and create Demand and
employment. Therefore, the development of the
derivatives market is the only way to develop the
Tangshan Shadow and even the Chinese shadow
market. It is believed that the support of the national
policy and the market are welcome, and the
development of the shadow film derivatives market
has ushered in new opportunities. The shadow culture
has shown a good momentum of vigorous
development.
2. MARKET SEGMENTATION
Market segmentation is the process by which an
enterprise divides the entire market into different
consumer groups based on different consumer needs.
It plays an extremely important role in the production
and marketing of enterprises. It can bring the
following aspects to help enterprises: develop optimal
marketing strategies, find market opportunities,
rationally allocate resources, gain competitive
advantage and improve economic efficiency.
Cluster analysis is one of the most commonly used
methods in market segmentation. Cluster analysis is
the process of dividing an object into several groups,
so that the data in the same group has a high degree
of similarity, while the data objects in different
groups are not similar. Through the K-means
clustering method, the villa daily rent purchasers are
divided into several different types, and targeted
marketing strategies are adopted for different types of
villa buyers to improve the company’s revenue.
International Journal of Computational and Engineering72
ACADEMIC PUBLISHING HOUSE

2. DATA PREPROOCESSING
Choose three subdivision variables: price tolerance,
quality demand, and the taste of the shadow play. The
raw data is processed, and the three variables of price
tolerance, quality demand and shadow taste are
divided into three grades: low, medium and high. The
processing methods are as follows.
2.1. Classification of Price Tolerance
For the Q13 four-priced shadow crafts in the
questionnaire, if the respondent answers “positive
choice”, it is recorded as 4 points; if the respondent
answers “possible choice”, it is recorded as 3 points;
if it is investigated If the respondent replies "may not
choose", it is recorded as 2 points; if the respondent
answers "definitely not selected", it is recorded as 1
point. Because the price of each craft is different, the
weights of different options are different. The weight
ratio is 1:2:3:4. The scores of each respondent are
weighted and averaged. The formula is as follows:
4321 4.03.02.01.0 FFFFF (1)
If the average score is greater than 3.2, it is defined as
the consumer with high price ability, and the
consumer is recorded as 3; if the average score is
greater than or equal to 2 and less than or equal to 3.2,
it is defined as the consumer with the price ability to
accept the general. Such consumers are recorded as 2;
if the average score is less than 2, they are defined as
consumers with low price ability, and such consumers
are recorded as 1. In this way, all respondents are
divided into three grades of high, average and low
preference for the shadow design elements.
2.2. Classification of the Quality Requirements of
Respondents
If the survey selects five or more of the options in
Questionnaire Q14, it is defined as a consumer with
high quality requirements, and marks such consumers
as 3; if selected, the option in Questionnaire Q14 is
selected. Three or four or one are defined as
consumers with average quality requirements, and
such consumers are marked as 2; if they are selected
by surveying two of the options in Questionnaire Q14,
they are defined as Consumers with low shadow
quality requirements and mark such consumers as 1.
(3) Classification of the taste of the respondents
If the survey selects three or more of the options in
Questionnaire Q15, it is defined as a consumer with a
high taste, and marks such a consumer as 3; if the
survey selects one of the options in Questionnaire
Q15 Or two, which are defined as consumers with a
taste of taste, and mark such consumers as 2; if the
“not interested” option in the option in Questionnaire
Q15 is selected, it is defined as low taste. Consumers
and mark such consumers as 1.
In theory, each aspect can divide consumers into three
categories, so the market is divided into 27 parts:
Integrate and analyze these twenty-seven categories.
According to the actual meaning, we can divide all
consumers into four categories:
Type 1 consumers: price-sensitive. For this type of
consumer, they value the price more than the quality.
Only the price is within the range they are willing to
consume. The group is usually a group of students or
a group with lower incomes.
The second type of consumer: the shadow element
preference type. This type of consumer does not
value the price of the shadow derivative, they value
the quality of the derivative, and the experience and
experience brought to them during the consumption
process.
The third category of consumers: early adopters.
Tangshan Pi Ying as a national intangible cultural
heritage, is a traditional industry, but due to the lack
of development in recent years, the narrow spread of
the status quo, leading many consumers, especially
young consumers, to contact the shadow culture less.
For them, the most important thing is the freshness of
the shadow culture.
The fourth category of consumers: irrelevant type. In
addition to the 1, 2, 3 and 3 categories of consumers,
there are some consumers are not very valued for the
price and quality of the shadow derivative, and there
is no sense of freshness. For this part of the consumer,
no matter how much energy the company puts into
satisfying the needs of such customers, they will not
(or will definitely) go to the villa for daily rental
consumption. Therefore, if companies invest too
much energy in such consumers, they will not
increase their turnover.
These four classifications are determined based on
theoretical knowledge plus actual conditions and will
serve as the basis for determining the K value in the
next K-Means cluster.
3. K-MEANS CLUSTERING
3.1. Output Result
Table 1 shows the results of one-way ANOVA
between various types of samples formed after rapid
cluster analysis. For the price bearing capacity, its
sum of squares between groups is 84.620, the sum of
squares in the group is 0.310, the F statistic is 72.704,
and the correlation probability of F statistic is 0.00
less than the significance level of 0.05, so for the
price bearing capacity, 4 types There are significant
differences between consumers. There is also the
same conclusion about quality demand and taste.
Therefore, the K-means clustering analysis classified
into four categories is successful, and the clustering
analysis is very effective.
Table 1. One-way ANOVA results between various
samples
Clustering Eror
F Sig. Mean
square Df
Mean
square Df
Price
bearing
capacity
84.620 3 0.310 806 272.704 .000
Quality
demand 98.892 3 0.326 806 303.383 .000
Taste of
taste 104.949 3 0.287 806 365.313 .000
International Journal of Computational and Engineering 73
ACADEMIC PUBLISHING HOUSE

Table 2. Number of samples included in each of the
four categories
Cluster Number of samples
1 376
2 169
3 111
4 154
Table 2 lists the number of samples for each of the
four classes. Among them, there are 376 in the first
category, 169 in the second category, 111 in the third
category, and 154 in the fourth category. 3.2. Result Analysis
Table 3. Specific differences in the four categories
Case cluster
number
Price
bearing
ability
score
Quality
demand
score
Taste of
taste
1
N 376 376 376
mean 2.45 2.69 1.52
median 3.00 3.00 1.00
Std. 0.651 0.641 0.628
2
N 169 169 169
mean 1.53 2.34 2.72
median 2.00 2.00 3.00
Std. 0.47 0.663 0.449
3
N 111 111 111
mean 1.18 1.36 1.45
median 1.00 1.00 1.00
Std. 0.386 0.441 0.362
4
N 154 154 154
mean 2.64 1.10 1.42
median 2.00 1.00 1.00
Std. 0.496 0.297 0.481
Table 3 shows the specific differences in price
tolerance, quality demand and early taste of the four
categories 1, 2, 3 and 4. It can be seen that the first
type of consumer quality demand average score is the
highest among the four types of consumers, so it is
the quality demand type consumer; the second type of
consumers have higher average scores of taste and
quality demand scores. However, the price tolerance
is low, which is the early adopter; the third category
of consumers has a score of less than 1.5, the price
tolerance is lower, and the price is sensitive; the
fourth type of consumer has higher price tolerance.
However, the skin taste and the price tolerance are
lower, which is an irrelevant consumer.
In summary, respondents are divided into four
categories, including quality demand consumers,
early adopters, price sensitive consumers, and
insignificant consumers. Among them, quality
demand consumers (like design products with
shadow elements) accounted for 376 people,
accounting for 46.4% of the total number of surveys;
taste consumers (like fresh shadow form) were 169,
accounting for 20.8 of the total number of surveys. %;
price-sensitive consumers (not interested in anything)
were 111, accounting for 13.7% of the total number
of surveys; unimportant consumers (like the shadow
itself) were 154, accounting for 19% of the total
number of surveys.
4. CONCLUSION.
Nearly half of the respondents are quality consumers,
and early adopters and price-sensitive consumers
each account for 20%.
Segmenting the shadow market, the respondents are
divided into four categories of consumers, including
quality demand consumers, early adopters, price
sensitive consumers and insignificant consumers.
Among them, 376 are quality demand consumers,
accounting for 46.4% of the total number of surveyed;
169 are early adopters, accounting for 20.8% of the
total survey; and 111 are price sensitive consumers,
accounting for 13.7% of the total surveyed. The
number of insignificant consumers was 154,
accounting for 19% of the total number of people
surveyed. Quality demand consumers are mainly
middle-income residents; early-stage consumers are
mainly young people; price-sensitive ones are mainly
students and young people who have just entered the
society; and irrelevant consumers have no obvious
trend.
REFERENCES
[1]Research on the Protection of the Shadows of
Dongdong Road from the Perspective of Intellectual
Property. Northwest Normal University, 2016.
[2]Xue H.P. On the Development of Shadow Play and
the Inheritance of New Ways. Journal of Chongqing
University of Science and Technology (Social
Science Edition), 2008, (11):169-170.
[3]Yang J.Y. Reflections on the Decline of Shadow
Plays. Art Education, 2006, (5):14-15.
[4]Pan C.X, Zhou Y.B. From Shadow Art to
Interactive Media Design. Decoration, 2003, (11):
26-27.
[5]Wei S. Development Status and Countermeasures
of Luoshan Shadow Play in Henan Province. Journal
of Kaifeng College of Education, 2018, (8): 254-255.
International Journal of Computational and Engineering74
ACADEMIC PUBLISHING HOUSE
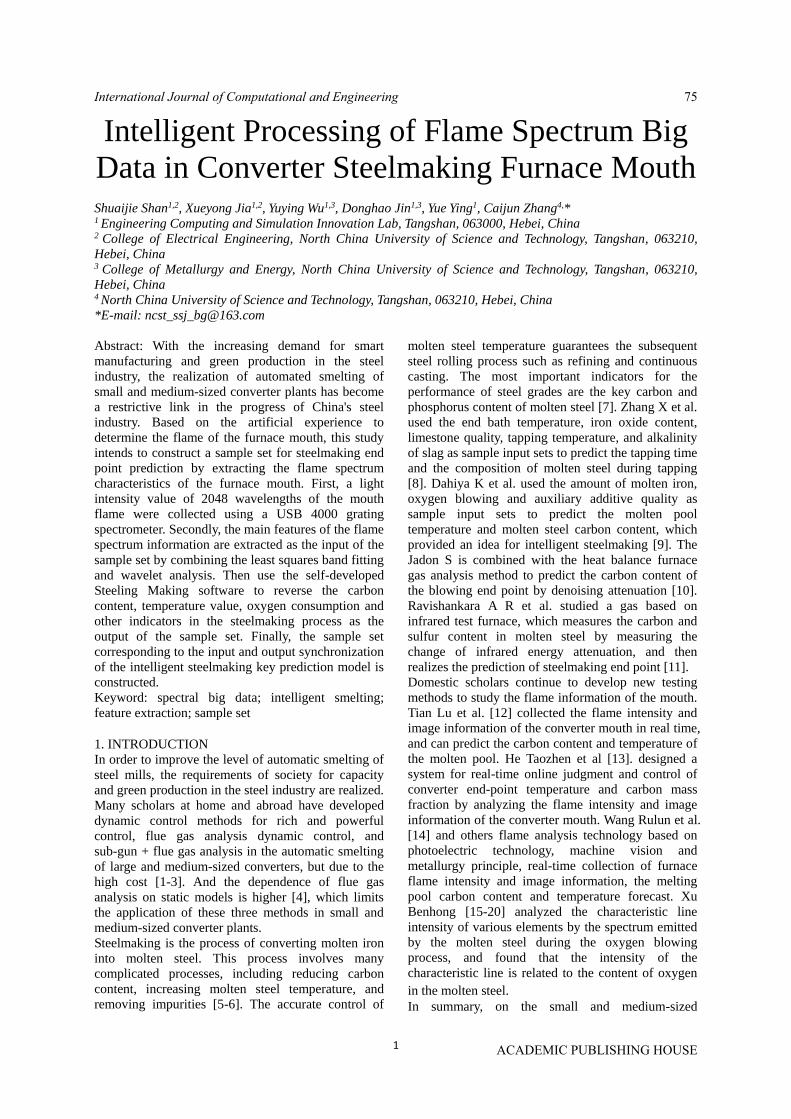
1
Intelligent Processing of Flame Spectrum Big
Data in Converter Steelmaking Furnace Mouth
Shuaijie Shan1,2, Xueyong Jia1,2, Yuying Wu1,3, Donghao Jin1,3, Yue Ying1, Caijun Zhang4,* 1 Engineering Computing and Simulation Innovation Lab, Tangshan, 063000, Hebei, China 2 College of Electrical Engineering, North China University of Science and Technology, Tangshan, 063210,
Hebei, China 3 College of Metallurgy and Energy, North China University of Science and Technology, Tangshan, 063210,
Hebei, China 4 North China University of Science and Technology, Tangshan, 063210, Hebei, China
*E-mail: [email protected]
Abstract: With the increasing demand for smart
manufacturing and green production in the steel
industry, the realization of automated smelting of
small and medium-sized converter plants has become
a restrictive link in the progress of China's steel
industry. Based on the artificial experience to
determine the flame of the furnace mouth, this study
intends to construct a sample set for steelmaking end
point prediction by extracting the flame spectrum
characteristics of the furnace mouth. First, a light
intensity value of 2048 wavelengths of the mouth
flame were collected using a USB 4000 grating
spectrometer. Secondly, the main features of the flame
spectrum information are extracted as the input of the
sample set by combining the least squares band fitting
and wavelet analysis. Then use the self-developed
Steeling Making software to reverse the carbon
content, temperature value, oxygen consumption and
other indicators in the steelmaking process as the
output of the sample set. Finally, the sample set
corresponding to the input and output synchronization
of the intelligent steelmaking key prediction model is
constructed.
Keyword: spectral big data; intelligent smelting;
feature extraction; sample set
1. INTRODUCTION
In order to improve the level of automatic smelting of
steel mills, the requirements of society for capacity
and green production in the steel industry are realized.
Many scholars at home and abroad have developed
dynamic control methods for rich and powerful
control, flue gas analysis dynamic control, and
sub-gun + flue gas analysis in the automatic smelting
of large and medium-sized converters, but due to the
high cost [1-3]. And the dependence of flue gas
analysis on static models is higher [4], which limits
the application of these three methods in small and
medium-sized converter plants.
Steelmaking is the process of converting molten iron
into molten steel. This process involves many
complicated processes, including reducing carbon
content, increasing molten steel temperature, and
removing impurities [5-6]. The accurate control of
molten steel temperature guarantees the subsequent
steel rolling process such as refining and continuous
casting. The most important indicators for the
performance of steel grades are the key carbon and
phosphorus content of molten steel [7]. Zhang X et al.
used the end bath temperature, iron oxide content,
limestone quality, tapping temperature, and alkalinity
of slag as sample input sets to predict the tapping time
and the composition of molten steel during tapping
[8]. Dahiya K et al. used the amount of molten iron,
oxygen blowing and auxiliary additive quality as
sample input sets to predict the molten pool
temperature and molten steel carbon content, which
provided an idea for intelligent steelmaking [9]. The
Jadon S is combined with the heat balance furnace
gas analysis method to predict the carbon content of
the blowing end point by denoising attenuation [10].
Ravishankara A R et al. studied a gas based on
infrared test furnace, which measures the carbon and
sulfur content in molten steel by measuring the
change of infrared energy attenuation, and then
realizes the prediction of steelmaking end point [11].
Domestic scholars continue to develop new testing
methods to study the flame information of the mouth.
Tian Lu et al. [12] collected the flame intensity and
image information of the converter mouth in real time,
and can predict the carbon content and temperature of
the molten pool. He Taozhen et al [13]. designed a
system for real-time online judgment and control of
converter end-point temperature and carbon mass
fraction by analyzing the flame intensity and image
information of the converter mouth. Wang Rulun et al.
[14] and others flame analysis technology based on
photoelectric technology, machine vision and
metallurgy principle, real-time collection of furnace
flame intensity and image information, the melting
pool carbon content and temperature forecast. Xu
Benhong [15-20] analyzed the characteristic line
intensity of various elements by the spectrum emitted
by the molten steel during the oxygen blowing
process, and found that the intensity of the
characteristic line is related to the content of oxygen
in the molten steel. In summary, on the small and medium-sized
International Journal of Computational and Engineering 75
ACADEMIC PUBLISHING HOUSE
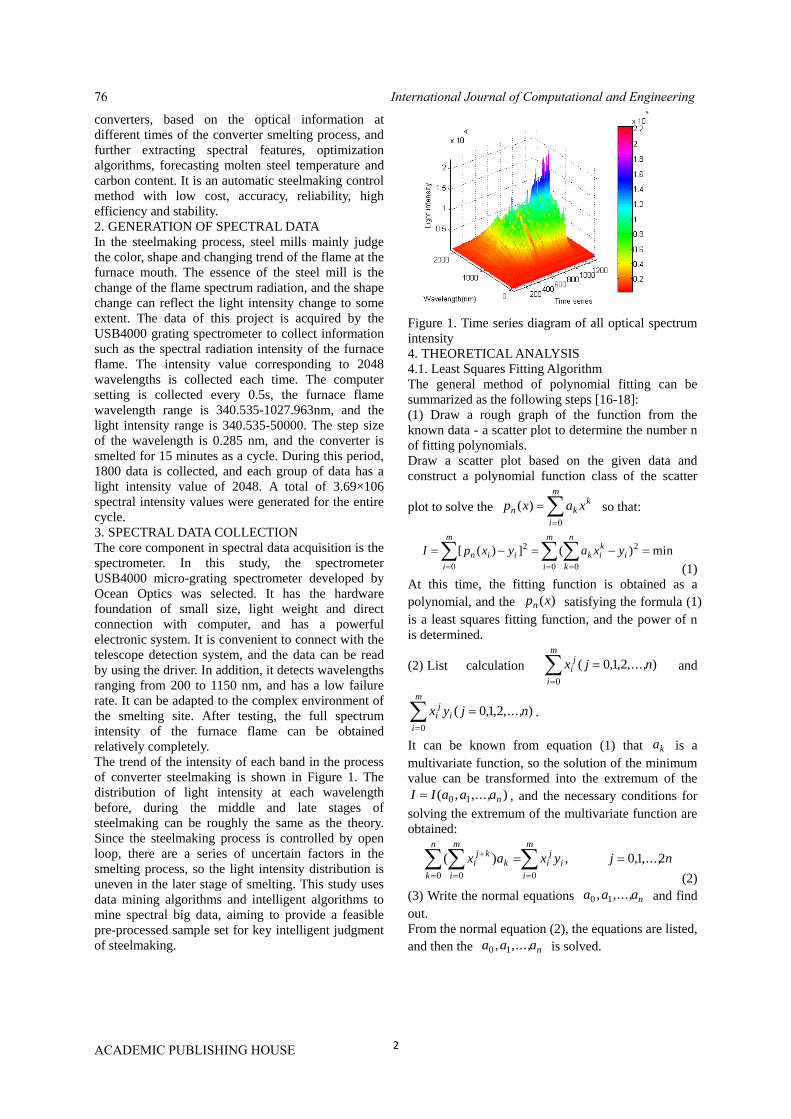
2
converters, based on the optical information at
different times of the converter smelting process, and
further extracting spectral features, optimization
algorithms, forecasting molten steel temperature and
carbon content. It is an automatic steelmaking control
method with low cost, accuracy, reliability, high
efficiency and stability.
2. GENERATION OF SPECTRAL DATA
In the steelmaking process, steel mills mainly judge
the color, shape and changing trend of the flame at the
furnace mouth. The essence of the steel mill is the
change of the flame spectrum radiation, and the shape
change can reflect the light intensity change to some
extent. The data of this project is acquired by the
USB4000 grating spectrometer to collect information
such as the spectral radiation intensity of the furnace
flame. The intensity value corresponding to 2048
wavelengths is collected each time. The computer
setting is collected every 0.5s, the furnace flame
wavelength range is 340.535-1027.963nm, and the
light intensity range is 340.535-50000. The step size
of the wavelength is 0.285 nm, and the converter is
smelted for 15 minutes as a cycle. During this period,
1800 data is collected, and each group of data has a
light intensity value of 2048. A total of 3.69×10⁶
spectral intensity values were generated for the entire
cycle.
3. SPECTRAL DATA COLLECTION
The core component in spectral data acquisition is the
spectrometer. In this study, the spectrometer
USB4000 micro-grating spectrometer developed by
Ocean Optics was selected. It has the hardware
foundation of small size, light weight and direct
connection with computer, and has a powerful
electronic system. It is convenient to connect with the
telescope detection system, and the data can be read
by using the driver. In addition, it detects wavelengths
ranging from 200 to 1150 nm, and has a low failure
rate. It can be adapted to the complex environment of
the smelting site. After testing, the full spectrum
intensity of the furnace flame can be obtained
relatively completely.
The trend of the intensity of each band in the process
of converter steelmaking is shown in Figure 1. The
distribution of light intensity at each wavelength
before, during the middle and late stages of
steelmaking can be roughly the same as the theory.
Since the steelmaking process is controlled by open
loop, there are a series of uncertain factors in the
smelting process, so the light intensity distribution is
uneven in the later stage of smelting. This study uses
data mining algorithms and intelligent algorithms to
mine spectral big data, aiming to provide a feasible
pre-processed sample set for key intelligent judgment
of steelmaking.
Figure 1. Time series diagram of all optical spectrum
intensity
4. THEORETICAL ANALYSIS
4.1. Least Squares Fitting Algorithm The general method of polynomial fitting can be
summarized as the following steps [16-18]:
(1) Draw a rough graph of the function from the
known data - a scatter plot to determine the number n
of fitting polynomials.
Draw a scatter plot based on the given data and
construct a polynomial function class of the scatter
plot to solve the
m
i
kkn xaxp
0
)( so that:
m
i
n
k
ikik
m
i
iin yxayxpI
0
2
00
2 min)(])([
(1)
At this time, the fitting function is obtained as a
polynomial, and the )(xpn satisfying the formula (1)
is a least squares fitting function, and the power of n
is determined.
(2) List calculation ),...,2,1,0(
0
njx
m
i
ji
and
),...,2,1,0(
0
njyx
m
i
ij
i
.
It can be known from equation (1) that ka is a
multivariate function, so the solution of the minimum
value can be transformed into the extremum of the
),...,,( 10 naaaII , and the necessary conditions for
solving the extremum of the multivariate function are
obtained:
njyxax
m
i
ij
i
n
k
m
i
kkj
i 2,...,1,0,)(
00 0
(2)
(3) Write the normal equations naaa ,...,, 10 and find
out.
From the normal equation (2), the equations are listed,
and then the naaa ,...,, 10 is solved.
International Journal of Computational and Engineering76
ACADEMIC PUBLISHING HOUSE
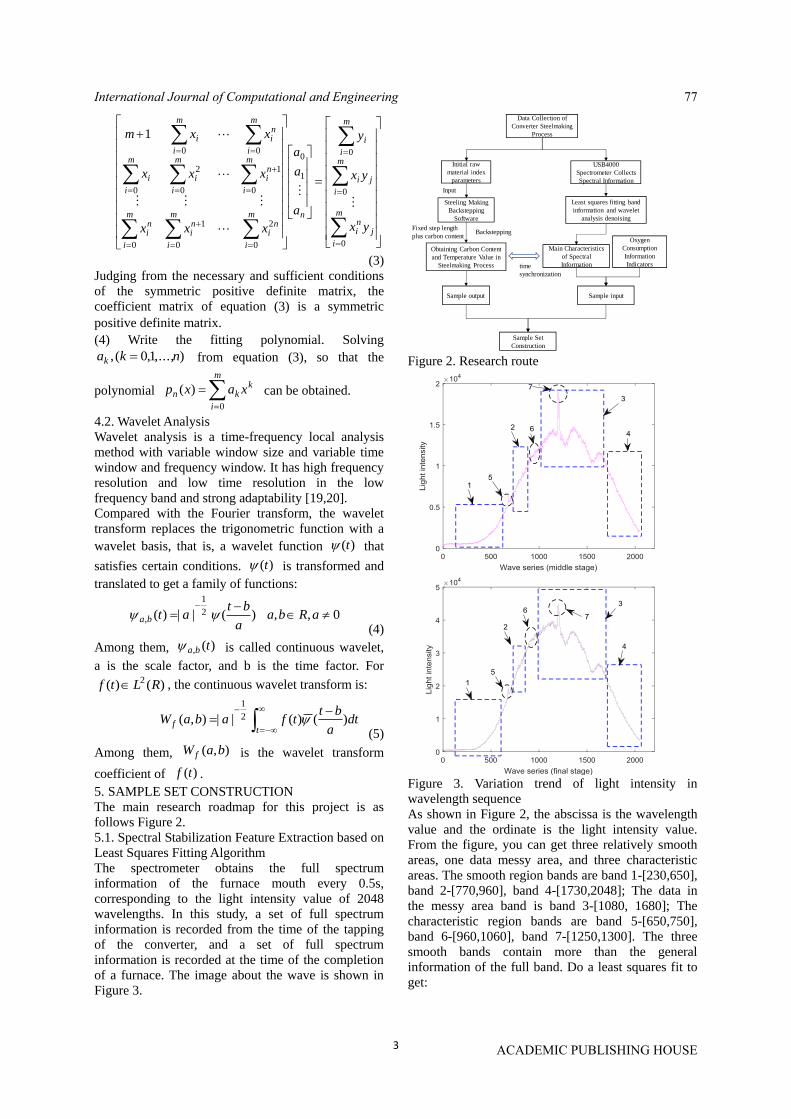
3
j
m
i
ni
j
m
i
i
m
i
i
nm
i
ni
m
i
ni
m
i
ni
m
i
ni
m
i
i
m
i
i
m
i
ni
m
i
i
yx
yx
y
a
a
a
xxx
xxx
xxm
0
0
0
1
0
0
2
0
1
0
0
1
0
2
0
00
1
(3)
Judging from the necessary and sufficient conditions
of the symmetric positive definite matrix, the
coefficient matrix of equation (3) is a symmetric
positive definite matrix.
(4) Write the fitting polynomial. Solving
),...,1,0(, nkak from equation (3), so that the
polynomial
m
i
kkn xaxp
0
)( can be obtained.
4.2. Wavelet Analysis
Wavelet analysis is a time-frequency local analysis
method with variable window size and variable time
window and frequency window. It has high frequency
resolution and low time resolution in the low
frequency band and strong adaptability [19,20]. Compared with the Fourier transform, the wavelet
transform replaces the trigonometric function with a
wavelet basis, that is, a wavelet function )(t that
satisfies certain conditions. )(t is transformed and
translated to get a family of functions:
0,,)(||)( 2
1
,
aRbaa
btatba
(4)
Among them, )(, tba is called continuous wavelet,
a is the scale factor, and b is the time factor. For
)()( 2 RLtf , the continuous wavelet transform is:
tf dt
a
bttfabaW )()(||),( 2
1
(5)
Among them, ),( baW f is the wavelet transform
coefficient of )(tf .
5. SAMPLE SET CONSTRUCTION
The main research roadmap for this project is as
follows Figure 2.
5.1. Spectral Stabilization Feature Extraction based on
Least Squares Fitting Algorithm
The spectrometer obtains the full spectrum
information of the furnace mouth every 0.5s,
corresponding to the light intensity value of 2048
wavelengths. In this study, a set of full spectrum
information is recorded from the time of the tapping
of the converter, and a set of full spectrum
information is recorded at the time of the completion
of a furnace. The image about the wave is shown in
Figure 3.
Data Collection of
Converter Steelmaking
Process
Obtaining Carbon Content
and Temperature Value in
Steelmaking Process
Initial raw
material index
parameters
Steeling Making
Backstepping
Software
USB4000
Spectrometer Collects
Spectral Information
Sample output
Fixed step length
plus carbon contentBackstepping
Least squares fitting band
information and wavelet
analysis denoising
Main Characteristics
of Spectral
Information
Oxygen
Consumption
Information
Indicators
Sample input
Sample Set
Construction
Input
time
synchronization
Figure 2. Research route
Figure 3. Variation trend of light intensity in
wavelength sequence As shown in Figure 2, the abscissa is the wavelength
value and the ordinate is the light intensity value.
From the figure, you can get three relatively smooth
areas, one data messy area, and three characteristic
areas. The smooth region bands are band 1-[230,650],
band 2-[770,960], band 4-[1730,2048]; The data in
the messy area band is band 3-[1080, 1680]; The
characteristic region bands are band 5-[650,750],
band 6-[960,1060], band 7-[1250,1300]. The three
smooth bands contain more than the general
information of the full band. Do a least squares fit to
get:
International Journal of Computational and Engineering 77
ACADEMIC PUBLISHING HOUSE

4
3231332
3
2221222
2
1211112
1
,
,
,
)(
cba
cba
cba
f (6)
5.2. Spectral Instability Feature Extraction based on
Wavelet Analysis
The characteristics of the spectral information in
Figure 2 can be obtained. The full-band spectral
intensity of the tapping steel has not only stable
characteristics, but also three peaks, which are
unstable characteristics, and the peak appears in a
fixed wavelength band. Therefore, it is judged that
there are some links between the three unstable
characteristics and the carbon content of molten steel
and the temperature of molten steel. The instability
characteristics of the full-band 2048 wavelengths are
located by wavelet analysis, and the processing results
are shown in Figure 4.
Figure 4. Wavelet reconstruction 3 layers approximate
1, 2, 3 layer detail map
It can be seen from Fig. 4 that the original signal from
the three-layer decomposition reconstruction in
wavelet denoising can be clearly observed. In the
full-band spectrum of the furnace flame, the light
intensity corresponding to different wavelengths has
large fluctuations, and the full-band light intensity
value has 3 smooth areas and 3 unstable areas. Finally,
the original signal of the 3-layer reconstruction is
obtained with err=1.4552e-11, and the reconstruction
degree is higher.
Figure 5. Three-layer approximation signal and
original signal
Wavelet analysis is used to identify individuals or
groups containing noise from the signal, and then
reconstruct the modified component signal. From
Figure 5 above, it can be concluded that the
continuous approximation is taken from the signal
with increasing high frequency information. The
noise becomes less and less, and the 3-layer
approximation becomes cleaner with the original
signal, which helps to stabilize the feature extraction.
Combine certain thresholds, discard some
high-frequency information, and not lose too many of
the sharp features in the original signal. Finally, the
unstable feature regions of the spectral information
are extracted by threshold limits and Threshold-ed
coefficients as shown in Figure 6.
Figure 6. Three-layer approximation signal detail
analysis
As can be seen from Figure 5, most of the noise
occurs in the middle of the spectral signal, and can be
clearly obtained from the fluctuations in the figure.
And further formalize the three unstable feature
points mentioned above, which are obtained by the
three sharpest fluctuations in Figure 6.
-4000
-3000
-2000
-1000
0
1000
2000
3000
4000
d4
Figure 7. Wavelet 1-D analytic results It can be seen from Figure 7 that there are seven
unstable characteristics (feature peaks) of the spectral
information, and the interval setting conditions are as
follows: Feature peak 1- [820,851], Feature peak
2-[918,936], Feature peak 3-[990,1008], Feature peak
4-[1083,1126], Feature peak 5-[1183,1312], Feature
peak 6-[1389,1496], Feature peak 7-[1676,1774]. In
order to better characterize the unstable characteristics
of the spectral information, in order to better
International Journal of Computational and Engineering78
ACADEMIC PUBLISHING HOUSE
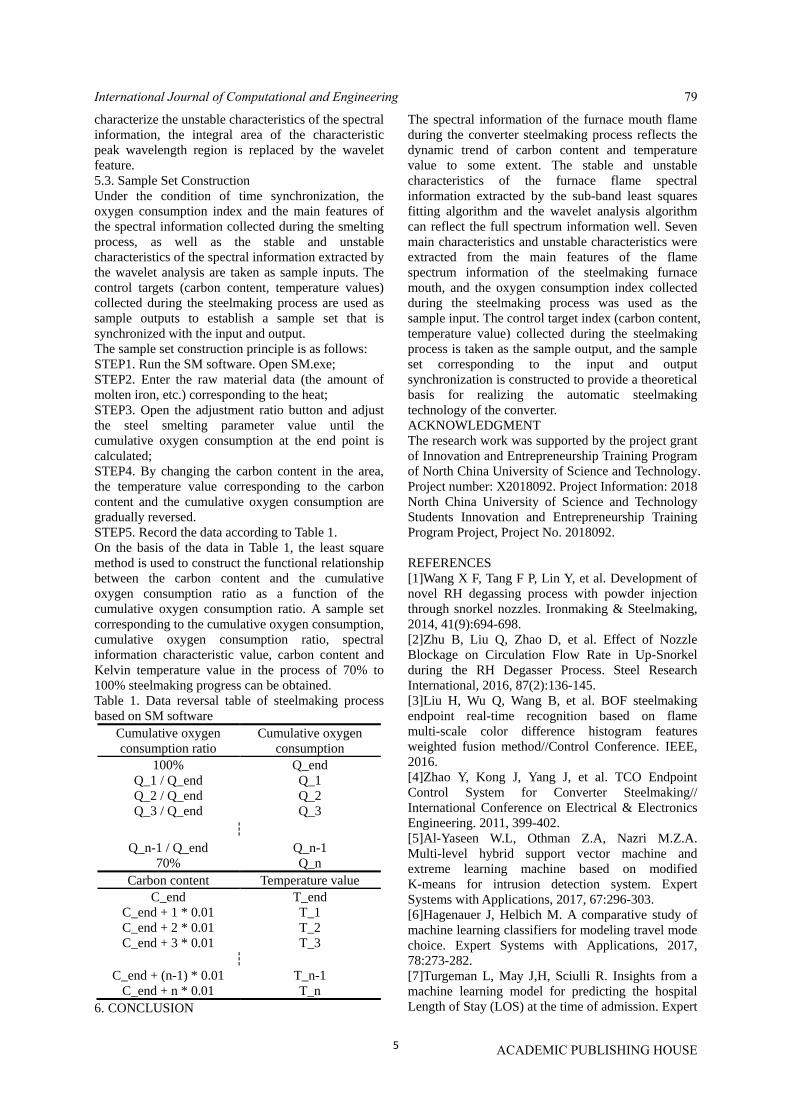
5
characterize the unstable characteristics of the spectral
information, the integral area of the characteristic
peak wavelength region is replaced by the wavelet
feature.
5.3. Sample Set Construction
Under the condition of time synchronization, the
oxygen consumption index and the main features of
the spectral information collected during the smelting
process, as well as the stable and unstable
characteristics of the spectral information extracted by
the wavelet analysis are taken as sample inputs. The
control targets (carbon content, temperature values)
collected during the steelmaking process are used as
sample outputs to establish a sample set that is
synchronized with the input and output.
The sample set construction principle is as follows: STEP1. Run the SM software. Open SM.exe;
STEP2. Enter the raw material data (the amount of
molten iron, etc.) corresponding to the heat;
STEP3. Open the adjustment ratio button and adjust
the steel smelting parameter value until the
cumulative oxygen consumption at the end point is
calculated;
STEP4. By changing the carbon content in the area,
the temperature value corresponding to the carbon
content and the cumulative oxygen consumption are
gradually reversed.
STEP5. Record the data according to Table 1. On the basis of the data in Table 1, the least square
method is used to construct the functional relationship
between the carbon content and the cumulative
oxygen consumption ratio as a function of the
cumulative oxygen consumption ratio. A sample set
corresponding to the cumulative oxygen consumption,
cumulative oxygen consumption ratio, spectral
information characteristic value, carbon content and
Kelvin temperature value in the process of 70% to
100% steelmaking progress can be obtained.
Table 1. Data reversal table of steelmaking process
based on SM software
Cumulative oxygen
consumption ratio
Cumulative oxygen
consumption
100% Q_end
Q_1 / Q_end Q_1
Q_2 / Q_end Q_2
Q_3 / Q_end Q_3
┆
Q_n-1 / Q_end Q_n-1
70% Q_n
Carbon content Temperature value
C_end T_end
C_end + 1 * 0.01 T_1
C_end + 2 * 0.01 T_2
C_end + 3 * 0.01 T_3
┆
C_end + (n-1) * 0.01 T_n-1
C_end + n * 0.01 T_n
6. CONCLUSION
The spectral information of the furnace mouth flame
during the converter steelmaking process reflects the
dynamic trend of carbon content and temperature
value to some extent. The stable and unstable
characteristics of the furnace flame spectral
information extracted by the sub-band least squares
fitting algorithm and the wavelet analysis algorithm
can reflect the full spectrum information well. Seven
main characteristics and unstable characteristics were
extracted from the main features of the flame
spectrum information of the steelmaking furnace
mouth, and the oxygen consumption index collected
during the steelmaking process was used as the
sample input. The control target index (carbon content,
temperature value) collected during the steelmaking
process is taken as the sample output, and the sample
set corresponding to the input and output
synchronization is constructed to provide a theoretical
basis for realizing the automatic steelmaking
technology of the converter.
ACKNOWLEDGMENT
The research work was supported by the project grant
of Innovation and Entrepreneurship Training Program
of North China University of Science and Technology.
Project number: X2018092. Project Information: 2018
North China University of Science and Technology
Students Innovation and Entrepreneurship Training
Program Project, Project No. 2018092.
REFERENCES
[1]Wang X F, Tang F P, Lin Y, et al. Development of
novel RH degassing process with powder injection
through snorkel nozzles. Ironmaking & Steelmaking,
2014, 41(9):694-698.
[2]Zhu B, Liu Q, Zhao D, et al. Effect of Nozzle
Blockage on Circulation Flow Rate in Up-Snorkel
during the RH Degasser Process. Steel Research
International, 2016, 87(2):136-145.
[3]Liu H, Wu Q, Wang B, et al. BOF steelmaking
endpoint real-time recognition based on flame
multi-scale color difference histogram features
weighted fusion method//Control Conference. IEEE,
2016.
[4]Zhao Y, Kong J, Yang J, et al. TCO Endpoint
Control System for Converter Steelmaking//
International Conference on Electrical & Electronics
Engineering. 2011, 399-402.
[5]Al-Yaseen W.L, Othman Z.A, Nazri M.Z.A.
Multi-level hybrid support vector machine and
extreme learning machine based on modified
K-means for intrusion detection system. Expert
Systems with Applications, 2017, 67:296-303.
[6]Hagenauer J, Helbich M. A comparative study of
machine learning classifiers for modeling travel mode
choice. Expert Systems with Applications, 2017,
78:273-282.
[7]Turgeman L, May J,H, Sciulli R. Insights from a
machine learning model for predicting the hospital
Length of Stay (LOS) at the time of admission. Expert
International Journal of Computational and Engineering 79
ACADEMIC PUBLISHING HOUSE

6
Systems with Applications, 2017, 78:376-385.
[8]Zhang X. Application of Static and Dynamic
Model for Automatic Steelmaking in Jinan Iron and
Steel Co. Angang Technology, 2007.
[9]Dahiya K, Chauhan V.K, Sharma A. Online
Support Vector Machine Based on Minimum
Euclidean Distance//Proceedings of International
Conference on Computer Vision and Image
Processing. Springer Singapore, 2017.
[10]Jadon S. Code clones detection using machine
learning technique: Support vector machine//
International Conference on Computing,
Communication and Automation. IEEE, 2017.
[11]Ravishankara A.R, Portmann R.W. Nitrous Oxide
(N2O): The Dominant Ozone-Depleting Substance
Emitted in the 21st Century. Science, 2009,
326(5949):123-5.
[12]Tian L. Converter end point prediction
technology based on furnace flame analysis. The
Chinese Society for Metals, Baosteel Group
Coporation. Proceedings of the 10th China Iron and
Steel Annual Conference and the 6th Baosteel
Academic Annual Conference. The Chinese Society
for Metals, Baosteel Group Coporation: 2015, 5.
[13]He T.W, Tian L, Wen H.B, Liu Z.M, Feng Z.J,
Zhou C.B. Endpoint Prediction System for Converter
Steelmaking Based on Furnace Flame Information.
China Metallurgy, 2013, 23(02): 40-43.
[14]Wang R.L, Liu Z.M, Tian L. Application of
Furnace Flame Information in End Point Control of
Converter Steelmaking. Shanxi Metallurgy, 2012,
35(05): 25-27.
[15]Xu B.H. Hyperspectral mapping and verification
based on spectral feature extraction parameters. China
University of Geosciences (Beijing), 2016.
[16]Yu L, Hong Y.S, Yan L, et al. Hyperspectral
estimation of soil organic matter content based on
partial least squares regression. Transactions of the
Chinese Society of Agricultural Engineering, 2015,
31(14): 103-109.
[17]Huang J.P, Li W, Li Q.Y, et al. A least squares
inverse time migration method based on plane wave
static coding. Chinese Journal of Geophysics, 2015,
58(6): 2046.
[18]Wang L.Y, Xu G.B. Post-test Estimation of
Weighted Total Least Squares Adjustment Stochastic
Model. Journal of Wuhan University·Information
Science Edition, 2016, 41(2): 255-261.
[19]Li Y, Bai Y, Li C. PM10 Concentration Prediction
Model Based on Wavelet Analysis and BP Neural
Network. Environmental Monitoring Management
and Technology, 2016: 24-28.
[20]Zhang L.F, Wang F, Yu L.B, et al. Experimental
study on reducing the lower limit of measurement of
tunable semiconductor laser absorption spectroscopy
by wavelet analysis. Spectroscopy And Spectral
Analysis, 2016, 36(06): 1794-1798.
International Journal of Computational and Engineering80
ACADEMIC PUBLISHING HOUSE
Big Data Driven Blast Furnace Temperature
Intelligent Prediction
Xueyong Jia1,2, Jiahao Wang1,3, Xiaojian Feng4,* 1 Engineering Computing and Simulation Innovation Lab, North China University of Science and Technology,
Tangshan 063210, Hebei, China 2 College of Electrical Engineering, North China University of Science and Technology, Tangshan 063210, Hebei,
China 3 College of Science, North China University of Science and Technology, Tangshan 063210, Hebei, China 4 Department of Discipline Construction, North China University of Science and Technology, Tangshan 063210,
Hebei, China
*E-mail: [email protected]
Abstract: A non-linear time series prediction model
based on nonlinear time series for RBF neural
networks is proposed, which overcomes the problem
that a single neural network is easy to fall into local
minimum values and slow network training in
nonlinear time series prediction. The key to the
construction of RBF neural network is to select the
center. The dynamic k-means clustering algorithm
adopts the method of adjusting the cluster center to
make the selection of the network center more precise.
In this paper, the structural principle of RBF neural
network is briefly described. Then the dynamic
K-means algorithm is applied to the center selection
of RBF neural network, and finally the simulation
experiment is carried out. The simulation results show
the practicability and effectiveness of the algorithm.
Keywords: RBF neural network; k-means; nonlinear
time series; prediction
1. INTRODUCTION
Steel is one of the most important raw materials in
modern society. Blast Furnace Ironmaking plays an
important role in China's economic development. In
the blast furnace production, maintaining a reasonable
furnace temperature is one of the necessary conditions
for production development. Due to the complexity of
the blast furnace ironmaking process and the
difficulty in measurement, it is difficult to directly
measure the furnace temperature. Therefore, the
silicon content of the blast furnace hot metal
(generally called chemical heat) is used to indirectly
reflect the temperature change in the furnace. The hot
state of the blast furnace hearth. In reality, the way to
detect the silicon content of molten iron mainly
includes the on-site observation of iron and the
monitoring of iron water quality. The method of direct
observation has the accuracy and the iron water
quality monitoring has a certain hysteresis, which
cannot meet the real-time and accurate response to the
production of blast furnace temperature and molten
iron quality. The establishment of mathematical
models for prediction has become an important means
of predictive control of silicon content in molten iron.
In response to the structural problem of Radial Basis
Function (RBF) neural network, Qiao Junfei et al.
proposed a structural dynamic optimization design
method, using Sensitivity analy (SA) to analyze
hidden layer neurons. The effect of output weighting
on the output of the neural network solves the
problem that the RBF neural network has too large or
too small RBF neural network structure [1]. Wei Min
et al. used the gradient descent method and
optimization method to derive the dynamic optimal
learning rate of RBF neural network and applied it to
the network learning algorithm. The prediction effect
of RBF neural network with dynamic optimal
learning rate is better than the traditional fixed
learning rate. The RBF neural network has a faster
convergence rate [2-8].
The prediction of silicon content in blast furnace hot
metal belongs to time series forecasting problem. The
main methods are traditional AR-MAX model and
neural network method. The neural network expert
system model is used to predict the silicon content of
molten iron, which has strong nonlinear mapping
ability. At present, BP neural network is used to
predict the silicon content of blast furnace hot metal.
However, in the BP learning algorithm, the network
weight mainly depends on the first derivative
information of the criterion function, and its
convergence speed is relatively slow. At the same
time, it may converge to a local minimum. The RBF
neural network not only has strong nonlinear mapping
ability, but also has the characteristics of fast
convergence and global optimization. To this end, this
paper uses the RBF neural network model to predict
the silicon content of molten iron for the stick-square
problem of blast furnace temperature. By using the
dynamic K-means algorithm to optimize the RBF
network center, a nonlinear time series prediction
model based on RBF neural network is established.
The model has high nonlinear mapping and parallel
processing capability. The radial basis network (RBF)
has excellent characteristics such as adaptive
determination of network structure and output
independent of initial weight. It can approximate any
International Journal of Computational and Engineering 81
ACADEMIC PUBLISHING HOUSE
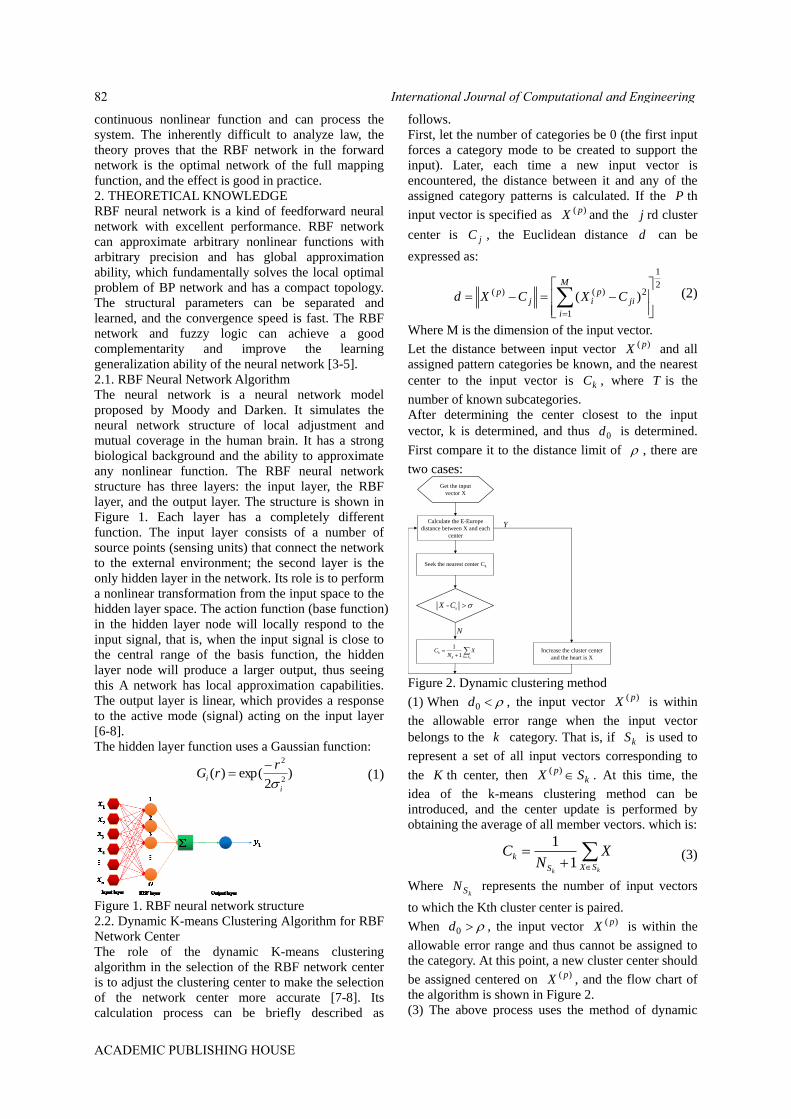
continuous nonlinear function and can process the
system. The inherently difficult to analyze law, the
theory proves that the RBF network in the forward
network is the optimal network of the full mapping
function, and the effect is good in practice.
2. THEORETICAL KNOWLEDGE
RBF neural network is a kind of feedforward neural
network with excellent performance. RBF network
can approximate arbitrary nonlinear functions with
arbitrary precision and has global approximation
ability, which fundamentally solves the local optimal
problem of BP network and has a compact topology.
The structural parameters can be separated and
learned, and the convergence speed is fast. The RBF
network and fuzzy logic can achieve a good
complementarity and improve the learning
generalization ability of the neural network [3-5].
2.1. RBF Neural Network Algorithm
The neural network is a neural network model
proposed by Moody and Darken. It simulates the
neural network structure of local adjustment and
mutual coverage in the human brain. It has a strong
biological background and the ability to approximate
any nonlinear function. The RBF neural network
structure has three layers: the input layer, the RBF
layer, and the output layer. The structure is shown in
Figure 1. Each layer has a completely different
function. The input layer consists of a number of
source points (sensing units) that connect the network
to the external environment; the second layer is the
only hidden layer in the network. Its role is to perform
a nonlinear transformation from the input space to the
hidden layer space. The action function (base function)
in the hidden layer node will locally respond to the
input signal, that is, when the input signal is close to
the central range of the basis function, the hidden
layer node will produce a larger output, thus seeing
this A network has local approximation capabilities.
The output layer is linear, which provides a response
to the active mode (signal) acting on the input layer
[6-8].
The hidden layer function uses a Gaussian function:
)2
exp()(2
2
i
i
rrG
(1)
Figure 1. RBF neural network structure
2.2. Dynamic K-means Clustering Algorithm for RBF
Network Center
The role of the dynamic K-means clustering
algorithm in the selection of the RBF network center
is to adjust the clustering center to make the selection
of the network center more accurate [7-8]. Its
calculation process can be briefly described as
follows.
First, let the number of categories be 0 (the first input
forces a category mode to be created to support the
input). Later, each time a new input vector is
encountered, the distance between it and any of the
assigned category patterns is calculated. If the P th
input vector is specified as )( pX and the j rd cluster
center is jC , the Euclidean distance d can be
expressed as:
2
1
1
2)()( )(
M
i
jip
ijp CXCXd (2)
Where M is the dimension of the input vector.
Let the distance between input vector )( pX and all
assigned pattern categories be known, and the nearest
center to the input vector is kC , where T is the
number of known subcategories.
After determining the center closest to the input
vector, k is determined, and thus 0d is determined.
First compare it to the distance limit of , there are
two cases:
Calculate the E-Europe
distance between X and each
center
Get the input
vector X
N
Y
Seek the nearest center Ck
k
CX -
kSXk
k XN
C1
1Increase the cluster center
and the heart is X
Figure 2. Dynamic clustering method
(1) When 0d , the input vector )( pX is within
the allowable error range when the input vector
belongs to the k category. That is, if kS is used to
represent a set of all input vectors corresponding to
the K th center, then kp SX )( . At this time, the
idea of the k-means clustering method can be
introduced, and the center update is performed by
obtaining the average of all member vectors. which is:
kk
SXS
k XN
C1
1 (3)
Where kSN represents the number of input vectors
to which the Kth cluster center is paired.
When 0d , the input vector )( pX is within the
allowable error range and thus cannot be assigned to
the category. At this point, a new cluster center should
be assigned centered on )( pX , and the flow chart of
the algorithm is shown in Figure 2.
(3) The above process uses the method of dynamic
International Journal of Computational and Engineering82
ACADEMIC PUBLISHING HOUSE
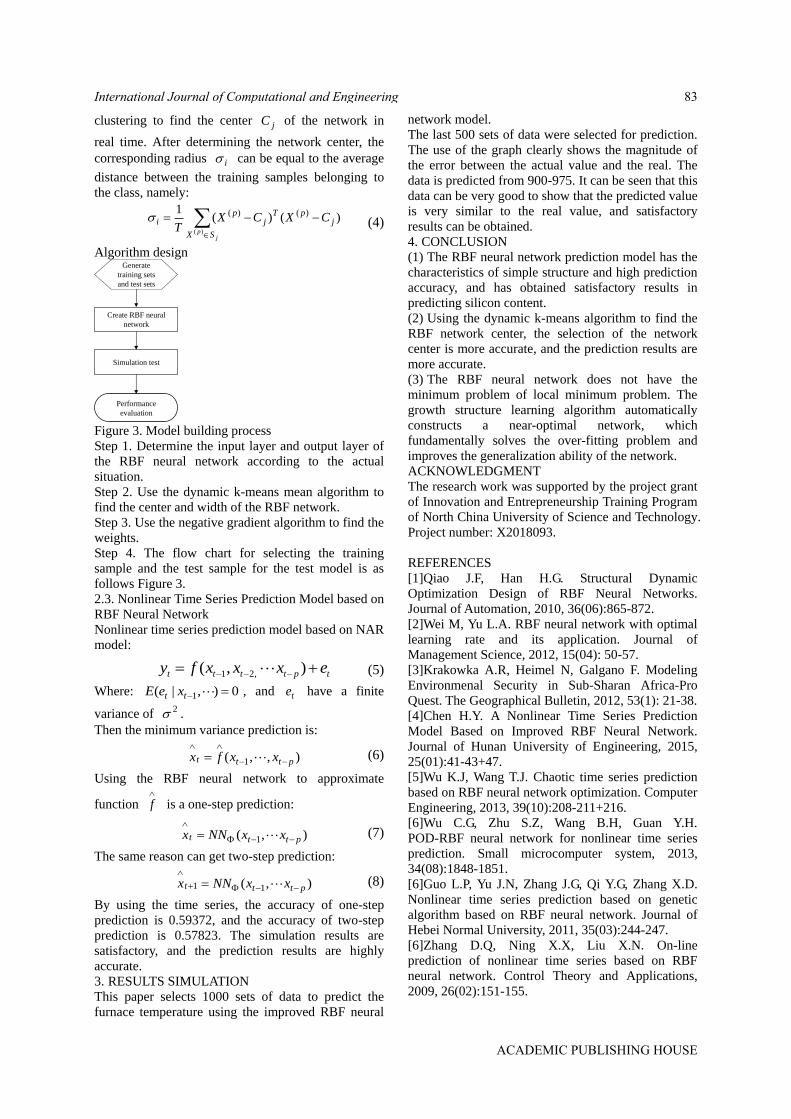
clustering to find the center jC of the network in
real time. After determining the network center, the
corresponding radius i can be equal to the average
distance between the training samples belonging to
the class, namely:
)()(1 )()(
)(
jpT
SX
jp
i CXCXT
jp
(4)
Algorithm design Generate
training sets
and test sets
Create RBF neural
network
Simulation test
Performance
evaluation
Figure 3. Model building process
Step 1. Determine the input layer and output layer of
the RBF neural network according to the actual
situation.
Step 2. Use the dynamic k-means mean algorithm to
find the center and width of the RBF network.
Step 3. Use the negative gradient algorithm to find the
weights.
Step 4. The flow chart for selecting the training
sample and the test sample for the test model is as
follows Figure 3.
2.3. Nonlinear Time Series Prediction Model based on
RBF Neural Network
Nonlinear time series prediction model based on NAR
model:
tptttt exxxfy ),( ,21 (5)
Where: 0),|( 1 tt xeE , and te have a finite
variance of 2 .
Then the minimum variance prediction is:
),,( 1 pttt xxfx
(6)
Using the RBF neural network to approximate
function
f is a one-step prediction:
),( 1 pttt xxNNx
(7)
The same reason can get two-step prediction:
),( 11 pttt xxNNx
(8)
By using the time series, the accuracy of one-step
prediction is 0.59372, and the accuracy of two-step
prediction is 0.57823. The simulation results are
satisfactory, and the prediction results are highly
accurate.
3. RESULTS SIMULATION
This paper selects 1000 sets of data to predict the
furnace temperature using the improved RBF neural
network model.
The last 500 sets of data were selected for prediction.
The use of the graph clearly shows the magnitude of
the error between the actual value and the real. The
data is predicted from 900-975. It can be seen that this
data can be very good to show that the predicted value
is very similar to the real value, and satisfactory
results can be obtained.
4. CONCLUSION
(1) The RBF neural network prediction model has the
characteristics of simple structure and high prediction
accuracy, and has obtained satisfactory results in
predicting silicon content.
(2) Using the dynamic k-means algorithm to find the
RBF network center, the selection of the network
center is more accurate, and the prediction results are
more accurate.
(3) The RBF neural network does not have the
minimum problem of local minimum problem. The
growth structure learning algorithm automatically
constructs a near-optimal network, which
fundamentally solves the over-fitting problem and
improves the generalization ability of the network.
ACKNOWLEDGMENT
The research work was supported by the project grant
of Innovation and Entrepreneurship Training Program
of North China University of Science and Technology.
Project number: X2018093.
REFERENCES
[1]Qiao J.F, Han H.G. Structural Dynamic
Optimization Design of RBF Neural Networks.
Journal of Automation, 2010, 36(06):865-872.
[2]Wei M, Yu L.A. RBF neural network with optimal
learning rate and its application. Journal of
Management Science, 2012, 15(04): 50-57.
[3]Krakowka A.R, Heimel N, Galgano F. Modeling
Environmenal Security in Sub-Sharan Africa-Pro
Quest. The Geographical Bulletin, 2012, 53(1): 21-38.
[4]Chen H.Y. A Nonlinear Time Series Prediction
Model Based on Improved RBF Neural Network.
Journal of Hunan University of Engineering, 2015,
25(01):41-43+47.
[5]Wu K.J, Wang T.J. Chaotic time series prediction
based on RBF neural network optimization. Computer
Engineering, 2013, 39(10):208-211+216.
[6]Wu C.G, Zhu S.Z, Wang B.H, Guan Y.H.
POD-RBF neural network for nonlinear time series
prediction. Small microcomputer system, 2013,
34(08):1848-1851.
[6]Guo L.P, Yu J.N, Zhang J.G, Qi Y.G, Zhang X.D.
Nonlinear time series prediction based on genetic
algorithm based on RBF neural network. Journal of
Hebei Normal University, 2011, 35(03):244-247.
[6]Zhang D.Q, Ning X.X, Liu X.N. On-line
prediction of nonlinear time series based on RBF
neural network. Control Theory and Applications,
2009, 26(02):151-155.
International Journal of Computational and Engineering 83
ACADEMIC PUBLISHING HOUSE

Determination of Seat Volume Based on Grey
Prediction
Zongchen Fan1,*, Chaoqun Ma1,2, Mengxiao Li1,2, Jian Xiao1,2 1 Mathematical Modeling Innovation Lab, North China University of Science and Technology, Tangshan, 063210,
Hebei, China 2 North China University of Science and Technology, Tangshan, 063210, Hebei, China
*E-mail: [email protected]
Abstract: With the progress of the times and the
development of science and technology, the concept
of sustainable development and the concept of
scientific development have become an indispensable
part of life. At the same time, the campus that
shoulders the heavy responsibility of education,
scientific research, and social services is also a major
resource. Therefore, it is very important to build a
conservation-oriented campus. In view of the
irrational problems in the allocation of seats in the
campus construction of North China University of
Science and Technology, the relevant model process
was established to evaluate and predict. Using grey
predictions to predict the number of students in the
school in the next three years, and to get the total
number of students in the school, combined with the
current number of seats in the school, the total
number of seats per student in the school from 2019
to 2021 is 3.19, respectively. 2.98, 2.75, and thus the
seat waste rate is 0.357, 0.313, 0.254. Finally,
according to the seat waste rate, the school should
make recommendations for the school, should take
the seat waste rate as the upper limit, combined with
the actual situation to close a certain proportion of
classrooms, thereby reducing waste of resources and
promoting the development of a conservation-
oriented campus.
Keywords: grey forecast; seat volume; saving campus
1. PROBLEM RAISED
Forecast the changes in the number of seats in the
next three years and give corresponding rewards and
punishments to a certain aspect of the construction of
a conservation-oriented campus based on the results
obtained [1-5].
2. ESTABLISHMENT OF PREDICTIVE MODELS
2.1. Prediction of Seat Volume in the Next Three
Years
Supposing sequentially𝑋(0)have observation value for
n,generate new sequences by accumulating 𝑋(1) =
{𝑋(1)(1), 𝑋(1)(2), … , 𝑋(1)(𝑛)} ,then the corresponding
differential equation of the GM(1,1) model is:
𝑑𝑋0
𝑑𝑡+ 𝑎𝑋0 = 𝜇 (1)
Among them: called the development gray number is
; called the endogenous control number is μ.
Set α as the parameter vector to be estimated, which
can be solved by the least squares method. Predict the
model by solving the differential equation:
𝑥𝑘+1(1)
= [𝑥(0)(1) −𝜇
𝛼] 𝑒−𝑒𝑘 +
𝜇
𝛼, 𝑘 = 1,2,… , 𝑛 (2)
2.2. Establishment of Grey Prediction Model
Because the analytic hierarchy process cannot
accurately express the change relationship of the
future seat volume, it has a certain impact on the
accuracy of the test results, as Table 1. Therefore, the
GM(1,1) model in the grey forecast is used to predict
the number of people reporting 2019, 2020, and 2021
in the next three years. Find out the number of
students reported by the University of Science and
Technology in 2015, 2016, 2017, and 2018. The
following Table 1 shows the following [6-10].
Table 1. Number of people reported in 2014-2018
Year of enrollment
/ year 2014 2015 2016 2017 2018
Admission number
/ person 5716 5612 6674 6944 7406
(1) The GM(1,1) model is used to predict the number
of people reported in the three years of 2019, 2020,
and 2021. The prediction formula is:
P = (1 − 𝑒−0.1017)(𝑥(0)(1) −4895.9397
−0.1017) (3)
(2) According to the formula, the results are 7822,
8659, and 9587 respectively. Considering that most of
the students are in the four-year system, according to
the number of people reported in recent years, the
formula (10) is used to calculate the total number of
students in the next three years, which are 28846,
30831, and 33474, respectively.
𝑃𝑧 = ∑ 𝑃𝑎4𝑎=1 (4)
(3) According to the predicted total number of
students in the three years, the actual per capita seats
in the year are calculated by formula (11) to be 3.19,
2.98, 2.76.
𝑍𝑠 = 𝑆/𝑃𝑧 (5) 2.3. Determination of the Per Capita Seat Waste Rate
Based on model building and actual analysis, Find the
per capita reasonable seat occupancy and per capita
actual seat occupancy in 2018 and 2019Therefore,
according to formula (6), the per capita seat waste
rate is calculated to be 0.406 and 0.357 respectively.
D =𝑍2−𝑍3
𝑍2∗ 100% (6)
According to the data obtained from the gray forecast,
the per capita seat waste rate in 2020 and 2021 is
predicted to be 0.313 and 0.254.
International Journal of Computational and Engineering84
ACADEMIC PUBLISHING HOUSE

2.4. Determination of Rewards and Punishments in
Energy Conservation
The school establishes relevant classrooms and
self-study rooms, and regulates students' self-study
attitudes. This is used as a comprehensive assessment
at the end of the period.
Privately occupy the classroom and study room,
minus 5 points.
Privately occupy the classroom, study room and lock
the door, prohibit others from entering, deduct 10
points.
Self-study littering, minus 2 points, and carry out
sanitary labor.
Influencing others to self-study, minus 2 points.
Self-study littering and affecting others' self-study,
minus 5 points, and carrying out sanitary labor.
Take up more than one seat and subtract 2 points.
1 months of self-study performance, plus 2 points,
can be accumulated.
Excellent self-study in 8.1 semesters, plus 15 points,
other points are not cumulative.
Students can be educated on multiple violations of
relevant content.
3. RESULT ANALYSIS
According to the data obtained by the gray forecast,
the per capita seat waste rate in 2020 and 2021 is
predicted to be 0.313 and 0.254 [11]. It can be seen
from the calculation results that there is a problem of
seat waste in our school, which may cause waste of
resources in power, manpower and material resources.
It is also foreseeable that in the next few years, due to
the expansion of enrollment in schools, the seat waste
rate will decrease year by year, but there is still waste.
Based on the above results, it is recommended that
the school can reduce the seat waste rate to achieve
energy saving purposes by combining the actual
situation with the seat waste rate as the upper limit
and closing the classroom according to a certain
percentage.
REFERENCES
[1]Feng L.Y, Ming M.M. Research on the Evaluating
Campus Evaluation Index System Based on Analytic
Hierarchy Process (AHP)—Taking Inner Mongolia
University of Finance and Economics as an Example.
Journal of Kunming Metallurgy College, 2013,
(04):22-25.
[2]Wang W. Research on determining the weight of
influencing factors of contact network segment
quality evaluation based on analytic hierarchy process.
China Railway, 2019, (04):60-64.
[3]Luo D, Wei B.L. A Unified Processing Method and
Application of a Class of Discrete Grey Prediction
Models. Systems Engineering-Theory & Practice,
2019, 39(02): 451-462.
[4]Tong M.Y. Grey modeling method and its
application in prediction. Chongqing University,
2016.
[5]Xie M. Multi-attribute grey decision-making
method based on analytic hierarchy process and its
application. Mathematics in Practice and Theory,
2018, 48(20):107-113.
[6]Lei M.Y, Mu Z.H, Lei J.C. Progress and Prospects
of Economical Campus Construction at Present.
China New Communications, 2019, 21(05): 167.
[7]Shi H.P, Yu Y.Y, Dong X.C. Research on the
Construction of Economical Campus and the
Cultivation of Young Talents. University Logistics
Research, 2018, (02): 19-21.
[8]Chen Z.X. Logistics Management and Innovation
of Colleges and Universities under the Background of
Economical Campus. Journal of Kunming Metallurgy
College, 2017, 33(02):8-13.
[9]Yu W.J. Research on the Construction of
Economical Campus. China Collective Economy,
2017, (06): 127-128.
[10]Yin S, Yan X.L. Progress and Prospects of
China's Economical Campus Construction.
Construction Technology, 2016, (12):10-12.
[11]Wang Q, Chen K. Data mining and analysis of
energy-saving campus building energy consumption.
Modern Economic Information, 2015, (24): 8
.
International Journal of Computational and Engineering 85
ACADEMIC PUBLISHING HOUSE
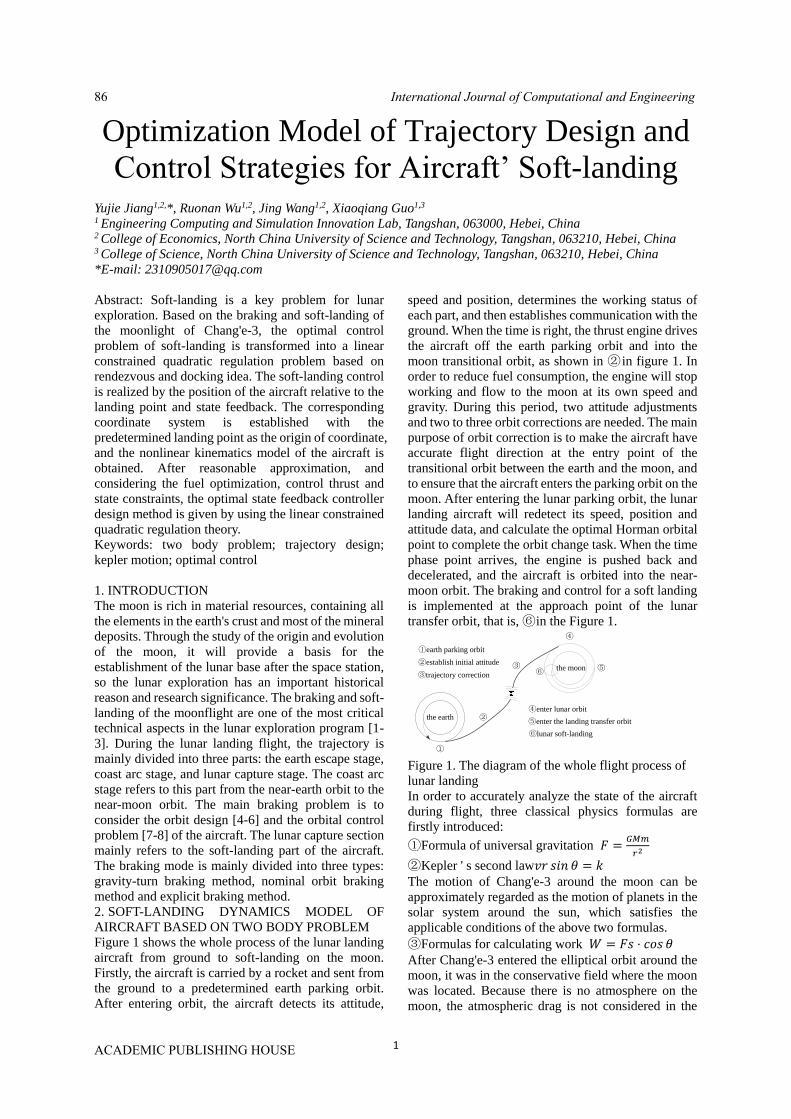
1
Optimization Model of Trajectory Design and
Control Strategies for Aircraft’ Soft-landing
Yujie Jiang1,2,*, Ruonan Wu1,2, Jing Wang1,2, Xiaoqiang Guo1,3
1 Engineering Computing and Simulation Innovation Lab, Tangshan, 063000, Hebei, China 2 College of Economics, North China University of Science and Technology, Tangshan, 063210, Hebei, China 3 College of Science, North China University of Science and Technology, Tangshan, 063210, Hebei, China
*E-mail: [email protected]
Abstract: Soft-landing is a key problem for lunar
exploration. Based on the braking and soft-landing of
the moonlight of Chang'e-3, the optimal control
problem of soft-landing is transformed into a linear
constrained quadratic regulation problem based on
rendezvous and docking idea. The soft-landing control
is realized by the position of the aircraft relative to the
landing point and state feedback. The corresponding
coordinate system is established with the
predetermined landing point as the origin of coordinate,
and the nonlinear kinematics model of the aircraft is
obtained. After reasonable approximation, and
considering the fuel optimization, control thrust and
state constraints, the optimal state feedback controller
design method is given by using the linear constrained
quadratic regulation theory.
Keywords: two body problem; trajectory design;
kepler motion; optimal control
1. INTRODUCTION
The moon is rich in material resources, containing all
the elements in the earth's crust and most of the mineral
deposits. Through the study of the origin and evolution
of the moon, it will provide a basis for the
establishment of the lunar base after the space station,
so the lunar exploration has an important historical
reason and research significance. The braking and soft-
landing of the moonflight are one of the most critical
technical aspects in the lunar exploration program [1-
3]. During the lunar landing flight, the trajectory is
mainly divided into three parts: the earth escape stage,
coast arc stage, and lunar capture stage. The coast arc
stage refers to this part from the near-earth orbit to the
near-moon orbit. The main braking problem is to
consider the orbit design [4-6] and the orbital control
problem [7-8] of the aircraft. The lunar capture section
mainly refers to the soft-landing part of the aircraft.
The braking mode is mainly divided into three types:
gravity-turn braking method, nominal orbit braking
method and explicit braking method.
2. SOFT-LANDING DYNAMICS MODEL OF
AIRCRAFT BASED ON TWO BODY PROBLEM
Figure 1 shows the whole process of the lunar landing
aircraft from ground to soft-landing on the moon.
Firstly, the aircraft is carried by a rocket and sent from
the ground to a predetermined earth parking orbit.
After entering orbit, the aircraft detects its attitude,
speed and position, determines the working status of
each part, and then establishes communication with the
ground. When the time is right, the thrust engine drives
the aircraft off the earth parking orbit and into the
moon transitional orbit, as shown in ② in figure 1. In
order to reduce fuel consumption, the engine will stop
working and flow to the moon at its own speed and
gravity. During this period, two attitude adjustments
and two to three orbit corrections are needed. The main
purpose of orbit correction is to make the aircraft have
accurate flight direction at the entry point of the
transitional orbit between the earth and the moon, and
to ensure that the aircraft enters the parking orbit on the
moon. After entering the lunar parking orbit, the lunar
landing aircraft will redetect its speed, position and
attitude data, and calculate the optimal Horman orbital
point to complete the orbit change task. When the time
phase point arrives, the engine is pushed back and
decelerated, and the aircraft is orbited into the near-
moon orbit. The braking and control for a soft landing
is implemented at the approach point of the lunar
transfer orbit, that is, ⑥ in the Figure 1.
①
②
③
④
⑤⑥
①earth parking orbit
②establish initial attitude
③trajectory correction
④enter lunar orbit
⑤enter the landing transfer orbit
⑥lunar soft-landing
the earth
the moon
Figure 1. The diagram of the whole flight process of
lunar landing
In order to accurately analyze the state of the aircraft
during flight, three classical physics formulas are
firstly introduced:
①Formula of universal gravitation 𝐹 =𝐺𝑀𝑚
𝑟2
②Kepler ' s second law𝑣𝑟 𝑠𝑖𝑛 𝜃 = 𝑘
The motion of Chang'e-3 around the moon can be
approximately regarded as the motion of planets in the
solar system around the sun, which satisfies the
applicable conditions of the above two formulas.
③Formulas for calculating work 𝑊 = 𝐹𝑠 ⋅ 𝑐𝑜𝑠 𝜃
After Chang'e-3 entered the elliptical orbit around the
moon, it was in the conservative field where the moon
was located. Because there is no atmosphere on the
moon, the atmospheric drag is not considered in the
International Journal of Computational and Engineering86
ACADEMIC PUBLISHING HOUSE

dynamic model of Chang'e-3. The soft-landing time
from orbit altitude of about 15 km to lunar surface is
short, usually within ten minutes. Therefore, the
gravitational perturbation of the sun and the earth to the
moon can be neglected, and only the motion rules
under the "two-body model" of the moon and Chang
'e-3 need to be studied. In order to more intuitively
represent the Chang 'e-3 landing preparation orbit, the
schematic diagram is as follows:
deorbit point
terminal landing phase
low lunner orbit
elliptic transition orbit
(Hohmann transfer orbit)
powered-descent initiation
power descent phaseThe moon
Figure 2. The diagram of landing preparation trajectory
of Chang’e-3
According to Figure 2, the speed of Chang'e-3 at
perilune and apolune in the elliptical orbit is angular to
the vector diameter, which can be obtained from
Kepler's second law:
𝑘 = 𝑣1𝑟1 𝑠𝑖𝑛 9 0∘ (1)
𝑘 = 𝑣2𝑟2 𝑠𝑖𝑛 9 0∘ (2)
Combine formula (1) and (2),
𝑣1𝑟1 = 𝑣2𝑟2 (3)
Taking the infinity as the zero potential energy point in
the gravitational field of the moon, the potential energy
−𝐺𝑀𝑚
𝑟 of Chang'e-3 at any point in the elliptical orbit
has the kinetic energy of 1
2𝑚𝑣2, so the total energy can
be expressed as 𝐸 =1
2𝑚𝑣2 −
𝐺𝑀𝑚
𝑟
Then the total energy of Chang'e-3 at the near and far
moon points is respectively: 𝐸1 =1
2𝑚𝑣1
2 −𝐺𝑀𝑚
𝑟1
𝐸2 =1
2𝑚𝑣2
2 −𝐺𝑀𝑚
𝑟2
According to question, the total energy of the Chang'e-
3 in the landing orbit is conserved, thus it can be
obtained that 𝐸1 = 𝐸2,that is 1
2𝑚𝑣1
2 −𝐺𝑀𝑚
𝑟1=
1
2𝑚𝑣2
2 −𝐺𝑀𝑚
𝑟2 (4)
Since the average radius, equatorial average radius and
polar radius of the moon are 1737.013km, 1737.646km
and 1735.843km respectively, and the shape oblateness
of the moon is 1/963.7256. The moon is regarded as a
sphere and its average radius 1737.013km is taken as
the radius of the sphere.
The distance from the near and far moon points to the
surface of the moon is much smaller than the average
radius of the moon, so the average radius of the moon
cannot be ignored. The perilunar to the center of the
moon is equal to the sum of the distance from the
perilunar to the surface of the moon and the mean
radius of the moon. So,
𝑟1 = 15 + 1737.013 = 1752.013𝑘𝑚 (5)
The same can be
𝑟2 = 100 + 1737.013 = 1837.013𝑘𝑚 (6)
Combine fomular (3)、(4)、(5) and (6), substitute 𝐺、𝑀, we can conclude that
𝑣1 = √2𝐺𝑀𝑟2
𝑟1(𝑟1+𝑟2)= 1.6927𝑘𝑚 ⋅ 𝑠−1 (7)
Substitute equation (7) into equation (3), we can
conclude that
𝑣2 =𝑟1
𝑟2𝑣1 = 1.6144𝑘𝑚 ⋅ 𝑠−1 (8)
The basic requirements of Chang’e-3 landing orbit
design: the preparation orbit for landing is the orbit
near the moon and the orbit far away from the moon;
The landing orbit is from the near moon point to the
landing site, and the soft landing process is divided into
six stages: landing preparation orbit, main deceleration,
attitude adjustment, obstacle avoidance stage, fine
obstacle avoidance, and slow decline stage. Minimize
fuel consumption during soft-landing.
Because Chang'e-3's landing site is
(19.51∘𝑊,44.12∘𝑁), leaning toward the very low
part. According to the data, the longitude and latitude
of Chang’e-3 are basically unchanged. According to
astronomical knowledge, we can see that the plane of
the landing orbit is perpendicular to the equatorial
plane of the moon, parallel to the longitude plane
44.12∘𝑁, and the landing orbit is from low latitude to
high latitude. Make the schematic diagram as follows
Figure 3:
y
z
perilune
x
19.51W
32.31N
Figure 3. The diagram of landing orbit
Chang'e-3 began to decline at the perilune. The
strength and direction of the initiative force of
Chang'e-3 have been changing all the time. Therefore,
we calculate the kinetic energy change by calculating
the external work of the initiative force, which can omit
the calculation process and simplify the calculation. In
this process, gravity does positive work and Chang'e-3
does negative work. The whole process of descent is
𝑇.The work did by combined external force equals to
the change of kinetic energy:
According to the kinetic energy theorem:
𝑚𝑔0 × (ℎ0 − 𝐻(𝑇)) − ∫ (𝐹(𝑡) × 𝑣(𝑡))𝑑𝑡 =1
2𝑚 ×
𝑇
0
(𝑣𝑇2 − 𝑣1
2) (9)
The horizontal displacement of the time period T:
𝑥(𝑇) = ∫ (𝑐𝑜𝑠 𝜃 (𝑡) × 𝑣(𝑡))𝑇
0𝑑𝑡 (10)
In the model hypothesis, we assume that Chang’e-3
always moves in a plane perpendicular to the lunar
equator during the descent process. We can get the
conversion relationship between distance and latitude
International Journal of Computational and Engineering 87
ACADEMIC PUBLISHING HOUSE
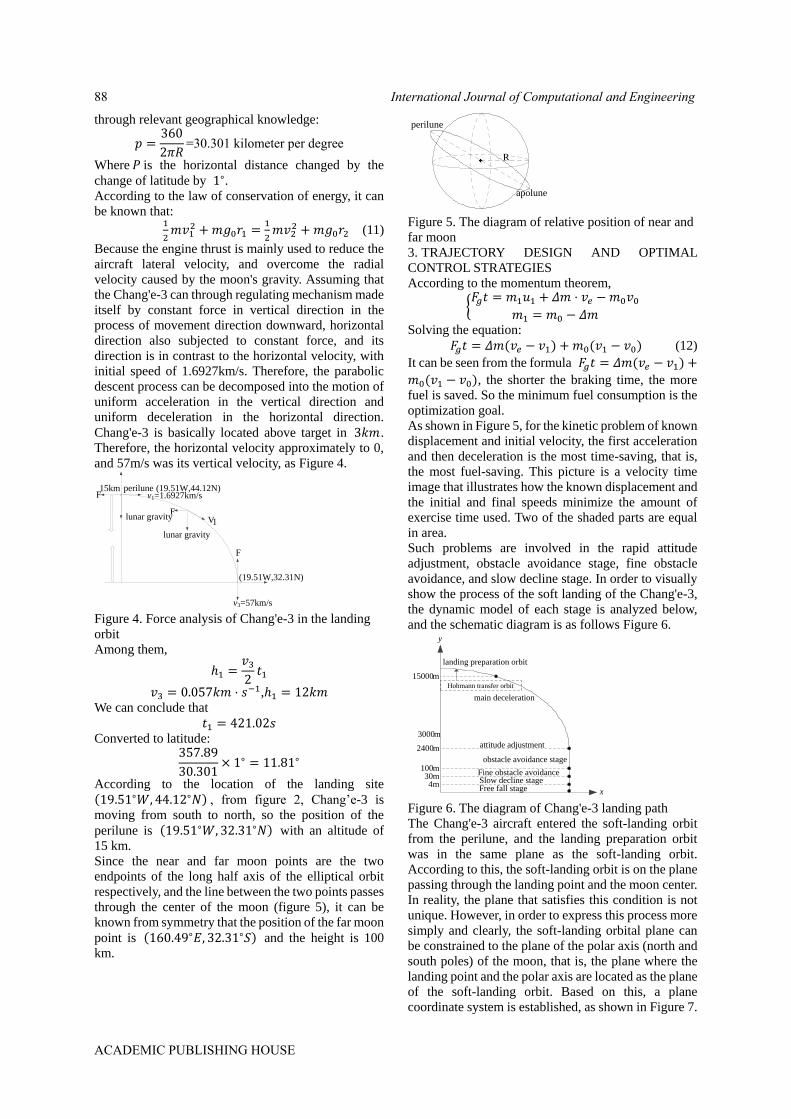
through relevant geographical knowledge:
𝑝 =360
2𝜋𝑅=30.301 kilometer per degree
Where 𝑃 is the horizontal distance changed by the
change of latitude by 1∘. According to the law of conservation of energy, it can
be known that: 1
2𝑚𝑣1
2 +𝑚𝑔0𝑟1 =1
2𝑚𝑣2
2 +𝑚𝑔0𝑟2 (11)
Because the engine thrust is mainly used to reduce the
aircraft lateral velocity, and overcome the radial
velocity caused by the moon's gravity. Assuming that
the Chang'e-3 can through regulating mechanism made
itself by constant force in vertical direction in the
process of movement direction downward, horizontal
direction also subjected to constant force, and its
direction is in contrast to the horizontal velocity, with
initial speed of 1.6927km/s. Therefore, the parabolic
descent process can be decomposed into the motion of
uniform acceleration in the vertical direction and
uniform deceleration in the horizontal direction.
Chang'e-3 is basically located above target in 3𝑘𝑚.
Therefore, the horizontal velocity approximately to 0,
and 57m/s was its vertical velocity, as Figure 4.
FV1
lunar gravity
F
F
lunar gravity
perilune15kmv1=1.6927km/s
(19.51W,44.12N)
(19.51W,32.31N)
v3=57km/s Figure 4. Force analysis of Chang'e-3 in the landing
orbit
Among them,
ℎ1 =𝑣32𝑡1
𝑣3 = 0.057𝑘𝑚 ⋅ 𝑠−1,ℎ1 = 12𝑘𝑚
We can conclude that
𝑡1 = 421.02𝑠 Converted to latitude:
357.89
30.301× 1∘ = 11.81∘
According to the location of the landing site (19.51∘𝑊,44.12∘𝑁) , from figure 2, Chang’e-3 is
moving from south to north, so the position of the
perilune is (19.51∘𝑊,32.31∘𝑁) with an altitude of
15 km.
Since the near and far moon points are the two
endpoints of the long half axis of the elliptical orbit
respectively, and the line between the two points passes
through the center of the moon (figure 5), it can be
known from symmetry that the position of the far moon
point is (160.49∘𝐸, 32.31∘𝑆) and the height is 100
km.
R
apolune
perilune
Figure 5. The diagram of relative position of near and
far moon
3. TRAJECTORY DESIGN AND OPTIMAL
CONTROL STRATEGIES
According to the momentum theorem,
{𝐹𝑔𝑡 = 𝑚1𝑢1 + 𝛥𝑚 ⋅ 𝑣𝑒 −𝑚0𝑣0
𝑚1 = 𝑚0 − 𝛥𝑚
Solving the equation:
𝐹𝑔𝑡 = 𝛥𝑚(𝑣𝑒 − 𝑣1) + 𝑚0(𝑣1 − 𝑣0) (12)
It can be seen from the formula 𝐹𝑔𝑡 = 𝛥𝑚(𝑣𝑒 − 𝑣1) +
𝑚0(𝑣1 − 𝑣0), the shorter the braking time, the more
fuel is saved. So the minimum fuel consumption is the
optimization goal.
As shown in Figure 5, for the kinetic problem of known
displacement and initial velocity, the first acceleration
and then deceleration is the most time-saving, that is,
the most fuel-saving. This picture is a velocity time
image that illustrates how the known displacement and
the initial and final speeds minimize the amount of
exercise time used. Two of the shaded parts are equal
in area.
Such problems are involved in the rapid attitude
adjustment, obstacle avoidance stage, fine obstacle
avoidance, and slow decline stage. In order to visually
show the process of the soft landing of the Chang'e-3,
the dynamic model of each stage is analyzed below,
and the schematic diagram is as follows Figure 6.
4m30m
100m
2400m
15000m
3000m
Free fall stageSlow decline stageFine obstacle avoidance
obstacle avoidance stage
attitude adjustment
landing preparation orbit
main deceleration
y
x
Hohmann transfer orbit
Figure 6. The diagram of Chang'e-3 landing path
The Chang'e-3 aircraft entered the soft-landing orbit
from the perilune, and the landing preparation orbit
was in the same plane as the soft-landing orbit.
According to this, the soft-landing orbit is on the plane
passing through the landing point and the moon center.
In reality, the plane that satisfies this condition is not
unique. However, in order to express this process more
simply and clearly, the soft-landing orbital plane can
be constrained to the plane of the polar axis (north and
south poles) of the moon, that is, the plane where the
landing point and the polar axis are located as the plane
of the soft-landing orbit. Based on this, a plane
coordinate system is established, as shown in Figure 7.
International Journal of Computational and Engineering88
ACADEMIC PUBLISHING HOUSE
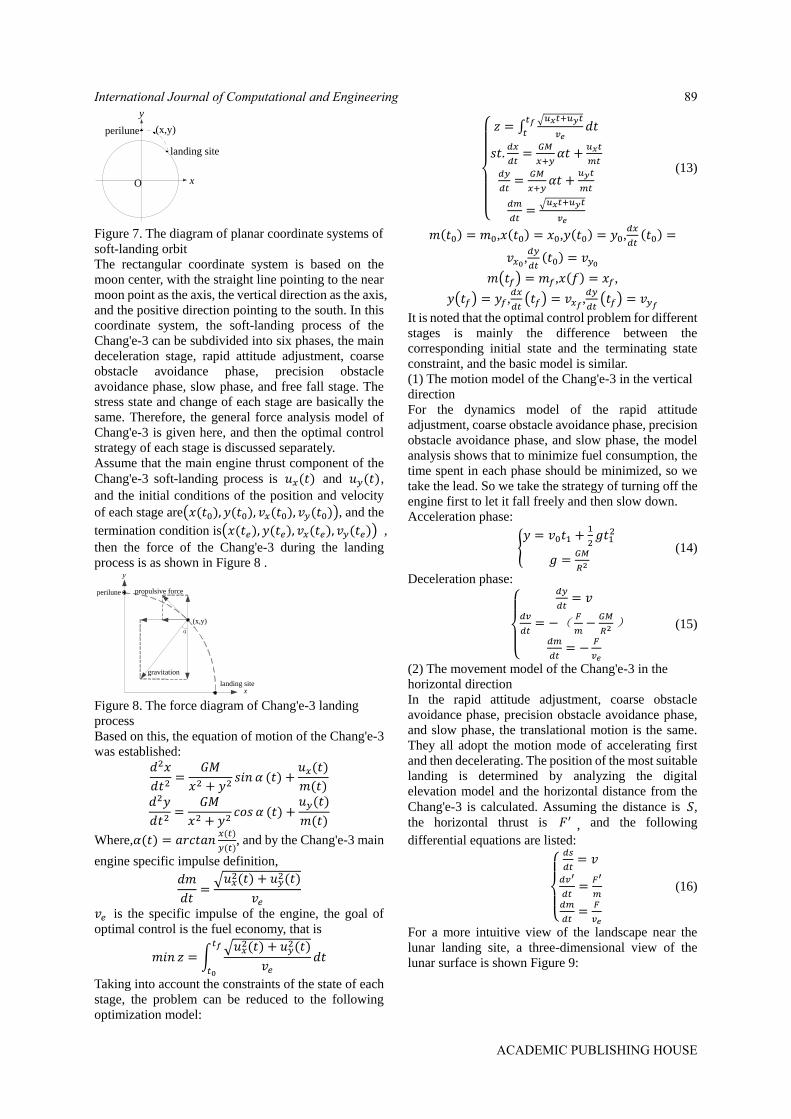
x
y
O
(x,y)perilune
landing site
Figure 7. The diagram of planar coordinate systems of
soft-landing orbit
The rectangular coordinate system is based on the
moon center, with the straight line pointing to the near
moon point as the axis, the vertical direction as the axis,
and the positive direction pointing to the south. In this
coordinate system, the soft-landing process of the
Chang'e-3 can be subdivided into six phases, the main
deceleration stage, rapid attitude adjustment, coarse
obstacle avoidance phase, precision obstacle
avoidance phase, slow phase, and free fall stage. The
stress state and change of each stage are basically the
same. Therefore, the general force analysis model of
Chang'e-3 is given here, and then the optimal control
strategy of each stage is discussed separately.
Assume that the main engine thrust component of the
Chang'e-3 soft-landing process is 𝑢𝑥(𝑡) and 𝑢𝑦(𝑡),
and the initial conditions of the position and velocity
of each stage are(𝑥(𝑡0), 𝑦(𝑡0), 𝑣𝑥(𝑡0), 𝑣𝑦(𝑡0)), and the
termination condition is(𝑥(𝑡𝑒), 𝑦(𝑡𝑒), 𝑣𝑥(𝑡𝑒), 𝑣𝑦(𝑡𝑒)) ,
then the force of the Chang'e-3 during the landing
process is as shown in Figure 8 .
gravitation
propulsive force
y
x
α
perilune
landing site
(x,y)
Figure 8. The force diagram of Chang'e-3 landing
process
Based on this, the equation of motion of the Chang'e-3
was established:
𝑑2𝑥
𝑑𝑡2=
𝐺𝑀
𝑥2 + 𝑦2𝑠𝑖𝑛 𝛼 (𝑡) +
𝑢𝑥(𝑡)
𝑚(𝑡)
𝑑2𝑦
𝑑𝑡2=
𝐺𝑀
𝑥2 + 𝑦2𝑐𝑜𝑠 𝛼 (𝑡) +
𝑢𝑦(𝑡)
𝑚(𝑡)
Where,𝛼(𝑡) = 𝑎𝑟𝑐𝑡𝑎𝑛𝑥(𝑡)
𝑦(𝑡), and by the Chang'e-3 main
engine specific impulse definition,
𝑑𝑚
𝑑𝑡=√𝑢𝑥
2(𝑡) + 𝑢𝑦2(𝑡)
𝑣𝑒
𝑣𝑒 is the specific impulse of the engine, the goal of
optimal control is the fuel economy, that is
𝑚𝑖𝑛 𝑧 = ∫√𝑢𝑥
2(𝑡) + 𝑢𝑦2(𝑡)
𝑣𝑒𝑑𝑡
𝑡𝑓
𝑡0
Taking into account the constraints of the state of each
stage, the problem can be reduced to the following
optimization model:
{
𝑧 = ∫
√𝑢𝑥𝑡+𝑢𝑦𝑡
𝑣𝑒𝑑𝑡
𝑡𝑓𝑡
𝑠𝑡.𝑑𝑥
𝑑𝑡=
𝐺𝑀
𝑥+𝑦𝛼𝑡 +
𝑢𝑥𝑡
𝑚𝑡
𝑑𝑦
𝑑𝑡=
𝐺𝑀
𝑥+𝑦𝛼𝑡 +
𝑢𝑦𝑡
𝑚𝑡
𝑑𝑚
𝑑𝑡=
√𝑢𝑥𝑡+𝑢𝑦𝑡
𝑣𝑒
(13)
𝑚(𝑡0) = 𝑚0,𝑥(𝑡0) = 𝑥0,𝑦(𝑡0) = 𝑦0,𝑑𝑥
𝑑𝑡(𝑡0) =
𝑣𝑥0,𝑑𝑦
𝑑𝑡(𝑡0) = 𝑣𝑦0
𝑚(𝑡𝑓) = 𝑚𝑓,𝑥(𝑓) = 𝑥𝑓,
𝑦(𝑡𝑓) = 𝑦𝑓,𝑑𝑥
𝑑𝑡(𝑡𝑓) = 𝑣𝑥𝑓,
𝑑𝑦
𝑑𝑡(𝑡𝑓) = 𝑣𝑦𝑓
It is noted that the optimal control problem for different
stages is mainly the difference between the
corresponding initial state and the terminating state
constraint, and the basic model is similar.
(1) The motion model of the Chang'e-3 in the vertical
direction
For the dynamics model of the rapid attitude
adjustment, coarse obstacle avoidance phase, precision
obstacle avoidance phase, and slow phase, the model
analysis shows that to minimize fuel consumption, the
time spent in each phase should be minimized, so we
take the lead. So we take the strategy of turning off the
engine first to let it fall freely and then slow down.
Acceleration phase:
{𝑦 = 𝑣0𝑡1 +
1
2𝑔𝑡1
2
𝑔 =𝐺𝑀
𝑅2
(14)
Deceleration phase:
{
𝑑𝑦
𝑑𝑡= 𝑣
𝑑𝑣
𝑑𝑡= −(
𝐹
𝑚−
𝐺𝑀
𝑅2)
𝑑𝑚
𝑑𝑡= −
𝐹
𝑣𝑒
(15)
(2) The movement model of the Chang'e-3 in the
horizontal direction
In the rapid attitude adjustment, coarse obstacle
avoidance phase, precision obstacle avoidance phase,
and slow phase, the translational motion is the same.
They all adopt the motion mode of accelerating first
and then decelerating. The position of the most suitable
landing is determined by analyzing the digital
elevation model and the horizontal distance from the
Chang'e-3 is calculated. Assuming the distance is 𝑆,
the horizontal thrust is 𝐹′ , and the following
differential equations are listed:
{
𝑑𝑠
𝑑𝑡= 𝑣
𝑑𝑣′
𝑑𝑡=
𝐹′
𝑚𝑑𝑚
𝑑𝑡=
𝐹
𝑣𝑒
(16)
For a more intuitive view of the landscape near the
lunar landing site, a three-dimensional view of the
lunar surface is shown Figure 9:
International Journal of Computational and Engineering 89
ACADEMIC PUBLISHING HOUSE
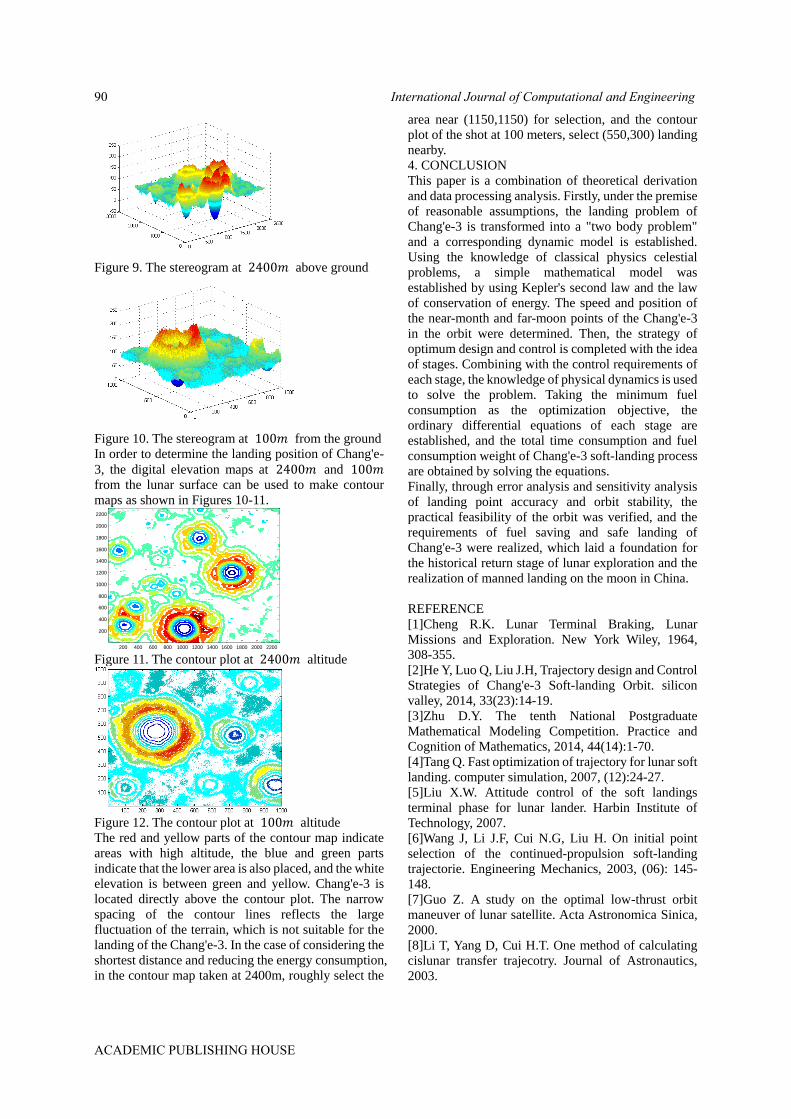
Figure 9. The stereogram at 2400𝑚 above ground
Figure 10. The stereogram at 100𝑚 from the ground
In order to determine the landing position of Chang'e-
3, the digital elevation maps at 2400𝑚 and 100𝑚
from the lunar surface can be used to make contour
maps as shown in Figures 10-11.
Figure 11. The contour plot at 2400𝑚 altitude
Figure 12. The contour plot at 100𝑚 altitude
The red and yellow parts of the contour map indicate
areas with high altitude, the blue and green parts
indicate that the lower area is also placed, and the white
elevation is between green and yellow. Chang'e-3 is
located directly above the contour plot. The narrow
spacing of the contour lines reflects the large
fluctuation of the terrain, which is not suitable for the
landing of the Chang'e-3. In the case of considering the
shortest distance and reducing the energy consumption,
in the contour map taken at 2400m, roughly select the
area near (1150,1150) for selection, and the contour
plot of the shot at 100 meters, select (550,300) landing
nearby.
4. CONCLUSION
This paper is a combination of theoretical derivation
and data processing analysis. Firstly, under the premise
of reasonable assumptions, the landing problem of
Chang'e-3 is transformed into a "two body problem"
and a corresponding dynamic model is established.
Using the knowledge of classical physics celestial
problems, a simple mathematical model was
established by using Kepler's second law and the law
of conservation of energy. The speed and position of
the near-month and far-moon points of the Chang'e-3
in the orbit were determined. Then, the strategy of
optimum design and control is completed with the idea
of stages. Combining with the control requirements of
each stage, the knowledge of physical dynamics is used
to solve the problem. Taking the minimum fuel
consumption as the optimization objective, the
ordinary differential equations of each stage are
established, and the total time consumption and fuel
consumption weight of Chang'e-3 soft-landing process
are obtained by solving the equations.
Finally, through error analysis and sensitivity analysis
of landing point accuracy and orbit stability, the
practical feasibility of the orbit was verified, and the
requirements of fuel saving and safe landing of
Chang'e-3 were realized, which laid a foundation for
the historical return stage of lunar exploration and the
realization of manned landing on the moon in China.
REFERENCE
[1]Cheng R.K. Lunar Terminal Braking, Lunar
Missions and Exploration. New York Wiley, 1964,
308-355.
[2]He Y, Luo Q, Liu J.H, Trajectory design and Control
Strategies of Chang'e-3 Soft-landing Orbit. silicon
valley, 2014, 33(23):14-19.
[3]Zhu D.Y. The tenth National Postgraduate
Mathematical Modeling Competition. Practice and
Cognition of Mathematics, 2014, 44(14):1-70.
[4]Tang Q. Fast optimization of trajectory for lunar soft
landing. computer simulation, 2007, (12):24-27.
[5]Liu X.W. Attitude control of the soft landings
terminal phase for lunar lander. Harbin Institute of
Technology, 2007.
[6]Wang J, Li J.F, Cui N.G, Liu H. On initial point
selection of the continued-propulsion soft-landing
trajectorie. Engineering Mechanics, 2003, (06): 145-
148.
[7]Guo Z. A study on the optimal low-thrust orbit
maneuver of lunar satellite. Acta Astronomica Sinica,
2000.
[8]Li T, Yang D, Cui H.T. One method of calculating
cislunar transfer trajecotry. Journal of Astronautics,
2003.
2400高空拍摄等高图
x方向坐标
y方向坐标
200 400 600 800 1000 1200 1400 1600 1800 2000 2200
200
400
600
800
1000
1200
1400
1600
1800
2000
2200
International Journal of Computational and Engineering90
ACADEMIC PUBLISHING HOUSE

Characteristics and Causes of Ozone
Concentration in Beijing
Hao Qin*, Xinyan Dong, Hanying Li
College of Science, North China University of Science and Technology, Tangshan, 063210, Hebei, China
*E-mail: [email protected]
Abstract: Photochemical smog pollution is an
important environmental issue affecting air quality in
Beijing. Using the National Population and Health
Science Data Sharing Service platform to provide
Beijing's 2015-2016 ozone and temperature,
precipitation and positive relative humidity and other
meteorological data, the hourly measurement data, the
basic characteristics of ozone concentration in Beijing,
and the combination of meteorology. The factors are
correlated with ozone meteorology and a quantitative
calculation model is given. Through the analysis of
the characteristics and causes of ozone concentration
in Beijing, it is expected to provide reference for the
prevention and control of ozone pollution in North
China.
Keywords: Beijing; ozone; spearman correlation;
meteorological factor
1. INTRODUCTION
Ozone (O3) plays an important role in global and
regional atmospheric environmental changes. It not
only has an important impact on the geothermal
radiation budget system, but also has significant
environmental effects. As a secondary pollutant,
near-surface ozone not only causes direct or indirect
damage to vegetation crops and ecological
environment, but also causes certain harm to human
health by affecting the human respiratory system [1-4].
Therefore, it is of great practical significance to study
the synergy between meteorological elements and
related sensitive diseases.
Ozone near the ground is mainly derived from
photochemical smog [5], but local ozone
concentration will be significantly affected by
meteorological factors [6-8]. Experts believe that
ozone pollution incidents generally occur under
conditions of high temperature, strong radiation, and
relatively low temperature. Due to many factors, the
meteorological conditions and photochemical
pollution in different regions are different, and there
may even be large differences. Liu et al. believe that
the concentration of VOC in Beijing affects the ozone
concentration in summer. In the weather with small
wind or static wind, high temperature and high
humidity, ozone is likely to exceed the standard [9].
This is caused by the influence of meteorological
factors on the surface ozone concentration. Less low
cloud cover, suitable relative humidity, strong solar
radiation, small ground wind speed and specific wind
direction will lead to the emergence of high
concentration ozone. Among them, ultraviolet
radiation and temperature are important factors
affecting ozone concentration. In Deng Xuejiao and
Yang Jie's research, it is also clear that terrestrial
ultraviolet radiation has a significant impact on the
photochemical reaction of ozone generation [10].
High temperature brings strong ultraviolet radiation,
which promotes the photochemical reaction and
increases the concentration of ozone.
Through the above research and analysis, we can find
that meteorological factors such as temperature,
ultraviolet radiation, wind speed, relative humidity,
cloud and fog have an important effect on the
near-surface O3 concentration, but in different cases,
the dominant factors are not the same. Guided by
various meteorological causes, the ground O3
gradually accumulates, causing the concentration to
rise. Based on the time-lapse data from 2015 to 2016
in Beijing, this study explores the causes and health
effects of gas pollutants and meteorological
conditions from multiple time granularities, and
establishes quantitative models for meteorological
and environmental data. In order to provide reference
for the prevention and control of ozone pollution in
North China.
2. ANALYSIS OF OZONE CONCENTRATION
CHARACTERISTICS IN BEIJING
The daily maximum 8h average ozone concentration
of Beijing in the three years of the year, month and
day was analyzed. From the special trend of ozone
concentration trend and its concentration change, the
basic concentration of Beijing 2016-2017 was
obtained.
2.1. Basic Situation of Ozone Pollution
Statistics on the maximum 8h average concentration
frequency of ozone day from January 2016 to
December 2016 in Beijing, and plot the frequency
distribution in Figure 1.
As can be seen from the above figure, the average 8h
average concentration of ozone in Beijing in 2016 is 360 ~ 120 /g m , with an average of 393.41 /g m . The
maximum daily concentration of 8h is greater than 3200 /g m , which occurs for 35 days, mainly
distributed from August to November, up to 3284.25 /g m . The average concentration is less than
20 and occurs for 43 days, mainly distributed from
January to April, with a minimum of 39.32 /g m .
International Journal of Computational and Engineering 91
ACADEMIC PUBLISHING HOUSE
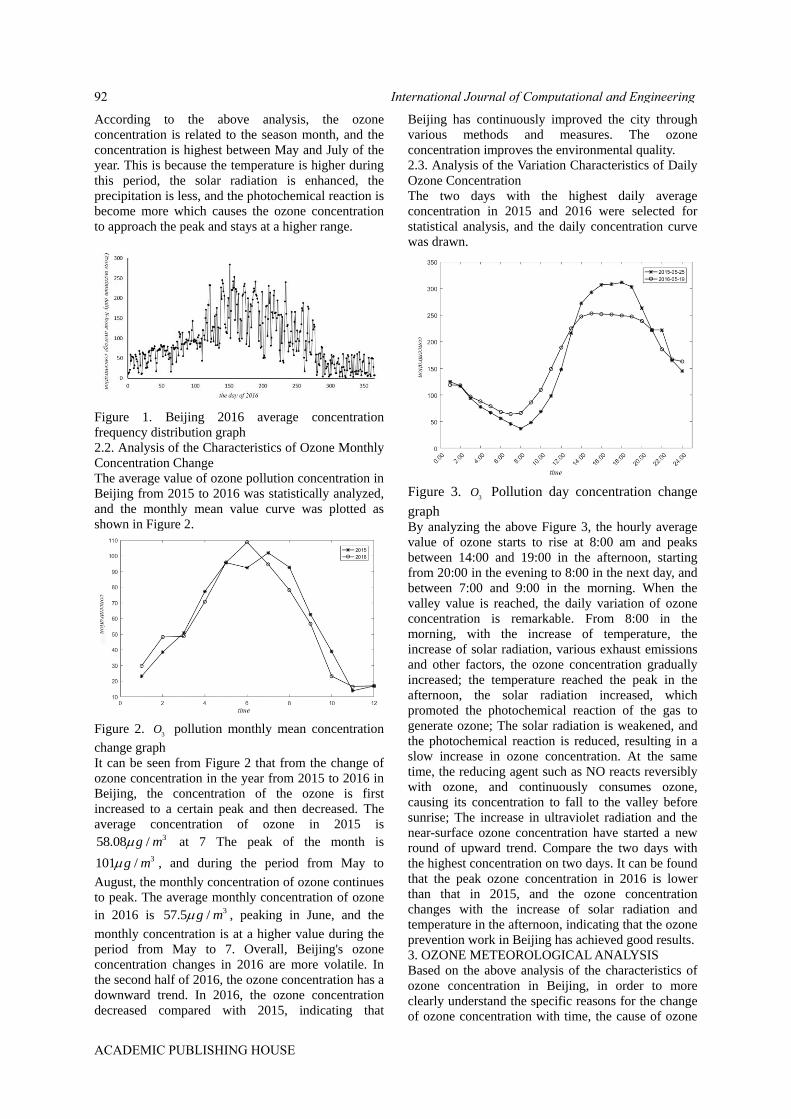
According to the above analysis, the ozone
concentration is related to the season month, and the
concentration is highest between May and July of the
year. This is because the temperature is higher during
this period, the solar radiation is enhanced, the
precipitation is less, and the photochemical reaction is
become more which causes the ozone concentration
to approach the peak and stays at a higher range.
Figure 1. Beijing 2016 average concentration
frequency distribution graph
2.2. Analysis of the Characteristics of Ozone Monthly
Concentration Change
The average value of ozone pollution concentration in
Beijing from 2015 to 2016 was statistically analyzed,
and the monthly mean value curve was plotted as
shown in Figure 2.
Figure 2.
3O pollution monthly mean concentration
change graph
It can be seen from Figure 2 that from the change of
ozone concentration in the year from 2015 to 2016 in
Beijing, the concentration of the ozone is first
increased to a certain peak and then decreased. The
average concentration of ozone in 2015 is 358.08 /g m at 7 The peak of the month is
3101 /g m , and during the period from May to
August, the monthly concentration of ozone continues
to peak. The average monthly concentration of ozone
in 2016 is 357.5 /g m , peaking in June, and the
monthly concentration is at a higher value during the
period from May to 7. Overall, Beijing's ozone
concentration changes in 2016 are more volatile. In
the second half of 2016, the ozone concentration has a
downward trend. In 2016, the ozone concentration
decreased compared with 2015, indicating that
Beijing has continuously improved the city through
various methods and measures. The ozone
concentration improves the environmental quality.
2.3. Analysis of the Variation Characteristics of Daily
Ozone Concentration
The two days with the highest daily average
concentration in 2015 and 2016 were selected for
statistical analysis, and the daily concentration curve
was drawn.
Figure 3.
3O Pollution day concentration change
graph By analyzing the above Figure 3, the hourly average
value of ozone starts to rise at 8:00 am and peaks
between 14:00 and 19:00 in the afternoon, starting
from 20:00 in the evening to 8:00 in the next day, and
between 7:00 and 9:00 in the morning. When the
valley value is reached, the daily variation of ozone
concentration is remarkable. From 8:00 in the
morning, with the increase of temperature, the
increase of solar radiation, various exhaust emissions
and other factors, the ozone concentration gradually
increased; the temperature reached the peak in the
afternoon, the solar radiation increased, which
promoted the photochemical reaction of the gas to
generate ozone; The solar radiation is weakened, and
the photochemical reaction is reduced, resulting in a
slow increase in ozone concentration. At the same
time, the reducing agent such as NO reacts reversibly
with ozone, and continuously consumes ozone,
causing its concentration to fall to the valley before
sunrise; The increase in ultraviolet radiation and the
near-surface ozone concentration have started a new
round of upward trend. Compare the two days with
the highest concentration on two days. It can be found
that the peak ozone concentration in 2016 is lower
than that in 2015, and the ozone concentration
changes with the increase of solar radiation and
temperature in the afternoon, indicating that the ozone
prevention work in Beijing has achieved good results.
3. OZONE METEOROLOGICAL ANALYSIS
Based on the above analysis of the characteristics of
ozone concentration in Beijing, in order to more
clearly understand the specific reasons for the change
of ozone concentration with time, the cause of ozone
International Journal of Computational and Engineering92
ACADEMIC PUBLISHING HOUSE
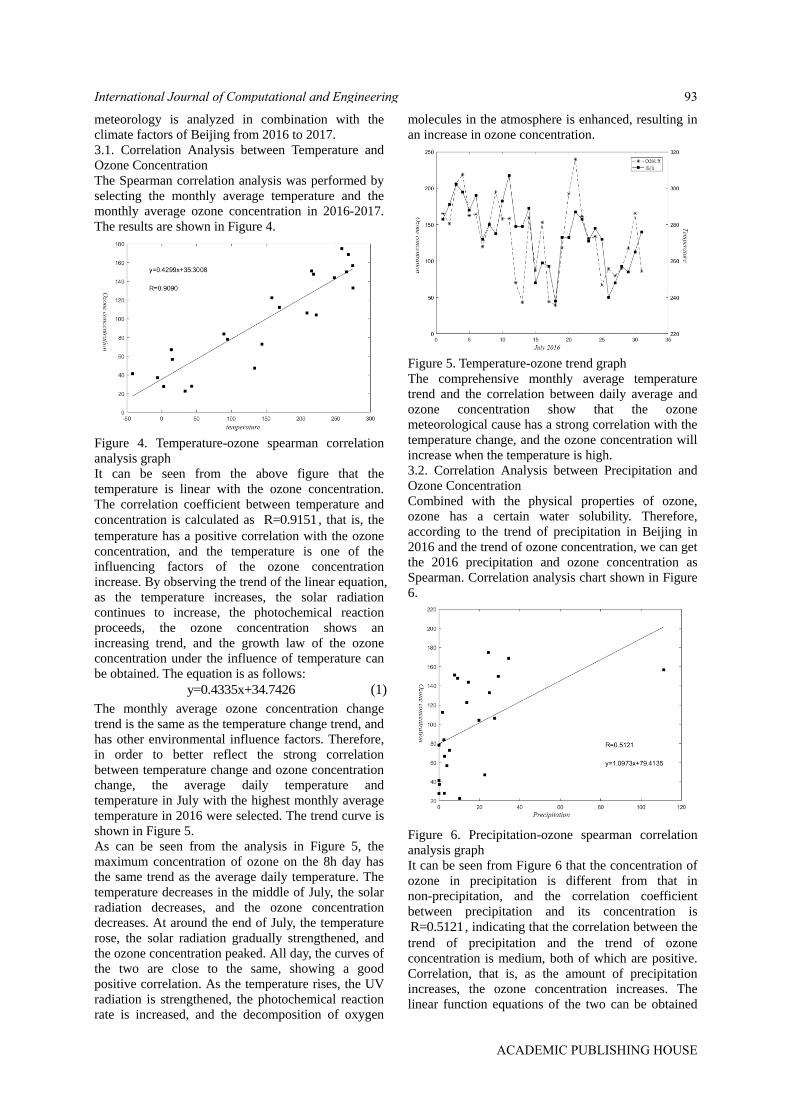
meteorology is analyzed in combination with the
climate factors of Beijing from 2016 to 2017.
3.1. Correlation Analysis between Temperature and
Ozone Concentration
The Spearman correlation analysis was performed by
selecting the monthly average temperature and the
monthly average ozone concentration in 2016-2017.
The results are shown in Figure 4.
Figure 4. Temperature-ozone spearman correlation
analysis graph
It can be seen from the above figure that the
temperature is linear with the ozone concentration.
The correlation coefficient between temperature and
concentration is calculated as R=0.9151 , that is, the
temperature has a positive correlation with the ozone
concentration, and the temperature is one of the
influencing factors of the ozone concentration
increase. By observing the trend of the linear equation,
as the temperature increases, the solar radiation
continues to increase, the photochemical reaction
proceeds, the ozone concentration shows an
increasing trend, and the growth law of the ozone
concentration under the influence of temperature can
be obtained. The equation is as follows:
y=0.4335x+34.7426 (1)
The monthly average ozone concentration change
trend is the same as the temperature change trend, and
has other environmental influence factors. Therefore,
in order to better reflect the strong correlation
between temperature change and ozone concentration
change, the average daily temperature and
temperature in July with the highest monthly average
temperature in 2016 were selected. The trend curve is
shown in Figure 5.
As can be seen from the analysis in Figure 5, the
maximum concentration of ozone on the 8h day has
the same trend as the average daily temperature. The
temperature decreases in the middle of July, the solar
radiation decreases, and the ozone concentration
decreases. At around the end of July, the temperature
rose, the solar radiation gradually strengthened, and
the ozone concentration peaked. All day, the curves of
the two are close to the same, showing a good
positive correlation. As the temperature rises, the UV
radiation is strengthened, the photochemical reaction
rate is increased, and the decomposition of oxygen
molecules in the atmosphere is enhanced, resulting in
an increase in ozone concentration.
Figure 5. Temperature-ozone trend graph
The comprehensive monthly average temperature
trend and the correlation between daily average and
ozone concentration show that the ozone
meteorological cause has a strong correlation with the
temperature change, and the ozone concentration will
increase when the temperature is high.
3.2. Correlation Analysis between Precipitation and
Ozone Concentration
Combined with the physical properties of ozone,
ozone has a certain water solubility. Therefore,
according to the trend of precipitation in Beijing in
2016 and the trend of ozone concentration, we can get
the 2016 precipitation and ozone concentration as
Spearman. Correlation analysis chart shown in Figure
6.
Figure 6. Precipitation-ozone spearman correlation
analysis graph
It can be seen from Figure 6 that the concentration of
ozone in precipitation is different from that in
non-precipitation, and the correlation coefficient
between precipitation and its concentration is
R=0.5121 , indicating that the correlation between the
trend of precipitation and the trend of ozone
concentration is medium, both of which are positive.
Correlation, that is, as the amount of precipitation
increases, the ozone concentration increases. The
linear function equations of the two can be obtained
International Journal of Computational and Engineering 93
ACADEMIC PUBLISHING HOUSE
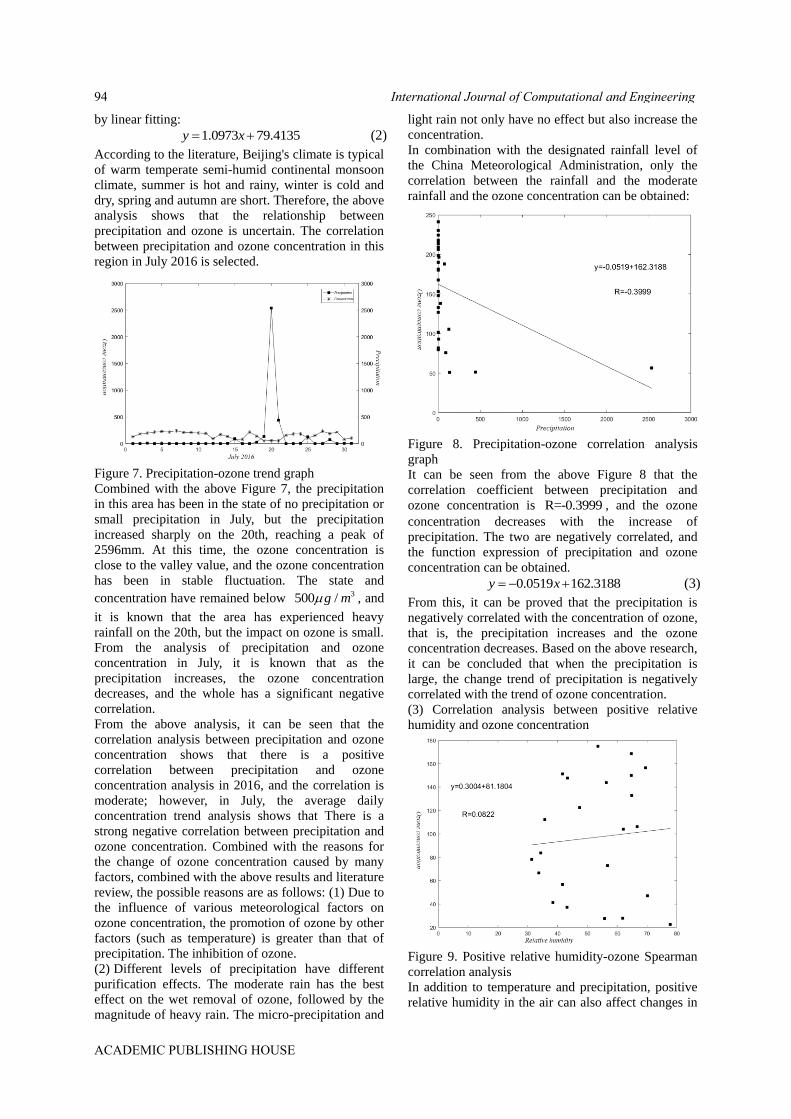
by linear fitting:
1.0973 79.4135y x (2)
According to the literature, Beijing's climate is typical
of warm temperate semi-humid continental monsoon
climate, summer is hot and rainy, winter is cold and
dry, spring and autumn are short. Therefore, the above
analysis shows that the relationship between
precipitation and ozone is uncertain. The correlation
between precipitation and ozone concentration in this
region in July 2016 is selected.
Figure 7. Precipitation-ozone trend graph
Combined with the above Figure 7, the precipitation
in this area has been in the state of no precipitation or
small precipitation in July, but the precipitation
increased sharply on the 20th, reaching a peak of
2596mm. At this time, the ozone concentration is
close to the valley value, and the ozone concentration
has been in stable fluctuation. The state and
concentration have remained below 3500 /g m , and
it is known that the area has experienced heavy
rainfall on the 20th, but the impact on ozone is small.
From the analysis of precipitation and ozone
concentration in July, it is known that as the
precipitation increases, the ozone concentration
decreases, and the whole has a significant negative
correlation.
From the above analysis, it can be seen that the
correlation analysis between precipitation and ozone
concentration shows that there is a positive
correlation between precipitation and ozone
concentration analysis in 2016, and the correlation is
moderate; however, in July, the average daily
concentration trend analysis shows that There is a
strong negative correlation between precipitation and
ozone concentration. Combined with the reasons for
the change of ozone concentration caused by many
factors, combined with the above results and literature
review, the possible reasons are as follows: (1) Due to
the influence of various meteorological factors on
ozone concentration, the promotion of ozone by other
factors (such as temperature) is greater than that of
precipitation. The inhibition of ozone.
(2) Different levels of precipitation have different
purification effects. The moderate rain has the best
effect on the wet removal of ozone, followed by the
magnitude of heavy rain. The micro-precipitation and
light rain not only have no effect but also increase the
concentration.
In combination with the designated rainfall level of
the China Meteorological Administration, only the
correlation between the rainfall and the moderate
rainfall and the ozone concentration can be obtained:
Figure 8. Precipitation-ozone correlation analysis
graph
It can be seen from the above Figure 8 that the
correlation coefficient between precipitation and
ozone concentration is R=-0.3999 , and the ozone
concentration decreases with the increase of
precipitation. The two are negatively correlated, and
the function expression of precipitation and ozone
concentration can be obtained.
0.0519 162.3188y x (3)
From this, it can be proved that the precipitation is
negatively correlated with the concentration of ozone,
that is, the precipitation increases and the ozone
concentration decreases. Based on the above research,
it can be concluded that when the precipitation is
large, the change trend of precipitation is negatively
correlated with the trend of ozone concentration.
(3) Correlation analysis between positive relative
humidity and ozone concentration
Figure 9. Positive relative humidity-ozone Spearman
correlation analysis
In addition to temperature and precipitation, positive
relative humidity in the air can also affect changes in
International Journal of Computational and Engineering94
ACADEMIC PUBLISHING HOUSE

ozone concentration. Spearman correlation analysis
was performed by selecting the relative humidity and
ozone concentration in 2016, as shown in Figure 9.
It can be seen from Figure 9 that the correlation
coefficient between relative humidity and ozone
concentration is 0.0822R , the correlation
coefficient approaches 0, and the correlation intensity
is almost zero. There is almost no linear relationship
between the two, and the change of relative humidity
hardly affects the change of ozone concentration.
Neglecting the effects of minor changes can be
considered as relative humidity is not related to ozone
concentration.
4. CONCLUSION
The three-grain changes in the annual, monthly and
daily ozone concentrations of Beijing 2015-2016 were
studied separately, and the changes in ozone
concentration were significantly seasonal. It can be
obtained from the annual average concentration
analysis. During the summer period from May to July,
the solar radiation is higher and the temperature is
higher. At this time, the concentration of ozone is
continuously accumulated. The reason for the analysis
is that high temperature promotes the occurrence of
photochemical reactions in the atmosphere, and
precursors such as CO, NO, and NO2 undergo
chemical reactions under ultraviolet radiation, and
oxygen molecules in the air are also decomposed
together to increase the concentration of ozone. After
the monthly concentration and daily concentration
statistics of ozone concentration, the overall trend of
the concentration can be increased first and then
decreased and peaked during the month of July. The
concentration gradually rises from 8 o'clock in the day
due to the gradual increase of solar radiation.
Between 14 and 19, the peak is reached due to the
continuous accumulation of concentration. At night,
the ozone concentration decreases due to the
temperature drop and the consumption of reducing
agent.
In addition, the causes of ozone were analyzed in
combination with temperature, precipitation and
positive relative humidity. The trend of temperature
change is linearly positively correlated with the trend
of ozone concentration. The trend of precipitation
under moderate rain is positively correlated with the
trend of ozone concentration. The trend of
precipitation above moderate rain is linearly
negatively correlated with ozone concentration.
ACKNOWLEDGMENT
North China University of Science and Technology
College (X2018053).
REFERENCES
[1]Liu S.K, Cai S, Chen Y, et al. The effect of
pollutional haze on pulmonary function. Thorac Dis,
2016, 8(1): E41-E56.
[2]Zychowski K.E, Lucas S.N, Sanchez B, et al.
Hypoxia-induced pulmonary arterial hypertension
augments lung injury and airway reactivity caused by
ozone exposure. Toxicol Appl Pharm, 2016, 305(6):
40-45.
[3]Hu H, Ha S.D, Xu X.H. Ozone and hypertensive
disorders of pregnancy in Florida: Identifying critical
windows of exposure. Environ Res, 2017, 153:
120-125.
[4]Di Q, Wang Y, Zanobetti A, et al. Air pollution and
mortality in the medicare population. N Engl J Med,
2017, 376(26): 2513-2522.
[5]Meng X.P, Gao Y. Electric Systems Analysis.
Beijing: Higher Education Press, 2004, 3-21.
[6]Sillman S. The relation between ozone, NOx and
hydrocarbons in urban and polluted rural
environments. Atmospheric Environment, 1999,
33(12): 1821-1845.
[7]Hidy G.M. Ozone process insights from field
experiments part I: overview. Atmospheric
Environment, 2000, 34(12):2001-2022.
[8]Solomon P, Cowling E, Hidy G, et al. Companrison
of scientific findings from major ozone field studies
in North America and Europe. Atmospheric
Environment, 2000, 34(12):1885-1920.
[9]Wu K, Kang P, Wang Z.S. Ozone temporal
variation and its meteorological factors over Chengdu
City. Acta Scientiae Circumstantiate, 2017, 37(11):
4241-4252.
[10]Wang L, Liu R.Y, Han G.R. Study on the
relationship between surface ozone concentrations
and meteorological conditions in Nanjing, China.
Acta Scientiae Circumstantiate, 2018, 38(04):
1285-1296.
International Journal of Computational and Engineering 95
ACADEMIC PUBLISHING HOUSE
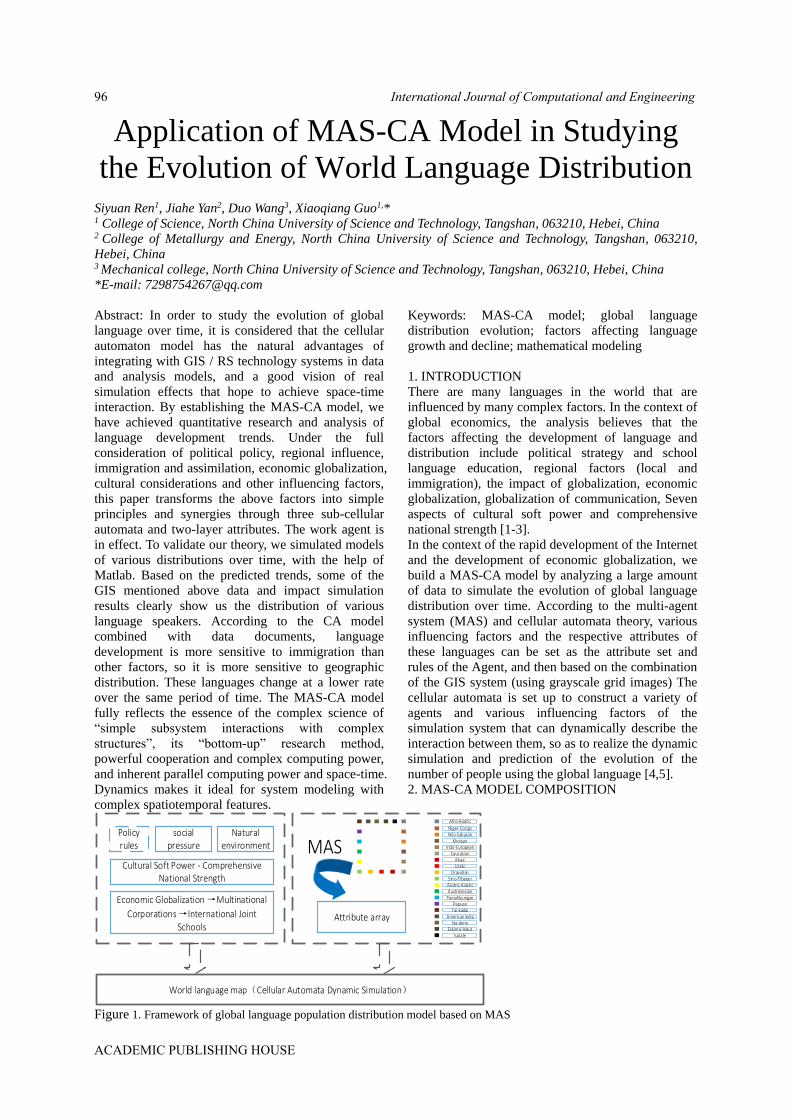
Application of MAS-CA Model in Studying
the Evolution of World Language Distribution
Siyuan Ren1, Jiahe Yan2, Duo Wang3, Xiaoqiang Guo1,* 1 College of Science, North China University of Science and Technology, Tangshan, 063210, Hebei, China 2 College of Metallurgy and Energy, North China University of Science and Technology, Tangshan, 063210,
Hebei, China 3 Mechanical college, North China University of Science and Technology, Tangshan, 063210, Hebei, China
*E-mail: [email protected]
Abstract: In order to study the evolution of global
language over time, it is considered that the cellular
automaton model has the natural advantages of
integrating with GIS / RS technology systems in data
and analysis models, and a good vision of real
simulation effects that hope to achieve space-time
interaction. By establishing the MAS-CA model, we
have achieved quantitative research and analysis of
language development trends. Under the full
consideration of political policy, regional influence,
immigration and assimilation, economic globalization,
cultural considerations and other influencing factors,
this paper transforms the above factors into simple
principles and synergies through three sub-cellular
automata and two-layer attributes. The work agent is
in effect. To validate our theory, we simulated models
of various distributions over time, with the help of
Matlab. Based on the predicted trends, some of the
GIS mentioned above data and impact simulation
results clearly show us the distribution of various
language speakers. According to the CA model
combined with data documents, language
development is more sensitive to immigration than
other factors, so it is more sensitive to geographic
distribution. These languages change at a lower rate
over the same period of time. The MAS-CA model
fully reflects the essence of the complex science of
“simple subsystem interactions with complex
structures”, its “bottom-up” research method,
powerful cooperation and complex computing power,
and inherent parallel computing power and space-time.
Dynamics makes it ideal for system modeling with
complex spatiotemporal features.
Keywords: MAS-CA model; global language
distribution evolution; factors affecting language
growth and decline; mathematical modeling
1. INTRODUCTION
There are many languages in the world that are
influenced by many complex factors. In the context of
global economics, the analysis believes that the
factors affecting the development of language and
distribution include political strategy and school
language education, regional factors (local and
immigration), the impact of globalization, economic
globalization, globalization of communication, Seven
aspects of cultural soft power and comprehensive
national strength [1-3].
In the context of the rapid development of the Internet
and the development of economic globalization, we
build a MAS-CA model by analyzing a large amount
of data to simulate the evolution of global language
distribution over time. According to the multi-agent
system (MAS) and cellular automata theory, various
influencing factors and the respective attributes of
these languages can be set as the attribute set and
rules of the Agent, and then based on the combination
of the GIS system (using grayscale grid images) The
cellular automata is set up to construct a variety of
agents and various influencing factors of the
simulation system that can dynamically describe the
interaction between them, so as to realize the dynamic
simulation and prediction of the evolution of the
number of people using the global language [4,5].
2. MAS-CA MODEL COMPOSITION
Policy rules
Natural environment
Cultural Soft Power - Comprehensive National Strength
Economic Globalization →Multinational
Corporations →International Joint Schools
World language map(Cellular Automata Dynamic Simulation)
MAS
Attribute array
Afro-Asiatic
Niger-CongoNilo-Saharan
KhoisanIndo-European
CaucasianAltaicUralic
DravidianSino-Tibetan
Austro-AsiaticAustrones ian
PamaNyunganPapuan
Tai-kadaiAmericanIndia
Na-deneEskimo-Aleut
Isolate
social pressure
Figure 1. Framework of global language population distribution model based on MAS
International Journal of Computational and Engineering96
ACADEMIC PUBLISHING HOUSE
According to the data from GIS, a global language
dynamic distribution model based on multi-agent will
be buit here. It consists of a comprehensive
environment, a multi-agent system, and a regional
population density of 3 parts. Among them, the
integrated environment is mainly used to consider the
impact factor, which consists of two layers and three
cellular automata, which are the policy rule layer and
the natural geographic layer; the three cellular
automata are cultural soft power-comprehensive
country Power Cellular Automata, Economic
Globalization - Multinational Corporations -
International Union School Cellular Network
Automaton and Positional Pressure Cellular Automata;
in a multi-agent system, each agent program array
stores behavior, location information, and so on The
attributes of the agent; the regional population density
of each language includes demographic data and
corresponding density data from around the world.
The model framework can be seen in Figure 1, and
the agent is affected by the influencing factors and
acts on these factors.
3. ESTABLISHMENT OF MAS-CA MODEL
MODEL
The experimental area covers the entire world. The
data used includes nearly 20 years of remote sensing
images, texts and political quotas, and the national
soft power rankings of national cultural languages.
The statistics are mainly from the China Institute of
Statistics, China Statistical Yearbook and the National
Bureau of Statistics report US Bureau of Statistics,
combined with Matlab and Arc-Object to build the
system and apply it. In order to increase the speed of
the system, all spatial data is evenly converted into
100 meters in ArcGIS 10.2 * 100m grid raster data.
3.1. Integrated Environment
Languages used and promoted by the government in a
country or school, social pressure, immigration and
immigration, globalization of international business
relationships and rapid development of the Internet,
including increasing global tourism and social media,
these factors intersect. The resulting integrated
environment has a huge impact on language
development trends. The integrated environment
consists of two layers of integrated environment layer
and three cellular automata, which capture the 5 * 5
windows through the mobile, each layer interacts with
the agent, applies the mobile window to all data layers,
and the data is stored in the corresponding
intelligence. In the array of attributes of the body,
consider all the influencing factors for comprehensive
evaluation.
3.1.1. Integrated environment layer attribute design
(1) Policy planning layers
The language promoted by the government is one of
the most important issues in a country when
considering the language used in the school. National
policy planning plays an important role in the
evolution of language development and the
distribution of the number of people using language.
The role of language guides the evolution of national
language and thus affects the development of world
language. In order to simulate the distribution of users
of various languages over time, the policy plans of
some major countries involving the top ten languages
are supplemented and the corresponding areas are
designated as overlays.
(2) Natural environment layer
Since ancient times, people have been demanding the
natural environment of the living area. They do not
consider the language development in the ocean,
namely the Arctic Circle, the Antarctic Circle, the
desert and the plateau. To this end, we regard
mountain woodland as the public 6 green space and
water body as natural environmental factors, and use
the exponential distance attenuation function to reflect
the state of the natural environment.
n
i
D
ijr
beltGcecE river
1221
41 (1)
Where: Eij That the state of the natural environment;
Driver Indicates the vertical distance to the body of
water; δ1: Said water body space attenuation
coefficient; r: Said neighborhood radius; G-belt: said
the number of green spaces in the neighborhood;
c1,c2: said that the weight coefficient, set to equal.
3.1.2. Integrated environment cellular automaton
Cellular Automata, consists of four parts: cell, cell
space, neighbors and rules, fully embodying the
essence of complex science. "Complex structures
come from the interaction of simple subsystems. Its
"bottom-up" research Methods, powerful complex
computing power, inherent parallel computing power
and spatiotemporal dynamics make it an ideal feature
for simulating systems with complex time and space.
The corresponding cell state is the state language
system involved in the corresponding language. The
conversion rules and determinations can simulate the
dynamic development of the world language in the
time interval. The three cellular automata involved in
this paper are constructed as follows:
3.1.3. Cultural soft power-comprehensive national
strength cellular automaton
(1) Cultural soft power assessment part
The CA of cultural soft power mainly considers the
factors of cultural migration and group assimilation.
After consulting a large amount of literature research
data, the corresponding test formula can be obtained
from the existing hard index system of cultural soft
power: Cultural Soft Power = the efficiency of the
political system and the degree of domestic
recognition [overseas] [art diplomacy (impact of
values + international image and international
reputation + Outreach of sports and international
competitions + Performance and effectiveness) +
(cultural innovation ability + strategic decision level +
policy effectiveness) (scientific strength + education
level + talent pool or human capital + international
International Journal of Computational and Engineering 97
ACADEMIC PUBLISHING HOUSE

cultural products and cultural heritage impact +
national ethical standards)]. Using English letters
instead of the above, you can get a simplified cultural
soft power evaluation formula:
MCHETPSCSPIVDSP IeyIepe (2)
Despite the fact that all indicators or indicators in the
formula require another formula or calculation
method. However, by roughly comparing and roughly
measuring each indicator, we can get the cultural soft
power data of major countries or regions and their
approximate ranking order from front to back: UK,
Germany, USA, France, Canada, Australia,
Switzerland, Japan. , Sweden, the Netherlands,
Denmark, Italy, Austria, Spain, Finland, New Zealand,
Belgium, Norway, Ireland, South Korea, Singapore,
Portugal, Brazil, Poland, Greece, Israel, Czech
Republic, Turkey, Mexico, China.
(2) Comprehensive national strength assessment
section
Comprehensive national strength is the most
important basic indicator for measuring a country's
national conditions and basic resources. In order to be
able to quantify it, this paper divides the national
strategic resources into seven resource types and
twenty-three indicators, and the weighted sum of
these indicators constitutes the comprehensive
national strength. These seven resources are:
① Economic resources (GNP or GDP);
② Human capital;
③ Capital resources;
④ Knowledge and technical resources;
⑤ Government resources;
⑥ Military power;
⑦ International resources.
According to the large amount of data research results
of authoritative scholars, we have obtained the
empirical formula for calculating the comprehensive
national strength, that is, the sum of the corresponding
weight and the ranking product.
RiaiNP * (3)
The report of the comprehensive national strength
factor and its weighting factor table is shown in Table
1.
Table 1. Comprehensive national strength factor and
its weight coefficient
Comprehensive national strength Weight
coefficient
Economic power 0.35
Science and technology 0.20
Military force 0.10
Social development level 0.10
Ecological power 0.10
Government regulation and
control
0.08
Diplomacy 0.07
total 1.00
According to the report of the Institute of Modern
Studies, the China International Relations and
Strategy Research Group's data statistics report, the
Chinese Academy of Sciences' Sustainable
Development Research Institute of Chinese Academy
of Sciences' Sustainable Development Strategy
Research Group released the 2003 China Sustainable
Development Strategy Report, comparing and ranking
the 13 largest countries in the world. Comprehensive
national strength. According to the statistical methods
and calculation methods of the report, each country
has different weights in different periods and ranks
differently. Table 2 shows the results of the integrated
country rankings in 1990. In 1995, three different
periods were reported in 13 countries and 2000.
For language, the influence of comprehensive
national strength and soft power on language
development each account for a certain proportion.
Therefore, it is necessary to give it the right to operate,
and the parameter value is determined by parameter
estimation.
Table 2. Thirteen countries comprehensive national
empowerment program sort
country 1990 1995 2000
Australia 10 9 9
Brazil 11 11 11
Canada 3 3 3
China 9 8 7
France 5 5 5
Germany 4 4 4
India 12 12 12
Italy 8 10 10
Japan 2 2 2
Russia 6 7 8
South Africa 13 13 13
United Kingdom 7 6 6
United States 1 1 1
3.1.4. Multinational corporations-international joint
schools cellular automata
The model requires four kinds of input data, all data
must have the same data format, the same number of
rows and columns, the same projection and the same
size, data are grid representation.
3.1.5. Location pressure cellular automata
(1) Slope
Terrain is the most basic condition for urban
development. Flat and wide urban areas or suburbs
are more suitable for establishing and building large
multinational companies and international cooperative
schools. The slope level must be a percentage of the
slope value (not the degree slope value), ranging from
0 to 100. The slope usually comes from the Digital
Elevation Model (DEM). The cell below the threshold
is "live-1"; the cell that exceeds the threshold is
"Death-0"
(2) Transportation
Using the binary taxonomy, a cell with a value of 0
indicates that entering a non-urban area is "death 0"
due to inconvenient traffic, and considering any cell
11 greater than 0 as an easily accessible urban area,
the Cell status is " Live-1". Identify urban areas
International Journal of Computational and Engineering98
ACADEMIC PUBLISHING HOUSE
primarily through digital city maps and aerial
photographs, threshold remote sensing images or
population density distribution.
3.1.6. Multinational corporations & international joint
schools
Following a binary taxonomy, cells with a value of
zero represent multinational companies or
international co-op schools that do not have a
language in their area, with a cell status of "death-0"
and any cells greater than 0 are considered local
Language of multinational companies or international
joint schools, cell status is "live-1".
In the development of single-core countries, assuming
that the social pressure in the region is getting closer
to the development center, a simple distance factor is
used to express the overall pressure. However, with
the development of single-core countries and the
increasing population of large cities, employment
pressure will certainly increase, which will promote
the learning and development of second and third
languages. Therefore, as the population of the region
grows, cell pressure will increase:
n
i
Dt
ijr
PopdedP heart
1221
41 (4)
When t is said, the pressure in the department of the
Agent (the main language) indicates the distance
between the centers of the attenuation indices. It also
indicates that the pressure development center
distance and the population-induced pressure increase
weight coefficient density are respectively. r
represents the radius of the neighborhood, Pop
represents the person near the number, and is set to be
equal. The simulation of the sub-battery displays the
distribution of the number of users as a second
language and a third language in a particular region of
the country.
3.1.7. Cellular automaton rules
(1) At the current time, if the number of cells N alive
around one cell is 3.
Then the next time the cell is live.
(2) At the current moment, if the number of cells N
alive around one cell is 2.
Then the next life and death of the cell state remains
unchanged.
(3) In other cases, the cell is dead (ie, the cell turns to
death if it originally lived, but remains unchanged if it
had previously died).
Using Matlab language to represent the above three
alternative rules as shown in equation (5)
32& NNXX (5)
3.2. Multi-Agent Comprehensive Decision Rules
Multi-agent, a smart individual who is active in the
cell. This model attempts to abstract and properly
describe agents, simulating agents in various
languages to detect and react to social environmental
information, and social environmental information
affects behavior. According to the historical statistical
yearbook and GIS data, we set the initial attributes of
each major language agent, and add the primary
language domain of the main language agent, describe
the attribute factions of historical language
development and the convenience of mutual learning
between different factions. Array to save.
(1) In a self-organizing Esperanto distribution system,
the development of language distribution is an
interactive process with the surrounding environment.
In the process, past agents experience agents that act
in the future through interaction with the environment.
The agent search f or the appropriate development
environment can be relocated according to its own
requirements and actual conditions. Population
density and comprehensive assessment coordinates
within and around the area of 31,521 square
kilometers.
k
t
ijk
t
ij
t
ij WFwrE , (6)
𝑟𝑖𝑗𝑡 :is to assess the suitability of the overall
environment of population living at the moment, is
the comprehensive evaluation of the impact factor k;
𝑊𝑘:is the weight of each impact factor, w is a joint
function to calculate the development of each impact
factor; Φ :is the agent's action function. Can be
simplified as
t
ij
t
ij
t
ijij
t
ij PbEbTbSbF 4321 (7)
Where: Sij, Tij, Eij, Pij respectively, service facilities,
traffic accessibility, natural environment and location
pressure factors; b1, b2, b3, b4, reflect the weight of
each impact factor.
The average of Esperanto data over the past five years
was brought into the model to reconstruct the 2005
world population distribution. Since each language
has its own evaluation preferences, this method is
used to obtain the simulation results and actual results
of the data matrix in the subjective preference weight
MCE of the impact factor. The entropy method is
used to correct the weights of various influencing
factors. Entropy is a theoretical measure of
"uncertainty" in information. The larger the amount of
information, the smaller the uncertainty, the smaller
the entropy, and the more stable the weight impact
factor.
Updating the data of three cellular automata,
combined with updated GIS information and policy
information, can simulate the evolution of the agent
over time.
(2) The growth and demise of agents
The integrated social environment affects the cellular
automaton in its own attribute array in 19 languages).
In the simulation, 1. Based on the natural growth rate
of the population, it increases the number of agents
and provides them with initial attributes. According to
the mortality rate of deaths, the population population
system is randomly assigned to the intelligent
population system, and then the regional population
density model system that is fed back to the
intelligent body language is eliminated, and the
International Journal of Computational and Engineering 99
ACADEMIC PUBLISHING HOUSE

corresponding population is reduced. 2. Influence Set
the above social environment rules to determine if the
agent is growing or dying.
(3) Renewing the Cultural Soft Power-Integrated
State Cellular Automata and the International Joint
Schools Cellular Automata (Cellular Automata), with
updated GIS and policy information to simulate the
evolution of agents' Development and evolution.
4. CONCLUSION
According to the CA model and combining with the
data documents, language development is more
sensitive to immigration than other factors, thus the
geographic distributions of these languages change
over this same period of time. But its speed is a little
slower than the condition, as Table 3.
Table 3. Distribution of world languages by area of origin
Area Living languages Number of speakers
Count Percent Total Percent Mean Median
Africa 2144 30.2 887310542 13.4 413858 29000
Americas 1061 14.9 50704628 0.8 47789 1110
Asia 2294 32.3 3981523335 59.9 1735625 12000
Europe 287 4.0 1716625664 25.88 5981274 36400
Pacific 1313 18.5 6873346 0.1 5235 970
Totals 7099 100.0 6643037515 100.0 935771 7000
Model the distribution of various language speakers
over time.
The model is ideal for system modeling with complex
spatiotemporal features. The corresponding cell state
is the state language system involved in the
corresponding language. According to some
conversion rules and time inte to determine rval, we
can simulate the dynamic distribution of the world
language; in order to simulate th over time, we use the
MAS-CA model to simulate different global
languages to use the world language as a proxy to
formulate corresponding attribute rules.
REFERENCES
[1]He M.S. Based on the development trend of
English language to explore the compatibility of
English vocabulary. Essay hundred (new language),
2016 (08): 197-198.
[2]Ke C.Q, Ouyang X.Y. Cellular Automata Models
of Urban Spatial Simulation Research Progress.
Journal of Nanjing University (Natural Science), 2006,
(01).
[3]Jia H.T. China's Comprehensive Assessment of
National Strength and World Ranking: Theory,
Reality and Evaluation Formula. Journal of Nanjing
University of Science and Technology (Social
Science), 2012, 25(05): 116.
[4]Ligtenberg A, Bregt A.K, Lammeren R.
Multi-actor-based land use modeling: spatial planning
using agents. Landscape and Urban Planning. 2001.
[5]Jing N. Prediction of urban population distribution
based on multi-agent and GIS. Graduate School of the
Chinese Academy of Sciences (Guangzhou Institute
of Geochemistry), 2007.
International Journal of Computational and Engineering100
ACADEMIC PUBLISHING HOUSE
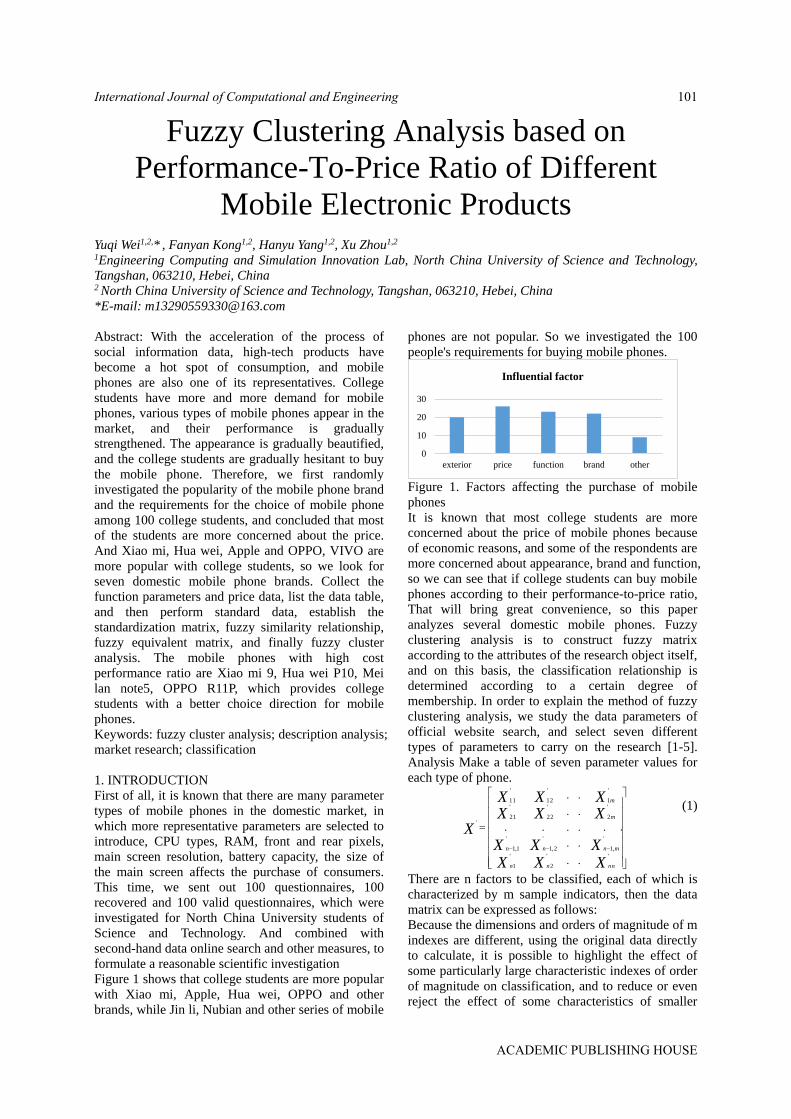
Fuzzy Clustering Analysis based on
Performance-To-Price Ratio of Different
Mobile Electronic Products
Yuqi Wei1,2,* , Fanyan Kong1,2, Hanyu Yang1,2, Xu Zhou1,2
1Engineering Computing and Simulation Innovation Lab, North China University of Science and Technology,
Tangshan, 063210, Hebei, China 2 North China University of Science and Technology, Tangshan, 063210, Hebei, China
*E-mail: [email protected]
Abstract: With the acceleration of the process of
social information data, high-tech products have
become a hot spot of consumption, and mobile
phones are also one of its representatives. College
students have more and more demand for mobile
phones, various types of mobile phones appear in the
market, and their performance is gradually
strengthened. The appearance is gradually beautified,
and the college students are gradually hesitant to buy
the mobile phone. Therefore, we first randomly
investigated the popularity of the mobile phone brand
and the requirements for the choice of mobile phone
among 100 college students, and concluded that most
of the students are more concerned about the price.
And Xiao mi, Hua wei, Apple and OPPO, VIVO are
more popular with college students, so we look for
seven domestic mobile phone brands. Collect the
function parameters and price data, list the data table,
and then perform standard data, establish the
standardization matrix, fuzzy similarity relationship,
fuzzy equivalent matrix, and finally fuzzy cluster
analysis. The mobile phones with high cost
performance ratio are Xiao mi 9, Hua wei P10, Mei
lan note5, OPPO R11P, which provides college
students with a better choice direction for mobile
phones.
Keywords: fuzzy cluster analysis; description analysis;
market research; classification
1. INTRODUCTION
First of all, it is known that there are many parameter
types of mobile phones in the domestic market, in
which more representative parameters are selected to
introduce, CPU types, RAM, front and rear pixels,
main screen resolution, battery capacity, the size of
the main screen affects the purchase of consumers.
This time, we sent out 100 questionnaires, 100
recovered and 100 valid questionnaires, which were
investigated for North China University students of
Science and Technology. And combined with
second-hand data online search and other measures, to
formulate a reasonable scientific investigation
Figure 1 shows that college students are more popular
with Xiao mi, Apple, Hua wei, OPPO and other
brands, while Jin li, Nubian and other series of mobile
phones are not popular. So we investigated the 100
people's requirements for buying mobile phones.
Figure 1. Factors affecting the purchase of mobile
phones
It is known that most college students are more
concerned about the price of mobile phones because
of economic reasons, and some of the respondents are
more concerned about appearance, brand and function,
so we can see that if college students can buy mobile
phones according to their performance-to-price ratio,
That will bring great convenience, so this paper
analyzes several domestic mobile phones. Fuzzy
clustering analysis is to construct fuzzy matrix
according to the attributes of the research object itself,
and on this basis, the classification relationship is
determined according to a certain degree of
membership. In order to explain the method of fuzzy
clustering analysis, we study the data parameters of
official website search, and select seven different
types of parameters to carry on the research [1-5].
Analysis Make a table of seven parameter values for
each type of phone.
.
..
..
.....
..
..
''
2
'
1
'
,1
'
2,1
'
1,1
'
2
'
22
'
21
'
1
'
12
'
11
'
XXXXXX
XXXXXX
X
nnnn
mnnn
m
m
(1)
There are n factors to be classified, each of which is
characterized by m sample indicators, then the data
matrix can be expressed as follows:
Because the dimensions and orders of magnitude of m
indexes are different, using the original data directly
to calculate, it is possible to highlight the effect of
some particularly large characteristic indexes of order
of magnitude on classification, and to reduce or even
reject the effect of some characteristics of smaller
0
10
20
30
exterior price function brand other
Influential factor
International Journal of Computational and Engineering 101
ACADEMIC PUBLISHING HOUSE

order of magnitude [6]. As a result, as long as an
indicator changes the unit, it will also change the
classification results. Therefore, it is necessary to deal
with the original data dimensionless, so that each
index value is unified with a common data
characteristic range. The mean value and standard
deviation, maximum value, minimum value, mean
value and standard deviation of each parameter are
calculated by SPSS.
There are many methods for standardization of
sample data, such as standard deviation
standardization method, maximum normalization
method, extreme deviation standardization method
and mean normalization method. This time, the
standard deviation standardization method is adopted,
and its model is as follows:
j
jij
ij S
xxX
''
(2)
Similarity relation R is a fuzzy measure method to
measure the similarity between samples, and it is a
fuzzy similarity matrix.
rrr
rrrrrr
nnnn
n
n
R
.....
.
.
21
22221
11211
(3)
We use the distance formula method, and its
mathematical model is as follows:
m
kjkikij xxr c
1
2)(1 (4)
Where: C is capable of making 10 rij A constant of,
i, j=1, 2, ...n.
Table 1. Fuzzy similarity relation matrix
1 2 3 4 5 6 7
1 1 0.423 0.4665 0.4647 0.4822 0.624 0.4744
2 0.423 1 0.7933 0.1688 0.1759 0.5086 0.3919
3 0.4665 0.7933 1 0.0102 0.2619 0.2201 0.635
4 0.4647 0.1688 0.0102 1 0.3406 0.2315 0.1534
5 0.4822 0.1759 0.2619 0.3406 1 0.1939 0.4202
6 0.624 0.5086 0.2201 0.2314 0.1939 1 0.3928
7 0.4744 0.3919 0.635 0.1534 0.4202 0.0383 1
In general, the fuzzy similarity relation matrix only
satisfies reflexivity and symmetry, however, in order
to cluster R, it must be fuzzy equivalence relation,
which not only satisfies transitivity, but also needs to
be modified. The method of transformation is to
multiply R by itself 2RRR 422 RRR .
Table 2. Fuzzy equivalence relation matrix
1 2 3 4 5 6 7
1 1 0.6826 0.6826 0.4616 0.521 0.4605 0.7303
2 0.6826 1 0.8011 0.4616 0.521 0.4605 0.6826
3 0.6826 0.8011 1 0.4616 0.521 0.4605 0.6826
4 0.4616 0.4616 0.4616 1 0.4616 0.4605 0.4616
5 0.521 0.521 0.521 0.4616 1 0.4605 0.521
6 0.4605 0.4605 0.4605 0.4605 0.4605 1 0.4605
7 0.7303 0.6826 0.6826 0.4616 0.521 0.4605 1
To get different )10( Horizontal intercept array.
In this study, we selected the 6.0 The lower
intercept array.
Table 3. Intercept matrices of fuzzy equivalent
matrices
1 1 1 0 0 0 1
1 1 1 0 0 0 1
1 1 1 0 0 0 1
0 0 0 1 0 0 0
0 0 0 0 1 0 0
0 0 0 0 0 1 0
1 1 1 0 0 0 1
As can be seen from table 6, when 6.0 Mobile
phone brands can be divided into four categories, {1,
2, 3, 7}, {4}, {5}, {6}.Therefore, we can see that
Xiaomi 9, Huawei p10, Mei lan note5, OPPO R11P
performance-price ratio is similar, these four brands
are domestic hot brands, and are liked by the majority
of consumers, so our analysis is reasonable and
scientific.
2. CONCLUSIONS
The advantages of fuzzy clustering analysis method:
the advantage of cluster analysis model is
intuitionistic and the conclusion form is concise.
Disadvantages: when the sample size is large, it is
difficult to obtain the clustering conclusion.
According to the market research, we analyze that the
biggest hindrance to the choice of mobile phone for
college students is the price problem. For college
students, they have no source of income and can only
live with their parents’ money, so the
performance-price ratio is very important to college
students. We used cluster analysis method to analyze
several kinds of domestic mobile phones. Finally, we
divided them into four categories: Xiao mi 6, Hua wei
p10, Mei lan note5, OPPO R11P, which have high
performance price, Nu bi ya z17, one plus five.
International Journal of Computational and Engineering102
ACADEMIC PUBLISHING HOUSE

Although the configuration parameters of Jinli s10 are
also good, the price is too high and the performance
price is a little lower, so if you want to buy it A
mobile phone with a high cost-effective value can be
selected in Xiao mi 9, Hua wei p10, and the Mei lan
note5, OPPO R11P. It can also be seen from FIG.1
that the college students are fonder of the four brands,
so the rationality of the fuzzy clustering analysis is
verified.
REFERENCES
[1]Chen W.Y, Song Y.Q, Bai H.J, et al. Parallel
spectral clustering in distributed systems. IEEE
Transactions on Pattern Analysis and Machine
Intelligence, 2010, 33(3).
[2]Li J, Cheng J.L, A new algorithm of fuzzy
clustering based on feature weighting. High-tech
wave, Electronics. 2006 (01).
[3]Kwong S, Liu H.Y. Fuzzy cluster analysis of urban
housing construction in China. Journal of Tsinghua
University (Natural Science Edition). 1989, (05).
[4]Uykan Z, Güzeliş C, Celebi M.E, et al..Analysis of
input-output clustering for determining centers of
RBFN. IEEE Transactions on Neural Networks, 2008,
11(4).
[5]Xu A.P, Xu W.P. Fuzzy clustering research based
on self-organized competition neural network
technology. Computer engineering and science. 2006,
(11).
[6]Zhang Y, Song W.Y. Fuzzy cluster analysis method
in graduate enrollment. Zeng Literature and Art,
Journal of Beijing normal University (Natural Science
Edition). 2001, (04).
International Journal of Computational and Engineering 103
ACADEMIC PUBLISHING HOUSE
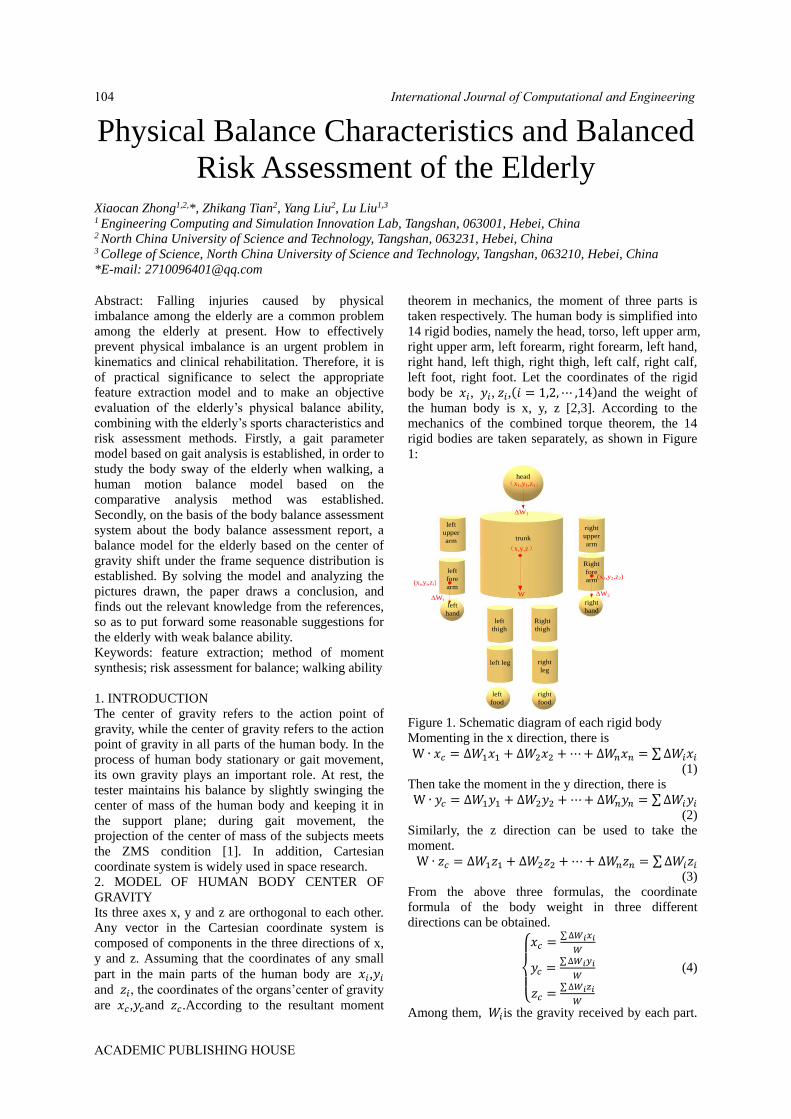
Physical Balance Characteristics and Balanced
Risk Assessment of the Elderly
Xiaocan Zhong1,2,*, Zhikang Tian2, Yang Liu2, Lu Liu1,3
1 Engineering Computing and Simulation Innovation Lab, Tangshan, 063001, Hebei, China 2 North China University of Science and Technology, Tangshan, 063231, Hebei, China 3 College of Science, North China University of Science and Technology, Tangshan, 063210, Hebei, China
*E-mail: [email protected]
Abstract: Falling injuries caused by physical
imbalance among the elderly are a common problem
among the elderly at present. How to effectively
prevent physical imbalance is an urgent problem in
kinematics and clinical rehabilitation. Therefore, it is
of practical significance to select the appropriate
feature extraction model and to make an objective
evaluation of the elderly’s physical balance ability,
combining with the elderly’s sports characteristics and
risk assessment methods. Firstly, a gait parameter
model based on gait analysis is established, in order to
study the body sway of the elderly when walking, a
human motion balance model based on the
comparative analysis method was established.
Secondly, on the basis of the body balance assessment
system about the body balance assessment report, a
balance model for the elderly based on the center of
gravity shift under the frame sequence distribution is
established. By solving the model and analyzing the
pictures drawn, the paper draws a conclusion, and
finds out the relevant knowledge from the references,
so as to put forward some reasonable suggestions for
the elderly with weak balance ability.
Keywords: feature extraction; method of moment
synthesis; risk assessment for balance; walking ability
1. INTRODUCTION
The center of gravity refers to the action point of
gravity, while the center of gravity refers to the action
point of gravity in all parts of the human body. In the
process of human body stationary or gait movement,
its own gravity plays an important role. At rest, the
tester maintains his balance by slightly swinging the
center of mass of the human body and keeping it in
the support plane; during gait movement, the
projection of the center of mass of the subjects meets
the ZMS condition [1]. In addition, Cartesian
coordinate system is widely used in space research.
2. MODEL OF HUMAN BODY CENTER OF
GRAVITY
Its three axes x, y and z are orthogonal to each other.
Any vector in the Cartesian coordinate system is
composed of components in the three directions of x,
y and z. Assuming that the coordinates of any small
part in the main parts of the human body are 𝑥𝑖,𝑦𝑖 and 𝑧𝑖, the coordinates of the organs’center of gravity
are 𝑥𝑐,𝑦𝑐and 𝑧𝑐.According to the resultant moment
theorem in mechanics, the moment of three parts is
taken respectively. The human body is simplified into
14 rigid bodies, namely the head, torso, left upper arm,
right upper arm, left forearm, right forearm, left hand,
right hand, left thigh, right thigh, left calf, right calf,
left foot, right foot. Let the coordinates of the rigid
body be 𝑥𝑖, 𝑦𝑖, 𝑧𝑖,(𝑖 = 1,2,⋯ ,14)and the weight of
the human body is x, y, z [2,3]. According to the
mechanics of the combined torque theorem, the 14
rigid bodies are taken separately, as shown in Figure
1:
(xi,yi,zi)
head
trunk
left
upper
arm
left
fore
arm
left
hand
right
hand
right
upper
arm
Right
fore
arm
left
thigh
Right
thigh
left leg right
leg
left
food
right
food
W
(x,y,z)
ΔW1
(x1,y1,z1)
ΔW2
(x2,y2,z2)
ΔWi
Figure 1. Schematic diagram of each rigid body
Momenting in the x direction, there is
W ∙ 𝑥𝑐 = ∆𝑊1𝑥1 + ∆𝑊2𝑥2 +⋯+ ∆𝑊𝑛𝑥𝑛 = ∑∆𝑊𝑖𝑥𝑖
(1)
Then take the moment in the y direction, there is
W ∙ 𝑦𝑐 = ∆𝑊1𝑦1 + ∆𝑊2𝑦2 +⋯+ ∆𝑊𝑛𝑦𝑛 = ∑∆𝑊𝑖𝑦𝑖
(2)
Similarly, the z direction can be used to take the
moment.
W ∙ 𝑧𝑐 = ∆𝑊1𝑧1 + ∆𝑊2𝑧2 +⋯+ ∆𝑊𝑛𝑧𝑛 = ∑∆𝑊𝑖𝑧𝑖
(3)
From the above three formulas, the coordinate
formula of the body weight in three different
directions can be obtained.
{
𝑥𝑐 =
∑∆𝑊𝑖𝑥𝑖
𝑊
𝑦𝑐 =∑∆𝑊𝑖𝑦𝑖
𝑊
𝑧𝑐 =∑∆𝑊𝑖𝑧𝑖
𝑊
(4)
Among them, 𝑊𝑖is the gravity received by each part.
International Journal of Computational and Engineering104
ACADEMIC PUBLISHING HOUSE
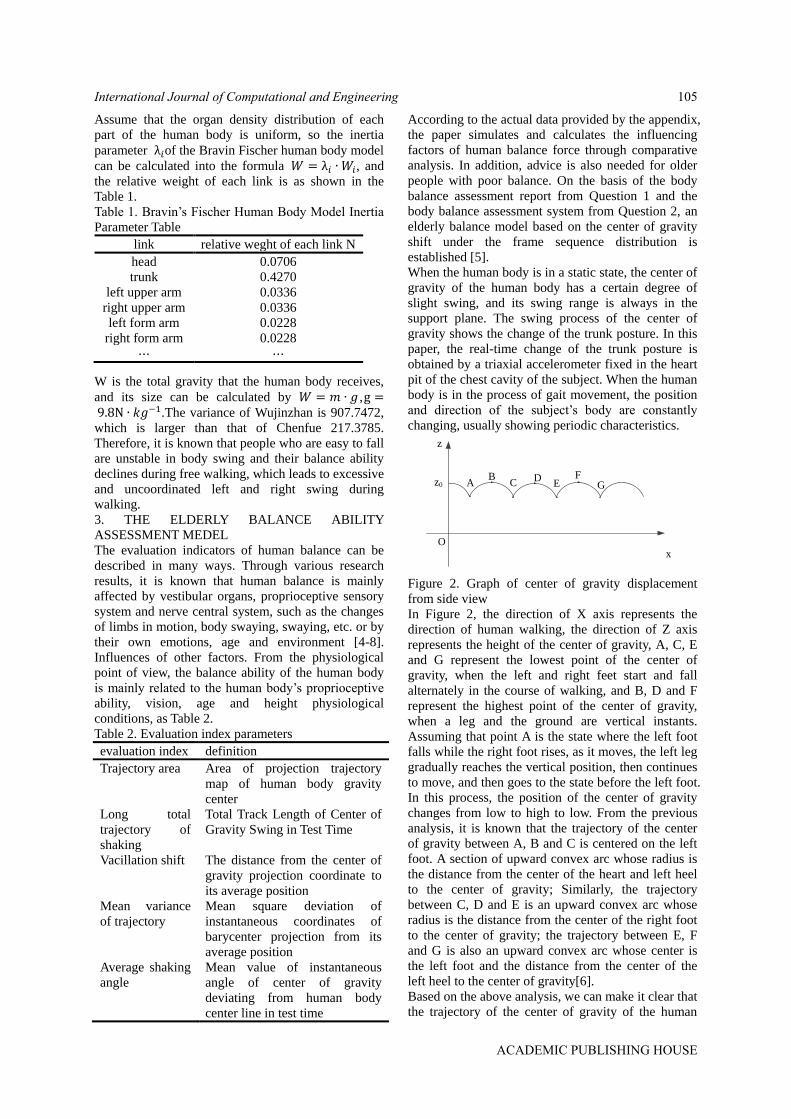
Assume that the organ density distribution of each
part of the human body is uniform, so the inertia
parameter λ𝑖of the Bravin Fischer human body model
can be calculated into the formula 𝑊 = λ𝑖 ∙ 𝑊𝑖, and
the relative weight of each link is as shown in the
Table 1.
Table 1. Bravin’s Fischer Human Body Model Inertia
Parameter Table
link relative weght of each link N
head 0.0706
trunk 0.4270
left upper arm 0.0336
right upper arm 0.0336
left form arm 0.0228
right form arm 0.0228
⋯ ⋯
W is the total gravity that the human body receives,
and its size can be calculated by 𝑊 = 𝑚 ∙ 𝑔 ,g = 9.8N ∙ 𝑘𝑔−1.The variance of Wujinzhan is 907.7472,
which is larger than that of Chenfue 217.3785.
Therefore, it is known that people who are easy to fall
are unstable in body swing and their balance ability
declines during free walking, which leads to excessive
and uncoordinated left and right swing during
walking.
3. THE ELDERLY BALANCE ABILITY
ASSESSMENT MEDEL
The evaluation indicators of human balance can be
described in many ways. Through various research
results, it is known that human balance is mainly
affected by vestibular organs, proprioceptive sensory
system and nerve central system, such as the changes
of limbs in motion, body swaying, swaying, etc. or by
their own emotions, age and environment [4-8].
Influences of other factors. From the physiological
point of view, the balance ability of the human body
is mainly related to the human body’s proprioceptive
ability, vision, age and height physiological
conditions, as Table 2.
Table 2. Evaluation index parameters
evaluation index definition
Trajectory area Area of projection trajectory
map of human body gravity
center
Long total
trajectory of
shaking
Total Track Length of Center of
Gravity Swing in Test Time
Vacillation shift The distance from the center of
gravity projection coordinate to
its average position
Mean variance
of trajectory
Mean square deviation of
instantaneous coordinates of
barycenter projection from its
average position
Average shaking
angle
Mean value of instantaneous
angle of center of gravity
deviating from human body
center line in test time
According to the actual data provided by the appendix,
the paper simulates and calculates the influencing
factors of human balance force through comparative
analysis. In addition, advice is also needed for older
people with poor balance. On the basis of the body
balance assessment report from Question 1 and the
body balance assessment system from Question 2, an
elderly balance model based on the center of gravity
shift under the frame sequence distribution is
established [5].
When the human body is in a static state, the center of
gravity of the human body has a certain degree of
slight swing, and its swing range is always in the
support plane. The swing process of the center of
gravity shows the change of the trunk posture. In this
paper, the real-time change of the trunk posture is
obtained by a triaxial accelerometer fixed in the heart
pit of the chest cavity of the subject. When the human
body is in the process of gait movement, the position
and direction of the subject’s body are constantly
changing, usually showing periodic characteristics.
Ox
z
z0 AB
C DE
FG
Figure 2. Graph of center of gravity displacement
from side view In Figure 2, the direction of X axis represents the
direction of human walking, the direction of Z axis
represents the height of the center of gravity, A, C, E
and G represent the lowest point of the center of
gravity, when the left and right feet start and fall
alternately in the course of walking, and B, D and F
represent the highest point of the center of gravity,
when a leg and the ground are vertical instants.
Assuming that point A is the state where the left foot
falls while the right foot rises, as it moves, the left leg
gradually reaches the vertical position, then continues
to move, and then goes to the state before the left foot.
In this process, the position of the center of gravity
changes from low to high to low. From the previous
analysis, it is known that the trajectory of the center
of gravity between A, B and C is centered on the left
foot. A section of upward convex arc whose radius is
the distance from the center of the heart and left heel
to the center of gravity; Similarly, the trajectory
between C, D and E is an upward convex arc whose
radius is the distance from the center of the right foot
to the center of gravity; the trajectory between E, F
and G is also an upward convex arc whose center is
the left foot and the distance from the center of the
left heel to the center of gravity[6].
Based on the above analysis, we can make it clear that
the trajectory of the center of gravity of the human
International Journal of Computational and Engineering 105
ACADEMIC PUBLISHING HOUSE

body is a spatial curve in the course of walking.
Assuming that people move along a straight line, and
the characteristics of each cycle are the same,
according to this characteristic, we can try to establish
a mathematical model for it.
4. ANALYSIS OF VARIANCEMODEL OF
HOMEOSTASIS
In the past statistical analysis, variance analysis has
become a widely used means of data analysis because
of its effectiveness and accuracy. Based on this, we
can take walking speed as the impact of gait
symmetry and regularity as the research target, and
use one-way ANOVA model to analyze variance.
One-way ANOVA model is as follows:
𝑌𝑖 = 𝜎 + 𝜇𝑖 + 𝜀𝑖𝑛 (5)
Among them, 𝜎 represents the mean value of gait
indicators, 𝜇𝑖 represents the additional effect of gait
symmetry and regularity indicators in 𝑖(𝑖 =1, ,2,⋯ , 𝑛)class, 𝜀𝑖𝑛 is random error obeying normal
distribution, andn is joint number.
In the process of human gait movement, human
dynamic balance ability plays a fundamental role. In
reference [7], it can be known that dynamic balance
refers to the ability of the human body to adjust and
maintain this posture automatically under different
walking speeds, different road conditions or
disturbances. Among them, Zero Moment Point (ZMP)
is widely used in relevant professional field, as Figure
3.
Figure 3. Dynamic changes of human walking
The zero-moment point was first proposed by
Vukobratovic et al. in the late 1970s, which can be
understood as an equivalent point of zero resultant
moment in the support surface. When the human body
is in gait motion, under the influence of inertia, the
ground projection of the center of gravity has the
possibility of escaping from the support surface, but
as long as the ZMP point remains in the support
surface, the human body can maintain dynamic
balance. The ZMP formula is as follows:
ZMP =∑[𝑚𝑖�̅�𝑙(�̅�𝑙
′+𝑔)−𝑚𝑖�̅�𝑙�̅�𝑙′+𝐿𝑧,𝑖]
∑𝑚𝑖(�̅�𝑙′+𝑔)
(6)
In the formula,�̅�𝑖、�̅�𝑖、�̅�𝑖′、�̅�𝑖
′enotes the position and
acceleration of the center of gravity on limb i,
respectively. 𝐿𝑧,𝑖 is the differential of the angular
momentum of each limb in the vertical direction with
respect to time, that is, the rate of angular momentum
change. ZMP is a rule that human gait movement
must obey. It can be calculated by the main joint parts
and get its score. The higher the score, the stronger
the balance ability, and vice versa, the weaker the
balance ability.
5. MODEL SENSITIVITY VERIFICATION
Sensitivity analysis is to ensure that the predicted
value of the model does not deviate from the expected
value. If the difference is too large, it means that it
needs to be improved. In addition, it can ensure that
the model and the assumptions are fully coordinated.
Based on this, sensitivity analysis is carried out and
the results are as follows Table 3:
Table 3. Changes in two factors under different
conditions
conditions 𝛼𝑖increase10% 𝛼𝑖decrease10%
𝛽𝑖 -0.118 0.139
conditions 𝛽𝑖increase10% 𝛽𝑖decrease10%
𝛼𝑖 -0.103 0.124
It can be seen from the above table that the sensitivity
order of these two factors is 𝛼𝑖 < 𝛽𝑖, which indicates
that𝛽𝑖 has a significant effect on the balance of the
elderly. Therefore, we can draw a conclusion that the
model is more accurate.
6. EVALUATION
According to the literature on human balance ability,
the balance ability of the elderly is not only closely
related to their age, but also includes changes in
muscle strength, decreased joint flexibility, visual
impairment, vestibular dysfunction, and decreased
sense of vibration [8]. Exercise can delay the decline
of balance. Research shows that long-term and
continuous practice of Taijiquan, Taiji flexibility ball,
strong walking and mountain climbing can help
prevent the decline of standing ability on one foot,
and can prevent the decline of balance function to a
certain extent. These sports have a certain effect on
maintaining and improving the balance function of
the upright posture of the elderly. Therefore, it is
suggested that the elderly should actively participate
in these projects which are of great help to the balance
ability of the human body, so as to reduce the
probability of falls of the elderly to a certain extent.
REFERENCES
[1]Wang B.M. Research on the evaluation of human
balance ability and the predicitin effect of fall risk
based on the balancer. Northeast Normal University,
2018.
[2]Kawanabe K, Kawashima A, Sashimoto I, et al.
Effect of whole-body vibration exercise and muscle
strengthening, balance, and walking exercises on
walking ability in the elderly. Keio J Med, 2007,
56(1): 28.
[3]Huang P, Zhong M.H, Chen B, Qian N.D.
Three-dimensional gait analysis in normal young
adults: temporal, kinematic and mechanical
parameters. Tissue Engineering Research in China,
2015, 19(24): 3882-3888.
[4]Xie Y.X, Bai W, Zhang Y. Research Status and
Trend of Lower Limb Rehabilitation Training Robot.
China Medical Device Information, 2010, 16(02):
5-8+56.
[5]Giaquinto S, Galli M, Nolfe G. A polynomial
function of gait performance. Funct Neurol. 2007,
International Journal of Computational and Engineering106
ACADEMIC PUBLISHING HOUSE

22(1): 43-46.
[6]Zhang Z.H. Study on the Body Balance Ability and
Fall Risk of the Elderly in China. Summary of Papers
of the 20th National Academic Exchange Conference
on Sports Biomechanics. Sports Biomechanics
Branch of Chinese Sports Science Society, 2018, 3.
[7]Xiang J, Xu F.Y. Research Progress of Gait
Analysis in Clinical Rehabilitation. Modern medicine
and health, 2014, 30(22): 3411-3413.
[8]Shan R.S, Huang G.Z, Zeng Q, Huang X.H.
Effects of gait triggered functional electrical
stimulation on temporal-spatial parameters of gait in
foot drop patients after stroke. Chinese Journal of
Rehabilitation Medicine, 2013, 28(06): 558-563.
International Journal of Computational and Engineering 107
ACADEMIC PUBLISHING HOUSE

Groundwater Numerical Simulation and
Environmental Capacity Analysis of
Petroleum Industry Based on Modflow
Cancan Zhang
School of Water Resources and Environment, Hebei Geo University, Hebei, 050031, China
E-mail:[email protected]
Abstract: With the integrated development of the
Beijing-Tianjin-Hebeiregion,the petroleum industry in
coastal cities has gradually increased. Langfang is an
important base for the petroleum industry in North
China, and its petroleum base is abundant. However,
“running and leaking” in the exploitation of the
petroleum industry poses a serious threat to
groundwater pollution. Taking a gas station in
Langfang as an example, this paper uses GMS
software to establish a three-dimensional visual
hydrogeological model, and through the MT3DMS
solute transport module, to determine the damage
caused to the groundwater caused by the leakage of
oil in the process of utilization. The results show that
under normal conditions, due to the poor diffusion
ability of groundwater aquifers in the study area, the
impact on surrounding groundwater will continue to
affect for a certain period of time, and the
environmental capacity of petroleum will gradually
decrease from northeast to southwest.
Keywords: numerical simulation; groundwater;
pollutant transport; environmental capacity
1. INTRODUCTION
Petroleum industry is the main supplier of energy and
it plays an important role in the development of
national economy [1-3]. Petroleum and its processed
products not only bring many conveniences to
people's life, but also cause certain pollution to the
surrounding groundwater [4-6]. The leakage of oil
industry under accident scenario is the main form of
groundwater pollution. Numerical simulation can be
used to accurately predict the possible pollution scope
and degree of surrounding groundwater caused by oil
tank leakage and the environmental capacity of
groundwater oil, providing theoretical basis for
groundwater pollution prevention and control [7-9].
2. EXAMPLES OF GROUNDWATER
ENVIRONMENTAL PROTECTION
MODFLOW is a set of three-dimensional finite
difference numerical simulation software specially
developed by the United States geological survey in
the 1980s for groundwater flow in pore media [10]. It
is widely used to simulate the effects of well flow,
rivers, drainage, evaporation, and recharge on
heterogeneous and complex boundary condition flow
systems. MT3DMS is a three-dimensional solute
transport model simulating convection, dispersion and
chemical reactions in groundwater systems. In the
simulation calculation, MT3DMS should be used
together with MODFLOW [11].
2.1. General Situation of the Study Area
The study area is located in the south of Langfang city,
bordering Tianjin in the east, Bazhou in the west,
Cangzhou in the south and Langfang in the north. The
terrain of the region is low and flat, with the ground
elevation generally ranging from 5 to 7m and the
ground slope less than 1/10000. It is located in the
low plain of Hebei plain in China.
The surface is formed by the alluvial accumulation of
Yongdingriver, and the main landform types are
gentle hills, slopes and depressions formed by the
alluvial accumulation. The small landform types
include gentle hills, sloping lands, low flat lands and
shallow depressions, as well as local dune residues
such as river sand beach [12].
2.2. Hydrogeological Conditions
The direction of groundwater flow field in the study
area is from northwest to southeast. The area is
located in the alluvial plain, with hydraulic gradient
less than 1/1000.Its runoff is slow and the water
quality is poor, mostly salt water.Shallow
groundwater isⅠandⅡwater group, which is diving
and micro artesian water. Its buried depth is within
130-160m, and its aquifer thickness is 20-50m. Its
lithology is mainly medium fine sand and coarse sand,
with a unit inflow of 10-15m3/ h·m, and the
groundwater type is HCO3-MgCa water.Deep
groundwater is Ⅲ and Ⅳ water group, and the
lithology is fine sand, medium sand and coarse sand
with gravel. Itsunit water inflow is 15-30m3 / h·m,and
its buried depth is 310-550m. The aquifer is 75-175m
thick with a unit inflow of 5-30m3/ h·m, and the
groundwater type is HCO3-Na water. The study is
given priority to with shallow waterwhich is supplied
mainly by precipitation, and it is consumed by
evaporation. It is dominated by salt water, so it is
undrinkable and unirrigated. Due to insufficient
exploitation and utilization at present, groundwater
dynamics are mostly in a natural state. Therefore, the
equilibrium elements of shallow groundwater mainly
include atmospheric rainfall infiltration recharge,
lateral boundary recharge, evaporation discharge and
lateral runoff discharge [13].
International Journal of Computational and Engineering108
ACADEMIC PUBLISHING HOUSE

According to the pumping test study [14-15], the
permeability coefficient range in the study area is
5-10m/d. According to the test of porosity, the
porosity of mucky clay is 0.12. Its porosity of silty
clay is 0.18, and the porosity of floury soil is 0.21. Its
longitudinal dispersion is 6.2.
2.3. Numerical Simulation
2.3.1. Flow model
Three dimensional groundwater flow system can be
described by the definite solution of the following
differential equation: 𝜕
𝜕𝑥(𝑘𝑥𝑥
𝜕𝐻
𝜕𝑥) +
𝜕
𝜕𝑦(𝑘𝑦𝑦
𝜕𝐻
𝜕𝑦) +
𝜕
𝜕𝑧(𝑘𝑧𝑧
𝜕𝐻
𝜕𝑧) + w =
0,(𝑥, 𝑦, 𝑧) ∈ Ω
𝐻(𝑥, 𝑦, 𝑧) = 𝐻1,(𝑥, 𝑦, 𝑧) ∈ 𝑆1
𝐾𝜕𝐻
𝜕𝑛|𝑆2 = q(x, y, z),(x, y, z) ∈ 𝑆2
(1)
Where, Ω stands forGroundwater seepage area;
H1 stands for designated water level,m;
S1 stands for boundary of the first kind;
S2 stands for boundary of the second kind;
Kxx, Kyy, Kzz stand for Permeability coefficients in
the x, y, and z principal directions, m/d;
W stands for Source sink term, and it includes
evaporation, rainfall infiltration supply and well
drainage, m3/d;
q(x,y,z) stands for the flow at different locations on
the boundary, m3/d; 𝜕𝐻
𝜕𝑛standsfor the component of the hydraulic gradient
on the boundary normal.
2.3.2. Water quality model
Three-dimensional mathematical model of water
quality uses theconvection-dispersion equation to
describe the migration of pollutants in
three-dimensional groundwater flow.The
mathematical model of NAPLs migration dissolved in
groundwater can be expressed as follows: 𝜕𝐶
𝜕𝑡=
𝜕
𝜕𝑥(𝐷𝑥𝑥
𝜕𝐶
𝜕𝑥) +
𝜕
𝜕𝑦(𝐷𝑦𝑦
𝜕𝐶
𝜕𝑦) +
𝜕
𝜕𝑧(𝐷𝑧𝑧
𝜕𝐶
𝜕𝑧)
−𝜕(𝜇𝑥𝑐)
𝜕𝑥−
𝜕(𝜇𝑦𝑐)
𝜕𝑦−
𝜕(𝜇𝑧𝑐)
𝜕𝑧+ 𝑓
C(𝑥, 𝑦, 𝑧, 0) = 𝐶0(𝑥, 𝑦, 𝑧)(𝑥, 𝑦, 𝑧) ∈ Ω , 𝑡 = 0 (2)
Where, the first three on the right stand for dispersion
items, and the next three terms stand for convection
items. f stands for an increment of solute produced by
a chemical reaction or adsorption; Dxx; Dyy; Dzzstand
for dispersion coefficients in the x, y and z directions;
μx; μy; μzstand for the actual flow velocity in the x, y,
and z directions; C stands for the solute concentration,
mg/L; Ω stands for the region of the seepage of the
solute; C0 stands for the initial concentration, mg/L.
Based on the numerical model of groundwater
seepage which has been identified and tested, couple
pollutant transport equation. Then the solute transport
model of groundwater can be obtained [16-17].
2.4. Predicted Results
This project adopts double-layer oil tank for oil
storage. The outer wall of oil tank is reinforced with
glass fiber reinforced plastics, and the inner wall of
oil tank is made of steel. Tank tank adopts concrete
structure. Under normal operation, there will be no oil
product leakage, which may be caused by
emergencies and accidents such as geological collapse,
old equipment corrosion, etc. This project is aimed at
the prediction of groundwater environmental impact
under the accident state.The accident status of similar
projects is set as shown in table
Table 1. Oil tank leakage accident scene setting
Storage tank Number of
tanks
The material of
tank
The volume of
a tank
Degree of
filling Reserves Leakage The proportion
Diesel fuel tank 2 Double steel 30m3/ tank 90% 45.36t 45.36kg/d 0.1%
The petrol tank 2 Double steel 30m3/ tank 90% 39.96t 39.96kg/d 0.1%
MT3DMS software was used to simulate and
calculate the migration distance, overrun range and
influence range of petroleum in different time periods.
The scope of petroleum exceeding the standard shall
refer to the requirements in Sanitary standards for
drinking water(GB 5649-2006), and the lower limit of
petroleum detection shall refer to the lower limit of
conventional instrument detection. Details are shown
in table 2.
Table 2. List of evaluation factors and evaluation
criteria
The evaluation factors Petroleum
Quality standard (mg/L) 0.3
Detection range (mg/L) 0.01
In all the following simulated predictions, the black
line indicates that the oil concentration exceeds the
water quality standard limit (Excess range), and color
slants red to indicate exceed bid more serious. The
range within the red line indicates that the pollutant
concentration can be detected (the influence range).
Numerical simulation and prediction of groundwater
pollution are carried out for the pollution point
sources in gas stations in different production periods
according to the set pollution source intensity. The
results of groundwater environmental pollution are
shown in figure 1-4 and table 3.
Table 3. Groundwater oil pollution prediction result chart
Time(d) Maximum superbid
distance(m)
Scope of pollution
(m2)
Maximum concentration of pollution
halo(mg/L)
Maximum depth of
contamination (m)
100 18 956 0.002 5
1000 126 7442 0.010 12
International Journal of Computational and Engineering 109
ACADEMIC PUBLISHING HOUSE
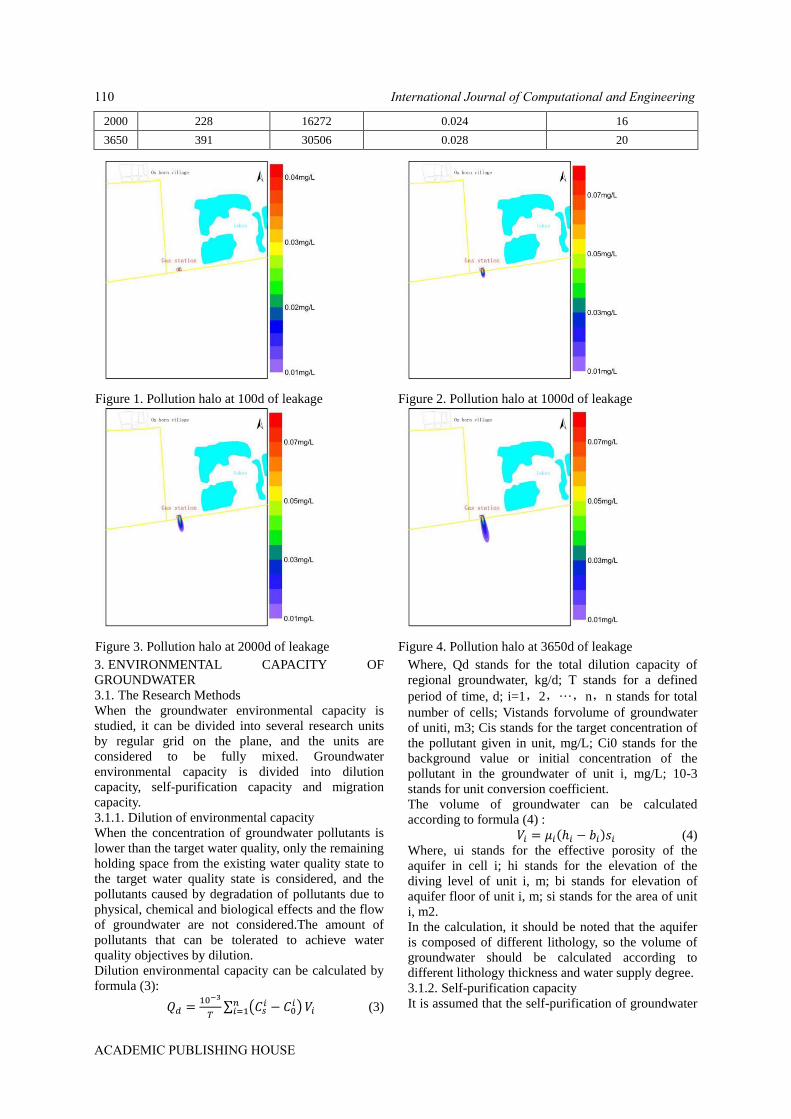
2000 228 16272 0.024 16
3650 391 30506 0.028 20
3. ENVIRONMENTAL CAPACITY OF
GROUNDWATER
3.1. The Research Methods
When the groundwater environmental capacity is
studied, it can be divided into several research units
by regular grid on the plane, and the units are
considered to be fully mixed. Groundwater
environmental capacity is divided into dilution
capacity, self-purification capacity and migration
capacity.
3.1.1. Dilution of environmental capacity
When the concentration of groundwater pollutants is
lower than the target water quality, only the remaining
holding space from the existing water quality state to
the target water quality state is considered, and the
pollutants caused by degradation of pollutants due to
physical, chemical and biological effects and the flow
of groundwater are not considered.The amount of
pollutants that can be tolerated to achieve water
quality objectives by dilution.
Dilution environmental capacity can be calculated by
formula (3):
𝑄𝑑 =10−3
𝑇∑ (𝐶𝑠
𝑖 − 𝐶0𝑖)𝑛
𝑖=1 𝑉𝑖 (3)
Where, Qd stands for the total dilution capacity of
regional groundwater, kg/d; T stands for a defined
period of time, d; i=1,2,···,n,n stands for total
number of cells; Vistands forvolume of groundwater
of uniti, m3; Cis stands for the target concentration of
the pollutant given in unit, mg/L; Ci0 stands for the
background value or initial concentration of the
pollutant in the groundwater of unit i, mg/L; 10-3
stands for unit conversion coefficient.
The volume of groundwater can be calculated
according to formula (4) :
𝑉𝑖 = 𝜇𝑖(ℎ𝑖 − 𝑏𝑖)𝑠𝑖 (4)
Where, ui stands for the effective porosity of the
aquifer in cell i; hi stands for the elevation of the
diving level of unit i, m; bi stands for elevation of
aquifer floor of unit i, m; si stands for the area of unit
i, m2.
In the calculation, it should be noted that the aquifer
is composed of different lithology, so the volume of
groundwater should be calculated according to
different lithology thickness and water supply degree.
3.1.2. Self-purification capacity
It is assumed that the self-purification of groundwater
Figure 1. Pollution halo at 100d of leakage Figure 2. Pollution halo at 1000d of leakage
Figure 3. Pollution halo at 2000d of leakage Figure 4. Pollution halo at 3650d of leakage
International Journal of Computational and Engineering110
ACADEMIC PUBLISHING HOUSE
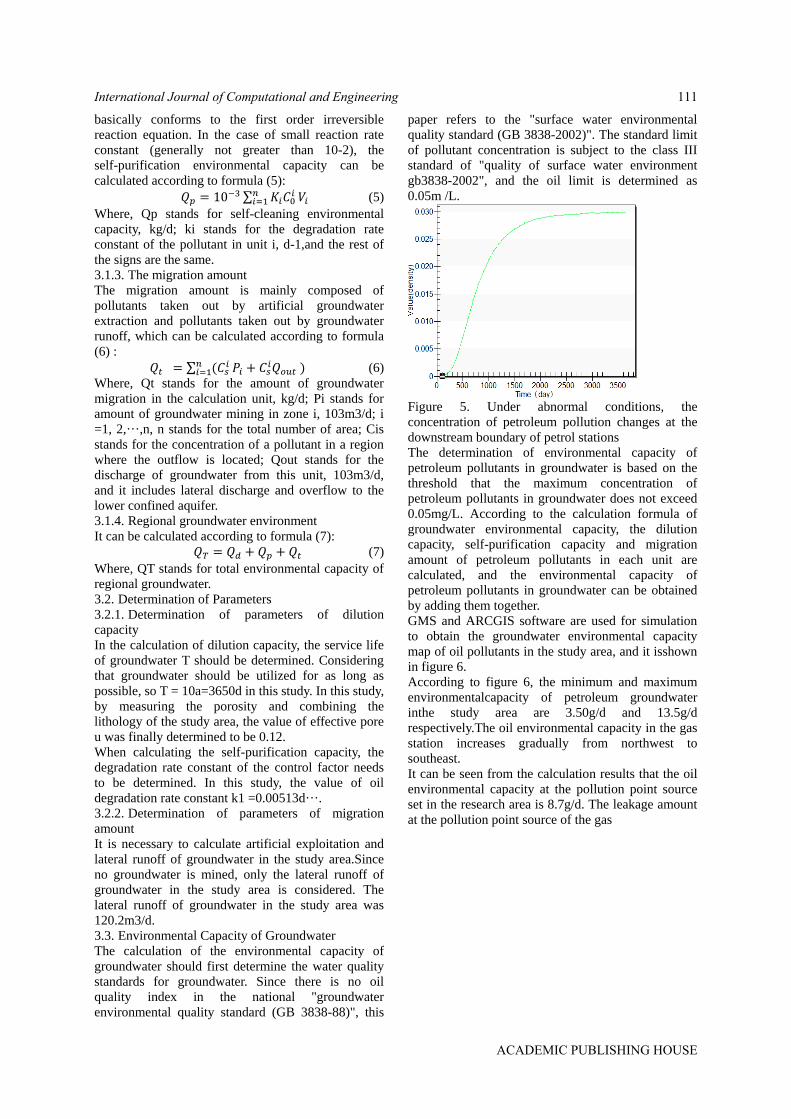
basically conforms to the first order irreversible
reaction equation. In the case of small reaction rate
constant (generally not greater than 10-2), the
self-purification environmental capacity can be
calculated according to formula (5):
𝑄𝑝 = 10−3 ∑ 𝐾𝑖𝐶0𝑖𝑛
𝑖=1 𝑉𝑖 (5)
Where, Qp stands for self-cleaning environmental
capacity, kg/d; ki stands for the degradation rate
constant of the pollutant in unit i, d-1,and the rest of
the signs are the same.
3.1.3. The migration amount
The migration amount is mainly composed of
pollutants taken out by artificial groundwater
extraction and pollutants taken out by groundwater
runoff, which can be calculated according to formula
(6) :
𝑄𝑡 = ∑ (𝐶𝑠𝑖𝑛
𝑖=1 𝑃𝑖 + 𝐶𝑠𝑖𝑄𝑜𝑢𝑡 ) (6)
Where, Qt stands for the amount of groundwater
migration in the calculation unit, kg/d; Pi stands for
amount of groundwater mining in zone i, 103m3/d; i
=1, 2,···,n, n stands for the total number of area; Cis
stands for the concentration of a pollutant in a region
where the outflow is located; Qout stands for the
discharge of groundwater from this unit, 103m3/d,
and it includes lateral discharge and overflow to the
lower confined aquifer.
3.1.4. Regional groundwater environment
It can be calculated according to formula (7):
𝑄𝑇 = 𝑄𝑑 + 𝑄𝑝 + 𝑄𝑡 (7)
Where, QT stands for total environmental capacity of
regional groundwater.
3.2. Determination of Parameters
3.2.1. Determination of parameters of dilution
capacity
In the calculation of dilution capacity, the service life
of groundwater T should be determined. Considering
that groundwater should be utilized for as long as
possible, so T = 10a=3650d in this study. In this study,
by measuring the porosity and combining the
lithology of the study area, the value of effective pore
u was finally determined to be 0.12.
When calculating the self-purification capacity, the
degradation rate constant of the control factor needs
to be determined. In this study, the value of oil
degradation rate constant k1 =0.00513d···.
3.2.2. Determination of parameters of migration
amount
It is necessary to calculate artificial exploitation and
lateral runoff of groundwater in the study area.Since
no groundwater is mined, only the lateral runoff of
groundwater in the study area is considered. The
lateral runoff of groundwater in the study area was
120.2m3/d.
3.3. Environmental Capacity of Groundwater
The calculation of the environmental capacity of
groundwater should first determine the water quality
standards for groundwater. Since there is no oil
quality index in the national "groundwater
environmental quality standard (GB 3838-88)", this
paper refers to the "surface water environmental
quality standard (GB 3838-2002)". The standard limit
of pollutant concentration is subject to the class III
standard of "quality of surface water environment
gb3838-2002", and the oil limit is determined as
0.05m /L.
Figure 5. Under abnormal conditions, the
concentration of petroleum pollution changes at the
downstream boundary of petrol stations
The determination of environmental capacity of
petroleum pollutants in groundwater is based on the
threshold that the maximum concentration of
petroleum pollutants in groundwater does not exceed
0.05mg/L. According to the calculation formula of
groundwater environmental capacity, the dilution
capacity, self-purification capacity and migration
amount of petroleum pollutants in each unit are
calculated, and the environmental capacity of
petroleum pollutants in groundwater can be obtained
by adding them together.
GMS and ARCGIS software are used for simulation
to obtain the groundwater environmental capacity
map of oil pollutants in the study area, and it isshown
in figure 6.
According to figure 6, the minimum and maximum
environmentalcapacity of petroleum groundwater
inthe study area are 3.50g/d and 13.5g/d
respectively.The oil environmental capacity in the gas
station increases gradually from northwest to
southeast.
It can be seen from the calculation results that the oil
environmental capacity at the pollution point source
set in the research area is 8.7g/d. The leakage amount
at the pollution point source of the gas
International Journal of Computational and Engineering 111
ACADEMIC PUBLISHING HOUSE
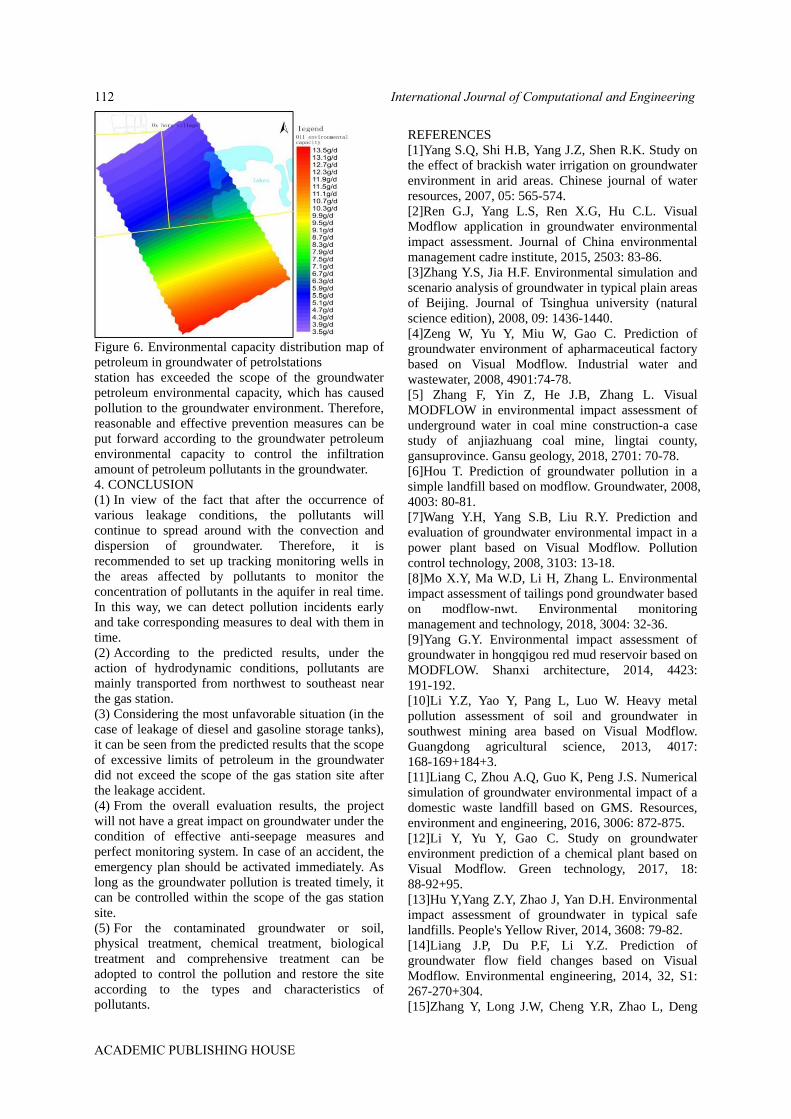
Figure 6. Environmental capacity distribution map of
petroleum in groundwater of petrolstations
station has exceeded the scope of the groundwater
petroleum environmental capacity, which has caused
pollution to the groundwater environment. Therefore,
reasonable and effective prevention measures can be
put forward according to the groundwater petroleum
environmental capacity to control the infiltration
amount of petroleum pollutants in the groundwater.
4. CONCLUSION
(1) In view of the fact that after the occurrence of
various leakage conditions, the pollutants will
continue to spread around with the convection and
dispersion of groundwater. Therefore, it is
recommended to set up tracking monitoring wells in
the areas affected by pollutants to monitor the
concentration of pollutants in the aquifer in real time.
In this way, we can detect pollution incidents early
and take corresponding measures to deal with them in
time.
(2) According to the predicted results, under the
action of hydrodynamic conditions, pollutants are
mainly transported from northwest to southeast near
the gas station.
(3) Considering the most unfavorable situation (in the
case of leakage of diesel and gasoline storage tanks),
it can be seen from the predicted results that the scope
of excessive limits of petroleum in the groundwater
did not exceed the scope of the gas station site after
the leakage accident.
(4) From the overall evaluation results, the project
will not have a great impact on groundwater under the
condition of effective anti-seepage measures and
perfect monitoring system. In case of an accident, the
emergency plan should be activated immediately. As
long as the groundwater pollution is treated timely, it
can be controlled within the scope of the gas station
site.
(5) For the contaminated groundwater or soil,
physical treatment, chemical treatment, biological
treatment and comprehensive treatment can be
adopted to control the pollution and restore the site
according to the types and characteristics of
pollutants.
REFERENCES
[1]Yang S.Q, Shi H.B, Yang J.Z, Shen R.K. Study on
the effect of brackish water irrigation on groundwater
environment in arid areas. Chinese journal of water
resources, 2007, 05: 565-574.
[2]Ren G.J, Yang L.S, Ren X.G, Hu C.L. Visual
Modflow application in groundwater environmental
impact assessment. Journal of China environmental
management cadre institute, 2015, 2503: 83-86.
[3]Zhang Y.S, Jia H.F. Environmental simulation and
scenario analysis of groundwater in typical plain areas
of Beijing. Journal of Tsinghua university (natural
science edition), 2008, 09: 1436-1440.
[4]Zeng W, Yu Y, Miu W, Gao C. Prediction of
groundwater environment of apharmaceutical factory
based on Visual Modflow. Industrial water and
wastewater, 2008, 4901:74-78.
[5] Zhang F, Yin Z, He J.B, Zhang L. Visual
MODFLOW in environmental impact assessment of
underground water in coal mine construction-a case
study of anjiazhuang coal mine, lingtai county,
gansuprovince. Gansu geology, 2018, 2701: 70-78.
[6]Hou T. Prediction of groundwater pollution in a
simple landfill based on modflow. Groundwater, 2008,
4003: 80-81.
[7]Wang Y.H, Yang S.B, Liu R.Y. Prediction and
evaluation of groundwater environmental impact in a
power plant based on Visual Modflow. Pollution
control technology, 2008, 3103: 13-18.
[8]Mo X.Y, Ma W.D, Li H, Zhang L. Environmental
impact assessment of tailings pond groundwater based
on modflow-nwt. Environmental monitoring
management and technology, 2018, 3004: 32-36.
[9]Yang G.Y. Environmental impact assessment of
groundwater in hongqigou red mud reservoir based on
MODFLOW. Shanxi architecture, 2014, 4423:
191-192.
[10]Li Y.Z, Yao Y, Pang L, Luo W. Heavy metal
pollution assessment of soil and groundwater in
southwest mining area based on Visual Modflow.
Guangdong agricultural science, 2013, 4017:
168-169+184+3.
[11]Liang C, Zhou A.Q, Guo K, Peng J.S. Numerical
simulation of groundwater environmental impact of a
domestic waste landfill based on GMS. Resources,
environment and engineering, 2016, 3006: 872-875.
[12]Li Y, Yu Y, Gao C. Study on groundwater
environment prediction of a chemical plant based on
Visual Modflow. Green technology, 2017, 18:
88-92+95.
[13]Hu Y,Yang Z.Y, Zhao J, Yan D.H. Environmental
impact assessment of groundwater in typical safe
landfills. People's Yellow River, 2014, 3608: 79-82.
[14]Liang J.P, Du P.F, Li Y.Z. Prediction of
groundwater flow field changes based on Visual
Modflow. Environmental engineering, 2014, 32, S1:
267-270+304.
[15]Zhang Y, Long J.W, Cheng Y.R, Zhao L, Deng
International Journal of Computational and Engineering112
ACADEMIC PUBLISHING HOUSE

C.G. Prediction of groundwater pollution in a
chemical industrial park based on Visual Modflow.
Groundwater, 2016, 3802: 88-90.
[16]Liu J.G, Xu G.Z, Ma X.L, Lei J.M, Wu H.
Comparative study on the application of different
simulation software in groundwater eia.
Environmental science and technology, 2008, 41, S1:
359-362.
[17]Sun J. Prediction of effects of zinc ions on
shallow groundwater quality. Journal of hunan
institute of technology, 2012, 1205: 14-15.
International Journal of Computational and Engineering 113
ACADEMIC PUBLISHING HOUSE

Research on Information-Based Teaching
Practice of Road and Bridge Engineering
Measurement Course
Guizhen Wang
School of Architecture and Engineering, Chongqing Vocational Institute of Engineering (cqvie), Chongqing,
402260, China
E-mail: [email protected]
Abstract: Measurement is a technology that
emphasizes both theory and practice. A reform idea of
the road and bridge engineering measurement
information teaching practice has been put forward,
aiming at solving the problems that the traditional
measurement teaching over-emphasizing theory, the
students' low enthusiasm for learning, low training
efficiency, and the single assessment mode. This idea,
based on the retention of students' after-school
training, introduced a variety of modern information
based technology and information resources,
optimized teaching methods, coordinated the various
elements of the teaching process, and guided students
to transform from the passive learning mode of
listening, remembering, remembering and practicing
to active inquiry learning, thereby improving the
learning efficiency.
Keywords: information based teaching; road and
bridge engineering; measurement course
1. INTRODUCTION
Engineering measurement, a typical course which
integrates theory and practice, is a sufficient theory
and emphasis on the characteristics of skill and
practice. It is the basic compulsory course of many
majors of the department of water conservancy and
hydropower engineering, such as water conservancy
and construction engineering, construction
engineering technology, construction engineering
supervision, architectural decoration engineering
technology and water supply and drainage
engineering technology [1].
Although the tasks and techniques of the special
measurement course vary according to the needs of
each major, the instrument and the basic principles
and basic measurement methods are the same. Thus,
the Department of Water Conservancy and
Architectural Engineering has carried out a teaching
reform through collective research, dividing the
original engineering surveying courses into two parts,
the basic course of Engineering surveying,which is
the common part of each major, and the professional
engineering survey, which developed into a separate
course integrating the theory and practice and would
be carried out in two weeks [2].
The basic part of engineering surveying aims at
strengthening the students’ basic training so that they
can master the operation methods and basic usage of
leveling instrument, theodolite, steel ruler, total
station instrument and RTK (real-time dynamic). The
proper use of information-based teaching methods can
enable students to experience and learn knowledge in
various ways, which would be a big help to build a
flipped classroom, where students can review, and
think at any time, and improve constantly [3].
2. CHARACTERISTICS OF INFORMATION-
BASED TEACHING OF ROAD AND BRIDGE
ENGINEERING SURVEY
Supported by information technology and applied
with modern teaching methods, information-based
Teaching is an activity guided by modern teaching
concept. It is a comprehensive process of interaction,
integration and practice. The wide application of
modern information technology, such as network
platform, multimedia and distance education, can
accelerate the process of education reform and
development. The measurement technology of road
and bridge engineering is also developing towards
information, intellectualization and networking [4-5].
Specifically, in terms of teaching software and
hardware in the course of road and Bridge
Engineering survey, many kinds of modern
information technology and information resources are
used, such as network learning platform, live
broadcasting vehicle system, simulation software, and
Wechat communication platform [6-7].
By optimizing teaching methods and arranging all
elements of teaching process, students are guided to
change from passive acceptance learning mode of
“listening, memorizing, reciting and practicing” to
active inquiry learning mode, which would definitely
improve classroom efficiency.
The student's dominant position was fully considerate
not only in-class, but also pre-class andafter-class by
providing students with online communication
learning platform, creating an independent inquiry
learning space and a lively and interesting learning
environment.
2.1. Analysis of Course Information-based Teaching
Design
It is necessary to carry out design analysis, which is
the premise of Information-based design, before
International Journal of Computational and Engineering114
ACADEMIC PUBLISHING HOUSE

carrying out the course Information-based teaching
design. The analysis of Information-based teaching
course design includes the analysis of learning
conditions of the students, analysis of the teaching
goals, analysis of the teaching contents and analysis
of the teaching methods.
2.2. Analysis of Learning Conditions of the Students
Students paly many roles in the information based
teaching classroom, they are not only the ones who
need the knowledge construction, knowledge
absorption and internalization, but also the
protagonist of information-based classroom, the
communicator of teachers ‘emotions, the collaborator
and collaborator of peer learning. Their learning
conditions, such as the basic knowledge of subject
and mastery of information technology, autonomous
learning ability, application ability of information
technology and team cooperation abilities all directly
affect all aspects of information-based teaching
design.
Therefore, in the analysis of students’ learning
conditions, it is necessary to analyze students' original
knowledge, skill level, information ability, cognitive
ability, physical and mental emotions, etc. In the
information-based teaching of highway and bridge
engineering courses in Higher Vocational colleges, the
importance of learning situation analysis is
particularly important for the reason that, with the
reform of college entrance examination system, the
types and structures of students in higher vocational
colleges are diversified, and their professional
foundations and learning abilities vary greatly.
Taking Wuhan Vocational College of
Communications as an example, there are four
different sources of students majoring in road and
bridge engineering: general college entrance
examination enrollment, technical college entrance
examination students, single enrollment students, and
“3 + 2” high school and vocational education
convergence training students.
Among them, technical college entrance examination
students, single enrollment students and “3 + 2”
students have learned the basic operation of
“Engineering Survey” before entering higher
vocational education, and their measurement skills
have reached a certain level, while the general college
entrance examination enrollment students in the
“Engineering Survey” learning is completely a zero
start. Their learning bases are totally different.
2.3. Analysis of the Teaching Goals
The analysis of teaching goals determines the general
direction of information-based teaching design. The
selection and design of teaching content, strategy,
methods, situations and learning evaluation should be
based on teaching goals.
For road and bridge Engineering courses, the analysis
of teaching goals mainly includes knowledge goals,
technical goals and professional accomplishment
goals.
Taking the course of Engineering Survey as an
example, its knowledge goal is to enable students to
master basic measuring principles and methods of
elevation, angle, distance, coordinates, and the basic
processes and methods of control survey, mapping,
construction lofting, etc; its technical goal is to enable
students to master the use of total station, level, GPS
and other measuring instruments, and to have the
ability to solve practical measurement problems in
engineering construction; its professional
accomplishment is to train the students to become the
surveyors and mappers who can go down, stay,
endure hardships and be energetic. In addition, for
different students, different stages and different
contents, a detailed analysis of teaching goals is still
needed.
2.4. Analysis of the Teaching Contents
By analyzing of teaching content in the course of
information-based teaching design, the teaching
content would be integrated and optimized, the
teaching knowledge and skills would be organized
and the key and difficult points of teaching would be
distinguished.
Taking the course “Engineering Survey” as an
example, the teaching content of “Engineering Survey”
is mainly divided into basic knowledge of
Engineering survey, basic survey skills, special survey
skills and comprehensive survey skills.
The basic knowledge of engineering surveying mainly
includes the basic concepts of Engineering surveying,
the basic principles of point location determination
and the working principles of surveying, etc; the basic
measurement skills include leveling, angle
measurement, distance measurement, coordinate
measurement, etc; the special surveying skills include
control surveying, mapping drawing and construction
lofting and the comprehensive survey skills include
road engineering survey, bridge and culvert
engineering survey, tunnel engineering survey,
pipeline engineering survey, etc.
For the course, the point is to improve the
comprehensive measurement skills by studying basic
measurement skills and the training of special
measurement skills. The difficulty lies in improving
the comprehensive measurement skills.
Besides, in each teaching project, the teaching content
of each sub-project is needed to be analyzed to get
more detailed teaching content and specify the
teaching difficulties.
2.5. Analysis of the Teaching Methods
Traditional teaching methods mainly includes
teaching, conversation, discussion, guidance,
demonstration, visiting, exercises, experiments and
practice assignments, they all have their own
advantages and disadvantages.
In the information-based teaching design, the teaching
methods that effectively achieve teaching goals
should be selected according to the results of students’
learning condition analysis, teaching goal analysis
International Journal of Computational and Engineering 115
ACADEMIC PUBLISHING HOUSE

and teaching content analysis, the characteristics of
students and teaching content, the accumulation of
curriculum information resources, and the current
status of the school information hardware and the
construction of information-based teaching platform.
It is particularly necessary to summarize the difficult
problems of traditional teaching methods, which can
be easily solved by information technology.According
to the student’s learning condition analysis, the
theories of students are generally weak in the courses.
It is important to lay emphasis on the training of
students’ practical ability and vocational skills to
cultivate high-quality technical and skilled talents. In
the course of road and bridge engineering, the method
of obtaining direct experience in the form of intuition,
or the method of forming skills and skills in the form
of practical training should be adopted more often.
For example, in the teaching of Engineering Survey,
adopting the traditional teaching method has resulted
in the separation of theory and practice, the separation
of internal and external work, the virtual software and
data, which leads to teachers’ poor teaching and
students’ poor learning. The information resources are
becoming rich and intuitive, the informational
methods are more convenient and fast, and the
information technology is mature and popularized,
which makes it possible to make full use of the
information resources and information technology to
arrange various teaching sections, apply project
teaching method, demonstrate teaching method and
simulate training teaching method.
3. THE TEACHING DESIGN OF THE
INFORMATION BASED COURSE
3.1. Situational Design of Information Based
Teaching
Constructivism holds that learning is always
associated with a certain social and cultural
background (i.e. context), which means that learners
can assimilate or adapt to the new knowledge they
have learned by using the relevant experience in their
original cognitive structure. By assimilation and
adaptation, the learners can construct new knowledge.
Therefore, situational design is the first link of
information-based instructional design. In the
situational design of course information based
teaching, it is necessary to collect and accumulate a
large number of course-related information materials.
On the basis of making fully use of information
resources and information technology, such as text,
image, audio, video, artificial intelligence,
three-dimensional modeling, to design and create
situations to arouse students ‘interest, stimulate
students' associations, and complete the purpose of
“assimilation” and “adaptation” of knowledge. The
methods of creating situation in information-based
teaching mainly include creating problem situation,
story situation, simulation situation and collaboration
situation. Several methods could be synthetically
applied in the design of information-based teaching
situation. For example, several questions such as
“Where will maps be used in life?” “What
information can we get from Baidu Map?” “How did
Baidu Map and Gaode Map in the middle of mobile
phone come into being?” could be proposed in the
teaching design of “Surveying and Mapping of Large
Scale Topographic Maps” in Engineering Survey. By
asking these questions to guide students to open their
mobile map to display traffic and tourism maps of
various cities, and so on, to enable students to have a
strong interest in the process of map generation in the
surroundings of the map. In the “coordinate lofting”, a
fast shot built from wasteland to high-rise buildings,
and virtual construction scene could be designed. And
students can play different roles, such as surveying
director, instrument operator, ruler, data recorder and
so on. Students can experience different roles in the
simulated environment of construction site.
3.2. Design of the Implementation Process of
Information-Based Teaching
The implementation process design of information-
based teaching is the decomposition of teaching steps
and the time allocation of each link. It is an important
link of information-based teaching design. It is a
script for teachers ‘directors and students' actors to
complete information-based classroom teaching
together, which directly affects the effect of
information-based teaching.
The curriculums of road and bridge engineering have
the characteristics of practicability of knowledge,
pertinence of occupation, multi-level objectives,
dynamic updating of curriculum content and so on.
Therefore, in the process design of information-based
teaching of road and Bridge Engineering courses, we
can adopt the project-based process design based on
working process. Driven by tasks and interacted
with teachers and students in teaching, the process
takes students as the center of learning process, so
that students can independently acquire information,
make, implement and evaluate plans. In the process of
doing their own practical tasks they can master
professional knowledge and improve professional
skills.
For example, in the teaching design of “Surveying
and Mapping of Large Scale Topographic Maps” in
Engineering Survey,map a topographic in the form of
task-driven, and the teaching process are designed as:
Course Introduction, Audiovisual Experience,
Synchronized Operation, Skills Training, Assessment
Interactive, Communication, Summary and
Homework. Each process is allocated with time, so
that students can master the mapping process of
large-scale topographic maps and improve the
mapping ability.
The following advice should be paid attention to in
the process design of information-based teaching of
road and Bridge Engineering courses: In the process
of teaching design of information-based teaching of
road and Bridge Engineering courses, the students
International Journal of Computational and Engineering116
ACADEMIC PUBLISHING HOUSE
must be taken as the center, teachers should be taken
as guides. Teachers should teach students in the
process of practicing, and students should learn in the
process of practicing. The teaching and learning
should be integrated, and the interaction between
teachers and students should be reflected; the
implementation process design of information-based
teaching is different from normal classroom design. It
is an extension of classroom design, including the
preparation of information materials before class and
feedback after class; the teaching process design of
course information based teaching implementation
process is not the design of a course, but the teaching
process design of a course. In this process design, it is
necessary to integrate all knowledge points so that
students can master knowledge and skills in the
process of systematization and achieve teaching goals;
the design of the implementation process of
information-based teaching cannot remain unchanged.
It needs to be flexibly adjusted according to the
different teaching objectives, teaching contents and
teaching goals.
3.3. Evaluation Design of Information Based
Teaching
Teaching evaluation is the feedback of teaching effect,
and its design directly reflects the teaching
effect.According to the teaching evaluation, teachers
can summarize the advantages and disadvantages of
the teaching design and methods, understand students
‘learning status, so as to teach students in accordance
with their aptitude and optimize teaching design;
students can see their own learning growth track, to
improve their learning enthusiasm, summarize their
learning experience and reflect on their own
shortcomings.
In the design of information-based teaching
evaluation, data statistics tools can be used to
automate statistics to generate information such as
scores and student feedback, so as to make teaching
evaluation more intuitive, reduce workload and
improve efficiency; internet plus information
technology can be used to ensure the timeliness and
multifaceted nature of evaluation, such as using
micro-blog, WeChat, QQ and other information
communication methods to make teaching
evaluation.For example, in the large-scale topographic
map surveying and mapping of Engineering Survey,
according to the principle of “emphasizing results and
more on process”, the evaluation mechanism of
“emphasizing process and emphasizing practical
effect” is designed. The evaluation among groups,
members, students, teachers and students is realized
by checking storage, assessment forms and QQ
evaluation and other methods. Students’ topographic
maps were evaluated by experts outside school and
peers of enterprises through micro-blog and forums.
The following points should be paid attention to in the
design of information-based teaching evaluation of
road and Bridge Engineering courses:
Information-based teaching evaluation should be
student-centered, the results should be emphasis, but
process is more important. Students ‘participation,
interest and attitude, and improve students' thinking
ability should be lay heavy emphasis;
information-based teaching evaluation needs to track
students’ development, systematically record students'
skill, practical ability and professional
accomplishment, and dynamically adjust teaching
evaluation methods according to students’ current
ability; the evaluation of information-based teaching
should be carried out in an all-round, multi-level and
diversified way, and the aspects of students, teachers,
parents, schools, society and other subjects and levels
should be considered comprehensively; after the
evaluation of information-based teaching, specific
suggestions for improvement and feedback each
subject must be put forward in a scientific,
appropriate and constructive way, and form a
development-oriented evaluation mechanism of
information-based teaching.
3.4. Application and Practice of Information-Based
Teaching
Twenty-five scenarios were designed, 17
micro-classes were made, and 12 evaluation forms for
the course Engineering Survey were designed based
on the result of the analysis of learning conditions and
the decomposed teaching goals of Engineering Survey.
The analysis of learning conditions result analyzed
three different types of students, namely, the
single-enrollment province of road and Bridge
Engineering specialty, the unified enrollment of
general college entrance examination and the
technical college entrance examination. And the result
of decomposed teaching goals of Engineering Survey
is obtained by decomposing the knowledge target,
skill target, the knowledge and skill of the course
teaching of project systematization and professional
accomplishment target of the course teaching goals of
Engineering Survey, distinguishing the key and
difficult points of teaching, and adopting flexible
teaching methods.
Sixty class hours of the information-based teaching
design of were designed by using the comprehensive
application of audio-visual perception, synchronous
learning, task-driven, simulation training and other
means, making full use of network, communication,
multimedia and other information technology
methods, such as pictures, video, audio, documents,
data, charts and data, and using task-driven to arrange
all aspects of the teaching process.
Three teachers of engineering surveying specialty in
Wuhan Vocational College of Communications have
compiled teaching plans and implemented
information-based classroom teaching according to
the information-based teaching design scheme. This
teaching scheme guides students learn from easy to
hard, from perception to rationality in the way of
“learning by doing, doing by learning, combining
International Journal of Computational and Engineering 117
ACADEMIC PUBLISHING HOUSE

work with study, learning to do “, so that students
gradually master engineering measurement skills, the
key and difficult points of learning, thus achieving
teaching goals. And this teaching design has gradually
formed the characteristics of “information teaching
integration, paying equal attention to both skills and
qualities”.
As a result, students generally find it interesting and
easy to learn, while teachers find it easy to teach, and
the efficiency is much higher. The results of the
teaching evaluation of Engineering Survey rank in the
front rank of the whole school.
4. A CASE OF INFORMATION-BASED
TEACHING REFORM: TAKING HORIZONTAL
ANGLE MEASUREMENT AS AN EXAMPLE
4.1. Establishment of Wechat Group and Network
Learning Platform
In view of the characteristics of the popularity of
Wechat among college students, the Wechat
Communication Group of this course was established
by the teachers before the beginning of the course, so
that students can join the Wechat Group, and,
excellent graduates in the measurement posts and
surveying instructors inside and outside the school are
invited to join the group at the same time.Before class
teachers arrange discussion topics in the Wechat
Group. Students can consult the information on the
Internet and start the Wechat discussion. Relevant
questions can be promptly instructed and answered by
the seniors or teachers.
Establishing professional network learning platform,
so that students loaded the road and bridge
engineering technology network learning platform
before class, and entered the road and bridge
engineering survey course to preview the content of
horizontal angle measurement unit, study training
instruction andfamiliarize with measurement norms.
The platform also uploaded small software related to
measurement for students to download to mobile
phones to use, to enhance students’ interest in
learning.
4.2. Introducing Live Broadcasting System and
Simulating Software
With the information-based teaching reform, the
teaching hardware conditions have been improved.
The live broadcast system has been introduced into
the classroom. This system can display the operation
details of measuring instruments in an all-round way
by magnifying demonstration and changing angle.
After the teacher has explanation, the students will go
to the stage to operate the system, and the teacher will
guide the other students in the class.Under the
guidance of the teacher, while learning and practicing,
they can quickly grasp the operation steps, operation
essentials and matters needing attention of theodolite.
On the other hand, the conditions of teaching software
and the quality of making electronic courseware were
improved.
For the measurement principles which are difficult to
understand, teachers can use animation and video to
create situations to help students digest and
understand. In the past, due to their unfamiliar with
the instruments, students often spent a lot of time
exploring the operation, which causes the low
efficiency. In order to solve this problem, the
three-dimensional simulation software of road and
bridge measurement was introduced, and the learning
and training mode is simulated first and then practiced.
The three-dimensional simulation software for
measurement includes virtual simulation training
module and virtual operation testing module. Students
can conduct three-dimensional simulation training in
computer room. In the training module, students
conduct measurement simulation training in the
simulation environment. In the training process, the
system designs the corresponding theoretical
knowledge examination tests, by doing these tests,
students ‘understanding of the operation process
would be constantly strengthened, and the operation
errors would be reminded to correct. Under the test
module, the students need to simulate the
measurement tasks correctly within the specified time,
and the system automatically counts the results of the
simulation operation. The field practice can be carried
out only after the results are qualified. Teachers adjust
team members according to feedback data in time to
balance the strength of each group. Through the
operation of the software, the students subtly transfer
the points of attention and key points of the angle
measurement, which lays a foundation for the practice
of operating the instrument. The system simulates the
road and bridge construction site environment and
embeds engineering survey norms, which is helpful to
cultivate students ‘safety consciousness, normative
consciousness and quality consciousness.
4.3. Team Division of Labor and Implementation of
Tasks
Students enter the after-class training process after
passing the simulated examination. Taking the
horizontal angle measurement as an example, the
students would carry out the angle measurement
according to the designated points. In order to
improve students’ autonomous learning ability and
cultivate the sense of teamwork, the division of tasks
was determined by the students through group
discussion according to the training tasks.
After measuring an angle, the role rotation is carried
out and the angle is measured again, and the precision
analysis is carried out by looking up the norms to
cultivate the normative consciousness. In task
implementation, students can use online learning
platform to re-learn, record and calculate angles
through electronic handbook, and upload the results to
online teaching platform. After class, in order to
cultivate the students’ ability of continuous learning,
teachers assigned different difficult assignments on
the network learning platform to enhance the ability
of students at different levels.Students can exchange
International Journal of Computational and Engineering118
ACADEMIC PUBLISHING HOUSE

questions on the problems they encounter through the
online learning platform to consolidate their learning
achievements. From the training effect, compared
with the previous classes that did not carry out
information-based teaching, the average time for
students to complete their first task was reduced from
55 minutes to 32 minutes, the error rate of students’
operation was reduced from 36% to 20%, and the
average score of skill test was increased from 73 to
81.
4.4. Assessment of Courses in Different Stages
This course was assessed in three stages. With the
help of professional network teaching platform, the
total scores of simulation training evaluation, field
practice evaluation and online test evaluation are
evaluated by 30%, 40% and 30% weights
respectively.
The results were recorded automatically by teaching
platform. Each student's learning situation and
evaluate the teaching effect was analyzed by teachers
in schools and business instructors, so that they can
provide targeted counseling in the later stage for the
students. Students can analyze their weaknesses and
find out the direction they need to work hard by
checking their test scores at all stages.
5. CONCLUSION
In summary, with the support of information based
technology and information resources such as
web-based learning platform, Wechat communication
learning group, live broadcasting information system,
measurement simulation software and so on, the
teaching methods and arrangements of teaching
process were optimized by teachers so that students
can break through the limitation of classroom time,
which means they can review and consolidate at any
time, and the space limitation,which is to say
students can perform the measuring instrument
operation for outdoor construction environment in
doors with simulated system. Students can practice in
learn and learn by practicing. This information-based
teaching reform has solved the problems of traditional
teaching such as difficult to guide students, not
accessible to practicing, easy to make errors and the
potential instrument damage. By using the
information based technology, the sources of the
course are all on the internet, the content is much
more interesting, the software learned was much more
intelligence and the learning evaluations are much
more dynamic.
REFERENCE
[1]Wang X.F. Discussion on teaching research of
electric power engineering construction survey course.
Guangdong vocational and technical education and
research, 2018(06): 72-74.
[2]Zheng H. Reform of practical teaching mode of
engineering surveying under the information
condition. Research and practice of innovation and
entrepreneurship theory, 2014, 1(08): 89-90.
[3]Lin K. Practical research on informatization
teaching of engineering surveying technology. Wind
of science and technology, 2018, (03): 44.
[4]Shen W.L, Zhang K.C. Information-based teaching
design of architectural engineering surveying course
in higher vocational colleges-taking “level 3 and level
4 surveying” as an example. Western quality-oriented
education, 2017, 3(22): 200-201.
[5]Liu L.L, Zhou L. Construction of effective
evaluation system of information-based teaching in
higher vocational colleges-taking engineering survey
as an example. Information technology and
informatization, 2017, (10): 77-80.
[6]Lu Y.F, Tan Q.F, Gu H, Lian Y. Informatization
teaching design of practical training course of
architectural engineering survey in higher vocational
colleges. Journal of anhui water resources and
hydropower vocational and technical college, 2016,
16(04): 59-61.
[7]Sun S, Wu L.Y, Ye W. Research on teaching design
of vocational college curriculum
informatization-taking the course of “road and bridge
engineering detection technology” as an example.
Journal of zhenjiang technical college, 2016, 29(04):
101-103.
International Journal of Computational and Engineering 119
ACADEMIC PUBLISHING HOUSE
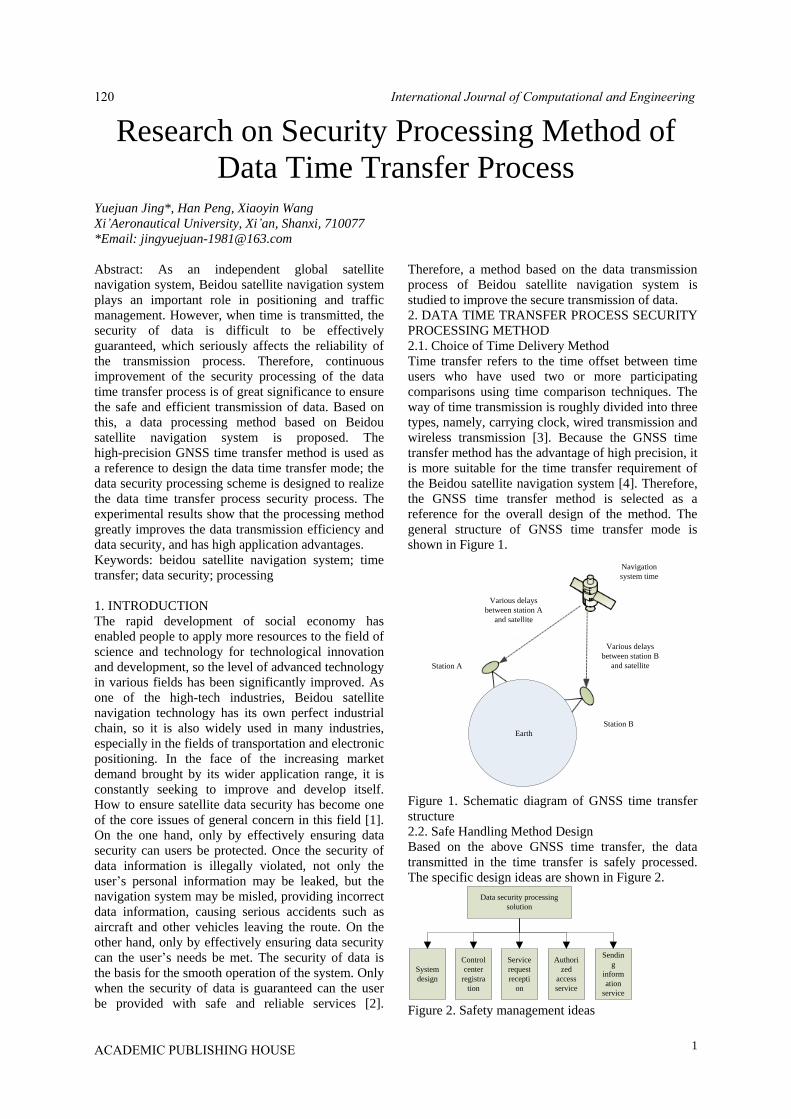
1
Research on Security Processing Method of
Data Time Transfer Process
Yuejuan Jing*, Han Peng, Xiaoyin Wang
Xi’Aeronautical University, Xi’an, Shanxi, 710077
*Email: [email protected]
Abstract: As an independent global satellite
navigation system, Beidou satellite navigation system
plays an important role in positioning and traffic
management. However, when time is transmitted, the
security of data is difficult to be effectively
guaranteed, which seriously affects the reliability of
the transmission process. Therefore, continuous
improvement of the security processing of the data
time transfer process is of great significance to ensure
the safe and efficient transmission of data. Based on
this, a data processing method based on Beidou
satellite navigation system is proposed. The
high-precision GNSS time transfer method is used as
a reference to design the data time transfer mode; the
data security processing scheme is designed to realize
the data time transfer process security process. The
experimental results show that the processing method
greatly improves the data transmission efficiency and
data security, and has high application advantages.
Keywords: beidou satellite navigation system; time
transfer; data security; processing
1. INTRODUCTION
The rapid development of social economy has
enabled people to apply more resources to the field of
science and technology for technological innovation
and development, so the level of advanced technology
in various fields has been significantly improved. As
one of the high-tech industries, Beidou satellite
navigation technology has its own perfect industrial
chain, so it is also widely used in many industries,
especially in the fields of transportation and electronic
positioning. In the face of the increasing market
demand brought by its wider application range, it is
constantly seeking to improve and develop itself.
How to ensure satellite data security has become one
of the core issues of general concern in this field [1].
On the one hand, only by effectively ensuring data
security can users be protected. Once the security of
data information is illegally violated, not only the
user’s personal information may be leaked, but the
navigation system may be misled, providing incorrect
data information, causing serious accidents such as
aircraft and other vehicles leaving the route. On the
other hand, only by effectively ensuring data security
can the user’s needs be met. The security of data is
the basis for the smooth operation of the system. Only
when the security of data is guaranteed can the user
be provided with safe and reliable services [2].
Therefore, a method based on the data transmission
process of Beidou satellite navigation system is
studied to improve the secure transmission of data.
2. DATA TIME TRANSFER PROCESS SECURITY
PROCESSING METHOD
2.1. Choice of Time Delivery Method
Time transfer refers to the time offset between time
users who have used two or more participating
comparisons using time comparison techniques. The
way of time transmission is roughly divided into three
types, namely, carrying clock, wired transmission and
wireless transmission [3]. Because the GNSS time
transfer method has the advantage of high precision, it
is more suitable for the time transfer requirement of
the Beidou satellite navigation system [4]. Therefore,
the GNSS time transfer method is selected as a
reference for the overall design of the method. The
general structure of GNSS time transfer mode is
shown in Figure 1.
Station A
Various delays
between station A
and satellite
Various delays
between station B
and satellite
Station B
Navigation
system time
Earth
Figure 1. Schematic diagram of GNSS time transfer
structure
2.2. Safe Handling Method Design
Based on the above GNSS time transfer, the data
transmitted in the time transfer is safely processed.
The specific design ideas are shown in Figure 2.
Data security processing
solution
System
design
Control
center
registra
tion
Service
request
recepti
on
Authori
zed
access
service
Sendin
g
inform
ation
service
Figure 2. Safety management ideas
International Journal of Computational and Engineering120
ACADEMIC PUBLISHING HOUSE
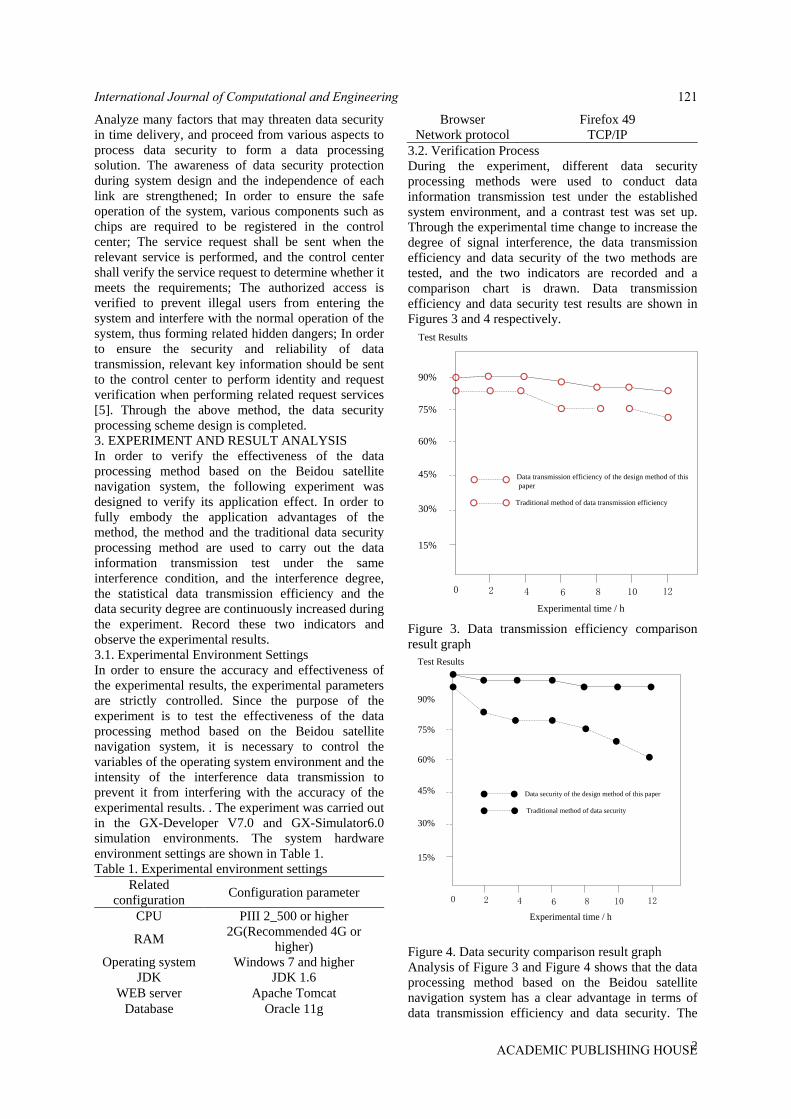
2
Analyze many factors that may threaten data security
in time delivery, and proceed from various aspects to
process data security to form a data processing
solution. The awareness of data security protection
during system design and the independence of each
link are strengthened; In order to ensure the safe
operation of the system, various components such as
chips are required to be registered in the control
center; The service request shall be sent when the
relevant service is performed, and the control center
shall verify the service request to determine whether it
meets the requirements; The authorized access is
verified to prevent illegal users from entering the
system and interfere with the normal operation of the
system, thus forming related hidden dangers; In order
to ensure the security and reliability of data
transmission, relevant key information should be sent
to the control center to perform identity and request
verification when performing related request services
[5]. Through the above method, the data security
processing scheme design is completed.
3. EXPERIMENT AND RESULT ANALYSIS
In order to verify the effectiveness of the data
processing method based on the Beidou satellite
navigation system, the following experiment was
designed to verify its application effect. In order to
fully embody the application advantages of the
method, the method and the traditional data security
processing method are used to carry out the data
information transmission test under the same
interference condition, and the interference degree,
the statistical data transmission efficiency and the
data security degree are continuously increased during
the experiment. Record these two indicators and
observe the experimental results.
3.1. Experimental Environment Settings
In order to ensure the accuracy and effectiveness of
the experimental results, the experimental parameters
are strictly controlled. Since the purpose of the
experiment is to test the effectiveness of the data
processing method based on the Beidou satellite
navigation system, it is necessary to control the
variables of the operating system environment and the
intensity of the interference data transmission to
prevent it from interfering with the accuracy of the
experimental results. . The experiment was carried out
in the GX-Developer V7.0 and GX-Simulator6.0
simulation environments. The system hardware
environment settings are shown in Table 1.
Table 1. Experimental environment settings
Related
configuration Configuration parameter
CPU PIII 2_500 or higher
RAM 2G(Recommended 4G or
higher)
Operating system Windows 7 and higher
JDK JDK 1.6
WEB server Apache Tomcat
Database Oracle 11g
Browser Firefox 49
Network protocol TCP/IP
3.2. Verification Process
During the experiment, different data security
processing methods were used to conduct data
information transmission test under the established
system environment, and a contrast test was set up.
Through the experimental time change to increase the
degree of signal interference, the data transmission
efficiency and data security of the two methods are
tested, and the two indicators are recorded and a
comparison chart is drawn. Data transmission
efficiency and data security test results are shown in
Figures 3 and 4 respectively.
30%
60%
15%
45%
0 4
75%
90%
8 126 102
Experimental time / h
Data transmission efficiency of the design method of this
paper
Test Results
Traditional method of data transmission efficiency
Figure 3. Data transmission efficiency comparison
result graph
30%
60%
15%
45%
0 4
75%
90%
8 126 102
Experimental time / h
Test Results
Data security of the design method of this paper
Traditional method of data security
Figure 4. Data security comparison result graph
Analysis of Figure 3 and Figure 4 shows that the data
processing method based on the Beidou satellite
navigation system has a clear advantage in terms of
data transmission efficiency and data security. The
International Journal of Computational and Engineering 121
ACADEMIC PUBLISHING HOUSE

3
data transmission efficiency is analyzed. The data
transmission efficiency of the method is always
between 90% and 80%, and the average data
transmission efficiency can reach 85%. The data
transmission efficiency using the traditional method is
significantly larger than the method, and its data
transmission The efficiency dropped from 85% to
70% and the average transmission efficiency was
77.5%. Therefore, compared with the traditional
method, the data processing method based on the
Beidou satellite navigation system can improve the
data transmission efficiency by 7.5%.
The data security degree is analyzed and the data
security degree based on the data processing method
of Beidou satellite navigation system is always
96%-100%, and it is hardly affected by the increased
degree of interference. The average data security can
reach 98%; while the data security using the
traditional method has dropped from 95% to 60%,
indicating that in the case of serious interference, the
traditional method is difficult to resist external
interference, and the average data security is only
77.5%. Therefore, compared with the traditional
method, this method can improve the data security by
20.5%.
In summary, the data processing method based on the
Beidou satellite navigation system can improve the
data transmission efficiency by 7.5% and improve the
data security by 20.5%, which is extremely effective.
4. CONCLUSION
Based on the selection of time transfer method and
data security processing, the data processing method
based on Beidou satellite navigation system is
designed. The comparison of experiments shows that
the method improves data transmission efficiency and
data security. Effectiveness, able to support the secure
transmission of data.
ACKNOWLEDGEMENT
School-level research fund project Project No.
2017KY0206; Shaanxi Provincial Key Research and
Development Project, Project No. 2018GY-028.
REFERENCES
[1]Li Z.B, Li W.L, Wei Z.Z, et al. Research and
implementation of key module of data security
processing mechanism in software defined network.
Journal of Computer Applications, 2018, 38(7):
1929-1935.
[2]Ju A.K, Guo Y.B, Zhu T.M. Security Situational
Awareness and Early Warning Architecture of Big
Data Network Based on Open Source Tool Set.
Journal of Computer Science, 2017, 44(5): 125-131.
[3]Wang J.R, Ma P, Wang W. Application of
Composite Quantile Regression Based on Genetic
Algorithm in Settlement Data Processing. Industrial
Safety and Environmental Protection, 2017, 43(3):
52-55.
[4]Ma Y.Y, Shi Y.Y, Zhang H, et al. Security Data
Feature Processing Method Based on Cultural Gene
Algorithm and Least Squares Support Vector
Machine. Computer Science, 2017, 44(3): 237-241.
[5]Wang L, Li L.W, Shi J.W, et al. Research on data
transmission and security control operation method of
data interaction between EMS and DMS. Power
System Protection and Control, 2018, 46(10):75-80.
International Journal of Computational and Engineering122
ACADEMIC PUBLISHING HOUSE

Application of Sensing Technology in
Automatic Control System of Agricultural
Machinery
Yanguo Guo
Guangxi Science & Technology Normal University, Laibin, 546199, China
E-mail: [email protected]
Abstract: In recent years, the level of agricultural
machinery automation technology has been
continuously improved, and the automation
requirements for agricultural machinery automatic
control systems are also constantly improving. The
effective application of sensing technology to the
automatic control system of agricultural machinery
can effectively improve the planting efficiency of
agriculture, promote the rapid development of
agricultural machinery automation technology in
China, and escort the development of agriculture.
Therefore, the article first explores the development
of sensor technology and the impact on the automatic
control system of agricultural machinery, focusing on
the specific application of sensor technology in the
automatic control system of agricultural machinery.
Keywords: sensing technology; agricultural
machinery automatic control system; application
1. INTRODUCTION
With the current rapid development of China's
agricultural development, the machinery and
equipment used in agriculture is accelerating the
development of automation, and this is also an
important manifestation of the current modernization
of the agricultural industry. As a very key component
in the mechatronics system, the main function of the
sensor is to obtain important information in all aspects
quickly and accurately [1]. This provides a powerful
way for the automation of agricultural machinery in
China and the identification of machinery. The
support of information and data is the basis for an
important level of improvement in the development of
agricultural machinery. If the sensor is not used
effectively in agricultural machinery, it will seriously
affect the accuracy of agricultural machinery work,
and at the same time affect the information processing
and monitoring in agricultural production. Therefore,
in actual agricultural production processes, the use of
sensors can affect the overall performance of
agricultural machinery.
2. OVERVIEW OF THE AUTOMATIC CONTROL
OF THE SPECIFIC CONTROL IN THE TRACTOR
Tractor has a wide range of applications in the
agricultural production process [2]. The rotation of
the agricultural machinery in the tractor and the
connection between the various constructions need to
be strengthened, and the direction of rotation of the
agricultural machinery also needs to be controlled.
However, since the sensing system in the roll angle of
the tractor mainly measures the tractor roll angle, the
tractor and the agricultural implement need to
maintain the same inclination in the field work, and it
is necessary to combine the horizontal in the
automatic control process. Rolling angles enhance
control decisions and promote good working practices
in agricultural machinery control. Figure 1 is a control
structure diagram.
Figure 1. Control structure diagram (1. Tractor; 2.
Displacement sensor; 3. Hydraulic cylinder; 4. Wire
rope; 5. Agricultural machinery; 6. Rotating
mechanism; 7. Rolling angle sensing system; 8.
Automatic leveling controller)
3. SENSOR APPLICATION IN AGRICULTURAL
AUTOMATION EQUIPMENT
3.1. Digital Sensor Positioning
In the process of agricultural machinery production,
the high-precision GPS positioning system is
relatively complicated. This technology requires a lot
of capital investment, and this technology cannot be
effectively implemented in some small-scale
agricultural operations; For GPS positioning systems
with low technical content, the specific positioning
accuracy during the working process is very low, and
it is not suitable for use in some small-scale farmland
cultivation. In response to this situation, the most
effective way in the agricultural labor process is to
automate the agricultural machinery. The use of
sensors can improve the overall working efficiency of
International Journal of Computational and Engineering 123
ACADEMIC PUBLISHING HOUSE
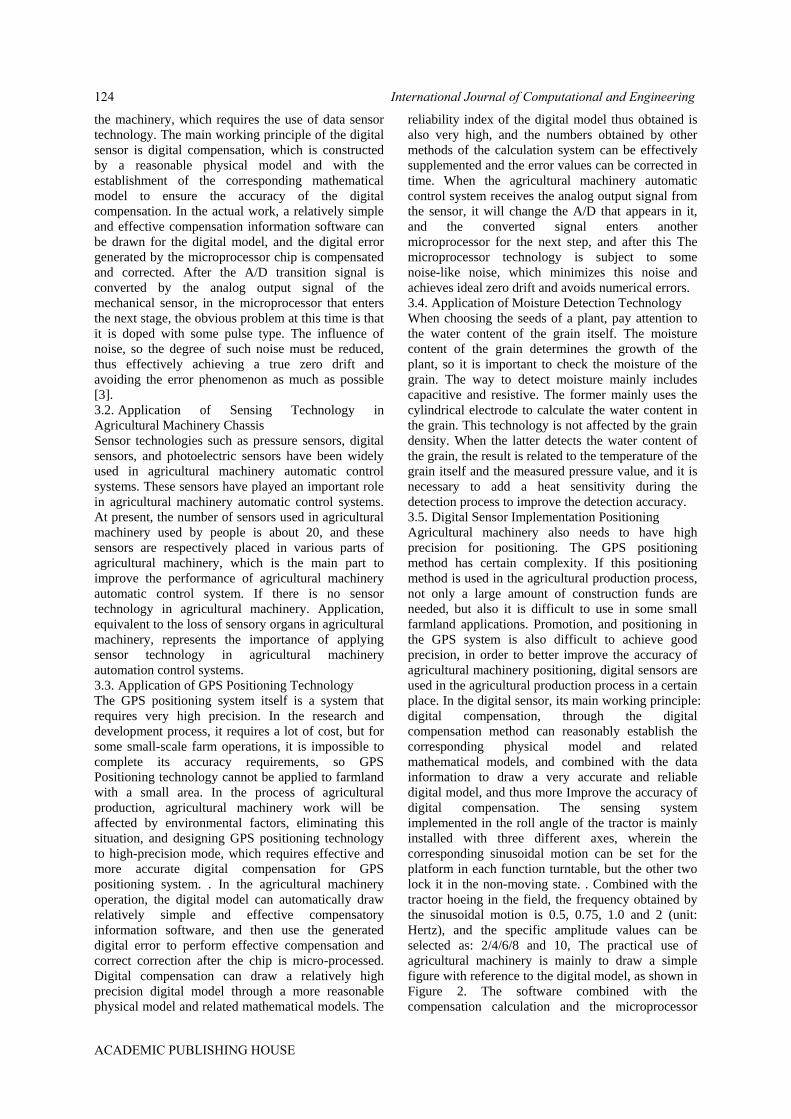
the machinery, which requires the use of data sensor
technology. The main working principle of the digital
sensor is digital compensation, which is constructed
by a reasonable physical model and with the
establishment of the corresponding mathematical
model to ensure the accuracy of the digital
compensation. In the actual work, a relatively simple
and effective compensation information software can
be drawn for the digital model, and the digital error
generated by the microprocessor chip is compensated
and corrected. After the A/D transition signal is
converted by the analog output signal of the
mechanical sensor, in the microprocessor that enters
the next stage, the obvious problem at this time is that
it is doped with some pulse type. The influence of
noise, so the degree of such noise must be reduced,
thus effectively achieving a true zero drift and
avoiding the error phenomenon as much as possible
[3].
3.2. Application of Sensing Technology in
Agricultural Machinery Chassis
Sensor technologies such as pressure sensors, digital
sensors, and photoelectric sensors have been widely
used in agricultural machinery automatic control
systems. These sensors have played an important role
in agricultural machinery automatic control systems.
At present, the number of sensors used in agricultural
machinery used by people is about 20, and these
sensors are respectively placed in various parts of
agricultural machinery, which is the main part to
improve the performance of agricultural machinery
automatic control system. If there is no sensor
technology in agricultural machinery. Application,
equivalent to the loss of sensory organs in agricultural
machinery, represents the importance of applying
sensor technology in agricultural machinery
automation control systems.
3.3. Application of GPS Positioning Technology
The GPS positioning system itself is a system that
requires very high precision. In the research and
development process, it requires a lot of cost, but for
some small-scale farm operations, it is impossible to
complete its accuracy requirements, so GPS
Positioning technology cannot be applied to farmland
with a small area. In the process of agricultural
production, agricultural machinery work will be
affected by environmental factors, eliminating this
situation, and designing GPS positioning technology
to high-precision mode, which requires effective and
more accurate digital compensation for GPS
positioning system. . In the agricultural machinery
operation, the digital model can automatically draw
relatively simple and effective compensatory
information software, and then use the generated
digital error to perform effective compensation and
correct correction after the chip is micro-processed.
Digital compensation can draw a relatively high
precision digital model through a more reasonable
physical model and related mathematical models. The
reliability index of the digital model thus obtained is
also very high, and the numbers obtained by other
methods of the calculation system can be effectively
supplemented and the error values can be corrected in
time. When the agricultural machinery automatic
control system receives the analog output signal from
the sensor, it will change the A/D that appears in it,
and the converted signal enters another
microprocessor for the next step, and after this The
microprocessor technology is subject to some
noise-like noise, which minimizes this noise and
achieves ideal zero drift and avoids numerical errors.
3.4. Application of Moisture Detection Technology
When choosing the seeds of a plant, pay attention to
the water content of the grain itself. The moisture
content of the grain determines the growth of the
plant, so it is important to check the moisture of the
grain. The way to detect moisture mainly includes
capacitive and resistive. The former mainly uses the
cylindrical electrode to calculate the water content in
the grain. This technology is not affected by the grain
density. When the latter detects the water content of
the grain, the result is related to the temperature of the
grain itself and the measured pressure value, and it is
necessary to add a heat sensitivity during the
detection process to improve the detection accuracy.
3.5. Digital Sensor Implementation Positioning
Agricultural machinery also needs to have high
precision for positioning. The GPS positioning
method has certain complexity. If this positioning
method is used in the agricultural production process,
not only a large amount of construction funds are
needed, but also it is difficult to use in some small
farmland applications. Promotion, and positioning in
the GPS system is also difficult to achieve good
precision, in order to better improve the accuracy of
agricultural machinery positioning, digital sensors are
used in the agricultural production process in a certain
place. In the digital sensor, its main working principle:
digital compensation, through the digital
compensation method can reasonably establish the
corresponding physical model and related
mathematical models, and combined with the data
information to draw a very accurate and reliable
digital model, and thus more Improve the accuracy of
digital compensation. The sensing system
implemented in the roll angle of the tractor is mainly
installed with three different axes, wherein the
corresponding sinusoidal motion can be set for the
platform in each function turntable, but the other two
lock it in the non-moving state. . Combined with the
tractor hoeing in the field, the frequency obtained by
the sinusoidal motion is 0.5, 0.75, 1.0 and 2 (unit:
Hertz), and the specific amplitude values can be
selected as: 2/4/6/8 and 10, The practical use of
agricultural machinery is mainly to draw a simple
figure with reference to the digital model, as shown in
Figure 2. The software combined with the
compensation calculation and the microprocessor
International Journal of Computational and Engineering124
ACADEMIC PUBLISHING HOUSE

correct the error, which allows the sensor to obtain an
effective output of good analog information.
Figure 2. Digital model diagram
4. CONCLUSION
The automatic control system of agricultural
machinery is the product of the development of
science and technology technology and the inevitable
trend of agricultural development in the future.
Therefore, it is necessary to strengthen the application
degree of sensor technology in the automatic control
system of agricultural machinery, improve the
agricultural production efficiency of agricultural
machinery and equipment, and improve the overall
agricultural machinery. The operation performance
helps agricultural machinery to better maintain
high-efficiency agricultural performance in
agricultural fields with poor farming environment and
promote the development of agricultural automatic
mechanization in China.
REFERENCES
[1]Zhu Y.B. Practice Analysis of Application of
Sensing Technology in Automatic Control System of
Agricultural Machinery. South China Agriculture,
2017, 11(23): 98-100.
[2]Ayi X, Li T.Y. Simulink Simulation Design and
Implementation of Pseudo-code Phase Modulation
System. Journal of Xinjiang Normal University
(Natural Science Edition), 2013, (04): 39-42.
[3]Wang X.Y. On the Importance of Sensors in
Agricultural Machinery. Agricultural technology and
equipment, 2016, (04): 21-22,25.
International Journal of Computational and Engineering 125
ACADEMIC PUBLISHING HOUSE

Research Status of Mask Projection Stereo
Lithography Apparatus and Selective Laser
Sintering
Wenbo Xu*, Xuewen Zong
Mechanical Engineering Department, Henan Institute of Technology, Xinxiang, 453003, China
*E-mail: [email protected]
Abstract: The classification and development of
Stereo Lithography Apparatus and Selective Laser
Sintering are introduced, the working principle of
these two forming methods is explained in detail. The
advantages and problems of mask projection process
are pointed out, the factors influencing the quality of
sintered parts in Selective Laser Sintering are
expounded from different aspects. The development
trend of mask projection Stereo Lithography
Apparatus and Selective Laser Sintering is
summarized.
Keywords: stereo lithography apparatus; mask
projection; oxygen inhibition; selective laser sintering
1. INTRODUCTION
The most outstanding advantage of 3D Printing
Technology is that it is not limited by part structure.
That is to say, it can quickly process parts with
arbitrary complex shapes in principle [1]. Compared
with the traditional manufacturing method, it can
reduce about 60% of the production time and 70% of
the manufacturing cost [2]. 3D Printing Technology is
suitable for new product development, rapid single
and small batch parts manufacturing, complex shape
parts manufacturing, mold design and manufacturing,
etc. It has great development prospects. Castings
suitable for rapid casting are shown in Figure 1.
Figure 1. Castings suitable for rapid casting
3D Printing Technology includes Stereo Lithography
Apparatus (SL), Selective Laser Sintering (SLS),
Fused Deposition Modeling (FDM), Laminated
Object Manufacturing (LOM) and 3Dimensional
Printing (3DP). The parts manufactured by these
printing methods have different applications because
of different raw materials and working principles.
SLA is based on liquid photosensitive resin as raw
material. It is controlled by a computer control system
that laser beams of specific wavelength and intensity
are gathered on the surface of liquid photosensitive
resin in the resin tank and cured by scanning
irradiation to solidify layer by layer until the solid
model is formed. SLA was first proposed by Charles
W. Hull in 1984 and applied for a national patent in
the United States. The advantages of parts made by
SLA process are high surface quality and precision,
and can produce parts with great complexity of
structure, which are excellent for investment casting.
SLS is an additive manufacturing technology that
uses laser as heat source and solidifies powder
materials by sintering layer by layer, and eventually
adds solid models. There are many kinds of raw
materials used in SLS process, such as paraffin,
polystyrene, nylon, ceramics, coated sand and even
metal powder. The advantages of this process are
good mechanical properties of prototype parts, high
intensity without design and construction support,
wide selection of forming materials, and high
utilization rate. On the other hand, the disadvantages
of this process are low precision, rough surface and
post-processing is necessary.
2. RESEARCH STATUS OF MASK PROJECTION
TECHNOLOGY
With the continuous development of SLA technology,
John R et al. have increased the manufacturing speed
of Z-axis by more than 100 times in recent years by
using Continuous Liquid Interface Production (CLIP)
of oxygen-inhibiting mechanism. This makes the
manufacturing method of mask projection stereo
lithography apparatus become a research hotspot [3-4],
the working principle of CLIP is shown in the Figure
2.
Figure 2. The working principle of CLIP
International Journal of Computational and Engineering126
ACADEMIC PUBLISHING HOUSE
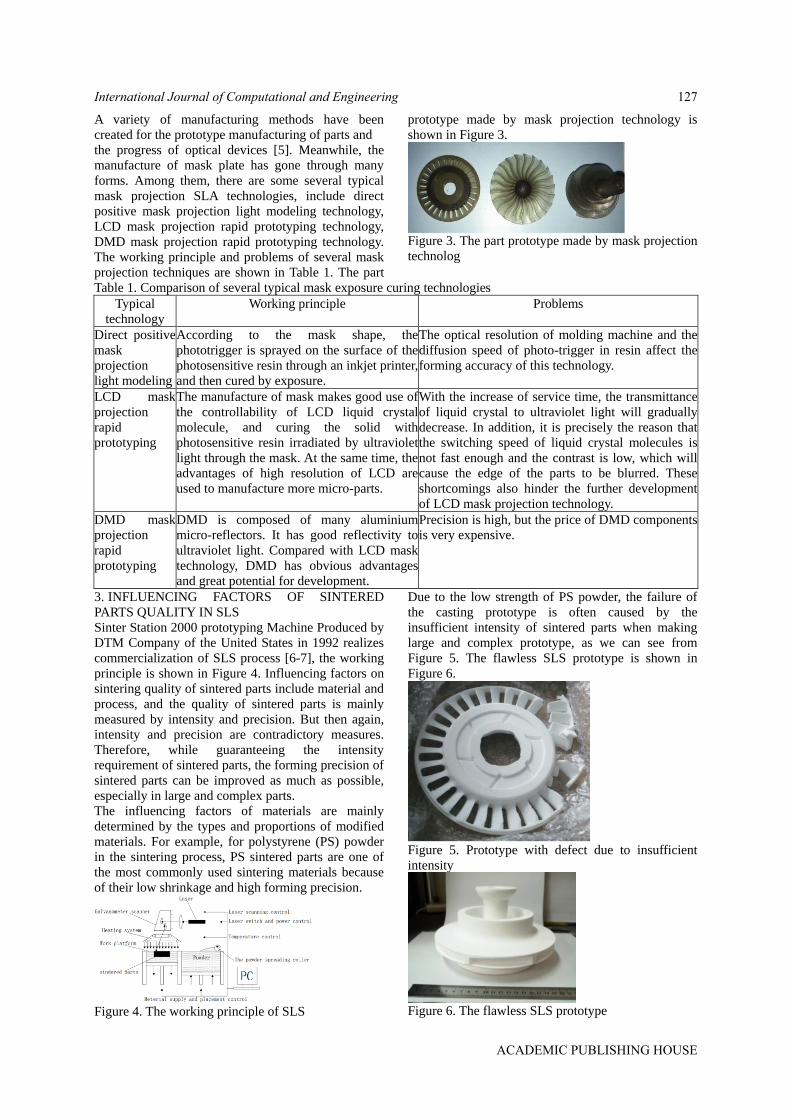
A variety of manufacturing methods have been
created for the prototype manufacturing of parts and
the progress of optical devices [5]. Meanwhile, the
manufacture of mask plate has gone through many
forms. Among them, there are some several typical
mask projection SLA technologies, include direct
positive mask projection light modeling technology,
LCD mask projection rapid prototyping technology,
DMD mask projection rapid prototyping technology.
The working principle and problems of several mask
projection techniques are shown in Table 1. The part
prototype made by mask projection technology is
shown in Figure 3.
Figure 3. The part prototype made by mask projection
technolog
Table 1. Comparison of several typical mask exposure curing technologies
Typical
technology
Working principle Problems
Direct positive
mask
projection
light modeling
According to the mask shape, the
phototrigger is sprayed on the surface of the
photosensitive resin through an inkjet printer,
and then cured by exposure.
The optical resolution of molding machine and the
diffusion speed of photo-trigger in resin affect the
forming accuracy of this technology.
LCD mask
projection
rapid
prototyping
The manufacture of mask makes good use of
the controllability of LCD liquid crystal
molecule, and curing the solid with
photosensitive resin irradiated by ultraviolet
light through the mask. At the same time, the
advantages of high resolution of LCD are
used to manufacture more micro-parts.
With the increase of service time, the transmittance
of liquid crystal to ultraviolet light will gradually
decrease. In addition, it is precisely the reason that
the switching speed of liquid crystal molecules is
not fast enough and the contrast is low, which will
cause the edge of the parts to be blurred. These
shortcomings also hinder the further development
of LCD mask projection technology.
DMD mask
projection
rapid
prototyping
DMD is composed of many aluminium
micro-reflectors. It has good reflectivity to
ultraviolet light. Compared with LCD mask
technology, DMD has obvious advantages
and great potential for development.
Precision is high, but the price of DMD components
is very expensive.
3. INFLUENCING FACTORS OF SINTERED
PARTS QUALITY IN SLS
Sinter Station 2000 prototyping Machine Produced by
DTM Company of the United States in 1992 realizes
commercialization of SLS process [6-7], the working
principle is shown in Figure 4. Influencing factors on
sintering quality of sintered parts include material and
process, and the quality of sintered parts is mainly
measured by intensity and precision. But then again,
intensity and precision are contradictory measures.
Therefore, while guaranteeing the intensity
requirement of sintered parts, the forming precision of
sintered parts can be improved as much as possible,
especially in large and complex parts.
The influencing factors of materials are mainly
determined by the types and proportions of modified
materials. For example, for polystyrene (PS) powder
in the sintering process, PS sintered parts are one of
the most commonly used sintering materials because
of their low shrinkage and high forming precision.
Figure 4. The working principle of SLS
Due to the low strength of PS powder, the failure of
the casting prototype is often caused by the
insufficient intensity of sintered parts when making
large and complex prototype, as we can see from
Figure 5. The flawless SLS prototype is shown in
Figure 6.
Figure 5. Prototype with defect due to insufficient
intensity
Figure 6. The flawless SLS prototype
International Journal of Computational and Engineering 127
ACADEMIC PUBLISHING HOUSE

The influencing factors of process parameters are
mainly composed of the following parameters.
(1) Laser power: Laser power determines the laser
energy scanning on the powder surface. With the
increase of laser power, more energy is absorbed by
powder and the intensity of sintered parts is higher.
On the one hand, when the laser power is too high,
the excess heat will diffuse to the sintered powder on
the side surface and bottom of the sintered parts,
resulting in poor dimensional precision, large
shrinkage, warpage deformation, gasification and
even carbonization. On the other hand, when the laser
power is low, the melting of the material is
insufficient, and the interlaminar adhesion may occur.
(2) Scanning speed: The scanning speed determines
the scanning and heating time of the laser beam.
When the laser power is constant, the lower the
scanning speed, the longer the time of laser heating
the powder and the more heat acting on the powder
surface, the higher the intensity. On the one hand,
when the scanning speed is low, it is difficult to clear
powder and the positive deviation is large. On the
other hand, when the scanning speed is fast, the
melting degree of powder particles is low, which
leads to low strength, and makes the size error deviate
from the negative direction.
(3) Scanning distance: The scanning distance is
related to the laser spot diameter. The size of scanning
distance determines the overlap and separation degree
of two adjacent laser lines. When the laser power is
constant, If the scanning distance is larger, the
overlapping parts of the adjacent two scanning lines
will be less, and the powders melted will be less and,
resulting in the lower intensity of the sintered parts.
The smaller the scanning distance is, the smaller the
state change of powder particles, the smaller the
shrinkage deformation and the better the dimensional
precision are.
(4) Single layer thickness: The single layer thickness
not only affects the energy absorbed by the layers, but
also affects the forming efficiency. The smaller the
thickness of single layer, the stronger the downward
penetration ability of laser, the better the bonding
strength between layers, and the lower the forming
efficiency. The larger single layer thickness, the lower
the laser energy to reach the bottom powder of each
layer, which is not conducive to the bonding between
the layers, and the lower the intensity.
(5) Preheating temperature: In order to reduce the
temperature difference between the upper and lower
surfaces during powder sintering, and to reduce the
shrinkage and warpage of sintered parts. We should
make the preheating temperature of amorphous
polymers generally lower than the glass transition
temperature (Tg).
4. CONCLUSION
After decades of development, Stereo Lithography
Apparatus has changed from traditional scanning
curing to MIP-SLA mask projection technology based
on digital micromirror array. With the continuous
improvement of Continuous Liquid Interface
Production technology, there is a trend that mask
projection technology will replace the traditional SLA
process. At the same time, due to the continuous
production of large-size surface light sources, new
mask projection exposure technology will have
greater breakthroughs in large-size parts.
Selective Laser Sintering technology needs to make
breakthroughs in modeling and simulation. Sintering
process is complex and difficult to observe in real
time. At the same time, in order to better grasp the
sintering process and guide the selection of process
parameters, it is necessary to develop computer
simulation of sintering process. In the optimization of
post-treatment process, although SLS can directly
form metal parts, the mechanical and thermal
properties of the parts can not meet the requirements
of using directly. The performance of sintered parts
can be improved obviously after the post-treatment
process, but it will have a great impact on the
dimensional precision. Therefore, it is necessary to
optimize the existing post-treatment process to
improve the comprehensive quality. In recent years,
there will be more breakthroughs in surface quality,
dimensional precision, mechanical properties and
manufacture of Large-scale Prototype.
REFERENCES
[1]Salmoria G.V, Lauth V.R, Cardenuto M.R, et al.
Characterization of PA12/PBT specimens prepared by
selective laser sintering. Optics and Laser Technology,
2017, 98: 92-96.
[2]Klahn C, Leutenecker B, Meboldt M. Design
strategies for the process of additive manufacturing.
Procedia CIRP. 2015, 36: 230-235.
[3]John R. Tumbleston R, David S, Nikita E, et al.
Continuous liquid interface production of 3D objects.
Science, 2015, 347(6228): 1349-1352.
[4]Janusziewicz R, Tumbleston J.R, Quintanilla A.L,
et al. Layerless fabrication with continuous liquid
interface production. Proc Natl Acad Sci USA, 2016,
113(42): 11703.
[5]Lan H.B, Li D.C, Lu B.H. Micro-and nanoscale 3D
printing. Scientia Sinica (Technologica), 2015, 45(09):
919-940.
[6]Kumar S. Selective Laser Sintering/Melting.
Reference Module in Materials Science and Materials
Engineering. 2014, 10: 93-134.
[7]Kwon D , Park E , Ha S , et al. Effect of humidity
changes on dimensional stability of 3D printed parts
by selective laser sintering[J]. International Journal of
Precision Engineering and Manufacturing, 2017,
18(9):1275-1280.
International Journal of Computational and Engineering128
ACADEMIC PUBLISHING HOUSE

Application of Automatic Control Technology
in Machinery
Yongyang Li
Guangdong University of Science & Technology, Dongguan, 523083, China
E-mail:[email protected]
Abstract: Science and technology are constantly
developing and the society is constantly improving.
This paper starts with the analysis of the main control
methods of automatic control technology, and
discusses the application of automatic control
technology in machinery. It is expected that the
research in this paper will help to promote the
improvement of mechanical properties.
Key words: machinery; automatic control technology;
control method
1. INTRODUCTION
For each country, agricultural production occupies an
extremely important position. The economy and
future of a country are determined by its level of
mechanization, and directly affect the national
economy and people's livelihood. With the further
development of science and technology, the
automation technology is promoted towards the
development of mechanical and electrical cooperation
[1]. At the same time, the microprocessors in the past
have been replaced by virtual instruments, which is
conducive to the exchange and communication of
information. In addition, in the context of the
information age, people's lives are increasingly
inseparable from mechanical information. Based on
the current mechanical development, China's
machinery industry has begun to apply automatic
control technology widely [2]. Through this
technology, it can more accurately analyze the quality
of agricultural products, and more accurately locate
seeding and harvesting, creating a broader
development space and more. The possibility.
2. CHARACTERISTICS OF MECHANICAL
AUTOMATIC CONTROL TECHNOLOGY
For the development of machinery, the introduction of
automatic control technology can effectively improve
the operational efficiency of the machine, and ensure
that the use of machinery for agricultural production
activities to achieve better returns.
(1) Stability Through the application of automatic
control technology in the machine, it is ensured that in
the process of mechanical work, it can achieve better
stability and ensure the efficiency and efficiency of
agricultural machinery operation.
(2) Flexible and simple configuration The application
of automatic control technology promotes the use of
machinery for the corresponding production activities,
with more flexible application effects, making the
operation of the machine easier [3].
(3) Real-time control In order to ensure the
operational efficiency of the machine and improve the
efficiency of mechanical control, the real-time control
objectives of agricultural machinery can be fully
achieved through the application of automatic control
technology. In this way, it is ensured that in the
conduct of agricultural production work, reasonable
control of different machinery can be carried out in
real time to ensure that the expected agricultural
production targets are achieved.
(4) Autonomous fault diagnosis Through the
application of automatic control technology, it is
ensured that independent diagnosis and
troubleshooting can be achieved for the problems
occurring in the mechanical application process
during the specific use of the machine. Based on the
automatic control technology, the operation and
maintenance personnel can be combined with the
corresponding fault alarms to find the fault location in
the first time and complete the fault investigation
quickly and efficiently.
3. AUTOMATIC CONTROL TECHNOLOGY IN
THE APPLICATION OF MACHINERY
3.1. PLC Technology
The PLC is an electronic system with programmable
functions. The edited program can be directly stored
in the memory. The textile machine can automatically
complete the production task according to the
corresponding code instructions. In textile machinery,
PLC technology is mainly used on the flower cleaning
machine and the yarn doubling machine, thereby
greatly improving the working efficiency of the
mechanical equipment.
3.2. Programmable Computer Controller Technology
The programmable controller has been upgraded and
upgraded, and a programmable computer controller
has been introduced to realize the multi-threading of
the operating system, so that the reserve of
application software is continuously expanded. The
programmable computer controller can meet the
various functional requirements of different modules.
Different control measures can be used for different
modules. The data can be packaged and stored in the
CPU to ensure the high efficiency of the operating
system and meet the overall control of the project.
demand. In short, the programmable computer
controller has great advantages, meets the
International Journal of Computational and Engineering 129
ACADEMIC PUBLISHING HOUSE

development standards of the industry, has good
development potential, and needs to further improve
the technical application in the future development
process.
3.3. Space Temperature and Humidity Automatic
Control Technology
In the greenhouse vegetable cultivation, farmers can
obtain higher profits by planting off-season
vegetables. However, because the anti-season
vegetables have higher requirements on the
temperature and humidity of the planting environment,
it is required to supervise the agricultural personnel in
the past greenhouse vegetable cultivation [4]. For the
growth of crops, in the design of automated vegetable
greenhouses, designers need to skillfully apply
temperature and humidity sensors to smart vegetable
greenhouses, and set multiple temperature and
humidity sensors to fixed positions in greenhouses.
Collect temperature and humidity information, and
send the information to the central computer. The
computer will combine the preset thresholds to
properly control the humidification, exhaust and other
mechanical equipment to ensure that the humidity and
temperature in the vegetable greenhouse are in the
proper range. Figure 1 inside.
Figure 1. Humidity and temperature automatic
controller in vegetable greenhouse
3.4. Application of Automatic Control Technology in
Coal Mine Machinery
China is not only a large coal producing country, but
also a large coal country. In order to increase the total
output of coal, the automatic control technology can
be rationally used in coal mining machinery. In the
coal mining machinery, the remote automatic control
system is widely used, and the system can remotely
and automatically control the equipment such as the
shearer and the scraper conveyor. 1) Application in
the shearer The application of the remote automatic
control system in the shearer can realize the real-time
positioning and video tracking of the shearer. The
remote control center can start and stop the shearer
and the running speed. The automatic control is
carried out, so that the shearer can automatically
increase and accelerate the acceleration and
deceleration according to a preset program on the
working surface, which not only greatly improves the
coal mining efficiency, but also prevents the
occurrence of a safety accident. 2) Application of
scraper conveyor in scraper conveyor is one of the
most important mechanical equipments in coal mine
production. Through the application of remote
automatic control technology, online monitoring and
real-time control of conveyor operation can be carried
out.
3.5. Linear Motor Drive Technology
The drive system of the transmission machine is a
rotary motor system, and the mechanical structure is
relatively restrictive, which makes it difficult to
improve its performance. Current researchers need to
increase efforts to develop linear motor drive systems.
By using the linear motor drive system, the error of
the mechanical rotation of the motor table can be
reduced. During the rotation of the machine tool, the
chain length can also be shortened to achieve the
advantage of zero rotation. While ensuring the
running speed of the machine, it can also improve the
accuracy and rigidity of the operation, reduce the
generation of noise, and further prolong the formation
of motion. At present, the linear motor drive
technology is widely used in the operation of the
machine tool. For example, a company using linear
motor drive technology for production can improve
production efficiency, ensure efficient processing
technology, and further improve production
performance.
3.6. Full Closed Loop AC Servo Drive Technology
Among many electromechanical power plant products,
digital AC servo system technology is widely used.
This technology is relatively simple to operate and
easy to debug, and can meet the requirements of
digitization and precision. Using this technology, the
position of the sampling photoelectric encoder is
obtained by digital signal, and the control loop of
position and speed is formed. The high-speed
operation of the processor is used to increase the
efficiency of the automatic control system. By driving
the high-turning Fourier, the resonance generated by
the mechanical operation can be realized. Eliminate.
By using closed-loop AC servo drive technology
during mechanical operation, the precision control of
the machine can be continuously improved, and
researchers are constantly introducing a more
advanced full-closed AC servo system. The position
feedback component is installed in the mechanical
motion terminal, which can improve the advanced
nature of the full-closed AC servo system. The motor
encoder can eliminate the gap problem of the
mechanical transmission, reduce the error of the
mechanical rotating component, and improve the
positioning accuracy. Many automation equipments
International Journal of Computational and Engineering130
ACADEMIC PUBLISHING HOUSE

are currently undergoing retrofit and upgrade of servo
systems and have a wide range of applications.
4. APPLICATION ADVANTAGES
In machinery, automatic control technology has the
following application advantages:
(1) Real-time control of the machine. In the machine,
the automatic control technology is mainly based on
electrical control, and the control effect is achieved by
signal transmission. This allows real-time control of
the mechanical operation process.
(2) It can improve the overall performance of the
machine. When the automatic control technology is
applied in the machine, the I/O signal is usually used,
so that the internal circuit of the machine can be
isolated from the external environment, and the
filtering device can effectively suppress the
interference, thereby making the machine The overall
performance has been further improved.
(3) Self-diagnosis of faults can be realized. Because
the machinery needs to work in the field, affected by
environmental factors, the machine often has various
failures, and the application of automatic control
technology can realize the self-diagnosis of
mechanical failure. When a fault occurs, the
automatic control device or system in the machine
will diagnose the fault in the first time, and handle the
fault through self-repair. For the fault that cannot be
handled, the machine will issue an alarm prompt. This
ensures the safety and stability of the operation.
5. CONCLUSION
In summary, with the rapid development of
technology, the automatic control technology has
become more and more perfect. This technology has
been widely used in many fields due to its various
advantages. The application of automatic control
technology in the field of machinery can greatly
improve the operational safety, stability and reliability
of mechanical equipment, thereby significantly
increasing the related production efficiency.
REFERENCES
[1]Li J, Zhu Q.F, Exploring the Design of Automatic
Control System of Robot Arms in Non-structural
Environment, 2018, (04): 56-58.
[2]Cao R.H, Discussion on the design of automatic
control system for mechanical three-dimensional
parking equipment. China Equipment Engineering,
2017, (10): 109-111.
[3]Liu Y.Q, Le G.Q, Analysis of the application of
automatic control technology of mechanical
equipment under the control of microelectronic
sensing signals. Southern Agricultural Machinery,
2018, (03): 43-44.
[4]Fang L.W, Zhang K. Design of automatic control
system for mechanical auxiliary equipment based on
CAN bus. Science and Technology, 2017, (10):
102-104.
International Journal of Computational and Engineering 131
ACADEMIC PUBLISHING HOUSE
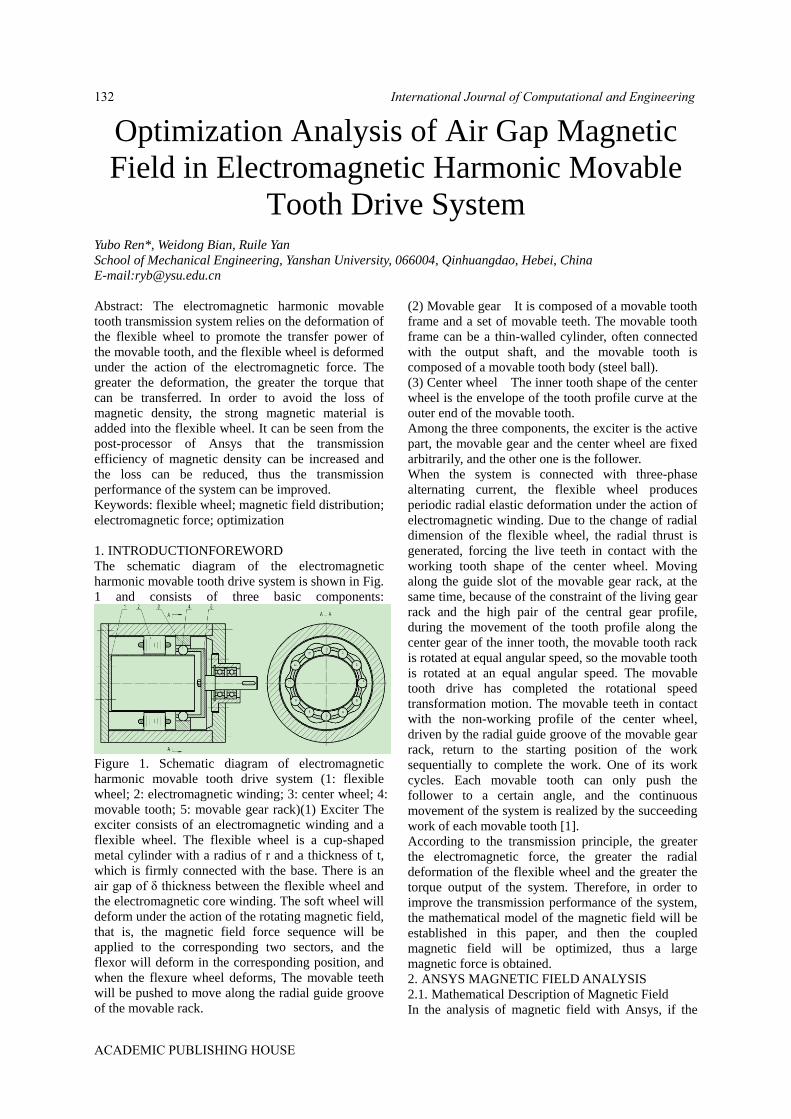
Optimization Analysis of Air Gap Magnetic
Field in Electromagnetic Harmonic Movable
Tooth Drive System
Yubo Ren*, Weidong Bian, Ruile Yan
School of Mechanical Engineering, Yanshan University, 066004, Qinhuangdao, Hebei, China
E-mail:[email protected]
Abstract: The electromagnetic harmonic movable
tooth transmission system relies on the deformation of
the flexible wheel to promote the transfer power of
the movable tooth, and the flexible wheel is deformed
under the action of the electromagnetic force. The
greater the deformation, the greater the torque that
can be transferred. In order to avoid the loss of
magnetic density, the strong magnetic material is
added into the flexible wheel. It can be seen from the
post-processor of Ansys that the transmission
efficiency of magnetic density can be increased and
the loss can be reduced, thus the transmission
performance of the system can be improved.
Keywords: flexible wheel; magnetic field distribution;
electromagnetic force; optimization
1. INTRODUCTIONFOREWORD
The schematic diagram of the electromagnetic
harmonic movable tooth drive system is shown in Fig.
1 and consists of three basic components:
Figure 1. Schematic diagram of electromagnetic
harmonic movable tooth drive system (1: flexible
wheel; 2: electromagnetic winding; 3: center wheel; 4:
movable tooth; 5: movable gear rack)(1) Exciter The
exciter consists of an electromagnetic winding and a
flexible wheel. The flexible wheel is a cup-shaped
metal cylinder with a radius of r and a thickness of t,
which is firmly connected with the base. There is an
air gap of δ thickness between the flexible wheel and
the electromagnetic core winding. The soft wheel will
deform under the action of the rotating magnetic field,
that is, the magnetic field force sequence will be
applied to the corresponding two sectors, and the
flexor will deform in the corresponding position, and
when the flexure wheel deforms, The movable teeth
will be pushed to move along the radial guide groove
of the movable rack.
(2) Movable gear It is composed of a movable tooth
frame and a set of movable teeth. The movable tooth
frame can be a thin-walled cylinder, often connected
with the output shaft, and the movable tooth is
composed of a movable tooth body (steel ball).
(3) Center wheel The inner tooth shape of the center
wheel is the envelope of the tooth profile curve at the
outer end of the movable tooth.
Among the three components, the exciter is the active
part, the movable gear and the center wheel are fixed
arbitrarily, and the other one is the follower.
When the system is connected with three-phase
alternating current, the flexible wheel produces
periodic radial elastic deformation under the action of
electromagnetic winding. Due to the change of radial
dimension of the flexible wheel, the radial thrust is
generated, forcing the live teeth in contact with the
working tooth shape of the center wheel. Moving
along the guide slot of the movable gear rack, at the
same time, because of the constraint of the living gear
rack and the high pair of the central gear profile,
during the movement of the tooth profile along the
center gear of the inner tooth, the movable tooth rack
is rotated at equal angular speed, so the movable tooth
is rotated at an equal angular speed. The movable
tooth drive has completed the rotational speed
transformation motion. The movable teeth in contact
with the non-working profile of the center wheel,
driven by the radial guide groove of the movable gear
rack, return to the starting position of the work
sequentially to complete the work. One of its work
cycles. Each movable tooth can only push the
follower to a certain angle, and the continuous
movement of the system is realized by the succeeding
work of each movable tooth [1].
According to the transmission principle, the greater
the electromagnetic force, the greater the radial
deformation of the flexible wheel and the greater the
torque output of the system. Therefore, in order to
improve the transmission performance of the system,
the mathematical model of the magnetic field will be
established in this paper, and then the coupled
magnetic field will be optimized, thus a large
magnetic force is obtained.
2. ANSYS MAGNETIC FIELD ANALYSIS
2.1. Mathematical Description of Magnetic Field
In the analysis of magnetic field with Ansys, if the
International Journal of Computational and Engineering132
ACADEMIC PUBLISHING HOUSE

change of the magnetic field in axial direction is
ignored, it becomes a two-dimensional problem. In
the analysis, scalar magnetic potential φ is often
introduced. For the nonlinear plane quasi-stable
magnetic field, the scalar magnetic potential satisfies
the quasi-Poisson equation, and its boundary value
problem equation can be expressed as follows:
qn
uS
uuS
fy
u
yx
u
xyx
:
:
)()(:
2
01
(1)
In the formula Ω is the electromagnetic field; 𝑆1、𝑆2
is the boundary of the first and second types of
magnetic fields; x,y,n is flexor axial, circumferential
and radial; 𝑢 denote magnetic potential φ; 𝛽 is the
magnetic permeability μ or the magnetic reluctivity ; 𝑓 current density 𝐽𝑧 ; 𝑢0 the known magnetic
potential values on boundary; q is the intensity of the
normal magnetic field on the boundary 𝐻𝑛 or
tangential magnetic induction intensity 𝐵𝑡. For harmonic motor, the finite element method can be
used to solve the harmonic motor because its
magnetic field contains many kinds of media, and the
non-linearity of the material is considered for
ferromagnetic materials. When the continuation finite
element method is used to calculate the
electromagnetic field quantity at any point in the
element, the calculation of electromagnetic field
quantity is [2]:
(1) For scalar potential φ the intensity of the
magnetic field H can be obtained, the components
are:
N
ii
iy
N
ii
ix
y
N
yH
x
N
xH
1
1
(2)
(2) For vector potential Az the magnetic induction
intensity B can be obtained, the components are:
N
iZ
iZy
N
iZ
iZx
i
i
Ax
N
x
AB
Ay
N
y
AB
1
1
(3)
In the formula the Ni is a generalized shape function,
for the triangular elements, the number of terms N is
of the extended Ritz interpolation function, which is
greater than 3, so the higher order interpolation is
realized on the linear element.
2.2. Model Building
Ansys provides two modeling methods from top to
bottom and from bottom to top, and users can choose
the appropriate modeling mode according to the
actual situation. In this paper, the model is on a single
plane, the whole model is not complex, its specific
parameters are shown in Table 1, the bottom-to-top
modeling method can be used. First, a series of key
points are drawn, then the appropriate key points are
selected to form the desired lines, and then the surface
is drawn by the lines. Finally, a suitable model can be
constructed by Boolean operation of some columns.
Table 1. Model parameter
Number of
phases
Number of
pole-pairs
Stator slot
number
Stator inner
diameter
Stator outer
diameter
Flexible wheel inner
diameter
Pulley outer
diameter
3 1 24 35mm 50mm 34.2mm 34.4mm
The slot shape of the stator selects a common
semi-closed slot, the shape of which is shown in
Figure 2, and its specific dimensions are as
follows:b0 = 1.3mm ,b1 = 2.4mm ,b2 = 3mm ,h0 =0.47mm,h1 = 0.48mm,h2 = 3.04mm.
The finite element model is shown in Figure 3.
Figure 2. Semi-closed slot
Figure 3. Two-dimensional finite element model
2.3. Grid Division
After the attributes and mesh size settings are
complete, you can mesh. There are two types of
meshes, free mesh and mapping mesh. In this paper,
free mesh is selected, and the result is shown in
Figure 4.
1
X
Y
Z
AREAS
TYPE NUM
International Journal of Computational and Engineering 133
ACADEMIC PUBLISHING HOUSE
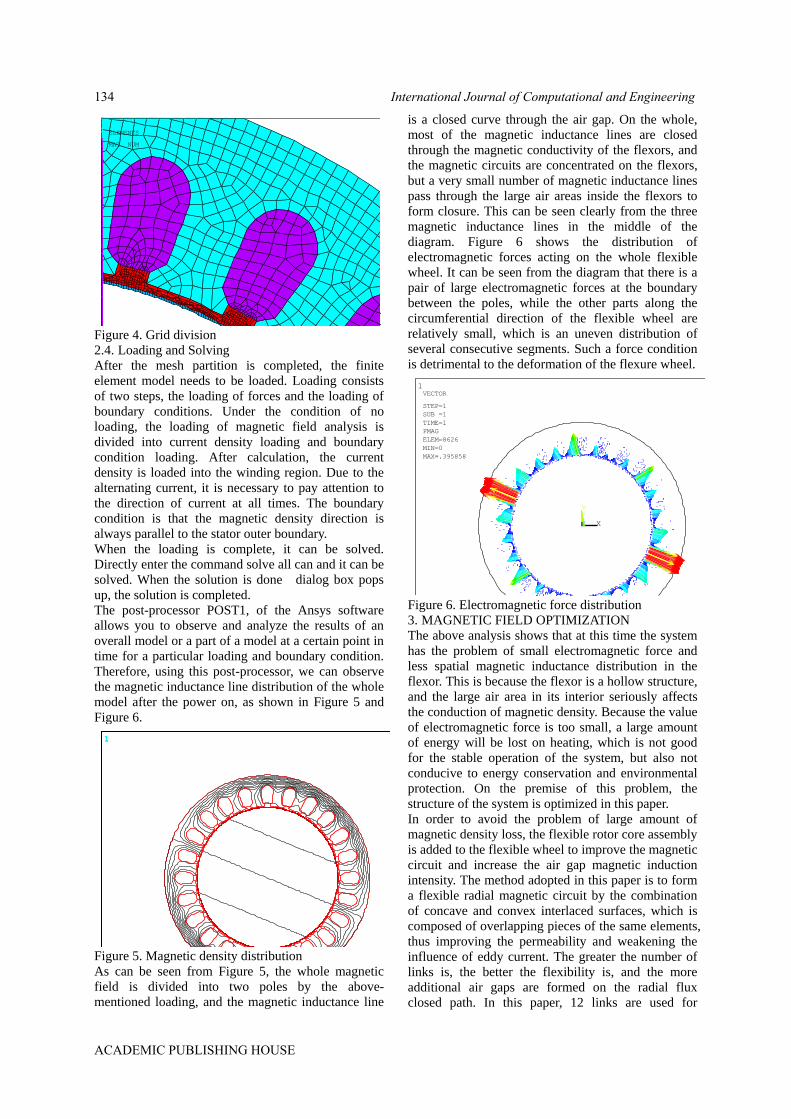
Figure 4. Grid division
2.4. Loading and Solving
After the mesh partition is completed, the finite
element model needs to be loaded. Loading consists
of two steps, the loading of forces and the loading of
boundary conditions. Under the condition of no
loading, the loading of magnetic field analysis is
divided into current density loading and boundary
condition loading. After calculation, the current
density is loaded into the winding region. Due to the
alternating current, it is necessary to pay attention to
the direction of current at all times. The boundary
condition is that the magnetic density direction is
always parallel to the stator outer boundary.
When the loading is complete, it can be solved.
Directly enter the command solve all can and it can be
solved. When the solution is done dialog box pops
up, the solution is completed.
The post-processor POST1, of the Ansys software
allows you to observe and analyze the results of an
overall model or a part of a model at a certain point in
time for a particular loading and boundary condition.
Therefore, using this post-processor, we can observe
the magnetic inductance line distribution of the whole
model after the power on, as shown in Figure 5 and
Figure 6.
Figure 5. Magnetic density distribution
As can be seen from Figure 5, the whole magnetic
field is divided into two poles by the above-
mentioned loading, and the magnetic inductance line
is a closed curve through the air gap. On the whole,
most of the magnetic inductance lines are closed
through the magnetic conductivity of the flexors, and
the magnetic circuits are concentrated on the flexors,
but a very small number of magnetic inductance lines
pass through the large air areas inside the flexors to
form closure. This can be seen clearly from the three
magnetic inductance lines in the middle of the
diagram. Figure 6 shows the distribution of
electromagnetic forces acting on the whole flexible
wheel. It can be seen from the diagram that there is a
pair of large electromagnetic forces at the boundary
between the poles, while the other parts along the
circumferential direction of the flexible wheel are
relatively small, which is an uneven distribution of
several consecutive segments. Such a force condition
is detrimental to the deformation of the flexure wheel.
Figure 6. Electromagnetic force distribution
3. MAGNETIC FIELD OPTIMIZATION
The above analysis shows that at this time the system
has the problem of small electromagnetic force and
less spatial magnetic inductance distribution in the
flexor. This is because the flexor is a hollow structure,
and the large air area in its interior seriously affects
the conduction of magnetic density. Because the value
of electromagnetic force is too small, a large amount
of energy will be lost on heating, which is not good
for the stable operation of the system, but also not
conducive to energy conservation and environmental
protection. On the premise of this problem, the
structure of the system is optimized in this paper.
In order to avoid the problem of large amount of
magnetic density loss, the flexible rotor core assembly
is added to the flexible wheel to improve the magnetic
circuit and increase the air gap magnetic induction
intensity. The method adopted in this paper is to form
a flexible radial magnetic circuit by the combination
of concave and convex interlaced surfaces, which is
composed of overlapping pieces of the same elements,
thus improving the permeability and weakening the
influence of eddy current. The greater the number of
links is, the better the flexibility is, and the more
additional air gaps are formed on the radial flux
closed path. In this paper, 12 links are used for
1
ELEMENTS
MAT NUM
ANSYS 14.0
NODAL SOLUTION
STEP=1
SUB =1
TIME=1
AZ
RSYS=0
SMN =-.001386
SMX =.001386
1
ZV =1
*DIST=.071573
*XF =.014693
*YF =-.490E-03
-.001334
-.001232
-.001027
-.924E-03
-.719E-03
-.513E-03
-.411E-03
-.205E-03
-.694E-07
.103E-03
.308E-03
.411E-03
.616E-03
.821E-03
.924E-03
.001129
.001334
1
1
1
1
1
1
1
1
1
1
1
X
Y
Z
0
.043984.087968
.131953.175937
.219921.263905
.307889.351874
.395858
VECTOR
STEP=1
SUB =1
TIME=1
FMAG
ELEM=8626
MIN=0
MAX=.395858
International Journal of Computational and Engineering134
ACADEMIC PUBLISHING HOUSE

analysis, as shown in Figure 7.
Figure 7. Chain-link flexible core assembly
Figure 8. Magnetic field distribution
Figure 9. Electromagnetic force distribution
Figure 8 and Figure 9 show the improved distribution
of the magnetic inductance line and the flexure wheel
force. From the comparison between Figure 8 and
Figure 5, it is obvious that the linear density of air gap
magnetic inductance increases after optimization,
indicating that the value of air gap magnetic density
increases at this time. Figure 9 contrasts with figure 6,
where the maximum electromagnetic force is
0.395N ∙ m without optimization, and the maximum
electromagnetic force after optimization is 3.76N ∙ m,
which can be seen to be nearly 10 times greater than
before. And its distribution is more uniform, which
improves the performance of the system.
4. CONCLUSIONTHE ENDING
In order to solve the problem that the electromagnetic
force of the system is small and the distribution of
spatial magnetic inductance lines in the flexor is less,
the magnetic field system is optimized in this paper,
and flexible core components are added to the inner
region of the flexible wheel to improve the magnetic
circuit. By means of Ansys analysis, it can be seen
that after optimization, the linear density of air gap
magnetic induction increases, the air gap magnetic
density increases, and the electromagnetic force of the
optimized air gap increases obviously. The output
torque of the system can be greatly improved.
ACKNOWLEDGEMENT
This paper is supported by National Natural Science
Foundation of China. (No. 51875497)
REFERENCE
[1]Ren Y.B, Xu L.Z, Liang Y.L. Analysis of torque
characteristics of electromagnetic Harmonic movable
Tooth Drive. Mechanical Engineering of China, 2015,
26(15): 2000-2004.
[2]Tang Y.C, Liang Y.P. Analysis and calculation of
electromagnetic Field of Motor, Beijing, Mechanical
Industry Press, 2010, 11-13.
ANSYS 14.0
NODAL SOLUTION
STEP=1
SUB =1
TIME=1
AZ
RSYS=0
SMN =-.005753
SMX =.005744
1
ZV =1
*DIST=.071574
*XF =.017178
A =-.005114
B =-.003837
C =-.00256
D =-.001282
E =-.455E-05
F =.001273
G =.00255
H =.003828
I =.005105
1
1
1
1
1
1
1
1
1
1
1
X
Y
Z
0
.417568.835135
1.25271.67027
2.087842.50541
2.922973.34054
3.75811
VECTOR
STEP=1
SUB =1
TIME=1
FMAG
ELEM=8536
MIN=0
MAX=3.75811
International Journal of Computational and Engineering 135
ACADEMIC PUBLISHING HOUSE

Design of Fault Diagnosis Module Based on
Virtual Instrument and Multi-signal Model for
Target Search Combination of Certain
Equipment
Yiwei Zhao1,*, Xuanhai Li1, Qianyu Chen1, Mingfang Wang2, Yuhao Dong3 1PLA Dalian Naval Academy 2Unit 93861 3PLA Air Force Engineering University, Xi’an, Shanxi, 710051
*E-mail: [email protected]
Abstract: In this paper, virtual instrument technology
is proposed to integrate the modular instrument of
USB bus and construct the field fault diagnosis
equipment based on portable military reinforced
computer as the main control platform [1]. Using
virtual instrument software to develop fault detection
system and embedding fault diagnosis strategy
generated by multi-signal model can not only satisfy
in-situ detection of equipment signals such as
real-time acquisition, signal processing and analysis,
but also realize fault diagnosis and isolation.
Keywords: Fault Diagnosis, technical requirements,
hardware design
1. INTRODUCTION
A search radar is one of the most important electronic
information equipments of a certain type of
equipment, which is responsible for the important task
of searching and tracking targets. The search radar is
a complex equipment which integrates machinery,
electronics and electromagnetism. It usually works in
high altitude, mountains, islands and other harsh
environments. Its components are easily damped and
aged. Its combat readiness is directly related to the
normal operation and operational effectiveness of a
certain type of equipment, which puts forward higher
requirements for the field maintenance and guarantee
of radar [2]. In order to quickly and accurately detect
the signal detection and fault diagnosis of large and
complex equipment, and solve the problem that the
testing and diagnostic equipment is difficult to solve
in the field or in a narrow space, field-level fault
diagnosis devices are often used. The field level fault
diagnosis device needs to consider the requirements
of function, volume and power consumption,
especially the internal function module is the key
factor in the design, and it is also a difficult problem
to solve.
2. DESIGN TECHNICAL INDICATORS OF FAULT
DIAGNOSIS DEVICE FOR A SEARCH RADAR
According to the requirement analysis of the test and
diagnosis of a search radar, the main technical
requirements of the maintenance support auxiliary
equipment used at the field level are determined as
follows.
Table 1 The main technical requirements
Pulse period 20us
Pulse width 2us
Frequency of carrier signal 30MHZ
Range 0-300V(2V,10V,50V,100V,300V)
Accuracy ±0.30%
Range of frequency 20Hz-1MHz(1KHz,50KHz,200KHz,1MHz,10MHz)
Frequency accuracy ±0.5%
Accuracy of amplitude ±2%
Period of Pulse 20us
Working Temperature Conditions -15-40℃
Vibration 1.5G(5Hz~200Hz)
Attacking 15g@11ms
Fault detection rate: refers to the ability to detect and
find one or more faults in the equipment. Generally
defined as the ratio of the number of faults correctly
detected by a specified method to the total number of
possible faults, it can be expressed as a percentage.
International Journal of Computational and Engineering136
ACADEMIC PUBLISHING HOUSE

100%DFDR
(1) Fault isolation rate: Generally defined as the ratio of
the number of faults detected and isolated to the total
number of possible faults, it can be expressed as a
percentage.
100%L
D
FIR
(2) 3. HARDWARE DESIGN OF FAULT DIAGNOSIS
DEVICE
According to the design requirements and technical
indicators of the fault diagnosis device, it can be seen
that the main control module, multimeter module,
oscilloscope module and signal source generation
module are needed, and these modules are the key to
the design of the field fault diagnosis device. Because
it is easy to carry and use in the field. At the same
time, the performance and volume of each module
should also be fully considered.
To sum up the above factors, we adopt mature
specialized modules in the market to achieve. Because
of the high integration requirement of the fault
diagnosis device, the portable military reinforced
computer is used as the main control platform, and the
modular instrument of USB bus is integrated to
construct the fault diagnosis device. Among them, the
functions and indicators of each module are as
follows [3].
(1) Main control module: the whole machine control
of the control fault diagnosis device. Intel Atom N270
low power processor, 1.6GHz CPU and 1G memory
military hardened computer are used to realize this
function. At the same time, the control of oscilloscope
module and multimeter module is realized by USB
bus.
(2) Oscilloscope module: complete the waveform
measurement of the response signal of the test circuit.
The Nextkit acquisition card of Panhua Measurement
and Control Company is used. It is a USB data
interface and can be integrated into the computer. The
acquisition board has the function of waveform
acquisition, which can be defined by users, and has
the function of secondary development.
(3) Multimeter module: complete the measurement of
the voltage, current and impedance of the circuit
board under test. It is implemented by NI's USB-4065
multimeter module. With the following indicators:
channel number: 5; resolution digit: 6.5 bits;
maximum DC: 300 V.
(4) Signal Source Module: It mainly generates radar
pulse signal, so as to test and diagnose the circuit
board. Because the signal source module of this
module is very important in radar signal detection, the
design is introduced separately.
(5) Power supply module: There are two ways to
supply power: one is to change 220V AC current into
+ 19V DC power through AC-DC adapter, and charge
the battery at the same time; the other is to use lithium
battery to supply power, using 5000mAh capacity,
power up to 65W, efficiency up to 85%. At the same
time, the intelligent lithium battery controller is
configured to monitor the output current and voltage
of the battery. The monitored data is output through
bus protocol. It can configure various functions in the
battery management configuration tools and
configuration software, mainly to adjust the pressure
difference between the charge and discharge of the
batteries.
4. CONCLUSION
After testing, other performance indicators of the fault
diagnosis device can meet the design requirements.
Based on virtual instrument and multi-signal model,
the system develops corresponding signal source
module [4], oscilloscope module, multimeter module
and control module, and realizes the design of
field-level fault diagnosis equipment. The
experimental results show that the performance index
of the system fully meets the design requirements. At
present, it has been successfully applied to the on-site
maintenance of a search radar and plays an important
role in the maintenance and support of the search
radar.
REFERENCES
[1]Parag K. Lala, Fellow, IEEE, and Alfred L. Burress,
Self-Checking Logic Design for FPGA
Implementation, IEEE Transactions on
instrumentation and measurement, Vol.52, No. 5,
October 2003, pp.1391-1398.
[2]Roman Lysecky, Frank Vahid, A Configurable
Logic Architecture for Dynamic Hardware/Software
Partitioning, Proceedings of the Design, Automation
and testing in Europe Conference and Exhibition
(DATE04), 2004, IEEE, pp.01-06.
[3]Vince Hopkin, Bob Kirk, FPGA MIGRATION TO
ASICS, Wescon/95, Conference record.
Microelectronics Communications Technology
Producing Quality. pp. 268-271.
[4]Jemika Malik, Anand Ojha, Design of A Vlsi Fpga
Intrgrated Circuit, 2005 IEEE Region 5 and IEEE
Denver Section Technical, Professional and Student
Development Workshop, 2005, pp.12-15
International Journal of Computational and Engineering 137
ACADEMIC PUBLISHING HOUSE
Combustion Simulation of High-concentration
Organic Liquid Wastes
Xiaowen Hao1,*, Zhijun Zhang2, Zhengyu Wang2 1 School of New Energy, Harbin Institute of Technology, Weihai, 264209, China 2 The First Company of China Eighth Engineering Division LTD, Jinan, 250014, China
*E-mail: [email protected]
Abstract: Incinerators are widely used for processing
liquid wastes with organic of high concentration. The
liquid jet incinerators of L type have the advantages
of high combustion efficiency, fast adjustment
temperature, relatively low construction cost and
maintenance cost dealing with the wastes. However,
the combustion reactions of the organic in the
incinerator are very complex, and it is very difficult to
carry out experimental research. The simulation can
be more intuitive to obtain the regulation in the
incinerator although the simulation research being far
more enough. This manuscript numerically simulated
the waste incinerator of a chemical enterprise. The
inlet air velocity and the waste mass flow were the
main variables in the simulation. By studying the
combustion regulation of organic liquid waste in
incinerator, the regulations of combustion and flow in
the incinerator were obtained. The calculations
showed that the increase in inlet air velocity and
waste mass flow rate changed the combustion process.
The uniformity of flow and temperature distributions
have been changed by higher inlet velocity. The
efficiency of the waste treatment in the incinerator
was very high. The simulation provides the basis for
the design of the incinerator.
Keywords: Velocity field, Temperature field, Organic
liquid wastes incinerator, Numerical simulation,
Combustion.
1. INTRODUCTION
The pharmaceutical, textile, petroleum, chemical and
other industries emit a large amount of
high-concentration organic liquid wastes every year.
The treatment of waste liquids can be biologically and
physically chemistry in the industry, which are not up
to standard and costly. Microbial methods, magnetic
separation methods, and ion exchange methods have
been studied [1-3], whose industrial applications have
not yet been realized due to various reasons such as
immature technology and cost. The use of Incinerator
to treat organic liquid wastes is simpler and more
efficient than other technologies. It can not only
recover heat, reduce treatment costs, but also
incinerate harmful substances to achieve
comprehensive utilization of waste and protect the
environment [4-5]. At present, intensive combustion
methods have been widely used in developed
countries to treat high-concentration organic liquid
wastes [6].
Theoretical analysis, experimental and industrial
applications are proceeded for the organic liquid
waste incinerators. The study for the incinerators
include pyrolysis and combustion kinetics of waste
[7-9], design calculation and optimization of
incinerator operation [10-13], sulfur dioxide, nitrogen
oxides and hydrogen chloride emission control
[14-16], and so on. Fluidized bed boilers have the
most research, with liquid jet incinerators and rotary
kiln incinerators being the least. The liquid jet
incinerator has strong adaptability and has obvious
advantages such as low construction cost, fast
adjustment temperature and relatively low
maintenance cost. The liquid jet incinerator can
handle complex organic liquid wastes of various
components.
The liquid-jet incinerator are available in vertical,
horizontal, L and Π types. The L type incinerator has
been widely used due to the long residence time of the
flue gas and the small area. However, its research is
still insufficient. This is mainly due to the turbulent
flow in the incinerator, the complex combustion
reaction, and the high temperature in the furnace.
There are great difficulties in experimental research.
However, its research is still insufficient. This is
mainly due to the turbulent flow, the complex
combustion reaction, and the high temperature in the
incinerator. There are great difficulties in
experimental research.
A three-dimensional physical model and
mathematical model were established for the L type
incinerator in this manuscript. The velocity field and
temperature field in the liquid waste incinerator were
analyzed. The incineration characteristics of the waste
liquid in the furnace were analyzed. The effects of
incinerator inlet air velocity and waste liquid mass
flow on the characteristics of the incinerator were
analyzed, too.
2. PHYSICAL MODEL
An L type liquid-jet incinerator with a treatment
capacity of 10t/h in a refinery was composed of three
parts of the thermal oxidation chambers I, II and III as
shown in Fig.1. The thermal oxidation chamber I was
vertically arranged, and the tails were arranged
horizontally with the chamber II and III [17]. When
the device was in operation, the concentrated
industrial organic waste liquid was transported
International Journal of Computational and Engineering138
ACADEMIC PUBLISHING HOUSE

through the waste liquid distributor and uniformly
sprayed into the furnace through the mechanical
atomizing burner in the upper part of the thermal
oxidation chamber I. An auxiliary fuel gas burner and
a primary air inlet were vertically disposed at the top
of the chamber I. The six mechanical atomizing
nozzles were 30° from the central axis of the chamber
I. The industrial organic liquid wastes were sprayed
into the combustion chamber through the atomizing
nozzle to enhance the turbulent mixing and waste
liquid incineration efficiency.
(a) Structure diagram
(b) 3-D Model
1. Thermal oxidation chamber I, 2. Thermal oxidation
chamber II, 3. Thermal oxidation chamber III,
4. Air inlet, 5. Atomizing nozzle, 6. Flue gas outlet
Figure 1. Structure of the L type liquid-jet incinerator
3. SIMULATION METHOD
3.1. Assumptions of the Simulation Process
The geometry of the incinerator was relatively special,
the components of the chemical liquid waste were
very complicated, and the combustion process
involved many complicated chemical reactions. The
physical model and mathematical model must be
simplified and assumed In order to obtain stable and
realistic calculation results. The following
assumptions were used for simulation calculations:
(1) The device was stable in operation. The liquid
waste proposed and the primary air injected during
operation were constant. The secondary air into the
nozzles was ignored. The effect of the auxiliary fuel
on the combustion in the incinerator was ignored. The
auxiliary fuel is only used for preheating and ignition
of the incinerator.
(2) The fluid in the incinerator was assumed to be a
fully developed turbulent state.
(3) The liquid wastes were uniformly atomized by the
nozzles. The particle size distribution of the wastes
conforms to the Rosin-Rammler law. The velocity of
the wastes was determined by the nozzle outlet
cross-sectional area and the volume flow rate of the
liquid waste. The nozzle was simplified to a point
where the atomization phase was omitted and the
atomized droplets were sprayed into the furnace using
a conical jet source.
(4) There is heat dissipation from the incinerator wall.
(5) Since the time scale of the heterogeneous reaction
is much larger than the turbulent pulsation time scale,
the influence of turbulent pulsation on the
heterogeneous reaction is negligible. So it can be
assumed that the reactant and product concentration
were calculated on a time-averaged basis.
(6) It is difficult to accurately obtain the chemical
composition of the liquid waste and its parameters
such as the heating value. The simulated liquid used
herein was n-Pentane (C5H12), the molecular weight
was 72, the boiling point was 309.1K, the density was
3.4537 kg/Nm3, and the heat of combustion was 3245
kJ/mol.
3.2. Initial Conditions
The Realizable k-ε model is derived from the
experimental phenomena and has a wide range of
application and acceptable accuracy, which was
selected in flow simulation. The Discrete Random
Walk Model (RSM) was selected to track the
trajectory of waste combustion particles and the effect
of instantaneous turbulent pulsation on the
combustion particles of liquid wastes. The Finite
Chemical-Rate/Eddy-Dissipation model was used to
simulate the waste liquid combustion process. The
Discrete Phase Mode (DPM) model was used to
simulate the distribution of atomized organic liquid
wastes. The effects of droplet gasification and internal
heat transfer on heat transfer and mass transfer were
considered in the calculation process of the DPM
model. The P-1Model model was chosen to simulate
the radiation process in the incinerator.
C5H12 was set as discrete phase and was injected into
the furnace at a fixed location by the nozzles during
the simulation. The air was blown into the incinerator
as a continuous phase.
Tab. 1 shows the simulation conditions. There are two
conditions. The first one is that the liquid mass flow
rate of per nozzle is a constant, which is 0.1 kg/s. The
inlet air velocity (air flow) is changed. The second
one is that the inlet air velocity is a constant, which is
15m/s. The flow rate of per nozzle is changed.
Table 1. Simulation conditions
Condition
number
Mass flow rate of per
nozzle (kg/s)
Inlet air
velocity (m/s)
1-1
0.1
12.5
1-2 15.0
1-3 17.5
1-4 20.0
1-2 0.1
15.0 2-1 0.2
2-2 0.3
2-3 0.4
International Journal of Computational and Engineering 139
ACADEMIC PUBLISHING HOUSE

The profile of the central section and of the
cross-sections A1-A2 and B1-B2 (the height from the
bottom of the thermal oxidation chamber I being 6.4
m and 3.5 m) were analyzed.
4. RESULT AND DISCUSSION 4.1. Inlet Air Velocity on Velocity and Temperature
Fields in the Incinerator
4.1.1. Resultant velocity in the incinerator
Fig. 2 shows the resultant velocity distributions in the
incinerator. The velocity range of ordinate increases
with the increase of inlet velocity. The velocity
distributions in the cross-sections A1-A2 are affected
by the nozzle. And the velocity distributions along the
axis are uniform in the chamber I till the turn to the
chamber II. The velocity are more ununiform in the
chamber II and III with higher inlet velocity. So the
baffles are necessary installed in the turn.
(a) 1-1
(b) 1-2
(c) 1-3
(d) 1-4
Figure 2. Resultant velocity distributions with four
inlet velocities, m/s.
4.1.2. Temperature fields in the incinerator
Fig. 3 shows the temperature fields in the incinerator.
The velocity distribution affected the temperature
distribution. But oxygen was excessive and the
residence time was long enough in the simulation. So
the C5H12 can be burned with the efficiency higher
than 99%.
There is a fierce gas phase combustion reaction in the
flame center, so the inner flame temperature is higher
than the outer flame. An elongated central combustion
zone is formed in the chamber I, and the area of the
central combustion zone becomes larger as the inlet
air velocity increases. As the waste liquid is exhausted,
the high-temperature flue gas gradually diffuses
toward the bottom of the chamber I and forms a large
high-temperature zone at the lowest part of the
chamber I. So there is violently chemical reaction in
the lowest part. The flue gas continues to propagate
along the chamber II and III, and the temperature
slowly decreases in the horizontal section.
The higher the inlet air velocity, the more
incompletely burned waste liquid is brought to the
lower part of the chamber I. The high temperature
flue gas continues to diffuse into the bottom of the
chamber I and the chamber II due to the gravity,
inertia, and furnace geometry.
(a) 1-1
(b) 1-2
(c) 1-3
International Journal of Computational and Engineering140
ACADEMIC PUBLISHING HOUSE

(d) 1-4
Figure 3. Temperature fields with four inlet velocities,
K.
4.2. The Mass Flow of the Liquid Waste on Velocity
and Temperature Fields in the Incinerator
The mass flow of the liquid waste, which has low
impact on the velocity. The greater the mass flow, the
more liquid is burned, and the higher the temperature,
the faster the velocity.
Fig. 4 shows velocity along the vertical axis in the
chamber I. The velocity of the flue gas initially
decreases sharply and then flattens, and finally drops
sharply from the top to the bottom of the chamber I.
This is because the reaction is intense at the top, the
temperature of the flue gas rises sharply, the volume
of the flue gas increases rapidly. And at the low part,
the flue gas gradually flows to the chamber II.
Figure 4. Velocity along the axis in the vertical
chamber I.
(a) 1-2
(b) 2-1
(c) 2-2
(d) 2-3
Figure 5. Temperature fields with the mass flow
varies, K
Fig. 5 shows Temperature fields with the mass flow
varies. The central high temperature zone changes
from the previous cross shape to the flat shape as the
mass flow rate of the waste liquid increasing. The
high temperature area spreads to the furnace wall, the
area of the main combustion area in vertical section is
getting larger and larger with larger mass flow.
Temperature in the horizontal section is increased,
and the temperature distribution is more uniform with
larger mass flow in this section.
5. CONCLUSIONS
An organic liquid waste incinerator of L type was
simulated. The regulations of velocity and
temperature fields were got with reasonable
assumptions.
The inertia of air flow in incinerator is greater and the
uniformity is better with the increasing inlet velocity
of the primary air in thermal oxidation chamber I. But
the velocity are more ununiform in the chamber II and
III with higher inlet velocity. An elongated central
combustion zone is formed in the chamber I, and the
area of the central combustion zone becomes larger as
the inlet air velocity increases.
The larger the mass flow rate of liquid waste is, the
larger the high temperature combustion area is in the
vertical section and horizontal one.
REFERENCES
[1]J. Svoboda, A realistic description of the process of
high-gradient magnetic separation, Minerals
Engineering, 2001, 14(11): 1493-1503.
[2]J. Lu, Y. Ma, Y. Liu, and M. H. Li, Treatment of
hypersaline wastewater by a combined
neutralization-precipitation with ABR-SBR technique,
Desalination, 2011, 277(1): 321-324.
[3]M. Kazemimoghadam, New nanopore zeolite
International Journal of Computational and Engineering 141
ACADEMIC PUBLISHING HOUSE

membranes for water treatment, Desalination, 2010,
251(1-3): 176-180.
[4]Q. Y. Fang, A. A. B. Musa, Y. Wei, Z. X. Luo, and
H. C. Zhou. Numerical Simulation of Multifuel
Combustion in a 200 MW Tangentially Fired Utility
Boiler, Energy & Fuels, 2012, 26(1): 313-323.
[5]Y. Bai, Y. B. Bao, X. L. Cai, C. H. Chen, and X. C.
Ye, Feasibility of disposing waste glyphosate
neutralization liquor with cement rotary kiln, Journal
of Hazardous Materials, 2014, 278: 500-505.
[6]D. W. Sevon, and D. J. Cooper. Modeling
combustion efficiency in a circulating fluid bed liquid
incinerator, Chemical Engineering Science, 1991,
(46): 2983-2996.
[7]L. F. Calvo, M. Otero, and B. M, Jenkins, Heating
process characteristics and kinetics of sewage sludge
in different atmospheres, Thermochimica Acta, 2004,
409 (2):127-135.
[8]K. Ehrhardt, A. Ehret, and W. Leuckel,
Experimental study on the dependence of burnout on
the operation conditions and physical properties in
wastewater incineration, Symposium (International)
on Combustion, 1998, 27 (1):1293-1299.
[9]C. L. Sun, and J. A. Kozinski, Ignition behavior of
pulp and paper combustible wastes, Fuel, 2000,
25(79): 1597-1593.
[10]Zeng L, Pels J and Van H, Direct causticization of
kraft black liquor solids with TiO2 in a fluidized bed,
Tappi Journal, 2000, 83(12):53.
[11]D. W. Sevon, and D. J. Copper, Modeling
combustion efficiency in a circulating fluid bed liquid
incinerator, Chemical Engineering Science, 1991,
46(12): 2983-2996.
[12]R. S. Bie, Y. L. Bao, and L. D. Yang, Thermal
calculation method of incineration of organic waste
liquid in fluidized bed incinerator, Journal of Harbin
Institute of Technology, 1998, 30(1):39-42.
[13]G. Z. Zhu. Study on using cement turning kiln to
incinerate hazardous waste along with cement
materials, Acta Scientiae Circumstantiae, 2000, 20(6):
810-812.
[14]Zell U, Shamekhi R and Roth P., Waste water
combustion in laboratory swirl burners-II. NO
formation from dissolved N-compounds, Chemical
Engineering Science, 1988, 43(7):1667-1676.
[15]X. Li, K. Zhao, Y. Liu, Experimental Study on the
emission of HCl from incineration of chlorinated
waste water in fluidized bed, Boiler Technology, 2004,
35(2): 73-75.
[16]J. Nadziakiewicz, and M. Koziol, Co-combustion
of sludge with coal, Apply Energy 2003, 13(75):
239-248.
[17]H. C. Yin, L. X. Fu, J. B. Chen, P. Ying, and L.
Mu, Numerical investigation of characteristics of
combustion process and pollutant emission in waste
water incineration, Journal of thermal Science and
Technology, 2015, 14(4): 297-304.
International Journal of Computational and Engineering142
ACADEMIC PUBLISHING HOUSE

Research of Photoelectric Counting for Online
Bars
Jianhong Huang1, Dongdong Zhao2, Xindong Wang2, Yidong Xu2, Zhijie Li2 1SHANG YANG Machinery Co., Ltd of Zhejiang, Quzhou 324000, China 2Key Laboratory of Air-drive Equipment Technology of Zhejing Province Quzhou, Zhejiang 324000, China
Abstract: In this paper, a new type of on-line bar
counter is introduced, which uses photoelectric sensor
and photoelectric encoder to achieve accurate
counting. The bar technology device was
manufactured in the laboratory, and the bar counting
process was simulated. The results show that the
mechanical pretreatment device designed before
calculation can sort out the bar in disorderly
arrangement on the transmission chain, eliminate the
overlap and cross of the bar, and realize the accurate
bar counting by the joint calculation of two sensors.
Keywords: Bar counting device; Sensors;
Photoelectric counting
1. INTRODUCTION
The automatic counting of threaded steel bar (bar) is
an important subject that has not been completely
solved in China, and it is also one of the difficult
problems that need to be solved urgently in the
production practice of steel mills. With the
improvement of dimension accuracy and performance
prediction accuracy of bar rolling, it is urgent for
users and distributors to require steel rolling
enterprises to deliver in negative tolerance. Negative
tolerance delivery refers to the theoretical weight of
bars out of the factory valuation [1-3]. The actual
quality of bars is the actual data obtained by
electronic metering and weighing, while the
theoretical quality is calculated theoretically
according to the standard geometric size and number
of supports of different specifications of products.
The theoretical quality is equal to the standard cross-
sectional area of steel with corresponding
specifications, the standard length, the steel density
and the number of bars [4-5]. The standard geometric
dimensions and the density of bars are known by
agreement. Therefore, obtaining the accurate number
of bars is the key to determine the theoretical quality
and realize the packing of the fixed number of bars.
According to the requirement of GB1499-1998, the
allowable deviation between the actual weight and
the theoretical weight of bars is between (+7%-4%),
so the benefits brought by the delivery of bars on
negative tolerance by enterprises to production
enterprises, suppliers and users are obvious. At
present, domestic bar manufacturers mainly adopt
manual methods. Because the manual counting
method has high labor intensity, low accuracy and
low production efficiency, it cannot meet the
requirements of fierce competition in bar production
industry.
2. COMPOSITION OF A NEW ON-LINE BAR
COUNTER
Aiming at the problems existing in the field of on-line
bar counting, a new mechanical-photoelectric
counting system is proposed, which mainly consists
of mechanical and photoelectric parts. The following
are introduced separately.
1) Mechanical part: The main function is to sort out
the disorderly arrangement of bars in the transmission
chain, eliminate the overlapping and crossing of bars,
prepare for the subsequent counting of electrical
components, and divide the bars according to the
counting results after counting, so as to realize the
function of fixed support and bundling.
The overall working process is as follows: (1) Bar
separation pretreatment; (2) Number of lead screw; (3)
Bar batch processing. It includes: 1#, 2# transmission
chain, plucking claw/combination stop, screw
counting device, lifting baffle and 4# transmission
chain, as shown in Figure 1.
Figure 1. Composition of bar-counting machine
(2) Photoelectric part: This part mainly detects the
bar and sends out signals according to the test results.
There are many kinds of photoelectric components,
including photoresistors, photodiodes,
phototransistors, photocontrolled silicon controllers
and integrated photosensitive devices [6-7], but they
all belong to photosensitive sensors made of
photoelectric effects of semiconductors. The core of
counting is composed of light emitters and light
receivers (see Figure 2). When there is no bar passing
International Journal of Computational and Engineering 143
ACADEMIC PUBLISHING HOUSE
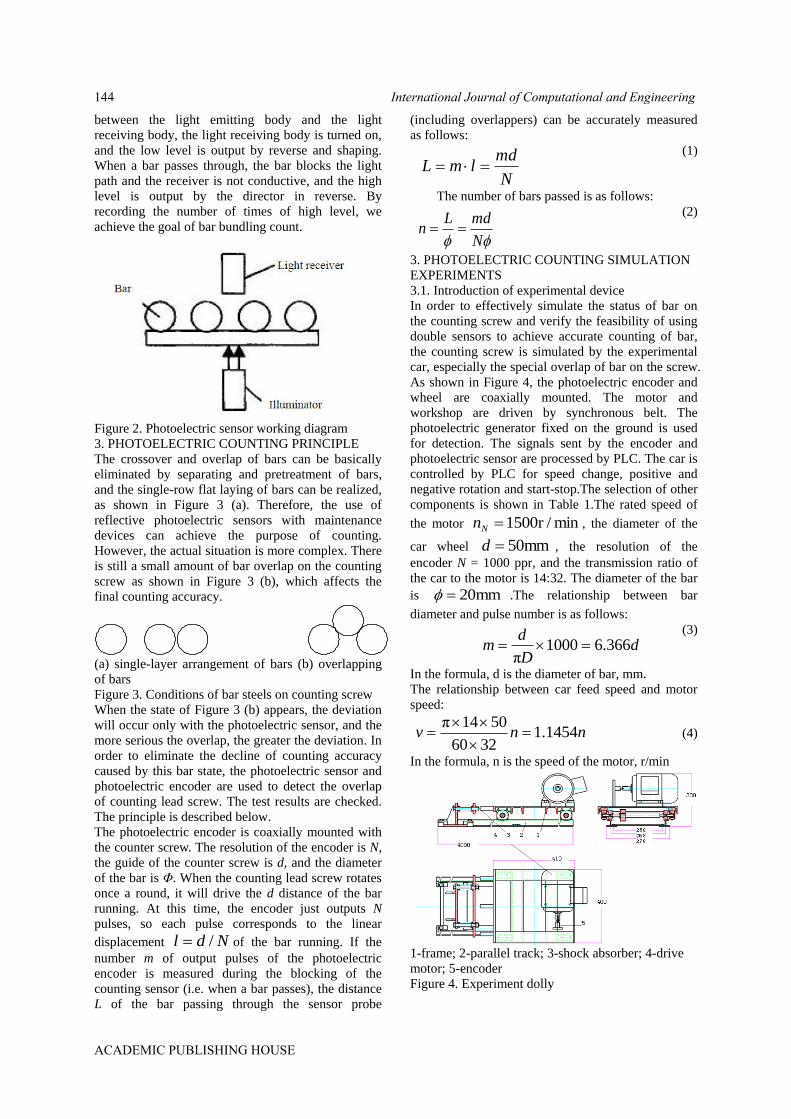
between the light emitting body and the light
receiving body, the light receiving body is turned on,
and the low level is output by reverse and shaping.
When a bar passes through, the bar blocks the light
path and the receiver is not conductive, and the high
level is output by the director in reverse. By
recording the number of times of high level, we
achieve the goal of bar bundling count.
Figure 2. Photoelectric sensor working diagram
3. PHOTOELECTRIC COUNTING PRINCIPLE
The crossover and overlap of bars can be basically
eliminated by separating and pretreatment of bars,
and the single-row flat laying of bars can be realized,
as shown in Figure 3 (a). Therefore, the use of
reflective photoelectric sensors with maintenance
devices can achieve the purpose of counting.
However, the actual situation is more complex. There
is still a small amount of bar overlap on the counting
screw as shown in Figure 3 (b), which affects the
final counting accuracy.
(a) single-layer arrangement of bars (b) overlapping
of bars
Figure 3. Conditions of bar steels on counting screw
When the state of Figure 3 (b) appears, the deviation
will occur only with the photoelectric sensor, and the
more serious the overlap, the greater the deviation. In
order to eliminate the decline of counting accuracy
caused by this bar state, the photoelectric sensor and
photoelectric encoder are used to detect the overlap
of counting lead screw. The test results are checked.
The principle is described below.
The photoelectric encoder is coaxially mounted with
the counter screw. The resolution of the encoder is N,
the guide of the counter screw is d, and the diameter
of the bar is Φ. When the counting lead screw rotates
once a round, it will drive the d distance of the bar
running. At this time, the encoder just outputs N
pulses, so each pulse corresponds to the linear
displacement Ndl / of the bar running. If the
number m of output pulses of the photoelectric
encoder is measured during the blocking of the
counting sensor (i.e. when a bar passes), the distance
L of the bar passing through the sensor probe
(including overlappers) can be accurately measured
as follows:
N
mdlmL
(1)
The number of bars passed is as follows:
N
mdLn
(2)
3. PHOTOELECTRIC COUNTING SIMULATION
EXPERIMENTS
3.1. Introduction of experimental device
In order to effectively simulate the status of bar on
the counting screw and verify the feasibility of using
double sensors to achieve accurate counting of bar,
the counting screw is simulated by the experimental
car, especially the special overlap of bar on the screw.
As shown in Figure 4, the photoelectric encoder and
wheel are coaxially mounted. The motor and
workshop are driven by synchronous belt. The
photoelectric generator fixed on the ground is used
for detection. The signals sent by the encoder and
photoelectric sensor are processed by PLC. The car is
controlled by PLC for speed change, positive and
negative rotation and start-stop.The selection of other
components is shown in Table 1.The rated speed of
the motor min/r1500Nn , the diameter of the
car wheel mm50d , the resolution of the
encoder N = 1000 ppr, and the transmission ratio of
the car to the motor is 14:32. The diameter of the bar
is mm20 .The relationship between bar
diameter and pulse number is as follows:
dD
dm 366.61000
π
(3)
In the formula, d is the diameter of bar, mm.
The relationship between car feed speed and motor
speed:
nnv 1454.13260
5014π
(4)
In the formula, n is the speed of the motor, r/min
1-frame; 2-parallel track; 3-shock absorber; 4-drive
motor; 5-encoder
Figure 4. Experiment dolly
International Journal of Computational and Engineering144
ACADEMIC PUBLISHING HOUSE

Table 1. List of experiment devices
Name Model Main parameter Details
Photoelectric switch HJ18-R33DPK UN=10-36VDC
PNP output mode
Shanghai Juma Electric Co., Ltd.
Encoder
ZKX-
6A100BM1-
G24F
N=1000
VH=0.7VCC
VL=0.06VCC
Changchun Yuheng Optics Co., Ltd.
CPU212 6ES7-212-
1BB23-0XB8 Digital Quantity:8I/6O
Siemens (China) Co., Ltd.
Extension module
6ES7 232-
0HB22-0XA8 Analogs:2AO
Programming Cable 6ES7 901-
3CB30-0XA0 PC/PPI Series
Frequency converter AC60-T3-R75G UN=380V
PN=0.75kW
Shenzhen Weichuang Electric Co., Ltd.
Asynchronous motor Y Series PN=0.55kW
nN=1500r/min
Wuxi Hadian Motor Co., Ltd.
Table 2. Relation between check object and checking height
Detection height mm 45 65 0~2000 0~2000
Minimum Diameter of Detecting Object mm 1.5 3 5 >5
3.2. Experimental results and analysis
3.2.1. Study on the detection characteristics of
photoelectric sensors
(1) The smallest detection diameter of photoelectric
sensor increases with the detection distance and the
smallest diameter of detectable object. The reason is
due to the divergence of infrared light. When the
detection distance is too large, the infrared light
divergence will make the spot bigger, and the
diameter of the detection object smaller, which will
cause the phenomenon of missed detection and false
detection. When the detected object is ≥ 5 mm, the
detected object can be recognized accurately. The
relationship between the detected object and the
probe height of the sensor is measured
experimentally as shown in Table 2.
(2) The influence of the minimum diameter of the
object detected by the sensor on the bar detection
Because of the influence of the ribs of the threaded
bars, the spacing of the two threaded bars when they
are placed side by side densely is smaller than the
minimum detection diameter of the photoelectric
sensor. In this regard, the pulse calibration using
photoelectric sensors and coders can be distinguished
by program checking, as shown in Figure 5.
3.2.2. Effect of different motion speed on bar testing
results
The bar counting of the trolley at different moving
speeds is set in the experiment. According to the bar
counting results under different conditions, the
influence of the bar moving speed on the counting
results is obtained. The 12 bars are arranged in
various forms. The results of test under different
conveying speeds are shown in Table 3.
Table 3. Relation between transporting velocity of bar and checking resul
Motor speed r/min 131.0 174.6 281.3 262.0 305.5 350.0
Speed m/s 0.15 0.20 0.25 0.3 0.35 0.4
Number of bars (pcs) 12 12 12 12 12 12
Bar diameter (mm) 20 20 20 20 20 20
The corresponding detection time of a single
bar (ms) 133 100 80 67 57 50
Counting results (pcs) 12 12 12 12 12 12
From Table 2, it can be concluded that: Under the
existing working conditions, the bar conveying speed
has little effect on the test results. The reasons are as
follows: The response speed of the counting depends
on the response time of the photoelectric sensor and
the response speed of the processor. Because the
response time of the sensor is less than 1 ms < 100
ms (the maximum detection time of a single bar), and
the response speed of the system is faster than that of
the sensor, the conveying speed has no effect on the
detection results under the existing working
conditions.
3.2.3. Counting of bars in different arrangements
Pulse Counting Principle: The photoelectric encoder
is coaxially installed with the counting trolley. The
actual running speed n of the motor, i is the
transmission ratio of the motor to the trolley [5], the
diameter D of the trolley wheel, the resolution of the
encoder N (the number of pulses output by the
encoder in one rotation cycle), and the diameter of
the bar . When the motor rotates for one round,
the running distance of the trolley is Di
nd
60
International Journal of Computational and Engineering 145
ACADEMIC PUBLISHING HOUSE
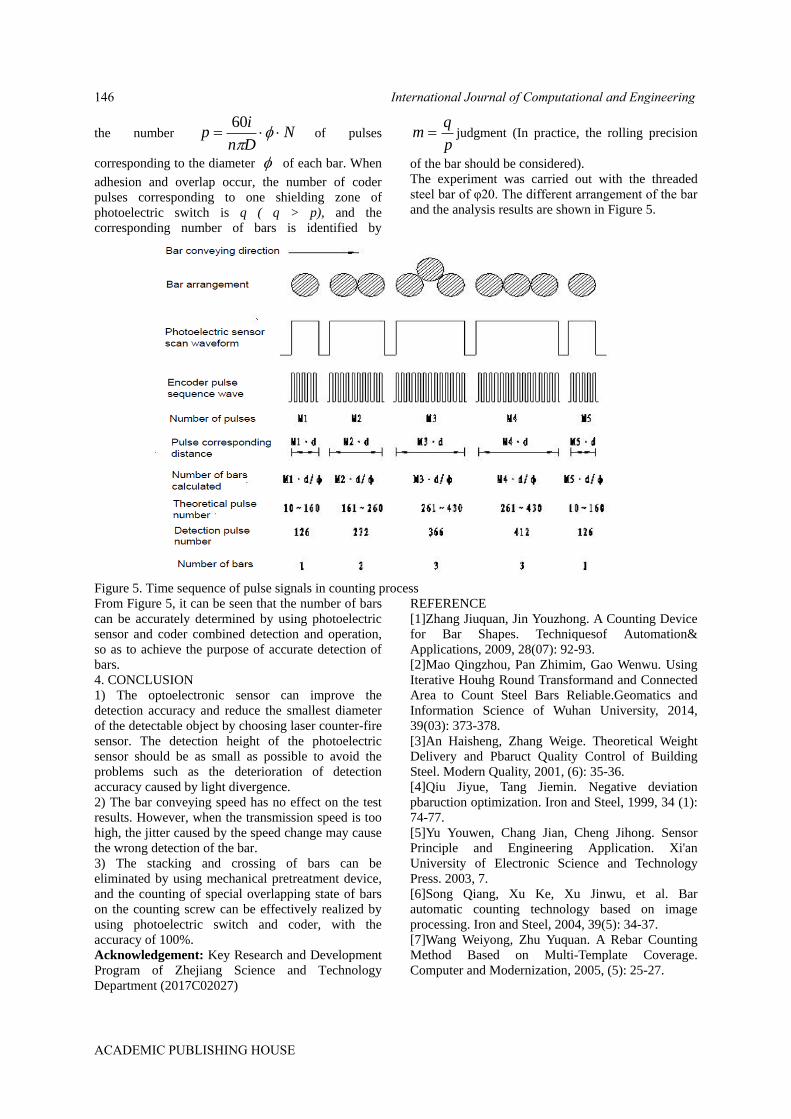
the number NDn
ip
60of pulses
corresponding to the diameter of each bar. When
adhesion and overlap occur, the number of coder
pulses corresponding to one shielding zone of
photoelectric switch is q ( q > p), and the
corresponding number of bars is identified by
p
qm judgment (In practice, the rolling precision
of the bar should be considered).
The experiment was carried out with the threaded
steel bar of φ20. The different arrangement of the bar
and the analysis results are shown in Figure 5.
Figure 5. Time sequence of pulse signals in counting process
From Figure 5, it can be seen that the number of bars
can be accurately determined by using photoelectric
sensor and coder combined detection and operation,
so as to achieve the purpose of accurate detection of
bars.
4. CONCLUSION
1) The optoelectronic sensor can improve the
detection accuracy and reduce the smallest diameter
of the detectable object by choosing laser counter-fire
sensor. The detection height of the photoelectric
sensor should be as small as possible to avoid the
problems such as the deterioration of detection
accuracy caused by light divergence.
2) The bar conveying speed has no effect on the test
results. However, when the transmission speed is too
high, the jitter caused by the speed change may cause
the wrong detection of the bar.
3) The stacking and crossing of bars can be
eliminated by using mechanical pretreatment device,
and the counting of special overlapping state of bars
on the counting screw can be effectively realized by
using photoelectric switch and coder, with the
accuracy of 100%.
Acknowledgement: Key Research and Development
Program of Zhejiang Science and Technology
Department (2017C02027)
REFERENCE
[1]Zhang Jiuquan, Jin Youzhong. A Counting Device
for Bar Shapes. Techniquesof Automation&
Applications, 2009, 28(07): 92-93.
[2]Mao Qingzhou, Pan Zhimim, Gao Wenwu. Using
Iterative Houhg Round Transformand and Connected
Area to Count Steel Bars Reliable.Geomatics and
Information Science of Wuhan University, 2014,
39(03): 373-378.
[3]An Haisheng, Zhang Weige. Theoretical Weight
Delivery and Pbaruct Quality Control of Building
Steel. Modern Quality, 2001, (6): 35-36.
[4]Qiu Jiyue, Tang Jiemin. Negative deviation
pbaruction optimization. Iron and Steel, 1999, 34 (1):
74-77.
[5]Yu Youwen, Chang Jian, Cheng Jihong. Sensor
Principle and Engineering Application. Xi'an
University of Electronic Science and Technology
Press. 2003, 7.
[6]Song Qiang, Xu Ke, Xu Jinwu, et al. Bar
automatic counting technology based on image
processing. Iron and Steel, 2004, 39(5): 34-37.
[7]Wang Weiyong, Zhu Yuquan. A Rebar Counting
Method Based on Multi-Template Coverage.
Computer and Modernization, 2005, (5): 25-27.
International Journal of Computational and Engineering146
ACADEMIC PUBLISHING HOUSE
Research of Bicycle Automatic Control System by Using LQR Optimal Theory
Yishu Zhang College of Mechanical Engineering, Xi'an University of Science and Technology, Xi'an, 710054, China *E-mail: [email protected] Abstract: The bicycle plant is a typical multi-variable, nonlinear and statically unstable system. In such a rapidly growing and highly automatic society, how to make bicycle automatically work is more and more worthy to be studied. In this paper, the mathematical modeling of the bicycle is firstly established. Based on the as-built model, the automatic controller of the bicycle is designed based on linear quadratic regulator (LQR) optimal theory. In addition, the computer simulation is carried out to verify the validation of the proposed LQR optimal controller, and the bicycle automatic control system presents the satisfactory performance in the existence of uncertain disturbance. Keywords: Autopilot; Bicycle control; Disturbance; LQR; Optimal control 1. INTRODUCTION In engineering practice, the proportional, integral and differential (PID) control is the most widely-used regulation method. According to the current error of control system, PID controller can calculate out the control quantity by means of the proportional, integral and differential operations [1]. The history of PID has up to nearly 80 years ago, and it has become one of the main technologies in industrial control because of its obvious advantages, such as simple structure, good stability, reliable work and convenient adjustment. A certain research showed that more than 90% of the controllers employed the PID method for the process control systems in 1989 [2]. However, when the traditional PID controller is applied in the bicycle control system, the satisfactory control effect will not obtained, because the bicycle plant is a typical unstable, multi-variable, nonlinear and strong coupling control plant[3]. Therefore, other better regulation technologies should be studies in the control of bicycle plant. The linear quadratic regulator (LQR) theory [4] belongs to a state-space design method, and it has the earliest and the most mature development in the modern control theories. Through the optimal LQR theory, the designed state feedback controller can minimize the quadratic objective function, which is an attractive feature of LQR approach. Therefore, the LQR system can possess the good advantage in the comprehensive performance. In other word, we can get the ideal state convergence performance by using smaller control consumption. Particularly speaking, LQR can get the optimal control law in the form of
linear state feedback, and it is easy to constitute a closed-loop optimal control, therefore it has been widely applied in many areas and studied in many literatures [5-8]. Moreover, LQR has enough ability to deal with the unstable, multi-variable and coupling systems. In addition, the application of MATLAB software provides the favorable condition for the simulation verification of LQR control scheme. As a result, we will introduce the LQR theory to construct the optimal controller for bicycle system. The remainder of this paper will be organized as follows. The Section 2 will describe the bicycle plant and then establish a state-space model for this plant. Based on the as-built model in state-space form, the automatic controller will be designed for bicycle system by using LQR theory in Section 3. Section 4 will present the verification and the advantage of the proposed LQR controller by means of computer simulation and scheme comparison. In addition, the corresponding conclusions will be given in Section 5. 2. PROBLEM DESCRIPTION The bicycle is a typical multi-variable, nonlinear and statically unstable plant, and it is illustrated in Figure 1, where f denotes the friction force, N denotes the holding force from the ground, and Mr denotes the hinge moment. The bicycle has three inputs, which involves the yaw moment to change the yawing direction, the roll moment produced during the deflection of bicycle body, and the hinge moment to provide a push force. Moreover, assume that the bicycle has a symmetrical structure, and its mass-center is placed on the symmetrical plane.
Figure 1. The structure diagram of bicycle plant
Figure 2. The force diagram of the bicycle
International Journal of Computational and Engineering 147
ACADEMIC PUBLISHING HOUSE

The force diagram of the bicycle is shown as Figure 2, In Figure 2, oxyz deno s the coordinate system of
cycle traveling path, te
bi denotes the yawing angle,
denotes the yawing angle, F denotes the coupling force in yaw direction, and G denotes the force of
inciples, the
t
, and the yawing direction is chosen in this
e d
simplify into the yawing
in a shorter time, which is illustrated by Figure 3.
gravity. Based on the following simplification prmodel of the bicycle will be established. Principle 1. Assume the bicycle is driven in uniform linear motion, and its velocity is 5m/s, which is a usual velocity in practice. The hinge moment provides the push force, which always balances the friction force. Therefore, we ignore the degree of freedom (DOF) with respect to the horizontal hinge moment, and then the bicycle can be simplified into two DOF. Principle 2. The rolling angle rate of bicycle is coupling with the yawing angle rate. In concrete, the rolling motion can automatically generate the yawing acceleration, meanwhile he yawing motion can also automatically generate the rolling acceleration. Therefore, the bicycle can be further simplified into single DOFpaper. Principle 3. The disturbance can be simplified into the initial yawing angle. Moreover, when the bicycle encount rs the un-rough roads or the sud en wind, the rolling angle (which can generate the yawing acceleration) or the yawing angle will occur. After balancing, both of them can angle with disturbance. The design goal of bicycle automatic control system is to realize the correction of yawing angle with disturbance, and then to recover the standard yawing direction
Figure 3. The illustration diagram of the control goal. From Figure2, we can get the following equation:
(1)
r equation with respect to (1), which is shown in (2).
(2)
yawing angle speed is expressed by Eqs. (3)-(4).
cos 0
0
N Gqìï - =ïïíï - =ïïî sinN Fq
Based on cos 1q » and sinq q» , we can get the linea
0N Gìï - =ïïí 0N Fqï - =ïïî
The coupling force between the rolling angle speed and the
2vF m
r= (3)
s v t v
t
rj
j j= » =
(4)
Where, v is the speed of bicycle, m is the mass of bicycle, and is the radius of curvature. rAccording to Eqs. (2)-(4), we can get the following equation:
2
N mg
vN m mvq j
r
ìï =ïïïíï = =ïïïî
(5)
According to (5), the simplification equation will be acquired.
g
v
qj =
(6)
The location of bicycle in the coordinate system of traveling path is expressed by:
0 0
0 0
cos
sin
f f
f f
t t
t t
t t
t t
x v dt x vdt
y v dt y v dt
j
j j
ì ìï ïï ïï ï= »ï ïï ïï ïï ïí íï ïï ïï ï= »ï ïï ïï ïï ïî î
ò ò
ò ò (7)
With the differential operation on (7), we can get:
0x v x
y v y vj j
ì ìï ïï ï= =ï ïï ïí íï ïï ï= =ï ïï ïî î
(8)
According to Eqs. (6) and (8), we can choose the following state variables:
1
2 1
2 1
x y
x x v
x x v g
j
j q
ìï =ïïïïï = =íïïïï = = =ïïî
(9)
Then, we can further get the following differential equation:
1 2
210
x x
x gq q
ìïï =ïïíïï = =ïïî
(10)
Based on Eq. (10), the state-space model of bicycle can be finally acquired as Eq. (11).
y
qìïï = +ïíï =ïïî
x Ax b
Cx
(11)
Where, the vectors and matrices are shown as:
1
2
0 1 0 1 0, , ,
0 0 10 0 0
x
x
é ù é ù é ù é ùê ú ê ú ê ú ê= = = = úê ú ê ú ê ú ê úê ú ê ú ê ú ê úë û ë û ë û ë
x A b Cû
The terminal condition is set as:
0fty =
International Journal of Computational and Engineering148
ACADEMIC PUBLISHING HOUSE
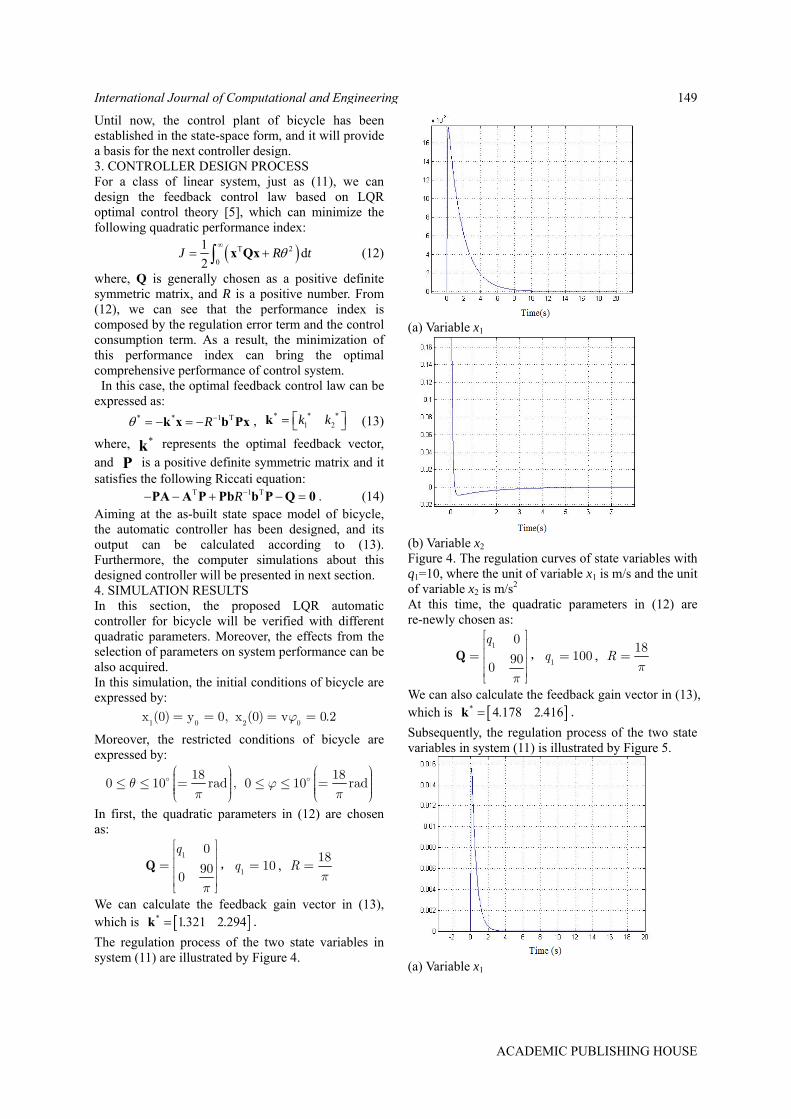
Until now, the control plant of bicycle has been established in the state-space form, and it will provide a basis for the next controller design. 3. CONTROLLER DESIGN PROCESS For a class of linear system, just as (11), we can design the feedback control law based on LQR optimal control theory [5], which can minimize the following quadratic performance index:
T 2
0
1d
2J R
x Qx t
*
(12)
where, Q is generally chosen as a positive definite symmetric matrix, and R is a positive number. From (12), we can see that the performance index is composed by the regulation error term and the control consumption term. As a result, the minimization of this performance index can bring the optimal comprehensive performance of control system. In this case, the optimal feedback control law can be expressed as:
* * 1 TR k x b Px , (13) * *1 2k k k
where, represents the optimal feedback vector,
and is a positive definite symmetric matrix and it satisfies the following Riccati equation:
*kP
T 1 TR PA A P Pb b P Q 0 . (14) Aiming at the as-built state space model of bicycle, the automatic controller has been designed, and its output can be calculated according to (13). Furthermore, the computer simulations about this designed controller will be presented in next section. 4. SIMULATION RESULTS In this section, the proposed LQR automatic controller for bicycle will be verified with different quadratic parameters. Moreover, the effects from the selection of parameters on system performance can be also acquired. In this simulation, the initial conditions of bicycle are expressed by:
1 0 2 0x (0) y 0, x (0) v 0.2j= = = =
Moreover, the restricted conditions of bicycle are expressed by:
18 180 10 rad , 0 10 radq j
p p
æ ö æ ö÷ ÷ç ç÷ ÷£ £ = £ £ =ç ç÷ ÷ç ç÷ ÷ç çè ø è ø
In first, the quadratic parameters in (12) are chosen as:
10
900
q
p
é ùê úê ú= ê úê úë û
Q ,q , 110=
18R
p=
We can calculate the feedback gain vector in (13), which is * 1.321 2.294k .
The regulation process of the two state variables in system (11) are illustrated by Figure 4.
(a) Variable x1
(b) Variable x2 Figure 4. The regulation curves of state variables with q1=10, where the unit of variable x1 is m/s and the unit of variable x2 is m/s2 At this time, the quadratic parameters in (12) are re-newly chosen as:
10
900
q
p
é ùê úê ú= ê úê úë û
Q ,q , 1100=
18R
p=
We can also calculate the feedback gain vector in (13), which is * 4.178 2.416k .
Subsequently, the regulation process of the two state variables in system (11) is illustrated by Figure 5.
(a) Variable x1
International Journal of Computational and Engineering 149
ACADEMIC PUBLISHING HOUSE

(b) Variable x2 Figure 5. The regulation curves of state variables with q1=100, where the unit of variable x1 is m/s and the unit of variable x2 is m/s2 From Figures. 4-5, we can see that the designed controller can automatically generate the inverse yawing angle speed, in order to correct the effect resulted from the disturbance. Furthermore, if q1 is chosen as a larger value, the faster regulation speeds of state variables will be presented. Until now, the simulation verification about the proposed controller has been completed. 5. CONCLUSIONS The bicycle plant is a typical multi-variable, nonlinear and statically unstable system. Based on LQR optimal theory, a kind of automatic controller for the bicycle is proposed in this paper. Computer simulations are carried out to verify the effectiveness and the validity of the proposed controller. The results show that the designed controller can correct the effects resulted from the disturbance and then the standard yawing direction is recovered in a shorter time. Moreover, the
proposed control approach can be extended into some other similar plants. REFERENCES [1]Wu L., Bao H., Du J.L. et al. A Learning Algorithm for Parameters of Automatic Disturbances Rejection Controller. Acta Automatica Sinica, 2014, 40(3): 556-560. [2]Astrom K.J., Hagglund H. PID Controllers: Theory, Design and Tuning. NC: Instrument Society of America, 1995. [3]Wang L.B, Ge Y., Hu D.W. Balance Control for Unmanned Bicycles Based on T-S Mode. Control Engineering of China, 2008, 15(S1): 109-112. [4]Naidu D.S. Optimal control systems, Special Indian edition. FL: CRC Press, 2002. [5]Shakir H. and Kim W.J. Nanoscale Path Planning and Motion Control with Maglev Positioners. IEEE/ASME Trans. Mechatronics, 2006, 11(5): 625-633. [6]Basina M., Rodriguez-Gonzaleza J., Fridmanb L. Optimal and Robust Control for Linear State-Delay Systems. Journal of the Franklin Institute, 2007, 344(6): 830-845. [7]Dragan V., Mukaidani H., Shi P. The Linear Quadratic Regulator Problem for A Class of Controlled Systems Modeled by Singularly Perturbed ito Differential Equations. SIAM Journal on Control and Optimization, 2012, 50(1): 448-470. [8]Priess M.C., Conway R., Choi J. et al. Solutions to the Inverse LQR Problem with Application to Biological Systems Analysis. IEEE Transactions on Control Systems Technology, 2015, 23(2): 770-777.
.
International Journal of Computational and Engineering150
ACADEMIC PUBLISHING HOUSE
Classification of Planting Structure in Remote
Sensing Images Based on Semantic
Segmentation Network Models
College of Information Engineering, Henan University of Technology, Zhengzhou, 450001, China
*E-mail:[email protected]
Abstract: This paper takes Xiaokaihe Irrigation Area as
the research area, Landsat8 high resolution remote
sensing image as the data source, select its 543 band
for RGB synthesis, and the panchromatic band was
fused to improve the resolution to 15 meters. According to the fusion image, make training set and
test set, and verification set is made by using precise
classification map of planting structure obtained by
supervised classification. Three kinds of semantic
segmentation network models are selected: FCN (full
convolution neural network) model, SegNet model and
U-Net model to classify planting structures and
analyze the effects of different semantic segmentation
networks on classification accuracy. The results
showed that under the same conditions, the overall
classification accuracy of U-Net model reached 90.7%,
FCN model had the highest recognition rate of 78.7%
for wheat, and SegNet had only 88.2% accuracy for
plant structure extraction under similar spectral
information. Therefore, the U-Net network model can
get better classification results in areas with serious
mixed features.
Keywords: deep learning; semantic segmentation
network; remote sensing; classification
1. INTRODUCTION
Crop planting structure is the main basis for monitoring
and estimating crop growth, analysing crop yield,
adjusting and optimizing cropping structure, and
managing crop irrigation [1]. Because agricultural land
is dominated by farmers freely, the phenomenon of
mixed planting is serious and spectral mixing is
widespread, the application of high resolution remote
sensing images can significantly improve the accuracy
of crop classification [2-4]. Crop classification method
based on Multi-temporal image can make full use of
seasonal rhythm characteristics of crops, clearly reflect
the changing trend of different crops with time, and
effectively reduce crop misclassification, it is the
mainstream method of crop planting structure remote
sensing extraction [5-10]. However, there is little
research on crop planting structure classification using
deep learning method.
Deep learning has become a hotspot in the
development of large data and artificial intelligence on
the Internet. The biggest difference between deep
learning and traditional machine learning methods is
that it has the characteristics of automatic learning
from large sample data sets rather than manual design.
In addition, the deep network structure also makes it
have strong learning and expression ability [11]. Convolutional neural network (CNN) is one
representative algorithms of deep learning, with its
advantages of automatic feature extraction and
classification, it has significant advantages in the field
of remote sensing [12-14]. At present, full
convolutional network (FCN), as a very important
network model in semantic segmentation research, is
widely used in high resolution remote sensing images
[15-22]. FCN improves the traditional convolution
neural network models (AlexNet, VGG-Net, Google
LeNet, etc.), it replaces the full connection layer with
convolution layer, which contains huge parameters,
and accepts image input of any size, the output results
are consistent with the size of the input image, it is a
real end-to-end network [23]. Many scholars have
reformed the FCN model. Badrinarayanan et al.
proposed SegNet network, it follows the idea of image
semantics segmentation based on FCN. The network
combines the characteristics of coding-decoding
structure and jumping network, which enables the
model to obtain more accurate output feature map and
more accurate classification results under the condition
of limited training samples [24]. Ronneberger O et al.
proposed U-Net network based on FCN. The most
important modification of this network is that there are
a large number of characteristic channels in the upper
sampling part, which allows the network to propagate
the context information to a higher resolution layer.
The expansion path and contraction path are
symmetrical, forming a U-shaped structure, enabling
the network to run with fewer training images and to
perform more accurate segmentation operations [25].
But most of these studies are about single network
model. It is still a question about which model training
can get better training results for image sample input.
For this reason, this paper analyses the influence of
different network models on the classification effect of
high-resolution remote sensing images.
2. RESEARCH AREA AND EXPERIMENTAL
DATA
The research area of this paper is Xiaokaihe Irrigation
District, Binzhou City, Shandong Province. Xiaokaihe
Irrigation Area is a large-scale irrigation area for the
International Journal of Computational and Engineering 151
ACADEMIC PUBLISHING HOUSE
Weidong Li*,Fanqian Meng, Ullah Inam
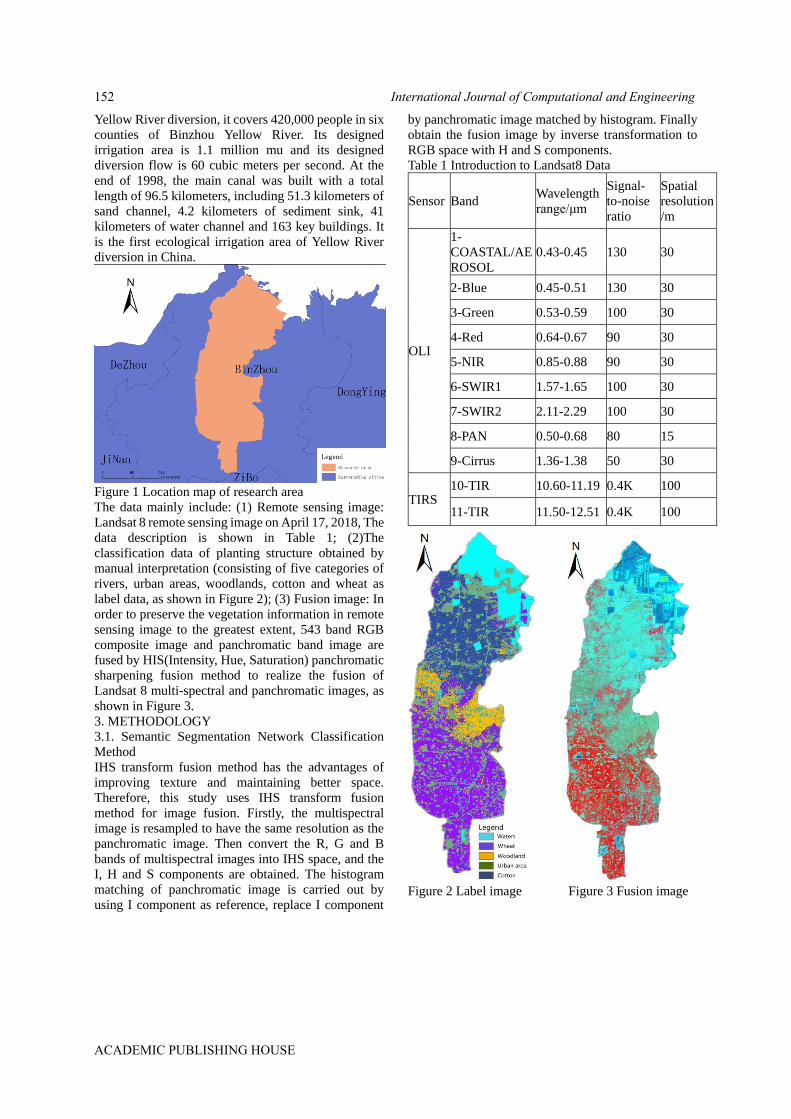
Yellow River diversion, it covers 420,000 people in six
counties of Binzhou Yellow River. Its designed
irrigation area is 1.1 million mu and its designed
diversion flow is 60 cubic meters per second. At the
end of 1998, the main canal was built with a total
length of 96.5 kilometers, including 51.3 kilometers of
sand channel, 4.2 kilometers of sediment sink, 41
kilometers of water channel and 163 key buildings. It
is the first ecological irrigation area of Yellow River
diversion in China.
Figure 1 Location map of research area
The data mainly include: (1) Remote sensing image:
Landsat 8 remote sensing image on April 17, 2018, The
data description is shown in Table 1; (2)The
classification data of planting structure obtained by
manual interpretation (consisting of five categories of
rivers, urban areas, woodlands, cotton and wheat as
label data, as shown in Figure 2); (3) Fusion image: In
order to preserve the vegetation information in remote
sensing image to the greatest extent, 543 band RGB
composite image and panchromatic band image are
fused by HIS(Intensity, Hue, Saturation) panchromatic
sharpening fusion method to realize the fusion of
Landsat 8 multi-spectral and panchromatic images, as
shown in Figure 3.
3. METHODOLOGY
3.1. Semantic Segmentation Network Classification
Method
IHS transform fusion method has the advantages of
improving texture and maintaining better space.
Therefore, this study uses IHS transform fusion
method for image fusion. Firstly, the multispectral
image is resampled to have the same resolution as the
panchromatic image. Then convert the R, G and B
bands of multispectral images into IHS space, and the
I, H and S components are obtained. The histogram
matching of panchromatic image is carried out by
using I component as reference, replace I component
by panchromatic image matched by histogram. Finally
obtain the fusion image by inverse transformation to
RGB space with H and S components.
Table 1 Introduction to Landsat8 Data
Sensor Band Wavelength
range/μm
Signal-
to-noise
ratio
Spatial
resolution
/m
OLI
1-
COASTAL/AE
ROSOL
0.43-0.45 130 30
2-Blue 0.45-0.51 130 30
3-Green 0.53-0.59 100 30
4-Red 0.64-0.67 90 30
5-NIR 0.85-0.88 90 30
6-SWIR1 1.57-1.65 100 30
7-SWIR2 2.11-2.29 100 30
8-PAN 0.50-0.68 80 15
9-Cirrus 1.36-1.38 50 30
TIRS 10-TIR 10.60-11.19 0.4K 100
11-TIR 11.50-12.51 0.4K 100
Figure 2 Label image Figure 3 Fusion image
International Journal of Computational and Engineering152
ACADEMIC PUBLISHING HOUSE
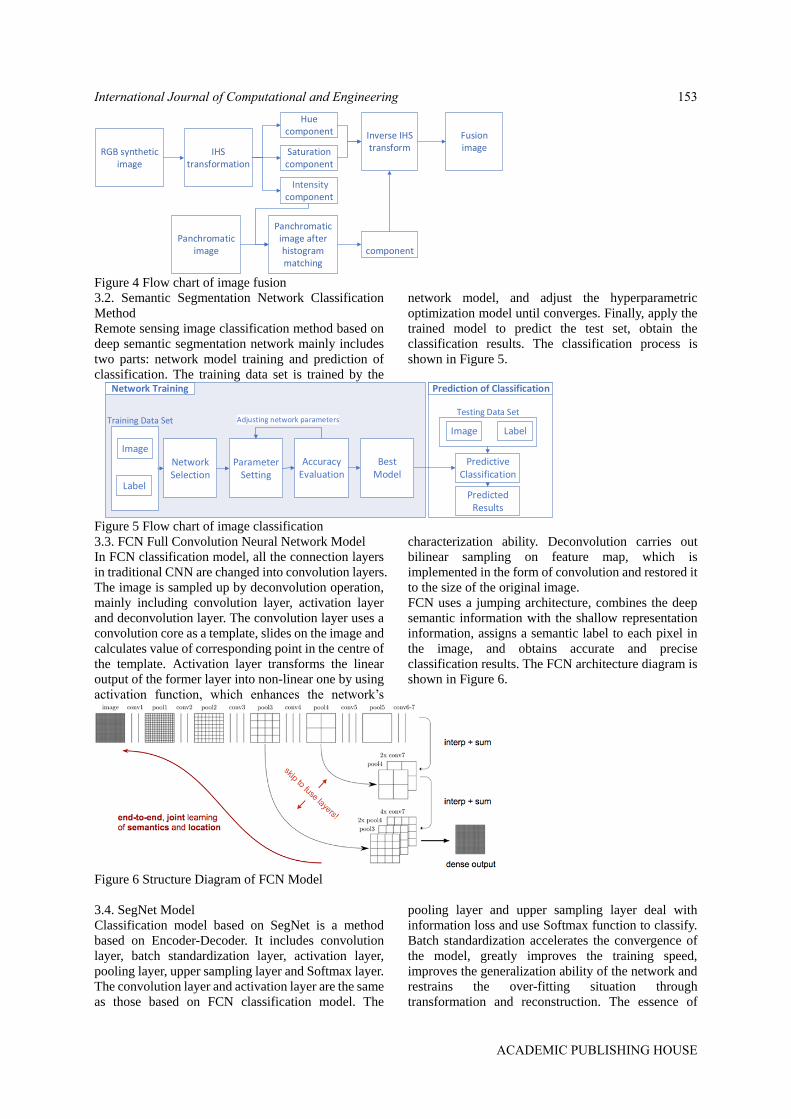
RGB synthetic image
IHS transformation
Hue component
Saturation component
Intensity component
Inverse IHS transform
Intensity component
Panchromatic image after histogram matching
Panchromatic image
Fusion image
Figure 4 Flow chart of image fusion
3.2. Semantic Segmentation Network Classification
Method
Remote sensing image classification method based on
deep semantic segmentation network mainly includes
two parts: network model training and prediction of
classification. The training data set is trained by the
network model, and adjust the hyperparametric
optimization model until converges. Finally, apply the
trained model to predict the test set, obtain the
classification results. The classification process is
shown in Figure 5.
Image
Label
Training Data Set
Network Selection
Testing Data Set
Predictive Classification
Image Label
Network Training Prediction of Classification
Parameter Setting
Accuracy Evaluation
BestModel
Adjusting network parameters
Predicted Results
Figure 5 Flow chart of image classification
3.3. FCN Full Convolution Neural Network Model
In FCN classification model, all the connection layers
in traditional CNN are changed into convolution layers.
The image is sampled up by deconvolution operation,
mainly including convolution layer, activation layer
and deconvolution layer. The convolution layer uses a
convolution core as a template, slides on the image and
calculates value of corresponding point in the centre of
the template. Activation layer transforms the linear
output of the former layer into non-linear one by using
activation function, which enhances the network’s
characterization ability. Deconvolution carries out
bilinear sampling on feature map, which is
implemented in the form of convolution and restored it
to the size of the original image.
FCN uses a jumping architecture, combines the deep
semantic information with the shallow representation
information, assigns a semantic label to each pixel in
the image, and obtains accurate and precise
classification results. The FCN architecture diagram is
shown in Figure 6.
Figure 6 Structure Diagram of FCN Model
3.4. SegNet Model
Classification model based on SegNet is a method
based on Encoder-Decoder. It includes convolution
layer, batch standardization layer, activation layer,
pooling layer, upper sampling layer and Softmax layer.
The convolution layer and activation layer are the same
as those based on FCN classification model. The
pooling layer and upper sampling layer deal with
information loss and use Softmax function to classify. Batch standardization accelerates the convergence of
the model, greatly improves the training speed,
improves the generalization ability of the network and
restrains the over-fitting situation through
transformation and reconstruction. The essence of
International Journal of Computational and Engineering 153
ACADEMIC PUBLISHING HOUSE
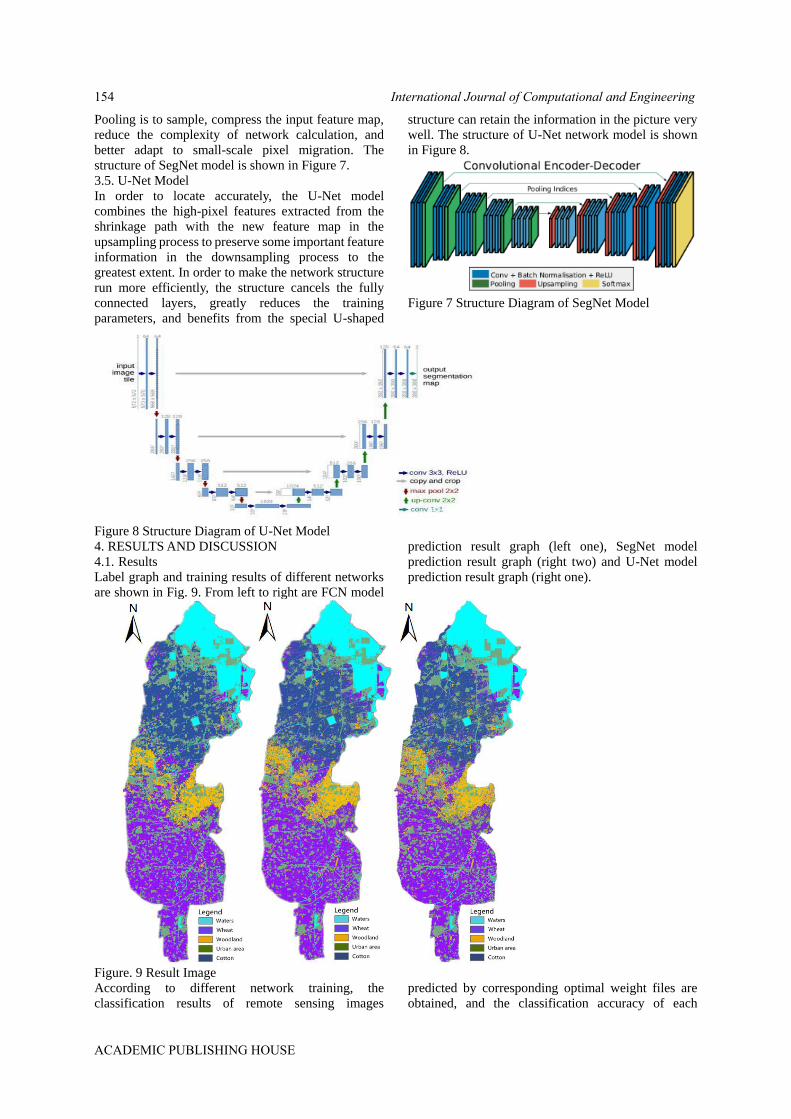
Pooling is to sample, compress the input feature map,
reduce the complexity of network calculation, and
better adapt to small-scale pixel migration. The
structure of SegNet model is shown in Figure 7.
3.5. U-Net Model
In order to locate accurately, the U-Net model
combines the high-pixel features extracted from the
shrinkage path with the new feature map in the
upsampling process to preserve some important feature
information in the downsampling process to the
greatest extent. In order to make the network structure
run more efficiently, the structure cancels the fully
connected layers, greatly reduces the training
parameters, and benefits from the special U-shaped
structure can retain the information in the picture very
well. The structure of U-Net network model is shown
in Figure 8.
Figure 7 Structure Diagram of SegNet Model
Figure 8 Structure Diagram of U-Net Model
4. RESULTS AND DISCUSSION
4.1. Results
Label graph and training results of different networks
are shown in Fig. 9. From left to right are FCN model
prediction result graph (left one), SegNet model
prediction result graph (right two) and U-Net model
prediction result graph (right one).
Figure. 9 Result Image
According to different network training, the
classification results of remote sensing images
predicted by corresponding optimal weight files are
obtained, and the classification accuracy of each
International Journal of Computational and Engineering154
ACADEMIC PUBLISHING HOUSE

category is analyzed by superimposing them with label
images. Table 1 shows the classification accuracy of
each category.
Table 2 Statistical tables of prediction accuracy for different networks
Category
Accuracy
Networks
Waters
Urban area
Woodlands
Cotton
Wheat
Whole
FCN 92.5% 84.2% 56.9% 74.1% 78.7% 88.2%
SegNet 86.2% 80.4% 48.5% 61% 75% 84.2%
U-Net 94.4% 87.9% 77.6% 80% 76.8% 90.7%
4.2. Discussion
According to Table 2, the prediction accuracy of
different types of ground objects in each network
model can be summarized as follows:
(1) The accuracy of river regional classification is over
86% in the three models.
(2) The classification accuracy of rivers and cities with
obvious characteristics is higher than that of other
types;
(3) Woodland, cotton and wheat belong to vegetation
with similar characteristic information, the
classification accuracy of them is low;
(4) Compared with FCN model and SegNet model, U-
Net model can get better classification results, the
overall accuracy rate is 90.7%.;
(5) FCN network has the best recognition effect on
wheat, reaching 78.7%;
(6) Under the condition of serious mixed planting
structure, the identification accuracy of SegNet is only
84.2%.
5. CONCLUSION
Based on three commonly used semantic segmentation
models, this paper classifies and predicts high-
resolution remote sensing fused images. Taking
Xiaokaihe Irrigation District of Binzhou City,
Shandong Province as the research area, use different
semantic segmentation networks to predict and classify
various types of land features, and analyse the
corresponding results. It is concluded that under the
same conditions, the overall classification accuracy of
U-Net is the highest, FCN is the best for wheat
recognition, and SegNet is not ideal in the case of
serious mixing of objects. Because of the complexity
of crop cultivation in the study area, there is a serious
mix of different plant types. It is necessary to further
improve the correlation between adjacent pixels and
consider the influence of different network models on
the classification accuracy of remote sensing images
under different sizes, and provides a high accuracy and
applicability image preprocessing flow for remote
sensing image classification based on depth learning.
ACKNOWLEDGMENTS
The authors express gratitude to Henan Science and
Technology key Project (NO.182106000025).
REFERENCES
[1]ARVOR D, JONATHAN M, MEIRELLES M S P,
et al. Classification of MODIS EVI time series for crop
mapping in the state of MatoGrosso, Brazil.
International Journal of Remote Sensing, 2011,
32(22):7847-7871.
[2]SONG Qian, ZHOU Qingbo, WU Wenbin, et al.
Recent progresses in research of integrating multi-
source remote sensing data for crop mapping, Scientia
Agricultura Sinica, 2015, 48(6):1122-1135.
[3]WU Bingfang, LI Qiangzi. Crop acreage estimation
using two individual sampling frameworks with
stratification, Journal of Remote Sensing, 2004,
8(6):551-569.
[4]LIU Jia, WANG Limin, YAO Baomin, et al. Ningxia
rice area remote sensing estimation on large scale
based on multi-temporal OLI data, Transactions of the
Chinese Society of Agricultural Engineering, 2017,
33(15):200-209.
[5]HU Qiong, WU Wenbin, SONG Qian, et al. Recent
progresses in research of crop patterns mapping by
using remote sensing, Scientia Agricultura Sinica,
2015, 48(10):1900-1914.
[6]MA Li, XU Xingang, LIU Liangyun, et al. Study on
crops classification based on multi-temporal NDVI
and characteristic Bands, Remote Sensing Technology
and Application, 2008, 23(5):520-524.
[7]KANG Jun, HOU Xuehui, NIU Zheng, et al.
Decision tree classification based on fitted phenology
parameters from remotely sensed vegetation data,
Transactions of the Chinese Society of Agricultural
Engineering, 2014, 30(9):148-156.
[8]ZHANG Huanxue, CAO Xin, LI Qiangzi, et al.
Research on crop identification using multi-temporal
NDVI HJ images, Remote Sensing Technology and
Application, 2015, 30(2):304-311.
[9]LI Xiao, JIANG Qigang. Extraction of farmland
classification based on multi-temporal remote sensing
Dada, Transactions of the Chinese Society of
Agricultural Engineering, 2015, 31(7):145-150.
[10]CHEN Junying, TIAN Qingjiu. Vegetation
classification based on high-resolution satellite image,
Journal of Remote Sensing, 2007, 11(2):221-227.
[11]BALL J E, ANDERSON D T, CHAN C S. A
comprehensive survey of deep learning in remote
sensing: theories, tools and challenges for the
community, Journal of Applied Remote Sensing, 2017,
International Journal of Computational and Engineering 155
ACADEMIC PUBLISHING HOUSE

11(4): 042609.
[12]ZHANG L, ZHANG L, DU B. Deep learning for
remote sensing data: a technical tutorial on the state of
the art, IEEE Geoscie nce and Remote Sensing
Magazine, 2016,4(2):22-40.
[13]CHENG G, HAN J, LU X. Remote sensing image
scene classification: benchmark and state of the art//
Proceedings of the IEEE. [S.l.:s.n.]2017,
105(10):1865-1883.
[14]ZHU X X, TUIA D, et al. Deep learning in remote
sensing: a comprehensive review and list of resources,
IEEE Geoscience and Remote Sensing Magazine,
2017, 5(4):8-36.
[15]MOU L, ZHU X X. RiFCN: Recurrent network in
fully convolutional network for semantic segmentation
of high resolution remote sensing images [EB/OL].
(2018-05-16). https:// arxiv.org/abs/1805.02091.
[16]ZHAO W Z, DU S H, EMERY W J. Object-based
convolutional neural network for high-resolution
imagery classification, IEEE Journal of Selected
Topics in Applied Earth Observations and Remote
Sensing, 2017:1-11.
[17]XUAN Yongcang. Research on the Semantic
segmentation of complex scene image of field based on
fully convolutional networks, Xi’an: Northwest A & F
University, 2017.
[18]FANG Xu, WANG Guanghui, YANG Huachao, et
al. High resolution remote sensing image classification
combining with mean-shift segmentation and fully
convolution neural network, Laser & Optoelectronics
Progress, 2018(55):446 -454.)
[19]CHEN Guangsheng, CHEN Shouyu, JING
Weipeng, et al. Remote sensing image pixel -level
classification with genetic algorithm and fully
convolu-tional network, Journal of Chinese Computer
Systems, 2018, 39(7):1590-1595.
[20]SHRESTHA S, VANNESCHI L. Improved fully
convolutional network with conditional random fields
for building extraction, Remote Sensing, 2018,
10(7):1135.
[21]FU G, LIU C J, ZHOU R, et al. Classification for
high resolution remote sensing imagery using a fully
convolutional network, Remote Sensing, 2017,
9(5):498.
[22]MOU L, ZHU X X. Vehicle instance segmentation
from aerial image and video using a multitask learning
residual fully convolutional network, IEEE
Transactions on Geoscience and Remote Sensing, 2018,
56(11): 6699 – 6711.
[23]LONG J, SHELHAMER E, DARRELL T. LONG
J, DARRELL T. Fully convolutional networks for
semantic segmentation, IEEE, Transactions on Pattern
Analysis & Machine Intelligence, 2014, 39(4):640-651.
[24]Badrinarayanan V, Kendall A, Cipolla R. SegNet:
a deep convolutional encoder -decoder architecture for
image segmentation [EB/OL]. (2015-11-02).
https://arxiv.org/abs/ 1511.00561.
[25]Ronneberger O, Fischer P, Brox T.U-Net:
Convolutional networks for biomedical image
segmentation, Medical Image Computing and
Computer-Assisted Intervention (MICCAI) , 2015 , 93
51: 234-241.
International Journal of Computational and Engineering156
ACADEMIC PUBLISHING HOUSE
Design of Playground Ticketing Scheme
Based on Logit Model Algorithm
Yanan Zhang
Jincheng Campus, Taiyuan University of Science and Technology, Jincheng, Shanxi, China, 048011
E-mail: [email protected]
Abstract: With the improvement of living standards,
people are increasingly demanding leisure and
entertainment. Large-scale playgrounds have become
an important place for people to entertain and
entertain. At the same time, people are thinking about
how to save time and spend their time. In some large
playgrounds, there are usually a variety of ways to
buy tickets for people to choose. One is the pass: you
can play all the facilities in the playground; one is the
ticket: you can only enter the gate of the playground,
and the corresponding items need to buy tickets. At
the same time, there are two kinds of play rules in the
playground: the items that need to be reserved and the
items that can be played at any time. This paper
analyzes the statistical analysis of the large-scale
playground project charging standards and the
number of participants in some projects, using gray
prediction, least squares method and linear
programming. The horizontal numerical analysis of
the large-scale playground project reception statistics
table was carried out, and the MATLAB model was
established. The data change law and development
trend were summarized. The numerical estimation
was carried out and the corresponding data and laws
were obtained. Through the longitudinal numerical
analysis of the number of receptions of large-scale
playground projects, the number of visitors on the day
of the corresponding date is extracted, and the
queuing theory is used to establish a model for the
charging standards of large-scale playground projects.
According to the analysis of the charging situation of
large-scale playground items and the waiting time, the
relevant number arrangement is obtained. In the ideal
state and the normal state, and considering the
queuing time, correspondingly establish the relevant
model of the selection order, perform a selected Logit
model algorithm in the Probit calculation, determine
the optimal budget plan, and realize the suitability of
the play.
Keywords: grey prediction, least squares method,
curve fitting, fare, theoretical study
1. INTRODUCTION
With the improvement of living standards, people’s
quality of life is getting higher and higher, people’s
requirements for leisure and entertainment are getting
higher and higher. Large amusement parks have
become an important place for people to enjoy leisure
and entertainment, and they can enjoy life.
Corresponding to the issue of pass and ticket fees in
the large-scale playground, the issue of the order of
the items when playing, and the higher the benefits of
the playground while making the tourists have a good
gaming experience.
Almost all economic theories remind that property
rights should be clearly defined before making
decisions, thereby avoiding unclear responsibilities
due to unclear property rights and improving the
efficiency of resource allocation. The same is true for
tourist attraction pricing [1]. The distribution of
benefits is an important means to balance and
coordinate the distribution of benefits during the
duration of the scenic spot, and it is also a guarantee
for balancing and coordinating the rights of
stakeholders. Zhang Yufeng and Wu Kaichao pointed
out that under the traditional planning system of
China, the ownership of scenic resources is owned by
the state or collectively. With the continuous
expansion of China’s tourism market and the rapid
development of the tourism industry, various interest
groups have seen the resource asset characteristics of
scenic resources, and have struggled to compete for
the rights of scenic resources. However, the authors of
many articles recognize that the reform of the
property rights system of scenic spots is a multi-party
game process full of contradictions and conflicts.
Many researchers believe that the government has a
positive role in the management of scenic spots,
including ticket pricing. However, there are also
voices that local governments have too much
intervention in scenic area management in the context
of unclear property rights [2]. Wang Zanxin believes
that the development of county tourism industry
depends on the complementarity and behavior
coordination of the government and the market.
Zhang Yufeng and Wu Kaichao realized that the
state’s ownership of scenic resources became a kind
of illusion, and the local government became the
actual representative of the ownership of scenic
resources. Due to the inconsistency of the strength
and status of the stakeholders in the scenic resources
during the game, the acquisition of the interests of the
institutional change is also quite unequal. The capital
owners and local governments become the greatest
interests, national interests and community residents.
The benefits are weaker. Some scholars have
compared the way of price management of foreign
tourist attractions. Xiang Rong pointed out that the
International Journal of Computational and Engineering 157
ACADEMIC PUBLISHING HOUSE

United States and other developed countries have
adopted specialized institutions (such as national
parks) for vertical management, which have the
following characteristics: (1) centralized functions; (2)
basic use of national income for the maintenance of
scenic spots, regardless of ticket income; 3) The
manager is a national public official, not a corporate
employee. As a result, the national ticket prices in the
United States are low and the protection is doing very
well. Of course, due to the nature of tourism resources
and the number of tourists, foreign policies have only
a reference for our research and have no decisive
reference value.
2. THE MECHANISM AND STATUS QUO OF
TICKET PRICING
As a commodity, the pricing of tourist attraction
tickets requires not only the cost of maintaining the
daily operation of the scenic spot, but also the value
of tourism resources as a commodity and the
regulation of market demand. Pan Qiuling and Cao
Sanqiang believe that the pricing of tourist attractions
should be considered from the following five
dimensions: (1) resource value; (2) cost input; (3)
market supply and demand; (4) property rights of
scenic spots; (5) quality of service. Xu Feng and Shi
Xiaoyan believe that due to the nature of quasi-public
products in tourist areas, the ticket prices of tourist
attractions are formed during the game of market
competition and government intervention. The final
decision of price depends on the autonomy of
enterprises and the control. In the government’s
public welfare goal, every price fluctuation is a
multiple game at different levels. Generally speaking,
in the traditional sense, the price of tourist attraction
tickets mainly includes three major items: operating
costs, taxes and profits.
For the current situation of scenic spot tickets, most
researchers believe that most of the tourist attractions
in this stage are overpriced. Song Zhanghai believes
that the ticket prices of many scenic spots in China
are already higher than the social best price or even
the monopoly price. The practice of rising ticket
prices in scenic spots is not a measure for the
sustainable development of tourist attractions. It will
not only ruin the value of the scenic spot as a public
good, but will also damage the rights enjoyed by
some low-income tourists and cause unfairness in the
public interest[3]. Xiang Rong also believes that
tourist attractions are not only unreasonable in pricing
basis, but also do not reflect fairness in pricing
procedures. They should avoid unfair pricing through
reasonable and open means.
3. MODELING
Following in table 1 is the symbol description.
Table 1 Symbol Description
Symbol Symbol Description
µ Number of customers served per unit of time
λ Number of customers coming in per unit time
Ls Number of customers in the system (n) expected value
Lq The number of customers queued for service in the system
Ws Stay time
Wq Waitting Time
s Number of service desks
ρ Service strength,
x Average arrival rate / minute / person
y Average service rate / minute / person
M/M/S A type of queuing service model
L Corresponding to the date in the curve fit
Wi Number of playground visitors (i is an integer from 1-5)
3.1 MODEL ESTABLISHMENT AND SOLUTION
Using the appendix given data, use MATLAB to
establish a gray prediction model (gray prediction:
prediction made by the gray system. The so-called
gray system is a transition system between the white
system and the black box system. Its specific meaning
Yes: If all the information of a system is known as a
white system, all information is unknown as a black
box system, some information is known, some
information is unknown, then this system is a gray
system.) Statistics on the number of tourists in July
and August 2018, Get the chart below (Figure 1):
International Journal of Computational and Engineering158
ACADEMIC PUBLISHING HOUSE
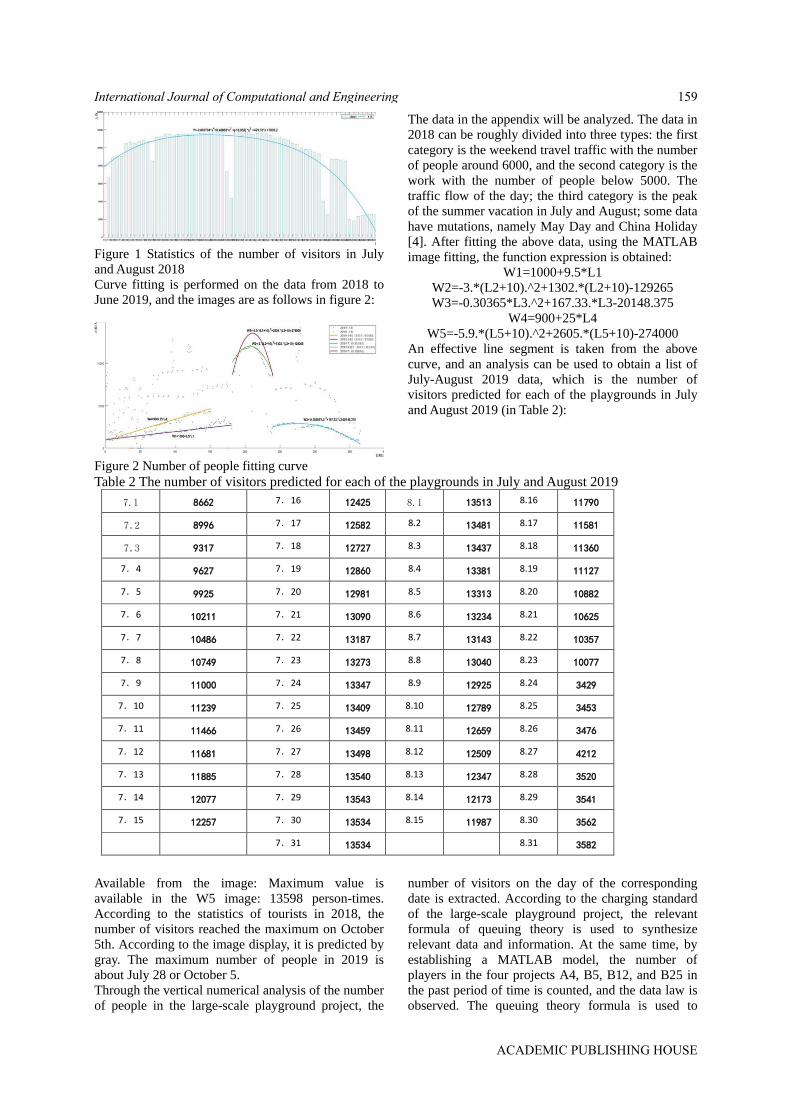
Figure 1 Statistics of the number of visitors in July
and August 2018
Curve fitting is performed on the data from 2018 to
June 2019, and the images are as follows in figure 2:
Figure 2 Number of people fitting curve
The data in the appendix will be analyzed. The data in
2018 can be roughly divided into three types: the first
category is the weekend travel traffic with the number
of people around 6000, and the second category is the
work with the number of people below 5000. The
traffic flow of the day; the third category is the peak
of the summer vacation in July and August; some data
have mutations, namely May Day and China Holiday
[4]. After fitting the above data, using the MATLAB
image fitting, the function expression is obtained:
W1=1000+9.5*L1
W2=-3.*(L2+10).^2+1302.*(L2+10)-129265
W3=-0.30365*L3.^2+167.33.*L3-20148.375
W4=900+25*L4
W5=-5.9.*(L5+10).^2+2605.*(L5+10)-274000
An effective line segment is taken from the above
curve, and an analysis can be used to obtain a list of
July-August 2019 data, which is the number of
visitors predicted for each of the playgrounds in July
and August 2019 (in Table 2):
Table 2 The number of visitors predicted for each of the playgrounds in July and August 2019
7.1 8662 7.16 12425 8.1 13513 8.16 11790
7.2 8996 7.17 12582 8.2 13481 8.17 11581
7.3 9317 7.18 12727 8.3 13437 8.18 11360
7.4 9627 7.19 12860 8.4 13381 8.19 11127
7.5 9925 7.20 12981 8.5 13313 8.20 10882
7.6 10211 7.21 13090 8.6 13234 8.21 10625
7.7 10486 7.22 13187 8.7 13143 8.22 10357
7.8 10749 7.23 13273 8.8 13040 8.23 10077
7.9 11000 7.24 13347 8.9 12925 8.24 3429
7.10 11239 7.25 13409 8.10 12789 8.25 3453
7.11 11466 7.26 13459 8.11 12659 8.26 3476
7.12 11681 7.27 13498 8.12 12509 8.27 4212
7.13 11885 7.28 13540 8.13 12347 8.28 3520
7.14 12077 7.29 13543 8.14 12173 8.29 3541
7.15 12257 7.30 13534 8.15 11987 8.30 3562
7.31 13534 8.31 3582
Available from the image: Maximum value is
available in the W5 image: 13598 person-times.
According to the statistics of tourists in 2018, the
number of visitors reached the maximum on October
5th. According to the image display, it is predicted by
gray. The maximum number of people in 2019 is
about July 28 or October 5.
Through the vertical numerical analysis of the number
of people in the large-scale playground project, the
number of visitors on the day of the corresponding
date is extracted. According to the charging standard
of the large-scale playground project, the relevant
formula of queuing theory is used to synthesize
relevant data and information. At the same time, by
establishing a MATLAB model, the number of
players in the four projects A4, B5, B12, and B25 in
the past period of time is counted, and the data law is
observed. The queuing theory formula is used to
International Journal of Computational and Engineering 159
ACADEMIC PUBLISHING HOUSE
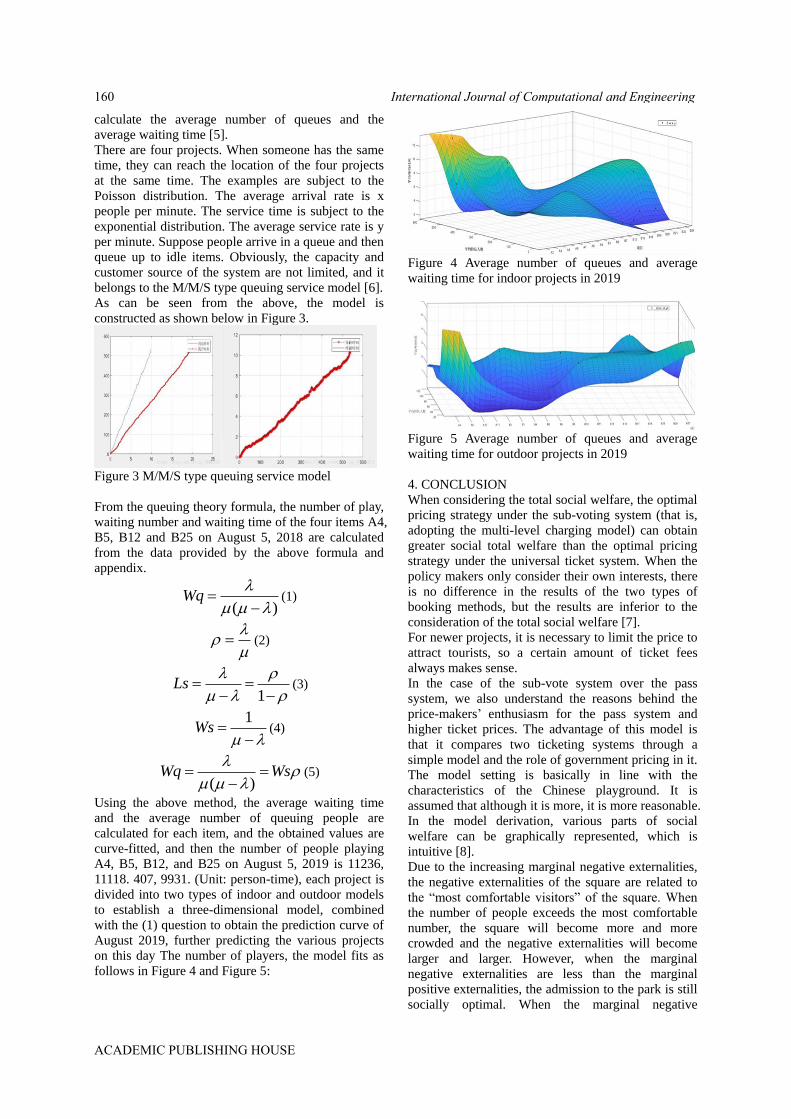
calculate the average number of queues and the
average waiting time [5].
There are four projects. When someone has the same
time, they can reach the location of the four projects
at the same time. The examples are subject to the
Poisson distribution. The average arrival rate is x
people per minute. The service time is subject to the
exponential distribution. The average service rate is y
per minute. Suppose people arrive in a queue and then
queue up to idle items. Obviously, the capacity and
customer source of the system are not limited, and it
belongs to the M/M/S type queuing service model [6].
As can be seen from the above, the model is
constructed as shown below in Figure 3.
Figure 3 M/M/S type queuing service model
From the queuing theory formula, the number of play,
waiting number and waiting time of the four items A4,
B5, B12 and B25 on August 5, 2018 are calculated
from the data provided by the above formula and
appendix.
( )Wq
(1)
(2)
1Ls
(3)
1Ws
(4)
( )Wq Ws
(5)
Using the above method, the average waiting time
and the average number of queuing people are
calculated for each item, and the obtained values are
curve-fitted, and then the number of people playing
A4, B5, B12, and B25 on August 5, 2019 is 11236,
11118. 407, 9931. (Unit: person-time), each project is
divided into two types of indoor and outdoor models
to establish a three-dimensional model, combined
with the (1) question to obtain the prediction curve of
August 2019, further predicting the various projects
on this day The number of players, the model fits as
follows in Figure 4 and Figure 5:
Figure 4 Average number of queues and average
waiting time for indoor projects in 2019
Figure 5 Average number of queues and average
waiting time for outdoor projects in 2019
4. CONCLUSION
When considering the total social welfare, the optimal
pricing strategy under the sub-voting system (that is,
adopting the multi-level charging model) can obtain
greater social total welfare than the optimal pricing
strategy under the universal ticket system. When the
policy makers only consider their own interests, there
is no difference in the results of the two types of
booking methods, but the results are inferior to the
consideration of the total social welfare [7].
For newer projects, it is necessary to limit the price to
attract tourists, so a certain amount of ticket fees
always makes sense.
In the case of the sub-vote system over the pass
system, we also understand the reasons behind the
price-makers’ enthusiasm for the pass system and
higher ticket prices. The advantage of this model is
that it compares two ticketing systems through a
simple model and the role of government pricing in it.
The model setting is basically in line with the
characteristics of the Chinese playground. It is
assumed that although it is more, it is more reasonable.
In the model derivation, various parts of social
welfare can be graphically represented, which is
intuitive [8].
Due to the increasing marginal negative externalities,
the negative externalities of the square are related to
the “most comfortable visitors” of the square. When
the number of people exceeds the most comfortable
number, the square will become more and more
crowded and the negative externalities will become
larger and larger. However, when the marginal
negative externalities are less than the marginal
positive externalities, the admission to the park is still
socially optimal. When the marginal negative
International Journal of Computational and Engineering160
ACADEMIC PUBLISHING HOUSE

externality exceeds the marginal positive externality,
it is necessary to collect admission tickets.
Since the number of tourist areas will fluctuate
according to the season, tickets should also be floated
according to the off-season season. In addition,
considering the pricing process as a game model
between policy makers (governments) and policy
benefits/victims (tourists) can better overcome the
trade-offs between different utilities in the model, and
more in line with the actual pricing process is more
realistic.
If policy makers (governments) have stronger game
power, balanced pricing results are still better than the
pass system; if policy makers (governments) only
consider income, due to the existence of tourist power,
the vote system The optimal result will be better than
the pass system, but the gap will be narrowed, and the
degree of reduction will be determined by the relative
size of the two game forces.
5. COUNTERMEASURES
Establish and improve a sound management system,
clarify the distribution of property rights of tourism
resources, realize the rational distribution of
management rights and management rights; rationally
classify resources in the scenic area, find ancient
cultural relics and ecological environment that need to
be protected, and implement multi-level management;
Through the use of historical data research, market
research to determine the market supply and demand
relationship, and comprehensive benefits, in multiple
parties (government, tourists, businesses) in the equal
game and negotiation of multi-level reasonable
pricing of attractions; improve tourist attractions from
a single The transition from sightseeing to
comprehensive service industry development.
REFERENCES
[1]Wen C H, Chen T N, Fu C. A factor-analytic
generalized nested logit model for determining market
position of airlines. Transportation Research Part A,
2014, 62(4):71-80.
[2]Srinivasan K K, Mahmassani H S. A Dynamic
Kernel Logit Model for the Analysis of Longitudinal
Discrete Choice Data: Properties and Computational
Assessment. Transportation Science, 2005,
39(2):160-181.
[3]Oshagbemi T, Ocholi S A. Influences on leadership
behaviour: a binomial logit model. International
Journal of Social Economics, 2013, volume
40(2):102-115.
[4]Luca A D. A Logit Model with a Variable Response
and Predictors on an Ordinal Scale to Measure
Customer Satisfaction. Quality & Reliability
Engineering International, 2010, 22(5):591-602.
[5]Yi Liu, Jiawen Peng, and Zhihao Yu. 2018. Big
Data Platform Architecture under the Background of
Financial Technology: In the Insurance Industry As
An Example. In Proceedings of the 2018 International
Conference on Big Data Engineering and Technology
(BDET 2018). ACM, New York, NY, USA, 31-35.
[6]Lu J, Feng T, Timmermans H, et al. An integrated
Markov decision process and nested logit consumer
response model of air ticket pricing. Transportmetrica
A Transport Science Transportmetrica A Transport
Science, 2017, 13(6):1-3
[7]Kruger J W, Anna-Marie. Forecasting Ticket Sales
– the Case of Commuter Rail in South Africa. Ssrn
Electronic Journal, 2011.
[8]Kekana S L. The impact of rapid urban growth on
the commuter rail sector: the case of Gauteng
province. 2013.
International Journal of Computational and Engineering 161
ACADEMIC PUBLISHING HOUSE

On the English Translation of Song of a PipaPlayer from the Perspective of
Three Beauties PrincipleDu Zenghui , Cheng XiongyongHenan University of Technology, School of Foreign Languages Zhengzhou, Henan 450001, ChinaEmail:[email protected]
Abstract: Poetry is a unique literary art. Poetrytranslation, as a bridge of interculturalcommunication, plays an important role intransmitting the aesthetic beauty and the ideas ofthe original poem. Bai Juyi’s poetry is a product inthe specific historical period with particularcharacteristics. Bai’s poetry illustrates the beauty ofsound, form, and sense of Chinese classical poetry,which requires that the English translation ofclassical poetry should not only follow the meaningof the original text faithfully and smoothly, but alsoconvey the poetic imagery beauty of the originalpoetry. On the basis of the previous Englishtranslation studies on classical Chinese poetry, thisthesis conducts the qualitative analysis of XuYuanchong's English translation of Bai’s Song of aPipa Player from the perspective of the "ThreeBeauties" Theory. According to the characteristicsof Song of a Pipa Player in the aspects of sound,form and sense, this thesis analyzes how Xupresents the beauty of sound, form, and sense of theoriginal poem in the translation process from theperspective of translation aesthetics, whichindicates that the "Three Beauties" Theory has aclear guiding significance and great theoreticalcontribution to the English translation practice ofChinese classical poetry.Key words: the “Three Beauties” Theory; Song ofa Pipa Player; poetry translationIntroductionWith its long history and profound culture, China isgradually entering into the center of the world in thewell-rounded aspects. Poetry, a unique form oflanguage, has its ingenious literature style expressingthe culture and society of a nation. Poetry translationplays an increasingly important role in thedissemination of the various cultures of China, whichfacilitates the cultural transmission and benefitsChina and the whole world. Translating Chinesepoems into other languages is not only regarded asthe process of Chinese literature going to the world,but also the necessary way of developing Chineseculture itself.Bai’s poetry occupies an important position inChinese poetry history. Bai’s personality andcharacters are vividly shown in his poems, and thecharm of Bai’s poems is mainly derived from the
originality of the images. Although the Englishtranslation of Bai’s poems has a history of decades,the related research has not been focusedcontinuously, which leads to the fact that it has notbeen a major breakthrough in the field, and has notbeen rooted deeply and theoretically. Although someChinese scholars touch the related research, it is stillin the initial stage with lacking systematisms,comprehensiveness and profundity.When it comes to the translation of poems, XuYuanchong cannot be neglected because of hisoutstanding contributions to this field. Hissupereminence in poem translation field is not onlyattributed to his rich and beautiful translation works,but also because of his outstanding contribution totranslation theory. Most of his translation theoriesand principles come from his rich translation practice.His ideas on literary translation, especially on poetrytranslation, have made great repercussions in thetranslation field, of which the most important is the"Three Beauties" theory which gains the mostpopular theory in poem translation. Professor XuYuanchong is the expert in English translation ofancient Chinese poetry. He advocated in thetranslation theory of "Three Beauties" that theoriginal poetry should be kept and transmitted fromthe three levels of sense, sound and form. The theoryof "Three Beauties" has made a very importantcontribution to poetry translation studies.Literature ReviewChinese poem translation has been emphasized for along time since China has launched the reform andopening up policy, which is regarded as the symbolof the development and prosperity of Chinese culture.However, the related research on poem translationhas been paid less attention than the poem translationitself, even though the scholars are graduallyrealizing this situation and trying to do more studiesin this field. According to the research contents, therelated studies are mainly categorized into fouraspects: poem translation practice, poem translationtheory, the research on poem translation versions,and the research on translators.As for the research on poem translation practice,many scholars focus on the ideas about how totranslate Chinese poems, and what kind of skillsshould be involved to poem translation. In details,
International Journal of Computational and Engineering162
ACADEMIC PUBLISHING HOUSE

different dimensions are emphasized by differentscholars on poem translation. For instance, Gao(2017) emphasizes the cultural factors whichinfluences the translation qualities, and in theresearch poem translation is regarded as the way ofcommunication between different cultures, in whichthe relevance theory is introduced to the poemtranslation to deal with the cultural influences onpoem translation. Li (2009) carry out the study onthe ideology that takes effects in translating poems todeliberate that poem translation is not only about theexchange of different languages, and not about beingconfined to the words themselves, but also about themacroscopical context in which the outside factors,such as the ideology of the author, should be takeninto consideration when doing poem translation. Andsome scholars are still having the argument aboutwhether the poems can be translated or not. However,the mainstream about this is holding the viewpointthat although it is difficult to translate Chinesepoems into other languages considering the culture,history, and traditions, Chinese poem translation isstill possible, which needs a tough journey to go.As to the poem translation theory, the relatedtranslation theories and ideas are flourishingdramatically. Chinese poem translation is deeplyaffected by the translation theories put forwardabroad. For example, Nida's functional equivalencetheory is one of the most popular translation theoriesadopted in Chinese poem translation. There isanother translation theory which is also popular inpoem translation theory in China, namely,domestication and foreignization theory that is putforward by Lawrence Venuti (1995). Zheng (2014)analyzes the translation strategies of Du Fu’s poetryfrom the perspective of domestication andforeignization theory. In the research, the authorsuggests that compared with the western countries,Chinese culture and literature are not that strongnowadays, so the translators should be encouragedmore to adopt foreignization strategy to translateChinese poems into other languages. There are stillother scholars trying to propose another theoreticalperspectives to Chinese poem translation, such asecological translation, reception aesthetics theory,and so on.All the previous studies reviewed above illustratesthe fact that the research on the English translation ofChinese poems are gradually flourishing during therecent decades. However, the related translationtheory developed or created by Chinese translatorsare not paid more attention than those abroad.Generated and nourished by the development ofChinese economy, culture, and society, Chinesetranslation theory owns its unique merits in doing theresearch on the English translations of Chinesepoems. To enhance and enrich the study of Englishtranslation of Chinese poems under the help ofChinese translation theory, this thesis mainly adopts
Xu Yuanchong’s “three beauties” theory to analyzeXu’s English translation of Bai’s landscape poems tojustify the application of “Three Beauties” theory inBai’s poems and try to provide the applicablestrategies of Chinese poetry translation.Theoretical FoundationSince the birth of Xu Yuanchong’s "Three Beauties"theory, the comprehensive changes have taken placein carrying out the analysis of poem translation. Thispart deliberates the theoretical foundation of thisthesis with the brief introduction to Xu Yuanchong.ABrief Introduction to Xu YuanchongProfessor Xu Yuanchong is outstanding in thetranslation field because of his rich and beautifultranslation works, and his prominent contribution totranslation theory. Most of his translation theoriescome from his rich translation practice. For literarytranslation, especially in poetry translation, his ideashave made great repercussions in the translation field,of which the most important is the "three beauties"theory. On the basis of the "three beauties" theory,Xu Yuanchong also put forward the theory of"superiority" and "competition theory". Hisachievements in translation practice are also obviousto all. He translated the world masterpieces such as"Reminiscence", "John Christoph", "Red and Black"and "Mrs. Bovary" into Chinese, and translated "theBook of Songs", "Chu Ci", "Romance of the WesternChamber" and "Three Hundred Tang Poems" intoEnglish or French. Indeed, Mr. Xu has achievedremarkable achievements both in translation practiceand in translation theory.“Three Beauties” TheoryThe "Three Beauties" theory refers to the beauty ofsense, the beauty of form and the beauty of sound.The "Three Beauties" theory is inspired by Lu Xunabout how to write articles. However, Mr. Xu appliesthis theory to literary translation. According to Xu,when translating poems, the beauty of sound andform should be concerned as much as possiblewithout breaking the beauty of sense. Then in“Journal of Foreign Languages”, Xu added therelationship between the “Three Beauties”. Thebeauty of sense is the most important factor, thebeauty of sound is the secondary, and the beauty ofform follows them, which means the beauty of soundshould be pursued as much as possible withoutbreaking the beauty of sense, and the beauty of formshould be improved as much as possible on theconditions of pursuing the beauty of sense and sound(Xu, 1979). Those three beauties are indispensable.Mr. Xu actively advocates the use of the "ThreeBeauties" theory to guide the translation of poetry,and to carry out his translation standards in thepractice of translation.With regard to the beauty of sense, Mr. Xu explainedthat the historical factors or associative factors areusually involved in dealing with the beauty of sense.When translating the poems into another language,
International Journal of Computational and Engineering 163
ACADEMIC PUBLISHING HOUSE

without the similarly historical and associativeexperiences, it is not easy to convey the sense beautyof the original poem. Therefore, when translating themeaning of the original poems, it is not only toexpress the meanings of its surface, but also toexpress its underlying meanings. In translation, theproper words in meaning should be chosen in thetarget language to meet with the sense of beauty insource language, and sometimes the beauty of sensecan be realized by the sense of form and sound.Regarding the beauty of form, Xu Yuanchongbelieves that this is mainly in terms of the length andthe integrity of the poem. In his "Art of Translation"and many other papers on translation studies, Mr. Xuhas repeatedly emphasized the importance of thebeauty of form combining with the different rhymepatterns, which indicates his insistence that thestructural factors should be paid more attention whendoing translation. Mr. Xu also insists that length andsymmetry should be included when dealing with thebeauty of form. Generally speaking, it is difficult tofollow the similar structure from source languagewhen doing the translation to meet with the beauty offorms in target language. However, Xu has neverbeen afraid of overcoming the difficulties, and hasbeen brave to try and translate countless outstandingworks.As for the beauty of sound, the different rhymepatterns can be deployed according to the commonusage of target language to meet with the sourcelanguage, in which the rhymes in target language canbe correspondingly chosen according to the rhymesin source language. Reduplication, repetition, andalliteration can be also employed to accomplish thebeauty of sound. Mr. Xu is also very concernedabout rhymes. Chinese ancient poetry is very strict intone, rhyme and number of sentences, just likedancing with handcuffs and fetters. In his translation,he put on the "handcuffs and fetters", trying to makethe translation with strict rhythm, sound step andnumber of sentences, so that the translation had thesame harmony and aesthetic feeling as the original.Analysis of the Translation of Song of a PipaPlayer from “Three Beauties” TheoryThe previous parts of this thesis have beendeliberated the literature review of the Englishtranslation of Chinese poems, the features of Bai’spoems, and the theoretical framework of Xu’s “ThreeBeauties” Theory. This part conducts the specificanalysis of the Xu Yuanchong’s English translationof Song of a Pipa Player from “Three Beauties”Theory with taking the concrete examples toillustrate the justification of the employment of the“three beauties” when translating Song of a PipaPlayer.Analysis from the Beauty of SenseAccording to the “Three Beauties” Theory, thebeauty of sense involves dealing with theconnotative meaning of a poem. The underlying
meaning of a poem should be put into the first placeto be considered when translating a poem. Thebeauty of sense is to achieve the faithful conveyingof the sense. Mr. Xu once analyzed the "sensebeauty" in the translation of poetry in a TV program:Tang poetry emphasizes "the combination of poetryand painting", with painting in the poem and poetryin the painting. The poet is very particular aboutartistic conception, and only a few words or phrasesare used to depict the beautiful "artistic conception”.It is this artistic beauty that he tries his best toembody in his translation.In maple leaves and rushes autumn seemed tosighThis poem explained the story of the time - mapleleaves, flowers, rustling autumn wind night. Throughthree kinds of natural scenery - maple leaf, flowerand autumn wind - the author reposed the feeling ofdesponding sadness in his heart. Xu not onlyfaithfully translate the maple leaves, autumn, flowers,but also add a verb ‘sigh’. The maple leaves howl insuch a somber autumn wind, but the reality is thepoet sighing. The use of the verb sigh seems to makethe "sense" more beautiful. Here is another exampleextracted from this poemWithout flute songs we drank our cups withheavy heart;The moonbeams blent with water when wewere to part.‘With heavy heart’ have combined the words "不成
欢 " and "惨 " into one preposition phrase. In histranslation, the moonbeams blend with water in theboundless river and the reflection of a bright moon inthe water. Perhaps the reflection in the autumn windis still moving and quiet. This gives people a sense ofemptiness, loneliness and frustration.Silence reigned left and right of the boat, east andwest;We saw but autumn moon white in river’s breast.These two poems write pipa player’s performanceeffect. Silence reigned and left and right of the boat,east and west mesmerized the listeners, who werestill immersed in music and the silence surroundingthem was well expressed. The word "breast" in Xu'stranslation is commonly used to express the humanor animal breast or refer to the human breast. Here,river's breast reminds people of the bright moon,which is printed not only in the river, but also in thepoet's heart.Analysis from the Beauty of Form and SoundChinese traditional poetry emphasizes rhyme whichaccords to the law, level and contrast. While modernEnglish poetry are relatively free, no rules, no leveland oblique tones, antithesis, refined language,image clear. The huge differences between the twolanguages make it difficult to translate Chinesemetrical poems into English. In his translation, Xunot only needs "sense beauty", but also needs soundbeauty (with sound ruler, tonal pattern and rhyme)
International Journal of Computational and Engineering164
ACADEMIC PUBLISHING HOUSE

and shape beauty (with symmetrical pattern and evensentence). Song of a Pipa Player is the original poemfor the seven-word poem, rhyme between sentences.In Xu’s English translation, it can be seen that thetranslated poem has a neat rhyme, a neat step, andthe number of sentences is equal to that of theoriginal poem.The thick strings loudly thrummed like thepattering rain;The fine strings softly tinkled in a murmuringstrain.These two sentences describe the image of music ofpipa music. The original poem rhymes with neatcontraptions. The onomatopoeia of "snappy" and"sharp" are used to describe the sound of largestrings and small strings popping up. In terms ofsound beauty, rain rhymes with strain, and theoriginal poem is also used to make thick strings andfine strings, intensive thrummed and josh tinkled, thepattering rain and murmuring strain compare witheach other in form, adding light and light tones, it ishard to find a sense of music beauty.Suddenly we heard water burst a silver jar,And the clash of spears and sabers come fromafar.This sentence means music burst out from the almostfrozen place, reflecting the intense burst of pipa girl'sfeelings. Xu translated "乍 " to mean "Suddenly" inthe original text. However, there are similarities inthe sound effect. The verb "burst" conveys the imageof water bursting into an object, and "clash" is usedto express the "shooting" of knives and guns.Rhyming with the jar in the previous sentence, thetranslator deliberately changed the sound of knivesand guns to "come from afar", indicating thetranslator's determination to pursue "sound beauty".ConclusionThe “Three Beauties” theory has exerted a greatinfluence on poem translation studies. This thesis hasdiscussed Xu’s English translation of Song of a PipaPlayer under the framework of the “Three Beauties”theory put forward by Xu Yuanchong who is theprominent poem translator. A general view can bearrived at that the “Three Beauties” theory is a
successful and effective device to examine Song of aPipa Player from the aesthetic aspect. Specifically,as for the beauty of sense, Xu follows the meaning ofthe original poems with using various rhetoricaldevices and he put the beauty of sense into the firstplace with taking the risk of losing the beauty ofsound and the beauty of form. As to the beauty ofform, Xu’s translation on Song of a Pipa Playerpursues the similarity of the structures in phrase andsentence with slightly changing the orders of themeanings in the lines. In terms of the beauty ofsound, Xu’s translation on Song of a Pipa Playerdeals with the rhymes and meter between lines withobeying the musical quality of Song of a Pipa Player.Although, it is difficult to completely fulfill the threeprinciples in the “Three Beauties” theory, Xu’stranslation has been trying the best to meet with theall the principles to represent the beauty of theoriginal poems in different dimensions, and to realthe images and emotions of the author. Therefore,this thesis exemplifies the effectiveness of the “ThreeBeauties” theory as a tool of translating Chineseclassic poems into English.References:[1] Yang Xianyi, Dai Naidie. Chinese-Englishtranslation of ancient poetry garden. Tang poetry.Foreign languages publishing house, 2003.[2] Xu Yuanchong. 300 Tang Poems. Highereducation press, 2000.[3] Xu Yuanchong. Dare to be the first intranslation studies. Chinese translation, 1999, (2).[4] Xu Yuanchong. The art of translation. Chinaforeign translation publishing company, 1984.[5] Rao Fanzi. Chinese and western comparativeliterature and art. Beijing: China social sciencespress, 1999.[6] Yao Kefu. Human poetry and words.Bibliographic literature publishing house, 1983.[7] Liu Zhengguang. Metaphorical thinking in theuse of nouns [J]. Foreign language teaching andresearch, 2000 (5):335-339.[8] Mao Ronggui. Translation aesthetics [M].Shanghai: Shanghai jiao tong university press,2005:216.
International Journal of Computational and Engineering 165
ACADEMIC PUBLISHING HOUSE