
Object-Oriented and Classical Software Engineering - TaiLieu ...
Upload
khangminh22Category
view
5download
0
2021 volume 15 issue 1


2021 volume 15 issue 1

Editor-in-ChiefLech Madeyski ([email protected], http://madeyski.e-informatyka.pl)Editor-in-Chief EmeritusZbigniew Huzar ([email protected])
Faculty of Information and Communication Technology, Department of Applied InformaticsWrocław University of Science and Technology,50-370 Wrocław, Wybrzeże Wyspiańskiego 27, Poland
e-Informatica Software Engineering Journalwww.e-informatyka.pl, DOI: 10.37190/e-infEditorial Office Manager: Wojciech ThomasTypeset by Wojciech Myszka with the LATEX 2𝜀 Documentation Preparation System
All rights reserved. No part of this publication may be reproduced, stored in a retrieval system,transmitted in any form, or by any means, electronic, mechanical, photocopying, recording, orotherwise, without the prior written permission of the publishers.
© Copyright by Oficyna Wydawnicza Politechniki Wrocławskiej, Wrocław 2021
OFICYNA WYDAWNICZA POLITECHNIKI WROCŁAWSKIEJWybrzeże Wyspiańskiego 27, 50-370 Wrocławwww.oficyna.pwr.edu.pl;e-mail: [email protected]; [email protected]
ISSN 1897-7979
Print and binding: beta-druk, www.betadruk.pl

Editorial BoardEditor-in-Chief
Lech Madeyski (Wrocław University of Science and Technology, Poland)
Editor-in-Chief Emeritus
Zbigniew Huzar (Wrocław University of Science and Technology, Poland)
Editorial Board Members
Pekka Abrahamsson (NTNU, Norway)Apostolos Ampatzoglou (University ofMacedonia, Thessaloniki, Greece)Sami Beydeda (ZIVIT, Germany)Miklós Biró (Software Competence CenterHagenberg, Austria)Markus Borg (SICS Swedish ICT AB Lund,Sweden)Pearl Brereton (Keele University, UK)Mel Ó Cinnéide (UCD School of ComputerScience & Informatics, Ireland)Steve Counsell (Brunel University, UK)Maya Daneva (University of Twente TheNetherlands)Norman Fenton (Queen Mary Universityof London, UK)Joaquim Filipe (Polytechnic Instituteof Setúbal/INSTICC, Portugal)Thomas Flohr (University of Hannover,Germany)Francesca Arcelli Fontana (Universityof Milano-Bicocca, Italy)Félix García (University of Castilla-LaMancha, Spain)Carlo Ghezzi (Politecnico di Milano, Italy)Janusz Górski (Gdańsk Universityof Technology, Poland)Tracy Hall (Lancaster University, UK)Andreas Jedlitschka (Fraunhofer IESE,Germany)Barbara Kitchenham (Keele University,UK)Stanisław Kozielski (Silesian Universityof Technology, Poland)Pericles Loucopoulos (The Universityof Manchester, UK)
Kalle Lyytinen (Case Western ReserveUniversity, USA)Leszek A. Maciaszek (Wrocław Universityof Economics, Polandand Macquarie University Sydney, Australia)Jan Magott (Wrocław University of Scienceand Technology, Poland)Zygmunt Mazur (Wrocław Universityof Science and Technology, Poland)Bertrand Meyer (ETH Zurich, Switzerland)Matthias Müller (IDOS Software AG,Germany)Jürgen Münch (University of Helsinki,Finland)Jerzy Nawrocki (Poznan Universityof Technology, Poland)Mirosław Ochodek (Poznan Universityof Technology, Poland)Janis Osis (Riga Technical University, Latvia)Fabio Palomba (University of Salerno, Italy)Mike Papadakis (Luxembourg University,Luxembourg)Kai Petersen (Hochschule Flensburg,University of Applied Sciences, Germany)Łukasz Radliński (West PomeranianUniversity of Technology in Szczecin, Poland)Guenther Ruhe (University of Calgary,Canada)Krzysztof Sacha (Warsaw Universityof Technology, Poland)Martin Shepperd (Brunel UniversityLondon, UK)Rini van Solingen (Drenthe University,The Netherlands)Miroslaw Staron (IT University of Göteborg,Sweden)

4
Tomasz Szmuc (AGH University of Scienceand Technology Kraków, Poland)Guilherme Horta Travassos (FederalUniversity of Rio de Janeiro, Brazil)Adam Trendowicz (Fraunhofer IESE,Germany)Burak Turhan (University of Oulu, Finland)Rainer Unland (Universityof Duisburg-Essen, Germany)Sira Vegas (Polytechnic University of Madrit,Spain)Corrado Aaron Visaggio (Universityof Sannio, Italy)
Bartosz Walter (Poznan Universityof Technology, Poland)Dietmar Winkler (Technische UniversitätWien, Austria)Bogdan Wiszniewski (Gdańsk Universityof Technology, Poland)Marco Zanoni (University of Milano-Bicocca,Italy)Jaroslav Zendulka (Brno Universityof Technology, The Czech Republic)Krzysztof Zieliński (AGH Universityof Science and Technology Kraków, Poland)

Contents
What Support do Systematic Reviews Provide for Evidence-informed Teachingabout Software Engineering Practice?
David Budgen, Pearl Brereton, Nikki Williams, Sarah Drummond . . . . . . . . . . 7A Deep-Learning-Based Bug Priority Prediction Using RNN-LSTM Neural Networks
Hani Bani-Salameh, Mohammed Sallam, Bashar Al shboul . . . . . . . . . . . . . . . 29Use of Agile Practices in Start-up Companies
Eriks Klotins, Michael Unterkalmsteiner, Panagiota Chatzipetrou, Tony Gorschek,Rafael Prikladnicki, Nirnaya Tripathi, Leandro Bento Pompermaier . . . . . . . . . 47
A Framework for the Regression Testing of Model-to-Model TransformationsIssam Al-Azzon, Saqib Iqbal . . . . . . . . . . . . . . . . . . . . . . . . . . . . . . . . 65
Mining Non-Functional Requirements using Machine Learning TechniquesRajni Jindal, Ruchika Malhotra, Abha Jain, Ankita Bansal . . . . . . . . . . . . . . 85
Software Deterioration Control Based on Issue ReportsOmid Bushehrian, Mohsen Sayari, Pirooz Shamsinejad . . . . . . . . . . . . . . . . . 115
A Systematic Reuse Process for Automated Acceptance Tests: Constructionand Elementary Evaluation
Mohsin Irshad, Kai Petersen . . . . . . . . . . . . . . . . . . . . . . . . . . . . . . . 133Multi-View Learning for Software Defect Prediction
Elife Ozturk Kiyak, Derya Birant, Kokten Ulas Birant . . . . . . . . . . . . . . . . . 163Business Model Flexibility and Software-intensive Companies: Opportunitiesand Challenges
Magnus Wilson, Krzysztof Wnuk, Lars Bengtsson . . . . . . . . . . . . . . . . . . . . 185


e-Informatica Software Engineering Journal, Volume 15, Issue 1, 2021, pages: 7–27, DOI 10.37190/e-Inf210101
Fixing Design Inconsistencies of PolymorphicMethods Using Swarm Intelligence
Renu George∗, Philip Samuel∗∗Department of Computer Science, Cochin University of Science and Technology, India
[email protected], [email protected]
AbstractBackground: Modern industry is heavily dependent on software. The complexity of designingand developing software is a serious engineering issue. With the growing size of software systemsand increase in complexity, inconsistencies arise in software design and intelligent techniques arerequired to detect and fix inconsistencies.Aim: Current industrial practice of manually detecting inconsistencies is time consuming, errorprone and incomplete. Inconsistencies arising as a result of polymorphic object interactions arehard to trace. We propose an approach to detect and fix inconsistencies in polymorphic methodinvocations in sequence models.Method: A novel intelligent approach based on self regulating particle swarm optimization to solvethe inconsistency during software system design is presented. Inconsistency handling is modelledas an optimization problem that uses a maximizing fitness function. The proposed approach alsoidentifies the changes required in the design diagrams to fix the inconsistencies.Result: The method is evaluated on different software design models involving static and dynamicpolymorphism and inconsistencies are detected and resolved.Conclusion: Ensuring consistency of design is highly essential to develop quality software andsolves a major design issue for practitioners. In addition, our approach helps to reduce the timeand cost of developing software.
Keywords: UML models, software design inconsistency, polymorphism, particle swarmoptimization
1. Introduction
Today′s biggest industry is software industry interms of manpower, complex interactions andchanging tasks with evolving designs. The waypeople coordinate activities and work has seena major transformation since the use of softwarein industries. With the increasing relevance ofsoftware in industries, software development hasbecome more complex. Software changes are fre-quent due to evolution, agility and adaptability.Customized software is used to increase produc-tivity in industries and quality of the softwareis a prime concern. Design and development ofquality software is a major challenge for softwaredevelopers and many a times, the process is man-
ual. Artificial intelligence (AI) techniques canreplace many of these manual efforts to make thedevelopment of software easier and cost effective.
Artificial intelligence replicates human deci-sion making techniques to make machines moreintelligent. Software development involves sev-eral complex human decision makings that dealwith the task of designing, implementing anddeploying complex systems. Software engineer-ing problems can be represented as optimizationproblems. Search based software systems use op-timization techniques and computational searchtechniques to solve problems in software engineer-ing [1]. Although search based systems addressmany problems in software requirements anddesign, design verification is not yet addressed
Submitted: 08 April 2020; Revised: 02 November 2020; Accepted: 14 December 2020; Available online: 02 February 2021

8 Renu George, Philip Samuel
[2, 3]. Particle swarm optimization (PSO) is anoptimization technique based on population withcomputational intelligence [4]. Self RegulatingParticle Swarm Optimization (SRPSO) is an im-proved version of PSO that provides optimumsolutions by incorporating the best strategiesfor human learning [5]. We present an intelli-gent approach based on SRPSO to solve theinconsistency in polymorphic methods duringthe software system design.
The modelling language widely used for re-quirements modelling and documentation of thesystem is Unified Modeling Language (UML).UML models handle the complexity of the sys-tem by expressing different views with differentdiagrams that consist of a number of interre-lated model elements. The interrelated designdiagrams contain redundant information in theoverlapping model elements. Hence, the proba-bility of occurrence of design inconsistencies ismore. The diagrams of a single system repre-senting the static and dynamic aspects shouldbe consistent and not contradictory [6]. Explicitmechanisms are required to verify the consistencyof redundant information present across the dia-grams [7, 8]. Generally, models are constructedfor a specific application and the models are even-tually implemented, usually in an object orientedprogramming language. Validating the modelsfor consistency in the design phase guaranteethat the design inconsistencies are not carriedover to the code generation phase of softwaredevelopment. Automated consistency checkingduring the design phase ensures software quality,reduced development and maintenance cost andless time to market. Inconsistent design resultsin incorrect code, design rework, failure to meettimelines, and increase in cost of production.
Polymorphism is one of the key concepts thatdetermine the quality of object oriented softwaresystems [9]. Polymorphism enables different be-havior to be associated with a method name. Newmethods with different implementation can becreated with the same interface and the amount ofwork required to handle and distinguish differentobjects is reduced [9]. The result of execution ofa polymorphic method depends on the object thatexecutes themethod andproduces different results
when received by different objects. The advan-tages of designingmultiple methods with the samename make polymorphism an efficient approachduring software design.We define an inconsistencyrelated to object interactions in polymorphic andnon-polymorphic methods: method-invocationinconsistency. Inconsistency exists if the methodinvocations are bound to a wrong class in thesequence diagram, i.e., the method is not invokedon an object of the class in which the method isdefined. Inconsistencies in polymorphic methodinvocations cannot be identified by validatingthe method names as all polymorphic methodshave the same name. Hence, detection of methodinvocation inconsistency in polymorphic methodsrequires more effort than non-polymorphic meth-ods. As the design complexity increases, manualverification of inconsistencies in polymorphicmethods is not practical. Intelligent techniquesthat require expertise are required to detect andsolve the inconsistencies.
Method-invocation inconsistency occurs whena polymorphic or non-polymorphic method is in-voked on a wrong object in the sequence diagram.The existing approaches of detecting inconsisten-cies in method invocations specified in [10–15]do not mention inconsistencies in polymorphicmethods. Although polymorphism has a numberof advantages, serious flaws may occur due toinconsistencies. Programmers may find it a chal-lenging task to understand all the interactionsbetween sender and receiver objects [16]. Under-standing polymorphic codes is hard and there-fore, fault-prone. Usually inconsistencies relatedto polymorphic method invocations are difficultto identify during testing phase. Separate tests arerequired for each polymorphic method binding.Identifying and testing all possible bindings ofcertain polymorphic references is difficult therebyincreasing the chances of errors [17]. Inconsistentpolymorphic behaviours may cause huge financialproblems when detected.
Software design is prone to errors and designimperfections have a significant effect on softwarequality. Software failure can be attributed to var-ious factors starting from requirements gatheringto testing and poor quality management [18]. In-consistencies in the design lead to the generation

Fixing Design Inconsistencies of Polymorphic Methods Using Swarm Intelligence 9
of defective software. One of the major activi-ties in ensuring quality involves detection andremoval of defects in the design. As the errors arecarried over from the software design phase to thedevelopment phase, the cost incurred in fixingthe error also increases. Defect detection duringthe design phase significantly prevents propaga-tion of errors to further stages of software devel-opment and reduces development cost [19, 20].Hence, code generation is based on consistentdesigns. This facilitates generation of softwarewith fewer faults and improves the quality ofthe software generated. Development of softwarewith fewer faults reduces the maintenance costof the software. Cost increases with the delay indetecting and correcting the error. The cost of de-tecting defects after release is 30 times more thanthe cost of detecting defects in the analysis anddesign phase [19]. Therefore, inconsistency detec-tion in the software design phase is inevitable forthe development of accurate and quality software.We propose an intelligent approach to detectand fix inconsistencies during the design phaseof software development. Inconsistencies are de-tected and handled with a fitness function bygenerating fitness values for each polymorphicand non-polymorphic method in the class dia-gram and sequence diagram. Inconsistencies arehandled by maximizing the fitness values of meth-ods subject to the constraint that the methodsare invoked on the right classes. The proposedautomated intelligent approach for consistencychecking during the design phase facilitates gen-eration of software with fewer faults, improvessoftware quality, and reduces development andmaintenance cost.
The organization of the paper is as follows.The related works in the areas of consistencychecking and the various applications of PSO andits variants is presented in Section 2. Section 3deals with the inconsistencies in polymorphicmethods. The architecture of the consistencychecking system is described in Section 4 andthe implementation of the proposed approach ispresented in Section 5. Results and discussionare presented in Section 6, threats to validity ispresented in Section 7 and Section 8 concludesthe paper.
2. Related work
The section presents the consistency handlingtechniques available in the literature and theapplications of PSO techniques to find optimalsolutions in software development and industries.
Inconsistencies in the design may result inthe failure of a software project. The problemsof establishing and maintaining consistency isdiscussed in [21]. The authors state that it isimpossible to avoid inconsistency and more flexi-bility can be obtained by using tools that manageand tolerate inconsistency. A tool that detectsinconsistency and locates the choices for fixinginconsistency is proposed in [10]. Model profilingis used to determine the model elements affectedwhile evaluating a rule; a set of choices for fixingthe inconsistency is proposed and the designer de-cides the choice for fixing the inconsistency. Themethod proposed in [11] fixes inconsistencies inclass, sequence and statechart diagrams by gen-erating a set of concrete changes automatically.The work focuses on deciding a method to fixinconsistencies. An approach that performs realtime detection and tracking of inconsistenciesin class, sequence and state chart diagrams ispresented in [12]. Consistency checks are initiatedduring a model change.
The algorithm proposed in [13] performs con-sistency check on class and sequence diagramsbased on the syntax specified and generates a se-quence of Relational Calculus of Object Sys-tems (rCOS) class declarations. Inconsistenciesin well-formed class and sequence diagrams aredetected with an algorithm based on breadth firstsearch technique. Transformation, refactoring,merging or repair of models result in changes inthe model and during consistency checking it maylead to performance problems. An automatedapproach with tool support to re-validate partsof the design rule affected by model transforma-tion or repair is proposed in [22]. Although thepaper mentions inconsistency in sequence andclass diagrams, the focus is on improving theperformance of incremental consistency check-ing by identifying parts of the model affectedby model changes. A prototype tool developedusing a UML based approach to handle impact

10 Renu George, Philip Samuel
analysis is proposed in [14]. Consistency checkis performed on the UML diagrams, differencebetween the two versions is identified and themodel elements that are directly or indirectlyaffected by the changes are determined. The fo-cus of the paper is on changes and its impact,i.e., which model elements are affected by thechange. Instant detection of consistency betweensource code and design models is performed in[23] and a live report of the consistency statusof the project is provided to the developers.
A classification of model repair techniquesbased on features is presented in [24]. The fo-cus is on proposing taxonomy for model repairtechniques and not on inconsistency detectionand causes of inconsistency. The paper [15] pro-poses a method for automatic generation of exe-cutable and concrete repairs for models based onthe inconsistency information, a set of generatorfunctions and abstract repairs. An automatedplanning approach based on artificial intelligenceis proposed in [25] to resolve inconsistencies. A re-gression planner is implemented in Prolog. Theapproach is restricted to detection of structuralinconsistencies in class diagrams only.
A review of the consistency management ap-proaches available in the literature is presentedin [26]. The works described does not addressinconsistencies related to polymorphic methods.Object Constraint Language (OCL) rules are spec-ified for consistency checking of UML model in[27], the approach does not address polymorphicmethods. Consistency rules to detect inconsis-tencies in method invocations between sequenceand class diagrams are presented in [28], but noapproaches are presented to detect and fix in-consistency. A method to detect inconsistenciesbetween state diagrams and communication dia-grams using the language Alloy is presented in [29].
Soft computing techniques find its applicationin providing solutions to problems in industries.PSO is used to minimize the cost of heating sys-tem [30], to assign applications to resources in thecloud [31], in job-shop scheduling [32], in network-ing [33], power systems [34, 35], signal processing[36], control system [37] and many more. PSO isalso applied to find effective solutions to prob-lems in software development. PSO is applied to
UML class diagram and an algorithm for classresponsibility assignment problem is presentedin [38]. The PSO method reassigns the attributesand methods to the different classes indicated inthe class diagram. The application of SRPSO andPSO in detecting and resolving inconsistencies inclass attribute definitions is presented in [39, 40].The fitness value determines the consistency ofattributes and the PSO and SRPSO algorithmiterates to fix inconsistency by optimizing thefitness value of attributes. The papers deal withfixing inconsistencies in attribute definitions only.The performance of SRPSO algorithm is betterthan PSO in term of statistical evaluation pa-rameters and convergence. An SRPSO basedapproach to fix state change inconsistencies instate diagrams and sequence diagrams is pro-posed in [41]. Inconsistencies are detected andfixed with a fitness function.
An optimization based approach using PSOand simulated annealing to find transformationfragments that best cover the source model isproposed in [42]. PSO is applied to achieve highstructural code coverage in evolutionary struc-tural testing by generating test cases automat-ically [43]. Parameter estimation using PSO topredict reliability of software reliability growthmodels (SRGM) is described in [44]. Duringtesting, faults are detected and a mathemati-cal model SRGM, models the properties of theprocess. A comparative study of metaheuristicoptimization framework is proposed in [45] andthe study states that a wider implementation ofsoftware engineering practices is required.
The application of PSO in diverse areas of en-gineering has yielded better results over existingmethods, but works that describe the applica-tion of PSO in the design phase for softwaredesign consistency checking is rare. Althoughconsistency checking of UML models is a widelydiscussed problem and different techniques todetect and fix inconsistencies are available in theliterature, techniques that perform consistencychecking of polymorphic methods are rarely re-ported. We present an intelligent approach thatdetects inconsistencies with a fitness function.Inconsistencies are fixed by remodelling the se-quence diagram method invocations during iter-

Fixing Design Inconsistencies of Polymorphic Methods Using Swarm Intelligence 11
ations of the SRPSO algorithm. Our approachefficiently detects and fixes the inconsistencies.
3. Inconsistenciesin polymorphic methods
Polymorphism is an important feature of objectoriented programming that provides simplicityand flexibility to the design and code. It en-ables different behaviour to be associated witha method name. Polymorphism keeps the designsimple, flexible and extensible [46]. New meth-ods with different implementation can be createdwith the same interface and the amount of workrequired to handle and distinguish different ob-jects is reduced. Each polymorphic method hasa class specific way to respond to a message. Poly-morphic methods execute different subroutinesdepending on the type of object they are appliedto. Inconsistency occurs if the method is invokedon a wrong class. Two methods of implement-ing polymorphism are (a) static binding: meth-ods have the same name, different signature anddifferent implementation (b) dynamic dispatch:methods have the same name, same signatureand different implementation [47]. Static bindingoccurs with method overloading at compile timeand the method to be invoked is determined fromthe signature of the method call. Dynamic dis-patch is related to inheritance hierarchy. Methodoverriding provides a superclass/subclass inher-itance hierarchy allowing different subclass im-plementation of inherited methods [48, 49]. Theoverriding methods represent different function-alities and require different algorithms [50]. Theexact method to which the method call is boundis known only at run time. Method overriding isimplemented with dynamic dispatch [49].
Inconsistency in UML models occurs whentwo or more diagrams describe different aspectsof the system and they are not jointly satisfiable.Any method invoked on an object in the sequencediagram should be defined in the class instan-tiated by the receiving object. The rule is partof the UML well-formedness principle. There isscope for many subtle errors with polymorphismsince a method name occurs in more than one
class. The exact operation to be performed is de-termined from the data types of the argumentsin static polymorphism. The same signature isused by more than one class in dynamic poly-morphism and determining whether the correctmethod is invoked in the sequence diagram isan issue. Understanding polymorphic codes ishard and therefore fault-prone [16]. Hence, in-consistency detection during the design phasehas become inevitable for the development ofaccurate software [16]. We propose an intelligentapproach using SRPSO algorithm to detect andfix method-invocation inconsistency in polymor-phic methods. Method invocation inconsistencyis identified from the signatures of the class di-agram and sequence diagram methods in staticpolymorphism. The method signatures are thesame for all polymorphic methods in dynamicpolymorphism and hence more difficult. Incon-sistency is detected from the guard condition formessage invocation in the sequence diagram andprecondition for the method in the class diagram.
The inconsistencies are illustrated with theUML models 3DObject and ThreeDObject repre-sented in Figures 1 and 2, respectively. The classdiagram and sequence diagram for the UMLmodel 3DObject is represented in Figure 1 . Themodel provides an example of static polymor-phism. The class diagram consists of 4 classes.A generalized class ThreeDShape is defined withan attribute Area of type float. The classesSphere, Cuboid and Cylinder are specializationsof the class ThreeDShape. The methods com-puteArea() and perimeter() defined in the classesSphere, Cuboid and Cylinder are polymorphicsince methods with the same name and differentsignature are defined. The method vertices()defined in the class Cuboid is non-polymorphic.The sequence diagram represents the method in-vocations to compute the area of the objects. Theclass Cuboid has a method computeArea(l, b, h)with signature computeArea(int, int, int). Simi-larly, the signatures of the method computeArea()defined in the classes Sphere and Cylinder arecomputeArea(int) and computeArea(float, fint),respectively. The signatures of the method com-puteArea() invoked on the objects of classesCuboid, Sphere and Cylinder in the sequence

12 Renu George, Philip Samuel
Figure 1. Class Diagram and Sequence Diagram for UML Model for 3DObject
Figure 2. Class Diagram and Sequence Diagram for UML Model for 3DObject
diagram are computeArea(int, int, int), com-puteArea(float, int) and computeArea(int). Theinvocations of the polymorphic method com-puteArea(l, b, h) and the non-polymorphicmethod vertices() are consistent whereas theinvocations of the polymorphic methods, com-puteArea(s) and computeArea(r, h) are incon-sistent. The inconsistencies, if unnoticed willresult in a wrong value for area. Inconsistenciesare detected by computing the fitness valuesof methods. The fitness value computation todetect inconsistency is represented in Table 1.
A UML model ThreeDObject representingdynamic polymorphism is depicted in Figure 2.A method computeArea() and two attributesArea and face are defined in the class Three-DObject. The method is overridden in the childclasses since the method of computing area de-pends on the shape of the object. The attributeface represents the number of faces possessed byan object. Sphere has no face, Cylinder has twofaces, Cuboid and Cube have 6 faces and Triangu-larPrism has 5 faces. Constraints are defined forthe methods and expressed as preconditions in
Table 1. Fitness values of methods in UML Models 3DObject and ThreeDObject
Method name CD Class SD Class Fitness value UML ModelcomputeArea(r, h) Cylinder Sphere 0.9375 3DObjectcomputeArea(l, b, h) Cuboid Cuboid 1 3DObjectvertice() Cuboid Cuboid 1 3DObjectcomputeArea(s) Sphere Cylinder 1.11 3DObjectcomputeArea() Cylinder Cylinder 1 ThreeDObject

Fixing Design Inconsistencies of Polymorphic Methods Using Swarm Intelligence 13
object constraint language. The preconditions forthe method computeArea() in the classes Cuboid,Cube, Sphere, TriangularPrism and Cylinderstate that the value of the attribute face shouldbe equal to 6, 6, 0, 5 and 2, respectively. Asthe signatures of all the methods involved indynamic polymorphism are the same, it is impos-sible to detect inconsistency by comparing themethod signatures. The guard conditions and thepreconditions are compared and method invoca-tion inconsistency is detected with the methodcomputeArea() invoked on the objects of classesCuboid, Sphere and Cylinder. The method com-puteArea() invoked on the object of class Sphereshould satisfy the guard condition face = 6 whichis not true resulting in run time errors. The in-vocation of the method computeArea() on theobject of class TriangularPrism is consistent asthe value of the attribute face in the guard con-dition and precondition is equal to 5.
The inconsistent method invocations in Fig-ures 1 and 2 result in wrong value for Area. Ifthe models are used in the cost estimation ofbuildings, the estimated cost will be computedwith wrong values of area. The cost estimationwill produce a wrong value affecting the feasi-bility of the project. Since the design errors arepropagated to the code generation phase, thesoftware generated will have errors. Identifyingthe source of errors in the code and fixing the er-rors is more difficult, time consuming and costlythan detecting the errors in the software design.Errors detected in the testing phase may delaythe software project. The errors identified duringthe testing phase or after delivery of the soft-
ware product increases the time to market aswell as development and maintenance cost of thesoftware.
4. Architecture of the consistencyhandling system
PSO is an intelligent algorithm that can be usedin scientific and engineering area [51]. Consis-tency checking is formulated as an optimizationproblem with a maximizing fitness function thatoperates on the diagram specification. An opti-mization problem maximizes or minimizes a fit-ness function subject to the condition that theconstraints are satisfied. In our approach thefitness function represents the consistency andcompleteness of method invocations. The aimof the SRPSO algorithm is to optimize the con-sistency of polymorphic method invocations insequence diagram subject to the constraint thatthe methods are invoked on the right classes. TheSRPSO algorithm is preferred because it doesnot require transformation of models and canbe directly applied on UML model specification.The inconsistent particles are guided by the bestparticles to achieve consistency and hence searchspeed is high [52].
The architecture of the system to performconsistency checking using SRPSO is describedin Figure 3. The algorithms are implemented inJava running on a windows platform. The con-sistency checking system comprises of UML toolto model the requirements, parser to generatediagram specification and consistency checker to
Figure 3. Architecture of Consistency Checking System

14 Renu George, Philip Samuel
detect method-invocation inconsistency and fixthe inconsistency using SRPSO algorithm.
4.1. UML tool
The requirements of the system to be designedare gathered and modelled into graphical rep-resentations using a UML tool. Several UMLmodelling tools like Magic Draw, Rational Soft-ware Architect, Agro UML, Papyrus, etc. areavailable for modelling software. Our methodcan be integrated with any tool that give XMIformat. The models are saved in XMI format.The static and dynamic aspects are representedusing class diagram and sequence diagram. Classdiagrams represent the information regardingthe classes required to implement a system andthe type of relationship that exists between theclasses. The attributes and operations describethe properties and behaviour of the objects ofa class. Preconditions associated with method in-vocations are also represented. The preconditionsof the overridden methods in the super class andsubclass are different [50]. Sequence diagram rep-resents the dynamic aspects by portraying theinteractions in the form of messages/methodsbetween objects and the ordering of the interac-tions to produce a desired outcome. Polymorphicbehaviour can be represented using a sequencediagram by controlling the polymorphic invoca-tions with guard conditions.
4.2. Parser
The parser parses the UML model and producesspecifications of the diagrams. We have used theDocument Object model (DOM) parser to parsethe diagrams saved in XMI format. A class dia-gram specification comprises of the classes, thetype of association between the classes, attributesand methods of each class and the preconditionsfor method invocations. The sequence diagramspecification consists of the objects in the se-quence diagram, messages, sender and receiverof each message, the guard conditions on themessage invocations and the order of methodinvocations.
4.3. Consistency checker
The design inconsistencies in polymorphicmethodinvocations are detected by consistency checkermodule. Although the focus is on detection ofinconsistencies in polymorphic methods, the algo-rithm detects inconsistencies in polymorphic andnon-polymorphic methods. The specifications ofclass and sequence diagrams are input to the con-sistency checker. Inconsistencies are detected bya fitness function. The inconsistency is resolvedby reassigning methods with the SRPSO algo-rithm. Consistency checking is a two-step process:a) inconsistency detection and b) inconsistencyfixing.
4.3.1. Inconsistency detection
The fitness function, fs computes the fitnessvalue of the methods to detect inconsistency.The fitness value is computed as a function ofthe class name, method signature and propertiesof the method. The sequence diagram method isdefined in terms of its properties like name, id,parameters, sender, receiver, guard and a numberthat represents the message order. Each methodhas a specific value for a property (denoted asweight) and each position in the vector corre-sponds to one property of the method. The valuesfor the properties are set as 5, 3, 5, 5, 5, 4 and 3,respectively. The fitness function fs computes thefitness value of each sequence diagram method.A method invocation is classified as inconsistentif the fitness value is not equal to one. The fitnessfunction is defined with equation 1 as
fs =
(m∑
i=1ti ∗ wi) ∗ (wn + wcs +
n∑
k=1wk ∗ pk
)
W ∗
q∑
j=1wj ∗ pj
(1)where ti represents the property i of methodspecification, wi represents the weight of theproperty ti, wn represents the weight value as-sociated with the method name n, pj and wj
represents the position and weight of parame-

Fixing Design Inconsistencies of Polymorphic Methods Using Swarm Intelligence 15
ter j of the method n in the class diagram, pk
and wk denotes the position and weight of theparameter k of the method n in the sequencediagram, wcc represents the class name of themethod in the class diagram, wcs represents theclass name of the object on which the methodis invoked in sequence diagram and W repre-sents the weight assigned to a complete methodspecification. The value of W is set as 30. A com-plete method specification has values for all itsproperties. Unique values are assigned as theweights for method names, class names and datatype of parameters. Distinct method names, datatypes and classes have distinct weight. All poly-morphic methods have the same weight valuefor name and any numerical value can be se-lected to correspond to wn. The UML model inFigure 1 has a polymorphic method with namecomputeArea. The value of wn is set as 5. Thevalue of wn for the method names vertices() andperimeter() are set as 3 and 4, respectively. Theclasses are assigned weights in the range [1 . . . n]where n is the number of classes. Each class hasa unique weight. A class name present in boththe class diagram (wcc) and sequence diagram(wcs) has the same weight. The UML model inFigure 1 has four classes Cuboid, Sphere, Cylin-der and ThreeDShape and the weight values forthe classes Cuboid, Sphere, Cylinder and Three-DShape are 1, 2, 3 and 4, respectively. The weightvalue of parameter is defined as the number ofbytes required for the storing the data type ofthe parameter and the weights of char, int andfloat are defined as 1, 2 and 4, respectively. Theweights assign unique numerical values to themethod name, class name and data types of theparameters. The fitness value computation forthe methods in the sequence diagram of Figures 1and 2 is illustrated in Table 1.
Method invocation inconsistency is detectedwith the methods computeArea(r, h) and com-puteArea(s) since the fitness values of the meth-ods are not equal to one. The methods com-puteArea(l, b, h) and vertices() are consistentsince the fitness values are equal to one. Althoughinconsistency is detected from the fitness value instatic polymorphism, fitness value alone does notreveal inconsistency in dynamic polymorphism.
Irrespective of the object on which the methodis invoked, the fitness value of the method com-puteArea() in the UML model ThreeDObject isone since the method is overridden in the childclasses. Hence, validation of the guard condi-tion and method precondition is necessary. Theguard condition and precondition are representedas tuples consisting of attribute, operator-valuepairs. Depending on the precondition, there canbe more than one operator-value pair. The tu-ples are compared to identify inconsistency. Thetuple corresponding to the guard condition forthe method computeArea() in Figure 2 in thesequence diagram invoked on the object of classCylinder is (face, (=, 0)). The tuple represen-tation for the precondition of the method com-puteArea() in the class Cylinder is (face, (=, 2)).There is a mismatch in the value of the attributeface and method invocation inconsistency is de-tected.
4.3.2. Inconsistency fixing with SRPSO
The inconsistency is resolved by identifying theright classes and remodelling the sequence dia-gram by replacing the inconsistent method in-vocations with consistent method invocationsusing SRPSO. To identify the right class, wecompute the cohesion of the attributes of theinconsistent method to all the classes in theclass diagram. The inconsistent method is re-assigned to the class with the highest cohesionvalue. The cohesion value between the method at-tributes and the class attributes is computed foreach method-class pair. The method attributesMA(m) of method m are derived from the pa-rameters of the method. The class attributesof class C, CA(C) are obtained from the classspecification. The cohesion value of a method mto class C is computed using equation 2 as
cohesion(m,C) = n(CA(C) ∩MA(m))n(MA(m)) (2)
where CA(C) represents the attributes definedin class C, MA(m) represents the attributes ofmethod m and n represents the number of at-tributes. The SRPSO algorithm iterates until allthe method definitions are complete and consis-

16 Renu George, Philip Samuel
tent. The sequence diagram is remodelled duringiterations of the SRPSO algorithm. With staticbinding, the cohesion value determines the classto which an inconsistent method is to be reas-signed whereas in dynamic binding, the cohesionvalue and guard condition together determinethe class to which the method belongs.
5. Consistency handlingwith SRPSO algorithm
SRPSO is a bio-inspired metaheuristic techniquethat can provide better results than exact tech-niques even with increased size of search space.Metaheuristic techniques are more effective infinding software errors utilizing less number ofresources when compared with exact techniques[53]. SRPSO is an intelligent, optimization proce-dure in which the solution space contains a swarmof particles and the optimum value is attainedby an iterative process of updating generations.The particles occupy a position in the solutionspace. They have a velocity, a fitness value andthe particles update their velocity and positionbased on the direction of a) the previous velocity,b) the personal best position and c) position ofthe global best [54]. The fitness function deter-mines how close a particle is to the optimumsolution by computing the fitness value. Thevelocity directs the movement of particles andduring each iteration of the SRPSO algorithmthe particles compute their new velocity. Theposition is updated using the new velocity andwith each position update the particle moves toa better position. The process is iterated untilan optimum solution is reached.
5.1. Fitness function
The fitness function is an integral part of theSRPSO algorithm and it determines how closea particle is to the optimum solution. We havedefined a maximizing fitness function, fs to de-tect and fix method invocation inconsistency.The fitness function is defined with equation 1.The consistency and completeness of a sequencediagram method is computed using the fitness
function. The invocations of inconsistent meth-ods are removed from the sequence diagram andthe inconsistent methods are added to the set ofinconsistent methods (IM).
5.2. Particle creation
The search space of the SRPSO algorithm is ini-tialized with particles. The proposed approachfocuses on inconsistency in polymorphic andnon-polymorphic method invocations and hence,the methods invoked in the sequence diagram aretreated as particles. A sequence diagram methodis specified using a set of properties and is rep-resented as a vector. The representation of thesequence diagram method (SeqM) is SeqM =[name id param sender receiver guard number]
The representation of SeqM consists ofa method name, a unique xmi id, the parameters,sender class of the method, receiver class of themethod, guard condition for method invocationand number representing the message order inthe sequence diagram. Each method has a spe-cific value for a property and each position inthe vector corresponds to one property of themethod. The values for the properties are fixed as5, 3, 5, 5, 5, 4 and 3, respectively. Any numericalvalue can be used to represent a property. Therestriction is that the value of W should be equalto the sum of the numerical values assigned tothe properties. The inconsistent methods in theset IM are represented as particles.
5.3. Velocity and position update
The particles in the search space are characterizedby a position and velocity. A particle is defined interms of its properties and in our approach; theposition of a particle represents the number ofproperties defined for the particle. The specifica-tion of the inconsistent particle initially has onlyone property, name and hence, the value of posi-tion is one. As the iteration progresses, dependingon the value of velocity the particle specificationwill be updated with its properties like id, sender,receiver etc. The number of properties of the par-ticle to be updated in one iteration is determinedby the value of velocity. If the value of velocity

Fixing Design Inconsistencies of Polymorphic Methods Using Swarm Intelligence 17
is one, one property will be added to the particlespecification and position will be incremented byone. Velocity of the best particle is computed withequation 3, velocity of the rest of the particleswith equation 4, position is updated using theequation 5 and inertia weight with equation 6.
Vk(t+ 1) = ωk + Vk(t) (3)
Vk(t+ 1) = ωk + Vk(t) + a1 ∗ r1 ∗ (pBestk
−Xk(t)) + a2 ∗ r2 ∗ pso ∗ (gBest−Xk(t)) (4)
Xk(t+ 1) = Xk(t) + Vk(t+ 1) (5)
ωk(t) ={ωk + η∆ω for best particleωk −∆ω otherwise
(6)
where Vk(t) represents the velocity of particle k attime t, a1 and a2 are the acceleration coefficients,r1 and r2 are the random numbers, Xk(t) repre-sents the position of particle k at time t, pBestk
represents the personal best of particle k and gBestthe global best of all the particles in the swarm,pso is the perception for the social cognition, ωk
is the inertia weight of the kth particle, ∆ω =(∆ωI −∆ωF )/Itr , ∆ωI = 1.05 and ∆ωF = 0.5,Itr is the number of iterations, and η = 1 is theconstant to control the rate of acceleration.
5.4. Stopping criteria
The SRPSO algorithm resolves method invoca-tion inconsistency. The algorithm iterates untilmethod invocation inconsistency is resolved orthe number of iterations reaches a maximumlimit. We have defined a variable method con-sistency count (MCC) that keeps track of thenumber of methods with consistent and completeinvocations. MCC is incremented if fitness valueof a method is equal to one. If MCC is equal tothe number of inconsistent methods in the setIM, method invocation inconsistency is resolved.
5.5. Algorithm
The consistency checking algorithm for polymor-phic methods is outlined in algorithm 1.Algorithm 1: Consistency CheckingBeginInitialize SRPSO parameters, IM = φ
for each method, m in sequence diagram doidentify sender class, SC(m) and receiver class,RC(m)compute fs(m) with equation 1Case I: fs(m) == 1
if guard conditions do not matchIM = IM ∪ {m}
endifCase II: fs(m) 6= 1
IM = IM ∪ {m}endforidentify the receiving classfor each method, m in set IM do
identify method attributes, MA(m)for each class, Ci in class diagram do
determine class attributes CA(Ci)endforcompute cohesion(m, Ci)RCnew = Cj where Cj = max(cohesion(m, Ci),
i = 1 to number of classesdelete sequence diagram invocation for the
method mendforInitialize the search space with particles in the setIMrepeat
for each particle k in IM docompute fitness of particle kif (fs(Xk) > fs(pBestk))
pBestk = Xk(t)endifif (fs(Xk) > fs(gBest))
gBest = Xk(t)endifCompute inertia weight using equation 6Update velocity of gBest particle using equa-
tion 3for each particle except gBest particle do
Generaterandomnumber,rbetween 0and 1if (r > 0.5)pso = 1 else pso = 0
endifCompute velocity using equation 4
endforif(Vk(t+ 1) > 1
Vk(t+ 1) = 1 else Vk(t+ 1) = 0endifUpdate position using equation 5

18 Renu George, Philip Samuel
if (fs(Xk(t+ 1)) == 1)Increment MCC
endifendforIncrement iteration count, Itr
until Itr = maxCount or MCC = number of incon-sistent methodsEnd
The algorithm initializes the search spacewith particles and SRPSO parameters. The ac-celeration coefficients are set as 1.49445 [5], Itr isinitialized as zero, W is set as 30 and maxCountis set as 35. The set IM is initialized to null. Thealgorithm computes the fitness values of methods.The guard conditions and preconditions of meth-ods are also validated. The inconsistent methodnames are added to the set IM and the inconsis-tent method invocations are removed from thesequence diagram.
To fix the inconsistency, the inconsistentmethods in the set IM are treated as new par-ticles and the position of the particles are ini-tialized. The cohesion of each method in the setIM to the different classes of the class diagramis computed to identify the new receiving class,RCnew. The class with the maximum cohesionvalue is identified as RCnew. The receiving classis identified from the precondition and cohesionvalue in dynamic polymorphism.
The newly created particles are inconsistentsince its properties are not completely specified.Initially, all the inconsistent particles have onlyone property, its name. The fitness values of theparticles in their current position are computedusing the fitness function, fs. If the current po-sition is better than the personal best (pBest)position of the particle, the personal best positionof the particle is updated. If the current positionis better than the global best (gBest) positionof all the particles in the swarm, the global bestposition is updated. New velocity and positionof the particles are computed. Depending onthe velocity value, properties such as id, sender,receiver etc. are added to the particle specification.The velocity component determines the numberof properties to be updated in one iteration. If thefitness value is equal to one, the method consis-tency count is incremented. The velocity, position,
fitness value, pBest and gBest values of all theparticles in the set IM are updated during aniteration of the algorithm. The iteration count isalso incremented. The SRPSO algorithm iteratesuntil the method consistency count is equal tonumber of particles in the set IM or maximumnumber of iterations is reached. The updation ofthe properties of the inconsistent particles ensuresthat inconsistencies are resolved and the methodspecification is complete. The SRPSO algorithmefficiently detects and resolves inconsistency.
6. Results and discussions
The consistency checking algorithm is appliedto the UML models to detect method invoca-tion inconsistency. The UML model in Figure 1contains the polymorphic method computeArea.The method-invocation inconsistency detectionmodule detects two inconsistent methods: com-puteArea(r, h) and computeArea(s) by comput-ing the fitness values of the methods. The incon-sistent methods are added to the set IM and thesequence diagram invocations of the inconsistentmethods are removed. The attributes requiredfor the implementation of the method are derivedfrom the parameters of the method. The cohesionof the method attributes to the different classesin the class diagram is computed. The cohesionvalues of the inconsistent methods to differentclasses are represented in Table 2.Table 2. Cohesion Value for UML Model 3DObject
Method Class NameCube Cuboid Cylinder
computeArea(r, h) 0.0 f 0.5 1.0computeArea(s) 1.0 0.0 0.0
The class Cylinder has the highest cohesionvalue for the method computeArea(float, int)and the class Cube has the highest cohesionvalue for the method computeArea(int). The re-ceiving class of the inconsistent method com-puteArea(r, h) is identified as class Cylinderand the new receiving class of the method com-puteArea(s) is identified as class Cube. The se-quence diagram methods are specified with a set

Fixing Design Inconsistencies of Polymorphic Methods Using Swarm Intelligence 19
of properties. On detecting inconsistency, theproperties related to the method invocation ofthe inconsistent methods are also deleted. Theinconsistency is fixed during iterations of theSRPSO algorithm. During each iteration of theSRPSO algorithm, the specification of the se-quence diagram method in the set IM is updatedby adding the properties of the methods. The ap-proach ensures that method invocation inconsis-tency is resolved and the method specification iscomplete. The algorithm terminates when MCCbecomes equal to the number of inconsistentmethods or when Itr reaches the maxCount.
A graph representing the fitness value of theinconsistent methods computeArea(r, h) andcomputeArea(s) during different iterations of theSRPSO algorithm with acceleration coefficientvalues equal to 1.49445 is represented in Figure 4.The method computeArea(s) has a fitness value0.0925 during the first iteration of the algorithm.As the iteration count increases, the fitness valueof the particle increases. In iteration 8, the fitnessvalues of the two inconsistent particles becomeone and the UML model 3DObject is consistentin terms of polymorphic method invocation andspecification. The fitness value of the inconsis-tent method in the UML model ThreeDObject isrepresented in Figure 5. The algorithm is imple-mented with acceleration coefficient values equalto 1.49445 and converges in 8 iterations.
The result of implementation of the algorithmis represented in Figure 6. The XMI parser identi-fies the methods present in each class of the classdiagram. The method computeArea() is overrid-den in all child classes. The signatures of the class
diagram method and sequence diagram methodsare compared and no inconsistency is detected.A further validation of guard conditions and pre-conditions identifies three inconsistent methodsdue to wrong guard conditions. The SRPSO algo-rithm resolves the inconsistencies in 8 iterationsand the sequence diagram specification has con-sistent method invocations with guard conditionsmatching the preconditions. The execution timeof the algorithm is 875 ms.
The UML model Deposit and Payroll Sys-tem used for evaluating the algorithm are rep-resented in Figures 7 and 8, respectively. TheUML model exhibits dynamic polymorphism,whereas the UML model Payroll system exhibitsstatic polymorphism. The UML model Deposithas three inconsistent method invocations. Themethod invocations are prefixed with the guardcondition. The UML model Payroll System has9 method invocations out of which 5 invocationsare inconsistent. The UML model Deposit inFigure 7 forms a part of the banking systemto compute the interest of term deposits. Themethod Interest() is overridden in the derivedclasses. The interest rate depends on the periodof the term deposit. The three method invoca-tions are inconsistent. Inconsistent design resultsin wrong values for the interest calculated andmaturity value. This creates a set of unsatisfiedcustomers and affects the credibility of the bank-ing system. Inconsistent design results in thecreation of software with faults. This affects thesoftware quality. The errors may be identifiedeither during the testing phase or after deliveryof the product, which increases the software de-
Figure 4. Fitness Values of Inconsistent Methodsfor UML model 3DObject
Figure 5. Fitness Values of Inconsistent Methodsfor UML model ThreeDObject

20 Renu George, Philip Samuel
Figure 6. Handling Inconsistencies for the UML model ThreeDObject
Figure 7. UML Model Deposit
vlopment cost, maintenance cost, and time tomarket the software.
The algorithm is evaluated based on twocriteria: convergence and execution time. Theconvergence of the algorithm is evaluated based
on the number of iterations required to resolveinconsistency. Inconsistency is resolved when thefitness values of all particles in the swarm areequal to one. We have modelled different casestudies and the algorithm is experimented on

Fixing Design Inconsistencies of Polymorphic Methods Using Swarm Intelligence 21
Figure 8. UML Model Payroll System
22 Renu George, Philip Samuel
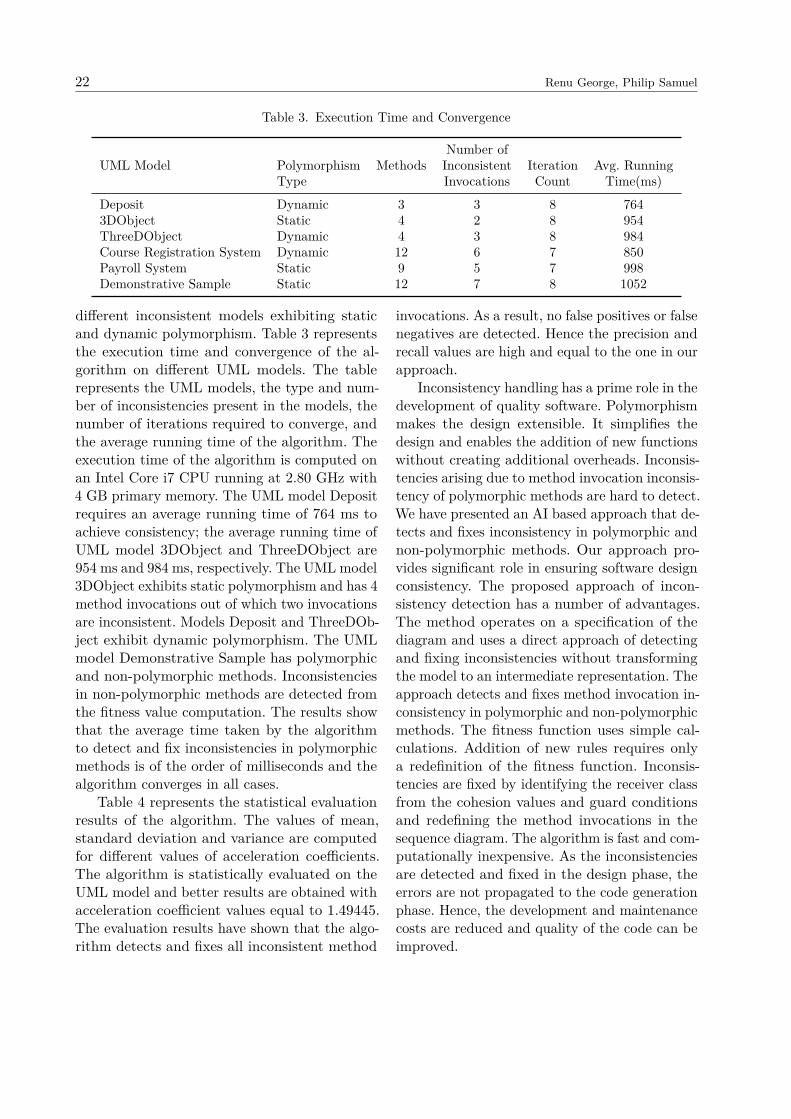
Table 3. Execution Time and Convergence
Number ofUML Model Polymorphism Methods Inconsistent Iteration Avg. Running
Type Invocations Count Time(ms)Deposit Dynamic 3 3 8 7643DObject Static 4 2 8 954ThreeDObject Dynamic 4 3 8 984Course Registration System Dynamic 12 6 7 850Payroll System Static 9 5 7 998Demonstrative Sample Static 12 7 8 1052
different inconsistent models exhibiting staticand dynamic polymorphism. Table 3 representsthe execution time and convergence of the al-gorithm on different UML models. The tablerepresents the UML models, the type and num-ber of inconsistencies present in the models, thenumber of iterations required to converge, andthe average running time of the algorithm. Theexecution time of the algorithm is computed onan Intel Core i7 CPU running at 2.80 GHz with4 GB primary memory. The UML model Depositrequires an average running time of 764 ms toachieve consistency; the average running time ofUML model 3DObject and ThreeDObject are954 ms and 984 ms, respectively. The UML model3DObject exhibits static polymorphism and has 4method invocations out of which two invocationsare inconsistent. Models Deposit and ThreeDOb-ject exhibit dynamic polymorphism. The UMLmodel Demonstrative Sample has polymorphicand non-polymorphic methods. Inconsistenciesin non-polymorphic methods are detected fromthe fitness value computation. The results showthat the average time taken by the algorithmto detect and fix inconsistencies in polymorphicmethods is of the order of milliseconds and thealgorithm converges in all cases.
Table 4 represents the statistical evaluationresults of the algorithm. The values of mean,standard deviation and variance are computedfor different values of acceleration coefficients.The algorithm is statistically evaluated on theUML model and better results are obtained withacceleration coefficient values equal to 1.49445.The evaluation results have shown that the algo-rithm detects and fixes all inconsistent method
invocations. As a result, no false positives or falsenegatives are detected. Hence the precision andrecall values are high and equal to the one in ourapproach.
Inconsistency handling has a prime role in thedevelopment of quality software. Polymorphismmakes the design extensible. It simplifies thedesign and enables the addition of new functionswithout creating additional overheads. Inconsis-tencies arising due to method invocation inconsis-tency of polymorphic methods are hard to detect.We have presented an AI based approach that de-tects and fixes inconsistency in polymorphic andnon-polymorphic methods. Our approach pro-vides significant role in ensuring software designconsistency. The proposed approach of incon-sistency detection has a number of advantages.The method operates on a specification of thediagram and uses a direct approach of detectingand fixing inconsistencies without transformingthe model to an intermediate representation. Theapproach detects and fixes method invocation in-consistency in polymorphic and non-polymorphicmethods. The fitness function uses simple cal-culations. Addition of new rules requires onlya redefinition of the fitness function. Inconsis-tencies are fixed by identifying the receiver classfrom the cohesion values and guard conditionsand redefining the method invocations in thesequence diagram. The algorithm is fast and com-putationally inexpensive. As the inconsistenciesare detected and fixed in the design phase, theerrors are not propagated to the code generationphase. Hence, the development and maintenancecosts are reduced and quality of the code can beimproved.

Fixing Design Inconsistencies of Polymorphic Methods Using Swarm Intelligence 23
Table 4. Statistical Evaluation of the Algorithm
UML Model Parameter a1 = a2 = 1.49445 a1 = a2 = 14 Runs 7 Runs 4 Runs 9 Runs
3DObjectMean 0.4685 0.95 0.2768 1SD 0 –5.551E–17 0 0Variance 0.017292 0.0025 0.003624 0
ThreeDObjectMean 0.544444 0.9333333 0.488889 1SD –3.70E–17 –1.110E–16 0 0Variance 0.00617 0.0022222 0.000202 0
DepositMean 0.65556 0.95556 0.4888809 1SD 0 3.701E–17 –1.850E–17 0Variance 0.006173 0.003951 0.00617284 0
Course Registration SystemMean 0.711111 1 0.416667 0.911111SD 0 0 9.2519E–18 –3.701E–17Variance 0.006173 0 0.001389 0.003951
Payroll SystemMean 0.7 1 0.413333 1SD 0 0 –1.110E–17 0Variance 0.006667 0 0.0016 0
7. Threats to validity
The section deals with threats to validity.External Validity concerns with how the
result of the experiments can be generalized toother environments. As part of the evaluation, wehave evaluated the algorithms on UML modelsinvolving polymorphic method invocations. Theproposed approach detects and fixes inconsisten-cies involving static and dynamic polymorphicmethod invocations. The algorithm canbe general-ized to detect inconsistencies in non-polymorphicmethod invocations and handle other inconsis-tencies involving sequence diagrams. The gen-eralization can be performed by modifying thefitness function. This argument is substantiatedby describing how another inconsistency relatedto the class and sequence diagram is handled. Theconsistency rule states that two objects in the se-quence diagram interact only if there is an associ-ation in the class diagram between the interactingobjects. The fitness function can be modified toinclude another term comprising of the senderand receiver classes in the class and sequencediagram. The proposed approach models inconsis-tency handling as an optimization problem anddetecting inconsistencies with fitness function.The algorithm can be expanded to detect and
fix intra-model inconsistencies among differentdiagrams. We have defined the fitness function interms of the properties of the inconsistent modelelements. Inconsistency detection among differentdiagrams requires definition of the fitness functionin terms of the properties of the inconsistentmodelelement and a particle representation has to beformulated for the inconsistent model element interms of its properties.
Construct Validity refers to the extent towhich the experiment setting reflects the theory.We are able to successfully implement the algo-rithm on a set of UML models involving staticand dynamic polymorphic method invocations.The fitness functions are defined with the aim ofdetecting method invocation inconsistencies andinconsistencies are identified and resolved accu-rately. The UML models are a representative ofthe models on which a consistency check can beperformed. The number of inconsistencies in theUML models varies from 3 to 7 and the numberof method invocations varies from 3 to 12.
Internal Validity represents the extent towhich the casual relationship established can-not be explained by other factors. The casualrelationships between class diagram method sig-nature and sequence diagram method signatureare analyzed to detect inconsistency. Method

24 Renu George, Philip Samuel
invocation inconsistency arises due to the invoca-tion of a method on an object of a class in whichthe method is not defined. Fitness function isdefined in terms of the method signature andclass names. Hence, the method signature is themajor component in inconsistency detection andthe casual relationship between method signa-tures is exploited to detect inconsistencies. In thecase of dynamic polymorphism, since the methodsignatures of the polymorphic methods are thesame, a further comparison of guard conditionsand constraints is performed.
Conclusion Validity: We have performeda statistical evaluation of the algorithm and theresults are summarized in Table 4. The modelsused for evaluation are a representative of theUML models used in the design of software sys-tems. The statistical evaluation results show thatthe algorithm converges in less number of itera-tions with acceleration coefficient values equal to1.49445. The convergence of the algorithm andexecution time are also computed. The averageexecution time is of the order of milliseconds andthe number of iterations required for the algo-rithm to converge is independent of the numberof method invocations or the number of inconsis-tencies.
8. Conclusion
With the increasing relevance of software in in-dustries and manufacturing, the complexity andsize of the software and the complexity of thedesign has increased. Developing quality softwareis one of the major challenges faced by softwaredevelopers. One of the definitions of quality soft-ware is fitness for purpose and quality softwareshould be able to function as per the user′s re-quirements. One of the key aspects to ensuringsoftware quality is good design. Inconsistent de-sign leads to the generation of software withfaults. A periodic review of the software designis one the factors that can enhance the softwarequality and reduce software failures thereby im-proving manufacturing and productivity. The re-view helps to detect inconsistencies and fix the in-consistencies. Polymorphism is an important fea-
ture that makes the software design compact andextensible. It is hard to trace the polymorphismas it is often detected at run time. We introducean intelligent automated approach that uses theSRPSO algorithm to detect and fix inconsistencyin polymorphic methods. The algorithm is evalu-ated on different case study involving static anddynamic polymorphism. The method detects andfixes inconsistencies in all cases. Analysis of theresults shows that the inconsistency detectionand fixing in our approach is quick, easy, andeffective. The proposed approach has a numberof advantages. The algorithm can be invokedafter the application is modelled or during andafter refinements to the models. The methodoperates directly on the diagram specificationand does not require transformation to anotherrepresentation. Addition of new rules requiresonly a redefinition of the fitness function. Thefitness function uses simple calculations. Thetime required to detect and fix inconsistenciesis of the order of milliseconds. The inconsisten-cies developed in the design are detected andcorrected in the same phase. Maintenance costof software is a huge burden for manufacturingindustries. Automatic detection of inconsisten-cies in polymorphic methods during the designphase ensures quality of the code produced andreduces development and maintenance cost ofthe software.
References
[1] M. Harman, “The role of artificial intelligencein software engineering,” in First InternationalWorkshop on Realizing AI Synergies in SoftwareEngineering (RAISE). IEEE, 2012, pp. 1–6.
[2] M. Harman and B.F. Jones, “Search-based soft-ware engineering,” Information and SoftwareTechnology, Vol. 43, No. 14, 2001, pp. 833–839.
[3] O. Raiha, “A survey on search-based softwaredesign,” Computer Science Review, Vol. 4, No. 4,2010, pp. 203–249.
[4] J. Kennedy and R. Eberhart, “Particle swarmoptimization,” in Proceedings of IEEE Interna-tional Conference on Neural Networks. IEEE,1995, pp. 1942–1948.
[5] M.R. Tanweer, S. Suresh, and N. Sundararajan,“Self regulating particle swarm optimization al-

Fixing Design Inconsistencies of Polymorphic Methods Using Swarm Intelligence 25
gorithm,” Information Sciences, Vol. 294, 2015,pp. 182–202.
[6] P. Stevens and R.J. Pooley, Using UML: Soft-ware engineering with objects and components.Pearson Educationr, 2006.
[7] R. France and B. Rumpe, “Model-driven develop-ment of complex software: A research roadmap,”in Future of Software Engineering. IEEE Com-puter Society, 2007, pp. 37–54.
[8] B. Selic, “The pragmatics of model-driven devel-opment,” IEEE Software, Vol. 20, No. 5, 2003,pp. 19–25.
[9] C. Pons, L. Olsina, and M. Prieto, “A for-mal mechanism for assessing polymorphism inobject-oriented systems,” in Proceedings of FirstAsia-Pacific Conference on Quality Software.IEEE, 2000, pp. 53–62.
[10] A. Egyed, “Fixing inconsistencies in UML de-sign models,” in 29th International Conferenceon Software Engineering (ICSE’07). IEEE, 2007,pp. 292–301.
[11] A. Egyed, E. Letier, and A. Finkelstein, “Gener-ating and evaluating choices for fixing inconsis-tencies in UML design models,” in Proceedingsof the 23rd IEEE/ACM International Confer-ence on Automated Software Engineering. IEEEComputer Society, 2008, pp. 99–108.
[12] A. Egyed, “Automatically detecting and trackinginconsistencies in software design models,” IEEETransactions on Software Engineering, Vol. 37,No. 2, 2011, pp. 188–204.
[13] Q. Long, Z. Liu, X. Li, and H. Jifeng, “Con-sistent code generation from UML models,” inProceedings of the Australian Software Engineer-ing Conference. IEEE, 2005, pp. 23–30.
[14] L.C. Briand, Y. Labiche, and L. O’Sullivan, “Im-pact analysis and change management of UMLmodels,” in Proceedings of the International Con-ference on Software Maintenance, ICSM 2003.IEEE, 2003, pp. 256–265.
[15] R. Kretschmer, D.E. Khelladi, A. Demuth,R.E. Lopez-Herrejon, and A. Egyed, “Fromabstract to concrete repairs of model incon-sistencies: An automated approach,” in 24thAsia-Pacific Software Engineering Conference(APSEC). IEEE, 2017, pp. 456–465.
[16] A. Rountev, A. Milanova, and B.G. Ryder,“Fragment class analysis for testing of polymor-phism in Java software,” IEEE Transactionson Software Engineering, Vol. 30, No. 6, 2004,pp. 372–387.
[17] D.K. Saini, “Testing polymorphism in objectoriented systems for improving software quality,”ACM SIGSOFT Software Engineering Notes,Vol. 34, No. 4, 2009, pp. 1–5.
[18] R. Kaur and J. Sengupta, “Software process mod-els and analysis on failure of software develop-ment projects,” arXiv preprint arXiv:1306.1068,2013.
[19] K.A. Briski, P. Chitale, V. Hamilton, A. Pratt,B. Starr, J. Veroulis, and B. Villard, “Minimiz-ing code defects to improve software quality andlower development costs,” Development Solu-tions White Paper, IBM, 2008.
[20] P. Jalote, “An integrated approach to softwareengineering,” Springer Science and Business Me-dia, 2012.
[21] B. Nuseibeh, S. Easterbrook, and A. Russo,“Making inconsistency respectable in softwaredevelopment,” Journal of Systems and Software,Vol. 58, No. 2, 2001, pp. 171–180.
[22] A. Reder and A. Egyed, “Incremental consis-tency checking for complex design rules andlarger model changes,” in International Con-ference on Model Driven Engineering Languagesand Systems. Springer, Berlin, Heidelberg, 2012,pp. 202–218.
[23] M.R. Ehrenleitner, A. Demut, and A. Egyed,“Towards model-and-code consistency checking,”in 38th Annual Computer Software and Applica-tions Conference. IEEE, 2014, pp. 85–90.
[24] N. Macedo, T. Jorge, and A. Cunha, “A fea-ture-based classification of model repair ap-proaches,” IEEE Transactions on Software En-gineering, Vol. 43, No. 7, 2017, pp. 615–640.
[25] J.P. Puissant, R.V.D. Straeten, and T. Mens,“A regression planner to resolve design model in-consistencies,” in European Conference on Mod-elling Foundations and Applications. Springer,Berlin, Heidelberg, 2012, pp. 146–161.
[26] F.J. Lucas, F. Molina, and A. Toval, “A sys-tematic review of UML model consistency man-agement,” Information and Software technology,Vol. 51, No. 12, 2009, pp. 1631–1645.
[27] D. Kalibatiene, O. Vasilecas, and R. Dubauskaite,“Rule based approach for ensuring consistency indifferent UML models,” in EuroSymposium onSystems Analysis and Design. Springer, Berlin,Heidelberg, 2013, pp. 1–16.
[28] C.F. Borbaand and A.E.A. Da Silva, “Knowl-edge-based system for the maintenance registra-tion and consistency among UML diagrams,” inBrazilian Symposium on Artificial Intelligence.Springer, Berlin, Heidelberg, 2010, pp. 51–61.
[29] D. Torre, Y. Labiche, and M. Genero, “ML con-sistency rules: A systematic mapping study,” inProceedings of the 18th International Confer-ence on Evaluation and Assessment in SoftwareEngineering. Springer, Berlin, Heidelberg, 2014,pp. 1–10.

26 Renu George, Philip Samuel
[30] R.J. Ma, N.Y. Yu, and J.Y. Hu, “Applicationof particle swarm optimization algorithm in theheating system planning problem,” The Scien-tific World Journal, 2013, pp. 1–11.
[31] S. Pandey, L. Wu, S.M. Guru, and R. Buyya,“A particle swarm optimization-based heuristicfor scheduling workflow applications in cloudcomputing environments,” in 24th InternationalConference on Advanced Information Networkingand Applications. IEEE, 2010, pp. 400–407.
[32] D.Y. Sha and H.H. Lin, “A multi-objective PSOfor job-shop scheduling problems,” Expert Sys-tems with Applications, Vol. 37, No. 2, 2010,pp. 1065–1070.
[33] M. Gong, Q. Cai, X. Chen, and L. Ma, “Complexnetwork clustering by multiobjective discreteparticle swarm optimization based on decom-position,” IEEE Transactions on EvolutionaryComputation, Vol. 18, No. 1, 2014, pp. 82–97.
[34] N.K. Sharma, D.S. Babu, and S.C. Choube, “Ap-plication of particle swarm optimization tech-nique for reactive power optimization,” in Inter-national Conference on Advances in Engineer-ing, Science and Management (ICAESM-2012).IEEE, 2012, pp. 88–93.
[35] P. Sivakumar, S.S. Grace, and R.A. Azeezur,“Investigations on the impacts of uncertain windpower dispersion on power system stabilityand enhancement through PSO technique,” inInternational Conference on Energy EfficientTechnologies for Sustainability. IEEE, 2013,pp. 1370–1375.
[36] F. Li, D. Li, C. Wang, and Z. Wang, “Net-work signal processing and intrusion detectionby a hybrid model of LSSVM and PSO,” in 15thIEEE International Conference on Communica-tion Technology. IEEE, 2013, pp. 11–14.
[37] Z. Jun and Z. Kanyu, “A particle swarm opti-mization approach for optimal design of PIDcontroller for temperature control in HVAC,” inThird International Conference on MeasuringTechnology and Mechatronics Automation. IEEE,2011, pp. 230–233.
[38] D.K. Saini and Y. Sharma, “Soft computingparticle swarm optimization based approach forclass responsibility assignment problem,” In-ternational Journal of Computer Applications,Vol. 40, No. 12, 2012, pp. 19–24.
[39] R. George and P. Samuel, “Fixing class design in-consistencies using self regulating particle swarmoptimization,” Information and Software Tech-nology, Vol. 99, 2018, pp. 81–92.
[40] R. George and P. Samuel, “Particle swarm op-timization method based consistency checking
in UML class and activity diagrams,” in Inno-vations in Bio-Inspired Computing and Applica-tions. Springer, Cham, 2016, pp. 117–127.
[41] R. George and P. Samuel, “Fixing state changeinconsistency with self regulating particle swarmoptimization,” Soft Computing, Vol. 24, No. 24,2020, pp. 18 937–18 952.
[42] M. Kessentini, H. Sahraoui, and M. Boukadoua,“Search-based model transformation by example,”Software and Systems Modeling, Vol. 11, No. 2,2012, pp. 209–226.
[43] A. Windisch, S. Wappler, and J. Wegener, “Ap-plying particle swarm optimization to softwaretesting,” in Proceedings of the 9th annual confer-ence on Genetic and evolutionary computation.ACM, 2007, pp. 1121–1128.
[44] R. Malhotra and A. Negi, “Reliability mod-eling using particle swarm optimization,” In-ternational Journal of System Assurance Engi-neering and Management, Vol. 4, No. 3, 2013,pp. 275–283.
[45] J.A. Parejo, A. Ruiz-Cortes, S. Lozano, andP. Fernandezi, “Metaheuristic optimizationframeworks: A survey and benchmarking,” SoftComputing, Vol. 16, No. 3, 2012, pp. 527–561.
[46] S. Milton and H. Schmidt, “Dynamic dispatchin object-oriented languages,” The AustralianNational University, Canberra, Technical ReportTR-CS-94-02, January 1994.
[47] E. Ernst and D.H. Lorenz, “Aspects and poly-morphism in AspectJ,” in Proceedings of the 2ndInternational Conference on Aspect-OrientedSoftware Development. ACM, 2003, pp. 150–157.
[48] D. Ancona, S. Drossopoulou, and E. Zucc, “Over-loading and inheritance,” in FOOL’ 01 – Inter-national. Workshop on Foundations of ObjectOriented Languages, 2001.
[49] D.P. Friedman, M. Wand, and C.T. Haynes,Essentials of Programming Languages, 2nd ed.,Prentice-Hall of India, 2001.
[50] R.V. Binder, “Testing object oriented soft-ware: A survey,” Software Testing, Verifica-tion and Reliability, Vol. 6, No. 3–4, 1996, pp.125–252.
[51] D.P. Rini, S.M. Shamsuddin, and S.S. Yuha-niz, “Particle swarm optimization: technique,system and challenges,” International Journalof Computer Applications, Vol. 14, No. 1, 2011,pp. 19–26.
[52] Q. Bai, “Analysis of particle swarm optimizationalgorithm,” Computer and Information Science,Vol. 3, No. 1, 2010, pp. 180–184.
[53] M. Ferreira, F. Chicano, E. Alba, andJ.A. Gomez-Pulido, “Detecting protocol errors

Fixing Design Inconsistencies of Polymorphic Methods Using Swarm Intelligence 27
using particle swarm optimization with Javapathfinder,” in Proceedings of the High Perfor-mance Computing and Simulation Conference(HPCS 08), 2008, pp. 319–325.
[54] D. Floreano and C. Mattiuss, “Bio-inspired ar-tificial intelligence: theories, methods, and tech-nologies,” MIT Press, Aug 2008.


e-Informatica Software Engineering Journal, Volume 15, Issue 1, 2021, pages: 29–45, DOI 10.37190/e-Inf210102
A Deep-Learning-Based Bug Priority PredictionUsing RNN-LSTM Neural Networks
Hani Bani-Salameh∗, Mohammed Sallam∗, Bashar Al shboul∗∗Department of Software Engineering, The Hashemite University, Jordan
[email protected], [email protected], [email protected]
AbstractContext: Predicting the priority of bug reports is an important activity in software maintenance.Bug priority refers to the order in which a bug or defect should be resolved. A huge number of bugreports are submitted every day. Manual filtering of bug reports and assigning priority to eachreport is a heavy process, which requires time, resources, and expertise. In many cases mistakeshappen when priority is assigned manually, which prevents the developers from finishing theirtasks, fixing bugs, and improve the quality.Objective: Bugs are widespread and there is a noticeable increase in the number of bug reportsthat are submitted by the users and teams’ members with the presence of limited resources, whichraises the fact that there is a need for a model that focuses on detecting the priority of bug reports,and allows developers to find the highest priority bug reports.This paper presents a model that focuses on predicting and assigning a priority level (high or low)for each bug report.Method: This model considers a set of factors (indicators) such as component name, summary,assignee, and reporter that possibly affect the priority level of a bug report. The factors areextracted as features from a dataset built using bug reports that are taken from closed-sourceprojects stored in the JIRA bug tracking system, which are used then to train and test theframework. Also, this work presents a tool that helps developers to assign a priority level for thebug report automatically and based on the LSTM’s model prediction.Results: Our experiments consisted of applying a 5-layer deep learning RNN-LSTM neuralnetwork and comparing the results with Support Vector Machine (SVM) and K-nearest neighbors(KNN) to predict the priority of bug reports.The performance of the proposed RNN-LSTM model has been analyzed over the JIRA dataset withmore than 2000 bug reports. The proposed model has been found 90% accurate in comparison withKNN (74%) and SVM (87%). On average, RNN-LSTM improves the F -measure by 3% comparedto SVM and 15.2% compared to KNN.Conclusion: It concluded that LSTM predicts and assigns the priority of the bug more accuratelyand effectively than the other ML algorithms (KNN and SVM). LSTM significantly improves theaverage F -measure in comparison to the other classifiers. The study showed that LSTM reportedthe best performance results based on all performance measures (Accuracy = 0.908, AUC = 0.95,F -measure = 0.892).
Keywords: Assigning, Priority, Bug Tracking Systems, Bug Priority, Bug Severity,Closed-Source, Data Mining, Machine Learning (ML), Deep Learning, RNN-LSTM, SVM,KNN
Submitted: 03 July 2020; Revised: 07 November 2020; Accepted: 23 December 2020; Available online: 08 February 2021

30 Hani Bani-Salameh et al.
1. Introduction
Software projects (both open and closed source)get an overwhelming number of bug reports, andthe presence of bugs usually affects reliability,quality, and cost management of software. Inpractice, it is impossible to have a bug-free soft-ware unless the software is implemented carefullyand developers can quantify software behaviorsas being a bug or not [1].
Bugs are prevalent, and many software pro-jects are delivered with bugs. To address thesebugs and to improve the quality of the releasedproducts, bug tracking systems such as JIRAand Bugzilla allow users and team members toreport bugs [2].
Bug tracking systems help to predict theprogress of a milestone-based on bug reportsraised. They allow users to add stories (functionalrequirements) and divide them into tasks, as wellas preparing bug reports and test suites [2].
Developers and testers can create new bugreports, monitor the state of bug reports as wellas any update on existing bug reports. Bug re-ports progress through a series of states, wherethe bug reports begin when the bug is found andends when the bug reports are closed [1].
Bug reports may then be used to direct thesoftware corrective maintenance behavior andcontribute to creating more stable software sys-tems. Prioritizing software bug reports can helpto handle the bug triaging process, and allowsdevelopers to prioritize and fix important reportsfirst [2]. Developers are often receiving numer-ous bugs reports and may fail to fix it due todifferent constraints including time. The pro-cess of prioritizing bug reports is manual and istime-consuming. Thus, there is a need to developa bug’s priority prediction model that helps toautomate the priority’s prediction process.
The model helps to (1) improve accuracy andeffectiveness in predicting the priority of the bugreports, (2) improve efficiency by reducing thetime spent during manual priority prediction, and(3) reduce the cost of assigning incorrect priority.
This article proposes a framework that useda dataset extracted from five closed-source pro-jects containing more than 2000 bug reports (pro-vided by JIRA). Also, it uses different algorithms,
namely RNN-LSTM, SVM, and KKN, to predictthe priority and compare the accuracy results.
The rest of this paper is organized as follows.The rest of Section 1 provides background aboutthe bug reports lifecycle and machine learning(ML) and its relationship with software bug prob-lems. Section 2 presents the related works. Sec-tion 3 presents the detailed description of theproposed approach. The results of the study arepresented in Section 4. Section 5 discusses thepriority prediction tool. The possible threats tothe validity of our work were listed in Section 6.Finally, Section 7 presents the conclusion of theresearch work along with future work directionsand enhancement.
1.1. Bug reports lifecycle
Bug reports go through a cycle during their life-time. This article divides the life cycle of thebug reports into five states: Open, InProgress,Resolved, Closed, and Reopened. These phasesare described hereunder (see Fig. 1).
When a tester posts a bug, a bug report isopened and logged in to the tracking system,the status is set to OPEN. After that, the leaderapproves that the bug exists and assigns the bugto the appropriate developer. Once the developerstarts analysis and works on fixing the bug, thestatus set to INPROGRESS.
If a bug is posted twice, the status is setto CLOSED with a resolution duplicate. If thedeveloper feels that the bug is not logical orincompatible with the specific user experience,the status is set to CLOSED with resolutionwill not do. If the bug is not reproducible (allattempts to reproduce this bug have failed, or in-sufficient information was available to reproducethe bug), then the status is set to CLOSEDwith resolution cannot reproduce.
Once the developer fixes the issue and verifiesthe changes, the status is set to RESOLVED.After fixing the bug, testing is pending and thetester either confirms the change or re-test thechanges to make sure that the bug is no longerexists in the software. Next, the status is set toCLOSED with the decision done. If the bugstill exists and not resolved, the status is set toREOPEN.

A Deep-Learning-Based Bug Priority Prediction Using RNN-LSTM Neural Networks 31
Figure 1: Lifecycle of bug reports
Finally, when the software delivery date(deadline) reaches and low priority bugs are notfixed, they must be moved to the next releaseby the product owner, and the status remainsOPENED.
1.2. Bug reports contents
A bug report contains information on how thebug could be reproduced and the informationthat can help in its debugging and tracing. A bug
report includes a set of factors like summary,descriptions, report id, project name, priority, en-vironment, attachment, assignee, reporter, createddate, status, fix version, and component. Table 1shows the defined factors.
2. Related works
This article focuses on related works and studiesthat are mainly related to machine learning (ML)
Table 1: Summary of bug report fields
Field DescriptionSummary A brief one-line summary of the bug.Descriptions Details including test step, actual result, and expected result to reproduce this bugReport ID A unique identifier for this bugProject Name The parent project to which the bug belongs.Priority How quickly a bug should be fixed and deployed (e.g., Low, Medium, and High)Environment The environment in which the issue occurred (e.g., production, pre-production, staging,
and development.)Attachment Documents, screenshots, and other elements that can help in identifying and fixing bugs.Assignee A person who created the bug (e.g., QA).Reporter A person who is responsible for fixing the bug (e.g., QA, scrum master, and owner).Created Date Date when a bug is submitted.Status The stage the bug is currently in during the lifecycle (workflow).Fix Version Project version(s) that contains the bug.Component Component(s) to which the bug relates (e.g., Android, IOS, and Backend (DB)).

32 Hani Bani-Salameh et al.
and the techniques were applied to assigning bugspriority and prediction. This section introducesrecent studies and literature that are related tobugs’ priority.
2.1. Bug reports assignment
Anvik et al. [3] introduced a machine learningmethod that classifies appropriate developernames to resolve the report based on classify-ing and reporting bug using accuracy and recall.Applying their method on Firefox and Eclipse,they achieved +50% accuracy.
Wang et al. [4] address three limitations ofthe supervised bug fix approaches and propose anunsupervised method for assigning bugs for de-velopers based on their involvement (“activenessscore”) in the project. The result of experimentsshowed that FixerCache gives better accuracywhen compared with the supervised approaches,and it achieves prediction accuracy up to 96.32%and diversity up to 91.67% in Eclipse and Mozilladatasets.
Recently, Mani et al. [5] proposed an algo-rithm using a deep-bidirectional recurrent neu-ral network (DBRNN-A) model. The model isfor a specific software bug reports classifyingan adequate developer depending on the titleand characteristics of the bug reports usingnaive Bayes, cosine distance, SVM, and soft-max. Experiments on bug reports from softwareprojects (e.g., Google Chromium, Mozilla Core,and Mozilla Firefox). It showed a precision of 47%for Google Chromium, 43% precision for MozillaCore, and 56% precision for Mozilla Firefox.
2.2. Bug priority prediction
Prioritizing bug reports is not an easy task. Onlya small percentage of bug reports are extremelyimpactive reports (e.g., according to Ohira etal. [6] less than 1% of Ambari bug reports areabsent in the dataset).
2.2.1. Traditional approachesto bug priority prediction
Tian et al. [2, 7] suggested an automated classifica-tion method to predict the priority of bug reports.
They used a machine learning (ML) algorithmto prioritize bug reports and achieved an averageF -measure of 209%. The dataset of the bug re-ports is usually unbalanced according to the lownumber of high impact bugs in the project.
Umer et al. [8] proposed an emotion-basedautomated priority prediction approach. Theirapproach combines the NLP techniques and MLalgorithms. It allows team members to assignappropriate priority level bug reports in an auto-mated manner. The results suggest that the pro-posed approach outperforms the state-of-the-areand it improves F1-score by more than 6%.
Mihaylov [9] conducted a study that aimsto examine the behavior of NNs and predictthe priority of bug reports. Their focus was toanalyze the importance of adding numerical fea-tures to textual features by combining differentkinds of NNs. The results suggest that addingnumerical features to textual features improvesthe accuracy of priority classification. The resultsshow that the priority classification improves theaccuracy of about 85.5%.
Choudhary et al. [10] introduce an ANN tech-nique used to develop prediction models for sev-eral Eclipse versions that set priority levels basedon the textual, temporal, relevant report, author,severity, and the product.
Yu et al. [11] proposed an enhanced ANN--based system to predict the priorities of fivedifferent product bugs identified by an inter-national health-care company. The threefoldcross-validation tests suggest that the alternativeapproach is better in terms of precision, recall,and F -measure.
Jaweria Kanwal [12] proposed an ML-basedrecommender to automatically prioritize reportedbugs. They used SVM to train a classification--based approach on Eclipse bug reports. The eval-uation of the proposed approach used precision,retrieval, and F -measure to set the priority of theautomatic defect.
Lin et al. [19] applies both of SVM and C4.5classifiers on different fields (e.g., bug type, sub-mitter, phase-ID, module-ID, and priority). Theyused a dataset with 2,576 bug reports. Theirmodels achieve the accuracy of up to 77.64%.
Sharma et al. [13] proposed a priority pre-diction approach using SVM, NB, KNN, and

A Deep-Learning-Based Bug Priority Prediction Using RNN-LSTM Neural Networks 33
neural networks. The proposed approach allowsto predict the priority of the bug reports. Theresults showed that the accuracy of the usedmachine learning techniques in predicting thepriority of bugs’ reports within the project isfound above 70% except NB technique.
Alenezi and Banitaan [14] proposed an ap-proach to predict bugs’ priority prediction. Theyused different ML techniques NB, Decision Tree,
and Random Forests. The results show that theproposed approach is feasible in predicting thepriority of bug reports. Also, the study shows thatRandom Forests and Decision Trees beat NB.
Others [15] They proposed an approach thatconstructs multiple decision trees based on exist-ing datasets and features, which selects the best de-cision trees to measure the new bugs’ priority andseverity. They proposed the applicability of ran-
Table 2: Summary of machine learning based bug priority approaches available in literature
Paper(s) Performance Features Used Classifier(s)Traditional Bug Priority Prediction
[7] improves the average ofF -measure by a relative im-provement of 58.61%
temporal, textual, author,related-report, severity,product
Drone, SVM, NBM,
[8] improves F -score by morethan 6%
summary NLP + ML algorithm
[9] accuracy = 85.5% sentiment and textual anal-ysis
MLP, CNN, LSTM
[10] both algorithms are efficient temporal, textual, severity,product, component
MLP, NB
[11] suggested improvement interms of precision, recall,and F -measure
milestone, category, module,main workflow, function, in-tegration, frequency, sever-ity, and tester
Rnhanced ANN, Bayes
[12] SVM is better categorical, summary, longdescription
SVM, NB
[13] above 70% except NB SVM, NB, KNN[14] F -measure values (Random
Forest = 0.611, DecisionTrees = 0.603, NB = 0.593)
component, operating sys-tem, severity
RF, DT, NB
[15] accuracy = 75% – Decision Trees (DT), Ran-dom Forest(RF)
Deep Learning in Bug Priority Prediction[5] improvement = 12–15%, ac-
curacy = 37–43%title, description softmax, SVM, MNB, cosine
distance based machine[16] accuracy = 56–88% title, component, priority,
productNB, TF-IDF with SVM,fastText, and DeepTriag
[17] F1-measure improved by14% and AUC by 7%
– CNN, RNN-LSTM, andDP-ARNN
[18] F1-measure improved by7.9%
– CNN, LSTM), MultinomialNB (MNB), RF
Our approach accuracy = 90.8% component, summary, as-signee, and reporter of bugreports.
LSTM, SVM, KNN

34 Hani Bani-Salameh et al.
dom forest (RF) for bug reports analysis. Resultsshowed that RF yields 75% as an accuracy score.
2.2.2. Deep learning approachesto bug priority prediction
Mani et al. [5] propose a a bug report represen-tation algorithm using deep-bidirectional RNNnetwork model (DBRNN-A). They chose two fea-tures as input for the classification (title, descrip-tion of the issues). They used bug reports fromdifferent projects such as Chromium, MozillaCore, and Mozilla Firefox. The result shows thatDBRNN-A achieves an improvement of 12–15%and performance between 37–43% when com-pared to other classifiers. Lyubinets et. al [16]present a model to label bugs reports using RNNs.The achieved accuracy were 56–88%.
Fan et al. [17] proposed a deep learning-basedmethod called DP-ARNN, to help predictprospective code defects. They used the attentionmechanism to capture important features thatmight help improve the defect prediction per-formance. They made use of seven open-sourceprojects. Results indicated that DP-ARNN im-proves the state-of-the-art traditional methodsof software defects prediction where F 1-measureimproved by 14% and AUC improved by 7%.
Ramay et al. [18] proposed a deep neuralnetwork-based approach for bug reports severity.They evaluated their model on the history-dataof bug reports. The results showed that thereis an improvement in the F -measure by 7.90%,which indicates that the approach outperformsthe state-of-the-art approaches.
The above mentioned closely related workson bug priority are summarized in Table 2.
These studies have focused on using on bothof deep learning and traditional classification al-gorithms such as C4.5, Bayesian, MLP, and Sup-port Vector Machine (SVM). Our work presentsan approach to predict and assign bugs’ prioritylevel using deep learning. The proposed approachuse of LSTM and outperforms the other classi-fiers where accuracy improved by 90.8%.
3. Proposed approach
Given a dataset of bug reports from closed-sourcesoftware projects, this study uses RNN-LSTMneural networks to detect and prioritizes bug re-ports. The process of assigning the priority levelfor bug reports consists of two phases (see Fig. 2).This section briefly explains the process phases.
Figure 2: Proposed framework
Phase 1: involves data collection, formattingpriority of the bug reports, and text preprocess-ing (tokenization, stop words, and stemming).

A Deep-Learning-Based Bug Priority Prediction Using RNN-LSTM Neural Networks 35
Phase 2: involves feature selection, datasettraining, applying ML algorithms (LSTM, SVM,and KNN), and finally evaluation process.
3.1. Data collection
As mentioned earlier, this study used a datasetthat was extracted from the JIRA bug track-ing system using the INTIX DWC companydashboard [25]. The datasets consist of datafrom five closed-source projects and contain-ing more than 2000 bug reports. Past studies[3, 4, 12, 26–28] used common datasets extractedfrom Bugzilla [29] system that are related toEclipse and Mozilla.
JIRA dataset consists of 17 columns. Thefactors are summary, description, bug id, sta-tus, project name, project lead, priority, resolu-tion, assignee, reporter, created date, resolveddate, component, environment, sprint, attach-ment files, and comments.
In this work, we used a specific number offactors from the chosen dataset. The factors thatare considered as the most appropriate to pre-dict the priority level (high, medium, and low):component, summary, assignee, and reporter ofbug reports.
Table 3 shows the bug reports in the closed--source projects included in the used dataset,which are Martix, Hashfood, Tazaj, Workspaces,
and Maharah. The project with the highest num-ber of bug reports is Hashfood. The bug reportsare divided into three levels of priority (high,medium, and low). The number of bug reportswith medium priority is higher in each datasetcompared to the number of low and high priorities.
3.1.1. Labeling priority of reports
The priority of bug reports was labeled usingthe to_categorical function from the TensorFlowKeras library [30]. The used labels are 0 and 1,where 0 refers to the high priority and 1 refersto the low priority of bug reports.
3.1.2. Text preprocessing
Text preprocessing is applied using the NaturalLanguage Toolkit library [31]. This is performedby practicing Python programming using Py-Charm [32].
This section gives a brief definition of eachactivity.– Tokenization: the process of splitting text
into sentences, words, and clauses. It replacesall the punctuations with blank spaces, re-moves all the nonprintable escape characters,and converts all the words to lowercase [7].
– Stop word removal: prepositions, articles,conjunctions, verbs, pronouns, nouns, adjec-
Table 3: High, medium, low, and unselect priority levels in each project dataset
Projects name High Medium Low UnselectMartix [20] 207 489 135 38Hashfood [21] 453 659 95 0Tazaj [22] 80 169 18 0Workspaces [23] 143 186 9 0Maharah [24] 55 61 9 0
Figure 3: Text preprocessing activities

36 Hani Bani-Salameh et al.
Table 4: Example illustrates the effect of preprocessing activities
Original Description Crashed when clicking on order details “Consumer application”Tokenization Crash when I click on order details consumer applicationStop Words Crashed click order details consumer applicationStemming Crash click order detail consumer application
Table 5: The top-30 keywords based on their frequency (sorted using NLTK)
Rank Keyword Rank Keyword Rank Keyword1 IOS 11 search 21 back2 Android 12 seller 22 login3 Screen 13 click 23 logo4 app 14 App 24 account5 incorrect 15 Api 25 network6 message 16 backend 26 payment7 product 17 chat 27 google8 user 18 button 28 service9 order 19 mobile 29 server10 error 20 design 30 web
Table 6: Keywords classified based on the priority level
Keywords Count of frequency Priority level Keywords Count of frequency Priority levelcrash 186 high color 29 lowerror 159 high inconsistent 22 lowicon 110 low layout 21 lowphoto 108 low avatar 20 lowtab 65 low placeholder 20 lowimage 101 low doesn’t Work 16 highmenu 53 low ux 16 lowdesign 52 low toolbar 15 lowlogo 47 low textview 9 lowlabel 45 low hot fix 9 hightitle 34 low failure 8 high
tives, and adverbs, which has no meaning inNL processing [7].
– Stemming: is the process for reducing wordsto their stem or root. All words with a com-mon stem are replaced. For example, wordslike “take”, “takes”, “took”, and “taking” canbe replaced with a single word as “take” [7].Table 4 illustrates the preprocessing activities
using Natural Language Toolkit (NLTK) [31].
3.1.3. Feature selection
Text preprocessing generates a large set of fea-tures that are still costly to be processed using
the proposed machine learning algorithms. Thus,it is important to decide what features of theinput are relevant.
Various techniques have been proposed toderive relevant features (terms/keywords) fromthe bug reports. This research used the NLTKlibrary [7] as a features’ selection technique toreduce the number of input features and helpimprove the performance.
Features are derived from the bug reports toprovide the most important words that impactthe priority level, then the words are rankedhighest to lowest based on the frequency of theword (see Table 5).

A Deep-Learning-Based Bug Priority Prediction Using RNN-LSTM Neural Networks 37
Also, manual analysis was applied and iden-tified the strongest set of keywords that referto the low and high priority levels of the bugreports (see Table 6).
3.2. Evaluation metrics
The performance and effectiveness of theclassification algorithms were evaluated usingwell-known metrics such as precision, accuracy,recall, F -measure, and improvement [18].
Also, these metrics were used to evaluate theperformance of the proposed approach to thepriority bug reports. The metrics present theprecision, accuracy, recall, and F -measure of theproposed approach in assigning priority of thebug reports. Following is a description of theused metrics.
Accuracy is the percentage of correctly pre-dicted observation to the total, which is consid-ered as an important performance measure whenusing asymmetric datasets that present whenfalse positive and false negatives are the samevalue [33]. Accuracy can be measured using thefollowing formula:
Accuracy = TP + TNTP + FP + FN + TN (1)
Precision is the ratio of correctly predictedpositive to the total predicted positive. The per-centage of priority bug reports was predicted, andthen considered precision for the high and lowlevel of priority [33]. Precision can be measuredusing the following formula:
Precision = TPFP + TP (2)
Recall (Sensitivity) is the ratio of correctlypredicted positive to the total observation in thesame class. The percentage of all high-priorityand low-priority bug reports that are correctlypredicted [33]. Recall can be measured using thefollowing formula:
Recall = TPTP + FN (3)
F -measure means the average accuracy andrecall taking into account false positives and falsenegatives. F -measure is more effective than accu-racy, especially if the data distribution is unbal-anced. If false positives and false negatives havethe same results, this means that the accuracy ismore effective [33]. F -measure can be measuredusing the following formula:
F -measure = 2 ∗ Precision ∗ RecallPrecision + Recall (4)
Improvement considers calculating the im-provement between selected classification algo-rithms [34]. Improvement can be measured usingthe following formula:
Improvement =
(F -measureLSTM)− (F -measureKNN)F−measureKNN
(5)
Also, to measure the quality of the classifiers,we calculated Mathews Coefficient Correlation(MCC).
MCC =
(T P ∗T N)−(F P ∗F N)√(T P +F P )(T P +F N)(T N+F P )(T N+F N)
(6)
3.3. Machine learning algorithms
The proposed approach is compared with someexisting ML algorithms. We used three differ-ent machine learning algorithms to predict thebug reports’ priority. Theses algorithms areLong Short-Term Memory (LSTM), Support Vec-tor Machine (SVM), and K-nearest neighbors(KNN).
3.3.1. Long short-term memory (LSTM)
RNN-LSTM is an example of supervised learn-ing used in deep learning, which uses historymeasurements to generate bandwidth predictionand remembers the information for long peri-ods. It can learn to transform input data intoa preferred response and is widely used for pre-

38 Hani Bani-Salameh et al.
diction problems [35]. RNN-LSTM can remem-ber past events that are seen and forget unim-portant data. This happens through differentactivation function layers called gates. The In-ternal Cell State presents the relevant informa-tion that was selected to be saved. RNN-LSTMis a type of a Recurrent Neural Network(RNN) that uses past events to inform futureones [35–38].
In this research, we implemented a Pythoncode for the LSTM neural network with five hid-den layers feed-forward to predict the priority ofthe bug reports. The number of hidden layers hasbeen selected to achieve the best performance.It includes a cell that saves relevant informationwhich has an impact on the priority level. Themodel helps to assign an appropriate prioritylevel of bug reports [38].
3.3.2. Support vector machine (SVM)
SVM is a supervised machine learning model thatapplies classification on two-group classificationproblems. It can be used for classifications, re-gression, and outliers’ detection. The objective ofapplying SVMs is to classify the dataset space byfinding the best line or hyperplane [39–41]. SVMis implemented using a Python code, mainly us-ing Sklearn.svm library [42, 43].
3.3.3. K -nearest neighbors (KNN)
KNN is a supervised machine learning algorithmthat can be used to solve both classification and
regression problems. Using KNN, the input vari-ables consist of the k closest training examplesin the dataset. Predicting the output depends onwhether k-NN is used for classification or regres-sion problems [44, 45]. KNN is implemented usinga Python code, mainly using Sklearn.neighbourslibrary [42].
3.4. Building the LSTM neural network
As mentioned earlier, Python was used to imple-ment the LSTM neural network with five hiddenlayers feed-forward to predict the priority of bugreports.
3.4.1. Input variables
The input variables were selected to predict thepriority level by considering a set of factors (in-dicators). The factors are component name, sum-mary, assignee, and reporter of the bug reports(see Table 7).
3.4.2. Output variables
In this study, Priority is the output variableused in the ML algorithms to be predicted (seeTable 8).
3.5. Supervised training of LSTM
To train the LSTM neural network, we are usinga python library called TensorFlow [46] thatdivides the datasets into training and test sets
Table 7: Factors considered from the bug reports
Field name Field description Field valueComponent Bug component(s) to which this bug relates. Android, IOS, Backend (DB).Summary A brief one-line summary of the bug. String(crash, failure, design, UX, or UI).Assignee A person who created a bug Senior, Junior, and a fresh graduate.Reporter A person who is responsible to fix the bug. QA, developer, scrum master, product owner.
Table 8: Output variable
Field name Field description Field valuePriority How quickly the bug should be fixed and
deployed?Low/High

A Deep-Learning-Based Bug Priority Prediction Using RNN-LSTM Neural Networks 39
in the ratio 8:2. The datasets were convertedfrom the .xlsx format into .cvs format using thepanda’s library [47] to make the module faster.
The priority data is converted into [0, 1] usingthe to_categorical function from the TensorFlowKeras library [46]. The assigned values to thepriority of bug reports are (0 = high priority, 1 =low priority).
The architecture of LSTM units was trainedusing Adam algorithms and the Mean SquareError loss function. Adam algorithm has beenused in our research instead of the traditionalalgorithms to update network weights based ontraining data [48]. The main benefits of Adamalgorithms are computationally efficient and suit-able for handling problems with large data.
The learning rate variable is set to 0.001 andit decays every 5 epochs and drops-out in eachlayer in 0.2 to remove any loss value in valida-tion split. In this article, the model has beentrained with 100 sequences per batch and thecount of the batches is 64 with patience from3 samples.
4. Experimental results and discussion
The performance of the proposed LSTM modelwas evaluated by the experiment on a datasetextracted from five different projects, which areMatrix, Hashfood, Tazaj, Workspaces, and Ma-harah, which have a different number of prioritybug reports, as shown earlier in Table 4.
The proposed approach is compared with theexisting ML algorithm. Three ML algorithmswere utilized on the selected dataset. The evalua-tion was performed with LSTM, KNN, and SVMafter defining that the test size is equal to 0.20 ofour dataset, then the bug reports were selectedrandomly. This is done using the train_test_splitPython library to split datasets into a randomtrain and test subsets [49]. The model was trainedand tested with more than 2000 bug reports.
This rest of this section presents the resultsof the experiment that was conducted to validatethe proposed model and answers the researchquestion.
4.1. Research question
This work investigates the following researchquestion to evaluate the proposed framework:
“Does the proposed approach outperform theother machine learning algorithms in predictingand assigning bug priority? Does the proposed ap-proach improve the accuracy of assigning prioritylevels of bug reports?”
The research question compares the selecteddeep neural network (LSTM) against other al-ternatives as shown in Sections 4.1–4.3. Also,it investigates the performance improvement ofthe proposed approach as shown in Sections 4.4and 4.5.
4.2. LSTM neural network
The experiments performed on LSTMNeural Net-work after training epoch. The LSTM recurrentneural network model was developed in Pythonusing the Keras deep learning library [30].
Accuracy and loss in Keras model for valida-tion data could be changed with different cases.When every epoch increases, the loss becomeslower and the accuracy becomes higher. WithKeras validation loss and accuracy, the followingcases may occur [50]:– The model is not learning (cramming
values): when validation loss starts increas-ing, validation accuracy starts decreasing.
– Overfitting: both of validation loss and val-idation accuracy start increasing.
– The model is learning probably: vali-dation loss starts decreasing, and validationaccuracy starts increasing.As shown in Figures 4(a) and 4(b), this re-
search defined the loss and accuracy functionswhich are considered as a return to the differencebetween the training and testing data (predictedand actual outcome). Then we calculated theaccuracy, precision, recall, and F -measure.
Figures 4(a) and 4(b) illustrate that themodel has higher training accuracy and lowervalidation accuracy, thus it is learning probably.The training loss is decreasing, which means thatthe model is learning to recognize the training

40 Hani Bani-Salameh et al.
(a) Model loss (b) Model accuracy
Figure 4: Comparison between training and validation(loss and accuracy)
set. Also, the model is a good fit because trainingloss is slightly higher than validation loss.
4.3. Support vector machine (SVM)
This section presents the results when SVM wasapplied to datasets extracted from closed-sourceprojects. Table 9 shows the performance resultsof the SVM model based on the level of priority.Based on the High priority, the metrics values are(F -measure = 0.87, Recall = 0.88, and Precision= 0.85). Based on the Low priority, the metricsvalues are (F -measure = 0.86, Recall = 0.85, andPrecision = 0.88).Table 9: Performance metrics results from apply-ing SVM
Priority level Precision Recall F -measureHigh 0.85 0.88 0.87Low 0.88 0.85 0.86
4.4. K-nearest neighbors (KNN)
Based on the performance results of KNN, themetrics values are Accuracy = 0.741, F -measure= 0.740, Recall = 0.742, and Precision = 0.740.
Table 10 shows the evaluation results of thethree algorithms. It shows the performance ofLSTM, SVM, and KNN.
Table 10: A comparison between performanceresults from applying LSTM, SVM, and KNN
LSTM SVM KNNAccuracy 0.898 0.865 0.741F -measure 0.892 0.865 0.742Recall 0.897 0.865 0.741Precision 0.876 0.866 0.743MCC 0.796 0.732 0.485
Figure 5 illustrates the performance differ-ences between the three ML algorithms.
4.5. Comparison between LSTM, SVMand KNN results
The results of our experiments indicate that theproposed framework based on LSTM NeuralNetwork correctly predicts the priority of the bugreports and the performance can be significantlyincreased compared with both SVM and KNN asshown in Figure 5.
Based on Table 11 and Figure 5, we make thefollowing observations:– The proposed approach obtains a slight im-
provement in performance. The LSTM im-provement was calculated and compared withthe other selected algorithms SVM and KNN.
– F -measure results show a 3% improvementfor LSTM compared with SVM. Also, it showsa 15% improvement for LSTM compared withKNN.

A Deep-Learning-Based Bug Priority Prediction Using RNN-LSTM Neural Networks 41
Figure 5: Comparison between LSTM, SVM, and KNN
Table 11: LSTM Improvement compared to SVM and KNN
SVM LSTM Improvement KNN LSTM ImprovementF -measure 0.865 0.892 3% F -measure 0.742 0.892 15.2%MCC 0.732 0.796 6.4% MCC 0.485 0.796 31.1%
– MCC values improved by 6.4% compared toSVM and by 31.1% compared to KNN, whichshow that LSTM outperforms the other al-gorithms in detecting and assigning the bugspriority.
4.6. LSTM, SVM, KNN– Output quality comparison
To compare the selected algorithms, this studysummarizes and compares the performance ofeach classifier by calculating the area under theROC curve (AUC).
Figure 6: ROC curve for SVM Figure 7: ROC curve for KNN

42 Hani Bani-Salameh et al.
Figure 8: ROC curve for LSTM
Results show that LSTM is with better AUC,which is an effective measure of sensitivity andspecificity (a measure of predictive accuracy).The AUC values for LSTM, SVM, and KNNare 0.95, 0.87, and 0.74, respectively (see Fig-ures 6–8).
5. Bugs’ priority prediction tool
Assigning priority to bugs’ reports may play animportant role in improving the bug triaging pro-cess which is an important process in softwaremaintenance.
Figure 9: Predicting priority level for a bug report
This article introduces a tool that helps de-velopers and team to predict and assign prior-ity for bugs’ reports. This tool was built usingpyqt5.qt widgets [51]. It allows them to enter theinput (RNN-LSTM input features) as a single
comma separated statement (component name,summary, assignee, and author). Then, the neu-ral network predicts the priority of the report.Figure 9 shows an example of the labeling panelin the proposed tool.
6. Threats to validity
Like any research, some factors may affect theperformance of the proposed approach. Thethreats to the validity of our study are as follows.
The internal validity relates to the adoptionof LSTM and not the other algorithms. We choseLSTM since others proved it effective for textclassification [52, 53]. Also, the results are verifiedto avoid any errors.
External validity makes it difficult to gener-alize the results. As mentioned earlier the useddataset extracted from bug reports related tofive closed-source projects. Using datasets fromother projects, it is not sure to achieve the sameperformance results.
7. Conclusion
This research provides a framework for automat-ically assigning the appropriate priority level forbug reports to avoid time-consuming and limitedresources during the software testing process.
The proposed framework involves the use oftext pre-processing methods (tokenization, stopwords, and stemming) and then extracting im-portant keywords from the description of thebug reports. A dataset was extracted from JIRAusing the INTIX DWC company dashboard [4],which consists of five closed-source projects andcontaining more than 2000 bug reports. Thedataset was divided into training and test casesand applied dataset variations (20% test and80% training).
The proposed model has been validated ona dataset extracted from five real projects. Theperformance of the model is compared with twowell-known ML algorithms, SVM and KNN. Theresults show that LSTM predicts and assigns thepriority of the bug more accurately and effec-tively. LSTM significantly improves the average

A Deep-Learning-Based Bug Priority Prediction Using RNN-LSTM Neural Networks 43
F -measure in comparison to the other classi-fiers. The study showed that LSTM reportedthe best performance results based on all perfor-mance measures (Accuracy = 0.908, AUC = 0.95,F -measure = 0.892). This answers our researchquestion, which suggests that LSTM outperformsthe alternatives and improves performance.
In the future, we will validate other deeplearning approaches on open-source projects likeEclipse and Mozilla. This includes experimentsto evaluate the performance of different classifierssuch as Naive Bayes, RBF Networks, and Func-tional Trees. Also, a future work direction mightinvolve integrating the proposed framework withJIRA software.
References
[1] H. Rocha, G. De Oliveira, H. Marques-Neto,and M.T. Valente, “NextBug: a Bugzilla exten-sion for recommending similar bugs,” Journal ofSoftware Engineering Research and Development,Vol. 3, No. 1, 2015, p. 3.
[2] Y. Tian, D. Lo, X. Xia, and C. Sun, “Auto-mated prediction of bug report priority usingmulti-factor analysis,” Empirical Software Engi-neering, Vol. 20, No. 5, 2015, pp. 1354–1383.
[3] J. Anvik, L. Hiew, and G.C. Murphy, “Whoshould fix this bug?” in Proceedings of the 28thinternational conference on Software engineering,2006, pp. 361–370.
[4] S. Wang, W. Zhang, and Q. Wang, “FixerCache:Unsupervised caching active developers for di-verse bug triage,” in Proceedings of the 8thACM/IEEE International Symposium on Em-pirical Software Engineering and Measurement,2014, pp. 1–10.
[5] S. Mani, A. Sankaran, and R. Aralikatte, “Deep-Triage: Exploring the Effectiveness of DeepLearning for Bug Triaging,” arXiv:1801.01275[cs], Jan. 2018. [Online]. http://arxiv.org/abs/1801.01275
[6] M.Ohira,Y.Kashiwa,Y.Yamatani,H.Yoshiyuki,Y. Maeda, N. Limsettho, K. Fujino, H. Hata,A. Ihara, and K. Matsumoto, “A dataset of highimpact bugs:Manually-classified issue reports,” inIEEE/ACM 12th Working Conference on MiningSoftware Repositories. IEEE, 2015, pp. 518–521.
[7] Y. Tian, D. Lo, and C. Sun, “DRONE: Predict-ing Priority of Reported Bugs by Multi-factorAnalysis.(2013),” in 29th IEEE International
Conference on Software Maintenance (ICSM),2013, pp. 22–28.
[8] Q. Umer, H. Liu, and Y. Sultan, “Emotion basedautomated priority prediction for bug reports,”IEEE Access, Vol. 6, 2018, pp. 35 743–35 752.
[9] M. Mihaylov and M. Roper, Predicting the Reso-lution Time and Priority of Bug Reports: A DeepLearning Approach, Ph.D. dissertation, Depart-ment of Computer and Information Sciences,University of Strathclyde, 2019. [Online]. https://local.cis.strath.ac.uk/wp/extras/msctheses/papers/strath_cis_publication_2727.pdf
[10] P.A. Choudhary, “Neural network based bug pri-ority prediction model using text classificationtechniques,” International Journal of AdvancedResearch in Computer Science, Vol. 8, No. 5, 2017.
[11] L. Yu, W.T. Tsai, W. Zhao, and F. Wu, “Pre-dicting defect priority based on neural net-works,” in International Conference on AdvancedData Mining and Applications. Springer, 2010,pp. 356–367.
[12] J. Kanwal and O. Maqbool, “Bug prioritizationto facilitate bug report triage,” Journal of Com-puter Science and Technology, Vol. 27, No. 2,2012, pp. 397–412.
[13] M. Sharma, P. Bedi, K.K. Chaturvedi, andV.B. Singh, “Predicting the priority of a reportedbug using machine learning techniques and crossproject validation,” in 12th International Con-ference on Intelligent Systems Design and Ap-plications (ISDA). IEEE, 2012, pp. 539–545.
[14] M. Alenezi and S. Banitaan, “Bug reports prior-itization: Which features and classifier to use?”in 12th International Conference on MachineLearning and Applications, Vol. 2. IEEE, 2013,pp. 112–116.
[15] H.M. Tran, S.T. Le, S. Van Nguyen, and P.T. Ho,“An analysis of software bug reports using ma-chine learning techniques,” SN Computer Sci-ence, Vol. 1, No. 1, 2020, p. 4.
[16] V. Lyubinets, T. Boiko, and D. Nicholas, “Au-tomated labeling of bugs and tickets usingattention-based mechanisms in recurrent neuralnetworks,” in IEEE Second International Con-ference on Data Stream Mining and Processing(DSMP). IEEE, 2018, pp. 271–275.
[17] G. Fan, X. Diao, H. Yu, K. Yang, and L. Chen,“Software defect prediction via attention-basedrecurrent neural network,” Scientific Program-ming, Vol. 2019, 2019.
[18] W.Y. Ramay, Q. Umer, X.C. Yin, C. Zhu, andI. Illahi, “Deep neural network-based severityprediction of bug reports,” IEEE Access, Vol. 7,2019, pp. 46 846–46 857.

44 Hani Bani-Salameh et al.
[19] Z. Lin, F. Shu, Y. Yang, C. Hu, and Q. Wang,“An empirical study on bug assignment au-tomation using Chinese bug data,” in 3rd In-ternational Symposium on Empirical SoftwareEngineering and Measurement. IEEE, 2009,pp. 451–455.
[20] Martix. [Online]. https://www.martix.me/ (Lastaccessed May 17, 2020).
[21] Hashfood. [Online]. https://itunes.apple.com/us/app/hashfood/id1117103333?l=ar&ls=1&mt=8 (Last accessed May 17, 2020).
[22] Tazej. [Online]. https://itunes.apple.com/jo/app/%D8%B7%D8%A%D8%B2%D8%AC/id1150041871?mt=8 (Last accessed May 17, 2020).
[23] Workspaces. [Online]. https://itunes.apple.com/us/app/theworkspacesid1246555146?l=ar&ls=1&mt=8 (Last accessed May 17, 2020).
[24] Maharah. [Online]. https://play.google.com/store/apps/details?id=com.mharah.app&hl=ar(Last accessed May 17, 2020).
[25] INTIX DWC Company. [Online]. http://intix.net/ (Last accessed May 17, 2020).
[26] S.N. Ahsan, J. Ferzund, and F. Wotawa, “Pro-gram file bug fix effort estimation using ma-chine learning methods for open source softwareProjects,” Institute for Software TechnologistTechnical, 2009.
[27] L. Marks, Y. Zou, and A.E. Hassan, “Study-ing the fix-time for bugs in large open sourceprojects,” in Proceedings of the 7th InternationalConference on Predictive Models in Software En-gineering, 2011, pp. 1–8.
[28] P. Kaur and C. Singh, “A systematic approachfor bug severity classification using machinelearning’s text mining techniques,” Journal ofComputer Science and Information Technology,Vol. 5, No. 7, 2016.
[29] Bugzilla. [Online]. https://www.bugzilla.org/(Last accessed May 17, 2020).
[30] M. Günel, Keras: Deep Learning library forTheano and TensorFlow. [Online]. https://web.cs.hacettepe.edu.tr/~aykut/classes/spring2016/bil722/tutorials/keras.pdf (Last accessed May17, 2020).
[31] S. Bird, E. Klein, and E. Loper,Natural LanguageProcessing with Python: Analyzing Text withthe Natural Language Toolkit, 1st ed. Beijing;Cambridge Mass.: O’Reilly Media, Jul. 2009.
[32] Pycharm, The Python IDE for Professionals.[Online]. https://www.jetbrains.com/pycharm/(Last accessed May 17, 2020).
[33] Z. Imran, Predicting bug severity in open-sourcesoftware systems using scalable machine learning
techniques, mathesis, Youngstown State Univer-sity, 2016.
[34] I. Mani and I. Zhang, “kNN approach to unbal-anced data distributions: A case study involv-ing information extraction,” in Proceedings ofWorkshop on Learning from Imbalanced Datasets,Vol. 126, 2003.
[35] S. Hochreiter and J. Schmidhuber, “Long short--term memory,” Neural Computation, Vol. 9,No. 8, 1997, pp. 1735–1780.
[36] M.N. Karim and S.L. Rivera, “Comparisonof feed-forward and recurrent neural net-works for bioprocess state estimation,” Com-puters and Chemical Engineering, Vol. 16, 1992,pp. S369–S377.
[37] R. Santos, M. Rupp, S. Bonzi, and A.M. Fileti,“Comparison between multilayer feedforward neu-ral networks and a radial basis function networkto detect and locate leaks in pipelines transport-ing gas,” Chemical Engineering Transactions,Vol. 32, 2013, pp. 1375–1380.
[38] L. Mei, R. Hu, H. Cao, Y. Liu, Z. Han, F. Li,and J. Li, “Realtime mobile bandwidth predic-tion using lstm neural network,” in InternationalConference on Passive and Active Network Mea-surement. Springer, 2019, pp. 34–47.
[39] S. Ray, “Suppor vector machine algorithm inmachine learning,” Sep. 2017. [Online]. https://www.analyticsvidhya.com/blog/2017/09/understaing-support-vector-machine-example-code/
[40] W. Harrad, “A top machine learning algorithmexplained: Support vector machines (svms),” Feb.2020. [Online]. https://www.vebuso.com/2020/02/a-top-machine-learning-algorithm-explained-support-vector-machines-svms/
[41] M. Waseem, “Support vector machine in python,”Nov. 2019. [Online]. https://www.edureka.co/blog/support-vector-machine-in-python/
[42] sklearn.metrics.accuracy_score. [Online]. https://scikit-learn.org/stable/modules/generated/sklearn.metrics.accuracy_score.html (Lastaccessed April 30, 2020).
[43] U. Malik, Implementing SVM and Kernel SVMwith Python’s Scikit-Learn. [Online]. https://stackabuse.com/implementing-svm-and-kernel-svm-with-pythons-scikit-learn/ (Last accessedApril 30, 2020).
[44] O. Harrison, Machine Learning Basics with theK-Nearest Neighbors Algorithm, 2018. [Online].https://towardsdatascience.com/machine-learning-basics-with-the-k-nearest-neighbors-algorithm-6a6e71d01761 (Last accessed April30, 2020).

A Deep-Learning-Based Bug Priority Prediction Using RNN-LSTM Neural Networks 45
[45] KNNAlgorithm - Finding Nearest Neighbors. [On-line]. https://www.tutorialspoint.com/machine_learning_with_python/machine_learning_with_python_knn_algorithm_finding_nearest_neighbors.htm (Last accessed April 30, 2020).
[46] Google Brain Team, tensorflow. Develop andtrain ML models, 2015. [Online]. https://www.tensorflow.org/ (Last accessed December 15,2019).
[47] T. Mester, Pandas Basics (Reading Data Files,DataFrames, Data Selection), 2019. [Online].https://data36.com/pandas-tutorial-1-basics-reading-data-files-dataframes-data-selection/(Last accessed May 17, 2020).
[48] D.P. Kingma and J. Ba, “Adam: A methodfor stochastic optimization,” arXiv preprintarXiv:1412.6980, 2014.
[49] train_test_split. [Online]. https://scikit-learn.org/stable/modules/generated/sklearn.model
_selection.train_test_split.html (Last accessedMay 17, 2020).
[50] J. Brownlee, How to Diagnose Overfitting andUnderfitting of LSTM Models, 2017. [Online].https://machinelearningmastery.com/diagnose-overfitting-underfitting-lstm-models/ (Lastaccessed May 17, 2020).
[51] PyQt5 Reference Guide. [Online]. https://www.riverbankcomputing.com/static/Docs/PyQt5/(Last accessed September 05, 2020).
[52] G. Yang, S. Baek, J.W. Lee, and B. Lee, “Analyz-ing emotion words to predict severity of softwarebugs: A case study of open source projects,” inProceedings of the Symposium on Applied Com-puting, 2017, pp. 1280–1287.
[53] T. Young, D. Hazarika, S. Poria, and E. Cambria,“Recent trends in deep learning based natural lan-guage processing,” IEEE Computational Intelli-gence Magazine, Vol. 13, No. 3, 2018, pp. 55–75.


e-Informatica Software Engineering Journal, Volume 15, Issue 1, 2021, pages: 47–64, DOI 10.37190/e-Inf210103
Use of Agile Practices in Start-up Companies
Eriks Klotins∗, Michael Unterkalmsteiner∗, Panagiota Chatzipetrou∗∗, Tony Gorschek∗∗∗,Rafael Prikladnicki∗∗∗∗, Nirnaya Tripathi∗∗∗∗∗, Leandro Bento Pompermaier∗∗∗∗∗∗
∗Software Engineering Research Lab, Blekinge Institute of Technology, Sweden∗∗Department of Informatics, CERIS, Örebro University School of Business, Sweden
∗∗∗Software Engineering Research Lab, Blekinge Institute of Technology, Sweden∗∗∗∗Software Engineering Research Lab, Pontifical Catholic University of Rio Grande do Sul, Brasil
∗∗∗∗∗Software Engineering Research Lab, University of Oulu, Finland∗∗∗∗∗∗Software Engineering Research Lab, Pontifical Catholic University of Rio Grande do Sul, [email protected], [email protected], [email protected],
[email protected], [email protected], [email protected],[email protected]
AbstractContext Software start-ups have shown their ability to develop and launch innovative softwareproducts and services. Small, motivated teams and uncertain project scope makes start-ups goodcandidates for adopting Agile practices.Objective We explore how start-ups use Agile practices and what effects can be associated withthe use of those practices.Method We use a case survey to analyze 84 start-up cases and 56 Agile practices. We applystatistical methods to test for statistically significant associations between the use of Agile practices,team, and product factors.Results Our results suggest that development of the backlog, use of version control, coderefactoring, and development of user stories are the most frequently reported practices. We identify22 associations between the use of Agile practices, team, and product factors. The use of Agilepractices is associated with effects on source code and overall product quality. A teams’ positive ornegative attitude towards best engineering practices is a significant indicator for either adoptionor rejection of certain Agile practices. To explore the relationships in our findings, we set fortha number of propositions that can be investigated in future research.Conclusions We conclude that start-ups use Agile practices, however without following anyspecific methodology. We identify the opportunity for more fine-grained studies into the adoptionand effects of individual Agile practices. Start-up practitioners could benefit from Agile practicesin terms of better overall quality, tighter control over team performance, and resource utilization.
Keywords: Agile practices, start-up companies
1. Introduction
Software start-ups are important suppliers ofinnovation, new products, and services. However,engineering of software in start-ups is a com-plicated endeavor as the start-up context poseschallenges to software engineers [1]. As a resultof these challenges, most start-ups do not survive
the first few years of operation and cease to existbefore delivering any value [2, 3].
Uncertainty, changing goals, limited humanresources, extreme time, and resource constraintsare reported as characteristics of start-ups [1, 4].
To survive in such a context, start-ups usead hoc engineering practices and attempt totailor agile methods to their needs. However,
Submitted: 31 August 2020; Revised: 04 December 2020; Accepted: 12 January 2021; Available online: 29 March 2021

48 Eriks Klotins et al.
scaled-down agile methods could be irrelevantand ignore start-up specific challenges [5, 6].
Giardino et al. [7] suggest that start-upsadopt practices as a response to some problem-atic situations and do not consider adopting fullagile methodologies, e.g., scrum or XP, at leastin early stages.
Pantiuchina et al. [8] make a similar obser-vation and argue that start-ups focus more onspeed-related practices, e.g., iterations and fre-quent releases, than quality-related practices,e.g., unit testing and refactoring.
In this study, we explore the use of Agilepractices in start-ups. We focus on identifyingthe associations between certain Agile practices,product, and team factors. We aim to understandwhat positive, and potentially adverse effects canbe associated with the use of specific practices.We use our results to formulate propositions forfurther exploration.
We use a case survey to collect data from84 start-up cases [9]. We use statistical meth-ods to analyze 11,088 data points and identifyassociations between the use of Agile practicesand respondents’ estimates on various team andproduct factors.
We identify 20 statistically significant asso-ciations pointing towards potential causes andeffects of using Agile practices. We identify thatthe use of automated tests and continuous in-tegration is associated with positive attitudestowards following best practice. However, theuse of planning and control practices are moreassociated with negative attitudes towards fol-lowing the best practices.
The rest of this paper is structured as follows.In Section 2, we discuss relatedwork. Section 3 cov-ers the research methodology, data collection, andour approach to data analysis. Section 4 presentsthe results. We answer our research questions anddiscuss the implications for research and practicein Section 5. Section 6 concludes the paper.
2. Background and related work2.1. Software start-ups
Software start-ups are small companies createdfor developing and bringing an innovative soft-
ware intensive product or service to the market,and to benefit from economies of scale.
Start-up companies rely on external fundingto support their endeavors. In 2015 alone, start--up companies have received investments of 429billion USD in the US and Europe alone [10, 11].With an optimistic start-up failure rate of 75%that constitutes of 322 billion USD of capitalpotentially wasted on building unsuccessful prod-ucts.
Earlier studies show that product engineer-ing challenges and inadequacies in applied en-gineering practices could be linked to start-upfailures [1, 12]. To what extent software engi-neering practices are responsible or linked to thesuccess rate is very hard to judge. However, ifimproved software engineering practices couldincrease the likelihood of success by only a fewpercent, it would yield a significant impact oncapital return.
Some authors, e.g., Sutton [13] and Giardino[3], point out the unique challenges in start-ups,such as high risk, uncertainty, lack of resources,rapid evolution, immature teams, and time pres-sure among other factors. At the same time,start-ups are flexible to adopt new engineeringpractices, and reactive to keep up with emerg-ing technologies and markets [7]. However, ourearlier study [12] analyzing the amount of em-pirical evidence supporting the uniqueness ofstart-ups found that most start-up character-istics are based on anecdotal evidence. Thus,there could be a negligible difference betweenstart-ups and other organizations launching newsoftware-intensive products on the market interms of software engineering.
2.2. Agile practices
Agile software engineering practices originatefrom the Agile manifesto, proposing a shift fromheavyweight, plan-driven engineering towardsmore lightweight, customer-oriented, and flex-ible methodologies [14]. Agile methodologies,such as Scrum and XP, prescribe specific sets ofAgile practices [15, 16]. However, in practice,by-the-book methodologies are often tailoredwith additional practices to address specific con-cerns [17, 18]. Thus, we focus our study on what

Use of Agile Practices in Start-up Companies 49
practices start-ups use, without considering anyspecific agile methodology.
Small organizations have successfully adoptedAgile practices for projects where requirementsare uncertain and expected to change [19, 20].In theory, Agile practices could be perfect forsoftware start-ups [6]. However, successful adop-tion of Agile practices requires highly skilledteams and support throughout the organiza-tion [19, 21].
Earlier work on software engineering practicesin start-ups suggests that start-ups initially relyon an ad hoc approach to engineering and adoptagile principles incrementally when the need formore systematic practice arises. The shift is oftenmotivated by excessive technical debt, hinderingquality, and lack of control over the engineeringprocess [7].
The motivations for adopting agile practicesin start-ups include accelerated product deliv-ery, ability to manage changing priorities, andincreased team productivity. Practices concern-ing team collaboration such as open work areas,use of task boards, and a prioritized backlog arereported as the most widely used [22]. Souza etal. [23] reports that start-ups primarily adoptpractices that provide immediate benefits andhelp to accelerate time-to-market.
We explore the associations between 56 Agilepractices, product, and team factors. We use a listand descriptions of Agile practices compiled byAgile Alliance, a non-profit community promot-ing agile principles [24]. To our best knowledge,their website contains the most comprehensivelist of Agile practices to date.
In this study, we consider the following prac-tices whose definitions can be found at the Ag-ile Alliance’s website [24]: Card, Conversation,Confirmation (3C’s), Acceptance tests, Accep-tance Test-Driven Development (ATDD), Au-tomated build, Backlog, Backlog grooming, Be-havior Driven Development, Burndown chart,Collective ownership, Continuous deployment,Continuous integration, Class Responsibility Col-laborator (CRC) Card cards, Daily meeting, Def-inition of Done, Definition of Ready, Exploratorytesting, Facilitation, Frequent releases, Given--When-Then, Heartbeat retrospective, Incremen-
tal development, INVEST, Iterations, Iterativedevelopment, Kanban board, Lead time, Mockobjects, Niko-Niko, Pair Programming, Personas,Planning poker, Point estimates, Project char-ters, Quick design session, Refactoring, Relativeestimation, Role-Feature-Reason, Rules of sim-plicity, Scrum of Scrums, Sign up for tasks, Sim-ple design, Story mapping, Story splitting, Sus-tainable Pace, Task board, Team, Team room,Test-driven development, Three Questions, Time-box, Ubiquitous language, Unit tests, Usabilitytesting, User stories, Velocity, and Version con-trol.
In this paper, we follow Agile Alliance namingof the practices. Some of the terms describingpractices can also refer to artifacts, e.g., accep-tance tests. When we use such a term, we meanthe practice of creating and utilizing acceptancetests.
2.3. Effects of using Agile practices
The use of Agile practices is associated withincreased product quality and fewer defects com-pared to plan-driven approaches [25, 26]. Weanalyze the associations between the use of Agilepractices, product documentation, software archi-tecture, quality of the source code, tests, and theoverall product quality. In this paper, we adoptthe product view on software quality, recogniz-ing the relationship between internal productcharacteristics and quality of use [27].
Product documentation comprises of writtenrequirements, architecture documentation, andtest cases. Deficiencies in such artifacts are as-sociated with hindered knowledge distributionin the team and with adverse effects on furtherdevelopment and maintenance of the product [28].Note that we analyze if documentation artifactsare understandable and useful without implyingany specific format.
Even though the Agile manifesto emphasizesworking software over comprehensive documen-tation, some documentation is essential [14]. Forexample, user stories are one of the key agile toolsto document requirements [29]. System metaphoris useful to communicate the logical structure ofthe software to all stakeholders [30]. The use of

50 Eriks Klotins et al.
automated testing in continuous integration anddeployment pipelines require formally definedtests [31].
Software architecture denotes how differentcomponents, modules, and technologies are com-bined to compose the product. Symptoms suchas outdated components, a need for workaroundsand patches point towards deficiencies in thesoftware architecture and the lack of attentionto refactoring [32, 33].
Source code quality is determined using cod-ing standards and refactoring practices [34, 35].Degrading architecture and poorly organizedsource code is associated with increased softwarecomplexity, difficult maintenance, and productquality issues down the road [28].
We analyze the quality (or lack thereof) ofautomated test scripts, removing the need to per-form manual regression testing on every releaseof the product. The effort of manual regressiontesting grows exponentially with the number offeatures, slowing down release cycles and makingdefect detection a time-consuming and tedioustask [28].
We also examine the associations betweenproduct quality and the use of Agile practices.With product quality, we understand nonfunc-tional aspects of the product, such as perfor-mance, scalability, maintainability, security, ro-bustness, and the ability to capture any defectsbefore the product is released to customers [28].
Good communication, teamwork, adequateskills, and a positive attitude towards the follow-ing best practices are recognized as essential teamfactors for project success [19]. Agile softwareengineering practices aim to facilitate communi-cation, empower individuals, and improve team-work [36]. We analyze the associations betweenteam characteristics and the use of specific Agilepractices.
Attitudes determine the level of apathy orinterest in adopting and following the best en-gineering practices. Skills characterize to whatextent individual members of a start-up teampossess relevant engineering skills and knowl-edge. Communication captures to what extentthe team can communicate and coordinate the
engineering work. Giardino et al. [7] identify theteam as the catalyst for product development instart-ups. Sufficient skills, positive attitudes, andefficient communication are essential for rapidproduct development in both agile and start-upcontexts [7, 19].
Pragmatism characterizes to what extenta team can handle trade-offs between investingin perfected engineering solutions and time-to--market. Agile practices advocate for frequentreleases and good-enough solutions [15]. Suchpractices help to validate the product featuresearly and gather additional feedback from cus-tomers [12]. On the other hand, quick product re-leases need to be accompanied by frequent refac-toring and unit tests to manage technical debtand keep regression defects under control [19].Start-ups often overlook such corrective prac-tices [7, 12].
Sufficient time and resources for product engi-neering are essential for project success [19]. Weanalyze what Agile practices can be associatedwith better resource estimation and planning instart-ups. Several authors, e.g., Giardino et al. [3]and Sutton [13] identify resource shortage as oneof the critical challenges in start-ups. However,we, in our earlier study identify the lack of ade-quate resources, planning and control practicesin early start-ups [9].
We look into respondent estimates on the en-gineering process in their organizations. Processcharacterizes to what extent product engineeringis hindered by unanticipated changes in organiza-tional priorities, goals, and unsystematic changesin the product itself. Lack of organizational sup-port for agile product engineering contributes toproject failures [19]. On the other hand, Agilepractices offer some room for adjusting to unclearand changing objectives [20].
Agile methods on a high level attempt toaddress and promise improvements in all theseconcerns [36]. However, analyzing the effects ofapplying the whole methodology on a large num-ber of factors does not help to pinpoint specificpractices for specific challenges. We aim to es-tablish a fine-grained view on the use and effectsof individual practices.

Use of Agile Practices in Start-up Companies 51
3. Research methodology
3.1. Research aim
We aim to explore how software start-ups useAgile practices and what positive and negativeeffects can be associated with specific practices.
3.2. Research questions
To guide our study, we define the following re-search questions (RQ):RQ1: How are Agile practices used in start-ups?Rationale: With this question, we identify whatAgile practices and in what combinations start--ups use.RQ2: What are the associations between specificAgile practices and product factors?Rationale: With this question, we explore the as-sociations between specific Agile practices, qual-ity of documentation, architecture, source code,testing, and overall product quality.RQ3: What are the associations between specificAgile practices and team factors?Rationale:With this question, we explore the asso-ciations between specific Agile practices, attitudestowards following best engineering practices,pragmatism, communication, skills, resources,engineer process, and teams’ productivity.
3.3. Data collection
We used a case survey method to collect primarydata from start-up companies [9, 37].
The case survey method is based on a ques-tionnaire and is a compromise between a tradi-tional case study and a regular survey [38]. Wehave designed the questionnaire to collect prac-titioners’ experiences in specific start-up cases.
During the questionnaire design phase, weconducted multiple internal and external reviewsto ensure that all questions are relevant, clearand that we receive meaningful answers. First,the questions were reviewed in multiple roundsby the first three authors of this paper to refinethe scope of the survey and question formula-tions. Then, with the help of other researchers
from the Software Start-up Research Network1,we conducted a workshop to gain external inputon the questionnaire. A total of 10 researchersparticipated and provided their input.
Finally, we piloted the questionnaire withfour practitioners from different start-ups. Dur-ing the pilot, respondents filled in the question-naire while discussing questions, their answers,and any issues with with the first author of thispaper.
As a result of these reviews, we improved thequestion formulations and removed some irrele-vant questions. The finalized questionnaire con-tains 85 questions in 10 sections. The question-naire captures 285 variables from each start-upcase.
We use a list of 56 Agile practices to cap-ture the respondent’s answers on what practicesthey use in their companies, as described in Sec-tion 2.2. The answers are captured in a binaryuse or not use format. In addition to specific prac-tices, we offer an “I do not know” and “other” op-tion to accommodate for the lack of respondentsknowledge and to discover other, unlisted prac-tices. We rely on the respondents best judgmentto gauge whether the extent of using a practicein their start-ups qualifies as an application ofthe practice or not.
We use 45 other questions to capture respon-dents evaluations of product and team-relatedstatements, such as:– Initial product/service architecture has be-
come outdated;– Communication and collaboration within
the development team regarding the prod-uct/service architecture is insufficient;
– Incremental changes to the product/serviceare unsystematic and degrades the architec-ture;
– Quick delivery of functionality is consideredmore important than good code.The questions capture the respondents’ agree-
ment with a statement characterizing a factor ona Likert scale: not at all (1), a little (2), some-what (3), very much (4). The values indicatethe degree of agreement with a statement. State-ments are formulated consistently in a way that
1The Software Start-up Research Network, https://softwarestartups.org/

52 Eriks Klotins et al.
lower values indicate less, and higher values in-dicate more agreement with the statement.
The questionnaire is designed to be filled inby one person and we analyze one response perstart-up. To control this, we collect the contactinformation of the respondent and the title oftheir company. In addition to questions aboutsoftware engineering, the questionnaire containsquestions inquiring about the respondents back-ground, and engineering context in the start-up.The full questionnaire is available as supplemen-tal material on-line2.
The data collection occurred between De-cember 1, 2016, and June 15, 2017. The sur-vey was promoted through personal contacts,by attending industry events, and with postson social media websites. The survey was pro-moted as “help us to understand what engineer-ing practices work and does not work in start-ups”and targeted for practitioners with an under-standing about the engineering parts of theirstart-up.
We invited other researchers from the Soft-ware Start-up Research Network to collaborateon the data collection. This collaboration helpedto spread the survey across many geographicallocations in Europe, North and South America,and Asia.
3.4. Data analysis methods
To analyze the survey responses, we used severaltechniques. We started by screening the dataand filtering out duplicate cases, responses withfew questions answered, or otherwise unusableresponses. In the screening, we attempt to beas inclusive as possible and do not remove anycases based on the provided responses.
Overall, we analyzed responses from 84 start--up cases, 132 data points per each case, and11,088 data points. We use the Chi-Squared testof association to test if the associations betweenthe examined variables are not due to chance.To prevent Type I errors, we used exact tests,specifically, the Monte-Carlo test of statisticalsignificance based on 10,000 sampled tables andassuming (p < 0.05) [39].
To examine the strength of associations, weuse Cramer’s V test. We interpret the test re-sults as suggested by Cohen [40], see Table 1.To explore the specifics of the association, suchas which cases are responsible for this associa-tion, we performed post hoc testing using ad-justed residuals. We consider an adjusted resid-ual significant if the absolute value is above1.96 (Adjusted residual > 1.96), as suggested byAgresti [41].
Table 1. Interpretation of Cramer’s V test
Cramer’s Vvalue Interpretation
≥0.1 Weak association≥0.3 Moderate association≥0.5 Strong association
The adjusted residuals drive our analysis onhow different groups of start-ups estimate as-pects of technical debt. However, due to theexploratory nature of our study, we do not stateany hypotheses upfront and drive our analysiswith research questions.
3.5. Validity threats
In this section, we follow the guidelines by Rune-son et al. [42] and discuss four types of validitythreats and applied countermeasures in the con-text of our study.
3.5.1. Construct validity
Construct validity concerns whether operationalmeasures represent the studied subject [42]. A po-tential threat is that the statements we use tocapture respondent estimates are not capturingthe indented team and product factors.
To address this threat, we organized a seriesof workshops with other researchers and poten-tial respondents to ensure that the questions areclear to the point and to capture the studiedphenomenon.
We triangulate each factor by capturing it by3–4 different questions in the questionnaire. Toavoid biases stemming from respondents precon-
2Full questionnaire: http://eriksklotins.lv/files/GCP_questionnaire.pdf

Use of Agile Practices in Start-up Companies 53
ceived opinions about the effects of agile prac-tices, we separate questions about the use ofpractices and questions inquiring about teamand product factors.
To accommodate for the fact that a respon-dent may not know the answers to some of thequestions, we provide an explicit “I do not know”answer option to all Likert scale questions.
Regarding the use of agile practices, we aska binary question capturing the use/not use ofa practice. Such an approach does not capturethe extent, nor other specifics of the applicationof a practice. This creates a room for a wideinterpretation of what entails using the practice.For example, cases having one automated testand cases with an extensive suite of automatedtests would be treated the same.
In this study, we aim for breadth, in termsof studied cases and practices, to understandwhat agile practices are relevant to start-ups andthe team and product factors associated withspecific practices. Details of the optimal use ofthe practices is an avenue for further work.
3.5.2. Internal validity
This type of validity threat addresses causal re-lationships in the study design [42].
In our study, we do not seek to establishcausal relationships, thus this type of validitythreat is not relevant.
3.5.3. External validity
This type of validity threat concerns to whatextent the results could be valid to start-upsoutside the study [42]. The study setting forparticipants was close to real life as possible.That is, the questionnaire was filled in withoutresearcher intervention and in the participant’senvironment.
The sampling of participants is a concern toexternal validity. We use convenience samplingto recruit respondents and with the help of otherresearchers, distributed the survey across severaldifferent start-up communities. Demographic in-formation from respondent answers shows thatour sample is skewed towards active companies,
respondents with little experience in start-ups,young companies, and small development teamsof 1–8 engineers. In these aspects, our sample fitsthe general characteristics of start-ups, see, for ex-ample, Giardino et al. [1, 3] and Klotins et al. [5].However, there is a survivor bias, that is, failedstart-ups are underrepresented. Thus, our resultsreflect state-of-practice in active start-ups.
Another threat to external validity stemsfrom case selection. We marketed the question-naire to start-ups building software-intensiveproducts. However, due to the broad definitionof software start-ups (see Giardino et al. [3]),it is difficult to differentiate between start-upsand small-medium enterprises. We opted to beas inclusive as possible and to discuss relevantdemographic information along with our findings.
3.5.4. Conclusion validity
This type of validity threat concerns the possi-bility of incorrect interpretations arising fromflaws in, for example, instrumentation, respon-dent and researcher personal biases, and externalinfluences [42].
To make sure that respondents interpret thequestions in the intended way, we conductedseveral pilots, workshops and improved the ques-tionnaire afterwards. To minimize the risk of sys-tematic errors, the calculations and the first andthe third author performed statistical analysisindependently, and the findings were discussedamong the authors.
It could be that some respondents may lackthe knowledge to fully answer our questions. Wemitigate this threat by providing the “I do notknow” option to all our questions. We furtheranalyze the respondent demographics and back-ground (see Section 4) to gauge the credibilityof their responses. However, we cannot excludethat in some cases the responses are incomplete.As a result, we cannot reliably make conclusionsfrom the absence of information in the responses.
To test if the order of appearance of Agilepractices affects practitioner responses, we runa Spearman’s rank-order correlation test [43].We examine a potential relationship between theorder of appearance and the frequency chosen by

54 Eriks Klotins et al.
respondents. The results showed that there is nostatistically significant correlation (p > 0.05).
4. Results
The majority of the surveyed start-ups (63 outof 84, 75%) are active and have been operatingfor 1–5 years (58 out of 84, 69%). Start-ups aregeographically distributed among Europe (34 outof 84, 40%), South America (41 out of 84, 49%),Asia (7 out of 84, 8%), and North America (2 outof 84, 2%).
Our sample is about equally distributed interms of the product development phase. Wefollow the start-up life-cycle model proposed byCrowne [44] and distinguish between inception,stabilization, growth, and maturity phases. Inour sample, 16 start-ups have been working ona product but have not yet released it to themarket, 24 teams have released the first versionand actively develop it further with customerinput, 26 start-ups have a stable product and
they focus on gaining customer base, and another16 start-ups have mature products, and they fo-cus on developing variations of their products.
The questionnaire was filled in mostly bystart-up founders (64 out of 84, 76%) and engi-neers employed by start-ups (15 out of 84, 18%).About half of the respondents have specified thattheir area of expertise is software engineering(49 out of 84, 58%). Others have specified mar-keting, their respective domains, and businessdevelopment as their areas of expertise.
The respondents’ length of software engineer-ing experience ranges from 6 months to morethan 10 years. A large portion of respondents(44 out of 84, 52%) had less than 6 months ofexperience in working with start-ups at the timewhen they joined their current start-up.
We provide a complete list of studied casesand their demographical information as supple-mental material on-line3.
The responses on what development type bestcharacterizes the company suggest that mostcompanies, 51 out of 84, 60%, follow agile and
��-��� ��������� ���� ��������� ����� � �� ��� ���� �/� ������
��
��
��
��
Figure 1. Use of development approaches in the studied cases
3The studied cases: http://eriksklotins.lv/files/GCP_demographics.pdf

Use of Agile Practices in Start-up Companies 55
� � �� �� �� �� �� �� �� �� �� �� �� ���
��
��
��
��
���� #
#�������������������
Figure 2. The number of reported agile practices in the studied start-up companies. y-axis show the numberof reported practices, x-axis show the studied cases. The cases are sorted by the number of reported practices
����� �� ����������������� ������������-�������������� ������������� �������������-�������-��������� ��������������������� ����������������� �������� ���������������-����-���������������������������������� ����� ��� (����� ������������� ������������)������������ �� ��� ��������� ������������ �� �������������� �������������������� �� �����
����� �������������-������ ������������������� ��������������� ���������� ������������ ������ ������������ ������������������������ ���������������� �����
������ ����������������� ��������������������� ������������������� �� ������������� ������������������ ��������������������� ����������
��������� ������������������� ����������������� ��������� �������������������������� ����������� �����
���������� ��������������� ����������� ����������� ����������������
������� ��������������
� �� �� �� �� ��
�% ����% ����% ����% ����% ����%
Figure 3. Frequency of Agile practices

56 Eriks Klotins et al.
iterative processes. A few 2 out of 84 followa waterfall-like process, 10 companies report us-ing an ad hoc approach, see Figure 1.
We presented respondents with a list of 56 Ag-ile practices and asked to tick off the practicesthat they use in their companies. Most start-upsuse between 0 and 20 Agile practices. However,the majority of companies report using only a fewpractices, see Figure 2. There is also a smallcluster of companies reporting the use of morethan 35 individual practices. Only 7 companiesexplicitly reported not using any agile practices,16 respondents have not provided their answers.
The most frequently used Agile practices arebacklog and version control reported by 42 and39 companies, respectively (50% and 46% outof 84 cases). The use of other practices varies,see Figure 3. Respondents do not report theuse of practices such as the Niko-Niko calendar(visualizing the team’s mood changes), projectcharters (a poster with a high level summaryof the project), and rules of simplicity (a set ofcriteria to evaluate source code quality).
4.1. Overview of the findings
In Table 2, we summarize the associations be-tween the use of certain practices and product
factors. In Table 3, we summarize the associa-tions between the use of certain practices andteam factors. We show only practices with sta-tistically significant associations (p < 0.05). Thenumbers in the table show Cramer’s V valuesdenoting the strength of the associations, seeTable 1 for interpretation of the values.
4.2. Interpretation of associations
An association shows that a specific practice andcertain estimates of a factor are reported together.We use the Pearsons Chi-squared test (p < 0.05)to determine if the association is statistically sig-nificant. However, from associations alone, we can-not explain the phenomenon with confidence andguide guide practitioners in adopting Agile prac-tices in start-ups. To explain the associations, weformulate 5 archetypes (A) of propositions charac-terizing the potential explanations of our findings:
It could be that a statistically significant asso-ciation is a false positive. That is, the associationbetween a practice and a factor is due to an erroror some confounding factor.A0: There is a spurious association between
P and F .An association could point towards a causal
relationship between the use of a practice (P ) andTable 2. Results of Cramer’s V test on the association between product factors and use of Agile practiceswith p < 0.05. Up (↑) and down (↓) arrows denote whether the association is positive, i.e., use of the practice
is associated with more positive responses, or negative, i.e., use of the practice is associated with morenegative estimates from respondents
Practice Docum
entatio
n
Architecture
Source
code
Testing
Overallqu
ality
Card, Conversation, Confirmation – – – 0.422↑ –Unit tests – – – 0.391↑ –Automated build – – 0.374↑ – –Facilitation – – 0.330↓ – –Given-When-Then – – 0.330↓ – –INVEST – – 0.330↓ – –Iterations – 0.359↑ – – –Continuous integration – – – – 0.368↑Collective ownership – – – – 0.372↓
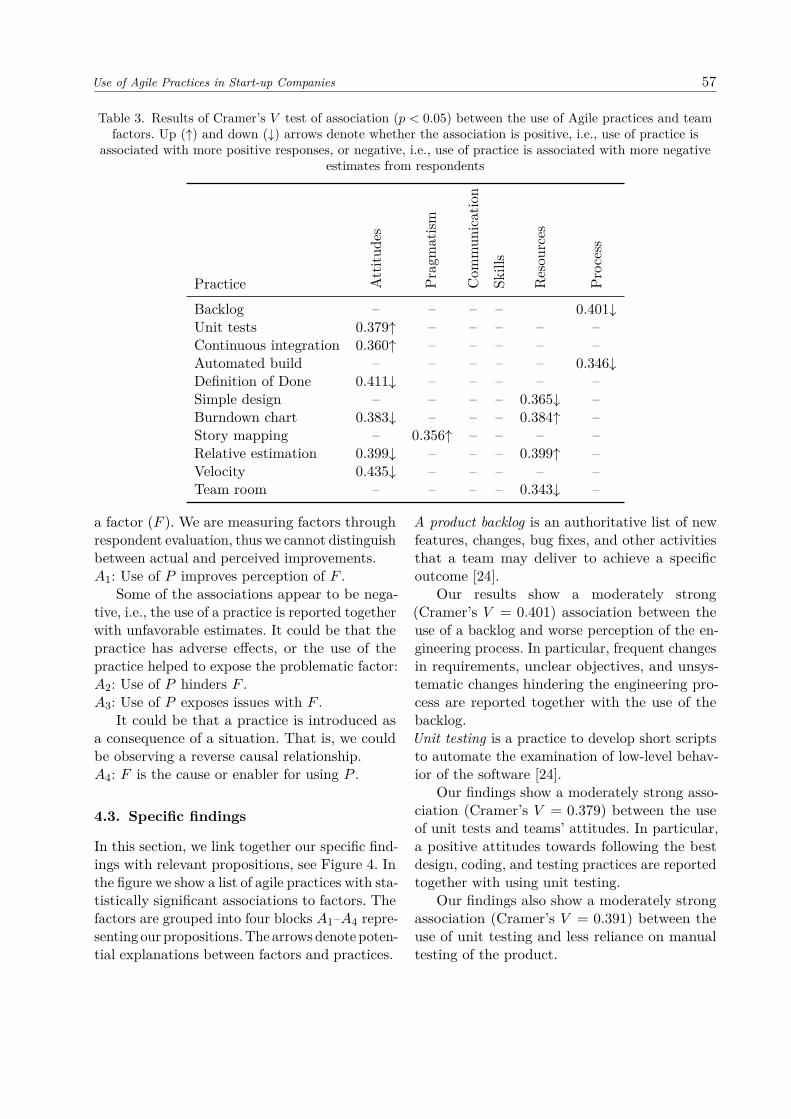
Use of Agile Practices in Start-up Companies 57
Table 3. Results of Cramer’s V test of association (p < 0.05) between the use of Agile practices and teamfactors. Up (↑) and down (↓) arrows denote whether the association is positive, i.e., use of practice is
associated with more positive responses, or negative, i.e., use of practice is associated with more negativeestimates from respondents
Practice Attitu
des
Prag
matism
Com
mun
ication
Skills
Resou
rces
Process
Backlog – – – – 0.401↓Unit tests 0.379↑ – – – – –Continuous integration 0.360↑ – – – – –Automated build – – – – – 0.346↓Definition of Done 0.411↓ – – – – –Simple design – – – – 0.365↓ –Burndown chart 0.383↓ – – – 0.384↑ –Story mapping – 0.356↑ – – – –Relative estimation 0.399↓ – – – 0.399↑ –Velocity 0.435↓ – – – – –Team room – – – – 0.343↓ –
a factor (F ). We are measuring factors throughrespondent evaluation, thus we cannot distinguishbetween actual and perceived improvements.A1: Use of P improves perception of F .
Some of the associations appear to be nega-tive, i.e., the use of a practice is reported togetherwith unfavorable estimates. It could be that thepractice has adverse effects, or the use of thepractice helped to expose the problematic factor:A2: Use of P hinders F .A3: Use of P exposes issues with F .
It could be that a practice is introduced asa consequence of a situation. That is, we couldbe observing a reverse causal relationship.A4: F is the cause or enabler for using P .
4.3. Specific findings
In this section, we link together our specific find-ings with relevant propositions, see Figure 4. Inthe figure we show a list of agile practices with sta-tistically significant associations to factors. Thefactors are grouped into four blocks A1–A4 repre-senting our propositions.The arrows denote poten-tial explanations between factors and practices.
A product backlog is an authoritative list of newfeatures, changes, bug fixes, and other activitiesthat a team may deliver to achieve a specificoutcome [24].
Our results show a moderately strong(Cramer’s V = 0.401) association between theuse of a backlog and worse perception of the en-gineering process. In particular, frequent changesin requirements, unclear objectives, and unsys-tematic changes hindering the engineering pro-cess are reported together with the use of thebacklog.Unit testing is a practice to develop short scriptsto automate the examination of low-level behav-ior of the software [24].
Our findings show a moderately strong asso-ciation (Cramer’s V = 0.379) between the useof unit tests and teams’ attitudes. In particular,a positive attitudes towards following the bestdesign, coding, and testing practices are reportedtogether with using unit testing.
Our findings also show a moderately strongassociation (Cramer’s V = 0.391) between theuse of unit testing and less reliance on manualtesting of the product.

58 Eriks Klotins et al.
A2: Use of P hinders FPotential adverse effects from
using practices
A3: Use of P exposes issues with FSituations potentially exposed by using
practices
A1: P improves perception of FPotential (perceived) improvements
from using a practice
A4: F is a the cause for using PSituations potentially causing a
practice to be used
Unit testing
Positive attitude towards following the best practices
Continuous integration
Story mapping
Relative estimation
Balanced tradeoff between time-to-market and scope
Minimal resources and time pressure
More automation and less dependency on manual
testing
Automated build
Card, conversation, confirmation
Good source code quality
Iterations
Up to date architecture and more optimal technologies
Better overall product quality
Given-When-Then
INVEST
Collective ownership
Backlog
Facilitation
Definition of done
Velocity
Simple design
Team room
Good process in place to handle vague goals and
changing objectives
Poor source code quality
Substantial resources and time pressure
Poor overall product quality
Improved attitude towards following the best practices
Improved tradeoff between time-to-market and scope
Alleviated resources and time pressure
More automation and less dependency on manual
testing
Improved source code quality
Improved architecture and optimal selection of
technologies
Improved overall product quality
Exposes issues with source code quality
Exposes issues with overall product quality
Exposes process issues from unanticipated changes and
vague objectives
Exposes negative attitudes towards following the best
practices
Exposes issues with resources and time
constraints
Creates issues with source code quality
Hinders overall product quality
Introduces unanticipated changes and vague objectives
Fosters negative attitudes towards following the best
practices
Tightens resources and time constraints
Burndown chart
Negative attitudes towards following the best practices
Agile practices (P)
Figure 4. Overview of the findings and the propositions.We show agile practices and different explanations for the associations (A1–A4)
Continuous integration aims to minimize the du-ration and effort of each integration episode andmaintain readiness to deliver a complete productat any moment [24].
Our findings show a moderately strong asso-ciation (Cramer’s V = 0.360) between the useof continuous integration and more positive atti-tudes towards using sound design, coding, andtesting practices.
Our findings also show a moderately strongassociation (Cramer’s V = 0.368) between theuse of continuous integration and more positiveestimates of product internal and external qual-ity, and less slipped defects.Automated build is a practice to automate thesteps of compiling, linking, and packaging thesoftware for deployment [24].
Our findings show a moderately strong(Cramer’s V = 0.346) association between the
use of automated build and worse estimates inthe engineering process.
Our findings also show a moderately strong(Cramer’s V = 0.374) association between theuse of automated builds and more positive esti-mates on the source code quality.Definition of done is a list of criteria which a taskmust meet before it is considered done [24].
Our findings show a moderately strong(Cramer’s V = 0.411) association between theuse of a definition of done and worse attitudestowards following best engineering practices.Simple design is a practice to favor simple, mod-ular, and reusable software designs that are cre-ated as needed [24].
Our findings show a moderately strong as-sociation (Cramer’s V = 0.365) between simpledesign practices and more pressing time and re-source concerns.

Use of Agile Practices in Start-up Companies 59
Burndown chart is a graph visualizing the re-maining work (x-axis) over time (y-axis) [24].
Our findings show a moderately strong as-sociation (Cramer’s V = 0.383) between theuse of the burndown chart and worse estimateson teams’ attitudes towards following the bestengineering practices.
Our findings also show a moderately strongassociation (Cramer’s V = 0.384) between theuse of the burndown chart and less time andresource pressure.Story mapping is a practice to organize user sto-ries in a two-dimensional map according to theirpriority and level of sophistication. Such a mapis used to identify requirements for a bare-bonesbut usable first release, and subsequent levels ofincreased functionality [24].
Our findings show a moderately strong asso-ciation (Cramer’s V = 0.356) between the use ofstory mapping and a more pragmatic approachto handing the trade-off between time-to-marketand following best engineering practices.Relative estimation comprises of estimating taskeffort in relation to other similar tasks, and notabsolute units [24].
Our findings show a moderately strong as-sociation (Cramer’s V = 0.399) between theuse of relative estimation and worse attitudestowards following the best testing, architecture,and coding practices.
Our results also show a moderately strong as-sociation (Cramer’s V = 0.399) between the useof relative estimates and less time and resourcepressure.Velocity is a metric to calculate how long it willtake to complete the project based on past per-formance [24].
Our findings show a moderately strong asso-ciation (Cramer’s V = 0.435) between the use ofvelocity and worse attitudes towards followingthe best engineering practices.Team room is a dedicated, secluded, and equippedspace for an agile team to collaborate on theproject [24].
Our findings show a moderately strong as-sociation (Cramer’s V = 0.343) between theuse
of a team room and more pressing time andresource constraints.Facilitation is a practice to have a dedicatedperson in the meeting, ensuring effective com-munication, and maintaining focus on the objec-tives [24].Given-When-Then is a template for formulat-ing user stories comprising of some contextualinformation, triggers or actions, and a set ofobservable consequences [24].INVEST is a checklist to evaluate the quality ofa user story [24].
Our findings show a moderately strong as-sociation (Cramer’s V = 0.330) between theuse of any of the three practices (Facilitation,Given-When-Then, and INVEST) and worse es-timates on the product source code quality.Iterations are time-boxed intervals in an agileproject in which the work is organized. Theproject consists of multiple iterations, tasks, andobjectives for the next iteration and is revisedjust before it starts [24].
Our findings show a moderately strong asso-ciation (Cramer’s V = 0.359) between the useof iterations and more positive estimates on thequality of the product architecture. Specifically,respondents report fewer workarounds, more op-timal selection of technologies, and fewer issueswith outdated designs.Collective ownership is a practice to empowerany developer to modify any part of the projectsource code [24].
Our findings show a moderately strong asso-ciation (Cramer’s V = 0.372) between collectiveownership and worse estimates on the product’sinternal and external quality.Card, Conversation, Confirmation is a patterncapturing the life cycle of a user story. The life cy-cle starts with a tangible “card”, “conversations”regarding the user story occurs throughout theproject; finally, a “confirmation” is received ofa successful implementation of the user story [24].
Our findings show a moderately strong asso-ciation (Cramer’s V = 0.422) between the useof the life-cycle pattern and less dependence onmanual testing of the product.

60 Eriks Klotins et al.
5. Discussion
5.1. Answers to our research questions
RQ1: How are Agile practices used in start--ups. Our results show that start-ups use Agilepractices, even though they do not follow anyspecific agile methodology. Such results confirmearlier findings, e.g., Giardino et al. [7], and Yauand Murphy [6], stated that engineering practicesand processes in start-ups gradually evolve fromrudimentary and ad hoc to more systematic.
The most frequently used practices are a back-log, version control, refactoring, user stories, unittests, and kanban board. We could not identifyany clear tendencies comparing the frequenciesof practices between different cohorts, e.g., teamsize, product stage, and team skill levels.
Our results show limited adoption of ver-sion control, a backlog, and refactoring. The useof these practices is reported only by 30–50%of cases. Disuse of such practices is reportedboth by respondents with and without softwareengineering background. This is surprising, as,e.g., version control is a widely adopted soft-ware development practice, can be applied withminimal overhead, and provide substantial ben-efits [45, 46]. Thus, not benefiting from versioncontrol to manage the source code is difficultto excuse with lack of resources, time shiftingpriorities, or other pressing concerns [3].
The use of Agile practices does not implythat an organization follows agile principles asproposed by the Agile manifesto [14]. Many ofthe Agile practices, for example, version con-trol, unit testing, and refactoring, among others,could be equally well applied to other types ofdevelopment methodologies. That said, a major-ity of start-ups characterize their developmentmethodology as agile. Exploring the maturity ofagile processes in start-ups remains a directionfor further exploration [9, 47].RQ2: What are the associations betweenspecific Agile practices and product factors.We identify associations between the use of Agilepractices and product architecture, source codequality, test automation, and the overall level ofquality. We could not identify any associations
regarding the quality and understandability ofproduct documentation.
Practices related to automation, e.g., unittests, automated build, and continuous inte-gration, are associated with positive estimatesof product factors. Practices related to re-quirements quality, e.g., Given-When-Then, andINVEST, show negative associations. It couldbe that start-ups introduce such practices asa response to the adverse effects of poor require-ments. However, the causal effects of using Agilepractices need to be explored further to drawany definitive conclusions.
The use of collective ownership is associatedwith negative estimates of overall product qual-ity. We propose two interpretations: a) collectiveownership exposes the actual state of productinternal quality, b) collective ownership has ad-verse effects.
If two or more developers collaborate on thesame part of the product, they may have a moreobjective view of its flaws. A single developerworking on and “owning” a part of a productmay be biased in estimating its quality [48].
Alternatively, inviting other developers towork on the part of a product could introducedefects. Other developers, who are not the orig-inal authors, may lack the essential contextualinformation to evaluate and change the compo-nent without introducing defects. Practices suchas unit testing, continuous integration, and pairprogramming may help to prevent defects anddistribute knowledge in the team. Collective own-ership could be an example of a practice thatmust be supported by other practices to avoidadverse effects.RQ3: What are the associations betweenspecific Agile practices and team factors.Most associations pertain to teams’ attitudes to-wards the following the best engineering practices.Both positive and negative attitudes towards thebest engineering practices are precedents for usingseveral practices. Automation practices, such asunit tests and continuous integration, are asso-ciated with positive attitudes. However, controland planning practices, such as the definition ofdone, burndown chart, relative estimation, andvelocity, are associated with negative attitudes to-

Use of Agile Practices in Start-up Companies 61
wards the following the best engineering practices.We explain such results with the need for tightercontrol over the team’s performance when theydo not see the benefits of following best practices.
We observe several associations between theuse of Agile practices and respondents’ estimatestowards time and resource pressures. The useof burndown charts and relative estimates areassociated with less pressure. We interpret suchfindings that the use of resource planning andcontrol practices helps to plan any amount ofresources better and alleviate the pressure.
We have not identified any associations aboutcommunication in the team. Other authors, e.g.,Yau et al. [6] and Sutton [13], have identifiedthat in small start-up teams, communication isnot an issue. Small collocated teams do not needadditional support for coordination. Such find-ing leads us to argue that the primary reasonsfor introducing Agile practices in start-ups aretighter control over a team’s performance andresource utilization.
5.2. Implications to research
In this study, we have set forth a number propo-sitions for further investigation. Looking at thepropositions summarized in Figure 4, we identifyseveral cross-cutting concerns to address withfurther studies in the area.
Our results suggest that software start-upsadopt Agile practices one by one without fol-lowing any particular agile methodology, e.g.,scrum or XP. Such finding is supported by ear-lier work, for example, Giardino et al. [7] andGralha et al. [49], reporting that new practicesare introduced gradually and aimed at address-ing specific concerns. However, existing researchon adopting agile software engineering considersmostly the adoption of whole methodologies, e.g.,scrum or XP, and not individual practices [36].We identify an opportunity for more fine-grainedresearch on how to adopt Agile practices in smallorganizations to address their specific concerns.
Our results suggest a limited adoption of ubiq-uitous engineering practices such as the use of ver-sion control, backlog, and refactoring, reportedonly by 30–50% of cases, see Figure 3. While
this result could be explained by the limitationsof the survey data collection method, it alsosuggests a potential disuse of essential softwareengineering practices in start-ups. This resultinvites further research to understand how muchneglect of the best engineering practices is moti-vated by the engineering context and how muchby the lack of engineering acumen in start-ups.
Related work identifies the need to be moreflexible and to alleviate the need for rigorous up-front planning as the primary goal for adoptingagile. Other objectives include the aim to improveproduct quality, shorten feedback loops with cus-tomers, and to improve teams’ morale [36]. Suchobjectives are superficial and do not support theadoption of specific practices or addressing spe-cific start-up specific challenges [3]. We identifyan opportunity to explore the precedents of intro-ducing specific Agile practices, and longitudinalstudies examining the effects of specific practices.
5.3. Implications for practitioners
Examining our findings, we identify several rele-vant patterns for practitioners.
Teams’ attitudes towards following the bestengineering practices appear as a strong denomi-nator of adopting a range of Agile practices. Pos-itive attitudes towards good practices drive theadoption of automated testing and continuousintegration. Such practices have further positiveeffects on software quality.
Many respondents, both with and withouta software engineering background, failed to re-port using, for example, version control, refactor-ing, and unit tests. These are standard softwareengineering practices, applicable with minimaloverhead, and could provide substantial benefitsin any software development context.
Negative attitudes towards best practices areassociated with the use of practices for progresscontrol, such as the definition of a done, burn-down chart, and effort estimation. Our explana-tion for such a finding is that teams implementsuch practices to have tighter control over thedevelopment process.
Our results suggest that the primary benefitsof adopting Agile practices are tighter control

62 Eriks Klotins et al.
over the team’s performance and product quality.The use of progress control practices alleviatesresource pressures.
6. Conclusions
In this study, we investigate associations betweenthe use of Agile practices and perceived impacton various product and team factors in softwarestart-ups. Based on our findings, we set forth anumber of propositions that narrow down thespace of investigation for future studies on Agilepractices and start-ups.
We conclude that start-ups adopt Agile prac-tices, however do not follow any specific method-ology. The use of Agile practices is associatedwith improved product quality, more positiveattitudes towards following the best engineeringpractices, and tighter control over resource uti-lization. However, the exploration of the causaleffects remains a direction of further work.
We have formulated several implications forresearchers and practitioners. We identify an op-portunity for more fine-grained studies (on apractice level) into the adoption and effects ofAgile practices. We conclude that Agile practicesshow a potential to be used in start-ups setting,however, adopting individual practices withoutconsidering supporting practices could lead toadverse effects.
7. Acknowledgements
The authors of this paper would like to thankall practitioners who found time and motiva-tion to participate in this study. Reaching thisdiverse population of start-ups would not bepossible without help and support from Soft-ware Start-up Research Network4 community,and specifically Nana Assyne, Anh Nguyen Duc,Ronald Jabangwe, Jorge Melegati, Bajwa SohaibShahid, Xiaofeng Wang, Rafael Matone Chanin,and Pekka Abrahamsson.
This work is partially funded by the Foun-dation for Research Support of the State of Rio
Grande do Sul (17/2551-0001/205-4) and theBrazilian National Council for Scientific andTechnological Development.
References
[1] C. Giardino, S.S. Bajwa, and X. Wang, “Keychallenges in early-stage software startups,” inAgile Processes, in Software Engineering, andExtreme Programming, Vol. 212, 2015, pp. 52–63.
[2] S. Blank, “Why the lean start up changes every-thing,” Harvard Business Review, Vol. 91, No. 5,2013, p. 64.
[3] C. Giardino, M. Unterkalmsteiner, N. Paternos-ter, T. Gorschek, and P. Abrahamsson, “Whatdo we know about software development in star-tups?” IEEE Software, Vol. 31, No. 5, 2014,pp. 28–32.
[4] N. Paternoster, C. Giardino, M. Unterkalm-steiner, T. Gorschek, and P. Abrahamsson,“Software development in startup companies:A systematic mapping study,” Information andSoftware Technology, Vol. 56, No. 10, 2014,pp. 1200–1218.
[5] E. Klotins, M. Unterkalmsteiner, andT. Gorschek, “Software engineering in start-upcompanies: An analysis of 88 experience reports,”Empirical Software Engineering, Vol. 24, No. 1,2019, pp. 68–102.
[6] A. Yau and C. Murphy, “Is a rigorous agilemethodology the best development strategy forsmall scale tech startups?” University of Pennsyl-vania Department of Computer and InformationScience, Tech. Rep., 2013.
[7] G. Carmine, N. Paternoster, M. Unterkalm-steiner, T. Gorschek, and P. Abrahamsson, “Soft-ware development in startup companies: Thegreenfield startup model,” IEEE Transactionson Software Engineering, Vol. 42, No. 6, 2016,p. 233.
[8] J. Pantiuchina, M. Mondini, D. Khanna,X. Wang, and P. Abrahamsson, “Are softwarestartups applying agile practices? the state ofthe practice from a large survey,” in Interna-tional Conference on Agile Software Develop-ment. Springer, Cham, 2017, pp. 167–183.
[9] E. Klotins, M. Unterkalmsteiner, P. Chatzi-petrou, T. Gorschek, R. Prikladniki, N. Tripathi,and L. Pompermaier, “A progression model ofsoftware engineering goals, challenges, and prac-tices in start-ups,” IEEE Transactions on Soft-ware Engineering, 2019.
4The Software Start-up Research Network, https://softwarestartups.org/

Use of Agile Practices in Start-up Companies 63
[10] PitchBook Data, Inc., “European middle marketreport 2h 2015,” Tech. Rep., 2015.
[11] PitchBook Data, Inc., “U.S. middle market re-port Q4 2015,” Tech. Rep., 2015.
[12] E. Klotins, “Software start-ups through an em-pirical lens: are start-ups snowflakes?” in 1stInternational Workshop on Software-IntensiveBusiness: Start-Ups, Ecosystems and Platforms,SiBW 2018, Espoo, Finland, 3 December 2018.CEUR-WS, 2018.
[13] S.M. Sutton, E.C. Cubed, and M. Andretti, “Therole of process in a software start-up,” IEEESoftware, Vol. 17, No. 4, 2000, pp. 33–39.
[14] K. Beck, M. Beedle, A. Van Bennekum, A. Cock-burn, W. Cunningham, M. Fowler, J. Grenning,J. Highsmith, A. Hunt, R. Jeffries et al., “Mani-festo for agile software development,” 2001.
[15] L. Rising and N.S. Janoff, “The Scrum softwaredevelopment process for small teams,” IEEESoftware, No. August, 2000, pp. 26–32.
[16] V.E. Jyothi and K.N. Rao, “Effective implemen-tation of agile practices-incoordination with leankanban,” International Journal on ComputerScience and Engineering, Vol. 4, No. 1, 2012,p. 87.
[17] P. Diebold and M. Dahlem, “Agile practices inpractice: a mapping study,” in Proceedings ofthe 18th International Conference on Evaluationand Assessment in Software Engineering. ACM,2014, p. 30.
[18] S. Jalali and C. Wohlin, “Global software en-gineering and agile practices: a systematic re-view,” Journal of software: Evolution and Pro-cess, Vol. 24, No. 6, 2012, pp. 643–659.
[19] T. Chow and D.B. Cao, “A survey study ofcritical success factors in agile software projects,”Journal of Systems and Software, Vol. 81, No. 6,2008, pp. 961–971.
[20] S. Misra, V. Kumar, U. Kumar, K. Fantazy,and M. Akhter, “Agile software developmentpractices: evolution, principles, and criticisms,”International Journal of Quality and ReliabilityManagement, Vol. 29, No. 9, 2012, pp. 972–980.
[21] A. Solinski and K. Petersen, “Prioritizing agilebenefits and limitations in relation to practiceusage,” Software Quality Journal, Vol. 24, No. 2,2016, pp. 447–482.
[22] E. Mkpojiogu, N. Hashim, A. Al-Sakkaf, andA. Hussain, “Software startups: Motivations foragile adoption,” International Journal of Inno-vative Technology and Exploring Engineering,Vol. 8, No. 8S, 2019, pp. 454–459.
[23] R. Souza, L. Rocha, F. Silva, and I. Machado,“Investigating agile practices in software star-
tups,” in Proceedings of the XXXIII Brazil-ian Symposium on Software Engineering, 2019,pp. 317–321.
[24] Agile Alliance, “Agile glossary,” https://www.agilealliance.org/agile101/agile-glossary/, 2018,[Online; accessed 20-April-2018].
[25] L. Layman, L. Williams, and L. Cunningham,“Exploring extreme programming in context: anindustrial case study,” in Agile DevelopmentConference. IEEE, 2004, pp. 32–41.
[26] S. Ilieva, P. Ivanov, and E. Stefanova, “Analysesof an agile methodology implementation,” inProceedings. 30th Euromicro Conference. IEEE,2004, pp. 326–333.
[27] B. Kitchenham and S.L. Pfleeger, “Software qual-ity: the elusive target [special issues section],”IEEE Software, Vol. 13, No. 1, 1996, pp. 12–21.
[28] E. Tom, A. Aurum, and R. Vidgen, “An explo-ration of technical debt,” Journal of Systems andSoftware, Vol. 86, No. 6, 2013, pp. 1498–1516.
[29] G. Lucassen, F. Dalpiaz, J.M.E. van der Werf,and S. Brinkkemper, “Forging high-quality userstories: towards a discipline for agile require-ments,” in IEEE 23rd international require-ments engineering conference (RE). IEEE, 2015,pp. 126–135.
[30] R. Khaled, P. Barr, J. Noble, and R. Bid-dle, “System metaphor in extreme program-ming: A semiotic approach,” in 7th InternationalWorkshop on Organizational Semiotics. Citeseer,2004.
[31] E.F. Collins and V.F. de Lucena, “Software testautomation practices in agile development en-vironment: An industry experience report,” in7th International Workshop on Automation ofSoftware Test (AST). IEEE, 2012, pp. 57–63.
[32] R. Moser, P. Abrahamsson, W. Pedrycz, A. Sil-litti, and G. Succi, “A case study on the impactof refactoring on quality and productivity in anagile team,” in IFIP Central and East EuropeanConference on Software Engineering Techniques.Springer, 2007, pp. 252–266.
[33] B. Selic, “Agile documentation, anyone?” IEEESoftware, Vol. 26, No. 6, 2009.
[34] F. Palomba, G. Bavota, M. Di Penta, R. Oliveto,and A. De Lucia, “Do they really smell bad?A study on developers’ perception of bad codesmells,” in IEEE International Conference onSoftware Maintenance and Evolution. IEEE,2014, pp. 101–110.
[35] M. Mantyla, J. Vanhanen, and C. Lassenius,“A taxonomy and an initial empirical study ofbad smells in code,” in International Conferenceon Software Maintenance, 2003, pp. 381–384.

64 Eriks Klotins et al.
[36] T. Dybå and T. Dingsøyr, “Empirical studies ofagile software development: A systematic review,”Information and Software Technology, Vol. 50,No. 9-10, 2008, pp. 833–859.
[37] E. Klotins, “Using the case survey method to ex-plore engineering practices in software start-ups,”in Proceedings of the 1st International Work-shop on Software Engineering for Startups. IEEEPress, 2017, pp. 24–26.
[38] R. Larsson, “Case survey methodology: Quanti-tative analysis of patterns across case studies,”Academy of Management Journal, Vol. 36, No. 6,1993, pp. 1515–1546.
[39] A.C. Hope, “A simplified Monte Carlo signifi-cance test procedure,” Journal of the Royal Sta-tistical Society. Series B (Methodological), 1968,pp. 582–598.
[40] J. Cohen, Statistical power analysis for the be-haviour sciences. Lawrence Erlbaum Associates,1988.
[41] A. Agresti, An introduction to categorical dataanalysis. Wiley New York, 1996, Vol. 135.
[42] P. Runeson, M. Höst, A. Rainer, and B. Reg-nell, Case study research in software engineering.John Wiley and Sons, Inc., 2012.
[43] W.W. Daniel, “Spearman rank correlation coef-ficient,” Applied Nonparametric Statistics, 1990,pp. 358–365.
[44] M. Crowne, “Why software product startupsfail and what to do about it,” in EngineeringManagement Conference. Cambridge, UK: IEEE,2002, pp. 338–343.
[45] B. De Alwis and J. Sillito, “Why are softwareprojects moving from centralized to decentral-ized version control systems?” in ICSE Workshopon Cooperative and Human Aspects on SoftwareEngineering. IEEE, 2009, pp. 36–39.
[46] E. Daka and G. Fraser, “A survey on unit test-ing practices and problems,” in IEEE 25th In-ternational Symposium on Software ReliabilityEngineering. IEEE, 2014, pp. 201–211.
[47] L. Gren, R. Torkar, and R. Feldt, “The prospectsof a quantitative measurement of agility: A valida-tion study on an agilematuritymodel,” Journal ofSystems and Software, Vol. 107, 2015, pp. 38–49.
[48] M. Ozer and D. Vogel, “Contextualized rela-tionship between knowledge sharing and per-formance in software development,” Journalof Management Information Systems, Vol. 32,No. 2, 2015, pp. 134–161.
[49] C. Gralha, D. Damian, A.I.T. Wasserman,M. Goulão, and J. Araújo, “The evolution ofrequirements practices in software startups,”in Proceedings of the 40th International Con-ference on Software Engineering. ACM, 2018,pp. 823–833.

e-Informatica Software Engineering Journal, Volume 15, Issue 1, 2021, pages: 65–84, DOI 10.37190/e-Inf210104
A Framework for the Regression Testing ofModel-to-Model Transformations
Issam Al-Azzoni∗, Saqib Iqbal∗∗Department of Software Engineering and Computer Science, Al Ain University, Al Ain, UAE
[email protected], [email protected]
AbstractBackground: Model transformations play a key role in Model-Driven Engineering (MDE).Testing model transformation is an important activity to ensure the quality and correctness of thegenerated models. However, during the evolution and maintenance of these model transformationprograms, frequently testing them by running a large number of test cases can be costly. Regressiontest selection is a form of testing, which selects tests from an existing test suite to test a modifiedprogram.Aim: The aim of the paper is to present a test selection approach for the regression testing ofmodel transformations. The selected test case suite should be smaller in size than the full testsuite, thereby reducing the testing overhead, while at the same time the fault detection capabilityof the full test suite should not be compromised.Method: approach is based on the use of a traceability mapping of test cases with theircorresponding rules to select the affected test items. The approach is complemented with a toolthat automates the proposed process.Results: Our experiments show that the proposed approach succeeds in reducing the size of theselected test case suite, and hence its execution time, while not compromising the fault detectioncapability of the full test suite.Conclusion: The experimental results confirm that our regression test selection approach iscost-effective compared to a retest strategy.
Keywords: Model Transformation, Regression Testing, MDE
1. Introduction
Model-Driven Engineering (MDE) refers to rep-resenting, designing, and developing a systemin the form of models [1]. A model is a coreartifact of MDE, which refers to an abstractrepresentation of data and behavior of a sys-tem. Model transformations are currently usedin a variety of industrial projects [2] and ensur-ing their correctness is important [3, 4]. Modeltransformation programs are frequently changedduring the evolution and maintenance phasesof their life cycle. Several techniques for testingmodel transformations have been proposed inthe literature [5, 6]. However, these techniques
generally require executing a large number oftest cases to ensure the desired coverage criteria.This can be time-consuming and may requiredays or even weeks to complete.
During the regression testing of model trans-formations, a test suite is generally availablefor reuse [7]. However, a retest-all approach inwhich all tests are rerun may consume excessivetime and resources. In contrast, regression testselection techniques aim to reduce the time re-quired to retest a modified program by selectinga smaller subset of the existing test suite [7, 8].
There have been many regression test se-lection techniques proposed for conventionalsoftware written in regular programming lan-
Submitted: 15 August 2020; Revised: 31 January 2020; Accepted: 09 February 2021; Available online: 29 March 2021

66 Issam Al-Azzoni, Saqib Iqbal
guages [8]. However, only a few exist for testingmodel transformation programs. For example,the work of Alkhazi et al. [3] proposes an ap-proach for test case selection for model transfor-mations based on a multiobjective search. An-other work by Shelburg et al. [9] examined theissue of determining which test cases becomeinvalid when changes occur in a model transfor-mation program. The work of Troya et al. [4]presents an approach for fault localization formodel transformations.
In this paper, we present a framework for theregression testing of model transformations, whichis based on the use of a metamodel that links testcases to their corresponding test items and testartifacts. To the best of our knowledge, this isthe first paper specifically proposing a frameworkfor the regression testing of model transforma-tion programs based on traceability models. Wepresent a tool that can automatically create thetraceability model, given the source meta-modeland a set of input test models. The tool can alsobe queried to obtain the set of selected test casesfor a changed rule.
Regression testing approaches can be classi-fied into three main categories [8]: test suite min-imization, test case selection, and test case pri-oritization. Test suite minimization approachesaim to reduce the size of a test suite by perma-nently eliminating redundant test cases from thetest suite. Test case selection approaches aim toselect a subset of test cases that will be used totest the changed parts of the software. Finally,test case prioritization approaches attempt toorder test cases in a way that maximizes desir-able properties, such as early fault detection. Inthe context of model transformation testing, ourproposed approach can be classified into the testcase selection category.
The main contributions of this paper are sum-marized as follows:1. We present a test case metamodel that can be
exploited in the regression testing of modeltransformations.
2. We present a tool that can automaticallybuild the required traceability models and se-lect test cases based on the names of changedrules.
3. We demonstrate the effectiveness of the pro-posed framework using several experimentswhich involve introducing several mutationsto the model transformation program andbeing able to kill all the mutants using onlya subset of the test case set that is chosenbased on the framework. The experimentsalso demonstrate the time saving benefit ofthe proposed approach.The organization of the rest of this paper is
as follows: First, we provide the necessary back-ground and a motivating example in Section 2.Our proposed approach for regression testing ispresented in Section 3. Section 4 discusses andevaluates our experiments. The related literatureis discussed in Section 5. The conclusion andfuture work are discussed in Section 6.
2. Study background and motivatingexample
This section provides a description of the coreconcepts and terms used in this research. In ad-dition, we present a model transformation exam-ple which motivates the regression test selectionframework presented in the paper.
2.1. Models and model transformation
Models play a central role in MDE. A modelrepresents a simplified or abstract representa-tion of a part of a world (system) [10]. Modelsof a system help to analyze certain propertiesof the system without the need to consider itsfull details. Models help designers and architectsto deal with the complexity present in systems.The model needs to conform to a metamodel.This means that the model needs to satisfy therules defined in the metamodel and it must re-spect its semantics. A meta-modeling language isused to specify metamodels. For example, Ecoreis a meta-modeling language used to specifymetamodels in the Eclipse Modeling Framework(EMF) [11].
Models can be transformed into other modelsallowing for several types of analysis at differentlevels of abstraction. Model transformation refers

A Framework for the Regression Testing of Model-to-Model Transformations 67
Figure 1: Model transformations pattern [12]
(a) Class diagram before executing the pushdown method transformation
(b) Class diagram after executing the pushdown method transformation
Figure 2: Class diagram before and after executing the push down method transformation
to automatically creating a target model froman existing source model by following transfor-mation rules. A source model that conforms toa source metamodel is transformed into a tar-get model that conforms to a target metamodel.A model-to-model transformation language isused to specify the transformation rules. TheEpsilon Transformation Language (ETL), oneof the Epsilon platform [13, 14] set of languagesand tools, is a model-to-model transformationlanguage that can be used to transform modelsspecified in metamodels conforming to Ecore.ETL builds on the Epsilon Object Language(EOL), which is the main language in Epsilon forproviding common model management facilitiesupon which several Epsilon-based languages arebased. The ATLAS Transformation Language(ATL) is another model transformation languagedeveloped on top of the Eclipse platform [15].
Figure 1, taken from [12], depicts the generalpattern of model transformations. M1 in Figure 1represents the models, which are instances of themetamodels represented by M2. Transformationrules are specified to transform the model ele-ments of the source model to the model elementsof the target model. The transformations areperformed by a transformation engine, whichreads a source model conforming to a sourcemetamodel and produces a target model thatconforms to a target metamodel.
Figure 2 shows an example of a model trans-formation where a push-down method transfor-mation has been applied to a class diagram. Thetransformation pushed one of the methods fromthe super class to a child class while implement-ing better cohesiveness. Figure 2 (a) shows thesource model and Figure 2 (b) shows the tar-get model. The automatic model transformation

68 Issam Al-Azzoni, Saqib Iqbal
saves time and energy compared to the manualconversion and brings in the consistency of theinformation provided the model transformationis correctly defined.
In this paper, we used several languages andtools from Epsilon. Epsilon [13, 14] is a family oflanguages and tools for automating model man-agement tasks, such as model transformationand model testing. Epsilon is built on top ofthe Eclipse platform and supports EMF-basedmodel management tasks. One of the languagesof Epsilon is the Epsilon Unit Testing Frame-work (EUnit)’s language. EUnit [16, 17] is a unittesting framework, specifically designed to testmodel transformations. It is based on EOL andAnt’s workflow task description. EUnit providesa language for comparing models. Test cases canbe defined, reused, and automatically run ondifferent sets of models. The results of the testcases can be viewed, and the differences betweenthe expected and the actual models are graphi-cally visualized. EUnit uses EMF Compare as thecomparison engine [18]. For example, if the valueof an attribute of an element in the source modelis not equal to the value of the same elementin the target model, then the two models areconsidered not equivalent. In this case, EUnitreports the test case as a failed one.
2.2. Motivation example
In this example, we consider a model transfor-mation example that uses ETL to transforma model that conforms to an Object-Oriented(OO) metamodel to a model that conforms toa Database (DB) metamodel. The code of theexample was obtained from [19] and is presentedin the Appendix. Model transformation fromOO to DB models is a classic example which hasbeen used by several authors in the literature toevaluate new techniques and approaches [20–22].
Figure 3 shows the OO metamodel. We onlyinclude the metamodel elements that are involvedin the ETL transformation. The names of ab-stract classes are shown in italics. There are fourconcrete classes in the OO metamodel: Class, At-tribute, Reference, and Package. In an OO model,a package can be composed of other packages andclasses. A class can have features: attributes andreferences. A feature can have a type: a DataTypein the case of an attribute and a Class in the caseof a reference. A class may extend another class.In this case, the class will inherit all features ofthe parent class.
Figure 4 shows the DB metamodel. We onlyinclude the metamodel elements that are involvedin the ETL transformation. The names of ab-
OO
Class
isAbstract: Boolean
extends
0..1
0..*
extendedBy
Classifier
PackagableElement
NamedElement
name: String
Attribute
Feature
StructuredFeature
isMany: Boolean
owner0..1
0..*features
0..1type
Reference
Package
package contents0..*
DataType
Figure 3: The OO metamodel

A Framework for the Regression Testing of Model-to-Model Transformations 69
DB
Database
DatabaseElement
NamedElement
name: String
0..*
contentsdatabase
Column
type: String
ForeignKey
isMany: Boolean
Table 0..*
table columns
0..*primaryKeys 0..10..1
parentchild
Figure 4: The DB metamodel
stract classes are shown in italics. There are fourconcrete classes in the DB metamodel: Table, Col-umn, ForeignKey, and Database. In a DB model,a database is composed of database elements:tables, columns, and foreign keys. A table iscomposed of zero or more columns. For a table,a set of columns represent the primary keys forthe table. A foreign key is associated with twocolumns: a child column and a parent columnthat could be in different tables. The table hasa name attribute. Columns and foreign keys havename and type attributes.
The ETL code for the OO to DB model trans-formation consists of four rules: Class2Table,SingleValuedAttribute2Column, MultiValuedAt-tribute2Table, and Reference2ForeignKey. A briefdescription of each rule is provided in the com-ments. In ETL, each rule has a unique nameand also specifies one source element and atleast one target element. A rule can optionallydefine a guard which is a Boolean expressionspecifying a condition that must be met by thesource element in order to apply the rule onthat element. The body of a rule contains thelogic specifying how to populate the values ofthe features of the target model elements. Someof the rules invoke one or more of the threeuser-defined EOL operations listed at the endof the code: primaryKeyName(), valuesTable-Name(), and toDbType(). The operation prima-ryKeyName() returns a string that represents thename of the primary key of the new table. The
operation valuesTableName() returns a stringthat represents the name of the new table corre-sponding to a multivalued attribute in the OOmodel. The operation toDbType() returns a stringthat represents a type in the DB model.
ownertype
demo:Package
Student:Class
isAbstract=false
Class:Class
isAbstract=false
students:Reference
isMany=true
Figure 5: A sample source test model
During the testing of the model transforma-tion program, a tester typically creates a largenumber of test cases. In each test case, the testerdefines two test models: the first one is the sourcetest model and the second one is the target testmodel. The source test model conforms to thesource metamodel, while the target test modelconforms to the target metamodel. The assump-tion is that in order for the test case to pass, themodel generated by the model transformationprogram when the input is the source modelmust be equivalent to the target model. Figure 5

70 Issam Al-Azzoni, Saqib Iqbal
:Database
Student:Table Class:Table
students:ForeignKey
studentID:Column
type="INT"
studentsId:Column
type="INT"
classId:Column
type="INT"
parentchild
primaryKeys
primaryKeys
Figure 6: The target model corresponding to the source model in Figure 5
shows a sample source test model. It is an OOmodel containing two Classes: Student and Classcontained in the Package named demo. BothClasses are not abstract (the value of isAbstractis false in both Classes). There is a Referencenamed students whose owner is Class and typeis Student. The target DB model obtained whenexecuting the model transformation is shown inFigure 6. As expected, the Database containstwo Tables: Student and Class. The primary keycolumns, classID and studentID, are created bythe rule Class2Table. The ForeignKey namedstudents and the foreign key column studentsIdare created by the rule Reference2ForeignKey.The parent and child references of the studentsForeignKey are also set by the same rule to clas-sId and studentsId, respectively.
The problem that this paper aims to tacklecan be summarized as follows. Suppose thata tester has created a large number of test cases,each with its corresponding source and targetmodels. During the maintenance and evolutionof the model transformation program, severalchanges can be made to the program. A changeusually involves one or more of the transforma-tion program’s rules. When a change is madeto the program, a tester needs to rerun the testcases to ensure the correctness of the program.However, instead of rerunning the whole test casesuite, this paper proposes a new framework that
selects a subset of the test cases in a way thatdoes not reduce the fault detection capability ofthe original suite. The framework exploits thetraceability links between the rules in the trans-formation program and the source and targetmodels of the related test cases. By applying thisregression test selection framework, the testerbenefits from the overhead and execution timethat are saved when using a smaller subset oftest cases for testing.
3. Approach
The proposed framework for regression test selec-tion for model transformation relies on the useof a metamodel that links test cases with theircorresponding test items and test artifacts. A testitem represents an item under test. In the contextof model transformation, a test item correspondsto a rule (or a statement block within the rule).A test case has a name that is used as an identifierfor the test case. The test artifacts identify thetest models related to the test item, includingthe source (input) and target (expected) models.
A metamodel that meets such requirementsis shown in Figure 7. The metamodel is named asTestCasesMM. A test case set consists of zero ormore test cases. Each test case is associated witha test item which corresponds to the rule being

A Framework for the Regression Testing of Model-to-Model Transformations 71
TestCasesMM
TestCase
name: String
TestCaseSet
0..*testCases
SourceModel
name: String
TargetModel
name: String
sourceModel
0..1
targetModel
0..1
Rule
name: Stringrule testCases0..1 0..*
Figure 7: The test cases metamodel
tested by the test case. In cases where a test caseis related to more than one rule, the metamodeldefinition allows to have repeated instances ofthe TestCase meta-class, with the same name,where each one is linked to an instance of theRule meta-class. In addition, a test case has twotest artifacts: a source model and a target model.When a rule is changed, the model of the testcase set which conforms to TestCasesMM canbe used to identify the test cases that need to bereexecuted. In addition, the model can be usedto identify the source and target models requiredby each test case.
The traceability links in a test case modelcan also be used to provide information on theadequacy of the test cases. One example is check-ing that every rule is linked to at least one testcase. If a rule is not linked to any test case, thiscould indicate that this rule is not covered bythe test case set. In this case, a tester wouldneed to reexamine the test case set and add newtest cases to improve its coverage. In the ObjectConstraint Language (OCL) [23] which is thecommon standard to express constraints on mod-els specified using object-oriented metamodelingtechnologies, the constraint that every rule islinked to at least one test case can be stated asfollows:
context Ruleinv RuleLinkedToAtLeastOneTestCase :s e l f . t e s tCases −>notEmpty ( )
Here, for a test case model to be valid, this con-straint requires that the collection of test caseslinked to any rule is not empty. The keywordcontext is used to specify the model elementto which the statement of the constraint applies.This statement is a Boolean expression referredto as invariant. The keyword inv is used to spec-ify the invariant: first the name of the invariant isprovided, followed by a colon, which is followedby the Boolean expression. In the expression,self refers to the model element on which theconstraint is evaluated (i.e., whose name followsthe keyword context). Note that this example isjust one possible option for describing constraintson test case models and that our approach doesnot require it.
We have developed a tool to automate theregression test selection process. The main objec-tive of the tool is to automatically create the testcase model which conforms to the metamodelshown in Figure 7. The project files are availableon GitHub at https://github.com/ialazzon/RegressionTestSelectionTool. The tool is a Javaprogram that does the following. First, it parsesthe model transformation program and the EUnitfile containing the test case definitions. It alsoreads all source test model files that are used bythe test cases defined in the EUnit file. Then,it automatically creates the test case model, asspecified by our approach. Finally, when a testerenters the name of a modified rule in the model

72 Issam Al-Azzoni, Saqib Iqbal
transformation program, the tool shows the con-tents of a new EUnit file defining the test casesselected by our approach. The tester can runthis EUnit file to execute the selected test cases,rather than rerunning the original EUnit file con-taining the full set of test cases. The tool was usedin all experiments conducted when validating theapproach (see Section 4).
4. Validation
To evaluate our approach, we conducted severalexperiments using four different model transfor-mation programs. This section starts with a listof two research questions that the experimentsattempt to address. This is followed by a dis-cussion of the experimental setup and results.Finally, a discussion on the threats to validity isprovided.
4.1. Research questions
We defined two research questions as follows:– RQ1: How does our approach of regression
test selection compare with a re-test-all strat-egy? Investigating this question serves asa sanity check step. If the results of our exper-iments show no benefit of using our approach,then we can conclude that our approach isnot needed and hence a tester would be betteroff rerunning all test cases in a test suite.
– RQ2: How cost-effective is our approach?We want to ensure that the fault detectioncapability when rerunning a selected set oftest cases is not compromised, while at thesame time there is a significant saving in theoverhead involved when running these testcases.
4.2. Experimental setupand results discussion
To evaluate these research questions, we appliedour approach using the automated tool discussedin Section 3 on four different transformationprograms. The first one is the OO2DB trans-formation which has been presented as a moti-
vating example in Section 2.2. The second oneis the QN2QPN transformation which trans-forms queueing networks into queueing Petrinets. The QN2QPN transformation is written inATL [15]. It was developed by one of the authorsand is presented in [24]. The third one is theBibTeX2DocBook transformation which trans-forms a BibTeX model to a DocBook composeddocument [25]. The fourth one is the CPL2SPLtransformation which transforms a CPL modelto an SPL model [26]. CPL and SPL are twodomain-specific languages used in telephony sys-tems. Both BibTeX2DocBook and CPL2SPLtransformations are written in ATL and availablein the ATL Zoo [27].
Consider the OO2DB transformation. Forregression testing, we adopt the test case meta-model, TestCasesMM, shown in Figure 7. Fig-ure 8 shows part of the test case set model cre-ated by our tool. It shows three test cases: TC1,TC2, and TC3, with their associated rules andtest artifacts. For example, the test case TC1 isdesigned to test the rule Reference2ForeignKey.For this test case, the source model is OO1 andthe target model is DBExpected1. Note that themodel OO1 is the model shown in Figure 5 andthe model DBExpected1 is the model shown inFigure 6.
We manually created a total of 15 test casesusing EUnit [17]. Five of the test cases weredesigned to achieve full line coverage. These testcases apply a white-box approach for testing themodel transformation code. For example, testcase TC1 whose input model is shown in Fig-ure 5 covers the rule Reference2Foreign. Also,two test cases TC3 and TC5 are needed to coverthe rule Class2Table since it has a Boolean con-dition: one for the case where a class extendssome other class and one for the case where nosuch class exists. The remaining test cases weredesigned to achieve full partition coverage for allclasses, attributes, and associations in the OOmetamodel. This test design applies the coverageadequacy criteria as defined by the black-boxmodel transformation testing approach in [28].For example, in the OO metamodel (see Fig-ure 3) a Class can have zero or more features.Following the approach in [28], if a property

A Framework for the Regression Testing of Model-to-Model Transformations 73
TC1:TestCase
:TestCaseSet
OO1:SourceModel
DBExpected1:TargetModel
sourceModel
targetModel
Reference2ForeignKey:Rule
TC2:TestCaseOO2:SourceModel
DBExpected2:TargetModel
sourceModel
targetModel
SingleValuedAttribute2Column:Rule
TC3:TestCaseOO3:SourceModel
DBExpected3:TargetModel
sourceModel
targetModel
Class2Table:Rule
Figure 8: A partial model of the test case set
Table 1: The list of mutants
Mutant Line Original Code Modified CodeNumber Number
1 102 fkCol.type=”INT”; fkCol.type=”INTX”;2 54 c.name=a.name; c.name=”name”;3 86 fkCol.type=”INT”; fkCol.type=”INTX”;4 19 t .columns.add(pk); Line removed5 36 childFkCol.type=”INT”; childFkCol.type=”INTX”;
Table 2: The test cases corresponding to the mutants in Table 1 and their results
Mutant Affected Selected Test No. of Coverage No. ofNumber Rule Cases Selected Failed
Test Cases Test Cases1 Reference2ForeignKey TC1, TC9 2 13.33% 22 SingleValuedAttribute2Column TC2, TC6–8 4 26.67% 33 MultiValuedAttribute2Table TC4 1 6.67% 14 Class2Table TC3, TC5-15 12 80.00% 125 Class2Table TC3, TC5-15 12 80.00% 3

74 Issam Al-Azzoni, Saqib Iqbal
has a multiplicity of 0..*, a partition such as{{0}, {1}, {x}}, with x ≥ 2, is defined to ensurethat the test model contains instances where thisproperty holds with zero, one and more than oneobject. Test cases TC6, TC7, and TC8 includea Class which has zero, one, and two attributes,respectively.
We introduced several mutations to modeltransformation. For each mutant, our tool buildsthe model of the test case set to trace the affectedrules to the test cases that need to be rerun. Ta-ble 1 shows a list of the five mutants used in theexperiments. For each mutant, Table 2 shows theset of test cases selected by our tool in addition totheir total number and coverage and the test caseresults. Here, coverage refers to the proportionof the number of selected test cases out of thetotal number of available test cases. The resultsshow that our tool was successful in reducingcoverage in every case. It can also be observedthat at least one test case failed for each mutant.This indicates that using the traceability linksin the test case model was effective in identify-ing a subset of test cases that need to be rerunand that are able to kill the mutants withoutrequiring to rerun the complete set of test cases.In other words, the reduction in coverage of theselected test cases did not compromise the faultdetection capability of our tool.
Consider the QN2QPN model transforma-tion. This transformation consists of 10 rules. Ta-ble 3 shows the information and results concern-
ing ten experiments using the QN2QPN trans-formation. We created a mutation on a singlerule in every experiment. For each experiment,the table shows which rule was mutated and thetype of mutation that was applied. The experi-ments covered the four main types of mutationoperators on ATL transformations presented byTroya et al. [29]. These mutation operators wereintroduced by previous researchers to resemblecommon semantic faults that programmers makein model transformations [4]. Our experimentswere designed to have a good coverage of allmutation operators proposed in literature. Foreach experiment, the table shows the number oftest cases that were run and the execution timein milliseconds (ms) when rerunning all the testcases and when rerunning only the test cases se-lected by our tool. The percentages shown in redare the reductions (savings) that were achievedwhen rerunning the selected test cases only vs.rerunning all test cases. Larger values for thereductions represent higher savings.
To report the execution times, we conductedthe experiments on a desktop with 4-core CPUrunning at 2.7 GHz and 8 GBs of RAM. Everymeasurement was repeated 10 times and theaverage values are presented here. Before eachrepetition, a warm-up session was conducted toeliminate the overhead caused by initializationprocesses in EUnit. The execution time of run-ning a test suite was reported by EUnit as thewallclock time of executing the whole test suite.
Table 3: Results for the QN2QPN model transformation example
ID Rule Affected Type of Change Rerun All Rerun Selected Only# of test Execution # of test Execution
cases time (ms) cases time (ms)1 Main Binding – Value Change 34 13064 34 (0%) 13255 (−1%)2 Server Filter – Addition 34 13762 23 (32%) 9015 (34%)3 SourceNode Binding – Deletion 34 12982 17 (50%) 6804 (48%)4 SinkNode In Pattern Element – Class Change 34 11890 7 (79%) 2937 (75%)5 NonServerNode Binding – Deletion 34 13375 13 (62%) 5442 (59%)6 ThinkDevice Matched Rule – Deletion 34 12256 13 (62%) 5157 (58%)7 Arc Out Pattern Element – Addition 34 13446 23 (32%) 8982 (33%)8 ServiceRequest Binding – Deletion 34 13277 22 (35%) 8263 (38%)9 WorkloadRouting Binding – Value Change 34 12898 22 (35%) 8474 (34%)
10 Workload Out Pattern Element – Addition andDeletion
34 12013 30 (12%) 10462 (13%)

A Framework for the Regression Testing of Model-to-Model Transformations 75
Table 4: Results for the BibTeX2DocBook model transformation example
ID Rule affected Type of change Rerun all Rerun selected only# of tests Execution # of tests Execution
cases time (ms) cases time (ms)1 Author Binding – Value Change 25 7038 24 (4%) 6710 (4.66%)2 TitledEntry Title NoArticle Binding – Deletion 25 6765 9 (64%) 2813 (58.42%)3 Article Title Journal Binding – Deletion 25 7007 19 (24%) 5269 (24.80%)4 Article Title Journal Matched Rule
– Deletion25 6737 19 (24%) 5157 (20.26%)
5 Main Out Pattern Element– Addition
25 6690 25 (0%) 6690 (0%)
6 UntitledEntry Binding – Deletion 25 5844 25 (0%) 5844 (0%)7 TitledEntry Title NoArticle Binding – Value Change 25 6648 9 (64%) 2666 (59.90%)
The results in Table 3 show good reductionin terms of the number of selected cases and theexecution time. The exception is in the first rule,Main, where there is no reduction in the numberof selected test cases. This is because this rule isexecuted by the transformation on every inputmodel, and hence any input test model will beautomatically selected by our tool. The reduc-tions reached more than 75% in Experiment 4.It is also important to mention that in each ex-periment at least one of the test cases failed thetest (as reported by the EUnit tool) in both theRerun all and Rerun Selected-only cases. Thisindicates that the fault detection capability wasnot diminished when rerunning the selected testcases. At the same time, a good savings in termsof the testing execution time were materialized.
Table 4 presents the results concerning theBibTeX2DocBook transformation. Note that thistransformation consists of nine rules. In ourexperiments, we randomly selected a total of25 test cases out of the 100 test cases availablein the test suite taken from a previous work onspectrum-based fault detection in model transfor-mations [4]. The test cases in the test suite weresemi-automatically created using model genera-tion scripts. We obtained the test suite from [30].These 25 test cases represent the full test suitethat is input to our tool for test case selection.The table shows good reductions in the size of theselected test cases and the execution time as well.However, there is little or no reduction in cases 1,5, and 6. For case 1, the Author rule applies onAuthor elements which appear in almost all of
the test cases. Hence, our tool selects all of thesetest cases resulting in a very small reduction inthe size of the selected test cases. For cases 5 and6, the Main and UntitledEntry rules apply onsource meta-classes whose instances appear inall of the test cases. For example, the Main rulewhich applies on BibTeXFile elements is executedon every input model since every BibTex modelhas a root element of type BibTeXFile. Also, theUntitledEntry rule applies on elements of the Bib-TeXEntry source meta-class which is a superclassfor many of the source meta-classes. Note that ineach of the cases in Table 4 at least one of the testcases failed when running the selected test cases.
Table 5 presents the results concerning theCPL2SPL transformation. This transforma-tion consists of 19 rules. Similar to the Bib-Tex2DocBook transformation case, we randomlyselected a total of 35 test cases from the test suitetaken from [30]. In all cases, the table shows goodreductions in the size of the selected test casesand the execution time as well. In addition, inall cases, rerunning the test cases selected byour tool resulted in at least one test case failure,indicating that the test suites selected by ourtool were able to discover the mutants.
Table 6 shows the execution time results forthe four case studies. For each case study, thetable shows the time it took our tool to generatethe test case model. The table shows the confi-dence intervals on a 95% confidence level. Theseintervals were obtained using the one-samplet-test [31] which is valid to be used in our casesince the same size is small (30 execution time

76 Issam Al-Azzoni, Saqib Iqbal
Table 5: Results for the CPL2SPL model transformation example
ID Rule affected Type of change Rerun all Rerun selected only# of test Execution # of test Execution
cases time (ms) cases time (ms)1 NoAnswer2SelectCase Binding – Value
Change35 12656 2 (94.29%) 1118 (91.17%)
2 Busy2SelectCase Filter – Addition 35 14130 3 (91.43%) 1419 (89.96%)3 NoAnswer2SelectCase Binding – Deletion 35 14459 2 (94.29%) 1131 (92.18%)4 StringSwitch2SelectStat In Pattern Element
– Class Change35 13224 11 (68.57%) 4458 (66.29%)
5 SwitchedAddress2SelectCase Binding – Deletion 35 13039 1 (97.14%) 739 (94.33%)6 Outgoing2Method Matched Rule
– Deletion35 13191 2 (94.29%) 1087 (91.76%)
7 SubAction2Function Out Pattern Element– Addition
35 13529 4 (88.57%) 1858 (86.27%)
8 StringSwitch2SelectStat Binding – Deletion 35 14792 11 (68.57%) 5052 (65.85%)9 Incoming2Method Binding – Value
Change35 12716 4 (88.57%) 1889 (85.14%)
10 Proxy2Select Out Pattern Element– Addition andDeletion
35 14064 5 (85.71%) 1251 (91.10%)
Table 6: The execution times for test case model generation
Case Study Mean (ms) The 95% Confidence IntervalOO2DB2 29.73 (25.46, 34.00)QN2QPN 62.17 (54.62, 69.72)
BibTeX2DocBook 54.63 (48.73, 60.54)CPL2SPL 75.13 (65.25, 85.01)
results in each case study) and the normalitycheck provides good support for the assumptionthat the population is normally distributed. It isof interest to note that these observed executiontimes are very small compared with the test caseexecution time results noted in the previous ta-bles in this section. In addition, our tool was ableto automatically generate the test case modelswith no considerable cost on part of the tester.
4.3. Threats to validity
There are four basic types of validity threats thatcan affect the validity of the conclusions of ourexperiments [32]:1. Conclusion Validity: Threats to the conclu-
sion validity are concerned with factors thataffect the ability to draw the correct conclu-sions based on the observed data. To address
this threat, we used confidence intervals basedon a 95% confidence level. These intervalswere obtained using the one-sample t-testafter passing the normality check. Also, weused the wallclock times reported by the EU-nit tool for all test case suite execution timeresults reported in the paper. We have alsoused a variety of mutation operators in theexperiments.
2. Construct Validity: This validity is concernedwith the relationship between theory and ob-servation. To address this threat, we usedstandard performance measures and metrics,including rule coverage and execution time.These metrics have been used in other similarwork on regression testing for model transfor-mations, such as [3, 4].
3. Internal Validity: This validity is concernedwith establishing a causal relationship be-

A Framework for the Regression Testing of Model-to-Model Transformations 77
tween the treatment (in this case, the appli-cation of our approach) and the results of ourevaluation. Threats to this validity includeany disturbing factor that might influence theresults. As our experiments demonstrated,the execution time of a test case suite is di-rectly proportional to its size. Therefore, theobserved reductions in execution time can bejustified by the selection of a smaller num-ber of test cases by applying our approach.In addition, in every experiment we madea mutation to a single rule only. Every mu-tation applied one of the mutation operatorsproposed in literature [29, 33]. If a rule ismutated, then this would affect any inputtest model that includes an element on whichthe rule is applied. Hence, our tool wouldautomatically select the corresponding testcase for rerun. Hence, the fault detection ca-pability of the original test case suite is notcompromised by the suite of the test casesselected by our tool.
4. External Validity: This validity is concernedwith generalization. The evaluation appliedour approach on two model transformationswritten in two languages: ETL and ATL. Weapplied different types of mutation opera-tors, and the test models were of differentsizes. The test cases were created manuallyto achieve a variety of coverage criteria. Yet,we cannot make a firm conclusion that ourresults can be generalized for all model trans-formations. More experiments are needed inthe future to confirm our findings on a widerscope of model transformations, including dif-ferent languages, coverage criteria, types ofmutations and faults, and input test models.
5. Related work
Alkhazi et al. [3] propose an approach for testcase selection for model transformation basedon multiobjective search. The approach enablesa tester to find the best tradeoff between two con-flicting objectives: maximizing rule coverage andminimizing the execution time of the selected testcases. A multiobjective algorithm (NSGA-II) is
used to find the Pareto-optimal solutions for thisproblem. The approach was validated using differ-ent transformation programs written in ATL. Incomparison to their approach, our approach aimsto be a safe test case selection technique. A testselection technique is said to be safe if it selectsall modification-revealing tests [7]. Our proposedtechnique will select any test case for rerun whenits input model contains an element that couldbe affected by a change in one of the model trans-formation rules. Our approach does not considerthe trade-off between rule coverage and execu-tion time. However, our experiments show goodsaving in test execution time when applying ourapproach while not compromising the fault de-tection capability of the full test case suite.
In [20], model transformation traceability isused to enhance the automation of qualifyingand improving a set of test models in the mu-tation analysis of model transformation. Theapproach relies on a representation of differentmutation operators and a traceability mecha-nism to establish links between the input andoutput models of each transformation. Patternsare used to identify cases where an input testmodel lets a given mutant alive. Subsequently,heuristics provide recommendations to generatenew test models that are able to kill the mutant.Several aspects of the approach are independentfrom the transformation language being used,including the traceability and the mutation op-erator representation. Our approach focuses onregression testing of model transformation ratherthan mutation analysis. Hence, our approach usesa traceability model linking test cases to the rulesin a given model transformation. When a ruleis changed, the traceability model can be usedto identify the test cases that need to be rerun.Our traceability model differs from that in [20]which maintains links between elements of theinput and output models for each mutant. Thisis a more detailed model suitable for mutationanalysis of model transformation.
A multiobjective optimization algorithm isemployed in [9] to generate test models for theregression testing of model transformations. Theproposed approach assumes that the changesoccur in the input metamodel only. In this case,

78 Issam Al-Azzoni, Saqib Iqbal
a test model may become invalid when it doesnot conform to the updated input metamodel.The optimization algorithm has three objectivesthat define the characteristics of a good solution:maximize coverage of the updated metamodel,minimize the number of input model elementsthat do not conform to the updated metamodel,and minimize the number of refactorings used torefactor the existing test models. In our approach,we assume that the input and output metamod-els are fixed and only the model transformationprogram may change. While the approach in [9]is useful to determine and update the test modelsthat become invalid due to a change in the inputmetamodel, our approach utilizes traceabilitylinks to determine the test cases that need to bererun due to an update in the model transforma-tion program.
Honfi et al. [34] presented a method on howmodel-based regression testing can be achieved inthe context of autonomous robots. The methoduses optimization for selecting the minimal sub-set of tests that have a maximum test cover-age of the changed components. Although themethod is presented in the context of robots,it is applicable to other domains which employModel-Driven Development (MDD) paradigm.In MDD, models are adopted as the main devel-opment artifacts. These models are commonlycreated using domain specific languages (DSLs).When a model is changed, this can impact thesystem functions and properties and hence theinfluenced parts of the system need to be retested.A prototype tool that implements the methodusing the Eclipse framework [35] and its modelingplatform EMF [11] is presented. The tool sup-ports model checkpointing and automatic changedetection. Our approach is similar to [34] in termsof employing a metamodel to represent the rela-tionship between the test items and the test cases.However, our approach is focused on applyingregression testing to a model transformation. Weconsider the issues specific to a model transfor-mation which can be more useful to a tester ofmodel transformation programs.
A survey of model transformation testing ap-proaches is provided in [6] and [36]. Gonzalexand Cabot [37] developed a tool, called ATLTest,
to generate test input models for ATL transfor-mations. The tool applies a white-box approachfor model transformation testing. In the work ofFleurey et al. [28], model fragments are used asa test adequacy criterion which forms the basisof the black-box approach proposed by the au-thors. Other approaches rely on formal methodsto verify the transformation and its associatedproperties [38–40]. The problem with these ap-proaches is their computational complexity whichbecomes cumbersome with the scale of the modeltransformation program.
Zech et al. proposed a model-based regres-sion testing method based on OCL [41]. Themethod derives test cases for a given systemunder test (SUT) based on the availability ofa class diagram that captures its system design.The approach is based on a Model Versioningand Evolution (MoVE) framework and uses UMLtesting profile (UTP) to model test cases. Themethod calculates a delta from a base model(the initial development model) and the workingmodel (the current development model). Theresulting change set (delta) then contains the dif-ferences between the two versions of the model.There are three main differences between themethod by Zech et al. and our method. First, ourmethod presents a regression testing approach formodel transformation while the method by Zechet al. presents a regression testing approach ofa software system using its design model. Second,Our approach requires a metamodel of the testcase set while the method by Zech et al. doesnot need any metamodel, but rather uses thefacilities provided in an MoVE framework. Thelast difference is that our approach exploits trace-ability links between models while the methodby Zech et al. does not use any traceability link.A similar model-based regression testing for soft-ware systems that works with sequence diagramsis presented in [42]. In [43], Al-Refai et al. pro-vide a framework for model-based regression testselection supporting modifications to UML classand activity diagrams. Using mutation testing,their experimental results demonstrate that theselected test cases achieve the same fault detec-tion capability as that achieved by the completeset of test sets.

A Framework for the Regression Testing of Model-to-Model Transformations 79
The work of Troya et al. [44] proposes an ap-proach for automatically inferring metamorphicrelations for testing ATL model transformations.The inferred metamorphic relations can be usedto detect faults in model transformations in sev-eral application scenarios including regressiontesting. The metamorphic relations are inferredby exploiting the trace model produced whena transformation is executed. The trace modelis composed of traces. When a rule is executed,a trace can be automatically obtained by usingtools such as TraceAdder [45]. For the executedrule, a trace links the name of the rule with theelements instantiating the classes of its sourcemetamodel and the new elements that are cre-ated by the rule and hence instantiate classesin the target metamodel. The authors usedmutation-based testing, similar to what is done inthis paper, to evaluate how effective the approachis in detecting faults in regression testing.
PIn [4], Troya et al. presented an approachfor debugging and fault localization for modeltransformations by applying spectrum-based faultlocalization techniques. The approach is basedon the use of a trace model that can be obtainedwhen the test cases are executed. When a test casefails, the approach ranks the transformation rulesaccording to how much they are suspected of hav-ing the fault causing its failure. Mutation-basedtesting is applied to validate the effectiveness oftheir approach in fault localization.
In [46], Naslavsky et al. presented an ap-proach for selective regression testing that ismodel-based. In this approach, test cases areselected for retesting based on modifications tothe model, rather than to the source code. Theapproach uses traceability links between model el-ements and test cases that traverse such elements.As a modeling perspective, the approach adoptsUML class and sequence diagrams. While theirpresented approach is designed for testing gen-eral software programs, our work is designed fortesting model-to-model transformation programs.In our approach, we exploit the traceability linksbetween test cases and model transformationprogram elements such as rules.
Our approach for regression testing of modeltransformation utilizes traceability links between
test cases and test artifacts. Traceability hasbeen studied by researchers in the areas of re-quirements engineering and model-driven devel-opment (MDD) for a long time. Winkler andPilgrim [47] provide an extensive literature sur-vey on traceability in both areas.
Due to the continuous increase in the size andcomplexity of software, model-based engineeringis gaining a lot of interest from the industry andresearch community [48]. Model-based testing,which is an important part of model-based engi-neering tests the consistency of information andbehavior of source models by applying transfor-mation mechanisms. The automatic nature ofmodel-based testing makes it a more adoptableapproach for detecting software defects fast andeffectively [49, 50]. Regression testing is a quitea tedious work which is repeated with everysizeable refactoring of the model. Model-basedapproaches can make this process easier by au-tomating, managing, and documenting efficiently.Yoo et.al [8] suggest, based on their extensivesurvey, that model-based regression testing tech-niques increase the effectiveness and scalabilityof the overall testing of the system. Model-basedregression testing approaches have several ad-vantages over code-based testing [51, 52]. Theeffort could be estimated at a very early stageand the tools are largely language independent.The models are mostly abstract, which makesthe size of the testable data considerably smallerthan the code.
The majority of model-based regression test-ing approaches exploit UML models for devel-oping test suites for regression testing. UMLclass models have been used for this purposealong with state machines, sequence diagramand activity diagrams [51–53]. Farooq et al. [52]use state machines to represent changes in thetested parts of the system. The method is alsoautomated using an Eclipse-based tool. Briand etal. [51, 54] presented a sequence diagram-basedtechnique to classify and analyze regression testsuites. The approach is complemented with a toolto evaluate the presented models. Finite StateMachines (FSMs) have also been used to gener-ate regression test suites. Chen et al. [55] havedeployed extended FSMs to model the effects of

80 Issam Al-Azzoni, Saqib Iqbal
changes and generate test suites for the modifiedparts of the system. Korel et al [56] have useda similar approach and have exploited extendedFSMs to reduce the size of an existing regressiontest suite. In both approaches, modifications (up-dates, additions and deletions) are representedas transitions of extended FSMs. In one study,Vaysburg et al. [57] used extended FSMs for thedependency analysis of the system that representvarious interactions between components for theregression test selection process. In another study,Almasri et al [58] conducted an impact analysisusing extended FSMs to identify the parts ofthe system that are affected the most. Feldere etal. [59, 60] also used FSMs to represent all modelelements of the system. They proposed a processto identify model elements which trigger changeevents. The identified models are then changedto make the system consistent.
6. Conclusion and future work
In this paper, we have presented a framework forthe regression test selection for model transfor-mation programs. The framework exploits thetraceability links in a test case model. In theevaluation, we applied the framework to severalmodel transformation examples and showed theeffectiveness and time-saving benefit of the frame-work. The experiments were performed in thecontext of the Epsilon platform of integratedtools and languages for model management. Wealso presented a tool that can automatically buildthe test case model and thus facilitate the imple-mentation of our proposed framework.
Following this work, there are several av-enues for future research. First, the proposedframework needs to be integrated with exist-ing model transformation tools and technologies.For instance, when a designer makes a changeto the model transformation code, the relevanttest cases identified by our framework can beautomatically rerun by the integrated tools. Inthis case, the designer does not need to manuallyrerun the test cases. Second, it is recommendedto apply the proposed framework to industrial
case studies involving larger models and morecomplex model transformation logic.
7. Acknowledgement
This work has not received any funding.
References
[1] A.R. da Silva, “Model-driven engineering: A sur-vey supported by the unified conceptual mode,”Computer Languages, Systems & Structures,Vol. 43, 2015, pp. 139–155.
[2] P. Mohagheghi and V. Dehlen, “Where is theproof? – A review of experiences from applyingmde in industry,” in Proceedings of the EuropeanConference on Model Driven Architecture – Foun-dations and Applications, 2008, pp. 432–443.
[3] B. Alkhazi, C. Abid, M. Kessentini, D. Leroy, andM. Wimmer, “Multi-criteria test cases selectionfor model transformations,” Automated SoftwareEngineering, Vol. 27, No. 1, 2020, pp. 91–118.
[4] J. Troya, S. Segura, J.A. Parejo, and A. Ruiz--Cortes, “Spectrum-based fault localization inmodel transformations,” ACM Transactions onSoftware Engineering and Methodology, Vol. 27,No. 3, 2018.
[5] D. Calegari and N. Szasz, “Verification of modeltransformations: A survey of the state-of-the-art,”Electronic Notes in Theoretical Computer Sci-ence, Vol. 292, 2013, pp. 5–25.
[6] G.M.K. Selim, J.R. Cordy, and J. Dingel, “Modeltransformation testing: The state of the art,” inProceedings of the First Workshop on the Analy-sis of Model Transformations, 2012, pp. 21–26.
[7] G. Rothermel and M.J. Harrold, “Analyzing re-gression test selection techniques,” IEEE Trans-actions on Software Engineering, Vol. 22, No. 8,1996, pp. 529–551.
[8] S. Yoo and M. Harman, “Regression testing min-imization, selection and prioritization: A survey,”Software Testing, Verification and Reliability,Vol. 22, No. 2, 2012, pp. 67–120.
[9] J. Shelburg, M. Kessentini, and D.R. Tauritz,“Regression testing for model transformations:A multi-objective approach,” in Proceedings ofthe International Symposium on Search BasedSoftware Engineering, 2013, pp. 209–223.
[10] E. Seidewitz, “What models mean,” IEEE Soft-ware, Vol. 20, No. 5, 2003, pp. 26–32.

A Framework for the Regression Testing of Model-to-Model Transformations 81
[11] Eclipse Modeling Framework (EMF), EclipseFoundation. [Online]. https://www.eclipse.org/modeling/emf/ [Accessed December 2020].
[12] K. Czarnecki and S. Helsen, “Feature-based sur-vey of model transformation approaches,” IBMSystems Journal, Vol. 45, No. 3, 2006, pp. 621–645.
[13] Eclipse Epsilon, Eclipse Foundation. [Online].https://www.eclipse.org/epsilon/ [AccessedDecember 2020].
[14] D. Kolovos, L. Rose, A. Garcıa-Domınguez, andR. Paige, The epsilon book. Eclipse Foundation.,2018. [Online]. https://www.eclipse.org/epsilon/doc/book/
[15] ATL – A model transformation technology,Eclipse Foundation. [Online]. https://www.eclipse.org/atl/ [Accessed December 2020].
[16] The Epsilon Unit Testing Framework, EclipseFoundation. [Online]. https://www.eclipse.org/epsilon/doc/eunit/ [Accessed December 2020].
[17] A. Garcıa-Domınguez, D.S. Kolovos, L.M. Rose,R.F. Paige, and I. Medina-Bulo, “EUnit: A unittesting framework for model management tasks,”in Proceedings of the International Conferenceon Model Driven Engineering Languages andSystems, 2011, pp. 395–409.
[18] EMF Compare, Eclipse Foundation. [Online].https://www.eclipse.org/emf/compare/ [Ac-cessed December 2020].
[19] Epsilon – Examples. [Online]. https://www.eclipse.org/epsilon/examples/ [Accessed December2020].
[20] V. Aranega, J. Mottu, A. Etien, T. Degueule,B. Baudry, and J. Dekeyser, “Towards an au-tomation of the mutation analysis dedicated tomodel transformation,” Software Testing, Ver-ification and Reliability, Vol. 25, No. 5-7, 2015,pp. 653–683.
[21] F. Fleurey, J. Steel, and B. Baudry, “Valida-tion in model-driven engineering: Testing modeltransformations,” in Proceedings of the First In-ternational Workshop on Model, Design and Val-idation, 2004, pp. 29–40.
[22] S. Sen, B. Baudry, and J. Mottu, “On combiningmulti-formalism knowledge to select models formodel transformation testing,” in Proceedingsof the First International Conference on Soft-ware Testing, Verification, and Validation, 2008,pp. 328–337.
[23] Object Constraint Language, Object Manage-ment Group, 2014. [Online]. http://www.omg.org/spec/OCL/2.4 [Accessed December 2020].
[24] I. Al-Azzoni, “ATL transformation of queueingnetworks to queueing Petri nets,” in Proceedings
of the International Conference on Model-DrivenEngineering and Software Development (MOD-ELSWARD), 2017, pp. 261–268.
[25] ATL Transformation Example: BibTeXML toDocBook, 2005. [Online]. https://www.eclipse.org/atl/atlTransformations/BibTeXML2DocBook/ExampleBibTeXML2DocBook[v00.01].pdf[Accessed December 2020].
[26] F. Jouault, J. Bezivin, C. Consel, I. Kurtev, andF. Latry, “Building DSLs with AMMA/ATL,a case study on SPL and CPL telephony lan-guages,” in Proceedings of the ECOOP Workshopon Domain-Specific Program Development, 2006.
[27] ATL Transformations Zoo, Eclipse Foundation.[Online]. https://www.eclipse.org/atl/atlTransformations/ [Accessed December 2020].
[28] F. Fleurey, B. Baudry, P. Muller, and Y.L. Traon,“Qualifying input test data for model transfor-mations,” Software and System Modeling, Vol. 8,No. 2, 2009, pp. 185–203.
[29] J. Troya, A. Bergmayr, L. Burgueno, and M. Wim-mer, “Towards systematic mutations for and withATL model transformations,” in Proceedings of In-ternational Conference on Software Testing, Veri-fication and Validation Workshops, 2015, pp. 1–10.
[30] J. Troya, Implementation of the Spectrum-BasedFault Localization in Model Transformations,2018. [Online]. https://github.com/javitroya/SBFL MT [Accessed December 2020].
[31] D.C. Montgomery and G.C. Runger, AppliedStatistics and Probability for Engineers, 6th Edi-tion. John Wiley and Sons, 2013.
[32] C. Wohlin, P. Runeson, M. Hst, M.C. Ohlsson,B. Regnell, and A. Wessln, Experimentation inSoftware Engineering. Springer Publishing Com-pany, 2012.
[33] E. Guerra, J. Sanchez Cuadrado, and J. de Lara,“Towards effective mutation testing for ATL,” inProceedings of the International Conference onModel Driven Engineering Languages and Sys-tems, 2019, pp. 78–88.
[34] D. Honfi, G. Molnar, Z. Micskei, and I. Majzik,“Model-based regression testing of autonomousrobots,” in Proceedings of the International Sys-tem Design Language Forum, 2017, pp. 119–135.
[35] Eclipse, Eclipse Foundation. [Online]. https://www.eclipse.org/ [Accessed December 2020].
[36] L.A. Rahim and J. Whittle, “A survey of ap-proaches for verifying model transformations,”Software and Systems Modeling, Vol. 14, No. 2,2015, pp. 1003–1028.
[37] C.A. Gonzalez and J. Cabot, “ATLTest: A white--box test generation approach for ATL transfor-

82 Issam Al-Azzoni, Saqib Iqbal
mations,” in Proceedings of the InternationalConference on Model Driven Engineering Lan-guages and Systems, 2012, pp. 449–464.
[38] J. Cabot, R. Clariso, E. Guerra, and J. de Lara,“Verification and validation of declarative model--to-model transformations through invariants,”Journal of Systems and Software, Vol. 83, No. 2,2010, pp. 283–302.
[39] K. Ehrig, J.M. Kuster, and G. Taentzer, “Gener-ating instance models from meta models,” Soft-ware and Systems Modeling, Vol. 8, No. 4, 2009,pp. 479–500.
[40] J. Troya and A. Vallecillo, “Towards a rewritinglogic semantics for ATL,” in Proceedings of theInternational Conference on Theory and Practiceof Model Transformations, 2010, pp. 230–244.
[41] P. Zech, P. Kalb, M. Felderer, C. Atkinson, andR. Breu, “Model-based regression testing byOCL,” International Journal on Software Toolsfor Technology Transfer, Vol. 19, No. 1, 2017,pp. 115–131.
[42] L. Naslavsky, H. Ziv, and D.J. Richardson,“A model-based regression test selection tech-nique,” in Proceedings of the IEEE Interna-tional Conference on Software Maintenance,2009, pp. 515–518.
[43] M. Al-Refai, S. Ghosh, and W. Cazzola, “Support-ing inheritance hierarchy changes in model-basedregression test selection,” Software and SystemsModeling, Vol. 18, No. 2, 2019, pp. 937–958.
[44] J. Troya, S. Segura, and A. Ruiz-Cortes, “Auto-mated inference of likely metamorphic relationsfor model transformations,” The Journal of Sys-tems and Software, Vol. 136, 2018, pp. 188–208.
[45] F. Jouault, “Loosely coupled traceability forATL,” in Proceedings of the European Confer-ence on Model Driven Architecture Workshop onTraceability, 2005, pp. 29–37.
[46] L. Naslavsky, H. Ziv, and D. Richardson, “Mb-SRT2: Model-based selective regression testingwith traceability,” in Proceedings of the Interna-tional Conference on Software Testing, Verifica-tion and Validation, 2010, pp. 89–98.
[47] S. Winkler and J. von Pilgrim, “A survey oftraceability in requirements engineering andmodel-driven development,” Software and Sys-tems Modeling, Vol. 9, No. 4, 2010, pp. 529–565.
[48] B. Legeard, “Model-based testing: Next gener-ation functional software testing,” in PracticalSoftware Testing: Tool Automation and HumanFactors, M. Harman, H. Muccini, W. Schulte, andT. Xie, Eds. Schloss Dagstuhl – Leibniz-Zentrumfur Informatik, Germany, 2010.
[49] A.C. Dias Neto, R. Subramanyan, M. Vieira,and G.H. Travassos, “A survey on model-based
testing approaches: A systematic review,” inProceedings of the International Workshop onEmpirical Assessment of Software EngineeringLanguages and Technologies, 2007, pp. 31–36.
[50] M. Utting and B. Legeard, Practical Model--Based Testing – A Tools Approach. MorganKaufmann, 2007.
[51] L.C. Briand, Y. Labiche, and S. He, “Automatingregression test selection based on UML designs,”Information and Software Technology, Vol. 51,No. 1, 2009, pp. 16–30.
[52] Q. Farooq, M.Z.Z. Iqbal, Z.I. Malik, andA. Nadeem, “An approach for selective state ma-chine based regression testing,” in Proceedingsof the International Workshop on Advances inModel-based Testing, 2007, pp. 44–52.
[53] Y. Chen, R.L. Probert, and D.P. Sims, “Specifi-cation-based regression test selection with riskanalysis,” in Proceedings of the Conference ofthe Centre for Advanced Studies on CollaborativeResearch, 2002.
[54] L.C. Briand, Y. Labiche, and G. Soccar, “Au-tomating impact analysis and regression testselection based on UML designs,” in Proceed-ings of the International Conference on SoftwareMaintenance, 2002, pp. 252–261.
[55] Y. Chen, R.L. Probert, and H. Ural, “Regressiontest suite reduction using extended dependenceanalysis,” in Proceedings of the InternationalWorkshop on Software Quality Assurance, 2007,pp. 62–69.
[56] B. Korel, L.H. Tahat, and B. Vaysburg, “Modelbased regression test reduction using dependenceanalysis,” in Proceedings of the InternationalConference on Software Maintenance, 2002.
[57] B. Vaysburg, L.H. Tahat, and B. Korel, “Depen-dence analysis in reduction of requirement basedtest suites,” in Proceedings of the InternationalSymposium on Software Testing and Analysis,2002, pp. 107–111.
[58] N. Almasri, L. Tahat, and B. Korel, “Towardautomatically quantifying the impact of a changein systems,” Software Quality Journal, Vol. 25,No. 3, 2017, pp. 601–640.
[59] M. Felderer, B. Agreiter, and R. Breu, “Evolu-tion of security requirements tests for service-cen-tric systems,” in Engineering Secure Softwareand Systems, U. Erlingsson, R. Wieringa, andN. Zannone, Eds. Berlin, Heidelberg: SpringerBerlin Heidelberg, 2011, pp. 181–194.
[60] M. Felderer, B. Agreiter, and R. Breu, “Manag-ing evolution of service centric systems by testmodels,” in Proceedings of the Tenth IASTEDInternational Conference on Software Engineer-ing, 2011, pp. 72–80.

A Framework for the Regression Testing of Model-to-Model Transformations 83
Appendix: ETL OO2DB code
pre {2 ”Running ETL”.println();
var db : new DB!Database;4 }
6 // Transforms a class into a table and// a primary key column
8 rule Class2Tabletransform c : OO!Class
10 to t : DB!Table, pk : DB!Column {
12 t .name = c.name;t .database = db;
14// Fill the details of the primary key
16 // of the tablepk.name = t.primaryKeyName();
18 pk.type = ”INT”;t .columns.add(pk);
20 t .primaryKeys.add(pk);
22 // If the class extends some other class// create a foreign key pointing towards
24 // the primary key of the parent classif (c .‘ extends‘. isDefined()){
26var fk : new DB!ForeignKey;
28 var childFkCol : new DB!Column;var parentFkCol : DB!Column;
30 var parentTable : DB!Table;
32 parentTable ::= c .‘ extends‘;parentFkCol = parentTable.primaryKeys.first();
34childFkCol.name = parentFkCol.name;
36 childFkCol.type = ”INT”;childFkCol.table = t;
38fk .database = db;
40 fk .parent = parentFkCol;fk . child = childFkCol;
42 fk .name = c.name + ”Extends” + c.‘extends‘.name;}
44 }
46 // Transforms a single−valued attribute// to a column
48 rule SingleValuedAttribute2Columntransform a : OO!Attribute
50 to c : DB!Column {
52 guard : not a.isMany
54 c.name = a.name;c. table ::= a.owner;
56 c.type = a.type.name.toDbType();}
58// Transforms a multi−valued attribute
60 // to a table where its values are stored// and a foreign key
62 rule MultiValuedAttribute2Tabletransform a : OO!Attribute
64 to t : DB!Table, pkCol : DB!Column, valueCol :DB!Column, fkCol : DB!Column,
66 fk : DB!ForeignKey {
68 guard : a.isMany
70 // The table that stores the values// has an ”id” column and a ”value” column
72 t .name = a.valuesTableName();t .database = db;
74pkCol.name = ”id”;
76 pkCol.table = t;pkCol.type = ”INT”;
78 valueCol.name = ”value”;valueCol.table = t;
80 valueCol.type = a.type.name.toDbType();
82 // Another column is added into the table// to link with the ”id” column of the
84 // values tablefkCol.name = a.name + ”Id”;
86 fkCol.table ::= a.owner;fkCol.type = ”INT”;
88// The foreign key that connects
90 // the two columns is definedfk .parent = pkCol;
92 fk . child = fkCol;fk .database = db;
94 }
96 // Transforms a referecne into a foreign keyrule Reference2ForeignKey
98 transform r : OO!Referenceto fk : DB!ForeignKey, fkCol : DB!Column {
100fkCol.table ::= r .type;
102 fkCol.name = r.name + ”Id”;fkCol.type = ”INT”;
104 fk .database = db;fk .parent = r.owner.equivalent().primaryKeys.first ();
106 fk . child = fkCol;fk .name = r.name;
108}
110operation DB!Table primaryKeyName() : String {
112 return self .name.firstToLowerCase() + ”Id”;}
114operation OO!Attribute valuesTableName() : String {
116 return self .owner.name + ” ” +self .name.firstToUpperCase() + ”Values”;
118 }
120 operation Any toDbType() : String {var mapping : OO2DB!TypeMapping;
122 mapping = OO2DB!TypeMapping.allInstances().select (tm|tm.source = self). first ;
124 if (not mapping.isDefined()){(”Cannot find DB type for OO type ” + self +
126 ”. Setting the default .”). println ();return OO2DB!TypeMap.allInstances().first().
128 ‘ default ‘. target ;}
130 else {return mapping.target;
132 }}


e-Informatica Software Engineering Journal, Volume 15, Issue 1, 2021, pages: 85–114, DOI 10.37190/e-Inf210105
Mining Non-Functional Requirements usingMachine Learning Techniques
Rajni Jindal∗, Ruchika Malhotra∗∗, Abha Jain∗∗∗, Ankita Bansal∗∗∗∗∗Dept. of Computer Science Engineering, Delhi Technological University, India
∗∗Dept. of Software Engineering, Delhi Technological University, India∗∗∗Dept. of Computer Science, Delhi University, India
∗∗∗∗Division of Information Technology, Netaji Subhas University of Technology, [email protected], [email protected], [email protected],
AbstractBackground: Non-Functional Requirements (NFR) have a direct impact on the architecture of thesystem, thus it is essential to identify NFRs in the initial phases of software development. Aim: Thework is based on extraction of relevant keywords from NFR descriptions by employing text miningsteps and thereafter classifying these descriptions into one of the nine types of NFRs. Method:For each NFR type, keywords are extracted from a set of pre-categorized specifications usingInformation-Gain measure. Then models using 8 Machine Learning (ML) techniques are developedfor classification of NFR descriptions. A set of 15 projects (containing 326 NFR descriptions)developed by MS students at DePaul University are used to evaluate the models.Results: The study analyzes the performance of ML models in terms of classification and misclas-sification rate to determine the best model for predicting each type NFR descriptions. The NaïveBayes model has performed best in predicting “maintainability” and “availability” type of NFRs.Conclusion: The NFR descriptions should be analyzed and mapped into their correspondingNFR types during the initial phases. The authors conducted cost benefit analysis to appreciatethe advantage of using the proposed models.
Keywords: requirement engineering, text mining, non-functional requirements, machinelearning, receiver operating characteristics
1. Introduction
Non-Functional Requirements (NFRs) are thebasic quality constraints which specify the oper-ation of a system [1, 2]. NFRs go hand-in-handwith the Functional Requirements (FRs) andare highly essential to ensure the developmentof an efficient and a reliable software systemthat meets the customers needs and fulfills theirexpectations [3]. Set of NFRs need to be cor-rectly identified in the initial phases of SoftwareDevelopment Lifecycle (SDLC) process as theyplay a crucial role in the architecture and designof the system which in turn affects the quality ofthe system [4]. NFRs form the basis for architects
to create the technical architecture of the system.This architecture of the system then acts a plat-form in which the functionality of the system isdelivered [5]. Unfortunately, NFRs are discoveredin the later phases of software development. Thismay be due the reason that some requirementengineers tend to overlook NFRs failing to realizetheir importance and thereby assume them tobe implicitly understood [6]. They do not elicitNFRs in the Software Requirement Specification(SRS) document as clearly as they state FRs, butrather state NFRs in a very adhoc and randomfashion due to which the final SRS document isorganized by functionality with non-functionalrequirements scattered throughout the document
Submitted: 27 February 2020; Revised: 08 January 2021; Accepted: 19 February 2021; Available online: 28 June 2021

86 Rajni Jindal et al.
[7, 8]. Failure to identify and analyze NFRs in theearly phases can result in unclassified, incompleteor conflicting NFRs, requiring costly rework inlater stages of the software development [5]. Thework in this paper focuses on mining the descrip-tions of NFRs which are stated throughout therequirement specification document in an adhocand random fashion and thereafter classify theminto one of the types of NFRs using a suitableMachine Learning (ML) technique. In this work,nine types of NFRs have been considered viz.Availability (A), Look-and-Feel (LF), Legal (L),Maintainability (MN), Operational (O), Perfor-mance (PE), Scalability (SC), Security (SE) andUsability (US). The work is based on extrac-tion of relevant keywords from NFR descrip-tions by employing a series of text mining steps.Firstly, the NFR descriptions are pre-processedto remove irrelevant words from the descriptions.These are the stop words like prepositions, arti-cles, conjunctions, verbs, pronouns, nouns, adjec-tives and adverbs whose presence will not haveany impact on the performance of the predictionmodels but will rather degrade their performance.Once pre-processing is done, we need to find thewords which are relevant in describing the NFRdescriptions. One of the methods is to extractthe relevant words using fixed set of pre-definedkeywords available in the catalogues. These cat-alogues contain a standardized set of keywordsspecific to different types of NFRs. However, themain problem of using this approach (standardkeyword method) is the difficulty of finding ac-cepted and standardized catalogues for all thetypes of NFR specified in the datasets [9]. Evenfor the NFR types whose catalogues were avail-able, it was observed that the keywords specifiedin the catalogue for that particular NFR typecould not classify the NFR descriptions pertain-ing to that NFR type accurately. This was ob-served by the authors Cleland-Huang et al. [9]who concluded that classification of NFRs basedthe keywords extracted from the catalogues resultin unclassified, incomplete or conflicting NFRs.
In order to address this problem, the authorsin this paper are using a training set to discovera set of keywords specific to each type of NFR.Since the keywords in our study are extracted from
pre-categorized requirement specifications, there-fore problem of finding accepted and standardizedcatalogues for all the NFR types is removed.
These keywords are the weighted indicatorterms (specific to each NFR type) which areextracted using Information-Gain (IG) measure.IG measure extracts those keywords (also knownas indicator terms) from the specifications thatmost accurately identify the target concept (NFRtype). For example, terms such as “authenticate”and “access” represent strong indicator terms forsecurity NFRs as they most accurately definesecurity requirements as compared to other typesof requirements. IG measure works by associatinga weight to each of the word obtained afterpre-processing and then the top-N scoring wordsare selected as the indicator terms. In our work,the value of N is considered as 10 as the paper byCleland-Huang et al. [9] showed that good resultswere achieved when top-10 words were consideredas compared to the results achieved when top-5words or all the words were considered together.Once the indicator terms for each NFR typeare identified, prediction models are developedfor the classification of future NFR descriptionswhose NFR type is not known. The authors inthis paper have used in total eight ML algorithmsviz. J48 decision tree (J48), Random Forest (RF),Logitboost (LB), Adaboost (AB), Multi-LayerPerceptron (MLP), Radial Basis Function net-work (RBF), Bagging, Naïve Bayes (NB) forpredicting each type of NFR. The usage of largenumber of ML algorithms allows the authors toperform exhaustive comparison and evaluation.The authors concluded the best ML model foreach NFR type which can be used by softwarepractitioners and researchers in classifying anunknown NFR description into its respectivetype. In addition to this, the authors have alsoconducted cost benefit analysis to understand andappreciate the advantage of using the proposedmodels in contrast to not using the models interms of cost incurred in both the cases.
Thus, there are three main goals of this studywhich we thrive to achieve:1. To apply text mining steps to identify indica-
tor terms As discussed, top-10 indicator termsfor each NFR type are identified by following

Mining Non-Functional Requirements using Machine Learning Techniques 87
a series of text mining steps. This begins byapplying pre-processing steps to remove ir-relevant words from the specifications andthereafter applying IG measure to retrievesignificant words. IG measure works by asso-ciating a weight to each of the word obtainedafter pre-processing and then the top-N scor-ing words are selected as the indicator termsspecific to each NFR type. These indicatorterms serve as independent variables used formodel prediction.
2. To develop machine learning models for eachtype of NFR Corresponding to each NFRtype, a separate dataset was considered withtop-10 indicator terms of that particular NFRtype as independent variables and a binarydependent variable with the value of 1 (ifNFR description belongs to that particularNFR type) or 0 (if NFR description does be-long to that particular NFR type). Eight MLalgorithms are applied to each dataset andtherefore eight different prediction modelswere considered for each NFR type.
3. To conduct cost-benefit analysis Once theprediction models are developed, it is veryimportant to analyze their benefits in terms ofthe cost incurred. Thus, a cost-benefit analy-sis is conducted to understand and appreciatethe advantage of using the proposed modelsin contrast to not using the models in termsof cost incurred in both the cases.Empirical analysis is conducted using an open
source PROMISE dataset freely available at http://promisedata.org/repository. A set of 15 projectsmade by MS students at DePaul University thatconsisted of a total of 326 NFR descriptions cate-gorized into nine types of NFR (“A”, “LF”, “L”,“MN”, “O”, “PE”, “SC”, “SE”, “US”) were usedto evaluate the results. The performance of theML classifiers was compared and evaluated to findout the ML classifier that best predicted the NFRtype using themeasures derived fromReceiver Op-erating Characteristic (ROC) analysis viz. AreaUnder the ROC Curve (AUC) and recall. Theresults indicated the performance of NB classifierhas been best in predicting all theNFRs except SE.Also from cost-benefit analysis, it was concludedthat the cost incurred without using our proposed
models is more than the cost incurred when usingthe proposed models. Thus, we suggest that anyprofessional from the industry who would use ourmodels for classifying the NFRs into their typeswould be in profit.
The paper includes in total eight sections. Thecurrent literature has been provided in Section 2.Section 3 explains the background of the research.The methodology behind the research has beenhighlighted in Section 4. The result analysis ispresented in Section 5, and Section 6 provides thediscussion of the results in terms of cost/benefitanalysis and how the work can be useful for theindustry practitioners. Section 7 provides threatsto validity. Finally, the paper is concluded inSection 8 highlighting the future work.
2. Related work
The area of NFR classification is an emergingarea wherein a lot of research is still beingcarried out. Different authors have employeddifferent techniques and methodologies in or-der to classify the descriptions of NFRs intotheir respective types. Table 1 summarizes thework done in the area of NFR classificationwith respect to types of NFR into which NFRdescriptions have been categorized, ML tech-nique used to perform NFR classification, Natu-ral Language Processing (NLP) techniques usedto pre-process the data and the dataset usedfor conducting empirical validation. (The ab-breviations and their full forms used in Ta-ble 1 are – NB: Naïve Bayes; DT: Decision Tree;SVM: Support Vector Machine; MNB: Multino-mial Naïve Bayes; EM: Expectation Maximisa-tion; DMNB: Discriminative MNB, LDA: LatentDirichlet Allocation; KNN: K-Nearest Neighbor;RB: Rule-Based; HAC: Hierarchical Agglomer-ative Clustering; ET: Extra Tree; LR: LogisticRegression; NFR: Non-Functional Requirement;FR: Functional Requirement; A: Availability;LF: Look-and-Feel; L: Legal; MN: Maintainabil-ity; O: Operational; PE: Performance; SC: Scal-ability; SE: Security; US: Usability).
Till now, only a few authors have exploredthis area and an efficient utilization of resources

88 Rajni Jindal et al.
and manpower is required to devise new method-ologies and techniques for classifying the NFRs.The primary work in this area has been donebythe authors Cleland-Huang et al. [9]. The au-thors have used NFR-classifier which is basedon information retrieval approach. The methodis based on characterizing the different typesof NFR using the concept of keywords. Thesekeywords are used to detect requirements per-taining to a particular type of NFR. The workby the authors Hussain et al. [10] extended theidea of Cleland-Huang et al. and showed thatthe usage of linguistic knowledge is very helpfulin the classification. The work incorporates theusage of a part-of-speech (POS) tagger. Apartfrom this, the authors Gokyer et al. [11] haveused SVM algorithm in order to relate NFRsin a textual data to the quality determining at-tributes. This was accomplished with the help ofa knowledge base provided by an expert. Rash-wan et al. [12] too used SVM algorithm for auto-matic categorization of sentences into differentclasses based on the field of ontology. Similarwork was done in the paper [13] that extractedNFRs from textual documents and used theextracted requirements to improve the descrip-tions of NFRs supporting other RequirementEngineering (RE) tasks. The papers by the au-thors Casamayor et al. [14] performed classifica-tion using a semi-supervised learning approachwhich is based on a lesser number of require-ments in contrast to the supervised approach.The authors proposed a recommender systembased on Multinominal Naïve Bayes classifierin combination with Expectation-Maximization(EM) technique. Zhang et al. [15] incorporateda SVM classifier and repeated the experimentsof Cleland-Huang et al. [9] again in 2011. Theyhave reported comparatively higher results ofprecision, although lower results of recall thanCleland-Huang et al. [9]. They have shown thata model based on the individual words outper-formed the models based on multi-words. Thepaper by Slankas et al. [16] utilized a K-nearestneighbor (KNN) supervised learning algorithmfor performing NFR classification and comparedits performance with SVM and Naïve Bayes tech-niques. It was observed that SVM algorithm
performed better than Multinomial Naïve Bayesclassifier and KNN classifier outperformed opti-mal Naïve Bayes classifier with a unique distancemetric. The authors Singh et al. [17] have in-corporated rule-based classification technique inorder to identify and classify the requirement sen-tences into NFR sub-classes using the concept ofthematic roles. PROMISE corpus and Concordiacorpus have been used to validate the results.The authors Kurtanovic et al. [18] studied howaccurately the classification of requirements asFRs and NFRs can be done with supervised MLapproach incorporating meta-data, lexical, andsyntactical features. Similar work was done bythe authors in their paper [19–24] which aimedat identifying NFRs in the informal documentslike user comments, commit messages and in-stallation manuals. Apart from this, few authors[25–28] have primarily worked on the extractionand classification of only the security require-ments as these were considered the most signifi-cant type of NFR essential for the developmentof secure and reliable software.
The work in this paper is based on extractionof relevant keywords from NFR descriptions byemploying a series of text mining steps and there-after classify them into one of the nine types ofNFRs (“A”, “LF”, “L”, “MN”, “O”, “PE”, “SC”,“SE”, “US”) using a suitable ML based predictionmodel. These keywords (also known as indicatorterms) are extracted for each NFR type using IGmeasure. Once the indicator terms for each NFRtype are identified, prediction models are devel-oped for the classification of future NFR descrip-tions whose NFR type is not known. In this study,eight different prediction models (correspondingto eight different ML techniques) were developedfor each type of NFR. Since there were ninetypes of NFR considered in this work, thereforea total of 72 prediction models were developed.An extensive evaluation and comparison of these72 models was performed with the aim to identifybest prediction model for each NFR type thatcould accurately classify future NFR descriptionswhose NFR type is not known. The literatureshows (Table 1) that majority of the studieshave worked on very few classifiers (maybe twoor three). Most of the studies have used SVM and

Mining Non-Functional Requirements using Machine Learning Techniques 89
NB classifiers for developing prediction models.The usage of large number of ML techniquesallows us to provide a fair evaluation and con-clude the best prediction model that could mostaccurately classify each type of NFR description.Once we have found the best prediction modelcorresponding to each type of NFR, we have also
performed cost-benefit analysis. This analysiswas done to understand and appreciate the costof using the proposed models vis-à-vis the costof not using the models. This analysis is veryimportant from industry point of view when themodels are required to be used in real sense. Thisanalysis is also missing in majority of the studies.
Table 1: Summary of the studies pertaining to NFR classification
S. No. Paper Types of NFR usedML tech-niquesused
NLPtechniqueused
Dataset used
1 [9] A, LF, L, MN, O,PE, SC, SE, US
NFR-Clas-sifier
Stemming,Stop-wordsremoval,tokenization
Promise NFR dataset (http://promisedata.org/repository) created by students of DePaulUniversity. It contains 15 projects consistingof a total of 684 requirements specifications(326 NFR + 358 FR).
2 [10] Not provided DT Stemming,POS,tokenization
Promise NFR dataset created by students ofDePaul University. It contains 15 projects con-sisting of a total of 765 requirements specifi-cations (495 NFR + 270 FR).
3 [11] PE, MN, US,Integrity,Portability,Deployability,Dependability
SVM Stemming,POS
Web-based transactional applications imple-mented at Cybersoft.
4 [14] A, LF, L, MN, O,PE, SC, SE, US,Portability, Fitness,Functionality
MNBcoupledwith EM
Stemming,Stop-wordsremoval, Nor-malization
Promise NFR dataset (http://promisedata.org/repository) created by students of DePaulUniversity. It contains 15 projects consistingof a total of 625 requirements specifications(370 NFR + 255 FR).
5 [15] SE, PE, A, SC,MN, L, US, O, LF,Palm Operational,Fitness
SVM Stemming,POS,N -gram,RegularExpression
Promise NFR dataset (http://promisedata.org/repository) created by students of DePaulUniversity. It contains 15 projects consistingof a total of 625 requirements specifications(370 NFR + 255 FR).
6 [25] Securityrequirements,security-relevantsentences andsecurity-relatedsentences
NB tokenization Three industrial requirements documentsviz. Common Electronic Purse Specification(ePurse), Customer Premises Network speci-fication (CPN) and Global Platform Specifi-cation (GP). Total number of requirementsis 124, 210, 176 for ePurse, CPN, GP withnumber of security requirements being 83, 42,63 for ePurse, CPN, GP.
7 [19] SE, MN, PE, US,Integrity,Portability,Efficiency,Reliability,
SVM,NB,MNB,DMNB,LDA
Stop-wordsremoval
Three different open-source, partially-commer-cial database systems: (1) MySQL 3.23: con-tains 320 KLOC of C and C++ source code.Its source control history was used from 31July 2000–9 August 2004. (2) MaxDB 7.500:

90 Rajni Jindal et al.
Table 1 continued
S. No. Paper Types of NFR used ML tech-niquesused
NLPtechniqueused
Dataset used
Interoperability,Testability,Traceability,Accuracy,Modifiability,Modularity,Correctness,Verifiability,Functionality,Understandability,Flexibility
contains 940 KLOC. Its source control historywas used from 29 June 2004–19 June 2006.(3) PostgreSQL 7.3: contains 306 KLOC ofC code. Its source control history was usedfrom 9 May 2002–26 August 2004.
8 [12] SE, US, Efficiency,Functionality,Reliability
SVM Stemming,tokenization
(1) Promise NFR dataset (http://promisedata.org/repository) created by students of De-Paul University, contains 15 projects consist-ing of a total of 684 requirements specifications(326 NFR + 358 FR). (2) A manually anno-tatedcorpus containing 6 types of requirementdocuments, 4 are SRSs of different products(online shopping center, student managementsystem, institute of space physics, hospital pa-tient system), 1 supplementary specificationdocument, and 1 use case document. Thesedocuments contain 3064 sentences, manuallyannotated in four main classes (FR, Externaland Internal Quality, Constraints and otherNFRs).
9 [16] A, SE, L, LF, MN,O, US, AccessControl, Audit,Privacy, Capacity,Performance,Recoverability,Reliability
SVM,KNN
Stop-wordsremoval,POS,Lemmatiza-tion,Dependencyparsing
A series of 11 documents related to ElectronicHealth Records (EHRs) (https://github.com/RealsearchGroup/NFRLocator). Forrequirement specifications, CCHIT Ambula-tory Requirements, iTrust, and the PROMISENFR Data Set (http://promisedata.googlecode.com) were used.
10 [20] Not provided SVM,MNB
N -gram 2 specifications from Mercedes-Benz (automo-tive industry).
11 [26] Confidentiality,Integrity,Identification,Authentication,Accountability,Privacy Availability
SVM,NB, KNN
tokenization 10,963 sentences in six different documentsfrom healthcare domain.
12 [29] Not provided SVM N -gram Specifications from Mercedes-Benz (automo-tive industry).
13 [13] A, LF, L, MN, O,PE, SC, SE, US,Portability, Fitness,Functionality
RB Stop-wordsremoval,Lemmatiza-tion,Dependencyparsing
Promise NFR dataset created by students ofDePaul University, contains 15 projects con-sisting of a total of 625 requirements specifi-cations (370 NFR + 255 FR).

Mining Non-Functional Requirements using Machine Learning Techniques 91
Table 1 continued
S. No. Paper Types of NFR used ML tech-niquesused
NLPtechniqueused
Dataset used
14 [30] SE, PE, SC, US,Reliability
KNN Not provided 2 case studies: 1st case study utilized thePredictor Models in Software Engineering(PROMISE) dataset, 2nd case study utilizedthe European Union eProcurement System”s26 FRs.
15 [31] SE, PE, L, A,Safety, Privacy,Accuracy,Portability,Reliability,Interoperability,Accessibility
K-meanscluster-ing, HAC
Stemming,Stop-wordsremoval,Lemmatiza-tion
Three experimental software Java systemsfrom different application domains viz.SmartTrip (an Android mobile application),SafeDrink with a mobile application interface,BlueWallet (subscription-based Web service)
16 [27] Securityrequirements oftypeAuthentication,Authorization,Access control,Cryptography-En-cryption, Dataintegrity
DT Stemming,Stop-wordsremoval,tokenization
Promise NFR dataset (http://promisedata.org/repository) created by students of DePaulUniversity. It contains 15 projects consistingof a total of 684 requirements specifications(326 NFR + 358 FR). Out of 326 NFR speci-fications, the total number of security require-ment specifications is 58.
17 [28] Securityrequirements oftypeAuthentication,Authorization,Access control,Cryptography-En-cryption, Dataintegrity
DT Stemming,Stop-wordsremoval,tokenization
Promise NFR dataset (http://promisedata.org/repository) created by students of DePaulUniversity. It contains 15 projects consistingof a total of 684 requirements specifications(326 NFR + 358 FR). Out of 326 NFR speci-fications, the total number of security require-ment specifications is 58.
18 [17] Efficiency (Timebehavior, ResourceUtilization),Functionality(Suitability,Accuracy, SE), US(Operability,Understandability,Attractiveness)
RB Stemming,POS,tokenization
(1) Promise NFR dataset (http://promisedata.org/repository) created by students of DePaulUniversity. It contains 15 projects consistingof a total of 635 requirements specifications(370 NFR + 265 FR). (2) A manually anno-tated corpus containing 6 types of requirementdocuments, 4 are SRSs of different products(online shopping center, student managementsystem, institute of space physics, hospitalThese documents contain 3064 sentences, man-ually annotated in four main classes (FR, Ex-ternal and Internal Quality, Constraints andother NFRs).
19 [21] Reliability,Portability, PE, US
NB, DT,Bagging
Stemming,Stop-wordsremoval,Lemmatiza-tion
Two popular Apps viz. Apple App (iBooks inthe books category) and Google Play (Whats-App in the communication category). Total21969 raw user reviews (6696 FRom iBooksand 4400 FRom WhatsApp) were obtained.

92 Rajni Jindal et al.
Table 1 continued
S. No. Paper Types of NFR used ML tech-niquesused
NLPtechniqueused
Dataset used
20 [22] PE, US, Reliability,Supportability,Functionality
SVM,NB, DT,KNN
Stemming 40 Apps from the App Store falling into 10categories (books, education, games, health,lifestyle, navigation, news, productivity, traveland utilities). A total of 932,388 reviews wereobtained.
21 [23] Reliability, PE,Lifecycle,CapabilityUsability, SystemInterface
SVM,KNN
Lemmatiza-tion
User requests of open source projects fromsourceforge.net, whose user base consists ofboth software developers and ordinary soft-ware consumers.
22 [18] PE, US, O, SE SVM Stop-wordsremoval,POS,Lemmatiza-tion, N -gram
NFR dataset consisting of a total of 625requirements specifications (370 NFR +255 FR).
23 [32] A, MN, US, LF,PE, SC,Operability, FaultTolerance,Portability, Legaland Licensing
MNB,LDA,K-means,HAC
POS,RegularExpression,EntityTagging,TemporalTagging
TERA Promise NFR dataset created by stu-dents of DePaul University and was updatedin 2010. It contains 15 projects consistingof a total of 625 requirements specifications(370 NFR + 255 FR).
24 [24] MN, US, Reliability,Efficiency,Portability,Functionality
LDA Stop-wordsremoval, Nor-malization
Extracted posts (21.7 million) and comments(32.5 million) of the Stack Overflow fromJuly 31, 2008 to September 14, 2014 providedby the MSR (Mining Software Repositories)challenge.
25 [33] A, L, LF, MN, O,PE, SC, SE, US,Fault tolerance,Portability
Multi-nomialNB,BernoulliNB,GaussianNB, DT,ET, ETs,KNN,LinearLR, MLP,SVM,LabelPropaga-tion,LabelSpread
Stemming,Stop-wordsremoval,tokenization
TERA Promise NFR dataset created by stu-dents of DePaul University and was updatedin 2010. It contains 15 projects consistingof a total of 625 requirements specifications(370 NFR + 255 FR).

Mining Non-Functional Requirements using Machine Learning Techniques 93
3. Background of the research
This section includes a brief overview of the MLtechniques used for classification along with thedescription of performance evaluation measuresused for evaluating the performance of the pre-diction models.
3.1. Overview of machine learningtechniques
From the literature survey (Table 1) it was ob-served that majority of the authors have incorpo-rated ML techniques for NFR classification whichfall under supervised learning approaches as com-pared to the techniques which fall under unsu-pervised learning approaches or semi-supervisedlearning approaches. Supervised learning MLtechniques have accurately performed NFR clas-sification producing promising results. Keepingthis in mind, we intended to work on supervisedML techniques. The techniques under supervisedlearning can be broadly categorized under thefollowing domains: Ensemble Learners, NeuralNetworks, Bayesian Networks, and Decision Tree.To have a fair evaluation of techniques under allthe domains, we selected 1 to 3 ML techniquesunder each of the domains. In total, we comparedand contrasted eight different ML techniques, viz.RF, LB, AB, Bagging (Ensemble learner), MLP,RBF (Neural network), NB (Bayesian network)and J48 (Decision tree). These techniques arepopularly used for binary classification in otherfields such medical diagnosis [34, 35] networkintrusion detection [36], credit card fraud detec-tion [37], defect and change prediction [38, 39],etc. and have shown promising results. Thus,the authors want to explore them for identifyingthe type of NFR description. A brief overviewof these ML techniques is presented in Table 2.These ML classifiers are implemented using thedefault control settings of an open source tool,WEKA http://www.cs.waikato.ac.nz/ml/weka/.The default control parameters for each of theML classifier are also provided in Table 2. Wehave used the default settings and have not tunedthe parameters as over-fitting of the parametersmay become a threat to external validity.
3.2. Measures for evaluating models
Once the models are trained, testing is performedto evaluate the performance of the models. Theperformance of the models would be highly op-timistic if the testing is performed on the samedataset as the one on which training is performed.Hence, we have used intra-validation techniquewhere the same dataset is partitioned into twosubsets, one of which is used for training, whilethe other is used for testing. The intra-validationtechnique used in this study is 10-cross validationtechnique wherein the entire dataset (326 NFRdescriptions) is partitioned into 10 equally sizedparts (P1, P2,. . . , P10). As can be seen from theFigure 1, for the first time, one part is used fortesting (P1), while remaining 9 parts (P2–P10)are used for training the model [48]. The pro-cedure is continued 10 times such that each in-stance gets validated once and finally a singleestimate is produced by combining all the 10results [49].
Figure 1. Procedure of 10-foldcross validation technique
For evaluating the performance of the mod-els, we need appropriate performance measureswhich are suitable to be applied in the givenstudy. In this study, amongst a number of mea-sures available, the authors choose to use twoperformance measures, recall (also known as re-call) and the area under the ROC curve (AUC).The rationale behind using these performancemeasures has been explained below. Recall is oneof the traditional measures which tells that out ofactual positive data, how many times the modelpredicted correctly [50]. Another commonly usedtraditional measure which is not used in this

94 Rajni Jindal et al.
Table 2. Description of machine learning techniques and control parameters used in the study
MLTechnique
Description Parameter Settings
J48 decisiontree [40, 41]
It is an implementation of C4.5 decision tree algorithm used tohandle the classification problems. It generates a binary treewhich could be either pruned or unpruned. The pruned treedoes not have an influence on the performance of the modelwhile discarding the nodes and branches. It also reduces therisk of overfitting to the training data.
Set confidence factoras 0.25. Set minimumnumber of objects inleaves as 2 and number offolds as 3. Set seed as 1.
Randomforest [42]
It is used for building a number of classification trees, therebyleading to a forest. Each object which needs to be classifiedacts as an input to the tree in the forest. The process ofclassification is performed by each tree, and it is said that thetree “votes” for that particular class.
Set the classifier as Deci-sion Tree. Set maximumdepth as 0, number of fea-tures as 0, seed as 1 andnumber of trees as 100.
Bagging [42] In this technique, a sample of data is used to generate varioussub-samples of the data which are the training sets and usedfor making the required predictions by developing the desiredmodel.
Set the classifier as Deci-sion Stump or REPTree.Set number of iterationsas 10, weight thresholdas 100 and seed as 1. Noresampling is used.
Logit-boost[43]
In this technique, the regression technique is used as the baselearner and this is followed by performing additive logisticregression. It is the most important type of the Boostingtechnique.
Set the classifier as Deci-sion Stump. Set number ofiterations as 10, number ofruns and seeds as 1 andweight threshold as 100.No resampling is used.
Ada-boost[43]
This technique is based on combining different weak learningtechniques in order to improve the process of classification,leading to improved results. This is done by first assigningequal weights to all the instances present in the training set andthereafter multiple rounds are conducted and in each roundthe weights of the examples which have not been correctlyclassified are increased. This is how the performance of a weaklearner is improved.
Set the classifier as De-cision Stump. Set num-ber of iterations as 10,number of runs and seedsas 1 and weight thresholdas 100. No resampling isused.
Multi-LayerPerceptron[44]
In this technique, a set of input values are mapped to a set ofoutput values wherein learning is done using back-propagation.Firstly the inputs are given to the network. Using the weightsapplied on each layer and the inputs, the desired output ofthe network is calculated. Then the error is computed which isdifference of the actual value of the output and the calculatedvalue. Based on this computed error value, the weights areupdated and accordingly the parameters of the network areadjusted. To achieve the desired performance, this process isrepeated again and again.
Set number of hidden lay-ers as a wildcard value “a”= (no. of attributes + no.of classes)/2. Set learningrate as 0.3 and momen-tum as 0.2. Set sigmoidfunction for transfer.
Radial BasisFunctionnetwork [45]
An artificial neural network having a single layer is called RBFnetwork. The activation function used here is the radial functionswhich are applied to the inputs. These inputs are combinedwith the weights to produce the desired output of the network.
Set number of clustersas 2 and clustering seedas 1.
Naïve Bayes[46, 47]
This is one of the simplest classifier based on probabilitywherein the approach for classification is based on Bayes” the-orem. The most probable class for a new instance is found outusing this technique. A parametric model is used to generatethe test data. The Bayes” estimates for the model parametersare calculated using the training data.
Set kernel estimator asfalse. Set supervised dis-cretization as false.

Mining Non-Functional Requirements using Machine Learning Techniques 95
study is precision. Precision tells that when themodel predicts something positive, how manytimes they were actually positive. Mathemati-cally, recall and precision are defined as follows:
Recall = TPTP + FN
Precision = TPTP + FP
where, TP (True Positive): When the documentactually belongs to a category “A” (positive)and is predicted by the model to be in category“A” (positive), FN (False Negative): When thedocument actually belongs to a category “A”(positive) and is predicted by the model in cat-egory “Not A” (negative), FP (False Positive):When the document actually belongs to a cate-gory “Not A” (negative) and is predicted by themodel to be in category “A”. We have focusedon recall and did not use precision because ofthe following two reasons:1. In this study, FN is more significant than FP
and as a result FN cannot be ignored. If wecannot ignore FN , then we have to take intoaccount recall measure. Let us understandwhy recall is more important than precisionin this study. FN occurs when a document ispredicted by a model to be in category “Not A”when it actually belongs to category “A”. FPoccurs when a document is predicted by themodel to be in category “A”, when it actuallybelongs to category “Not A”. Now when a FNoccurs, a document which actually belongs tocategory “A” is ignored by the stakeholdersof the software because it is predicted to be incategory “Not A”. This may result in deliveryof poor quality software and may have seriousimplications on the industry in terms of itsreputation in long term. However, when a FPoccurs, some extra resources of the industry(in terms of time, money and manpower) maybe utilized as the document actually belongsto a category “Not A” (negative) and is pre-dicted by the model to be in category “A”.Clearly, FN holds a more significant positionas releasing poor quality software is more dis-astrous as compared to utilization of some
extra resources. Thus, in this study, we havereported recall and did not consider precision.
2. Moreover, the datasets (9 datasets with bi-nary dependent variable formed from a singledataset) used in this work for model predictionare imbalanced where the number of instancesbelonging to negative class is more than thenumber of instances belonging to the positiveclass. Studies in literature have criticized theuse of precision when the models are validatedusing imbalanced datasets [51, 52].
Instead, to handle the imbalance nature ofthe datasets, we have used an effective perfor-mance measure known as Area Under ROCCurve (AUC). ROC curve is a plot of recall(true-positive) on the y-coordinate versus its1-specificity (false positive) on the x-coordinate.It is used to measure the accuracy of the modeland its values lie in the range of 0 to 1, wherean AUC value of 1 indicates the best prediction.When the data is imbalanced, the model is biasedtowards the majority class while the minorityclass is predicted with less accuracy. To handlethis, studies [51, 53, 54] propose the use of AUCas it is insensitive to class distribution changes.In other words, it is robust to imprecise classdistribution and misclassification costs [55].
4. Methodology behind the work
This section discusses the methodology incorpo-rated to accomplish the classification of NFRs.Figure 2 depicts three steps used to develop thepredictive models. The steps have been explainedin the following subsections.
4.1. Gathering of NFR descriptions
The dataset used in this work for empirical anal-ysis was the same dataset which was used by theauthors Cleland-Huang et al. [9]. This datasetconsist of a set of 15 projects which were madeby MS students at DePaul University available atthe open source PROMISE software engineeringrepository http://promisedata.org/repository.These projects contained a total of 326 NFRdescriptions and 358 FR descriptions. These

96 Rajni Jindal et al.
Figure 2. Framework used for classifying NFR descriptions
Figure 3. Percentage of requirements belonging to each type of NFR
326 NFR descriptions have been categorized intonine types of NFR viz. availability, look-and-feel,legal, maintainability, operational, performance,
scalability, security, and usability. The percent-age of NFRs belonging to each NFR type isshown in Figure 3.

Mining Non-Functional Requirements using Machine Learning Techniques 97
4.2. Application of text miningtechniques
This step concerns with the analysis of NFRdescriptions to identify significant keywords (in-dicator terms) pertaining to each type of NFR.326 NFR descriptions were extracted from therequirement specification documents and appliedto a series of text mining steps. Figure 2 demon-strates the steps of text mining which has beenexplained below:1. Pre-processing: Each document is represented
using Bag of Words (BOW) representationmethod in which a document is considered tobe a collection of thousands of words whichoccur in it at least once. Many of these wordsare not relevant for the learning task andtheir usage can degrade the performance ofa classifier. Thus, a series of preprocessingtasks like tokenization, stop-words removaland stemming are required in order to removethe irrelevant words from the document. Textmining process begins by first converting theentire document in the form of tokens, i.e.,a set of words. This is known as tokenization.This is followed by removing the words fromthe document that do not add any meaningto the data (stop words like prepositions, arti-cles, conjunctions, etc.). Finally, stemming isperformed [56]. Instead of stemming, anotherpopular technique which could be used islemmatization. However, we preferred stem-ming over lemmatization as the computationtime involved in stemming is lesser as com-pared to lemmatization which is useful incaseof large datasets and long texts.
2. Feature-Selection: Once pre-processing is per-formed, set of relevant words called indicatorterms need to be identified specific to eachtype of NFR. In this work, Information-Gain(IG) measure has been used as the featureselection method. The working of IG measureis based on finding a collection of words fromthe document that best identify the targetconcept (NFR type) [57]. It is based on theconcept of entropy deduction which occurswhen the dataset is split on an attribute [57].In other words, IG is the amount of infor-
mation that is gained by evaluating the IGvalue of each attribute in the dataset. It isdefined as the difference of the entropy of thedataset before the split and the entropy of thedataset after the split. Entropy of the entiredataset determines the amount of uncertaintyin the information that needs to be assessed.IG measure works by associating a weightto each of the word obtained after pre-pro-cessing and then the top-N scoring words areselected as the indicator terms. In our work,the value of N is considered as 10 as thepaper by Cleland-Huang et al [9] showed thatgood results were achieved when top-10 wordswere considered as compared to the resultsachieved when top-5 words or all the wordswere considered together. Table 3 depicts thetop-10 indicator terms in decreasing orderof IG measure, corresponding to each of thenine NFR types.
3. Vector Space Model: Once feature selectionhas been done using IG measure, we willhave total number of N indicator termswhich can be represented as t1, t2, . . . , tN .Each ith document is then represented asa N -dimensional vector consisting of N val-ues written as (Xi1, Xi2, . . . , XiN ). Here, Xij
is a TF-IDF (Term Frequency Inverse Docu-ment Frequency) weight measuring the impor-tance of the jth term tj in the ith document.The complete set of vectors correspondingto all the documents under consideration iscalled a Vector Space Model (VSM).
4.3. Development of prediction models
Once the indicator terms for each NFR typeare identified, prediction models are developedfor the classification of future NFR descriptionswhose NFR type is not known. As depicted inFigure 4, nine datasets are developed correspond-ing to each NFR type from an initial dataset.
This initial dataset is the original NFR docu-ment that consists of 326NFRdescriptions belong-ing to one of the nine NFR types. Each dataset hasthe total number of instances as 326with top-10 in-dicator terms of that particular NFR type as inde-pendent variables and a binary dependent variable.

98 Rajni Jindal et al.
Figure 4. Process involved in NFR classification
Table 3. Top-10 indicator terms specific to each NFR type sorted by IG measure
Rank A LF L MN O PE SC SE US1 achiev simul regul updat environ second simultan access easi2 hour ship compli mainten interfac respons handl author train3 day sound disput chang window time year ensur understand4 pm interfac legal nfl server longer capabl authent intuit5 time appear rule season user minut support prevent instruct6 long appeal histori releas web return number allow select7 onlin shot requir integr establish fast expect logon realtor8 avail color complianc code oper flow concurr secur learn9 technic compli conform pattern second add increas polici symbol10 year access standard offer custom prepaid launch malici natur
These top-10 indicator terms (extracted using IGmeasure) specific to each NFR type are shown inTable 3. Dependent variables will have the value of1 or 0 depending on the type of NFR. For instance,dataset 1 is pertaining to “A” NFR type, so it willhave the value of the dependent variable as 1 for allthe NFR descriptions pertaining to “A” NFR typeand the value of 0 for all other remaining NFRdescriptions. Corresponding to each of the ninedatasets, 8 prediction models are developed byemploying 8ML techniques (J48 decision tree, RF,Logitboost, Adaboost, MLP, RBF network, Bag-ging,NB) on each of the datasets. These predictionmodels can be used for the classification of futureNFR descriptions whose NFR type is not known.
5. Result analysis
This section presents the results of eight differentML techniques when applied to nine differentmod-els developed with respect to their correspondingNFR types. The performance measures whichhave been used in evaluating the performance ofthese ML techniques are AUC and recall.
In this section, we will broadly discuss thefollowing two Research Questions (RQs):RQ1: Which ML technique is best for predictingeach type of NFR such as performance, security,look-and-feel, etc.?RQ2: Which NFR has been best predicted interms of classification and misclassification rate?

Mining Non-Functional Requirements using Machine Learning Techniques 99
5.1. Analysis of RQ1
To address the RQ1, the performance of the MLclassification models to predict each category of
NFR is depicted in Figure 5. Figure 5 depicts thecomparative analysis of the ML models and de-termines how well these models have performedin predicting different types of NFR. The data
Figure 5. Graphical representation depicting the performance of ML techniques

100 Rajni Jindal et al.
values corresponding to each figure are shownin appendix (Tables A1–A4). We can observefrom the Figure 5 that different NFR types re-sponded differently to each classification method.For example, the performance of “A” NFR interms of AUC when predicted by different classi-fiers is quite different, ranging from 0.65 to 0.97.Similar observations can be seen with all otherNFR types. In other words, if a particular MLmodel has given a high value of AUC in pre-dicting a particular type of NFR, it may not benecessary that it is also giving high accuracy inpredicting other NFR types. This may be due tothe reason that each NFR is very different fromthe others and thus, the top-10 words selectedcorresponding to each NFR are very different.Since the classification models are based on thesetop-10 words, the same classifier is performeddifferently on different NFRs. Given this scenario,the identification of a suitable classifier to predicteach type of NFR will be highly beneficial forresearchers and academicians. Figure 5 showsthat the NFR “A” has been best predicted byNB giving AUC values as high as 0.97 and recallvalue as 90.0%. This is followed by RF givingAUC of 0.91 and recall as 85.0%. The graphsshow that all NFRs except “SE” are best pre-dicted by NB classifier. NB gives the highestAUC of 0.97, 0.83, 0.97, 0.95, 0.81, 0.86, 0.88,and 0.77 for “A”, “LF”, “L”, “MN”, “O”, “PE”,“SC” and “US” types of NFR, respectively. Theircorresponding recall values are also high in themajority of the cases. The probable reason of NBperforming well could be due to its assumptionof attributes to be independent given the valueof class variable [40]. Moreover, NB does not fitnearly as much, so there is no need to pruneor process the network. For “SE” NFR, MLPhas given the highest AUC of 0.85. After NBtechnique, RF and RBF techniques have shownthe second highest AUC for the majority of theNFRs. The AUC of RF and RBF lies in therange of 0.67 to 0.91 and 0.72 to 0.92, respec-tively. The performance of the bagging techniquecan be considered as an average in predicting theNFR descriptions of all types with the values ofAUC lying in the range of 0.74 to 0.85. Similarperformance has been depicted by LB and AB
techniques. The performance of these techniqueshas been overall good in predicting the NFRdescriptions with the values of AUC lying in therange of 0.73 to 0.88 corresponding to LB andthe AUC value falls in the range of 0.72 to 0.83with respect to AB. On the contrary, J48 decisiontree technique has not performed well in classi-fying the NFR descriptions into their respectivetypes as the highest value of AUC obtained is0.75 with 66.0% recall value. J48 has shown thelowest performance (in terms of both AUC andrecall) in predicting all types of NFRs. Fromthe above analysis, it is summarized that theperformance of NB has outperformed all otherclassifiers and it is overall best in predicting theNFRs. We suggest researchers and academiciansto use NB models for predicting the NFRs.
5.2. Analysis of RQ2
To address RQ2, NFRs are compared across eachother by comparing the classification and misclas-sification ability of the best ML model for eachtype of NFR found in RQ1. The classificationability of the ML model is found by comparingthe NFRs using AUC and recall values. In thisstudy, the keywords form the basis for the identi-fication of NFR documents into their respectivetypes of NFRs. Thus, the performance of theML model also depends on the values of thesekeywords. The NFRs which is predicted withhigh AUC and recall implies that the keywordspertaining to that NFR type are of great signif-icance for the particular ML model to performclassification. It also implies that the dataset inturn consists of a good number of these require-ments and thus the ML models are trained wellon such datasets.
Whereas, the misclassifications by the MLmodel are found by determining the number ofFalse Negative (FN ) and False Positive (FP)of each type of NFR. As we have discussed inSection 3.2, FN occurs when the document actu-ally belongs to a category “A” (positive) and ispredicted by the model in category “Not A” (neg-ative). Whereas, FP occurs when the documentactually belongs to a category “Not A” (negative)and is predicted by the model to be in category

Mining Non-Functional Requirements using Machine Learning Techniques 101
Figure 6. Bar graph showing comparison amongst NFRs in terms of AUC and recall
Table 4. Number of misclassifications of NFRs
NRF Type Misclassifications Misclassificationsdone by ML model
False Negative False Positive Total(FN ) (FP) (FN+FP)
Availability (A) 7 (2.01%) 8 (2.30%) 15 (4.32%) NBLegal (L) 8 (2.30%) 5 (1.44%) 13 (3.74%) NBLook-and-Feel (LF) 8 (2.30%) 22 (6.34) 30 (8.64%) NBMaintainability (MN) 4 (1.15%) 5 (1.44%) 9 (2.59%) NBOperational (O) 15 (4.32%) 36 (10.37%) 55 (15.85%) NBPerformance (PE) 25 (7.20%) 7 (2.01%) 32 (9.22%) NBScalability (SC) 15 (4.32%) 8 (2.30%) 23 (6.62%) NBSecurity (SE) 8 (2.30%) 35 (10.08%) 43 (12.39%) MLPUsability (US) 1 (0.28%) 29 (8.35%) 30 (8.64%) NB
“A”. It is also discussed in Section 3.2 that FN ismore significant that FP and thus, a model withlower FN is more desirable. The classificationability of the best ML model in predicting eachtype of NFR can be seen from Figure 6. On theother hand, the number of misclassifications doneby the best ML classification model for each typeof NFR is shown in Table 4. Table 4 shows themisclassifications for each type of NFR in termsof number of FN and FP along with their per-centages. It can be seen from Figure 6 that “A”,“L” and “MN” (in this order) have shown highAUC values, followed by “PE”, “SC” and “SE”.High recall values are shown by “MN”, “L”, and“A” (in this order). Thus, we can say that overall(taking AUC and recall together) “L” has beenbest predicted amongst all NFRs. This mightbe due to the reason that the “L” type of NFRis comparatively easy to understand and collectand thus, the data consisted of a good number of
correctly elicited requirements pertaining to thisNFR. In addition to this, Table 4 shows that only13 “L” type NFRs are misclassified by NB modelwhich is amongst the lowest compared to othermisclassification rates. However, amongst these13 misclassifications, there are more number ofFN than FP, which is not desirable. Hence, suchmodels may not be used for future unknown pre-dictions. In contrast, the misclassification ratesto predict “Ă” and “MN” type of NFR are alsolow (4.32% and 2.59%, respectively). “MN” infact has been least misclassified amongst all theNFRs. Also, the number of FN is less than FPfor both “A” and “MN”. Thus, overall, we cansay that NB model has performed best in pre-dicting “MN” and “A” types of NFRs when bothclassification and misclassification are taken to-gether. The NFR which is predicted with lowestAUC and recall is “US” as can be seen fromFigure 6. It can also be seen from Table 4 that

102 Rajni Jindal et al.
30 “US” type NFR have been misclassified whichis amongst the highest. NB has given the highestmisclassification rate (15.85%) for “O” type ofNFR, implying that 55 “O” types of NFRs havebeen misclassified as some other NFRs. In termsof AUC and recall also “O” has been predictedwith low values. The possible reason of misclas-sification may be due to the ambiguities causedby the indicator terms (keywords). These key-words form the basis for the identification of NFRdocuments into their respective types of NFRsand hence need to be carefully analysed to avoidmisclassification. However, it has been observedthat some of the NFR specifications of differentNFR types have been described by the sameset of keywords. In other words, some keywordstend to occur across multiple requirements ofdifferent NFR types. This gives rise to ambigui-ties, thus leading to false classification. Similarobservations were given by Cleland-Huang et al.[9] and Sharma et al. [5]. Let us understand thiswith the help of a suitable example. Consider thekeyword “colour” which is an indicator term oflook-and-feel NFR. Presence of the term “colour”in the requirement sentence “The applicationshall match the colour of the schema set forth byDepartment of Homeland Security” clearly showsthat the requirement is about look-and-feel NFR.However, the presence of the term “colour” in therequirement sentence “The list of dispute casesmust be colour coded for easy identification ofdispute cases based upon the dispute case status”does not necessarily represent any look-and-feelNFR, but rather represent “usability” NFR. Thehint to identify look-and feel type NFR is thepresence of other terms/patterns in the require-ment sentence. For example, in the first sentence,the term “match” puts a constraint on “colourof the schema”. However, in the second sentence,no such constraint is there to guarantee thatit is a look-and-feel NFR. Thus, identificationof the NFR using keywords may lead to falseclassification and a detailed analysis of semanticpatterns and structure of NFR descriptions couldbe done to improve the results. Thus, future workwill therefore investigate the possibility of usingcategories of indicator terms or extended trainingto improve these retrieval results.
5.3. Comparison with state-of-art
In this section, we discuss the implication ofthe results where we provide important insightsinferred. We have compared our results to thestate of the art [9, 12] and have qualitativelyexamined the wrongly classified cases to gener-ate some useful insights. We have also discussedwhat could be done which may lead to improvedperformance of the proposed models.
The comparison in terms of recall values isshown in Table 5. For the purpose of comparison,we have considered the highest value of recall givenby the different ML models for predicting eachtype of NFR. The bar chart in Figure 6 shows thehighest recall value (given by differentMLmodels)for each type of NFR. The authors, Rashwan etal. (2013) [12] have used the same dataset as usedin our study and have classified the NFR descrip-tions using SVM classifier. From Table 5, it can beclearly seen that the prediction models proposedin this study have classifiedNFRdescriptions of alltypes with higher recall values than the model de-velopedbyRashwan et al. [12] using SVMclassifier.This is despite the fact that SVM classifier is oneof the most popularly used ML techniques in thefield of NFR classification as can be seen from theliterature survey (Table 1). We can even observefrom the table that for some of the NFR types, viz.“MN” and “SC”, the model of Rashwan et al. [12]has given extremely lowvalues of recall (below 0.5).A recall value of 0.5 means that for every correctprediction, the next prediction is incorrect. Thereis no practical usage of such classifiers and they areknown as random classifiers. The study [12] hasshown that the SVM classifier has performed evenworse than a random classifier for “MN” and “SC”NFR types. On the contrary, in this study, “MN”has been predicted with the highest recall valueof 0.93 amongst all other NFRs. Similar observa-tions are made when the recall values of NFRsin this study are compared with the recall valuesobtained in another study by Cleland-Huang et al.[9]. Table 5 shows that the recall values of all NFRsexcept “US” are higher than the recall values ob-tained in [9]. Thus, overall we can conclude thatthe results in this study are higher than the resultsobtained in both the compared studies [9] and [12].

Mining Non-Functional Requirements using Machine Learning Techniques 103
Table 5. Comparison with state-of art
NRF Type Recall (State-of-Art) Recall (Our Model)Cleland, Huang et al. [9] Rashwan et al. [12]Availability (A) 0.89 0.66 0.90Legal (L) 0.70 0.61 0.92Look-and-Feel (LF) 0.51 0.63 0.76Maintainability (MN) 0.88 0.41 0.93Operational (O) 0.72 0.66 0.75Performance (PE) 0.62 0.70 0.83Scalability (SC) 0.72 0.38 0.86Security (SE) 0.81 0.70 0.81Usability (US) 0.98 0.62 0.68
Next, we analyze the NFR type which hasbeen predicted with the lowest recall value inthis study. As can be seen from Table 5, “US”NFR type has been predicted with the lowestrecall.This might be due to the reason that NFRdescriptions pertaining to “US” NFR type maybe comparatively difficult to understand and col-lect. This is also evident from the dataset usedin this study which shows that there are only 3%of NFR descriptions pertaining to “US” type ofNFR. This low percentage of “US” type NFRdescriptions give a low value of recall. Anotherimplication which can be drawn from our resultsis that our models have not shown exceptionalperformance with respect to few of the NFR types.This might be because of the reason that NFRidentification was done on the basis of indicatorterms (keywords). In other words, the indicatorterms form the basis of the classification of anunknown NFR type into its correct type. However,it has been observed that some keywords tendto occur across multiple requirements of differentNFR types, leading to false classification. Similarobservations were given by Cleland-Huang et al.[9] andSharma et al. [5]. The illustration to explainthis has been given in Section 5.2 (last paragraph).
6. Discussion
This section provides a discussion of the resultsin terms of cost/benefit analysis and how the re-sults retrieved from this study can be useful forindustry practitioners. The work in this paper isconcerned with the development of nine different
classification models specific to each type of NFRwith the aim to classify NFRs into the respectivetypes based on their descriptions specified in therequirement specification document. During theelicitation process, requirements analysts maygenerate large amounts of unstructured SRS doc-uments consisting of the requirement specifica-tions being scattered throughout the documentin a random and adhoc fashion. The descriptionsare extracted from the document and applied toa series of text mining steps to retrieve indica-tor terms specific to each NFR, leading to thedetection and classification of NFR in the initialphases of SDLC process.
6.1. Analyzing returns on investment
We conducted cost-benefit analysis to evaluatethe effectiveness of prediction models used forpredicting the type of NFRs. The result section(Section 5) concludes the best ML technique forpredicting each type of NFR amongst the variousML techniques used. In other words, we suggestthat researchers, practitioners, and academiciansmay use those ML techniques for predicting therequired NFR type. In this section, we discussthe cost of using the proposed model and thecost of not using the proposed model.
To calculate the cost of the model, we haveconsidered a cost matrix having the value of1 unit for false positives and false negatives (in-correct predictions), whereas 0 unit for true pos-itives and true negatives (correct prediction).The values of 1 unit and 0 unit for incorrect andcorrect decisions, respectively, are considered asit is well understood that one may need to pay

104 Rajni Jindal et al.
Table 6. Cost incurred with/without using proposed models
NRF Type Proposed Cost Cost Gain Profit/LossML Model of the Model without ModelAvailability NB 12 41 29 ProfitLook-and-Feel NB 24 59 36 ProfitLegal NB 10 25 15 ProfitMaintainability NB 9 27 19 ProfitOperational NB 45 99 55 ProfitPerformance NB 28 80 52 ProfitScalability NB 21 28 7 ProfitSecurity MLP 34 103 69 ProfitUsability NB 30 85 55 Profit
Figure 7. Cost/benefit curve
the price when the model takes wrong decisionswhile there is no cost involved when the modeltakes correct decisions. Therefore, the cost ofusing the model is calculated using the formula:(No. offalsepositives×1)+(No. offalsenegatives×1). To conduct the cost-benefit analysis, the mod-els are run at different threshold values and theperformance of the models is analysed throughthe confusion matrix at each threshold value.The cost of the model, measured in terms offalse positives and false negatives changes as thethreshold changes. The minimum cost obtained isconsidered as the cost of the classification model(shown in Table 6). This cost is compared tothe cost incurred without using the model. Thecost incurred without using the model is foundby selecting the same number of instances atrandom [58]. The difference between the valuesof the cost function by random selection andthe value of the cost from the model is calledgain. The Gain can be interpreted as the profitobtained by using the classification model in-stead of random selection of the same number ofinstances. We can observe from Table 6 that in
all the cases, the cost incurred without using themodel is more than the cost incurred by using theproposed model. In other words, we suggest thatany professional from the industry who woulduse our model for classifying the NFRs into theirtypes would be in profit from the gain as shownin Table 6.
For the purpose of demonstration, a plotof “cost/benefit curve” and “threshold curve”is depicted for MLP model used for predicting“SE” type of NFR. We have shown the plot cor-responding to MLP model as it has given thehighest gain of 69 units. Likewise, we can drawfor all other models and infer the similar mean-ing. The “cost/benefit curve” is a plot of samplesize (part of selected samples) on X-axis andcost/benefit on the Y -axis [59]. The “thresholdcurve” is a plot of true positive rate on Y -axisand sample size on X-axis. Threshold curve cor-responds to the part of the selected instances(“Sample Size”). In other words, the thresholdcurve depicts the dependence of the part of “pos-itive” samples retrieved during virtual screeningupon the part of the samples selected from the

Mining Non-Functional Requirements using Machine Learning Techniques 105
whole dataset used for screening. It should benoted that only those samples are selected duringvirtual screening, for which the estimated prob-ability of being “positive” exceeds the chosenthreshold. The “cost/benefit curve” in Figure 7shows that the minimum cost is 34 which isincreasing reaching the maximum value of 283.The cross symbol denoted by “X” denotes thesample size retrieved during virtual screening.This sample size is important as we take thesame number of instances to calculate the costincurred without using the model. Similar infer-ences can be drawn for all other “cost/benefitcurves” and “threshold curves”.
6.2. Implications from industry viewpoint
The results of this work will be of interest toresearchers as well as practitioners from the in-dustry, who are interested in finding the typeof NFR based on their descriptions in the earlyphases of software development, thus improvingsoftware quality. Timely identification of qualityrequirements would be of great benefit to the soft-ware developers from the industry as these qualityrequirements play a critical role in the design andarchitecture of the system. The architecture of thesystem built acts as the scaffolding in which thefunctionality of the system is delivered, thus ensur-ing that the system deliveredmeets the customer’sfunctional expectations and needs. Consider a sit-uation where a NFR remains undiscovered or isnot elicitated properly during the early phase ofsoftware development, and is discovered at thelater stages of development or when the softwareis released. In such a situation, the entire techni-cal architecture has to be redesigned, leading tothe wastage of limited resources in terms of time,money, and manpower [60, 61]. Thus, to avoid thissituation, the models proposed in this study canbe used in the early phases for the identificationand classification of NFRs. When the softwareis released and the customer finds that all hisrequirements (both functional as well as nonfunc-tional) are met, the customer feels satisfied andhappy. This leads to the increasing the reputationand status of the software organization (in whichthe software is developed) in the market. Thus,
customer satisfaction which is of utmost impor-tance in today’s scenario is met. Furthermore,practitioners from industry will be able to detectand classify NFRs from a previously uncatego-rized requirement specification in an automatedway, thus avoiding the need for manual evaluationwhich like all human activities has a tendency tobe error prone. It will also help researchers fromthe industry to extract viewpoints for differentNFR qualities of interest. For example, a securityanalyst could issue a request to retrieve all descrip-tions related to security issues, or a GUI designercould issue a request to retrieve information aboutstakeholders” usability or look-and-feel concerns.
Thus, we have seen how industries can usethe proposed models for identifying the NFRsand predicting the unknown NFR with its NFRtype. Instead of using the proposed models, theidentification of NFRs can also be done manuallywith the help of a human analyst. We have brieflydiscussed the effort required to conduct the workmanually and have shown that the manual iden-tification and prediction of NFRs is not feasible.
Human analyst can be considered as the re-quirement engineers in this study. Since the SRSdocuments are large enough and the NFRs arescattered throughout the document, it is very dif-ficult or not feasible for the requirement engineers(human analyst) to perform the task of identify-ing the NFRs manually. Thus, this motivated theauthors to automate this process with the helpof algorithms and tools. This automation is donewith the help of text mining techniques, whichare used for extracting useful information (inthe form of indicator terms specific to each NFRtype) from a large number of documents (a largedocument corpus) without requiring humans toactually read and summarize the text. The au-tomation of identification and classification ofNFRs broadly consists of the following steps:1. Use of text mining steps to retrieve the in-
dependent variables: A series of text min-ing steps were applied on the NFRs descrip-tions to retrieve the independent variables(indicator terms). These steps begin withpre-processing (tokenization, stop words re-moval, stemming) followed by application offeature selection method and finally apply-

106 Rajni Jindal et al.
ing TF-IDF weighting. Each of these stepscan be studied in detail from Section 4.2. Inthis work, a dataset consisting of a total of326 NFR descriptions which are categorizedinto 9 types of NFR was considered. For eachtype of NFR, indicator terms (top-10 words)were retrieved. So, we had to run our textmining module nine number of times and eachtime the above steps of text mining were done.An automated text mining module takes asinput all the 326 NFR descriptions at a timewhich had not been the case if it was doneby human analyst. Text mining steps had tobe applied to each of the 326 NFR descrip-tions individually if it was done manually byhuman analyst. The same procedure had tobe done 9 times for each NFR type. Thisis humanly impossible as each of the abovetext mining steps is complex in nature, thusconsuming a lot of time. Pre-processing stepinvolves natural language complications aswe deal with textual requirements which arepurely written in a natural language whichis followed by feature selection and TF-IDFweighting that involves mathematical calcula-tions. It is therefore not possible to do manualcomputation on each NFR to retrieve top-10words and then calculate TF-IDF values forthese words.Thus, we have automated this process with thehelp of a tool developed by the authors. Theinput to this tool is a set of 326 NFRs descrip-tions and the output is top-10 words sortedon the basis of Information-Gain measure(feature selection method). Thus, the entireprocess is automated and the time taken toproduce the output is less than approximately1 minute. Whereas, to perform the same ac-tivities manually, it would take us hours andmay not be even feasible for large datasets.
2. Development of prediction models using ma-chine learning classifiers: Once indicatorterms (independent variables) for each NFRtype are retrieved, then dataset correspond-ing to each of the 9 types of NFR is madeconsisting of a binary dependent variable(NFR type) having the value of 1 or 0 depend-ing on the type of NFR. Corresponding to
each dataset, eight different prediction modelswere developed by employing eight ML clas-sifiers on each dataset viz. J48 decision tree,Random Forest (RF), Logitboost, Adaboost,Multi-Layer Perceptron (MLP), Radial Ba-sis Function (RBF) network, Bagging, NaïveBayes (NB). These ML classifiers are imple-mented through an open source tool, WEKA.There were in total 72 models (9 datasets * 8ML classifiers = 72 prediction models) and itwas observed that to run each model, CPUtime of approximately 30 sec to 1:30 minuteswas required.Had the same task been done manually, thehuman analyst would have to use his skillsand knowledge in classifying NFR descrip-tion into particular type of NFR. Also, asthe number of models is quite large (72), itwould have taken a lot of time to complete thecomputation. Moreover, it would have beenvery difficult to achieve a high performanceas achieved by our models.Never the less, human computation is alwaysprone to error. Human error is inevitable andnormal which may lead to system failure ifnot handled at the right time. Thus, we con-clude that our prediction models are highlyrecommended in contrast to human analyst(i.e., work done manually) for classification offuture NFR descriptions whose NFR type isnot known, leading to less computation timeand more accuracy.
7. Threats to validity
The empirical validation in this work has certainlimitations which may adversely affect the valid-ity of the results. These limitations are discussedin terms of four threats to validity, viz. constructvalidity, internal validity, external validity, andconclusion validity.1. Construct Validity
Construct validity is one of the most impor-tant threats to validity. It is defined as the ex-tent to which the variables (independent anddependent variables) and the performance pa-

Mining Non-Functional Requirements using Machine Learning Techniques 107
rameters precisely measure the concept theyintend to measure [62–64].This threat can be due to the improper col-lection of the dependent variable and theindependent variables. The dependent vari-able used in the study refers to the “typesof NFRs” and the independent variables arethe top few words of the document which de-termine how important they are within thatparticular document and also across a groupof other documents. The collection of datafor the classification of NFRs into their re-spective types has been done by mining thedescriptions of NFRs specified in SRS doc-ument using text mining techniques. Thesetext mining techniques cannot ensure com-plete correctness. This is so as this moduleis based on a number of pre-processing stepslike tokenization, stop-words removal, stem-ming, etc., before the application of IG mea-sure and Tf-Idf weighting approach could bedone. Now, all these pre-processing steps usea set of English vocabulary words availableonline as their base, which may result inarbitrariness. However, these pre-processingsteps were manually evaluated to reduce theamount of randomness and uncertainty inthe accuracy and preciseness of the results soobtained. In addition to this, we have useda standard performance measure, viz, AreaUnder the ROC Curve (AUC) to measurethe performance of the models. This measureis widely used in related research and suffi-ciently measures the performance of the mod-els accurately. Thus, the proper collectionof independent and the dependent variableand the use of a stable performance measureminimize the threat to construct validity toa large extent.
2. Internal Validity“Internal validity is defined as the degreeto which conclusions can be drawn aboutthe causal effect of independent variableon the dependent variable” [64]. In thiswork, independent variables used are a set ofpre-processed words obtained using IG mea-sure. These independent variables are notrelated to each other in any way. All these
words together determine the value of depen-dent variable (type of NFR). It is not possibleto determine the causal effect of each inde-pendent variable on the dependent variable.In other words, the goal of this study is to de-velop prediction models for classifying NFRsinto various categories rather than discover-ing the cause-effect relationships. Thus, thethreat to internal validity does not exist inthe study.
3. External ValidityExternal validity is defined as the extent towhich the results of the study can be gen-eralized universally. It concerns itself withfinding out whether the results produced bythe study are applicable in different domainsor can be replicated in different scenariosfor which the results are not evaluated [65].In other words, external validity could beensured if we could have applied the sameapproach on a different dataset and producedthe same results. To ensure external validity,more research is needed as in this work, au-thors have not used the proposed models onsome other datasets to identify the type ofNFR. Authors have planned to take differentdatasets and use the same models to identifyNFR specifications in their future work. Inthe future, we will be comparing the resultsof different datasets across different projectshaving diverse characteristics.
4. Conclusion ValidityConclusion validity threats include all thosethreats which affect the conclusion of thestudy. In other words, all the threats whichmay lead to improper results or conclusionsof the study are called as conclusion validitythreats [65]. The authors in this study havenot performed the statistical evaluation ofthe results using statistical tests. Thus, thisleads to a conclusion validity threat. How-ever, to provide strong conclusions, we havecompared the performance of 8 ML classifiersto classify 9 types of NFRs. Very few studiesin literature have used such a large numberof ML classifiers. Thus, such comparison andevaluation may lead to fair conclusion, reduc-ing the threat to conclusion validity.

108 Rajni Jindal et al.
In addition to this, conclusion validity threatmay also occur since we had worked on thedataset consisting of less number of projects.Thedatasetused in thiswork for empirical anal-ysis was the same dataset which was used byauthors Cleland-Huang et al. [9]. This datasetconsists of a set of 15 projects which weremade by MS students at DePaul University,containing a total of 326 NFR descriptions.To eliminate this threat, we may include moresuch projects in the future study leading tostronger conclusions. Also, conclusion validitythreatmayoccur sincewehaveworked on a lim-ited number of basic NFRs. There are morefine-grained NFRs listed by ISO standards9126 and 25010 [65]. The inclusion of suchNFRsmayaffect the results andchange theper-formance of the models to some extent. How-ever, the NFRs we considered covered most ofthe quality constraints enforced in our exper-imental setup. In addition to this, the datasetwe used has the requirements pertaining tothese basic NFR types. Due to these reasons,we did not feel the requirement to include finegrained NFRs. Inclusion of such fine grainedNFRs may also increase the complexity of thework and thus, maybe included only whenthere is a requirement of extensive analysis.
8. Conclusions and future work
Classification of NFR descriptions into their re-spective types is very essential for software de-velopment meeting the basic quality determiningfeatures like security, scalability, maintainabil-ity, etc. The NFR descriptions in the softwarerequirement specification document should there-fore be analyzed carefully and mapped into theircorresponding NFR types. In this paper, textmining steps have been incorporated to minethe NFR descriptions and thereby identify a setof few keywords. These keywords are the topfew words which hold the essential informationabout NFR. Keywords help to classify the NFRdescriptions using different ML techniques. Eightdifferent ML techniques viz. J48, RF, LB, AB,MLP, RBF, Bagging and NB have been used to
classify the NFR descriptions into nine types ofNFR. The results which have been obtained fromthe study are summarized as follows:1. With respect to each of the nine NFR types,
eight prediction models have been developedcorresponding to eight ML techniques.
2. The retrieval of the keywords specific to eachtype of NFR has been done using IG measureas the feature selection method. These key-words hold essential information about theNFR type and are used to develop predictionmodels by employing a suitable ML technique.Top-10 words sorted by IG measure have beenselected corresponding to each of the ninemodels.
3. The study analyzes the performance of MLmodels in terms of classification and misclas-sification rate to determine the best modelfor predicting each type NFR descriptions.
4. The performance of each of these nine mod-els is evaluated using ROC analysis. The re-sults indicated that the performance of allthe NFRs except “SE” is best predicted byNB classifier. NB gives the highest AUC of0.97, 0.83, 0.97, 0.95, 0.81, 0.86, 0.88, and0.77 for “A”, “LF”, “L”, “MN”, “O”, “PE”,“SC”, and “US” types of NFR respectively.Their corresponding recall values are alsohigh in majority of the cases. This is so be-cause this technique has a high bias and lowvariance which works well for the datasethaving a small size.
5. This is followed by the performance of RBFand RF technique. The AUC values of RFand RBF lies in the range of 0.67 to 0.91and 0.72 to 0.92, respectively. Average perfor-mance has been depicted by the remainingtechniques which are LB, AB, Bagging, andMLP.
6. On the contrary, J48 decision tree techniquehas not performed well in classifying the NFRdescriptions into their respective types. Thistechnique has shown the lowest performance(in terms of both AUC and recall) in predict-ing all the types of NFRs.
7. Among all the NFRs, it has been observedthat most of the classifiers predicted “PE”and “A” type of NFR most accurately. On

Mining Non-Functional Requirements using Machine Learning Techniques 109
the other hand, “US” NFR type has been pre-dicted with lowest accuracy as there are only3% (lowest percentage) of NFR descriptionspertaining to this NFR type in the dataset,thus giving low value of recall.
8. Overall, we concluded that the performanceof NB model has performed best in predict-ing “MN” and “A” type of NFRs when bothclassification and misclassifications are takentogether.
9. Also, cost-benefit analysis was conductedfrom which it was concluded that the costincurred without using our proposed modelsis more than the cost incurred when usingthe proposed models.
As our future work, we intend to replicate ourempirical study across more datasets of similartype, i.e., academic datasets where requirementsare written by students and researchers to ob-tain generalized and well-formed results. Apartfrom this, we also intend to conduct more exper-iments and provide benchmarks for future per-formance by exploring different types of datasetslike industrial datasets where requirements arewritten to describe or simulate industrial prod-ucts or informal datasets where requirementsare written by end-users as comments, reviews,posts and requests in open source communities(sourceforge.net) or written in different Appsof varying categories (books, education, games,health, lifestyle, navigation, news, productivity,travel and utilities). Moreover, we can analyzethe effectiveness of the classification models byincorporating more search-based or evolutionaryalgorithms instead of basic ML algorithms.
References
[1] M. Glinz, “On non-functional requirements,” inProceedings of the 15th IEEE International Re-quirements Engineering Conference. Delhi, India:IEEE, 2010, pp. 21–26.
[2] M. Glinz, “Rethinking the notion of non-func-tional requirements,” in Proceedings of the 3rdworld congress for software quality, Munich, Ger-many, 2005, pp. 55–64.
[3] L. Chung, B. Nixon, E. Yu, and J. Mylopou-los, Non-Functional Requirements in SoftwareEngineering. KluwerAcademic, 2000.
[4] S. Amasaki and P. Leelaprute, “The effects ofvectorization methods on non-functional require-ments classification,” in 44th Euromicro Con-ference on Software Engineering and AdvancedApplications (SEAA). Prague, Czech Republic:IEEE, 2018, pp. 175–182.
[5] V. Sharma, R. Ramnani, and S. Sengupta,“A framework for identifying and analysingnon-functional requirements from text,” in Pro-ceedings of the 4th International Workshop onTwin Peaks of Requirements and Architecture.New York, USA: ACM, 2014, pp. 1–8.
[6] L. Hakim and S. Rochimah, “Oversampling im-balance data: Case study on functional and nonfunctional requirement,” in Electrical Power,Electronics, Communications, Controls and In-formatics Seminar (EECCIS). Batu, East Java,Indonesia: IEEE, 2018, pp. 315–319.
[7] D. Méndez-Fernández, S. Wagner, M. Kali-nowski, M. Felderer, P. Mafra, A. Vetro,T. Conte, M. Christiansson, D. Greer, C. Lasse-nius, T. Mannisto, M. Nayebi, M. Oivo, B. Pen-zenstadler, D. Pfahl, R. Prikladnicki, G. Ruhe,A. Schekelmann, S. Sen, R. Spinola, A. Tuzcu,J. de la Vara, and R.Wieringa, “Naming the painin requirements engineering,” Empirical softwareengineering, Vol. 22, No. 5, 2017, pp. 2298–2338.
[8] R. Svensson, M. Host, and B. Regnell, “Manag-ing quality requirements: A systematic review,”in 36th EUROMICRO Conference on SoftwareEngineering and Advanced Applications. Lille,France: IEEE, 2010, pp. 261–268.
[9] J. Cleland-Huang, R. Settimi, X. Zou, andP. Solc, “Automated classification of non-func-tional requirements,” Requirements Engineering,Vol. 12, No. 2, 2007, pp. 103–120.
[10] I. Hussain, L. Kosseim, and O. Ormandjieva,“Using linguistic knowledge to classify non-func-tional requirements in SRS documents,” in Inter-national Conference on Application of NaturalLanguage to Information Systems. London, UK:Springer, 2008, pp. 287–298.
[11] G. Gokyer, S. Cetin, C. Sener, and M. Yon-dem, “Non-functional requirements to architec-tural concerns: ML and NLP at crossroads,” inProceedings of the 2008 the 3rd international con-ference on software engineering advances. Sliema,Malta: IEEE, 2008, pp. 400–406.
[12] A. Rashwan, O. Ormandjieva, and R. Witte,“Ontology-based classification of non-functionalrequirements in software specifications: A newcorpus and svm-based classifier,” in 37th AnnualComputer Software and Applications Conference.Kyoto, Japan: IEEE, 2013, pp. 381–386.

110 Rajni Jindal et al.
[13] T. Nguyen, J. Grundy, and M. Almorsy,“Rule-based extraction of goal-use case modelsfrom text,” in Proceedings of the 2015 10th JointMeeting on Foundations of Software Engineering.Bergamo, Italy: ACM, 2015, pp. 591–601.
[14] A. Casamayor, D. Godoy, and M. Campo, “Iden-tification of non-functional requirements in tex-tual specifications: A semi-supervised learningapproach,” Information and Software Technol-ogy, Vol. 52, No. 4, 2010, pp. 436–445.
[15] W. Zhang, Y. Yang, Q. Wang, and F. Shu, “Anempirical study on classification of non-func-tional requirements,” in Twenty-Third Inter-national Conference on Software Engineeringand Knowledge Engineering, Miami Beach, USA,2011, pp. 444–449.
[16] J. Slankas and L. Williams, “Automated ex-traction of non-functional requirements in avail-able documentation,” in 1st International Work-shop on Natural Language Analysis in SoftwareEngineering. San Francisco, USA: IEEE, 2013,pp. 9–16.
[17] P. Singh, D. Singh, and A. Sharma, “Rule-basedsystem for automated classification of non-func-tional requirements from requirement specifica-tions,” in International conference on Advancesin Computing, Communications and Informatics.Jaipur, India: IEEE, 2016, pp. 620–626.
[18] Z. Kurtanovic and W. Maalej, “Automaticallyclassifying functional and non-functional require-ments using supervised machine learning,” in25th International Requirements EngineeringConference Workshops. Lisbon, Portugal: IEEE,2017, pp. 490–495.
[19] A. Hindle, N.A. Ernst, M.W. Godfrey, and J. My-lopoulos, “Automated topic naming,” Empiri-cal Software Engineering, Vol. 18, No. 6, 2013,pp. 1125–1155.
[20] D. Ott, “Automatic requirement categoriza-tion of large natural language specifications atMercedes-Benz for review improvements,” in In-ternational Working Conference on RequirementsEngineering: Foundation for Software Quality.Essen, Germany: Springer, 2013, pp. 50–64.
[21] M. Lu and P. Liang, “Automatic classificationof non-functional requirements from augmentedapp user reviews,” in 21st International Confer-ence on Evaluation and Assessment in SoftwareEngineering (EASE). Karlskrona, Sweden: ACM,2017, pp. 344–353.
[22] R. Deocadez, R. Harrison, and D. Rodriguez,“Automatically classifying requirements fromapp stores: A preliminary study,” in 25th In-ternational Requirements Engineering Confer-
ence Workshops. Lisbon, Portugal: IEEE, 2017,pp. 367–371.
[23] C. Li, L. Huang, J. Ge, B. Luo, and V. Ng, “Auto-matically classifying user requests in crowdsourc-ing requirements engineering,” Journal of Sys-tems and Software, Vol. 138, 2018, pp. 108–123.
[24] J. Zou, L. Xu, M. Yang, X. Zhang, and D. Yang,“Towards comprehending the non-functional re-quirements through developers’ eyes: An explo-ration of stack overflow using topic analysis,”Information and Software Technology, Vol. 84,2017, pp. 19–32.
[25] E. Knauss, S. Houmb, K. Schneider, S. Islam,and J. Jürjens, “Supporting requirements engi-neers in recognising security issues,” in Inter-national Working Conference on RequirementsEngineering: Foundation for Software Quality.Essen, Germany: Springer, 2011, pp. 4–18.
[26] M. Riaz, J. King, J. Slankas, and L.Williams,“Hidden in plain sight: Automatically identify-ing security requirements from natural languageartifacts,” in International Conference on Re-quirements Engineering Conference. Karlskrona,Sweden: IEEE, 2014, pp. 183–192.
[27] R. Jindal, R. Malhotra, and A. Jain, “Auto-mated classification of security requirements,”in 2016 International Conference on Advancesin Computing, Communications and Infor-matics (ICACCI). Jaipur, India: IEEE, 2016,pp. 2027–2033.
[28] R. Malhotra, A. Chug, A. Hayrapetian, andR. Raje, “Analyzing and evaluating security fea-tures in software requirements,” in Innovationand Challenges in Cyber Security. Noida, India:IEEE, 2016, pp. 26–30.
[29] E. Knauss and D. Ott, “(Semi-) automatic cat-egorization of natural language requirements,”in International Working Conference on Re-quirements Engineering: Foundation for Soft-ware Quality. Essen, Germany: Springer, 2014,pp. 39–54.
[30] R. Maiti and F. Mitropoulos, “Capturing, elic-iting, predicting and prioritizing (CEPP) non--functional requirements metadata during theearly stages of agile software development,” inProceedings of the SoutheastCon. Fort Laud-erdale, USA: IEEE, 2015, pp. 1–8.
[31] A. Mahmoud and G. Williams, “Detecting, clas-sifying, and tracing non-functional software re-quirements,” Requirements Engineering, Vol. 21,No. 3, 2016, pp. 357–381.
[32] Z. Abad, O. Karras, P. Ghazi, M. Glinz, G. Ruhe,and K. Schneider, “What works better? A studyof classifying requirements,” in 25th International
Mining Non-Functional Requirements using Machine Learning Techniques 111
Requirements Engineering ConferenceWorkshops.Lisbon, Portugal: IEEE, 2017, pp. 496–501.
[33] L. Toth and L. Vidacs, “Study of various clas-sifiers for identification and classification ofnon-functional requirements,” in InternationalConference on Computational Science and ItsApplications. Springer, 2018, pp. 492–503.
[34] S. Uddin, A. Khan, M. Hossain, and M. Moni,“Comparing different supervised machine learn-ing algorithms for disease prediction,” BMC Med-ical Informatics and Decision Making, Vol. 19,No. 281, 2019, pp. 1–16.
[35] Y. Dengju, J. Yang, and X. Zhan, “A novelmethod for disease prediction: Hybrid of ran-dom forest and multivariate adaptive regressionsplines,” Journal of Computers, Vol. 8, No. 1,2013, pp. 170–177.
[36] C. Sinclair, L. Pierce, and S. Matzner, “An appli-cation ofmachine learning to network intrusion de-tection,” in Proceedings of 15th Annual ComputerSecurity Applications Conference (ACSAC’99).Phoenix, AZ, USA: IEEE, 1999, pp. 371–377.
[37] E. Aleskerov, B. Freisleben, and B. Rao, “Card-watch: A neural network based database min-ing system for credit card fraud detection,” inProceedings of the IEEE/IAFE ComputationalIntelligence for Financial Engineering (CIFEr).New York, NY, USA: IEEE, 1997, pp. 220–226.
[38] S. Rathore and S. Kumar, “An empirical study ofsome software fault prediction techniques for thenumber of faults prediction,” Soft Computing,Vol. 21, 2016, pp. 7417–7434.
[39] A. Okutan and O. Yildiz, “Software defectprediction using bayesian networks,” Empiri-cal Software Engineering, Vol. 19, No. 1, 2014,pp. 154–181.
[40] T. Patil and S. Sherekar, “Performance analysisof Naïve Bayes and J48 classification algorithmfor data classification,” International Journalof Computer Science and Applications, Vol. 6,No. 2, 2013, pp. 256–261.
[41] J. Qinlan, C4.5: Programs for machine Learn-ing, 1st ed. San Mateo, CA: Morgan KaufmannPublishers, 1993.
[42] M. Danham and S. Sridhar, Data mining: Intro-ductory Advanced Topics, 1st ed. Person Educa-tion, 2006.
[43] Y. Freund and R. Schapire, “A short introduc-tion to boosting,” Journal of Japanese Societyfor Artificial Intelligence, Vol. 14, No. 5, 1999,pp. 771–780.
[44] B. Widro and M. Lehr, “30 years of adaptiveneural networks: Perceptron, madaline, and back-
propagation,” Proceedings of the IEEE, Vol. 78,No. 9, 1990, pp. 1415–1442.
[45] D. Broomhead and D. Lowe, “Multivariablefunctional interpolation and adaptive networks,”Complex Systems, Vol. 2, 1998, pp. 321–355.
[46] S. Eyheramendy, D. Lewis, and D. Madigan, “Onthe Naive Bayes model for text categorization,”in Proceedings of the 9th International Workshopon Artificial Intelligence and Statistics, 2002.
[47] A. McCallum and K. Nigam, “A comparison ofevent models for Naive Bayes text classification,”in Learning for Text Categorization, M. Sahami,Ed. AAAI Press, 1998, pp. 41–48.
[48] R. Malhotra, Empirical Research in Software En-gineering – Concepts, Analysis and Applications,1st ed. India: CRC Press, 2015.
[49] M. Stone, “Cross-validatory choice and assess-ment of statistical predictions,” Journal of theRoyal Statistical Society, Vol. 36, No. 2, 1974,pp. 111–147.
[50] Y. Jiang, B. Cukic, and Y. Ma, “Techniquesfor evaluating fault prediction models,” Empiri-cal Software Engineering, Vol. 13, No. 15, 2008,pp. 561–595.
[51] H. He and E. Garcia, “Learning from imbal-anced data,” IEEE Transactions on Knowledgeand Data Engineering, Vol. 21, No. 9, 2009,pp. 1263–1284.
[52] T. Menzies, A. Dekhtyar, J. Distefance, andJ. Greenwald, “Problems with precision: A re-sponse to “comments on ‘data mining static codeattributes to learn defect predictors’”,” IEEETransactions on Software Engineering, Vol. 33,No. 9, 2007, pp. 637–640.
[53] F. Provost and T. Fawcett, “Robust classificationfor imprecise environments,” Machine Learning,Vol. 42, 2001, pp. 203–231.
[54] R. Shatnawi, “Improving software fault-predic-tion for imbalanced data,” in Proc. of Inter-national Conf. on Innovations in InformationTechnology. Abu Dhabi, United Arab Emirates:IEEE, 2012, pp. 54–59.
[55] T. Fawcett, “An introduction to ROC analy-sis,” Pattern Recogn. Lett., Vol. 27, No. 8, 2006,pp. 861–874.
[56] F. Sebastiani, “Machine learning in automatedtext categorization,” ACM Computing Surveys,Vol. 34, No. 1, 2002.
[57] T. Menzies and A. Marcus, “Automated severityassessment of software defect reports,” in IEEEInternational Conference on Software Main-tenance (ICSM). Beijing, China: IEEE, 2008,pp. 346–355.

112 Rajni Jindal et al.
[58] E. Arisholm and L. Briand, “Predictingfault-prone components in a Java legacy system,”in Proceedings of ACM/IEEE international sym-posium on empirical software engineering. IEEE,2006, pp. 8–17.
[59] R. Malhotra and M. Khanna, “An explorato-ry study for software change prediction inobject-oriented systems using hybridized tech-niques,” Autom. Softw. Eng., Vol. 24, No. 3, 2017,pp. 673–717.
[60] L. Briand, J. Wust, and J. Daly, “Exploringthe relationship between design measures andsoftware quality in object-oriented systems,” J.Syst. Softw., Vol. 51, No. 3, 2000, pp. 245–273.
[61] L. Briand, J. Wust, and H. Lounis, “Replicatedcase studies for investigating quality factors inobject oriented designs,” Empir. Softw. Eng. J.,Vol. 6, No. 1, 2001, pp. 11–58.
[62] R. Malhotra and M. Khanna, “Threats to va-lidity in search-based predictive modelling forsoftware engineering,” IET Software, Vol. 12,No. 4, 2018, pp. 293–305.
[63] A. Dean, D. Voss, and D. Draguljic, Designand analysis of experiments, 10th ed. New York:Springer, 1999.
[64] Y. Zhou, H. Leung, and B. Xu, “Examining thepotentially confounding effect of class size onthe associations between object-oriented met-rics and change-proneness,” IEEE Transactionson Software Engineering, Vol. 35, No. 5, 2009,pp. 607–623.
[65] R. Harrison, S. Counsell, and R. Nithi, “Exper-imental assessment of the effect of inheritanceon the maintainability of object-oriented sys-tems,” Journal of Systems and Software, Vol. 52,No. 2–3, 2000, pp. 173–179.

Mining Non-Functional Requirements using Machine Learning Techniques 113
A. Appendix
Table A1. Performance evaluation of random forest and J48 decision tree techniques
S. No. Type of NFR Random Forest J48AUC Sens (%) CutOff AUC Sens (%) CutOff
1 A 0.91 85.0 0.02 0.65 60.0 0.022 LF 0.82 73.0 0.05 0.58 64.9 0.083 L 0.83 69.2 0.05 0.48 30.8 0.024 MN 0.80 80.0 0.00 0.42 33.3 0.045 O 0.79 67.2 0.12 0.58 52.5 0.126 PE 0.84 77.4 0.05 0.75 66.0 0.067 SC 0.67 66.7 0.01 0.53 57.1 0.058 SE 0.80 73.4 0.06 0.65 60.9 0.129 US 0.76 68.3 0.09 0.48 38.1 0.18
Table A2. Performance Evaluation of Bagging and Naïve Bayes techniques
S. No. Type of NFR Bagging Naïve BayesAUC Sens (%) CutOff AUC Sens (%) CutOff
1 A 0.77 75.0 0.03 0.97 90.0 0.102 LF 0.80 75.7 0.07 0.83 75.7 0.013 L 0.75 69.0 0.02 0.97 92.3 0.014 MN 0.81 73.3 0.02 0.95 93.3 0.065 O 0.78 70.5 0.10 0.81 67.2 0.126 PE 0.80 75.5 0.07 0.86 83.0 0.017 SC 0.85 85.7 0.04 0.88 85.7 0.018 SE 0.80 71.9 0.09 0.81 73.4 0.039 US 0.74 68.3 0.10 0.77 68.3 0.06
Table A3. Performance Evaluation of MLP and RBF network techniques
S. No. Type of NFR MLP RBFAUC Sens (%) CutOff AUC Sens (%) CutOff
1 A 0.67 60.0 0.00 0.81 75.0 0.012 LF 0.80 73.0 0.04 0.80 67.6 0.063 L 0.76 76.9 0.01 0.92 92.3 0.054 MN 0.62 60.0 0.01 0.85 80.0 0.015 O 0.80 68.9 0.10 0.75 65.6 0.136 PE 0.84 77.4 0.06 0.81 71.7 0.067 SC 0.66 61.9 0.02 0.80 71.4 0.028 SE 0.85 79.7 0.08 0.83 81.3 0.089 US 0.76 66.7 0.09 0.72 61.9 0.09

114 Rajni Jindal et al.
Table A4. Performance Evaluation of Logitboost and Adaboost techniques
S. No. Type of NFR Logitboost AdaboostAUC Sens (%) CutOff AUC Sens (%) CutOff
1 A70.87 85.0 0.05 0.73 70.0 0.022 LF 0.79 70.3 0.05 0.72 64.9 0.063 L 0.75 76.9 0.01 0.72 69.2 0.014 MN 0.88 86.7 0.04 0.79 73.3 0.015 O 0.80 67.2 0.12 0.78 75.4 0.146 PE 0.82 77.4 0.09 0.83 77.4 0.067 SC 0.79 76.0 0.02 0.76 71.4 0.028 SE 0.78 70.3 0.08 0.74 68.8 0.099 US 0.73 61.9 0.11 0.66 57.1 0.11

e-Informatica Software Engineering Journal, Volume 15, Issue 1, 2021, pages: 115–132, DOI 10.37190/e-Inf210106
Software Deterioration ControlBased on Issue Reports
Omid Bushehrian∗, Mohsen Sayari∗, Pirooz Shamsinejad∗∗Department of Computer Engineering and Information Technology, Shiraz University of Technology,
Shiraz, [email protected], [email protected], [email protected]
AbstractIntroduction: Successive code changes during the maintenance phase may cause the emergenceof bad smells and anti-patterns in code and gradually results in deterioration of the code anddifficulties in its maintainability. Continuous Quality Control (QC) is essential in this phase torefactor the anti-patterns and bad smells.Objectives: The objective of this research has been to present a novel component called CodeDeterioration Watch (CDW) to be integrated with existing Issue Tracking Systems (ITS) in orderto assist the QC team in locating the software modules most vulnerable to deterioration swiftly.The important point regarding the CDW is the fact that its function has to be independent of thecode level metrics rather it is totally based on issue level metrics measured from ITS repositories.Methods: An issue level metric that properly alerts us of bad-smell emergence was identifiedby mining software repositories. To measure that metric, a Stream Clustering algorithm calledReportChainer was proposed to spot Relatively Long Chains (RLC) of incoming issue reports asthey tell the QC team that a concentrated point of successive changes has emerged in the software.Results: The contribution of this paper is partly creating a huge integrated code and issuerepository of twelve medium and large size open-source software products from Apache and Eclipse.By mining this repository it was observed that there is a strong direct correlation (0.73 on average)between the number of issues of type “New Feature” reported on a software package and thenumber of bad-smells of types “design” and “error prone” emerged in that package. Besides a strongdirect correlation (0.97 on average) was observed between the length of a chain and the magnitudeof times it caused changes to a software package.Conclusion: The existence of direct correlation between the number of issues of type “NewFeature” reported on a software package and (1) the number of bad-smells of types “design” and“error prone” and (2) the value of “CyclomaticComplexity” metric of the package, justifies theidea of Quality Control merely based on issue-level metrics. A stream clustering algorithm can beeffectively applied to alert the emergence of a deteriorated module.
Keywords: Code Smells, Issue report, maintainability, document classification
1. Introduction
Mining open-source software repositories andparticularly bug repositories managed by IssueTracking Systems (ITS) such as BugZilla [1] andJira [2] has recently attracted much attractionamong the software research community. Manyresearchers have studied the possible correlationsamong stored knowledge in bug repositories and
software quality aspects. By interpreting thenumber of reported bugs on a specific softwareversion as quality indicator of that version, someworks have focused on the correlation among thenumber of previously reported bugs (and hencechanges) and the number of bugs in future release[3, 4]. Maintainability has been another qualityaspect of interest and some research works havebeen dedicated to find meaningful correlations
Submitted: 27 October 2020; Revised: 12 June 2021; Accepted: 17 June 2021; Available online: 25 August 2021

116 Omid Bushehrian et al.
between software maintainability and defect met-rics extracted from ITS repositories [5].
The maintainability of a software product isusually defined as its readiness to accept suc-cessive modification very easily and with mini-mum effort [6]. These modifications are due torequested new features, reported bugs, perfor-mance difficulties or adapting the software toa new environment and are carried out by themaintenance team. Some studies have argued,particularly in open-source software, neither timelags in fixing bugs nor the distribution of bugscan be considered as the direct representativemetrics of maintainability [7]. On the other hand,many research works in the field of software main-tainability have proved that the maintainabilityof software after delivery is significantly depen-dent to its original design quality [8]. As a result,building the predictive models to assist the de-signers to better assess the maintainability oftheir future code based on the current designquality metrics at very first stages of develop-ment life cycle has attracted much attention inthis research field [8–10]. In addition to the orig-inal design of the software, the quality of codemodifications during the maintenance phase alsomatters and affects the maintainability of thesoftware and its future defects number and sever-ity [11]. It is now widely accepted that the main-tainability of a software product could be mea-sured by: (1) the number of residual or emergedfaults in the maintenance phase (corrective main-tainability), (2) the extent to which the code isunderstandable (adaptive maintainability) whichis greatly affected by the degree of exploiting thesoftware design patterns and best practices indevelopment process and (3) the extent to whichit is modifiable (perfective maintenance) whichis again affected by the amount of anti-patternsand bad-smells [12] in the code [5, 7, 8].
Successive changes made by the develop-ers may cause the emergence of bad smells incode and gradually result in code deteriorationand lowering the code maintainability indirectly.Hence continuous Quality Control (QC) is essen-tial in this phase to avoid formation of anti-pat-terns and bad smells in code. However this QCprocess could be very tedious or even ineffec-
tive task without the help of assisting tools.Since the change requests (and issue reports)are recorded and tracked in ITSs, we believethat these software tools could be equipped witha recommender component that enables the QCteam to spot software modules (packages) thatare most vulnerable to early deterioration andto put those modules in their priority list forcode inspection and refactoring. We call thiscomponent CDW (Code Deterioration Watch)and it is capable of reporting the packages thatneed immediate quality check by QC team to seeif the refactoring is necessary. The fundamentalrequirement in designing CDW is that it shouldbe able to estimate the deterioration level ofsoftware modules using issue metrics rather thancode metrics. This is the key difference betweenthis research and similar studies where CDWdoes its function merely by relying on ITS repos-itory data and independent of code repository.We believe that this ability is so important dueto the fact that code QC has to be carried outbased on a priority list in specific time intervalsand this priority list is provided by CDW whichcontinuously analyzes incoming issue streams effi-ciently. The high priority modules for refactoringare those that have become deteriorated andhence error-prone due to the successive changesperformed not in compliance with best-practicesand standard design patterns.
The function of CDW is simply based on thisgeneral hypothesis: “modules absorbing highernumber of issues are those with higher number of(born) code smells and are the hot spots for refac-toring”. We studied a variety of open-source soft-ware repositories from Apache [13] and Eclipse[14] to answer these research questions:
RQ1: Can the QC team evaluate the qual-ity level of the code, which is under successivechanges during the maintenance phase, only byobserving issue-related metrics such as the num-ber of reported issues on a software package?Is the type of reported issues important in thisevaluation?
RQ2: Is there an effective stream cluster-ing method to categorize incoming sequence ofissue reports such that a bloated category betruly interpreted as the concentration of frequent

Software Deterioration Control Based on Issue Reports 117
changes on a specific software package and hencebe reported as possible point of deterioration?
The rest of this paper is organized as follows:Section 2 explains the related works, Section 3explains the concept of “code deterioration” andits relation to bad-smells, Section 4 presents theproposed continuous Quality Control model, Sec-tion 5 reports the results of experiments, thediscussion and justification of the results arepresented in section 6, Section 7 provides thethreats to the validity of the study and finallySection 8 concludes the paper.
2. Related works
In the field of software maintainability, thereare many research works dedicated to the main-tainability prediction of software based on theknowledge collected in early stages of SDLC [8].In [9] the superiority of the dynamic metrics overstatic metrics for maintainability prediction isstudied. They concluded that the dynamic met-rics outperform the static ones regardless of themachine learning algorithm used for prediction.
Extracting useful knowledge from bug reposi-tories to estimate quality andmaintainability of anopen-source software has been the subject of manystudies. In [3] authors concluded that the num-ber of bugs, as software quality indicator, in theith release has no significant correlation with thechange size of its previous release. In [4] a class levelquality assurance metric named Qi was definedand the correlation of the number of defects andQi was analyzed but they observed no significantcorrelation among them. In [7] the maintainabilityof some open- source software was studied empiri-cally and they reported that neither the time lag ofreported bugs nor the distribution of bug reportscan represent the maintainability indicator.
In [15] a recommender system to advice devel-opers to avoid bad smells and apply quality prac-tices during the programming is presented. Theyhave built a quality model which is continuouslyupdated based on the reported issues and the (de-tected) bad smells that have triggered the issue.The SZZ algorithm [16] which identifies the rootcause of an issue has been applied by this study
to track down the earliest change that has givenbirth to the exception. Subsequently the badsmells detected in code snippet identified as theroot cause of the exception is related to the issue.Machine learning algorithm have been applied tobuild the quality model. In [17] to improve thesoftware quality metrics and remove bad smellsa multi-objective evolutionary algorithm is pro-posed by which the best sequence of refactoringactivities is sought in a large search space of pos-sible solutions. To obtain this a predicting modelbased on time series is applied to estimate theimpact of each sequence of refactoring actions onthe future software quality. In [10] thirty differentsoftware quality prediction models were studied.Using two standard datasets they concluded thatregression and LWL outperformed others.
There are some studies on the relationshipbetween the amount of code-smells and the bugproneness level of the software. In [18] it wasshown that adding smell-related features (code--smell intensity) to the bug prediction modelscould improve the accuracy of the predictionmodels. The impact of presence of anti-patternson the change and fault-proneness of the classeshas been investigated in [19]. The results con-firmed that the classes involving anti-patterns aremore change and fault-prone. A Systematic Lit-erature Review has been conducted and reportedin [20] on the impact of code-smells on softwarebugs. The adverse effects of bad architecturaldecisions (architectural smells) on the maintain-ability of the software in terms of number offorthcoming issues and increased maintenanceefforts have been studied in [21].
The classification or clustering of bug reportshas also been the subject of some previous stud-ies. The classification of bug reports are used topredict a variety of factors regarding them. Forinstance in [23] a two-phased classifier has beenproposed to predict the files likely to be fixedusing the bug report textual description. In [24]a clustering method based on EM (ExpectationMaximization) and X-means has been proposedto categorize bug reports according to their sub-ject similarities. They have used topic modelingto vectorize bug reports and subsequently applieda labeling algorithm to characterize each cluster.

118 Omid Bushehrian et al.
There are also some studies on refactoring pri-oritization. In [25] a machine learning approachfor classification of code smell severity to priori-tizing the refactoring effort has been presented.They have reported a relatively high correlationbetween the predicted and actual severity bymodeling the problem as an ordinal classificationproblem. In [26] a semi-automated refactoringprioritization method to assist developers hasbeen presented. They have applied a combina-tion of three criteria: past modifications history,the relevance of the smell to the architecture andthe smell type to rank the refactoring activities.
The contribution of this paper is to proposea novel model of Software Quality Control whichenables the QC team to judge about the internalquality of software, constantly changed by devel-opers, without the need of source code analysisand merely by monitoring the incoming issuereports and their sequence. To this end first,a thorough correlation analysis between the codequality metrics (the number of bad-smells) and
issue-level metrics (issue absorption rate) hasbeen conducted. Subsequently a new stream clus-tering method is presented to effectively catego-rize incoming sequence of issue reports such thata bloated category truly indicates the existenceof a software package with high issue absorptionrate. It is important to note that in contrast tothe previous studies on refactoring prioritization,the proposed method uses the issue-level met-rics to find the top-module to refactor withoutneeding to analyze or access the source code.
3. Code deterioration and bad-smells
There are a variety of bad-smell and anti-patternsintroduced in the literature that may emerge inthe code gradually due to the subsequent changesmade by the development team [12]. The PMDstatic source analyzer [22] has presented a verygood categorization of bad-smells in its documen-tations (Code Style, Design, Error-prone, Doc-
Table 1. Bad-smells according to the categorization presented in [22]
Category Some Bad smells in this category Example
Design(46 bad-smells)
AbstractClassWithoutAnyMethod,ClassWithOnlyPrivateConstructorsShouldBeFinal,CouplingBetweenObjects, CyclomaticComplexityDataClass, ExceptionAsFlowControlExcessiveClassLength, GodClass,ImmutableField, LawOfDemeter,LogicInversion, LoosePackageCoupling,NPathComplexity,. . .
DataClass:
public class DataClass {public int bar = 0;public int na = 0;private int bee = 0;public void setBee(int n) {bee = n;}}
Error Prone(98 bad-smells)
AssignmentInOperand,AssignmentToNonFinalStatic,AccessibilityAlteration,AssertAsIdentifier,BranchingStatementAsLastInLoop,CallingFinalize,CatchingNPE, CatchingThrowable,DecimalLiteralsInBigDecimalConstructor,DuplicateLiterals, EnumAsIdentifier,FieldNameMatchingMethodName,FieldNameMatchingTypeName,InstanceofChecksInCatchClause,LiteralsInIfCondition,LosingExceptionInformation,. . .
AssignmentInOperand:
public void bar() {int x = 2;if ((x = getX()) == 3) {System.out.println("3!");}
}

Software Deterioration Control Based on Issue Reports 119
S s=Facory.getInstance();s.m();
Class S { int type; ….}
S s=new S();….Switch (s.type){case A: statements1 ;case B: statements2;….}
Figure 1. Replacing switch/case statements with polymorphism to reduce the “CyclomaticComplexity” value
Table 2. Issue categories [2]
Issue Type Example Issue Ref. Studied inthis paper
Bug New version of Java 11 seems does not work well NETBEANS-5636 YesNew Feature Have python-archives also take tar.gz FLINK-22519 YesImprovement Upgrade Kotlin version in Kotlin example to 1.4.x BEAM-12252 No
Task Remove landmark directories from web and shim YUNIKORN-662 NoSub-Task Optional removal of fields with UpdateRecord NIFI-8243 No
Test Remove some Freon integration tests HDDS-5160 NoUmbrella Add SQL Server functions TRAFODION-3146 No
Documentation SQL DataFrameReader unescapedQuoteHandlingparameter is misdocumented SPARK-35250 No
umentation, Multithreading, Performance andSecurity) and among thosewehave focused on “De-sign” and “Error-Prone” categories since they referto much more general forms of anti-patterns com-pared to other categories that contain more partic-ular subjects. Some bad-smells in either categoriesalong with examples are presented in Table 1.
Apart from these bad-smells we have alsoanalyzed the method-level complexity using twowell-known metrics: “Cyclomatic Complexity”and “NpathComplexity” as their high values arevery good indicators of missing fundamental de-sign patterns such as strategy, composite, proxy,adapter and many others that are based on poly-morphism rather than conditional logics. The for-mer is the number of decision points in the codeand the latter is the number of full paths fromthe beginning to the end of the block of a method[27]. The refactoring practice corresponding tothe high method complexity (measured using“CyclomaticComplexity” and “NpathComplex-ity”) is illustrated in Figure 1.
These aforementioned bad-smells are code--level structures (or measures) that alert us of
deteriorated code. However the aim of this re-search is to investigate issue-level metrics thatdoes the same without relying on the code repos-itory and hence make the QC activity possibleby merely watching the issue repository. In theAnalysis section (Section 5) it will be arguedthat the number of issues of type “New Feature”reported on a software package is an effectiveissue-level metric to inform the QC team of thecode deterioration extent. See Table 2 for differ-ent issue categories and those that are involvedin this study.
4. Code deterioration assessmentmodel
The proposed model which incorporates the QCcomponent, called CDW (Code DeteriorationWatch) into the ITS, is illustrated in Figure 2.This component keeps track of the reported issuesand categorizes them incrementally to detect rel-atively long sequences of related reports as a signof possible code deterioration. By analyzing the

120 Omid Bushehrian et al.
Figure 2. The code quality control based on issue monitoring
Figure 3. The CDW sub-components
long sequences of reports, CDW prioritizes thesoftware modules to be scrutinized by the QCteam for refactoring activities. There are twomain sub-components of CDW working togetherto produce the final refactoring recommendationas shown in Figure 3. The Stream Clusteringthat splits the incoming sequence of issue re-ports into a set of chains and the RefactoringRecommender.
Ideally CDW should have the capability ofnotifying the QC team of the packages that arebeing changed frequently far more than othersas they are code segments very likely to get de-teriorated soon and need immediate attentionfor refactoring (this hypothesis will be verifiedin Section 6). Even if CDW be able to alert theQC team of existence of such packages withoutidentifying them, it would be very helpful yet.Note that identifying these packages accurately ispossible by analyzing the code repository at thelater time, however CDW is part of the ITS (andnot the version control) and it is supposed to giveus insights about the evolution of the softwaremerely by monitoring the incoming sequence ofissue reports ( issue metrics rather than codemetrics).
As the Stream Clustering sub-componentclusters the incoming issue reports into chains theidea is to spot Relatively Long Chains (RLC) ofincoming issue reports as they tell the QC teamthat a concentrated point of successive changeshas emerged in the software (this correlation willbe discussed in Section 6). RLCs are those thattheir lengths (the number of issue reports in thechain) exceed the average chain length signifi-cantly (as much as threshold ß). Note that that ifall chains are long, none of them is considered asRLC due to the fact that RLC concept is basedon significant size difference in a group and notthe absolute size itself.
We define the “target” of each chain as thepackage which is expected to incur majority ofthe changes as the issue reports in that chainare being resolved. The “target hit number” ofa chain is also defined as the expected changefrequency of the chain target. For instance ina chain of three reports: R1, R2 and R3 labeledwith {P1, P2, P3}, {P1, P3} and {P1}, respec-tively, as the packages to be changed, the chaintarget is P1 and its hit number is three.
Obviously a chain with a relatively high tar-get hit number is telling us that a package (the

Software Deterioration Control Based on Issue Reports 121
target) is being changed frequently far more thanothers. In Section 5 it will be verified that thechain size is a good metric to identify chains witha relatively high target hit number.
4.1. Stream Clustering
A simple stream clustering called “Report-Chainer” is presented here that splits the se-quence of issue reports into chains based on theirsimilarity to the previously formed chains. A splitthreshold controls formation of a new chain. Firstall documents are vectorized using Tf-Idf method[28] and cosine similarity is applied to computethe similarity of the current issue report withprevious ones. If the similarity values are lessthan the split threshold then it is added to newchain otherwise it is added to the most similarchain (see Algorithm 1).
Vectorizing document d in a collection of Ndocuments using Tf-idf method consists of twosteps: first, the frequency of each term t in dis counted (denoted tf t,d and then the value oftf t,d is scaled using the idf t (inverse documentfrequency) value:
idf t = N
dft(1)
Where df t is the number of documents inthe collection containing term t. The value ofTf-idf corresponding to term t in document d iscalculated using the following formula [28]:
Tfidf t,d = tf t,d × idf t (2)
In fact the Tf-idf method assigns lowerweights to the terms with no or very little discrim-inating power in a document. To compute thesimilarity of two documents d1 and d2, vectorizedusing the Tf-idf method, the cosine similarity hasbeen applied [28]:
sim(d1, d2) = (V (d1).V (d2))(|V (d1)| × |V (d2)|) (3)
Where V (d1) and V (d2) denote the vectorrepresentation of d1 and d2, respectively, ob-tained using the Tf-idf method. The advantageof using the cosine similarity method over the or-dinary method of computing the vector distancesis that the cosine similarity formula is insensitiveto the documents’ length.
In the next section it will be shown that thereis a significant linear correlation between thelength of a chain and the magnitude of timesthat the chain target has been changed. Accord-ingly the longer chains are good candidates forQC attention. We will also show that, at least for10 cases studies, not only can a split thresholdbe found to result a high correlation value butalso this value is bounded.
4.2. Refactoring Recommender
The Refactoring Recommender component takesa set of chains C as its input and produces therecommendation by selecting, from the candidatelist, those chains whose size differences with theaverage chain size are greater than threshold β(line 13 in Algorithm 2). These chains are consid-
Algorithm 1. Sequence Clustering AlgorithmmaxSim = 0chainNum = –1thisVec = TF_IDF(r)for Each vec in C do
Sim = cosineSim(thisVec, vec)if Sim > maxSim then
maxSim = simchainNum = vec.chainNum
end ifend forif maxSim < t then
chainNum = C.newChain()end ifC.add(thisVec, chainNum)

122 Omid Bushehrian et al.
Algorithm 2. Refactoring recommender algorithm1: Algorithm RefactoringRecommender(Chains C): List2: List r = ∅3: Package p4: int issueCnt = 05: int chainCnt = 06: for Each chain c in C do7: if c. numberOfNotVisitedIssues()> α then8: issueCnt += c.numberOfNotVisitedIssues()9: chainCnt += 1
10: end if11: end for12: for Each chain c in C do13: if c.numberOfNotVisitedIssues() – (issueCnt / chainCnt)) > β then14: p = targetAnalyze(c)15: r.add(p)16: end if17: end for18: return r19:20: Algorithm On_RefactoringCompleted(chain c)21: for Each Issue s in C do22: s.visited = True23: r.add(p)24: end for
Figure 4. Issues have been categorized in four chains; In round n of recommendation,candidate set is {C1, C2, C3, C4} and C4 is detected as RLC; during next k rounds C4
is excluded from the candidate set and no RLC is reported by the algorithm
ered as RLCs. Subsequently the targetAnalyze()function determines the target package of eachRLC (line 14). This function can be carried outusing supervisedmachine learningmethods as pre-sented in [23] or be done manually by experts. Assoon as a recommended refactoring is performedby the QC team, all issues in the correspondingchain are excluded from the subsequent roundsof process by labeling them as “Visited” (line20–24). Moreover the chain is excluded from thecandidate list in the subsequent rounds of processuntil the number of “Not-Visited” issues reachesthreshold α (line 7). This prevents the algorithm
to falsely identify most of the candidate chainsas RLCs since recently recommended chain hasa few number of “Not Visited” issues and hencemoves down the average chain size significantly(see Figure 4). A reasonable value for a could bethe average chain size of the current candidate list.
5. Analysis
The objective of our experiments was first tostudy the correlation between the issue-level met-rics and code-level metrics and second to evaluate

Software Deterioration Control Based on Issue Reports 123
the proposed RepChainer algorithm. There aretwo issue-level metrics to study: Bug AbsorptionDegree (BAD) and Feature Absorption Degree(FAD) defined as the number of bugs and thenumber of new features reported on a softwaremodule in a period of time respectively. Thecode-level metrics are “CyclomaticComplexity”,“NpathComplexity” and the number of detected“Design+ErrorProne” bad-smells as explained inSection 3. The software module granularity waschosen to be the package (a set of related classes).The rationale behind choosing the package granu-larity is to have more specialized task assignment(i.e. refactoring tasks) to developers. Since pack-ages are often focused on specific subjects theycan easily be assigned to developers who are spe-cialized in the respective area to refactor all theclasses of them. Moreover another set of experi-ments were conducted to evaluate the accuracyand usefulness of the stream clustering algorithmused in detecting bloated categories(RLCs) ofissue reports.
5.1. Dataset
To do the experiments, a dataset with the schemashown in Figure 5 of medium and large scaleopen-source software repositories from Apacheand Eclipse were created. Table 3 summarizes
class
commit
commitRep
change
product
report
metric
Figure 5. Dataset schema
the products metadata. For each product, itsGit [29] repository was cloned and analyzed us-ing a program written with Node.Js. This pro-gram extracted all the commits and their as-sociated objects from the repository using theisoMorphic-Git [30] library. During the analysisphase the code metrics: “CyclomaticComplexity”,“NpathComplexity” and the number of detected“Design+ErrorProne” bad-smells were also mea-sured using the PMD source code analyzer [22].
The Javascript code snippet to invoke PMDprogram is shown in Listing 1. A custom orbuilt-in rule set has to be passed to PMD toanalyze the source code accordingly. For detect-ing “Design+ErrorProne” bad-smells the built-inrule sets: category/java/design.xml and cate-
Table 3. Products metadata
Product License Language No. ofClasses
No. ofpackages
No. ofreportedissues
No. ofanalyzedcommits
ITS
Cloudstack Apache Java,Python 16100 639 3451 5565 JIRA
Geode Apache Java 27277 961 3805 6565 JIRA
Spark ApacheJava,Python,Scala
8494 490 13289 15044 JIRA
Camel Apache Java 37702 2393 9655 18299 JIRAGeronimo Apache Java 13163 846 2127 3115 JIRAHadoop Apache Java 27045 1168 3671 15902 JIRAHbase Apache Java 8255 261 9445 11164 JIRAMyfaces Apache Java 2805 219 1594 2640 Bugzilla4diac.ide Eclipse Java 1598 255 1126 504 BugzillaAcceleo Eclipse Java 896 210 969 520 BugzillaCommon Eclipse Java 1496 177 105 287 BugzillaApp4mc Eclipse Java 1370 68 131 186 Bugzilla

124 Omid Bushehrian et al.
const cp = require(’child_process’ );cp.execSync("e:\\pmd\\bin\\pmd.bat−dir e:\\pmd\\input_cloudstack−format xml −R e:\\pmd\\ru.xml >e:\\pmd\\output_cloudstack\\out.xml");cp.execSync("e:\\pmd\\bin\\pmd.bat−dir e:\\pmd\\input_cloudstack−format xml −R category/java/design.xml,category/java/errorprone.xml,>e:\\pmd\\output_cloudstack\\out.xml");
Listing 1. Javascript code snippet to invoke PMDprogram using a custom ruleset: ru.xml (top) andthe predefined “design” and “error prone” rule sets
(bottom)gory/java/errorprone.xml were used. To measure“CyclomaticComplexity” and “NPathComplex-ity” metrics a custom rule set ru.xml was usedas listed in Listing 2.
Due to the size of repositories the analysistook over a week to complete on a cluster ofcore-i7 PCs during which the analyzer programwas running round the clock. To the best ofour knowledge such an integrated dataset of is-sues, measured code metrics and bad-smells andmetadata of all commits on Eclipse and Apache
products has not been published elsewhere andwe are working to make it online soon.
The issues reported on products were im-ported into “report” table from the respectiveITS. Apache-Jira and Eclipse-Bugzilla ITSs areaccessible at [31] and [32] respectively.
5.2. Correlation Analysis
Assume that Ni and Bi are the number of re-solved issues of type “New Feature” and “Bug”on package Pi, respectively, (issues for which Pi
was not modified are excluded) and Ii = Ni⋃Bi
denotes the number of all resolved issue typeson Pi. Moreover ∆bi,m denotes the variation ofcode metricm during the successive changes of Pi:
∆bi,m = mmax,i −minit,i
m ∈
”CyclomaticComplexity”,”NpathComplexity”,”Design + ErrorPron”
(4)
where mmax,i and minit,i are the maximum andinitial values of code metric m measured over all
<?xml version="1.0"?><ruleset name="Custom␣Rules"xmlns="http://pmd.sourceforge.net/ruleset/2.0.0"xmlns:xsi="http://www.w3.org/2001/XMLSchema−instance"xsi:schemaLocation="http://pmd.sourceforge.net/ruleset/2.0.0␣␣␣https://pmd.sourceforge.io/ruleset_2_0_0.xsd"><description>My custom rules</description><rule ref="category/java/design.xml/CyclomaticComplexity"><properties><property name="classReportLevel" value="1" /><property name="methodReportLevel" value="1" /><property name="cycloOptions" value="" /></properties></rule><rule ref="category/java/design.xml/NPathComplexity"><properties><property name="reportLevel" value="1" /></properties></rule></ruleset>
Listing 2. PMD custom rule-set applied to measure “CyclomaticComplexity”and “NPathComplexity” metrics

Software Deterioration Control Based on Issue Reports 125
Figure 6. The Pearson correlation analysis on 12 products: (top left): “Design+errorProne” bad smells,(top right) “CyclomaticComplexity” metric and (bottom) “NpathComplexity” metric
variations of classes in Pi:
mmax,i =C∈Pi∑
Maxversions(c){val(mC)} (5)
where versions(c) is the set of all successive ver-sions of class C stored in the Git repository dueto subsequent changes made by committers andval(mC) denotes the measured value of metric mon class C. Likewise:
minit,i =C∈Pi∑{val(mC0)} (6)
where C0 denotes the initial version of class C inGit repository. The objective of the correlationanalysis is to examine the random variable pairs:(∆bi, Ni), (∆bi, Ii) and (∆bi, Bi) for existence of
significant linear correlation. The correlation wasanalyzed using the Pearson test and the resultsare illustrated in Figure 6. The main reason thatwe considered the difference between the maxand the initial metric values has been to obtainthe added number of smells to the base valueduring the successive commits. In other words theincrease in the number of smells matters most inour study.
For the Eclipse products the separate corre-lation analysis for BAD and FAD metrics wasnot possible as the classification of issue reportsinto “Bug” and “New Feature” is not providedby the Bugzilla ITS. The highest correlation wasobserved between the “Design+ErrorProne” codemetric and the FAD issue metric. With respect to

126 Omid Bushehrian et al.
0
0.2
0.4
0.6
0.8
1
1.2
10 20 30 40 50 60 70 80 90 100
Co
rre
lati
on
percentage of the reports
Correlation variations
hadoop cloudstack
geode camel
geronimo spark
myfaces hbase
org.eclipse.app4mc org.eclipse.acceleo
org.eclipse.actf.common org.eclipse.4diac.ide
Figure 7. The correction between the number of reports of type “New Feature” and the number ofbad-smells of type: “Design+ErrorProne” computed for different dataset sizes
the “CyclomaticComplexity” and “NpathCom-plexity” metrics, as the indicators of the extentto which polymorphism is missing in the design,good correlation is observed between the “Cyclo-maticComplexity” metric and the FAD metric.The variation of the correlation values (betweenthe FAD and “Design+ErrorProne” metrics) overthe maintenance period has also been studiedby stepwise correlation analysis using differentrepository sizes. As shown in Figure 7 the frac-tional correlation analysis has been performedon data set sizes ranging from 10% to 100% ofthe issue reports in the repository. The results ofthe above analysis will be discussed in Section 6.
5.3. Stream Clustering Analysis
To evaluate the proposed RepChainer algorithm,issue reports from 10 Apache products wereanalyzed. Each report is associated with a set ofcommits and the set of packages changed by therespective commits is used as the report label.A sample report and its label is shown in Figure 8.
For each product three streams of reports:small, medium and large size were prepared toevaluate the ReportChainer algorithm. The smallsize stream was used for finding the best value forsplit threshold (learning set) and the two otherstreams used for evaluation. A Python programiterates through threshold values in the range[0.1 0.8] and for each threshold the chains arecreated and the “chain lengths” and their corre-sponding “target hit numbers” are extracted tocompute the correlation value. The “target hitnumber” of each chain is determined based onthe labels of reports in the chain; for instancefor the following chain: (R1, {P1, P2, P3}) →(R2, {P1, P3}) → (R3, {P1}) consisting of threereports R1, R2 and R3 and labels {P1, P2, P3},{P1, P3} and {P1} the chain target is packageP1 and its hit number is three. The objective ofthis experiment is to show that the longer thechain is the higher the target hit number will be.Note that opposed to many previous studies (forexample [23]) that aimed at finding the targetpackage which is a more difficult problem to solve

Software Deterioration Control Based on Issue Reports 127
Weights assigned to terms using the Tf-idf method:
({'unifi': 0.29447407686889265, 'reflectutil': 0.33919324980824395, 'classutil':
0.33539379704513483, 'class': 0.29411422057139275, 'current': 0.07138622368723736,
'histor': 0.16959662490412197, 'grown': 0.16959662490412197, 'differ': 0.0953196864204431,
'respons': 0.08685632305052403,'load': 0.09871841273198587, 'one': 0.16448033360810138,
'origin': 0.12487745196477068, 'facelet': 0.07820264606359888, 'codebas':
0.16959662490412197, 'homegrown': 0.16959662490412197, 'advantag':
0.16959662490412197, 'disadvantag': 0.16959662490412197, 'probabl':
0.14723703843444633, 'share': 0.09224516449127132, 'long': 0.12487745196477068, 'run':
0.07820264606359888,'post': 0.11767927289011874},
Label: {'org.apache.myfaces.view.facelets.compiler',
'org.apache.myfaces.view.facelets.tag.jsf.core',
'org.apache.myfaces.view.facelets.util', 'org.apache.myfaces.shared.util',
'org.apache.myfaces.view.facelets.el'}
)
Figure 8. A sample vectorized issue report and its label
Table 4. Pearson test results for random variables: (chainLen, hitNumber).
Product Learning set size(number of reports) Learned Threshold Pearson
coefficient valueBest
ThresholdBest Pearson
coefficient valueCloudstack 26 0.35 1 0.35 1Geode 507 0.1 0.98 0.1 0.98Spark 1243 0.7 0.84 0.1 0.97Camel 796 0.1 0.94 0.1 0.94Geronimo 673 0.7 0.85 0.1 0.94Hadoop 550 0.25 0.80 0.1 0.97Myfaces 192 0.1 0.95 0.1 0.95Hive 3070 0.1 0.99 0.1 0.99Hbase 783 0.15 0.95 0.1 0.98Cassandra 70 0.35 0.93 0.1 0.99
even with supervised machine learning methods,the intent of the ReportChainer is merely form-ing the chains correctly. The correlation valuewas computed using the Pearson method imple-mented in NumPy [33]. The results are listed inTable 4. The samples of (chainLen, hitNumber)pairs are plotted in Figure 9.
According to the observed results, for almostall of the products, the threshold value 0.1 resultedin chains with the highest correlation value. Itwas observed that for fairly long sequences of
reports this threshold value worked fine acrossApache products. There were products for whichthe learned threshold value differed from the bestvalue (for instance CloudStack and Cassandra)due to the relatively few number of samples inthe learning sequence: 26 and 70 respectively.Generally it can be argued that the shorterthe sequence of reports, the higher thresholdvalue will result in the best set of chains (interms of the Pearson correlation metric). Onthe other hand, a lower threshold value creates

128 Omid Bushehrian et al.
Figure 9. Plot of pairs: (chainLen, hitNumber) for six Apache products: Camel, Cassandra, CloudStack,Geode, Geronimo and Hadoop. The x and y axes are chain length and target hit numbers, respectively.
The chains were created with split threshold = 0.1
fewer equal (short) length of chains due to theirless join rejection rate. Many equal short sizechains prevent the recommender module fromworking properly. For instance in CloudStackthe best threshold learned 0.35, however by ex-amining the resulted chains, many short equallength chains were observed. By choosing thethreshold value less (= 0.1) this problem wasovercome.
6. Discussion
The results confirmed strong linear direct corre-lation (0.73 on average) between the FAD metricand the “Design+ErrorProne” deterioration met-ric. Moreover the FAD metric is correlated withthe “CyclomaticComplexity” deterioration met-ric well. Hence the FAD metric could be appliedas a good indicator of the code deterioration level

Software Deterioration Control Based on Issue Reports 129
in terms of the number of emerged bad-smellsand the extent to which the polymorphism is re-placed wrongly by the complex conditional logicsin the design. The statistical analysis using theStudent”s T distribution showed that the meanvalue of the correlations (between FAD and “De-sign+ErrorProne”) falls within [0.32, 1.14] withconfidence 95%. Moreover as shown in Figure 7,the correlation value is almost independent of thenumber of received issue-reports on the productand at any time, as the product changes, theFAD metric can be used to measure the relativedeterioration level.
To justify the relatively lower correlation val-ues between FAD and “NpathComplexity” met-rics, it should be noted that though both “Npath-Complexity” and “CyclomaticComplexity” met-rics measure the amount of complex conditionallogics in the code, the former is very sensitive tothe composition of the conditional statements inthe code while the latter only counts the numberof decision points.
Furthermore to explain why the FAD metricis superior to the BAD metric in terms of the cor-relation strength to the deterioration code-levelmetrics, we argue that:
(1) Usually adding a feature involves more(re-)design activities than fixing a bug and it ismore likely to incorporate bad- structures intothe code compared to fixing bugs.
(2) A good design suppresses the subsequent“New Feature” requests whereas a bad designproduces forthcoming related “New Feature” re-quests: It is easy to see (as we have seen in ourindustrial experiences) that if a “New Feature”request is designed properly using well-defineddesign patterns (mostly based on polymorphism),the resulted code will involve the abstract con-cepts rather than concrete classes and hencethe subsequent requests are likely to be vari-ants and special cases of the initially requestedfeature and could be easily addressed by addingnew classes rather than modifying the existingcode (Open-Close principle [34]). Hence in this
Figure 10. Classes with more anti-pattern constructs absorb more subsequent New Features.Three related New Feature requests: NF1,NF2 and NF3. Using strategy design pattern (top),
using conditional constructs (bottom)

130 Omid Bushehrian et al.
case less forthcoming requests of type “New Fea-ture” is expected to be received. In contrast,the more polymorphism and design pattern con-structs are replaced with conditional logics (andanti-patterns) in the code, the higher number ofsubsequent New Feature requests will be gener-ated and absorbed by the module. This conceptis illustrated in Figure 10.
To our best knowledge, there has been nostudy on the impact of different change typeson the deterioration level of the code so far. Ac-cording to the literature [34, 35]. This is widelyaccepted in the software engineering communitythat successive changes in the maintenance phaseof software gradually causes the software to rotand the symptoms of deterioration to emerge:rigidity, fragility, needless complexity, opacity,immobility and these are due to bad smells inthe code. Hence the more changes to the code themore deteriorated the code becomes. The resultsobtained in our study also corroborates the liter-ature in the sense that “New Features” are subtypes of “Change” and hence we could expectto see a good correlation between the numberof “New Features” and the deterioration level.Now we can answer to our mentioned researchquestions:
RQ1: Can the QC team evaluate the qual-ity level of the code, which is under successivechanges during the maintenance phase, only byobserving issue-related metrics such as the num-ber of reported issues on a software package?Is the type of reported issues important in thisevaluation?
Answer: According to the analysis presentedin Section 5, yes. Issue reports are clustered usingthe stream clustering algorithm and the targetpackage of the longest chain is recommended asthe package with a high change rate. Due to thestrong correlation between the value of FAD met-ric and the number of bad-smells, this packageis presumed to be a priority for refactoring.
RQ2: Is there an effective stream cluster-ing method to categorize incoming sequence ofissue reports such that a bloated category betruly interpreted as the concentration of frequentchanges on a specific software package and hencebe reported as possible point of deterioration?
Answer: According to the correlation anal-ysis results presented in Table 4, the proposedstream clustering algorithm could successfullycreate sequences of related issue reports suchthat the issue reports in each sequence are mostlyfocused on a specific package called target.
7. Threats to validity
As the most important threat to validity of theproposed QC approach to mention is the ac-curacy of the presented stream clustering algo-rithm, the parameters of this algorithm has tobe fine-tuned according to the issue-report pecu-liarities and the product characteristics. Anotherthreat to validity is the accuracy of the PMD badsmell detection tool. In [36] a comparative studyof bad smell detection tools has been presented.In this study a detailed comparative study of fourtools including PMD showed that this tool wasable to reach up to 100% precision and 50% recallon particular test-cases and could outperformother tools in precision while rival in the recallvalue. Another limitation is that the study is de-limited in the Object Oriented programming fieldthough the strength of the proposed approach isindependent of the used programming language.
8. Conclusions and future works
The continuous modifications of software mod-ules lead to emergence of bad-smells and it isdesirable to equip ITSs with assisting tools tonotify the QC team about parts of the codethat need immediate refactoring attentions. Inthis paper by creating a dataset of issue reportsand their corresponding change information ex-tracted from Apache and Eclipse open-sourcesoftware repositories, a thorough study was con-ducted. The results confirmed a significant lineardirect correlation between the FAD issue-levelmetric measured on a software package and the“Design+ErrorProne” and “CyclomaticComplex-ity” code-level metrics. Hence the packages withhigher measured values for FAD can be consid-ered as good candidates of parts highly exposed

Software Deterioration Control Based on Issue Reports 131
to deterioration, they need immediate attentionof the QC team. A challenging part of the pro-posed model was to design a stream clustering tobe able to split the sequence of reports into chainsin a way that the length of the chains be a validindicator of its target hit number. According tothe observed results, for most of the products,the threshold value 0.1 resulted in chains withthe highest Pearson correlation between chainlengths and their target hit numbers. As thefuture work we aim at studying other bad-smelltypes as well as other latent bug level metrics topredict the deterioration trend of the softwareduring the maintenance phase. Another futurework could be studying the same dataset withother smell detection tools apart from PMD.
References
[1] Bugzilla. [Online]. http://www.bugzilla.org (Ac-cessed on 2018-06-06).
[2] Atlassian. [Online]. https://www.atlassian.com/software/jira (Accessed on 2018-06-06).
[3] L. Yu, S. Ramaswamy, and A. Nair, “Using bugreports as a software quality measure,” 2013.
[4] M. Badri, N. Drouin, and F. Touré, “On under-standing software quality evolution from a defectperspective: A case study on an open source soft-ware system,” in International Conference onComputer Systems and Industrial Informatics.IEEE, 2012, pp. 1–6.
[5] C. Chen, S. Lin, M. Shoga, Q. Wang, andB. Boehm, “How do defects hurt qualities? Anempirical study on characterizing a softwaremaintainability ontology in open source soft-ware,” in International Conference on SoftwareQuality, Reliability and Security (QRS), 2018,pp. 226–237.
[6] Standard for Software Maintenance, IEEE Std.1219-1998, 1998.
[7] L. Yu, S. Schach, and K. Chen, “Measuring themaintainability of open-source software,” in In-ternational Symposium on Empirical SoftwareEngineering, 2005, p. 7.
[8] R. Malhotra and A. Chug, “Software maintain-ability: Systematic literature review and currenttrends,” International Journal of Software En-gineering and Knowledge Engineering, Vol. 26,No. 8, 2016, pp. 1221–1253.
[9] H. Sharma and A. Chug, “Dynamic metrics aresuperior than static metrics in maintainabilityprediction: An empirical case study,” in 4th Inter-
national Conference on Reliability, Infocom Tech-nologies and Optimization (ICRITO) (Trendsand Future Directions). IEEE, 2015, pp. 1–6.
[10] S. Shafi, S.M. Hassan, A. Arshaq, M.J. Khan,and S. Shamail, “Software quality predictiontechniques: A comparative analysis,” in 4th In-ternational Conference on Emerging Technolo-gies. IEEE, 2008, pp. 242–246.
[11] P. Piotrowski and L. Madeyski, “Software defectprediction using bad code smells: A systematicliterature review,” Data-Centric Business andApplications, 2020, pp. 77–99.
[12] M. Fowler, Refactoring: improving the design ofexisting code. Addison-Wesley Professional, 2018.
[13] Apache. [Online]. https://projects.apache.org/projects.html (Accessed on 2018-06-06).
[14] Eclipse. [Online]. https://www.eclipse.org/ (Ac-cessed on 2018-06-06).
[15] V. Lenarduzzi, A.C. Stan, D. Taibi, D. Tosi,and G. Venters, “A dynamical quality model tocontinuously monitor software maintenance,” inThe European Conference on Information Sys-tems Management. Academic Conferences Inter-national Limited, 2017, pp. 168–178.
[16] S. Kim, T. Zimmermann, K. Pan, andE.J. Whitehead, Jr., “Automatic identificationof bug-introducing changes,” in 21st IEEE/ACMInternational Conference on Automated SoftwareEngineering (ASE ’06), 2006, pp. 81–90.
[17] H. Wang, M. Kessentini, W. Grosky, and H. Med-deb, “On the use of time series and search basedsoftware engineering for refactoring recommen-dation,” in Proceedings of the 7th InternationalConference on Management of computationaland collective intElligence in Digital EcoSystems,2015, pp. 35–42.
[18] F. Palomba, M. Zanoni, F.A. Fontana, A. De Lu-cia, and R. Oliveto, “Smells like teen spirit: Im-proving bug prediction performance using theintensity of code smells,” in International Con-ference on Software Maintenance and Evolution(ICSME). IEEE, 2016, pp. 244–255.
[19] F. Khomh, M. Di Penta, Y.G. Guéhéneuc, andG. Antoniol, “An exploratory study of theimpact of antipatterns on class change-andfault-proneness,” Empirical Software Engineer-ing, Vol. 17, No. 3, 2012, pp. 243–275.
[20] A.S. Cairo, G. de F. Carneiro, and M.P. Mon-teiro, “The impact of code smells on softwarebugs: A systematic literature review,” Informa-tion, Vol. 9, No. 11, 2018, p. 273.
[21] D.M. Le, D. Link, A. Shahbazian, and N. Medvi-dovic, “An empirical study of architectural decayin open-source software,” in International con-

132 Omid Bushehrian et al.
ference on software architecture (ICSA). IEEE,2018, pp. 176–17 609.
[22] PMD static code analyzer. [Online]. https://pmd.github.io/latest/pmd_rules_java.html (Ac-cessed on 2018-06-06).
[23] D. Kim, Y. Tao, S. Kim, and A. Zeller, “Whereshould we fix this bug? A two-phase rec-ommendation model,” IEEE transactions onsoftware Engineering, Vol. 39, No. 11, 2013,pp. 1597–1610.
[24] N. Limsettho, H. Hata, A. Monden, and K. Mat-sumoto, “Unsupervised bug report categoriza-tion using clustering and labeling algorithm,”International Journal of Software Engineeringand Knowledge Engineering, Vol. 26, No. 7, 2016,pp. 1027–1053.
[25] F.A. Fontana and M. Zanoni, “Code smell sever-ity classification using machine learning tech-niques,” Knowledge-Based Systems, Vol. 128,2017, pp. 43–58.
[26] S.A. Vidal, C. Marcos, and J.A. Díaz-Pace, “Anapproach to prioritize code smells for refactor-ing,” Automated Software Engineering, Vol. 23,No. 3, 2016, pp. 501–532.
[27] T.J. McCabe, “A complexity measure,” IEEETransactions on software Engineering, No. 4,1976, pp. 308–320.
[28] C.D. Manning, P. Raghavan, and H. Schütze, In-troduction to Information Retrieval. CambridgeUniversity Press, 2008.
[29] GitHub. [Online]. https://github.com/ (Accessedon 2018-06-06).
[30] isomorphic-git. [Online]. https://isomorphic-git.org/ (Accessed on 2018-06-06).
[31] Apache’s JIRA issue tracker! [Online]. https://issues.apache.org/jira/secure/Dashboard.jspa(Accessed on 2018-06-06).
[32] bugs.eclipse.org. [Online]. https://bugs.eclipse.org/bugs/ (Accessed on 2018-06-06).
[33] NumPy. [Online]. https://numpy.org/[34] R.C. Martin, Clean code: A handbook of ag-
ile software craftsmanship. Pearson Education,2009.
[35] R.C. Martin, M. Martin, and M. Martin, Agileprinciples, patterns, and practices in C#. Pren-tice Hall, 2007.
[36] E. Fernandes, J. Oliveira, G. Vale, T. Paiva,and E. Figueiredo, “A review-based comparativestudy of bad smell detection tools,” in Proceed-ings of the 20th International Conference onEvaluation and Assessment in Software Engi-neering, EASE ’16. ACM, 2016.

e-Informatica Software Engineering Journal, Volume 15, Issue 1, 2021, pages: 133–162, DOI 10.37190/e-Inf210107
A Systematic Reuse Process for AutomatedAcceptance Tests:
Construction and Elementary Evaluation
Mohsin Irshad∗, Kai Petersen∗∗∗Ericsson Sweden AB, Karlskrona, Sweden
∗∗Blekinge Institute of Technology, Karlskrona, Sweden and University of Applied Sciences Flensburg,Germany
[email protected], [email protected]
AbstractContext: Automated acceptance testing validates a product’s functionality from the customer’sperspective. Text-based automated acceptance tests (AATs) have gained popularity because theylink requirements and testing.Objective: To propose and evaluate a cost-effective systematic reuse process for automatedacceptance tests.Method: A systematic approach, method engineering, is used to construct a systematic reuseprocess for automated acceptance tests. The techniques to support searching, assessing, adapting thereusable tests are proposed and evaluated. The constructed process is evaluated using (i) qualitativefeedback from software practitioners and (ii) a demonstration of the process in an industry setting.The process was evaluated for three constraints: performance expectancy, effort expectancy, andfacilitating conditions.Results: The process consists of eleven activities that support development for reuse, developmentwith reuse, and assessment of the costs and benefits of reuse. During the evaluation, practitionersfound the process a useful method to support reuse. In the industrial demonstration, it was notedthat the activities in the solution helped in developing an automated acceptance test with reusefaster than creating a test from scratch i.e., searching, assessment and adaptation parts.Conclusion: The process is found to be useful and relevant to the industry during the preliminaryinvestigation.
Keywords: Software components and reuse, software testing, analysis and verification,agile software development methodologies and practices, software quality
1. Introduction
Software testing provides information on thequality of the software product [1]. An essentialaspect of software testing is to verify that newlydeveloped features of a product work accordingto the agreed requirements, and existing func-tionality is still working correctly (i.e., regressiontesting) [2]. With the advent of new technologiesand processes, software testing’s importance hasincreased as well. Existing testing approaches,such as unit testing and test-driven development,
verify that software is working and developedaccording to the requirements. However, theseapproaches do not take into account the test-ing of business requirements. Acceptance testingverifies the business-critical aspects of softwareproduct [3]. The business requirements of a prod-uct and the user needs are the focus of acceptancetesting [4]. The objective is to validate these busi-ness requirements before accepting the softwareproduct [3]. These business requirements, in theform of acceptance tests, are automated so thatthese are tested repeatedly and frequently similar
Submitted: 01 February 2021; Revised: 07 August 2021; Accepted: 09 August 2021; Available online: 25 October 2021

134 Mohsin Irshad, Kai Petersen
to unit tests [5]. Such automated tests are calledautomated acceptance tests (AATs) [5]. Studiesin AAT have identified that AATs are responsi-ble for high development and maintenance costswhen the product is still changing frequently [5].
In agile development methodologies (such asExtreme Programming), the acceptance testsare scripted (using any programming languagesource code) by the development teams to getcontinuous feedback on the product’s quality, andcompleteness [6]. Such scripted testing is referredto as “automated acceptance testing”, and thetests are known as “automated acceptance tests”(abbreviated as AAT in this study). In agile de-velopment methodologies development of AATsstarts much early and these AATs are executedfrequently [6]. Empirical studies on AATs haveestablished that AATs facilitate the organiza-tion’s knowledge transfer by describing businessrequirements as test cases [7].
Software reuse improves productivity andquality during software development [8]. Stud-ies have suggested that software reuse is mostbeneficial when organizations have a “system-atic reuse process” [9]. In a systematic reuseprocess, the reusable artifacts are developed tosupport “development for reuse” [10], and thesereusable artifacts are easy to find and adapt forreuse purposes [9]. The new development uti-lizes these reusable artifacts, and this is called“development with reuse” in which the identi-fication, evaluation, and adaptation effort andcosts are considerably reduced [10, 11]. A reuseprocess starts with “reuse assessment”, which isa two-step activity, i.e., identification and evalu-ation of software components for reuse [12]. Theevaluation of components for reuse involves theevaluation of the technical aspects (i.e., how toreuse) and the economic aspects (cost of reusevs. benefits of reuse) of the component [12].
Almeida et al. suggested that the systematicreuse process’s decisions should be financially jus-tified (i.e., costs vs. benefits of reuse) before theactual reuse takes place [13]. Studies in literaturehave suggested that in “development for reuse”,the costs of developing the reusable artifacts arehigh because the artifact should have high qual-ity and artifact reused easily [9]. However, after
multiple reuse instances, the benefits becomemore than the costs [14]. To calculate the reusecosts and reuse benefits, several cost models andmetrics exist in the literature. However, many ofthese metrics and models only capture the costsand benefits of artifacts consisting of source code[15].
In scientific literature, solutions/processesthat are constructed to solve a specific businessproblem can be developed using various existingpractices [16]. An integrated solution (or a pro-cess) combines multiple activities that were notpreviously related to each other to address a criti-cal business problem, e.g., finding a defect, fixingthe defective code, and verifying the new codechange [17]. Method engineering is a disciplineof engineering that helps construct new solu-tions/processes from existing methods [18]. Inthis study, we have utilized method engineeringto support the systematic reuse process of AATs.
This idea of a systematic reuse process canbe applied to AATs to address the high develop-ment and maintenance costs of AATs. ReusableAATs can be developed to support the develop-ment of several new AATs, thus reducing thetime to develop, increasing maintainability (bydecreasing redundancy) and increasing quality ofthe automated acceptance tests [19]. Reusability(what to reuse, how to reuse, how to calculatereuse costs, and when to reuse) of AATs is a newarea, and very few studies have addressed thereuse in AATs. To the best of our knowledge,there is a lack of suitable methods that supportthe reusability of AATs. The contribution of thisinvestigation are:– to provide a systematic reuse process that
supports economically justified “developmentwith reuse” and “development for reuse” oftext-based AATs.
– to evaluate the proposed systematic reuse pro-cess for AATs with the help of experiencedpractitioners.
– to evaluate the proposed process using anindustrial scale example.Section 2 describes the background and re-
lated work, Section 3 contains research approachand the results are described in Section 4. Sec-tion 5 contains a discussion on the results of this

Systematic Reuse Process for Automated Acceptance Tests . . . 135
investigation and Section 6 describes threats tothe validity of this study. Important conclusionsare described in Section 7.
2. Background and related work
This section describes the background and re-lated work on AATs.
2.1. Automated acceptance tests (AATs)
An acceptance test is used to verify that therequirements are developed according to the con-tract/agreed specification [20][21]. The accep-tance tests are derived from the customer re-quirements, and their focus is to verify the com-pleteness of the implementation of requirements[22]. It was proposed that customers specify theseacceptance tests, and these tests can be used asa form of requirements [7]. In a literature review[5], Haugset and Hanssen found the followingbenefits associated with AATs:– AATs improve the understanding of the do-
main and product.– AATs improve the communication with the
customer by involving the customer in thetest documentation process.
– AATs improve the system’s quality by makingit safe to make a code change in the product.Several AAT formats (to write AATs) ex-
ist in literature such as source code, text-baseddomain-specific languages (DSL) and FIT tables[19, 23, 24]. From the existing literature, we haveidentified four types of AAT formats used bypractitioners and researchers. These four formatsare described below:
GUI-based formats.GUI-based acceptancetests are written to verify the functionality ofGUI-based applications such as websites and mo-bile applications [25]. These tests emulate theuser’s actions (e.g., clicks, inputs) and validatethe GUI-based application’s output. These GUIactions are based on the scenarios described bythe software requirements [25].
Code-based format. In the code-basedAATs, programming language (e.g., Java, Python)is utilized to develop test execution logic. The testcode implements and executes the scenarios ina programming language. The code-based AATis triggered by a test framework such as JUnit1.These types of acceptance tests can be writtenusing the existing practices and tools used forproduct development [26]. However, a drawbackwith this format is the difficulty for a customer tobe part of the development of the acceptance testprocess [7].
Data-driven formats. In the data-drivenformats, the acceptance tests are written so thatinput and output values are written in tabu-lar form [27]. These input and correspondingoutput values are used with the same test ex-ecution logic. FitNesse2 is the most commonlyused framework for data-driven acceptance test-ing. A literature review on AATs identified thatmost of the studies present in literature are onthe FitNesse (21 out of 26 identified studies) [7].The data-driven formats are also useful whenperforming regression testing on systems withvarying input and output values [28].
Text-based formats. Software practitionersprefer to write requirements in natural languagetext [29] and the text-based AAT frameworks(such as Cucumber3, Robot Framework4) supportthe use of these requirements as the test-casesfor software products, i.e., acceptance tests. Be-havior-driven format, Keyword-driven format,Scenario by example, are popular text-based for-mats. The text-based AATs are gaining popular-ity because they help to promote a common un-derstanding of requirements in the organizationand increase collaboration among practitioners[30]. An experiment on comparing text-basedAATs and FIT tables revealed that text-basedAATs are easier to understand. These tests aredeveloped in shorter duration as compared toFIT tables [31].
In behavior-driven format, the tests are writ-ten in template of Given, When and Then parts.Each behavior-driven test case validates a busi-
1https://junit.org2http://fitnesse.org/3https://cucumber.io/4https://robotframework.org

136 Mohsin Irshad, Kai Petersen
ness requirement described by the customer [32].Keyword-driven acceptance tests describe an exe-cutable requirementwritten using domain-specifickeywords [33]. In specification by example, exam-ple scenarios are described in natural languageby the stakeholders. These example scenariosare used to execute automated acceptance tests[34]. Each of these formats requires different toolsand development frameworks. These formatsallow the developers to write the tests in variousstyles and do not enforce any control over thevocabulary used in the AATs. Each statement ofAAT (e.g., “the mobile is sent to customer” in theScenario 1 below) is connected with a method incode called fixture/glue-code/hook that performthe actions associated with each statement. Thismethod is written in any programming language(Python, Java, etc.) or a library publishes it (e.g.,Selenium5).
Existing studies on AATs have discussed code--based and FIT tables (as an AAT format); littlework is done on the text-based automated ac-ceptance tests [7]. An example of a text-basedautomated acceptance test (a customer buyinga mobile phone) is shown below using behav-ior-driven development format:Scenario 1: A customer buys a mobile phone.
Given the customer accesses the web shopAnd he enters his name and id-card num-
berWhen he selects a mobile phoneAnd customer pays the money using debit
cardThen the mobile is sent to customers ad-
dressAnother automated acceptance test in key-
word-driven format is shown below verifying a usecase of a customer buying a mobile phone.Scenario 2: A customer buys a mobile phone.
Open Browser To Page example.com/shopInput name SamInput id 939393Submit informationClick button Buy to purchase mobileClose Browser
Existing literature has described several ap-proaches to generate automated test cases from
manual acceptance tests automatically. Paiva etal. proposed a process where requirements aretransformed into manual acceptance tests usinga domain-specific language called RequirementsSpecification Language (RSL) [35]. Later, theseRSL-based test cases are transformed into anautomated test-scripts executable using RobotFramework. Later, their proposed process is eval-uated using an example application. Soeken etal. provided a semi-automated approach to gen-erate automated acceptance tests from naturallanguage requirements [36]. The phrases fromrequirements are used to extract stubs executingthe test scenarios. Later, the proposed approachwas evaluated using an example case. Researchstudies have also utilized IDE-plugins and toolsto generate automated acceptance tests from theuse cases such as Fitclipse by Deng et al. [37] andTest-Duo by Hsieh et al. [38]. Such tools are oftenlimited to a specific framework or acceptance testformats.
2.2. Systematic software reuse
Software reuse describes the practice of reusingexisting software artifacts for developing a newproduct or maintaining an old product [39]. Thefield has been the subject of research for severalyears, and different aspects of software reusesuch as costs, testing, artifacts, the level of reuse,stakeholders, and reuse processes have been in-vestigated thoroughly by the researchers [40–44].Software reuse can take place at any time duringa project’s life-cycle, starting from the require-ments analysis phase to the maintenance phase[43, 45].
Organizations apply systematic softwarereuse to improve the quality, and productivity[41]. Various software development artifacts (re-quirements, test cases, code) can be systemati-cally reused across the entire development pro-cess [46]. Lam et al. described a 10-step processto support the systematic reuse of software re-quirements [47]. The study suggested that a sys-tematic reuse process can be successful when theorganization produces and consumes reusablesoftware artifacts. Research studies have identi-
5https://www.selenium.dev/

Systematic Reuse Process for Automated Acceptance Tests . . . 137
fied the following characteristics of a systematicsoftware reuse process [12, 48]:– Development for reuse: reusable artifacts are
produced to support the organization’s futuresoftware development needs.
– Development with reuse: new developmentoccurs using reusable artifacts whenever pos-sible.
– Guidelines (or techniques) to produce reusableartifacts exist and are practiced in the organi-zation.
– Guidelines (or techniques) on reusing an arti-fact exist and are used in the organization.
– Development teams consider the extra costsand risks associated with the reuse of arti-facts.
2.3. Related work: reuse in automatedacceptance tests
The concept of text-based AATs is new, and theirtextual nature differentiates these tests from theconventional code-based test-cases, thus requir-ing a different approach for reuse.
In a study on reuse of AATs, Landhaußer andGenaid suggested an ontology-based approach(F-TRec) that enables reusing tests written innatural language. They found that approachlacked precision when retrieving test steps forreuse [49]. Crispin and House provided a tool tocreate AATs that can be reused across differentmodules [50]. They suggested that before reusingany AATs to develop a new AAT, practition-ers should evaluate the effort spent writing andmaintaining the new AATs. They also claimedthat their proposed method could quickly createnew test cases from the existing reusable tests,thus reducing development time and increasingquality. Rahman and Gao recommended an archi-tecture that enables the reuse of Behavior-drivenacceptance tests across multiple repositories [19].They claim that their proposed approach canreduce maintenance costs, which are consideredone of the pain points of AATs. Binamungu et al.,in their study on the maintenance of BDD tests,found duplication as a critical challenge facingthe practitioners [51]. Irshad et al. also found du-
plication among AATs in their study refactoringBBD specifications [52]. This duplication can bedecreased with the help of an increase in reuse.
Liebel et al. identified costs related to writingthe automated acceptance tests as one of themajorproblems of these acceptance tests [25]. In theirindustrial case study, Hanssen et al. suggestedthat the benefits of automated acceptance testsshould be weighed against the costs associatedwith these tests [23]. They found that automatedacceptance tests verifying the graphical userinterface (GUI) are often hard to develop andmaintain.GUI-tests are unstable and requiremoremaintenance. Angmo and Sharma evaluated AATtools and proposed that cost-benefits analysisshould be done when considering a tool for au-tomated acceptance tests [53]. Shelly and Frankconducted a literature review on story test-drivendevelopment. They found that cost of writingAATs is high, and many organizations do nothave a budget to account for this high-cost [54].
Xie describes time as the measure of cost in de-velopment andmaintenance of AATs [55]. Haugsetand Stalhane claim that AAT can benefit organi-zations in two ways (i) increasing the correctnessof requirements and (ii) automated test-ability ofrequirements. Borg and Kropp described a toolthat helps maintain and refactor automated ac-ceptance tests, reducing their maintenance costs[56]. To support reuse and reduce costs, Schwarzet al. introduced and evaluated a plugin (Eclipse6IDE plugin) that rapidly develops AATs. Theyclaim that using this plugin can quickly developautomated acceptance tests quickly [57].
In short, we identified the following gaps inthe literature, and our investigation attempts toprovide a solution to these research gaps.– Lack of support to systematic reuse of
AATs: Only one study is identified that pro-vides methods for “developing with reuse”,and “developing for reuse”. However, thestudy’s approach is limited to the use ofa specific tool provided by the authors ofthe study [50].
– Lack of generic reuse practices support-ing diverse AAT formats: There is a needfor a generic practice supporting the reuse of
6https://www.eclipse.org/

138 Mohsin Irshad, Kai Petersen
all types of AAT formats. Several formats towrite text-based AATs exist in research andpractice (BDD, keyword-drive, specificationby example).
– Lack of means to calculate benefits ofreusing AATs: AATs are costly to writeand reuse, and costs should be consideredwhen reusing AATs [7, 23]. An instrument tocalculate the reuse costs of AATs may helpperform cost vs. benefits analysis of reuseinstances.This study complements the existing work by
providing a systematic reuse process that sup-ports economically justifiable “development forreuse”, and “development with reuse” of AATs,independent of any particular text-based AATformats, independent of any particular tools andframeworks.
3. Research approach
This section describes the research questions,study execution, data collection, and data analy-sis performed during this investigation.
3.1. Research questions
In order to achieve the objectives of this study,we have devised the following research questions:– RQ 1: How can the cost-effective systematic
reuse of text-based AATs be achieved?This research question details the establish-ment of a systematic reuse process for AATsalong with suitable activities and techniquesused in the process. The proposed processincorporates the cost-benefit aspects of AATswhen evaluating reuse opportunities.
– RQ 2: How does the systematic reuse process,from RQ 1, perform concerning performanceexpectancy, effort expectancy, and facilitatingconditions in the industrial context?RQ 2 addresses the preliminary industrialevaluation of the systematic reuse process ofAATs with the help of industry professionalsand practical demonstration.
3.2. Study execution
The study is executed using method engineeringthat is a research framework to develop newtools and methods. Method engineering consistsof individual method fragments that can combineto form a project-specific (or product-specific)customized method [58]. Method engineering isapplied using the following phases (defined byMayer [18]):– Document motivation: the motivation to de-
velop a new process is identified and docu-mented.
– Search for existing methods: the existingmethods are identified that may help in thenew process.
– Tailor existing methods: the identified meth-ods are adapted to suit the needs of the pro-cess.
– Design method application technique: a newprocess is formed using the modified existingmethods.
– Test candidate design elements: the process(and its components) are evaluated to identifypotential shortcomings and modifications.
– Refine method design: The process is modi-fied/refined based on the evaluation.The first four phases help in constructing
a new process, i.e., see Figure 1. Later, the lasttwo phases (see Figure 1) evaluates and improvethe new process. The study approach and theresearch questions are described in Figure 1. Thefirst step (construction of process) identifies themotivation, requirements and develops a newsystematic reuse process for text-based AATs.The second step (Evaluation and refining of theprocess) evaluates the new process by assessingthe performance expectancy, effort expectancy,and facilitating conditions of the process, as sug-gested by [61]. The evaluation consists of:– qualitative feedback on the process from ex-
perienced software practitioners (also referredto as static validation in [62]),
– by demonstrating the usage of the proposedprocess in an industrial application by anauthor.

Systematic Reuse Process for Automated Acceptance Tests . . . 139
Figure 1. Research approach inspired by method engineering [18]
The sections below provide the details of theconstruction of the process and its evaluation(i.e., research method, the data collection, andanalysis). The final version of the method is re-leased after incorporating the feedback from theevaluation.
3.2.1. Construction of process – using methodengineering
This step is used to construct a process support-ing “development with reuse”, and “developmentfor reuse” of AATs also considering the costs vs.benefits of AATs, i.e., a systematic reuse process.The details of the four phases of this step aredescribed below.Phase 1: Documentmotivation. The existingstudies that report the problems related to thereuse of AATs were identified and examined. Theauthors read the literature reviews and mappingstudies on AATs to identify supporting methodsfor reusing AATs. We have focused on text-based(non-code) AATs only as the reuse of other typesof AATs (code, FIT Tables) is already discussedin existing [7]. One of the authors conducted thefollowing step using Google Scholar7.– Find and examine the literature reviews/
mapping studies on AATs. Table 1 describeskeywords and identified studies.
– Examine the reference/citations in identifiedliterature reviews.
– Manually analyzes the identified studies tofind issues linked with AATs.
– Manually analyze the identified studies to finddetails on the reuse of AATs.The identified literature reviews/mapping
studies on the AATs [5, 7, 54, 59, 60] do notexplicitly discuss the reuse of AATs. However, weidentified studies using citations and referencesto review studies. The analysis (documented Sec-tion 2) concludes that a supporting process isneeded that should address the three require-ments/needs: AAT format, AAT reuse process,and AAT reuse costs. These three requirements/needs are described below.
AAT format: The process should be indepen-dent of the AAT format. Different AAT frame-works support other formats, e.g., in Cucumber,BDD format is used, and the Robot Frameworksupports keyword-driven and BDD formats. Thereuse process of AATs should be independent offormats dictated by different AAT frameworks.
AAT reuse process: The reuse process of AATshould support “develop for reuse” and “developwith reuse”. The process should contain activitiesto search for a reusable AAT, assessment of AATfor reuse, and adaption for reusing AATs.
Table 1. Keywords and identified studies
Keywords Identified review studiesAutomated Acceptance Testing review [5], [7]Acceptance Testing review [5], [59]Story-driven review [54]BDD Review [60]
7https://scholar.google.com/

140 Mohsin Irshad, Kai Petersen
AAT reuse costs: The process should incor-porate activities for assessment of reuse costs ofan AAT. Previous research has shown the highcost of writing and reusing AATs [53, 63].Phase 2: Search for existing methods. Inthis phase, the existing methods are identifiedto match the needs/requirements of an AATsreuse process identified in the previous phase,i.e., AAT format, AAT reuse process, and AATreuse costs.
AAT format: The following AAT formats areidentified Behavior-driven tests, story-based testformat, specification by example format, and key-word-driven tests. These formats were identifiedusing the existing literature reviews on AATs([7, 23, 59, 64]).
AAT reuse process: Mili et al. [65] suggestedthree stages for a reuse process: (i) finding thereusable artifact, (ii) assessing the relevance ofreusable artifact, and (iii) adaptation of the ar-tifact for reuse. For the first and second stage(finding and assessing relevance), techniques suit-able for text-based artifacts were identified thatcould help in these stages. The two suggestedapproaches are (i) normalized compression dis-tance (NCD) [66], and text classification usingmachine learning [67]. For the third stage (anadaptation of AATs for reuse), no existing studyprovides guidelines on adapting AATs for reuse.Since software requirements and AATs are text--based artifacts; therefore, we propose that thereuse methods used in software requirements cansupport reuse of text-based AATs [68].
AAT reuse costs: Software reuse cost modelsare categorized into three categories (by [14]):1. Return-on-investment models (ROI) that
measure benefits after an organization hasinvested in developing reusable artifacts.
2. Cost-benefit models that are used for makingbetter decisions on reuse investments.
3. Cost-avoidance models that help in calcu-lating costs avoided through reuse of arti-facts [14].We believe that cost-avoidance models are
best suited for reusability assessment since thesedo not assume that an upfront reuse relatedinvestment was made, as required by ROI andcost-benefit methods [14]. The methods provided
in the review study on cost-avoidance throughreuse were identified for capturing reuse costs ofAATs [15].Phase 3: Tailor existing method. The identi-fied methods from the previous phase are tailoredto address the needs of a systematic reuse processof AATs.
AAT format: For AAT formats, no tailoringis needed.
AAT reuse process: In the AAT reuse pro-cess, to find and assess the AAT candidates forreuse, two techniques (Normalized compressiondistance and text classification using machinelearning) are tailored to be used for AATs. TheAATs are text-based, and the AAT content isstructured so that each line acts as a single inde-pendent, reusable test statement (see examples inSection 2). The two techniques were implementedusing scripts (available at [69]) to apply them onthe AAT suite. Section 4 described the workingof these two techniques.
For the AAT adaption template (to support“develop for reuse”), four templates (Structuring,Matching, Analogy, Parametrization) from theidentified review study [68] were selected for theirapplicability over AATs. The reuse of softwarerequirements inspires these templates. Section 4describes the details of these templates.
AAT reuse costs: The study on reuse costavoidance methods described four approaches tocalculate reuse cost-avoidance [15]. Only two ofthe reuse cost methods ([70] and [15]) are appli-cable over non-code artifacts such as text-basedAATs. These two methods and their correspond-ing metrics do not require any tailoring for AATs.Phase 4: Design method application tech-nique: In this phase, the identified activitiesconcerning the components of the process areassembled to form a process.
The three identified requirements/needs (AATformat, reuse process, and reuse costs) and theiridentified methods are converted into activitiesof a process. As discussed in Section 2.3, AATscan be costly to write and maintain; therefore,a check is introduced in the process that letspractitioners decide when to write a new AATand when to reuse an existing AAT. Furthermore,it was decided among the authors to divide the

Systematic Reuse Process for Automated Acceptance Tests . . . 141
activities into two levels, i.e., organizational levelactivities and test developer-level activities. Theseactivities are described below:
Organizational/Team level activities and de-cisions: The organization-level activities are de-cided when setting up the reuse related process,and these are rarely changed. Some examples ofthese activities are the format used in the orga-nization (e.g., BDD, keywords files), the supportfor the reuse approach, and the test frameworkused in the organization. The actor in these ac-tivities is the test architect.
Test developer-level activities and decisions:The activities performed during this level are theprimary activities relevant to developing a newAAT. An example of such activities is selectingan ATT for reusing purposes. Test developersperform these activities. The activities are guidedby the choices made during the organizationalactivities, e.g., which artifact to reuse, how tomodify an artifact for reuse.
The constructed systematic reuse process isdocumented in Section 4.1.
3.2.2. Evaluation and refining of process
After developing a reuse process, the next stepinvolves the evaluation and refinement of theprocess. The sections below describe the typesof evaluation and refinement steps.Phase 5: Test candidate design elements.After designing the process and its activities, thenext step evaluates the process for its usefulnessconcerning the reuse of AATs. [62] has suggestedthat validation with practitioners helps assess theindustrial usage of the process before applyingit in the industry.
Petersen and Wohlin described six contextfacets for explaining the context of the evaluation[71]. The evaluation in this study is conducted inthe context of large-scale software development.The complexity concerning the reuse of AATs isconsidered high for large-scale organizations witha considerably large test base. The developmentprocess is assumed to be an agile developmentmethod where new requirements, development,and testing are conducted in each iteration.
This survey questionnaire’s participants be-long to two large telecommunication organiza-tions, and the industrial demonstration is con-ducted in one organization’s product verificationunit. The details of the evaluation are describedbelow.
Qualitative feedback of software practi-tioners. In this evaluation, software practition-ers provided feedback on the proposed systematicreuse process.
Objective: The objective of this evaluationwas to identify generic findings on the applicabil-ity of the process and sanity-check the processfor performance expectancy, effort expectancyand facilitating conditions as suggested in uni-fied theory of acceptance and use of technology(UTAUT) by [61].
Wohlin et al. describe “exploratory surveys”as a way to validate the proposals before a thor-ough investigation is conducted [72]. As the firststep, the proposed systematic reuse process inthis study was evaluated using an exploratory sur-vey to improve the process before implementingand evaluating it in the industry, which requiresa longitudinal study. This longitudinal study isplanned as the next step after this study becauseit requires resources, budget, and changes in theorganization’s current ways of working. Wohlinet al. suggested questionnaires and interviews astwo data collection methods during the surveys.We developed a questionnaire and asked the sub-jects to fill the questionnaire during an onlinesession (for direct interaction like an interview).
Questionnaire design: In this evaluation,a questionnaire (available at [73]) is developedthat contained four parts: (a) description of reusein automated acceptance testing, (b) descriptionof our proposed process, (c) an example of ex-plaining the usage of our proposed process, and(d) practitioners feedback on the proposed pro-cess. The questionnaire’s design, as per Mollériet al. can be classified as “self-administrated”,i.e., online form [74]. This questionnaire is usedto execute the industrial evaluation. The detailson designing the questionnaire, selecting partic-ipants, data collection, and data analysis areprovided below.

142 Mohsin Irshad, Kai Petersen
The following questions (under each UTAUTconstruct) were part of the questionnaire.
Performance expectancy. This constructdescribes “the degree to which technology willbenefit users” [61].– Question 1: In your opinion, what are the
benefits of using the proposed process?– Question 2: What are the drawbacks/limita-
tions of the process? How can we improve/revise the process?Effort expectancy. This construct describes
“the degree to which technology is easy to use” [61].– Question 3: In your opinion, how easy is it to
use this process?– Question 4: Do you have any recommendations
to improve the ease of use?Facilitating Condition. This construct de-
scribes “the degree to which technology helps inperforming a task” [61].– Question 5: Are there any other steps that
should be added to the process?– Question 6: Are their steps that should be
removed from the process? If yes, then kindlylist those items here and also state why doyou recommend removing them?Subjects: Initially, two academic researchers
(not authors) working on AATs were invitedto review the questionnaire and process forsanity-check. They suggested improvement inthe questionnaire (i.e., text, process flow). Afterincorporating the input of the researchers, weconducted an industrial evaluation.
During the industrial evaluation, five industryparticipants with knowledge of AATs in large--scale products and considerable working expe-rience are considered. As the reuse of AATs isa relatively new area, it is difficult to find partici-pants with relevant experience. Five participantsevaluated the process and provided their feed-back on the process. These participants were
selected from two large-scale organizations withmore than five years of experience with devel-opment. The background of the participants isprovided in Table 2.
Study execution: The authors have presentedthe study’s purpose, the working of the process,and its activities to the participants in an on-line meeting. The participating subjects askedquestions about things they do not understandduring the presentation of the process. The de-tails were provided to the inquiring participants.This step was conducted to overcome the sur-vey questionnaires’ critique that subjects mightnot understand the concepts and processes byreading the questionnaire.
In the next step, the participants were pro-vided the link to the survey questionnaire, andthey were asked to fill in the information. Theauthor remained online while the respondentsfilled out the form to have direct interactionand allow participants to ask follow-up questions.These sessions lasted between 45–65 minutes, asshown in Table 2. These online sessions helpedimprove the qualitative feedback and relevanceof the feedback for the reuse of AATs.
All five participants responded to the surveyquestionnaire in the presence of an author. Inthe form of responses to the questionnaire, thefeedback is evaluated using the “Constant com-parison” method [75]. This method can help inthe identification of common themes present inthe qualitative data. During the analysis, theresponses are divided into themes related to theprocess’s benefits, usefulness, and completeness.Later, the final process is improved based onidentified themes corresponding to performanceexpectancy, effort expectancy, and facilitatingconditions.
Demonstrating industrial application ofthe proposed process – an example. Stous-
Table 2. Background of the software practitioners (P1–P5) participating in the evaluation
Work experience Experience in AAT Role Product type Online sessionP1 12 years 5+ years Developer Large-scale 60 minutesP2 17 years 5+ years Architect Large-scale 45 minutesP3 12 years 4 years Test developer Large-scale 55 minutesP4 5 years 3 years Test developer Large-scale 65 minutesP5 13 years 2 years Developer Large-scale 50 minutes

Systematic Reuse Process for Automated Acceptance Tests . . . 143
trup identified that lack of practicality or anexcessive level of complexity results in the failureof seemingly successful research projects whenthese projects are applied in the industry [76].A demonstration is conducted in an industrialsetting using the proposed systematic reuse pro-cess to address this concern.
Objective: The purpose of this evaluation is tocheck the feasibility of implementing the processin the context of a real software developmentenvironment using the existing tools and knowl-edge present in the organization (e.g., metrics toidentify reuse costs). This evaluation will helpidentify lessons regarding each activity before theprocess is applied and evaluated in the industrywithout authors’ involvement.
The author (working in the organization) eval-uated details related to:– the effort to create an AAT using the pro-
posed process,
– the number of tasks performed in each activ-ity of the proposed process,
– details of tasks performed in each activity ofthe proposed process.This demonstration took place in one of the
system verification units of an organization thatdevelops a large-scale product consisting of 28micro-services. The unit of analysis is the AATsuite used by the end-to-end verification team.Four experienced test developers manage theAAT test suite. The AAT suite was introducedin the year 2016 and contained 87 system-levelAATs. Each system level AAT is based on a com-plete use-case. The AATs are written in key-word-driven format (text-based), with fixtureswritten in Java. The AAT suite is extended whenthe test developers find a stable product no longermodified by the development teams. The AATsare executed each night using Jenkins to build,execute the AAT, and generate AAT reports.
Table 3. Activities in a systematic reuse process for automated acceptance tests (AATs)
Activity Input Output Actor Type
A1: Select keywords Requirements in naturallanguage
Keywords extractedfrom requirements tofind reusable AAT
. Testdeveloper Manual
A2: Select AAT format
AAT formats (an organi-zation can seek help fromliterature if it does nothave a pre-decided for-mat)
Selected AAT type, e.g.,BDD
TestArchitect Manual
A3: Select artifact adap-tation template
List of adaptation ap-proaches to support “de-velop for reuse”. See 4.1.3
Selected approach toadapt AAT for reuseand to help in search
TestArchitect Manual
A4: Search for reusableAATs
Keywords from A1 anda search technique. De-tails in 4.1.4
The list of AATsmatching keywords
Testdeveloper Automated
A5: Assess relevance ofAATs
The AATs matching key-words from output of A4
The potentially reusableAATs
Testdeveloper Manual
A6: Select reuse costmethod and metrics
The available metrics,the reuse cost calculationmethod. Details in 4.1.6
A selected reuse costmethod
Testdeveloper Manual
A7: Calculate cost ofreuse
The value of metrics andthe reuse cost method
Evaluation if reuse isbeneficial or not
Testdeveloper Automated
A8: Develop new AAT byreuse
The selected reusableAATandadaptation tech-nique from activity A3
A new AAT supporting“development for reuse”
Testdeveloper Manual
A9: Develop a new AATSoftware requirements,adaptation techniquefrom activity A3
A new AAT supporting“development for reuse”
Testdeveloper Manual
A10: Add new AAT torepository
A new (or reused) AATtest-case
A new AAT is added tothe repository
Testdeveloper Manual
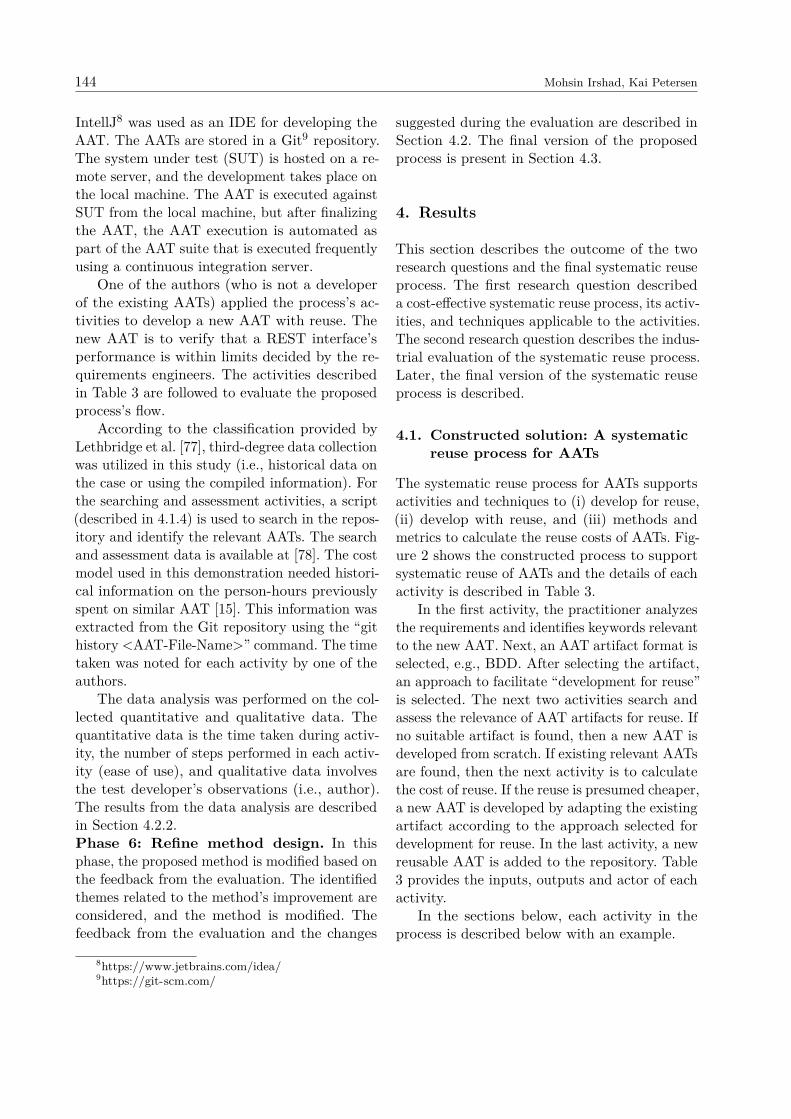
144 Mohsin Irshad, Kai Petersen
IntellJ8 was used as an IDE for developing theAAT. The AATs are stored in a Git9 repository.The system under test (SUT) is hosted on a re-mote server, and the development takes place onthe local machine. The AAT is executed againstSUT from the local machine, but after finalizingthe AAT, the AAT execution is automated aspart of the AAT suite that is executed frequentlyusing a continuous integration server.
One of the authors (who is not a developerof the existing AATs) applied the process’s ac-tivities to develop a new AAT with reuse. Thenew AAT is to verify that a REST interface’sperformance is within limits decided by the re-quirements engineers. The activities describedin Table 3 are followed to evaluate the proposedprocess’s flow.
According to the classification provided byLethbridge et al. [77], third-degree data collectionwas utilized in this study (i.e., historical data onthe case or using the compiled information). Forthe searching and assessment activities, a script(described in 4.1.4) is used to search in the repos-itory and identify the relevant AATs. The searchand assessment data is available at [78]. The costmodel used in this demonstration needed histori-cal information on the person-hours previouslyspent on similar AAT [15]. This information wasextracted from the Git repository using the “githistory <AAT-File-Name>” command. The timetaken was noted for each activity by one of theauthors.
The data analysis was performed on the col-lected quantitative and qualitative data. Thequantitative data is the time taken during activ-ity, the number of steps performed in each activ-ity (ease of use), and qualitative data involvesthe test developer’s observations (i.e., author).The results from the data analysis are describedin Section 4.2.2.Phase 6: Refine method design. In thisphase, the proposed method is modified based onthe feedback from the evaluation. The identifiedthemes related to the method’s improvement areconsidered, and the method is modified. Thefeedback from the evaluation and the changes
suggested during the evaluation are described inSection 4.2. The final version of the proposedprocess is present in Section 4.3.
4. Results
This section describes the outcome of the tworesearch questions and the final systematic reuseprocess. The first research question describeda cost-effective systematic reuse process, its activ-ities, and techniques applicable to the activities.The second research question describes the indus-trial evaluation of the systematic reuse process.Later, the final version of the systematic reuseprocess is described.
4.1. Constructed solution: A systematicreuse process for AATs
The systematic reuse process for AATs supportsactivities and techniques to (i) develop for reuse,(ii) develop with reuse, and (iii) methods andmetrics to calculate the reuse costs of AATs. Fig-ure 2 shows the constructed process to supportsystematic reuse of AATs and the details of eachactivity is described in Table 3.
In the first activity, the practitioner analyzesthe requirements and identifies keywords relevantto the new AAT. Next, an AAT artifact format isselected, e.g., BDD. After selecting the artifact,an approach to facilitate “development for reuse”is selected. The next two activities search andassess the relevance of AAT artifacts for reuse. Ifno suitable artifact is found, then a new AAT isdeveloped from scratch. If existing relevant AATsare found, then the next activity is to calculatethe cost of reuse. If the reuse is presumed cheaper,a new AAT is developed by adapting the existingartifact according to the approach selected fordevelopment for reuse. In the last activity, a newreusable AAT is added to the repository. Table3 provides the inputs, outputs and actor of eachactivity.
In the sections below, each activity in theprocess is described below with an example.
8https://www.jetbrains.com/idea/9https://git-scm.com/

Systematic Reuse Process for Automated Acceptance Tests . . . 145
Figure 2. A systematic reuse process for automated acceptance tests (AATs)
4.1.1. A1: Select keywords
Software requirements are often written in nat-ural language [29], and in this activity, relevantkeywords are selected that represent the require-ments. These keywords will help in searching forreusable AATs in the existing test-base. This isa manual activity performed by a test developer.This activity may be performed in several itera-tions before finalizing the keywords; e.g., an ini-tial selection of keywords may not provide goodsearch results; therefore, it needs several revisions(or discussion with experts) before reaching theconcluding choices.
Example: The test developer has the require-ments: (i) “As a user I should be able to registermy new account”, and (ii) “As a user, I am ableto view the products using my account”. In thisexample, the relevant keywords selected fromthe requirements are “register account”, “viewproducts”.
4.1.2. A2: Select AAT format
The text-based AATs are written in a varietyof formats. Each of these formats has a uniqueway of writing AATs, e.g., stories, specifications,behaviors, features. Therefore, it is necessary toselect the format in which the new AATs arewritten or reused, e.g., a selection from Behav-ior-driven tests, story-based tests, feature files,keyword-driven tests. This activity is performedmanually.
Example: As an example, we can assume thatthe organization writes AAT in a Behavior-drivenformat; therefore, BDD is selected as the formatof AAT.
4.1.3. A3: Select artifact adaptation template
In this activity, a reuse adaptation template isselected for writing a new AAT from existingartifacts. The objective of this activity is to sup-port “development for reuse”. The new AAT willbe modified and saved according to the artifactadaptation template. The four templates sup-porting development for the reuse of AATs arestructuring, matching, analogy, and parameteri-zation as described in Table 4. This selection ofartifact adaptation template is a manual activity.A detailed discussion on the reuse adaptationapproaches for text-based software requirementsis provided by Irshad et al. [68].
Example: In this case, “Structuring” (fromTable 4) is selected as reuse adaptation templatebecause BDD test cases are written in structuredformat of “Given, When, and Then” [32].
4.1.4. A4: Search for reusable AATs
A vital activity of the constructed process is tosearch for reusable AATs in the repository. Thissearch is conducted using the keywords fromactivity A1. The search operation can be imple-mented using an automated script that searchesfor AATs matching the keywords.

146 Mohsin Irshad, Kai Petersen
Table 4. Templates supporting “development for reuse”. Inspired by [68]
Approach DescriptionStructuring Reusable AATs are saved in specific/pre-defined format to reuse, e.g., directory struc-
ture.Matching Reusable AATs are saved in formats such AATs are retrieved using matching, e.g.,
supports search using lexical or semantic matching.Analogy Reusable AATs can be storied in languages/formats that support retrieval using
analogy-based approaches, e.g., special languages supporting analogical matching ofAATs.
Parameterization AATs can support parameterization for reuse, e.g., the use of variables in keywords.Many AAT frameworks (Robot, Cucumber) support this adaptation approach.
We have identified two techniques that areuseful for searching for text-based reusable AATs.These techniques are applicable over the text con-tent of AATs only and do not consider the fixture/hooks/glue-code of AAT. We have provided anautomated script for each of these techniques aspart of the reuse process. These techniques aredescribed below.
Normalized compression distance (NCD)With this technique, the similarity between anAAT and keywords is calculated using a compres-sion algorithm [79]. In this study’s context, NCDhelps calculate the pair-wise distance betweenall the AATs present in the test base againstthe keywords identified. Later, this compressiondistance helps in the assessment of similar anddissimilar AATs. NCD can be defined by thefollowing equation [79]:
NCD(s1, s2) = Z(s1s2)−min{Z(s1), Z(s2)}max{Z(s1), Z(s2)} ,
(1)Here, s1 is an automated acceptance test
present in the test suite, and s2 is a keywordused to search and assess reusable automatedacceptance tests. Z represents the compressorused for the calculation of NCD. Z(s1) representsthe compressed size of AAT s1, Z(s2) representsthe compressed size of AAT s2 and Z(s1s2) rep-resents the compressed size of the concatenationof s1 and s2. NCD values lie between 0 and 1,where 0 means that the BDD specifications aresimilar, while 1 represents that they are entirelydifferent. A script implementing NCD is providedas part of the proposed process [69].
Text-classification using machine learningtext-classification can help in identifying reusableAATs by training a classifier using a super-vised machine-learning algorithm [67]. For text--classification commonly used machine learn-ing-based algorithms are Naive Bayes and Sup-port Vector Machines [80]. A machine learn-ing-based algorithm improves the classificationprocess because it considers the domain-spe-cific language used in the AAT instead of usingWikipedia or large-text databases present overthe internet [67]. The existing AAT suite is usedto train the text classifier using each AATs titleas a category. Later, this text classifier helps insuggesting the closest matching reusable AATcases to the selected keywords. The followingsequence of steps is followed when using ma-chine-learning based text classification to searchfor and assess a reusable AAT.Step 1: Place each AAT in a separate file
where each file’s name is unique. This isneeded to allow ML-algorithm to assign a cat-egory to each AAT in the training set.
Step 2: Load the training AAT files into mem-ory.
Step 3: Extract features from AAT files usingBag of Words.
Step 4: Train a classifier from these features.Step 5: Use the search keywords to query the
classifier to identify the reusable AAT.It is important to note that Step 1 to Step 5
are executed only if new changes are introducedin the AAT suite. A script providing the imple-mentation from Step 1 to Step 5 is provided aspart of this proposed process (available at [69]).

Systematic Reuse Process for Automated Acceptance Tests . . . 147
Table 5. NCD values generated by the automated-script
Selected keyword Scenario 1 NCD value Scenario 2 NCD valueview products 0.620 0.290register account 0.720 0.850
Example: For the sake of simplicity, we as-sume that there are only two AAT scenariosin the repository and a test-developer wants touse the keywords (from A1) to search for theclosest matching scenario to the keywords. Thetest-developer uses the automated-script (See[69]) to perform this activity.Scenario 1: A user deletes a product in the
systemGiven A product is configured in the systemWhen User sends a Delete request to delete
the productsThen User is able to delete the productScenario 2: A user view a product in the sys-
temGiven A product is configured in the systemWhen User sends a Get request to fetch the
productsThen User is able to view the product
The distance measures (such as NCD) repre-sent a mathematical concept of similarity [81, 82].The similarity is high when the distance betweenobjects (in comparison) is low, i.e., a value closerto “0”. An advantage of distance measure is thatthey can classify the similarity and dissimilar-ity of two objects on a numerical rating scaleby suggesting how closely similar or how dif-ferent objects are from each other, i.e., 0.90means very dissimilar, 0.75 means dissimilar,0.248 means similar, 0.05 means very similar.The text-classification approaches often classifyin the binary format, i.e., two objects are alikeor different.
The test developer selects “NormalizedCompression Distance (NCD)” to retrieve thereusable AATs with help of keywords “registeraccount”, “view products”. The search activ-ity is performed using the script implementingNCD, and a pairwise comparison of each keywordand scenario is conducted. For each comparison,a value between “0” and “1” is produced. Thevalues are shown in Table 5, e.g., Scenario 2 andkeyword “view product” has lower NCD value
(0.290), showing higher similarity because key-words “view”, “products” are found in Scenario 2but not in Scenario 1.
4.1.5. A5: Assess relevance of AATs
In this activity, an assessment is made on the rel-evance of the identified reusable AATs from thesearching activity. This assessment involves howclosely the identified AATs are related to the re-quirements. This activity requires domain knowl-edge and understanding of the existing AATs;therefore, it is a manual activity, e.g., if severalclosely matching reusable AATs are identified,a manual assessment to select the most suitablereusable AAT.
Example: The search results of activity A4 (inTable 5) contains results from the search opera-tion. Table 5 shows that the NCD values betweenthe keywords and two scenarios. As stated earlier,an NCD value closer to 0 means higher similarity,and a value closer to 1 means lower similarity.Scenario 2 and keyword “view product” has value0.290, showing higher similarity and relevance asa candidate for reuse.
4.1.6. A6: Select reuse cost method and metrics
In this activity, a method is selected to calculateand compare costs of developing a new AATby reusing an existing AAT and costs of cre-ating a new AAT from scratch. The metricsrequired to apply the method are selected inthis activity. This activity is necessary becausethe development of text-based AATs is knownfor higher costs, and in some cases developinga new AAT from scratch can provide more sav-ings than reusing an AAT. The reuse cost calcula-tion methods and metrics used in the code-basedartifacts are not applicable over the text-basedAATs because they use “lines of source code” (orindirect metrics such as complexity and functionpoints) as an essential metric to calculate the
148 Mohsin Irshad, Kai Petersen
cost. The selection of the cost model depends onthe following factors:1. Maturity of the existing reuse process in the
organization, i.e., ad-hoc or systematic reuse.2. Easiness to collect the required metrics:
Each model uses various metrics to calculatereuse-related costs. Therefore, a key consider-ation when selecting a model is the availabil-ity of the required metrics in the organization.Manual estimation can be used if the needed
metrics are not available or time-consuming tocollect these metrics. The manual estimate can bebased on (i) the size of a similar task completedpreviously, (ii) the complexity of the task, and(iii) the experience level of the software practi-tioners.
We identified two methods and their metricsthat could help in calculating the reuse relatedcosts of AATs. These methods are described be-low.
Amar and Coffey’s reuse cost calculationmethod [70] Amar and Coffey attempted to pro-vide a unified unit of measure capable of cal-culating the costs that occurred during a reuseinstance [70]. They claim that the reuse-relatedexpenses are directly related to the time spenton reuse activities. They claim that the timespent during each of these activities should beconsidered. The method and metrics proposedby Amar and Coffey are described below.
% of reuse cost avoided per AAT =
=
S − (T + U)×
N
iB− S × M
B
× 100 (2)
where S is the search hit rate (i.e., the numberof attempted searches yielding a reuse instanceis divided by the number of total searches), Tis time to locate a reusable AAT, U is time tounderstand the AAT, N is a number of AATsanalyzed, i is a number of reuse instances ofAAT, M is time to integrate (reuse) the (e.g.,after adapting a reusable artifact), and B is timeto develop an AAT from scratch. Further detailson the working and evaluation of this methodare found in study [70].
Irshad et al.’s reuse cost calculation method[15] According to Irshad et al., their proposedmetric can calculate cost avoidance by reusingany software artifact [15]. Their provided instru-ment considers the effort spent reusing an artifactvs. effort spent on developing it from scratch. Thebasic formula is described below in the contextof this study.
Reuse Costs = (O − I)×H (3)
where O is the personnel hours when an AAT isdeveloped from scratch, I is the personnel hoursspent on the adaptation of reusable AAT (i.e.,changing an artifact to match the needs) and, His the cost of one personnel hour. According toIrshad et al., historical data or expert opinioncan estimate the personal hours when AAT isdeveloped from scratch. Further details on theinstrument and its evaluation can be found inthe study [15].
Example: For the sake of this example, wecan assume that the test developer selects a reusecost model [15] i.e., Equation 3.
4.1.7. A7: Calculate cost of reuse
In this activity, the selected cost-avoidancemethod and its metrics are applied to calculatethe cost of reusing the identified AATs. The reusecosts are only calculated for the artifact that isdeemed relevant. The activity can help in de-cisions like should a new test be developed orexisting ones are modified. This activity can beperformed with the help of automated scripts ormanually.
Example: Using the metrics and method, thetest developer calculates that the new develop-ment cost is 40 person-hours, and the cost ofReusing by Adaptation Scenario 2 is 30 per-son-hours. Therefore, it makes sense to reuseScenario 2 to develop a new AAT as it saves tenperson-hours.
4.1.8. A8: Develop new AAT by reuse
In this activity, a new AAT is developed byreusing the reusable AAT. This activity takesplace if the reuse is deemed as cost-effective in

Systematic Reuse Process for Automated Acceptance Tests . . . 149
activity A7. During this activity, one of the adap-tation templates is applied to develop the newAAT that supports future reuse opportunities(present in Section 4.1.3).
Test developer performs this activity manu-ally. When developing a new AAT by reuse (usingthe proposed process), the following pre-requi-sites are needed:– The format in which the new AAT will be
written so that it becomes a reusable assetfor the future.
– The cost-efficient reusable test case(or testcases) which will be used to develop a newAAT (or parts of a new AAT).Example: When the reuse is considered ben-
eficial, we assume that the test developer uses“Structuring” as a reuse approach to developinga new AAT scenario that test registration ofa user account and viewing products below. Thegrey colored lines show the reuse from the exist-ing scenario (Scenario 2 described in activity A4).Scenario 3: As a user I should be able to create
account and view productGiven A product is configured in the sys-
temAND A login system is present for the productAND A user is able to access the GUI Regis-
tration systemWhen User Registration is successfulAND User sends a Get request to fetch
the productsThen User is able to view the productAND a new user account is created
4.1.9. A9: Develop a new AAT
In this activity, the development of a new AATfrom scratch takes place. This activity happensif the reuse from existing AATs is not possible,i.e., no relevant reusable AAT or reuse has unfa-vorable cost vs. benefits. While developing thenew AATs, the vocabulary and existing rules ofwriting an AAT are considered. An adaptationtemplates is selected to develop the new AATthat supports future reuse opportunities (presentin Section 4.1.3). A test developer performs thisactivity manually.
The example from activity A8 (Scenario 3)shows a new AAT if developed from scratch.
4.1.10. A10: Add new AAT to repository
The final activity is to add the newly developed(or reused) AAT into the existing test repository.These steps help in improving and developingtest-base. This activity is performed manually.
An example of the repository is a Git reposi-tory10, which is used by the majority of the soft-ware development organization to version-controlthe software artifacts.
4.2. Evaluation and refiningof systematic reuse process
We first evaluated the proposed process withexperienced practitioners who have first-hand ex-perience working with AATs. Later, the authorsassessed the process using it in an AAT suitefrom a large-scale software product.
4.2.1. Qualitative feedbackof software practitioners
The industrial evaluation with five participantsis conducted with the help of a questionnaire.The results from each section, based on UTAUT[61], are described below:Performance expectancy: According to prac-titioner one, combining the reuse process and thereuse cost is very beneficial. Other participantsalso found this solution beneficial for the reuseof AATs. The quotes below describe the specificstatements from the respondent of the surveyquestionnaire.
“It guides a systematic approach, and it willhelp in optimizing the AAT process. Providedif it does not involve additional execution costand the process is automated.” (P1)“The possible benefit of the process is thereduction in the effort to write the new testcase.” (P2)“In my point of view, this process will reallyhelp the software practitioner to select thetest cases and use it for automated acceptance
10https://git-scm.com/

150 Mohsin Irshad, Kai Petersen
tests. The use of this process can be cost ef-fective in sense of saving time by selecting thetest cases with respect to the score of eachtest.” (P3)“In case of low assess relevance and less costof reuse, it will improve the quality of thetests by having already reliable tests. Also,it’ll reduce the time to test a functionalitythat is closer to already existing and selectedTC.” (P3)
Effort expectancy. The participants, overall,seems happy with respect to the effort expectancyof the proposed process. They suggested that ac-tivities in the process are easy to follow. However,they posed a few interesting questions (in quotesbelow) that we have attempted to resolve in thefinal design of the proposed process. Some of thequotes from the practitioners are given below:
“The process seems to be simple and easy touse, provided if process tasks are automated.”(P3)“The only thing I have found its hard toimplement this process in the existing projectbecause it takes time to change the processand this process has involved many steps butthis one time cost of implementation can savea lot in future.” (P4)“The relevance and cost estimation shouldbe automated. The increasing number ofreusable artifacts will affect the efficiency ofsearch. So some mechanisms should be intro-duced to speed up the search, e.g., indexingetc.” (P3)When asked about ease of use, four practi-
tioners marked the process as easy or very easyto use. One practitioner suggested it as “Normal”to use. The results are shown in Table 6.Facilitating Condition. The participantsstated that the solution is right to have, butthe organization-level activities should be recon-
sidered because they add an over-head in theprocess. The respondents of the survey suggestedthe following improvements with respect to facil-itating conditions.
“Organizational level activities should not bethe part of the process, rather these shouldbe the pre-requisites of the process.” (P1)“Steps A2 and A3 can cause possible delay, sothey should be a pre-requisite to the process,and not a part of the process.” (P3)“Reassessment after cost evaluation withother closely related test cases.” (P4)From the evaluation, we found that:
– The systematic reuse process saves the timeto write new AATs.
– The organizational level activities areone-time activities, and test developersshould skip these activities.
– There can be more reuse candidates than one.A new AAT can use parts of multiple existingreusable AAT.
– The scripts implementing search and assess-ment activities should be part of the system-atic reuse process. In the future, the focusshould be to automate many of these activi-ties.
4.2.2. Demonstrating industrial applicationof the proposed process
An industrial AAT was implemented using theactivities of the proposed process. A summary ofquantitative data captured during the evaluationis shown in Table 7 and qualitative informationmentioned in the sections below. The contextand details of the industrial demonstration arediscussed in the research approach (Section 3.2.2Phase 5: Test candidate design elements).Details of tasks in each activity. Each activ-ity inside the proposed process consists of one
Table 6. How easy it is to use the process
Participant Very Easy Easy Normal Difficult Very difficultParticipant 1 XParticipant 2 XParticipant 3 XParticipant 4 XParticipant 5 X

Systematic Reuse Process for Automated Acceptance Tests . . . 151
or more tasks that are performed in the activity.The tasks performed in each activity are assessed,and important lessons are documented. It wasnoted that A4, A5, A6, and A8 activities takemore time and contain multiple tasks per activity.The tasks under each activity are described inTable 7 and in the sub-sections below:
A1: Select Keywords: The test developer (au-thor) selected 3 keywords (a) REST (b) <In-terface Name> (c) a description of performancerequirement.
Select AAT format: From the availablechoices (BDD or keyword-driven), the test devel-oper selected keyword-driven as AAT format.The existing AATs were also written in key-word-driven format.
Select artifact adaptation template: “Param-etrization” is selected as artifact adaptation tem-plate because parameterization is by default sup-ported by the keyword-driven frameworks, and ex-isting AAT is also based on keyword-driven tests.
Search for reusable AATs: The searching ofAATs was executed using the script providedas part of the proposed process (See [69]). Be-fore the search is executed, libraries requiredfor the script are installed. The existing AATsare checked-out from the repository. Three files,each containing one keyword, are created in thesame directory. The NCD script is executed toidentify the AATs closely matching the keywords.The first search did not yield AATs that wereclosely matching with keywords. Later, keywordswere changed (mentioned in the activity “selectkeywords” above) that produced better results.The output of this activity is available online [78].
Assess Relevance of AATs: The output ofsearch activity is sorted in ascending order. Theoutput of the five pairs with lowest NCD val-ues (i.e., similar) is shown in Table 8. The pairswith the lowest NCD values are selected for theanalysis. After manually analyzing the content ofselected AATs (from pairs with the lowest NCD),two AATs (testcase27, testcase26) are selectedfor reuse purposes.
Select reuse cost method and metrics: The ver-ification team keeps track of tasks in a ticketingsystem. The time spent on each task in each phase(in backlog, in development, in Done) is present
in the system. Therefore, it was decided to usea person-hour based metric and model. The reusecost calculation method proposed by Irshad et al.[15] was selected to calculate reuse costs.
Calculate cost of reuse: The developmenttime of testcase27 and testcase26 was four weeksfor each test case. We estimated that by reusing(without change) some parts of the testcase26(related to SUT configuration and test data gen-eration and cleaning), we could save three weeksof development effort. Other parts of testcase27(related to validation) support parametrization.These parametrization supporting parts were alsoreused using different values for the parameters.An example of parametrization is found on a linkhere [83].
Develop new AAT by reuse: The new AATwas developed using the parameterization ap-proach (See example of parametrization [83]. Thereusable lines from the testcase27 already sup-ported parametrization. Seven out of twenty-fivenew AAT lines were reused (by using differentparameter values) from the testcase27.
Add new AAT to repository: Once the AATis ready and approved by the reviewers, the AATis pushed to the central repository. This tasktriggers the build on the build server, executingthe AAT.Number of tasks performed in each activity.The number of tasks in an activity may show theeffort required to perform the activity. An activitywith a large number of tasks may require moreeffort from the practitioners. The test developer(one of the authors) kept a record of the numberof tasks performed in each activity, e.g., searching,changing code. The tasks varied from 1 task to 3tasks in activity. The number of tasks performedin each activity is described in Table 7.Effort to create an AAT. To capture thisconstruct, we measured the time taken duringeach activity. The time taken by each activity isshown in Table 7. The development (writing, test-ing, refactoring) of the AAT took the most time(1 week). Other activities in the process took lessthan 30 minutes each. The practitioner trackedthe time spent on the task, and the practitionerused minutes to track the precise time. In thework management tool used by the organization,

152 Mohsin Irshad, Kai Petersen
Table 7. Evaluation: Time spent, no of tasks, the tasks performed during each activity of the process,description of the tasks and comparison with existing (manual) activity
Activity Timespent
No. oftasks Description of tasks in the activity
Comparison withexisting (manual)activity
A1: SelectKeywords
5 minutes 2 (a) Reading requirements description. (b)Deciding suitable keyword.
Not needed in man-ual process
A2: Select AATformat*
1 minute 1 Selecting “Keyword-driven” as AAT for-mat.
No such activity ex-ists, a practitionerdecides the formathe has previous ex-perience with.
A3: Selectartifactadaptationtemplate
1 minute 1 Selecting “Parametrization” as adapta-tion template to support develop withreuse.
No such activity ex-ists.
A4: Searchreusable AATs*
27 minutes 3 (a) Configuring libraries for NCD script,a one-time task (20 minutes). (b) Writingkeywords from activity A1 in separatefiles (5 minutes). (c) Executing script inthe repository (takes 2 minutes).
A practitioner useshis/her experiencefrom test suite.
A5: Assessrelevance ofAATs*
30 minutes 3 (a) Sort and analyse the output of NCDscript (excel file) 10 minutes. (b) Selecttop relevant AATs and analyse for rele-vance (10 minutes). (c) Select one AATmost suitable for a new AAT (10 min-utes).
A practitioner useshis/her experienceof domain.
A6: Select reusecost method andmetrics
11 minutes 2 (a) Analysis of the metric present in theorganization/unit (10 minutes). (b) Selectsuitable cost model (1 minute).
No such activity ex-ists.
A7: Calculatecost of reuse
15 minutes 1 Apply cost model to AAT (15 minutes). No such activity ex-ists.
A8: Develop newAAT by reuse*
1 week 4 (a) Selecting reusable parts of AAT fromtask “C” in activity A5 (20 minutes). (b)Adapting reusable parts to fit the newlydeveloped AAT (24 hours). (c) Testingthe new AAT (10 hour). (d) Refactoringthe new AAT (6 hours).
A test case by reuseis developed usingactivities, A1–A7.
A9: Developa new AAT*
0 0 Not performed. A test case fromscratch is developedusing activities, A2and A3.
A10: Add newAAT torepository*
1 minute 3 Using commands: git add <filename>and git commit -m “<Message>” andgitpush
Similar to manualprocess.
* shows activity exists in manual and automated process.
the development of the new AAT took nearly5-working days.
The time spent on a similar existing AATwas identified from the organization’s archiveddata (using Git history, we found the develop-
ment task and determined the time spent in thetask development phase). A similar AAT wasdeveloped in four weeks, as per the developmentphase of the task. This difference is because, inthe newly developed AAT, the test data setup,

Systematic Reuse Process for Automated Acceptance Tests . . . 153
Table 8. NCD values of comparison between Keywords and existing AATs
AAT 1 Keywords NCD valuetestcase27 keywords.txt 0.169testcase26 keywords.txt 0.174testcase84 keywords.txt 0.294testcase25 keywords.txt 0.299testcase83 keywords.txt 0.307
the SUTs state configuration, and the test datadeletion parts were reused from an existing AAT.Magnitude of reused statement. Utilizingthe reuse cost calculation activity is essential torecognize benefits before reusing any AATs. Thecost savings through AAT’s reuse depends on(i) the number of reusable AAT statements and(ii) the functionality corresponding to the reusedstatement. For example, only seven out of 25lines were reused in the demonstration. However,these seven reused lines perform functionalitythat is time-consuming to develop, so the costsavings were almost 75% (1 week when reusingvs. 4-weeks of development time from scratch).Another example can be a case where many state-ments are reused, but these statements requirea small amount of development time when de-veloping from scratch; in that case, cost savingsmay not be a lot.
The evaluation from the industrial assessmentidentified the following lessons:– Finding suitable keywords may require multi-
ple iterations before finding the most usefulreusable AAT.
– There were more than one AATs identifiedas reusable during the assessment of reusableAAT. There should be a guideline on how toselect the best out of the possible reusableartifacts.
– The automated scripts provide a mechanismto search and assess the existing AATs.
4.3. Final version of systematicreuse process
Following changes were introduced in the pro-posed process, based on the feedback from prac-titioners and application in an industrial setting:– A condition is introduced to skip organiza-
tional-level activities if these are already de-fined, as per the participants’ suggestions.
– A condition is modified to select multiple can-didates and perform reuse cost calculationson each of these candidates.
– A new activity is introduced to evaluate themost suitable candidate from a list of candi-dates having lower costs and requiring fewerchanges. The activity takes input on a list of
Figure 3. Final Version: A systematic reuse process for automated acceptance tests (AATs)

154 Mohsin Irshad, Kai Petersen
AATs with high relevance and low costs andlists the most feasible reusable AAT.
– A new activity, Associate Keywords withAAT, is introduced that stores the selectedkeywords when storing the new test case inthe repository. These keywords help in catego-rizing the test cases and optimize the searchfunctionality.
– The activities that can be automated witha script’s help are mentioned in Table 3.The final version of the process is shown in
Figure 3.
5. Discussion
This section provides a discussion on the analysisof the evaluation, characteristics and benefits ofthe proposed process.
5.1. Analysis of industrial evaluation
This section describes the findings and analysisof industrial evaluation.Analysis on performance expectancy. Per-formance expectancy has implications on usingthe proposed reuse process if the process is ad-vantageous for the software practitioners [12]. Ifthe process is perceived as advantageous, then itis likely that other software practitioners and thesoftware industry embrace the proposed process.In the evaluation, practitioners provided positivefeedback with regards to performance expectancy.The practitioners listed the following advantagesregarding performance expectancy of the process:– A systematic process to support reuse of au-
tomated acceptance tests.– The activities of searching and assessment of
a reusable test case can help software practi-tioners.
– New tests can be developed with less effort.This feedback was re-confirmed during the
industrial demonstration of the process where thetest developer (an author) followed the activitiesand techniques proposed in the systematic reuseprocess and successfully developed the test case.Analysis on effort expectancy. Effort ex-pectancy identifies the level of ease to use the
proposed reuse process. The easiness of using theprocess has direct implications on the adaptabil-ity of the process in the industry. Software prac-titioners found the process easy to use. However,to increase the effort expectancy, practitionerssuggested that the majority of the process ac-tivities should be automated with the help ofscripts. Practitioners also suggested that thereare many activities involved in the process, andimplementing these activities in their existingprocess can be challenging. They suggested au-tomating these activities to reduce the impact ofa large number of activities.
During the industrial demonstration, it wasnoted that the time spent on the activities of theprocess and the number of tasks in each activityare low in numbers. The activity with the highestnumber of tasks (4) and time is taken (1 week) isdeveloping the new AAT. Overall the activities inthe process were easy to use for the test developerwell familiar with the process (an author).
Analysis on facilitating conditions. Theprocess’s impact on the development of AATsis evaluated using the facilitating condition con-struct. The practitioners, during the evaluation,suggested changes that can help improve theconstruct of facilitating conditions. Practitionersbelieved that the proposed process could becomebetter by:– making few activities pre-requisite to execute
(only once) when the process is applied in anyorganization,
– allowing assessment of more than onereusable AATs before selecting the finalreusable AAT.
The tool support and the competence needed touse the process was evaluated in the industrialdemonstration. It was noted that tools and li-braries need to be installed before running theprovided scripts for searching and assessment.The calculation of reuse cost required metricsthat were already available in the organization,i.e., better-facilitating conditions.
5.2. Guidelines for AATs reuse
The activities of proposed process act as guide-lines for reusing the AAT. In the existing litera-
Systematic Reuse Process for Automated Acceptance Tests . . . 155
ture, limited studies have discussed the reuse ofAAT, and this study provides step-by-step guid-ance for developing with reuse and developing forreuse. The input, the output, the actor and tech-niques relevant for each activity are describedin Table 3 and Section 4. Practitioners and re-searchers can use this information as guidelinesfor supporting the reuse of AATs.
5.3. Compare reuse opportunities
The two activities (i.e., assess the relevance ofAAT and reuse cost analysis) in the process canhelp the practitioners evaluate a reuse oppor-tunity’s effectiveness. With these two activities,the practitioners have an instrument to evaluateand compare the value of reusing different AATs.Based on their comparison, they can select theAAT, which is more suitable for their purpose.
5.4. Flexible techniques
Section 4 provides different techniques that applyto the activities of reuse process. The implemen-tation of some of these techniques is also providedto support the practitioners. However, an orga-nization can add its own techniques to search,assess, or calculate reuse costs if it wants to usecustomized techniques. The reuse process is notbound to fix a set of searching and calculationtechniques.
5.5. Support for automation
Several steps in the proposed process are eitherautomated already or have the potential (e.g.,selecting keywords) to be automated. This canresult in cost savings for the practitioners by(i) reducing time to develop an AAT and (ii) re-ducing the time to analyze, search, and assessthe AATs. In future work, we want to provideautomated scripts for activities A1, A6, and A7from Table 3.
5.6. Verdict on the diversity of AAT-suite
The activities of the process can also be usedto assess the diversity in an organization’s AAT
suite. A higher diversity means that the testsuite has more test coverage. The search andassessment using NCD provides pair-wise com-parison values of all the AATs. These valuescan be a good indicator of diversity in the AATsuite. A suite with low diversity could have manypairs with low NCD values (i.e., very similarto each other), indicating that refactoring isneeded to diversify the AATs or remove theduplicates.
5.7. Tool support for reuse of AATs:
AATs are text-based artifacts different from tra-ditional code-based test cases. IDE features oftensupport the code-based reuse process to detectduplicates, detect similar usage, provide modu-larization of code snippets, etc. These basic reusefeatures are not yet mature enough for non-codeartifacts. Therefore, we have provided easy touse techniques and scripts that can be appliedto support the reuse of text-based AATs.
5.8. Increased coupling
Existing research literature has described the is-sue with decreased maintainability among AATs[7]. A key concern when developing by reusingparts of different reusable AATs is an increase incoupling (dependency between test cases) in thetest base [84]. This increase in coupling decreasesthe maintainability of the test cases. Therefore,during the activity A5 (Assessing the relevanceof reusable AATs), it is vital to consider theincrease in coupling between the reused andreusable AATs.
5.9. Comparison with existing literature
Park and Maurer proposed three strategies thatcan be used to develop reusable assets in soft-ware product lines [85]. These three strategies are(i) proactive mode in which organization makesupfront investment in developing reusable assets,(ii) reactive mode in which reusable assets are de-veloped when needed, and (iii) extractive modein which existing product is reused [85]. Ourproposed process can be classified as a reactive

156 Mohsin Irshad, Kai Petersen
model, in which we develop new reusable assetswhen there is a need for writing a new test.
In their study on variability managementin software product lines, Kiani et al. proposedamethod inwhich reusable assets are developed ondemand when the need arises [86]. This is similarto our proposed approach in which reusable AATsare createdwhen there is a need towrite a new test,i.e., no upfront costs are required. In addition, deSilva proposed a software product line approachthat uses automated acceptance tests to linkscoping of requirements, implementation, andtesting [87]. Our proposed process complimentsthis SPL-based study by suggesting a reuse-basedapproach to derive the reusable AATs along withrequirements, implementation, and testing.
In a study by Mink et al., software practition-ers suggested that specifying the granular detailsof automated acceptance tests, i.e., format anddetails of AATs is cumbersome and requires moretime from them [3]. In another study, Mink etal. investigated executable acceptance testing.They found that AATs help in (i) preserving thedomain knowledge and (ii) improve the commu-nication among the developers [3]. Our studyidentified similar findings during the evaluationof the proposed process using experienced soft-ware practitioners. Thus, our approach may helpthe software practitioner specify the details ofthe automated acceptance tests by providinga specific AAT format and suggesting existingreusable AATs.
5.10. Scalability of Approach
Searching for reusable software artifacts is knownas a time-consuming process (with high costs)during software reuse [43]. The cost of searchingand retrieving a reusable software artifact growswhen new artifacts are added to the repository[43]. Therefore, the scalability of the searchingtechniques is a vital characteristic to support fu-ture reuse opportunities. We evaluated performedan evaluation of the search approach. In an exam-ination (by the authors) with a specification baseof 500 AATs, reusable candidates were identifiedin less than 5 minutes using the scripts providedas part of the proposed process (See script [69].)
6. Threats to validity
Runeson et al. [88] classified the validity threatsinto four types (reliability, construct validity,internal validity, and external validity). Thesethreats to the study’s validity and the measuresto address these validity threats are discussed inthis section.
Internal validity deals with the case whenthe factors studied by the researchers are affectedby any other factors unknown to the researchers.This threat applies to the design and develop-ment of the questionnaire for industrial evalua-tion. The questionnaire design can be classifiedas “self-administrated,” i.e., online form. As theproposed process is developed for software orga-nization, we evaluated the process using the con-structs suggested by the unified theory of accep-tance and technology use (UTAUT) [61]. Thesethree constructs (performance expectancy, effortexpectancy, and facilitating condition) help theauthors to develop evaluation questions relatedto the proposed process systematically. Eachquestion in the questionnaire is mapped to a con-struct that it addresses. The details are providedin Section 3. We believe that we have addressedthis threat to this investigation’s internal validityby following a systematic method to design anddevelop the questionnaire.
External validity concerns with the gen-eralization of results. The proposed process de-veloped in this study is considered useful forlarge-scale software organizations. Hence, we eval-uated the proposed process using an industrialuse-case for large-scale systems. During the evalu-ation, the process’s completeness and usability forlarge-scale product organizations are evaluated.Furthermore, we involved five experienced practi-tioners from two large-scale organizations to eval-uate the proposed process and provide feedback.
The experienced practitioners involved in thisstudy worked in different roles in large-scale or-ganizations. They were selected because theyhave a prior understanding of automated accep-tance testing and reuse. As reuse of AATs is stilla new area, it is difficult to find practitionerswho understand these concepts. Furthermore,we involved practitioners from two large-scale

Systematic Reuse Process for Automated Acceptance Tests . . . 157
organizations to improve the generalizability ofthe proposed process. However, the authors be-lieve that a reuse process should be applied andevaluated in the industry before the results ofthis study are considered generalizable, which ispart of our future work.
Reliability deals with how the data collec-tion and analysis are dependent on the researcher.The researcher independently conducted the firstevaluation to validate a process in the industrysetting. This practice is called lab validation byGorscheck et al. [62]. Since this evaluation wasconducted by a software practitioner (an author),the threat to the validity of data collection andanalysis exists. To mitigate this threat to theevaluation’s validity, in the second part of theevaluation (using experienced practitioners), thedata collection was done in an online form with-out the author’s active involvement in filling theform. A critical threat to the reliability of thestudy is related to the response bias of survey re-spondents. The responses from the practitionersreflect the belief of those practitioners, and thesebeliefs may be contrary to real-world contexts.We believe that this threat is relevant to thisstudy, and in future evaluations of the proposedprocess, work is needed to address this concern.The usage of online form reduces the chance oflosing any valuable feedback from practitioners.For data analysis, we used a systematic methodcalled constant comparison to interpret the on-line questionnaire’s feedback.
Construct validity deals with how well thestudy captures the intended constructs. Duringthe evaluation, each subject involved presentedthe motivation, background, and walk-throughof the proposed process during online sessions.The subjects asked questions about the study,the process, and the questionnaire during thesepresentations. Furthermore, one of the study au-thors has considerable experience working in thesame domain and industry. Hence, he was ableto explain the concepts in the language/termsunderstood by the subjects. This step helps inreducing confusion or ambiguities related to thereuse process.
Furthermore, the questionnaire (available at[73]) provides a detailed description of concepts,
the activities used in the process, techniques usedin these activities, and a working example of theproposed process. These details were provided tothe respondents to make sure the study capturesthe intended constructs.
7. Conclusion
The reuse of automated acceptance tests helpdevelop new tests cheaply, quickly, and with highquality. However, the textual nature of these testsmakes the reuse of these tests different fromcode-based tests. In this investigation, we de-scribe a systematic reuse process for text-basedautomated acceptance tests. We constructed thisreuse process using the method engineering andperformed an initial evaluation of the reuse pro-cess before applying it to the industry.
RQ 1: How can the cost-effective systematicreuse of text-based AATs be achieved? The con-struction of systematic reuse process starts withthe identification of the motivation and require-ments of the new process. The identified require-ments are (i) the process should consider devel-opment with reuse and development for reuse,(ii) the process should be independent of severaltext-based formats (e.g., BDD, keywords) andframeworks of automated acceptance tests (e.g.,Cucumber, Robot Framework), and (iii) the costof reuse should be calculated before developinga new test by reusing existing tests. For thesethree requirements, we identified and tailoredexisting methods present in the literature. Thefinal outcome is a systematic reuse process thatsupports the reuse of various types of text-basedautomated acceptance tests. The process activi-ties are divided into two types, i.e., organizationallevel activities and test developer-level activities.We provided expected input, expected output, ac-tor, examples, and techniques (automated usingscripts) suitable for the process’s activities.
RQ 2: How does the systematic reuse process,from RQ 1, perform concerning performance ex-pectancy, effort expectancy, and facilitating con-ditions in the industrial context? After construct-ing the process, an elementary industrial evalua-tion assesses the performance expectancy, effort

158 Mohsin Irshad, Kai Petersen
expectancy, and facilitating conditions concern-ing the process. This evaluation is performedto sanity-check and improves the process beforeit is ready for a long and detailed industrialevaluation. Initially, five participants with con-siderable experience in automated acceptancetesting provided qualitative feedback on the sys-tematic reuse process. They found that the pro-cess can save time and reduce the effort to writeand maintain automated acceptance tests. Thepractitioners suggested that activities are easyto use, and the reuse cost metrics are easy tofind and apply using the proposed techniques.They suggested changes in the process, and thesechanges were incorporated in the final versionof the process. This evaluation shows promisingresults concerning the processes’ performanceexpectancy, effort expectancy, and facilitatingconditions.
Later an illustration of the usage of a processin the industry is conducted. During the evalu-ation, a new test case is developed by reusingexisting automated acceptance tests. This evalu-ation’s objective was to identify and sanity-checkthe tasks in the process’s activities and evaluatetheir complexity. One of the authors, from thesame organization, conducted this demonstration.The evaluation helped identify several differentgranular tasks required to perform in each activ-ity of the process. The number of tasks variesfrom 1 to 4 between different activities. Theseidentified tasks can act as guidelines when usingthe process in the industry. The evaluation alsorecorded the time spent in each activity. It wasnoted that most of the time is spent developingthe new test by reusing existing automated ac-ceptance tests. The development time with thereuse process was 4-times quicker than develop-ing a new artifact from scratch.
In the future, we want to have a longitudi-nal investigation on the process’s transfer andusage in the industry, as application and evalu-ation of the process may take a long durationand resources. The current study enables theresearchers to sanity-check the process beforeevaluating it in industrial settings. Secondly, inthe next study, we want to automate most ofthe proposed process activities and evaluate the
process using automated activities. Furthermore,we want to evaluate the precision and recall ofthe search and assessment functionality proposedin this process.
References[1] M.J. Harrold, “Testing: A roadmap,” in Proceed-
ings of the Conference on the Future of SoftwareEngineering, 2000, pp. 61–72.
[2] W.E. Wong, J.R. Horgan, S. London, andH. Agrawal, “A study of effective regressiontesting in practice,” in Proceedings., The EighthInternational Symposium on Software ReliabilityEngineering. IEEE, 1997, pp. 264–274.
[3] G. Melnik and F. Maurer, “Multiple perspectiveson executable acceptance test-driven develop-ment,” in International Conference on ExtremeProgramming and Agile Processes in SoftwareEngineering. Springer, 2007, pp. 245–249.
[4] “Standard glossary of terms used in software test-ing,” International Software Testing Qualifica-tions Board, Standard 3.5, 2020. [Online]. https://www.istqb.org/downloads/glossary.html
[5] B. Haugset and G.K. Hanssen, “Automated ac-ceptance testing: A literature review and an in-dustrial case study,” in Agile Conference. IEEE,2008, pp. 27–38.
[6] M. Huo, J. Verner, L. Zhu, and M.A. Babar,“Software quality and agile methods,” in Proceed-ings of the 28th Annual International ComputerSoftware and Applications Conference, 2004.COMPSAC 2004. IEEE, 2004, pp. 520–525.
[7] J. Weiss, A. Schill, I. Richter, and P. Mandl,“Literature review of empirical research studieswithin the domain of acceptance testing,” in 42thEuromicro Conference on Software Engineeringand Advanced Applications (SEAA). IEEE, 2016,pp. 181–188.
[8] W.B. Frakes and K. Kang, “Software reuse re-search: Status and future,” IEEE Transactionson Software Engineering, Vol. 31, No. 7, 2005,pp. 529–536.
[9] R. Capilla, B. Gallina, C. Cetina, and J. Favaro,“Opportunities for software reuse in an uncertainworld: From past to emerging trends,” Journal ofSoftware: Evolution and Process, Vol. 31, No. 8,2019, p. e2217.
[10] W.B. Frakes and S. Isoda, “Success factors ofsystematic reuse,” IEEE software, Vol. 11, No. 5,1994, pp. 14–19.
[11] D. Rombach, “Integrated software process andproduct lines,” in Software Process Workshop.Springer, 2005, pp. 83–90.

Systematic Reuse Process for Automated Acceptance Tests . . . 159
[12] M. Ramachandran, “Software re-use assessmentfor quality,” WIT Transactions on Informationand Communication Technologies, Vol. 9, 1970.
[13] E.S. de Almeida, A. Alvaro, D. Lucrédio,V.C. Garcia, and S.R. de Lemos Meira, “Riseproject: Towards a robust framework for softwarereuse,” in Proceedings of the International Con-ference on Information Reuse and Integration.IEEE, 2004, pp. 48–53.
[14] J.S. Poulin, Measuring software reuse: principles,practices, and economic models. Addison-WesleyReading, MA, 1997.
[15] M. Irshad, R. Torkar, K. Petersen, and W. Afzal,“Capturing cost avoidance through reuse: system-atic literature review and industrial evaluation,”in Proceedings of the 20th International Confer-ence on Evaluation and Assessment in SoftwareEngineering. ACM, 2016, p. 35.
[16] A. Davies, T. Brady, and M. Hobday, “Chartinga path toward integrated solutions,” MIT Sloanmanagement review, Vol. 47, No. 3, 2006, p. 39.
[17] W.E. Wong, “An integrated solution for creat-ing dependable software,” in Proceedings 24thAnnual International Computer Software andApplications Conference. COMPSAC2000. IEEE,2000, pp. 269–270.
[18] R.J. Mayer, J.W. Crump, R. Fernandes, A. Keen,and M.K. Painter, “Information integration forconcurrent engineering (IICE) compendium ofmethods report,” Knowledge Based Systems Inc.,Tech. Rep., 1995.
[19] M. Rahman and J. Gao, “A reusable automatedacceptance testing architecture for microservicesin behavior-driven development,” in Symposiumon Service-Oriented System Engineering (SOSE).IEEE, 2015, pp. 321–325.
[20] G. Meszaros, “Agile regression testing usingrecord and playback,” in Companion of the18th Annual ACM SIGPLAN Conference on Ob-ject-Oriented Programming, Systems, Languages,and Applications. ACM, 2003, pp. 353–360.
[21] A.K. Onoma, W.T. Tsai, M. Poonawala, andH. Suganuma, “Regression testing in an in-dustrial environment,” Communications of theACM, Vol. 41, No. 5, 1998, pp. 81–86.
[22] P. Hsia, D. Kung, and C. Sell, “Software re-quirements and acceptance testing,” Annalsof Software Engineering, Vol. 3, No. 1, 1997,pp. 291–317.
[23] G.K. Hanssen and B. Haugset, “Automated ac-ceptance testing using fit,” in 42nd Hawaii Inter-national Conference on System Sciences. IEEE,2009, pp. 1–8.
[24] E. Pyshkin, M. Mozgovoy, and M. Glukhikh, “Onrequirements for acceptance testing automationtools in behavior driven software development,”in Proceedings of the 8th Software EngineeringConference in Russia (CEE-SECR), 2012.
[25] G. Liebel, E. Alégroth, and R. Feldt, “State-of--practice in GUI-based system and acceptancetesting: An industrial multiple-case study,” in39th EUROMICRO Conference on Software En-gineering and Advanced Applications (SEAA).IEEE, 2013, pp. 17–24.
[26] H. Munir and P. Runeson, “Software testingin open innovation: An exploratory case studyof the acceptance test harness for Jenkins,” inProceedings of the International Conference onSoftware and System Process, 2015, pp. 187–191.
[27] G. Melnik and F. Maurer, “The practice of spec-ifying requirements using executable acceptancetests in computer science courses,” in Companionto the 20th Annual ACM SIGPLAN Conferenceon Object-Oriented Programming, Systems, Lan-guages, and Applications, 2005, pp. 365–370.
[28] M. Hayek, P. Farhat, Y. Yamout, C. Ghorra,and R.A. Haraty, “Web 2.0 testing tools: A com-pendium,” in International Conference on In-novation and Intelligence for Informatics, Com-puting, and Technologies (3ICT). IEEE, 2019,pp. 1–6.
[29] P. Gandhi, N.C. Haugen, M. Hill, and R. Watt,“Creating a living specification using FIT doc-uments,” in Agile Development Conference(ADC’05). IEEE, 2005, pp. 253–258.
[30] D. North, “Introducing behaviour driven devel-opment,” Better Software Magazine, 2006.
[31] E.C. dos Santos and P. Vilain, “Automatedacceptance tests as software requirements: Anexperiment to compare the applicability offit tables and gherkin language,” in Interna-tional Conference on Agile Software Develop-ment. Springer, 2018, pp. 104–119.
[32] C. Solis and X. Wang, “A study of the charac-teristics of behaviour driven development,” in37th EUROMICRO Conference on Software En-gineering and Advanced Applications (SEAA).IEEE, 2011, pp. 383–387.
[33] R. Hametner, D. Winkler, and A. Zoitl, “Ag-ile testing concepts based on keyword-driventesting for industrial automation systems,”in IECON 2012-38th Annual Conference onIEEE Industrial Electronics Society. IEEE, 2012,pp. 3727–3732.
[34] E. Bache and G. Bache, “Specification by ex-ample with gui tests-how could that work?” in

160 Mohsin Irshad, Kai Petersen
International Conference on Agile Software De-velopment. Springer, 2014, pp. 320–326.
[35] A.C. Paiva, D. Maciel, and A.R. da Silva, “Fromrequirements to automated acceptance tests withthe RSL language,” in International Conferenceon Evaluation of Novel Approaches to SoftwareEngineering. Springer, 2019, pp. 39–57.
[36] M. Soeken, R. Wille, and R. Drechsler, “Assistedbehavior driven development using natural lan-guage processing,” in International Conferenceon Modelling Techniques and Tools for Com-puter Performance Evaluation. Springer, 2012,pp. 269–287.
[37] C. Deng, P. Wilson, and F. Maurer, “Fitclipse:A fit-based eclipse plug-in for executable accep-tance test driven development,” in InternationalConference on Extreme Programming and Ag-ile Processes in Software Engineering. Springer,2007, pp. 93–100.
[38] C.Y. Hsieh, C.H. Tsai, and Y.C. Cheng, “Test--Duo: A framework for generating and executingautomated acceptance tests from use cases,” in8th International Workshop on Automation ofSoftware Test (AST). IEEE, 2013, pp. 89–92.
[39] C.W. Krueger, “Software reuse,” ACM Com-puting Surveys (CSUR), Vol. 24, No. 2, 1992,pp. 131–183.
[40] D.M. Rafi, K.R.K. Moses, K. Petersen, andM.V. Mäntylä, “Benefits and limitations of auto-mated software testing: Systematic literature re-view and practitioner survey,” in Proceedings ofthe 7th International Workshop on Automationof Software Test. IEEE Press, 2012, pp. 36–42.
[41] W. Frakes and C. Terry, “Software reuse: metricsand models,” ACM Computing Surveys (CSUR),Vol. 28, No. 2, 1996, pp. 415–435.
[42] W. Tracz, “Where does reuse start?” ACMSIGSOFT Software Engineering Notes, Vol. 15,No. 2, 1990, pp. 42–46.
[43] T. Ravichandran and M.A. Rothenberger, “Soft-ware reuse strategies and component markets,”Communications of the ACM, Vol. 46, No. 8,2003, pp. 109–114.
[44] P. Mohagheghi and R. Conradi, “Quality, pro-ductivity and economic benefits of softwarereuse: A review of industrial studies,” Empir-ical Software Engineering, Vol. 12, No. 5, 2007,pp. 471–516.
[45] V. Karakostas, “Requirements for CASE toolsin early software reuse,” ACM SIGSOFT Soft-ware Engineering Notes, Vol. 14, No. 2, 1989,pp. 39–41.
[46] J.L. Cybulski, “Introduction to software reuse,”Department of Information Systems, The Univer-
sity of Melbourne, Parkville, Australia, Vol. 11,1996, p. 12.
[47] W. Lam, J.A. McDermid, and A. Vickers, “Tensteps towards systematic requirements reuse,”Requirements Engineering, Vol. 2, No. 2, 1997,pp. 102–113.
[48] R.G. Fichman and C.F. Kemerer, “Incentivecompatibility and systematic software reuse,”Journal of Systems and Software, Vol. 57, No. 1,2001, pp. 45–60.
[49] A. Genaid et al., “Connecting user stories andcode for test development,” in Third Interna-tional Workshop on Recommendation Systemsfor Software Engineering (RSSE). IEEE, 2012,pp. 33–37.
[50] L. Crispin and T. House, “Testing in the fastlane: Automating acceptance testing in an ex-treme programming environment,” in XP Uni-verse Conference. Citeseer, 2001.
[51] L.P. Binamungu, S.M. Embury, and N. Kon-stantinou, “Maintaining behaviour driven de-velopment specifications: Challenges and oppor-tunities,” in 25th International Conference onSoftware Analysis, Evolution and Reengineering(SANER). IEEE, 2018, pp. 175–184.
[52] M. Irshad, J. Börster, and K. Petersen, “Support-ing refactoring of BDD specifications – An em-pirical study,” Information and Software Tech-nology, 2022.
[53] R. Angmo and M. Sharma, “Performance eval-uation of web based automation testing tools,”in 5th International Conference – ConfluenceThe Next Generation Information TechnologySummit (Confluence). IEEE, 2014, pp. 731–735.
[54] S. Park and F. Maurer, “A literature reviewon story test driven development,” in Interna-tional Conference on Agile Software Develop-ment. Springer, 2010, pp. 208–213.
[55] Q. Xie, “Developing cost-effective model-basedtechniques for GUI testing,” in Proceedings ofthe 28th International Conference on SoftwareEngineering. ACM, 2006, pp. 997–1000.
[56] R. Borg and M. Kropp, “Automated acceptancetest refactoring,” in Proceedings of the 4th Work-shop on Refactoring Tools. ACM, 2011, pp. 15–21.
[57] C. Schwarz, S.K. Skytteren, and T.M. Ovste-tun, “AutAT: An eclipse plugin for automaticacceptance testing of web applications,” in Com-panion to the 20th Annual ACM SIGPLAN Con-ference on Object-Oriented Programming, Sys-tems, Languages, and Applications. ACM, 2005,pp. 182–183.
[58] B. Fitzgerald, N.L. Russo, and T. O’Kane, “Soft-ware development method tailoring at motorola,”
Systematic Reuse Process for Automated Acceptance Tests . . . 161
Communications of the ACM, Vol. 46, No. 4,2003, pp. 64–70.
[59] P. Raulamo-Jurvanen, M. Mäntylä, andV. Garousi, “Choosing the right test automationtool: a grey literature review of practitionersources,” in Proceedings of the 21st InternationalConference on Evaluation and Assessment inSoftware Engineering, 2017, pp. 21–30.
[60] A. Egbreghts, “A literature review of behaviordriven development using grounded theory,” in27th Twente Student Conference on IT., 2017.
[61] V. Venkatesh, J.Y. Thong, and X. Xu, “Con-sumer acceptance and use of information tech-nology: Extending the Unified Theory of Accep-tance and Use of Technology,” MIS quarterly,2012, pp. 157–178.
[62] T. Gorschek, P. Garre, S. Larsson, and C. Wohlin,“A model for technology transfer in practice,”IEEE software, Vol. 23, No. 6, 2006, pp. 88–95.
[63] M. Finsterwalder, “Automating acceptance testsfor GUI applications in an extreme programmingenvironment,” in Proceedings of the 2nd Inter-national Conference on eXtreme Programmingand Flexible Processes in Software Engineering.Addison-Wesley Boston MA, 2001, pp. 114–117.
[64] S. Park and F. Maurer, “An extended reviewon story test driven development,” University ofCalgary, Tech. Rep., 2010.
[65] H. Mili, F. Mili, and A. Mili, “Reusing software:Issues and research directions,” IEEE Transac-tions on Software Engineering, Vol. 21, No. 6,1995, pp. 528–562.
[66] R. Feldt, S. Poulding, D. Clark, and S. Yoo,“Test set diameter: Quantifying the diversity ofsets of test cases,” in International Conferenceon Software Testing, Verification and Validation(ICST). IEEE, 2016, pp. 223–233.
[67] W.H. Gomaa, A.A. Fahmy et al., “A survey oftext similarity approaches,” International Jour-nal of Computer Applications, Vol. 68, No. 13,2013, pp. 13–18.
[68] M. Irshad, K. Petersen, and S. Poulding, “A sys-tematic literature review of software require-ments reuse approaches,” Information and Soft-ware Technology, Vol. 93, 2018, pp. 223–245.
[69] M. Irshad, Source Code for Scripts, 2021. [On-line]. https://zenodo.org/record/4765079
[70] L. Amar and J. Coffey, “Measuring the benefitsof software reuse-examining three different ap-proaches to software reuse,” Dr Dobbs Journal,Vol. 30, No. 6, 2005, pp. 73–76.
[71] K. Petersen and C. Wohlin, “Context in in-dustrial software engineering research,” in 3rdInternational Symposium on Empirical Soft-
ware Engineering and Measurement. IEEE, 2009,pp. 401–404.
[72] C. Wohlin, M. Höst, and K. Henningsson, “Em-pirical research methods in software engineering,”in Empirical methods and studies in softwareengineering. Springer, 2003, pp. 7–23.
[73] M. Irshad, “Questionnaire: The reusability ofautomated acceptance tests,” 2021. [Online].https://zenodo.org/record/4765102
[74] J.S. Molléri, K. Petersen, and E. Mendes, “Anempirically evaluated checklist for surveys insoftware engineering,” Information and SoftwareTechnology, Vol. 119, 2020, p. 106240.
[75] B.G. Glaser, A.L. Strauss, and E. Strutzel, “Thediscovery of grounded theory; strategies for quali-tative research,” Nursing research, Vol. 17, No. 4,1968, p. 364.
[76] J. Stoustrup, “Successful industry/academia co-operation: From simple via complex to lucidsolutions,” European Journal of Control, Vol. 19,No. 5, 2013, pp. 358–368.
[77] T.C. Lethbridge, S.E. Sim, and J. Singer, “Study-ing software engineers: Data collection tech-niques for software field studies,” Empiricalsoftware engineering, Vol. 10, No. 3, 2005,pp. 311–341.
[78] M. Irshad, “Search and assessment data,” 012021. [Online]. http://shorturl.at/juIZ6
[79] P.M. Vitányi, F.J. Balbach, R.L. Cilibrasi, andM. Li, “Normalized information distance,” inInformation theory and statistical learning.Springer, 2009, pp. 45–82.
[80] B.Y. Pratama and R. Sarno, “Personality classi-fication based on Twitter text using Naive Bayes,KNN and SVM,” in Proceedings of the Interna-tional Conference on Data and Software Engi-neering, 2015, pp. 170–174.
[81] J.C. Corrales, Behavioral matchmaking for ser-vice retrieval, Ph.D. dissertation, Université deVersailles-Saint Quentin en Yvelines, 2008.
[82] S.S. Choi, S.H. Cha, and C.C. Tappert, “A sur-vey of binary similarity and distance measures,”Journal of Systemics, Cybernetics and Informat-ics, Vol. 8, No. 1, 2010, pp. 43–48.
[83] “Parameterize BDD tests,” 2021. [Online].https://support.smartbear.com/testcomplete/docs/bdd/parameterize.html
[84] G. Gui and P.D. Scott, “Coupling and cohesionmeasures for evaluation of component reusabil-ity,” in Proceedings of the 2006 InternationalWorkshop on Mining Software Repositories, 2006,pp. 18–21.
[85] S. Park and F. Maurer, “Communicating domainknowledge in executable acceptance test driven

162 Mohsin Irshad, Kai Petersen
development,” in International Conference onAgile Processes and Extreme Programming inSoftware Engineering. Springer, 2009, pp. 23–32.
[86] A.A. Kiani, Y. Hafeez, M. Imran, and S. Ali,“A dynamic variability management approachworking with agile product line engineering prac-tices for reusing features,” The Journal of Su-percomputing, 2021, pp. 1–42.
[87] I.F. Da Silva, “An agile approach for softwareproduct lines scoping,” in Proceedings of the 16thInternational Software Product Line ConferenceVolume 2, 2012, pp. 225–228.
[88] P. Runeson, M. Host, A. Rainer, and B. Reg-nell, Case study research in software engineering:Guidelines and examples. John Wiley and Sons,2012.
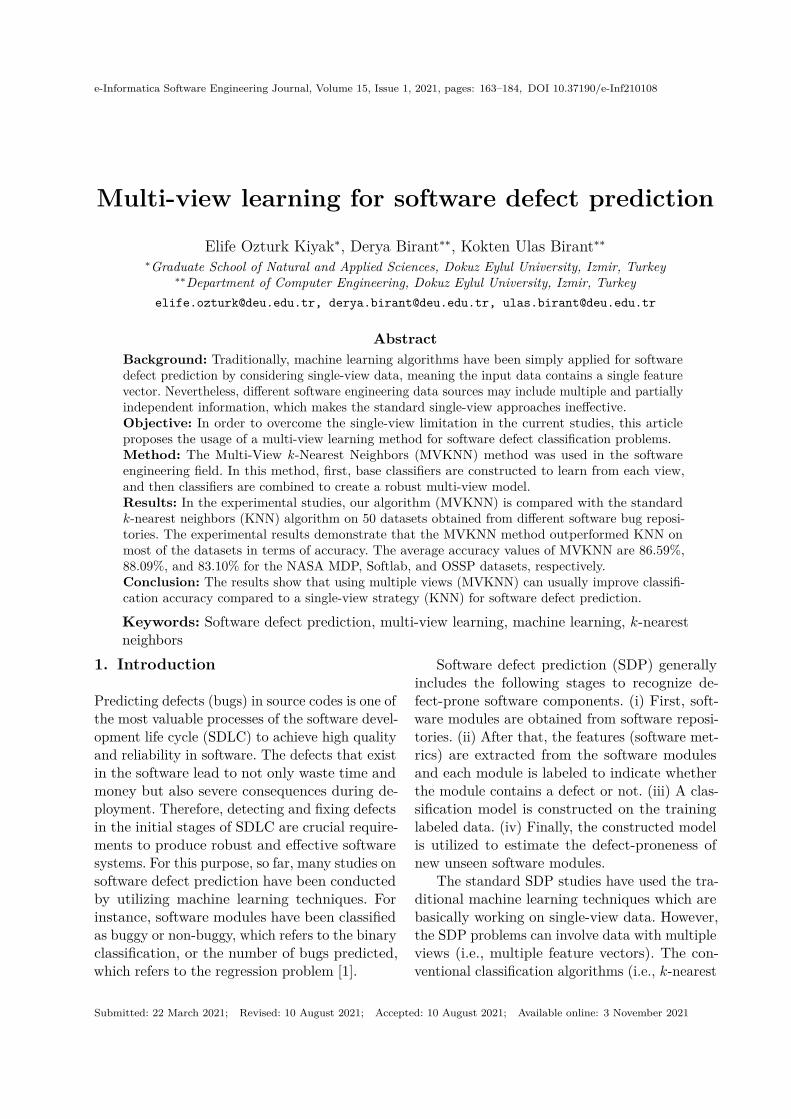
e-Informatica Software Engineering Journal, Volume 15, Issue 1, 2021, pages: 163–184, DOI 10.37190/e-Inf210108
Multi-view learning for software defect prediction
Elife Ozturk Kiyak∗, Derya Birant∗∗, Kokten Ulas Birant∗∗∗Graduate School of Natural and Applied Sciences, Dokuz Eylul University, Izmir, Turkey
∗∗Department of Computer Engineering, Dokuz Eylul University, Izmir, [email protected], [email protected], [email protected]
AbstractBackground: Traditionally, machine learning algorithms have been simply applied for softwaredefect prediction by considering single-view data, meaning the input data contains a single featurevector. Nevertheless, different software engineering data sources may include multiple and partiallyindependent information, which makes the standard single-view approaches ineffective.Objective: In order to overcome the single-view limitation in the current studies, this articleproposes the usage of a multi-view learning method for software defect classification problems.Method: The Multi-View k-Nearest Neighbors (MVKNN) method was used in the softwareengineering field. In this method, first, base classifiers are constructed to learn from each view,and then classifiers are combined to create a robust multi-view model.Results: In the experimental studies, our algorithm (MVKNN) is compared with the standardk-nearest neighbors (KNN) algorithm on 50 datasets obtained from different software bug reposi-tories. The experimental results demonstrate that the MVKNN method outperformed KNN onmost of the datasets in terms of accuracy. The average accuracy values of MVKNN are 86.59%,88.09%, and 83.10% for the NASA MDP, Softlab, and OSSP datasets, respectively.Conclusion: The results show that using multiple views (MVKNN) can usually improve classifi-cation accuracy compared to a single-view strategy (KNN) for software defect prediction.
Keywords: Software defect prediction, multi-view learning, machine learning, k-nearestneighbors
1. Introduction
Predicting defects (bugs) in source codes is one ofthe most valuable processes of the software devel-opment life cycle (SDLC) to achieve high qualityand reliability in software. The defects that existin the software lead to not only waste time andmoney but also severe consequences during de-ployment. Therefore, detecting and fixing defectsin the initial stages of SDLC are crucial require-ments to produce robust and effective softwaresystems. For this purpose, so far, many studies onsoftware defect prediction have been conductedby utilizing machine learning techniques. Forinstance, software modules have been classifiedas buggy or non-buggy, which refers to the binaryclassification, or the number of bugs predicted,which refers to the regression problem [1].
Software defect prediction (SDP) generallyincludes the following stages to recognize de-fect-prone software components. (i) First, soft-ware modules are obtained from software reposi-tories. (ii) After that, the features (software met-rics) are extracted from the software modulesand each module is labeled to indicate whetherthe module contains a defect or not. (iii) A clas-sification model is constructed on the traininglabeled data. (iv) Finally, the constructed modelis utilized to estimate the defect-proneness ofnew unseen software modules.
The standard SDP studies have used the tra-ditional machine learning techniques which arebasically working on single-view data. However,the SDP problems can involve data with multipleviews (i.e., multiple feature vectors). The con-ventional classification algorithms (i.e., k-nearest
Submitted: 22 March 2021; Revised: 10 August 2021; Accepted: 10 August 2021; Available online: 3 November 2021

164 Elife Ozturk Kiyak et al.
neighbors – KNN) simply concatenate all mul-tiple views into a single view for learning. How-ever, this simple view-concatenation approachmay produce undesirable prediction results sinceeach view has its own specific characteristics.Therefore, multi-view learning (MVL) methodsare needed to individually explore diverse infor-mation from several different feature vectors and,hence, to increase learning performance by takinginto account the diversity of various views. Forthis purpose, in this work, we propose the usageof a multi-view learning approach for softwaredefect prediction problems.
The fundamental contributions of this papercan be pointed out as follows. (i) This study usesthe Multi-View k-Nearest Neighbors (MVKNN)algorithm in the software engineering area. (ii) Itcompares the MVKNN and KNN algorithms forsoftware defect prediction. (iii) This study is alsooriginal in that it investigates the effects of thenumber of neighbors (the parameter k) on thesoftware defect prediction performance.
In the experimental studies, we demonstratedthe effectiveness of the multi-view learning ap-proach on the SDP. Our MVKNN method wastested on 50 datasets obtained from differentsoftware bug repositories. The experiment re-sults show that our MVKNN algorithm achievedhigher accuracy values than the KNN algorithmon most of the datasets.
The remainder of this article is basically or-ganized in the following manner. In Section 2, wegive an overview of the previous studies relatedto the topic. In Section 3, we explain the meth-ods used in this study. In Section 4, we describethe main characteristics of the datasets, presentthe experimental studies, and discuss the results.The last part (Section 5) provides concludingremarks and intended future works.
2. Related work
In single-view learning, a classification methodis applied to the entire feature set or the spe-cific part of the feature set [2]. In multi-viewlearning, various distinct feature sets (views) areevaluated [3]. These views can be collected from
diverse sources, or a single raw data can be sepa-rated into different feature sets. For example, inweb mining, the textual content can be consid-ered as one view, and image data can be repre-sented as another view. Similarly, a single docu-ment can have multiple representations (views)in different languages. Another typical exampleis the music emotion recognition, in which lyrics(view 1) and song (view 2) can be consideredas multiple views. The views can be multiplemeasurement modalities such as jointly repre-sented audio signals + video signals in televisionbroadcast, biological + chemical data in drugdiscovery, or images from different angles.
Recently, multi-view learning (MVL) hasbeen combined with different machine learningparadigms such as active learning [4], ensem-ble learning [5, 6], multi-task learning [7], andtransfer learning [8]. In the literature, many stud-ies on MVL have been focused on classificationand/or regression problems [4, 5, 8]; however, re-cently, some studies have focused on a clusteringtask [3, 6]. Until now, MVL has been used indifferent fields such as health [5, 9], finance [6],and transportation [7]. However, MVL studiesare considerably limited in software engineering,especially for software defect prediction.
2.1. Related studies on single-viewlearning for software engineering
Researchers have concentrated on machine learn-ing (ML) methods in software defect prediction.However, they have applied ML techniques on thewhole feature set or the selected feature subset.In the literature, a massive number of existingSDP studies have built classification models onspecific features which have been determined byusing a feature selection method. For example,Laradji et al. [10] used an ensemble classifier andclaimed that the reduction of unimportant andirrelevant features improves the performance ofdefect prediction. They applied a greedy-forwardselection method to obtain a subset of softwaremetrics. Agarwal and Tomar [11] applied theF-score feature selection method which was uti-lized to determine the important software metricset that was distinctly affecting the defect classifi-

Multi-view learning for software defect prediction 165
cation in software projects. The study conductedby Wang et al. [12] used the filter-based fea-ture ranking techniques to determine how manymetrics should be selected when constructinga defect prediction model. First, the top 10,15, and 20 metrics were chosen according totheir scores, and then three different classifica-tion models were constructed. Although differentfeature sets achieved high accuracy for differentclassifiers, their results showed that a predic-tor could be constructed with only three fea-tures.
In the literature, ML methods have been usu-ally used to perform within-project defect pre-diction (WPDP). However, when historical datawas insufficient within a project, the cross-projectdefect prediction (CPDP) approach [13] has beenapplied to employ the information from otherprojects. Moreover, some studies used advancedML paradigms in software defect prediction, suchas ensemble learning [14], semi-supervised learn-ing [15], and transfer learning [13].
All the aforementioned studies performed ex-periments on a single feature vector (view). How-ever, in our study, we used several feature sets(views) to learn diverse information obtainedfrom various data sources, and therefore to in-crease learning performance by taking into ac-count the diversity of different views.
2.2. Related studies on multi-viewlearning for software engineering
Recently, lots of information about a subject havebeen acquired easily, as well as various kinds ofdata (i.e., image, audio, text, video) have been ob-tained from multiple sources. As many MVL stud-ies [3] indicated that the information acquired byusing data gathered from multiple sources canbe more valuable than the information obtainedfrom single-view data. Thus, multi-view learninghas been used in a variety of areas for differentpurposes, such as text classification [16], imageclassification [17], face identity recognition [18],and speech recognition [19].
Multi-view learning in software engineering isconcerned with the problem of learning from data
that describe a particular SE problem and is rep-resented by multiple distinct feature sets (calledviews). Many SE problems can be expressed withdifferent data views. One of the most well-knownexamples is that software engineering data canconsist of several views such as the module de-pendency graph (view 1), execution logs (view2),and the vocabulary (view 3) used in the sourcecode. Since all of them collectively describe a soft-ware system, the integration of all these uniqueand complementary views can be jointly usedfor analysis [20]. A software system can also beinvestigated from different perspectives, relatingto a variable group or representation scheme de-picting that domain. For instance, evolutionaryinformation is a set of group variables describingthe co-changing frequency of software units. An-other example in the software engineering area isthe identification of programming language fromdifferent views. For example, source code classifi-cation can be performed by applying multi-viewlearning to the same piece of code data obtainedas text (view1) and image (view2) [21]. In thesoftware defect prediction area, as in this study,the software metrics extracted from source codescan be divided into different views, consideringthat they are obtained from different perspec-tives.
In the literature, only a limited numberof studies have focused on multi-view learn-ing for software defect classification. In 2017,Phan and Nguyen [22] applied a multi-view con-volutional neural network to predict software de-fects from assembly instruction sequences. Theyrepresented each instruction with two views: thecontent (view 1) and the group (view 2). Foreach view, convolutional layers were applied andmerged before feeding them to the fully-con-nected layers. In 2019, Chen et al. [23] proposeda multi-view NN-based heterogeneous transferlearning model built by partitioning features intogroups for software defect prediction. However,in the former study, source code was used asa dataset, and in the latter study, different fea-ture sets were evaluated. Our approach is lever-aged by combining KNN algorithms separatelyimplemented to each view.

166 Elife Ozturk Kiyak et al.
2.3. Related studies on KNN for softwaredefect prediction
By means of its simplicity and ease of implemen-tation, the KNN algorithm has been implementedin many ML applications. For defect prediction,several studies have been developed using theKNN algorithm in various ways, such as weightedKNN [24], hybrid model using Naive Bayes andKNN [25], boosting-based KNN [26], and KNNregression [27]. Although these studies are relatedto defect prediction, experiments were conductedusing single view data. Different from these pre-vious studies, we used an improved version ofKNN for multi-view software defect data.
Until now, the KNN algorithm has been em-ployed in various multiple learning studies indifferent areas. For example, multi-label learn-ing (ML-KNN) [28], multi-instance learning(FuzzyKNN) [29], multi-class learning (DEMST--KNN) [30], and multi-task learning (ssMTTL--KNN) [31]. Unlike these previous studies, weused the multi-view KNN method proposedin [32].
3. Material and methods
In this section, the KNN and MVKNN algo-rithms are briefly described.
3.1. K-nearest neighbors
K-nearest neighbors (KNN) is a typical super-vised ML algorithm utilized in both classificationand regression problems. The KNN algorithmworks on labeled data samples and uses themto classify a new sample based on its similar-ity to the k closest neighbors. In this study,we chose KNN as a machine learning algorithmsince it has many advantages such as simplicity,easy implementation, efficiency, and ease of un-derstanding the results [33]. The advantages ofKNN also include that it supports incrementaldata; therefore, re-training is not required for thenewly-arrived observations. The other advantageof KNN is that it can be successfully used fornonlinear data. Moreover, it has the ability to
predict both categorical and discrete variablesand to deal with noisy data. Furthermore, itcan be directly used for multi-class classification,in addition to binary classification. KNN hasbeen proven to be an effective method in variousstudies [24–31] and thus, it has been widely usedin many applications.
Considering k as the number of nearestneighbors and n labeled data samples, D ={s1, s2, . . . , sn} be the training set in the formof si = (xi, ci), where xi is the feature vector ofthe sample with d-dimension, denoted by xi =(xi1, xi2, . . . , xid) and comes from data space X,and ci is the class label that si assigned to andit is from a set of classes Y = {c1, c2, . . . , cm}.A classifier is a function in the form of f : X → Ythat maps a new data sample X onto an itemof Y . The KNN algorithm starts with a newsample s′ = (x′, ?) whose class label is unknown.Distance dis(x′, xi) is calculated between s′ andall si in the dataset D. The most widely-useddistance measures are Euclidean and Manhattandistance metrics. Then, the k closest neighborsto s′ in the training samples are selected. Fi-nally, class label c′ is assigned to s′ based on themajority class of neighbors.
3.2. Multi-view k-nearest neighbors
Our algorithm, called multi-view k-nearest neigh-bors (MVKNN), was proposed in [32]. It is anadvanced version of KNN that combines individ-ual models developed for each view.
Let Sv = (Xv, c) be a sample of a view v,where Xv is the feature set of v such that Xv ={xv
1, xv2, . . . , x
vd} for v = 1, 2, . . . , V and c refers to
the class label of the sample, where V is the num-ber of views. The dataset D consists of n samplesand denoted by D = {(X1
i , X2i , . . . , X
Vi , ci), i =
1, 2, . . . , n}, where Xi is the ith sample and ci ε Yis the class label of it and Xj
i refers to the ithinstance of the jth view. Views are mutuallyexclusive, so they have different feature sets suchthat ∀(p,q)X
p ∩Xq = ∅. Since views express dif-ferent representations of the same object, eachinstance in different views has the same classlabel ci ε Y , where Y = {c1, c2, . . . , cn}. Firstly,in the view-based classification, a set of classifiers

Multi-view learning for software defect prediction 167
are built for each view by using different k inputparameters such that fj : Xj → Y . After that,in the multi-view-based classification, a numberof view-based classifiers fj are combined to de-termine the final prediction.
Figure 1 shows the general overview of theMVKNN method that can be used for soft-ware defect classification. The MVKNN methodconsists of three main steps: data preparation,view-based classification, and multi-view-basedclassification.
Step 1 – Data preparation: Raw data obtainedfrom a software repository may require prepara-tion before yielding results, so it has been pre-pared for view-based classification. To increasedata quality and to acquire more accurate out-
comes, various preprocessing techniques may beapplied such as completing missing data or re-moving duplicate instances. Since the datasetconsists of several views, data preprocessingshould be performed for all views. It can benoted here that each view has a different featureset. In other words, each view is represented asdisjoint features of the same object, so distinctfeatures and class label of an object exist in eachview.
Step 2 – View-based classification: This clas-sification aims at creating a model learning fromeach view using an adaptive method in whicheach instance is classified with a different numberof neighbors, rather than utilizing only a singlevalue of k. For each view, weak KNN classifiers
1-NN . . .2-NN
Voting
View 1Classifier
Voting
Multi-View
ClassifierNew Software Data
Prediction
View 2Classifier
View vClassifier
Data Preparation
View 1 View 2 … View v
...
View-Based Classification
1-NN . . .2-NN
Voting
1-NN . . .2-NN 𝒏-NN
Voting
Buggy/Clean
Multi-View-Based Classification
𝒏-NN 𝒏-NN
Data Preparation
...
...
Multi-View Software Defect Data
Figure 1: The general overview of the MVKNN method for software defect prediction

168 Elife Ozturk Kiyak et al.
are constructed with different parameters (k),where k is ranged from 1 to the square rootof the number of samples (
√n). The classifiers
(1-NN, 2-NN, 3-NN, . . . ,√n-NN) are combined
to form a strong ensemble model for a specificview. In the end, the class label of a particularview is determined by using a voting strategythat selects the class having the highest numberof votes, where n refers to the number of samplesin the dataset.
Step 3 – Multi-view-based classification: Inthis step, a number of view-based learners arecombined to form a general model for classifi-cation. A majority voting strategy is utilized tocombine outcomes from each view and the finalclass label of a new instance is specified as buggyor clean.
The MVKNN method can be used for soft-ware detect prediction to provide many advan-tages as follows:– A single-view software data is dependent on
a single view-point, whereas multi-view soft-ware data usually contains complementaryinformation since it typically includes manyview-points. In multi-view learning, the lackof information of one view can be comple-mented by the sufficiency of other views.Thanks to this essential property of MVKNN,it eliminates the weaknesses of single-viewsoftware defect prediction.
– Compared to the traditional KNN algo-rithm which is substantially developed forsingle-view data, MVKNN is expected toyield more robust outcomes in the presenceof noisy software defect data. Because noisein one view can be reduced by a voting mech-anism among multiple views.
– Numerous software metrics can be extractedfrom software projects and so data can behigh dimensional. The MVKNN method hasthe ability to handle a large number of fea-tures since it considers high-dimensional dataas a union of multiple low-dimensional sub-spaces, called views. Software defect data cancontain many metrics from different perspec-tives such as Halstead’s measures and Mc-Cabe’s measures. Therefore, considering highdimensional data containing a group of dif-
ferent feature sets, we can separate the datainto appropriate views, each correspondingto a disjoint feature set.In spite of numerous benefits, the MKKNN
method considers correlations at the view level;however, it does not take into account implicitcorrelations between features in multiple views.In addition, MVKNN is computationally moreexpensive than KNN since it separately learnsfrom each view dataset and runs the base learnermany times to jointly learn from multiple k pa-rameters rather than a single k parameter.
4. Experimental studies
In this section, software defect datasets aredescribed, and several experiments conductedwith the MVKNN method are presented. TheMVKNN and KNN methods were compared forsoftware defect prediction. The obtained resultswere validated utilizing statistical tests to ensurethat the differences between the methods in thedatasets were significant. For this purpose, weapplied the Wilcoxon test which is a well-knownnon-parametric statistical test.
The MVKNN algorithm was implemented uti-lizing the WEKA machine learning library [34]and C# programming language. The implemen-tation of the MVKNN method is available atthe website https://github.com/elifeozturk/MVKNN. As an evaluation method, the10-fold cross-validation technique was used, inwhich the dataset is divided into 10 parts andthen each part is used once as a test set whilethe remaining parts form the training set. Inthis study, four evaluation metrics (Accuracy,Precision, Recall, and F1 Score) were used toevaluate the classification performances. Accu-racy is the most widely-used performance mea-sure that calculates the ratio between the num-ber of correctly predicted instances and all in-stances. It is calculated as follows: Accuracy =(TN + TP )/(TP +FP + TN +FN), where TN(true negatives) and TP (true positives) are cor-rectly predicted as real labels. In other words,if the real label is “positive” and the predictedlabel is “positive” or the actual label is “nega-

Multi-view learning for software defect prediction 169
tive” and the predicted label is “negative”, it isTP or TN, respectively. Unlike correct estimates,FP and FN point out that instances did notcorrectly classified as actual labels. Precisionshows the ratio of correctly predicted positive in-stances to the total predicted positive instances.Precision is calculated as follows: Precision =TP/(TP + FP ). Recall is the number of correctpredictions divided by the number of all pre-dictions in the actual class. It is calculated asfollows: Recall = TP/(TP + FN). F1 Score isthe harmonic mean of the precision and recall.This evaluation measure is particularly preferredwhen datasets have uneven class distribution.F1 Score is calculated as follows: F1 Score =2 × (Recall × Precision)/(Recall + Precision).Precision, Recall, and F1 Score are useful met-rics for evaluating “learning from imbalanceddatasets”.
4.1. Dataset description
In this work, we conducted experiments on50 bug datasets from three different reposito-ries available in the software engineering area:Tera-PROMISE Open Source Software Projects(OSSP), NASA MDP (Metrics Data Program),and Softlab that included 40, 5, and 5 datasets,respectively. Table A2 lists the main characteris-tics of the datasets, including their names, thegroups to which the datasets belong, the numberof samples in the datasets, and defect percent-ages (%). To be able to test MVKNN on imbal-anced data, we especially used the NASA MDPdatasets where defect percentages ranged be-tween 7% and 23%. Furthermore, these datasetshave been widely used in many machine learningstudies [10, 14, 15]. MVKNN is designed for gen-eral purposes; therefore, it can be further appliedto different datasets with different software en-gineering metrics when the research communityhas presented new ones.
More details about datasets are describedbelow, and supplemental information and tablesare included in Appendix A.– OSSP Datasets [35]: The datasets in this
group consists of 20 independent object-ori-
ented source code metrics and one dependentdefect variable that indicates buggy or not.
– NASA MDP Datasets [36]: The datasets(named cm1, jm1, kc1, kc2, pc1) in this groupwere obtained from NASA software projects.These datasets include 21 static code featuresthat were extracted from a software productbased on the McCabe metric, Basic Halsteadmeasures, and Derived Halstead measures.
– Softlab Datasets [37]: The datasets were de-noted by a Software Research Laboratoryand collected from a Turkish white-goodsmanufacturer. The ar1 and ar6 datasets werecollected from an embedded controller forwhite goods, while the other (ar5, ar4, ar3)datasets were obtained from a refrigerator,dishwasher, and washing machine, respec-tively. The datasets contain 29 static codeattributes.Table A3 presents the fundamental charac-
teristics of datasets, containing the number ofclasses (i.e., buggy or clean), the number of views,and the number of features that belong to eachview.
Tables A4, A5 and A6 show all the soft-ware metrics and their categories in each datasetgroup for NASA, OSSP and SOFTLAB datasets,respectively. The datasets have different viewsdesigned based on the previous studies [38–40].The NASA MDP datasets have three views asgiven in [38]: McCabe, Basic Halstead, and De-rived Halstead features with 4, 9, and 8 soft-ware metrics, respectively. The OSSP datasetscontain object-oriented measures that indicatethe characteristics of inheritance, coupling, co-hesion, complexity, and line features of softwareprograms [39]. The Softlab datasets consist offour views [40], including Halstead, McCabe,LOC, and Miscellaneous metrics. Halstead met-rics show the program complexity obtained byanalyzing the source code. McCabe metrics quan-tify the control flows in a program. LOC metricsrefer to the measures related to lines of code,such as the number of executable lines and thenumber of comment lines. Finally, the rest soft-ware metrics are additionally included in the“Miscellaneous” group.

170 Elife Ozturk Kiyak et al.
4.2. Experimental results
Table 1 shows the comparison of the KNN andMVKNN algorithms on the NASA MDP andSoftlab datasets in terms of accuracy. Accordingto the results, our MVKNN algorithm achieved86.59% and 88.09% accuracy values on averagefor the NASA MDP and Softlab datasets, re-spectively. However, KNN reached only 86.46%and 86.60% accuracy values on average. It isclear that MVKNN outperformed KNN on fourdatasets (jm1, kc1, kc2, pc1) from the NASAMDP group, while only on one dataset (cm1)both algorithms have the same classification ac-curacy (90.16%). The results obtained from theSoftlab datasets show that our MVKNN algo-rithm demonstrated better or equal accuracy onall datasets compared to the KNN algorithm.
According to the results, it is possible to saythat quality assurance teams can effectively al-locate limited resources for validating softwareproducts since the constructed defect predictionmodels provide satisfactory results (>86%) onaverage when identifying bug-prone software ar-tifacts. This result indicates that the models cancorrectly predict defect-prone software moduleswith a rate of 86% before defects are discovered;thus, the predictive models can be used to pri-oritize software quality assurance efforts. Thecode areas that potentially contain defects canbe predicted to help developers allocate theirtesting efforts by first checking potentially buggycode. As the size of software projects becomeslarger, the constructed defect prediction modelsplay a more critical role to support developers.Furthermore, they speed up time to market aswell as with more robust software products.
Figure 2 shows the comparison of KNN andMVKNN on the OSSP datasets in terms of ac-curacy. The results show that our MVKNN al-gorithm has equal to or higher accuracy thanthe KNN algorithm on 34 out of 40 datasets.Therefore, our MVKNN algorithm is better thanKNN on 85% of the datasets. In particular, thebiggest accuracy differences between the methodswere observed on the “berek” and “velocity 1.6”datasets, where our method increased the accu-racy by over 6.98% and 6.37%, respectively. For
example, our method (86.05%) achieved betterperformance than the existing method (79.07%)in the “berek” dataset in terms of accuracy. In the“velocity 1.6” dataset, accuracy of our method(72.05%) is higher than the accuracy of the ex-isting method (65.68%). These results show thatour method usually gives more accurate outputsfor software defect prediction by using a differentperspective.
Some datasets were obtained from differentversions of a software project, such as Jedit 4.0,Jedit 4.1, Jedit 4.2, and Jedit 4.3. In this case,within-project defect prediction (WPDP) can beused to identify defect-prone modules in a forth-coming version of a software project. However,some datasets were obtained from a single versionof a software project, such as the “arc” dataset. Inthis case, cross-project defect prediction (CPDP)can be applied since the target project may bea new project or does not have enough labeledmodules.
In addition to accuracy, we evaluated theperformances of the methods using the Precision,Recall, and F1 Score metrics. As can be seenin Table B1, when considering the NASA MDPdatasets, MVKNN achieved equal or higher ac-curacy than KNN. In the Softlab datasets, it isclearly seen that the MVKNN model has bet-ter results than the KNN model on average. Inaddition, Table B2 shows the Precision, Recall,and F1 Score results for the OSSP datasets. Ac-cording to the results, the MVKNN algorithmachieved the values of 0.79, 0.83, and 0.81 for theprecision, recall, and F1 Score metrics, respec-tively; whereas, KNN only obtained the valuesof 0.77, 0.81, and 0.79 on average.
Though MVKNN achieved usually higher ac-curacy than KNN, all the results (Table 1 andFigure 2) were also validated using statisticaltests. We utilized a well-known non-parametricstatistical test: Wilcoxon Test, also known asWilcoxon signed-rank test. Since it is used toanalyze matched-pair data, it can be consid-ered a rank-based alternative to the two-samplet-test [41]. Wilcoxon test does not rely on theassumption of data complying with any distri-bution. It considers the sign and magnitude ofthe distribution of cumulative observations. In

Multi-view learning for software defect prediction 171
Table 1: Comparison of the KNN and MVKNN algorithms on the NASA MDP and Softlab datasets
NASA MDP SoftlabDataset KNN MVKNN Dataset KNN MVKNNcm1 90.16 90.16 ar1 92.56 92.56jm1 80.98 81.08 ar3 90.08 90.48kc1 84.97 85.30 ar4 83.88 85.98kc2 83.14 83.33 ar5 79.86 83.33pc1 93.03 93.06 ar6 85.15 85.15
Avg. 86.46 86.59 Avg. 86.60 88.09
60
65
70
75
80
85
90
95
100
ant
1.3
ant
1.4
ant
1.5
ant
1.6
ant
1.7 arc
ber
ek
e-le
arn
ing
forr
est
0.7
forr
est
0.8
jed
it 3
.2
jed
it 4
.0
jed
it 4
.1
jed
it 4
.2
jed
it 4
.3
log4
j 1.0
log4
j 1.1
log4
j 1.2
pb
ean
s 1
pb
ean
s 2
po
i 1.5
po
i 2.0
po
i 2.5
po
i 3.0
pro
p-6
red
akto
r
sera
pio
n
syn
apse
1.0
syn
apse
1.1
syn
apse
1.2
tom
cat
velo
city
1.4
velo
city
1.5
velo
city
1.6
xala
n 2
.4
xala
n 2
.6
xala
n 2
.7
xerc
es 1
.2
xerc
es 1
.3
xerc
es 1
.4
Acc
ura
cy (
%)
OSSP Datasets
KNNMVKNN
Figure 2: Comparison of the KNN and MVKNN algorithms on the OSSP datasets
this statistical test, the null hypothesis (H0) in-dicates that there is no difference or relationshipbetween methods. The alternative hypothesis(H1) states that there is a significant differenceor relationship between methods. A significancelevel (α) is usually specified as 0.05. The p-valueis used to determine the presence of statisticalsignificance since it shows the level of evidenceof the difference. If the obtained p-value is lowerthan the threshold level (p < 0.05), the nullhypothesis (H0) is rejected, which means thatthe difference is significant. Since the p-valueobtained from the Wilcoxon test is 0.0000027and it is smaller than the significance level, H0 isrejected. Therefore, it implies that the obtained
results are statistically significant. As can beseen in Figure 3, MVKNN showed the medianaccuracy of 83.6%, while KNN had the medianaccuracy of 82.0%.
In order to show performance comparisonsbetween KNN and MVKNN, supplemental ta-bles and figures are presented in Appendix B.Figure B1 displays individual view-based per-formances. When each view in the datasets isexamined separately, it can be seen that MVKNNhas good performance on the view-based clas-sification, but it does not always better thanKNN. However, the multi-view-based classifica-tion results of MVKNN are either greater than orequal to the KNN accuracy values for all datasets.

172 Elife Ozturk Kiyak et al.
Figure 3: The spread of the accuracy scores for each algorithm
This is because of the complementary power ofMVKNN.
In the traditional KNN algorithm, a singleand fixed k value is used for classification. How-ever, in a real dataset, data points may be dis-tributed irregularly, or some of them can be noisy.To consider the density variations in the data,different k parameters can be used to benefitfrom both more neighbors in dense regions andless in sparse regions. Liu et al. pointed out thata fixed k value is not suitable for many test sam-ples in a given training set [42]. For this reason,in our study, rather than just using a single andfixed value of k, the algorithm is run with variousk values. MVKNN learns from k values, startingfrom 1 to
√n, where n is the number of instances.
The maximum k value was selected as√n on the
basis of many studies [43–45]. Choosing the max-imum value of k as
√n is an appropriate decision
since the probability of overfitting significantlyincreases if k is selected as too small or too large.Park and Lee [44] reported that setting k as thesquare root of the data size is a good empiricalground rule. Lall and Sharma [43] also proved
this statement theoretically using a generalizedcross-validation (GCV) score function. Mitra etal. [45] also stated that k =
√n is usually suitable
for test samples. If the k value is small, then theresults can be susceptible to noisy instances; oth-erwise, if the k value is large, the neighborhoodmay cover many instances from other classes.Therefore, the square root is a reasonable choicefor the searching neighborhood. Figure B2 dis-plays accuracy values obtained for different k val-ues. It compares KNN and MVKNN performanceon the k values starting from 1 to the square rootof the number of samples for each dataset. Forall the datasets, MVKNN starts with greater ac-curacy than KNN, and at the maximum k value,it is either greater than or equal to the KNNaccuracy.
Table B3 separately shows the performancesof the KNN and MVKNN algorithms for eachview in the OSSP datasets. It is clearly observedthat MVKNN has equal to or higher accuracythan KNN for 34 out of 40 datasets. It can beseen that our MVKNN method (83.10%) outper-formed the traditional KNN method (81.37%)

Multi-view learning for software defect prediction 173
in classification on average. According to theresults given in Table B3, the proposed method(MVKNN) is more successful than the tradi-tional KNN method in terms of accuracy. Thus,multi-view learning can achieve more accurateresults than single-view learning in defect predic-tion since it benefits from different perspectivesof data.
4.3. Validity
This section discusses the validity of the research,the threats, and countermeasures of the contextunder common guidelines given in [46].i. Construct validityThreats to construct validity are concernedwith establishing correct measures for theconcepts addressed in empirical analysis. Theselection of performance measures is the basiclimitation. In our study, the most commonlyused performance measure (accuracy) wasselected to overcome the threat of measureselection. In other words, the predictive validi-ties of the constructed models were assessedby using the accuracy measure. According tothe results, the proposed approach achieved86.59%, 88.09%, and 83.10% accuracy valueson average for the NASA MDP, Softlab, andOSSP datasets, respectively. Thereby, pre-dictive validity was proven, since all averageaccuracy results are higher than the accept-able level (>80%).
ii. Internal validityInternal validity is related to uncontrolledfactors that can cause a difference in experi-mental measurements. To reduce this threat,we used the k-fold cross-validation techniquein which the validation procedure is repeatedk times until each of the k data subsets hasserved as a test set. In addition, we ran allthe experiments in the same environment.Another internal threat is related to datacollection. We tested our approach on publicand most widely-used software engineeringdatasets in the literature [11, 13–15]. The in-formation on data collection and its validitycan be found in [35–37].
iii. External validityExternal validity concerns the generalizabil-ity of a conclusion or experimental findingreached on the sample group under experi-mental conditions in various environments.In this study, our approach was tested ona total of 50 datasets from three differentdata repositories to reduce the threat of thiskind of validity. In addition, since MVKNNis designed for general-purpose, it can be ap-plied to various domains from transportationto medicine.
iv. Conclusion validityConclusion validity is concerned with the re-lationship between the treatment in an exper-iment and the actual outcome we observed. Itis considered as the evaluation of statisticalpower, significance testing, and effect size. Forthis purpose, we used the Wilcoxon statisti-cal test to ensure the differences in KNN andMVKNN performances are statistically sig-nificant. Since the p-value obtained from thestatistical test (0.0000027) is smaller than thesignificance level (<0.05), it is possible to saythat the results are statistically significant.
5. Conclusion and future work
The standard software defect classification stud-ies work on single-view data. They do not uti-lize different feature sets, called views. However,a software defect prediction problem can involvedata with multiple views in which the featurespace includes multiple feature vectors. There-fore, in this study, the multi-view k-nearest neigh-bors (MVKNN) algorithm is used for softwaredefect classification. Here, the software defectmetrics are grouped under several views accord-ing to their feature extractors. MVKNN consistsof two parts. First, base classifiers are constructedto learn from each view. Second, classifiers arecombined to create a strong multi-view model.
In this study, several experiments were con-ducted on 50 bug datasets from different repos-itories to show the capability of the MVKNNmethod. It can be concluded from the results that

174 Elife Ozturk Kiyak et al.
the MVKNN algorithm usually achieved betterperformance compared to the KNN algorithm.
As future work, the MVKNN method canbe used for other software engineering problemssuch as software cost estimation, software effortprediction, readability analysis, refactoring, soft-ware clone detection, vulnerability prediction,and software design pattern mining.
References
[1] R. Ozakinci and A. Tarhan, “Early software de-fect prediction: A systematic map and review,”The Journal of Systems and Software, Vol. 144,Oct. 2018, pp. 216–239.
[2] K. Bashir, T. Li, and M. Yahaya, “A novel fea-ture selection method based on maximum likeli-hood logistic regression for imbalanced learningin software defect prediction,” The InternationalArab Journal of Information Technology, Vol. 17,No. 5, Sep. 2020, pp. 721–730.
[3] J. Zhao, X. Xie, X. Xu, and S. Sun, “Multi-viewlearning overview: Recent progress and new chal-lenges,” Information Fusion, Vol. 38, No. 1, Nov.2017, pp. 43–54.
[4] F. Liu, T. Zhang, C. Zheng, Y. Cheng, X. Liu,M. Qi, J. Kong, and J. Wang, “An intelligentmulti-view active learning method based on adouble-branch network,” Entropy, Vol. 22, No. 8,Aug. 2020.
[5] Y. Chen, D. Li, X. Zhang, J. Jin, and Y. Shen,“Computer aided diagnosis of thyroid nodulesbased on the devised small-datasets multi-viewensemble learning,” Medical Image Analysis,Vol. 67, No. 8, Jan. 2021.
[6] Y. Song, Y. Wang, X. Ye, D. Wang, Y. Yin, andY. Wang, “Multi-view ensemble learning basedon distance-to-model and adaptive clustering forimbalanced credit risk assessment in p2p lend-ing,” Information Sciences, Vol. 525, Jul. 2020,pp. 182–204.
[7] S. Cheng, F. Lu, P. Peng, and S. Wu, “Multi-taskand multi-view learning based on particle swarmoptimization for short-term traffic forecasting,”Knowledge-Based Systems, Vol. 180, Sep. 2019,pp. 116–132.
[8] Y. He, Y. Tian, and D. Liu, “Multi-view trans-fer learning with privileged learning frame-work,” Neurocomputing, Vol. 335, Mar. 2019,pp. 131–142.
[9] J. Li, L. Wu, G. Wen, and Z. Li, “Exclusivefeature selection and multi-view learning foralzheimer’s disease,” Journal of Visual Commu-
nication and Image Representation, Vol. 64, Oct.2019.
[10] I.H. Laradji, M. Alshayeb, and L. Ghouti, “Soft-ware defect prediction using ensemble learningon selected features,” Information and SoftwareTechnology, Vol. 58, Feb. 2015, pp. 388–402.
[11] S. Agarwal and D. Tomar, “A feature selectionbased model for software defect prediction,” In-ternational Journal of Advanced Science andTechnology, Vol. 65, 2014, pp. 39–58.
[12] H. Wang, T.M. Khoshgoftaar, and N. Seliya,“How many software metrics should be se-lected for defect prediction?” in Proceedings ofthe Twenty-Fourth International Florida Arti-ficial Intelligence Research Society Conference,R.C. Murray and P.M. McCarthy, Eds. PalmBeach, Florida, USA: AAAI Press, May 2011.
[13] W. Wen, B. Zhang, X. Gu, and X. Ju, “Anempirical study on combining source selectionand transfer learning for cross-project defect pre-diction,” in 2019 IEEE 1st International Work-shop on Intelligent Bug Fixing (IBF). Hangzhou,China: IEEE, 2019, pp. 29–38.
[14] A. Iqbal, S. Aftab, I. Ullah, M.S. Bashir, andM.A. Saeed, “A feature selection based ensem-ble classification framework for software defectprediction,” International Journal of ModernEducation and Computer Science, Vol. 11, No. 9,2019, pp. 54–64.
[15] A. Arshad, S. Riaz, L. Jiao, and A. Murthy, “Theempirical study of semi-supervised deep fuzzyc-mean clustering for software fault prediction,”IEEE Access, Vol. 6, 2018, pp. 47 047–47 061.
[16] M.M. Mirończuk, J. Protasiewicz, and W. Ped-rycz, “Empirical evaluation of feature projectionalgorithms for multi-view text classification,” Ex-pert Systems with Applications, Vol. 130, 2019,pp. 97–112.
[17] C. Zhang, J. Cheng, and Q. Tian, “Multi-viewimage classification with visual, semantic andview consistency,” IEEE Transactions on ImageProcessing, Vol. 29, 2020, pp. 617–627.
[18] Z. Zhu, P. Luo, X. Wang, and X. Tang, “Multi--view perceptron: a deep model for learningface identity and view representations,” in Ad-vances in Neural Information Processing Sys-tems 27: Annual Conference on Neural Infor-mation Processing Systems 2014, Z. Ghahra-mani, M. Welling, C. Cortes, N.D. Lawrence,and K.Q. Weinberger, Eds. Montreal, Quebec,Canada: Citeseer, Dec. 2014, pp. 217–225.
[19] S.R. Shahamiri and S.S.B. Salim, “A multi-viewsmulti-learners approach towards dysarthricspeech recognition using multi-nets artificial neu-

Multi-view learning for software defect prediction 175
ral networks,” IEEE Transactions on NeuralSystems and Rehabilitation Engineering, Vol. 22,No. 5, Sep. 2014, pp. 1053–1063.
[20] A. Saeidi, J. Hage, R.Khadka, and S. Jansen, “Ap-plications of multi-view learning approaches forsoftware comprehension,” The Art, Science, andEngineering of Programming, Vol. 3, No. 3, 2019.
[21] E.O. Kiyak, A.B. Cengiz, K.U. Birant, andD. Birant, “Comparison of image-based andtext-based source code classification using deeplearning,” SN Computer Science, Vol. 1, No. 5,2020, pp. 1–13.
[22] A.V. Phan and M.L. Nguyen, “Convolutionalneural networks on assembly code for predict-ing software defects,” in 2017 21st Asia PacificSymposium on Intelligent and Evolutionary Sys-tems (IES). Hanoi, Vietnam: IEEE, Nov. 2017,pp. 37–42.
[23] J. Chen, Y. Yang, K. Hu, Q. Xuan, Y. Liu, andC. Yang, “Multiview transfer learning for soft-ware defect prediction,” IEEE Access, Vol. 7,Jan. 2019, pp. 8901–8916.
[24] D. Ulumi and D. Siahaan, “Weighted k-NN usinggrey relational analysis for cross-project defectprediction,” Journal of Physics: Conference Se-ries, Vol. 1230, Jul. 2019, p. 012062.
[25] R. Sathyaraj and S. Prabu, “A hybrid approachto improve the quality of software fault pre-diction using naïve bayes and k-nn classifica-tion algorithm with ensemble method,” Interna-tional Journal of Intelligent Systems Technolo-gies and Applications, Vol. 17, No. 4, Oct. 2018,pp. 483–496.
[26] L. He, Q.B. Song, and J.Y. SHEN, “Boost-ing-based k-NN learning for software defect pre-diction,” Pattern Recognition and Artificial In-telligence, Vol. 25, No. 5, 2012, pp. 792–802.
[27] R. Goyal, P. Chandra, and Y. Singh, “Suitabilityof k-NN regression in the development of inter-action based software fault prediction models,”IERI Procedia, Vol. 6, No. 1, 2014, pp. 15–21.
[28] S.K. Srivastava and S.K. Singh, “Multi-labelclassification of twitter data using modifiedML-kNN,” in Advances in Data and InformationSciences, Lecture Notes in Networks and Sys-tems, K. M., T. M., T. S., and S. V., Eds., Vol. 39.Singapore: Springer, Jun. 2019, pp. 31–41.
[29] P. Villar, R. Montes, A.M. Sánchez, and F. Her-rera, “Fuzzy-citation-k-NN: A fuzzy nearestneighbor approach for multi-instance classifica-tion,” in 2016 IEEE International Conference onFuzzy Systems (FUZZ-IEEE). Vancouver, BC,Canada: IEEE, Jul. 2016, pp. 946–952.
[30] Y. Xia, Y. Peng, X. Zhang, and H.Y. Bae,“DEMST-KNN: A novel classification frame-work to solve imbalanced multi-class prob-lem,” in Artificial Intelligence Trends in In-telligent Systems, Advances in Intelligent Sys-tems and Computing, R. Silhavy, R. Senkerik,Z.K. Oplatková, Z. Prokopova, and P. Silhavy,Eds., Vol. 573. Cham, Germany: Springer, Apr.2017, pp. 291–301.
[31] S. Gupta, S. Rana, B. Saha, D. Phung, andS. Venkatesh, “A new transfer learning frame-work with application to model-agnostic multi--task learning,” Knowledge and Information Sys-tems, Vol. 49, No. 3, Feb. 2016, pp. 933–973.
[32] E.O. Kiyak, D. Birant, and K.U. Birant, “An im-proved version of multi-view k-nearest neighbors(MVKNN) for multiple view learning,” TurkishJournal of Electrical Engineering and ComputerSciences, Vol. 29, No. 3, 2021, pp. 1401–1428.
[33] S. Li, E.J. Harner, and D.A. Adjeroh, “RandomKNN feature selection – A fast and stable alter-native to random forests,” BMC bioinformatics,Vol. 12, No. 1, 2011, pp. 1–11.
[34] I.H. Witten, E. Frank, M.A. Hall, and C.J. Pal,Data Mining: Practical Machine Learning Toolsand Techniques, 4th ed., The Morgan KaufmannSeries in Data Management Systems. Cambridge,MA, USA: Elsevier Science, 2016.
[35] “Tera-promise data,” accessed: 10.05.2020. [On-line]. https://github.com/klainfo/DefectData/tree/master/inst/extdata/terapromise
[36] “NASA MDP data,” accessed: 07.05.2020. [On-line]. https://github.com/klainfo/NASADefectDataset/tree/master/OriginalData/MDP
[37] B. Turhan, T. Menzies, A.B. Bener, and J.D. Ste-fano, “On the relative value of cross-companyand within-company data for defect prediction,”Empirical Software Engineering, Vol. 14, No. 5,Jan. 2009, pp. 540–578.
[38] E. Borandag, A. Ozcift, D. Kilinc, and F. Yu-calar, “Majority vote feature selection algorithmin software fault prediction,” Computer Scienceand Information Systems, Vol. 16, No. 2, 2019,pp. 515–539.
[39] Z. Yao, J. Song, Y. Liu, T. Zhang, and J. Wang,“Research on cross-version software defect pre-diction based on evolutionary information,” IOPConference Series: Materials Science and Engi-neering, Vol. 563, Aug. 2019, p. 052092.
[40] T. Menzies, J. Greenwald, and A. Frank, “Datamining static code attributes to learn defect pre-dictors,” IEEE transactions on software engi-neering, Vol. 33, No. 1, Dec. 2006, pp. 2–13.

176 Elife Ozturk Kiyak et al.
[41] R.F. Woolson, Wilcoxon Signed-Rank Test. Wi-ley Encyclopedia of Clinical Trials, 2008, pp. 1–3.
[42] H. Liu, S. Zhang, J. Zhao, X. Zhao, and Y. Mo,“A new classification algorithm using mutualnearest neighbors,” in 2010 Ninth InternationalConference on Grid and Cloud Computing. Nan-jing, China: IEEE, Nov. 2010, pp. 52–57.
[43] U. Lall and A. Sharma, “A nearest neighborbootstrap for resampling hydrologic time series,”Water Resources Research, Vol. 32, No. 3, Mar.1996, pp. 679–693.
[44] J. Park and D.H. Lee, “Parallelly runningk-nearest neighbor classification over seman-
tically secure encrypted data in outsourcedenvironments,” IEEE Access, Vol. 8, 2020,pp. 64 617–64 633.
[45] P. Mitra, C. Murthy, and S. Pal, “Unsuper-vised feature selection using feature similar-ity,” IEEE Transactions on Pattern Analysisand Machine Intelligence, Vol. 24, No. 3, 2002,pp. 301–312.
[46] P. Runeson and M. Höst, “Guidelines forconducting and reporting case study re-search in software engineering,” EmpiricalSoftware Engineering, Vol. 14, No. 2, 2009,pp. 131–164.
Appendix A. Description of datasets
Table A2. The main characteristics of the datasets
Group Dataset Release Number of Instances Defect (%)
Ope
nSo
urce
Softw
arePr
ojects
(OSS
P)
ant
1.3 125 16.001.4 178 22.471.5 293 10.921.6 351 26.211.7 745 22.28
arc – 234 11.54berek – 43 37.21
e-learning – 64 7.81forrest 0.7 29 17.24
0.8 32 6.25
jedit
3.2 272 3.314.0 306 24.514.1 312 25.324.2 367 13.084.3 492 2.24
log4j1.0 135 25.191.1 109 33.951.2 205 92.20
pbeans 1.0 26 76.922.0 51 19.61
poi1.5 237 59.492.0 314 11.782.5 385 64.413.0 442 63.57
prop 6 661 9.98redactor – 176 15.34serapion – 45 20.00
synapse1.0 157 10.191.1 222 27.031.2 256 33.59
tomcat – 858 8.97

Multi-view learning for software defect prediction 177
Table A2 continuedGroup Dataset Release Number of Instances Defect (%)
OSS
P
velocity1.4 196 75.001.5 214 66.361.6 229 34.06
xalan2.4 723 15.212.6 885 46.442.7 909 98.79
xerces1.2 440 16.141.3 453 15.231.4 588 74.32
Softlab
ar1 – 121 7.44ar3 – 63 12.70ar4 – 107 18.69ar5 – 36 22.22ar6 – 101 14.85
NASA
MDP cm1 – 498 9.83
jm1 – 10885 19.00kc1 – 2109 15.45kc2 – 522 20.49pc1 – 1109 6.94
Table A3: The number of classes, views, and features of each dataset group
Dataset Group #Classes #Views #Features
NASA MDP 2 3 McCabe Basic Halstead Derived Halstead4 9 8
OSSP 2 5 Coupling Complexity Cohesion Inheritance Scale5 3 3 3 6
SOFTLAB 2 4 Halstead McCabe LOC Miscellaneous12 3 5 9
Table A4. Categories of software metrics in the NASA datasets
NASA MDPView Symbol Metric Full Name
MCCABE v(g) Cyclomatic complexity
ev(g) Essential complexityIv(g) Design complexity
DER
IVED
HALS
TEA
D
N Total operators + operandsV VolumeL Program lengthD DifficultyI IntelligenceE Effort to write codeB Effort estimate

178 Elife Ozturk Kiyak et al.
Table A4 continuedNASA MDP
View Symbol Metric Full NameT Time estimator
BASIC
HALS
TEA
D
IOCode Line countIOComment Comment countIOBlank Blank line countIOCodeAndComment # of code and comment lines
Uniq_Op # of unique operatorsUniqOpnd #of unique operandsTotal_Op #of total operatorsTotal_Opnd # of total operandsbranch_count # of branch counts
Table A5: Categories of software metrics in the OSSP datasets
OSSPView Symbol Metric Full Name
COUPL
ING ca Afferent couplings
cbm Coupling between methodscbo Coupling between object classesce Efferent couplingsic Inheritance coupling
COHES
ION
lcom Lack of cohesion in methodslcom3 Lack of cohesion in methodscam Cohesion among methods of class
COMPL
EXIT
Y
amc Average method complexityavg_cc Average McCabemax_cc Maximum McCabe
INHER
ITANCE
dit Depth of inheritancemoa Measure of aggregationmfa Measure of function abstraction
SCALE
loc Lines of codenoc Number of childrenrfc Response for a classnpm Number of public methodswmc Weighted methods per classdam Data access metric

Multi-view learning for software defect prediction 179
Table A6: Categories of software metrics in the Softlab datasets
SOFTLAB
View Symbol Metric Full Name
MCCABE v(g) Cyclomatic complexity
iv(G) Cyclomatic densityIv(G) Design complexity
LOC
loc_total Total lines of codeloc_blank number of blank linesloc_comments number of comment linesloc_code_and_comment number of code and comment linesloc_executable number of lines of executable code
HALS
TEA
D
N1 number of operatorsN2 number of operandsµ1 number of unique operatorsµ2 number of unique operandsN program lengthV volume (program size)L program levelD difficulty levelI content cE effort to implementB estimated number of bugsT implementation time
MISCEL
LANEO
US
branch_count number of branch countscall_pairs number of calls to other functionscondition_count number of conditionals in a given moduledecision_count number of decision pointsdecision_density Condition count / Decision countdesign_density iv(G) / v(G)multiple condition count number of multiple conditionsnormalized_cyclomatic_complexity v(G) / number of linesformal parameters Identifiers used in a method
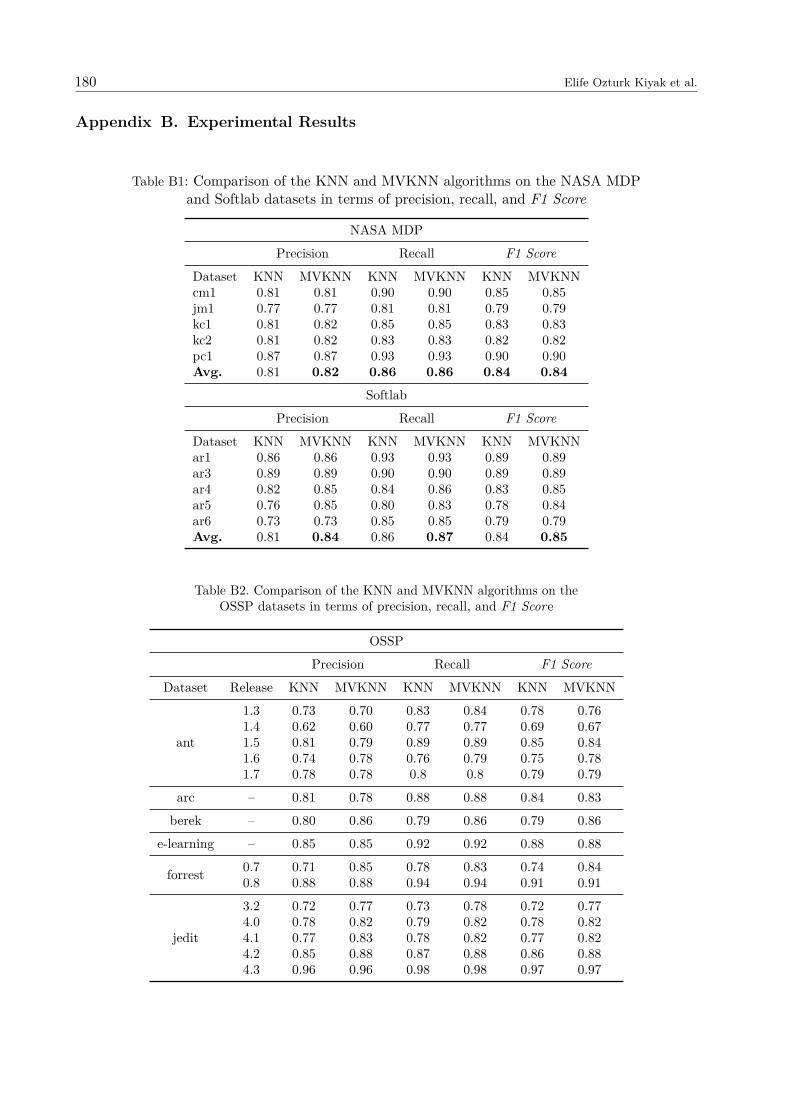
180 Elife Ozturk Kiyak et al.
Appendix B. Experimental Results
Table B1: Comparison of the KNN and MVKNN algorithms on the NASA MDPand Softlab datasets in terms of precision, recall, and F1 Score
NASA MDPPrecision Recall F1 Score
Dataset KNN MVKNN KNN MVKNN KNN MVKNNcm1 0.81 0.81 0.90 0.90 0.85 0.85jm1 0.77 0.77 0.81 0.81 0.79 0.79kc1 0.81 0.82 0.85 0.85 0.83 0.83kc2 0.81 0.82 0.83 0.83 0.82 0.82pc1 0.87 0.87 0.93 0.93 0.90 0.90Avg. 0.81 0.82 0.86 0.86 0.84 0.84
SoftlabPrecision Recall F1 Score
Dataset KNN MVKNN KNN MVKNN KNN MVKNNar1 0.86 0.86 0.93 0.93 0.89 0.89ar3 0.89 0.89 0.90 0.90 0.89 0.89ar4 0.82 0.85 0.84 0.86 0.83 0.85ar5 0.76 0.85 0.80 0.83 0.78 0.84ar6 0.73 0.73 0.85 0.85 0.79 0.79Avg. 0.81 0.84 0.86 0.87 0.84 0.85
Table B2. Comparison of the KNN and MVKNN algorithms on theOSSP datasets in terms of precision, recall, and F1 Score
OSSPPrecision Recall F1 Score
Dataset Release KNN MVKNN KNN MVKNN KNN MVKNN
ant
1.3 0.73 0.70 0.83 0.84 0.78 0.761.4 0.62 0.60 0.77 0.77 0.69 0.671.5 0.81 0.79 0.89 0.89 0.85 0.841.6 0.74 0.78 0.76 0.79 0.75 0.781.7 0.78 0.78 0.8 0.8 0.79 0.79
arc – 0.81 0.78 0.88 0.88 0.84 0.83berek – 0.80 0.86 0.79 0.86 0.79 0.86
e-learning – 0.85 0.85 0.92 0.92 0.88 0.88
forrest 0.7 0.71 0.85 0.78 0.83 0.74 0.840.8 0.88 0.88 0.94 0.94 0.91 0.91
jedit
3.2 0.72 0.77 0.73 0.78 0.72 0.774.0 0.78 0.82 0.79 0.82 0.78 0.824.1 0.77 0.83 0.78 0.82 0.77 0.824.2 0.85 0.88 0.87 0.88 0.86 0.884.3 0.96 0.96 0.98 0.98 0.97 0.97

Multi-view learning for software defect prediction 181
Table B2 continuedOSSP
Precision Recall F1 ScoreDataset Release KNN MVKNN KNN MVKNN KNN MVKNN
log4j1.0 0.73 0.75 0.76 0.77 0.74 0.761.1 0.76 0.82 0.76 0.81 0.76 0.811.2 0.85 0.85 0.92 0.92 0.88 0.88
pbeans 1.0 0.63 0.58 0.71 0.73 0.67 0.652.0 0.69 0.64 0.8 0.78 0.74 0.70
poi
1.5 0.67 0.7 0.67 0.7 0.67 0.702.0 0.8 0.78 0.88 0.88 0.84 0.832.5 0.75 0.78 0.75 0.78 0.75 0.783.0 0.77 0.81 0.76 0.81 0.76 0.81
prop 6 – 0.81 0.81 0.9 0.9 0.85 0.85redactor – 0.85 0.88 0.87 0.89 0.86 0.88serapion – 0.74 0.85 0.8 0.82 0.77 0.83
synapse1.0 0.81 0.81 0.9 0.9 0.85 0.851.1 0.68 0.73 0.73 0.75 0.70 0.741.2 0.7 0.7 0.71 0.71 0.70 0.70
tomcat – 0.83 0.83 0.91 0.91 0.87 0.87
velocity1.4 0.8 0.84 0.81 0.82 0.80 0.831.5 0.7 0.77 0.72 0.74 0.71 0.751.6 0.63 0.72 0.66 0.72 0.64 0.72
xalan2.4 0.77 0.72 0.85 0.85 0.81 0.782.6 0.69 0.75 0.68 0.74 0.68 0.742.7 0.98 0.98 0.99 0.99 0.98 0.98
xerces1.2 0.7 0.87 0.84 0.84 0.76 0.851.3 0.81 0.89 0.86 0.89 0.83 0.891.4 0.74 0.78 0.77 0.79 0.75 0.78
Avg. 0.77 0.79 0.81 0.83 0.79 0.81

182 Elife Ozturk Kiyak et al.
Table B3: Comparison of single-view and multi-view accuracy values of the KNN and MVKNNalgorithms on the OSSP datasets
ID DatasetName
KNN MVKNN
view1 view2 view3 view4 view5 Allviews view1 view2 view3 view4 view5 All
views1 ant 1.3 80.80 84.00 84.00 84.00 82.40 83.04 80.80 83.20 83.20 83.20 82.40 84.002 ant 1.4 77.53 76.40 76.40 76.97 76.97 76.85 75.84 74.72 74.16 72.47 74.16 76.973 ant 1.5 88.74 89.08 88.74 89.08 90.10 89.15 89.08 89.08 88.40 88.4 91.13 89.084 ant 1.6 78.06 76.92 73.79 73.22 80.06 76.41 77.49 76.35 75.21 75.78 78.92 79.205 ant 1.7 80.67 80.94 79.60 78.52 81.48 80.24 80.81 80.94 79.46 78.93 80.27 80.006 arc 88.46 88.46 87.18 88.46 88.89 88.29 88.03 88.03 88.03 87.61 87.61 88.037 berek 81.40 83.72 76.74 72.09 81.40 79.07 72.09 90.70 86.05 72.09 88.37 86.058 e-learning 92.19 92.19 92.19 92.19 92.19 92.19 90.62 92.19 92.19 92.19 90.62 92.199 forrest 0.7 86.21 75.86 75.86 82.76 68.97 77.93 82.76 75.86 75.86 89.66 72.41 82.7610 forrest 0.8 93.75 93.75 93.75 93.75 93.75 93.75 93.75 90.62 90.62 93.75 93.75 93.7511 jedit 3.2 70.59 66.54 73.90 75.74 76.47 72.65 68.38 65.44 73.53 75.00 76.10 77.5712 jedit 4.0 78.10 79.74 76.80 79.41 81.70 79.15 74.51 80.07 75.49 80.39 81.37 82.0313 jedit 4.1 81.41 77.24 77.56 76.92 78.53 78.33 80.45 78.21 78.85 78.21 80.13 81.7314 jedit 4.2 87.74 86.65 87.19 86.92 88.01 87.30 88.56 86.92 88.01 87.19 87.47 88.2815 jedit 4.3 97.76 97.76 97.76 97.76 97.76 97.76 97.76 97.76 97.76 97.76 97.76 97.7616 log4j 1.0 77.04 71.11 78.52 77.04 77.78 76.30 76.30 72.59 80.00 80.00 80.00 77.0417 log4j 1.1 77.06 74.31 70.64 77.06 79.82 75.78 75.23 71.56 76.15 80.73 79.82 80.7318 log4j 1.2 92.20 92.20 92.20 92.20 92.20 92.20 92.20 92.20 92.20 92.20 90.73 92.2019 pbeans 1 73.08 69.23 69.23 76.92 69.23 71.54 76.92 65.38 80.77 76.92 73.08 73.0820 pbeans 2 80.39 78.43 84.31 80.39 80.39 80.78 80.39 74.51 82.35 78.43 74.51 78.4321 poi 1.5 72.15 57.38 65.82 69.2 70.04 66.92 70.04 65.82 64.98 68.78 69.62 70.0422 poi 2.0 88.22 88.85 88.22 88.22 88.22 88.35 88.22 88.85 86.94 88.22 88.22 88.2223 poi 2.5 78.96 67.27 76.36 73.51 79.74 75.17 76.36 71.69 77.92 72.21 81.30 77.9224 poi 3.0 76.70 78.05 75.34 73.98 75.79 75.97 76.24 77.15 76.70 73.98 78.28 80.7725 prop-6 90.00 90.00 90.00 90.00 90.00 90.00 89.85 90.00 90.00 90.00 90.00 90.0026 redaktor 88.07 84.09 90.34 86.36 87.50 87.27 85.23 85.80 90.34 87.50 87.50 89.227 serapion 80.00 80.00 77.78 80.00 82.22 80.00 77.78 71.11 77.78 80.00 86.67 82.2228 synapse 1.0 89.17 89.17 89.81 89.81 89.81 89.55 89.17 89.17 88.54 89.81 88.54 89.8129 synapse 1.1 72.52 70.27 75.68 71.17 76.13 73.15 72.07 72.07 73.87 72.07 77.03 74.7730 synapse 1.2 71.09 71.88 73.44 67.58 72.27 71.25 69.53 70.70 72.27 67.19 70.70 71.4831 tomcat 91.03 91.03 91.03 91.03 91.03 91.03 91.14 90.91 90.91 90.79 91.49 91.0332 velocity 1.4 80.10 75.51 84.69 83.67 80.10 80.81 81.63 74.49 84.69 84.69 77.04 82.1433 velocity 1.5 73.83 73.36 70.09 66.82 74.30 71.68 70.56 71.50 72.90 69.63 72.90 74.3034 velocity 1.6 64.19 62.01 71.18 64.19 66.81 65.68 64.19 68.12 69.87 67.25 67.25 72.0535 xalan 2.4 84.79 84.79 84.79 84.79 84.92 84.82 84.09 84.09 84.65 84.92 84.65 84.7936 xalan 2.6 72.43 71.30 65.88 61.13 71.64 68.48 70.17 71.86 69.27 69.49 74.12 73.6737 xalan 2.7 98.79 98.79 98.79 98.79 98.79 98.79 98.79 98.79 98.79 98.79 98.79 98.7938 xerces 1.2 83.86 83.86 83.86 83.86 83.86 83.86 83.86 83.64 83.86 83.86 83.64 83.8639 xerces 1.3 86.75 84.55 86.75 83.44 87.64 85.83 86.53 84.33 88.52 85.65 87.64 88.5240 xerces 1.4 71.94 77.89 92.18 72.45 71.94 77.28 72.45 77.89 92.52 72.45 71.60 79.42
Average 81.94 80.36 81.71 80.79 82.02 81.37 81.00 80.36 82.34 81.45 82.19 83.10

Multi-view learning for software defect prediction 183
50
60
70
80
90
v1 v2 v3 All v1 v2 v3 All
KNN MVKNN
cm1Accuracy(%)
50
60
70
80
90
v1 v2 v3 v4 All v1 v2 v3 v4 All
KNN MVKNN
ar1Accuracy(%)
50
60
70
80
90
v1 v2 v3 All v1 v2 v3 All
KNN MVKNN
jm1Accuracy(%)
50
60
70
80
90
v1 v2 v3 v4 All v1 v2 v3 v4 All
KNN MVKNN
ar3Accuracy(%)
50
60
70
80
90
v1 v2 v3 All v1 v2 v3 All
KNN MVKNN
kc1Accuracy(%)
50
60
70
80
90
v1 v2 v3 v4 All v1 v2 v3 v4 All
KNN MVKNN
ar4Accuracy(%)
50
60
70
80
90
v1 v2 v3 All v1 v2 v3 All
KNN MVKNN
kc2Accuracy(%)
50
60
70
80
90
v1 v2 v3 v4 All v1 v2 v3 v4 All
KNN MVKNN
ar5Accuracy(%)
50
60
70
80
90
v1 v2 v3 All v1 v2 v3 All
KNN MVKNN
pc1Accuracy(%)
50
60
70
80
90
v1 v2 v3 v4 All v1 v2 v3 v4 All
KNN MVKNN
ar6Accuracy(%)
Figure B1: View-based comparison of the KNN and MVKNN algorithms

184 Elife Ozturk Kiyak et al.
80
82
84
86
88
90
92
1 3 5 7 9 11 13 15 17 19 21
Acc
ura
cy(%
)
k
cm1
KNN MVKNN
86
87
88
89
90
91
92
93
1 2 3 4 5 6 7 8 9 10 11
Acc
ura
cy(%
)
k
ar1
KNN MVKNN
75
76
77
78
79
80
81
82
1 11 21 31 41 51 61 71 81 91 101
Acc
ura
cy(%
)
k
jm1
KNN MVKNN
83
84
85
86
87
88
89
90
91
92
93
1 2 3 4 5 6 7 8
Acc
ura
cy(%
)
k
ar3
KNN MVKNN
81
82
83
84
85
86
87
1 6 11 16 21 26 31 36 41 46
Acc
ura
cy(%
)
k
kc1
KNN MVKNN
76
78
80
82
84
86
88
1 2 3 4 5 6 7 8 9 10
Acc
ura
cy(%
)
k
ar4
KNN MVKNN
78
79
80
81
82
83
84
85
1 3 5 7 9 11 13 15 17 19 21 23
Acc
ura
cy(%
)
k
kc2
KNN MVKNN
72
74
76
78
80
82
84
86
88
90
1 2 3 4 5 6
Acc
ura
cy(%
)
k
ar5
KNN MVKNN
89
90
91
92
93
94
1 4 7 10 13 16 19 22 25 28 31
Acc
ura
cy(%
)
k
pc1
KNN MVKNN
70
72
74
76
78
80
82
84
86
88
90
1 2 3 4 5 6 7 8 9 10
Acc
ura
cy(%
)
k
ar6
KNN MVKNN
Figure B2: Comparison of single-view and multi-view versions of the KNN algorithm on variousk values

e-Informatica Software Engineering Journal, Volume 15, Issue 1, 2021, pages: 185–204, DOI 10.37190/e-Inf210109
Business Model Flexibility and Software-intensiveCompanies: Opportunities and Challenges
Magnus Wilson∗, Krzysztof Wnuk∗∗, Lars Bengtsson∗∗∗∗Ericsson, Karlskrona, Ericsson, Sweden
∗∗Department of Software Engineering, Blekinge Institute of Technology, Sweden∗∗∗Industrial Engineering and Management, LTH, Lund University, Sweden
[email protected], [email protected], [email protected]
AbstractBackground: Software plays an essential role in enabling digital transformation via digital servicesadded to traditional products or fully digital business offerings. This calls for a better understandingof the relationships between the dynamic nature of business models and their realization usingsoftware engineering practices. Aim: In this paper, we synthesize the implications of digitalization onbusiness model flexibility for software-intensive companies based on an extensive literature surveyand a longitudinal case study at Ericsson AB. We analyze how software-intensive companies canbetter synchronize business model changes with software development processes and organizations.Method: We synthesize six propositions based on the literature review and extensive industrialexperience with a large software-intensive company working in the telecommunication domain.Conclusions: Our work is designed to facilitate the cross-disciplinary analysis of business modeldynamics and business model flexibility by linking value, transaction, and organizational learning tobusiness model change. We believe that software engineering tools and methods can play a crucialrole in enabling more automated synchronization between technology and business model changes.Keywords: business flexibility, digital business modeling, equivocality, learning organiza-tion
1. Introduction
Digitalization brings new opportunities and in-creased connectivity is the primary fuel for dig-italization. Ericsson, as a major player in thetelecommunications market, is an actor deeplyinvolved in this process1. The advent of the 5Gnetwork stands as a prominent example of oppor-tunities and challenges associated with massiveconnectivity when all value-chain members andpartners must rethink or reorganize their posi-tions if necessary. For many companies, 5G willforce them to redefine their business offeringsand create new business opportunities. However,with this speed of technological changes, the busi-ness models can not remain static or re-activelyrespond to changes.
Digitalization drives significant changes tothe process level, organization level, businesslevel of any company and its customers [1]. Dig-italization offers a significantly shorter trans-action turnaround time. Consequently, the in-creased transaction speed drives new challengesfor the alignment between business and technologychanges. Companies that used to sell traditionalproducts enter new markets and ecosystems wheredigital products and services dominate. The logicof creating these products, monetizing their corevalue, and maintaining them is significantly differ-ent and often counterintuitive at first glance. Thus,software engineers and managers often need torethink their strategies and operational processesto better align with the nature of the digitalbusiness. An example here could be data-driven
1https://www.ericsson.com/en/reports-and-papers/networked-society-insights [last visited 23.06.2021].
Submitted: 20 November 2020; Revised: 30 June 2021; Accepted: 03 August 2021; Available online: 05 November 2021

186 Magnus Wilson et al.
experimentation and feature discovery via A/Btesting that significantly changes requirementsengineering practice and demands great changesto software architecture [2].
This paper discusses the implications of digi-talization for software-intensive companies basedon an extensive literature survey and a longi-tudinal case study at Ericsson. We synthesizesix propositions for improved handling of busi-ness model change and discuss each proposition’simplications on software engineering practicesand principles. This paper presents a cross-dis-ciplinary synthesis of digitalization’s impact onthe alignment between business and technologychange (including software engineering methodsand tools). We also discuss new ways of handlingbusiness model flexibility in software-intensiveproduct development.
Companies are undergoing significant trans-formations and are struggling with the alignmentof business and technology changes [3]. Until re-cently, companies handled increasing size andcomplexity by 1) clearly distinguishing betweenthe planning and realization layers for companystrategy, product portfolios, and individual prod-ucts; and 2) handling change mainly in the re-alization layer and ensuring that the planninglayer remains reasonably stable.
Digitalization increases the speed of change inthe planning layer, which in many cases, reachesthe speed of changes in the realization layer. Asa result, negotiation and risk management canno longer only rely on the sales and engineeringdepartments, as the business models shift focusto the ecosystem and collaboration [4, 5], andcompanies choose operating multi-business-mod-els [6]. Business modeling literature also recog-nizes the need for efficiently handling changeas several authors discuss the dynamic natureof business models and change in the businessenvironment, e.g., [5, 7, 8], just to name a few.
The paper is structured as follows: In Sec-tion 2, we present our synthesis based on back-ground and related work. In Section 3, we presenthow the business environment changes for ourindustry case and our findings from the longitudi-nal study. In Section 4, we summarize and discussour results using the derived value membrane
concept and develop one additional proposition.In Section 5, we conclude our paper.
2. Background and related work
The synthesis provided in this section is based onan extensive systematic literature review aboutefficiency, effectiveness [9], and flexibility of busi-ness modeling [10], published in our previouswork and updated using the snowballing liter-ature review method. It is also derived fromour design science study on capturing chang-ing business intents using context frames [11].Our synthesis responds to multiple requests forcross-disciplinary research agenda [12–15]. Thefocal point of this study is the misalignmentbetween the planning (define) and the realiza-tion (execute) of the software business in thefast-changing environment that a software-inten-sive company operates. A change to either thestrategy or the realization has the potential totrigger an escalating misalignment. Formulatingand executing a digitalization strategy [16] hasthe goal of reducing such misalignment by man-aging the change. The term digital transforma-tion strategy implies a business-centric contextwhen coordinating strategies for products, ser-vices, and business models as a whole.
Inspired by Ritter and Littl’s focus on broaderimplications for business-model research, we takethe analogy for the business model as a membranebetween theories [12]. By analyzing uncertaintyand equivocality [17] with value within a trans-action, as the membrane between two actors inan activity system [13], we propose the businessmodel can also act as the “contextual agent” inwhat we call the value membrane (VaM). Thishelps identify the cause of the misalignment andminimize gaps between needed change, plannedchange, and implemented change.
Most scholars focus on detecting or prepar-ing change at one level (strategy, portfolio, orproduct) or analyzing the organization’s broaderexternal aspects, without integrating the activi-ties [9]. Many scholars call for further research onchange realization, e.g., [14, 18, 19]. Meier andBosslau argue that there is almost no attention in

Business Model Flexibility and Software-intensive Companies: Opportunities and Challenges 187
research to the dynamic aspects, flexibility, vali-dation, and implementation of business models[20], while Richter et al. emphasize the impor-tance of understanding the degree of flexibilityneeded to realize change [21]. Seeing businessmodels as activity systems helps organizations(as responsible for the business) adapt to changeand generate value [15]. Therefore, our focus isprimarily on the dynamics aspects of the busi-ness model change and business flexibility andits implications on software engineering.
3. Research method
We utilized the snowballing literature reviewmethod to collect relevant articles [22]. The startset was the articles identified in our two previousliterature reviews [9, 10]. These two studies usedthe following search string on the Google Scholardatabase:
SS1: (business modelling OR business modelOR business ecosystem) AND value creationAND strategy,SS2: (“business modelling” OR “business model-ing” OR “business ecosystem”) AND “businessstrategy” AND “value creation” AND (“effective-ness” OR “efficiency” OR “business flexibility”OR modularity OR “variability in realization”OR “governance” OR “multi-business”).
Executing SS1 and SS2 (limited to title-ab-stract-keywords) and screening candidates leftus with ten papers in the start set. After 4 snow-balling iterations, we included 58 studies [9, 10].These 58 articles were screened to find new cita-tions after 2018.
3.1. Updates for new papers after 2018
The previously selected 58 papers now becamethe start set for one snowballing iteration. As weare looking for new evidence, we only analyzedcitations since references to these 58 papers wereanalyzed in our previous work [9, 10].
16833 new iterations were identified since2018 and screened. From these citations, 60 ar-
ticles were identified from the title and abstractscreening. These 60 articles were carefully readand further evaluated. We excluded 40 papersbecause they were focusing on business modelinnovation by creating new business models. Sixpapers were excluded after the full read sincethey focused on a general notion of a businessmodel. Fourteen papers were finally accepted andincluded in the synthesis. Next, we revisited thepreviously selected 58 papers from the previousliterature review [9, 10]. Each of these 58 paperswas carefully screened and evaluated focusingon the implications of digitalization on businessmodel change. We included seven papers from the58 evaluated. The total set of papers used for thesynthesis included 24 papers, detailed in Table 1.
3.2. Data analysis and synthesis
The 24 papers included in the data analysis andsynthesis were carefully investigated. We focusedon analyzing patterns within the identified pa-pers, according to the steps recommended byCruzes [44]. Two authors read all 24 papersand identified relevant segments of text asso-ciated with digitalization and business modelchange. Next, these segments were discussed ina meeting, and 25 codes were identified usingthe open coding technique. Next, differences andsimilarities between these codes were discovered,and codes were merged into higher order state-ments. We focused on associating the 25 codeswith the following categories: digitalization, valuetransformation, business model change, businessflexibility, abstraction layers in business modelchange. Next, we constructed interpretations ineach area and explored the relationships betweenthe five themes (areas). Our high-order factorsbecame the propositions presented in this paper.We provide the list of the most relevant articlesfrom the set of 24 articles included in this workfor each proposition. Our theory (frame of ref-erence) was that digitalization has an impacton software engineering practices and productoffering at Ericsson and also changes the currentbusiness models.

188 Magnus Wilson et al.
Table 1. Selected papers including a short summary of the main contributionsin these papers and the most associated propositions
Paper Authors Comments AssociatedProposition(s)
P1 Woodard et al. [23] Digital business strategy and component architec-tures
3, 6
P2 Chew [24] Linking servitization and business model design 4P3 Romero and Molina [5] Engineering dynamic business models with the help
of network organizations and customer communi-ties
1
P4 Meier et al. [20] Dynamic business models for product-service sys-tems
3, 4
P5 Richter et al. [21] Flexibility in product-service systems via use-ori-ented business models
1, 4
P6 Eurich et al. [25] Business Model innovation process with networkthinking and holistic approach
5
P7 Mason and Mouzas [26] Flexible business models and their architectures 1, 4P8 Gul [27] Changes in business models and digital strategy 4, 6P9 Sjodin et al. [28] Value creation and value capture in business model
innovation4
P10 Antikainen [29] Business Model Experimentation 2, 3P11 Trapp et al. [30] Business model innovation tools 5P12 Chritofi et al. [31] How agility and flexibility is discussed in business
research4
P13 Teece [32] Business Model and Dynamic Capabilities 2P14 Linde et al. [33] Value capture model for digital servitization 2, 5P15 Hacklin et al. [34] Migrating value in business model innovation 2, 6P16 Vendrell-Herrero et al. [35] Business model experimentation in dynamic con-
texts3, 4
P17 Szopinski et al. [36] Software tools for business model innovation 5P18 Wirtz [37] Drivers that trigger business model change 2P19 Gebauer et al. [38] Digitalization and servitization 4P20 Moellers [39] System dynamics in business model innovation 3P21 Nailler et al. [40] Business model evolution and value anticipation 4P22 Clauss et al. [41] Strategic agility and business model innovation 2, 5P23 Schaffer et al. [42] Dynamic business models 3, 4, 5P24 Pratama and Iijima [43] Linking value and business models 2
3.3. The longitudinal study,industrializing services at Ericsson
3.3.1. Case study research designand data collection methods
We report the case study objectives and otherdesign aspects following guidelines suggested byRuneson and Host [45] The objective of thecase study was exploratory and focuses on digi-talization and the resulting increased flexibilityin offering of software-intensive products andservices at Ericsson. Digitaliation is a contempo-
rary complex phenomenon; therefore the bestapproach is to study it in a real world con-text. We opted for a holistic case study [46]with one unit of analysis (service organiza-tion). We decided to conduct a longitudinal casestudy at Ericsson, following the developmentand growth of the service organization and itsimpact on software engineering practices. Obser-vations and participation took place for 4 years,giving us the opportunity to explore and under-stand the implications and impact of digitaliza-tion on business models and software engineeringpractices.

Business Model Flexibility and Software-intensive Companies: Opportunities and Challenges 189
Our goal was to explore the impact of servicetransformation on the business models that Eric-sson offers and on software engineering practicesutilized to execute these business models. Erics-son had a strong division between the researchand development teams. The research organi-zation mostly develops new solutions while thedevelopment organizations focus on deploymentand customer adaptations for various global re-gions.
The theory associated with this case studyassumes that the introduction of digital servicesimpacts the ways of working and handling busi-ness operations. Since the offered products aremostly digital, their deployment could be con-tinuous and remote, and their update time isdrastically reduced. This has also impact on busi-ness models. Back in 2012, the Ericssons’ serviceorganization was mainly working in two types ofbusiness models:– Managed Services – running the operator’s
network for them with large, long-term con-tracts.
– Service consultancy and Delivery model – fo-cused on project deliveries and learning ser-vices.As part of a corporate strategy, the service
organization devised their strategic program“Global Scale – Local Reach”, involving 75000+resources (global, regional, and contractors) innine regions, working in three segments of theservice portfolio (Managed Services, Product Re-lated Services, and Consulting and System Inte-gration). The goal of the program was to improvecustomer responsiveness, improve productivity,and improve internal evaluation. The part of thistransformation included either offering currentproducts as services or creating services on top ofthe current software-intensive products. In manyaspects, Ericsson followed the servitization trans-formation of the business environment[47].Data Collection and Analysis Methods.We combined observations, document analysis,and interviews [48]. We also actively participatedalongside program managers, the steering group,and requirements analysts. The research teamhas analyzed the collected empirical data andsynthesized it in Section 5.2. Between 2012–2016,
we actively worked alongside teams responsiblefor:– supporting the program manager and his
steering group with a business and enterprisearchitecture analysis,
– responsible for the business level requirementstowards tools and IT development, and
– consultants for the deployment (business pro-cesses and training) into the sales and deliveryorganization (global plus nine regions).At the beginning of the program (2012–2013),
we participated in eleven extensive workshopsinterviewing practitioners from affected areas:finance; product management (services and soft-ware products); key account managers; EricssonIT (master data, business processes, and sys-tem responsible); sales; delivery (project); andsupport processes (planning, development, andpricing, of services). The 3–4 hours workshopswere based on a short introduction to the work-shop and the program, followed by practitionerspresenting their current business processes andways of working. Practitioners were then inter-viewed on current issues, and potential opportu-nities were discussed under the frame of the newprogram, providing us with great insights intothe scope plus the strategical and operationalissues facing the program. The workshops alsoprovided a deeper understanding of uncertainty,equivocality, and rivalry between the differentroles and organizations. We were also given con-tinuous access to all program-related information,monthly reports, and steering group protocols.We also conducted two sets of individual, 60+minutes interviews with a delivery project man-ager and a solution architect, to identify anymisalignment against the program’s goals andthe actual outcome.
3.4. Validity threats
We adopted the validity guidelines suggested byRuneson [45]. We mitigated the industrial expe-rience bias of the leading author by involving theother two authors as reviewers of the work. Wehave also followed the thematic analysis approachsteps [44]. The selected 24 papers are highly het-erogeneous and therefore minimize the bias on

190 Magnus Wilson et al.
specific author or terminology. To minimize thedata synthesis bias, two researchers performedthe initial read and coding, and these codes werelater discussed and merged.
We minimized potential internal validitythreats by following the snowballing literaturereview guidelines [22]. Because of the interdisci-plinary nature of this study, the risk remains thatsome aspects are underrepresented and other as-pects are over-represented. In particular, businessmodel innovation or business process modelingseems to be heavily researched in the businessmanagement and the computer science commu-nity. However, we decided to focus on the inter-play between business model change and digi-talization and excluded papers that primarilyfocus on business model innovation realized bythe creation of new business models.
Finally, we are aware that a single case studypresented in this paper may not offer sufficientexternal validity. However, we opt for analyticalgeneralization rather than statistical one as sug-gested by Flyvbjerg [49]. We provide an extensivedescription of the analyzed case and contrast itwith the findings from the literature review.
4. Results
We have synthesized five propositions based onthe literature review results and one based on thecase study. We applied thematic synthesis to thepapers presented in Table 1. The propositionsare detailed in the subsections that follow.
4.1. The impact of digital transformationon the nature of negotiatinga business deal and equivocality
Negotiating a business deal was traditionallya discussion focused on the functionality, price,and any potential project risks. The surround-ing business environment (legislation, platformsand technology, partners and competition, etc.)gave little uncertainty related to the lifespanof the contract and the contractual obligations.Therefore, the negotiations could focus on thescope and usage of the underlying technical (soft-
ware-based) solution. The business environment,including actors, business processes, and infras-tructure, was predominately “stable within rea-sonable risks” throughout the lifespan of thecontract and could be tracked by strategic plan-ning, competitor and market analysis, monitoringstandardization, and other regular managementinitiatives.
For example, the negotiations in the GSM and3G telecommunication standardization includeda well-defined business environment and inter-faces between the components. Suppliers couldconcentrate their risk management to monitorand participate in the standards developmentwhile mainly focusing on optimal technology so-lutions for each component. Negotiating a newbusiness deal was fundamentally about under-standing what components, the quantity, andany potential customer-specific features neededto sweeten the deal. This kind of contractualflexibility could be implemented by the productand solution engineers under the strict coordi-nation and risk management of sales, productmanagement, and top management.
Software Engineering has developed severalconcepts to support contractual flexibility, e.g.,implementing Software Product Lines (SPL), it-erative, lean, and agile software developmentwith daily code deliveries enabling increased cus-tomization. The ways of working need to be syn-chronized with other core business processes likesales and delivery, and hence into the businessmodel. Product Service Systems (PSS) [50, 51],Industrial PSS [20, 52], and service-based busi-ness models [53, 54] are examples of how thisfusion of engineering and business processes iscontinuously evolving.
With the digital transformation of the busi-ness environment [3, 55], negotiation and riskmanagement can no longer rely on the salesand engineering departments but need to en-act business model changes towards ecosystemand collaboration [4], [5]. Romero and Molinaadvocate collaborative networked organizationand customer communities for supporting valueco-creation and innovation [5]. These experi-ence-centric networks help for co-creating valuenot only for the customers (like the previous sup-

Business Model Flexibility and Software-intensive Companies: Opportunities and Challenges 191
plier relationships) but also formulating alliancesbetween the companies offering digital (software)products to its customers. The key enabler forthese type of partnerships is openness in not onlyin shared source code but also Open Innovationinitiatives [56]. This also means sharing softwaredevelopment tools and environments and openlydiscussing future plans and requirements.
Richter et al. suggest focusing on user-ori-ented business models that capture the necessaryflexibility for product-service systems [21]. Heincludes agility as one of the aspects of changeabil-ity. Considering software development as a capitalinvestment that should bring value to the cus-tomers is critical since software products needmaintenance and operational support. This partis often neglected by Agile software developmentthat focuses primarily on delivering new function-ality rather than maintaining existing systems.Efficient maintenance improves long-term perfor-mance and changes the risk profile to asymmetricby introducing more flexibility early in the process.
Mason and Mouzas introduce the concept of“flexible business models” to capture and realizethe necessary flexibility [26]. They include trans-action relationships and ownership as the mostcritical aspects of flexibility. This has implica-tions for software engineering since companiesdo not need to own the entire codebase andoften co-create value in a software ecosystem.Gul describes what new strategies companiesshould realize in the digital environment, suchas software [27].
The negotiating power, coming from knowingwhat business flexibility (BF) can be offered andhow this business flexibility is translated intocontractual flexibility that can be absorbed bythe business model realization. The realizationshould be done without jeopardizing the under-lying effectiveness and efficiency of products andtechnical solutions (promised contractual char-acteristics); emerges as a critical competitiveadvantage. However, with more roles participat-ing in the negotiation [11, Figure 7 p. 1182],uncertainty and equivocality (multiple and con-flicting interpretations of a goal, situation, ortask) can negatively impact the quality, cost, and
lead-time of both the planning and realizationphases [17, 57, 58].
Companies undergoing the digitalizationtransformation should detect if the previouslyused realization strategy (the combination of thebusiness model, products, and services) still willadhere to the changed contractual terms andconditions. This involves checking if the currentbusiness model will accommodate the new termsand conditions and the associated risks to deliverthe changed contractual terms. The distance be-tween strategizing, innovating, and planning forBusiness Model Change (BMCh) is significantlyreduced. We argue that such risk managementshould be done before signing any contract, andtherefore propose that,
Proposition 1: A mechanism for earlydetection of business model change isa critical factor in maintaining a company’snegotiating power to ensure business suc-cess via improved risk management de-rived from the business flexibility.The impact on software engineering. Soft-ware engineering should more clearly focus onrisk management and negotiation. Risk manage-ment has traditionally been assigned to projectmanagement activities. Risk management in soft-ware engineering was performed assuming thatthe business model remains stable and the iden-tified risks are most of technical nature [59]. Wepostulate that more effort should be dedicatedto risk management on the requirements level.Some work was already done in the uniREPMmodel, where risk management is divided intoproject risk management and requirements riskmanagement [60]. We believe that requirementsrisk analysis should be extended on the impact onbusiness models and revenue strategies. Softwaremanagers should also consider software develop-ment as a capital investment that is long-term.This means taking care of software platforms andarchitectures and minimizing technical debt asmuch as delivering functionality and respondingto ever-changing customer needs. Test automa-tion is also a necessary component for keepingthe negotiating power and understanding thelimitations of the current codebase.

192 Magnus Wilson et al.
4.2. The gap between business modelplanning and execution
Business model experimentation is gaining moreimportance for software companies as a responseto a growing need for business model innovation[61] and digitalization [3]. Experimentation isan approach to achieve effective change to thebusiness, driven by the rationale that in “highlyuncertain environments, strategies are about in-sight, rapid experimentation, and evolutionarylearning as much as the traditional skills of plan-ning and rock-ribbed execution” [62]. Many com-panies that offer software products invest inproduct decision support based on experimen-tation and A/B testing [63]. Despite the un-questionable potential of online experimentation,they often provide very incremental improve-ments and are not suitable for radical strategicchanges. Business model associated changes areoften more radical than incremental. This con-tributes to a gap between business model planningand execution.
To analyze the gap between planning andexecution, we complement Hofflinger’s top-downdefinition of the business model with Rohrbecket al. bottom-up definition of business modeling,“to be a creative and inventive activity that in-volves experimenting with content, structure, andgovernance of transactions that are designed tocreate and capture value” [64].
Rohrbeck et al. focus on experimenting asa “round-trip” process of “translating an ideainto execution, test, evaluate, and change untilsatisfied” (similar to the agile method of develop-ing software products followed up by proper ret-rospectives). Secondly, they also focus on trans-actions, connecting the business model to humanbehavior and value in execution and planningactivities. Thirdly, they make a clear distinc-tion between value created and captured, as two(role-dependent) views of a transaction, imply-ing an information representation suitable formaintaining (observe, analyze, decide, change)many relationships to support effective and ef-ficient collaborations (through all the stages ofthe business model lifecycle, e.g., plan, design,deployment, execution, phase out).
Antikainen et al. [29] suggest the businessmodel experimentation method that supportscompanies in innovating their B2B business mod-els by benefiting from the shared economy oppor-tunities. The ownership principle is replaced bytemporary access and reusing (the two embeddedcharacteristics of software as one piece of softwarecan be reused forever and shared with as manypartners as required).
Linde et al. [33] suggest a framework for cap-turing value while designing, developing or scal-ing digital services. They highlight agile devel-opment and value co-creation (risk and rewardsharing) as the two main elements of value andrevenue creation for digital services. This movesthe main responsibility for a service offering fromprimarily the software company to the ecosystemof partners that share the risks and benefits.
Teece [32] highlight the role of dynamic capa-bilities in responding to changing business needsand customer requirements. Software and soft-ware engineering capabilities should be consid-ered as such dynamic capabilities that constitutethe strength of business agility of digital organiza-tions. As dynamic capabilities are underpinned inorganizational routines, selecting the appropriatesoftware development processes and caring aboutteam values and culture becomes important forsoftware organizations. Software companies of-ten experience pivots or other radical changes.In these cases, organizations with high absorp-tive capability respond and often succeed in thistransformation.
Hacklin et al. [34] describe how value is mi-grated during business model innovation in com-puter and telecommunication industries wherevalue migrated to value-added service providersfrom device manufacturers, network providers,and infrastructure companies. This exampleshows clearly that software as the primary carrierof value not only can penetrate many industriesbut also disrupt value creation and capture inhighly established and often regulated industries.This has deep implications for software engineer-ing principles used by these companies.
Clauss et al. [41] describe how value creationand value capture relate to strategic agility inturbulent business environments. Wirtz [37] out-

Business Model Flexibility and Software-intensive Companies: Opportunities and Challenges 193
lines markets, technology, and deregulation asthe main drivers for business model change. Soft-ware plays a key role in the deregulation of manyindustries, and the Open Source Movement re-moves monetary incentives in selling softwareas source code. Software products and servicesdisrupt many “traditional” industries, such asfor example finance or automotive. Therefore,software engineers have to remember that thepotential of software innovation stretches greatlybeyond the software industry.
Pratama and Iijma [43] describe how to trans-late the value proposition components from theexisting business model to a new business modelwithout losing the content. This approach hasimportant implications for software engineeringsince the software is almost never fully disposedor destroyed, rather reused or reshaped with thenew business idea in mind.
Inspired by Fjeldstad and Snow, we adopt theidea of value as the contingency variable affectingall other elements of the business model [15], andto understand the transaction- and role-depen-dent Direction of Value (DoV), we build on thevalue concept proposed in the Value DeliveryMetamodel (VDML) [65]. Neither Hofflinger [8],Fjeldstad and Snow [15], nor VDML [65] makesa clear separation between value creation andvalue capture. Therefore, we postulate that:
Proposition 2: Value translation andvalue transformation capabilities are essen-tial for business modeling. By exploringvalue, in an interaction on the individuallevel as the unit of analysis, we can resolveambiguities in relation to the different ar-eas of the business model (e.g., product de-livery, product development, finance, cus-tomer relationships, partner management)stemming from: (1) the direction of value;(2) inter-level relationships of source andtarget for value; and (3) aggregation is-sues for value creation and value capture(scalability and value slippage).
Impact on Software Engineering. Wepostulate that business model experimentationshould be integrated with data-driven continu-ous experimentation [66, 67]. For example, TheRIGHT model for continuous experimentation
is a good start as it has the business model andstrategy element in the build-measure-learn pro-cess [66]. We believe that this integration shouldsupport the transformation into a “data-drivenorganization at scale” [67], where continuousexperimentation is synchronized with businessmodel evolution. We also postulate that softwareengineers need to consider two aspects whenstarting the development of new features or prod-ucts: 1) what is the business viability of these fea-tures or products, and 2) how can we co-developor co-create value.
4.3. Handling business model change
Both radical or incremental business modelchanges need to be addressed both at the plan-ning and the realization levels [7]. Cavalcanteet al. [68] divided BMCh into four types ofchange: business model creation, extension, re-vision, and termination. They further arguedthere is a “pre-stage” of “potential of BMCh”before the actual change occurs, often includinganalysis, experimentation, and other activities tobuild insights, learning, and commitment. In soft-ware engineering, this phase would include exten-sive prototyping or building the minimum viableproduct. Therefore, Cavalcante proposes to de-velop a detailed guide for analyzing BMCh, bothat the level of cognition as well as action, wherehe sees continuous experimentation and learningas fundamental pillars for effective BMCh, trans-forming the company into a “permanent learninglaboratory”.
To address change on the planning level,a company needs to understand the As-Is sit-uation (which capabilities exist) and the effectson the To-Be situation (needed abilities). Such in-sights require understanding how strategy relatesto a business model [23], tactics, and residualchoices [69], in combination with what strategicagility [70] and level of strategic flexibility [27, 71]the organization has. This could be achieved bybusiness model experimentation as pointed outby Antikainen [29] and highlighted in proposi-tion 2. Flexible business models and their archi-tecture appears to be the central concept here[26]. Dynamic business models and their depen-

194 Magnus Wilson et al.
dencies in the complex software-intensive systemsemerge as an area with increasing importancefor further research [42].
To facilitate such insights, we propose to rep-resent a business model by combining the workby Ghezzi’s on value networks (VN) and resourcemanagement (RM) [72], with Osterwalder’s busi-ness model canvas (BMC) [73]. Therefore, a com-pany’s need for business model change can bederived from having profound knowledge anda sound understanding of the three dimensions:(1) the customer(s) and related relationships;(2) the value proposition (revenue streams, whatvalues to create, how to deliver it to the cus-tomer); and (3) the company’s assets (products,resources, activities, cost structures, and partnerrelationships).
Woodard et al. [23] divide digital businessstrategy into design capital and design moves.The important but often invisible aspects of de-sign capital are technical debt and option value.Both have a fundamental impact on the businessagility of software development organizations. Anorganization holding significant technical debtloses a lot of flexibility in realization and haslimited options for creating and delivering value.
Meyer and Boßlau [20] suggest developingboth products and services at the same time andtherefore capturing more customer value andbuilding long-term relationships with the cus-tomers. This helps to integrate business modeldesign and engineering activities. For softwareservices, it appears to be very beneficial dueto the possibility of dynamically deploying andupdating software services for the customers.
Vendrell-Herrero [35] study the economicvalue of business model experimentation in manysectors and industries. Experimentation helps tostrengthen the network effects and also capturevalue from various customer needs. Therefore,establishing software-driven experimentation isa way forward for many companies that are be-coming software-intensive as it allows for explor-ing and understanding previously unknown ex-ternalities that could in the future become thecore value proposition elements.
Moellers [39] utilized system dynamics dur-ing different phases of business model innovation.
Among the positive results is an improved un-derstanding of how to accommodate a businessmodel from a different context. This is importantfor software-intensive companies as they oftenoperate in many domains and contexts and thuscan reuse the business models between them.
Schaffer et al. [42] highlight understandingcomplex interactions of the sub-componentswithin dynamic business models and their evolu-tion and important emerging future topics.
To address change on the realization level, i.e.,solutions implemented in products, processes,and organizations, literature discuss conceptslike business model operationalization (BMO),implying reconfiguration, and tuning of the com-pany’s assets depending on the system dynam-ics [39], business model experimentation [61],[62], collaborative business modeling [5], busi-ness model experimentation [29, 35], DynamicSoftware Product lines [74], R&D as innovationexperiment systems [75], just to name a few.With the advent of the digital business strategy[23], we propose that,
Proposition 3: Software companies pos-sess a unique advantage for detecting andimplementing business model change. Us-ing their software development process tointegrate their business model innovationwith their product innovation, they can ef-ficiently develop “native” product supportfor managing the linkage of contractualflexibility to the configuration of softwareproducts to achieve richer levels of busi-ness model experimentation and collabo-rative business modeling.Impact on Software Engineering. We pos-tulate that too much effort is dedicated to thecreation and extension phases and too little ef-fort on revision and termination. For example,requirements engineering focuses primarily onadding new features rather than reducing thecomplexity of the product (e.g., feature reduction[76]) or understanding stakeholder inertia and re-sistance to revolutionary change [77]. We believethat strategic planning of software platforms, e.g.,SPL [78] should also include possible revisionsor discontinuation of this platform, not foreverextensions and growth. Moreover, software prod-

Business Model Flexibility and Software-intensive Companies: Opportunities and Challenges 195
ucts also end their life and get replaced by newproducts or new businesses [79]. We believe manybusiness model changes should result in endinga product and replacing it with a new one ratherthan extensively changing or evolving it.
4.4. Increasing business flexibility
Flexibility helps organizations to “adapt whenconfronted with new circumstances...and pro-vides the organization with the ability to respondquickly to market forces and uncertainty in theenvironment.“ [80]. Richter et al. point out thatembedding flexibility into system design can opti-mize stakeholders’ incentives, turning incompletecontracts into opportunities [21]. They discusschangeability as a term to better understand invest-ments in flexibility related to value, cost, and risk.Changeability is defined by options under internal(“robustness” and “adaptability”) respectivelyexternal control (“flexibility” and “agility”).
In the business and management literature,flexibility is discussed in many different contexts,as related to business models and as ways tomanage change, e.g., strategic flexibility [26, 71],resource and organizational flexibility versus dy-namic capabilities [81], [82], [83], flexible businessmodels and their architectures [26], dynamic busi-ness models in product-service systems [20, 21],linking servitization and business model design[24], and business model flexibility [26, 84].
Chritofi et al. provide a comprehensive liter-ature summary of how agility and flexibility aredescribed in the business literature [31]. Theypoint out several organizational aspects that arerelevant for software engineering research andpractice, e.g. organizational process alignment,investments in intangible assets, and resourcecomplementarity.
Gul [27] looks at how companies can gaina competitive advantage by executing digitalstrategies where production and storage arecheaper, deployment is faster, and organizationsare collaborative and flexible. Software organi-zations need to become more collaborative (e.g.,work in software ecosystems) and flexible inreusing OSS or previous software componentsto compete in this new business reality.
Sjodin et al. [28] advocate integrating value--creation and value-capture during value proposi-tion definition, value provision design, and value--in-use delivery. They suggest a process for busi-ness model innovation that software-intensivecompanies can easily apply when designing andexperimenting new products with the customers.
Nailler et al. [40] outline six processes by whichbusiness models evolve, motivated by the causalmechanism of value anticipation/realization.Gebauer et al. [38] discuss how to increase flexi-bility by introducing digital servitization.
We define Business Flexibility (BF), as the“negotiable options in: 1) Relationship; 2) Finan-cial; and 3) the Value proposition between twoparties trying to reach an agreement”. Theseoptions enable effective negotiation to lever-age a company’s ability to compromise withoutbreaking the promise in the final contractualagreement. The terms Relationship, Financial,and Value proposition refer to the context ofOsterwalder’s right side of the BMC [73]. Usingthe BMC, a company visualizes the strategicdecisions and critical business options that char-acterize the rationale of the business idea andhow it strategy-wise will be turned into a suc-cessful business (model) realization.
A change (on planning or realization level)is triggered by a gap (misalignment) in expecta-tions and what is delivered. Closing these gaps(transforming a capability into an efficient ability)requires significant investments in time and effort,involving many collaborations. Closing this gapmay also require changes in the digital strategy[27], extensive business model experimentation[35], the evolution of the current business modelto anticipate more value [40], or a better un-derstanding of the dynamics of current businessmodels [42]. Therefore, we propose the following.
Proposition 4: Software companies havea unique opportunity for implementingbusiness flexibility and efficiently creat-ing value propositions. Software companiesshould develop software architectures andsoftware functionality to enable a synchro-nized change in their business model.Impact on Software Engineering. We be-lieve that the recent development in micro-

196 Magnus Wilson et al.
-services [85] is a step towards greater flexibil-ity in business model experimentation [29], anda better understanding of the system dynam-ics [39]. Many software companies offer servicesinstead of products. This means they need totake a large part of the operational cost andalso provide frequent updates and new releases.Understanding the product usage data helps toadapt the business models and the offering andtherefore optimize the constant operational costs.This helps subscription-based software offeringsto stay price competitive. Finally, data-drivenexperimentation for software products helps tocombine value-creation and value-capture duringproduct definition and evolution.
4.5. Supporting dynamic business modelchange with the help of softwaretools
Casadesus-Masanell and Ricart argued a cleardistinction between strategy and the businessmodel, where the business model “is a reflection ofthe firm’s realized strategy” and that the strategyis the plan and process to reach the desired goalvia the business model and onto tactics [69]. Strat-egy refers to the choice of the business model,while tactics refer to the possible realizationchoices.
Eurich et al. [25] suggest using network think-ing as a tool for designing a business model. De-pendencies and alternatives are discussed earlyin this process; this fits very well for software--intensive products as they can be composed ofmultiple components originating from varioussources. Trapp et al. [30] develop a businessmodel innovation identification tool that offersstraightforward criteria and indicators to assistpractitioners at accelerating BMI in establishedfirms. They tested their tool in four large Euro-pean corporations.
Bosch suggested a three-layer product modelfor managing growth and organizes product archi-tecture into a commoditized functionality layer,a differentiating functionality layer, and an inno-vative and experimental functionality layer [86].
The creation of the business model design alter-natives and the analysis of the interdependenciesbetween the business models and the technolog-ical capabilities seems to be a promising wayforward here [25].
Software tools can provide valuable supportin this process by helping to automatically iden-tify criteria and indicators to assist in acceler-ating business model change [30]. However, theproblem remains as most software tools designedto support business modeling focus mainly onbusiness model development rather than evolu-tion [36]. However, most software systems arecreated once every 10–20 years and later up-dated, reused, and evolved [87]. This means thatthe support for this evolution is not covered bymost business modeling tools, and the inheritedpowerful flexibility of software is not considered.Given this long-time perspective understandingstrategic agility points [41] and supporting thedynamics aspect of the business models appearsto be critical [42].
Proposition 5: Software developmenttools can provide valuable and mostly au-tomated support for understanding thegap between the capabilities (what soft-ware does today) and the planned businessmodel changes and adaptations.Impact on Software Engineering. Softwareengineers can use many tools to support collabo-rative software development and automate manytime-consuming tasks. We postulate that a largepart of the data generated during the softwaredevelopment process can be used as input forunderstanding business flexibility and possiblebusiness opportunities from the developed soft-ware. An example here can be mutation testingthat helps to understand the boundaries of soft-ware and its limitations beyond the specified oranticipated behavior [88]. Another example couldbe the data-driven extraction of features fromthe source code and understanding the offeredquality aspects (e.g., security or performance).These aspects can provide valuable indicators forthe directions of the business model change, notonly for improving engineering activities.
Business Model Flexibility and Software-intensive Companies: Opportunities and Challenges 197
5. Case study: adapting to the digitaltransformation in thetelecommunication industry
For Ericsson AB2, one critical aspect of achievingthe business and technology transformation andmanaging change has been a long-term focus onindustrialization and automation of the prod-uct development and the delivery (via processinnovation). Digitalization requires additionalstrategies for handling the fast-paced businessenvironment than driving technology standards.The technology innovation must be in concertwith an equally dramatic and accelerating busi-ness model innovation. Ericsson’s business modelhas evolved from the resource-centric, standardproduct-sales model, via several service models,over into different use models, where software-in-tensive products and services are now sold anddelivered as-a-service and on-demand. Today,Ericsson is running multi-business-model opera-tions, and with that, facing additional challengesto keep up with the pace of change. A majorityof these challenges can be structured accordingto Ritter and Lettl’s framework [12].
5.1. Business model change at Ericsson
Digitalization shifted the business risks to newdimensions, e.g., business ecosystem (sharing andcollaborating in fierce competition), rather thanoptimizing its assets as a part of a value-deliverychain (e.g., traditionally mitigating risks withlong-term business agreements and interna-tional standards). Such Business Model Change(BMCh), profoundly impacts the financial steer-ing and control, as much of the investmentsneed to be taken up-front, while the majorityof revenues shift to on-demand usage rather thansales of products [20, 21]. The transition frombusiness models based on selling products orhourly-rated services (with a strong focus onadd-on sales), into value-based, knowledge-inten-sive, customer-unique use-models has affectedmany of Ericsson’s dynamic and strategic capa-bilities and most of the core business processes.
For Ericsson, this also impacted the organiza-tional design, requiring extended focus on organi-zational learning and incentives, governance, andmanagement structures suited for the inherentdynamics, as well as collaborating with strategicand operational information. It also required en-hanced clarity in responsibility and authority forthe business model activities.
As a pilot, Ericsson applied the industrial-izing of the sales and delivery processes in 30+deliveries to customers in three regions during2013. These pilot projects delivered contract scop-ing efficiency and accuracy improvement by 88%. The ordering process was considered simpli-fied, while delivery lead time and project costswere reduced by 12–35%. However, the programcomplexity and program duration were signif-icantly underestimated (duration exceeded by150%). We identified three main reasons for theincreased complexity:– the scalability of the piloted solution turned
out a bigger issue than anticipated.– the inherent complexity (flexibility and
re-usability) of the services to be industri-alized and the services’ dependency on theskills and knowledge of the service deliverystaff.
– frequent re-organizations – this could betraced back to a substantial business modelchange together with insufficient support forfast and cross-organizational learning, nega-tively impacting the transformation program.The program struggled with two major chal-
lenges: 1) to decide what services to industrializeand which should remain “customer-specific”, 2)to find the best balance for the new and updatedIT tools to minimize disruptions to operationswhile concurrently updating the business pro-cesses.
The technical solution to the first challengewas basically divided into five parts, with a needfor completely new tools to be integrated withexisting tools and processes.– Defining the granularity and scope of each
service’s content (covering all the differentproducts and roles the services are related to).
2https://www.ericsson.com/en [last visited 26.06.2021].

198 Magnus Wilson et al.
– Defining the structure and content of theservice catalog and the structure and repre-sentation of a service.
– The IT tools needed to plan, develop anddeploy a service (so it’s available in the prod-uct and service catalog ready for marketing,ordering, and sales).
– The IT tools needed in a delivery projectto sell, order, plan, and deliver instances ofservices, plus the benchmark of projects andthe outcome of each individual service andit’s delivered instances.
– Non-industrialized services were managedmanually with little or no automation.The challenge of the dependency of the indus-
trialized services from the skills and knowledgeof the service delivery staff proved to be complexmainly due to the volume of implicit and ex-plicit information in various forms of knowledgerepresentations, and realizations with efficientknowledge management systems.
The decisions between investing in tool sup-port versus investing in business process flex-ibility turned out to be very challenging fordecision-makers and top management. As a con-sequence, the “traditional” IT update and in-tegration process of new and existing tools tomatch the evolving business processes was af-fected by misunderstandings and delays leadingto temporary solutions in the sales and deliveryorganization. Under customer pressure to deliveron signed contracts, this led to decreased trustbetween organizations, affecting the efficiency ofthe collaboration.
It also proved difficult to synchronize thebusiness process development (sales and deliveryprocesses to use industrialized services) with theagile Ericsson product development (the newgeneration of products to be delivered using theupdated business processes). We identified thefollowing four root causes of the misalignment:– temporal effects due to different life cycles of
these two core business processes,– organizational steering, coordination, and in-
centives,– expected capabilities that did not deliver on
the requested abilities in customer projects,and
– the differences between the old and new prod-uct generations, the needed training of theservice delivery staff, and their valuable cus-tomer experience feedback to the R&D orga-nization.
5.1.1. Temporal effects of organizationallearning
The temporal effects of organizational learningcreated a gap between different organizations(R&D, sales, delivery, and Ericsson IT) were occu-pied with their life-cycles of change as committedin earlier plans, see [11, Figure 5]. The symptomsof this were observed in areas of communication,coordination, training, and reporting, resulting inuncertainty, equivocality, and sub-optimizationat best, and a lack of abilities at worst.
Scaling the solution was affected sinceplanned capabilities needed by different orga-nizations were not translated (in time) into re-quired abilities, i.e., integrated tools and staff ad-equately trained in relation to the new or changedbusiness processes (so they could perform thetasks demanded by the evolving business model).The scale of the industrialization problem wasamong the most significant factors since it af-fected the amount of information and the re-lationships between the affected organizationsinvolved in the change processes. The ripplingchange-reaction escalated and started to violateexisting goals, commitment, and reporting, lead-ing to more efforts spent on temporary, localsolutions to assure customer contracts could behonored.
5.2. Case study resultssummary and synthesis
Ericsson’s traditional, engineering-centered in-dustrialization approach would have benefitedby categorizing the strategic program’s require-ments and associated risks into the five ar-eas (strategic decisions, business logic, businessmodel artifacts, misalignment, and BMa) andhighlighting that the program was actually fac-ing a business model change. By addressing themisalignment between the effectiveness (“do the

Business Model Flexibility and Software-intensive Companies: Opportunities and Challenges 199
right thing” as a top-down strategic planningprocess) and the efficiency (as the bottom-upchange of existing business models, business pro-cesses, organizations, and tools), we believe thescale of the program, as well as the temporaleffects, could have been predicted and managedin a better way by proposing a set of differenttactics, thereby invoking a higher degree of topmanagement commitment and attention.
This study confirms opportunities and chal-lenges for digitalization reported by scholars, forexample, [6, 21, 24, 52]. Our interviews revealedthat in practice, the scalability, the complexityof roles and (changing) business intents, and thesize of the solution were perceived as the mostsignificant challenges. Given the global, widescope of the program and frequent organizationalchanges, establishing a reporting structure forhow the different tactics supported each other(and executed by the different parts of the or-ganization) , turned out to be slow and ineffi-cient, causing mistrust and unnecessary tensions.We believe this program would have benefitedfrom a BMCh-centered approach, rather thana engineering-focused servitization approach, byachieving over-arching clarity and consensus be-tween top-management, middle management,and the affected organizations, highlighting itwas not just “business as usual”.
The case study also highlights the added com-plexity of BMCh for large software companiesthat operate with contracts spawning years tocomplete. This calls for a combination of BMChand organizational design. What appears to beinevitable is that the business environment willchange during the execution of the underlyingagreements. Our interview respondents believedthat governance mechanisms should facilitate theexploration phase (Knowledge Creation process),transforming tacit knowledge into explicit knowl-edge fast enough and made it available throughthe Knowledge Management process.
We believe it requires fast, efficient feedbackloops between R&D, sales, and service deliveryorganizations, illustrating the continuous interac-tion between knowledge creation and knowledgemanagement processes. Support for these loopsshould preferably be implemented both in the
products as well as in the business processes. We,therefore, propose that,
Proposition 6: The practice of Digi-tal Business Modeling (DBM) should becoined as a fusion between current prac-tices of business modeling and requirementengineering, and become a key practicein facilitating business model innovationthrough experimentation.
6. Conclusion
Many distinguished scholars have highlightedthe cross-disciplinary complexity stemming fromthe ongoing digitalization and transformation ofthe business environment [3, 13, 14, 89], just toname a few. This paper highlights three criti-cal aspects of business modeling in the analysisof the misalignment between planning and ex-ecution. Firstly, focus on experimenting [64] asa “round-trip” process of “translating an ideainto execution, test, evaluate, and change un-til satisfied” (similar to the agile method of de-veloping software products). Secondly, focus ontransactions, thereby connecting the businessmodel to human behavior and value in execu-tion and planning activities. Thirdly, the anal-ysis is direction-sensitive, with minimum two(role-dependent) views of the transaction, imply-ing an information representation suitable formaintaining (observe, analyze, decide, change)many relationships (through all the stages of thebusiness model lifecycle) [11]. FInally, we analyzehow software engineering methods and tools cansupport business model flexibility and promptlyrealizing business model changes.
This paper is an initial step for such a de-tailed, cross-disciplinary guide for handing busi-ness model change. Synthesizing from the twoprevious two literature reviews [9, 10], a designscience study [11], and the case study presentedin this paper, we present six propositions for ad-dressing the challenges of aligning the planningand execution layers for software-intensive prod-uct development. We also highlight four criticalaspects that software-intensive companies needto address:

200 Magnus Wilson et al.
– Business model innovation for the businessecosystem, e.g., driven by markets and con-textual changes, co-creation of value, collab-oration within and between organizations,partners, communities, and customers, newstreams of revenue while sharing of risks, rev-enues, and costs [5, 64].
– Software tools that focus on automation andintegration of business and software architec-ture. These tools should support the sharedeconomy aspect of new business models andthe service-driven economy [90–92].
– Organizations prepared for experimentationand collaboration in a digital business world,affecting both the product development aswell as the value delivery, e.g., agreementstructures, incentives, processes, knowledgemanagement and organizational learning,measurements of effectiveness and efficiency,revenues, cost, decision-making based onmultifaceted optimization and transparency[93, 94].
– The level of integration and automation be-tween the four processes of value creation,value capture, knowledge creation, and knowl-edge management [95, 96]. This is the founda-tion for an innovative enterprise and shouldbe nurtured as a key competitive advantage.
Acknowledgment
We would like to acknowledge that this work wassupported by the KKS foundation through theS.E.R.T. Research Profile project at BlekingeInstitute of Technology.
References
[1] P. Parviainen, M. Tihinen, J. Kaariainen, andS. Teppola, “Tackling the digitalization chal-lenge: how to benefit from digitalization in prac-tice,” International Journal of Information Sys-tems and Project Management, Vol. 5, No. 1,2017, pp. 63–77.
[2] S. Gupta, L. Ulanova, S. Bhardwaj, P. Dmitriev,P. Raff, and A. Fabijan, “The anatomy of a large--scale experimentation platform,” in International
Conference on Software Architecture (ICSA).IEEE, 2018, pp. 1–109.
[3] C. Legner, T. Eymann, T. Hess, C. Matt,T. Bohmann, P. Drews, A. Madche, N. Urbach,and F. Ahlemann, “Digitalization: Opportunityand challenge for the business and informationsystems engineering community,” Business andInformation Systems Engineering, Vol. 59, 2017,pp. 301–308.
[4] J. Moore, “The rise of a new corporate form,”Washington Quarterly, Vol. 21, 1998, pp. 167–181.
[5] D. Romero and A. Molina, “Collaborative net-worked organisations and customer communities:value co-creation and co-innovation in the net-working era,” Production Planning and Control:The Management of Operations, Vol. 22, No. 5–6,2011, pp. 447–472.
[6] Y. Snihur and J. Tarzijan, “Managing complexityin a multi-business-model organization,” LongRange Planning, Vol. 51, No. 1, 2017, pp. 50–63.
[7] S.A. Cavalcante, “Preparing for business modelchange: The ‘pre-stage’ finding,” Journal ofManagement and Governance, Vol. 18, 2014,pp. 449–469.
[8] N.F. Hoflinger, “The business model conceptand its antecedents and consequences – Towardsa common understanding,” Academy of Man-agement Proceedings: Organization Developmentand Change, Vol. 2014:1, 2014.
[9] M. Wilson, K. Wnuk, J. Silvander, and T. Gors-chek, “A literature review on the effective-ness and efficiency of business modeling,”e-Informatica Software Engineering Journal,Vol. 12, No. 1, 2018, pp. 265–302. [Online].http://www.e-informatyka.pl/attach/e-Informatica - Volume 12/eInformatica2018Art11.pdf
[10] M. Wilson and K. Wnuk, “Business model-ing and flexibility in software-intensive productdevelopment – a systematic literature review,”in Challenges and Opportunities in the Digi-tal Era. Springer International Publishing, 2018,pp. 292–304.
[11] J. Silvander, M. Wilson, K. Wnuk, and M. Svahn-berg, “Supporting continuous changes to busi-ness intents,” International Journal of SoftwareEngineering and Knowledge Engineering, Vol. 27,2017, pp. 1167–1198.
[12] T. Ritter and C. Lettl, “The wider implicationsof business-model research,” Long Range Plan-ning, 2017, pp. 1–8.
[13] C. Zott and R. Amit, “The business model: A the-oretically anchored robust construct for strategicanalysis,” Strategic Organization, Vol. 11, No. 4,2013, pp. 403–411.
Business Model Flexibility and Software-intensive Companies: Opportunities and Challenges 201
[14] D. Veit, E. Clemons, A. Benlian, P. Buxmann,T. Hess, D. Kundisch, J.M. Leimeister, P. Loos,and M. Spann, “Business models: An informa-tion systems research agenda,” Business andInformation Systems Engineering, Vol. 6, 2014,pp. 45–53.
[15] O.D. Fjeldstad and C.C. Snow, “Business modelsand organization design,” Long Range Planning,Vol. 51, No. 1, 2018, pp. 32–39.
[16] C. Matt, T. Hess, and A. Benlian, “Digital trans-formation strategies,” Business and InformationSystems Engineering, Vol. 57, 2015, pp. 339–343.
[17] P.E. Eriksson, P.C. Patel, D.R. Sjodin, J. Frisham-mar, and V. Parida, “Managing interorganiza-tional innovation projects: Mitigating the neg-ative effects of equivocality through knowledgesearch strategies,” Long Range Planning, Vol. 49,No. 6, 2016, pp. 691–705.
[18] A. Osterwalder, Y. Pigneur, and C. Tucci, “Clar-ifying business models: Origins, present, andfuture of the concept,” Communications of theAssociation for Information Systems, Vol. 15,No. 1, 2005, pp. 1–25.
[19] P. Ballon, “Business modelling revisited: the con-figuration of control and value,” Info, Vol. 9,No. 5, 2007, pp. 6–19.
[20] H. Meier and M. Boßlau, “Design and engi-neering of dynamic business models for indus-trial product-service systems,” in The Philoso-phers Stone for Sustainability. Springer, 2013,pp. 179–184.
[21] A. Richter, T. Sadek, and M. Steven, “Flexi-bility in industrial product-service systems anduse-oriented business models,” CIRP Journal ofManufacturing Science and Technology, Vol. 3,No. 2, 2010, pp. 128–134.
[22] C. Wohlin, “Guidelines for snowballing in sys-tematic literature studies and a replication insoftware engineering,” in Proceedings of the18th International Conference on Evaluationand Assessment in Software Engineering, 2014,pp. 1–10.
[23] C.J. Woodard, N. Ramasubbu, F.T. Tschang,and V. Sambamurthy, “Design capital and de-sign moves: The logic of digital business strategy,”MIS Quarterly: Management Information Sys-tems, Vol. 37, No. 2, 2013, pp. 537–564.
[24] E.K. Chew, “Linking a service innovation-basedframework to business model design,” in 16thConference on Business Informatics, Vol. 1.IEEE, 2014, pp. 191–198.
[25] M. Eurich, T. Weiblen, and P. Breitenmoser,“A six-step approach to business model innova-tion,” International Journal of Entrepreneur-
ship and Innovation Management, Vol. 18, No. 4,2014, pp. 330–348.
[26] K. Mason and S. Mouzas, “Flexible businessmodels,” European Journal of Marketing, Vol. 46,No. 10, 2012, pp. 1340–1367.
[27] M. Gul, “Digital business strategies and com-petitive superiority,” International Journal ofBusiness Ecosystem, Vol. 2, No. 1, Feb. 2020,p. 17–31. [Online]. https://www.bussecon.com/ojs/index.php/ijbes/article/view/106
[28] D. Sjodin, V. Parida, M. Jovanovic, and I. Vis-njic, “Value creation and value capture alignmentin business model innovation: A process viewon outcome-based business models,” Journal ofProduct Innovation Management, Vol. 37, No. 2,2020, pp. 158–183.
[29] M. Antikainen, A. Aminoff, and J. Heikkila,“Business model experimentations in advancingb2b sharing economy research,” in ISPIM Inno-vation Symposium. The International Society forProfessional Innovation Management (ISPIM),2018, pp. 1–12.
[30] M. Trapp, K.I. Voigt, and A. Brem, “Businessmodels for corporate innovation management:Introduction of a business model innovation toolfor established firms,” International Journal ofInnovation Management, Vol. 22, No. 01, 2018,pp. 18–40.
[31] M. Christofi, V. Pereira, D. Vrontis, S. Tarba,and A. Thrassou, “Agility and flexibility in in-ternational business research: A comprehensivereview and future research directions,” Journalof World Business, Vol. 56, No. 3, 2021, p. 101194.[Online]. https://www.sciencedirect.com/science/article/pii/S1090951621000067
[32] D.J. Teece, “Business models and dynamic ca-pabilities,” Long Range Planning, Vol. 51, No. 1,2018, pp. 40–49. [Online]. https://www.sciencedirect.com/science/article/pii/S0024630117302868
[33] L. Linde, J. Frishammar, and V. Parida, “Rev-enue models for digital servitization: A valuecapture framework for designing, developing, andscaling digital services,” IEEE Transactions onEngineering Management, Vol. 5, No. 22, 2021,pp. 1–16.
[34] F. Hacklin, J. Bjorkdahl, and M.W. Wallin,“Strategies for business model innovation: Howfirms reel in migrating value,” Long Range Plan-ning, Vol. 51, No. 1, 2018, pp. 82–110. [Online].https://www.sciencedirect.com/science/article/pii/S0024630117302881
[35] F. Vendrell-Herrero, G. Parry, M. Opazo-Basaez,and F.J. Sanchez-Montesinos, “Does business

202 Magnus Wilson et al.
model experimentation in dynamic contexts en-hance value capture?” International Journal ofBusiness Environment, Vol. 10, No. 1, 2018,pp. 14–34.
[36] D. Szopinski, T. Schoormann, T. John, R. Knack-stedt, and D. Kundisch, “Software tools for busi-ness model innovation: Current state and futurechallenges,” Electronic Markets, Vol. 30, No. 3,2020, pp. 469–494.
[37] B.W. Wirtz, Adaptation and Modification ofBusiness Models. Cham: Springer InternationalPublishing, 2020, pp. 227–238.
[38] H. Gebauer, M. Paiola, N. Saccani, and M. Ra-paccini, “Digital servitization: Crossing the per-spectives of digitization and servitization,” In-dustrial Marketing Management, Vol. 93, 2021,pp. 382–388. [Online]. https://www.sciencedirect.com/science/article/pii/S0019850120304855
[39] T. Moellers, L. von der Burg, B. Bansemir,M. Pretzl, and O. Gassmann, “System dynamicsfor corporate business model innovation,” Elec-tronic Markets, Vol. 29, No. 3, 2019, pp. 387–406.
[40] C. Nailer and G. Buttriss, “Processes of businessmodel evolution through the mechanism of antic-ipation and realisation of value,” Industrial Mar-keting Management, Vol. 91, 2020, pp. 671–685.[Online]. https://www.sciencedirect.com/science/article/pii/S0019850116302735
[41] T. Clauss, M. Abebe, C. Tangpong, and M. Hock,“Strategic agility, business model innovation, andfirm performance: An empirical investigation,”IEEE Transactions on Engineering Management,2019, pp. 1–18.
[42] N. Schaffer, M. Pfaff, and H. Krcmar, “Dynamicbusiness models: A comprehensive classificationof literature,” in Thirteenth Mediterranean Con-ference on Information Systems (MCIS 2019),2019.
[43] N. Pratama and J. Iijima, “Value operation:Linking value in new business model creation pro-cess,” in 23rd Pacific Asia Conference on Infor-mation Systems: Secure ICT Platform for the 4thIndustrial Revolution, PACIS, 2019, pp. 12–32.
[44] D.S. Cruzes and T. Dyba, “Recommended stepsfor thematic synthesis in software engineering,”in 2011 International Symposium on EmpiricalSoftware Engineering and Measurement, 2011,pp. 275–284.
[45] P. Runeson and M. Host, “Guidelines for con-ducting and reporting case study research insoftware engineering,” Empirical Software Engi-neering, Vol. 14, 2009, pp. 131–164.
[46] R.K. Yin, Applications of case study research.Sage Publications, 2011.
[47] F. Adrodegari and N. Saccani, “A maturitymodel for the servitization of product-centriccompanies,” Journal of Manufacturing Technol-ogy Management, 2020.
[48] T.C. Lethbridge, S.E. Sim, and J. Singer, “Study-ing software engineers: Data collection tech-niques for software field studies,” Empiricalsoftware engineering, Vol. 10, No. 3, 2005,pp. 311–341.
[49] B. Flyvbjerg, “Five misunderstandings aboutcase-study research,” Qualitative inquiry, Vol. 12,No. 2, 2006, pp. 219–245.
[50] W. Reim, V. Parida, and D. Ortqvist, “Strategy,business models or tactics – What is product-ser-vice systems (PSS) literature talking about?” inProceedings of the International Conference onEngineering Design, ICED, 2013, pp. 309–318.
[51] W. Reim, V. Parida, and D. Ortqvist, “Prod-uct-service systems (PSS) business models andtactics – a systematic literature review,” Journalof Cleaner Production, 2014.
[52] H. Meier, R. Roy, and G. Seliger, “IndustrialProduct-Service systems – IPS2,” CIRP Annals
– Manufacturing Technology, Vol. 59, No. 2, 2010,pp. 607–627.
[53] D. Kindstrom, “Towards a service-based busi-ness model – Key aspects for future competi-tive advantage,” European Management Journal,Vol. 28, No. 6, 2010, pp. 479–490.
[54] A. Zolnowski and T. Bohmann, “Business mod-eling for services: Current state and researchperspectives,” in AMCIS 2011 Proceedings, 2011,pp. 1–8.
[55] A. Bharadwaj, O.A. El Sawey, P.A. Pavlou,N. Venkatraman, O.a. El Sawy, P.A. Pavlou,and N. Venkatraman, “Digital business strat-egy: Toward a next generation of insights,” MISQuarterly, Vol. 37, No. 2, 2013, pp. 471–482.
[56] H. Munir, K. Wnuk, and P. Runeson, “Openinnovation in software engineering: a systematicmapping study,” Empirical Software Engineer-ing, Vol. 21, No. 2, 2016, pp. 684–723.
[57] X. Koufteros, M. Vonderembse, and J. Jayaram,“Internal and external integration for productdevelopment: The contingency effects of uncer-tainty, equivocality, and platform strategy,” De-cision sciences, Vol. 36, No. 1, 2005, pp. 97–133.
[58] A. Chang and C.C. Tien, “Quantifying uncer-tainty and equivocality in engineering projects,”Construction Management and Economics,Vol. 24, 2006, pp. 171–184.
[59] B.W. Boehm, “Software risk management: prin-ciples and practices,” IEEE Software, Vol. 8,No. 1, 1991, pp. 32–41.

Business Model Flexibility and Software-intensive Companies: Opportunities and Challenges 203
[60] M. Svahnberg, T. Gorschek, T.T.L. Nguyen, andM. Nguyen, “Uni-repm: validated and improved,”Requirements Engineering, Vol. 18, No. 1, 2013,pp. 85–103.
[61] H. Chesbrough, “Business Model Innovation: Op-portunities and Barriers,” Long Range Planning,Vol. 43, No. 2–3, 2010, pp. 354–363.
[62] R.G. McGrath, “Business models: A discoverydriven approach,” Long Range Planning, Vol. 43,No. 2–3, apr 2010, pp. 247–261.
[63] R. Kohavi, D. Tang, and Y. Xu, Trustworthyonline controlled experiments: A practical guideto a/b testing. Cambridge University Press, 2020.
[64] R. Rohrbeck, L. Konnertz, and S. Knab, “Col-laborative business modelling for systemic andsustainability innovations,” International Jour-nal of Technology Management, Vol. 63, No. 1/2,2013, p. 4.
[65] OMG, Value Delivery Modeling Language Spec-ification, v1.0. Object Management Group,OMG.org, 2015, [Online; accessed 2018-08-08]http://www.omg.org/spec/VDML/About-VDML/.
[66] F. Fagerholm, A. Sanchez Guinea, H. Maenpaa,and J. Munch, “The right model for continu-ous experimentation,” Journal of Systems andSoftware, Vol. 123, 2017, pp. 292–305.
[67] A. Fabijan, P. Dmitriev, H.H. Olsson, andJ. Bosch, “The evolution of continuous exper-imentation in software product development:From data to a data-driven organization at scale,”in 39th International Conference on SoftwareEngineering (ICSE), 2017, pp. 770–780.
[68] S. Cavalcante, P. Kesting, and J. Ulhøi,“Business model dynamics and innovation:(re)establishing the missing linkages,” Manage-ment Decision, Vol. 49, 2011, pp. 1327–1342.
[69] R. Casadesus-Masanell and J.E. Ricart, “FromStrategy to Business Models and onto Tactics,”Long Range Planning, Vol. 43, No. 2–3, 2010,pp. 195–215.
[70] Y.L. Doz and M. Kosonen, “Embedding strate-gic agility: A leadership agenda for acceleratingbusiness model renewal,” Long Range Planning,Vol. 43, No. 2–3, 2010, pp. 370–382.
[71] S. Schneider and P.A.T. Spieth, “Business modelinnovation and strategic flexibility: insights froman experimental research design,” InternationalJournal of Innovation Management, Vol. 18,No. 6, 2014, pp. 1–22.
[72] A. Ghezzi, “Revisiting business strategy underdiscontinuity,” Management Decision, Vol. 51,No. 7, 2013, pp. 1326–1358.
[73] A. Osterwalder and Y. Pigneur, Business modelgeneration: A handbook for visionaries, gamechangers, and challengers. Hoboken, NJ: Wiley,2010.
[74] R. Capilla, J. Bosch, P. Trinidad, A. Ruiz-Cortes,and M. Hinchey, “An overview of dynamic soft-ware product line architectures and techniques:Observations from research and industry,” Jour-nal of Systems and Software, Vol. 91, 2014,pp. 3–23.
[75] H. Holmstrom Olsson, J. Bosch, and H. Alahyari,“Towards R&D as innovation experiment systems:A framework for moving beyond agile softwaredevelopment,” in Proceedings of the IASTED In-ternational Conference on Software Engineering,2013, pp. 798–805.
[76] S. Marciuska, C. Gencel, X. Wang, and P. Abra-hamsson, “Feature usage diagram for featurereduction,” in International Conference onAgile Software Development. Springer, 2013,pp. 223–237.
[77] K. Wnuk, R.B. Svensson, and D. Callele, “The ef-fect of stakeholder inertia on product line require-ments,” in Second IEEE International Workshopon Requirements Engineering for Systems, Ser-vices, and Systems-of-Systems (RESS). IEEE,2012, pp. 34–37.
[78] K. Pohl, G. Bockle, and F.J. van Der Linden,Software product line engineering: foundations,principles and techniques. Springer Science andBusiness Media, 2005.
[79] S. Jansen, K.M. Popp, and P. Buxmann, “Thesun also sets: Ending the life of a software prod-uct,” in Software Business, B. Regnell, I. van deWeerd, and O. De Troyer, Eds. Berlin, Heidel-berg: Springer, 2011, pp. 154–167.
[80] H.C. Lucas and M. Olson, “The impact of infor-mation technology on organizational flexibility,”Journal of Organizational Computing, Vol. 4,1994, pp. 155–176.
[81] J. Barney, “Firm resources and sustained com-petitive advantage,” Journal of management,Vol. 17, No. 1, 1991, pp. 99–120.
[82] R. Sanchez and J.T. Mahoney, “Modularity, flex-ibility, and knowledge management in productand organization design,” Strategic ManagementJournal, Vol. 17, 1996, pp. 63–76.
[83] D.J. Teece, G. Pisano, and A. Shuen, “Dy-namic capabilities and strategic management,”Strategic Management Journal, Vol. 18, 1997,pp. 509–533.
[84] K.J.K. Mason and S. Leek, “Learning to Builda Supply Network: An Exploration of Dynamic

204 Magnus Wilson et al.
Business Models,” Journal of Management Stud-ies, Vol. 45, No. 4, 2008, pp. 774–799.
[85] D. Namiot and M. Sneps-Sneppe, “On micro-ser-vices architecture,” International Journal ofOpen Information Technologies, Vol. 2, No. 9,2014, pp. 24–27.
[86] J. Bosch, “Achieving simplicity with the three--layer product model,” Computer, Vol. 46, No. 11,Nov. 2013, pp. 34–39.
[87] J.C. Munson, “Software lives too long,” IEEESoftware, Vol. 15, No. 4, Jul. 1998, pp. 18, 20.
[88] Y. Jia and M. Harman, “An analysis and surveyof the development of mutation testing,” IEEETransactions on Software Engineering, Vol. 37,No. 5, 2010, pp. 649–678.
[89] D. Romero and F. Vernadat, “Enterprise infor-mation systems state of the art: Past, presentand future trends,” Computers in Industry,Vol. 79, 2016, pp. 3–13.
[90] D. Olausson and C. Berggren, “Managing uncer-tain, complex product development in high-techfirms: In search of controlled flexibility,” R&DManagement, Vol. 15, 2010, p. 383–399.
[91] R. Capilla, J. Bosch, and K.C. Kang, Sys-tems and Software Variability Management Con-cepts, Tools and Experiences. Berlin, Heidelberg:Springer, 2013.
[92] T. Magnusson and N. Lakemond, “Evolvingschemes of interpretation: investigating the dualrole of architectures in new product devel-opment,” R&D Management, Vol. 47, 2017,pp. 36–46.
[93] F. Laloux and K. Wilber, Reinventing Organi-zations. Laloux, Frederic, 2014. [Online]. http://www.reinventingorganizations.com/pay-what-feels-right.html
[94] D. Kahneman, Thinking, Fast and Slow. Farrar,Straus and Giroux, 2011.
[95] D.P. Lepak, K.G. Smith, and M.S. Taylor, “In-troduction to special topic forum value creationand value capture: A multilevel perspective,”Academy of Management Review, Vol. 32, 2007,pp. 180–194.
[96] C. Curado, “Organisational learning and organ-isational design,” The Learning Organization,Vol. 13, No. 1, 2006, pp. 25–48.
e-Informatica Software Engineering Journal (eISEJ) is an international, open access, no authorship fees, blind peer-reviewedjournal that concerns theoretical and practical issues pertaining development of software systems. Our aim is to focus onexperimentation and machine learning in software engineering.The journal is published under the auspices of the Software Engineering Section of the Committee on Informatics of thePolish Academy of Sciences and Wrocław University of Science and Technology.Aims and Scope:The purpose of e-Informatica Software Engineering Journal is to publish original and significant results in all areas ofsoftware engineering research.The scope of e-Informatica Software Engineering Journal includes methodologies, practices, architectures, technologiesand tools used in processes along the software development lifecycle, but particular stress is laid on empirical evaluation.e-Informatica Software Engineering Journal is published online and in hard copy form. The on-line version is from thebeginning published as a gratis, no authorship fees, open access journal, which means it is available at no charge to thepublic. The printed version of the journal is the primary (reference) one.Topics of interest include, but are not restricted to:— Software requirements engineering and modeling— Software architectures and design— Software components and reuse— Software testing, analysis and verification— Agile software development methodologies and practices— Model driven development— Software quality— Software measurement and metrics— Reverse engineering and software maintenance— Empirical and experimental studies in software engineering (incl. replications)— Evidence based software engineering— Systematic reviews and mapping studies— Meta-analyses— Object-oriented software development— Aspect-oriented software development— Software tools, containers, frameworks and development environments— Formal methods in software engineering.— Internet software systems development— Dependability of software systems— Human-computer interaction— AI and knowledge based software engineering— Data mining in software engineering— Prediction models in software engineering— Mining software repositories— Search-based software engineering— Multiobjective evolutionary algorithms— Tools for software researchers or practitioners— Project management— Software products and process improvement and measurement programs— Process maturity modelsImportant information: Papers can be rejected administratively without undergoing review for a variety reasons, such asbeing out of scope, being badly presented to such an extent as to prevent review, missing some fundamental components ofresearch such as the articulation of a research problem, a clear statement of the contribution and research methods viaa structured abstract or the evaluation of the proposed solution (empirical evaluation is strongly suggested).Funding acknowledgements: Authors are requested to identify who provided financial support for the conduct of theresearch and/or preparation of the article and to briefly describe the role of the sponsor(s), if any, in study design; in thecollection, analysis and interpretation of data; in the writing of the paper. If the funding source(s) had no such involvementthen this should be stated as well.The submissions will be accepted for publication on the base of positive reviews done by international Editorial Board(https://www.e-informatyka.pl/index.php/einformatica/editorial-board/) and external reviewers. English isthe only accepted publication language. To submit an article please enter our online paper submission site (https://mc.manuscriptcentral.com/e-InformaticaSEJ).Subsequent issues of the journal will appear continuously according to the reviewed and accepted submissions.

Copyright © 2022 FDOKUMEN