International Journal of Computational Intelligence Research
214
International Journal of Computational Intelligence Research ISSN 0973-1873 Editor-in-Chief: Keshav Dahal, Ph.D. MOSAIC Research Centre,School of Informatics, University of Bradford, U.K. E-mail: [email protected] Editorial Board Members Hisao Ishibuchi, Japan R. Poli, UK S.K. Halgamuge, Australia R. Langari, USA R. Weber, Chile, Chile A. Satyadas, USA M. Köppen, Germany Nedjah, Brazil M.J. Geiger, Germany N.Ravi Shankar, India Mohammed Ali Hussain, India A. Atiya, Egypt A. Aggarwal, Canada Abdul Hannan India C. Bessiere, France J. Burns, Ireland G. Ciobanu, Romania C.A. Coello Coello, Mexico D. Corne, UK K. Dahal, UK B. De Baets, Belgium Y. Dote, Japan T. Fukuda, Japan M. Gams, Slovenia A. Gelbukh, Mexico B. Grabot, France J. L. Grantner, USA S. Hawamdeh, USA F. Herrera, Spain L. C. Jain, Australia J. Kacprzyk, Poland A. Kelemen, University of Niagra, USA I. King, Hong Kong S. G. Kong, USA D. H. Kraft, USA V. Kreinovich, USA R. Kruse, Germany C. T. Lin, Taiwan V. Loia, Italy R. E. Mercer, Canada G. C. Nandi, India V. Palade, UK W. Pedrycz, Canada I. Perfilieva, Ostrava C. Rego, USA G. Rudolph, Germany Q. Shen, UK P.V.S. Srinivas, India. T. Sudkamp, USA R. Sun, USA G. Tecuci, USA A. Vasilakos, Greece F. Xhafa, Spain R. R. Yager, USA Z. Yi, China X. J. Zeng, UK W. Zhang, China Anand Kumar, India El-Sayed M. El-Alfy, Saudi Arabia Published by RIP Research India Publications Head Office: B-2/84, Ground Floor, Rohini Sector-16, Delhi-110089, INDIA Tel No.: +91-11-65394240 Fax No.: +91-11-27297815 Website: www.ripublication.com E-mail: [email protected]
-
Upload
khangminh22 -
Category
Documents
-
view
1 -
download
0
Transcript of International Journal of Computational Intelligence Research

International Journal of Computational
Intelligence Research ISSN 0973-1873
Editor-in-Chief:
Keshav Dahal, Ph.D.
MOSAIC Research Centre,School of Informatics, University of Bradford, U.K.
E-mail: [email protected]
Editorial Board Members Hisao Ishibuchi, Japan
R. Poli, UK
S.K. Halgamuge, Australia
R. Langari, USA
R. Weber, Chile, Chile
A. Satyadas, USA
M. Köppen, Germany
Nedjah, Brazil
M.J. Geiger, Germany
N.Ravi Shankar, India
Mohammed Ali Hussain, India
A. Atiya, Egypt
A. Aggarwal, Canada
Abdul Hannan India
C. Bessiere, France
J. Burns, Ireland
G. Ciobanu, Romania
C.A. Coello Coello, Mexico
D. Corne, UK
K. Dahal, UK
B. De Baets, Belgium
Y. Dote, Japan
T. Fukuda, Japan
M. Gams, Slovenia
A. Gelbukh, Mexico
B. Grabot, France
J. L. Grantner, USA
S. Hawamdeh, USA
F. Herrera, Spain
L. C. Jain, Australia
J. Kacprzyk, Poland
A. Kelemen, University of Niagra, USA
I. King, Hong Kong
S. G. Kong, USA
D. H. Kraft, USA
V. Kreinovich, USA
R. Kruse, Germany
C. T. Lin, Taiwan
V. Loia, Italy
R. E. Mercer, Canada
G. C. Nandi, India
V. Palade, UK
W. Pedrycz, Canada
I. Perfilieva, Ostrava
C. Rego, USA
G. Rudolph, Germany
Q. Shen, UK
P.V.S. Srinivas, India.
T. Sudkamp, USA
R. Sun, USA
G. Tecuci, USA
A. Vasilakos, Greece
F. Xhafa, Spain
R. R. Yager, USA
Z. Yi, China
X. J. Zeng, UK
W. Zhang, China
Anand Kumar, India
El-Sayed M. El-Alfy, Saudi Arabia
Published by
RIP Research India Publications Head Office: B-2/84, Ground Floor, Rohini Sector-16, Delhi-110089, INDIA
Tel No.: +91-11-65394240 Fax No.: +91-11-27297815
Website: www.ripublication.com E-mail: [email protected]

International Journal of Computational
Intelligence Research http://www.ripublication.com/ijcir.htm
Aim and Scope
IJCIR is a peer reviewed international journal with a key objective to provide the academic and
industrial community a medium for presenting original cutting edge research related to
computational intelligence and its applications. IJCIR invites authors to submit their original and
unpublished work that communicates current research on computational intelligence both the
theoretical and methodological aspects, as well as various applications in real world problems
from science, technology, business or commerce.
Frequency of Publication
Publish one volume with four issues per year.
Submission of Manuscripts
Submitted papers must be in English and should not have been published elsewhere or being
currently under consideration by any other journal. The final decision on publication is made by
the Editor-in-Chief upon recommendation of an Associate Editor and / or an Editorial Board
Members.
International Journal of Computational Intelligence Research is online at
http://www.ripublication.com/ijcir.htm. Visit the journal’s home pages for details of aims and
scope, readership, instruction to authors and publishing procedure and table of contents. Use
website to order a subscription, reprints, a sample copy or individual articles.
Subscription Information
Subscription orders may be directed to the publisher or contact your preferred subscription agent.
Regular subscription price
US$380/Libraries and US$360/Individual (Outside India)
Rs.3000/Libraries and Rs.1800/Individual (Inside India)
Publisher
All business correspondence, enquires and subscription orders should be addressed to
Editorial Office
Research India Publications
B-2/84, Ground Floor,
Rohini Sector-16,
Delhi-110089, INDIA
Fax No.: +91-011-27297815
Email: [email protected]
Website: www.ripublication.com
© 2018 Research India Publications, India
Printed in India
All material published in this journal is protected by copyright, which covers exclusive rights to
reproduce and distribute the material. No material published in this journal may be reproduced or
stored on microfilm or in electronic, optical or magnetic form without the written authorization of
the publisher.

============================================================================================
International Conference
on
ADVANCES IN SCIENCE & TECHNOLOGY-(ICAST-2018)
Organized by
K. J. Somaiya Institute of Engineering and
Information Technology, Sion, Mumbai-22
In Association with
University of Mumbai and The Institution of Engineering and Technology
(The IET, India) ============================================================================================


International Journal of Computational Intelligence Research (IJCIR)
Volume 14, Number 1, 2018 (Special Issue)
I N D E X
Paper
ID
Title & Authors Page
No.
01 Review on Adaptive Spatial Modulation using Huffman Mapping
Shilpa K.P1 Shoby N. Shaji2
1
02 Detection and Correction of SNM (Static Noise Margin) of SRAM Using BTI (Bias
Temperature Instability) Sensor
Kumar Neeraj1 J.K. Das2 Harishankar Srivastava3
4
03 A Survey on Security & Electrical Appliances for Home Automation Systems
Darshin Shah1 Meet Sanghvi2 Raj Mehta3
11
04 G-SMART ATM
Mukeshkumar Patel1 Mitali Pawar2 Pratiksha Viraskar3 Ms. Rashmi Adatkar4
19
05 Smart Shopping System
Mihir Ethan Awale1 Swamini Ambre2 Shubham Avhad3 Jay Bhosale4 Dr. Jayashree Khanapuri5
23
06 Low Cost Self Assistive Wheelchair
Nirav Mange1 Sahil Boble2 Akshat Sharma3 Raj Misal4 Ms. Sheetal Jagtap5
27
07 IoT Based Routine Health Checkup
Swapnil Sutar1 Deep Metha2 Venkatesh Mondi3 Pranali Nakti4 Ms. Rupali Satpute5
32
08 Sustainable Water Management System for Smart Cities using IoT
Atul Singh1 Sushrut Thosar2 Shubham Sharma3 Mayur Waghela4 Ms. Namrata Ansari5
36
09 Automated PNG Meter Reading and Monitoring Using Internet of Things
Akash Deshpande1 Himanshu Dhedhu2 Dhanesh Bhat3 Vipul Bhanushali4
40
10 Urban Farming using Artificial Light
Krunal Kasar1 Raj Vadariya2 Kiran Sapkale3 Ms. Sarika Mane4
45
11 Universal Data Logger
Adnan Shaikh1 Harish Kumar Naikar2 Rohan Mestry3 Mohammed Shabaz Ansari4 Mr. Pankaj
Deshmukh5
49
12 A Comparative Study of Different Similarity Measures for Texture Based Color Image
Retrieval
Dr. Jayashree Khanapuri
54
13 Image Security Enhancement using Steganography
Shoeb Ahmed Shaikh1 Nitin Nagori2
59
14 Low Level Signal Processing system for PCB based Rogowski Coil
Sumit Aole1 Nilima Warke2
65
15 Review of Fractional and Complex-order Derivatives and Integrals
Balu Bhusari1 Mukesh Patil2 Vishwesh Vyawahare3
70

16 Smart Pick and Place Robotic Arm Using Belt Drive
Bharatesh Alman1 Nikhil Anjane2 Suyash Chavan3 Pratik Chavan4 Dr. Milind Nemade
77
17 Review on Graph Signal Processing
Bhakti Kaushal1 Dr. Mukesh D. Patil2
80
18 Rail track monitoring technique currently used for crack detection in India
Manisha Vohra1 S.K Gabhane2
86
19 Implementation of time based 3-axis Capacitive Accelerometer using COMSOL Multiphysics
Surabhi Jadhav1 Jennefer Sen2 Nikhil Sarode3 Trupti Agarkar4 Akshay Jadhav5
90
20 Improved Ant Colony Optimization for MANETs
Gaurav Kavhar1 Guneesh Bhatia2 Uday Vasave 3Aditya Gadge4 Puja Padiya5
95
21 Health Monitoring and Disease Prediction System
Chetan Ingle1 Saurabh Gaikwad2 Pratik Shenoy3 Mrugank Jadhav4 Shilpa Kolte5
99
22 Malware Classification Using Machine Learning
Vijaykumar Ingle1 Amit Joshi2 Abhishek Nilajagi3 Pavan Chanda4 Smita Bharne5
211
23 Car Parking System
Suyash Sangale1 Sanjana Dubey2 Prachi Bhanushali3 Ms. Vaishali Gaikwad4
108
24 Result Accuracy Authentication of Outsourced Frequent Itemset Mining
Sukhada Bhingarkar1 Deven Shah2 Priyanka Birajdar3
114
25 Recommendation Engine for E-commerce with additional modules
Ashutosh Pandey1 Sumeet Khaitan2 Ajinket Singh3 Ravindra Sangle4
120
26 ThumbPay
Manan Shah1 Parth Maisheri2 Ms. Vijaya Pinjarkar3
126
27 IoT based Petrol Level Detection
Shantanu Kharat1 Ronak Gal2 Akash Kawale3 Mr. Uday Rote4
130
28 Tracking Quality of Healthcare Services
Karan Thakkar1 Phalguni Rathod2 Vishakha Oram3
135
29 Rubber Viscosity Variation Reduction Using Advanced Predictive Analytics
Mr. Kamran Niyazi1 Dr. Vahida Attar2 Mr. Sunil Kumar3 Dr. Saibal Dutta4
140
30 A Tourist Place Recommendation and Recognition System
Viken Parikh1 Madhura Keskar2 Dhwanil Dharia3 Pradnya Gotmare4
144
31 Widely Used Irrigation Techniques for agriculture in India
Bhushan Patil1 S.K Gabhane2 S.S Repal3
149
32 Mobile Application for Volunteer Management using Collaborative Filtering Technique
Soham Mankad1 Nagesh Khamkar2 Sanket Nimbalkar3 Ms. Nilambari Joshi4
155
33 Automated System for malaria Parasite Detection
Aishwarya Pannala1 Omkeshwari Pilare2 Alifia Ghantiwala3 Ms. Sandhya Kadam4
159
34 Learning Aid for Autistic Children
Meet Karia1 Bharat Jadeja 2 Ms. Shubhada Labde
164
35 Tourist Guide with Intelligent Chatbox
Aaroosh Pandoh1 Ankita Gawde2 Delrina Michael3 Gaurav Singh4 Hari Chavhan5
168

36 Analysis of various parameters tested at onset of labor
Ms. Sneha Chogale1 Dr. Sunita R. Patil2
173
37 Short-Term Household Load Forecasting using Neural Networks and Support Vector
Regression
Mr. Heman Shamachurn1 Mr. Sheik Lallmahomed2
182
38 The Fractional Fourier Transform in Signal Processing as a Modern Tool
Dr. Kanchan Kumar Sinha1 Mr. Pankaj Deshmukh2
188
39 Removal of Heavy Metals from Effluent of Metal Plating Industry by Absorbent from Peanut
Shell
Deepak Sharma1 Parmeshkumar Chaudhari2 Abhinesh Kumar Prajapati3
190
40 TQM Implementation Barriers in Indian Certified SMEs
Mr. Rajesh Meshram1 Mr. Ramesh Lakhe2 Ms. Archana Meshram3
195
41 Assessment of Feed Stock Properties of Seed Oil of Amoora Rohituka and Heptapleurum
Venulosum for The Biodiesel Production
Sangeeta Benni1 Ravindra Munnolli2 Kariyappa Katagi3
199
42 Plant Leaf Disease Detection using Image Processing Techniques and Classification Based on
Neural Networks
Jaynish Shah1 Parth Rathod2 Rahul Deshpande3 Ms. Chitra Bhole4
203
43 Survey on Normal or C-Section Delivery Process
Sneha Chogale, Dr. Sunita R. Patil
207

REVIEW ON ADAPTIVE SPATIAL MODULATION USING HUFFMAN CODING
Shibla K.p. PG Scholar Royal College of Engineering& Technology
Thrissur, India [email protected]
Shoby N Shaji Asst. Prof. Department of ECE Royal College of
Engineering& Technology Thrissur, India [email protected]
Abstract—Adaptive Spatial Modulation(ASM) using Huffman coding explore both Spatial modulation (SM) and transmit antenna selection. Using huffman coding, transmit antennas can be activated with variation in probabilities. In ASM, block of information bits are divided into two units and the first unit is mapped into the antenna index whereas the second unit is mapped into a symbol in the constellation diagram. The proposed system increases the capacity of the MIMO systems. The data rate in SM can be much more increased by using antenna subset spatial modulation. In this, transmitting antennas are grouped into subsets. Antenna selection divides a block of information bits to two units. The first unit is mapped into the antenna index and the second unit for constellation mapping. Optimum activation probability is obtained from optimizing capacity (channel gain). At the receiver, Maximum Likelihood Detector(MLD) is used in order to minimize probability of error
Index Terms—Adapive Spatial Modulation, Spatial Modulation
I. INTRODUCTION
Impressive improvements in the world of communication demands an uninterrupted access to the information with high quality, higher data rate, reduction in cost, etc. Adding more antennas at the transmitter and receiver improves the quality and reliability of transmission. This concept lead to the evolution of MIMO technology. The introduction of Multiple input multiple output (MIMO) transmission system has given wireless communication a new dimension, it has improved data rate and diversity. However, regardless of the use as spatial multiplexing, diversity, or smart antenna system, the main drawback of any MIMO scheme is an increase in complexity and cost. This is mainly due to multiple Radio Frequency (RF) chains, which are needed to transmit all the signals simultaneously and are, in general, expensive. In order to solve this problem transmission schemes that utilizes single RF frond end can be adopted.
II. SPATIAL MODULATION AND TRANSMIT ANTENNA SELECTION
Spatial Modulation (SM) is a recently developed transmis- sion scheme that utilizes single RF front end. The basic idea in SM is to divide block of information bits into two units, that is the first unit is mapped into the antenna index whereas
the second unit is mapped into a symbol in the constellation diagram. Compared to the conventional MIMO system, SM uses only one active antenna at a time to avoid Inter Channel Interference (ICI). Let Nt be the number of transmit antennas and Nr be the number of receive antennas. In SM Nt transmit antennas are equally probable for transmission. Let M be the size of Signal Constellations. The length n of information block will be:
n = log2NT + log2M
The channel qualities of possible links between transmitter and receiver are different. Information sending via a weak link is worst than sending a signal over strong link. These effects the performance of spatial modulation.
Another dominant transmission scheme that utilizes single RF front end MIMO is transmit antenna selection. Here, strongest transmit antenna is chosen for transmission and all other antennas are kept silent. Different from spatial modula- tion, the information is fully carried by signal symbol and no information is conveyed via antenna index. Antenna selection mainly relays on the feedback path from the receiver in order to choose the specific antenna, along with that transmit diver- sity can be obtained.Limitations in design flexibility restricts the enhancement in system performance.
Performance of spatial modulation depends on channel qualities of each link, which makes it inferior when weak link exist. On the other hand, antenna selection depends only on the strongest link and it is not affected by weak link.S aims to maximize the spatial information but signal information is not fully optimized. Transmit antenna selection intended to maximize the signal information and no spatial information is conveyed via antenna index. So the main objective is to design flexibile transmission scheme that generalize both SM and antenna selection. Huffman mapping helps to adjust activation probability of each transmit antenna with the use of feedback path from the receiver section. Channel capacity(channel gain) can be optimized for good approximation.
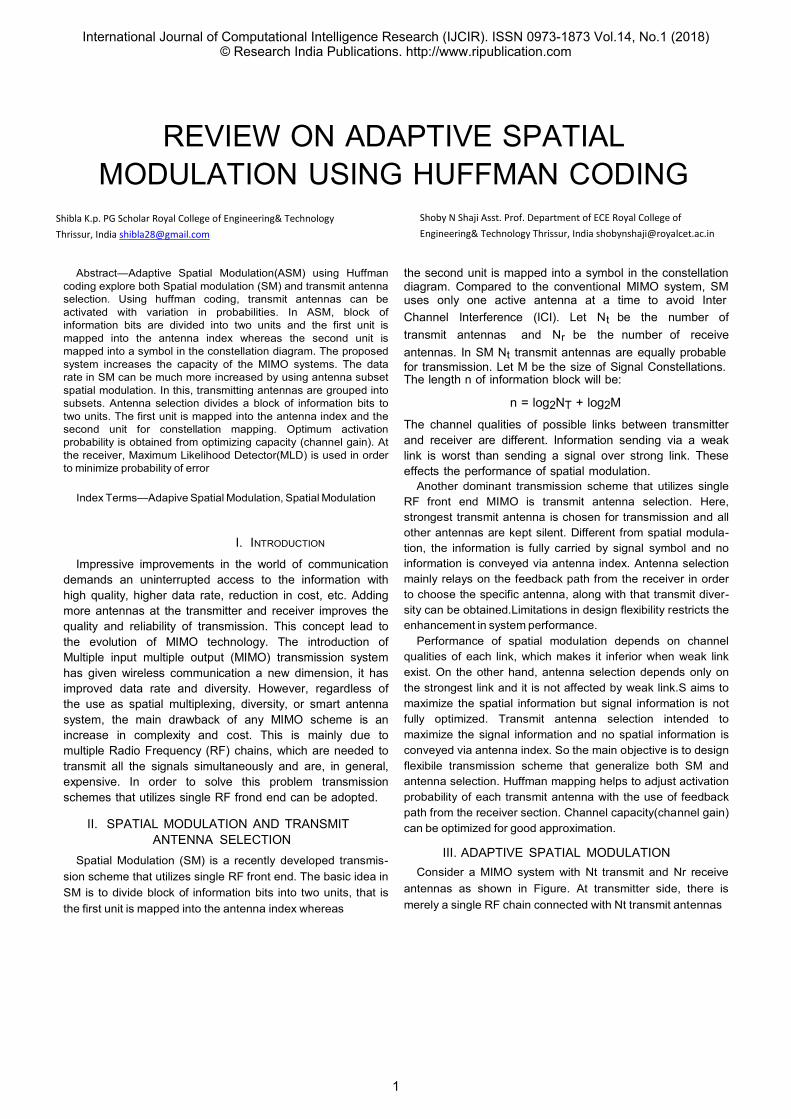
III. ADAPTIVE SPATIAL MODULATION Consider a MIMO system with Nt transmit and Nr receive
antennas as shown in Figure. At transmitter side, there is merely a single RF chain connected with Nt transmit antennas
International Journal of Computational Intelligence Research (IJCIR). ISSN 0973-1873 Vol.14, No.1 (2018)© Research India Publications. http://www.ripublication.com
1
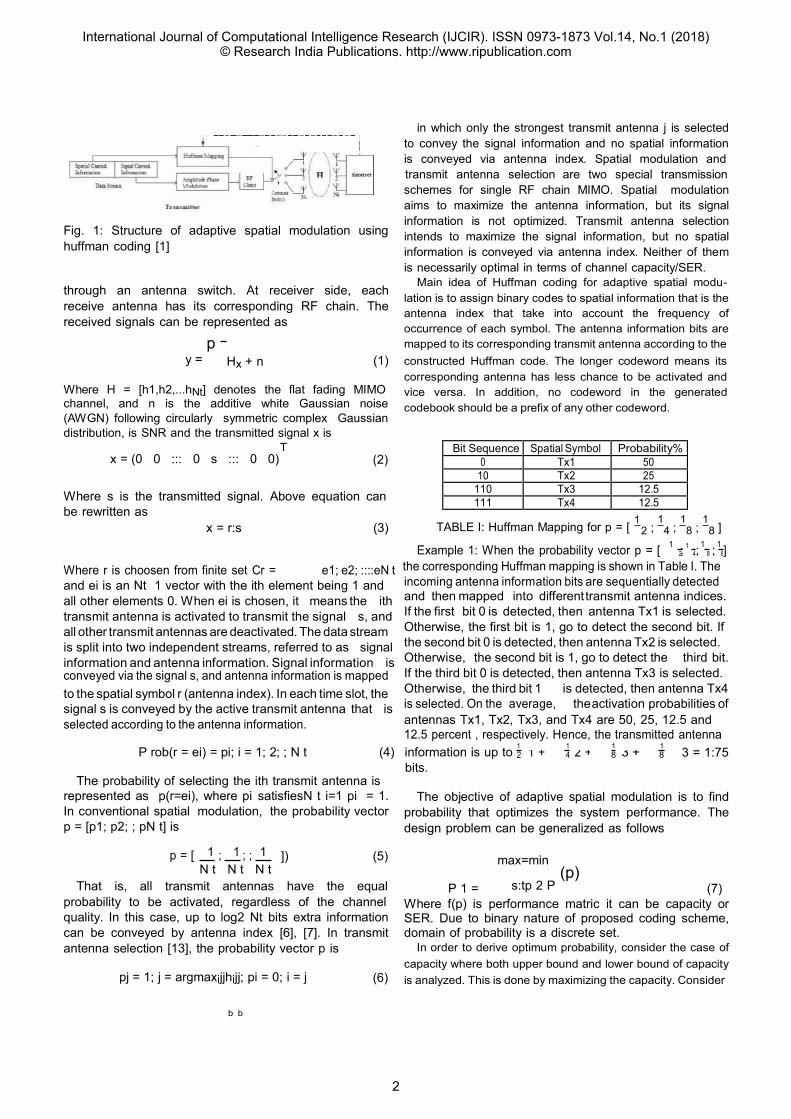
Bit Sequence Spatial Symbol Probability% 0 Tx1 50
10 Tx2 25 110 Tx3 12.5 111 Tx4 12.5
1 1 1 1 2 1 + 4 2 + 8 3 + 8
2 ; ;
2 4 8 8
;
in which only the strongest transmit antenna j is selected to convey the signal information and no spatial information is conveyed via antenna index. Spatial modulation and transmit antenna selection are two special transmission
Fig. 1: Structure of adaptive spatial modulation using huffman coding [1]
through an antenna switch. At receiver side, each receive antenna has its corresponding RF chain. The received signals can be represented as
p
schemes for single RF chain MIMO. Spatial modulation aims to maximize the antenna information, but its signal information is not optimized. Transmit antenna selection intends to maximize the signal information, but no spatial information is conveyed via antenna index. Neither of them is necessarily optimal in terms of channel capacity/SER.
Main idea of Huffman coding for adaptive spatial modu- lation is to assign binary codes to spatial information that is the antenna index that take into account the frequency of occurrence of each symbol. The antenna information bits are mapped to its corresponding transmit antenna according to the
y = Hx + n (1) constructed Huffman code. The longer codeword means its corresponding antenna has less chance to be activated and
Where H = [h1,h2,...hNt] denotes the flat fading MIMO channel, and n is the additive white Gaussian noise (AWGN) following circularly symmetric complex Gaussian distribution, is SNR and the transmitted signal x is
T
vice versa. In addition, no codeword in the generated codebook should be a prefix of any other codeword.
x = (0 0 ::: 0 s ::: 0 0) (2)
Where s is the transmitted signal. Above equation can be rewritten as
x = r:s (3) TABLE I: Huffman Mapping for p = [ 1
1 1 1 4 8 8 ]
Example 1: When the probability vector p = [ 1 ; 1 ; 1 ; 1 ] Where r is choosen from finite set Cr = e1; e2; ::::eN t the corresponding Huffman mapping is shown in Table I. The and ei is an Nt 1 vector with the ith element being 1 and all other elements 0. When ei is chosen, it means the ith transmit antenna is activated to transmit the signal s, and all other transmit antennas are deactivated. The data stream is split into two independent streams, referred to as signal information and antenna information. Signal information is conveyed via the signal s, and antenna information is mapped
incoming antenna information bits are sequentially detected and then mapped into different transmit antenna indices. If the first bit 0 is detected, then antenna Tx1 is selected. Otherwise, the first bit is 1, go to detect the second bit. If the second bit 0 is detected, then antenna Tx2 is selected. Otherwise, the second bit is 1, go to detect the third bit. If the third bit 0 is detected, then antenna Tx3 is selected.
to the spatial symbol r (antenna index). In each time slot, the signal s is conveyed by the active transmit antenna that is
Otherwise, the third bit 1 is selected. On the average,
is detected, then antenna Tx4 theactivation probabilities of
selected according to the antenna information. antennas Tx1, Tx2, Tx3, and Tx4 are 50, 25, 12.5 and 12.5 percent , respectively. Hence, the transmitted antenna
P rob(r = ei) = pi; i = 1; 2; ; N t (4) information is up to bits.
3 = 1:75
The probability of selecting the ith transmit antenna is represented as p(r=ei), where pi satisfiesN t i=1 pi = 1. In conventional spatial modulation, the probability vector p = [p1; p2; ; pN t] is
The objective of adaptive spatial modulation is to find
probability that optimizes the system performance. The design problem can be generalized as follows
p = [ 1 ; 1 ; ; 1 N t N t N t
That is, all transmit antennas
]) (5)
have the equal
P 1 =
max=min
s:tp 2 P
(p)
(7)
probability to be activated, regardless of the channel quality. In this case, up to log2 Nt bits extra information can be conveyed by antenna index [6], [7]. In transmit antenna selection [13], the probability vector p is
pj = 1; j = argmaxijjhijj; pi = 0; i = j (6)
Where f(p) is performance matric it can be capacity or SER. Due to binary nature of proposed coding scheme, domain of probability is a discrete set.
In order to derive optimum probability, consider the case of capacity where both upper bound and lower bound of capacity is analyzed. This is done by maximizing the capacity. Consider
b b
International Journal of Computational Intelligence Research (IJCIR). ISSN 0973-1873 Vol.14, No.1 (2018)© Research India Publications. http://www.ripublication.com
2
the case where ith antenna is chosen for transmission, such that received signal will be
p
IV. CONCLUSION ASM using huffman coding scheme proposes a system that
utilizes spatial modulation and transmit antenna selection. y j (r = ei) = shi + n Priority is given to the antenna index for the purpose of index
Assume that y follows a normal distribution and using prob-ability density function derive capacity in order to optimize probability[1]. At receiver end detectors like maximum like-lihood detector(MLD) can be utilized. MLD searches for the symbol xbfrom the codebook to minimize euclidean distance metric
mapping. Antenna selection helps to find out which link is strongest for transmission using gain or capacity. Based on highest value of gain/capacity receiver feedback the information to antenna index and whatever the priority will be, antenna having highest gain is chosen for transmission. Here , using spatial modulation index mapping is first prioritized and
xb = argminxi2 k y
Performance Comparison
p 2 Hxi k A.
then according to antenna selection channel gain transmit antenna adjust the activation probability. After comparing the performance of conventional spatial modulation and transmit
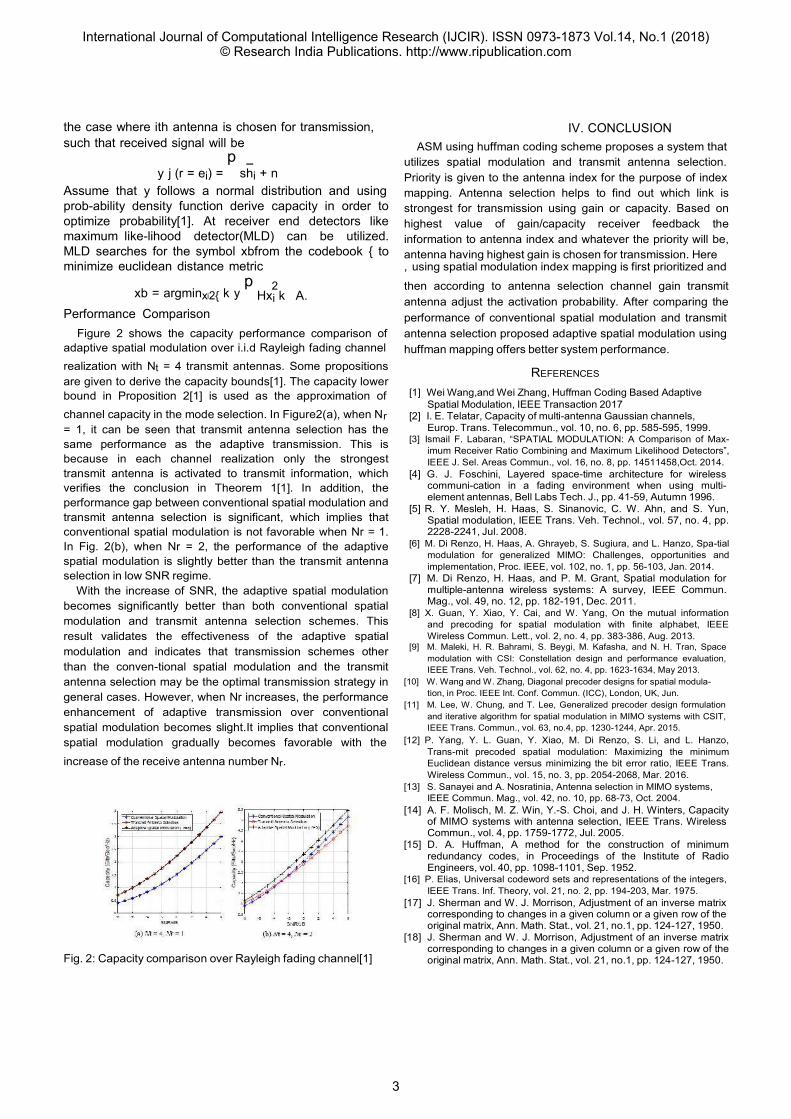
Figure 2 shows the capacity performance comparison of adaptive spatial modulation over i.i.d Rayleigh fading channel realization with Nt = 4 transmit antennas. Some propositions are given to derive the capacity bounds[1]. The capacity lower bound in Proposition 2[1] is used as the approximation of channel capacity in the mode selection. In Figure2(a), when Nr = 1, it can be seen that transmit antenna selection has the same performance as the adaptive transmission. This is because in each channel realization only the strongest transmit antenna is activated to transmit information, which verifies the conclusion in Theorem 1[1]. In addition, the performance gap between conventional spatial modulation and transmit antenna selection is significant, which implies that conventional spatial modulation is not favorable when Nr = 1. In Fig. 2(b), when Nr = 2, the performance of the adaptive spatial modulation is slightly better than the transmit antenna selection in low SNR regime.
With the increase of SNR, the adaptive spatial modulation becomes significantly better than both conventional spatial modulation and transmit antenna selection schemes. This result validates the effectiveness of the adaptive spatial modulation and indicates that transmission schemes other than the conven-tional spatial modulation and the transmit antenna selection may be the optimal transmission strategy in general cases. However, when Nr increases, the performance enhancement of adaptive transmission over conventional spatial modulation becomes slight.It implies that conventional spatial modulation gradually becomes favorable with the increase of the receive antenna number Nr.
Fig. 2: Capacity comparison over Rayleigh fading channel[1]
antenna selection proposed adaptive spatial modulation using huffman mapping offers better system performance.
REFERENCES
[1] Wei Wang,and Wei Zhang, Huffman Coding Based Adaptive Spatial Modulation, IEEE Transaction 2017
[2] I. E. Telatar, Capacity of multi-antenna Gaussian channels, Europ. Trans. Telecommun., vol. 10, no. 6, pp. 585-595, 1999.
[3] Ismail F. Labaran, “SPATIAL MODULATION: A Comparison of Max- imum Receiver Ratio Combining and Maximum Likelihood Detectors”,
IEEE J. Sel. Areas Commun., vol. 16, no. 8, pp. 14511458,Oct. 2014. [4] G. J. Foschini, Layered space-time architecture for wireless
communi-cation in a fading environment when using multi- element antennas, Bell Labs Tech. J., pp. 41-59, Autumn 1996.
[5] R. Y. Mesleh, H. Haas, S. Sinanovic, C. W. Ahn, and S. Yun, Spatial modulation, IEEE Trans. Veh. Technol., vol. 57, no. 4, pp. 2228-2241, Jul. 2008.
[6] M. Di Renzo, H. Haas, A. Ghrayeb, S. Sugiura, and L. Hanzo, Spa-tial modulation for generalized MIMO: Challenges, opportunities and implementation, Proc. IEEE, vol. 102, no. 1, pp. 56-103, Jan. 2014.
[7] M. Di Renzo, H. Haas, and P. M. Grant, Spatial modulation for multiple-antenna wireless systems: A survey, IEEE Commun. Mag., vol. 49, no. 12, pp. 182-191, Dec. 2011.
[8] X. Guan, Y. Xiao, Y. Cai, and W. Yang, On the mutual information and precoding for spatial modulation with finite alphabet, IEEE Wireless Commun. Lett., vol. 2, no. 4, pp. 383-386, Aug. 2013.
[9] M. Maleki, H. R. Bahrami, S. Beygi, M. Kafasha, and N. H. Tran, Space modulation with CSI: Constellation design and performance evaluation, IEEE Trans. Veh. Technol., vol. 62, no. 4, pp. 1623-1634, May 2013.
[10] W. Wang and W. Zhang, Diagonal precoder designs for spatial modula- tion, in Proc. IEEE Int. Conf. Commun. (ICC), London, UK, Jun.
[11] M. Lee, W. Chung, and T. Lee, Generalized precoder design formulation and iterative algorithm for spatial modulation in MIMO systems with CSIT, IEEE Trans. Commun., vol. 63, no.4, pp. 1230-1244, Apr. 2015.
[12] P. Yang, Y. L. Guan, Y. Xiao, M. Di Renzo, S. Li, and L. Hanzo, Trans-mit precoded spatial modulation: Maximizing the minimum Euclidean distance versus minimizing the bit error ratio, IEEE Trans. Wireless Commun., vol. 15, no. 3, pp. 2054-2068, Mar. 2016.
[13] S. Sanayei and A. Nosratinia, Antenna selection in MIMO systems, IEEE Commun. Mag., vol. 42, no. 10, pp. 68-73, Oct. 2004.
[14] A. F. Molisch, M. Z. Win, Y.-S. Choi, and J. H. Winters, Capacity of MIMO systems with antenna selection, IEEE Trans. Wireless Commun., vol. 4, pp. 1759-1772, Jul. 2005.
[15] D. A. Huffman, A method for the construction of minimum redundancy codes, in Proceedings of the Institute of Radio Engineers, vol. 40, pp. 1098-1101, Sep. 1952.
[16] P. Elias, Universal codeword sets and representations of the integers, IEEE Trans. Inf. Theory, vol. 21, no. 2, pp. 194-203, Mar. 1975.
[17] J. Sherman and W. J. Morrison, Adjustment of an inverse matrix corresponding to changes in a given column or a given row of the original matrix, Ann. Math. Stat., vol. 21, no.1, pp. 124-127, 1950.
[18] J. Sherman and W. J. Morrison, Adjustment of an inverse matrix corresponding to changes in a given column or a given row of the original matrix, Ann. Math. Stat., vol. 21, no.1, pp. 124-127, 1950.
International Journal of Computational Intelligence Research (IJCIR). ISSN 0973-1873 Vol.14, No.1 (2018)© Research India Publications. http://www.ripublication.com
3
Detection and Correction of SNM Using BTI Sensor for
SRAM Using 15nm Technology
Kumar Neeraj¹ J.K. Das² Hari Shanker Srivastava³
1. Research scholar, KIIT University, Bhubaneshwar, India
2. Assoc. Professor, KIIT University, Bhubaneswar, India
3. Assoc. Professor, Anurag Group OF Institutions, Hyderabad, India
Abstract: The continuous scaling of CMOS
technology exponentially increases the power
density per unit area (means temperature) and
other effect such as lifetime reliability. Bias
temperature instability (BTI) is the serious effect
which originates due to scaling of MOS , the effect
of BTI on the design of SRAM; it decreases the
SNM of the SRAM. In this paper a prototype BIT
sensor is proposed which used for correction of
SNM of SRAM .It is designed on 15nm technology
and simulated in Hspice in Cadence 6.15 the
precision found after simulation is under
1.15mv(+-3% approx) for 1v supply.
Index Terms— Bias temperature instability (BTI),
reliability, SRAM, static noise margin (SNM)
degradation, Cadence, Hspice
1. INTRODUCTION
Advancement of CMOS technology increases the
performance aggression of digital circuits but the
adverse effect is the long time hardware failure or
reliability of the system. Continuous scaling of
CMOS technology adversely affect the electron
migration (EM), stress migration (SM), time
dependent dielectric breakdown (gate oxide
breakdown) and thermal cycle (TC) all the affect
arise due to the power density increment (due to
temperature increment) as this is due to non linear
scaling in between supply voltage, threshold voltage
vs channel length of MOSFET (scaling of MOSFET).
[1]–[4]. Among different reliability issues, bias
temperature instability (BTI) is the most serious
concern [2]–[4]. The BTI gradually increases the
absolute value of transistors threshold voltage (Vth)
and decreases the mobility (µ) of the charge carriers
as well [2], [4]. High electric field on the gate
insulator, at the elevated temperature, accelerates BTI
phenomenon [5]. When a transistor is in linear or
saturation state, electric field on gate insulator that
reaches to the millions of volts per meter breaks the
Si–H bonds, which had been established at the
fabrication time to passivate incomplete bonds
between Si and SiO2. Interface traps that are
generated due to this dissociation slow-down the
movement of charge carriers. On the other hand, the
generated Si ions, due to Si–H bonds break, push the
transistor channel away and increase the absolute
value of Vth, forming the stress phase of BTI [5], [6].
On the contrary, when the electric field is removed,
some of the broken Si–H bonds will be formed again
and put the transistor in the recovery phase. In this
way, the previous Vth degradation is partially
compensated in the recovery phase. The total effect
of BTI is a gradual increase of Vth over time. The
amount of Vth degradation is strongly proportional to
the duty cycle (the ratio of stress to recovery time),
the supply voltage, and the operating temperature [5],
[6]. The effect of BTI on p-type and n-type
transistors is called NBTI and PBTI, respectively. In
the previous fabrication technology sizes, the NBTI
has been far more severe than PBTI; however,
nowadays by the development of high-k materials,
the PBTI has become a major concern as well [7],
[8]. The main effect of BTI on combinational circuits
can be observed as propagation delay increase [9],
[10] and the delay variation can be accurately
monitored using timing violation sensors [11]–[13].
But, BTI effect on SRAM cells, which occupy up to
90% of processors die area [14], leads to static noise
margin (SNM) degradation. The SNM is the
minimum noise voltage that can flip the state of the
SRAM cell. However, tiny shift in SNM can hardly
be monitored using built-in sensors and the sensor
International Journal of Computational Intelligence Research (IJCIR). ISSN 0973-1873 Vol.14, No.1 (2018)© Research India Publications. http://www.ripublication.com
4
precision steps down due to process variation and
other environmental parameters change. To assess the
amount of SRAM SNM change due to NBTI, Liu and
Chen [15] proposed error-correcting code (ECC)
double checking technique, which distinguishes
between soft errors and aging-caused errors. This
technique can only detect the permanent failures due
to NBTI effect. Qi et al. [8] suggested an asymmetric
SRAM cell with tracking and polling phases as a BTI
sensor. The most challenging issue for sub threshold
SRAM is increasing reliability during read/write. A
good metric for read/write margin is critically
important to all kinds of SRAM designs. Moreover,
the stability of the SRAM cell is seriously affected by
the increase in variability and by the decrease in
supply voltage. Furthermore, new SRAM cell circuit
designs have been developed to maximize the cell
stability for future technology nodes.It estimates
aging state of the entire SRAM block by putting
multiple numbers of redundant cells as sensors
(within original SRAM cells) under constant stress to
achieve reasonable accuracy. However, this paper
cannot guarantee the occurrence/nonoccurrence of
aging in SRAM cells. Ahmed and Milor [16]
proposed a method to drive the p-type transistors
currents into the bit lines and to make NBTI
degradation observable. This is done by storing zero
on both internal nodes (Q and Q) of SRAM cells by
force. This design needs some essential modification
of SRAM block row decoder and read/write circuitry,
which are not easily applicable to the SRAM block
and imposes area and performance overhead.
Furthermore, such a sensor is required for each bit
line with considerable area overhead. Kang et al. [17]
suggested an NBTI sensor to monitor SRAM leakage
current to specify aging state of memory block.
However, in nanoscale technology sizes, leakage
current is related to many causes, like gate oxide
breakdown and gate leakage currents, rather than
only Vth shifts [18]
2. STATIC NOISE MARGIN
(SNM)
SNM is the measure of strength of the SRAM cell to
hold its information against noise .SNM of SRAM is
defined as minimum amount of noise voltage present
on the storing nodes of SRAM required to flip the
state of cell. There are two strategies to find the SNM
of SRAM cell. Initially technique is a graphical
approach in which SNM can be acquired by drawing
and reflecting the inverter qualities and afterward
finding the extreme conceivable square between
them. Another approach includes the utilization of
noise source voltages at the node as appeared in
figure 4 (a). SNM Dependences [19] incorporates cell
ratio (CR), supply voltage and furthermore pull up
ratio .Cell ratio [20] is the proportion between sizes
of the driver transistor to the load transistor in the
read activity. Pull up proportion [20] is the proportion
between sizes of the load transistor to the access
transistor in the write operation.
With reference to figure 1
(During Read operation)
(During Write operation)
If the cell ratio increases, size of the driver transistor
also increases, consequently increasing the current.
As current increases, the speed of the SRAM cell also
increases.
2.1 The SRAM cell read stability
Information maintenance of the SRAM cell, both in
standby mode and read mode is an imperative
practical limitation in cutting edge innovation hubs.
The cell turns out to be less steady with bring down
supply voltage expanding spillage streams and
expanding changeability, subsequent from innovation
scaling. The stability is generally calculated by the
SNM [21] as the greatest estimation of DC noise
voltage that can be handled by the SRAM cell
without changing the stored bit.
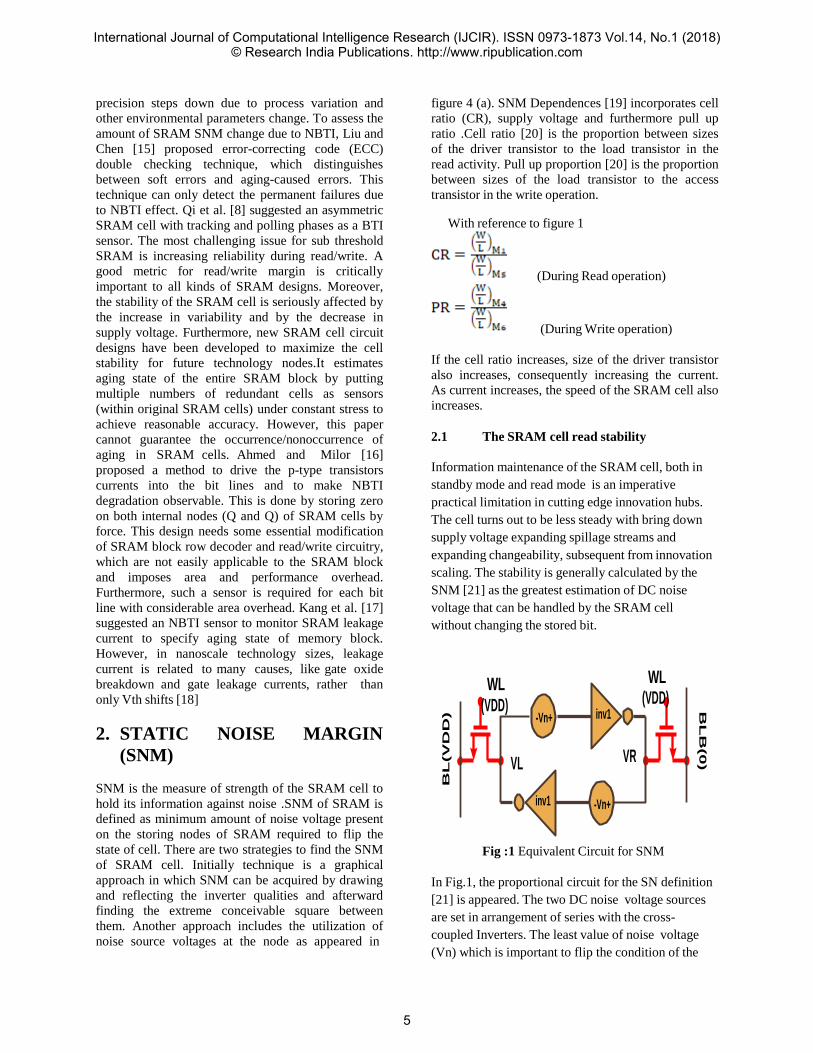
Fig :1 Equivalent Circuit for SNM
In Fig.1, the proportional circuit for the SN definition
[21] is appeared. The two DC noise voltage sources
are set in arrangement of series with the cross-
coupled Inverters. The least value of noise voltage
(Vn) which is important to flip the condition of the
WL (VDD)
WL (VDD)
-Vn+ inv1
VL VR
inv1 -Vn+
BL
B(0)
BL
(V
DD
)
International Journal of Computational Intelligence Research (IJCIR). ISSN 0973-1873 Vol.14, No.1 (2018)© Research India Publications. http://www.ripublication.com
5
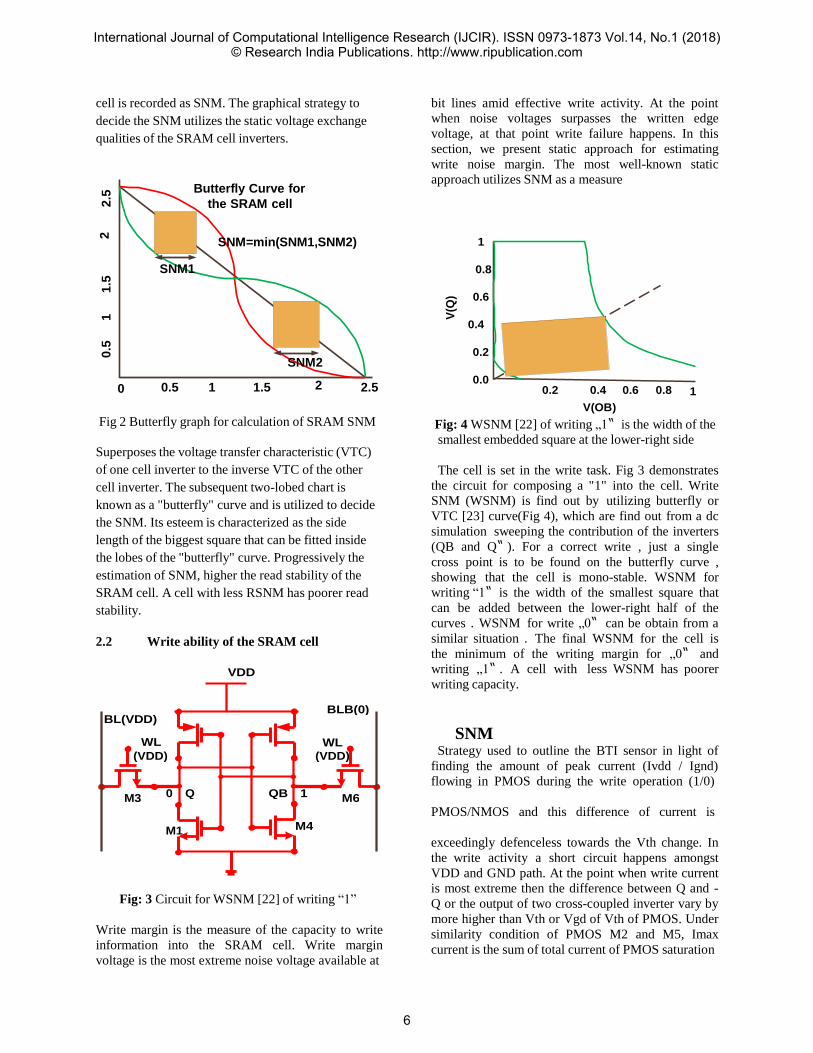
cell is recorded as SNM. The graphical strategy to
decide the SNM utilizes the static voltage exchange
qualities of the SRAM cell inverters.
Butterfly Curve for
the SRAM cell
bit lines amid effective write activity. At the point
when noise voltages surpasses the written edge
voltage, at that point write failure happens. In this
section, we present static approach for estimating
write noise margin. The most well-known static
approach utilizes SNM as a measure
SNM1
SNM=min(SNM1,SNM2) 1
0.8
0.6
0.4
SNM2
0 0.5 1 1.5 2
2.5
0.2
0.0
0.2
0.4 V(OB)
0.6
0.8 1
Fig 2 Butterfly graph for calculation of SRAM SNM
Superposes the voltage transfer characteristic (VTC)
of one cell inverter to the inverse VTC of the other
cell inverter. The subsequent two-lobed chart is
known as a "butterfly" curve and is utilized to decide
the SNM. Its esteem is characterized as the side
length of the biggest square that can be fitted inside
the lobes of the "butterfly" curve. Progressively the
estimation of SNM, higher the read stability of the
SRAM cell. A cell with less RSNM has poorer read
stability.
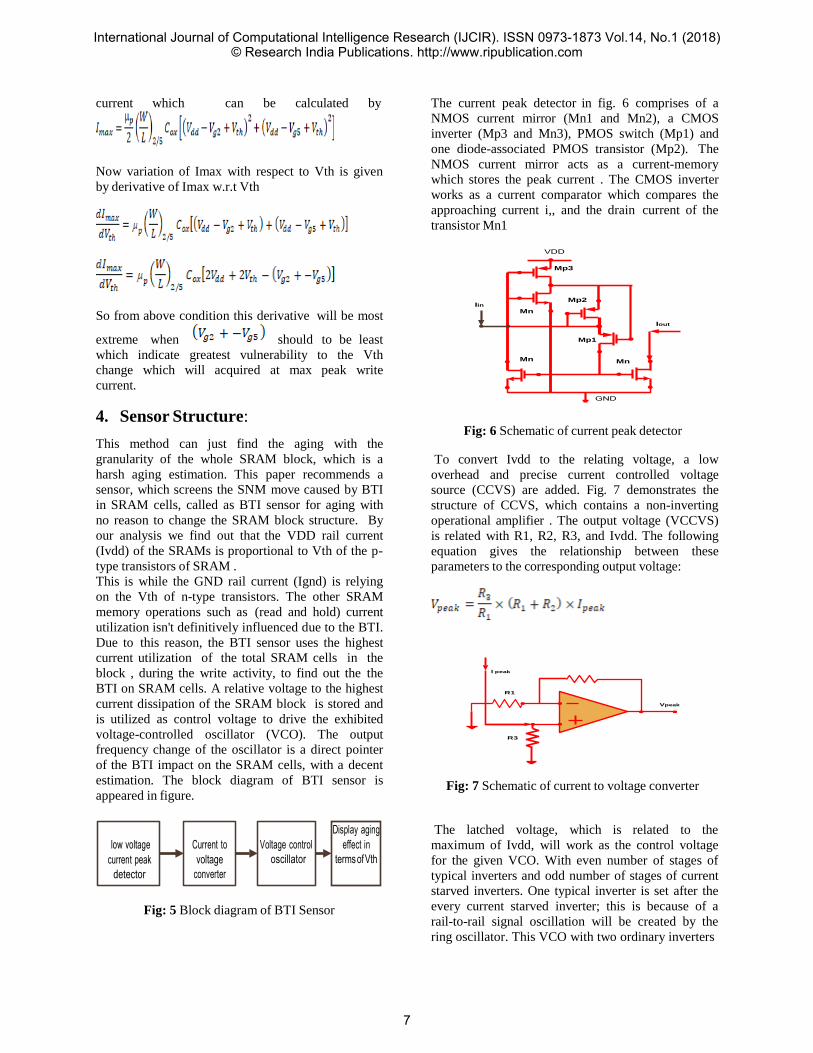
2.2 Write ability of the SRAM cell
VDD
Fig: 4 WSNM [22] of writing „1‟ is the width of the
smallest embedded square at the lower-right side
The cell is set in the write task. Fig 3 demonstrates
the circuit for composing a "1" into the cell. Write
SNM (WSNM) is find out by utilizing butterfly or
VTC [23] curve(Fig 4), which are find out from a dc
simulation sweeping the contribution of the inverters
(QB and Q‟ ). For a correct write , just a single
cross point is to be found on the butterfly curve ,
showing that the cell is mono-stable. WSNM for
writing “1‟ is the width of the smallest square that
can be added between the lower-right half of the
curves . WSNM for write „0‟ can be obtain from a
similar situation . The final WSNM for the cell is
the minimum of the writing margin for „0‟ and
writing „1‟ . A cell with less WSNM has poorer
writing capacity.
Fig: 3 Circuit for WSNM [22] of writing “1”
Write margin is the measure of the capacity to write
information into the SRAM cell. Write margin
voltage is the most extreme noise voltage available at
SNM Strategy used to outline the BTI sensor in light of
finding the amount of peak current (Ivdd / Ignd)
flowing in PMOS during the write operation (1/0)
PMOS/NMOS and this difference of current is
exceedingly defenceless towards the Vth change. In
the write activity a short circuit happens amongst
VDD and GND path. At the point when write current
is most extreme then the difference between Q and -
Q or the output of two cross-coupled inverter vary by
more higher than Vth or Vgd of Vth of PMOS. Under
similarity condition of PMOS M2 and M5, Imax
current is the sum of total current of PMOS saturation
BLB(0) BL(VDD)
WL
(VDD) WL
(VDD)
M3 0 Q QB 1 M6
M1 M4
2
0.5
1
1
.5
2.5
V(Q
)
International Journal of Computational Intelligence Research (IJCIR). ISSN 0973-1873 Vol.14, No.1 (2018)© Research India Publications. http://www.ripublication.com
6
current which can be calculated by
Now variation of Imax with respect to Vth is given
by derivative of Imax w.r.t Vth
So from above condition this derivative will be most
extreme when should to be least
which indicate greatest vulnerability to the Vth
change which will acquired at max peak write
current.
4. Sensor Structure:
This method can just find the aging with the
granularity of the whole SRAM block, which is a
harsh aging estimation. This paper recommends a
sensor, which screens the SNM move caused by BTI
in SRAM cells, called as BTI sensor for aging with
no reason to change the SRAM block structure. By
our analysis we find out that the VDD rail current
(Ivdd) of the SRAMs is proportional to Vth of the p-
type transistors of SRAM .
This is while the GND rail current (Ignd) is relying
on the Vth of n-type transistors. The other SRAM
memory operations such as (read and hold) current
utilization isn't definitively influenced due to the BTI.
Due to this reason, the BTI sensor uses the highest
current utilization of the total SRAM cells in the
block , during the write activity, to find out the the
BTI on SRAM cells. A relative voltage to the highest
current dissipation of the SRAM block is stored and
is utilized as control voltage to drive the exhibited
voltage-controlled oscillator (VCO). The output
frequency change of the oscillator is a direct pointer
of the BTI impact on the SRAM cells, with a decent
estimation. The block diagram of BTI sensor is
appeared in figure.
Fig: 5 Block diagram of BTI Sensor
The current peak detector in fig. 6 comprises of a
NMOS current mirror (Mn1 and Mn2), a CMOS
inverter (Mp3 and Mn3), PMOS switch (Mp1) and
one diode-associated PMOS transistor (Mp2). The
NMOS current mirror acts as a current-memory
which stores the peak current . The CMOS inverter
works as a current comparator which compares the
approaching current i,, and the drain current of the
transistor Mn1
VDD
Fig: 6 Schematic of current peak detector
To convert Ivdd to the relating voltage, a low
overhead and precise current controlled voltage
source (CCVS) are added. Fig. 7 demonstrates the
structure of CCVS, which contains a non-inverting
operational amplifier . The output voltage (VCCVS)
is related with R1, R2, R3, and Ivdd. The following
equation gives the relationship between these
parameters to the corresponding output voltage:
I peak
R1
Vpeak
R3
Fig: 7 Schematic of current to voltage converter
The latched voltage, which is related to the
maximum of Ivdd, will work as the control voltage
for the given VCO. With even number of stages of
typical inverters and odd number of stages of current
starved inverters. One typical inverter is set after the
every current starved inverter; this is because of a
rail-to-rail signal oscillation will be created by the
ring oscillator. This VCO with two ordinary inverters
Mp3
Mp2 Iin
Mn3
Iout
Mp1
Mn1
Mn2
GND
Display aging effect in
terms of Vth
low voltage
current peak
detector
Current to voltage
converter
Voltage control
oscillator
International Journal of Computational Intelligence Research (IJCIR). ISSN 0973-1873 Vol.14, No.1 (2018)© Research India Publications. http://www.ripublication.com
7
𝐼
and one current starved inverter is given in Fig. 8.
The output frequency of the displayed VCO is
straightly reliant on the input voltage in the
2000
Vdd=940mv
Vdd=970mv
frequency range that runs a sensor
VDD
M1 M2
1650
1250
1500
Vdd=1v Vdd=1030mv Vdd=1060mv
Vpeak M3
M4
M10
M11
M8 M6
M9 M7
M5
GND
fout
500
20 40
60
∆𝑽𝒕𝒉
(𝒎𝑽)
80 100
1150
850
Fig 8 Schematic of VCO
Fig: 9 shows the block diagram for testing of Vth
degradation of NMOS & PMOS of cross-coupled
inverters used in SRAM for data storage.
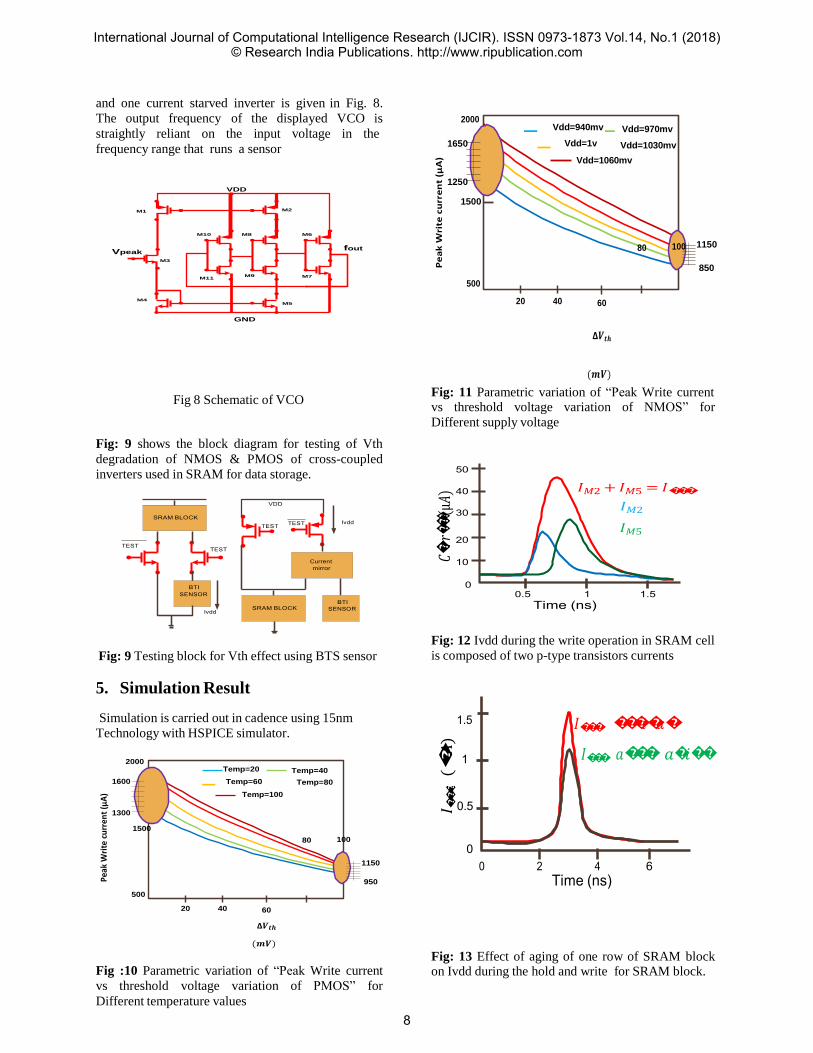
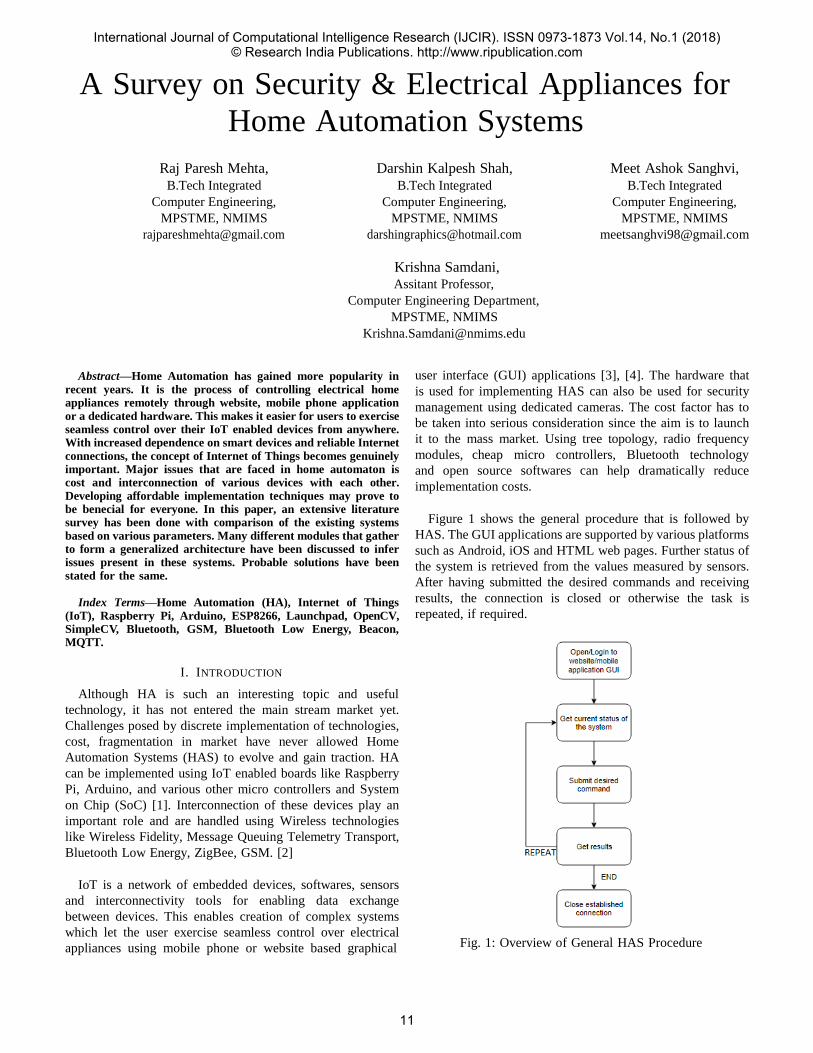
Fig: 11 Parametric variation of “Peak Write current vs threshold voltage variation of NMOS” for
Different supply voltage
50
40 𝐼𝑀2 + 𝐼𝑀5 = 𝐼
30 𝐼𝑀2
𝐼𝑀5 20
10
0 0.5 1 1.5
Time (ns)
Fig: 9 Testing block for Vth effect using BTS sensor
5. Simulation Result
Fig: 12 Ivdd during the write operation in SRAM cell
is composed of two p-type transistors currents
Simulation is carried out in cadence using 15nm
Technology with HSPICE simulator.
2000
1.5
1
𝐼 𝑖𝑎
𝐼 𝑎𝑟 𝑎𝑖 Temp=20 Temp=40
1600
1300
Temp=60 Temp=80
Temp=100
0.5
1500
500
20 40
60
∆𝑽𝒕𝒉
(𝒎𝑽)
80 100
1150
950
0 0 2 4 6
Time (ns)
Fig :10 Parametric variation of “Peak Write current
vs threshold voltage variation of PMOS” for
Different temperature values
Fig: 13 Effect of aging of one row of SRAM block on Ivdd during the hold and write for SRAM block.
Current mirror
SRAM BLOCK BTI
SENSOR
VDD
TEST Ivdd TEST
SRAM BLOCK
BTI SENSOR
TEST TEST
Ivdd
Pea
k W
rite
cu
rren
t (µ
A)
𝐶𝑟𝑟(
µ𝐴)
Pe
ak
Wri
te c
urr
en
t (µ
A)
(𝐴
)
International Journal of Computational Intelligence Research (IJCIR). ISSN 0973-1873 Vol.14, No.1 (2018)© Research India Publications. http://www.ripublication.com
8
Pea
k W
rite
cu
rren
t (µ
A)
Pea
k W
rite
cu
rre
nt
(µA
)
1
0.8
0.6
0.4
nominal Vth shift=50 mV
Vth shift=75 mV
Vth shift=100 mV
1
0.8
0.6
0.4
nominal Vth shift=50 mV
Vth shift=75 mV
Vth shift=100 mV
0.2 0.2
0 0 0.2 0.4 0.6 0.8 1
QA (v)
0 0 0.2 0.4 0.6 0.8 1
QA (v)
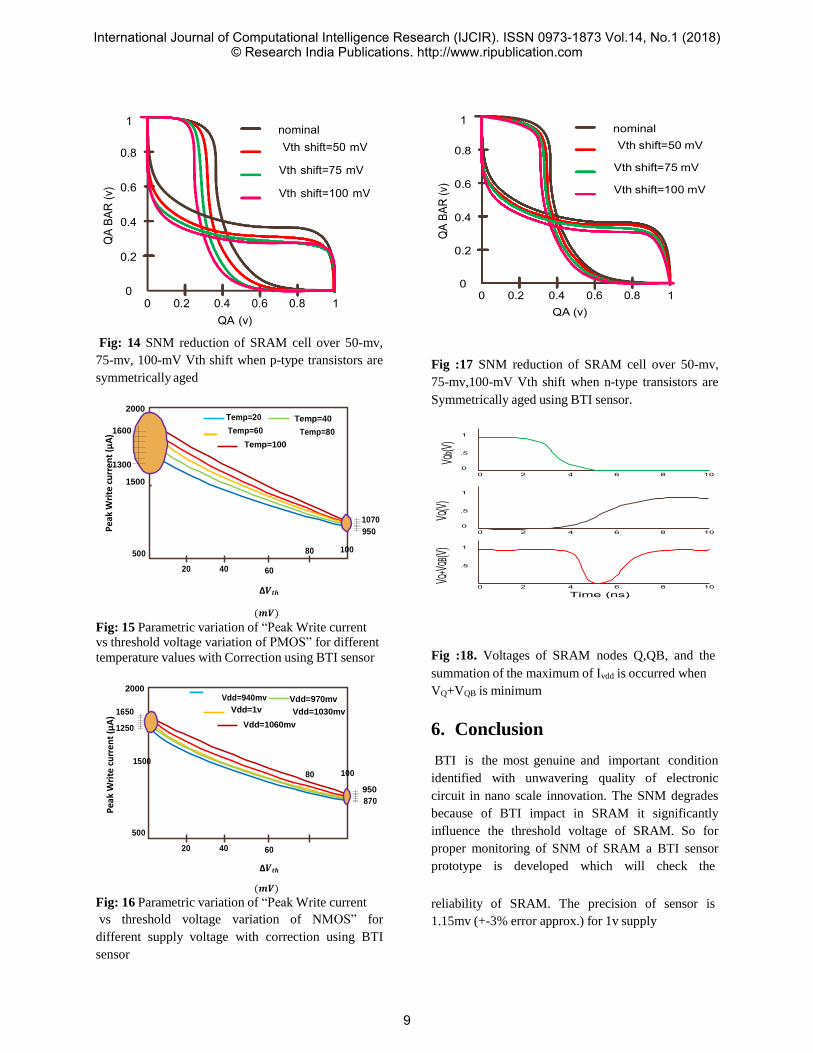
Fig: 14 SNM reduction of SRAM cell over 50-mv,
75-mv, 100-mV Vth shift when p-type transistors are
symmetrically aged
2000
Fig :17 SNM reduction of SRAM cell over 50-mv,
75-mv,100-mV Vth shift when n-type transistors are
Symmetrically aged using BTI sensor.
Temp=20 Temp=40 1600
1300
1500
Temp=60 Temp=80
Temp=100
1
.5
0 0 2 4 6 8 10
1
1070 950
.5
0 0 2 4 6 8 10
500
20 40
60
∆𝑽𝒕𝒉
(𝒎𝑽)
80 100
1
.5
0 2 4 6 8 10
Time (ns)
Fig: 15 Parametric variation of “Peak Write current vs threshold voltage variation of PMOS” for different
temperature values with Correction using BTI sensor
2000
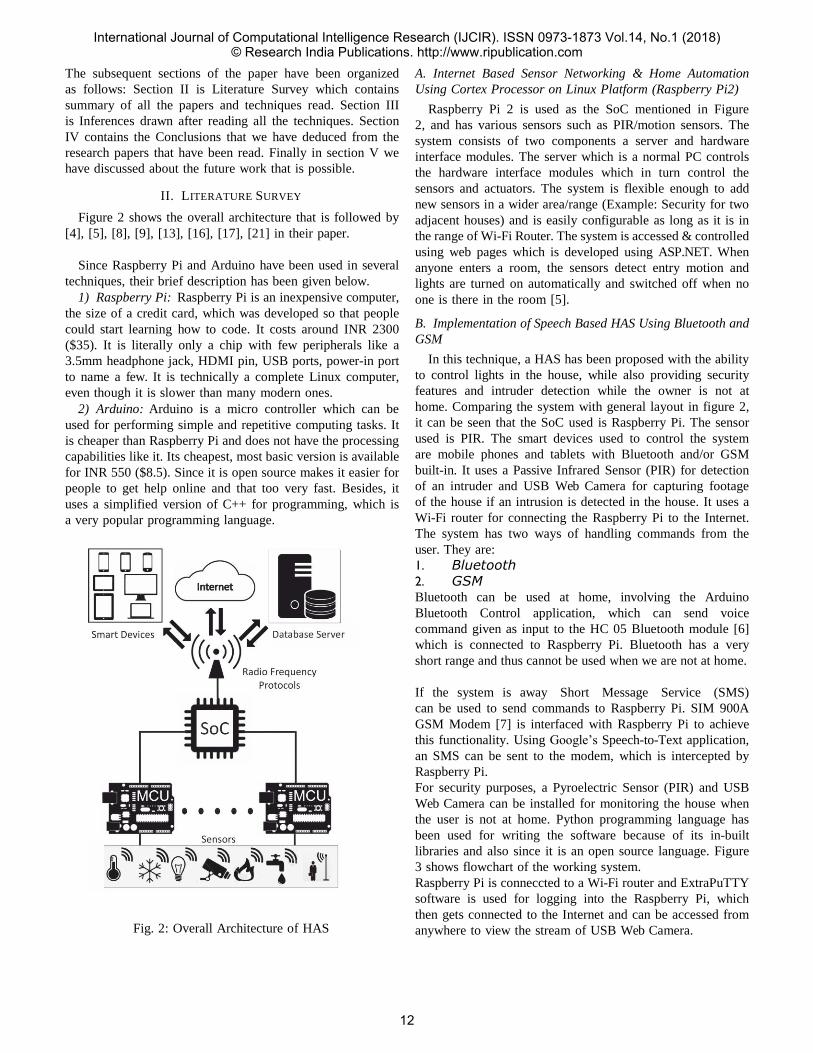
Fig :18. Voltages of SRAM nodes Q,QB, and the
summation of the maximum of Ivdd is occurred when
VQ+VQB is minimum Vdd=940mv Vdd=970mv
1650
1250
Vdd=1v Vdd=1030mv
Vdd=1060mv 6. Conclusion
1500
500
20 40
60
∆𝑽𝒕𝒉
(𝒎𝑽)
80 100
950 870
BTI is the most genuine and important condition
identified with unwavering quality of electronic
circuit in nano scale innovation. The SNM degrades
because of BTI impact in SRAM it significantly
influence the threshold voltage of SRAM. So for
proper monitoring of SNM of SRAM a BTI sensor
prototype is developed which will check the
Fig: 16 Parametric variation of “Peak Write current
vs threshold voltage variation of NMOS” for
different supply voltage with correction using BTI
sensor
reliability of SRAM. The precision of sensor is
1.15mv (+-3% error approx.) for 1v supply
QA
BAR
(v)
VQ+VQ
B(V)
VQ(V)
Q
A BA
R (v
) VQ
b(V)
International Journal of Computational Intelligence Research (IJCIR). ISSN 0973-1873 Vol.14, No.1 (2018)© Research India Publications. http://www.ripublication.com
9

References
1. J. Srinivasan, S. V. Adve, P. Bose, and J. A.
Rivers, “The impact of technology scaling on
lifetime reliability,” in Proc. Int. Conf.
Depend.Syst. Netw., Apr. 2004, pp. 177–186.
2. G. Gielen et al., “Emerging yield and reliability
challenges in nanometer CMOS technologies,”
in Proc. Conf. Des. Autom. Test Eur., 2008,pp.
1322–1327.
3. L. Peters, “NBTI: A growing threat to device
reliability,” Semiconduct. Int., vol. 27, no. 3,
2004.
4. J. W. McPherson, “Reliability challenges for
45nm and beyond,” in Proc. 43rd Annu. Des.
Autom. Conf., 2006, pp. 176–181.
5. J. Franco, B. Kaczer, and G. Groeseneken,
Reliability of High Mobility SiGe Channel
MOSFETs for Future CMOS Applications.
Dordrecht, The Netherlands: Springer, 2014.
6. M. A. Alam, H. Kufluoglu, D. Varghese, and S.
Mahapatra, “A comprehensive model for PMOS
NBTI degradation: Recent progress,”
Microelectron. Rel., vol. 47, no. 6, pp. 853–862,
Jun. 2007.
7. B. Cheng, A. R. Brown, and A. Asenov,
“Impact of NBTI/PBTI on SRAM stability
degradation,” IEEE Electron Device Lett., vol.
32, no. 6, pp. 740–742, Jun. 2011.
8. Z. Qi, J. Wang, A. Cabe, S. Wooters, T. Blalock,
B. Calhoun, and M. Stan, “SRAM-based
NBTI/PBTI sensor system design,” in Proc. 47th
Des Autom. Conf., 2010, pp. 849–852.
9. W. Wang et al., “The impact of NBTI on the
performance of combinational and sequential
circuits,” in Proc. 44th Annu. Des. Autom.
Conf., 2007, pp. 364–369.
10. W. Wang, S. Yang, S. Bhardwaj, S. Vrudhula, F. Liu, and Y. Cao,“The impact of NBTI effect
on combinational circuit: Modeling, simulation
and analysis,” IEEE Trans. Very Large Scale
Integr. (VLSI) Syst.,vol. 18, no. 2, pp. 173–183,
Feb. 2010.
11. M. Agarwal, B. C. Paul, M. Zhang, and S.
Mitra, “Circuit failure prediction and its
application to transistor aging,” in Proc. 25th
IEEE VLSI Test Symp. (VTS), May 2007, pp.
277–286.
12. G. Yan, Y. Han, and X. Li, “A unified online
fault detection scheme via checking of stability
violation,” in Proc. Conf Des., Autom. Test Eur.,
2009, pp. 496–501.
13. M. Agarwal et al., “Optimized circuit failure
prediction for aging: Practicality and promise,”
in Proc. IEEE Int. Test Conf., Oct. 2008, pp. 1–
10.
14. N. Ravindra, “International technology roadmap
for semiconductors (ITRS),” J. Electron. Mater.,
vol. 30, no. 12, pp. 1478–1627, New York, NY,
USA: Springer, 2001.
15. B. Liu and C.-H. Chen, “Testing, diagnosis and
repair methods for NBTI-induced SRAM faults,”
in Proc. IEEE Int. Conf. IC Des., Technol., May
2014, pp. 1–4.
16. F. Ahmed and L. Milor, “NBTI resistant SRAM
design,” in Proc. 4th IEEE Int. Workshop Adv.
Sensors Int. (IWASI), Jul. 2011, pp. 82–87.
17. K. Kang, M. A. Alam, and K. Roy,
“Characterization of NBTI induced temporal
performance degradation in nano-scale SRAM
array using IDDQ,” in Proc. IEEE Int. Test
Conf., Oct. 2007, pp. 1–10.
18. A. Agarwal, S. Mukhopadhyay, C. H. Kim, A.
Raychowdhury, and K. Roy, “Leakage power
analysis and reduction for nano-scale circuits,”
Syst.-Chip, Next Generat. Electron., vol. 18, no.
2, p. 415, 2006.
19. B. Alorda, G. Torrens, S. Bota and J. Segura.,
Static-Noise Margin Analysis during Read
Operation of 6T SRAM Cells, Univ. de les Illes
Balears, Dept. Fisica, Cra. Valldemossa, 07071
Palma de Mallorca, Spain.
20. Debasis Mukherjee1, Hemanta Kr. Mondal2 and
B.V.R. Reddy3, Static Noise Margin Analysis of
SRAM Cell for High Speed Application, IJCSI
International Journal of Computer Science
Issues, Vol. 7, Issue 5, September 2010.
21. Evelyn Grossar, Michele Stucchi, KarenMaex,
Read Stability and Write-Ability Analysis of
SRAM Cells for Nanometer Technologies, IEEE
Journal Of Solid- State Circuits, Vol. 41, NO.
11, November 2006, pp.2577-2588.
22. Jiajing Wang, Satyanand Nalam, and Benton
H.Calhoun, Analyzing Static and Dynamic Write
Margin for Nanometer SRAMs, Department of
Electrical and Computer Engineering, University
of Virginia.
23. Andrei S. Pavlov, Design and Test of Embedded
SRAMs, doctoral diss., University of Waterloo,
Ontario, Canada, 2005.
International Journal of Computational Intelligence Research (IJCIR). ISSN 0973-1873 Vol.14, No.1 (2018)© Research India Publications. http://www.ripublication.com
10
A Survey on Security & Electrical Appliances for
Home Automation Systems
Raj Paresh Mehta,
B.Tech Integrated
Computer Engineering,
MPSTME, NMIMS
Darshin Kalpesh Shah,
B.Tech Integrated
Computer Engineering,
MPSTME, NMIMS
Meet Ashok Sanghvi,
B.Tech Integrated
Computer Engineering,
MPSTME, NMIMS
Krishna Samdani, Assitant Professor,
Computer Engineering Department,
MPSTME, NMIMS
Abstract—Home Automation has gained more popularity in
recent years. It is the process of controlling electrical home appliances remotely through website, mobile phone application
or a dedicated hardware. This makes it easier for users to exercise seamless control over their IoT enabled devices from anywhere. With increased dependence on smart devices and reliable Internet
connections, the concept of Internet of Things becomes genuinely important. Major issues that are faced in home automaton is cost and interconnection of various devices with each other.
Developing affordable implementation techniques may prove to be benecial for everyone. In this paper, an extensive literature survey has been done with comparison of the existing systems
based on various parameters. Many different modules that gather to form a generalized architecture have been discussed to infer issues present in these systems. Probable solutions have been
stated for the same.
Index Terms—Home Automation (HA), Internet of Things
(IoT), Raspberry Pi, Arduino, ESP8266, Launchpad, OpenCV, SimpleCV, Bluetooth, GSM, Bluetooth Low Energy, Beacon, MQTT.
I. INTRODUCTION
Although HA is such an interesting topic and useful
technology, it has not entered the main stream market yet.
Challenges posed by discrete implementation of technologies,
cost, fragmentation in market have never allowed Home
Automation Systems (HAS) to evolve and gain traction. HA
can be implemented using IoT enabled boards like Raspberry
Pi, Arduino, and various other micro controllers and System
on Chip (SoC) [1]. Interconnection of these devices play an
important role and are handled using Wireless technologies
like Wireless Fidelity, Message Queuing Telemetry Transport,
Bluetooth Low Energy, ZigBee, GSM. [2]
IoT is a network of embedded devices, softwares, sensors
and interconnectivity tools for enabling data exchange
between devices. This enables creation of complex systems
which let the user exercise seamless control over electrical
appliances using mobile phone or website based graphical
user interface (GUI) applications [3], [4]. The hardware that
is used for implementing HAS can also be used for security
management using dedicated cameras. The cost factor has to
be taken into serious consideration since the aim is to launch
it to the mass market. Using tree topology, radio frequency
modules, cheap micro controllers, Bluetooth technology
and open source softwares can help dramatically reduce
implementation costs.
Figure 1 shows the general procedure that is followed by
HAS. The GUI applications are supported by various platforms
such as Android, iOS and HTML web pages. Further status of
the system is retrieved from the values measured by sensors.
After having submitted the desired commands and receiving
results, the connection is closed or otherwise the task is
repeated, if required.
Fig. 1: Overview of General HAS Procedure
International Journal of Computational Intelligence Research (IJCIR). ISSN 0973-1873 Vol.14, No.1 (2018)© Research India Publications. http://www.ripublication.com
11
The subsequent sections of the paper have been organized
as follows: Section II is Literature Survey which contains
summary of all the papers and techniques read. Section III
is Inferences drawn after reading all the techniques. Section
IV contains the Conclusions that we have deduced from the
research papers that have been read. Finally in section V we
have discussed about the future work that is possible.
II. LITERATURE SURVEY
Figure 2 shows the overall architecture that is followed by
[4], [5], [8], [9], [13], [16], [17], [21] in their paper.
Since Raspberry Pi and Arduino have been used in several
techniques, their brief description has been given below.
1) Raspberry Pi: Raspberry Pi is an inexpensive computer,
the size of a credit card, which was developed so that people
could start learning how to code. It costs around INR 2300
($35). It is literally only a chip with few peripherals like a
3.5mm headphone jack, HDMI pin, USB ports, power-in port
to name a few. It is technically a complete Linux computer,
even though it is slower than many modern ones.
2) Arduino: Arduino is a micro controller which can be
used for performing simple and repetitive computing tasks. It
is cheaper than Raspberry Pi and does not have the processing
capabilities like it. Its cheapest, most basic version is available
for INR 550 ($8.5). Since it is open source makes it easier for
people to get help online and that too very fast. Besides, it
uses a simplified version of C++ for programming, which is
a very popular programming language.
Fig. 2: Overall Architecture of HAS
A. Internet Based Sensor Networking & Home Automation
Using Cortex Processor on Linux Platform (Raspberry Pi2)
Raspberry Pi 2 is used as the SoC mentioned in Figure
2, and has various sensors such as PIR/motion sensors. The
system consists of two components a server and hardware
interface modules. The server which is a normal PC controls
the hardware interface modules which in turn control the
sensors and actuators. The system is flexible enough to add
new sensors in a wider area/range (Example: Security for two
adjacent houses) and is easily configurable as long as it is in
the range of Wi-Fi Router. The system is accessed & controlled
using web pages which is developed using ASP.NET. When
anyone enters a room, the sensors detect entry motion and
lights are turned on automatically and switched off when no
one is there in the room [5].
B. Implementation of Speech Based HAS Using Bluetooth and
GSM
In this technique, a HAS has been proposed with the ability
to control lights in the house, while also providing security
features and intruder detection while the owner is not at
home. Comparing the system with general layout in figure 2,
it can be seen that the SoC used is Raspberry Pi. The sensor
used is PIR. The smart devices used to control the system
are mobile phones and tablets with Bluetooth and/or GSM
built-in. It uses a Passive Infrared Sensor (PIR) for detection
of an intruder and USB Web Camera for capturing footage
of the house if an intrusion is detected in the house. It uses a
Wi-Fi router for connecting the Raspberry Pi to the Internet.
The system has two ways of handling commands from the
user. They are:
1. Bluetooth 2. GSM Bluetooth can be used at home, involving the Arduino
Bluetooth Control application, which can send voice
command given as input to the HC 05 Bluetooth module [6]
which is connected to Raspberry Pi. Bluetooth has a very
short range and thus cannot be used when we are not at home.
If the system is away Short Message Service (SMS)
can be used to send commands to Raspberry Pi. SIM 900A
GSM Modem [7] is interfaced with Raspberry Pi to achieve
this functionality. Using Google’s Speech-to-Text application,
an SMS can be sent to the modem, which is intercepted by
Raspberry Pi.
For security purposes, a Pyroelectric Sensor (PIR) and USB
Web Camera can be installed for monitoring the house when
the user is not at home. Python programming language has
been used for writing the software because of its in-built
libraries and also since it is an open source language. Figure
3 shows flowchart of the working system.
Raspberry Pi is conneccted to a Wi-Fi router and ExtraPuTTY
software is used for logging into the Raspberry Pi, which
then gets connected to the Internet and can be accessed from
anywhere to view the stream of USB Web Camera.
International Journal of Computational Intelligence Research (IJCIR). ISSN 0973-1873 Vol.14, No.1 (2018)© Research India Publications. http://www.ripublication.com
12
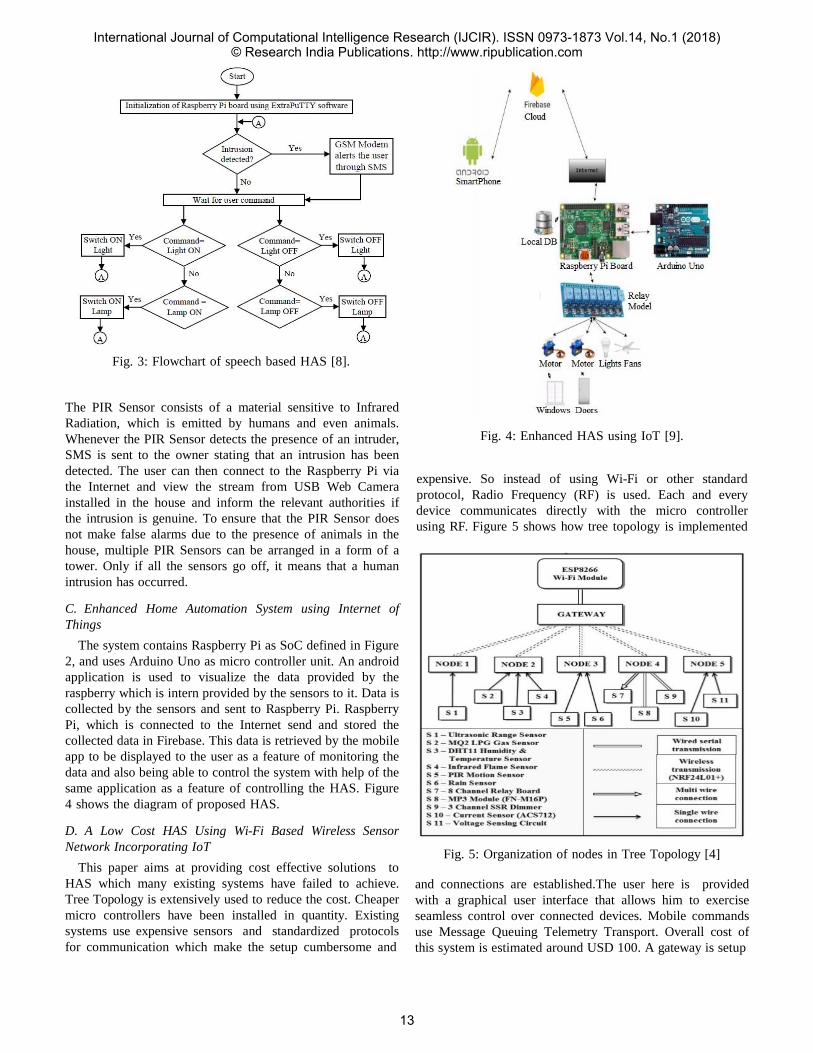
Fig. 3: Flowchart of speech based HAS [8].
The PIR Sensor consists of a material sensitive to Infrared
Radiation, which is emitted by humans and even animals.
Whenever the PIR Sensor detects the presence of an intruder,
SMS is sent to the owner stating that an intrusion has been
detected. The user can then connect to the Raspberry Pi via
the Internet and view the stream from USB Web Camera
installed in the house and inform the relevant authorities if
the intrusion is genuine. To ensure that the PIR Sensor does
not make false alarms due to the presence of animals in the
house, multiple PIR Sensors can be arranged in a form of a
tower. Only if all the sensors go off, it means that a human
intrusion has occurred.
C. Enhanced Home Automation System using Internet of
Things
The system contains Raspberry Pi as SoC defined in Figure
2, and uses Arduino Uno as micro controller unit. An android
application is used to visualize the data provided by the
raspberry which is intern provided by the sensors to it. Data is
collected by the sensors and sent to Raspberry Pi. Raspberry
Pi, which is connected to the Internet send and stored the
collected data in Firebase. This data is retrieved by the mobile
app to be displayed to the user as a feature of monitoring the
data and also being able to control the system with help of the
same application as a feature of controlling the HAS. Figure
4 shows the diagram of proposed HAS.
D. A Low Cost HAS Using Wi-Fi Based Wireless Sensor
Network Incorporating IoT
This paper aims at providing cost effective solutions to
HAS which many existing systems have failed to achieve.
Tree Topology is extensively used to reduce the cost. Cheaper
micro controllers have been installed in quantity. Existing
systems use expensive sensors and standardized protocols
for communication which make the setup cumbersome and
Fig. 4: Enhanced HAS using IoT [9].
expensive. So instead of using Wi-Fi or other standard
protocol, Radio Frequency (RF) is used. Each and every
device communicates directly with the micro controller
using RF. Figure 5 shows how tree topology is implemented
Fig. 5: Organization of nodes in Tree Topology [4]
and connections are established.The user here is provided
with a graphical user interface that allows him to exercise
seamless control over connected devices. Mobile commands
use Message Queuing Telemetry Transport. Overall cost of
this system is estimated around USD 100. A gateway is setup
International Journal of Computational Intelligence Research (IJCIR). ISSN 0973-1873 Vol.14, No.1 (2018)© Research India Publications. http://www.ripublication.com
13
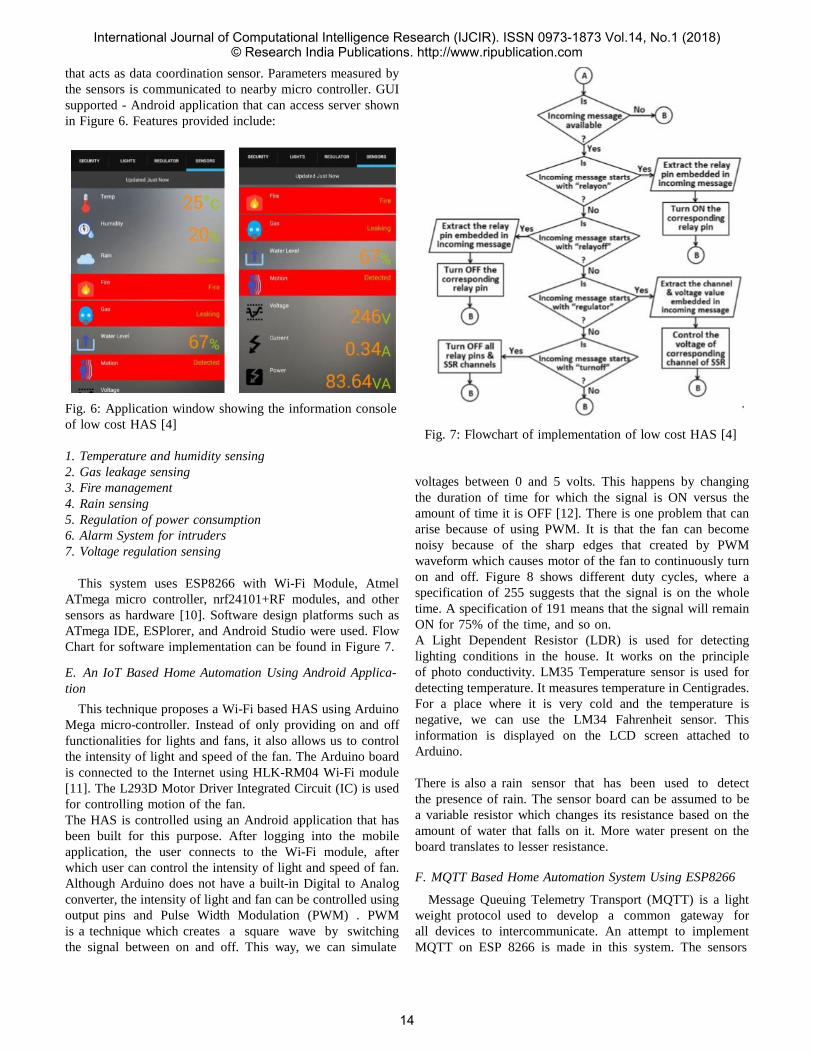
that acts as data coordination sensor. Parameters measured by
the sensors is communicated to nearby micro controller. GUI
supported - Android application that can access server shown
in Figure 6. Features provided include:
Fig. 6: Application window showing the information console
of low cost HAS [4]
1. Temperature and humidity sensing
2. Gas leakage sensing
3. Fire management
4. Rain sensing
5. Regulation of power consumption
6. Alarm System for intruders
7. Voltage regulation sensing
This system uses ESP8266 with Wi-Fi Module, Atmel
ATmega micro controller, nrf24101+RF modules, and other
sensors as hardware [10]. Software design platforms such as
ATmega IDE, ESPlorer, and Android Studio were used. Flow
Chart for software implementation can be found in Figure 7.
E. An IoT Based Home Automation Using Android Applica-
tion
This technique proposes a Wi-Fi based HAS using Arduino
Mega micro-controller. Instead of only providing on and off
functionalities for lights and fans, it also allows us to control
the intensity of light and speed of the fan. The Arduino board
is connected to the Internet using HLK-RM04 Wi-Fi module
[11]. The L293D Motor Driver Integrated Circuit (IC) is used
for controlling motion of the fan.
The HAS is controlled using an Android application that has
been built for this purpose. After logging into the mobile
application, the user connects to the Wi-Fi module, after
which user can control the intensity of light and speed of fan.
Although Arduino does not have a built-in Digital to Analog
converter, the intensity of light and fan can be controlled using
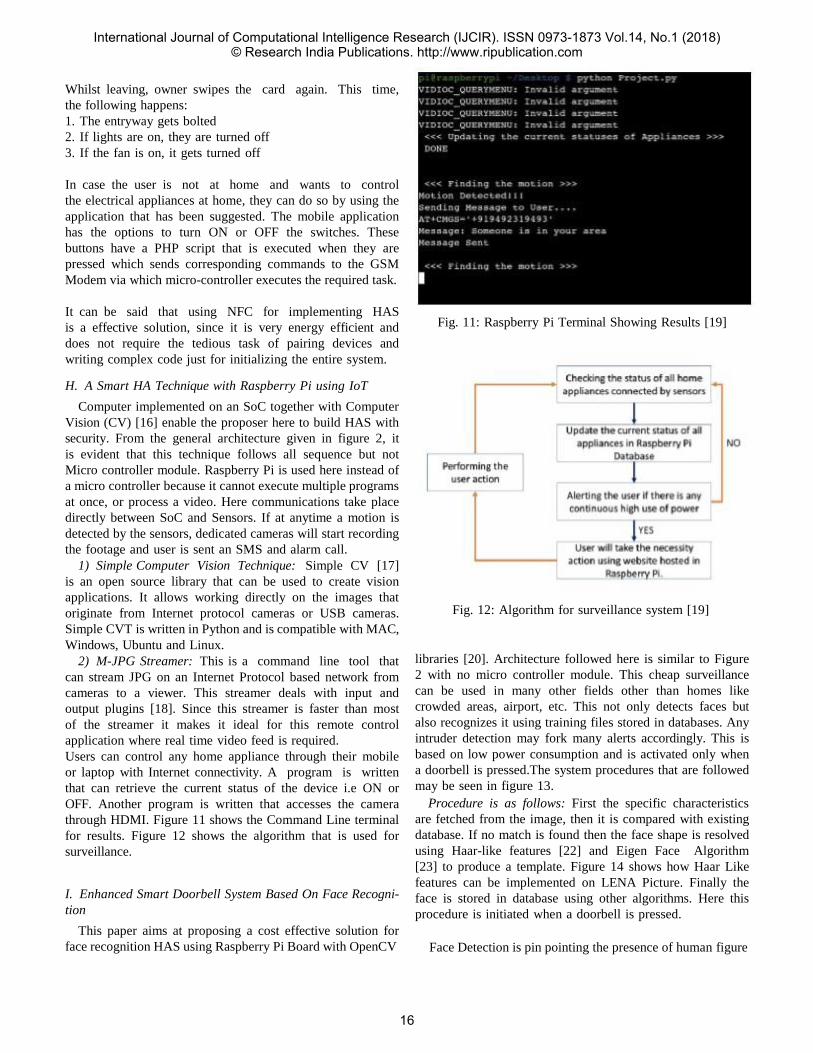
output pins and Pulse Width Modulation (PWM) . PWM
is a technique which creates a square wave by switching
the signal between on and off. This way, we can simulate
Fig. 7: Flowchart of implementation of low cost HAS [4]
voltages between 0 and 5 volts. This happens by changing
the duration of time for which the signal is ON versus the
amount of time it is OFF [12]. There is one problem that can
arise because of using PWM. It is that the fan can become
noisy because of the sharp edges that created by PWM
waveform which causes motor of the fan to continuously turn
on and off. Figure 8 shows different duty cycles, where a
specification of 255 suggests that the signal is on the whole
time. A specification of 191 means that the signal will remain
ON for 75% of the time, and so on.
A Light Dependent Resistor (LDR) is used for detecting
lighting conditions in the house. It works on the principle
of photo conductivity. LM35 Temperature sensor is used for
detecting temperature. It measures temperature in Centigrades.
For a place where it is very cold and the temperature is
negative, we can use the LM34 Fahrenheit sensor. This
information is displayed on the LCD screen attached to
Arduino.
There is also a rain sensor that has been used to detect
the presence of rain. The sensor board can be assumed to be
a variable resistor which changes its resistance based on the
amount of water that falls on it. More water present on the
board translates to lesser resistance.
F. MQTT Based Home Automation System Using ESP8266
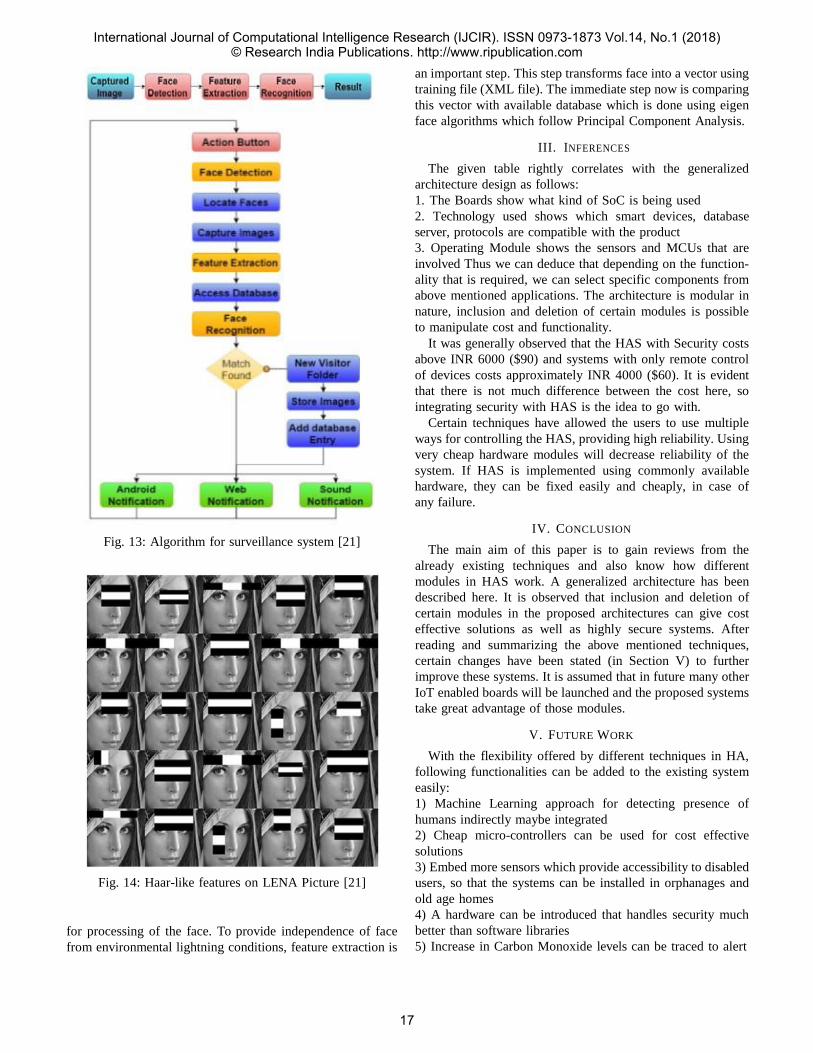
Message Queuing Telemetry Transport (MQTT) is a light
weight protocol used to develop a common gateway for
all devices to intercommunicate. An attempt to implement
MQTT on ESP 8266 is made in this system. The sensors
International Journal of Computational Intelligence Research (IJCIR). ISSN 0973-1873 Vol.14, No.1 (2018)© Research India Publications. http://www.ripublication.com
14
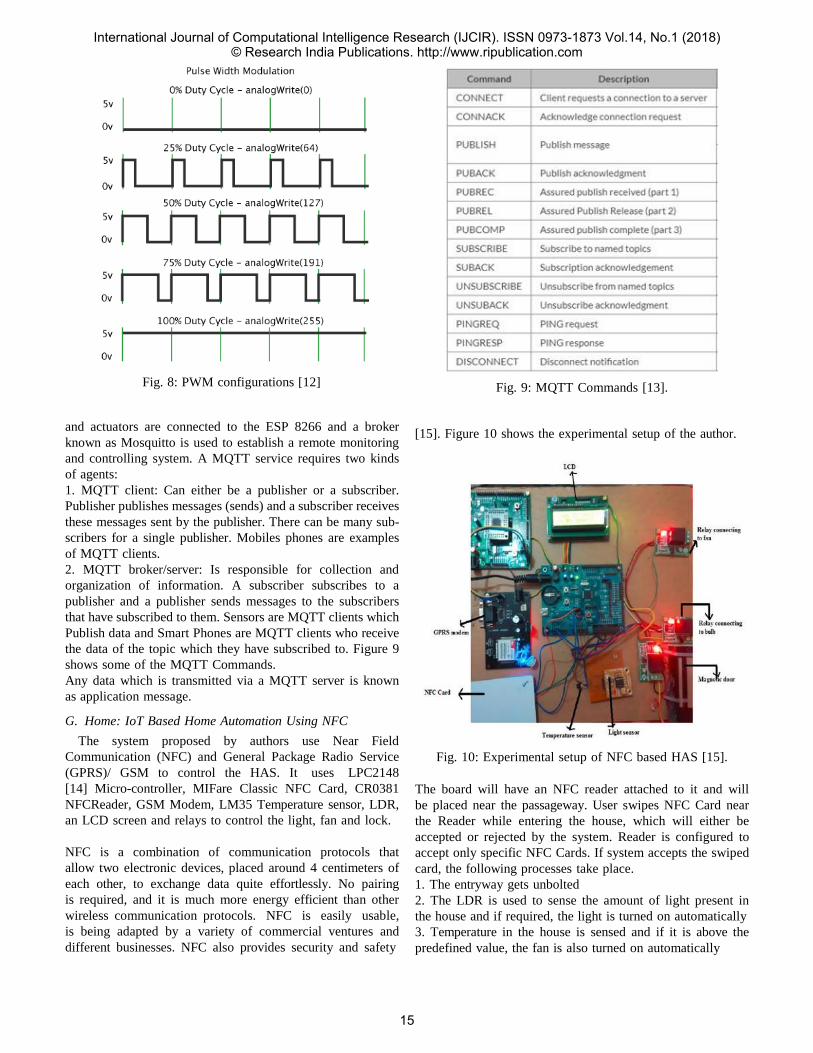
Fig. 8: PWM configurations [12]
and actuators are connected to the ESP 8266 and a broker
known as Mosquitto is used to establish a remote monitoring
and controlling system. A MQTT service requires two kinds
of agents:
1. MQTT client: Can either be a publisher or a subscriber.
Publisher publishes messages (sends) and a subscriber receives
these messages sent by the publisher. There can be many sub-
scribers for a single publisher. Mobiles phones are examples
of MQTT clients.
2. MQTT broker/server: Is responsible for collection and
organization of information. A subscriber subscribes to a
publisher and a publisher sends messages to the subscribers
that have subscribed to them. Sensors are MQTT clients which
Publish data and Smart Phones are MQTT clients who receive
the data of the topic which they have subscribed to. Figure 9
shows some of the MQTT Commands.
Any data which is transmitted via a MQTT server is known
as application message.
G. Home: IoT Based Home Automation Using NFC
The system proposed by authors use Near Field
Communication (NFC) and General Package Radio Service
(GPRS)/ GSM to control the HAS. It uses LPC2148
[14] Micro-controller, MIFare Classic NFC Card, CR0381
NFCReader, GSM Modem, LM35 Temperature sensor, LDR,
an LCD screen and relays to control the light, fan and lock.
NFC is a combination of communication protocols that
allow two electronic devices, placed around 4 centimeters of
each other, to exchange data quite effortlessly. No pairing
is required, and it is much more energy efficient than other
wireless communication protocols. NFC is easily usable,
is being adapted by a variety of commercial ventures and
different businesses. NFC also provides security and safety
Fig. 9: MQTT Commands [13].
[15]. Figure 10 shows the experimental setup of the author.
Fig. 10: Experimental setup of NFC based HAS [15].
The board will have an NFC reader attached to it and will
be placed near the passageway. User swipes NFC Card near
the Reader while entering the house, which will either be
accepted or rejected by the system. Reader is configured to
accept only specific NFC Cards. If system accepts the swiped
card, the following processes take place.
1. The entryway gets unbolted
2. The LDR is used to sense the amount of light present in
the house and if required, the light is turned on automatically
3. Temperature in the house is sensed and if it is above the
predefined value, the fan is also turned on automatically
International Journal of Computational Intelligence Research (IJCIR). ISSN 0973-1873 Vol.14, No.1 (2018)© Research India Publications. http://www.ripublication.com
15
Whilst leaving, owner swipes the card again. This time,
the following happens:
1. The entryway gets bolted
2. If lights are on, they are turned off
3. If the fan is on, it gets turned off
In case the user is not at home and wants to control
the electrical appliances at home, they can do so by using the
application that has been suggested. The mobile application
has the options to turn ON or OFF the switches. These
buttons have a PHP script that is executed when they are
pressed which sends corresponding commands to the GSM
Modem via which micro-controller executes the required task.
It can be said that using NFC for implementing HAS
is a effective solution, since it is very energy efficient and
does not require the tedious task of pairing devices and
writing complex code just for initializing the entire system.
H. A Smart HA Technique with Raspberry Pi using IoT
Computer implemented on an SoC together with Computer
Vision (CV) [16] enable the proposer here to build HAS with
security. From the general architecture given in figure 2, it
is evident that this technique follows all sequence but not
Micro controller module. Raspberry Pi is used here instead of
a micro controller because it cannot execute multiple programs
at once, or process a video. Here communications take place
directly between SoC and Sensors. If at anytime a motion is
detected by the sensors, dedicated cameras will start recording
the footage and user is sent an SMS and alarm call.
1) Simple Computer Vision Technique: Simple CV [17]
is an open source library that can be used to create vision
applications. It allows working directly on the images that
originate from Internet protocol cameras or USB cameras.
Simple CVT is written in Python and is compatible with MAC,
Windows, Ubuntu and Linux.
2) M-JPG Streamer: This is a command line tool that
can stream JPG on an Internet Protocol based network from
cameras to a viewer. This streamer deals with input and
output plugins [18]. Since this streamer is faster than most
of the streamer it makes it ideal for this remote control
application where real time video feed is required.
Users can control any home appliance through their mobile
or laptop with Internet connectivity. A program is written
that can retrieve the current status of the device i.e ON or
OFF. Another program is written that accesses the camera
through HDMI. Figure 11 shows the Command Line terminal
for results. Figure 12 shows the algorithm that is used for
surveillance.
I. Enhanced Smart Doorbell System Based On Face Recogni-
tion
This paper aims at proposing a cost effective solution for
face recognition HAS using Raspberry Pi Board with OpenCV
Fig. 11: Raspberry Pi Terminal Showing Results [19]
Fig. 12: Algorithm for surveillance system [19]
libraries [20]. Architecture followed here is similar to Figure
2 with no micro controller module. This cheap surveillance
can be used in many other fields other than homes like
crowded areas, airport, etc. This not only detects faces but
also recognizes it using training files stored in databases. Any
intruder detection may fork many alerts accordingly. This is
based on low power consumption and is activated only when
a doorbell is pressed.The system procedures that are followed
may be seen in figure 13.
Procedure is as follows: First the specific characteristics
are fetched from the image, then it is compared with existing
database. If no match is found then the face shape is resolved
using Haar-like features [22] and Eigen Face Algorithm
[23] to produce a template. Figure 14 shows how Haar Like
features can be implemented on LENA Picture. Finally the
face is stored in database using other algorithms. Here this
procedure is initiated when a doorbell is pressed.
Face Detection is pin pointing the presence of human figure
International Journal of Computational Intelligence Research (IJCIR). ISSN 0973-1873 Vol.14, No.1 (2018)© Research India Publications. http://www.ripublication.com
16
an important step. This step transforms face into a vector using
training file (XML file). The immediate step now is comparing
this vector with available database which is done using eigen
face algorithms which follow Principal Component Analysis.
III. INFERENCES
The given table rightly correlates with the generalized
architecture design as follows:
1. The Boards show what kind of SoC is being used
2. Technology used shows which smart devices, database
server, protocols are compatible with the product
3. Operating Module shows the sensors and MCUs that are
involved Thus we can deduce that depending on the function-
ality that is required, we can select specific components from
above mentioned applications. The architecture is modular in
nature, inclusion and deletion of certain modules is possible
to manipulate cost and functionality.
It was generally observed that the HAS with Security costs
above INR 6000 ($90) and systems with only remote control
of devices costs approximately INR 4000 ($60). It is evident
that there is not much difference between the cost here, so
integrating security with HAS is the idea to go with.
Certain techniques have allowed the users to use multiple
ways for controlling the HAS, providing high reliability. Using
very cheap hardware modules will decrease reliability of the
system. If HAS is implemented using commonly available
hardware, they can be fixed easily and cheaply, in case of
any failure.
Fig. 13: Algorithm for surveillance system [21]
Fig. 14: Haar-like features on LENA Picture [21]
for processing of the face. To provide independence of face
from environmental lightning conditions, feature extraction is
IV. CONCLUSION
The main aim of this paper is to gain reviews from the
already existing techniques and also know how different
modules in HAS work. A generalized architecture has been
described here. It is observed that inclusion and deletion of
certain modules in the proposed architectures can give cost
effective solutions as well as highly secure systems. After
reading and summarizing the above mentioned techniques,
certain changes have been stated (in Section V) to further
improve these systems. It is assumed that in future many other
IoT enabled boards will be launched and the proposed systems
take great advantage of those modules.
V. FUTURE WORK
With the flexibility offered by different techniques in HA,
following functionalities can be added to the existing system
easily:
1) Machine Learning approach for detecting presence of
humans indirectly maybe integrated
2) Cheap micro-controllers can be used for cost effective
solutions
3) Embed more sensors which provide accessibility to disabled
users, so that the systems can be installed in orphanages and
old age homes
4) A hardware can be introduced that handles security much
better than software libraries
5) Increase in Carbon Monoxide levels can be traced to alert
International Journal of Computational Intelligence Research (IJCIR). ISSN 0973-1873 Vol.14, No.1 (2018)© Research India Publications. http://www.ripublication.com
17

user for maintaining quality lifestyle
6) Including support for Email service with SMS will remove
the cost of sending SMS. Besides, if there is no Internet
connection, we can still control HAS by sending SMS.
7) Integration of cloud backup systems to train machine
learning modules
REFERENCES
[1] Ali Raza,Ataul Aziz Ikram,Asfand Amin,”A review of low cost and
power efficient development boards for IoT applications”, Future Tech- nologies Conference (FTC),6-7 Dec. 2016,pp. 786-790.
[2] Lecture Notes of Wireless Technology by Independent Education Union [Online], Avaliable:http://homes.ieu.edu.tr/hozcan/CE360/Lect1- Wireless-Introduction.pdf, 29 Oct. 2017.
[3] Rui Madeira ,Luis Nunes,”A Machine Learning Approach for Indirect Human Presence Detection Using IOT Devices”, Digital Information Management (ICDIM), 2016 Eleventh International Conference,19-21 Sept. 2016,pp. 145-150.
[4] Vikram.N, Harish K.S, Nihaal M.S,Raksha Umesh, Shetty Aashik Ashok Kumar,”A Low Cost Home Automation System Using Wi-Fi Based Wireless Sensor Network Incorporating Internet of Things(IoT)”, Ad- vance Computing Conference (IACC), 2017 IEEE 7th International,5-7 Jan. 2017,pp. 174-178.
[5] M. Subhashini, A. Venkateswara Rao, ”Internet based sensor networking & home automation using cortex processor on Linux platform (Rass- berry Pi2)”, Signal Processing, Communication, Power and Embedded System (SCOPES), 2016 International Conference, 3-5 Oct. 2016, pp. 456-460.
[6] Data Sheet of Bluetooth to Serial Port Module [Online], Available: http://www.electronicaestudio.com/docs/istd016A.pdf, 28 Oct. 2017.
[7] DataSheet of SIM900 GSM Modem [Online], Available: http://www.rhydolabz.com/documents/gps gsm/sim900 rs232 gsm modem opn.pdf, 23rd Oct. 2017.
[8] Dhiraj Sunehra, Vemula Tejaswi, ”Implementation of Speech Based
Home Automation System using Bluetooth and GSM”, Signal Process- ing, Communication, Power and Embedded System (SCOPES), 2016 International Conference, 3-5 Oct. 2016, pp. 807-813.
[9] S L S Sri Harsha, S Chakrapani Reddy, S Prince Mary, ”Enhanced home automation system using Internet of Things”, I-SMAC (IoT in Social, Mobile, Analytics and Cloud) (I-SMAC), 2017 International Conference, 10-11 Feb. 2017, pp. 89-93.
[10] Information on Alternatives to Raspberry Pi [Online], Avail- able: http://www.zdnet.com/pictures/10-alternatives-to-the-raspberry-pi/, 29 Oct. 2017.
[11] Data Sheet of HLK-RM04 Wi-Fi module [Online], Avail- able:http://www.hlktech.net/inc/lib/download/download.php?DId=22,29 Oct. 2017.
[12] Explanation of PWM on Arduino Website [Online], Available: https://www.arduino.cc/en/Tutorial/PWM, 29 Oct. 2017.
[13] Ravi Kishore Kodali, SreeRamya Soratkal, ”MQTT based home au-
tomation system using ESP8266”,2016 IEEE Region 10 Humanitarian Technology Conference (R10-HTC),21-23 Dec. 2016, pp. 1-5.
[14] Data Sheet of LPC2148 micro controller [Online], Avail- able:www.datasheetspdf.com/datasheet/LPC2148.html, 29 Oct. 2017.
[15] Vagdevi P., Divya Nagaraj, Golla Vara Prasad, ”Home: IOT Based Home Automation Using NFC”, I-SMAC (IoT in Social, Mobile, Analytics and Cloud) (I-SMAC), 2017 International Conference, 10-11 Feb. 2017, pp. 861-865.
[16] Wikipedia Page for Computer Vision [Online], Avail- able:https://en.wikipedia.org/wiki/Computer vision, 29 Oct. 2017.
[17] Motion JPEG Git Page [Online], Available:https://github.com/jackson liam/mjpg-streamer, 29 Oct. 2017.
[18] SimpleCV [Online], Available:simplecv.org/ , 29 Oct. 2017. [19] Vamsikrishna Patchava, Hari Babu Kandala, P Ravi Babu,”A Smart
Home Automation Technique with Raspberry Pi using IoT”, 2015 International Conference on Smart Sensors and Systems (IC-SSS),21- 23 Dec. 2015,pp. 1-4.
[20] OpenCV [Online], Available:https://opencv.org/ , 29 Oct. 2017. [21] Ayman Ben Thabet, Nidhal Ben Amor, ”Enhanced Smart Doorbell
System Based OnFace Recognition”,2015 16th International Confer- ence on Sciences and Techniques of Automatic Control and Computer Engineering (STA),21-23 Dec. 2015,pp 373 - 377.
[22] Document on OpenCV: Face Detec- tion using Haar Cascades [Online], Avail- able:https://docs.opencv.org/trunk/d7/d8b/tutorial py face detection.html , 29 Oct. 2017.
[23] Wikipedia Page for Eigenface [Online], Avail- able:https://en.wikipedia.org/wiki/Eigenface, 29 Oct. 2017.
International Journal of Computational Intelligence Research (IJCIR). ISSN 0973-1873 Vol.14, No.1 (2018)© Research India Publications. http://www.ripublication.com
18
G-SMART ATM
Pratiksha Viraskar
UG Student, KJSIEIT, Mumbai
University of Mumbai, India
Mitali Pawar
UG Student, KJSIEIT, Mumbai
University of Mumbai, India
Mukeshkumar Patel
UG Student, KJSIEIT, Mumbai
University of Mumbai, India
Rashmi Adatkar
Faculty, KJSIEIT, Mumbai
University of Mumbai, India
Abstract - The aim of this system is to design an embedded ATM
machine with unique identity. The system consists of database
where the fingerprints of an account holder are stored. Wherein
further on access of an account the fingerprint stored in the
database is compared with the user’s fingerprint. On successful
matching of fingerprint GSM modem connected to the
microcontroller of the system generates OTP which is received on
users registered mobile number. After entering the OTP, it is
matched with the OTP generated by the system. On successful
authentication the right is provided to the user to access his bank
account or to work on transactions related to his account.
Keywords- Fingerprint Recognition, GSM (global system for
mobile), ATM (automated teller machine) Terminal, PIC16F877.
I. INTRODUCTION
The problem in the existing ATM system is that once the
user’s bank card is lost or stolen and the PIN is known by
unauthorized person, the user’s account is vulnerable to attack.
Thus, to diminish the problem, our proposed ATM system has
three security levels. There are three main stages in our
project. First is PIN verification, second is OTP generation
and verification and third is Fingerprint Recognition. In this
system, first a database containing the user’s name, PIN,
fingerprint and mobile number is created and stored in PIC
16F8777 microcontroller. The system will ask the user to enter
the PIN. This entered PIN would be matched with that in the
database and it would then display the user name associated
with that PIN. The user needs to remember the PIN and should
not share it with others to prevent unauthorized access to his
account. Then the system asks the user to enter the PIN. The
received PIN is compared with the PIN from database.
OTP generation algorithm typically makes use of pseudo
randomness or randomness. This is necessary because
otherwise it would be easy to predict future OTPs by
observing previous ones. [1] Thus, this project requires OTPs
which are valid only for a short period of time. In these OTP
systems, time is an important part of the password algorithm,
since the generation of new passwords is based on the current
time. Minutiae are the points of interest in a fingerprint, such
as bifurcations and ridge endings. Thus, points are required to
be extracted from the scanned fingerprint and compare with
minutiae of the fingerprint in the database. A fast fingerprint
enhancement and minutiae extraction algorithm which
improves the clarity of the ridge and valley structures of the
input fingerprint images based on the frequency and
orientation of the local ridges and thereby extracting correct
minutiae is required. [7]
II. LITERATURE SURVEY
Kaul Urvashi (2007) in his article, “ATM: The Power of
Cash” explained the importance and benefits of ATM, the
players in the Indian market and presented various statistical
data concerning the growth of ATM. Manager FSDNCR
Corporation India Pvt. Ltd. [2] (2008) in his article, “ATMs:
Changing Fundamentals” stressed that he Indian ATM
industry has seen explosive growth in recent times and Banks
have committed to substantial capital outlays on ATM
deployment, recognizing the significance of the 3 Ms –
Maintenance, Monitoring and Management – of the ATMs to
make the self-service channel a reliable and profitable one. [2]
In today’s world, fingerprint is one of the essential variables
used for enforcing security and maintaining a reliable
identification of any individual. Fingerprints are used as
variables of security during voting, examination, operation of
bank accounts among others. The comparative analysis by the
result of the survey conducted by International Biometric
Group with other Biometrics in 2012 is shown below.
International Journal of Computational Intelligence Research (IJCIR). ISSN 0973-1873 Vol.14, No.1 (2018)© Research India Publications. http://www.ripublication.com
19

0
10
20
30
40
50
60
Face Fingerprint Signature Voice
Figure 1: Comparative survey of fingerprint with
other Biometrics.
III. SYSTEM DESIGN
A) Authorized Access
Authorized access i.e. for the successful transaction, firstly
the system would display “G Smart ATM Security
K.J.S.I.E.I.T Year 2017-18” and would ask the user to enter
the respective password. For example if the password of a
particular user is “786” he will enter it using keypad if at all
the password matches with the same as stored in database of
the respective user, the system will response using LCD which
says “match found”. Since the system consist of double
security it would generate the OTP and will ask the user to
enter the OTP same as received on the user’s mobile number.
After successful matching of OTP system will ask user to scan
its finger which is also authenticated by matching the
fingerprint stored in the database of the respective user. If all
those steps are done successfully only then the system would
allow user to make the transaction by entering the amount
he/she wants to withdraw/deposit. SMS about the transaction
is received on user’s mobile number using GSM.
B) Unauthorized Access
Unauthorized access i.e. for the unsuccessful transaction, the
procedure till the system asking for the password in the above
section would be same. This is unauthorized i.e. if the
password entered by the user is false or the match is not found.
The system would ask you to try again and will also inform
the user by sending him the SMS about the incorrect
password. If the passwords seems to be correct but the OTP
sent on the user’s mobile is entered wrong, this incorrectness
of OTP is also informed to the user using GSM and the system
would display “OTP IS MISMATCHED SORRY” and then
transaction is not proceeded further it is cancelled.
IV. PROPOSED MODEL
A) Hardware Design
i) LCD
Various display devices such as seven segment
displays, LCD display can be interfaced with
microcontroller to read the output directly. In our
project we use a two-line LCD display with 16
characters each.
FEATURES:
• 5 x 8 dots with cursor
• Built-in controller (KS 0066 or Equivalent)
• + 5V power supply
• 1/16 duty cycle
• B/L to be driven by pin 1, pin 2 or pin 15, pin 16 or
A.K (LED)
• N.V. optional for + 3V power supply.
ii) Finger Print Module
This module uses biometrics which secures this
system. This module will make port, and sends data
to, detect prints, and take photos, search and hash.
You can also enroll new fingerprints verification and
fingerprint detection simple. It consists of DSP chip
that does the calculation, image rendering, searching
and feature-finding.[2] This module can be connected
to any microcontroller or system with TTL serial
directly that is up to 162 finger prints can be stored in
the onboard FLASH memory. There's a red LED in
the lens that lights up during a scan so you know it’s
working properly.
iii) GSM Module
This module is today the most successful digital
mobile communication system. This second-
generation system provides voice and limited data
services and uses digital modulation with improved
audio quality. GSM Module is used to establish
communication between a computer and a GSM
System. GSM module consists of communication
interfaces like RS-232 for computer. The GSM
module that we are using in this unit is the SIM300
module. [6]
iv) Microcontroller
Controller which we are using in this system is PIC
16F877A. This Controller Controls this system.
International Journal of Computational Intelligence Research (IJCIR). ISSN 0973-1873 Vol.14, No.1 (2018)© Research India Publications. http://www.ripublication.com
20

Microcontroller used in this system is interfaced with
LCD display, GSM, Fingerprint Module, and
Keypad. As the user enters the passcode through
keypad controller will check for the same code in
database if it is matched. OTP is send to user’s
personal number via GSM. User enters this OTP and
LCD displays ‘Scan Finger’. After Scanning this
fingerprint is verified by controller with fingerprint
stored in the database. If it gets verified transaction
process begins.
B) Software Design
Admin mode User mode
Figure 2. The overall flowchart of software.
The above flowchart shows the overall flow of program of the
system. The program consists of two modes, the user mode
and the admin mode. The person accessing the ATM machine
for transactions would automatically enter the user mode by
selecting the option of user mode. If at all the system needs
any changes or wants to add the user in it or want to store the
fingerprint the person would enter the admin mode
automatically by selecting the admin mode.
Figure 3. The flowchart of fingerprint recognition
This algorithm of fingerprint recognition plays an important
role in this ATM system. There are two steps to process the
image of fingerprint.
1. Fingerprint recognition process.
2. Fingerprint image enhancement.
Fingerprint recognition process: In this process pre-processing of fingerprint image is
required. Pre-processing are the ones like filtering, histogram
computing, image binarization and image enhancement. [4]
The characteristics obtained from the users fingerprint while
accessing is further compared with the image stored in the
database to verify whether the characteristics matches or it
does not.
Fingerprint image enhancement: Fingerprint image enhancement is based on Gabor filter.
The Gabor filter in used to remove the noise from the image
and strengthen it. The Gabor filter best states the definition
Start
Enter the mode
you want?
1. User mode
2. Admin
mode Read the
finger print Scan the
fingerprint
& add the
module
number
Scan in the
database
Check for
authentication
Send the alert
message to
account
holder
Send
password to
account
holder
Enter
password in
ATM for
accessing
Transaction
done
Start
Initialize system
clock
Open interrupt task
Initialize system task
Judge and enter
process of module
Start to attempt
multiple tasks
International Journal of Computational Intelligence Research (IJCIR). ISSN 0973-1873 Vol.14, No.1 (2018)© Research India Publications. http://www.ripublication.com
21

between valley and ridge. But this algorithm fails for high
capacity requirement. [5]
V. RESULT AND CONCLUSION
Table 1. Comparison of existing and proposed ATM
system
Technique Existing ATM
system
Proposed ATM
system
PIN (Personal
identification
number)
Yes No
OTP (one-time
password)
No Yes
Fingerprint
recognition
No Yes
Time required 1 minute 1 minute 30 secs
The existing ATM system takes less time for the transaction
but is insecure due to tremendous increase in the number of
criminals and their activities. Instead, the proposed ATM
system requires more time for transaction than the existing
ATM system but provides immense security due to fingerprint
recognition and OTP. So we have to compromise with time for
the sake of security. Thus the proposed ATM system works
with only the authorized ATM card holder. This system can be
implemented firstly at small industries and institutions with
limited workers.
VI. REFERENCES
[1] Kande Archana1, Dr.A .Govardhan, “Enhance the Security
in the ATM System with Multimodal Biometrics and Two-
Tier Security”, IJARCSSE vol.3, no. 10, ISSN: 2277 128X,
October 2013.
[2] Mr. Mahesh A. Patil, Mr. Sachin P. Wanere, Mr. Rupesh
P. Maighane, Mr. Aashay R. Tiwari, “ATM Transaction Using
Biometric Fingerprint Technology”, IJECSCSE vol. 2, no. 6,
ISSN: 2277-947.
[3] Rajkumar Buyya, Chee Shin Yeo, Srikumar Venugopal,
James Broberg, Ivona Brandic, Proc. “Cloud computing and
emerging IT platforms: Vision, hype, and reality for delivering
computing as the 5th utility,” (Elsevier), 2009.
[4] “An Enhanced ATM Security System using Second-Level
Authentication”, IJCA (0975 – 8887) vol. 111, no. 5, February
2011.
[5] “A Novel Method to Enhance the Security of ATM using
Biometrics”, IEEE 978-1- 4799-7075-9/15, 2015.
[6] Jain A.K, Ross A. and Prabhakar S., IEEE Transactions on
Circuits and Systems for Video Technology, 14, 4-20, 2009.
[7] RAVI J, K. B. RAJA, VENUGOPAL, “Fingerprint
Recognition Using Minutiae Score Matching”, IJEST,
vol.1(2), no. 35-42, 2009.
International Journal of Computational Intelligence Research (IJCIR). ISSN 0973-1873 Vol.14, No.1 (2018)© Research India Publications. http://www.ripublication.com
22
Smart Shopping System
Mihir Ethan Sanjay Awale
UG Student, KJSIEIT, Mumbai
University of Mumbai, India
Swamini Ambre
UG Student, KJSIEIT, Mumbai
University of Mumbai, India
Shubham Bhaurao Avhad
UG Student, KJSIEIT, Mumbai
University of Mumbai, India
Jay Bhosale
UG Student, KJSIEIT, Mumbai
University of Mumbai, India
Jayashree Khanapuri
Faculty, KJSIEIT, Mumbai
University of Mumbai, India
Abstract-As the population of India grows, there is more
and more crowding in urban cities. Consequently, the
number of people in the retail shops and malls has
increased manifold. Within a span of 5 years, the number
of shopping malls in India has almost doubled, so has the
number of people visiting these malls. Another factor
causing growth of people visiting malls is the decrease in
product prices and the large number of sales and
discounts with run throughout the year. This has also
resulted in an increase in the waiting times at the
checkout queue. This is a major inconvenience to the
consumers as they have to wait a long time in these
queues. We have designed a system to reduce these
queues by reducing the checkout times using smart
shopping baskets.This isachieved by implementing a
system in which the items are scanned before reaching
the queue itself. The product information will be stored in
the cart and the count will be displayed with a facility to
prevent misuse of the system. This can be used to increase
the throughput in the shops as it will allow people to get
in and out faster and is beneficial for the shop. This paper
will discuss the aforementioned system with obtained
results.
Keywords-Shopping, barcodes, RFID, application,
Android
I. INTRODUCTION
In this consumer age, people prefer to shop at bigger
stores like shopping malls and supermarkets. These
places usually make use of shopping carts and
baskets to ease the process of shopping. The
customers have to place the desired products in their
cart and then proceed to pay the bill and check out.
The billing process is a long-drawn process that
requires sufficient manpower, yet takes a lot of times
to complete as seen in paper [1]. In this paper, we
propose a system through which the waiting time of
the customer can be reduced to a great extent. This
will allow a smoother process of shopping and
prevent the formation of long queues. It will consist
of two parts a barcode reader mobile application, and
microprocessor with Bluetooth module, a LCD
display, and a rechargeable battery on the cart. The
customer will scan the barcodes using an application
on their mobile device. The barcode information will
be stored into the mobile application and sent over
Bluetooth to microprocessor. The mobile application
process the parameters and display relevant
information on the cart screen. If the customer is
ready to make a checkout, he would pass the cart
through the cashier. The total price and other required
details will be sent to the cashier and the receipt will
be automatically printed. The customer will just have
to pay the bill using the appropriate payment method
and then proceed to leave without waiting for a long
time. The above details will be mentioned in the
following sections. Section II discusses the work
done un this field. Section III discusses the current
shopping process with its limitations and section IV
describes the proposed solution. The results of the
application are presented in section V.
International Journal of Computational Intelligence Research (IJCIR). ISSN 0973-1873 Vol.14, No.1 (2018)© Research India Publications. http://www.ripublication.com
23
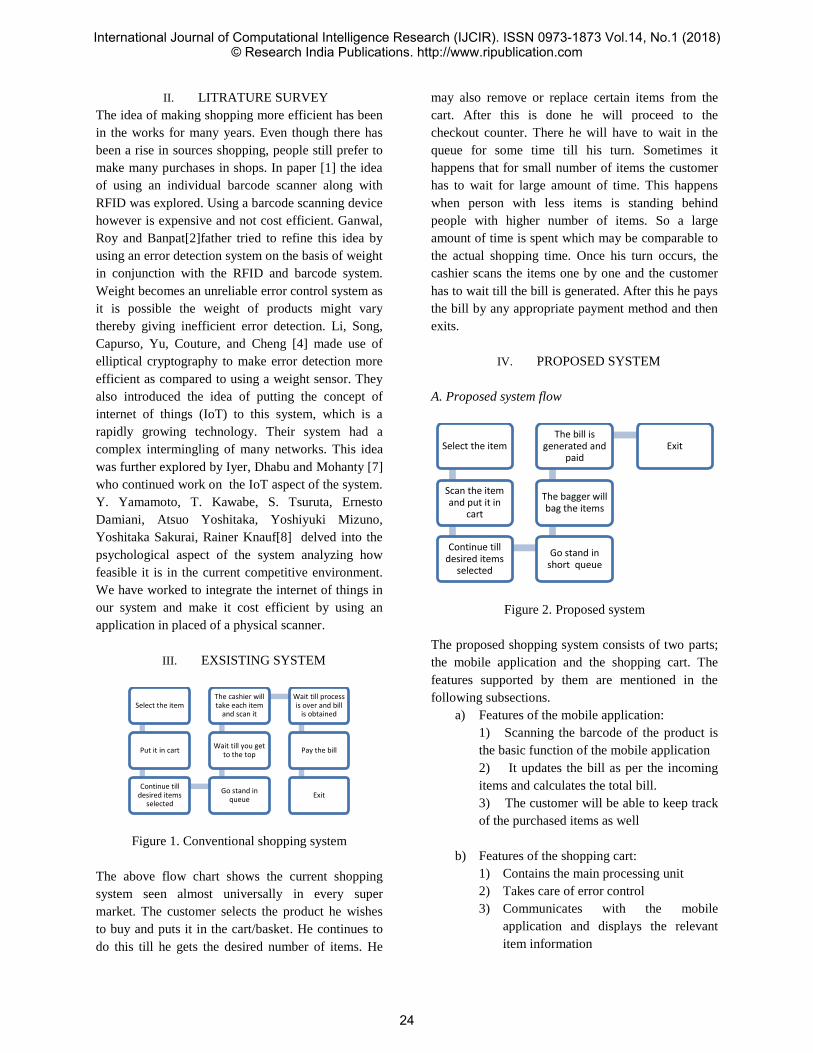
II. LITRATURE SURVEY
The idea of making shopping more efficient has been
in the works for many years. Even though there has
been a rise in sources shopping, people still prefer to
make many purchases in shops. In paper [1] the idea
of using an individual barcode scanner along with
RFID was explored. Using a barcode scanning device
however is expensive and not cost efficient. Ganwal,
Roy and Banpat[2]father tried to refine this idea by
using an error detection system on the basis of weight
in conjunction with the RFID and barcode system.
Weight becomes an unreliable error control system as
it is possible the weight of products might vary
thereby giving inefficient error detection. Li, Song,
Capurso, Yu, Couture, and Cheng [4] made use of
elliptical cryptography to make error detection more
efficient as compared to using a weight sensor. They
also introduced the idea of putting the concept of
internet of things (IoT) to this system, which is a
rapidly growing technology. Their system had a
complex intermingling of many networks. This idea
was further explored by Iyer, Dhabu and Mohanty [7]
who continued work on the IoT aspect of the system.
Y. Yamamoto, T. Kawabe, S. Tsuruta, Ernesto
Damiani, Atsuo Yoshitaka, Yoshiyuki Mizuno,
Yoshitaka Sakurai, Rainer Knauf[8] delved into the
psychological aspect of the system analyzing how
feasible it is in the current competitive environment.
We have worked to integrate the internet of things in
our system and make it cost efficient by using an
application in placed of a physical scanner.
III. EXSISTING SYSTEM
Figure 1. Conventional shopping system
The above flow chart shows the current shopping
system seen almost universally in every super
market. The customer selects the product he wishes
to buy and puts it in the cart/basket. He continues to
do this till he gets the desired number of items. He
may also remove or replace certain items from the
cart. After this is done he will proceed to the
checkout counter. There he will have to wait in the
queue for some time till his turn. Sometimes it
happens that for small number of items the customer
has to wait for large amount of time. This happens
when person with less items is standing behind
people with higher number of items. So a large
amount of time is spent which may be comparable to
the actual shopping time. Once his turn occurs, the
cashier scans the items one by one and the customer
has to wait till the bill is generated. After this he pays
the bill by any appropriate payment method and then
exits.
IV. PROPOSED SYSTEM
A. Proposed system flow
Figure 2. Proposed system
The proposed shopping system consists of two parts;
the mobile application and the shopping cart. The
features supported by them are mentioned in the
following subsections.
a) Features of the mobile application:
1) Scanning the barcode of the product is
the basic function of the mobile application
2) It updates the bill as per the incoming
items and calculates the total bill.
3) The customer will be able to keep track
of the purchased items as well
b) Features of the shopping cart:
1) Contains the main processing unit
2) Takes care of error control
3) Communicates with the mobile
application and displays the relevant
item information
Select the item
Put it in cart
Continue till desired items
selected
Go stand in queue
Wait till you get to the top
The cashier will take each item
and scan it
Wait till process is over and bill
is obtained
Pay the bill
Exit
Select the item
Scan the item and put it in
cart
Continue till desired items
selected
Go stand in short queue
The bagger will bag the items
The bill is generated and
paidExit
International Journal of Computational Intelligence Research (IJCIR). ISSN 0973-1873 Vol.14, No.1 (2018)© Research India Publications. http://www.ripublication.com
24

As the goal of the Smart Shopping System is
speeding up the shopping process, one major
requirement is to have the bar code of a product
scanned by the customer itself, instead of scanning at
the checkout counter. RFID tags would also be
present on the product to provide additional security.
So even if the customer fails to scan the item using
bar code the product will be added in the item list on
the application. Hence, this design includes a
android-based bar code scanner application and
efficient use of RFID technology. The same details
will be contained in the RFID tags placed on
expensive items. The information contained in the
barcode is name, weight, price and class. Each item
will be assigned a weight class. The processor would
also keep a track of the inventory system. Thus at
checkout the data from mobile application is sent to
the server through wireless communication. This
saves a lot of time of the customer as s/he is not
supposed to wait in long queues.
B. Operation
Following is the operation of the smart system:
First, when the customer enters the shop, he picks up
the smart shopping cart. When mobile app is
launched, Bluetooth needs to be enabled and should
be connected to the cart by accepting the connection.
Then further s/he would pick an item, scan it using
the application and the product details would be
displayed on the mobile screen as well as on the LCD
screen. Then as more number of items are scanned
and placed in the cart, the total amount and total
count of items is displayed on the screen. If the
customer wants to remove an item s/he would simply
select the item from the list and press the remove
item button on the screen. Now the updated amount
and count is displayed. As the app is connected to the
cart via Bluetooth, the product details on the LCD
screen are also updated. In any case if the customer
does not scan the item and directly puts it in the cart,
then the RFID tag contained on it will be read by the
RFID programmer and thus the item details will be
automatically added in the list on the mobile app. As
and when a customer scans the item using the app,
the corresponding changes in the inventory would be
reflected in the inventory database. When customer is
done with shopping, he should press the checkout
button on the app and he would get a digital bill. This
bill is sent to the server database .so at the checkout
he just has to pay and get the products packed.
V. RESULTS
1) Mobile app was tested and successfully
implemented.
2) RFID tag was programmed and verified.
3) Cart Hardware and app were connected and
relevant information was exchanged.
The mobile application results are shown below
Figure 3
Figure 4
Figure 3 shows the basic layout of the application. It
consists of a simple interface that initially has all the
buttons locked except the connect to cart button.
Figure 4 is the connect screen accessed by selecting
connect to the cart. Here the addresses of the
Bluetooth devices are displayed and the user needs to
connect to the cart.
Figure 5
Figure 6
Figure 5 shows the app screen after connection has
been established. Now add to the cart button and
International Journal of Computational Intelligence Research (IJCIR). ISSN 0973-1873 Vol.14, No.1 (2018)© Research India Publications. http://www.ripublication.com
25
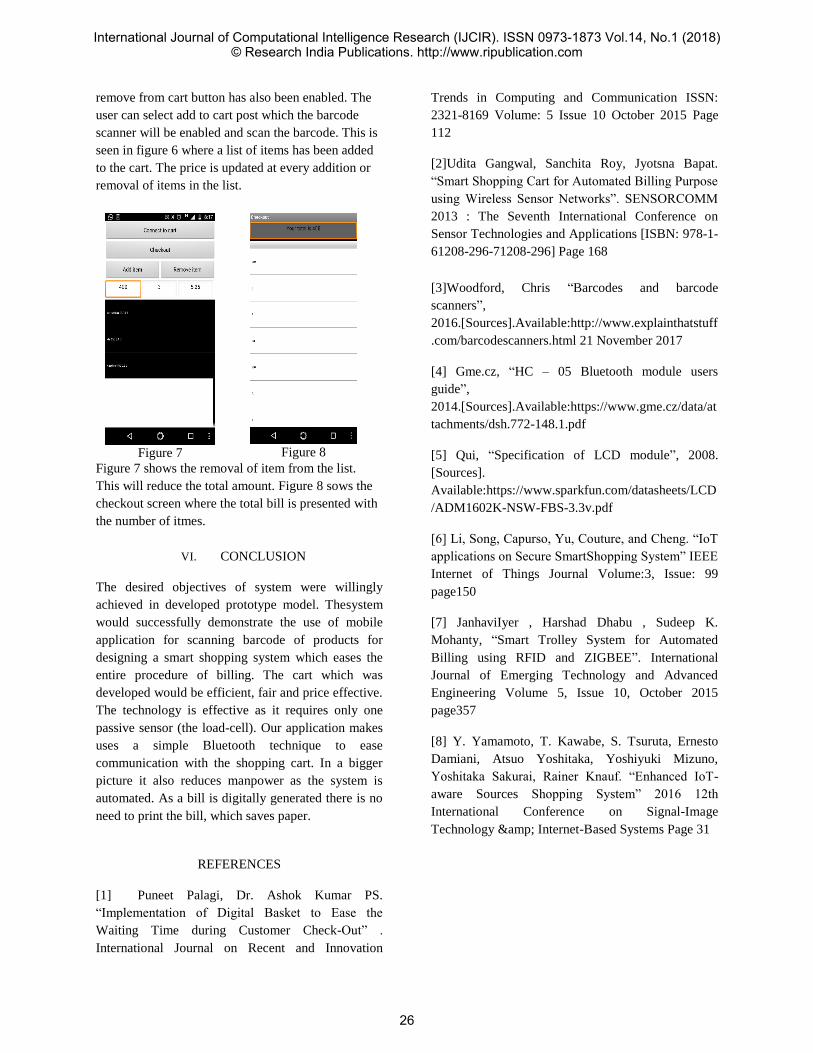
remove from cart button has also been enabled. The
user can select add to cart post which the barcode
scanner will be enabled and scan the barcode. This is
seen in figure 6 where a list of items has been added
to the cart. The price is updated at every addition or
removal of items in the list.
Figure 7
Figure 8
Figure 7 shows the removal of item from the list.
This will reduce the total amount. Figure 8 sows the
checkout screen where the total bill is presented with
the number of itmes.
VI. CONCLUSION
The desired objectives of system were willingly
achieved in developed prototype model. Thesystem
would successfully demonstrate the use of mobile
application for scanning barcode of products for
designing a smart shopping system which eases the
entire procedure of billing. The cart which was
developed would be efficient, fair and price effective.
The technology is effective as it requires only one
passive sensor (the load-cell). Our application makes
uses a simple Bluetooth technique to ease
communication with the shopping cart. In a bigger
picture it also reduces manpower as the system is
automated. As a bill is digitally generated there is no
need to print the bill, which saves paper.
REFERENCES
[1] Puneet Palagi, Dr. Ashok Kumar PS.
“Implementation of Digital Basket to Ease the
Waiting Time during Customer Check-Out” .
International Journal on Recent and Innovation
Trends in Computing and Communication ISSN:
2321-8169 Volume: 5 Issue 10 October 2015 Page
112
[2]Udita Gangwal, Sanchita Roy, Jyotsna Bapat.
“Smart Shopping Cart for Automated Billing Purpose
using Wireless Sensor Networks”. SENSORCOMM
2013 : The Seventh International Conference on
Sensor Technologies and Applications [ISBN: 978-1-
61208-296-71208-296] Page 168
[3]Woodford, Chris “Barcodes and barcode
scanners”,
2016.[Sources].Available:http://www.explainthatstuff
.com/barcodescanners.html 21 November 2017
[4] Gme.cz, “HC – 05 Bluetooth module users
guide”,
2014.[Sources].Available:https://www.gme.cz/data/at
tachments/dsh.772-148.1.pdf
[5] Qui, “Specification of LCD module”, 2008.
[Sources].
Available:https://www.sparkfun.com/datasheets/LCD
/ADM1602K-NSW-FBS-3.3v.pdf
[6] Li, Song, Capurso, Yu, Couture, and Cheng. “IoT
applications on Secure SmartShopping System” IEEE
Internet of Things Journal Volume:3, Issue: 99
page150
[7] JanhaviIyer , Harshad Dhabu , Sudeep K.
Mohanty, “Smart Trolley System for Automated
Billing using RFID and ZIGBEE”. International
Journal of Emerging Technology and Advanced
Engineering Volume 5, Issue 10, October 2015
page357
[8] Y. Yamamoto, T. Kawabe, S. Tsuruta, Ernesto
Damiani, Atsuo Yoshitaka, Yoshiyuki Mizuno,
Yoshitaka Sakurai, Rainer Knauf. “Enhanced IoT-
aware Sources Shopping System” 2016 12th
International Conference on Signal-Image
Technology & Internet-Based Systems Page 31
International Journal of Computational Intelligence Research (IJCIR). ISSN 0973-1873 Vol.14, No.1 (2018)© Research India Publications. http://www.ripublication.com
26

Low Cost Self Assistive Wheelchair
Prof. Sheetal Jagtap Faculty, KJSIEIT, Mumbai
Sahil Boble, NiravMange, RajMisal, Akshat Sharma UG Students, KJSIEIT, Mumbai
Abstract— The Automated Wheelchair facilitates the
physically disabled person to automatically operate the
wheelchair with the help of a joystick. The aim of this project is
to use a joystick to drive a wheelchair. It grants the user to
mobilize independently, with the help of joystick from which the
motors are driven. A micro-controller is used in the project
because of its efficient features & synchronization with various
other devices. The whole setup is carried out in an economical
way so that it can be afforded by various deprivileged,
overcoming financial barriers.
Keywords— wheelchair, automated, joystick, microcontroller,
motors, physically disabled, cost-effective.
I. INTRODUCTION
Wheelchair is an important vehicle for handicapped person
to move somewhere. The typical wheelchair is roughly
classified as follows: the self-controlled type wheelchair and
helper-controlled type wheelchair. The user drives self-
controlled wheelchair using physical force imparted by our
upper limbs using a mechanical wheel setup equipped at
outside of rear wheel. Whereas the helper-controlled type has
a support, for instance, joystick-controlled type is equipped
with a joystick with the help of which user can move around. Disability is an impairment that substantially affects a person's
life activities. A person with locomotive disabilities needs a
wheelchair to perform various functions. One can move the
wheelchair manually by pushing the wheelchair with hands.
However, it gets difficult for an individual with weak upper
limbs to move a wheelchair manually. Hence there arise a
need of automated wheelchair that can be controlled via
joystick. Thus, we aim to design and develop a smart
wheelchair which will facilitate the movement of a disabled
people so as to help them live a life with less dependence on
others. This project is a simple implementation of this approach. Command are taken through a joystick, processed in
computer and sent to the wheelchair and finally the wheelchair acts accordingly.
II. AIM OF PROJECT
The project aims at controlling a wheelchair by means of
joystick. It enables a disabled person to move around
independently, using a joystick which is interfaced with
motors. The wheelchair is built using a micro-controller,
chosen for its low cost, in addition to its versatility and
performance. The system has been designed and implemented
in a cost-effective way so that if our project is commercialized
the needy users in developing countries will benefit from it.
III. INDIAN STATISTICS ON DISABILITY
We know that there is rapid growth in the world’s population & it is multiplying at an exponential rate. In India 120.5
million people are disabled out of which 41.325% are
physically disabled unfortunately, due to various medical
conditions or accidents. The graphical representation of
disability in India is represented in the figure given below
[12]:
International Journal of Computational Intelligence Research (IJCIR). ISSN 0973-1873 Vol.14, No.1 (2018)© Research India Publications. http://www.ripublication.com
27
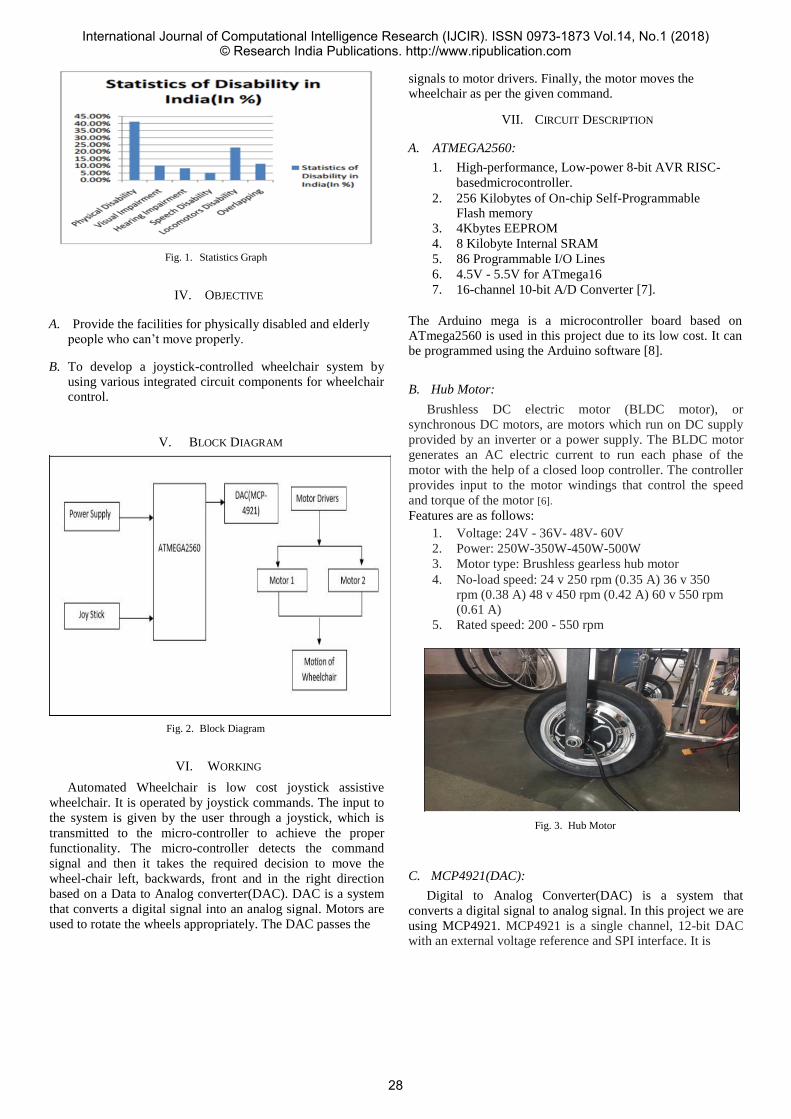
Fig. 1. Statistics Graph
IV. OBJECTIVE
A. Provide the facilities for physically disabled and elderly
people who can’t move properly. B. To develop a joystick-controlled wheelchair system by
using various integrated circuit components for wheelchair control.
V. BLOCK DIAGRAM
signals to motor drivers. Finally, the motor moves the wheelchair as per the given command.
VII. CIRCUIT DESCRIPTION
A. ATMEGA2560:
1. High-performance, Low-power 8-bit AVR RISC-
basedmicrocontroller. 2. 256 Kilobytes of On-chip Self-Programmable
Flash memory 3. 4Kbytes EEPROM 4. 8 Kilobyte Internal SRAM
5. 86 Programmable I/O Lines
6. 4.5V - 5.5V for ATmega16
7. 16-channel 10-bit A/D Converter [7].
The Arduino mega is a microcontroller board based on ATmega2560 is used in this project due to its low cost. It can be programmed using the Arduino software [8].
B. Hub Motor:
Brushless DC electric motor (BLDC motor), or
synchronous DC motors, are motors which run on DC supply
provided by an inverter or a power supply. The BLDC motor
generates an AC electric current to run each phase of the
motor with the help of a closed loop controller. The controller
provides input to the motor windings that control the speed
and torque of the motor [6]. Features are as follows:
1. Voltage: 24V - 36V- 48V- 60V
2. Power: 250W-350W-450W-500W
3. Motor type: Brushless gearless hub motor 4. No-load speed: 24 v 250 rpm (0.35 A) 36 v 350
rpm (0.38 A) 48 v 450 rpm (0.42 A) 60 v 550 rpm (0.61 A)
5. Rated speed: 200 - 550 rpm
Fig. 2. Block Diagram
VI. WORKING
Automated Wheelchair is low cost joystick assistive
wheelchair. It is operated by joystick commands. The input to
the system is given by the user through a joystick, which is
transmitted to the micro-controller to achieve the proper
functionality. The micro-controller detects the command
signal and then it takes the required decision to move the
wheel-chair left, backwards, front and in the right direction
based on a Data to Analog converter(DAC). DAC is a system
that converts a digital signal into an analog signal. Motors are
used to rotate the wheels appropriately. The DAC passes the
Fig. 3. Hub Motor
C. MCP4921(DAC):
Digital to Analog Converter(DAC) is a system that
converts a digital signal to analog signal. In this project we are
using MCP4921. MCP4921 is a single channel, 12-bit DAC with an external voltage reference and SPI interface. It is
International Journal of Computational Intelligence Research (IJCIR). ISSN 0973-1873 Vol.14, No.1 (2018)© Research India Publications. http://www.ripublication.com
28
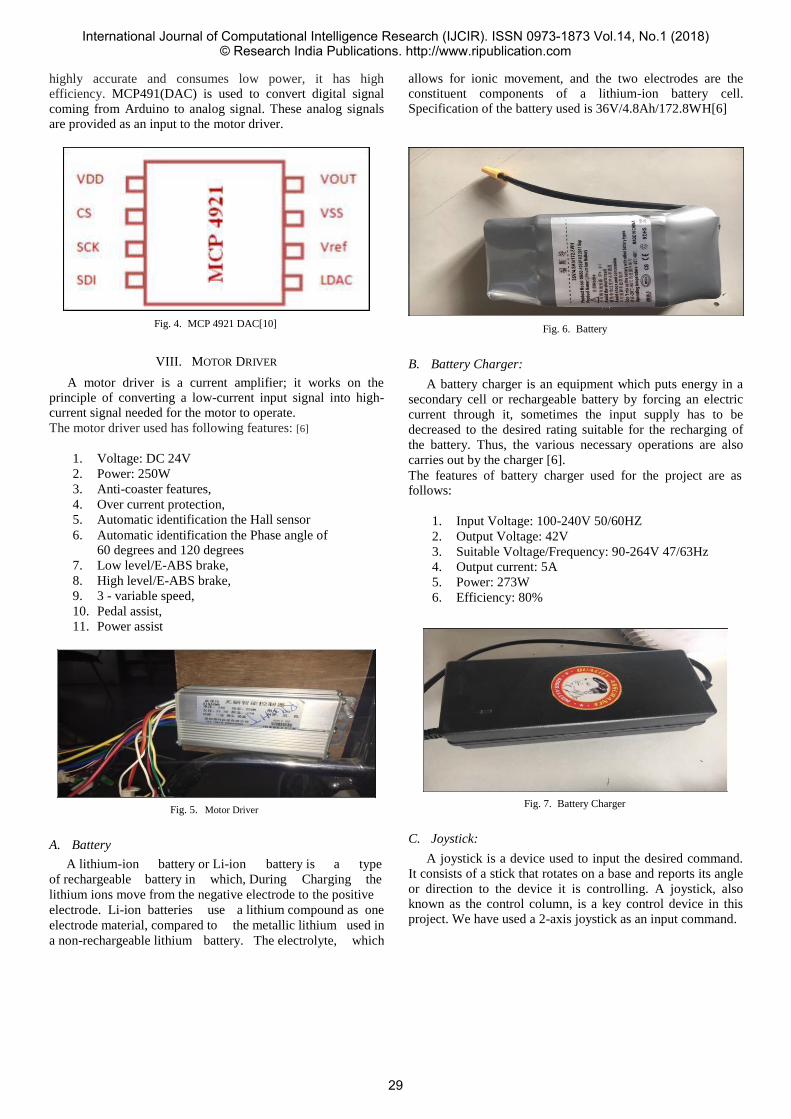
highly accurate and consumes low power, it has high efficiency. MCP491(DAC) is used to convert digital signal
coming from Arduino to analog signal. These analog signals are provided as an input to the motor driver.
allows for ionic movement, and the two electrodes are the constituent components of a lithium-ion battery cell. Specification of the battery used is 36V/4.8Ah/172.8WH[6]
Fig. 4. MCP 4921 DAC[10]
VIII. MOTOR DRIVER
A motor driver is a current amplifier; it works on the principle of converting a low-current input signal into high-current signal needed for the motor to operate. The motor driver used has following features: [6]
1. Voltage: DC 24V
2. Power: 250W
3. Anti-coaster features,
4. Over current protection,
5. Automatic identification the Hall sensor 6. Automatic identification the Phase angle of
60 degrees and 120 degrees 7. Low level/E-ABS brake,
8. High level/E-ABS brake,
9. 3 - variable speed,
10. Pedal assist,
11. Power assist
Fig. 5. Motor Driver
A. Battery
A lithium-ion battery or Li-ion battery is a type
of rechargeable battery in which, During Charging the lithium ions move from the negative electrode to the positive
electrode. Li-ion batteries use a lithium compound as one
electrode material, compared to the metallic lithium used in
a non-rechargeable lithium battery. The electrolyte, which
Fig. 6. Battery
B. Battery Charger:
A battery charger is an equipment which puts energy in a
secondary cell or rechargeable battery by forcing an electric
current through it, sometimes the input supply has to be
decreased to the desired rating suitable for the recharging of
the battery. Thus, the various necessary operations are also
carries out by the charger [6]. The features of battery charger used for the project are as follows:
1. Input Voltage: 100-240V 50/60HZ
2. Output Voltage: 42V
3. Suitable Voltage/Frequency: 90-264V 47/63Hz
4. Output current: 5A 5. Power: 273W
6. Efficiency: 80%
Fig. 7. Battery Charger
C. Joystick:
A joystick is a device used to input the desired command.
It consists of a stick that rotates on a base and reports its angle
or direction to the device it is controlling. A joystick, also known as the control column, is a key control device in this
project. We have used a 2-axis joystick as an input command.
International Journal of Computational Intelligence Research (IJCIR). ISSN 0973-1873 Vol.14, No.1 (2018)© Research India Publications. http://www.ripublication.com
29
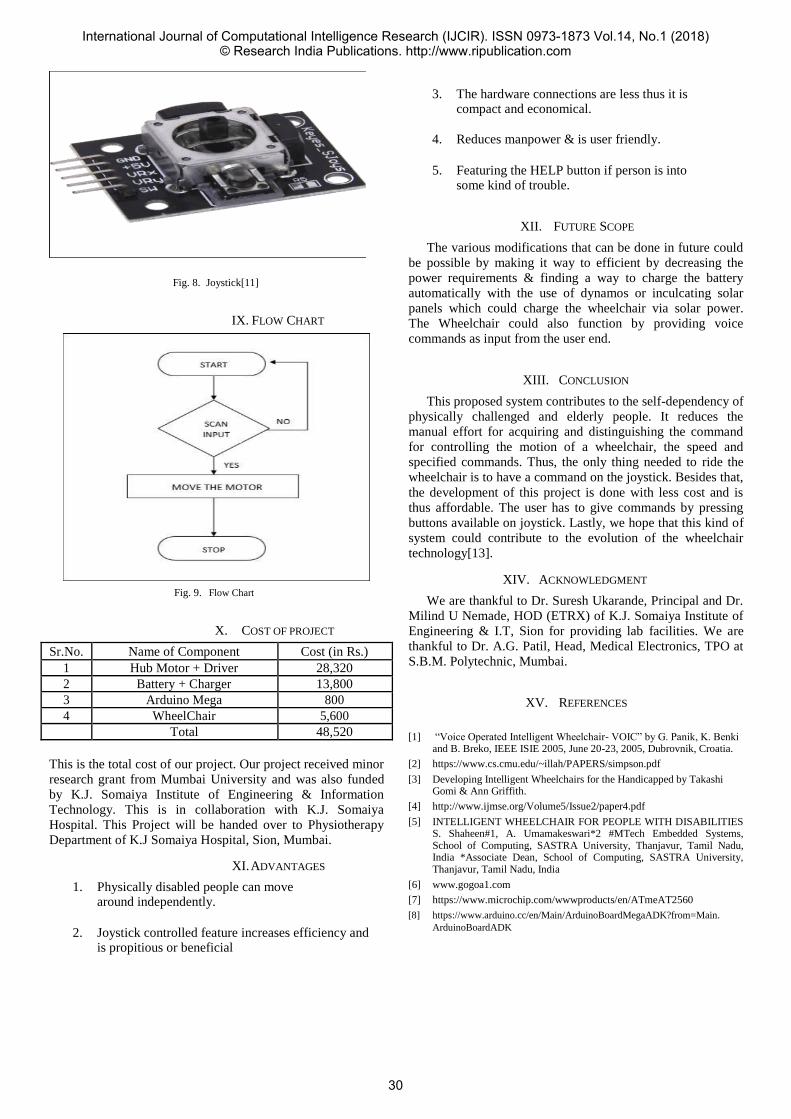
Fig. 8. Joystick[11]
IX. FLOW CHART
Fig. 9. Flow Chart
X. COST OF PROJECT
Sr.No. Name of Component Cost (in Rs.)
1 Hub Motor + Driver 28,320
2 Battery + Charger 13,800
3 Arduino Mega 800
4 WheelChair 5,600
Total 48,520
This is the total cost of our project. Our project received minor
research grant from Mumbai University and was also funded
by K.J. Somaiya Institute of Engineering & Information
Technology. This is in collaboration with K.J. Somaiya
Hospital. This Project will be handed over to Physiotherapy
Department of K.J Somaiya Hospital, Sion, Mumbai.
XI. ADVANTAGES
1. Physically disabled people can move around independently.
2. Joystick controlled feature increases efficiency and
is propitious or beneficial
3. The hardware connections are less thus it is compact and economical.
4. Reduces manpower & is user friendly.
5. Featuring the HELP button if person is into
some kind of trouble.
XII. FUTURE SCOPE
The various modifications that can be done in future could
be possible by making it way to efficient by decreasing the
power requirements & finding a way to charge the battery
automatically with the use of dynamos or inculcating solar
panels which could charge the wheelchair via solar power.
The Wheelchair could also function by providing voice
commands as input from the user end.
XIII. CONCLUSION
This proposed system contributes to the self-dependency of
physically challenged and elderly people. It reduces the
manual effort for acquiring and distinguishing the command
for controlling the motion of a wheelchair, the speed and
specified commands. Thus, the only thing needed to ride the
wheelchair is to have a command on the joystick. Besides that,
the development of this project is done with less cost and is
thus affordable. The user has to give commands by pressing
buttons available on joystick. Lastly, we hope that this kind of
system could contribute to the evolution of the wheelchair
technology[13].
XIV. ACKNOWLEDGMENT
We are thankful to Dr. Suresh Ukarande, Principal and Dr.
Milind U Nemade, HOD (ETRX) of K.J. Somaiya Institute of
Engineering & I.T, Sion for providing lab facilities. We are
thankful to Dr. A.G. Patil, Head, Medical Electronics, TPO at
S.B.M. Polytechnic, Mumbai.
XV. REFERENCES
[1] “Voice Operated Intelligent Wheelchair- VOIC” by G. Panik, K. Benki
and B. Breko, IEEE ISIE 2005, June 20-23, 2005, Dubrovnik, Croatia. [2] https://www.cs.cmu.edu/~illah/PAPERS/simpson.pdf [3] Developing Intelligent Wheelchairs for the Handicapped by Takashi
Gomi & Ann Griffith. [4] http://www.ijmse.org/Volume5/Issue2/paper4.pdf [5] INTELLIGENT WHEELCHAIR FOR PEOPLE WITH DISABILITIES
S. Shaheen#1, A. Umamakeswari*2 #MTech Embedded Systems, School of Computing, SASTRA University, Thanjavur, Tamil Nadu, India *Associate Dean, School of Computing, SASTRA University, Thanjavur, Tamil Nadu, India
[6] www.gogoa1.com [7] https://www.microchip.com/wwwproducts/en/ATmeAT2560 [8] https://www.arduino.cc/en/Main/ArduinoBoardMegaADK?from=Main.
ArduinoBoardADK
International Journal of Computational Intelligence Research (IJCIR). ISSN 0973-1873 Vol.14, No.1 (2018)© Research India Publications. http://www.ripublication.com
30

[9] http://mospi.nic.in/sites/default/files/publication_reports/Disabled
[10] _perso21&tag=googinkenshoo-21&ascsubtag=2dd84f03-f74d-4269-b59a- ns_in_India_2016.pdf 1418a8d04043
[10] https://www.pantechsolutions.net/fpga-tutorials/dac-interface-with- [12] http://www.prb.org/Publications/LessonPlans/HumanPopulation/
spartan6-fpga-project-kit Population Growth.aspx
[11] https://www.amazon.in/Generic-GNRC_17-Joystick-Module- [13] www.ijmer.com/Maiin.Wheelchair-21_paper112236-21&ascsubtag Arduino/dp/B019EUNZGM?tag=googinhydr18418- =2df87y03.aspx
International Journal of Computational Intelligence Research (IJCIR). ISSN 0973-1873 Vol.14, No.1 (2018)© Research India Publications. http://www.ripublication.com
31
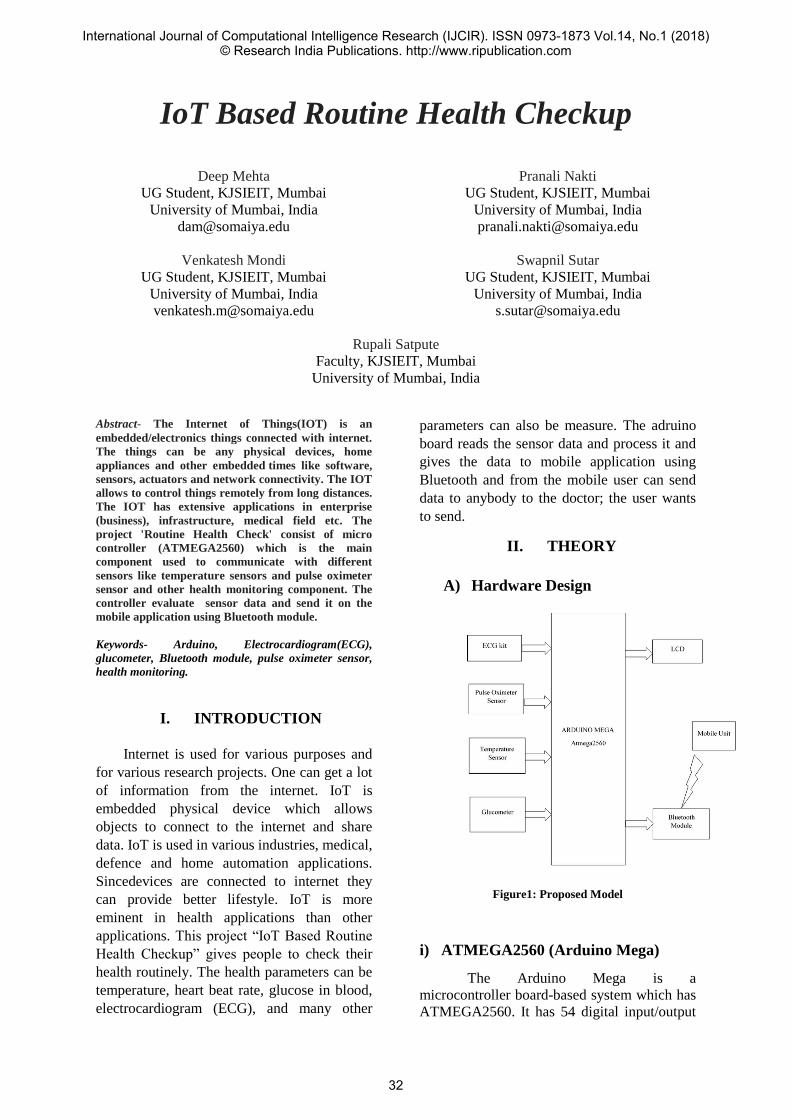
IoT Based Routine Health Checkup
Deep Mehta
UG Student, KJSIEIT, Mumbai
University of Mumbai, India
Venkatesh Mondi
UG Student, KJSIEIT, Mumbai
University of Mumbai, India
Pranali Nakti
UG Student, KJSIEIT, Mumbai
University of Mumbai, India
Swapnil Sutar
UG Student, KJSIEIT, Mumbai
University of Mumbai, India
Rupali Satpute
Faculty, KJSIEIT, Mumbai
University of Mumbai, India
Abstract- The Internet of Things(IOT) is an
embedded/electronics things connected with internet.
The things can be any physical devices, home
appliances and other embedded times like software,
sensors, actuators and network connectivity. The IOT
allows to control things remotely from long distances.
The IOT has extensive applications in enterprise
(business), infrastructure, medical field etc. The
project 'Routine Health Check' consist of micro
controller (ATMEGA2560) which is the main
component used to communicate with different
sensors like temperature sensors and pulse oximeter
sensor and other health monitoring component. The
controller evaluate sensor data and send it on the
mobile application using Bluetooth module.
Keywords- Arduino, Electrocardiogram(ECG),
glucometer, Bluetooth module, pulse oximeter sensor,
health monitoring.
I. INTRODUCTION
Internet is used for various purposes and
for various research projects. One can get a lot
of information from the internet. IoT is
embedded physical device which allows
objects to connect to the internet and share
data. IoT is used in various industries, medical,
defence and home automation applications.
Sincedevices are connected to internet they
can provide better lifestyle. IoT is more
eminent in health applications than other
applications. This project “IoT Based Routine
Health Checkup” gives people to check their
health routinely. The health parameters can be
temperature, heart beat rate, glucose in blood,
electrocardiogram (ECG), and many other
parameters can also be measure. The adruino
board reads the sensor data and process it and
gives the data to mobile application using
Bluetooth and from the mobile user can send
data to anybody to the doctor; the user wants
to send.
II. THEORY
A) Hardware Design
Figure1: Proposed Model
i) ATMEGA2560 (Arduino Mega)
The Arduino Mega is a
microcontroller board-based system which has
ATMEGA2560. It has 54 digital input/output
International Journal of Computational Intelligence Research (IJCIR). ISSN 0973-1873 Vol.14, No.1 (2018)© Research India Publications. http://www.ripublication.com
32

pins, 16 analog inputs, 16MHz crystal
oscillator, 4 UARTs, USB connection, a power
jack, an ICSP header, and a reset button. It has
plenty of opportunities and rooms for
maintaining effectiveness and simplicity of
Arduino platform.
FEATURES:
Operating voltage - 5V Input voltage (recommended) - 7 to
12V DC current per I/O pin - 20 mA Flash memory - 256 KB
(ATMEGA2560) of which 8 KB used
by bootloader SRAM - 8 KB Clock speed - 16 MHz
ii) Electrocardiogram (ECG KIT)
ECG measures the Heart electrical activity
to show is it working normally. It records the
heart's rhythm by interpreting the peaks and
dips on screen. Things an ECG can detect are:
Heart attack held previously Clogging up heart's blood supply Enlargement of one side of the heart.
iii) Glucose Meter
Glucose Meter is a medical device for
measuring concentration of glucose in blood.
In general terms it is used by diabetes patients.
In this glucose meter diagnostic strip is used
which oxidizes enzymes from glucose. These
enzymes transfer electrons to the electrode
which is further converted to electrical signal
via a INA219 module.
iv) Temperature sensor (DS18B20)
The DS18B20 digital thermometer
which is 1 wire sensor. It has three pins in
which one is for input voltage, second for
ground and third for data output.
Figure2: DS18B20
FEATURES:
Unique 1-Wire Interface Requires
Only One Port Pin for Communication Measures Temperatures from -55°C to
+125°C (-67°F to +257°F) ±0.5°C Accuracy from -10°C to
+85°C 9-Bit Resolution No External Components Required
v) Liquid crystal display (LCD)
To display arbitrary images or fixed
images with low informative content. LCD
screens are used in consumer electronics
products like DVD players, clocks, etc. In this
project we are using 16x2 LCD display which
is a very basic module.
FEATURES:
Low power consumption Highly efficient Cost effective
vi) Pulse Oximetry Sensors
Pulse oximeters are medical sensors
used to measure Oxygen Saturation (SPO2) of
haemoglobin in blood. It shows percentage of
blood loaded with oxygen. It contains two
light emitting diode; one emitting red light and
other emitting near infrared light, it also has a
photo detector. The photo detectormeasures
transmitted light intensity and using the
reading difference content of oxygen in blood
is calculated.
International Journal of Computational Intelligence Research (IJCIR). ISSN 0973-1873 Vol.14, No.1 (2018)© Research India Publications. http://www.ripublication.com
33

vii) Bluetooth Module
To send data to the mobile we use
Bluetooth module which is connected on serial
port of Arduino. Bluetooth module is used for
serial communication. Using this module, we
are going to show health parameters on the
mobile.
B) Software Design
i) Proteus 8.0 Professional
It’s a PCB design and simulation
software. Simulation of various
projects and their testing can be done
in it.
ii) Arduino Software
It is Arduino board programming
software and is freely available on the
internet. It provides Integrated
Virtual Environment to user. It is
compactible to all Arduino boards.
iii) Android Studio
It provides Integrated Development
Environment to user for developing
applications on Android operating
system.
Figure3: Flow chart
International Journal of Computational Intelligence Research (IJCIR). ISSN 0973-1873 Vol.14, No.1 (2018)© Research India Publications. http://www.ripublication.com
34
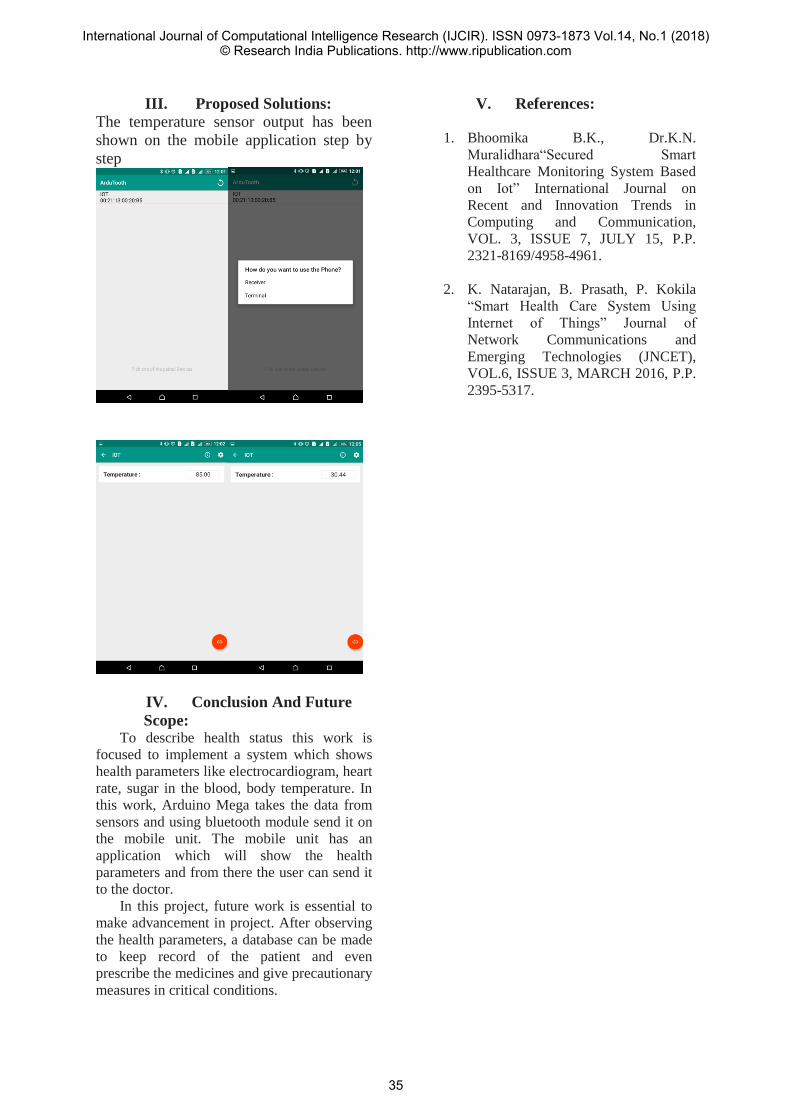
III. Proposed Solutions:
The temperature sensor output has been
shown on the mobile application step by
step
IV. Conclusion And Future
Scope: To describe health status this work is
focused to implement a system which shows
health parameters like electrocardiogram, heart
rate, sugar in the blood, body temperature. In
this work, Arduino Mega takes the data from
sensors and using bluetooth module send it on
the mobile unit. The mobile unit has an
application which will show the health
parameters and from there the user can send it
to the doctor.
In this project, future work is essential to
make advancement in project. After observing
the health parameters, a database can be made
to keep record of the patient and even
prescribe the medicines and give precautionary
measures in critical conditions.
V. References:
1. Bhoomika B.K., Dr.K.N.
Muralidhara“Secured Smart
Healthcare Monitoring System Based
on Iot” International Journal on
Recent and Innovation Trends in
Computing and Communication,
VOL. 3, ISSUE 7, JULY 15, P.P.
2321-8169/4958-4961.
2. K. Natarajan, B. Prasath, P. Kokila
“Smart Health Care System Using
Internet of Things” Journal of
Network Communications and
Emerging Technologies (JNCET),
VOL.6, ISSUE 3, MARCH 2016, P.P.
2395-5317.
International Journal of Computational Intelligence Research (IJCIR). ISSN 0973-1873 Vol.14, No.1 (2018)© Research India Publications. http://www.ripublication.com
35
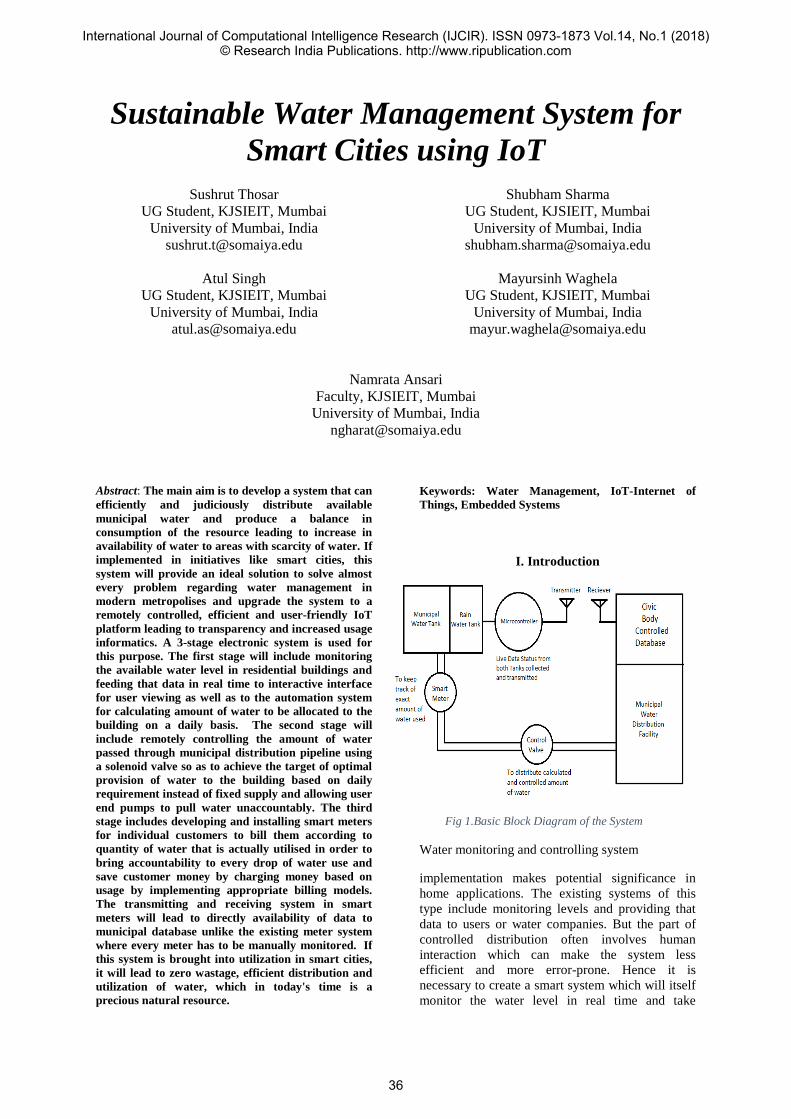
Fig 1.Basic Block Diagram of the System
Sustainable Water Management System for
Smart Cities using IoT
Sushrut Thosar
UG Student, KJSIEIT, Mumbai
University of Mumbai, India
Atul Singh
UG Student, KJSIEIT, Mumbai
University of Mumbai, India
Shubham Sharma
UG Student, KJSIEIT, Mumbai
University of Mumbai, India
Mayursinh Waghela
UG Student, KJSIEIT, Mumbai
University of Mumbai, India
Namrata Ansari
Faculty, KJSIEIT, Mumbai
University of Mumbai, India
Abstract: The main aim is to develop a system that can
efficiently and judiciously distribute available
municipal water and produce a balance in
consumption of the resource leading to increase in
availability of water to areas with scarcity of water. If
implemented in initiatives like smart cities, this
system will provide an ideal solution to solve almost
every problem regarding water management in
modern metropolises and upgrade the system to a
remotely controlled, efficient and user-friendly IoT
platform leading to transparency and increased usage
informatics. A 3-stage electronic system is used for
this purpose. The first stage will include monitoring
the available water level in residential buildings and
feeding that data in real time to interactive interface
for user viewing as well as to the automation system
for calculating amount of water to be allocated to the
building on a daily basis. The second stage will
include remotely controlling the amount of water
passed through municipal distribution pipeline using
a solenoid valve so as to achieve the target of optimal
provision of water to the building based on daily
requirement instead of fixed supply and allowing user
end pumps to pull water unaccountably. The third
stage includes developing and installing smart meters
for individual customers to bill them according to
quantity of water that is actually utilised in order to
bring accountability to every drop of water use and
save customer money by charging money based on
usage by implementing appropriate billing models.
The transmitting and receiving system in smart
meters will lead to directly availability of data to
municipal database unlike the existing meter system
where every meter has to be manually monitored. If
this system is brought into utilization in smart cities,
it will lead to zero wastage, efficient distribution and
utilization of water, which in today's time is a
precious natural resource.
Keywords: Water Management, IoT-Internet of
Things, Embedded Systems
I. Introduction
Water monitoring and controlling system
implementation makes potential significance in
home applications. The existing systems of this
type include monitoring levels and providing that
data to users or water companies. But the part of
controlled distribution often involves human
interaction which can make the system less
efficient and more error-prone. Hence it is
necessary to create a smart system which will itself
monitor the water level in real time and take
International Journal of Computational Intelligence Research (IJCIR). ISSN 0973-1873 Vol.14, No.1 (2018)© Research India Publications. http://www.ripublication.com
36
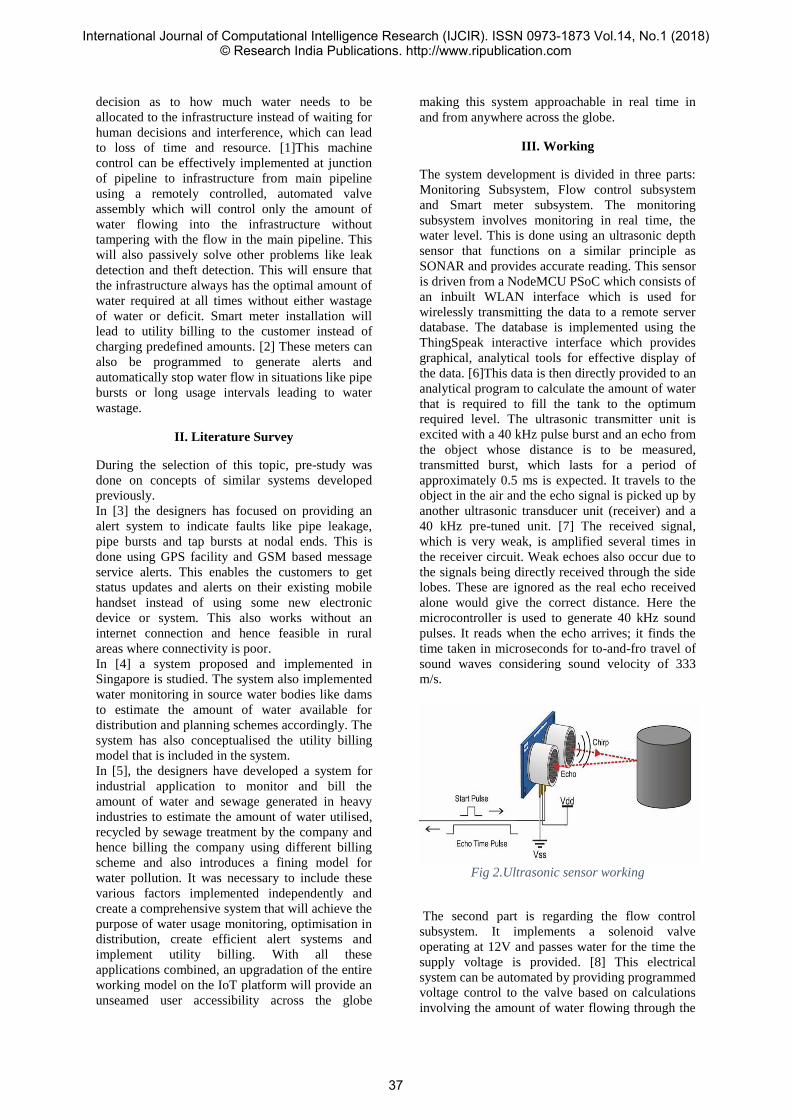
decision as to how much water needs to be
allocated to the infrastructure instead of waiting for
human decisions and interference, which can lead
to loss of time and resource. [1]This machine
control can be effectively implemented at junction
of pipeline to infrastructure from main pipeline
using a remotely controlled, automated valve
assembly which will control only the amount of
water flowing into the infrastructure without
tampering with the flow in the main pipeline. This
will also passively solve other problems like leak
detection and theft detection. This will ensure that
the infrastructure always has the optimal amount of
water required at all times without either wastage
of water or deficit. Smart meter installation will
lead to utility billing to the customer instead of
charging predefined amounts. [2] These meters can
also be programmed to generate alerts and
automatically stop water flow in situations like pipe
bursts or long usage intervals leading to water
wastage.
II. Literature Survey
During the selection of this topic, pre-study was
done on concepts of similar systems developed
previously.
In [3] the designers has focused on providing an
alert system to indicate faults like pipe leakage,
pipe bursts and tap bursts at nodal ends. This is
done using GPS facility and GSM based message
service alerts. This enables the customers to get
status updates and alerts on their existing mobile
handset instead of using some new electronic
device or system. This also works without an
internet connection and hence feasible in rural
areas where connectivity is poor.
In [4] a system proposed and implemented in
Singapore is studied. The system also implemented
water monitoring in source water bodies like dams
to estimate the amount of water available for
distribution and planning schemes accordingly. The
system has also conceptualised the utility billing
model that is included in the system.
In [5], the designers have developed a system for
industrial application to monitor and bill the
amount of water and sewage generated in heavy
industries to estimate the amount of water utilised,
recycled by sewage treatment by the company and
hence billing the company using different billing
scheme and also introduces a fining model for
water pollution. It was necessary to include these
various factors implemented independently and
create a comprehensive system that will achieve the
purpose of water usage monitoring, optimisation in
distribution, create efficient alert systems and
implement utility billing. With all these
applications combined, an upgradation of the entire
working model on the IoT platform will provide an
unseamed user accessibility across the globe
making this system approachable in real time in
and from anywhere across the globe.
III. Working
The system development is divided in three parts:
Monitoring Subsystem, Flow control subsystem
and Smart meter subsystem. The monitoring
subsystem involves monitoring in real time, the
water level. This is done using an ultrasonic depth
sensor that functions on a similar principle as
SONAR and provides accurate reading. This sensor
is driven from a NodeMCU PSoC which consists of
an inbuilt WLAN interface which is used for
wirelessly transmitting the data to a remote server
database. The database is implemented using the
ThingSpeak interactive interface which provides
graphical, analytical tools for effective display of
the data. [6]This data is then directly provided to an
analytical program to calculate the amount of water
that is required to fill the tank to the optimum
required level. The ultrasonic transmitter unit is
excited with a 40 kHz pulse burst and an echo from
the object whose distance is to be measured,
transmitted burst, which lasts for a period of
approximately 0.5 ms is expected. It travels to the
object in the air and the echo signal is picked up by
another ultrasonic transducer unit (receiver) and a
40 kHz pre-tuned unit. [7] The received signal,
which is very weak, is amplified several times in
the receiver circuit. Weak echoes also occur due to
the signals being directly received through the side
lobes. These are ignored as the real echo received
alone would give the correct distance. Here the
microcontroller is used to generate 40 kHz sound
pulses. It reads when the echo arrives; it finds the
time taken in microseconds for to-and-fro travel of
sound waves considering sound velocity of 333
m/s.
Fig 2.Ultrasonic sensor working
The second part is regarding the flow control
subsystem. It implements a solenoid valve
operating at 12V and passes water for the time the
supply voltage is provided. [8] This electrical
system can be automated by providing programmed
voltage control to the valve based on calculations
involving the amount of water flowing through the
International Journal of Computational Intelligence Research (IJCIR). ISSN 0973-1873 Vol.14, No.1 (2018)© Research India Publications. http://www.ripublication.com
37
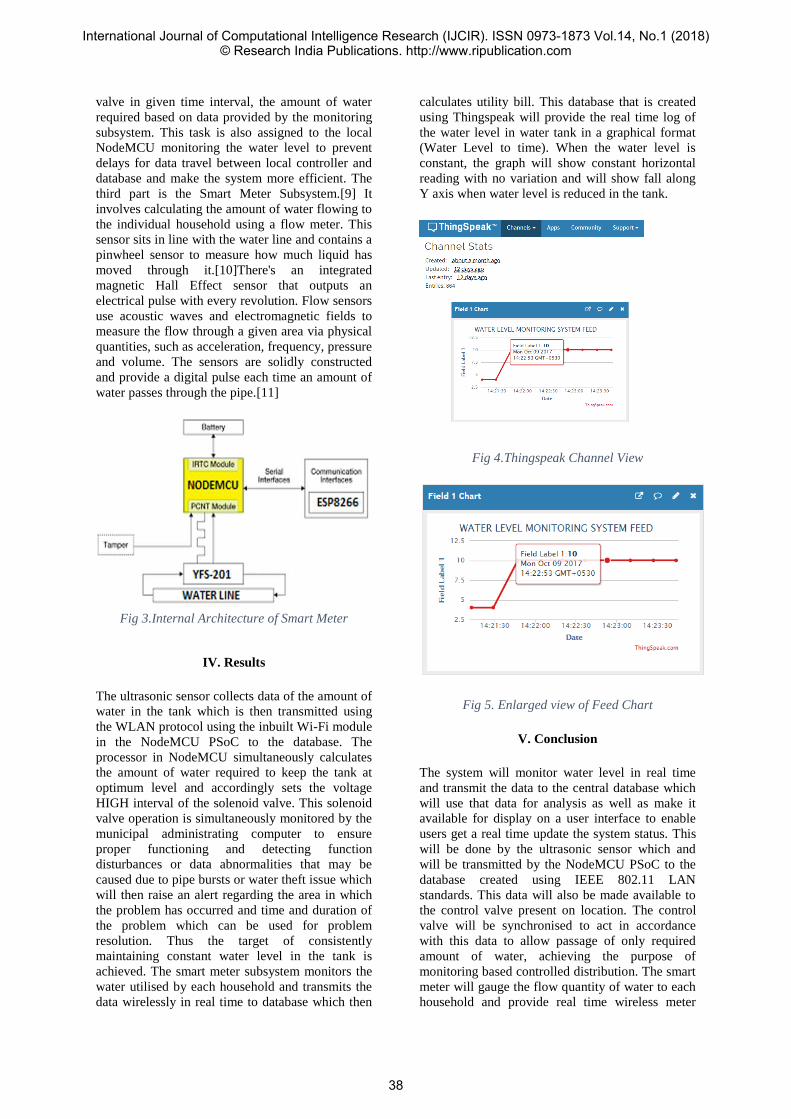
valve in given time interval, the amount of water
required based on data provided by the monitoring
subsystem. This task is also assigned to the local
NodeMCU monitoring the water level to prevent
delays for data travel between local controller and
database and make the system more efficient. The
third part is the Smart Meter Subsystem.[9] It
involves calculating the amount of water flowing to
the individual household using a flow meter. This
sensor sits in line with the water line and contains a
pinwheel sensor to measure how much liquid has
moved through it.[10]There's an integrated
magnetic Hall Effect sensor that outputs an
electrical pulse with every revolution. Flow sensors
use acoustic waves and electromagnetic fields to
measure the flow through a given area via physical
quantities, such as acceleration, frequency, pressure
and volume. The sensors are solidly constructed
and provide a digital pulse each time an amount of
water passes through the pipe.[11]
Fig 3.Internal Architecture of Smart Meter
IV. Results
The ultrasonic sensor collects data of the amount of
water in the tank which is then transmitted using
the WLAN protocol using the inbuilt Wi-Fi module
in the NodeMCU PSoC to the database. The
processor in NodeMCU simultaneously calculates
the amount of water required to keep the tank at
optimum level and accordingly sets the voltage
HIGH interval of the solenoid valve. This solenoid
valve operation is simultaneously monitored by the
municipal administrating computer to ensure
proper functioning and detecting function
disturbances or data abnormalities that may be
caused due to pipe bursts or water theft issue which
will then raise an alert regarding the area in which
the problem has occurred and time and duration of
the problem which can be used for problem
resolution. Thus the target of consistently
maintaining constant water level in the tank is
achieved. The smart meter subsystem monitors the
water utilised by each household and transmits the
data wirelessly in real time to database which then
calculates utility bill. This database that is created
using Thingspeak will provide the real time log of
the water level in water tank in a graphical format
(Water Level to time). When the water level is
constant, the graph will show constant horizontal
reading with no variation and will show fall along
Y axis when water level is reduced in the tank.
Fig 4.Thingspeak Channel View
Fig 5. Enlarged view of Feed Chart
V. Conclusion
The system will monitor water level in real time
and transmit the data to the central database which
will use that data for analysis as well as make it
available for display on a user interface to enable
users get a real time update the system status. This
will be done by the ultrasonic sensor which and
will be transmitted by the NodeMCU PSoC to the
database created using IEEE 802.11 LAN
standards. This data will also be made available to
the control valve present on location. The control
valve will be synchronised to act in accordance
with this data to allow passage of only required
amount of water, achieving the purpose of
monitoring based controlled distribution. The smart
meter will gauge the flow quantity of water to each
household and provide real time wireless meter
International Journal of Computational Intelligence Research (IJCIR). ISSN 0973-1873 Vol.14, No.1 (2018)© Research India Publications. http://www.ripublication.com
38

reading for utility billing. This meter system will
also provide alerts to user and the central system
about tap bursts, excessive usage and allow remote
controlling of the system from anywhere in the
world which will save water wastage efficiently.
The total development cost of this system will be
around 500 rupees and it will help save potable
water worth crores of rupees everyday.
VI. References
[1] Association of Water Technologies,
homepage: http://www.awt.org/, last
viewed November 2014, 2014.
[2] S. Khennas & A. Barnett, "Best Practices
for Sustainable Development of Micro
Hydro Power in Developing Countries”,
Final Synthesis Report, Department for
International Development, UK, March,
2000.
[3] T. Robles, R. Alcarria, D. Mart´ın, and A.
Morales, “An Internet of Things-based
model for smart water management,”
in Proc. of the 8th International
Conference on Advanced Information
Networking and Applications Workshops
(WAINA’14), Victoria, Canada. IEEE,
May 2014, pp. 821–826
[4] Cecilia Tortajada, “Water Management in
Singapore” in Water Resources
Development, Vol.22,No. 2, 227-240,
June 2006
[5] “GSMA Smart Cities Guide: Water
Management”
(www.gsma.com/smartcities)
[6] ThingspeakWebpage
(https://thingspeak.com/)
[7] Ultrasonic Sensor essentials
(https://www.bjultrasonic.com/ultrasonic-
technical-info/how-do-ultrasonic-sensors-
work/)
[8] R. Alcarria, T. Robles, A. Morales, D. L.
de Ipina, and U. Aguilera, “Enabling
flexible and continuous ˜ capability
invocation in mobile prosumer
environments,” Sensors, vol. 12, no. 7, pp.
8930–8954, June 2012.
[9] Iot Projects by circuit digest
https://circuitdigest.com/microcontroller-
projects/iot-temperature-
humiditymonitoring-using-arduino
[10]“Micro Hydropower Basics (Introduction
to Micro Hydro)"
(http://www.microhydropower.net/index.h
tml)
International Journal of Computational Intelligence Research (IJCIR). ISSN 0973-1873 Vol.14, No.1 (2018)© Research India Publications. http://www.ripublication.com
39
Automated PNG Meter Reading and Monitoring
Using Internet of Things
Vipul Bhanushali
UG Student, KJSIEIT, Mumbai
University of Mumbai, India
Akash Deshpande
UG Student, KJSIEIT, Mumbai
University of Mumbai, India
Dhanesh Bhat
UG Student, KJSIEIT, Mumbai
University of Mumbai, India
Himanshu Dhedhu
UG Student, KJSIEIT, Mumbai
University of Mumbai, India
Sunil Patil
Faculty, KJSIEIT, Mumbai
University of Mumbai, India
Abstract— With the rapid growth in use of PNG by domestic
customers for cooking purpose, there is a dire need to automate
the PNG meter reading. Currently the process of meter reading
is as follows:
The general pattern of billing is to bill for gas consumption every
two months. The first bill is as per the meter reading. It gives
actual gas consumption. The second bill is as per “assessed”
basis. Thereafter, repetition of actual reading and assessed
reading is done alternately for billing purpose. If actual reading
is unavailable, for whatsoever reason, the bill is then generated
on “estimated” basis.
Thus in order to overcome the drawbacks and to minimize
human involvement and efforts, automatic bill reading and
monitoring system is required. Since the meter data is readily
available, the billing cycles are available to the customers instead
of the traditional billing cycles. Automatic bill reading and
monitoring system also provides improved billing and tracking of
usage.
This project focuses on automatically collecting consumption
data from gas meter and transfer of that data to a central
database for the purpose of troubleshooting, billing and
analyzing.
Keywords—PNG Meter, Internet of Things (IoT), BMP180,
Arduino.
I. INTRODUCTION
A PNG meter is primarily used for the measurement of volume of gas consumed at residential, commercial or industrial premises.
Gas meters can be categorized into two types:
1. Basic/Analog: Analog gas meters need a meter reader to record the measured data. multiply current network speed.
2. Smart/Digital: Smart meters are capable of wireless communication, and transmit all the necessary information related to gas consumption.[2]
II. SMART METERS:
1) PNG Smart meters work with a smart energy monitor, that can be placed anywhere in homes, to show how much energy has been used and an indication of how much it's costing the consumer, in desired currency. It can view both your gas and electricity consumption.
2) The smart PNG meters are the new trend setters in energy
market because of the major benefits.
BENEFITS OF SMART METERS:
1) Better management of energy use: The smart energy monitor displays the natural gas consumption rates in real time. It helps the user to manage consumption and restrict gas use through small changes such as switching off appliances when not in use, thereby leading to considerable savings.[2]
Classification of PNG Meters
Basic/Analog Smart/Digital
Residential Commercial Industrial
International Journal of Computational Intelligence Research (IJCIR). ISSN 0973-1873 Vol.14, No.1 (2018)© Research India Publications. http://www.ripublication.com
40
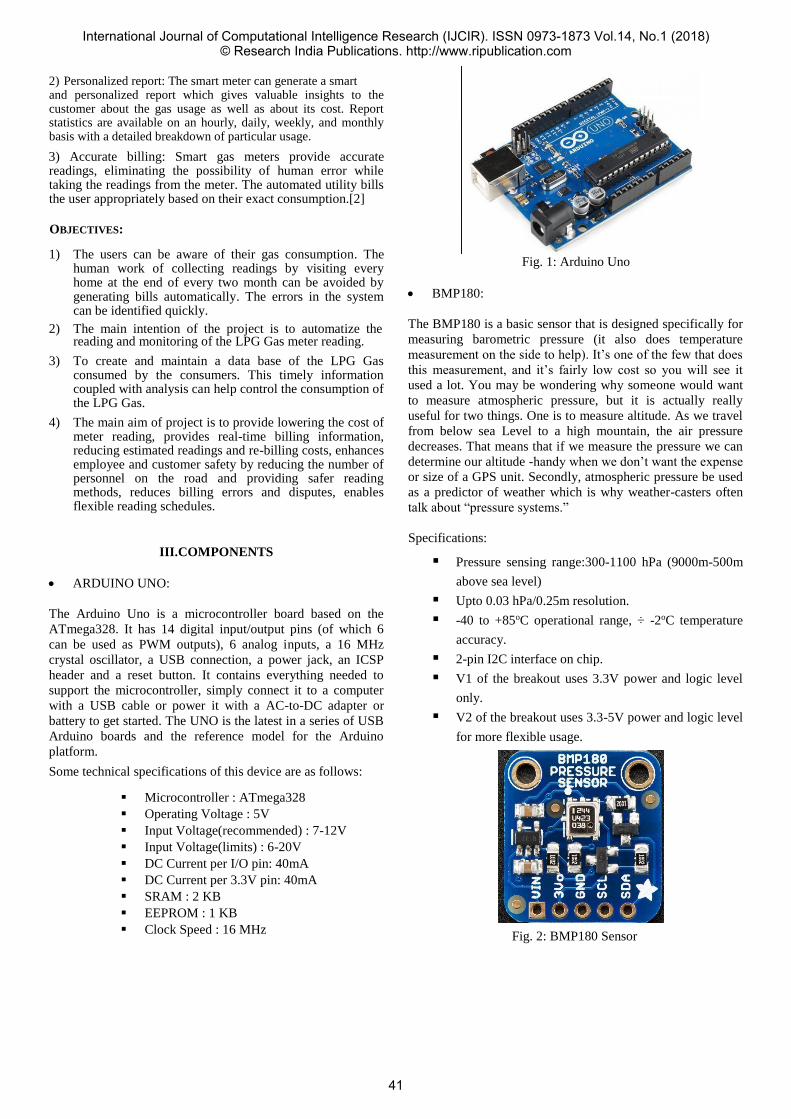
2) Personalized report: The smart meter can generate a smart and personalized report which gives valuable insights to the customer about the gas usage as well as about its cost. Report statistics are available on an hourly, daily, weekly, and monthly basis with a detailed breakdown of particular usage. 3) Accurate billing: Smart gas meters provide accurate readings, eliminating the possibility of human error while taking the readings from the meter. The automated utility bills the user appropriately based on their exact consumption.[2]
OBJECTIVES:
1) The users can be aware of their gas consumption. The human work of collecting readings by visiting every home at the end of every two month can be avoided by generating bills automatically. The errors in the system can be identified quickly.
2) The main intention of the project is to automatize the
reading and monitoring of the LPG Gas meter reading. 3) To create and maintain a data base of the LPG Gas
consumed by the consumers. This timely information coupled with analysis can help control the consumption of the LPG Gas.
4) The main aim of project is to provide lowering the cost of meter reading, provides real-time billing information, reducing estimated readings and re-billing costs, enhances employee and customer safety by reducing the number of personnel on the road and providing safer reading methods, reduces billing errors and disputes, enables flexible reading schedules.
III.COMPONENTS
ARDUINO UNO:
The Arduino Uno is a microcontroller board based on the
ATmega328. It has 14 digital input/output pins (of which 6
can be used as PWM outputs), 6 analog inputs, a 16 MHz
crystal oscillator, a USB connection, a power jack, an ICSP
header and a reset button. It contains everything needed to
support the microcontroller, simply connect it to a computer
with a USB cable or power it with a AC-to-DC adapter or
battery to get started. The UNO is the latest in a series of USB
Arduino boards and the reference model for the Arduino
platform.
Some technical specifications of this device are as follows:
Microcontroller : ATmega328
Operating Voltage : 5V
Input Voltage(recommended) : 7-12V
Input Voltage(limits) : 6-20V
DC Current per I/O pin: 40mA
DC Current per 3.3V pin: 40mA
SRAM : 2 KB
EEPROM : 1 KB
Clock Speed : 16 MHz
Fig. 1: Arduino Uno
BMP180:
The BMP180 is a basic sensor that is designed specifically for
measuring barometric pressure (it also does temperature
measurement on the side to help). It’s one of the few that does
this measurement, and it’s fairly low cost so you will see it
used a lot. You may be wondering why someone would want
to measure atmospheric pressure, but it is actually really
useful for two things. One is to measure altitude. As we travel
from below sea Level to a high mountain, the air pressure
decreases. That means that if we measure the pressure we can
determine our altitude -handy when we don’t want the expense
or size of a GPS unit. Secondly, atmospheric pressure be used
as a predictor of weather which is why weather-casters often
talk about “pressure systems.”
Specifications:
Pressure sensing range:300-1100 hPa (9000m-500m
above sea level)
Upto 0.03 hPa/0.25m resolution.
-40 to +85oC operational range, ÷ -2oC temperature
accuracy.
2-pin I2C interface on chip.
V1 of the breakout uses 3.3V power and logic level
only.
V2 of the breakout uses 3.3-5V power and logic level
for more flexible usage.
Fig. 2: BMP180 Sensor
International Journal of Computational Intelligence Research (IJCIR). ISSN 0973-1873 Vol.14, No.1 (2018)© Research India Publications. http://www.ripublication.com
41
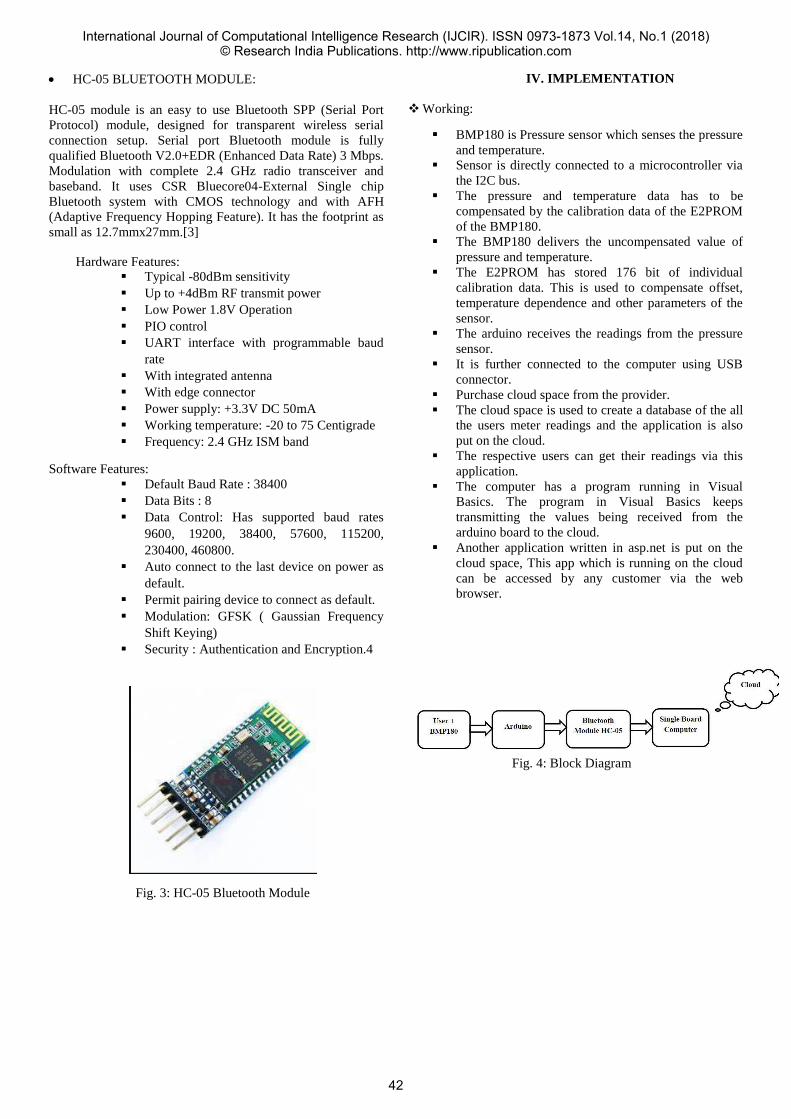
HC-05 BLUETOOTH MODULE:
HC-05 module is an easy to use Bluetooth SPP (Serial Port
Protocol) module, designed for transparent wireless serial
connection setup. Serial port Bluetooth module is fully
qualified Bluetooth V2.0+EDR (Enhanced Data Rate) 3 Mbps.
Modulation with complete 2.4 GHz radio transceiver and
baseband. It uses CSR Bluecore04-External Single chip
Bluetooth system with CMOS technology and with AFH
(Adaptive Frequency Hopping Feature). It has the footprint as
small as 12.7mmx27mm.[3]
Hardware Features:
Typical -80dBm sensitivity
Up to +4dBm RF transmit power
Low Power 1.8V Operation
PIO control
UART interface with programmable baud
rate
With integrated antenna
With edge connector
Power supply: +3.3V DC 50mA
Working temperature: -20 to 75 Centigrade
Frequency: 2.4 GHz ISM band
Software Features:
Default Baud Rate : 38400
Data Bits : 8
Data Control: Has supported baud rates
9600, 19200, 38400, 57600, 115200,
230400, 460800.
Auto connect to the last device on power as
default.
Permit pairing device to connect as default.
Modulation: GFSK ( Gaussian Frequency
Shift Keying)
Security : Authentication and Encryption.4
Fig. 3: HC-05 Bluetooth Module
IV. IMPLEMENTATION
Working:
BMP180 is Pressure sensor which senses the pressure
and temperature.
Sensor is directly connected to a microcontroller via
the I2C bus.
The pressure and temperature data has to be
compensated by the calibration data of the E2PROM
of the BMP180.
The BMP180 delivers the uncompensated value of
pressure and temperature.
The E2PROM has stored 176 bit of individual
calibration data. This is used to compensate offset,
temperature dependence and other parameters of the
sensor.
The arduino receives the readings from the pressure
sensor.
It is further connected to the computer using USB
connector.
Purchase cloud space from the provider.
The cloud space is used to create a database of the all
the users meter readings and the application is also
put on the cloud.
The respective users can get their readings via this
application.
The computer has a program running in Visual
Basics. The program in Visual Basics keeps
transmitting the values being received from the
arduino board to the cloud.
Another application written in asp.net is put on the
cloud space, This app which is running on the cloud
can be accessed by any customer via the web
browser.
Fig. 4: Block Diagram
International Journal of Computational Intelligence Research (IJCIR). ISSN 0973-1873 Vol.14, No.1 (2018)© Research India Publications. http://www.ripublication.com
42
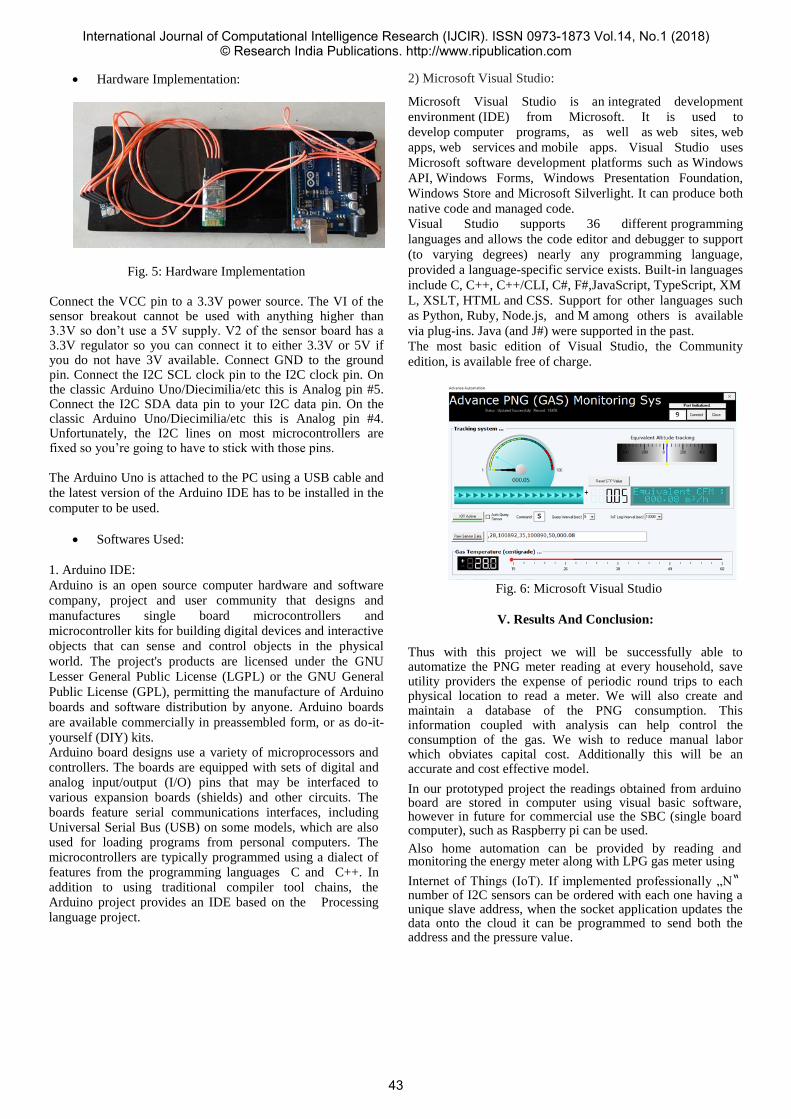
Hardware Implementation:
Fig. 5: Hardware Implementation
Connect the VCC pin to a 3.3V power source. The VI of the sensor breakout cannot be used with anything higher than 3.3V so don’t use a 5V supply. V2 of the sensor board has a 3.3V regulator so you can connect it to either 3.3V or 5V if you do not have 3V available. Connect GND to the ground pin. Connect the I2C SCL clock pin to the I2C clock pin. On the classic Arduino Uno/Diecimilia/etc this is Analog pin #5. Connect the I2C SDA data pin to your I2C data pin. On the classic Arduino Uno/Diecimilia/etc this is Analog pin #4. Unfortunately, the I2C lines on most microcontrollers are fixed so you’re going to have to stick with those pins. The Arduino Uno is attached to the PC using a USB cable and
the latest version of the Arduino IDE has to be installed in the
computer to be used.
Softwares Used:
1. Arduino IDE:
Arduino is an open source computer hardware and software
company, project and user community that designs and
manufactures single board microcontrollers and
microcontroller kits for building digital devices and interactive
objects that can sense and control objects in the physical
world. The project's products are licensed under the GNU
Lesser General Public License (LGPL) or the GNU General
Public License (GPL), permitting the manufacture of Arduino
boards and software distribution by anyone. Arduino boards
are available commercially in preassembled form, or as do-it-
yourself (DIY) kits. Arduino board designs use a variety of microprocessors and controllers. The boards are equipped with sets of digital and analog input/output (I/O) pins that may be interfaced to various expansion boards (shields) and other circuits. The boards feature serial communications interfaces, including Universal Serial Bus (USB) on some models, which are also used for loading programs from personal computers. The microcontrollers are typically programmed using a dialect of features from the programming languages C and C++. In addition to using traditional compiler tool chains, the Arduino project provides an IDE based on the Processing language project.
2) Microsoft Visual Studio:
Microsoft Visual Studio is an integrated development
environment (IDE) from Microsoft. It is used to
develop computer programs, as well as web sites, web
apps, web services and mobile apps. Visual Studio uses
Microsoft software development platforms such as Windows
API, Windows Forms, Windows Presentation Foundation,
Windows Store and Microsoft Silverlight. It can produce both
native code and managed code.
Visual Studio supports 36 different programming
languages and allows the code editor and debugger to support
(to varying degrees) nearly any programming language,
provided a language-specific service exists. Built-in languages
include C, C++, C++/CLI, C#, F#,JavaScript, TypeScript, XM
L, XSLT, HTML and CSS. Support for other languages such
as Python, Ruby, Node.js, and M among others is available
via plug-ins. Java (and J#) were supported in the past.
The most basic edition of Visual Studio, the Community
edition, is available free of charge.
Fig. 6: Microsoft Visual Studio
V. Results And Conclusion:
Thus with this project we will be successfully able to automatize the PNG meter reading at every household, save utility providers the expense of periodic round trips to each physical location to read a meter. We will also create and maintain a database of the PNG consumption. This information coupled with analysis can help control the consumption of the gas. We wish to reduce manual labor which obviates capital cost. Additionally this will be an accurate and cost effective model. In our prototyped project the readings obtained from arduino board are stored in computer using visual basic software, however in future for commercial use the SBC (single board computer), such as Raspberry pi can be used. Also home automation can be provided by reading and monitoring the energy meter along with LPG gas meter using Internet of Things (IoT). If implemented professionally „N‟ number of I2C sensors can be ordered with each one having a unique slave address, when the socket application updates the data onto the cloud it can be programmed to send both the address and the pressure value.
International Journal of Computational Intelligence Research (IJCIR). ISSN 0973-1873 Vol.14, No.1 (2018)© Research India Publications. http://www.ripublication.com
43

Applications:
Domestic Gas Meters.
Commercial Gas Meters.
Prepaid Gas Meters.
Future Scope and Benefits:
Benefits of advanced metering:
Advanced metering systems can provide benefits for utilities, retail providers and customers. Benefits will be recognized by the utilities with increased efficiencies, outage detection, tamper notification and reduced labor cost as a result of automating reads, connections and disconnects. Retail providers will be able to offer new innovative products in addition to customizing packages for their customers. In addition, with the meter data being readily available, more flexible billing cycles would be available to their customers instead of following the standard utility read cycles. With timely usage information available to the customer, benefits will be seen through opportunities to manage their energy consumption and change from one REP to another with actual meter data. Because of these benefits, many utilities are moving towards implementing some types of AMR solutions. The benefits of smart metering for the utility:
Accurate meter reading, no more estimates.
Improved billing.
Accurate profile classes and measurement classes,
true costs applied.
Improved security and tamper detection for
equipment.
Energy management through profile data graphs.
Less financial burden correcting mistakes.
Less accrued expenditure.
Transparency of “cost to read” metering.
Improved procurement power though more accurate
data - ‘de-risking” price.
The benefits of smart metering for the customer:
Improved billing and tracking of usage.
REFERENCES
[1]www.mahanagargas.com
[2]http://vibrantgujarat.com/writereaddata/images/pdf/project-
profiles/PNG-Meters-for-Residential-Commercial-and-Industrial-
Use.pdf
[3] Y. Zhang, D. Raychadhuri, L. Grieco, E. Baccelli, J. Burke, R. Ravindran, and G. Wang. ICN based Architecture for IoT - Requirements and Challenges. Draft- zhang-iot-icn-challenges-02 (work in progress), Aug.2015.
[4] IEEE. IEEE Recommended Practice for Information technology- Telecommunications and information exchange between systems-Local and metropolitan area networks-Specific requirements Part 15.5: Mesh Topology Capability in Wireless Personal Area Networks (WPANs). IEEE Std 802.15.5- 2009, pages 1-166, May 2009. [5]https://books.google.co.in/books?id=iYkKAgAAQBAJ&pr intsec=frontcover&dq=Internet+of+things&hl=en&sa=X&red ir_esc=y#v=onepage&q=Internet%20of%20things&f=false [6] AD0 Programming in Visual Basic 6 by Steven Holzner.
International Journal of Computational Intelligence Research (IJCIR). ISSN 0973-1873 Vol.14, No.1 (2018)© Research India Publications. http://www.ripublication.com
44
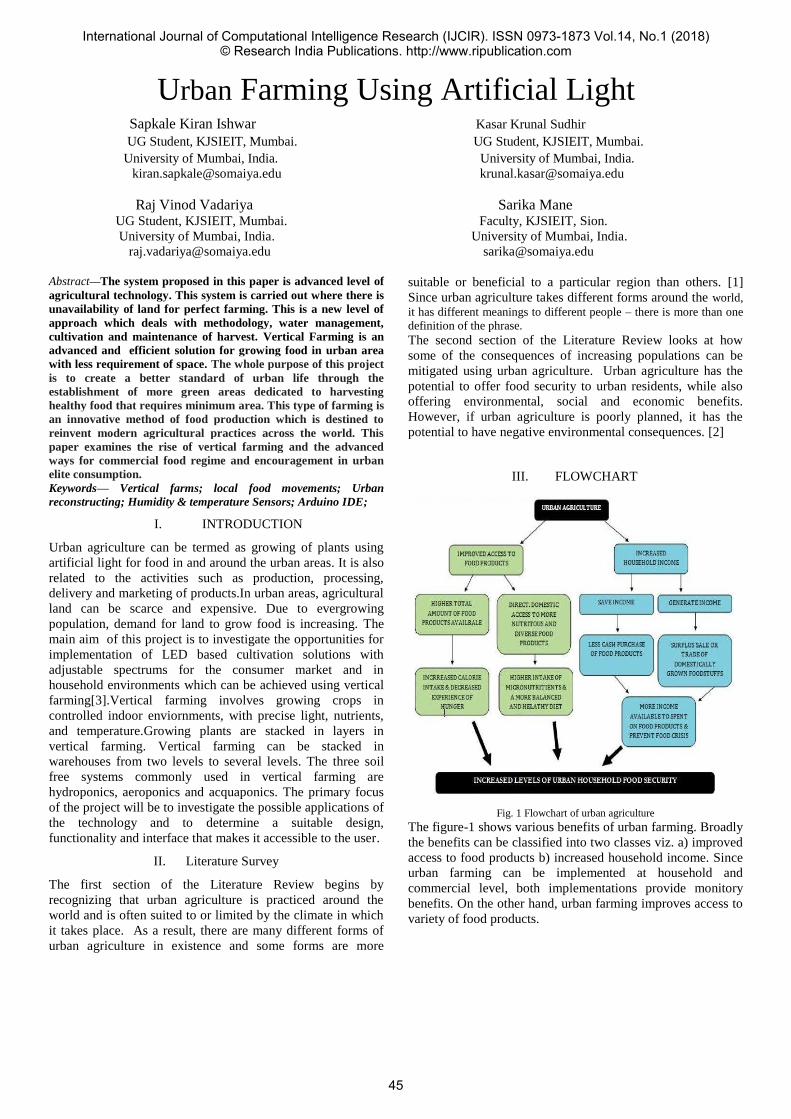
Urban Farming Using Artificial Light Sapkale Kiran Ishwar Kasar Krunal Sudhir
UG Student, KJSIEIT, Mumbai. UG Student, KJSIEIT, Mumbai.
University of Mumbai, India. University of Mumbai, India.
[email protected] [email protected]
Raj Vinod Vadariya Sarika Mane UG Student, KJSIEIT, Mumbai. Faculty, KJSIEIT, Sion.
University of Mumbai, India. University of Mumbai, India.
[email protected] [email protected]
Abstract—The system proposed in this paper is advanced level of
agricultural technology. This system is carried out where there is
unavailability of land for perfect farming. This is a new level of
approach which deals with methodology, water management,
cultivation and maintenance of harvest. Vertical Farming is an
advanced and efficient solution for growing food in urban area
with less requirement of space. The whole purpose of this project
is to create a better standard of urban life through the
establishment of more green areas dedicated to harvesting
healthy food that requires minimum area. This type of farming is
an innovative method of food production which is destined to
reinvent modern agricultural practices across the world. This
paper examines the rise of vertical farming and the advanced
ways for commercial food regime and encouragement in urban
elite consumption.
Keywords— Vertical farms; local food movements; Urban
reconstructing; Humidity & temperature Sensors; Arduino IDE;
I. INTRODUCTION
Urban agriculture can be termed as growing of plants using
artificial light for food in and around the urban areas. It is also
related to the activities such as production, processing,
delivery and marketing of products.In urban areas, agricultural
land can be scarce and expensive. Due to evergrowing
population, demand for land to grow food is increasing. The
main aim of this project is to investigate the opportunities for
implementation of LED based cultivation solutions with
adjustable spectrums for the consumer market and in
household environments which can be achieved using vertical
farming[3].Vertical farming involves growing crops in
controlled indoor enviornments, with precise light, nutrients,
and temperature.Growing plants are stacked in layers in
vertical farming. Vertical farming can be stacked in
warehouses from two levels to several levels. The three soil
free systems commonly used in vertical farming are
hydroponics, aeroponics and acquaponics. The primary focus
of the project will be to investigate the possible applications of
the technology and to determine a suitable design,
functionality and interface that makes it accessible to the user.
II. Literature Survey
The first section of the Literature Review begins by
recognizing that urban agriculture is practiced around the
world and is often suited to or limited by the climate in which
it takes place. As a result, there are many different forms of
urban agriculture in existence and some forms are more
suitable or beneficial to a particular region than others. [1]
Since urban agriculture takes different forms around the world,
it has different meanings to different people – there is more than one
definition of the phrase.
The second section of the Literature Review looks at how
some of the consequences of increasing populations can be
mitigated using urban agriculture. Urban agriculture has the
potential to offer food security to urban residents, while also
offering environmental, social and economic benefits.
However, if urban agriculture is poorly planned, it has the
potential to have negative environmental consequences. [2]
III. FLOWCHART
Fig. 1 Flowchart of urban agriculture
The figure-1 shows various benefits of urban farming. Broadly
the benefits can be classified into two classes viz. a) improved
access to food products b) increased household income. Since
urban farming can be implemented at household and
commercial level, both implementations provide monitory
benefits. On the other hand, urban farming improves access to
variety of food products.
International Journal of Computational Intelligence Research (IJCIR). ISSN 0973-1873 Vol.14, No.1 (2018)© Research India Publications. http://www.ripublication.com
45
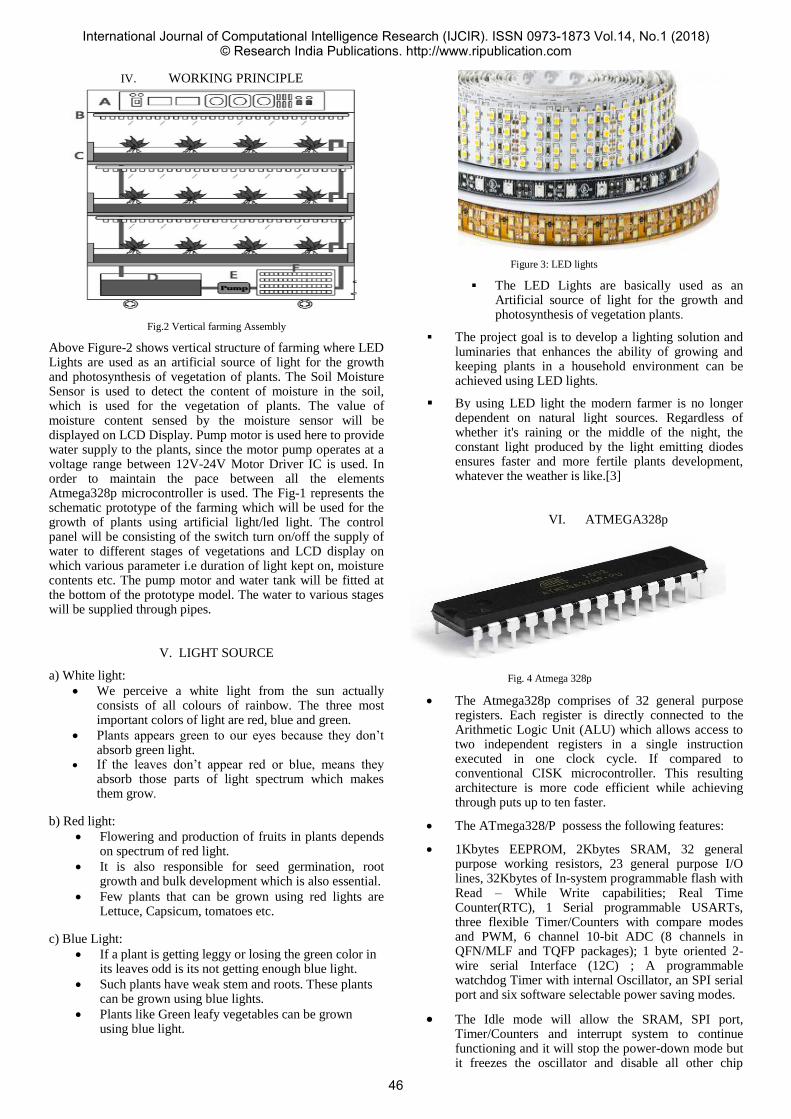
IV. WORKING PRINCIPLE
Fig.2 Vertical farming Assembly
Above Figure-2 shows vertical structure of farming where LED Lights are used as an artificial source of light for the growth and photosynthesis of vegetation of plants. The Soil Moisture Sensor is used to detect the content of moisture in the soil, which is used for the vegetation of plants. The value of moisture content sensed by the moisture sensor will be displayed on LCD Display. Pump motor is used here to provide water supply to the plants, since the motor pump operates at a voltage range between 12V-24V Motor Driver IC is used. In order to maintain the pace between all the elements Atmega328p microcontroller is used. The Fig-1 represents the schematic prototype of the farming which will be used for the growth of plants using artificial light/led light. The control panel will be consisting of the switch turn on/off the supply of water to different stages of vegetations and LCD display on which various parameter i.e duration of light kept on, moisture contents etc. The pump motor and water tank will be fitted at the bottom of the prototype model. The water to various stages will be supplied through pipes.
V. LIGHT SOURCE
a) White light:
We perceive a white light from the sun actually consists of all colours of rainbow. The three most important colors of light are red, blue and green.
Plants appears green to our eyes because they don’t absorb green light.
If the leaves don’t appear red or blue, means they absorb those parts of light spectrum which makes them grow.
b) Red light:
Flowering and production of fruits in plants depends on spectrum of red light.
It is also responsible for seed germination, root growth and bulk development which is also essential.
Few plants that can be grown using red lights are Lettuce, Capsicum, tomatoes etc.
c) Blue Light:
If a plant is getting leggy or losing the green color in its leaves odd is its not getting enough blue light.
Such plants have weak stem and roots. These plants can be grown using blue lights.
Plants like Green leafy vegetables can be grown using blue light.
Figure 3: LED lights
The LED Lights are basically used as an Artificial source of light for the growth and photosynthesis of vegetation plants.
The project goal is to develop a lighting solution and luminaries that enhances the ability of growing and keeping plants in a household environment can be achieved using LED lights.
By using LED light the modern farmer is no longer dependent on natural light sources. Regardless of whether it's raining or the middle of the night, the constant light produced by the light emitting diodes ensures faster and more fertile plants development, whatever the weather is like.[3]
VI. ATMEGA328p
Fig. 4 Atmega 328p
The Atmega328p comprises of 32 general purpose registers. Each register is directly connected to the Arithmetic Logic Unit (ALU) which allows access to two independent registers in a single instruction executed in one clock cycle. If compared to conventional CISK microcontroller. This resulting architecture is more code efficient while achieving through puts up to ten faster.
The ATmega328/P possess the following features:
1Kbytes EEPROM, 2Kbytes SRAM, 32 general purpose working resistors, 23 general purpose I/O lines, 32Kbytes of In-system programmable flash with Read – While Write capabilities; Real Time Counter(RTC), 1 Serial programmable USARTs, three flexible Timer/Counters with compare modes and PWM, 6 channel 10-bit ADC (8 channels in QFN/MLF and TQFP packages); 1 byte oriented 2-wire serial Interface (12C) ; A programmable watchdog Timer with internal Oscillator, an SPI serial port and six software selectable power saving modes.
The Idle mode will allow the SRAM, SPI port, Timer/Counters and interrupt system to continue functioning and it will stop the power-down mode but it freezes the oscillator and disable all other chip
International Journal of Computational Intelligence Research (IJCIR). ISSN 0973-1873 Vol.14, No.1 (2018)© Research India Publications. http://www.ripublication.com
46

functions until the hardware is reset or next interrupt occurs. The power save mode allows the user to maintain timer base while rest of the device is sleeping and the asynchronous timer continues to run. The ADC to minimize switching noise during ADC conversions and it stops CPU and all I/O modules.
VII. TEMPERATURE/HUMIDITY SENSOR DHT11
DHT11 temperature and humidity sensor feature a temperature and humidity sensor complex with a calibrated digital signal output. By using the exclusive digital signal acquisition technique and temperature and humidity sensing technology, it ensures high reliability and excellent long tern stability. This sensor includes a resistive type humidity measurement component and an NTC temperature measurement component and connects to high performance 8-bit microcontroller , offering excellent quality , fast response, anti interference ability and cost effectiveness. Each DHT11 element is strictly calibrated in the laboratory that is extremely calibrated in humidity calibration. The calibration coefficients are stored at program in the OTP memory, which are used by the sensors internal signal detecting process. The single wire serial interface makes systems integration quick and easy. Its small size, low power consumption and up-to-20 meter signal transmission making it the best choice for various applications, including those most demanding ones. The component is 4-pin single row pin package can be provided according to users request.
VIII. TEMPERATURE SENSOR
Temperature sensor senses the atmosphere and give a
comparative indication of hot or cold . The value is indicated
in 0C or 0F. two types of sensors are available ie. Contact or
Non-Contact type sensors. Major properties that has to be
taken into consideration are as follows:-
Range – Range is the maximum and minimum value
of temperature over which the sensor works well.
Accuracy – Accuracy indicates the precise
availability of sensor to measure in an absolute sense.
Resolution – Resolution is the ability of sensor to see
minor differences in readings.
Repeatability- Ability of sensor to repeat a
measurement when the sensor is put back into the
same environment or condition. The value sensed by
the
Fig.5 DHT11 Temperature Humidity Sensor
sensor is in the form of streams of 1s & 0s. DHT11
operates at the voltage supply of 3-5V DC. It is
recommended not to send any instruction to the sensor for
the duration of 1 second in order to pass the unstable
status. A capacitor of 100F can also be used for power
filtering data signal between VDD and GND. When the
data transferring and visiting starts between Atmega 328
and DTH11, the program burned in the Atmega 328 MCU
increase the voltage and waits 20ms-40ms for DTH11’s
response.
IX. SOIL MOISTURE SENSOR
Fig.6 Moisture Sensor
Soil moisture sensor senses all the water content from
the soil. The gravimetric measure of soil moisture content,
drying, and weighting of a sample, soil moisture sensors
senses the water content by using some properties of soil such
as electrical resistance, dielectric constant or interaction with
neutrons as a proxy for the moisture content in the soil .The
relation of measured properties with the soil moisture must be
calibrated and may differ depending on the type of soil.
Temperature and electric conductivity also affects the value of
moisture content.
The other type of sensors measure different property of
moisture in soil known as water potential. These Sensors are
usually called as water potential Sensor and also includes
tensiometer. Such type of potable instruments are used in
modern agriculture.
From Agriculture point of view measuring the soil moisture
content is very important as it helps the farmers to regulate the
supply of water to the soil. Moisture sensor also helps to
prevent excessing watering to the soil.
X. OBSERVATION
While testing various plants under different kind of artificial
lights we observe that the yield of few vegetation plants can be
increased by using specific colored artificial lights. Moreover,
using various sensors and automated irrigation facilities we
can reduce the human intervention and make the agriculture
process more automated.
XI. RESULTS
Fig. 7 Growth of plants under artificial light
International Journal of Computational Intelligence Research (IJCIR). ISSN 0973-1873 Vol.14, No.1 (2018)© Research India Publications. http://www.ripublication.com
47

Fig.8 Growth of plants under artificial light
REFERENCES [1] "Resource Centres on Urban Agriculture and Food Security,"
[Online]. Available: http://www.ruaf.org/node/512. [Accessed
15 September 2017].
[2] S. Vadlapatla, "Urban agriculture booms in Hyderabad," 4 may
2013. [Online]. Available: www.timesofindia.com. [Accessed
22 September 2017].
[3] tmr (Tailer-made-reports) “Vertical farming
market171206091644”.[Accessed 5 January 2018].
[4] ATTRA(Sustainable agriculture) https://attra-
pub/viewhtml.php?id=512[Accessed 5January 2018]
International Journal of Computational Intelligence Research (IJCIR). ISSN 0973-1873 Vol.14, No.1 (2018)© Research India Publications. http://www.ripublication.com
48

Universal Data Logger
Mohammed Shabaz Ansari Rohan Mestry
UG Students KJSIEIT, Mumbai UG Students KJSIEIT, Mumbai
University of Mumbai, India. University of Mumbai, India.
[email protected] [email protected]
Harish Naikar Adnan Shaikh
UG Students ,KJSIEIT, Mumbai UG Students,KJSIEIT,Mumbai
University of Mumbai, India. University of Mumbai, India.
[email protected] [email protected]
Pankaj Deshmukh Kanchan K. Sinha
Faculty ,KJSIEIT, Mumbai Faculty, KJSIEIT, Mumbai
University of Mumbai, India. University of Mumbai, India. [email protected] [email protected]
Ashwani Kaul (Faculty) Current Technology(CEO),Thane,Vasai
ashwani@luak.
Abstract—This paper reports design of an automated, low
cost universal data logging system for measuring
application. Different measuring parameters such as
environmental temperature, voltage, current is acquired in
real time and stored in a database such as memory card and
personal computer for future reference. The data can be
analyzed in standard condition or using Personal Computer
(PC) for offline analysis and report. PIC18F8720 micro-
controller (in-built ADC) and MP Lab Software are used to
develop the system.
Keywords—PIC(Programmable Interrupt Controller),
ADC(Analog to Digital convertor), Sensors, Data-Logger,
MAX 232, RTC(Real Time Clock).
I. INTRODUCTION
A data logger is a compact, battery-powered device
which is equipped with a micro-controller, data
storageunit and one or more sensors and sensor ports.
Data loggers can be employed in variety of environments,
for recording measurements at set intervals of time,
unattended. Depending on a particular data logger,
measurements can include air temperature, relative
humidity, AC/DC current and voltage, time-of-use (lights,
motors, etc.), light intensity, water temperature, soil
moisture, wind speed and direction, plug load, and many
more. A data logger can be astand-alone device, a single
unit that fits in the palm of a human hand, or it can be a
multi-channel data collection instrument which can be
equipped with one or more external sensors [1]. There are
many advantages of using a data logger such as
measurements are always taken at the right time as per the
timing requirements. Unlike a human, the computer will
not forget to take a reading at specific time interval,
neither it will take a reading with delay. Mistakes are not
made in reading the results in a digital form whereas
human can make errors, data can even be sent to areas
where humans cannot reach. But the main disadvantage of
using a data logging system is the initial cost of investing
in the equipment. For example, if we purchase a
thermometer it will cost us around 200 rupees and the
component cost for data logger system for recording
temperature is very high. So, to overcome this, we have
tried to make a low cost multi-channel universal data
logger [1].
The main aim of this paper is to develop a low-cost data
logging system (Data Logger), which can be used to
measure voltage(Ac/Dc), current and temperature. This
data logger has following structure-an interfacing of LCD
to display the output of various modules, an interfacing of
real-timec lock with the microcontroller, an interfacing of
EEPROM with the microcontroller and then interfacing of
the data logger to the personal computer by serial
communication using (RS-232).
II. SENSOR INTERFACING TO THE CONTROLLER
The basic equipment for adata-logger issensors, a sensor is a device which measures physical quantity and converts it into equivalent electrical signal, that can be analog as well as digital. This analog/digital signals can be visualize by the observer or the instrument. The main function of data-logger is monitoring the variables provided by the sensors which are used to sense the changes in the parameter and forward it to controller which is than displayed on LCD or monitored time to time and also can be stored. The parameter which are measured here are voltage, current and temperature. So, the sensors used are voltage, current and temperature sensors [2].
International Journal of Computational Intelligence Research (IJCIR). ISSN 0973-1873 Vol.14, No.1 (2018)© Research India Publications. http://www.ripublication.com
49
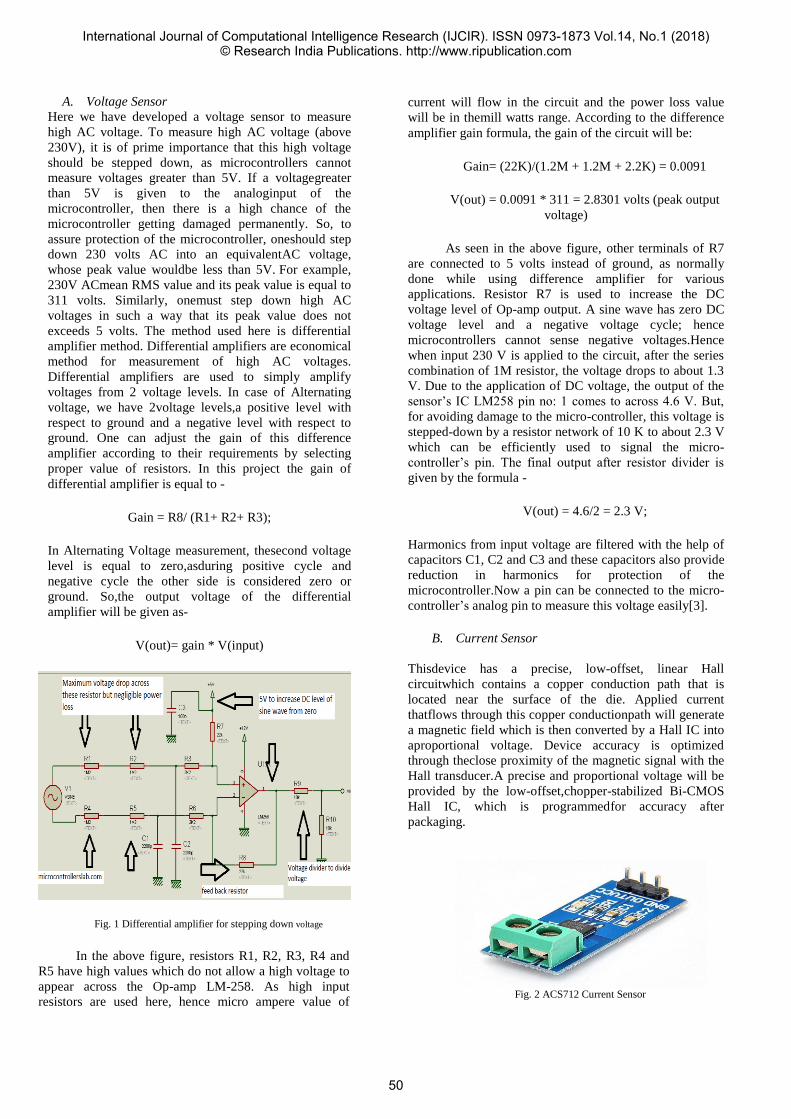
A. Voltage Sensor
Here we have developed a voltage sensor to measure
high AC voltage. To measure high AC voltage (above
230V), it is of prime importance that this high voltage
should be stepped down, as microcontrollers cannot
measure voltages greater than 5V. If a voltagegreater
than 5V is given to the analoginput of the
microcontroller, then there is a high chance of the
microcontroller getting damaged permanently. So, to
assure protection of the microcontroller, oneshould step
down 230 volts AC into an equivalentAC voltage,
whose peak value wouldbe less than 5V. For example,
230V ACmean RMS value and its peak value is equal to
311 volts. Similarly, onemust step down high AC
voltages in such a way that its peak value does not
exceeds 5 volts. The method used here is differential
amplifier method. Differential amplifiers are economical
method for measurement of high AC voltages.
Differential amplifiers are used to simply amplify
voltages from 2 voltage levels. In case of Alternating
voltage, we have 2voltage levels,a positive level with
respect to ground and a negative level with respect to
ground. One can adjust the gain of this difference
amplifier according to their requirements by selecting
proper value of resistors. In this project the gain of
differential amplifier is equal to -
Gain = R8/ (R1+ R2+ R3);
In Alternating Voltage measurement, thesecond voltage
level is equal to zero,asduring positive cycle and
negative cycle the other side is considered zero or
ground. So,the output voltage of the differential
amplifier will be given as-
V(out)= gain * V(input)
Fig. 1 Differential amplifier for stepping down voltage
In the above figure, resistors R1, R2, R3, R4 and
R5 have high values which do not allow a high voltage to
appear across the Op-amp LM-258. As high input
resistors are used here, hence micro ampere value of
current will flow in the circuit and the power loss value
will be in themill watts range. According to the difference
amplifier gain formula, the gain of the circuit will be:
Gain= (22K)/(1.2M + 1.2M + 2.2K) = 0.0091
V(out) = 0.0091 * 311 = 2.8301 volts (peak output
voltage)
As seen in the above figure, other terminals of R7
are connected to 5 volts instead of ground, as normally
done while using difference amplifier for various
applications. Resistor R7 is used to increase the DC
voltage level of Op-amp output. A sine wave has zero DC
voltage level and a negative voltage cycle; hence
microcontrollers cannot sense negative voltages.Hence
when input 230 V is applied to the circuit, after the series
combination of 1M resistor, the voltage drops to about 1.3
V. Due to the application of DC voltage, the output of the
sensor’s IC LM258 pin no: 1 comes to across 4.6 V. But,
for avoiding damage to the micro-controller, this voltage is
stepped-down by a resistor network of 10 K to about 2.3 V
which can be efficiently used to signal the micro-
controller’s pin. The final output after resistor divider is
given by the formula -
V(out) = 4.6/2 = 2.3 V;
Harmonics from input voltage are filtered with the help of
capacitors C1, C2 and C3 and these capacitors also provide
reduction in harmonics for protection of the
microcontroller.Now a pin can be connected to the micro-
controller’s analog pin to measure this voltage easily[3].
B. Current Sensor
Thisdevice has a precise, low-offset, linear Hall
circuitwhich contains a copper conduction path that is
located near the surface of the die. Applied current
thatflows through this copper conductionpath will generate
a magnetic field which is then converted by a Hall IC into
aproportional voltage. Device accuracy is optimized
through theclose proximity of the magnetic signal with the
Hall transducer.A precise and proportional voltage will be
provided by the low-offset,chopper-stabilized Bi-CMOS
Hall IC, which is programmedfor accuracy after
packaging.
Fig. 2 ACS712 Current Sensor
International Journal of Computational Intelligence Research (IJCIR). ISSN 0973-1873 Vol.14, No.1 (2018)© Research India Publications. http://www.ripublication.com
50
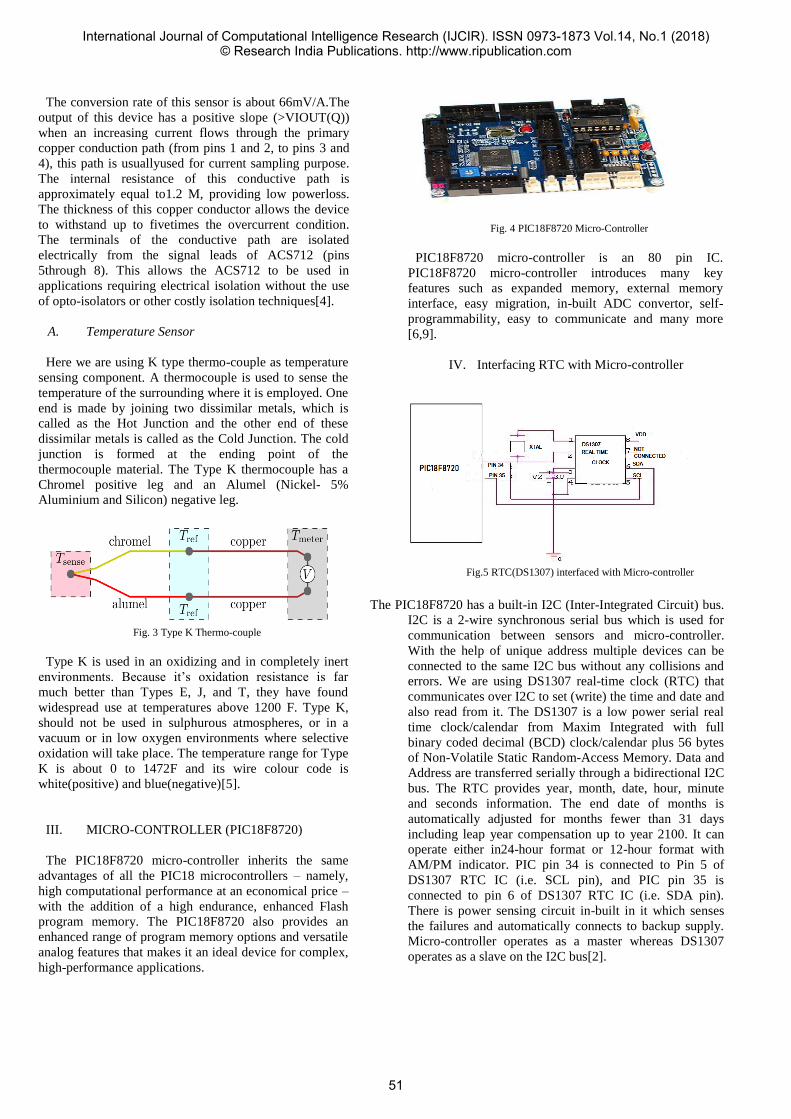
The conversion rate of this sensor is about 66mV/A.The
output of this device has a positive slope (>VIOUT(Q))
when an increasing current flows through the primary
copper conduction path (from pins 1 and 2, to pins 3 and
4), this path is usuallyused for current sampling purpose.
The internal resistance of this conductive path is
approximately equal to1.2 M, providing low powerloss.
The thickness of this copper conductor allows the device
to withstand up to fivetimes the overcurrent condition.
The terminals of the conductive path are isolated
electrically from the signal leads of ACS712 (pins
5through 8). This allows the ACS712 to be used in
applications requiring electrical isolation without the use
of opto-isolators or other costly isolation techniques[4].
A. Temperature Sensor
Here we are using K type thermo-couple as temperature
sensing component. A thermocouple is used to sense the
temperature of the surrounding where it is employed. One
end is made by joining two dissimilar metals, which is
called as the Hot Junction and the other end of these
dissimilar metals is called as the Cold Junction. The cold
junction is formed at the ending point of the
thermocouple material. The Type K thermocouple has a
Chromel positive leg and an Alumel (Nickel- 5%
Aluminium and Silicon) negative leg.
Fig. 3 Type K Thermo-couple
Type K is used in an oxidizing and in completely inert
environments. Because it’s oxidation resistance is far
much better than Types E, J, and T, they have found
widespread use at temperatures above 1200 F. Type K,
should not be used in sulphurous atmospheres, or in a
vacuum or in low oxygen environments where selective
oxidation will take place. The temperature range for Type
K is about 0 to 1472F and its wire colour code is
white(positive) and blue(negative)[5].
III. MICRO-CONTROLLER (PIC18F8720)
The PIC18F8720 micro-controller inherits the same
advantages of all the PIC18 microcontrollers – namely,
high computational performance at an economical price –
with the addition of a high endurance, enhanced Flash
program memory. The PIC18F8720 also provides an
enhanced range of program memory options and versatile
analog features that makes it an ideal device for complex,
high-performance applications.
Fig. 4 PIC18F8720 Micro-Controller
PIC18F8720 micro-controller is an 80 pin IC.
PIC18F8720 micro-controller introduces many key
features such as expanded memory, external memory
interface, easy migration, in-built ADC convertor, self-
programmability, easy to communicate and many more
[6,9].
IV. Interfacing RTC with Micro-controller
Fig.5 RTC(DS1307) interfaced with Micro-controller
The PIC18F8720 has a built-in I2C (Inter-Integrated Circuit) bus.
I2C is a 2-wire synchronous serial bus which is used for
communication between sensors and micro-controller.
With the help of unique address multiple devices can be
connected to the same I2C bus without any collisions and
errors. We are using DS1307 real-time clock (RTC) that
communicates over I2C to set (write) the time and date and
also read from it. The DS1307 is a low power serial real
time clock/calendar from Maxim Integrated with full
binary coded decimal (BCD) clock/calendar plus 56 bytes
of Non-Volatile Static Random-Access Memory. Data and
Address are transferred serially through a bidirectional I2C
bus. The RTC provides year, month, date, hour, minute
and seconds information. The end date of months is
automatically adjusted for months fewer than 31 days
including leap year compensation up to year 2100. It can
operate either in24-hour format or 12-hour format with
AM/PM indicator. PIC pin 34 is connected to Pin 5 of
DS1307 RTC IC (i.e. SCL pin), and PIC pin 35 is
connected to pin 6 of DS1307 RTC IC (i.e. SDA pin).
There is power sensing circuit in-built in it which senses
the failures and automatically connects to backup supply.
Micro-controller operates as a master whereas DS1307
operates as a slave on the I2C bus[2].
International Journal of Computational Intelligence Research (IJCIR). ISSN 0973-1873 Vol.14, No.1 (2018)© Research India Publications. http://www.ripublication.com
51
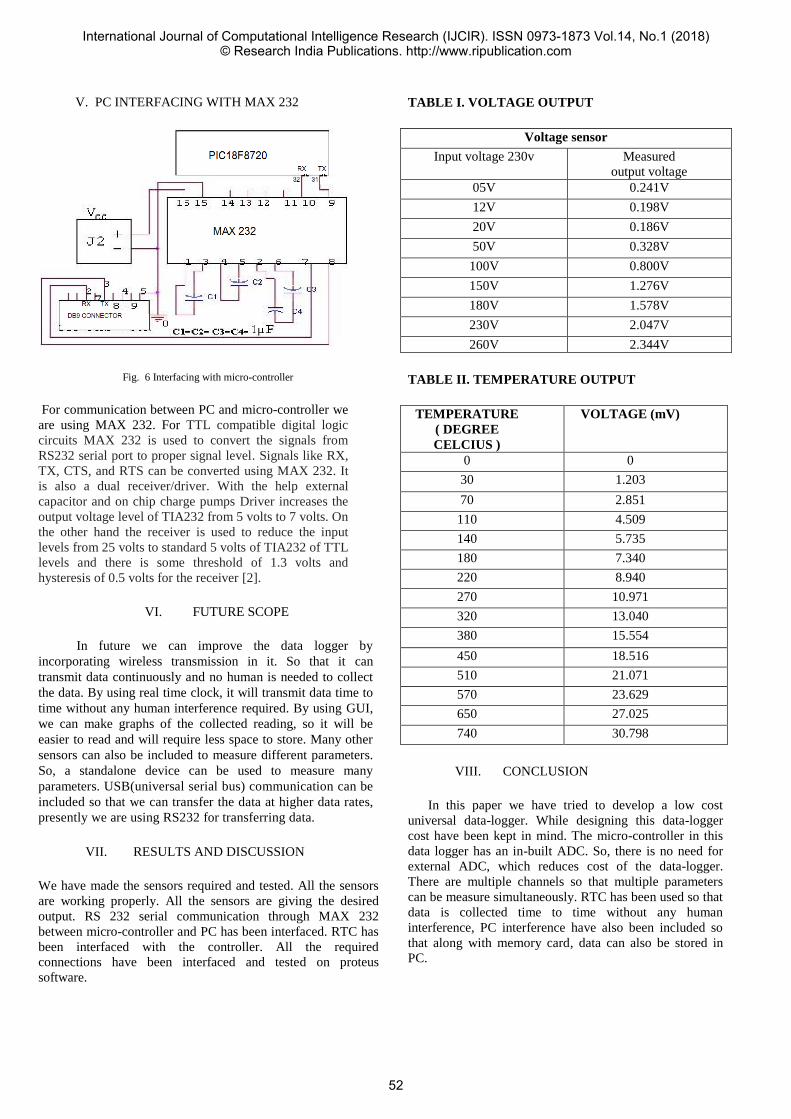
V. PC INTERFACING WITH MAX 232
Fig. 6 Interfacing with micro-controller
For communication between PC and micro-controller we
are using MAX 232. For TTL compatible digital logic
circuits MAX 232 is used to convert the signals from
RS232 serial port to proper signal level. Signals like RX,
TX, CTS, and RTS can be converted using MAX 232. It
is also a dual receiver/driver. With the help external
capacitor and on chip charge pumps Driver increases the
output voltage level of TIA232 from 5 volts to 7 volts. On
the other hand the receiver is used to reduce the input
levels from 25 volts to standard 5 volts of TIA232 of TTL
levels and there is some threshold of 1.3 volts and
hysteresis of 0.5 volts for the receiver [2].
VI. FUTURE SCOPE
In future we can improve the data logger by
incorporating wireless transmission in it. So that it can
transmit data continuously and no human is needed to collect
the data. By using real time clock, it will transmit data time to
time without any human interference required. By using GUI,
we can make graphs of the collected reading, so it will be
easier to read and will require less space to store. Many other
sensors can also be included to measure different parameters.
So, a standalone device can be used to measure many
parameters. USB(universal serial bus) communication can be
included so that we can transfer the data at higher data rates,
presently we are using RS232 for transferring data.
VII. RESULTS AND DISCUSSION
We have made the sensors required and tested. All the sensors
are working properly. All the sensors are giving the desired
output. RS 232 serial communication through MAX 232
between micro-controller and PC has been interfaced. RTC has
been interfaced with the controller. All the required
connections have been interfaced and tested on proteus
software.
TABLE I. VOLTAGE OUTPUT
Voltage sensor
Input voltage 230v Measured
output voltage
05V 0.241V
12V 0.198V
20V 0.186V
50V 0.328V
100V 0.800V
150V 1.276V
180V 1.578V
230V 2.047V
260V 2.344V
TABLE II. TEMPERATURE OUTPUT
TEMPERATURE
( DEGREE
CELCIUS )
VOLTAGE (mV)
0 0
30 1.203
70 2.851
110 4.509
140 5.735
180 7.340
220 8.940
270 10.971
320 13.040
380 15.554
450 18.516
510 21.071
570 23.629
650 27.025
740 30.798
VIII. CONCLUSION
In this paper we have tried to develop a low cost
universal data-logger. While designing this data-logger
cost have been kept in mind. The micro-controller in this
data logger has an in-built ADC. So, there is no need for
external ADC, which reduces cost of the data-logger.
There are multiple channels so that multiple parameters
can be measure simultaneously. RTC has been used so that
data is collected time to time without any human
interference, PC interference have also been included so
that along with memory card, data can also be stored in
PC.
International Journal of Computational Intelligence Research (IJCIR). ISSN 0973-1873 Vol.14, No.1 (2018)© Research India Publications. http://www.ripublication.com
52

REFERENCES
[1] Information about data-logger- www.onset.com.
[2] Anuj Kumar, I.P. Singh and S.K. Sud, “Design and
Development of multi-channel data logger for built-in environment.
[3] AC voltage measurement using micro-controller-
microcontrollerslab.com [4] ACS712 Current Sensor- Data Sheet.
[5] Type K thermocouple-
https//www.thermocoupleinfo.com/typek- thermocouple.htm.
[6] Micro-chip PIC18F8720- Data Sheet.
[7] RTC(Real Time Clock)- http://www.studentcompanion.co.za/interfacing-
the-ds1307- real-time-clock-with-pic-
microcontroller-mikroc/ [8] DatasheetofrealtimeclockDS1307.
[9] www.microchip.com.
[10] www.futurlec.com.
International Journal of Computational Intelligence Research (IJCIR). ISSN 0973-1873 Vol.14, No.1 (2018)© Research India Publications. http://www.ripublication.com
53

A Comparative Study of Different Similarity
Measures for Texture Based Color Image
Retrieval
Jayashree V Khanapuri
Faculty, KJSIEIT, Mumbai
University of Mumbai, India
Abstract—Description of images with color and texture features
plays very important rolein Content Based Image Retrieval System
(CBIR) when images are retrieved from a vast image database.
Though these features are very significant, many a times, it is equally
important to determine effective similarity measure to construct an
effective search system that provides fast and accurate retrieval.
Thus, determining similarities among given dataset is anessential task
of content-based retrieval system. Representing the contents of the
database with better feature representation and determining the
similarities among the retrieved images of dataset by applying
different distance measures to find their efficiency and effectiveness
will help in establishing better similarity measure method for image
retrieval. This paper discusses the behavior of different similarity
measures on a given datasetand suggests the best among the
considered measures in terms of retrieval accuracy. The findings will
help in providing direction in the development of efficient system for
content based image retrieval.
Keywords—similarity measures, content-based retrieval,
Retrieval accuracy
I INTRODUCTION
Internet provides a super freeway of information for
the user. Over the years, there is a vast growth in the
number of users that are accessing huge amount of data
from the internet. This growth has led to the development
of huge image database such as databases for multimedia
and digital libraries. This rapid growth of information has
generated the necessity for image retrieval system with
effective and efficient search algorithm.
Content- Based Image Retrieval (CBIR) is an area which is
devoted to image retrieval problems [1] and already has
large number of developed image database systems [2].
Three main features such as color, texture and shape of
image take significant part in content based retrieval
systems [3] that exists today.
II. LITERATURE SURVEY
The main goal of any efficient system for image
retrieval is to acquire the image that is different from other
similar images by capturing its important characteristics.
Most of the indexing techniques are centered on features
provided by spatial domain such as color [4], texture [5],
and shape [6]. Color is most extensively used feature for
retrieval as it is easier to acquire the color images. Different
methods based on texture such as texture analysis,
classification and segmentation are also proposed
encompassing the study to texture in color images thus
providing faster way of achieving texture based image
retrieval. The color bands are used to extract the texture
characteristics of images to provide color texture
information. [7,8,9,10,11]. In all these cases, creation of
image database with robust and effective indices that are
useful for efficient retrieval become important aspect of
image databases [15]. In CBIR based systems; extraction
of feature vectors from visual information of the images is
carried out and stored as database. Features are also
extracted from query image in a similar fashion. The
comparison of query features with database features is
carried out by using different distance measures to retrieve
similar images [12]. Color histograms are also implemented
for image retrieval in majority of retrieval techniques. The
problems such as histogram dimensionality, immunity to
noise etc. still exist though; histogram-based techniques
provide better results. The requirement of good similarity
measures has led to the development of new techniques.
In this paper, study of several distance measures and
their behavior on the selected database is carried out. We
have implemented these distance measures on Wang image
database. The texture features of the images in Wang
database is considered for image retrieval. The texture
feature extraction is carried out using DT-CWT (Dual Tree
Complex Wavelet Transform) to extract the prominent
features of the images. The extracted features are
represented as vectors for image database. Image similarity
is determined by using different distance measures [13].
The main goal of this paper is to determine an
efficient method that provides effective distance measure to
obtain better average retrieval accuracy. The paper is
organized as follows. Section I provides the introduction.
Discussion on Dual Tree Complex Wavelets and
extractionof texture features is provided in section III.
Section IV discusses various distance measures that are
International Journal of Computational Intelligence Research (IJCIR). ISSN 0973-1873 Vol.14, No.1 (2018)© Research India Publications. http://www.ripublication.com
54

implemented for color image retrieval based on texture. The
experimental results are discussed in section V and
conclusion based on results is given in section VI.
III. FEATURE EXTRACTION AND REPRESENTATION
It is necessary to represent the images using feature
vector in order to determine the effective indexing method.
Different researchers have proposed large number of
researches based on frequency domain indexing. These
frequency domain techniques extract the features from various
frequency domain methods such as wavelet transform, Gabor
transform and Fourier transform etc. These indexing
techniques have become more prevalent as they are less
complex. The Dual Tree Complex Wavelet Transform (DT-
CWT) is found to be one of the most efficient methods for
texture feature extraction. Though, there are many different
techniques that provide various algorithms for efficient
extraction of texture features. The computational advantage of
approaches based on complex wavelet has emerged as
effective over other methods. The disadvantages related with
other transforms are overcome in Complex wavelet [9] since
they are orthogonal and provide fast computation. The shift
invariant property and generation of separate sub-bands make
DT-CWT more special. The DT-CWT provides sub bands
with orientation in six different directions that include both
positive and negative orientations making it superior over
other wavelets [15]. The wavelet transform overcomes the
drawback related with conventional wavelets like shift
variance, poor directional selectivity etc. The Complex
Wavelet Transforms (CWT) retrieves the texture features in an
effective manner with less redundancy and computational
complexity. These properties are attained due to dual tree
structure of the Complex Wavelet. The CWT replaces the tree
structure representation of conventional wavelet transform. In
this, real part is produced by one tree of the dual-tree complex
wavelet coefficients while imaginary part is produced by other
tree at each scale [15]. This helps in achieving symmetric real
parts and anti-symmetric imaginary parts. The overall
complex impulse responses obtained by alternate use of even
and odd filters. Thus, the final feature vector consists of the
texture features of color image that are extracted from dual-
tree complex wavelet filter.
A. Dual- Tree Complex Wavelet transform (DT-CWT)
The low pass data represents the approximated
version of high-resolution image in all multi resolution
analysis of wavelets, the sharper variation details of the image
are always provided by high pass filter. The output is
generated by incorporating two trees in parallel. The output of
dual Tree complex wavelet is interpreted real and imaginary
part of complex coefficient. The analysis branch provides real
and imaginary coefficients by using two sets of QMF pairs [3].
The decomposition of image by transform at each stage into
sub bands provides two approximated versions and
information about orientation in six different directions. All
these analysis filters are real & orthogonal [16, 17]. The
outputs obtained by the QMF filters are represented as
follows.
𝚽1(𝑥, 𝑦) = 𝚽ℎ(𝑥). 𝚽ℎ(𝑦), 𝚽2(𝑥, 𝑦) = 𝚽𝑔(𝑥). 𝚽𝑔(𝑦) (1)
𝚿1,1(𝑥, 𝑦) = 𝚽ℎ(𝑥). 𝚿ℎ(𝑦)𝚿2,1(𝑥, 𝑦) = 𝚽𝑔(𝑥). 𝚿𝑔(y) (2)
𝚿1,2(𝑥, 𝑦) = 𝚿ℎ(𝑥). 𝚽ℎ(𝑦)𝚿2,2(𝑥, 𝑦) = 𝚿𝑔(𝑥). 𝚽𝑔(y) (3)
𝚿1,3(𝑥, 𝑦) = 𝚿ℎ(𝑥). 𝚿ℎ(𝑦)𝚿2,3(𝑥, 𝑦) = 𝚿𝑔(𝑥). 𝚿𝑔(y) (4)
Equation (2), (3) and (4) generate resultant wavelets in six
different directions as follows:
𝚿𝑖(𝑥, 𝑦) = 𝚿ℎ,𝑖(𝑥) + 𝚿𝑔,𝑖(𝑦) (5)
𝚿𝑖+3(𝑥, 𝑦) = 𝚿ℎ,𝑖(𝑥) + 𝚿𝑔,𝑖(𝑦) (6)
These resultant wavelets are redundant but directional. These
six wavelets obtained are oriented in +150, +450, +750, -150,-
450, -750 to provide information in mentioned direction and
shift invariant. .
IV.DIFFERENT DISTANCE MEASURES
Content based image retrieval system comprises of three
major constituents i.e. feature extraction, indexing and system
design. An image is characterized by a set of relevant features
that can yield better retrieval performance. In order to have an
effective retrieval, it is essential to incorporate suitable
similarity measure that works similar to human judgment.
Therefore, it is required to carry out comparison of retrieval
results using such similarity measures that can provide better
results. Lot of literature survey on usage of different distance
measures has been carried out to discover most efficient
measure to retrieve the images. Accordingly, different
similarity measures have been proposed for retrieval to match
the human similarity judgments. The analysis has been
carried out on retrieval results obtained by different similarity
metrics such as Euclidean, City block, Matusita, Chi-square,
Canberra and modified Canberra and the results are compared
for retrieval accuracy. If ‘xi’ and ‘yi’ are the ith feature vector
components of the database and query image respectively. The
‘D’ is the distance between query and database feature vector
is given for different similarity measures discussed in next
section.
A. Euclidean Distance (l2)
Euclidean distance is one of the best common
distance metrics used in many of the literature related to image
retrieval [18]. When r=2, it relates to the Minkowski-form
distance, and is given as:
𝐷 = √∑(𝑥𝑖 − 𝑦𝑖)2
𝑖
B. City Block Distance (Or Manhattan Distance)
The Minkowski-form distance for r=1 is known as
the city block distance. The computation time required by the
International Journal of Computational Intelligence Research (IJCIR). ISSN 0973-1873 Vol.14, No.1 (2018)© Research India Publications. http://www.ripublication.com
55

City Block Distance is less as compared to many of the
distance metrics[18], and is defined as:
𝐷 = ∑|𝑥𝑖 − 𝑦𝑖|
𝑖
C. Matusita Distance
The Matusita distance is given as[18]:
𝐷 = √∑(√𝑥 − √𝑦)2
𝑖
D. Chi-Square Distance
Theun–binned distributions can be handled by Chi-
square statistics. But comparison between binned distributions
like histograms also uses this distance measure [18]. Chi-
square distance is the widely used distance metric and is
represented as:
𝐷 = ∑(𝑥𝑖 − 𝑦𝑖)2
𝑥𝑖 + 𝑦𝑖𝑖
E. Wave - Hedges Distance
The Wave-Hedges metric[18] is given as:
𝐷 = (1 −𝑚𝑖𝑛(𝑥𝑖 , 𝑦𝑖)
𝑚𝑎𝑥(𝑥𝑖 , 𝑦𝑖))
F. Canberra Distance
Canberra metric is widely used in many CBIR
applications due to its popularity. It provides high retrieval
efficiency with low computational complexity as compared to
other distance matrices [18]. In this, the numerator indicates
the difference between the feature vector components and
denominator normalizes the difference. Thus, the distance will
be one when any of the attributes is zero, but not exceed one.
Thus, it is a good similarity measure that avoids scaling effect.
𝐷 = ∑|𝑥𝑖 − 𝑦𝑖|
|𝑥𝑖| + |𝑦𝑖|𝑖
G. Modified Canberra Distance
A new similarity measure has been proposed which
is the modification of Canberra distance for efficient color
image retrieval. The proposed distance measure performs
better than Canberra distance measure and resolves the
ambiguity arising if feature vector components of both
database & query images happen to be identical. The modified
Canberra distance is given by:
𝐷 = ∑|𝑥𝑖 − 𝑦𝑖|
1 + |𝑥𝑖| + |𝑦𝑖|𝑖
V.RESULTS
The experiment was implemented 1000 images
belonging to Wang database of size 256x384 or 384x256
respectively. There are 10 different classes under Wang
database. These classes are categorized as People, Beach,
Elephant, Horse, Food, Monument, Rose, Dinosaur, Bus and
Mountain[3]. The resizing of images to 256x256 is carried out
in pre-processing stage and changing into gray scale images.
The extraction of texture feature is carried out by down
scaling the image up to fourth level. The energy and standard
deviation parameters are calculated at each scale. Thus, the
texture feature vector for each database image consists of 64
features corresponding to DT – CWT. The similarity of query
image with the images in database is calculated using different
distance measure methods as discussed in section 3 by
considering each of the images in database as query image.
The performance evaluation of the system is carried out by
considering only the texture features obtained by DT-CWT.
The retrieval accuracy of each class is carried out followed by
average retrieval accuracy for image under consideration is
calculated w.r.t query image. The expression for Retrieval
Accuracy is given as [15],
Retrieval Accuracy =No.of Relevant images Retrieved
Total No.of Relevant Images (7)
The Average Retrieval Accuracy of each class is given by,
Average Retrieval Accuracy
= 1
n∑ Retrieval Accuracy
n
i=1
(8)
Where n=No. of images in each class
The average retrieval accuracy of the class is calculated. The
retrieval accuracy is calculated for different distance
measures. All these methods are compared with respect to
average computation time and the retrieval accuracy.
Figure1. Comparison of Average Retrieval Accuracy of
database for Different Distance measures
Figure 1 represents the average retrieval accuracy obtained
using the different distances measures for all the classes
present in the database.
0
20
40
60
80
100
120
Pe
op
le
Be
ach
Mo
nu
me
nt
Bu
s
Din
osa
ur
Elep
han
t
Ro
se
Ho
rse
Mo
un
tain
Foo
d
Ave
rage
Ret
riev
al A
ccu
racy
Different Classes
Comparison of average Retrieval Accuracy
Euclidean
City block
Matusita
Chi-Square
Hedge
Canberra
M-Canberra
International Journal of Computational Intelligence Research (IJCIR). ISSN 0973-1873 Vol.14, No.1 (2018)© Research India Publications. http://www.ripublication.com
56
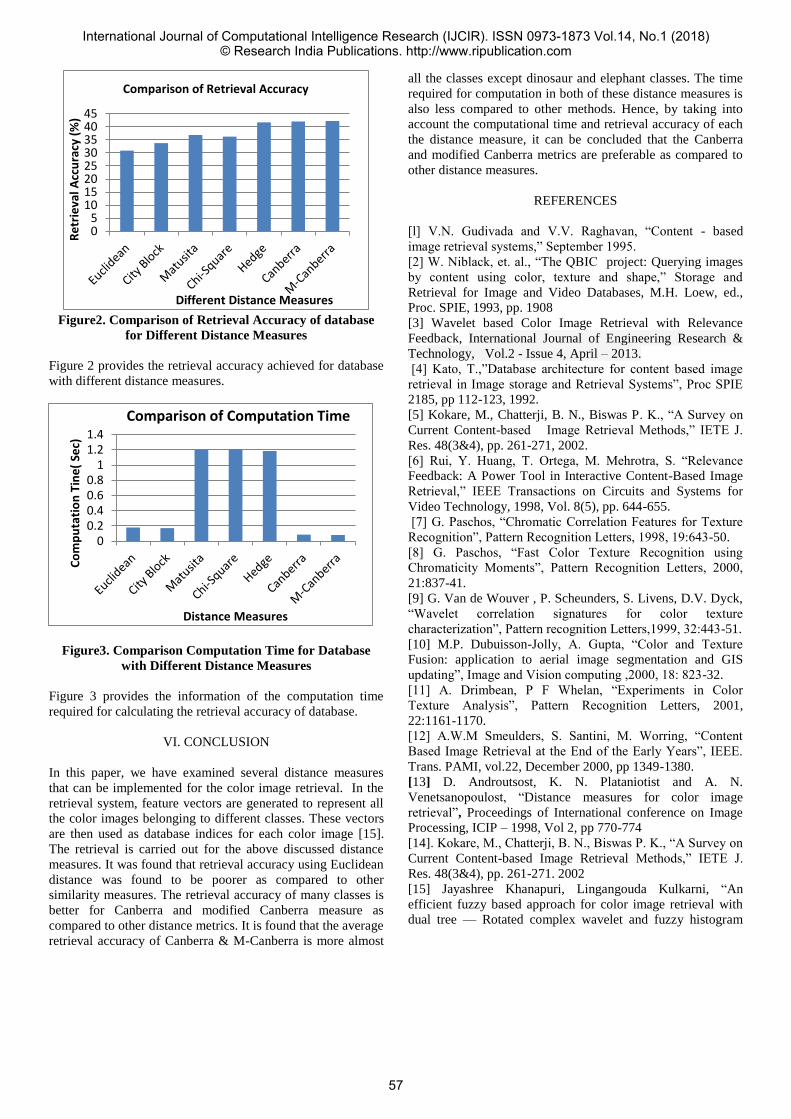
Figure2. Comparison of Retrieval Accuracy of database
for Different Distance Measures
Figure 2 provides the retrieval accuracy achieved for database
with different distance measures.
Figure3. Comparison Computation Time for Database
with Different Distance Measures
Figure 3 provides the information of the computation time
required for calculating the retrieval accuracy of database.
VI. CONCLUSION
In this paper, we have examined several distance measures
that can be implemented for the color image retrieval. In the
retrieval system, feature vectors are generated to represent all
the color images belonging to different classes. These vectors
are then used as database indices for each color image [15].
The retrieval is carried out for the above discussed distance
measures. It was found that retrieval accuracy using Euclidean
distance was found to be poorer as compared to other
similarity measures. The retrieval accuracy of many classes is
better for Canberra and modified Canberra measure as
compared to other distance metrics. It is found that the average
retrieval accuracy of Canberra & M-Canberra is more almost
all the classes except dinosaur and elephant classes. The time
required for computation in both of these distance measures is
also less compared to other methods. Hence, by taking into
account the computational time and retrieval accuracy of each
the distance measure, it can be concluded that the Canberra
and modified Canberra metrics are preferable as compared to
other distance measures.
REFERENCES
[l] V.N. Gudivada and V.V. Raghavan, “Content - based
image retrieval systems,” September 1995.
[2] W. Niblack, et. al., “The QBIC project: Querying images
by content using color, texture and shape,” Storage and
Retrieval for Image and Video Databases, M.H. Loew, ed.,
Proc. SPIE, 1993, pp. 1908
[3] Wavelet based Color Image Retrieval with Relevance
Feedback, International Journal of Engineering Research &
Technology, Vol.2 - Issue 4, April – 2013.
[4] Kato, T.,”Database architecture for content based image
retrieval in Image storage and Retrieval Systems”, Proc SPIE
2185, pp 112-123, 1992.
[5] Kokare, M., Chatterji, B. N., Biswas P. K., “A Survey on
Current Content-based Image Retrieval Methods,” IETE J.
Res. 48(3&4), pp. 261-271, 2002.
[6] Rui, Y. Huang, T. Ortega, M. Mehrotra, S. “Relevance
Feedback: A Power Tool in Interactive Content-Based Image
Retrieval,” IEEE Transactions on Circuits and Systems for
Video Technology, 1998, Vol. 8(5), pp. 644-655.
[7] G. Paschos, “Chromatic Correlation Features for Texture
Recognition”, Pattern Recognition Letters, 1998, 19:643-50.
[8] G. Paschos, “Fast Color Texture Recognition using
Chromaticity Moments”, Pattern Recognition Letters, 2000,
21:837-41.
[9] G. Van de Wouver , P. Scheunders, S. Livens, D.V. Dyck,
“Wavelet correlation signatures for color texture
characterization”, Pattern recognition Letters,1999, 32:443-51.
[10] M.P. Dubuisson-Jolly, A. Gupta, “Color and Texture
Fusion: application to aerial image segmentation and GIS
updating”, Image and Vision computing ,2000, 18: 823-32.
[11] A. Drimbean, P F Whelan, “Experiments in Color
Texture Analysis”, Pattern Recognition Letters, 2001,
22:1161-1170.
[12] A.W.M Smeulders, S. Santini, M. Worring, “Content
Based Image Retrieval at the End of the Early Years”, IEEE.
Trans. PAMI, vol.22, December 2000, pp 1349-1380.
[13] D. Androutsost, K. N. Plataniotist and A. N.
Venetsanopoulost, “Distance measures for color image
retrieval”, Proceedings of International conference on Image
Processing, ICIP – 1998, Vol 2, pp 770-774
[14]. Kokare, M., Chatterji, B. N., Biswas P. K., “A Survey on
Current Content-based Image Retrieval Methods,” IETE J.
Res. 48(3&4), pp. 261-271. 2002
[15] Jayashree Khanapuri, Lingangouda Kulkarni, “An
efficient fuzzy based approach for color image retrieval with
dual tree — Rotated complex wavelet and fuzzy histogram
05
1015202530354045
Re
trie
val A
ccu
racy
(%
)
Different Distance Measures
Comparison of Retrieval Accuracy
00.20.40.60.8
11.21.4
Co
mp
uta
tio
n T
ine
( Se
c)
Distance Measures
Comparison of Computation Time
International Journal of Computational Intelligence Research (IJCIR). ISSN 0973-1873 Vol.14, No.1 (2018)© Research India Publications. http://www.ripublication.com
57

using selective relevance feedback approach” International
conference for convergence of Technology(I2CT), April 2014
[16] N G Kingsbury, “The dual tree complex wavelet
transform: A new technique for shift invariance and
directional filters”, in Proc. 8th IEEE DSP workshop, Utah,
Aug 9-12, 1998.
[17] K N Prakash, K Satyaprasad, “M - Band Dual tree
complex wavelet transform for texture Image Indexing and
Retrieval”, International Journal of Advance in Engineering &
Technology, Vol 4, Issue1, July 2012, pp. 661-671.
[18]MariaHatzigiorgaki ; AthanassiosN.
Skodras,”Compressed Domain retrieval : a comparative study
of similarity metrics”, Proc. SPIE 5150, Visual
Communications and Image Processing 2003, 439 (June 16,
2003); doi:10.1117/12.507669
International Journal of Computational Intelligence Research (IJCIR). ISSN 0973-1873 Vol.14, No.1 (2018)© Research India Publications. http://www.ripublication.com
58
Image Security Enhancement using Steganography
Shaikh Shoeb Ahmed
Dept. of Electronics and Telecommunication
K.J Somaiya College of Engineering
Mumbai, India.
Nitin S. Nagori
Dept. of Electronics and Telecommunication
K.J Somaiya college of Engineering
Mumbai, India
Abstract— A novel data hiding method is proposed for
embedding significant Facial Data in a single fingerprint image.
This technique uses the properties of Discrete Cosine Transform
(DCT) and Discrete Wavelet Transform (DWT) to embed the
facial image onto the Fingerprint image. LSB steganography is
used to hide text in the face hidden image. The Face Image is first
compressed using Discrete Cosine Transform and then is
embedded into the HH sub-band of the fingerprint Image which
is acquired using 1-level DWT. Fingerprint features i.e. minutiae
stay unaffected during and after the process. The evaluation if
this embedding technique shows that it is capable of handling
larger facial data and text for a single Image. Also it gives good
results in the form of computed PSNR, SSIM and Normalized
Cross Correlation.
Keywords-watermark; DWT; DCT;Face;Fingeprint;text.
I. INTRODUCTION
Steganography is often confused with cryptology because the two are similar in the way that they both are used to protect important information. The difference between the two is that Steganography involves hiding information so it appears that no information is hidden at all. The purpose of steganography is to protect your data from illegitimate manipulation; in short it's a way which provides security of information from manipulation of original data. The information or message which is digitalis hidden in digital signal that contains owner information data to provide secure and avoid the modification or duplication of the original data (video, audio, Image, etc.). For better copyright protection, we should have to notice some important fact that the imposing of secret data should not affect original information quality. The algorithm should be affective and robust, unauthorized distributer cannot eliminate and manipulate the Secret data. It means the content should be detected by authorized person. There are several important factors useful to check integrity. For providing much secureness it depends on the embedding technique which is used by the owner. When hiding information inside images the LSB (Least Significant Byte) method is usually used. When hiding information inside files the technique usually used is low bit encoding which is somewhat similar to LSB that is generally used in Images. The problem with low bit encoding is that it is usually noticeable, so it is a rather risky method for someone to use if they are trying to mask information inside of a file. Spread Spectrum is another method used to conceal information inside of a file. This method works by adding random noises to the signal, the information is conceal inside a carrier and spread across the frequency spectrum. When
information is hidden inside video the program or person hiding the information will usually use the DCT (Discrete Cosine Transform) method. Steganography in Videos is similar to that of Steganography in Images, apart from information is hidden in each frame of video. When only a small amount of information is hidden inside of video it generally isn’t noticeable at all, however the more information that is hidden the more noticeable it becomes. So Steganography in Images is preferred. In today’s modern world authentication and security is of major concern. In such case biometrics plays a vital role as it offers high security as compared to traditional methods. Finger print recognition is one of the most widely used biometric security system as it is easy to access and implement. The existing finger print technology does not provide much accuracy thus resulting into implementation of fusion techniques in the existing technology. Fusion at sample level finger print recognition also called as finger print recognition using hybrid technology provides high security at low cost. With the widespread applications of fingerprint techniques in authentication systems, protecting the privacy of the fingerprint becomes an important issue. Traditional encryption is not sufficient for fingerprint privacy protection because decryption is required before the fingerprint matching, which exposes the fingerprint to the attacker. Therefore, in recent years, significant efforts have been put into developing specific protection techniques for fingerprint.
II. LITERATURE REVIEW
A. Traditional Methods for ssecuring data.
Three complementary techniques are being used: encryption, steganography and watermarking [1]. Encryption is a conspicuous and secure technique to converse data into a scrambled code that can be distributed and deciphered through a private or public network. Generally speaking, in both research and application fields, encryption and cryptographic algorithms serve copyright owners as an approach to protect the secure transmission of confidential multimedia data between a distributor or publisher and the purchaser of the multimedia data over public channels. Using variations of symmetrical and asymmetrical styles or forms of encrypting data, the permutated original multimedia contents are non- recognizable in appearance, unsystematic, and disorderly [2]. Although encryption algorithms can be applied to avoid illegal access to digital contents, it appears that encryption by itself is not sufficient enough to prevent an unauthorized pirate from illegally replicating multimedia content and protect multimedia data all along its lifetime. Once multimedia content has been
International Journal of Computational Intelligence Research (IJCIR). ISSN 0973-1873 Vol.14, No.1 (2018)© Research India Publications. http://www.ripublication.com
59

decrypted into its original style and the protection of information is invalidated for further manipulations because there is no degradation of quality in subsequent works and no verification differences between one copy and any other derivative copy. Therefore, unauthorized replicating copy and transmission of multimedia data cannot be obstructed [2]. Steganography [3] represents a technique that is used to convey communicating secret data by writing hidden messages into an appropriate multimedia carrier, e.g., audio, image and video. The existence of the message is suspected except by the sender and intended receiver. Unlike cryptography techniques, the goal of steganography is to conceal the very existence of the hidden messages, together with avoiding arouse suspicion and not attracting attention to themselves. However, steganography conventionally involves associating secret point-to-point transmission and Communication. Thus, steganography approaches are typically not resistant to transformation of the carriers, or hold only restricted robustness.
B. Previous works
The [5] states the four different images of fingerprint, where every image is further isolated into 4 different quadrants and every quadrant watermarked image with the encrypted numeric digit. As four watermarked image of fingerprints with a modified ATM pin number of the same client, the proposed work discovers application in security usage in view of cryptographic unique fingerprint watermarking. Such a combination of watermarking strategies and encryption gives a level of security and further shields the client's personality from assaults because of the procedure's strength. The experimental study is complete on a limited number of clients and the outcomes show that hybrid methodology gives enhanced results as far as other existing methodologies. [6] Shows a technique to hiding biometric information, which uses a combination of steganography and asymmetric digital watermarking. The combination of these strategies enables system to the handle numerous problems associated with storing and also transferring information of raw biometric. What it proposes is a multilayer system that initially, encodes eigen-components removed from the raw face images, into the fingerprint image. Consecutively, every watermarked fingerprint image is encoded within an arbitrary host image unrelated to biometrics or crime scene investigation, transfer image securing.DWT has shown better performance in terms of robustness and payload capacity [9], [10], butas the payload is increased, imperceptibility and robustness are decreased. Multi-level DWT can be used to improve imperceptibility, but it reduces the robustness and size of the payload [11]. The understanding of the previous works is required as a pre- requisite for the implementation of the algorithm being proposed. This was explained in the current chapter, whereas the next chapter gives a brief overview about some of the important concepts that would be required to understand the algorithm in a smooth manner. [12] A steganography system is designed for encoding and decoding a secret file embedded into an image file using random LSB insertion method in which the secret data are spread out among the image data in a seemingly random manner. This can be achieved using a secret key. The key used to generate pseudorandom numbers, which will identify where, and in what order the hidden message is laid out. The advantage of this method is that it incorporates
some cryptography in that diffusion is applied to the secret message.
III. METHODOLOGY
Before A single-level of DWT is performed to get the high frequency sub-band HH and LL of the host fingerprint image. The DCT algorithm is used for compression, quantization and conversion purposes to convert a grayscale image into a compressed binary array of data. The embedding procedure is completed by taking the inverse discrete cosine transforms (IDCT) of the HH and LL sub-bands, followed by the inverse discrete wavelet transform (IDWT) of the resultant image. The extraction steps are similar but in the reverse order. The watermarked sub-band regions LL and HH are then independently subjected to DCTs to recover the modified DCT coefficients, from which the watermark greyscale facial and text are extracted.
A. Discrete Wavelet Transform (DWT)
The fingerprint image is first decomposes into a low frequency band (LL) and high frequency bands (HL, LH and HH) as shown in figure. The low frequency sub-band (LL) contains most of the energy of the image. Thus, embedding data in this band will cause degradation to the image. Also Hh band contains mostly high frequency component and is mostly irrelevant to the original data.
Fig.1 DWT levels
B. Discrete Cosine Transform (DCT)
A discrete cosine transform (DCT) expresses a finite sequence of data points in terms of a sum of cosine functions oscillating at different frequencies. DCTs are important to numerous applications in science and engineering, from lossy compression of audio (e.g. MP3) and images (e.g. JPEG) (where small high-frequency components can be discarded), to spectral methods for the numerical solution of partial differential equations. The use of cosine rather than sine functions is critical for compression, since fewer cosine functions are needed to approximate a typical signal. The DCT- based algorithm is implemented for compression, quantization and conversion of the grayscale facial image to binary image. The image compression using the DCT is utilized to add redundancy which will improve the robustness of the algorithm.
C. Text Hiding
In the last years the Internet has been considered as a suitable medium for transferring digital data and multimedia. Its main advantage is the availability to almost everyone and data can be received within a few seconds. The main disadvantage of using the Internet is the weak data security, because data can be monitored by any unauthorized viewers.
International Journal of Computational Intelligence Research (IJCIR). ISSN 0973-1873 Vol.14, No.1 (2018)© Research India Publications. http://www.ripublication.com
60
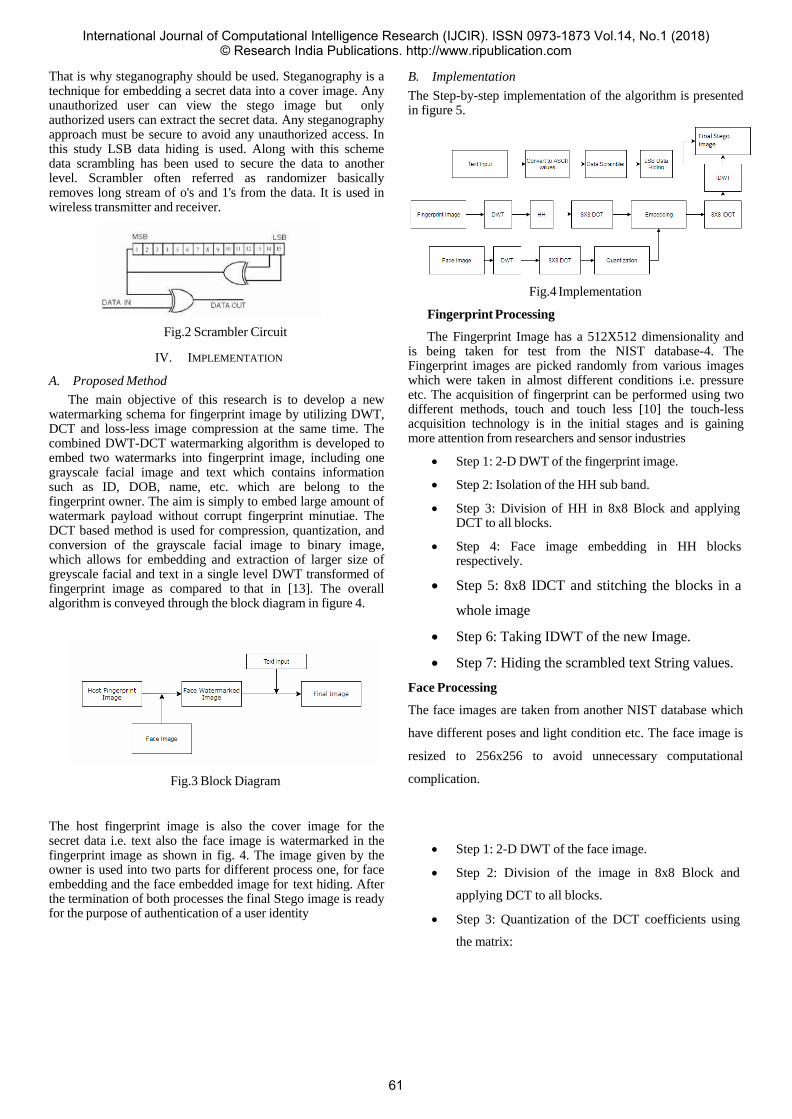
That is why steganography should be used. Steganography is a technique for embedding a secret data into a cover image. Any unauthorized user can view the stego image but only authorized users can extract the secret data. Any steganography approach must be secure to avoid any unauthorized access. In this study LSB data hiding is used. Along with this scheme data scrambling has been used to secure the data to another level. Scrambler often referred as randomizer basically removes long stream of o's and 1's from the data. It is used in wireless transmitter and receiver.
Fig.2 Scrambler Circuit
IV. IMPLEMENTATION
A. Proposed Method
The main objective of this research is to develop a new watermarking schema for fingerprint image by utilizing DWT, DCT and loss-less image compression at the same time. The combined DWT-DCT watermarking algorithm is developed to embed two watermarks into fingerprint image, including one grayscale facial image and text which contains information such as ID, DOB, name, etc. which are belong to the fingerprint owner. The aim is simply to embed large amount of watermark payload without corrupt fingerprint minutiae. The DCT based method is used for compression, quantization, and conversion of the grayscale facial image to binary image, which allows for embedding and extraction of larger size of greyscale facial and text in a single level DWT transformed of fingerprint image as compared to that in [13]. The overall algorithm is conveyed through the block diagram in figure 4.
Fig.3 Block Diagram
The host fingerprint image is also the cover image for the secret data i.e. text also the face image is watermarked in the fingerprint image as shown in fig. 4. The image given by the owner is used into two parts for different process one, for face embedding and the face embedded image for text hiding. After the termination of both processes the final Stego image is ready for the purpose of authentication of a user identity
B. Implementation
The Step-by-step implementation of the algorithm is presented in figure 5.
Fig.4 Implementation
Fingerprint Processing
The Fingerprint Image has a 512X512 dimensionality and is being taken for test from the NIST database-4. The Fingerprint images are picked randomly from various images which were taken in almost different conditions i.e. pressure etc. The acquisition of fingerprint can be performed using two different methods, touch and touch less [10] the touch-less acquisition technology is in the initial stages and is gaining more attention from researchers and sensor industries
Step 1: 2-D DWT of the fingerprint image.
Step 2: Isolation of the HH sub band.
Step 3: Division of HH in 8x8 Block and applying DCT to all blocks.
Step 4: Face image embedding in HH blocks respectively.
Step 5: 8x8 IDCT and stitching the blocks in a
whole image
Step 6: Taking IDWT of the new Image.
Step 7: Hiding the scrambled text String values.
Face Processing
The face images are taken from another NIST database which
have different poses and light condition etc. The face image is
resized to 256x256 to avoid unnecessary computational
complication.
Step 1: 2-D DWT of the face image.
Step 2: Division of the image in 8x8 Block and
applying DCT to all blocks.
Step 3: Quantization of the DCT coefficients using
the matrix:
International Journal of Computational Intelligence Research (IJCIR). ISSN 0973-1873 Vol.14, No.1 (2018)© Research India Publications. http://www.ripublication.com
61
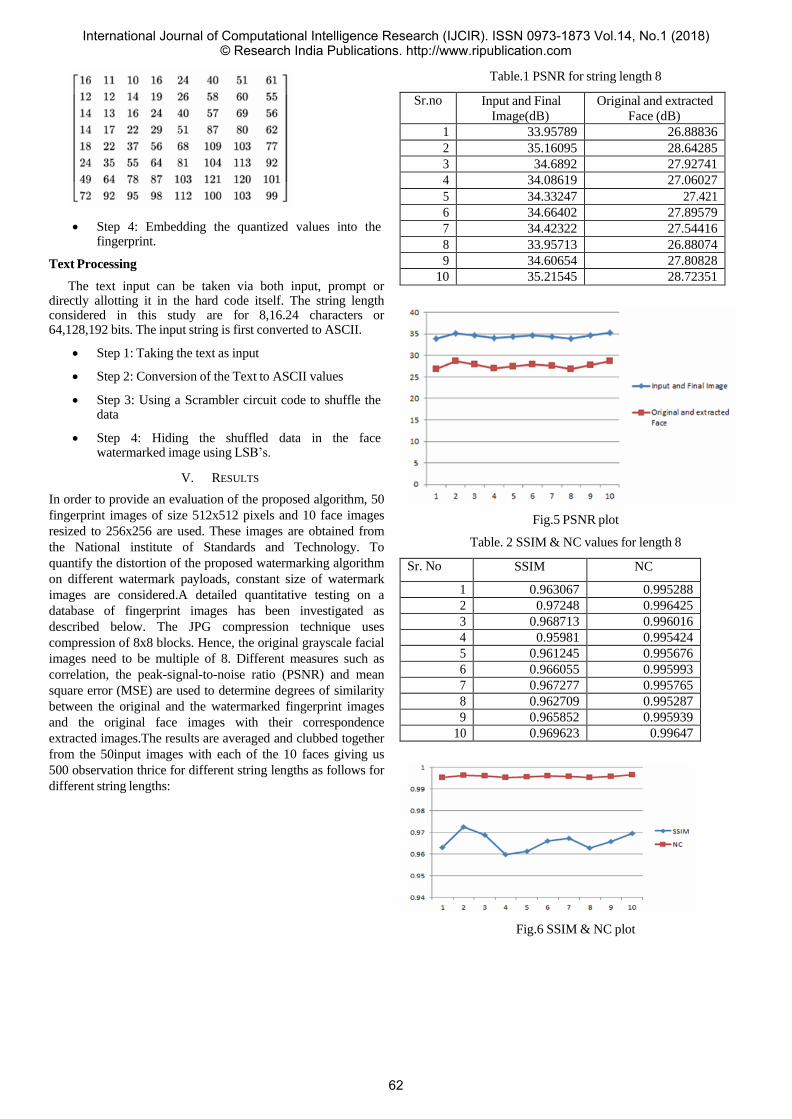
Step 4: Embedding the quantized values into the fingerprint.
Text Processing
The text input can be taken via both input, prompt or directly allotting it in the hard code itself. The string length considered in this study are for 8,16.24 characters or 64,128,192 bits. The input string is first converted to ASCII.
Step 1: Taking the text as input
Step 2: Conversion of the Text to ASCII values
Step 3: Using a Scrambler circuit code to shuffle the data
Step 4: Hiding the shuffled data in the face watermarked image using LSB’s.
V. RESULTS
In order to provide an evaluation of the proposed algorithm, 50
fingerprint images of size 512x512 pixels and 10 face images
resized to 256x256 are used. These images are obtained from
the National institute of Standards and Technology. To
quantify the distortion of the proposed watermarking algorithm
on different watermark payloads, constant size of watermark
images are considered.A detailed quantitative testing on a
database of fingerprint images has been investigated as
described below. The JPG compression technique uses
compression of 8x8 blocks. Hence, the original grayscale facial
images need to be multiple of 8. Different measures such as
correlation, the peak-signal-to-noise ratio (PSNR) and mean
square error (MSE) are used to determine degrees of similarity
between the original and the watermarked fingerprint images
and the original face images with their correspondence
extracted images.The results are averaged and clubbed together
from the 50input images with each of the 10 faces giving us
500 observation thrice for different string lengths as follows for
different string lengths:
Table.1 PSNR for string length 8
Sr.no Input and Final
Image(dB)
Original and extracted
Face (dB)
1 33.95789 26.88836
2 35.16095 28.64285
3 34.6892 27.92741
4 34.08619 27.06027
5 34.33247 27.421
6 34.66402 27.89579
7 34.42322 27.54416
8 33.95713 26.88074
9 34.60654 27.80828
10 35.21545 28.72351
Fig.5 PSNR plot
Table. 2 SSIM & NC values for length 8
Sr. No SSIM NC
1 0.963067 0.995288
2 0.97248 0.996425
3 0.968713 0.996016
4 0.95981 0.995424
5 0.961245 0.995676
6 0.966055 0.995993
7 0.967277 0.995765
8 0.962709 0.995287
9 0.965852 0.995939
10 0.969623 0.99647
Fig.6 SSIM & NC plot
International Journal of Computational Intelligence Research (IJCIR). ISSN 0973-1873 Vol.14, No.1 (2018)© Research India Publications. http://www.ripublication.com
62
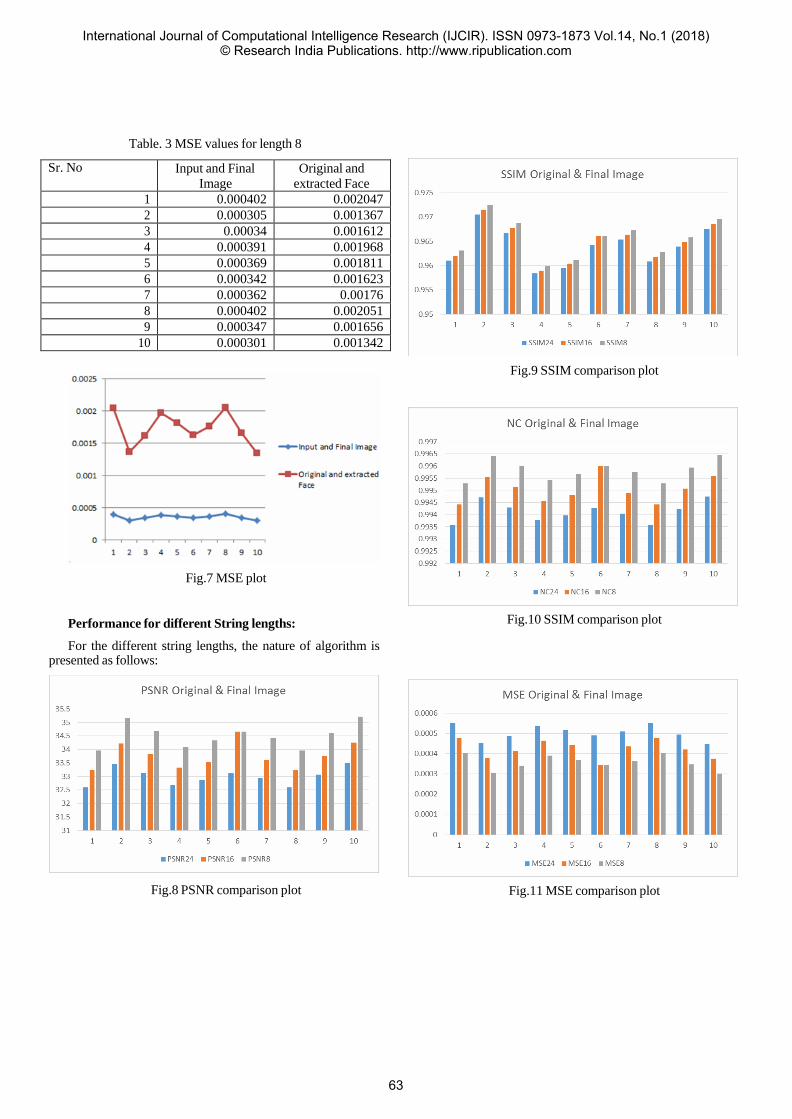
Table. 3 MSE values for length 8
Fig.7 MSE plot
Performance for different String lengths:
For the different string lengths, the nature of algorithm is presented as follows:
Fig.8 PSNR comparison plot
Fig.9 SSIM comparison plot
Fig.10 SSIM comparison plot
Fig.11 MSE comparison plot
Sr. No Input and Final
Image
Original and
extracted Face
1 0.000402 0.002047
2 0.000305 0.001367
3 0.00034 0.001612
4 0.000391 0.001968
5 0.000369 0.001811
6 0.000342 0.001623
7 0.000362 0.00176
8 0.000402 0.002051
9 0.000347 0.001656
10 0.000301 0.001342
International Journal of Computational Intelligence Research (IJCIR). ISSN 0973-1873 Vol.14, No.1 (2018)© Research India Publications. http://www.ripublication.com
63

Fig.12 PSNR for face comparison plot
Fig.13 MSE for face comparison plot
VI. CONCLUSION
Data Hiding after scrambling in their corresponding
fingerprint images helps in creating a new virtual identity for the user. User facial and identification information in the form of text data are embedded into owner’s fingerprint image. The proposed algorithm utilizes the strengths of DWT-DCT techniques. The algorithm performs robustly due throughout the face images set with minimum or no distortion. For every face image as long as the dimensions are unchanged the results are similar throughout the fingerprint image set. The variations of the observations are boiled down to a single factor as long as the images are same i.e. string/character length. As the number of character increases a drop in the values of PSNR, SSIM,NC is observed. PSNR values decrease with the increase in character length. The same is followed by SSIM and NC. The MSE values increase along the length
REFERENCES
1. Hai Tao, Li Chongmin, Jasni Mohamad Zain, Ahmed N. Abdalla. “Robust Image Watermarking Theories and Techniques: A Review”.
2. Liang, H. Y., Cheng, C. H., Yang, C. Y., & Zhang, K. F. (2013). A Blind Data Hiding Technique with Error
Correction Abilities and a High Embedding Payload. Journal of Applied Research and Technology, 11,259- 271.
3. Pereira S. and Pun T., 2000. Robust template matching for affine resistant image watermarks. IEEE Trans. Image Processing, 9:1123–1129.
4. MayankGarg, Shashikant Gupta ,Pallavi Khatri “Fingerprint Watermarking and Steganography for ATM Transaction using LSB-RSA and 3-DWT Algorithm” , 2015 International Conference on Communication Networks (ICCN).
5. R. Ashoka Rajanl, R.Angelinjosphia2, Ms .PVS.Gayathd, T.Rajendran4 ,Po Anandhakumar5," A Novel Approach for Secure ATM Transactions Using Fingerprint Watermarking", 2013 Fifth International Conference on Advanced Computing (ICoAC).
6. CameronWhitelam, Nnamdi Asia and Thirimachos Bourlai," Securing Multimodal Biometric Data through Watermarking and Steganography", pp.: 61- 66.
7. Mohammed Alkhathami, Fengling Han and Ron Van Schyndel,” Fingerprint Authentication Enhancement Using Combination of DWT and DCT”, 2015 IEEE 10th Conference on Industrial Electronics and Applications (ICIEA).
8. Lahouari Ghouti, Ahmed Bouridane, Mohammad K Ibrahim, and Said Boussakta. Digital image watermarking using balanced multiwavelets. Signal Processing, IEEE Transactions on, 54(4):1519–1536, 2006.
9. Huming Gao, Liyuan Jia, and Meiling Liu. A digital watermarking algorithm for color image based ondwt. TELKOMNIKA Indonesian Journal of Electrical Engineering, 11(6):3271–3278, 2013.
10. .Parmeshwar Birajadar; Shubham Gupta; Pushkaraj Shirvalkar; Varun Patidar; Utkarsh Sharma; Ameya Naik; Vikram Gadre, “Touch-less fingerphoto feature extraction, analysis and matching using monogenic wavelets “,2016 International Conference on Signal and Information Processing (IConSIP).
11. Rajlaxmi Chouhan, Agya Mishra, and Pritee Khanna. “Fingerprint authentication by wavelet- based digital watermarking”. International Journal of Electrical & Computer Engineering (2088-8708), 2(4), 2016.
12. M. S. Sutaone, M.V. Khandare “Image Based Steganography Using LSB Insertion Technique”
International Journal of Computational Intelligence Research (IJCIR). ISSN 0973-1873 Vol.14, No.1 (2018)© Research India Publications. http://www.ripublication.com
64
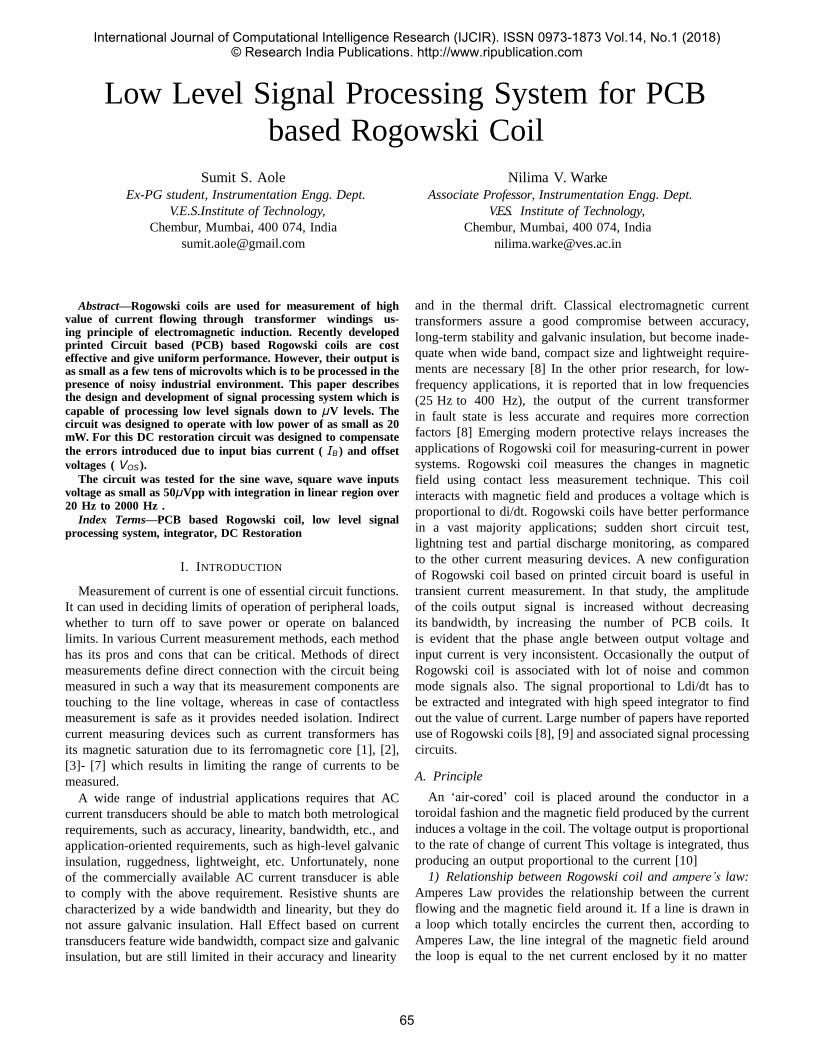
Low Level Signal Processing System for PCB
based Rogowski Coil
Sumit S. Aole
Ex-PG student, Instrumentation Engg. Dept.
V.E.S.Institute of Technology,
Chembur, Mumbai, 400 074, India
Nilima V. Warke
Associate Professor, Instrumentation Engg. Dept.
V.E.S. Institute of Technology,
Chembur, Mumbai, 400 074, India
Abstract—Rogowski coils are used for measurement of high
value of current flowing through transformer windings us- ing principle of electromagnetic induction. Recently developed printed Circuit based (PCB) based Rogowski coils are cost effective and give uniform performance. However, their output is as small as a few tens of microvolts which is to be processed in the presence of noisy industrial environment. This paper describes the design and development of signal processing system which is
capable of processing low level signals down to µV levels. The circuit was designed to operate with low power of as small as 20 mW. For this DC restoration circuit was designed to compensate
the errors introduced due to input bias current ( IB ) and offset
voltages ( VOS ). The circuit was tested for the sine wave, square wave inputs
voltage as small as 50µVpp with integration in linear region over
20 Hz to 2000 Hz .
Index Terms—PCB based Rogowski coil, low level signal
processing system, integrator, DC Restoration
I. INTRODUCTION
Measurement of current is one of essential circuit functions.
It can used in deciding limits of operation of peripheral loads,
whether to turn off to save power or operate on balanced
limits. In various Current measurement methods, each method
has its pros and cons that can be critical. Methods of direct
measurements define direct connection with the circuit being
measured in such a way that its measurement components are
touching to the line voltage, whereas in case of contactless
measurement is safe as it provides needed isolation. Indirect
current measuring devices such as current transformers has
its magnetic saturation due to its ferromagnetic core [1], [2],
[3]- [7] which results in limiting the range of currents to be
measured.
A wide range of industrial applications requires that AC
current transducers should be able to match both metrological
requirements, such as accuracy, linearity, bandwidth, etc., and
application-oriented requirements, such as high-level galvanic
insulation, ruggedness, lightweight, etc. Unfortunately, none
of the commercially available AC current transducer is able
to comply with the above requirement. Resistive shunts are
characterized by a wide bandwidth and linearity, but they do
not assure galvanic insulation. Hall Effect based on current
transducers feature wide bandwidth, compact size and galvanic
insulation, but are still limited in their accuracy and linearity
and in the thermal drift. Classical electromagnetic current
transformers assure a good compromise between accuracy,
long-term stability and galvanic insulation, but become inade-
quate when wide band, compact size and lightweight require-
ments are necessary [8] In the other prior research, for low-
frequency applications, it is reported that in low frequencies
(25 Hz to 400 Hz), the output of the current transformer
in fault state is less accurate and requires more correction
factors [8] Emerging modern protective relays increases the
applications of Rogowski coil for measuring-current in power
systems. Rogowski coil measures the changes in magnetic
field using contact less measurement technique. This coil
interacts with magnetic field and produces a voltage which is
proportional to di/dt. Rogowski coils have better performance
in a vast majority applications; sudden short circuit test,
lightning test and partial discharge monitoring, as compared
to the other current measuring devices. A new configuration
of Rogowski coil based on printed circuit board is useful in
transient current measurement. In that study, the amplitude
of the coils output signal is increased without decreasing
its bandwidth, by increasing the number of PCB coils. It
is evident that the phase angle between output voltage and
input current is very inconsistent. Occasionally the output of
Rogowski coil is associated with lot of noise and common
mode signals also. The signal proportional to Ldi/dt has to
be extracted and integrated with high speed integrator to find
out the value of current. Large number of papers have reported
use of Rogowski coils [8], [9] and associated signal processing
circuits.
A. Principle
An ‘air-cored’ coil is placed around the conductor in a
toroidal fashion and the magnetic field produced by the current
induces a voltage in the coil. The voltage output is proportional
to the rate of change of current This voltage is integrated, thus
producing an output proportional to the current [10]
1) Relationship between Rogowski coil and ampere’s law:
Amperes Law provides the relationship between the current
flowing and the magnetic field around it. If a line is drawn in
a loop which totally encircles the current then, according to
Amperes Law, the line integral of the magnetic field around
the loop is equal to the net current enclosed by it no matter
International Journal of Computational Intelligence Research (IJCIR). ISSN 0973-1873 Vol.14, No.1 (2018)© Research India Publications. http://www.ripublication.com
65
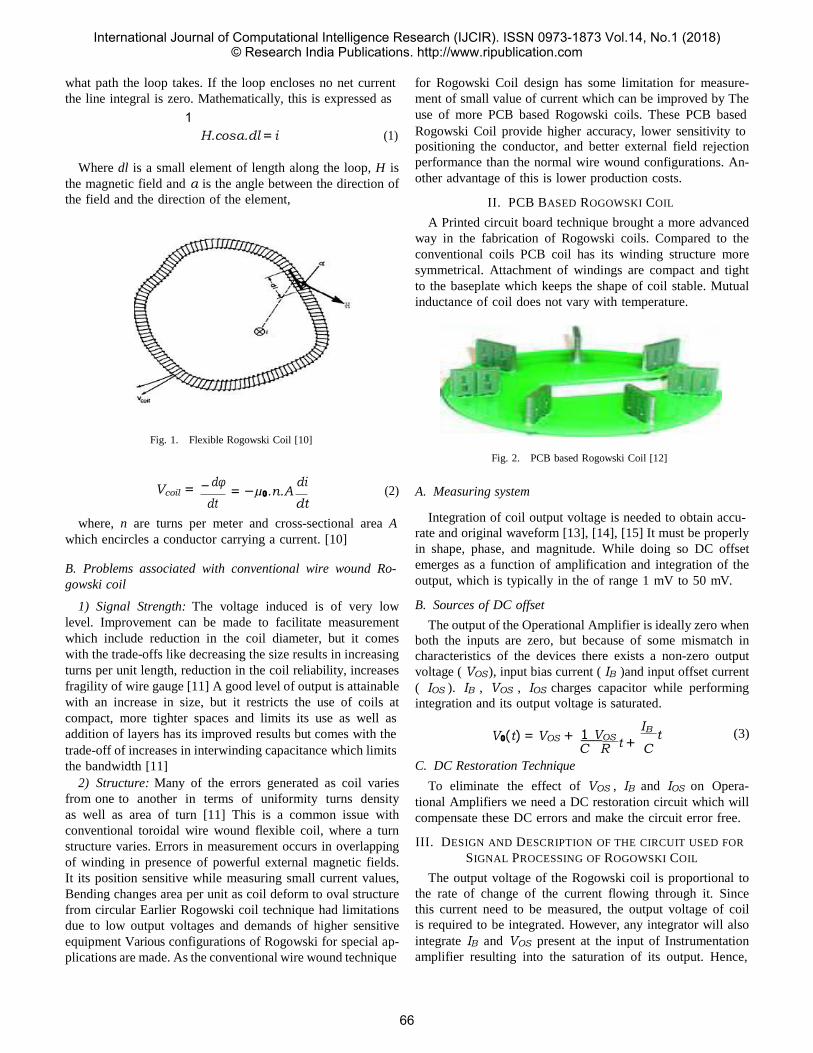
what path the loop takes. If the loop encloses no net current
the line integral is zero. Mathematically, this is expressed as
1
for Rogowski Coil design has some limitation for measure-
ment of small value of current which can be improved by The
use of more PCB based Rogowski coils. These PCB based
H.cosα.dl = i (1)
Where dl is a small element of length along the loop, H is
the magnetic field and α is the angle between the direction of
the field and the direction of the element,
Fig. 1. Flexible Rogowski Coil [10]
Rogowski Coil provide higher accuracy, lower sensitivity to
positioning the conductor, and better external field rejection
performance than the normal wire wound configurations. An-
other advantage of this is lower production costs.
II. PCB BASED ROGOWSKI COIL
A Printed circuit board technique brought a more advanced
way in the fabrication of Rogowski coils. Compared to the
conventional coils PCB coil has its winding structure more
symmetrical. Attachment of windings are compact and tight
to the baseplate which keeps the shape of coil stable. Mutual
inductance of coil does not vary with temperature.
Fig. 2. PCB based Rogowski Coil [12]
dφ Vcoil =
di = −µ0.n.A
(2)
A. Measuring system
dt dt
where, n are turns per meter and cross-sectional area A
which encircles a conductor carrying a current. [10]
B. Problems associated with conventional wire wound Ro-
gowski coil
1) Signal Strength: The voltage induced is of very low
level. Improvement can be made to facilitate measurement
which include reduction in the coil diameter, but it comes
with the trade-offs like decreasing the size results in increasing
turns per unit length, reduction in the coil reliability, increases
fragility of wire gauge [11] A good level of output is attainable
with an increase in size, but it restricts the use of coils at
compact, more tighter spaces and limits its use as well as
Integration of coil output voltage is needed to obtain accu-
rate and original waveform [13], [14], [15] It must be properly
in shape, phase, and magnitude. While doing so DC offset
emerges as a function of amplification and integration of the
output, which is typically in the of range 1 mV to 50 mV.
B. Sources of DC offset
The output of the Operational Amplifier is ideally zero when
both the inputs are zero, but because of some mismatch in
characteristics of the devices there exists a non-zero output
voltage ( VOS ), input bias current ( IB )and input offset current
( IOS ). IB , VOS , IOS charges capacitor while performing
integration and its output voltage is saturated.
addition of layers has its improved results but comes with the V0(t) = VOS + 1 VOS t +
IB
t (3)
trade-off of increases in interwinding capacitance which limits
the bandwidth [11]
2) Structure: Many of the errors generated as coil varies
from one to another in terms of uniformity turns density
as well as area of turn [11] This is a common issue with
conventional toroidal wire wound flexible coil, where a turn
structure varies. Errors in measurement occurs in overlapping
of winding in presence of powerful external magnetic fields.
It its position sensitive while measuring small current values,
Bending changes area per unit as coil deform to oval structure
from circular Earlier Rogowski coil technique had limitations
due to low output voltages and demands of higher sensitive
equipment Various configurations of Rogowski for special ap-
plications are made. As the conventional wire wound technique
C R C
C. DC Restoration Technique
To eliminate the effect of VOS , IB and IOS on Opera-
tional Amplifiers we need a DC restoration circuit which will
compensate these DC errors and make the circuit error free.
III. DESIGN AND DESCRIPTION OF THE CIRCUIT USED FOR
SIGNAL PROCESSING OF ROGOWSKI COIL
The output voltage of the Rogowski coil is proportional to
the rate of change of the current flowing through it. Since
this current need to be measured, the output voltage of coil
is required to be integrated. However, any integrator will also
integrate IB and VOS present at the input of Instrumentation
amplifier resulting into the saturation of its output. Hence,
−
International Journal of Computational Intelligence Research (IJCIR). ISSN 0973-1873 Vol.14, No.1 (2018)© Research India Publications. http://www.ripublication.com
66
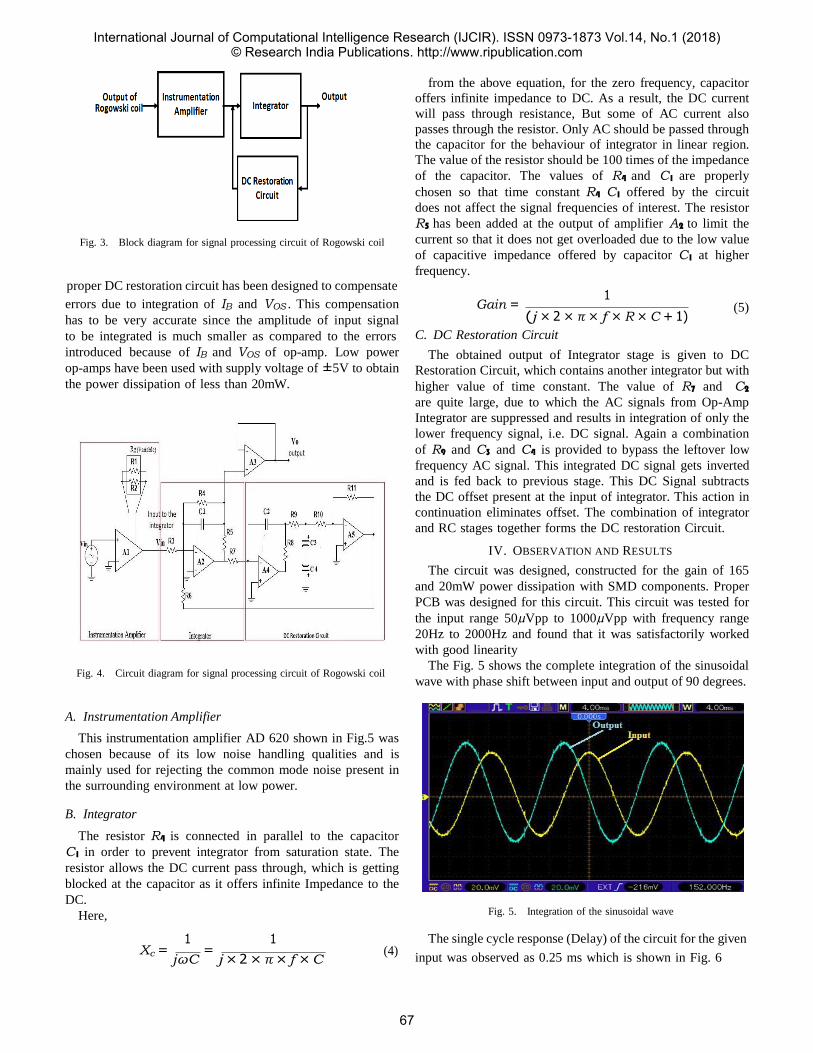
Fig. 3. Block diagram for signal processing circuit of Rogowski coil
proper DC restoration circuit has been designed to compensate
from the above equation, for the zero frequency, capacitor
offers infinite impedance to DC. As a result, the DC current
will pass through resistance, But some of AC current also
passes through the resistor. Only AC should be passed through
the capacitor for the behaviour of integrator in linear region.
The value of the resistor should be 100 times of the impedance
of the capacitor. The values of R4 and C1 are properly
chosen so that time constant R4 C1 offered by the circuit
does not affect the signal frequencies of interest. The resistor
R5 has been added at the output of amplifier A2 to limit the
current so that it does not get overloaded due to the low value
of capacitive impedance offered by capacitor C1 at higher
frequency.
errors due to integration of IB and VOS . This compensation
has to be very accurate since the amplitude of input signal
to be integrated is much smaller as compared to the errors
1 Gain =
(j × 2 × π × f × R × C + 1)
C. DC Restoration Circuit
(5)
introduced because of IB and VOS of op-amp. Low power
op-amps have been used with supply voltage of ±5V to obtain
the power dissipation of less than 20mW.
Fig. 4. Circuit diagram for signal processing circuit of Rogowski coil
A. Instrumentation Amplifier
This instrumentation amplifier AD 620 shown in Fig.5 was
chosen because of its low noise handling qualities and is
mainly used for rejecting the common mode noise present in
the surrounding environment at low power.
B. Integrator
The resistor R4 is connected in parallel to the capacitor
C1 in order to prevent integrator from saturation state. The
resistor allows the DC current pass through, which is getting
blocked at the capacitor as it offers infinite Impedance to the
DC.
Here,
The obtained output of Integrator stage is given to DC
Restoration Circuit, which contains another integrator but with
higher value of time constant. The value of R7 and C2
are quite large, due to which the AC signals from Op-Amp
Integrator are suppressed and results in integration of only the
lower frequency signal, i.e. DC signal. Again a combination
of R9 and C3 and C4 is provided to bypass the leftover low
frequency AC signal. This integrated DC signal gets inverted
and is fed back to previous stage. This DC Signal subtracts
the DC offset present at the input of integrator. This action in
continuation eliminates offset. The combination of integrator
and RC stages together forms the DC restoration Circuit.
IV. OBSERVATION AND RESULTS
The circuit was designed, constructed for the gain of 165
and 20mW power dissipation with SMD components. Proper
PCB was designed for this circuit. This circuit was tested for
the input range 50µVpp to 1000µVpp with frequency range
20Hz to 2000Hz and found that it was satisfactorily worked
with good linearity
The Fig. 5 shows the complete integration of the sinusoidal
wave with phase shift between input and output of 90 degrees.
Fig. 5. Integration of the sinusoidal wave
1 1 The single cycle response (Delay) of the circuit for the given Xc =
jωC =
j × 2 × π × f × C (4)
input was observed as 0.25 ms which is shown in Fig. 6
International Journal of Computational Intelligence Research (IJCIR). ISSN 0973-1873 Vol.14, No.1 (2018)© Research India Publications. http://www.ripublication.com
67
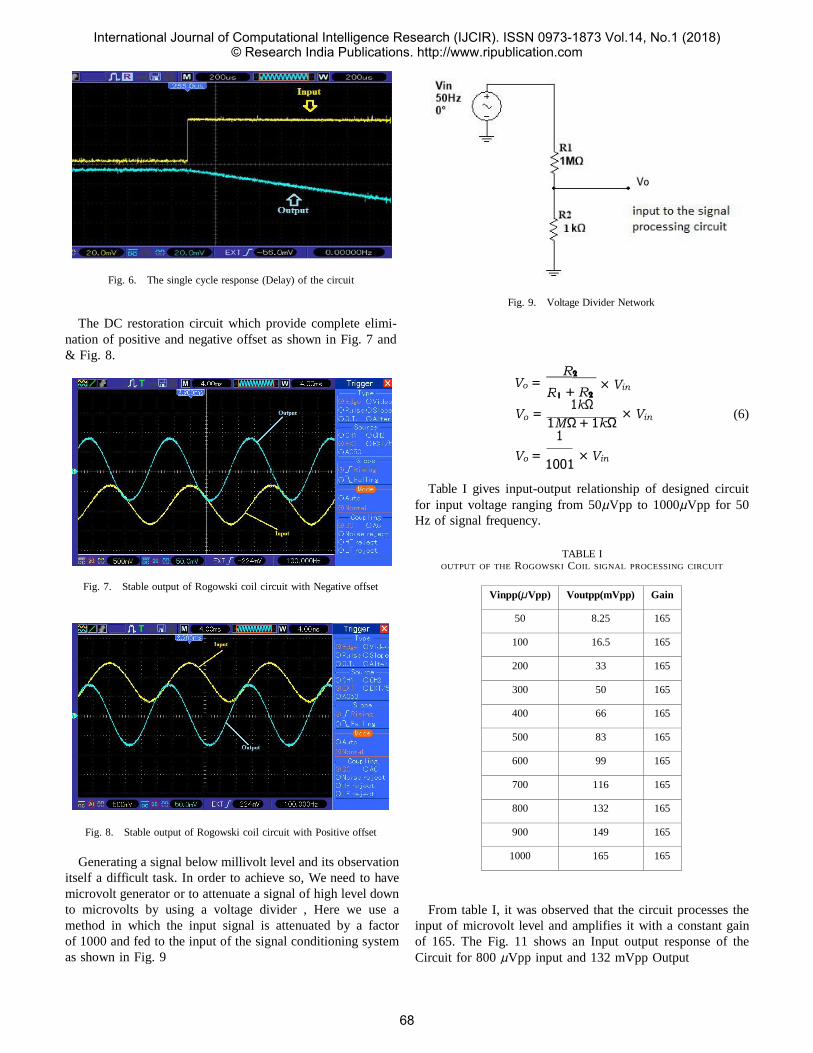
Fig. 6. The single cycle response (Delay) of the circuit
The DC restoration circuit which provide complete elimi-
nation of positive and negative offset as shown in Fig. 7 and
& Fig. 8.
Fig. 9. Voltage Divider Network
R2
Vo = 1 + R2
× Vin
1kΩ Vo =
1M Ω + 1kΩ × Vin
1
Vo = 1001
× Vin
(6)
Table I gives input-output relationship of designed circuit
for input voltage ranging from 50µVpp to 1000µVpp for 50
Hz of signal frequency.
Fig. 7. Stable output of Rogowski coil circuit with Negative offset
TABLE I OUTPUT OF THE ROGOWSKI COIL SIGNAL PROCESSING CIRCUIT
Fig. 8. Stable output of Rogowski coil circuit with Positive offset
Generating a signal below millivolt level and its observation
itself a difficult task. In order to achieve so, We need to have
microvolt generator or to attenuate a signal of high level down
to microvolts by using a voltage divider , Here we use a
method in which the input signal is attenuated by a factor
of 1000 and fed to the input of the signal conditioning system
as shown in Fig. 9
From table I, it was observed that the circuit processes the
input of microvolt level and amplifies it with a constant gain
of 165. The Fig. 11 shows an Input output response of the
Circuit for 800 µVpp input and 132 mVpp Output
R
Vinpp(µVpp) Voutpp(mVpp) Gain
50 8.25 165
100 16.5 165
200 33 165
300 50 165
400 66 165
500 83 165
600 99 165
700 116 165
800 132 165
900 149 165
1000 165 165
International Journal of Computational Intelligence Research (IJCIR). ISSN 0973-1873 Vol.14, No.1 (2018)© Research India Publications. http://www.ripublication.com
68
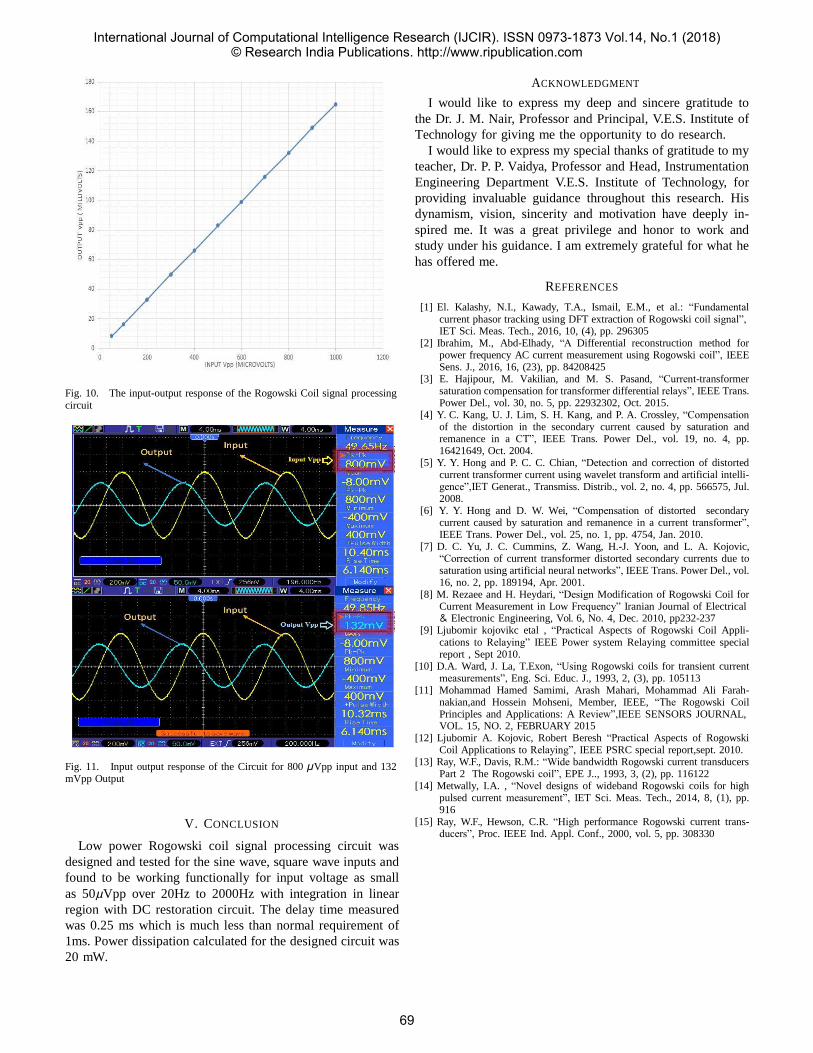
ACKNOWLEDGMENT
I would like to express my deep and sincere gratitude to
the Dr. J. M. Nair, Professor and Principal, V.E.S. Institute of
Technology for giving me the opportunity to do research.
I would like to express my special thanks of gratitude to my
teacher, Dr. P. P. Vaidya, Professor and Head, Instrumentation
Engineering Department V.E.S. Institute of Technology, for
providing invaluable guidance throughout this research. His
dynamism, vision, sincerity and motivation have deeply in-
spired me. It was a great privilege and honor to work and
study under his guidance. I am extremely grateful for what he
has offered me.
Fig. 10. The input-output response of the Rogowski Coil signal processing circuit
Fig. 11. Input output response of the Circuit for 800 µVpp input and 132 mVpp Output
V. CONCLUSION
Low power Rogowski coil signal processing circuit was
designed and tested for the sine wave, square wave inputs and
found to be working functionally for input voltage as small
as 50µVpp over 20Hz to 2000Hz with integration in linear
region with DC restoration circuit. The delay time measured
was 0.25 ms which is much less than normal requirement of
1ms. Power dissipation calculated for the designed circuit was
20 mW.
REFERENCES
[1] El. Kalashy, N.I., Kawady, T.A., Ismail, E.M., et al.: “Fundamental current phasor tracking using DFT extraction of Rogowski coil signal”, IET Sci. Meas. Tech., 2016, 10, (4), pp. 296305
[2] Ibrahim, M., Abd-Elhady, “A Differential reconstruction method for power frequency AC current measurement using Rogowski coil”, IEEE Sens. J., 2016, 16, (23), pp. 84208425
[3] E. Hajipour, M. Vakilian, and M. S. Pasand, “Current-transformer saturation compensation for transformer differential relays”, IEEE Trans. Power Del., vol. 30, no. 5, pp. 22932302, Oct. 2015.
[4] Y. C. Kang, U. J. Lim, S. H. Kang, and P. A. Crossley, “Compensation of the distortion in the secondary current caused by saturation and remanence in a CT”, IEEE Trans. Power Del., vol. 19, no. 4, pp. 16421649, Oct. 2004.
[5] Y. Y. Hong and P. C. C. Chian, “Detection and correction of distorted current transformer current using wavelet transform and artificial intelli- gence”,IET Generat., Transmiss. Distrib., vol. 2, no. 4, pp. 566575, Jul. 2008.
[6] Y. Y. Hong and D. W. Wei, “Compensation of distorted secondary current caused by saturation and remanence in a current transformer”, IEEE Trans. Power Del., vol. 25, no. 1, pp. 4754, Jan. 2010.
[7] D. C. Yu, J. C. Cummins, Z. Wang, H.-J. Yoon, and L. A. Kojovic, “Correction of current transformer distorted secondary currents due to saturation using artificial neural networks”, IEEE Trans. Power Del., vol. 16, no. 2, pp. 189194, Apr. 2001.
[8] M. Rezaee and H. Heydari, “Design Modification of Rogowski Coil for Current Measurement in Low Frequency” Iranian Journal of Electrical & Electronic Engineering, Vol. 6, No. 4, Dec. 2010, pp232-237
[9] Ljubomir kojovikc etal , “Practical Aspects of Rogowski Coil Appli- cations to Relaying” IEEE Power system Relaying committee special report , Sept 2010.
[10] D.A. Ward, J. La, T.Exon, “Using Rogowski coils for transient current measurements”, Eng. Sci. Educ. J., 1993, 2, (3), pp. 105113
[11] Mohammad Hamed Samimi, Arash Mahari, Mohammad Ali Farah- nakian,and Hossein Mohseni, Member, IEEE, “The Rogowski Coil Principles and Applications: A Review”,IEEE SENSORS JOURNAL, VOL. 15, NO. 2, FEBRUARY 2015
[12] Ljubomir A. Kojovic, Robert Beresh “Practical Aspects of Rogowski Coil Applications to Relaying”, IEEE PSRC special report,sept. 2010.
[13] Ray, W.F., Davis, R.M.: “Wide bandwidth Rogowski current transducers Part 2 The Rogowski coil”, EPE J.., 1993, 3, (2), pp. 116122
[14] Metwally, I.A. , “Novel designs of wideband Rogowski coils for high pulsed current measurement”, IET Sci. Meas. Tech., 2014, 8, (1), pp. 916
[15] Ray, W.F., Hewson, C.R. “High performance Rogowski current trans- ducers”, Proc. IEEE Ind. Appl. Conf., 2000, vol. 5, pp. 308330
International Journal of Computational Intelligence Research (IJCIR). ISSN 0973-1873 Vol.14, No.1 (2018)© Research India Publications. http://www.ripublication.com
69
2 1
Review of Fractional and Complex-order
Derivatives and Integrals
Balu P. Bhusari
Department of Electronics Engineering
Ramrao Adik Institute of Technology
Nerul, Navi-Mumbai 400 706
Email: [email protected]
Mukesh D. Patil
Department of Electronics and
Telecommunication Engineering
Ramrao Adik Institute of Technology
Nerul, Navi-Mumbai 400 706
Email: [email protected]
Vishwesh A. Vyawahare
Department of Electronics Engineering
Ramrao Adik Institute of Technology
Nerul, Navi-Mumbai 400 706
Email: [email protected]
Abstract—Conventionally the normal integer-order (IO)
derivatives are used for modeling and any system and its control. Since last four decades, their extensions, fractional order (FO) derivatives have been found to provide a better representation
for many real order system and processes. FO control has also proved its superiority over the conventional IO control. The next paradigm shift in this field is the exploitation of non local
and memory features provided by complex-order (CO) operators (integral and derivatives) for even better modelling and efficient control. This idea holds immense research potential provided one
is ready to extend, modify and apply the conventional modeling and analysis technique with these new tools. In this paper a brief survey of involve analysis of linear and non linear CO systems
in all the essential system representations like transfer functions, state space structure, etc. is presented. The paper also analyzes the linear multi input multi output CO systems and investigate
various features.
I. INTRODUCTION
Fractional calculus is a 300 years old subject which involves
the study of differentiation and integration to non-integer
order. The field of fractional calculus is almost as old as
classical calculus, but over the last decades the usefulness
of this mathematical theory in applications has become more
and more evident. Recently, fractional calculus has played
an important role in modeling complex phenomena in the
fields of physics, chemistry, biology and engineering. The
origin of fractional calculus is dated back to the Lebnitzs
letter to LHopital in the year 1695, where the notation for
derivative of non integer order 1 is deliberated. In addition to
and integrals, where the order is a complex number z ∈ c,
that is, z = a + jb with a, b ∈ R. Thus, the order of
the differentiation and integrals are already generalized to
incorporate complex-order powers. This is true because these
derivatives and integrals, being linear operators are Laplace
transformable. So it is possible to analyze the solution of lin-
ear complex-order differential equations. Thus, the necessary
mathematical framework for the analysis of complex-order
systems is already available. Already, it has been shown in the
literature that fractional-order description of the real-world and
engineering system provides a more faithful representation.
This is due to the infinite-dimensional nature of fractional-
order system. So it can be very well guaranteed that differential
equation with complex-order integro-differential operators will
surely provide an even better representation of these systems.
The fractional derivative of a function to order α has some
boundary conditions, these are discussed in detain in [2, 3].
Further generalizations have been made to the complex-order
operator [4–6] Hartley et al. showed that when a complex-
order operator is paired with its conjugate-order operator, real
time-responses are created. This is analogous to a complex
pole of an integer-order system. A single complex pole has
a complex time-response, but when encountered with its
complex conjugate pole, the resulting time-response is real
valued. Complex poles always occur in complex conjugates.
Similarly, for a real time response complex-order operators
always occur in complex conjugate pairs [7]. Systems with it Lebnitz writes : Thus it follows that d 2 will be equal to
x√
dx : x. This is an apparent paradox from which, one day
useful consequences will be drawn [1]. The question raised
by Leibniz for a fractional derivative was an ongoing topic
in the last 300 years. Several mathematicians contributed to
this subject over the years. People like Liouville, Riemann
and Weyl made major contributions to the theory of fractional
calculus. The story of the fractional calculus continued with
contributions from Fourier, Abel, Leibniz, Grunwald-Letnikov.
Fractional calculus, as its name suggests, refers to fractional-
order integration and fractional-order differentiation.
A recent extension of fractional-order system is the
complex-order (CO) systems. The basic underlying mathemat-
ical tool for this is the definitions of complex-order derivatives
complex-order differintegrals can arise from a variety of
situations. The CRONE controller makes use of conjugated-
order differintegrals in a limited manner [8]. Such a system
can also be artificially constructed and implemented using the
techniques of Jiang et al. [9]. Such a system results from
identification, as proposed by Adams et al. [10].
II. BASIC CONCEPTS
Fractional calculus, as its name suggests, refers to
fractional-order integration and fractional-order differentiation.
Fractional-order integration often means Riemann-Liouville
integral. But for fractional-order differentiation, there are
several kinds of fractional derivatives. In this section, some
of the definitions are introduced.
International Journal of Computational Intelligence Research (IJCIR). ISSN 0973-1873 Vol.14, No.1 (2018)© Research India Publications. http://www.ripublication.com
70

GLDα
GLDα
j
CD−α m−α−1
m
m−α−1
1
1
A. Riemann-Liouville Integral Definition
The left fractional-order integral (or the left RL integral)
and right fractional-order integral (or the right RL integral)
with order α > 0 of the function f(t), t ∈ (a, b) are defined as,
t
III. LITERATURE SURVEY ON FRACTIONAL CALCULUS
Many real dynamic systems are better characterized using a
non-integer order dynamic model based on fractional calculus
or, differentiation or integration of non-integer order. Tradi-
tional calculus is based on integer-order differentiation and
integration. The concept of fractional calculus has tremendous D−α −α
r α−1
and
a,t f (t) =RL Da,t f (t) = Γ (α)
(t − s) a
b
f (s) ds,
(1)
potential to change the way we see, model, and control
the nature around us. Denying fractional derivatives is like
saying that zero, fractional, or irrational numbers do not exist. YangQuan Chen, Ivo Petras and Dingyu Xue offered a tutorial
D−α −α
r α−1
t,b f (t) =RL Dt,b f (t) = Γ (α)
(s − t) t
f (s) ds.
(2)
on fractional calculus in controls [11]. In this tutorial, basic
definitions of fractional calculus, fractional-order dynamic sys-
tems and fractional-order PID controllers are introduced which B. Riemann-Liouville Derivative Definition
The left and right Riemann-Liouville derivative with order
α > 0 of the given function f (t), t ∈ (a, b) are defined as,
makes fractional-order controllers ubiquitous in industry.
Applications of Fractional calculus can be broadly classified
into modeling and control. For last five decades, fractional
RLDα
dm r −(m−α)l calculus has been increasingly used in modeling real world
a,tf (t) = dtm
Da,t f (t), (3) and engineering systems.
1 dm
= r t
(t − s) m−α−1 f (s) ds, A. Fractional-order Modeling
Γ (m − α) dtm a
(4) • Modelling of lossy coils using fractional derivatives
Coils exposed to eddy current and hysteresis losses are
where m is an integer value and m−1 < α < m, if 0 < α < 1 then m = 1.
C. Grunwald-Letnikov Derivative Definition
Grunwald and Letnikov independently developed another
non-integer derivative nearly the same time when Riemann and
Liouville developed Riemann-Liouville fractional derivative to
solve fractional differential equations. Later on many other
authors use this Grunwald-Letnikov fractional derivative to
construct numerical methods for fractional differential equa-
tions. The left and right Grunwald-Letnikov with order α > 0
of f(t), t ∈ (a, b) are defined as,
conventionally described by an inductance with equiva-
lent core-loss resistance connected in parallel. The value
of the equivalent core-loss resistance depends on the
working frequency and the external wiring. Thus the
model is less than satisfactory. Schafer, Ingo, and Klaus
Kruger [12] proposed to describe loss inductance using
fractional derivatives containing both a loss term and a
storage term in their paper. The operating mode of the
fractional coil model is explained by the authors with
the example of an RLC oscillating circuit. Subsequent
measurements of a series resonant circuit with a lossy
coil impressively confirmed the theoretical model with
regard to both the frequency and time domains.
and
a,tf (t) = lim h h→0
N −α j=0
N
(−1) /α
j
/α
f (t − jh) , (5) • Modeling of transformer characteristics using
fractional-order transfer functions
In the advanced maintenance techniques of the
transformer, Sweep Frequency Response Analysis
(SFRA) method is one of the established techniques
t,bf (t) = lim h h→0
−α j=0
(−1) f (t + jh) , (6) j
that include the modelling of the transformer frequency
response. This includes identifying the transfer function
where h is the step size and (α) = αCj .
D. Caputo Derivative Definition
The left and right Caputo derivatives with order α > 0 of the function f(t), t ∈ (a, b) are defined as,
and realising into circuit parameters so that the incipient
fault detection is correlated with the changes in the
circuit parameters. A.K Kamath, J.R Gandhi, A.S Bohra,
A. V. Goel, D.U Patil, O.V Kulkarni and J.O Chandle
[13] have proposed a fractional-order transfer function
in their paper which has been observed to be the most
1 r t
a,t f (t) = Γ (m − α)
(t − s) f (m) (s) ds, (7) appropriate mathematical model for almost all the real
time processes, the frequency response of the transformer
being one of them is modelled in this paper. and
CD−α (−1) r a
(s − t) f (m) (s) ds,
• Fractional modeling and identification of thermal systems.
t,b f (t) = Γ (m − α)
where m − 1 < α < m.
(8)
Heat transfer in homogeneous media obeys to diffusion
phenomenon which can be modeled with the help of frac-
tional systems. J.D Gabano and T. Poinot [14] have used a
j
j
a
t
International Journal of Computational Intelligence Research (IJCIR). ISSN 0973-1873 Vol.14, No.1 (2018)© Research India Publications. http://www.ripublication.com
71
2
parsimonious black box model based on an original frac-
tional integrator whose order 1 acts only over a limited
spectral band in their paper. The authors have carried out
simulations of front face thermal experimentations which
consist in measuring the temperature at the surface of a
material where a random heat flux is applied. The authors
considered the characterization of the thermal behaviour
of a sphere and experimental results are given.
• Fractional-order models of the super capacitors in the
form of RC ladder networks
W. Mitkowski and P. Skruch [15] have investigated
mathematical models of the super capacitors in their
paper. The models are based on electrical circuits in the
form of RC ladder networks. The dynamic behaviour of
the circuit is described using fractional-order differential
equations and its properties are analyzed. The results
of numerical simulations are compared with the results
measured experimentally in the physical system.
B. Fractional-order control
Fractional-order control is found to provide a better robust
closed loop design with lower control effort from the repre-
sentative literature discussed below.
• Fractional-order systems and PIλDµ controllers
In 1999, Igor Podlubny [16] has presented a paper
in which, dynamic systems of an arbitrary real order
(fractional-order systems) are considered. A concept of a
fractional-order PID controller, involving fractional-order
integrator and fractional-order differentiator, is proposed.
The Laplace transform formula for a new function of
the Mittag-Leffler type made it possible to obtain ex-
plicit analytical expressions for the unit-step and unit-
impulse response of a linear fractional-order system with
fractional-order controller both for the open and closed
loop. An example using the obtained formulas and the
advantages of the proposed PID controllers is given.
• Fractional-order feedback control of a D.C motor
Petras, Ivo [17] deals with the feedback control of a DC
motor speed with using the fractional-order controller in
his paper. The mathematical description of the fractional-
order controller and its implementation in the analog and
the discrete domains are presented by the author. An
example of simulation and possible realization of the
particular case of digital fractional-order PIλDδ controller
are shown as well. The hardware realization is proposed
in digital form with the microprocessor and in analog
form with the fractance circuits.
• Evaluation of a fractional-order PI controller applied
to induction motor speed control
Manuel A., Duarte-Mermoud, Felipe J. Mira, Ian S.
Pelissier and Juan C. Travieso-Torres [18] have published
a paper which deals with the speed control of induction
motor applying a fractional-order proportional integral
(FOPI) controller within a field oriented control (FOC)
scheme. This allows obtaining responses of the controlled
system with different characteristics such as oscillations,
stability and rise time. In this study FOPI strategy is
simulated within a FOC scheme using a mathematical
model of an induction motor.
• Analysis of nonlinear dynamics and chaos in a
fractional-order financial system with time delay
Wang Zhen, Huang Xia and Shi Guodong [19] have
proposed a delayed fractional-order financial system and
the complex dynamical behaviours of such a system
are discussed by numerical simulations. A great variety
of interesting dynamical behaviours of such a system
including single-periodic, multiple-periodic, and chaotic
motions are displayed. In particular, the effect of time
delay on the chaotic behaviour is investigated, it is found
that an approximate time delay can enhance or suppress
the emergence of chaos. Meanwhile, corresponding to
different values of delay, the lowest orders for chaos to
exist in the delayed fractional order financial systems are
determined, respectively.
• Model predictive control for fractional-order System
Mandar M. Joshi, Vishwesh A. Vyawahare and Mukesh
D. Patil [20] in their paper have applied model predictive
control methodology, to solve a classical servo problem
in the context of linear fractional-order (FO) system with
the help of an approximation method. A finite horizon op-
timal control problem is solved at each sampling instant
to obtain the current control action. The optimization
delivers an optimal control sequence and the control thus
obtained is applied to the plant. Oustaloups recursive
approximation delivers equivalent integer-order transfer
function for a fractional-order system, which is then
utilized as an internal model in model predictive control.
Analytically calculated output equation for FO system
has been utilized to represent process model to make
simulations look more realistic by considering current
and initial states in process model. The paper attempts
to present the effect of modeling and approximations
of fractional-order system on the performance of model
predictive control strategy.
• Fractional-order nonlinear systems modeling, analysis
and simulation
The book by Ivo Petras [21] as titled above presents a
brief introduction to fractional-order chaotic systems. It
provides fundamentals of fractional calculus, its proper-
ties and integral transfer methods. This book also includes
a presentation of fractional-order systems, their descrip-
tion and properties. Fractional linear time-invariant (LTI),
nonlinear systems, and fractional-order controllers are
also considered.
IV. LITERATURE SURVEY ON COMPLEX-ORDER
DERIVATIVES
Use of complex-order derivatives in modeling and control
is quiet recent field of research. There are only few refrences
available and these are broadly classified as contributions in
complex-order(CO) calculus, CO modeling and CO control.
International Journal of Computational Intelligence Research (IJCIR). ISSN 0973-1873 Vol.14, No.1 (2018)© Research India Publications. http://www.ripublication.com
72
∞
x
0dq
A. Complex-order calculus
Following are the references available for complex-order
calculus :
• A use for a derivative of complex-order in the frac-
The transfer function of this system is,
p(sq − k)−1 + p(sq − k)−1 (12)
having a time-response
tional calculus In 1977, Bertam Ross , Francis H. Northover, [22] have 2 t(n+1)u−1(Re(
pk
)cos((n + 1)υlnt)
presented an alternative technique in which an explicit use
is made of a derivative of complex order. The Riemann-
Liouville operator of arbitrary order Dv is applied to the
Euler type differential equation,
n=0 Γ((n + 1)q)
pkn
−Im( Γ((n + 1)q)
)sin((n + 1)υlnt)). (13)
x2yn + αxyl + βy = 0. (9)
This result is the same as that obtained by standard
classical means but the method of fractional calculus is
used.
• Fractional derivatives in complex planes
Changpin Lia, Xuanhung Dao and Peng Guo [23] have
presented a paper in which they have first studied the
important properties of the Caputo derivative in real line.
Then they have studied the recently developed fractional
derivative in complex plane by Ortigueira, which was
very useful in signal processing. They have also general-
ized the Caputo derivative in real line to that in complex
plane then studied its properties. These discussions were
helpful in understanding fractional calculus and establish-
ing fractional models in science and engineering.
• Definitions of complex order integrals and complex
order derivatives using operator approach.
Raoelina Andriambololona, Ranaivoson Tokiniaina and Hanitriarivo Rakotoson [24] have stated in their paper
that for a complex number s, the s - order integral of
a function f fulfilling some conditions is defined as the
action of an operator, noted Js, on f . The definition of
the operator Js is given firstly for the case of complex
number s with positive real part. Then, using the fact
that the operator of first order derivative D1 , is the left
hand side inverse of the operator J 1, an s-order derivative
operator, noted Ds , is also defined for complex number
s with positive real part. Finally, considering the relation
Js = D−s the definition of the s-order integral and s- order derivative is extended for any complex number.
• A solution to the fundamental linear complex-order
differential equation
This paper by Jay L. Adams , Tom T. Hartley, Lynn I.
Adams [25] provides the solution to the complex-order
differential equation,
t x(t) = kx(t) + bu(t), (10)
where both q and k are complex.
The time-response solution is shown to be a series that is complex-valued. Combining this system with its complex
conjugate-order system yields the following generalized
differential equation,
The transfer function has an infinite number of complex-
conjugate pole pairs. Bounds on the parameters u =
Re(q) , υ = Im(q) and k are determined for system
stability.
• Euler-Lagrange Equations for Lagrangians contain-
ing complex-order fractional derivatives
Teodor M. Atanackovi , Marko Janev , Stevan Pilipovi
and Dusan Zorica [26] have considered two variational
problems of finding the Euler-Lagrange equations corre-
sponding to Lagrangians containing fractional derivatives
of real-and complex-order. The first one is the uncon-
strained variational problem, while the second one is
the fractional optimal control problem. The expansion
formula for fractional derivatives of complex-order is
derived in order to approximate the fractional derivative
appearing in the Lagrangian. It is shown that the sequence
of approximated Euler-Lagrange equations converges to
the original one in the weak sense as well as that the
sequence of the minimal values of approximated action
integrals tends to the minimal value of the original one.
B. Complex-order modeling
Following are the references available for complex-order
modeling :
• Complex order dynamics in hexapod locomotion
Manuel F. Silva and J.A Tenreiro Machado [27] presented
a set of model based experiments reveals the influence the
locomotion velocity on the foot ground transfer function,
which presents complex order dynamics. In this paper,
the simulation results for different robot velocities are
consistent with each other and reveal that, in the range
of locomotion velocities under consideration, this system
reveals complex order dynamics.
• Fractional order system identification using complex
order distribution
Jay L. Adams, Tom T. Hartley, Carl F. Lorenzo [28] pre-
sented a paper in Workshop on Fractional Differentiation
and its Applications Porto, Portugal, July 19-21, 2006,
which discusses the identification of fractional systems
using the concepts of complex order-distribution. Based
on the ability to define systems using complex order
distributions, it is shown that system identification in the
frequency domain using a least squares approach can be performed.
0d2Re(q) q q
t x(t) − k0dt x(t) − k0dt x(t) + kkx(t) = p0d
qu(t)) + p0d
qu(t)) − (k + k)u(t). (11) • Complex order fractional derivatives in viscoelasticity
In their paper on complex order, Teodor M. Atanackovic, t t
n
International Journal of Computational Intelligence Research (IJCIR). ISSN 0973-1873 Vol.14, No.1 (2018)© Research India Publications. http://www.ripublication.com
73

Sanja Konjik, Stevan Pilipovi and Dusan Zoric [29] have
introduced complex order fractional derivatives in models
that describe viscoelastic materials. This cannot be carried
out unrestrictedly, and therefore they have derived, for the
first time, real valued compatibility constraints, as well as
physical constraints that lead to acceptable models. As
a result, they introduced a new form of complex order
fractional derivative. Also, they considered a fractional
differential equation with complex derivatives, and study
its solvability. Results obtained for stress relaxation and
creep are illustrated by several numerical examples.
• Complex order Van der Pol oscillator
Carla M.A., Pinto and J.A. Tenreiro Machado [30] con-
sidered a complex-order van der Pol oscillator in their
paper. The complex derivative Dα ± jβ, with α, β ∈ R+ is a generalization of the concept of integer derivative,
where α = 1, β = 0. By applying the concept of complex
derivative, the authors have obtained a high-dimensional
parameter space. Amplitude and period values of the
periodic solutions of the two versions of the complex-
order van der Pol oscillator are studied for variation
of these parameters. Fourier transforms of the periodic
solutions of the two oscillators are also analyzed.
• Conditions for stable and causal conjugate-order sys-
tems
Jay L. Adams, Tom T. Hartley and Robert J. Veillette [31]
have studied the stability properties of the fundamental
linear conjugate-order system in their paper. The values
of the complex order for which this system is stable and
causal are determined. It is shown that all stable, causal
systems have orders that lie within unit-radius circles
centered at ± 1 or on the imaginary axis in the order plane. Plots are given to illustrate these results for several
examples. It is shown that as the system bandwidth moves
to large or small values relative to unity, the stability
region in the order plane becomes more fragmented.
• Effect of drug-resistance in a fractional complex-order
model for HIV infection
Carla M.A., Pinto and Ana R.M. Carvalho [32] have
studied fractional complex-order (FO) model for drug-
resistance in HIV infection during therapy. The authors
simulate the model for different values of the fractional
derivative of complex order (FD) Dα ± jβ, where α, β ∈ R+. The FD is a generalization of the integer order
derivative where α = 1, β = 0. The FO system reveals
rich dynamics. The novelty of this paper is attributed to
the dynamics of the model promoted by the variation
of the complex-order derivative. The obtained interesting
dynamics may point in other directions to model the
intracellular delay.
• Vibrations of an elastic rod on a viscoelastic founda-
tion of complex fractional KelvinVoigt type
Teodor M. Atanackovic ,Marko Janev , Sanja Konjik ,
Stevan Pilipovic and Dusan Zorica [33] have considered
the vibrations of an elastic rod loaded by axial force
of constant intensity and positioned on a viscoelastic
foundation of complex order fractional derivative type.
The solution to the problem is obtained by the separation
of variables method. The critical value of axial force,
guaranteeing stability, is determined.
C. Complex-order control
Following are the references available for complex-order
control :
• Outer synchronization between fractional-order com-
plex networks: A non-fragile observer-based control
scheme
In 2013 ,Meichun Zhao and Junwei Wang [34],addresses
the global outer synchronization problem between two
fractional-order complex networks coupled in a drive-
response conguration in their paper. In the paper, they
have proposed a novel observer-based control scheme
for outer synchronization between two complex networks
with fractional-order derivatives. The designed controllers
have the following two features:
1) They use only scalar output signals to couple two
FCNs in a drive-response manner
2) They are non-fragile for both additive and multi-
plicative control gain perturbations
• Robust control of nonlinear PEMFC against uncer-
tainty using fractional complex order control
Masoomeh Shahiri, Abolfazl Ranjbar, Mohammad Reza
Karami and Reza Ghaderi [35] have proposed their
work of a fractional complex order controller (FCOC)
design strategy to cope with uncertainty in a proton
exchange membrane fuel cell (PEMFC) model. The fuel
cell dynamic behaviour is inherently nonlinear and time
varying. Accordingly, a locally linearization technique is
used to achieve a linear interpretation in form of transfer
function instead of nonlinear dynamics. When the current
load is suddenly changed, the voltage and consequently
the operating point are dramatically varying. Therefore,
the resultant linearized model of the PEMFC changes.
The discrepancy between those deviated models from the
nominal plant will be regarded as system uncertainties,
which must be cured by robust controller. In PEMFC
dynamic, the ratio of the oxygen with respect to the air
supply.
• Combination complex synchronization among three
incommensurate fractional-order chaotic systems
In the paper titled above Cuimei Jiang, Changan Liu,
Shutang Liu, Fangfang Zhang [36] have introduced, ana-
lyzed, and validated a novel form of chaos synchroniza-
tion that can involve two drive systems and one response
system, namely combination complex synchronization.
On the basis of the stability theory of in commensu-
rate fractional-order systems and the feedback control
approach, authors designed controllers to realize combi-
nation complex synchronization among three fractional-
order chaotic systems with incommensurate orders. The
proposed synchronization scheme directs the attention of
International Journal of Computational Intelligence Research (IJCIR). ISSN 0973-1873 Vol.14, No.1 (2018)© Research India Publications. http://www.ripublication.com
74
secure communication to fractional-order chaotic com-
plex systems within commensurate orders, which may
increase the number of state variables to further enhance
the security of private communications.
• New tuning design schemes of fractional complex-
order PI controller
The manuscript presented by Masoomeh Shahiri, Abol-
fazl Ranjbar, Mohammad Reza Karami and Reza Ghaderi
[37] shows two systematic design procedures, to tune
parameters of a fractional complex-order PI (FCO-PI)
controller in the form of PIa+ib. The PIa+ib controller
uses extra parameter(s) than the conventional fractional
and/or integer order PI controllers. The proposed design
procedures are based on realizing some frequency domain
restrictions. These are eventually stated in terms of Ms
and Mp constraints, developing integral gain optimization
tuning method. In this method, optimized amount of
parameters are assessed based on minimizing the integral
error indices with a constraint on the maximum sensitivity
functions. Tuning of parameters of fractional complex-
order controller via M constraint integral gain optimiza-
tion (FC-MIGO)algorithm is innovatively defined and
then the so-called FC-MIGO rule is proposed by applying
FC-MIGO algorithm on a test batch.
• Optimal Controllers with Complex Order Derivatives
The paper of J.A. Tenreiro Machado [38] studies the op-
timization of complex-order algorithms for the discrete-
time control of linear and nonlinear systems. Complex-
order control schemes and their implementation are eval-
uated in the perspective of evolutionary optimization.
The results demonstrate not only that complex-order
derivatives constitute a valuable alternative for deriving
control algorithms, but also the feasibility of the adopted
optimization strategy.
• Robust Design Based on Complex-Order Integrator
Loop Gain
Mohammad R. Rahmani ,Mehdi Abadi, Khosro Khan-
dani, Iraj Kheirizad, and Ali A. Jalali [39] have pro-
posed a novel, easy-to-use, robust design method for
stable time delay processes. The purpose is obtaining a
desired phase margin at a known crossover frequency.
The design methodology is based on complex order
integration. Complex-order controllers are the extended
version of fractional order controllers in which the order
of the transfer function has imaginary and real parts,
rather than integer or non-integer real part. Introducing a
complex order for the open-loop transfer function makes
it possible to fulfil additional specifications of design
ensuring a robust performance of the closed-loop system
with respect to gain variations. This extra parameter
enables designing a controller which makes the phase
diagram remain flat around the gain crossover frequency.
This leads to a fixed phase margin around the crossover
frequency. The design procedure and the validity of the
results are illustrated through some examples.
V. CONCLUSION
The paper has discussed the basics of fractional and
complex-order control. It has been proved from the refrences
and literature survey that fractional-order (FO) derivatives have
been found to provide a better representation for many real
order system and processes. The exploitation of non local and
memory features provided by complex order (CO) operaters
for even better modelling and efficient control have also been
studied.
REFERENCES
[1] Concepcion A Monje, YangQuan Chen, Blas M Vinagre,
Dingyu Xue, and Vicente Feliu-Batlle. Fractional-order
systems and controls: fundamentals and applications.
Springer Science & Business Media, 2010.
[2] Joseph M Kimeu. Fractional calculus: Definitions and
applications. 2009.
[3] Roberto Garrappa and Marina Popolizio. Evaluation of
generalized mittag–leffler functions on the real line. Ad-
vances in Computational Mathematics, 39(1):205–225,
2013.
[4] Tilak Raj Prabhakar. A singular integral equation with
a generalized mittag leffler function in the kernel. The
Yokohama mathematical journal, 19(1):7–15, 1971.
[5] Changpin Li, Xuanhung Dao, and Peng Guo. Fractional
derivatives in complex planes. Nonlinear Analysis: The-
ory, Methods & Applications, 71(5-6):1857–1869, 2009.
[6] J Tenreiro Machado. Fractional order junctions. Com-
munications in Nonlinear Science and Numerical Simu-
lation, 20(1):1–8, 2015.
[7] Kenneth S Miller and Bertram Ross. An introduction to
the fractional calculus and fractional differential equa-
tions. 1993.
[8] Patrick Lanusse, Rachid Malti, and Pierre Melchior.
Crone control system design toolbox for the control
engineering community: tutorial and case study. Phil.
Trans. R. Soc. A, 371(1990):20120149, 2013.
[9] Cuimei Jiang, Shutang Liu, and Da Wang. General-
ized combination complex synchronization for fractional-
order chaotic complex systems. Entropy, 17(8):5199–
5217, 2015.
[10] Jay L Adams, Robert J Veillette, and Tom T Hartley.
Conjugate-order systems for signal processing: stability,
causality, boundedness, compactness. Signal, Image and
Video Processing, 6(3):373–380, 2012.
[11] YangQuan Chen, Ivo Petras, and Dingyu Xue. Fractional
order control-a tutorial. In American Control Conference,
2009. ACC’09., pages 1397–1411. IEEE, 2009.
[12] Ingo Schafer and Klaus Kruger. Modelling of lossy
coils using fractional derivatives. Journal of Physics D:
Applied Physics, 41(4):045001, 2008.
[13] AK Kamath, JR Gandhi, AS Bohra, AV Goel, DU Patil,
OV Kulkarni, and JO Chandle. Modeling of transformer
characteristics using fractional order transfer functions.
In Control and Automation, 2009. ICCA 2009. IEEE
International Journal of Computational Intelligence Research (IJCIR). ISSN 0973-1873 Vol.14, No.1 (2018)© Research India Publications. http://www.ripublication.com
75
International Conference on, pages 2123–2128. IEEE,
2009.
[14] J-D Gabano and Thierry Poinot. Fractional modelling
and identification of thermal systems. Signal Processing,
91(3):531–541, 2011.
[15] W Mitkowski and P Skruch. Fractional-order models of
the supercapacitors in the form of rc ladder networks.
Bulletin of the Polish Academy of Sciences: Technical
Sciences, 61(3):581–587, 2013.
[16] Igor Podlubny. Fractional-order systems and pi/sup/spl
lambda//d/sup/spl mu//-controllers. IEEE Transactions
on automatic control, 44(1):208–214, 1999.
[17] Ivo Petras. Fractional-order feedback control of a dc
motor. Journal of electrical engineering, 60(3):117–128,
2009.
[18] Manuel A Duarte-Mermoud, Felipe J Mira, Ian S
Pelissier, and Juan C Travieso-Torres. Evaluation of a
fractional order pi controller applied to induction motor
speed control. In Control and Automation (ICCA), 2010
8th IEEE International Conference on, pages 573–577.
IEEE, 2010.
[19] Zhen Wang, Xia Huang, and Guodong Shi. Analysis of
nonlinear dynamics and chaos in a fractional order finan-
cial system with time delay. Computers & Mathematics
with Applications, 62(3):1531–1539, 2011.
[20] Mandar M Joshi, Vishwesh A Vyawahare, and Mukesh D
Patil. Model predictive control for fractional-order
system a modeling and approximation based analysis.
In Simulation and Modeling Methodologies, Technolo-
gies and Applications (SIMULTECH), 2014 International
Conference on, pages 361–372. IEEE, 2014.
[21] Ivo Petras. Fractional-order nonlinear systems: mod-
eling, analysis and simulation. Springer Science &
Business Media, 2011.
[22] BERTRAM Ross, West Haven, and FRANCIS H
NORTHOVER. A use for a derivative of complex order
in the fractional calculus or. 1978.
[23] Changpin Li, Xuanhung Dao, and Peng Guo. Fractional
derivatives in complex planes. Nonlinear Analysis: The-
ory, Methods & Applications, 71(5-6):1857–1869, 2009.
[24] Raoelina Andriambololona, Tokiniaina Ranaivoson, and
Rakotoson Hanitriarivo. Definitions of complex order
integrals and derivatives using operator approach. arXiv
preprint arXiv:1209.0400, 2012.
[25] Jay L Adams, Tom T Hartley, and Lynn I Adams. A
solution to the fundamental linear complex-order differ-
ential equation. Advances in Engineering Software, 41
(1):70–74, 2010.
[26] Teodor M Atanackovic, Marko Janev, Stevan Pilipovic,
and Dusan Zorica. Euler–lagrange equations for la-
grangians containing complex-order fractional deriva-
tives. Journal of Optimization Theory and Applications,
174(1):256–275, 2017.
[27] Manuel F Silva, JA Tenreiro Machado, and Ramiro S
Barbosa. Complex-order dynamics in hexapod locomo-
tion. Signal processing, 86(10):2785–2793, 2006.
[28] Jay L Adams, Tom T Hartley, and Carl F Lorenzo.
Fractional-order system identification using complex
order-distributions. IFAC Proceedings Volumes, 39(11):
200–205, 2006.
[29] Teodor M Atanackovic, Sanja Konjik, Stevan Pilipovic,
and Dusan Zorica. Complex order fractional derivatives
in viscoelasticity. Mechanics of Time-Dependent Mate-
rials, 20(2):175–195, 2016.
[30] Carla MA Pinto and JA Tenreiro Machado. Complex
order van der pol oscillator. Nonlinear Dynamics, 65(3):
247–254, 2011.
[31] Jay L Adams, Robert J Veillette, and Tom T Hartley.
Conditions for stable and causal conjugate-order systems.
In Industrial Electronics (ISIE), 2010 IEEE International
Symposium on, pages 108–113. IEEE, 2010.
[32] Carla MA Pinto and Ana RM Carvalho. Effect of drug-
resistance in a fractional complex-order model for hiv
infection. IFAC-PapersOnLine, 48(1):188–189, 2015.
[33] Teodor M Atanackovic, Marko Janev, Sanja Konjik, Ste-
van Pilipovic, and Dusan Zorica. Vibrations of an elastic
rod on a viscoelastic foundation of complex fractional
kelvin–voigt type. Meccanica, 50(7):1679–1692, 2015.
[34] Meichun Zhao and Junwei Wang. Outer synchroniza-
tion between fractional-order complex networks: A non-
fragile observer-based control scheme. Entropy, 15(4):
1357–1374, 2013.
[35] Masoomeh Shahiri, Abolfazl Ranjbar, Mohammad Reza
Karami, and Reza Ghaderi. Robust control of nonlinear
pemfc against uncertainty using fractional complex order
control. Nonlinear Dynamics, 80(4):1785–1800, 2015.
[36] Cuimei Jiang, Changan Liu, Shutang Liu, and Fang-
fang Zhang. Combination complex synchronization
among three incommensurate fractional-order chaotic
systems. JOURNAL OF MATHEMATICS AND COM-
PUTER SCIENCE-JMCS, 16(3):308–323, 2016.
[37] Masoomeh Shahiri, Abolfazl Ranjbar, Mohammad Reza
Karami, and Reza Ghaderi. New tuning design schemes
of fractional complex-order pi controller. Nonlinear
Dynamics, 84(3):1813–1835, 2016.
[38] JA Tenreiro Machado. Optimal controllers with complex
order derivatives. Journal of Optimization Theory and
Applications, 156(1):2–12, 2013.
[39] Mohammad R Rahmani Mehdi Abadi, Khosro Khandani,
Iraj Kheirizad, and Ali A Jalali. Robust design based
on complex-order integrator loop gain. In Control,
Instrumentation and Automation (ICCIA), 2011 2nd In-
ternational Conference on, pages 496–501. IEEE, 2011.
International Journal of Computational Intelligence Research (IJCIR). ISSN 0973-1873 Vol.14, No.1 (2018)© Research India Publications. http://www.ripublication.com
76
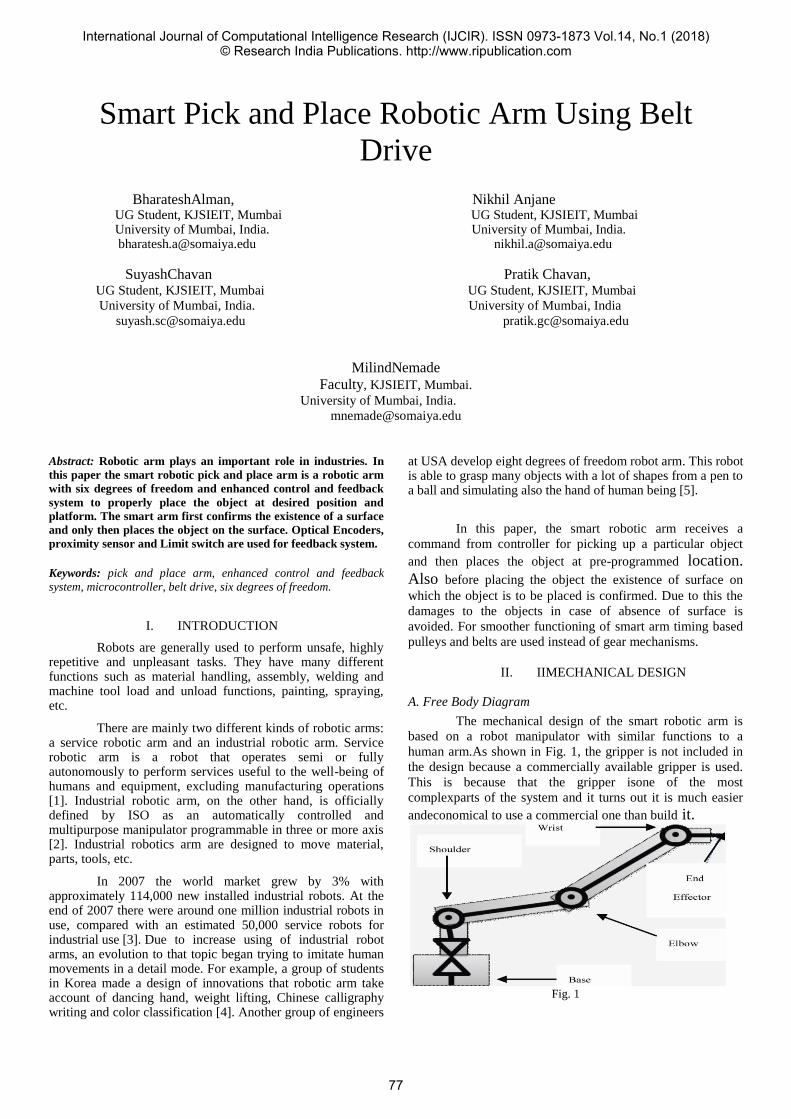
Smart Pick and Place Robotic Arm Using Belt
Drive
BharateshAlman, Nikhil Anjane UG Student, KJSIEIT, Mumbai UG Student, KJSIEIT, Mumbai University of Mumbai, India. University of Mumbai, India. [email protected] [email protected]
SuyashChavan Pratik Chavan, UG Student, KJSIEIT, Mumbai UG Student, KJSIEIT, Mumbai
University of Mumbai, India. University of Mumbai, India
[email protected] [email protected]
MilindNemade
Faculty, KJSIEIT, Mumbai.
University of Mumbai, India. [email protected]
Abstract: Robotic arm plays an important role in industries. In
this paper the smart robotic pick and place arm is a robotic arm
with six degrees of freedom and enhanced control and feedback
system to properly place the object at desired position and
platform. The smart arm first confirms the existence of a surface
and only then places the object on the surface. Optical Encoders,
proximity sensor and Limit switch are used for feedback system.
Keywords: pick and place arm, enhanced control and feedback
system, microcontroller, belt drive, six degrees of freedom.
I. INTRODUCTION
Robots are generally used to perform unsafe, highly repetitive and unpleasant tasks. They have many different functions such as material handling, assembly, welding and machine tool load and unload functions, painting, spraying, etc.
There are mainly two different kinds of robotic arms: a service robotic arm and an industrial robotic arm. Service robotic arm is a robot that operates semi or fully autonomously to perform services useful to the well-being of humans and equipment, excluding manufacturing operations [1]. Industrial robotic arm, on the other hand, is officially defined by ISO as an automatically controlled and multipurpose manipulator programmable in three or more axis [2]. Industrial robotics arm are designed to move material, parts, tools, etc.
In 2007 the world market grew by 3% with approximately 114,000 new installed industrial robots. At the end of 2007 there were around one million industrial robots in use, compared with an estimated 50,000 service robots for industrial use [3]. Due to increase using of industrial robot arms, an evolution to that topic began trying to imitate human movements in a detail mode. For example, a group of students in Korea made a design of innovations that robotic arm take account of dancing hand, weight lifting, Chinese calligraphy writing and color classification [4]. Another group of engineers
at USA develop eight degrees of freedom robot arm. This robot is able to grasp many objects with a lot of shapes from a pen to a ball and simulating also the hand of human being [5].
In this paper, the smart robotic arm receives a
command from controller for picking up a particular object
and then places the object at pre-programmed location.
Also before placing the object the existence of surface on
which the object is to be placed is confirmed. Due to this the
damages to the objects in case of absence of surface is
avoided. For smoother functioning of smart arm timing based
pulleys and belts are used instead of gear mechanisms.
II. IIMECHANICAL DESIGN
A. Free Body Diagram
The mechanical design of the smart robotic arm is
based on a robot manipulator with similar functions to a
human arm.As shown in Fig. 1, the gripper is not included in
the design because a commercially available gripper is used.
This is because that the gripper isone of the most
complexparts of the system and it turns out it is much easier
andeconomical to use a commercial one than build it.
Fig. 1
International Journal of Computational Intelligence Research (IJCIR). ISSN 0973-1873 Vol.14, No.1 (2018)© Research India Publications. http://www.ripublication.com
77
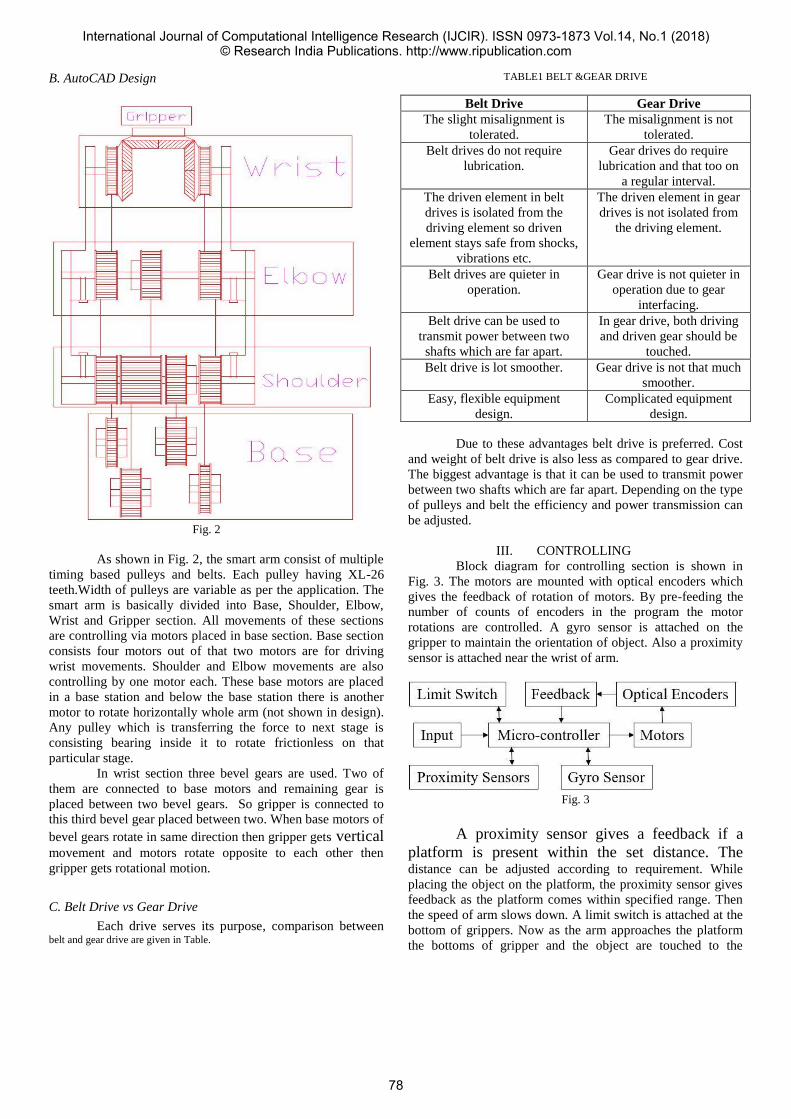
B. AutoCAD Design
Fig. 2
As shown in Fig. 2, the smart arm consist of multiple
timing based pulleys and belts. Each pulley having XL-26
teeth.Width of pulleys are variable as per the application. The
smart arm is basically divided into Base, Shoulder, Elbow,
Wrist and Gripper section. All movements of these sections
are controlling via motors placed in base section. Base section
consists four motors out of that two motors are for driving
wrist movements. Shoulder and Elbow movements are also
controlling by one motor each. These base motors are placed
in a base station and below the base station there is another
motor to rotate horizontally whole arm (not shown in design).
Any pulley which is transferring the force to next stage is
consisting bearing inside it to rotate frictionless on that
particular stage.
In wrist section three bevel gears are used. Two of
them are connected to base motors and remaining gear is
placed between two bevel gears. So gripper is connected to
this third bevel gear placed between two. When base motors of
bevel gears rotate in same direction then gripper gets vertical movement and motors rotate opposite to each other then
gripper gets rotational motion.
C. Belt Drive vs Gear Drive
Each drive serves its purpose, comparison between belt and gear drive are given in Table.
TABLE1 BELT &GEAR DRIVE
Belt Drive Gear Drive
The slight misalignment is
tolerated.
The misalignment is not
tolerated.
Belt drives do not require
lubrication.
Gear drives do require
lubrication and that too on
a regular interval.
The driven element in belt
drives is isolated from the
driving element so driven
element stays safe from shocks,
vibrations etc.
The driven element in gear
drives is not isolated from
the driving element.
Belt drives are quieter in
operation.
Gear drive is not quieter in
operation due to gear
interfacing.
Belt drive can be used to
transmit power between two
shafts which are far apart.
In gear drive, both driving
and driven gear should be
touched.
Belt drive is lot smoother. Gear drive is not that much
smoother.
Easy, flexible equipment
design.
Complicated equipment
design.
Due to these advantages belt drive is preferred. Cost
and weight of belt drive is also less as compared to gear drive.
The biggest advantage is that it can be used to transmit power
between two shafts which are far apart. Depending on the type
of pulleys and belt the efficiency and power transmission can
be adjusted.
III. CONTROLLING
Block diagram for controlling section is shown in
Fig. 3. The motors are mounted with optical encoders which
gives the feedback of rotation of motors. By pre-feeding the
number of counts of encoders in the program the motor
rotations are controlled. A gyro sensor is attached on the
gripper to maintain the orientation of object. Also a proximity
sensor is attached near the wrist of arm.
Fig. 3
A proximity sensor gives a feedback if a
platform is present within the set distance. The distance can be adjusted according to requirement. While
placing the object on the platform, the proximity sensor gives
feedback as the platform comes within specified range. Then
the speed of arm slows down. A limit switch is attached at the
bottom of grippers. Now as the arm approaches the platform
the bottoms of gripper and the object are touched to the
International Journal of Computational Intelligence Research (IJCIR). ISSN 0973-1873 Vol.14, No.1 (2018)© Research India Publications. http://www.ripublication.com
78
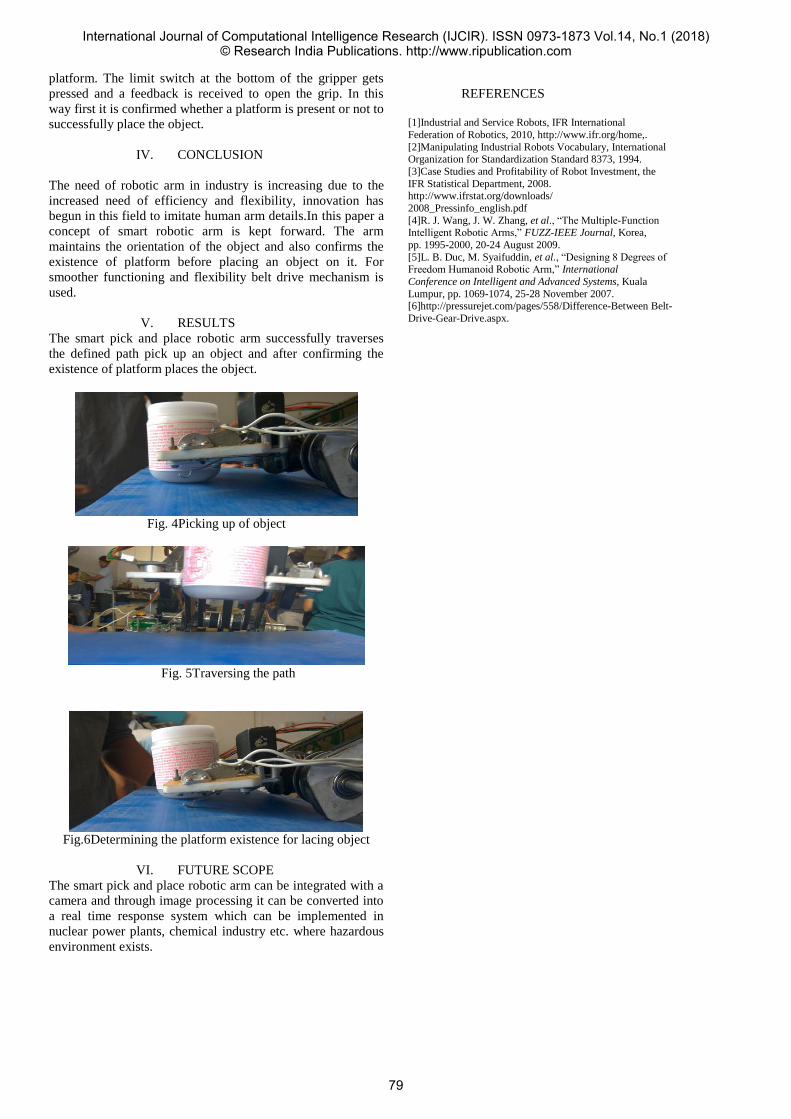
platform. The limit switch at the bottom of the gripper gets
pressed and a feedback is received to open the grip. In this
way first it is confirmed whether a platform is present or not to
successfully place the object.
IV. CONCLUSION
The need of robotic arm in industry is increasing due to the
increased need of efficiency and flexibility, innovation has
begun in this field to imitate human arm details.In this paper a
concept of smart robotic arm is kept forward. The arm
maintains the orientation of the object and also confirms the
existence of platform before placing an object on it. For
smoother functioning and flexibility belt drive mechanism is
used.
V. RESULTS
The smart pick and place robotic arm successfully traverses
the defined path pick up an object and after confirming the
existence of platform places the object.
Fig. 4Picking up of object
Fig. 5Traversing the path
Fig.6Determining the platform existence for lacing object
VI. FUTURE SCOPE
The smart pick and place robotic arm can be integrated with a
camera and through image processing it can be converted into
a real time response system which can be implemented in
nuclear power plants, chemical industry etc. where hazardous
environment exists.
REFERENCES
[1]Industrial and Service Robots, IFR International
Federation of Robotics, 2010, http://www.ifr.org/home,.
[2]Manipulating Industrial Robots Vocabulary, International Organization for Standardization Standard 8373, 1994.
[3]Case Studies and Profitability of Robot Investment, the
IFR Statistical Department, 2008. http://www.ifrstat.org/downloads/
2008_Pressinfo_english.pdf
[4]R. J. Wang, J. W. Zhang, et al., “The Multiple-Function Intelligent Robotic Arms,” FUZZ-IEEE Journal, Korea,
pp. 1995-2000, 20-24 August 2009.
[5]L. B. Duc, M. Syaifuddin, et al., “Designing 8 Degrees of Freedom Humanoid Robotic Arm,” International
Conference on Intelligent and Advanced Systems, Kuala
Lumpur, pp. 1069-1074, 25-28 November 2007. [6]http://pressurejet.com/pages/558/Difference-Between Belt-
Drive-Gear-Drive.aspx.
International Journal of Computational Intelligence Research (IJCIR). ISSN 0973-1873 Vol.14, No.1 (2018)© Research India Publications. http://www.ripublication.com
79
2θ2 ≤
Review on Graph Signal Processing
Bhakti Kaushal Dept. of Electronics and Telecommunication Engineering
Ramrao Adik Institute of Technology, Nerul
Navi-Mumbai, India
Mukesh D. Patil Dept. of Electronics and Telecommunication Engineering
Ramrao Adik Institute of Technology, Nerul
Navi-Mumbai, India
Abstract—The emerging field of Graph Signal Processing
(GSP) directs to develop data processing tools which are present in complex and irregular graph structures. In this paper, we
first discuss an overview of the idea of GSP which is analogous to classical signal processing. We then provide a summary of the basic concepts theorized for understanding GSP. At last, we
finish by providing an overview about the recent application areas which uses the concepts of GSP, including fresh research on the processing and analysis of data present in the sensor network,
and applications to machine learning and image processing. Index Terms—Graph signal Processing, Graph Laplacian,
eigenvalues, eigenvectors.
I. INTRODUCTION
A massive amount of data is present all around us and is
stands for the set of edges in the graph, and W is a weighted
adjacency matrix or the matrix of edge weights [1]. The entry
Wi,j in the weighted adjacency matrix depicts the edge weight,
if there is a path or an edge e = (i, j) between vertices i and
j, Wi,j = 1; otherwise,Wi,j = 0 [1]. When the graph G is not
linked and contains M linked components (M > 1), signals on
G can be separated into M pieces analogous to the M linked
components, and can be separately processed as independent
signals on each and every subgraphs [1].
When an application could not naturally define the edge
weights, a thresholded Gaussian kernel weighting function can
be used to define the edge weights connecting the vertices i
and j [1] and is given by
being recorded at all measures. This high dimensional data is
now present on irregular and complex structures [1]. Some of Wi,j =
(exp(−
[dist(i,j)]2 ) if dist(i,j) κ
(1)
the examples of this complex structures are sensor networks,
images, online social media, etc. We cannot analyze the data
present on it by standard tools because of complexity of the
structure [2].
Graphs hold the ability to model the irregular structure and
their complex interactions with each other [2]. For instance,
consider a facebook user as a vertex of graph, its friends other
vertices on the same graph and the friend connections can be
considered as edges between the vertices [2]. These vertices
carry a lot of information about the facebook user like their
year of graduation, date of birth, etc. This information present
on such vertices can be modeled as signals on a graph and then
they can be used for processing and analysis. The field that
collects all this and merges the concepts of graph theory and
classical signal processing is called Graph Signal Processing
(GSP) [1].
II. BASIC CONCEPTS
In this section, the basic definitions and notation for graphs
are stated and how the signals on graphs can be represented.
Next, the classical signal processing Fourier transforms are
generalized to the irregular structure of graph. Finally, an
overview of operators for processing graph signals in a dis-
tributed fashion is discussed.
A. Weighted Graphs and Graph Signals
Consider, an undirected, connected, weighted graph G =
(V, E, W ), where V represents a finite set of vertices V with
|V | = N where N is the number of nodes or vertices, E
0 otherwise,
In the above equation dist(i, j) stands for the Euclidean
distance joining two feature vectors representing i and j or
a physical distance joining vertices i and j, for two of the
parameters θ and κ. A function or signal g : V → R specified on the vertices of
the graph might be represented as a vector g ∈ RN , where
the ith component of the vector g represents the function value
at the ith vertex in V [1]. The Fig. 1 below shows the graph
signal as an example [1].
B. The Graph Laplacian
The combinatorial graph Laplacian is defined as L := D −
W , where D represents the degree matrix and is a diagonal
matrix whose ith diagonal element di is equal to the sum of the weights of all the edges incident to vertex i [1]. For any signal g ∈ RN , the graph Laplacian is said to be a difference
operator and it satisfies the below condition [1] which is given
by
(Lg)(i) = )'
Wi,j [g(i) − g(j)], (2)
j∈Ni
where the neighborhood N i represents a connection by an
edge between vertex i and a set of vertices.
If u is an eigenvector of a square matrix A, then it satisfies
[1] Au = λu, where λ is a scalar and eigenvalue corresponding
to the eigenvector u. For a graph Laplacian L with a complete
set of orthonormal eigenvectors denoted by ul l=0,1,...,N-1, the
International Journal of Computational Intelligence Research (IJCIR). ISSN 0973-1873 Vol.14, No.1 (2018)© Research India Publications. http://www.ripublication.com
80
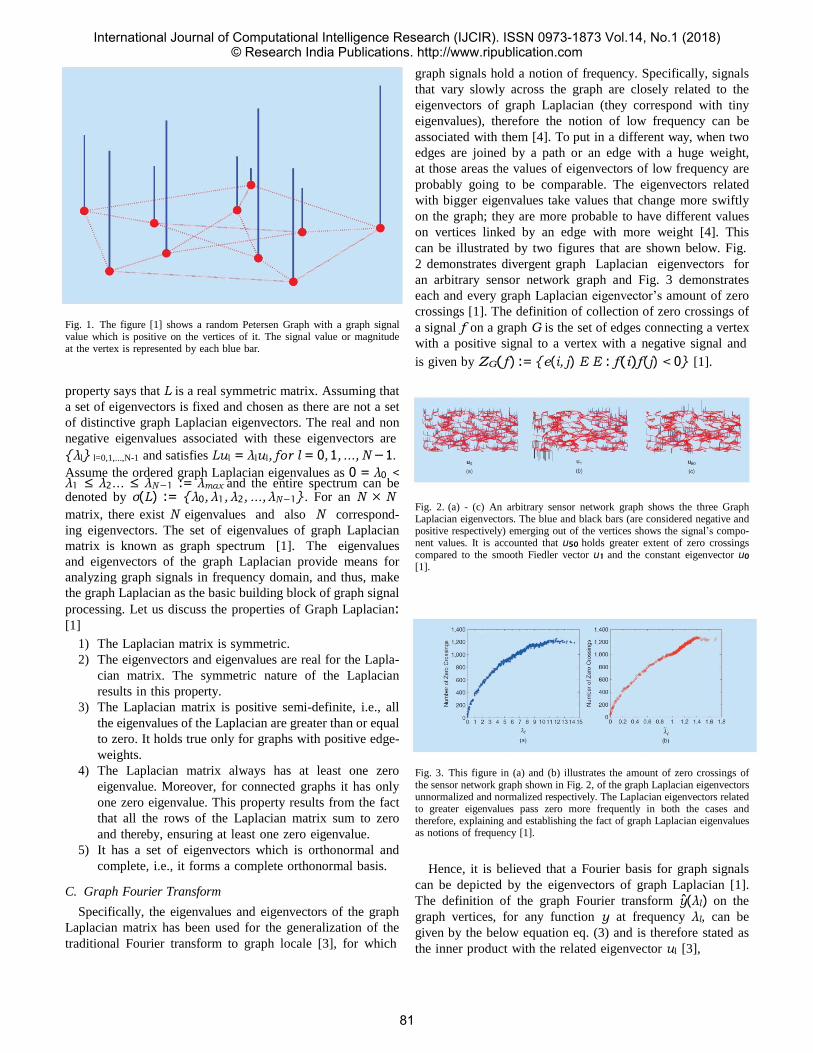
Fig. 1. The figure [1] shows a random Petersen Graph with a graph signal value which is positive on the vertices of it. The signal value or magnitude at the vertex is represented by each blue bar.
property says that L is a real symmetric matrix. Assuming that
a set of eigenvectors is fixed and chosen as there are not a set
of distinctive graph Laplacian eigenvectors. The real and non
negative eigenvalues associated with these eigenvectors are
λl l=0,1,...,N-1 and satisfies Lul = λlul, for l = 0, 1, ..., N − 1.
Assume the ordered graph Laplacian eigenvalues as 0 = λ0 < λ1 ≤ λ2... ≤ λN −1 := λmax and the entire spectrum can be denoted by σ(L) := λ0, λ1, λ2, ..., λN −1. For an N × N
matrix, there exist N eigenvalues and also N correspond-
ing eigenvectors. The set of eigenvalues of graph Laplacian
matrix is known as graph spectrum [1]. The eigenvalues
and eigenvectors of the graph Laplacian provide means for
analyzing graph signals in frequency domain, and thus, make
the graph Laplacian as the basic building block of graph signal
processing. Let us discuss the properties of Graph Laplacian: [1]
1) The Laplacian matrix is symmetric.
2) The eigenvectors and eigenvalues are real for the Lapla-
cian matrix. The symmetric nature of the Laplacian
results in this property.
3) The Laplacian matrix is positive semi-definite, i.e., all
the eigenvalues of the Laplacian are greater than or equal
to zero. It holds true only for graphs with positive edge-
weights.
4) The Laplacian matrix always has at least one zero
eigenvalue. Moreover, for connected graphs it has only
one zero eigenvalue. This property results from the fact
that all the rows of the Laplacian matrix sum to zero
and thereby, ensuring at least one zero eigenvalue.
5) It has a set of eigenvectors which is orthonormal and
complete, i.e., it forms a complete orthonormal basis.
C. Graph Fourier Transform
Specifically, the eigenvalues and eigenvectors of the graph
Laplacian matrix has been used for the generalization of the
traditional Fourier transform to graph locale [3], for which
graph signals hold a notion of frequency. Specifically, signals
that vary slowly across the graph are closely related to the
eigenvectors of graph Laplacian (they correspond with tiny
eigenvalues), therefore the notion of low frequency can be
associated with them [4]. To put in a different way, when two
edges are joined by a path or an edge with a huge weight,
at those areas the values of eigenvectors of low frequency are
probably going to be comparable. The eigenvectors related
with bigger eigenvalues take values that change more swiftly
on the graph; they are more probable to have different values
on vertices linked by an edge with more weight [4]. This
can be illustrated by two figures that are shown below. Fig.
2 demonstrates divergent graph Laplacian eigenvectors for
an arbitrary sensor network graph and Fig. 3 demonstrates
each and every graph Laplacian eigenvector’s amount of zero
crossings [1]. The definition of collection of zero crossings of
a signal f on a graph G is the set of edges connecting a vertex
with a positive signal to a vertex with a negative signal and
is given by ZG(f ) := e(i, j) E E : f (i)f (j) < 0 [1].
Fig. 2. (a) - (c) An arbitrary sensor network graph shows the three Graph Laplacian eigenvectors. The blue and black bars (are considered negative and positive respectively) emerging out of the vertices shows the signal’s compo- nent values. It is accounted that u50 holds greater extent of zero crossings compared to the smooth Fiedler vector u1 and the constant eigenvector u0
[1].
Fig. 3. This figure in (a) and (b) illustrates the amount of zero crossings of the sensor network graph shown in Fig. 2, of the graph Laplacian eigenvectors unnormalized and normalized respectively. The Laplacian eigenvectors related to greater eigenvalues pass zero more frequently in both the cases and therefore, explaining and establishing the fact of graph Laplacian eigenvalues as notions of frequency [1].
Hence, it is believed that a Fourier basis for graph signals
can be depicted by the eigenvectors of graph Laplacian [1].
The definition of the graph Fourier transform y(λl) on the
graph vertices, for any function y at frequency λl, can be
given by the below equation eq. (3) and is therefore stated as
the inner product with the related eigenvector ul [3],
International Journal of Computational Intelligence Research (IJCIR). ISSN 0973-1873 Vol.14, No.1 (2018)© Research India Publications. http://www.ripublication.com
81
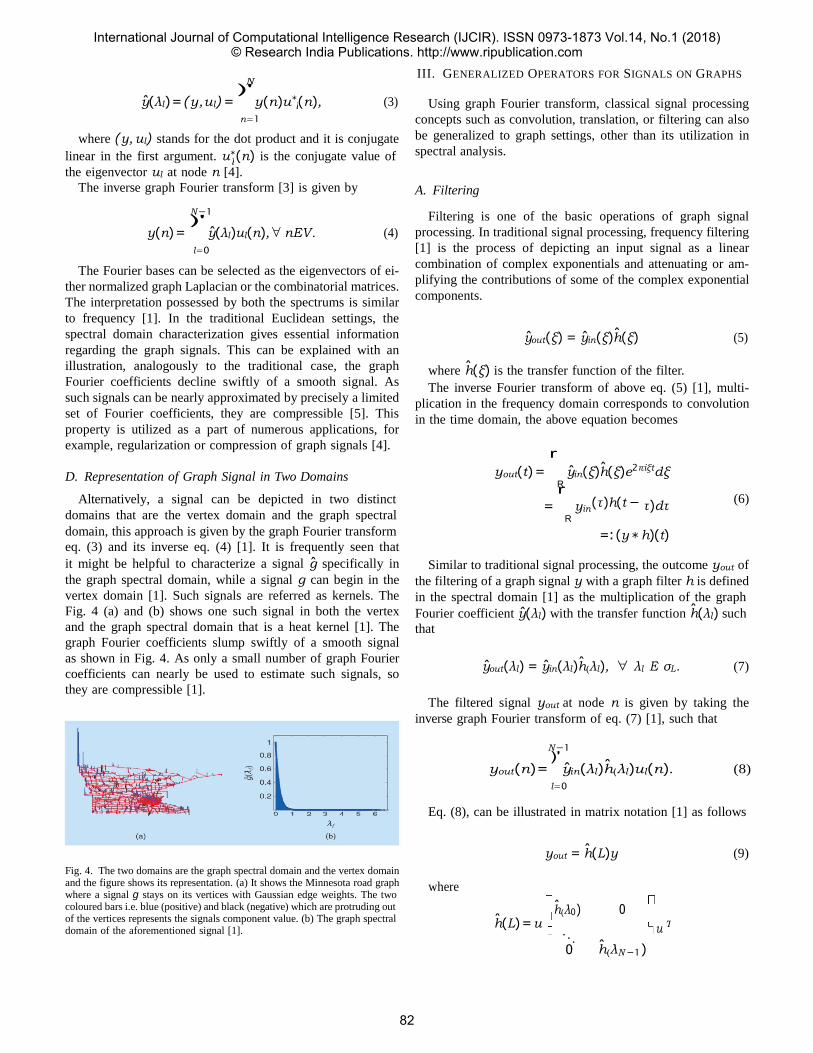
l
l
N
y(λl) = (y, ul) = )'
y(n)u∗(n), (3)
n=1
where (y, ul) stands for the dot product and it is conjugate
linear in the first argument. u∗(n) is the conjugate value of
the eigenvector ul at node n [4].
The inverse graph Fourier transform [3] is given by
N −1
y(n) = )'
y(λl)ul(n), ∀ nEV. (4)
l=0
The Fourier bases can be selected as the eigenvectors of ei-
ther normalized graph Laplacian or the combinatorial matrices.
The interpretation possessed by both the spectrums is similar
to frequency [1]. In the traditional Euclidean settings, the
spectral domain characterization gives essential information
regarding the graph signals. This can be explained with an
illustration, analogously to the traditional case, the graph
Fourier coefficients decline swiftly of a smooth signal. As
such signals can be nearly approximated by precisely a limited
set of Fourier coefficients, they are compressible [5]. This
property is utilized as a part of numerous applications, for
example, regularization or compression of graph signals [4].
III. GENERALIZED OPERATORS FOR SIGNALS ON GRAPHS
Using graph Fourier transform, classical signal processing
concepts such as convolution, translation, or filtering can also
be generalized to graph settings, other than its utilization in
spectral analysis.
A. Filtering
Filtering is one of the basic operations of graph signal
processing. In traditional signal processing, frequency filtering
[1] is the process of depicting an input signal as a linear
combination of complex exponentials and attenuating or am-
plifying the contributions of some of the complex exponential
components.
yout(ξ) = yin(ξ)h(ξ) (5)
where h(ξ) is the transfer function of the filter.
The inverse Fourier transform of above eq. (5) [1], multi-
plication in the frequency domain corresponds to convolution
in the time domain, the above equation becomes
r
D. Representation of Graph Signal in Two Domains yout(t) = yin(ξ)h(ξ)e2πiξtdξ R
Alternatively, a signal can be depicted in two distinct
domains that are the vertex domain and the graph spectral
r = yin
R (τ )h(t − τ )dτ
(6)
domain, this approach is given by the graph Fourier transform
eq. (3) and its inverse eq. (4) [1]. It is frequently seen that
it might be helpful to characterize a signal g specifically in
the graph spectral domain, while a signal g can begin in the
vertex domain [1]. Such signals are referred as kernels. The
Fig. 4 (a) and (b) shows one such signal in both the vertex
and the graph spectral domain that is a heat kernel [1]. The
graph Fourier coefficients slump swiftly of a smooth signal
as shown in Fig. 4. As only a small number of graph Fourier
coefficients can nearly be used to estimate such signals, so
they are compressible [1].
=: (y ∗ h)(t)
Similar to traditional signal processing, the outcome yout of
the filtering of a graph signal y with a graph filter h is defined
in the spectral domain [1] as the multiplication of the graph
Fourier coefficient y(λl) with the transfer function h(λl) such
that
yout(λl) = yin(λl)h(λl), ∀ λl E σL. (7)
The filtered signal yout at node n is given by taking the
inverse graph Fourier transform of eq. (7) [1], such that
N −1
yout(n) = )'
yin(λl)h(λl)ul(n). (8)
l=0
Eq. (8), can be illustrated in matrix notation [1] as follows
Fig. 4. The two domains are the graph spectral domain and the vertex domain and the figure shows its representation. (a) It shows the Minnesota road graph where a signal g stays on its vertices with Gaussian edge weights. The two
where
yout = h(L)y (9)
coloured bars i.e. blue (positive) and black (negative) which are protruding out of the vertices represents the signals component value. (b) The graph spectral
h(λ0) 0 domain of the aforementioned signal [1].
h(L) = u . . .
0
u
h(λN −1)
T
International Journal of Computational Intelligence Research (IJCIR). ISSN 0973-1873 Vol.14, No.1 (2018)© Research India Publications. http://www.ripublication.com
82
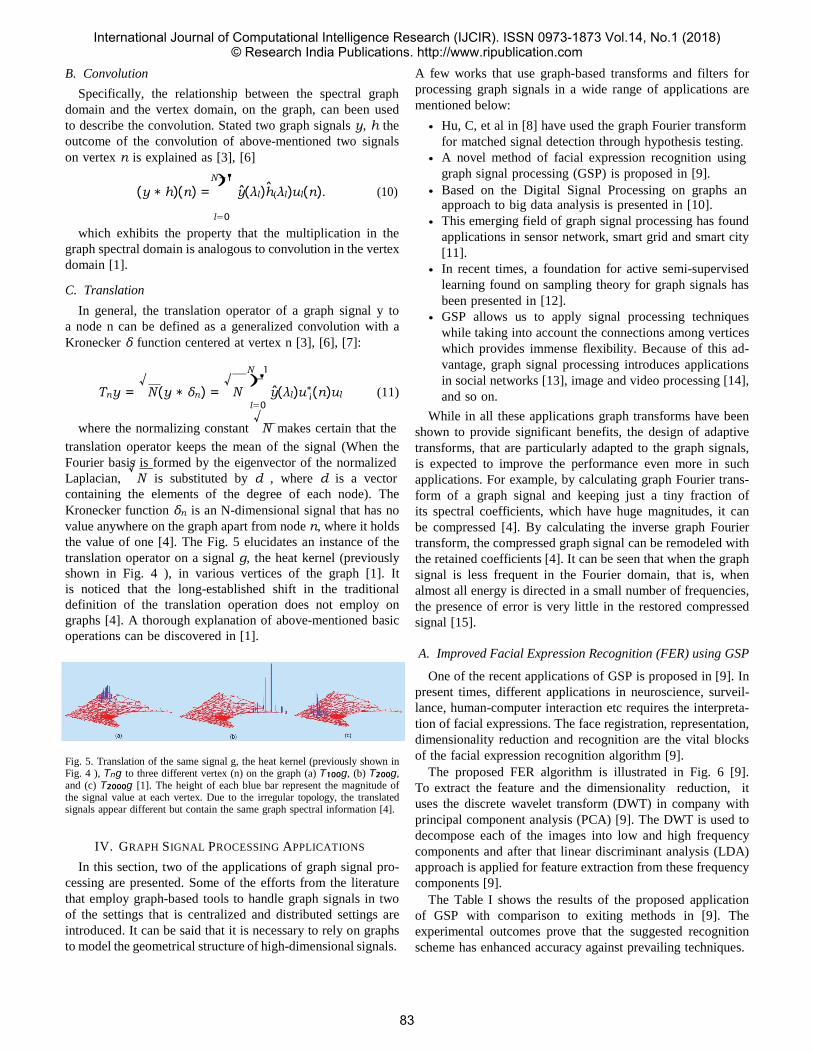
−
l
B. Convolution
Specifically, the relationship between the spectral graph
domain and the vertex domain, on the graph, can been used
to describe the convolution. Stated two graph signals y, h the
outcome of the convolution of above-mentioned two signals
on vertex n is explained as [3], [6]
N −1
(y ∗ h)(n) = )'
y(λl)h(λl)ul(n). (10)
A few works that use graph-based transforms and filters for
processing graph signals in a wide range of applications are
mentioned below:
• Hu, C, et al in [8] have used the graph Fourier transform
for matched signal detection through hypothesis testing.
• A novel method of facial expression recognition using
graph signal processing (GSP) is proposed in [9].
• Based on the Digital Signal Processing on graphs an
l=0
which exhibits the property that the multiplication in the
graph spectral domain is analogous to convolution in the vertex
domain [1].
C. Translation
In general, the translation operator of a graph signal y to
a node n can be defined as a generalized convolution with a
Kronecker δ function centered at vertex n [3], [6], [7]:
N 1
Tny = √
N (y ∗ δn) = √
N )'
y(λl)u∗(n)ul (11)
l=0
where the normalizing constant √
N makes certain that the
translation operator keeps the mean of the signal (When the
Fourier basis is formed by the eigenvector of the normalized
Laplacian, √
N is substituted by d , where d is a vector
containing the elements of the degree of each node). The
Kronecker function δn is an N-dimensional signal that has no
value anywhere on the graph apart from node n, where it holds
the value of one [4]. The Fig. 5 elucidates an instance of the
translation operator on a signal g, the heat kernel (previously
shown in Fig. 4 ), in various vertices of the graph [1]. It
is noticed that the long-established shift in the traditional
definition of the translation operation does not employ on
graphs [4]. A thorough explanation of above-mentioned basic
operations can be discovered in [1].
Fig. 5. Translation of the same signal g, the heat kernel (previously shown in Fig. 4 ), Tng to three different vertex (n) on the graph (a) T100g, (b) T200g, and (c) T2000g [1]. The height of each blue bar represent the magnitude of the signal value at each vertex. Due to the irregular topology, the translated signals appear different but contain the same graph spectral information [4].
IV. GRAPH SIGNAL PROCESSING APPLICATIONS
In this section, two of the applications of graph signal pro-
cessing are presented. Some of the efforts from the literature
that employ graph-based tools to handle graph signals in two
of the settings that is centralized and distributed settings are
introduced. It can be said that it is necessary to rely on graphs
to model the geometrical structure of high-dimensional signals.
approach to big data analysis is presented in [10].
• This emerging field of graph signal processing has found
applications in sensor network, smart grid and smart city
[11].
• In recent times, a foundation for active semi-supervised
learning found on sampling theory for graph signals has
been presented in [12].
• GSP allows us to apply signal processing techniques
while taking into account the connections among vertices
which provides immense flexibility. Because of this ad-
vantage, graph signal processing introduces applications
in social networks [13], image and video processing [14],
and so on.
While in all these applications graph transforms have been
shown to provide significant benefits, the design of adaptive
transforms, that are particularly adapted to the graph signals,
is expected to improve the performance even more in such
applications. For example, by calculating graph Fourier trans-
form of a graph signal and keeping just a tiny fraction of
its spectral coefficients, which have huge magnitudes, it can
be compressed [4]. By calculating the inverse graph Fourier
transform, the compressed graph signal can be remodeled with
the retained coefficients [4]. It can be seen that when the graph
signal is less frequent in the Fourier domain, that is, when
almost all energy is directed in a small number of frequencies,
the presence of error is very little in the restored compressed
signal [15].
A. Improved Facial Expression Recognition (FER) using GSP
One of the recent applications of GSP is proposed in [9]. In
present times, different applications in neuroscience, surveil-
lance, human-computer interaction etc requires the interpreta-
tion of facial expressions. The face registration, representation,
dimensionality reduction and recognition are the vital blocks
of the facial expression recognition algorithm [9].
The proposed FER algorithm is illustrated in Fig. 6 [9].
To extract the feature and the dimensionality reduction, it
uses the discrete wavelet transform (DWT) in company with
principal component analysis (PCA) [9]. The DWT is used to
decompose each of the images into low and high frequency
components and after that linear discriminant analysis (LDA)
approach is applied for feature extraction from these frequency
components [9].
The Table I shows the results of the proposed application
of GSP with comparison to exiting methods in [9]. The
experimental outcomes prove that the suggested recognition
scheme has enhanced accuracy against prevailing techniques.
International Journal of Computational Intelligence Research (IJCIR). ISSN 0973-1873 Vol.14, No.1 (2018)© Research India Publications. http://www.ripublication.com
83
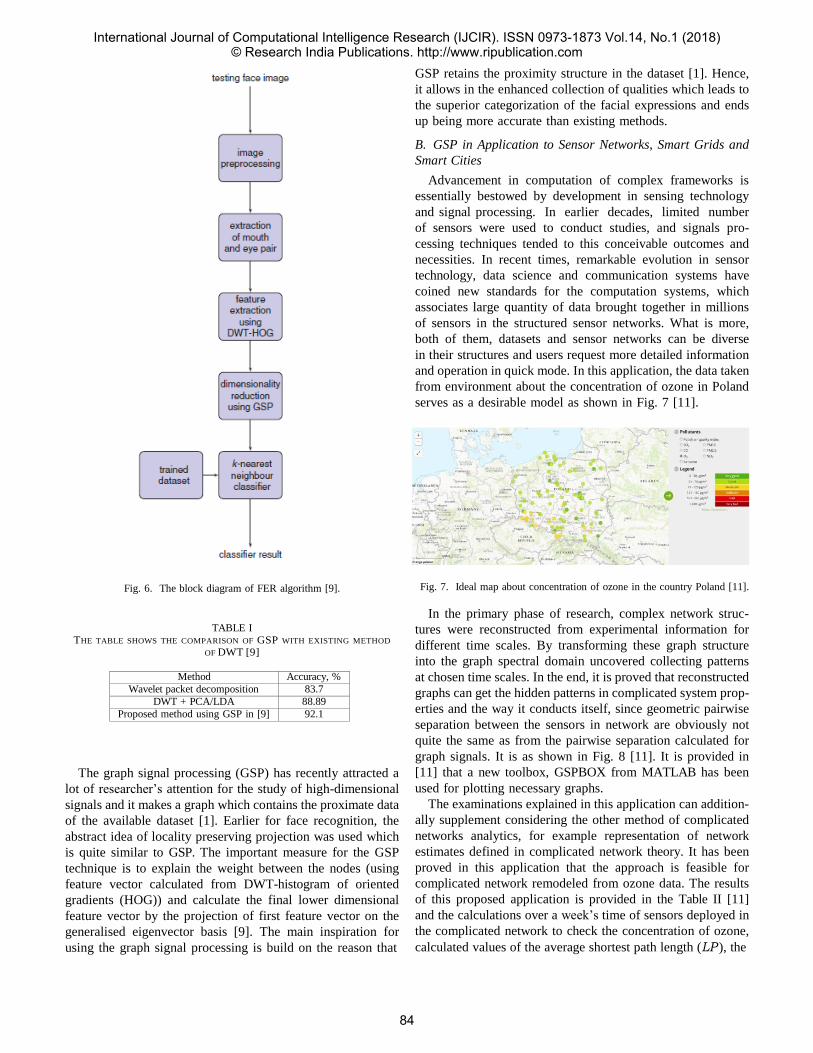
Fig. 6. The block diagram of FER algorithm [9].
TABLE I
THE TABLE SHOWS THE COMPARISON OF GSP WITH EXISTING METHOD
OF DWT [9]
Method Accuracy, %
Wavelet packet decomposition 83.7
DWT + PCA/LDA 88.89
Proposed method using GSP in [9] 92.1
The graph signal processing (GSP) has recently attracted a
lot of researcher’s attention for the study of high-dimensional
signals and it makes a graph which contains the proximate data
of the available dataset [1]. Earlier for face recognition, the
abstract idea of locality preserving projection was used which
is quite similar to GSP. The important measure for the GSP
technique is to explain the weight between the nodes (using
feature vector calculated from DWT-histogram of oriented
gradients (HOG)) and calculate the final lower dimensional
feature vector by the projection of first feature vector on the
generalised eigenvector basis [9]. The main inspiration for
using the graph signal processing is build on the reason that
GSP retains the proximity structure in the dataset [1]. Hence,
it allows in the enhanced collection of qualities which leads to
the superior categorization of the facial expressions and ends
up being more accurate than existing methods.
B. GSP in Application to Sensor Networks, Smart Grids and
Smart Cities
Advancement in computation of complex frameworks is
essentially bestowed by development in sensing technology
and signal processing. In earlier decades, limited number
of sensors were used to conduct studies, and signals pro-
cessing techniques tended to this conceivable outcomes and
necessities. In recent times, remarkable evolution in sensor
technology, data science and communication systems have
coined new standards for the computation systems, which
associates large quantity of data brought together in millions
of sensors in the structured sensor networks. What is more,
both of them, datasets and sensor networks can be diverse
in their structures and users request more detailed information
and operation in quick mode. In this application, the data taken
from environment about the concentration of ozone in Poland
serves as a desirable model as shown in Fig. 7 [11].
Fig. 7. Ideal map about concentration of ozone in the country Poland [11].
In the primary phase of research, complex network struc-
tures were reconstructed from experimental information for
different time scales. By transforming these graph structure
into the graph spectral domain uncovered collecting patterns
at chosen time scales. In the end, it is proved that reconstructed
graphs can get the hidden patterns in complicated system prop-
erties and the way it conducts itself, since geometric pairwise
separation between the sensors in network are obviously not
quite the same as from the pairwise separation calculated for
graph signals. It is as shown in Fig. 8 [11]. It is provided in
[11] that a new toolbox, GSPBOX from MATLAB has been
used for plotting necessary graphs.
The examinations explained in this application can addition-
ally supplement considering the other method of complicated
networks analytics, for example representation of network
estimates defined in complicated network theory. It has been
proved in this application that the approach is feasible for
complicated network remodeled from ozone data. The results
of this proposed application is provided in the Table II [11]
and the calculations over a week’s time of sensors deployed in
the complicated network to check the concentration of ozone,
calculated values of the average shortest path length (LP ), the
International Journal of Computational Intelligence Research (IJCIR). ISSN 0973-1873 Vol.14, No.1 (2018)© Research India Publications. http://www.ripublication.com
84
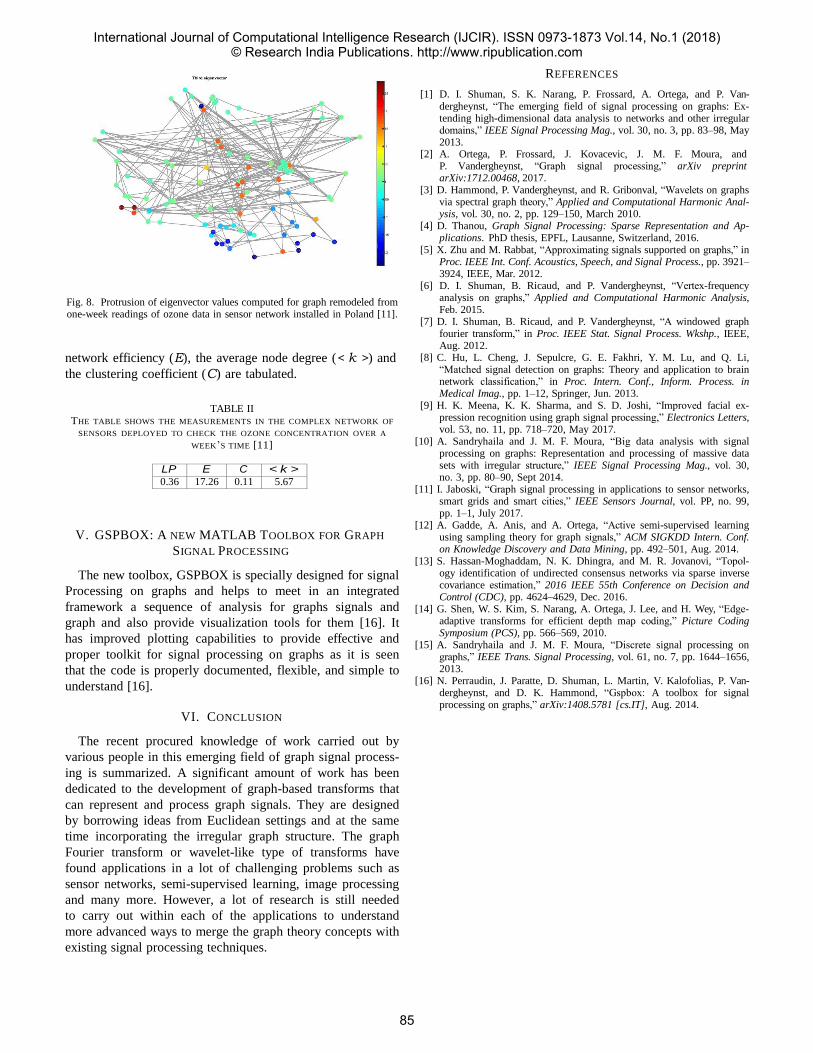
Fig. 8. Protrusion of eigenvector values computed for graph remodeled from one-week readings of ozone data in sensor network installed in Poland [11].
network efficiency (E), the average node degree (< k >) and
the clustering coefficient (C) are tabulated.
TABLE II
THE TABLE SHOWS THE MEASUREMENTS IN THE COMPLEX NETWORK OF
SENSORS DEPLOYED TO CHECK THE OZONE CONCENTRATION OVER A
WEEK’S TIME [11]
LP E C < k > 0.36 17.26 0.11 5.67
V. GSPBOX: A NEW MATLAB TOOLBOX FOR GRAPH
SIGNAL PROCESSING
The new toolbox, GSPBOX is specially designed for signal
Processing on graphs and helps to meet in an integrated
framework a sequence of analysis for graphs signals and
graph and also provide visualization tools for them [16]. It
has improved plotting capabilities to provide effective and
proper toolkit for signal processing on graphs as it is seen
that the code is properly documented, flexible, and simple to
understand [16].
VI. CONCLUSION
The recent procured knowledge of work carried out by
various people in this emerging field of graph signal process-
ing is summarized. A significant amount of work has been
dedicated to the development of graph-based transforms that
can represent and process graph signals. They are designed
by borrowing ideas from Euclidean settings and at the same
time incorporating the irregular graph structure. The graph
Fourier transform or wavelet-like type of transforms have
found applications in a lot of challenging problems such as
sensor networks, semi-supervised learning, image processing
and many more. However, a lot of research is still needed
to carry out within each of the applications to understand
more advanced ways to merge the graph theory concepts with
existing signal processing techniques.
REFERENCES
[1] D. I. Shuman, S. K. Narang, P. Frossard, A. Ortega, and P. Van- dergheynst, “The emerging field of signal processing on graphs: Ex- tending high-dimensional data analysis to networks and other irregular domains,” IEEE Signal Processing Mag., vol. 30, no. 3, pp. 83–98, May 2013.
[2] A. Ortega, P. Frossard, J. Kovacevic, J. M. F. Moura, and P. Vandergheynst, “Graph signal processing,” arXiv preprint arXiv:1712.00468, 2017.
[3] D. Hammond, P. Vandergheynst, and R. Gribonval, “Wavelets on graphs via spectral graph theory,” Applied and Computational Harmonic Anal- ysis, vol. 30, no. 2, pp. 129–150, March 2010.
[4] D. Thanou, Graph Signal Processing: Sparse Representation and Ap- plications. PhD thesis, EPFL, Lausanne, Switzerland, 2016.
[5] X. Zhu and M. Rabbat, “Approximating signals supported on graphs,” in Proc. IEEE Int. Conf. Acoustics, Speech, and Signal Process., pp. 3921– 3924, IEEE, Mar. 2012.
[6] D. I. Shuman, B. Ricaud, and P. Vandergheynst, “Vertex-frequency analysis on graphs,” Applied and Computational Harmonic Analysis, Feb. 2015.
[7] D. I. Shuman, B. Ricaud, and P. Vandergheynst, “A windowed graph fourier transform,” in Proc. IEEE Stat. Signal Process. Wkshp., IEEE, Aug. 2012.
[8] C. Hu, L. Cheng, J. Sepulcre, G. E. Fakhri, Y. M. Lu, and Q. Li, “Matched signal detection on graphs: Theory and application to brain network classification,” in Proc. Intern. Conf., Inform. Process. in Medical Imag., pp. 1–12, Springer, Jun. 2013.
[9] H. K. Meena, K. K. Sharma, and S. D. Joshi, “Improved facial ex- pression recognition using graph signal processing,” Electronics Letters, vol. 53, no. 11, pp. 718–720, May 2017.
[10] A. Sandryhaila and J. M. F. Moura, “Big data analysis with signal processing on graphs: Representation and processing of massive data sets with irregular structure,” IEEE Signal Processing Mag., vol. 30, no. 3, pp. 80–90, Sept 2014.
[11] I. Jaboski, “Graph signal processing in applications to sensor networks, smart grids and smart cities,” IEEE Sensors Journal, vol. PP, no. 99, pp. 1–1, July 2017.
[12] A. Gadde, A. Anis, and A. Ortega, “Active semi-supervised learning using sampling theory for graph signals,” ACM SIGKDD Intern. Conf. on Knowledge Discovery and Data Mining, pp. 492–501, Aug. 2014.
[13] S. Hassan-Moghaddam, N. K. Dhingra, and M. R. Jovanovi, “Topol- ogy identification of undirected consensus networks via sparse inverse covariance estimation,” 2016 IEEE 55th Conference on Decision and Control (CDC), pp. 4624–4629, Dec. 2016.
[14] G. Shen, W. S. Kim, S. Narang, A. Ortega, J. Lee, and H. Wey, “Edge- adaptive transforms for efficient depth map coding,” Picture Coding Symposium (PCS), pp. 566–569, 2010.
[15] A. Sandryhaila and J. M. F. Moura, “Discrete signal processing on graphs,” IEEE Trans. Signal Processing, vol. 61, no. 7, pp. 1644–1656, 2013.
[16] N. Perraudin, J. Paratte, D. Shuman, L. Martin, V. Kalofolias, P. Van- dergheynst, and D. K. Hammond, “Gspbox: A toolbox for signal processing on graphs,” arXiv:1408.5781 [cs.IT], Aug. 2014.
International Journal of Computational Intelligence Research (IJCIR). ISSN 0973-1873 Vol.14, No.1 (2018)© Research India Publications. http://www.ripublication.com
85
Rail track monitoring technique currently used
in India for crack detection
Manisha vohra S.K.Gabhane
Electronics and Telecommunication Engineering Electronics and Telecommunication Engineering
Rajiv Gandhi Institute of Technology Rajiv Gandhi Institute of Technology
Mumbai, India Mumbai, India
[email protected] [email protected]
Abstract–Railways are one of the mostly largely used
modes of public transportation throughout the world.
Monitoring rail tracks for detection of cracks is
necessary to prevent accidents. Various monitoring
techniques are practiced across the world for rail track
crack detection. Indian railway utilizes ultrasonic waves
based rail track monitoring technique. This paper
discusses and analyzes this technique. The drawbacks of
this technique are also listed in this paper. In order to
overcome the drawbacks of currently used rail track
monitoring technique for crack detection in Indian
railways, crack detection robot concept along with the
use of web page for rail track monitoring is introduced
and proposed in this paper.
Keywords–Monitoring, rail tracks, cracks, robot,
microcontroller, infrared (IR) sensor, Global Positioning
System (GPS), Global System for Mobile
Communications (GSM), General Packet Radio Services
(GPRS), web page.
I.INTRODUCTION
A huge percentage of population throughout the
world majorly relies on railways for transportation.
There are various advantages associated with
railways. For e.g. trains moving on rail tracks travel
at a very high speed, due to which it is able to cover
vast distance in a very short time. Also, the cost of
traveling through railways is quite cheap, which
makes it affordable for everyone. Besides, railways
also contribute to the economy of every country
across the world. In India, rail network is very
extensive and is an important contributor in Indian
economy.
II. WORKING PROCESS OF RAILWAYS
Railways consist of very huge infrastructure. Many
trains travel in different directions across the rail
tracks on a daily basis. In order to avoid any
confusion and to ensure smooth management of
railways, the working process of railways is divided
into different stages. The first stage is proper
scheduling of trains. The next stage is monitoring of
rail track for detecting faults in it. After monitoring,
the next stage is servicing of trains.
A) Scheduling of trains
Across the whole rail area in India, a huge number of
trains run on a daily basis. If trains keep on running
on railway tracks without any proper scheduling then,
there is a possibility of a clash of trains or heavy
traffic of trains occurring on rail tracks. To ensure
that there is no clash or traffic of trains, trains are
scheduled by making a time table for trains and also
signaling system is used to make sure that if there is
any delay in running time of trains, then the trains
running on same track do not clash with each other.
B) Monitoring of rail track
After scheduling of trains, monitoring the rail tracks
is quite essential. Monitoring of rail tracks is usually
carried out when trains are not running on rail tracks.
Monitoring is done to find out whether the track
consisting of any fault or not. If fault like crack is
present on rail track then, it can cause rail accident to
occur. Hence, monitoring is a very important stage in
working process of railways.
C) Servicing of trains
Along with giving importance to monitoring rail
tracks, servicing of trains time to time is also
necessary. During servicing, the trains are checked
for flaws and are repaired if detected with any flaws.
III. RAIL TRACK MONITORING TECHNIQUE
FOR CRACK DETECTION CURRENTLY USED
IN INDIA
In India, the railways most widely use the broad
gauge. A gauge in rail network means the
measurement between the two inner faces of the rails.
Four types of gauge are present in railways in India.
They are broad gauge, meter gauge and two different
narrow gauge. The broad gauge is 1676mm in width.
International Journal of Computational Intelligence Research (IJCIR). ISSN 0973-1873 Vol.14, No.1 (2018)© Research India Publications. http://www.ripublication.com
86

The height of rail in Indian railways is 172 mm and its width is 74 mm. At present, a rail car which works on manual operation is used for monitoring the rail tracks in India. There are two types of rail cars, i.e. single rail tester and double rail tester car. Single rail tester car can test upto two kilometer (km) of rail track per day and double rail tester car can test upto
four km of rail track per day. Different probes i.e. 00
probe, 370
probe, 700
probe and 450
probe are utilized in this crack detection process. These probes generate ultrasonic waves to detect cracks. An oscilloscope is used to scrutinize the behavior of ultrasonic waves passing through the rails. The waves get reflected
back on detection of a crack. 00
probe helps in checking whether the rail track consists of horizontal
head cracks, while 370
probe is used for examining
bolt hole cracks. 700
probe checks the rail for
detecting presence of rail head crack and 450
probe examines whether any vertical head cracks exist on rail surface or not. The frequency of testing rail cracks is decided on the basis of gross million tonne (GMT) traffic, which is basically the indication of the traffic of the train passing through a rail track on daily basis.
IV. LIMITATIONS OF CURRENTLY USED
CRACK DETECTION TECHNIQUE IN INDIA
A) The rail car requires to be operated manually.
B) The oscilloscope needs to be observed carefully
continuously to find out if any wave is getting
reflected back, which indicates the presence of crack.
C) Single rail and double rail tester car are limited to
testing two and four km of rail area per day
respectively.
V. INTRODUCTION OF CRACK DETECTION
ROBOT WITH WEB PAGE
The limitations of the current crack detection
technique can be overcome using crack detection
robot with web page.
A) Use of crack detection robot
Crack detection robot is a robot which is specially
made for moving on tracks for monitoring it for crack
detection purpose. A system is proposed based on
this robot. There are two different units in the
proposed system. The first unit is the robotic unit,
while the other unit is the receiver unit. Fig. 1 and
fig. 2 show the block diagram of robotic unit and
receiver unit respectively. The robotic unit constitutes
of motor driver, direct current (D.C.) motors, infrared
(IR) sensors, motor driver, direct current (D.C.)
motors, microcontroller, Global Positioning System
(GPS) and Global System for Mobile
Communications/General Packet Radio Services
(GSM/GPRS) module. The receiver unit constitutes
of a personal computer (PC) or laptop with internet
connection GSM/GPRS module. The robotic unit
constitutes of a robot with four wheels. This robot
will driven by D.C. motors with the help of motor
driver. L293D motor driver shall be used in this
system. The robot shall start detection of cracks on
rail tracks after receiving a message to start the
monitoring process. The GSM/GPRS module of the
robotic unit shall receive this message. ARM7
LPC2148 microcontroller and SIM900 GSM/GPRS
module shall be utilized in this proposed system. The
cracks on the rail tracks will be detected with the help
of IR sensors. The reason for selecting IR sensors for
detecting cracks is their working principle, i.e. a
change will be observed in the voltage of the receiver
circuit of IR sensor in accordance to the IR light
received from the emitter circuit of the sensor. Based
on this working principle, the IR sensor’s voltage
variations obtained on presence of crack as compared
to the voltage variations obtained without any
presence of cracks will help in detecting the crack
quite easily. During monitoring of track, if the robot
detects the presence of any crack, it will stop there at
that instant. The detected crack location will be
obtained using the GPS module. GSM/GPRS module
shall send the information regarding the crack
detected and its location to the registered mobile
number via short message service (SMS).
B) Role of web page
The information that will be sent via SMS to the
registered mobile number, the same information will
also be displayed on the web page through the
internet connection. Besides, the status of the rail
track and the location of the robot will be regularly
updated on the web page.
International Journal of Computational Intelligence Research (IJCIR). ISSN 0973-1873 Vol.14, No.1 (2018)© Research India Publications. http://www.ripublication.com
87
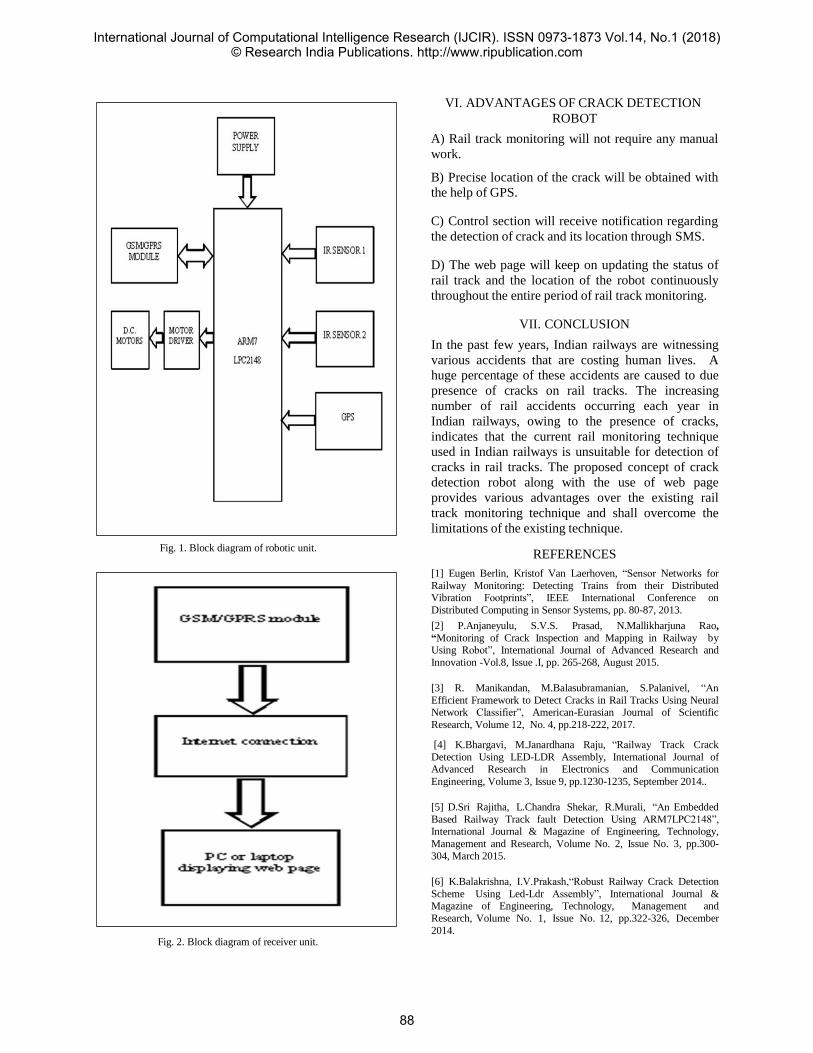
VI. ADVANTAGES OF CRACK DETECTION
ROBOT
A) Rail track monitoring will not require any manual
work.
B) Precise location of the crack will be obtained with
the help of GPS.
C) Control section will receive notification regarding
the detection of crack and its location through SMS.
D) The web page will keep on updating the status of
rail track and the location of the robot continuously
throughout the entire period of rail track monitoring.
Fig. 1. Block diagram of robotic unit.
Fig. 2. Block diagram of receiver unit.
VII. CONCLUSION
In the past few years, Indian railways are witnessing
various accidents that are costing human lives. A
huge percentage of these accidents are caused to due
presence of cracks on rail tracks. The increasing
number of rail accidents occurring each year in
Indian railways, owing to the presence of cracks,
indicates that the current rail monitoring technique
used in Indian railways is unsuitable for detection of
cracks in rail tracks. The proposed concept of crack
detection robot along with the use of web page
provides various advantages over the existing rail
track monitoring technique and shall overcome the
limitations of the existing technique.
REFERENCES
[1] Eugen Berlin, Kristof Van Laerhoven, “Sensor Networks for
Railway Monitoring: Detecting Trains from their Distributed Vibration Footprints”, IEEE International Conference on
Distributed Computing in Sensor Systems, pp. 80-87, 2013.
[2] P.Anjaneyulu, S.V.S. Prasad, N.Mallikharjuna Rao,
“Monitoring of Crack Inspection and Mapping in Railway by Using Robot”, International Journal of Advanced Research and
Innovation -Vol.8, Issue .I, pp. 265-268, August 2015.
[3] R. Manikandan, M.Balasubramanian, S.Palanivel, “An
Efficient Framework to Detect Cracks in Rail Tracks Using Neural Network Classifier”, American-Eurasian Journal of Scientific
Research, Volume 12, No. 4, pp.218-222, 2017.
[4] K.Bhargavi, M.Janardhana Raju, “Railway Track Crack
Detection Using LED-LDR Assembly, International Journal of Advanced Research in Electronics and Communication
Engineering, Volume 3, Issue 9, pp.1230-1235, September 2014..
[5] D.Sri Rajitha, L.Chandra Shekar, R.Murali, “An Embedded
Based Railway Track fault Detection Using ARM7LPC2148”, International Journal & Magazine of Engineering, Technology,
Management and Research, Volume No. 2, Issue No. 3, pp.300-
304, March 2015.
[6] K.Balakrishna, I.V.Prakash,“Robust Railway Crack Detection
Scheme Using Led-Ldr Assembly”, International Journal & Magazine of Engineering, Technology, Management and
Research, Volume No. 1, Issue No. 12, pp.322-326, December
2014.
International Journal of Computational Intelligence Research (IJCIR). ISSN 0973-1873 Vol.14, No.1 (2018)© Research India Publications. http://www.ripublication.com
88

[7] Fatima Imdad, Muhammad Tabish Niaz and Hyung Seok Kim,
“Railway track structural health monitoring system”, 15th
International Conference on Control, Automation and Systems”, pp. 769-772, 2015.
[8] Aliza Raza Rizvi, Pervez Rauf Khan, Dr. Shaqeef Ahmad, “Crack Detection in Railway Track Using Image
Processing”,International Journal of Advance Research, Ideas and
Innovations in Technology”, Volume 3, Issue 4, pp.489-496, 2017.
[9] S.Zheng, X.An, X.Chai, L.Li, “Railway track gauge inspection
method based on computer vision” IEEE International Conference on Mechatronics and automation, pp.1292-1296, 2012.
[10] Vishnu Kiran.B, S.Sandeep, “A Novel Approach Railway
Track Damage Detection Robot Using GPRS Technology”, SSRG
International Journal of Electronics and Communication Engineering, volume 1, issue 4, pp. 20-23, June 2014.
[11] Prachi Bawangade, K. R. Dabhekar, P. Y. Pawade, “Monitoring System for Railway Track”, International Journal of
Science Technology & Engineering, Volume 3, Issue 10, pp. 29-
32, April 2017.
[12] M.Singh, S.Singh, J.Jaiswal, J.Hempshall, “Autonomus rail track inspection using vision based system”, IEEE International
Conference on Computational Intelligence for Homeland Security
and Personal Safety , pp.56-59, October 2006.
[13] P.Navaraja, “Crack Detection System for Railway Track by
Using Ultrasonic and Pir Sensor”, International Journal of Advanced Information and Communication Technology, Volume
1, Issue 1, pp. 126-130, May 2014.
[14] Ramavath Swetha, P. V.Prasad Reddy, “Railway Track Crack
Detection Autonomous Vehicle”, Global Journal of Advanced Engineering Technologies, Volume 4, Issue 3, pp. 170-175, 2015.
[15] Victoria J. Hodge, Simon O’Keefe, Michael Weeks, Anthony Moulds, “Wireless Sensor Networks for Condition Monitoring in
the Railway Industry: A Survey”, IEEE Transactions on Intelligent
Transportation Systems, Volume 16, Issue 3, pp. 1088 – 1106, June 2015.
[16] Sindhu, Veeresh Pujari, Dr.Basawaraj Gadgay, “IR Sensor Based Squats Detection of Railway Track using Robot”,
International Journal for Research in Applied Science &
Engineering Technology, Volume 5, Issue VI, pp. 2729-2732, 2017.
[17] E. Aboelela, W. Edberg, C. Papakonstantinou, V. Vokkarane,
"Wireless sensor network based model for secure railway
operations", IEEE International Performance Computing and Communications Conference, pp. 1-6, 2006.
[18] Pranav Lad, Mansi Pawar, “Evolution of Railway Track Crack Detection System”, 2nd IEEE International Symposium on
Robotics and Manufacturing Automation (ROMA), pp. 1-6, 2016.
[19] Z. Sam Daliri1, S. Shamshirband, M.A. Besheli “Railway security through the use of wireless sensor networks based on fuzzy logic”. International Journal of the Physical Sciences,
Volume 6, No. 3, pp. 448-458, 4th February 2011.
[20] Nisthul G, Lijo George, Nelson Varghese, Sebin Jose, Nithin John, Nandhumon K R, “Automatic Railway Track Crack
Detection System”, Imperial Journal of Interdisciplinary Research,
Volume 3, Issue 4, pp. 2272-2275, 2017.
International Journal of Computational Intelligence Research (IJCIR). ISSN 0973-1873 Vol.14, No.1 (2018)© Research India Publications. http://www.ripublication.com
89
Implementation of Time based 3-Axis Capacitive Accelerometer using COMSOL
Multiphysics
Nikhil Sarode1, Surabhi Jadhav2, Jennefer Sen3, Trupti Agarkar4, Akshay Jadhav5
12345Deprtment of Electronics Engineering 12345Ramrao Adik Institute of Technology, Nerul, India
[email protected], [email protected], [email protected], [email protected], [email protected]
Abstract—Micro-electro-mechanical system or MEMS simply
can be understood as a miniaturized mechanical and electro-
mechanical elements i.e sensors, actuators, and microelectron-
ics, that are made using methods of fabrication. Capacitive
accelerometers are devices that measure the acceleration on a
surface using capacitive sensing techniques. It can sense both
static and dynamic acceleration. After this, it converts this
acceleration into voltage or current. Whereas, in the capacitive
pressure sensors, the pressure is sensed by mechanical elements
such as plates, shells, and tubes that are designed and con-
structed to deflect when pressure is applied. These Capacitive
pressure sensors have an edge over the piezoresistive ones since
they consume less power. They are usually less temperature
sensitive and have a lower fundamental noise floor. This model
performs an analysis of a hypothetical sensor design using
the electromechanical interface. The results throw light on the
importance of considering packaging in the MEMS [micro-
electro-mechanical system] design process. The sensor is part
of a silicon that has been bonded to a metal.
Keywords-Micro-electro-mechanical system(MEMS); Capaci-
tive Accelerometer; Capacitive Pressure Sensor.
1. INTRODUCTION
The accelerometer is an electromechanical device that can measure the change in velocity or force of acceleration caused by gravity or movement over time. It can measure acceleration in one, two or three axes. Most of them are MicroElectro- Mechanical-Sensors(MEMS) Two of the most common types are capacitive sensing and piezoelectric effect to sense the displacement of the proof mass which is pro- portional to the applied acceleration. The output voltage of the capacitive sensor is dependent on the distance between the two capacitive plates. The acceleration of piezoelectric sensor is directly proportional to the force. Whenever certain type of a crystal is compressed, the charges of opposite po- larity accumulate on opposite side of the crystal.In addition to this, we also have a piezoresistive pressure sensor which is one of the very first products of the MEMS technology. These devices are widely used in household appliances. We are using the capacitive sensing accelerometer because it is
known for its accuracy and stability. In addition to this, they are less prone to noise and its variation with temperature is also marginally less.
1.1. Problem Statement
An accelerometer is an electromechanical device that will measure both static (gravity) and dynamic (motion or vibration) accelerations. The evolutiont of the MEMS accelerometers has revolutionized the application of ac- celerometers, making them smaller, lower power and easily integrated into a wide range of applications. MEMS ac- celerometers are used in cars, planes, industrial applications, mobile phones in fact almost everywhere. There are three main MEMS technologies for converting acceleration to an electrical signal i.e. piezoelectric, piezore-sistive and capac- itive. We have selected capacitive sensing because it offers the best in terms of long-term stability while achieving out- standing sensitivity. For this reason, our high-performance sensors are used in some of the most challenging applica- tions that are addressed by MEMS sensors.
2. CAPACITIVE SENSOR
According to those implemented using capacitive sens- ing, give a voltage output dependent on a distance between two planar surfaces i.e. capacitive plates. Both these plates are charged with the help of electric current. By changing the gap between capacitor plates, the electric capacity of the system changes. This is measured as the output voltage [16]. The biggest advantage of using capacitive sensor is that they have a very large bandwidth due to internal feedback circuitry. Furthermore, these sensors are very stable and accurate. In addition to this, they dissipate very less power [1].
2.1. Parallel Plate Capacitance
The electric field between two parallel plates is given by σ
E = E
Where
σ = ChargeDensity
International Journal of Computational Intelligence Research (IJCIR). ISSN 0973-1873 Vol.14, No.1 (2018)© Research India Publications. http://www.ripublication.com
90
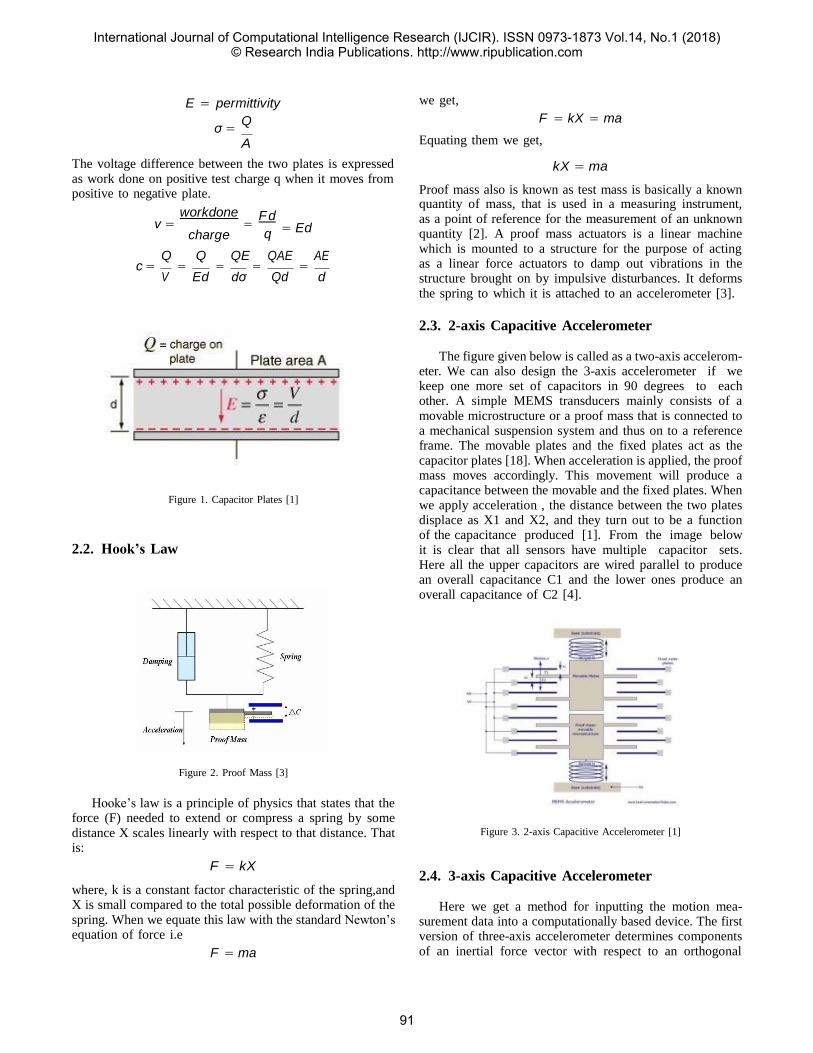
E = permittivity Q
σ =
we get,
F = kX = ma
A The voltage difference between the two plates is expressed as work done on positive test charge q when it moves from
Equating them we get,
kX = ma
positive to negative plate.
workdone v = =
charge
F d
q
= Ed
Proof mass also is known as test mass is basically a known quantity of mass, that is used in a measuring instrument, as a point of reference for the measurement of an unknown quantity [2]. A proof mass actuators is a linear machine which is mounted to a structure for the purpose of acting
Q c = =
V Q QE
= = Ed dσ
QAE AE =
Qd d as a linear force actuators to damp out vibrations in the structure brought on by impulsive disturbances. It deforms the spring to which it is attached to an accelerometer [3].
2.3. 2-axis Capacitive Accelerometer
Figure 1. Capacitor Plates [1]
2.2. Hook’s Law
Figure 2. Proof Mass [3]
Hooke’s law is a principle of physics that states that the
force (F) needed to extend or compress a spring by some distance X scales linearly with respect to that distance. That is:
The figure given below is called as a two-axis accelerom- eter. We can also design the 3-axis accelerometer if we keep one more set of capacitors in 90 degrees to each other. A simple MEMS transducers mainly consists of a movable microstructure or a proof mass that is connected to a mechanical suspension system and thus on to a reference frame. The movable plates and the fixed plates act as the capacitor plates [18]. When acceleration is applied, the proof mass moves accordingly. This movement will produce a capacitance between the movable and the fixed plates. When we apply acceleration , the distance between the two plates displace as X1 and X2, and they turn out to be a function of the capacitance produced [1]. From the image below it is clear that all sensors have multiple capacitor sets. Here all the upper capacitors are wired parallel to produce an overall capacitance C1 and the lower ones produce an overall capacitance of C2 [4].
Figure 3. 2-axis Capacitive Accelerometer [1]
F = kX
where, k is a constant factor characteristic of the spring,and X is small compared to the total possible deformation of the spring. When we equate this law with the standard Newton’s equation of force i.e
F = ma
2.4. 3-axis Capacitive Accelerometer
Here we get a method for inputting the motion mea- surement data into a computationally based device. The first version of three-axis accelerometer determines components of an inertial force vector with respect to an orthogonal
International Journal of Computational Intelligence Research (IJCIR). ISSN 0973-1873 Vol.14, No.1 (2018)© Research India Publications. http://www.ripublication.com
91

coordinate system [6]. The accelerometer comprises of a sensor die that is made up of a semiconductor substrate having a frame element, a proof mass element, and an elastic element mechanically coupling the frame and the proof mass [15]. The accelerometer also contains three or more stress- sensitive IC components integrated into the elastic element next to the frame element for electrical connectivity without any metal conductor traversal of the elastic element [17].
Figure 4. 3-axis Capacitive Accelerometer [9]
3. MATERIAL REQUIRED
The choice of good material for MEMS devices in not largely based on the carrier mobility of microelectronics, but more on the mechanical aspect. In MEMS devices, silicon and silicon compounds are widely used in the fabrication of micro pressure sensor. Silicon has excellent mechanical properties. It is a strong material but lighter than steel [13]. It has large critical stress and no elasticity limit at room temperature and is also a perfect crystal that ensures it will recover from large strain. It has a large piezoresistive coefficient for sensing application. Silicon has a greater density in a liquid state than in solid state, and so like water, unlike most substances [6]. Silicon material is used to design the diaphragms of the pressure sensors and is also used to measure ultra-low pressure. Steel AISI material is also used in the MEMS devices [5].
4. SOFTWARE REQUIRED
COMSOL Multiphysics version 5.2 delivers new fea- tures, enhanced stability and robustness, and faster exe- cution. It also improves your simulation capabilities with better features to the core functionality. In COMSOL Mul- tiphysics version 5.2, the Model Builder and Application Builder are more tightly integrated. You now have the option to include dynamic graphics updates to plots while solving [17]. A new Editor Tools feature enables you to quickly create standard interface components in apps. COMSOL Server launches apps up to five times faster and lets users set a specific app to open automatically when they log in.Additional updates to this version of COMSOL Multi- physics include more powerful meshing, plot annotations, and a simple way to import externally generated mesh. For mechanical simulations, you can now express nonlinear materials as C code [2].
5. IMPLEMENTATION OF MODEL
We have already implemnted capacitive accelerometer in COMSOL multiphysics. The flowchart for the model in COMSOL is given below:-
Figure 5. Flowchart
Figure 6. Capacitive Accelerometer
Figure 7. 2-axis Capacitive Accelerometer
Implementation steps of the Model in the COMSOL multi- physics are given below:- Step:1 In the First step we have to design 2D or 3D geometry. It can be done by two way importing supporting file in COMSOL or by constructing geometrical shapes as we have shown in figure 8
Figure 8. Step:1 Designing Geometry
Step:2 In second step we have to select material to appro- priate domain of the model.
International Journal of Computational Intelligence Research (IJCIR). ISSN 0973-1873 Vol.14, No.1 (2018)© Research India Publications. http://www.ripublication.com
92
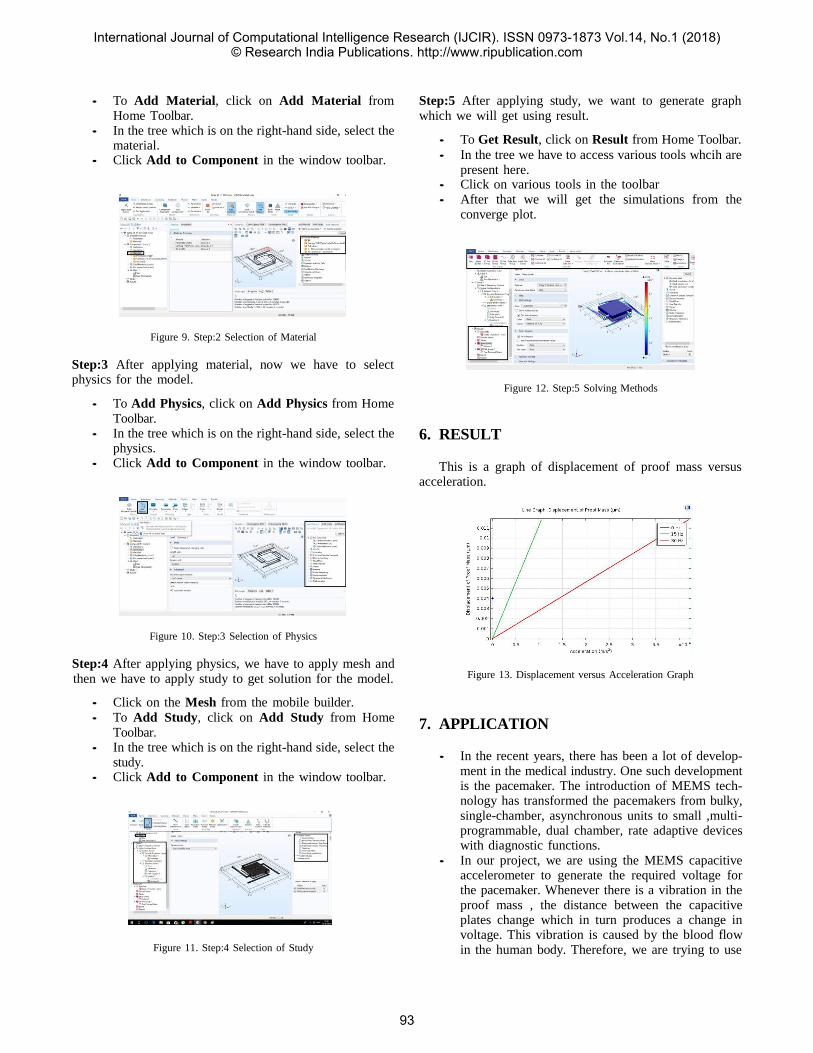
• To Add Material, click on Add Material from Home Toolbar.
• In the tree which is on the right-hand side, select the material.
• Click Add to Component in the window toolbar.
Figure 9. Step:2 Selection of Material
Step:5 After applying study, we want to generate graph which we will get using result.
• To Get Result, click on Result from Home Toolbar.
• In the tree we have to access various tools whcih are present here.
• Click on various tools in the toolbar • After that we will get the simulations from the
converge plot.
Step:3 After applying material, now we have to select physics for the model.
• To Add Physics, click on Add Physics from Home Toolbar.
• In the tree which is on the right-hand side, select the physics.
6. RESULT
Figure 12. Step:5 Solving Methods
• Click Add to Component in the window toolbar.
Figure 10. Step:3 Selection of Physics
Step:4 After applying physics, we have to apply mesh and then we have to apply study to get solution for the model.
• Click on the Mesh from the mobile builder.
• To Add Study, click on Add Study from Home Toolbar.
• In the tree which is on the right-hand side, select the study.
• Click Add to Component in the window toolbar.
Figure 11. Step:4 Selection of Study
This is a graph of displacement of proof mass versus acceleration.
Figure 13. Displacement versus Acceleration Graph
7. APPLICATION
• In the recent years, there has been a lot of develop- ment in the medical industry. One such development is the pacemaker. The introduction of MEMS tech- nology has transformed the pacemakers from bulky, single-chamber, asynchronous units to small ,multi- programmable, dual chamber, rate adaptive devices with diagnostic functions.
• In our project, we are using the MEMS capacitive accelerometer to generate the required voltage for the pacemaker. Whenever there is a vibration in the proof mass , the distance between the capacitive plates change which in turn produces a change in voltage. This vibration is caused by the blood flow in the human body. Therefore, we are trying to use
International Journal of Computational Intelligence Research (IJCIR). ISSN 0973-1873 Vol.14, No.1 (2018)© Research India Publications. http://www.ripublication.com
93

the body energy i.e. blood flow in the vessels, for charging the pacemaker.
• In addition to this, the MEMS capacitive accelerom- eter has been implemented in many commercial ap- plications, such as automobile air bags, navigation, and instrumentation.
8. ADVANTAGES
• It requires simple signal conditioning.
• Capacitive accelerometers are very sensitive. • Capacitive accelerometers are ideally suited to mea-
sure low-frequency low level acceleration. • Reliable accuracy • Excellent Price Performance • Measures DC Acceleration
9. DISADVANTAGES
• Low Bandwidth(frequency B.W. upto 5000Hz)
• Relatively Fragile • Sensitive to temperature • Hysteresis error • Less longevity • Increased efficiency with time • Spring system is not always accurate. • Fluctuations in mass leads to wrong calculations.
10. CONCLUSION
In this paper, the various types of accelerometers and the various materials required in its designing are studied thoroughly. A three-axis MEMS capacitive accelerometer is implemented in COMSOL Multiphysics where we are applying the force in the positive z-direction. The results can be used to calculate the change in distance between the capacitive plates w.r.t change in capacitance which is linear in nature.This has its applications especially in the bio-medical industry where we can use this in pacemakers, eye surgery, kidney dialysis and much more other life-saving operations.
ACKNOWLEDGEMENT
We extend our sincere thanks to our Principal Sir and HOD sir.
References
[1] Neuzil, P., Yong Liu, Han-Hua Feng and Wenjiang Zeng (2005). Mi- cromachined bolometer with single-crystal silicon diode as temperature sensor. IEEE Electron Device Letters, 26(5), pp.320-322.
[2] N, D., V, J. and Kumar B, R. (2015). Design and Simulation of MEMS Accelerometer Using COMSOL Multiphysics Software. International Journal of Engineering Trends and Technology, 20(5), pp.244-247.
[3] Sensors-actuators-info.blogspot.fi. (2018). Sensors and Actuators. [on- line] Available at: http://sensors-actuators-info.blogspot.fi/ [Accessed 16 Feb. 2018].
[4] T. Agarkar, A. Jadhav, S. Kodagali,Advanced Real time High Perfor- mance Time Based 3 Axis Capacitive Accelerometer,2016
[5] Matsumoto, Y., Iwakiri, M., Tanaka, H., Ishida, M. and Nakamura, T. (1996). A capacitive accelerometer using SDB-SOI structure. Sensors and Actuators A: Physical, 53(1-3), pp.267-272.
[6] MacDonald, G. (1990). A review of low cost accelerometers for vehicle dynamics. Sensors and Actuators A: Physical, 21(1-3), pp.303-307.
[7] Chen, H., Bao, M., Zhu, H. and Shen, S. (1997). A piezoresistive ac- celerometer with a novel vertical beam structure. Sensors and Actuators A: Physical, 63(1), pp.19-25.
[8] Kavitha, S., Joseph Daniel, R. and Sumangala, K. (2016). Design and Analysis of MEMS Comb Drive Capacitive Accelerometer for SHM and Seismic Applications. Measurement, 93, pp.327-339.
[9] Origin-maximintegrated.com. (2018). Accelerometer and Gyroscopes Sensors: Operation, Sensing, and Applications - Application Note - Maxim. [online] Available at: https://origin- www.maximintegrated.com/en/app-notes/index.mvp/id/5830 [Accessed 16 Feb. 2018].
[10] Senturia, S., Harris, R., Johnson, B., Kim, S., Nabors, K., Shulman,
M. and White, J. (1992). A computer-aided design system for micro- electromechanical systems (MEMCAD). Journal of Microelectrome- chanical Systems, 1(1), pp.3-13.
[11] Legtenberg, R., Groeneveld, A. and Elwenspoek, M. (1996). Comb- drive actuators for large displacements. Journal of Micromechanics and Microengineering, 6(3), pp.320-329.
[12] Structure Design of Micromechanical Silicon Resonant Accelerome- ter. (2013). Sensors and Materials, p.479.
[13] Park, K., Lee, C., Jang, H., Oh, Y. and Ha, B. (1999). Capacitive type surface-micromachined silicon accelerometer with stiffness tuning capability. Sensors and Actuators A: Physical, 73(1-2), pp.109-116.
[14] Roylance, L. and Angell, J. (1979). A batch-fabricated silicon ac- celerometer. IEEE Transactions on Electron Devices, 26(12), pp.1911- 1917.
[15] Shuangfeng, L., Tiehua, M. and Wen, H. (2008). Design and fab- rication of a new miniaturized capacitive accelerometer. Sensors and Actuators A: Physical, 147(1), pp.70-74.
[16] Yeh, C. and Najafi, K. (1997). A low-voltage tunneling-based silicon microaccelerometer. IEEE Transactions on Electron Devices, 44(11), pp.1875-1882.
[17] Khan, M., Iqbal, A., Bazaz, S. and Abid, M. (2011). Physical Level Simulation of PolyMUMPs Based Monolithic Tri-Axis MEMS Ca- pacitive Accelerometer Using FEM Technique. Advanced Materials Research, 403-408, pp.4625-4632.
[18] Benevicius, V., Ostasevicius, V. and Gaidys, R. (2013). Identification of Capacitive MEMS Accelerometer Structure Parameters for Human Body Dynamics Measurements. Sensors, 13(12), pp.11184-11195.
International Journal of Computational Intelligence Research (IJCIR). ISSN 0973-1873 Vol.14, No.1 (2018)© Research India Publications. http://www.ripublication.com
94

Improved Ant Colony Optimization for MANETs
Gaurav Kavhar
Computer Engineering
RamraoAdik Institute Of Technology
Navi Mumbai, India
Guneesh Bhatia Computer Engineering
RamraoAdik Institute Of Technology
Navi Mumbai, India
Aditya Gadge
Computer Engineering
RamraoAdik Institute Of Technology
Navi Mumbai, India
Uday Vasave
Computer Engineering
RamraoAdik Institute Of Technology
Navi Mumbai, India
Puja Padiya Assistant Professor
Computer Engineering
RamraoAdik Institute Of Technology
Navi Mumbai, India
Abstract— Mobile Ad Hoc Network (MANET) is a dynamic
multihop wireless network which is established by a set of mobile
nodes on a shared wireless channel. Its complexity increases due
to various characteristics like dynamic topology, time varying
QoS(Quality of Service) requirements, limited resources and
energy etc. Routing in an ad hoc network is extremely
challenging because of its dynamic nature, limited bandwidth
and power energy. Swarm Intelligence based techniques such as
ant colony optimization (ACO) algorithms will be a good
technique for developing routing algorithms for ad hoc networks
because their routing scheme is based on the behaviour of
foraging ants. We propose improvement in ACO as IMVPACO
algorithm to be used as a routing protocol in Mobile ad hoc
networks(MANETs).
Keywords— MANETs, Quality of Service(QoS), Routing, Swarm
Inteligence, Ant Colony Optimization(ACO)
INTRODUCTION
In mobile ad hoc network (MANET), the nodes work
together in a distributed fashion to enable routing among
them. Because of the lack of centralized control, routing
becomes a central issue and a major challenge as the
network topology is constantly changing. It is a collection
of mobile nodes that are dynamically and arbitrarily
located in such a manner that the interconnections
between nodes are capable of changing on a continual
basis. Each node can act as a receiver, transmitter or
router. The main problem of the ad-hoc network is
mobility of the nodes resulting in fast variations of their
availability. At one time the node is in range and while at
other that node is out of the range. Another problem is the
power and battery lifetime of each device in the network.
There are many applications for MANET. For example,
in a military field, search and rescue operations, or any
remote geographical area where is no base station for
communication.
In order to solve the problems faced in MANETs, the
basic ant colony optimization (ACO) algorithm is
improved to propose an efficient and intelligent ant
colony optimization (IMVPACO)algorithm. In the
IMVPACO algorithm, the updating rules and adaptive
adjustment strategy of pheromones are modify in order to
better reflect the quality of the solution based on the
increment of pheromone. The dynamic evaporation factor
strategy is used to achieve the better balance between the
solving efficiency and solving quality, and effectively
avoid falling into local optimum for quickening the
convergence speed. The movement rules of the ants are
modify to make it adaptable for large-scale problem
solving, optimize the path and improve search efficiency.
A boundary symmetric mutation strategy is used to obtain
the symmetric mutation for iteration results, which not
International Journal of Computational Intelligence Research (IJCIR). ISSN 0973-1873 Vol.14, No.1 (2018)© Research India Publications. http://www.ripublication.com
95

only strengthens the mutation efficiency, but also
improves the mutation quality. Finally, the proposed
IMVPACO algorithm is applied in solving the traveling
salesman problem. The simulation experiments show that
the proposed IMVPACO algorithm can obtain very good
results in finding optimal solution[10]. And It takes on
better global search ability and convergence performance
than other traditional methods.
LITERATURE REVIEW
For any project planning activity, a good reading of existing
projects, ideas and technology is needed. The following
subsections provide much needed excerpts from important
research papers and literary documents. These research papers
were a huge help for understanding the working of Ant
Colony Optimization algorithm and the different routing
protocols used in Ad Hoc Networks.
1) Ping Duan and Yong ai - “Research on an
improved ant colony optimization and its
application”[10]- This paper has suggested the new IMVPACO
algorithm on which the system will be built. It
contains the new improvements in the basic ACO
algorithm and the analysis done on the IMVPACO
algorithm based on the standard datasets of TSP on
MATLAB.
2) Anuj K. Gupta, Harsh Sadawarti, and Anil K.
Verma – ”MANET Routing Protocols Based on
Ant Colony Optimization”[11]- This paper suggests the working of ACO for
MANETs. We learned about the basic routing
protocols used in the MANETs and how the ACO
algorithm can be used as one of the routing
algorithms.
3) Nabendu Chaki, Sugata Sanyal-“Ant Colony
based Routing for Mobile Ad-Hoc Networks
towards Improved Quality of Services”[12]- This paper suggests improvement in the routing
protocols. It takes into the account the Quality of
Services offered by different routing protocols.
PREVIOUS WORK
Some works related to ACO and OLSR are found in the
literature. In [1], the authors described a hybrid routing
algorithm for MANETs based on ACO and zone routing
framework of bordercasting. A new QoS routing protocol
combined with the flow control mechanism has been done in
[2]. This proposed routing solution is modeled by an systems.
The proposed routing protocol in [2] uses a new metric to find
the route with higher transmission rate, less latency and better
stability. P.Deepalakshmi. et.al [4] proposed a new on demand
QoS routing algorithm based on ant colony metaheuristic. An
algorithm of ant colony optimization for mobile ad hoc
networks has been described in [5]. But the QoS issues end-to-
end delay, available bandwidth, cost, loss probability, and
error rate is not considered in [5]. A hybrid QoS routing
algorithm has been proposed in [6]. In [6], the authors used
ant’s pheromone update process approach for improving QoS.
But the authors described only bandwidth. Other QoS issues
are not considered in [6]. Shahab Kamali. et.al [7]
implemented a new ant colony based routing algorithm that
uses the information about the location of nodes.
PROPOSED SYSTEM
A Mobile ad hoc network (MANET) is a decentralized group
of mobile nodes which exchange information temporarily by
means of wireless transmission. Since the nodes are mobile,
the network topology may change rapidly and unpredictably
over time. The network topology is unstructured and nodes
may enter or leave at their will. A node can communicate to
other nodes which are within its transmission range. This kind
of network promises many advantages in terms of cost and
flexibility compared to network with infrastructures.
MANETs are very suitable for a great variety of applications
such as data collection, seismic activities, and medical
applications.
Unfortunately nodes in MANETs are limited in energy,
bandwidth. The main problem solved by any routing protocol
is to direct traffic from sources to destinations, but nowadays,
because of increasing complexity in modern networks, routing
algorithms face important challenges.
The routing function is particularly challenging in these
networks because the network structure is constantly changing
and the network resources are limited. Routing algorithms
lack of adaptability to frequent topological changes, limited
resources, energy availability reduces network performance.
The working of IMVPACO algorithm for Travelling Salesman
Problem(TSP)[10] is as follows:-
Step 1. Initialize parameters.
The parameters of the proposed IMVPACO algorithm are
initialized. These parameters include the ant size( m ), the
maximum iteration times( max T ), the pheromone factor,
heuristic factor, evaporation factor of pheromone, pheromone
amount (Q), initial concentration of pheromone, initial
uniform probability and so on.
Step 2. Classification of cities.
These cities are divided into the centre city and boundary city
according to the geographic coordinate information of cities.
The classified result is saved and sorted in order to prepare for
the subsequent running of the IMVPACO algorithm.
Step 3. The m ants are randomly placed into n cities, and this
city is added into. Tabu list of the ant.
Step 4. For each ant, when Tabu table is not null, the selection
probability to the next city is calculated according to the
equation in the dynamic movement rules of ants. Then this
city is added into the Tabu list, and the pheromone is locally
updated.
Step 5. After the ants have completed a choice, the path length
is calculated. Then the respective Tabu list is modified. Repeat
Step 4 until the completed touring of the ant. The current
International Journal of Computational Intelligence Research (IJCIR). ISSN 0973-1873 Vol.14, No.1 (2018)© Research India Publications. http://www.ripublication.com
96
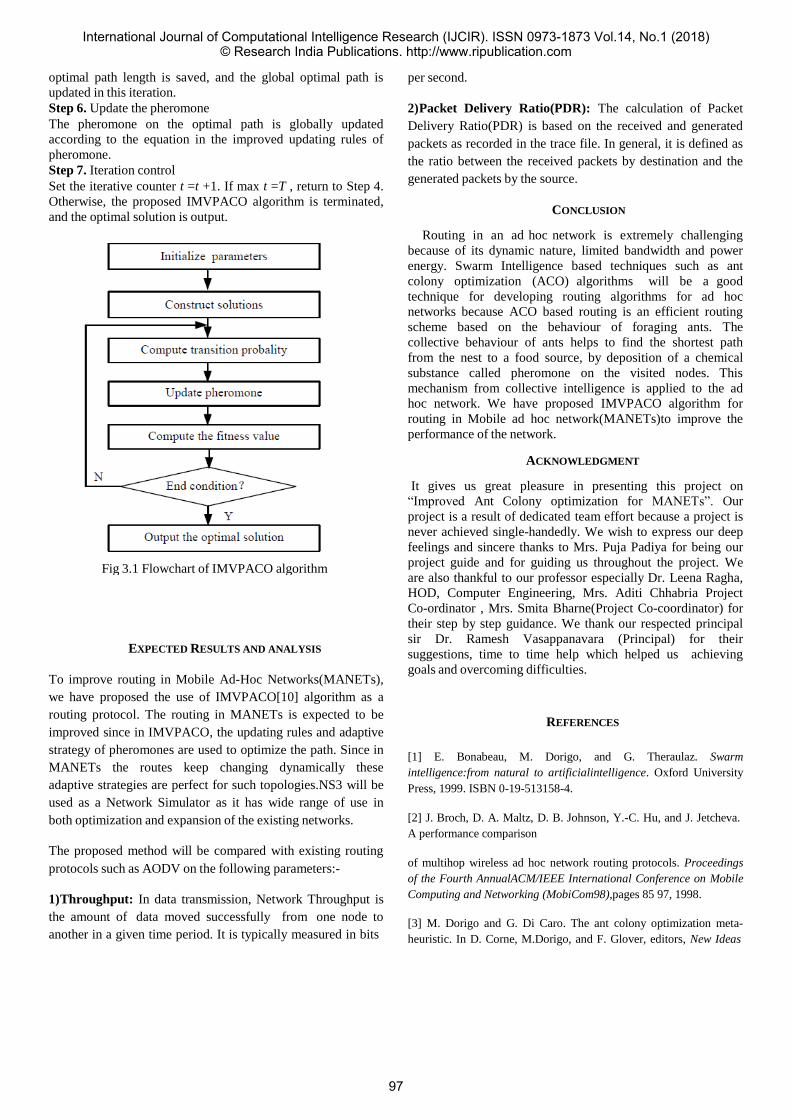
optimal path length is saved, and the global optimal path is
updated in this iteration.
Step 6. Update the pheromone
The pheromone on the optimal path is globally updated
according to the equation in the improved updating rules of
pheromone.
Step 7. Iteration control
Set the iterative counter t =t +1. If max t =T , return to Step 4.
Otherwise, the proposed IMVPACO algorithm is terminated,
and the optimal solution is output.
EXPECTED RESULTS AND ANALYSIS
To improve routing in Mobile Ad-Hoc Networks(MANETs),
we have proposed the use of IMVPACO[10] algorithm as a
routing protocol. The routing in MANETs is expected to be
improved since in IMVPACO, the updating rules and adaptive
strategy of pheromones are used to optimize the path. Since in
MANETs the routes keep changing dynamically these
adaptive strategies are perfect for such topologies.NS3 will be
used as a Network Simulator as it has wide range of use in
both optimization and expansion of the existing networks.
The proposed method will be compared with existing routing
protocols such as AODV on the following parameters:-
1) Throughput: In data transmission, Network Throughput is
the amount of data moved successfully from one node to
another in a given time period. It is typically measured in bits
per second.
2) Packet Delivery Ratio(PDR): The calculation of Packet
Delivery Ratio(PDR) is based on the received and generated
packets as recorded in the trace file. In general, it is defined as
the ratio between the received packets by destination and the
generated packets by the source.
CONCLUSION
Routing in an ad hoc network is extremely challenging
because of its dynamic nature, limited bandwidth and power
energy. Swarm Intelligence based techniques such as ant
colony optimization (ACO) algorithms will be a good
technique for developing routing algorithms for ad hoc
networks because ACO based routing is an efficient routing
scheme based on the behaviour of foraging ants. The
collective behaviour of ants helps to find the shortest path
from the nest to a food source, by deposition of a chemical
substance called pheromone on the visited nodes. This
mechanism from collective intelligence is applied to the ad
hoc network. We have proposed IMVPACO algorithm for
routing in Mobile ad hoc network(MANETs)to improve the
performance of the network.
ACKNOWLEDGMENT
It gives us great pleasure in presenting this project on
“Improved Ant Colony optimization for MANETs”. Our
project is a result of dedicated team effort because a project is
never achieved single-handedly. We wish to express our deep
feelings and sincere thanks to Mrs. Puja Padiya for being our
project guide and for guiding us throughout the project. We
are also thankful to our professor especially Dr. Leena Ragha,
HOD, Computer Engineering, Mrs. Aditi Chhabria Project
Co-ordinator , Mrs. Smita Bharne(Project Co-coordinator) for
their step by step guidance. We thank our respected principal
sir Dr. Ramesh Vasappanavara (Principal) for their
suggestions, time to time help which helped us achieving
goals and overcoming difficulties.
REFERENCES
[1] E. Bonabeau, M. Dorigo, and G. Theraulaz. Swarm
intelligence:from natural to artificialintelligence. Oxford University
Press, 1999. ISBN 0-19-513158-4.
[2] J. Broch, D. A. Maltz, D. B. Johnson, Y.-C. Hu, and J. Jetcheva.
A performance comparison
of multihop wireless ad hoc network routing protocols. Proceedings
of the Fourth AnnualACM/IEEE International Conference on Mobile
Computing and Networking (MobiCom98),pages 85 97, 1998.
[3] M. Dorigo and G. Di Caro. The ant colony optimization meta-
heuristic. In D. Corne, M.Dorigo, and F. Glover, editors, New Ideas
Fig 3.1 Flowchart of IMVPACO algorithm
International Journal of Computational Intelligence Research (IJCIR). ISSN 0973-1873 Vol.14, No.1 (2018)© Research India Publications. http://www.ripublication.com
97

in Optimization, pages 11-32. McGraw- Hill, London,1999.
[4] C. E. P. (Editor). Ad Hoc Networking. Addison-Wesley, 2001.
ISBN 0-201-30976-9.
[5] K. Fall and K. Varadhan. The ns Manual, Nov 2000.
[6] D. B. Johnson, D. A. Maltz, Y.-C. Hu, and J. G. Jetcheva. The
dynamic source routingprotocol for mobile ad hoc networks. IETF
Internet draft, draft-ietf-manet-dsr-04.txt, November2000.
[7] J. P. Macker and M. S. Corson. Mobile ad hoc networking and the
IETF. Mobile Computingand Communications Review,
2(1):914, 1998.
[8]C. E. Perkins and P. Bhagvat. Hihgly dynamic
destinationsequenced distnace-vector routing(dsdv) for mobile
computers.Computer Communications Rev., pages 234-244, October
1994.
[9] C. E. Perkins, E. M. Royer, and S. R. Das. Ad hoc ondemand
distance vector (aodv) routing.IETF Internet draft, draft-ietf-manet-
aodv-07.txt, November 2000.
[10]Ping Duan and Yong ai - “Research on an improved ant colony
optimization and its application”
[11] Anuj K. Gupta, Harsh Sadawarti, and Anil K. Verma –
”MANET Routing Protocols Based on Ant Colony Optimization
[12] Nabendu Chaki, Sugata Sanyal-“Ant Colony based Routing for
Mobile Ad-Hoc Networks towards Improved Quality of Services”
[13]http://www.iwr.uniheidelberg.de/groups/comopt/software/TSPLI
B95/
International Journal of Computational Intelligence Research (IJCIR). ISSN 0973-1873 Vol.14, No.1 (2018)© Research India Publications. http://www.ripublication.com
98

Health Monitoring and Disease Prediction System
Saurabh Gaikwad Chetan Ingle Pratik Shenoy
Department of Department of Department of
Computer Engineering Computer Engineering Computer Engineering
Ramrao Adik Institute of Technology Ramrao Adik Institute of Technology Ramrao Adik Institute of Technology
Navi Mumbai, Maharashtra 400706 Navi Mumbai, Maharashtra 400706 Navi Mumbai, Maharashtra 400706
Email: [email protected] Email: [email protected] Email: [email protected]
Mrugank Jadhav Shilpa Kolte Department of Department of
Computer Engineering Computer Engineering
Ramrao Adik Institute of Technology Ramrao Adik Institute of Technology
Navi Mumbai,Maharashtra 400706 Navi Mumbai,Maharashtra 400706 Email: [email protected] Email: [email protected]
Abstract—There has been a tremendous growth in medical
industry over the years, due to the advancement in technology and
an increase in health problems have been observed. Due to the
hectic and busy schedules of people has led to increased health
issues. But as almost everyone in recent times carries their
smartphones a healthcare android application can prove very
beneficial. The intention behind this project is to create an android
application which can be used by people for managing their health.
Prediction of whether a person will suffer from diabetes or not will
be obtained using decision trees. The user will have to answer a
questionnaire which will consist of various parameters regarding
the user’s health. This application will consist of features such as
Order medicines, Book doctor’s appointment, medications and diet
reminders. The classification models of decision tree resemble to
actual tree structure, with branches and leaves. The dataset is
divided into smaller branches which are subsets, the leaves store
the decision. The tree classifies the dataset considering the instances.
The value is in the branch which helps in classifying. Decision tree can
handle discrete and continuous data. The classification takes from root
node and continues till it reaches any rootnode.
Key word — data mining techniques, decision tree, C5
classifier, data sets
I. INTRODUCTION
Data mining is the method of examining huge pre-existing
databases for generation of new information. Diagnosing and
Predicting an individual’s health is an important goal of this
project. This goal can be attained by implementing advanced
machine learning algorithms of decision tree. An Android
application is one of the easy method for a person for health
management due to the increased use of smartphones. The
application will consist of a set of questions which the user will
have to answer. This will then immediately predict the
possibility if diabetes. Besides this the app will also consist of
features like diet monitoring where a user can monitor his/her
diet and the app will send notifications or reminders about the
same. Other features will be the provision the book
a doctor’s appointment. The app will also allow the user the
order medicines. Different factors like gender, age, blood
sugar level, cholesterol, hereditary disease and many other
factors are taken into consideration in this proposed system.
Thus to find out whether the user is prone to diabetes or not.
The main objective is predicting the occurrences of diabetes
and monitor a person’s health based on the answers provided
by the user of the questionnaire. Other features also include
diet monitoring, booking doctor’s appointment and ordering
medicines. There are many predictions algorithms used but
because of the parameter consideration or algorithm
inefficiency the accuracy is not so high. Hence, we are
considering many parameters and also using C5 Classifier
algorithm which gives a high accuracy.
The rest is divided into 7 sections. In section 2 and 3, related work and proposed work is presented paper is structured. In section 4, the proposed methodology is presented and details regarding the algorithm to be used is explained. In section 5, results obtained by implementing in python are discussed. The conclusion and future work is in section 6 and 7 respectively.
II. RELATED WORK
Health Monitoring Android Application and Diabetes
Prediction using Data Mining Techniques [1], in this paper the
authors have proposed a project which seeks to apply
information and to create an android application which can be
used by patients for management of their health care problems
and would thus enable them to have a good life. The
applications also creates a system for predicting whether a
person has a risk of developing the disease diabetes in the next
10 to 15 years. The system uses questionnaire method using
Naïve Bayes algorithm.
[2], in this, the authors have proposed such a system that
International Journal of Computational Intelligence Research (IJCIR). ISSN 0973-1873 Vol.14, No.1 (2018)© Research India Publications. http://www.ripublication.com
99

can predict heart disease occurrence with the help of neural
networks. This system is capable of predicting with an accuracy of 100%. The system considers 14 medical parameters like age, sex, BP, etc. Disease Predicting System Using Data Mining Techniques [3] have proposed a system
which also used data mining for better disease prediction. Classification, clustering, association rule mining are the different data mining techniques used to implement and find the different kinds of heart problems a patient can suffer from. Survey of Machine Learning Algorithms for Disease
Diagnostic [4] have provided us with the analysis of many algorithms of data mining which can be implemented on system that can predict diseases of heart, lungs, diabetes, dengue. C5.0 Algorithm has better feature selection and
reduced error pruning compared to all previous algorithms.
The best results are obtained by C5.0 classifier. C5.0 classifier has capacity to give output with greater accuracy and it also uses less space compared to other. Feature selection technique removes all the features which have no effect and which provide no important information. The over fitting problem of the decision tree is solved by the Reduced Error Pruning Technique.
TABLE I
Comparison of existing projects
Researc
h Paper
Data set
used
Methodology
used Limitations
Health
Monitoring Android
Application
and Diabetes Prediction
using Data
Mining Techniques
Gender, exercise smoking
, body type, alcohol,
prediabetes
and family
hereditary.
Naïve Bayes Classifier
Accuracy is not up to the mark,
as the simplest
algorithm is used.
A Data
Mining
Approach for Prediction of
Heart Disease
Using Neural Networks
Age, sex,
cholesterol
level, chest pain, heart
rate, blood
sugar, exercise,
blood
pressure, etc.
MPNN with
back
Propagation
As such no
limitation, the
algorithm with all parameters
results in almost
100% accuracy, but
only for heart
disease.
Disease Predicting
System Using
Data Mining Techniques
Age, sex, cholesterol
level, exercise,
chest pain, heart rate,
blood sugar.
MAFIA
(Maximal
Frequent
Item set Algorithm); C4.5
Algorithm; K-means
clustering
The datasets have a small
sample space.
94% accurate for a particular data
of a region.
Fig. 1. Comparison of existing projects
Decision trees can handle both classification and regression
problems. Decision trees require only a table of data with
which they will build a classifier directly. On the other hand,
Naive Bayes requires you build a classification by hand. If
given a bunch of tabular data, it will fail to pick the best
features which can be used to classify. Using C5 Classifier
Decision Tree the prediction will be done.
III. PROPOSED WORK
This application requires the user to answer a questionnaire
which will be related to symptoms of the patient and his habits.
This will be taken as input and by using decision trees algorithm
the possibility of diabetes can be predicted. The application has
a feature where the user can enter his/her diet. This app will
monitor it and give the required analysis. The medication
consumed by the user will also be monitored. The user can also
book a doctor’s appointment using this app. The details of the
appointment will be sent to the doctor.
The following are the modules of the system:
1. Prediction
2. Diagnosis
3. Diet plan
4. Reminders and alarm and
5. Ordering medicines.
The possibility of the user being prone to diabetes or not, will be accurately predicted by this system using prediction
algorithm computations. New users need to register themselves in order to create their respective accounts in
the system. Access to the system is provided to the user
through a login interface. The user can login using username and password on which the user will be directed
to the home page of the system. The user can then enter data
for prediction of diabetes. We are mainly focusing on Mellitus type of diabetes. The user can also use the
additional features like maintaining a diet, reminding of dosage, call for an appointment of a doctor, etc. The
following are the parameters which would be considered in
the data set for the prediction algorithm:
1. Gender
2. Age
3. BMI
4. Blood Pressure
5. Smoking
6. Weekly exercise
7. Consumption of Salty Food
8. Consumption of Alcohol
9. Work Stress
10. Family History of Blood Pressure/Diabetes
11. Pregnant (if female)
12. Blood fat level
13. Health food consumption
14. Fatty food consumption
The flow for prediction of diabetes will be:
International Journal of Computational Intelligence Research (IJCIR). ISSN 0973-1873 Vol.14, No.1 (2018)© Research India Publications. http://www.ripublication.com
100
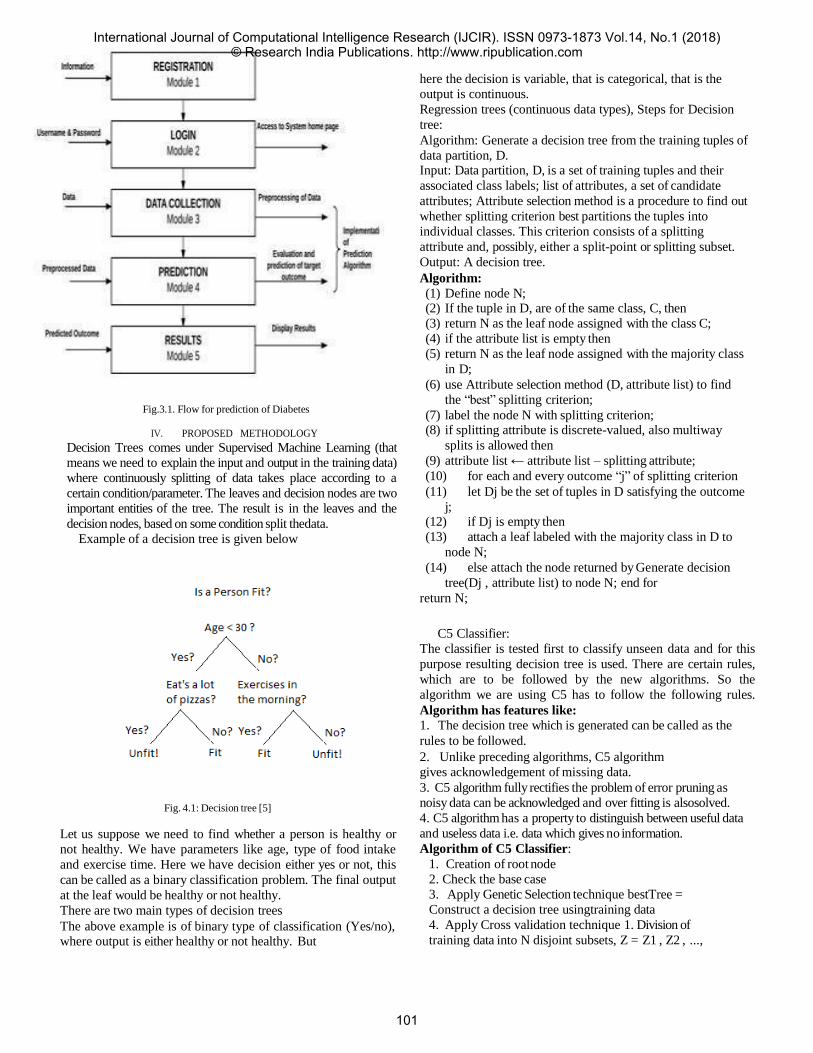
Fig.3.1. Flow for prediction of Diabetes
IV. PROPOSED METHODOLOGY
Decision Trees comes under Supervised Machine Learning (that
means we need to explain the input and output in the training data)
where continuously splitting of data takes place according to a
certain condition/parameter. The leaves and decision nodes are two
important entities of the tree. The result is in the leaves and the
decision nodes, based on some condition split thedata.
Example of a decision tree is given below
Fig. 4.1: Decision tree [5]
Let us suppose we need to find whether a person is healthy or
not healthy. We have parameters like age, type of food intake
and exercise time. Here we have decision either yes or not, this
can be called as a binary classification problem. The final output
at the leaf would be healthy or not healthy.
There are two main types of decision trees
The above example is of binary type of classification (Yes/no), where output is either healthy or not healthy. But
here the decision is variable, that is categorical, that is the
output is continuous.
Regression trees (continuous data types), Steps for Decision
tree:
Algorithm: Generate a decision tree from the training tuples of
data partition, D. Input: Data partition, D, is a set of training tuples and their
associated class labels; list of attributes, a set of candidate
attributes; Attribute selection method is a procedure to find out
whether splitting criterion best partitions the tuples into
individual classes. This criterion consists of a splitting
attribute and, possibly, either a split-point or splitting subset.
Output: A decision tree.
Algorithm:
(1) Define node N; (2) If the tuple in D, are of the same class, C, then
(3) return N as the leaf node assigned with the class C;
(4) if the attribute list is empty then
(5) return N as the leaf node assigned with the majority class
in D;
(6) use Attribute selection method (D, attribute list) to find
the “best” splitting criterion;
(7) label the node N with splitting criterion; (8) if splitting attribute is discrete-valued, also multiway
splits is allowed then
(9) attribute list ← attribute list – splitting attribute;
(10) for each and every outcome “j” of splitting criterion
(11) let Dj be the set of tuples in D satisfying the outcome
j; (12) if Dj is empty then
(13) attach a leaf labeled with the majority class in D to
node N;
(14) else attach the node returned by Generate decision
tree(Dj , attribute list) to node N; end for
return N;
C5 Classifier:
The classifier is tested first to classify unseen data and for this
purpose resulting decision tree is used. There are certain rules,
which are to be followed by the new algorithms. So the
algorithm we are using C5 has to follow the following rules.
Algorithm has features like: 1. The decision tree which is generated can be called as the
rules to be followed.
2. Unlike preceding algorithms, C5 algorithm
gives acknowledgement of missing data.
3. C5 algorithm fully rectifies the problem of error pruning as
noisy data can be acknowledged and over fitting is alsosolved.
4. C5 algorithm has a property to distinguish between useful data
and useless data i.e. data which gives no information.
Algorithm of C5 Classifier:
1. Creation of root node
2. Check the base case
3. Apply Genetic Selection technique bestTree =
Construct a decision tree usingtraining data
4. Apply Cross validation technique 1. Division of
training data into N disjoint subsets, Z = Z1 , Z2 , ...,
International Journal of Computational Intelligence Research (IJCIR). ISSN 0973-1873 Vol.14, No.1 (2018)© Research India Publications. http://www.ripublication.com
101
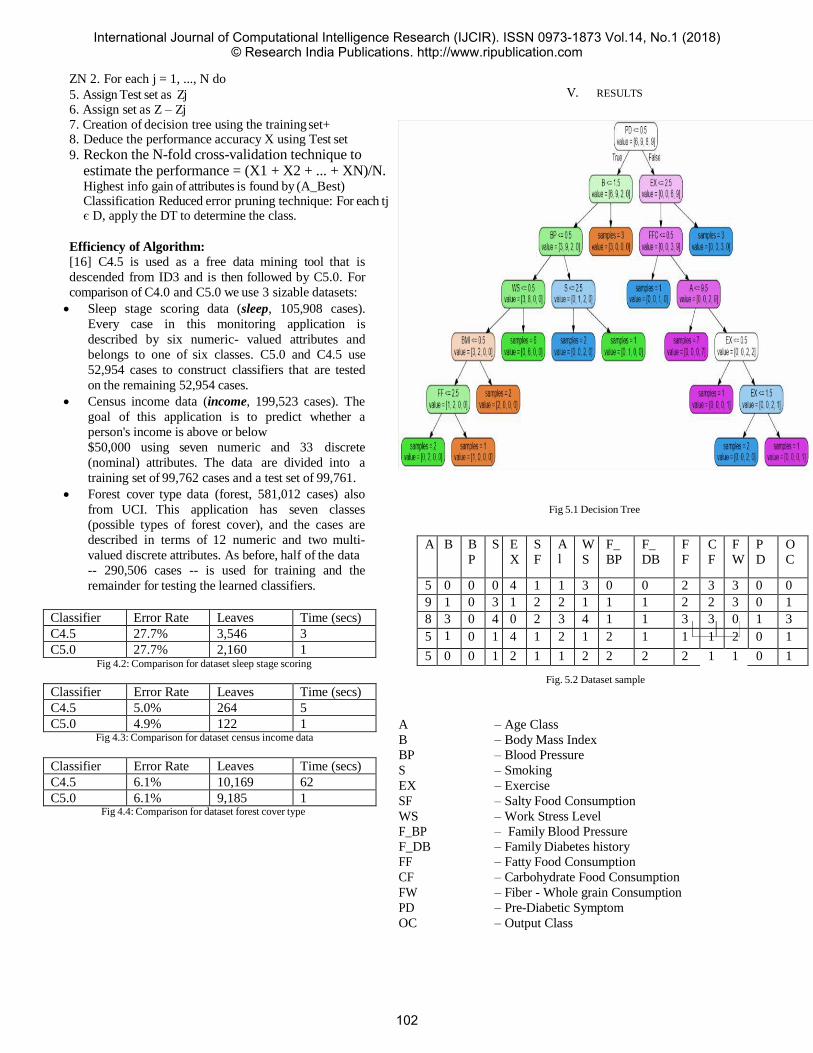
ZN 2. For each j = 1, ..., N do
5. Assign Test set as Zj 6. Assign set as Z – Zj 7. Creation of decision tree using the training set+ 8. Deduce the performance accuracy X using Test set
9. Reckon the N-fold cross-validation technique to estimate the performance = (X1 + X2 + ... + XN)/N. Highest info gain of attributes is found by (A_Best) Classification Reduced error pruning technique: For each tj є D, apply the DT to determine the class.
Efficiency of Algorithm: [16] C4.5 is used as a free data mining tool that is
descended from ID3 and is then followed by C5.0. For
comparison of C4.0 and C5.0 we use 3 sizable datasets:
Sleep stage scoring data (sleep, 105,908 cases).
Every case in this monitoring application is
described by six numeric- valued attributes and
belongs to one of six classes. C5.0 and C4.5 use
52,954 cases to construct classifiers that are tested
on the remaining 52,954 cases.
Census income data (income, 199,523 cases). The
goal of this application is to predict whether a
person's income is above or below
$50,000 using seven numeric and 33 discrete
(nominal) attributes. The data are divided into a
training set of 99,762 cases and a test set of 99,761.
Forest cover type data (forest, 581,012 cases) also
from UCI. This application has seven classes
(possible types of forest cover), and the cases are
described in terms of 12 numeric and two multi-
valued discrete attributes. As before, half of the data
-- 290,506 cases -- is used for training and the
remainder for testing the learned classifiers.
V. RESULTS
Fig 5.1 Decision Tree
Fig 4.2: Comparison for dataset sleep stage scoring
Fig 4.3: Comparison for dataset census income data
Fig 4.4: Comparison for dataset forest cover type
Fig. 5.2 Dataset sample
A – Age Class
B – Body Mass Index
BP – Blood Pressure
S – Smoking
EX – Exercise
SF – Salty Food Consumption
WS – Work Stress Level
F_BP – Family Blood Pressure
F_DB – Family Diabetes history
FF – Fatty Food Consumption
CF – Carbohydrate Food Consumption
FW – Fiber - Whole grain Consumption
PD – Pre-Diabetic Symptom
OC – Output Class
Classifier Error Rate Leaves Time (secs)
C4.5 27.7% 3,546 3
C5.0 27.7% 2,160 1
Classifier Error Rate Leaves Time (secs)
C4.5 5.0% 264 5
C5.0 4.9% 122 1
Classifier Error Rate Leaves Time (secs)
C4.5 6.1% 10,169 62
C5.0 6.1% 9,185 1
A B B
P
S E
X
S
F
A l
W
S
F_
BP
F_
DB
F
F
C
F
F
W
P
D
O
C
5 0 0 0 4 1 1 3 0 0 2 3 3 0 0
9 1 0 3 1 2 2 1 1 1 2 2 3 0 1
8 3 0 4 0 2 3 4 1 1 3 3 0 1 3
5 1 0 1 4 1 2 1 2 1 1 1 2 0 1
5 0 0 1 2 1 1 2 2 2 2 1 1 0 1
International Journal of Computational Intelligence Research (IJCIR). ISSN 0973-1873 Vol.14, No.1 (2018)© Research India Publications. http://www.ripublication.com
102

VI. CONCLUSION
This report provides the comparison of different systems for
disease prediction. We have studied various data mining and
machine learning algorithms and have come to the consensus
that Decision trees is the most efficient. The algorithm C5
classifier, which we are using predicts disease to a better extent.
The application is software specific, hence it is cost effective
and can be widely used. The application provides a diabetes
prediction system which would help the patients take
precautions and hence avoid or prevent the occurrence of
diabetes. The automated message facility for major fluctuations
of vital signs can be useful during the time of emergencies. The
application also helps in regulating the diet of a person and also
the remind him/her of medicines dosage. Hence the proposed
system will make the process of health care management quite
easy and efficient.
VII. FUTURE WORK
The current system only deals with the prediction of diabetes.
Using advance machine learning algorithms and data mining
the system can be updated for other diseases. The system can be
updated to take the patient’s blood report as an input and
determine the possible diseases or complications that may arise.
In the future, the concept of image processing can play an
important role in prediction of diseases, the patient’s health can
be predicted using images of the patient. There are also many
types of diabetes, as we have selected mellitus diabetes,
furthermore, applications can perform prediction of other types
of diseases using machine learning algorithm or image
processing. The application in near future can search hospitals
according to the area in which the user is located. It is impossible
to generate or get data set of all the existing individuals, but it
can happen that someone generates data set with many
parameters and data of almost every individual.
VIII. REFERENCES [1] A Data Mining Approach for Prediction of Heart Disease
Using Neural Networks (International Journal of Computer
Engineering and Technology (IJCET), Volume 3, Issue 3,
October-December 2012.
[2] Disease Predicting System Using Data Mining Techniques
(International Journal of Technical Research and Applications
e- ISSN: 2320-8163, Volume 1, Issue 5 (Nov-Dec 2013).
[3] Survey of Machine Learning Algorithms for Disease Diagnostic (Journal of Intelligent Learning Systems and Applications, 2017).
[4] C5.0 Algorithm to Improved Decision Tree with Feature
Selection and Reduced Error Pruning (International Journal of
Computer Applications (0975-8887), Volume 117 – No. 16,
May 2015). [5] www.xoriant.com/blog/product-engineering/decision-
trees- machine-learning-algorithm
[6]Data Mining: Concepts and Techniques, 3rd Edition by
Jiawei Han and Micheline Kamber.
[7]Introduction to Data Mining by Michael Steinbach, Pang –
Ning Tan, and Vipin Kumar.
[8] https://machinelearningmastery.com/blog/
[9] http://mlweekly.com/
[10] The Elements of Statistical Learning. Book by Jerome H. Friedman, Robert Tibshirani, and Trevor Hastie.
[11] Data Mining with Decision Trees: Theory and appliances.
Book by Oded Z. Maimon.
[12] The Decision Tree: How to Make Better Choices and Take
Control of Your Health. Book by Thomas Goetz
[13] https://www.tutorialspoint.com/data_mining/
[14] https://stackoverflow.com/questions/tagged/decision- tree
[15] https://www.smartdraw.com/decision-tree
[16] http://rulequest.com/see5-comparison.html
International Journal of Computational Intelligence Research (IJCIR). ISSN 0973-1873 Vol.14, No.1 (2018)© Research India Publications. http://www.ripublication.com
103

Malware Classification Using Machine Learning
Vijaykumar Ingle
Department of Computer Engineering
Ramrao Adik Institute of Technology
Nerul, Navi Mumbai 400706.
Amit Joshi
Department of Computer Engineering
Ramrao Adik Institute of Technology
Nerul, Navi Mumbai 400706.
Mrs. Smita Bharne
Department of Computer Engineering
Ramrao Adik Institute of Technology
Nerul, Navi Mumbai 400706.
Pavan Chanda
Department of Computer Engineering
Ramrao Adik Institute of Technology
Nerul, Navi Mumbai 400706.
Abhishek Nilajagi
Department of Computer Engineering
Ramrao Adik Institute of Technology
Nerul, Navi Mumbai 400706.
Abstract— Malwares are commonly found headache in almost
all the mobile phones, laptops, memory cards etc. Most common
technique used by malwares to avoid detection is binary
obfuscation either by either by using encryption. One of the
techniques used by malware to escape detection is binary
obfuscation either by encryption(polymorphism) or metamorphic
attacks (different code for the same functionality). For detecting
them quickly and effectively, we should group them in
accordance of their family. This gives rise to a growing need for
automated, self-learning, fast and efficient technique that will be
robust to these attacks. In this paper we only intent to classify the
malwares into their respective families and not detect them
(identify if they are malwares or not). A criterion of 500 counts of
an observed value is to be selected for our feature dataset which
will be used by our machine learning algorithms. In this paper
we focus on novel data visualization techniques like image
representation of the malwares and classification based on
Artificial Neural Networks and K-Nearest Neighbour.
Keywords— malwares, machine learning, malware classification,
malware analysis, k-Nearest Neighbours, Artificial Neural
Network.
I. INTRODUCTION
New signatures of malwares are generated daily, Symantec
report states corpus ranging from 169,323 new signatures in
2008 to 2.89 million in 2009 to 286 million in 2010 [9].
Because of this malware classification is important.
Malware analysis is usually done as ‘Static Analysis’,
‘Dynamic Analysis’ and also ‘signature based’. In static
analysis, the disassembly code files are analyzed for the
malicious system calls. A model is to be built for the control
flow graphs [12]. Whereas, in Dynamic malware analysis
technique, Data is analyzed in controlled environment and it’s
also traces (system logs). This mentioned process is extremely
slow and also resource and time consuming. Both of the
mentioned techniques work’s well, but static code analysis
suffers from malware implementation differences, while
dynamic malware analysis is limited to environment and the
malware triggering conditions, and hence it is also a scalable
option. To analyze the malware signature, the signature has to
be built using N-Gram techniques. The malware disassembly
is analyzed for the most repetitions of the op-codes, and N-
Grams are to be built on top of that [4] .
In order to visualize the data, we make use of malware
visualization techniques. We will convert every malware bytes
code to a grayscale image. Malwares from different families
have similarities in visual appearance, this is the basic
principle which is followed [1]. These images are to be use for
image based classification. OPCODE is to be calculated from
disassembly code.
II. OBJECTIVE
The purpose of this paper is to implement machine
learning algorithms in order to classify the malwares into their
respective families. Data is to be taken from www.kaggle.com
provided by Microsoft containing 10868 samples of malwares
belonging to total 9 different classes namely- files are from
nine different malware families, namely Ramnit, Lollipop,
Kelihos ver3, Vundo, Simda, Tracur, Kelihos ver1,
Obfuscator. ACY, and Gatak respectively. Objective here is to
analyze, visualize malwares and to parse data beforehand. So
the objective is to develop new integrated model which takes
advantage of all the models.
International Journal of Computational Intelligence Research (IJCIR). ISSN 0973-1873 Vol.14, No.1 (2018)© Research India Publications. http://www.ripublication.com
104

III. PROBLEM DEFINITION
Extensive work has been done in terms of analyzing
malwares. Static, Dynamic and Signature based malware
analyzing techniques have been researched in many papers.
A publication based on image based malware visualization
was one of the preferred way [1] it explains how to form an
image out of binary malware files, how to visualize those
images. In the alternate approach to extract data from
disassembly code, which could be used for classification [2]
data accuracy was not optimal. This paper suggests a way
to extract novel features based on N-Grams, code sections
and op-codes sequence and DLL calls. But even before we
could develop signatures for malwares certain tasks has to
be carried out within the scope of Malware detection and
classification.
IV. RELATED WORK
There has been extensive work done on analyzing
malwares. Many papers are published which denotes Static,
dynamic and signature based malware analyzing
techniques. A publication based on image based malware
visualization was one of the preferred way [1]. This paper
explains how to form an image out of binary malware files,
how to visualize those images. This, machines are used for
image based classifications. We also referred a paper which
defines how to extract data from disassembly code, which
could be used for classification. [2]. This paper suggests a
way to extract novel features based on N-Grams, code
sections and op-codes sequence and DLL calls. But even
before we could develop signatures for malwares certain
tasks has to be carried out within the scope of Malware
detection and classification.
91% of proposed accuracy was achieved using random
forest for Gray-Scale Format. The accuracy rate of 86%
was achieved for colored images and 91% for gray-scale
images using Random Forest algorithm[6].
Performance Analysis of Machine Learning and Pattern
Recognition Algorithms for Malware Classification paper
states every malware belonging to a family has a distinct
signature pattern. KNN performs the best with accuracy
rate of 96.6% among the classifiers in this project. Whereas
ANN performs satisfactorily with accuracy rate of 94.6%
[4].
Image Visualization Techniques are implemented to obtain
average predictive accuracy of 95% using Deep Neural
Network [2].
V. ANALYSIS
Research analysis indicates that Malware Images:
Visualization and automatic classification[1], Deep Neural
Network based Malware Detection Using 2-D Binary
Programs features [2], Machine learning based Malware
Classification for Android Applications using Multimodal
Image Representations[3] are the methodologies for the
Malware classification. By analyzing the performance of
these models on standard dataset it is found that in case of
missing data multi-layer perception model and logic
regression is also good. So the objective is to develop new
integrated model which takes advantage of all the models.
Image Visualization Techniques are implemented to obtain
average predictive accuracy of 95% using Deep Neural
Network. We also found that the method gives optimal
result. Whereas in the Machine learning based Malware
Classification for Android Applications using Multimodal
Image Representations [3] is bit slow, when it comes to
data processing.
VI. PROPOSED METHODOLOGY
To analyze the signature, the signature is built from N-
Gram techniques. The malware disassembly is analyzed for
the most repetitions of the op-codes, and N-Grams are built
on top of that. We propose to use malware visualization
techniques. We aim to convert every malware bytes code to
a grayscale image. In research and analysis it was observed
that malwares from different families have similarities in
visual appearance, presenting us an opportunity to exploit
this weakness. These malware images will be used for
image based classification. From the disassembly code, we
will compute the OP-CODE counts, DLLs and section
count from assembly codes provided. The top features
parsed out of all the assembly files were used for
classification of the malwares. A criterion of 500 counts of
an observed value is to be selected for our feature dataset
which will be used by our machine learning algorithms
[11]. These different parsed data sets would be used for
classification, done on MATLAB’s machine learning
toolbox. In this paper, we have described the data
visualization methods, parsing, selection of classification
algorithms, and the outputs expected. We will be using
testing and training data provided at Kaggle.com [8].
We will try to tune the hidden nodes in ANN[7] and
distance K-values in KNN to get best performance. We will
also try different number of hidden layers to obtain highest
accuracy on classification of data. ANN algorithm with
different variable size will observe the results [10]. We will
try KNN with different neighboring values and distances.
For this we will use data files obtained from disassembly
files and the images (grayscale).
We will analyze the performance of KNN algorithm for
different neighbor. Learning rate is 0.5. We used random
values for training dataset.
Total iterations are 1500. Variable Hidden layer and
sizes. 100 used for best players. Learning rate is equal to
0.5.
A. Data Visualization
As suggested in malware image generation and
classification technique, every byte of data is converted into a
grayscale pixel. The array or the byte stream was converted in
to an image [1]. Image representation of the malwares,
produce a very convincing images of malware. The
polymorphic malwares appear similar with slight deviation of
the code segments. Segments/fragments from the binary file.
International Journal of Computational Intelligence Research (IJCIR). ISSN 0973-1873 Vol.14, No.1 (2018)© Research India Publications. http://www.ripublication.com
105

From the figure (3), the parts of the sections can be observed.
The .text segment contains all the code and the zero padding.
Figure 2: Segregation of malware image [1]
The .rdata segment contains all the constants. The .data
segment contains all the data, which is initialized. The .Rsrc
section involves icons of the files. The author of [1] also
managed to obtain various pictures from this segments on his
test data. In our observation, we did not get any icons from/for
the malwares. Every class of data provided unique texture to
the image, which helped features selection.
Figure 3: Conversion into grayscale image [1]
highest valued features. Top valued 321 frequencies as
features are to be selected. This model is hybrid data retrieval
model [4]. We will obtain an open BSD licensed parser
written in python code which does this same.
VII. DESIGN OF A SYSTEM
The figure (4) shows the proposed flowchart of the system we
Fig 4: Proposed Working Flowchart
are proposing for classification of malwares based on machine
learning.
B. Data Parsing
The malware binary files will be converted to a grayscale
image. Since these images are variable and very high at
dimensions. We at first will shrink the images in direction to a
constant small dimensional image. We will also use python’s
numpy library for the image formation and reducing the
dimension size. One these small images, we computed gist to
summarize the gradient information of the images. Gist
computes Gabor filter’s which are similarity measures of
texture in images and as malwares produced, similar textures
in images, these features could be used as data. From the
disassembly, extracted are all the lines of code segments, all
the op-codes and the DLL calls. After the extraction,
summation is to be performed on all the columns to see the
VIII. PROPOSED RESULTS AND ANALYSIS
We will try running ANN with Various Different Neighboring
values and distances. For this we will use both the data files
we obtained, i.e. one from the disassembly file and one from
the images Fig. 3. ANN tuning on disassembly data [1]. ANN
tuning on image data [1] We compiled the same on
MATLAB’s tool box for 10 folds, and the results obtained
were as follows: We wrote a MATLAB code to analyze the
performance of KNN algorithm for different Neighbor values
and the distances From the tuning data obtained, we got least
objective function value for Cityblock, and with distance 1, on
image data. From the code we developed, and we got 91.26%
accuracy. It is very close to the output we obtained from
machine learning toolbox on Matlab. From the tuning data
obtained, we got least objective function value for Sphereman,
International Journal of Computational Intelligence Research (IJCIR). ISSN 0973-1873 Vol.14, No.1 (2018)© Research India Publications. http://www.ripublication.com
106

and with distance 1, on .asm data. From the code we
developed, and we got 98.8% accuracy. It is also very close to
the output we obtained from machine learning toolbox on
MATLAB.
IX. EXPECTED PROJECT OUTCOMES
We will be able to understand the functioning of different
machine learning algorithms and also deduce which one of
them produces optimal results. We will also learn novel data
extraction techniques to convert malware files into grey scale
images and classify them into their respective families based
upon their signatures. This Project would be very beneficial
for AV vendors as it is a self-learning and automated
classification process.
X. CONCLUSION
Amongst the classifiers mentioned in this paper we hope to
achieve optimal results from ANN. We will study analyze and
compare two machine learning algorithm techniques i.e. ANN
and KNN algorithms. The desirable result’s to be expected
from ANN would be around 95% in terms of accuracy. We
plan to achieve better results using ANN using Novel data
extraction techniques. This is due to the fact that images
obtained from the malware files from same family is so
similar that the distance between them is similar. In case of
greater distance files different families are considered. We are
also hopeful to get a detection rate of 91% along with False-
positive rate of 0.1%. Apart from this our approach needs
modest computation to perform and also to analyze. It also
comes to attention that dataset can be trained to automatically
classify malwares into their respective families on the basis of
the given or self-defined parameters.
XI. FUTURE WORK/EXTENSION
We plan to implement Xgboost and ensembles to combine
the result of different models we tried, which gave best results.
Also, there is a possibility to work around on the dis-assembly
code, and simulate the malwares in controlled environment.
We can collect the system calls and the logs could be used as
another data set. With all, this could be combined with the
other models for the ensembles. Also, we can try to extract N-
Grams from the hex data, and this could be combined with
data obtained from dis-assembly code to build a training data
set. As per the publications, this should produce better result.
ACKNOWLEDGMENT
We take this opportunity to express our deep regards
to those who offered their invaluable guidance throughout the
making of this paper.
Amongst all others, we express our gratitude towards our
respected Principal Dr.Ramesh Vasappanavara and the Head
Of Department for Computer Engineering, Mrs.Leena Ragha
for their mentorship, guidance and immense co-operation.
Also, this paper would not have been possible without the
guidance of our Internal Project Guide Mrs. Smita Bharne,
who helped us at every step during our paper research and
writing through her enriching and vast knowledge and
experience in our paper domain.
REFERENCES
[1] Nataraja, S. Karthikeyan, G. Jacob, B. S. Manjunath,“Malware
Images: Visualization and Automatic Classification” in Proceedings of
VizSec, 2011.
[2] Mansour Ahmadi, Mansour Ahmadi,Stanislav Semenov, Mikhail
Trofimov and Giorgio Jacinto, “Novel Feature Extraction, Selection and Fusion for Effective Malware Family Classification” in IEEE 2012
[3] Mohammad M. Masud, Latifur Khan, BhavaniThuraisingham, “A
scalable multi-level feature extraction technique to detect maliciousexecutables” in IEEE 2015. K. Elissa, “Title of paper if
known,” unpublished.
[4] Barath Narayanan Narayanan, OubotiDjaneye-Boundjou and
Temesguen M. Kebede, “Performance Analysis of Machine Learning and Pattern Recognition
Algorithms for Malware Classification” in IEEE Feb16, 2017
[5] Sarvam, Blog online available at http://sarvam.ece.ucsb.edu
[6] Ajit Kumar, K Pramod Sagar, K. S. Kuppusamy, “Machine learning
based Malware Classification for Android Applications using Multimodal Image Representations” in IEEE Nov 3, 2016
[7] Resources available online at the following
https://www.analyticsvidhya.com/blog/2014/10/ann-work-simplif
[8] Microsoft Malware Classification Challenge By Kaggle.com Forums available at https://www.kaggle.com/c/malware-classification/discussion
[9] Symantec Global Internet Security Threat Report, April 2010.
[10] Reference Book- Neural Network Design by Martin T. Hagan.
[11] Resources available online at the following https://devblogs.nvidia.com/malware-detection-neural- networks/
[12] Aziz Makandar, Anita Patrot, “ Malware analysis and classification
using Artificial Neural Network”in IEEE 2016.
International Journal of Computational Intelligence Research (IJCIR). ISSN 0973-1873 Vol.14, No.1 (2018)© Research India Publications. http://www.ripublication.com
107

Car Parking System
Suyash Sangale
K. J. Somaiya Institute of Engineering
& Information technology,
Affiliated to Mumbai University
Sanjana Dubey
K. J. Somaiya Institute of Engineering
& Information technology,
Affiliated to Mumbai University
Prachi Bhanushali
K. J. Somaiya Institute of Engineering
& Information technology,
Affiliated to Mumbai University
Prof. Vaishali Gaikwad
K. J. Somaiya Institute of Engineering
& Information technology,
Affiliated to Mumbai University
Abstract- The rapid increase of vehicles is causing the
problem of unavailability of parking space. Most of the
times we struggle to find free parking space and have to go
through a lot of slots to find one available space .It is a
time consuming process and needs a fully automated
parking system which not only regulates parking in a
given area but also keeps the manual intervention to
minimum. The car arriving at the entrance will be stopped
at the main gate. Only after the verification of the QR code
the car would be allowed to enter the premise. The user
has given one more option of parking the car without
using the android app i.e. by using the offline option, the
user can enter his details into the console and get
registered at that time itself. Our system has two main
modules i.e. identification module and slot checking
module. Identification module identifies the visitor. Slot
checking module checks the slot status. Once the user gets
authenticated the Boom Barrier will get open according to
the input forwarded. This will save the time of users
looking out for parking space.
Keywords- Android application, QR code, Automobiles,
Google Maps, GCM.
I. INTRODUCTION
We visit a lot of public places on various occasions.
Places like 4-star, 5-star hotels, shopping malls, cinema halls,
etc. We face a lot of problem at these places for finding the
availability of parking space. Most of the times we struggle to
find free parking space and have to go through a lot of slots to
find one available space. The problem is much more serious
with multi-storeyed. Therefore, it is a time consuming process
and we need to a fully automated parking system which not
only regulate sparking in a given area but also keeps the
manual intervention to minimum.
Our project presents a fully automated car parking
system which lets the user find a free space and also regulates
the number of cars that can be parked in a given space.
When the user arrives at the gate, the user has to
register to our system through an android application. Upon
registration the user data will be passed on to the
administrator. The administrator is responsible for generating
the QR code. This QR code is responsible for validating the
user. The user can choose an available location for parking the
vehicle but the main entry will be allowed only after the user
has verified his QR code at the entrance. Otherwise the sensor
will deny access.
The user has given one more option of parking the
car without using the android app i.e. by using the offline
option, the user can enter his details into the console and get
registered at that time itself.
Use of QR code:
QR code is nothing but a type of barcode. It is used
to provide access to information in an easy way. The mobile
user opens the barcode reader app and points it towards the
QR code for scanning it and using it for various purposes.
Use of Google Cloud Messaging:
Google Cloud Messaging (commonly referred to as
GCM) is a service which was developed by Google. It is used
for mobile notification that enables third-party application
developers to send notification data or information. It is
available to developers for free. The data or the information
can be send from developer-run servers to applications that
target the Google Android Operating System, as well as
applications or extensions developed for the Google Chrome
internet browser.
.
The paper is categorized intro several modules. The I module
presents the introduction of our project. Giving details on how
and why our car parking system is useful. The II module is
International Journal of Computational Intelligence Research (IJCIR). ISSN 0973-1873 Vol.14, No.1 (2018)© Research India Publications. http://www.ripublication.com
108
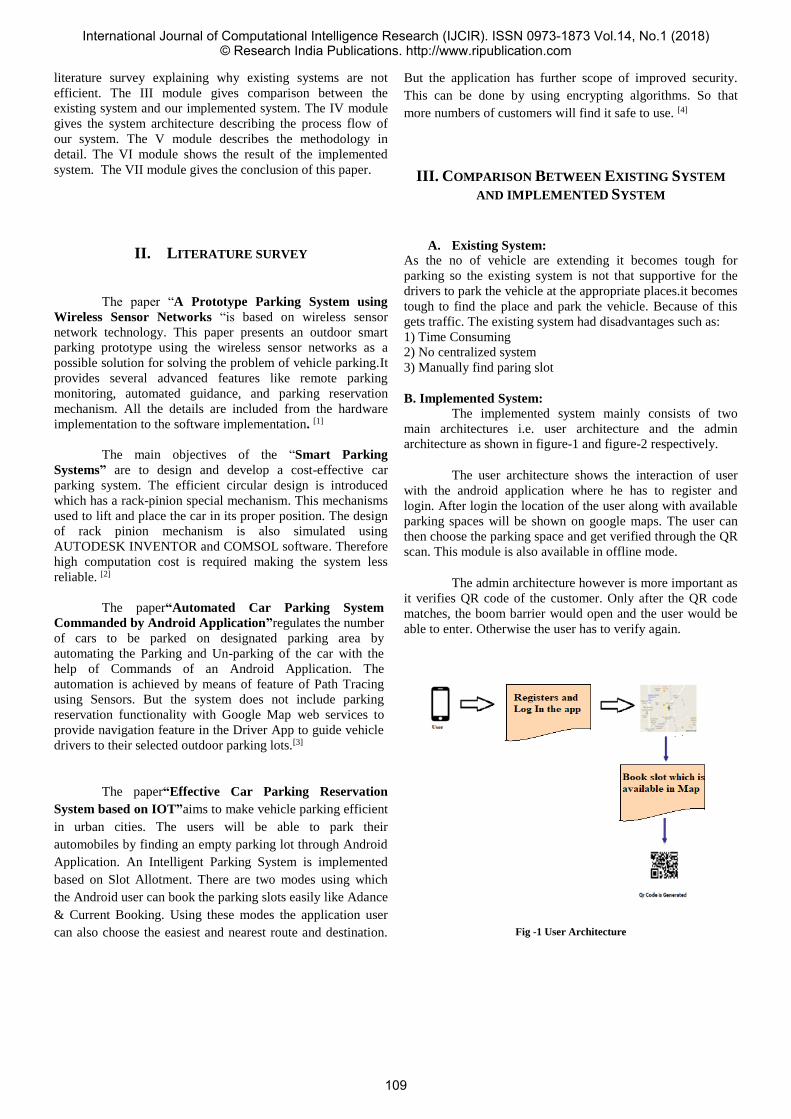
literature survey explaining why existing systems are not
efficient. The III module gives comparison between the
existing system and our implemented system. The IV module
gives the system architecture describing the process flow of
our system. The V module describes the methodology in
detail. The VI module shows the result of the implemented
system. The VII module gives the conclusion of this paper.
II. LITERATURE SURVEY
The paper “A Prototype Parking System using
Wireless Sensor Networks “is based on wireless sensor
network technology. This paper presents an outdoor smart
parking prototype using the wireless sensor networks as a
possible solution for solving the problem of vehicle parking.It
provides several advanced features like remote parking
monitoring, automated guidance, and parking reservation
mechanism. All the details are included from the hardware
implementation to the software implementation. [1]
The main objectives of the “Smart Parking
Systems” are to design and develop a cost-effective car
parking system. The efficient circular design is introduced
which has a rack-pinion special mechanism. This mechanisms
used to lift and place the car in its proper position. The design
of rack pinion mechanism is also simulated using
AUTODESK INVENTOR and COMSOL software. Therefore
high computation cost is required making the system less
reliable. [2]
The paper“Automated Car Parking System
Commanded by Android Application”regulates the number
of cars to be parked on designated parking area by
automating the Parking and Un-parking of the car with the
help of Commands of an Android Application. The
automation is achieved by means of feature of Path Tracing
using Sensors. But the system does not include parking
reservation functionality with Google Map web services to
provide navigation feature in the Driver App to guide vehicle
drivers to their selected outdoor parking lots.[3]
The paper“Effective Car Parking Reservation
System based on IOT”aims to make vehicle parking efficient
in urban cities. The users will be able to park their
automobiles by finding an empty parking lot through Android
Application. An Intelligent Parking System is implemented
based on Slot Allotment. There are two modes using which
the Android user can book the parking slots easily like Adance
& Current Booking. Using these modes the application user
can also choose the easiest and nearest route and destination.
But the application has further scope of improved security.
This can be done by using encrypting algorithms. So that
more numbers of customers will find it safe to use. [4]
III. COMPARISON BETWEEN EXISTING SYSTEM
AND IMPLEMENTED SYSTEM
A. Existing System:
As the no of vehicle are extending it becomes tough for
parking so the existing system is not that supportive for the
drivers to park the vehicle at the appropriate places.it becomes
tough to find the place and park the vehicle. Because of this
gets traffic. The existing system had disadvantages such as:
1) Time Consuming
2) No centralized system
3) Manually find paring slot
B. Implemented System:
The implemented system mainly consists of two
main architectures i.e. user architecture and the admin
architecture as shown in figure-1 and figure-2 respectively.
The user architecture shows the interaction of user
with the android application where he has to register and
login. After login the location of the user along with available
parking spaces will be shown on google maps. The user can
then choose the parking space and get verified through the QR
scan. This module is also available in offline mode.
The admin architecture however is more important as
it verifies QR code of the customer. Only after the QR code
matches, the boom barrier would open and the user would be
able to enter. Otherwise the user has to verify again.
Fig -1 User Architecture
International Journal of Computational Intelligence Research (IJCIR). ISSN 0973-1873 Vol.14, No.1 (2018)© Research India Publications. http://www.ripublication.com
109
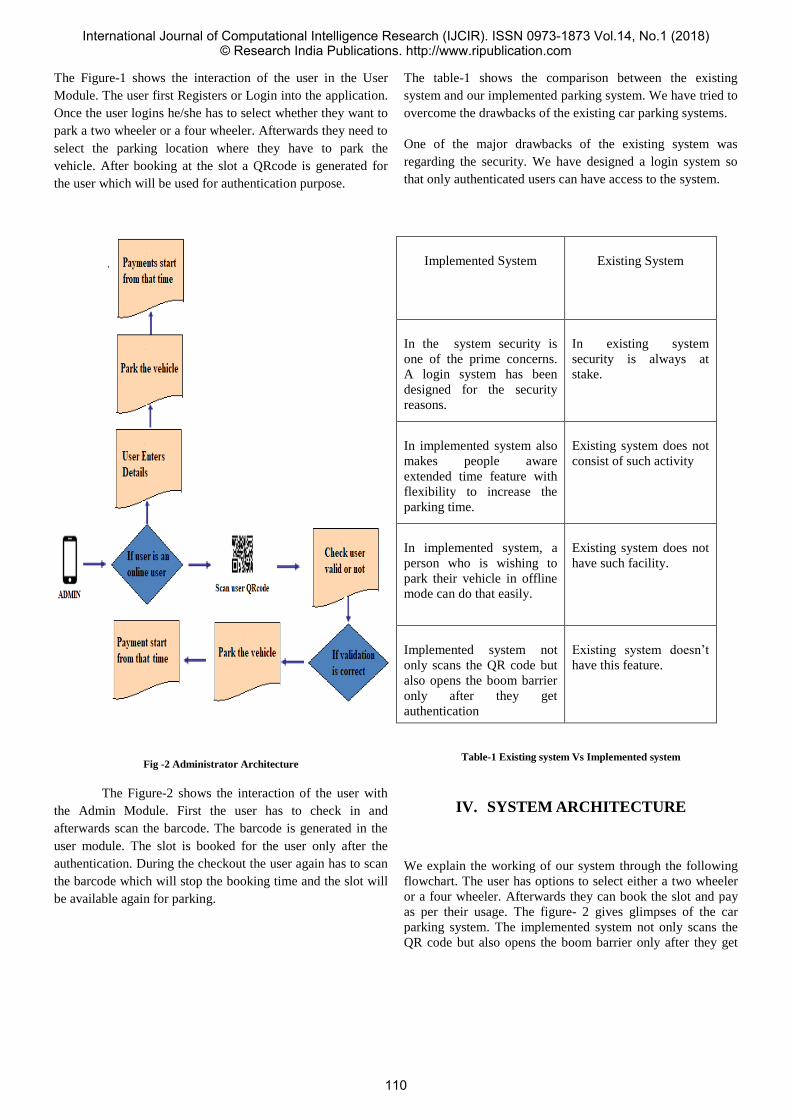
The Figure-1 shows the interaction of the user in the User
Module. The user first Registers or Login into the application.
Once the user logins he/she has to select whether they want to
park a two wheeler or a four wheeler. Afterwards they need to
select the parking location where they have to park the
vehicle. After booking at the slot a QRcode is generated for
the user which will be used for authentication purpose.
Fig -2 Administrator Architecture
The Figure-2 shows the interaction of the user with
the Admin Module. First the user has to check in and
afterwards scan the barcode. The barcode is generated in the
user module. The slot is booked for the user only after the
authentication. During the checkout the user again has to scan
the barcode which will stop the booking time and the slot will
be available again for parking.
The table-1 shows the comparison between the existing
system and our implemented parking system. We have tried to
overcome the drawbacks of the existing car parking systems.
One of the major drawbacks of the existing system was
regarding the security. We have designed a login system so
that only authenticated users can have access to the system.
Implemented System Existing System
In the system security is
one of the prime concerns.
A login system has been
designed for the security
reasons.
In existing system
security is always at
stake.
In implemented system also
makes people aware
extended time feature with
flexibility to increase the
parking time.
Existing system does not
consist of such activity
In implemented system, a
person who is wishing to
park their vehicle in offline
mode can do that easily.
Existing system does not
have such facility.
Implemented system not
only scans the QR code but
also opens the boom barrier
only after they get
authentication
Existing system doesn’t
have this feature.
Table-1 Existing system Vs Implemented system
IV. SYSTEM ARCHITECTURE
We explain the working of our system through the following
flowchart. The user has options to select either a two wheeler
or a four wheeler. Afterwards they can book the slot and pay
as per their usage. The figure- 2 gives glimpses of the car
parking system. The implemented system not only scans the
QR code but also opens the boom barrier only after they get
International Journal of Computational Intelligence Research (IJCIR). ISSN 0973-1873 Vol.14, No.1 (2018)© Research India Publications. http://www.ripublication.com
110
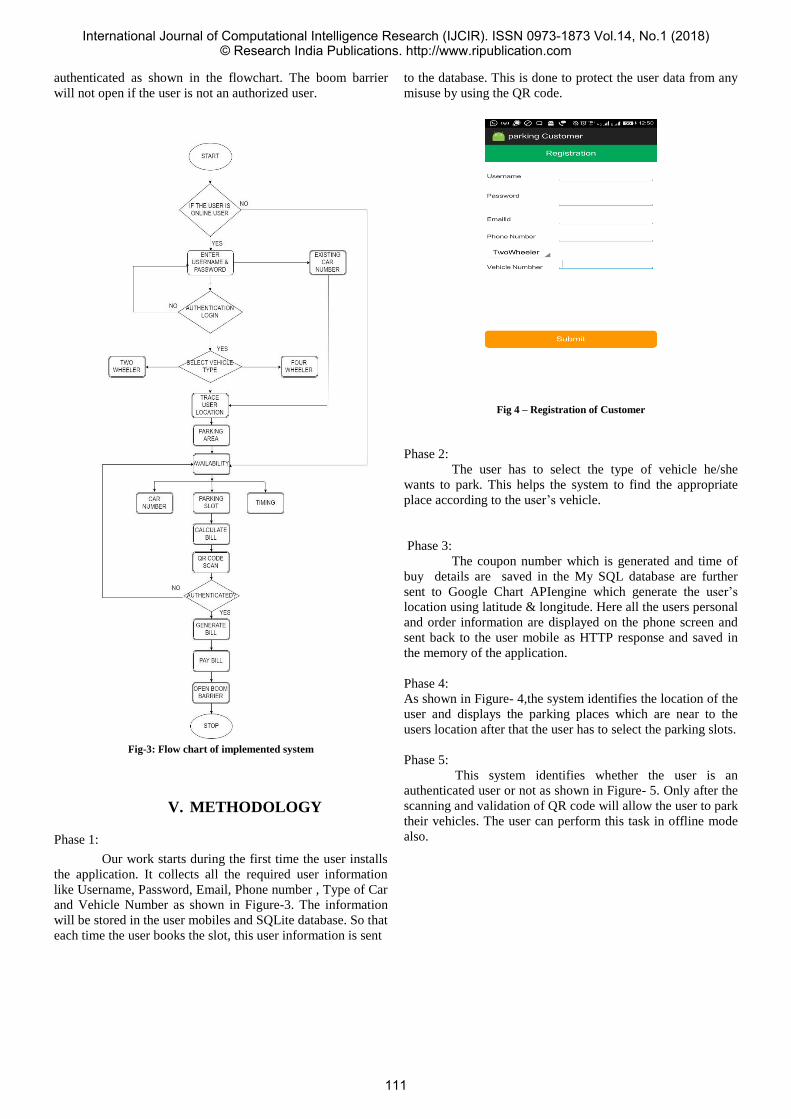
authenticated as shown in the flowchart. The boom barrier
will not open if the user is not an authorized user.
Fig-3: Flow chart of implemented system
V. METHODOLOGY
Phase 1:
Our work starts during the first time the user installs
the application. It collects all the required user information
like Username, Password, Email, Phone number , Type of Car
and Vehicle Number as shown in Figure-3. The information
will be stored in the user mobiles and SQLite database. So that
each time the user books the slot, this user information is sent
to the database. This is done to protect the user data from any
misuse by using the QR code.
Fig 4 – Registration of Customer
Phase 2:
The user has to select the type of vehicle he/she
wants to park. This helps the system to find the appropriate
place according to the user’s vehicle.
Phase 3:
The coupon number which is generated and time of
buy details are saved in the My SQL database are further
sent to Google Chart APIengine which generate the user’s
location using latitude & longitude. Here all the users personal
and order information are displayed on the phone screen and
sent back to the user mobile as HTTP response and saved in
the memory of the application.
Phase 4:
As shown in Figure- 4,the system identifies the location of the
user and displays the parking places which are near to the
users location after that the user has to select the parking slots.
Phase 5:
This system identifies whether the user is an
authenticated user or not as shown in Figure- 5. Only after the
scanning and validation of QR code will allow the user to park
their vehicles. The user can perform this task in offline mode
also.
International Journal of Computational Intelligence Research (IJCIR). ISSN 0973-1873 Vol.14, No.1 (2018)© Research India Publications. http://www.ripublication.com
111

Fig 5 – Slot booking using Google API’s
Fig 6- QRcode Generation
Phase 6:
This module will finally calculate the time and
generate the bill according to the time. The user can also
extend the booking time. A lot of times, user do not know in
advance how much time they will spend at a particular
location. Our application comes in handy. The user will scan
the QR code and pay the bill. This becomes easy and reduces
the time.
Phase 7:
Once the user is authenticated by scanning the
QRcode then the boom barrier will opened. If not then the
user has to again try to get authenticated. The boom barrier
will not open if the user is not an authorized user.
VI. RESULT
Our implemented system helps in reduction of time for
obtaining the available parking space. This in turn helps in
reduction of vehicle pollution. The figure- 7 and figure- 8
gives a sneak peek of our system’s results.
Figure- 7 shows various options provided to the
customers. They can view the available parking slots, QRcode
as well as the payment details. The customer can also avail the
parking space for extended time using this interface.
Fig 7- Parking Customer Interface
Figure- 8 shows the balance details of the customer.
The customers can check and update the balance in their
account according to their convenience.
Fig 8- Balance Details Interface
International Journal of Computational Intelligence Research (IJCIR). ISSN 0973-1873 Vol.14, No.1 (2018)© Research India Publications. http://www.ripublication.com
112
VI. CONCLUSION
The searching for the availability of parking space is
a major problem faced by many people today. Our
implemented system built an Android App would reduce the
human intervention to the minimal and also save the time of
users looking out for available space to park. They don’t have
to manually drive through each slot and waste their time. The
application is not only beneficial in urban areas but also will
be useful in various remote areas..
Our implemented system resolves problem of traffic
congestion by automating the car parking. The system can
regulate and manage the number of cars that can be parked in
a given space at any given time based on the availability of
parking spot.
The existing car parking systems are not efficient.
This is because they require human interaction with the
application. This major drawback has been resolved in our
implemented system. We have built our system in such a way
that it is least human dependent.
VII. REFERENCES
[1] Mr.P.Vijay Kumar,Siddarth T.S Asst. Prof. (Sr.G)
Department“A Prototype Parking System using Wireless
Sensor Networks” , SRM University,Chennai, India. – Vol2.
No1. ISSN: 0976–1349 July – Dec 2010
[2]M.O. Reza, M.F. Ismail, “Smart Parking System with
Image Processing Facility” , A.A. Rokoni, M.A.R. Sarkar
DOI: 10.5815/ijisa.2012.03.06
[3]Prof. D. J. Bonde , Rohit S. Shende, Ketan S. Gaikwad,
Akshay S. Kedari,Amol U. Bhokre“Automated Car Parking
System Commanded by Android Application”, Vol. 5 (3) ,
2014, 3001-3004.
[4]P. Sheelarani* ,S. Preethi Anand1 , S. Shamili2 , K.
Sruthi3“Effective Car Parking Reservation System Based
On Internet of Things Technologies”, 2016 World
Conference on Futuristic Trends in Research and Innovation
for Social Welfare (WCFTR’16)
[5]Shah Alam,“Mobile Outdoor Parking Space Detection
Application”, 2017 IEEE 8th Control and System Graduate
Research Colloquium (ICSGRC 2017), 4 - 5 August 2017,
Malaysia.
[6]Shyam Ravishankar Nrithya Theetharappan, “Cloud
Connected Smart Car Park”, Tamil Nadu, India.
International conference on I-SMAC (IoT in Social, Mobile,
Analytics and Cloud) (I-SMAC 2017)
[7] International Symposium on V.W. S. Tang, Y. Zheng,
Sensor Networks Proceedings of the 1st and J. Cao, "An
Intelligent Car Park Management System based on
Wireless Pervasive Computing and Applications”, pp. 65-
70, Aug 2006.
[8] Jermsurawong J., Ahsan, M., et al. (2012) “Car Parking
Vacancy Detection and Its Application in 24-Hour
Statistical Analysis.” 10th International Conference on
Frontiers of Information Technology, Islamabad, 17-19
December 2012, 84-90.
[9] M. Ataur Rehman, M.M. Rashid, A. Musa, A. Farhana and
N. Farhana, "Automatic parking management and parking
fee collection based On Number Plate Recognition",
International Journal of Machine Learning and Computing,
vol. 2, no. 2, pp. 93-98, 2012.
[10] Jae KyuSuhr · Ho Gi Jung · Kwang hyuk Bae Jaihie Kim
(2010) “Automatic free parking space detection by using
motion stereo-based 3D reconstruction”, Machine Vision
and Applications 21: 163–176DOI10.1007/s00138-008- 0156-
9.
[11] Hongwei Wang, Wenbo He, "A Reservation-based
Smart Parking System", The First International Workshop
on Cyber-Physical Networking system IEEE, pp. 701-706,
2011.
[12] Norazwinawati Basharuddin, R. Yusnita, Fariza Norbaya,
"Intelligent Parking space detection system based on
image Processing”, Internation Journal of Innovation,
Management and Technology, vol. 3, no. 3, pp. 232-253,
2012.
[13] E. Maeda, K. lshii, "Evaluation of Normalized
Principal Component Features in Object
Detection", IEICE Trans. Information and Systems, vol. J75-
D-11, no. 3, pp. 520-5?9, 1992.
[14]Pijush Kanti Babu,Kousik MandalJatindra Bimal
Mukherjee, (2006) “Coin Operated Automatic Car Parking
System”, A note on car parking. (pp 1, 2, 6).
[15] I. Masaki, "Machine-vision systems for intelligent
transportation systems", IEEE Conference on Intelligent
Transportation System, vol. 13, no. 6, pp. 24-31, 1998.
[16] Jung-Ho Moon, Tae Kwon Ha, "A Car Parking
Monitoring System Using Wireless Sensor
Networks", International Journal of Electrical Robotics
Electronics and Communications Engineering, vol. 7, no. 10,
2013.
International Journal of Computational Intelligence Research (IJCIR). ISSN 0973-1873 Vol.14, No.1 (2018)© Research India Publications. http://www.ripublication.com
113
Result Accuracy Authentication of Outsourced
Frequent Itemset Mining
Prof. Sukhanda Bhingarkar
Department of computer engineering
MIT College of Engineering, Pune, India
Prof. Dr. Deven Shah Department of Information Technology
Thakur College of Engineering & Technology,
Kandewali, India
Priyanka Birajdar
Department of computer engineering
MIT College of Engineering, Pune, India
Abstract— Now a days, most of the small companies and research
teams have started to deal with third party service providers
(cloud server), to store their huge amount of data. These services
provide various cloud computing facilities along with data
mining based services. Such outsourcing of data is effective,
efficient and helpful but also raises various serious problems.
One of these problems is the chances regarding inauthentic
results returned by cloud servers to users or clients. To overcome
this issue of verification of outsourced frequent itemset mining, a
probabilistic and deterministic approach is been used to check if
the server returns the complete and correct results. Probabilistic
approach catches the incorrect results with high probability,
while the determinist approach measures the result correctness
with 100 per cent certainty.
Keywords— Cloud computing, data mining, frequent itemset
mining, result integrity.
I. INTRODUCTION
Cloud computing is often referred to as ‘the cloud’ were the
delivery of on-demand computing resources is provided over
the internet. This service provided is on a pay-as-you-go basis.
Cloud computing also provides dynamically scalable and often
the virtualized resources. Cloud computing now-a-days is
gaining popularity because of its mobility, huge availability
and low costs.
Frequent itemset is a set of data values, whose no. of co-
occurrences exceeds a given threshold. It is an important
technique used in various applications like market data
analysis, networking data study.
Previous researches shows that frequent itemset mining can
be computationally intensive. For such clients of limited
computational resources, outsourcing frequent itemset mining
to computationally powerful cloud service providers is a
natural solution. It is a cost effective method, but the end user
hesitates to place full trust on the cloud service providers. This
raises a serious security issue of integrity of the mining results.
There could be many reasons for the service providers to
return incorrect answers. So the focus is to verify whether the
server returned correct and complete frequent itemsets.
Correctness means that all itemsets returned by the server are
frequent and completeness means that no frequent itemset is
missing in the returned result.
To overcome these issues an efficient and robust result
accuracy authentication technique is discussed in this paper.
Firstly, a probabilistic approach is designed to catch mining
results that does not meet the predefined
correctness/completeness. To achieve this, a set of (in)
frequent itemset is constructed from the real items, and is used
as the evidence to check the integrity of the server’s mining
results. Second, a deterministic approach is designed to catch
any incorrect/incomplete frequent itemset mining. This
involves construction of cryptographic proofs of the mining
results. The measurement of correctness and completeness of
the mining results will be compared against the proofs.
The rest of the paper is structured as follows; section II
describes literature about current work in this direction.
Section III explains the proposed approach. Section IV
describes the illustration of the proposed approach with the
help of an example and finally the conclusion is provided in
section V.
II. LITERATURE SURVEY
Below literature review focuses on different techniques
used to ensure result integrity.
An efficient probabilistic and deterministic approach is
proposed in [1], for the verification of the returned result from
the server. In probabilistic approach evidence generation takes
place for both the frequent and infrequent itemset. In
deterministic approach a cryptographic proof is constructed
using a merkle hash tree and results are compared with the
root hash values. The proposed approach is similar to the
technique mentioned in [1] except the use of budget value
which is explained in section III.
A novel hybrid method is implemented in [2]. Hybrid here
means adding and removing some data items, in order to
International Journal of Computational Intelligence Research (IJCIR). ISSN 0973-1873 Vol.14, No.1 (2018)© Research India Publications. http://www.ripublication.com
114
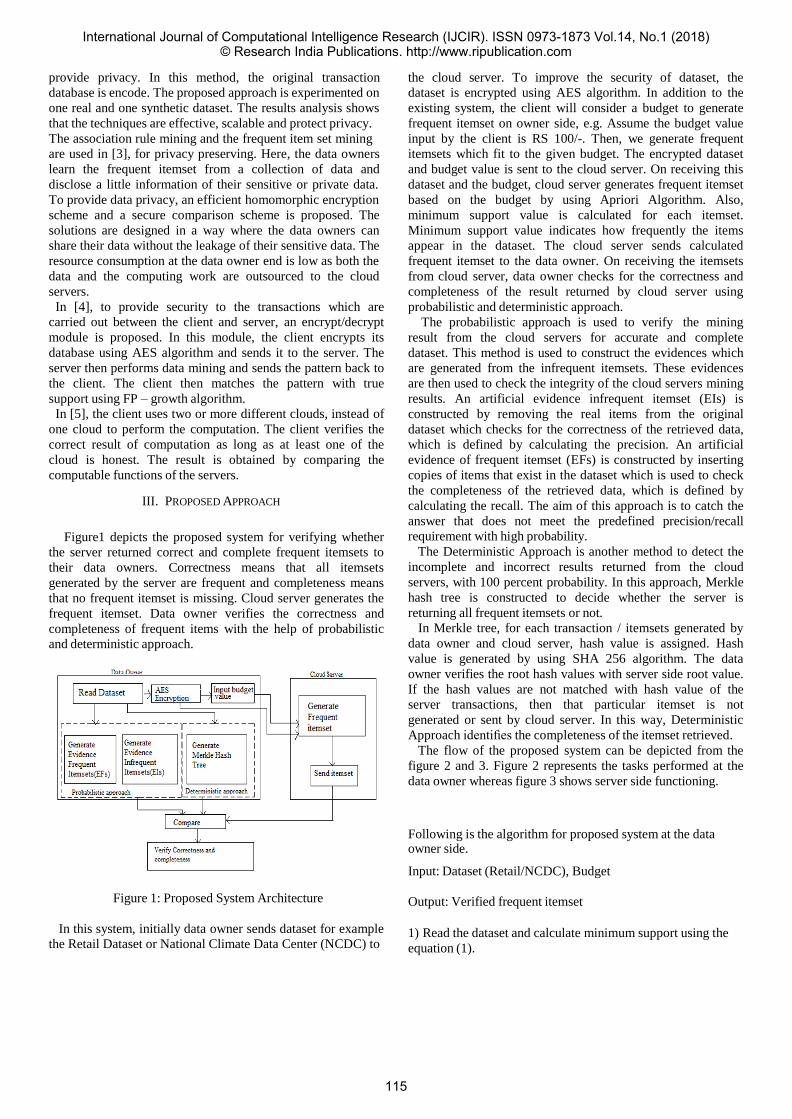
provide privacy. In this method, the original transaction
database is encode. The proposed approach is experimented on
one real and one synthetic dataset. The results analysis shows
that the techniques are effective, scalable and protect privacy.
The association rule mining and the frequent item set mining
are used in [3], for privacy preserving. Here, the data owners
learn the frequent itemset from a collection of data and
disclose a little information of their sensitive or private data.
To provide data privacy, an efficient homomorphic encryption
scheme and a secure comparison scheme is proposed. The
solutions are designed in a way where the data owners can
share their data without the leakage of their sensitive data. The
resource consumption at the data owner end is low as both the
data and the computing work are outsourced to the cloud
servers.
In [4], to provide security to the transactions which are
carried out between the client and server, an encrypt/decrypt
module is proposed. In this module, the client encrypts its
database using AES algorithm and sends it to the server. The
server then performs data mining and sends the pattern back to
the client. The client then matches the pattern with true
support using FP – growth algorithm.
In [5], the client uses two or more different clouds, instead of
one cloud to perform the computation. The client verifies the
correct result of computation as long as at least one of the
cloud is honest. The result is obtained by comparing the
computable functions of the servers.
III. PROPOSED APPROACH
Figure1 depicts the proposed system for verifying whether
the server returned correct and complete frequent itemsets to
their data owners. Correctness means that all itemsets
generated by the server are frequent and completeness means
that no frequent itemset is missing. Cloud server generates the
frequent itemset. Data owner verifies the correctness and
completeness of frequent items with the help of probabilistic
and deterministic approach.
Figure 1: Proposed System Architecture
In this system, initially data owner sends dataset for example
the Retail Dataset or National Climate Data Center (NCDC) to
the cloud server. To improve the security of dataset, the
dataset is encrypted using AES algorithm. In addition to the
existing system, the client will consider a budget to generate
frequent itemset on owner side, e.g. Assume the budget value
input by the client is RS 100/-. Then, we generate frequent
itemsets which fit to the given budget. The encrypted dataset
and budget value is sent to the cloud server. On receiving this
dataset and the budget, cloud server generates frequent itemset
based on the budget by using Apriori Algorithm. Also,
minimum support value is calculated for each itemset.
Minimum support value indicates how frequently the items
appear in the dataset. The cloud server sends calculated
frequent itemset to the data owner. On receiving the itemsets
from cloud server, data owner checks for the correctness and
completeness of the result returned by cloud server using
probabilistic and deterministic approach.
The probabilistic approach is used to verify the mining
result from the cloud servers for accurate and complete
dataset. This method is used to construct the evidences which
are generated from the infrequent itemsets. These evidences
are then used to check the integrity of the cloud servers mining
results. An artificial evidence infrequent itemset (EIs) is
constructed by removing the real items from the original
dataset which checks for the correctness of the retrieved data,
which is defined by calculating the precision. An artificial
evidence of frequent itemset (EFs) is constructed by inserting
copies of items that exist in the dataset which is used to check
the completeness of the retrieved data, which is defined by
calculating the recall. The aim of this approach is to catch the
answer that does not meet the predefined precision/recall
requirement with high probability.
The Deterministic Approach is another method to detect the
incomplete and incorrect results returned from the cloud
servers, with 100 percent probability. In this approach, Merkle
hash tree is constructed to decide whether the server is
returning all frequent itemsets or not.
In Merkle tree, for each transaction / itemsets generated by
data owner and cloud server, hash value is assigned. Hash
value is generated by using SHA 256 algorithm. The data
owner verifies the root hash values with server side root value.
If the hash values are not matched with hash value of the
server transactions, then that particular itemset is not
generated or sent by cloud server. In this way, Deterministic
Approach identifies the completeness of the itemset retrieved.
The flow of the proposed system can be depicted from the
figure 2 and 3. Figure 2 represents the tasks performed at the
data owner whereas figure 3 shows server side functioning.
Following is the algorithm for proposed system at the data owner side.
Input: Dataset (Retail/NCDC), Budget
Output: Verified frequent itemset
1) Read the dataset and calculate minimum support using the
equation (1).
International Journal of Computational Intelligence Research (IJCIR). ISSN 0973-1873 Vol.14, No.1 (2018)© Research India Publications. http://www.ripublication.com
115
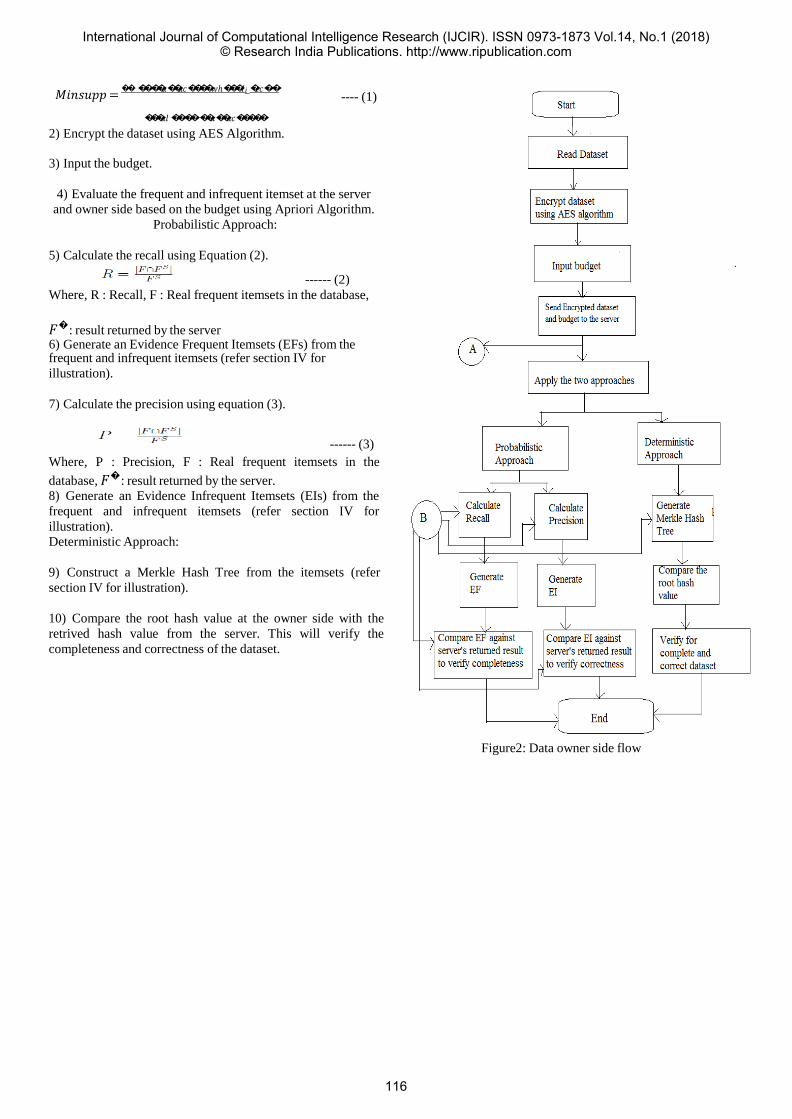
𝑀𝑖𝑛𝑠𝑢𝑝𝑝 = 𝑎 𝑎𝑐 𝑤ℎ 𝐼 𝑖 𝑐𝑐
𝑎𝑙 𝑎𝑎𝑐
2) Encrypt the dataset using AES Algorithm.
3) Input the budget.
---- (1)
4) Evaluate the frequent and infrequent itemset at the server
and owner side based on the budget using Apriori Algorithm.
Probabilistic Approach:
5) Calculate the recall using Equation (2).
------ (2)
Where, R : Recall, F : Real frequent itemsets in the database,
𝐹 : result returned by the server 6) Generate an Evidence Frequent Itemsets (EFs) from the frequent and infrequent itemsets (refer section IV for
illustration).
7) Calculate the precision using equation (3).
------ (3)
Where, P : Precision, F : Real frequent itemsets in the
database, 𝐹 : result returned by the server.
8) Generate an Evidence Infrequent Itemsets (EIs) from the
frequent and infrequent itemsets (refer section IV for
illustration).
Deterministic Approach:
9) Construct a Merkle Hash Tree from the itemsets (refer
section IV for illustration).
10) Compare the root hash value at the owner side with the
retrived hash value from the server. This will verify the
completeness and correctness of the dataset.
Figure2: Data owner side flow
International Journal of Computational Intelligence Research (IJCIR). ISSN 0973-1873 Vol.14, No.1 (2018)© Research India Publications. http://www.ripublication.com
116

Figure3: Server side flow
IV. ILLUSTRATION WITH EXAMPLE
The probabilistic and detrmininstic approach is illustrated
below with the help of an example
Probabilistic approach : Construction of EFs
Consider a data set:
Table 1. Sample Dataset
The above transactions: I2,I4,I5 and I1,I2,I3 are used
to construct the mini graph.
Figure 4: Mini Graph Construction
Step 3: Thus,for above example insert the itemsets at level 2 in
the EF
EF => I4 : 1, I1 :1
If it satisfies the completeness then move to next step else
insert the itemsets at level 3 and repeat till it satisfies the
completness,
Step 4: For each picked EF, the number of artificial
transactions are to be added. The calculation is as follows:
i)Calculate
Total frequency
= Addition of frequenciesof itemsets appearing in EF -------(4)
Therefore, f = 2 for above example.
ii) Compute no. of itemset need to be added as,
No of itemsets to be added = minisupp − f .
Here, No. of itemsets to be added = 3 -2 = 1
------(5)
According to Equation (1),
Minsupp = 3
Assume the infrequent itemset as follows:
I2,I4,I5
I1,I2,I3
Now, Evidence Frequent itemset is constructed usig Mini
Grapgh approach as follows:
Step 1: The itemset having highest frequency is assigned as
Iseed value.
Eg: I2 : 2
Iseed I1 : 1
I4 : 1
I5 : 1
I3 : 1
Step 2: Construct the mini graph as below
The Iseed is considered as the root
iii) 1 artificial transaction will be added into the dataset.
Thus, EF contains inserted copies of items that exist in the
original dataset.
Proabilistic Approach : Construction of EI
Step 1: Exclude the itemsets considered in the construction of
EF. Add the number of 1- frequent itemset in the evidence
repository. Consider the repository to be R.
If it satisfies the correctness with 1- frequent itemset
considered in R, stop else continue to step 2.
Step 2: If in Step 1, R is not satisfied with the correctness then
transform some frequent itemset to infrequent.To transform
select a set of transactions from original dataset for itemset
removal.
i) To help pick the transactions, construct the matrix 𝑀∗
where u: no of itemset and n: no of transactions. M[i,j]=1
when itemset 𝐼 appears in 𝑇 else 0.
ii) let V be the binary vector. The value is 1 when the
transaction is picked.
Transaction ID Itemset
T100 I1,I2,I5
T200 I2,I4
T300 I2,I3
T400 I1,I2,I4
T500 I1,I3
T600 I2,I3
T700 I1,I3
T800 I1,I2,I3,I5
T900 I1,I2,I3
International Journal of Computational Intelligence Research (IJCIR). ISSN 0973-1873 Vol.14, No.1 (2018)© Research India Publications. http://www.ripublication.com
117

iii) Consider A to be the no of transaction having the frequent
itemset. Where A= V*M.
Step 3: Remove the itemset from the transaction.For which
construct 𝐼𝑀∗𝑦 matrix where u: is the number of itemset and y: is the number of unique itemset. IM[I,j] =1 when 𝐼 contains
𝑖 else 0. Then,IM[i,1]= 1 are added into the output and are removed.
To elaborate this,consider a dataset shown in table 2.
Table 2: Sample dataset
Transaction ID Itemset
T100 I1,I2,I5
T200 I2,I4
T300 I2,I3
T400 I1,I2,I4
Here,consider that step 1 is not satisfied so construction is
done from step 2 as follows:
Step 2: i)Construct the matrix M for the above transactions
given
1 0 0 1 1 1 1 1
M = 0 0 1 0 0 1 0 1
[1 0 0 0 ] ii) Here we considere T100 and T400 are the picked transactions, so
1 V =[
0 ]
0 1
2 2
Figure 5: merkle hash tree construction
Step 1: Consider 4 transaction Tx1,Tx2,Tx3 and Tx4. The
hash values of these transactions are obtained using the SHA
256 Algorithm.
Step 2: To construct merkle hash tree, the given transactions
are considered as leaf nodes. Then we calculate hash values of
these transactions using SHA 256.The non leaf node is an
aggregation of hash values of its child nodes. Thus, finally
root node is created. Here, in the Example, H1234 is the root
node.
Step 3: To verify completeness and correctness the root hash
values of retrived data set is monitored.In the above example,
if the retrived dataset having root hash value is H234, means
the transaction Tx1 is missing.
V. CONCLUSION
Outsourced data may have many issues one of which is the
integrity verification. The two approaches probabilistic and
deterministic are presented for outsourcing of the frequent
itemset mining. The probabilistic approach constructs two
evidences for the correctness and completeness verification
with high probability. The deterministic approach constructs
iii) A = V*M = 0 0 [1]
the merkle hash tree, where the correctness and the completeness of the retrieved dataset are verified.
REFERENCES
Step 3: For the above example the IM is constructed as
0 0
0 0
[1] B. Dong, R. Liu and H. W. Wang, “Trust-but- Verify: Verifying Result
Correctness of Outsourced Frequent Itemset Mining in Data-Mining- As-a- Service Paradigm,” in IEEE Transactions on Services Computing, vol. 9, no.
1, pp. 18-32, Jan.-Feb. 1 2016.
IM = 1 0 0 0
[ 0 1 ]
[2] I. Chandrasekharan, P. K. Baruah and R. Mukkamala, ”Privacy-preserving frequent itemset mining in outsourced transaction databases,” Advances in Computing, Communications and Informatics (ICACCI), 2015 International
Conference on, Kochi, 2015, pp. 787-793. The EI contains I3,I5, which are to be removed.
Thus, EI contains the real item which are removed from
original dataset.
Detrministic approach: Construction of merkle hash tree.
Figure 5 represents the merkle hash tree construction.
[3] L. Li, R. Lu, K. K. R. Choo, A. Datta and J. Shao, ”Privacy-Preserving-
Outsourced Association Rule Mining on Vertically Partitioned Databases,” in IEEE Transactions on Information Forensics and Security, vol. 11, no. 8, pp.
1847-1861, Aug. 2016. [4] Kumbhare, Trupti A., and Santosh V. Chobe. ”Secure Mining of the
Outsourced Transaction Databases.” International Journal of Science,
Engineering and Computer Technology 4.10 (2014): 250.
International Journal of Computational Intelligence Research (IJCIR). ISSN 0973-1873 Vol.14, No.1 (2018)© Research India Publications. http://www.ripublication.com
118

[5] Ran Canetti, Ben Riva, and Guy N.Rothblum. “Verifiable computation ith two or more clouds. In Workshop on Cryptography and Security in Clouds”, 2011.
International Journal of Computational Intelligence Research (IJCIR). ISSN 0973-1873 Vol.14, No.1 (2018)© Research India Publications. http://www.ripublication.com
119
Recommendation Engine for E-commerce with
additional modules
Ashutosh Pandey Sumeet Khaitan
Student, Vidyalankar Institute of Technology Student, Vidyalankar Institute of Technology
Mumbai, India Mumbai, India
[email protected] [email protected]
Ajinket Singh Ravindra Sangle Student, Vidyalankar Institute of Technology Ass. Professor, Vidyalankar Institute of Technology
Mumbai, India Mumbai, India
[email protected] [email protected]
Abstract— As the exponential blast of different substance created
on the Web, Recommendation strategies have turned out to be
progressively vital. Incalculable various types of proposals are
made on the Web each day, including music, pictures, books
proposals, question recommendations, and so on. Regardless of
what sorts of information sources are utilized for the proposals,
basically these information sources can be displayed as charts.
Suggestion frameworks are broadly utilized as a part of web-
based business applications. The motor of a present proposal
framework prescribes things to a specific client considering client
inclinations and past high appraisals. Different suggestion plans,
for example, cooperative sifting and substance-based
methodologies are utilized to fabricate a proposal framework.
Affiliation run mining is an information mining system. It is
utilized for finding the things from an exchange list which
happen together often. The vast majority of current proposal
frameworks were created to fit a specific space, for example,
books, articles, and films. We propose a half and half structure
suggestion framework. In this paper, going for giving a general
system on digging Web diagrams for suggestions. We initially
propose a novel dispersion technique which proliferates
likenesses between various suggestions and prescribe items
utilizing Apriori based affiliation run mining. At that point we
outline how to sum up various proposal issues into our diagram
dissemination structure. The proposed system can be used in
numerous proposal assignments on the World Wide Web,
including inquiry proposals, picture suggestions, and so on. We
additionally propose a novel framework for marking down and
offering procedure to be consolidated in the web application.
Keywords— Apriori, recommendation, association rule
mining.
1. LITERATURE SURVEY
1.1 Traditional recommendation and prediction
approach: The following are traditional recommendation and prediction approaches:
1..1.1 Content-based filtering:
Content-based recommender frameworks work with profiles of clients that are made toward the start. A profile has data about a client and his taste which depends on how client rates the things. By and large, while making a profile, recommender frameworks influence a study, to get introductory data about a client so as to maintain a strategic distance from the new- client issue. In the proposal procedure, the motor analyzes things that were at that point decidedly appraised by client with things he didn't rate and searches for likenesses. Those things that are generally like the emphatically evaluated ones, will be prescribed to the client. Content-based recommender frameworks generally utilize labels or catchphrases for proficient and better separating. For this situation the profiles of different clients are not basic, and they don't impact the proposals of the client, as the suggestions depend on singular data. Going in points of interest of strategies for collective sifting, we can recognize most prominent methodologies: client based, thing based and mod-el-based methodologies.
1.1.2 Collaborative Filtering: Shared separating ended up a standout amongst the most re-looked procedures of recommender frameworks since this approach was specified and depicted by Paul Resnick and Hal Varian in 1997. The possibility of communitarian separating is, finding the clients in a group that offer thanks. On the off chance that two clients have same or relatively same appraised things in like manner, at that point they have comparable tastes. Such clients construct a gathering or a purported neighborhood. A client inspires proposals to pick things that he/she has not appraised previously, but rather that were at that point emphatically evaluated by clients in his/her neighborhood. Community sifting is generally utilized as a part of internet business. Clients can rate books, melodies, films and after that get suggestions in regard to those issues in future. Besides cooperative separating is used in perusing of specific records (e.g. reports among logical works, articles, and magazines).
1.2 Modern recommendation and prediction approach:
International Journal of Computational Intelligence Research (IJCIR). ISSN 0973-1873 Vol.14, No.1 (2018)© Research India Publications. http://www.ripublication.com
120
The following are the modern approaches for recommendation and predictions:
1.2.1 Context aware approach: Setting is the data about the earth of a client and the points of interest of circumstance he/she is in. Such points of interest may assume substantially more noteworthy part in proposals than appraisals of things, as the evaluations alone don't have itemized data about under which conditions they were given by clients. A few suggestions are more reasonable to the client in night and doesn't coordinate his inclinations early in the day at all and he/she might want to complete one thing when it's One of the most serious issues of setting mindful recommender frameworks is acquiring setting data. The data can be acquired expressly by straightforwardly cooperating with client asking him/her to round out a shape and making an overview. In spite of the fact that it is for the most part alluring to acquire setting data without making the entire rating and inspecting process convoluted. Another way is gathering data verifiably utilizing the sources like GPS, to get area, or a timestamp on exchange. The last method for data extraction is examining clients and watching their conduct or utilizing information mining systems.
1.2.2 Semantic-based approach: The majority of the depictions of things, clients in recommender frameworks and whatever is left of the web are displayed in the web in a literary shape. Utilizing labels and catchphrases with no semantic implications doesn't enhance the exactness of proposals in all cases, as a few watchwords might be homonyms. That is the reason comprehension and organizing of content is an exceptionally noteworthy part suggestion. Customary content mining approaches that base on lexical and grammatical investigation demonstrate depictions that can be comprehended by a client yet not a PC or a recommender framework. That was a reason of making new content mining methods that depended on semantic investigation. Recommender frameworks with such procedures are called semantic based recommender frameworks. The execution of semantic recommender frameworks depends on information base typically characterized as an idea graph (like scientific classification) or philosophy.
1.2.3 Peer to peer approaches:
The recommender systems with P2P approaches are
decentralized. Each peer can relate itself to a group of other
peers with same interests and get recommendations from the
users of that group. Recommendations can also be given based
on the history of a peer. Decentralization of recommender
system can solve the scalability problem.
1.2.4 Cross-Domain based approach: Finding comparable clients and building an exact neighborhood is an imperative piece of prescribing procedure of community-oriented recommender frameworks. Likenesses of two clients are found in light of their thanks of things. In any case, comparable thanks in one space don't most likely imply that in another area valuations are comparative too.
1.2.5 Cross Lingual approach: The recommender framework considering cross-lingual approach gives the clients a chance to get proposals to the things that have depictions in dialects they don't talk and get it. Yang, Chen and Wu purposed an approach for a cross lingual news amass suggestion. The primary thought is to delineate content and catchphrases in various dialects into a solitary component space, in other words a likelihood appropriation over inactive themes. From the depictions of things, the framework parses catchphrases than deciphers them in one characterized dialect utilizing word references. From that point onward, utilizing cooperative or other separating, the framework offers suggestions to clients.
1.2.6 Bidding: The hypothetical model proposed here isn't limited to online closeouts; it adds to the general sale hypothesis writing. Dissimilar to most past work on successive sell-offs that spotlights on value slants in limited groupings of closeouts (spurred by the "value decrease irregularity" reported in true sale arrangements by Ashenfelter [1989] and others), this article examines the impact of open data about not so distant future sell-offs on infinite horizon consistent state offering. The model broadens Milgrom and Weber's (2000) limited skyline and indistinguishable merchandise model to an unending skyline and on a level, plane separated products show. A basic separation into a limited number of totally unrelated composes is accepted, so the augmentation adds up to expecting a few haphazardly interweaved successions of indistinguishable merchandise groupings. In this manner, the proposed demonstrate is the easiest model that includes unit-request bidders and nontrivial data about the not so distant future sales. Since the model considers a grouping of closeouts for nonidentical objects with learning of future items, it likewise broadens the model of Gale and Hausch (1994), who look at the instance of consistently heterogeneous questions by concentrating on the uncommon instance of two bidders and two sales. The expansion past two closeouts is proficient because of the rearranging presumption that the item heterogeneity is caught by a limited number of sorts. The nearest less complex benchmark is given by the model of heterogeneous yet inconspicuous future items (EngelbrechtWiggans 1994), an extraordinary instance of which is settled in the proposed display; when just some settled basic conveyance of future items is known, bidders can in any case participate in forward-looking methodologies, yet they can't utilize the forward-seeing techniques examined here. Inside the online sale writing, the issue of multi-auction offering has not been tended to, aside from in crafted by Bajari and Hortacsu (2003), who think about bidder section in like manner esteem sales, and Dholakia and Soltysinski (2001), who discover a "grouping inclination" (i.e., customers running to prevalent closeouts regardless of the presence of different sell-offs for substitute things). The grouping inclination is particularly significant to the present work since it gives another layer of behavioral many-sided quality past the levelheaded conduct portrayed here.
2. PROPOSED SYSTEM
International Journal of Computational Intelligence Research (IJCIR). ISSN 0973-1873 Vol.14, No.1 (2018)© Research India Publications. http://www.ripublication.com
121
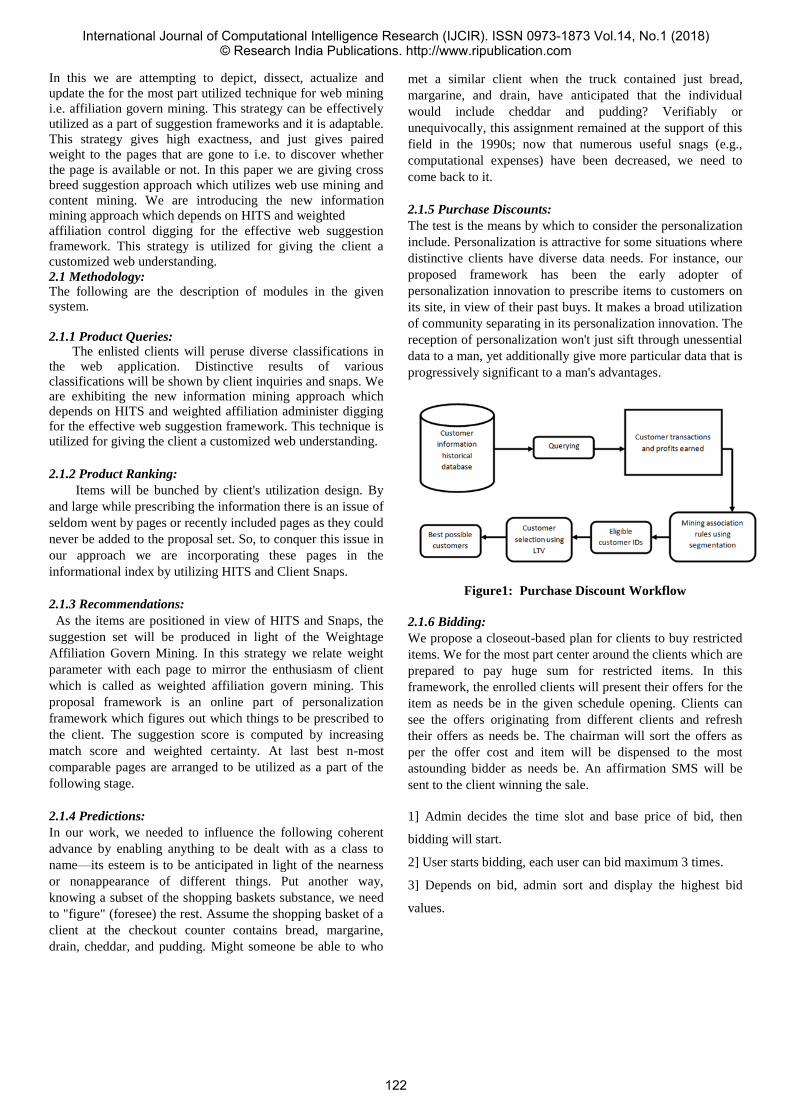
In this we are attempting to depict, dissect, actualize and
update the for the most part utilized technique for web mining
i.e. affiliation govern mining. This strategy can be effectively
utilized as a part of suggestion frameworks and it is adaptable.
This strategy gives high exactness, and just gives paired
weight to the pages that are gone to i.e. to discover whether
the page is available or not. In this paper we are giving cross
breed suggestion approach which utilizes web use mining and
content mining. We are introducing the new information
mining approach which depends on HITS and weighted
affiliation control digging for the effective web suggestion
framework. This strategy is utilized for giving the client a
customized web understanding.
2.1 Methodology: The following are the description of modules in the given system.
2.1.1 Product Queries: The enlisted clients will peruse diverse classifications in the web application. Distinctive results of various classifications will be shown by client inquiries and snaps. We are exhibiting the new information mining approach which depends on HITS and weighted affiliation administer digging for the effective web suggestion framework. This technique is utilized for giving the client a customized web understanding.
2.1.2 Product Ranking:
Items will be bunched by client's utilization design. By
and large while prescribing the information there is an issue of
seldom went by pages or recently included pages as they could
never be added to the proposal set. So, to conquer this issue in
our approach we are incorporating these pages in the
informational index by utilizing HITS and Client Snaps.
2.1.3 Recommendations:
As the items are positioned in view of HITS and Snaps, the
suggestion set will be produced in light of the Weightage
Affiliation Govern Mining. In this strategy we relate weight
parameter with each page to mirror the enthusiasm of client
which is called as weighted affiliation govern mining. This
proposal framework is an online part of personalization
framework which figures out which things to be prescribed to
the client. The suggestion score is computed by increasing
match score and weighted certainty. At last best n-most
comparable pages are arranged to be utilized as a part of the
following stage.
2.1.4 Predictions:
In our work, we needed to influence the following coherent
advance by enabling anything to be dealt with as a class to
name—its esteem is to be anticipated in light of the nearness
or nonappearance of different things. Put another way,
knowing a subset of the shopping baskets substance, we need
to "figure" (foresee) the rest. Assume the shopping basket of a
client at the checkout counter contains bread, margarine,
drain, cheddar, and pudding. Might someone be able to who
met a similar client when the truck contained just bread,
margarine, and drain, have anticipated that the individual
would include cheddar and pudding? Verifiably or
unequivocally, this assignment remained at the support of this
field in the 1990s; now that numerous useful snags (e.g.,
computational expenses) have been decreased, we need to
come back to it.
2.1.5 Purchase Discounts:
The test is the means by which to consider the personalization
include. Personalization is attractive for some situations where
distinctive clients have diverse data needs. For instance, our
proposed framework has been the early adopter of
personalization innovation to prescribe items to customers on
its site, in view of their past buys. It makes a broad utilization
of community separating in its personalization innovation. The
reception of personalization won't just sift through unessential
data to a man, yet additionally give more particular data that is
progressively significant to a man's advantages.
Figure1: Purchase Discount Workflow
2.1.6 Bidding:
We propose a closeout-based plan for clients to buy restricted
items. We for the most part center around the clients which are
prepared to pay huge sum for restricted items. In this
framework, the enrolled clients will present their offers for the
item as needs be in the given schedule opening. Clients can
see the offers originating from different clients and refresh
their offers as needs be. The chairman will sort the offers as
per the offer cost and item will be dispensed to the most
astounding bidder as needs be. An affirmation SMS will be
sent to the client winning the sale.
1] Admin decides the time slot and base price of bid, then
bidding will start.
2] User starts bidding, each user can bid maximum 3 times.
3] Depends on bid, admin sort and display the highest bid
values.
International Journal of Computational Intelligence Research (IJCIR). ISSN 0973-1873 Vol.14, No.1 (2018)© Research India Publications. http://www.ripublication.com
122
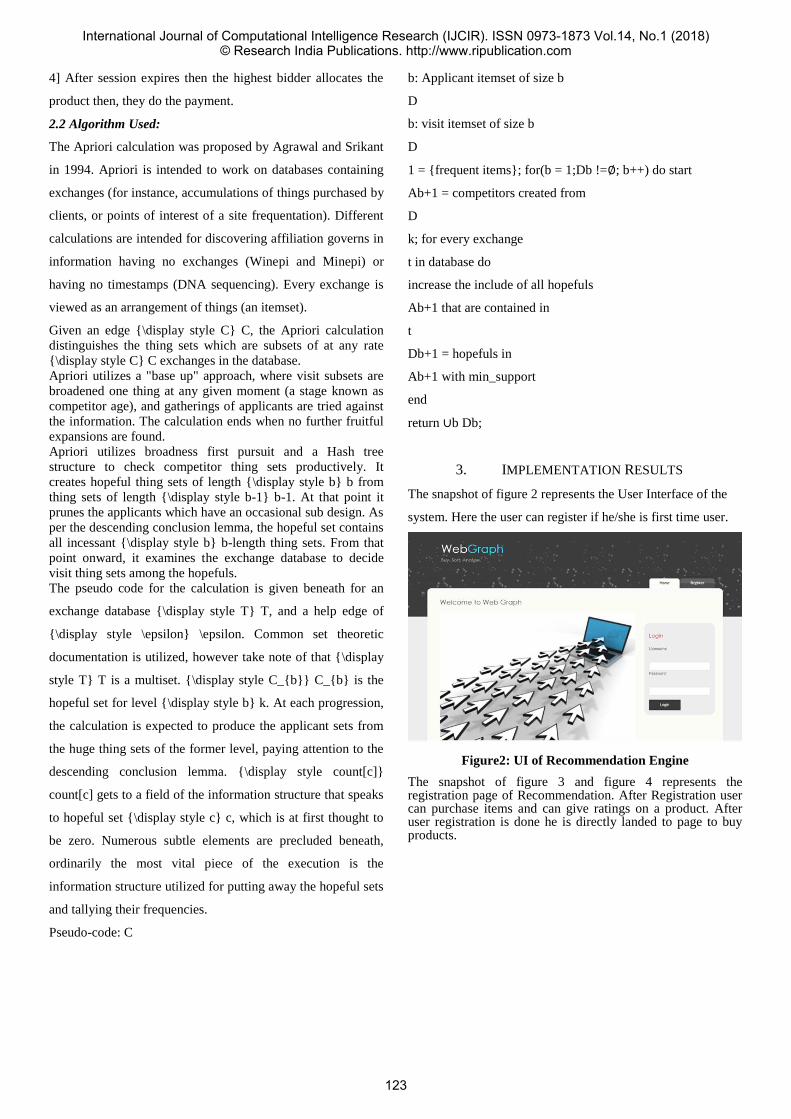
4] After session expires then the highest bidder allocates the
product then, they do the payment.
2.2 Algorithm Used:
The Apriori calculation was proposed by Agrawal and Srikant
in 1994. Apriori is intended to work on databases containing
exchanges (for instance, accumulations of things purchased by
clients, or points of interest of a site frequentation). Different
calculations are intended for discovering affiliation governs in
information having no exchanges (Winepi and Minepi) or
having no timestamps (DNA sequencing). Every exchange is
viewed as an arrangement of things (an itemset).
Given an edge \display style C C, the Apriori calculation
distinguishes the thing sets which are subsets of at any rate
\display style C C exchanges in the database.
Apriori utilizes a "base up" approach, where visit subsets are
broadened one thing at any given moment (a stage known as
competitor age), and gatherings of applicants are tried against
the information. The calculation ends when no further fruitful
expansions are found.
Apriori utilizes broadness first pursuit and a Hash tree
structure to check competitor thing sets productively. It
creates hopeful thing sets of length \display style b b from
thing sets of length \display style b-1 b-1. At that point it
prunes the applicants which have an occasional sub design. As
per the descending conclusion lemma, the hopeful set contains
all incessant \display style b b-length thing sets. From that
point onward, it examines the exchange database to decide
visit thing sets among the hopefuls.
The pseudo code for the calculation is given beneath for an
exchange database \display style T T, and a help edge of
\display style \epsilon \epsilon. Common set theoretic
documentation is utilized, however take note of that \display
style T T is a multiset. \display style C_b C_b is the
hopeful set for level \display style b k. At each progression,
the calculation is expected to produce the applicant sets from
the huge thing sets of the former level, paying attention to the
descending conclusion lemma. \display style count[c]
count[c] gets to a field of the information structure that speaks
to hopeful set \display style c c, which is at first thought to
be zero. Numerous subtle elements are precluded beneath,
ordinarily the most vital piece of the execution is the
information structure utilized for putting away the hopeful sets
and tallying their frequencies.
Pseudo-code: C
b: Applicant itemset of size b
D
b: visit itemset of size b
D
1 = frequent items; for(b = 1;Db !=∅; b++) do start
Ab+1 = competitors created from
D
k; for every exchange
t in database do
increase the include of all hopefuls
Ab+1 that are contained in
t
Db+1 = hopefuls in
Ab+1 with min_support
end
return ∪b Db;
3. IMPLEMENTATION RESULTS
The snapshot of figure 2 represents the User Interface of the
system. Here the user can register if he/she is first time user.
Figure2: UI of Recommendation Engine
The snapshot of figure 3 and figure 4 represents the registration page of Recommendation. After Registration user can purchase items and can give ratings on a product. After user registration is done he is directly landed to page to buy products.
International Journal of Computational Intelligence Research (IJCIR). ISSN 0973-1873 Vol.14, No.1 (2018)© Research India Publications. http://www.ripublication.com
123

Figure 3: Registration Page
Figure 4: User’s Personal Page
The snapshot shown in Figure 5 shows that user has logged in
system and he is product search page. The page also
represents recommendation of products that are frequently
searched in Most Searched columns.
Figure 5: Product Search and Recommendation of Most
Searched Products
The snapshot of figure 6 represents the products list according
to the category chosen by user
Figure 6: Products List
The snapshot of figure 7 represents that Transactions made by
user and products purchased by him.
Figure 7: products purchased by user
International Journal of Computational Intelligence Research (IJCIR). ISSN 0973-1873 Vol.14, No.1 (2018)© Research India Publications. http://www.ripublication.com
124

4. CONCLUSION AND FUTURE SCOPE
Here we have proposed another web suggestion framework in view of weighted affiliation lead mining and content mining. In this approach, weight is doled out to each page to demonstrate its significance relying upon the time spent by every client on a specific page or going to recurrence of each page. The component announced in this paper centers around one of the most seasoned assignments in affiliation mining: in view of deficient data about the substance of a shopping basket, would we be able to anticipate which different things the shopping basket contains? Our writing study shows that, while a portion of the as of late distributed frameworks can be utilized to this end, their functional utility is compelled, for example, by being restricted to spaces with not very many things. Another web -based offering approach is utilized for constrained release items with the goal that the two clients and merchants can have the advantages.
5. REFERENCES
[1] Dubois, D., Hüllermeier, E. and Prade, H., “A
Systematic Approach to the Assessment of Fuzzy
Association Rules,” Data Mining and Knowledge
Discovery Journal, Vol. 13, No. 2, (2006), 167 – 192.
[2] Paul Resnik,Hall Varian, “Recommender
System”, Communication of the ACM,Vol
40,No.3,1997
[3] Gabor Takacs, Istvan Pilaszy, Bottyan Nemeth,
and Do-monkos Tikk, “Scalable Collaborative
Filtering Ap-proaches for Large Recommender
Systems,” The Journal of Machine Learning
Research, vol. 10, pp. 623-656, 2009
[4] Salvatore Orlando, Raffaele Perego and Claudio
Silvestri, "A new algorithm for gap constrained
sequence mining", In Proceedings of the ACM
Symposium on applied com-puting, pp. 540 – 547,
Nicosia, Cyprus, 2004.
[5] Robin Burke, “Hybrid Recommender System:
Survey and experiments”, User modelling and
interaction
[6] Baltrunas and X. Amatriain. Towards time-
dependant recommendation based on implicit
feedback. In Workshop on Context-Aware
Recommender Systems (CARS 2009). New York,
2009.
[7] Y.Shavitt, W.Ela, W.udi,”Buildingrecommender
syterm using peer to peer shared content”, CIKM’10,
October 25–29, 2010.
[8] Cheng-Zen yang,Ing-Xiang chen,Ping-Jung
Yu,”Cross lingual news group Recommendation
using cluster based cross training”, Computational
linguistic and Chinese language processing,Vol.
13,No. 1,2008,pp41-60
[9] “Introduction to data mining” by Tan, Steinbach
& Kumar,pp. 150-168.
[10] Data Mining: Concepts and Techniques, Third
Edition by Han, Kamber & Pei,pp. 100-135.
International Journal of Computational Intelligence Research (IJCIR). ISSN 0973-1873 Vol.14, No.1 (2018)© Research India Publications. http://www.ripublication.com
125
ThumbPay
Mrs. Vijaya Pinjarkar
Assistant Professor,
Department of Information Technology,
K J Somaiya Institute of Engineering. & IT, Sion,
Mumbai, Maharashtra, India.
Bro. Manan K. Shah Bro. Parth K. Maisheri Department of Information Technology, K J Somaiya
Institute of Engineering & IT, Sion, Sion, Mumbai, Maharashtra, India.
Abstract — The paper is about Biometric Payments using our idea, ThumbPay. This application will allow operators to make
payments at a sales terminal using their finger impressions in an
active fashion, hence, eradicating the necessity of carrying
numerous magnetic cards for making payments. ThumbPay is
expected to be an industrial uprising in the customer payments
industry to have such an application that will accept payments
through biometric means and not be divulging the actual details
of the consumer during the processing of the transaction.
Keywords— Biometrics, SDK, FPS, Fingerprints.
I. INTRODUCTION
In last few years, the perspective of how things actually happen among us has completely changed. The Industry of Payment is not an exclusion. It’s also seen a lot of advancements after just being a Fiat-currency based System to an Electronic Reimbursement System. These Electronic Payment Systems have evolved from traditional cards like MasterCard & Visa cards etc., to Contactless Cards to Net Banking also, convenient Mobile Wallets. Now, the next enormous improvement in the line of payments is making payments using Biometric features.
Earth will soon experience a fully functional Biometric
Payment system where a user will make a reimbursement using
imprint of a finger. Some of the big technology colossuses have
predicted the latent paybacks of integration of Payment platforms
with biometrics and hence concentrating on deriving a key which
offers many benefits like the convenience of cardholders &
security of payments. However, in today’s available solutions the
use of Biometrics is presently limited to just Authentication of
Cardholders or initiating Application Login. Our idea inculcates
implementation of a Payment application using Biometrics which
will empower customers to pay any retail point with just the
imprint of their finger. Also,
Department of Information Technology, K J Somaiya
Institute of Engineering. & IT, Sion, Sion, Mumbai, Maharashtra, India.
the main aim of the system is to exclude the need for carrying Wallets along with cards and cash & purchasing exclusive cell phones, subscribed just for the solitary purpose of making payments in a convenient manner. also to eradicate the jeopardy of misplacing valuables as your fingers will always be with you and that is all that you will need to make a payment. Our System “ThumbPay” proposes a Biometric Payment model using our idea of making payments just with using your thumb or any particular finger. The General applications can be imagined but the future scope can be expanded to unimaginable places of work. This Biometric system will basically work in the following steps:
- The consumer comes to the stage of payment where he has to pay a certain amount.
- The retailer will now add the bill amount to the
ThumbPay app.
- The consumer will now be asked to scan the finger on the FP Scanner.
- The app will identify the person.
- After identification comes to the verification stage.
- The consumer is asked for the 4-character pin.
- The consumer enters the pin.
- Voila! The Payment is now done directly from the
consumer’s account to retailer’s account. This is how making payments will become a much shorter
and hassle-free plus easy process to pursue.
International Journal of Computational Intelligence Research (IJCIR). ISSN 0973-1873 Vol.14, No.1 (2018)© Research India Publications. http://www.ripublication.com
126

II. LITERATURE SURVEY A. A Review of Existing Systems and limitations. Lots of accomplishment stories about the Mobile platforms using
biometrics. Tech companies like Samsung, PayPal, and Apple
have by now constructed reimbursement solutions with the help
of biometrics for their individual cellular stages where clients can
perform economic transactions using relevant touch IDs or with
the scans of their thumbprints. Separately from this, a portion of
effort is made in the domain of payments using Biometric
Authentication. Let’s take an example, customers will be able to
validate their uniqueness in an Automated Teller Machine or at a
trade Point of Sale (POS) unit by just using their biometrics.
Conferring to one media proclamation made via Gartner, 30% of
administrations will custom Biometric Authentication for Mobile
Devices by 2016. Figures disclose that internationally biometric
tech market is emergent at a multi-layered twelve-monthly
development degree of about 21.6%. Nonetheless, while it originates to Biometric
Expenditures at Mercantile Point of Sale, however, a little exertion has been completed by many businesses in an internal
atmosphere, a fully-fledged biometric payments open-loop
stage is still to be raised inhabitation. According to a source which is apparently payments, a
bronzing barbershop executed a solution where an alternative
is offered in the direction of the clienteles to recompense store
charges by the use of their finger impressions in place of
spending via magnetic card. One more fascinating resolution
constructed by Carnegie Mellon University scholars permits
an operator to catalog numerous finger impressions by linking
to a bank or some magnetic card for improvised safekeeping.
Likewise, prominent payment grid supplier,
B. Analysis of Requirements Effecting Payments made with the use of Biometrics will
create the requirement to alter mercantile setup in a huge way. So, implementation of Payments using biometrics could be an
affluent proposal. (A Fingerprint Scanner will be required). Individually finger impression scan is transformed into some
unique value called as Byte Arrays. Refined programs which
are proficient in computing Byte Array value matchlessly &
precisely is essential to be advanced. (To manage the accuracy
a Finger Print Scanner Software Development Kit will be
required). Security, Storage of all the Biometric Data strongly is an
immense encounter as thumbprint arrangement of an individual
can be pilfered through by the likes of impostors for making
deceitful reimbursements and payments. Also, a different layer
may be required for authentication, to reduce scams, deceptions
and heighten the system’s security. It could be accomplished by
dispensing a PIN, such as Palm imprint, multiple fingerprints
during transaction approval, processing, and authorization. (OTP
Authorization or PIN authorization can be used).
III. COMPARISON BETWEEN EXISTING SYSTEM &
PROPOSED SYSTEM A. Existing System Lots of accomplishment stories about the Mobile platforms using
biometrics. Tech companies like Samsung, PayPal, and Apple
have by now constructed reimbursement solutions with the help
of biometrics for their individual cellular stages where clients can
perform economic transactions using relevant touch IDs or with
the scans of their thumbprints. Separately from this, a portion of
effort is made in the domain of payments using Biometric
Authentication. Let’s take an example, customers will be able to
validate their uniqueness in an Automated Teller Machine or at a
trade Point of Sale (POS) unit by just using their biometrics.
Conferring to one media proclamation made via Gartner, 30% of
administrations will custom Biometric Authentication for Mobile
Devices by 2016. Figures disclose that internationally biometric
tech market is emergent at a multi-layered twelve-monthly
development degree of about 21.6%. Nonetheless, while it originates to Biometric
Expenditures at Mercantile Point of Sale, however, a little exertion has been completed by many businesses in an internal
atmosphere, a fully-fledged biometric payments open-loop
stage is still to be raised inhabitation. We also need to carry a lot of things with us including wallets or cards, cash etc. which makes the payment process bulkier. B. Proposed System
The proposed system basically focuses on the need to travel hassle-free and without carrying physical devices or any sort of cash. Be it magnetic or hard paper cash. Our System “ThumbPay” presents a Payment model which is biometric i.e., using our idea of making payments just with using your thumb or any particular finger. This application will assist operators to make payments anywhere at any mercantile station just by using fingerprints in a safe method, hence, eradicating the necessity of carrying numerous magnetic cards for making payments. It is expected to be a technological revolution in the consumer payments industry. This system will practically eliminate the need to carry cash or any cards with us. The General applications can be imagined but the future scope can be expanded to unimaginable places of work.
Proposed System Existing System
1. Time consumed for making a 1. Payment takes time, as the payment will be reduced because consumer needs to do the nothing needs to be fetched, fingers are painstaking job of finding out right in the hand of the consumer and taking out the cash/ card/
device.
2. Banks earn profit ominously 2. Banks face a lot of frauds because of fewer scams and lesser rates online and offline for payments of chargeback
3. Customers will no more need to 3. Consumers need to carry carry physical cards or purchase costly wallets, cards, cash, and devices cell phones just for the solitary purpose just in order to make payments. of joining in NFC qualified payments
International Journal of Computational Intelligence Research (IJCIR). ISSN 0973-1873 Vol.14, No.1 (2018)© Research India Publications. http://www.ripublication.com
127
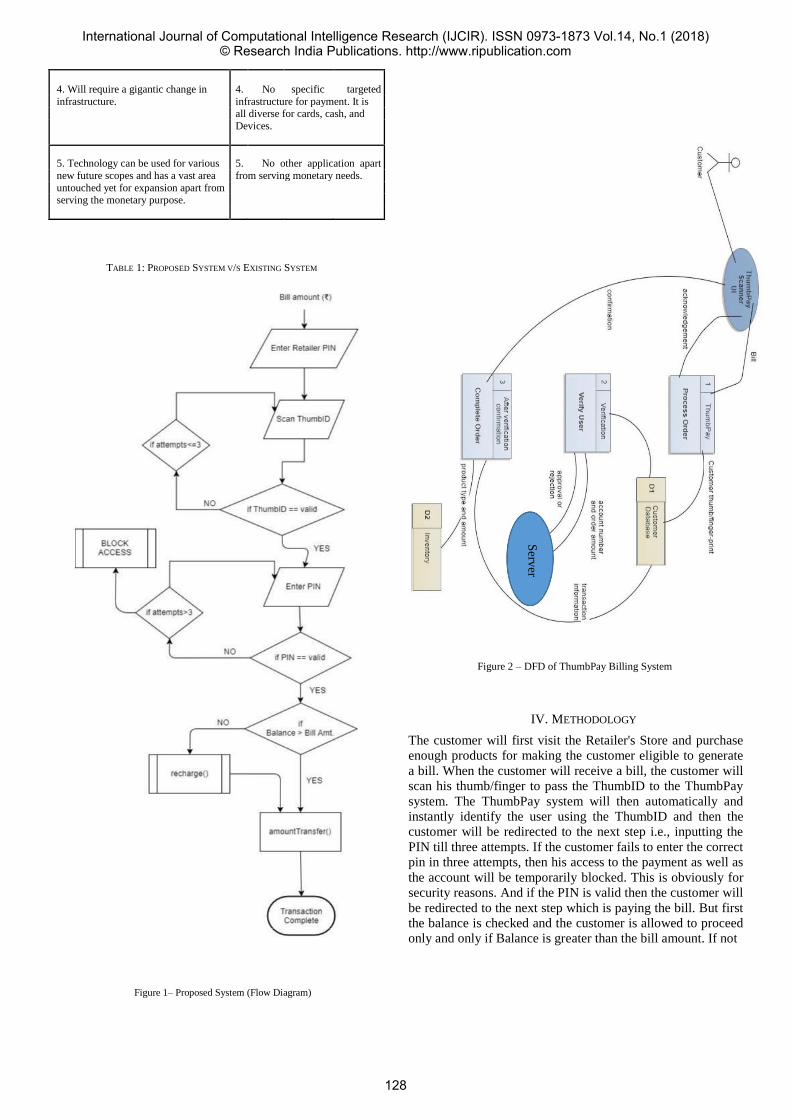
4. Will require a gigantic change in 4. No specific targeted infrastructure. infrastructure for payment. It is
all diverse for cards, cash, and Devices.
5. Technology can be used for various 5. No other application apart new future scopes and has a vast area from serving monetary needs. untouched yet for expansion apart from
serving the monetary purpose.
TABLE 1: PROPOSED SYSTEM V/S EXISTING SYSTEM
Serv
er
Figure 2 – DFD of ThumbPay Billing System
IV. METHODOLOGY
The customer will first visit the Retailer's Store and purchase
enough products for making the customer eligible to generate
a bill. When the customer will receive a bill, the customer will
scan his thumb/finger to pass the ThumbID to the ThumbPay
system. The ThumbPay system will then automatically and
instantly identify the user using the ThumbID and then the
customer will be redirected to the next step i.e., inputting the
PIN till three attempts. If the customer fails to enter the correct
pin in three attempts, then his access to the payment as well as
the account will be temporarily blocked. This is obviously for
security reasons. And if the PIN is valid then the customer will
be redirected to the next step which is paying the bill. But first
the balance is checked and the customer is allowed to proceed
only and only if Balance is greater than the bill amount. If not
Figure 1– Proposed System (Flow Diagram)
International Journal of Computational Intelligence Research (IJCIR). ISSN 0973-1873 Vol.14, No.1 (2018)© Research India Publications. http://www.ripublication.com
128

so, then the customer is redirected to the recharge subroutine.
And the payment is made final after the balance is eligible to
make the complete payment. After the payment is made the
bill amount is transferred from the consumers account to the
retailer's account. After the amount is transferred both of them
i.e., consumer and the retailer are notified and finally, after
that, the transaction is complete.
V. IMPLEMENTATION PLAN As we have seen the flow diagram above we know how the transaction is going to take place through ThumbPay. The fingerprint sensor will be required for scanning a vector input map of the thumb/fingerprint, which will act as an authentication measure for the consumer when the consumer will pass the authentication. Now comes into picture the other design details which are PHP, MySQL, and MariaDB which will properly authorize the user, uphold the transactions and keep the records.
All of the interaction will be taking place on an Android device which will have a fingerprint sensor built-in or attached via a USB.
VI. CONCLUSION Biometric Payments is the succeeding huge entity in the payment
industry. Magnetic cards will be exemplified with user’s
exceptional features like Thumbprints, Retinal Scan, Facial Scan,
Thumb/Palm imprint etc. Though acceptance of payments using
biometric will stance numerous encounters, it’s
undeniably a mandatory step to achieve expansion in customer
payments. It eventually will eradicate the need for carrying
magnetic cards & purchasing costly cell phones, promised for
the solitary resolution of expedient payments. It’ll similarly
disregard the jeopardy of trailing our cards or cell phones
because our biometric imprints (or Payment Fingers) will
always be with us and that’s what is wholly what we require to
make a reimbursement. In a husk, even though there are
numerous encounters for the implementation of the Biometric
payment system, it surely delivers an upcoming roadmap to
amalgamated, benign, secure and cool payments experience.
REFERENCES
[1] Ram Kumar Garg," Developing Secure Biometric Payments Model Using Tokenization”, 2015 International Conference on Soft Computing Techniques and Implementation –(ICSTCI).
[2] Mark Prior – Egerton, Solution Marketing Manager at Logic Group “Blog: Do consumers dream of biometric payments?” http://www.planetbiometrics.com/articledetails/i/2708/desc/blo g-do- consumers-dream-of-biometric-payments/
[3] New Science Transaction Security Article, “Biometrics for Payments” Summer 2014 UL.COM/NEWSCIENCE http://newscience.ul.com/wpcontent/uploads/2014/07/NS_TS_A rticle_BiometricsForPayments.pdf
[4] R. Pressman, "Software engineering - A Practitioner's Approach.", in Software Development 7th ed. New York: McGraw-Hill, 2014.
[5] W. Stallings and B. Chandavarkar, "Network security essentials”,
in networking 5th ed. Boston: Pearson, 2014. [6] Forouzan and S. Fegan, "Data communications and networking”,
in communication" 4th ed. New York: McGraw-Hill Higher Education, 2007
International Journal of Computational Intelligence Research (IJCIR). ISSN 0973-1873 Vol.14, No.1 (2018)© Research India Publications. http://www.ripublication.com
129

IoT Based Petrol Level Detection Shantanu Kharat
Information Technology
KJSIEIT
Affiliated to Mumbai University
Mumbai,India
Ronak Gal Information Technology
KJSIEIT
Affiliated to Mumbai University
Mumbai,India
Akash Kawale Information Technology
KJSIEIT
Affiliated to Mumbai University
Mumbai,India
Prof. Uday Rote Information Technology
KJSIEIT
Affiliated to Mumbai University
Mumbai,India
Abstract- Nowadays, the actual record/measurement
of fuel filled and fuel used by the vehicles is not
maintained. While filling the fuel the customer has to
rely on the fuel filling machine to know the amount of
fuel filled which will avoid a financial loss. To avoid
this we are implementing an IOT fuel level filing and
monitoring system. We are using two sensors namely
one flow rate sensor and one float rate sensor and the
output will be seen on the display device in tabular
form. Flow rate will be active only when filling is done
and then float rate sensor will measure the amount of
liquid.
Keywords - Petrol Level, IoT, Ultrasonic, flow level,
GUI, LED display, fuel tank.
I. INTRODUCTION
As Automotive industry is growing very fast and
estimation of fuel level and its indication is very
much required to make aware the vehicle owner
about the distance it can cover. Thus the
requirement of fuel level management system and
associated algorithms becomes more prominent.
The system have to be robust, effective and
durable. So as to provide the exact calibrated value
to the owner, and will be more effective if it can
give you the idea of estimation of distance it can
travel at different velocities. The embedded system
and the associated algorithms with complete
hardware helps in achieving this. Involvement of
M2M (Machine to machine) communication helps
in providing the information to the user within
his/her reach ( i.e. data can be transported to user
smart phone). This paper aims at the system which
can pinpoint the issues like calibrating fuel level in
bumpy surfaces, hilly areas (fuel sloshing
problem); porting the fuel level information to the
user's phone. To achieve the set goal a system is
developed using a system comprising
microcontroller, sensor and display unit.
II. LITERATURE SURVEY
A. Working of the existing system.
Fig.1: Existing Fuel Gauge Mechanism
In today’s vehicles the fuel gauge consists of two
parts:
The sensing unit which is located in
the tank
The indicator which is located on
the dashboard
A float connected to a potentiometer is used by the
sensing unit which typically is printed ink design
in a modern automobile. As the tank level starts to
decrease, the float drops and slides a moving
contact along the resistor, increasing its resistance.
In addition, when the resistance is at a certain
point, it will also turn on a "low fuel" light in all
vehicles .Magneto resistance type fuel level
sensors, now becoming common in small aircraft
applications, offer a potential alternative for
International Journal of Computational Intelligence Research (IJCIR). ISSN 0973-1873 Vol.14, No.1 (2018)© Research India Publications. http://www.ripublication.com
130

automotive use. These fuel level sensors work
similar to the potentiometer example, however a
sealed detector at the float pivot determines the
angular position of a magnet pair at the pivot end of
the float arm.
These are highly accurate, and the electronics are
completely outside the fuel. The non-contact nature
of these sensors address the fire and explosion
hazard, and also the issues related to any fuel
combinations or additives to gasoline or to any
alcohol fuel mixtures. Magneto resistive sensors
are suitable for all fuel or fluid combinations,
including LPG and CNG. The fuel level output for
these senders can be ratio metric voltage or
preferable can be digital. These sensors also fail-
safe in that they either provide a level output or
nothing. [1]
III. PROPOSED SYSTEM
A. Sensor Mechanism and Formula
The fuel level can be sensed using a fuel level
sensor, which should be robust and strong enough
to work during mechanical shocks. The
conventional step for fuel level estimation is to
mount a float-arm assembly to either a resistive,
capacitive or inductive sensor which is finally
digitized using an analogue to digital converter. But
the calibration done using float-arm based
assembly is not absolute. Thus, to avoid the errors
and to capture the data from the fuel tank two
sensor mechanism logic can be followed
* Pulse frequency (Hz) = 7.5Q, Q is flow rate in
Litres/minute
*Flow Rate (Litres/hour) = (Pulse frequency x 60
min) / 7.5Q
In other words:
*Sensor Frequency (Hz) = 7.5 * Q (Litres/min)
litres = Q * time elapsed (seconds) /
60(seconds/minute)
*litres = (Frequency (Pulses/second) / 7.5) * time
elapsed(seconds)/60*litres = Pulses / (7.5 * 60)
Once the flow started, application will start. [2]
B. Hardware and Software Details
Hardware:
Arduino Microcontroller
RAM: 4GB or more
Ultrasonic sensor
HCSRO4 Sensor.
Software:
WAMP Server version 2.2
Windows Operating System.
C. Technologies Used
1. PHP (The Hypertext Preprocessor):
PHP is one of the three dynamic web-page
technologies i.e. ASP, JSP and PHP. This
technology will be used as a business layer
scripting technology. PHP is an open source server-
side scripting technology which proves very useful
at business layer because of its easiness. PHP
version used for development of this web
application is 5.3.5. This version also supports
object-oriented programming in PHP which will
prove very useful as OOP is the concept which
reduces the programming load by a large amount.
PHP runs on WAMP (Windows AJAX MySQL
PHP) as well as LAMP (Linux AJAX MySQL
PHP) server. This server is available free of cost on
internet. Other than these two servers XAMPP
server can also be used which will on both Linux
and Windows platform.
Back End
MySQL is used for the purpose of web
database which is also the most widely
used open-source database (back-end). It
uses structured query language. It runs on
all platforms namely Linux, Unix,
Windows. It is relational database
management system [3]
D. Scope of the project
The scope of the project is the system on which the
hardware is installed, i.e. the project is developed
as a system which will monitor the amount of fuel
or liquid present in the container. [4]
International Journal of Computational Intelligence Research (IJCIR). ISSN 0973-1873 Vol.14, No.1 (2018)© Research India Publications. http://www.ripublication.com
131

IV. COMPARISON BETWEEN
EXISTING AND PROPOSED
SYSTEM
A. Existing System
In the existing system the customer does not get the
exact count of fuel. We don’t get fuel count (flow
rate). Petrol theft is a high possibility. The existing
system is being used since past so many years and
no innovation has been made. In the existing
system, the customer has to rely on petrol filling
system (machine) and hence does not get the exact
amount of petrol that has been filled
B. Proposed System
In the proposed system we get the exact count of
petrol that has been filled in the petrol tank. We
also use the flow rate sensor which helps to
measure the flow rate at which petrol is being
filled. There is no chance of fuel theft. Two sensors
used are flow rate sensor and float rate sensor
which give output on a led device which has a user-
friendly interface for the better understanding of
the customer.
Existing System Proposed System
In the existing system
the customer does not
get the exact count of
fuel.
In the proposed system we
get the exact count of petrol
that has been filled in the
petrol tank.
We don’t get fuel
count (flow rate)
We also use the flow rate
sensor which helps to
measure the flow rate at
which petrol is being filled.
Petrol theft is a high
possibility.
Petrol theft is not possible
The existing system is
being used since many
years and no
innovation has been
made.
The proposed system is
fairly new and innovative
which helps you give the
exact measurement
Table 1: Existing System v/s Proposed System
The main purpose of IoT based petrol pump sensor
is to provide exact amount of fuel which is
currently present in the container
We can cross check how much fuel is
deposited.
We can also check total amount of fuel we
have deposited.
Instant Notification.
The proposed system will make sure that
how much amount of fuel is exactly
deposited to avoid loss of amount of
money.
V. METHODOLOGY
Fig. 1: Block Diagram of Proposed System
Following is the working:
1. Flow rate sensor and Ultrasonic level
sensor will measure the data and feed to
Arduino Microcontroller
2. Arduino will measure the analogue value
and convert to digital
3. The digital value will be transmitted to PC
and displayed in real time
4. This data will also be recorded in database
5. The database can be opened to view the
details of the recordings
6. The screen can be used to view the real
time data
Non Standard Fuel Tank
Ultrasonic Sensor
Flow Sensor
Arduino UNO
PC (Visual
Studio)
database
International Journal of Computational Intelligence Research (IJCIR). ISSN 0973-1873 Vol.14, No.1 (2018)© Research India Publications. http://www.ripublication.com
132
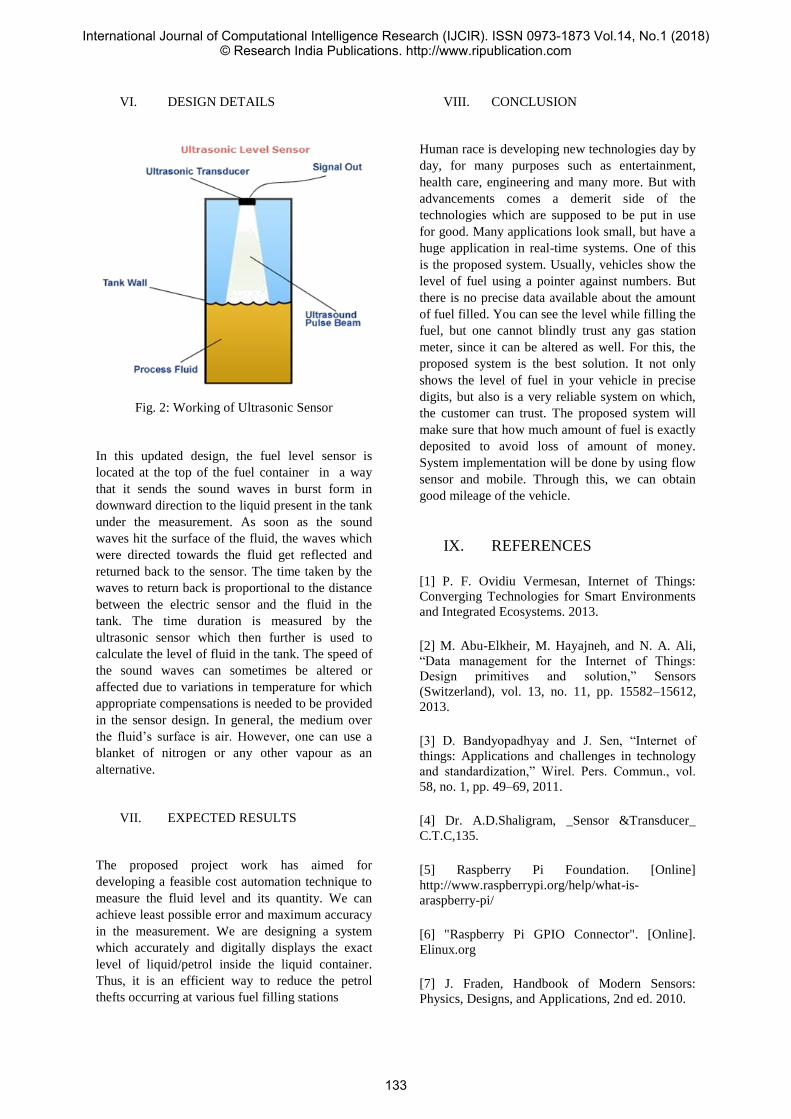
VI. DESIGN DETAILS
Fig. 2: Working of Ultrasonic Sensor
In this updated design, the fuel level sensor is
located at the top of the fuel container in a way
that it sends the sound waves in burst form in
downward direction to the liquid present in the tank
under the measurement. As soon as the sound
waves hit the surface of the fluid, the waves which
were directed towards the fluid get reflected and
returned back to the sensor. The time taken by the
waves to return back is proportional to the distance
between the electric sensor and the fluid in the
tank. The time duration is measured by the
ultrasonic sensor which then further is used to
calculate the level of fluid in the tank. The speed of
the sound waves can sometimes be altered or
affected due to variations in temperature for which
appropriate compensations is needed to be provided
in the sensor design. In general, the medium over
the fluid’s surface is air. However, one can use a
blanket of nitrogen or any other vapour as an
alternative.
VII. EXPECTED RESULTS
The proposed project work has aimed for
developing a feasible cost automation technique to
measure the fluid level and its quantity. We can
achieve least possible error and maximum accuracy
in the measurement. We are designing a system
which accurately and digitally displays the exact
level of liquid/petrol inside the liquid container.
Thus, it is an efficient way to reduce the petrol
thefts occurring at various fuel filling stations
VIII. CONCLUSION
Human race is developing new technologies day by
day, for many purposes such as entertainment,
health care, engineering and many more. But with
advancements comes a demerit side of the
technologies which are supposed to be put in use
for good. Many applications look small, but have a
huge application in real-time systems. One of this
is the proposed system. Usually, vehicles show the
level of fuel using a pointer against numbers. But
there is no precise data available about the amount
of fuel filled. You can see the level while filling the
fuel, but one cannot blindly trust any gas station
meter, since it can be altered as well. For this, the
proposed system is the best solution. It not only
shows the level of fuel in your vehicle in precise
digits, but also is a very reliable system on which,
the customer can trust. The proposed system will
make sure that how much amount of fuel is exactly
deposited to avoid loss of amount of money.
System implementation will be done by using flow
sensor and mobile. Through this, we can obtain
good mileage of the vehicle.
IX. REFERENCES
[1] P. F. Ovidiu Vermesan, Internet of Things:
Converging Technologies for Smart Environments
and Integrated Ecosystems. 2013.
[2] M. Abu-Elkheir, M. Hayajneh, and N. A. Ali,
“Data management for the Internet of Things:
Design primitives and solution,” Sensors
(Switzerland), vol. 13, no. 11, pp. 15582–15612,
2013.
[3] D. Bandyopadhyay and J. Sen, “Internet of
things: Applications and challenges in technology
and standardization,” Wirel. Pers. Commun., vol.
58, no. 1, pp. 49–69, 2011.
[4] Dr. A.D.Shaligram, _Sensor &Transducer_
C.T.C,135.
[5] Raspberry Pi Foundation. [Online]
http://www.raspberrypi.org/help/what-is-
araspberry-pi/
[6] "Raspberry Pi GPIO Connector". [Online].
Elinux.org
[7] J. Fraden, Handbook of Modern Sensors:
Physics, Designs, and Applications, 2nd ed. 2010.
International Journal of Computational Intelligence Research (IJCIR). ISSN 0973-1873 Vol.14, No.1 (2018)© Research India Publications. http://www.ripublication.com
133

[8] O. Bello and S. Zeadally, “Intelligent Device-
to-Device Communication in the Internet of
Things,” Ieeexplore.Ieee.Org, pp. 1–11, 2015.
[9] D. Rountree and I. Castrillo, “The Basics of
Cloud Computing,” Basics Cloud Comput., pp.
123–149, 2014.
[10] Carretero, J. & García, J. D. The Internet of
Things: connecting the world. Personal Ubiquitous
Computing.(2013)
International Journal of Computational Intelligence Research (IJCIR). ISSN 0973-1873 Vol.14, No.1 (2018)© Research India Publications. http://www.ripublication.com
134

Tracking Quality of Healthcare Services Phalguni Rathod - [email protected], Vishakha Oram - [email protected],
Karan Thakkar - [email protected]
UG Students, Department of Computer Engineering
K J Somaiya Institute of Engineering and Information Technology,Sion,Mumbai
Abstract—Health systems in India are grappling with the
effects of existing communicable and non-communicable means
to cater to the needs of the people. Lack of adequate progress on
these underlying social determinants of health has been
acknowledged as a glaring failure of public healthcare system.
The government is providing various services and funds for the
betterment of the medical sector in the rural areas. But the
resources provided reach in a scarce quantity to these areas of
requirement. In order to keep track of the services provided and
improvement being done, very few services are available and they
are seldom being used. Providing a service that can efficiently do
the functions and help the government in a better way is the aim
of this system. Taking timely feedbacks and providing the
necessary services to the patients on the feedback obtained will be
the functions of this system. Evaluation of the data collected
through feedbacks will help the government in betterment of the
economically poor society.
Keywords—Feedback System ; Android ; Patient ; Doctor ;
Interactive Feedback ; Medical .
I. INTRODUCTION
Medical centres are unable to maintain the accurate
data record of the patients(100%) during the feedback
process.
The main motto to take up this problem is to cater to
each and every need of the patient as well as monitor his/her
health from the time he/she first visits the hospital till he/she
totally recovers. Additional attention and adequate support to
ensure faster recovery is not possible as there is a poor
communication channel/link between the doctor and the
patient after the check-up. Due to insufficient data obtained in
the form of feedback, the government and the NGOs are
unable to do the necessary improvements required in this
field. According to the statistics, feedback from merely 5-
10% of the patients is collected monthly from any of the
government aided medical centres. Course of medication
prescribed to patients is seldom monitored.The staff is
neglected in terms of their behaviour and supportiveness
towards the needs of the patients.
Though the government is providing various facilities free of
cost, there is hardly any evidence whether the facilities are
being utilised properly. No proper medium is available for the
patients through which they can give their feedback about
their experiences and suggestions/complaints.
II. BACKGROUND AND RELATED WORKS
A. Android OS
Android is a mobile operating system developed by
Google, based on a modified version of the Linux kernel and
other open source software and designed primarily for
touchscreen mobile devices such as smartphones and tablets.
In addition, Google has further developed Android TV for
televisions, Android Auto for cars, and Android Wear for
wrist watches, each with a specialized user interface. Variants
of Android are also used on game consoles, digital cameras,
PCs and other electronics.
Android has been the best-selling OS worldwide on
smartphones since 2011 and on tablets since 2013. As of May
2017, it has over two billion monthly active users, the largest
installed base of any operating system, and as of 2017, the
Google Play store features over 3.5 million apps.
B. Android Applications
Applications ("apps"), which extend the functionality
of devices, are written using the Android software
development kit (SDK) and, often, the Java programming
language.
The SDK includes a comprehensive set of
development tools, including a debugger, software libraries, a
handset emulator based on QEMU, documentation, sample
code, and tutorials. Initially, Google's supported integrated
development environment (IDE) was Eclipse using the
Android Development Tools (ADT) plugin; in December
2014, Google released Android Studio, based on IntelliJ
IDEA, as its primary IDE for Android application
development.
C. SQLite
SQLite is an in-process library that implements a
self-contained, serverless, zero-configuration, transactional
SQL database engine. SQLite is an embedded SQL database
engine. Unlike most other SQL databases, SQLite does not
have a separate server process.
International Journal of Computational Intelligence Research (IJCIR). ISSN 0973-1873 Vol.14, No.1 (2018)© Research India Publications. http://www.ripublication.com
135
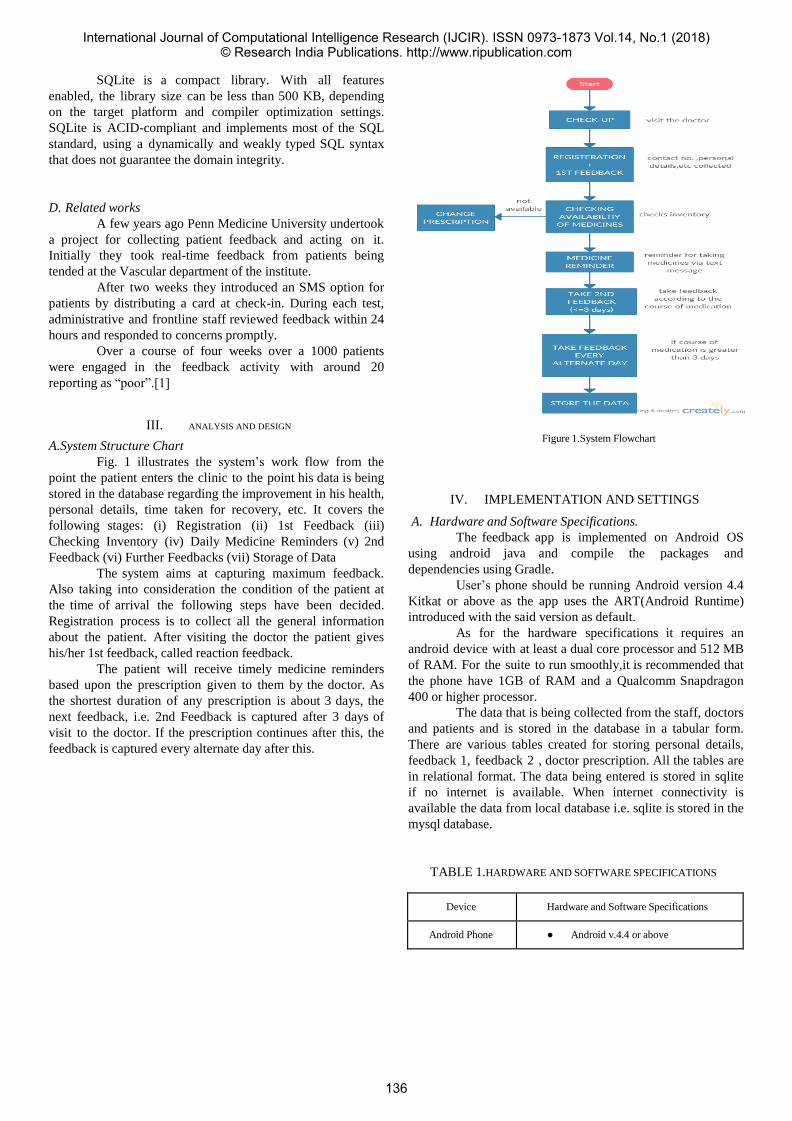
SQLite is a compact library. With all features
enabled, the library size can be less than 500 KB, depending
on the target platform and compiler optimization settings.
SQLite is ACID-compliant and implements most of the SQL
standard, using a dynamically and weakly typed SQL syntax
that does not guarantee the domain integrity.
D. Related works
A few years ago Penn Medicine University undertook
a project for collecting patient feedback and acting on it.
Initially they took real-time feedback from patients being
tended at the Vascular department of the institute.
After two weeks they introduced an SMS option for
patients by distributing a card at check-in. During each test,
administrative and frontline staff reviewed feedback within 24
hours and responded to concerns promptly.
Over a course of four weeks over a 1000 patients
were engaged in the feedback activity with around 20
reporting as “poor”.[1]
III. ANALYSIS AND DESIGN
A.System Structure Chart
Fig. 1 illustrates the system’s work flow from the
point the patient enters the clinic to the point his data is being
stored in the database regarding the improvement in his health,
personal details, time taken for recovery, etc. It covers the
following stages: (i) Registration (ii) 1st Feedback (iii)
Checking Inventory (iv) Daily Medicine Reminders (v) 2nd
Feedback (vi) Further Feedbacks (vii) Storage of Data
The system aims at capturing maximum feedback.
Also taking into consideration the condition of the patient at
the time of arrival the following steps have been decided.
Registration process is to collect all the general information
about the patient. After visiting the doctor the patient gives
his/her 1st feedback, called reaction feedback.
The patient will receive timely medicine reminders
based upon the prescription given to them by the doctor. As
the shortest duration of any prescription is about 3 days, the
next feedback, i.e. 2nd Feedback is captured after 3 days of
visit to the doctor. If the prescription continues after this, the
feedback is captured every alternate day after this.
Figure 1.System Flowchart
IV. IMPLEMENTATION AND SETTINGS
A. Hardware and Software Specifications.
The feedback app is implemented on Android OS
using android java and compile the packages and
dependencies using Gradle.
User’s phone should be running Android version 4.4
Kitkat or above as the app uses the ART(Android Runtime)
introduced with the said version as default.
As for the hardware specifications it requires an
android device with at least a dual core processor and 512 MB
of RAM. For the suite to run smoothly,it is recommended that
the phone have 1GB of RAM and a Qualcomm Snapdragon
400 or higher processor.
The data that is being collected from the staff, doctors
and patients and is stored in the database in a tabular form.
There are various tables created for storing personal details,
feedback 1, feedback 2 , doctor prescription. All the tables are
in relational format. The data being entered is stored in sqlite
if no internet is available. When internet connectivity is
available the data from local database i.e. sqlite is stored in the
mysql database.
TABLE 1.HARDWARE AND SOFTWARE SPECIFICATIONS
Device Hardware and Software Specifications
Android Phone Android v.4.4 or above
International Journal of Computational Intelligence Research (IJCIR). ISSN 0973-1873 Vol.14, No.1 (2018)© Research India Publications. http://www.ripublication.com
136
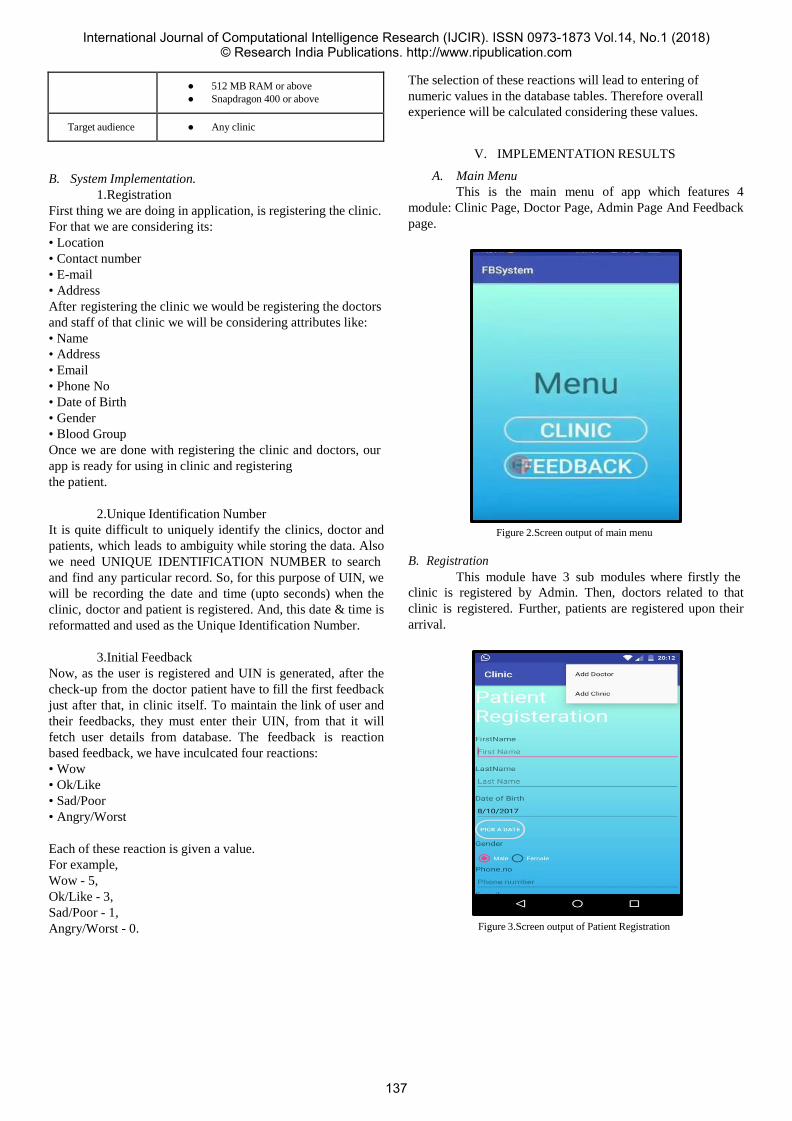
The selection of these reactions will lead to entering of
numeric values in the database tables. Therefore overall
experience will be calculated considering these values.
B. System Implementation.
1.Registration
First thing we are doing in application, is registering the clinic.
For that we are considering its:
• Location
• Contact number
• Address
After registering the clinic we would be registering the doctors
and staff of that clinic we will be considering attributes like:
• Name
• Address
• Phone No
• Date of Birth
• Gender
• Blood Group
Once we are done with registering the clinic and doctors, our
app is ready for using in clinic and registering
the patient.
V. IMPLEMENTATION RESULTS
A. Main Menu
This is the main menu of app which features 4
module: Clinic Page, Doctor Page, Admin Page And Feedback
page.
2.Unique Identification Number
It is quite difficult to uniquely identify the clinics, doctor and
patients, which leads to ambiguity while storing the data. Also
we need UNIQUE IDENTIFICATION NUMBER to search
B. Registration
Figure 2.Screen output of main menu
and find any particular record. So, for this purpose of UIN, we
will be recording the date and time (upto seconds) when the
clinic, doctor and patient is registered. And, this date & time is
reformatted and used as the Unique Identification Number.
3.Initial Feedback
Now, as the user is registered and UIN is generated, after the
check-up from the doctor patient have to fill the first feedback
just after that, in clinic itself. To maintain the link of user and
their feedbacks, they must enter their UIN, from that it will
fetch user details from database. The feedback is reaction
based feedback, we have inculcated four reactions:
• Wow
• Ok/Like
• Sad/Poor
• Angry/Worst
Each of these reaction is given a value.
For example,
Wow - 5,
Ok/Like - 3,
Sad/Poor - 1,
Angry/Worst - 0.
This module have 3 sub modules where firstly the
clinic is registered by Admin. Then, doctors related to that
clinic is registered. Further, patients are registered upon their
arrival.
Figure 3.Screen output of Patient Registration
512 MB RAM or above
Snapdragon 400 or above
Target audience Any clinic
International Journal of Computational Intelligence Research (IJCIR). ISSN 0973-1873 Vol.14, No.1 (2018)© Research India Publications. http://www.ripublication.com
137
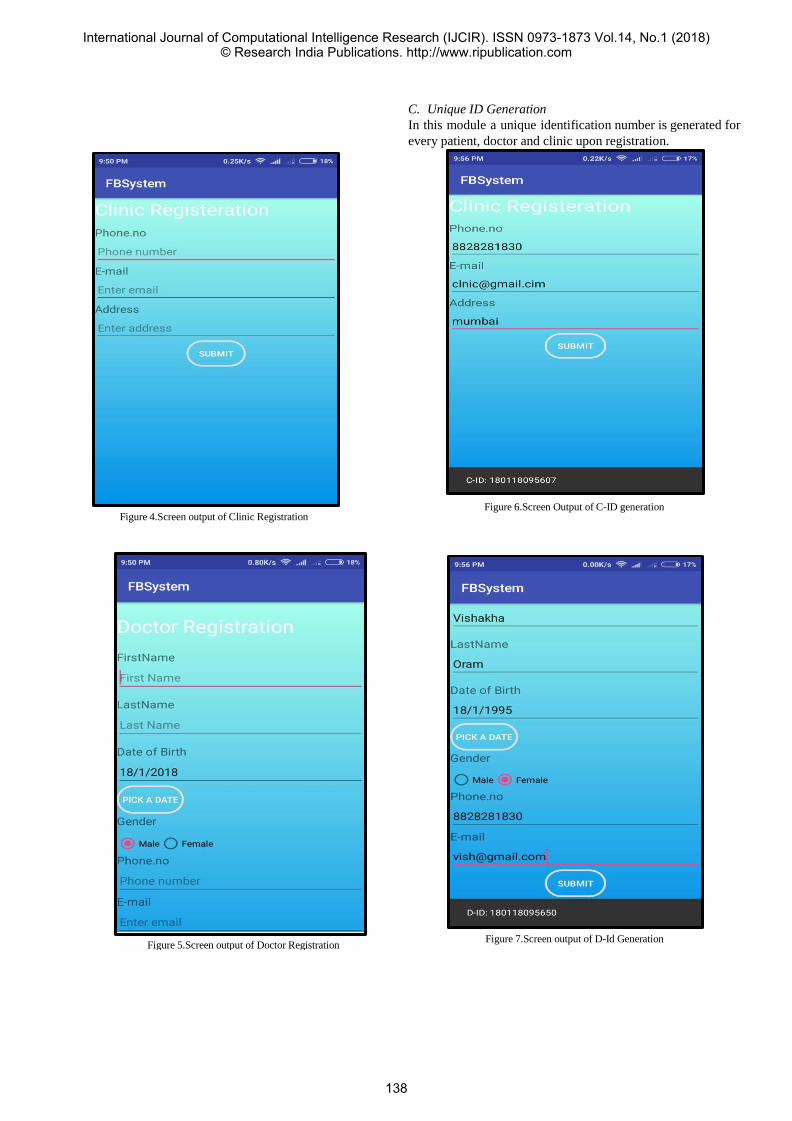
C. Unique ID Generation
In this module a unique identification number is generated for
every patient, doctor and clinic upon registration.
Figure 4.Screen output of Clinic Registration Figure 6.Screen Output of C-ID generation
Figure 7.Screen output of D-Id Generation
Figure 5.Screen output of Doctor Registration
International Journal of Computational Intelligence Research (IJCIR). ISSN 0973-1873 Vol.14, No.1 (2018)© Research India Publications. http://www.ripublication.com
138

Figure 9. Screen output of feedback form
VI. CONCLUSION AND FUTURE WORK
The to-be system aims at overcoming the problem of
improper data management of feedbacks and which facilitates
easy SMS based feedback and health monitoring system. The
system can analyze the data and can give priority to user’s
opinion. The future scope of this projects will involve
following activities: similar application on other platforms like
Apple and Windows, API connections with various
application for more ease of use.
D. Reaction Based Feedback
In this module, feedback of patient is taken
immediately after doctor’s checkup. User have to give reaction
for every question asked in feedback form.
REFERENCES
[1] Pennsylvania Medicine University project [Online].
Available:https://www.ic.groupish.com/projects/collecting-pat
ient-feedback
[2] http://ieeexplore.ieee.org/abstract/document/6392192/
[Online]
[3] http://ieeexplore.ieee.org/abstract/document/5600284/
[Online]
[4]https://708e8bd3-a-bb6ad6f3-s-sites.googlegroups.com/a/ijr
it.com/papers/home/V2I4177.pdf?attachauth=ANoY7crPujCL
QTLfE6s62L-9L-PsmRmGiSpTE-fhlL3F4t_2RdvfneGrmy45
1S3bohw0V4bYvyM4MZ0pUf3s8YcCqvp6qJMd8ZqQcBQO
OlkBcVCncvEcXgmYjP0NtQm4PvqWb-qSXwJ3TKWLAM
72xl3eqI3xRTBK1HfDruSIC93rxrZTJ9hEkv22R_SejoRDSb
Cg-h0ZrlxLSPkgDRa-rOnsoeu4MGJvbQ%3D%3D&attredire
cts=0
[5] http://www.gramvaani.org/?p=1629
[6] https://www.ncbi.nlm.nih.gov/pmc/articles/PMC4014652/
[7]https://www.brookings.edu/opinions/india-the-crisis-in-rura
l-health-care/
[8]https://thewire.in/150277/rural-healthcare-poor-quality/
[9]http://ieeexplore.ieee.org.library.somaiya.edu/document/78
67504/
[10]https://thewire.in/111658/healthcare-rural-india-policy/
Figure 8.Screen output of P-ID Generation
International Journal of Computational Intelligence Research (IJCIR). ISSN 0973-1873 Vol.14, No.1 (2018)© Research India Publications. http://www.ripublication.com
139
Rubber Viscosity Variation Reduction Using
Advanced Predictive Analytics Kamran Niyazi Dr. V.Z. Attar
Department of Computer Engineering,
College of Engineering, Pune
Pune, India
Sunil Kumar M. Tech. IITB
Pune, India
Dr. Saibal Dutta Ph. D. IITKGP
Pune, India
Dr. Lokesh Nagar Ph. D. IITB
Pune, India
Abstract—Manufacturing industries are always trying to
reduce waste and variability in their production processes and
dramatically improve product quality and yield (the amount of
output per unit of input). One such industry is of Tyre or Rubber.
Manufacturers of tyres face wastage and losses due to large
variability in rubber viscosity during manufacturing. This work
tries to identify the controllable factors which affect the rubber
viscosity during manufacturing using principal component
analysis, correlation and varimax rotation. It then attempts to
create a predictive model for viscosity using multivariate linear
regression. The performance of the model was tested and had a
good accuracy. This model was then used to identify the range for
the factors to construct a control system such that the viscosity was
well within specified limits.
Keywords—Tyre Manufacturing; Viscosity; Predictive
Modelling; Regression; Correlation; Principal Component Analysis
(PCA); Varimax Rotation; GRG Non Linear Equation Solver, Range
Optimization.
I. INTRODUCTION
Tyre production process is a complex process. It can be broadly divided into the sequence: (1) reception of raw materials → (2) compounding → (3) mixing → (4) inspection of mix → (5) extrusion/calendering → (6) vulcanizing → (7) finishing/inspection. Rather than functioning in isolation, however, the steps in this sequence interact with one another. Briefly, in the first step, the raw materials mainly include natural rubber, synthetic rubber, carbon black, silica, resins and oil, chemical adhesives, sulphur, elastomers, accelerators, anti- oxidants, anti-ozonants, extenders, vulcanizers, pigments, plasticizer, and reinforcing agents. The second step of compounding is the operation of selecting the ingredients to be mixed in a batch of rubber depending up on the intended use of the tyre. The objective may be to optimize performance, to maximize traction in both wet and dry condition, or to achieve superior rolling resistance etc. of the tyre. The third step of mixing of the raw ingredients is done using Banburry Mixer. The aim of mixing is to produce a product that has the ingredients dispersed and distributed sufficiently thoroughly that will process satisfactorily in the next process, cure efficiently and give the required properties for the end application. The fourth step of extrusion is a process used to create objects of a fixed cross-sectional profile. Here, unvulcanized rubber is pushed through a die of the desired cross-section. The fifth step of vulcanizing is done to harden the rubber object by treating it with sulphur at a high temperature. And finally in the sixth step, the rubber object is inspected and finishing is done before shipping.
A. Mixing
It is one of the most critical step of rubber processing. The mixing process outcome happens through multiple stages. Polymer and chemicals are added in multiple stages in the Banbury mixer to get a required compound with specific properties. Depending on quality of tyre to be produced (supreme, mid, low), acceptable ranges for viscosity are specified. Any rubber with viscosity out of specified range is either waste or need to be used in a relatively lower quality rubber. The mixing process outcome is measured through a sampling process of Minimum Viscosity (MV) and the objective is to get consistent Minimum Viscosity with minimum deviation, as any large deviation in the minimum viscosity in any of the stages has an impact on the subsequent stages. Typically, 10% of the batches are sampled randomly for measurement, as measuring viscosity using Mooney Viscometer (Apparatus used to measure viscosity) is a time taking process. It is practically infeasible to have measurements for all batches. Since the Mixing process requires deciding the recipe / formulation which includes raw material-age, raw-material quantity and the interaction for various compounds with sequence, the time, speeds, pressures, temperatures controlling the minimum viscosity within a specified range across the stages is a challenge. It is desirable to know viscosity measurements for all batches correctly before mixing them into the next stage so that wastage is avoided and desired viscosity is obtained within specified limit.
II. RELATED RESEARCH
In order to understand and identify the factors that affect the rubber mixing process and viscosity we went through the work of H. Kondo [3], M. Bousmina [8]et al and Wan Idris Wan Yaacob [9] which were mainly based on physical interaction of the mixer blades and chemical analysis of the additives mixed with the rubber during manufacturing. However, to identify the significant factors from within the collected data surveys of Sorzano et al [1] and Girish Chandrashekar et al [2] were helpful. A good example of factor selection using filter method based on correlation (Girish Chandrashekar et al [2]) and dimensionality reduction using PCA rotation (Sorzano et al [1]) is the work of Bashir HA[6]. Similar approach is used in this paper. Also, many studies that have proposed mathematical or computational models for rubber viscosity variation control during manufacturing, have proposed models which are complex and involve uncontrollable parameters to control the process. For instance, in M. Bratina [5] et al have used neural networks to create a closed loop control system for mixing rubber compounds in internal mixers using uncontrollable parameters
International Journal of Computational Intelligence Research (IJCIR). ISSN 0973-1873 Vol.14, No.1 (2018)© Research India Publications. http://www.ripublication.com
140

like torque, energy as input to control rotor speed of the mixer. Similarly, L. P. Specht[7] et al only created a predictive model for asphalt rubber viscosity using neural networks based on experimental data. Xiankui Zeng [4] et al created a linear regression based predictive model for viscosity of rubber manufactured on the open mill. As these studies did not create easy to use and parsimonious models for internal mixers like Banburry, to automatically control mixing of rubber in large industries, we intend to make a simple model based on only controllable parameters to handle viscosity such that it is well within specified limit for producing tyres.
III. METHODOLOGY:
The methodology mainly involves creation of predictive model by identifying controllable factors which cause variation in viscosity and then creating a control system which controls these factors such that there is reduction in variation of viscosity. The major steps are -
Data Collection.
Factor Selection.
Model Construction.
Model Testing.
Model Equation Solving & Simulation
Controller Design
A. Data Collection
Predictive models use historical data from previously completed processes to establish mathematical relationships capable of generating estimates for outputs of future processes using their inputs.
A major step of data collection is to select the sample size. In a very general sense, the best way to ensure predictive power in regression is to use a sufficiently large sample size. The data required for the analysis should be available and reasonably accurate. Data correctness, completeness, consistency needs to be ensured.
B. Factor Selection
Developing a parametric model requires a careful
selection of the factors that have predictive relationships to the
target or response variable (here viscosity). These factors
should be identified among more than one hundred candidate
factors, which influence during the mixing process. After
reviewing previously published research and considering the
requirements, it was decided to consider only controllable
variables as possible predictors or factors for viscosity.
However, due to large number of controllable variables still
further selection was required to be done. Similar to the
approach in Bashir HA [6] following steps were done to select
the factors -
Generation of the correlation coefficient matrix;
Extraction of the initial factors using the PCA method;
Optimization of the initial factors using varimax
rotation technique.
Calculation of absolute product of factor loadings and
correlation.
Selection of variable with maximum product as a predictor.
C. Model Construction
Having identified the predictor variables, regression was performed to get the equation for the model. However, based on significance testing (t test / two-tailed test) variables were further dropped to get the best predictive model with most important predictor variables. In significance testing, p-value for each term tests the null hypothesis that the coefficient is equal to zero (no effect). A low p-value (< 0.05) indicates that you can reject the null hypothesis. In other words, a predictor that has a low p-value is likely to be a meaningful addition to your model because changes in the predictor's value are related to changes in the response variable. Conversely, a larger (insignificant) p-value suggests that changes in the predictor are not associated with the changes in the response variable. Thus, regression was again performed using only significant variables to obtain the model equation.
D. Model Testing
There are a number of objective criteria that can be used for
the evaluation of a model. The most widely used criteria include
the mean magnitude of relative error (MMRE) and the
coefficient of multiple determination (R2). These criteria are
often in disagreement and there is no general acceptance of any
specific one. We have also used mean absolute percentage error
(MAPE) a slight modification of MMRE and prediction at a
given level (PRED(l)) (Bashir HA [6]) to evaluate the
developed predictive model.
E. Model Equation Solving & Simulation
GRG Non Linear Equation Solver was used to reduce the
initial range of predictor variables such that the response
variable was well within specified range. GRG stands for
“Generalized Reduced Gradient”. It can handle both linear and
non-linear smooth functions. In its most basic form, this solver
method looks at the gradient or slope of the objective function
as the input values (or decision variables) change and
determines that it has reached an optimum solution when the
partial derivatives equal zero. The solution you obtain with this
algorithm is highly dependent on the initial conditions and may
not be the global optimum solution. The solver will most likely
stop at the local optimum value nearest to the initial conditions
(initial ranges of decision or predictor variables), giving you a
solution that may or may not be optimized globally. This
reduced range was further optimized using few simulations so
that the standard deviation of the response variable was as per
the six sigma standards.
F. Controller Design
Based on the method of control variates which is used to reduce the variance of an estimator, a control system can be designed which can be used to reduce the variation of viscosity during manufacturing by maintaining the range of factors which
International Journal of Computational Intelligence Research (IJCIR). ISSN 0973-1873 Vol.14, No.1 (2018)© Research India Publications. http://www.ripublication.com
141

are identified as predictors well within the limit obtained in the previous step.
IV. RESULTS
Due to limitation of the space results of the most significant
first stage of the mixing process are described below.
A. Data Collection
Over the period of 2 years, around 10,000 observations and 117
variables were collected for the first stage. However, after data
cleaning only 796 observation and 45 variables were left for
further steps.
B. Factor Selection
The Pearson correlation coefficients between viscosity and
other variables were calculated. Then, the principal component
analysis was done on the variables excluding target variable -
viscosity. This was different from Bashir HA [6] approach
where he had used all variables including response variable for
PCA. Based on the eigenvalue greater than or equal to 1
criterion, only 10 factors / components accounted for most of
the variation which was 82.74 % of the total variation. Varimax
rotation technique was applied on this initial 10 factor matrix to
obtain optimized rotated matrix. After rotation, each variable
was only related to one of the factors / components and each
factor / component had high correlation with only a small set of
variables. As shown in “TABLE I”, absolute product of variable
loading on each factor from rotated matrix and variable
correlation coefficient with viscosity was calculated to select
the variable with maximum product as predictor variable from
each factor.
C. Model Construction
Using the 10 variables selected model was constructed using
multivariate regression. But by rejecting 5 variables with p-
value > 0.05 final model was constructed as –
3.0675 * C1412_QTY + 3.5178 * C1621_QTY + 1.9518 *
_10RPM_ - 0.3873 * _12PRESS_ + 0.2432 * _17PRESS_ -
227.4
TABLE I. FACTOR SELECTION
D. Model Testing
TABLE II. MODEL TESTING
Regression Model
R-Square 0.1883
TRAIN DATA TEST DATA
MAPE 5.50776089 5.628114
PRED(0.1) 85.91% 86.06%
Naive Model
R-Square 0
TRAIN DATA TEST DATA
MAPE 6.28088824 6.2286689
PRED(0.1) 82.69% 81.21%
Factor /
Compon
ent
Variable
Loading
Correlatio
n
Abs.
Product
1
C1621_QTY -0.98563 0.27815 0.274152985
C1540_QTY -0.6968 0.01919 0.013371592
_11_PRESS 0.96748 -0.28004 0.270933099
_1_RPM 0.76575 -0.15604 0.11948763
_2_RPM 0.73934 -0.13918 0.102901341
_11_RPM 0.8178 -0.17586 0.143818308
_12_RPM 0.9935 -0.24194 0.24036739
_13_RPM 0.9935 -0.24194 0.24036739
_14_RPM 0.99496 -0.25387 0.252590495
_15_RPM 0.99477 -0.25475 0.253417658
_16_RPM 0.99104 -0.25082 0.248572653
_17_RPM 0.99104 -0.25082 0.248572653
2
_4_PRESS 0.86343 0.11577 0.099959291
_7_PRESS 0.87066 0.11159 0.097156949
_10_PRESS 0.86206 0.11087 0.095576592
_16_PRESS 0.8887 0.24553 0.218202511
_17_PRESS 0.8887 0.24553 0.218202511
3
_3_PRESS 0.77317 -0.12692 0.098130736
_6_PRESS 0.83023 -0.02269 0.018837919
_9_PRESS 0.54204 -0.06569 0.035606608
_12_PRESS 0.91266 -0.11423 0.104253152
_13_PRESS 0.91366 -0.10933 0.099890448
4
_9_PRESS 0.61785 -0.06569 0.040586567
_3_RPM 0.9853 0.03518 0.034662854
_4_RPM 0.96737 -0.01602 0.015497267
_5_RPM 0.9773 0.02195 0.021451735
5
C1524_QTY 0.7879 0.0944 0.07437776
C1552_QTY 0.58729 -0.05704 0.033499022
C1048_QTY 0.80969 0.0441 0.035707329
C1412_QTY 0.74382 0.16595 0.123436929
CD491_QTY 0.6959 0.01285 0.008942315
6 _1_PRESS 0.90549 0.02941 0.026630461
7 _9_RPM 0.94269 0.05112 0.048190313
8 _7_RPM 0.82997 -0.02154 0.017877554
9 _10_RPM 0.82189 0.18498 0.152033212
10 _8_RPM 0.95967 -0.04672 0.044835782
International Journal of Computational Intelligence Research (IJCIR). ISSN 0973-1873 Vol.14, No.1 (2018)© Research India Publications. http://www.ripublication.com
142

From “TABLE II” it can be seen that the model performs
better than the Naïve model and the MAPE is around 5% only.
Also, PRED (0.1) > 85% that means, more than 85% of the
predicted values are within 10% of their actual values.
E. Model Equation Solving & Simulation
We reduce the range of predictor variables according to the
desired range of response variable using GRG Non Linear
Equation Solver. The initial constraints for the predictor
variables used in solver were obtained from training data. For
example initial constraint for _12PRESS_ was that its value was
between 0 and 100 as per the training data, but after solving the
equation its range was found to be between 85 and 90 for
viscosity to be between 58 and 70.
However, with respect to six sigma standard, the standard
deviation in the viscosity was required to be 2 only, so that the
mean viscosity was 64 and 58, 70 were 3 standard deviation
away from the mean. Therefore, we had to use model simulation
to further manually optimize the range of predictor variables.
For simulation values for predictor variables were drawn
randomly using uniform distribution from the range identified
by solving the equation in previous step. “TABLE III” shows
the final optimized range for predictor variables which result in
the mean to be 64 and standard deviation to be 1.982.
TABLE III. FINAL RANGES
unusual situations. It also does not take into account
uncontrollable factors which may sometime drastically affect
the result. Therefore, it is only useful in a relatively constant
environment.
REFERENCES
[1] Sorzano, C. O. S., Vargas, J. & Montano, A. P. A survey of dimensionality reduction techniques. Preprint at http://arxiv.org/abs/1403.2877 (2014)
[2] Girish Chandrashekar and Ferat Sahin, A survey on feature selection methods, computer and Electrical Engineering 40(2014)16-28
[3] Kondo, H. Evaluation of rubber processing in unvulcanised Rubber. International Polymer Science and Technology; Shropshire Vol. 41, Iss.
7, (2014): T51-T57.
[4] X. K. Zeng et al., "Study of the Mathematical Model for Online Predicting Mix Mooney Viscosity on the Rubber Open Mill", Key Engineering
Materials, Vol. 561, pp. 54-58, 2013
[5] Bratina, M & Šušterič, Z & Šter, Branko & Lottič, U & Dobnikar, Andrej. (2009). Predictive Control of Rubber Mixing Process Based on Neural
Network Models. KGK Kautschuk Gummi Kunststoffe. 62. 378-382.
[6] Bashir HA. Modeling of development time for hydro electric generators using factor and multiple regression analyses. J Project Manage.
2008;26:457–64.
[7] Specht, Luciano Pivoto, Khatchatourian, Oleg, Brito, Lélio Antônio Teixeira, & Ceratti, Jorge Augusto Pereira. (2007). Modeling of asphalt-
rubber rotational viscosity by statistical analysis and neural networks.
Materials Research, 10(1), 69-74. https://dx.doi.org/10.1590/S1516-
14392007000100015
[8] M. Bousmina, A. Ait-Kadi, and J. B. Faisant.(1999).Determination of shear rate and viscosity from batch mixer data. Journal of Rheology
(1978-present) 43, 415 (1999); doi: 10.1122/1.551044
[9] Wan Idris Wan Yaacob, (1978). Doctoral Theses – “Dispersion of particulate additives in rubber using the batch operated internal mixer : a study of flow behaviour and properties of rubber mixes”, Loughborough
University Institutional Repository,
https://dspace.lboro.ac.uk/2134/10466
V. CONCLUSION
The results clearly show us that the correlation between the
predictor variables and the response variables was not much
high still the method used to select variables gave us the best
predictor variables. Though we have not shown the model
comparison with other models, the model constructed using this
approach was found to be better than the models constructed
using other approaches like forward selection, backward
selection, stepwise selection, ridge regression etc. Based on
target variable range, optimizing the range of predictor
variables using equation solver actually reduces the number of
simulations and manual workload of the data scientist. The
approach used here can be used by all the industries to create
their specific models for product development as per their
quality control requirements.
VI. LIMITATION
The model obtained cannot be generalized. The model cannot
be constructed unless there is a pattern of relationships between
dependent variable and one or more factors as independent
variables. In addition, the model does not take into account
Variable Min. Max.
C1621_QTY 2.3 2.4
C1412_QTY 61 63
_12PRESS_ 86 87
_17PRESS_ 35 37
_10RPM_ 59.5 61.5
VISCOSITY 58 70
International Journal of Computational Intelligence Research (IJCIR). ISSN 0973-1873 Vol.14, No.1 (2018)© Research India Publications. http://www.ripublication.com
143

Widely Used Irrigation Techniques for
agriculture in India
Bhushan Patil S.K.Gabhane S.S.Repal
Electronics and Telecommunication
Engineering
Electronics and Telecommunication
Engineering
Electronics and Telecommunication
Engineering
Rajiv Gandhi Institute of
Technology
Rajiv Gandhi Institute of
Technology
Rajiv Gandhi Institute of
Technology
Mumbai, India Mumbai, India Mumbai, India
[email protected] [email protected] [email protected]
Abstract–Agriculture is one of the biggest resources of
food in this world. Agriculture requires irrigation to be
performed on a timely basis. Various irrigation
techniques are practiced across the world for irrigation.
Indian agriculture widely utilizes three irrigation
techniques. This paper discusses and analyzes these
techniques. The drawbacks of these techniques are also
listed in this paper. In order to overcome the drawbacks
of the widely used irrigation techniques in India,
wireless sensor network (WSN) concept along with the
use of web page is introduced and proposed in this
paper.
Keywords–Agriculture, irrigation, wireless sensor
network (WSN), soil moisture sensor, temperature sensor,
microcontroller, Global System for Mobile
Communications (GSM), General Packet Radio Service
(GPRS), web page.
I. INTRODUCTION
Mankind worldwide is majorly dependent on
agriculture to fulfill his food requirement. Agriculture
also has an extensive contribution in the economy of
each and every country throughout the world.
Besides, agriculture also serves as a source of
employment and specifically in India, a considerable
amount of population has undertaken agriculture as
their means of earning livelihood.
II. PROCESS OF AGRICULTURE
Agriculture is a huge process. It requires a lot of time
and consists of various stages. The first and the
foremost important stage of agricultural process is
planning, where the type of crops to be grown is
decided based on different criteria. The next stage is
making the agricultural field ready for sowing seeds.
A) Planning
In an agricultural field, numerous varieties of crops
are grown throughout the year. Selecting the type of
crops to be grown requires planning. This stage of
planning is quite essential as the climatic condition of
the region where the crops are to be grown should be
suitable for the growth of the selected crops. All
crops have different requirements for their growth
and the climatic conditions play a great role in the
growth of crops. That is why it becomes quite
important that climatic conditions of the region are
apt for the growth of crops. Based on the crop growth
requirement, different varieties of crops are grown in
different regions. For e.g. in the western region of
India, considering the case of Maharashtra state,
crops like wheat, chickpeas, cotton, sugarcane, etc.
are grown in a huge quantity as the climatic
conditions of Maharashtra are quite suitable for the
growth of these crops.
B) Preparing the agricultural field for sowing seeds
Once the crops to be grown are selected, preparation
of the agricultural field for the purpose of sowing
seeds is necessary. An organization of horizontal and
vertical lines is made with the help of the tractor
throughout the area of field where crops are to be
grown. The seeds of the crops are sowed in both the
lines of the agricultural field, i.e. vertical as well as
horizontal lines.
C) Irrigation
The contribution of irrigation in agriculture is the
most vital contribution. Irrigation is basically
providing water to the crops through pumps. Without
irrigation, the crops cannot sustain their lives.
D) Using pesticides
Different kind of insects cause harm to crops. These
insects affect the growth of the crops and many times
even make the crops unsuitable for use. To prevent
this from occurring, pesticides are used to protect the
crops from the insects.
International Journal of Computational Intelligence Research (IJCIR). ISSN 0973-1873 Vol.14, No.1 (2018)© Research India Publications. http://www.ripublication.com
149
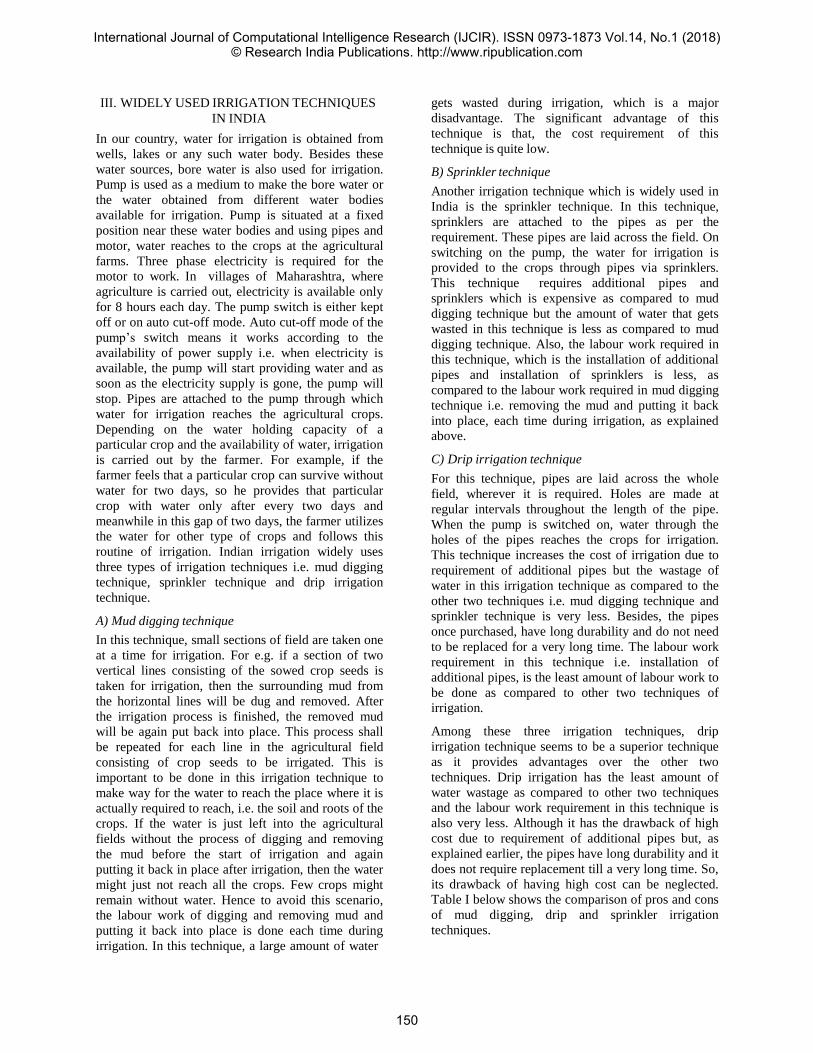
III. WIDELY USED IRRIGATION TECHNIQUES
IN INDIA
In our country, water for irrigation is obtained from
wells, lakes or any such water body. Besides these
water sources, bore water is also used for irrigation.
Pump is used as a medium to make the bore water or
the water obtained from different water bodies
available for irrigation. Pump is situated at a fixed
position near these water bodies and using pipes and
motor, water reaches to the crops at the agricultural
farms. Three phase electricity is required for the
motor to work. In villages of Maharashtra, where
agriculture is carried out, electricity is available only
for 8 hours each day. The pump switch is either kept
off or on auto cut-off mode. Auto cut-off mode of the
pump’s switch means it works according to the
availability of power supply i.e. when electricity is
available, the pump will start providing water and as
soon as the electricity supply is gone, the pump will
stop. Pipes are attached to the pump through which
water for irrigation reaches the agricultural crops.
Depending on the water holding capacity of a
particular crop and the availability of water, irrigation
is carried out by the farmer. For example, if the
farmer feels that a particular crop can survive without
water for two days, so he provides that particular
crop with water only after every two days and
meanwhile in this gap of two days, the farmer utilizes
the water for other type of crops and follows this
routine of irrigation. Indian irrigation widely uses
three types of irrigation techniques i.e. mud digging
technique, sprinkler technique and drip irrigation
technique.
A) Mud digging technique
In this technique, small sections of field are taken one
at a time for irrigation. For e.g. if a section of two
vertical lines consisting of the sowed crop seeds is
taken for irrigation, then the surrounding mud from
the horizontal lines will be dug and removed. After
the irrigation process is finished, the removed mud
will be again put back into place. This process shall
be repeated for each line in the agricultural field
consisting of crop seeds to be irrigated. This is
important to be done in this irrigation technique to
make way for the water to reach the place where it is
actually required to reach, i.e. the soil and roots of the
crops. If the water is just left into the agricultural
fields without the process of digging and removing
the mud before the start of irrigation and again
putting it back in place after irrigation, then the water
might just not reach all the crops. Few crops might
remain without water. Hence to avoid this scenario,
the labour work of digging and removing mud and
putting it back into place is done each time during
irrigation. In this technique, a large amount of water
gets wasted during irrigation, which is a major
disadvantage. The significant advantage of this
technique is that, the cost requirement of this
technique is quite low.
B) Sprinkler technique
Another irrigation technique which is widely used in
India is the sprinkler technique. In this technique,
sprinklers are attached to the pipes as per the
requirement. These pipes are laid across the field. On
switching on the pump, the water for irrigation is
provided to the crops through pipes via sprinklers.
This technique requires additional pipes and
sprinklers which is expensive as compared to mud
digging technique but the amount of water that gets
wasted in this technique is less as compared to mud
digging technique. Also, the labour work required in
this technique, which is the installation of additional
pipes and installation of sprinklers is less, as
compared to the labour work required in mud digging
technique i.e. removing the mud and putting it back
into place, each time during irrigation, as explained
above.
C) Drip irrigation technique
For this technique, pipes are laid across the whole
field, wherever it is required. Holes are made at
regular intervals throughout the length of the pipe.
When the pump is switched on, water through the
holes of the pipes reaches the crops for irrigation.
This technique increases the cost of irrigation due to
requirement of additional pipes but the wastage of
water in this irrigation technique as compared to the
other two techniques i.e. mud digging technique and
sprinkler technique is very less. Besides, the pipes
once purchased, have long durability and do not need
to be replaced for a very long time. The labour work
requirement in this technique i.e. installation of
additional pipes, is the least amount of labour work to
be done as compared to other two techniques of
irrigation.
Among these three irrigation techniques, drip
irrigation technique seems to be a superior technique
as it provides advantages over the other two
techniques. Drip irrigation has the least amount of
water wastage as compared to other two techniques
and the labour work requirement in this technique is
also very less. Although it has the drawback of high
cost due to requirement of additional pipes but, as
explained earlier, the pipes have long durability and it
does not require replacement till a very long time. So,
its drawback of having high cost can be neglected.
Table I below shows the comparison of pros and cons
of mud digging, drip and sprinkler irrigation
techniques.
International Journal of Computational Intelligence Research (IJCIR). ISSN 0973-1873 Vol.14, No.1 (2018)© Research India Publications. http://www.ripublication.com
150

TABLE I. COMPARISON OF PROS AND CONS OF WIDELY
USED IRRIGATION TECHNIQUES IN INDIA
Widely used
irrigation
techniques
in India
Pros Cons
Mud digging Low cost Requires a lot
of labour work
and a large
amount of
water is wasted
Sprinkler Doesn’t require
much labour
work
Cost is high and
water wastage
also takes place
Drip Water wastage
is very less
compared to
other two
techniques and
also the labour
work is very
less
Cost is high
IV. CASE STUDIES OF MUD DIGGING, DRIP
AND SPRINKLER IRRIGATION TECHNIQUES
WITH RESULTS
In order to get a better understanding of mud digging,
drip and sprinkler irrigation techniques, let us
consider their case studies with results. Mahatma
Phule Krishi Vidyapeeth at Rahuri in Maharashtra
state conducted a study on drip irrigation. They grew
five different types of crops using drip irrigation
method and mud digging method and compared their
results with each other. The mud digging technique
of irrigation is also called as traditional technique or
traditional method.
Table II shows the types of crops grown at Rahuri,
the amount of water applied in centimetre (cm) using
the traditional as well as drip irrigation method and
yield of crop in quantity per hectare (q/ha) using both
the irrigation methods i.e. tradtional and drip
irrigation. Also the table shows water use efficiency
(W.U.E) in kilogram per hectare per centimetre
(kg/ha/cm). Along with this, the water saved by using
drip irrigation and increase in yield of crops in terms
of percentage using drip irrigation as compared to the
traditional irrigation method is given in this table. In
this study, for the drip irrigation system used, a
pressure of 0.5 kg/cm is applied in the laterals of the
drip system. From the results seen in above table II,
it is clearly evident that for all the different types of
crops grown in this study, around 30 to 60 percentage
of water is saved using drip irrigation as compared to
the traditional or mud digging method of irrigation.
The yield of the crops also increased for about five to
twenty four percent for different crops grown at
Rahuri using drip irrigation method as compared to
the traditional irrigation method. Thus, on basis of
this case study and their associated results, it can be
rightly stated that, drip irrigation is more beneficial
than the mud digging irrigation method.
TABLE II. WATER APPLIED, YIELD, WATER USE
EFFICIENCY (W.U.E) AS INFLUENCED BY DIFFERENT METHODS OF IRRIGATION FOR DIFFERENT CROPS AT
RAHURI
Source: Indian National Committee on Irrigation and Drainage (INCID), 1994 [12].
To understand sprinkler irrigation method more
clearly let us consider the case study of sprinkler
irrigation.
TABLE III. PERCENTAGE INCREASE IN YIELD OF
DIFFERENT CROPS USING SPRINKLER AND DRIP IRRIGATION
S.NO. Crop Sprinkler Drip
1.
2.
3.
4.
Coconut
Coffee
Sugarcane
Vegetables
14
17
11
9-30
29
39
20
20-80
Source: A.H.Padhye, Proceedings of International Congress on The Use of Plastics in Agriculture, 1989 [13].
A survey was carried out at all India basis for
comparing the sprinkler and drip irrigation method.
As seen in results from above table III, the increase in
yield of crops in terms of percentage in the case of
drip irrigation is almost double as compared to
sprinkler irrigation. Hence, drip irrigation can
evidently be considered as a superior irrigation
technique as compared to mud digging and sprinkler
irrigation technique.
International Journal of Computational Intelligence Research (IJCIR). ISSN 0973-1873 Vol.14, No.1 (2018)© Research India Publications. http://www.ripublication.com
151
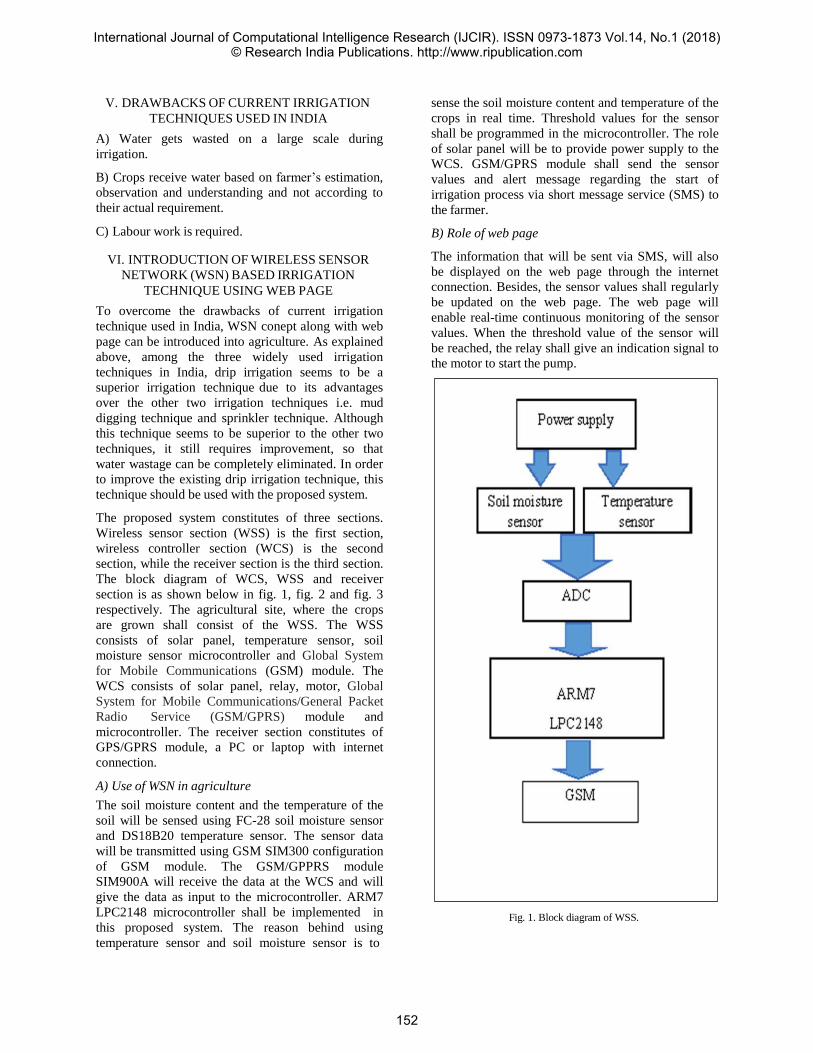
V. DRAWBACKS OF CURRENT IRRIGATION
TECHNIQUES USED IN INDIA
A) Water gets wasted on a large scale during
irrigation.
B) Crops receive water based on farmer’s estimation,
observation and understanding and not according to
their actual requirement.
C) Labour work is required.
VI. INTRODUCTION OF WIRELESS SENSOR
NETWORK (WSN) BASED IRRIGATION
TECHNIQUE USING WEB PAGE
To overcome the drawbacks of current irrigation
technique used in India, WSN conept along with web
page can be introduced into agriculture. As explained
above, among the three widely used irrigation
techniques in India, drip irrigation seems to be a
superior irrigation technique due to its advantages
over the other two irrigation techniques i.e. mud
digging technique and sprinkler technique. Although
this technique seems to be superior to the other two
techniques, it still requires improvement, so that
water wastage can be completely eliminated. In order
to improve the existing drip irrigation technique, this
technique should be used with the proposed system.
The proposed system constitutes of three sections.
Wireless sensor section (WSS) is the first section,
wireless controller section (WCS) is the second
section, while the receiver section is the third section.
The block diagram of WCS, WSS and receiver
section is as shown below in fig. 1, fig. 2 and fig. 3
respectively. The agricultural site, where the crops
are grown shall consist of the WSS. The WSS
consists of solar panel, temperature sensor, soil
moisture sensor microcontroller and Global System
for Mobile Communications (GSM) module. The
WCS consists of solar panel, relay, motor, Global
System for Mobile Communications/General Packet
Radio Service (GSM/GPRS) module and
microcontroller. The receiver section constitutes of
GPS/GPRS module, a PC or laptop with internet
connection.
A) Use of WSN in agriculture
The soil moisture content and the temperature of the
soil will be sensed using FC-28 soil moisture sensor
and DS18B20 temperature sensor. The sensor data
will be transmitted using GSM SIM300 configuration
of GSM module. The GSM/GPPRS module
SIM900A will receive the data at the WCS and will
give the data as input to the microcontroller. ARM7
LPC2148 microcontroller shall be implemented in
this proposed system. The reason behind using
temperature sensor and soil moisture sensor is to
sense the soil moisture content and temperature of the
crops in real time. Threshold values for the sensor
shall be programmed in the microcontroller. The role
of solar panel will be to provide power supply to the
WCS. GSM/GPRS module shall send the sensor
values and alert message regarding the start of
irrigation process via short message service (SMS) to
the farmer.
B) Role of web page
The information that will be sent via SMS, will also
be displayed on the web page through the internet
connection. Besides, the sensor values shall regularly
be updated on the web page. The web page will
enable real-time continuous monitoring of the sensor
values. When the threshold value of the sensor will
be reached, the relay shall give an indication signal to
the motor to start the pump.
Fig. 1. Block diagram of WSS.
International Journal of Computational Intelligence Research (IJCIR). ISSN 0973-1873 Vol.14, No.1 (2018)© Research India Publications. http://www.ripublication.com
152
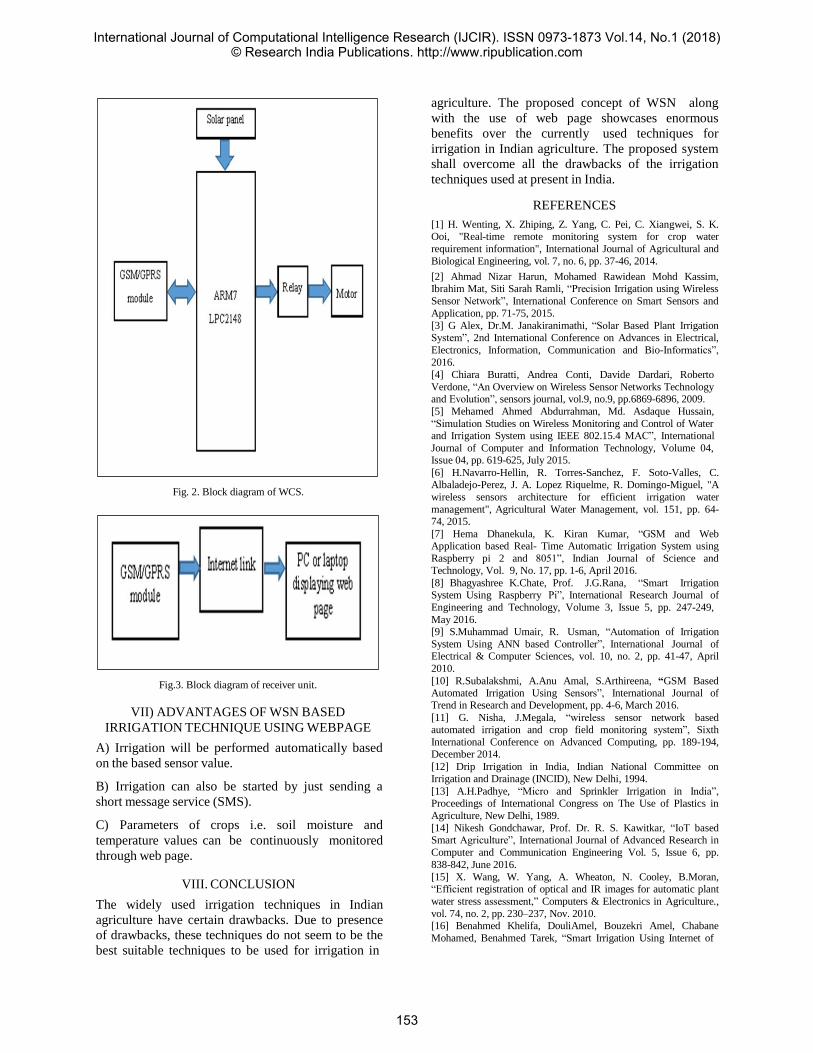
Fig. 2. Block diagram of WCS.
Fig.3. Block diagram of receiver unit.
VII) ADVANTAGES OF WSN BASED
IRRIGATION TECHNIQUE USING WEBPAGE
A) Irrigation will be performed automatically based
on the based sensor value.
B) Irrigation can also be started by just sending a
short message service (SMS).
C) Parameters of crops i.e. soil moisture and
temperature values can be continuously monitored
through web page.
VIII. CONCLUSION
The widely used irrigation techniques in Indian
agriculture have certain drawbacks. Due to presence
of drawbacks, these techniques do not seem to be the
best suitable techniques to be used for irrigation in
agriculture. The proposed concept of WSN along
with the use of web page showcases enormous
benefits over the currently used techniques for
irrigation in Indian agriculture. The proposed system
shall overcome all the drawbacks of the irrigation
techniques used at present in India.
REFERENCES
[1] H. Wenting, X. Zhiping, Z. Yang, C. Pei, C. Xiangwei, S. K. Ooi, "Real-time remote monitoring system for crop water
requirement information", International Journal of Agricultural and
Biological Engineering, vol. 7, no. 6, pp. 37-46, 2014.
[2] Ahmad Nizar Harun, Mohamed Rawidean Mohd Kassim, Ibrahim Mat, Siti Sarah Ramli, “Precision Irrigation using Wireless
Sensor Network”, International Conference on Smart Sensors and
Application, pp. 71-75, 2015.
[3] G Alex, Dr.M. Janakiranimathi, “Solar Based Plant Irrigation
System”, 2nd International Conference on Advances in Electrical,
Electronics, Information, Communication and Bio-Informatics”,
2016.
[4] Chiara Buratti, Andrea Conti, Davide Dardari, Roberto
Verdone, “An Overview on Wireless Sensor Networks Technology and Evolution”, sensors journal, vol.9, no.9, pp.6869-6896, 2009.
[5] Mehamed Ahmed Abdurrahman, Md. Asdaque Hussain,
“Simulation Studies on Wireless Monitoring and Control of Water and Irrigation System using IEEE 802.15.4 MAC”, International
Journal of Computer and Information Technology, Volume 04, Issue 04, pp. 619-625, July 2015.
[6] H.Navarro-Hellin, R. Torres-Sanchez, F. Soto-Valles, C. Albaladejo-Perez, J. A. Lopez Riquelme, R. Domingo-Miguel, "A
wireless sensors architecture for efficient irrigation water
management", Agricultural Water Management, vol. 151, pp. 64- 74, 2015.
[7] Hema Dhanekula, K. Kiran Kumar, “GSM and Web Application based Real- Time Automatic Irrigation System using
Raspberry pi 2 and 8051”, Indian Journal of Science and Technology, Vol. 9, No. 17, pp. 1-6, April 2016.
[8] Bhagyashree K.Chate, Prof. J.G.Rana, “Smart Irrigation System Using Raspberry Pi”, International Research Journal of
Engineering and Technology, Volume 3, Issue 5, pp. 247-249,
May 2016. [9] S.Muhammad Umair, R. Usman, “Automation of Irrigation
System Using ANN based Controller”, International Journal of Electrical & Computer Sciences, vol. 10, no. 2, pp. 41-47, April
2010.
[10] R.Subalakshmi, A.Anu Amal, S.Arthireena, “GSM Based Automated Irrigation Using Sensors”, International Journal of Trend in Research and Development, pp. 4-6, March 2016.
[11] G. Nisha, J.Megala, “wireless sensor network based automated irrigation and crop field monitoring system”, Sixth
International Conference on Advanced Computing, pp. 189-194, December 2014.
[12] Drip Irrigation in India, Indian National Committee on
Irrigation and Drainage (INCID), New Delhi, 1994.
[13] A.H.Padhye, “Micro and Sprinkler Irrigation in India”, Proceedings of International Congress on The Use of Plastics in
Agriculture, New Delhi, 1989.
[14] Nikesh Gondchawar, Prof. Dr. R. S. Kawitkar, “IoT based Smart Agriculture”, International Journal of Advanced Research in
Computer and Communication Engineering Vol. 5, Issue 6, pp.
838-842, June 2016.
[15] X. Wang, W. Yang, A. Wheaton, N. Cooley, B.Moran, “Efficient registration of optical and IR images for automatic plant
water stress assessment,” Computers & Electronics in Agriculture.,
vol. 74, no. 2, pp. 230–237, Nov. 2010. [16] Benahmed Khelifa, DouliAmel, Bouzekri Amel, Chabane
Mohamed, Benahmed Tarek, “Smart Irrigation Using Internet of
International Journal of Computational Intelligence Research (IJCIR). ISSN 0973-1873 Vol.14, No.1 (2018)© Research India Publications. http://www.ripublication.com
153

Things”, Fourth International Conference on Future Generation
Communication Technology, pp. 1-6, 2015.
[17] Indu Gautam, S.R.N.Reddy, “Innovative Gsm Bluetooth based Remote Controlled Embedded System for Irrigation”,
International Journal of Computer Applications, Volume 47,
No.13, pp. 1-7, June 2012.
[18] Chandan Kumar Sahu, Pramitee Behera, “A Low Cost Smart
Irrigation Control System”, 2nd International Conference on Electronics and Communication System, pp. 1146-1152, February
2015.
International Journal of Computational Intelligence Research (IJCIR). ISSN 0973-1873 Vol.14, No.1 (2018)© Research India Publications. http://www.ripublication.com
154

MOBILE APPLICATION FOR VOLUNTEER
MANAGEMENT USING COLLABORATIVE
FILTERING TECHNIQUE
Soham Mankad
Computer Engineering
K.J.Somaiya Institute of Engineering & I.T.
Mumbai, India
Nagesh Khamkar
Computer Engineering
K.J.Somaiya Institute of Engineering & I.T.
Mumbai, India
Sanket Nimbalkar
Computer Engineering
K.J.Somaiya Institute of Engineering & I.T.
Mumbai, India
Prof. Nilambari Joshi
Computer Engineering
K.J.Somaiya Institute of Engineering & I.T.
Mumbai, India
Abstract—As per companies act it is mandatory for any
organisation to plough back 2% of their profit for betterment of
society. Due to this a large number of volunteers are engaged in
different CSR activities. The problem that is being faced is that
management is not up to the mark when events are to be
conducted. The solution that we propose is an end to end real
time application with modules that will notify volunteers about
upcoming events, volunteers can log their attendance through the
app, check locations using maps incorporated in the app and also
provide feedback for the events attended. Collaborative Filtering
engines are more versatile, in the sense that they can be applied
to any domain, and with some care could also provide cross-
domain recommendations. Collaborative engines need item
metadata, so they require domain modeling and their extension
to different domains is an issue. And hence any and every data of
volunteer available would be compared to other volunteers using
collaborative filtering and specific events will be recommended to
the volunteers in the application developed.
Keywords—Collaborative Filtering; Data Mining;
Recommendations; Volunteer (key words)
I. INTRODUCTION
Data mining is used for finding and computing patterns in
large sets of data. The main aim of data mining is to extract
information that is useful from data sets and structure it for
further use[9]. Collaborative Filtering(CF) is used by
recommender systems and is used for making automatic
predictions about interest of users by collecting likes, dislikes
and preferences of many users[10]. In general sense
collaborative filtering is the process of filtering or sorting
information using methods which involve collaboration of
multiple agents, viewpoints, data sources etc. Hence we
propose use of Collaborative filtering to solve the proposed
problem.
II. LITERATURE REVIEW
The statistical data mentioned on CSR portal of organizations
like TCS states that volunteers
invested their 58,362 hours in volunteering different activities
that reached 57,90,604 beneficiaries[12]. TCS has made 42
global partners and spent Rs 51.39 crores on 22 key global
programmes.[12]
Whenever a CSR activity like cleaning a lake, teaching
students or awareness events takes place a lot of volunteers are
needed. To manage them via manual attendance sheets and
tracking their records manually would create a lot of wastage
of time and energy. If a system that notifies volunteers of
upcoming events, log their time spent in volunteering and ask
them for their feedback for how the event could be more
successful and also show the images and data related to
previous events can be developed it would boost the morale of
volunteers and also help the organizations to manage the
volunteers by generating annual participation records.
In recommendation system collaborative filtering is a widely
accepted approach for recommendation generation[1]. Some
of the popular websites that use collaborative filtering are
www.amazon.com, www.technorati.com and
www.flickr.com[11]. Collaborative filtering systems
recommend items based on similarity measures between users
International Journal of Computational Intelligence Research (IJCIR). ISSN 0973-1873 Vol.14, No.1 (2018)© Research India Publications. http://www.ripublication.com
155

and items. This approach is based on the ideology that similar
users prefer similar items and uses tags as the implicit data
used for recommendation generation. An interesting direction
for encouraging tagging in a “Recommendation System”
approach is where a user uses the metadata in the form of
content or a word to define its interest in item(s)[11].
The existing technologies available in market are either
android applications or websites. They either serve
volunteering purposes or administrative purposes.[13]
Volunteering purposes means that volunteers can find events
related to their choices and then they attend it on their will.
Administrative solutions means that the data related to events
are processed and stored in database for future purposes.
There is no application existing in market that links both
volunteering and administrative modules together. The current
features and modules of existing applications are as follows:
(1) Administrative Analysis
(2) Tracking or Analysis of Volunteers
(3) Attendance based recommendation
(4) eg:E-volunteer, LocalCoordinators[13]
III. PROPOSED METHODOLOGY
The proposed methodology for this project is explained as
follows: There are two modules one for the volunteers, let us
call them Users. Another for people managing volunteers, let
them be called as Admins. The users will give inputs like
comments, images, and suggestions on previous events. The
Admins would notify the volunteers about the upcoming
events and track their attendance for the same. The Users
would also be provided with graphical participation data on
yearly basis by using the Graph API for android and also
volunteers would be notified about the events of their specific
interests based on their participation records. Besides these
facilities we would like to add some features like goal setting
and tracking and badge popups as rewards after achieving the
goals. For tracking the attendances we would be using the
Google location API to avoid manual attendance. The web
application will be used to track attendance, problem
correction like attendance not marked, if any and analysis
purpose by the Admins to take required actions. Now from all
the data that would be gathered we will use collaborative
filtering technique to recommend various events to the
volunteers registered with the app.
The modules included in the project are:
1.Modules for Volunteer:
(a) Registration and Login
(b) Checking updated events
(c) Registering for an event
(d) Logging attendance using app
(e) Checking locations using inbuilt map
(f) Providing Feedback of Events
2.Modules for Admin:
(a) Check volunteer registrations
(b) Update & Remove events
(c) Notify using Firebase
(d) Check attendances recorded for any event
(e) Check Feedbacks for events happened
(f) Checking output of recommender system
A. Data Structure
The data structure we propose consists of two lists: an event
list, and user list. Event list plays a role of indexing by using
event ids.. For each event user list stores pairs of volunteers
their preferences of events and feedbacks for events attended.
For a target user proposed method finds similar volunteers
efficiently by using this data structure. First it identifies the
data of user list of target volunteer. Then we find the
volunteers with similar data in user list. Finally it computes
similarities of target volunteer to volunteers retrieved from
user list.
B. Algorithm
The simple algorithm we use for design of recommender
system is as explained below:
Figure 1: Algorithm
Algorithm: To calculate R
Input: U, E
Output: R
1: for i= 1 to U.length():
2: for each j in E:
3: S(i)=Euclidean_distance(Ui,Ej)
4: end
5: end
6: sort_similarity(S)
7: top_n=S.get(n)
8: R= Recommend(Ui, E)
International Journal of Computational Intelligence Research (IJCIR). ISSN 0973-1873 Vol.14, No.1 (2018)© Research India Publications. http://www.ripublication.com
156
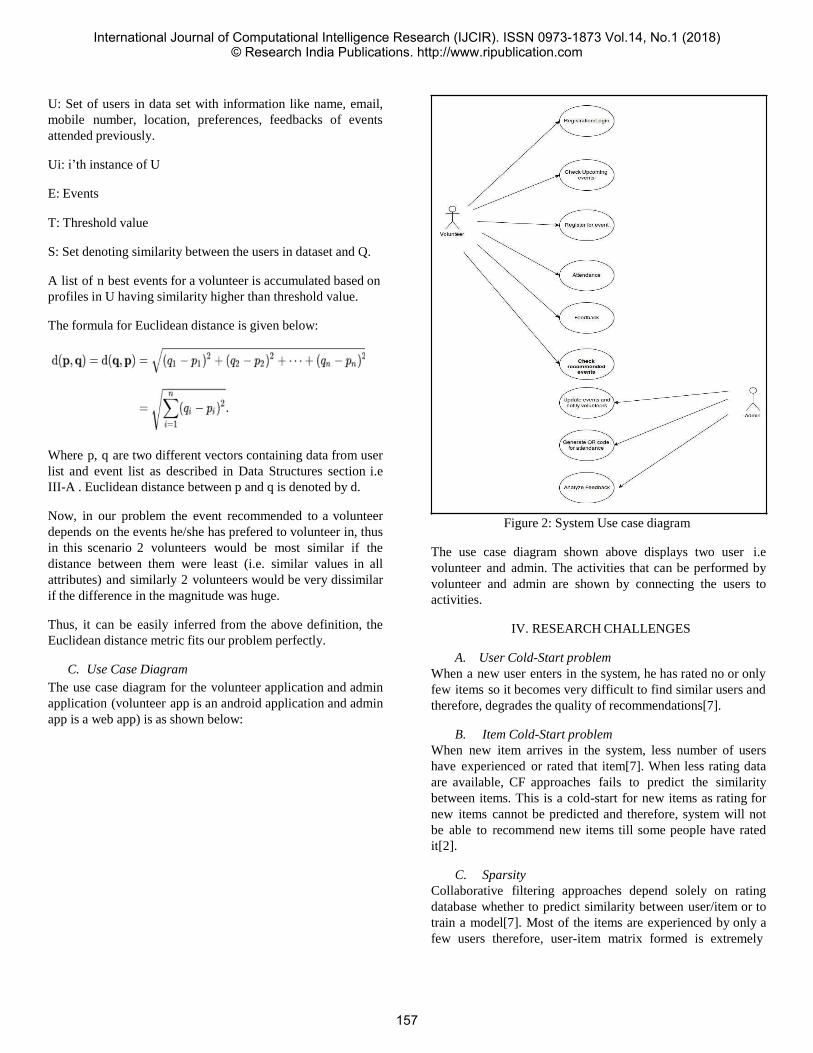
U: Set of users in data set with information like name, email,
mobile number, location, preferences, feedbacks of events
attended previously.
Ui: i’th instance of U
E: Events
T: Threshold value
S: Set denoting similarity between the users in dataset and Q.
A list of n best events for a volunteer is accumulated based on
profiles in U having similarity higher than threshold value.
The formula for Euclidean distance is given below:
Where p, q are two different vectors containing data from user
list and event list as described in Data Structures section i.e
III-A . Euclidean distance between p and q is denoted by d.
Now, in our problem the event recommended to a volunteer
depends on the events he/she has prefered to volunteer in, thus
in this scenario 2 volunteers would be most similar if the
distance between them were least (i.e. similar values in all
attributes) and similarly 2 volunteers would be very dissimilar
if the difference in the magnitude was huge.
Thus, it can be easily inferred from the above definition, the
Euclidean distance metric fits our problem perfectly.
C. Use Case Diagram
The use case diagram for the volunteer application and admin
application (volunteer app is an android application and admin
app is a web app) is as shown below:
The use case diagram shown above displays two user i.e
volunteer and admin. The activities that can be performed by
volunteer and admin are shown by connecting the users to
activities.
IV. RESEARCH CHALLENGES
A. User Cold-Start problem
When a new user enters in the system, he has rated no or only
few items so it becomes very difficult to find similar users and
therefore, degrades the quality of recommendations[7].
B. Item Cold-Start problem
When new item arrives in the system, less number of users
have experienced or rated that item[7]. When less rating data
are available, CF approaches fails to predict the similarity
between items. This is a cold-start for new items as rating for
new items cannot be predicted and therefore, system will not
be able to recommend new items till some people have rated
it[2].
C. Sparsity
Collaborative filtering approaches depend solely on rating
database whether to predict similarity between user/item or to
train a model[7]. Most of the items are experienced by only a
few users therefore, user-item matrix formed is extremely
Figure 2: System Use case diagram
International Journal of Computational Intelligence Research (IJCIR). ISSN 0973-1873 Vol.14, No.1 (2018)© Research India Publications. http://www.ripublication.com
157

sparse due to insufficient rating data which makes algorithms
inefficient to measure similarity between users[3]. One of the
reasons for sparsity is huge item-to-user ratio.
D. Scalability
As system gets mature with time, number of users and items
increases, leads to millions of ratings which results in slow
computations and degrades the quality of recommendation
system[7].
VI. CONCLUSION
The application we are developing is a generalised and
customizable application as we have used simple principles
and easily modifiable code work. It can be used by any college
committee, office department or any college department.
Hence due to simple architecture the app can be taken to any
imaginable levels. The recommendation engine part using
collaborative filtering can also be used at any platform where
maintaining user interest is must in organization or groups.
Collaborative Filtering engine works best when the user space
is large and hence we propose to increase accuracy of the
recommendations considering large amount of data and
multiple attributes of user.
VII. REFERENCES
[1] S. Deng, L. Huang, G. Xu, X. Wu, and Z. Wu, "On Deep Learning for
Trust-Aware Recommendations in Social Networks," IEEE Transactions
on Neural Networks and Learning Systems, vol. PP, pp. 1-14, 2016.
[2] R. Burke, Knowledge-Based Recommender Systems:Marcel Dekker,
2000.
[3] G. Jennifer, "Generating predictive movie recommendations from trust
in social networks," in 4th international conference on Trust
Management Pisa, Italy: Springer-Verlag, 2006.
[4] R. Burke, "Hybrid web recommender systems," in The adaptive web:
Springer, 2007, pp. 377-408.
[5] 3rd IEEE International Conference on "Computational Intelligence and
Communication Technology" (IEEE-CICT 2017) Collaborative
Filtering–Based Recommender System: Approaches and Research
Challenges
[6] R. Paul, I. Neophytos, S. Mitesh, B. Peter, and R. John, "GroupLens: an
open architecture for collaborative filtering of netnews," in ACM
conference on Computer supported cooperative work Chapel Hill, North
Carolina, USA: ACM, 1994.
[7] Bellogin, A., Castells, P., & Cantador, I. (2014). Neighbor selection and
weighting in user-based collaborative filtering: A performance
prediction approach. ACM Transactions on the Web (TWEB), 8(2), 12.
[8] Cai, Y., Leung, H. F., Li, Q., Min, H., Tang, J., & Li, J. (2014).
Typicality-Based Collaborative Filtering Recommendation. IEEE Trans.
Knowl. Data Eng., 26(3), 2014, pp 766-779.
[9] Jinjun Chen, Wanchun Dou, Xuyun Zhang, "KASR: A Keyword-Aware
Service Recommendation Method on MapReduce for Big Data
Application," IEEE Transactions on Parallel and Distributed Systems, 17
March 2014, pp 1-9.
[10] Pazzani, Michael J. "A framework for collaborative, content-based and
demographic filtering." Artificial Intelligence Review 13, no. 5-6
(1999): 393-408.
[11] Pazzani, M., & Billsus, D. (1997). Learning and revising user profiles:
The identification of interesting websites. Machine learning, 27(3),
313-331.
[12] Jing Jiang, Jie Lu, Guangquan Zhang, Guodong Long, "Scaling-up Item-
based Collaborative Filtering Recommendation Algorithm based on
Hadoop", IEEE World Congress on Services, Sydney, Australia, 2011,
pp. 490-497, DOI 10.1109/SERVICES.2011.66
[13] Z. D. Zhao and M. S. Shang, "User-Based Collaborative-Filtering
Recommendation Algorithms on Hadoop," in International Workshop on
Knowledge Discovery and Data Mining, Phuket, Thailand, 2010, pp.
478-481.
[14] “Data Mining”.Available: https://en.wikipedia.org/wiki/Data_mining
[15] “Collaborative Filtering”. Available:
https://en.wikipedia.org/wiki/Collaborative_filtering
[16] “Data Analytics”. Available: http://www.wikihow.com/Data-Analytics
[17] “TCS Corporate Social Responsibility”. Available:
https://www.tcs.com/corporate-sustainability/sustainability-strategy
[18] “Softwares for Volunteer Management”. Available:
https://blog.capterra.com/free-volunteer-management-software-options/
[19] “Recommendation Engine”. Available:
https://www.analyticsvidhya.com/
International Journal of Computational Intelligence Research (IJCIR). ISSN 0973-1873 Vol.14, No.1 (2018)© Research India Publications. http://www.ripublication.com
158

Automated System for Malaria Parasite
Detection
Alifia Ghantiwala, Aishwarya Pannala, Omkeshwari Pilare,Mrs.Sandhya Kadam
Department of Computer Engineering
K. J. Somaiya Institute of Engineering and Information Technology, Sion 400022.
University of Mumbai
[email protected], [email protected], [email protected],[email protected]
Abstract-- The traditional method involves detection of
malaria under microscope which takes few hours and
also highly trained professionals. The proposed method
involves detection of malarial parasite by using
segmentation and morphological operations. The
feature extraction of all the blood cells present in the
smear will take a long time. In this paper, k-means
algorithm is used for segmentation and we apply feature
extraction only to the infected cells and obtained results
to detect malarial parasite faster. The proposed
automated system for Malaria Parasite detection is
implemented in MATLAB to provide the count of
malaria parasite infected cells. The total number of
malaria infected RBCs are counted and calculated in
percent with respect to total number of RBCs present in
a blood smear. Watershed algorithm is also used for
segmentation.
Keywords-- Malaria parasite, segmentation, infected
cells, RBC .
I. INTRODUCTION
Malaria is responsible for nearly one million deaths
worldwide in a year according to WHO. Majority
deaths occur in Africa. This happens because of the
poor environmental conditions that are suitable for
breeding mosquitoes. Automation is needed in this
area to obtain the results faster and to avoid human
error. The automated detection involves various
stages as image acquisition, preprocessing,
segmentation, feature extraction, morphological
operations.
II. LITERATURE REVIEW
The detection of malaria stages is studied[1]. The
detection of malaria parasite is done using forward
curvelet transform[2]. The feature extraction is done
for preprocessed blood smears and clusters are
formed by grouping into classes as infected and non
infected malaria parasites[3]. The concept of artificial
neural network can be applied for detection of
malaria parasite[4]. Ncut algorithm is also studied[5].
The various edge detection operators are also
studied[6]. Various image segmentation techniques
with their advantages and disadvantages are
studied[7]. Two algorithms are implemented together
which are binarzation and morphological operations.
Also color based segmentation is done[8]. For
implementation of Normalized Cut algorithm, FGPA
based architecture is used[9].
III. PROPOSED SYSTEM
The flow diagram of the proposed system is shown
below in Fig 1. The various stages in the proposed
system are image acquisition, preprocessing of blood
smears, segmentation using watershed feature
extraction and morphological operations. The
preprocessing is done using filtering. The blood
smears are preprocessed and used for segmentation.
Segmentation is performed on the preprocessed
image. Algorithms like k-means, watershed can be
used to perform this operation. Depending on
various colors present in the image, formation of
clusters can be done since the non-infected cells are
of purple color but the infected cells are of blue color.
International Journal of Computational Intelligence Research (IJCIR). ISSN 0973-1873 Vol.14, No.1 (2018)© Research India Publications. http://www.ripublication.com
159
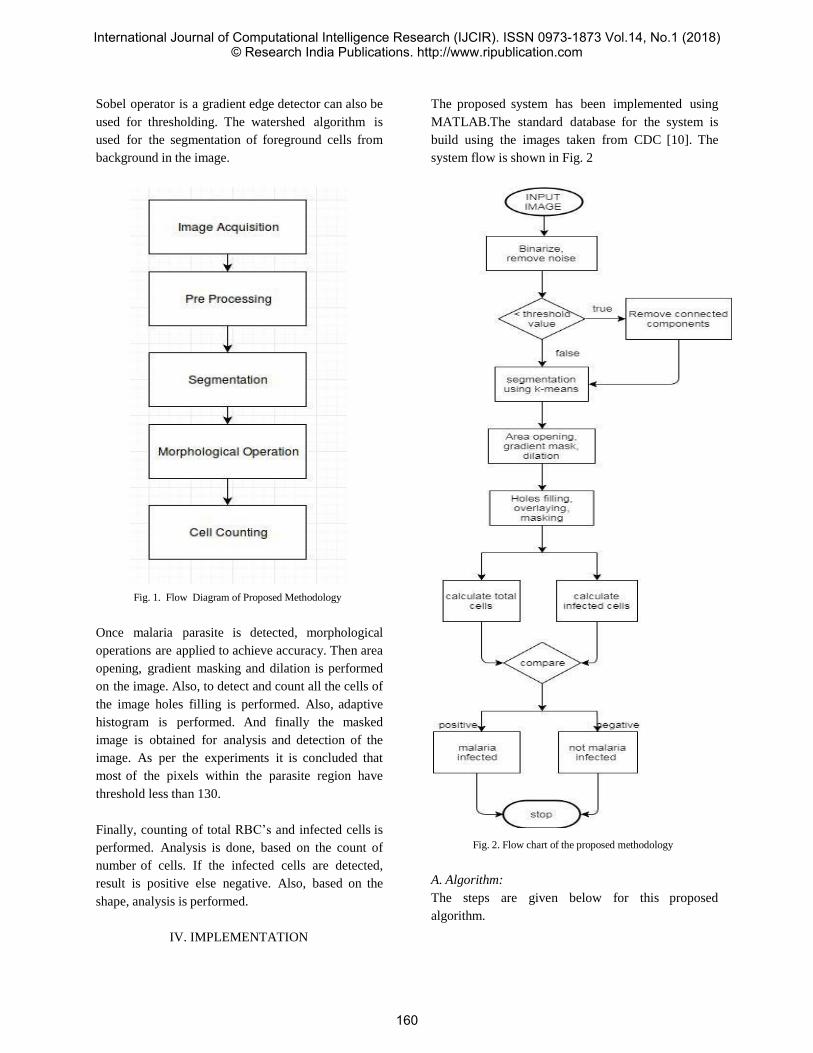
Sobel operator is a gradient edge detector can also be
used for thresholding. The watershed algorithm is
used for the segmentation of foreground cells from
background in the image.
Fig. 1. Flow Diagram of Proposed Methodology
Once malaria parasite is detected, morphological
operations are applied to achieve accuracy. Then area
opening, gradient masking and dilation is performed
on the image. Also, to detect and count all the cells of
the image holes filling is performed. Also, adaptive
histogram is performed. And finally the masked
image is obtained for analysis and detection of the
image. As per the experiments it is concluded that
most of the pixels within the parasite region have
threshold less than 130.
Finally, counting of total RBC’s and infected cells is
performed. Analysis is done, based on the count of
number of cells. If the infected cells are detected,
result is positive else negative. Also, based on the
shape, analysis is performed.
IV. IMPLEMENTATION
The proposed system has been implemented using
MATLAB.The standard database for the system is
build using the images taken from CDC [10]. The
system flow is shown in Fig. 2
Fig. 2. Flow chart of the proposed methodology
A. Algorithm:
The steps are given below for this proposed
algorithm.
International Journal of Computational Intelligence Research (IJCIR). ISSN 0973-1873 Vol.14, No.1 (2018)© Research India Publications. http://www.ripublication.com
160
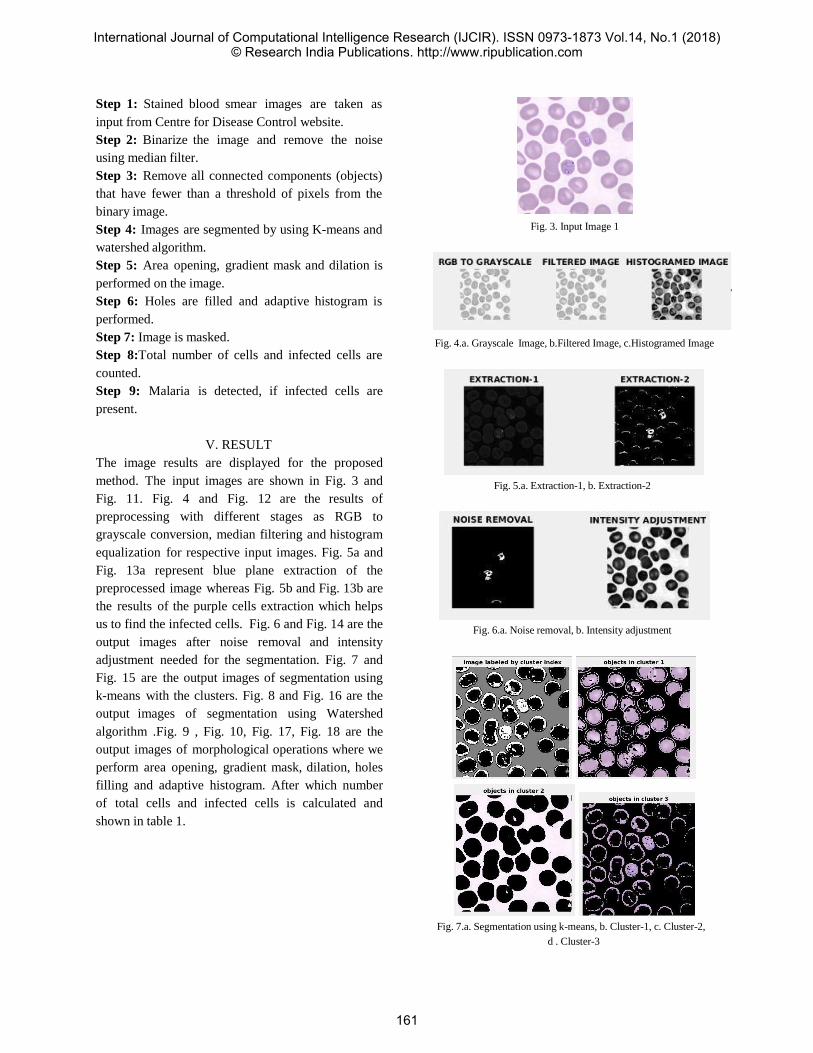
Step 1: Stained blood smear images are taken as
input from Centre for Disease Control website.
Step 2: Binarize the image and remove the noise
using median filter.
Step 3: Remove all connected components (objects)
that have fewer than a threshold of pixels from the
binary image.
Step 4: Images are segmented by using K-means and
watershed algorithm.
Step 5: Area opening, gradient mask and dilation is
performed on the image.
Step 6: Holes are filled and adaptive histogram is
performed.
Step 7: Image is masked.
Step 8:Total number of cells and infected cells are
counted.
Step 9: Malaria is detected, if infected cells are
present.
V. RESULT
The image results are displayed for the proposed
method. The input images are shown in Fig. 3 and
Fig. 11. Fig. 4 and Fig. 12 are the results of
preprocessing with different stages as RGB to
grayscale conversion, median filtering and histogram
equalization for respective input images. Fig. 5a and
Fig. 13a represent blue plane extraction of the
preprocessed image whereas Fig. 5b and Fig. 13b are
the results of the purple cells extraction which helps
us to find the infected cells. Fig. 6 and Fig. 14 are the
output images after noise removal and intensity
adjustment needed for the segmentation. Fig. 7 and
Fig. 15 are the output images of segmentation using
k-means with the clusters. Fig. 8 and Fig. 16 are the
output images of segmentation using Watershed
algorithm .Fig. 9 , Fig. 10, Fig. 17, Fig. 18 are the
output images of morphological operations where we
perform area opening, gradient mask, dilation, holes
filling and adaptive histogram. After which number
of total cells and infected cells is calculated and
shown in table 1.
Fig. 3. Input Image 1
Fig. 4.a. Grayscale Image, b.Filtered Image, c.Histogramed Image
Fig. 7.a. Segmentation using k-means, b. Cluster-1, c. Cluster-2,
d . Cluster-3
Fig. 5.a. Extraction-1, b. Extraction-2
Fig. 6.a. Noise removal, b. Intensity adjustment
International Journal of Computational Intelligence Research (IJCIR). ISSN 0973-1873 Vol.14, No.1 (2018)© Research India Publications. http://www.ripublication.com
161

Fig. 14.a. Noise removal, b.Intensity adjustment
Fig. 8.Segmentation using Watershed
Fig. 9.a. Area opening, b.Gradient mask, c.Dilation
Fig. 10 a. Holes filling, b. Adaptive histogram
Fig. 11. Input Image 2
Fig. 15.a. Segmentation using k-means, b. Cluster-1, c. Cluster-2,
d . Cluster-3
Fig. 12.a. Grayscale Image, b.Filtered Image, c.Histogramed
Image
Fig. 13.a. Extraction-1, b. Extraction-2
Fig. 16 .Segmentation using Watershed
Fig. 17.a. Area opening, b. Gradient mask, c. Dilation
Fig. 18.a. Holes filling, b. Adaptive histogram
International Journal of Computational Intelligence Research (IJCIR). ISSN 0973-1873 Vol.14, No.1 (2018)© Research India Publications. http://www.ripublication.com
162

Table 1. Result Analysis
Input 1 Input 2
Percentage of
infected RBCs
22.22% 14.28%
Number of total
RBC count
14 12
As table 1 shows percentage of infected RBCs,
malaria parasite is detected for given image.
VI. CONCLUSION
Automated system for malaria parasite detection is
successfully implemented in MATLAB. The standard
database of blood smears is input to the proposed
system. The malarial parasite infected cells are
detected. It also provides count for infected RBCs.
The detection of malaria parasite is done using k-
means algorithm for segmentation and features are
extracted only for infected cells. The image results
are displayed. The percentage of infected cells is also
calculated. The result of segmentation using
watershed algorithm is also displayed. In future,
automated malaria parasite detection algorithm using
watershed algorithm will be implemented and results
will be compared with the present method.
REFERENCES
[1] Akshay Nanoti, Sparsh Jain, Chetan Gupta, Garima Vyas,
“Detection of malaria parasite species and life cycle stages using
microscopic images of thin blood smear”
[2] Ahmedelmubarak Bashir, Zeinab A.Mustafa, Islah
Abdelhameid, Rimaz Ibrahem “Detection of Malaria Parasites
Using Digital Image Processing”
[3] Deepali Ghate ,Chaya Jadhav,N Usha Rani,“Automatic
Detection Of Malaria Parasite from Blood Images”
[4] Kristofer E. Delas Peñas ,Pilarita T. Rivera, Prospero C.
Naval,“Malaria Parasite Detection and Species Identification on
Thin Blood Smears Using a Convolutional Neural Network”
[5] Subhamoy Mandal, Amit Kumar, J Chatterjee, Member,
Manjunatha and Ajoy K Ray, “Segmentation of Blood Smear
Images using Normalized Cuts for Detection of Malarial Parasites”
,2010 Annual IEEE India Conference (INDICON).
[6] Pranati Rakshit, Kriti Bhowmik, “ Detection of Presence of
Parasites in Human RBC In case of Diagnosing Malaria using
Image Processing”, Proceedings of the 2013 IEEE Second
(ICIIP-2013).
[7] Wassem Khan, “Image Segmentation Techniques: A Survey”,
Journal of image and graphics (vol.1,No.4,December 2013)
[8] Kaushik Chakrabortya, Arnab Chattopadhyayb, Amlan
Chakrabarti, Tinku Acharyad and Anjan Kr Dasguptae, “A
Combined Algorithm for Malaria Detection from Thick Smear
Blood Slides”,(JHMI -2015)
[9] Shumit Saha, Kazi Hasan Uddin, Md. Shajidul Islam, Md.
Jahiruzzaman, A. B. M. Awolad Hossain, “Implementation of
Simplified Normalized Cut Graph Partitioning Algorithm on
FPGA for Image Segmentation” (IEEE-2014).
[10]https://www.cdc.gov/dpdx/malaria/index.html
International Journal of Computational Intelligence Research (IJCIR). ISSN 0973-1873 Vol.14, No.1 (2018)© Research India Publications. http://www.ripublication.com
163

Learning Aid For Autistic Children
Meet Karia, Bharat Jadeja, Prof. Shubhada
Labde(Guide)
Department of Computer Engineering
K .J. Somaiya Institute of Engineering &
Information Technology Sion, Mumbai
Abstract—Autism or Autism spectrum disorder(ASD) are
terms related to the mental condition that affects the neurological
development of the brain. The word ‘spectrum’ refers to a range
of conditions that are found in people diagnosed with it.
Symptoms of autism are seen from early childhood. They could
be difficulties in social interaction, communication, having
repetitive behaviors, less attention span and hyperactivity. There
is no specific cure for autism but there are medications which can
help them to improve, such as certain therapies and medical
interventions. Also, autistic children are attracted to technology
such as mobile gadgets. Such technology could help them in
learning certain things that they are not able to learn so easily.
So, with proper guidance of parents or therapists, children would
be able to learn various concepts at their own pace. Making it
entertaining, this technology can be useful in the treatment of
autistic children. So, the aim of the project is to develop a phone
application which could help autistic children in learning new
concepts. The project would aim to cover as many challenges as
possible faced by them and try to provide solutions that would
benefit them. The application would work on Android devices.
Keywords—Autism, Autism Spectrum Disorder, ASD,
Disability, Learning Aid, Mobile Application.
I. INTRODUCTION
Autism, or autism spectrum disorder, [1]refers to a range
of conditions characterized by challenges with social skills,
repetitive behaviors, speech and nonverbal communication, as
well as by unique strengths and differences. Some of the
individuals with the autism have extraordinary skills in visual
abilities, music, academics and many more. Many autistic
people pride themselves about viewing the world in their own
fascinating ways. But there are many who have severe
disability, cannot live independently and require special
attention. Approximately, 25 percent of the people having
Autism spectrum disorder are verbally weak but are able to
learn other ways to communicate.
The aim of this project is to improve the lives of those
having Autism spectrum disorder. ASD is an early childhood
disorder. Parents are not able to detect that in the early stage.
If found in the earlier stages, it could be beneficial for the
children. Some developmental delays associated with ASD can
be identified and addressed even earlier. The project aims to
help autistic ‘children’ in their early stages. It is meant to
address the considerable changes in communication, education
and cognition so that it could help them in the future.
Before developing solutions for their problems it is first
important to know what problems they are facing in detail. So
some of the issues and challenges faced by the autistic children
are as follows :
Difficulties with social communication and social
interaction.
Repetitive patterns of behaviour, interests or
activities.
Cognitive problems such as difficulties with attention
and concentration.
Frustration due to the ignorance by other people and
their prejudice against autism.
Developmental condition such as attention deficit
hyperactivity disorder, dyspraxia and epilepsy.
Mental health problems such as anxiety, depression
and obsessive compulsions.
Sensory problems such as hearing and sound
sensitivity, visual disturbances.
Not able to maintain relationships with others.
Not able to find right school or type of education.
It is important that they be provided with interventions
that can help them. These problems can be worked on and
their impact can be reduced significantly. Therefore, the
International Journal of Computational Intelligence Research (IJCIR). ISSN 0973-1873 Vol.14, No.1 (2018)© Research India Publications. http://www.ripublication.com
164

proposed application includes modules that will help in
improving all the problems faced by them described above.
This paper is partitioned in four chapters. The first being
the introduction itself. The second chapter explains about
technologies related to this project. The third chapter explains
the proposed system for the learning aid in detail. The fourth
chapter is the last chapter of this paper which concludes the
topic along with the references.
II. PREVIOUS WORKS
There are several systems that are available which serve a
similar purpose as the proposed project. But there are various
drawbacks each of them face. The existing systems are as
follows :
Teaching Aid Software :
It is a computer software that aims to develop various
attributes of autistic children with the help of various modules
such as learning alphabets, words and sentences. Also, teaches
mathematical concepts with the help of various games.
Autiaid :
It is also a learning mobile application for autistic
children. It has three modules: scheduling, monitoring and
gaming. Scheduling prepares the schedules for the children,
monitoring helps to keep track of the progress and gaming
contains various games that help in developing skills.
Educational Games for Kids :
It is an android based application which has several games
for teaching the kids things like alphabets, numbers,
relationships, colours etc. The disadvantage of this system is
that it might work fine for other kids but autistic children may
find it a little difficult to cope up with.
Animal Memory :
It is a classical tile game which helps in improving the
memory of the kids. It uses attractive and vibrant images of
animals and also helps in recognition and matching for the
kids.
Autism iHelp :
It is a teaching aid which proves helpful in vocabulary
teaching and speech therapy. It is developed due to the need
for specific language intervention tools for children with
autism.
Touch Emotions :
It is an application which focuses on teaching different
kinds of human emotions with the help of images and a voice
over. The disadvantage of this system is that the voice over
does not depict the emotion represented through the images
accurately.
III. PROPOSED SYSTEM
Learning Aid for Autistic Students is a mobile application
that will make learning easy and fun for the kids. We propose
an educational app that would help the autistic children not
only in improving their skills but also eliminating their
disability. It is designed specifically for the autistic students,
keeping in mind their requirements and needs. The app would
be developed Android devices. It is an integrated solution
which would be developed using Android Studio.
There are many systems that are made for autistic children
to help the learn and improve. But only few of them are
mobile apps. There are many advantages of mobile
applications over desktop applications such as :
Android phones can be carried anywhere.
Easy to use.
They are cheap in compared to desktop devices.
There will be two modules. The first module is ‘Learn’
module. Basically, it would help the children in learning. It
would contain many sub-modules that would aim to teach
various basic educational concepts. These sub-modules would
focus on improving their special education which would
involve games that would teach them basics like alphabets,
numbers, colors, fruits, vegetables, transport, etc. Also, it
would help them understand various day-to-day things. It
would also concentrate on improving the social skills of the
kids.
The second module is the ‘Play’ module. It would contain
games and tests that would help the children to practice what
they learned in the ‘Learn’ module. These games include
matching alphabets, counting numbers, naming colors,
animals, fruits, currency, guessing time by looking at the
clock and many more. Also, contains certain games that will
help them recognize human emotions and thus clearing their
confusion regarding human emotions which is a big hurdle in
their communication mechanism. These modules would also
help the children on improving their memory and cognition.
Also the user will have the facility to choose the lessons he
wishes to take first and also to select the levels of difficulties
for the tests which would be available for each module. There
would also be provisions that would help the parents and
teachers to tack the progress of their wards.
International Journal of Computational Intelligence Research (IJCIR). ISSN 0973-1873 Vol.14, No.1 (2018)© Research India Publications. http://www.ripublication.com
165
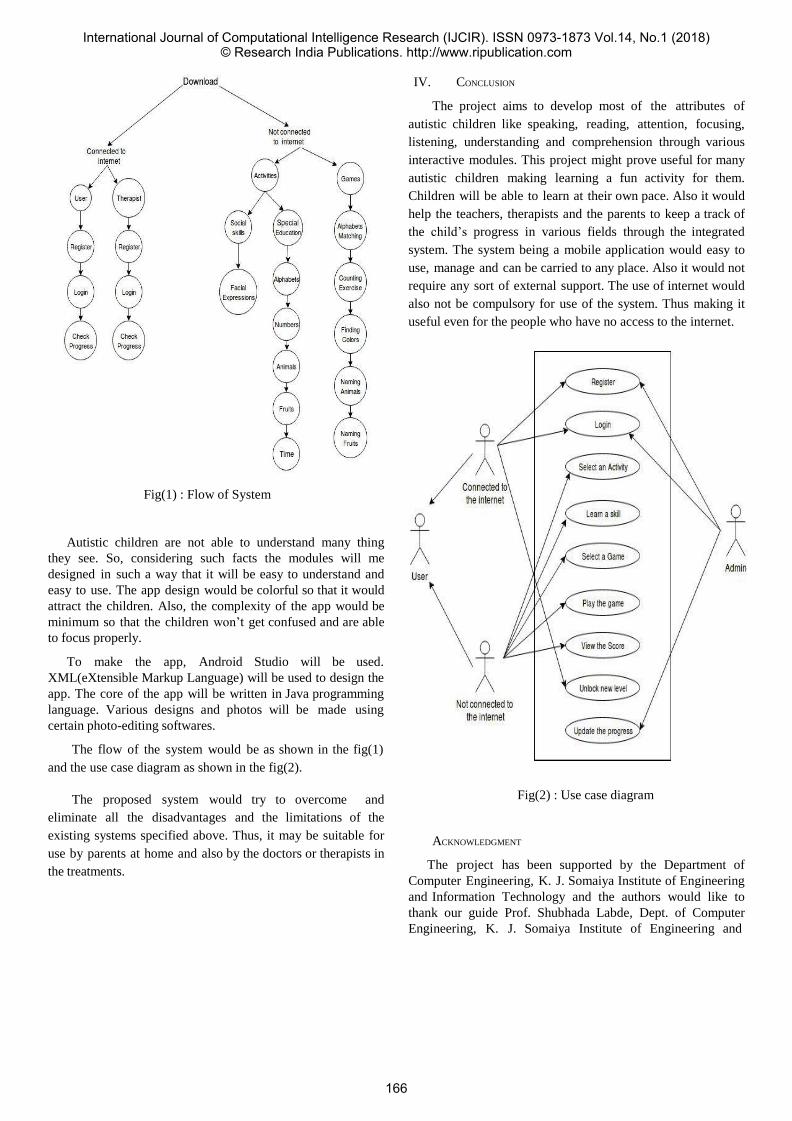
Fig(1) : Flow of System
Autistic children are not able to understand many thing
they see. So, considering such facts the modules will me
designed in such a way that it will be easy to understand and
easy to use. The app design would be colorful so that it would
attract the children. Also, the complexity of the app would be
minimum so that the children won’t get confused and are able
to focus properly.
To make the app, Android Studio will be used.
XML(eXtensible Markup Language) will be used to design the
app. The core of the app will be written in Java programming
language. Various designs and photos will be made using
certain photo-editing softwares.
The flow of the system would be as shown in the fig(1)
and the use case diagram as shown in the fig(2).
The proposed system would try to overcome and
eliminate all the disadvantages and the limitations of the
existing systems specified above. Thus, it may be suitable for
use by parents at home and also by the doctors or therapists in
the treatments.
IV. CONCLUSION
The project aims to develop most of the attributes of
autistic children like speaking, reading, attention, focusing,
listening, understanding and comprehension through various
interactive modules. This project might prove useful for many
autistic children making learning a fun activity for them.
Children will be able to learn at their own pace. Also it would
help the teachers, therapists and the parents to keep a track of
the child’s progress in various fields through the integrated
system. The system being a mobile application would easy to
use, manage and can be carried to any place. Also it would not
require any sort of external support. The use of internet would
also not be compulsory for use of the system. Thus making it
useful even for the people who have no access to the internet.
Fig(2) : Use case diagram
ACKNOWLEDGMENT
The project has been supported by the Department of
Computer Engineering, K. J. Somaiya Institute of Engineering
and Information Technology and the authors would like to
thank our guide Prof. Shubhada Labde, Dept. of Computer
Engineering, K. J. Somaiya Institute of Engineering and
International Journal of Computational Intelligence Research (IJCIR). ISSN 0973-1873 Vol.14, No.1 (2018)© Research India Publications. http://www.ripublication.com
166
Information Technology for her guidance in developing the
project.
REFERENCES
[1] “Learn the Signs of Autism,” Autism Speaks Inc., [Online]. Available:
https://www.autismspeaks.org/what-autism/learn-signs.
[2] Moutaz S. Saleh, Jihad M. Aljaam “Learning Games for Children with
Intellectual Challenges”,Qatar University Doha, Qatar,2012.
[3] Alja’am J., Jaoua A., Alhazbi S., Hassan M., and Elsaddik A.: “An
Assistive Computerized System for Children with Moderate Intellectual
and Learning Disabilities”. In The IEEE Global Engineering Education
Conference (EDUCON-2011) – “Learning Environments and
Ecosystems in Engineering Education”, Jordan, 2011.
[4] Moutaz S. Saleh, Jihad M. Aljaam,”An Integrated e-Learning System for
MID and MLD Children in Qatar”,Doha, Qatar.
[5] Raafat Aburukba; Fadi Aloul; Anam Mahmoud; Kamil Kamili; Suad
Ajmal, “AutiAid: A learning mobile application for autistic children”,
2017 IEEE 19th International Conference on e-Health Networking.
[6] Debashis Chakraborty; Ranganath Bannerjee; Shouvik Das; Abhijit Das,
“Teaching aid software — Training autistic children through
computers”, 2017 5th National Conference on E-Learning & E-Learning
Technologies.
[7] EGENFELDT-NIELSEN: Third Generation Educational Use of
Computer Games. Jl. of Educational Multimedia and Hypermedia,16(3),
pp. 263-281. 2007.
[8] Baytak A. and Land S.: “A case study of educational game design by
kids and for kids”. Procedia Social and Behavioral Sciences 2 (5242-
5246). 2010.
[9] “Common Issues and Challenges facing Children on the Autism
Spectrum”, Research Autism, [Online]. Available:
http://www.researchautism.net.
[10] “Autism”, Wikipedia, [Online]. Available:
https://en.wikipedia.org/wiki/Autism.
International Journal of Computational Intelligence Research (IJCIR). ISSN 0973-1873 Vol.14, No.1 (2018)© Research India Publications. http://www.ripublication.com
167
Tourist Guide with intelligent chatbox
Aaroosh Pandoh
Information Technology Department
Fr. C. Rodrrigues Institute of Technology
Vashi, Navi Mumbai, India
Ankita Gawde
Information Technology Department
Fr. C. Rodrrigues Institute of Technology
Vashi, Navi Mumbai, India
Delrina Michael
Information Technology Department
Fr. C. Rodrrigues Institute of Technology
Vashi, Navi Mumbai, India
Gaurav Singh
Information Technology Department
Fr. C. Rodrrigues Institute of Technology
Vashi, Navi Mumbai, India
Hariram Chavan
Information Technology Department
Fr. C. Rodrrigues Institute of Technology
Vashi, Navi Mumbai, India
Abstract—Tourism is imminent across the globe. A lot of new
technologies are developed to augment the advancement of
tourism. This augmented technology helps to get rid of
divergent opinion and provides updated information for
different places. The use of technology aims to contribute and
make it feasible for tourists to get point of interest(POI) within
the vicinity, access path between locations and intelligent chat
box. Chatbox solves user queries related to POI. Chatbox
makes tourist guide unique and efficient.
Keywords—Chat Box, Mashup, POI, Tourist Guide
I. INTRODUCTION
Travel & Tourism is an important metier, whose rapid
growth influences the economy of the country. The
conventional ways to reach end users are magazine,
newspaper and advertisements. These are static and may not
create a profound impact on end users. In recent days, the
penetration rate of mobile and internet is very high, so
building an application using these two will reach to the
maximum people around the globe. Even though accessibility
of internet is very high, obtaining required information is a
tedious task. This is the motivational factor to visualize the
concept of Tourist Guide.
Today, Mobile phones have become an essential part of our
lives. “Smart” has become a rather colloquial term in
marketing of mobile phones and gadgets. Smartness is usually
closely related to enhancing the usability by implementing
technologies. Mobile phones do more than just making calls
and come with much functionality. A global positioning
system (GPS) is one of them. From navigating new cities to
locating missing people, GPS devices have progressed since
being introduced to the world.
The GPS system uses two important parameter to get
accurate location of person i.e. latitude and longitude. Global
navigation makes use of latitude and longitude lines to
pinpoint the user’s location. Map API is used to display the
location. Map API uses mashup technology to get all the
locations around it. A mashup is a web Application or Web
page uses functionality from two or more sources to generate a
new service. Mashups are done via Web services or public
APIs. Google Places API is used to get all the locations in a
particular vicinity. It stores information in JSON format. The
information stored in Places API includes Name, Latitude,
Longitude, Type of Location, Ratings of the location etc. It
uses a API key in order to access the places around it.
Tourist Guide will also have a personal assistant which is
built using machine learning. Nowadays, there are a lot of
open-source software libraries for machine learning. However
tensorflow stands apart from the competition. Tensorflow is
an open-source software library that is used for machine
learning in different tasks. It can be a structure for establishing
and training neural networks for the purpose of identifying or
deciphering patterns as well as correlations. Apart from that, it
is employed in research or production in google. It is a bit
similar to human learning or reasoning.
Tourist guide is location based application. It helps users
get information like traffic analysis, distance to be travelled. It
also solves user’s queries related to a specific location. There
are various applications available but there are certain
limitation in those applications. We are also working towards
making our application intelligent. The Tourist guide
application empowers users to get information on the go. The
implementation, technologies used and work flow of the
application will be explained in the further sections.
For tourism sector, many mobile applications are available
which are helpful for tourists. These applications only help to
International Journal of Computational Intelligence Research (IJCIR). ISSN 0973-1873 Vol.14, No.1 (2018)© Research India Publications. http://www.ripublication.com
168

show the information about places and to do advance booking
for the tour. But the problem with these applications is that
they are not efficient, not able to show information when the
tourist is travelling. Tourist need to use different applications
for booking cabs. Doubts related to places can’t be solved in
existing applications. If tourist has some queries then they
have to search it on internet.
II. LITERATURE SURVEY
The proposed system involves guiding of tourist with the
help of an android application which is available to the tourist
on the move. The tourist also is provided with an assistant
using artificial intelligence to solve the tourist’s queries. In
this section we will discuss the existing applications and
papers that will help us to refine our application keeping in
mind the previous attempts made.
.
A. Related Work
The main objective of this paper is not only to provide
updated information to tourist but also give the concise
information about places. To pioneer the Tourist Guide
various technologies has been used. These are referred from
the work which had done previously.
The Mashup server is used to display the various web pages in combined form. The request is sent to the mashup
server when user access web pages which will activate GPS[2]. The current location of user identified by GPS and
end users information is received by mashup server[1]. Mashup server is used to analyze the users information which
is stored in database to obtain the users preferences requirement. GPS is obligatory to add a timer to web page,
that it is able to upgrade users geographical information to the mashup server within time. This is Google Map based
application, which starts with simple map. In Google map, Overlays are used to represent the point of interest, lines
denoting areas, routes or other relevant information about
location on map. Controls are used to zoom in and zoom out the map and move the map effectively. Google map API
provides many services like Geocoding which returns a current location on map, directions with detailed route
instructions which takes user from one location to another[2]. Google map server mark the users current location on the map.
The nearest attractions, hotels, restaurants are marked on map because mashup server integrates all information based on the
map. The mobile phone cursor moves to marked on map and shows the relevant information of the marked point. All these
information is send by mahsup server to the mobile device. The results are displayed on the mobile device[1]. REST API
is used as communication protocol to link data or content[4].
REST API helps in retrieving the appropriate data from the
trusted websites and gives information to the users about the location at which tourist reached.
III. TECHNOLOGIES
Before you begin to format your paper, first write and save the content as a separate text file. Keep your text and graphic
files separate until after the text has been formatted and styled. Do not use hard tabs, and limit use of hard returns to only one
return at the end of a paragraph. Do not add any kind of pagination anywhere in the paper. Do not number text heads-
the template will do that for you.
Finally, complete content and organizational editing before
formatting. Please take note of the following items when proofreading spelling and grammar:
A. GPS
It is the global positioning system used to track device’s
location and do the operations accordingly. It is essential in tourism based application or web apps in order to give the response according to the device location. Internet connection enhances the usage of GPS.
B. Mashup
A Mashup can be defined as the technology which is used to take input from various other websites and show it as a
combination of all the information in one page. Mashup is used in this paper by integrating it will Google Map API. This
API takes input from various different places in Google and produces the final output in a small Map fragment. It requires
API key in order to retrieve the result of the required output. The Mashup is also required to obtain various visualisation of
the map content given in the fragment.
C. Google Map API
The Google Maps API allows the developers to embed Google Maps on their web apps or mobile applications. The
functionalities of the API can be accessed by either Javascript(web apps) or Java(mobile application) language.
This API consists of over 50 languages and map across the globe. It uses REST API to collect the data from different
websites. We can customise the maps and can use it in hybrid view as well as in 45 degree perspective view. The Hybrid
view includes roadmap, satellite, terrain views. It reflects the user interface of the maps shown as final output. The 45
degree perspective view is supported by satellite as well as hybrid view. if the zoom operation is performed by the user at
45 degree rotation map results in altering the perspective view.
D. Places API
PLACES API is used Connect users with information about millions of places. The Place API allow to build
application where users can search and received detailed information for places. This places are retrieved in JSON
format. some others details retrieved are place icon, opening hours, closing hours, vicinity, ratings, reviews and many more.
These places are retrieved taking latitude and longitude as input. The places divided in Places API are of particular types
which includes restaurant, place of interest, health, geocode etc. It can also help in getting the street view of particular
place. It uses RESTful API in order to retrieve the locations in JSON format.
E. Heatmap API Heatmap is used for the distribution and relative intensity of
data points on map which will be easy to understand the users.
Instead of placing market at each location on the map, Heat
map uses color to represent the distribution of data. Heat maps
show such places where people are tapping the most. The
main purpose of Heat maps are to assist you in making your
International Journal of Computational Intelligence Research (IJCIR). ISSN 0973-1873 Vol.14, No.1 (2018)© Research India Publications. http://www.ripublication.com
169
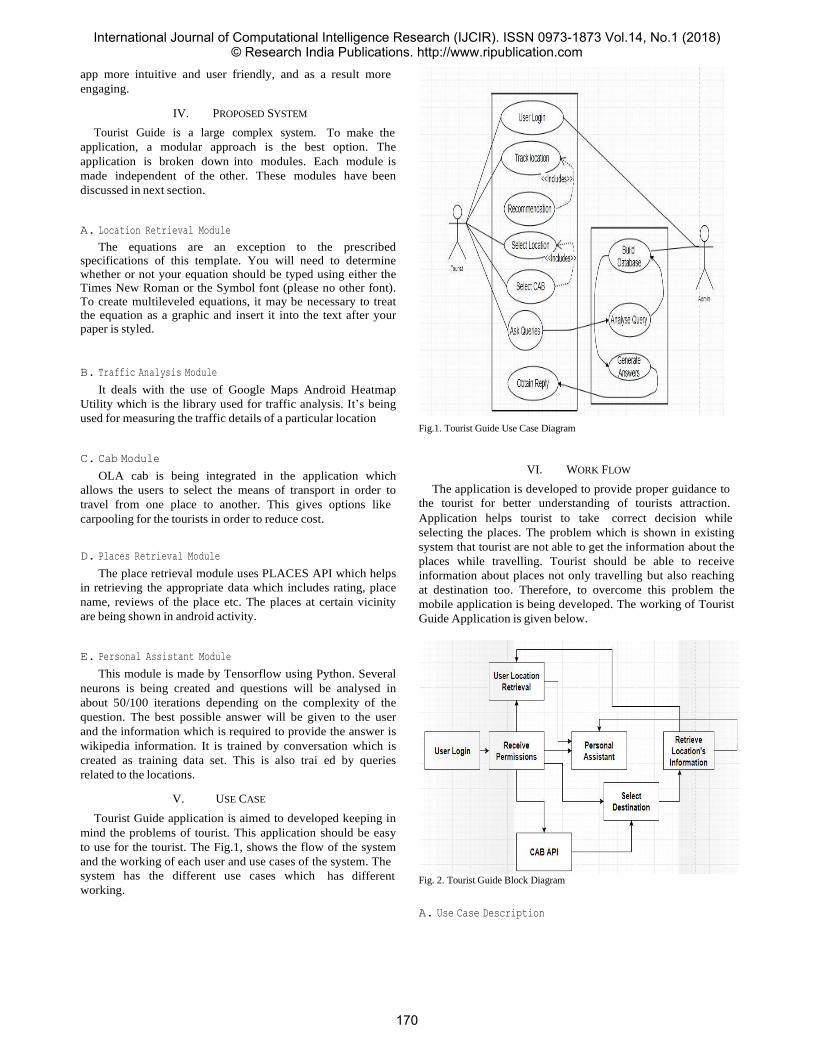
app more intuitive and user friendly, and as a result more
engaging.
IV. PROPOSED SYSTEM
Tourist Guide is a large complex system.
To make the
application, a modular approach is the best option. The
application is broken down into modules. Each module is
made independent of the other. These modules have been
discussed in next section.
A. Location Retrieval Module The equations are an exception to the prescribed
specifications of this template. You will need to determine
whether or not your equation should be typed using either the Times New Roman or the Symbol font (please no other font).
To create multileveled equations, it may be necessary to treat the equation as a graphic and insert it into the text after your
paper is styled.
B. Traffic Analysis Module
It deals with the use of Google Maps Android Heatmap
Utility which is the library used for traffic analysis. It’s being
used for measuring the traffic details of a particular location
C. Cab Module OLA cab is being integrated in the application which
allows the users to select the means of transport in order to
travel from one place to another. This gives options like
Fig.1. Tourist Guide Use Case Diagram
VI. WORK FLOW
The application is developed to provide proper guidance to
the tourist for better understanding of tourists attraction.
carpooling for the tourists in order to reduce cost. Application helps tourist to take correct decision while
D. Places Retrieval Module The place retrieval module uses PLACES API which helps
in retrieving the appropriate data which includes rating, place
name, reviews of the place etc. The places at certain vicinity
are being shown in android activity.
E. Personal Assistant Module This module is made by Tensorflow using Python. Several
neurons is being created and questions will be analysed in
about 50/100 iterations depending on the complexity of the
question. The best possible answer will be given to the user
and the information which is required to provide the answer is
wikipedia information. It is trained by conversation which is
created as training data set. This is also trai ed by queries
related to the locations.
V. USE CASE
Tourist Guide application is aimed to developed keeping in
mind the problems of tourist. This application should be easy
to use for the tourist. The Fig.1, shows the flow of the system
and the working of each user and use cases of the system. The
selecting the places. The problem which is shown in existing
system that tourist are not able to get the information about the
places while travelling. Tourist should be able to receive
information about places not only travelling but also reaching
at destination too. Therefore, to overcome this problem the
mobile application is being developed. The working of Tourist
Guide Application is given below.
system has the different use cases which
working.
has different Fig. 2. Tourist Guide Block Diagram
A. Use Case Description
International Journal of Computational Intelligence Research (IJCIR). ISSN 0973-1873 Vol.14, No.1 (2018)© Research India Publications. http://www.ripublication.com
170

◻ USER LOGIN: Basic information of the user which includes the country from which they belong and other details are taken for authentication.
◻ PERMISSIONS: The user is asked for permissions to
help guide the user more efficiently.
◻ LOCATION TRACKING: Once the user location is
tracked the request is send to mashup server. Google
map API is able mark the user’s current location. The
Mash up server fetches the information about current
location and provides recommendation for the places
within certain radius. The locations are retrieved on
basis the of the reviews and ratings given by people
who have visited earlier.
◻ CAB BOOKING: The user can select places which
he/she wants to explore. For users, OLA API is
provided in Tourist guide application. There is no
need to use different application for just book a cab
to travel. All features related to OLA cab are
achieved in Tourist Guide application
◻ TRAFFIC ANALYSIS: The application shows the
efficient path to travel by calculating the minimum
distance to travel and analyzing the traffic on the
same route between the source location and
destination selected by the user.
◻ User is able to receive the information in the form of
notification on the application about places which are coming on the route while travelling in.
◻ QUERY SOLVING: Personal assistant helps users to
solve their queries. The best possible answer is being
given, of the question asked by the user. It uses back
propagation algorithm to solve the queries.
VII. OUTPUT
The tourist guide is developed using Android studio and
Python IDE There are various activities involved in creating
the application.
Fig. 3. User’s Location retrieval
Fig. 3 depicts the retrieval of user’s location[7,9]. It tracks
the location using GPS as explained in above paper. It needs
to get user’s permission in order to retrieve the location
Fig. 4. Places around user
Fig. 4 depicts the retrieved restaurants in 5 km vicinity
which is having ratings above 3.7[6]. It gives best restaurants
around the user. To retrieve the best places in a state places
with Point of interest tag is selected from the JSON data
retrieved by Google places API
Fig.5. Path to target location
Fig. 5 depicts the shortest path from user’s location to the
place selected[8]. It uses heatmap API for traffic analysis in
order to show the most optimum path[5].
Another part of the application shows the path from one
location to another. It is done based on shortest path and
traffic analysis. For traffic analysis heatmap API is used.
It also shows the Chatbox trained by neural network. It
requires more than one million queries from a dataset to train
the neural network. The 1 layered neural network is formed.
International Journal of Computational Intelligence Research (IJCIR). ISSN 0973-1873 Vol.14, No.1 (2018)© Research India Publications. http://www.ripublication.com
171

VIII. RESULT
The output of this paper depicts that it will solve many
problems faced by the users. One such problem is, it is a cost
effective solution. User’s do not need to hire the guide every
time they visit a location. The Environmental constraint is
taken into consideration too as user’s do not need to purchase
tourist guide books for getting the information.
IX. CONCLUSION
This paper presents the tourist guide application and its
various functionalities. Tourist Guide has several advantages
over the current applications. It provides features which are
not present in the current applications. It tracks user’s location,
recommends the nearest tourist places within certain radius
and suggests the efficient path by calculating the distance
between two places and performing traffic analysis. Intelligent
chatbox helps to solve user's queries related to places. It also
acts as a personal assistant of the user. Tourist Guide has a cab
api through which the user’s can book cabs hence save their
time. In all, Tourist Guide is a very efficient application which
will help ease the life of the tourists.
X. REFERENCES
[1] Aleksandar Pejic, Szilveszter Pletl, Bojan Pejic. “An Expert System for Tourists Using Google Maps API” 7th International Symposium on
Intelligent Systems and Informatics Year: 2009 Pages: 317 - 322
[2] Dadape Jinendra R, Jadhav Bhagyashri R., Gaidhani Pranav Y,
Vyavahare Seema U, AchaliyaParag N. “SMART TRAVEL GUIDE-
Application For Android Mobile” 1 st International Conference on
Recent Trends in Engineering & Technology, Mar-2012 Special Issue of
International Journal of electronics, Communication & Soft Computing
Science & Engineering Pages 115-120
[3] Casali, Ana & Godo, Lluis & Sierra, Carles. (2008). A Tourism
Recommender Agent: from theory to practice. Inteligencia artificial:
Revista Iberoamericana de Inteligencia Artificial, ISSN 1137-3601, Nº.
40, 2008, pages. 23-38. 12. 10.4114/ia.v12i40.978.
[4] SearchMicroservices. (2018). What is RESTful API? - Definition from WhatIs.com. [online] Available at: http://searchcloudstorage.techtarget.c
om/definition/RESTful-API [Accessed 1 Mar. 2018].
[5] Google Developers. (2018). Markers | Google Maps Android API |
Google Developers. [online] Available at: https://developers.google.com/maps/documentation/android-api/marker [Accessed 6 Feb 2018].
[6] Google Developers. (2018). Select Current Place and Show Details on a
Map | Google Maps Android API | Google Developers. [online]
Available at: https://developers.google.com/maps/documentation/
android-api/current-place-tutorial [Accessed 8 Feb. 2018].
[7] Anon, (2018). [online] Available at: https://developers.google.com/maps/documentation/android-api/current-
place-tutorial [Accessed 12 Feb. 2018].
[8] Svennerberg, G. (2018). Calculating Distances and Areas in Google
Maps API 3 – In usability we trust. [online] Svennerberg.com. Available
at: http://www.svennerberg.com/2011/04/calculating-distances-and-
areas-in-google-maps-api-3/ [Accessed 11 Feb. 2018].
[9] Google Developers. (2018). Adding a Map with a Marker | Google
Maps Android API | Google Developers. [online] Available at:
https://developers.google.com/maps/documentation/android-api/map-
with-marker [Accessed 15 Feb. 2018].
International Journal of Computational Intelligence Research (IJCIR). ISSN 0973-1873 Vol.14, No.1 (2018)© Research India Publications. http://www.ripublication.com
172
Analysis of Various Parameters Tested at Onset of Labor
Ms. Sneha Chogale
PG Students,
University of Mumbai
Dr. Sunita R. Patil
Profesor,K J SomaiyaIEIT,Sion
University of Mumbai
Abstract—In Maternity Care, a quick decision has to be made
about the most suitable delivery type for the expected to be
mother in labor. This study identifies obstetric and pregnancy
factors that can be used to predict the most appropriate delivery
technique, through the induction of data mining models using
data gathered from hospital. This paper considers individual’s
specific risk factors such as BP and Cervical length of expecting
mother, fetus position in womb, fetal heart rate, while
recommending the normal or C-section delivery. Using Naive
Bayes classification algorithm, the mode of delivery can be
determined in case of emergency. This paper gives monitoring
and data analysis of all parameters that are tested in the normal
labor delivery process and predicting complications in the
normal delivery, if any.
Keywords—Naive Bays Classification, Cardiotocography, Fetal
Heart Rate, occiput presentation, Cervical length.
I. INTRODUCTION
Labor and delivery are continuously monitored to collect data
set. The objective of this paper is to predict the mode of
delivery based on few specific parameters identified to help
women in being mentally and financially prepared with few
predefined parameters related to pregnancy, based on this
system determines the delivery type using Naïve Bays
classification [1]. For predicting the normal delivery time and
continuous monitoring of mother and fetus, few parameters
are tested in medical fields [2].
1.1 Parameters tested at the time of delivery
Some crucial parameters are to be tested at the time of normal
delivery:
a. Heartbeat of fetus
b. Blood Pressure of expecting mother
c. Cervix length of expecting mother
d. Fetus position in womb
a. The Heartbeat of fetus
In most cases, fetal heart rate is monitored during labor to see
fetus status and to identify potential problems ahead of time.
Electronic Fetal Monitoring(EFM) is currently used to monitor
almost all women in hospitals. Labor and delivery are
monitored electronically with sensors that measure and record
maternal uterine pressure (UP) and fetal heart rate (FHR), a is
referred to as cardiotocography (CTG). The standard range
for a full term baby’s heart rate during labor is between 110
and 160 beats per minute (bpm). Higher or lower rates can be
a sign fetus is having trouble coping with labor, depending on
a number of factors. If the baseline rate is less than 110bpm, it
is called bradycardia (abnormally slow heart rate) and if FHR
are greater than 160bpm it is called tachycardia (abnormally
high slow rate).
b. Blood Pressure of expecting mother
Normal blood pressure of a person is usually somewhere close
to 120/80 mm Hg. Blood pressure between 140/90 and 149/99
mmHg is called Mildly high, between 150/100 and 159/109
mmHg is called Moderately high and of 160/110 mmHg or
higher is called severely high blood pressure. If the BP of
mother is not in normal range then there are various risks to
mother as well as fetus. Few risks to mother are as follows:
a. An increased chance of having a stroke.
b. Damage to kidneys and liver.
c. An increased risk of blood clotting problems.
d. An increased risk of severe bleeding from placenta.
If developed pre-eclampsia, then it can cause serious damage
to organs, including brain and kidneys.
The risks to fetus are as follows:
a. An increased chance of poor growth.
b. An increased chance of premature birth.
c. Cervix length of expecting mother
Normal cervical length measures 4 to 5 cm when woman is
not pregnant. During a normal pregnancy, the cervix remains
firm, long, and closed until late in the third trimester. It
usually starts to soften, shorten (efface) and open up (dilate) as
body prepares itself for labor. Normally, in the late second and
early third trimester the cervical length measures anywhere
between 3 cm to 3.5 cm (30-35mm) and decreases
progressively as the pregnancy advances, in preparation for
labor. When cervical length is less than 2.2 cm (abnormal),
women are not in progress to deliver normally. Normal cervix
length should be10 cm at the time of delivery.
d. Fetus position in womb
The most common and abnormal combination of fetus
position are as follows:
a. Cephalic Presentation
b. Occiput-posterior Presentation: c. Brow Presentation
d. Breech Presentation
e. Shoulder Presentation
a. Cephalic presentation
The normal position of a fetus is facing rearward (toward the
woman’s back) with the face and body angled to one side and
the neck flexed, and presentation is head first. Figure 1
shows the normal position of fetus in mother’s womb.
International Journal of Computational Intelligence Research (IJCIR). ISSN 0973-1873 Vol.14, No.1 (2018)© Research India Publications. http://www.ripublication.com
173

Fig. 1 Normal Fetus Positions
Figure 2 shows the abnormal position and presentation of fetus
in mother’s womb.
Fig. 2 Abnormal Fetus Presentation
b. Occiput posterior presentation
In the occiput posterior presentation (sunny-side up), the fetus
is head first but is facing up (toward the mother's abdomen). It
is the most common abnormal position or presentation. When
a fetus faces forward, the neck is often straightened rather than
bent, and the head requires more space to pass through the
birth canal. Delivery by a vacuum extractor or forceps or
cesarean delivery may be necessary.
c. Brow Presentation
If your baby is in a brow presentation, this means the largest
area of head will be trying to fit through your pelvis during
birth. Brow presentation usually happens when baby's neck
and head are slightly extended (deflexed), as if baby is looking
up.
positioning of the fetus, the doctor may try for vaginal birth
only if the baby’s head, or buttock, or feet are at the bottom.
Hence, the vaginal birth will be unthinkable for the mother
and she has unquestionably to undergo a C-section.
The decision for usage of forceps or a vacuum assistance is guided by the indication for an instrumented delivery and the
clinician’s experience [3].
II. LITERATURE SURVEY
2.1 Pregnancy period tests & devices
Various devices are used to monitor the wellness of fetus
and mother as listed & explained below:
a. Ultra scan
As shown in Figure 3, an ultrasound scan sends sound waves
through womb (uterus). These waves bounce off the baby as
echoes. The echoes are turned into an image on a screen that
shows fetal position and movements. Hard tissues such as
bone, reflect the sound waves and make the biggest echoes. It
includes white in the image and soft tissues as grey. Fluids
such as the amniotic fluid surrounding the baby appear as
black. This is because the sound waves go through with no
echoes. A first-trimester scan will test that baby's heart is
beating and also look at the basic examination of baby’s head,
abdominal wall, and limbs.
d. Breech presentation
The buttocks or sometimes the feet present first. Breech
presentation occurs in 3 to 4% of full-term deliveries. When. b. Doppler Ultrasound
Fig.3 Ultrasound Scan
delivered vaginally, babies that present buttocks first are more likely to be injured than those that present head first. Such
injuries may find before, during, or after birth. The baby may
even die. Complications are less likely when breech
presentation is detected before labor or delivery .Sometimes
the doctor can turn the fetus to present head first by pressing
on the woman’s abdomen before labor begins, usually after 36
weeks of pregnancy. However, if labor begins and the fetus is
in breech presentation, problems may occur.
e. Shoulder Presentation
Shoulder presentation is an abnormal position of the fetus at
the time of delivery. In this, the fetus lies transversely so that
its vertebral column lies perpendicular to the maternal position
of spine. So, the part that enters the birth canal will be the
trunk or shoulder. In spite of some deviations in the
A Doppler is a form of ultrasound scan that helps to assess
baby's health [4]. It measures the blood flow in different parts
of fetal body, such as umbilical cord, brain, and heart. This
helps to show whether fetal is getting all the oxygen and
nutrients needs via the placenta. The transducer sends out
sound waves, which bounces off the blood flow to fetal body
through the cord as well as his blood circulation system. This
creates an image on a display which shows how the blood is
flowing. This is shown in Figure 3.
International Journal of Computational Intelligence Research (IJCIR). ISSN 0973-1873 Vol.14, No.1 (2018)© Research India Publications. http://www.ripublication.com
174

about the fetal heart rate and uterine contractions to a remote
monitor. Remote monitoring allows to walk around freely.
The position of the heart rate monitor changes periodically to
adjust to the movement of baby. For a non-stress test, the
sensors are placed on belly of the labor. It is asked to push a
button on the machine every time baby moves or have a
contraction. Fetal heart rate is recorded and compared to the
record of movement or contractions.
c. CT Scan
Fig.3 Doppler Ultra Scan
f. Electrode with a wire & tube
Internal fetal monitoring is done only after cervix has dilated
to at least 2 centimeters (cm) and amniotic sac has ruptured.
Once started, internal monitoring is done continuously. A thin
A doctor or physician may order a Computerized tomography
(CT) scan of the fetus to formulate detailed pictures and
analyze the internal structure. Computerized Tomography
(CT) scanning is useful to get a very detailed 3D image of
certain parts of the body. The same is shown in Figure 4.
Fig. 4 CT Scan
d. Stethoscope
External Electronic Fetal monitoring can be done by listening
to baby's heartbeat with a special stethoscope. External
monitoring is done using two flat devices known as sensors
held in place with elastic belts on belly. One sensor makes use
of reflected sound waves i.e. ultrasound to keep track of fetal
heart rate. The other sensor measures the strength and duration
of uterine contractions. The sensors are connected to a
machine to keep the track of information. External monitoring
is used for a non-stress test which records baby's heart rate
while baby is moving and not moving. A non-stress test may
be combined with a fetal ultrasound to evaluate the amount of
amniotic fluid. External monitoring is also made for a
contraction stress test, which records changes in
baby's heart rate when to have uterine contractions. It may be
done to check on fetal health during a non-stress test. It may
help to predict whether the baby can handle the stress of labor
and vaginal delivery.
e. Telemetry
External monitoring can also be done remotely called as telemetry, without need to be connected by wires to a
machine. At some places, the sensors send the information
wire (electrode) is guided through vagina and cervix and attached to baby's scalp. A small tube is also inserted through
vagina to attach a device to monitors the contractions inside
uterus. The electrode and the tube are attached with wires to a
recording device to record of fetal heart rate as well as the
strength and duration of uterine contractions.
g.. Monitors
Monitors are used to detect the baby's heart rate and length
and frequency of the contractions. There are even monitors
that allow patients to walk around while it keeps track of the
heart rate and contractions. Figure 5 shows the same.
Fig. 5 Monitor
h. Delivery assistance (operative vaginal delivery) It is
hand held metal instrument with blade extensions that are
applied to each side of the fetal head part for delivery process.
The traction force of the blades helps to aids in neonate
delivery as shown in Figure 6.
Fig. 6 Operative Vaginal Delivery
i. Forceps The Use of forceps has decreased over the past several decades.
The indications for forceps are included in prolonged second
stage of labor or ineffective maternal push power. The
presenting part needs to be at +2 station part before forceps
should be applied to the labor for the delivery [5]. If the
presenting part is at higher station, abdominal delivery should
International Journal of Computational Intelligence Research (IJCIR). ISSN 0973-1873 Vol.14, No.1 (2018)© Research India Publications. http://www.ripublication.com
175
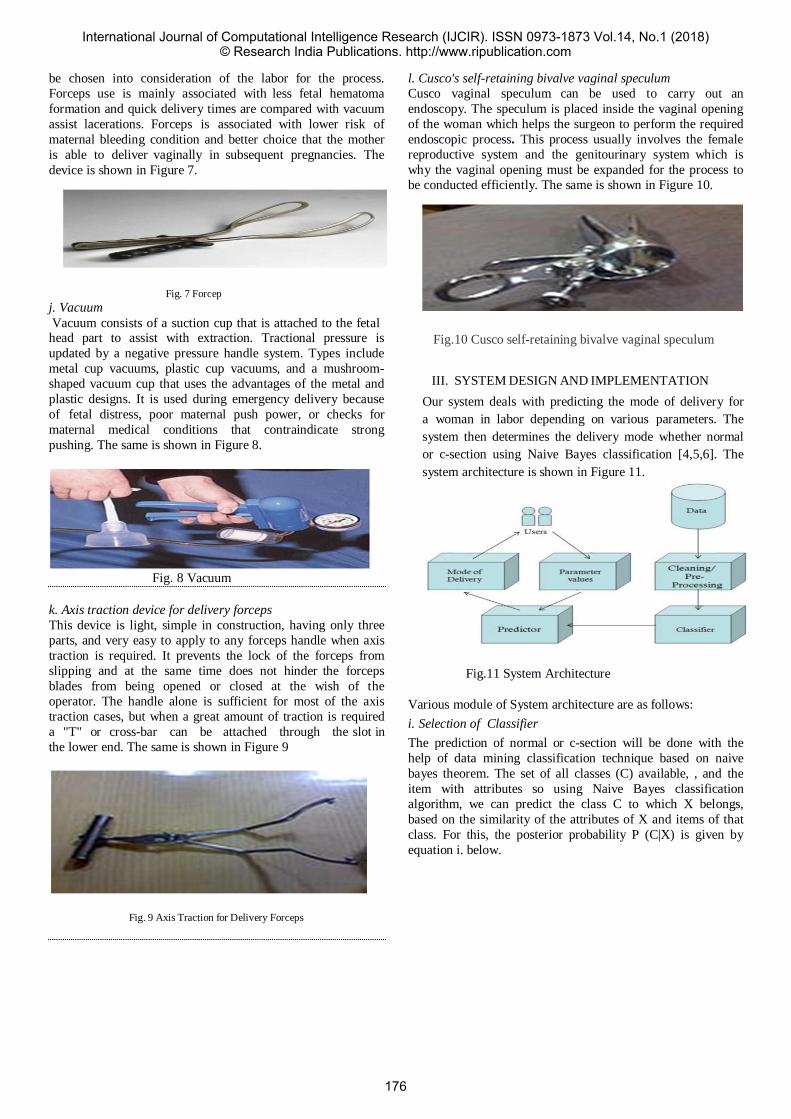
be chosen into consideration of the labor for the process.
Forceps use is mainly associated with less fetal hematoma
formation and quick delivery times are compared with vacuum
assist lacerations. Forceps is associated with lower risk of
maternal bleeding condition and better choice that the mother
is able to deliver vaginally in subsequent pregnancies. The
device is shown in Figure 7.
l. Cusco's self-retaining bivalve vaginal speculum
Cusco vaginal speculum can be used to carry out an
endoscopy. The speculum is placed inside the vaginal opening
of the woman which helps the surgeon to perform the required
endoscopic process. This process usually involves the female
reproductive system and the genitourinary system which is
why the vaginal opening must be expanded for the process to
be conducted efficiently. The same is shown in Figure 10.
j. Vacuum
Fig. 7 Forcep
Vacuum consists of a suction cup that is attached to the fetal head part to assist with extraction. Tractional pressure is
updated by a negative pressure handle system. Types include
metal cup vacuums, plastic cup vacuums, and a mushroom-
shaped vacuum cup that uses the advantages of the metal and
plastic designs. It is used during emergency delivery because
of fetal distress, poor maternal push power, or checks for
maternal medical conditions that contraindicate strong
pushing. The same is shown in Figure 8.
Fig. 8 Vacuum
k. Axis traction device for delivery forceps
This device is light, simple in construction, having only three
parts, and very easy to apply to any forceps handle when axis
traction is required. It prevents the lock of the forceps from
slipping and at the same time does not hinder the forceps
blades from being opened or closed at the wish of the
operator. The handle alone is sufficient for most of the axis
traction cases, but when a great amount of traction is required
a "T" or cross-bar can be attached through the slot in
the lower end. The same is shown in Figure 9
Fig. 9 Axis Traction for Delivery Forceps
Fig.10 Cusco self-retaining bivalve vaginal speculum
III. SYSTEM DESIGN AND IMPLEMENTATION
Our system deals with predicting the mode of delivery for
a woman in labor depending on various parameters. The
system then determines the delivery mode whether normal
or c-section using Naive Bayes classification [4,5,6]. The
system architecture is shown in Figure 11.
Fig.11 System Architecture
Various module of System architecture are as follows:
i. Selection of Classifier
The prediction of normal or c-section will be done with the
help of data mining classification technique based on naive
bayes theorem. The set of all classes (C) available, , and the
item with attributes so using Naive Bayes classification
algorithm, we can predict the class C to which X belongs,
based on the similarity of the attributes of X and items of that
class. For this, the posterior probability P (C|X) is given by
equation i. below.
International Journal of Computational Intelligence Research (IJCIR). ISSN 0973-1873 Vol.14, No.1 (2018)© Research India Publications. http://www.ripublication.com
176

where P(X|C) is the conditional probability of X given C.
Equation I
ii. Pre-Processing and Cleaning of the input data set
After eliminating some record for which the parameters are
missing or incorrect values, the ultimate data set should
obtained each containing 4 parameters. After selecting the
parameters, the numeric values were converted into categories
like – LOW, HIGH, and NORMAL for simplifying the
classification process.
iii. lassification and Prediction
Classification is a two step-model. First step is division of
data into training set used for predicting relations and testing
data set used for assessing the strength and accuracy of the
relations predicted. In the next step, the training set is used to
build the classifier model and the testing set is used to validate
the model built. The goal is to classify the mode of delivery as
NORMAL or NOT_NORMAL based on the known attributes.
The second class consists of all other delivery types like
Caesarean (C-section), vacuum delivery, forceps delivery etc.
The user inputs values of all the 4 parameters to the
classification algorithm. After processing, the predictor
determines whether a normal delivery is possible or not.
IV. RESULT
Result of parameter comparison is shown using various tables
below. The normal and abnormal values of all required
parameters to be tested for verifying expected mother status
in labor and fetus condition, exactly before delivery process
are shown in tables I below. It also discusses the necessary
action to be taken by expecting mother in labor and expert
doctor opinion. Table II to Table VI shows comparison of
various parameters against each other for predicting normal or
caesarean delivery depending on the complications involved.
Computing the results with naïve bayes classifier the system
acts like a predictor tool, allowing the users to enter values of
the specified parameters and giving the most likely mode of
delivery as the output.
IV. CONCLUSION
The proposed system helps to monitor the health condition of
pregnant women at regular intervals. The sensor-based hand
held device predicts the mode of delivery as normal or c-
section. It also determines the mode of delivery by monitoring
values of various parameters need to be tested against each
other to decide on normal or c-section delivery.
V. FUTURE SCOPE
In future the device can be improved by allowing users to
contribute to all medically relevant parameter values. The
device can be made full proof to work on many more
parameters giving accurate result and early prediction for
delivery mode. The system would also be modified further to
obtain associations and possible anomalies for better analysis
and medical care of the fetus & expected mother.
REFERENCES
[1] K. Ming Leung, “Naïve Bayes Classifier”, Polytechnic University Department of Computer Science / Finance and Risk Engineering.
[2] ] Maria Elisabete Teixeira da silva, Marco Paulo Lages Parente, Renato Manuel Natal Jorge, “Biomechanical study of fetus during vaginal delivery”,
Bioengineering(ENBENG) 2013 ,Braga, Portugal.
[3] Yavar Naddaf, Mojdeh Jalali Heravi and Amit Satsangi, “Predicting
Preterm Birth Based on Maternal and Fetal Data”, 2008.
[4] R. Levy, S. Zakas, A. Ben-Arie, S. Perlman, Z. Hagay and E. Vaisbuch: “Can angle of progression in pregnant women before onset of labor predict
mode of delivery?” Ultrasound Obstet Gynecol 2012; 40: 332–337 Published
online in Wiley Online Library (wileyonlinelibrary.com)
[5] CA Kalu, OU Umeora, EV Egwuatu, A Okwor: “Predicting mode of delivery using mid pregnancy ultrasonographic measurement” Vol 15
[6] Shamsa, A., Bai, J., Raviraj, P. and Gyaneshwar, R. (2013) “Mode of
delivery and its associated maternal and neonatal outcomes”. Open Journal of
Obstetrics and Gynecology.
[7] Quinlan, J.R. . “Induction of decision trees Machine Learning” Centre for
Advanced Computing Sciences, New South Wales Institute of Technology,
Sydney 2007, Australia
[8] Harleen Kaur and Siri Krishan Wasan: “Empirical Study on Applications of Data Mining Techniques in Healthcare”, Journal of Computer Science 2
International Journal of Computational Intelligence Research (IJCIR). ISSN 0973-1873 Vol.14, No.1 (2018)© Research India Publications. http://www.ripublication.com
177

TABLE I Parameter Values
BP of mother (mm Hg) Fetus Heart Rate(bpm) Cervix length of
mother(cm) Position of fetus in womb
Classifier Prediction Classifier Prediction Classifier
Prediction Classifier Prediction
115/75 (Accurate
value)
Need not to worry 110-160 (Normal )
Need not to worry
10cm Fully dilated Cephalic presentation
Best position. Can wait for normal delivery
140/90 to 149/99 (Mildly
High BP)
Doctor try to maintain normal BP of mother
<110 Bradycardia
It is not usually a
problem
0cm Closed Occipito-posterior labor may be long and slow, with bouts of contractions
starting and stopping
150/100 to 159/109
(Moderately high BP)
Doctor try to maintain
normal BP of mother otherwise preeclampsia
<100 Bradycardia
Sign of
fetal distress.
<2.2cm Short cervix length.
Breech Not ideal for delivery.
Above 160/110 (Severely high
BP)
Preeclampsia which is at high risk of placental abruption
>160 Tachycardia
It is not always a sign of fatal
distress
<1.5cm C-section is necessary
Left Shoulder Presentation
Chance for a prolapsed cord
90/60 (Borderline
low BP)
The normal drop in BP typically does not cause
any problems
>180 Tachycardia
Sign of foetus
distress.
3.0 cm to 3.5
cm
Normal Back Down Position
Baby can be pushed into the right position.
60/40 (Mild low BP)
Greater risk of stillbirth relative to normotensive
pregnancies. Need close care and treatment
+FHR >15 bpm, lasting
>15s but <10 min Accelerations
Doctor may need to
induce acceleration s.
4-5 Anterior position
Right shoulder presentation
Require a C-section.
50/33 (Extremely
low BP)
A severe drop in blood pressure can result in
organ damage.
-FHR >15 bpm, lasting
>15 s but <10 min Deceleration
It can be a problem C-
section is needed
5+ Baby is ready to come out
Brow Presentation Doctor may recommend caesarean
Table II shows the comparison of BP of mother with cervical length of mother and the prediction accordingly
TABLE II BP of Mother with Cervical Length of Mother
BP of mother Cervix length of mother Classifier Prediction
115/75(normal) 10cm Cervix is fully dilated 115/75(normal) 5+ Baby is ready to come out 115/75(normal) >2.2 cm Doctors try to open the cervix >140/90 (mild high BP) 10cm Need not to worry. Continuous monitoring is required >140/90 (mild high BP) 5+ Need not to worry. Continuous monitoring is required >140/90 (mild high BP) >2.2 cm Doctors try to open the cervix 150/100 to 159/109(Moderate high BP) 10cm Need not to worry but careful attention is needed to BP 150/100 to 159/109(Moderate high BP) 5+ Need not to worry but careful attention is needed to BP 150/100 to 159/109(Moderate high BP) >2.2 cm Doctor may advised to go under c-section Above 160/110(Severely high BP) 10cm Doctor tries everything possible to maintain normal BP. If not
controlled then caesarean Above 160/110(Severely high BP) 5+ Doctor tries everything possible to maintain normal BP. If not
controlled then caesarean Above 160/110(Severely high BP) >2.2 cm Probably caesarean 50/33 (Extremely low BP) 10cm Doctor tries everything possible to maintain normal BP. If not
controlled then caesarean 50/33 (Extremely low BP) 5+ Doctor tries everything possible to maintain normal BP. If not
controlled then caesarean 50/33 (Extremely low BP) >2.2 cm Probably caesarean
International Journal of Computational Intelligence Research (IJCIR). ISSN 0973-1873 Vol.14, No.1 (2018)© Research India Publications. http://www.ripublication.com
178

Table III shows the comparison of Blood pressure (BP) of mother with Heart Beat of fetus(FHR) and prediction accordingly.
TABLE III BP of Mother with FHR of Fetus
BP of mother Heartbeat of
fetus Classifier Prediction
115/75(normal) 110-160 (normal) Happy outcome for both expect other risk factors.
115/75(normal) <110 (bradycardia)
Healthcar e pr ovider will ru n fur ther tests a nd tak e a ny a ppr opriate a ction necessar y to r egu late FHR.
115/75(normal) >160 (tachycardia)
If the ba by’ s hear t rate is consistently high, your doctor may pr escribe you medication that is pa ssed thr ou gh the pla centa to the baby to help r egulate the heartbeat.
>140/90 (mild high BP) 110-160 (normal) If your blood pressure remains mildly to moderately raised and you do not develop pre-eclampsia then the risk is low
>140/90(mild high BP) <110 bradycardia
If your blood pressure remains mildly to moderately raised and you do not develop pre-eclampsia then the risk is low but bradycardia may be a problem it is below 100 BPM, especially if there are other abnormal heart rate patterns, such as poor beat-to-beat variability. continuously assess expectant mothers with preeclampsia and
monitor FHR. >140/90(mild high BP) >160 tachycardia High blood pressure and tachycardia can be dangerous. Continuously assess expectant mothers with preeclampsia
and monitor FHR. 150/100 to 159/109(Moderate high
BP)
110-160(normal) A woman with mild-to-moderate hypertension could develop severe hypertension if not managed correctly
150/100 to 159/109(Moderate high
BP)
<110 bradycardia If your blood pressure remains mildly to moderately raised and you do not develop pre-eclampsia then the risk is low but bradycardia may be a problem it is below 100 BPM , especially if there are other abnormal heart rate
patterns, such as poor beat-to-beat variability. continuously assess expectant mothers with preeclampsia and monitor FHR.
150/100 to
159/109(Moderate high BP)
>160 (tachycardia)
If your blood pressure remains mildly to moderately raised and you do not develop pre-eclampsia then the risk is low but tachycardia may be a problem if it is greater than 180.
Above
160/110(Severely high
BP)
110-160(normal) It may develop Preeclampsia which can cause serious complications both in the mother and the baby if left untreated.
Above
160/110(Severely high BP)
<110 bradycardia
Doctor may preferred to go under caesarean
Above160/110 (Severely high BP)
>160 tachycardia
Doctor may preferred to go under caesarean
50/33 (Extremely low BP)
110-160(normal) The normal drop in BP typically does not cause any problems but a severe drop in blood pressure can result in organ damage such as stroke, kidney failure, and heart attack
50/33 (Extremely low BP)
<110 bradycardia
Doctor may preferred to go under caesarean
50/33 (Extremely low BP)
>160 tachycardia Doctor may preferred to go under caesarean
International Journal of Computational Intelligence Research (IJCIR). ISSN 0973-1873 Vol.14, No.1 (2018)© Research India Publications. http://www.ripublication.com
179

Table IV shows BP of mother with fetus position in womb and prediction accordingly
TABLE IV BP of Mother with Fetus Position
BP of mother Fetus position in womb Classifier Prediction 115/75(normal) cephalic presentation Both are safe 115/75(normal) occipito-posterior, Brow presentation Delivery by a vacuum extractor or forceps or caesarean delivery may be
necessary. 115/75(normal) Breech presentation,
Shoulder presentation Sometimes the doctor can turn the Fetus to present head first by pressing on the woman’s abdomen otherwise caesarean delivery is preferred
>140/90 (mild high BP) cephalic presentation Doctor tries to control BP >140/90 (mild high BP) occipital-posterior, Brow presentation Delivery by a vacuum extractor or forceps or caesarean delivery may be
necessary >140/90 (mild high BP) Breech presentation,
Shoulder presentation Sometimes the doctor can turn the fetus to present head first by pressing on the woman’s abdomen otherwise caesarean delivery is preferred
150/100 to 159/109(Moderate high BP) cephalic presentation Doctor tries to control BP 150/100 to 159/109(Moderate high BP) occipital-posterior, Brow presentation Delivery by a vacuum extractor or forceps or caesarean delivery 150/100 to 159/109(Moderate high BP) Breech presentation,
Shoulder presentation Sometimes the doctor can turn the Fetus to present head first by pressing on the woman’s abdomen otherwise caesarean delivery is preferred
Above 160/110(Severely high BP) cephalic presentation Doctor tries to control BP otherwise caesarean is preferred Above 160/110(Severely high BP) occipital-posterior, Brow presentation Delivery by a vacuum extractor or forceps or caesarean delivery may be
necessary Above 160/110(Severely high BP) Breech presentation,
Shoulder presentation Sometimes the doctor can turn the fetus to present head first by pressing on the woman’s abdomen otherwise caesarean delivery is preferred
50/33 (Extremely low BP) cephalic presentation Doctor tries to control BP otherwise caesarean is preferred 50/33 (Extremely low BP) occipital-posterior, Brow presentation Delivery by a vacuum extractor or forceps or caesarean delivery may be
necessary 50/33 (Extremely low BP) Breech presentation,
Shoulder presentation Sometimes the doctor can turn the fetus to present head first by pressing on the woman’s abdomen otherwise caesarean delivery is preferred
Table V shows comparison of BP of mother ,cervix length of mother and Fetal heart rate and prediction accordingly.
TABLE V BP of Mother, Fetus Position in Womb and Cervix Length
BP of Mother FHR Cervix length Classifier Prediction
115/75(normal) 110-160 (normal) 10cm Both are safe. normal delivery is possible 115/75(normal) <110 (bradycardia) 5+ FHR need to be monitored continuously 115/75(normal) >160 (tachycardia) >2.2 cm FHR need to be monitored continuously and
doctors try to open the cervix. If not managed then caesarean is possible
>140/90 (mild high BP) 110-160 (normal) 10cm Both are safe. normal delivery is possible >140/90 (mild high BP) <110 (bradycardia) 5+ FHR need to be monitored continuously >140/90 (mild high BP) >160 (tachycardia) >2.2 cm FHR need to be monitored continuously and
doctors try to open the cervix. If not managed
then caesarean is possible 150/100 to 159/109(Moderate high BP) 110-160 (normal) 10cm Both are safe. normal delivery is possible 150/100 to 159/109(Moderate high BP) <110 (bradycardia) 5+ FHR need to be monitored continuously 150/100 to 159/109(Moderate high BP) >160 (tachycardia) >2.2 cm FHR need to be monitored continuously and
doctors try to open the cervix. If not managed
then caesarean is possible Above 160/110(Severely high BP) 110-160 (normal) 10cm Doctor tries to control BP otherwise caesarean is
preferred Above 160/110(Severely high BP) <110 (bradycardia) 5+ Doctor tries to control BP otherwise caesarean is
preferred Above 160/110(Severely high BP) >160 (tachycardia) >2.2 cm Doctor advised to go under c-section 50/33 (Extremely low BP) 110-160 (normal) 10cm Doctor tries to control BP otherwise caesarean is
preferred 50/33 (Extremely low BP) <110 (bradycardia) 5+ Doctor tries to control BP otherwise caesarean is
preferred 50/33 (Extremely low BP) >160 (tachycardia) >2.2 cm Doctor advised to go under c-section
International Journal of Computational Intelligence Research (IJCIR). ISSN 0973-1873 Vol.14, No.1 (2018)© Research India Publications. http://www.ripublication.com
180
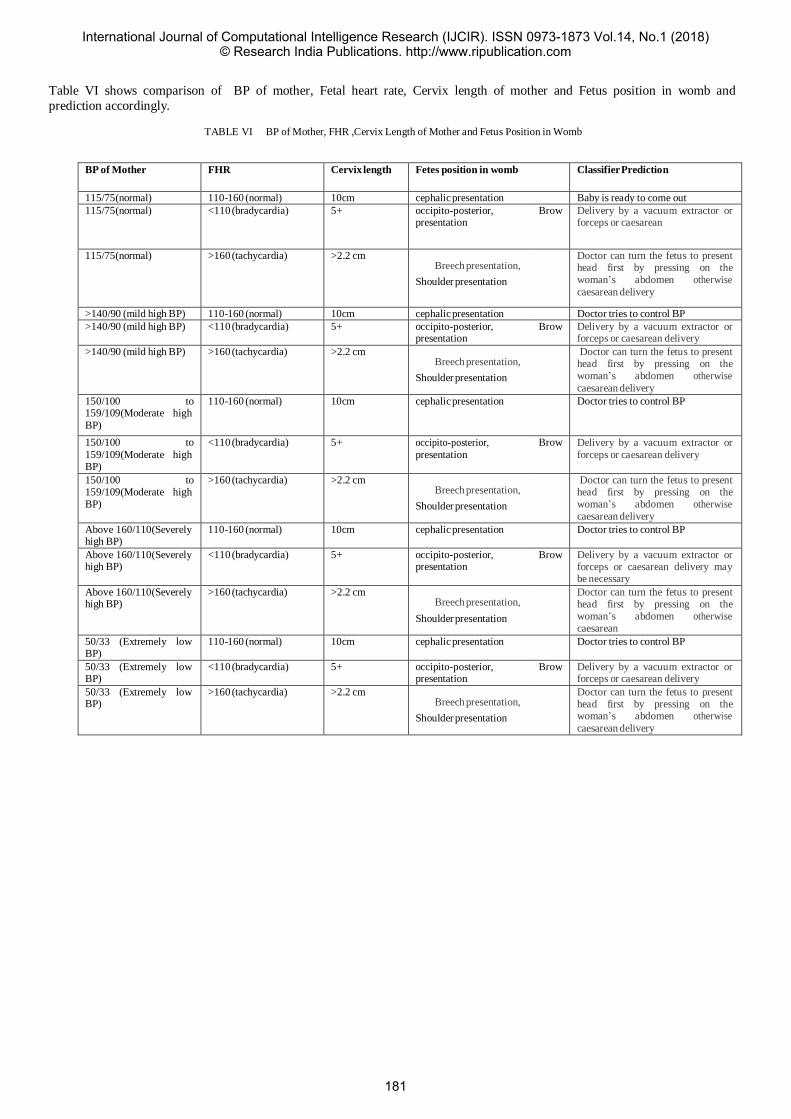
Table VI shows comparison of BP of mother, Fetal heart rate, Cervix length of mother and Fetus position in womb and
prediction accordingly.
TABLE VI BP of Mother, FHR ,Cervix Length of Mother and Fetus Position in Womb
BP of Mother FHR Cervix length Fetes position in womb Classifier Prediction
115/75(normal) 110-160 (normal) 10cm cephalic presentation Baby is ready to come out 115/75(normal) <110 (bradycardia) 5+ occipito-posterior,
presentation Brow Delivery by a vacuum extractor or
forceps or caesarean
115/75(normal) >160 (tachycardia) >2.2 cm
Breech presentation,
Shoulder presentation
Doctor can turn the fetus to present head first by pressing on the woman’s abdomen otherwise
caesarean delivery
>140/90 (mild high BP) 110-160 (normal) 10cm cephalic presentation Doctor tries to control BP >140/90 (mild high BP) <110 (bradycardia) 5+ occipito-posterior,
presentation Brow Delivery by a vacuum extractor or
forceps or caesarean delivery >140/90 (mild high BP) >160 (tachycardia) >2.2 cm
Breech presentation,
Shoulder presentation
Doctor can turn the fetus to present head first by pressing on the woman’s abdomen otherwise
caesarean delivery 150/100 to 159/109(Moderate high
BP)
110-160 (normal) 10cm cephalic presentation Doctor tries to control BP
150/100 to
159/109(Moderate high BP)
<110 (bradycardia) 5+ occipito-posterior, presentation
Brow Delivery by a vacuum extractor or forceps or caesarean delivery
150/100 to 159/109(Moderate high BP)
>160 (tachycardia) >2.2 cm
Breech presentation,
Shoulder presentation
Doctor can turn the fetus to present head first by pressing on the woman’s abdomen otherwise caesarean delivery
Above 160/110(Severely high BP)
110-160 (normal) 10cm cephalic presentation Doctor tries to control BP
Above 160/110(Severely high BP)
<110 (bradycardia) 5+ occipito-posterior, presentation
Brow Delivery by a vacuum extractor or forceps or caesarean delivery may be necessary
Above 160/110(Severely high BP)
>160 (tachycardia) >2.2 cm
Breech presentation,
Shoulder presentation
Doctor can turn the fetus to present head first by pressing on the woman’s abdomen otherwise caesarean
50/33 (Extremely low BP)
110-160 (normal) 10cm cephalic presentation Doctor tries to control BP
50/33 (Extremely low BP)
<110 (bradycardia) 5+ occipito-posterior, presentation
Brow Delivery by a vacuum extractor or forceps or caesarean delivery
50/33 (Extremely low BP)
>160 (tachycardia) >2.2 cm
Breech presentation,
Shoulder presentation
Doctor can turn the fetus to present head first by pressing on the woman’s abdomen otherwise
caesarean delivery
International Journal of Computational Intelligence Research (IJCIR). ISSN 0973-1873 Vol.14, No.1 (2018)© Research India Publications. http://www.ripublication.com
181
Short-Term Household Load Forecasting using
Neural Networks and Support Vector Regression
Heman Shamachurn, Sheik Lallmahomed
Department of Electrical and Electronic Engineering,
University of Mauritius, Reduit, Mauritius [email protected]
Abstract—Short-term load forecasting (STLF) for a
single house is a complex process due to the uncertain and
varying occupants’ behavior. However, it is nowadays
receiving increasing attention as it can contribute to the
efficient operation of future smart-grids. Accurate
knowledge about the next-step load of a house will enable a
utility to make a decision about controlling appliances to
match the demand to the supply. This paper presents the
very first results of a comparative study between the
performances of multi-layer feed-forward neural network
(MLNN), support vector regression (SVR) and elman
recurrent neural network (ERNN) for the one-step ahead
quarter hourly, daily and daily peak power demand
forecasting for a house in France based on actual
energy/power meter measurements. MLNN was found to
have superior performances than ERNN and SVR, with
mean absolute percentage errors varying in the range 2.34
% to 9.03 %. The MLNN models therefore have a huge
potential to be implemented in actual residential STLF
cases where a large dataset of power measurements is
available.
Keywords—Short-term load forecasting; Residential load;
neural network; Support Vector Regression
I. INTRODUCTION
Short-term load forecasting (STLF) is the prediction of electricity demand over periods of up to a week ahead, and is useful for the efficient operation of power systems. For instance, it is used to make the supply match the load demand, to manage system reserves, and to calculate the varying price of electricity. Aggregated load forecasting for large geographical regions such as an entire country is well established. However, limited research has been carried out on load forecasting of individual houses [1], which is challenging due to noisy and volatile data [2]. Future smart-grids will include significant integration of distributed energy resources so that STLF at a disaggregated level will be necessary for efficient grid operation. This will necessitate the installation of smart meters at individual houses. These meters will offer fast and reliable communication of more detailed information to utilities with minimal human intervention. The measured data can be used to predict the next-step load of individual houses by using several techniques, which will make utilities and electricity network
operators more efficient. For instance, knowing the future load accurately can help formulate the time-of-use electricity tariffs to make better use of the existing grid infrastructure. Moreover, appliances can easily be controlled to match the electricity demand of houses to the availability of renewable energy.
STLF at the local level has been useful in numerous state- of-the-art applications including demand side management [3] and electric vehicle integration [4]. Limited research has been carried out on the comparison of different artificial intelligence (AI)-based techniques for residential STLF. Seven different machine learning algorithms were evaluated in [5] to predict the next hour building energy consumption, based on measurements having a resolution of 15 minutes. The results showed that support vector regression (SVR) performed better than multi-layer feed-forward neural network (MLNN) and the lowest achieved mean absolute percentage error (MAPE) was 16.11 %. Moreover, it was shown that the inclusion of the actual previous energy consumption information in the model improves its forecasting accuracy. MLNN and support vector machines were used to predict a house’s load for the next 24 hours in [6], based on previous energy consumption and internal temperature information, and both provided reasonable forecasting accuracies. Based on their results, the authors stressed out that load forecasting on individual household level is a complex task. MLNN was used as model without any weather variable input to predict the hourly and daily energy usage of households in Portugal [7]. For 46 households analyzed, the daily energy consumption forecasting had a maximum and average MAPE of 18.1 % and 4.2 % respectively. For 2 particular houses, the hourly energy demand forecasting had MAPE varying between 10.0 % and 23.5 %.
In this paper, we investigated the use of a household’s metered actual electrical parameters to develop models for the next quarter hourly, next day and next day peak load forecasting by employing MLNN, elman recurrent neural network (ERNN) and SVR AI methods without the use of weather data. The rest of this paper is organized as follows: Section II describes the methodology adopted in this work, section III provides the results and their discussions, and section IV eventually concludes the paper.
International Journal of Computational Intelligence Research (IJCIR). ISSN 0973-1873 Vol.14, No.1 (2018)© Research India Publications. http://www.ripublication.com
182
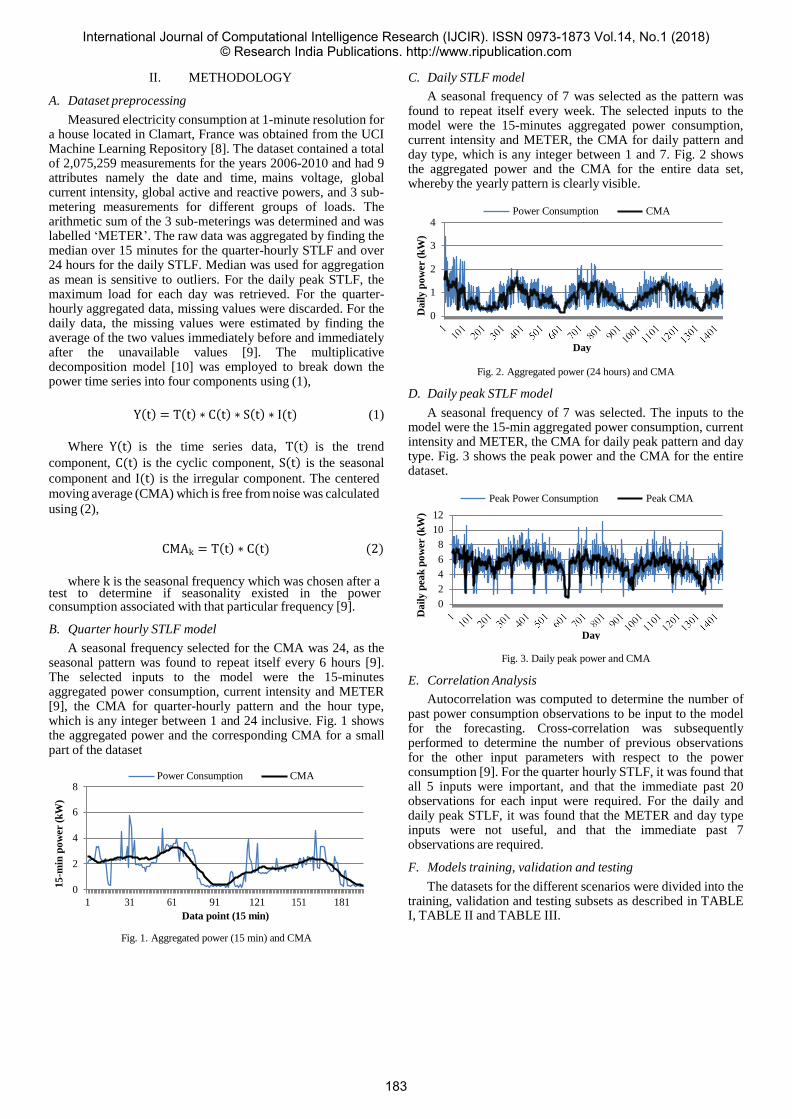
II. METHODOLOGY
A. Dataset preprocessing
Measured electricity consumption at 1-minute resolution for a house located in Clamart, France was obtained from the UCI Machine Learning Repository [8]. The dataset contained a total of 2,075,259 measurements for the years 2006-2010 and had 9 attributes namely the date and time, mains voltage, global current intensity, global active and reactive powers, and 3 sub- metering measurements for different groups of loads. The arithmetic sum of the 3 sub-meterings was determined and was labelled ‘METER’. The raw data was aggregated by finding the median over 15 minutes for the quarter-hourly STLF and over 24 hours for the daily STLF. Median was used for aggregation as mean is sensitive to outliers. For the daily peak STLF, the maximum load for each day was retrieved. For the quarter- hourly aggregated data, missing values were discarded. For the daily data, the missing values were estimated by finding the average of the two values immediately before and immediately after the unavailable values [9]. The multiplicative decomposition model [10] was employed to break down the power time series into four components using (1),
Y(t) = T(t) ∗ C(t) ∗ S(t) ∗ I(t) (1)
Where Y(t) is the time series data, T(t) is the trend
component, C(t) is the cyclic component, S(t) is the seasonal
component and I(t) is the irregular component. The centered
moving average (CMA) which is free from noise was calculated
using (2),
CMAk = T(t) ∗ C(t) (2)
where k is the seasonal frequency which was chosen after a test to determine if seasonality existed in the power consumption associated with that particular frequency [9].
B. Quarter hourly STLF model
A seasonal frequency selected for the CMA was 24, as the seasonal pattern was found to repeat itself every 6 hours [9]. The selected inputs to the model were the 15-minutes aggregated power consumption, current intensity and METER [9], the CMA for quarter-hourly pattern and the hour type, which is any integer between 1 and 24 inclusive. Fig. 1 shows the aggregated power and the corresponding CMA for a small part of the dataset
Power Consumption CMA
8
6
4
2
0
1 31 61 91 121 151 181
Data point (15 min)
Fig. 1. Aggregated power (15 min) and CMA
C. Daily STLF model
A seasonal frequency of 7 was selected as the pattern was found to repeat itself every week. The selected inputs to the model were the 15-minutes aggregated power consumption, current intensity and METER, the CMA for daily pattern and day type, which is any integer between 1 and 7. Fig. 2 shows the aggregated power and the CMA for the entire data set, whereby the yearly pattern is clearly visible.
Power Consumption CMA
4
3
2
1
0
Fig. 2. Aggregated power (24 hours) and CMA
D. Daily peak STLF model
A seasonal frequency of 7 was selected. The inputs to the model were the 15-min aggregated power consumption, current intensity and METER, the CMA for daily peak pattern and day type. Fig. 3 shows the peak power and the CMA for the entire dataset.
Peak Power Consumption Peak CMA
12
10
8
6
4
2
0
Fig. 3. Daily peak power and CMA
E. Correlation Analysis
Autocorrelation was computed to determine the number of past power consumption observations to be input to the model for the forecasting. Cross-correlation was subsequently performed to determine the number of previous observations for the other input parameters with respect to the power consumption [9]. For the quarter hourly STLF, it was found that all 5 inputs were important, and that the immediate past 20 observations for each input were required. For the daily and daily peak STLF, it was found that the METER and day type inputs were not useful, and that the immediate past 7 observations are required.
F. Models training, validation and testing
The datasets for the different scenarios were divided into the training, validation and testing subsets as described in TABLE I, TABLE II and TABLE III.
Day
Day
15
-min
po
wer (
kW
)
Dail
y p
eak
po
wer (
kW
) D
ail
y p
ow
er (
kW
)
International Journal of Computational Intelligence Research (IJCIR). ISSN 0973-1873 Vol.14, No.1 (2018)© Research India Publications. http://www.ripublication.com
183
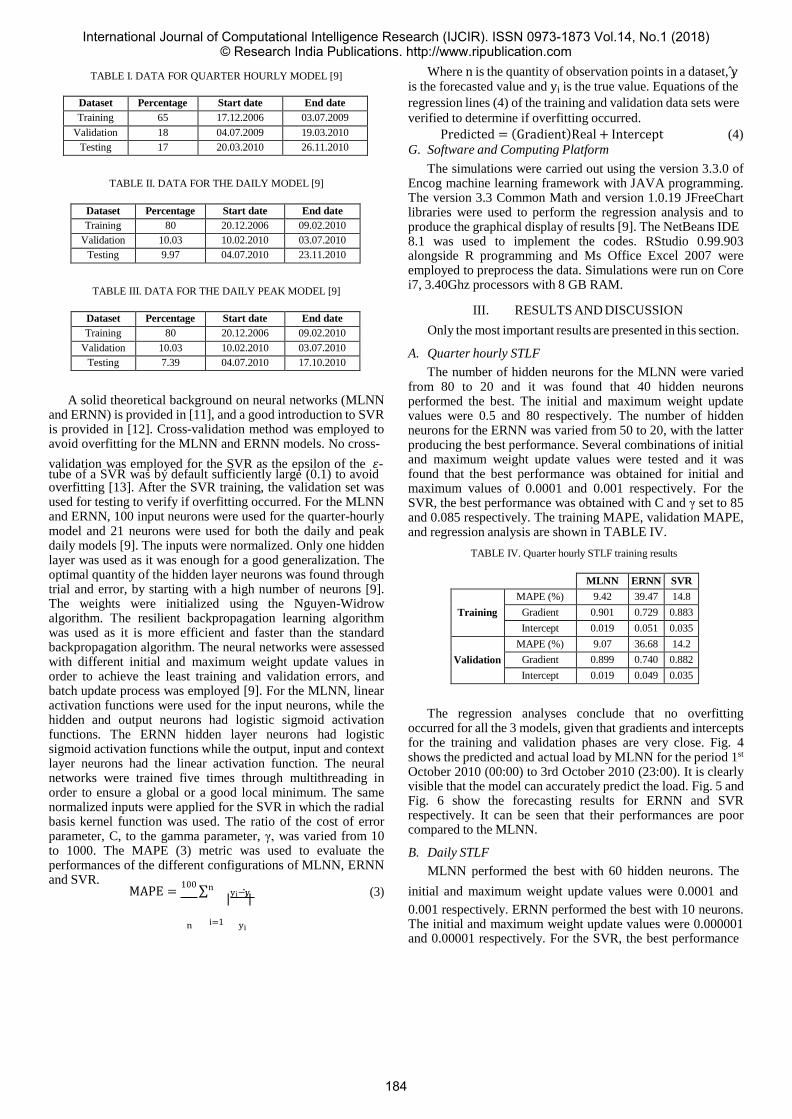
TABLE I. DATA FOR QUARTER HOURLY MODEL [9]
Dataset Percentage Start date End date
Training 65 17.12.2006 03.07.2009
Validation 18 04.07.2009 19.03.2010
Testing 17 20.03.2010 26.11.2010
TABLE II. DATA FOR THE DAILY MODEL [9]
Dataset Percentage Start date End date
Training 80 20.12.2006 09.02.2010
Validation 10.03 10.02.2010 03.07.2010
Testing 9.97 04.07.2010 23.11.2010
TABLE III. DATA FOR THE DAILY PEAK MODEL [9]
Dataset Percentage Start date End date
Training 80 20.12.2006 09.02.2010
Validation 10.03 10.02.2010 03.07.2010
Testing 7.39 04.07.2010 17.10.2010
A solid theoretical background on neural networks (MLNN and ERNN) is provided in [11], and a good introduction to SVR is provided in [12]. Cross-validation method was employed to avoid overfitting for the MLNN and ERNN models. No cross-
validation was employed for the SVR as the epsilon of the 𝜀- tube of a SVR was by default sufficiently large (0.1) to avoid overfitting [13]. After the SVR training, the validation set was used for testing to verify if overfitting occurred. For the MLNN and ERNN, 100 input neurons were used for the quarter-hourly model and 21 neurons were used for both the daily and peak daily models [9]. The inputs were normalized. Only one hidden layer was used as it was enough for a good generalization. The optimal quantity of the hidden layer neurons was found through trial and error, by starting with a high number of neurons [9]. The weights were initialized using the Nguyen-Widrow algorithm. The resilient backpropagation learning algorithm was used as it is more efficient and faster than the standard backpropagation algorithm. The neural networks were assessed with different initial and maximum weight update values in order to achieve the least training and validation errors, and batch update process was employed [9]. For the MLNN, linear activation functions were used for the input neurons, while the hidden and output neurons had logistic sigmoid activation functions. The ERNN hidden layer neurons had logistic sigmoid activation functions while the output, input and context layer neurons had the linear activation function. The neural networks were trained five times through multithreading in order to ensure a global or a good local minimum. The same normalized inputs were applied for the SVR in which the radial basis kernel function was used. The ratio of the cost of error parameter, C, to the gamma parameter, γ, was varied from 10 to 1000. The MAPE (3) metric was used to evaluate the performances of the different configurations of MLNN, ERNN and SVR.
Where n is the quantity of observation points in a dataset, yi is the forecasted value and yi is the true value. Equations of the
regression lines (4) of the training and validation data sets were
verified to determine if overfitting occurred.
Predicted = (Gradient)Real + Intercept (4)
G. Software and Computing Platform
The simulations were carried out using the version 3.3.0 of Encog machine learning framework with JAVA programming. The version 3.3 Common Math and version 1.0.19 JFreeChart libraries were used to perform the regression analysis and to produce the graphical display of results [9]. The NetBeans IDE 8.1 was used to implement the codes. RStudio 0.99.903 alongside R programming and Ms Office Excel 2007 were employed to preprocess the data. Simulations were run on Core i7, 3.40Ghz processors with 8 GB RAM.
III. RESULTS AND DISCUSSION
Only the most important results are presented in this section.
A. Quarter hourly STLF
The number of hidden neurons for the MLNN were varied from 80 to 20 and it was found that 40 hidden neurons performed the best. The initial and maximum weight update values were 0.5 and 80 respectively. The number of hidden neurons for the ERNN was varied from 50 to 20, with the latter producing the best performance. Several combinations of initial and maximum weight update values were tested and it was found that the best performance was obtained for initial and maximum values of 0.0001 and 0.001 respectively. For the SVR, the best performance was obtained with C and γ set to 85 and 0.085 respectively. The training MAPE, validation MAPE, and regression analysis are shown in TABLE IV.
TABLE IV. Quarter hourly STLF training results
MLNN ERNN SVR
Training
MAPE (%) 9.42 39.47 14.8
Gradient 0.901 0.729 0.883
Intercept 0.019 0.051 0.035
Validation
MAPE (%) 9.07 36.68 14.2
Gradient 0.899 0.740 0.882
Intercept 0.019 0.049 0.035
The regression analyses conclude that no overfitting occurred for all the 3 models, given that gradients and intercepts for the training and validation phases are very close. Fig. 4 shows the predicted and actual load by MLNN for the period 1st
October 2010 (00:00) to 3rd October 2010 (23:00). It is clearly visible that the model can accurately predict the load. Fig. 5 and Fig. 6 show the forecasting results for ERNN and SVR respectively. It can be seen that their performances are poor compared to the MLNN.
B. Daily STLF
MLNN performed the best with 60 hidden neurons. The
MAPE = 100
∑n
|yi−yi|
(3) initial and maximum weight update values were 0.0001 and
n i=1 yi
0.001 respectively. ERNN performed the best with 10 neurons. The initial and maximum weight update values were 0.000001 and 0.00001 respectively. For the SVR, the best performance
International Journal of Computational Intelligence Research (IJCIR). ISSN 0973-1873 Vol.14, No.1 (2018)© Research India Publications. http://www.ripublication.com
184
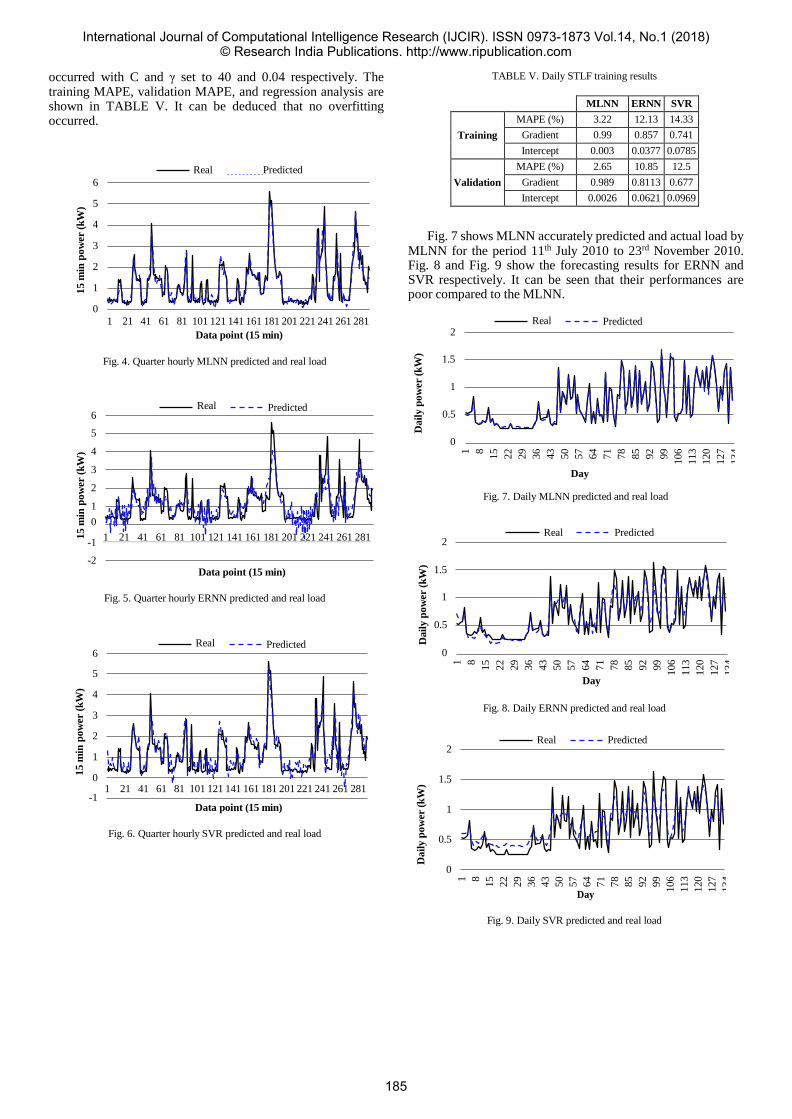
Dail
y p
ow
er (
kW
)
1
8
15
22
29
36
43
50
57
64
71
78
85
92
99
106
113
120
127
134
1
8
15
22
29
36
43
50
57
64
71
78
85
92
99
106
113
120
127
134
occurred with C and γ set to 40 and 0.04 respectively. The training MAPE, validation MAPE, and regression analysis are shown in TABLE V. It can be deduced that no overfitting occurred.
TABLE V. Daily STLF training results
Real Predicted
6
5
4
3
2
1
0
Fig. 7 shows MLNN accurately predicted and actual load by MLNN for the period 11th July 2010 to 23rd November 2010. Fig. 8 and Fig. 9 show the forecasting results for ERNN and SVR respectively. It can be seen that their performances are poor compared to the MLNN.
1 21 41 61 81 101 121 141 161 181 201 221 241 261 281
Data point (15 min)
Real 2
Predicted
Fig. 4. Quarter hourly MLNN predicted and real load 1.5
Real
6
5
4
3
2
1
0
Predicted
1
0.5
0
Day
Fig. 7. Daily MLNN predicted and real load
-1 1 21 41 61 81 101 121 141 161 181 201 221 241 261 281
-2 Data point (15 min)
2
1.5
Real Predicted
Fig. 5. Quarter hourly ERNN predicted and real load 1
Real 6
5
4
3
Predicted
0.5
0
Day
Fig. 8. Daily ERNN predicted and real load
2
1
0 1 21 41 61 81 101 121 141 161 181 201 221 241 261 281
-1 Data point (15 min)
Fig. 6. Quarter hourly SVR predicted and real load
2
1.5
1
0.5
Real
Predicted
0
Day
Fig. 9. Daily SVR predicted and real load
15 m
in p
ow
er (
kW
) 1
5 m
in p
ow
er (
kW
) 1
5 m
in p
ow
er (
kW
)
Dail
y p
ow
er (
kW
) D
ail
y p
ow
er (
kW
)
1
8
15
22
29
36
43
50
57
64
71
78
85
92
99
106
113
120
127
134
MLNN ERNN SVR
Training
MAPE (%) 3.22 12.13 14.33
Gradient 0.99 0.857 0.741
Intercept 0.003 0.0377 0.0785
Validation
MAPE (%) 2.65 10.85 12.5
Gradient 0.989 0.8113 0.677
Intercept 0.0026 0.0621 0.0969
International Journal of Computational Intelligence Research (IJCIR). ISSN 0973-1873 Vol.14, No.1 (2018)© Research India Publications. http://www.ripublication.com
185
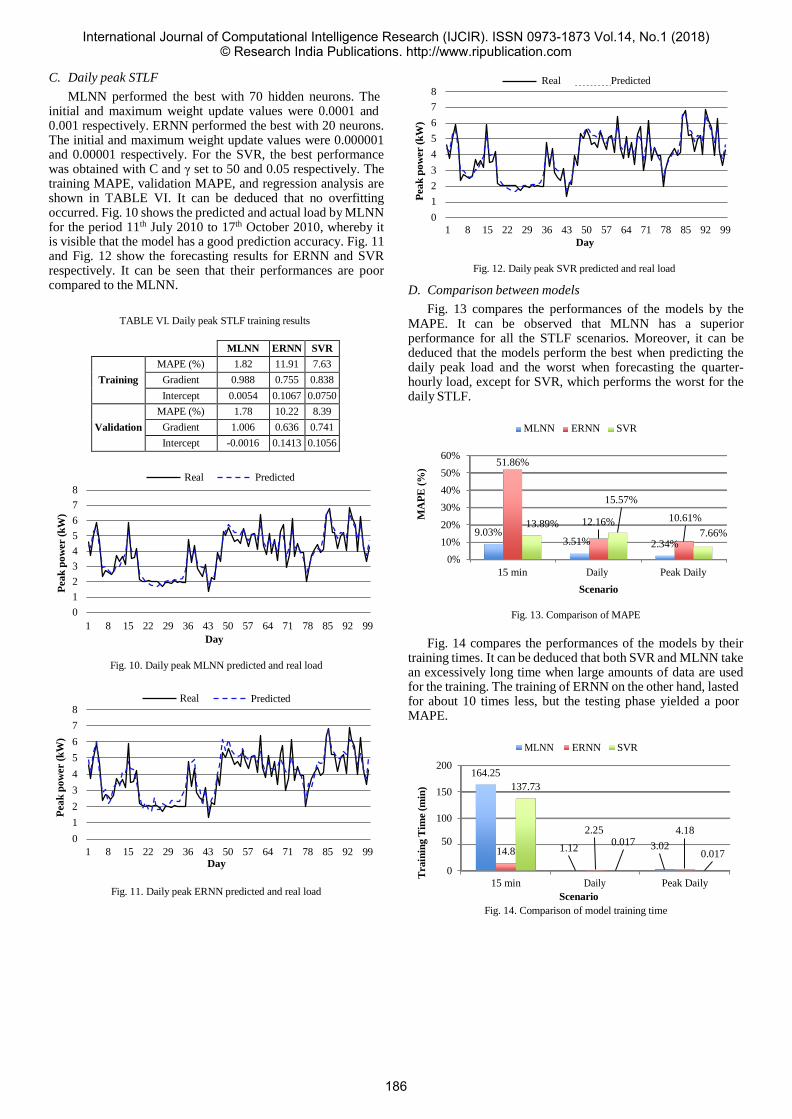
C. Daily peak STLF
MLNN performed the best with 70 hidden neurons. The initial and maximum weight update values were 0.0001 and 0.001 respectively. ERNN performed the best with 20 neurons. The initial and maximum weight update values were 0.000001 and 0.00001 respectively. For the SVR, the best performance was obtained with C and γ set to 50 and 0.05 respectively. The training MAPE, validation MAPE, and regression analysis are shown in TABLE VI. It can be deduced that no overfitting occurred. Fig. 10 shows the predicted and actual load by MLNN for the period 11th July 2010 to 17th October 2010, whereby it is visible that the model has a good prediction accuracy. Fig. 11 and Fig. 12 show the forecasting results for ERNN and SVR respectively. It can be seen that their performances are poor compared to the MLNN.
TABLE VI. Daily peak STLF training results
Real Predicted 8
7
6
5
4
3
2
1
0
1 8 15 22 29 36 43 50 57 64 71 78 85 92 99
Day
Fig. 12. Daily peak SVR predicted and real load
D. Comparison between models
Fig. 13 compares the performances of the models by the MAPE. It can be observed that MLNN has a superior performance for all the STLF scenarios. Moreover, it can be deduced that the models perform the best when predicting the daily peak load and the worst when forecasting the quarter- hourly load, except for SVR, which performs the worst for the daily STLF.
Real
8
7
6
5
4
3
2
1
0
Predicted
60%
50%
40%
30%
20%
10%
0%
MLNN ERNN SVR
15 min Daily Peak Daily
Scenario
Fig. 13. Comparison of MAPE
1 8 15 22 29 36 43 50 57 64 71 78 85 92 99
Day
Fig. 10. Daily peak MLNN predicted and real load
Fig. 14 compares the performances of the models by their training times. It can be deduced that both SVR and MLNN take an excessively long time when large amounts of data are used for the training. The training of ERNN on the other hand, lasted
Real 8
7
6
5
4
3
2
1
0
Predicted for about 10 times less, but the testing phase yielded a poor MAPE.
MLNN ERNN SVR
200
150
100
50
1 8 15 22 29 36 43 50 57 64 71 78 85 92 99 Day
Fig. 11. Daily peak ERNN predicted and real load
0
15 min Daily Peak Daily
Scenario
Fig. 14. Comparison of model training time
51.86%
15.57%
13.89% 9.03%
12.16%
3.51%
10.61%
7.66% 2.34%
164.25
137.73
2.25 4.18 0.017
14.8 1.12 3.02 0.017
Pea
k p
ow
er
(kW
) P
ea
k p
ow
er (
kW
)
Pea
k p
ow
er (
kW
) M
AP
E (
%)
Tra
inin
g T
ime
(min
)
MLNN ERNN SVR
Training
MAPE (%) 1.82 11.91 7.63
Gradient 0.988 0.755 0.838
Intercept 0.0054 0.1067 0.0750
Validation
MAPE (%) 1.78 10.22 8.39
Gradient 1.006 0.636 0.741
Intercept -0.0016 0.1413 0.1056
International Journal of Computational Intelligence Research (IJCIR). ISSN 0973-1873 Vol.14, No.1 (2018)© Research India Publications. http://www.ripublication.com
186

For the daily and daily peak STLF, all the models, particularly MLNN and SVR, have relatively much lower training times as compared to the quarter hourly models, due to lesser amount of training data. Moreover, SVR took about 200 times shorter for the training as compared to MLNN and ERNN for the peak load scenario. The high training time for the quarter hourly MLNN model does not limit its real application because once training has been accomplished, the system can quickly provide accurate forecasts for the next step load.
IV. CONCLUSION
This paper presented the very first comparison between MLNN, ERNN, and SVR for the STLF of the next-step ahead quarter hourly, daily, daily peak electrical load forecasting for a house based on actual energy/power meter measurements. It was found that the MLNN model has very good forecasting accuracies based on the selected input data, with MAPE as low as 2.34 %. The model has a great potential to be implemented for houses equipped with smart meters and where only a few years’ measurements are available. SVR and ERNN performed acceptably for the daily peak STLF with the MAPE varying in the range of 7.66 % - 15.57 %. A future study will involve comparing other AI techniques as well as different combinations of inputs, for several scenarios of STLF including quarter hourly, half hourly, hourly, daily, peak daily, weekly and peak weakly. A thorough investigation shall be carried out on all the variable parameters of the different AI techniques.
REFERENCES
[1] H. Shi, M. Xu and R. Li, "Deep Learning for
Household Load Forecasting – A Novel Pooling Deep
RNN," IEEE Transactions on Smart Grid, vol. PP, no.
99, pp. 1-1, 2017.
[2] S. Haben, J. Ward, D. V. Greetham, C. Singleton and
P. Grindrod, "A new error measure for forecasts of
household-level, high resolution electrical energy
consumption," International Journal of Forecasting,
vol. 30, no. 2, pp. 246-256, 2014.
[3] B. Moradzadeh and K. Tomsovic, "Two-stage
residential energy management considering network
operational constraints," IEEE Transactions on Smart
Grid, vol. 4, no. 4, pp. 2339 - 2346, 2013.
[4] A. Mohamed, V. Salehi, T. Ma and O. Mohammed,
"Real-Time Energy Management Algorithm for Plug-
In Hybrid Electric Vehicle Charging Parks Involving
Sustainable Energy," IEEE Transactions on
Sustainable Energy , vol. 5, no. 2, pp. 577 - 586, 2013.
[5] R. E. Edwards, J. New and L. E. Parker, "Predicting
future hourly residential electrical consumption: A
machine learning case study," Energy and Buildings,
vol. 49, pp. 591-63, 2012.
[6] K. Gajowniczek and T. Ząbkowski, "Short term
electricity forecasting using individual smart meter
data," Procedia Computer Science, vol. 35, pp. 589-
597, 2014.
[7] F. Rodrigues, C. Cardeira and J. Calado, "The daily and
hourly energy consumption and load forecasting using
artificial neural network method: a case study using a
set of 93 households in Portugal," Energy Procedia,
vol. 62, pp. 220-229, 2014.
[8] M. Lichman, "UCI Machine Learning Repository,"
Center for Machine Learning and Intelligent Systems,
University of California, 2013. [Online]. Available:
http://archive.ics.uci.edu/ml/index.php. [Accessed 10
January 2018].
[9] S. M. R. T. A. S. LALLMAHOMED, "DETECTING
ANOMALIES IN A HOUSEHOLD ELECTRIC
POWER CONSUMPTION USING PREDICTIVE
MODELING," University of Mauritius, Reduit, 2017.
[10] W.-Y. Peng and C.-W. Chu, "A comparison of
univariate methods for forecasting container
throughput volumes," Mathematical and Computer
Modelling, vol. 50, no. 7-8, pp. 1045-1057, 2009.
[11] L. V. Fausett, Fundamentals of Neural Networks:
Architectures, Algorithms And Applications, Pearson,
1993.
[12] A. J. Smola and B. Schölkopf, "A tutorial on support
vector regression," Statistics and Computing, vol. 14,
no. 3, pp. 199-222, 2004.
[13] C.-C. Chang and C.-J. Lin, "LIBSVM: A library for
support vector machines," ACM Transactions on
Intelligent Systems and Technology, vol. 2, no. 3, 2011.
International Journal of Computational Intelligence Research (IJCIR). ISSN 0973-1873 Vol.14, No.1 (2018)© Research India Publications. http://www.ripublication.com
187

The Fractional Fourier Transform in Signal Processing as a modern tool
Dr. Kanchan Kumar Sinha , Prof. PankajDeshmukh
Assistant Prof. (KJSIEIT), Mumbai Assistant Prof. (KJSIEIT),
[email protected], [email protected]
Abstract—The Fractional Fourier Transform is the
generalization of the classical Fourier Transform and was
introduced many years ago in mathematics literature. The
original purpose of Fractional Fourier Transform is to solve the
differential equation in quantum mechanics problems in optics.
Most of the applications of Fractional Fourier Transform in
optics.It depends on a parameterα and can be interpreted as
rotation by an angle α in the time frequency plane or
decomposition of the signal in terms of chirps. It is also used in
digital domain. Because of its simple and of beautiful properties
in time – frequency plane, there are many new applications
waiting for signal processing.
Keywords—: Fractional Fourier Transform, signal
processing and analysis.
I. INTRODUCTION
Fractional Fourier transform is depend on fraction calculus and
is more generalized form of calculus, unlike the integer order
calculus where operation are centered mainly at the integers
,fractional calculus consider every real number where v>0. The
meaning and application of this new type of calculus are quite
comparable to those of the ordinary calculus, especially
whenv>0 gets closer and closer to certain integers. The first
fractional operator will introduce the fractional integral which is
a generalization of the n-tuple in iterated integral to any real
order and any nth iterated integral as a single integral.
Although the idea of fractional calculus was born more than
300 year ago, only recently has serious effort has been
dedicated to it study, still, ordinary calculus much more
familiars, and more preferred, may be because of its application
are more apparent. However we believe that in addition to
opening our minds to braches of thought by filling the gap of
ordinary calculus, fractional calculus has the potential of
presenting intriguing and useful application in future.
II. Contents
The fourth power of 3 is defined as 34, but 33.5= 37/2 = may be
defined in this manner.
The first and the second derivatives of the function f(x) as df(x)/dx
and f(x)/d = f(x)
Now what is the 2.5th derivative of a function? Let F(u) denote
FT(Fourier Transform) of f(x).
The F.T. of the nth derivative of the f(x) be given by(i2πu)n F(u) , for
any positive integer n.
Generalizingthis property by replacing n with real order a andtake it
as the ath derivative of f(x), thus we can find daf(x)/dxa , the
athderivative of f(x) and the inverse F.T. of (i2πu)a F(u). Both of these
will deal with the fraction ofan operation performed on an entity,
rather than fractions of the entity itself.
Let T be the transformation and describing T as following
Tf(x) = F(u)
Where f and F are the two functions with variables x and u,
respectively, where F is a T transform . thus we can also consider
one new transform as
f(x) = Fd(u)
Where , the α-order fractional T transform, and the parameter α is
called the ‘fractional order’ and this kind of Transform is called
“fractional transform”, which satisfies the following conditions
BOUNDARY T0f(x) = f(u)
CONDITIONS T1f(x) = F(u).
Additive Property: TβTαf(x)= f(x)
As we know the two functions f and F are F.T. pair if
F(v)= exp (-i2 vx)dx
&
f(x) = exp (i2πvx)dv
Which reduce to operator notation as F= £f where £ denotes
the conventional F.T. Thus£2f(x) = f(-x) ; £4f(x) = f(x).
Thus the notation means doing the £ for α times.
The F.T. by expressing it in terms of these Eigen functions as
following
f(x) = ψn(x)
An = (x) f(x)dx
£ f(x) = e-inπ/2ψn(x)
The αthorder Fractional Fourier Transform give the same Eigen
functions as the F.T., but its Eigen value are the αth power of the
Eigen values of the ordinary F.T.
The Fractional operator of order α may be defined through Eigen
functions of the Conventional Fourier operator as
£αψn(x) = e-iαnπ/2ψn(n)
If the operator be linear, the fractional transform
of an arbitrary function may be expected as
£α[f(x)](x) = e-αnπ/2ψn(x)
Thus, we have the following essential properties:
(1) The FFT operation is Linear.
(2) The first-order Transform ‘£’ corresponds to the
Conventional F.T. £ and the zeroth-order transform
£0, ie. doing no transform.
(3) The fractional operator is additive £β£α =£α+
International Journal of Computational Intelligence Research (IJCIR). ISSN 0973-1873 Vol.14, No.1 (2018)© Research India Publications. http://www.ripublication.com
188

FRCTIONAL FT. OF SOME SIGNALS
SIGNAL Fr FT with order
∂(t-τ)
1
cos(νt)
sin(νt)
We have introduced some relations between them, which are quite
important because many applications are based on them. The first
FRFT have several applications in the area of Optics and Signal
Processing, which leads to generalization of notation of space or time
and frequency domain which are central concepts of Signal
processing. The generalization of F.T , Fr. F.T in a useful tool for
Signal Processing. Since the flexibility of Fr. F.T is better than
conventional F.T., many problems that cannot be solved well by
Conventional F.T. are solved here.
It has many applications in the solutions of Differential Equation,
Optical Beam Propagation and Spherical mirror resonators, Optical
Diffraction theory, Optical Signal Processing, Signal Detectors and
finds other relation between Fr. F.T. and other signal representation.
III. FUTURE SCOPE
Using ideas of ordinary calculus we can differentiate a function
f(x) =x to the 1st or nth order and we can also established a mean
or some potential application of the results and we can
differentiate the same function to 1/2th order. Better still, can be
established a mean of some potential application of the results?
We may not achieve that through ordinary calculus but we may
through fractional calculus –a more generalised form of
calculus.
We know how to solve some fractional order differial equation
using the Laplacetransform, we can solve these problem using
both the integer and fractional order operations.
They fractional matrix function ( A ) which we computed
using extended Putzeralogrithim and defined as
( A ) = ( A ) , where ( A ) is the
matrix Mittag – Leffler function .
We would like to consider in the future extending the ideas
specially rounding the above matrix function and again this
idea can be extended to any n×n matrix.
IV. CONCLUSION
We have introduce two different form of fractional derivative
,the Riemann Liouville and caputo forms and examine some
basic properties of each . We can solve some simple fractional
differential equation leading up to the fractional damped
harmonic oscillator problems here we have used the concept
of fractional derivatives, fractional integration and using
application of Laplace transform also. Here given the concept
of fractional calculus by Riemann Liouville concept of
fractional integral and derivative at some fractional
differentialequations with an emphasis of the Laplace
transform of the fractional integral and derivatives
REFERENCES
1. Hale Nick (oct 2010) fractional calculus in
chebfun.http://
www2.maths.ox.ac.uk/chebfun/example/integro/html/
Fraccale.shtml.
2. Loverro,Adam.(8may 2004). Fractional calculus:
History Definitions and Application for the Engineer.
3. McGonegal,Ben(13 Jan 2014). Fractional
BrownianMotion and the fractional Stochastic calculus.
4. Weissteineric W “Mittage–lefler.”From Mathaworld-A
wolfram.WebResourse,
http://mathworld.wolfram.com/Mittag-Leffler function.html.
5. Chung,Wonsang,Jung Min.(2013 Feb 18). On Fractional
damped oscillator and fractional forced oscillator.
.
International Journal of Computational Intelligence Research (IJCIR). ISSN 0973-1873 Vol.14, No.1 (2018)© Research India Publications. http://www.ripublication.com
189

REMOVAL OF HEAVY METALS FROM EFFLUENT OF METAL
PLATING INDUSTRY BY ADSORBENT PREPARED FROM
PEANUT SHELL
Deepak Sharmaa*, Parmesh Kumar Chaudharia, Abhinesh Kumar Prajapatib
aDepartment of Chemical Engineering, National Institute of Technology Raipur, Raipur 492001, India
bDepartment of Chemical Engineering, Institute of Engineering & Science Indore, Indore 452001, India
[email protected] , [email protected]
Abstract
This study deals with the adsorption of Fe and Ni from
Metal Plating Industry Effluent by using peanut husk
as prepared adsorbent .Batch adsorption studies were
studied to optimize the effect of various parameters
such as adsorbent doze (gm), initial (pHo), contact
time, initial concentration for the removal of Nickel
and Iron. The maximum removal of Nickel was found
to be (75.5 % at pH 3.5) and that of Iron was found to
be (80 % at 3.5 pH) when using peanut husk. The
sludge can be simply filtered and dried and can be
used as a fuel in a boiler furnace and in incineration
thus its heating value can be recovered.\
Keywords: Heavy Metal, Metal Plating Industry
(MPI), Iron, Nickel
INTRODUCTION
Industrial progress is positive indication to improve
human life. Metal plating industries take appropriate
place. Due to these industries environment is suffering
from the effects of pollution. Heavy metals such as Ni,
Fe etc are unpleasantly affecting our ecosystem due to
their toxicological and physiological effects in
environment. When these metals, are present in excess
limit then it can be a serious health hazard which can
create many disturbance in human beings and to the
animals and cause water pollution if discharged in
water receiving bodies. [1]. Basic reason for heavy
metal pollution is due to metal-plating, battery
manufacturing, mining and metallurgical engineering.
[2]. The main heavy metals which cause metal ion
pollution are Fe, Ni, Cr, Pb, Cd etc. Iron and Nickel
are toxic pollutants which causes serious problems in
environment and human health. When accumulated at
high levels of Iron and Nickel, can generate serious
problems and when concentration reaches 0.1 mg/g
body weight, it can ultimately become serious [3].
HEAVY METAL FOUND IN WASTEWATER
Heavy metals found in wastewater include Fe, Ni, Cr,
Pb etc. These metals, when found in sufficient
concentrations, can be detrimental to human health as
well as the environment. There are various
conventional methods for the removal the heavy
metals from MPE such as chemical precipitation,
filtration, ion exchange, evaporation, reverse osmosis,
solvent extraction, and electrochemical treatment and
membrane technologies [4]. It has been seen that these
methods are quite expensive and high sludge
generation. [5]. Therefore it became a challenge for
opting new technique for efficient metal removal from
water and wastewater. With reference to other
conventional methods adsorption method has found to
be most convenient method due to its simplicity and
high efficiency, as well as the availability of a wide
range of adsorbents. The most common used adsorbent
is Activated carbon for the removal of heavy metals
from MPE. But due to its higher cost and loss during
the regeneration restrict its applications.
ELECTROPLATING INDUSTRIES
Electroplating is the method of a metal coating to a
metallic or other conducting surface by an
electrochemical process. The article to be plated (the
work) is made the cathode (negative electrode) of an
electrolysis cell through which a direct electric current
is passed. The article is immersed in an aqueous
solution (the bath) containing the required metal in an
International Journal of Computational Intelligence Research (IJCIR). ISSN 0973-1873 Vol.14, No.1 (2018)© Research India Publications. http://www.ripublication.com
190
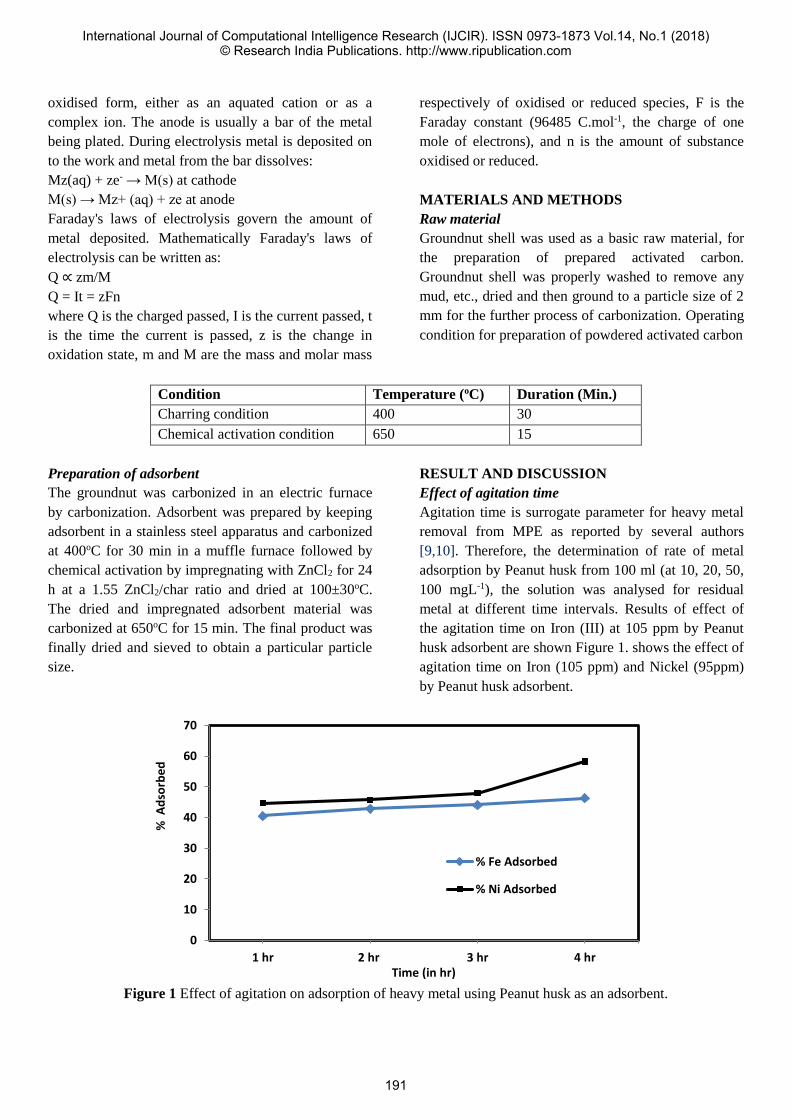
oxidised form, either as an aquated cation or as a
complex ion. The anode is usually a bar of the metal
being plated. During electrolysis metal is deposited on
to the work and metal from the bar dissolves:
Mz(aq) + ze- → M(s) at cathode
M(s) → Mz+ (aq) + ze at anode
Faraday's laws of electrolysis govern the amount of
metal deposited. Mathematically Faraday's laws of
electrolysis can be written as:
Q ∝ zm/M
Q = It = zFn
where Q is the charged passed, I is the current passed, t
is the time the current is passed, z is the change in
oxidation state, m and M are the mass and molar mass
respectively of oxidised or reduced species, F is the
Faraday constant (96485 C.mol-1, the charge of one
mole of electrons), and n is the amount of substance
oxidised or reduced.
MATERIALS AND METHODS
Raw material
Groundnut shell was used as a basic raw material, for
the preparation of prepared activated carbon.
Groundnut shell was properly washed to remove any
mud, etc., dried and then ground to a particle size of 2
mm for the further process of carbonization. Operating
condition for preparation of powdered activated carbon
Condition Temperature (oC) Duration (Min.)
Charring condition 400 30
Chemical activation condition 650 15
Preparation of adsorbent
The groundnut was carbonized in an electric furnace
by carbonization. Adsorbent was prepared by keeping
adsorbent in a stainless steel apparatus and carbonized
at 400oC for 30 min in a muffle furnace followed by
chemical activation by impregnating with ZnCl2 for 24
h at a 1.55 ZnCl2/char ratio and dried at 100±30oC.
The dried and impregnated adsorbent material was
carbonized at 650oC for 15 min. The final product was
finally dried and sieved to obtain a particular particle
size.
RESULT AND DISCUSSION
Effect of agitation time
Agitation time is surrogate parameter for heavy metal
removal from MPE as reported by several authors
[9,10]. Therefore, the determination of rate of metal
adsorption by Peanut husk from 100 ml (at 10, 20, 50,
100 mgL-1), the solution was analysed for residual
metal at different time intervals. Results of effect of
the agitation time on Iron (III) at 105 ppm by Peanut
husk adsorbent are shown Figure 1. shows the effect of
agitation time on Iron (105 ppm) and Nickel (95ppm)
by Peanut husk adsorbent.
Figure 1 Effect of agitation on adsorption of heavy metal using Peanut husk as an adsorbent.
0
10
20
30
40
50
60
70
1 hr 2 hr 3 hr 4 hr
% A
dso
rbe
d
Time (in hr)
% Fe Adsorbed
% Ni Adsorbed
International Journal of Computational Intelligence Research (IJCIR). ISSN 0973-1873 Vol.14, No.1 (2018)© Research India Publications. http://www.ripublication.com
191
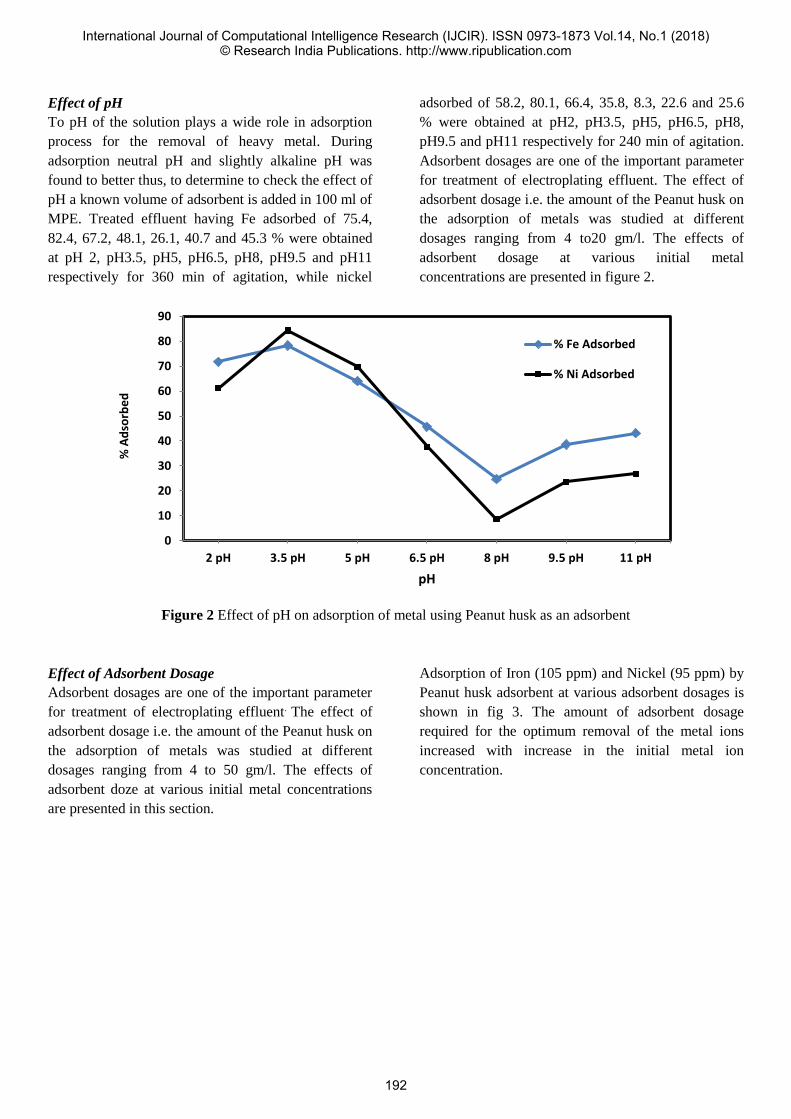
Effect of pH
To pH of the solution plays a wide role in adsorption
process for the removal of heavy metal. During
adsorption neutral pH and slightly alkaline pH was
found to better thus, to determine to check the effect of
pH a known volume of adsorbent is added in 100 ml of
MPE. Treated effluent having Fe adsorbed of 75.4,
82.4, 67.2, 48.1, 26.1, 40.7 and 45.3 % were obtained
at pH 2, pH3.5, pH5, pH6.5, pH8, pH9.5 and pH11
respectively for 360 min of agitation, while nickel
adsorbed of 58.2, 80.1, 66.4, 35.8, 8.3, 22.6 and 25.6
% were obtained at pH2, pH3.5, pH5, pH6.5, pH8,
pH9.5 and pH11 respectively for 240 min of agitation.
Adsorbent dosages are one of the important parameter
for treatment of electroplating effluent. The effect of
adsorbent dosage i.e. the amount of the Peanut husk on
the adsorption of metals was studied at different
dosages ranging from 4 to20 gm/l. The effects of
adsorbent dosage at various initial metal
concentrations are presented in figure 2.
Figure 2 Effect of pH on adsorption of metal using Peanut husk as an adsorbent
Effect of Adsorbent Dosage
Adsorbent dosages are one of the important parameter
for treatment of electroplating effluent. The effect of
adsorbent dosage i.e. the amount of the Peanut husk on
the adsorption of metals was studied at different
dosages ranging from 4 to 50 gm/l. The effects of
adsorbent doze at various initial metal concentrations
are presented in this section.
Adsorption of Iron (105 ppm) and Nickel (95 ppm) by
Peanut husk adsorbent at various adsorbent dosages is
shown in fig 3. The amount of adsorbent dosage
required for the optimum removal of the metal ions
increased with increase in the initial metal ion
concentration.
0
10
20
30
40
50
60
70
80
90
2 pH 3.5 pH 5 pH 6.5 pH 8 pH 9.5 pH 11 pH
% A
dso
rbe
d
pH
% Fe Adsorbed
% Ni Adsorbed
International Journal of Computational Intelligence Research (IJCIR). ISSN 0973-1873 Vol.14, No.1 (2018)© Research India Publications. http://www.ripublication.com
192
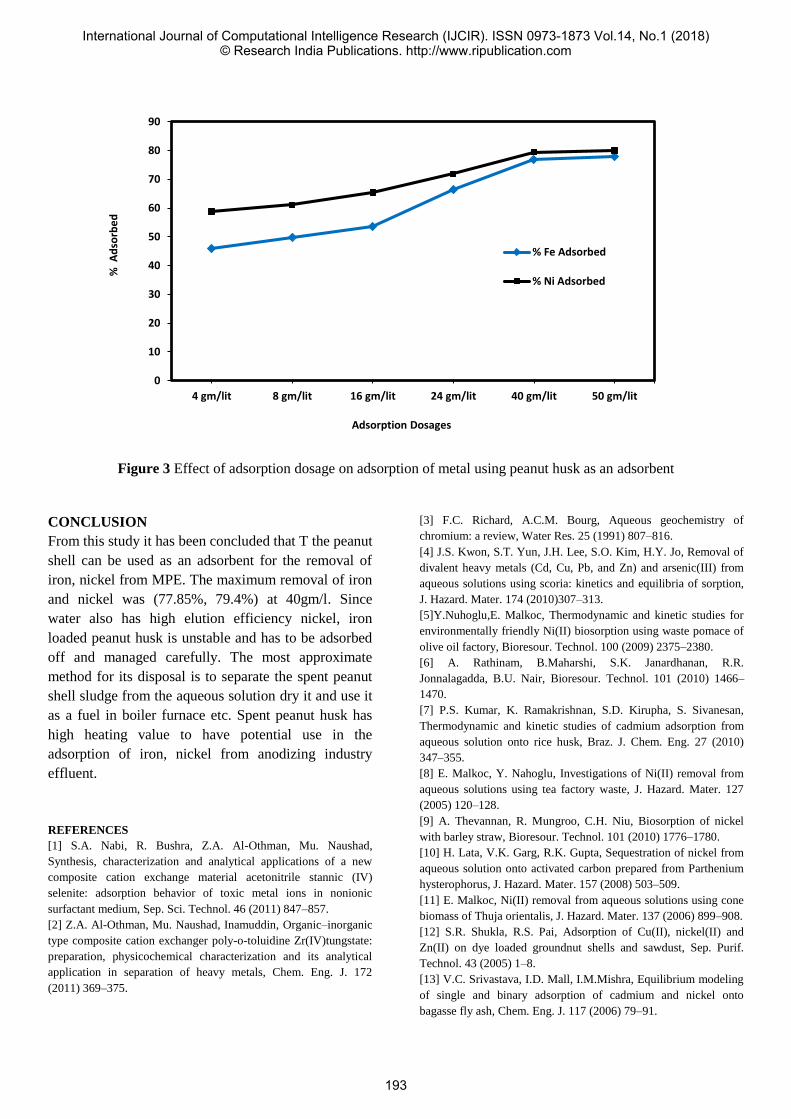
Figure 3 Effect of adsorption dosage on adsorption of metal using peanut husk as an adsorbent
CONCLUSION
From this study it has been concluded that T the peanut
shell can be used as an adsorbent for the removal of
iron, nickel from MPE. The maximum removal of iron
and nickel was (77.85%, 79.4%) at 40gm/l. Since
water also has high elution efficiency nickel, iron
loaded peanut husk is unstable and has to be adsorbed
off and managed carefully. The most approximate
method for its disposal is to separate the spent peanut
shell sludge from the aqueous solution dry it and use it
as a fuel in boiler furnace etc. Spent peanut husk has
high heating value to have potential use in the
adsorption of iron, nickel from anodizing industry
effluent.
REFERENCES
[1] S.A. Nabi, R. Bushra, Z.A. Al-Othman, Mu. Naushad,
Synthesis, characterization and analytical applications of a new
composite cation exchange material acetonitrile stannic (IV)
selenite: adsorption behavior of toxic metal ions in nonionic
surfactant medium, Sep. Sci. Technol. 46 (2011) 847–857.
[2] Z.A. Al-Othman, Mu. Naushad, Inamuddin, Organic–inorganic
type composite cation exchanger poly-o-toluidine Zr(IV)tungstate:
preparation, physicochemical characterization and its analytical
application in separation of heavy metals, Chem. Eng. J. 172
(2011) 369–375.
[3] F.C. Richard, A.C.M. Bourg, Aqueous geochemistry of
chromium: a review, Water Res. 25 (1991) 807–816.
[4] J.S. Kwon, S.T. Yun, J.H. Lee, S.O. Kim, H.Y. Jo, Removal of
divalent heavy metals (Cd, Cu, Pb, and Zn) and arsenic(III) from
aqueous solutions using scoria: kinetics and equilibria of sorption,
J. Hazard. Mater. 174 (2010)307–313.
[5]Y.Nuhoglu,E. Malkoc, Thermodynamic and kinetic studies for
environmentally friendly Ni(II) biosorption using waste pomace of
olive oil factory, Bioresour. Technol. 100 (2009) 2375–2380.
[6] A. Rathinam, B.Maharshi, S.K. Janardhanan, R.R.
Jonnalagadda, B.U. Nair, Bioresour. Technol. 101 (2010) 1466–
1470.
[7] P.S. Kumar, K. Ramakrishnan, S.D. Kirupha, S. Sivanesan,
Thermodynamic and kinetic studies of cadmium adsorption from
aqueous solution onto rice husk, Braz. J. Chem. Eng. 27 (2010)
347–355.
[8] E. Malkoc, Y. Nahoglu, Investigations of Ni(II) removal from
aqueous solutions using tea factory waste, J. Hazard. Mater. 127
(2005) 120–128.
[9] A. Thevannan, R. Mungroo, C.H. Niu, Biosorption of nickel
with barley straw, Bioresour. Technol. 101 (2010) 1776–1780.
[10] H. Lata, V.K. Garg, R.K. Gupta, Sequestration of nickel from
aqueous solution onto activated carbon prepared from Parthenium
hysterophorus, J. Hazard. Mater. 157 (2008) 503–509.
[11] E. Malkoc, Ni(II) removal from aqueous solutions using cone
biomass of Thuja orientalis, J. Hazard. Mater. 137 (2006) 899–908.
[12] S.R. Shukla, R.S. Pai, Adsorption of Cu(II), nickel(II) and
Zn(II) on dye loaded groundnut shells and sawdust, Sep. Purif.
Technol. 43 (2005) 1–8.
[13] V.C. Srivastava, I.D. Mall, I.M.Mishra, Equilibrium modeling
of single and binary adsorption of cadmium and nickel onto
bagasse fly ash, Chem. Eng. J. 117 (2006) 79–91.
0
10
20
30
40
50
60
70
80
90
4 gm/lit 8 gm/lit 16 gm/lit 24 gm/lit 40 gm/lit 50 gm/lit
% A
dso
rbe
d
Adsorption Dosages
% Fe Adsorbed
% Ni Adsorbed
International Journal of Computational Intelligence Research (IJCIR). ISSN 0973-1873 Vol.14, No.1 (2018)© Research India Publications. http://www.ripublication.com
193

[14] B.S. Gupta, M. Curran, S. Hasan, T.K. Ghosh, Adsorption
characteristics of Cu and Ni on Irish peat moss, J. Environ.
Manage. 90 (2008) 954–960.
[15] A. Ewecharoen, P. Thiravetyan, W. Nakbanpote, Comparison
of nickel adsorption from electroplating rinse water by coir pith
and modified coir pith, Chem.Eng. J. 137 (2008) 181–188.
[16] F. Guzel, H. Yakut, G. Topal, Determination of kinetic and
equilibrium parameters of the batch adsorption of Mn(II), Co(II),
Ni(II) and Cu(II) from aqueous solution by black carrot (Daucus
carota L) residues, J. Hazard. Mater. 153 (2008) 1275–1287.
[17] V. Padmavathy, Biosorption of nickel(II) ions by baker’s
yeast: kinetic, thermodynamics and desorption studies, Bioresour.
Technol. 99 (2008) 3100–3109.
International Journal of Computational Intelligence Research (IJCIR). ISSN 0973-1873 Vol.14, No.1 (2018)© Research India Publications. http://www.ripublication.com
194
TQM implementation barriers in Indian certified SMEs
Assistant Professor
Rajesh Meshram, Ramesh Lakhe, Archana Meshram K. J Somaiya Institute of Engineering & IT Mumbai, Shreyas Quality Management Systems Nagpur, J.J Hospital Byculla Mumbai.
[email protected], [email protected], [email protected]
Abstract—The formalized system of ISO 9000 series enable to
develop an environment to adopt advanced quality management
system like TQM in order to meet the increase in quality demand
from consumers and competitiveness between SMEs. This study
examines the barriers in the development of TQM among ISO
9001certified SMEs in India. The empirical data was obtained
from 200 certified companies of the four regions of India. The
perspective barriers were analyzed using SPSS software. The key
barriers in the adoption of TQM practices are resistance to
change, lack of reward and recognition and lack of training while
the favorable barriers are top management commitment and
customer focus. The ranking of barriers provide preference to
management of SMEs to attack upon in order to implement
TQM.
Keywords—TQM, ISO9001, SMEs, Barriers
I. INTRODUCTION
Today industries are under an environment of severe competition from domestic and international organizations. The competitiveness is to meet the demand for superior quality products and services. Consequently, many organizations have been adopting simple quality aspects to advanced quality system such as ISO9001, Total quality management (TQM), six sigma etc. An organization with an effective management system is expected to be more efficient in using its resources than an organization without an effective management system [1]. So, a good quality and its management, is well recognized for its issues strongly impacting the overall performance in industries that’s why, adequate quality systems are of paramount importance from competitive point of view [2].
The organizations in developing countries like India prefer to achieve competitive advantage through the effective deployment of ISO 9000 quality management system (ISO9000QMS).The certification system encourages the SMEs facing with limited resources and tremendous competitive pressure, to broaden the focus of their quality approach to TQM. Developing TQM implementation for firms in India is not easy task, where there are many factors resisting its implementation [3], but the SMEs affirmative in perceiving total quality is due to its ability to counter the major emerged challenges of cost reduction, quality improvement and delivery in time [4]. In view of the sustenance of SMEs with good quality practices it is essential to overcome the barriers. This study is an attempt to identify and evaluate the barriers in the adoption of total quality practices among the ISO9001certified Indian SMEs. The prioritization of barriers helps management to attack with optimum resources and implement TQM.
II. LITERATURE REVIEW
A. Quality improvement path in Indian organizations
In India the improvement of quality has been adopted through four distinct stages is shown in “Fig 1”. Before 1947, India was a British colony, had very little industrial production and typically exported raw materials to the United Kingdom for processing. Very little efforts existed in improving the quality of Indian goods. Since the 1920s, a number of Indian engineering companies started industrial production and some of them established a reputation for quality products. However, there were no organized efforts to improve quality [5]. After independence, the products manufactured in Indian companies were to be used by the Indian customers. The quality had been convinced with inspection to separate the non-acceptable quality product and get through with its scrap or rework. Next came the quality control up gradation through supervised skills, written specification, measurement and standardization, the fruits of which reaped mainly by the good managed and professional firms. It is started with customers accept the quality decided by the firms and not as per their expectations as the processes are aligned according to the written specifications. In conjunction to this, many SMEs focuses on local and domestic market which confined quality as per regional standard of ISI Certification Mark (The Bureau of Indian Standards) introduced by the Government of India jointly with Quality council of India. Their products range from cosmetics to food and heavy industrial materials sporting ISI certification tags that indicate safety and assurance of certain level quality. The quality tags on products are to guarantee safe purpose for the customers to meet quality standards. This quality had been accepted by customers till SMEs in general gave quality recognition through an emphasis on quality assurance and developing quality management system practices for producing goods and services that confirm to quality as per the customer requirements. The changed situation has happened with the open market in India which gave rise selection power to customers. The Indians and SMEs are left with no option but to take quality competitively and as per the customers’ expectations.
The competent SMEs in India have recognized the importance of ISO certification and understand the
International Journal of Computational Intelligence Research (IJCIR). ISSN 0973-1873 Vol.14, No.1 (2018)© Research India Publications. http://www.ripublication.com
195
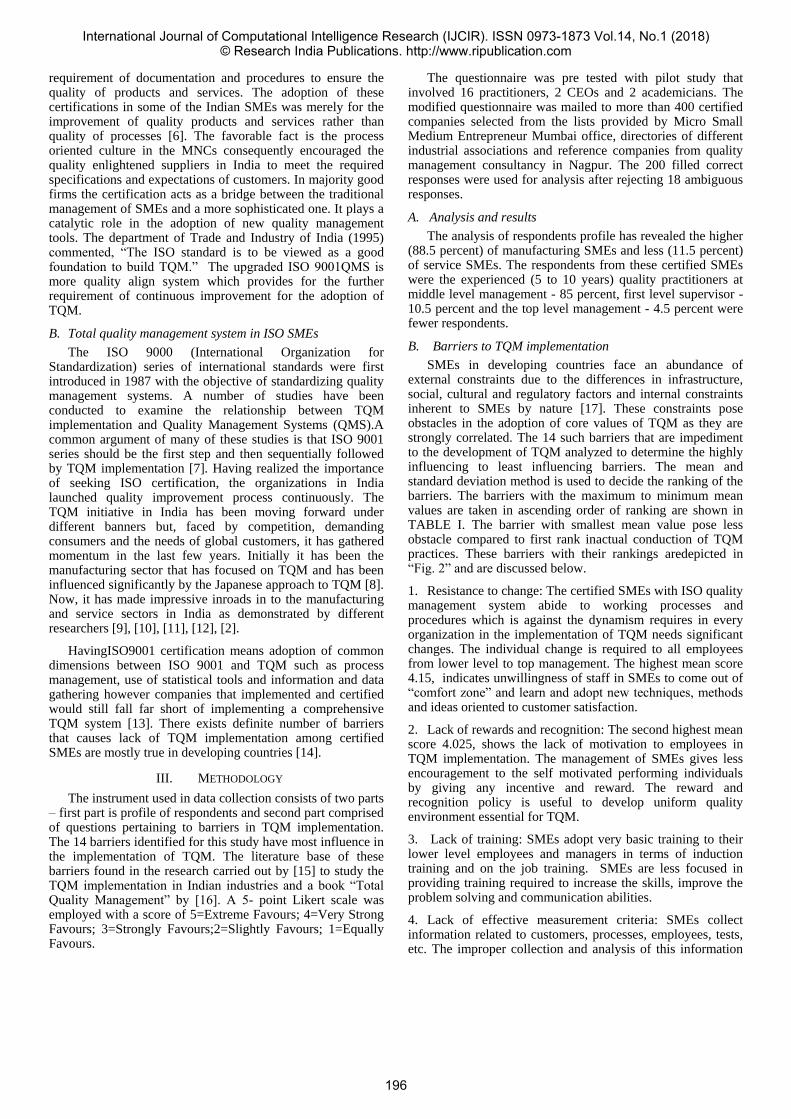
requirement of documentation and procedures to ensure the quality of products and services. The adoption of these certifications in some of the Indian SMEs was merely for the improvement of quality products and services rather than quality of processes [6]. The favorable fact is the process oriented culture in the MNCs consequently encouraged the quality enlightened suppliers in India to meet the required specifications and expectations of customers. In majority good firms the certification acts as a bridge between the traditional management of SMEs and a more sophisticated one. It plays a catalytic role in the adoption of new quality management tools. The department of Trade and Industry of India (1995) commented, “The ISO standard is to be viewed as a good foundation to build TQM.” The upgraded ISO 9001QMS is more quality align system which provides for the further requirement of continuous improvement for the adoption of TQM.
B. Total quality management system in ISO SMEs
The ISO 9000 (International Organization for Standardization) series of international standards were first introduced in 1987 with the objective of standardizing quality management systems. A number of studies have been conducted to examine the relationship between TQM implementation and Quality Management Systems (QMS).A common argument of many of these studies is that ISO 9001 series should be the first step and then sequentially followed by TQM implementation [7]. Having realized the importance of seeking ISO certification, the organizations in India launched quality improvement process continuously. The TQM initiative in India has been moving forward under different banners but, faced by competition, demanding consumers and the needs of global customers, it has gathered momentum in the last few years. Initially it has been the manufacturing sector that has focused on TQM and has been influenced significantly by the Japanese approach to TQM [8]. Now, it has made impressive inroads in to the manufacturing and service sectors in India as demonstrated by different researchers [9], [10], [11], [12], [2].
HavingISO9001 certification means adoption of common dimensions between ISO 9001 and TQM such as process management, use of statistical tools and information and data gathering however companies that implemented and certified would still fall far short of implementing a comprehensive TQM system [13]. There exists definite number of barriers that causes lack of TQM implementation among certified SMEs are mostly true in developing countries [14].
III. METHODOLOGY
The instrument used in data collection consists of two parts – first part is profile of respondents and second part comprised of questions pertaining to barriers in TQM implementation. The 14 barriers identified for this study have most influence in the implementation of TQM. The literature base of these barriers found in the research carried out by [15] to study the TQM implementation in Indian industries and a book “Total Quality Management” by [16]. A 5- point Likert scale was employed with a score of 5=Extreme Favours; 4=Very Strong Favours; 3=Strongly Favours;2=Slightly Favours; 1=Equally Favours.
The questionnaire was pre tested with pilot study that involved 16 practitioners, 2 CEOs and 2 academicians. The modified questionnaire was mailed to more than 400 certified companies selected from the lists provided by Micro Small Medium Entrepreneur Mumbai office, directories of different industrial associations and reference companies from quality management consultancy in Nagpur. The 200 filled correct responses were used for analysis after rejecting 18 ambiguous responses.
A. Analysis and results
The analysis of respondents profile has revealed the higher (88.5 percent) of manufacturing SMEs and less (11.5 percent) of service SMEs. The respondents from these certified SMEs were the experienced (5 to 10 years) quality practitioners at middle level management - 85 percent, first level supervisor - 10.5 percent and the top level management - 4.5 percent were fewer respondents.
B. Barriers to TQM implementation
SMEs in developing countries face an abundance of external constraints due to the differences in infrastructure, social, cultural and regulatory factors and internal constraints inherent to SMEs by nature [17]. These constraints pose obstacles in the adoption of core values of TQM as they are strongly correlated. The 14 such barriers that are impediment to the development of TQM analyzed to determine the highly influencing to least influencing barriers. The mean and standard deviation method is used to decide the ranking of the barriers. The barriers with the maximum to minimum mean values are taken in ascending order of ranking are shown in TABLE I. The barrier with smallest mean value pose less obstacle compared to first rank inactual conduction of TQM practices. These barriers with their rankings aredepicted in “Fig. 2” and are discussed below.
1. Resistance to change: The certified SMEs with ISO quality management system abide to working processes and procedures which is against the dynamism requires in every organization in the implementation of TQM needs significant changes. The individual change is required to all employees from lower level to top management. The highest mean score 4.15, indicates unwillingness of staff in SMEs to come out of “comfort zone” and learn and adopt new techniques, methods and ideas oriented to customer satisfaction.
2. Lack of rewards and recognition: The second highest mean score 4.025, shows the lack of motivation to employees in TQM implementation. The management of SMEs gives less encouragement to the self motivated performing individuals by giving any incentive and reward. The reward and recognition policy is useful to develop uniform quality environment essential for TQM.
3. Lack of training: SMEs adopt very basic training to their lower level employees and managers in terms of induction training and on the job training. SMEs are less focused in providing training required to increase the skills, improve the problem solving and communication abilities.
4. Lack of effective measurement criteria: SMEs collect information related to customers, processes, employees, tests, etc. The improper collection and analysis of this information
International Journal of Computational Intelligence Research (IJCIR). ISSN 0973-1873 Vol.14, No.1 (2018)© Research India Publications. http://www.ripublication.com
196

prevents owners and managers to gauge the correct depth of quality improvement require. Even the recorded data, managers could not analyze for routine or consistent use of it to contribute to the efficiency of the overall system.
5. Lack of systems and structures for TQM activities: The documented sequential and interrelated processes deployed to implement TQM lagging the recorded effectiveness.
6. Costly consultancies and training programs: Not many SMEs seek the expert services from management consultancies which come at reasonable cost. The important criterion is consistent management according to the set parameters and practices for implementation of TQM.
7. Lack of understanding: The moderate (mean=3.8750) understanding shows moderate involvement of everyone that is from CEO to shop floor person in the process of TQM. They contribute through moderate knowledge of processes and facets of TQM since everyone in company contributes for TQM. Due to this managers unable to use proper decision making tools and techniques, changes in the systems due to fear of losing market etc. are enveloped to these SMEs in India.
8. Lack of evaluation of procedures and benchmark indices: The SMEs have moderate evaluation of the processes, services, products, customers, employees etc. that are benchmarked for improvement.
9. Training with no purpose: The continuous improvement for a job and a process as one of the tenets of TQM require training on different aspects such as employee involvement, cooperation and teamwork, problem solving and learning and statistical tools. Such purposeful training lags in Indian SMEs.
10. Lack of top management commitment: The firm’s quality and cultural commitment is not clear to CEO and managers. Top management and owner of the firm are less aware, knowledgeable and committed to act as the change agent for TQM. The lack of experience and confidence in quality system implementation are mainly from the indigenous SMEs in India.
11. Lack of preparation: SMEs has moderatepreparatory contribution to TQM implementation.
12. Lack of resources: The good use of technical, human, customer, facility and other resources of the firm involve prioritization and allotment to ensure quality during production.
13. Lack of vision: Lack of vision and customer focus share the same ranking and pose less barrier to TQM implementation. The product and services are focused towards customer requirement but lag continuous improvement of processes, products and services.
14. Lack of customer focus: The minimum barrier for customer focus shows Indian SMEs have good understanding of customer needs to maintain customer satisfaction.
IV. CONCLUSION
It is apparent from this study that due to barriers the implementation of TQM practices is weak among Indian SMEs except few that are good managed and multinational SMEs. The first three major barriers are resistance to change, lack of rewards and recognition and lack of training while the last four barriers in terms of rank are lack of vision, lack of customer focus, lack of resources, lack of preparation and lack of top management commitment. The initial three barriers are related to human nature and with motivation the employees could be trained for their willing involvement into the task. The certified manufacturing and service SMEs have to overcome these barriers by severe quality practices. The implementation of TQM is viable due to the favorable practices of management commitment, resources availability and customer focus.
TABLE I. TQM BARRIERS RANKING
Sr.
no.
Barriers Mean Standard
deviation
Rank
1. Resistance to
change (Too busy)
4.1500 0.90643 1
2. Lack of rewards and
recognition
4.0250 0.98449 2
3. Lack of training 4.0200 0.96136 3
4. Lack of effective
measurement
criteria
3.9350 0.85700 4
5. Lack of systems and
structures for TQM
activities
3.9343 0.91281 5
6. Costly
consultancies,
training programs
3.9200 0.90980 6
7. Lack of
understanding
3.8750 0.76963 7
8. Lack of evaluation
procedures and
benchmark indices
3.8300 0.90842 8
9. Training with no
purpose
3.8250 0.97937 9
10. Lack of top
management
commitment
3.7450 1.09360 10
11. Lack of preparation 3.7400 0.90914 11
12. Lack of resources 3.6850 1.13677 12
13. Lack of vision 3.5050 1.11634 13
14. Lack of customer
focus
3.5050 1.19882 13
International Journal of Computational Intelligence Research (IJCIR). ISSN 0973-1873 Vol.14, No.1 (2018)© Research India Publications. http://www.ripublication.com
197
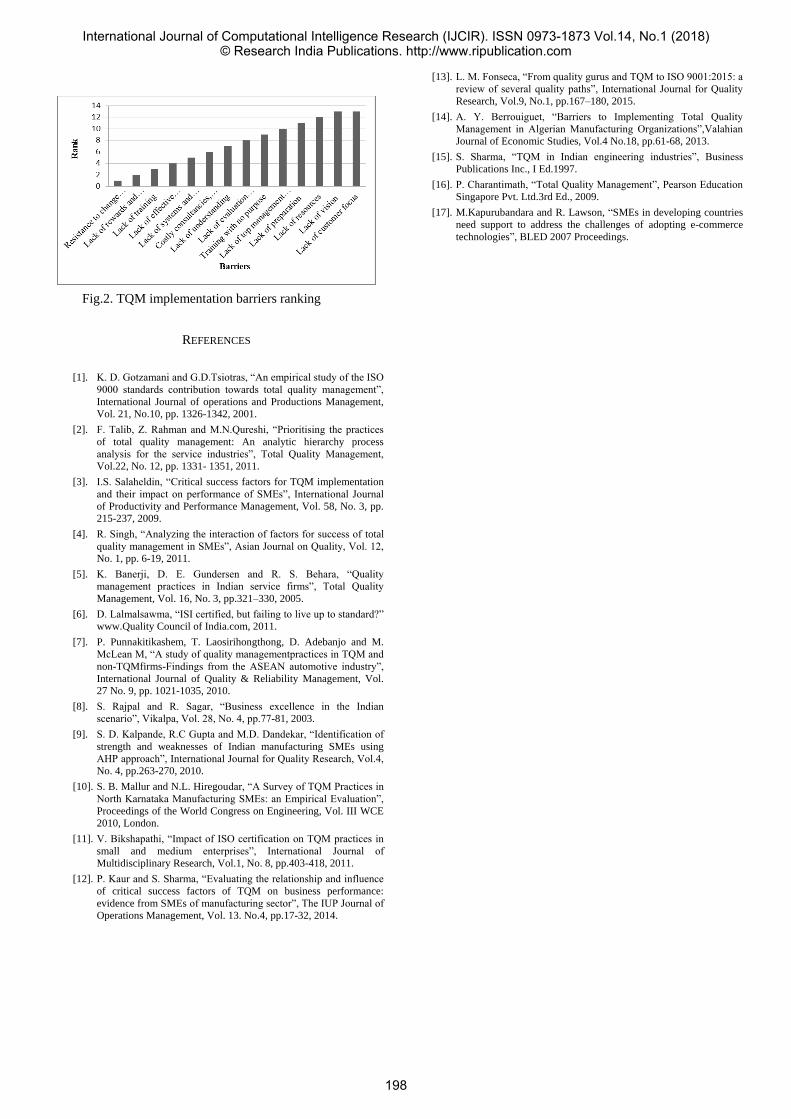
Fig.2. TQM implementation barriers ranking
REFERENCES
[1]. K. D. Gotzamani and G.D.Tsiotras, “An empirical study of the ISO
9000 standards contribution towards total quality management”,
International Journal of operations and Productions Management,
Vol. 21, No.10, pp. 1326-1342, 2001.
[2]. F. Talib, Z. Rahman and M.N.Qureshi, “Prioritising the practices
of total quality management: An analytic hierarchy process
analysis for the service industries”, Total Quality Management,
Vol.22, No. 12, pp. 1331- 1351, 2011.
[3]. I.S. Salaheldin, “Critical success factors for TQM implementation
and their impact on performance of SMEs”, International Journal
of Productivity and Performance Management, Vol. 58, No. 3, pp.
215-237, 2009.
[4]. R. Singh, “Analyzing the interaction of factors for success of total
quality management in SMEs”, Asian Journal on Quality, Vol. 12,
No. 1, pp. 6-19, 2011.
[5]. K. Banerji, D. E. Gundersen and R. S. Behara, “Quality
management practices in Indian service firms”, Total Quality
Management, Vol. 16, No. 3, pp.321–330, 2005.
[6]. D. Lalmalsawma, “ISI certified, but failing to live up to standard?”
www.Quality Council of India.com, 2011.
[7]. P. Punnakitikashem, T. Laosirihongthong, D. Adebanjo and M.
McLean M, “A study of quality managementpractices in TQM and
non-TQMfirms-Findings from the ASEAN automotive industry”,
International Journal of Quality & Reliability Management, Vol.
27 No. 9, pp. 1021-1035, 2010.
[8]. S. Rajpal and R. Sagar, “Business excellence in the Indian
scenario”, Vikalpa, Vol. 28, No. 4, pp.77-81, 2003.
[9]. S. D. Kalpande, R.C Gupta and M.D. Dandekar, “Identification of
strength and weaknesses of Indian manufacturing SMEs using
AHP approach”, International Journal for Quality Research, Vol.4,
No. 4, pp.263-270, 2010.
[10]. S. B. Mallur and N.L. Hiregoudar, “A Survey of TQM Practices in
North Karnataka Manufacturing SMEs: an Empirical Evaluation”,
Proceedings of the World Congress on Engineering, Vol. III WCE
2010, London.
[11]. V. Bikshapathi, “Impact of ISO certification on TQM practices in
small and medium enterprises”, International Journal of
Multidisciplinary Research, Vol.1, No. 8, pp.403-418, 2011.
[12]. P. Kaur and S. Sharma, “Evaluating the relationship and influence
of critical success factors of TQM on business performance:
evidence from SMEs of manufacturing sector”, The IUP Journal of
Operations Management, Vol. 13. No.4, pp.17-32, 2014.
[13]. L. M. Fonseca, “From quality gurus and TQM to ISO 9001:2015: a
review of several quality paths”, International Journal for Quality
Research, Vol.9, No.1, pp.167–180, 2015.
[14]. A. Y. Berrouiguet, “Barriers to Implementing Total Quality
Management in Algerian Manufacturing Organizations”,Valahian
Journal of Economic Studies, Vol.4 No.18, pp.61-68, 2013.
[15]. S. Sharma, “TQM in Indian engineering industries”, Business
Publications Inc., I Ed.1997.
[16]. P. Charantimath, “Total Quality Management”, Pearson Education
Singapore Pvt. Ltd.3rd Ed., 2009.
[17]. M.Kapurubandara and R. Lawson, “SMEs in developing countries
need support to address the challenges of adopting e-commerce
technologies”, BLED 2007 Proceedings.
International Journal of Computational Intelligence Research (IJCIR). ISSN 0973-1873 Vol.14, No.1 (2018)© Research India Publications. http://www.ripublication.com
198
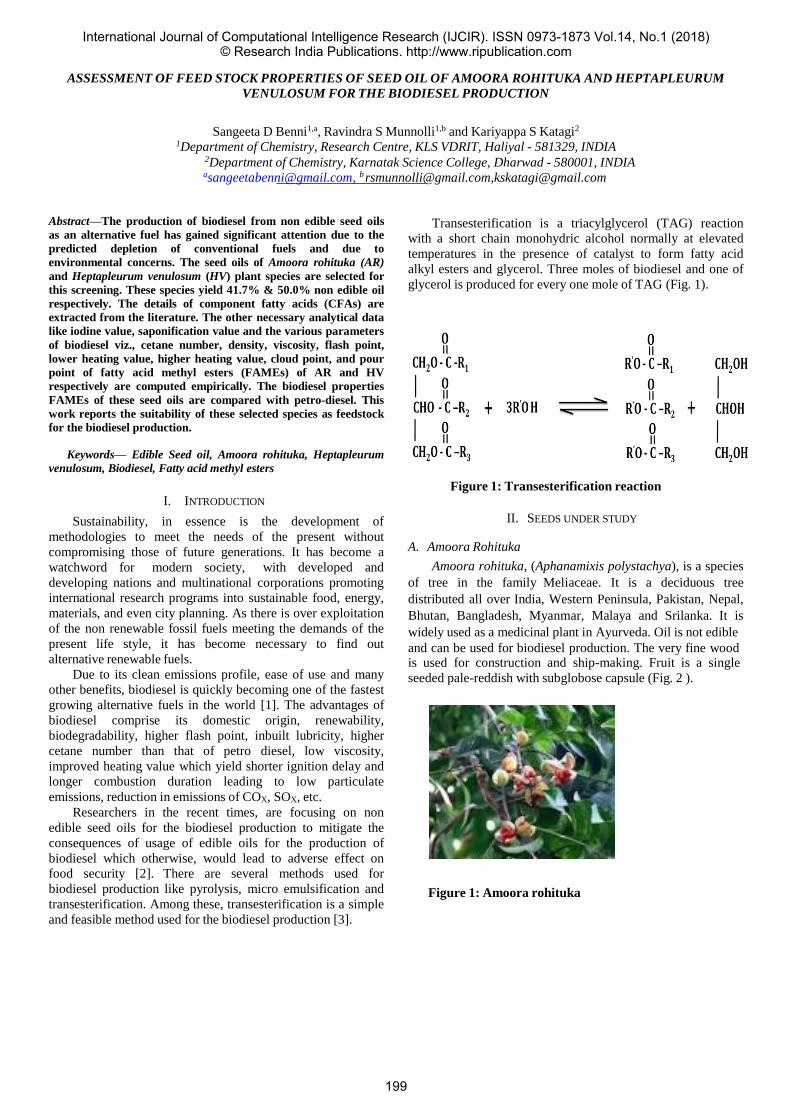
ASSESSMENT OF FEED STOCK PROPERTIES OF SEED OIL OF AMOORA ROHITUKA AND HEPTAPLEURUM
VENULOSUM FOR THE BIODIESEL PRODUCTION
Sangeeta D Benni1,a, Ravindra S Munnolli1,b and Kariyappa S Katagi2
1Department of Chemistry, Research Centre, KLS VDRIT, Haliyal - 581329, INDIA 2Department of Chemistry, Karnatak Science College, Dharwad - 580001, INDIA [email protected], b [email protected],[email protected]
Abstract—The production of biodiesel from non edible seed oils
as an alternative fuel has gained significant attention due to the
predicted depletion of conventional fuels and due to
environmental concerns. The seed oils of Amoora rohituka (AR)
and Heptapleurum venulosum (HV) plant species are selected for
this screening. These species yield 41.7% & 50.0% non edible oil
respectively. The details of component fatty acids (CFAs) are
extracted from the literature. The other necessary analytical data
like iodine value, saponification value and the various parameters
of biodiesel viz., cetane number, density, viscosity, flash point,
lower heating value, higher heating value, cloud point, and pour
point of fatty acid methyl esters (FAMEs) of AR and HV
respectively are computed empirically. The biodiesel properties
FAMEs of these seed oils are compared with petro-diesel. This
work reports the suitability of these selected species as feedstock
for the biodiesel production.
Keywords— Edible Seed oil, Amoora rohituka, Heptapleurum
venulosum, Biodiesel, Fatty acid methyl esters
I. INTRODUCTION
Sustainability, in essence is the development of
methodologies to meet the needs of the present without
compromising those of future generations. It has become a
watchword for modern society, with developed and
developing nations and multinational corporations promoting
international research programs into sustainable food, energy,
materials, and even city planning. As there is over exploitation
of the non renewable fossil fuels meeting the demands of the
present life style, it has become necessary to find out
alternative renewable fuels.
Due to its clean emissions profile, ease of use and many
other benefits, biodiesel is quickly becoming one of the fastest
growing alternative fuels in the world [1]. The advantages of
biodiesel comprise its domestic origin, renewability,
biodegradability, higher flash point, inbuilt lubricity, higher
cetane number than that of petro diesel, low viscosity,
improved heating value which yield shorter ignition delay and
longer combustion duration leading to low particulate
emissions, reduction in emissions of COX, SOX, etc. Researchers in the recent times, are focusing on non
edible seed oils for the biodiesel production to mitigate the
consequences of usage of edible oils for the production of
biodiesel which otherwise, would lead to adverse effect on
food security [2]. There are several methods used for
biodiesel production like pyrolysis, micro emulsification and
transesterification. Among these, transesterification is a simple
and feasible method used for the biodiesel production [3].
Transesterification is a triacylglycerol (TAG) reaction
with a short chain monohydric alcohol normally at elevated
temperatures in the presence of catalyst to form fatty acid
alkyl esters and glycerol. Three moles of biodiesel and one of
glycerol is produced for every one mole of TAG (Fig. 1).
Figure 1: Transesterification reaction
II. SEEDS UNDER STUDY
A. Amoora Rohituka
Amoora rohituka, (Aphanamixis polystachya), is a species
of tree in the family Meliaceae. It is a deciduous tree
distributed all over India, Western Peninsula, Pakistan, Nepal,
Bhutan, Bangladesh, Myanmar, Malaya and Srilanka. It is
widely used as a medicinal plant in Ayurveda. Oil is not edible
and can be used for biodiesel production. The very fine wood is used for construction and ship-making. Fruit is a single
seeded pale-reddish with subglobose capsule (Fig. 2 ).
Figure 1: Amoora rohituka
International Journal of Computational Intelligence Research (IJCIR). ISSN 0973-1873 Vol.14, No.1 (2018)© Research India Publications. http://www.ripublication.com
199
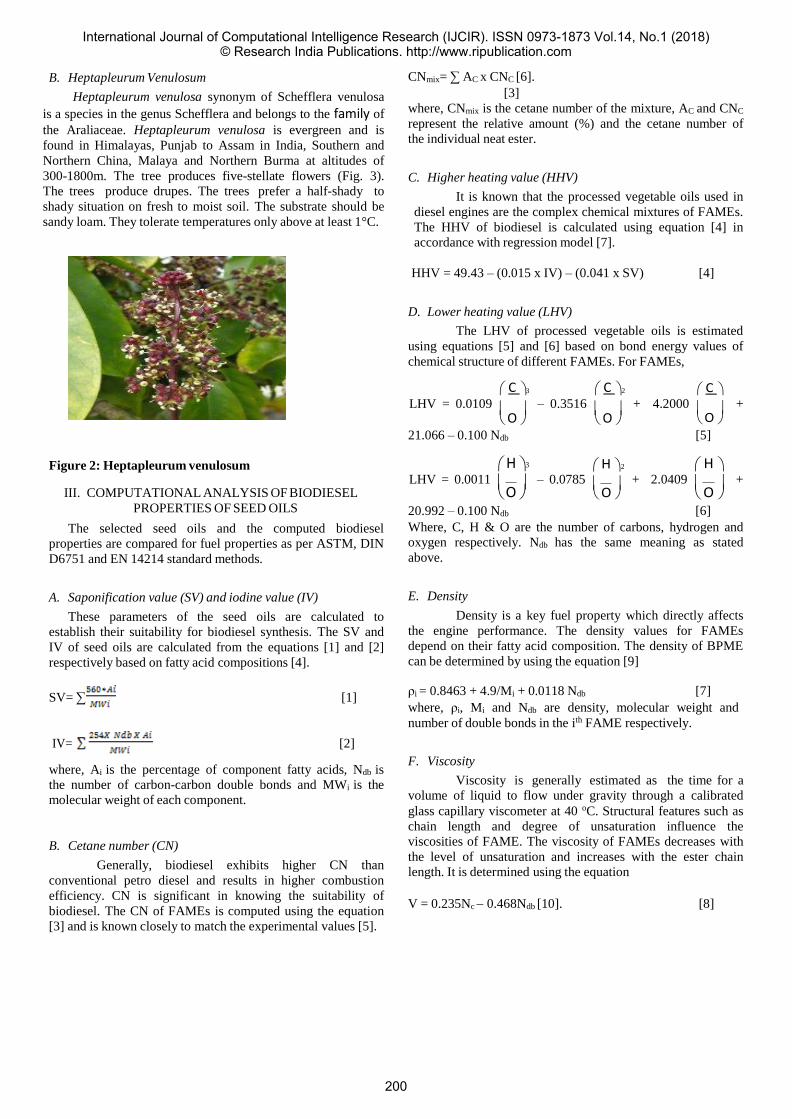
B. Heptapleurum Venulosum
Heptapleurum venulosa synonym of Schefflera venulosa
is a species in the genus Schefflera and belongs to the family of
the Araliaceae. Heptapleurum venulosa is evergreen and is
found in Himalayas, Punjab to Assam in India, Southern and
Northern China, Malaya and Northern Burma at altitudes of
300-1800m. The tree produces five-stellate flowers (Fig. 3).
The trees produce drupes. The trees prefer a half-shady to
shady situation on fresh to moist soil. The substrate should be
sandy loam. They tolerate temperatures only above at least 1°C.
CNmix= ∑ AC x CNC [6]. [3]
where, CNmix is the cetane number of the mixture, AC and CNC
represent the relative amount (%) and the cetane number of
the individual neat ester.
C. Higher heating value (HHV)
It is known that the processed vegetable oils used in
diesel engines are the complex chemical mixtures of FAMEs.
The HHV of biodiesel is calculated using equation [4] in
accordance with regression model [7].
HHV = 49.43 – (0.015 x IV) – (0.041 x SV) [4]
D. Lower heating value (LHV)
The LHV of processed vegetable oils is estimated
using equations [5] and [6] based on bond energy values of
chemical structure of different FAMEs. For FAMEs,
C C C LHV = 0.0109 – 0.3516 + 4.2000 +
O O O 21.066 – 0.100 Ndb [5]
Figure 2: Heptapleurum venulosum H H H LHV = 0.0011 – 0.0785 + 2.0409 +
III. COMPUTATIONAL ANALYSIS OF BIODIESEL O O O PROPERTIES OF SEED OILS
The selected seed oils and the computed biodiesel
properties are compared for fuel properties as per ASTM, DIN
D6751 and EN 14214 standard methods.
A. Saponification value (SV) and iodine value (IV)
These parameters of the seed oils are calculated to
establish their suitability for biodiesel synthesis. The SV and
IV of seed oils are calculated from the equations [1] and [2]
respectively based on fatty acid compositions [4].
SV= ∑ [1]
IV= [2]
where, Ai is the percentage of component fatty acids, Ndb is
the number of carbon-carbon double bonds and MWi is the
molecular weight of each component.
B. Cetane number (CN)
Generally, biodiesel exhibits higher CN than
conventional petro diesel and results in higher combustion
efficiency. CN is significant in knowing the suitability of
biodiesel. The CN of FAMEs is computed using the equation
[3] and is known closely to match the experimental values [5].
20.992 – 0.100 Ndb [6] Where, C, H & O are the number of carbons, hydrogen and
oxygen respectively. Ndb has the same meaning as stated
above.
E. Density
Density is a key fuel property which directly affects
the engine performance. The density values for FAMEs
depend on their fatty acid composition. The density of BPME
can be determined by using the equation [9]
ρi = 0.8463 + 4.9/Mi + 0.0118 Ndb [7]
where, ρi, Mi and Ndb are density, molecular weight and
number of double bonds in the ith FAME respectively.
F. Viscosity
Viscosity is generally estimated as the time for a
volume of liquid to flow under gravity through a calibrated
glass capillary viscometer at 40 oC. Structural features such as
chain length and degree of unsaturation influence the
viscosities of FAME. The viscosity of FAMEs decreases with
the level of unsaturation and increases with the ester chain
length. It is determined using the equation
V = 0.235Nc 0.468Ndb [10]. [8]
3 2
3 2
International Journal of Computational Intelligence Research (IJCIR). ISSN 0973-1873 Vol.14, No.1 (2018)© Research India Publications. http://www.ripublication.com
200

where, Nc is the weighted average number of carbon atoms
and Ndb is the weighted average number of double bonds
present in FAMEs.
G. Flash point
Flash point is a parameter that is usually considered
to determine handling, transportation and fuel storage
conditions. This property is defined as the minimum
temperature at which the volatile fuel flashes or ignites
momentarily when in contact with a flame or spark at a
pressure of 101.325kPa. It is calculated empirically using the
equation
FP = 23.362 Nc + 4.854 Ndb [10]. [9]
Where, Nc is the weighted average number of carbon atoms
and Ndb is the weighted average number of double bonds.
is consistency in the SV (Table 3). This signifies that Amoora
rohituka and Heptapleurum venulosum are ideal for the
biodiesel as per the conclusion derived by Knothe (Knothe,
2008). It may be noted that higher SV infers higher proportion
of fatty acids per unit mass of oil and subsequent higher
proportion of FAMEs in the biodiesel. Also, because, the
FAMEs are oxygenates, improved combustion efficiency and
CN is expected and the values are satisfied by both the seeds
under study
Density limits for FAMEs in the European EN norm
are in the range of 0.860 g/cm3− 0.900 g/cm3. Density of
FAMEs of AR and HV are 0.870 g/cm3 and 0.875 g/cm3
respectively which are in the range specified by EN Standards.
The density values of FAMEs of AR and HV are higher than
petro-diesel (Table 3), this is because of presence of
unsaturated compounds mainly C18:1 and C18:2 methyl
esters.
H. Cold flow properties (cloud point and pour point)
The US (ASTM D6751-08) and EN 14214 standards
limit the biodiesel viscosity in the range of 1.9− 6.0 mm2 s-1
2 -1
Cloud point is the temperature when fuel starts and 3.5− 5.0 mm s . The calculated viscosity of AR and HV
forming a cloudy appearance due to the formation of solidified are 4.020 mm2 s-1 and 3.905 mm2
s-1 which seems to be lesser
wax. The wax formed thickens the fuel and clogs fuel filters
and injectors in engines. The methyl esters having higher
degree of saturation tend to have poor cold flow properties.
Cloud point is determined by the equation CP = 18.134 Nc – 0.790 UFAME [10]. [10] Where, Nc is the weighted average number of carbon atoms
and UFAME is the composition of unsaturated FAMEs in the
biodiesel.
Pour point is the temperature at which the biodiesel
solidifies and stops flowing and it is calculated using the
equation,
PP = 18.880 Nc – 1.000 UFAME [10]. [11] Where, Nc is the weighted average number of carbon atoms
and UFAME is the composition of unsaturated FAMEs in the
biodiesel.
IV. RESULTS AND DISCUSSION Biodiesel properties of seed oils of Amoora rohituka and
than that of petro-diesel (Table 3). The empirically calculated viscosity of FAMEs of Amoora rohituka and Heptapleurum
venulosum meet the ASTM and EN standards.
Biodiesel standards of USA (ASTM D6751),
Germany (DIN 51606) and European Organization (EN
14214) have set CN value as 47, 49 and 51 respectively
(Krisnangkura, 1986). The computed values of CN for the
FAMEs of seed oils of Amoora rohituka and Heptapleurum
venulosum 52.2 and 54.6 respectively whereas, the CN of
petro-diesel is 42.0. The empirically calculated CN value of
FAMEs of Amoora rohituka and Heptapleurum venulosum
meet the ASTM standards.
The HHV of a fuel is a function of its carbon,
hydrogen and oxygen content and it is evaluated using the
equation [4]. The HHV is seen to be almost same at about
39.5 MJ kg-1 for the biodiesels derived from the investigated seed oils which is slightly lower than that of petrodiesel
[43 MJ kg-1], or petroleum [42 MJ kg-1], but is higher than that
of coal [32–37 MJ kg-1]. The LHVs are estimated using two
equations [5] and [6]. The computed LHVs of respective -1
Heptapleurum venulosum are computed based on the data biodiesels are about 38.0 MJ kg . The European Biofuels
from the literature (G.G. Bhat and Daulatabad, 1997). The component fatty acids (CFAs) are determined with the help of Gas Chromatography. GC MS helps in determining various chemical products regardless of water contents, polymeric emulsions, spent cake, spent catalyst, liquors, soil sample and sediments. The CFAs and other analytical values of seed oils and properties of biodiesel are depicted in Table-2 and Table-3 respectively. The computed parameters of biodiesel from both Amoora rohituka and Heptapleurum venulosum are complimentary to quality biodiesel and make them befitting candidates for the synthesis of biodiesel.
Technology Platform 2011 reported the LHV for biodiesel as 37.1 MJ kg-1 (Biofuels Technology Platform, 2011). This is
slightly lower than the LHV of petro-diesel [43 MJ kg-1]. It
may be noted that heating values are a function of mainly
carbon content in the fuel. ASTM D6751 and EN 14214 fixes the minimum value of
flash point at 120oC. Flash point of AR and HV are 164.7 oC
and 166.9 oC respectively which are higher than that of petro- diesel (Table 3). The values obtained for AR and HV meet the
ASTM and EN standards.
The cloud point and pour point values of AR and HV
Iodine value of seed oils should not exceed 120 mg I2 are 8.05oC , 6.26 oC and 1.9 oC, -0.021 oC respectively which
g-1 which best fits for both Amoora rohituka and
Heptapleurum venulosum as per the limitation laid by
European standard organization EN 14214 for biodiesel. There
are higher than petro-diesel (Table 3).
International Journal of Computational Intelligence Research (IJCIR). ISSN 0973-1873 Vol.14, No.1 (2018)© Research India Publications. http://www.ripublication.com
201
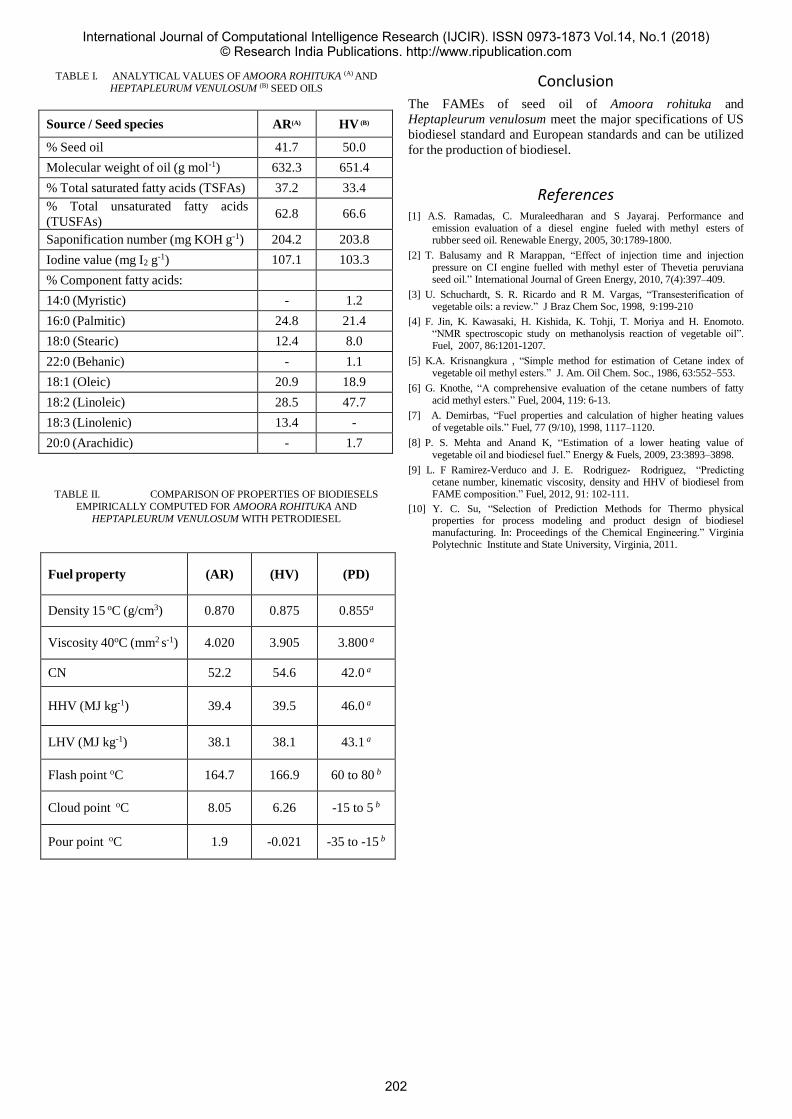
TABLE I. ANALYTICAL VALUES OF AMOORA ROHITUKA (A) AND
HEPTAPLEURUM VENULOSUM (B) SEED OILS
TABLE II. COMPARISON OF PROPERTIES OF BIODIESELS
EMPIRICALLY COMPUTED FOR AMOORA ROHITUKA AND
HEPTAPLEURUM VENULOSUM WITH PETRODIESEL
Conclusion
The FAMEs of seed oil of Amoora rohituka and
Heptapleurum venulosum meet the major specifications of US
biodiesel standard and European standards and can be utilized
for the production of biodiesel.
References [1] A.S. Ramadas, C. Muraleedharan and S Jayaraj. Performance and
emission evaluation of a diesel engine fueled with methyl esters of rubber seed oil. Renewable Energy, 2005, 30:1789-1800.
[2] T. Balusamy and R Marappan, “Effect of injection time and injection pressure on CI engine fuelled with methyl ester of Thevetia peruviana seed oil.” International Journal of Green Energy, 2010, 7(4):397–409.
[3] U. Schuchardt, S. R. Ricardo and R M. Vargas, “Transesterification of vegetable oils: a review.” J Braz Chem Soc, 1998, 9:199-210
[4] F. Jin, K. Kawasaki, H. Kishida, K. Tohji, T. Moriya and H. Enomoto. “NMR spectroscopic study on methanolysis reaction of vegetable oil”. Fuel, 2007, 86:1201-1207.
[5] K.A. Krisnangkura , “Simple method for estimation of Cetane index of vegetable oil methyl esters.” J. Am. Oil Chem. Soc., 1986, 63:552–553.
[6] G. Knothe, “A comprehensive evaluation of the cetane numbers of fatty acid methyl esters.” Fuel, 2004, 119: 6-13.
[7] A. Demirbas, “Fuel properties and calculation of higher heating values of vegetable oils.” Fuel, 77 (9/10), 1998, 1117–1120.
[8] P. S. Mehta and Anand K, “Estimation of a lower heating value of vegetable oil and biodiesel fuel.” Energy & Fuels, 2009, 23:3893–3898.
[9] L. F Ramirez-Verduco and J. E. Rodriguez- Rodriguez, “Predicting cetane number, kinematic viscosity, density and HHV of biodiesel from FAME composition.” Fuel, 2012, 91: 102-111.
[10] Y. C. Su, “Selection of Prediction Methods for Thermo physical properties for process modeling and product design of biodiesel manufacturing. In: Proceedings of the Chemical Engineering.” Virginia Polytechnic Institute and State University, Virginia, 2011.
Fuel property
(AR)
(HV)
(PD)
Density 15 oC (g/cm3) 0.870 0.875 0.855a
Viscosity 40oC (mm2 s-1) 4.020 3.905 3.800 a
CN 52.2 54.6 42.0 a
HHV (MJ kg-1) 39.4 39.5 46.0 a
LHV (MJ kg-1) 38.1 38.1 43.1 a
Flash point oC 164.7 166.9 60 to 80 b
Cloud point oC 8.05 6.26 -15 to 5 b
Pour point oC 1.9 -0.021 -35 to -15 b
Source / Seed species AR(A) HV (B)
% Seed oil 41.7 50.0
Molecular weight of oil (g mol-1) 632.3 651.4
% Total saturated fatty acids (TSFAs) 37.2 33.4
% Total unsaturated fatty acids
(TUSFAs) 62.8 66.6
Saponification number (mg KOH g-1) 204.2 203.8
Iodine value (mg I2 g-1) 107.1 103.3
% Component fatty acids:
14:0 (Myristic) - 1.2
16:0 (Palmitic) 24.8 21.4
18:0 (Stearic) 12.4 8.0
22:0 (Behanic) - 1.1
18:1 (Oleic) 20.9 18.9
18:2 (Linoleic) 28.5 47.7
18:3 (Linolenic) 13.4 -
20:0 (Arachidic) - 1.7
International Journal of Computational Intelligence Research (IJCIR). ISSN 0973-1873 Vol.14, No.1 (2018)© Research India Publications. http://www.ripublication.com
202

Plant Leaf Disease Detection Using Image Processing Techniques and
Classification Based On Neural Networks U.G Student
Jaynish Shah, Parth Rathod, Rahul Deshpande, Prof. Chitra Bhole
K.J.Somaiya Institute of Engineering and Information Technology,Sion 400022
[email protected], [email protected], [email protected], [email protected]
Abstract: Agriculture is the backbone of the
Indian economy. Majority of population depends
on it and it also contributes towards a large part
of GDP. Plant leaf diseases can result in the
reduction of both quality and quantity of
agricultural yield. Naked eye observation is not
the best way to observe minute variation in the
infected part of leaf. In this paper, we are
providing software solution to automate detection
and classification of plant leaf diseases. In this we
are using various computer vision and machine
learning techniques to classify diseases & then
appropriate measures can be carried out. This
approach will enhance productivity of crops and
increase the efficiency and accuracy of disease
detection in plant leaves. It includes several steps
viz. Image acquisition, image pre-processing,
segmentation, features extraction and neural
network based classification.
Keywords: image processing, artificial neural
networks, OTSU segmentation, co-occurence
matrix, KNN classifier, feature extraction.
I. Introduction
Plant diseases causes many significant
damages and losses in crops around the
world. Appropriate measures on disease
identification should be introduced to
prevent the problems and minimize the
losses. Technical approaches using
machine learning and computer vision are
actively researched to achieve intelligence
farming by early detection on plant
disease. A mobile application is obviously
desirable to aid the farmers in diagnosing
what sorts of diseases a plant has.
Although some similar applications exist,
most of them achieve the function by
submitting the image to a team of plant
pathologists or expert garden advisors to
get possible identification results and some
advice. This paper presents the research,
design and implementation of a system to
automatically identify the plants diseases
based on its leaf appearance using
computer vision and machine learning
techniques. Many studies on different
segmentation, feature extraction and
classification methods were done in order
to find the most effective and accurate
approach.
The system comprises of five main
phases;performing image acquisition in
image processing is always the first step in
the workflow sequence because, without
an image, no processing is possible. The
second phase is pre-processing of input
image to improve the quality of image and
to remove the undesired distortion from
the image. Clipping of the leaf image is
performed to get the interested image
region.
The third phase is to check each individual
pixel to see whether it belongs to an object
of interest or not. This operation is called
segmentation and produces a binary
image. Segmentation is the operation at the
threshold between low-level image
processing and image analysis. In fourth
phase we calculate the texture features for
the segmented infected area of the
leaf.Finally, in the fifth phase;
classification, extraction and comparison
of the co-occurrence features is carried out
and stored in the feature dataset with the
help of machine learning techniques and
neural networks.
II. Literature Review
Medical image processing for diagnosing
disease has become popular these years,
because it can not only give a rapid and
reliable result to assess patients’ condition,
but also reduce the cost significantly in
International Journal of Computational Intelligence Research (IJCIR). ISSN 0973-1873 Vol.14, No.1 (2018)© Research India Publications. http://www.ripublication.com
203
comparison to the traditional diagnosis
(Dhawan, 1990). In the past decades,
image processing and pattern recognition
for plant disease detection has also been an
active research area. The overwhelming
majority of the technique is similar. First
some images are taken from the
environment of study by camera. And
useful features are extracted from the
meaningful part segmented from the
original image by some image processing
technique. Afterward various classifiers
should be applied as a determinant to
classify the images into different
categories. The segmentation and feature
extraction technique of image processing
technique and classification learning
method are extremely vital to get a correct
result. Shapes, color properties and texture
based classifier are commonly used
approach in the past researches.
Texture is a kind of very useful feature to
discriminate the species of disease. The
first time to use color texture as the feature
to analyze was reported by Shearer et al.
(1990) developed an algorithm to
recognize cucumber anthracnose using
infrared reflection features and optical
filter features. However the recognition
accuracy was not high enough because the
color texture information was not fully
utilized. Pydipati et al. (2006) reported a
study to identify citrus disease using a
texture based hue, saturation and intensity
(HSI) feature combined with statistical
algorithms, which achieves over 95%
classification accuracy rate. Another
method successfully recognizing rice
brown spot and rice blast via color texture
analysis, was developed by Sanyal & Patel
(2008).
Segmentation is another important task
which can affect the whole leaf
disease identification.However the usual
segmentation method is too slow to
implement an interactive mobile
application. Mobile systems aiding to
identify the plant species based on leaf
photograph recognition were proposed by
Agarwal et al. (2006); Belhumeur et al.
(2008). The systems use shape of the leaf
as the discriminator to classify the species
and the photograph requires to be taken in
a white background.
A white background is a somewhat
controlled condition, while the leaf
pictures in this project are in a complex
environment with many coins, branches
and different color background. Leaf
segmentation in the unconstrained
background is much more difficult. Some
automatic segmentation on leaf images
have been developed by some researcher,
however none of them is completely
successful with limited result. A k-means
segmentation clustering the pixels into leaf
and background was developed by
Casanova et al. (2012). Yanikoglu et al.
(2012) also experimented an approach by
assuming the leaf in the centre of the
image, so that the leaf color can be
attained by the most clustered pixels in the
centre. With the leaf color known, it is
easy to segment the leaf image by a simple
watershed method according to the
distance to the sample leaf color.
However this method is not applied to
many leafs which randomly distributed in
the image. Neto et al. (2006) also develop
a method to segment the leaf in
unconstrained condition. At the beginning
of their method, candidate pixels are
selected out based on the color index and
make a fragmentation on the candidate
pixels. Final decision was made by sieving
the convex shape on the fragments. This
approach works but cannot segment all the
leaves out sometimes.
III. Proposed System
Digital camera or similar devices are use
to take images of leafs of different types,
International Journal of Computational Intelligence Research (IJCIR). ISSN 0973-1873 Vol.14, No.1 (2018)© Research India Publications. http://www.ripublication.com
204
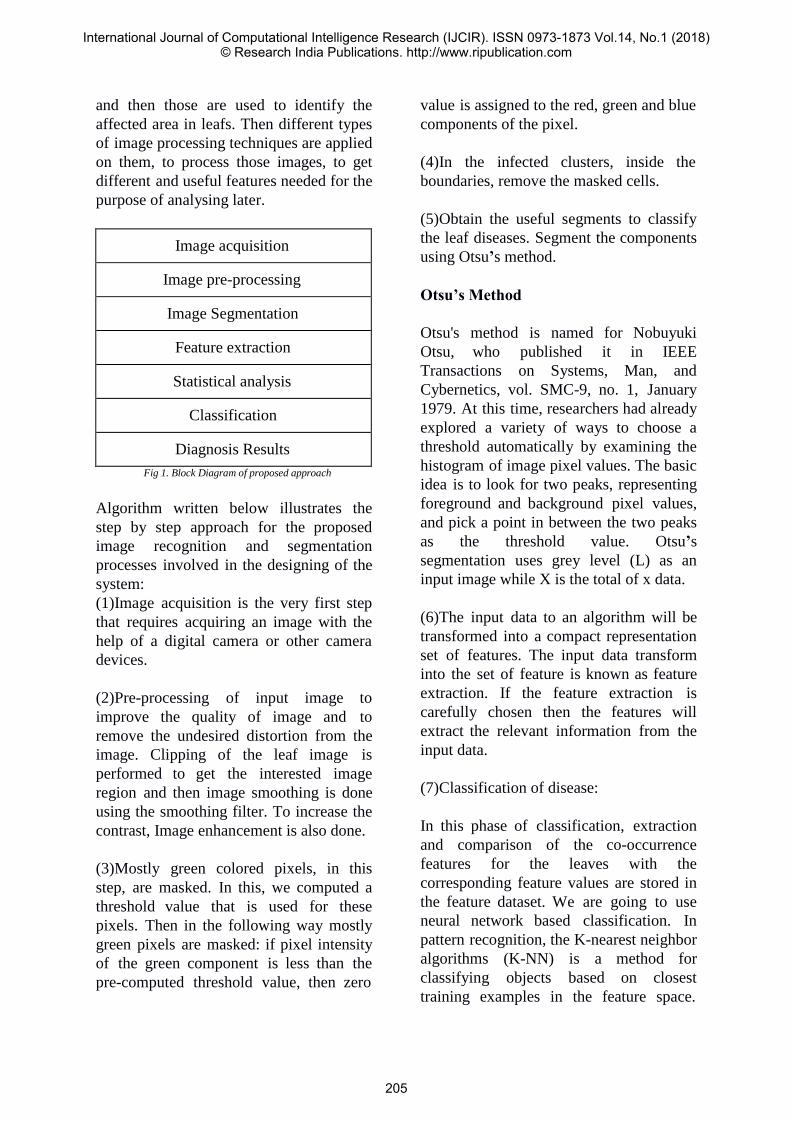
and then those are used to identify the
affected area in leafs. Then different types
of image processing techniques are applied
on them, to process those images, to get
different and useful features needed for the
purpose of analysing later.
Image acquisition
Image pre-processing
Image Segmentation
Feature extraction
Statistical analysis
Classification
Diagnosis Results
Fig 1. Block Diagram of proposed approach
Algorithm written below illustrates the
step by step approach for the proposed
image recognition and segmentation
processes involved in the designing of the
system:
(1)Image acquisition is the very first step
that requires acquiring an image with the
help of a digital camera or other camera
devices.
(2)Pre-processing of input image to
improve the quality of image and to
remove the undesired distortion from the
image. Clipping of the leaf image is
performed to get the interested image
region and then image smoothing is done
using the smoothing filter. To increase the
contrast, Image enhancement is also done.
(3)Mostly green colored pixels, in this
step, are masked. In this, we computed a
threshold value that is used for these
pixels. Then in the following way mostly
green pixels are masked: if pixel intensity
of the green component is less than the
pre-computed threshold value, then zero
value is assigned to the red, green and blue
components of the pixel.
(4)In the infected clusters, inside the
boundaries, remove the masked cells.
(5)Obtain the useful segments to classify
the leaf diseases. Segment the components
using Otsu’s method.
Otsu’s Method
Otsu's method is named for Nobuyuki
Otsu, who published it in IEEE
Transactions on Systems, Man, and
Cybernetics, vol. SMC-9, no. 1, January
1979. At this time, researchers had already
explored a variety of ways to choose a
threshold automatically by examining the
histogram of image pixel values. The basic
idea is to look for two peaks, representing
foreground and background pixel values,
and pick a point in between the two peaks
as the threshold value. Otsu’s
segmentation uses grey level (L) as an
input image while X is the total of x data.
(6)The input data to an algorithm will be
transformed into a compact representation
set of features. The input data transform
into the set of feature is known as feature
extraction. If the feature extraction is
carefully chosen then the features will
extract the relevant information from the
input data.
(7)Classification of disease:
In this phase of classification, extraction
and comparison of the co-occurrence
features for the leaves with the
corresponding feature values are stored in
the feature dataset. We are going to use
neural network based classification. In
pattern recognition, the K-nearest neighbor
algorithms (K-NN) is a method for
classifying objects based on closest
training examples in the feature space.
International Journal of Computational Intelligence Research (IJCIR). ISSN 0973-1873 Vol.14, No.1 (2018)© Research India Publications. http://www.ripublication.com
205
K-NN is a type of instance-based learning
where the function and computation is
deferred until classification. So the K-
nearest neighbor algorithm is the powerful
of all machine learning algorithms. The
object is classified of its neighbors and
being assigned to the class most common
to its K nearest neighbors. Here K is an
integer and if K = 1 then the object is
assigned to the class of its nearest
neighbour.
N o. of correctly classif ied text data
using computer vision and machine
learning techniques. This is an efficient
and accurate approach towards
detection of plant diseases which will
help in minimizing major production
and economic losses, ensuring both
quality and quantity of agricultural
products and making the overall task of
disease detection in plants much easier.
References
CR = T otal no. of text data x 100 [1] Prof. Sanjay B. Dhaygude, Mr.Nitin P.Kumbhar
“Agricultural plant Leaf Disease Detection Using
Image Processing” International Journal of Advanced
Research in Electrical, Electronics and
IV. Results and Analysis:
All the experiments are performed in
MATLAB. The trained features are
obtained from the sugarcane leaves. Each
and every class is tested differently to
differentiate from normal and diseased
leaves.The number in a particular cell
indicates that correctly classified leaves
against all the conditions of the leaves.
The overall accuracy using K-NN
Classifier is 95%. The CR is called as
classification rate. From the results it is
clear that texture analysis can be used for
feature extraction and also it is used to
observe that normal and diseased leaves,
which can be classified easily.
Classifiers
Performance Measure
Accuracy
Precision
Sensitivity
SVM
85%
90%
84%
KNN
91%
95%
94%
Table(1): Performance Comparison
V. Conclusion
This paper presents the research, design
and implementation of a system to
automatically identify the plants
diseases based on its leaf appearance
Instrumentation Engineering Vol. 2, Issue 1, January
2013.
[2] Franz Augstburger, Jorn Berger, Udo
Censkowsky, Petra Heid, Joachim Milz, Christine
Streit, “Organic
Farming in the Tropics and Subtropics Exemplary
Description of 20 Crops”, 1st ed.Naturland e.V,
German, 2000, ch. 2, pp. 6-12.
[3] Arti N.Rathod, Bhavesh A. Tanawala, Vatsal
H.Shah, “Leaf Disease Detection Using Image
Processing and Neural Network,” International
Journal of Advance Engineering and Research
Development, vol. 1, pp. 28-31, June 2014.
[4] Tavares JMRS, Image processing and analysis:
applications and trends, AES-ATEMA’2010, Fifth
international conference, Canada, June 27–July 03;
2010. pp. 27–41, ISBN: 978-0-9780479-7-9.
[5] Patil Sanjay B et al. Leaf disease severity
measurement using image processing. Int J Eng
Technol 2011; 3 (5):297–301.
[6] S. Arivazhagan, R. Newlin Shebiah, S. Ananthi,
S. Vishnu Varthini “Detection of unhealthy region of
plant leaves and classification of plant leaf diseases
using texture features” Agric Eng Int: CIGR Journal,
15(1): 211-217 2013.
[7] Zhen Ma, Tavares JMRS, Natal Jorge RM, A
review on the current segmentation algorithms for
medical images. In: 1st international conference on
imaging theory and applications (IMAGAPP),
Portugal; 2009. p. 135–140, ISBN:
978-989-8111-685.
[8] Kulkarni Anand H, Ashwin Patil RK.
Applying image processing technique to detect plant
diseases. Int J Mod Eng Res 2012;2(5):3661–4.
[9] Sabah Bashir, Navdeep Sharma “Remote
Area Plant Disease Detection Using Image
Processing”, IOSR Journal of Electronics and
Communication Engineering, ISSN : 2278-2834
Volume 2, Issue 6 2012, PP 31-34.
[10] Smita Naikwadi, Niket Amoda “Advances In
Image Processing For Detection Of Plant Diseases” ,
International Journal of Application or Innovation in
Engineering & Management , Volume 2, Issue 11,
November 2013.
International Journal of Computational Intelligence Research (IJCIR). ISSN 0973-1873 Vol.14, No.1 (2018)© Research India Publications. http://www.ripublication.com
206

Survey on Normal or C-Section Delivery Process Ms. Sneha Birwadkar, Dr. Sunita R. Patil
PG Student, YTCEM, Karjat Professor, KJSIEIT, Sion, Mumbai
[email protected] [email protected]
Abstract— The continuous monitoring of expected mother
and fetus is the key fact about labor delivery process. Sensors can
be used to measure the dilation and effacement of the cervix and
also to measure the time required to deliver a child. The focus of
this paper is to survey parameters that are important at the time
of child birth deciding on normal or caesarean delivery.
Keywords— Fetal Heart Rate, Electronic Fetal Monitoring
,Occiput-presentation, Breech presentation.
I. INTRODUCTION
This survey paper provides monitoring and data analysis of the
parameters that are important in the normal labor delivery
process. Sensor based technologies can be used to monitor the
labor delivery process. Labor and delivery are continuously
monitored electronically with sensors that measure and record
Fetal Heart Rate (FHR) which is referred as Cardiotocography
(CTG). The delivery of a full-term newborn fetus refers to
a gestation age of 37-42 weeks, as determined by the last
menstrual period of labor or via ultra-sonographic technique
and evaluation. Basically, the normal delivery process is
divided into 3 stages as shown in the Figure 1 [1].
Fig.1 Stages of Normal Delivery Process
1.1. Stage 1: Dilation and Effacement of the Cervix
This stage consists of 3 phases as follows,
a. Early or Latent phase,
b. Active phase,
c. Transition phase.
The same is shown in Figure 2.
Fig. 2 Dilation and Effacement of the Cervix
1.1.1 Early or Latent Phase (cervix dilates from 0 to 4 cm)
In the first phase of normal delivery process, childbirth can
take 6 to 10 hours for a first-time mother. The beginning of
labor happens differently in every woman. In some women,
the cervix can dilate to three centimeters well before any
noticeable, real contractions begin. Some women can have
strong contractions that don't change their cervical dilation at
all. But, in general, the early phase brings some effacement
thinning and softening of the cervix and dilation to 3
centimeters over a period of hours or days. Contractions are
mild and sometimes irregular, coming from 5 to 30 minutes,
lasting 30 to 45 seconds. The water may break in this early
phase.
1.1.2. Active Phase (cervix dilates from 4 to 7 cm)
In this phase, serious labor for baby delivery begins, and when
most women begin to labor more intensely. It can last an
average of three to six hours for first baby, and about half that
for subsequent births. During the active phase, contractions
usually come steadily, gradually increasing in intensity and
frequency, from three to five minutes. Pains may be centered
in the lower back, abdomen, or thighs, and they may be
intense enough to make it hard for mother to talk. The mother
might also experience an increased amount of pinkish or
brownish discharge, or what's sometimes called a “bloody
show”.
1.1.3. Transition phase(cervix dilates from 8 to 10 cm)
The final phase of the first stage can last 20 minutes to two
hours for fetal, and may go quite quickly in subsequent birth.
Contractions during this phase are intense, spaced about one to
three minutes. Sometimes fatigue, shakiness, and nausea are
all common in this phase, as mother body does the hard work
of reaching complete dilation and effacement. It may feel a
International Journal of Computational Intelligence Research (IJCIR). ISSN 0973-1873 Vol.14, No.1 (2018)© Research India Publications. http://www.ripublication.com
207

strong urge to push or bear down, along with pressure in the
rectal area and stinging in the vaginal area as the fetal head
moves down toward the vaginal opening.
1.2. Stage 2: Pushing and Birth
The second stage of labor is the time between full cervical
dilation and delivery of the fetus. This phase mainly lasts from
minutes to hours. The maximum time for the second stage
mainly depends on the patient's parity and whether the labor
has an epidural condition.
1.3. Stage 3: Delivery of the Placenta
The normal delivery of the placenta is the final and last stage
of labor in the process; it normally occurs within 30 minutes
of delivery of the newborn fetus. As the uterus contracts, a
plane of separation develops at the placenta-endometrial
interface. As the uterus further contracts of the labor, the
placenta is expelled.
II. LITERATURE SURVEY
For predicting the normal delivery time and monitoring of
mother and fetus, few important parameters are tested through
some devices and techniques are used in medical field.
2.1 Parameters tested at the time of delivery
Some crucial parameters are to be tested at the time of normal
delivery:
a. Heartbeat of fetus
b. Blood Pressure of expecting mother
c. Cervix length of expecting mother
d. Fetus position in womb
2.1.1. The Heartbeat of fetus
In most cases, fetal heart rate is monitored during labor to see
fetus status and to identify potential problems ahead of time.
Electronic Fetal Monitoring (EFM) is currently used to
monitor almost all women in hospitals which describe the
heart rate variability for contraction and non-contraction
intervals in forms of movement frequency in MHz Labor and
delivery are monitored electronically with sensors that
measure and record maternal uterine pressure (UP) and fetal
heart rate (FHR), a procedure referred to as cardiotocography
(CTG) [2,3]. The normal range for a full term baby’s heart rate
during labor is between 110 and 160 beats per minute (bpm).
Higher or lower rates can be a sign fetus is having trouble
coping with labor, depending on a number of factors. If the
baseline rate is less than 110bpm, it is called bradycardia
(abnormally slow heart rate) and if FHR are greater than
160bpm it is called tachycardia (abnormally high slow rate).
2.1.2. Blood Pressure of expecting mother
Normal blood pressure of a person is usually somewhere close
to 120/80 mmHg. Blood pressure between 140/90 and 149/99
mmHg is called Mildly high, between 150/100 and 159/109
mmHg is called Moderately high and of 160/110 mmHg or
higher is called severely high blood pressure. If the BP of
mother is not in normal range then there are various risks to
mother as well as fetus. Few risks to mother are as follows.
a. An increased chance of having a stroke.
b. Damage to kidneys and liver.
c. An increased risk of blood clotting problems.
d. An increased risk of severe bleeding from placenta. If
developed pre-eclampsia, then it can cause serious damage to
organs, including brain and kidneys.
The risks to fetus are as follows
a. An increased chance of poor growth.
b. An increased chance of premature birth.
2.1.3. Cervix length of expecting mother
Normal cervical length measures 4 to 5 cm when woman is
not pregnant. During a normal pregnancy, the cervix remains
firm, long, and closed until late in the third trimester. It
usually starts to soften, shorten (efface) and open up (dilate) as
body prepares itself for labor. Normally, in the late second and
early third trimester, the cervical length measures anywhere
between 3 cm to 3.5 cm (30-35mm) and decreases
progressively as the pregnancy advances, in preparation for
labor. When cervical length is less than 2.2 cm (abnormal),
women are not in progress to deliver normally. Normal cervix
length should be 10 cm at the time of delivery.
2.1.4. Fetus position in womb
The most common and abnormal combination of fetus
position:
a. Cephalic Presentation
b. Occiput-posterior Presentation
c. Brow Presentation
d. Breech Presentation
e. Shoulder Presentation
a. Cephalic presentation
The normal position of a fetus is facing rearward (toward the
woman’s back) with the face and body angled to one side and
the neck flexed, and presentation is head first. Figure 3 shows
the normal position o fetus in mother’s womb.
Fig. 3 Normal Fetus Positions
International Journal of Computational Intelligence Research (IJCIR). ISSN 0973-1873 Vol.14, No.1 (2018)© Research India Publications. http://www.ripublication.com
208

Figure 4 shows the abnormal position and presentation of fetus
in mother’s womb.
Fig. 4 Abnormal Fetus Presentation
b. Occiput-posterior presentation
In the occiput-posterior presentation (also called sunny-side
up), the fetus is head first but is facing up (toward the mother's
abdomen). It is the most common abnormal position or
presentation. When a fetus faces forward, the neck is often
straightened rather than bent, and the head requires more
space to pass through the birth canal. Delivery by a vacuum
extractor or forceps or caesarean delivery may be necessary.
c. Brow Presentation
If baby is in a brow presentation, this means the largest area of
fetus head will be trying to fit through mother's pelvis during
birth. Brow presentation usually happens when baby's neck
and head are slightly extended (deflexed), as if baby is looking
up. d. Breech presentation The buttocks or sometimes the feet present first. Breech
presentation occurs in 3 to 4% of full-term deliveries. When
delivered vaginally, babies that present buttocks first are more
likely to be injured than those that present head first. Such
injuries may find before, during, or after birth. The baby may
even die. Complications are less likely when breech
presentation is detected before labor or delivery .Sometimes
the doctor can turn the fetus to present head first by pressing
on the woman’s abdomen before labor begins, usually after 36
weeks of pregnancy. However, if labor begins and the fetus is
in breech presentation, problems may occur.
e. Shoulder Presentation
Shoulder presentation is an abnormal position of the fetus at
the time of delivery. In this, the fetus lies transversely so that
its vertebral column lies perpendicular to the maternal position
of spine. So, the part that enters the birth canal will be the
trunk or shoulder. In spite of some deviations in the
positioning of the fetus, the doctor may try for vaginal birth
only if the baby’s head, or buttock, or feet are at the bottom.
Hence, the vaginal birth will be unthinkable for the mother
and she has unquestionably to undergo a C-section.
The decision for usage of forceps or a vacuum assistance is
guided by the indication for an instrumented delivery and the
clinician’s experience.
2.2 Pregnancy period tests & devices
Various devices are used to monitor the wellness of fetus and
mother as follows:
2.2.1. Ultra scan
As shown in Figure 5, an ultrasound scan sends sound waves
through womb (uterus). These waves bounce off the baby as
echoes. The echoes are turned into an image on a screen that
shows fetal position and movements. Hard tissues such as
bone, reflect the sound waves and make the biggest echoes. It
includes white in the image and soft tissues as grey. Fluids
such as the amniotic fluid surrounding the baby appear as
black. This is because the sound waves go through with no
echoes. A first-trimester scan will test that baby's heart is
beating and also look at the basic examination of baby’s head,
abdominal wall, and limbs.
Fig.5 Ultrasound Scan
. 2.2.2. Doppler Ultrasound
A Doppler is a form of ultrasound scan that helps to assess
baby's health [4]. It measures the blood flow in different parts
of fetal body, such as umbilical cord, brain, and heart. This
helps to show whether fetal is getting all the oxygen and
nutrients needs via the placenta. The transducer sends out
sound waves, which bounces off the blood flow to fetal body
through the cord as well as his blood circulation system. This
creates an image on a display which shows how the blood is
flowing. This is shown in Figure 6.
Fig.6 Doppler Ultra Scan
International Journal of Computational Intelligence Research (IJCIR). ISSN 0973-1873 Vol.14, No.1 (2018)© Research India Publications. http://www.ripublication.com
209

2.2.3. CT Scan
A doctor or physician may order a Computerized tomography
(CT) scan of the fetus to formulate detailed pictures and
analyze the internal structure. Computerized Tomography
(CT) scanning is useful to get a very detailed 3D image of
certain parts of the body. The same is shown in Figure 7.
Fig. 7 CT Scan
2.2.4. Stethoscope
External Electronic Fetal monitoring can be done by listening
to baby's heartbeat with a special stethoscope. External
monitoring is done using two flat devices known as sensors
held in place with elastic belts on belly. One sensor makes use
of reflected sound waves i.e. ultrasound to keep track of fetal
heart rate. The other sensor measures the strength and duration
of uterine contractions. The sensors are connected to a
machine to keep the track of information. External monitoring
is used for a non-stress test which records baby's heart rate
while baby is moving and not moving. A non-stress test may
be combined with a fetal ultrasound to evaluate the amount of
amniotic fluid. External monitoring is also made for a
contraction stress test, which records changes in
baby's heart rate when to have uterine contractions. It may be
done to check on fetal health during a non-stress test. It may
help to predict whether the baby can handle the stress of labor
and vaginal delivery.
2.2.5. Telemetry
External monitoring can also be done remotely called as
telemetry, without need to be connected by wires to a
machine. At some places, the sensors send the information
about the fetal heart rate and uterine contractions to a remote
monitor. Remote monitoring allows to walk around freely.
The position of the heart rate monitor changes periodically to
adjust to the movement of baby. For a non-stress test, the
sensors are placed on belly of the labor. It is asked to push a
button on the machine every time baby moves or have a
contraction. Fetal heart rate is recorded and compared to the
record of movement or contractions.
2.2.6. Electrode with a wire & tube
Internal fetal monitoring is done only after cervix has dilated
to at least 2 centimeters (cm) and amniotic sac has ruptured.
Once started, internal monitoring is done continuously. A thin
wire (electrode) is guided through vagina and cervix and
attached to baby's scalp. A small tube is also inserted through
vagina to attach a device to monitors the contractions inside
uterus. The electrode and the tube are attached with wires to a
recording device to record of fetal heart rate as well as the
strength and duration of uterine contractions.
2.2.7. Monitors
Monitors are used to detect the baby's heart rate and length
and frequency of the contractions. There are even monitors
that allow patients to walk around while it keeps track of the
heart rate and contractions. Figure 8 shows the same.
Fig. 8 Monitor
2.2.8. Delivery assistance (operative vaginal delivery)
It is hand held metal instrument with blade extensions that are
applied to each side of the fetal head part for delivery process.
The traction force of the blades helps to aids in neonate
delivery as shown in Figure 9.
Fig. 9 Operative Vaginal Delivery
2.2.9.Forceps
The Use of forceps has decreased over the past several
decades. The indications for forceps are included in prolonged
second stage of labor or ineffective maternal push power. The
presenting part needs to be at +2 station part before forceps
should be applied to the labor for the delivery [5]. If the
presenting part is at higher station, abdominal delivery should
be chosen into consideration of the labor for the process.
Forceps use is mainly associated with less fetal hematoma
formation and quick delivery times are compared with vacuum
assist lacerations. Forceps is associated with lower risk of
maternal bleeding condition and better choice that the mother
is able to deliver vaginally in subsequent pregnancies. The
device is shown in Figure 10.
International Journal of Computational Intelligence Research (IJCIR). ISSN 0973-1873 Vol.14, No.1 (2018)© Research India Publications. http://www.ripublication.com
210
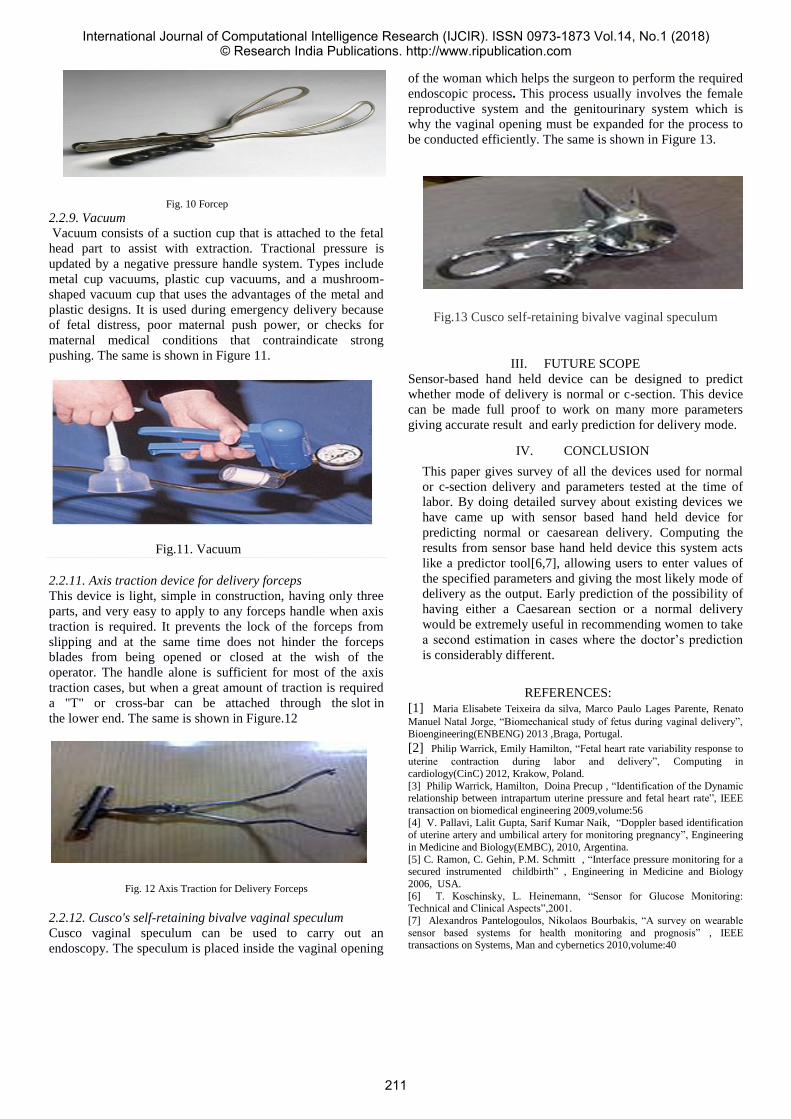
Fig. 10 Forcep
2.2.9. Vacuum
Vacuum consists of a suction cup that is attached to the fetal
head part to assist with extraction. Tractional pressure is
updated by a negative pressure handle system. Types include
metal cup vacuums, plastic cup vacuums, and a mushroom-
shaped vacuum cup that uses the advantages of the metal and
plastic designs. It is used during emergency delivery because
of fetal distress, poor maternal push power, or checks for
maternal medical conditions that contraindicate strong
pushing. The same is shown in Figure 11.
Fig.11. Vacuum
2.2.11. Axis traction device for delivery forceps
This device is light, simple in construction, having only three
parts, and very easy to apply to any forceps handle when axis
traction is required. It prevents the lock of the forceps from
slipping and at the same time does not hinder the forceps
blades from being opened or closed at the wish of the
operator. The handle alone is sufficient for most of the axis
traction cases, but when a great amount of traction is required
a "T" or cross-bar can be attached through the slot in
the lower end. The same is shown in Figure.12
Fig. 12 Axis Traction for Delivery Forceps
2.2.12. Cusco's self-retaining bivalve vaginal speculum
Cusco vaginal speculum can be used to carry out an
endoscopy. The speculum is placed inside the vaginal opening
of the woman which helps the surgeon to perform the required
endoscopic process. This process usually involves the female
reproductive system and the genitourinary system which is
why the vaginal opening must be expanded for the process to
be conducted efficiently. The same is shown in Figure 13.
Fig.13 Cusco self-retaining bivalve vaginal speculum
III. FUTURE SCOPE
Sensor-based hand held device can be designed to predict
whether mode of delivery is normal or c-section. This device
can be made full proof to work on many more parameters
giving accurate result and early prediction for delivery mode.
IV. CONCLUSION
This paper gives survey of all the devices used for normal
or c-section delivery and parameters tested at the time of
labor. By doing detailed survey about existing devices we
have came up with sensor based hand held device for
predicting normal or caesarean delivery. Computing the
results from sensor base hand held device this system acts
like a predictor tool[6,7], allowing users to enter values of
the specified parameters and giving the most likely mode of
delivery as the output. Early prediction of the possibility of
having either a Caesarean section or a normal delivery
would be extremely useful in recommending women to take
a second estimation in cases where the doctor’s prediction
is considerably different.
REFERENCES:
[1] Maria Elisabete Teixeira da silva, Marco Paulo Lages Parente, Renato
Manuel Natal Jorge, “Biomechanical study of fetus during vaginal delivery”,
Bioengineering(ENBENG) 2013 ,Braga, Portugal.
[2] Philip Warrick, Emily Hamilton, “Fetal heart rate variability response to
uterine contraction during labor and delivery”, Computing in
cardiology(CinC) 2012, Krakow, Poland.
[3] Philip Warrick, Hamilton, Doina Precup , “Identification of the Dynamic relationship between intrapartum uterine pressure and fetal heart rate”, IEEE
transaction on biomedical engineering 2009,volume:56
[4] V. Pallavi, Lalit Gupta, Sarif Kumar Naik, “Doppler based identification of uterine artery and umbilical artery for monitoring pregnancy”, Engineering
in Medicine and Biology(EMBC), 2010, Argentina.
[5] C. Ramon, C. Gehin, P.M. Schmitt , “Interface pressure monitoring for a secured instrumented childbirth” , Engineering in Medicine and Biology
2006, USA.
[6] T. Koschinsky, L. Heinemann, “Sensor for Glucose Monitoring: Technical and Clinical Aspects”,2001.
[7] Alexandros Pantelogoulos, Nikolaos Bourbakis, “A survey on wearable
sensor based systems for health monitoring and prognosis” , IEEE transactions on Systems, Man and cybernetics 2010,volume:40
International Journal of Computational Intelligence Research (IJCIR). ISSN 0973-1873 Vol.14, No.1 (2018)© Research India Publications. http://www.ripublication.com
211