Engineering and Technology Journal
8
Engineering and Technology Journal Vol. 38, Part A (2020), No. 07, Pages 967-974 Engineering and Technology Journal Journal homepage: engtechjournal.org 967 Publishing rights belongs to University of Technology’s Press, Baghdad, Iraq. Influence of Loading Pattern Regime on Behavior of Self Compacting Concrete Voided Slab Strips under Repeated Load Ihsan A. Al-shaarbaf a* , Amar A. Ali b , Mohammed A. Ahmed c a Civil Engineering Department, AL- ESRAA university collage .Baghdad, Iraq. [email protected] b Civil Engineering Department, University of Technology. Baghdad, Iraq. [email protected] c Civil Engineering Department, University of Technology. Baghdad, [email protected] *corresponding author Submitted: 15/07/2019 Accepted: 08/09/2019 Published: 25/07/2020 KEYWORDS ABSTRACT self-compacted concrete (SCC), voided slabs, monotonic and repeated loading, concrete and steel strain. This study presents an experimental approach to investigate the structural behavior of normal and moderately high strength Self Compacted Concrete (SCC) voided slab strips under repeated loading system. The experiments were carried out on eight one-way simply supported slabs. Four of them have been tested under two types of repeated loading regime. The required number of cycles of the first load pattern (R1) to achieve permanent damage in the slab is more than 40 cycles, while the second type of repeated loading regime (R2) requires more than 20 cycles to achieve complete damage in the slab for the selected loading scheme. The remaining four additional slabs were tested under monotonically increasing loads. The loading techniques have been applied under the displacement control scheme. The experimental results show that for moderately thick reinforced SCC one way slab having (3 voids, dia. =75mm) under repeated load R1, the ultimate load is reduced by about 10% relative to the reference solid. In this research, the number of cycles required to achieve permanent damage is decreased by about 7% and the mid-span deflection at ultimate load is increased by about 3.4% relative to the reference solid slab. The ultimate load for slab having (3 voids, dia. =75mm) under repeated load R2 is decreased by about 6%, the deflection at ultimate load and the number of cycles are decreased by about 6.1%and 16.7% respectively concerning SCC reference solid slab. How to cite this article: I. A. Al-shaarbaf, A. A. Ali and Mohammed A .Ahmed, “Influence of loading pattern regime on behavior of self compacting concrete voided slab strips under repeated load” Engineering and Technology Journal, Vol. 38, Part A, No. 07, pp. 967-974, 2020. DOI: https://doi.org/10.30684/etj.v38i7A.458 This is an open access article under the CC BY 4.0 license (http://creativecommons.org/licenses/by/4.0). 1. Introduction Repeated loading occurs when the force is applied many times, which affects the material by inducing various stresses resulting from continuity of loading and unloading cases, within a certain
-
Upload
khangminh22 -
Category
Documents
-
view
0 -
download
0
Transcript of Engineering and Technology Journal
Engineering and Technology Journal Vol. 38, Part A (2020), No. 07, Pages 967-974
Engineering and Technology Journal Journal homepage: engtechjournal.org
967 Publishing rights belongs to University of Technology’s Press, Baghdad, Iraq.
Influence of Loading Pattern Regime on Behavior of Self
Compacting Concrete Voided Slab Strips under Repeated Load
Ihsan A. Al-shaarbafa*
, Amar A. Ali b, Mohammed A. Ahmed
c
a Civil Engineering Department, AL- ESRAA university collage .Baghdad, Iraq. [email protected]
b Civil Engineering Department, University of Technology. Baghdad, Iraq. [email protected]
c Civil Engineering Department, University of Technology. Baghdad, [email protected]
*corresponding author
Submitted: 15/07/2019 Accepted: 08/09/2019 Published: 25/07/2020
K E Y W O R D S A B S T R A C T
self-compacted concrete
(SCC), voided slabs,
monotonic and repeated
loading, concrete and
steel strain.
This study presents an experimental approach to investigate the structural
behavior of normal and moderately high strength Self Compacted
Concrete (SCC) voided slab strips under repeated loading system. The
experiments were carried out on eight one-way simply supported slabs.
Four of them have been tested under two types of repeated loading regime.
The required number of cycles of the first load pattern (R1) to achieve
permanent damage in the slab is more than 40 cycles, while the second
type of repeated loading regime (R2) requires more than 20 cycles to
achieve complete damage in the slab for the selected loading scheme. The
remaining four additional slabs were tested under monotonically
increasing loads. The loading techniques have been applied under the
displacement control scheme. The experimental results show that for
moderately thick reinforced SCC one way slab having (3 voids, dia.
=75mm) under repeated load R1, the ultimate load is reduced by about
10% relative to the reference solid. In this research, the number of cycles
required to achieve permanent damage is decreased by about 7% and the
mid-span deflection at ultimate load is increased by about 3.4% relative to
the reference solid slab. The ultimate load for slab having (3 voids, dia.
=75mm) under repeated load R2 is decreased by about 6%, the deflection
at ultimate load and the number of cycles are decreased by about 6.1%and
16.7% respectively concerning SCC reference solid slab.
How to cite this article: I. A. Al-shaarbaf, A. A. Ali and Mohammed A .Ahmed, “Influence of loading pattern regime
on behavior of self compacting concrete voided slab strips under repeated load” Engineering and Technology Journal,
Vol. 38, Part A, No. 07, pp. 967-974, 2020.
DOI: https://doi.org/10.30684/etj.v38i7A.458
This is an open access article under the CC BY 4.0 license (http://creativecommons.org/licenses/by/4.0).
1. Introduction
Repeated loading occurs when the force is applied many times, which affects the material by
inducing various stresses resulting from continuity of loading and unloading cases, within a certain

Engineering and Technology Journal Vol. 38, Part A, (2020), No. 07, Pages 967-974
968
amplitude[1]. In 2008 Sivagamasundari[2] tested twenty one Glass Fiber Reinforced Polymer
(GFRP) bars reinforced concrete one- way slabs under monotonic, constant amplitude repeated and
variable amplitude repeated loading. The slabs were divided into three groups with seven slabs in
each group. The first category of slabs was tested under static loads and the second category of slabs
was subjected to constant repeated load. The first crack load and initial propagation of cracks had
been observed at a low load level of 10% of the ultimate static load. And the failure occurred at a
load level of 80% of the ultimate static load. The third group of slabs was subjected to the variable
amplitude of fatigue loading with percentages of 20%, 40%, 60%, and 80% of the static ultimate
loads of the slabs. It was observed that with the increase in the number of load cycles, the
corresponding deflection at ultimate load, number, and width of the cracks were increased. An
experimental study was carried out in 2015 by Al-Sulayvani[3]. He tested thirteen two way slab
specimens under repeated loading. The slab specimens were simply supported at all edges. The
repeated loads have been applied at the center of the slabs for many cycles. The load was started at(5
kN) and increased by (5 kN) for each successive cycle up to failure by using a hydraulic jack. The
interval time between cycles was kept constant. At the tension face of the slab, radial cracks were
continuously formed for each stage of loading. It was also observed that the cracks became wider and
permanent and extended beyond the loaded area directly toward the slab edges. As per the flexural
behavior of eight normal and high strength SCC slabs, it was shown experimentally that, the
improvement in high strength SCC slabs in terms of first crack load, ultimate load, and deflection at
ultimate load was less than that of corresponding normal strength SCC slabs. However, for all the
tested slabs, the concrete was cracked and the cracks initiated at the center of the tension face
(bottom face) of the slabs and extended radially toward the edges. The crack pattern at failure
showed that the cracks were narrow and multiple [4]. A comparative study has been presented in
2011 by Sivagamasundari [5] between voided flat slabs with the solid slab. It was noticed that a
reduction of 35% in the overall weight of the solid plate slab was achieved, and the results showed
that the voided slabs had lower stiffness than that of the solid slabs. Also, there was a reduction in
stiffness due to the presence of spherical balls which were about 10% to 20% of the values of the
solid slabs.
2. Purpose of Research
The main objective of the experimental work is to understand the effectiveness of different repeated
load patterns on the SCC slabs tested under two-point external repeated loads. The obtained ultimate
strength and mode of failure of the voided slabs are compared to those of reference solid slab. Also to
study experimentally the structural behavior of one way reinforced SCC slab strips with longitudinal
voids, the cracking and ultimate loads and the load-mid span deflection response investigated, and
the load-carrying capacity is also studied.
3. Experimental Program
The tested slabs were 1500 mm in length, with a width of 600 mm and a thickness of 150 mm and all
the slabs had the same amount of reinforcement. They were designed according to the ACI 318M-
2014 Code. The flexural reinforcements were 4-Ø8 longitudinal bars and 8-Ø8 transverse bars for
tested slabs designated as (SN and 3V75N), as shown in Fig1. The symbol (S) refers to Solid slab
and the symbol (V) refers to the Voided slab,
symbol (N) refers to Normal strength SCC and lob ys ehts, (3) refer to lob number of voids as listed
in Table 1. The slabs were tested with an overall clear span of 1380 mm. These specimens were
classified according to concrete type normal or high strength SCC, concrete compressive strength
(f'c), presence of voids, size and number of voids. Table 3 shows some tests which have been carried
out on fresh SCC and compared with related standard limitation. The slump flow test, T500mm, and L-
box test were conducted. as shown in Figure 2. It also presents the properties of reinforcing steel bars
used in this work as shown in Table 2.
Table 1: ssataeret Cr eCc fcrsecreCretcCrahC
Slab
designation
Type of
concrete
Main rienf. No. of
voids
voids dia.
(mm)
ltbuxelt ylbbt
ellah )ρ(
Void
ratio%
SN NSCC Ø8@180
mm
- - 0.0027 -
3V75N NSCC 3 75 0.0027 14.7

Engineering and Technology Journal Vol. 38, Part A, (2020), No. 07, Pages 967-974
969
Table 2: Properties of steel reinforcement cC
Nominal Diameter
(mm) Measured diameter
(mm) Surface
texture Bar area
(mm2)
Yield stress
(MPa) Ultimate stress
(MPa) 8 7.9 deformed 49 440 655
Figure 1: Cross sections of slab specimens SN and 3V75N
Table 3: Test results of fresh properties of SCC were obtained according specifications and limitations
guidelines of EFNARC[6]
Mix designation Slump flow (mm) T500mm test (sec) L – box test (H2/H1)
NSC 690 3.5 0.85
HSCC 720 4.3 0.90
Limits of EFNARC 650-800 2-5 0.8-1
Limits of ACI-237 450-760 2-5 0.8-1
Figure 2: T500 mm, Slump flow test
The normal strength SCC has a compressive strength (fʹc < 41 MPa) according to ACI
363R[7].While the high strength SCC has (fʹc > 41 MPa). In this work, the presented strength for
SCC depended on the average test results of three of 150mm x 300mm cylinders. The concrete
compressive strength (fc'), splitting tensile strength (fct), modulus of rupture (fr) and modulus of
elasticity (Ec)are shown in Table 4.The values presented in this table also represent the average
results of three specimens.
4. Instruments Used in the Study
Solid slab (SN)

Engineering and Technology Journal Vol. 38, Part A, (2020), No. 07, Pages 967-974
970
The instruments that have been used to measure the response of concrete surface strains and the
tensile strain occurred in flexural reinforcement were two types of pre-wired (120Ώ) electrical strain
gauges that applied at the top and bottom faces of concrete and at flexural typical steel rebar. Strain
gauges were mounted on smooth cleaned surfaces that were prepared before. The vertical deflection
of all specimens was measured using linear variable transformer (LVDT) cable connected to a data
logger to measure the deflection at the center of the span of specimens, as shown in Figure 3.
Table 4: Mechanical properties of SCC at age of testing slabs
Mix designation fʹc (MPa) ft (MPa) fr (MPa) Ec (MPa)
NSCC 31.52 3.16 3.49 25390
HSCC 45.17 4.3 5.11 32527
Figure 3: Longitudinal section in slab.
5. Specimens Tested under Repeated Loads
The experimental program of slabs tested under repeated loading pattern consisted of four one-way
SCC simply supported slabs, included two as solid slabs (SNR1 and SNR2) and the remaining two as
voided slabs, 3 voids of 75mm diameter (3V75NR1), and (3V75NR2). All the slabs had the same
properties as normal SCC. Each one of these slabs has been tested under repeated loading system
depending on the results of the corresponding reference monotonically tested slab. The repeated
loading history which was applied to the specimen represented a modified load history of cyclic load
recommended by the Federal Emergency Management Agency[2]. The adopted loading history was
two types of repeated load patterns, the first category (R1) was applied according to the positive
loading scenario shown in Fig 4. This scenario simulates the track loading applied on bridges. The
loading history included the number of stages, the first stage represents low cycle fatigue which was
conducted by applying ten cycles of repeated load. Each cycle has a deformation amplitude equal to
10% of the ultimate deformation of the monotonically tested reference slab (i.e. ∆1 = 10% ∆ult).
Then the second stage consisted of three more cycles of the value of deformation that equal to 1.2
times the deformation value of the first stage (i.e.∆2 = 1.2∆1). For each of the successive stages, the
deformation amplitude was increased subsequently by 0.2 ( (i.e.∆3 =1.2∆2), (∆4 = 1.2∆3), (∆5 =
1.2∆4), (∆6 = 1.2∆5), (∆7 = 1.2∆6...etc) ). These stages were continued to apply until permanent
damage has occurred. The second category (R2) was applied as per the positive loading scenario
shown in Fig 5. The loading history is started at the first stage by executed eight cycles has lowest
deformation amplitude of the monotonically tested reference slab (i.e. ∆1 = ∆cr ), then the second
stage consisted of two cycles which had deformation value is equal to 0.048 of ultimate deformation
of the monotonically tested reference slab (i.e. ∆2 = 4.8% ∆ult). The third stage consisted of two
more cycles of the value of deformation that equal to 1.4 times the deformation value of the second
stage (i.e.∆3 = 1.4∆2). For each of each remaining successive stages, the deformation amplitude was
increased subsequently by 0.4 ( (i.e.∆3 =1.4∆2), (∆4 = 1.4∆3), (∆5 = 1.4∆4), (∆6 = 1.4∆5), (∆7 =
1.4∆6...etc.) ).

Engineering and Technology Journal Vol. 38, Part A, (2020), No. 07, Pages 967-974
971
Figure 4: Loading history of tested slab 3V75NR1 under repeated loading pattern ( R1 )
Figure 5: Loading history of tested slab 3V75NR2 under repeated loading pattern ( R2)
6. Test Results and Discussion
I. Load Deflection Response and Crack Patterns
The deflection was recorded using an LVDT fixed at mid-span of the specimen. It has been observed
that the first crack appeared in the middle region of the clear span of the tested slabs then running
upward vertically through the thickness of the specimen. Usually, it has been observed at the initial
stage that, the cracks had opened within loading face and closed completely during unloading face.
But when the number of cycles was progressively increased through the test, the developed cracks
remained open even though at unloading face. For repeated load pattern (R1), the deformation
amplitude of every cycle was represented by 0.1of the deflection at the ultimate load of control
specimen which was already tested monotonically. The cracks of specimen 3V75NR1, as shown in
Fig 6. have been occurred at range magnitude between 0.1∆ult to 0.3∆ult. These cracks at first cycles
of initial stages were opened during applying load and, they remained open through the unloading
stage. The cracks developed widely and extended vertically upward at displacement level equal to
1∆ult. However, for a similar specimen under repeated load pattern ( R2 ), as shown in Fig 7. no
cracks at the initial stage of cycles were observed, then the sudden crack occurred at 0.13∆ult. The
cracks were taken place until 0.8∆ult then the complete damage occurred at 0.99∆ult.
Figure 7: Bottom face of tested slab 3V75NR2
under repeated load pattern (R2)
II. Effect of Repeated Loading Regime on Cracking and peak ultimate Loads
The cracking and peak ultimate loads of the tested specimens are given in Table 5. The first cracks of
specimens (SNR1 and 3V75NR1) under repeated loading pattern R1 were observed in the range
(47% and 60.7%) respectively of the peak ultimate load of slabs, while the first cracks of the
specimens (SNR2 and 3V75NR2) under repeated loading pattern R2 were observed at (46% and

Engineering and Technology Journal Vol. 38, Part A, (2020), No. 07, Pages 967-974
972
55.8%) respectively of the peak ultimate load of the slabs. Furthermore, it can be noticed that the
ultimate load of specimens (SNR1,3V75NR1, SNR2 and 3V75NR2) which were tested under two
types of repeated loading regimes (R1 and R2 ) were decreased by about (17.2%, 10%, 11%, and
6%) respectively, concerning the corresponding load of control specimen that was tested under
monotonic loading.
III. Load deflection response under repeated loads
The deflection values at a first cracking load of the slabs are recorded in Table 6. These cracks are
almost compatible with those occurred at the control specimens that were tested under monotonic
load. The value of deflection at the ultimate load was increased for the specimen (3V50NR1), tested
under repeated load pattern R1 by about (17.5%) for control specimens. As shown in Figs (8, and 9).
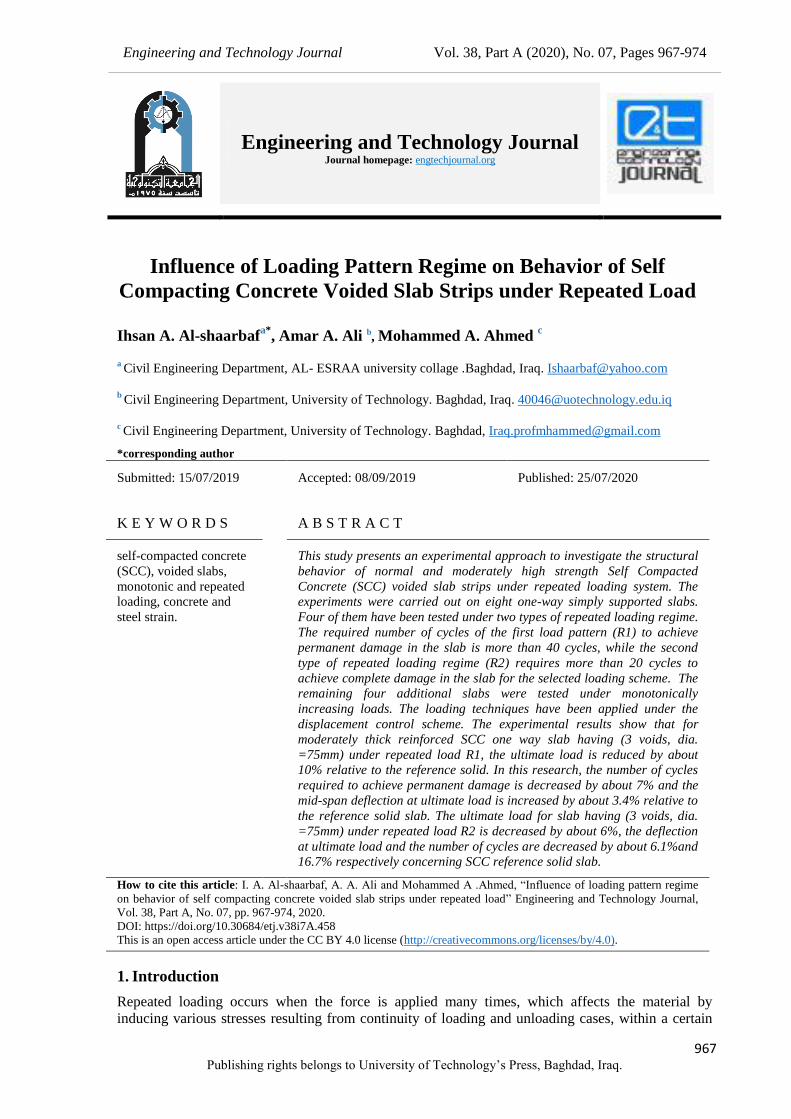
In contrast, there was a decrease in deflection for SNR1and SNR2 specimens by about 17.7% and
28% respectively relative to the control specimen. Figs (10 and 11).
Table 5: Cracking and ultimate loads of the tested slabs (SNR1, 3V75NR1, SNR2 and 3V75NR2).
Specimen
designation
Monotonic
Load
(Control)
specimen
Repeated
Load(R)
Monotonic
Load
(Control)
specimen
Repeated
Load(R) %Decrease in
ultimate load with
respect to control
specimen Cracking
load (Pcr)
(kN)
Cracking load (Pcr)
(kN)
Ultimate
load (Pu)
(kN)
Ultimate
load (Pu)
(kN)
SN 23.9 22.2 R1 57.4 47.5 17.2
3V75N 25.9 24.8 R1 45.8 41 10
SN 23.9 23.5 R2 57.4 51 11
3V75N 25.9 24 R2 45.8 43 6
Figure 8: Load mid-span deflection curve for
solid slab (SNR1)
Table 6: Mid-span deflation at cracking and ultimate loads under repeated load of tested slabs
( SNR1, SNR2, 3V75NR1 and 3V75NR2).
Specimens
designation
Monotonic
Load(M)
(Control)
specimen
Repeated
Load(R)
Monotonic
Load(M)
(Control)
specimen
Repeated
Load(R) % Increase in
deflection at
ultimate load
with respect to
control
Deflection at
first crack load
(mm)
Deflection at
first crack load
(mm)
Deflection at
ultimate load
(mm)
Deflection at
ultimate load
(mm)
SN 3 8.2 R1 58.5 48.12 -
3V75N 2.8 3 R1 45.8 53.8 17.5
SN 3 2.6 R2 58.5 42 -
3V75N 2.8 3 R2 45.8 53 15.7
Engineering and Technology Journal Vol. 38, Part A, (2020), No. 07, Pages 967-974
973
Figure 9:Load mid-span deflection curve for
voided slab (3V75NR1) ,void ratio= 14.7%
Figure 10: Load mid-span deflection curve for
solid slab (SNR2).
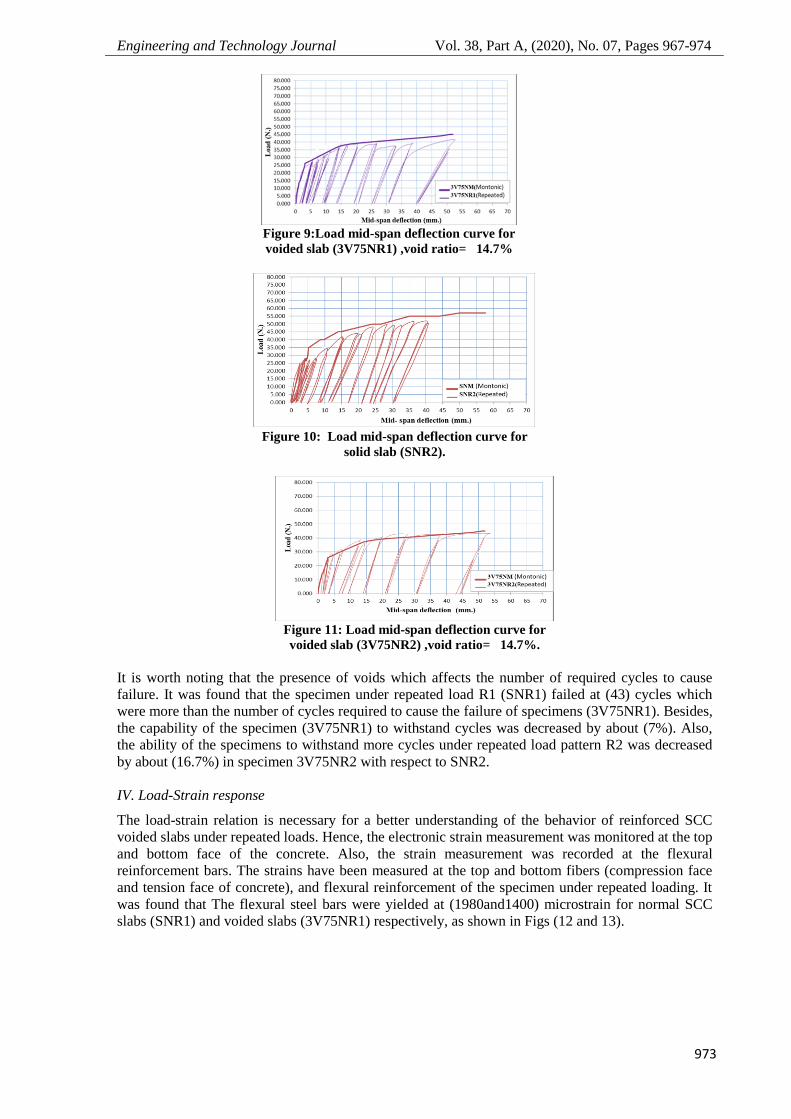
Figure 11: Load mid-span deflection curve for
voided slab (3V75NR2) ,void ratio= 14.7%.
It is worth noting that the presence of voids which affects the number of required cycles to cause
failure. It was found that the specimen under repeated load R1 (SNR1) failed at (43) cycles which
were more than the number of cycles required to cause the failure of specimens (3V75NR1). Besides,
the capability of the specimen (3V75NR1) to withstand cycles was decreased by about (7%). Also,
the ability of the specimens to withstand more cycles under repeated load pattern R2 was decreased
by about (16.7%) in specimen 3V75NR2 with respect to SNR2.
IV. Load-Strain response
The load-strain relation is necessary for a better understanding of the behavior of reinforced SCC
voided slabs under repeated loads. Hence, the electronic strain measurement was monitored at the top
and bottom face of the concrete. Also, the strain measurement was recorded at the flexural
reinforcement bars. The strains have been measured at the top and bottom fibers (compression face
and tension face of concrete), and flexural reinforcement of the specimen under repeated loading. It
was found that The flexural steel bars were yielded at (1980and1400) microstrain for normal SCC
slabs (SNR1) and voided slabs (3V75NR1) respectively, as shown in Figs (12 and 13).

Engineering and Technology Journal Vol. 38, Part A, (2020), No. 07, Pages 967-974
974
Figure 12: Load–strain curves at typical flexural steel reinforcing bars of the specimen (SNR2)
Figure 13: Load–strain curves at the top face of concrete of specimen (3V75NR1)
7. Conclusions
Based on the experimental results of solid and voided slabs, the main conclusions can be summarized
as follows:
1. The failure mode of specimens that were conducted under repeated loads was almost similar to
that occurred in corresponding specimens tested under monotonic load.
2. Some cracks of slab specimens that tested under repeated load regime were larger than those that
took place incomparable specimens which were tested under monotonic load.
3. The value of the maximum load of the specimen tested under repeated load regime was smaller
than that of slab specimen which was tested under monotonic load in the range between (6% -
17.2%).
4. The capability of specimen that tested under repeated load regime R1 to withstand loading cycles
was decreased by about 7% with the presence of voids and for the specimen tested under repeated
load regime R2 for the peak ultimate load decreased by about 16.7% as compared with to the solid
slabs tested under similar load pattern.
5. The deflection at peak ultimate load of the specimens tested under repeated load regime was
greater than that of corresponding specimens tested under .
References
[1] A.A. Allawi and A.H. Jabir, “Response of laced reinforced concrete one way slab to repeated loading”.
Journal of Engineering, 22(9): p. 36-54, 2016.
[2] R. Sivagamasundari and G. Kumaran “A comparative study on the flexural behaviour of one-way concrete
slabs reinforced with GFRP reinforcements and conventional reinforcements when subjected to monotonic and
repeated loading," Open Civil Engineering Journal, 2: p. 24-34, 2008.
[3] B.J. Al-Sulayvani and D.N Al-Talabani, “Strengthening and repair of circular RC slabs with openings
using CFRP strips under repeated loading”. Construction and Building Materials, 84: p. 73-83, 2015.
[4] M.A. Ismael “Flexural behavior of steel fiber self-compact concrete slabs,” Diayala Journal of
Engineering, 8(4): p. 83-99, 2015.
[5] R. Sivagamasundari and G. Kumaran, “Experimental study on the behaviour of concrete one way slabs
reinforced with GFRP reinforcements under constant and variable amplitude repeated loadings,” International
Journal of Civil & Structural Engineering, 2(2): p. 556-578, 2011.
[6] Concrete, Self-Compacting, "The european guidelines for self-compacting concrete," BIBM, et al 22
(2005).
[7] ACI Committee 363, “State-of-art report on high-strength concrete (ACI 363R-92),” American Concrete
Institute, Farmington Hills, Michigan, 55 pp. Council, A.T., 1992.