
LiDAR Surveys and Flood Mapping of Digos River - UP ...
195
1 LiDAR Surveys and Flood Mapping of Digos River
-
Upload
khangminh22 -
Category
Documents
-
view
5 -
download
0
Transcript of LiDAR Surveys and Flood Mapping of Digos River - UP ...
1
LiDAR Surveys and Flood Mapping of Digos River

2
Hazard Mapping of the Philippines Using LiDAR (Phil-LiDAR 1)

i
LiDAR Surveys and Flood Mapping of Digos River
© University of the Philippines Diliman and University of the Philippines Mindanao 2017
Published by the UP Training Center for Applied Geodesy and Photogrammetry (TCAGP) College of Engineering University of the Philippines – Diliman Quezon City 1101 PHILIPPINES
This research project is supported by the Department of Science and Technology (DOST) as part of its Grants-in-Aid Program and is to be cited as:
E.C. Paringit and J.E. Acosta (Eds.), (2017), LiDAR Surveys and Flood Mapping of Digos River. Quezon City: UP Training Center for Applied Geodesy and Photogrammetry -193pp.
The text of this information may be copied and distributed for research and educational purposes with proper acknowledgement. While every care is taken to ensure the accuracy of this publication, the UP TCAGP disclaims all responsibility and all liability (including without limitation, liability in negligence) and costs which might incur as a result of the materials in this publication being inaccurate or incomplete in any way and for any reason.
For questions/queries regarding this report, contact:
Dr. Joseph E. AcostaProject Leader, Phil-LiDAR 1 ProgramUniversity of the Philippines MindanaoDavao City, Davao Del Sur, Philippines [email protected]
Enrico C. Paringit, Dr. Eng.Program Leader, Phil-LiDAR 1 Program University of the Philippines Diliman Quezon City, Philippines 1101 E-mail: [email protected]
National Library of the PhilippinesISBN: 987-621-430-165-2
i

ii
Hazard Mapping of the Philippines Using LiDAR (Phil-LiDAR 1)
ii
iii
LiDAR Surveys and Flood Mapping of Digos River
LIST OF TABLES.....................................................................................................................................vLIST OF FIGURES.................................................................................................................................viiLIST OF ACRONYMS AND ABBREVIATIONS.........................................................................................xCHAPTER 1: OVERVIEW OF THE PROGRAM AND DIGOS RIVER..........................................................1
1.1 Background of the Phil-LiDAR 1 Program..................................................................................11.2 Overview of the Digos River Basin............................................................................................1
CHAPTER 2: LIDAR ACQUISITION OF THE DIGOS FLOODPLAIN..........................................................42.1 Flight Plans..............................................................................................................................42.2 Ground Base Stations..............................................................................................................62.3 Flight Missions.........................................................................................................................82.4 Survey Coverage.......................................................................................................................9
CHAPTER 3. LIDAR DATA PROCESSING OF THE DIGOS FLOODPLAIN................................................113.1 Overview of the LiDAR Data Pre-Processing............................................................................113.2 Transmittal of Acquired LiDAR Data........................................................................................123.3 Trajectory Computation.........................................................................................................123.4 LiDAR Point Cloud Computation................................................................................................143.5 LiDAR Quality Checking..........................................................................................................143.6 LiDAR Point Cloud Classification and Rasterization..................................................................193.7 LiDAR Image Processing and Orthophotograph Rectification...................................................203.8 DEM Editing and Hydro-Correction.........................................................................................203.9 Mosaicking of Blocks..............................................................................................................213.10 Calibration and Validation of Mosaicked LiDAR Digital Elevation Model........................................223.11 Integration of Bathymetric Data into the LiDAR Digital Terrain Model....................................253.12 Feature Extraction...............................................................................................................26 3.12.1 Quality Checking of Digitized Features’ Boundary.......................................................27 3.12.2 Height Extraction......................................................................................................27 3.12.3 Feature Attribution...................................................................................................27 3.12.4 Final Quality Checking of Extracted Features.............................................................29
CHAPTER 4. LIDAR VALIDATION SURVEY AND MEASUREMENTS OF THE DIGOS RIVER BASIN.......304.1 Summary of Activities............................................................................................................304.2 Control Survey........................................................................................................................314.3 Baseline Processing...............................................................................................................364.4 Network Adjustment.............................................................................................................37 4.5 Cross-section, Bridge As-Built, and Water Level Marking .......................................................... 414.6 Validation Points Acquisition Survey .......................................................................................... 454.7 River Bathymetric Survey ........................................................................................................... 46
CHAPTER 5. FLOOD MODELING AND MAPPING.49 5.1 Data Used for Hydrologic Modeling ........................................................................................... 49
5.1.1 Hydrometry and Rating Curves ..................................................................................... 495.1.2 Precipitation .................................................................................................................. 49
5.1.3 Rating Curves and River Outflow................................................................................505.2 RIDF Station...........................................................................................................................515.3 HMS Model...........................................................................................................................525.4 Cross-Section Data................................................................................................................575.5 Flo 2D Model.........................................................................................................................575.6 Results of HMS Calibration ..........................................................................................................595.7 Calculated Outflow Hydrographs and Discharge Values for Different Rainfall Return Models....61
5.7.1 Hydrograph Using the Rainfall Runoff Model.............................................................61 5.7.2 Discharge data using Dr. Horritt’s hydrologic method.................................................625.8 River Analysis Model Simulation.............................................................................................705.9 Flow Depth and Flood Hazard................................................................................................715.10 Inventory of Areas Exposed to Flooding................................................................................795.11 Flood Validation..................................................................................................................142
REFERENCES.....................................................................................................................................145ANNEXES..........................................................................................................................................146
Annex 1. Optech Technical Specification of the Gemini Sensor.....................................................146Annex 2. NAMRIA Certificates of Reference Points Used.............................................................147Annex 3. Baseline Processing Reports of Reference Points Used..................................................148Annex 4. The Survey Team.........................................................................................................149
TABLE OF CONTENTS
iii

iv
Hazard Mapping of the Philippines Using LiDAR (Phil-LiDAR 1)
Annex 5. Data Transfer Sheet for Digos Floodplain......................................................................150Annex 6. Flight Logs..................................................................................................................151Annex 7. Flight Status Report.....................................................................................................154Annex 8. Mission Summary Reports...........................................................................................158Annex 9. Digos Model Basin Parameters.....................................................................................168Annex 10. Digos Model Reach Parameters..................................................................................170Annex 11. Digos Field Validation................................................................................................172Annex 12. Educational Institutions affected in Digos Floodplain..................................................177Annex 13. Health Institutions affected in Digos Floodplain..........................................................180
iv

v
LiDAR Surveys and Flood Mapping of Digos River
LiST OF TABLES
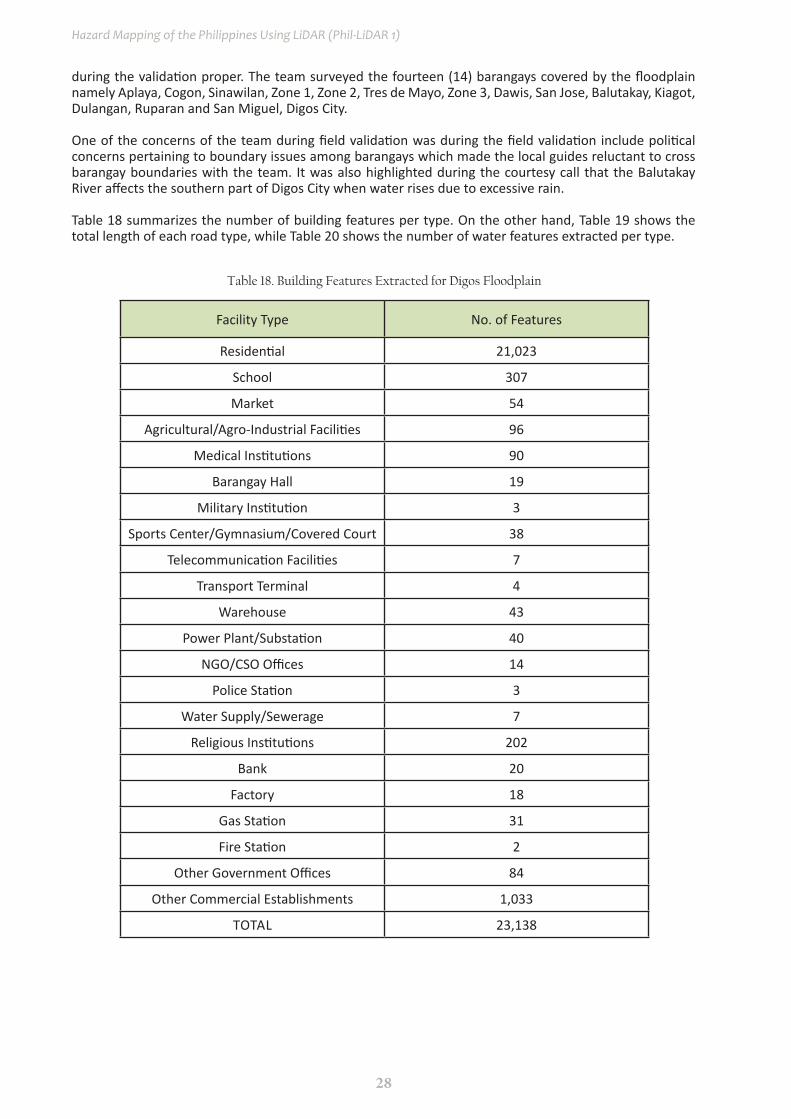
Table 1. Digos River Class B Water Quality Assessment ................................................................................3Table 2. Digos River Class C Water Quality Assessment ................................................................................3Table 3. Flight planning parameters for Gemini LiDAR system ......................................................................4Table 4. Details of the recovered NAMRIA horizontal control point DVS-85 used as base station for the LiDAR acquisition ...............................................................................7Table 5. Details of the recovered horizontal control point BLLM-20 used as base station for the LiDAR acquisition with established coordinates ................................8Table 6. Ground control points used during LiDAR data acquisition .............................................................8Table 7. Flight missions for LiDAR data acquisition in Digos floodplain .........................................................8Table 8. Actual parameters used during LiDAR data acquisition ...................................................................9Table 9. List of municipalities and cities surveyed during Digos floodplain LiDAR survey .............................9Table 10. Self-Calibration Results values for Digos flights ............................................................................14Table 11. List of LiDAR blocks for Digos floodplain ......................................................................................15Table 12. Digos classification results in TerraScan .......................................................................................19Table 13. LiDAR blocks with its corresponding area ....................................................................................20Table 14. Shift Values of each LiDAR Block of Digos Floodplain ...................................................................21Table 15. Calibration Statistical Measures ...................................................................................................24Table 16. Validation Statistical Measures ....................................................................................................25Table 17. Quality Checking Ratings for Digos Building Features ..................................................................27Table 18. Building Features Extracted for Digos Floodplain .........................................................................28Table 19. Total Length of Extracted Roads for Digos Floodplain ..................................................................29Table 20. Number of Extracted Water Bodies for Digos Floodplain .............................................................29Table 21. List of Reference and Control Points used in Digos River Survey .................................................33Table 22. Baseline Processing Report for Digos River Basin Static Survey ....................................................37Table 23. Control Point Constraints .............................................................................................................38Table 24. Adjusted Grid Coordinates ...........................................................................................................38Table 25. Adjusted geodetic coordinates ....................................................................................................39Table 26. Reference and control points and its location (Source: NAMRIA, UP-TCAGP) ...............................40Table 27. RIDF values for Davao Rain Gauge computed by PAGASA .............................................................51Table 28. Range of Calibrated Values for Digos River Basin.........................................................................60Table 29. Summary of the Efficiency Test of Digos HMS Model ...................................................................61Table 30. Peak values of the Digos HECHMS Model outflow using the Davao RIDF .....................................62Table 31. Summary of Digos Padada-Mainit river (1) discharge generated in HEC-HMS ..............................68Table 32. Summary of Digos Padada-Mainit river (2) discharge generated in HEC-HMS ..............................68Table 33. Summary of Digos Padada-Mainit river (3) discharge generated in HEC-HMS ..............................68Table 34. Summary of Digos Padada-Mainit river (4) discharge generated in HEC-HMS ..............................68Table 35. Summary of Digos Padada-Mainit river (5) discharge generated in HEC-HMS .............................68Table 36. Summary of Digos Padada-Mainit river (6) discharge generated in HEC-HMS .............................68Table 37. Summary of Digos Padada-Mainit river (7) discharge generated in HEC-HMS .............................69Table 38. Summary of Digos Padada-Mainit river (8) discharge generated in HEC-HMS .............................69Table 39. Summary of Digos Padada-Mainit river (9) discharge generated in HEC-HMS ..............................69Table 40. Summary of Digos Padada-Mainit river (10) discharge generated in HEC-HMS .............................69Table 41. Validation of river discharge estimates ......................................................................................70Table 42. Municipalities affected in Digos Floodplain ..................................................................................72Table 43. Affected Areas in Bansalan, Davao del Sur during 5-Year Rainfall Return Period ............................79Table 44. Affected Areas in Digos City, Davao del Sur during 5-Year Rainfall Return Period ............................82Table 45. Affected Areas in Hagonoy, Davao del Sur during 5-Year Rainfall Return Period ............................83
v
vi
Hazard Mapping of the Philippines Using LiDAR (Phil-LiDAR 1)
Table 46. Affected Areas in Kiblawan, Davao del Sur during 5-Year Rainfall Return Period ............................86Table 47. Affected Areas in Kiblawan, Davao del Sur during 5-Year Rainfall Return Period ............................87Table 48. Affected Areas in Magsaysay, Davao del Sur during 5-Year Rainfall Return Period ......................88Table 49. Affected Areas in Matanao, Davao del Sur during 5-Year Rainfall Return Period ............................89Table 50. Affected Areas in Matanao, Davao del Sur during 5-Year Rainfall Return Period ............................91Table 51. Affected Areas in Padada, Davao del Sur during 5-Year Rainfall Return Period ............................93Table 52. Affected Areas in Santa Cruz, Davao del Sur during 5-Year Rainfall Return Period ............................94Table 53. Affected Areas in Sulop, Davao del Sur during 5-Year Rainfall Return Period ..............................95Table 54. Affected Areas in Sulop, Davao del Sur during 5-Year Rainfall Return Period ..............................96Table 55. Affected Areas in Sulop, Davao del Sur during 5-Year Rainfall Return Period ..............................96Table 56. Affected Areas in Columbio, Sultan Kudarat during 5-Year Rainfall Return Period ......................98Table 57. Affected Areas in Bansalan, Davao del Sur during 25-Year Rainfall Return Period .......................98Table 58. Affected Areas in Digos City, Davao del Sur during 25-Year Rainfall Return Period ......................99Table 59. Affected Areas in Hagonoy, Davao del Sur during 25-Year Rainfall Return Period ......................101Table 60. Affected Areas in Kiblawan, Davao del Sur during 25-Year Rainfall Return Period ......................103Table 61. Affected Areas in Kiblawan, Davao del Sur during 25-Year Rainfall Return Period ....................105Table 62. Affected Areas in Magsaysay, Davao del Sur during 25-Year Rainfall Return Period ......................107Table 63. Affected Areas in Malalag, Davao del Sur during 25-Year Rainfall Return Period ......................108Table 64. Affected Areas in Matanao, Davao del Sur during 25-Year Rainfall Return Period ..................... 109Table 65. Affected Areas in Matanao, Davao del Sur during 25-Year Rainfall Return Period ......................111Table 66. Affected Areas in Padada, Davao del Sur during 25-Year Rainfall Return Period ........................112Table 67. Affected Areas in Padada, Davao del Sur during 25-Year Rainfall Return Period ........................113Table 68. Affected Areas in Santa Cruz, Davao del Sur during 25-Year Rainfall Return Period ........................114Table 69. Affected Areas in Sulop, Davao del Sur during 25-Year Rainfall Return Period ..........................115Table 70. Affected Areas in Sulop, Davao del Sur during 25-Year Rainfall Return Period ..........................116Table 71. Affected Areas in Sulop, Davao del Sur during 25-Year Rainfall Return Period ..........................117Table 72. Affected Areas in Columbio, Sultan Kudarat during 25-Year Rainfall Return Period ..........................118Table 73. Affected Areas in Bansalan, Davao del Sur during 100-Year Rainfall Return Period ..........................119Table 74. Affected Areas in Digos City, Davao del Sur during 100-Year Rainfall Return Period ..........................120Table 75. Affected Areas in Hagonoy, Davao del Sur during 100-Year Rainfall Return Period ..........................122Table 76. Affected Areas in Kiblawan, Davao del Sur during 100-Year Rainfall Return Period ..........................124Table 77. Affected Areas in Kiblawan, Davao del Sur during 100-Year Rainfall Return Period ..........................127Table 78. Affected Areas in Magsaysay, Davao del Sur during 100-Year Rainfall Return Period .......................129Table 79. Affected Areas in Malalag, Davao del Sur during 100-Year Rainfall Return Period ............................129Table 80. Affected Areas in Matanao, Davao del Sur during 100-Year Rainfall Return Period ...........................130Table 81. Affected Areas in Matanao, Davao del Sur during 100-Year Rainfall Return Period ...........................132Table 82. Affected Areas in Padada, Davao del Sur during 100-Year Rainfall Return Period ............................134Table 83. Affected Areas in Padada, Davao del Sur during 100-Year Rainfall Return Period ............................135Table 84. Affected Areas in Santa Cruz, Davao del Sur during 100-Year Rainfall Return Period ........................136Table 85. Affected Areas in Sulop, Davao del Sur during 100-Year Rainfall Return Period ............................137Table 86. Affected Areas in Sulop, Davao del Sur during 100-Year Rainfall Return Period ............................138Table 87. Affected Areas in Sulop, Davao del Sur during 100-Year Rainfall Return Period ............................138Table 88. Affected Areas in Columbio, Sultan Kudarat during 100-Year Rainfall Return Period .......................139Table 89. Actual Flood Depth vs Simulated Flood Depth in Digos River Basin...........................................140
vi
vii
LiDAR Surveys and Flood Mapping of Digos River
LiST OF FiGURES
Figure 1. Map of the Digos River Basin (in brown) .................................................................................. 1Figure 2. Flight plans and base stations used for Digos Floodplain. ........................................................5Figure 3. GPS set-up over DVS-85 located inside Mariano Sarona Elementary School, inside the fence of the flagpole (a) and NAMRIA reference point DVS-85 (b) as recovered by the field team. ............................................................................................... 6Figure 4. GPS set-up over BLLM-20 located inside Mariano Sarona Elementary School, inside the fence of the flagpole (a) and NAMRIA reference point BLLM-20 (b) as recovered by the field team ................................................................................................ 7Figure 5. Actual LiDAR survey coverage for Digos Floodplain.................................................................10Figure 6. Schematic Diagram for Data Pre-Processing Component........................................................11Figure 7. Smoothed Performance Metrics of Digos flight 7406GC.........................................................12Figure 8. Solution Status Parameters of Digos Flight 7406GC.................................................................13Figure 9. Best estimated trajectory for Digos Floodplain........................................................................14Figure 10. Boundary of the processed LiDAR data on top of a SAR Elevation Data over Digos Floodplain...........................................................................................................15Figure 11. Image of data overlap for Digos Floodplain...........................................................................16Figure 12. Pulse density map of merged LiDAR data for Digos Floodplain ............................................17Figure 13. Elevation difference map between flight lines for Digos Floodplain. ...................................18Figure 14. Quality checking for a Digos flight 7406GC using the Profile Tool of QT Modeler ................18Figure 15. Tiles for Digos floodplain (a) and classification results (b) in TerraScan ...............................19Figure 16. Point cloud before (a) and after (b) classification .................................................................19Figure 17. The production of last return DSM (a) and DTM (b), first return DSM (c) and secondary DTM (d) in some portion of Digos Floodplain .............................................20Figure 18. Portions in the DTM of Digos Floodplain – a building before (a) and after (b) manual editing ................................................................................................ 21Figure 19. Map of Processed LiDAR Data for Digos Floodplain .............................................................22Figure 20. Map of Digos Floodplain with validation survey points in green ..........................................23Figure 21. Correlation plot between calibration survey points and LiDAR data ....................................24Figure 22. Correlation plot between validation survey points and LiDAR data .....................................25Figure 23. Map of Digos Flood Plain with bathymetric survey points shown in blue ............................26Figure 24. QC blocks for Digos building features ................................................................................... 27Figure 25. Extracted features for Digos floodplain ................................................................................ 29Figure 26. Digos River survey extent ..................................................................................................... 31Figure 27. Overall GNSS Survey loop of Digos River Basin .....................................................................32Figure 28. GNSS base receiver setup, Trimble® SPS 852 at DVS-1 at the east side of Pier, in Brgy. Leon Garcia Sr., Davao City, Davao Del Sur.................................................................................33Figure 29. GNSS base receiver setup, Trimble® SPS 882 at DV-76 at the Gov. Miranda Bridge Approach, Brgy. Guadalupe, Municipality of Carmen, Davao Del Norte............................................................................34Figure 30. GNSS base receiver setup, Trimble® SPS 882 at DS-09 located at stair of Nograles Park along Mac Arthur Highway, in Brgy. Talomo, Davao City, Davao Del Sur................................34Figure 31. GNSS base receiver setup, Trimble® SPS 852 at UP-CEB on the right approach of Cebulan Bridge in Brgy Darong, Municipality of Santa Cruz, Davao Del Sur......................35Figure 32. GNSS base receiver setup, Trimble® SPS 882 at UP-DIG, right approach of Digos Bridge in Brgy. Aplaya, Digos City, Davao Del Sur.....................................................35Figure 33. GNSS base receiver setup, Trimble® SPS 852 at UP-LIP2, on the right approach
vii

viii
Hazard Mapping of the Philippines Using LiDAR (Phil-LiDAR 1)
of Lipadas Bridge along National Highway in Brgy. Lizada, Toril District, Davao Del Sur ......36Figure 34. GNSS base receiver setup, Trimble® SPS 882 at UP-PAD, Padada Bridge, Brgy. Guihing, Municipality of Hagonoy, Davao del Sur .......................................................36Figure 35. Cross-section survey at the downstream side of Digos Bridge in Brgy. Aplaya, Digos City, Davao Del Sur ..................................................................................................... 41Figure 36. Digos bridge cross-section location map .............................................................................. 42Figure 37. Digos Bridge cross-section diagram ...................................................................................... 43Figure 38. Digos Bridge Data Form ........................................................................................................ 44Figure 39. MSL water level markings in Digos Bridge’s Pier...................................................................45Figure 40. Validation points acquisition survey setup............................................................................45Figure 41. LiDAR Ground validation survey along Digos River Basin .....................................................46Figure 42. Manual bathymetric survey in Digos River ...........................................................................47Figure 43. Bathymetric points gathered from Digos River .....................................................................47Figure 44. Digos riverbed centerline profile .......................................................................................... 48Figure 45. The location map of Digos HEC-HMS model used for calibration .........................................49Figure 46. Cross-Section Plot of Digos Bridge ........................................................................................ 50Figure 47. Rating Curve at Digos Bridge 2, Aplaya, Digos City ...............................................................50Figure 48. Rainfall and outflow data at Digos used for modeling ..........................................................51Figure 49. Davao RIDF location relative to Digos River Basin ................................................................52Figure 50. Synthetic storm generated for a 24-hr period rainfall for various return periods ................52Figure 51. Soil Map of Digos River Basin ............................................................................................... 53Figure 52. Land Cover Map of Digos River Basin (Source: NAMRIA) .....................................................53Figure 53. Slope map of the Digos River Basin ..................................................................................... 54Figure 54. Stream Delineation Map of Digos River Basin .....................................................................55Figure 55. The Digos river basin model generated using HEC-HMS ......................................................56Figure 56. River cross-section of Digos River generated through Arcmap HEC GeoRAS tool ................57Figure 57. Screenshot of subcatchment with the computational area to be modeled in FLO-2D GDS Pro 58Figure 58. Generated 100-year rain return hazard map from FLO-2D Mapper .....................................58Figure 59 Generated 100-year rain return flow depth map from FLO-2D Mapper ...............................59Figure 60. Outflow Hydrograph of Digos produced by the HEC-HMS model compared with observed outflow ....................................................................................... 60Figure 61. Outflow hydrograph at Digos Station generated using Davao RIDF simulated in HEC-HMS .62Figure 62. Digos Padada-Mainit river (1) generated discharge using 5-, 25-, and 100-year GenSan rainfall intensity-duration-frequency (RIDF) in HEC-HMS ................63Figure 63. Digos Padada-Mainit river (2) generated discharge using 5-, 25-, and 100-year GenSan rainfall intensity-duration-frequency (RIDF) in HEC-HMS.................63Figure 64. Digos Padada-Mainit river (3) generated discharge using 5-, 25-, and 100-year GenSan rainfall intensity-duration-frequency (RIDF) in HEC-HMS.................64Figure 65. Digos Padada-Mainit river (4) generated discharge using 5-, 25-, and 100-year GenSan rainfall intensity-duration-frequency (RIDF) in HEC-HMS.................64Figure 66. Digos Padada-Mainit river (5) generated discharge using 5-, 25-, and 100-year GenSan rainfall intensity-duration-frequency (RIDF) in HEC-HMS.................65Figure 67. Digos Padada-Mainit river (6) generated discharge using 5-, 25-, and 100-year GenSan rainfall intensity-duration-frequency (RIDF) in HEC-HMS.................65Figure 68. Digos Padada-Mainit river (7) generated discharge using 5-, 25-, and 100-year GenSan rainfall intensity-duration-frequency (RIDF) in HEC-HMS.................66Figure 69. Digos Padada-Mainit river (8) generated discharge using 5-, 25-, and 100-year GenSan rainfall intensity-duration-frequency (RIDF) in HEC-HMS.................66
viii
ix
LiDAR Surveys and Flood Mapping of Digos River
Figure 70. Digos Padada-Mainit river (9) generated discharge using 5-, 25-, and 100-year GenSan rainfall intensity-duration-frequency (RIDF) in HEC-HMS.................67Figure 71. Digos Padada-Mainit river (10) generated discharge using 5-, 25-, and 100-year GenSan rainfall intensity-duration-frequency (RIDF) in HEC-HMS.................67Figure 72. Sample output of Digos RAS Model ...................................................................................... 71Figure 73. 100-year Flood Hazard Map for Digos Floodplain ................................................................73Figure 74. 100-year Flow Depth Map for Digos Floodplain ...................................................................74Figure 75. 25-year Flood Hazard Map for Digos Floodplain ..................................................................75Figure 76. 25-year Flow Depth Map for Digos Floodplain .....................................................................76Figure 77. 5-year Flood Hazard Map for Digos Floodplain ....................................................................77Figure 78. 5-year Flood Depth Map for Digos Floodplain ......................................................................78Figure 79. Affected Areas in Bansalan, Davao del Sur during 5-Year Rainfall Return Period .................80Figure 80. Affected Areas in Digos City, Davao del Sur during 5-Year Rainfall Return Period ................80Figure 81. Affected Areas in Digos City, Davao del Sur during 5-Year Rainfall Return Period ...............81Figure 82. Affected Areas in Hagonoy, Davao del Sur during 5-Year Rainfall Return Period .................84Figure 83. Affected Areas in Hagonoy, Davao del Sur during 5-Year Rainfall Return Period .................84Figure 84. Affected Areas in Kiblawan, Davao del Sur during 5-Year Rainfall Return Period .................85Figure 85. Affected Areas in Kiblawan, Davao del Sur during 5-Year Rainfall Return Period ...............85Figure 86. Affected Areas in Kiblawan, Davao del Sur during 5-Year Rainfall Return Period ...............88 Figure 87. Affected Areas in Magsaysay, Davao del Sur during 5-Year Rainfall Return Period .............89Figure 88. Affected Areas in Malalag, Davao del Sur during 5-Year Rainfall Return Period .................90Figure 89. Affected Areas in Matanao, Davao del Sur during 5-Year Rainfall Return Period ...............90Figure 90. Affected Areas in Matanao, Davao del Sur during 5-Year Rainfall Return Period ...............92Figure 91. Affected Areas in Matanao, Davao del Sur during 5-Year Rainfall Return Period ...............92Figure 92. Affected Areas in Padada, Davao del Sur during 5-Year Rainfall Return Period ..................94Figure 93. Affected Areas in Padada, Davao del Sur during 5-Year Rainfall Return Period ..................95Figure 94. Affected Areas in Sta. Cruz, Davao del Sur during 5-Year Rainfall Return Period ................96Figure 95. Affected Areas in Sulop, Davao del Sur during 5-Year Rainfall Return Period .......................97 Figure 96. Affected Areas in Sulop, Davao del Sur during 5-Year Rainfall Return Period .......................97Figure 97. Affected Areas in Sulop, Davao del Sur during 5-Year Rainfall Return Period .......................98Figure 98. Affected Areas in Columbio, Sultan Kudarat during 5-Year Rainfall Return Period ...............99Figure 99. Affected Areas in Bansalan, Davao del Sur during 25-Year Rainfall Return Period .............100Figure 100. Affected Areas in Digos City, Davao del Sur during 25-Year Rainfall Return Period ..........100Figure 101. Affected Areas in Digos City, Davao del Sur during 25-Year Rainfall Return Period ..........102Figure 102. Affected Areas in Hagonoy, Davao del Sur during 25-Year Rainfall Return Period ...........102Figure 103. Affected Areas in Hagonoy, Davao del Sur during 25-Year Rainfall Return Period ...........104Figure 104. Affected Areas in Kiblawan, Davao del Sur during 5-Year Rainfall Return Period .............104Figure 105. Affected Areas in Kiblawan, Davao del Sur during 5-Year Rainfall Return Period .............106Figure 106. Affected Areas in Kiblawan, Davao del Sur during 5-Year Rainfall Return Period .............106Figure 107. Affected Areas in Magsaysay, Davao del Sur during 25-Year Rainfall Return Period.........108Figure 108. Affected Areas in Malalag, Davao del Sur during 25-Year Rainfall Return Period .............109Figure 109. Affected Areas in Matanao, Davao del Sur during 25-Year Rainfall Return Period ...........110Figure 110. Affected Areas in Matanao, Davao del Sur during 25-Year Rainfall Return Period ...........110Figure 111. Affected Areas in Matanao, Davao del Sur during 25-Year Rainfall Return Period ...........113Figure 112. Affected Areas in Padada, Davao del Sur during 25-Year Rainfall Return Period ..............114Figure 113.. Affected Areas in Padada, Davao del Sur during 25-Year Rainfall Return Period .............115Figure 114. Affected Areas in Santa Cruz, Davao del Sur during 25-Year Rainfall Return Period .........116Figure 115. Affected Areas in Sulop, Davao del Sur during 25-Year Rainfall Return Period .................117Figure 116. Affected Areas in Sulop, Davao del Sur during 25-Year Rainfall Return Period .................118
ix
x
Hazard Mapping of the Philippines Using LiDAR (Phil-LiDAR 1)
x
Figure 117. Affected Areas in Sulop, Davao del Sur during 25-Year Rainfall Return Period .................119Figure 118. Affected Areas in Columbio, Sultan Kudarat during 25-Year Rainfall Return Period .........120Figure 119. Affected Areas in Bansalan, Davao del Sur during 100-Year Rainfall Return Period .........121Figure 120. Affected Areas in Digos City, Davao del Sur during 100-Year Rainfall Return Period ........123Figure 121. Affected Areas in Digos City, Davao del Sur during 100-Year Rainfall Return Period ........123Figure 122. Affected Areas in Hagonoy, Davao del Sur during 100-Year Rainfall Return Period ..........125Figure 123. Affected Areas in Hagonoy, Davao del Sur during 100-Year Rainfall Return Period ..........125Figure 124. Affected Areas in Kiblawan, Davao del Sur during 100-Year Rainfall Return Period .........126Figure 125. Affected Areas in Kiblawan, Davao del Sur during 100-Year Rainfall Return Period .........128Figure 126. Affected Areas in Kiblawan, Davao del Sur during 100-Year Rainfall Return Period .........128Figure 127. Affected Areas in Magsaysay, Davao del Sur during 100-Year Rainfall Return Period.......130Figure 128. Affected Areas in Malalag, Davao del Sur during 100-Year Rainfall Return Period ...........131Figure 129. Affected Areas in Matanao, Davao del Sur during 100-Year Rainfall Return Period .........131Figure 130. Affected Areas in Matanao, Davao del Sur during 100-Year Rainfall Return Peri .............133Figure 131. Affected Areas in Matanao, Davao del Sur during 100-Year Rainfall Return Peri .............133Figure 132. Affected Areas in Padada, Davao del Sur during 100-Year Rainfall Return Period ............135Figure 133. Affected Areas in Padada, Davao del Sur during 100-Year Rainfall Return Period ............136Figure 134. Affected Areas in Santa Cruz, Davao del Sur during 100-Year Rainfall Return Period .......137Figure 135. Affected Areas in Sulop, Davao del Sur during 100-Year Rainfall Return Period ...............138Figure 136. Affected Areas in Sulop, Davao del Sur during 100-Year Rainfall Return Period ...............139Figure 137. Affected Areas in Sulop, Davao del Sur during 100-Year Rainfall Return Period ...............140Figure 138. Affected Areas in Columbio, Sultan Kudarat during 100-Year Rainfall Return Period .......141Figure 139. Flood Validation Points of Digos River Basin .....................................................................143Figure 140. Flood Map Depth vs Actual Flood Depth ..........................................................................143

xi
LiDAR Surveys and Flood Mapping of Digos River
LiST OF ACRONYMS AND ABBREviATiONSAAC Asian Aerospace Corporation
Ab abutment
ALTM Airborne LiDAR Terrain Mapper
ARG automatic rain gauge
ATQ Antique
AWLS Automated Water Level Sensor
BA Bridge Approach
BM benchmark
CAD Computer-Aided Design
CN Curve Number
CSRS Chief Science Research Specialist
DAC Data Acquisition Component
DEM Digital Elevation Model
DENR Department of Environment and Natural Resources
DOST Department of Science and Technology
DPPC Data Pre-Processing Component
DREAM Disaster Risk and Exposure Assessment for Mitigation [Program]
DRRM Disaster Risk Reduction and Management
DSM Digital Surface Model
DTM Digital Terrain Model
DVBC Data Validation and Bathymetry Component
FMC Flood Modeling Component
FOV Field of View
GiA Grants-in-Aid
GCP Ground Control Point
GNSS Global Navigation Satellite System
GPS Global Positioning System
HEC-HMS Hydrologic Engineering Center - Hydrologic Modeling System
HEC-RAS Hydrologic Engineering Center - River Analysis System
HC High Chord
IDW Inverse Distance Weighted [interpolation method]
IMU Inertial Measurement Unit
kts knots
LAS LiDAR Data Exchange File format
LC Low Chord
LGU local government unit
LiDAR Light Detection and Ranging
LMS LiDAR Mapping Suite
m AGL meters Above Ground Level
MMS Mobile Mapping Suite
MSL mean sea level
NSTC Northern Subtropical ConvergencePAF Philippine Air Force
PAGASA Philippine Atmospheric Geophysical and Astronomical Services
AdministrationPDOP Positional Dilution of Precision
PPK Post-Processed Kinematic [technique]
PRF Pulse Repetition Frequency
PTM Philippine Transverse Mercator
QC Quality Check
QT Quick Terrain [Modeler]
RA Research Associate
RIDF Rainfall-Intensity-Duration-Frequency
RMSE Root Mean Square Error
SAR Synthetic Aperture Radar
SCS Soil Conservation Service
SRTM Shuttle Radar Topography Mission
SRS Science Research Specialist
SSG Special Service Group
TBC Thermal Barrier Coatings
UPM University of the Philippines Mindanao
UP-TCAGP University of the Philippines – Training Center for Applied Geodesy and
Photogrammetry
UTM Universal Transverse Mercator
WGS World Geodetic System
xi

xii
Hazard Mapping of the Philippines Using LiDAR (Phil-LiDAR 1)
xii
1
LiDAR Surveys and Flood Mapping of Digos River
CHAPTER 1: OvERviEW OF THE PROGRAM AND DiGOS RivER
Enrico C. Paringit, Dr. Eng., Engr. Joseph Acosta, and Engr. Ruth James
1.1 Background of the Phil-LiDAR 1 Program
The University of the Philippines Training Center for Applied Geodesy and Photogrammetry (UP-TCAGP) launched a research program entitled “Nationwide Hazard Mapping using LiDAR” or Phil-LiDAR 1 in 2014, supported by the Department of Science and Technology (DOST) Grant-in-Aid (GiA) Program. The program was primarily aimed at acquiring a national elevation and resource dataset at sufficient resolution to pro-duce information necessary to support the different phases of disaster management. Particularly, it target-ed to operationalize the development of flood hazard models that would produce updated and detailed flood hazard maps for the major river systems in the country.
Also, the program was aimed at producing an up-to-date and detailed national elevation dataset suitable for 1:5,000 scale mapping, with 50 cm and 20 cm horizontal and vertical accuracies, respectively. These accuracies were achieved through the use of the state-of-the-art Light Detection and Ranging (LiDAR) air-borne technology procured by the project through DOST. The methods applied in this report are thorough-ly described in a separate publication entitled “Flood Mapping of Rivers in the Philippines Using Airborne LiDAR: Methods.” (Paringit, et. Al. 2017)
The implementing partner university for the Phil-LiDAR 1 Program is the University of the Philippines Min-danao (UPM). UPM is in charge of processing LiDAR data and conducting data validation reconnaissance, cross section, bathymetric survey, validation, river flow measurements, flood height and extent data gath-ering, flood modeling, and flood map generation for the 13 river basins in the Southern Mindanao Region. The university is located in Davao City in the province of Davao del Sur.
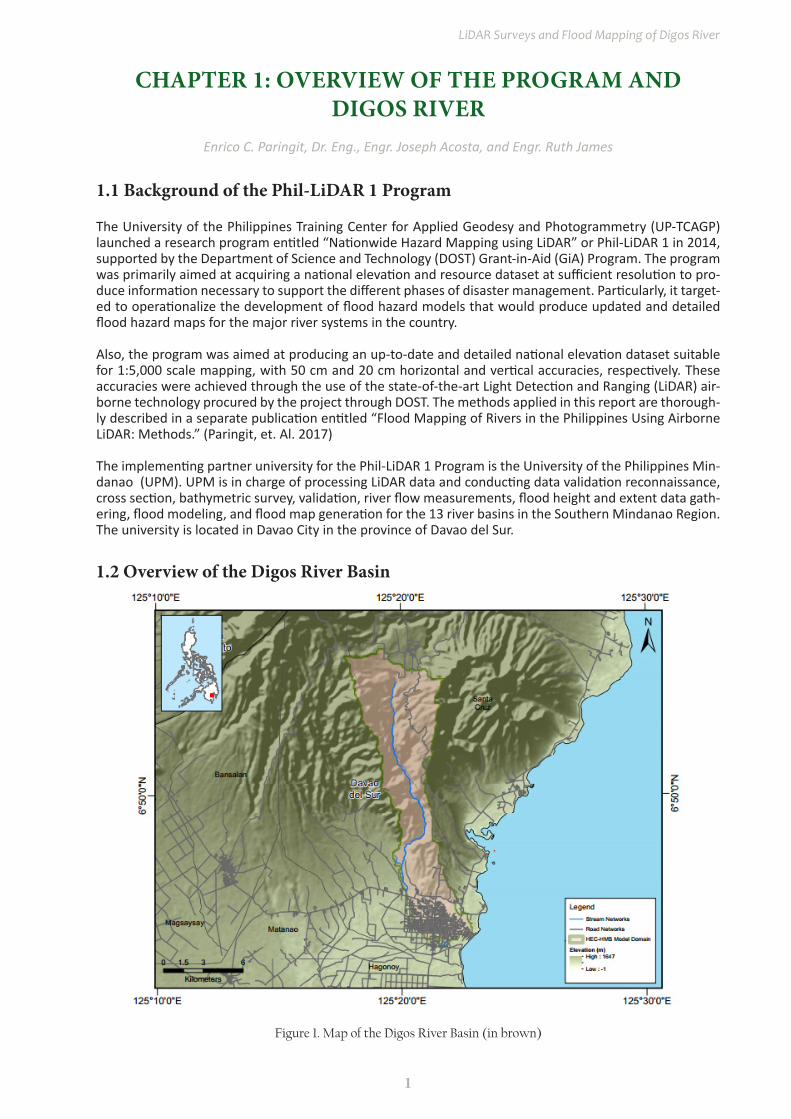
1.2 Overview of the Digos River Basin
Figure 1. Map of the Digos River Basin (in brown)
2
Hazard Mapping of the Philippines Using LiDAR (Phil-LiDAR 1)
The region is blessed with good climate as it experiences Types II and IV climate and lies outside the typhoon belt. Type II climate is characterized by no dry season with very pronounced maximum rainfall. Moreover, Type IV is characterized by more or less evenly distributed rainfall throughout the year. Warm temperature is experienced from February to October while the coolest months start from November up to January. The Region is not directly hit by typhoons and low-pressure systems and is rarely affected by high winds. Generally, climate in Digos falls under the fourth type while wind direction is prevalent from northeast to southwest (Regional Profile - Davao Region, n.d.).
Digos shares common boundaries with the municipalities of Hagonoy in the south, Bansalan in the north and northwest by Siranagan and Miral Creek and with Sta. Cruz in the northeast. It lies on the western shore of the Davao Gulf and southern foothills of Mount Apo on the island of Mindanao, centrally located between the two major cities in Mindanao, Davao City and General Santos City. It has a total land area of 28,710 hectares (70,900 acres) consisting of 26 barangays; nine (9) of which comprise the poblacion or urban center. (Digos, n.d.)Its land topography ranges from hilly to mountainous in the north-northeast portion and flat and slightly rolling at the coastal barangays, while the urban area and the surrounding barangays in the south portion are generally flat. Digos River is next to the hilly portion and is located in the province of Davao del Sur, Philippines.
Digos is a second class city in and capital of the province Davao del Sur, Philippines. According to the 2015 census, it has a population of 169,393 people, distributed among the twenty-six barangays, namely: Aplaya, Balabag, Binaton, Cogon, Colorado, Dawis, Dulangan, Goma, Igpit, Kiagot, Lungag, Mahayahay, Matti, Kapatagan (Rizal), Ruparan, San Agustin, San Jose (Balutakay), San Miguel (Odaca), San Roque, Sinawilan, Soong, Tiguman, Tres de Mayo, and Poblacion (Zones 1, 2, and 3). (Digos, n.d.)
Agriculture is a major component of Digos City economy. Some 9,330 households or 37% of the total households are dependent on agriculture for their livelihood. Of the total households dependent on agriculture, 91% are engaged in farming and the remaining 9% in fishing. The total area devoted to agriculture covered 8, 944.1 hectares, representing 31% of the total land area of Digos. The more important agricultural crops grown in the area include coconut, sugarcane, mango and banana. Among the agricultural crops, the staple crops rice and corn are the most widely grown (Digos Flood Hazard Modeling and Mapping, 2017).It is also known for its sweet-juicy ‘carabao variety mango,’ sold locally and exported abroad, thus being dubbed as the Mango Capital City of the Philippines. It is also considered as The Gate City Of The South. (Digos, n.d.)
Digos River Basin is located in the southeastern part of Mindanao. It is a stream located at the latitude and longitude coordinates of 6.740833 and 125.382222 and within Davao Region and is nearby to Aplaya, Digos Islet and Dawis Beach (Digos River, n.d.). It traverses through the municipality of Santa Cruz down to Digos City in the province of Davao del Sur. It covers an area of 140.15 square kilometres and travels for 33.68 kilometers from its source to its mouth in Davao Gulf with 69 sub basins. The river outlet is between Barangay Aplaya and Barangay Cogon in Digos City (Digos HEC-HMS and HEC-RAS Model Report, 2017).
Located at the southern foothills of Mount Apo, Digos serves as one of the major jump points for mountain climbers preparing to scale the Philippines’ highest mountain peak. Mount Apo is home to over 272 bird species, 111 of which are endemic to the area. This includes the critically endangered Philippine Eagle, the country’s national bird. Although declared a Natural Park, trash can be seen littered through the climbing trail (Inquirer, 2014).
The water quality of the river conforms to the standards for Class B and C waters. Class B waters are defined as recreational waters for bathing, swimming, skin diving, and those designated for tourism purposes. Class C on the other hand is used as fishery water, non-contact recreational activities such as boating, and as industrial water supply for manufacturing processes. This could be attributed to the wastewater coming from industry, slaughterhouse, residential, hospital, institutional and commercial establishments, agricultural run-off and improper solid waste management (DENR, 2016).
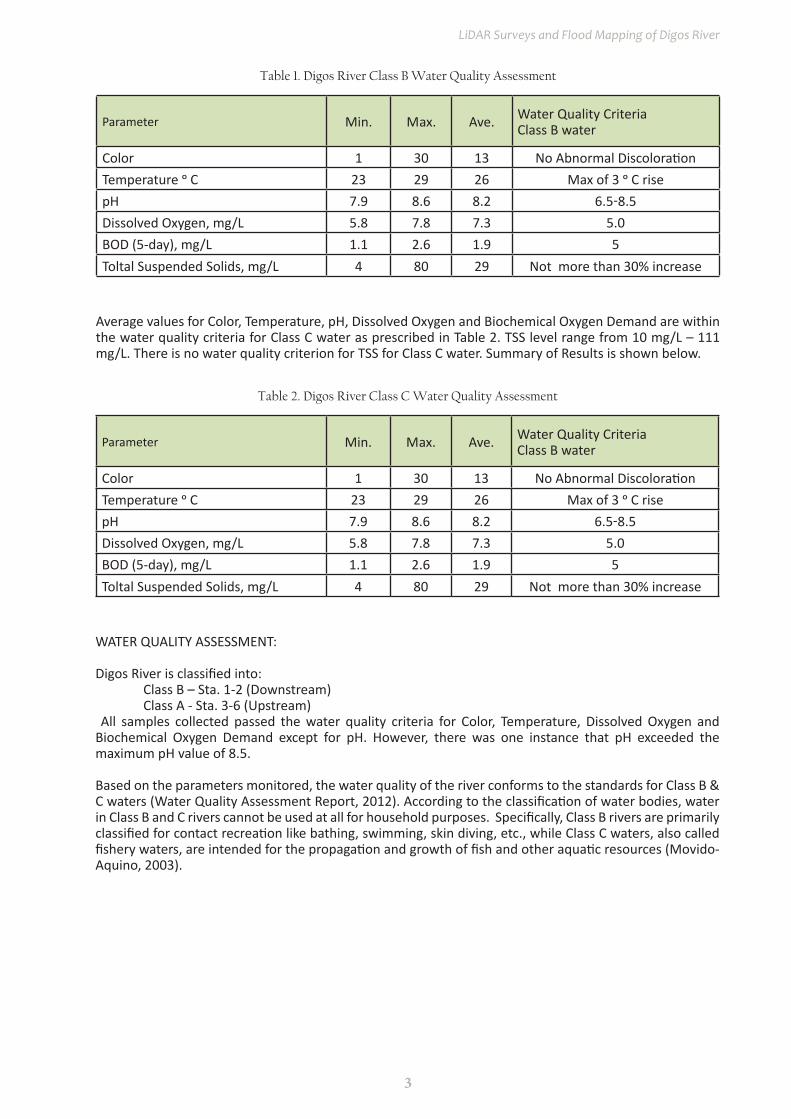
Average values for Color, Temperature, pH, Dissolved Oxygen and Biochemical Oxygen Demand are within the water quality criteria for Class B water as prescribed in Table 1. Total suspended Solids (TSS) level range from 4 mg/L – 80 mg/L. There is no water quality criterion for TSS for Class B water.
3
LiDAR Surveys and Flood Mapping of Digos River
Table 1. Digos River Class B Water Quality Assessment
Parameter Min. Max. Ave. Water Quality CriteriaClass B water
Color 1 30 13 No Abnormal DiscolorationTemperature ᵒ C 23 29 26 Max of 3 ᵒ C risepH 7.9 8.6 8.2 6.5-8.5Dissolved Oxygen, mg/L 5.8 7.8 7.3 5.0BOD (5-day), mg/L 1.1 2.6 1.9 5Toltal Suspended Solids, mg/L 4 80 29 Not more than 30% increase
Average values for Color, Temperature, pH, Dissolved Oxygen and Biochemical Oxygen Demand are within the water quality criteria for Class C water as prescribed in Table 2. TSS level range from 10 mg/L – 111 mg/L. There is no water quality criterion for TSS for Class C water. Summary of Results is shown below.
Table 2. Digos River Class C Water Quality Assessment
Parameter Min. Max. Ave. Water Quality CriteriaClass B water
Color 1 30 13 No Abnormal DiscolorationTemperature ᵒ C 23 29 26 Max of 3 ᵒ C risepH 7.9 8.6 8.2 6.5-8.5Dissolved Oxygen, mg/L 5.8 7.8 7.3 5.0BOD (5-day), mg/L 1.1 2.6 1.9 5Toltal Suspended Solids, mg/L 4 80 29 Not more than 30% increase
WATER QUALITY ASSESSMENT:
Digos River is classified into: Class B – Sta. 1-2 (Downstream) Class A - Sta. 3-6 (Upstream) All samples collected passed the water quality criteria for Color, Temperature, Dissolved Oxygen and Biochemical Oxygen Demand except for pH. However, there was one instance that pH exceeded the maximum pH value of 8.5.
Based on the parameters monitored, the water quality of the river conforms to the standards for Class B & C waters (Water Quality Assessment Report, 2012). According to the classification of water bodies, water in Class B and C rivers cannot be used at all for household purposes. Specifically, Class B rivers are primarily classified for contact recreation like bathing, swimming, skin diving, etc., while Class C waters, also called fishery waters, are intended for the propagation and growth of fish and other aquatic resources (Movido-Aquino, 2003).
4
Hazard Mapping of the Philippines Using LiDAR (Phil-LiDAR 1)
CHAPTER 2: LiDAR ACQUiSiTiON OF THE DiGOS FLOODPLAiN
Engr. Louie P. Balicanta, Engr. Christopher Cruz, Lovely Grace Acuña, Engr. Gerome Hipolito, Pauline Joanne G. Arceo, and Engr. Kenneth A. Quisado
The methods applied in this Chapter were based on the DREAM methods manual (Sarmiento, et al., 2014) and further enhanced and updated in Paringit, et al. (2017).
2.1 Flight Plans
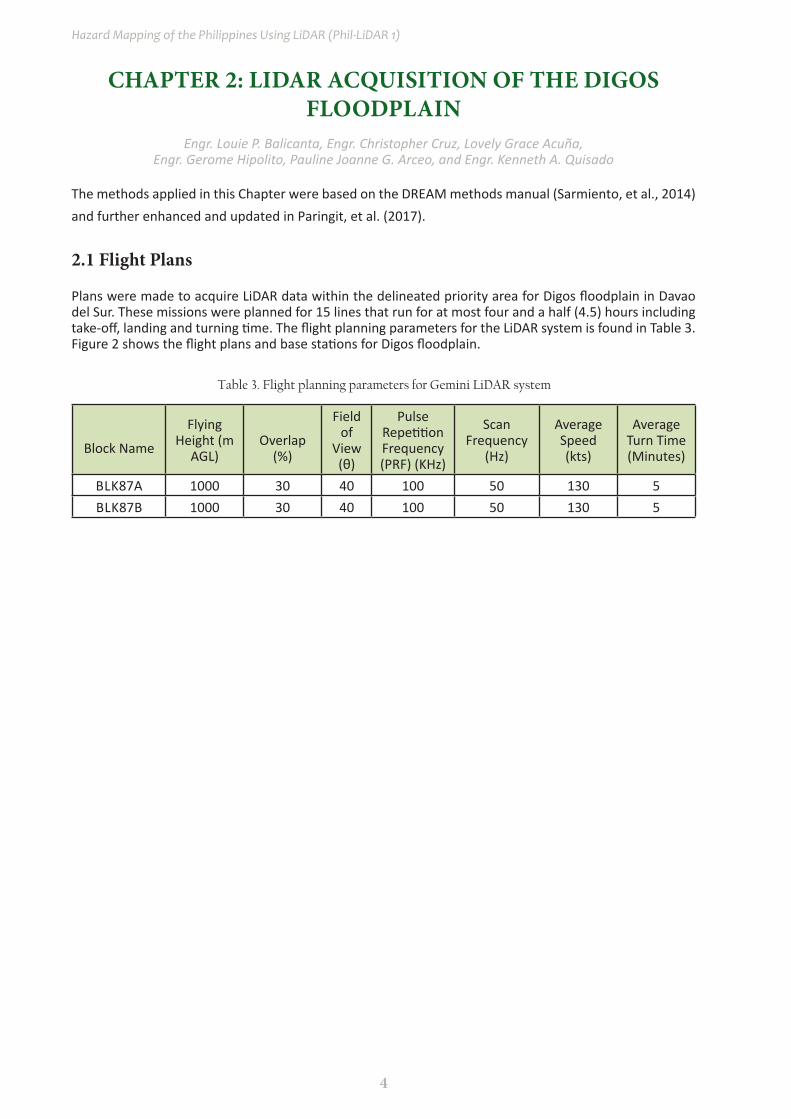
Plans were made to acquire LiDAR data within the delineated priority area for Digos floodplain in Davao del Sur. These missions were planned for 15 lines that run for at most four and a half (4.5) hours including take-off, landing and turning time. The flight planning parameters for the LiDAR system is found in Table 3. Figure 2 shows the flight plans and base stations for Digos floodplain.
Table 3. Flight planning parameters for Gemini LiDAR system
Block Name
Flying Height (m
AGL)Overlap
(%)
Field of
View(θ)
Pulse Repetition Frequency (PRF) (KHz)
Scan Frequency
(Hz)
Average Speed(kts)
Average Turn Time (Minutes)
BLK87A 1000 30 40 100 50 130 5BLK87B 1000 30 40 100 50 130 5

5
LiDAR Surveys and Flood Mapping of Digos River
Figure 2. Flight plans and base stations used for Digos Floodplain.
6
Hazard Mapping of the Philippines Using LiDAR (Phil-LiDAR 1)
2.2 Ground Base Stations
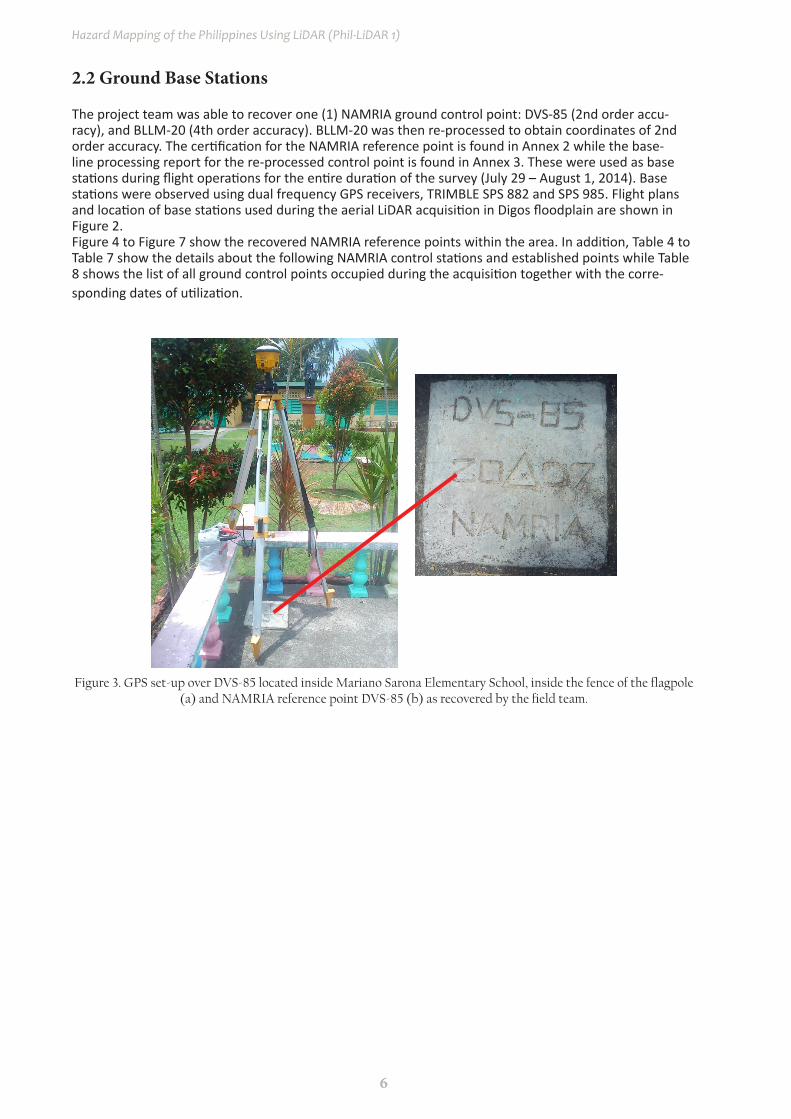
The project team was able to recover one (1) NAMRIA ground control point: DVS-85 (2nd order accu-racy), and BLLM-20 (4th order accuracy). BLLM-20 was then re-processed to obtain coordinates of 2nd order accuracy. The certification for the NAMRIA reference point is found in Annex 2 while the base-line processing report for the re-processed control point is found in Annex 3. These were used as base stations during flight operations for the entire duration of the survey (July 29 – August 1, 2014). Base stations were observed using dual frequency GPS receivers, TRIMBLE SPS 882 and SPS 985. Flight plans and location of base stations used during the aerial LiDAR acquisition in Digos floodplain are shown in Figure 2.Figure 4 to Figure 7 show the recovered NAMRIA reference points within the area. In addition, Table 4 to Table 7 show the details about the following NAMRIA control stations and established points while Table 8 shows the list of all ground control points occupied during the acquisition together with the corre-sponding dates of utilization.
Figure 3. GPS set-up over DVS-85 located inside Mariano Sarona Elementary School, inside the fence of the flagpole (a) and NAMRIA reference point DVS-85 (b) as recovered by the field team.
7
LiDAR Surveys and Flood Mapping of Digos River
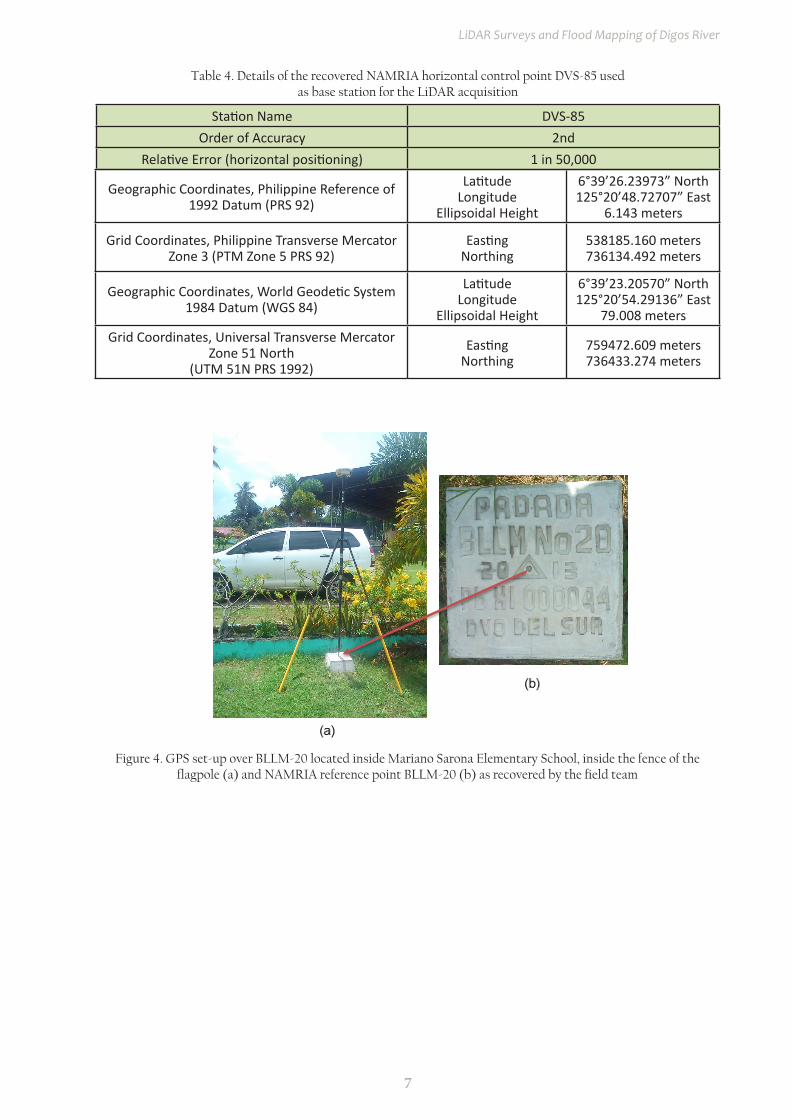
Table 4. Details of the recovered NAMRIA horizontal control point DVS-85 used as base station for the LiDAR acquisition
Station Name DVS-85Order of Accuracy 2nd
Relative Error (horizontal positioning) 1 in 50,000
Geographic Coordinates, Philippine Reference of 1992 Datum (PRS 92)
LatitudeLongitude
Ellipsoidal Height
6°39’26.23973” North125°20’48.72707” East
6.143 meters
Grid Coordinates, Philippine Transverse Mercator Zone 3 (PTM Zone 5 PRS 92)
EastingNorthing
538185.160 meters736134.492 meters
Geographic Coordinates, World Geodetic System 1984 Datum (WGS 84)
LatitudeLongitude
Ellipsoidal Height
6°39’23.20570” North125°20’54.29136” East
79.008 metersGrid Coordinates, Universal Transverse Mercator
Zone 51 North (UTM 51N PRS 1992)
EastingNorthing
759472.609 meters736433.274 meters
Figure 4. GPS set-up over BLLM-20 located inside Mariano Sarona Elementary School, inside the fence of the flagpole (a) and NAMRIA reference point BLLM-20 (b) as recovered by the field team
8
Hazard Mapping of the Philippines Using LiDAR (Phil-LiDAR 1)
Table 5. Details of the recovered horizontal control point BLLM-20 used as base station for the LiDAR acquisition with established coordinates
Station Name BLLM-20Order of Accuracy 2nd
Relative Error (horizontal positioning) 1 in 50,000
Geographic Coordinates, Philippine Reference of 1992 Datum (PRS 92)
LatitudeLongitude
Ellipsoidal Height
6°39’25.99473” North125°20’48.37658”
East5.656 meters
Grid Coordinates, Philippine Transverse Mercator Zone 3 (PTM Zone 5 PRS 92)
EastingNorthing
538174.400 meters736126.960 meters
Geographic Coordinates, World Geodetic System 1984 Datum (WGS 84)
LatitudeLongitude
Ellipsoidal Height
6°39’22.96071” North125°20’53.94087”
East78.521 meters
Grid Coordinates, Universal Transverse Mercator Zone 51 North
(UTM 51N PRS 1992)
EastingNorthing
759461.875 meters736425.694 meters
Table 6. Ground control points used during LiDAR data acquisition
Date Surveyed Flight Number Mission Name Ground Control Points
July 29, 2014 7400GC 2BLK87A210A DVS-85 & BLLM-20
July 31, 2014 7404GC 2BLK87AS212A DVS-85 & BLLM-20
August 01, 2014 7406GC 2BLK87BC213A DVS-85 & BLLM-20
2.3 Flight Missions
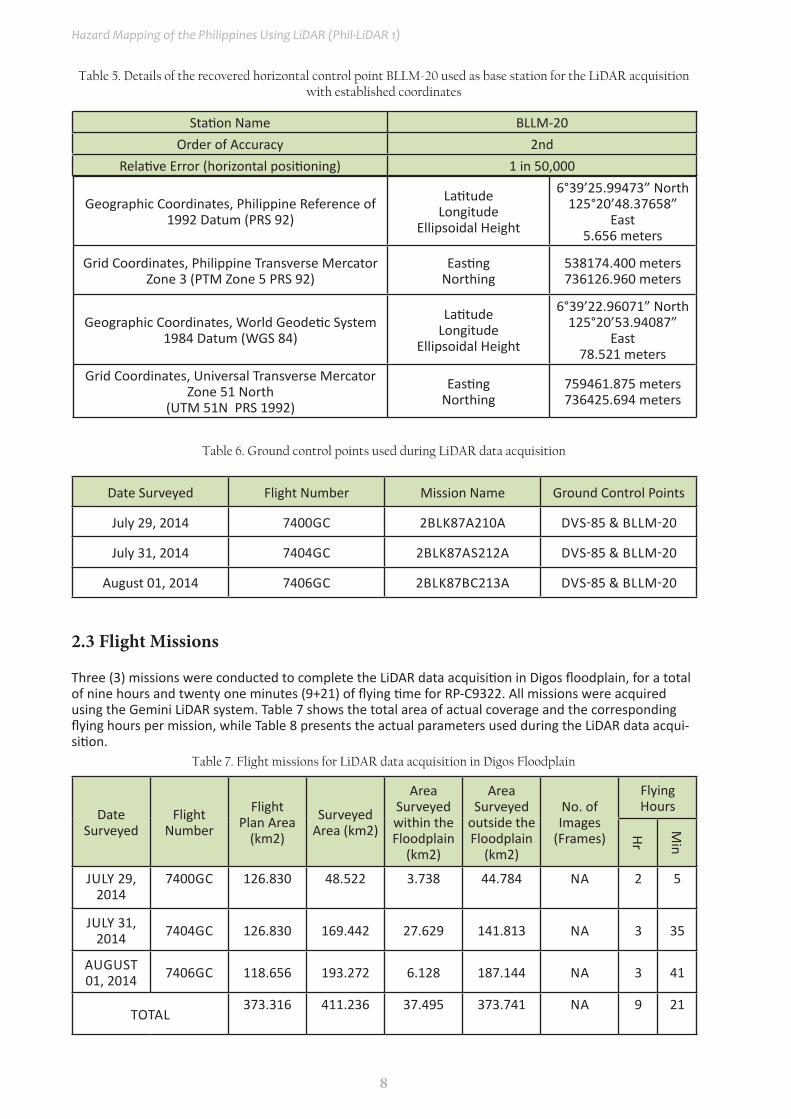
Three (3) missions were conducted to complete the LiDAR data acquisition in Digos floodplain, for a total of nine hours and twenty one minutes (9+21) of flying time for RP-C9322. All missions were acquired using the Gemini LiDAR system. Table 7 shows the total area of actual coverage and the corresponding flying hours per mission, while Table 8 presents the actual parameters used during the LiDAR data acqui-sition.
Table 7. Flight missions for LiDAR data acquisition in Digos Floodplain
Date Surveyed
Flight Number
Flight Plan Area
(km2)
Surveyed Area (km2)
Area Surveyed within the Floodplain
(km2)
Area Surveyed
outside the Floodplain
(km2)
No. of Images
(Frames)
Flying Hours
Hr
Min
JULY 29, 2014
7400GC 126.830 48.522 3.738 44.784 NA 2 5
JULY 31, 2014 7404GC 126.830 169.442 27.629 141.813 NA 3 35
AUGUST 01, 2014 7406GC 118.656 193.272 6.128 187.144 NA 3 41
TOTAL373.316 411.236 37.495 373.741 NA 9 21
9
LiDAR Surveys and Flood Mapping of Digos River
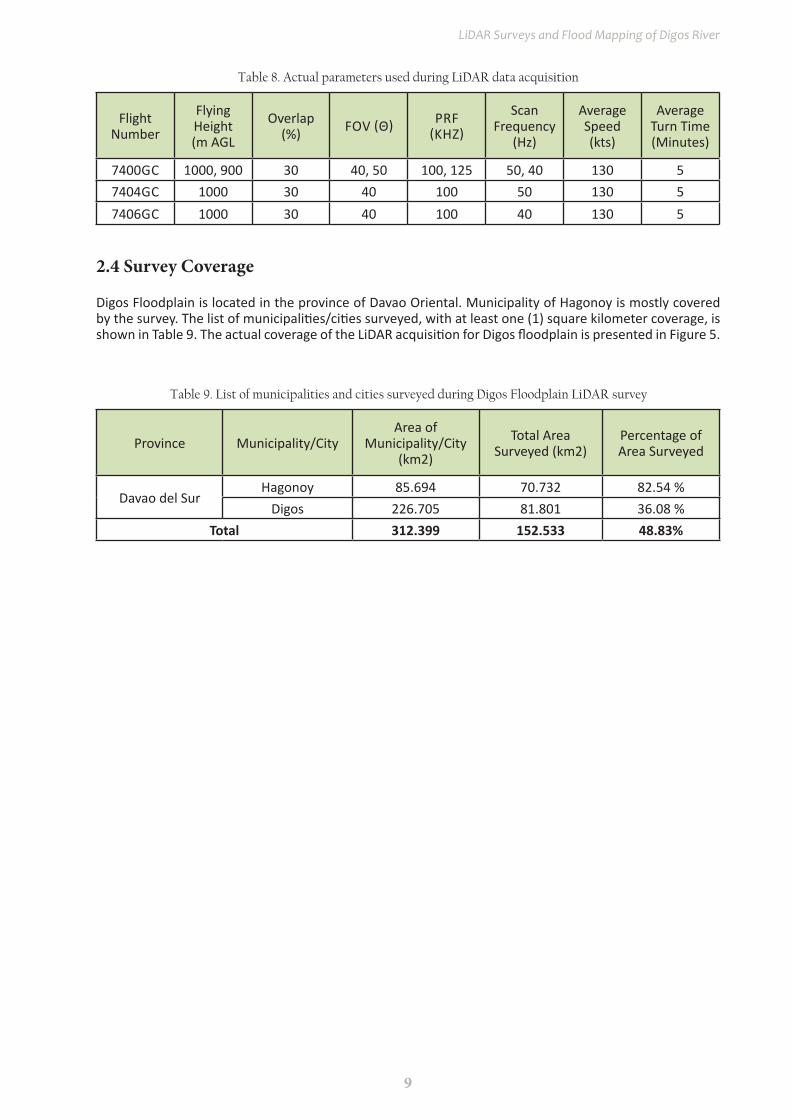
Table 8. Actual parameters used during LiDAR data acquisition
Flight Number
Flying Height (m AGL
Overlap (%) FOV (Θ) PRF
(KHZ)
Scan Frequency
(Hz)
Average Speed(kts)
Average Turn Time (Minutes)
7400GC 1000, 900 30 40, 50 100, 125 50, 40 130 57404GC 1000 30 40 100 50 130 57406GC 1000 30 40 100 40 130 5
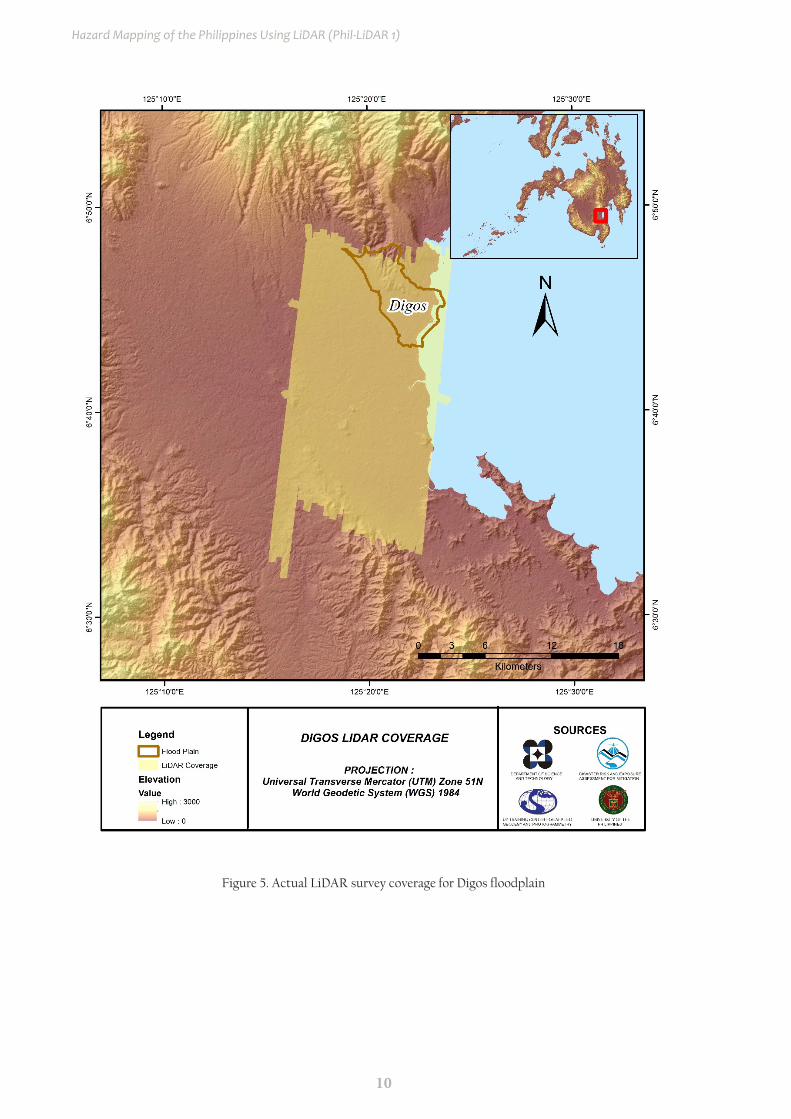
2.4 Survey Coverage
Digos Floodplain is located in the province of Davao Oriental. Municipality of Hagonoy is mostly covered by the survey. The list of municipalities/cities surveyed, with at least one (1) square kilometer coverage, is shown in Table 9. The actual coverage of the LiDAR acquisition for Digos floodplain is presented in Figure 5.
Table 9. List of municipalities and cities surveyed during Digos Floodplain LiDAR survey
Province Municipality/CityArea of
Municipality/City (km2)
Total Area Surveyed (km2)
Percentage of Area Surveyed
Davao del SurHagonoy 85.694 70.732 82.54 %
Digos 226.705 81.801 36.08 %Total 312.399 152.533 48.83%
10
Hazard Mapping of the Philippines Using LiDAR (Phil-LiDAR 1)
Figure 5. Actual LiDAR survey coverage for Digos floodplain
11
LiDAR Surveys and Flood Mapping of Digos River
CHAPTER 3. LiDAR DATA PROCESSiNG OF THE DiGOS FLOODPLAiN
Engr. Ma. Rosario Concepcion O. Ang, Engr. John Louie D. Fabila, Engr. Sarah Jane D. Samalburo , Engr. Harmond F. Santos , Engr. John Dill P. Macapagal , Engr. Ma. Ailyn L. Olanda, Engr. Velina Angela S.
Bemida, Alex John B. Escobido , Engr. Ben Joseph J. Harder, and Engr. Karl Adrian P. Vergara
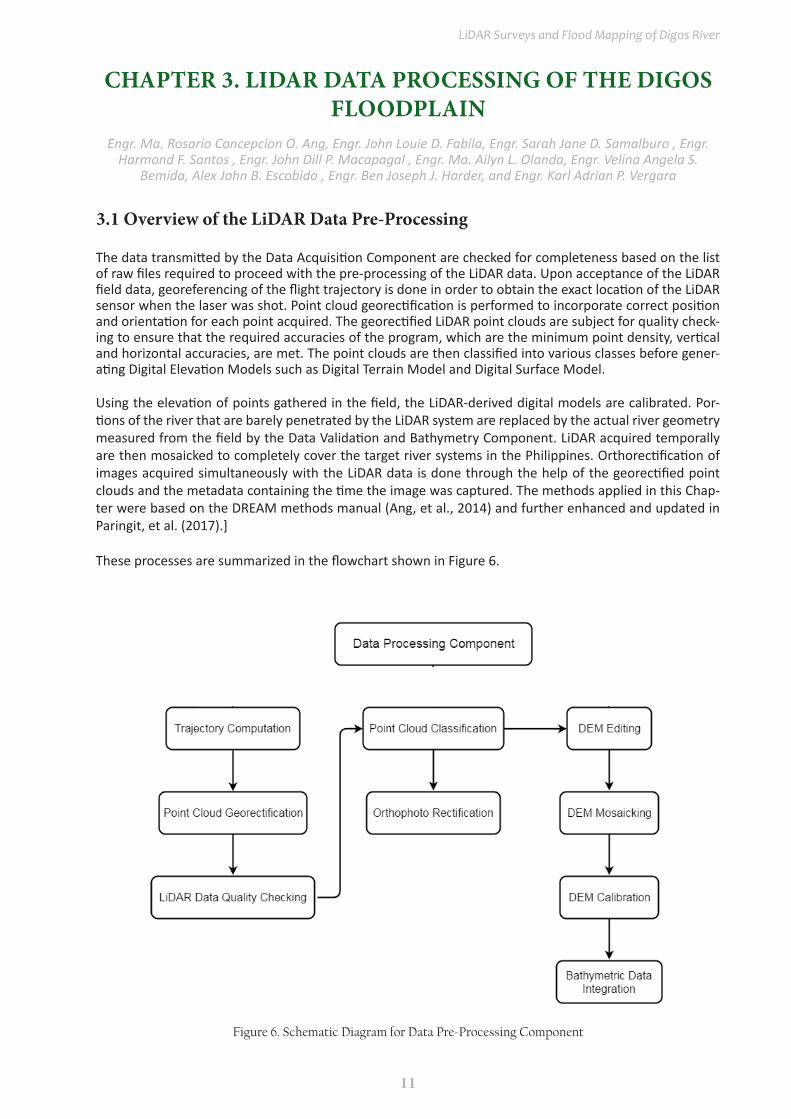
3.1 Overview of the LiDAR Data Pre-Processing
Figure 6. Schematic Diagram for Data Pre-Processing Component
The data transmitted by the Data Acquisition Component are checked for completeness based on the list of raw files required to proceed with the pre-processing of the LiDAR data. Upon acceptance of the LiDAR field data, georeferencing of the flight trajectory is done in order to obtain the exact location of the LiDAR sensor when the laser was shot. Point cloud georectification is performed to incorporate correct position and orientation for each point acquired. The georectified LiDAR point clouds are subject for quality check-ing to ensure that the required accuracies of the program, which are the minimum point density, vertical and horizontal accuracies, are met. The point clouds are then classified into various classes before gener-ating Digital Elevation Models such as Digital Terrain Model and Digital Surface Model.
Using the elevation of points gathered in the field, the LiDAR-derived digital models are calibrated. Por-tions of the river that are barely penetrated by the LiDAR system are replaced by the actual river geometry measured from the field by the Data Validation and Bathymetry Component. LiDAR acquired temporally are then mosaicked to completely cover the target river systems in the Philippines. Orthorectification of images acquired simultaneously with the LiDAR data is done through the help of the georectified point clouds and the metadata containing the time the image was captured. The methods applied in this Chap-ter were based on the DREAM methods manual (Ang, et al., 2014) and further enhanced and updated in Paringit, et al. (2017).]
These processes are summarized in the flowchart shown in Figure 6.
12
Hazard Mapping of the Philippines Using LiDAR (Phil-LiDAR 1)
3.2 Transmittal of Acquired LiDAR Data
Data transfer sheets for all the LiDAR missions for Digos floodplain can be found in Annex 5. Data Transfer Sheets. Missions flown during the first survey conducted on July 2014 used the Airborne LiDAR Terrain Mapper (ALTM™ Optech Inc.) Gemini system over Digos City, Davao Del Sur. The Data Acquisition Com-ponent (DAC) transferred a total of 40.24 Gigabytes of Range data, 520 Megabytes of POS data and 13.49 Megabytes of GPS base station data to the data server on August 1, 2014. The Data Pre-processing Com-ponent (DPPC) verified the completeness of the transferred data. The whole dataset for Digos was fully transferred on August 12, 2014 as indicated on the Data Transfer Sheets for Digos floodplain.
3.3 Trajectory Computation
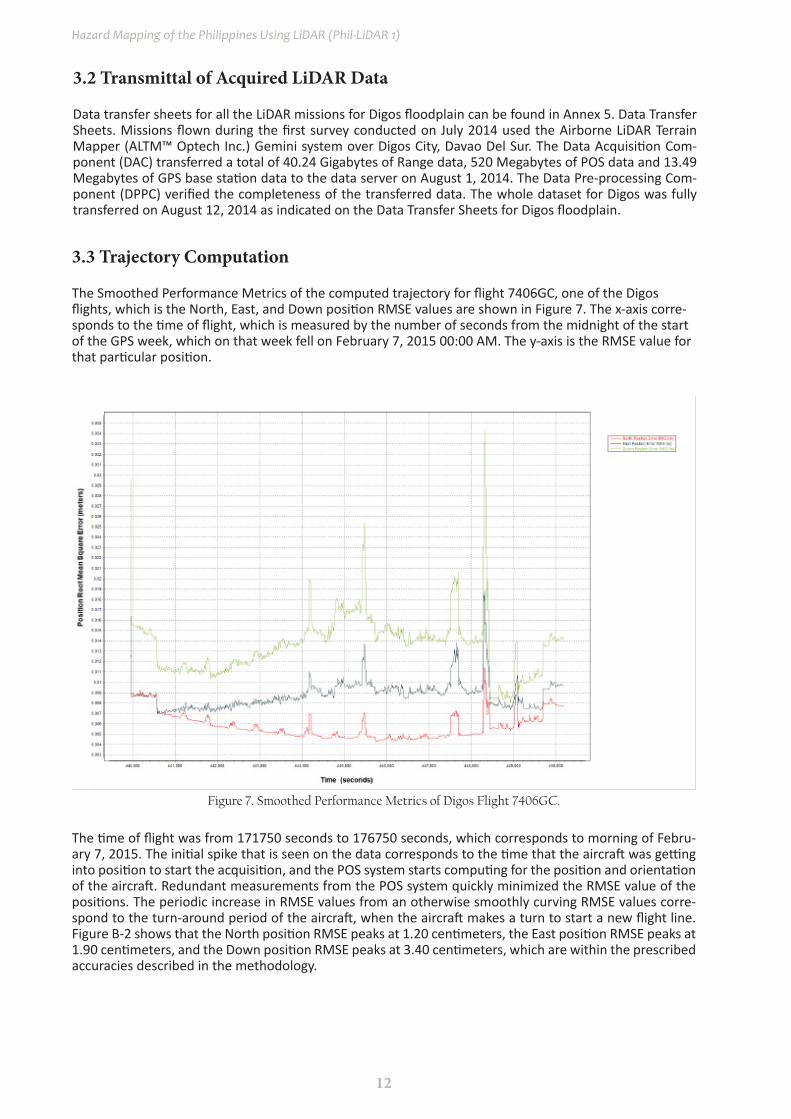
The Smoothed Performance Metrics of the computed trajectory for flight 7406GC, one of the Digos flights, which is the North, East, and Down position RMSE values are shown in Figure 7. The x-axis corre-sponds to the time of flight, which is measured by the number of seconds from the midnight of the start of the GPS week, which on that week fell on February 7, 2015 00:00 AM. The y-axis is the RMSE value for that particular position.
Figure 7. Smoothed Performance Metrics of Digos Flight 7406GC.
The time of flight was from 171750 seconds to 176750 seconds, which corresponds to morning of Febru-ary 7, 2015. The initial spike that is seen on the data corresponds to the time that the aircraft was getting into position to start the acquisition, and the POS system starts computing for the position and orientation of the aircraft. Redundant measurements from the POS system quickly minimized the RMSE value of the positions. The periodic increase in RMSE values from an otherwise smoothly curving RMSE values corre-spond to the turn-around period of the aircraft, when the aircraft makes a turn to start a new flight line. Figure B-2 shows that the North position RMSE peaks at 1.20 centimeters, the East position RMSE peaks at 1.90 centimeters, and the Down position RMSE peaks at 3.40 centimeters, which are within the prescribed accuracies described in the methodology.
13
LiDAR Surveys and Flood Mapping of Digos River
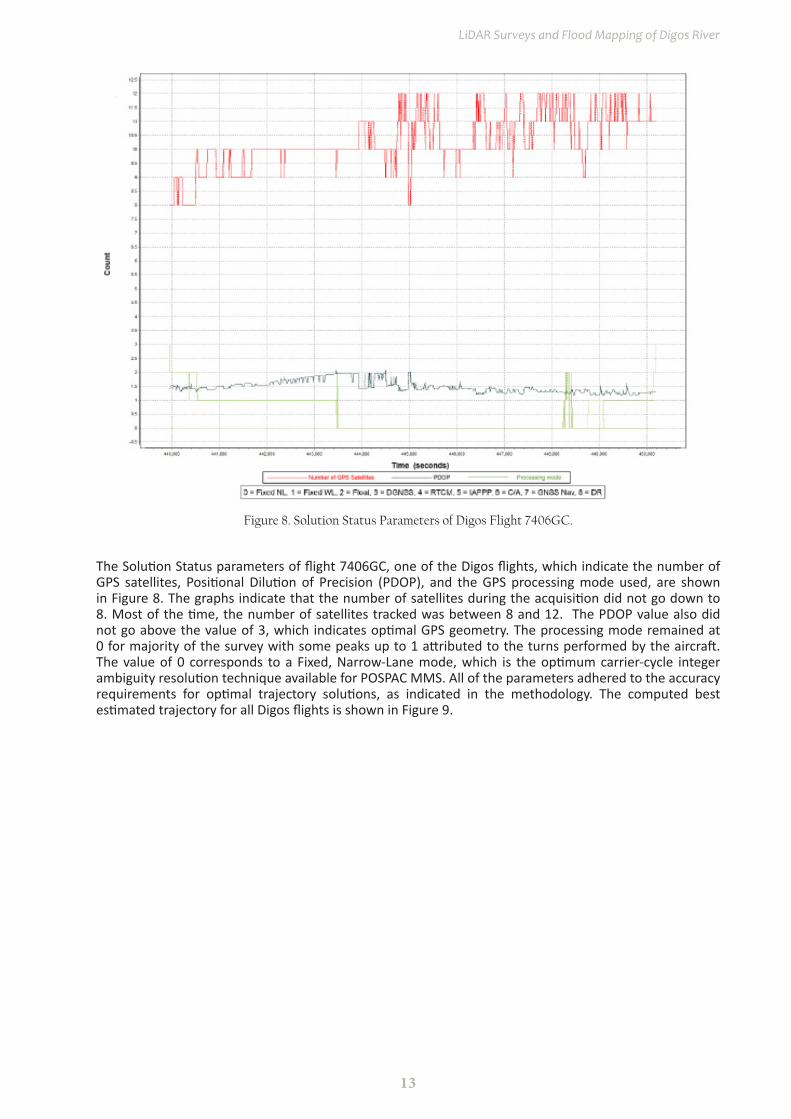
Figure 8. Solution Status Parameters of Digos Flight 7406GC.
The Solution Status parameters of flight 7406GC, one of the Digos flights, which indicate the number of GPS satellites, Positional Dilution of Precision (PDOP), and the GPS processing mode used, are shown in Figure 8. The graphs indicate that the number of satellites during the acquisition did not go down to 8. Most of the time, the number of satellites tracked was between 8 and 12. The PDOP value also did not go above the value of 3, which indicates optimal GPS geometry. The processing mode remained at 0 for majority of the survey with some peaks up to 1 attributed to the turns performed by the aircraft. The value of 0 corresponds to a Fixed, Narrow-Lane mode, which is the optimum carrier-cycle integer ambiguity resolution technique available for POSPAC MMS. All of the parameters adhered to the accuracy requirements for optimal trajectory solutions, as indicated in the methodology. The computed best estimated trajectory for all Digos flights is shown in Figure 9.

14
Hazard Mapping of the Philippines Using LiDAR (Phil-LiDAR 1)
Figure 9. Best estimated trajectory for Digos Floodplain
3.4 LiDAR Point Cloud Computation
The produced LAS data contains 30 flight lines, with each flight line containing one channel, since the Gemini system contains only one channel. The summary of the self-calibration results obtained from LiDAR processing in LiDAR Mapping Suite (LMS) software for all flights over Digos floodplain are given in Table 10.
Parameter Acceptable Value
Boresight Correction stdev (<0.001degrees) 0.000252
IMU Attitude Correction Roll and Pitch Corrections stdev (<0.001degrees) 0.000646
GPS Position Z-correction stdev (<0.01meters) 0.0017
The optimum accuracy is obtained for all Digos flights based on the computed standard deviations of the corrections of the orientation parameters. Standard deviation values for individual blocks are available in the Annex 8. Mission Summary Reports.
3.5 LiDAR Quality Checking
The boundary of the processed LiDAR data is shown in Figure 10. The map shows gaps in the LiDAR cover-age that are attributed to cloud coverage.
Table 10. Self-Calibration Results for Digos Flights
15
LiDAR Surveys and Flood Mapping of Digos River
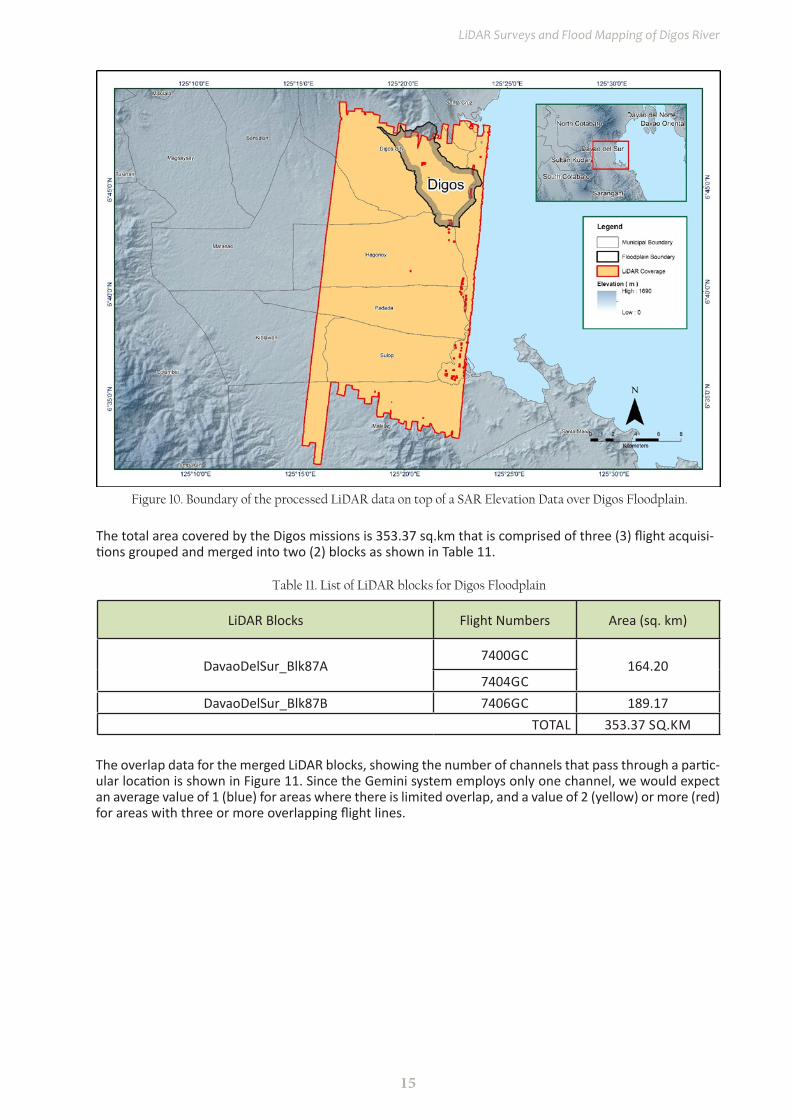
Figure 10. Boundary of the processed LiDAR data on top of a SAR Elevation Data over Digos Floodplain.
The total area covered by the Digos missions is 353.37 sq.km that is comprised of three (3) flight acquisi-tions grouped and merged into two (2) blocks as shown in Table 11.
LiDAR Blocks Flight Numbers Area (sq. km)
DavaoDelSur_Blk87A7400GC
164.207404GC
DavaoDelSur_Blk87B 7406GC 189.17TOTAL 353.37 SQ.KM
Table 11. List of LiDAR blocks for Digos Floodplain
The overlap data for the merged LiDAR blocks, showing the number of channels that pass through a partic-ular location is shown in Figure 11. Since the Gemini system employs only one channel, we would expect an average value of 1 (blue) for areas where there is limited overlap, and a value of 2 (yellow) or more (red) for areas with three or more overlapping flight lines.
16
Hazard Mapping of the Philippines Using LiDAR (Phil-LiDAR 1)
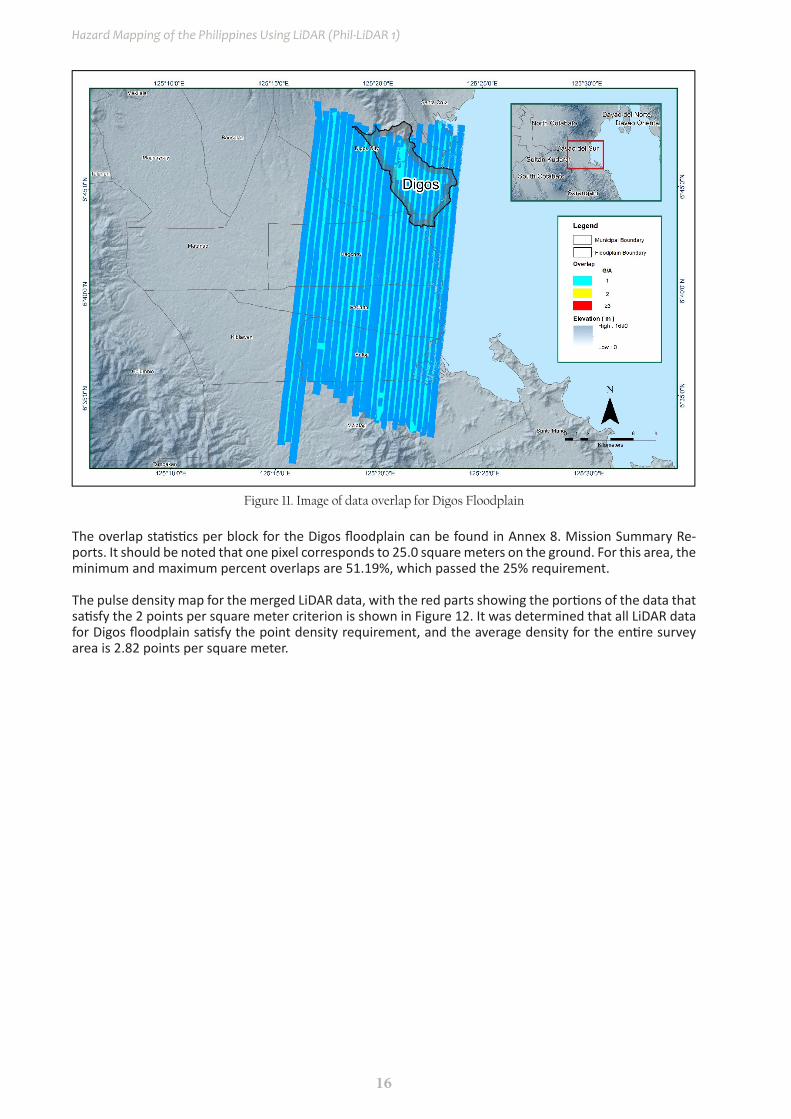
Figure 11. Image of data overlap for Digos Floodplain
The overlap statistics per block for the Digos floodplain can be found in Annex 8. Mission Summary Re-ports. It should be noted that one pixel corresponds to 25.0 square meters on the ground. For this area, the minimum and maximum percent overlaps are 51.19%, which passed the 25% requirement.
The pulse density map for the merged LiDAR data, with the red parts showing the portions of the data that satisfy the 2 points per square meter criterion is shown in Figure 12. It was determined that all LiDAR data for Digos floodplain satisfy the point density requirement, and the average density for the entire survey area is 2.82 points per square meter.
17
LiDAR Surveys and Flood Mapping of Digos River
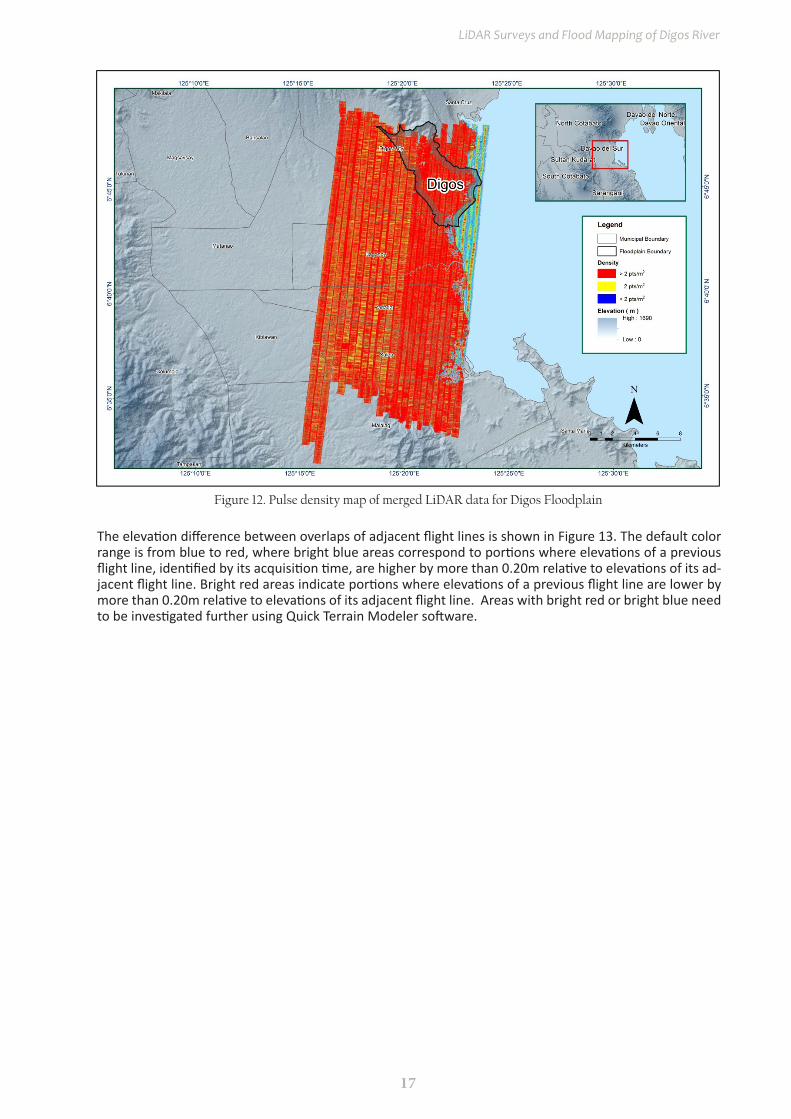
Figure 12. Pulse density map of merged LiDAR data for Digos Floodplain
The elevation difference between overlaps of adjacent flight lines is shown in Figure 13. The default color range is from blue to red, where bright blue areas correspond to portions where elevations of a previous flight line, identified by its acquisition time, are higher by more than 0.20m relative to elevations of its ad-jacent flight line. Bright red areas indicate portions where elevations of a previous flight line are lower by more than 0.20m relative to elevations of its adjacent flight line. Areas with bright red or bright blue need to be investigated further using Quick Terrain Modeler software.
18
Hazard Mapping of the Philippines Using LiDAR (Phil-LiDAR 1)
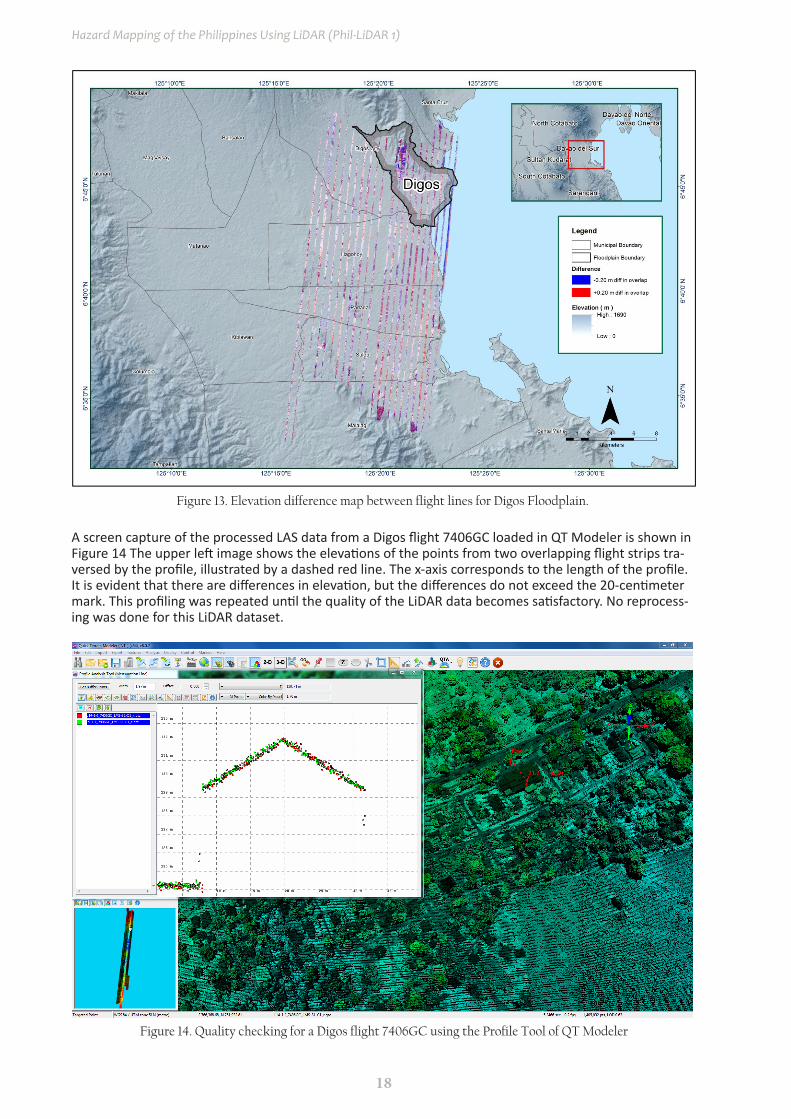
Figure 13. Elevation difference map between flight lines for Digos Floodplain.
A screen capture of the processed LAS data from a Digos flight 7406GC loaded in QT Modeler is shown in Figure 14 The upper left image shows the elevations of the points from two overlapping flight strips tra-versed by the profile, illustrated by a dashed red line. The x-axis corresponds to the length of the profile. It is evident that there are differences in elevation, but the differences do not exceed the 20-centimeter mark. This profiling was repeated until the quality of the LiDAR data becomes satisfactory. No reprocess-ing was done for this LiDAR dataset.
Figure 14. Quality checking for a Digos flight 7406GC using the Profile Tool of QT Modeler

19
LiDAR Surveys and Flood Mapping of Digos River
3.6 LiDAR Point Cloud Classification and Rasterization
The tile system that TerraScan employed for the LiDAR data and the final classification image for a block in Digos floodplain is shown in Figure 15. A total of 446 1km by 1km tiles were produced. The number of points classified to the pertinent categories is illustrated in Table 12. The point cloud has a maximum and minimum height of 565.04 meters and 68.87 meters respectively.
Pertinent Class Total Number of Points
Ground 142,479,850Low Vegetation 159,869,354
Medium Vegetation 236,241,132High Vegetation 402,003,963
Building 13,034,767
Table 12. Digos classification results in TerraScan
Figure 15. Tiles for Digos floodplain (a) and classification results (b) in TerraScan
An isometric view of an area before and after running the classification routines is shown in Figure 16. The ground points are in orange, the vegetation is in different shades of green, and the buildings are in cyan. It can be seen that residential structures adjacent or even below canopy are classified correctly, due to the density of the LiDAR data.
Figure 16. Point cloud before (a) and after (b) classification
20
Hazard Mapping of the Philippines Using LiDAR (Phil-LiDAR 1)
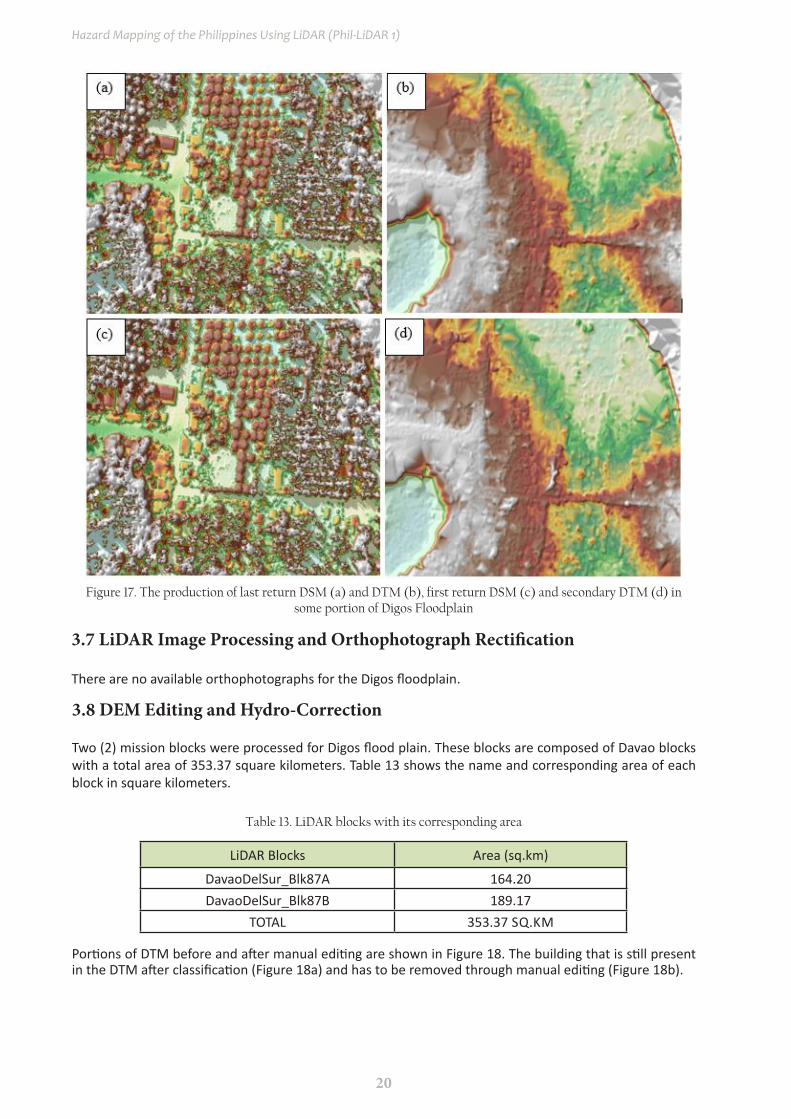
Figure 17. The production of last return DSM (a) and DTM (b), first return DSM (c) and secondary DTM (d) in some portion of Digos Floodplain
3.7 LiDAR image Processing and Orthophotograph Rectification
There are no available orthophotographs for the Digos floodplain.
3.8 DEM Editing and Hydro-Correction
Two (2) mission blocks were processed for Digos flood plain. These blocks are composed of Davao blocks with a total area of 353.37 square kilometers. Table 13 shows the name and corresponding area of each block in square kilometers.
LiDAR Blocks Area (sq.km)
DavaoDelSur_Blk87A 164.20DavaoDelSur_Blk87B 189.17
TOTAL 353.37 SQ.KM
Table 13. LiDAR blocks with its corresponding area
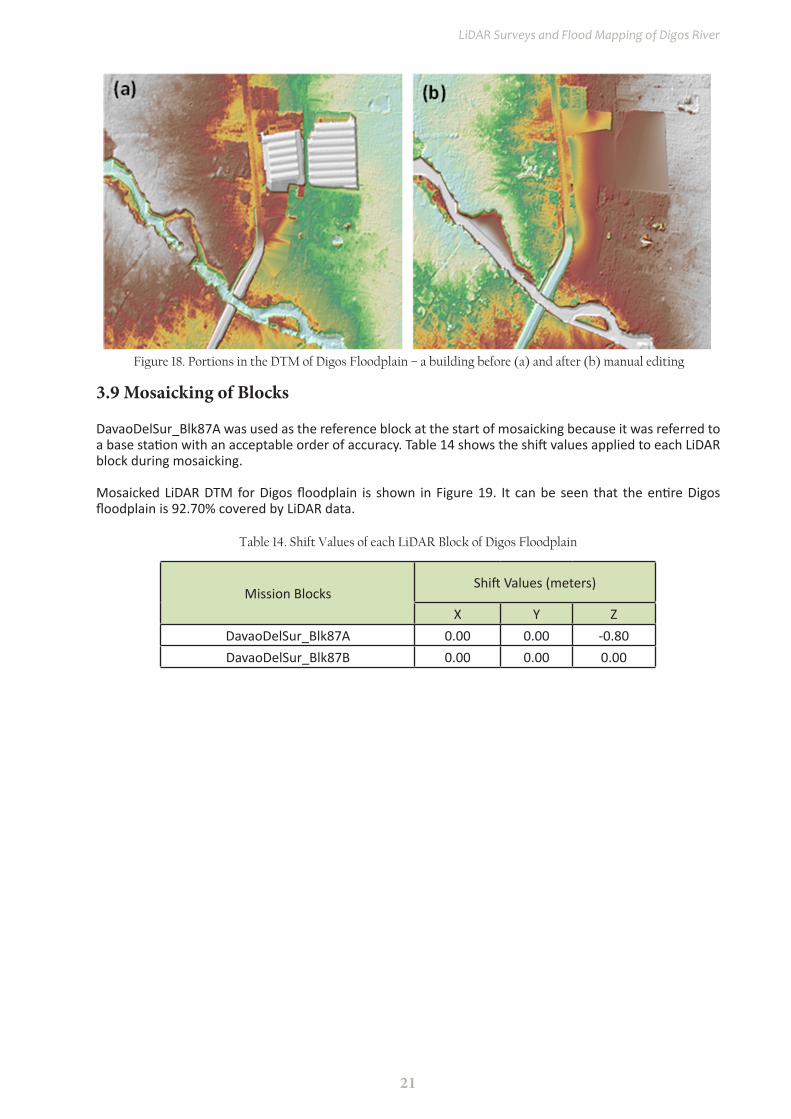
Portions of DTM before and after manual editing are shown in Figure 18. The building that is still present in the DTM after classification (Figure 18a) and has to be removed through manual editing (Figure 18b).
21
LiDAR Surveys and Flood Mapping of Digos River
3.9 Mosaicking of Blocks
DavaoDelSur_Blk87A was used as the reference block at the start of mosaicking because it was referred to a base station with an acceptable order of accuracy. Table 14 shows the shift values applied to each LiDAR block during mosaicking.
Mosaicked LiDAR DTM for Digos floodplain is shown in Figure 19. It can be seen that the entire Digos floodplain is 92.70% covered by LiDAR data.
Table 14. Shift Values of each LiDAR Block of Digos Floodplain
Figure 18. Portions in the DTM of Digos Floodplain – a building before (a) and after (b) manual editing
Mission BlocksShift Values (meters)
X Y ZDavaoDelSur_Blk87A 0.00 0.00 -0.80DavaoDelSur_Blk87B 0.00 0.00 0.00
22
Hazard Mapping of the Philippines Using LiDAR (Phil-LiDAR 1)
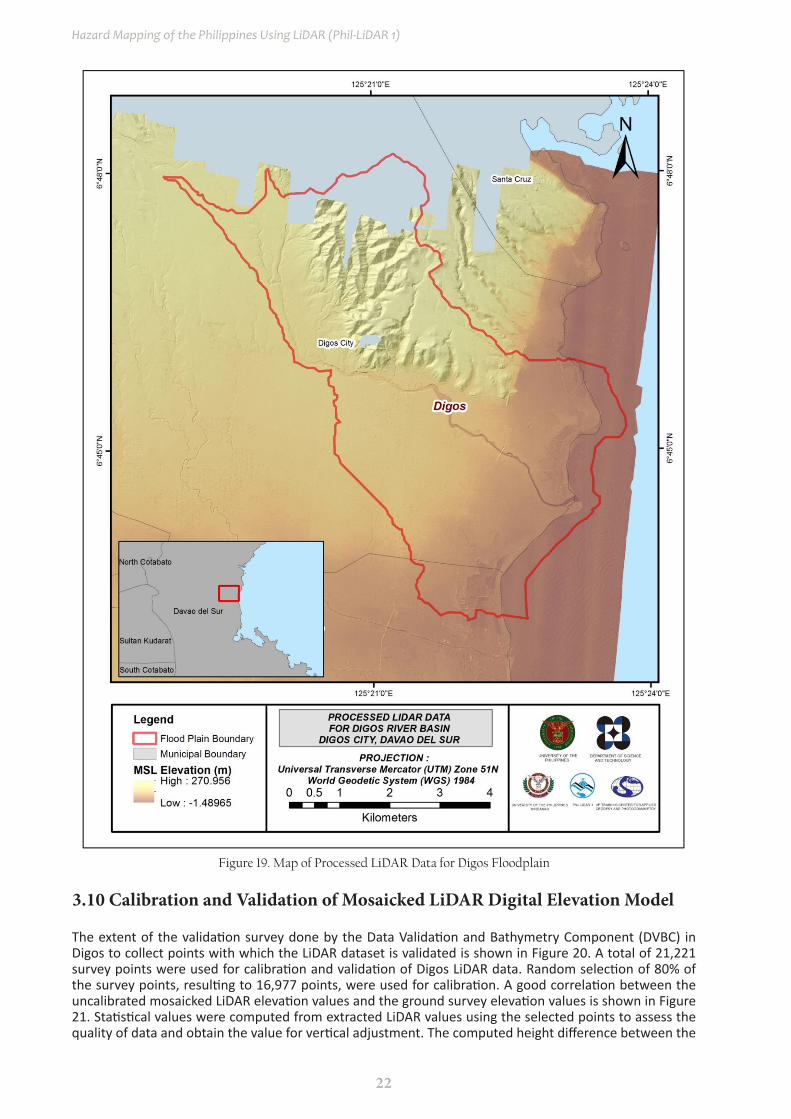
Figure 19. Map of Processed LiDAR Data for Digos Floodplain
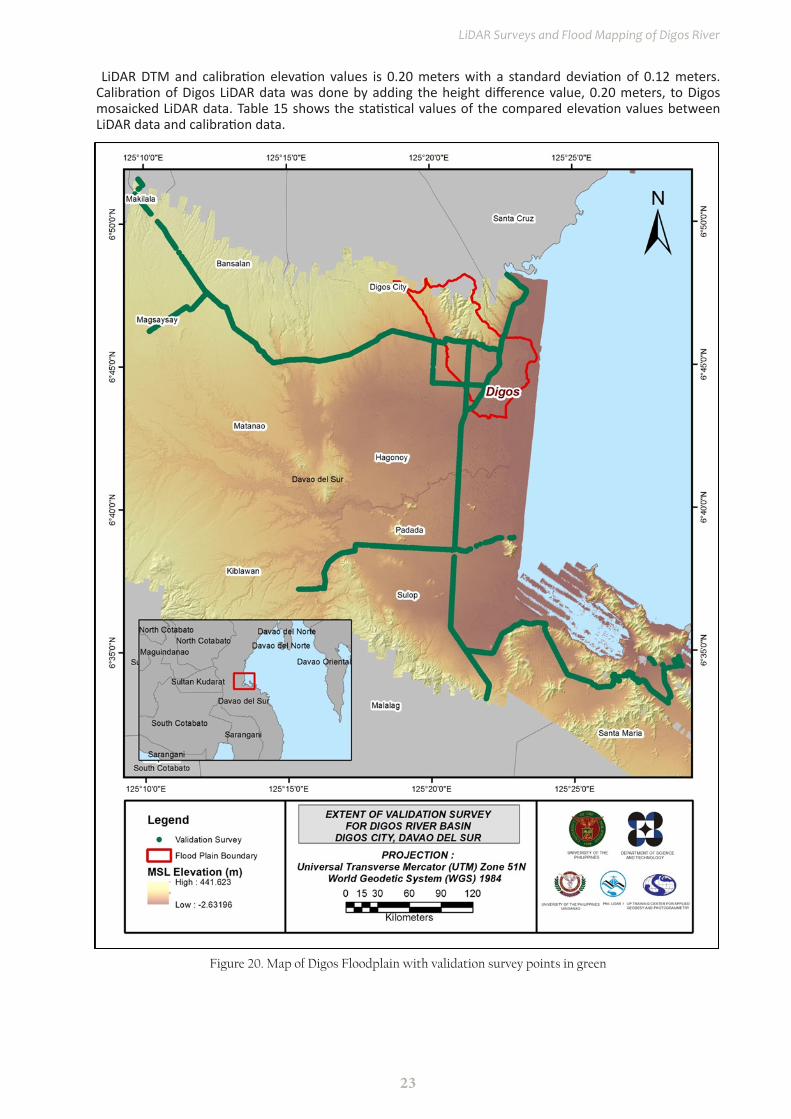
3.10 Calibration and validation of Mosaicked LiDAR Digital Elevation Model
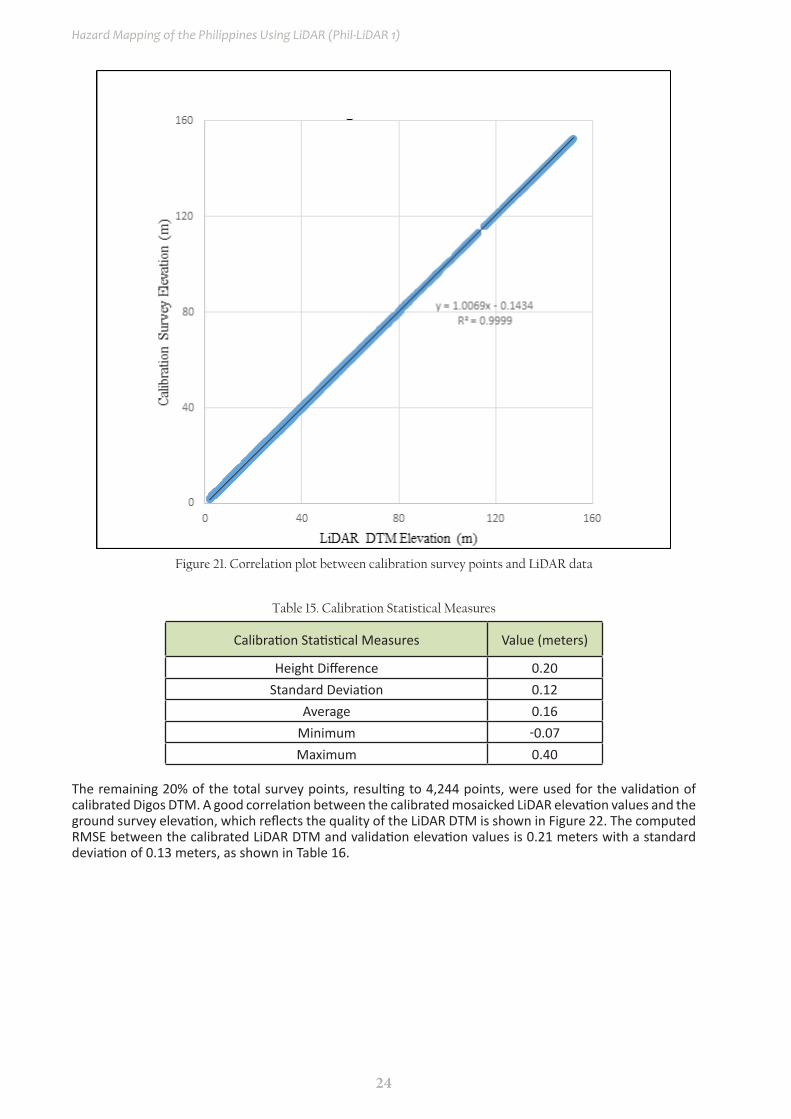
The extent of the validation survey done by the Data Validation and Bathymetry Component (DVBC) in Digos to collect points with which the LiDAR dataset is validated is shown in Figure 20. A total of 21,221 survey points were used for calibration and validation of Digos LiDAR data. Random selection of 80% of the survey points, resulting to 16,977 points, were used for calibration. A good correlation between the uncalibrated mosaicked LiDAR elevation values and the ground survey elevation values is shown in Figure 21. Statistical values were computed from extracted LiDAR values using the selected points to assess the quality of data and obtain the value for vertical adjustment. The computed height difference between the
23
LiDAR Surveys and Flood Mapping of Digos River
LiDAR DTM and calibration elevation values is 0.20 meters with a standard deviation of 0.12 meters. Calibration of Digos LiDAR data was done by adding the height difference value, 0.20 meters, to Digos mosaicked LiDAR data. Table 15 shows the statistical values of the compared elevation values between LiDAR data and calibration data.
Figure 20. Map of Digos Floodplain with validation survey points in green
24
Hazard Mapping of the Philippines Using LiDAR (Phil-LiDAR 1)
Figure 21. Correlation plot between calibration survey points and LiDAR data
Table 15. Calibration Statistical Measures
Calibration Statistical Measures Value (meters)
Height Difference 0.20Standard Deviation 0.12
Average 0.16Minimum -0.07Maximum 0.40
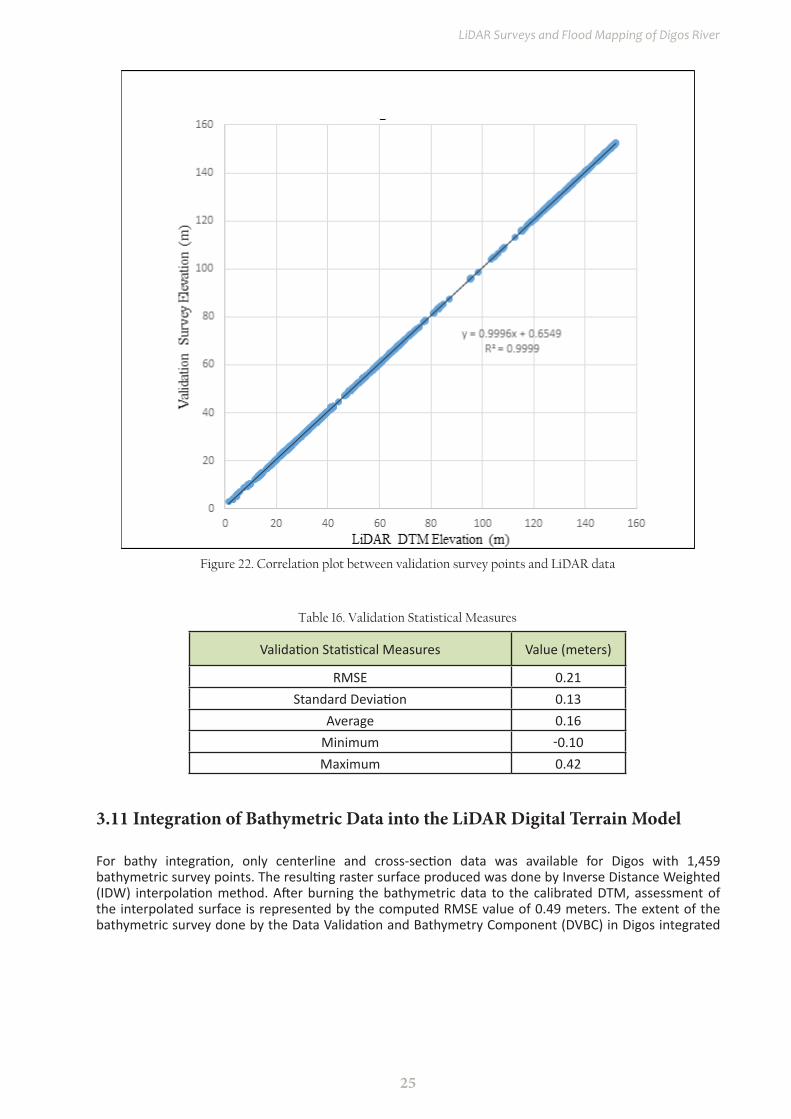
The remaining 20% of the total survey points, resulting to 4,244 points, were used for the validation of calibrated Digos DTM. A good correlation between the calibrated mosaicked LiDAR elevation values and the ground survey elevation, which reflects the quality of the LiDAR DTM is shown in Figure 22. The computed RMSE between the calibrated LiDAR DTM and validation elevation values is 0.21 meters with a standard deviation of 0.13 meters, as shown in Table 16.
25
LiDAR Surveys and Flood Mapping of Digos River
Figure 22. Correlation plot between validation survey points and LiDAR data
Table 16. Validation Statistical Measures
Validation Statistical Measures Value (meters)
RMSE 0.21Standard Deviation 0.13
Average 0.16Minimum -0.10Maximum 0.42
For bathy integration, only centerline and cross-section data was available for Digos with 1,459 bathymetric survey points. The resulting raster surface produced was done by Inverse Distance Weighted (IDW) interpolation method. After burning the bathymetric data to the calibrated DTM, assessment of the interpolated surface is represented by the computed RMSE value of 0.49 meters. The extent of the bathymetric survey done by the Data Validation and Bathymetry Component (DVBC) in Digos integrated
3.11 integration of Bathymetric Data into the LiDAR Digital Terrain Model

26
Hazard Mapping of the Philippines Using LiDAR (Phil-LiDAR 1)
Figure 23. Map of Digos Flood Plain with bathymetric survey points shown in blue
The features salient in flood hazard exposure analysis include buildings, road networks, bridges and water bodies within the floodplain area with 200 m buffer zone. Mosaicked LiDAR DEM with 1 m resolution was used to delineate footprints of building features, which consist of residential buildings, government offices, medical facilities, religious institutions, and commercial establishments, among others. Road networks comprise of main thoroughfares such as highways and municipal and barangay roads essential for routing of disaster response efforts. These features are represented by a network of road centerlines.
3.12 Feature Extraction

27
LiDAR Surveys and Flood Mapping of Digos River
Digos floodplain, including its 200 m buffer, has a total area of 42.06 sq km. For this area, a total of 5.0 sq km, corresponding to a total of 3295 building features, are considered for QC. Figure 24 shows the QC blocks for Digos floodplain.
3.12.1 Quality Checking of Digitized Features’ Boundary
Figure 24. QC blocks for Digos building features
Quality checking of Digos building features resulted in the ratings shown in Table 17.
Table 17. Quality Checking Ratings for Digos Building Features
FLOODPLAIN COMPLETENESS CORRECTNESS QUALITY REMARKSDIGOS 98.17 99.48 96.48 PASSED
Height extraction was done for 23,882 building features in Digos floodplain. Of these building features, 744 was filtered out after height extraction, resulting to 23,138 buildings with height attributes. The lowest building height is at 2.00 m, while the highest building is at 11.99 m.
3.12.2 Height Extraction
Before the actual field validation, courtesy calls were conducted to seek permission and assistance from the Local Government Units of each barangay. This was done to ensure the safety and security in the area for the field validation process to go smoothly. Verification of barangay boundaries was also done to finalize the distribution of features for each barangay.
The courtesy calls and project presentations were done on January 13 - 15, 2016. Barangay Health Workers (BHWs) were requested and hired to guide the University of the Philippines Mindanao Phil-LiDAR1 field enumerators during validation. The field work activity was conducted from January 25 to February 4, 2016. The local hires deployed by the barangay captains were given a brief orientation by the field enumerators before the actual field work. Some of the personnel volunteered to use their own motorcycle vehicles
3.12.3 Feature Attribution
28
Hazard Mapping of the Philippines Using LiDAR (Phil-LiDAR 1)
during the validation proper. The team surveyed the fourteen (14) barangays covered by the floodplain namely Aplaya, Cogon, Sinawilan, Zone 1, Zone 2, Tres de Mayo, Zone 3, Dawis, San Jose, Balutakay, Kiagot, Dulangan, Ruparan and San Miguel, Digos City.
One of the concerns of the team during field validation was during the field validation include political concerns pertaining to boundary issues among barangays which made the local guides reluctant to cross barangay boundaries with the team. It was also highlighted during the courtesy call that the Balutakay River affects the southern part of Digos City when water rises due to excessive rain.
Table 18 summarizes the number of building features per type. On the other hand, Table 19 shows the total length of each road type, while Table 20 shows the number of water features extracted per type.
Facility Type No. of Features
Residential 21,023
School 307
Market 54
Agricultural/Agro-Industrial Facilities 96
Medical Institutions 90
Barangay Hall 19
Military Institution 3
Sports Center/Gymnasium/Covered Court 38
Telecommunication Facilities 7
Transport Terminal 4
Warehouse 43
Power Plant/Substation 40
NGO/CSO Offices 14
Police Station 3
Water Supply/Sewerage 7
Religious Institutions 202
Bank 20
Factory 18
Gas Station 31
Fire Station 2
Other Government Offices 84
Other Commercial Establishments 1,033
TOTAL 23,138
Table 18. Building Features Extracted for Digos Floodplain
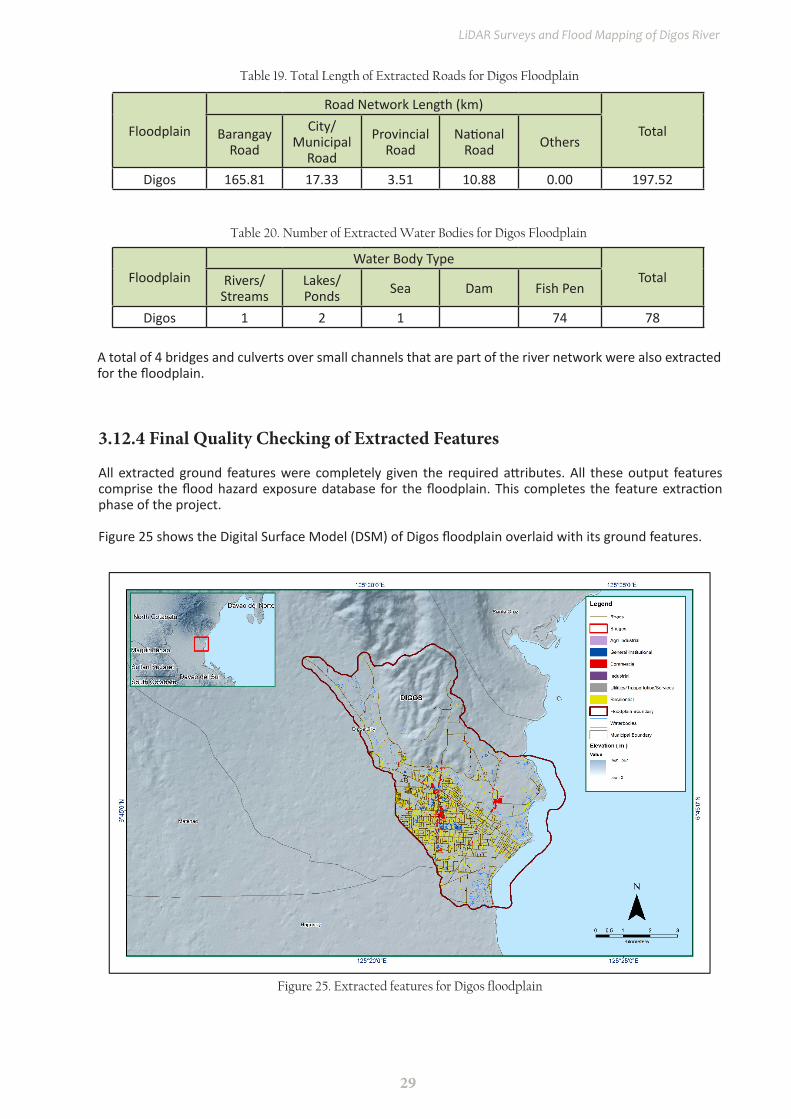
29
LiDAR Surveys and Flood Mapping of Digos River
Figure 25. Extracted features for Digos floodplain
Floodplain
Road Network Length (km)
TotalBarangay Road
City/Municipal
Road
Provincial Road
National Road Others
Digos 165.81 17.33 3.51 10.88 0.00 197.52
Table 19. Total Length of Extracted Roads for Digos Floodplain
FloodplainWater Body Type
TotalRivers/Streams
Lakes/Ponds Sea Dam Fish Pen
Digos 1 2 1 74 78
Table 20. Number of Extracted Water Bodies for Digos Floodplain
A total of 4 bridges and culverts over small channels that are part of the river network were also extracted for the floodplain.
All extracted ground features were completely given the required attributes. All these output features comprise the flood hazard exposure database for the floodplain. This completes the feature extraction phase of the project.
Figure 25 shows the Digital Surface Model (DSM) of Digos floodplain overlaid with its ground features.
3.12.4 Final Quality Checking of Extracted Features
30
Hazard Mapping of the Philippines Using LiDAR (Phil-LiDAR 1)
CHAPTER 4. LiDAR vALiDATiON SURvEY AND MEASUREMENTS OF THE DiGOS RivER BASiN
Engr. Louie P. Balicanta, Engr. Joemarie S. Caballero, Ms. Patrizcia Mae. P. dela Cruz, Engr. Dexter T. Lozano, For. Dona Rina Patricia C. Tajora, Elaine Bennet Salvador, and For. Rodel C. Alberto
Digos River Basin in the Eastern area of Davao Del Sur encompasses the Municipality of Santa Cruz and has a catchment area of approximately 87.135 km2 according to the Flood Modelling Component. The basin has a run-off amount of approximately 350 MCM according to the DENR-RCBO. The area in the vicinity of the Digos River Basin, the Digos City is classified to be highly susceptible to landslide and flooding based from the 2007 Mines and Geosciences Bureau’s (MGB) Geohazard Maps.
Its main stem, Digos River channel has an estimated length of 9 km, is among the fourteen (14) river systems in Davao Del as shown in Figure 26. It is bounded by Brgy. Ruparan in the North; Digos City and Brgy. Tres de Mayo in the West; Bry. Balutakay in the South; and the Davao Gulf in the East. Its water, according to its beneficial use is categorized as Class C by the Department of Environmental Management. Its uses are for Fishery Water for the propagation and growth of fish and other aquatic resources; Recreational Water Class II such as Boatings; and Industrial Water Supply Class I for manufacturing processes after treatment. Davao del Sur has a total population of 574,910 based on the 2010 NSO census. The province suffered flooding due to massive rain produced by Typhoon Pablo last December 4, 2012 which is also considered as the strongest storm to hit Mindanao in two decades according to PAG-ASA. Typhoon Pablo also known by its international name Typhoon Bopha, put Mindanao under the state of calamity. The typhoon also resulted to power outrage and destruction of properties of the community.
In line with this, a field survey in Digos River on June 28 to July 12, 2015 with the following scope of work: reconnaissance survey to determine the viability of traversing the planned routes for bathymetric survey; courtesy call to LGU Digos City; control survey for the establishment of control point UP-DIG at Digos bridge approach occupied as base station for GNSS surveys and cross-section, bridge-as-built and water level marking in MSL of Digos Bridge piers; LiDAR acquired ground validation survey with estimated distance of 84.5 km; and bathymetric survey of Digos River covering the areas of Brgy. Tres de Mayo, Brgy. Zone 2, Canos Bridge, Digos Bridge and Brgy. Aplaya with an approximate length of 9 km utilizing GNSS PPK survey technique. The survey extent is shown in Figure 26.
4.1 Summary of Activities
The methods applied in this Chapter were based on the DREAM methods manual (Balicanta, et al., 2014) and further enhanced and updated in Paringit, et al. (2017).
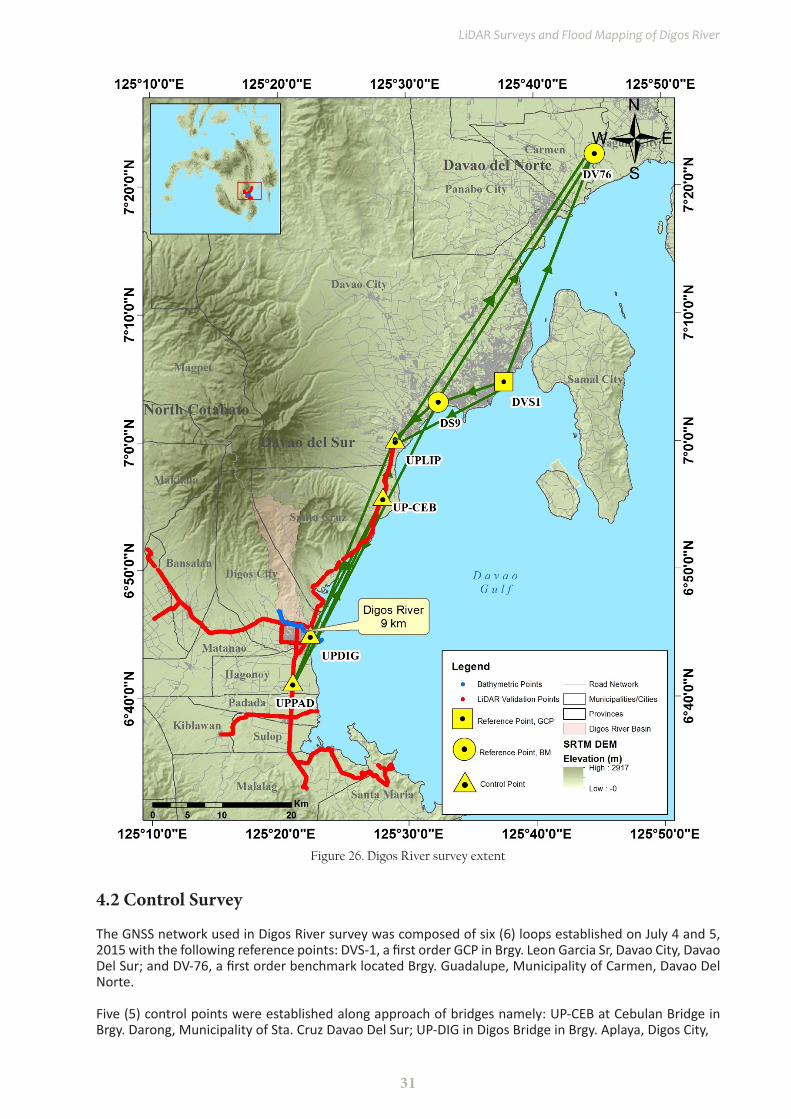
31
LiDAR Surveys and Flood Mapping of Digos River
Figure 26. Digos River survey extent
The GNSS network used in Digos River survey was composed of six (6) loops established on July 4 and 5, 2015 with the following reference points: DVS-1, a first order GCP in Brgy. Leon Garcia Sr, Davao City, Davao Del Sur; and DV-76, a first order benchmark located Brgy. Guadalupe, Municipality of Carmen, Davao Del Norte.
Five (5) control points were established along approach of bridges namely: UP-CEB at Cebulan Bridge in Brgy. Darong, Municipality of Sta. Cruz Davao Del Sur; UP-DIG in Digos Bridge in Brgy. Aplaya, Digos City,
4.2 Control Survey
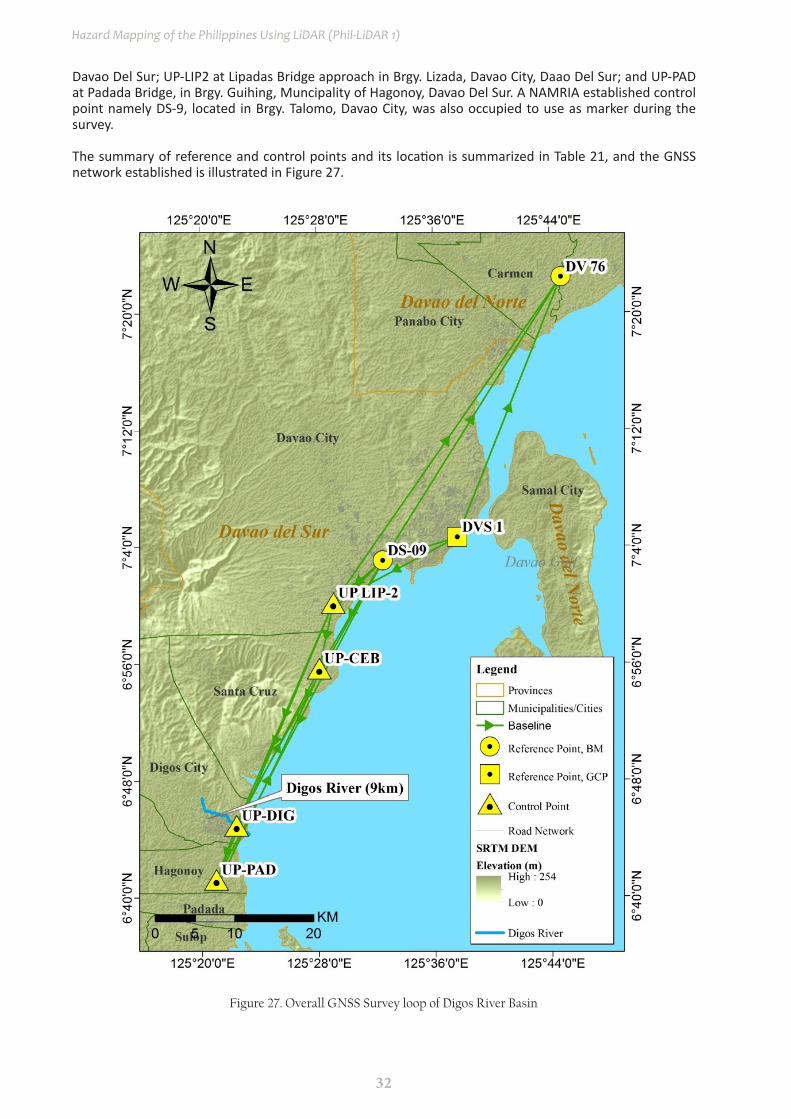
32
Hazard Mapping of the Philippines Using LiDAR (Phil-LiDAR 1)
Davao Del Sur; UP-LIP2 at Lipadas Bridge approach in Brgy. Lizada, Davao City, Daao Del Sur; and UP-PAD at Padada Bridge, in Brgy. Guihing, Muncipality of Hagonoy, Davao Del Sur. A NAMRIA established control point namely DS-9, located in Brgy. Talomo, Davao City, was also occupied to use as marker during the survey.
The summary of reference and control points and its location is summarized in Table 21, and the GNSS network established is illustrated in Figure 27.
Figure 27. Overall GNSS Survey loop of Digos River Basin
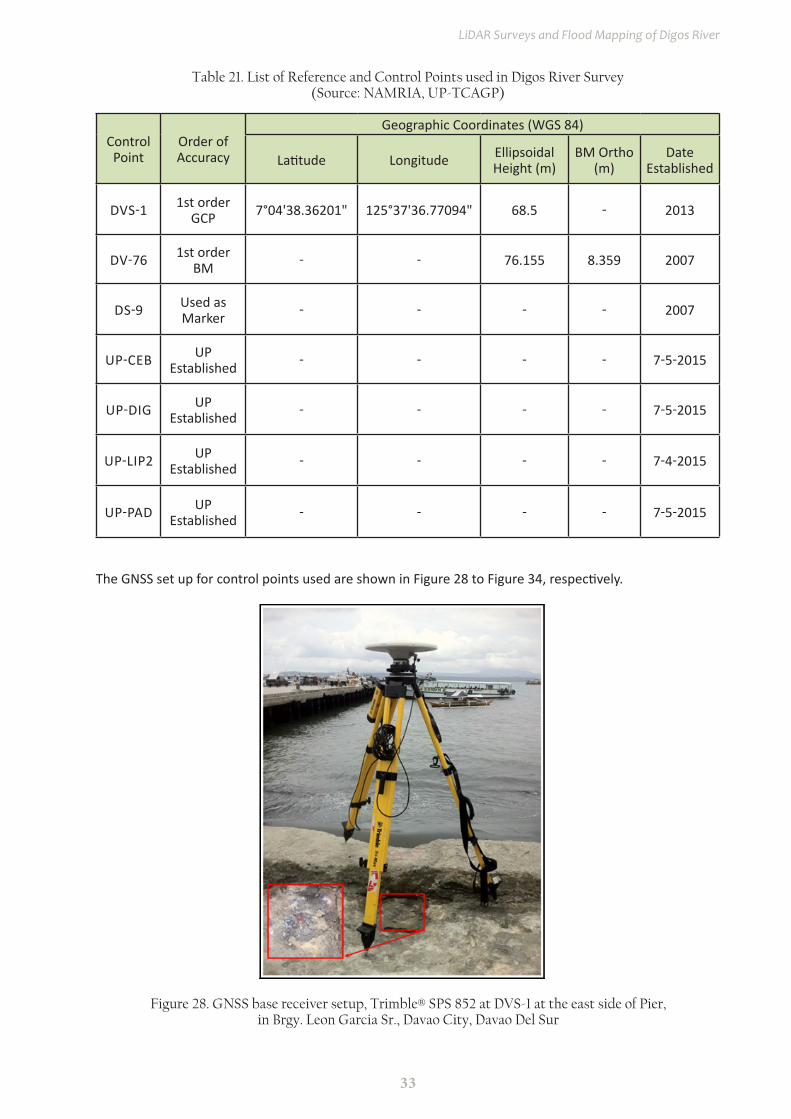
33
LiDAR Surveys and Flood Mapping of Digos River
Control Point
Order of Accuracy
Geographic Coordinates (WGS 84)
Latitude Longitude Ellipsoidal Height (m)
BM Ortho (m)
Date Established
DVS-1 1st order GCP 7°04'38.36201" 125°37'36.77094" 68.5 - 2013
DV-76 1st order BM - - 76.155 8.359 2007
DS-9 Used as Marker - - - - 2007
UP-CEB UP Established - - - - 7-5-2015
UP-DIG UP Established - - - - 7-5-2015
UP-LIP2 UP Established - - - - 7-4-2015
UP-PAD UP Established - - - - 7-5-2015
Table 21. List of Reference and Control Points used in Digos River Survey (Source: NAMRIA, UP-TCAGP)
The GNSS set up for control points used are shown in Figure 28 to Figure 34, respectively.
Figure 28. GNSS base receiver setup, Trimble® SPS 852 at DVS-1 at the east side of Pier, in Brgy. Leon Garcia Sr., Davao City, Davao Del Sur
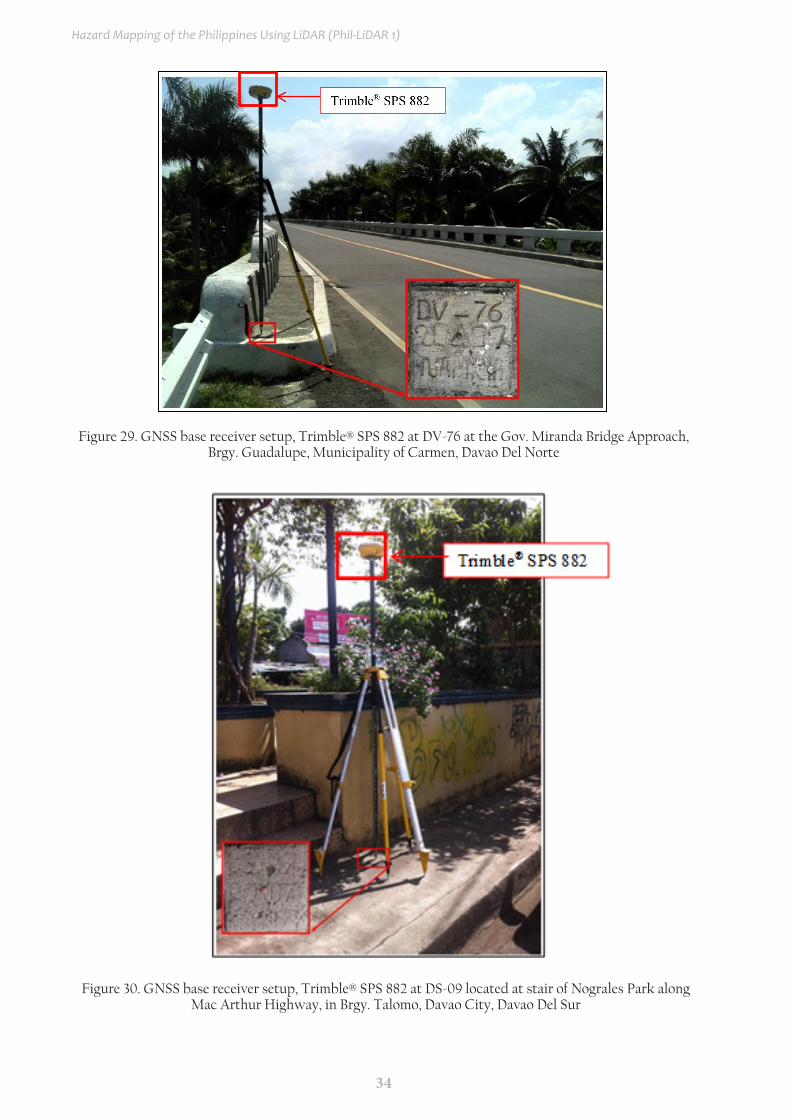
34
Hazard Mapping of the Philippines Using LiDAR (Phil-LiDAR 1)
Figure 29. GNSS base receiver setup, Trimble® SPS 882 at DV-76 at the Gov. Miranda Bridge Approach, Brgy. Guadalupe, Municipality of Carmen, Davao Del Norte
Figure 30. GNSS base receiver setup, Trimble® SPS 882 at DS-09 located at stair of Nograles Park along Mac Arthur Highway, in Brgy. Talomo, Davao City, Davao Del Sur

35
LiDAR Surveys and Flood Mapping of Digos River
Figure 32. GNSS base receiver setup, Trimble® SPS 882 at UP-DIG, right approach of Digos Bridge in Brgy. Aplaya, Digos City, Davao Del Sur
Figure 31. GNSS base receiver setup, Trimble® SPS 852 at UP-CEB on the right approach of Cebulan
Bridge in Brgy Darong, Municipality of Santa Cruz, Davao Del Sur

36
Hazard Mapping of the Philippines Using LiDAR (Phil-LiDAR 1)
4.3 Baseline Processing
The GNSS baselines were processed simultaneously in TBC by observing that all baselines have fixed solutions with horizontal and vertical precisions within +/- 20 cm and +/- 10 cm requirement, respectively. In cases where one or more baselines did not meet all of these criteria, masking is performed. Masking is done by removing portions of these baseline data using the same processing software. It is repeatedly processed until all baseline requirements are met. If the reiteration yields out of the required accuracy, resurvey is initiated. Baseline processing result of control points in Digos River Basin is summarized in Table 22, generated by TBC software.
Figure 33. GNSS base receiver setup, Trimble® SPS 852 at UP-LIP2, on the right approach of Lipadas Bridge along National Highway in Brgy. Lizada, Toril District, Davao Del Sur
Figure 34. GNSS base receiver setup, Trimble® SPS 882 at UP-PAD, Padada Bridge, Brgy. Guihing, Municipality of Hagonoy, Davao del Sur

37
LiDAR Surveys and Flood Mapping of Digos River
Observation Date of Observation
Solution Type
H. Prec.(Meter)
V. Prec.(Meter)
Geodetic Az.
Ellipsoid Dist.
(Meter)
ΔHeight(Meter)
UPPAD --- UPCEB 7-4-2015 Fixed 0.005 0.024 26°11'09" 29668.539 20.427
DVS1 --- DS9 6-30-2015 Fixed 0.004 0.013 252°53'03" 9875.482 3.720
DVS1 --- UPLIP2 7-4-2015 Fixed 0.003 0.016 242°19'23" 17735.680 10.641
UPLIP2 --- UPPAD 7-4-2015 Fixed 0.004 0.017 203°09'13" 37929.527 4.455
UPLIP2 --- UPCEB 7-4-2015 Fixed 0.004 0.024 192°23'44" 8451.500 24.864
UPPAD --- UPTOL 7-4-2015 Fixed 0.003 0.014 240°13'14" 2487.973 1.230
DVS1 --- DS9 6-30-2015 Fixed 0.006 0.033 252°53'03" 9875.477 3.723
DS9 --- UPLIP2 6-30-2015 Fixed 0.006 0.042 229°36'22" 8229.009 6.907
UPLIP2 --- DS9 6-30-2015 Fixed 0.006 0.035 229°36'23" 8228.967 6.965
DS9 --- UPPAD 6-30-2015 Fixed 0.011 0.036 207°47'10" 45445.416 11.450
DS9 --- UPCEB 7-5-2015 Fixed 0.011 0.046 210°44'50" 15809.215 31.878
DS9 --- DV76 6-30-2015 Fixed 0.005 0.049 32°23'13" 42306.620 3.850
DVS1 --- DV76 7-5-2015 Fixed 0.003 0.015 21°57'24" 35381.584 7.644
UPLIP2 --- DV76 7-5-2015 Fixed 0.006 0.021 35°09'36" 50225.907 -2.996
DS9 --- UPDIG 6-30-2015 Fixed 0.006 0.039 209°08'05" 38212.638 8.511
UPLIP2 --- UPDI 7-5-2015 Fixed 0.003 0.017 203°44'17" 30638.805 1.495
UPDIG --- UPPAD 7-5-2015 Fixed 0.004 0.017 200°41'13" 7298.998 2.930
Table 22. Baseline Processing Report for Digos River Basin Static Survey
As shown in Table 22 a total of 18 baselines were processed and all of them passed the required accuracy set by the project.
4.4 Network Adjustment
After the baseline processing procedure, network adjustment is performed using TBC. Looking at the Adjusted Grid Coordinates Table C-of the TBC generated Network Adjustment Report, it is observed that the square root of the sum of the squares of x and y must be less than 20 cm and z less than 10 cm or in equation form:
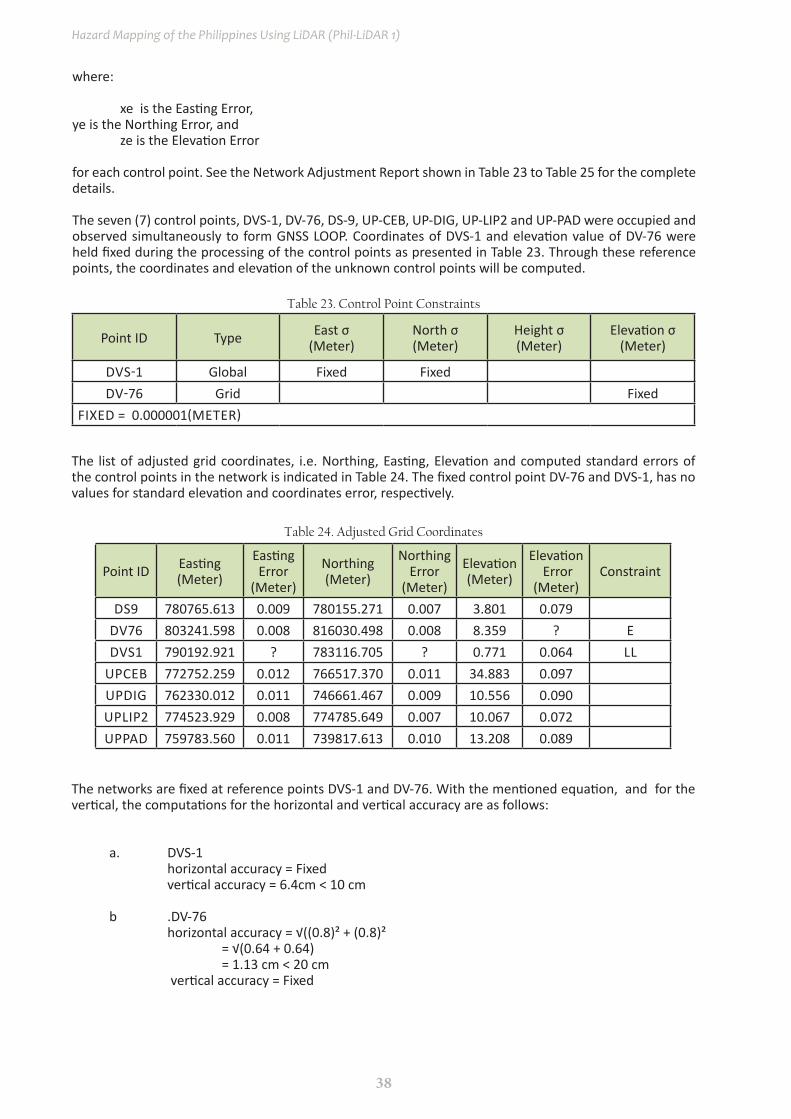
38
Hazard Mapping of the Philippines Using LiDAR (Phil-LiDAR 1)
Table 23. Control Point Constraints
where:
xe is the Easting Error, ye is the Northing Error, and ze is the Elevation Error
for each control point. See the Network Adjustment Report shown in Table 23 to Table 25 for the complete details.
The seven (7) control points, DVS-1, DV-76, DS-9, UP-CEB, UP-DIG, UP-LIP2 and UP-PAD were occupied and observed simultaneously to form GNSS LOOP. Coordinates of DVS-1 and elevation value of DV-76 were held fixed during the processing of the control points as presented in Table 23. Through these reference points, the coordinates and elevation of the unknown control points will be computed.
Point ID Type East σ(Meter)
North σ(Meter)
Height σ(Meter)
Elevation σ(Meter)
DVS-1 Global Fixed FixedDV-76 Grid Fixed
FIXED = 0.000001(METER)
The list of adjusted grid coordinates, i.e. Northing, Easting, Elevation and computed standard errors of the control points in the network is indicated in Table 24. The fixed control point DV-76 and DVS-1, has no values for standard elevation and coordinates error, respectively.
Point ID Easting(Meter)
EastingError
(Meter)
Northing(Meter)
Northing Error
(Meter)
Elevation(Meter)
Elevation Error
(Meter)Constraint
DS9 780765.613 0.009 780155.271 0.007 3.801 0.079 DV76 803241.598 0.008 816030.498 0.008 8.359 ? E DVS1 790192.921 ? 783116.705 ? 0.771 0.064 LL
UPCEB 772752.259 0.012 766517.370 0.011 34.883 0.097 UPDIG 762330.012 0.011 746661.467 0.009 10.556 0.090 UPLIP2 774523.929 0.008 774785.649 0.007 10.067 0.072 UPPAD 759783.560 0.011 739817.613 0.010 13.208 0.089
Table 24. Adjusted Grid Coordinates
The networks are fixed at reference points DVS-1 and DV-76. With the mentioned equation, and for the vertical, the computations for the horizontal and vertical accuracy are as follows:
a. DVS-1 horizontal accuracy = Fixed vertical accuracy = 6.4cm < 10 cm
b .DV-76 horizontal accuracy = √((0.8)² + (0.8)² = √(0.64 + 0.64) = 1.13 cm < 20 cm vertical accuracy = Fixed
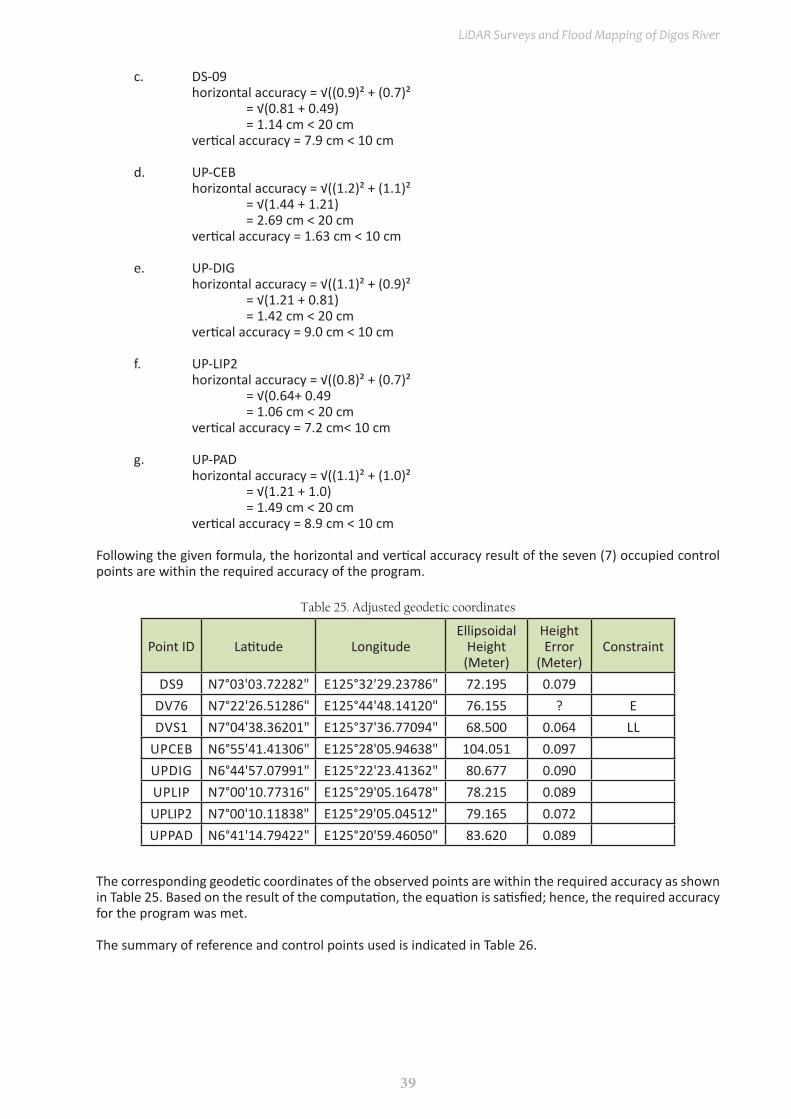
39
LiDAR Surveys and Flood Mapping of Digos River
Table 25. Adjusted geodetic coordinates
c. DS-09 horizontal accuracy = √((0.9)² + (0.7)² = √(0.81 + 0.49) = 1.14 cm < 20 cm vertical accuracy = 7.9 cm < 10 cm
d. UP-CEB horizontal accuracy = √((1.2)² + (1.1)² = √(1.44 + 1.21) = 2.69 cm < 20 cm vertical accuracy = 1.63 cm < 10 cm
e. UP-DIG horizontal accuracy = √((1.1)² + (0.9)² = √(1.21 + 0.81) = 1.42 cm < 20 cm vertical accuracy = 9.0 cm < 10 cm
f. UP-LIP2 horizontal accuracy = √((0.8)² + (0.7)² = √(0.64+ 0.49 = 1.06 cm < 20 cm vertical accuracy = 7.2 cm< 10 cm
g. UP-PAD horizontal accuracy = √((1.1)² + (1.0)² = √(1.21 + 1.0) = 1.49 cm < 20 cm vertical accuracy = 8.9 cm < 10 cm
Following the given formula, the horizontal and vertical accuracy result of the seven (7) occupied control points are within the required accuracy of the program.
Point ID Latitude LongitudeEllipsoidal
Height (Meter)
Height Error
(Meter)Constraint
DS9 N7°03'03.72282" E125°32'29.23786" 72.195 0.079 DV76 N7°22'26.51286" E125°44'48.14120" 76.155 ? E DVS1 N7°04'38.36201" E125°37'36.77094" 68.500 0.064 LL
UPCEB N6°55'41.41306" E125°28'05.94638" 104.051 0.097 UPDIG N6°44'57.07991" E125°22'23.41362" 80.677 0.090 UPLIP N7°00'10.77316" E125°29'05.16478" 78.215 0.089 UPLIP2 N7°00'10.11838" E125°29'05.04512" 79.165 0.072 UPPAD N6°41'14.79422" E125°20'59.46050" 83.620 0.089
The corresponding geodetic coordinates of the observed points are within the required accuracy as shown in Table 25. Based on the result of the computation, the equation is satisfied; hence, the required accuracy for the program was met.
The summary of reference and control points used is indicated in Table 26.
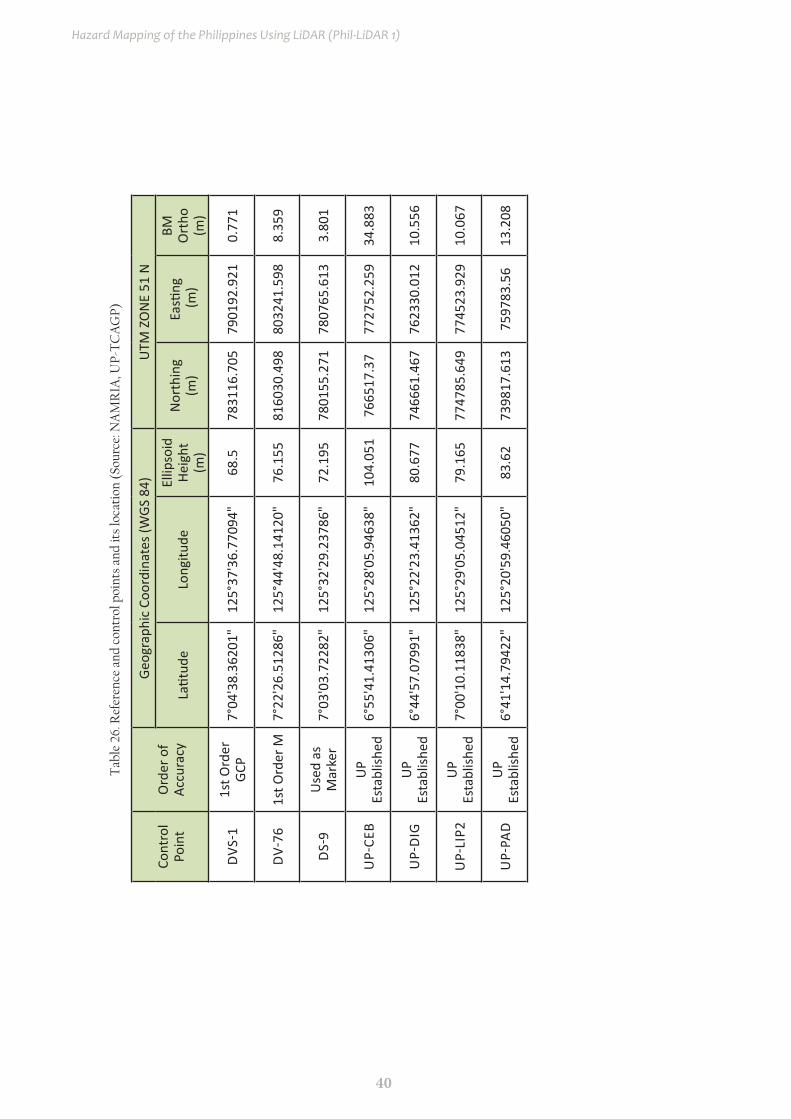
40
Hazard Mapping of the Philippines Using LiDAR (Phil-LiDAR 1)
Tab
le 2
6. R
efer
ence
and
con
trol
poi
nts
and
its
loca
tion
(So
urce
: NA
MR
IA, U
P-T
CA
GP)
Cont
rol
Poin
tO
rder
of
Accu
racy
Geog
raph
ic C
oord
inat
es (W
GS 8
4)U
TM Z
ON
E 51
N
Latit
ude
Long
itude
Ellip
soid
Heig
ht
(m)
Nor
thin
g (m
)Ea
sting
(m)
BM
Ort
ho
(m)
DVS
-11s
t Ord
er
GCP
7°04
'38.
3620
1"12
5°37
'36.
7709
4"68
.578
3116
.705
7901
92.9
210.
771
DV-
761s
t Ord
er M
7°22
'26.
5128
6"12
5°44
'48.
1412
0"76
.155
8160
30.4
9880
3241
.598
8.35
9
DS-
9U
sed
as
Mar
ker
7°03
'03.
7228
2"12
5°32
'29.
2378
6"72
.195
7801
55.2
7178
0765
.613
3.80
1
UP-
CEB
UP
Esta
blish
ed6°
55'4
1.41
306"
125°
28'0
5.94
638"
104.
051
7665
17.3
777
2752
.259
34.8
83
UP-
DIG
UP
Esta
blish
ed6°
44'5
7.07
991"
125°
22'2
3.41
362"
80.6
7774
6661
.467
7623
30.0
1210
.556
UP-
LIP2
UP
Esta
blish
ed7°
00'1
0.11
838"
125°
29'0
5.04
512"
79.1
6577
4785
.649
7745
23.9
2910
.067
UP-
PAD
UP
Esta
blish
ed6°
41'1
4.79
422"
125°
20'5
9.46
050"
83.6
273
9817
.613
7597
83.5
613
.208
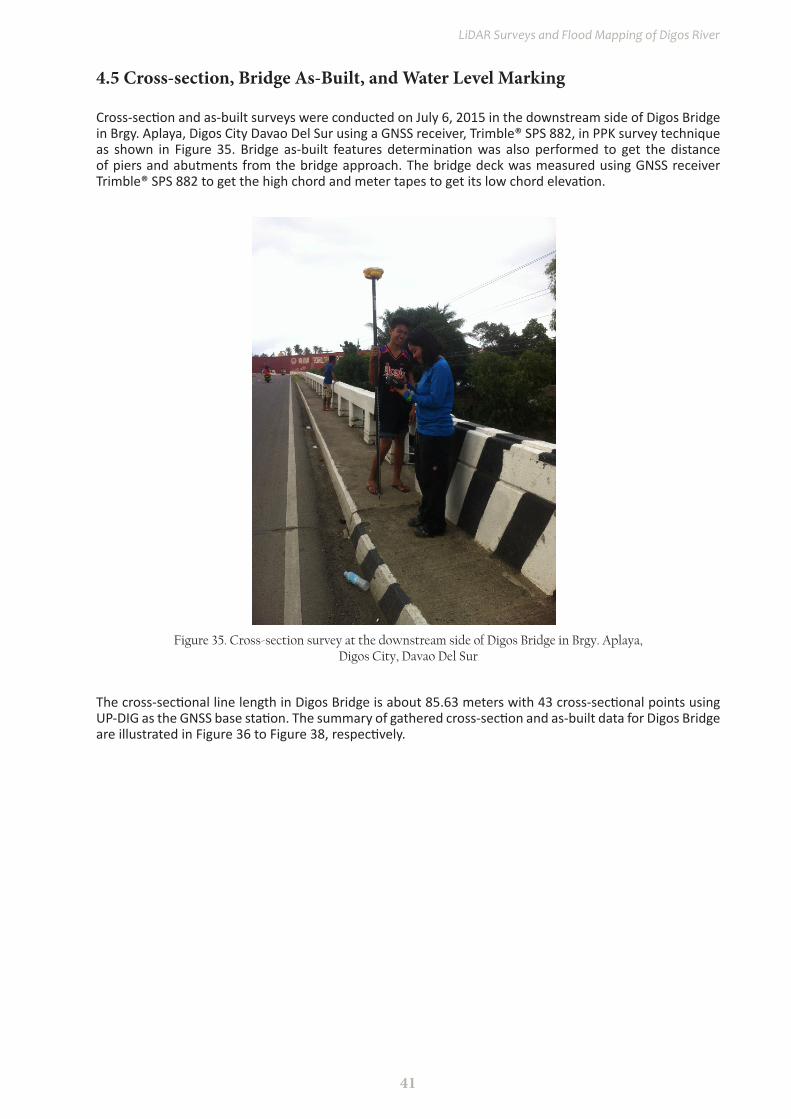
41
LiDAR Surveys and Flood Mapping of Digos River
Figure 35. Cross-section survey at the downstream side of Digos Bridge in Brgy. Aplaya, Digos City, Davao Del Sur
4.5 Cross-section, Bridge As-Built, and Water Level Marking
Cross-section and as-built surveys were conducted on July 6, 2015 in the downstream side of Digos Bridge in Brgy. Aplaya, Digos City Davao Del Sur using a GNSS receiver, Trimble® SPS 882, in PPK survey technique as shown in Figure 35. Bridge as-built features determination was also performed to get the distance of piers and abutments from the bridge approach. The bridge deck was measured using GNSS receiver Trimble® SPS 882 to get the high chord and meter tapes to get its low chord elevation.
The cross-sectional line length in Digos Bridge is about 85.63 meters with 43 cross-sectional points using UP-DIG as the GNSS base station. The summary of gathered cross-section and as-built data for Digos Bridge are illustrated in Figure 36 to Figure 38, respectively.
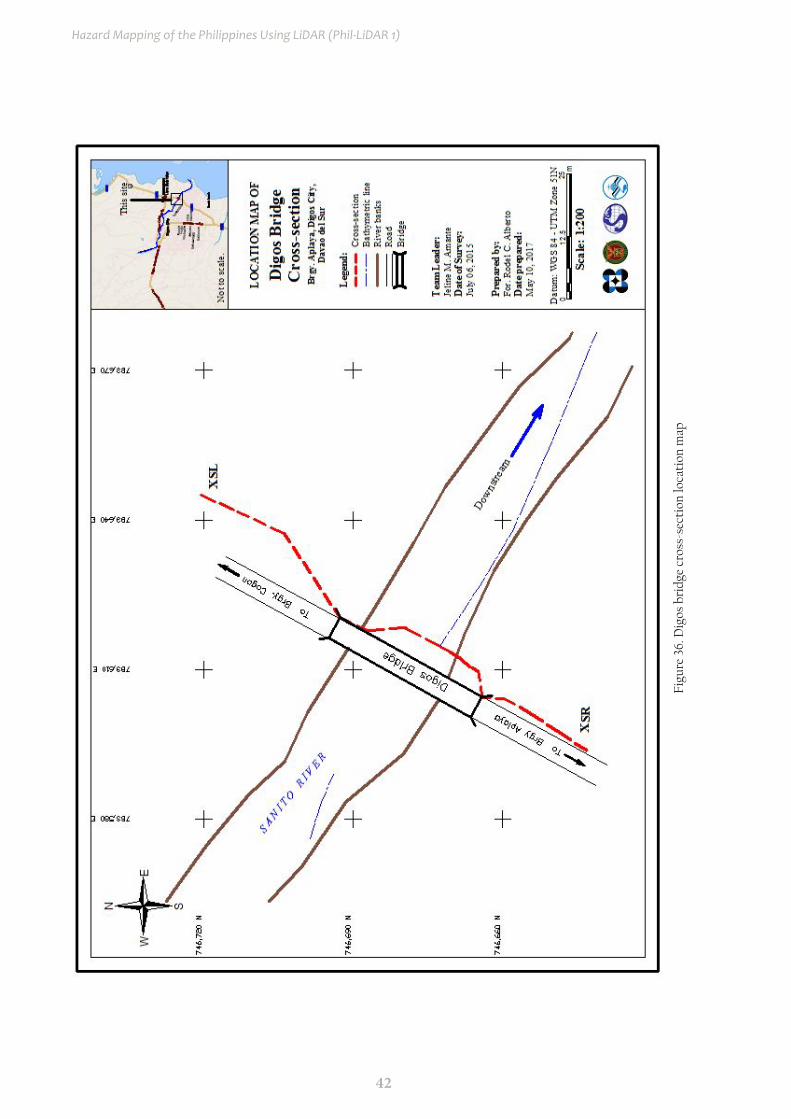
42
Hazard Mapping of the Philippines Using LiDAR (Phil-LiDAR 1)
Figu
re 3
6. D
igos
bri
dge
cros
s-se
ctio
n lo
cati
on m
ap
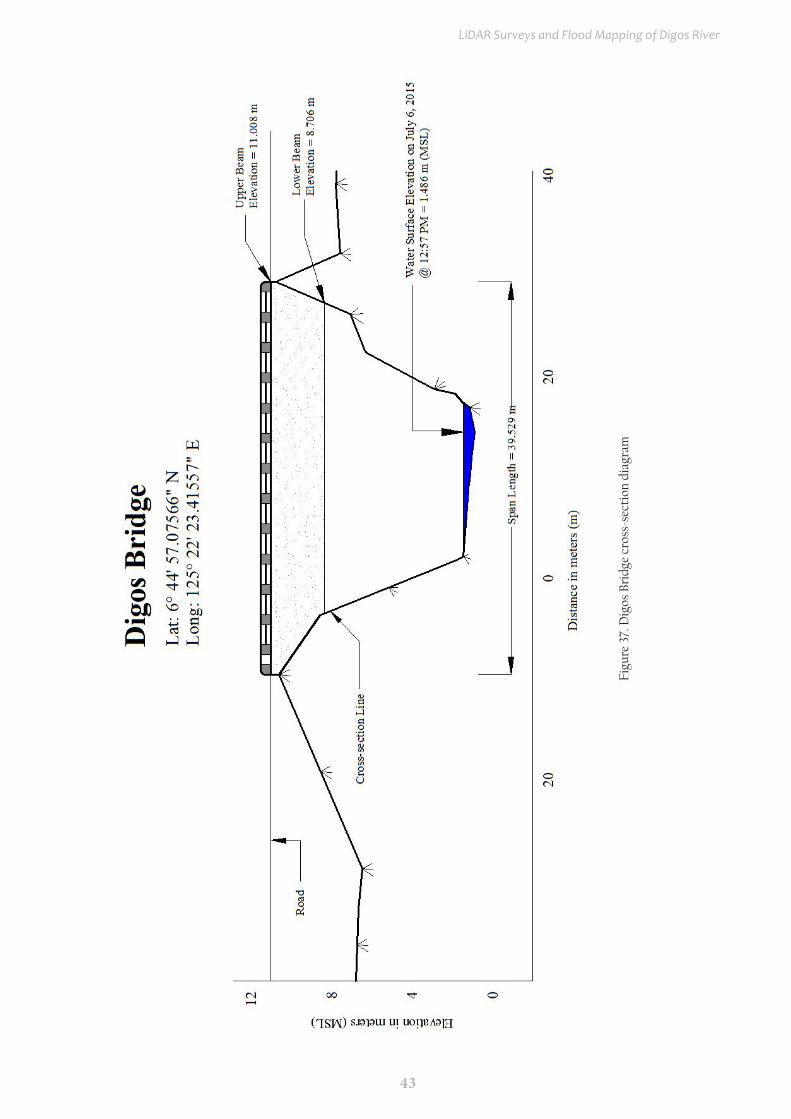
43
LiDAR Surveys and Flood Mapping of Digos River
Figu
re 3
7. D
igos
Bri
dge
cros
s-se
ctio
n di
agra
m
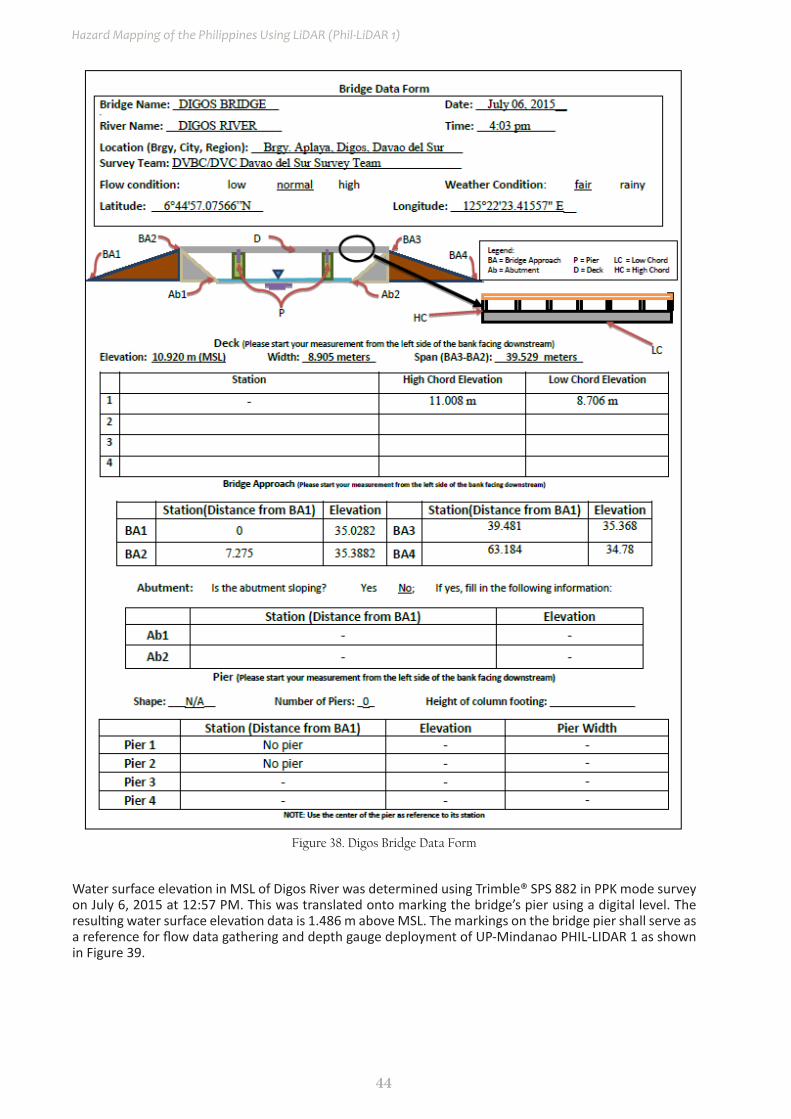
44
Hazard Mapping of the Philippines Using LiDAR (Phil-LiDAR 1)
Figure 38. Digos Bridge Data Form
Water surface elevation in MSL of Digos River was determined using Trimble® SPS 882 in PPK mode survey on July 6, 2015 at 12:57 PM. This was translated onto marking the bridge’s pier using a digital level. The resulting water surface elevation data is 1.486 m above MSL. The markings on the bridge pier shall serve as a reference for flow data gathering and depth gauge deployment of UP-Mindanao PHIL-LIDAR 1 as shown in Figure 39.
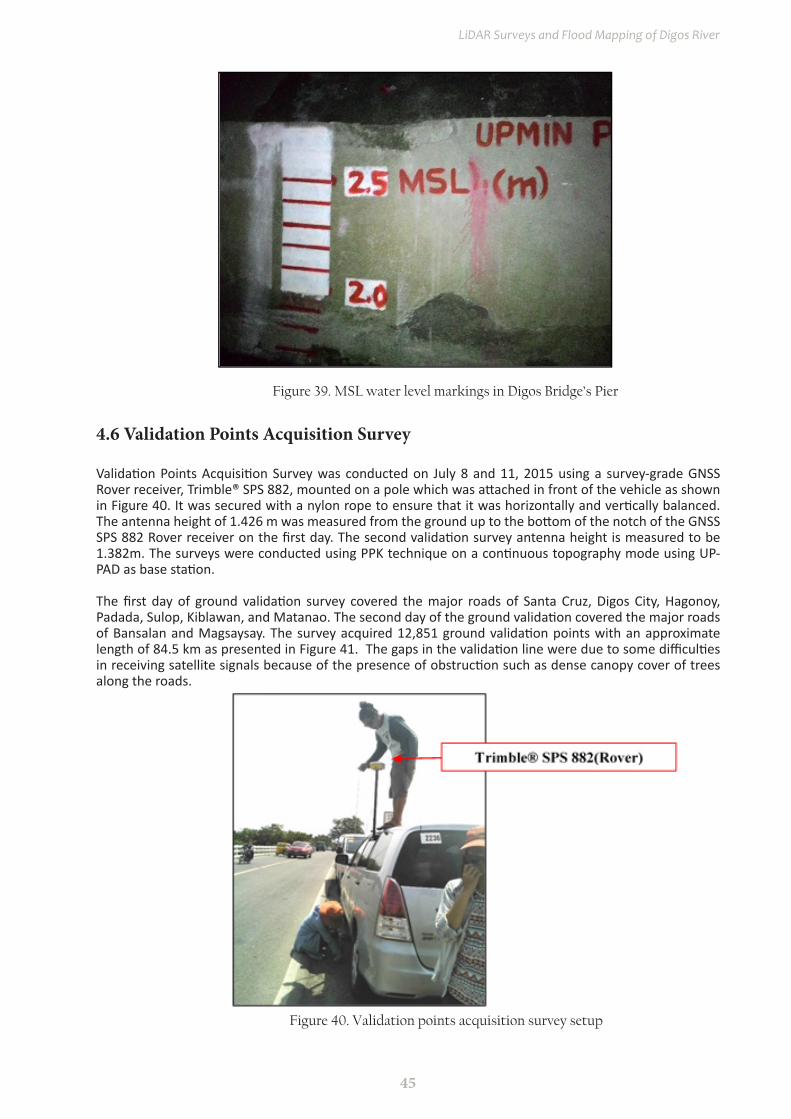
45
LiDAR Surveys and Flood Mapping of Digos River
Figure 39. MSL water level markings in Digos Bridge’s Pier
Figure 40. Validation points acquisition survey setup
4.6 validation Points Acquisition Survey
Validation Points Acquisition Survey was conducted on July 8 and 11, 2015 using a survey-grade GNSS Rover receiver, Trimble® SPS 882, mounted on a pole which was attached in front of the vehicle as shown in Figure 40. It was secured with a nylon rope to ensure that it was horizontally and vertically balanced. The antenna height of 1.426 m was measured from the ground up to the bottom of the notch of the GNSS SPS 882 Rover receiver on the first day. The second validation survey antenna height is measured to be 1.382m. The surveys were conducted using PPK technique on a continuous topography mode using UP-PAD as base station. The first day of ground validation survey covered the major roads of Santa Cruz, Digos City, Hagonoy, Padada, Sulop, Kiblawan, and Matanao. The second day of the ground validation covered the major roads of Bansalan and Magsaysay. The survey acquired 12,851 ground validation points with an approximate length of 84.5 km as presented in Figure 41. The gaps in the validation line were due to some difficulties in receiving satellite signals because of the presence of obstruction such as dense canopy cover of trees along the roads.
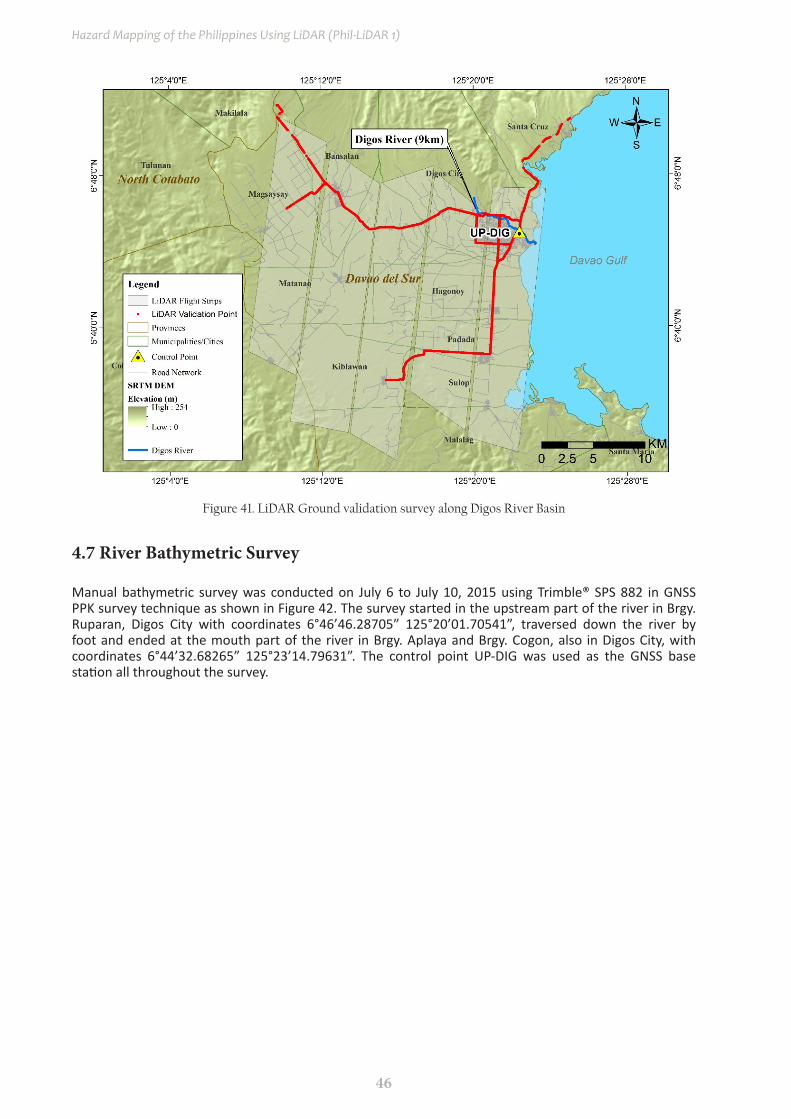
46
Hazard Mapping of the Philippines Using LiDAR (Phil-LiDAR 1)
Figure 41. LiDAR Ground validation survey along Digos River Basin
4.7 River Bathymetric Survey
Manual bathymetric survey was conducted on July 6 to July 10, 2015 using Trimble® SPS 882 in GNSS PPK survey technique as shown in Figure 42. The survey started in the upstream part of the river in Brgy. Ruparan, Digos City with coordinates 6°46’46.28705” 125°20’01.70541”, traversed down the river by foot and ended at the mouth part of the river in Brgy. Aplaya and Brgy. Cogon, also in Digos City, with coordinates 6°44’32.68265” 125°23’14.79631”. The control point UP-DIG was used as the GNSS base station all throughout the survey.
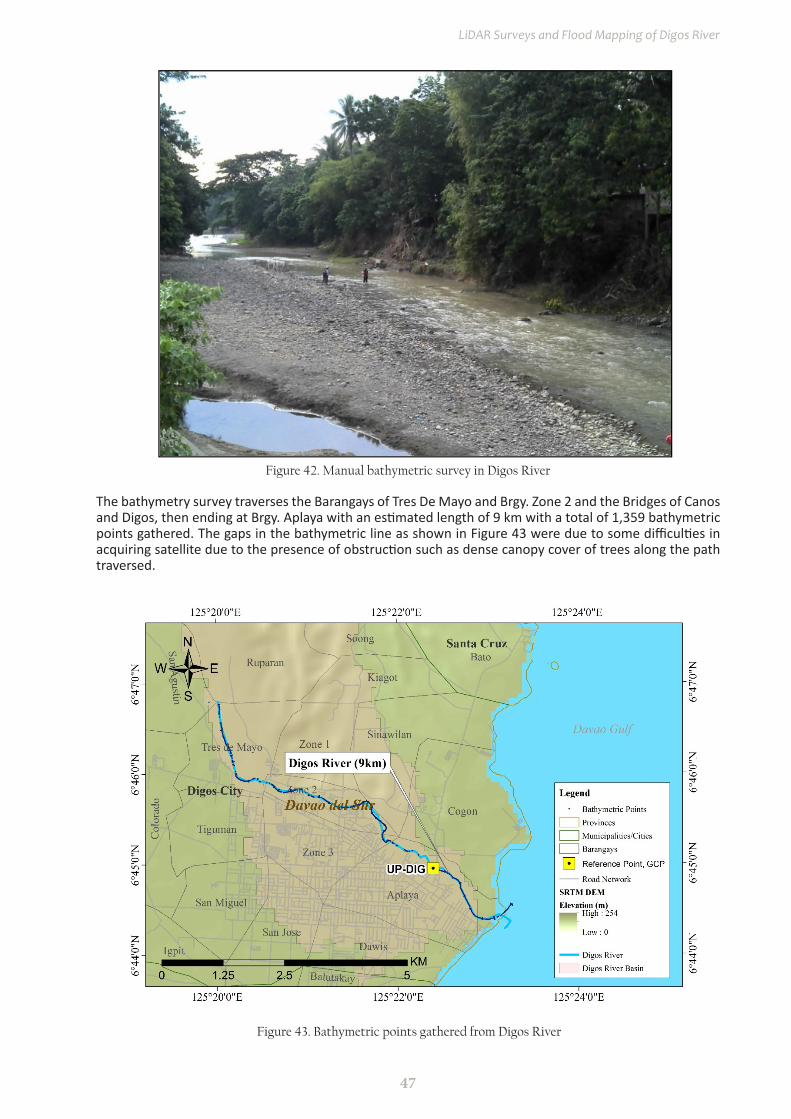
47
LiDAR Surveys and Flood Mapping of Digos River
Figure 43. Bathymetric points gathered from Digos River
Figure 42. Manual bathymetric survey in Digos River
The bathymetry survey traverses the Barangays of Tres De Mayo and Brgy. Zone 2 and the Bridges of Canos and Digos, then ending at Brgy. Aplaya with an estimated length of 9 km with a total of 1,359 bathymetric points gathered. The gaps in the bathymetric line as shown in Figure 43 were due to some difficulties in acquiring satellite due to the presence of obstruction such as dense canopy cover of trees along the path traversed.
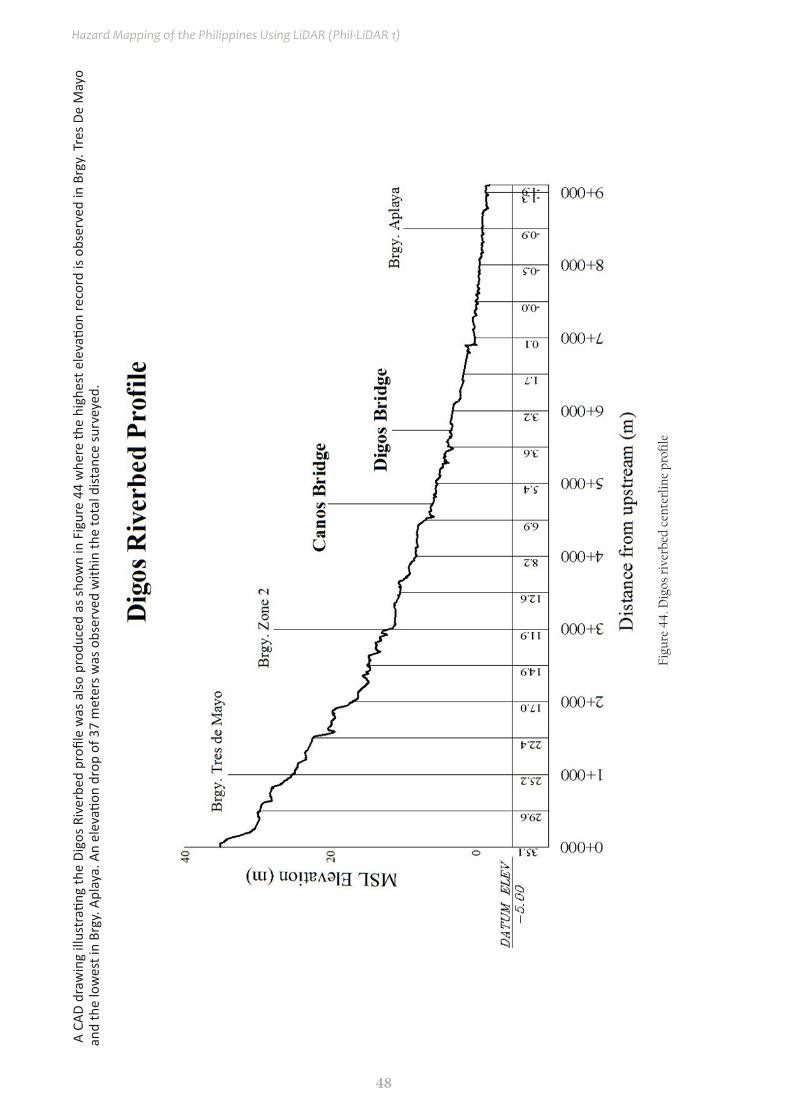
48
Hazard Mapping of the Philippines Using LiDAR (Phil-LiDAR 1)
Figu
re 4
4. D
igos
riv
erbe
d ce
nter
line
profi
le
A C
AD d
raw
ing
illus
trati
ng th
e Di
gos R
iver
bed
profi
le w
as a
lso p
rodu
ced
as sh
own
in F
igur
e 44
whe
re th
e hi
ghes
t ele
vatio
n re
cord
is o
bser
ved
in B
rgy.
Tre
s De
May
o an
d th
e lo
wes
t in
Brgy
. Apl
aya.
An
elev
ation
dro
p of
37
met
ers w
as o
bser
ved
with
in th
e to
tal d
istan
ce su
rvey
ed.
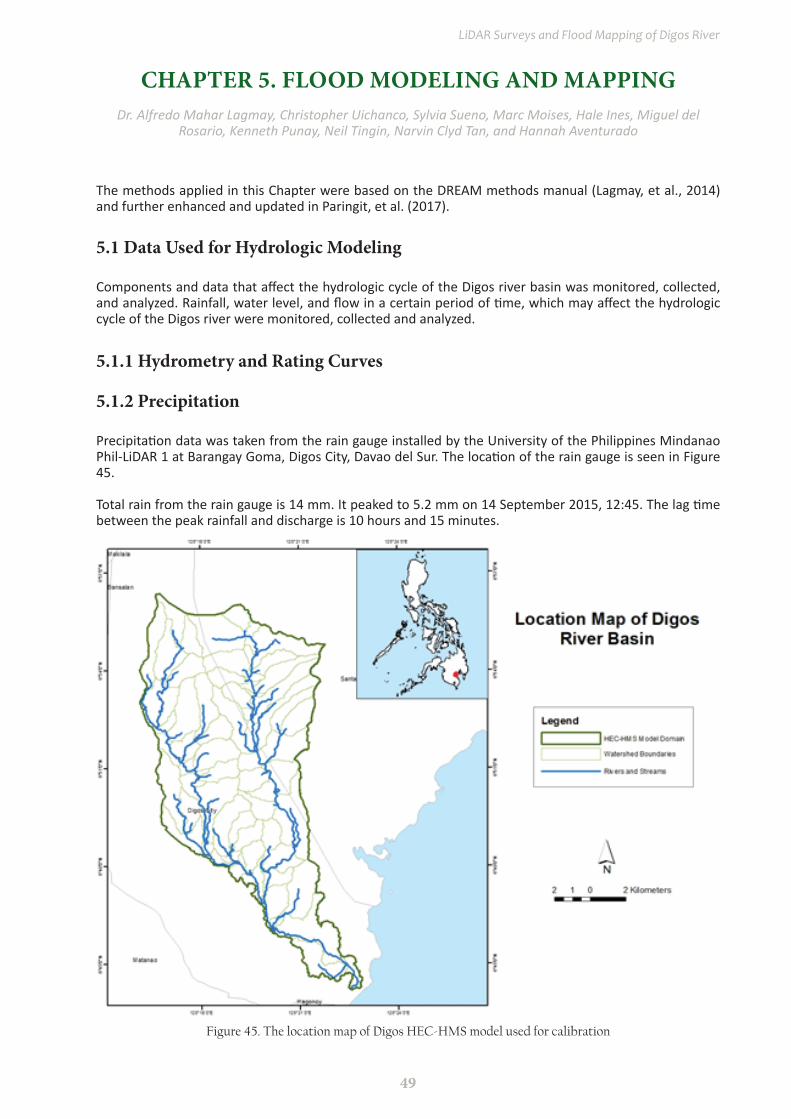
49
LiDAR Surveys and Flood Mapping of Digos River
CHAPTER 5. FLOOD MODELiNG AND MAPPiNGDr. Alfredo Mahar Lagmay, Christopher Uichanco, Sylvia Sueno, Marc Moises, Hale Ines, Miguel del
Rosario, Kenneth Punay, Neil Tingin, Narvin Clyd Tan, and Hannah Aventurado
The methods applied in this Chapter were based on the DREAM methods manual (Lagmay, et al., 2014) and further enhanced and updated in Paringit, et al. (2017).
5.1 Data Used for Hydrologic Modeling
Components and data that affect the hydrologic cycle of the Digos river basin was monitored, collected, and analyzed. Rainfall, water level, and flow in a certain period of time, which may affect the hydrologic cycle of the Digos river were monitored, collected and analyzed.
5.1.1 Hydrometry and Rating Curves
5.1.2 Precipitation
Precipitation data was taken from the rain gauge installed by the University of the Philippines Mindanao Phil-LiDAR 1 at Barangay Goma, Digos City, Davao del Sur. The location of the rain gauge is seen in Figure 45.
Total rain from the rain gauge is 14 mm. It peaked to 5.2 mm on 14 September 2015, 12:45. The lag time between the peak rainfall and discharge is 10 hours and 15 minutes.
Figure 45. The location map of Digos HEC-HMS model used for calibration
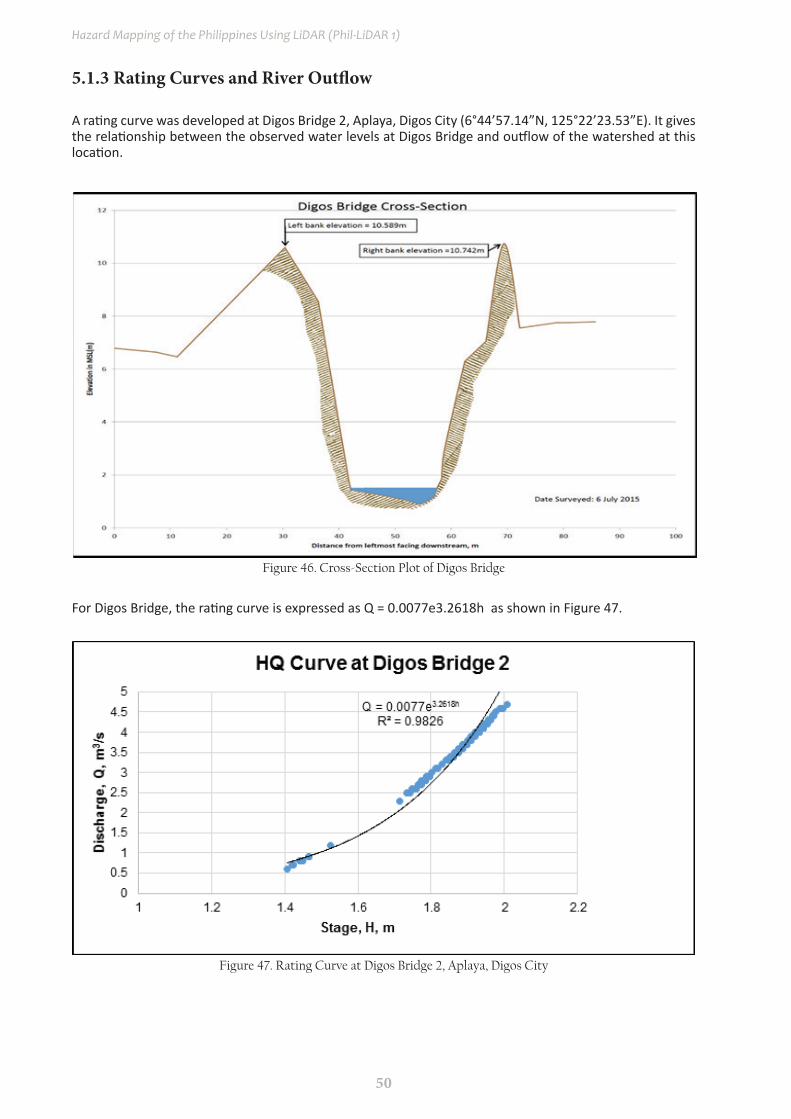
50
Hazard Mapping of the Philippines Using LiDAR (Phil-LiDAR 1)
5.1.3 Rating Curves and River Outflow
A rating curve was developed at Digos Bridge 2, Aplaya, Digos City (6°44’57.14”N, 125°22’23.53”E). It gives the relationship between the observed water levels at Digos Bridge and outflow of the watershed at this location.
Figure 46. Cross-Section Plot of Digos Bridge
Figure 47. Rating Curve at Digos Bridge 2, Aplaya, Digos City
For Digos Bridge, the rating curve is expressed as Q = 0.0077e3.2618h as shown in Figure 47.
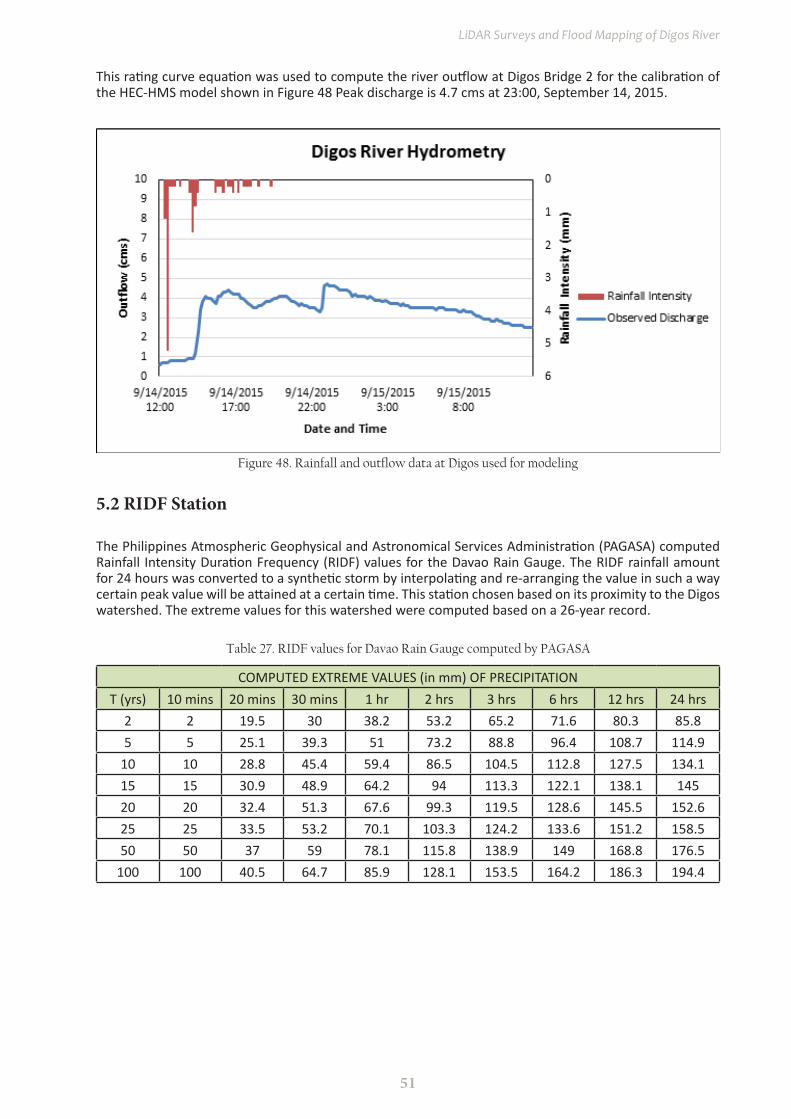
51
LiDAR Surveys and Flood Mapping of Digos River
This rating curve equation was used to compute the river outflow at Digos Bridge 2 for the calibration of the HEC-HMS model shown in Figure 48 Peak discharge is 4.7 cms at 23:00, September 14, 2015.
Figure 48. Rainfall and outflow data at Digos used for modeling
5.2 RiDF Station
The Philippines Atmospheric Geophysical and Astronomical Services Administration (PAGASA) computed Rainfall Intensity Duration Frequency (RIDF) values for the Davao Rain Gauge. The RIDF rainfall amount for 24 hours was converted to a synthetic storm by interpolating and re-arranging the value in such a way certain peak value will be attained at a certain time. This station chosen based on its proximity to the Digos watershed. The extreme values for this watershed were computed based on a 26-year record.
Table 27. RIDF values for Davao Rain Gauge computed by PAGASA
COMPUTED EXTREME VALUES (in mm) OF PRECIPITATIONT (yrs) 10 mins 20 mins 30 mins 1 hr 2 hrs 3 hrs 6 hrs 12 hrs 24 hrs
2 2 19.5 30 38.2 53.2 65.2 71.6 80.3 85.85 5 25.1 39.3 51 73.2 88.8 96.4 108.7 114.9
10 10 28.8 45.4 59.4 86.5 104.5 112.8 127.5 134.115 15 30.9 48.9 64.2 94 113.3 122.1 138.1 14520 20 32.4 51.3 67.6 99.3 119.5 128.6 145.5 152.625 25 33.5 53.2 70.1 103.3 124.2 133.6 151.2 158.550 50 37 59 78.1 115.8 138.9 149 168.8 176.5
100 100 40.5 64.7 85.9 128.1 153.5 164.2 186.3 194.4
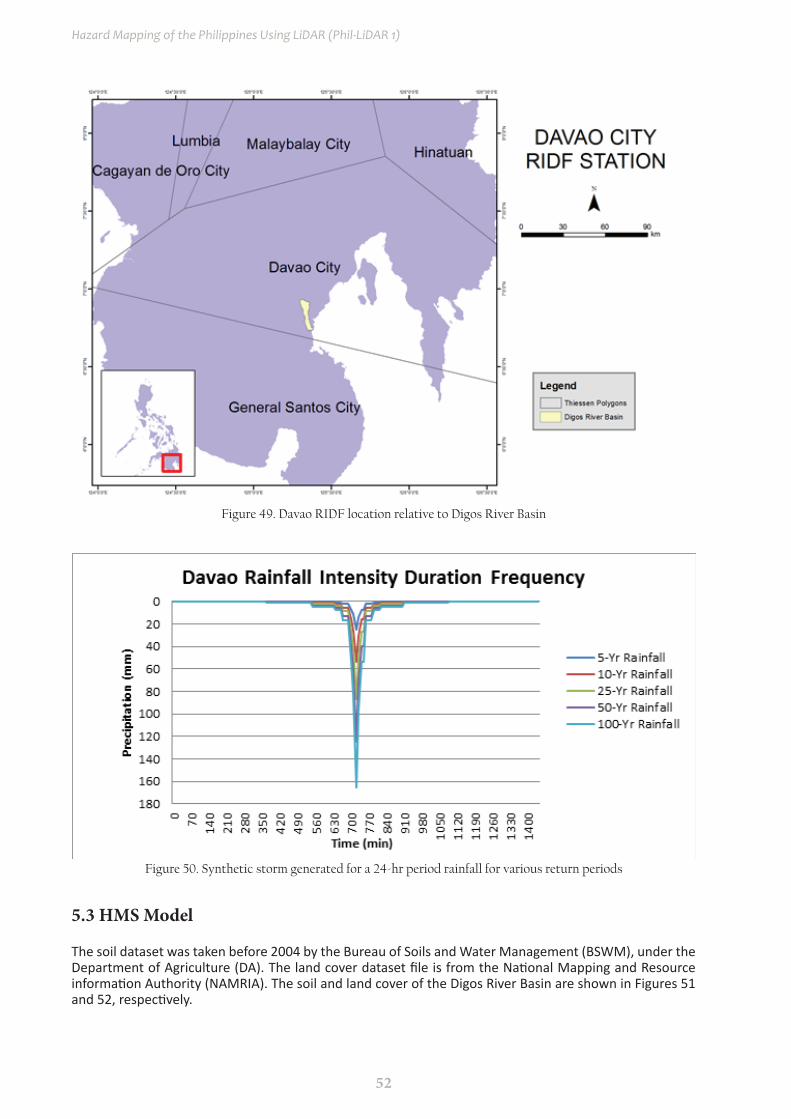
52
Hazard Mapping of the Philippines Using LiDAR (Phil-LiDAR 1)
5.3 HMS Model
The soil dataset was taken before 2004 by the Bureau of Soils and Water Management (BSWM), under the Department of Agriculture (DA). The land cover dataset file is from the National Mapping and Resource information Authority (NAMRIA). The soil and land cover of the Digos River Basin are shown in Figures 51 and 52, respectively.
Figure 49. Davao RIDF location relative to Digos River Basin
Figure 50. Synthetic storm generated for a 24-hr period rainfall for various return periods
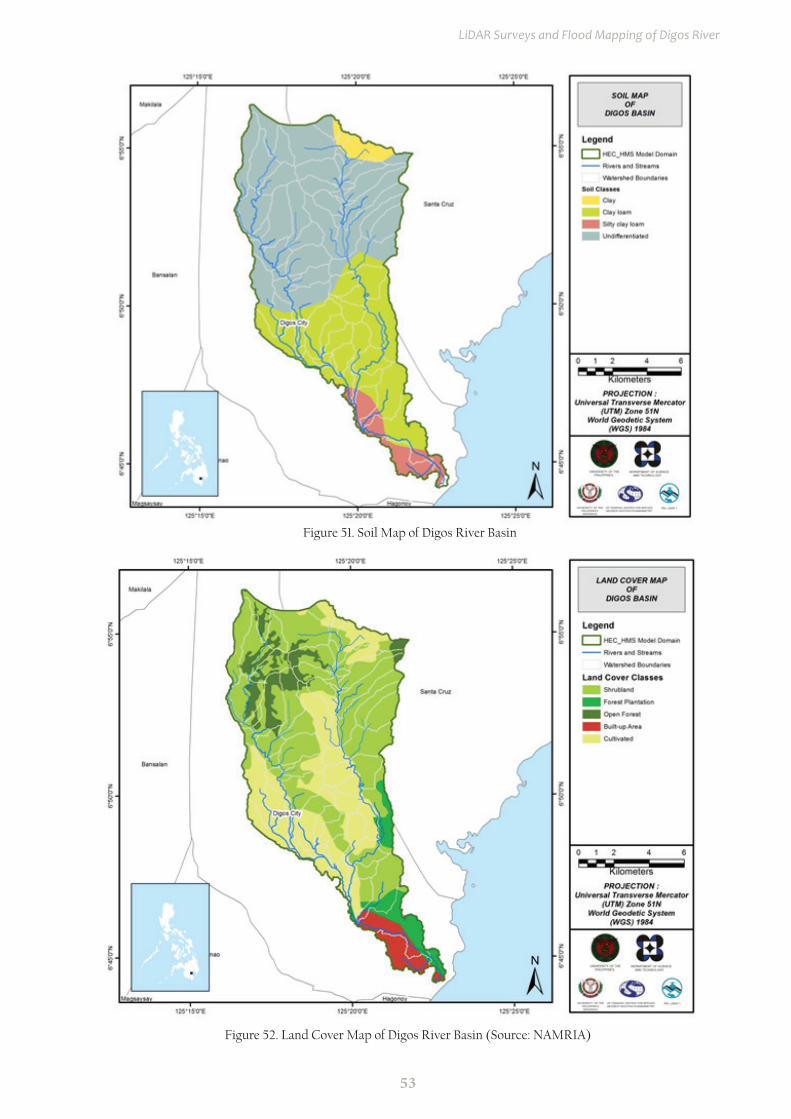
53
LiDAR Surveys and Flood Mapping of Digos River
Figure 51. Soil Map of Digos River Basin
Figure 52. Land Cover Map of Digos River Basin (Source: NAMRIA)

54
Hazard Mapping of the Philippines Using LiDAR (Phil-LiDAR 1)
For Digos, four soil classes were identified. These are clay, clay loam, silty clay loam and undifferentiated land. Moreover, five land cover classes were identified. These are shrublands, forest plantations, open forest, built-up areas, and cultivated areas.
Figure 53. Slope map of the Digos River Basin

55
LiDAR Surveys and Flood Mapping of Digos River
Figure 54. Stream Delineation Map of Digos River Basin
Using the SAR-based DEM, the Digos basin was delineated and further subdivided into subbasins. The model consists of 69 sub basins, 34 reaches, and 34 junctions as shown in Figure 56. The main outlet is at Digos Bridge.

56
Hazard Mapping of the Philippines Using LiDAR (Phil-LiDAR 1)
Figure 55. The Digos river basin model generated using HEC-HMS
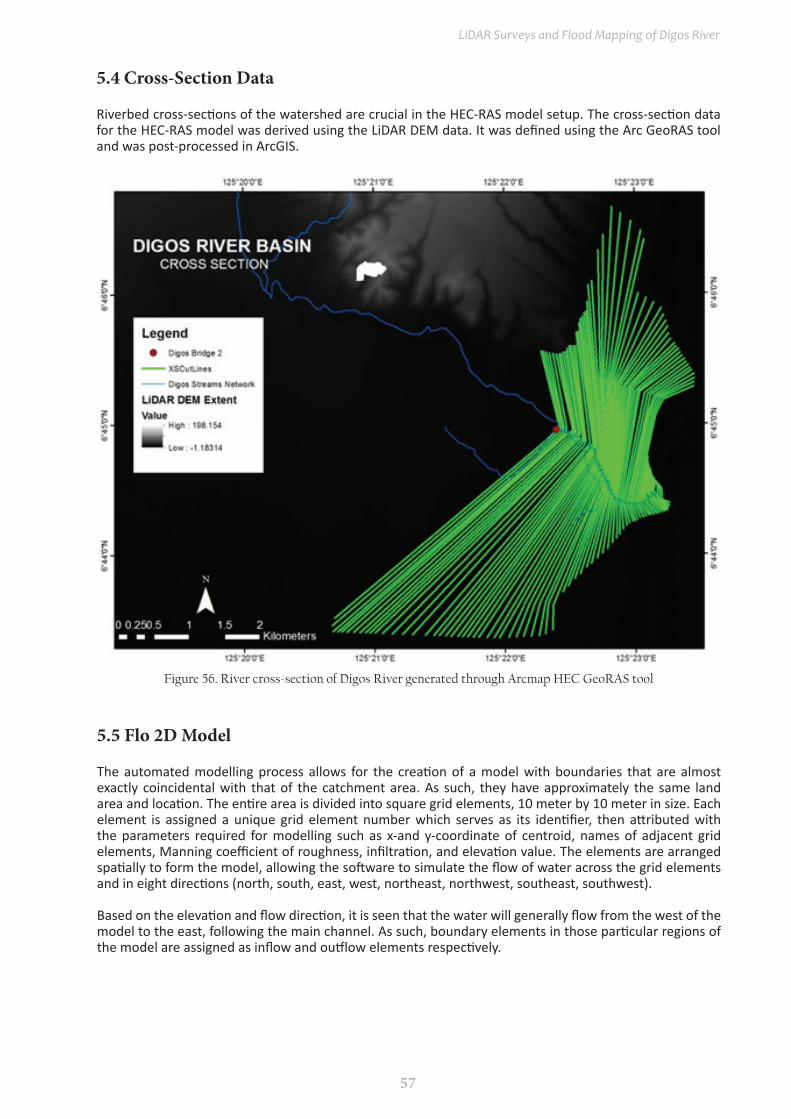
57
LiDAR Surveys and Flood Mapping of Digos River
5.4 Cross-Section Data
Riverbed cross-sections of the watershed are crucial in the HEC-RAS model setup. The cross-section data for the HEC-RAS model was derived using the LiDAR DEM data. It was defined using the Arc GeoRAS tool and was post-processed in ArcGIS.
Figure 56. River cross-section of Digos River generated through Arcmap HEC GeoRAS tool
5.5 Flo 2D Model
The automated modelling process allows for the creation of a model with boundaries that are almost exactly coincidental with that of the catchment area. As such, they have approximately the same land area and location. The entire area is divided into square grid elements, 10 meter by 10 meter in size. Each element is assigned a unique grid element number which serves as its identifier, then attributed with the parameters required for modelling such as x-and y-coordinate of centroid, names of adjacent grid elements, Manning coefficient of roughness, infiltration, and elevation value. The elements are arranged spatially to form the model, allowing the software to simulate the flow of water across the grid elements and in eight directions (north, south, east, west, northeast, northwest, southeast, southwest).
Based on the elevation and flow direction, it is seen that the water will generally flow from the west of the model to the east, following the main channel. As such, boundary elements in those particular regions of the model are assigned as inflow and outflow elements respectively.
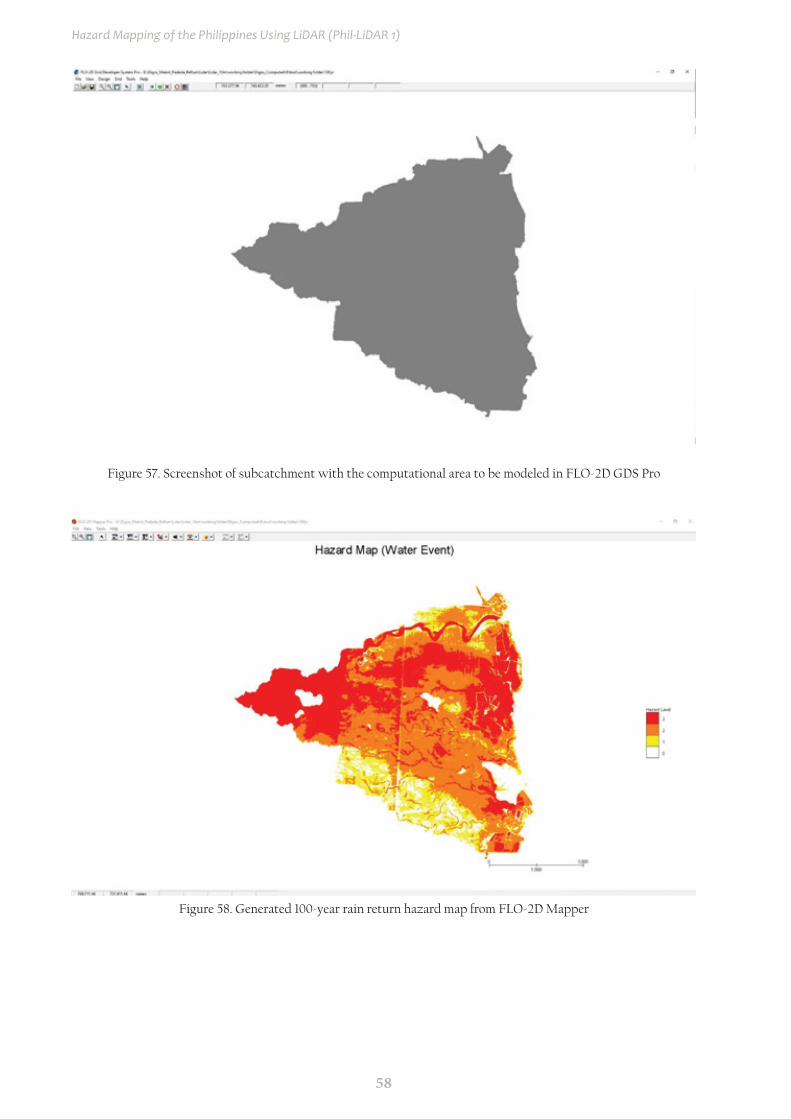
58
Hazard Mapping of the Philippines Using LiDAR (Phil-LiDAR 1)
Figure 58. Generated 100-year rain return hazard map from FLO-2D Mapper
Figure 57. Screenshot of subcatchment with the computational area to be modeled in FLO-2D GDS Pro
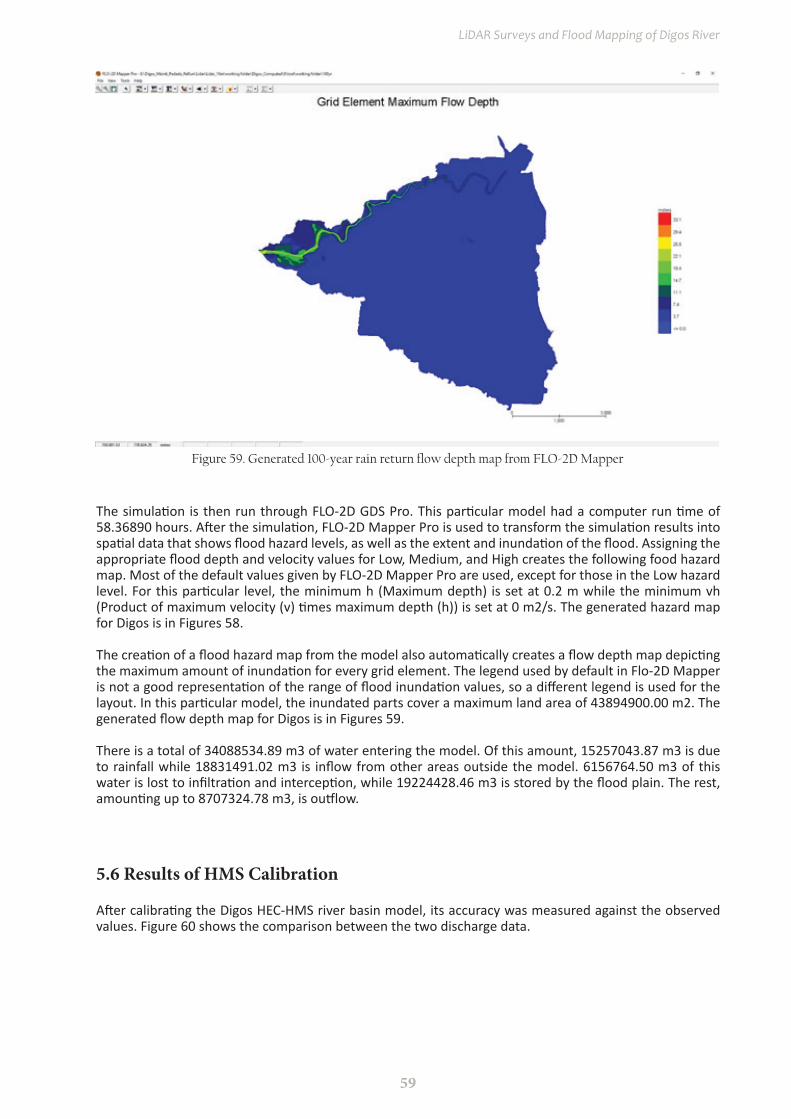
59
LiDAR Surveys and Flood Mapping of Digos River
Figure 59. Generated 100-year rain return flow depth map from FLO-2D Mapper
The simulation is then run through FLO-2D GDS Pro. This particular model had a computer run time of 58.36890 hours. After the simulation, FLO-2D Mapper Pro is used to transform the simulation results into spatial data that shows flood hazard levels, as well as the extent and inundation of the flood. Assigning the appropriate flood depth and velocity values for Low, Medium, and High creates the following food hazard map. Most of the default values given by FLO-2D Mapper Pro are used, except for those in the Low hazard level. For this particular level, the minimum h (Maximum depth) is set at 0.2 m while the minimum vh (Product of maximum velocity (v) times maximum depth (h)) is set at 0 m2/s. The generated hazard map for Digos is in Figures 58.
The creation of a flood hazard map from the model also automatically creates a flow depth map depicting the maximum amount of inundation for every grid element. The legend used by default in Flo-2D Mapper is not a good representation of the range of flood inundation values, so a different legend is used for the layout. In this particular model, the inundated parts cover a maximum land area of 43894900.00 m2. The generated flow depth map for Digos is in Figures 59.
There is a total of 34088534.89 m3 of water entering the model. Of this amount, 15257043.87 m3 is due to rainfall while 18831491.02 m3 is inflow from other areas outside the model. 6156764.50 m3 of this water is lost to infiltration and interception, while 19224428.46 m3 is stored by the flood plain. The rest, amounting up to 8707324.78 m3, is outflow.
5.6 Results of HMS Calibration
After calibrating the Digos HEC-HMS river basin model, its accuracy was measured against the observed values. Figure 60 shows the comparison between the two discharge data.

60
Hazard Mapping of the Philippines Using LiDAR (Phil-LiDAR 1)
Figure 60. Outflow Hydrograph of Digos produced by the HEC-HMS model compared with observed outflow
Enumerated in Table 28 are the adjusted ranges of values of the parameters used in calibrating the model.
Table 28. Range of Calibrated Values for Digos River Basin
Hydrologic Element
Calculation Type Method Parameter Range of
Calibrated Values
Basin
Loss SCS Curve NumberInitial Abstraction (mm) 0.3328 – 24.26
Curve Number 36.566 – 99
Transform Clark Unit Hydrograph
Time of Concentration (hr) 0.0167 – 0.396
Storage Coefficient (hr) 0.0167 – 1.1
Baseflow RecessionRecession Constant 0.13 - 1
Ratio to Peak 0.06 – 0.34
Reach Routing Muskingum-Cunge Manning's Coefficient 0.0715
Initial abstraction defines the amount of precipitation that must fall before surface runoff. The magnitude of the outflow hydrograph increases as initial abstraction decreases. The range of values from 0.3328 mm to 24.26 mm means that there is a small initial fraction of the storm depth after which runoff begins, increasing the river outflow.
The curve number is the estimate of the precipitation excess of soil cover, land use, and antecedent moisture. The magnitude of the outflow hydrograph increases as curve number increases. The range of 65 to 90 for curve number is advisable for Philippine watersheds depending on the soil and land cover of the area (M. Horritt, personal communication, 2012).

61
LiDAR Surveys and Flood Mapping of Digos River
For Digos, the basin consists mainly of shrublands and cultivated areas and the soil consists of mostly undifferentiated land and clay loam.
Time of concentration and storage coefficient are the travel time and index of temporary storage of runoff in a watershed. The range of calibrated values from 0.0167 hours to 1.1 hours determines the reaction time of the model with respect to the rainfall. The peak magnitude of the hydrograph also decreases when these parameters are increased.
Recession constant is the rate at which baseflow recedes between storm events and ratio to peak is the ratio of the baseflow discharge to the peak discharge. Recession constant values within the range of 0.13 to 1 indicate that the discharge leaving every subbasin within Digos recede differ significantly. Values of ratio to peak within the range of 0.06 to 0.34 indicate a much steeper receding limb of the outflow hydrograph.
Manning’s roughness coefficients correspond to the common roughness of Philippine watersheds. Digos river basin reaches’ Manning’s coefficient is 0.0715, showing that the catchment is mostly filled with floodplains with heavy brushlands (Brunner, 2010).
Accuracy Measure
Value
RMSE 0.99R2 0.98
NSE 0.76PBIAS 1.90RSR 0.49
Table 29. Summary of the Efficiency Test of Digos HMS Model
The Root Mean Square Error (RMSE) method aggregates the individual differences of these two measurements. It was computed as 0.991 (m3/s).
The Pearson correlation coefficient (r2) assesses the strength of the linear relationship between the observations and the model. This value being close to 1 corresponds to an almost perfect match of the observed discharge and the resulting discharge from the HEC HMS model. Here, it measured 0.983.
The Nash-Sutcliffe (E) method was also used to assess the predictive power of the model. Here the optimal value is 1. The model attained an efficiency coefficient of 0.760.
A positive Percent Bias (PBIAS) indicates a model’s propensity towards under-prediction. Negative values indicate bias towards over-prediction. Again, the optimal value is 0. In the model, the PBIAS is 1.904.
The Observation Standard Deviation Ratio, RSR, is an error index. A perfect model attains a value of 0 when the error in the units of the valuable a quantified. The model has an RSR value of 0.490.
5.7 Calculated Outflow Hydrographs and Discharge values for Different Rain-fall Return Models
5.7.1 Hydrograph Using the Rainfall Runoff Model The summary graph (Figure 61) shows the Digos outflow using the Davao Rainfall Intensity-Duration-Frequency curves (RIDF) in 5 different return periods (5-year, 10-year, 25-year, 50-year, and 100-year rainfall time series) based on the Philippine Atmospheric Geophysical and Astronomical Services Administration (PAG-ASA) data. The simulation results reveal significant increase in outflow magnitude as the rainfall intensity increases for a range of durations and return periods.

62
Hazard Mapping of the Philippines Using LiDAR (Phil-LiDAR 1)
5.7.2 Discharge data using Dr. Horritt’s hydrologic method
The river discharge values for the three rivers entering the floodplain are shown in Figure 62 to Figure 71 and the peak values are summarized in Table 31 to Table 40.
Figure 61. Outflow hydrograph at Digos Station generated using Davao RIDF simulated in HEC-HMS
A summary of the total precipitation, peak rainfall, peak outflow and time to peak of the Digos discharge using the Davao Rainfall Intensity-Duration-Frequency curves (RIDF) in five different return periods is shown in Table 30.
Table 30. Outflow hydrograph at Digos Station generated using Davao RIDF simulated in HEC-HMS
RIDF Period Total Precipitation (mm) Peak rainfall (mm) Peak outflow (cms) Time to Peak
5-Year 121.1 25.1 520.2 8 hours10-Year 140.7 28.8 689.3 7 hours, 50 minutes25-Year 165.5 33.5 928.1 7 hours, 40 minutes50-Year 183.9 37 1114.6 7 hours, 40 minutes
100-Year 202.1 40.5 1310.9 7 hours, 30 minutes

63
LiDAR Surveys and Flood Mapping of Digos River
Figure 62. Digos Padada-Mainit river (1) generated discharge using 5-, 25-, and 100-year GenSan rainfall intensity-duration-frequency (RIDF) in HEC-HMS
Figure 63. Digos Padada-Mainit river (2) generated discharge using 5-, 25-, and 100-year GenSan rainfall intensity-duration-frequency (RIDF) in HEC-HMS
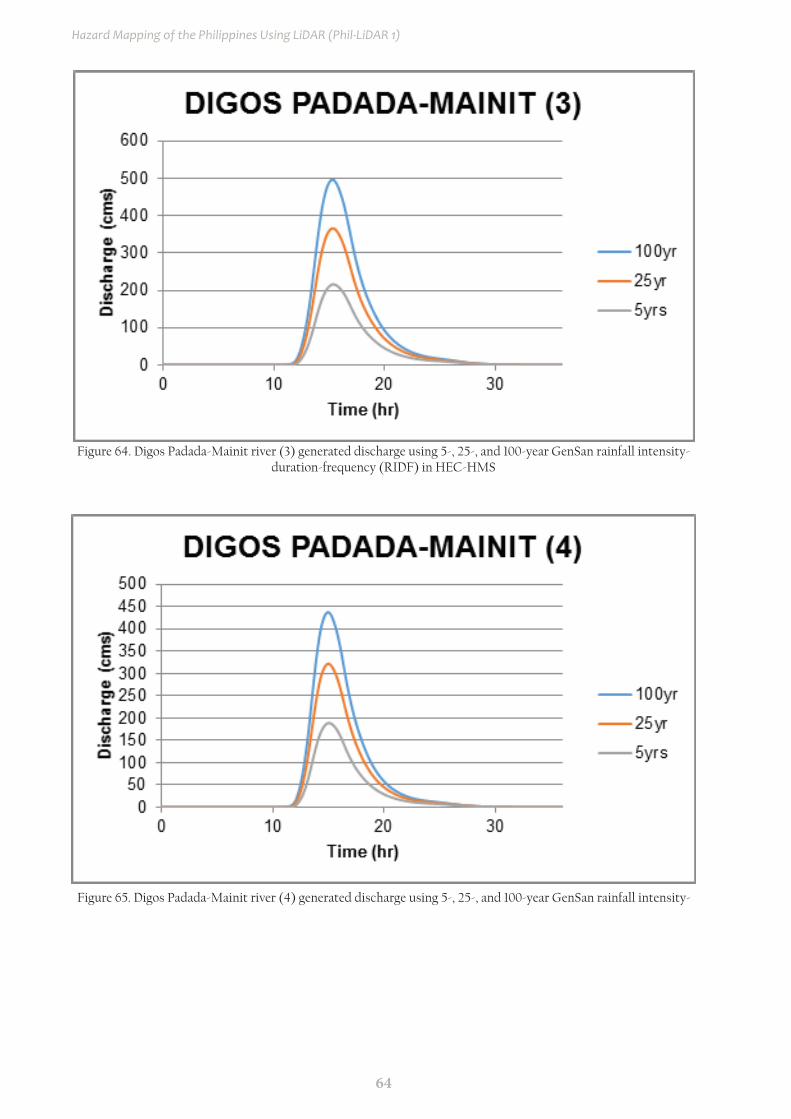
64
Hazard Mapping of the Philippines Using LiDAR (Phil-LiDAR 1)
Figure 64. Digos Padada-Mainit river (3) generated discharge using 5-, 25-, and 100-year GenSan rainfall intensity-duration-frequency (RIDF) in HEC-HMS
Figure 65. Digos Padada-Mainit river (4) generated discharge using 5-, 25-, and 100-year GenSan rainfall intensity-
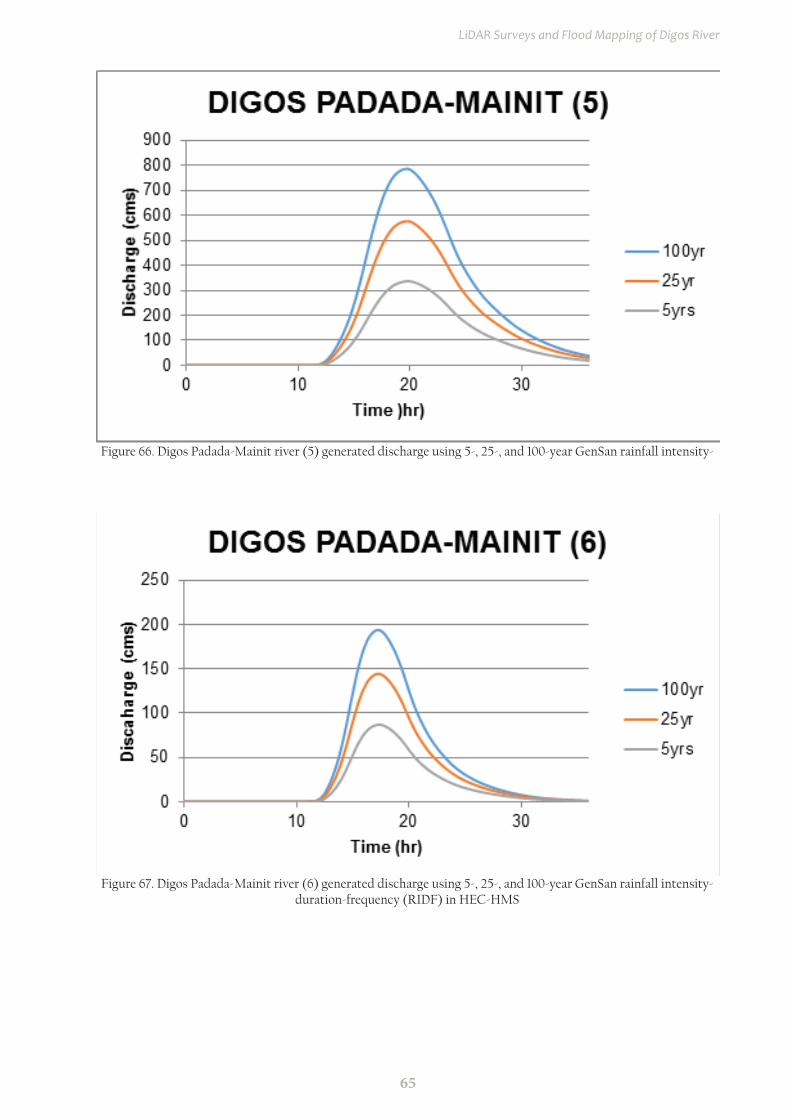
65
LiDAR Surveys and Flood Mapping of Digos River
Figure 66. Digos Padada-Mainit river (5) generated discharge using 5-, 25-, and 100-year GenSan rainfall intensity-
Figure 67. Digos Padada-Mainit river (6) generated discharge using 5-, 25-, and 100-year GenSan rainfall intensity-duration-frequency (RIDF) in HEC-HMS
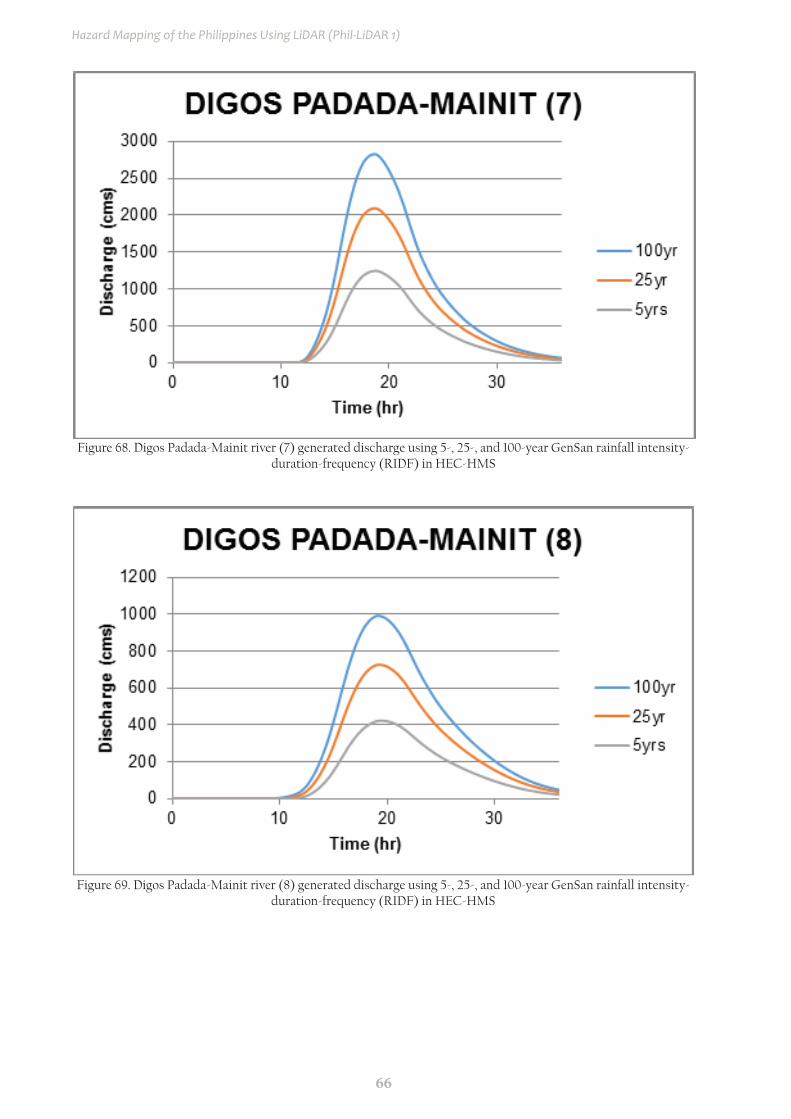
66
Hazard Mapping of the Philippines Using LiDAR (Phil-LiDAR 1)
Figure 68. Digos Padada-Mainit river (7) generated discharge using 5-, 25-, and 100-year GenSan rainfall intensity-duration-frequency (RIDF) in HEC-HMS
Figure 69. Digos Padada-Mainit river (8) generated discharge using 5-, 25-, and 100-year GenSan rainfall intensity-duration-frequency (RIDF) in HEC-HMS
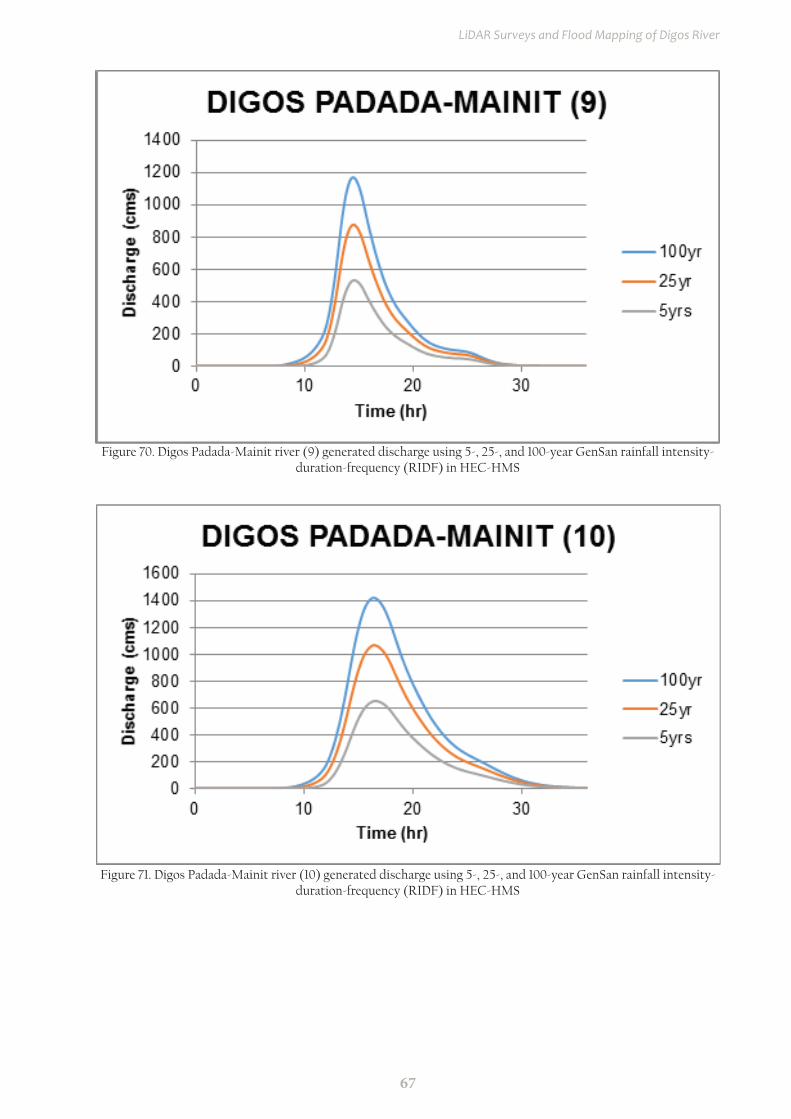
67
LiDAR Surveys and Flood Mapping of Digos River
Figure 70. Digos Padada-Mainit river (9) generated discharge using 5-, 25-, and 100-year GenSan rainfall intensity-duration-frequency (RIDF) in HEC-HMS
Figure 71. Digos Padada-Mainit river (10) generated discharge using 5-, 25-, and 100-year GenSan rainfall intensity-duration-frequency (RIDF) in HEC-HMS
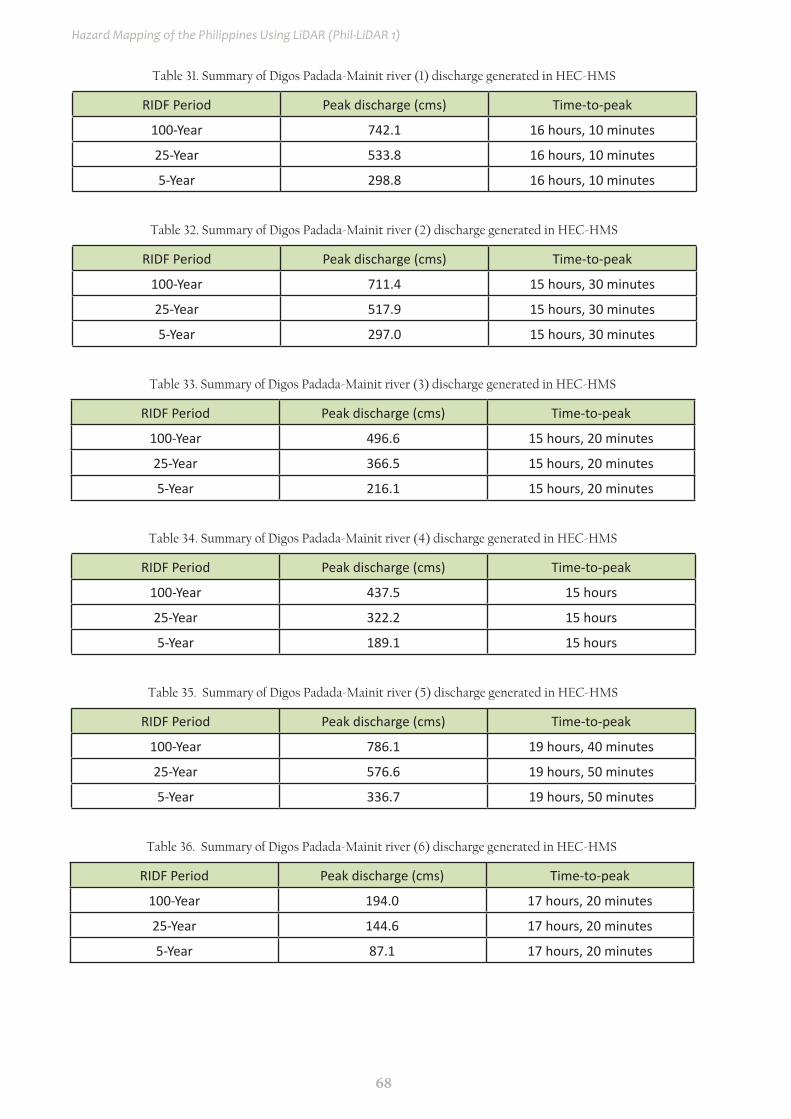
68
Hazard Mapping of the Philippines Using LiDAR (Phil-LiDAR 1)
Table 31. Summary of Digos Padada-Mainit river (1) discharge generated in HEC-HMS
Table 34. Summary of Digos Padada-Mainit river (4) discharge generated in HEC-HMS
Table 32. Summary of Digos Padada-Mainit river (2) discharge generated in HEC-HMS
Table 35. Summary of Digos Padada-Mainit river (5) discharge generated in HEC-HMS
Table 33. Summary of Digos Padada-Mainit river (3) discharge generated in HEC-HMS
Table 36. Summary of Digos Padada-Mainit river (6) discharge generated in HEC-HMS
RIDF Period Peak discharge (cms) Time-to-peak
100-Year 742.1 16 hours, 10 minutes
25-Year 533.8 16 hours, 10 minutes
5-Year 298.8 16 hours, 10 minutes
RIDF Period Peak discharge (cms) Time-to-peak
100-Year 437.5 15 hours
25-Year 322.2 15 hours
5-Year 189.1 15 hours
RIDF Period Peak discharge (cms) Time-to-peak
100-Year 711.4 15 hours, 30 minutes
25-Year 517.9 15 hours, 30 minutes
5-Year 297.0 15 hours, 30 minutes
RIDF Period Peak discharge (cms) Time-to-peak
100-Year 786.1 19 hours, 40 minutes
25-Year 576.6 19 hours, 50 minutes
5-Year 336.7 19 hours, 50 minutes
RIDF Period Peak discharge (cms) Time-to-peak
100-Year 496.6 15 hours, 20 minutes
25-Year 366.5 15 hours, 20 minutes
5-Year 216.1 15 hours, 20 minutes
RIDF Period Peak discharge (cms) Time-to-peak
100-Year 194.0 17 hours, 20 minutes
25-Year 144.6 17 hours, 20 minutes
5-Year 87.1 17 hours, 20 minutes
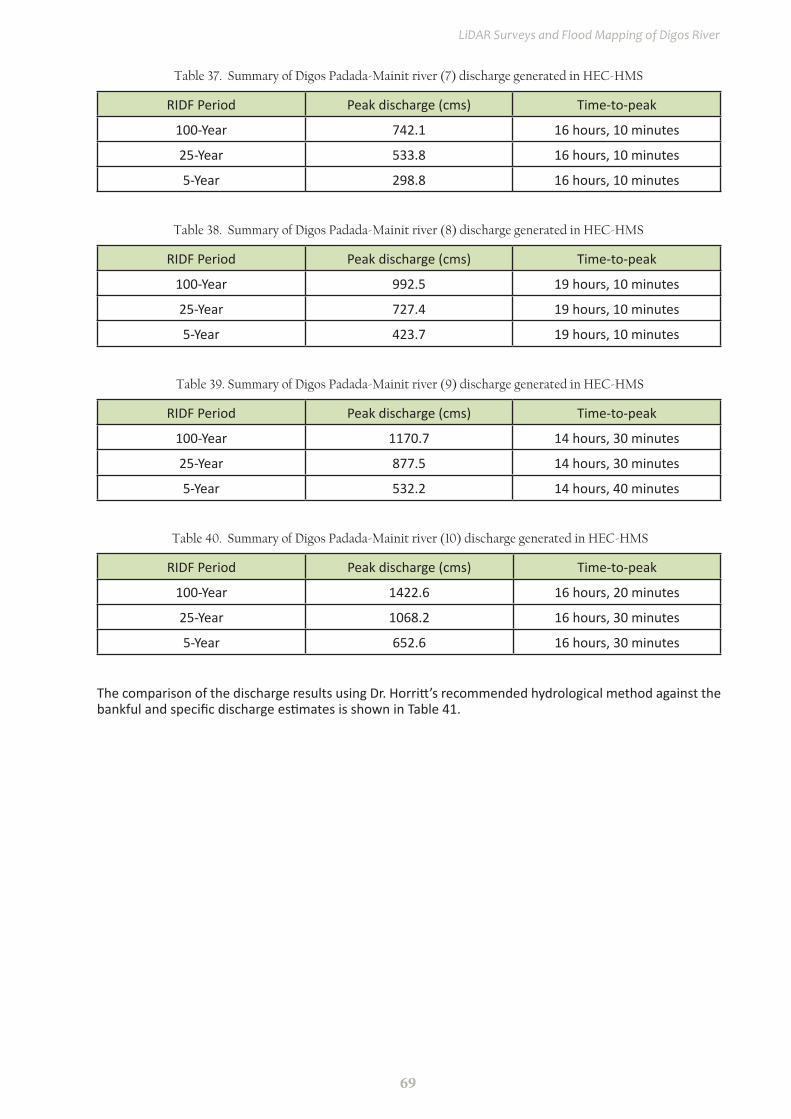
69
LiDAR Surveys and Flood Mapping of Digos River
Table 37. Summary of Digos Padada-Mainit river (7) discharge generated in HEC-HMS
Table 40. Summary of Digos Padada-Mainit river (10) discharge generated in HEC-HMS
Table 38. Summary of Digos Padada-Mainit river (8) discharge generated in HEC-HMS
Table 39. Summary of Digos Padada-Mainit river (9) discharge generated in HEC-HMS
RIDF Period Peak discharge (cms) Time-to-peak
100-Year 742.1 16 hours, 10 minutes
25-Year 533.8 16 hours, 10 minutes
5-Year 298.8 16 hours, 10 minutes
RIDF Period Peak discharge (cms) Time-to-peak
100-Year 1422.6 16 hours, 20 minutes
25-Year 1068.2 16 hours, 30 minutes
5-Year 652.6 16 hours, 30 minutes
RIDF Period Peak discharge (cms) Time-to-peak
100-Year 992.5 19 hours, 10 minutes
25-Year 727.4 19 hours, 10 minutes
5-Year 423.7 19 hours, 10 minutes
RIDF Period Peak discharge (cms) Time-to-peak
100-Year 1170.7 14 hours, 30 minutes
25-Year 877.5 14 hours, 30 minutes
5-Year 532.2 14 hours, 40 minutes
The comparison of the discharge results using Dr. Horritt’s recommended hydrological method against the bankful and specific discharge estimates is shown in Table 41.

70
Hazard Mapping of the Philippines Using LiDAR (Phil-LiDAR 1)
Table 41. Validation of river discharge estimates
Discharge Point QMED(SCS), cms
QBANKFUL, cms
QMED(SPEC), cms
VALIDATIONBankful
DischargeSpecific
DischargeDigos Padada-
Mainit (1) 174.416 124.630 259.924 PASS Pass
Digos Padada-Mainit (2) 261.360 505.830 221.683 Pass Pass
Digos Padada-Mainit (3) 190.168 203.899 162.377 Pass Pass
Digos Padada-Mainit (4) 166.408 151.237 140.196 Pass Pass
Digos Padada-Mainit (5) 296.296 731.433 36743.401 Fail Fail
Digos Padada-Mainit (6) 76.648 76.674 107.938 Pass Pass
Digos Padada-Mainit (7) 1095.688 1309.632 690.353 Pass Fail
Digos Padada-Mainit (8) 372.856 15.040 447.020 Fail Pass
Digos Padada-Mainit (9) 468.336 5882.497 312.181 Fail Fail
Digos Padada-Mainit (10) 574.288 7881.141 430.064 Fail Pass
Eight out of nine of the results from the HEC-HMS river discharge estimates were able to satisfy the conditions for validation using the bankful and specific discharge methods. One did not pass and will need further recalculation. The eight passing values are based on theory but are supported using other discharge computation methods so they were good to use flood modeling. These values will need further investigation for the purpose of validation. It is therefore recommended to obtain actual values of the river discharges for higher-accuracy modeling.
5.8 River Analysis Model Simulation
The HEC-RAS Flood Model produced a simulated water level at every cross-section for every time step for every flood simulation created. The resulting model will be used in determining the flooded areas within the model. The simulated model will be an integral part in determining real-time flood inundation extent of the river after it has been automated and uploaded on the DREAM website. For this publication, only a sample output map river was to be shown, since only the UPM-FMC base flow was calibrated. The sample generated map of Digos River using the calibrated HMS base flow is shown in Figure 72.

71
LiDAR Surveys and Flood Mapping of Digos River
Figure 72. Sample output of Digos RAS Model
5.9 Flow Depth and Flood Hazard
The resulting hazard and flow depth maps have a 10m resolution. Figure 73 to Figure 78 shows the 5-, 25-, and 100-year rain return scenarios of the Digos floodplain.
The generated flood hazard maps for the Digos Floodplain were used to assess the vulnerability of the educational and medical institutions in the floodplain. Using the flood depth units of PAG-ASA for hazard maps - “Low”, “Medium”, and “High” - the affected institutions were given their individual assessment for each Flood Hazard Scenario (5 yr, 25 yr, and 100 yr). Table 42 shows the percentage of area affected by flooding per municipality.
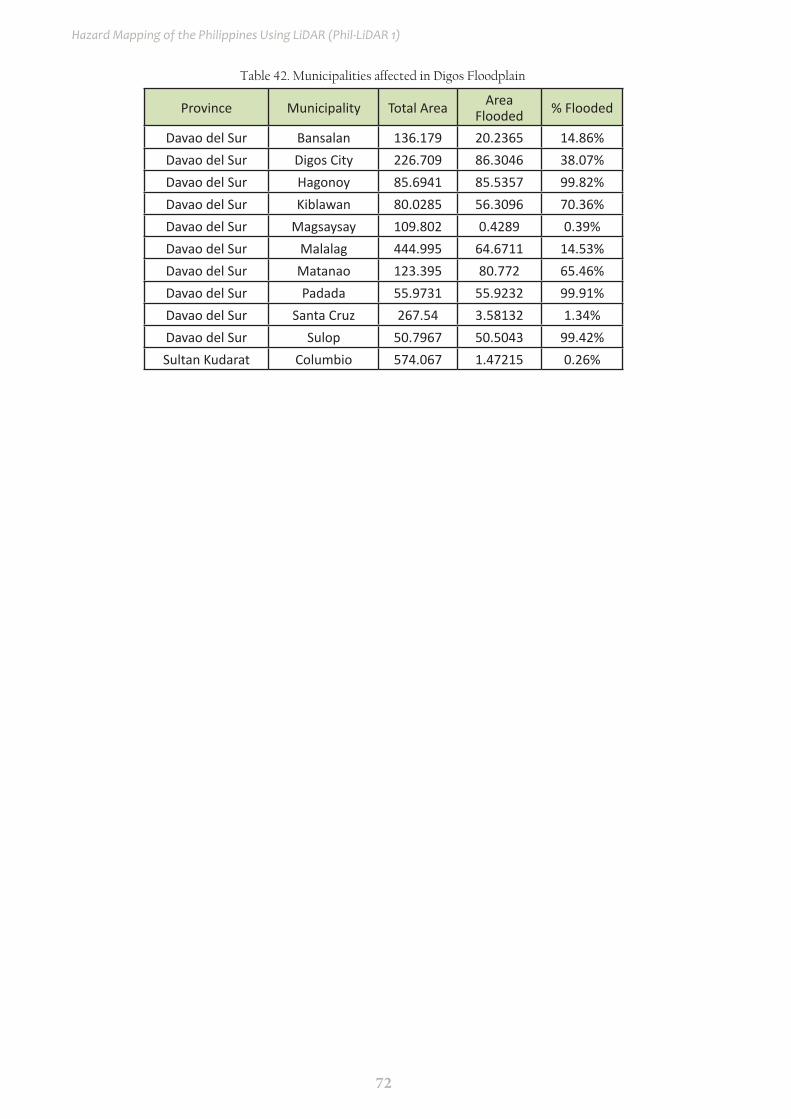
72
Hazard Mapping of the Philippines Using LiDAR (Phil-LiDAR 1)
Table 42. Municipalities affected in Digos Floodplain
Province Municipality Total Area Area Flooded % Flooded
Davao del Sur Bansalan 136.179 20.2365 14.86%Davao del Sur Digos City 226.709 86.3046 38.07%Davao del Sur Hagonoy 85.6941 85.5357 99.82%Davao del Sur Kiblawan 80.0285 56.3096 70.36%Davao del Sur Magsaysay 109.802 0.4289 0.39%Davao del Sur Malalag 444.995 64.6711 14.53%Davao del Sur Matanao 123.395 80.772 65.46%Davao del Sur Padada 55.9731 55.9232 99.91%Davao del Sur Santa Cruz 267.54 3.58132 1.34%Davao del Sur Sulop 50.7967 50.5043 99.42%Sultan Kudarat Columbio 574.067 1.47215 0.26%
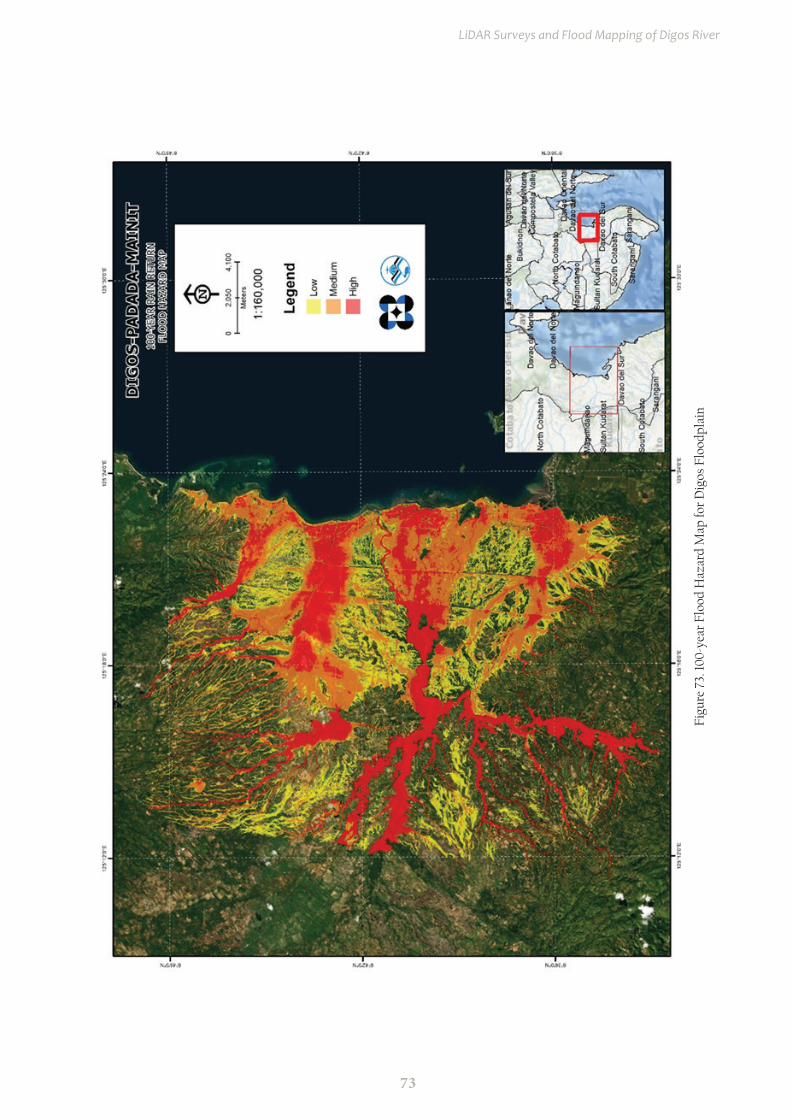
73
LiDAR Surveys and Flood Mapping of Digos River
Figu
re 7
3. 10
0-ye
ar F
lood
Haz
ard
Map
for
Dig
os F
lood
plai
n
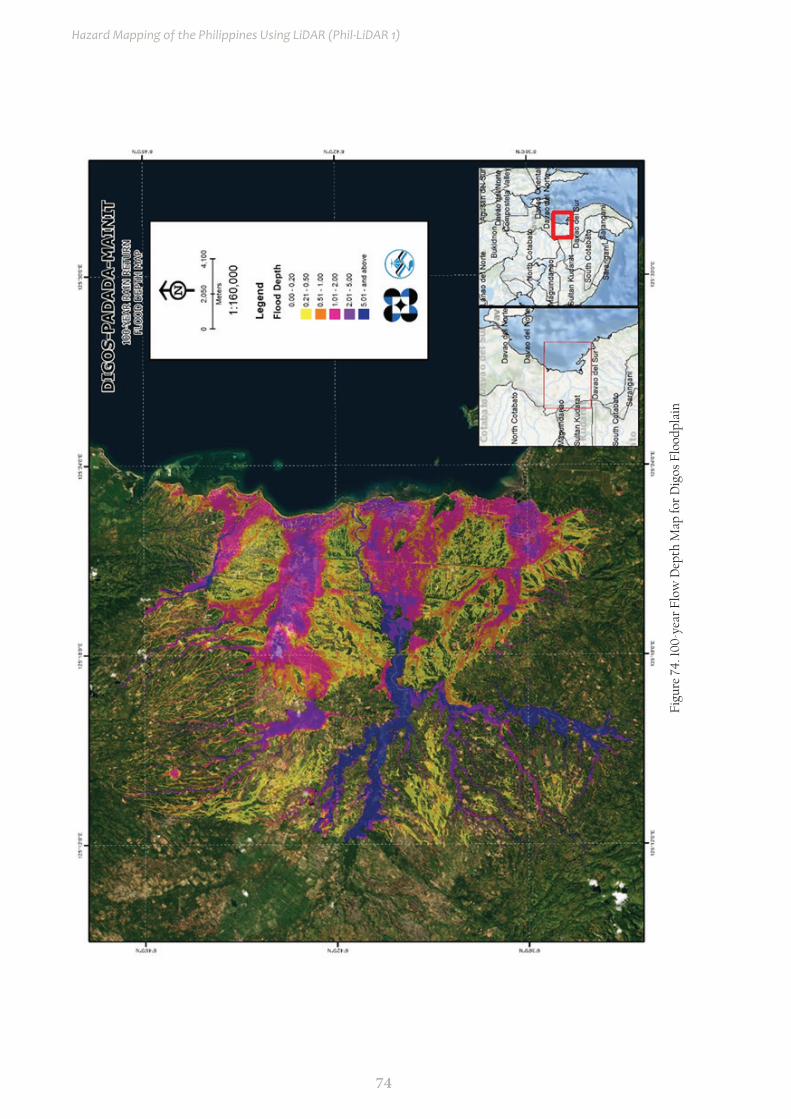
74
Hazard Mapping of the Philippines Using LiDAR (Phil-LiDAR 1)
Figu
re 7
4. 10
0-ye
ar F
low
Dep
th M
ap fo
r D
igos
Flo
odpl
ain
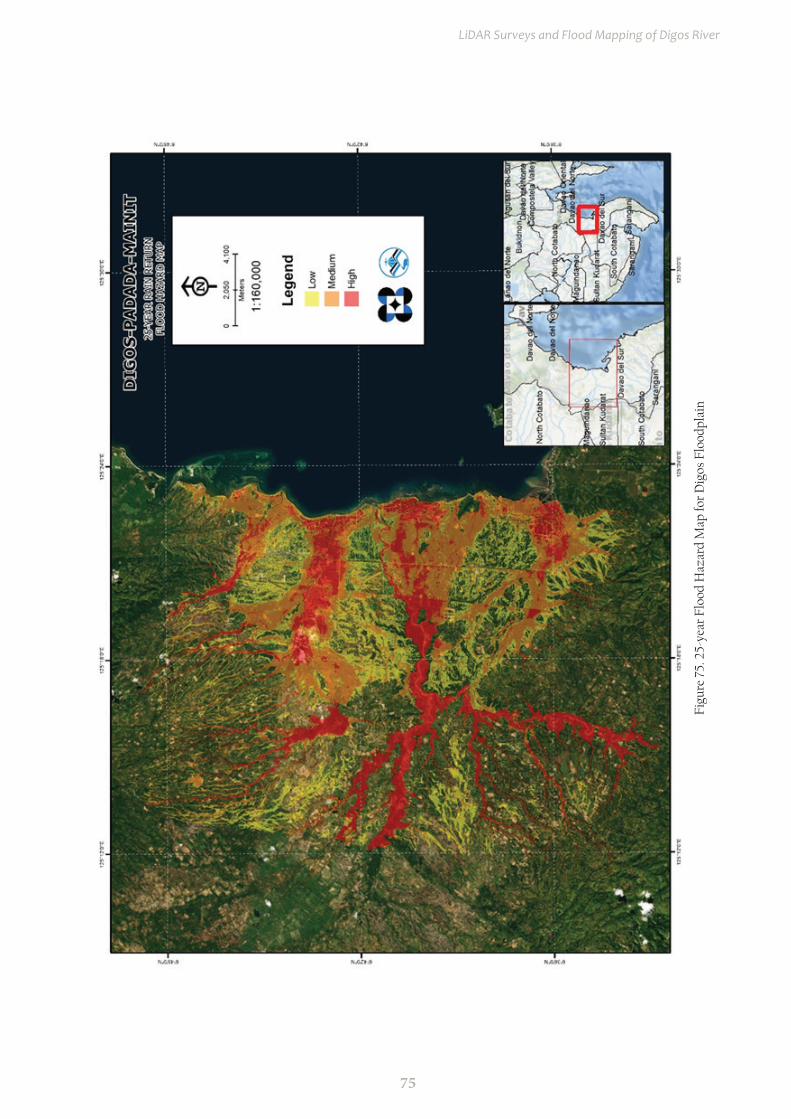
75
LiDAR Surveys and Flood Mapping of Digos River
Figu
re 7
5. 2
5-ye
ar F
lood
Haz
ard
Map
for
Dig
os F
lood
plai
n

76
Hazard Mapping of the Philippines Using LiDAR (Phil-LiDAR 1)
Figu
re 7
6. 2
5-ye
ar F
low
Dep
th M
ap fo
r D
igos
Flo
odpl
ain
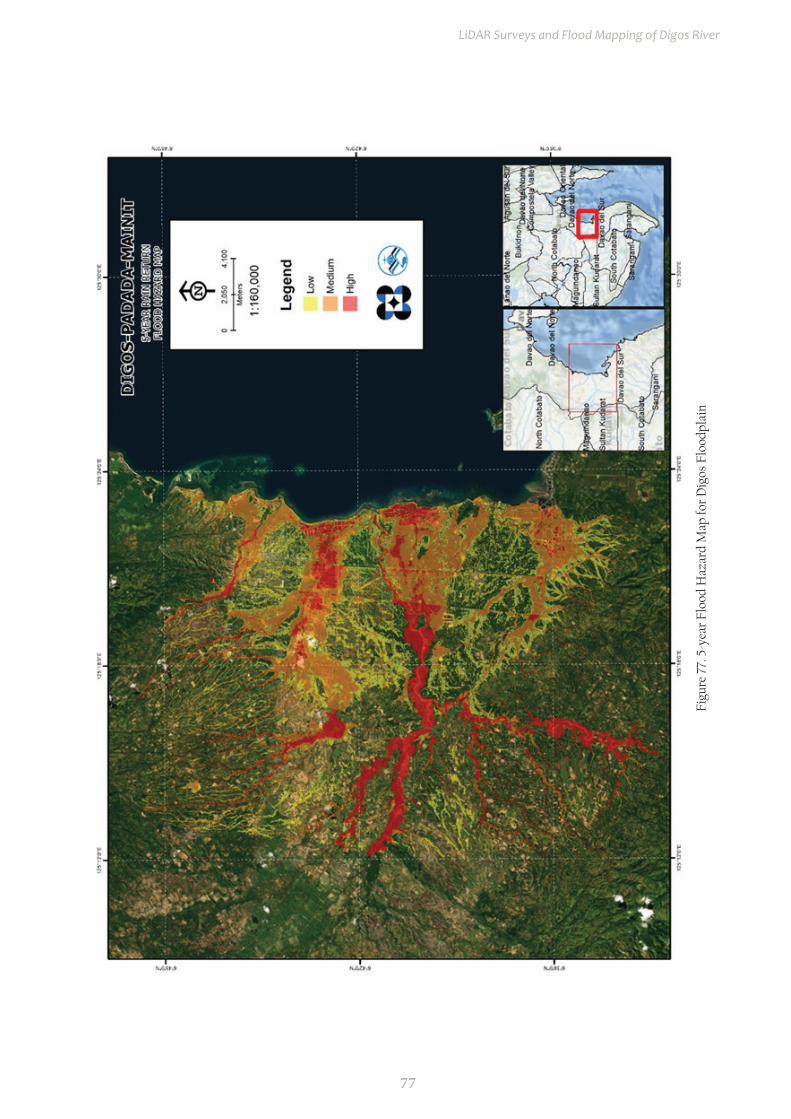
77
LiDAR Surveys and Flood Mapping of Digos River
Figu
re 7
7. 5
-yea
r Fl
ood
Haz
ard
Map
for
Dig
os F
lood
plai
n
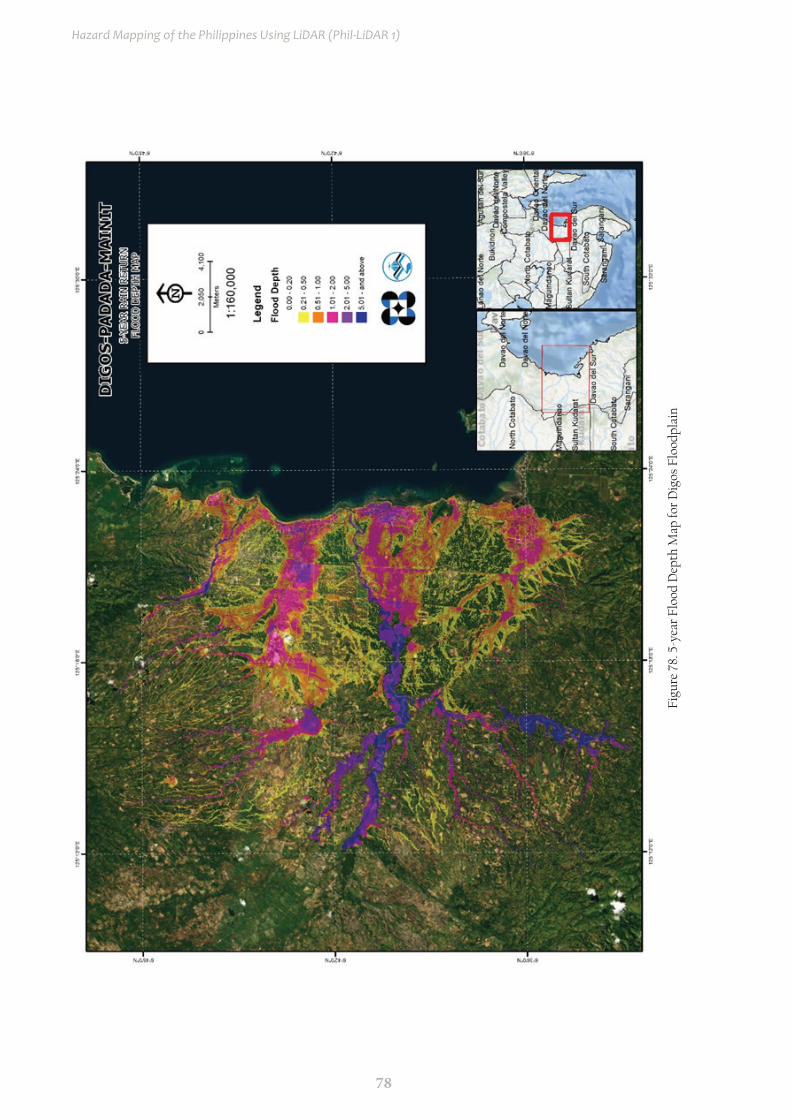
78
Hazard Mapping of the Philippines Using LiDAR (Phil-LiDAR 1)
Figu
re 7
8. 5
-yea
r Fl
ood
Dep
th M
ap fo
r D
igos
Flo
odpl
ain
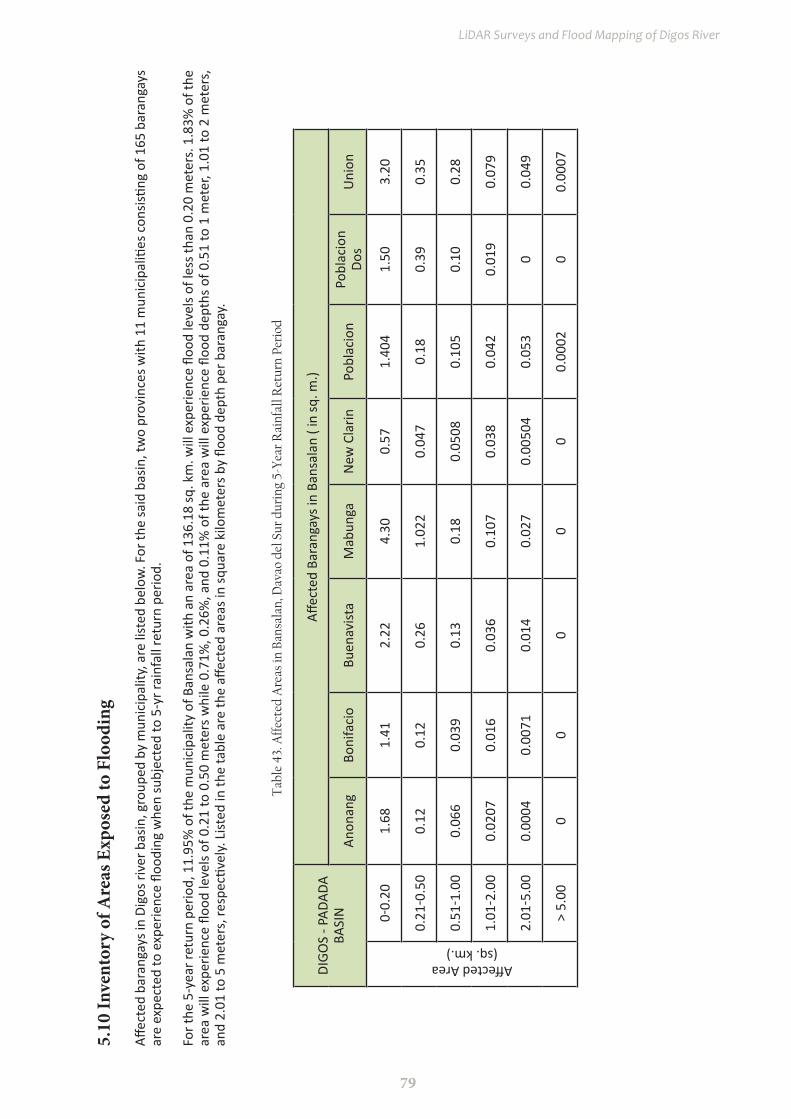
79
LiDAR Surveys and Flood Mapping of Digos River
5.10
inve
ntor
y of
Are
as E
xpos
ed to
Flo
odin
g
Affec
ted
bara
ngay
s in
Digo
s riv
er b
asin
, gro
uped
by
mun
icip
ality
, are
list
ed b
elow
. For
the
said
bas
in, t
wo
prov
ince
s with
11
mun
icip
aliti
es c
onsis
ting
of 1
65 b
aran
gays
ar
e ex
pect
ed to
exp
erie
nce
flood
ing
whe
n su
bjec
ted
to 5
-yr r
ainf
all r
etur
n pe
riod.
For t
he 5
-yea
r ret
urn
perio
d, 1
1.95
% o
f the
mun
icip
ality
of B
ansa
lan
with
an
area
of 1
36.1
8 sq
. km
. will
exp
erie
nce
flood
leve
ls of
less
than
0.2
0 m
eter
s. 1
.83%
of t
he
area
will
exp
erie
nce
flood
leve
ls of
0.2
1 to
0.5
0 m
eter
s w
hile
0.7
1%, 0
.26%
, and
0.1
1% o
f the
are
a w
ill e
xper
ienc
e flo
od d
epth
s of
0.5
1 to
1 m
eter
, 1.0
1 to
2 m
eter
s,
and
2.01
to 5
met
ers,
resp
ectiv
ely.
List
ed in
the
tabl
e ar
e th
e aff
ecte
d ar
eas i
n sq
uare
kilo
met
ers b
y flo
od d
epth
per
bar
anga
y.
DIGO
S - P
ADAD
A BA
SIN
Affec
ted
Bara
ngay
s in
Bans
alan
( in
sq. m
.)
Anon
ang
Boni
faci
oBu
enav
ista
Mab
unga
New
Cla
rinPo
blac
ion
Pobl
acio
n Do
sU
nion
Affected Area(sq. km.)
0-0.
201.
681.
412.
224.
300.
571.
404
1.50
3.20
0.21
-0.5
00.
120.
120.
261.
022
0.04
70.
180.
390.
35
0.51
-1.0
00.
066
0.03
90.
130.
180.
0508
0.10
50.
100.
28
1.01
-2.0
00.
0207
0.01
60.
036
0.10
70.
038
0.04
20.
019
0.07
9
2.01
-5.0
00.
0004
0.00
710.
014
0.02
70.
0050
40.
053
00.
049
> 5.
000
00
00
0.00
020
0.00
07
Tab
le 4
3. A
ffec
ted
Are
as in
Ban
sala
n, D
avao
del
Sur
dur
ing
5-Y
ear
Rai
nfal
l Ret
urn
Peri
od
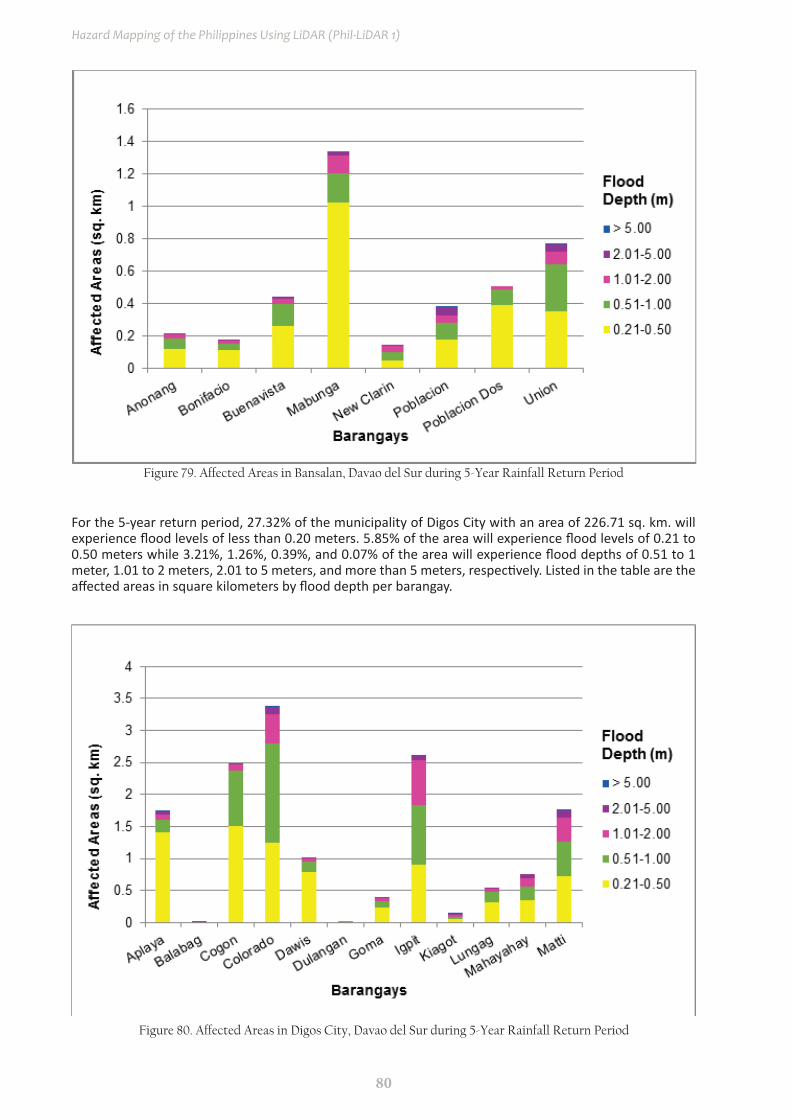
80
Hazard Mapping of the Philippines Using LiDAR (Phil-LiDAR 1)
Figure 79. Affected Areas in Bansalan, Davao del Sur during 5-Year Rainfall Return Period
For the 5-year return period, 27.32% of the municipality of Digos City with an area of 226.71 sq. km. will experience flood levels of less than 0.20 meters. 5.85% of the area will experience flood levels of 0.21 to 0.50 meters while 3.21%, 1.26%, 0.39%, and 0.07% of the area will experience flood depths of 0.51 to 1 meter, 1.01 to 2 meters, 2.01 to 5 meters, and more than 5 meters, respectively. Listed in the table are the affected areas in square kilometers by flood depth per barangay.
Figure 80. Affected Areas in Digos City, Davao del Sur during 5-Year Rainfall Return Period

81
LiDAR Surveys and Flood Mapping of Digos River
Figure 81. Affected Areas in Digos City, Davao del Sur during 5-Year Rainfall Return Period

82
Hazard Mapping of the Philippines Using LiDAR (Phil-LiDAR 1)
DIGO
S - P
ADAD
A BA
SIN
Affec
ted
Bara
ngay
s in
Digo
s City
Apla
yaBa
laba
gCo
gon
Colo
rado
Daw
isDu
lang
anG
oma
Igpi
tKi
agot
Lung
agM
ahay
ahay
Matti
Affected Area(sq. km.)
0-0.
201.
681.
412.
224.
30.
571.
41.
53.
21.
954.
794.
385.
010.
21-0
.50
0.12
0.12
0.26
1.02
0.04
70.
180.
390.
350.
057
0.32
0.36
0.73
0.51
-1.0
00.
066
0.03
90.
130.
180.
051
0.11
0.1
0.28
0.02
90.
150.
210.
541.
01-2
.00
0.02
10.
016
0.03
60.
110.
038
0.04
20.
019
0.07
90.
032
0.05
60.
120.
372.
01-5
.00
0.00
040.
0071
0.01
40.
027
0.00
50.
053
00.
049
0.01
40.
006
0.06
90.
13>
5.00
00
00
00.
0002
00.
0007
0.00
030
00.
0026
DIGO
S - P
ADAD
A BA
SIN
Affec
ted
Bara
ngay
s in
Digo
s City
Rupa
ran
San
Agus
tinSa
n Jo
seSa
n M
igue
lSa
n Ro
que
Sina
wila
nSo
ong
Tigu
man
Tres
de
May
oZo
ne 1
Zone
2Zo
ne 3
Affected Area(sq. km.)
0-0.
203.
124.
521.
81.
175.
343.
580.
81.
562.
292.
161.
022.
060.
21-0
.50
0.13
0.5
0.72
0.95
0.59
0.54
0.02
30.
760.
450.
064
0.29
0.64
0.51
-1.0
00.
069
0.25
0.24
0.51
0.35
0.25
0.01
0.34
0.37
0.03
70.
088
0.06
11.
01-2
.00
0.04
10.
10.
180.
120.
092
0.05
70.
0072
0.03
0.13
0.02
80.
032
0.00
822.
01-5
.00
0.03
30.
044
0.00
20
0.02
90.
023
0.00
350.
0003
0.12
0.03
40.
099
0.00
58>
5.00
0.00
220
00
00.
0081
00
0.02
50.
0017
0.09
60.
0095
Tab
le 4
4. A
ffec
ted
Are
as in
Dig
os C
ity,
Dav
ao d
el S
ur d
urin
g 5-
Yea
r R
ainf
all R
etur
n Pe
riod

83
LiDAR Surveys and Flood Mapping of Digos River
DIGO
S - P
ADAD
A BA
SIN
Affec
ted
Bara
ngay
s in
Hago
noy
Balu
taka
yCl
ibG
uihi
ngG
uihi
ng
Apla
yaHa
gono
y Cr
ossi
ngKi
buay
aLa
Uni
onLa
nuro
Lapu
laba
oLe
ling
Mah
ayah
ay
Affected Area(sq. km.)
0-0.
200.
842.
531.
633.
371.
891.
663.
191.
722.
986.
121.
750.
21-0
.50
0.63
0.35
0.58
1.48
0.64
1.03
0.26
1.06
1.22
3.14
0.61
0.51
-1.0
00.
80.
360.
10.
330.
081.
940.
190.
620.
551.
790.
081.
01-2
.00
1.67
0.13
0.02
50.
093
0.03
21
0.14
0.74
0.09
52.
340.
015
2.01
-5.0
00.
570.
070.
078
0.05
30.
170.
340.
048
0.00
034
0.01
10.
390.
0072
> 5.
000
0.01
80.
090.
0018
0.07
70
0.01
00.
0021
00.
0003
DIGO
S - P
ADAD
A BA
SIN
Affec
ted
Bara
ngay
s in
Hago
noy
Mal
aban
g Da
msi
teM
aliit
Di
gos
New
Q
uezo
nPa
ligue
Pobl
acio
nSa
cub
San
Gui
llerm
oSa
n Is
idro
Sina
yaw
anTo
loga
n
Affected Area(sq. km.)
0-0.
202.
461.
62.
880.
782.
724.
10.
810.
093
1.27
1.06
0.21
-0.5
00.
270.
370.
430.
40.
862.
470.
220.
250.
820.
220.
51-1
.00
0.23
0.72
0.28
0.14
0.1
0.37
0.4
0.78
0.67
0.05
71.
01-2
.00
0.07
50.
180.
560.
017
0.06
60
0.2
1.16
0.25
0.03
62.
01-5
.00
0.04
70.
019
0.85
00.
028
00.
120.
230
0.04
5>
5.00
0.00
010.
0002
00
0.01
20
00
00.
096
Tab
le 4
5. A
ffec
ted
Are
as in
Hag
onoy
, Dav
ao d
el S
ur d
urin
g 5-
Yea
r R
ainf
all R
etur
n Pe
riod
For t
he 5
-yea
r ret
urn
perio
d, 5
3.04
% o
f the
mun
icip
ality
of H
agon
oy w
ith a
n ar
ea o
f 85.
69 sq
. km
. will
exp
erie
nce
flood
leve
ls of
less
than
0.2
0 m
eter
s. 2
0.20
% o
f the
ar
ea w
ill e
xper
ienc
e flo
od le
vels
of 0
.21
to 0
.50
met
ers w
hile
12.
37%
, 10.
31%
, 3.6
1%, a
nd 0
.36%
of t
he a
rea
will
exp
erie
nce
flood
dep
ths o
f 0.5
1 to
1 m
eter
, 1.0
1 to
2
met
ers,
2.0
1 to
5 m
eter
s, a
nd m
ore
than
5 m
eter
s, re
spec
tivel
y. L
isted
in th
e ta
ble
are
the
affec
ted
area
s in
squa
re k
ilom
eter
s by
flood
dep
th p
er b
aran
gay.
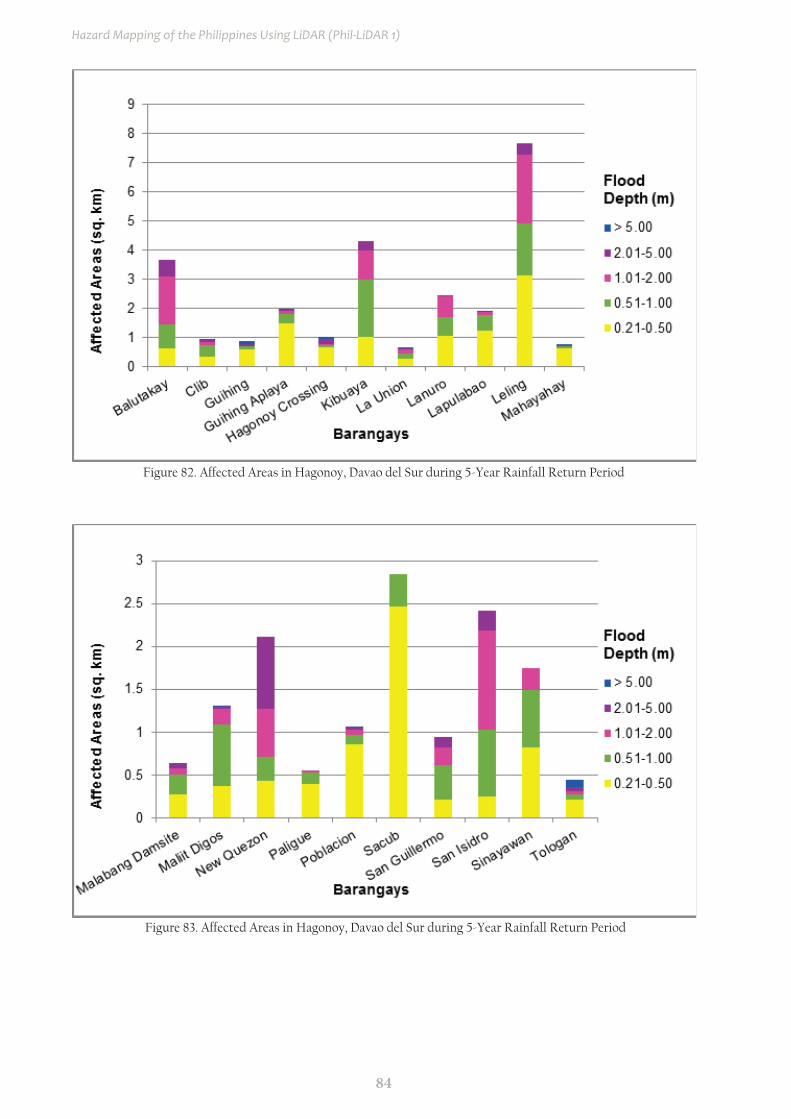
84
Hazard Mapping of the Philippines Using LiDAR (Phil-LiDAR 1)
Figure 82. Affected Areas in Hagonoy, Davao del Sur during 5-Year Rainfall Return Period
Figure 83. Affected Areas in Hagonoy, Davao del Sur during 5-Year Rainfall Return Period
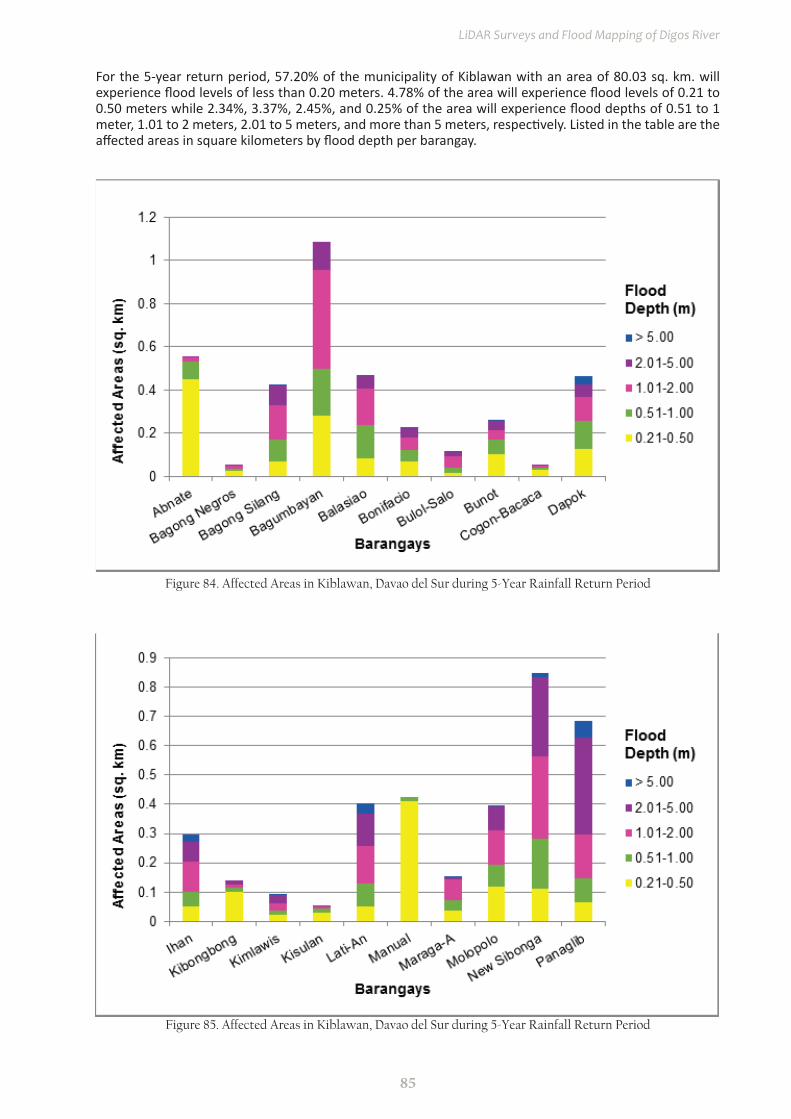
85
LiDAR Surveys and Flood Mapping of Digos River
For the 5-year return period, 57.20% of the municipality of Kiblawan with an area of 80.03 sq. km. will experience flood levels of less than 0.20 meters. 4.78% of the area will experience flood levels of 0.21 to 0.50 meters while 2.34%, 3.37%, 2.45%, and 0.25% of the area will experience flood depths of 0.51 to 1 meter, 1.01 to 2 meters, 2.01 to 5 meters, and more than 5 meters, respectively. Listed in the table are the affected areas in square kilometers by flood depth per barangay.
Figure 84. Affected Areas in Kiblawan, Davao del Sur during 5-Year Rainfall Return Period
Figure 85. Affected Areas in Kiblawan, Davao del Sur during 5-Year Rainfall Return Period
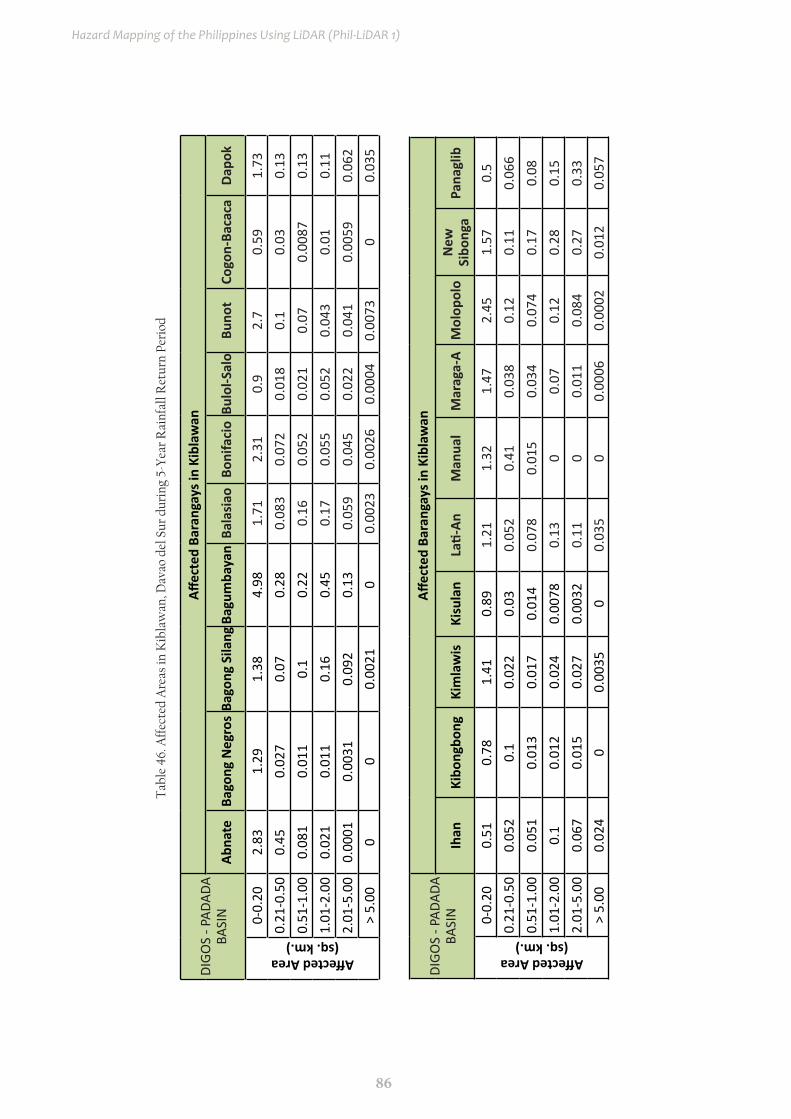
86
Hazard Mapping of the Philippines Using LiDAR (Phil-LiDAR 1)
DIGO
S - P
ADAD
A BA
SIN
Affec
ted
Bara
ngay
s in
Kibl
awan
Abna
teBa
gong
Neg
ros
Bago
ng S
ilang
Bagu
mba
yan
Bala
siao
Boni
faci
oBu
lol-S
alo
Buno
tCo
gon-
Baca
caDa
pok
Affected Area(sq. km.)
0-0.
202.
831.
291.
384.
981.
712.
310.
92.
70.
591.
730.
21-0
.50
0.45
0.02
70.
070.
280.
083
0.07
20.
018
0.1
0.03
0.13
0.51
-1.0
00.
081
0.01
10.
10.
220.
160.
052
0.02
10.
070.
0087
0.13
1.01
-2.0
00.
021
0.01
10.
160.
450.
170.
055
0.05
20.
043
0.01
0.11
2.01
-5.0
00.
0001
0.00
310.
092
0.13
0.05
90.
045
0.02
20.
041
0.00
590.
062
> 5.
000
00.
0021
00.
0023
0.00
260.
0004
0.00
730
0.03
5
DIGO
S - P
ADAD
A BA
SIN
Affec
ted
Bara
ngay
s in
Kibl
awan
Ihan
Kibo
ngbo
ngKi
mla
wis
Kisu
lan
Lati-
AnM
anua
lM
arag
a-A
Mol
opol
oN
ew
Sibo
nga
Pana
glib
Affected Area(sq. km.)
0-0.
200.
510.
781.
410.
891.
211.
321.
472.
451.
570.
50.
21-0
.50
0.05
20.
10.
022
0.03
0.05
20.
410.
038
0.12
0.11
0.06
60.
51-1
.00
0.05
10.
013
0.01
70.
014
0.07
80.
015
0.03
40.
074
0.17
0.08
1.01
-2.0
00.
10.
012
0.02
40.
0078
0.13
00.
070.
120.
280.
152.
01-5
.00
0.06
70.
015
0.02
70.
0032
0.11
00.
011
0.08
40.
270.
33>
5.00
0.02
40
0.00
350
0.03
50
0.00
060.
0002
0.01
20.
057
Tab
le 4
6. A
ffec
ted
Are
as in
Kib
law
an, D
avao
del
Sur
dur
ing
5-Y
ear
Rai
nfal
l Ret
urn
Peri
od
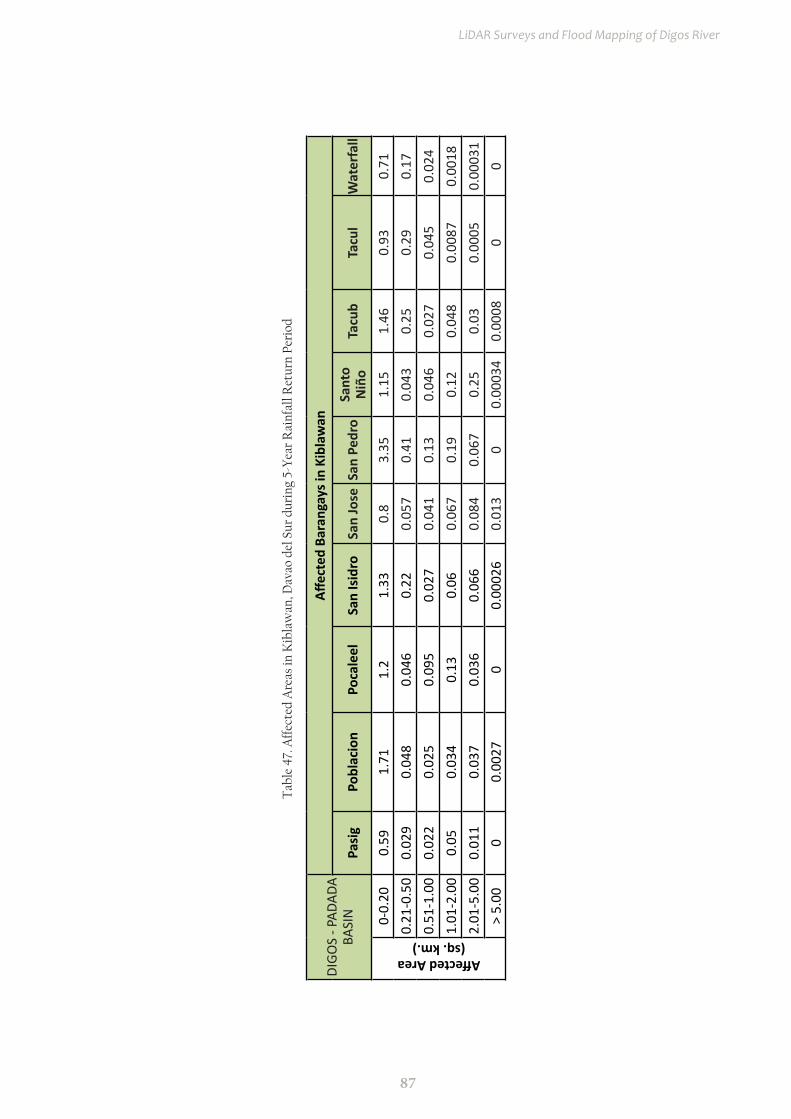
87
LiDAR Surveys and Flood Mapping of Digos River
DIGO
S - P
ADAD
A BA
SIN
Affec
ted
Bara
ngay
s in
Kibl
awan
Pasi
gPo
blac
ion
Poca
leel
San
Isid
roSa
n Jo
seSa
n Pe
dro
Sant
o N
iño
Tacu
bTa
cul
Wat
erfa
ll
Affected Area(sq. km.)
0-0.
200.
591.
711.
21.
330.
83.
351.
151.
460.
930.
710.
21-0
.50
0.02
90.
048
0.04
60.
220.
057
0.41
0.04
30.
250.
290.
170.
51-1
.00
0.02
20.
025
0.09
50.
027
0.04
10.
130.
046
0.02
70.
045
0.02
41.
01-2
.00
0.05
0.03
40.
130.
060.
067
0.19
0.12
0.04
80.
0087
0.00
182.
01-5
.00
0.01
10.
037
0.03
60.
066
0.08
40.
067
0.25
0.03
0.00
050.
0003
1>
5.00
00.
0027
00.
0002
60.
013
00.
0003
40.
0008
00
Tab
le 4
7. A
ffec
ted
Are
as in
Kib
law
an, D
avao
del
Sur
dur
ing
5-Y
ear
Rai
nfal
l Ret
urn
Peri
od

88
Hazard Mapping of the Philippines Using LiDAR (Phil-LiDAR 1)
Figure 86. Affected Areas in Kiblawan, Davao del Sur during 5-Year Rainfall Return Period
For the 5-year return period, 0.33% of the municipality of Magsaysay with an area of 109.8 sq. km. will experience flood levels of less than 0.20 meters. 0.04% of the area will experience flood levels of 0.21 to 0.50 meters while 0.01% and 0.01% of the area will experience flood depths of 0.51 to 1 meter and 1.01 to 2 meters, respectively. Listed in the table are the affected areas in square kilometers by flood depth per barangay.
DIGOS - PADADA BASIN
Affected Barangay in Magsaysay
New Ilocos
Affec
ted
Area
(sq.
km
.)
0-0.20 0.36
0.21-0.50 0.04
0.51-1.00 0.015
1.01-2.00 0.0098
2.01-5.00 0.0008
> 5.00 0
Table 48. Affected Areas in Magsaysay, Davao del Sur during 5-Year Rainfall Return Period

89
LiDAR Surveys and Flood Mapping of Digos River
Figure 87. Affected Areas in Magsaysay, Davao del Sur during 5-Year Rainfall Return Period
For the 5-year return period, 11.03% of the municipality of Malalag with an area of 445 sq. km. will experience flood levels of less than 0.20 meters. 1.43% of the area will experience flood levels of 0.21 to 0.50 meters while 1.08%, 0.71%, 0.27%, and 0.02% of the area will experience flood depths of 0.51 to 1 meter, 1.01 to 2 meters, 2.01 to 5 meters, and more than 5 meters, respectively. Listed in the table are the affected areas in square kilometers by flood depth per barangay.
DIGOS - PADADA BASIN
Affected Barangays in Malalag
Bagumbayan Bolton Kiblagon Lapu-Lapu Mabini New Baclayon
Affec
ted
Area
(sq.
km
.)
0-0.20 0.018 0.59 13.37 31.26 1.38 2.480.21-0.50 0.0079 0.074 3.95 1.61 0.032 0.670.51-1.00 0.005 0.018 2.64 1.36 0.018 0.771.01-2.00 0.00082 0.012 1.35 1.54 0.0094 0.242.01-5.00 0 0.0081 0.17 1 0.013 0.0068
> 5.00 0 0.0003 0.0089 0.07 0.0042 0
Table 49. Affected Areas in Malalag, Davao del Sur during 5-Year Rainfall Return Period
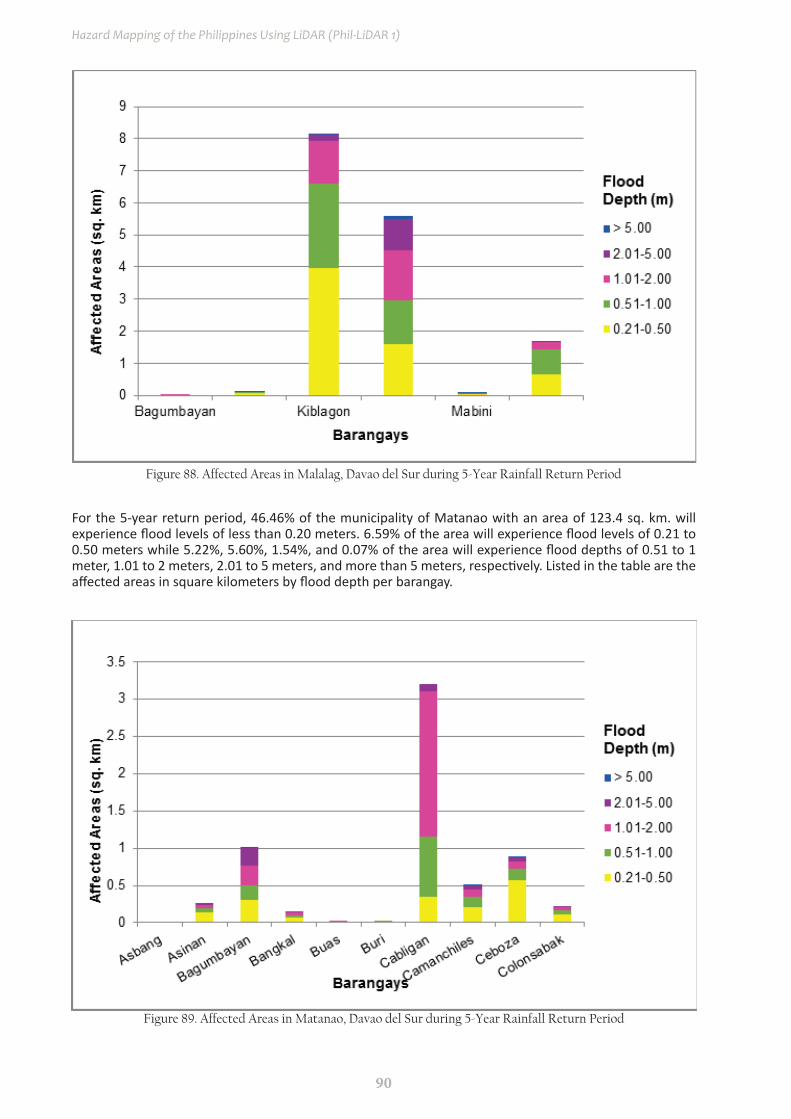
90
Hazard Mapping of the Philippines Using LiDAR (Phil-LiDAR 1)
Figure 88. Affected Areas in Malalag, Davao del Sur during 5-Year Rainfall Return Period
For the 5-year return period, 46.46% of the municipality of Matanao with an area of 123.4 sq. km. will experience flood levels of less than 0.20 meters. 6.59% of the area will experience flood levels of 0.21 to 0.50 meters while 5.22%, 5.60%, 1.54%, and 0.07% of the area will experience flood depths of 0.51 to 1 meter, 1.01 to 2 meters, 2.01 to 5 meters, and more than 5 meters, respectively. Listed in the table are the affected areas in square kilometers by flood depth per barangay.
Figure 89. Affected Areas in Matanao, Davao del Sur during 5-Year Rainfall Return Period
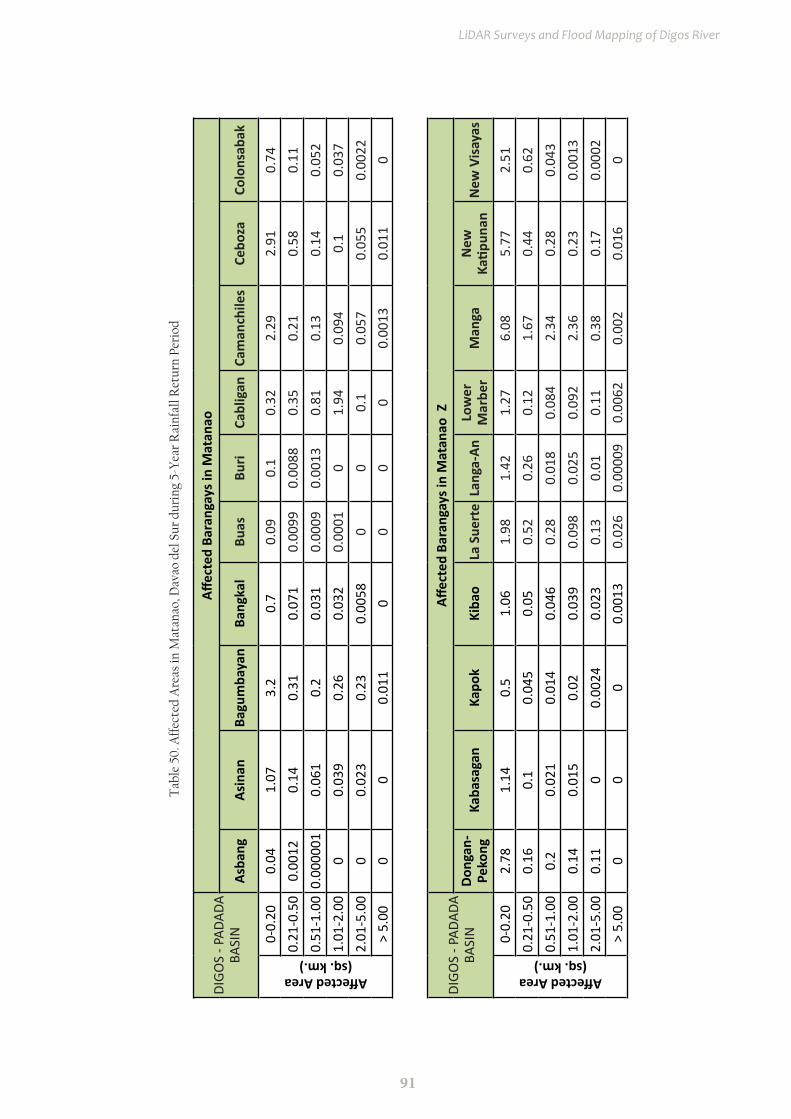
91
LiDAR Surveys and Flood Mapping of Digos River
DIGO
S - P
ADAD
A BA
SIN
Affec
ted
Bara
ngay
s in
Mat
anao
Asba
ngAs
inan
Bagu
mba
yan
Bang
kal
Buas
Buri
Cabl
igan
Cam
anch
iles
Cebo
zaCo
lons
abak
Affected Area(sq. km.)
0-0.
200.
041.
073.
20.
70.
090.
10.
322.
292.
910.
740.
21-0
.50
0.00
120.
140.
310.
071
0.00
990.
0088
0.35
0.21
0.58
0.11
0.51
-1.0
00.
0000
010.
061
0.2
0.03
10.
0009
0.00
130.
810.
130.
140.
052
1.01
-2.0
00
0.03
90.
260.
032
0.00
010
1.94
0.09
40.
10.
037
2.01
-5.0
00
0.02
30.
230.
0058
00
0.1
0.05
70.
055
0.00
22>
5.00
00
0.01
10
00
00.
0013
0.01
10
DIGO
S - P
ADAD
A BA
SIN
Affec
ted
Bara
ngay
s in
Mat
anao
Z
Dong
an-
Peko
ngKa
basa
gan
Kapo
kKi
bao
La S
uert
eLa
nga-
AnLo
wer
M
arbe
rM
anga
New
Ka
tipun
anN
ew V
isay
as
Affected Area(sq. km.)
0-0.
202.
781.
140.
51.
061.
981.
421.
276.
085.
772.
510.
21-0
.50
0.16
0.1
0.04
50.
050.
520.
260.
121.
670.
440.
620.
51-1
.00
0.2
0.02
10.
014
0.04
60.
280.
018
0.08
42.
340.
280.
043
1.01
-2.0
00.
140.
015
0.02
0.03
90.
098
0.02
50.
092
2.36
0.23
0.00
132.
01-5
.00
0.11
00.
0024
0.02
30.
130.
010.
110.
380.
170.
0002
> 5.
000
00
0.00
130.
026
0.00
009
0.00
620.
002
0.01
60
Tab
le 5
0. A
ffec
ted
Are
as in
Mat
anao
, Dav
ao d
el S
ur d
urin
g 5-
Yea
r R
ainf
all R
etur
n Pe
riod
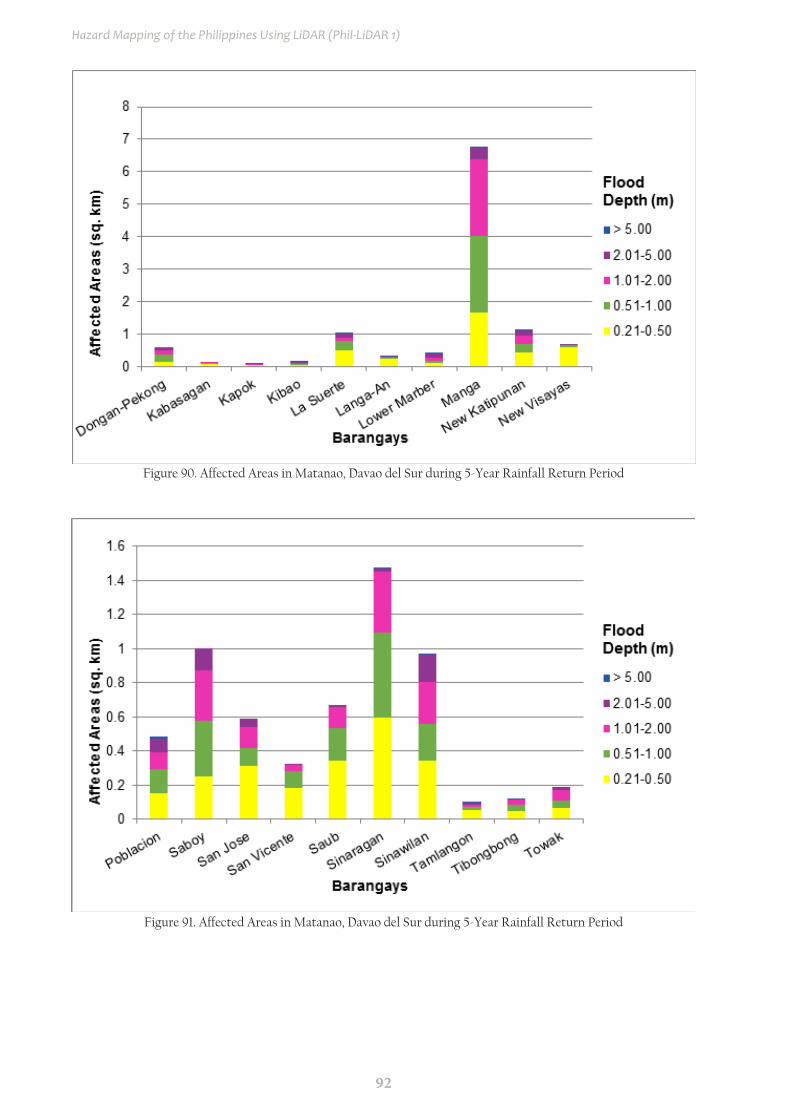
92
Hazard Mapping of the Philippines Using LiDAR (Phil-LiDAR 1)
Figure 90. Affected Areas in Matanao, Davao del Sur during 5-Year Rainfall Return Period
Figure 91. Affected Areas in Matanao, Davao del Sur during 5-Year Rainfall Return Period
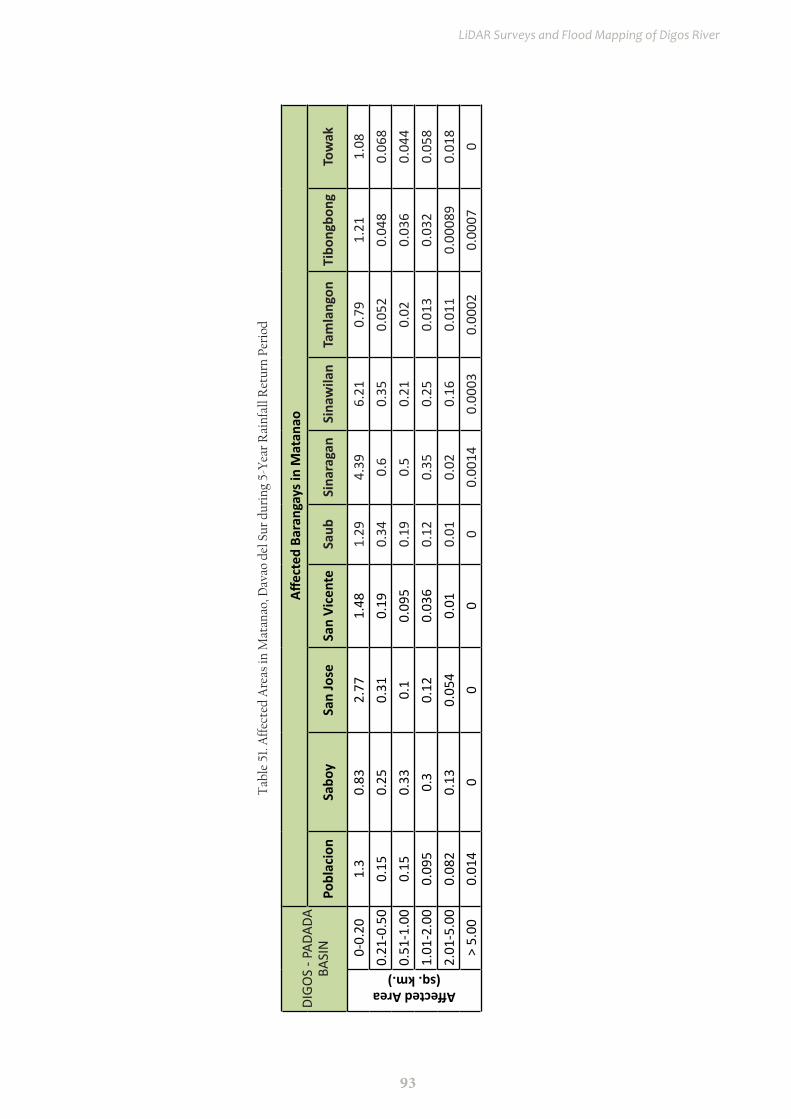
93
LiDAR Surveys and Flood Mapping of Digos River
Tab
le 5
1. A
ffec
ted
Are
as in
Mat
anao
, Dav
ao d
el S
ur d
urin
g 5-
Yea
r R
ainf
all R
etur
n Pe
riod
DIGO
S - P
ADAD
A BA
SIN
Affec
ted
Bara
ngay
s in
Mat
anao
Pobl
acio
nSa
boy
San
Jose
San
Vice
nte
Saub
Sina
raga
nSi
naw
ilan
Tam
lang
onTi
bong
bong
Tow
ak
Affected Area(sq. km.)
0-0.
201.
30.
832.
771.
481.
294.
396.
210.
791.
211.
080.
21-0
.50
0.15
0.25
0.31
0.19
0.34
0.6
0.35
0.05
20.
048
0.06
80.
51-1
.00
0.15
0.33
0.1
0.09
50.
190.
50.
210.
020.
036
0.04
41.
01-2
.00
0.09
50.
30.
120.
036
0.12
0.35
0.25
0.01
30.
032
0.05
82.
01-5
.00
0.08
20.
130.
054
0.01
0.01
0.02
0.16
0.01
10.
0008
90.
018
> 5.
000.
014
00
00
0.00
140.
0003
0.00
020.
0007
0
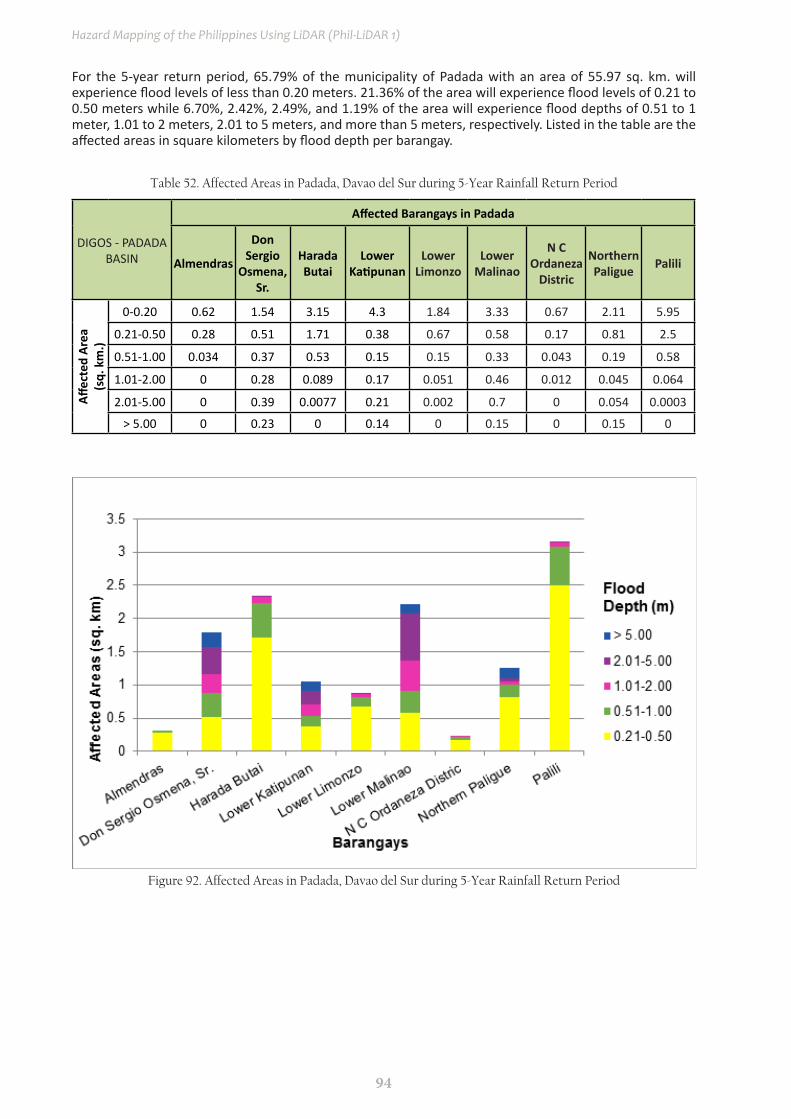
94
Hazard Mapping of the Philippines Using LiDAR (Phil-LiDAR 1)
For the 5-year return period, 65.79% of the municipality of Padada with an area of 55.97 sq. km. will experience flood levels of less than 0.20 meters. 21.36% of the area will experience flood levels of 0.21 to 0.50 meters while 6.70%, 2.42%, 2.49%, and 1.19% of the area will experience flood depths of 0.51 to 1 meter, 1.01 to 2 meters, 2.01 to 5 meters, and more than 5 meters, respectively. Listed in the table are the affected areas in square kilometers by flood depth per barangay.
Table 52. Affected Areas in Padada, Davao del Sur during 5-Year Rainfall Return Period
DIGOS - PADADA BASIN
Affected Barangays in Padada
Almendras
Don Sergio
Osmena, Sr.
Harada Butai
Lower Katipunan
Lower Limonzo
Lower Malinao
N C Ordaneza
Distric
Northern Paligue Palili
Affec
ted
Area
(sq.
km
.)
0-0.20 0.62 1.54 3.15 4.3 1.84 3.33 0.67 2.11 5.95
0.21-0.50 0.28 0.51 1.71 0.38 0.67 0.58 0.17 0.81 2.5
0.51-1.00 0.034 0.37 0.53 0.15 0.15 0.33 0.043 0.19 0.58
1.01-2.00 0 0.28 0.089 0.17 0.051 0.46 0.012 0.045 0.064
2.01-5.00 0 0.39 0.0077 0.21 0.002 0.7 0 0.054 0.0003
> 5.00 0 0.23 0 0.14 0 0.15 0 0.15 0
Figure 92. Affected Areas in Padada, Davao del Sur during 5-Year Rainfall Return Period
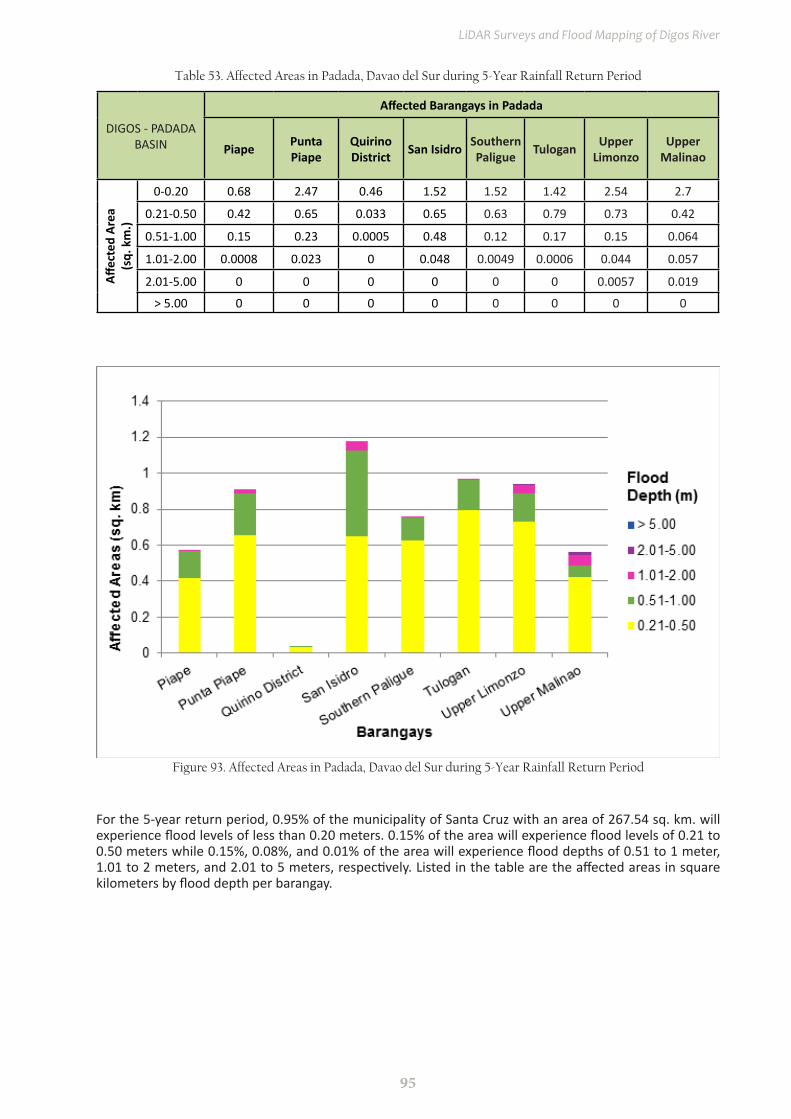
95
LiDAR Surveys and Flood Mapping of Digos River
DIGOS - PADADA BASIN
Affected Barangays in Padada
Piape Punta Piape
Quirino District San Isidro Southern
Paligue Tulogan Upper Limonzo
Upper Malinao
Affec
ted
Area
(sq.
km
.)
0-0.20 0.68 2.47 0.46 1.52 1.52 1.42 2.54 2.7
0.21-0.50 0.42 0.65 0.033 0.65 0.63 0.79 0.73 0.42
0.51-1.00 0.15 0.23 0.0005 0.48 0.12 0.17 0.15 0.064
1.01-2.00 0.0008 0.023 0 0.048 0.0049 0.0006 0.044 0.057
2.01-5.00 0 0 0 0 0 0 0.0057 0.019
> 5.00 0 0 0 0 0 0 0 0
Table 53. Affected Areas in Padada, Davao del Sur during 5-Year Rainfall Return Period
Figure 93. Affected Areas in Padada, Davao del Sur during 5-Year Rainfall Return Period
For the 5-year return period, 0.95% of the municipality of Santa Cruz with an area of 267.54 sq. km. will experience flood levels of less than 0.20 meters. 0.15% of the area will experience flood levels of 0.21 to 0.50 meters while 0.15%, 0.08%, and 0.01% of the area will experience flood depths of 0.51 to 1 meter, 1.01 to 2 meters, and 2.01 to 5 meters, respectively. Listed in the table are the affected areas in square kilometers by flood depth per barangay.
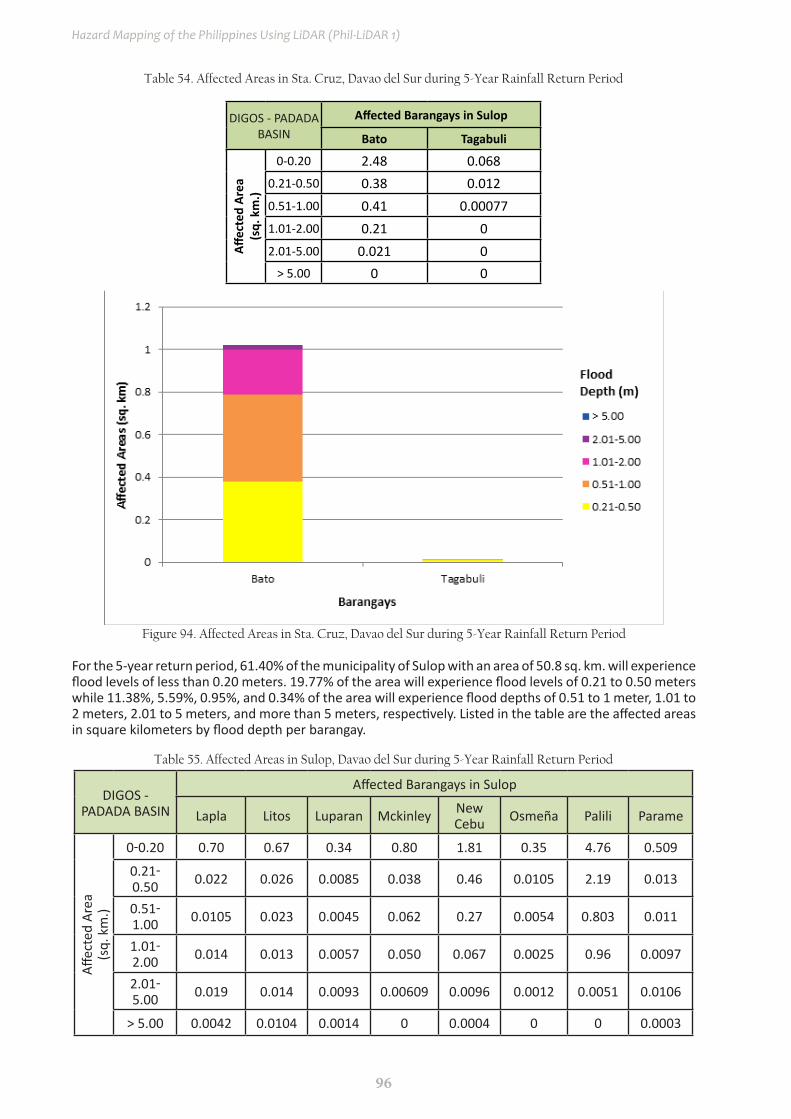
96
Hazard Mapping of the Philippines Using LiDAR (Phil-LiDAR 1)
Table 54. Affected Areas in Sta. Cruz, Davao del Sur during 5-Year Rainfall Return Period
DIGOS - PADADA BASIN
Affected Barangays in Sulop
Bato Tagabuli
Affec
ted
Area
(sq.
km
.)
0-0.20 2.48 0.0680.21-0.50 0.38 0.0120.51-1.00 0.41 0.000771.01-2.00 0.21 02.01-5.00 0.021 0
> 5.00 0 0
Figure 94. Affected Areas in Sta. Cruz, Davao del Sur during 5-Year Rainfall Return Period
Table 55. Affected Areas in Sulop, Davao del Sur during 5-Year Rainfall Return Period
DIGOS - PADADA BASIN
Affected Barangays in Sulop
Lapla Litos Luparan Mckinley New Cebu Osmeña Palili Parame
Affec
ted
Area
(sq.
km
.)
0-0.20 0.70 0.67 0.34 0.80 1.81 0.35 4.76 0.509
0.21-0.50 0.022 0.026 0.0085 0.038 0.46 0.0105 2.19 0.013
0.51-1.00 0.0105 0.023 0.0045 0.062 0.27 0.0054 0.803 0.011
1.01-2.00 0.014 0.013 0.0057 0.050 0.067 0.0025 0.96 0.0097
2.01-5.00 0.019 0.014 0.0093 0.00609 0.0096 0.0012 0.0051 0.0106
> 5.00 0.0042 0.0104 0.0014 0 0.0004 0 0 0.0003
For the 5-year return period, 61.40% of the municipality of Sulop with an area of 50.8 sq. km. will experience flood levels of less than 0.20 meters. 19.77% of the area will experience flood levels of 0.21 to 0.50 meters while 11.38%, 5.59%, 0.95%, and 0.34% of the area will experience flood depths of 0.51 to 1 meter, 1.01 to 2 meters, 2.01 to 5 meters, and more than 5 meters, respectively. Listed in the table are the affected areas in square kilometers by flood depth per barangay.

97
LiDAR Surveys and Flood Mapping of Digos River
0
0.2
0.4
0.6
0.8
1
1.2
1.4
1.6
1.8
2
BalasinonBuguis
Carre Clib
Harada Butai
Katipunan
KiblagonLabon
Laperas
Affe
cted
Are
as (s
q. k
m)
Barangays
> 5.00
2.01-5.00
1.01-2.00
0.51-1.00
0.21-0.50
Figure 96. Affected Areas in Sulop, Davao del Sur during 5-Year Rainfall Return Period
0
0.5
1
1.5
2
2.5
3
3.5
4
4.5
Lapla LitosLuparan
Mckinley
New CebuOsmeña
PaliliParame
Affe
cted
Are
as (s
q. k
m)
Barangays
> 5.00
2.01-5.00
1.01-2.00
0.51-1.00
0.21-0.50
Figure 95. Affected Areas in Sulop, Davao del Sur during 5-Year Rainfall Return Period

98
Hazard Mapping of the Philippines Using LiDAR (Phil-LiDAR 1)
0
0.5
1
1.5
2
2.5
PoblacionRoxas
Solongvale
TagolilongTala-O
Talas
Tanwalang
Waterfall
Affe
cted
Are
as (s
q. k
m)
Barangays
> 5.00
2.01-5.00
1.01-2.00
0.51-1.00
0.21-0.50
Figure 97. Affected Areas in Sulop, Davao del Sur during 5-Year Rainfall Return Period
For the 5-year return period, 0.24% of the municipality of Columbio with an area of 574.067 sq. km. will experience flood levels of less than 0.20 meters. 0.01% of the area will experience flood levels of 0.21 to 0.50 meters while 0.00% of the area will experience flood depths of 0.51 to 1 meter. Listed in the table are the affected areas in square kilometers by flood depth per barangay.
Table 57. Affected Areas in Sulop, Davao del Sur during 5-Year Rainfall Return Period
DIGOS - PADADA BASIN
Affected Barangays in Sulop
Poblacion Roxas Solongvale Tagolilong Tala-O Talas Tanwalang Waterfall
Affec
ted
Area
(sq.
km
.)
0-0.20 0.502 3.22 2.302 1.039 2.55 1.12 1.77 0.901
0.21-0.50 0.58 0.17 1.13 0.028 0.77 0.84 0.65 0.492
0.51-1.00 0.68 0.18 0.46 0.011 0.37 0.59 0.27 0.30
1.01-2.00 0.702 0.12 0.092 0.011 0.11 0.17 0.060 0.022
2.01-5.00 0.0007 0.0502 0.0005 0.0056 0.0001 0.0004 0.24 0.00099
> 5.00 0 0.016 0 0.0005 0 0 0.12 0
DIGOS - PADADA BASIN
Affected Barangays in Sulop
Balasinon Buguis Carre Clib Harada Butai Katipunan Kiblagon Labon Laperas
Affec
ted
Area
(sq.
km
.)
0-0.20 0.23 1.19 0.9 0.52 2.1 1.18 0.43 0.48 0.830.21-0.50 0.15 0.046 0.04 0.015 0.95 0.45 0.67 0.018 0.280.51-1.00 0.055 0.033 0.024 0.0078 0.48 0.067 0.96 0.0081 0.0911.01-2.00 0.00074 0.035 0.021 0.0017 0.099 0.016 0.25 0.0054 0.00252.01-5.00 0 0.034 0.017 0.0012 0.0028 0.047 0 0.0048 0.0006
> 5.00 0 0 0.0036 0.00014 0 0.011 0 0.0014 0
Table 56. Affected Areas in Sulop, Davao del Sur during 5-Year Rainfall Return Period
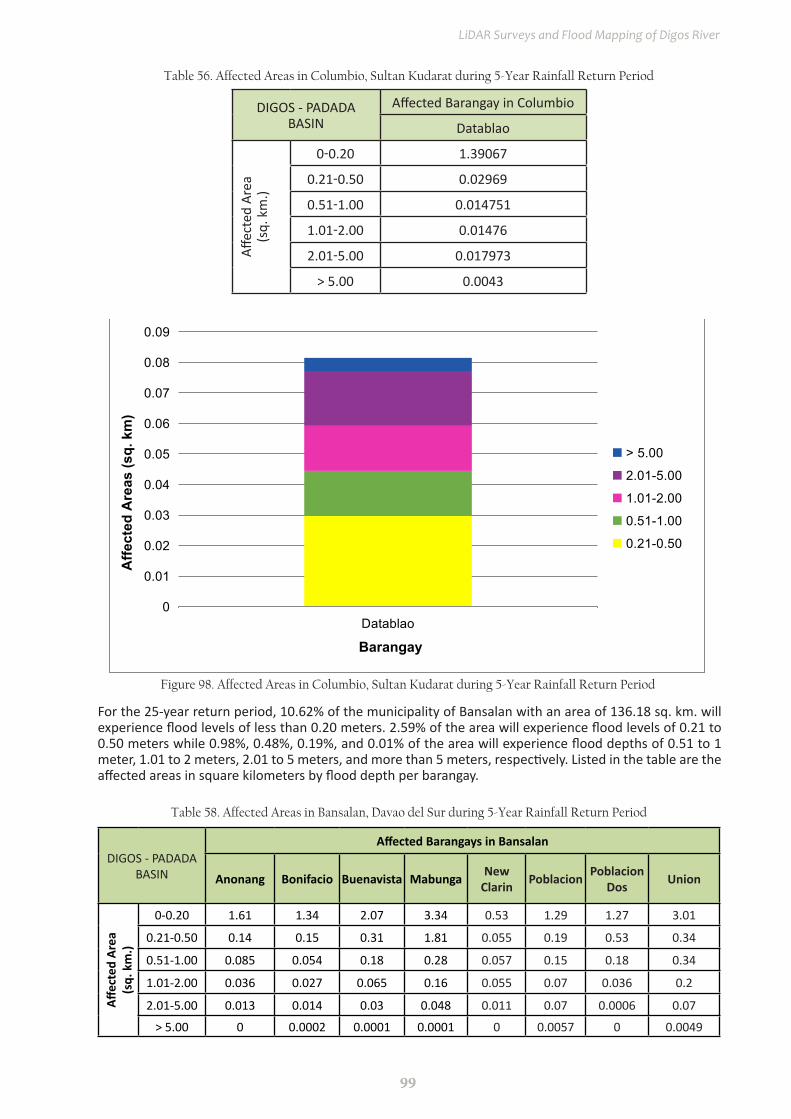
99
LiDAR Surveys and Flood Mapping of Digos River
Figure 98. Affected Areas in Columbio, Sultan Kudarat during 5-Year Rainfall Return Period
Table 56. Affected Areas in Columbio, Sultan Kudarat during 5-Year Rainfall Return Period
DIGOS - PADADA BASIN
Affected Barangay in Columbio
Datablao
Affec
ted
Area
(sq.
km
.)
0-0.20 1.39067
0.21-0.50 0.02969
0.51-1.00 0.014751
1.01-2.00 0.01476
2.01-5.00 0.017973
> 5.00 0.0043
0
0.01
0.02
0.03
0.04
0.05
0.06
0.07
0.08
0.09
Datablao
Affe
cted
Are
as (s
q. k
m)
Barangay
> 5.00
2.01-5.00
1.01-2.00
0.51-1.00
0.21-0.50
For the 25-year return period, 10.62% of the municipality of Bansalan with an area of 136.18 sq. km. will experience flood levels of less than 0.20 meters. 2.59% of the area will experience flood levels of 0.21 to 0.50 meters while 0.98%, 0.48%, 0.19%, and 0.01% of the area will experience flood depths of 0.51 to 1 meter, 1.01 to 2 meters, 2.01 to 5 meters, and more than 5 meters, respectively. Listed in the table are the affected areas in square kilometers by flood depth per barangay.
Table 58. Affected Areas in Bansalan, Davao del Sur during 5-Year Rainfall Return Period
DIGOS - PADADA BASIN
Affected Barangays in Bansalan
Anonang Bonifacio Buenavista Mabunga New Clarin Poblacion Poblacion
Dos Union
Affec
ted
Area
(sq.
km
.)
0-0.20 1.61 1.34 2.07 3.34 0.53 1.29 1.27 3.01
0.21-0.50 0.14 0.15 0.31 1.81 0.055 0.19 0.53 0.34
0.51-1.00 0.085 0.054 0.18 0.28 0.057 0.15 0.18 0.34
1.01-2.00 0.036 0.027 0.065 0.16 0.055 0.07 0.036 0.2
2.01-5.00 0.013 0.014 0.03 0.048 0.011 0.07 0.0006 0.07
> 5.00 0 0.0002 0.0001 0.0001 0 0.0057 0 0.0049

100
Hazard Mapping of the Philippines Using LiDAR (Phil-LiDAR 1)
Figure 99. Affected Areas in Bansalan, Davao del Sur during 25-Year Rainfall Return Period
0
0.5
1
1.5
2
2.5
Anonang
Bonifacio
Buenavista
Mabunga
New Clarin
Poblacion
Poblacion DosUnion
Affe
cted
Are
as (s
q. k
m)
Barangays
> 5.00
2.01-5.00
1.01-2.00
0.51-1.00
0.21-0.50
For the 25-year return period, 24.44% of the municipality of Digos City with an area of 226.71 sq. km. will experience flood levels of less than 0.20 meters. 6.71% of the area will experience flood levels of 0.21 to 0.50 meters while 4.44%, 2.15%, 0.63%, and 0.11% of the area will experience flood depths of 0.51 to 1 meter, 1.01 to 2 meters, 2.01 to 5 meters, and more than 5 meters, respectively. Listed in the table are the affected areas in square kilometers by flood depth per barangay.
0
0.5
1
1.5
2
2.5
3
3.5
4
4.5
AplayaBalabag
Cogon
ColoradoDawis
DulanganGoma
IgpitKiagot
Lungag
MahayahayMatti
Affe
cted
Are
as (s
q. k
m)
Barangays
> 5.00
2.01-5.00
1.01-2.00
0.51-1.00
0.21-0.50
Figure 100. Affected Areas in Digos City, Davao del Sur during 25-Year Rainfall Return Period

101
LiDAR Surveys and Flood Mapping of Digos River
DIGO
S - P
ADAD
A BA
SIN
Affec
ted
Bara
ngay
s in
Digo
s City
Apla
yaBa
laba
gCo
gon
Colo
rado
Daw
isDu
lang
anG
oma
Igpi
tKi
agot
Lung
agM
ahay
ahay
Matti
Affected Area(sq. km.)
0-0.
202.
120.
172.
083.
781.
660.
098
2.49
1.18
1.92
4.69
4.35
4.7
0.21
-0.5
01.
780.
0071
1.3
1.02
1.07
0.00
790.
370.
940.
071
0.37
0.44
0.81
0.51
-1.0
00.
620.
0044
1.46
1.82
0.27
0.00
037
0.17
0.95
0.03
10.
220.
270.
61.
01-2
.00
0.08
50.
0039
0.3
0.89
0.05
70.
0000
150.
066
1.2
0.03
60.
085
0.18
0.51
2.01
-5.0
00.
071
0.00
270.
0075
0.22
0.01
80
0.02
60.
120.
025
0.03
0.12
0.25
> 5.
000.
015
00
0.00
270
00
00.
0007
80
0.00
460.
0068
DIGO
S - P
ADAD
A BA
SIN
Affec
ted
Bara
ngay
s in
Digo
s City
Rupa
ran
San
Agus
tinSa
n Jo
seSa
n M
igue
lSa
n Ro
que
Sina
wila
nSo
ong
Tigu
man
Tres
de
May
oZo
ne 1
Zone
2Zo
ne 3
Affected Area(sq. km.)
0-0.
203.
034.
071.
310.
715.
043.
390.
791.
132.
042.
120.
841.
670.
21-0
.50
0.18
0.79
1.04
1.06
0.67
0.49
0.03
10.
930.
460.
071
0.35
0.94
0.51
-1.0
00.
081
0.33
0.29
0.69
0.46
0.43
0.01
20.
550.
460.
047
0.16
0.14
1.01
-2.0
00.
053
0.15
0.28
0.3
0.19
0.09
0.00
80.
077
0.21
0.03
0.04
90.
012
2.01
-5.0
00.
047
0.07
50.
0034
00.
056
0.03
70.
0061
0.00
063
0.16
0.04
40.
092
0.00
67>
5.00
0.00
410
00
00.
0099
00
0.05
60.
0057
0.14
0.01
Tab
le 5
9. A
ffec
ted
Are
as in
Dig
os C
ity,
Dav
ao d
el S
ur d
urin
g 25
-Yea
r R
ainf
all R
etur
n Pe
riod
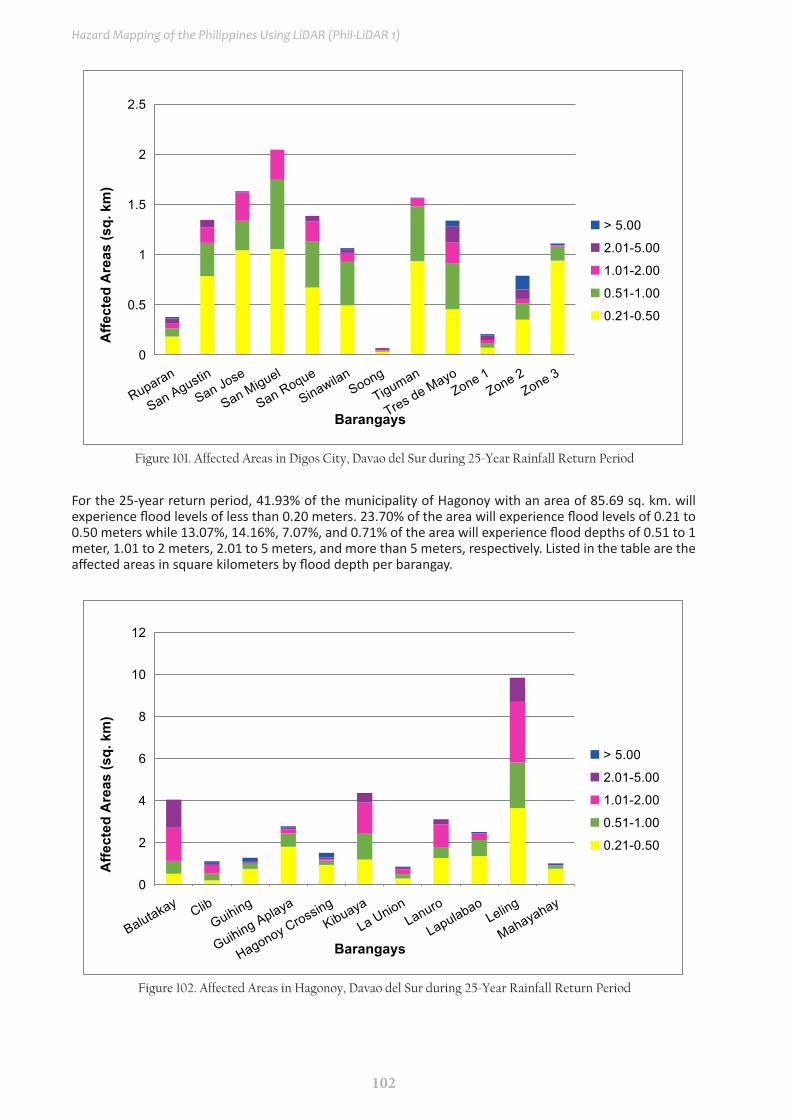
102
Hazard Mapping of the Philippines Using LiDAR (Phil-LiDAR 1)
For the 25-year return period, 41.93% of the municipality of Hagonoy with an area of 85.69 sq. km. will experience flood levels of less than 0.20 meters. 23.70% of the area will experience flood levels of 0.21 to 0.50 meters while 13.07%, 14.16%, 7.07%, and 0.71% of the area will experience flood depths of 0.51 to 1 meter, 1.01 to 2 meters, 2.01 to 5 meters, and more than 5 meters, respectively. Listed in the table are the affected areas in square kilometers by flood depth per barangay.
Figure 101. Affected Areas in Digos City, Davao del Sur during 25-Year Rainfall Return Period
Figure 102. Affected Areas in Hagonoy, Davao del Sur during 25-Year Rainfall Return Period
0
0.5
1
1.5
2
2.5
Ruparan
San Agustin
San Jose
San Miguel
San Roque
SinawilanSoong
Tiguman
Tres de MayoZone 1
Zone 2Zone 3
Affe
cted
Are
as (s
q. k
m)
Barangays
> 5.00
2.01-5.00
1.01-2.00
0.51-1.00
0.21-0.50
0
2
4
6
8
10
12
Balutakay ClibGuihing
Guihing Aplaya
Hagonoy CrossingKibuaya
La UnionLanuro
LapulabaoLeling
Mahayahay
Affe
cted
Are
as (s
q. k
m)
Barangays
> 5.00
2.01-5.00
1.01-2.00
0.51-1.00
0.21-0.50

103
LiDAR Surveys and Flood Mapping of Digos River
DIGO
S - P
ADAD
A BA
SIN
Affec
ted
Bara
ngay
s in
Hago
noy
Balu
taka
yCl
ibG
uihi
ngG
uihi
ng
Apla
yaHa
gono
y Cr
ossi
ngKi
buay
aLa
Uni
onLa
nuro
Lapu
laba
oLe
ling
Mah
ayah
ay
Affected Area(sq. km.)
0-0.
200.
482.
41.
232.
61.
41.
723.
031.
042.
633.
951.
520.
21-0
.50
0.52
0.2
0.75
1.8
0.94
1.19
0.29
1.27
1.35
3.64
0.75
0.51
-1.0
00.
610.
320.
240.
640.
211.
230.
210.
490.
772.
170.
161.
01-2
.00
1.58
0.42
0.05
40.
190.
058
1.48
0.23
1.11
0.31
2.88
0.02
12.
01-5
.00
1.33
0.09
60.
078
0.08
40.
097
0.41
0.07
20.
240.
028
1.15
0.01
3>
5.00
00.
029
0.16
0.01
70.
210.
0013
0.01
20
0.00
290
0.00
12
DIGO
S - P
ADAD
A BA
SIN
Affec
ted
Bara
ngay
s in
Hago
noy
Mal
aban
g Da
msi
teM
aliit
Dig
osN
ew
Que
zon
Palig
uePo
blac
ion
Sacu
bSa
n G
uille
rmo
San
Isid
roSi
naya
wan
Tolo
gan
Affected Area(sq. km.)
0-0.
202.
31.
442.
560.
522.
072.
740.
710.
023
0.8
0.75
0.21
-0.5
00.
260.
380.
470.
531.
363.
20.
110.
053
0.89
0.36
0.51
-1.0
00.
290.
710.
250.
240.
211.
090.
250.
330.
660.
131.
01-2
.00
0.16
0.36
0.29
0.04
10.
079
0.00
520.
51.
50.
820.
051
2.01
-5.0
00.
061
0.06
31.
420.
0001
0.05
10
0.16
0.61
00.
093
> 5.
000.
0013
0.00
040.
0001
00.
021
00.
015
00
0.13
Tab
le 6
0. A
ffec
ted
Are
as in
Hag
onoy
, Dav
ao d
el S
ur d
urin
g 25
-Yea
r R
ainf
all R
etur
n Pe
riod
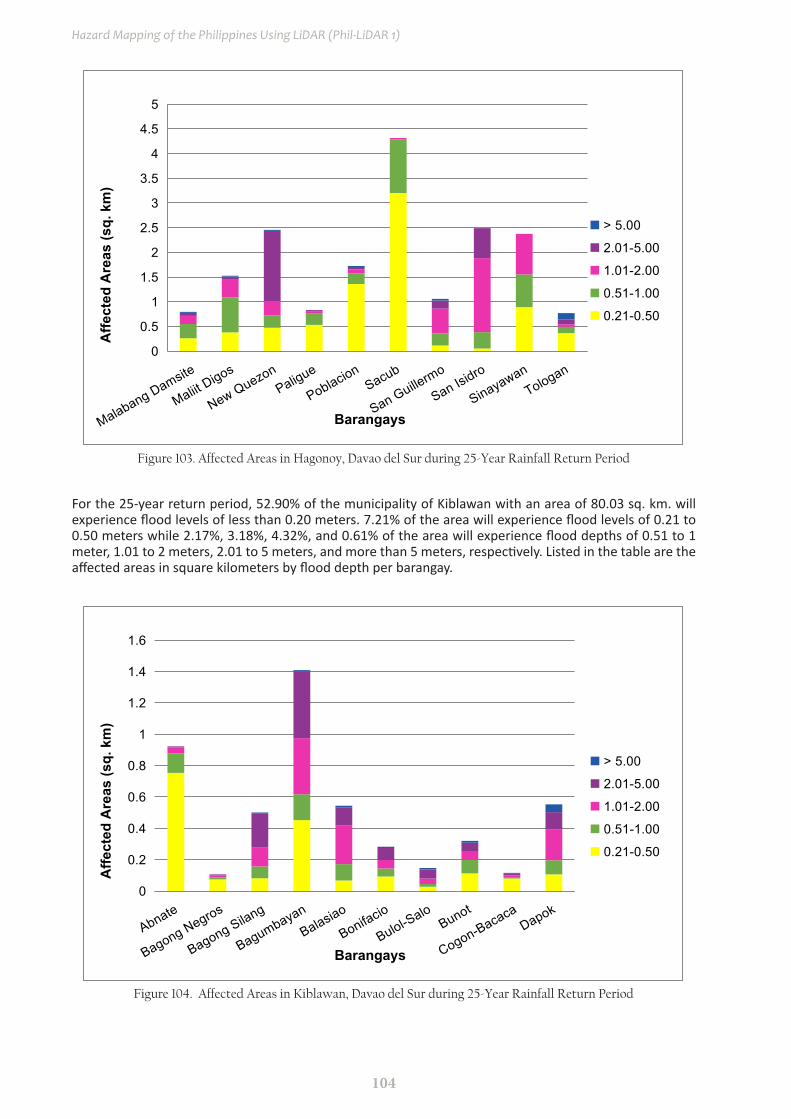
104
Hazard Mapping of the Philippines Using LiDAR (Phil-LiDAR 1)
0
0.5
1
1.5
2
2.5
3
3.5
4
4.5
5
Malabang Damsite
Maliit Digos
New QuezonPaligue
PoblacionSacub
San Guillermo
San Isidro
SinayawanTologan
Affe
cted
Are
as (s
q. k
m)
Barangays
> 5.00
2.01-5.00
1.01-2.00
0.51-1.00
0.21-0.50
Figure 103. Affected Areas in Hagonoy, Davao del Sur during 25-Year Rainfall Return Period
Figure 104. Affected Areas in Kiblawan, Davao del Sur during 25-Year Rainfall Return Period
For the 25-year return period, 52.90% of the municipality of Kiblawan with an area of 80.03 sq. km. will experience flood levels of less than 0.20 meters. 7.21% of the area will experience flood levels of 0.21 to 0.50 meters while 2.17%, 3.18%, 4.32%, and 0.61% of the area will experience flood depths of 0.51 to 1 meter, 1.01 to 2 meters, 2.01 to 5 meters, and more than 5 meters, respectively. Listed in the table are the affected areas in square kilometers by flood depth per barangay.
0
0.2
0.4
0.6
0.8
1
1.2
1.4
1.6
Abnate
Bagong Negros
Bagong Silang
BagumbayanBalasiao
Bonifacio
Bulol-SaloBunot
Cogon-BacacaDapok
Affe
cted
Are
as (s
q. k
m)
Barangays
> 5.00
2.01-5.00
1.01-2.00
0.51-1.00
0.21-0.50
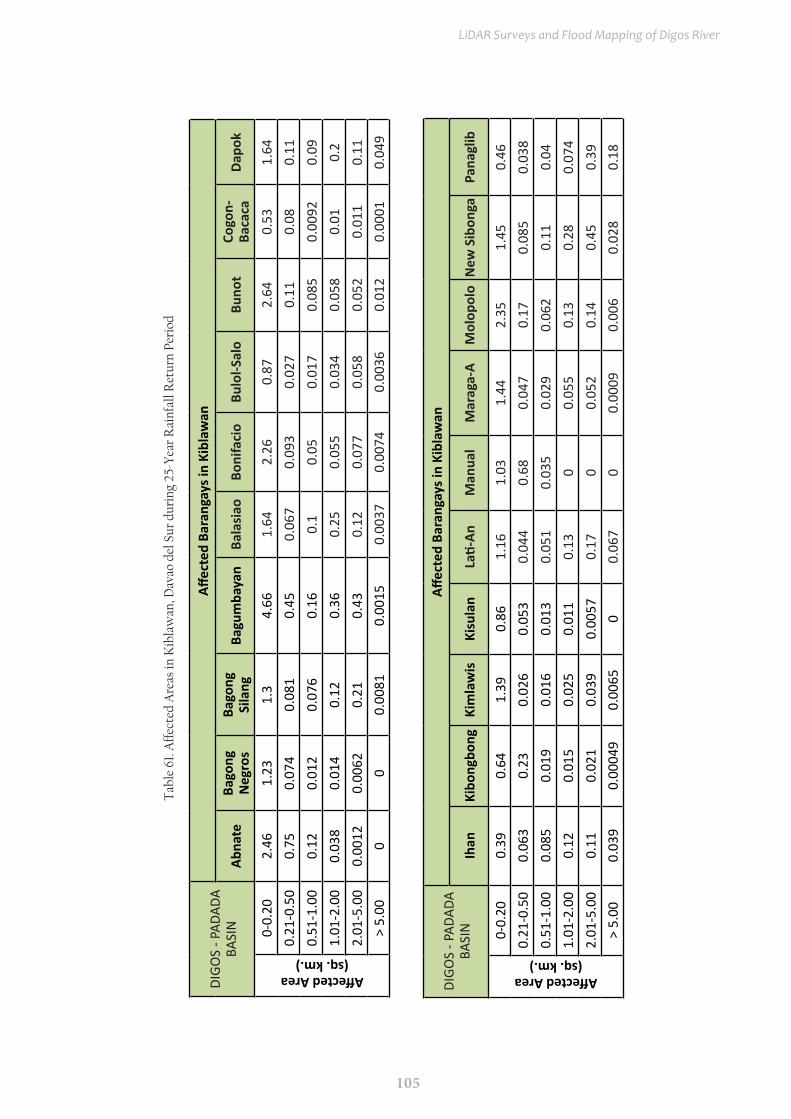
105
LiDAR Surveys and Flood Mapping of Digos River
DIGO
S - P
ADAD
A BA
SIN
Affec
ted
Bara
ngay
s in
Kibl
awan
Abna
teBa
gong
N
egro
sBa
gong
Si
lang
Bagu
mba
yan
Bala
siao
Boni
faci
oBu
lol-S
alo
Buno
tCo
gon-
Baca
caDa
pok
Affected Area(sq. km.)
0-0.
202.
461.
231.
34.
661.
642.
260.
872.
640.
531.
640.
21-0
.50
0.75
0.07
40.
081
0.45
0.06
70.
093
0.02
70.
110.
080.
110.
51-1
.00
0.12
0.01
20.
076
0.16
0.1
0.05
0.01
70.
085
0.00
920.
091.
01-2
.00
0.03
80.
014
0.12
0.36
0.25
0.05
50.
034
0.05
80.
010.
22.
01-5
.00
0.00
120.
0062
0.21
0.43
0.12
0.07
70.
058
0.05
20.
011
0.11
> 5.
000
00.
0081
0.00
150.
0037
0.00
740.
0036
0.01
20.
0001
0.04
9
DIGO
S - P
ADAD
A BA
SIN
Affec
ted
Bara
ngay
s in
Kibl
awan
Ihan
Kibo
ngbo
ngKi
mla
wis
Kisu
lan
Lati-
AnM
anua
lM
arag
a-A
Mol
opol
oN
ew S
ibon
gaPa
nagl
ib
Affected Area(sq. km.)
0-0.
200.
390.
641.
390.
861.
161.
031.
442.
351.
450.
460.
21-0
.50
0.06
30.
230.
026
0.05
30.
044
0.68
0.04
70.
170.
085
0.03
80.
51-1
.00
0.08
50.
019
0.01
60.
013
0.05
10.
035
0.02
90.
062
0.11
0.04
1.01
-2.0
00.
120.
015
0.02
50.
011
0.13
00.
055
0.13
0.28
0.07
42.
01-5
.00
0.11
0.02
10.
039
0.00
570.
170
0.05
20.
140.
450.
39>
5.00
0.03
90.
0004
90.
0065
00.
067
00.
0009
0.00
60.
028
0.18
Tab
le 6
1. A
ffec
ted
Are
as in
Kib
law
an, D
avao
del
Sur
dur
ing
25-Y
ear
Rai
nfal
l Ret
urn
Peri
od

106
Hazard Mapping of the Philippines Using LiDAR (Phil-LiDAR 1)
0
0.2
0.4
0.6
0.8
1
1.2
Ihan
Kibongbong
KimlawisKisulan
Lati-An
Manual
Maraga-A
Molopolo
New Sibonga
Panaglib
Affe
cted
Are
as (s
q. k
m)
Barangays
> 5.00
2.01-5.00
1.01-2.00
0.51-1.00
0.21-0.50
Figure 105. Affected Areas in Kiblawan, Davao del Sur during 25-Year Rainfall Return Period
0
0.2
0.4
0.6
0.8
1
1.2
Pasig
PoblacionPocaleel
San Isidro
San Jose
San Pedro
Santo NiñoTacub
Tacul
Waterfall
Affe
cted
Are
as (s
q. k
m)
Barangays
> 5.00
2.01-5.00
1.01-2.00
0.51-1.00
0.21-0.50
Figure 106. Affected Areas in Kiblawan, Davao del Sur during 25-Year Rainfall Return Period

107
LiDAR Surveys and Flood Mapping of Digos River
DIGO
S - P
ADAD
A BA
SIN
Affec
ted
Bara
ngay
s in
Kibl
awan
Pasi
gPo
blac
ion
Poca
leel
San
Isid
roSa
n Jo
seSa
n Pe
dro
Sant
o N
iño
Tacu
bTa
cul
Wat
erfa
ll
Affected Area(sq. km.)
0-0.
200.
571.
661.
171.
10.
763.
071.
091.
220.
720.
560.
21-0
.50
0.04
20.
083
0.04
60.
430.
050.
580.
046
0.46
0.45
0.3
0.51
-1.0
00.
019
0.02
90.
052
0.03
20.
045
0.17
0.03
80.
029
0.09
10.
043
1.01
-2.0
00.
047
0.03
10.
160.
032
0.06
20.
120.
068
0.04
70.
016
0.00
242.
01-5
.00
0.02
70.
057
0.08
40.
110.
110.
220.
350.
055
0.00
093
0.00
091
> 5.
000
0.00
470
0.00
150.
034
0.00
030.
026
0.00
220
0
Tab
le 6
2. A
ffec
ted
Are
as in
Kib
law
an, D
avao
del
Sur
dur
ing
25-Y
ear
Rai
nfal
l Ret
urn
Peri
od

108
Hazard Mapping of the Philippines Using LiDAR (Phil-LiDAR 1)
For the 25-year return period, 0.30% of the municipality of Magsaysay with an area of 109.8 sq. km. will experience flood levels of less than 0.20 meters. 0.05% of the area will experience flood levels of 0.21 to 0.50 meters while 0.02%, 0.01%, and 0.01% of the area will experience flood depths of 0.51 to 1 meter, 1.01 to 2 meters, and 2.01 to 5 meters, respectively. Listed in the table are the affected areas in square kilometers by flood depth per barangay.
Table 63. Affected Areas in Magsaysay, Davao del Sur during 25-Year Rainfall Return Period
DIGOS - PADADA BASIN
Affected Barangay in Magsaysay
New IlocosAff
ecte
d Ar
ea(s
q. k
m.)
0-0.20 0.33
0.21-0.50 0.059
0.51-1.00 0.021
1.01-2.00 0.016
2.01-5.00 0.0057
> 5.00 0
0
0.02
0.04
0.06
0.08
0.1
0.12
New Ilocos
Affe
cted
Are
as (s
q. k
m)
Barangay
> 5.00
2.01-5.00
1.01-2.00
0.51-1.00
0.21-0.50
Figure 107. Affected Areas in Magsaysay, Davao del Sur during 25-Year Rainfall Return Period
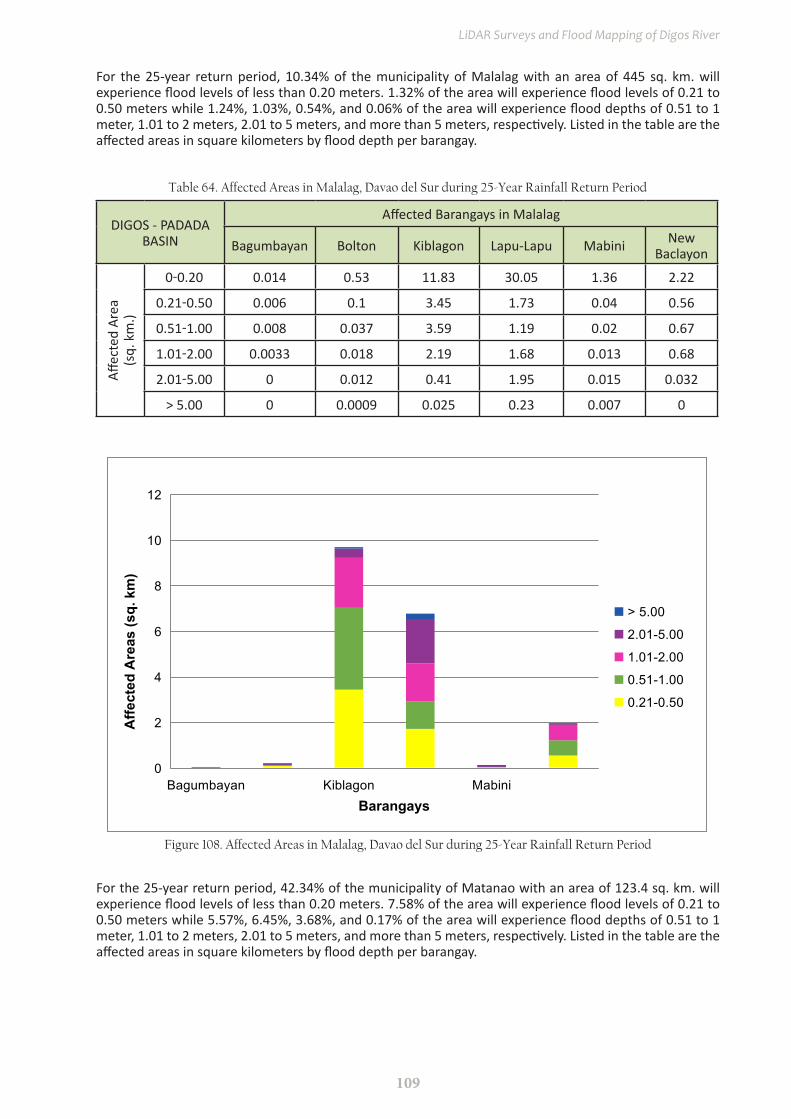
109
LiDAR Surveys and Flood Mapping of Digos River
For the 25-year return period, 10.34% of the municipality of Malalag with an area of 445 sq. km. will experience flood levels of less than 0.20 meters. 1.32% of the area will experience flood levels of 0.21 to 0.50 meters while 1.24%, 1.03%, 0.54%, and 0.06% of the area will experience flood depths of 0.51 to 1 meter, 1.01 to 2 meters, 2.01 to 5 meters, and more than 5 meters, respectively. Listed in the table are the affected areas in square kilometers by flood depth per barangay.
Table 64. Affected Areas in Malalag, Davao del Sur during 25-Year Rainfall Return Period
DIGOS - PADADA BASIN
Affected Barangays in Malalag
Bagumbayan Bolton Kiblagon Lapu-Lapu Mabini New Baclayon
Affec
ted
Area
(sq.
km
.)
0-0.20 0.014 0.53 11.83 30.05 1.36 2.22
0.21-0.50 0.006 0.1 3.45 1.73 0.04 0.56
0.51-1.00 0.008 0.037 3.59 1.19 0.02 0.67
1.01-2.00 0.0033 0.018 2.19 1.68 0.013 0.68
2.01-5.00 0 0.012 0.41 1.95 0.015 0.032
> 5.00 0 0.0009 0.025 0.23 0.007 0
Figure 108. Affected Areas in Malalag, Davao del Sur during 25-Year Rainfall Return Period
0
2
4
6
8
10
12
Bagumbayan Kiblagon Mabini
Affe
cted
Are
as (s
q. k
m)
Barangays
> 5.00
2.01-5.00
1.01-2.00
0.51-1.00
0.21-0.50
For the 25-year return period, 42.34% of the municipality of Matanao with an area of 123.4 sq. km. will experience flood levels of less than 0.20 meters. 7.58% of the area will experience flood levels of 0.21 to 0.50 meters while 5.57%, 6.45%, 3.68%, and 0.17% of the area will experience flood depths of 0.51 to 1 meter, 1.01 to 2 meters, 2.01 to 5 meters, and more than 5 meters, respectively. Listed in the table are the affected areas in square kilometers by flood depth per barangay.
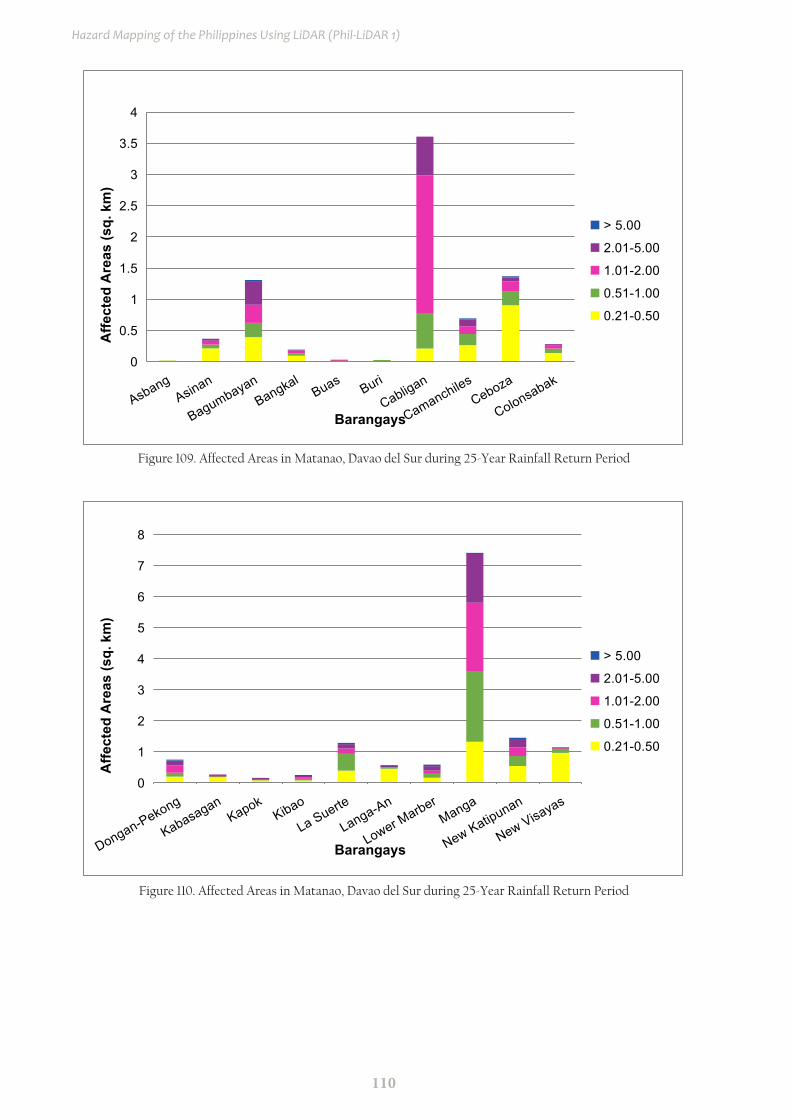
110
Hazard Mapping of the Philippines Using LiDAR (Phil-LiDAR 1)
0
0.5
1
1.5
2
2.5
3
3.5
4
AsbangAsinan
BagumbayanBangkal
Buas Buri
Cabligan
CamanchilesCeboza
Colonsabak
Affe
cted
Are
as (s
q. k
m)
Barangays
> 5.00
2.01-5.00
1.01-2.00
0.51-1.00
0.21-0.50
0
1
2
3
4
5
6
7
8
Dongan-Pekong
KabasaganKapok
Kibao
La Suerte
Langa-An
Lower Marber
Manga
New Katipunan
New Visayas
Affe
cted
Are
as (s
q. k
m)
Barangays
> 5.00
2.01-5.00
1.01-2.00
0.51-1.00
0.21-0.50
Figure 109. Affected Areas in Matanao, Davao del Sur during 25-Year Rainfall Return Period
Figure 110. Affected Areas in Matanao, Davao del Sur during 25-Year Rainfall Return Period
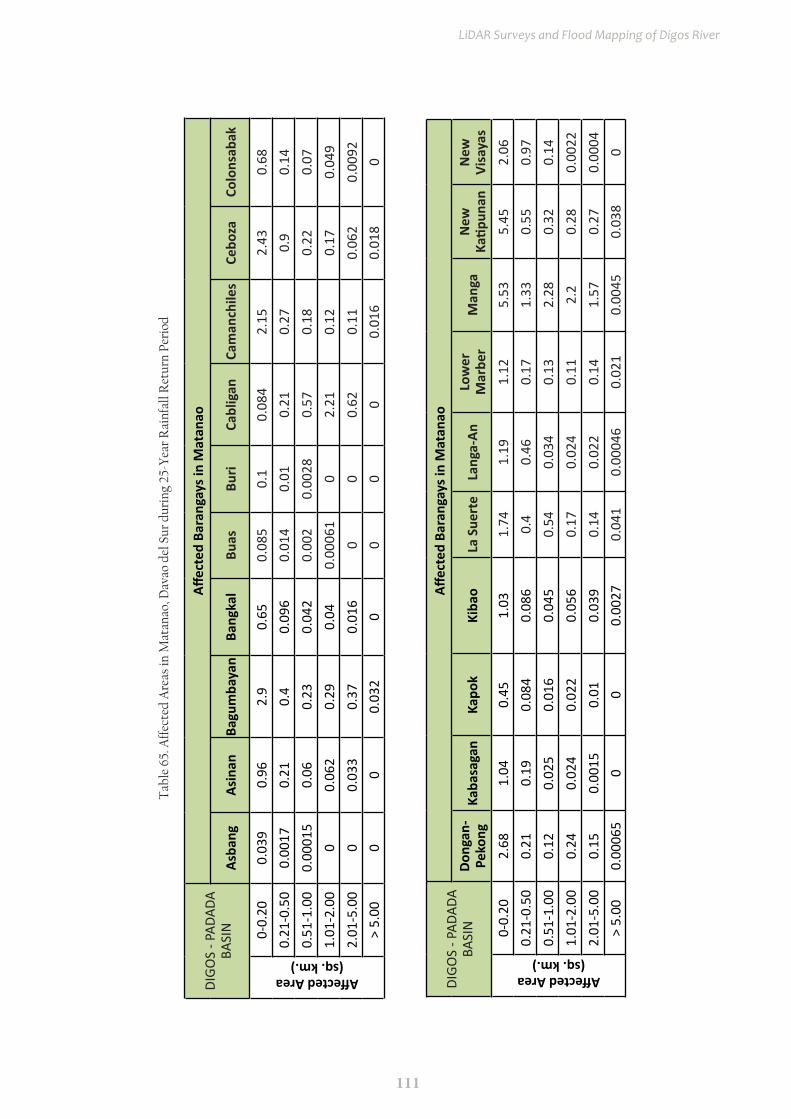
111
LiDAR Surveys and Flood Mapping of Digos River
DIGO
S - P
ADAD
A BA
SIN
Affec
ted
Bara
ngay
s in
Mat
anao
Asba
ngAs
inan
Bagu
mba
yan
Bang
kal
Buas
Buri
Cabl
igan
Cam
anch
iles
Cebo
zaCo
lons
abak
Affected Area(sq. km.)
0-0.
200.
039
0.96
2.9
0.65
0.08
50.
10.
084
2.15
2.43
0.68
0.21
-0.5
00.
0017
0.21
0.4
0.09
60.
014
0.01
0.21
0.27
0.9
0.14
0.51
-1.0
00.
0001
50.
060.
230.
042
0.00
20.
0028
0.57
0.18
0.22
0.07
1.01
-2.0
00
0.06
20.
290.
040.
0006
10
2.21
0.12
0.17
0.04
92.
01-5
.00
00.
033
0.37
0.01
60
00.
620.
110.
062
0.00
92>
5.00
00
0.03
20
00
00.
016
0.01
80
DIGO
S - P
ADAD
A BA
SIN
Affec
ted
Bara
ngay
s in
Mat
anao
Dong
an-
Peko
ngKa
basa
gan
Kapo
kKi
bao
La S
uert
eLa
nga-
AnLo
wer
M
arbe
rM
anga
New
Ka
tipun
anN
ew
Visa
yas
Affected Area(sq. km.)
0-0.
202.
681.
040.
451.
031.
741.
191.
125.
535.
452.
060.
21-0
.50
0.21
0.19
0.08
40.
086
0.4
0.46
0.17
1.33
0.55
0.97
0.51
-1.0
00.
120.
025
0.01
60.
045
0.54
0.03
40.
132.
280.
320.
141.
01-2
.00
0.24
0.02
40.
022
0.05
60.
170.
024
0.11
2.2
0.28
0.00
222.
01-5
.00
0.15
0.00
150.
010.
039
0.14
0.02
20.
141.
570.
270.
0004
> 5.
000.
0006
50
00.
0027
0.04
10.
0004
60.
021
0.00
450.
038
0
Tab
le 6
5. A
ffec
ted
Are
as in
Mat
anao
, Dav
ao d
el S
ur d
urin
g 25
-Yea
r R
ainf
all R
etur
n Pe
riod
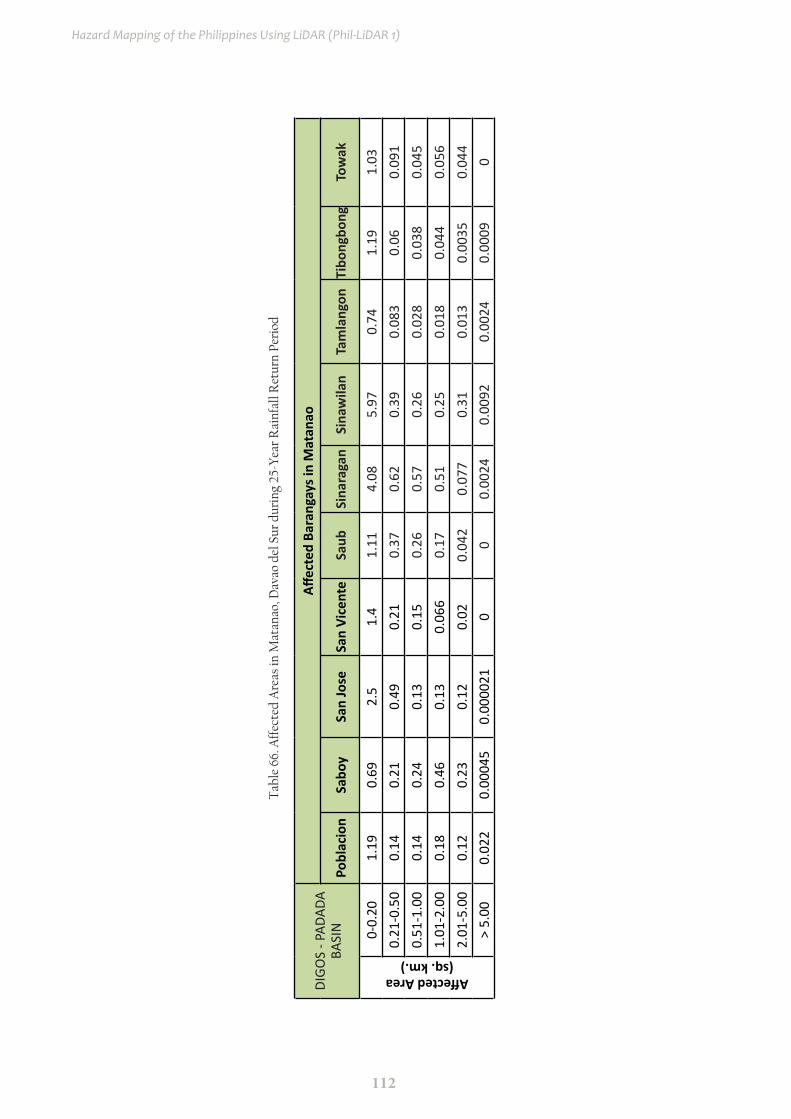
112
Hazard Mapping of the Philippines Using LiDAR (Phil-LiDAR 1)
DIGO
S - P
ADAD
A BA
SIN
Affec
ted
Bara
ngay
s in
Mat
anao
Pobl
acio
nSa
boy
San
Jose
San
Vice
nte
Saub
Sina
raga
nSi
naw
ilan
Tam
lang
onTi
bong
bong
Tow
ak
Affected Area(sq. km.)
0-0.
201.
190.
692.
51.
41.
114.
085.
970.
741.
191.
030.
21-0
.50
0.14
0.21
0.49
0.21
0.37
0.62
0.39
0.08
30.
060.
091
0.51
-1.0
00.
140.
240.
130.
150.
260.
570.
260.
028
0.03
80.
045
1.01
-2.0
00.
180.
460.
130.
066
0.17
0.51
0.25
0.01
80.
044
0.05
62.
01-5
.00
0.12
0.23
0.12
0.02
0.04
20.
077
0.31
0.01
30.
0035
0.04
4>
5.00
0.02
20.
0004
50.
0000
210
00.
0024
0.00
920.
0024
0.00
090
Tab
le 6
6. A
ffec
ted
Are
as in
Mat
anao
, Dav
ao d
el S
ur d
urin
g 25
-Yea
r R
ainf
all R
etur
n Pe
riod
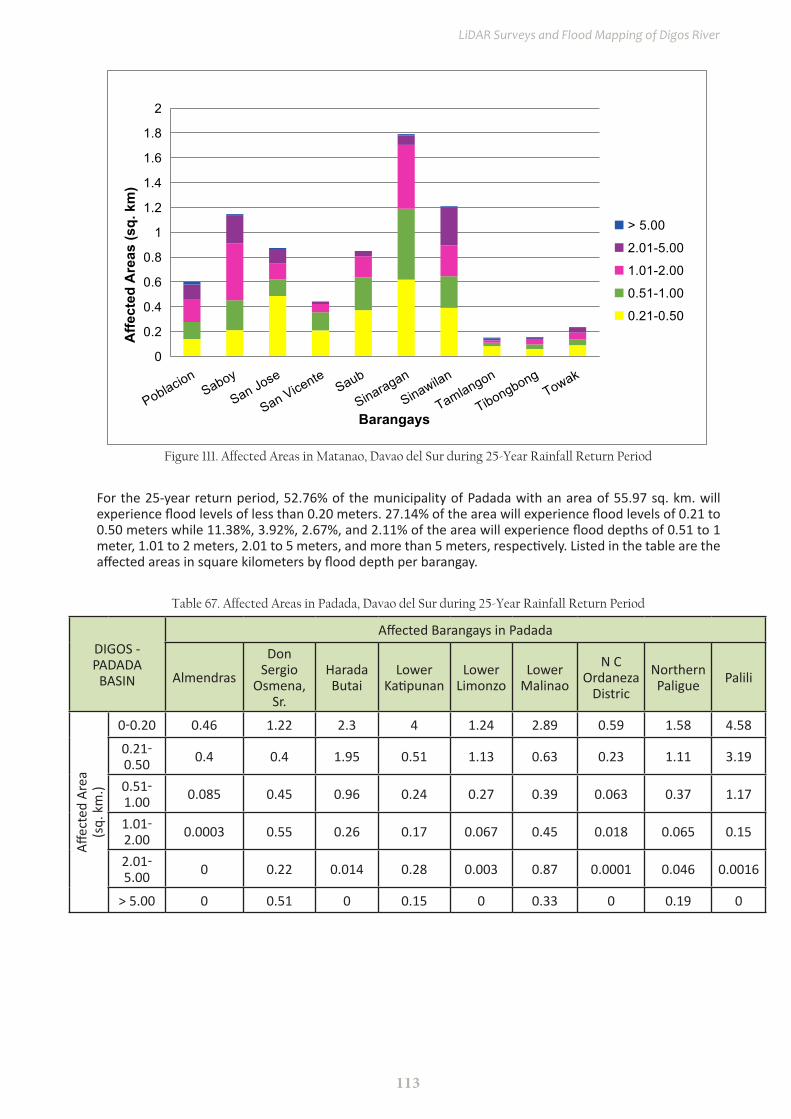
113
LiDAR Surveys and Flood Mapping of Digos River
0
0.2
0.4
0.6
0.8
1
1.2
1.4
1.6
1.8
2
PoblacionSaboy
San Jose
San VicenteSaub
Sinaragan
Sinawilan
Tamlangon
TibongbongTowak
Affe
cted
Are
as (s
q. k
m)
Barangays
> 5.00
2.01-5.00
1.01-2.00
0.51-1.00
0.21-0.50
Figure 111. Affected Areas in Matanao, Davao del Sur during 25-Year Rainfall Return Period
For the 25-year return period, 52.76% of the municipality of Padada with an area of 55.97 sq. km. will experience flood levels of less than 0.20 meters. 27.14% of the area will experience flood levels of 0.21 to 0.50 meters while 11.38%, 3.92%, 2.67%, and 2.11% of the area will experience flood depths of 0.51 to 1 meter, 1.01 to 2 meters, 2.01 to 5 meters, and more than 5 meters, respectively. Listed in the table are the affected areas in square kilometers by flood depth per barangay.
Table 67. Affected Areas in Padada, Davao del Sur during 25-Year Rainfall Return Period
DIGOS - PADADA
BASIN
Affected Barangays in Padada
Almendras
Don Sergio
Osmena, Sr.
Harada Butai
Lower Katipunan
Lower Limonzo
Lower Malinao
N C Ordaneza
Distric
Northern Paligue Palili
Affec
ted
Area
(sq.
km
.)
0-0.20 0.46 1.22 2.3 4 1.24 2.89 0.59 1.58 4.58
0.21-0.50 0.4 0.4 1.95 0.51 1.13 0.63 0.23 1.11 3.19
0.51-1.00 0.085 0.45 0.96 0.24 0.27 0.39 0.063 0.37 1.17
1.01-2.00 0.0003 0.55 0.26 0.17 0.067 0.45 0.018 0.065 0.15
2.01-5.00 0 0.22 0.014 0.28 0.003 0.87 0.0001 0.046 0.0016
> 5.00 0 0.51 0 0.15 0 0.33 0 0.19 0
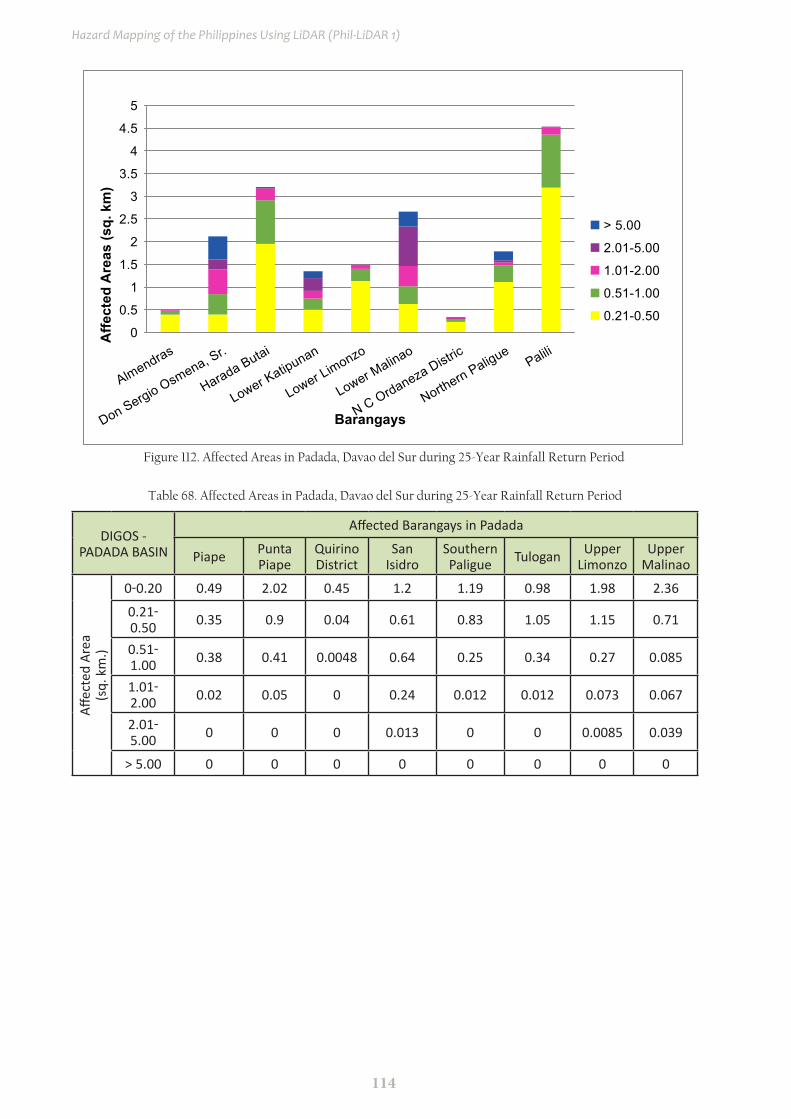
114
Hazard Mapping of the Philippines Using LiDAR (Phil-LiDAR 1)
0
0.5
1
1.5
2
2.5
3
3.5
4
4.5
5
Almendras
Don Sergio Osmena, Sr.
Harada Butai
Lower Katipunan
Lower Limonzo
Lower Malinao
N C Ordaneza Distric
Northern PaliguePalili
Affe
cted
Are
as (s
q. k
m)
Barangays
> 5.00
2.01-5.00
1.01-2.00
0.51-1.00
0.21-0.50
Figure 112. Affected Areas in Padada, Davao del Sur during 25-Year Rainfall Return Period
Table 68. Affected Areas in Padada, Davao del Sur during 25-Year Rainfall Return Period
DIGOS - PADADA BASIN
Affected Barangays in Padada
Piape Punta Piape
Quirino District
San Isidro
Southern Paligue Tulogan Upper
LimonzoUpper
Malinao
Affec
ted
Area
(sq.
km
.)
0-0.20 0.49 2.02 0.45 1.2 1.19 0.98 1.98 2.36
0.21-0.50 0.35 0.9 0.04 0.61 0.83 1.05 1.15 0.71
0.51-1.00 0.38 0.41 0.0048 0.64 0.25 0.34 0.27 0.085
1.01-2.00 0.02 0.05 0 0.24 0.012 0.012 0.073 0.067
2.01-5.00 0 0 0 0.013 0 0 0.0085 0.039
> 5.00 0 0 0 0 0 0 0 0
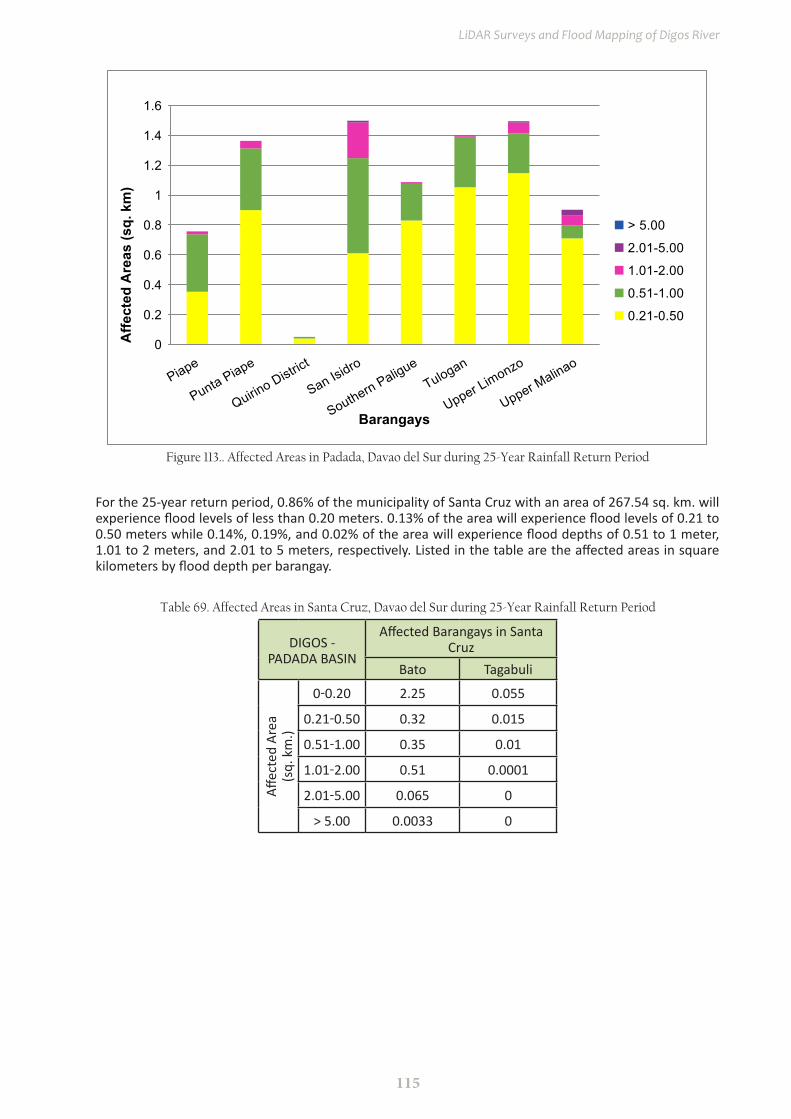
115
LiDAR Surveys and Flood Mapping of Digos River
Figure 113.. Affected Areas in Padada, Davao del Sur during 25-Year Rainfall Return Period
0
0.2
0.4
0.6
0.8
1
1.2
1.4
1.6
Piape
Punta Piape
Quirino District
San Isidro
Southern PaligueTulogan
Upper Limonzo
Upper Malinao
Affe
cted
Are
as (s
q. k
m)
Barangays
> 5.00
2.01-5.00
1.01-2.00
0.51-1.00
0.21-0.50
Table 69. Affected Areas in Santa Cruz, Davao del Sur during 25-Year Rainfall Return Period
DIGOS - PADADA BASIN
Affected Barangays in Santa Cruz
Bato Tagabuli
Affec
ted
Area
(sq.
km
.)
0-0.20 2.25 0.055
0.21-0.50 0.32 0.015
0.51-1.00 0.35 0.01
1.01-2.00 0.51 0.0001
2.01-5.00 0.065 0
> 5.00 0.0033 0
For the 25-year return period, 0.86% of the municipality of Santa Cruz with an area of 267.54 sq. km. will experience flood levels of less than 0.20 meters. 0.13% of the area will experience flood levels of 0.21 to 0.50 meters while 0.14%, 0.19%, and 0.02% of the area will experience flood depths of 0.51 to 1 meter, 1.01 to 2 meters, and 2.01 to 5 meters, respectively. Listed in the table are the affected areas in square kilometers by flood depth per barangay.
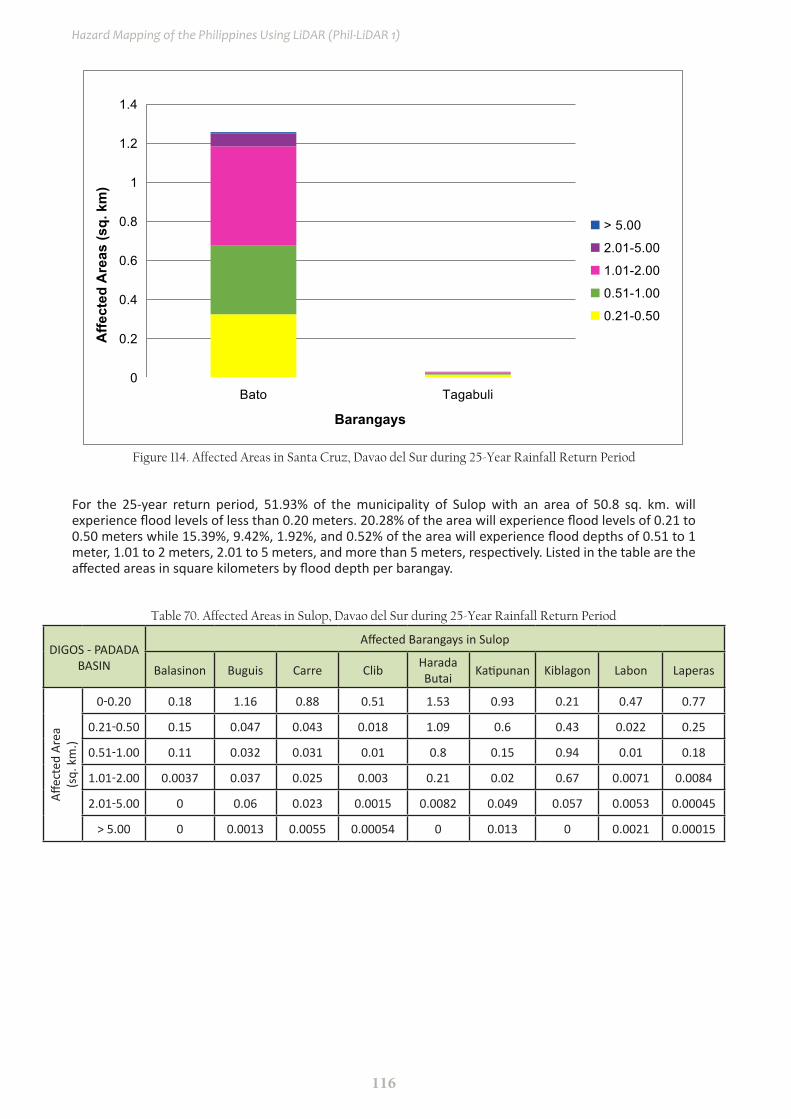
116
Hazard Mapping of the Philippines Using LiDAR (Phil-LiDAR 1)
0
0.2
0.4
0.6
0.8
1
1.2
1.4
Bato Tagabuli
Affe
cted
Are
as (s
q. k
m)
Barangays
> 5.00
2.01-5.00
1.01-2.00
0.51-1.00
0.21-0.50
Table 70. Affected Areas in Sulop, Davao del Sur during 25-Year Rainfall Return Period
DIGOS - PADADA BASIN
Affected Barangays in Sulop
Balasinon Buguis Carre Clib Harada Butai Katipunan Kiblagon Labon Laperas
Affec
ted
Area
(sq.
km
.)
0-0.20 0.18 1.16 0.88 0.51 1.53 0.93 0.21 0.47 0.77
0.21-0.50 0.15 0.047 0.043 0.018 1.09 0.6 0.43 0.022 0.25
0.51-1.00 0.11 0.032 0.031 0.01 0.8 0.15 0.94 0.01 0.18
1.01-2.00 0.0037 0.037 0.025 0.003 0.21 0.02 0.67 0.0071 0.0084
2.01-5.00 0 0.06 0.023 0.0015 0.0082 0.049 0.057 0.0053 0.00045
> 5.00 0 0.0013 0.0055 0.00054 0 0.013 0 0.0021 0.00015
Figure 114. Affected Areas in Santa Cruz, Davao del Sur during 25-Year Rainfall Return Period
For the 25-year return period, 51.93% of the municipality of Sulop with an area of 50.8 sq. km. will experience flood levels of less than 0.20 meters. 20.28% of the area will experience flood levels of 0.21 to 0.50 meters while 15.39%, 9.42%, 1.92%, and 0.52% of the area will experience flood depths of 0.51 to 1 meter, 1.01 to 2 meters, 2.01 to 5 meters, and more than 5 meters, respectively. Listed in the table are the affected areas in square kilometers by flood depth per barangay.
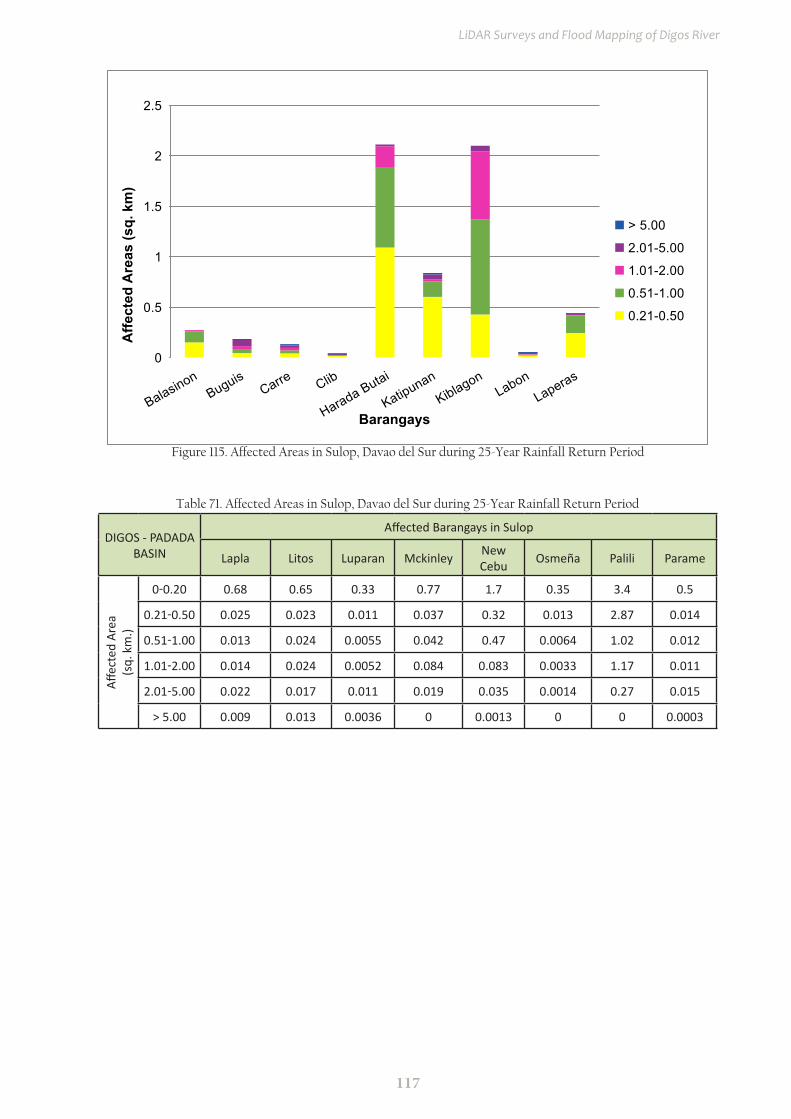
117
LiDAR Surveys and Flood Mapping of Digos River
Table 71. Affected Areas in Sulop, Davao del Sur during 25-Year Rainfall Return Period
DIGOS - PADADA BASIN
Affected Barangays in Sulop
Lapla Litos Luparan Mckinley New Cebu Osmeña Palili Parame
Affec
ted
Area
(sq.
km
.)
0-0.20 0.68 0.65 0.33 0.77 1.7 0.35 3.4 0.5
0.21-0.50 0.025 0.023 0.011 0.037 0.32 0.013 2.87 0.014
0.51-1.00 0.013 0.024 0.0055 0.042 0.47 0.0064 1.02 0.012
1.01-2.00 0.014 0.024 0.0052 0.084 0.083 0.0033 1.17 0.011
2.01-5.00 0.022 0.017 0.011 0.019 0.035 0.0014 0.27 0.015
> 5.00 0.009 0.013 0.0036 0 0.0013 0 0 0.0003
Figure 115. Affected Areas in Sulop, Davao del Sur during 25-Year Rainfall Return Period
0
0.5
1
1.5
2
2.5
BalasinonBuguis
Carre Clib
Harada Butai
Katipunan
KiblagonLabon
Laperas
Affe
cted
Are
as (s
q. k
m)
Barangays
> 5.00
2.01-5.00
1.01-2.00
0.51-1.00
0.21-0.50
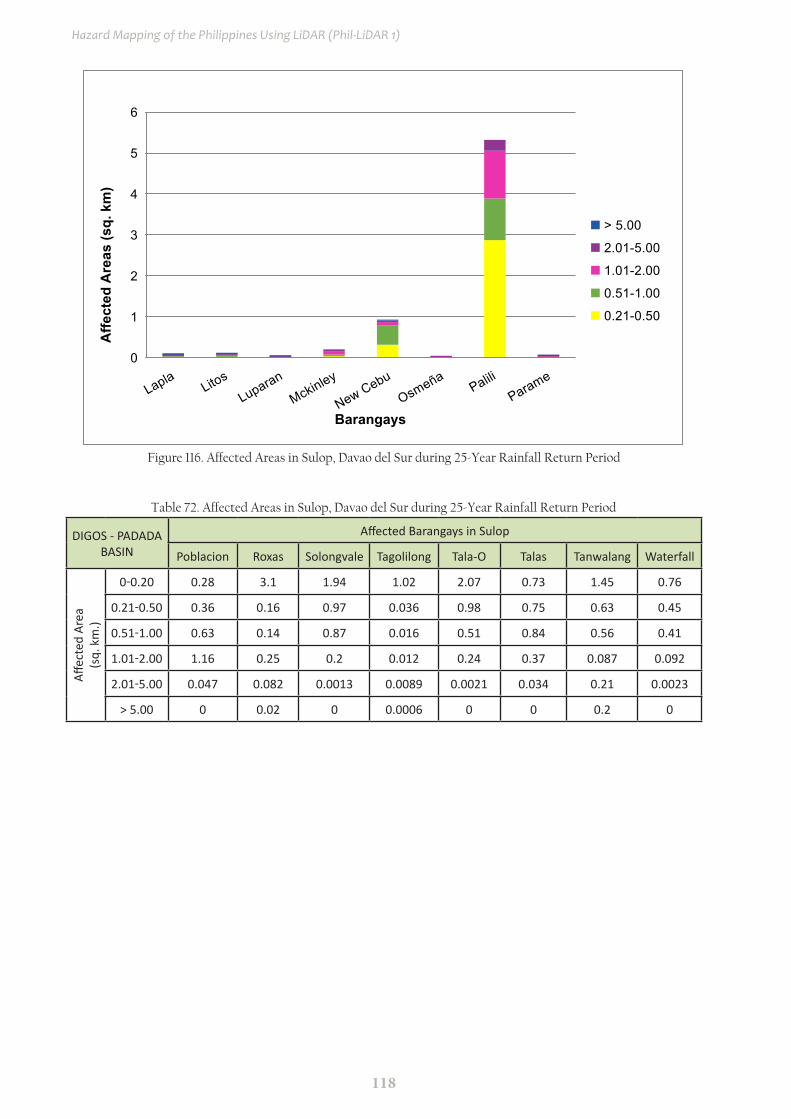
118
Hazard Mapping of the Philippines Using LiDAR (Phil-LiDAR 1)
0
1
2
3
4
5
6
Lapla LitosLuparan
Mckinley
New CebuOsmeña
PaliliParame
Affe
cted
Are
as (s
q. k
m)
Barangays
> 5.00
2.01-5.00
1.01-2.00
0.51-1.00
0.21-0.50
Figure 116. Affected Areas in Sulop, Davao del Sur during 25-Year Rainfall Return Period
Table 72. Affected Areas in Sulop, Davao del Sur during 25-Year Rainfall Return Period
DIGOS - PADADA BASIN
Affected Barangays in Sulop
Poblacion Roxas Solongvale Tagolilong Tala-O Talas Tanwalang Waterfall
Affec
ted
Area
(sq.
km
.)
0-0.20 0.28 3.1 1.94 1.02 2.07 0.73 1.45 0.76
0.21-0.50 0.36 0.16 0.97 0.036 0.98 0.75 0.63 0.45
0.51-1.00 0.63 0.14 0.87 0.016 0.51 0.84 0.56 0.41
1.01-2.00 1.16 0.25 0.2 0.012 0.24 0.37 0.087 0.092
2.01-5.00 0.047 0.082 0.0013 0.0089 0.0021 0.034 0.21 0.0023
> 5.00 0 0.02 0 0.0006 0 0 0.2 0
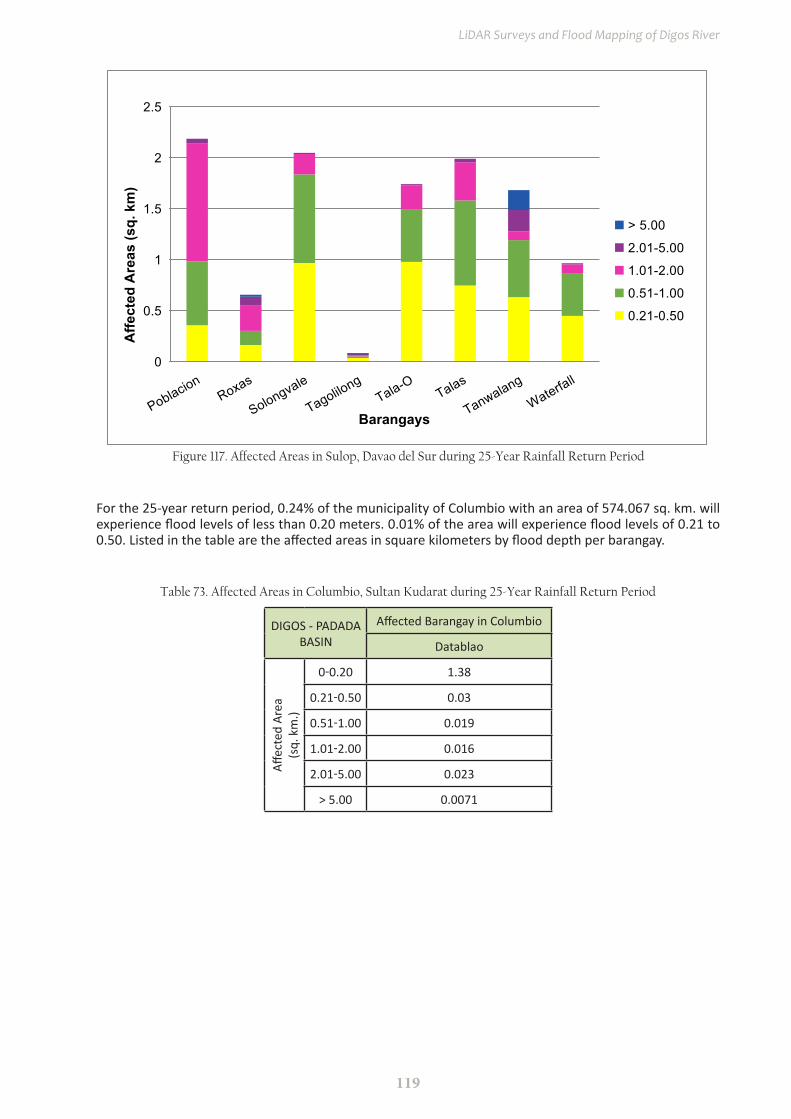
119
LiDAR Surveys and Flood Mapping of Digos River
0
0.5
1
1.5
2
2.5
PoblacionRoxas
Solongvale
TagolilongTala-O
Talas
Tanwalang
Waterfall
Affe
cted
Are
as (s
q. k
m)
Barangays
> 5.00
2.01-5.00
1.01-2.00
0.51-1.00
0.21-0.50
Figure 117. Affected Areas in Sulop, Davao del Sur during 25-Year Rainfall Return Period
Table 73. Affected Areas in Columbio, Sultan Kudarat during 25-Year Rainfall Return Period
DIGOS - PADADA BASIN
Affected Barangay in Columbio
Datablao
Affec
ted
Area
(sq.
km
.)
0-0.20 1.38
0.21-0.50 0.03
0.51-1.00 0.019
1.01-2.00 0.016
2.01-5.00 0.023
> 5.00 0.0071
For the 25-year return period, 0.24% of the municipality of Columbio with an area of 574.067 sq. km. will experience flood levels of less than 0.20 meters. 0.01% of the area will experience flood levels of 0.21 to 0.50. Listed in the table are the affected areas in square kilometers by flood depth per barangay.

120
Hazard Mapping of the Philippines Using LiDAR (Phil-LiDAR 1)
0
0.01
0.02
0.03
0.04
0.05
0.06
0.07
0.08
0.09
0.1
Datablao
Affe
cted
Are
as (s
q. k
m)
Barangay
> 5.00
2.01-5.00
1.01-2.00
0.51-1.00
0.21-0.50
Figure 118. Affected Areas in Columbio, Sultan Kudarat during 25-Year Rainfall Return Period
Table 74. Affected Areas in Bansalan, Sultan Kudarat during 25-Year Rainfall Return Period
For the 100-year return period, 9.70% of the municipality of Bansalan with an area of 136.18 sq. km. will experience flood levels of less than 0.20 meters. 3.08% of the area will experience flood levels of 0.21 to 0.50 meters while 1.16%, 0.67%, 0.25%, and 0.02% of the area will experience flood depths of 0.51 to 1 meter, 1.01 to 2 meters, 2.01 to 5 meters, and more than 5 meters, respectively. Listed in the table are the affected areas in square kilometers by flood depth per barangay.
DIGOS - PADADA BASIN
Affected Barangays in Bansalan
Anonang Bonifacio Buenavista Mabunga New Clarin Poblacion Poblacion
Dos Union
Affec
ted
Area
(sq.
km
.)
0-0.20 1.55 1.29 1.96 2.7 0.5 1.21 1.12 2.87
0.21-0.50 0.16 0.16 0.34 2.28 0.064 0.22 0.61 0.36
0.51-1.00 0.11 0.069 0.24 0.4 0.058 0.17 0.23 0.32
1.01-2.00 0.051 0.04 0.083 0.2 0.067 0.094 0.054 0.32
2.01-5.00 0.021 0.017 0.046 0.064 0.018 0.076 0.0016 0.091
> 5.00 0 0.0008 0.0013 0.0004 0 0.011 0 0.01
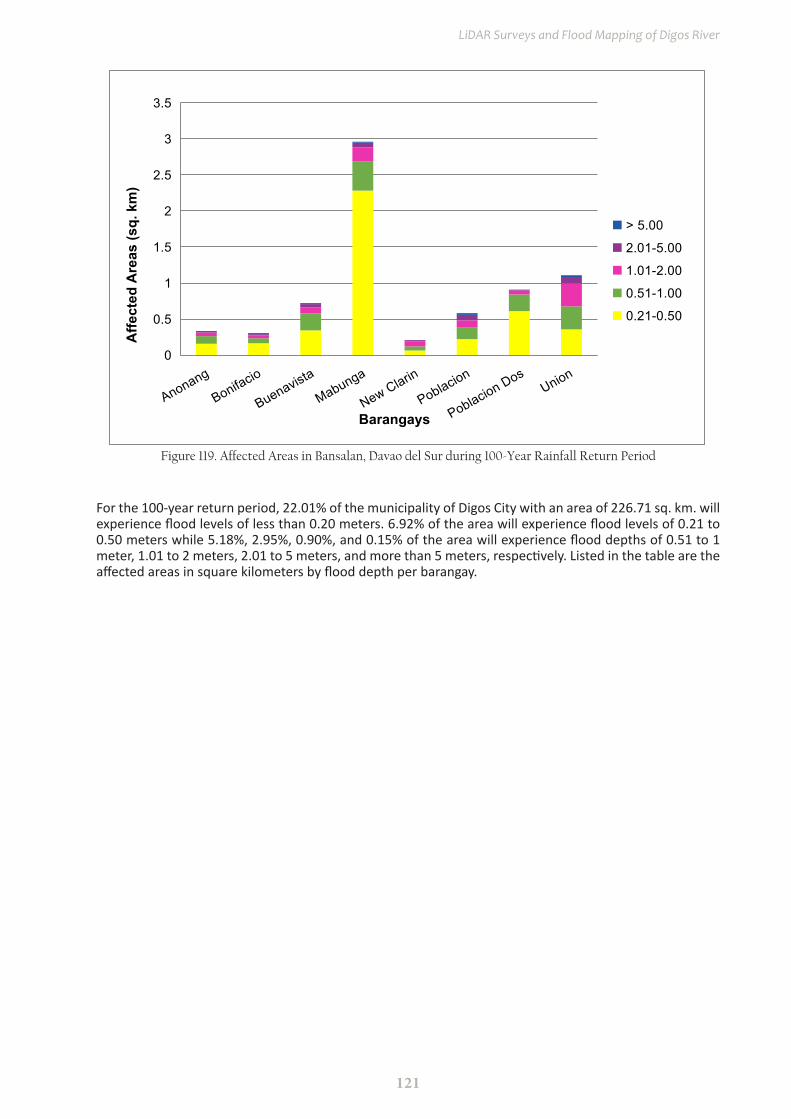
121
LiDAR Surveys and Flood Mapping of Digos River
Figure 119. Affected Areas in Bansalan, Davao del Sur during 100-Year Rainfall Return Period
For the 100-year return period, 22.01% of the municipality of Digos City with an area of 226.71 sq. km. will experience flood levels of less than 0.20 meters. 6.92% of the area will experience flood levels of 0.21 to 0.50 meters while 5.18%, 2.95%, 0.90%, and 0.15% of the area will experience flood depths of 0.51 to 1 meter, 1.01 to 2 meters, 2.01 to 5 meters, and more than 5 meters, respectively. Listed in the table are the affected areas in square kilometers by flood depth per barangay.
0
0.5
1
1.5
2
2.5
3
3.5
Anonang
Bonifacio
Buenavista
Mabunga
New Clarin
Poblacion
Poblacion DosUnion
Affe
cted
Are
as (s
q. k
m)
Barangays
> 5.00
2.01-5.00
1.01-2.00
0.51-1.00
0.21-0.50

122
Hazard Mapping of the Philippines Using LiDAR (Phil-LiDAR 1)
DIGO
S - P
ADAD
A BA
SIN
Affec
ted
Bara
ngay
s in
Digo
s City
Apla
yaBa
laba
gCo
gon
Colo
rado
Daw
isDu
lang
anG
oma
Igpi
tKi
agot
Lung
agM
ahay
ahay
Matti
Affected Area(sq. km.)
0-0.
201.
590.
111.
793.
351.
370.
042.
230.
811.
94.
564.
064.
320.
21-0
.50
1.63
0.00
291.
040.
921.
220.
023
0.48
0.77
0.08
40.
350.
450.
830.
51-1
.00
1.23
0.00
231.
831.
60.
390.
039
0.21
10.
031
0.25
0.27
0.65
1.01
-2.0
00.
160.
0031
0.47
1.35
0.07
20.
0033
0.14
1.4
0.03
80.
10.
20.
62.
01-5
.00
0.07
90.
0003
30.
016
0.3
0.02
60.
0008
90.
059
0.3
0.03
20.
053
0.14
0.36
> 5.
000.
017
00
0.00
510
00
00.
002
00.
0074
0.01
3
DIGO
S - P
ADAD
A BA
SIN
Affec
ted
Bara
ngay
s in
Digo
s City
Rupa
ran
San
Agus
tinSa
n Jo
seSa
n M
igue
lSa
n Ro
que
Sina
wila
nSo
ong
Tigu
man
Tres
de
May
oZo
ne 1
Zone
2Zo
ne 3
Affected Area(sq. km.)
0-0.
202.
943.
521.
010.
494.
853.
30.
780.
871.
872.
10.
641.
40.
21-0
.50
0.23
1.1
1.18
1.03
0.71
0.44
0.03
61.
060.
470.
077
0.44
1.11
0.51
-1.0
00.
095
0.43
0.39
0.76
0.51
0.53
0.01
40.
550.
460.
050.
220.
241.
01-2
.00
0.06
30.
240.
350.
480.
260.
120.
0081
0.21
0.3
0.03
50.
070.
016
2.01
-5.0
00.
060.
130.
012
00.
081
0.04
60.
0079
0.00
120.
190.
048
0.09
50.
0068
> 5.
000.
0069
0.01
00
0.00
020.
011
0.00
010
0.09
90.
010.
160.
01
Tab
le 7
5. A
ffec
ted
Are
as in
Dig
os C
ity,
Dav
ao d
el S
ur d
urin
g 10
0-Y
ear
Rai
nfal
l Ret
urn
Peri
od
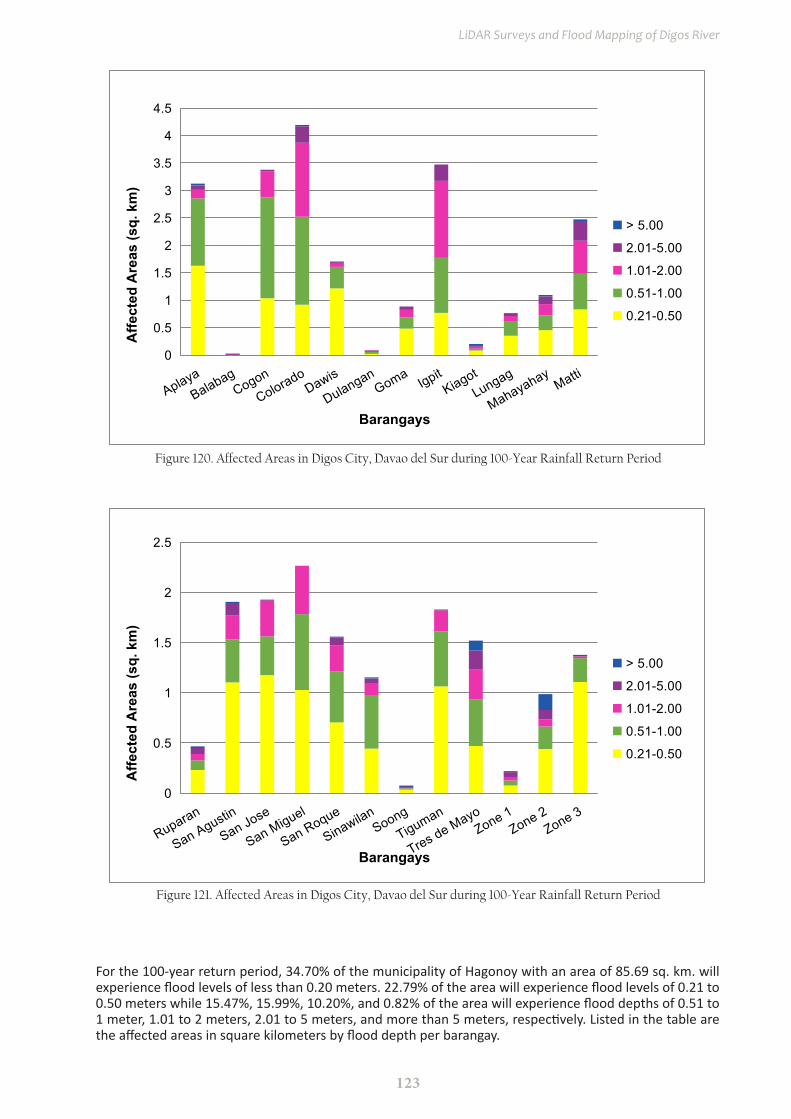
123
LiDAR Surveys and Flood Mapping of Digos River
0
0.5
1
1.5
2
2.5
3
3.5
4
4.5
AplayaBalabag
Cogon
ColoradoDawis
DulanganGoma
IgpitKiagot
Lungag
MahayahayMatti
Affe
cted
Are
as (s
q. k
m)
Barangays
> 5.00
2.01-5.00
1.01-2.00
0.51-1.00
0.21-0.50
Figure 120. Affected Areas in Digos City, Davao del Sur during 100-Year Rainfall Return Period
0
0.5
1
1.5
2
2.5
Ruparan
San Agustin
San Jose
San Miguel
San Roque
SinawilanSoong
Tiguman
Tres de MayoZone 1
Zone 2Zone 3
Affe
cted
Are
as (s
q. k
m)
Barangays
> 5.00
2.01-5.00
1.01-2.00
0.51-1.00
0.21-0.50
Figure 121. Affected Areas in Digos City, Davao del Sur during 100-Year Rainfall Return Period
For the 100-year return period, 34.70% of the municipality of Hagonoy with an area of 85.69 sq. km. will experience flood levels of less than 0.20 meters. 22.79% of the area will experience flood levels of 0.21 to 0.50 meters while 15.47%, 15.99%, 10.20%, and 0.82% of the area will experience flood depths of 0.51 to 1 meter, 1.01 to 2 meters, 2.01 to 5 meters, and more than 5 meters, respectively. Listed in the table are the affected areas in square kilometers by flood depth per barangay.
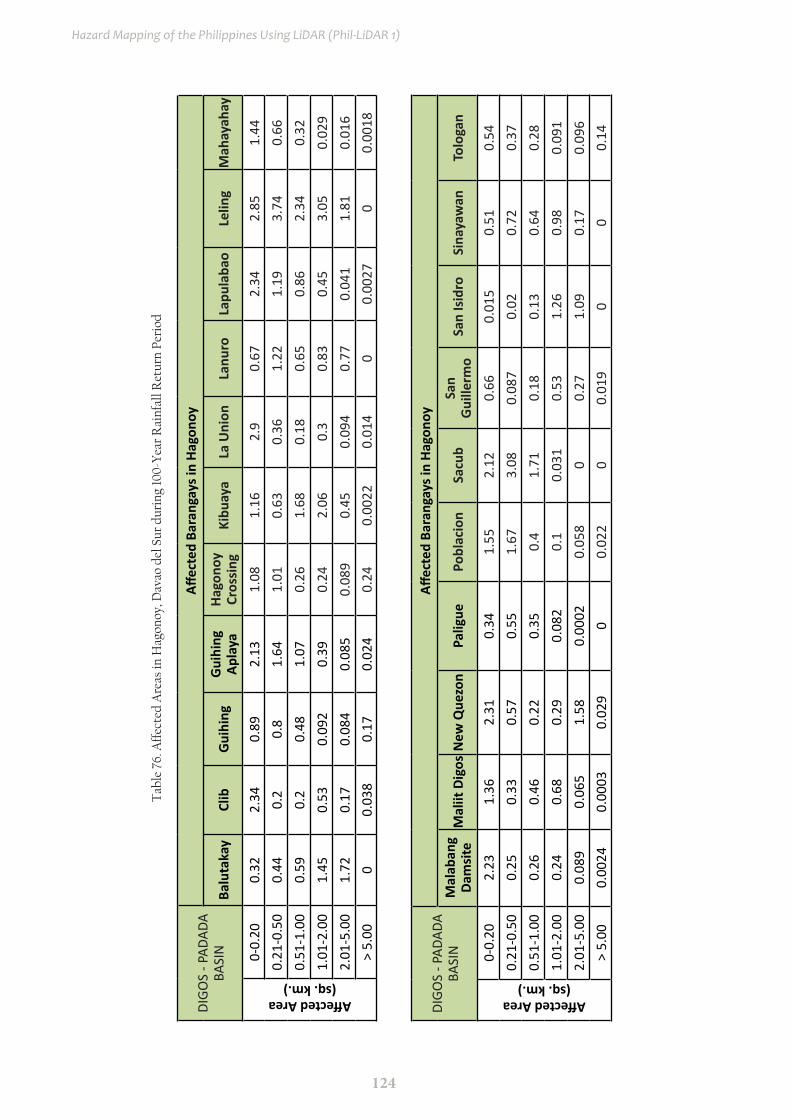
124
Hazard Mapping of the Philippines Using LiDAR (Phil-LiDAR 1)
DIGO
S - P
ADAD
A BA
SIN
Affec
ted
Bara
ngay
s in
Hago
noy
Balu
taka
yCl
ibG
uihi
ngG
uihi
ng
Apla
yaHa
gono
y Cr
ossi
ngKi
buay
aLa
Uni
onLa
nuro
Lapu
laba
oLe
ling
Mah
ayah
ay
Affected Area(sq. km.)
0-0.
200.
322.
340.
892.
131.
081.
162.
90.
672.
342.
851.
440.
21-0
.50
0.44
0.2
0.8
1.64
1.01
0.63
0.36
1.22
1.19
3.74
0.66
0.51
-1.0
00.
590.
20.
481.
070.
261.
680.
180.
650.
862.
340.
321.
01-2
.00
1.45
0.53
0.09
20.
390.
242.
060.
30.
830.
453.
050.
029
2.01
-5.0
01.
720.
170.
084
0.08
50.
089
0.45
0.09
40.
770.
041
1.81
0.01
6>
5.00
00.
038
0.17
0.02
40.
240.
0022
0.01
40
0.00
270
0.00
18
DIGO
S - P
ADAD
A BA
SIN
Affec
ted
Bara
ngay
s in
Hago
noy
Mal
aban
g Da
msi
teM
aliit
Dig
osN
ew Q
uezo
nPa
ligue
Pobl
acio
nSa
cub
San
Gui
llerm
oSa
n Is
idro
Sina
yaw
anTo
loga
n
Affected Area(sq. km.)
0-0.
202.
231.
362.
310.
341.
552.
120.
660.
015
0.51
0.54
0.21
-0.5
00.
250.
330.
570.
551.
673.
080.
087
0.02
0.72
0.37
0.51
-1.0
00.
260.
460.
220.
350.
41.
710.
180.
130.
640.
281.
01-2
.00
0.24
0.68
0.29
0.08
20.
10.
031
0.53
1.26
0.98
0.09
12.
01-5
.00
0.08
90.
065
1.58
0.00
020.
058
00.
271.
090.
170.
096
> 5.
000.
0024
0.00
030.
029
00.
022
00.
019
00
0.14
Tab
le 7
6. A
ffec
ted
Are
as in
Hag
onoy
, Dav
ao d
el S
ur d
urin
g 10
0-Y
ear
Rai
nfal
l Ret
urn
Peri
od
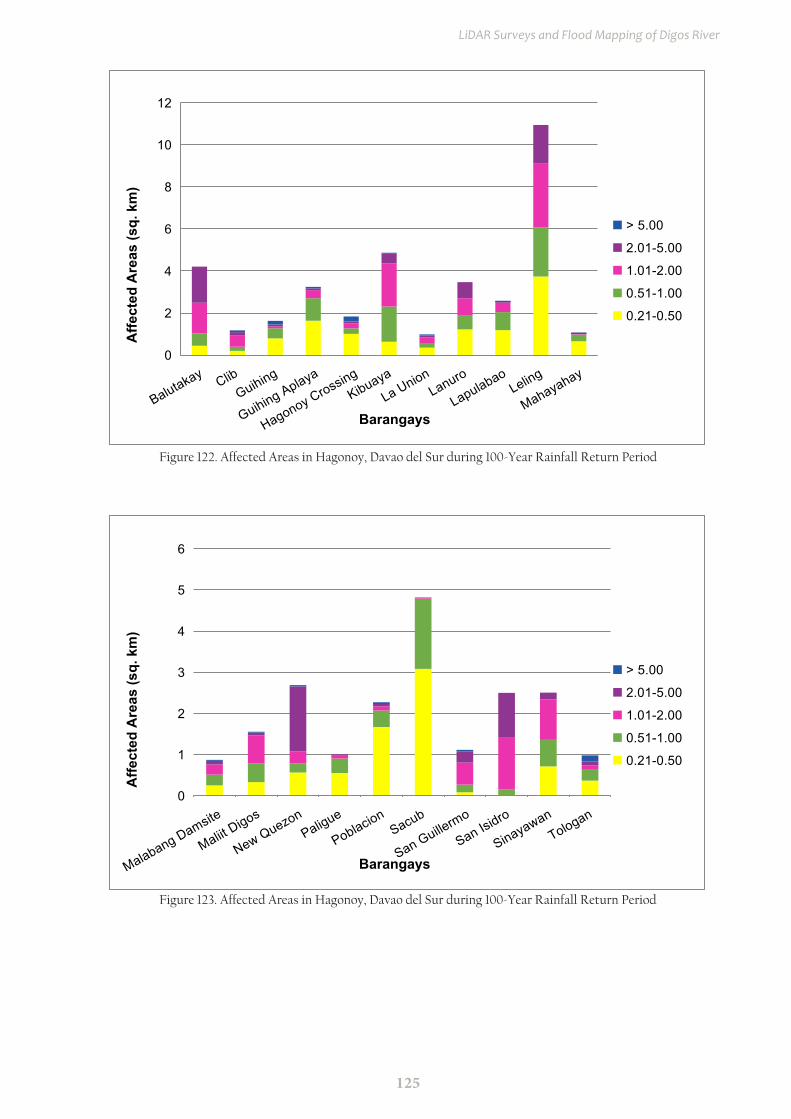
125
LiDAR Surveys and Flood Mapping of Digos River
0
2
4
6
8
10
12
Balutakay ClibGuihing
Guihing Aplaya
Hagonoy CrossingKibuaya
La UnionLanuro
LapulabaoLeling
Mahayahay
Affe
cted
Are
as (s
q. k
m)
Barangays
> 5.00
2.01-5.00
1.01-2.00
0.51-1.00
0.21-0.50
Figure 122. Affected Areas in Hagonoy, Davao del Sur during 100-Year Rainfall Return Period
0
1
2
3
4
5
6
Malabang Damsite
Maliit Digos
New QuezonPaligue
PoblacionSacub
San Guillermo
San Isidro
SinayawanTologan
Affe
cted
Are
as (s
q. k
m)
Barangays
> 5.00
2.01-5.00
1.01-2.00
0.51-1.00
0.21-0.50
Figure 123. Affected Areas in Hagonoy, Davao del Sur during 100-Year Rainfall Return Period

126
Hazard Mapping of the Philippines Using LiDAR (Phil-LiDAR 1)
For the 100-year return period, 49.73% of the municipality of Kiblawan with an area of 80.03 sq. km. will experience flood levels of less than 0.20 meters. 9.12% of the area will experience flood levels of 0.21 to 0.50 meters while 2.36%, 2.89%, 5.12%, and 1.18% of the area will experience flood depths of 0.51 to 1 meter, 1.01 to 2 meters, 2.01 to 5 meters, and more than 5 meters, respectively. Listed in the table are the affected areas in square kilometers by flood depth per barangay.
0
0.2
0.4
0.6
0.8
1
1.2
1.4
1.6
1.8
Abnate
Bagong Negros
Bagong Silang
BagumbayanBalasiao
Bonifacio
Bulol-SaloBunot
Cogon-BacacaDapok
Affe
cted
Are
as (s
q. k
m)
Barangays
> 5.00
2.01-5.00
1.01-2.00
0.51-1.00
0.21-0.50
Figure 124. Affected Areas in Kiblawan, Davao del Sur during 100-Year Rainfall Return Period
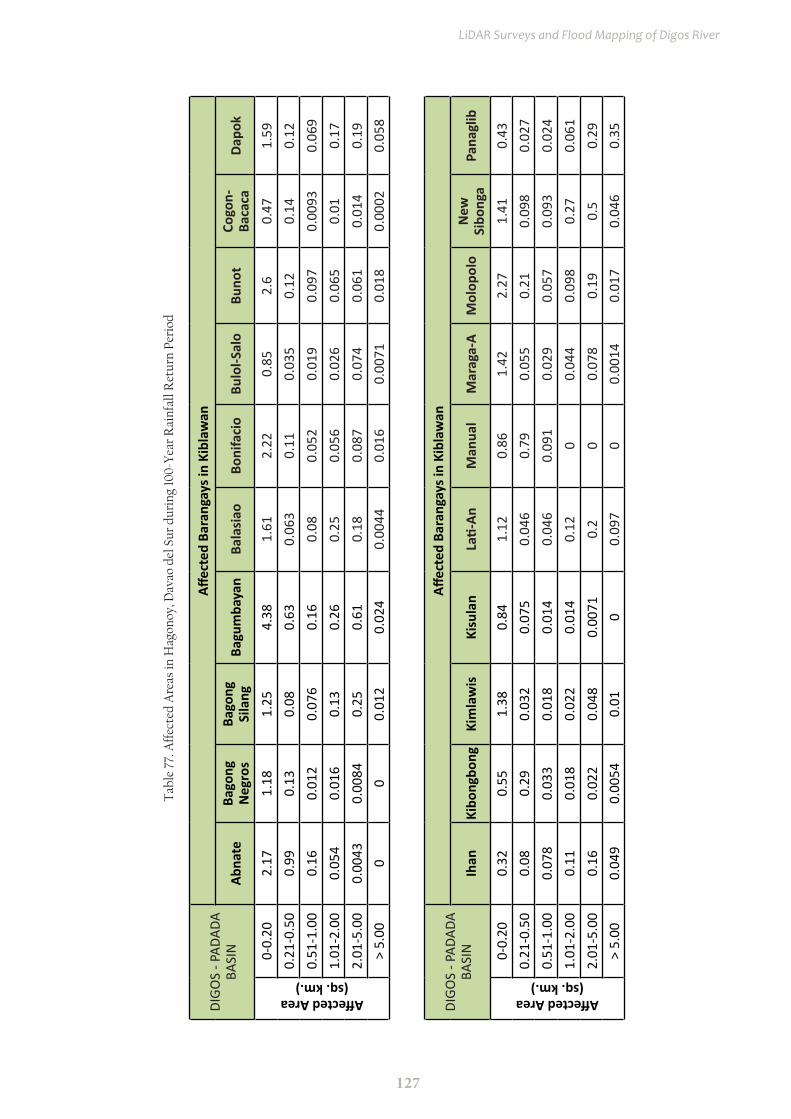
127
LiDAR Surveys and Flood Mapping of Digos River
DIGO
S - P
ADAD
A BA
SIN
Affec
ted
Bara
ngay
s in
Kibl
awan
Abna
teBa
gong
N
egro
sBa
gong
Si
lang
Bagu
mba
yan
Bala
siao
Boni
faci
oBu
lol-S
alo
Buno
tCo
gon-
Baca
caDa
pok
Affected Area(sq. km.)
0-0.
202.
171.
181.
254.
381.
612.
220.
852.
60.
471.
590.
21-0
.50
0.99
0.13
0.08
0.63
0.06
30.
110.
035
0.12
0.14
0.12
0.51
-1.0
00.
160.
012
0.07
60.
160.
080.
052
0.01
90.
097
0.00
930.
069
1.01
-2.0
00.
054
0.01
60.
130.
260.
250.
056
0.02
60.
065
0.01
0.17
2.01
-5.0
00.
0043
0.00
840.
250.
610.
180.
087
0.07
40.
061
0.01
40.
19>
5.00
00
0.01
20.
024
0.00
440.
016
0.00
710.
018
0.00
020.
058
DIGO
S - P
ADAD
A BA
SIN
Affec
ted
Bara
ngay
s in
Kibl
awan
Ihan
Kibo
ngbo
ngKi
mla
wis
Kisu
lan
Lati-
AnM
anua
lM
arag
a-A
Mol
opol
oN
ew
Sibo
nga
Pana
glib
Affected Area(sq. km.)
0-0.
200.
320.
551.
380.
841.
120.
861.
422.
271.
410.
430.
21-0
.50
0.08
0.29
0.03
20.
075
0.04
60.
790.
055
0.21
0.09
80.
027
0.51
-1.0
00.
078
0.03
30.
018
0.01
40.
046
0.09
10.
029
0.05
70.
093
0.02
41.
01-2
.00
0.11
0.01
80.
022
0.01
40.
120
0.04
40.
098
0.27
0.06
12.
01-5
.00
0.16
0.02
20.
048
0.00
710.
20
0.07
80.
190.
50.
29>
5.00
0.04
90.
0054
0.01
00.
097
00.
0014
0.01
70.
046
0.35
Tab
le 7
7. A
ffec
ted
Are
as in
Hag
onoy
, Dav
ao d
el S
ur d
urin
g 10
0-Y
ear
Rai
nfal
l Ret
urn
Peri
od
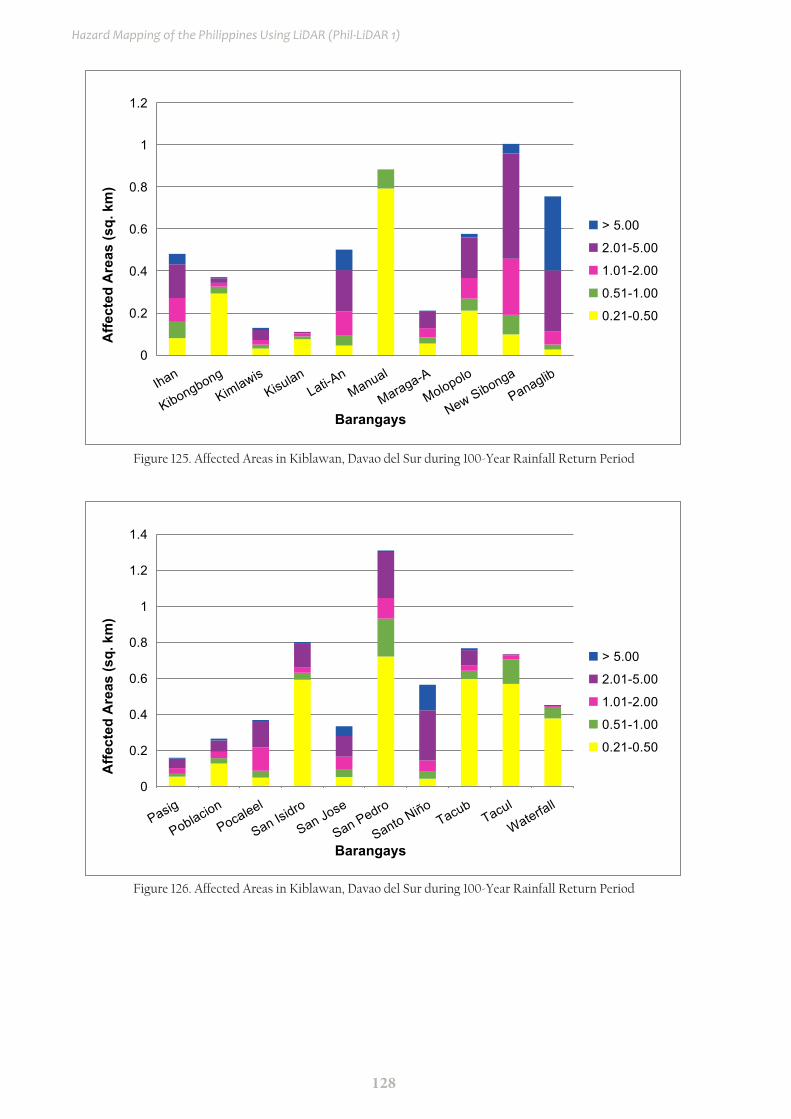
128
Hazard Mapping of the Philippines Using LiDAR (Phil-LiDAR 1)
0
0.2
0.4
0.6
0.8
1
1.2
Ihan
Kibongbong
KimlawisKisulan
Lati-An
Manual
Maraga-A
Molopolo
New Sibonga
Panaglib
Affe
cted
Are
as (s
q. k
m)
Barangays
> 5.00
2.01-5.00
1.01-2.00
0.51-1.00
0.21-0.50
Figure 125. Affected Areas in Kiblawan, Davao del Sur during 100-Year Rainfall Return Period
0
0.2
0.4
0.6
0.8
1
1.2
1.4
Pasig
PoblacionPocaleel
San Isidro
San Jose
San Pedro
Santo NiñoTacub
Tacul
Waterfall
Affe
cted
Are
as (s
q. k
m)
Barangays
> 5.00
2.01-5.00
1.01-2.00
0.51-1.00
0.21-0.50
Figure 126. Affected Areas in Kiblawan, Davao del Sur during 100-Year Rainfall Return Period
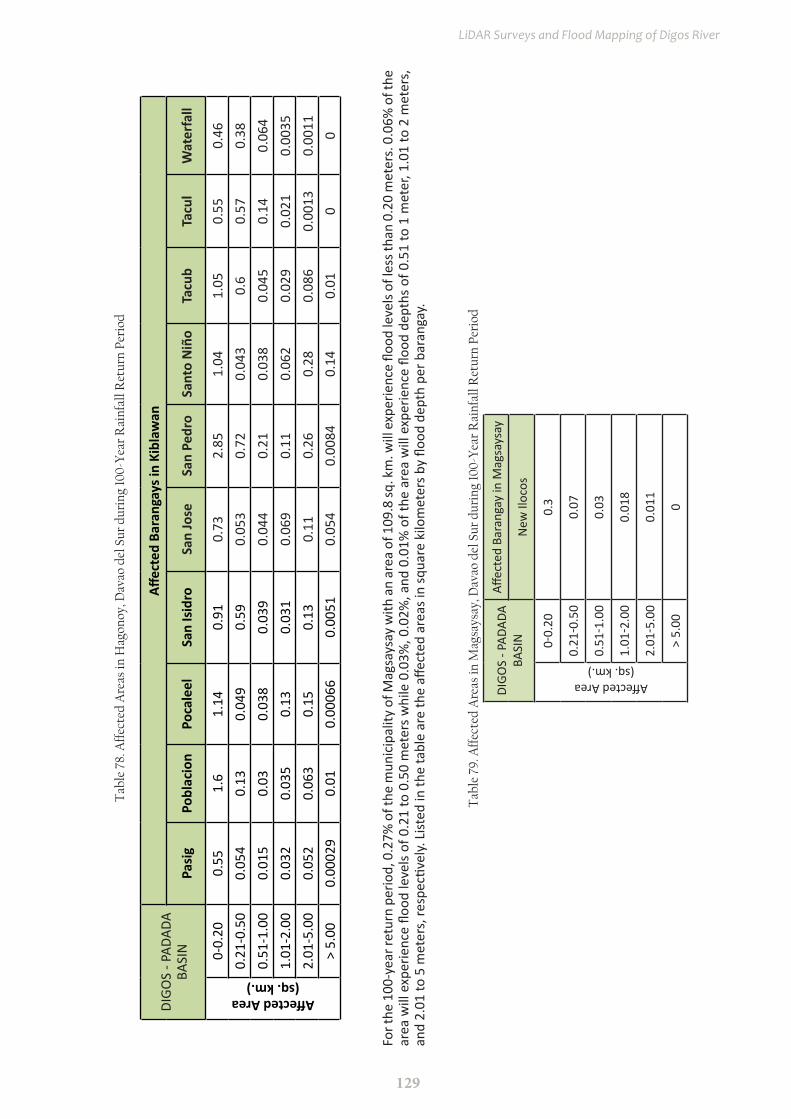
129
LiDAR Surveys and Flood Mapping of Digos River
DIGO
S - P
ADAD
A BA
SIN
Affec
ted
Bara
ngay
s in
Kibl
awan
Pasi
gPo
blac
ion
Poca
leel
San
Isid
roSa
n Jo
seSa
n Pe
dro
Sant
o N
iño
Tacu
bTa
cul
Wat
erfa
ll
Affected Area(sq. km.)
0-0.
200.
551.
61.
140.
910.
732.
851.
041.
050.
550.
460.
21-0
.50
0.05
40.
130.
049
0.59
0.05
30.
720.
043
0.6
0.57
0.38
0.51
-1.0
00.
015
0.03
0.03
80.
039
0.04
40.
210.
038
0.04
50.
140.
064
1.01
-2.0
00.
032
0.03
50.
130.
031
0.06
90.
110.
062
0.02
90.
021
0.00
352.
01-5
.00
0.05
20.
063
0.15
0.13
0.11
0.26
0.28
0.08
60.
0013
0.00
11>
5.00
0.00
029
0.01
0.00
066
0.00
510.
054
0.00
840.
140.
010
0
Tab
le 7
8. A
ffec
ted
Are
as in
Hag
onoy
, Dav
ao d
el S
ur d
urin
g 10
0-Y
ear
Rai
nfal
l Ret
urn
Peri
od
Tab
le 7
9. A
ffec
ted
Are
as in
Mag
says
ay, D
avao
del
Sur
dur
ing
100-
Yea
r R
ainf
all R
etur
n Pe
riod
DIGO
S - P
ADAD
A BA
SIN
Affec
ted
Bara
ngay
in M
agsa
ysay
New
Iloc
os
Affected Area(sq. km.)
0-0.
200.
3
0.21
-0.5
00.
07
0.51
-1.0
00.
03
1.01
-2.0
00.
018
2.01
-5.0
00.
011
> 5.
000
For t
he 1
00-y
ear r
etur
n pe
riod,
0.2
7% o
f the
mun
icip
ality
of M
agsa
ysay
with
an
area
of 1
09.8
sq. k
m. w
ill e
xper
ienc
e flo
od le
vels
of le
ss th
an 0
.20
met
ers.
0.0
6% o
f the
ar
ea w
ill e
xper
ienc
e flo
od le
vels
of 0
.21
to 0
.50
met
ers
whi
le 0
.03%
, 0.0
2%, a
nd 0
.01%
of t
he a
rea
will
exp
erie
nce
flood
dep
ths
of 0
.51
to 1
met
er, 1
.01
to 2
met
ers,
an
d 2.
01 to
5 m
eter
s, re
spec
tivel
y. L
isted
in th
e ta
ble
are
the
affec
ted
area
s in
squa
re k
ilom
eter
s by
flood
dep
th p
er b
aran
gay.
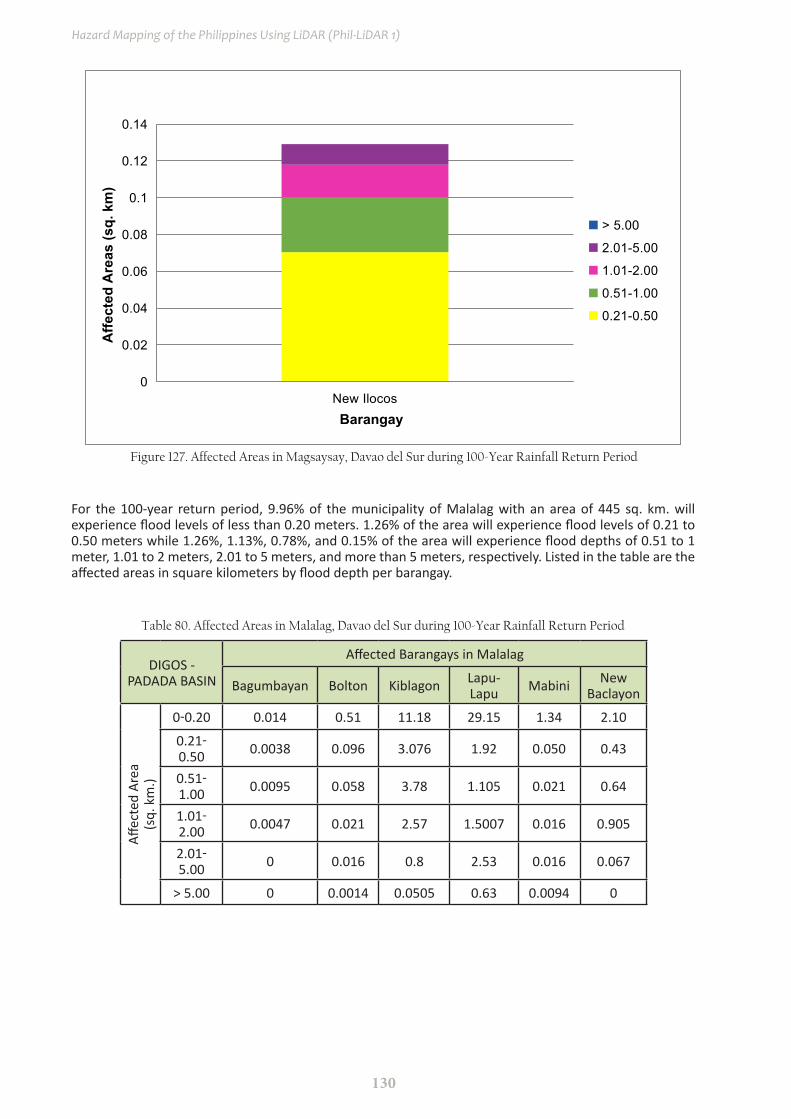
130
Hazard Mapping of the Philippines Using LiDAR (Phil-LiDAR 1)
0
0.02
0.04
0.06
0.08
0.1
0.12
0.14
New Ilocos
Affe
cted
Are
as (s
q. k
m)
Barangay
> 5.00
2.01-5.00
1.01-2.00
0.51-1.00
0.21-0.50
Figure 127. Affected Areas in Magsaysay, Davao del Sur during 100-Year Rainfall Return Period
Table 80. Affected Areas in Malalag, Davao del Sur during 100-Year Rainfall Return Period
For the 100-year return period, 9.96% of the municipality of Malalag with an area of 445 sq. km. will experience flood levels of less than 0.20 meters. 1.26% of the area will experience flood levels of 0.21 to 0.50 meters while 1.26%, 1.13%, 0.78%, and 0.15% of the area will experience flood depths of 0.51 to 1 meter, 1.01 to 2 meters, 2.01 to 5 meters, and more than 5 meters, respectively. Listed in the table are the affected areas in square kilometers by flood depth per barangay.
DIGOS - PADADA BASIN
Affected Barangays in Malalag
Bagumbayan Bolton Kiblagon Lapu-Lapu Mabini New
Baclayon
Affec
ted
Area
(sq.
km
.)
0-0.20 0.014 0.51 11.18 29.15 1.34 2.10
0.21-0.50 0.0038 0.096 3.076 1.92 0.050 0.43
0.51-1.00 0.0095 0.058 3.78 1.105 0.021 0.64
1.01-2.00 0.0047 0.021 2.57 1.5007 0.016 0.905
2.01-5.00 0 0.016 0.8 2.53 0.016 0.067
> 5.00 0 0.0014 0.0505 0.63 0.0094 0
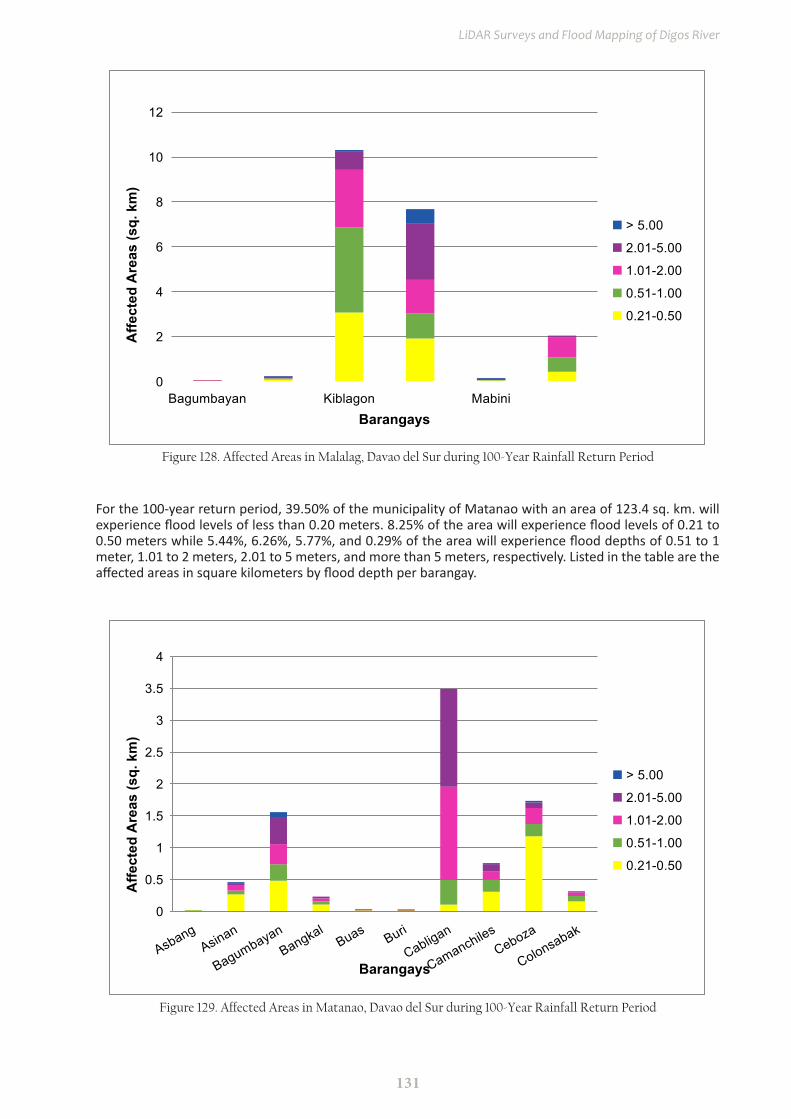
131
LiDAR Surveys and Flood Mapping of Digos River
Figure 128. Affected Areas in Malalag, Davao del Sur during 100-Year Rainfall Return Period
Figure 129. Affected Areas in Matanao, Davao del Sur during 100-Year Rainfall Return Period
For the 100-year return period, 39.50% of the municipality of Matanao with an area of 123.4 sq. km. will experience flood levels of less than 0.20 meters. 8.25% of the area will experience flood levels of 0.21 to 0.50 meters while 5.44%, 6.26%, 5.77%, and 0.29% of the area will experience flood depths of 0.51 to 1 meter, 1.01 to 2 meters, 2.01 to 5 meters, and more than 5 meters, respectively. Listed in the table are the affected areas in square kilometers by flood depth per barangay.
0
2
4
6
8
10
12
Bagumbayan Kiblagon Mabini
Affe
cted
Are
as (s
q. k
m)
Barangays
> 5.00
2.01-5.00
1.01-2.00
0.51-1.00
0.21-0.50
0
0.5
1
1.5
2
2.5
3
3.5
4
AsbangAsinan
BagumbayanBangkal
Buas Buri
Cabligan
CamanchilesCeboza
Colonsabak
Affe
cted
Are
as (s
q. k
m)
Barangays
> 5.00
2.01-5.00
1.01-2.00
0.51-1.00
0.21-0.50
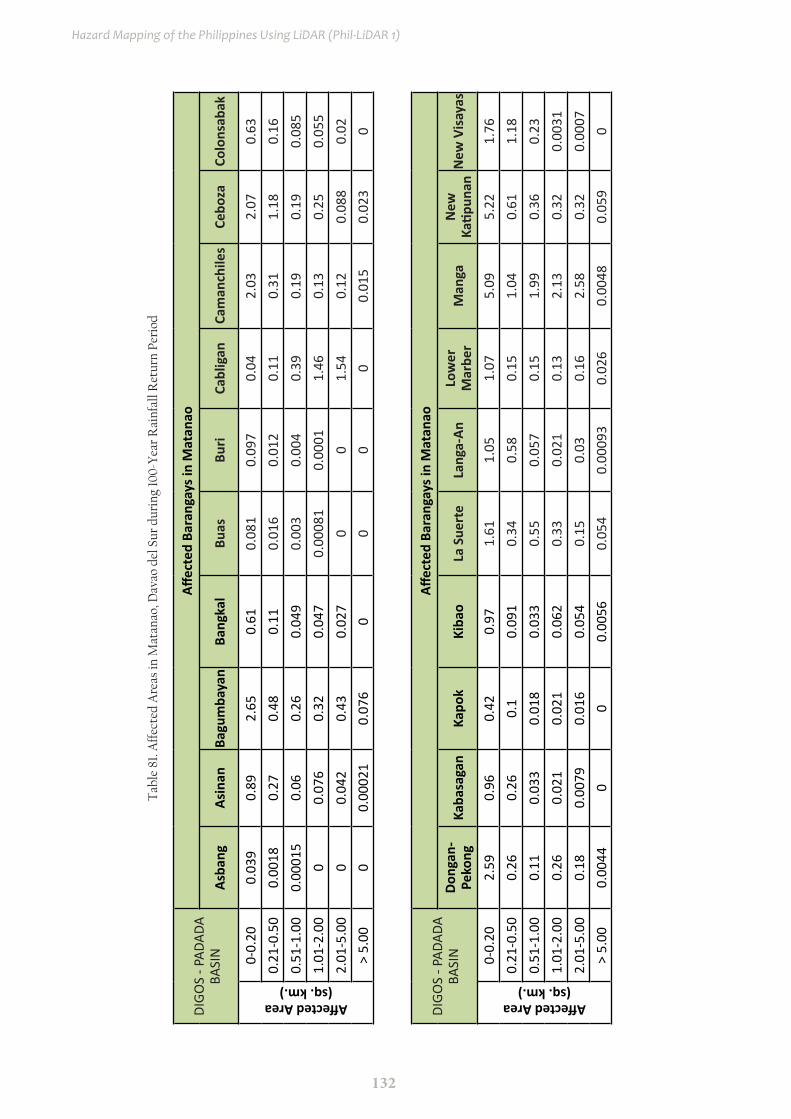
132
Hazard Mapping of the Philippines Using LiDAR (Phil-LiDAR 1)
DIGO
S - P
ADAD
A BA
SIN
Affec
ted
Bara
ngay
s in
Mat
anao
Asba
ngAs
inan
Bagu
mba
yan
Bang
kal
Buas
Buri
Cabl
igan
Cam
anch
iles
Cebo
zaCo
lons
abak
Affected Area(sq. km.)
0-0.
200.
039
0.89
2.65
0.61
0.08
10.
097
0.04
2.03
2.07
0.63
0.21
-0.5
00.
0018
0.27
0.48
0.11
0.01
60.
012
0.11
0.31
1.18
0.16
0.51
-1.0
00.
0001
50.
060.
260.
049
0.00
30.
004
0.39
0.19
0.19
0.08
51.
01-2
.00
00.
076
0.32
0.04
70.
0008
10.
0001
1.46
0.13
0.25
0.05
52.
01-5
.00
00.
042
0.43
0.02
70
01.
540.
120.
088
0.02
> 5.
000
0.00
021
0.07
60
00
00.
015
0.02
30
DIGO
S - P
ADAD
A BA
SIN
Affec
ted
Bara
ngay
s in
Mat
anao
Dong
an-
Peko
ngKa
basa
gan
Kapo
kKi
bao
La S
uert
eLa
nga-
AnLo
wer
M
arbe
rM
anga
New
Ka
tipun
anN
ew V
isay
as
Affected Area(sq. km.)
0-0.
202.
590.
960.
420.
971.
611.
051.
075.
095.
221.
760.
21-0
.50
0.26
0.26
0.1
0.09
10.
340.
580.
151.
040.
611.
180.
51-1
.00
0.11
0.03
30.
018
0.03
30.
550.
057
0.15
1.99
0.36
0.23
1.01
-2.0
00.
260.
021
0.02
10.
062
0.33
0.02
10.
132.
130.
320.
0031
2.01
-5.0
00.
180.
0079
0.01
60.
054
0.15
0.03
0.16
2.58
0.32
0.00
07>
5.00
0.00
440
00.
0056
0.05
40.
0009
30.
026
0.00
480.
059
0
Tab
le 8
1. A
ffec
ted
Are
as in
Mat
anao
, Dav
ao d
el S
ur d
urin
g 10
0-Y
ear
Rai
nfal
l Ret
urn
Peri
od
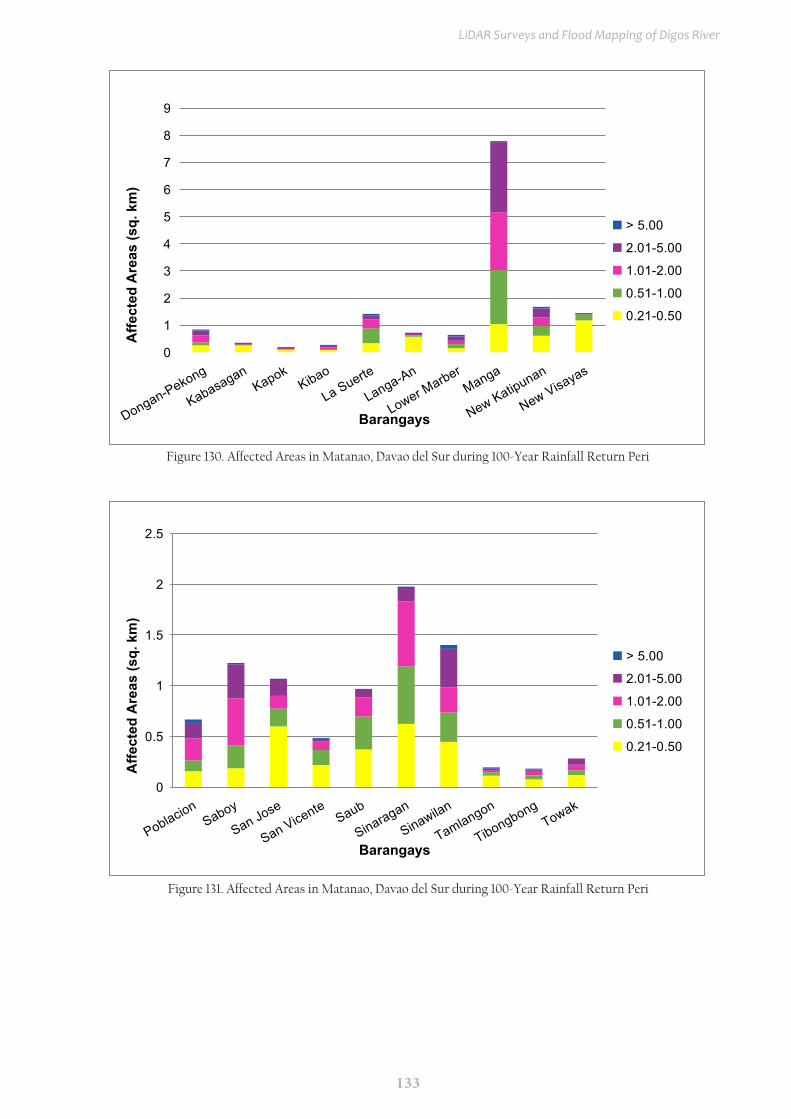
133
LiDAR Surveys and Flood Mapping of Digos River
0
1
2
3
4
5
6
7
8
9
Dongan-Pekong
KabasaganKapok
Kibao
La Suerte
Langa-An
Lower Marber
Manga
New Katipunan
New Visayas
Affe
cted
Are
as (s
q. k
m)
Barangays
> 5.00
2.01-5.00
1.01-2.00
0.51-1.00
0.21-0.50
Figure 130. Affected Areas in Matanao, Davao del Sur during 100-Year Rainfall Return Peri
0
0.5
1
1.5
2
2.5
PoblacionSaboy
San Jose
San VicenteSaub
Sinaragan
Sinawilan
Tamlangon
TibongbongTowak
Affe
cted
Are
as (s
q. k
m)
Barangays
> 5.00
2.01-5.00
1.01-2.00
0.51-1.00
0.21-0.50
Figure 131. Affected Areas in Matanao, Davao del Sur during 100-Year Rainfall Return Peri
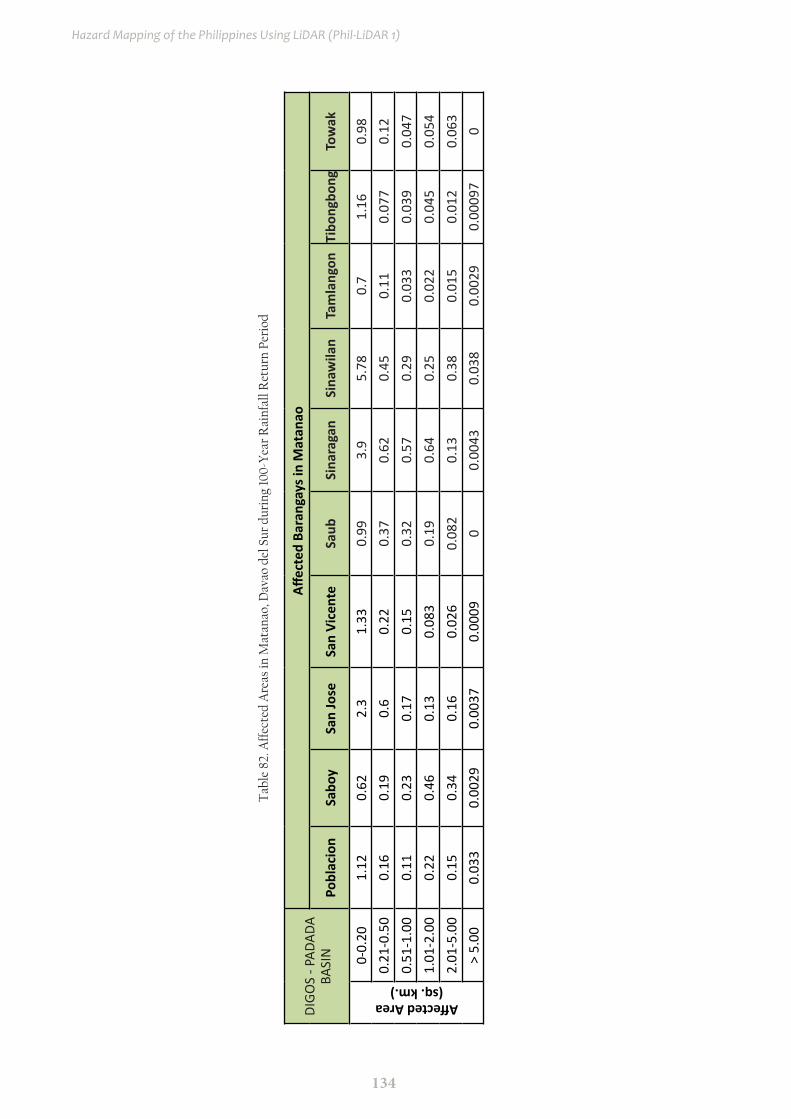
134
Hazard Mapping of the Philippines Using LiDAR (Phil-LiDAR 1)
DIGO
S - P
ADAD
A BA
SIN
Affec
ted
Bara
ngay
s in
Mat
anao
Pobl
acio
nSa
boy
San
Jose
San
Vice
nte
Saub
Sina
raga
nSi
naw
ilan
Tam
lang
onTi
bong
bong
Tow
ak
Affected Area(sq. km.)
0-0.
201.
120.
622.
31.
330.
993.
95.
780.
71.
160.
980.
21-0
.50
0.16
0.19
0.6
0.22
0.37
0.62
0.45
0.11
0.07
70.
120.
51-1
.00
0.11
0.23
0.17
0.15
0.32
0.57
0.29
0.03
30.
039
0.04
71.
01-2
.00
0.22
0.46
0.13
0.08
30.
190.
640.
250.
022
0.04
50.
054
2.01
-5.0
00.
150.
340.
160.
026
0.08
20.
130.
380.
015
0.01
20.
063
> 5.
000.
033
0.00
290.
0037
0.00
090
0.00
430.
038
0.00
290.
0009
70
Tab
le 8
2. A
ffec
ted
Are
as in
Mat
anao
, Dav
ao d
el S
ur d
urin
g 10
0-Y
ear
Rai
nfal
l Ret
urn
Peri
od
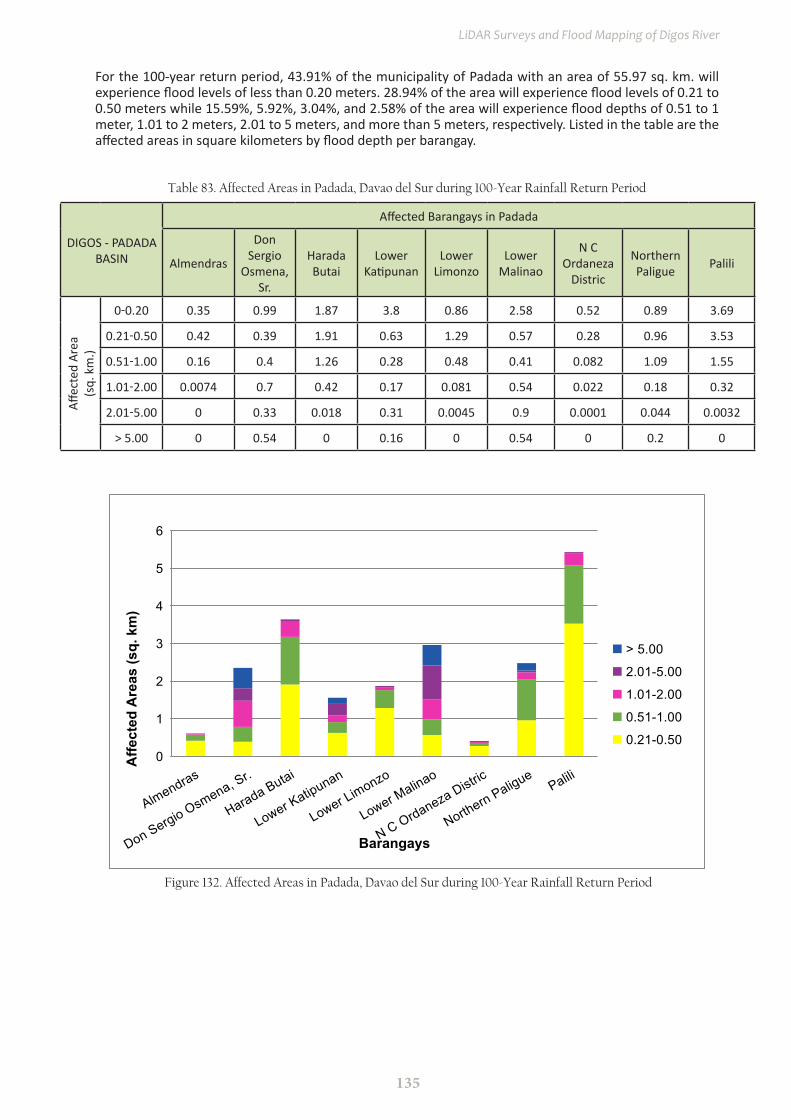
135
LiDAR Surveys and Flood Mapping of Digos River
Table 83. Affected Areas in Padada, Davao del Sur during 100-Year Rainfall Return Period
For the 100-year return period, 43.91% of the municipality of Padada with an area of 55.97 sq. km. will experience flood levels of less than 0.20 meters. 28.94% of the area will experience flood levels of 0.21 to 0.50 meters while 15.59%, 5.92%, 3.04%, and 2.58% of the area will experience flood depths of 0.51 to 1 meter, 1.01 to 2 meters, 2.01 to 5 meters, and more than 5 meters, respectively. Listed in the table are the affected areas in square kilometers by flood depth per barangay.
DIGOS - PADADA BASIN
Affected Barangays in Padada
Almendras
Don Sergio
Osmena, Sr.
Harada Butai
Lower Katipunan
Lower Limonzo
Lower Malinao
N C Ordaneza
Distric
Northern Paligue Palili
Affec
ted
Area
(sq.
km
.)
0-0.20 0.35 0.99 1.87 3.8 0.86 2.58 0.52 0.89 3.69
0.21-0.50 0.42 0.39 1.91 0.63 1.29 0.57 0.28 0.96 3.53
0.51-1.00 0.16 0.4 1.26 0.28 0.48 0.41 0.082 1.09 1.55
1.01-2.00 0.0074 0.7 0.42 0.17 0.081 0.54 0.022 0.18 0.32
2.01-5.00 0 0.33 0.018 0.31 0.0045 0.9 0.0001 0.044 0.0032
> 5.00 0 0.54 0 0.16 0 0.54 0 0.2 0
0
1
2
3
4
5
6
Almendras
Don Sergio Osmena, Sr.
Harada Butai
Lower Katipunan
Lower Limonzo
Lower Malinao
N C Ordaneza Distric
Northern PaliguePalili
Affe
cted
Are
as (s
q. k
m)
Barangays
> 5.00
2.01-5.00
1.01-2.00
0.51-1.00
0.21-0.50
Figure 132. Affected Areas in Padada, Davao del Sur during 100-Year Rainfall Return Period
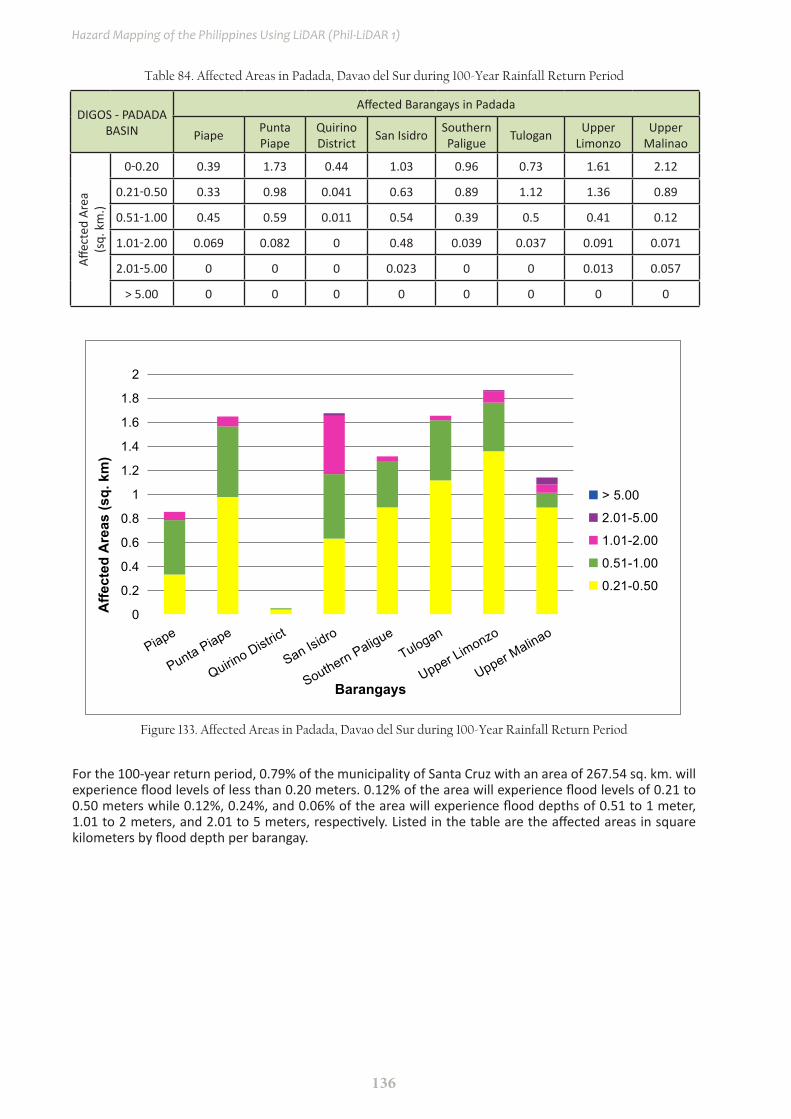
136
Hazard Mapping of the Philippines Using LiDAR (Phil-LiDAR 1)
Table 84. Affected Areas in Padada, Davao del Sur during 100-Year Rainfall Return Period
DIGOS - PADADA BASIN
Affected Barangays in Padada
Piape Punta Piape
Quirino District San Isidro Southern
Paligue Tulogan Upper Limonzo
Upper Malinao
Affec
ted
Area
(sq.
km
.)
0-0.20 0.39 1.73 0.44 1.03 0.96 0.73 1.61 2.12
0.21-0.50 0.33 0.98 0.041 0.63 0.89 1.12 1.36 0.89
0.51-1.00 0.45 0.59 0.011 0.54 0.39 0.5 0.41 0.12
1.01-2.00 0.069 0.082 0 0.48 0.039 0.037 0.091 0.071
2.01-5.00 0 0 0 0.023 0 0 0.013 0.057
> 5.00 0 0 0 0 0 0 0 0
0
0.2
0.4
0.6
0.8
1
1.2
1.4
1.6
1.8
2
Piape
Punta Piape
Quirino District
San Isidro
Southern PaligueTulogan
Upper Limonzo
Upper Malinao
Affe
cted
Are
as (s
q. k
m)
Barangays
> 5.00
2.01-5.00
1.01-2.00
0.51-1.00
0.21-0.50
Figure 133. Affected Areas in Padada, Davao del Sur during 100-Year Rainfall Return Period
For the 100-year return period, 0.79% of the municipality of Santa Cruz with an area of 267.54 sq. km. will experience flood levels of less than 0.20 meters. 0.12% of the area will experience flood levels of 0.21 to 0.50 meters while 0.12%, 0.24%, and 0.06% of the area will experience flood depths of 0.51 to 1 meter, 1.01 to 2 meters, and 2.01 to 5 meters, respectively. Listed in the table are the affected areas in square kilometers by flood depth per barangay.

137
LiDAR Surveys and Flood Mapping of Digos River
Table 85. Affected Areas in Santa Cruz, Davao del Sur during 100-Year Rainfall Return Period
DIGOS - PADADA BASIN
Affected Barangays in Santa Cruz
Bato Tagabuli
Affec
ted
Area
(sq.
km
.)
0-0.20 2.07 0.041
0.21-0.50 0.31 0.019
0.51-1.00 0.31 0.0099
1.01-2.00 0.63 0.011
2.01-5.00 0.17 0
> 5.00 0.012 0
0
0.2
0.4
0.6
0.8
1
1.2
1.4
1.6
Bato Tagabuli
Affe
cted
Are
as (s
q. k
m)
Barangays
> 5.00
2.01-5.00
1.01-2.00
0.51-1.00
0.21-0.50
Figure 134. Affected Areas in Santa Cruz, Davao del Sur during 100-Year Rainfall Return Period
For the 100-year return period, 46.68% of the municipality of Sulop with an area of 50.8 sq. km. will experience flood levels of less than 0.20 meters. 20.09% of the area will experience flood levels of 0.21 to 0.50 meters while 16.71%, 11.57%, 3.82%, and 0.61% of the area will experience flood depths of 0.51 to 1 meter, 1.01 to 2 meters, 2.01 to 5 meters, and more than 5 meters, respectively. Listed in the table are the affected areas in square kilometers by flood depth per barangay.

138
Hazard Mapping of the Philippines Using LiDAR (Phil-LiDAR 1)
Table 86. Affected Areas in Sulop, Davao del Sur during 100-Year Rainfall Return Period
DIGOS - PADADA BASIN
Affected Barangays in Sulop
Balasinon Buguis Carre Clib Harada Butai Katipunan Kiblagon Labon Laperas
Affec
ted
Area
(sq.
km
.)
0-0.20 0.15 1.14 0.87 0.51 1.18 0.76 0.15 0.46 0.73
0.21-0.50 0.14 0.05 0.046 0.021 1.13 0.67 0.28 0.024 0.21
0.51-1.00 0.15 0.028 0.033 0.011 0.96 0.25 0.73 0.012 0.24
1.01-2.00 0.0075 0.036 0.028 0.0046 0.35 0.021 1.06 0.0081 0.016
2.01-5.00 0 0.068 0.026 0.0017 0.014 0.05 0.087 0.0054 0.00074
> 5.00 0 0.011 0.0065 0.0011 0 0.013 0 0.0026 0.00024
0
0.5
1
1.5
2
2.5
3
BalasinonBuguis
Carre Clib
Harada Butai
Katipunan
KiblagonLabon
Laperas
Affe
cted
Are
as (s
q. k
m)
Barangays
> 5.00
2.01-5.00
1.01-2.00
0.51-1.00
0.21-0.50
Figure 135. Affected Areas in Sulop, Davao del Sur during 100-Year Rainfall Return Period
Table 87. Affected Areas in Sulop, Davao del Sur during 100-Year Rainfall Return Period
DIGOS - PADADA BASIN
Affected Barangays in Sulop
Lapla Litos Luparan Mckinley New Cebu Osmeña Palili Parame
Affec
ted
Area
(sq.
km
.)
0-0.20 0.67 0.64 0.33 0.75 1.65 0.34 2.54 0.5
0.21-0.50 0.027 0.025 0.013 0.041 0.24 0.015 3.25 0.015
0.51-1.00 0.014 0.023 0.0052 0.036 0.55 0.0076 1.11 0.011
1.01-2.00 0.013 0.027 0.0052 0.086 0.11 0.0048 1.21 0.012
2.01-5.00 0.025 0.021 0.011 0.035 0.051 0.0015 0.61 0.017
> 5.00 0.012 0.014 0.0059 0 0.0022 0 0 0.0009
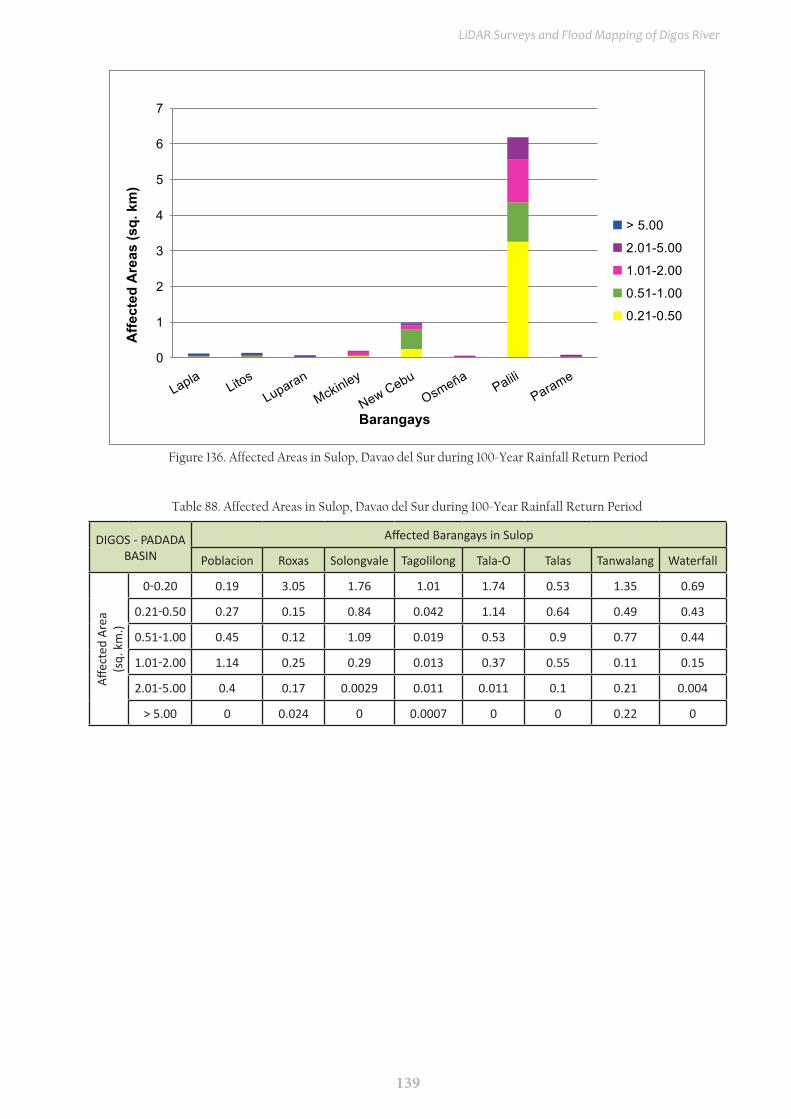
139
LiDAR Surveys and Flood Mapping of Digos River
0
1
2
3
4
5
6
7
Lapla LitosLuparan
Mckinley
New CebuOsmeña
PaliliParame
Affe
cted
Are
as (s
q. k
m)
Barangays
> 5.00
2.01-5.00
1.01-2.00
0.51-1.00
0.21-0.50
Figure 136. Affected Areas in Sulop, Davao del Sur during 100-Year Rainfall Return Period
Table 88. Affected Areas in Sulop, Davao del Sur during 100-Year Rainfall Return Period
DIGOS - PADADA BASIN
Affected Barangays in Sulop
Poblacion Roxas Solongvale Tagolilong Tala-O Talas Tanwalang Waterfall
Affec
ted
Area
(sq.
km
.)
0-0.20 0.19 3.05 1.76 1.01 1.74 0.53 1.35 0.69
0.21-0.50 0.27 0.15 0.84 0.042 1.14 0.64 0.49 0.43
0.51-1.00 0.45 0.12 1.09 0.019 0.53 0.9 0.77 0.44
1.01-2.00 1.14 0.25 0.29 0.013 0.37 0.55 0.11 0.15
2.01-5.00 0.4 0.17 0.0029 0.011 0.011 0.1 0.21 0.004
> 5.00 0 0.024 0 0.0007 0 0 0.22 0

140
Hazard Mapping of the Philippines Using LiDAR (Phil-LiDAR 1)
0
0.5
1
1.5
2
2.5
PoblacionRoxas
Solongvale
TagolilongTala-O
Talas
Tanwalang
Waterfall
Affe
cted
Are
as (s
q. k
m)
Barangays
> 5.00
2.01-5.00
1.01-2.00
0.51-1.00
0.21-0.50
Figure 137. Affected Areas in Sulop, Davao del Sur during 100-Year Rainfall Return Period
For the 100-year return period, 0.24% of the municipality of Columbio with an area of 574.067 sq. km. will experience flood levels of less than 0.20 meters. 0.01% of the area will experience flood levels of 0.21 to 0.50 meters while 0.00% of the area will experience flood depths of 0.51 to 1 meter. Listed in the table are the affected areas in square kilometers by flood depth per barangay.
Table 89. Affected Areas in Columbio, Sultan Kudarat during 100-Year Rainfall Return Period
DIGOS - PADADA BASIN
Affected Barangay in Columbio
Datablao
Affec
ted
Area
(sq.
km
.)
0-0.20 1.36
0.21-0.50 0.036
0.51-1.00 0.021
1.01-2.00 0.017
2.01-5.00 0.026
> 5.00 0.0096
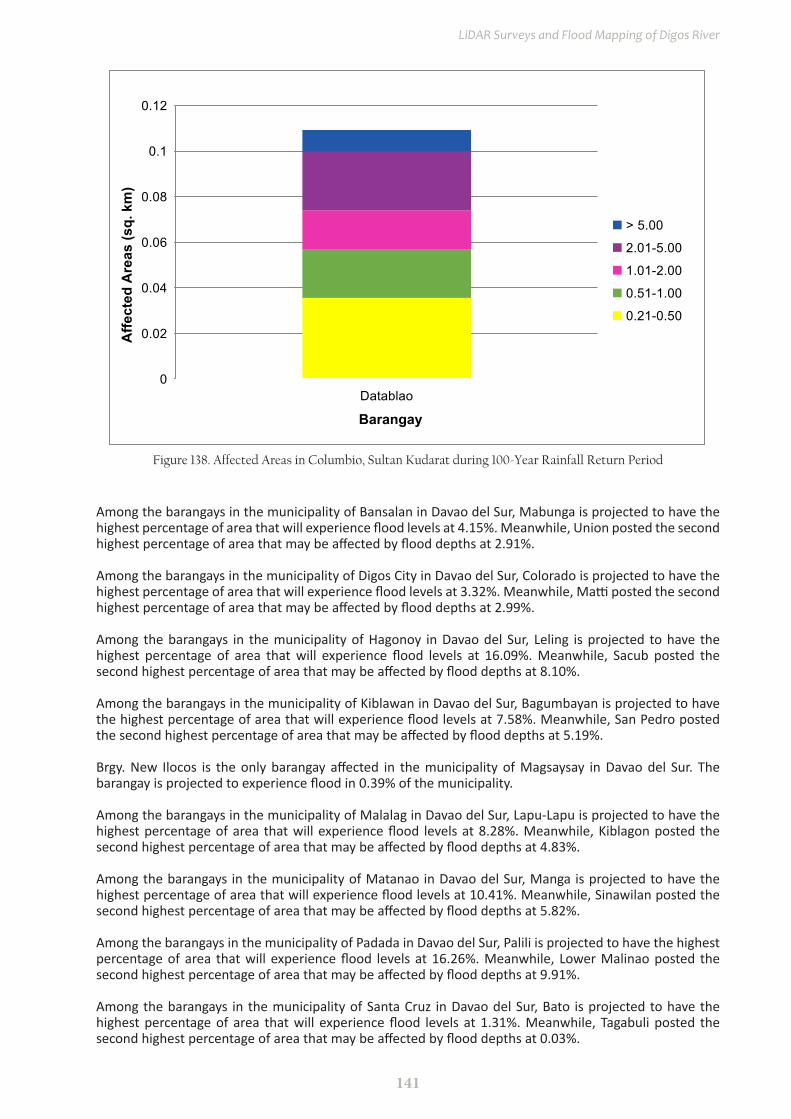
141
LiDAR Surveys and Flood Mapping of Digos River
Figure 138. Affected Areas in Columbio, Sultan Kudarat during 100-Year Rainfall Return Period
Among the barangays in the municipality of Bansalan in Davao del Sur, Mabunga is projected to have the highest percentage of area that will experience flood levels at 4.15%. Meanwhile, Union posted the second highest percentage of area that may be affected by flood depths at 2.91%.
Among the barangays in the municipality of Digos City in Davao del Sur, Colorado is projected to have the highest percentage of area that will experience flood levels at 3.32%. Meanwhile, Matti posted the second highest percentage of area that may be affected by flood depths at 2.99%.
Among the barangays in the municipality of Hagonoy in Davao del Sur, Leling is projected to have the highest percentage of area that will experience flood levels at 16.09%. Meanwhile, Sacub posted the second highest percentage of area that may be affected by flood depths at 8.10%.
Among the barangays in the municipality of Kiblawan in Davao del Sur, Bagumbayan is projected to have the highest percentage of area that will experience flood levels at 7.58%. Meanwhile, San Pedro posted the second highest percentage of area that may be affected by flood depths at 5.19%.
Brgy. New Ilocos is the only barangay affected in the municipality of Magsaysay in Davao del Sur. The barangay is projected to experience flood in 0.39% of the municipality.
Among the barangays in the municipality of Malalag in Davao del Sur, Lapu-Lapu is projected to have the highest percentage of area that will experience flood levels at 8.28%. Meanwhile, Kiblagon posted the second highest percentage of area that may be affected by flood depths at 4.83%.
Among the barangays in the municipality of Matanao in Davao del Sur, Manga is projected to have the highest percentage of area that will experience flood levels at 10.41%. Meanwhile, Sinawilan posted the second highest percentage of area that may be affected by flood depths at 5.82%.
Among the barangays in the municipality of Padada in Davao del Sur, Palili is projected to have the highest percentage of area that will experience flood levels at 16.26%. Meanwhile, Lower Malinao posted the second highest percentage of area that may be affected by flood depths at 9.91%.
Among the barangays in the municipality of Santa Cruz in Davao del Sur, Bato is projected to have the highest percentage of area that will experience flood levels at 1.31%. Meanwhile, Tagabuli posted the second highest percentage of area that may be affected by flood depths at 0.03%.
0
0.02
0.04
0.06
0.08
0.1
0.12
Datablao
Affe
cted
Are
as (s
q. k
m)
Barangay
> 5.00
2.01-5.00
1.01-2.00
0.51-1.00
0.21-0.50
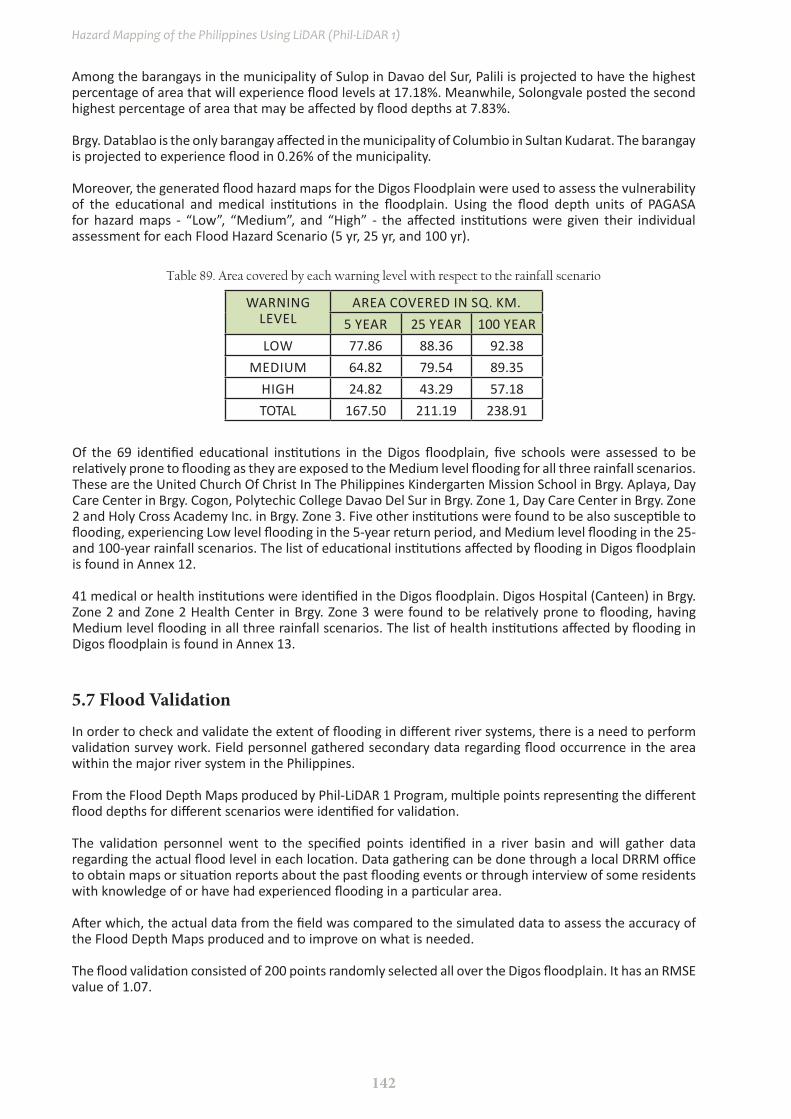
142
Hazard Mapping of the Philippines Using LiDAR (Phil-LiDAR 1)
Among the barangays in the municipality of Sulop in Davao del Sur, Palili is projected to have the highest percentage of area that will experience flood levels at 17.18%. Meanwhile, Solongvale posted the second highest percentage of area that may be affected by flood depths at 7.83%.
Brgy. Datablao is the only barangay affected in the municipality of Columbio in Sultan Kudarat. The barangay is projected to experience flood in 0.26% of the municipality.
Moreover, the generated flood hazard maps for the Digos Floodplain were used to assess the vulnerability of the educational and medical institutions in the floodplain. Using the flood depth units of PAGASA for hazard maps - “Low”, “Medium”, and “High” - the affected institutions were given their individual assessment for each Flood Hazard Scenario (5 yr, 25 yr, and 100 yr).
WARNING LEVEL
AREA COVERED IN SQ. KM.5 YEAR 25 YEAR 100 YEAR
LOW 77.86 88.36 92.38MEDIUM 64.82 79.54 89.35
HIGH 24.82 43.29 57.18TOTAL 167.50 211.19 238.91
Table 89. Area covered by each warning level with respect to the rainfall scenario
Of the 69 identified educational institutions in the Digos floodplain, five schools were assessed to be relatively prone to flooding as they are exposed to the Medium level flooding for all three rainfall scenarios. These are the United Church Of Christ In The Philippines Kindergarten Mission School in Brgy. Aplaya, Day Care Center in Brgy. Cogon, Polytechic College Davao Del Sur in Brgy. Zone 1, Day Care Center in Brgy. Zone 2 and Holy Cross Academy Inc. in Brgy. Zone 3. Five other institutions were found to be also susceptible to flooding, experiencing Low level flooding in the 5-year return period, and Medium level flooding in the 25- and 100-year rainfall scenarios. The list of educational institutions affected by flooding in Digos floodplain is found in Annex 12.
41 medical or health institutions were identified in the Digos floodplain. Digos Hospital (Canteen) in Brgy. Zone 2 and Zone 2 Health Center in Brgy. Zone 3 were found to be relatively prone to flooding, having Medium level flooding in all three rainfall scenarios. The list of health institutions affected by flooding in Digos floodplain is found in Annex 13.
In order to check and validate the extent of flooding in different river systems, there is a need to perform validation survey work. Field personnel gathered secondary data regarding flood occurrence in the area within the major river system in the Philippines. From the Flood Depth Maps produced by Phil-LiDAR 1 Program, multiple points representing the different flood depths for different scenarios were identified for validation. The validation personnel went to the specified points identified in a river basin and will gather data regarding the actual flood level in each location. Data gathering can be done through a local DRRM office to obtain maps or situation reports about the past flooding events or through interview of some residents with knowledge of or have had experienced flooding in a particular area. After which, the actual data from the field was compared to the simulated data to assess the accuracy of the Flood Depth Maps produced and to improve on what is needed.
The flood validation consisted of 200 points randomly selected all over the Digos floodplain. It has an RMSE value of 1.07.
5.7 Flood validation

143
LiDAR Surveys and Flood Mapping of Digos River
Figure 139. Flood Validation Points of Digos River Basin
R2 = 0.7493
0
1
2
3
4
5
6
7
8
9
10
0 2 4 6 8 10
Act
ual F
lood
Dep
th (m
)
Flood Map Depth (m)
Validation Points
Linear (Validation Points)
Figure 140. Flood Map Depth vs Actual Flood Depth

144
Hazard Mapping of the Philippines Using LiDAR (Phil-LiDAR 1)
Table 90. Actual Flood Depth vs Simulated Flood Depth in Digos River Basin
DIGOS BASINModeled Flood Depth (m)
0-0.20 0.21-0.50 0.51-1.00 1.01-2.00 2.01-5.00 > 5.00 TOTALAc
tual
Flo
od D
epth
(m) 0-0.20 21 14 9 8 3 1 56
0.21-0.50 4 7 9 3 0 0 23
0.51-1.00 4 13 12 7 0 0 36
1.01-2.00 1 3 4 5 11 0 24
2.01-5.00 0 0 0 8 17 12 37
> 5.00 1 0 0 0 3 20 24
Total 31 37 34 31 34 33 200
The overall accuracy generated by the flood model is estimated at 41.00%, with 82 points correctly matching the actual flood depths. In addition, there were 85 points estimated one level above and below the correct flood depths while there were 19 points and 14 points estimated two levels above and below, and three or more levels above and below the correct flood depth. A total of 77 points were overestimated while a total of 41 points were underestimated in the modelled flood depths of Digos.
Table 91. Summary of Accuracy Assessment in Digos River Basin Survey
No. of Points %
Correct 82 41.00
Overestimated 77 38.50
Underestimated 41 20.50
Total 200 100

145
LiDAR Surveys and Flood Mapping of Digos River
REFERENCES
Ang M.O., Paringit E.C., et al. 2014. DREAM Data Processing Component Manual. Quezon City, Philippines: UP Training Center for Applied Geodesy and Photogrammetry.
Balicanta L.P., Paringit E.C., et al. 2014. DREAM Data Validation Component Manual. Quezon City, Philippines: UP Training Center for Applied Geodesy and Photogrammetry.
Brunner, G. H. 2010a. HEC-RAS River Analysis System Hydraulic Reference Manual. Davis, CA: U.S. Army Corps of Engineers, Institute for Water Resources, Hydrologic Engineering Center.
Department of Envirionment and Natural Resources (2016). Additional List of Classified Water Bodies. Quezon City.
Digos. (n.d.). Retrieved from revolvy.com: https://www.revolvy.com/topic/Digos&uid=1575
Digos Flood Hazard Modeling and Mapping. (2017).
Digos HEC-HMS and HEC-RAS Model Report. (2017).
Digos River. (n.d.). Retrieved from MyFishMaps.com: http://www.myfishmaps.com/intl-fishing-maps/Philippines/fishing-Water_Locations/Stream/Davao_Del_Sur/Digos_River/
Inquirer. (2014, April 12). Davao municipality sets cap to Mt. Apo trekkers. Retrieved from Inquirer.net: http://newsinfo.inquirer.net/593799/davao-municipality-sets-cap-to-mt-apo-trekkers
Island Properties. n.d. Zamboanga del Norte Province. Available from http://www.islandsproperties.com/places/zambonor.htm
Lagmay A.F., Paringit E.C., et al. 2014. DREAM Flood Modeling Component Manual. Quezon City, Philippines: UP Training Center for Applied Geodesy and Photogrammetry.
Movido-Aquino, C. (2003). Water Matters. INDUSTRY ENVIRONEWS.
National Disaster Risk Reduction and Management Council. 2017. General Flood Advisories. NDRRMC Advisory. Available from www.ndrrmc.gov.ph/attachments/article/3/ADVISORY_GFA_No.06-REGII,_No.05-REG_III,_No.01-REG_IX,_No.02-REG_X,_No.02-REG_XI,_No.02-CARAGA,_No.05-CAR,_No.01-ARMM.pdf
Paringit E.C, Balicanta L.P., Ang, M.O., Sarmiento, C. 2017. Flood Mapping of Rivers in the Philippines Using Airborne LiDAR: Methods. Quezon City, Philippines: UP Training Center for Applied Geodesy and Photogrammetry.
Regional Profile - Davao Region. (n.d.). Retrieved from http://davao.da.gov.ph/index.php/about-us/regional-profile
Sarmiento C., Paringit E.C., et al. 2014. DREAM Data Acquisition Component Manual. Quezon City, Philippines: UP Training Center for Applied Geodesy and Photogrammetry.
UP-TCAGP 2016, Acceptance and Evaluation of Synthetic Aperture Radar Digital Surface Model (SAR DSM) and Ground Control Points (GCP). Quezon City, Philippines: UP Training Center for Applied Geodesy and Photogrammetry.
Water Quality Assessment Report. (2012).

146
Hazard Mapping of the Philippines Using LiDAR (Phil-LiDAR 1)
ANNExESAnnex 1. Optech Technical Specifications of the Gemini Sensor
Parameter Specification
Operational envelope (1,2,3,4) 150-4000 m AGL, nominal
Laser wavelength 1064 nm
Horizontal accuracy (2) 1/5,500 x altitude, (m AGL)
Elevation accuracy (2) <5-35 cm, 1 σ
Effective laser repetition rate Programmable, 33-167 kHz
Position and orientation system POS AV™ AP50 (OEM);220-channel dual frequency GPS/GNSS/Galileo/L-Band receiver
Scan width (WOV) Programmable, 0-50˚
Scan frequency (5) Programmable, 0-70 Hz (effective)
Sensor scan product 1000 maximum
Beam divergence Dual divergence: 0.25 mrad (1/e) and 0.8 mrad (1/e), nominal
Roll compensation Programmable, ±5˚ (FOV dependent)
Range capture Up to 4 range measurements, including 1st, 2nd, 3rd, and last returns
Intensity capture Up to 4 intensity returns for each pulse, including last (12 bit)
Video Camera Internal video camera (NTSC or PAL)
Image capture Compatible with full Optech camera line (optional)
Full waveform capture 12-bit Optech IWD-2 Intelligent Waveform Digitizer (optional)
Data storage Removable solid state disk SSD (SATA II)
Power requirements 28 V; 900 W;35 A(peak)
Dimensions and weight Sensor: 260 mm (w) x 190 mm (l) x 570 mm (h); 23 kgControl rack: 650 mm (w) x 590 mm (l) x 530 mm (h); 53 kg
Operating temperature -10˚C to +35˚C (with insulating jacket)
Relative humidity 0-95% no-condensing
Table A-1.1 Parameters and Specifications of the Gemini Sensor
Figure A-1.1 Gemini Sensor

147
LiDAR Surveys and Flood Mapping of Digos River
Annex 2. NAMRiA Certificates of Reference Points Used
Figure A-2.1 DVS-85
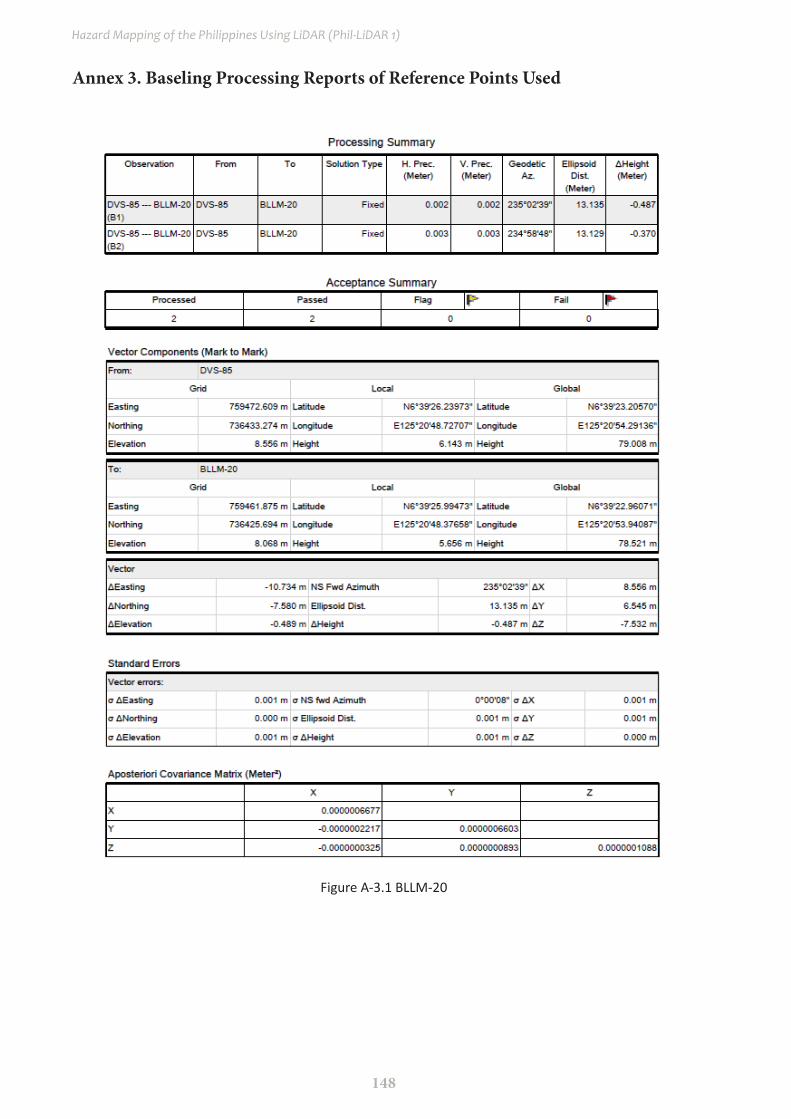
148
Hazard Mapping of the Philippines Using LiDAR (Phil-LiDAR 1)
Annex 3. Baseling Processing Reports of Reference Points Used
Figure A-3.1 BLLM-20
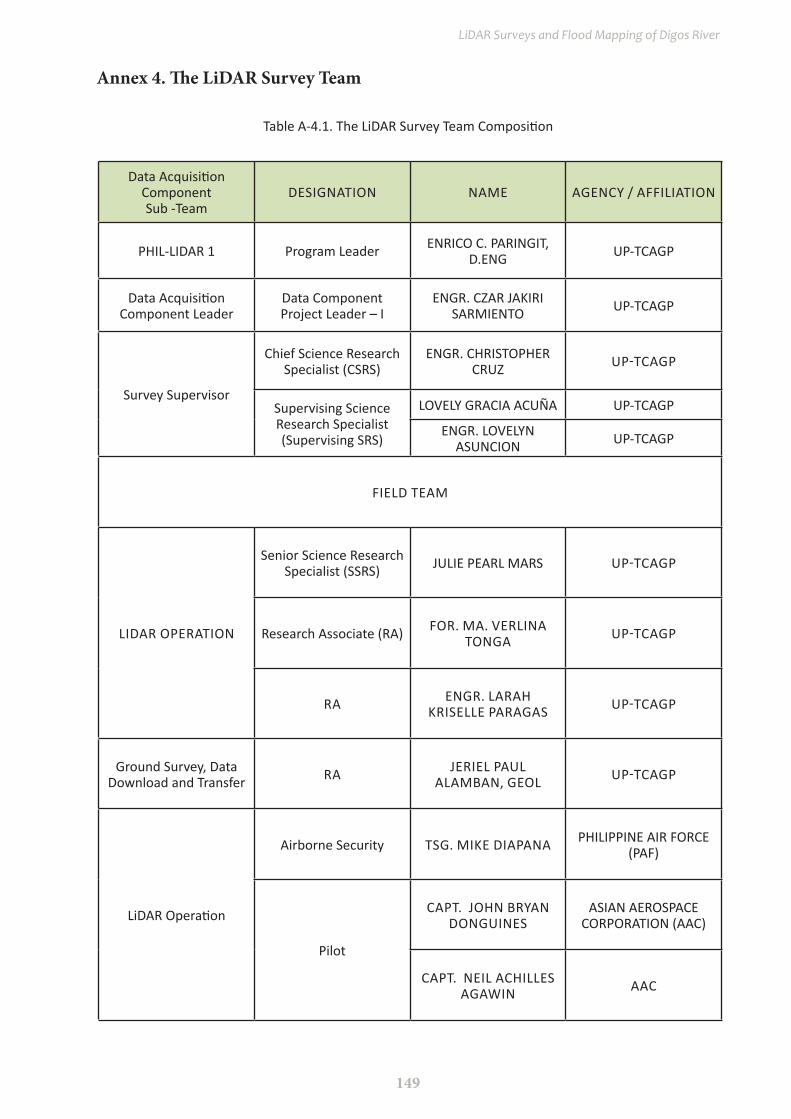
149
LiDAR Surveys and Flood Mapping of Digos River
Annex 4. The LiDAR Survey Team
Data Acquisition Component Sub -Team
DESIGNATION NAME AGENCY / AFFILIATION
PHIL-LIDAR 1 Program Leader ENRICO C. PARINGIT, D.ENG UP-TCAGP
Data Acquisition Component Leader
Data Component Project Leader – I
ENGR. CZAR JAKIRI SARMIENTO UP-TCAGP
Survey Supervisor
Chief Science Research Specialist (CSRS)
ENGR. CHRISTOPHER CRUZ UP-TCAGP
Supervising Science Research Specialist (Supervising SRS)
LOVELY GRACIA ACUÑA UP-TCAGP
ENGR. LOVELYN ASUNCION UP-TCAGP
FIELD TEAM
LIDAR OPERATION
Senior Science Research Specialist (SSRS) JULIE PEARL MARS UP-TCAGP
Research Associate (RA) FOR. MA. VERLINA TONGA UP-TCAGP
RA ENGR. LARAH KRISELLE PARAGAS UP-TCAGP
Ground Survey, Data Download and Transfer RA JERIEL PAUL
ALAMBAN, GEOL UP-TCAGP
LiDAR Operation
Airborne Security TSG. MIKE DIAPANA PHILIPPINE AIR FORCE (PAF)
Pilot
CAPT. JOHN BRYAN DONGUINES
ASIAN AEROSPACE CORPORATION (AAC)
CAPT. NEIL ACHILLES AGAWIN AAC
Table A-4.1. The LiDAR Survey Team Composition
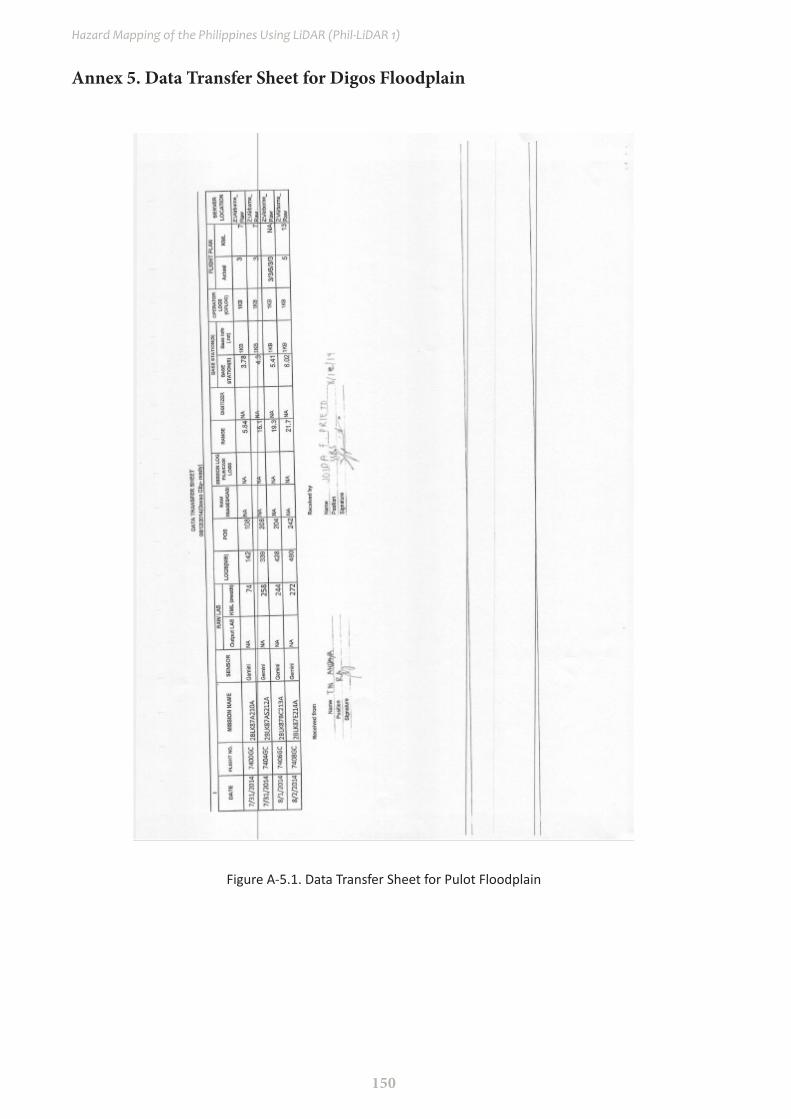
150
Hazard Mapping of the Philippines Using LiDAR (Phil-LiDAR 1)
Annex 5. Data Transfer Sheet for Digos Floodplain
Figure A-5.1. Data Transfer Sheet for Pulot Floodplain

151
LiDAR Surveys and Flood Mapping of Digos River
Annex 6. Flight Logs
Figure A-6.1 Flight Log for 7400GC Mission
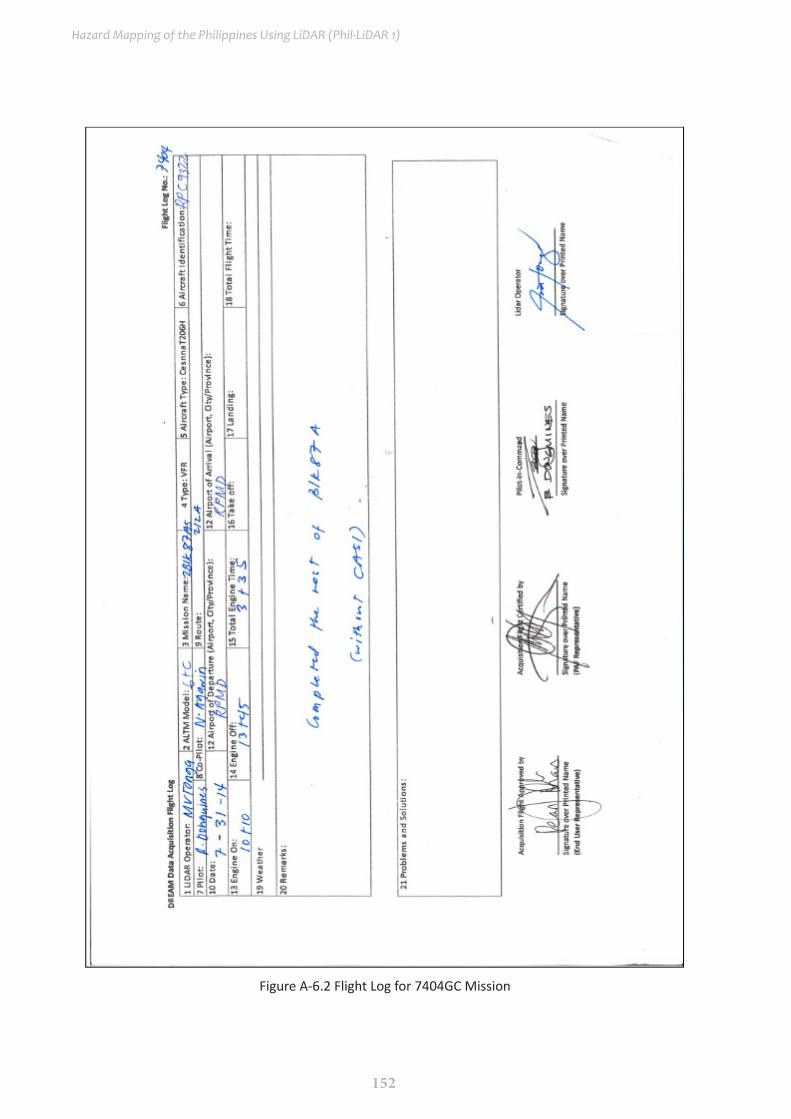
152
Hazard Mapping of the Philippines Using LiDAR (Phil-LiDAR 1)
Figure A-6.2 Flight Log for 7404GC Mission
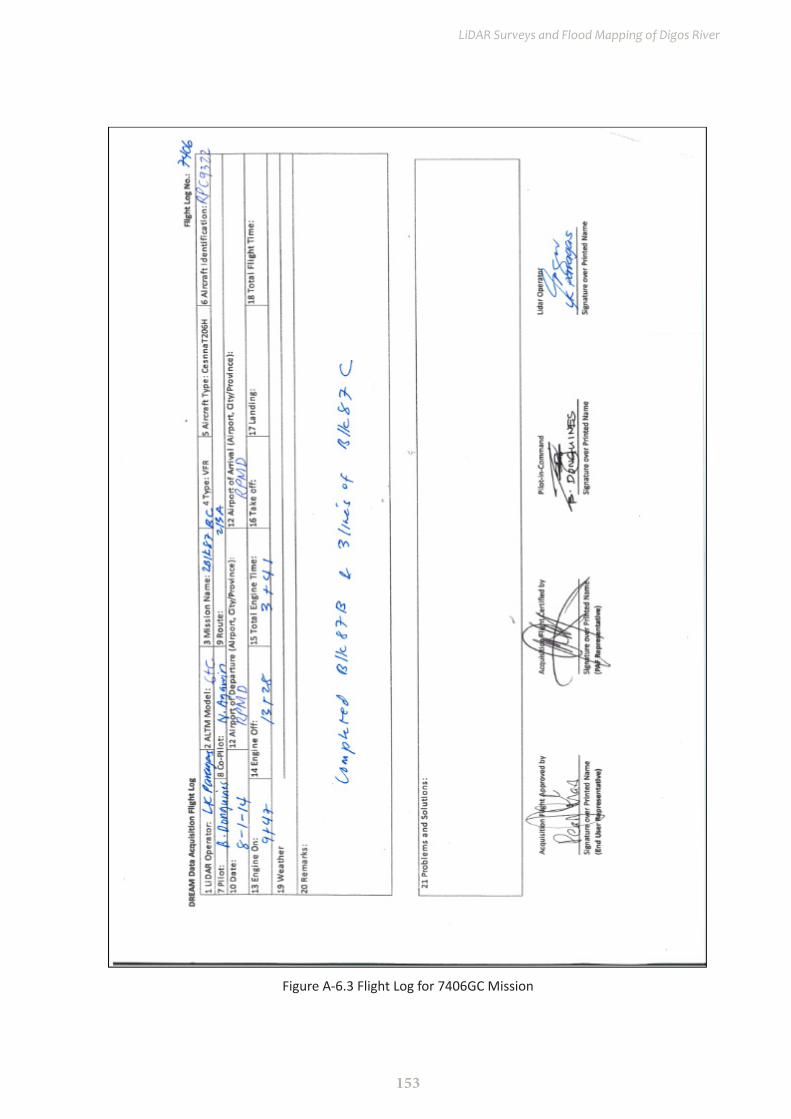
153
LiDAR Surveys and Flood Mapping of Digos River
Figure A-6.3 Flight Log for 7406GC Mission
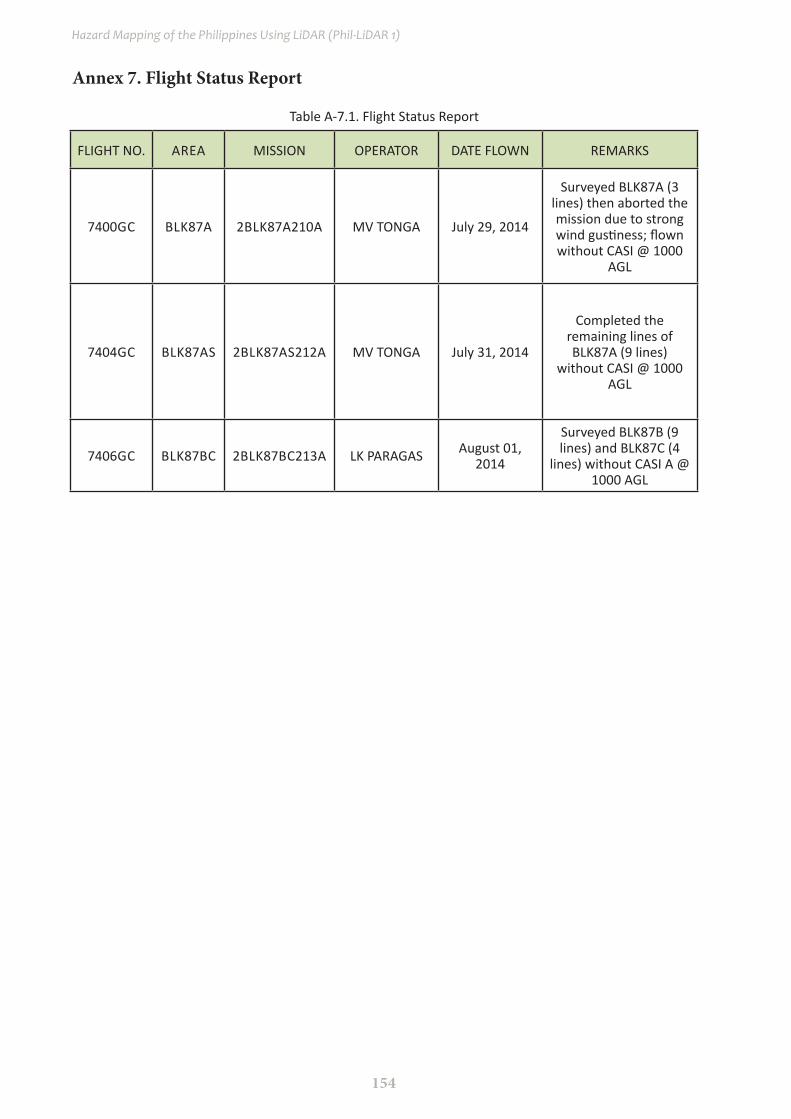
154
Hazard Mapping of the Philippines Using LiDAR (Phil-LiDAR 1)
Annex 7. Flight Status Report
FLIGHT NO. AREA MISSION OPERATOR DATE FLOWN REMARKS
7400GC BLK87A 2BLK87A210A MV TONGA July 29, 2014
Surveyed BLK87A (3 lines) then aborted the mission due to strong wind gustiness; flown without CASI @ 1000
AGL
7404GC BLK87AS 2BLK87AS212A MV TONGA July 31, 2014
Completed the remaining lines of BLK87A (9 lines)
without CASI @ 1000 AGL
7406GC BLK87BC 2BLK87BC213A LK PARAGAS August 01, 2014
Surveyed BLK87B (9 lines) and BLK87C (4
lines) without CASI A @ 1000 AGL
Table A-7.1. Flight Status Report
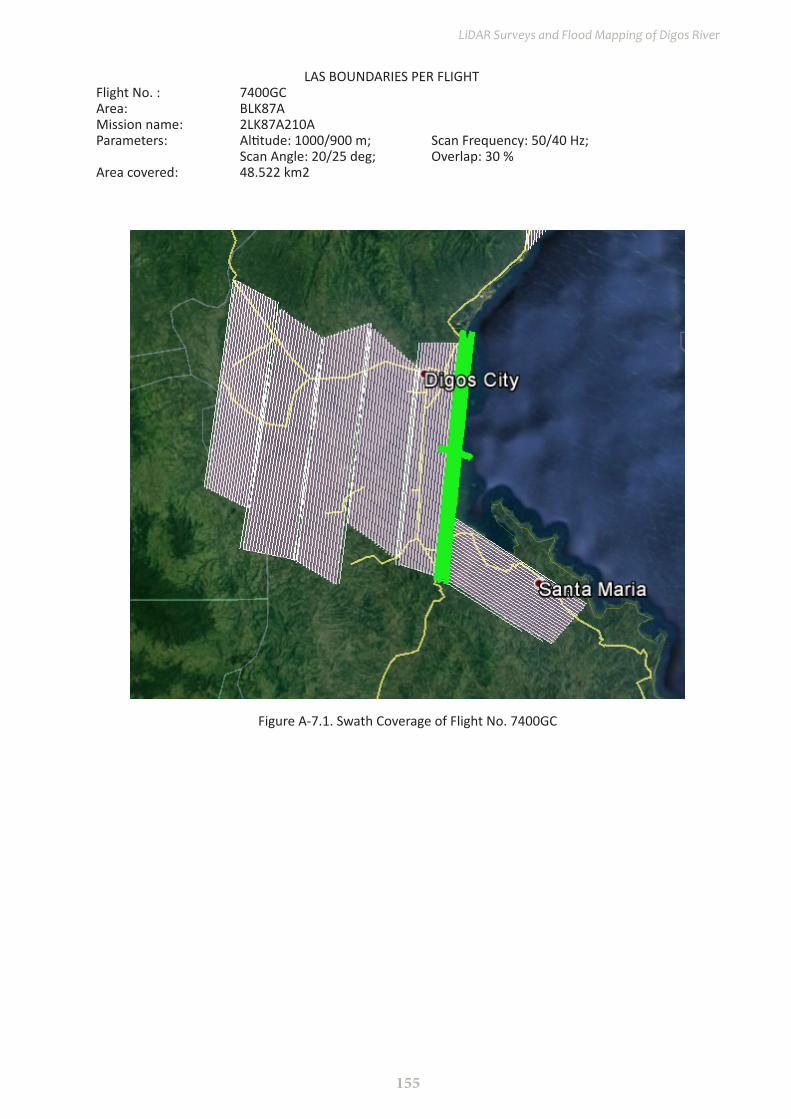
155
LiDAR Surveys and Flood Mapping of Digos River
LAS BOUNDARIES PER FLIGHTFlight No. : 7400GCArea: BLK87AMission name: 2LK87A210AParameters: Altitude: 1000/900 m; Scan Frequency: 50/40 Hz; Scan Angle: 20/25 deg; Overlap: 30 %Area covered: 48.522 km2
Figure A-7.1. Swath Coverage of Flight No. 7400GC
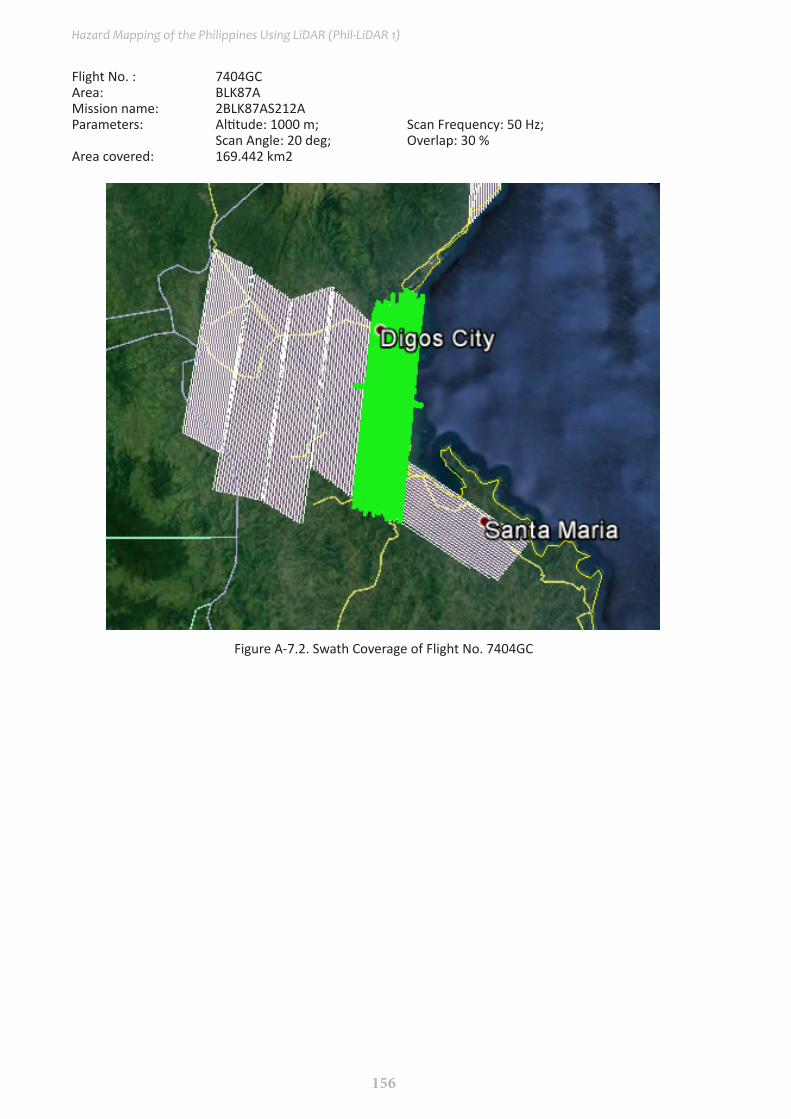
156
Hazard Mapping of the Philippines Using LiDAR (Phil-LiDAR 1)
Flight No. : 7404GCArea: BLK87AMission name: 2BLK87AS212AParameters: Altitude: 1000 m; Scan Frequency: 50 Hz; Scan Angle: 20 deg; Overlap: 30 %Area covered: 169.442 km2
Figure A-7.2. Swath Coverage of Flight No. 7404GC
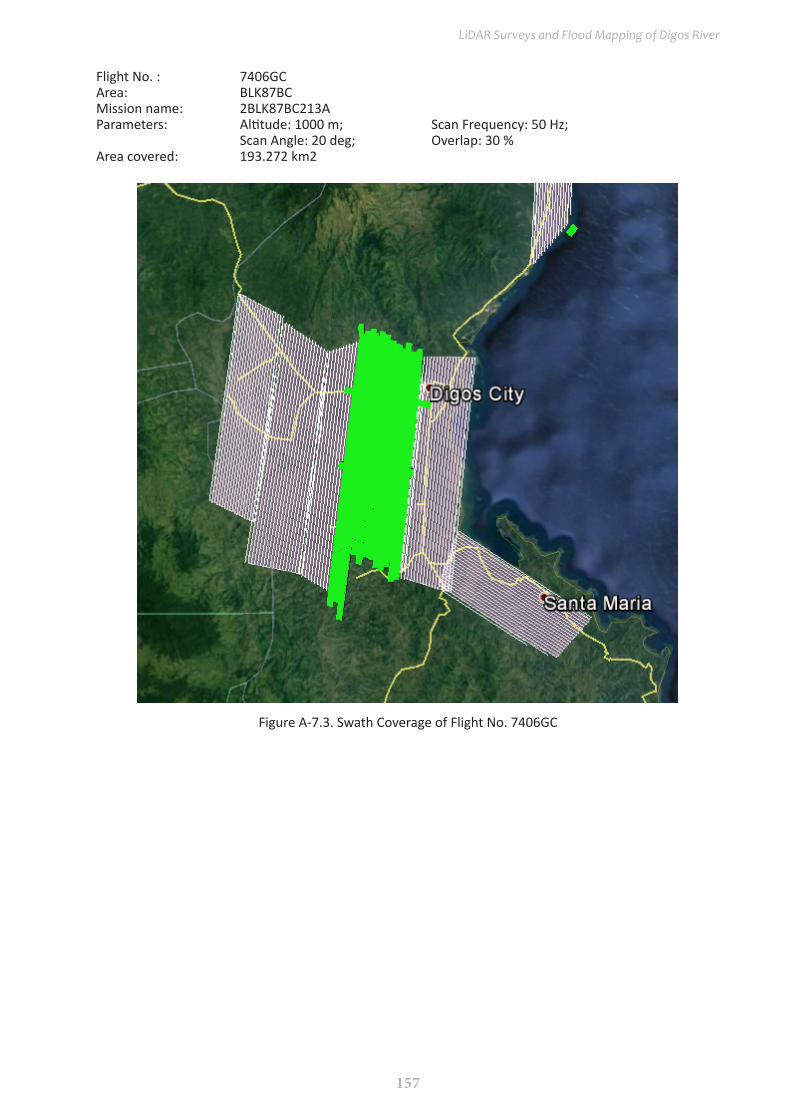
157
LiDAR Surveys and Flood Mapping of Digos River
Flight No. : 7406GCArea: BLK87BCMission name: 2BLK87BC213AParameters: Altitude: 1000 m; Scan Frequency: 50 Hz; Scan Angle: 20 deg; Overlap: 30 %Area covered: 193.272 km2
Figure A-7.3. Swath Coverage of Flight No. 7406GC
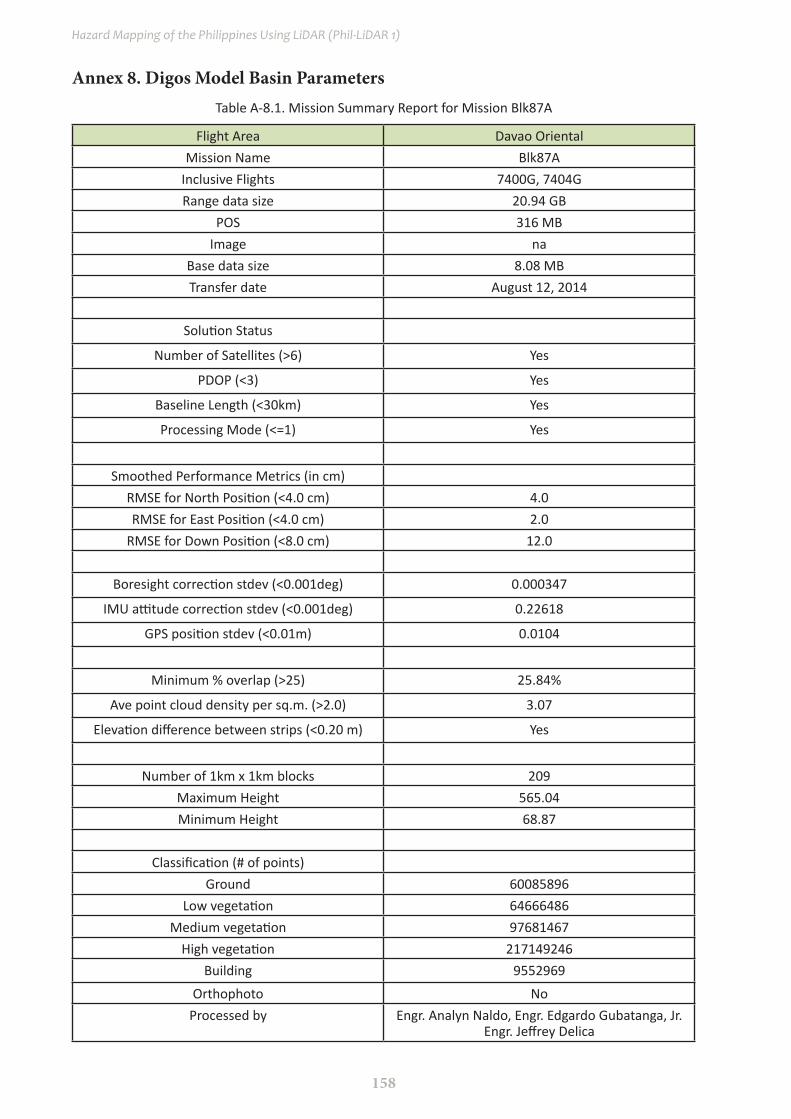
158
Hazard Mapping of the Philippines Using LiDAR (Phil-LiDAR 1)
Annex 8. Digos Model Basin Parameters
Flight Area Davao OrientalMission Name Blk87A
Inclusive Flights 7400G, 7404GRange data size 20.94 GB
POS 316 MBImage na
Base data size 8.08 MBTransfer date August 12, 2014
Solution Status
Number of Satellites (>6) Yes
PDOP (<3) Yes
Baseline Length (<30km) Yes
Processing Mode (<=1) Yes
Smoothed Performance Metrics (in cm)RMSE for North Position (<4.0 cm) 4.0RMSE for East Position (<4.0 cm) 2.0
RMSE for Down Position (<8.0 cm) 12.0
Boresight correction stdev (<0.001deg) 0.000347
IMU attitude correction stdev (<0.001deg) 0.22618
GPS position stdev (<0.01m) 0.0104
Minimum % overlap (>25) 25.84%
Ave point cloud density per sq.m. (>2.0) 3.07
Elevation difference between strips (<0.20 m) Yes
Number of 1km x 1km blocks 209Maximum Height 565.04Minimum Height 68.87
Classification (# of points)Ground 60085896
Low vegetation 64666486Medium vegetation 97681467
High vegetation 217149246Building 9552969
Orthophoto NoProcessed by Engr. Analyn Naldo, Engr. Edgardo Gubatanga, Jr.
Engr. Jeffrey Delica
Table A-8.1. Mission Summary Report for Mission Blk87A

159
LiDAR Surveys and Flood Mapping of Digos River
Figure A.8.1. Solution Status
Figure A.8.2. Smoothed Performance Metric Parameters
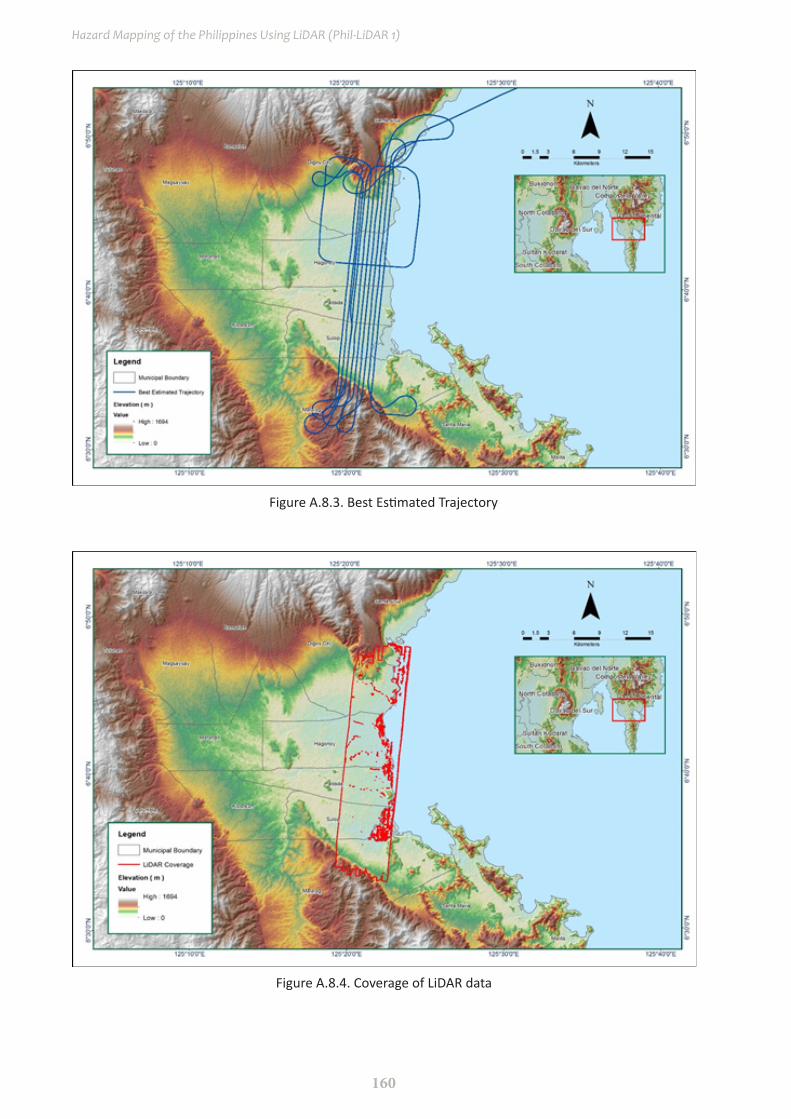
160
Hazard Mapping of the Philippines Using LiDAR (Phil-LiDAR 1)
Figure A.8.3. Best Estimated Trajectory
Figure A.8.4. Coverage of LiDAR data
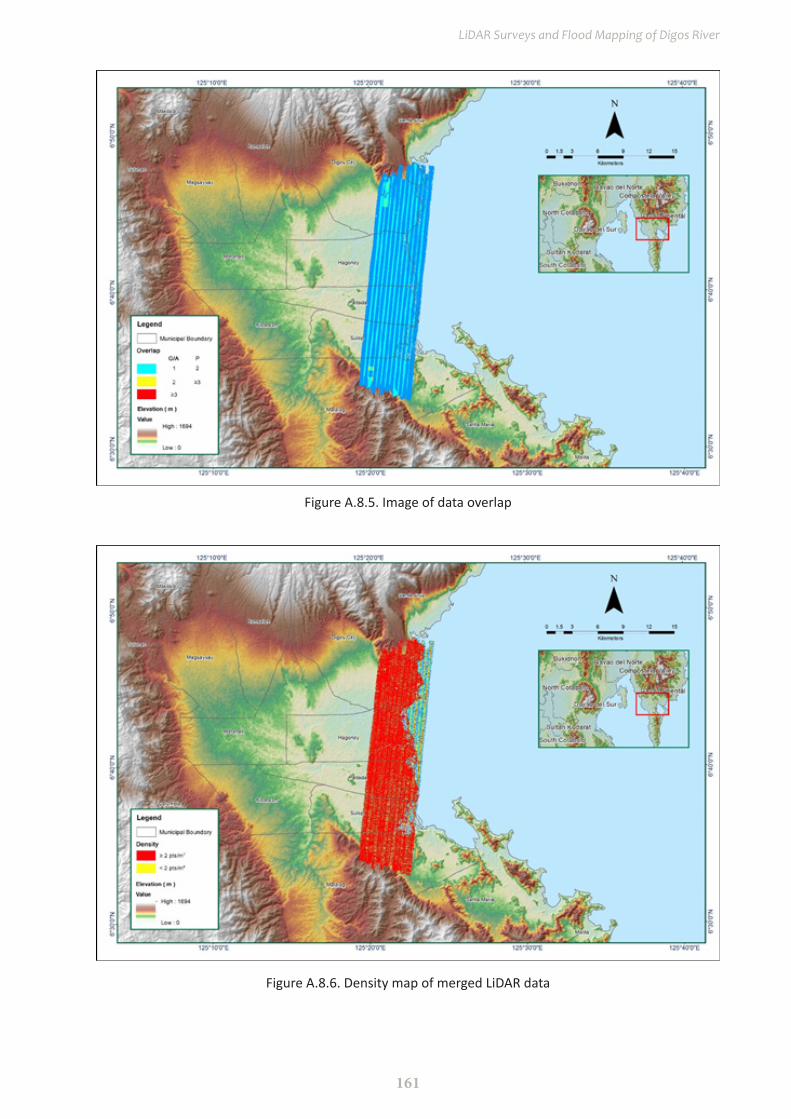
161
LiDAR Surveys and Flood Mapping of Digos River
Figure A.8.5. Image of data overlap
Figure A.8.6. Density map of merged LiDAR data
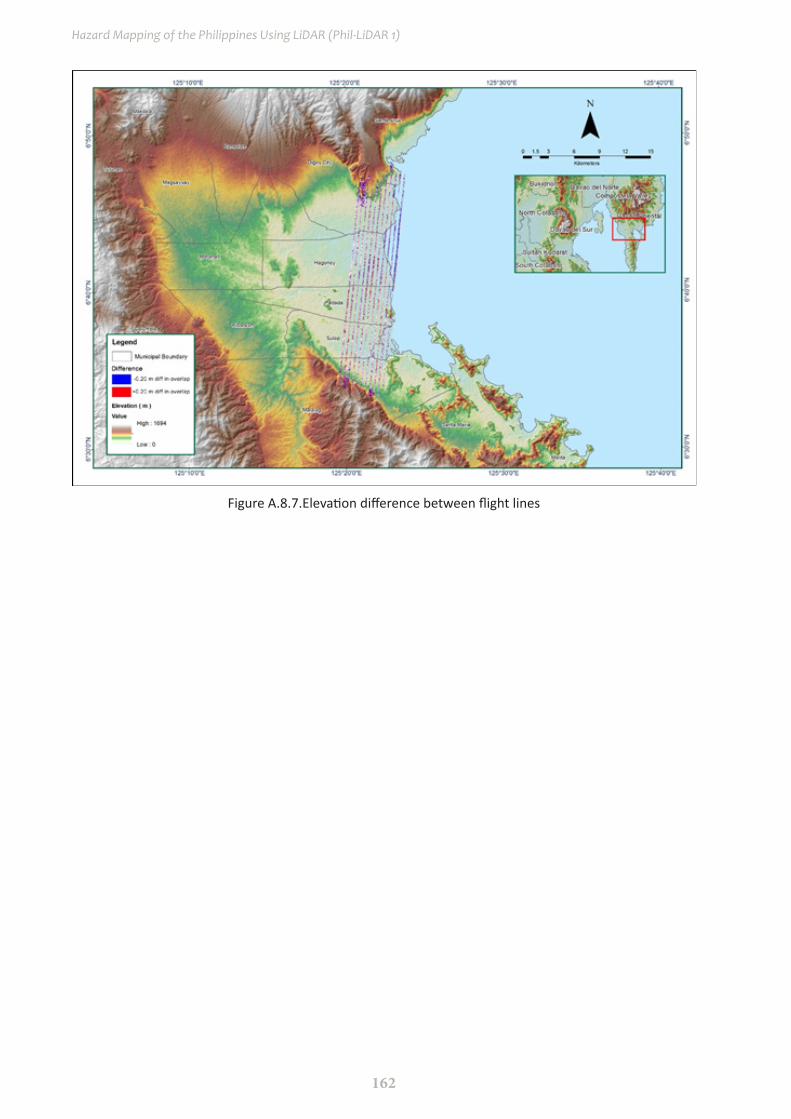
162
Hazard Mapping of the Philippines Using LiDAR (Phil-LiDAR 1)
Figure A.8.7.Elevation difference between flight lines
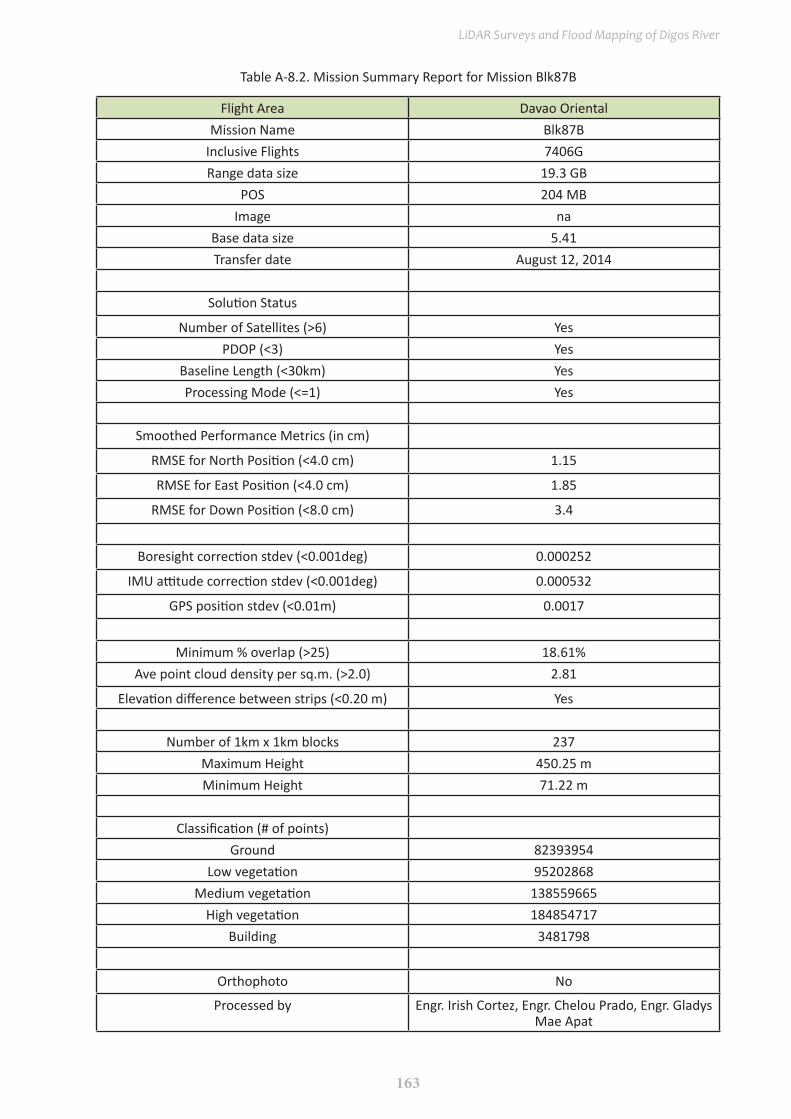
163
LiDAR Surveys and Flood Mapping of Digos River
Flight Area Davao OrientalMission Name Blk87B
Inclusive Flights 7406GRange data size 19.3 GB
POS 204 MBImage na
Base data size 5.41Transfer date August 12, 2014
Solution Status
Number of Satellites (>6) YesPDOP (<3) Yes
Baseline Length (<30km) YesProcessing Mode (<=1) Yes
Smoothed Performance Metrics (in cm)
RMSE for North Position (<4.0 cm) 1.15
RMSE for East Position (<4.0 cm) 1.85
RMSE for Down Position (<8.0 cm) 3.4
Boresight correction stdev (<0.001deg) 0.000252
IMU attitude correction stdev (<0.001deg) 0.000532
GPS position stdev (<0.01m) 0.0017
Minimum % overlap (>25) 18.61%Ave point cloud density per sq.m. (>2.0) 2.81
Elevation difference between strips (<0.20 m) Yes
Number of 1km x 1km blocks 237Maximum Height 450.25 mMinimum Height 71.22 m
Classification (# of points)Ground 82393954
Low vegetation 95202868Medium vegetation 138559665
High vegetation 184854717Building 3481798
Orthophoto No
Processed by Engr. Irish Cortez, Engr. Chelou Prado, Engr. Gladys Mae Apat
Table A-8.2. Mission Summary Report for Mission Blk87B

164
Hazard Mapping of the Philippines Using LiDAR (Phil-LiDAR 1)
Figure A.8.8. Solution Status
Figure A.8.9. Smoothed Performance Metric Parameters

165
LiDAR Surveys and Flood Mapping of Digos River
Figure A.8.10. Best Estimated Trajectory
Figure A.8.11. Coverage of LiDAR data
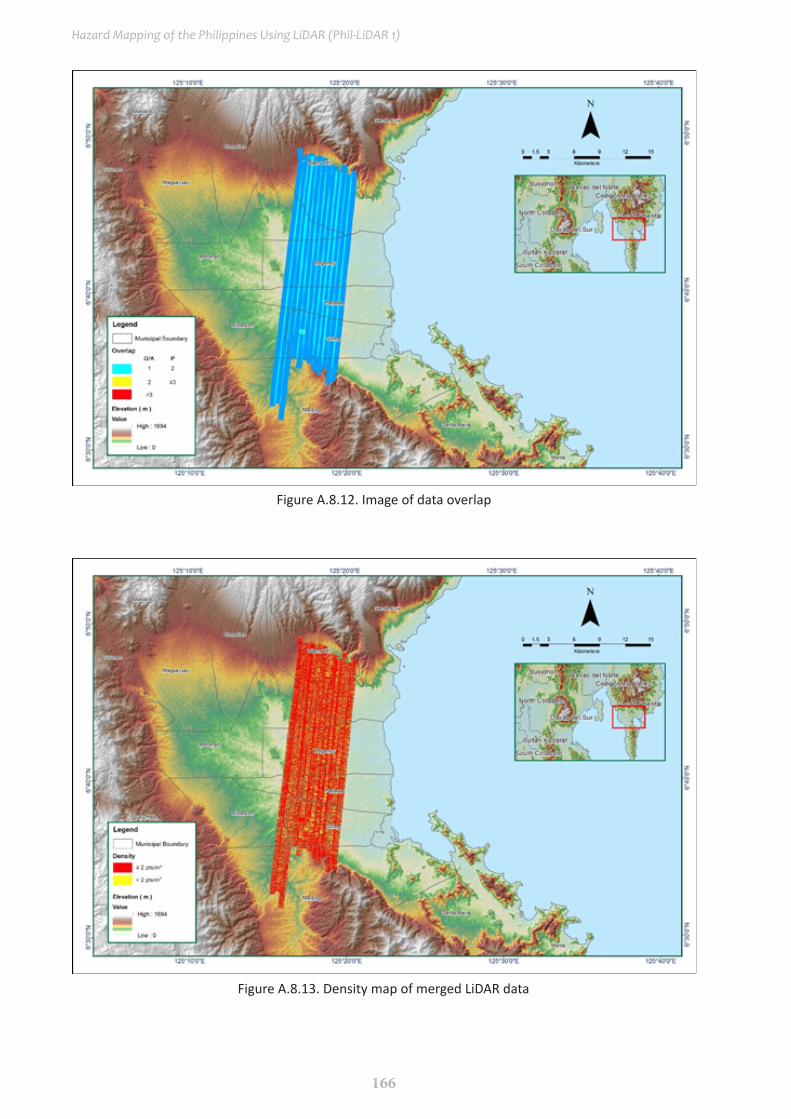
166
Hazard Mapping of the Philippines Using LiDAR (Phil-LiDAR 1)
Figure A.8.13. Density map of merged LiDAR data
Figure A.8.12. Image of data overlap
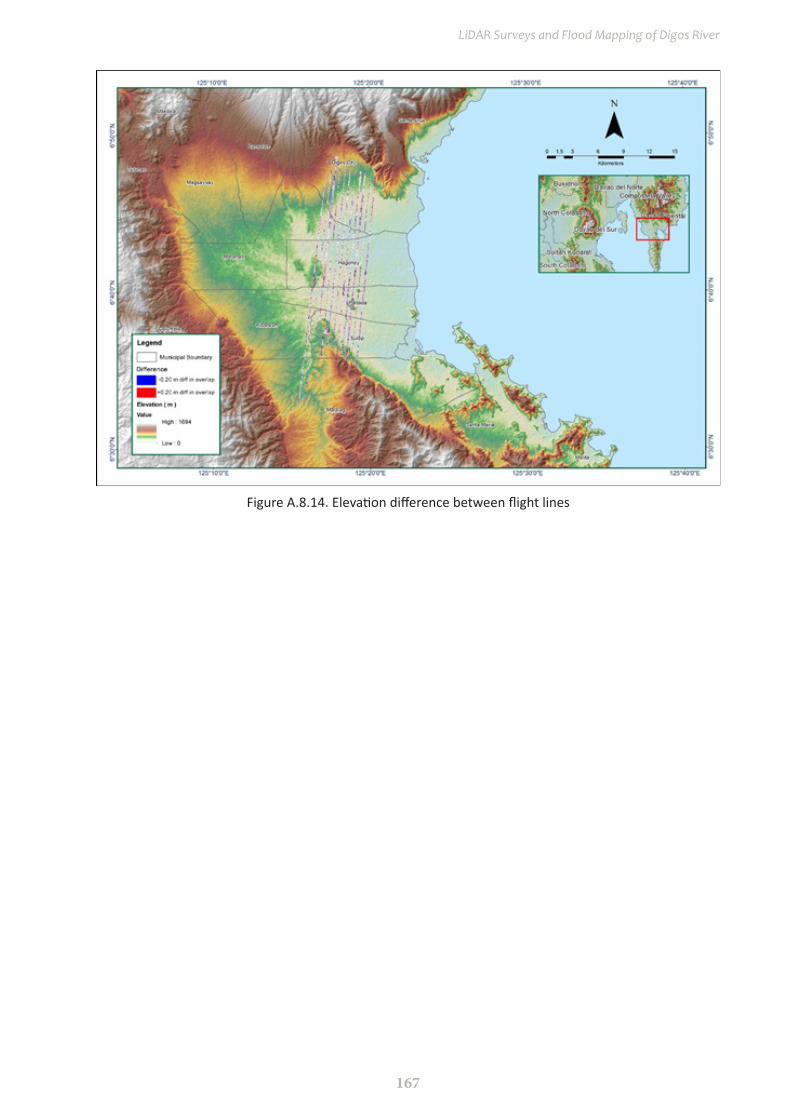
167
LiDAR Surveys and Flood Mapping of Digos River
Figure A.8.14. Elevation difference between flight lines

168
Hazard Mapping of the Philippines Using LiDAR (Phil-LiDAR 1)
Ann
ex 9
. Dig
os M
odel
Bas
in P
aram
eter
s
Basin
N
umbe
r
SCS
Curv
e N
umbe
r Los
sCl
ark
Uni
t Hyd
rogr
aph
Tran
sfor
mRe
cess
ion
Base
flow
Initi
al
Abst
racti
on
(mm
)
Curv
e N
umbe
rIm
perv
ious
(%
)
Tim
e of
Co
ncen
trati
on
(HR)
Stor
age
Coeffi
cien
t (H
R)
Initi
al
Type
Initi
al
Disc
harg
e (M
3/S)
Rece
ssio
n Co
nsta
ntTh
resh
old
Type
Ratio
to
Peak
W10
0019
.758
083
.036
0.0
0.12
1340
0.66
6720
Disc
harg
e0.
0075
890
0.26
6670
Ratio
to P
eak
0.15
0730
W10
1044
.997
054
.454
0.0
0.26
4300
0.22
1710
Disc
harg
e0.
0056
416
0.29
0370
Ratio
to P
eak
0.22
5000
W10
2014
.732
099
.000
0.0
0.13
2740
0.49
2040
Disc
harg
e0.
0202
213
0.44
1870
Ratio
to P
eak
0.15
0000
W10
307.
1090
37.3
950.
00.
1335
000.
3336
80Di
scha
rge
0.00
3408
90.
1975
30Ra
tio to
Pea
k0.
0766
67W
1040
8.41
6163
.732
0.0
0.02
0000
0.02
9807
Disc
harg
e0.
0162
580
0.29
0370
Ratio
to P
eak
0.11
3260
W10
5010
.126
062
.844
0.0
0.06
0875
0.06
6455
Disc
harg
e0.
0065
581
0.19
6530
Ratio
to P
eak
0.06
6667
W10
6013
.299
049
.518
0.0
0.25
9600
0.62
9540
Disc
harg
e0.
0133
218
0.65
9290
Ratio
to P
eak
0.10
0000
W10
7010
.076
067
.956
0.0
0.08
1234
0.18
6050
Disc
harg
e0.
0017
341
0.61
1780
Ratio
to P
eak
0.33
7500
W10
8012
.484
071
.881
0.0
0.04
8557
0.07
9253
Disc
harg
e0.
0109
150
0.40
0000
Ratio
to P
eak
0.10
0000
W10
908.
1138
50.4
780.
00.
0313
770.
0343
08Di
scha
rge
0.00
6080
40.
2666
70Ra
tio to
Pea
k0.
1440
60W
1100
7.68
2154
.420
0.0
0.05
1936
0.33
2360
Disc
harg
e0.
0088
894
0.52
9200
Ratio
to P
eak
0.09
6040
W11
1010
.138
089
.074
0.0
0.11
4140
0.27
8360
Disc
harg
e0.
0014
489
0.43
3380
Ratio
to P
eak
0.22
5000
W11
2012
.680
065
.868
0.0
0.60
7630
0.44
4480
Disc
harg
e0.
0138
128
0.63
6810
Ratio
to P
eak
0.09
8982
W11
3010
.494
053
.687
0.0
0.11
5790
0.28
8690
Disc
harg
e0.
0002
043
0.21
6970
Ratio
to P
eak
0.09
6672
W11
406.
9419
39.6
430.
00.
4417
002.
1480
00Di
scha
rge
0.00
1646
90.
4268
50Ra
tio to
Pea
k0.
1507
50W
1150
12.4
240
60.1
580.
00.
2432
501.
9128
00Di
scha
rge
0.00
6054
50.
6666
70Ra
tio to
Pea
k0.
1507
50W
1160
1.53
4779
.988
0.0
0.09
1551
0.33
9480
Disc
harg
e0.
0099
392
0.66
6670
Ratio
to P
eak
0.14
7000
W11
7012
.133
049
.971
0.0
0.12
0400
0.20
3050
Disc
harg
e0.
0126
625
0.90
0000
Ratio
to P
eak
0.11
5550
W11
8013
.409
082
.666
0.0
0.27
4920
0.29
6280
Disc
harg
e0.
0135
634
0.65
3110
Ratio
to P
eak
0.10
1000
W11
907.
8528
75.5
200.
00.
0765
850.
6570
00Di
scha
rge
0.00
1311
40.
5930
90Ra
tio to
Pea
k0.
0984
90W
1200
2.28
7374
.551
0.0
0.12
8160
0.36
0200
Disc
harg
e0.
0129
281
0.66
6670
Ratio
to P
eak
0.09
9639
W12
103.
5762
84.8
880.
00.
0803
470.
2695
60Di
scha
rge
0.00
6187
70.
6666
70Ra
tio to
Pea
k0.
1470
00
Tabl
e A-
9.1.
Dig
os M
odel
Bas
in P
aram
eter
s
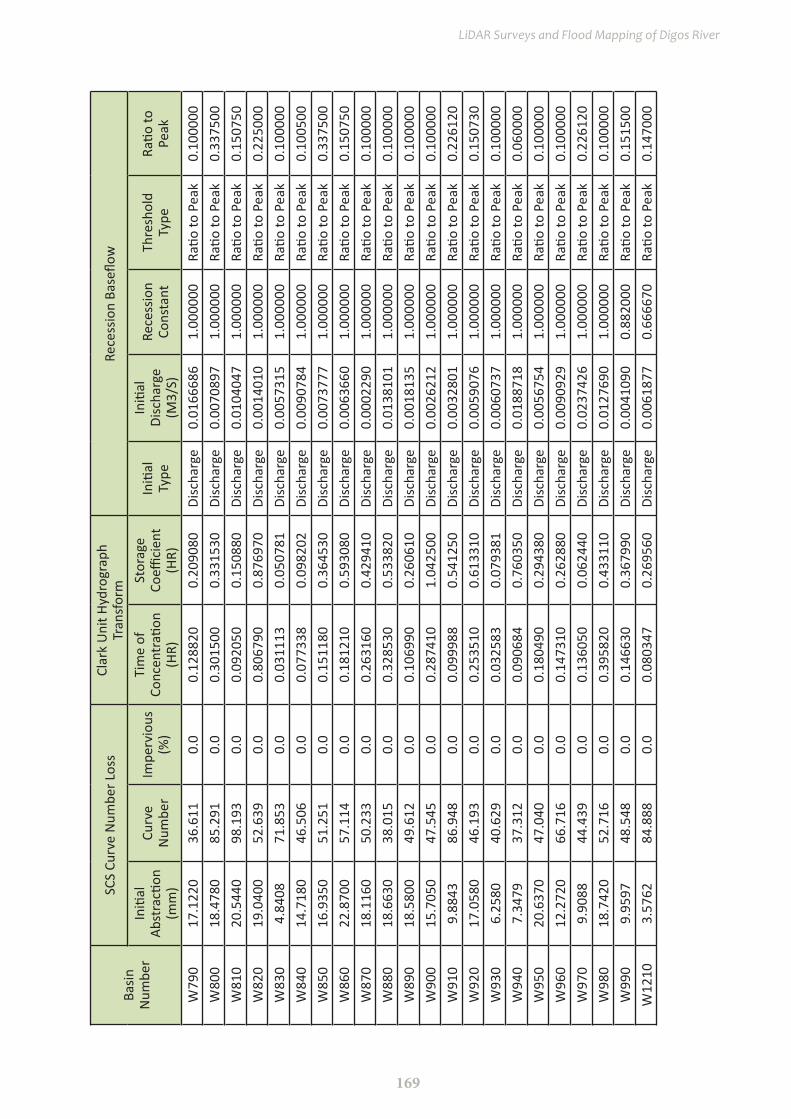
169
LiDAR Surveys and Flood Mapping of Digos River
Basin
N
umbe
r
SCS
Curv
e N
umbe
r Los
sCl
ark
Uni
t Hyd
rogr
aph
Tran
sfor
mRe
cess
ion
Base
flow
Initi
al
Abst
racti
on
(mm
)
Curv
e N
umbe
rIm
perv
ious
(%
)
Tim
e of
Co
ncen
trati
on
(HR)
Stor
age
Coeffi
cien
t (H
R)
Initi
al
Type
Initi
al
Disc
harg
e (M
3/S)
Rece
ssio
n Co
nsta
ntTh
resh
old
Type
Ratio
to
Peak
W79
017
.122
036
.611
0.0
0.12
8820
0.20
9080
Disc
harg
e0.
0166
686
1.00
0000
Ratio
to P
eak
0.10
0000
W80
018
.478
085
.291
0.0
0.30
1500
0.33
1530
Disc
harg
e0.
0070
897
1.00
0000
Ratio
to P
eak
0.33
7500
W81
020
.544
098
.193
0.0
0.09
2050
0.15
0880
Disc
harg
e0.
0104
047
1.00
0000
Ratio
to P
eak
0.15
0750
W82
019
.040
052
.639
0.0
0.80
6790
0.87
6970
Disc
harg
e0.
0014
010
1.00
0000
Ratio
to P
eak
0.22
5000
W83
04.
8408
71.8
530.
00.
0311
130.
0507
81Di
scha
rge
0.00
5731
51.
0000
00Ra
tio to
Pea
k0.
1000
00W
840
14.7
180
46.5
060.
00.
0773
380.
0982
02Di
scha
rge
0.00
9078
41.
0000
00Ra
tio to
Pea
k0.
1005
00W
850
16.9
350
51.2
510.
00.
1511
800.
3645
30Di
scha
rge
0.00
7377
71.
0000
00Ra
tio to
Pea
k0.
3375
00W
860
22.8
700
57.1
140.
00.
1812
100.
5930
80Di
scha
rge
0.00
6366
01.
0000
00Ra
tio to
Pea
k0.
1507
50W
870
18.1
160
50.2
330.
00.
2631
600.
4294
10Di
scha
rge
0.00
0229
01.
0000
00Ra
tio to
Pea
k0.
1000
00W
880
18.6
630
38.0
150.
00.
3285
300.
5338
20Di
scha
rge
0.01
3810
11.
0000
00Ra
tio to
Pea
k0.
1000
00W
890
18.5
800
49.6
120.
00.
1069
900.
2606
10Di
scha
rge
0.00
1813
51.
0000
00Ra
tio to
Pea
k0.
1000
00W
900
15.7
050
47.5
450.
00.
2874
101.
0425
00Di
scha
rge
0.00
2621
21.
0000
00Ra
tio to
Pea
k0.
1000
00W
910
9.88
4386
.948
0.0
0.09
9988
0.54
1250
Disc
harg
e0.
0032
801
1.00
0000
Ratio
to P
eak
0.22
6120
W92
017
.058
046
.193
0.0
0.25
3510
0.61
3310
Disc
harg
e0.
0059
076
1.00
0000
Ratio
to P
eak
0.15
0730
W93
06.
2580
40.6
290.
00.
0325
830.
0793
81Di
scha
rge
0.00
6073
71.
0000
00Ra
tio to
Pea
k0.
1000
00W
940
7.34
7937
.312
0.0
0.09
0684
0.76
0350
Disc
harg
e0.
0188
718
1.00
0000
Ratio
to P
eak
0.06
0000
W95
020
.637
047
.040
0.0
0.18
0490
0.29
4380
Disc
harg
e0.
0056
754
1.00
0000
Ratio
to P
eak
0.10
0000
W96
012
.272
066
.716
0.0
0.14
7310
0.26
2880
Disc
harg
e0.
0090
929
1.00
0000
Ratio
to P
eak
0.10
0000
W97
09.
9088
44.4
390.
00.
1360
500.
0624
40Di
scha
rge
0.02
3742
61.
0000
00Ra
tio to
Pea
k0.
2261
20W
980
18.7
420
52.7
160.
00.
3958
200.
4331
10Di
scha
rge
0.01
2769
01.
0000
00Ra
tio to
Pea
k0.
1000
00W
990
9.95
9748
.548
0.0
0.14
6630
0.36
7990
Disc
harg
e0.
0041
090
0.88
2000
Ratio
to P
eak
0.15
1500
W12
103.
5762
84.8
880.
00.
0803
470.
2695
60Di
scha
rge
0.00
6187
70.
6666
70Ra
tio to
Pea
k0.
1470
00
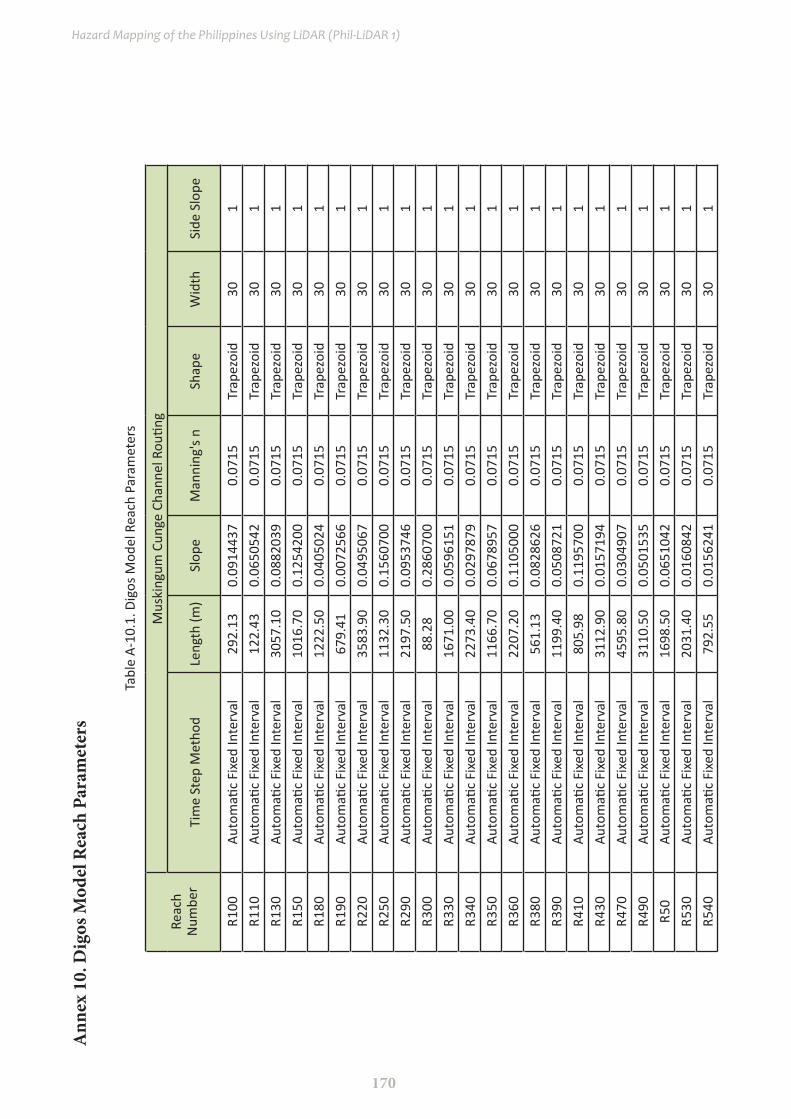
170
Hazard Mapping of the Philippines Using LiDAR (Phil-LiDAR 1)
Reac
h N
umbe
r
Mus
king
um C
unge
Cha
nnel
Rou
ting
Tim
e St
ep M
etho
dLe
ngth
(m)
Slop
eM
anni
ng's
n Sh
ape
Wid
th
Side
Slo
pe
R100
Auto
mati
c Fi
xed
Inte
rval
292.
130.
0914
437
0.07
15Tr
apez
oid
301
R110
Auto
mati
c Fi
xed
Inte
rval
122.
430.
0650
542
0.07
15Tr
apez
oid
301
R130
Auto
mati
c Fi
xed
Inte
rval
3057
.10
0.08
8203
90.
0715
Trap
ezoi
d30
1R1
50Au
tom
atic
Fixe
d In
terv
al10
16.7
00.
1254
200
0.07
15Tr
apez
oid
301
R180
Auto
mati
c Fi
xed
Inte
rval
1222
.50
0.04
0502
40.
0715
Trap
ezoi
d30
1R1
90Au
tom
atic
Fixe
d In
terv
al67
9.41
0.00
7256
60.
0715
Trap
ezoi
d30
1R2
20Au
tom
atic
Fixe
d In
terv
al35
83.9
00.
0495
067
0.07
15Tr
apez
oid
301
R250
Auto
mati
c Fi
xed
Inte
rval
1132
.30
0.15
6070
00.
0715
Trap
ezoi
d30
1R2
90Au
tom
atic
Fixe
d In
terv
al21
97.5
00.
0953
746
0.07
15Tr
apez
oid
301
R300
Auto
mati
c Fi
xed
Inte
rval
88.2
80.
2860
700
0.07
15Tr
apez
oid
301
R330
Auto
mati
c Fi
xed
Inte
rval
1671
.00
0.05
9615
10.
0715
Trap
ezoi
d30
1R3
40Au
tom
atic
Fixe
d In
terv
al22
73.4
00.
0297
879
0.07
15Tr
apez
oid
301
R350
Auto
mati
c Fi
xed
Inte
rval
1166
.70
0.06
7895
70.
0715
Trap
ezoi
d30
1R3
60Au
tom
atic
Fixe
d In
terv
al22
07.2
00.
1105
000
0.07
15Tr
apez
oid
301
R380
Auto
mati
c Fi
xed
Inte
rval
561.
130.
0828
626
0.07
15Tr
apez
oid
301
R390
Auto
mati
c Fi
xed
Inte
rval
1199
.40
0.05
0872
10.
0715
Trap
ezoi
d30
1R4
10Au
tom
atic
Fixe
d In
terv
al80
5.98
0.11
9570
00.
0715
Trap
ezoi
d30
1R4
30Au
tom
atic
Fixe
d In
terv
al31
12.9
00.
0157
194
0.07
15Tr
apez
oid
301
R470
Auto
mati
c Fi
xed
Inte
rval
4595
.80
0.03
0490
70.
0715
Trap
ezoi
d30
1R4
90Au
tom
atic
Fixe
d In
terv
al31
10.5
00.
0501
535
0.07
15Tr
apez
oid
301
R50
Auto
mati
c Fi
xed
Inte
rval
1698
.50
0.06
5104
20.
0715
Trap
ezoi
d30
1R5
30Au
tom
atic
Fixe
d In
terv
al20
31.4
00.
0160
842
0.07
15Tr
apez
oid
301
R540
Auto
mati
c Fi
xed
Inte
rval
792.
550.
0156
241
0.07
15Tr
apez
oid
301
Ann
ex 1
0. D
igos
Mod
el R
each
Par
amet
ers
Tabl
e A-
10.1
. Dig
os M
odel
Rea
ch P
aram
eter
s
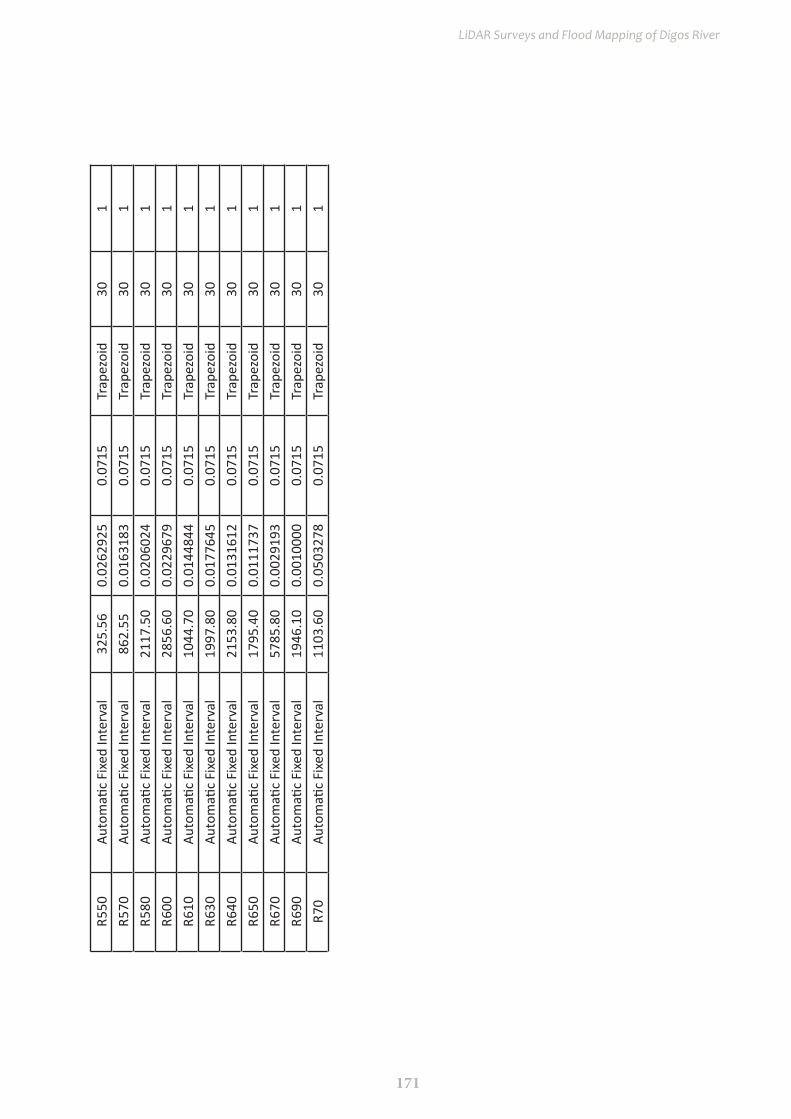
171
LiDAR Surveys and Flood Mapping of Digos River
R550
Auto
mati
c Fi
xed
Inte
rval
325.
560.
0262
925
0.07
15Tr
apez
oid
301
R570
Auto
mati
c Fi
xed
Inte
rval
862.
550.
0163
183
0.07
15Tr
apez
oid
301
R580
Auto
mati
c Fi
xed
Inte
rval
2117
.50
0.02
0602
40.
0715
Trap
ezoi
d30
1R6
00Au
tom
atic
Fixe
d In
terv
al28
56.6
00.
0229
679
0.07
15Tr
apez
oid
301
R610
Auto
mati
c Fi
xed
Inte
rval
1044
.70
0.01
4484
40.
0715
Trap
ezoi
d30
1R6
30Au
tom
atic
Fixe
d In
terv
al19
97.8
00.
0177
645
0.07
15Tr
apez
oid
301
R640
Auto
mati
c Fi
xed
Inte
rval
2153
.80
0.01
3161
20.
0715
Trap
ezoi
d30
1R6
50Au
tom
atic
Fixe
d In
terv
al17
95.4
00.
0111
737
0.07
15Tr
apez
oid
301
R670
Auto
mati
c Fi
xed
Inte
rval
5785
.80
0.00
2919
30.
0715
Trap
ezoi
d30
1R6
90Au
tom
atic
Fixe
d In
terv
al19
46.1
00.
0010
000
0.07
15Tr
apez
oid
301
R70
Auto
mati
c Fi
xed
Inte
rval
1103
.60
0.05
0327
80.
0715
Trap
ezoi
d30
1
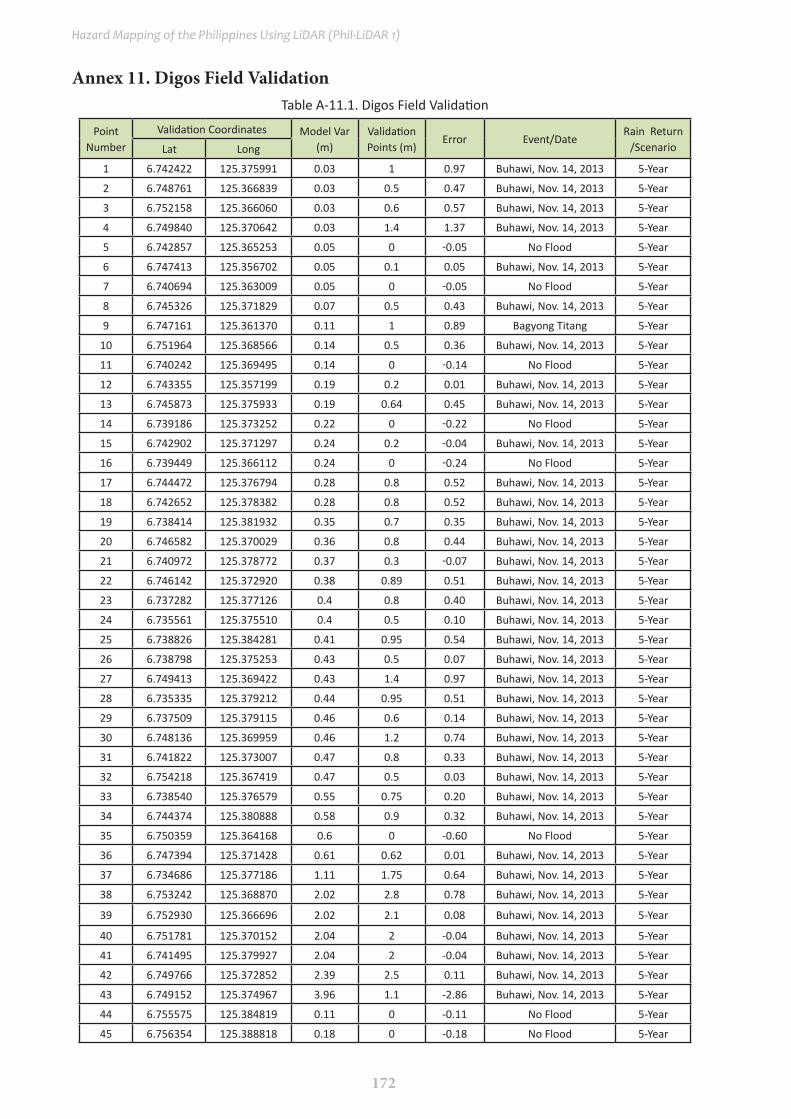
172
Hazard Mapping of the Philippines Using LiDAR (Phil-LiDAR 1)
Point Number
Validation Coordinates Model Var (m)
Validation Points (m)
Error Event/DateRain Return
/ScenarioLat Long
1 6.742422 125.375991 0.03 1 0.97 Buhawi, Nov. 14, 2013 5-Year
2 6.748761 125.366839 0.03 0.5 0.47 Buhawi, Nov. 14, 2013 5-Year
3 6.752158 125.366060 0.03 0.6 0.57 Buhawi, Nov. 14, 2013 5-Year
4 6.749840 125.370642 0.03 1.4 1.37 Buhawi, Nov. 14, 2013 5-Year
5 6.742857 125.365253 0.05 0 -0.05 No Flood 5-Year
6 6.747413 125.356702 0.05 0.1 0.05 Buhawi, Nov. 14, 2013 5-Year
7 6.740694 125.363009 0.05 0 -0.05 No Flood 5-Year
8 6.745326 125.371829 0.07 0.5 0.43 Buhawi, Nov. 14, 2013 5-Year
9 6.747161 125.361370 0.11 1 0.89 Bagyong Titang 5-Year
10 6.751964 125.368566 0.14 0.5 0.36 Buhawi, Nov. 14, 2013 5-Year
11 6.740242 125.369495 0.14 0 -0.14 No Flood 5-Year
12 6.743355 125.357199 0.19 0.2 0.01 Buhawi, Nov. 14, 2013 5-Year
13 6.745873 125.375933 0.19 0.64 0.45 Buhawi, Nov. 14, 2013 5-Year
14 6.739186 125.373252 0.22 0 -0.22 No Flood 5-Year
15 6.742902 125.371297 0.24 0.2 -0.04 Buhawi, Nov. 14, 2013 5-Year
16 6.739449 125.366112 0.24 0 -0.24 No Flood 5-Year
17 6.744472 125.376794 0.28 0.8 0.52 Buhawi, Nov. 14, 2013 5-Year
18 6.742652 125.378382 0.28 0.8 0.52 Buhawi, Nov. 14, 2013 5-Year
19 6.738414 125.381932 0.35 0.7 0.35 Buhawi, Nov. 14, 2013 5-Year
20 6.746582 125.370029 0.36 0.8 0.44 Buhawi, Nov. 14, 2013 5-Year
21 6.740972 125.378772 0.37 0.3 -0.07 Buhawi, Nov. 14, 2013 5-Year
22 6.746142 125.372920 0.38 0.89 0.51 Buhawi, Nov. 14, 2013 5-Year
23 6.737282 125.377126 0.4 0.8 0.40 Buhawi, Nov. 14, 2013 5-Year
24 6.735561 125.375510 0.4 0.5 0.10 Buhawi, Nov. 14, 2013 5-Year
25 6.738826 125.384281 0.41 0.95 0.54 Buhawi, Nov. 14, 2013 5-Year
26 6.738798 125.375253 0.43 0.5 0.07 Buhawi, Nov. 14, 2013 5-Year
27 6.749413 125.369422 0.43 1.4 0.97 Buhawi, Nov. 14, 2013 5-Year
28 6.735335 125.379212 0.44 0.95 0.51 Buhawi, Nov. 14, 2013 5-Year
29 6.737509 125.379115 0.46 0.6 0.14 Buhawi, Nov. 14, 2013 5-Year
30 6.748136 125.369959 0.46 1.2 0.74 Buhawi, Nov. 14, 2013 5-Year
31 6.741822 125.373007 0.47 0.8 0.33 Buhawi, Nov. 14, 2013 5-Year
32 6.754218 125.367419 0.47 0.5 0.03 Buhawi, Nov. 14, 2013 5-Year
33 6.738540 125.376579 0.55 0.75 0.20 Buhawi, Nov. 14, 2013 5-Year
34 6.744374 125.380888 0.58 0.9 0.32 Buhawi, Nov. 14, 2013 5-Year
35 6.750359 125.364168 0.6 0 -0.60 No Flood 5-Year
36 6.747394 125.371428 0.61 0.62 0.01 Buhawi, Nov. 14, 2013 5-Year
37 6.734686 125.377186 1.11 1.75 0.64 Buhawi, Nov. 14, 2013 5-Year
38 6.753242 125.368870 2.02 2.8 0.78 Buhawi, Nov. 14, 2013 5-Year
39 6.752930 125.366696 2.02 2.1 0.08 Buhawi, Nov. 14, 2013 5-Year
40 6.751781 125.370152 2.04 2 -0.04 Buhawi, Nov. 14, 2013 5-Year
41 6.741495 125.379927 2.04 2 -0.04 Buhawi, Nov. 14, 2013 5-Year
42 6.749766 125.372852 2.39 2.5 0.11 Buhawi, Nov. 14, 2013 5-Year
43 6.749152 125.374967 3.96 1.1 -2.86 Buhawi, Nov. 14, 2013 5-Year
44 6.755575 125.384819 0.11 0 -0.11 No Flood 5-Year
45 6.756354 125.388818 0.18 0 -0.18 No Flood 5-Year
Annex 11. Digos Field validationTable A-11.1. Digos Field Validation

173
LiDAR Surveys and Flood Mapping of Digos River
Point Number
Validation Coordinates Model Var (m)
Validation Points (m)
Error Event/DateRain Return
/ScenarioLat Long
46 6.752874 125.386519 0.22 0.6 0.38 Buhawi, Nov. 14, 2013 5-Year
47 6.753286 125.388243 0.23 0.5 0.27 Sealevel rise 5-Year
48 6.757200 125.383105 0.26 0 -0.26 No Flood 5-Year
49 6.756540 125.383920 0.38 0 -0.38 No Flood 5-Year
50 6.756531 125.373813 0.51 0.5 -0.01 Buhawi, Nov. 14, 2013 5-Year
51 6.755233 125.387152 0.59 0.7 0.11 Buhawi, Nov. 14, 2013 5-Year
52 6.755740 125.372524 0.54 0.3 -0.24 Buhawi, Nov. 14, 2013 5-Year
53 6.750157 125.382573 0.55 1.2 0.65 Buhawi, Nov. 14, 2013 5-Year
54 6.750600 125.384977 0.56 0.9 0.34 Buhawi, Nov. 14, 2013 5-Year
55 6.758093 125.389262 0.57 0 -0.57 No Flood 5-Year
56 6.754496 125.387696 0.59 0.7 0.11 Buhawi, Nov. 14, 2013 5-Year
57 6.748210 125.381821 0.6 1 0.40 Buhawi, Nov. 14, 2013 5-Year
58 6.758897 125.387185 0.64 0.6 -0.04 Buhawi, Nov. 14, 2013 5-Year
59 6.756807 125.370047 0.66 1 0.34 Buhawi, Nov. 14, 2013 5-Year
60 6.748824 125.384623 0.66 1.5 0.84 Buhawi, Nov. 14, 2013 5-Year
61 6.751523 125.385892 0.75 1.2 0.45 Buhawi, Nov. 14, 2013 5-Year
62 6.753706 125.373220 0.77 1.46 0.69 Buhawi, Nov. 14, 2013 5-Year
63 6.738844 125.352316 0.04 0 -0.04 No Flood 5-Year
64 6.738514 125.358903 0.11 0 -0.11 No Flood 5-Year
65 6.732786 125.360540 0.16 0 -0.16 No Flood 5-Year
66 6.733292 125.374216 0.38 1 0.62 Buhawi, Nov. 14, 2013 5-Year
67 6.734080 125.377038 0.8 0.6 -0.20 2Buhawi, Nov. 14, 2013 5-Year
68 6.733833 125.375762 1.01 1.3 0.29 Buhawi, Nov. 14, 2013 5-Year
69 6.729537 125.373580 1.05 0 -1.05 No Flood 5-Year
70 6.730773 125.374107 1.11 0 -1.11 No Flood 5-Year
71 6.779884 125.331562 2.45 2 -0.45 Buhawi, Nov. 14, 2013 5-Year
72 6.743658 125.351483 0.14 0 -0.14 No Flood 5-Year
73 6.760811 125.362517 0.51 0 -0.51 No Flood 5-Year
74 6.759553 125.366394 0.51 0.3 -0.21 Yolanda, Nov. 7, 2013 5-Year
75 6.761426 125.364400 0.64 0.5 -0.14 Buhawi, Nov. 14, 2013 5-Year
76 6.762487 125.360542 1.09 1.4 0.31 Buhawi, Nov. 14, 2013 5-Year
77 6.761234 125.361643 4.45 5.8 1.35 Buhawi, Nov. 14, 2013 5-Year
78 6.758775 125.364245 5.56 5.9 0.34 Buhawi, Nov. 14, 2013 5-Year
79 6.759689 125.363058 5.57 5 -0.57 Buhawi, Nov. 14, 2013 5-Year
80 6.757638 125.340214 0.38 0 -0.38 No Flood 5-Year
81 6.763430 125.339608 0.03 0 -0.03 No Flood 5-Year
82 6.771970 125.336881 0.46 0.3 -0.16 Buhawi, Nov. 14, 2013 5-Year
83 6.769632 125.336755 0.5 0.1 -0.40 Buhawi, Nov. 14, 2013 5-Year
84 6.771423 125.338626 0.53 0.2 -0.33 Buhawi, Nov. 14, 2013 5-Year
85 6.774788 125.337101 0.54 0.8 0.26 Buhawi, Nov. 14, 2013 5-Year
86 6.778863 125.335554 0.56 0 -0.56 No Flood 5-Year
87 6.777274 125.337763 0.84 0.5 -0.34 Buhawi, Nov. 14, 2013 5-Year
88 6.771895 125.335991 1.05 1 -0.05 Buhawi, Nov. 14, 2013 5-Year
89 6.767875 125.336357 1.07 1 -0.07 Buhawi, Nov. 14, 2013 5-Year
90 6.771863 125.341181 1.3 0.7 -0.60 Buhawi, Nov. 14, 2013 5-Year
91 6.766357 125.336799 1.5 2.6 1.10 Buhawi, Nov. 14, 2013 5-Year
92 6.767445 125.336470 2.1 1.2 -0.90 Buhawi, Nov. 14, 2013 5-Year
93 6.765809 125.341022 2.15 6.1 3.95 Buhawi, Nov. 14, 2013 5-Year

174
Hazard Mapping of the Philippines Using LiDAR (Phil-LiDAR 1)
Point Number
Validation Coordinates Model Var (m)
Validation Points (m)
Error Event/DateRain Return
/ScenarioLat Long
94 6.765746 125.337370 2.42 2.8 0.38 Buhawi, Nov. 14, 2013 5-Year
95 6.766666 125.336648 2.68 1.5 -1.18 Buhawi, Nov. 14, 2013 5-Year
96 6.766128 125.340863 5.02 7.9 2.88 Buhawi, Nov. 14, 2013 5-Year
97 6.765363 125.340033 5.03 5.8 0.77 Buhawi, Nov. 14, 2013 5-Year
98 6.765932 125.337285 5.25 4.6 -0.65 Buhawi, Nov. 14, 2013 5-Year
99 6.765458 125.338201 5.67 4.8 -0.87 Buhawi, Nov. 14, 2013 5-Year
100 6.765084 125.341266 6.3 7 0.70 Buhawi, Nov. 14, 2013 5-Year
101 6.765584 125.341224 7.53 8.5 0.97 Buhawi, Nov. 14, 2013 5-Year
102 6.760673 125.352006 0.03 0 -0.03 No Flood 5-Year
103 6.760137 125.357898 0.03 0 -0.03 No Flood 5-Year
104 6.759840 125.354136 0.06 0.5 0.44 Buhawi, Nov. 14, 2013 5-Year
105 6.761974 125.349945 0.06 0.1 0.04 Buhawi, Nov. 14, 2013 5-Year
106 6.758525 125.359029 0.1 0 -0.10 No Flood 5-Year
107 6.762050 125.353984 0.17 6 5.83 Buhawi, Nov. 14, 2013 5-Year
108 6.763989 125.346604 0.24 0 -0.24 No Flood 5-Year
109 6.761779 125.358536 0.28 0 -0.28 No Flood 5-Year
110 6.761207 125.355131 0.29 0 -0.29 No Flood 5-Year
111 6.757502 125.361866 0.4 0 -0.40 No Flood 5-Year
112 6.758275 125.361815 0.42 0.4 -0.02 Buhawi, Nov. 14, 2013 5-Year
113 6.762507 125.355036 0.46 0 -0.46 No Flood 5-Year
114 6.760926 125.347502 0.51 0 -0.51 No Flood 5-Year
115 6.759301 125.360173 0.52 0 -0.52 No Flood 5-Year
116 6.763178 125.359650 0.53 0.5 -0.03 Buhawi, Nov. 14, 2013 5-Year
117 6.756284 125.365595 0.55 0 -0.55 No Flood 5-Year
118 6.756585 125.358000 0.63 0.5 -0.13 Buhawi, Nov. 14, 2013 5-Year
119 6.756771 125.360206 0.66 0.5 -0.16 Buhawi, Nov. 14, 2013 5-Year
120 6.762803 125.353689 0.69 0 -0.69 No Flood 5-Year
121 6.761129 125.357829 1.07 0 -1.07 No Flood 5-Year
122 6.760429 125.358330 1.07 3.6 2.53 Buhawi, Nov. 14, 2013 5-Year
123 6.762340 125.350218 1.17 2.4 1.23 Buhawi, Nov. 14, 2013 5-Year
124 6.765644 125.345056 1.19 0 -1.19 No Flood 5-Year
125 6.765351 125.345216 1.2 0 -1.20 No Flood 5-Year
126 6.763236 125.348692 1.23 2.3 1.07 Bagyong Yolanda, Nov. 7, 2013 5-Year
127 6.761908 125.351475 1.26 4 2.74 Buhawi, Nov. 14, 2013 5-Year
128 6.758441 125.362431 1.38 1 -0.38 Buhawi, Nov. 14, 2013 5-Year
129 6.763407 125.353927 1.4 0.6 -0.80 Buhawi, Nov. 14, 2013 5-Year
130 6.760589 125.359333 1.43 2.6 1.17 Buhawi, Nov. 14, 2013 5-Year
131 6.756788 125.362958 1.57 2.7 1.13 Buhawi, Nov. 14, 2013 5-Year
132 6.757702 125.362290 1.69 3.5 1.81 Buhawi, Nov. 14, 2013 5-Year
133 6.763771 125.354036 1.76 0.5 -1.26 Drainage Overflow 5-Year
134 6.761453 125.354314 2.03 0 -2.03 No Flood 5-Year
135 6.762449 125.353173 2.03 2 -0.03 Heavy rain 5-Year
136 6.760620 125.357415 2.07 -2.07 No Flood 5-Year
137 6.761955 125.352657 2.1 2 -0.10 Buhawi, Nov. 14, 2013 5-Year
138 6.761151 125.353920 2.11 3.9 1.79 Buhawi, Nov. 14, 2013 5-Year
139 6.756785 125.363164 2.15 2.7 0.55 Buhawi, Nov. 14, 2013 5-Year
140 6.760486 125.358568 2.15 3.5 1.35 Buhawi, Nov. 14, 2013 5-Year
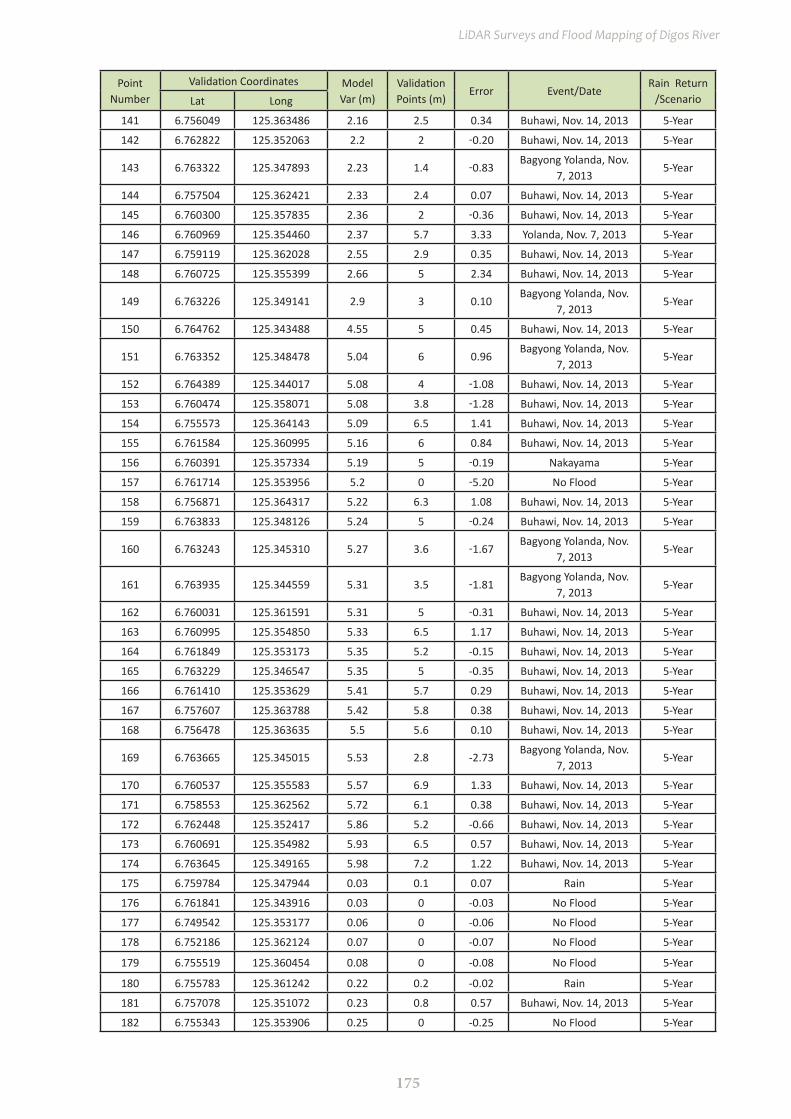
175
LiDAR Surveys and Flood Mapping of Digos River
Point Number
Validation Coordinates Model Var (m)
Validation Points (m)
Error Event/DateRain Return
/ScenarioLat Long
141 6.756049 125.363486 2.16 2.5 0.34 Buhawi, Nov. 14, 2013 5-Year
142 6.762822 125.352063 2.2 2 -0.20 Buhawi, Nov. 14, 2013 5-Year
143 6.763322 125.347893 2.23 1.4 -0.83Bagyong Yolanda, Nov.
7, 20135-Year
144 6.757504 125.362421 2.33 2.4 0.07 Buhawi, Nov. 14, 2013 5-Year
145 6.760300 125.357835 2.36 2 -0.36 Buhawi, Nov. 14, 2013 5-Year
146 6.760969 125.354460 2.37 5.7 3.33 Yolanda, Nov. 7, 2013 5-Year
147 6.759119 125.362028 2.55 2.9 0.35 Buhawi, Nov. 14, 2013 5-Year
148 6.760725 125.355399 2.66 5 2.34 Buhawi, Nov. 14, 2013 5-Year
149 6.763226 125.349141 2.9 3 0.10Bagyong Yolanda, Nov.
7, 20135-Year
150 6.764762 125.343488 4.55 5 0.45 Buhawi, Nov. 14, 2013 5-Year
151 6.763352 125.348478 5.04 6 0.96Bagyong Yolanda, Nov.
7, 20135-Year
152 6.764389 125.344017 5.08 4 -1.08 Buhawi, Nov. 14, 2013 5-Year
153 6.760474 125.358071 5.08 3.8 -1.28 Buhawi, Nov. 14, 2013 5-Year
154 6.755573 125.364143 5.09 6.5 1.41 Buhawi, Nov. 14, 2013 5-Year
155 6.761584 125.360995 5.16 6 0.84 Buhawi, Nov. 14, 2013 5-Year
156 6.760391 125.357334 5.19 5 -0.19 Nakayama 5-Year
157 6.761714 125.353956 5.2 0 -5.20 No Flood 5-Year
158 6.756871 125.364317 5.22 6.3 1.08 Buhawi, Nov. 14, 2013 5-Year
159 6.763833 125.348126 5.24 5 -0.24 Buhawi, Nov. 14, 2013 5-Year
160 6.763243 125.345310 5.27 3.6 -1.67Bagyong Yolanda, Nov.
7, 20135-Year
161 6.763935 125.344559 5.31 3.5 -1.81Bagyong Yolanda, Nov.
7, 20135-Year
162 6.760031 125.361591 5.31 5 -0.31 Buhawi, Nov. 14, 2013 5-Year
163 6.760995 125.354850 5.33 6.5 1.17 Buhawi, Nov. 14, 2013 5-Year
164 6.761849 125.353173 5.35 5.2 -0.15 Buhawi, Nov. 14, 2013 5-Year
165 6.763229 125.346547 5.35 5 -0.35 Buhawi, Nov. 14, 2013 5-Year
166 6.761410 125.353629 5.41 5.7 0.29 Buhawi, Nov. 14, 2013 5-Year
167 6.757607 125.363788 5.42 5.8 0.38 Buhawi, Nov. 14, 2013 5-Year
168 6.756478 125.363635 5.5 5.6 0.10 Buhawi, Nov. 14, 2013 5-Year
169 6.763665 125.345015 5.53 2.8 -2.73Bagyong Yolanda, Nov.
7, 20135-Year
170 6.760537 125.355583 5.57 6.9 1.33 Buhawi, Nov. 14, 2013 5-Year
171 6.758553 125.362562 5.72 6.1 0.38 Buhawi, Nov. 14, 2013 5-Year
172 6.762448 125.352417 5.86 5.2 -0.66 Buhawi, Nov. 14, 2013 5-Year
173 6.760691 125.354982 5.93 6.5 0.57 Buhawi, Nov. 14, 2013 5-Year
174 6.763645 125.349165 5.98 7.2 1.22 Buhawi, Nov. 14, 2013 5-Year
175 6.759784 125.347944 0.03 0.1 0.07 Rain 5-Year
176 6.761841 125.343916 0.03 0 -0.03 No Flood 5-Year
177 6.749542 125.353177 0.06 0 -0.06 No Flood 5-Year
178 6.752186 125.362124 0.07 0 -0.07 No Flood 5-Year
179 6.755519 125.360454 0.08 0 -0.08 No Flood 5-Year
180 6.755783 125.361242 0.22 0.2 -0.02 Rain 5-Year
181 6.757078 125.351072 0.23 0.8 0.57 Buhawi, Nov. 14, 2013 5-Year
182 6.755343 125.353906 0.25 0 -0.25 No Flood 5-Year
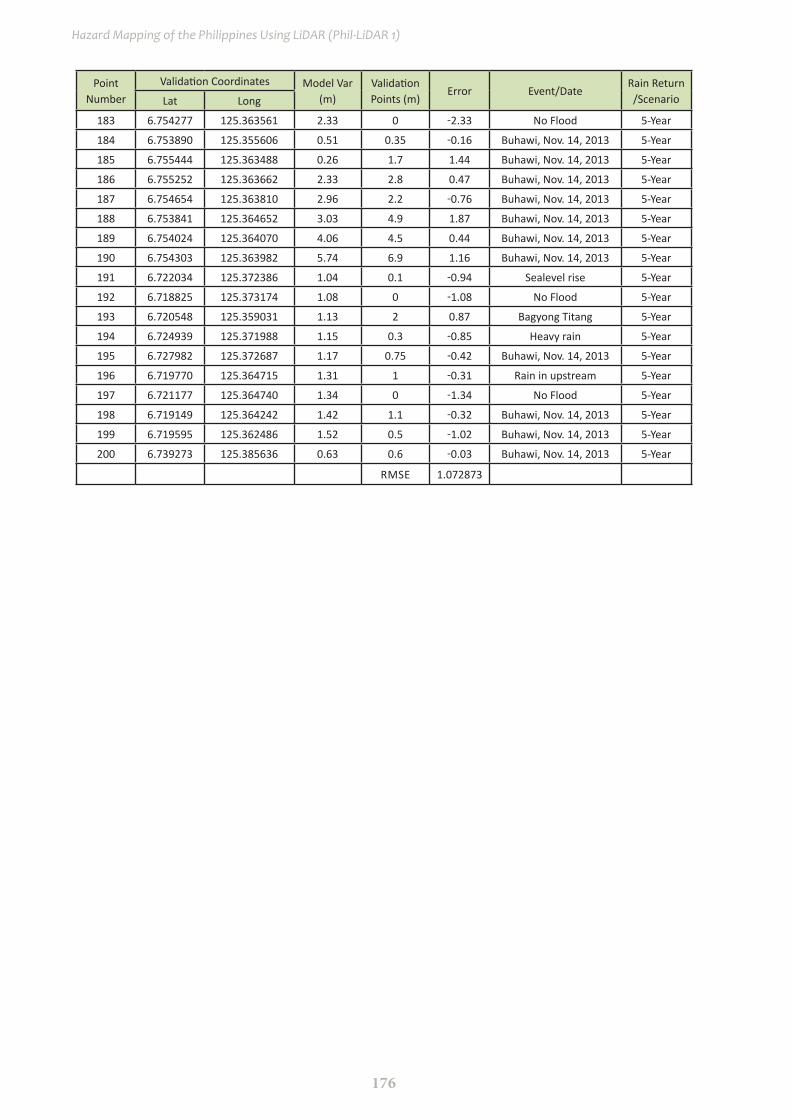
176
Hazard Mapping of the Philippines Using LiDAR (Phil-LiDAR 1)
Point Number
Validation Coordinates Model Var (m)
Validation Points (m)
Error Event/DateRain Return /ScenarioLat Long
183 6.754277 125.363561 2.33 0 -2.33 No Flood 5-Year
184 6.753890 125.355606 0.51 0.35 -0.16 Buhawi, Nov. 14, 2013 5-Year
185 6.755444 125.363488 0.26 1.7 1.44 Buhawi, Nov. 14, 2013 5-Year
186 6.755252 125.363662 2.33 2.8 0.47 Buhawi, Nov. 14, 2013 5-Year
187 6.754654 125.363810 2.96 2.2 -0.76 Buhawi, Nov. 14, 2013 5-Year
188 6.753841 125.364652 3.03 4.9 1.87 Buhawi, Nov. 14, 2013 5-Year
189 6.754024 125.364070 4.06 4.5 0.44 Buhawi, Nov. 14, 2013 5-Year
190 6.754303 125.363982 5.74 6.9 1.16 Buhawi, Nov. 14, 2013 5-Year
191 6.722034 125.372386 1.04 0.1 -0.94 Sealevel rise 5-Year
192 6.718825 125.373174 1.08 0 -1.08 No Flood 5-Year
193 6.720548 125.359031 1.13 2 0.87 Bagyong Titang 5-Year
194 6.724939 125.371988 1.15 0.3 -0.85 Heavy rain 5-Year
195 6.727982 125.372687 1.17 0.75 -0.42 Buhawi, Nov. 14, 2013 5-Year
196 6.719770 125.364715 1.31 1 -0.31 Rain in upstream 5-Year
197 6.721177 125.364740 1.34 0 -1.34 No Flood 5-Year
198 6.719149 125.364242 1.42 1.1 -0.32 Buhawi, Nov. 14, 2013 5-Year
199 6.719595 125.362486 1.52 0.5 -1.02 Buhawi, Nov. 14, 2013 5-Year
200 6.739273 125.385636 0.63 0.6 -0.03 Buhawi, Nov. 14, 2013 5-Year
RMSE 1.072873
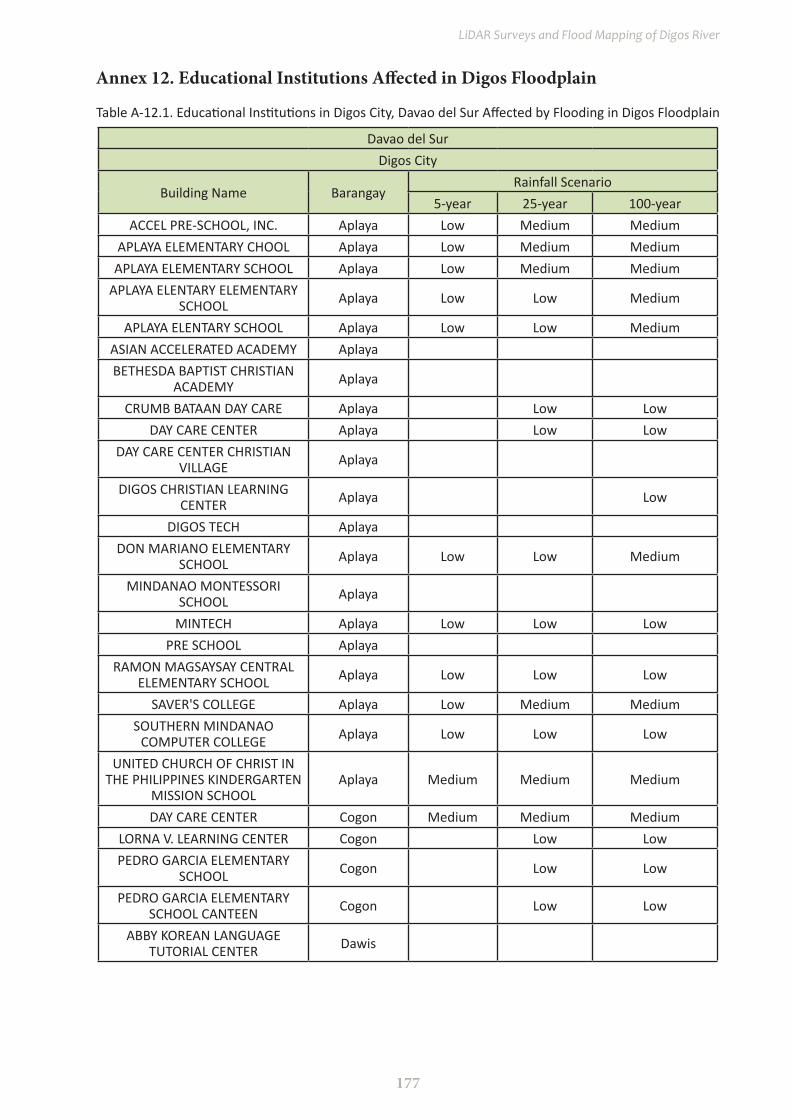
177
LiDAR Surveys and Flood Mapping of Digos River
Annex 12. Educational institutions Affected in Digos Floodplain
Davao del SurDigos City
Building Name BarangayRainfall Scenario
5-year 25-year 100-yearACCEL PRE-SCHOOL, INC. Aplaya Low Medium Medium
APLAYA ELEMENTARY CHOOL Aplaya Low Medium MediumAPLAYA ELEMENTARY SCHOOL Aplaya Low Medium Medium
APLAYA ELENTARY ELEMENTARY SCHOOL Aplaya Low Low Medium
APLAYA ELENTARY SCHOOL Aplaya Low Low MediumASIAN ACCELERATED ACADEMY AplayaBETHESDA BAPTIST CHRISTIAN
ACADEMY Aplaya
CRUMB BATAAN DAY CARE Aplaya Low LowDAY CARE CENTER Aplaya Low Low
DAY CARE CENTER CHRISTIAN VILLAGE Aplaya
DIGOS CHRISTIAN LEARNING CENTER Aplaya Low
DIGOS TECH AplayaDON MARIANO ELEMENTARY
SCHOOL Aplaya Low Low Medium
MINDANAO MONTESSORI SCHOOL Aplaya
MINTECH Aplaya Low Low LowPRE SCHOOL Aplaya
RAMON MAGSAYSAY CENTRAL ELEMENTARY SCHOOL Aplaya Low Low Low
SAVER'S COLLEGE Aplaya Low Medium MediumSOUTHERN MINDANAO
COMPUTER COLLEGE Aplaya Low Low Low
UNITED CHURCH OF CHRIST IN THE PHILIPPINES KINDERGARTEN
MISSION SCHOOLAplaya Medium Medium Medium
DAY CARE CENTER Cogon Medium Medium MediumLORNA V. LEARNING CENTER Cogon Low LowPEDRO GARCIA ELEMENTARY
SCHOOL Cogon Low Low
PEDRO GARCIA ELEMENTARY SCHOOL CANTEEN Cogon Low Low
ABBY KOREAN LANGUAGE TUTORIAL CENTER Dawis
Table A-12.1. Educational Institutions in Digos City, Davao del Sur Affected by Flooding in Digos Floodplain

178
Hazard Mapping of the Philippines Using LiDAR (Phil-LiDAR 1)
AMSAI (PRESCHOOL AND ELEMENTARY) Dawis
DAWIS DAY CARE CENTER Dawis Low LowDAWIS ELEMENTARY SCHOOL Dawis Low Low Low
DAY CARE CENTER DawisISAAC ABALAYAN ELEMENTARY
SCHOOL Dawis Low Low Low
SOUTH WILL LEARING CENTER DawisDAY CARE CENTER Goma
RUPARAN DAY CARE CENTER Ruparan Low Low LowRUPARAN ELEMENTARY SCHOOL Ruparan
RUPARAN ELEMENTARY SCHOOL San Agustin Low
RUPARAN NATIONAL HIGH SCHOOL San Agustin Low Low
DAY CARE CENTER San Jose Low Low LowDIGOS CENTRAL ADVENTIST
ACADEMY San Jose
DIGOS CITY-BRILLIANT CHILD ACADEMY, INC. San Jose Low
GREGORIO M. REUSORA CENTRAL ELEMENTARY SCHOOL Sinawilan
GREGORIO M. REUSORA DAY CARE Sinawilan
KIAGOT DAY CARE CENTER Sinawilan Low Medium Medium
CAVITE BIBLE BAPTIST ACADEMY Tres de MayoDAY CARE CENTER Tres de Mayo
JOLENCIO ALBERCA ELEMENTARY SCHOOL Tres de Mayo Low Low
COR JESU COLLEGE Zone 1DAY CARE CENTER Zone 1
KAMACHILLE DAYCARE Zone 1POLYTECHIC COLLEGE DAVAO DEL
SUR Zone 1 Medium Medium Medium
CLASSHOMES DAY CARE Zone 2 LowDAY CARE CENTER Zone 2 Medium Medium Medium
DAY CARE CENTER BARANGAY ZONE 1 Zone 2
DIGOS CENTRAL ELEMENTARY SCHOOL Zone 2 Low Low Medium
POLYTECHIC COLLEGE DAVAO DEL SUR Zone 2 Low Low Medium
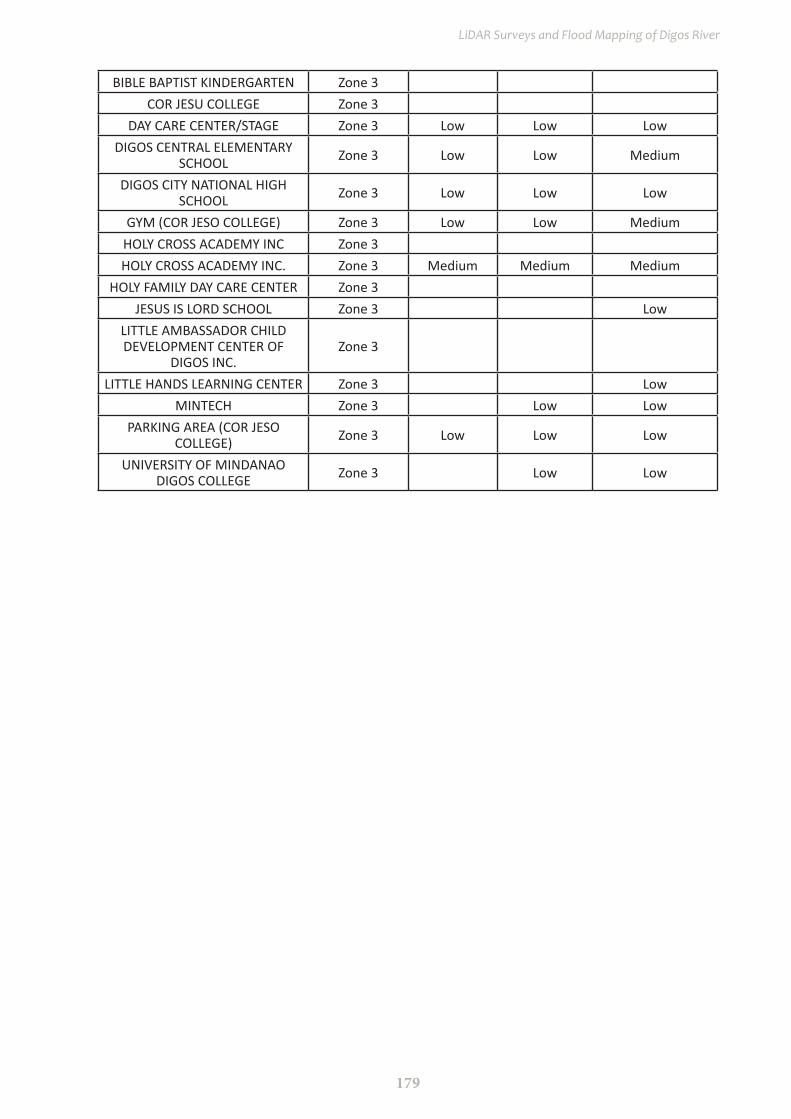
179
LiDAR Surveys and Flood Mapping of Digos River
BIBLE BAPTIST KINDERGARTEN Zone 3COR JESU COLLEGE Zone 3
DAY CARE CENTER/STAGE Zone 3 Low Low LowDIGOS CENTRAL ELEMENTARY
SCHOOL Zone 3 Low Low Medium
DIGOS CITY NATIONAL HIGH SCHOOL Zone 3 Low Low Low
GYM (COR JESO COLLEGE) Zone 3 Low Low MediumHOLY CROSS ACADEMY INC Zone 3HOLY CROSS ACADEMY INC. Zone 3 Medium Medium Medium
HOLY FAMILY DAY CARE CENTER Zone 3JESUS IS LORD SCHOOL Zone 3 Low
LITTLE AMBASSADOR CHILD DEVELOPMENT CENTER OF
DIGOS INC.Zone 3
LITTLE HANDS LEARNING CENTER Zone 3 LowMINTECH Zone 3 Low Low
PARKING AREA (COR JESO COLLEGE) Zone 3 Low Low Low
UNIVERSITY OF MINDANAO DIGOS COLLEGE Zone 3 Low Low
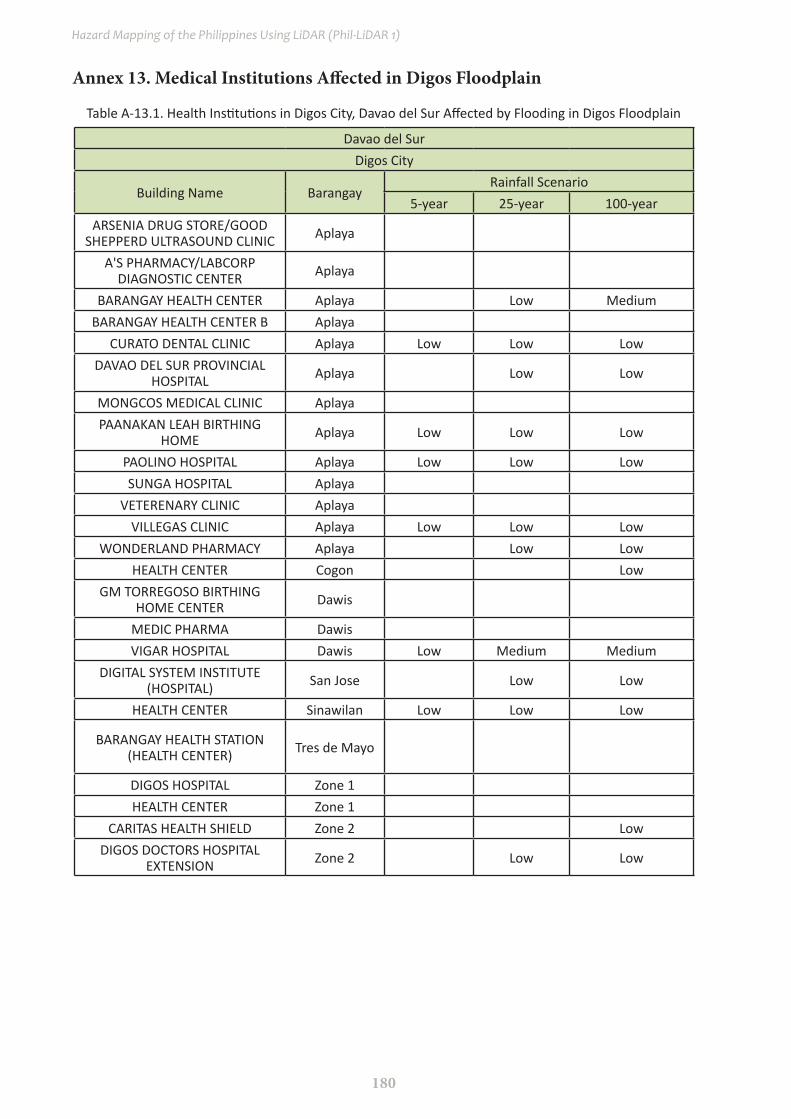
180
Hazard Mapping of the Philippines Using LiDAR (Phil-LiDAR 1)
Annex 13. Medical institutions Affected in Digos Floodplain
Davao del SurDigos City
Building Name BarangayRainfall Scenario
5-year 25-year 100-yearARSENIA DRUG STORE/GOOD
SHEPPERD ULTRASOUND CLINIC Aplaya
A'S PHARMACY/LABCORP DIAGNOSTIC CENTER Aplaya
BARANGAY HEALTH CENTER Aplaya Low MediumBARANGAY HEALTH CENTER B Aplaya
CURATO DENTAL CLINIC Aplaya Low Low LowDAVAO DEL SUR PROVINCIAL
HOSPITAL Aplaya Low Low
MONGCOS MEDICAL CLINIC AplayaPAANAKAN LEAH BIRTHING
HOME Aplaya Low Low Low
PAOLINO HOSPITAL Aplaya Low Low LowSUNGA HOSPITAL Aplaya
VETERENARY CLINIC AplayaVILLEGAS CLINIC Aplaya Low Low Low
WONDERLAND PHARMACY Aplaya Low LowHEALTH CENTER Cogon Low
GM TORREGOSO BIRTHING HOME CENTER Dawis
MEDIC PHARMA DawisVIGAR HOSPITAL Dawis Low Medium Medium
DIGITAL SYSTEM INSTITUTE (HOSPITAL) San Jose Low Low
HEALTH CENTER Sinawilan Low Low Low
BARANGAY HEALTH STATION (HEALTH CENTER) Tres de Mayo
DIGOS HOSPITAL Zone 1HEALTH CENTER Zone 1
CARITAS HEALTH SHIELD Zone 2 LowDIGOS DOCTORS HOSPITAL
EXTENSION Zone 2 Low Low
Table A-13.1. Health Institutions in Digos City, Davao del Sur Affected by Flooding in Digos Floodplain

181
LiDAR Surveys and Flood Mapping of Digos River
DIGOS HOSPITAL Zone 2 Low Low LowDIGOS HOSPITAL (CANTEEN) Zone 2 Medium Medium Medium
DIGOS HOSPITAL (PARKING AREA) Zone 2LLANOS MEDICAL CLINIC &
HOSPITAL Zone 2
MEDICAL CENTER OF DIGOS CITY Zone 2ACEBEDO OPTICAL Zone 3
ARENDAIN-KINTANAR MEDICAL CLINIC Zone 3 Low Medium Medium
BONE AND SKIN SPECIALIST Zone 3DOMINICAN HOSPITAL Zone 3 Low Medium MediumDURAY VERNON CLINIC Zone 3 Low Low
GONZALES MARANAN MEDICAL CENTER INCORPORATED Zone 3
J.A MASONGSONG CHILD CLINIC Zone 3KAHAYAG OPTICAL CLINIC Zone 3
KIDNEY CENTER Zone 3M.L TORRES CHILLDREN'S CLINIC Zone 3MEDICAL CENTER OF DIGOS CITY Zone 3
ZONE 2 HEALTH CENTER Zone 3 Medium Medium Medium


![.Noah's Flood WTJ2004[1]](https://static.fdokumen.com/doc/165x107/631c39e73e8acd997705cf6b/noahs-flood-wtj20041.jpg)


