
Energy Policies and Multitopic Household Surveys
66
THE WORLD BANK Kyran O’Sullivan Douglas F. Barnes WORLD BANK WORKING PAPER NO. 90 Energy Policies and Multitopic Household Surveys Guidelines for Questionnaire Design in Living Standards Measurement Studies 38061 Public Disclosure Authorized Public Disclosure Authorized Public Disclosure Authorized Public Disclosure Authorized Public Disclosure Authorized Public Disclosure Authorized Public Disclosure Authorized Public Disclosure Authorized
-
Upload
khangminh22 -
Category
Documents
-
view
0 -
download
0
Transcript of Energy Policies and Multitopic Household Surveys

THE WORLD BANK
Kyran O’SullivanDouglas F. Barnes
W O R L D B A N K W O R K I N G P A P E R N O . 9 0
Energy Policies and MultitopicHousehold SurveysGuidelines for Questionnaire Design in LivingStandards Measurement Studies
38061P
ublic
Dis
clos
ure
Aut
horiz
edP
ublic
Dis
clos
ure
Aut
horiz
edP
ublic
Dis
clos
ure
Aut
horiz
edP
ublic
Dis
clos
ure
Aut
horiz
edP
ublic
Dis
clos
ure
Aut
horiz
edP
ublic
Dis
clos
ure
Aut
horiz
edP
ublic
Dis
clos
ure
Aut
horiz
edP
ublic
Dis
clos
ure
Aut
horiz
ed


Kyran O’SullivanDouglas F. Barnes
W O R L D B A N K W O R K I N G P A P E R N O . 9 0
Energy Policies and MultitopicHousehold SurveysGuidelines for Questionnaire Design in Living Standards Measurement Studies
THE WORLD BANK
Washington, D.C.
ESMAP (Energy Sector Management Assistance Program)

Copyright © 2007The International Bank for Reconstruction and Development / The World Bank1818 H Street, N.W.Washington, D.C. 20433, U.S.A.All rights reservedManufactured in the United States of AmericaFirst Printing: November 2006
printed on recycled paper
1 2 3 4 5 09 08 07 06
World Bank Working Papers are published to communicate the results of the Bank’s work to the develop-ment community with the least possible delay. The manuscript of this paper therefore has not been pre-pared in accordance with the procedures appropriate to formally-edited texts. Some sources cited in thispaper may be informal documents that are not readily available.
The findings, interpretations, and conclusions expressed herein are those of the author(s) and do notnecessarily reflect the views of the International Bank for Reconstruction and Development/The WorldBank and its affiliated organizations, or those of the Executive Directors of The World Bank or the gov-ernments they represent.
The World Bank does not guarantee the accuracy of the data included in this work. The boundaries,colors, denominations, and other information shown on any map in this work do not imply any judgmenton the part of The World Bank of the legal status of any territory or the endorsement or acceptance ofsuch boundaries.
The material in this publication is copyrighted. Copying and/or transmitting portions or all of thiswork without permission may be a violation of applicable law. The International Bank for Reconstructionand Development/The World Bank encourages dissemination of its work and will normally grant permis-sion promptly to reproduce portions of the work.
For permission to photocopy or reprint any part of this work, please send a request with completeinformation to the Copyright Clearance Center, Inc., 222 Rosewood Drive, Danvers, MA 01923, USA,Tel: 978-750-8400, Fax: 978-750-4470, www.copyright.com.
All other queries on rights and licenses, including subsidiary rights, should be addressed to the Officeof the Publisher, The World Bank, 1818 H Street NW, Washington, DC 20433, USA, Fax: 202-522-2422,email: [email protected].
ISBN-10: 0-8213-6878-8 ISBN-13: 978-0-8213-6878-7eISBN: 0-8213-6879-6ISSN: 1726-5878 DOI: 10.1596/978-0-8213-6878-7
Cover photo taken during household interview in Ngara District, Kagera region of Tanzania during KageraHealth and Development Survey 2004. Courtesy of Kathleen Beegle.
Doug Barnes and Kyran O’Sullivan are Senior Energy Specialists in the Energy and Water Department ofthe World Bank.
Library of Congress Cataloging-in-Publication Data
O’Sullivan, Kyran, 1954-Energy policies and multitopic household surveys : guidelines for
questionnaire design in living standards measurement studies / Kyran O’Sullivanand Douglas F. Barnes.
p. cm. — (World bank working paper ; no. 90)Includes bibliographical references.ISBN-13: 978-0-8213-6878-7ISBN-10: 0-8213-6878-8ISBN-10: 0-8213-6879-6 (electronic)1. Households—Energy consumption. 2. Household surveys. 3. Cost and
standard of living. I. Barnes, Douglas F. II. Title.HD9502.A2O836 2006333.79'63130723—dc22
2006032775

Contents
Foreword
Acknowledgments
1. Introduction
Potential Value of LSMS Surveys for Analysis of Household Energy Use
Report Audience and Organization
2. Characteristics of LSMS Surveys and Specialized Household Energy Survey
Characteristics of LSMS Surveys
Characteristics of Specialized Household Energy Surveys
Other Distinguishing Features of Both Types of Surveys
Existing and Missing Energy Questions in LSMS Surveys
Energy and Development Outcomes: The Issue of Causality
3. Importance of LSMS Survey Data for Energy Policy Analysis
Household Energy Transitions
Using LSMS Surveys for Energy Policy Analysis
Rural Electrification and Development
4. The Way Forward
Fuel Sources Module
Electricity Sources Modules (Grid and Off-grid)
Durable Goods (Light Bulbs and Appliances) Module
Electricity and Fuels in the Community Module
5. Conclusion
Appendix
References
LIST OF TABLES
1. Respiratory Symptoms in Children, by Fuel and Cooking Space,Guatemala (2000)
2. ARI Prevalence among Children under Five Years of Age, Zimbabwe (1999)
3. Kerosene Use by Income Decile in Yemen (2003)
4. Willingness-to-pay Results from Three Projects
iii
v
vii
1
2
2
5
6
6
7
9
11
15
15
19
22
27
28
33
37
40
43
45
49
20
20
21
25
eys

5. Electricity and Education Links in India and Nicaragua
6. Fuels and Their Common Household Uses
A1. Typical Efficiencies at the Final Consumption Stage of Cooking
A2. Comparison of Non-electric and Electric Lamps for Domestic Lighting in Developing Countries
A3. Battery Electricity
LIST OF FIGURES
1. Share of Total Subsidy Received and Share of Subsidy in Household Budget,By Income Decile
2. Demand Curve for Lighting
3a. Fuel Sources (biomass and candles)—Prototype Module
3b. Fuel Sources (gaseous and liquid fuels)—Prototype Module
4a. Electricity Sources (Grid) Prototype Module
4b. Electricity Sources (Off-grid) Prototype Module
5. Durable Goods (Light Bulbs and Appliances) Prototype Module
6. Electricity and Fuels in the Community Prototype Module
LIST OF BOX
1. Potential Electricity Sources for Household Use
iv World Bank Working Paper
26
31
47
48
48
22
23
29
30
34
35
38
41
36
Foreword
Accurate data on household energy use, combined with other data on household well-being (including consumption, income, health, and education), is essential to monitor
progress in the household energy transition from traditional biomass fuels to modern fuelsand electricity and to evaluate the effect of government energy policies on living conditions.Multitopic socioeconomic household surveys, such as the World Bank’s Living StandardsMeasurement Study (LSMS), can provide data with which to make these measurements.Designers of LSMS and other multitopic household surveys can use these guidelines to helpensure that their surveys provide more extensive and reliable data on household energy usethan they do at present. The guidelines highlight weaknesses in current LSMS surveys withrespect to energy questions and discuss how such questions can be better formulated toyield more useful data for energy policy analysis. Household energy surveys implementedover the years offer lessons on which formulations of questions work best and provide themost consistent results. This experience has been drawn on to develop the prototype fueland electricity modules contained in these guidelines. Indicators that may be constructedfrom the data are also discussed; in this regard, the present report contributes to internationalefforts to define energy indicators for sustainable development. These efforts include thepublication Energy Indicators for Sustainable Development: Guidelines and Methodologies(IAEA 2005), which drew attention to using household surveys to provide data for con-structing indicators.
It is anticipated that these guidelines will help LSMS designers incorporate energymodules of the type proposed herein into LSMS survey questionnaires. Over time, as moresurveys containing these modules are implemented, more experience will be gained onwhich questions work best in particular country settings and which are most useful forpolicy analysis.
Jamal SaghirDirector, Energy and WaterChair, Energy and Mining Sector Board
v


vii
Acknowledgments
These guidelines were prepared by Kyran O’Sullivan and Douglas F. Barnes. DaleWhittington reviewed energy questions in LSMS surveys and prepared a background
report. The financial support of ESMAP is gratefully acknowledged. The authors wish tothank Kathleen Beegle, Aline Coudouel, Olivier Dupriez, Dominique Lallement, LucioMonari, Stefano Paternostro, Peter Roberts, Diane Steele, Caroline van den Berg, and Robertvan der Plas for their guidance and encouragement. We are grateful to Vivien Foster andKinnon Scott, who reviewed earlier drafts of the paper and made many useful suggestions.Norma Adams edited the paper.


CHAPTER 1
Introduction
Adequate and affordable supplies of electricity and modern fuels must be availableto households if they are to have a good living standard. Safe, reliable, and good-quality energy services1—lighting, heating, cooking, and motive and mechanical
power—are only available to households when they use electricity and modern fuels. Indeveloping countries, however, some 2 billion people cook and heat their homes withwood or other traditional biomass; 1.6 billion people do not have electricity in their homes(World Bank 1996). For these people, obtaining energy is costly and time-consuming; andthey may be denied the opportunity to earn income, read, and access information andentertainment.
Recognizing the role that energy services play in poverty reduction, governmentseverywhere wish to implement policies and make investments that will accelerate the tran-sition from use of traditional fuels to modern fuels and electricity. As a consequence, policy-makers increasingly seek empirical evidence of the relationship between investments madein energy infrastructure, the energy policies they implement, and welfare improvements atthe household level.
Analysis using data on household energy use from Living Standards MeasurementStudy (LSMS) surveys can help policymakers to identify which households are affected byenergy poverty and then design policies that will accelerate the household energy transi-tion. For households that have already made the transition to using modern fuels and elec-tricity, government policies in the sector will affect how much households pay and
1
1. Primary energy sources (crude oil, natural gas, coal, modern biomass and renewable energy) aretransformed into fuels and electricity to provide households energy services. Modern biomass includessustainable and safe use of biomass (e.g., biogas and wood used in improved cooking stoves).
consume. For example, regulatory policy for service providers may cause energy supply toimprove or deteriorate, and energy price and tax adjustments will affect households’ energyexpenditure and consumption. Data from LSMS surveys can be used before a policy isimplemented to construct hypotheses of the welfare changes that may occur. If data isavailable from two successive LSMS surveys (the first carried out before the policy inter-vention and the second after), the change in household welfare as a result of the inter-vention may be observed.
Energy services also affect household welfare through their role in the education andhealth status of household members. Literacy is much higher in households with electricitythan in those without, and children in households that use modern cooking fuels are lesslikely to suffer acute respiratory disease than children in households that use biomass. Othereffects on household welfare include time saving and increased productivity and income.
Potential Value of LSMS Surveys for Analysis of Household Energy Use
Unfortunately, data sets on which to base evaluation of energy services’ role in contribut-ing to these household welfare outcomes are in remarkably short supply. LSMS surveysoffer one possible source of better information gathering on providing energy services tohouseholds in developing countries. If LSMS surveys, which already provide high-qualitycomprehensive data on many aspects of household welfare, could also provide better dataon household energy use, the role of energy services in household welfare could be betterunderstood. LSMS surveys with fuels and electricity modules containing questions on thefuels and electricity sources available to households, quantities consumed, and householdcost and expenditures could be combined with other household socioeconomic charac-teristics and their relationships analyzed.
At present, household energy data collected through LSMS surveys is insufficient forextensive energy policy analysis. At the same time, specialized household energy surveysoften are not designed for such analysis; they are seldom national in scope and do not coverthe breadth of topics involving other sectors, which is the hallmark of LSMS surveys. Incor-porating the proposed energy modules found in this report into future LSMS surveys willprovide greater insight into the role energy services play in household welfare and thus willcontribute to energy infrastructure planning and energy policy analysis so that they achievethe highest possible social and development impact.
Report Audience and Organization
These guidelines advise on how an LSMS or other multitopic household survey can bemodified to improve its usefulness to the energy sector. Thus, the guidelines target twomain audiences. The first are designers of LSMS and other multitopic household surveyswho may not be familiar with the data needs of policy analysts working in the householdenergy sector. The second are energy policy analysts who wish to ensure that a plannedmultitopic household survey includes an adequate set of questions essential to their work.
This report begins by examining the characteristics and relative merits of LSMS andspecialized household energy surveys. It then reviews the types of questions currently used
2 World Bank Working Paper

in LSMS surveys, identifying important data gaps. Next, the issue of causality as it relatesto energy services and development is examined. The report then turns to examples of thetypes of energy analysis that benefit from enhanced LSMS survey data. Prototype energymodules (accompanied by notes on each question contained in them) are presented. It isproposed that the few ad hoc questions on energy use currently found in LSMS surveys—which yield little information useful to policymakers—be replaced by the questions presented in the prototype modules. Mindful that LSMS surveys are already lengthy,expensive, and time-consuming, and that increased demands on the LSMS should be care-fully considered, the additional questions in the proposed modules have been kept to aminimum while still being sufficient for the types of policy analysis that are most frequentlyconducted.
Energy Policies and Multitopic Household Surveys 3


CHAPTER 2
Characteristics of LSMS Surveysand Specialized Household
Energy Surveys
Since inception of the LSMS program in 1980 and piloting of the first surveys in Côted’Ivoire and Peru in 1985, the World Bank LSMS surveys have been used for povertyanalysis that underpins poverty reduction strategies in more than 50 countries. Inte-
grated household surveys, similar in design to the LSMS, have also been developed andimplemented in many countries.
LSMS surveys aim to provide a comprehensive picture of living standards. They are oneof the most extensively used tools for measuring and monitoring household monetary andnonmonetary welfare (including income; expenditure; employment; migration; housingconditions; school enrollment; educational attainment; health status; nutrition; and use oftransport, water, sanitation and energy services; Deaton 1997). Thus, government policy-makers can use the LSMS survey data to determine living conditions of the poor and otherdisadvantaged groups. The data can be used to model economic behavior in order to designbetter policies or choose between alternative public investments. Such analysis enables oneto assess the efficiency and efficacy of alternative policy designs and investments. For exam-ple, analysis of anthropometric data can be used to assess programs to reduce malnutritionor analyze health status used to evaluate immunization or HIV prevention.
Specialized household energy surveys, by contrast, are implemented to inform a par-ticular energy policy or investment. For example, they are used to assess the efficiency andefficacy of fuel price subsidies or to establish baseline information for and monitor ruralelectrification programs.
The distinguishing characteristics of LSMS and specialized household energy surveysare important in explaining the rationale for advocating a greater depth of energy cover-age in LSMS and other multitopic household surveys. To this end, it is also helpful to exam-ine the relative strengths and weaknesses of such surveys from the perspective of energypolicy analysts.
5
Characteristics of LSMS Surveys
LSMS surveys are both multitopic and multi-level (Grosh and Glewwe 2000; Grosh andMunoz 1996). They commonly use up to four survey instruments with which to examinea broad range of household welfare and behavioral factors, as follows:
Household questionnaire. This questionnaire collects detailed information on householdmembers. It is composed of modules that focus on specific topics. The questionnairealways collects detailed information to measure household consumption, which is the bestmonetary indicator of household welfare. The household questionnaire typically includesmodules on education, health, employment, migration, anthropometry, fertility, housing,agriculture, household enterprises, income, and savings and credit. Certain information(including employment, health, and education) is collected at the individual level. Fre-quently, the housing module covers information on fuels used for cooking and heating andelectricity services available to the household.
Community characteristics questionnaire. This questionnaire gathers information on localconditions common to all households living in the same community. Like the householdquestionnaire, the community questionnaire contains modules on specific topics, includ-ing schools, health facilities, agricultural practices, and infrastructure (for example, roads,fuel sources, electricity, and water). The questionnaire asks key community leaders andgroups about available services, economic activities, access to markets, and (more recently)social capital.
Price questionnaire. This questionnaire aims to gather information from market vendorson prevailing prices of commonly purchased items in shops and markets.
Facilities questionnaire. This questionnaire is administered to local service providers, suchas schools and health clinics.
Characteristics of Specialized Household Energy Surveys
Specialized household energy surveys typically contain the following sections:
Core information. Whatever the purpose of a specialized household energy survey, infor-mation usually considered essential includes the fuel and electricity sources available tohouseholds, supply (for example, pricing, quality, and reliability) and demand (the quan-tities consumed) characteristics of these sources, the energy services households derivefrom the fuels and electricity sources they consume, and household expenditures on thesefuels and electricity.
Initial cost of access. Because the cost of obtaining service (initial purchase of a liquefiedpetroleum gas [LPG] cylinder or electricity connection fee) is recognized as a significantbarrier to access, specialized household energy surveys frequently collect this information,along with data on sources of financing that households use to defray these costs.
Alternatives to grid electricity. In developing countries, many urban areas often face unreliablegrid-electricity supplies (they are available infrequently or subject to interruptions); inrural areas, electricity infrastructure may be lacking entirely. For these reasons, specialized
6 World Bank Working Paper

household energy surveys often focus on alternatives to grid electricity. The surveys com-monly investigate the use of diesel gensets, solar home photovoltaic (PV) systems, andcar (storage) batteries. The questionnaire usually covers access to these energy sourcesand expenditures for acquiring and operating them.
Time use. In areas where biomass is used extensively for cooking or heating, specializedhousehold energy surveys often contain large sections that investigate the time house-hold members spend collecting biomass and tending cooking fires.
Energy end use. Specialized household energy surveys can investigate in detail the enduses of the energy sources consumed in order to quantify the benefits that householdsobtain from them. For example, to measure electric lighting’s effects on rural households,one must know the number of lighting appliances customers used before and after elec-trification. For households without electricity, these appliances include non-electricequipment (for example, candles, simple kerosene wick lamps, regulated wick lamps[hurricane lanterns], and pressurized kerosene lamps). For households with electricity,they include incandescent, fluorescent, and compact fluorescent lamps. The question-naire must collect data on the length of time each lamp is used during a typical day. Withthis information, researchers can compare electrified and non-electrified rural householdswith regard to price and quantity of lumen hours used. Households with electric lampstypically consume more than 20 times more lighting than households with kerosenelamps; however, the price per unit of light is substantially lower. Analysts can use suchinformation to quantify the benefits of electric lighting for rural households, using meth-ods involving willingness to pay.
Attitudes. Specialized household energy surveys often contain sections that explore house-hold attitudes toward energy services. For example, households may have the option toconnect to grid electricity service, but for various reasons choose not to. Respondents canbe queried about the reasons for their choices. Their answers may reveal high up-front con-nection charges, side payments to utility providers, or inability to wire their houses inter-nally for lack of qualified electricians or because of safety issues involving the materials usedto construct their houses.
Socioeconomic information of households. Specialized household energy surveys usually con-tain a limited set of questions on sources of income and expenditures for non-energy goodsand services.2 In addition, specialized household energy surveys usually collect cursory infor-mation on other household socioeconomic characteristics (for example, housing or level ofeducational attainment); however, they rarely contain extensive modules on such topics.
Other Distinguishing Features of Both Types of Surveys
Questionnaire design. Questionnaires of LSMS surveys and specialized household energy sur-veys are not static or uniform. Both types vary considerably by country and are customized
Energy Policies and Multitopic Household Surveys 7
2. LSMS surveys, by contrast, aim at a comprehensive measure of household consumption; thus, theycontain more reliable income and expenditure data, which is essential for distributional analysis.
to the identified analytical needs that make a survey necessary. Typically, a national energyministry or energy utility commissions specialized household energy surveys and retainscontrol over their questionnaire design. This control can ensure that sufficient questionsare included to permit a detailed investigation of energy end use, time use, attitudes, ini-tial cost of obtaining service, and other information important for energy policy. Thedesign process should allow for adequate consultation with other sector ministries andresearch institutions in determining questionnaire content. In practice, however, suchconsultation is often ad hoc.
By contrast, design of LSMS survey questionnaires usually involves forming a com-mittee chaired by the national planning or statistical agency; the committee typicallyincludes members from sector ministries, civil society, research institutions, universi-ties, and development agencies. It oversees questionnaire design through an iterativeprocess. Because LSMS questionnaires can yield data useful for analysis of a great rangeof public-policy issues, many more modules and questions are usually proposed thancan be accommodated—the length of the questionnaire must be limited to avoid respon-dent fatigue. Thus, it is important that energy specialists fully participate in the LSMSsurvey design process to ensure that essential, well-formulated energy questions areincluded.
Sample design. Both types of surveys are based on multi-stage stratified probability designs,using small sample sizes of 2,000–5,000 households to minimize non-sampling errors.3
Their small size usually precludes disaggregating the results to small geographical areas.Domains of study (for example, urban/rural) are identified; within each, a stratified two-stage cluster design is used (clustering interviews helps to reduce cost). LSMS surveys aretypically national in coverage, while specialized household energy surveys are often imple-mented in a particular region (for example, where a pilot rural electrification or improvedstove program will be implemented).
Survey cost. LSMS surveys are significantly more expensive (US$0.5–1.5 million) than spe-cialized household energy surveys (US$50,000–150,000). Cost factors include sample andquestionnaire size, local per diem, and salaries. Collecting data on household energy usethrough a well-designed LSMS survey offers an extremely cost-effective opportunity.
Quality control. Extensive quality control is a hallmark of LSMS surveys. In terms ofquestionnaire design, quality control includes use of verbatim questions, explicit skippatterns, and translation of questions into respondents’ languages. Survey modules pro-vide the enumerator explicit suggestions for further probing. A custom-designed, data-entry program performs automated range and consistency checks within and acrossmodules. Other quality-control features include enumerator training (typically fourweeks), close field supervision, questionnaire pre-testing, piloting, and rigorous docu-menting of all survey stages. While specialized household energy surveys have adoptedmany of these features, their smaller budgets are a limitation that may sometimes com-promise quality control.
8 World Bank Working Paper
3. However, for LSMS surveys, larger samples are not uncommon. For example, the 2001 Bosnia andHerzegovina LSMS Survey sampled 5,402 households, and the 1994 South Africa Integrated HouseholdSurvey covered about 9,000 households.

Because the LSMS surveys are much longer, two field visits at two-week intervals toeach household are required to complete the household questionnaire. Between visits, datafor the first half of the household questionnaire are entered and checked for errors. Dur-ing the second visit, when the second half of the questionnaire is completed, these errorsare corrected. For specialized household energy surveys, households are visited only once;thus there is no re-interviewing opportunity to correct for errors.
Existing and Missing Energy Questions in LSMS Surveys
In developing these guidelines, completed LSMS surveys were reviewed to determine whatenergy questions they contained. The review found that most surveys contained someenergy questions. In the household questionnaire, energy questions centered mainly onfuel types used for cooking or lighting, along with types of household appliances. In thecommunity questionnaire, energy questions typically focused on local pricing of variouscommodities, including energy.
However, for LSMS surveys, larger samples are not uncommon. For example, the 2001Bosnia and Herzegovina LSMS Survey sampled 5,402 households, and the 1994 SouthAfrica Integrated Household Survey covered about 9,000 households.
Household Questionnaires: What Energy Questions Do They Currently Contain?
The typical LSMS household survey instrument contains four types of energy questionsthat analysts can use to better understand household energy-use patterns. These relate to:
■ electricity service providers,■ type of energy the household uses,■ expenditures on commercial fuels, and■ energy-using durable goods.
Electricity service providers. Nearly all LSMS household questionnaires ask householdswhether they have electricity service. This question is sometimes followed by another todetermine the service provider (utility, self-generated, or other), as well as other questionson monthly household expenditures.
Type of energy the household uses. Questions regarding the types of energy householdsuse ask respondents about their households’ energy sources for various end uses (forexample, “What is your principal source of lighting?” or “What is your primary fuel forcooking?”). In some cases, these questions may be followed by others regarding the sec-ondary fuels used for such activities (Komives, Whittington, and Wu 2002). Since anyhousehold that has electricity uses it for lighting, the question on source of energy usedfor lighting can be used to determine whether the household has an electricity connec-tion. In countries where space heating is common, respondents usually are asked suchquestions as “What is your primary fuel for space heating?” or “What is your main energysource for heating?”
Energy Policies and Multitopic Household Surveys 9

Expenditures on commercial fuels. Questions on expenditures ask respondents how muchmoney their households spent during the last week or month on listed non-food items,which often include a variety of fuels (for example, candles, batteries, bottled gas, kerosene,charcoal, and fuelwood). The responses reveal whether the household purchased a partic-ular fuel and the monthly expenditures on it. Certain fuels are sometimes lumped togetherin ways that make it difficult to disaggregate expenditures on individual fuels.
Energy-using durable goods. Questions on durable goods present respondents a long listfrom which they are asked to indicate which goods their households own. The list typicallyincludes electrical appliances (for example, fans and televisions) and cooking equipment(for example, stoves and hot plates). To enable a calculation of the flow of services fromsuch durable goods, further questions on the age and present value of the item are asked.
Although most LSMS household surveys contain all four sets of questions, the level ofsophistication varies widely. Some include only two questions with which to determinewhether a household has an electricity connection and, if so, the level of monthly expen-diture. Others include 10 or more questions to probe whether the household has a work-ing electricity meter, whether it shares its bill with other households, household billingfrequency, and number of hours of electricity service. Some instruments include smallenterprise modules to collect information on the electricity households use for business orother productive purposes.
Some LSMS household questionnaires ask energy questions with regard to time use(Harvey and Taylor 2000). These questions involve how much time household membersspend collecting fuelwood or other biomass fuels used for cooking and heating. The ques-tions sometimes detail which household members do this type of work, where the fuel iscollected, and the type of biomass stove used for cooking.
Community Questionnaires: What Energy Questions Do They Currently Contain?
In the LSMS community questionnaire, the most common energy-related questions involveavailability and prices. They ask respondents about the availability and pricing of such fuelsas charcoal, fuelwood, kerosene, LPG, candles, coal, and batteries. Some survey instru-ments include questions on the percentage of households in the community with electric-ity service or ask about the number of hours electricity service is usually available. A fewask how many years the community has had electricity service and whether electricity utilityownership is public or private.
LSMS Surveys: What Energy Questions Are Currently Missing?
Most LSMS surveys ask only about the main source of energy for a particular purpose.Because the survey permits only one answer, it is not possible to deduce which minorenergy sources households use for lighting, cooking, and other end uses. Community ques-tionnaires seldom include a comprehensive list of all energy sources when they ask whichfuels are available in the community; thus, it is not possible to deduce which energy sourcesavailable in the community households choose not to use. To model the determinants ofhouseholds’ fuel-choice thoroughly, it is important to accurately characterize all of theavailable energy options that a household does not choose.
10 World Bank Working Paper
In addition, LSMS surveys typically lack sufficiently detailed questions on:
■ pricing in order to accurately determine unit prices households pay for fuels andelectricity (community questionnaires do not always include questions on pricesof all the energy sources available in the community);
■ connection fees;■ service quality and supply reliability from service providers and retail distributors;■ seasonal variation, as it relates to pricing and service reliability;■ household coping costs (e.g., how households behave during power outages or fuel
shortages);■ quantities of fuels and electricity consumed;4 and■ attitudes toward various energy sources (e.g., whether households perceive par-
ticular types of energy as relatively clean or polluting, convenient, expensive, orreliable).
Energy and Development Outcomes: The Issue of Causality
The issue of causality is a fundamental concern for development research. Causal modelsare needed to link improvements in energy infrastructure services with such desired out-comes as improved household health, education, or income. An analyst must know howa policy intervention will affect household decisions and, in turn, energy markets. TheLSMS survey can be used to develop such causal models if better energy information isavailable.
However, the statistical and econometric work associated with using LSMS survey dataon pricing and quantities can be challenging, and the socioeconomic information withwhich to estimate household demand functions may not be available. To identify thedemand function, policy analysts must have access to variations in the price of fuel or elec-tricity resulting from changing cost conditions. These may not be available because ofunchanging, nationally uniform tariffs. Also, increasing block tariff structures pose diffi-culties because the marginal and average prices a household pays depend on its own deci-sion about how much to use. At a minimum, estimating demand functions necessitatesgathering data on the tariff structures applied to households in the LSMS survey sample.
In addition to estimating development outcomes (for example, improved health oreducational attainment), causality is important in analyzing the costs and benefits ofenergy services. Most cost-benefit analysis is based on “with and without” or “before andafter” comparisons, implying that the intervention is causally related to the change in sta-tus of an individual, household, business, or other social entity. Seriously evaluating theintervention’s effect requires some type of control group. After the causal (or at least attrib-uted) benefits are identified, the issue becomes how to measure them in order to comparethem to the cost of the energy service.
Energy Policies and Multitopic Household Surveys 11
4. Quantities of fuels consumed by the household must be back-calculated from data on householdexpenditures, using estimates of prices paid by households that sometimes are taken from a source otherthan the LSMS. In practice, this approach often proves problematic because information on the applica-ble tariff or price is not available or responses to the fuel expenditure questions are unreliable.

LSMS survey data can be used to estimate the benefits of infrastructure investmentsand policy interventions—and thereby help infrastructure analysts and task managers toappraise new projects—in three ways. The simplest method is to use data on the house-hold costs of coping with unreliable services as a measure of the benefits of service qualityimprovement. The argument is that, if service quality is improved, households will expe-rience economic benefits in the form of cost savings because they will no longer spendfinancial resources on coping with unreliable services.
The second method involves estimating a demand curve for a particular service basedon price-quantity relationships derived from LSMS energy questions. In addition to its usein predicting behavioral changes in response to changes in pricing policy, this demandcurve can be used to estimate welfare gains and losses using standard cost-benefit methods(Boardman and others 2001). With an estimated demand curve for a service such as elec-tric lighting, it is possible to estimate the benefit for a rural household that switches fromone lighting source to another. An example of this type of work was developed in thePhilippines from a specialized household energy survey conducted in four regions geo-graphically representative of that country.
In special circumstances, a third method may be used, whereby an energy or infra-structure analyst includes a “stated preference” module in the LSMS survey and directlyqueries respondents about their demand (willingness to pay) for improved energy ser-vices. For example, respondents could be asked if they would agree to a specifiedmonthly increase in their monthly electricity bill in exchange for improved service reli-ability. Alternatively, choice modeling techniques might be used to explore the condi-tions under which a household would switch fuels for various uses. These techniques usesurvey techniques to value willingness to pay for levels and types of services (Mitchelland Carson 1988; Kopp, Schwarz, and Pommerehne 1997). The techniques were firstpioneered to assess the value of such public goods as a clean environment. In this case,levels of pollution were described (sometimes aided by pictures for a given situation) toindividuals to elicit their responses regarding how much they would pay to attain a cleanenvironment. Stated preference techniques, such as the contingent valuation method(CVM) and choice modeling (CM), would probably not require the use of an entireLSMS survey sample. CM techniques in particular would require samples of only a fewhundred households, not thousands as in many LSMS surveys (Haab and McConnell2002; Bennett and Blamey 2001), so the questions could be administered to a subsampleof a large sample survey.
To date, the household energy sector has rarely used stated preference methods.Experience using these methods in other sectors in developing countries suggests they canbe used successfully in the household energy sector. However, this does not imply thatsuch work is easy or straightforward. Indeed, many applications of stated preferencemethods in both developing and developed countries have not provided policymakersreliable information. Generally, the problems have involved unsophisticated samplingand questions that ask respondents how much they are willing to pay for various levels ofenergy service. People generally know the national prices for electricity and other fuelsand thus are often reluctant to express their willingness to pay much higher prices in fearthat the hypothetical situation posed by the question will become a reality. Sophisticatedsampling techniques and well-crafted questions are necessary to ensure reliable informa-tion (Whittington 1998, 2002).
12 World Bank Working Paper

A possible alternative to these techniques requires the availability of high-quality,cross-sectoral information with which to develop models of household demand for spe-cific fuel types.5 Using this approach, household demand models can potentially explainhousehold fuel choices, as well as the quantities of each fuel type used as a function of fuelprices, household income, and other socioeconomic factors. Panel data from repeatedLSMS surveys are particularly useful in evaluating the effects of policy interventions overtime. However, one should not underestimate the complexity involved in formulating andestimating such household demand models in the energy sector.
Energy Policies and Multitopic Household Surveys 13
5. This is possible with LSMS surveys.


CHAPTER 3
Importance of LSMS Survey Datafor Energy Policy Analysis
Worldwide, as many as 2.4 billion poor people live in households that have yetto make the energy transition. The traditional fuels poor people use come ata high cost in time and labor. Hundreds of millions of people—mainly
women and children—spend several hours daily gathering wood for cooking. Because ofthese demands on their time and energy, women and children are denied opportunitiesto improve their quality of life.
Household transitions to cleaner, more efficient, and more productive energy uses candramatically affect the quality of life of people in developing countries. Cooking with LPGinstead of biomass and using efficient wood stoves with chimneys instead of open firesreduce indoor air pollution, a major cause of respiratory illness. Irrigating using electricmotors and diesel engines instead of traditional methods that use animal and humanpower can increase agricultural productivity. Using electric lighting rather than kerosenelamps encourages evening reading and school attendance. In addition, electricity supplyenables households to engage in income-generating activities.
Household Energy Transitions
A significant body of literature on household energy transitions has focused on how house-holds ascend what has been called an energy ladder (Barnes 1990; Leach 1986). At the bot-tom of the ladder, many people use low-grade biomass fuels (for example, straw, dung, andwood) in inefficient and unhealthful ways. At intermediate points along the ladder, theyturn to commercial fuels (for example, charcoal, coal, and kerosene), finally switching tocleaner and more convenient fuels (for example, LPG and electricity) that can significantlyimprove their quality of life.
15

This model theorizes that households switch from low-grade fuels to ones higher upthe ladder in incremental steps. The main factors determining the type and level of fuel-switching include income, price, and urbanization (Barnes, Krutilla, and Hyde 2005). Forexample, high levels of household income make fuels higher up the energy ladder moreaffordable. Similarly, as small settlements grow into large cities, fuelwood becomes scarcerwhile commercial fuels become more readily available as a result of improved economiesof scale in infrastructure development and fuel distribution. In short, this simple modelviews the household energy transition as a smoothly sequenced evolution from fuelwoodto charcoal and kerosene and ultimately to LPG and electricity.
Transitional Pathways
More recent empirical studies have found that households retain a portfolio of fuel options;that is, at any given time, they are likely to consume a range of fuels along the energy ladder(Barnes and Qian 1992; Dewees 1989; Hosier and Kipondya 1993). These findings have ledresearchers to propose more nuanced models of the household energy transition to explainthe variety of transitional pathways encountered. Reliability of supply is just one of the fac-tors thought to play a role. Another is the cost of energy forms for various uses. Energysources have different levels of cost effectiveness and substitutability for the energy servicesthat households require (for example, heating, cooking, lighting, and motive power). Degreeof convenience, level of safety, and amount of pollution emitted into the home associatedwith the various energy sources may also be key factors affecting household choices and lev-els of consumption. For example, it is not unusual for households to use charcoal to pre-pare tea or coffee early in the morning and use fuelwood to prepare a stew cooked overseveral hours, which is eaten later in the day. It has been found that even well-off householdsuse fuelwood to bake certain types of bread and meats because of the taste it imparts.
Lower-income households, which rely more on traditional fuels than do higher-income households, are disproportionately burdened by the costs (both monetary andnon-monetary) of household energy use. Poor households are more vulnerable to priceincreases and volatility and unreliable energy supply. High start-up costs also present a sig-nificant obstacle for poor households.
Greater focus on the energy service or utility that the various energy sources providein various end-use applications is also important for government policies that encouragethe household energy transition to cleaner and more efficient energy use. For example,improved fuelwood stoves (for example, stoves fitted with chimneys that are more efficientthan traditional threestone cooking fires) reduce the amount of firewood needed to pre-pare a meal and levels of indoor smoke (Wallmo and Jacobson 1998; Barnes and others1993). Similarly, pressurized lanterns are safer than simple kerosene wick lamps and pro-duce more light output per unit of fuel used.
Indicators to Measure the Energy Transition
Indicators constructed from LSMS survey data sets—access, consumption, pricing, and reli-ability, and levels of household pollution—can be used to diagnose and track the householdenergy transition. The indicators and their variables are described below, and the questionsin the prototype modules that may be used to construct the indicators are noted.
16 World Bank Working Paper

Access Indicators
The reasons why a particular household lacks access to a modern fuel or electricity involveeither a supply-side failure (the community where the household lives lacks a local distri-bution network) or a demand-side failure (the household chooses not to use the availableservice because it is too expensive, culturally unfamiliar, or otherwise inappropriate).Because the policy implications of these failures vary so greatly, access indicators shoulddifferentiate between the two situations.
Access ratio. This indicator refers to the percentage of all households that currently usea specific fuel or electricity. It does not discriminate between demand-and supply-sideexplanations for any shortfall in access [Question F01, Fuel Sources Module; Question E01,Electricity Sources Module].
Availability ratio. This indicator refers to the percentage of all households for whoma particular fuel or electricity service is available, regardless of whether they use it. The indi-cator captures the extent to which electricity service or a particular fuel supply has reachedall areas of a country, and hence the extent to which households have the option of usingthe particular fuel or electricity source [Question C11, Electricity and Fuels in the Com-munity Module].
Usage ratio. This indicator refers to the percentage of households in communitieswhere the fuel or electricity is available that choose to use it [Question F01 and F11, FuelSources Module; Question E01, Electricity Sources Module; Question C11, Electricity andFuels in the Community Module].
Appliance use. Several appliance-use indicators may be calculated. The stock of elec-trical appliances may be used as a proxy measure of household economic well-being (sim-ilar to the ways in which housing building materials and housing type are used). In addition,a proxy indicator of indoor air pollution is the percentage of households using biomass fuelsfor cooking that own an efficient wood stove fitted with a chimney that extracts smoke tothe exterior of the dwelling. Another proxy indicator is the percentage of all households thatuse electric stoves or LPG burners and stoves [Question A04, Durable Goods (Light Bulbsand Appliances) Module; Question F01 and F11, Fuel Sources Module].
Consumption Indicators
Consumption indicators provide policymakers a picture of the relative importance of var-ious fuels and their household end uses.
Gross energy consumption. This indicator is the total energy content of fuels and elec-tricity that a household purchases. To calculate gross energy consumption, one must con-vert the quantity of each of the fuels purchased by the household into a common unit (suchas kilojoules) for the purposes of aggregation (Appendix). Low values of gross energy con-sumption may indicate that households cannot afford to consume sufficient energy to meetbasic needs of cooking, lighting, and heating. Conversely, high values may indicate thatsome energy forms are underpriced, causing wasteful use [Questions F02, F03, F04, F12,F13 and F14, Fuel Sources Module; Questions E03, Electricity Sources Module].
Net energy consumption. This indicator is an adjustment to the gross energy consump-tion variable, reflecting the efficiency factors of various fuels in different end uses. It is there-fore a measure of the useful energy obtained by the household in end-use application. To
Energy Policies and Multitopic Household Surveys 17

calculate net energy consumption from gross energy consumption, one must disaggregategross energy consumption by end-use activity, identify the appliance associated with eachend-use activity, and scale down the gross energy consumption for each activity by the effi-ciency factor for the corresponding fuel and associated appliance (Appendix) [QuestionsF02, F03, F04, F12, F13 and F14, Fuel Sources Module; Question E03, Electricity SourcesModule; Question A04, Durable Goods (Light Bulbs and Appliances) Module].
Price Indicators
Because LSMS and other multitopic household surveys can be used to collect informationon prices paid, quantities used, and expenditures for all fuels used by a specific household,various price indicators can be calculated. High values or rapid changes in these indicatorsmay signal an affordability problem among certain groups. Analysis of variations in fuelprices may reveal the presence of spatial monopolies. Price indicators include unit price,mean-weighted unit price, energy expenditure, and start-up costs.
Unit price. This indicator is the market price of each fuel and of electricity per unitpurchased. The unit prices may vary geographically and may be an indicator of localmonopolies or fuel scarcity [Questions F05, F06, F15 and F16, Fuel Sources Module; Ques-tions E03 and E05, Electricity Sources Module].
Mean-weighted unit price. The household’s average gross unit price of energy is theaverage of the unit prices for each fuel purchased by the household, weighted by the shareof that fuel in the household’s overall gross energy consumption [Questions F05, F06, F15and F16, Fuel Sources Module; Questions E03 and E05, Electricity Sources Module].
Energy expenditure. This indicator is the price of each fuel, multiplied by the quantityconsumed. When summed for all energy sources, one can estimate the aggregate house-hold energy expenditures as a percentage of household expenditure or income [QuestionsF04, F06, F14 and F16, Fuel Sources Module; Question E05, Electricity Sources Module].
Start-up costs. This indicator represents the investment costs involved in securingaccess to an energy source (for example, electricity connection charges or cost of an initialcylinder of LPG). Connection costs can be expressed as a percentage of a poor household’smonthly income [Question C06 (for electricity connection charge only), Electricity andFuels in the Community Module].
Reliability Indicators
Reliability ratio. This indicator is the average percentage of time for a given period(usually a month) that any given fuel or electricity is available for use [Questions C03 andC04, Electricity and Fuels in the Community Module].
Reliability perception. This indicator refers to gauging perceptions on the relativeavailability and scarcity of various fuel and electricity sources [Question C11, Electricityand Fuels in the Community Module].
Pollution Indicators (Measurement of Indoor Air Pollution)
In India, a recent pilot study that tested an inexpensive air pollution monitor found it accu-rate and easy to use (Balakrishna and others 2005). If LSMS surveys can use this direct way
18 World Bank Working Paper
of estimating indoor air pollution, it may be possible to construct indicators that combineconcentrations of air pollutants with the various types of cooking fuels that households use.
Using LSMS Surveys for Energy Policy Analysis
LSMS surveys can be used to understand the relationships between use of energy servicesand household welfare; these analysis, in turn, can be used to adjust energy policies. Forexample, LSMS surveys can be used to investigate associations between use of biomass fuelsand incidence of acute respiratory infection (ARI), with consequences for public healthpolicy. LSMS data can also be used to estimate prices paid and expenditures incurred, withimplications for energy pricing policy. It can also help to establish the household benefitsof rural electrification, which can inform rural electrification policy. This section outlinesthese types of analysis.
Biomass Fuel Use and Acute Respiratory Infection
Exposure to smoke from the burning of traditional solid fuels (for example, fuelwood) forcooking and heating increases the risk of disease, most notably acute lower respiratory infec-tion (ARI), in both children and adults (Smith and Mehta 2003; Kammen 2001; WHO2002).6 Women and children are disproportionately affected, in part, because of women’sprimary role in food preparation and child care, which exposes them to indoor air pollution.
Using data from a 2000 LSMS survey in Guatemala, Table 1 illustrates the associationof fuel use and respiratory illness (Ahmed and others 2005). Incidence is less in householdsthat use mainly LPG and that have a separate kitchen. By contrast, incidence is higheramong households that use fuelwood only and that lack a separate kitchen.
A 1999 study, based on information from the fourth Zimbabwe Demographic andHealth Survey, illustrates analysis that can be performed to assess the effects of cooking fueltype on ARI (Mishra 2003). In this study, control variables, identified in the research lit-erature as covariates of ARI, included age of child, sex of child, birth order of child, nutri-tional status of child, mother’s age at childbirth, mother’s education in completed years ofschooling, mother’s religion, household standard of living, and region of residence.7 Infor-mation on fuel types was used to group households into three categories (Table 2).
The results show that the unadjusted odds of having suffered from ARI are almosttwice as high among children who live in households using high-pollution biomass fuelsthan among those living in households using low-pollution LPG/natural gas or electricityfor cooking. After adjusting for the nine above-mentioned socioeconomic variables, chil-dren in households using wood, dung, or straw for cooking were more than twice as likelyto have suffered from ARI as those in households using LPG/natural gas or electricity.
The mechanism by which cooking smoke can increase risk of ARI is not fully under-stood. Disentangling the causal associations with income, ventilation, kitchen-use patterns,
Energy Policies and Multitopic Household Surveys 19
6. For a comprehensive review of studies on indoor air pollution and ARI, see Smith and others(2000).
7. Typical socioeconomic variables for which LSMS survey data is collected.

exposure times, location of kitchen, and other factors remains the subject of much exper-imental research, including carefully designed epidemiological studies. Nevertheless, it isclear that LSMS studies can be used to investigate associations between household fuel-usepatterns and ARI, and all cooking fuels consumed by the household must be accuratelymeasured.
Energy Prices and Household Expenditure
The questions set out in the fuels and electricity prototype modules in this report aredesigned to obtain accurate data on household use, quantities consumed, and prices paid.LSMS data sets that provide good-quality data on these variables can be useful in analyz-ing the effect of price changes on household welfare. A specialized household energy sur-vey conducted in Yemen in 2003 used such questions, illustrating the types of analysispossible using such data.
Tables 3 summarizes, for each income decile, the percent of households reportingkerosene use and their average consumption and expenditure on kerosene purchases.What varies by income decile is not the quantity of kerosene used, but the percentage ofhouseholds using kerosene. Thus, for example, 92 percent of households in the lowestdecile and 57 percent in highest decile use kerosene. Rural households are more likely than
20 World Bank Working Paper
Fuel
Children with Mix of fuelwood, Clean only respiratory illness Fuelwood only LPG, and other (mainly LPG) Total
Percentage 48 46 40 47
Total no. cases 3,631 1,769 649 6,049
Fuel and room for cooking
Biomass, no Mixed, no Biomass, Mixed, LPG,kitchen kitchen kitchen kitchen kitchen Total
Percentage 50 53 47 43 42 47
Total no. cases 1,167 661 2,314 1,069 841 6,052
Table 1. Respiratory Symptoms in Children, by Fuel and Cooking Space, Guatemala (2000)
Source: 2000 LSMS (Ahmed and others 2005).
Cooking fuel type(pollution level)* Percent of sample ARI prevalence
High 66.1 17.9
Medium 10.6 15.0
Low 23.3 10.1
Table 2. ARI Prevalence among Children under Five Years of Age, Zimbabwe (1999)
*High = wood, dung, or straw; medium = kerosene or charcoal; low = electricity or LPG. Source: Mishra (2003).

urban households to use kerosene (83 percent compared to 46 percent on average acrossall income deciles) reflecting, in part, easier access to LPG in urban areas (survey questionson LPG access confirm this finding).
Because kerosene is essential to the poor for cooking and lighting, many countries sub-sidize kerosene prices with the policy objective of protecting the poor. The rationale is thatthe poor should not have to pay the full cost of the fuel. However, subsidized keroseneprices have implications for public finances since the difference between the economic andsubsidized price must be absorbed by the budget. Thus, policymakers would like to knowwho benefits from the subsidy and, if the subsidy were reduced, what the reduction in ben-efits would be. Analysis using the Yemen data illustrates one method of calculating the dis-tribution of benefits.
In Yemen, the economic price of kerosene is its international price (the cif price at theport of Aden), plus distribution costs and taxes. Since the 2003 ex-distributor price (17 rialsper liter) was substantially below that year’s economic price (40 rials per liter), the differ-ence represents the subsidy consumers received. Because the total quantity of kerosene con-sumed by each income decile is known, it is straightforward to calculate the distribution ofthe total amount of the subsidy. As Figure 1 shows, the poorest decile receives 13 percent ofthe total subsidy, while the richest receives 7 percent. The poverty rate in Yemen in 2003 wasabout 40 percent, meaning that 52 percent of the total subsidy goes to the non-poor. Usingthe data, it is also possible to estimate how removing the subsidy affects household expen-diture. Figure 1 shows the increase in expenditure as a percent of total household budget.The subsidy is equivalent to 2.5 percent of the total expenditure of the poorest households,but only 0.2 percent of the richest.8
Energy Policies and Multitopic Household Surveys 21
8. The calculation assumed no fuel switching and a price elasticity of −0.2.
Households reporting use Consumption Expenditure
Income (percent) (liters per month) (YR per month)
decile Urban Rural All Urban Rural All Urban Rural All
1 79 94 92 8 10 10 282 394 386
2 66 93 89 10 11 11 368 446 436
3 50 85 80 10 11 11 313 433 422
4 56 90 83 6 11 11 233 475 442
5 52 86 79 6 9 8 268 367 354
6 46 80 71 7 10 9 259 397 374
7 52 80 72 9 11 11 360 415 404
8 40 74 64 8 11 10 304 418 398
9 27 71 57 7 11 10 230 377 354
10 35 68 57 7 11 10 303 406 384
Average 46 83 75 8 10 10 297 414 397
Table 3. Kerosene Use by Income Decile in Yemen (2003)
Source: World Bank (2005).

Rural Electrification and Development
Rural electrification can transform rural people’s lives in several major ways. Electrifica-tion of households can directly improve household welfare. Electricity for such productiveuses as irrigation or rural enterprises can boost incomes. Electrification of rural health clin-ics, schools, and local government offices facilitates the delivery of public services.
For newly electrified households, the predominant use is lighting (Barkat and others2002; Barnes and Floor 1996; Denton 1979). Numerous studies have found a correlationbetween electricity used in rural households and the amount of time adults read and chil-dren study (Barnes 1988; World Bank 2002, 2004). The probable reason is that kerosenelamps and candles, the usual alternative to electricity in rural households, provide inade-quate light for reading (Nieuwenhout, Van de Rijt, and Wiggelinkhuizen 1998). The sig-nificantly higher levels of lighting that electric lamps provide enable comfortable reading,which can potentially improve education and school attendance (Khandker, Lavy, andFilmer 1994; Khandker 1996; Gordon 1997).
After lighting, household priority uses of electricity include televisions, fans, and otherhousehold appliances (Sathaye and Tyler 1991; World Bank 2002; Saunders and others1975). Television, increasingly found in electrified rural households, is an important sourceof entertainment and information.
Households with electricity may experience time savings if they no longer must travelto battery-charging stations in a nearby town. Rural electrification can potentially support
22 World Bank Working Paper
Figure 1. Share of Total Subsidy Received and Share of Subsidy in Household Budget, By Income Decile
15
10
Per
cent
Sha
re
5
% total subsidy
% HH budget
d[9]d[8]d[7]d[6]d[5]d[4]d[3]d[2]d[1]% total subsidy% HH budget
13%2.5%
13%1.4%
13%1.2%
9%1.0%
9%0.8%
9%0.7%
11%0.7%
8%0.6%
7% 7%0.4% 0.2%
d[10]0
Source: World Bank (2005).
improvements in rural productivity through the use of electric pumps for irrigation andsmall electrical appliances in rural businesses (Ranganathan and Ramanayya 1998; WorldBank 2002; Cabraal, Barnes, and Agarwal 2005; World Bank 1994).
The improvements that electrification brings are amplified when accompanied bycomplementary investments, such as infrastructure (USAID 1983). A 1999 study in Perufound that providing a combination of infrastructure services—such as electricity, water,sanitation, and telephones—has a greater effect on poverty reduction
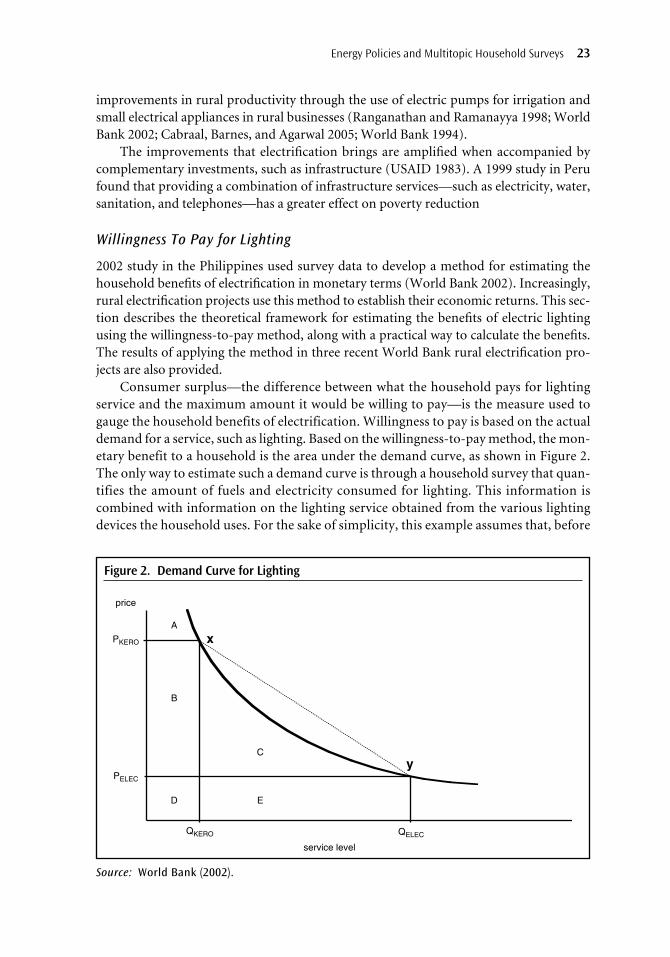
Willingness To Pay for Lighting
2002 study in the Philippines used survey data to develop a method for estimating thehousehold benefits of electrification in monetary terms (World Bank 2002). Increasingly,rural electrification projects use this method to establish their economic returns. This sec-tion describes the theoretical framework for estimating the benefits of electric lightingusing the willingness-to-pay method, along with a practical way to calculate the benefits.The results of applying the method in three recent World Bank rural electrification pro-jects are also provided.
Consumer surplus—the difference between what the household pays for lightingservice and the maximum amount it would be willing to pay—is the measure used togauge the household benefits of electrification. Willingness to pay is based on the actualdemand for a service, such as lighting. Based on the willingness-to-pay method, the mon-etary benefit to a household is the area under the demand curve, as shown in Figure 2.The only way to estimate such a demand curve is through a household survey that quan-tifies the amount of fuels and electricity consumed for lighting. This information iscombined with information on the lighting service obtained from the various lightingdevices the household uses. For the sake of simplicity, this example assumes that, before
Energy Policies and Multitopic Household Surveys 23
Figure 2. Demand Curve for Lighting
price
PKERO
PELEC
QKERO
D E
service level
QELEC
C
B
A
x
y
Source: World Bank (2002).

electrification, the household only uses kerosene in kerosene lamps for lighting (in addi-tion to kerosene, various other lighting sources, such as candles and dry-cell batteries,are usually used).
Before a household obtains electricity from the national or local grid, it uses keroseneor another form of energy for lighting. Thus, before electrification, the quantity of light-ing services (kilolumen hours [klm-hr] per month consumed) is QKERO, at the price PKERO.Thus, total household expenditure on lighting is QKERO × PKERO, which equals area B + D.When a household obtains electricity service, its demand for lighting changes to QELEC atprice PELEC.
Total willingness to pay for the service at level QKERO is the total area under the demandcurve to that level of consumption; that is, area A + B + D. This is the total benefit to theconsumer. However, the cost is area B + D, and therefore the net benefit or consumer sur-plus is the difference between the two, namely area A.
After electrification, the level of service (in the case of lighting, the number of lumen-hours) typically increases substantially; consumption increases from QKERO to QELEC, but theprice paid for the electrified service also falls from PKERO to PELEC. Now the household’s expen-diture for electricity is PELEC × QELEC, which equals area D + E.
At this level of consumption, the total area under the demand curve to QELEC—that is,the total benefit—is now area A + B + C + D + E. Therefore, the net benefit or consumersurplus, after subtracting the cost or D + E, equals A + B + C. Thus, it follows that the neteconomic benefit of electrification is the increase in consumer surplus, or area B + C. AreasB and D can be calculated using survey data on prices and quantities of kerosene used forlighting. The types of kerosene lanterns that households use may also be known from theLSMS survey (Durable Goods [Light Bulbs and Appliances] Module) or can be otherwisedetermined. The service obtained—expressed as klm-hr per month—can be obtained bymultiplying lamp light output by the number of hours per month that lamps owned by thehousehold are used.9
Similarly, area E is calculated by multiplying the total cost of electricity used for light-ing by the service obtained. To calculate the service obtained by the households, one mustacquire information on the number of electric lamps the household uses, their rating, andhours of usage per month. Manufacturer information on light output from various typesof light bulbs can then be used to calculate QELEC (klm-hr per month)10
The shape of the demand curve cannot be determined when only two demand points(for lighting obtained using kerosene and electricity) are known. In the absence of empir-ical data for intermediate points along the demand curve (for lighting obtained using dry-cell batteries, diesel gensets, or car batteries), assumptions on the shape of the curvebetween points x and y are critical to calculate area C; in such a case, a standard functionalspecification with a constant elasticity may be used.
24 World Bank Working Paper
9. A simple kerosene lamp may provide up to 40 lumens and a hurricane lamp 10–100 lumens,depending on the type of wick and lamp. A kerosene mantle lamp may provide approximately 400 lumens.Actual values vary and should be obtained from experimental data.
10. Approximate light output of a 40-W incandescent lamp is 400 lumens, 630 lumens for a 60-Wincandescent lamp, 600 lumens for a 15-W fluorescent lamp, and 900 lumens for a 16-W compact fluo-rescent lamp (CFL).

Since its development using survey data from the Philippines, this method has been appliedin economic analysis of several World Bank projects. Table 4 summarizes survey resultsfrom three projects. These calculations used data from specialized household energy sur-veys; however, similar calculations could be made using data from LSMS surveys thatincorporate the questions presented in the prototype modules.
These household benefits are for lighting alone, and they are well above the cost ofelectricity service. As is well known, households can derive an array of other benefitsfrom electricity, including entertainment, food preservation, and comfort from fans.
These household benefits are for lighting alone, and they are well above the cost of elec-tricity service. As is well known, households can derive an array of other benefits fromelectricity, including entertainment, food preservation, and comfort from fans.
Electricity and Education: Results from India and Nicaragua
As pointed out above, the benefits of electrification include time saving, increased produc-tivity, and improved health and education outcomes. Thus, the willingness-to-pay measurefor lighting represents only a portion of the benefits. The Philippines study described aboveis one of the few to have estimated the education and time-saving benefits of electrificationin monetary terms. When it estimated the combined effect of electricity and education onincome, it found that wage earners in households with electricity can expect to earn $37–47more per month than their counterparts without electricity. This amount represents about25 percent of a typical household’s monthly income in the survey areas.
Data from the LSMS and specialized household energy surveys can provide some evi-dence of the association between electrification and education, even if falling short of esti-mating monetary values of the benefits (Table 5).
Energy Policies and Multitopic Household Surveys 25
Project country
Factor Bolivia Lao PDR Peru
QKERO (klm-hr per month) 7 20 4.6
QELEC (klm-hr per month) 90 435 363
PKERO ($ per klm-hr) 0.48 0.195 0.57
PELEC ($ per klm-hr) 0.04 0.003 0.01
Elasticity −1.03 −1.74 −1.08
B (US$) 3.08 3.84 2.58
C (US$) 5.56 6.05 9.95
D (US$) 0.28 0.06 0.05
E (US$) 3.32 1.25 3.58
Total willingness to pay 12.24 11.20 16.16(per household per month)
Table 4. Willingness-to-pay Results from Three Projects
Sources: World Bank project appraisal documents: ERTIC Project PAD (Bolivia data), 2003; SecondSouthern Provinces Rural Electrification Project (Lao PRD data), 2004; Peru Rural ElectrificationProject (Peru data), 2005.

The 1996 India survey found that, in households without electricity, virtually nowomen read, regardless of income class. By contrast, in households with electricity, liter-acy was much higher, regardless of income class. Findings from the 1998 Nicaragua LSMSsurvey were similar. Electricity in the home was highly correlated with school attendanceand family literacy. Obviously, these correlations constructed from survey data do notestablish causality; nevertheless, the findings are compelling and are consistent with thosein other countries. The implication is that this could be an important research area forfuture LSMS surveys with better energy questions.
26 World Bank Working Paper
India Specialized Household Energy Survey, 1996
Family literacy (%) Women reading in the last 24 hours (%)
Income With Without With Without decile electricity electricity electricity electricity
Lowest 48.2 7.7 29.9 4.1
Middle 57.3 14.1 46.3 2.1
Highest 64.4 26.5 39.0 2.2
Nicaragua LSMS Survey, 1998
Household literacy (%) Children enrolled in school (%)
With Without With Without Region electricity electricity electricity electricity
Atlantic 74 46 77 40
Central 74 50 77 46
Pacific 77 62 73 62
Total 73 53 72 50
Table 5. Electricity and Education Links in India and Nicaragua
Sources: Kulkarni and Barnes (2005); World Bank (2002).

CHAPTER 4
The Way Forward
The purpose of these guidelines is to design a set of energy questions for use inLSMS surveys that, while not as extensive as those in the specialized householdenergy surveys, could still provide sufficient information with which to improve
analysis of household energy use.It is proposed that the few ad hoc questions on energy use currently found in LSMS
surveys—which yield little information useful to policymakers—be replaced by the ques-tions presented in the prototype energy modules that follow. The rationale for includingthese particular questions is based on the review of the key policy issues that householddata can inform and an assessment of the feasibility of including such questions in LSMSsurveys. The format of the proposed modules is similar to that often used in current LSMSsurveys in order to facilitate their adoption.
Formulation of the questions presented in the prototype modules draws on experiencefrom recent LSMS and specialized household energy surveys. The notes provided point outcommonly encountered problems and how they may be overcome. The notes caution thatthe questions must be customized to the particular country for which a survey is designed,taking into account its unique circumstances of fuel and electricity availability and use.
The prototype modules presented below have been designed for insertion in an LSMSsurvey as stand-alone modules. Since the questions in each prototype module complementeach other, their potential to yield the greatest amount of data on household energy use willbe realized if they are kept whole. However, because of the necessity to limit the number ofmodules, LSMS survey designers may not always be able to insert stand-alone modules.Instead, the electricity and fuels questions on access, consumption, prices, costs, and enduse in the prototype modules may be integrated into another module, such as the HousingModule, and questions on time spent collecting fuels into the Time Use and Labor Module.
27

Questions in the Durable Goods (Light Bulbs and Appliances) Module may be inte-grated into the LSMS Durable Goods Module. It should be kept in mind that, in additionto the question “Does your household own [item]?,” the essential complementary ques-tions (in order to estimate a monetary value of the benefits of energy use) are “How many[items] do you own?” and “How many hours during the last week did you use the [items]?”
For best results, it is recommended that all of the questions in the prototype modulesbe included.
Fuel Sources Module
The purpose of the Fuel Sources Module is to collect information on household access,consumption, and payment for all the fuels used (Figure 3). Those household membersthat pay for or collect fuels are usually the best-informed respondents.
The list of household fuels in this module is indicative (Table 6). The LSMS surveydesigner may need to delete fuels that are not available in the country for which the LSMSis being designed and add others. The survey designer should recall that fuel shortages orprice advantages of one fuel over another can induce fuel substitution. For example, if LPGis subsidized and gasoline is not, households can have their car fuel systems adapted to useLPG instead of gasoline.
Notes on Fuel Sources Prototype Module
F01 and F11: During the last 30 days, has your household used [for each fuel]?These questions establish which energy sources the household uses. It is important to collectinformation about all fuels used by the household, not simply those most frequently used, ashouseholds tend to use a portfolio of fuels. Design of the module ensures that enumeratorswill first determine which fuels and electricity sources households use. Only after establishingwhich fuels households have used in the last 30 days and which electricity sources are availableto them will the enumerator ask the follow-up questions for each fuel and electricity source.
F02 and F12: What is the typical unit of measure [for each fuel]?Sometimes atypical units are collected (for example, large tree limbs in the case of firewood).The enumerator will have to adjust these for a commonly used unit. Instructions shouldbe given to the enumerators to make notes of all such cases.
F03: What is the approximate weight or volume of a typical unit of [for each fuel]?F13: What is the approximate weight or volume of a typical unit of [for each fuel]?Accurate measurement of the units in which energy is consumed is critical to data quality. Thecomplexity of accurately capturing this information varies substantially across fuels. Some aremeasured in formal scientific units (for example, liters in the case of kerosene or kilogramsfor LPG). However, respondents may think more in terms of the cylinders or bottles in whichthe fuel is sold rather than the scientific units they represent. For example, kerosene is oftensold in several sizes of plastic bottles, and respondents may not know their volumetric con-tent. It is important to develop appropriate prompting strategies so that the enumerator canestablish which sizes the household uses and ensure that the correct weight is entered.
Specific fuels present their unique challenges. For example, the weight contained inLPG cylinders can differ markedly from that marked on the cylinders. Using LSMS survey
28 World Bank Working Paper
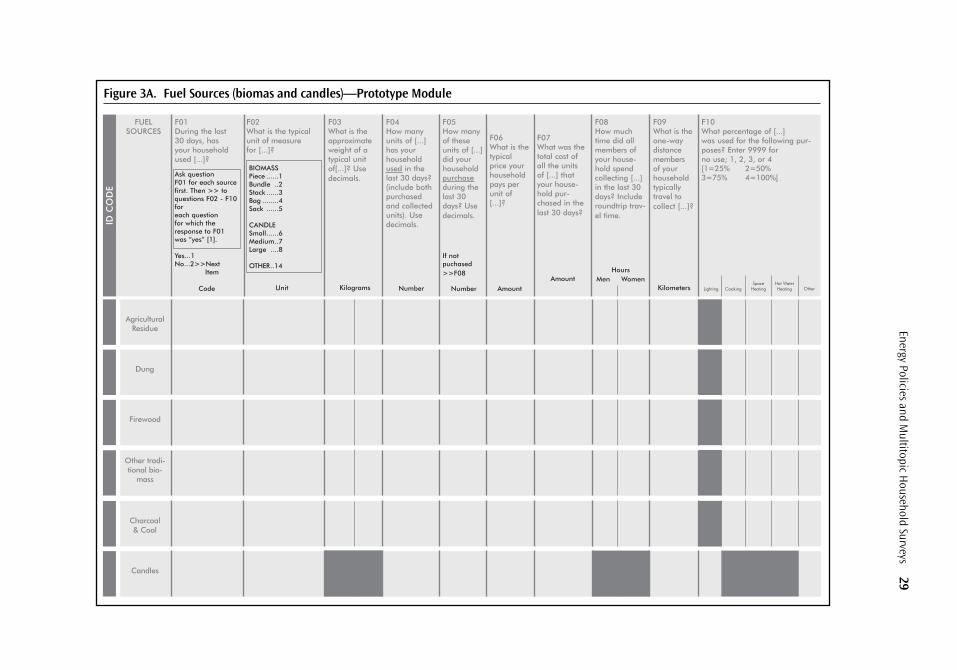
Energy Policies and Multitopic H
ousehold Surveys29
Figure 3A. Fuel Sources (biomas and candles)—Prototype Module

30W
orld Bank Working Paper
Figure 3B. Fuel Sources (gaseous and liquid fules)—Prototype Module

Energy Policies and Multitopic Household Surveys 31
data, the analyst (not the field enumerator) will need to establish the average net weight ofLPG cylinders sold. Biomass fuels present the most difficult case in that they tend to be soldor collected in measures—that is, bags of charcoal, bundles of firewood, or cakes of dung—for which only approximate conversion to scientific units may be possible. It is thereforeessential to begin the questionnaire design process with a detailed understanding of theunits in which fuels are measured and sold in local markets, as well as a method for con-verting these into scientific units. For example, in certain countries, it is not unusual forcharcoal to be sold in discarded fertilizer bags. It is not difficult to establish an averageweight for the amount of charcoal contained in these bags.
F04 and F14: How many units of [for each fuel] has your household used in the last 30 days?These questions record the household’s physical consumption of each fuel during the last30 days. Different fuels tend to have distinct time cycles for purchase and consumption,which make accurate responses problematic. Households tend to make frequent purchasesof certain fuels, such as kerosene. They purchase these in small quantities and consumethem entirely within days or weeks.
Households (especially poor ones) tend to make less frequent purchases of such fuelsas LPG, which may be available only in 11-kg cylinders. The household may consume asingle cylinder over a period longer than 30 days. The difficulty is to accurately estimatewhat fraction of the 11-kg cylinder the household consumed over the last 30-day period.As pointed out above, seasonality can be an important factor in fuel consumption. Con-sumption of fuels for space heating peaks during cold seasons. Religious festivals and har-vests are often a factor that causes increased consumption of transport and cooking fuels.Thus, local habits for obtaining fuels should be considered during the questionnaire designstage so that the choice of time period can be adapted as needed and appropriate prompt-ing strategies can be developed for the interview.
In deciding whether to specify the last 30 days or another time period for this question,as well as for Questions F05, F07, F15 and F17, the survey designer should take into account
Fuel Household use
Firewood, animal dung, Cooking andand other biomass hot-water heating
Charcoal Cooking and hot-water heating
Candles Lighting
Kerosene Lighting (wick and hurricane lamps)and cooking
Biogas Cooking
Liquefied petroleum gas (LPG) Cooking and lighting (less often)
Diesel Lighting (wick and hurricane lamps)and electricity (diesel generators)
Gasoline Transport (motor bikes and cars)
District heating Space heating
Natural gas Cooking and space heating
Table 6. Fuels and Their Common Household Uses

the particular country’s energy-use patterns and whether it has marked seasonal variationsof use. If households have marked seasonal variations in fuels consumption, it may be nec-essary to ask an additional question on the household’s average consumption per month.
F05 and F15: How many of these units of [for each fuel] did your household purchase inthe last 30 days?F06 and F16: What is the typical price your household pays per unit of [for each fuel]?F07 and F17: What was the total cost of all the units of [for each fuel] that your house-hold purchased in the last 30 days?Questions F05, F06, F07, F15, F16 and F17 are used to record the household’s expenditureon each fuel source during the last 30 days. Expenditure is calculated by multiplying thenumber of units purchased (F05 or F15) by the price paid (F06 or F16). The result of thiscalculation should be consistent with the response to Questions F07 and F17. If the resultsare not consistent, the analyst must decide which is more reliable. The answers are straight-forward for fuels purchased frequently in cash. However, as noted above, some fuels maybe purchased less frequently than once per month, making it harder for households to esti-mate monthly expenditure.
F08: How much time did all members of your household spend collecting [for each bio-mass fuel] in the last 30 days? Include time spent purchasing and collecting, as well asround-trip travel.This question identifies the extent to which households pay for different fuels in terms ofthe time they expend collecting them. This question is expected to be relevant primarily fortraditional biomass fuels, including dung and fuelwood. However, it may sometimes berelevant for other fuels (for example, car batteries, which may need to be taken to the nearesttown for recharging). This question, combined with other LSMS survey information, canbe used to explore which types of activities are curtailed by households who engage in woodcollection. Identity of the household members involved in fuel collection is importantbecause it affects the way in which the time dedicated to this activity is valued. Dependingon the context, it may be important to distinguish not only between men and women andadults and children, but also adults that earn income outside the household and children inand out of school. Households members may combine time spent collecting or purchasingfuels with other tasks. Local habits for obtaining fuels should be considered during thequestionnaire design stage so that the question can be adapted as needed.
F09: What is the one-way distance members of your household typically travel to collect[for each biomass fuel]?F18: What is the one-way distance members of your household typically travel to pur-chase for each liquid fuel]?These questions record the distance a household travels to reach the place where each typeof energy is collected or purchased. One should note that it may be difficult to obtain accu-rate distance estimates from respondents. Research addressing this issue and the relativemerits of asking for “time to source” is being undertaken and may be helpful to review.Some objective testing of this measure prior to conducting a survey is recommended.
F10 and F19: What percentage of [for each fuel] was used for the following purposes?These questions document the uses to which each fuel is put. The end-use categories arecountry-specific; thus, the module must be carefully reviewed so that it is adapted to theparticular country. For example, if the country’s use of fuels for space heating is negligi-
32 World Bank Working Paper

ble, that end-use category can be removed from the questionnaire. In-country testing maybe needed to determine if the percentages can be left open or if set categories (1 = 25%,2 = 50%, 3 = 75%, and 4 = 100%) are needed.
Electricity Sources Modules (Grid and Off-grid)
The Electricity Sources (Grid) Module (Figure 4a) pertains to electricity the householdobtains from a utility (for example, grid electricity), community system (for example,mini- and micro-hydro systems), or neighbor or relative (informal connections to a neigh-bor or relative’s grid supply or genset). The purpose of this module is to collect all relevantinformation on electricity access, consumption, payment, and uses, bearing in mind thathouseholds may rely on a variety of sources. The household member that pays for elec-tricity purchases is usually the best-informed respondent.
E01 and E06: Does your household have electricity from [for each electricity source]?This question is asked first for all possible electricity sources (Box 1). Only after answeringfor all possible sources does the interviewer ask Question E02 (for grid, genset, and micro-hydro sources). If the household obtains no electricity from the grid, the interviewer willmove on to Question E07 (for off-grid sources). Households may have access to grid elec-tricity from a utility without being utility customers if they obtain electricity illegally (unof-ficial grid connection) or informally (by wiring up to a neighbor’s system). The modulesomewhat artificially distinguishes between utility customers and non-customers by treat-ing grid electricity in the latter case as a distinct electricity source. The appropriate expres-sion for these types of arrangements must be determined by taking local conditions intoaccount. If the grid supply is particularly unreliable, the household may have both grid andnon-grid sources, with the latter used as a back-up system. Question E01 also clarifies thename of the electric utility that supplies the household so that it is possible to later verifythe tariffs and charges faced by the household. The names of all available formal electric-ity service providers should be listed on the printed questionnaire. The question shouldtherefore be adapted to local circumstances to ensure that this information is obtained.
Notes on Electricity Sources (Grid) Prototype Module
E02: What is electricity used for in your home?List up to five in order of importance. The end-use categories are country-specific and mustbe reviewed carefully when the module is adapted for use in any particular country. Forexample, if there is negligible electricity use for space heating, hot-water heating, or cook-ing in the country, these end-use categories can be removed from the questionnaire.Because substitution of electricity with fuels for certain applications may involve impor-tant policy issues, design of this question and the corresponding one in the fuels sourcesmodule (F10) may need to be considered together (for example, policymakers want to dis-courage use of electricity for cooking [because it causes demand to spike during eveninghours, making it impossible for the utility to match the demand load during that time] andpromote substitution by LPG or natural gas). Information obtained through the DurableGoods (Light Bulbs and Appliances) Module will complement and serve to validate theinformation obtained with this question.
Energy Policies and Multitopic Household Surveys 33

34W
orld Bank Working Paper
Figure 4a. Electricity Sources (Grid) Prototype Module

Energy Policies and Multitopic H
ousehold Surveys35
Figure 4b. Electricity Sources (Off-grid) Prototype Module
E06Does your householdhave electricity from[...]?
Ask question E06 for eachsource first. Then >> toquestions E07 - E011 foreach question for whichthe response to E06 was“yes” [1].
Yes...1No...2
E07What is electricity used for in yourhome? List up to five.
Lighting ..................................1TV/Radio ................................2Fans ......................................3Refrigerator ............................4Other(Specify) ..................................5
E08How much did youpay for your [...]?purchase cost ofsystem if obtainedfor free:code 9999
Amount
E09How did you pay for this [...]?
Cash Purchase ..............1Lease ............................2Credit ............................3Other ............................4
E10How much didyou pay to oper -ate your [...] inthe last 30days?
Amount
E11What is the rating of your[...]?
SOLAR(PV) HOME SYSTEM
STORAGE (CAR) BATTERY
GENSET(PERSONAL)
E12Do you use electricity in your household for homebusiness purposes?
Yes...1No...2
Watt peak(Wp)
Battery chargingcost for last 30Days
Volts Amp Hours
Fuel cost for last30 Days
kW
1st UseCode
2nd UseCode
3rd UseCode
4th UseCode
5th UseCode
DRY CELLBATTERIES
Cost of all drycell batteriesused in last 30Days
ELECTRICITY SOURCES(Continued)Now I would like to askyou about your source(s)of electricity . First I willask you questions aboutyour electricity usagefrom grid sources.
ID C
OD
E

E03: How much electricity did the household consume from [for each electricity source]during 30 days of the last billing period?For formal metered connections to grid electricity, consumption is recorded on the monthlybill received by the customer. If possible, the household should be asked to show the enu-merator the bill. If the norms of confidentiality permit, it may be desirable to record thehousehold’s customer number so that its consumption record can be matched with that ofthe customer database. When the bill cannot be shown by the respondent (or when thehousehold has a pre-payment meter and does not receive a bill), it is unlikely that respon-dents can answer this question accurately. Therefore, when the bill is unavailable, this boxshould be left blank. During analysis of the data set, the quantity of electricity consumedmay be inferred by applying the charges detailed in the published tariff schedule to thereported monthly expenditure (response to Question E06).
E04: What is the basis for the electricity charges that you pay for [for each electricitysource]?Households that live in rented accommodations may not be utility customers. Instead, theymay pay for electricity as part of their monthly rental; some households may not pay at all.Households that share a meter may pay a neighbor. It is important to record this infor-mation as it can help interpret the information provided on the amount the householdpaid for electricity (response to Question E06).
E05: How much did the household pay for 30 days of electricity use from [for each elec-tricity source]?Ideally, the answer to this question can be obtained from the utility bill, which the enu-merator should ask to see. In some countries, it may be possible and useful to record thehousehold’s customer number so that time-series information on the household’s con-sumption can be obtained from the utility’s database. The amount charged to the house-hold is determined by applying the tariff schedule, which may have fixed charges; variablegeneration, transmission, and distribution charges; and taxes and fees. The total amountof the bill (inclusive of all charges) should be recorded. If it is not possible to view the bill,the respondent should be asked to estimate this amount. As noted above, informationon the quantity of electricity consumed may have to be inferred from payment informa-tion; thus, it is key to obtain accurate information in response to this question. House-holds that share a meter may also share the bill (for billing purposes, one household is
36 World Bank Working Paper
Box 1. Potential Electricity Sources for Household Use
• Car (storage) batteries
• Household-owned electric generator (genset)
• Electric generator owned by neighbor
• Electricity from privately-owned, mini-grid or village/community grid
• Electricity from national, regional, or town grid
• Pico- and micro-hydro electric generator
• Solar (photovoltaic) home system (SHS)

Energy Policies and Multitopic Household Surveys 37
recorded as the customer in the utility’s billing system; this customer receives the bill, butother households connected to the meter share payment). The question may need to beadapted to take account of this.
Notes on Electricity Sources (Off-grid) Prototype Module
The Electricity Sources (Off-grid) Module refers to electricity sources that the householddoes not share with neighbors, such as its own genset, car (storage) battery, or solar (PV)home system (Figure 4b).
E06: See notes for Question E01 in the Electricity Sources (Grid) Module.E07: What is electricity used for in your home?This question is similar to Question E02 in the Electricity Sources (Grid) Module. How-ever, since gensets, dry cell batteries, car (storage) batteries, and solar home systems(SHSs) usually have sufficient capacity only to power lights, televisions, radios, and otherappliances, the list of possible end uses is not as extensive. As before, the end-use cate-gories are country-specific and must be reviewed carefully when the module is adaptedfor use in any particular country.
E08: How much did you pay for your [for each electricity source]?Answers to this question can help establish a household’s willingness to pay for gridelectricity, which is useful in planning electrification programs.
E09: How did you pay for this [. . .]?Answers to this question can help gauge the effectiveness of efforts to establish credit facil-ities and SHS dealer networks.
E10: How much did you pay to operate your [for each electricity source] in the last 30 days?This question is relevant for car batteries, dry cell batteries, and gensets but not for SHSs(the cost of replacing the battery every few years is the greatest running cost).
E11: What is the rating of your [for each electricity source]?For solar panels, the quantity of electricity consumption can be directly inferred from sys-tem capacity. For diesel generation, it can be inferred from system capacity and themonthly expenditure on diesel (Appendix).
E12: Do you use electricity in your household for home business purposes?As part of collecting basic information on household characteristics, LSMS surveys usuallycontain a question that asks if the household has a home business and other questions thatprobe the nature of a household’s home business. Thus, it may be unnecessary to ask thisquestion in the electricity module. If the household has a home-based business, electricityconsumption will often be much greater than otherwise expected.
Durable Goods (Light Bulbs and Appliances) Module
The purpose of the Durable Goods (Light Bulbs and Appliances) Module (Figure 5) is todetermine the uses of electricity (to complement and validate the information obtained

38W
orld Bank Working Paper
Figure 5. Durable Goods (Light Bulbs and Appliances) Prototype Module

Energy Policies and Multitopic Household Surveys 39
through Question E03 above). The electricity can be from any source (grid electricity, ownor neighbor’s genset, solar [PV] home system, and car [storage] battery are the most com-mon sources). Household members that are most often in the household are usually thebest-informed respondents. Information on appliance use provides insights into thehousehold’s priority uses of electricity service and can also be used to calculate monetaryestimates of the benefits of electrification. The quantity of electricity consumed by the var-ious appliances is calculated as follows: watt rating of appliance × hours of use per day ×30 days/1,000 = kWh consumed per month. The light output from the various classes oflight bulbs is calculated as follows: efficiency rate of light bulb (lumen/watt) × hours of useper month = light output (klm per month).
Notes on Durable Goods (Light Bulbs and Appliances) Prototype Module
A01: Does your household own [for each class of light bulb]?The wattage can usually be read from manufacturer markings on the light bulb. The listedclasses of light bulbs should be those that are available locally. The list should be com-prehensive, and not limited to the most common classes of light bulbs owned by house-holds. Otherwise, it will not be possible to construct a complete picture of electricity usefor lighting.
A02: How many [for each class of light bulb] do you own?The enumerator should enter the number of all light bulbs in each class owned by thehousehold. Experience with this question in specialized energy surveys has obtained rea-sonably good results. Poor households usually can readily answer this question and thosebelow. Respondents in non-poor households with many light bulbs and appliances expe-rience greater difficulty in accurately answering this question.
A03: How many hours during the last week did you use the [items]?The enumerator should enter the sum of hours of use for all light bulbs in the same class.Thus, if the household owns two 25-W light bulbs, one of which is used 14 hours per weekand the other 28, the enumerator should enter 42.
A04: How many of the following items does your household own? [for each appliance]?The items listed in the module should be adapted to include appliances that are locallyavailable. The list should be comprehensive and not just list the most common appliancesowned by households. Local names of appliances (for example, type of kerosene lamp orimproved wood stove) should be used. One should note that these questions have beenintegrated into the standard module on durable goods for an LSMS survey. The list of itemsshould contain all durable goods for which the LSMS requires data, plus any specific itemsrelevant to the energy needs (such as energy-efficient mud stoves). For all items for whichelectricity is used, the two additional questions on wattage (A06 and A07, respectively) willbe needed.
A05: How many years ago did you acquire the [item]?Household preferences for electricity use may be inferred from the answers to this question.
A06: According to current prices, what do you think you could get if you sold it?It is standard in household surveys to establish the market value of household assets.

A07: What is the average wattage rating of the [for each appliance]?Manufacturer markings that include the rating are usually affixed to the appliance. How-ever, it may be difficult to read some markings if they are worn or otherwise illegible oraffixed to an inaccessible part of the appliance. Training should enable enumerators toreadily identify the ratings of the most common brands or types of appliances, such aslocally available televisions and radios. Information on these ratings must be collected andprovided to the enumerators during training.
A08: How many hours during the last week did you use the [for each appliance]?This question establishes the number of hours of appliance use. In terms of televisions andradios, this question differs from those that ask households how many hours they watchtelevision or listen to the radio.
Electricity and Fuels in the Community Module
The Electricity and Fuels in the Community Module is designed to collect data on itemscommon to a cluster of households interviewed; it does not refer to a community in anyadministrative sense. These questions provide a snapshot of the choice set of energy sourcesavailable at the community level (Figure 6).
Notes on Electricity and Fuels in the Community Prototype Module
C01: Is electricity available in this community?Answers to this question help interpret individual household responses to Question E01(“Does your household have electricity from?”) in the electricity sources module.
C02: What is the main source of electricity in this community? (Which source of elec-tricity is available to the most households in this community?)Depending on local circumstances, the questionnaire should be adapted to collect infor-mation on the name of the provider, wherever a formal company is involved, to provide ameans of verifying information about the price of services.
C03: On average, how many hours a day is electricity available from [service provider]?Questions C03 and C04 establish the reliability of electricity supply in the community.
C04: How many times in the last 30 days did electricity from [. . .] fail for more than 15 minutes?Load shedding (electricity blackouts) may affect only part of the community. Duringdesign, blackout patterns should be considered so that the question can be adaptedaccordingly.
C05: In what year did [electricity source] become available to this community?This question makes it possible to reconstruct the historical diffusion of electricity servicesacross communities in the country, even in the absence of a long series of household sur-veys over time. If the electricity sources module also asks when the household obtainedelectricity service, it will be possible to examine the historical diffusion of coverage withincommunities.
40 World Bank Working Paper
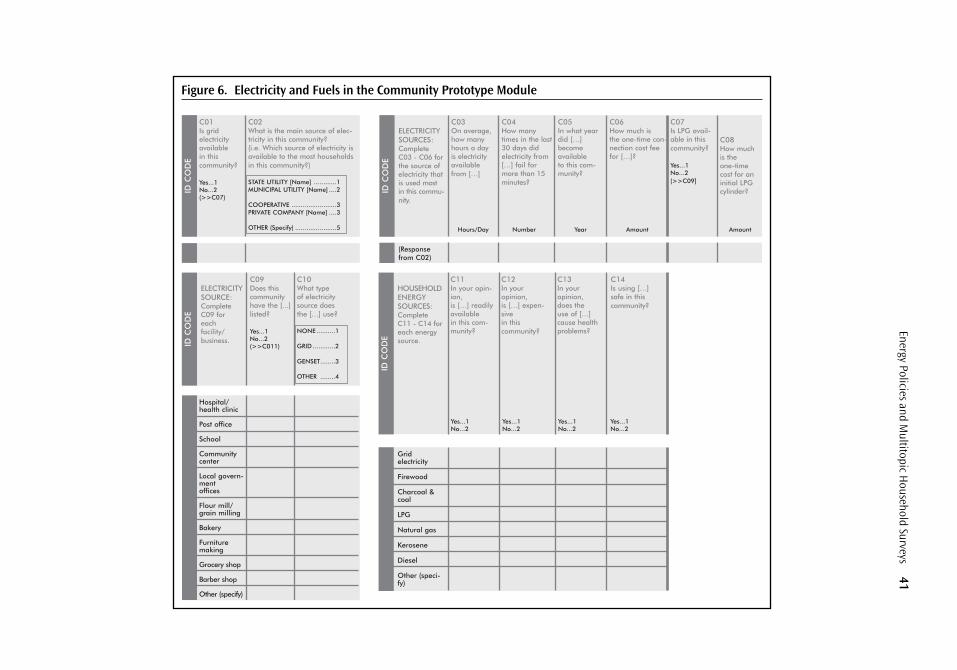
Energy Policies and Multitopic H
ousehold Surveys41
Figure 6. Electricity and Fuels in the Community Prototype Module
C06: How much is the one-time, connection-cost fee for [electricity source]?The cost of gaining access to electricity service varies by country location. For any partic-ular community, connection cost is a function of the community’s distance from the exist-ing grid, population density, and other demographic factors. The cost per household mayvary between US$400 and $1,000. Subsidies can defray the cost for individual households.Repayment of the hookup fee may be spread over several months (or in some cases, overseveral harvests), and it may be important to capture this information.
In addition, it may be useful to establish the start-up cost for other types of energy ser-vices, such as LPG (as it is necessary to purchase a cylinder to initiate fuel use) or car bat-teries (where the battery must be purchased initially). One should note that start-up costsdo not refer to the cost of appliances that may be needed to use the fuel (for example, lightbulbs, hurricane lamps, or stoves) since these are covered separately under the applianceinventory in the LSMS survey.
C07: Is LPG available in this community?The module focuses on LPG access because of LPG’s often critical role as a clean cooking fuel.
C08: How much is the one-time cost for an initial LPG cylinder?This information is important because the cost of the initial cylinder is often key to thehousehold’s decision to make the transition from kerosene for cooking. This question willreveal if cost of LPG cylinders varies significantly between regions in a country, indicatingsome market failure in regions with high costs.
C09: Does this community have the [facility/business] listed?C10: What type of energy source does the [facility/business] use?Questions C09 and C10 are important because the delivery of services may depend on thefacilities having electricity access.
C11: In your opinion, is [. . .] readily available in this community?Questions C08-C11 are sample questions that can be used to investigate local opinions ofenergy pricing, safety, and health issues.
C12: In your opinion, is [. . .] expensive in this community?Opinions of which fuels are expensive can provide valuable insights into community atti-tudes which may be markedly different in different regions of the country.
C13: In your opinion, does the use of [. . .] cause health problems?“Health problems” imply burns that people suffer from cooking fires or use of kerosenelamps and cooking appliances. They may also imply a respondent’s awareness of the healtheffects of indoor air pollution from use of biomass in cooking fires.
C14: Is using [. . .] safe in this community?“Safe” may imply household accidents (for example, fires) associated with using keroseneor wood fires. In certain countries, LPG use is considered unsafe because damaged LPGbottles may be in circulation.
42 World Bank Working Paper

CHAPTER 5
Conclusion
One goal of these guidelines is to promote the use of the modules in forthcomingLSMS surveys and to monitor which questions work best in different countrycontexts. It is anticipated that countries preparing LSMS surveys will make use
of these guidelines and may seek World Bank assistance in evaluating alternative energymodule designs.
It is anticipated that data sets from these enhanced LSMS survey modules can be used toformulate indicators that analysts in the energy sector can use as key decision-making tools.Data monitoring can ensure that welfare changes are taken into account when new policyinterventions are designed and that equity issues are addressed. For a program designed toreduce fuelwood consumption and indoor air pollution, LSMS data can monitor changes inconsumption after households adopt improved charcoaling techniques and cook stoves. Inaddition, LSMS data can monitor whether the expected cost savings from the competitiveprocurement of petroleum products and the introduction of competition in the marketingof petroleum prices are passed on to households in the form of lower prices and increasedreliability of supply. In terms of shifts in consumption, LSMS data can monitor changes inhousehold behavior when fuel-price subsidies are removed or electricity-service chargesraised, thereby gaining insight into the dynamics of the energy portfolios households main-tain to minimize risk. Finally, LSMS data can monitor the extent to which various groupsgain access to electricity and the effects that policy tools—such as lifeline rates, credit financ-ing schemes, or improved design standards and technologies—have on household welfare.
Summing up, LSMS surveys containing better information on household energy usewill provide important insights into the role that energy services play in household welfareand the policies that would be most effective in accelerating the household transition touse of modern fuels.
43

APPENDIX
Notes on Energy Appliances and Conversion Factors
Definitions
Car Battery. Commonly used in areas of developing countries without an electricity grid(motorcycle or lorry batteries are also used) to provide household electricity for lightingand to power televisions and radios. Recharging often occurs at battery-charging stationsusing grid electricity in the nearest grid-connected town. The amount of electricity perrecharge depends on the size of the battery, depth of discharge, and efficiency of thecharger. Wind generators, SHSs, or diesel generators can also be used to recharge batter-ies. The most common battery rating is ampere-hours; this unit of measurement for bat-tery electrical storage capacity is obtained by multiplying a current flow in amperes bythe time in hours of discharge. A battery that delivers 5 amperes for 20 hours delivers100 ampere-hours. Since watts equal volts × amps, a 12-volt battery with a 400 amp-hourcharge can deliver 12 × 400 or 4,800 watts for an hour or 4.8 kWh.
Horsepower. Unit for power or for measuring the rate of work; 1 horsepower equals 746 watts. Diesel generators used by households to generate electricity and diesel pumpsused to pump water are often rated in horsepower.
Joule (J). Standard international (SI) unit of energy and heat; 1 joule equals 0.2389calories.
Kilowatt hour (kWh). Work equals energy per time period; one kWh is equivalent to1,000 watts (joules per second) over a 1-hour period; thus, 1 kilowatt hour equals 3.6 ×10⁶ joules.
Lumen (lm). Quantity of light (luminous flux) emitted by a lamp. The quantity of light radi-ated or received for a period of 1 hour is a lumen-hour (lm hr). A 60 Watt incandescent
45

lamp and a 12 Watt compact fluorescent lamp emit approximately the same amount oflumens (720 lm).
Peak Watt (Wp). Power output that a photovoltaic (PV) module produces at StandardTest Conditions (STC) of a module operating temperature of 25°C with an irradiance of1,000 watts per square meter (usually attained at noon).
Power. Rate at which work is done (or rate at which heat released or energy converted). Alight bulb of 100 watts, for example, draws 100 joules of electrical energy per second.
Solar Home System (SHS). System whose main components typically include a solar(PV) module, inverter, battery, and charge controller (sometimes known as a regulator).The PV module may range in size from 20 to 100 peak watts (Wp). SHSs with 400 Wpor more are necessary to operate a refrigerator and are not common in developing coun-tries. A 50-Wp system can supply lighting and can power for a small television or radiofor several hours per day and a 12 Wp system can operate a lamp or a radio for severalhours per day.
Watt (W). Standard unit of measurement of electrical power; 1 watt equals 1 ampere of cur-rent flowing at 1 volt. Electric appliances (for example, radios, televisions, electric heatingcoils, and light bulbs) are rated in watts (W); a 60-W light bulb or a 60-W black-and-whitetelevision set operated 5 hours per day uses 9 kWh of electricity per month (60 watt ×5 hours × 30 days).
Conversion Equivalents
Units of mass1 kilogram (kg) = 2.2046 pounds (lb)1 pound (lb) = 0.454 kilograms (kg)
Units of volume1 liter (l) = 0.2642 gallons (gal) (U.S.) = 0.22 gal (UK or imperial)1 gallon (gal) (U.S.) = 0.8327 gal (UK) = 3.78528 liters (l)
Units of energy1 megajoule (MJ) = 238.84 kilocalories (kcal) = 0.2777 kilowatt hours (kWh)1 kilowatt hour (kWh) = 3.6 megajoules (MJ) = 860 kilocalories (kcal)
Cooking Efficiency
The term useful energy refers to work harnessed for the purpose of which the fuel is con-sumed. In the case of cooking, useful energy is the heat actually used for heating the food(transmitted to the food-cooking process). The annual amount of energy required forcooking varies with the type of food, fuel, and stove used and the specific cooking practices
46 World Bank Working Paper

of a household (Millennium Project 2005). Diet is also a factor in energy needs. Cookinghard staples such as maize and potatoes requires more energy than cooking fish. Theannual energy requirements for a family of five is about 5 gigajoules of useful energy (i.e.energy “into the pot”). Typically, households use a combination of fuels. Table A-1 pro-vides a comparison of typical efficiencies of different fuels in cooking
Household Lighting Appliances
In developing countries, households in areas not served by grid electricity use a great vari-ety of lighting appliances. Carbide (acetylene) lamps are simple lamps that produce andburn acetylene gas through the reaction of calcium carbide with water. Kerosene wicklamps are simple lamps consisting of a small receptacle for containing the kerosene and awick (usually made of cotton). The lower half of the wick is dipped, absorbing the kerosene,while the top part extends out of the top of the receptacle. Instead of kerosene, diesel oranimal fat are also used. A kerosene or gasoline mantle lamp has a fuel tank and a smallpump to pressurize the kerosene. A burner sits atop the lamp, directly underneath of whichis the mantle, which incandesces when heated by the gas flame. The most widely used gaslamps use cylinders of propane, butane, or a mixture thereof (LPG).
Energy Policies and Multitopic Household Surveys 47
Approximate quantityUseful energy at of fuel necessary to
Energy Conversion final consumption provide 5 Gigajoules of content efficiency stage of cooking useful energy for cooking
Fuel source (MJ per kg) (%) (MJ per kg) (Kilograms)
LPG 45.5 60 27.3 180
Natural gas 38 MJ/M3 60 219 M3
Kerosene (pressure) 43.0 55 23.6 210
Kerosene (wick) 43.0 35 15.1 330
Biogas (60% methane) 22.8 MJ/M3 60 365 M3
Charcoal (efficient) 30.0 30 9.0 550
Charcoal (traditional) 30.0 20 6.0 830
Bituminous coal 22.5 25 5.6 880
Fuelwood (efficient), 16.0 25 4.0 125015% moisture
Fuelwood (traditional), 16.0 15 2.4 200015% moisture
Crop residue 13.5 12 1.6 3000(straw, leaves, and grass), 5% moisture
Dung, 15% moisture 14.5 12 1.7 2900
Table A1. Typical Efficiencies at the Final Consumption Stage of Cooking
Sources: “Energy Statistics: A Manual for Developing Countries,” Series F, No. 56, United Nations,New York, U.S. and authors estimates.

Table A2 compares characteristic values of various lamps. Performance varies consid-erably, depending on the luminous conditions in rooms and such behavioral patterns asadjusting the lamp setting, cleaning glass covers, replacing mantles, and polishing reflec-tors. In addition, characteristics of the same type of lamp (for example, kerosene lamps)vary by lamp size. Table A-3 compares characteristic values of various batteries.
48 World Bank Working Paper
Output based on lumens per watt
Light output klmh per klmh perLighting type (lumens) kgOE kWh
Non-electric
Paraffin candle 11.8 2.33 0.20
Kerosene wick 11.4 1.15 0.10
Kerosene hurricane 32 1.92 0.16
Kerosene pressure 2,040 17.53 1.48
Incandescent (watts)
25 230 109.12 9.20
40 430 127.50 10.75
50 580 137.58 11.60
60 730 144.30 12.17
100 1,280 151.80 12.80
Florescent (watts)
10 600 711.63 60.00
20 1,200 711.63 60.00
40 1,613 478.27 40.33
Compact florescent
Philips lamp (15-W) 894 706.88 59.60
Philips lamp (9-W) 369 486.28 41.00
Osram sol lamp (6.14-W) 240 463.60 39.09
Table A2. Comparison of Non-electric and Electric Lamps for Domestic Lighting in Developing Countries
Source: Nieuwenhout, Van de Rijt, and Wiggelinkhuizen (1998).
Rating Storage capacity
Battery Type Amp Hours (Ah) Watt Hrs
High Quality D Cell (1.5 v) 7.5 11.25
Poor Quality D Cell (1.5 v) 3.5 5.25
Car battery (12 v) 60 720
Table A3. Battery Electricity
Note: A battery can only discharge to 80 percent of capacity.

References
Adegbulugbe, A. O., and J. F. K. Akinbami. 1995. “Urban Household Energy Use Patternsin Nigeria.” Natural Resources Forum 19(2):125–33.
Ahmed, Kulsum, Yewande Awe, Douglas Barnes, Maureen Cropper, and Masami Kojima.2005. Environmental Health and Traditional Fuel Use in Guatemala. Directions inDevelopment Series. Washington, D.C.: The World Bank.
Alam, Manzoor, Joy Dunkerley, K. N. Gopi, William Ramsay, and E. Davis. 1985. Fuelwoodin Urban Markets: A Case Study of Hyderabad. New Delhi: Concept Publishing Co.
Balakrishna, Kalpana, Douglas Barnes, Kyra Naumoff, Kirk Smith, R. Uma, and ReeveVanneman. 2005. “Measuring Indoor Air Pollution and Lung Function in Indian FieldSettings.” Paper prepared for the 2006 Population Association of America AnnualMeetings, Los Angeles.
Barkat, Abdul, M. Rahman, S. Zaman, A. Podder, S. Halim, N. Ratna, M. Majid, A. Mak-sud, A. Karim, and S. Islam. 2002. “Economic and Social Impact Evaluation Study ofthe Rural Electrification Program in Bangladesh.” Report to National Rural ElectricCooperative Association (NRECA) International, Dhaka.
Barnes, Douglas. 1988. Electric Power for Rural Growth: How Electricity Affects Rural Life inDeveloping Countries. Boulder, Colorado: Westview Press.
———. 1990. “Population Growth, Wood Fuels, and Resource Problems in DevelopingCountries.” In G. T. E. Acsadi, G. Johnson-Acsadi, and R. A. Bulatao, eds., PopulationGrowth and Reproduction in Sub-Saharan Africa: Technical Analyses of Fertility and ItsConsequences. Washington, D.C.: The World Bank.
Barnes, Douglas, and Willem Floor. 1996. “Rural Energy in Developing Countries: A Chal-lenge for Economic Development.” Annual Review of Energy and the Environment 21:497–530.
49

Barnes, Douglas, Kerry Krutilla, and William Hyde. 2005. The Urban Energy HouseholdTransition: Social and Environmental Impacts in the Developing World. Washington,D.C.: Resources for the Future.
Barnes, Douglas, and Liu Qian. 1992. “Urban Interfuel Substitution, Energy Use, andEquity in Developing Countries.” In James P. Dorian and Fereidun Fesharaki, eds.,International Issues in Energy Policy, Development, and Economics. Boulder, Colorado:Westview Press.
Barnes, Douglas, Keith Openshaw, Kirk R. Smith, and Robert van der Plas. 1993. “TheDesign and Diffusion of Improved Cooking Stoves.” The World Bank Research Observer8(2):114–41.
Bennett, J., and R. Blamey. 2001. The Choice Modeling Approach to Environmental Valua-tion. Cheltenham, UK: Edward Elgar.
Boardman, A., D. Greenburg, A. Vining, and D. Weimer. 2001. Cost-benefit Analysis:Concepts and Practice. Toronto: Prentice-Hall.
Bowonder, B., S. S. R. Prasad, and K. Raghuram. 1987. “Fuelwood Use in Urban Centres:A Case Study of Hyderabad.” Natural Resources Forum 11(2):189–95.
Cabraal, Anil, Douglas Barnes, and Sachin Agarwal. 2005. “Productive Uses of Energy forRural Development.” Annual Review of Environment and Resources.
Deaton, A. 1997. The Analysis of Household Surveys: A Microeconometric Approach to Devel-opment Policy. Baltimore, Maryland: The Johns Hopkins University Press.
Dewees, P. A. 1989. The Woodfuel Crisis Reconsidered: Observations on the Dynamicsand Abundance and Scarcity. World Development 17:1159–1172.
Denton, Frank H. 1979. Lighting Up the Countryside: The Story of Electric Cooperatives inthe Philippines. Development Academy of the Philippines. Manila: Academy Press.
Freeman, R. 2003. The Measurement of Environmental and Resource Values: Theory andMethods. 2nd ed. Washington, D.C.: Resources for the Future Press.
Gordon, Adele. 1997. “Facilitating Education in Rural Areas of South Africa: The Role ofElectricity and Other Sources of Energy.” University of Cape Town EDRC ReportSeries. Energy and Development Research Centre, Cape Town.
Grosh, M., and P. Glewwe, eds. 2000. Designing Household Survey Questionnaires for Devel-oping Countries. 3 vols. Washington, D.C.: The World Bank.
Grosh, M., and J. Munoz. 1996. “A Manual for Planning and Implementing the LivingsStandards Measurement Study Survey.” LSMS Working Paper No. 126. The WorldBank, Washington, D.C.
Haab, T. C., and K. E. McConnell. 2002. Valuing Environmental and Natural Resources:The Econometrics of Non-market Valuation. Cheltenham, UK: Edward Elgar.
Hartwick, J. M. 1992. “Deforestation and National Accounting.” Environmental andResource Economics 2:513–21.
Harvey, A., and M. Taylor. 2000. “Time Use.” In M. Grosh and P. Glewwe, eds., DesigningHousehold Survey Questionnaires for Developing Countries, vol. 2. Washington, D.C.:The World Bank.
Herrin, Alexandro. 1979. “Rural Electrification and Fertility Change in the SouthernPhilippines.” Population and Development Review 5(1):61–87.
Hosier, Richard H., and W. Kipondya. 1993. “Urban Household Energy Use in Tanzania:Prices, Substitutes and Poverty.” Energy Policy 21(5):454–73.
50 World Bank Working Paper

IAEA. 2005. Energy Indicators for Sustainable Development: Guidelines and Methodologies.Vienna: International Atomic Energy Agency.
Kammen, Daniel. 2001. “Quantifying the Effects of Exposure to Indoor Air Pollution fromBiomass Combustion on Acute Respiratory Infections in Developing Countries.”Environmental Health Perspectives 109(5):481–8.
Khandker, Shahidur. 1996. “Education Achievements and School Efficiency in RuralBangladesh.” World Bank Discussion Paper No. 319. Washington, D.C.: The WorldBank.
Khandker, Shahidur, Victor Lavy, and Deon Filmer. 1994. “Schooling and CognitiveAchievements of Children in Morocco: Can the Government Improve Outcomes?”World Bank Discussion Paper No. 264. Washington, D.C.: The World Bank.
Komives, K., D. Whittington, and X. Wu. 2002. “Infrastructure Coverage and the Poor: AGlobal Perspective.” In Penelope J. Brook and Timothy C. Irwin, eds., Infrastructurefor Poor People: Public Policy for Private Provision. Washington, D.C.: The World Bank.
Kopp, Raymond, Norbert Schwarz, and Werner W. Pommerehne. 1997. Determining theValue of Non-marketed Goods: Economics, Psychological and Policy Relevant Aspects ofContingent Valuation Methods. London: Springer.
Kulkarni, V., and D. Barnes. 2005. The Impact of Rural Electrification on Education Partici-pation in Nicaragua. ESMAP Draft Paper. The World Bank, Washington, D.C. Processed.
Leach, Gerald. 1986. Household Energy in South Asia. London: International Institute forEnvironment and Development.
Mishra, V. 2003. “Indoor Air Pollution from Biomass Combustion and Acute RespiratoryIllness in Preschool Age Children in Zimbabwe.” International Journal of Epidemiology32:847–53.
Mitchell, Robert, and Richard T. Carson. 1988. Using Surveys to Value Public Goods: TheContingent Valuation Method. Washington, D.C.: Resources for the Future Press.
Nieuwenhout, F., P. Van de Rijt, and E. Wiggelinkhuizen. 1998. “Rural Lighting Services.”Paper prepared for the World Bank, Netherlands Energy Research Foundation, Petten.
Ranganathan, V., and T. V. Ramanayya. 1998. “Long-term Impact of Rural Electrification:A Study in UP and MP.” Economic and Political Weekly 33:3181–84.
Sathaye, Jayant, and Stephen Tyler. 1991. “Transition in Household Energy Use in UrbanChina, India, the Philippines, Thailand, and Hong Kong.” Annual Review of Energyand Environment 16:295–335.
Saunders, John, J. Michael Davis, Galen C. Moses, and James E. Ross. 1975. Rural Electri-fication and Development: Social and Economic Impact in Costa Rica and Colombia.Boulder, Colorado: Westview Press.
Smith, Kirk, and Sumi Mehta. 2003. “The Burden of Disease from Indoor Air Pollution inDeveloping Countries: Comparison of Estimates.” International Journal of Hygieneand Environmental Health 206:279–89.
Smith, Kirk, Jonathan M. Samet, Isabelle Romeiu, and Nigel Bruce. 2000. “Indoor Air Pol-lution in Developing Countries and Acute Lower Respiratory Infections in Children.”Thorax 55:518–32.
USAID. 1983. “Power to the People: Rural Electrification Sector Summary Report.” Pro-gram Evaluation Report No. 11. Washington, D.C.: United States Agency for Inter-national Development.
Energy Policies and Multitopic Household Surveys 51

Wallmo, K., and S. Jacobson. 1998. “A Social and Environmental Evaluation of Fuel-efficient Cook-stoves and Conservation in Uganda.” Environmental Conservation25(2):99–108.
Whittington, D. 1998. “Administering Contingent Valuation Surveys in Developing Coun-tries.” World Development 26(1):21–30.
———. 2000. “Environmental Issues.” In M. Grosh and P. Glewwe, eds., Designing House-hold Survey Questionnaires for Developing Countries, vol. 2. Washington, D.C.: TheWorld Bank.
———. 2002. “Improving the Performance of Contingent Valuation Studies in Develop-ing Countries.” Environmental and Resource Economics 22(1–2):323–67.
WHO. 2002. The World Health Report 2002. Reducing Risks, Promoting Healthy Life.Geneva: World Health Organization.
World Bank. 1994. Rural Electrification in Asia: A Review of Bank Experience. Summary ofSector Study No. 13291. Operations Evaluation Department. Washington, D.C.: TheWorld Bank.
———. 1996. Rural Energy and Development: Improving Energy Supplies for Two BillionPeople. Development in Practice Series. Washington, D.C.: The World Bank.
———. 1999. “Poverty and Social Development in Peru, 1994–1997.” The World BankCountry Study, Washington, D.C.
———. 2002. “Rural Electrification and Development in the Philippines: Measuring theSocial and Economic Benefits.” Energy Sector Management Assistance Programme(ESMAP) Report No. 255/02. The World Bank, Washington, D.C.
———. 2004. “The Impact of Energy on Women’s Lives in Rural India.” Energy SectorManagement Assistance Programme (ESMAP) Report No. 276/04. The World Bank,Washington, D.C.
———. 2005. “Household Energy Supply and Use in Yemen” (ESMAP) Report No. 315/05.The World Bank, Washington, D.C.
52 World Bank Working Paper


Eco-AuditEnvironmental Benefits Statement
The World Bank is committed to preserving Endangered Forests and natural resources. Weprint World Bank Working Papers and Country Studies on 100 percent postconsumer recy-cled paper, processed chlorine free. The World Bank has formally agreed to follow the rec-ommended standards for paper usage set by Green Press Initiative—a nonprofit programsupporting publishers in using fiber that is not sourced from Endangered Forests. For moreinformation, visit www.greenpressinitiative.org.
In 2005, the printing of these books on recycled paper saved the following:
Trees*
463*40” in height and6-8” in diameter
Electricity
79,130KWH
Net Greenhouse Gases
42,614Pounds
Water
196,764Gallons
Solid Waste
21,693Pounds


THE WORLD BANK1818 H Street, NW
Washington, DC 20433 USA
Telephone: 202 473-1000
Internet: www.worldbank.org
E-mail: [email protected]
ISBN 0-8213-6878-8
Energy Policies and Multitopic Household Surveys is part of
the World Bank Working Paper series. These papers are pub-
lished to communicate the results of the Bank’s ongoing
research and to stimulate public discussion.
This paper will be of interest to those who are involved in
household survey design, monitoring and evaluation, and
the impact of energy on social and economic development.
Among others, this includes a wide range of social scientists
—economists, sociologists, anthropologists, and political
scientists.
The Energy Sector Management Assistance Program
(ESMAP) is a global technical assistance program that pro-
motes the role of energy in poverty reduction and
economic growth with redistribution. ESMAP undertakes
analytical work and provides policy advice on sustainable
energy development to governments and other institutions
in developing countries and economies in transition.
ESMAP was established in 1983 under the joint sponsorship
of the World Bank and the United Nations Development
Programme as a partnership in response to global energy
crises. Since its creation, ESMAP has operated in some 100
different countries through more than 500 activities
covering a broad range of energy issues.
World Bank Working Papers are available individually or on
standing order. Also available online through the World
Bank e-Library (www.worldbank.org/elibrary).