Ritual household deposits and the religious imaginaries of ...
Upload
khangminh22Category
view
0download
0
United Republic of Tanzania
NATIONAL SAMPLE CENSUS OF AGRICULTURL 2W-2,1'2003
VOLUME IV: SMAI HOIDER HOUSEHOLD CHARACTERISTICS AND ACCESS TO SERVICES AND NATURAL RESOURCES

United Republic of Tanzania
NATIONAL SAMPLE CENSUS OF AGRICULTURE2002/2003
VOLUME IV: SMALLHOLDER HOUSEHOLD CHARACTERISTICSAND ACCESS TO SERVICES AND NATURAL RESOURCES
National Bureau of Statistics, Ministry of Agriculture and Food Security,Ministry of Water and Livestock Development, Ministry of Cooperatives and Marketing,
Presidents Office, Regional Administration and Local -
Ministry of Finance and Economic Affairs - Z zibar
September 2006

T.O.C.
TABLE OF CONTENTS
Table of Contents ................................................................................................................................................................ iiiAbbreviations .......................................................................................................................................................................Preface .................................................................................................................................................................................. viIllustrations .......................................................................................................................................................................... vii
List of Tables ............................................................................................................................................................... vii- List of Charts .............................................................................................................................................................. vii- List of Maps ................................................................................................................................ ............................... viii
Executive Sung nary............................................................................................................................................................ ix
1 INTRODUCTION.................................................................................................................................................. 1
1.1 Introduction ............................................................................................................................................................ 1
....................................................................................................................................... 122
............................................................................................................................................. 2
1.3 Census Methodology ............................................................................. ............................................................... 31.3.1 Census Organisation .................................................................................................................................. 41.3.2 Tabulation Plan Preparation ..................................................................................................................... 41.3.3 Sample Design ........................................................................................................................................... 41.3.4 Questionnaire Design and Other Census Instruments ............................................................................ 51.3.5 Field Pre-testing of the Census Instruments ............................................................................................ 51.3.6 Training of Trainers, Supervisors and Enumerators ............................................................................... 51.3.7 Information, Education and Communication (IEC) Campaign .............................................................. 61.3.8 Data Collection .......................................................................................................... ............................. 61.3.9 Field Supervision and Consistency Checks ............................................................................................. 61.3.10 Data Processing .......................................................................................................... .............................. 6
Data Entry ........................................................................................................................................... 7Data Structure Formatting ................................................................................................................. 7Batch Vallidation ............................................................................................................................... 7
- Tabulations ......................................................................................................................................... 7Analysis and Report Preparation ...................................................................................................... 7
- Data Quality ....................................................................................................................................... 8
1.4 Funding Arrangements ......................................................................................................................................... 8
2. RESULTS ................................................................................................................................................................ 9
2.1 Demographics .......... .......... ---...--...- ..... ......... ........ ................ --..., ..
2.1.1 Population ................................................................................................................. ................................ 92.1.2 Age Structure ........................................................................................................................................... 10
2.2 Household Characteristics .................................................................................................................................. 102.2.1, Type of agriculture household ............................................................................................ ................ 102.2.2 Household Size ........................................................................................................... ........................... 112.2.3 Land Ownership/Tenure ......................................................................................................................... 112.2.4 Distance from Field ................................................................................................................................ 13
Distance from Field to Homestead ................................................................................................ 13- Distance from field to nearest Road .............................................................................................. 14
2.3. Literacy and Education of Rural Agriculture Population .............................................................. 142.3.1 Literacy ................................. 172.3.2 Education Status ..................................................................................................................................... 19
2.4 Livelihood Activities ............................................................................................................................................. 212.4.1 Important Livelihood Activities ............................................................................................................. 212.4.2 Main Household Activities ................................................................................................ .................. 212.4.3 Level of Participation in Farm Work .............................................................................. ..................... 22
2.5 Off-Fm ....... ....... ...... .......... ...... ..... ..... ..... 22
1.2 Background Information1.2.1 Census Objectives1.2.2 Census CoverageL2.3 Census Scope
Tanzania Agriculture Sample Cens us

2.5.1 Number of Off-Farm Activities per Household .................................................................................. 222.5.2 Households Main Sources of Income ................................................................................................. 23
2.6 Agriculture Credit ........................................................................................................»................................... 252.6.1 Access to Agriculture Credit .............................................................................................................. 252.6.2 Source of Agricultural Credit ............................................................................................................... 262.6.3 Use of Agricultural Credit ................................................................................................................... 262.6.4 Reasons for Not Using Agricultural Credit .............................................................................._......... 272.6.5 Purpose of Credit ................................................................................................................................. 27
2 .7 Living Conditions ........................................................................................................._......................,............ 272.7.1 Roofing Material .......................................................................................................-......................... 272.7.2 Toilet Facilities .................................................................................................................................... 282.7.3 Ownership of Assets ............................................................................................................................ 3©2.7.4 Main Source of Energy ......................................................................................................................... 30
Sourceof Energy for Lighting ............................................................................................._....... 30Source of Energy for Cooking ..................................................................................................... 31
2.7.5 Drinking Water .................................................................................................................................... 33- Access to Drinking Water .................................................................................................._......... 33- Source of Drinking Water ............................................................................................................ 33
2.7.6 Division of Labour ................................................ ..................................................... _........................ 342.7.7 Level of Subsistence ............................................................................................................................ 352.7.8 Food Consumption Pattern .................................................................................................................. 37
- Number of Meals per Day ............................................................................................................. 37- Animal Protein Consumption Frequencies ................................................................................... 38
2.79 Household Food Security ................................................................................................_................... 38
2.8 Access to Resources .......................................................................................................................................... 402.8.1 Access to Natural/Communal Resources ..................:................................................................_........ 402.8.2 Access to Social Services and Infrastructure ............................:.......................................................... 422.8.3 Land Sufficiency .................................................................................................................................. 42
3, REGIONAL PROFILES ................................................................................................................................. 45
4. APPENDICES ................................................................................................................._................................ 64
AppendixI Household Characteristics Tabulation List ..........................................................................................65
ApendixII Household Characteristics Tables ..................................................................................._....................69
AppendixIII Questionnaires .....................................................................................................................................157
Tanzania Agriculture Sample census

ABBREVIATIONS V
ABBREVIATIONS
ASDP ....................... Agricultural Sector Development Programme
CSPro ....................... Census and Survey Processing System
SPSS ......................... Statistical Package for Social Sciences
CSTWG .................... Census and Surveys Technical Working Group
EU ............................ European Union
DADIPS ................... District Agricultural Development and Investment Projects
DFID ........................ Department for International Development
FAO .......................... Food and Agriculture Organisation
GDP .......................... Gross Domestic Product
ICR ........................... Intelligent Character Recognition
IEC ........................... Information, Education and Communication
MCA ......................... Japan International Cooperation Agency
MAFS ....................... Ministry of Agriculture and Food Security
NBS .......................... National Bureau of Statistics
NSGRP ..................... National Strategy for Growth and Reduction of Poverty
NGO ......................... Non Government Organisation
OCGS ....................... Office of the Chief Government Statistician, Zanzibar
PORALG.................. Presidents Office, Regional Administration and Local Government
SAC .......................... Scotts Agriculture Consultancy.
UNDP ....................... United Nations Development Programme
ULG ......................... Ultek Laurence Gould Consultants
Tanzania Agriculture Sample Census

PREFACE
PREFACE
At the end of the 2002103 Agriculture Year, the National Bureau of Statistics and the Office of the Chief
Government Statistician in Zanzibar in collaboration with the Ministries of Agriculture and Food Security;
Water and Livestock Development; Cooperatives and Marketing as well as the Presidents Office, Regional
Administration and Local Government (PORALG) conducted the Agriculture Sample Census for 2002/2003.
This is the third Agriculture Census to be carried out in Tanzania, the first one was conducted in 1971/72, thesecond in 1993/94 and 1994/95 (during 1993/94 data on household characteristics and livestock count were
collected and data on crop area and production in 1994/95).
It is considered that this census is one of the largest to be carried out in Africa and indeed in many other
countries of the world. For the crop sub-sector, the census collected detailed data on all annual and permanentcrops. It also collected comprehensive input use, storage, processing, marketing, tree farming and erosion
control and extension services. As a result, the crop report from this census is much more detailed than the
previous censuses' reports and, for the first time, has a conclusion and makes recommendations.
In addition to this, the census was large in its coverage as it provides data that can be disaggregated at district
level and therefore allow comparisons with the 1998/99 District Integrated. Agricultural Survey. The census
covered smallholders in rural areas only and large scale farms. This report presents data disaggregated up to
regional level and it focuses on crops grown kept by smallholders. For the first time, it includes figures for
Zanzibar. The analysis in the report includes time series comparisons using data from the previous censuses and
surveys.
The extensive nature of the census in relation to its scope and coverage of the crop sub-sector is a result of the
increasing demand for more detailed information to assist in the proper planning of this sub-sector and in the
administrative decentralization of planning to district level. It is hoped that this report will provide new insights
for planners, policy makers, researchers and others involved in the agricultural sector in order to improve the
prevailing conditions faced by crop producers in the country.
On behalf of the Government of Tanzania, I wish to express my deep appreciation for the financial support
provided by the development partners, in particular, the European Union as well as DFID, UNDP, Japanese
Government, JICA and others who contributed through the pool fund mechanism.
Finally, my appreciation goes to all those who in one-way or the other contributed to the success of the survey.
In particular, I would also like to mention the enormous effort made by the Planning Group composed of
professionals from the Agriculture Statistics Department of the National Bureau of Statistics, the Office of the
Chief Government Statistician in Zanzibar and the Statistics Unit of the Ministry of Agriculture and Food
Security with technical assistance provided by Ultec Lawrence Gould, Scotts Agriculture Consultancy and the
Food and Agriculture Organisation of the United Nations.
Additionally, I would like to extend my appreciation to all professional staff of the National Bureau of Statistics,
the sector Ministries of Agriculture and PORALG, the Consultants as well as Regional and District Supervisors
and field enumerators for their commendable work. Certainly without their dedication, the census would not
have been such a success.
Radegunda Maro
Ag. Director GeneralNational Bureau of Statistics
Tanzania Agriculture Sample Census

illustrations vii
ILLUSTRATIONS
List of Tables
1.1 Census Sample Size ................................................................................................................................................. 42.1 Rank of Livelihood Activities by Type and Region ............................................................................................ 212.2 Number of Households by Purpose of Credit ...................................................................................................... 272.3 Households Toilet Facility by Sex of Household Head ....................................................................................... 282.4 Number of Households by Type of Asset Owned by the Household & Sex of Head of Household ............... 302.5 Number of Households by Type of Energy Used for Lighting and Sex of Head of Household .....................1 312.6 Number of Households by Type of Energy for Cooking and Sex of Head of Household ........................... 31
List of Charts
2.1 Population Trend - Mainland .................................................................................................................................. ..92.2 Population Growth Rate ...................................................................................................... ................................... ..92.3 Agriculture Population by Sex and Region - Tanzania .......................................................................................... 92.4 Rural Agriculture Population Pyramid - Mainland .............................................................................................. 102.5 Agriculture Households by Type .............................................................................................. .......................... 102.6 Number of Crops Only, Crop and Livestock and Livestock only Smallholder by Region ................................ 102.7 Time Series of Number of Agriculture Households by Type ............................................................................. 112.8 Agriculture Rural Household Size by Region - Tanzania ................................................................................... 112.9 Land Area by Type of Ownership ........................................................................................................................ 132.10 Land Area by Type of Ownership and Region .................................................................................. ................ 132.10a Time Series of Land Area by Type of Land Ownership ...................................................................................... 132.11 Number of Agriculture Households by Distance from Homestead to First Field ............................................. 132.12 Percent of Households by Distance from First Field and Region .............................................................. ........ 142.13 Number of Agriculture Households by Distance from Road to First Field ...................................................... 142,14 Percent of Households by Distance from First Field to Nearest Road and Region .......................................... 142.15 Agriculture Household Members by Literacy - Tanzania .................................................................................. 172.16 Percent Literacy Level of Household Members by Region ................................................................................ 172.17 Difference in Literacy Rates Between Sexes by Region ..................................................................................... 172.18 Literacy Rates of Heads of Households by Region ............................................................................................. 172.19 Percent of Rural Agriculture Population Aged Five Years and Above by Education Status - Tanzania ........ 192.20 Percent of Household Members by Education Status and Region - Tanzania .................................................. 192.21 Percent Distribution of Heads of Household by Education Attainment - Tanzania ......................................... 192.22 Education Status of the Household Heads by Region .......................................................................................... 192.23 Percent Distribution of Rural Population by Main Activity ................................................................................ 212.24 Involvement in Farming - Mainland .......................................................................................... .......................... 222.25 Involvement in Farming by Region - Mainland ................................................................................................... 222.26 Number of Agriculture Households by Number of Off-farm Activities ............................................................ 232.27 Percent Distribution of Agriculture Households by Number of Off-farm Activities and Region ................... 232.28 Number of Households by Mn Source of Cash Income .................................................................................. 232.29 Percent of Households by Source of Cash Income and Region .......................................................................... 232.30 Number of Households by Access to Credit - Tanzania ........................................................................ ............ 252.31 Number of Households Receiving Credit by Sex of Head of Household .......................................................... 252.32 Number of Households Receiving Credit by Region ............................................................................ ............. 252.33 Percentage Distribution of Households Receiving Credit by Main Source ...................................................... 262.34 Percentage Distribution of Households by Main Source of Credit and Region ................................................ 262.35 Proportion of Households Receiving Credit by Mn Purpose of the Credit ..................................................... 262.36 Reasons for Not Using Credit (Percent of Households) ....................................................................... ............. 272.37 Percentage Distribution of Households by Type of Roofing Material - Mainland ........................................... 272.38 Percent of Households by Modern or Traditional Roofing Material ............................................................ ..... 282.39 Number of Agriculture Households by Type of Toilet Facility - Mainland ..................................................... 282.40 Percent of Households with No Toilet Facility by Region .................................................................... ............ 282.41 Percent Distribution of Households Owning Assets by Type of Asset ............................................................. 302.42 Number of Households by Ownership of Assets and Region ............................................................................. 302.43 Percent Distribution of Households by Main Source of Energy for Lighting - Tanzania 302.44 Percent Distribution of Households by Type of Energy Used for Lighting and Region ................................. 312.45 Percent Distribution of Households by Main Source of Energy for Cooking .................................................... 312.46 Percent Distribution of Households by Type of Energy Used for Cooking and Region ................................. 332.47 Percent of Households by Distance to Source of Drinking Water ..................................................................... 332.48 Percent Distribution of Households by Source of Drinking Water during the Dry Season .............................. 33
Thnzania Agriculture Sample Census

Illustrations Vu
2.49 Percent Distribution of Households by Source of Drinking Water during the Wet Season ............................. 332.50 Percent of Households by Source of Drinking Water in the Dry Season and Region....... ............................... 34
- 2.51 Percent of Households by Type of Labour .................................................................................._..................... 34
2.52 Number of Households by Level of Contribution of All Livelihood Activities toNonSubsistence Purposes ................................................................................................................................. 35
2.53 Percent of Households by Level of Contribution to Non-Subsistence and Region .......................................... 352.54 Percent of Households by Level of Contribution of Different Livelihood Activities to Non-Subsistence ...... 372.55 Number of Agriculture Households by Number of Meals per Day ................................................................... 372.56 Percent of Agriculture Households by Number of Meals per Day and Region ................................................ 372.57 Number of Households by Frequency of Eating Animal Protein in One Week .............................................. 382.58 Percent of Households Eating Animal Protein by Number of Times per Week and Region ........................... 382.59 Number of Agriculture Households by Status of Food Satisfaction ................................................................. 382.60 Percent of Households by Level of Food Satisfaction and Region - Tanzania ................................................. 402.61 Access to Natural/Communal Resources ........................................................................................................... 402.62 Mean Distance to Natural/Communal Resources by Type and Region ............................................................ 402. 63 Mean Distance to Social Services and Infrastructure ........................................................................................ 422.64 Mean Distance to Services and Infrastructure by Region .................................................................................. 422.65 Number of Households by Level of Use of Available Land ............................................................................. 422.66 Number of Households by Whether or Not the Available Land is Sufficient ................................................... 432.67 Percentage of Households Reporting Sufficiency of Land by Region .............................................................. 43
List of Maps
2.1 Rural Agriculture Population by Region ............................................................................................................ 122.2 Average Household Size by Region .................................................................................................................. 122.3 Land Area and Percent of Land under Customary Law by Region ................................................................... 152.4 Number and Percent of Households with Homestead Less Than 100 m from the First Field .......................... 152.5 Number and Percent of Households with Less Than 100 m from the first Field to the Nearest Road ............. 162.6 Number and Percent of Literate Rural Agriculture Population by Region ....................................................... 182.7 Percent Difference in Literacy Rate between Sexes by Region ........................................................................ 182.8 Number and Percent of Rural Agriculture Population That Never Attended School by Region ..................... 202.9 Number and Percent of Head of Households that Have No Education by Region .......................................... 202.10 Number and Percent of Population Aged 5 and Above that Work Full Time in Farming by Region .............. 242.11 Number and Percent of Rural Agriculture Households with No Off-farm Income by Region ........................ 242.12 Number and Percent of Rural Agriculture Households with Modern Roofing Materials by Region ............... 292.13 Number and Percent of Rural Agriculture Households with No Toilet Facilities by Region ........................... 292.14 Number and Percent of Rural Agriculture Households Owning Bicycles by Region ...................................... 322.15 Number and Percent of Rural Agriculture Households Using Hurricane Lamps for Lighting by Region....... 322.16 Number and Percent of Rural Agriculture Households Using Piped Water by Region .................................. 362.17 Number and Percent of Rural Agriculture Households Using 25 Percent or Less, of their Livelihood
Activitiesfor Non-Subsistence Purposes ................................................................:......................................... 362.18 Number and Percent of Rural Agriculture Households Having at Least Three Meals per Day by Region ..... 392.19 Number and Percent of Rural Agriculture Housellolds That Do Not Eat Animal Protein in a
Weekby Region ............................................................................................................................:................... 392.20 Number and Percent of Rural Agriculture Households that Often or Always Face Problems in Satisfying the
HouseholdFood Requirements by Region ........................................................................................................ 412.21 Number and Percent of households reporting Land Insufficiency by Region ................................................. 44
Tanzania Agriculture Sample Census

Executive Summary ix
EXECUTIVE SUMMARY:
The household socioeconomic conditions and access to services and natural resources report contains details of rural
agriculture smallholders in Tanzania in relation to demographics, household characteristics, literacy and education of the
rural agriculture population, livelihood activities, off-farm income, agriculture credit, living conditions and access to
resources. It therefore contains data on a wide range of poverty issues and, where possible, it compares data with previous
censuses and surveys.
The population of rural agriculture smallholder households in Tanzania is 24,743,990, of which 12,304,187 are males and
12,439,803 are females. The rural agriculture smallholder population has increased from around 15 million in 1988 to
approximately 25 million in 2003. Shinyanga and Mwanza regions have the largest rural agriculture population in
Tanzania (2,426,406 and 2,134,382 respectively), Dar es Salaam region and Zanzibar have the smallest (99,030 and
540,508 respectively). The rural agriculture population consists of a high proportion of young people resulting in a high
dependency ratio of I to 0.9 and most out migration from the rural areas is between the age of 15 to 55.
The total number of rural agriculture households in Tanzania is 4,901,837 of which 4,804,315 are on the Mainland and
96,522 are in Zanzibar. There are 3,935,761 male headed households and 966,076 female headed households in the
country and the average household size is 5.2 persons per household, with Shinyanga having more than other regions (6.4)
and Mtwara having the smallest number (4.0 persons per household). Most rural agriculture households are involved in
crop production. The number of crop growing households has increased at a rate of 3.2 percent per year over the last ten
years.
Most smallholders have right to land through customary law (68% of total allocated land) and only a small percent is under
official land titles (5%). The highest percent of land under customary law are found in Ruvuma (83%) and Mara (78% and
the lowest are found in Zanzibar (32%) and Dar es Salaam region (33%). There has been little change in land ownership
patterns over the last 10 years.
Most households have got easy access to their fields with only 10 percent of rural agriculture households having the nearest
fields at a distance of over 3 km from their homesteads. Smallholders in Kagera, Dar as Salaam and Kilimanjaro have the
easiest access to their fields, whilst Mtwara has the worst access.
The overall literacy rate in Tanzania is 66.3 percent with no change since the last agriculture census. Kilimanjaro has the
highest literacy rate (87%), whilst Tabora has the lowest (53%). The literacy rate of the heads of households is 69 percent
which is comparable to that of the total rural agriculture population in the country and follows the same regional trend. In
Tanzania, 40 percent of the rural agriculture population has never attended school, with the highest percent of the
population that have never attended school in Tabora and the lowest percent in Kilimanjaro. More than half of the rural
agriculture heads of households have attained primary level education (57%), however there are very large differences in
the country with Zanzibar having the smallest number of heads of households with primary education (only around 5%).
Crop farming is the most important livelihood activity followed by forest resources and livestock keeping pd this is the
same for most regions. Off faun income is one of the least important activities and permanent crop farming k not important
in terms of livelihood in most regions. About 68 percent of the rural agriculture population works full time on farm and
only 3 percent never works on the farm. However there are large regional differences, with Dodoma and Arusha having theTanzania Agriculture Sample Census

Executive Summary
highest proportions of fulltime farmers (about 90%) and Manyara having the lowest with (less than 25%). Most rural
agriculture households have at least one member involved off-farm activities (72%). Doma region has the highest
percent of rural agriculture households with off-fam income, whilst Kagera has the lowest.
The sale of food crops is the most important cash earning activity for rural agriculture smallholders, Cash crops and other
casual earnings are also important. Sale of livestock, fish and forest products are least important for cash income. In
Kigoma . and Morogoro the sale of food crops is the most important source of cash income for over 50 percent of the
households in the regions, whereas in Singida, it is most important for less than 15 percent of the households.
The number of rural agriculture households that have access to credit facilities in Tanzania is very small (3%) and this has
not changed over the last 10 years. The main reason for not accessing credit is lack of awareness (60% of rural agriculture
households). The small number of households accessing credit makes it difficult to come up with concrete conclusions for
the other indicators on credit, however there are indications that male headed households have greater access to credit than
female headed households. The highest proportion of rural agriculture households accessing credit are found in Ruvuma
whilst the lowest proportion is found in Dar es Sthaam. The main sources of credit are cooperatives and family, friends and
relatives and the main use of credit is for purchasing inputs.
Most households use traditional locally available material for roofing (61% of rural agriculture households), however there
are large regional differences. Kilimanjaro has the highest proportion of households with modem roofing material (91%)
and this is dominated by iron sheets, whereas Tabora has the lowest percent (15%). Most households use traditional pit
latrines (88%), however, 8 percent of households do not have toilets. Zanzibar and Arusha region have the lowest
proportion of households with toilets (51% and 68% respectively) and Iringa Ruvuma and Mbeya have the highest (almost
100%).
The main source of energy used for lighting is wick lamp (70%) followed by hurricane lamp (22%), The highest percent of
households using wick lamps are found in Tabora and Kagera, whilst the smallest percent is in Kilimanjaro and Iringa
where there is also a high proportion of households using hu rricane lamps. The most important source of energy for
cooking is firewood (96% of households) and there are no regional differences with the exception of Dar es Salaam where a
small proportion of households use charcoal.
The distance to the main source of drinking water is less than 1 km for most households and there is little difference
between seasons, with the exception of drinking water sources located 3 km or more. Fifty percent of these households
obtain drinking water from a distance of 3 km or above in the dry season. Around 25 percent of households obtain water
from unprotected wells, however there is a high percent of households obtaining water from piped sources (24%). The
highest percent of protected water sources are found in Arusha, Kilimanjaro, Zanzibar and Dodoma, whilst the least are in
Tabora, Mara and Pwani.
Heads of households are mostly involved in fishing, cattle marketing, fish farming, bee keeping and goat and sheep
marketing. Adult females are mostly involved in beer making, collecting firewood, crop processing, collecting water and
milking. Children are mostly involved in livestock herding. In most households soil preparation by hand, planting,
weeding, harvesting and crop protection are done by adult male and females, however in many households these activities
are carried out by all household members.
Tanzania Agriculture Sample Census

Executive Summary xi
Most rural agriculture households assign I to 25 percent of their livelihood activities for non - subsistence purposes and
very few households use more than 75 percent of their livelihood activities for non subsistence purposes. Tanga region has
the most households living a total subsistence existence in the country (40% of the rural agriculture households use no
livelihood activity for non-subsistence purposes). Tabora, Pwani and Dar es Salaam regions have the highest proportion of
households using livelihood activities for non-subsistence purposes (between 51 and 75%). The level of contribution to
non subsistence purposes is highest for beekeeping, fishing and tree logging for charcoal and timber.
Most rural agriculture households in Tanzania take 2 meals per day and this is closely followed by 3 meals per day. Very
few households take more than 3 meals a day or one meal per day. However, large differences exist between regions with
Tanga region having the highest proportion of households that take three meals per day and Rukwa and Kagera the lowest.
Most households in Tanzania consume animal protein at least once in a week, and 49 percent of the households eat animal
protein at least 3 times a week. However 19 percent of households do not eat animal protein in a week and most of these
are found in Shinyanga, Dodoma, Kigoma and Arusha. In Mara, Kilimanjaro, Mwanza, Dar es Salaam very few
households do not eat meat in a week. Most households in Tanzania do not face problems in satisfying the food.
requirements for the households, however 24 percent at least sometimes face food shortage and 7 percent always face
problems. The most food insecure regions are Pwani, Singida, Lindi, Dodoma, Arusha and Shinyanga and the most food
secure regions are Ruvuma, Kigoma, Mbeya regions and Zanzibar.
Fishery and hunting resources are the most inaccessible resources in Tanzania, whilst water for livestock and communal
grazing are the most accessible especially during the wet season, Differences in access to communal resources between
regions is very small.
Feeder roads, primary schools all weather roads, health clinics and primary markets are most accessible to rural agriculture
households. Rukwa and Kigoma have the least access to services and infrastructure whilst Dares Salaam and Kilimanjaro
have the best access.
Tanzania Agriculture Sample Census

Introduction
1. INTRODUCTION
1.1 Introduction
The agricultural sector is the main source of employment and livelihood for more than two-thirds of the Tanzanian
population. It is an important economic sector in terms of food production, employment generation, production of raw
material for industries and generation of foreign exchange earnings. It accounts for about 46 percent of GDP (Economic
Survey, 2004).
Having a diversity of climatic and geographical zones, Tanzania's farmers grow a wide variety of annual and..permanent
crops. The country grows a large number of food crops including maize, cassava, beans, banana, paddy, sorghum and
millet. In addition smallholders produce a variety of fruits and vegetables such mangoes, oranges, water melon, tomatoes,
potatoes, egg plants, etc. Permanent crops like coffee, tea, spices, etc. are also grown. Coffee which is grown on estates
and by smallholders is a major export crop. Cotton, cashew nuts and tobacco are also grown by smallholders for export.
Smallholders in Tanzania mainly carry out rain-fed agriculture for subsistence purposes. The commercial large scale sub
sector is very small (1206 holdings) and produces some of the export crops in the country (coffee, tea, sisal, sugar, etc.).
Tanzania Mainland has around 50 million hectares of land fit for grazing and has the third largest livestock population in
Africa after Sudan and Ethiopia. The main types of livestock raised in Tanzania are cattle, goats, sheep, pigs and chicken.
Besides meat [production, other products from livestock include hides and skins, milk and eggs. Livestock also contributes
to crop and vegetable production by providing draft animals for cultivation and organic fertiliser.
The present report analyses the data related to population characteristics, poverty indicators (household characteristics,
household food security, access to services and infrastructure, access to natural resources, livelihood constraints and level
of subsistence and regulatory problems), labour use, access to credit and land ownership and tenure at National and
Regional levels.
The purpose of this report (Volume IV) is to provide stakeholders with base line data to monitor and assess the impact
government program on poverty, household's socio economic conditions and the level of access to common resources,
infrastructure and services. Other Census reports include the Technical Report (Volume I), Crop Report (Volume II),
Livestock Report (Volume III), 21 Regional Reports for the Mainland (Volume V), Large Scale Farms Report (Volume VI)
and two separate report for Zanzibar). In order to address the specific issue of gender, a separate thematic report on gender
has been published. Other thematic reports will be produced depending on the demand and availability of funds. In
addition to these reports, two dissemination applications have been produced to allow users to create their own tabulations,
charts and maps.
This report is divided into four main sections: Introduction, Results, Regional Profiles and Appendices. The definitions
relating to aspects of this report can be found in the questionnaire (Appendix III) and in Volume 1 (The Technical Report).
1.2 Background Information
In 2003, the Government of Tanzania launched the Agricultural Sample Census as an important „part of the Poverty
Monitoring Master Plan which supports the production of statistics for advocacy of effective public policy, including
Tanzania Agriculture Sample Census

Introduction 2
poverty reduction, access to services, gender, as well as the standard crop and livestock production data normally collected
in an agriculture census. The census is intended to fill the information gap and support planning and policy formulation by
high level decision making bodies. It is also meant to provide critical benchmark data for monitoring ASDP and other
agriculture and rural development programs well as prioritising specific interventions of most agriculture and rural
development programs.
Following the decentralisation of the Government's administration and planning functions, there has been a pressing need
for agriculture and rural development data disaggregated at regional and district levels. The provision of district level
estimates will provide essential baseline information on the state of agriculture and support decision making by the Local
Government Authorities in the design of District Agricultural Development and Investment Projects (DADIPS). The
increase in investment is an essential element in the national strategy for growth and reduction of poverty.
1.2.1 Census Objectives
The 2003 Agriculture Sample Census was designed to meet the data needs of a wide range of users down to district level
including policy makers at local, regional and national levels, rural development agencies, funding institutions, researchers,
NGOs, farmer organisations, etc. As a result, the dataset is both more numerous in its sample and detailed in its scope
compared to previous censuses and surveys, To date this is the most detailed Agricultural Census carried out in Africa. The
census was carried out in order to:
• Identify structural changes if any, in the size of farm household holdings, crop and livestock production, farm input
and implement use. It also seeks to determine if there are any improvements in rural infrastructure and in the level of
agriculture household living conditions;
• Provide benchmark data on productivity, production and agricultural practices in relation to policies and
interventions promoted by the Ministry of Agriculture and Food Security and other stake holders.
EStablish baseline data for the measurement of the impact of high level objectives of the Agriculture Sector
Development Programme (ASDP), National Strategy for Growth and Reduction of Poverty (NSGRP) and other rural
development programs projects.
Obtain benchmark data that will be used to address specific issues such security, rural poverty, gender, agro-
processing, marketing, service delivery, etc.
1.2.2 Census Coverage
The census covers both large and small scale farms. This report covers smallholder household characteristics and their
access to natural resources. Data was collected from a sample of 53.070 small scale households of which 48,315 were from
the Mainland and 4,755 from Zanzibar.
1.2.3 Census Scope
The census covered agriculture in detail as well as many other aspects of rural development and was conducted using three
different questionnaires:
• Small scale farm questionnaire
• Community level questionnaire
• Large scale farm questionnaire
Tanz7ta Agriculture Sample Cezus

Introduction 3
The small scale farm questionnaire was the main census instrument and includes questions related to crop and livestock
production and practices; population demographics; access to services, resources and infrastructure; and issues on poverty,
gender and subsistence versus profit making production units. The main topics covered were:
• Household demographics and activities of_the household members
• Land access/ownership/tenure and use
• Crop and livestock production and productivity
• Access to inputs and farming implements
• Access and use of credit
• Access to infrastructure (roads, district and regional headquarters, markets, advisory services, schools, hospitals,
veterinary clinics, etc...)
• Crop marketing, storage and agroprocessing
• Tree farming, agro-forestry and fish farming
• Access and use of communal resources (grazing, communal forest, water for humans and livestock, beekeeping etc.)
• Investment activities: Irrigation structures, water harvesting, erosion control, fencing, etc.
• Off farm income and non agriculture related activities
• Households living conditions (housing, sanitary facilities, etc.)
• Labour use, livelihood constraints and subsistence versus non subsistence activities
• Gender issues.
The community level questionnaire was designed to collect village level data such as access and use of common resources,
community tree plantations and seasonal farm gate prices.
The large scale farm questionnaire was administered to large farms which were either privately or corporately managed.
1.3 Census Methodology
The main focus at all stages of the census execution was on data quality and this is emphasised in this section. The main
activities undertaken include:
- Census organisation
- Tabulation plan preparation
- Sample design
- Design of census questionnaires and other instruments.
- Field pretesting of the census instruments
- Training of trainers, supervisors and enumerators
Information Education and Communication (IEC) campaign
Data Collection
Field supervision and consistency checks
Data processing:
Scanning
ICR extraction of data
Structure formatting application
Batch validation application
Manual data entry application
Tanzania Agriculture Sample Census

Table 1.1 Census Sam i k She
Households 48,315 4,755 53,070
V iliages(EAK 3,223 317 1 3,539
Districts ' 117 1 9 j 126
Regions 1 21 , 51 26
Introduction
Tabulation preparation using SPSS
Table formatting and charts using Excel, map generation using ArcView and Freehand.
Report preparation using Word and Excel.
1.3.1. Census Organisation
The Census was conducted by the National Bureau of Statistics (NBS) in collaboration with the sector Ministries of
Agriculture, and the Office of the Chief Government Statistician in Zanzibar (OCGS). At the National level the Census
was headed by the Director General of the National Bureau of Statistics with assistance from the Director of Economic
Statistics. The Planning Group oversaw the operational aspects of the Census and this consisted of staff from the
Department of Agriculture Statistics of NBS and three representatives of the Department of Policy and Planning of the
Ministry of Agriculture and Food Security (MAPS). At the regional level, implementation of census activities was
overseen by the Regional Statistical Office of NBS and the Regional Agriculture Supervisor from the Ministry of
Agriculture and Food Security. At the District level the Census activities were managed by two Supervisors from the
Presidents Office, Regional Administration and Local Government (PORALG). The supervisors managed the enumerators
who also came from PORALG.
The members of the Planning Croup had a minimum qualification of a bachelor degree; the Regional Supervisors were
Agriculture Economists, Statisticians or Statistical Officers. The District Supervisors and Enumerators had diploma level
qualifications in Agriculture,
The Census and Surveys Technical Working Group (CSTWG) provided support in sourcing financing, approving budget
allocations and Technical Assistance inputs as well as monitoring the progress of the Census, A Technical Committee for
the census was established with members from key stakeholder organisations and its function was to approve the proposed
instruments and procedures developed by the Planning Group. It also approved the tabulations and analytical reports
prepared from the Census data.
1.3.2 Tabulation Plan Preparation
The tabulation plan cvas developed following three user group workshops and thus reflects the information needs of the end
users. It took into consideration the tabulations from previous census and surveys to allow trend analysis and comparisons.
1.3.3 Sample Design
The Mainland sample consisted of 3,221 villages. These villages were drawn
from the National Master Sample (NMS) developed by the National Bureau of
Statistics (NBS) to serve as a national framework for the conduct of household
based surveys in the country. The National Master Sample was developed from
the 2002 Population and Housing Census. The total Mainland sample was
48,315 agricultural households. In Zanzibar a total of 317 EAs were selected and 4,755 agriculture households were
cover. Nationwide, all regions and districts were sampled except three urban district two from Mainland and one from
Zanzibar).
In both Mainland and Zanzibar, a stratified two stage sample was used, The number of villages/Enumeration. Areas (EAs)
were selected for the first stage with a probability proportional to the number of villages in each district. In the second
Tanzania Agriculture Sample Census

Introduction 5
stage, 15 households were selected from a list of farming households in each Village/EA using systematic random
sampling. Table 3.1 gives the sample size of households, villages and districts for Tanzania Mainland and Zanzibar.
1.3.4 Questionnaire Design and Other Census Instruments
The questionnaires were designed following user meetings to ensure that the questions asked were in line with users data
needs, Several features were incorporated into the design of the questionnaires to increase the accuracy of the data:
° Where feasible all variables were extensively coded to reduce post enumeration coding error.
• The definitions for each section were printed on the opposite page so that the enumerator could easily refer to the
instructions whilst interviewing the farmer.
• The responses to all questions were placed in boxes printed on the questionnaire, with one box per character. This
feature made it possible to use scanning and Intelligent Character Recognition (ICR) technologies for data entry.
• Skip patterns were used to reduce unnecessary and incorrect coding of sections which do not apply to the respondent.
• Each section was clearly numbered, which facilitated the use of skip patterns and provided a reference for data type
coding for the programming of CSPro, SPSS . and the dissemination applications.
Three other instruments were used:
• Village Listing Forms were used for listing households in the village and from this list a systematic sample of 15
agricultural households were selected.
• A Training Manual which was used by the trainers for the cascadeipyramid training of supervisors and enumerators
• Enumerator Instruction Manual which was used as reference material.
1.3.5 Field Pre -testing of the Census Instruments
The Questionnaire was pre-tested in five locations (Arusha, Dodoma, Tanga, Unguja and Pemba). This was done to test the
wording, flow and relevance of the questions and to finalise crop lists, questionnaire coding and manuals. In addition to
this, several data collection methodologies had to be finalised, namely, livestock numbers in pastoralist communities, cut
flower production, mixed cropping, use of percentages in the questionnaire and finalising skip patterns and documenting
consistency checks.
1.3.6 Training of Trainers, Supervisors and Enumerators
During training, cascade/pyramid training techniques were employed to maintain statistical standards. The top Ievel of
training was provided to 66 national and regional supervisors (3 supervisors per region plus Zanzibar). The trainers were
members of the Planning Group from the National Bureau of Statistics and the sector Ministries of Agriculture. In each
region, three training sessions were conducted for the district supervisors, and enumerators. In addition to training them in
field level Census methodology and definitions, emphasis was placed on training the enumerators and supervisors in
consistency checking. Tests were given to the supervisors and enumerators and the best 50 percent of the trainees were
selected for the enumeration of the smallholder questionnaire and the community level. questionnaire. This increased the
number of interviews per enumerator but it also released finance to increase the number of supervisors and hence the
Supervisor Enumerator Ratio. The household listing exercise was carried out by all trained enumerators.
Tanzania Agriculture Sample Census

Introduction 6
1.3.7 Information, Education and Communication (IEC) Campaign
Radio, television, newspapers, leaflets, t-shirts and caps were used to publicise the Agriculture Sample Census. This helped
in sensitising the public for the field level activities. The t-shirts and caps were given to the field staff and the village
chairpersons. The village chairpersons helped to locate the selected households.
1.3.8 Data Collection
Data collection activities for the 2003 Agriculture Sample Census took 3 months from January to March 2004. The data
collection methods used during the census was by interview and no physical measurements, e.g., crop cutting and field area
measurement were taken. Field work was monitored by a hierarchical system of supervisors at the top of which was the
Mobile Response Team followed by the Regional Supervisors and District Supervisors. The Mobile Response Team
consisted of 3 Principal Supervisors who provided overall direction to the field operations and responded to queries arising
outside the scope of the training exercise, The mobile response team consisted of the Manager of Agriculture Statistics
Department, Long-term Consultant and the Desk Officer for the Census. DeciSions made on definitions and procedures
were then communicated back to all enumerators via the Regional and District Supervisors.
On the Mainland district supervision and enumeration were done by staff from the President's Office, Regional
Administration and Local Government (PORALG). Regional and national supervision was provided by senior staff of the
National Bureau of Statistics and the sector Ministries of Agriculture. In Zanzibar the enumeration was done by staff from
the Ministry of Agriculture, Natural Resources, Environment and Cooperatives. Supervision was provided by senior
officers of the same ministry and the Office of the Chief Government Statistician.
During the household listing exercise, 3,222 extension staff were used on the Mainland and 317 in Zanzibar. For the
enumeration of the small holder questionnaire, 1,611 enumerators on Mainland and 158 in Zanzibar were used. An
additional 5 percent enumerators were held as reserves in case of drop outs during the enumeration exercise.
1.3.9 Field Supervision and Consistency Checks
Enumerators were trained to probe the respondents until they were satisfied with the response given before they recorded
them in the questionnaire. The first check of the questionnaires was done by enumerators in the field during enumeration.
The second check was done by the district supervisors followed by Regional and National Supervisors. Supervisory visits at
all levels of supervision focused on consistency checking of the questionnaires. Inconsistencies encountered were
corrected, and where necessary a return visit to the respondent was made by the enumerator to obtain the correct
information. Further quality control checks were made through a major post enumeration checking exercise where all
questionnaires were checked for consistencies by supervisors in the district offices.
1.3.10 Data Processing
Data processing consisted of the following processes:
• Data entry
• Data structure formatting
Batch validation
• Tabulation
Tanzania Agriculture Sample Census

Introduction 7
Data Entry
Scanning and ICR data capture technology for the small holder questionnaire was used on the Mainland, This not only
increased the speed of data entry, it also increased the accuracy due to the reduction of keystroke errors. Interactive
validation routines were incorporated into the ICR software to trap errors during the verification process. The scanning
operation was so successful that it is highly recommended that the technology be adopted for future censuses/surveys. In
Zanzibar all data was entered manually using CSPro.
Prior to scanning, all questionnaires underwent a manual cleaning exercise. This involved checking that the questionnaire
had a full set of pages, correct identification and good handwriting. A score was given to each questionnaire based on the
legibility and the completeness of enumeration. This score will be used to assess the quality of enumeration and
supervision in order to select the best field staff for future censuses/surveys.
CSPro was used for data entry of all Large Scale Farm and community based questionnaires due to the relatively small
number of questionnaires. It was also used to enter 2,880 of small holder questionnaires that were rejected by the ICR
extraction application.
Data Structure Formatting
A program was developed in visual basic to automatically alter the structure of the output from the scanning/extraction
process in order to harmonise it with the manually entered data. The program automatically checked and changed the
number of digits for each variable, the record type code, the number of questionnaires in the village, the consistency of the
Village ID Code and saved the data of one village in a file named after the village code.
Batch Validation
A batch validation program was developed in order to identify inconsistencies within a questionnaire. This is in addition to
the interactive validation during the ICR extraction process. The procedures varied from simple range checking within
each variable to more complexes checking between variables.. It took 6 months to screen, edit and validate the data from
the smallholder questionnaire. After the long, process of data cleaning, the tabulations were prepared based on a pre-
designed tabulation plan.
Tabulations
Statistical Package for Social Sciences (SPSS) was used to produce the Census tabulations and Microsoft Excel was used to
organize the tables and compute additional indicators.
Excel was also used to produce charts while Arc View and Freehand were used for the maps.
Analysis and Report Preparation
The analysis in this reportfocuses on regional comparisons, time series and national production estimates. Microsoft Excel
was used to produce charts; Arc View and Freehand were used for maps, whereas Microsoft Word was used to compile the
report.
Tanzania Agricullure Sample Census

Introduction
Data Quality
A great deal of emphasis was placed on data quality throughout the whole exercise from planning, questionnaire design,
training, supervision, data validation and cleaning/editing. As a result of this, it is believed that the census is highly
accurate and representative of what was experienced at field level during the Census year. With very few exceptions, the
variables in the questionnaire are within the nouns for Tanzania and they follow expected time series trends when
compared to historical data. Standard Errors and Coefficients of Variation for the main variables are presented in the
Technical Regan (Volume I).
1.4 Funding Arrangements
The Agricultural. Sample Census was supported mainly by the European Union (EU) who financed most of the operational
activities. Other funds for operational activities came from the Government of Tanzania, Government of Japan, and United
Nations Development Programme (UNDP) and other partners in the Pool fund of the Vice President's Office (VPO). In
addition to this technical assistance funds were provided by the European Union (EU), Department for International
Development (DFID) and Japan International Cooperation Agency (JICA). This was managed by Ultek Laurence Gould
Consultants (ULG), Scotts Agriculture Consultancy Ltd (SAC) and the Food and Agriculture Organisation (FAO).
Tanzania Agriculture Sample Census

Results I
2. RESULTS
This section presents the results an the demographics, education, literacy, off-farm income, type of productive activities of
household members, labour use, access to natural resources, community tree planting, credit, food security, and other
poverty related indicators. The results are presented in different forms including brief summaries, charts, condensed tables
and graphs and maps in order to make it easier for the users to understand. Comparisons are made between related
variables and between regions. Unless otherwise specified, all reference to households in this document refer to rural
agriculture households.
2.1 Demographics
2.1.1 Population
The rural population involved in agriculture activities in Tanzania in 2003 was 24,743,990 (12,304,187 males and
12,439,8©3 females), which is comparable with the figure obtained from the 2002 Population and Housing Census
(26,500,042). Note that the population census data on rural population includes non farming rural households
€bart2.I Pb "aflonTrend- Th ntaW Q art 2.2 Pop.^taii twi -os^th I ate
25,0^,^51
4
20.000,000 ' — 3
d
215,000,0(0
10,000,000 01. 967 1979 1988 2003 1967-78 1978-88 1988-03 1967-03
t ote: figares tar 1967 to 1998 rimers to totat nral poplatto whist the 2963figu-e is for ru-al 1^ ^nvdved in i"ure
•
Year LYear
The rural population involved in agriculture has increased from
11,336,355 in 1.967 to 24,743,990 in 2003 at an average rate of 2,3 percent per year (Charts 2.1 and 2.2). Most of the
population increase occurred between 1988 and 2003 when the average growth rate was 3.8 percent and almost all regions
-follow this general trend.
Shinyanga with a rural agriculture population of
2,426,406 is the largest in Tanzania. This is
followed by Mwanza (2,134,382) and Kagera
(1,739,8180). The smallest regional
populations are found in Dar es Salaam
(99,030), Zanzibar (540,508), Lindi (646,400)
and Pwani (712,995) (Map 2.1). Little
differences exist in population between the
sexes (Chart 2.3).

Results 10
O 2A
2.1.2. Age Structure
Chart 2,4 is the population pyramid
for the Mainland with a broad base
indicating a high fertility rate and a
youthful age structure. It also
shows a smaller number of males in
the age groups 20 to 50 possibly
because of migration coupled with
mortality. The dependency ratio is
1 to 0.9 which is extremely high
when compared to the country wide t
ratio (including urban population) which is 1 to 0.46. This means that there is a large burden on the active rural agriculture
population to support the inactive population (under 15 and 65 and above), The population pyramids for each region can
be found in Appendix II.
The overall sex ratio of the agriculture rural population is 99 males for every 100 females. However, for the age range 0 to
14 the sex ratio is 103 males to 100 females, for age 15 to 55 it is 90 males per 100 females and for age 55 and above it is
113 males to 100 females This may indicate that the main period of out migration is between the age 15 to 55 and most of
this is for males.
2.2 Household Characteristics
The total number of rural agriculture households in Tanzania is 4,901,837 of which 4,805315 are on the Mainland and
96,522 are in Zanzibar. There are 3,935,761 male headed households and 966,076 female headed households in the
country.
2.2.1 Type of Agriculture Household
At national level, crop farming is more important than livestock keeping with 99 percent of smallholder households
(4,858,810 households) involved in crop production against 36 percent (1,745,777 households) keeping livestock, Of the
crop growing households, 4,762,589 (98%) were on the Mainland and 96,221 (2%) in Zanzibar (Chart 2.5) and this is made
up of 3,156,060 crops only households and 1,702,750 households with both crops and livestock.

Time series data show an increase in all types of
agriculture households over the period 1994 to
2003 [1,210,853 households (32.2%) or 3.4% per
year].
For crop growing households the increase was
greater between 1993/94 and 1998/99 (3,2%
increase per year). Crop and livestock small
holders follow the same trend as that of crops
only smallholders (Chart 2.7). The increase in
livestock only households was large over
the period 1999 to 2403, however the 7.5
numbers are very small and caution must
be taken when using them.
2 .2 .2 Household Size
Results 11
Shinyanga has the highest number of crop growing households in the country. This is followed by Mbeya, Kagera,
Mwanza and Dodoma. Dar es Salaam and Zanzibar have the lowest number of households involved in crop production
(Chart 2.6). Zanzibar has the highest intensity of crop growing households with 39 crop growing households per square
kilometre of land.
Kilimanjaro, Arusha and Manyara are the only regions with a higher number of households with crops and livestock than
households growing crops only. Smallhoider households in Mtwara, Morogoro, Iringa, Lindi and Pwani keep very few
livestock and are practically totally dependant on crop growing in regard to their on farm activities. Pastoralists and
livestock only households (43,027 households) are mainly found in Arusha (16,379 households) (Chart 2.6).
Chart 2.7 Time Series of Nue rl x of Agr. icultu re
Humebdch by Th pe
4,(XO,(XIJ
2,946,678 3,156,060
3,OOD,00D ,396,472
4 11:u
2^0301.655.396 1,702,750
,27,51
1,ot10,00D _., 15,461 17,814 43,027
1994 1999 2.X73
Agricultu re Year
0 Clops Only M Clops & Uvestock N Livestock Only
a^ t 2.8 Agrk tune Rues t eh dsize Iy Region - Tanssuia
hQ ^;^
^, a
2.2.4 Land Ownership/Tenure
In Tanzania ownership by customary law means that the families using the land have inherited the land from their
forefathers and that no other family can use or gain access to the land without the families permission. Bought means that
the land has been bought from other families, certificate of ownership refers to an official government certificate declaring
ownership.
Tanzania Agriculture Sample Census

%e, tS
5.5%
Map ;;:iRuraf AgHeut:Anta Popu?ation and
Persentav by . -',;ogion
! AgNcukum Po
2,000,000 to 2,500,000
1.500,000 to 2,000,0001,000,000 to 1,500,000
..[ 500,000 to 1,000,000
• 0 to 500,000Ruvuma
2.6%
Lindi
Percentage Rural Agriculture Population
Map 2,2TANZANIAtumher and Average of Household
Size by Region
4.9%
3_!n0.••• •
&Household Se308,000 to 378,000236,000 to 308,005
i 184.000 to 236,00092,000 to 164,000
.! 20,000 to 000
42%
4,7%Aveiage of Hf..usehold Size
Itanzu Agrieulturo `;arnuls ( SUS

Bain sl, 374.272,J/
3%Ck.ixr ^eTecnn, C ttific e 1,919,
386.782; 3% tea, 518,177. ownexslnrp.160k4% 644,996, 5%
2,000.000
1,500,000wr
1000,000
500,000
Results 13
Q 2.9 L idAieaiwTijnuf4Aaaa p c]tstarrosyl.aw,Most land available to smallholders in Tanzania is
0,082,639. 08%
under customary law (68% of total allocated land),
followed by bought (16%). Only 5% of the small73.673, 1% .1: ..14
holder land area have official land titles (Chart 2.9). .
Ruvuma, Mara, Singida and Pwani have the highest
percent of land under customary law (83%, 78%,
76% and 76% respectively), whereas Zanzibar, Dar
es Salaam region and Kagera have the smallest area
of land under customary law area of land with only
32% 33% and 52% respectively (Map 2.3). In
general, regions that have a small percent of land
under customary law have more bought land
indicating a transfer of ownership from customary
law. Zanzibar had a high percent of borrowed land
compared to other regions. A higher percent of land
titles have been issued in Tanga, Zanzibar Manyara
and Morogoro, whilst Kigoma, Rukwa, Shinyanga,
and Kagera have the smallest percent of land with
certificates (Chart 2.10).
There has been little change in land ownership over the last 10 years with the only positive change being a small increase in
ownership of land under customary law (Chart lOa).
Chart Ella 'ntne series eflartd Area by Tape of Land Ownership
Area owned uodu
500 .,000 .^.^^_.^•--^—'^'•'_'•—V--^ Cuswnury Law
6,000,000
4,500,000
Area w gj tt3Og0W0
&
L9110 ,000...._ ............._.._....,..____._ __.,.__....,,.,._....-.,.._.
•'^'"`.^•^ rea leased 1
0 ,r Cxnificxte of
Agriculture Year nnhip1933195 2062813 O'v. 0 Area owned under Customary Law : <... Area Bo ht
C"" Area tented . a- - Area hIassd f Cerfticate of (he nershi.--!>•— Area derrow ed ^+--Area under Other tarot of Tenure
Chart 2.11 Number of Agriculture Anuseholds by Distance from
Homestead to ISrst Field2.500 ,000 ............_._.__m___________...._...^.._..._._.. _. .................._...^
45
I.Leas 100 to 300 to 500 to 1 2 3 to 5 to 10 Overthan 299 to 499 in 999 in toi.9 to2.9 49 km km 10 km
100 m km kmAistance p sories2 Socket
50
45
40
35 .130
25
20 °5
5
0
2.2.4 Distance from Field
Distance from Field to Homestead
In general, smallholder fields are located close to the homestead with 45 percent of households reporting that their first field
is less than 106m from the homestead. The households second and third fields are usually further from the homestead with
25 and 30 percent of households with 2 and 3 fields respectively reporting a distance of less than 100m from the homestead.
However, 20 percent of households reported that their first field is between 1 and 3 km from the homestead (Chart 2.11).
Differences in access to fields are closely related to region (Chart 2.12). In Kagera region the fields;nre'closer to the
homestead than in other regions with 85 percent of households living less than 100m from their homestead and a small
Tanzania Agriculture Sample Census

Chart 2.12 Percent of Households try Distance from first Field andRegion
e e•ion
0 Less than 100 m a 100 to 299 m 0 300 to 499 m
0 500 to 999 m a 1 to1.9 km fl 2 to2.9 km3 Se 4,9 km PJ 5 to10 km a Over 10 km
100%
80%
60%
0 40%
20%
0%
Chart 2.13 Number of Agriculture Households by Distance fromRoad to First Field
30
0
Less 100 to 300 to 500 to 1 tot.9 2 to2.9 3 to 5 to10 Over 10
than 299 m 499 m 999 m km km 4.9 km km km100 to DisOnce
I
%,%
qo.. c;c4 7..7,
Ip t.
iZ5t5; ..s. .- ,.
- - ? eae , Xi.; ,---.,
25
TJ
t 20
O15
0= 0
100%
80%
60%
Chart 2.14 Percent of households by Distance from First Field toNearest Read and Region
Results 14
number of households have fields located over 3 km from the homestead. Other regions with good access include Dar es
Salaam, Kilimanjaro, Tabora, Singida and Arusha.
This is in contrast to Mtwara region which has the
worst access to fields in the country with only 8
percent of households less than 100m from the
homestead to the first field. Most households in
Mtwara have fields located between 1 and 3 km
from their homesteads. Other regions with poor
access to fields are Morogoro, Tanga, Lindi and
Rukwa (Map 2.4). Kigoma, Rukwa, Ruvuma
regions have a higher percent of smallholders
living over 3 km from their first field. (Chart 2.12).
Distance from Field to Nearest Road
Roads are Maher from fields than homesteads.
Only 26 percent of households reported that their
first field is less than 100m from the road. Around
37 percent of households have fields that are
between 0.5km and 3 km from the nearest road.
However, only a few have their first field over 10
km from the nearest road (Chart 2.13).
Differences between regions in the distance from
the first field to the nearest road exist, but are not
as pronounced as the distance from the field to the
homestead.
0%
4°
woo.
0 Leas than 100 m 0 100 to 299 m 2 300 to 499 m 0 500 to 999 m 101.9 km2 to2.9 km E 3 to 4.9 km a 5 to10 km e Over 10 km
Kigoma, Rukwa,
Smallholder households in Kilimanjaro, Arusha40%
and Dar es Salaam have the best access from the
field to the nearest road, with between 40 and 50 20%
percent of the households in these regions having
fields that are 100m from the nearest road. In
contrast Mtwara, Morogoro, Shinyanga and Lindi
have the worst access to roads from their fields
with only 18 percent of households having their first field located less than 100m from the nearest road.
Shinyanga and Morogoro regions have around 20 percent of the households in each region with fields located more than 3
km from the nearest road (Chart 2.14 and Map 2.5).
2.3 Literacy and Education of Rural Agriculture Population
Information on literacy and education attainment were obtained for all persons aged five years and above in all sampled
households.
Tanzania Agriculture Sample Census

Results 15
• lap 2.3 TANZANIArj Lake N-itbr•a Land Area and Percent of Land
Kagera . ^ Mara Under Customary Law.. .^331,581 by Region
22,1 ;..: 78.3%
51.6% Shinyanga1
Arusha
60.9 911,178 ,7f1,2,^.^
61.9% 66% Kilimanjaro
igoma
272,660 Manyarab8.5°/
73%• Tabora
2554,282Tang
Singidaf f ' 640, 9
65.6% 235,756 ^/J
35171.2 675.9%
Dodoma Zanzibar
x.714 37,089
Rukwa-
66%ar es Salaam
s A 404810 Noro orog 11,94932.7%9 Pwani
°i°70.
MbeyaIringa 61.4% 237,058
472,221 75.7%4, t34963
A72.2%?' Lindi
244,000Land Area Under Customary Law
LIII56s000to9l2000 71.9%
LIII 405,000 to 565,0000 340,000 to 405,000 }: Ruvum
244,000 to 340,000 665,101LilIl 11,000 to 244,000 :, 83296 340,316 Mtwara
Land Area Under Customary Law.
71.5%
Tanzania Agriculture Sample Census

Map 2.5 TANZANIANumber and Percent of Households with
More Than 1Km From the First
Field to the Nearest Roadby Region
Mara.75145
40i
Kilimanjaro
30,..
14.4%
Dodoma
Zanzibar55,976
37.3%es Salaam4,418
22.6%
Tabora
72,259 Singida
31.1% 71•360
40.T,
- ' 55;701
40.9%
Number of Households
123,000 to 174,000
• •'.1 • •
....... .Mraraz•.:.. •
Lindi
64,227
want
Results 16
104,000 to 123,000
76,000 to104,800
56,000 to 76,000
4,000 to 56,000
Number of Holt sehofds
Percent of NU mber of Households
Tanzania A gricultu re Sample Census

tsct Real! Sbvahili &
'Mite,L- Ott)
Eng 111
7,358,918, o 1,079,368,4.9%24.864, OJ
33.7%
Chart 2.16 Percent Literacy Level of Household Members by
Region
100
80
60
40
20
. o
^o^Sa°mt0, -e"' tiy'^ ^y°^o^^^^^^^$
&9 o^^m^jC a ° ^ pq° ^^^^ t,° a^y`^ y 2^@
Region
Qi t 2.17 einLteraryRegme ket Se,es L y Rcgi ii36
32
q s
4
Chart 2.l s Literacy Rates of Head dMos &J ca by Regiun
Results 7
Chart Ibedtnfrr a dlVtnfb byLiteaacq2.3.1 Literacy TANZAN1A .
soli,Literacy in Tanzania is defined as the ability to 13,351,405,
read and write a simple sentence in Kiswahili only,61.2%
English only, both English and Swahili or in any
other language.
The literacy rate is highest in Kiswahili only with
61.2 percent of the rural agriculture population
followed by both Kiswahili and English (4.9%).
Literacy in any other Ianguages is very low (less
than 1%) (Chart 2.15). There has been no change
in literacy rates since the previous agriculture
census.
The average literacy rate for the rural agriculture
population in Tanzania is 59 percent, however
regional differences exist with Kilimanjaro region
having the highest literacy rate of 87 percent. This
is followed by Dar es Salaam (76%), Iringa (76%)
and Ruvuma (75%). The regions with the lowest
literacy rates are Tabora, Lindi, Shinyanga and
Dodoma with 53, 59, 59, and 61 percent
respectively (Chart 2,16 and Map 2.6).
In the rural agriculture population of Tanzania,
there is a small difference, of 9 percentage points
in the literacy rates between males and females
(the literacy rate is 71% for males and 62% for
females). However there are large differences
between regions with Rukwa Lindi, Dar es
Salaam and Pwani having 15.2, 13.6, 13.6 and
13.4 percent more literate males than females
respectively. In Kilimanjaro and Manyara, the
percent difference in literacy rate between males
and females is the smallest (3.4 and 4.9%
respectively) (Chart 2.17 and Map 2.7).
The average literacy rate of the heads of rural
agriculture households on the mainland is 69
90
75
90
45
3a
15
0percent, however there are large regional
differences. with Kilimanjaro having the highest o
literacy rate of 87 percent. This is followed by Ruvuma (83%), Dares Salaam (78%) and Morogoro .(77%). The lowest
Tanzania Agriculture Sample Census

Kilimanjaro
Map 2.6 TANZANIANumber and Percent of Literate
Rural Agriculture Populationby Region
Number of Literate RuralAgriculture Population
980,000 to 1, 0,000I 750,000 to 980,000
520,000 to 750,000290,000 to 520,000
60,000 to 290,000
Number of Literate Rural Agriculture PopulationPercent of Literate Rural Agriculture Population
Map 2.7 TANZANIAPercent Difference in Literacy
Rate between Sexesby Region
gonla
Tabora
112% y Ingda
8.5% Dodoma
Manyara
4.9%
3.4%
Tanga
11,1%
anzibar0%
Mor om
Mbeya
10.4%
Var es Salaam13.6%
Lndi
13 "'Percent Difference in Literacy Rate
12 to 15.29 to 126 to 93 to 60 to 3
Ruvuma
6,7% Mar
Sninyenga
12.5%
Results 18
Tanzania Agriculture Samp e Census

C hm t 220 Percent a H eWtb Ntmbee s by
Fckicntui Stun TAN14100% y^ ^9' c0 ate`® E^tiawtia^ er ^' `^ v+^'eas'as'mm^
75%
50%
25%
-c-.^r.+ .si ^n E:.pie:n.•u•:ar.ir:.sr:-ar:.^^.•rr^::•i ^•:i e.•r•:.V.•,v.re...s6 a - ir r^—r--r-r'^^^-r^-"-+--r--—r----r—^— rs
—mr ^
gi 0 Eonwleted ra Attendin¢ ig NeverAtLen
I ( rtZ22 r A a m Sat a'tj RsJaTegku I
The number of heads of agricultural households with
formal education in Tanzania is 3,258,983 (61% of
the rural agriculture households). The number of
household heads without formal education is
ao.r
w.o
aa.t^
Results 19
literacy rates among heads of rural agriculture households are found in Tabora (59%), Shinyanga (59%), Arusha (60%) and
Manyara (61%) (Chart 2.18).
2.3.2 EducationStatus
In Tanzania, 30 percent of the of the rural agricultural population aged 5 years and above have completed a certain level of
education and 30 percent are still attending school. The population that never attended school are 40 percent (Chart 2.19).
The Rural agricultural population in Kilimanjaro region has the highest percentage of population aged 5 years and above
who have either completed a certain level of education (52%) or are currently attending (37%) giving a total of 87% of the
rural agriculture population with education.. Ruvuma
has the second highest percent of the rural agriculture
population that have completed a certain level of
education (50%) and also have a high percent
currently attending school (30%). On the other hand,
Tabora and Zanzibar have the lowest completion
percentages (34% and 30% respectively). However,
Zanzibar has one of the highest attendance
percentages of 33 percent as opposed to Tabora
which has the smallest attendance of 21 percent
(Chart 2.20 and Map 2.8).
1,991,864 (37%) and those with only adult education
are 94,856 (2%). The majority of heads of agricultural 20.0
households (57%) had primary level education ^Q
whereas only 4 percent had post primary education ^ 5 a Q ^ ^ m^ a '^
(Chart 2.21). Zanzibar, Tabora, Shinyanga, Arusha r: k r^ GP,;,,, ,,« io„ mroRP, ».,,
and Manyara have the highest percent of heads of rural agricultural households with no education, wl
Ruvuma, Morogoro and Dar es Salaam have the smallest percent. The highest percent of heads of
a 4" ;s tgo'
Rio
•t Kilimanjaro,
Tanzania Agriculture Sample Census

Victoria
MaKager
Map.2:.••1 •Number and
Population School
27.89Amsha
209,30
29.6/. ilimaniaro
Kigoma1 'I.
10.7/Tabora::.
yi
45 394:Dodoma
34.6k
Number of RuralAgriculture Population
620,000 to 760,000 470,000 to 620,000 320,000 to 470,000
L 170,000 to 320,000J 20,000 to 170,000
Percent of Rural Acjcullure Population
Mara
Map 2.9 TANZANIANumber and Percent of Head of
Household that Have NoEducation by Region
wanz21 : ,.CW
Arusha:.-
Kilimanjaro
StngidaDodoma
MProgod i via ,
7. 6%
Number of Head ofHouseholds with No Education
390,500 to 487,000294,100 to 390,500197,700 to 294,100101,300 to 197,700
1.._] 4,900 to 101,300
Results 20
Tanzania Agriculture Sa nple Census
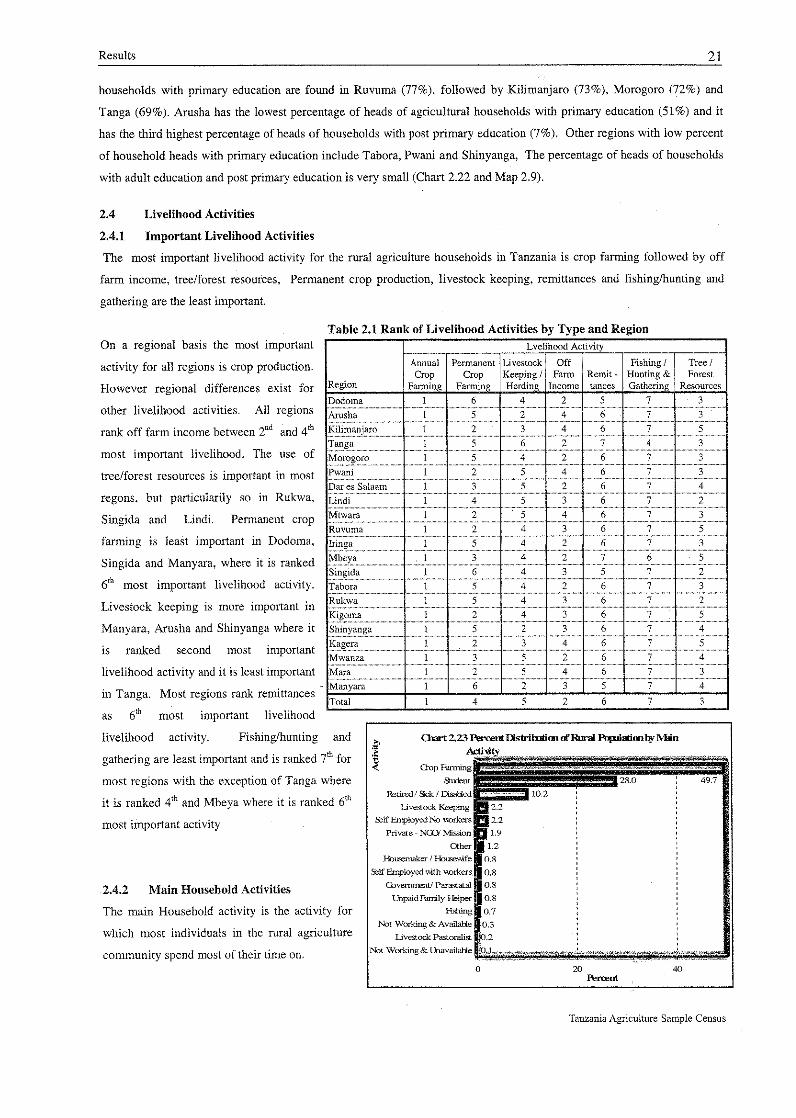
Results 21
households with primary education are found in Ruvuma (77%), followed by .Kilimanjaro (73%), Morogoro (72%) and
Tanga (69%). Arusha has the lowest percentage of heads of agricultural households with primary education (51%) and it
has the third highest percentage of heads of households with post primary education (7%). Other regions with low percent
of household heads with primary education include Tabora, Pwani and Shinyanga, The percentage of heads of households
with adult education and post primary education is very small (Chart 2.22 and Map 2.9).
2.4 Livelihood Activities
2.4.1 Important Livelihood Activities
The most important livelihood activity for the rural agriculture households in Tanzania is crop farming followed by off
farm income, tree/forest resources. Permanent crop production, livestock keeping, remittances and fishing/hunting and
gathering are the least important.
Table 2.1 Rank of Livelihood Activities by Type and RegionOn a regional basis the most important
activity for all regions is crop production.
However regional differences exist for
other livelihood activities. All regions
rank off farm income between 2" d and 4`t'
most important livelihood. The use of
tree/forest resources is important in most
regons, but particularily so in Rukwa,
Singida and Lindi. Permanent crop
farming is least important in Dodoma,
Singida and Manyara, where it is ranked
6th most important livelihood activity.
Livestock keeping is more important in
Manyara, Arusha and Shinyanga where it
is ranked second most important
livelihood activity and it is least important
in Tanga. Most regions rank remittances
Lvelihood Activity
Annual Permanent Livestock Off Fishing I Tree ICrop Crop Keeping I Farm Remit - Hunting & Forest
Region Farmin Farmin Herding Income lances Gathering Resources
Dodoma 1 4 2 5 7 3
Arusha 1..... .
5........
2 4 6 7 3........... ..... ....
Kilsroanjaro ..........
1 ..........,..,..,..,..,
2......... ..,..,..,..
3.,..,.... _.
4., .,.
6 7 5
Tanga 1 5 6 2 7 4 3Morogoro ......... 1.. ............
5.. ......... ... 4..,....,... _.
2.. -....,.. 6..- .-..,.....7- - .-..,...,...,
3...,...,..., .,..,...,..
Pwan 1 2 5 4 6 7 3......... ........Dares Salaam
.1 3 5 2 6 7 4
Lindi I 4 5 3 6 7 2
Mtwara 1 2 5 4 6 -., 7 3Ruvuma........... ... .. ........._,.-2 4 3
5.7
.,..,.....,., ....,.,..,. 5 .....,....,_ ............. .Innga 1 5 ....... .
., _ ., .4....... .. .. .._
2 - ....., 6 7--._ ..... 3
Mbeya1,..,....... _.
..
2 ........... .. . ........
7 6.......... ... ................
5
Singida 1 6 4 3 5 7 2
Tabora 1 5 4 2 6 7 3
Rukwa...... .............
1............ ....
5 4 3.,......, .,. .. -,..
6,....
7 2
Kigoma 1 2 4 3 6 7 5Shinyanga 1 5 2 3 6 7 4Kagera 1 2 3 4 6 7 5Mwanza
1 ............ . . .. 35 2 6 7 4
Mara 1 2 5 4 6 7 3_- ...
Manyara..........
I. ........." ' .,
6 2 3 5 7 4
Total 1 4 5 2 6 7 3as 6`s most important livelihood
livelihood activity. Fishing/hunting and
gathering are least important and is ranked 7th for
most regions with the exception of Tanga where
it is ranked 4`h and Mbeya where it is ranked 6`"
most important activity
2.4.2 Main Household Activities
The main Household activity is the activity for
which most individuals in the rural agriculture
community spend most of their time on,
( -t 2.23 entLslrilis1icttictt c it[rt P 1 Mtinr iwity
GopFarmin :a..;.._...z :....:.-....-- ..::::..::::. ,nA..:..:,..,.........^..,...:..^.„,:.:v.<::::.^.:,...r
&niant 2&0 49.7
Retved l Sick / 17isatied .:...............:..._ 10.2
Livestock Keeping 2.2
Self Toyed No waters 2.2
Private-NGYMission 1.9
Other 1.2
I-loint.niaker I Hnuseuife 0,8
Self employed cvith xorkers 0,8
Covernu=tl Paraetatal 0.8
UnpaidFamily 1-Eiper 0.8
Fishing 0.7
Not Working&AvailaHe 0,3
Livestock PaCoralist ,2
Not Workin8 & Unavailahle ?.:t . •.: r.,
0 20 40Percent
Tanzania Agriculture Sample Census

2.4.3 Level of Participation in Farm Work
The majority of the rural agriculture population
works full time on farm (68%), which further
emphasises the lack of other livelihood activities
in the mral areas of Tanzania. Other categories
of involvement (part time and rarely working on
farms) account for only 29 percent. A very small
portion never works on farms (Chart 2.24).
Chart 2.25 inwlcement in arming by Rion - Mainland
00
75
25
e e e,,AaS 6
Won
M Works Fa-time on Farm E Works Part-time on Farm G karely Works on Farm a Never Works on Far
Results 22
As with livelihood activities, crop farming is the activity which people spend most time on and this is followed by
education activities. Retired/sick /disabled is the 3 rd most important category and is in line with the high dependency ratio.
Businesses and self employment activities are very small which further emphasises the lack of employment opportunities
and the dependence on agriculture. All other activities are of minor importance (Chart 2.23).
The number of rural population working full
time on farm increased slightly by 4.4 percent
since 1994.
Large differences exist in the level of
involvement in farming between regions, with
Ruvuma, Mbeya, Shinyanga and Tabora having
the highest percent of full time farmers, whilst
Dodoma, Singida Morogoro and Dar es Salaam.
However, in the regions with the lowest percent
of full time involvement in farming they have the
in
population that have no involvement in f ing
highest percent part time involvement
f ng. There is no real difference in the percent of the aural agriculture
(Chart 2.25 and Map 2.10).
2.5 Off-farm Income
Off-farm income refers to cash generated from non-agricultural activities for those aged 5 years and above. This can be
either from permanent employment, temporary employment or casual labour. It also includes cash generated from working
on farms belonging to other farmers. Whilst off-farm income is not the most important livelihood activity amongst rural
agriculture households in Tanzania, most of these households have at least one member involved in this type of income
generating activity during the year (72% of rural agriculture households with at least one member has off-farm income).
2.5.1 Number of Off-farm Activities per Household
In Tanzania 2,026,799 rural agriculture households (41.6%) have only one household member involved in off-farm income
generating activities, 1,047,631 households (21.2%) have two members involved and 451,601 households (9.1%) have
Tanzania Agriculture Sample Census

CIa^ t2.2.8i jnu rrrofIloisehdtkbyMinSourceat'Cash
Wes of Food Qnps
Shies of Carta Chaps
Other Qsua1 Co<h Fuming
Be tni s Income
3ste of Livestock
wad &Salaries sn C. ,s` h
Cash kfemittance
U2 Sale of Sharon, Pror wts
Sale of ravestic]< rsr^tiEs
cxhor
not appIicatile
.75%
so%
25%
on ,a
58 3a1I of Fond Crops E9 Sale of LiveWock ® Sale of livestocic ProdLictsSales of (ash ( Dogs 58 51r&: of Forest Pre,drrs n I3uaness moan.,
® Warms & Soi nes m Oath ® Other Co-cwl COn morning 0 Gsh Rsr httanoar Fisome q Other 58 4115 OOI±Cthec
cla t2.29Perchof'F)dusehaicdmySaan'ceofCaliIxncooeItW Regim
100
Results 23
more than two members. However, a large number of rural agriculture households (1,375,805, 28%) have no off farm
income generating activities (Chart 2.26),
Dodoma region has the highest percentage of agriculture households with off-farm income (98.7% of total agriculture
households in the region). Other region with a high percent of agriculture households with off-farm income are Morogoro
(94.5%), Dar es Salaam (88,6%), Singida (88.4%) and Tabora (87.7%). Kagera, Shinyanga, Arusha and Manyara regions
have the lowest percent of agriculture households with off-farm income (47%, 51%, 57% and 59% respectively).
Chart 2.26 Number of Agriculture Househol ds by poe Off FarmNumber of Off-Farm Income Activities income,
LUU.0
2,026,799,42%
< < <.i <s }
t.}
t}
<S a k 'r Y Y
<s <yRs
< t < 4 r 5 RR <
R ta 4 S R Y^}'s i Yi t t t t t a 4- < t < t i t t i < > < S R Y < > i
75.6
><
S -> > k Y S Y Y Y -
Y Y< < t
%.. sr.:.^:..r.. I Y:..: • ^Y: a: i:'.r - P.'r
.Y'
.r. ':^..
Y: <,p'::.a: ;:.' :^: ^
a.:' :
r^^
25.0
0.0
Chart 2.27 Percentage Distribu tion of Agriculture Households byNumber of ©ff•Farm Activi ties and Region
No Off FarmT FarmTwo Off
§Off F' mworo a a m
Cat^d6W° 'P ^ $
a ^ @ '` ,o , ^^a d'9 5 '' ' tl`ro ^
.,ro6^t roo1'^4o` ^d 'Yo^^ot^Ja`
Income,come,
tya ' 4^ ^c^ .^ O1,375,805, Income, 1,047,631, del
028 / 451,601, 9%21%
Region 58 One off-farm D Two aft-Farm ® Three or more off-form 6 No off-farm
The region with the highest percent of agriculture households with more than one member with off-farm income was
Dodoma. Kagera region had very few agricultural households with more than one member having off-farm income (Chart
2.27 and Map 2.11),
2.5.2 Households Main Sources of Income
The results indicate that selling of food crops is the
main cash income earning activity (37.4% of all
rural agricultural households), followed by sale of
cash crops (17%), other casual cash earnings
(15.1%) and business income (9.4%). The
remaining income earning activities were sale of
livestock (5.2%), wages and salaries in cash
(3.9%), cash remittances (3.8%), sale of forest
products (3.5%), fishing (2.6%) and sale of
livestock products (1.0%) (Chart 2,28).
Kigoma region has the highest proportion of
households reporting sale of food crops as their
main source of cash income (64% of rural
agricultural households in the region), followed by
Morogoro (57%), Kagera (54%), Mbeya (50%) and
Ruvuma (49%). On the other hand Singida,
Dodoma and Lindi have the lowest income from
the sale of food crops. The highest proportion of households
Tanzania Agriculture Sample Census

Map 2.10 TANZANIANumber and Percent of Population Aged
5 and Above that Work Full Timein Farming by Region
Number of Head of HouseholdsWork Full in Farming
940,000 to 1,150,000 710,000 to 940,000 480,000 to 710,000 250,000 to 480,000 20,000 to 250,000
Ei.111nPercent of Households Work Full in Farming
Map 2.11 TANZANIANumber and Percent of Rural Agricultur
Households with No Off-farmIncome by Region
Arusha
392%
Lindi
303.39 i
54.3%
Lindi
27,4%
Ruvurna
Mara24.7%
31:7%
24%
Results 24
3i .5%
Kigoma
z Kilimaniaro
Manyera34.7%
Tabora33.6%
41% Tanga
12.3%Singida
Dodoma22.4%
11,6%
Rukwa 1.3%
co
23.5%
Morogoro
Mbeya Iringa 5.5% Pwani
/..)6.k94.
arizibar
ar es Salaam
11.411',
23.8%
Number of RuralAgriculture Householdswith No Off-farm income
160,000 to 190,000L.._J120,000 to 160,000r7 80,000 to 120,000
"I 40,000 to 80,0000 to 40,000
Percent at Rural Agriculture Households with NoOff-farm Income
Tanzania Agriculture Sample Census

Chart 232 Number of Households Receiving Crest by RegionTANZANIA
45,000
3o,a0ofl
a 15,000E
z
Results 25
reporting sale of cash crops as the main source of cash income is found in Lindi (41% of all agricultural households in the
region), Mtwara (37%), Shinyanga (32%) and Ruvuma (26%). Sources of income from businesses are more prominent in
Dar es Salaam (17%),Rukwa (16%) and Tanga (14%). Dodoma has the highest proportion of households reporting `other
casual earnings' as the main source of cash income (35% of all agricultural households in the region) followed by Singida
(30%) and Iringa (18%). Cash income earning from the sale of livestock is found more in Arusha, Manyara and Singida
regions (Chart 2.29).
2.6 Agriculture Credit
The number of rural agriculture households responding to the use of credit was so small that the results in this section
should be treated with caution. This is in relation to type, source, purpose and use of credit but not to the numbers
receiving credit.
2.6.1 Access to Agriculture Credit
Very few agricultural households in Tanzania have access to credit (149,224 households, only 3.0% of the total number of
agricultural households in the country) (Chart 2.30), out of which 123,449 households (83% of all households receiving
credit) were male-headed households and 25,775 households (17%) were female headed( (Chart 2.31). There has been no
improvement in the access to credit in the last 10 years.
Ruvuma region has the highest proportion of
households with access to credit (20.2% of the
total number of agricultural households)
followed by Tabora (10.9%) , Mbeya (5.7%),
Morogora (4,4%), Iringa (3.2%) and Mwanza
(2.9%). Access to credit in more than half of the
other regions is less than 1 percent of all
agricultural households in the respective regions
(Chart 2.32).
Tanzania Agriculture Sample Census

Chart 2.33 Percentage Distribution of HouseholdsReceiving Credit by Main Source
Co -operat ive,
52.324, 35%
Family, Friend
and Relative,
47,777, 32%
Other, 2,896,
2%
Commercial
Bank, 3,340,
2%
Trader Trade
Religious Store, 13,281,
Organisation / Saving & Credit 9%
NW / Project. Society, 12,462,
11,407, 8% 8%
rivate
Individual,5,870, 4%
Chart 2.34 Percent Distribution of Households by Main
Source of Credit and Region100%
75%
50%
25%
it Family, Friend and RelativeM Co-operative
Trader / Trade StoreE Reli 'ass Organisation !NW / Project
E Commercial BankE Saving & Credit Societyg Private In dividual0 Other
agricultural households in the region), Private individual is the main
Chart 2.35 Proportion of Households ReceivingCredit by Win Purpose of the Credit
Fertilizers,
68,453, 29%
6,673, 3%
Results 26
2.6.2 Source of Agricultural Credit
The main agriculture credit provider in Tanzania
are Cooperatives which provides credit to 52,324
agricultural households (35% of the total number
of households that accessed credit), followed by
family, friends and relatives (32%), trader/trade
store (9%), saving and credit society (8%),
religious organisationsNGO projects (8%),
private ithdividual (4%), commercial banks (2%)
and other sources (2%) (Chart 2.33).
Family, friends and relatives were the main
sources of credit in Mariyara and Iringa (over
50% of households receiving credit). Credit
from family friends play a significant role in
other regions except in Pwani, Tabora and Mara.
In Tabora, Pwani and Kigoma, practically all
credit was provided by cooperatives.
Cooperatives play an important role as a source
of credit for the majority of household Tabora
(86% of all agricultural households in the
region), followed by Kigoma (69%), Pwani
(65%) and Mtwara (47%). Trader/trade store is
the main source of credit in Mara region (72% of all
source in Arusha region (45%), savings and credit society is the main source in Mwanza (44%), commercial banks are the
main sources of credit in Dar es Salaam region and religious organization,/NGO projects are the main sources of credit for
Kilimanjaro (38%), Dodoma (37%), Kagera (37%) and Tanga (37%) (Ch 2.34).
2.6.3 Use of Agricultural Credit
A large proportion of the agricultural credit
provided to agricultural households in
Tanzania was used for purchasing fertilisers
(68,453 households, 29% of all households
receiving credit), followed by agro-chemicals
(48,036 households, 21%), seeds (37,121
households, 16%) and hiring labour (37,057
households, 16%). The proportion of credits
intended to be used for livestock rearing,
irrigation structures, tools/equipment and other
sources s was very small (Chart 2.35).
Tanzania Agriculture Sample Census

Table 2.2 Material Used for Roofm
Type of materialMale
Headed %FemaleHeaded % Total %
Grass / Leaves 1,793,323 46 456,526 48 2,249,850 47
Iron Sheets 1.453,770 38 329,925 35 1,783,695 37
Grass & Mud 549,664 14 143,983 15 693,646 14
Tiles 28.603 1 8,595 1 37.198 1
Asbestos 17,073 0 2,218 0 19,290 0
Concrete 9,074 0 2,162 0 11,236 0
Other 8,564 0 1,836 0 10,400 0
Total 3,860,070 100 945,244 100 4,805,315 100
Results 27
2.6.4 Reasons for Not Using Agricultural Credit
The main reason for not using agricultural
credit as a source of finance was little credit
awareness accounting for 60 percent of the
agricultural households ("did not know how to
get credit" and "don't know about credit").
This was followed by households reporting the
un-availability of credit (19%), "Not wanting
to go into debt" (10%) The rest of the reasons
were collectively less than 12 percent of the
households.
2.7 Living Conditions
2.7.1 Roofing Material
In Tanzania many types of roofing material are
used, however it is important to differentiate
between the traditional roofing material using
material locally available (grass/leaves/mud) and
improved roofing and manufactured material
(iron sheets, tiles, asbestos and concrete). The
analysis groups households with traditional
roofing together as the difference between the
material is mainly due to tribal/cultural/locationO
differences and not due to economic differences.
Did not want to Chart 2.36 Reasons for Not Using Credit ( % of'Households)
go into debt, Interest Rate/cost Did not know
474,419, 10% too high,how to get credit,
Not available,137,271, 3°k 1,792,131, 38%
921,660, 19% ;r i r f i r r;f:r w '::, :{:a:.,:.•.
Difficultbureaucracy
Not needed, Don't Know about procedure,198,467,4% credit, 1,061,394,- Credit granted too Other, 16,013, 120,476,3%
22% late, 30,343, 1% 0%
The most commonly used roofing material for the
main dwelling is grass and/or leaves and was used
by 47 percent of the rural agricultural households.
The percentage of households that use traditional
locally available material is 61 percent, whilst the
number of households using modern manufactured
material is 39 percent. Iron sheets are the most
popular modern roofing material used (Chart 2,37
and Table 2.2).
Tanzania Agriculture Sample Census

Chart 2.38 Percent of Households by M xlern or Traditional
RoofingMaterial
e e e 4e4e,e6
•Region Modern Traditional roof
100
75
g 50
25
0
Chart 2.40 Percent of Householdswith No Toilet Facility by Region
100.0
75.0
0.0
e ee,e e ee. e ,
Results 28
Tabora region had the highest percent of
households with traditional roofing
material (85%), followed by Lindi (83%),
Rukwa (79%) and Singida (79%).
Regions that have the most households
with modem roofing material are
Kilimanjaro (91%), followed by Dar es
Salaam (62%), Kagera (55%) and Arusha
(51%) (Chart 2.38 and Map 2.12).
2.7.2 Toilet Facilities
Most rural agricultural households in Tanzania use tradidonal pit latrines (4,242,138 households, 88.3%), however 368,675
households (7.7%) do not have toilets. Few households have improved pit latrines or flush toilets (75,165 households, 1.6%
and 114,053 households, 2.4% respectively) (Chart 2.39).
Table 2.3 Households Toilet Facility by Sex of HouseholdHead
Toilettype
MaleHeaded %
Female
Headed % Total %Traditional
Pit Latrine3 423 248
' '88.7 818,889 86.6 4,242,138 88.3
No Toilet IBush
277,703 7.2 90,972 9.6 368,675 7.7
FlushToilet
92,323 2.4 21,730 2.3 114,053 2.4
ImprovedPit Latrine 62,741 1.6 12,424 1.3 75,165 1.6
Other4,055 0.1 1,229 0.1 5,284 0.1Type
Total 3,860,070 100.0 945.244 100.0 4,805,315 100.0
There is little difference in the use of toilet facilities
between male and female headed households, with
7.2 percent of male headed households and 9.6
percent of female headed households (Table 2.3) with
no toilet facilities.
However, there are large regional differences with
Zanzibar having the highest percent of rural
agricultural households with no toilet facilities
(49%), followed by Arusha (32%), Mara (21%),
Tabora (17%) and Manyara (17%), whilst Iringa,
Ruvuma, Mbeya and Kilimanjaro regions have the
highest . percent of households with toilet facilities (99.3%, 98.9%, 98.3% and 98.1%) Chart 2,40 and Map 2.13).
Tanzania Agriculture Sample Census

Lindi
2.1%
Results 29
Lake: i/rciori2:Mara
K ea p Sf3,[}73r-i X55 298%
Map 2.12 TANZANIANumber and Percent of Rural Agriculture
Households with Modern RoofingMaterials by Region
Numberof Rural .• a4 ..:............. .............t-inci
Agriculture Householdsf a!' sw!ih Modern Roofing Materials ^ \f
151,000 to 197,000 f ^. 17 p:124,000 to 161,000 l'87,000 to 124,000 4 A50,000 to 87,00 f Ruvuma
637113,000 to 50.000
i 59 MtwaraRural ,^ rieuitti'e tiauschatds with M9oder ! I^- .34.3% o
23.1 /oPogYa^^ 1^Sa[^;i^,aS
Percent of Rural Agriculture Households with^ :c..
u'
Map 2.13 TANZANIAt ^n V rs^rtx Number and Percent of Rural Agriculture
'.1a a Households with No ToiletKagerz i a Facilities by Region
I lr ^^^...v wa P.r,.sha -
nZ Iii i^5rlya
Kilimanjaro 31 8 e t ^'"^^y"
Kigoma i T _ r^^r Manyara:") =G t 3
Tabora: 1 ;: 6.9 ° J Tanga
rr S-ng da , 1 f a_ E
108,o
Rukwa ^- v 12.9%
J _; 99 {' Morogoro ar es Salaam
1.9% ^_ ^• X977Pwani 0.1%
Mbeya Iringa 1.9% -8,9'32
Number of Rura'' -'AgricultureHouseho€ds With no Toilets Facilities
40,000 to 51,00030,000 to 40,00020,000 to 30,000
LIII 10,000 to 20,000RuvumaIr
0 to 10,000 ? + 7`^0Rawl ', -culture Hotuseholda with Nc Tc filet ' 0.6%l= .tciii k ,
Percent of Rural Agriculture Households with No -
Tanzania Agriculture Sample Census

Chart 2.41 Percentage Distribution of Households
Owning Assets of Asset
Table 2.4 Number of Households by Type of Asset
Owned by the Household & Sex of Head of Household
Asset type
MaleHeaded %
FemaleHeaded %
Radio 2,309,082 59.8 312,638 33.1
Mobile phone 82,983 2.1 11,101 1.2
Iron 805,356 20.9 121,147 12.8
Wheelbarrow 249,408 6.5 29,167 3.1
Bicycle 1,870,348 48.5 192,031 20.3
Vehicle 49,393 1.3 5,660 0.6
Television I Video 46,585 1.2 6,334 0.7
Lmdline phone 17,989 0.5 2,109 0.2
Total 3,860,070 945,244
5
z
RadioWhedeerrO
0 Bap
TelevisiOn / VideoMobile phone
a VehicleLandline phone
n Bicycle
Chart 2.43 Percentage Distribution of Households by
Wick Lamp, Main Source of Pnergy for Lighting Tanzania
3,431,902, 70.%
Huthcrae Lamp
1,085,622, 22%
PressureLamp,
166,413, 3.4%
Gas (Biogas),4,251, 0.1%
Mains
Candles, 8,460, Electricity,
0.2% 72,833, 1.5%
Results 30
2.7.3 Ownership of Assets
Radios are the most commonly owned asset in rural agriculture households with 55 percent of households owning at least
one. Bicycles are the next most common asset owned (43% of households) followed by an Iron (19%). Ownership of other
assets is minor, however it is worth noting that 2 percent have mobile phones (Chart 2.41).
60.0
40.0
20.0
0.0
Assets
In all cases, the percent of male headed
households owning different assets is higher th an
female headed households and in general terms it
is around 50 percent more than female headed
households (Table 2.4).
200.000
Dar es Salaam, Kilimanjaro Regions and
Zanzibar have the largest number of assets per
household with 2, 1.9 and 1.6 assets per
household respectively. Radios and irons are
more popular in Dar es Salaam and Kilimanjaro.
The regions with the smallest ownership of assets
per household are Singida, Rukwa, Dodoma Lindi and Mtwara (Chart 2.42). Differences exist in the ownership of bicycles
between regions (Map 2.14),
400,000
e eRegion
2.7.4 Main Source of Energy
Source of Energy for Lighting
Wick lamp is the most common source of
lighting energy in Tanzania. with 70 percent of
total rural agriculture households using it
followed by hurricane lamp (22%), pressure
lamp 3.4%), firewood (2.5%), mains electricity
(1.5%), candles (0.2%), solar (0.2%), and gas or
biogas (0.1%) (Chart 2,43).

headed households using wick lamps and less
hurricane lamps for lightning compared to male
headed households (Table 2,5)
However regional differences exist. Whilst wick
lamps are dominant in most regions they are most
used in Tabora, Kagera, Shinyanga, Singida and
Lindi (84% 83% 80% 80% respectively). In
Kilimanjaro, Iringa and Arusha less than 50
precent of households use wick lamps.
Hurricane lamps are the second most popular
source of lighting in all regions of Tanzania and
they are most prevalent in Kilimanjaro, Iringa,
Arusha and Ruvuma with 47, 44, and 42 percent
of households using them respectively (Map
2.15).
A small number of households use mains
Results 31
There is a small difference between male andTable 2.5 Number of Households by Type of Energy Used for
female headed households with more female i.,ah u , ,.nd ce ' of 14.,nd of Hnncphnld
Male FemaleSource Headed % Headed % Total %
Wick Lamp 2,660,247 68.9 701,408 74.2 3,361,655 70.0Hurricane Lamp 907,611 23.5 160,730 F 17.0 1,068,340 22,2
Pressure Lamp 130,866 i 3.4 31,870 1 3.4 162,737 3.4
I Firewood 86,045 2.2 35,266 3.7 121,311 2.5
Mains Electricity 55,897 1.4 11,965 1.3 67,863 1.4Candles 7,144 0.2 1,170 0.1 8,314 0.2
Solar 6,568 0.2 1,428 0.2 7,995 0.2
Gas(Biogas) 3,389 0.1 ' 861 0.1 4,251 0.1.
Other 2,303 0.1 546 0.1 2,849 0.1
Total 3,860.{)70 100 945,244 100 4,805,315 l0€?
Chart 2.44 Percentage Distribution of Households by Type of
Energy ttsed fir Lighting and RegionI OU _ _. :,
•. •.. s s •. ^» ^ 'rti w ti ^. ' ti -
S 5. 4 ti 5i 5 L 1 4 S
5. h: ••• :• Jai fi J. r. : f. `. ,^. .lr:
5. .:` 5 .:' Ty raw, :w :ti .ti •ti :ti :ti .• .•• .• .1: S. 5: .S. ., .1. ^i wi ,1'^ :^ '• 11 11 1. ,: i^•• h 'ti "5. 5. ti . a ti . .ti . ti. ^.^ "r L 5 ti •.
2S 1. ti y. .1.-.s _ ... '^'. .^: "'•
ti a ti ti ti ti{. 1. y. .ti. .ti •^. N:. r^' r:. r:
• s} r: r: r; ,r: dr,, • ,r ,..
€ ^p yiT $b j°' 4 i0 , Cb ^0 C tr '^ 'J ° ,p{a'b /gyp ^4 b .^2 $ mi0
`1''^^ 5 ell? ti .^° 4
s C^° 5° ^ m^^ya 0^ °ti
p S tS& spa J^ eta" ^ ^aoti
4a Region
© V. I amp p Hurricane Lamp 0 Mains Electricity t5 Pressure Lamp n Firewood0 Candles ® Solar [7 Gas (Riog,as) Otherelectricity for lighting in Kilimanjaro, Dar es
Salaam, Arusha and Zanzibar. The largest amount of households using firewood for lighting are in Dodoma, Arusha,
Kigoma and Manyara (Chart 2.44).
Source of Energy for Cooking
The most prevalent source of energy for cooking is firewood, which was used by 96.1 percent of all rural agricultural
households in Tanzania. This is followed by charcoal (2.6%). The rest of energy sources: crop residues, paraffin/kerosene,
mains electricity, solar and bottled gas are ibsignificant (only 1.3 percent of households in Tanzania) (Chart 2.45).
Chart 2,45 Percentage Distribution of HouseholdsFirewood,
by Main Source of Dsergy for Cooking255.643,
96.4%a
Mains S^^t44.^6FsyFO &4!#
Electricity, #^ 8 F(► Y t 4 did
378, 0.14%n$^ ^AdkAeir
Gas (Biogas),21,0.01%a
!Solar, 278,Charcoal,
0.10% 7.2 10, 2.72%
Parraffin 1 Livestock Bottled Gas,
Kerocine, 90, Dung, 106,Crop Residues. 735,0,28%
0.03% 0.04% 735, 0,28%
Table 2.6 Number of Households by Type of Energyfor Cnnkino anti Sex of Flead of Hnncµhnid
Male FemaleSource Headed % Heade % Total
Firewood 3,705,875 96.0 911,188 96.4 4,617,063 96.1
Charcoal 102,234 2.6 23,313 2.5 125,547 2.6
Crop Residues 19,839 0.5 4,835 0.5 24,674 0.5
Paraffin / Kerosene 7,879 0.2 1,777 0.2 9.656 0.2
Mains Electricity 7,862 0.2 [ 1,264 0.1 9,126 0.2
Bottled Gas 6,091 ' 0.2 517 0.1 6,607 0.1
Solar 4,363 0.1 1,374 € 0.1 5,737E 0.1
Livestock Dung 4,631 0.1 710s
0.1 5,340 0.1
Gas (Biogas) 1,133 0.0 267 0.0 1,400 0.0
Other 165 0.0 - - 165 0.0
Total 3,860,070 10810 i 945,244 100.0 4,805,315 100.0
Tanzania Agriculture Sample Census

Kilimanjaro
Lane 11645Ao
Kagera
Map 2.14 TANZANIANumber and Percent of Rural Agriculture
Households Owning Bicyclesby Region
Mara94.942
50.4%
61.2
Zanzibar49,913
51,7%Dar as Salaam
8.930
43.8%
28.3%
Tanga
85.03932.1%
Rukwa
04,577
37.5%
105,196
32.5%
Pwani
63.044
45%Mbeya
130,803
35.1%
Manyara.
64,464
Singida 41.8%
53,964
29.9% Dodoma
rings
103,799
372%
Number of Rural AgricultureHouseholds Owning Bicycles
200,000 to 247,000
k 52,000 to 200,000104,000 to 152,000
56,000 to 104,000
LJ 8,000 to 56,000Rural Agrieuliure lio)1H0101(18 Owning RiyclesPercent of Rural Agriculture Households OwningBicycles
r 1Ruvuma
69,70636.5%
Mtwara1)12,726
44.8%
Lindi
59,535
38.9%
Map 2.15 TANZANIANumber and Percent of Rural Agriculture
Households Using Hurricane Lampsfor Lighting by Region
3..) Kge
24,%
AtovIrsn Wth0lOY4Oga:
9 :205W ::53Y153.:
4 14.4%B45%
ManyaraTabora
23,70326,999
Singida 175%
1 % 21.58110,
12% Dodom
Rukwa
29,072
:I
I 6.9%
MogPrO
I gni;beia 22 4%
Kilimanjaro
••••Tanga
.•
7 Pwani21,204
Zanzibar17,281
18%
Dar es Salaam7.44430.5%
Rural AgricultureHouseholds UsingHurricane Lampsfr y- Lighting
120,000 to 140,00090,000 to 120,000
60,000 to 90,000
J 30,000 to 60,000n 0 to 30,000
Rural Agrimalum lions oith Using Horricalw1,,4 mpH 1 4hlingPercent of Rural Agriculture Households UsingHurricane Larrrps for Lighting
4; , 1:38 Mtwara
Shiyanga.:
Tabora
164,538
69.7%
02%
Lindi
22,413
14.6%
Results 32

Results 33
There is no difference in the type of energy
used for cooking between male and female
headed households and very small regional
differences occur with Dar es Salaam having
the highest percent of households using
charcoal (16%) (Chart 2.46 and Table 2.6).
2 7 5 flrhokino Water
Cheri 2.46 Percent of Rural Agriculture Households by Source of Energy for Cooking
by Region
I wo
! : ' :$ ! . d.4
r
* 4 4
e
#^s
d, 4:g 40.0 # • .d •
#.
2a.n +
+
4
+aogip 4
\^C^ ^ ^1' '<" SyFp,
yb^4`^`F'myi^'O ° dy^,Cag4R m ^0'`. h.^7R 1^^ ^m P'0 2 ^3a ^^'° ^'°
4 ' V` ^5` `^ C cc S C o'1tt`
Region,f,^v
ttl l hrcavcd q Charcoal q Crop Residues q P,rraffin ! Ker,n e - la Mains $kechid® Solar M Otter E Livestock Dung m Gun. e .- SI Bottled Caa
Access to Drinking Water
Most rural agriculture households on the Mainland (57%) live less than 1 kilometre from the nearest source of drinking
water during the wet season, compared to 48 percent during the dry season.
There is little difference in access to drinking water
between the wet and the dry season with the exception
of those households that live far from the source.
During the dry season 50 percent more households
obtain drinking water from a distance of 3 km or above.
Very few households travel more than 10 km to obtain
drinking water during the wet season, however during
the dry season it is 0.7 percent,
In general 83 percent and 73 percent of rural
agricultural households on Mainland Tanzania were
Chart 2.47 Percent of Households byDistance to Drinking Water
60 57
48
45
w 26 j
30
15
15 12l0 7
0
less than 'I 1 - 2 2 3 3+Distance (km) 1 Wet Season ® Dry Season
getting their drinking water within a distance of 2 kms
during the wet season and dry seasons respectively (Chart 2.47).
Source of Drinking Water
There are little differences between sources of drinking water for the wet and dry seasons and for this reason the data is
presented for both seasons at National Level. Regional differences are presented for the dry season only.
Chart 2.48 Percewnt of Households by Source of Drinking Water during Chart 2.49 Percewnt of Households by Source of Drinking Water during
the Dry Season the Wet Season Upraceeted Well
Piped WSFU,take / Dam f River ProtecECd f Covered 1,325,549, 26k
13nprotecrcd firing,^}
1,142,841 , 24°k&seam, 755,856, Spring. 580,302,450
661,825, l4%
Unprotected Siring, prntcard{`ll- " 703.103, 14% 633,208, 1310
7
Nell
7,
PtnEected Well,
,' A1' 668,754.14l i,
iPipce W.,. Lake l Date: ltiver!
prole e'i f Covemd 1,10.98.23% 6lStrwtn, 68 ,942,Unprowtett Well, Tanker TmrdL
Spring 192.522, 4yo Other, 39,824, 1 IA h1,333,705, 28 ;h 6,IRA,0% uncovered Rain Ba,tica wa[er, 108,
Covered Nsinvrerer^6Yteed 1Zei—t4 r
Catchment, 62,258, p^ [;rsCeveredR i Wa1F . CM-11-11, n.729,
Bottled Watce, 168, Water Vendor, Cafehment, I5S45, - Tanker Trvck,5,585, ater dar.vea 4,864, Ca[cment,1 %
0% ,938, P%. 9% Ord 9% BRn*
Tanzania Agriculture Sample Census

Chart 2.50 Percent of Households by Source of Drinking water inthe Dry Season and Region
100%
50%
25%
Fll Piped Water Protected Well 0 Protected 5pristgltl Un pro t ected Well 0 Unprotected Spring E Lake / Dam/River I Stearns15 Other
Char t 2.51 Percent of Hmsehol& hY Type of Labour
Fishing
Cattle marketing
Fish farming
Beekeeping
Cat and sheep marketing
Marketing
Off farm income generation
Pole cuffing0
Building maintaining houses
Timber wood cutting
Cattle rearing
Goat and sheep rearing
Land clearing
Pig rearing
Soil preparation oxen-tractor
Beer making
Poulry keeping
Hand soil preparation
Cattle herding
Csop protection
Goat and sheep herding
Milking
Collecting fire d
Crop piocessing
Flouring
Collecting water
Weeding
harvesting
Percent
r Head of Household OnlyE Both Male & Female A dultsr Both Boys & Girls
O Adults MalesE BoysMJ All Household Members
r Adult FemaleGrls
r Hired Labour
IE
161
.1
.'
25 50 75 100
Results 34
The main source of drinking water for rural agricultural households in Tanzania is from unprotected wells with 28 percent
of households using it as the main source in the dry season and 26 percent in the wet season. This is followed by piped
water (24% of households during the dry season and 23% in the wet season), lakes /dams/rivers (15% of households in the
dry season and 14% during the wet season), unprotected spring (14% for both wet and dry seasons) and protected wells
(14% of households in the dry season and 13% in the wet season) Other main sources of drinking water are of minor
importance (Charts 2.48 and 2A9).
Arusha region has the highest proportion of
households with piped water as a source of
drinking water during the dry season (59% of the
total agricultural households in the region),
followed by Kilimanjaro (56%) and Zanzibar
(51%). Relatively high proportions of households
with unprotected wells as sources of drinking water
are found in Tabora (68% of all agricultural
households in the region), followed by Pwani
(53%), Dar es Salaam (50%), Linda (43%) and
Mwanza (42%). The highest proportion of
households using protected wells as source of
drinking water are in Shinyanga (28% of all
agricultural households in the region), Rukwa
(25%), Mwanza (24%) and Morogoro (22%).
The regions with the highest proportion of rural
agriculture households using unprotected springs
as a source of drinking water are Kagera (28%),
Kilimanjaro (25%), Mbeya (24%) and Tanga
(24%) (Chart 2.50 and Map 2.16).
2.7.6 Division of Labour
This section covers the allocation of activities
within the rural agriculture household in terms of
sex and age of the household member. The
variables covered were many and exhaustive in
order to capture the actual situation in the
country.
Heads of households are almost solely involved
in fishing (80% of those involved in fishing),
cattle marketing (75%), fish farming (74%) bee
keeping (72%), goat and sheep marketing (72%).
Other individuals of the rural agriculture

Results 35
population involved in these activities are mainly adult males. General marketing (60%), off farm income (59%), pole
cutting (5$%), building/maintenance of houses (57%) and timber/wood cutting (57%) are also mostly the responsibility of
the head of household but to a lesser extent. However, in the case of Pole cutting, building/house maintenance and timber
/wood cutting most of the other individuals involved in these activities are adult males.
Activities that are mainly the responsibility of adult females are beer making, collecting water, collecting wood, crop
processing and milking. Both male and female adults are mostly involved in land clearing (30% of those involved in hand
soil preparation), hand soil preparation (46%), , planting (48%) weeding (49%) and crop protection 36%) and harvesting
(47%). Boys are more involved in goat and sheep rearing and cattle herding whilst girls are move involved in water and
wood collection and crop protection activities.
In a moderate percent of households, poultry keeping, weeding, harvesting, planting, pig rearing, goat and sheep rearing,
cattle rearing and hand soil preparation, are done by all household members: Activities that are done by hired labour
include soil preparation using oxen, timber wood cutting, building/maintenance of houses and cattle herding (Chart 2.51).
2.7.7 Level of Subsistence
Subsistence activities are for the survival of the
family rather than for the generation of cash.
This includes feeding the household, provision
of water and fuel for cooking. The source of
these products are usually from the land
resources available to the household" It is
important to note that not all cash earnings are
for Don-subsistence purposes as cash can be used
to purchase subsistence items e.g. food. On the
other hand non-subsistence refers to activities
which are not crucial for the survival of the
family. This includes modern medication, non
working clothes, refined beer, school fees, etc.
Of the total livelihood activities of the
household, most rural agriculture households
assign between 1 and 25 percent of their
livelihood activities for non - subsistence
purposes. This is followed by those who use
between 26 and 50 percent for non-subsistence
purposes. Very few households use more than
75 percent of their livelihood activities for non
subsistence purposes. There are 335.470 rural
Chart
ManyaraMara
M wanzaKagera
Shinyanga
KieomaRukwaTaboraSingidaMbey a
taingaRuvuttMtwara
Lin 6;Dares Salaam
PwaniMoingoro
TaugaK liamnjaro
AnishaDodoma
x
2.53 Percent of Households by Leel of Contribution of toNon-Suhsistenee and Region
0 20 40 60 80 10
n26- 5 0 C3 51 - 7 5 B 76 - 1 p(J Percent of HouseholdsL7 0 0 t - 25"
I^ t
ffiI C:
I C
i
agriculture households (7%) that are living in a total subsistence existence (Chart 2.52 and Map 2.17).
Tanzania Agriculture Sample Census

%.3%
Ruvuma
25.6%
o MY/
3'
52,5%
Results 36
wm).
37,485
10.6%
ie, Mara
4%
Shinpnga
37.22010.9% 48.074
Map 2.16 TANZANIANumber and Percent of Rural Agriculture
Households Using Piped Waterby Region
127% 7
Ru
'15.4%
Manyarait 40,827 4°/V
Ta mM.5%
‘-. i Tanga
4;194 S ,
1.8% 36,081(,:: D.106ma 22.1%
20.1%
Mya
5 _244
3.4%
Morogora
24.7% Pmni
19,353
13.7%
Zanzibar49,656
51.4%ar es Salaam
3,02314.8%
Numbe r of Rural AgricultureHouseholds Using Piped Water
120,000 to 150,000. • j 90,000 to 120,000
r 1 60,000 to 90,000 30,000 to 60,000
• 0 to 30,000Rural Agriculture Households Using Piped WaterPercent of Rural Agriculture Households UsingPiped . Water
Mara
42.3%
Map 2.17 TANZANIANumber and Percent of Rural Agriculture
Households Using 25 Percent or lessof Their Livelihood Activities for
Non-Subsistence Purposeby Region
1.. Kilimanjaro
Rukwa
Tabora
rSinOda r •
28.3°/0 c-;
M 1%nziba r00%
r es Salaam7,971
39.1%lOnga
14r.
52 1%
M heya
Numbe r ofRum!Households
160,000 to 210,000120,000 to 160,000
80,000 to 120,00040,000 to 80,000
0 to 40,000Households Using 25% or less of Their LivelihoodActivities for Non-Subsistence PurposePercent of HousehdsUsing 25% or lessof Their Livelihood Activities for
Pnr# Eiirnnce
g.7ti840.Wo -
Tanzania Agriculture Sample Census

Rem iE tances
Temporary Employmel !Off faun income
Permanent Employment / Off farm income
Beekeeping
j Fishing
Tree Logging for Charcoal
Tree Logging for Timber
Tree Logging for Poles
Tree Logging for Firewood
Vegetable Production
Livestock Production
Crop Production
Ems
WEB
0 20 40 60 60 1.005 - 100 Percent of Households
Results 37
Some regional differences exist, with Tanga having the most households having a total subsistence existence in. the country
(40% of the rural agriculture households use no livelihood activity for non subsistence purposes). A higher proportion of
rural agriculture households in Tabora, Pwani and Dar es Salaam use between 51 and 75 percent of the livelihood activities
for non-subsistence purposes. A very small proportion of households use between 76 and 1.00 percent of the livelihood
activities for non-subsistence purposes with the highest proportion in Pwani and Dar es Salaam regions (Chart 2.53).
Bee keeping is the most important activity used by
rural agriculture households for non-subsistence
purposes with 35 percent of bee keeping households
using between 76 and 100 percent of the livelihood
from bee keeping for non-subsistence purposes. This
is followed by fishing, tree logging for charcoal and
temporary employment/off farm income.
Tree logging for firewood and tree logging for poles
are mostly used for subsistence purposes, with
around 80 percent of rural agriculture households
using them for subsistence purposes only (Chart 2.54).
2.7.8 Food Consumption Pattern
Chart 2.54 Percent of Households by level of Contribution ofDifferent Liselihood Activities to Non -Subsistence
Number of Meals per Day
In general rural agriculture households in Tanzania
either take two meals per day (55.9% of the
households in the country) or three meals per day
(40.3%). Only 3.4 percent take one meal per day
and 0.4 percent four meals per day (Chart 2.55).
Large differences exist between regions. The
highest proportion of households that take three
meals per day are found in Tanga (72% of rural
agriculture households in the region), followed by
Pwani (65%), Ruvuma (65%), Dar as Salaam
(63%), Kilimanjaro (62%), Zanzibar (61%) and
Manyara (60%). The lowest percent of Households
that take three meals per day are found in Rukwa
(11%), Kagera (12%), Kigoma (16%), Mwanza
(26%) and Dodorna (26%). In regions with a high
percent of households having three meals per day,
they have a corresponding low percent of
households taking two meals per day. A small
proportion of rural agriculture households have one
Tanzania Agriculture Sample Census

Chart 2.57 Number of Households ttv Fl eweney of Eating Animal
Protein in One Week
Chart 2.58 Percent of Households Eating Animal ProteinU
Y Number of Times per Week and Region
Chart 2.59 Number of Agricultural Households
• the Status of Food Satisfaction
Results 38
meal per day. Very few households have four meals per day (Chart 2.56 and Map 2.18).
Animal Protein Consumption Frequencies
The frequency of animal protein consumption in this section is based on the quantities of meat or fish consumed in the
week prior to the day of enumeration of the census.
The number of agricultural households that
consume animal protein (either meat or fish)
in one week is around 3,925,364 (81% of the
rural agricultural household on the
Mainland). Most households consume
protein at least once a week. Whereas two
meals of protein are consumed per week by
18 percent of the rural agriculture
households and only 10 percent of the rural
agriculture households consume animal
protein every day. About 19 percent of the rural agriculture households on the Mainland do not eat animal protein in a week
(Chart 2.57).
Shinyanga, Dodoma, Kigoma, Arusha and
Manyara have the highest percent of households
that do not eat animal protein during a week and
these regions have a comparatively low percent
of households that eat animal protein four or
more times a week. In Mara, Kilimanjaro,
Mwanza, Dar es Salaam, Tanga and Ruvuma
regions, very few households do not eat meat in
a week and most of these regions have a high
percent of households that eat animal protein
four or more times a week (Chart 2.58 and Map
2.19).
2.7.9 Household Food Security
In Tanzania, 1,547,815 households (32% of the rural
agricultural households in the country) rarely
experience problems in satisfying the household food
requirements. Only 342,642 households (7%)
sometimes experience problems in satisfying their
food requirements, 10 percent often experience
problems and 7 percent of them always have food
problems. About 44 percent of the agricultural
households never experience food insufficiency
problems (Chart 2.59).Tanzania Agriculture Sample Census

Results 39
• Map 21& TANZANIALakg' l`rCt©na " Number and Percent of Rural Agriculture
Mara Households Having at Least ThreeKger 74,47t! Meals per Day by Region
x,207 .,., i•
^tw ^ ^ Ansha
12.2°u 89,164 Y' dw,05 176 2'lt53.6% Kilimanjaro
9F..,
Map 2,19 TANZANIA3k Victoria e Number and Percent of Rural Agriculture
Households That Do Not Eat AnimalC' $1 Protein in a Week by Region
I anz:a Shinvanaa.. Aru5^'la
Rural Agriculture tHouseholds That Do Not L€ndiEat Animal Protein in a Week 26,937
97,000 to 123,000 17.6%C 73,000 to 97,000
LII] 49.000 to 73,000 .25,000 to 49,000 Ruvuma
1,000 to 25,000 E7,02€Rural Agriculture HouseholdsThat Do Not Eat •
8.936 22,522Animal Proton in a Week 95Percent of Rural Agriculture HouseholdsUThat DoNot Eat Animal Protein in a Week —' t _
Tanzania Agriculture Sample Census

Chart 2,60 Percent of Households l
Lewl of Food Safisfaction and
Region - TANZANIA
Region
E &Idoni E OftenME me5g Never 1 Alwa ys
Dry SeasonAverage distance (km) E Wet Season
Fishing
Hun tin
Forest for Bees
toiiding Poles
Wood for aaicoal
Coinmund Firewo od
Communal Gratin
Water for Livesto.ek
Chart 2.62 Mew dis tance to Natural/Corxlmnnal Resources try Type
and Region
E Hunting B Forest for Bees Building Poles0 Wood for Ch ercoai 1 Communal Grazing Communal Firewood M Water for Livestock
Results 40
The regions that are most food insecure are Pwani Singida, Lindi, Dodoma and Arusha (about 25 % of households at least
sometimes face problems in providing food for their households). Least food insecure regions ue Kigoma, Ruvuma.
lringa, 7nzibar, Mbeya and Kilimanjaro (around
15% of households at least sometimes face problems
in feeding their household. Regions with the highest
proportion of households always facing problems in
providing their households with food are Singida and
Shinyanga (Chart 2.60 and Map 2.20).
2.8 Access to Resources
2.8.1 Access to Natural/Communal Resources
This section presents the results of the natural/communal resource component of the census which includes access to water
for livestock, communal grazing, communal firewood, wood for charcoal, building poles, forest for bees (honey), hunting
and fishing. The results regarding water resources for humans are presented under "drinking water" in section 2.6.
The distance to fishing and hunting resources are
further than other natural resources in both
season with an average distance of around 8 km
from the homestead. However 22 percent of
households live more than 10 km from hunting
and fishing resources.
The closest communal resource is water for
livestock which is 1 km during the wet season
and 2 km in the dry season. This is followed by
communal grazing and communal firewood
(around 2.2 km) (Chart 2.61).
Small regional differences exist with Rukwa
having the worse access to fishing (mean
distance of 17 km), hunting (12 km) and forest
for bees (8 km). Zanzibar has the best access to
fishing, hunting and forest for bees with average
distances of 3.2, 3.3 and 2.2 km from the
homestead respectively. (Chart 2.62)
Tanzania Agriculture Sample Census

y Zanzibar7,391
Results 41
Map 2.20 TANZANIAfake VVctooa Number and Percent of Rural Agriculture
J ' Households that Often or Alwaysagera Face Problems in Satisfyingw 84,74
'! { the Household FoodRequirements
s nranza{,, Arusia by Region
0 to 20,000 # RuvumaHouseholds that Often or Always Face :10919.Problems in iatisfyEng the HouseholdFood Requirements :.Percent of Households that Often or Always Face ` sProblems In Satisfying the Household y ^'
Tanzania Agriculture Sample Census

The services with the best access for rural
agriculture households are feeder roads, primary
schools, all weather roads, health clinics and
primary markets with mean distances of 1.7 km,
2.5 5.8 km, 6.9 km and 9.6 km respectively.
The worst access is to plant protection (162 km),
research stations (143 km), regional capitals (123
km) and livestock development centres (101 km)
(Chart 2.63),
Large regional differences exist. Rukwa has the
worst access to services and infrastructure and
this is mainly to research stations, plant
prottion labs, livestock development centres,
extension centres and tarmac roads. This is
followed by Kigoma, Lindi and Ruvuma. Lindi
has the worst access to veterinary clinics in the
country. Singida has one of the worst access to
Tarmac roads in the country.
The regions with the best access to services and
infrastructure are Dar es Salaam, Kilimanjaro
and Singida. (Chart 2.64)
2.8.3 Land sufficiency
Available land refers to the land that the
household has been allocated. It excludes large
areas of land which are suitable for agriculture
but have not been availed or are inaccessible to
the smallholder household.
Results 42
2.8.2 Access to Social Services and Infrastructure
Most households in Tanzania are fully utilising
the land that is available to them (3,097,729,
64%) with only 1,761,382, 36' percent of
households having available land that has not
been used (Chart 2.65).
Chart 2.63 Mean Distance to Social Services and InfrastructurePlant Protectio '1i
1.:.S
":1
: .7
,Q7g
,i:q
.7 .0
. Q: ACO7QX40>WAXa.7Research Station * ;
Regional Capital 1',:'1:,-.',,: ,.1 Wg:'_y,=;%. — ...... .. .
Livestock Dcv Centre 1:;;: Y;:KX!yC;:!;:r;8 e`,'Tarmac Road
Vet ClinicLand Registration Office
District Capitala Tertiary Market A
Hospital
AExtension Centre 4,_%41
Secondary Market4t Secondary School rA,1
- 8 Primary Market =
Health Clinic VIAll Weather Road Mc
E Primary School 1Feeder Road
Mean Distance {km) 0.0 30.0 60.0 90.0 120.0 150.0 180.1
Chart 2.64 1Vlean Distance to Services mdkfrtructhreRegion.
2,000.0
..1,500.0 .
Ca.Ea 1,000.0
hi
..
500.0gym; L ra w3
•_. ' _ m n . ' W. - .
.Sk0 0 &° ,S, e,e, e.
e
e,'s,e.e-0 && ‘, #- . ÷-
÷
a Primary School El Secondary School q Health Clinica Hospital a District Capital 0 Regional CapitalE Feeder Road 0 All Weather Road 0 Tarmac Roada Primary Market 0 Secondary Market 0 Tertiary MarketE Vet Clinic 0 Extension Centre S Research Stationa Plant Protection 0 Land Registration Office 0 Livestock Dev Centre
Chart 2.65 Number of Households by level of Use of
Available Land
All LandAvailable Used,3,097,729, 64%
.,,
o.o. r.e: pg 4 5;5R;=PPP; , .e. .,.,.%% pp•%....451545 p;::;v;:pp;.,.q:4,. :ppAp*.%•%. '
,;
All LandAvailable Not
used, 1,761,382,36%
Tanzania Agriculture Sample Census

Chart 2.66 Number of Households by Whether or not the
Available Landis SufficientAvailable LandNot Sufficient,
2,240,521, 46%
Large differences in land insufficiency exists
between regions with Arusha, Kilimanjaro, Mara
and Manyara having the highest percent of
households reporting insufficiency of land
(between 60 and 85%). Whilst in Ruvuma, Lindi
and Mtwara, only between 22 and 30 percent of
households reported land insufficiency (Chart
2.67 and Map)
Results 43
The number of households reporting insufficient
land is 2,240,521 (46% percent of rural
agriculture households). This implies that only
18% of the households that are fully utilising the
available land believe that they have sufficient
land (Chart 2.66).
The total land available to small holder
households has not changed over the last 10
years around 12 million hectares. However the
area utzosed by smallholders has increased
enormously over the last 10 years from 2,574,000 to 10,211,076 hectares in the last 10 years. This implies that, whilst
there is plenty of land that can be used for agriculture, the currently available land is close to being fully utilized and that
land pressure is common in Tanzania.
Tanzania Agriculture Sample Census

Map 2.21 TANZANIANumber of Agriculture Households by
Whether They Consider HavingInsufficient Land For the
Household byRegion
ICTO8
Mam113,218
61%
55%
50%:88,474
38%
lr ilimanjath
14 9Manyara
f 69%/87,3
/ 58%Tanga
117,17544%
DWmaN.120,877 r
Rural AgricultureHouseholds havingInsufficient Land
170,000 to 210,000130,000 to 170,00090,000 to 130,000
50,000 to 90,0001 10,000 to 50,000
Rural Agriculture Households HouseholdsHaving insufficient Land
Percent of Rural Agriculture Hou seholds HouseHaving Insufficient Land
191,5n
Tabora
37%
innga
1 K166
37%
. •. •.• • • •
.: 11 360 •• • • Pwani
4396 • • 50,587 •
:42;14028%
Ruvuma
46,622
24%
Results 44
Tanzania Agriculture Sample Census

Regional Profiles 45
3. REGIONAL PROFILES
3.1 Dodoma
Dodoma has the sixth highest rural agriculture population in Tanzania (1,115,206 persons of which 545,216 are males and
569,990 females). It has a moderate number of agriculture households involved in agriculture (216,173) compared to other
regions. It has an average household size of 5.2 persons per household and it has a low percent of female headed
households (16%). Livestock production is important in the region and mixed farming of both crops and livestock is
dominant. The region has no pastoralists, however it has a small number of households involved in livestock keeping only.
Right to land is mostly by customary law (70% of the total land area under agriculture). The region has one of the best
access to its fields in the country with over 80 percent of the households having their nearest field less than 100 m from the
homestead and the distance from the field to the nearest road is the shortest in the country.
Dodoma has the fifth lowest percent of literate rural agriculture population in the country (61%) and the difference between
the literacy rate of males and females is moderate with 8 percent more literate males than females. It has a comparatively
low percent of the rural agriculture population that have completed and the sixth highest percent of household heads with
no education.
The most important livelihood activity is crop farming followed by livestock keeping and remittances. Permanent crop
farming is the least important. The percent of the rural agriculture population working full time in farming (90%) is highest
in the country. All households in Dodoma have at least one off-fern activity with most households having two followed by
three activities. The region has one of the lowest percent of households whose main source of cash income is from the sale
of cash crops and most cash earnings come from casual cash earnings. Very small amount of credit is available in the
region and it is mostly through family friends/relatives or NGO/project/religious organisations.
Around 40 percent of households in Dodoma have the roof of the main dwelling made of modern material. (mainly iron
sheets) and the rest is mainly with grass/leaves/mud. Practically all households have toilet facilities (94%). Energy for
lighting is mainly from wick lamps. It has the, forth highest percent of households using piped water in the country (over
45%),
About 90 percent of the households in Dodoma use between 1 and 50 percent of their livelihood activities for non
subsistence purposes. The region has the second highest number of households that do not eat animal protein in a week and
1. to 2 times a week is the most common. It has the forth highest percent of households that face food shortages. The
region has a moderate access to services in the country About 37.4 percent of the households in the region reported
insufficiency of land.
3.2 Arusha
Arusha has a moderate agriculture population in Tanzania (834,601 persons of which 417,841 are males and 416,760
females), It has a.moderate number of agriculture households involved in agriculture (154,857) compared to other regions,
however, 85 percent of rural households and 54 percent of total households in the region (including urban) are involved in
agriculture. The region has an average household size of 5.2 persons per household and it has a low percent of female
Tanzania Agriculture Sample Census

Regional Profiles 46
headed households (20%). Livestock production is important in the region and mixed fanning of both crops and livestock
is dominant. The region has the highest proportion of livestock only households (10%) and pastoralist households (0.4%).
Right to land is mostly by customary law (72% of total land area under agriculture), however compared to other regions,
Arusha has a moderate percent of land under official certificate of ownership. The region has a good access to its fields
with over 60 percent of the households having their nearest field less than 100 m from the homestead and the distance from
the field to the nearest road is one of the best in the country.
Arusha has a moderate percent of literate rural agriculture population (68%) and the difference between the literacy rate of
males and females is 7 percent more literate males than females. It has a comparatively low percent of the rural agriculture
population that have completed school and the fourth highest percent of household heads with no education.
The most important livelihood activity is crop farming followed by remittances and tree/forest resources. Permanent crop
farming is the least important. The percent of the rural agriculture population working full time in farming is the second
highest in the country (80%). The main source of cash income is from the sale of food crops and livestock. Very small
amount of credit is available in the region and it is mostly from private individuals.
About 39 percent of households in the region have the roof of the main dwelling made of modern material (mainly iron
sheets) and the rest is mainly with grass/leaves/mud. The region has the highest percent of households with no toilet
facilities (32%). Energy for lighting is mainly from wick lamps and hurricane lamps and it has the highest percent of
households using firewood as a source of energy for lighting. Practically all households use firewood for cooking. Arusha
has the highest percent of households using piped drinking water supply (over 50%).
Most rural agriculture smallholders are living a subsistence existence with more than 65 percent of households using only 0
to 25 percent of their livelihood activities for non subsistence purposes. About 97 percent of the households eat two or
three meats a day. The region has the fourth highest percent of households that do not eat animal protein in a week and 1 to
2 times a week is the most common. About 33 percent of the households sometimes face food shortages. The region has a
good access to services and infrastructure in the country. About 73.9 percent of the households in the region reported
insufficiency of land which is the highest in the country.
3.3 Kilimanjaro
Kilimanjaro has a moderate agriculture population in Tanzania (1,115,206 persons of which 545,216 are males and
569,990 females). It has a moderate number of agriculture households involved in agriculture (216,173) compared to other
regions. The region has an average household size of 5.2 persons per household and it has a low percent of female headed
households (16%). Livestock production is important in the region and mixed farming of both crops and livestock is
dominant. The region has no pastoralists, however it has a small number of households involved in livestock keeping only.
Right to land is mostly by customary law (70% of total land area under agriculture). The region has one of the best access
to its fields in the country with over 80 percent of the households having their nearest field less than 100m from the
homestead and the distance from the field to the nearest road is the shortest in the country.
Tanzania , Agriculture Sample Census

Regional Profiles 47
Kilimanjaro has the highest percent of literate rural agriculture population in the country (86%) and the difference between
the literacy rate of males and females is the lowest with only 3 percent more literate males than females. It has the highest
percent of the rural agriculture population that have completed school and the highest percent of household heads with
education.
The most important livelihood activity is crop farming followed by livestock keeping and remittances. Permanent crop
farming is the least important. The percent of the rural agriculture population working full time in farming (85%) is
amongst the highest in the country. The main source of cash income is from the sale of food crops. Very small amount of
credit is available in the region and it is mostly through family friends/relatives or NGO/projectlreiigious organisation
Over 90 percent of households have the roof of the main dwelling made of modem material (mainly iron sheets) and the
rest is mainly with grass/leaves/mud. Practically all households have toilet facilities (98%). Energy for lighting is mainly
from hurricane lamps and it has the highest percent using electricity and pressure lamps. Kilimanjaro has the second
highest percent of households using piped drinking water supply (over 50%).
Most rural agriculture smallholders are living a subsistence existence with 70 percent of households using only 0 to 25
percent of their livelihood activities for non subsistence purposes. The region has the second lowest number of households
that do not eat animal protein in a week and 2 to 4 times a week is the most common. it has a low percent of households
that face food shortages. The region has the second best access to services in the country. About 69.2 percent of the
households in the region reported insufficiency of land which is the second highest in the country.
3.4 Tanga
Tanga Region has the seventh largest rural agriculture population in Tanzania (1,296,031 persons of which 633,967 are
males and 662,064 females). It has a moderate number of rural households involved in agriculture (265,198) compared to
other regions. It has 94 percent of rural households and 74 percent of total households in the region (including urban) that
are involved in agriculture. The region has an average household size of 4.9 persons per household and it has the fourth
highest percent of female headed households (24%). Crop only farming is most important in the region, however about 30
percent of households are both crop and livestock farmers. The proportion of livestock only households in the region is
very small (0.3%) and it also has a small number of pastoralist households.
Even though land under customary law is the predominant type of land ownership, accounting for 55 percent of the total
rural smallholder owned land, the region has highest percent of land under official certificate of ownership (18%). The
region has good access to its fields with over 60 percent of the households having their nearest field less than 100m from
the homestead and most smallholders have fields which are within 1km from the nearest road.
Tanga has a moderate to high percent of literate rural agriculture population (70%) and the difference between the literacy
rate of males and females is 10 percent more literate males than females, It has a comparatively high percent of the rural
agriculture population that have completed school and a low percent of household heads with no education.
The most important livelihood activity is crop farming followed by tree/forest resources and livestock keeping/herding.
Off farm income is the least important. The percent of the rural agriculture population working full time in farming is the
Tanzania Agriculture Sample Census

Regional Profiles 48
fourth highest in the country (over 80%). However, most households have one off-farm income activity and the region has
one of the lowest percent of 2 or more off farm activities. The main source of cash income for Tanga is from the sale of
food and cash crops and from casual cash earnings. Very small amount of credit is available in the region and it is mostly
from commercial banks.
A moderate percent of households use modem roofing material in the region (around 46%) and the rest is mainly with
grass/leaves/mud. The region has a moderate to low percent of households with no toilet facilities (11%). Energy for
lighting is mainly from wick lamps (77%). About 22 percent of households in Tanga region obtain drinking water from
pipes, most water is obtained from unprotected springs and unprotected wells.
Tanga Region has the highest percent of subsistence farmers in Tanzania with 40 percent of households not using their
livelihood activities for non subsistence purposes and 50 percent of households using between 1 and 25 percent of their
livelihood activities for non-subsistence purposes. Tanga has the highest percent of households that eat 3 meals per day
and one of the lowest percent of households that do not eat animal protein in a week. The region has one of the highest
percent of the households that sometimes face food shortages. It has one of the best access to services and infrastructure.
A moderate number of households (56%) reported that they have insufficient land. A moderate number of households
(44.5%) reported that they have insufficient land.
3.5 Morogoro
Morogoro Region has the eighth highest rural agriculture population in Tanzania (1,235,577 persons of which 614,454 are
males and 621,124 females). It has a moderate to high number of rural households involved in agriculture (260,746)
compared to other regions and 95 percent of rural households and 68 percent of total households in the region (including
urban) are involved in agriculture. The region has an average household size of 4.7 persons per household and it has
moderate percent of female headed households (20%) compared to other regions. Crop only farming is dominant in the
region and only a small number of households are involved in both crop and livestock production. The number of livestock
only households in the region is very small and it also has no pastoralist households.
Land under customary law is the predominant type of land ownership, accounting for 61 percent of the total rural
smallholder owned land. There is a small amount of land under official titles and bought (12 and 11% respectively). The
region has the second worst access to fields with only 23 percent of the rural agriculture households having their nearest
field less than 100m from the homestead. Most households have their nearest field between 0.5km and 3km from the
homestead. Access from the field to the nearest road is moderate to poor compared to other regions.
Morogoro has a moderate to high percent of literate rural agriculture population (68%) and the difference between the
literacy rate of males and females is 9 percent more literate males than females. It has a comparatively high percent of the
rural agriculture population that have completed school and a low percent of household heads with no education.
The most important livelihood activity is crop farming followed by tree/forest resources and remittances. Permanent crop
farming is the least important. The percent of the rural agriculture population working full time in farming is 77 percent.
The main source of cash income for Morogoro is from the sale of food crops and is the second highest in the country.
Tanzania Agriculture Sample Census

Regional Profiles 49
Morogoro has the fourth highest number of households receiving credit with over 11,000 smallholders receiving credit
during the year and most was from family friends and relatives.
A moderate percent of households use modern roofing material in the region (around 38%) and the rest is mainly with
grass/leaves/mud. The region has a low percent of households with no toilet facilities (2.7%). Energy for lighting is mainly
from wick lamps (70%) and only 25 percent of households use hurricane lamps. About 25 percent of households in
Morogoro region obtain drinking water from a piped water supply, with the remaining households mainly using protected
and unprotected wells and open water (lake, river etc).
Most rural agriculture smallholders are living a subsistence existence with only 5 percent of households using more than 50
percent of their livelihood activities for non-subsistence purposes. About 20 percent of households do not eat animal
protein and the most common is between 2 and 4 times in a week. Most households in their region either never or seldom
face problems with food shortage. The region has moderate access to services and infrastructure in the country. About 57%
of the households reported insufficiency of land.
3.6 Pwani
Pwani region has the fourth smallest ntral agriculture population in Tanzania (712,995 persons of which 354,379 are males
and 358.616 females), It has a moderate number of rural households involved in agriculture (141,530) compared to other
regions. It has 89.7 percent of rural households and 78.5 percent of total households in the region (including urban) that are
involved in agriculture. The region has an average household size of 5 persons per household and it has a low percent of
female headed households (19%) compared to other regions. Crop only farming dominates and there is virtually no
pastoralists in the region. The number of households keeping livestock only is very small.
Land under customary law is the predominant type of land ownership, accounting for 76 percent of the total rural
smallholder owned land. There is a very small amount of land under official titles. The region has an average access to
their fields with about 50 percent of the rural agriculture households having their nearest field less than 100 m from the
homestead. Access from the field to the nearest road is relatively poor.
Pwani region has comparatively low percent literate rural agriculture population in the country (63%) compared to other
regions and the difference between the literacy rate of males and females is fourth highest with 1.3.4 percent more literate
males than females.. It has a comparatively low percent of the rural agriculture population that have completed school and a
moderate percent of household heads with no education.
The most important livelihood activity is crop farming followed by livestock keepingirearing and tree/forest resources. Off
farm income is the least important livelihood activity. The percent of the rural agriculture population working full time in
farming is high (more than 75%). The main source of cash income for Pwani is from the sale of food crops followed by
sale of cash crops and sale of forest products. Pwani has a low percent of households receiving credit mainly from
cooperatives (65%).
The region has a low percent of households that use modern roofing material (around 27%) and the rest is mainly with
grass/leaves/mud. Almost all households in the region have toilet facilities (93.7%). Energy for lighting is mainly from
wick lamps 78.5%) and about 15 percent of households use hurricane lamps. Most water used for drinkingfn. Pwani is from
Tanzania Agriculture Sample Census

50
unprotected wells (53%), however, 14 percent of households use piped drinking water. About 10 percent of households in
Pwani region obtain drinking water from protected wells.
Most rural agriculture smallholders in Pwani are living a subsistence existence with about 25 percent of the agriculture
households using more than 50 percent of their livelihood activities for non subsistence purposes. Most households eat
three per day (64.7). It has a low percent of households that do not eat animal protein in one week and a relatively high
percent of households that eat animal protein every day. The region has the highest percent of households that face
problems in satisfying the household food requirements. It has a moderate access to services and infrastructure in the
country. About 36 percent of the households in the region reported insufficiency of land which is moderate in the country.
3.7 Dar es Salaam
Dar es Salaam region has smallest rural agriculture population in Tanzania (99,030 persons of which 50,030 are males and
49,000 females). It has a moderate number of rural households involved in agriculture (20,394 households) in the country
and 55 percent of the rural households and 6.2 percent of total households in the region (including urban) that are involved
in agriculture. The region has an average household size of 4.9 persons per household and it has a moderate percent of
female headed households (19%). Crop only farming dominates and virtually no pastoralists are found in the region. The
number of households keeping livestock only is very small.
Land ownership under customary law accounts for 33 percent of the total rural smallholder owned land whilst bought land
accounts for 41 percent. There is a small amount of land which is under official titles (5.7%). The region has the second
best access to the fields with more than 70 percent of the rural agriculture households having their nearest field less than
100 m from the homestead. Access from the field to the nearest road is relatively good.
Dar es Salaam region has a moderate percent of literate rural agriculture population (76%) compared to other regions and
the. difference between the literacy rate of males and females is the third highest in the country with 13.6 percent more
literate males than females. It has the third highest percent of the rural agriculture population that have completed school
and a moderate percent of the population that have never attended school. The region has the highest percent of household
heads with post primary education (15.3%), however, about 24 percent of household heads have no education.
The most important livelihood activity is crop farming followed by tree/forest resources and livestock keeping/rearing. Off
farm income is the least important livelihood activity. The percent of the rural agriculture population working full time in
fanning is high (79%). The main source of cash income for Dar es Salaam is from the sale of food crops followed by sale
of cash crops and business income. Dar es Salaam has the smallest number of households receiving credit in the country
mainly from commercial banks.
The region has the second highest percent of households that use modern roofing material (around 64%) and the rest is
mainly with grass/leaves/mud. Most households in the region have toilet facilities (97.3%), however 2.7 percent of
households do not have toilet facilities. Energy for lighting is mainly from wick lamps (52%) and about 37 percent of
households use hurricane lamps. Only 5.4 percent of the rural agricultural population in. Dar es Salaam use mains electricity
for lighting. Most water used for drinking in Dar es Salaam is unprotected wells (50%) followed by piped water (15%) and
protected wells (14%).
Tanzania Agriculture Sample Census

Profiles 51
Most rural agriculture smallholders in Dar es Salaam are living a subsistence existence with more than 40 percent of the
agriculture households using between 0 and 25 percent of their livelihood activities for non subsistence purposes. Most
households eat three meals per day (63%) and about 32 percent of households eat two meals a day. The region has a
relatively small percent of households that do not eat animal protein in one week. A moderate number of households eat
animal protein three to five times a week. The region has a moderate percent of households that face problems in . satisfying
the household food requirements. It has the best access to services and infrastructure in the country. About 56 percent of the
households in the region reported insufficiency of land which is relatively high in the country.
3.8 Lindi
Lindi has the third smallest rural agriculture population in Tanzania (646,399 persons of which 308,426 are males and
337,974 females). It has a small number of households involved in agriculture (153,173) compared to other regions,
however 96 percent of the rural agriculture households and 80% of the total number of households in the region (including
urban) are involved in agriculture. It has the second smallest household size of 4.2 persons per household in the country
and it has the second highest percent of female headed households (26%). The type of farming is completely dominated by
crop production and the region has one of the smallest percent of households keeping livestock in the country. The region
has no pastoralists.
Ownership of land is mostly by customary law (70% of total land area under agriculture). The region has one of the
poorest access to fields in the country with only 30 percent of the households having their nearest field less than 100 m
from the homestead. Access from the field to the nearest road is also poor compared to other regions
Lindi has the second lowest percent of literate rural agriculture population in the country (60%) and the difference between
the literacy rate of males and females is the second highest in the country with 13 percent more literate males than females.
It has a moderate percent of rural agriculture population that have completed school and has a moderate percent of
household heads with education.
The most important livelihood activity is crop farming followed by tree /forest resources. Off-farm income is the least
important. The percent of the rural agriculture population working full time in farming (90%) is moderate to high for the
country. About 50% of the households in the region have one off-faun activity. The region has one of the lowest percent of
households whose main source of cash income is from the sale of cash crops. Practically no credit is available in the
region.
The region has the second lowest percent of households that use modern roofing material in the region (around 17%) and
the rest is mainly with grass/leaves/mud. Most households in the region have toilet facilities (95%) Energy for lighting is
mainly from wick lamps (80%) and about 15 percent of households use hurricane lamps. It has a low percent of
households using piped drinking water (14%).
Most rural agriculture smallholders in Lindi are living a subsistence existence with over 60 percent of the agriculture
households using between 0 and 25 percent of their livelihood activities for non subsistence purposes. Most households eat
two or three meals per day (51.3 and 41.4% respectively) and it has a low percent of households that do not cat animal
protein in one week and a relatively high percent of households that eat animal protein every day. The region has one of
Tanzania Agriculture Sample Cetsus

Regional Profiles 52
the highest percent of households that face problems in satisfying the household food requirements. It has the third worst
access to services and infrastructure in the country. About 28 percent of the households in the region reported insufficiency
of land which is the second lowest in the country.
3.9 Mtwara
Mtwara Region has a moderate to low agriculture population in T anzania, 928,521 persons, of which 448,168 are males
and 480,352 females representing one of the highest gender imbalances in the country. It has a moderate to high number of
households involved in agriculture compared to other regions (229,313), with 97 percent of the rural households and 78
percent of the total households (incltiding urban) in the region classified as agriculture households. The region has the
lowest average household size of 4.0 persons per household and it has a high percent of female headed households (23%).
Crop production is the dominant type of agriculture with virtually no livestock farmers.
Ownership of land is mostly by customary law (81% of total land area under agriculture), however although small, it has a
comparatively high percent of land under official certificate of ownership compared to most regions. Access to fields is
low compared to other regions with only 6 percent of the households having their nearest field less than 100 m from the
homestead.
Mtwara has a comparatively low literate rural agriculture population compared to most other regions (62%) and the
difference between the literacy rate of males and fem al es is also moderate with 9 percent more literate m ales than fem ales.
It has a moderate to high percent of the rural agriculture population that have completed school and a high percent of
household heads with no education compared to other regions.
The most important livelihood activity is crop farming followed by livestock keeping and tree/forest resources. Off farm
income is the least important livelihood activity. The percent of the rural agriculture population working full time in
farming is seventh highest in the country and the region has a moderate number of households using food crops as their
main sources of cash income (about 50%of households). It is one of the regions with the highest percent of households that
use cash crops as their main source of cash income. And other sources are of minor importance. A very small amount of
credit is avai lable in the region, mostly from coo peratives and family friends and relatives.
A low percent of households (28%) have the roof of the main dwelling made of modern material (mainly iron sheets), the
rest is with grass/leaves/mud and only 3 percent of the households have no toilet facility. Energy for lighting is
predominantly from wick lamps and a very small proportion from hurricane lamps. The main sources of drinking water in
Mtwara region is from piped water and unprotected wells. It also has the highest percent of households obtaining water
from protected springs and lakes, rivers and s treams.
About 46 percent of the rural agriculture households in Mtwara region use 26 percent or more of their livelihood activities
for non — subsistence purposes, however a small proportion of the rural agriculture smallholders in Mtwara are living a
subsistence existence (14%). Most of the rural agriculture households in Mtwara region take two or three meal s per day
and though small, the region has the highest proportion of hou seholds taking one meal per day. More than 70 percent of the
rural households in the region eat animal protein at least twice a week and it has a relatively low percent of households that
do not eat animal protein in a week. The region has a high percent of households that never face food shortages (75%),
however it is also among the regions that have a high percent of households that often or always face shortages. Access to
Tanzania Agriculture Sample Census

Re Tonal Profiles 53
services and infrastructure is moderate. About 31.6 percent of the households in the region reported insufficiency of land
which is the third lowest percent in the country,
3.10 Ruvuma
Ruvuma region has the third smallest rural agriculture population in Tanzania (891,662 persons of which 438,796 are
males and 452,866 females). It has a moderate number of rural households involved in agriculture (191,175) compared to
other regions. It has 98 percent of rural households and 84 percent of total households in the region (including urban) that
are involved in agriculture. The region has an average household size of 4.7 persons per household and it has second
lowest percent of female headed households (14%) compared to other regions. Crop only farming dominates and there are
virtually no pastoralists in the region. The number of households keeping livestock only is very small.
Land under customary law is the predominant type of land ownership, accounting for more than 80 percent of the total rural
smallholder owned land. There is a very small amount of land under official titles. The region has poor access to their
fields with about 30 percent of the rural agriculture households having their nearest field less than 2 km from the
homestead. Access from the field to the nearest road is relatively poor.
Ruvuma region has the fourth highest percent literate rural agriculture population in the country (75%) compared to other
regions and the difference between the literacy rate of males and females is third lowest with 6.7 percent more literate
males than females. It has a comparatively moderate percent of the rural agriculture population that have completed school
and the second lowest percent of household heads with no education.
The most important livelihood activity is crop farming followed by livestock keeping/rearing and tree/forest resources.
Fishing/hunting and gathering is the least important livelihood activity. The percent of the rural agriculture population
working full time in fanning is high (72%). The main source of cash income for Ruvuma is from the sale of food crops
followed by sale of cash crops. Ruvuma has the highest percent of households receiving credit mainly from
family/friends/relatives (40%) and from cooperatives (39%).
The region has a .low percent of households that use modern roofing material (around 34%) and the rest is mainly with
grass/leaves/mud. Almost all households in the region have toilet facilities (99%). Energy for lighting is mainly from wick
lamps (51%) and about 44 percent of households use hurricane lamps. Most water used for drinking in Ruvuma is from
unprotected wells (29%), however, 26 percent of households use piped drinking water, About 38 and 15 percent of
households in Ruvuma region obtain drinking water from unprotected springs and unprotected wells.
Most rural agriculture smallholders in Ruvuma are living a subsistence existence with over 60 percent of the agriculture
households using between 0 and 25 percent of their livelihood activities for non subsistence purposes. Most households eat
three or two meals per day (64.5 and 33.4% respectively). It has a low percent of households that do not eat animal protein
in one week and a moderate percent of households that eat animal protein every day. The region has the lowest percent of
households that face problems in satisfying the household food requirements. It has the fourth worst access to services and
infrastructure in the country. About 24 percent of the households in the region reported insufficiency of land which is the
lowest in the country,
Tanzania Agriculture Sample Census

Regional Profiles 54
3.11 Iringa
Iringa Region has a moderate agriculture population, 1,235,122 persons, of which 588,637 are males and 64Ii6,485 females
representing the highest gender imbalance in the country. It has a high number of households involved in agriculture
(278,717, 98% of the rural households) compared to other regions. It has a low average household size of 4.4 persons per
household and it has the highest percent of female headed households in Tanzania (31%). Crop production is the dominant
type of agriculture. It has one of the smallest percent of households keeping livestock in the country and there are no
pastoralists.
Land ownership is mostly by customary law (70% of total land area under agriculture). Access to fields is low to moderate
with 36 percent of the households having their nearest field less than 100 m from the homestead
Iringa has the third highest percent of literate rural agriculture population in the country (86%) and the difference between
the literacy rate of males and females is moderate to high with 11 percent 4:e literate males than females, It has a
relatively high percent of the rural agriculture population that have con Dieted school and one of the highest percent of
household heads with education.
The most important livelihood activity is crop farming followed by nee/forest resources end remittances. Permanent crop
farming is the least important. The percent of the rural agriculture population working full time in farming (71%) is
moderate to high in the country. The main source (if cash income is from the sale of food crops and a relatively high
percent from other casual cash earnings. A very smell amount of credit is available in the region and it is mostly through
family friends and relatives.
Around 50 percent of households have the roof of the main dwelling made of modem materi0 (mainly iron sheets) and the
rest is with grass/leaves/mud. Iringa has the highest percent of households with toilets ( %). Energy for lighting is
mainly from hurricane lamps and wick lamp. Iringa has the fifth highest percent of households using pipezl drinking water
supply (over 25%) with unprotected wells being the next most important source of water.
Most rural agriculture smallholders are living a subsistence existence with wound 55 percent of households us * only 0 to
25% percent of their livelihood activities for non subsistence purposes. Animal protein is eaten between 1 and 3 times a
week by most households and it has the smallest percent of households that eat animal protein every. It has the third
highest percent of households that never experience food shortages. Access to services for the region is moderate. About
37.4 percent of the households in the region reported insufficiency of land.
3.12 Mbeya
Mbeya region has the fourth largest rural agriculture population in Tanzania (1,608,718 persons of which 780,102 are
males and 828,679 females). It has second Ingest number of rural households involved in agriculture (372,844) in the
country and 95.3 percent of the rural households and 79.5 percent of total households in the region (including urban) are
involved in agriculture. The region has an average household size of 4.3 persons per household and it has the second
highest percent of female headed households (25%) in the country. Crop only farming dominates and there is virtually no
pastoralists in the region. The number of households keeping livestock only is small.
Tanzania Agriculture Sample Census

Regional Profiles 55
Land under customary law is the predominant type of land ownership, accounting for 72 percent of the total rural
smallholder owned land. There is a very small amount of land under official titles. The region has an average access to
their fields with about 40 percent of the rural agriculture households having their nearest field less than 100 rn from the
homestead. Access from the field to the nearest road is relatively poor.
Mbeya region has a comparatively moderate percent of literate rural agriculture population in the country (68%) compared
to other regions and the difference between the literacy rate of males and females is fourth highest with 10.4 percent more
literate males than females. It has a small percent of the rural agriculture population that have completed school and a
moderate percent of household heads with no education.
The most important livelihood activity is crop farming followed by tree/forest resources and livestock keeping/rearing.
Permanent crop farming is the least important livelihood activity. The percent of the rural agriculture population working
full time in farming is the second highest in the country (87%). The main source of cash income for Mbeya is from the sale
of food crops followed by sale of cash crops. Mbeya has the third largest number of households receiving credit mainly
from family, friends and relatives (35%) and cooperatives (23%).
The region has a moderate percent of households that use modern roofing material (around 44%) and the rest is mainly with
grass/leaves/mud. Almost all households in the region have toilet facilities (98.3%). Energy for lighting is mainly from
wick lamps 67%) and about 26 percent of households use hurricane lamps. Most water used for drinking in Mbeya is from
unprotected springs (24%) and piped water (23%), however, 21 percent of households obtain drinking water from
unprotected wells.
Most rural agriculture smallholders in Mbeya are living a subsistence existence with more than 50 percent of the agriculture
households using between 0 and 25 percent of their livelihood activities for non subsistence purposes. Most households eat
two meals per day (69%). Only 28 percent of the households take three meals per day. The region has a low percent of
households that do not eat animal protein in one week. Most households eat animal protein twice or three times a week.
The region has a low percent of households that face problems in satisfying the household food requirements. It is one of
the regions with relatively good access to services and infrastructure in the country. About 46 percent of the households in
the region reported insufficiency of land which is high compared to other regions in the country.
3.13 Singida
Singida has a moderate agriculture population in Tanzania (936,792 persons of which 463,874 are males and 472,918
females), It has a moderate number of agriculture households involved in agriculture (179,915) compared to other regions
and 97 percent of rural households and 83 percent of total households in the region (including urban) are involved in
agriculture. The region has an average household size of 5.2 persons per household and it has a low percent of female
header.. °.iic>id.s (22%). Crop only and mixed farming are important in the region. The proportion of livestock only
households in the region is very small (0.3%).
Right to land is mostly by customary law (76% of total land area under agriculture). Compared to other regions, Singida
has a moderate percent of land under official certificate of ownership (9%). The region has a good access to its fields with
over 60 percent of the households having their nearest field less than 1QOm from the homestead and most homesteads are
within I km from the field to the nearest road.
T nzan.ia Agriculture Sample Census

Regional Profiles 56
Singida has a moderate percent of literate rural agriculture population (68%) and the difference between the literacy rate of
males and females is 8 percent more literate males than females. It has a comparatively low percent of the rural agriculture
population that have completed school and a moderate percent of household heads with no education.
The most important livelihood activity is crop f arming followed by tree/forest resources and remittances. Permanent crop
farming is the least important. The percent of the rural agriculture population working full time in farming is 70 percent.
The main source of cash income for Singida is from casual cash earnings and the region has the highest percent of
households using casual cash earnings as a source of cash income in the country. Very small amount of credit is available
in the region and it is mostly from cooperatives and family, friends and relatives.
A very small percent of households use modem roofing material in the region (arJund `Lz%) and the rest is mainly with
grass/leaves/mud. The region has a moderate to low percent of households with no toilet facilities (7%). Energy for
lighting is mainly from wick lamps (80%) and it has one of the highest percent of households using firewood as a source of
energy for cooking (95%). About 31 percent of households in Singida .egion obtain drinking water from unprotected
sources, whilst 20 percent has piped drinking water supply.
Most rural agriculture smallholders are living a subsistence existence with 60 percent of households using only 0 to 25
percent of their livelihood activities for non subsistencc, purposes. Most rural agriculture households in Singida eat two
meals per day (66%) and the region has a moderate to high percent of households that do not eat animal protein in a week
and 2 to 3 times a week is the most common. The region has one of the highest percent of households that sometimes face
food shortages, with the highest proportion of households that always face problems in satisfying the household food
requirements. The region has one of the best access to se rvices and infrastructure in the country. About 47 percent of the
households in the region reported insufficiency of land which is moderate.
3.14 Tabora
Tabora region has the third largest rural agriculture population in T anzania (1,420,300 persons of which 732,811 are males
and 687,489 females). It has a moderate number of rural households involved in agriculture (235,917) in the country. It
has 96.4 percent of rural households and 84 percent of total households in the region (including urban) that are involved in
agriculture. The region has an average household size of 6.0 persons per household which is the third highest in the
country and it has a low percent of female headed households (14%) in the country. Crop only farming dominates and
virtually no pastoralists are found in the region. The number of households keeping livestock only is moderate to low.
Land under customary law is the predominant type of land ownership, accounting for 71 percent of the total rural
smallholder owned land. There is a very small amount of land which is under official titles (1.8%). The region has a good
access to their fields with more than 60 percent of the rural agriculture households having their nearest field less than 100
m from the homestead. Access from the field to the nearest road is poor.
Tabora region has the lowest percent of literate rural agriculture population in the country (52%) compared to other regions
and the difference between the literacy rate of males and females is relatively high with 11.2 percent more literate males
than females. It has the second lowest percent of the rural agriculture population that have completed school and the
Tanzania Agriculture Sample Census

Regional Profiles 57
highest percent of population that have never attended school. The region has the second highest percent. of household
heads with no education (40%),
The most important livelihood activity is crop farming followed by tree/forest resources and remittances. Permanent crop
farming is the least important livelihood activity. The percent of the rural agriculture population working full time in
farming is moderate (63%). The main source of cash income for Tabora is from the sale of food crops followed by sale of
cash crops. Tabora has the second largest number of households receiving credit mainly from cooperatives (86%).
The region has the lowest percent of households that use modern roofing material (around 14.8%) and the rest is mainly
with grass/leaves/mud. Most households in the region have toilet facilities (83.1 %), however 16.9 percent of households
do not have toilet facilities. Energy for lighting is mainly from wick lamps (83.6%) and about 10.1 percent of households
use hurricane lamps. Most water used for drinking in Tabora is from unprotected wells (68%), however, only 2 percent of
households obtain drinking water from pipe water supply.
Most rural agriculture smallholders in Tabora are living a subsistence existence with about 30 percent of the agriculture
households using between 0 and 25 percent of their livelihood activities for non subsistence purposes. Most households eat
three meals per day (58%) and about 38 percent of households eat two meals a day. The region has a moderate percent of
households that do not eat animal protein in one week. A moderate number of households eat animal protein twice or three
times a week. The region has a moderate percent of households that face problems in satisfying the household food
requirements. It has a moderate access to services and infrastructure in the country. About 37.5 percent of the households in
the region reported insufficiency of land which is moderate in the country.
3.15 Rukwa
Rukwa has the eleventh highest rural agriculture population in Tanzania (942,268 of which 476,244 are males and
466,024 females). It has a small number of rural households involved in agriculture (172,260) compared to other regions,
however, 95 percent of rural households and 77 percent of total households in the region (including urban) are involved in
agriculture. It has moderate to high household size of 5.5 persons per household and it has the lowest percent of female
headed households in the .country (12%). Crop production is dominant, although there is a small amount of mixed crop and
livestock smallholders. Livestock production_is important in the region and mixed farming of both crops and livestock is
dominant. The region has no pastoralists.
Right to land is mostly by customary Iaw (73% of total land area under agriculture) and there is small but significant
amount of bought land. (20%). The region has one of the worst access to fields to with around 30 percent of the
households having their nearest field less than 100m from the Homestead.
Rukwa has a comparatively low literate rural agriculture population (61%) and the difference between the literacy rate of
males and females is the highest in the country with 15 percent more literate males than females.
The most important livelihood activity is crop farming followed by tree/forest resources and remittances. Permanent crop
farming is the least important. The percent of the rural agriculture population working full time in farming (70%) is eighth
lowest in the country. Seventy five percent of households have at least one off farm activity, however the highest percent
of cash income is generated through the sale of crops. A small amount of credit is available in the region.
Tanzania Agriculture Sample Census

Regional Profiles 58
A very small percent of households use modem roofing material in the region (around 22%). Practically all households
have toilet facilities (96%). It has a low percent of households using piped drinking water, with most households using
unprotected wells (over 50%).
About 95 percent of the households in Rukwa use between I and 50 percent of their livelihood activities for non
subsistence puwoses. Households in the region do not normally have food problems. It has the worst access to communal
resources, services and infrastructure in the country. About 36.6 percent of the households in the region reported
insufficiency of land.
3.16 Kigoma
Kigoma Region has a moderate agriculture population, 1,076,658 persons, of which 528,003 are males and 548,653
females. It has a moderate number of households involved in agriculture compared to other regions (323,719), representing
98% of the rural households in the region. It has a low average household size of 4.6 persons per household and it has a
moderate to high percent of female headed households in Tanzania (15%). Crop production is the dominant type of
agriculture and it has some households rearing livestock on a mixed farming basis and there are no pastoralists.
Ownership of land is mostly by customary law (80% of total land area under agriculture), however although small, it has
one of the highest percent of land under official certificate of ownership. Access to fields is low compared to other regions
with only 30% of the households having their nearest field less than I Wm from the Homestead.
Kigoma has a lower percent of literate rural agriculture population than most other regions and the difference between the
literacy rate of males and females is also moderate with 8 percent more literate males than females. It has a moderate to
low high percent of the rural agriculture population that have completed school and a high percent of household heads with
no education compared to other regions.
The most important livelihood activity is crop farming followed by tree/forest resources and remittances. Off farm income
is the least important livelihood activity. The percent of the rural agriculture population working full time in farming is
sixth lowest in the country and the region has the highest percent of households using food crops as their main source of
cash income (about 60% of households). Other sources are of minor importance. A very small amount of credit is
available in the region.
A moderate to low percent of households (28%) have the roof of the main dwelling made of modern material (mainly iron
sheets), the rest is with grass/leave mud and only 3 percent of the households have no toilet facility. Energy for lighting is
predominantly from wick lamps and a very small proportion from hurricane lamps. The main sources of drinking water in
Kigoma region is from piped water and lakes. It also has the highest percent of households obtaining water from protected
springs
Most rural agriculture smallholders are living a subsistence existence with around 55 percent of households using only 0 to
25% percent of their livelihood activities for non subsistence purposes. The region has the third highest percent of
households that do not eat animal protein in a week. It has the highest percent of households that never face food shortages
and one of the smallest percent that often or always face shortages. Access to services and infrastructure is the second
Tanzania Agriculture Sample Census

Regional Profiles 59
worst in the country. About 50.3 percent of the households in the region reported insufficiency of land which is high
compared to other regions in the country.
3.17 Shinyanga
Shinyanga has the largest rural agriculture population in 'Tanzania (2,426,406 persons of which 1,240,181 are male and
1,186,224 female). [It also has the highest number of rural agriculture households (377,857) which represents 96.4 percent
of the inumber of rural households and 84.9 percent of the total number of households in the region mciudes urban
households). The region has the highest number of persons per household (6.4 per household) and one of the lowest
percent of female headed households (14%). The crop farming only and mixed crop and livestock farming are equally
important. The !region has no pastoralists, however it has a moderate number of households involved au livestock herding
oaiiy.
Right to land is mostly by customary law (60% of total :land area under agriculture), however a moderate to high proportion
is bought land, ilt has one of The lowest percent of households with official certificates of ownership. Access to fields is
moderate compared to other regions with 50% of the households having their nearest field less than 100m from the
Homestead. However the distance from the field to the nearest road is one of the farthest in the country.
Shinyanga has the fourth lowest percent of literate rural agriculture population in The country and the difference between
the literacy rate of males and females is amongst the highest. It has a comparatively low percent of the rural agriculture
population that have completed school and the third highest percent of household heads with no education.
The most important livelihood activity is crap farming followed by remittances. The percent of the rural agriculture
population working full time in farming is fid lowest in the country, however it has one of the highest percent working
part time in agriculture. The main source of cash is from the sale of food crops, the second most important source of cash
income is from the sale of cash crops. Other sources are of minor importance. Very small amount of credit is available in
the region.
Around 30 percent of households have the roof of the main dwelling made of modern material (mainly iron sheets ) d the
rest is mainly with grass/leaveshnud and only 11 percent of the households have no toilet facility. Energy for lighting is
mainly from wick Ramps and a very small proportion from hurricane lamps. Shinyanga has one of the lowest percent of
piped drinking water supply and most is from unprotected or protected wells
Most rural agriculture smallholders are living a subsistence existence with only 5 percent of households using their
livelihood activities for non subsistence purposes. The region has the highest percent of households that do not eat animal
protein in a week and the smallest number that eat animal protein every day. It has a low percent of households that never
face food shortage and a high proportion that often or always face shortages. In general access to services is worse than
most other regions. About 55.4 percent of the households in the region reported insufficiency of land which is relatively
high when compared to some of the regions in the country.
Tanzania Agriculture Sample Census

Regional Profiles 60
3.18 Kagera
Kagera region has the third largest rural agriculture population in Tanzania (1,739,818 persons of which 866,030 are males
and 873,788 females). It has third largest number of rural households involved in agriculture (353,277) in the country. It
has 96.3 percent of rural households and 93.Ipercent of total households in the region (including urban) that are involved in
agriculture. The region has an average household size of 4.7 persons per household and it has a low percent of female
headed households (19%) in the country. Crop only farming dominates and is the highest in the country. Very few
pastoralists are found in the region and the number of households keeping livestock only is moderate.
Land under customary law is the predominant type of land ownership, accounting for 51.6 percent of the total rural
smallholder owned land. There is a moderate amount of land which was bought (37.2%), Very small amount of land is
under official titles. The region has the best access to their fields with more than 80 percent of the rural agriculture
households having their nearest field less than 100 m from the homestead. Access from the field to the nearest road is
moderate.
Kagera region has comparatively a moderate percent of literate rural agriculture population in the country (67%) compared
to other regions and the difference between the literacy rate of males and females indicates 9.2 percent more literate males
than females. It has a moderate percent of the rural agriculture population that have completed school and a moderate
percent of household heads with no education.
The most important livelihood activity is crop farming followed by livestock keeping/rearing and remittances.
Fishing/hunting and gathering are the least important livelihood activity. The percent of the rural agriculture population
working full time in farming is relatively low (46%). The main source of cash income for Kagera is from the sale of food
crops followed by sale of cash crops. Kagera has a small number of households receiving credit mainly from religious
organisations/NGOs (37%), cooperatives (26%) family, friends and relatives (25%).
The region has the third highest percent of households that use modern roofing material (around 54.5%) and the rest is
mainly with grass/leaves/mud. Most households in the region have toilet facilities (94.6%). Energy for lighting is mainly
from wick lamps 83%) and about 11 percent of households use hurricane lamps. Most water used for drinking in Kagera is
from unprotected springs (28%) and Lake/dam/river/stream (19%), however, 27 percent of households obtain drinking
water from protected sources (piped water (11%), protected wells (15%) and protected springs (12%)).
Most rural agriculture smallholders in Kagera are living a subsistence existence with more than 60 percent of the
agriculture households using between 0 and 25 percent of their livelihood activities for non subsistence purposes. Most
households eat two meals per day (84%). Only 12 percent of the households t ake three meals per day. The region has a low
percent of households that do not eat animal protein in one week. A moderate number of households eat animal protein
once or twice a week. The region has a moderate percent of households that face problems in satisfying the household food
requirements. It has a moderate access to se rvices and infrastructure in the country. About 49 percent of the households in
the region reported insufficiency of land which is high compared to other regions in the country. About 49.1 percent of the
households in the region reported insufficiency of land which is high compared to other regions in the country.
Tanzania Agriculture Sample Census

Reg ional Profiles 61
3.20 Mara
Mara Region has the eleventh highest rural agriculture population in Tanzania (1,097,741 persons of which 548,314 are
males and 549,427 females), It has a moderate number of rural households involved in agriculture (188,203) compared to
other regions. It has 96 percent of rural households and 76 percent of total households in the region (including urban) that
are involved in agriculture. The region has the fourth highest average household size in the country (5.8 persons per
household) and it has a high percent of female headed households (20%) compared to other regions. Crop only and both
crop and livestock production are the important types of farming in the region. The number of livestock only households in
the region is very small and it also has no pastoraist households.
Land under customary law is the predominant type of land ownership, accounting for almost 80 percent of the total rural
smallholder owned land and represents the second highest in the country.. There is a small amount of land under official
titles. The region has a moderate access to fields with about 45 percent of the rural agriculture households having their
nearest field less than 10©m from the homestead. Access from the field to the nearest road is moderate to poor compared to
other regions.
Mara has a high percent of literate rural agriculture population (68%) compared to other regions, however the difference
between the literacy rate of males and females is high with 13 percent more literate males than females. It has a
comparatively high percent of the rural agriculture population that have completed school and a low percent of household
heads with no education.
The most important livelihood activity is crop farming followed by livestock keeping and tree/forest resources. Off farm
Income is the least important. The percent of the rural agriculture population working full, time in farming is high (74%).
The main source of cash income for Mara is from the sale of food crops and It has the highest percent of rural agriculture
households depending on fishing as a source of cash income. Mara receives virtually no credit.
A low percent of households use modern roofing material in the region (around 30%) and the rest is mainly with
grass/]eaves/mud. The region has the third lowest number of households with no toilet facilities (21%). Energy for lighting
is mainly from wick lamps (50%) and about 30 percent of households use hurricane lamps. Mara has the second lowest
percent of households using piped drinking water. Most water is from unprotected wells and open water (lake/river etc)
About 25 percent of households in Mara region obtain drinking water from piped supplies, with the remaining households
mainly using protected and unprotected wells and open water (lake, river etc).
Most rural agriculture smallholders are living a subsistence existence. However, it has the fourth highest number of
households (15%) that use over 50% of their livelihood activities for non-subsistence purposes. It has the lowest number of
households that do not eat animal protein in one week and the highest percent of households that eat animal protein every
day. Most households in the region either never or seldom face problems with food shortage. The region has poor access
to services and infrastructure in the country. About 60% of the households reported insufficiency of land which is the third
highest in,the country.
Tanzania Agriculture Sample Census

Regional Profiles 62
3.20 Mwanza
Mwanza region has second largest rural agriculture population in Tanzania (2,134,328 persons of which 1,082,746 are
males and 1,051,636 females). It has the fourth largest number of rural households involved in agriculture (340,085
households) in the country and 92.3 percent of rural households and 74.3 percent of total households in the region
(including urban) are involved in agriculture. The region has an average household size of 6.3 persons per household
which is the second largest in the country. The region has a moderate percent of female headed households (16%) in the
country. Crop only farming dominates followed by crops and livestock keeping (41.5%). Virtually no pastoralists are
found in the region, however, there is a small number of households that keep livestock only.
Land under customary law is the predominant type of land ownership, accounting for 60.9 percent of the total rural
smallholder owned land followed by land that was bought (25.1%). Land ownership under official titles is very small
(3.8%). The region has a good access to fields with about 50 percent of the rural agriculture households having their nearest
field less than 100 m from the homestead. Access from the field to the nearest road is moderate.
Mwanza region has a moderate percent of literate rural agriculture population in the country (65%) compared to other
regions and the difference between the literacy rate of males and females is high with 10.8 percent more literate males than
females. It has a relatively low percent of the rural agriculture population that have completed school and a moderate
percent of population that have never attended school (33%). The region has a low percent of household heads with post
primary education (3.8%), however, about 36.4 percent of household heads have no education.
The most important livelihood activity is crop farming followed by tree/forest resources and livestock keeping/rearing. Off
farm income is the least important livelihood activity. The percent of the rural agriculture population working full time in
farming is comparatively low (45%), however, 46 percent of the rural agriculture households rarely work on farm. The
main source of cash income for Mwanza is from the sale of food crops followed by cash from other casual earnings and
sale of cash crops. Mwanza has a comparatively moderate number of households receiving credit in the country mainly
from service and credit societies (44%) and family, friends and relatives (33%).
The region has a moderate percent of households that use modern roofing material (41.5%) and the rest is mainly with
grass/leaves/mud. Most households in the region have toilet facilities (90.8%), with only 9.2 percent of households without
toilet facilities. Energy for lighting is mainly from wick lamps (73,6%) and about 20.5 percent of households use hurricane
lamps. Only 0.8 percent of the rural agricultural population in Mwanza use mains electricity for lighting. Most water used
for drinking in Mwanza is from unprotected wells (42%) followed by protected wells (24%).
Most rural agriculture smallholders in Mwanza are living a subsistence existence with more than 6() percent of the
agriculture households using between 0 and 25 percent of their livelihood activities for non subsistence purposes. Most
households eat two meals per day (72%) and about 25 percent of households eat three meals a day. The region has a
relatively small percent of households that do not eat animal protein in one week and it has the second highest percent of
households eat animal protein seven times a, week. The region has a moderate percent of households that face problems in
satisfying the household food requirements. It has a relatively good access to services and infrastructure in the country.
About 56.5 percent of the households in the region reported insufficiency of land which is relatively high in the country.
Tanzania Agriculture Sample Census

Profiles 63
3.21 Manyara
Manyara region has a moderate rural agriculture population in Tanzania (861,049 persons of which 450,336 are males and
410,714 females). It has a moderate number of rural households involved in agriculture (154,194) in the country and 92.3
percent of rural households and 83.6 percent of total households in the region (including urban) are involved in agriculture.
The region has an average household size of 5.6 persons per household and it has the second lowest percent of female
headed households (13%) in the country. The type of farming that dominates in the region is crop and livestock keeping
and very few pastoralists are found in the region. The percent of households keeping livestock only though small is the
third largest in the country.
Land under customary law is the predominant type of land ownership, accounting for 65.6 percent of the total rural
smallholder owned land. There is a small amount of land which is under official titles (11.6%). The region has a good
access to their fields with more than 50 percent of the rural agriculture households having their nearest field less than 100
.'from the homestead, Access from the field to the nearest road is relatively moderate.
Manyara region has a relatively low percent of literate rural agriculture population in the country (64%) compared to other
regions and the difference between the literacy rate of males and females is the second lowest in the country with 4.9
percent more literate males than females. It has the third lowest percent of the rural agriculture population that have
completed school and a high percent of population that have never attended school. The region has the fifth highest percent
of household heads with no education (40%).
The most important livelihood activity is crop farming followed by remittances and tree/forest resources. Permanent crop
farming is the least important livelihood activity. The percent of the rural agriculture population working full time in
farming is the smallest in the country (20%), however the majority of the rural population rarely works on farm. The main
source of cash income for Manyara is from the sale of food crops followed by sale of livestock. Manyara has the third
smallest number of households receiving credit mainly from family, friends and relatives (64%).
The region has a low percent of households that use modern roofing material (around 32.8%) and the rest is mainly with
grass/leaveslmud. Most households in the region have toilet facilities (83.4%), however 16.6 percent of households do not
have toilet facilities. Energy for lighting is mainly from wick lamps (72.8%) and about 17.5 percent of households use
hurricane lamps. Most water used for drinking in Manyara is piped water followed by unprotected wells (23%),
lakeldamlriver/stream (19%) and protected wells (16%).
Most rural agriculture smallholders in Manyara are living a subsistence existence with more than 50 percent of the
agriculture households using between 0 and 25 percent of their livelihood activities for non subsistence purposes. Most
households eat three meals per day (59.7%) and about 39 percent of households eat two meals a day. The region has a
relatively high percent of households that do not eat animal protein in one week. A moderate number of households eat
animal protein twice or three times a week. The region has a moderate percent of households that face problems in
satisfying the household food requirements. It has a moderate access to services and infrastructure in the country. About 58
percent of the households in the region reported insufficiency of land which is relatively high in the country.
Tanzania Agriculture Sample Census

Appendjces — Contents 64
4. Appendicies
Appendix I Household Characteristics Tabulation List ...................................................................................... 65
Apendix II Household Characteristics Table ......................................................................................................... 69
Appendix HI Questionnaires ..................................................................................................................................... 157

Appendix I — Table Listing 65
APPENDIX d: HOUSEHOLD CHARACTERISTICS AND ACCESS TO SERVICES AND NATURALRESOURCES
Type Of Agriculture Household2.1 Number of Households by type of Household and Region ...................................................................................... 71
2.2 Number of Agriculture Households by Type of Holding by Region ....................................................................... 71
2.3 Ranking of the Importance of different livelihood activities by Region .................................................................. 72
Household Demographics3.1 Number of Agriculture Household Members by sex and Age Group for the (row %) -- MAINLAND .................. 74
3,2 Number of Agriculture Household Members by sex and Age Group for the (col %) — MAINLAND ................... 74
3.3 Number of Agriculture Household Members by Sex and Region ............................................................................ 74
3.3a Rural Population and Growth Rate by Year .............................................................................................................. 74
3.4 Population Pyramids by Region ................................................................................................................................ 75
3.5 Number of Agriculture Household Members by Level of Formal Education .. Completed (up to primary level) andregion.......................................................................................................................................................................... 82
3.6 Number of Agriculture Household Members By Level of Formal Education Completed(secondary level and above) and Region ................................................................................................................... 82
3.7 Number of Agriculture Household Members. 5 years and above, who Can Read and WriteLanguagesby type of language and region ................................................................................................................ 83
3.7a Number of Agricultural Household Members reporting Literacy levels by Sex of Member and Region .............. 84
3.7b Number of Heads of Agricultural Households reporting Literacy levels by Sex of Head and Region .................. 85
3.8 Number of Agriculture Household Members by School Attendance and Region .................................................. 83
3.9 Number of Agricultural Household Members By Level of involvement in Farming Activity andRegion(excludes too old, disabled/retired and students) .......................................................................................... 86
3.10 Number of Household Members involved in off-farm income generating activities by Region ............................. 86
3.11 Number of Agriculture Household Members by Main Activity and Region .......................................................... 87
3.12 Number of Agriculture Households by sex of the head of the household and region .............................................. 88
3.13 Number of Agricultural Households and Average Household Size by Sex of the Head of Household and Region 88
3.14 Number of Heads of Agriculture Households by Maximum level of Education Attained by Region .................... 89
3.15 Number of Agriculture Households involved with off farm income generating activitiesbynumber of off farm income activities and Region ................................................................................................ 89
Land Ownership4.1 Number of Farming households by type of land Ownership/Tenure and Region .................................................... 91
4.2 Land Area by type of land Ownership/Tenure and Region ...................................................................................... 92
4.3 Percent Land Area by type of land Ownership/Tenure and Region ......................................................................... 92
4.4 Number of Agriculture Households by Whether they Consider Having Sufficient Landforthe Household and Region .................................................................................................................................... 93

Appendix I-- Table Listing 66
Access To Communal Resources:6.1 Average Distance (km) from Agriculture household to natural resource by type of Natural Resource,
Season and Region ........................................................................................................................................................ 95
6.2 Number of Agriculture households with Access to Water for Humans by type of Utilisation and Region ........... 96
6.3 Number of Agriculture households with Access to Water for livestock by type of Utilisation and Region .......... 97
6.4 Number of Agriculture households with Access to Communal Grazing by type of Utilisation and Region ......... 97
6,5 Number of agriculture households with Access to Communal Firewood by type of Utilisation and Region ........ 98
6.6 Number of agriculture households with Access to Wood for Charcoal by type of Utilisation and Region ........... 98
6.7 Number of agriculture households with Access to Forest for Building Poles by type of Utilisation by Region 99
6.8 Number of agriculture households with access to Forest for Bee products by type of Utilisation by Region ....... 99
6.9 Number of agriculture households with Access to Hunting Ground by type of Utilisation by Region ................ 100
6.10 Number of agriculture households with Access to Fishing Resources by type of Utilisation by Region ............ 100
Distance To Different Fields of The Household6.11 Number of Agricultural Holdings Reporting Distance from homestead to first field by Region .......................... 102
6.12 Number of Agricultural Holdings Reporting Distance from homestead to second field by Region ..................... 102
6.13 Number of Agricultural Holdings Reporting Distance from homestead to Third field by Region ........................ 103
6.14 Number of Agricultural Holdings Reporting Distance from Nearest Road to first field by Region ..................... 103
6.15 Number of Agricultural Holdings Reporting Distance from Nearest Road to second field by Region ................ 104
6.16 Number of Agricultural Holdings Reporting Distance from Nearest Road to Third field by Region .................. 104
6.17 Number of Agricultural Holdings Reporting Distance from Nearest Market to first field by Region ................. 105
6.18 Number of Agricultural Holdings Reporting Distance from Nearest Market to second field by Region ............ 105
6.19 Number of Agricultural Holdings Reporting Distance from Nearest Market to Third field by Region ............... 106
Agriculture Credit:13.1 Number of Agriculture Households receiving Credit by sex of household head and Region ............................... 108
13.2 Number of Credits by sex of the hh Member receiving credit and Region ............................................................ 108
13.3 Number of Credits Received by Source of Credit and Region ................................................................................ 109
13.4 Number of Credits Received by Purpose by Region ................................................................................................. 109
13.5 Number of Households Reporting the Main reasons for Not Using Credit by Region .......................................... 110
Tree Farming:14,1 Number of Households By Whether Village Have a Community Tree Planting Scheme By Region ................. 112
14.2 Number of Households By Distance to Community Planted Forest (Km) By Region .......................................... 112
14.3 Percent of Households By Distance to Community Planted Forest (Km) By Region ........................................... 113
14.4 Number of Households involved in community tree planting by Main scheme householdinvolvement and Region, 2002/03 agriculture year .................................................................................................. 114

Appendix I — Table Listing 67
14.5 Number of Households by Distance to Community Planted Forest (Km) by Region ........................................... 1.14
14.6 Number of Households involved in community tree planting by Main Purpose and Region ................................. 1 l.5
14.7 Number of Households involved in community tree planting by Use and Region--........................................... 1. 15
Constraints to Livelihood16.1 Order of MOST IMPORTANT constraints to livelihood by region ....................................................................... 117
16.2 Order of LEAST IMPORTANT constraints to livelihood by region ..................................................................... 118
Labour Use30.1 Number of Agriculture Household by type of Household Member and Region .................................................... 120
30.2 Percentage of Agriculture Household by type of Household Member .................................................................. 120
Access to Services
Number of Agriculture Households by Distance to Primary School and Region ................................................................ 122
Number of Agriculture Households by Distance to Secondary School and Region ........................................................... 122
Numberof Agriculture Households by Distance to Health Clinic and Region .................................................................... 123
Numberof Agriculture Households by Distance to Hospital and Region ............................................................................ 123
Numberof Agriculture Households by Distance to District Capital and Region ................................................................. 124
Number of Agriculture Households by Distance to Regional Capital and Region .............................................................. 124
Numberof Agriculture Households by Distance to Feeder Road and Region ..................................................................... 125
Number of Agriculture Households by Distance to All Weather Road and Region ........................................................... 125
Numberof Agriculture Households by Distance to Tarmac Road and Region .................................................................... 126
Numberof Agriculture Households by Distance to Primary Market and Region ................................................................ 126
Numberof Agriculture Households by Distance to Secondary Market and Region ............................................................ 127
Numberof Agriculture Households by Distance to Tertiary Market and Region ................................................................ 127
Numberof Agriculture Households by Distance to Veterinary Clinic and Region .............................................................. 128
Numberof Agriculture Households by Distance to Extension Centre and Region .............................................................. 128
Numberof Agriculture Households by Distance to Research Station and Region .............................................................. 129
Number of Agriculture Households by Distance to Plant Protection Lab and Region ....................................................... 129
Number of Agriculture Households by Distance to Land Registration Office and Region ................................................ 130
Number of Agriculture Households by Distance to Livestock Development Centre and Region ....................................... 130
MeanDistance to services by Type of Service and Region .................................................................................................. 131
Quality of Services33.1 Number of Agriculture Households By Level of Satisfaction of using Plant Protection Lab and Region............ 133
33.2 Number of Agriculture Households By Level of Satisfaction of using Research Station and Region,, ................. 133
33,3 Number of Agriculture Households by Level of Satisfaction of using Livestock Development Centre

Appendix I — Table Listing 68
and Region ................................................................................................................................................................... 134
33.4 Number of Agriculture Households By Level of Satisfaction of using Veterinary Clinic and Region ............... 134
33.5 Number of Agriculture Households by Level of Satisfaction of using Land Registration Office and Region .... 135
33.6 Number of Agriculture Households By Level of Satisfaction of using Extension Centre and Region................. 135
33.7 Number of Agriculture Households By Level of Satisfaction Using Infrastructure and Service .......................... 136
Household Facilities:34.1 Number of Agriculture Households by Type of Toilet and Region ........................................................................ 138
34.2 Number of Agriculture Households by Type of Roof Construction Materials and Region ................................... 138
34.3 Number of Agriculture Households by Type of Owned Assets and Region ........................................................ ... 139
34.4 Number of Agriculture Households by main source of energy used for Lighting and Region ............................ 140
34.5 Number of Agriculture Households by Main Source of Energy for Cooking and Region ................................... 141
34.6 Number of Agriculture Households by Main Source of Drinking Water by Season (wet and dry) and Region . 142
34.7 Percentage of Number of Agriculture Households Reporting Main Source of Drinking Water byseason (wet and dry) and Region ............................................................................................................................... 143
34.8 Number of Agriculture Households Reporting Distance to Main Source of Drinking Water duringWet Season by Region ........................................................................................................... ................................... 144
34.9 Percentage of Agriculture Households Reporting Distance to Main Source of Drinking Water duringWet Season and Region ............................................................................................................................................ 145
34.10 Number of Agriculture Households Reporting Time Spent to and from Main Source of DrinkingWater during Wet Season and Region ...................................................................................................................... 146
34.11 Percentage of Agriculture Households Reporting Time Spent to and from Main Source of DrinkingWater during Wet Season by Region ........................................................................................................................ 147
34.12 Number of Agriculture households by Number of meals the household normally has per day and Region ........ 148
34.13 Number of Agriculture Households by Number of days the household Consumed Meat during thePreceding Week and Region ...................................................................................................................................... 149
34.14 Number of Households by Number of days the household Consumed Fish during the PrecedingWeek and Region ........................................................................................................................................................ 150
34.14a Number of Agricultural Households Reporting Number of days the household Consumed Protein Food(MeaUFish) during the Preceding Week by Region ................................................................................................. 151
34.15 Number of Households Reporting the status of food satisfaction of the household during thePreceding Year by Region ......................................................................................................................................... 152
34.16 Number of Households by Main Source of Income and Region ............................................................................. 153
Subsistence versus Non-SubsistenceNumber of Households by Livelihood Activity and percent used for Non-Subsistence Purposes by Region .................... 155
Number of Households by Percent of Livelihood Used for Non Subsistence Purposes and Region ................................... 155
Rank of Number of Househyolds by Subsistence and Non subistence Generating activity by the Household andRegion ......................................................................................................................................................................... 156

Appendix II -- Tabulations 69
APPENDIX II HOUSEHOLD CHARACTERISTICS AND ACCESS TO SERVICES AND NATURALRESOURCES TABLES
Typeof Agriculture House'holds .......................................................................................................................................... 70
HouseholdDemographics ..................................................................................................................................................... 73
Land. Ownership .................................................................................................................................................. ........... 90
Accessto Communal Resources ........................................................................................................................................... 94
Distance to Different Fields of the Household .................................................................................................................. 101
AgricultureCredit ............................................................................................................_.................................................. 107
CommunalTree Farming ........................................................................................................_......................................... 111
Constraintsto Livelihood .....................................................................................................-.............................................. 116
Labouruse .............................................................................................................................................................................119
Accessto Services ................................................................................................................................................................. 121
Qualityof Services ............................................................................................................................................................... 132
HouseholdFacilities .........................................................................................................._.................................................. 137
Subsistenceversus non subsistence ............................................................................................_....................................... 154

Appendix II — Type of Agriculture Household 70
TYPE OF AGRICULTURE HOUSEHOLDS

Type of Agriculture Household 71
2.1 TYPE OF AGRICULTURE HOUSEHOLD: Number of Households by type of Household and Region during 2002103Agriculture Year
Agriculture, Non Agriculture and Urban Households
% of % of Total NumberRural Total Rural Total % of of
households rural households rural Total Households Percent ofinvolved in househ NOT involved house - Total Rural house- Urban % of Total (from 2002 totalAgriculture olds in Agriculture holds Households holds Households households Pop. census) households
Region Number fq Number a/ Number % Number % NumberDodorna 323,719 97.8 7.418 2.2 331,138 87.9 45.392 12.1 376,530 66.0Arusha 154,857 84.5 28,327 5.5 183,184 63.9 103,395 36,1 286,579 54.0Kilimarjara 216,173 94.1 13,493 5.9 229,666 77.2 67,773 22.8 297,43 72.7Tanga 265.198 94.4 15,869 5.6 281,067 78.7 75.926 21.3 356,993 74.3Morogoro 260.746 95.1 13,410 4.9 274,156 71.2 111,104 28.8 385,260 67.7Pwani 141.530 89,7 16,182 10.3 157,711 78.5 43,208 21.5 200,919 70.4Dar as Salaam 20 394 55.0 16,682 45.0 37,076 6.2 559,188 93.8 596,264 3.4Lindi 153,173 96.2 6,011. 3.8_ .._. ... 159,185 83.4 31.576 16.6 190,761 80.3Mtwara 229,314 96.5 6,210 3.5 237,524 80.8
.. -56,384
.1 9.2 293,908
-_.78.0
Ruvuma 191,175 98.1 3,739 1.9 1 94,914 83.9 37,426 16 .1 232,340 82.3Iringe 278,717 97.6 6,792 2,4 285,509 82.3 61,306 17.7 346,815 80.4Mbeya 372,844
-95,3 18,457 4.7 391,301 79.5 100.628 20.5 491,929 75.8
Singida 179,915 96.8 5,969 3.2 1 85,884 854 31.688 14.6 217,572 82.7Tabora 235,917 964 8,908 3.6 244,824 84,0 46,545 16.0 291,369 81.0Rukwa 172,261 95.3 6,469 4 .7 180,730 81.1 42,138 1 8.9 222,868 77.3Kigoma 195.765 97.2 5,602 2.8 201 ,367 83.0 41,166 17.0 242,533 80.7Shinyanga 377,857 96.4 14,205 3.6 392,062 88.1 52,958 11.9 445,020 84.9Kagera 353,277 95.3 13,501 31 366,778 93.1 27,350 6.9 394,128 89.6Mwanza 340,085 92,3 28,202 7.7 368,286 74.3 127,114 25 .7 495,400 68.6Mara 186,203 96.2 7,465 3.8 195,668 79.3 50,932 20.7 246.600 76.3Manyara 154.194 92.3 12,931 7.7 167,125 83.6 32,735 16.4 199,860 77,2Mainland 4,605,315 94.9 259,840 5.1 5,065,154 74.4 1,745,933 25.6 6,811,087Zanzibar 96,522 184,949 52.2National 4,901,837 6,996,036
Is 55„5U„L.Ir - or„us 110 3 5er yues qonnavre. cvumoer of rurai nousenaIcis not mvoivea in Agncuture - mousenord IE sung.Total Number of households - 2002 population Census. Number of Urban households is calculated by subtracting total rural households from Total number of householdsfrom the population census
2. 2 TYPE OF AGRICULTURE HH: Number of Agriculture Households by Type of Holding by Region during 2002/03 Agriculture Year
Crops Only Livestock Onl Pastoralist Crops & Livestock Total Total NumberTotal Number Number of of
Region Number Of a Number o Number of Numbero of Agriculture Households Householdshouseholds households households
o
households07
Households Growing RearingCrops Livestock
Dodoma 233,709 72.2 608 0.2 0 0.0 89,402 27. 323,719 323,112 90,010Arusha 30,513 19.7 15,709 10.1 670 0.4 107,966 69. 154,857 138 ,479 124.344Kilimanjaro 57,719 26,7 1,9 51 0.9 35 0.0 156,467 72.4 216,173 214,187 158,453Tanga 178,406 67.3 1,477 0.6 194 0.1 85,121 32.1 265,198 263,528 56,792Morogoro 224,222 56.0 1,500 0.6 0 0.0 35,024 13. 260,746 259,246 36,524Pwani 129,349 91.4 2,086 1.5 0 0.0 10,094 7.1 1 41,530 139,444 1 2,180Dares Salaam 15,844 77.7 1,130 5.5 0 0.0 3,420 16.8 20,394 19,264 4,550Lind1 135,034 90 .1 159 0 .1 0 0.0 14,981 9.8 153,173 1 53,015 15,139Mtwara 204,241 891 112 0.0 0 0.0 24,961.._..... 10. 229,314 229,202 25,07 3Ruvuma 141,619 74.1 132 0.1 0 0-0 49,424 25. 191,175 191,043 49,556Iringa 205.903 73.9 0 0.0 0 0,0 72,814 26.1 278,717 276,717 72,814Mbeya 232,209 62.3 1,195 0.3 0 0.0 139,441 37. 372,844 371,650 140,636Singide 96,837 53.8 516 0.3 0 0.0 82,563 45. 179,915 179,400 83,079Tabora 148.045 62.8 296 0.1 0 0.0 87,575 37.1 235,917 235,621 87,871
0.2 0 0.0Rukwa 1 14,069 66.2 416 57,775 33. 172,261 171,845 58,192Kigoma 135,655 69.3 911 0.5 160 0.1 59,040 30. 195 .765 194,695 60,110Shinyanga 200,778 53.1 2,310 0.6 0 0.0 174,769 46. 377,857 375,547 177,079Kagera 253,817 71.8 3,049 0.9 628 0.2 95,783 27.1 353,277 349,600 99,460Mwanza 197,780 582 1,156 0.3 0 0.0 1 41,149 41.5 340,085 338,929 142,305
1.3 0 0.0 82,482 43. 1 88,203 185,791 84,894Mara 103,309 54.9 2,412Manyara 53,923 35.0 3,776 2.4 141 0.1 96,354 62. 154,194 150,278 100,271Mainland 3,095,983 64.4 40,898 0.9 1,828 0,0 1,666,606 34. 4,805,315 4,762,589 1,709,331Zanzibar 60,077 62 301 0 0 0 36,144 37 96,522 96,221 36,445National 3,156,060 64.4 41,199 0.8 1,828 0.0 1,702,750 34.7 4,901,837 4,858,810 1 745.776
Tanzania Agriculture Sample Census - 2003

Type of Agriculture Household 72
2.3 TYPE OF AGRICULTURE HOUSEHOLD: Ranking of the impftance of different liviihood activities by Region during2002/03 Agriculture year
Region
livelihood activity
Annual CropFarming
PermanentCrop Farming
LivestockKeeping /Herding
Of FarmIncome Remittances
Fishing /Hunting &Gathering
Tree I ForestResources
Dodoma 1 7 5 6 3 4 2
Arusha 1 7 4 5 2 6 3
Kili manjaro 1 6 2 5 3 7 4
Tanga 1 6 3 7 4 5 2
Morogorc 1 7 4 6 3 5 2
Pwani 1 5 2 7 4 6 3
Dar as Salaam 1 5 3 7 4 6 2
indi 1 6 3 7 4 5 2
Mtwara 1 5 2 7 4 6 3
Ruvuma 1 5 2 6 4 7 3
Iringa 1 7 4 6 3 5 2
Mbeya 1 7 3 6 4 5 2
Singida 1 7 6 5 3 4 2
Tabora 1 7 4 6 3 5 2
Rukwa 1
175
42
J 67
34
56
23Kigoma
Shinyanga 1 7 4 5 2 6 3
Kagera 1 5 2 6 3 7 4
Mwanza 1 5 3 7 4 6 2
Mara 1 5 2 7 4 6 3
Many ra 1 7 6 4 2 5 3
Total
Tanzania Agriculture Sample Census - 2003

Appendix I1-- Land Access/Ownership 73
HOUSEHOLD DEMOGRAPHICS

Appendix II - Household Demographics 74
3.1 HOUSEHOLD DEMOGRAPHS: Number of AgricultureHousehold Members by sex and Age Group for the 2002.03
agriculture year (row %) - MAINLAND
3.2 HOUSEHOLD DEMOGRAPHS: Number of AgricultureHousehold Members by sex and Age Group for the 2002.03
agriculture year (col %) - MAINLAND
Age Group Male Female Total
Number
Age Group Male Female Total
NumberNumber % Number % Number % Number %
Less than 5 1,679,205 50 1,708,855 50 3,388,060 Less than 5 1.679,205 13.6 1,708,855 13.7 3,388.060
05 - 09 1,981,990 51 1,930,551 49 3,912,540 05 - 09 . 1,981.990 16.1 1,930,551 15.5 3,912,54010 - 14 1,854,460 51 1.764,597 49 3,619,056 10 - 14 1,854,460 15.1 1,764,597 14.2 3,619,056
15 - 19 1,374,601 52 1,261,168 48 2,635,770 15 - 19 1,374,601 11.2 1,261,168 10.1 2,635,770
20 - 24 929,854 46 1,095,170 54 2,026,025 20 - 24 929,854 7.6 1,096,170 8.8 2,026,02525 - 29 811,896 45 999,055 55 . 1,810,951 25 - 29 811,896 6.6 999,055 8.0 1,810,951
30 - 34 713,465 48 788,224 52 1,501,689 30 - 34 713,465 5.8 788,224 6,3 1,501,68935 - 39 593,201 48 642,897 52 1,236,097 35 - 39 593,201 4.8 642,897 5. 1,236,097
40 - 44 524,138 50 515,194 50 1,039,332 40 - 44 524,138 4.3 515,194 4.1 1,039,332
45 - 49 390,680 49 405,182 51 795,862 45 - 49 390,680 3.2 405,182 3.3 795,85250 - 54 350,104 49 361,461 51 711,564 50 - 54 350,104 2.8 361,461 2.9 711,564
55 - 59 258,072 53 230,310 47 488,382 55 - 59 258.072 2.1 230,310 1.9 488,382
60 - 64 247,285 51 234,200 49 481,485 60 - 64 247,285 2.0 234,200 1.9 481,48565 - 69 198,130 53 178,989 47 377,119 66 - 69 198.130 1.6 178,989 1.4 377,119
70 - 74 172,763 54 ' 145,311 46 318,074 70 - 74 172,763 1.4 145,311 1.2 318,074
75 - 79 103,195 59 72,663 41 175,858 75 - 79 103,195 0.8 72,663 0.6 175,85880 - 84 68,714 56 .54810 44 123,524 80 - 84 68,714 0.6 54,810 0.4 123,524
Above 85 52.435 51 .50,167 49 102,601 Above 85 52,435 0.4 50,167 0.4 102,601
Mainland-
12,304.187 50 12,439,803 50 24,743.990Mainland
12,304,187-
100 12,439,803 100 24,743,990
Zanzibar 270,915 50 269,593 50 540,508 Zanzibar 270,915 50 269,593 50 540,508
National 12,575,102 50 12,709,396 50 25,284,498National
12,575,102 50 12,709,396 50. 25,284,498
FONousehold Characteristics Reporhiables (Appendi013 Household DamoSAT ANEX.xlspopul ton age group
3 .3 HOUSEHOLD DEMOGRAPHS: Number of AgricultureHousehold Members by Sex and Region
3 .3a HOUSEHOLD DEMOGRAPHS: RuralPopulation and Growth Rate by year
RuralAgriculture Growth
Year Population Years Rate
1967 11,338,355 1967-78 2.44
1978 14,778,578 1978-'88 0.70
1988 15,851,005 . 1988-'03 3.75
2003 24,743,990 1967-'03 2.25
Region Male Female Total
Number % Number % Number
Dodoma 735,628 49 769,017 51 1,504,645
Arusha 417,841 50 416,760 50 834,601
Kilimanjaro 545,216 49 569,990 51 1,115,206Tanga 633,967 49 662,064 51 1,296,031
Morogoro 614,454 50 621,124 50 1,235,577
Pwani 354,379 50 358,616 50 712,99Dar es Salaam 50,030 51 49,000 49 99,03
Lindi 308,426 48 337,974 52 646,401
Mtwara 448,159 48 480,353 52 928,521
Ruvuma .438,796 49 452,866 51 891,662
Iringa 588,637 48 646,485 52 1,235,122
Mbeya 780,102 48 828,679 52 1,608,761
Singida 463,874 50 472,918 50 936,792
Tabora 732,811 52 687,489 48 1,420,300
Rukwa 476,244 51 466,024 49 942,269
Kigoma 528,004 49 548,654 51 1,076,658
ShiMyaga 1,240,182 51 1,186,224 49 2,426,406Kagera 866,030 50 873,788 50 1,739,81
Mwanza 1,082,746 51 1,051,636 49 2,134,38
Mara 548,314 50 549,427 50 1,097,742
Manyara 450,336 52 410,714 48 861,04•
Mainland 12,304,187 50 12,439,803 50 24,743,99
Zanzibar 270,915 50 269,593 50 540,508
National 12,575,102 50 12,709,396 50.3 25,284,498
Tanzania Agriculture Sample Census - 2003

Appendix II - Household Demographics 75
3.4 HOUSEHOLD DEMOGRAPHS: Population Pyramids by Region
Pnnijlufinn 735 e29 7119.017
Age
Age Male Female Class Male Female
00-04 105,546 120,526 00-04 7.01 8.0105-09 123 884 124,027 05-09 8.23 8.24
10-14 101,172 103,494 10-14 6.72 6.88
15-19 80.896 67,533 15-19 5.38 4.49
20-24 55,397 67,683 20-24 3.68 4.50
25-29 46,724 59,692 25-29 3.11 3.97
30-34 40,075 48,608 30-34 2.66 3.2335 - 39 35 139 41,403 35 - 39 2.34 2.75
40-44 33,912 31,187 40-44 2.25 2.07
45-49 22,935 22,329 45-49 1.52 1.48
50-54 22,049 21,973 50-54 1.47 1.4655 59 15,838 14,987 55-59 1.05 1.00
60-64 15,958 12,535 50-54 1.06 0.8365-69 10,888 11,665 65-69 0.72 0,7870-74 9,826 9,673 70-74 0.65 0.6475-79 5,963 3,745 75-79 0.40 0.2580+ 9,428 7,958 80+ 0.63 0.53
'opulation Pyramid - DODOMA REGION
Population 417,841 416,760
Age Male Female Age C€as Male Female00-04 61,251 64,516 00-04 7.34 7.73
05- 09 70,011 70,028 05-09 8.39 8.3910-14 59,064 59,218 10-14 7.08 7.10
15-19 48,086 45,467 15-19 5.76 5.45
20-24 30,996 36,459 20-24 3.71• 4.37
25-29 28,013 31,974 25-29 3.36 3.83
30-34 23,802 25,167 30-34 2.85 3.02
35-39 22,375 23,534 35-39 2.68 2.82
40-44 16,639 15,945 40-44 1.99 1.91
45-49 15,799 10,816 45-49 1.89 1.30
50-54 12,294 8,058 50-54 1.47 0.97
55-59 6,511 5,628 55-59 0.78 0.67
60-64 6,307 6,449 60 - 64 0.76 0.77
65-89 5,599 4,599 65-69 0.67 0.55
70-74 4,508 3,636 70-74 0.54 0.44
75-79 2,318 1,856 75-79 0.28 0.22
80+- 4,269 3,410 80+ 0.51 0.41
Population 545,216 569,990
Age Male Female Age Clas Male Female
00-04 47,819 44,669 00-04 4.29 4.01
05-09 74,298 64,389 05-09 6.66 7.57
10 - 14 89,194 88,989 10 - 14 8.00 7.98
15-19 57,553 64,089 15-19 5.16 5.75
20-24 42,869 44,148 20-24 3.84 3.96
25 - 29 33,977 36,167 25 - 29 3.05 3.24
30-34 30,228 34,291 30-34 2.71 3.07
35 - 39 26,198 27,264 35 - 39 2.35 2.44
40 - 44 24,985 28,734 40 - 44 2.24 2.58
45 - 49 20,703 26,280 45 - 49 1.86 2.36
50 - 54 23,971 24,534 50 - 54 2.15 2.20
55 - 59 18,433 14,104 55 - 59 1.65 1.26
60-64 14,908 14,369 60.64 1.34 1.29
65-69 11,574 11,318 65-69 1.04 1.01
70-74 11,907 11,076 70 - 74 1.07 0.99
75 - 79 8,250 5,559 75 - 79 0.74 0.50
80+ 8,351 10,011 80+ 0.75 0.90
Tanzania Agriculture Sample Census - 2003

Age Male Female Age Class Male Female00 - 04 70,972 70,616 00 - 04 5.74 5.7205 - 99 95,824 90,777 05 - 09 7.76 7.3510 - 14 90,246 85,852 10 - 14 7.30 6.9615 - 19 71840 66,723 15 - 19 5.81 5.4020 - 24 46,702 56,332 20 - 24 3.78 4,5625 - 29 39,261 54,366 25 - 29 3.18 4.4030 - 34 39,811 42,457 30 - 34 3.22 3,4435 - 39 32,361 34,453 35 - 39 2.62 2.7940 - 44 30,021 26,789 40 - 44 2.43 2.1745 - 49 20,643 23,072 45 - 49 1,67 1.8750 - 54 18,577 20,062 50 - 54 1.54 1.6255 - 59 14,891 11,889 55 - 59 1.21 0.9660 - 64 14,234 14,126 60 - 64 1.15 1.1466 - 69 9,953 8,486 65 - 69 0.81 0,6970 - 74 , 10,129 6,588 70 - 74 0.82 0.5375 - 79 3,689 3,107 75 - 79 0.30 0.25.80+ 5,298 5,428 80+ 0.43 0.44
80+75 - 7970 - 74 65 - 69 ,64 - 6455 - 59 150 - 54 45 - 4940 - 4435 - 3930 , 3425 - 2920 - 24
/910 - /405 09 ,00 - 04
10 8
Percent of Total Population
Appendix H - Household Demographics 76
Population 633,967 662,064Population Pyramid - TANGA REGION
Ag Male Femal Age Cl ss Male Female00 - 04 82,018 88,990 00 - 04 6.33 6.87 i
05 - 09 104,818 102,672 05 - . 09 8.09 7 87( '
10 - 14 141641 92,510 10 - 14 7.84_
7.1415 - 19 68,064 61,926 15 - 19 5.25 .4.7820 - 24 40,272 61,291 20 - 24 3-11 4.73'.25 - 29 43,942 51,603 25 - 29 3.39 . 3,9830 - 34 35_049 38.261 30 - 34 2.70 2.9535 - 39 28,872 37,812 35 - 39 2.23 2.9240 - 44 25,932 30,220 40 - 44 2.00 2.3345 - 49 23,468 23,258 46 - 49 1.81 1.7950 - 54 19,919 19,937 50 - 54 1,54 1.5455 - 59 13,381 10,934 55 - 59 1.03 0.8460 - 64 13,033 12,749 60 - 64 1.01 0.9565 - 69 11,024 9,540 65. 69 0.85 0.7470 -74 10,535 10,146 70 - 74 0.81 0.7876 - 7 9 4,669 3,763 75 - 79 0.38 0.2980+ 7,171 6,452 80+ 0.55 0.50
10 8 6 4 2 0 2 4 6 8 io
. Percent of Total Population Mai Fe_ .
Population 614,454 621,124Population Pyramid - MOROGORO REGION
Population 354,379 358,616
Age Male Female Age Cies Male Female43,497
.00 - 04 47,013 00 - 04 6 6.10 105 - 09 52,490 48,993 05 - 09 7.36 6.8710 - 14 55,708 52,064 0 - 14 7.81 7.30 I
15 - 19 39,173 34,204 5 - 19 5,49 4.8027 ,766
...20 - 24 23,194 20 - 24 3.25 3.89 125 - 29 18,140 26,783 25 - 29 2.54 3.7630 - 34 19,508 22,010 30 - 34 2.74 3.0935 - 39 15,160 16,610 35 - 39 2.13 2,33
1
40 - 13,903 15,543 40 - 44 1.83 2.18 l45 - 49 9,749 13,627 45 - 49 1.37 1.91. ,50 - 54 15,070 50 - 54 1.65 "2.11
7,378 55 - 59 1.22 1.0310,473 60 - 64 1.42 1.477,814 65 - 69 1.10 1.107,419 70 - 74 132 1.042,753 75 - 79 0.82 0.396,612 80m 1.03
11,98255 - 59 8,66660 - 64 10,09165 - 69 7,82170 - 74 9,40375 - 79 5,82760+ 7,371
80+75 - 7970 - 7465 - 6960 - 6455 - 5950 - 5445 - 49 1. ,.40 - 4435 - 39 11_30 - 3425 - 2920 - 24.115 -19
1-10 - 14 1 --05 - 09OD - 04 '4
Tanzania Agriculture Sample Census - 2003

Appendix II - Household Demographics 77
3.4 cont ....Population 50,030 49;OQQ
Age Male Female Age Clas Male Female00 - 04 5,034 5,677 00-04 5.08 5.9305 - 09 6,822 5.861 05 - 09 6.89 5.9210-14 6,719 7.558 10-14 6.79 7.6315-19 6,134 4,565 15-19 6.19 4.6120-24 4,419 4.94 20-24 4.46 5.0025 - 29 3.216
...... 3869 ...._ _25 _ 29
3.25.....
3.9330 - 34 3,236 2,680 30 - 34 327 2.7135 - 39 2,427 2,596 35 39 245 2.6240 - 44 2,318 2,304 40 - 44 2.34 2.3345 - 49 1,954 2,051 45 - 49 1.97 2.0750-54 1,588 1,765 50-54 1.60 1.7855 - 59 ....... 1,517 1,279. -...._. _ 55 - 59 1.53 1.2960 - 64
1,488.......1,085 60 - 64 1.50. 110
65 - 69 1,234 782 65 - 69 1.25 0.7970-74 918 920 70-74 0.93 0.975 - 79 497 501 75 - 79 0.50 0.5180+ 508 339 80+ 0.51 0.34
Population 308,426 337,974
Population Pyramid - LINDI REGIONAge Male Female Age Clas Male Female00-04 43,770 41,566 00 -04 6.77 6.4305 - 09 43,786 45,323 05 - 09 6.77 7.0110 - 14 41,516 40,879 10 - 14 6.42 6.3215-19 30,415 31,366 15-19 4.71 4.8520-24 18,698 32,537 20-24 2.89 5.0325 - 29 23,448 26,913 25 29 3.63 4.1630 - 34 19,250 24,311 30 - 34 2.98 3.7635 - 39 13,973 16,790 35 - 39 2.16 2.6040 - 44 14656 16,871 40 - 44 2.27 2.6145 - 49 10 730 10, 977 45 - 49 1.66 1.7050-54 11,478 13,372 50-54 1.78 2.0755-59 8,610 8,041 55-59 1.33 1.2460 - 64 8,606 9,584 60-64 1.3 S
65-5 7,142 7,047 65-69 1.10 1.0970-74 5.861 6,541 70-74 0.91 1.0175 - 79 2,900 2,506 75 79 Q.45 0.3980+ 3,586 3,349 80+ 0.55 0.52
Population 448,169 480,353Population Pyramid - M7WARA REGION
00-04 56,710 56,16905 - 09 65,699 63,99110-14 64 574 53 79715-19 41,722 40,81920-24 31,041 45,872
2S - 29 30,465 46,478
30-34 29,098 37,10835 39 23,203 29,55640-44 21,242 25,670
45-49 15,460 15,424
50-54 16,136 17,66055 59 12,892 9,534
80-64 13,635 1 4,083
55-53 9,017 9,37170-74 8,075
6,162
75-79 3,783 4,194
80+ 5,414 4,465
Age Clas Male Female ! 8000 -04 3.77 3.73 75 .'05 - 09 4,37 4.25 70 74;.10-14 42 3.58 64 69
15 19 2.77 2.71 60 64 j'
20-24 206 305; ;..50-54
25 29 2.02 3.09 45 - 4930 - 34 1.93 2.47 40 - 44',A35-39 1.54 1.96 35 - 39,
40-44 141......171. 39.a
45-49 1.03 1.0325
50 54 1.07 1.17 15 I9 55-59 086 063 10 l4 T,60-64 .0.91 0.94 05-09 .- .. ..65-69 0.60 062
,-- -° ,
70 74 0.54 0.41 10 8 6 4 2 0 7 I G 8 1075 79_-, 0 25 ...-0_28 1 -- °- a-Percent of Total Population LI Male ^ Female80+ 0.36 0.30 '',
Tanzania Agriculture Sample Census -"2003

Population Pyramid - RUVUMA REGION
80+75 - 79 " "70-7465 - 6960 - 6455 - 5950 - 5445 4940 44 ,35 - 39 30 - 34 ,
ID 8 6 4 2 4 6 8 10
Percent of Total Population Male M Female
80+75- 7970 - 7465 -6960 - 6455 - 5950 - 54
• 45 - 49• 40 - 44 I
35 - 3930 - 3425 - 2920 - 24 I
15 - 1910 - 1405- 09w _04 L
M Female
6 4 2 0 2
Male
10
Percent of Total Population
Population Pyramid - MBEYA REGION
go+75 79 1 -,
70 - 74 165 - 69 I
60- 64 1.
55 - 59 1
50- 54 1-45 - 49
• 40 - 44 L...35-39!30 - 3420
24
5 229 r2015 - 19 ,10 14 1
05-09104
10
Percent of Total Population
Appendix II - Household Demographics 78
3.4 cont
Population 438,796 452,866
Age Male Female Age Class Male Female00 - 04 62,317 64,189 00 - 04 6.99 7.2005 - 09 63,411. 63,734 05 - 09 7.11 7.1510 - 14 65,022 63,131 10 - 14 7.29 7.0815 - 19 47,274 47,037 15 - 19 5.30 52820 - 24 33,005 - 42,356 20 - 24 3.70 4.7525 - 29 29,388 35,733 25 - 29 3.30 4.0130 - 34 28,779 31.479 30 - 34 3.23 3.5335 - 39 23,264 25,396 36 - 39 2.61 2,8540 - 44 20,803 18,285... 40 - 44 2.33 2.0545 - 49 14,503 14,002 45 - 49 1.63 1.5750 - 54 11,763 13,401 50 - 54 1.32 1.5055 - 59 9,615 9,352 5E - 59 1.08 1.0560 - 64 8432 8,191 60 - 64 0.95 0.9265 - 69 7,675 7,201 65 - 69 0.86 0.8170 - 74 6,762 4,701 70 - 74 0,76 0.5375 - 79 3,187 1,865 75 - 79 0.36 0.2180+ 3,586 2,812 80+ 0.40 0.32
Population 588,637 646,485
Age Male Female Age Class Male FemaleDO - 04 71,278 77,136 00 - 04 5,77 6.2505- 09 95,069 98,928 05 - 09 7.70 8.0110 - 14 99,365 97,351 10 - 14 8.04 7.6815 - 19 71,325 65,533 15 - 19 5.77 5.3120 - 24 40,303 48,125 20 - 24 3,26 3.9025 - 29 35,184 56,410 25- 29 2.85 4.5730 - 34 34,513 41,892 30 - 34 2,79 3.3935 - 39 31,747 41,060 35 - 39 2.57 3.3240 - 44 26,102 27,844 40 - 44 2.11 2.2545 - 49 20,737 22,950 45 - 49 1.68 1.8650 - 64 15,872 19,114 50 - 54 1.29 1.5555 - 59 12,623 15,766 55 - 59 1.02 1.2860 - 64 10,876 12,027 60 - 64 0.88 0.9765 -6 9,244 10,876 56 - 69 0.75 0.8870 - 74 6,677 5,354 70 - 74 0.54 0.4375 - 79 3,286 2,25 75 - 79 0.27 0.1880+ 4,439 3,860 80+ 0.36 0.31
Population Pyramid - IRINGA REGION
Population 780,102 828,679
Age Male Female Age Class Male Female00 - 04 97,920 102,126 00 - 04 6.09 6.3505 - 09 126,051 126,750 05 - 09 7.84 7.8810 - 14 119,063 123,349 10 - 14 7.40 7.6715 - 19 90,482 85,869 15 - 19 5.62 5.3420 - 24 60,483 75,167 20 - 24 3.76 4.6725 - 29 52,937 71,276 25 - 29 3.29 4.4330 - 34 47,208 54,648 30 - 34 2.93 3.4035 - 39 40,057 44,888 35 - 39 2.49 2.7940 - 44 29,365 31,195 40 - 44 1,83 1,9445 - 49 25,266 25,995 45 - 49 1.57 1.6250 - 54 22,748.. 24,2U. . ... 50 - 54 . 1.41 1.5155 - 59 13,389 16,909 55 - 59 0.83 1.0550 - 64 17,291 14,173 60 - 64 1.07 0.8865 - 69 12,999 13,544 65 - 69 0.81 0,8470 - 74 11,853 8,850 70 - 74 0.74 0.55.75 - 79 7,346 5,705 75 - 79 0.46 0.3580+ 5, 5 3,951 80+ 0.35 0.25
Tanzania Agriculture Sample Census - 2003

Population Pyramid - SINGIDA REGION
80+75.7970-7465-6960-6455 - cc
8 6 4 2 0 2 4 6 8 10
Population® Male 0 Female
00 -04 , 84,200 84,32305-09 78,168 78,48010 . 14 68,091 85,52315-19 50,935 46,41720-24 36,308 41,50025-29 34,203 38,19430-34 29,158 24,656
35-39 20,352 22,881
40-44 20,166 18,053
45-49 17,029 13,95950-54 11,148 8,97655-59 7,123 5,77960-64._.._, 6,290 3,721..... ....,65-69 3,878... . 6,1707074 3,314 2.944
75-79 2,943 1,329
80+ 2.938 1,119
0 4 6 8 10
® Male G Female
Appendix 11 - Household Demographics 79
3.4 cont ....Population 463,874 472,918
Age Male Female Age C1as-
Male Female00-04 61,961 62,486 00 64 6.61 6.67
05 - 09 75,426 76,808 05 - 09 8.05 8.20
10-14 74,260 67,770 10-14 7.93 7.23
15-19 52,220 48,907 15-19 5.57 5.22
20-24 33,478 37,248 20-24 3.57 3.9
25 . 29 28,086 31,119 25-29 3.00 3.32
30-34 24,456 31,590 30-34 2.61 3.37
35 - 39 22,415 25,255 35 39 2.39 2.7040-44 20,633 19,597 40-44 2.20 2.0945 - 49 15,963 17,899 45-49 1,70 1.9150-54 13,061 14,689 50-54 1.39 1.5755 . 59 10,044 9,171 55-59 1.07 0.9860-64 10,146 8,999 60-64 1.08 0.9665-69 6,745 7,714 65-69 0.72 0.82
70 - 74 6,297 5,740 70 - 74 0.67 0,61
75-79 4,014 3,839 75 -79 0.43 0.41
80+ 4;670 4,087 80+ 0.50 044
Population 732,611 687,489
Age Male Female Age CEas Male Female00-04 97,618 92,435 00-04 6.87 6,51
05-09 121,677 114,599 0905-09 8.57..... .... .
8,0710-14 105,672 91,793 10-14 7.44 6.4615 - 19 84,870 70,772 15- 19 5.98 4-9820-24 57,246 64,992 20- 24 4.03 4.58
25-29 53,708 60,021 25 -29 3.78 4.23
30 - 34 43,396 42,548 30 - 34 3.06 3.00
35 - 39 35,393 30,611 35 - 39 2.49 2.16
40 .- 44 28,093 24,554 40. 44 1.98 1.73
45 49 19,436 21,691 45 - 49 1.37 1.5350 - 54 18,516 17,093 50 - 54 1.30 1.20
55-59 15,504 14,624 55-59 1.09 1.0360 - 64 13,585 14,514 60 - 64 0.96 1.02
65 - 69 13,941 9,131 65 - 69 0.98 06470-74 9,608 9,539 70-74 0.68 06775-79 7,796 3,634 75- 79 0.55 0.2680+ 6,752 4,938 80+ 0.48 0.35
Population 476,244 466,024
Tanzania Agriculture Sample Census - 2003

Population Pyramid - KIGOMA REGION
80+75 - 7970 - 7465 - 6960-6455 - 5950 - 5445 - 4940 - 4435 - 3930 - 3425 - 2920 - 2415-1910-1405 - 0900 - 04
80+175 - 7970 - 7465 - 69 60 - 64 ...55 - 59 . •50 54 1. ..45 - 49 1_7.:40 - 4435 - 39 J.._30-34125 - 29
1 •
20 - 24 i •15 - 19 t10 - 14:05 -09 E.00 - 04
10
Percent of Total Population
Population Pyramid - KAGERA REGION
1 80+75 - 7970 - 74) =65 - 69 •
55 - 59 150-54145 - 49
35-39`30 34] •25 - 2920- 241510 - 14105 -00 - 04 1
Appendix II - Household Demographics 80
3.4 oontPopulation 528,004 548,654
Age Male Female Age Class Male Female00 - 04 74,563 80,107 00 - 04 6.93 7.4405 - 09 89,769 90,221 05 - 09 8.34 8.3810 - 14 83,827 80,023 10 - 14 7.79 7.4315 - 19 61,776 61,091 15 - 19 5.74 5.6720 - 24 39,020 48,674 20 - 24 3.62 4.5225 - 29 35,203 38,617 25 - 29 3.27 3.5930 - 34 25,337 31,946 30 - 34 2.35 29735 - 39 24,189 27,846 35 - 39 2.25 2.5940 - 44 23,402 23,718 40 - 44 2.17 2.2045 - 49 16,273 17,089 45 - 49 1.51 1.5950 - 54 13,479 15,676 50 - M 1.25 1.4655 - 59 10,027 10,866 55 - 59 0.93 1.0160 - 64 9,935 9,788 60 - 64 0.92 0.9165 - 69 7,750 6,115 65 - 69 0,72 0.5770 - 74 4,830 3,947 70 - 74 0.45 0.3775 - 79 3,991 1,529 75 - 79 0.37 0.1480+ 4,633 1,402 80+ 0.43 0.13
Population 1,082,746 1,051,636
Age Male Female Age Class Male, Female00 - 04 141,729 143,356 N - 04 6.64 6.7205 - 09 187,272 170,228 05 - 09 8.77 7.9810 - 14 165,652 156,522 1014- 14 7.76 7.3315 - 19 125,138 114,394 15 19 5.86 5.3620 - 24 87,530 91,620 20 - 24 4.10 4.3925 - 29 77,199 85,253 25 - 29 3.62 3.9930 - 34 58,149 61,513 30 - 34 2.72 2.8835 - 39 49,009 48,027 35 - 39 2.30 2.2540 - 44 41,957 44,730 40 - 44 1.97 2.1045 - 49 29,990 32,881 45 - 49 1.41 1.5450 - M 26,714 30,130 50 - 54 1.25 1:41'55 - 59 24,296 16,649 55 - 59 1,14 0.7860 - 64 18,900 17,631 60 - 64 0 89 0.8365 - 69 16,595 13,281 65 - 69 0.78 0.62
70 - 74 14,442 11,077 70 - 74 0.68 0.5275 - 79 8,690 5,634 75 - 79 0,41 0.2680+ 9,483 6,709 80+ 0.44 0,31
Population 866,030 873,788
Ace Male Female Age Class Male Female00 - 04 128,334 1 37,84 0 00 - 04 7.38 7.9205 - 09 140,865 138,496 05 - 09 810. - 7.9610 - 14 135,190 128,087 10 - 14 7.77 7.3615 - 19 036 84,988 15 - 19 5.52 ._ 4.8820 - 24 69,202 79,182 20 - 24 3.98 4.5525 - 29 58,243 67,99 25 - 29 3,35 3,91
30 - 34 51,998 52,692 30 - 34 2.99 3.0335 - 39 38,618 41,406 35 - 39 2.22 2.3840 - 44 37,879 33,500 40 - 44 2.18 1.9345 - 49 22,928 26,631 45 - 49 1,32 1.5350 - 54 20,496 20,959 50 - 54 1.18 1.2055 - 59 . 12,799 12,711 55 - 59 0.74 0.7360 - 64 14,767 13,660 60 - 64 0.85 0.7965 - 69 13,361 9,888 65 - 69 0.77 0.5770 - 74 11,426 9,638 70 - 74 0,66 0.55
75 - 79 7,098 7,165 75 - 79 0.41 0.4180+ 6,791 8,950 80+ 0.39 0.51
Tanzania AgricUlWre Sample Census - 2003

00 - 0405 - 09
10-1415- 19
20 . 2425 - 29
30 - 3435 - 39
40-4445-49
50 - 5455-5960-84
65-6970-74
75 - 7980+
Population
00 - 0405 - 09
10-1415-19
20.2425-29
30-3435-3940-44
45 - 4950-55 - 5960- 64
65- 6970-74
75-7980+
Population Pyramid - SHINYANGA REGION
2.29
1.691.42
1.050.83
0.73
6.53
5.87
4.54
Appendix II - Household Demographics 81
aA aunt ....
Populat'Eon 548,314 549,427Population Pyramid - MARA REGION
Female3U+
Age Male Female Age C€as Male
00 - 04 87,572 82,857 00 - 04 7.98 7.55,._< .. ..
75-79=05 09 87,006 82,180 05 09 793 749 70 , 74
10 14 80.907 79 168 10 14 737 721 65 - 09
1 1915 67 562 56254 15 19 615 1 5 2
20 24 44635 49168 2024...-
407 448 50 - 5425 - 29 33,988 46,097 25 - 29 310 420 45 - 4930 - 34 28 467 30 935 30 34 2 59 2 82 471 - 44 } c
35 39 22,21 26 056 35 39 2 02 2.37 35 - 39
40 44 21,808 22 947 40 44 1 99 . ,2.09 30 34
45 - 49 18,154-
16,278_... _ ..45 - 49 1.6525_29r
1.48 ? ',20 - 24 s .,
50 - 54 13 305 14,630 50 - 54 1 21 1 33 t5 - 19' : __^, s55 59 9 337 11 696 55 59 0 .85 1,07 10 - 1 4
.^
60 64 9204 8,627 60 64 0.84 0.79 05 - 09 +! l....65 - 69 10151 7,817 65 - 69 0 .92
-- - - c0.71 00 04
70:74 6065 6 ,546 70-74 0.55 0.60 ', 10 8 6 4 2 0 2 4 6 8 1075-79
- -
79 -- -- Percent of Total Population Male II Female8Q +
4065 4460, 80+ 0.37 0.41 -©
Population 450,336 410,714
Population Pyramid - MANYARA REGION
56,229 55,23973,390 65,361
67,177 61,62950,574 43 , 302
39,070 36,77629,115 32,100
25,800 26,98623,994 21,904
19,707 1 4,533
14,529 13,5711,2,203 9.793
9,0417,142 7,983
6,3035,740
3,404 3,1 206,916 4,259
1,240,182 1,186,224
Age Male Female Age Cias Male Female00-04 195,350 190,510 00-04 8.05 7.85
05-09 206,278 188 ,729 05-09 8.50 7.7810- 14 180,43 9 165 ,889 10-14 7.44 6.84
15-19 132,500 11 7,885 15-19 5.46 4.8620- 24 95,986 102,328 2 0 - 24 3.96 4.22
25-29 77,454 98,379 25-29 3.19 4.0530-34 76,149 80,446 30-34 3.14 3.32
35-39 62 ,237 57,548 35-39 2. 56 2.3740 -44 51,436 42,797 40-44 2.1 2 1.7645-49 34,431 34,401 45-49 1.42 1.4250 -54 32,785 30,283 50-54 1.35 1.2555-59 23,534 17,330 55- 59 0.97 0.7 1
60 -64 22,459 19,434 60-64 0.93 0.8065 -69 15,236 13,377 65-69 0.63 0.55
70-74 14,598 11,592 70-74 0.60 0.4875-79 9,473 4,889 75-79 0.39 0.2080+ 9,836 10,405 80+ 0.41 0.43
Tanzania Agriculture Sample Census - 2003

Appendix II - Household Demographics 82
3.5 HOUSEHOLD DEMOGPHS: Number of Agriculture Household Members by Level of Formal Education Completed(up to primary level) and region for the 2002103 agriculture year
Level of education reached up to primary level
TrainingUnder After
Adult Standard Standard Standard Standard Standard Standard Standard Standard Standard PrimaryRegion Education One One Two Three Four Five Six Seven Eight Education Total
Dodoma 355.646 3.172 2,289 463.585Arusha 191,975 2.532 4,169 237,922Kilimanjaro 342,669 12,725 10,244 477.880Tanga 331,802 6.726 1,015 465,656Morogoro 357,073 5,951 1,767 482,088Pwani 152,919 2,822 781 215,821Dar es Salaam 26,567 965 54 35,610Lindi 145,176 2,283 1,009 219.930Mtwara 242.436 3,871 1,475 335,296Ruvuma 275.976 3,264 1,745... . 369,921.Iringa 358,861 2,672 5,544 467,708Mbeya 429,750 5,216 1,617 673,143Singida 240,375 3,811 744 301,444Tabora 286,652 4,147 1,692 396,272Rukwa 206,017 1,398 1,600 286,508Kigoma 255,902 2,819 809_._.. ., 347,014. ..... .Shinyanga 571.410 6,897 1,939 719,116Kagera 417,504 9,073 3,249 573,375Mwanza 498,032 7,869 1,832 677,673Mara 302,084 5,542 1,505 384,715Manyara 200,413 1,334 7,245 251,371Mainland 199,295 6,189,240 95,091 52,322 8,284,049%
74.7 1.1 0.6 109.0Zanzibar 20,856 3,278 3,8/8 80,184National 211,361 6,210,096 98,369 56,140 8,364,233% 2.5 74.2 1.2 0.7 100.0
3.6 HOUSEHOLD DEMOGRAPHS: Number of Agriculture Household Members By Level of Formal Education Completed(secondary level and above)) and Region for the 2002103 agriculture year
Education Level reached - secondary level and above
Training University &After Other
Pre Form Form Form Secondary TertiaryRegion One One Form Two Three Form Four Form Five Form Six Education Education TotalDodoma 3,474 5,595 2,075 8,352 111 100 2,006 691 36,217Arusha 3,420 9,005 3,594 19,421 546 606 3,134 849 45,066Kilimanjaro 10,529 17,281 6,853 45,310 1197 6,720 7,157 2.812Tanga 3,740 5,394 2,265 9,745 602 94 1,393 31,067Morogoro 618 2,317 5,858 1,786 6,549 0 987 895 167 27,546Pwani 841 1,038 2,288 971 4,329 141 405 863 563Dar es Salaam 44 585 975 438 3,039 161 780 871 1,002Lindi 833 1,001 2,004 888 3,618 0 28 259 37 15,973Mtwara 446 2,190 1,230 5,198 0 162 645 0Ruvuma 2,443 4,637 2,177 9,006 206 671 1,858 0 27,136Iringa 4,902 8,611 3,961. 10,774 666 531 3,426 246 47,649Mbeya 5,226 7,470 3,653 16,255 607 906 1,271 493Singida 750 2,967 2,856 1,558 6,498 185 448 566 118 19,819Tabora 709 1,826 3,215 2,063 7,503 105 1,007 601 151 23,511Rukwa 1,380 3,323 1,530 5,275 262 241 476 207 24,290Kigoma 1,326 3,356 1,424 5,013 0 130 1,639 107 30,192Shinyanga 3,466 7,751 3,397 10,121 119 691 2,285 217 37,000Kagera 5,695 11,874 1,543 18,236 34 1,566 3,873 1,097Mwanza 819 4,408 7,535 4,823 14,006 435 1,224 2, 3 281Mara 4,6 7,447 3,380 14,991 194 1,375 1,193 217Manyara 2,636 4,266 2,243 7,133 279 661 2,772 251 24,765National 67,496 122,934 55,854 230,973 5,850 19,226 40,123 9,832 730,758
3.9 9.2 16.8 7.6 31.6 0.8 3 5.5 1.3 100.0Zanzibar 7,241 18,074 14,541 9,320 127 292 1,832 197 55,654National 32,291 74,737 141,008 70,395 240,293 5,977 9,518 41,955 10,029 786,412% 26.1 16.7
Tanzania Agriculture Sample Census - 2003

Appendix Il - Household Demographics 83
3.7
HOUSEHOLD DEMOGRAPHS: Number of Agriculture Household Members, 5 years and above, who can Read and.
Write languages by type of language and region for the 2002/03 agriculture year.
Swahili Swahili & English Any Other Language Don't Read I WriteRegion Total
Number °! Number 5 Number % Number
Dodoma 743,694 58 30.486 2 1,200 0.09 503,193 39 1.278.573
Arusha 409628 58 73,519 10 119 0.02 225.569 32 708,835
Kiblmanjaro 740,094 72 147,957 14, 564 0.06 134,103 13 1,022,P9
Tanga 761,512 68 25,964 2 1,446 0.13 336,102 30 1,125,024
Morogoro 709,155 65 37,834 3 1,102 0.10 345,898 32 1,093,989
Pwani 374.493 60 17.250 3 3,354 0.54 227.388 37 622,485
Dar as Salaam 57.303 65 9,924 11 141 0.16 20,750 24 88,118
Lindi 321.687 57 9,709 2 786 0.14 228,881 41 561.064
Mtwara 481.984 59 22,962 3 1,890 0.23 308,805 38 815.642
Ruvuma 543,3.54 71 30,250 4 327 0.04 191,226 25t
765. ,56
iringa 755,574 70 66.396 6 160 0.01 264,579 24 1,086,708
Mbeya 887,614 63 70,954 5 1,533 0.11 448.634 32 1,408,735
Singida 433,376 53 117,921 15 81 0.01 260.968 32 812,346
Tabora 598.385 49 46,560 4 748 0.06 584,554 48 1,230,247
Rukwa 443,857 57 27,385 4 634 008 301,870 39 773,745
Kigoma 580,906 63 34,940 4 823 009 305,318 33 921,988
Shinyanga 1,152,190 56 59.005 3 1,651 0.08 827,698 41 2,040,545
Kagera 910,879 62 75,076 5 4,487 0.30 483,201 33 1.473,643
Mwanza 1,155,882 63 40,358 2 1,813 0.10 651,243 35 1,849,296
Mara 615,648 66 54,307 6 1,524 0.16 255,833 28 927,312
Manyara 450.219 60 32,634 4 481 0.06 266,249 36 749,582
Mainland 13,127,435 61 1,031,391 5 24,864 0,12 7,172,064 34 21,355,754
Zanzibar 223,969 49 47,976 10 0 0.00 186,854 41 458,860
National 13,351.404 61 1,079,368 5 24,864 011 7,358,918 34 21,814,553
3 .8 HOUSEHOLD DEMOGRAPHS: Number of Agriculture Household Members bySchool Attendance and Region for the 2002103 agricuture year.
School attendance
Region Attending School CompletedNever Attended
School Total
Number % Number % Number %
Dodoma 357,574 28 478,610 37 442,389 35 1,278,573
Arusha 238,119 34 261,410 37 209,305 30 708,835
Kilimanjaro 375,349 37 536,070 52 111,299 11 1,022,719
Tanga 377,006 34 481,327 43 266,691 24 1,125,024
Morogoro 287,555 26 496,730 45 309,704 28 1,093,989
Pwani 173,802 28 222,580 36 226.104 36 622,485
Dar es Salem 26,377 30 41,734 47 20,007 23 88,118
Lindi 132,899 24 225,230 40 202,935 36 561,064
Mtwara 199,846 25 1344,005 42 271,791 33 815,642
Ruvuma 227,703 30 385,184 50 152,269 20 765,156
ringa 370,004 34 487,'32 45 229,572 21 1,086,708
Mbeya 430,465 31 597,055 42 381,215 27 1,408,735
Singida 283,737 35 312,521 38 216,088 27 812,346
Tabora 259,109 21 413,537 34 557,601 45 1,230,247
Rukwa 214,292 28 295,862 38 263,591 34 773,745
Kigoma 289,307 31 354,185 36 278,496 30 921,988
Shinyanga 546,049 27 739,211 36 755,285 37 2,040,545...........Kagera 459,445 31 605,070 41 409,128 28 1,473,643
Mwanza 538,199 29 702,612 38 608,486 33 1,849,296
Mara 301,073 32 407,330 44 218,909 24 927,312
Manyara 238,303 32 262,067 35 249,212 33 749,582
Mainland 6,326,216 30 8,649,462 41 6,380,076 30 21,355,754
Zanzibar 152,297 33 135,899 30 170,664 37 458,800
National 6,478.513 30 6,785,361 40 6,550,680 30 21,814,553
Tanzania Agriculture Sample Census - 2003

Appendix If - Household Demographics 84
3,7a Number of Agricultural Household Members reporting Literacy levels by Sex of Membe nd Region, 200003 Agricultural Year
Male Female Total
Cannot Read Can Read and Cannot Read Can Read and Cannot Read Can Read andRegion and,Write Write Total and Write Write Total and Write Write Total
Dodoma 221,619 35 408,463 65 630,082 100 281,574 43 366,917 57 648,491 100 503,193 39 775,380 61 1,278,573 100
Arusha 100,703 28 255,887 72 356,590 100 124,866 35 227,378 65 352,245 100 225,569 32 483,266 68 708,835 100
Kilimanja 56,500 11 440,897 89 - 497,397 100 77,603 15 447,719 85 525,322 100 134,103 13 888,615 87 1,022,719 100
Tanga 133,683 24 418,266 76 551,950 100 202,419 35 370,656 65 573,074 100 336,102 30 788,922 70 1,125,024 100
Morogoro 146,672 27 396,809 73 543,481 100 199,226 36 351,282 64 550,508 100 345,898 32 748,091 68 1,093,989 100
ani 91,373 30 215,994 70 307,366 100 136,016 43 179,103 57 315,119 100 227,388 37 395,097 63 622,485 100
Dar es Sa 7,606 17 37,389 83 44,995 100 13,144 30 29,979 70 43,123 100 20,750 24 67,368 76 88,118 100
Lindi 88,875 34 175,780 66 264,656 100 140,006 47 156,402 53 296,408 100 228,881 41 332,183 59 561,064 100
Mtwara 129,459 33 262,000 67 391,459 100 179,346 42 244,837 58 424,183 100 308,805 38 506,837 62 815,642 100
Ruvuma 81,295 22 295,184 78 376,479 100 109,930 28 278,747 72 388,677 100 191,226 25 573,930 75 765,156 100
Iringa 96,744 19 420,616 81 517,360 100 167,836 29 401,513 71 569,348 100 264,579 24 822,129 76 1,086,708 100
Mbeya 180,561 26 501,621 74 682,182 100 268,073 37 458,479 63 726,553 100 448,634 32 960,101 68 1,408,735 100
Singida 111,952 28 289,961 72 401,913 100 149,016 36 261,417 64 410,433 100 260,968 32 551,378 68 812,346 100
Tabora 267,493 42 367,700 58 635,193 100 317,061 53 277,993 47 595,054 100 584,554 48 645,693 52 1,230,247 100
Rukwa 123484 31 268,561 69 392,044 100 178,386 47 203,315 53 381,701 100 301,870 39 471,875 61 773,745 100
Kigoma 126,403 28 327,037 72 453,441 100 178,915 38 289,632 62 468,547 100 305,318 33 616,670 67 921,988 100
Shinyanga 359,663 34 685,169 66 1,044,832 100 468,036 47 527,678 53 995,714 100 827,698 41 1,212,847 59 2,040,545 100
Kagera 208,027 28 529,669 72 737,696 100 275,174 37 460,773 63 735,947 100 483,201 33 990,442 67 1,473,643 100
Mwanza 281,450 30 659,567 70 941,017 100 369,793 41 538,486 59 908,279 100 651,243 35 1,198,053 65 1,849,296 100
Mara 21 363,122 79 460,742 100 158,213 34 308,357 66 466,570 100 255,833 28 671,479 72 927,312 100
Manyara 130,750 33 263,357 67 394,107 100 135,499 38 219,976 62 355,475 100 266,249 36 483,333 64 749,582 100
Total 3,041,931 29 7,583,051 71 10,624,982 100 4,130,133 38 6,600,639 62 10,730,772 100 7,172,064 34 14,183,690 66 21,355,754 100
Tanzania Agriculture Sample Census - 2003

85Appendix H - Household Demographics
3.7b Number of Heads of Agricultural Households reporting Literacy levels by Sex of Head and Region, 2002103 Agricultural Year
Male Female Total
Cannot Read Can Read and Cannot Read Can Read and Cannot Read Can Read andRegion and Write Write Total and Write Write Total and Write Write Total•
Dodoma 81,058 32 172,507--
68 .... 253,566 100 41,487 .._ 59 _ . 28,666 41 70,153..... 100 ..._ 122,546 38 201,173......... .._ 62 323,719 100
Arusha 39,889 32 83,393 68 123,281 100 21,657 69 9,919 31-
31,576......._. ...... 100 61,545 40 93,31 2 6 154,857 100
Kilimanja 17,192 10 163,594 90 180,786 100 10,774 30 24,613 70 35,386 100 27,966 13 188,207 87 216,173 100
Tanga 36,438 18 163,994 82 200,432 100 33,452 52 31,314 48 64,766 100 69,890 26 195,308 74 265,198 100
Morogoro 40,887 20 1 68,150 80 209,037 100 19 ,769 38 31,939 62 51,709._.._ 100-.._ 60,657......._ 23 200,089 77 260,746 100
Pwani 31,988 28 83,120 72 115,108 100 16,275 62 10,147 38 26,422 100 48,262 34 93,268 6 141 ,530 100
Czar es Sa 2,131 13 14,480 87 16,611 100 2,389 63 1,394 37 3,783 100 4,520 22 15,874 78 20,394 100
Lindi 30,227 27 82,391 73 112,618-
100-
23,833 59 16,722-.._.. 41_. ......._ 40,555 100 54,061 35 99,113 65 153,173........ 100
Mtwara 47,727 27 127,852 73 175,579 100 31,233 58 22,501 42 53,735 100 78,960 34 150,354 66 229,314_......_ 100..-.-Ruvuma 23,877 15 140,471 85 164,347 100 8,457 32 18,371 68 26,827.... ... ---
100...... ._ 32,333..... 17.. _._ 1 58,841._......._. 83 191,175 100
Iringa 28,328 15 1 65,274 85 193,603 100 42,356 50 42,758 50 85,114 100 70,685 25 208,032 75 278,717 100
Mbeya 59,889 21 2 18,724 79 278,613 100 55,479 59 38,752 41 94,232 100 115,368 31 257,476 69 372,844 100
Singida.........._- _... 36,569 26 102,985
_..----74......... 139,553.....--- 100........ 24,290 60.. 16 ,072 40 40,362 100 60,859 34 119,056_....... 66 1 79,915 100
235,917 100Tabora 74,030 37 128,066 63 202,097 100 22,342 66 11,478 34 33,820 100 96,372 41 139,545 5l
Rukwa 33,767 2-2 117,135 78 150,902 100 13,727 64 7,631 36 21 ,359 1 00 47,494...._ 28..._ ___ 124,767 72 172,261....._.. 100._^Kigoma 38,977 23 128,347 77 167,324 100 19,985 70 8,456 30
26
28,442
53,936
100
100
58,962
1 53,864
30
41
136,803
223,994...
70
59
195,765
377,857..... ..._._
100
100Shinyanga_...._.__ 113,776.._... _.- 35 210,146 65.. 323,921... --
100....... ........ 40, 088 74 13,848
Kagera 65,570 23 222,068 77 287, 638 100 33,899 52 31, 739 48 65,639 100 99,470 28 253,807 72 353,277 100
65 340,085 100Mwanza 84,054 29 201,847 71 285,901 100 35,869 66 1 8,315 34 54,184 1 00 119,923 35 220,161
145,187 100 23,993
12,610
56
63
19,024
7,316
44
37
43,016
19,926
1 00
100
49,944
60,609
27
39
138,259
93,586
Mara 25 ,95 1 18 119,235 82 73
61
188,203
154,194
100
100Manyara 47,999 36 86,270 64 134,268 100
Total 960,324 25 2,900,0481 75 3,860,372 1001 57 410,977 43 944,942L100 1,494,290 31 3,311,025 69 4,805,3151 100
Tanzania Agriculture Sample Census - 2003

Appendix IT - Household Demographics 86
3.9 HOUSEHOLDS DEMOGRAPHS: Number of Agricultural Household Members By Level of involvement in FarmingActivity and Region, 2002/03 Agricultural Year (excludes too old, disabiedlretired and students)
Involvement in Farming
Works Full- Works Part-RarelyWorks on
NeverWorks on
Region time on Farm % time on Farm % Farm % Farm % Total %
Dodoma 160.315 20 20,995 3 607,223 76 10,591 1 799,124 100
Arusha 304,908 73 30,334 7 68,656 16 14,439 3 418,327 100
Kilimanjaro 384,710 63 48,993 8 117,501 19 58,673 117 609,879 100
Tanga 430,606 63 99,367 15 130,211 1 9 19,283 3 679,466 100
Momgoro 312,037 45 50,204 7 320,787 46 13,128 2 696,155 100
Pwani 233,444 60 26,497 7 100,741 26 28,057 7 388,740 100
Dar es Salaam 27,619 46 9,863 17 15,481 26 6,530 11 59,493 10C
Lindi 303,259 79 17,159 4 40,777 11 24,461 6 385,655 109
Mtwara 318,803 56 86,102 15 126,493 22 33,972 6 565,371 100
Ruvuma 427,831 90 12,271 3 33,300 7 3,018 476,420 100
Iringa 457,335 71 33,841 5 145,636 22 11,656 2 648,469 100
Mbeya 748,598 87 30,173 3 67,665 8 17,703 2 864,143 100
Singida 183,191 38 35,474 7 250,048 53 7,376 2 476,090 100
Tabora 670,562 82 24,341 3 112,729 14 9.349 1 816,981 100
Rukwa 384,610 79 20,911 4 71,091 15 10,753 487,365 10C
Kigoma 354,713 68 57,924 11 96,807 18 13,894 3 523,337 10
Shinyanga 1,134,098 85 35,590 3 111,266 8 57,972 4 1,338,926 10
Kagera 692,258 79 42,663 5 124,273 14 20,119 2 879,314 100
Mwanza 794,799 72 31,871 3 268,176 24 16,714 2 1,111,560 10..
Mara 402,364 72 34,389 6 89,868 16 28,538 5 555,159 10
Manyara 314,421 69 22,506 5 100,136 22 16,687 4 453,750 10
Total 9,040,482 68 771,468 6 2,998,870 23 422,914 3 13,233,734 10
3 .10 HOUSEHOLD DEMOGRAPHS: Number of Household Members involved in off-farm income generatingactivities by Region for the 2002103 agriculture year
RegionHousehold
members involvedin off farm activities
Household mambosnot involved in off
farm activitiesTotal
Number % Number %
Dodoma 767,651 60 510,922 40 1,278,573
Arusha 123,582 17 585,253 83 708,835
Kilimanjaro
Tanga
. . .249,416
259,602
,24
23
.773,303
865,422
.76
77
. 1,022,719
1,126,024
Morogoro 395,134 36 698,855, ...t . 64.. 1,093,989
Pwani 205,782 33 416,703 67 622,485
Dar es Salaam 32,996 37 55,122 63 88,118
Lind 159,178 28 401,886.. ... 72 561,064
Mtwara 252,302 31 563,340 69 815,642
Ruvuma 195,796 26 569,360 74 766,166
Iringa 323,386 30 763,322. ....... 70 1,086,708
Mbeya 442,719 31 966016 69 1,408,735
Singida 252,879 31 559,467 69 812,346
Tabora 373,087 30 857,160 70 1,230,247
Rukwa 233,310 30 540,435 70 773,745
Kigoma 183,385 20 738,603 80 921,988
Shinyanga 333,728 16 1,706,817 84 2,040,545
Kagera 216,324 15 1,257,319 85 1,473,643
Mwanza 345580 19 1,503717 81 1,849,296
Mara 167,323 18 759,990 82 927,312
Manyara 157,292 21 592,290 79 749,582
Mainland 21,355,754
Zanzibar 141,159 31 317,641 69 458,80C
National 5,811,610 27 16,002,944 73 21,814,553
Tanzania Agriculture Sample Census - 2003

Appendix II - Household Demographics 87
3 .11 HOUSEHOLD DEMOGRAPHS: Number of Agriculture Household Members by Main Activity and Region for the 2002/03 agriculture year
Main activity of household members
Regino CropLivestock
Livestock GovernmentPrivate - Self Employed
Self Employed(Non Fannimg)
Unpaid Family Not Not Worki ngFlousemaker
Unable to Work1 Too ON /
FarmingKeeping I
PastoralistFishing
I ParastatalNGO f (Non Farmimg)
withoutHelper (Non Working & & 1 Housewife
StudentRetired ! Sick I
Other TotalHerding Mission F etc with Employees Agriculture) Employees
Avai€able UnavailableDisabled
Dodoma 651,414 17,936 2,121 1,072 7,626-
55,040 3,940 36,975.... 2,384.._..... 1,359 710 8,037 335,586 143,718 1Q,51 1,278,429
Arusha 242,423 98,269 4,696 62 8,577......... ..._.._-17,970 11,018 14,779 3,604 3,629.._ ....._. 79B 10,235 229,209 61,289 2,27 708,835
Kilimanjaro 393255 16,698 1,105 346 23,540 59,869 38.097 24,164 _ 8,443 6,950.. ...... --1,224:. ... ..__. 19,316......... ... _. 349,207-. 63,633 16,873 1,022,719
_Tanga
..450,932 13,782
........ _.....2,839
--4,387 10,118 67,814 ' 15,201 82,834 7,254 3,231 1,391 7,948 343,184 102,373 11,735 1,125,024
Morogora 568,135 13,336 549 1,180 8 ,299 21,773 7,638 44,089 13,027 3,746--
1,545 7,864 267,282 130,552 4,975 1,093,989
Pwani......_
295,018 6,546---..... .... -
2,035 7,541 4,166-
' 10,160... 7,721..._ 9,759 15,180 6,726 3,195 10,512 162,253 71,492 10,181. 622,485.. _. ..._....Dares Salaam 29,829 3,348 7 1,250 2,098 4,699 3,027 7,153 1,357 1 ,164 2,011 2,537 22,878 5,722 1,039 88,118
Lindi 311,082 1,708 78 5,246 3 ,149 4 ,348 2,484 26,0 14 6,852 2,437_...... _._°. 2,378-. .....- 2,463 126,553 48,856 17,413 561,064
Mtwara 501,889 1,202 16 1- --
5,426 3,939 2,195 4,546 4,078 4,425 2,467 3,696 2,844 188,130 62,140 28,503 815,642
Ruvuma 437,613 2,854 259 3,550 5,953 6,609 3,207 5,221 3,195 1,603 1,031 3,270 216,213 72,523 2,06 765,156
Iringa 531,092 4,750 769 2,261 1 1,059 33,1 50 11,752 27,066 6 ,261 2,678 780 5,477 348,633 89,607 11,37" 1,086,708-Mbeya 778,397 12,109 787 1,949 8,860 8,031
-7,778 12,535 11,731 4,195 1,873 6,299 404,749 139,843 9,59 1,408,735
Singida 352,926 79,757 1,022 1,264 5,729 7,324 2,136 14;423 3,934 1,495 144 2,315 275,628 60,458 3,619 812,176
Tabora 676,338 54,294 1.984 802 5,095 9,112 4,684 26,734 6,676 2,049 585 18,296 237,091 176,175 10,331 1,230,247
Rukwa 41 7,086 14,306 80 10,764 4,325 9,424 1,741 1 1,365 15,317 233 244 1,993 208,537 77,843 486 773,745
Kigoma 428,460 7,182 2,470 10,265 5,436 12.223 7,018 28,059 7,378 3,599 1,499 1,774 274,048 124,603 7,97 921,988
Shinyanga 1,201,216 25,013 2,383 253 8,394 3,917 5,765 3,021 16,642 2,147 1,888 11,087 504,410 197,210 57,199 2,040.545
Kagera 727,081 24,883 5,562 12,015.....,
13,857 36,732 12,793 24,497 4,883 2,176 ._.._. 1,080 6,592 437,188 157,142 7,162 1,473,643
Mwanza 948,466 22,363 704 36,055 10,794 13.450.._ - ..._._.-
11,317.........
33,424 6,342 4,084 632 7,625 518,794 218,943 16,304 1,849,296
Mara 438,687 1 2,649 452 22,560 8,385........ 9,704_-._._._ _...._._ 9,960 13,325 9,683 4,576 1,609 6,201 287,356 84,798 17,367 927.31.... ._._._.Manyara 354,529 51,216 2,761 254 4,673 6,281 4,715 2,505 3,228 1,696 1,315 9,008 222,386 73,446 11,56 749,58
Mainland 10,735,866 484,202 32,825 128,504 164,074 399,822 176,539 452,020 157,795 62,242 29,630 151,692 5,959,315 2,162,366 258,548 21,355,447
% 50 2 0 1 1 2 1 2 1 0 0 1 28 10 1 100
Zanzibar 108,081 5,950 0 20,569 14,359 13,771 2,903 17,838 8,926 8,975 1,291 33,405 150,082 72,075 57 458,80
National 10,843,947 490,152 32,825 149,072 178,433 413,593 179,442 469,858 166,721 71,217 30,921 185,097 6,109,397 2,234,441 259,124 21,814,239
Tanzania Agriculture Sample Census - 2003

Appendix II - Household Demographics 88
3.12 HOUSEHOLDS DEMOGRAPHS: Number of Agricultural Household by sex of the head of the household and regi, nas of the end of the 2002103 agriculture year
Regions
Male Female
TotalNumber OA Number
Dodoma 253,566 78 70,153 22 323,719Arusha 123,281 80 31,576 20 154,857Kilimanjaro 180,786 84 35,386 16 216,173'Tanga 200.432 76 64,766 24 265,198Morogoro 209.037 80 20 260,746Pwani 115.108 81 ^LL 26.422 19 141,539Dar es Salaam 16,611 81 3,783 19 20,394Lindi 112.618 74 40,555 26 153,173M twara 175,579 77 53,735 23 229,314Ruvuma 164,347 86 26,827 14 191,175Iringa 193,603 69 85,114 31 278,717Mbeya 278,613 75 94,232 25 372,844Singida 139,553 78 40,362 22 179,915Tabora 202,097 86 33,820 14 235,917Rukwa 150,902 88 21,359 12 172,261Kigoma 167,324 85 28,442 15 195,765Shinyanga 323,921 86 53,936 14 377,857Kagera 287,638 81 65,639 19 353,277Mwanza 285,901 84 54,184 16 340,085Mara 145,187 77 43,016 23 188,203Manyara 134,268 87 19,926 13 154,194Mainland 3,860.372 80 944,942 20 4,805,315Zanzibar 75,388 78 21,134 2.2 96,522National 3,935,761 80 966.076 20 4,901,837.
3.13 HOUSEHOLDS DEMOGRAPH CS: Number of Agricultural Households and Average HouseholdSize By Sex of the Head of Household and Region, 2002/03 Agricultural Year
Male Headed Household Female Headed Household Total
AverageHousehold
AverageHousehold
AverageHousehold
Region Number % Size Number % Size Number Size
Dodoma 253,566 78 4.9 70,153 22 3.8 323,719 4,6Arusha 123,281 80 5.5 31,576 20 4.9 154,857 5.4Kilimanjaro 180,786 84 5.4 35,386 16 4.0 216,173 5.2Tanga 200,432 76 5.1 64,766 24 4.2 265,198 5.5.Morogoro 209,037 80 4.9 51,709 20 4.2 260.746 5.4Pwani 115,108 81 5.3 26,422 19 4.1 14-..530 2.9Dar es Salaam 16,611 81 5.0 3,783 19 4.0 20,394 0.4Lindi 112,618 74 4,4 40,555 26 3.6 153,173 3.2Mtwara 175,579 77 4.3 53,735 23 3.3 229,314 4.8Ruvuma 164,347' 86 4.8 26,827 14 3.7 191,175 4.0Iringa 193,603 69 4.8 85,114 31 3.7 278,717 5.8Mbeya 278,613 75 4.6 94,232 25 3.4 372,844 7.8Singida 139,553 78 5.5 40,362 22 4.3 179,915 3.7Tabora 202,097 86 6.4 33,820 14 3.9 235,917 4,9Rukwa 150,902 88 5.7 21,359 12 3.9 172,261 3.6Kigoma 167,324 85 5.7 28,442 15 4.3 195,765 4.1Shinyanga 323,921 86 6.7 53,936 14 4.8 377,857 7.9Kagera 287,638 81 5.2 65,639 19 3.9 353,277 7.4Mwanza 285,901 84 6.5 54,184 16 5.0 340,085
_........._ 7.1
Mara 145,187 . 77 6.2 43,016 23 4.6 188,203 3.9Manyara 134,268 87 5.7 19,926 13 4.6 154,194 3.2Mainland 3,860,372 80 5.4 944,942 20 4.0 4,805,315 100.0Zanzibar 75,388 78 21,134 22 96,522 2.0National 3,935,761 966,076 4,901,837 102.0
Tanzania Agriculture Sample Census - 2003

Appendix II - Household Demographics 89
3.14 HOUSEHOLDS DEMOGRAPHS: Number of Agricultural Households by Maximum level of Education Attained byRegion for the 2002103 agriculture year
Maximum Level of Education Attained
Post Univorsty &No Primary Post Primary Secondary Secondary Equivalent Adult
Region Education education Education education education Education Education Total
Dodoma 122,64 184,73 754 6,475 713 330 8,06 323,71........ .... ...Arusha 62,599 78,288 1,815
._......__7,665 1,36 408 2,71 154,85
Kilimanjaro 28,714 158,643 3909 1 8,375 3,291 1 ,760 1,481 .._._... 216,17
Tanga 70,819 183016 539 6.548 742 236 329 265,19
Morogoro 59,504 187.363 835 7 ,391 492 167 4,99 ..._..._ _ 260.74
Pwani 53,472 76.70 468 3311 356 536 667 141,53
Dares Salaam 4,907 11,841 0 2071 410 648 51 20,39
Libel 53,043 92.30 553 2.349 224 37 4,66 153,17
Mtwara 79,566 140,495 937 4.479 441 0 3,38 229,31
7,854Ruvuma 30,529 147,227 1,26 1,290 0 3.00 191,17
innga 74,540 180,981 3 ,126 8,02 2,582 246 9,21 276,71
Mbeya 116,39 237.36 793 11,801 754 395 5,34 372,
Singida 61,18 111.93 359-
3,87 185 11 2,25 _ 179,91.._. - ....... .Tabora 97,76 127,864 97 5,724........ 367 151 3.06 235,91
Rukwa 47,479......_....
112,004-_
1,303 4 .908 476 72 6,01 172,261
K€goma 59,307 125,170 194 2,665 8 0 7 ,62 195,76
Shinyanga 152,70 210,174 849 7,898 1,77 ... 0------ -
4,33--
377,73--...._
Kagera_.
9,5,788 232,568 2,04 15,017 2,267 775 4,81 353,27
Mwanza 121,060 200,941 686 9,84 2,13 261 5,14 340 ,08
Mara 50,7 124,659 729 9,01 752 7 2,28 188.20
Manyara 62,15 84,30 2,017 2,624 1,146 148 1,79 154,19.
Total 1,504,950 3,008,59 24,161 147,916 22,573 6,314 90,68 4,805,19
31.3 62.6 0,5 3,1 0.5 0.1 1.9 100.0
Zanzibar 486,91 27,953 1,128 18,808 1,342 191 4,171 53,59
National 1,991,864 3,036,550 25,289 166,724 23,916 6,505 94,856 4,858,789
3.15 HOUSEHOLD DEMOGRAPHS: Number of Agriculture Households involved with off farm income geneting activities by
Re ion9
One Off Farm Income Two Off Farm incomeMore than Two Off Farm
income
Total Number ofhouseholds with off farm
income No Off FarmIncome
Total numberof Agriculture
No Off Households
Number % Number % Number % % FarmIncome
Dodoma 47.08 15 177,373 55 95 ,192 30 31 9,645 99 4,074 1 323,71
8 68,367 57 66,490 43 154,85 Arusha 63,663 72 18,032..- 20 6,673
Ki li manjaro 79,58( 38,97 28 22,299 1 6 141,161
192,543
65
7
75,011
72,655
36
27
216,17
265,19Tanga 146,351 7 34,169 1 8 12,023 6
Morogoro 139,10 56 79,217 32 28,027 11 246,35 94 14,393 6 260,74
Pwani 72.502 59 32,643 26 18,048 15 123,194 87 18,336 13 1 41,53
5 ,977 3 3,197 18 18,078 89 2,316 11 20,39Dar es Salaam 8,903 49
t indi 79,211 71 22,67 20 9 ,345 8 111,22 73 41,945 27 153,17
Mtwara 93,214 59 41,978 27 21,48 14 156,678 68 72,636 32 229,31.
Ruvuma 74,141 59 40,239 32 11,565 9 125,94 66 65,230 34 191,17
Iringa 129,318 61 62,793 30 19 ,71 9 211,82 76 66,894 24 278,71
Klbeya 158,917 56 102.664 36 22,48 8 284.069
159,036
76
81
84776
20,879
24
12
372,84
179,91Singida 92,591 58 49.008 31 1 7,437 11
Tabora 117,453 57 52,25 25 37,16 1 8 206,899 81 29,018 12 235,91
Rukwa 59,888 45 53,45 4 1 18,456 14 131,801 7 40,459 23 1 72,261
Kigoma 93,401 7 2 26,67 21 9,841 8 129,92 6 65,841 34 1 95,76
Shinyanga 1 13,52 5 50,868 26 25311 15 19270 51 185,151 49 377,85
Kagera 131,90 7 26,570 1 8,66 5 167,13t 47 186 ,142 53 353,27
Mwanza 157,65 5 68 50,366 22 24 ,841 11 232,86 68 107,222 32 340,08
58 78,415 42 188,20Mara 72,002 66 25,81 24 11 ,969 1 1 109,78
Manyara 46,40 51 32,014 35 12,581 14 91,00 59 63,192 41 154,19
Mainland 1,977,122 57 1,023,79 30 439,32 13 3,440,236 72 1,365,078 28 4,805,315
Zanzibar 49,677 58 23,53 28 12,279 14 85,795 89 10,7,27 '1i 96,522
National 2,026,799 21999571 1,047,631 11371344 451,601 9 3,526,032 72 1,375;805 28 4,901,837
Tanzania Agriculture Sample Census - 2003

Appendix II — Land Access/Ownership 90
LAND ACCESS/.OWNERSHIP

Land Access/Ownership 91
4.1 LAND ACCESS/OWNERSHIP: Number of Farming households by type of land OwnershipfTenure and Region for the 2002/03 agricultureyear
Land ownership/tenure
Households with Households withRegion Leased / Certi ficate Owned under area Share - area under Other Total
number ofof Ownership Customary Law Bought Rented Borrowed cropped forms of Tenure
householdsHouseholds % Households % Households % Households % Households % Households % Households %
Dodoma 39,490 12 .2 247,109 76.3 43,280 13.4 29,408 9.1 15 ,434 4.8 3,997 1.2 19,560 6.0 323,71Arusha 14,739 9.5 111,114 71.8 24,738 16.0 12,360 8-0 11,178 7.2 7,979 5.2 5,660 3.7 154,857Kilimanjaro 12,280 5.7 187,850 86.9 36,085 16.7 39,327 18.2 29,76 1 13.8 8 , 7 18 4.0 1 4,722 6.8 21617
Tanga 42,541 16.0 184,058 69.4 51,09 19.3 12,361 4.7 27 ,721 10.5 4,800 1.8 632 4.4 265,19Moro oro 31,126 11.9 186,595 71.6 42,792 16.4 47,689 18.3^._.,._. 23,452 9.0......... .. 6 ,317.. 2.4 16,092 6.2 260,74
f'wani..
6,847..
4.8 117,391 82.9 23,333 16 .5 2,302 1.6 10,670 7.5 1,803 1.3 5,571 3.9 141,53
6ar es Salaam 1,251 6.1 7,513 36.8 9,631 47.2 1,622 8-0 3,435 16-8 208 1.0 1,772 8.7 20,394 .Lindi 10,52 1 6.9
....... .123,145
-. -80.4 22,897 14.9 5,803 3.8 11,793 7.7 2,1 78 1.4 17,641 11.5 153,17
Mtwara 17,273 7.5 185,710 81-0 41,262 18.0 4,607 2.0 1 8,472 8.1 2,075 0.9 8,236 3.6 229,314
Ruvuma 8,770 4.6 172,512 90.2 26,563 13.9 9,839 5.1 16,190 8.5 1,624 0.8 11,332 5.9 191,17
lringa 26,564 9.5 227, 801 81.7 50,443 18.1 40,922 14.7 33,177 11.9 9,180 3.3 21,306 7.6 278,717Mbeya 19,212 5.2 3 16,795 85.0 65,852 17.7 58,012 15.6 31,159 8.4 3 ,169 0-8 17,194 4.6 372,844Singida 10,588 5.9 151,612 84.3 15,461 8.6 17,549 9.8 10,388 5.8 2,711 1.5 9,946 5.5 179,91
Tabora 5,057 2.1 181,777 77.1 51,387 21.8 22,706 9.6 22,397 9.5 4,155 1.8 7,847 3.3 235,91
Rukwa 3,3056,079
1.93.1
137,194
173,42979.688.6
43,43163,765
25.232.6
15,0994,505
8 .8
2.3
16 ,75827,132
9.713.9
1,238708
0.70.4
5,0727,706
2.93.9
172,261195,76Kigoma
Shinyanga 11, 307 3.0 259,181 68.6 111,422 29.5 7 1,989 19.1 29,748 7.9 4,849 1.3 12,417 3.3 377,85
Kagera 12,054 3.4 253,294 71.7 154,624 43.8 16,362 4.6 61,810 17.5 3,018 0.9 11,430 3.2 353,27Mwanza 20,878 6.1 236,041 69.4 99,716 29.3 67,053 19.7 30,762 9.0 4,009 1.2 11,857 3.5 340,08
Mara 15,961 8.5 86.6 21,645 11.5 20,508 10.9 24,123 12.8 4 ,833 2.6 12,506 6.6 188,201 62,902
6.5 154,194Manyara 23,856 15.5 110,322 71.5 19,780 12.8 15,760 10.2 6,079 3.9 1,064 0.7 10,001
Mainland 339,699 7.1 3,733,344 77.7 1,019,198 21.2 515,783 10.7 461,638 9.6 78,633 1.6 239,500 5.0 4,805,31
Zanzibar 15,550 16.1 45,091 46-7 12,822 13,3 1,617 1.7 51,406 53.3 0 0.0 17,155 17.8 96,522
National 355,249 7.2 3,778,435 77.1 1,032,020 21.1 517,399 10.6 513,044 10.5 78,633 1.6 256,655 5.2 4,901,837
FIKouseho$d Characteristics ReporRTables (Appendix}5[4 Land ownership & land use ANEX.xFs]Land access
Tanzania Agriculture Sample Census - 2003

OtherTenure Total
2.9 100.02.3 100.03.2 100.02.3 100.01.4 100.03.9 100.0
1 100.02,4 100.02.4 100.01.2 100.02.4 100.04.2 100.03.3 100.05.4 100.05.1 100.01.3 100.0
5.2 100.01.2 100.04.4 100.03.6 100.07.7 100.0
1.83.22.33.23.42.42.52.72.73.74.63.43.72.31.52.52.82.54.53.57.0
Land Access/Ownership 92
4.2 LAND ACCESS/OWNERSHIP: Land Area by type of land Ownership/Tenure and Region for the 2002/03agriculture year
Re g•
Land Ownership/Tenure - AreaArea leased /Certificate ofOwnershi
UWI leu ,^I
underCustomary
1 nlAf
Area Bought Area rented Area BorrowedArea
Share -cropped
Area underOther forms
of TenureTotal area
Dodoma 64,037 564,714 100,896 53,957 19,313 5,856 46,473 855,247Arusha 17,189 170,225 27,736 20,561 9.534 3.859 8,627 257,732Kilimanjaro .._ 13,326 189,269 31,300 18,244 12,646 4,876 6,615 276,276Tanga 93,934 285,756 81,704 9,786 23,506 6,800 22,910 524,396Morogoro 65,877 349,563 63,918 38,759 15,873 5,757 29,853 569,600Pwani 14,354 237,058 39,516 2,407 10,036 2,291 7,334 312,996Dar es Salaam 2.073 11,949 15,032 1,801 2,557 318 2,822 36,551Lindi 18,316 244,000 31,599 . _ 5,241 8,470 1,118 30,740 339,484Mtwara 30,132 340,316 73,745 3,976 12,908 3,174 11,645 475,895Ruvuma 29,855 665,101 57,032 8,052 14,408 1,270 23,550 799,269Iringa 48,249 472,221 77,172 36,342 23,391 5,184 29,259 691,818Mbeya 36,383 484,963 64,287 41,861 15,870 2,448. 26,330 672,142Singida 19,086 351,560 39,779 23,298 10,730 3,811 14,887 463,150Tabora 15,946 640,369 160,392 29,651 23,943 7,622 21,326 899,248Rukwa 8,376 404,810 109,887 20,409 20,983 2,079 7,135 573,679Kigoma 7,595 272,660 71,739 2,936 12,764 766 5,078 373,538Shinyanga 22,321 911,178 376,618 99,038 36,075 7,038 18,642 1,470,910Kagera 12,563 287,153 207,382 9,299 19,640 941 20,042 557,020Mwanza 32,661 526,839 216,710 52,710 21.592 3,510 10,498 864,520Mara_._. 33,120 381,581 24,993 17,110 15,814 3,554 11,370 487,543Manyara 44,929 254,262 39,915 21,473 5,801 1,402 19,802 387,585Mainland 630,322 8,045.549 1,911,352 516,909 335,854 73,673_ 374,939 11,888,599
5.3 67.7 16.1 4.3 2.8 0.6 3.2 100.0Zanzibar 14,674 37,089 8,6421 1,268 38,418 0 11.842 111,934National 644,996 8,082,638 1,919,994 518,177- 374,272 73,673 386,782 12,000,532
4.3 LAND ACCESS/OWNERSHIP: Percent Land Area by type of land Ownership/Tenure and Region for the2002/03 Agriculture Year
Land Ownership/Tenure - AreaRegion
CustomaryLaw Bought
71.270.668.568.366.066.065.661,961.460.954.551.632.7
83.2 7.15.1
75.9 8.675.7 12.673,0 19.2722 9.671.9 9.371.5 15.5
78.3
17.819.211.311.210.811.810.325.611.225.115.637.241.1
OwnershipCertificate Rented Borrowed
3.7 1.06.8 3.54.1 5.04.6 0.82.0 0.85.4 6.25.4 1.56.3 0.81.8 3.31.5 3.64.8 6.67.0 5.36.7 8.07.5 6.3
11.6 5.51.5 6.7
11.6 6.83.8 6.1
Tanzania Agriculture Sample Census - 2003

Appendix II - Household Demographics g3
4.4 LAND SUFFICIENCY: Number of AgricultureHouseholds by whether All Land Available to the
Household Was Used during 2002103 agriculture yearand Region
Was all Land Available to the Hh Used DuringRegion 2002103?
Yes % No % Total
Dodoma 242,727 75 80,385 21 323,11
Arusha 113,463 82 25,015 11 136,47
Kilimanjaro 183, 891 86 30,296 1 214,18
Tanga 175,77 67 87,754 31 263,52
Morogoro 182,114 70 77,132 31 259,24Pwani 92,412 66 47,032 3 139,44
Dares Salaam 14,746 77 4,518 2 19,26
Lindi 104,691 68 48,323 3 153,01
Mtwara 171,795 75 57,407 2 229,20
Ruvuma 59,442 31 131,601 6 191,04
fringe 147,079 53 131,638 4 278,71
Mbeya 289,627 78 82,023 2 371,65
Singida 115,556 64 63,844 3 179,40
Tabora 106,55 45 129,061 5 235,621
Rukwa 63,55 37 106,295 6 171,84
Kigoma 97,680 50 97,015 5 194,69
Shinyanga 231,463 62 144,084 3 375,54
Kagera 206,185 59 143,415 41 349,60
Mwanza 214,868 63 124,060 3 338,92
Mara 84,273 45 101,519 5 185,791
Manyara 114,404 76 35,873 2 150,27
Mainland 3,012,298 63 1,750,291 3 4,762,58
Zanzibar 85,431 69 11,091 11 96,52
Narional 3,097,729 64 1,761,382 3 4,859,111
4.6 LAND ACCESS/OWNERSHIPIT'ENURE: Number ofAgriculture Households By Whether Female Members ofthe Household Own or Have Cusomary Right to Land By
Region during 2002/03 Agriculture year
Do any Female Members of the Hh own or haveRegion customary right to Land
Yes % No % Total
Dodoma 71,136 22 251,976 71 323,11
Arusha 21,242 15 117,236 81 138,47
Kilimanjaro 30,474 14 183,71.3 81 214,18
Tanga 62,574 24 200,954 7 263,52'
Morogoro 75,200 29 184,047 71 259,24Pwani 36,799 26 102,644 7 139,44
Der as Salaam 5,174 27 14,090 71 19,26
Lindi 34,263 22 118,752 71 153,01
Mtwara 69,703 30 159,499 71 229,20
Ruvuma 29,192 15 161,851 81 191,04
Iringa 74,726 27 203,990 7 278,71
Mbeya 78,216 21 293.431 Zl 371,65Singida 37,854 21 141.546 71 179,40
Tabora 24,688 10 210,931 91 235,621
Rukwa 22,647 13 149,198 8 171,84
Kigoma 44,639 23 150,056 7 194,69
Shinyanga 40,758 11 334,789 81 375,54
Kagera 53,155 15 296,445 8 349,60
Mwanza 52,563 16 286,366 8 338.92
Mara 40,879 22 144,912 71 185,791Manyara 18,442 12 131,836 8 150,27
Mainland 924,325 19 3,838,264 81 4,762,58
Zanzibar 87,688 91 8,835 96,52
Narional 1,012,012 20.8 3,847,099 79.2 4,859,111
4,5 LAND SUFFICIENCY: Number of AgricultureHouseholds by Whether they Consider Having
Sufficient Land for the Household and Region during2002103 agriculture year
Do you Consider that you have sufficient land forRegion the Hh?
Yes No Total
Dodoma 202,235 63 120.877 31 323,11
Arusha 36,209 26 102,270 7i 138,47
Kilimanjaro 65,932 31 148,25 61 214,18
Tanga 146,353 56 117,175 4 263,52Morogoro 148,678 57 110,568 41 259,24Pwani 88,856 64 50,557 3 139,44Dar es Salaam 8,529 44 10,735 5 19,2$
Lindi 110,87 72 42,140 21 153,01
Mtwara 156,78 68 72,415 31 229,20
Ruvuma 144,421 76 46,622 24 191,04Iringa 174,551 63 104,166 51 278,71Mbeya
201,722 54 169,92 41 371,65Singide 94,620 53 84,780 4 179,40
Tabora 147,147 62 88,474 31 235,621
Rukwa 108,922 63 62,923 51 171,84Kigoma 96,761 50 97,934 51 194,69Shinyanga 167,533 45 208,014 51 375,54Kagera 177871 51 171,723 41 349,60
Mwanza 147,356 43 191,573 51 338,92
Mara 72,573 39 113,218 61 185,791
Manyara 62,879 42 87,399 51 150,27
Mainland 2,560,816 54 2,201,773 4 4,762,58
Zanzibar 57,774 60 38,748 41 96,52
Narional 2,618,590 54 2,240,521 41 4,859,111
Tanzania Agriculture Sample Census - 2003

Appendix II — Access to Communal Resources 94
ACCESS TO COMMUNAL RESOURCES

Appendix Il - Household Demographics 95
6.1 COMMUNAL RESOURCES: Average Distance (km) from Agriculture household to natural resource . by type ofNatural Resource, Season and Region for the 2002103
Water for Humans Water for Livestock Communal Grazing Communal Firewood
Distance Distance Distance Dtstance Distance Distance DistanceRegion Distance Wet Dry Wet Dry Wet Dry Wet
Dry Season Season Season Season Season Season Season Season
(km) (km) {km) (km) (km) (km) (km) (km)
Dodoma 2.0 1.1 2.6 1.5 32 2.5 ... 3.2 3.0
Arusha.....2.6 1.3 3.1
_ ..1.4 3.6 2.1 _.. 2.3 2-1
Killmanlaro 1.2 0.6..... ..
1.1 0.6........
2.9...-_.... .
2.0-
1.9...... . 1.-_
Tanga 1,5_._
0.8 1.9 1.0 3.0 2.0 2.4 2.
Morogoro 0.9 0 .4 1,7 0.9 3.3 2.4 2.5 2.
Pwani 2.1 0.7 2.2 1. 0 2.9 1 8 1 6 1 .
Dares Salaam 1.4 0.5 1.5 0 .6 2.5 1.8
Lindi 1.8 0.7 1.9 1.0 2.8 1.9 1.9 1.
Mtwara 3.6 2.1 2.5 1 .3 2.9 2.0 2.2 2.
Ruvuma 0.3 0.2 0 .6 0 .4 2.7 1.9 2.5 2.
Iringa 0.8 0.5 1.7 1.1 3.0..... 2.3 2.6 2.-
Mbeya 2.7
__„_-..........1.9 2.4 2.3
-.._..
0.9 0.5 1.7 1.0
Singida 1 .7 0.9 2.3 1.3 2.9--........... 2.0._-_ _. 2.5 2.1
Tabora 0 .6._._--
2.0 1.0 2.5 1.6 2.9 2.
Rukwa 0.7 0.5 1.9 1. 3 3.2 2.5 2.8^._. ..... 2.. _.........Kigoma
^...........---.....1 .0 0.7 2.2
.....m....__1 .8 3.6 2.7 4.0 3 .
Shinyanga 1.7 0.9 2.1 1.1 2.8 1.9 2.5 2.
Kagera 1.7 1 .2 2.3 1.6 2.9 2.3 2.2 2.
Mwanza 1.2 0 .7 1 .8 1.0 2 .6 1.7 1.8 1.
Mara 1.8 0.7 2.3 1. 1 2 .7 1.8 2.0 2.
Manyara 2.9 1.6 3.3 1.8 3.6 2.5 2.2 2.
Zanzibar 0.3 0.1 0.8 0.6 2.1 1.9 2.4 2.
Mainland 1.5 0.8 2.0 1.2 3.0 2.1 2.4 2.3
... Continued
Wood for Charcoal Building Poles Forest for Bees Hun ting Fishing
Distance Distance Distance Distance Distance Distance Distance DistanceDistance Wet D ry Wet Dry Wet D ry Wet Dry Distance
D ry Season Season Season Season Season Season Season Season Season Wet Season
Region (km) (km) (km) (km) {km) (km) (km) (km) (km) (km)
Dodoma 3.2 3.2 3.8 3.7 3.6 3,5 6.5 6.4 8.3 7.
Arusha 2,7 2.7 3.0 3.0 4.4 4.4 7.4 7.4 8.3 7.4
Kilimanjaro 2.8 2.8 23 2 .3 4.5 4.5 7.9 7 .9 9.3 8.4
Tanga 3.0 3.0 3.4 3.3 4.6 4-6 7.5 7.5 8.3 7.
Morogoro 2.9 2.8 3.1 3.0 4.4 4.4 8.4 8.2 9.2 8.1
Pwani 3.3 3.2 4.0 4.1 4.7 4.6 7.6 7.4 8.4 7 .4
Dares Salaam 2.3 2 .2 2.9 2.9 4.1 4.1 6.5 6.5 7. 1 6.4
Lindi 2.7 2.7 2.9 2.9 4.7 4.7 7.6 7.5 5.0 7.
Mtwara 2 .9 2.9 3.8 3.7 4.8 4.8 7.7 7.7 8:6 7.
Ruvuma 3.6 3.5 3 .4 3.3 5,0 4.9 9.1 9.1 9.7 8.
Iringa 2.7 2.7 3.0 3.0 4.5 4.5 7.5 7.5 8.5 7.
Mbeya 3.5 3.4 3.0 3.0 4.5 4.5 7.6 7.6 8.4 7.4
Singida 3.0 3.0 3.6 3.5 5.1 5.1 7.8 7,8 8. 5 7,
Tabora 2.9 2.8 3.6 3.7 6.1 6.3 8.2 6.4 9.2 8.6
Rukwa 4.1 4 .2 3.5 3.5 7.6 7.6 12.0 11.9 17.0 16.2
Kigoma 4.7 4.6 5.0 4.8 6 .4 6.4 9.3 9.2 9.3 8.6
Shinyanga 3.0 2.9 3.3 3.1 5.2 5.2 8.1 8.1 8.8 7.
Kagera 3.3 3.1 2 8 2.8 4.9 4.9 7.9 7.8 10.4 9.6
Mwanza 2.7 2.7 2.4 2.4 4.9 4.9 7.8 7.8 7.4 6.
Mara 2.9 2.8 2.5 2.5 5.0 5.0 8.0 8.0 8.2 7.3
Manyara 2.8 2.8 2.9 2.8 4.3 4.3 7. 8 7.8 8.6 7.
Zanzibar 2.5 2.5 3.8 3.8 2.2 2.2 3.3 3.2 3.2. 3•
Mainland 3.1 3.1 3.2 3.2 4.9 4.9 8.0 8.0 9.0 r 8.1
Tanzania Agriculture Sample Census - 2003

Appendix Tl - Household Demographics 96
6.2 COMMUNAL RESOURCES: Number of Agriculture households with Access to water for Humans by type ofUtilisation and Region for the 2002103 agriculture year
Water for Humans
Regions Home of FarmConsumption /
gold to VillageMarket
Not Avallabte TotalUtilization
-Lindi 321,280 144
.414 323,719
Arusha 154,570 0 0 164,857Kilimanjaro 209,427 0 5,351 216,173Tanga 264,093 0 146 265,198Morogoro 260,127 116 0 260,746Pwani 139,290 0 1,079 141,530Oar es Salaam 19,688 11 351 20,394Lindi 151,919 28 667 153,173Mtwara 226,829 0 2,106 229,314Ruvuma 189,072 0 1,193 191,175ihnga 275,918 0 _.,.. 756 278,717Mbeya 369,666 121 1,358- 372,844Singida 179,389 0 0 179,915Tabora 235,122 0 234 235,917Rukwa 172,044 35 0 172,261Kigoma 1 94,745 0 588 195,765Shinyanga 368,476 156 5,569 377,857Kagera 352,524 171 119 353,277Mwanza 338,064 153 1,123 340,085Mara 187,914 0 117 188,203Manyara 153,498 41 110 154,194Total 4,763,656 977 21,280 4,805,315% 99.13 0.02 0.44 100.00Zanzibar 96,510 12
.0 96,522
National 4,860,166 989 21,280 4,901,837
Tanzania Agriculture Sample Census 2003

II - Communal Resources 97
6.3 COMMUNAL RESOURCES: Number of Agriculture households with Access to Vtiater for livestock by type ofUtilisation and Region for the 2002103 agriculture year
Water for bivestoct
Regions Home of FarmSold to Sold to other Net Used byConsumption!
Neighbours outlets Household Not Available TotalUtilization
bndoma 114,117 129 346 206,490 2,63 323.719Arusha 135,430 844 328 10,377 7,878 154,857Kilirnaniaro 159,047 309 117 13,858 42,842 216,173Tanga 129 506 186 254 72,648 62,60 265,198Morogoro 57.077 539 353 63.710 • 139.066 260,746Pwani 18,433 23 140 34 811 88,122 141.530Dares Salaam 5805 42 0 6.392 8.154 20,394Linda 24,028 252 195 34,344 94,35 153,173Mtwara 32,116 653 410 25,723 170,411 229,314Ruvufna 114,929 134
__77
..._.--- ....57,786
....18.24 191,175
Irings 111,530 575 0 91,193 75,419 278,717Mbeya 193,715 176..._..... 93 135,448 43.411 372.544Singida 103.967 473
-0- ..--- .....__
67,911...._.._
7,56--,._. _.-
179.915Tabora 97.442 411 125 104,260 33,67 235,917Rukwa 83,240 134 80 86,728 2,077 172,261kigoma 82,956 163 0 92,640 20,00............
.....195,765
Sl{nyanga 1 77.808 274 640 53,939 145,19_-
377,8573Cagera 154,109 523 195 163,079 35,371 353,277Mwanza 177 581 424 243 84,044 77,79 340,085Mara 105 029 570 187 31,207 51,21 188,203.Mcanyare 116,974 318 155 33,137 3,69 154,194Mainland 2,194,840 7,154 3,939 1,469,725 1,129,657 4,805,31
% 45.88 0.15 0.08 30.59 23.51 100.00
Zanzibar 31.205 87 117 42.335 22,92 98522National 2,226,045 7,241 0 1,512,060 1,152,586 4,901,837
6.4 COMMUNAL RESOURCES: Number of Agriculture households with Access to CommunalGrazing by type of _ltilisation and Region for the 2002103 agriculture year
Communal Grazing
Regions Hone of Farm Sold to Sold to other Not Used byConsumption 1Neighbours outlets Household
Not Availab€e TotalUtikzatkon
Dodoms 80,713 1 ,07 6 719 220,052 21,15 323,719Arueha 55,160 332 575 6,266 92,52 154,857Kilimanjaro 17,718 118 810 22,267 175,26 216,173Tan
ga 50,820 723 924 70,136 142,59 265,198Morogoro 16,711 - 661 492 52,471 190,411 260,746P ar3 10,864 85 425 21,067 109,04 141,530Dares Salaam 1,487 54 23 2,823 16,007 20,3 94Linde 11634 100 28 29,106 112,30 153,173Mtwara 15 887 96 163 18 ,7 65 194,403 229314Ruvuma 25,429 537 91 3 68,512 95,7 191,175Iringa 61,848 243 384 110,537 105,70 278,7 17Mbeys 111,251 485 176 1 42,678 118,25 372,844Singida 85,018 1 61 122 66,936 27,679 179,915Tabora 62,720 618 413 93,816 78,35 235,917Rukwa 54 ,635 115 133 84,534 32,84 1 72,261Kigoina- 61,660 288 133 "89,801 43,884 195,765S inyan9a 73,337 301 913 37,909 265,397 377,857Kagera 92 ,459 652 830 178,764 80,57 353,277M roanza 81,492 660 322 55,089 202,54 1 340,085Mara 61,323 266 1 85 24.41 1 1 02,018 188 ,203Manyara 48,352 471 258 30,042 75,071 154,194Mainland 1,080,536 8,040 5,941 1,425,981 2,281,81 4,805,315
22.49 0.17 0.19 ^ 29.8 - 47.49 100.00Zanzibar 7,852 0 0 11,790 76,88 96,52National 1,088,388 8,040 8,941 1 437,771 2,358,697 4,901,837
Tanzania Agriculture Sample Census - 2003

Appendix II - Communal Resources 98
6.5 COMMUNAL RESOURCES: Number of agriculture households with Access to Communial Firewood by type ofUtilisation and Region for the 2002/03 agriculture year
Communal Firewood
Re ions Home or FarmConsumption /
Sold toNeighbourshbours
Sold toTraders on
Sold toVillage
Sold to LocalWholesale
Sold to MajorWholesale
Not Used byNot Available Total
Utilizatio the Farm Market Market MarketHousehold
Dodoma 292.67. 15,697 253 270 846 0 13,703 27 323,719Arusha 141,62 1110 130 94 244 0 3,289 8,36• 154,857Kilimanjaro 17371 2,450 530 2,590 1,225 256 1,604 33,80^ 216,173Tanga 246.961 2,299 722 165 107 0 3,434 11,50• 205,198Morogoro 245.817 4.532 261 624 224 127 5,113 4,04 260,746Pavan! 128,761 2,998 962 373 466 320 2.964 4,68' 141,530Dar es Salaam 15,764 163 34 55 15 0 1.695 2,64:' 20,394Lind' 147,83 947 141 54 0 0 2,609 1,59• 153,173Mtwara 219,574 945 0 96 284 0 1,976 6,43• 229,314Ruvuma 148.576 752 0 429 507 0 14,41• 26,49 191,175lringa 254.329 1,134 0 0 96 132 8,168 14.85 278,717Mbeya 328.129 2,129 244 795 823 47 12,581 28,09 372,844Singida 168,276 4,16 0 322 1,669 42 4.554 88• 179,915Tabora 219,631 7,048 600 419 780 301 5.631 1,50: 235,917Rukwa 166,489 2,228 188 185 34 201 2.597 33; 172,261Kigoma 181,565 558 524 473 531 34 6,934 5,14. 195,765Shlnyanga 266,396 2,810 1,144 297 2,830 0 7,487 96,89, 377,857Kagera 329,849 2,219 182 444 183 139 8,641 11,620 353,277Mwanza 317,936 2,643 153 858 745 88 6,161 11,501 340,085Mara 178,920 1,306 344 758 248 272 1,16s 5,19• 188,203Manyara 139,660 878 303 198 1,584 674 3,571 7,322 154,194Mainland 4,312,498 59,011 6,717 9,500 2,634 118,288 4,805,31
a aIMIIIIIIMIIIIIIIII
6.6 COMMUNAL RESOURCES; Number of agriculture househo ds with Access to Wood for Charcoal by type of Utilisationand Region for the 2002/03 agriculture year
Wood for Charcoal
Regions Home of FarmSold to Sofd to Sold to Sold to Local Sold to Major Not Used byConsumption I Neighbours Traders on Village Wholesale Wholesale Household Not Available Total
Utilization the Farm Market Market Market
Dadoma 43,092 30,405 5,40 0 6,211 2.68 229,588 6,33 323,719'A 823 173 56 130 84 117,10 154,857Kilimanjaro 7,598 944 376 501 312 44 173,93 216,173Tanga 19,083 5,273 10,202 49 240 1,083 158,64 265,198Morogoro 33 399 8,695 5,180 839 3,996 1,299 91,09P 260,746Pwani 14,669 5,562 22,391 645 5,786 1,307 50,311 141,530Dar es Salaam 1 867 448 185 0 189 52 11,301 20,394
6,756 1,208 478 228 570 53,08 153,173Mtwara 17 358 3,203 2,151 0 2,261 103 153,74 229,314Ruvuma 15 573 1,484 782 218 407 0 76,72 191,175Iringa 20,854 1,787 1,051 700 612 552 170,101 278,717Mbey
a 15417 2,537 3,793 395 830 293 210,92' 372,844Singida 31,226 6,629 569 395 1 , 004 1,162 53,22 179.915Tabora 27,305 5,666 3,215 1,578 670 987 54,16 235,917Rukwa 12 363 2,663 1 347 1,014 219 3,563 43,99 172261Kigoma 23,393 2,986 1,179 158 947 488 52,59 195,765Shinyanga 27 013 2,255 318 584 174 230 297,96 377,857Kagera 16,019 2,146 2,366 353 855 1,94 135,655 193,93 353,277f3wanza 18,046 3,819 1,209 2,330 989 379 221,48 340,085Mara 12 234 3,021 1,168 140 385 355 137,711 188,203Nlanyera 11,304 5,092 1,888 212 492 603 87,35 154,194Mainland 102,195 66,157 10,643, M 26,939 17,782 3 2 415„ 74 4,805,315
2 1 0 1 0 37 50 100Zanzibar 2,691 614 1,372 241 713 386 52,073
,58,43 96,522
'National 396,604 102,809 67,529 10,884 27,652 18,168 1,804,016 2,474,176 4,901,837
Tanzania Agculture Sample Census - 2003

x II - Communal Resources 99
6.7 COMMUNAL RESOURCES: Number of agriculture households with Access to Forest for Building Poles by type ofUtilisation by Region for the 2002/03 agriculture year
Building Poles
Regions Home of FarmSold to
Sold to Sold toSold toLocal
Sold toMajor Not Used by NotConsumption !
NeighboursTraders on Village
Wholesale Wholesale Household Available TotalUtilization the Farm Market
Market Market
Dodoma 201.05 24,265 597 224 3,512 327 92,732 toot 323,719Arusha 80,011 3,069 204 314 956 0-_ 24,042 46,26 154,857Kil i manjaro 62,618 3,508 892 1,337 4 ,526
...._.__.,97 33.555 109,64
..........216,173
Tanga 184,16 1,934 3,216 117 545 0 31,088 44,13 265,198Morogoro 177,83 3,671 610 856 238 12 53.1 2 24,391 260.746Pwani 98,458 1,782 1,462 771 956 252 15,125 22.72 141,530Dar as Salaam 6,404 364 391 7 87 0 3,036 10,10 20,394Lindi 118,669 1,074 199 492 411 0 21,287 11,041 153,173Mtwara 175,475 2,991 1,303 476 875 519 20,305 27,37 229,314
Ruvuma 101,283 609 0 0 406 42,545 46.332 191,1750inr ga 157,308 1,661 1 014 0 4 308 0 56,529 57,89 278,717Mbeya
218,160 3,678 519 1,612 1,438 62 80,647 66,72 372,844Singida 118,297 5,935 139 411 1,888 187 39,701 13.35:Tabora 178,262 4,475 400 380 1,263 148 41,855 9,134 235,917
Rukwa 138,099 3456 35 467 962 0 28,158 1,08 172,261Kigoma 112.424 519 675 197 481 301 57.606 23,561 195,765Shmyanga 152,943 1,229 571 394 441 0 27,344 194,931 377.857Kagera 1 67.208 10,584 1,108 778 623 0 111,48 61.49 353,277Mwanza 130,591 2,571 113^_ 254 .. 722.. 0 61,405 144,42 340,085Mara 95.279 2,036 246 0 1,191
.........0 19.701 69,75 188,203
Manyara 101,306 1,144 457 268 3,294 286 30,050 17,38 154,194Mainland 2,775,850 80,564 14,151 9,356 29,127 2,182 891,316 1,002,76 4,805,31
% 58 2 0 0 1 0 19 21 100
Zanzibar 23,026 609 246 299 902 440 32,144 38,85 96,52
National 2,798,876 81,173 14,398 9,654 30,032 2,622 923,460 1,041,62 4,901,83
6.8 COMMUNAL RESOURCES: Number of agriculture households with access to Forest for Bee productsby type of Utilisation by Region for the 2002103 agriculture year
Forest for Bees (Honey)
Regions Home of FarmSold to Sold to Sold to
Sold toLocal
Sold toMajor Not Used by NotConsumption
Neighbours a on VillageWholesale Wholesale Household Available
TotalUtilization the
the
FarmF MarketMarket Market
Dodoma 27,019 6,009 2,153 582 4,866 719 208,376 73,991 323,719Arusha 8,286 1,253 76 261 76 0 16,658 128,241 154,857Kilimanjaro 5,053 1,292 250 144 155 68 20,261 188,951 216,173Tanga 5,396 1,786 2,959 374 284 215 47,155 207,02 265,198Morogoro 5,125 789 388 131 250 0 58,047 196,03 260,746Pwani 3,599 376 47 0 48 0 20,9 116,51 141,530Dar es Salaam 426 29 0 16 23 0 3,357 16,54 20,394Lindi 4,510 758 191 82 0 28 27,437 120,16 163,173Mtwara 3,584 388 184 0 0 0 11,596 213,56 229,314Ruvuma 6,111 3,280 0 72 391 27 55,515 125,77 191,175Iringa 3,635 1,445 63 766 0 121 40,976 231,691 276,717Mbeya 9,290 1,271 1,328 531 786 0 83,385 276,25 372,844Singida 9,977 2,884 1,489 82 316 118 36,800 128,24 179,915Tabora 9,504 2,556 3,695 126 740 669 63,733 154,89 235,917Rukwa 3,835 1,510 358 134 76 402 85,421 80,52 172,261Kigoma 11,429 915 315 0 533 0 77,585 104,98 195,765Shinyanga 8,849 1,023 0 0 636 141 23,654 343,35 377,857Kagera 3,838 305 171 0 122 120 51,065 297,65 353,277Mwanza 1,917 1,202 88 0 345 164 19,856 316,51 340,085Mara 1.116 0 360 0 0 117 870 185,75 188,203Manyara 5,482 580 250 0 66 0 37,957 109,85 154,194Mainalnd 137,980 29,631 14,353 3,322 9,911 2,910 990,648 3,616,55 4,805,31
% 3 1 0 0 0 0 21 75 100
Zanzibar 537 67 110 52 40 0 6,751 88,96 96,52
National 30,168 29,697 14,463 3,374 9,951 2,910 997,399 3,705,525 4,901,837
Tanzania Agriculture Sample Census - 2003

Appendix II - Communal Resources 100
6.9 COMMUNAL RESOURCES: Number of agriculture households with Access to Hunting Ground by type ofutilisation by Region for the 2002103 agriculture year
Hunting (Animal Products)
Regions Home of FarmConsumption i
Utilization
Sold toNeighbours
Sold toTraders onthe Farm
Sold toVillageMarket
Sold to LocalWholesale
Market
Sold to MajorWholesale
Market
Not Used byHousehold
Not Available Total
Dodoma 2,923 1,462 0 234 328 0 125,126 193,645 323,719Arusha 178 291 0 0 0 0 6,374 148,01 154,857Kilimanjaro 556 241 0 0 118 264 11.786 203,20 216,173Tanga 4,183 806 811 0 139 0 40,693 218,573 265,198Morogoro 1,206 558 0 0 0 0 47,933 211,048 260.746Pwani 1,197 374 62 237 15 0 21.017 118,60• 141,530Dar es Salaam 185 33 0 151 11 0- . 3,289 16,725 20,394Lind 2,334_ . 523 128 0 140 88 27,961 122,000 153.173Mtwara 562 470 436 198 351 0 11,578 215,71• 229,314Ruvuma 2.295 490 132 509 151 0 51,645 135,953 191,175fringa 2,330 122 61 0 0 0 25,513 250.690 278,717Mbeya 3,708 927 393 483 287 0 61,004 306,04 372.844Singida 924 433 0 0 133 0 9,706 168,719 179,915Tabora 1,840 388 228 0 221 108 44,136 188,997 235,917Rukwa 2,121 431 112 0 0 36 73,826 95,73 172.261Kigoma 5,731 588 0 0 0 0 61,600 127.847. 195,765Shinyanga 222 193 0 0 0 81 16,446 360,91 377,857Kagera 2,446 459 195 0 472 0 51,150 298,55 353,277Mwanza 798 458 0 100 316 272 12,702 326.43 340,085Mare 250 132 82 111 316 132 2,052 185,128 188,203Manyara 697 234 310 0 87 913 10,553 141,400 154,194Mainland 36.687 9,607 2,971 2,023 3,087 1,892 716,088 4,032.95 4,805,315
MM1111111.111aME
6.10 COMMUNAL RESOURCES: Number of agriculture households with Access to Fishing Resources by typeof Utilisation by Region for the 2002/03 agriculture year
Fishing {Fish)
Regions Home of FarmConsumption /
Utilization
Sold toNeighbours
Sold toTraders onthe Farm
Sold toVillageMarket
Sold to LocalWholesale
Market
Sold to MajorWholesale
Market
Not Used byHousehold
Not Available Total
Dodoma 2,673 589 1,011 0 297 0 20,008 299,142 323,719Arusha 44 232 0 0 177 59 1,766. 152,57 154,857Kiflmanjaro 467 345 175 40 248 0 15,284 199,615 216,173Tanga 2,207 1,856 319 763 617 386 26,453 232,598 265,198Morogoro 3,923 2206 500 543 254 117 46,924 206,276 260,746Pwani 3,696 3,615 3,115 2,328 1,796 585 25,889 100,505 141,530Dar es Salaam 578 274 12 165 89 82 3,709 15,486 20,394Lindi 2,333 3,196 1,556 1,330 341 219 18,759' 125,439 153,173Mtwara 2,083 3,137 643 1,214 564 199 13,210 208,263 229,314Ruvuma 7108 5,610 1,051 1,763 417 119 39,957 135,150 191,175Irl a 3,295 580 539 56 0 0 16,799 257,446 278,717Mbeya 9,554 1,805 661 968 178 176- /64,848
/294,655 372,844
Singida 609 208 0 3,594 1,470 12 / 9,159 164,750 179,915.Tabora 1,471 874 359 497 0 159 25,321 207,235 235,917Rukwa 3,803 5,115 706 2,482 2,931 669 71,218 85,337 172,261Kigoma
Shinyanga9,712
1,929
1,693
425
1,387
342
1,673
0
668
82
548,
216
49 797,
14,009
130,287
360,854195,765
377,857Kagera 17,096 4,937 3,150 6,026 2,442 795 59,552 259,278 353,277Mwanza 12,586 4,925 3,188 7,038 4,270 4,763 51,886 251,428 340 0852Mara 7,73C 2,203 2,548 4,784 2,411 2,408 8,268 157,843 188,203Manyara 578 966 18 68 356 799 10,261 141,149 154,194Mainland 93,484 44,794 21,280 35,331 19,607 12,423 593.077 3,985,318 4,805,315
1.9 0.9 0.4 0.7 0.4 0.3 12.3 82.9 100.0Zanzibar 7,060 2,914 1,438 5,828 3,462 3.567 33,481 38,773 96,522National 100,544 47,708 22,718 41,159 23,070 15,990 626,558 4,024,091 4,901,837
Tanzania Agriculture Sample Census - 2003

IF — Distance from Fields 101
DISTANCE FROM FIELDS

Appendix II - Distance from Fields 102
Mi DISTANCE TO DIFFERENT FIELDS OF THE HOUSEHOLD: Number of Agricultural Holdings Reporting Distancefrom homestead to first field by Region, 2002103 Agricultural Year
HomesteadLess than
Region 100 m 100 to 299 m 300 to 499 m 500 to 999 m 1 101.9 km 2 to2.9 km 3 to 4.9 km 5 to10 km Over 10 km TotalKagera 289,200 14,693 8,629 10,106 9,966 6,558 4,304 1,311 833 343,603Dar es Se 14,562 1,013 454 973 1,301 686 205 109 213 19,516Kilimania 154,538 7,199 6,514 8,464 10,976 8,585 6,974 5,614 3,307 211,174Tabora 150,317 19,730 11,134 17,810 14.899 10,020 5,228 1,796 1,551 232,486Singida 112,406 16,413 6,700 9,527 13,805 9,770 4,877 2,798 1,450 177,74Arusha 86,696 18.885 8.461 7,786 7,580 5.827 2,416 1,443 1,36 140.457Manyara 79,946 14,547 7.326 11.491 11,922 8,898 6,126 3.869 2,499 146,626Mwanza 165,81a 32,634 24,414 41,470 39,914_ ... 17,303 7,564 4,310 710 334,140Pwani 66,482 8.202 6,797 13,838 15,374 11,035 8,374 3,616 2,622 136,342Shinyanga 177,448 38,123 23,006 42,685 33,824 31,067 14,366 3,955 2.505 366,982Mbeya 165,563 28,322 20.447 38,372 41,779 30.073 24,344 14,990 3,42 367,313Mara 82,658 23,293 13,270 20,862 21,603 .__ 13,653 6,641 1,867 641 184,488Kigoma 7,96574,367 8,885 11,559 16,044 22,688 23,730 14,937 9,731 189,908iringa 92.133 13,383 15,015 28,637 43.079 33,155 24,120 16,059 8,221 273,803Ruvuma 62,695 14.941 11,600 17,275 25,374 23,074 19,24 10,7 3,881 188,819Dodoma 104,894 29,480 21,876 45,387 41,753 33.452 22,370 12,62 6,081 317,910Rukwa 53,526 12,099 8,734 16,174 23,419 21,362 18,142 13,103 4,111 170,670Lindi 45,138 9,865 11,260 25,011 ._ 25,475 15,175 13,674 5,016 788 151,402Tanga 67,792 24,761 20,243 42,201 47,937 34,401 17,620 6,346 1,598 262,910Morogoro 63,046 23,986 19,426 36,328 39,702 31,777 21,140 15,282 8,425 259,113Mtwara 18.461 14,565 15.496 43,766 54,694 43,097 26,368 8,391 1,13G 225,96eTotal 2,127,682 374,120 266,692 489,723 540,424 411,661 277,828 148,172 65,088 4,701,391
45 8 6 10 11 9 6 3 1 1008 6 7 19 24 19 12 4 1 100
, t2 DISTANCE TO DIFFERENT FIELDS OF THE HOUSEHOLD: Number of Agricultural Holdings Reporting Distance fromhomestead to second field by Region, 200 =3 Agricultural Year
Homestead
Less than Between 100 Between 300 Between 500 Between 1 Between 2 Between 3 Between 5Region 100 m and 300 m and 500 m and 1 km and 2 km and 3 km and 5 km and 10 km Over 10 km Total
Dodoma 45,767 23,029 23,700 35,956 28,591 17,818 18,266 9,769 6,015 208,915Arusha 24,847 7,111 6,984 6,687 6,015 „._ 3,386 1,913 1,005 2,091 60,040Klima* 52,934 7,569 8,113 13,569 13,368 13,095 12,772 17,087 12,551 151,057Tanga 36,403 18,451 17,468 30,667 31,755 20,517 10,557 4,578 2,994 173,388Morogoro 48,507 19,298 18,016 32,290 28,867 22,088 15,720 6,685 7,192 198,864Pwani 20,004 8,231 7,205 9,313 10,446 6,316 4,722 2,137 1,161 69,537Dar es Sa 3,598 974 457 1,132 893 705 248 179 80 8,274Lind 17,760 7,993 8,469 16,651 17,855 10,248 8,563 3,316 724 91,579Mtwara 20,451 9,065 27,554 31,003 26,532 17,372 8,168 1,393 155,044Ruvuma 29,290 20,756 17,298 22,703 27,921 25,486 20,060 11,345 4,344 179,205irTnga 35,106 14,309 19,141 27,527 36,898 30,243 21,462 12,023 6,015 202,723Mbeya 79041 28,273 30,726 56,478 43,089 32,442 22,298 13,189 4,111 309,648Singida 31,937 21,179 13,910 14,488 12,957 10,495 5,944 2,040 712 113,662Tabora 51,536 32,830 25,773 25,313 21,614 10,544 6,002 2,292 1 212 177,117Rukwa 16,193 7,983 7,195 14,632 16,803 17,154 14,364 8,489 4,173 106,985Kigoma 15,951 6,008 13,230 22,415 26,478 28,737 31,261 15,711 6,568 166,36CShinyanga 66,179 37,654 30,949 47,056 40,119 29,975 16,212 4,296 1,108 273,548Kagera 42,306 34,290 25,071 26,389 23,634 14,539 8,281 3,407 2,013 179,630Mwanza 54,42 42,386 30,077 45,712 40,114 19,858 7,512 3,492 861 244,444Mara 49,125 20,714 15,837 19,553 21,07 1 ,608 6,417 1,991 335 145,650Manyara 20,782 9,961 8,872 9,448 7,179 5,034 2,338 981 1,367 65,963Total 761,843 378,066 341,694 505,835 486,673 356,823 251,292 132,379 67,033 3,281,638
23 12 10 15 15 11 8 4 2 100
Tanzania Agriculture Sample Census - 2003

I1 - Distance from Fields 303
613 DISTANCE TO DIFFERENT FIELDS OF THE HOUSEHOLD: Number of Agricultural Holdings Reporting Distancefrom homestead to Third field by Region, 2002103 Agricultural Year
Homestead
Less than Between 100 Between 300 Between 500 Between 1 Between 2 Between 3 Between 5
Region 100 m and 300 m and 500 m and 1 km and 2 km and 3 km and 5 km and 10 km Over 10 km Total
Dodoma 35,321 8,439 8.751 16,643 11,920 7,43 7,268 3,723 5,01 104,521
Arusha 17,871 1,012 1.269 2,05 1.440 1,26 782 0 851 26,54
KIimanja 54,136 2,965 4,124 5.491 6,40 4.884 3,640 3,832 3,361 88,85
Tanga 40,631 8.704 9,923 14,966...... 14,148.. ._. __. _... .,_ 9.616 7,661-- ... _. 3,619...._..._ _.__....- 2,16 111,43
Moragoro 47.870 9.788-
9.931 13,853 12,145 10 ,573 6,210 2,996 2.641 116.00-
Pwani 7,495 2,129 2,42 2220 3,248 1,948 1,986 862 761 23,06
Dares Sa 2,173 179 80 120 54 0 68 0 2.67
Lindi 7,522 2.073 2,926 4,477^... _ ...- 5,594 2,766 2,310 827 231....._. 28,72.........Mtwara 25,917 4,615 3,820 10,073 13,578 10,402 6,657 4,102 761 79,93
Ruvuma 29,364 11,775 11,071 19,787 21,195 1 8,557 13,845 10,101 3,811 139,50
Iringa 25.291 6,063 7,325 15,493 19,795 15.623 12.112 7,046 3,69 112,43
Mbeya 54,241 19,65 20,33 36,37 32,459 20,879 14,94...... 7,797..... 2,24 ......._ 208,92
Singida 10,791 5.571 9,000 7,039 8,565 3,849 1,993 725 571 48,10
Tabora 29,186 13,495 14,225 14.649 13,381 6.957 3.962 1,506 561 97,92
Rukwa 6,317 2,747..._ 3153 6,956 8,629 7.162 8,006 3,744 1,49 48.211
Kigoma........ ....
13,506 2,652 4,559 11,621 19.108 20.033 17,174 8,745 6,63 104,03
Shinyanga 36,72 19,589 14,724 22,236 23,969 15,208 10,076 3,785 1,15 147,47
Kagera 19,862 11,339 9,705 14,723 10,550 5,178 4 ,04 1,606 1,98 78,96
Mwanza 30,06 1 3,633 15,26 24,263 20,278 10,202...... 5,925 2,213----- - 59...._._^ _ 122,441......._..-Mara 31,492 11,408 8,586 13,162 11,712 6,935 4 ,069 1,208 48 89.05
Manyara 9,661 2,104 1,936 2,904 2,661 1,348 1,101 532 87 23.121
Total 535,439 159,935 163,12 259,10 260,83 180,821 133,834 68,96 39,91 1,801,97
30 9 9 14 14 10 7 4 2 100
6.14 DISTANCE TO DIFFERENT FIELDS OF THE HOUSEHOLD: Number of Agricultural Holdings Reporting Distance from Nearest
Road to first field by Region, 2002103 Agricultural Year
Nearest RoadLess than
Region 100 m 100 to 299 m 30010499 m 500 to 999 m 1 tol.9 km 2 to2.9 km 3 to 4.9 km 5 to10 krn Over 10 km Total
Kilimanjaro 110,667 32,656 19,271 16,431 14,72 10,257 3,450 1,517 55 211,53
Arusha 63,894 24,385 14,261 12,343 7,979 7,261 4,478 2,843 2,93 140,37
Dar es Salaam 8,379 2,95 1,60 2,213 2,738 947 50 192 3 19,56
Manyara 50,70 18.674 13,744 19,185 18,921 11,46 6,327 4,516 2, 92 146,46
Kagera 112,294 51,704 35,904 39,280 41,246 29,612 18,757 11,030 4,47 344,30
binge 82,764 28,657 23,162 34,171 38,682 29,003 19,28 11,895 6,68 274,30
Tabora 69,324 36,643 27.474 26,979 23,336 20,826 14,185 6,899 7,01 232,68
Mbeya 104,873 49,529 36,174
-
54,256 41,929 40,472 21,052 11,724 7,72 367,73
Mwanza 95,000 53,194 32,409 48,641 48,221 29,692 18,479 5,982 1 ,541 333,15
Ruvuma 51,435 23,102 17,015 21,63 24,752 19,621 17,534 10,212 3581 188,89
Pwani 33,975 13,613 13,429 19,330 17,868 1 3,1 17 1 0,22 9,119 5.27 136,04
Kigoma 43,851 17,720 16,635 22,85 17,829 19,19 18,463 15,337 12,40 184,29
Tanga 61,904 30,695 26,833 40,323 41,951 27,790 21,556 10,442 1,64 263,14
Rukwa 39,062 15,714 11601 19,683 21,856 22,063 17,637 14,184 8,60 170,40
Mara 37,300 25,374 19,339 27,923 26,943 23,275 15,01 6,417 3,49 185, 081
Dodorra 61,932 40,163 27,298 48,094 50,884 37 ,384 28,92 18,564 5,88 3 19, 12
18,410 14,168Singida 34,411 26,992 19,772 25,496 24,638 9,935 4,30 178,03
Lindi 28,180 14,605 5,004 26,138 24,969 16,40 14,952 6,146 1,75 151,15
Shinyanga 70,047 38,192 34,784 51,991 45,723 51,564 42,512 25,383 8,33 368,53
Morogoro 42,788 28,356 23,798 40,201 37,723 31,085 22,608 20,229 11,78 258,57
Mtwara 35,690
1,239,475
21,095
594,018
23,53
453,049
36,868
836,038
42,934
615,851
30,347
489,78
21,35
35 1,476
9 ,312
211,879
4,63
105,61
225,77
4,699, 18Total
26 13 10 14 13 10 7 5 2 100
Tanzania Agriculture Sample Census - 2003

Appendix II - Distance from Fields 104
6.15 DISTANCE TO DIFFERENT FIELDS OF THE HOUSEHOLD: Number of Agricultural Holdings Reporting Distancefrom Nearest Road to second field by Region, 2002/03 Agricultural Year
_
Nearest Road
Less than Between 100 Between 300 Between 500
-
Between 1 Between 2 Between 3,Between 5
Region 100 m and 300 m and 500 m and 1 km and 2 km and 3 km and 5 km and 10 km Over 10 km TotalDodoma 38,74 24,109 20,122 31,487 29,792 24,653 20.270 13.911 5,576 208,681Arusha 29,516 10,840 7,095 4,7N 3,033 2,442 1,419.._ 546 157 59,829Kilimanja 70,991 18,016 12,682 15,876 10,442 9,548. 6,691 4,357 2,206 150,810Tanga 41,22 20,363 19.848 27,588 23,425 17,994 12,135 7,664 2,805 173.045Morogoro 43,38 18,433 18,002 28,654 29,720 20,228 16,108 13,467 10,38E 198.385Pwani 14,979 7,356 6,970 10,827 10,267
_......
, 7,371 5,315 4,8 1,236. 69,1 MDar es Sa 3,15 972 870 1,251 752 585 426 147 46 8.208Lind; 15,02 8,926 7,748 16,987 17,092 11,330 8,750 4,392 1,242 91,496Mtwara 32,649 12,830 16,514 22,28 23,495 23.700 13,275 7,655 2,362 154,766Ruvuma 31,546 23,666
2 222.21,185 22,759
1 12
25,06 21,735 19.222 10,765 2,906 179,045Iringa 43,758 21,191 19,534
- 112
25,896 32,559„.....
25,116 17.394 10,842 5,688._
. ' 201,978Mbeya
Singida68.49.
15,384
35,140
15,023
34,874
14,452
48.980
15,892
43,1341122.-
19,605
36,508
14,142
22,842
10,926
12.006
6,295
8,207
2,460
310,18
114,179Tabora _-r 37,000 23,583 23,570 26,469 27.581 17.180 9 994, 6,9 11 4,161 176,449Rukwa 15,306 9,643 8,722 13.847 13,461 16,085 13.478 9,229 7,318 107,080Kigoma 14,961 12,036 16.327 21.9 19,059 23,426 22,037 18,162 14.431 162,384Shinyanga 39,437 27,040 26,558 40.939 38,068 35,821 36,224 22,632 6.38€ 273,104Kagera 34,49 23,205 21,039 29,708 25,920 20,278 13,513 7,387 3,728 179,275Mwanza 50.128 31,423 33,462 41,584 37,250 26,645 16,676 5,118 2.286 244,573Mara 23,460 22,254 14,781 22,689 22,408 20,153 12,211 4,922 2.586 145,462Manyara 21,5 8.585 6,88 _ 9.495 7,342 4,825 3,238 2,07G 2,0M 66,033Total 685,18 374,835 351.243 479,938 459,471 379,766 282,144 173,320 88,208 3,274,113
6.16 DISTANCE TO DIFFERENT FIELDS OF THE HOUSEHOLD: Number of Agricultural Holdings Reporting Distance from NearestRoad to Third field by Region, 2002103 Agricultural Year
Nearest Road
Less than Between 100 Between 300 Between 500 Between 1 Between 2 Between 3 Between 5Region 100 m and 300 m and 500 m and 1 km and 2 km and 3 km and 5 km and 10 km Over 10 km TotalDodoma 28,880 7,99 8,733 16,11 14,943 8,265 9,069 4,931 5,11 104,04Arusha 19,345 2,124 1,34: 2,427 54• 28. 123 73 7 26,34Kilirnanla 62,558 5,295 5,103 5,959 5,28 3,090 1,932 808 76' 90,79'Tanga
Morogoro44 63.
43,779
10,020
11,325
9,008
7,870
12,881
12,964
11,275
12,784
10,086
9,774
8,750
8,274
3,955
4,505
,1222 2,101
5,29:
112,7
116,5Pwani 6,294 1,594 2,291 2,348 3,477 2,56 1,810 1,053 93 24,36•Dar es Sa 2,269 203 81 122 71 52 47 4 * 2,885
' di 7,215 3,95 2,19 5,416 4,483 3,531 1,817 1,461 581 30,655Mtwara 34,640 6,192 5,402 8,441 9,118 8,361 4,675 3,742 1,02 81,801Ruvuma
iringa28,370
30,174
17,827
9,049
15,811
10,044
17,497
15,143
20,061
15,529.
17,0021222
12,963
11,542
11,028
9,308
5,270
2,2911 139,7
112,423,22Mbeya
Singida45,260
5,317
23,821
4,952
23,100
5,84
35,530
7,454
25,933
10,9711221
23,182
5,757
17,502
5,060
7,662
1,721
5,52
1,155
210,51•
48,23Tabora
-24,631 10,962 11,601 13,656, 15,409 10,066 5,306
-3,645 1,54 96,84.2221 2222_
Rukwa 6,972 4,050 3,252 6,987 7,571 6,821 6,967 3,81 2,191 48,62Kigoma 11,219 7,314 9,401 12,009 12,311 16,676 13,879 10.604 10,08 103,50*Shinyanga 27,416 12,06 12,03 19,24 21,82 20,711 16,519 13,807 6,42 150,05Kagera 18,291 10,364 8,507 11,797 10,403 7,414 5,928 4,124 2,10 78,93Mwanza
-27,42 13,621 14,328 21,816 20,083 13,439 8,756 3,042 1,61 124,12:-
Mara 16,050 12,791 9,645_
13,497 12,97• 12,093 6,499 3,87' 1,49 88,92Manyara 10,048 2,327 2,129 3,094 2,800 1,335 730 315 591 23,36'Total 502,79 177,848 167,732 244,399 240,857 193,48 146,41 87,759 54,15 ,815,44'
Tanzania Agriculture Sample Census - 2003

Appendix I3 - Distance from Fields1 05
6.17 DISTANCE TO DIFFERENT FIELDS OF THE HOUSEHOLD: Number of Agricultural Holdings Reporting Distancefrom Nearest Market to first field by Region, 2002/03 Agricultural Year
Nearest Market
Less than Between 100 Between 300 Between 500 Between I Between 2 Between 3 Between 5Region 100 m and 300w and 500 m and 1 km arrd 2 km and 3 km and S km and 10 km Over 10 km TotalDodoma 35.640 12,577 11,42 21,314 25,63 20,355 29,213 33018 1 27,64 316,81Arusha 7,147 6,693 7.237 7,96 9,668 17,189 24,510 22,497 37,35 140,26Kifimanja 8.179 10,849 12,796 17,82 5 29,253 43,196 30,186 35,894 23,93 212,11Tanga 14371 9,241 8,96 22,23 32,05 31,17 40,68 47.30 56,17 262,21Morogara 21,421 5,969 6,179 14.811 19,830 25,070 34,173 37,763 91,59 256,8Pwani 9.029 5,763 8,599 13.86 16,675 15,480 17,853 -- 17,12 31,161 135,58Dar ea St 1,834 921 817 1,306 1,65 9 2,497 2.131 3,407 4,89 19,47Linde 7,039 9,367 12.388 23,634 26,809 2146 22008 14.259 14,86 151.831Mtwara 15881 12,47 14,136 31,07 43,621 41,204 30,981 18,568 17,881 225,82Ruvuma 19,54 8,185 9,47 18,245 24,549 23,201 21,829 17.561 45,07 187,651longs 47,24 6,983 7,243 10,714 18.455 18,151 20,933 27,015 112,31 269,05Mbeya 39,932 15,604 17.3 33,491 43,26 44,827 53. 51,7 67,79 367,8S ngtda 8,494 4,183 4 060 7,762 16,21 15,06 18,735 30,905 71,891 177,31Tabora 13,252 9.71 8,714 13,837 15.621 18,233 32,04 34,98 83,471 229,86RukWa 11359 5,006 5,280 11,024 18,780 16,239 18,585 26,90 57,26 170,44Kigoma 11,827 11,35 14,354 22,933
-19,351
-_ ......25,006
- ...... ..26,332
_„- .... _28,079
_30,52
._ ...189,76
Sixinyenga 11.76 11,9 13.900 33,21 40,223 46,39 59,47 66,987 81,701 367,64Kagera 15,018 16,161 18,071 30,776 45,182 55,32 58,95 58,760 43,7E 344,03Nlwanzs 16,995 23,587 20,240 35,401 57,152 57,599 47,851 40,216 32,82 331,86Mars 6.603 8,687 10,324 19.6 24,70 26,771 31,67 34,441 22,1 184,91Manyara 17,277 4571 4,074 7,142 13,837 13,549 11,04 18,779 54,39 144,97Total 339,871 202,347 215,473 396.209 542,53 577,994 633,061 668,23 1,108.60 4,686,32
6.18 DISTANCE TO DIFFERENT FIELDS OF THE HOUSEHOLD: Number of Agricultural Holdings Reporting Distance from NearestMarket to second field b y Realon. 2002102 Aarieri1tural Year
Nearest Market
Less than Between 100 Between 300 Between 560 Between 1 Between 2 Between 3 Between 5Region 100 rn and 300 m and 500w and 1 km and 2 km and 3 km and 5 km and 10 km Over 10 km TotalDodoma 24,107 6,283 7,004 15,274 18,227 14,538 20,291 24,17 77,51 207,40Arusha 14,02 2,113 3,290 2,430 2,50' 5,81
_ ..... __7,925 10,051 1154
KE €i manje 33,953 5,192 3,927 5,767 12,971 35,557 20,306 32,407 20,06 150,13Tanga .........24,360 6,264 5,132 14,623 19,64 20,300 23,58 27,216 30,27 171,40Morogare 28,868 3,013 5 401 10,849 16.009 18,25 21,998 25,60, 67,46 197,46Pwani 5,629 1,981 4,183 6,755 9,756 8,243 7,854 8,720 15,40 68,50DaresSa 1,945 28 242 64 39 936 956 1,148 1,66 8,21Lmd, 5516 4,277 6,26 14,07 17,72 14,53 11,39 7,901 9,91 91,521Mtwara 20,204 7,078 9,319 20,003 28,495 26,805 19,16 13,781 9,69 154,74Ruvuma 14,988 7,720 8,851 14,964 24,7 21,60: 19,32 44,15 177,51Iringa 33,072 3,92 5,877 11,62 1461: 13,304 15,45 17,929 82,78 198,591Mbeya 28,01 9,554 12,462 25,763 35,310 42,23 43,68 49,609 61,85 309,48Singida 3,215 2,856 3,001 4,778 11,571 9,608 12,208 21,512 44,52 113,27Tabora 10 069 6,314 7 486 8,37 3,88 14,461 21,861 28,520 62,33 173,31Rukwa 676 3,311 3,01 6,641 10,007 11,18 13,55 15,327 37,21 107,01K3gama 4,763 3,449 6,16 14,43 20 352 28,124 32,76 27,98 27,63 165,69Sh1nyanga 9,261 7,402 10,679 27,111 27,718 30,78 42,383 48,010 68,88 272,26Kagera .9 ,241 5,877 7,219 15,72 23,19: 30,43 30,32 35,88 21,07 178,9Mwanza 13,5i 11,774 13,823 26,720 39,742 41,423 37,362 31,838 26,07 242,271Mara 5,835 6,766 8,702 12,865 19,186 20,061 25,060 29,98 16,82 145,28Manyara 10 209 2,368 2,377 3,693 5,849 6,039 5,043 5,849 24,15 65,57Total 308,560 107,799 134,423 263,121 371,6 394,24 434,271 482,775 761,261 3,258,35
Tanzania Agriculture Sample Census - 2003

Appendix II - Distance from Fields 106
6.19 DISTANCE TO DIFFERENT FIELDS OF THE HOUSEHOLD: Number of Agricultural Holdings Reporting Distancefrom Nearest Market to Third field by Region, 2002103 Agricultural Year
Nearest Market
Less than Between 100 Between 300 Between 500 Between 1 Between 2 Between 3 Between 5Region 100 m and 300 m and 500 m and 1 km and 2 km and 3 km and 5 km and 10 km Over 10 km Tota!
Dodoma 25, 4 1478 2,655 6.142 7,136 5,984 7,692 11,592 36.02• 104,66Arusha 15,509 719 354 847 1,270 1,029 1,305 2,809 2,52$ 26,361Kilirnanja 48.663 1.002 1,755 2,528 4,452 6,846 5.304 10.604 7.94..... . 89.09Tanga 33,900 2,836 3,166 5,270 9,763 11,376 12,343 14,663 15,86, 112,17•Morogoro ,684 2,661 2,877 4,919 8,452 8,082 12.508 11,550 30.32 116,060Pwani 3,035 557 1,398 1,237 3,707 2,503 2,662 2,262 5,62' 22,58Dar es Sa 1,946 79 102 47 12 142 7 28 294 2,65kLindi 2,712 2,041 2,155 4,682 4,829 4,359 2,64 2,506 3.29: 29.22M twara 25,456 4,035 4,069 7,270 12,390 9,785 7,170 5,427 4,14^ 79,74Ruvuma 6,571 5,041 6,363 11,087 18,048 14,91 14,950 13,792 3759• 138,361ringa 24,534 1,909 3,05 5,43$ 6,285 7,468 7,977 8,340 45.31: 110,31'
Mbeya 18,966 ,631 8,832 19,32. 24,754 26,697 28,427 34538 4308 4 209,45Singida 2.581 641 983 2,16 5,334 3,073 4,662 8,941 19,871. ... 48,25Tabora 11,906 2,774 4,04 4,034 8,48 9,161 9,52". 14,464 31,71' 96,41Rukwa 3,357 1,334 1,245.. .. 2,674 5,014 6,05: 6,369 6.179 15,97 46,20"Kigoma 3,802.. . 2,160 2,585 7,52$ 13,738 19,597 23,431 16,055 15.35. 104,24,Shinyanga 9,799 4,260 5,641 11,568 13,816 15,631 20,324 25.816 40,35° 147,21^
Kageta 8,72 2,257 2,77 6,527 9,993 13,41 13,260 12,667 J,86' 79,48:Mwanza 11.169 5,204 5,793 11,790 19,033 21,72$ 16,859 17,053 14,17: 122,79... Mara 6,320 4,153 3,655 6,491 11,065 12,084 16,05 19,975 10,10 . 90,10.
Manyara 7,073 199 204 901 1,197 1,516 1,012 1,297 10,161 23,560.Total 316,66: 50,173 ,908 125,456 165,772 201,438 214,688 240,559 399,60 1,801,271
Tanzania Agriculture Sample Census - 2003

Appendix I1 Access to Credit 107
AGRICULTURE CREDIT

Households Receiving CreditRegion
Dodoma
Arusha
Kilimanjaro
Tanga
Morogoro
Pwani
Dar es Salaam
Lndi
Mtwara
Ruvuma
Iringa
Mbeya
Singida
Tabora
Rukwa
Kigoma
Shinyanga
Kagera
Mwanza
Mara
Manyara
Male
1,493 85
270 61
2,967 81
453 44
7,799 68
1,521 90
49 46
405 76
1,410 93
32,939 85
6,796 75
16,887 80
1,516 56
24,679 96
6,833 93
3,211 94
5,402 77
750 75
7,356 74
419 62
114 43
Total receivingCredit
15 1,759
39 444
19 3,643
56 1,022
32 11,457
10 1.681
54 106
24 535
7 1,509
15 38,567
25 9,046
20 21,141
44 2,698
4 25,655
7 7,365
6 3,403
23 7,054
25 1,004
26 9,991
38 675
57 264
266
174
677
569
3,658
160
57
130
99
5,626
2,251
4,254
1,182
977
533
192
1,651
254
2,633
256
150
12 204
17 149,224
Female
17 149,020
RegionNumber of Credits
Total
Dodoma
Arusha
Kilimanjaro
Tanga
Morogoro
Pwani
Dar es Salaam
Lind'
Mtwara
Ruvuma
Iringa
Mbeya
Singida
Tabora
Rukwa
Kigoma
Shinyanga
Kagera
Mwanza
Mara
Manyara
Mainland 131,932
1,593
270
3,174
453
8,758
1,912
49
405
1,410
36,146
6,796
18,915
1,516
24,729
6,833
3,408
5,402
750
8,879
419
114
81
44
66
92
46
76
93
85
74
78
56
96
93
95
77
75
71
62
43
29,528
266
174
743
56'
4,517
160
57
130
99
6,147
2,383
5.439
1,162
1,076
533
192
1,651
254
3,550
256
150
161,46
1,85•
44'
3,91:'
1,02
13,27
2,072
10•
53
1,50*
42,29'
9,17'
24,35'
2,69:
25,80'
7,36
3,601
7,05'
1,00'
12,42*
67
26,
Zanzibar
National 132,111 29,553 161,664
Appendix II - Access to Credit 108
13.1 AGRICULTURE CREDIT: Number of Agriculture Households receiving Credit by sex of househod head and RegionDuring the 2002103 Agriculture Year
NotReceiving
CreditTotal Agriiculture
households
321,960 323,719
154,413 154,857
212,529 216,173
264,176 265.19
249,289 260,746
139,849 141,530
20,288 20,394
152,638 153,173
227,805 229,314
152,608 191,175
269,671 278,717
351,703 372,844
177,217 179,91
210,261 235,917
164,895 172,261
192,362 195,765370,804 377,857
352,273 353,277
330.094 340,085
187,528 188,203
153,930 154,194
4,6 6,294 4,805,315
96,318 96,522
4,752,613 , 4,901,837
13,2 AGRICULTURE CREDIT: Number of Credits by sex of the hhMember receiving credit and Region During the 2002/03 Agriculture
Year
Tanzania Agriculture Sample Census - 2003

Appendix Ti Access to Credit 109
13.3 AGRICULTURE CREDIT: Number of Credits Received by Source of Credit and Region During the 2002143Agriculture Year
Family Saving &Religious
Regions Friend and Commercial Co-operative Creditandi
Trader! Private OrganisationOther Total
RelativeBank
SocietyTrade Store Individual / NG01
Project
Dodoma 524... 467 117 0 650 0 1,75Arusha 112
_-_----0 0 !} 0 198 62 7 44
Kilimanjaro 1,660 107 73 281 126 0 1,396 0 3,64Tanga 21 3 20 7 382 10 1.02
Marogoro 5,176 909 117 1,256 2,565 847 510 7 11,45Pwani
0 98 1,094 0 162 8 247 1,681
Dar es Salaam 22 42 22 0 0 0 19 10Lindi 168 0 154 0 0 101 84 2 53Mtwara 446 151 716 162 0 0 26 1,50Ruvuma 15,355 408 14,853 2,414 2,547 953 1,536 201 38,556iringa 5,694 1 62 25 73 57 107 65 9,Mbeya 7,541 230 4,816 1,656 3,303 1,345 915 1,53 21,141S€ngida 911 122 1,124 215 ...................12 203 2,59Tabora 1,434 384 22,049 250 333 0 1,080 12 25,65Rukwa 1,941 0 2,685 0 2,616 155 101 7,49Kigoma 735 0 2,341 191 1 3,40Shinyanga 2,233 83 1,501 1,037 0 1,381 819 I 7,05Kagora 251 D 264 116 0 0 373 I 1,00Mwanza 3,26 295 44 4,35 137 89 1,409 9,991Mars 70 0 0 117 489 0 0 67Manyara 170 0 0 0 1 0 0Total 47,722 3,340 52,324 12,434 13,281 5,845 11,317 2,89 149,15
32 2 35 B 9 4 8 2 100Zanzibar 55 0 0 28 0 25 90 6 2National 47,777 3,340 52,324 12,462 13,281 5,870 11,407 2,896 149,357
13.4 AGRICULTURE CREDIT: Number of Credits Reveived by Purpose by Region During the2002103 Agriculture Year
Regions Labour Seeds FertilizersAgro- Tools 1 Irrigation
Livestock Other Totalchemicals Equipment StructuresDodoma 917 467 0 201 297 0 385 37 2,64Arusha 112 198 0 112 158 112
0 --. 1786
Kilimanjaro 880 1,981 1,639 954 152 0 530 56 6,69Tanga 347 181 261 107 107 8 40 1,6Morogoro 6720 fi 369 843 1,317 611 0 126 241 17,23Pwani 638 560 790 1,739 560 658 658 64 6,24Dares Salaam 42 58 22 11 11 0 0 3 18Lmdi 101 0 28 254 68 0 84 53Mtwara 162 0 C 1,32 15 1 2 1,671Ruvuma 7,663 3,799 19,233 7,533 2,409 77 1,944 4,401 47,05fringa 3,789 2,798 2,232 1,172 322 0 644 43 11,381Nbeya 7,62i 5,451 10,71 7,532 3,831 487 625 1,77 38,04Sing€da 445 76 1,117 883 74 0 0 1,54 4,13Tabora 1,159 8,684 23,894 18,386 3,14 1,201 431 3,701 60,6Rukwa 2,594 2,353 3,966 2,210 1,178 537 0 27 13,10Kigoma 0 795 2,806 958 0 0 0 4,55Shinyanga 218 2,78 1, 3,741 61 119 220 1,04 13,3Kagere 119 251 264 0 0 0 288 201 1,12Mwanza 5,836 2,958 52 1,214 2,876 16 1.31 2,67 17,36Mara 0 0 0 489 70 0 70 11 74Manyara 14 114 28 26 74 Q 74 16 62.Mainland 41,471 39,886 69,954 50,16 17,51 3,47 7,5 19,771 249,744
28 27 47 84 12 2 5 13 167Zanzibar 74 24 79 55 45 0 24 . ,, I 29National 41,545 39,909 70,032 50,220 17,564 3,470 7,632. 19,771 250,044
Tanzania Agriculture Sample Census - 2003

Appendix II - Access to Credit 110
13.5 AGRICULTURE CREDIT: Number of Households Reporting the Main reasons for Not Using Credit by RegionDuring the 2002103 Agriculture Year
Main Reason for NOT , using Credit
Regions Notneeded
Notavailable
Did not wantto go into
debt
Interestrate/costto high
Did not knowhow to get
credit
Difficultbureaucracyprocedure
Creditgranted too
lateOther
Don't knowabout credit
Total
Dodoma
Arusha8,910
17,075
64,325
10,875
27,138
15,848
7,762
5,79
132,023
67,732
7,190
3,04
2,657
365
2,465
765
69 551,
32,91
321.966
154.413Kilimanjaro 23,646 15,564 35,453 12.977 74,966 6,879 1,276 528 41,241 212,529Tanga 4,490 27,302 15,787 4,097 151,467 9,470 684 659 50,22 264,176Morogoro 9,883 45,746 22,278 7,4- 102,911 10,196 1,397 574 48,46 s 249,289Pwani 4,635 29,261 11,80 3,410 60,631 4,227 620 361 24,90 139,84Dar es Salaam 1,156 1,976 2,646 1,618 7,289 1,574 305 69 3,65. 20,288Lind y
3,255 35,759 9,052 1,191 62,954 4,359 1,006 166 3489 152.638Mtwara 5,384 46,096 13,458 2,039 98.881 6,2 10 1,121 393 54,13 227,805Ruvuma 5.238' 43,069 16,75 8,916 47,344 5,694 797 506 24,18 152,501iringa 7,212 93,923 29,749 10,028 73,149 5,981 3,416 1,441 44,77 269,671Mbeya 11878 82,391 45,54 14,231 107,370 7,312 3,183 1,954 77,83 351,703singida 8,133 23,298 21,368 2,784 74,405 2.315 679 909 43,33 177,217Tabora 744 47,318 21,58* 4,768 66,223 6,736 _._ 1,418 275 M,20 210,261Rukwa 6,198 51,657 21,899 5,662 43,580 4,476 393 0 30,89 164,762Kigoma 5,784 39,909 17,377 3,307 77,42 10.404 938 554 36,6 192,362Shinyanga 21,257 74,290 42,35• 12,564 112,955 3,798 2,529 560 190,49 370,804Kagera /3,185 44,763 30.59. 8,611 151,48• 7,202 2,692 2,150 91,58 352,273Mwanza 11 752 72.934 38,419 10,983 114,34
_ .5,10. 2,819 296 73,43 330,094
Mara 9,237 18,781 17.294 5,07 . 82,822 5,432 1,090 727 47.06 187,528Manyara 6,077 25,919 10,645 2,113 54,697 2,043 802 482 51,15 153,93GMainland 193,128 895,156 467,04 A 135,713 1,764,659 118,737 30,184 15,833 1,035,60 4,656,055% 4.1 19.2 10.0 2.9 37.9 2.6 0.6 0.3 22.2 100Zanzibar 5,339 26,704 7,376 1,558 27,472 1,740 159 181 25,79 96,319National 198,467 921,860 474,419 137,271 1,792,131 120,476 30,343 16,013 1,061,39 4,752,37
Tanzania Agriculture Sample Census - 2003

Appendix II Community Tree Planting
COMMUNITY TREE PLANTING

Appendix II - Community Tree Planting 112
14.1 TREE FARMING: Number of Households By Whether Village Have a Community Tree Planting Scheme By Rgion
Does your village have a Community Tree Planting Scheme
Region
Tree PlantingScheme
Community TreePlanting Scheme Total
Number r % Number % Number %
Dodoma 35,666 11 287,606 89 323,273 100
Arusha 14,652 9 139,947 91 154,599 100
Kilimanjaro 15,744 7 200,097 93 215,840 100
Tanga 28,048 11 236,391 8 264,438 100
Morogore 18,556 7 240,042 9 258,597 100
Pwani- -
4,778 3 136,578 97 141,356 100
Dar es Sa laam 1,608 8 18,682 20,290 100
Lind$ 1,286 1 151,707 9• 152,993 100
Mtwara 6,920 3 221,738 9 228,659 100
Ruvuma 34,602 18 155,033 82 189,636 100
ringa 97,579 35 179,801 6 277,380 100
Mya 89,744 24 281,805 7. 371,549 100
Singida 45,146 25 133,162 7 178,308 100
Tabora 26,518 11 208,416 8• 234,934 100
Rukwa 36,536 21 134,414 7• 170,949 1 00
Kigoma 24,091 12 171,267 8 195,358 100
Shinyanga 46,292 12. 328,162 8 374,454 100
Kagera 36,147 10 316,061 90 352,207 100
Mwanza 39,583 12 298,123 337,706 100
Mara 22,550 12 164,629 8; 187,179 100
Manyara 14,637 10 139,121 90 153,758 100
Total 640,683 13 4,142,782 87 4,783,465 100
14.2 TREE FARMING: Number of Households By Distance to Community PlantedForest (Km) By Region
Region
Distance to Community Plan ed Forest (km)
0-9 km 10-19 km 20-29 km 30-39 km 40-49 km 60+ km Total
Dodoma 16,383 6,644 4,885 2,939 1,839 2,975 35,666
Arusha 11,919 1,196 846 518 173 0 14,652
Kilimanjaro 5,898 2,753 3,317 1,221 1,968 586 15,744
Tanga 12,661 4,497 6,309 3,539 405 638 28,048
Morogoro 13,177 1,502 1,288 846 131 1,612 18,556-
Pwani 3,374 390 121 70 514 309 4,778
Dar es Salaam 543 26 652 336 0 52 1,608
Lind] 1,194 60 0 0 32 0 1,286
Mtwara 3,742 1,736 1,0 1 9 163 0 261 6,920
Ruvuma 15,644 5,738 5,492. 3,908 2,109 1,712 34,602
ringa 39,429 16,592 13,278 9,849 5,364 13,066 97,579
Mbeya 30,154 19,744 18,364 10,347 4,830 6,305 89,744
Singida 14,751 8,541 6,687 6,527 3,333 5,307 45,146
Tabora 11,807 5,116 5,094 2,146 408 1,946 26,518
Rukwa 18,593 7,105 5,250 2,110 465 3,012 36,536
Kigoma 13,612 5,549 3,882 919 0 129 24,091
Shinyanga 22,593 6,882 5,286 4,781 3,176 3,574 46,292
Kagera 16,064 7,250 5,613 2,914 1,480 2,826 36,147
Mwanza 12,914 11,382 8,262 5,279 1,076 671 39,583
Mara 10,7 3,368 3,051 1,699 1,660 2,031 , 22,550
Manyara 7,372 2,687 862 859 1,018 1,640 14,637
Tota l 282,567 118,758 99,558 60,969 29,979 48,852 640,683
Tanzania Agriculture Sample Census - 2003

Ap endix Ii Community Tree Planting 11314.3 TREE FARMING: Percent of Househods By Distance to Community Planted Forest (Km) By Region
Percent of households
Re on 0-9 14-19 km 20-29 km 30-39 km 40-49 km 64+ km TotalSingida 93 5 0 0 2 p 10Mbeya 81 8 6 4 1 0 10Dodnma 71 7 5 1 10Kagera 71 & 3 1 11 10Manyara 57 23 16 4 0 1 100Kigoma 54 21 15 2 0 lOfMara 51 19 14 6 1 10bar es Salaam 50 18 6 6 7 13 10Kilimanjaro 49 15 11 10 7 10Lind[ 48 15 14 8 7 9 10Iringa 46 19 1 4 8 5 100Marogoro 45 17 16
1.1 6 — 1_.
Rukwa 45 16 22 13 1 2 10Tabora 45 19 19 8 2 7 100Mtwara 44 20 16 8 4 8 100Mwanza 40 17 14 10 5 13 100Shinyanga 37 17 21 8 12 100Ruvuma 34 2 41 21 0 3 100Tanga 34 22 20 12 5 10Peusha 33 19 15 14 7 17 100Pwani 33 29 21 1 3 10Total 44 19 16 10 5 10
Tanzania Agriculture Sample Census - 2003

Appendix I1 - Communit Tree Planting 114
14,4 COMMUNITYhousehold
TREE PLANTING: Number of Househids involved in community treeinvolvement and Region, 2002/03 agriculture
planting by Main scheme
Region
Household Involvement
Only Planting Only Protection& Thinning Only Cutting Most or all
Activity Total
Dodoma 17,714 8,093 141 9,601 35,549Arusha 9,609 1,630 335 2,827 14,401Kilimanjaro 8,960 3,487 0 3,172 15,6Tanga 11,613 1,677 29 14,625 27,944Morogoro 6,078 3,333 600 7,630 17,641Pwani 1,091 589 0 3,098 4,778Dar es Salaam 161 31 0 1 405 1,59Lindi 323 81 0 915 1,318M twara 4,852 1,065 1,003 6,920Ruvuma 12,786 1,136 27 20 ,600 34,54lringa 33,309 12,229 366 51,415 97,31Mbeya 38,990 7,491 3,158 39,447 89,08Singida 16,813 9,385 661 18,288 45,14Tabora 11,290 2,765 158 12,371 26,58Rukwa 17,991 2,513 35 15,997 36,536Kigoma 14,048 588 0 8,666 23,302Shinyanga 19,985 3,843 423 22,041 46,29Kagera 9,550 10,225 3,034 13 ,150 35,95Mwanza 9,783 3,203 356 26,156 39,49Mara 13,091 4,685 116 3,650 21,541Manyara 6,347 2,262 114 5, 915 14,63Total 264,382 80,310 9,552 281,971 636,2 1
42 13 2 44 100
14.5 COMMUNITY TREE PLANTING: Number of Households by Distance to Community PlantedForest (Km) By Region, 2002/03 agriculture year
Distance
Region 0-9 Km 10-19 Km 20-29 Km 30-39 Km 40-49 Km Above 50 Km TotalDodoma 13,149 6,644 4,885 2,939 1,839 2,975 32,433Arusha 10, 346 1,196 890 518 173 0 13,123Kilimanjaro 2,416 2,753 3,317 1,221 1,968 586 12,261Tanga 11,687 4,497 6,309 3,539 405 638 27,073Morogoro 12,268 1,502 1,288 846 131 1,612 17,646Pwani 949 390 121 70 514 309 2,353Dar es Salaam 221 26 652 336 0 52 1,287Lind i 161 60 0 0 32 0 254Mtwara 1,595 1,736 1,019 163 0 261 4,773Ruvuma 12,982 5,738 5,492 3,908 2,109 1,712 31,940iringa 35,486 16,592 13,278 9,849 5,364 13,066 93,636Mbeya 26,328 19,744. 18,364 10,347 4,830 6,305 85,917Singida 12,05& 8,54 1 6,687 6,527 3,333 5,30T 42,454Tabora 9,056 5,348 5,094 2,146 408 1,973 24,026Rukwa 17,248 7,105 5,250 2,110 465 3,012 35,190Kigoma 12,823 5,549 3,882 919 0 129 23,302Shinyanga 20,244 6,882 5,286 4,781 3,176 3,574 43,942Kagera 13,823 7,250 5,613 2,914 1,480 2,826 33,906Mwanza 11,711 11,382 8,262 5,279 1,076 671 38,379Mara 10,118 3,368 3,051 1,699 1,660 2,031 21,926Manyara 6,260 2,687 862 859 1,018 1,840 1 3,528
Mainland 240,929 118,990 99,602 60,969 29,979 48,879 599,347' Zanzibar 2,039 0 0 0 0 0 2,039National 242,967 118,990 99,602 60,969 29,979 48,879
,601,386
Tanzania Apiculture Sample Census - 2003

Appendix It -Community Tree Planting 115
14.6 COMMUNITY TREE PLANTING: Number of Households involved in community tree planting by Main Purpose andRegron
Main PurposeErosion Production Production of Restoration of
Region Control of Poles Firewood Wildlife Other TotalDodoma 3,750 818 129 30,851 0 35,549Arusha 228 475 241 13708 0 14,65Kiliman)aro 859 291 73 14,407 11 15,74Tanga 904 1,607 6,923 18,333 131 27,902Morogoro 666 245 1,428 14,610 1,60 18,556Pwani 404 15 22 4 337 I 4,77Dar es Salaam p 353 0 1,243 0 1 596Linda 81 886 0 319 0 1,28Mtwara 1,375 187 0 5,358 0 6.920Ruvuma 3,180 2,416 128 28,545 148 34,417innga 4,854 12,06 7,92 54,488 18,18 97,52Mbeya 5,057 15,297 11,173 48,254 9,89 89,680Singida 4,664 3,000 2,870 33,956 655 45,146Tabora 494 1,526 3,424 21,024 50 26,51Rukwa 1,311 2,477 2,704 29,645
.... ,365 36,502
Kigoma 0 6,852 3,749 10,137 3,35 24,091Shinyanga 7,757 1,134 6,477 30,614 17 46,15Kagera 2,188 9,997 5,569 17,485 970 36,210Mwanza 1,006 1,739
-- _ ....9,291 27,683 321 39,450
Mara 615 5,152 135 14,896 1,75 22,55Menyara 3,285 2,256 207 8,348 541 14,637Total 42,676 68,794 62,468 427,653 38,269 639,860
7 11 10 67 6 100
14.( L UMMVIUNI I Y I H1t PLAN i INU,. Number at Ilousenotas involveo in community tree planting Dy Use anaRnei nn
Main use during 2002103Regions
Poles TimberCharcoal Firewood Not Ready to Not Allowed to
Other TotalLogs Use UseDodoma 1,131 6,224 0 7,078 4,816 16,547 35,796Arusha 2,979 1,605 74 755 3,170 6,067 0 14,65Kilimanjaro 1,485 146 113 2,859 3,794 7,051 15,44Tanga 1,484 3,952 146 9,464 8,022 5,437 201 28,71Morogoro 372 4,965 188 3,041 7,923 3,330 13 1 19,969Pwani 431 172 0 102 3,614 573 47 4,939Dar as Salaam 190 178 0 69 387 789 0 1,613Lind y
81 1,011 0 0 225 94 1 1,411Mtwara 954 786 89 341 93 3,951 35 7,41Ruvuma 6,634 5,720 146 2,951 11,492 6,985 1,16 35,092lringa 7,012 54,764 381 12,992 16,959 3,591 2,922 98,621Mbe aY 15,971 26,512 1,005 18,087 20,033 7,003 .2,29 90,909Singida 7,191 5,744 590 6,695 16,929 7,612 1,76 46,52Tabora 6,352 357 76 6,613 11,191 2,926 1 27,51Rukwa 1,344 9,978 415 4,710 16,097 4,201 614 37,359Kigoma 4,692 6,823 592 4,03 3, 017 0 5,12 24,28SftinyanJa 2,102 6,249 438 9,948 18,071 9,994 3,00 80Kagera 11,861 5,724 267 3,487, 14 ,073 2,530, Tf 0
0437
49,,99
Mwanza 3,008 8,871 608 16,510 7,728 3,019 16 39,90Mara 3,130 12,168 11 -- 70 4,825 2,768 108 23,186Manyara 3,416 2,017 19 2,316 3,396 3,029 16 14,53Mainland 81,822 163,987 5,44 112,122 176,699 97,498 18,072 655,64
12 25 1 17 27 15 3 100Zanzibar 1,503 335 25 282 526 187 4 2,90National 83,324 164,321 5,468 11 404 177,225 97,685 18,117 658,544
Tanzania Agriculture -Sample Census - 2003

Appendix II ivelihood Constraints 116
CONSTRAINTS TO LIVELIHOOD

Appendix 11
16,1 LIVELIHOOD CONSTRAINTS: Order of MOST IMPORTANT constraints to livelihood by region for 2002103 agriculture yearOrder of MOST important constraint to #iveilliood
Owner - Access to Access to Access to Hunting Access to Trau - Loral Access toAccess ship at Soil Colby Soil Improved Irrigation Chemical Cost of Eutension Forest and Potable Access Parses - Thre - Prone - Marketing sport f)ESIrucko i Pest and Government Cr8 Farm
Region to Land Land ation Feriility Seed Facilities Inputs Inputs Services Resources Gathering Water to Credit Iing skiing Slnrage sling Information Costs by Animals Stealing Disease Taxation Income
Dodoma 12 20 1 6 2 16 7 4 2 19 16 14 7 10 4 15 11 22 21 24 1B 9 23 13
Arusha 3 19 4 8 5 9 13 1 5 17 9 18 13 11 1 15 T 23 21 24 20 12 22 16
Kilimanjaro 3 20 4 5 9 7 12 1 9 15 7 16 12 11 1 18 14 22 21 24 19 6 23 17
Tanga 7 20 1 6 2 9 11 4 2 18 9 17 11 13 4 15 8 23 21 24 16 14 22 19
Morogaro 6 20 1 11 4 8 12 2 4 17 8 18 12 14 2 15 7 23 22 24 16 in 21 19
Pwani 14 21 1 13 4 11 7 2 4 19 11 18 7 16 2 17 6 23 22 24 16 9 20 15
Dares Salaam 7 20 1 4 5 19 13 2 5 17 10 18 13 12 2 16 8 23 21 24 15 9 22 19
tindi 18 21 1 16 2 13 7 4 2 19 13 75 7 10 4 12 6 23 22 24 11 9 20 17
Mtwara 12 19 1 $ 4 16 7 2 4 20 16 13 7 11 2 15 10 23 22 24 14 9 21 18
Ruvuma 12 20 3 4 5 16 10 1 5 19 16 14 10 7 1 13 8 24 22 23 15 9 21 18
triage 8 19 3 4 5 15 9 1 5 20 15 83 9 7 1 17 12 22 21 24 18 11 23 14
Mbeya 7 20 3 6 4 13 10 1 4 18 13 16 10 9 1 15 8 23 22 24 19 12 21 17
Siogida 7 19 1 6 2 13 9 4 2 18 13 16 9 11 4 17 12 23 21 24 20 8 22 15
Tabora—.. 12 19 1 4 5 13 8 2 5 17 13 15 8 10 2 16 7 23 22 24 20 11 21 18
Rukwa 8 20 1 6 4 14 9 2 4 19 14 16 9 12 2 13 7 23 21 24 18 11 22 17
Kigoma 7 18 1 4 5 18 10 2 5 20 16 12 10 9 2 19 13 23 22 24 15 8 21 14
Shinyanga 4 19 1 5 6 13 8 2 6 18 13 15 8 12 2 16 10 23 20 24 21 11 22 17
Kagera .. 7 19 1 2 5 16 10 3 6 20 16 18 10 12 3 13 8 23 22 24 15 9 21 14
Mwanza 2 18 1 5 6 12 10 3 6 17 12 16 1 0 14 3 15 8 23 21 24 20 9 22 19
Mara 2_18 1 1 3 If 9 5 3 47 11 16 9 13 5 15 6 22 21 24 19 14 23 20
Manyara 6 18 1 7 2 14 9 4 2 19 14 17 9 11 4 13 8 22 21 24 20 12 23 16
Total 7 20 1 6 4 13 10 2 4 19 13 16 10 12 2 15 8 23 21 24 18 9 22 17
Tanzania Agriculhare. Sample Census - 2003 t 17

4
51021
151112
713
7
I I_ •
10
810
1343
1712
5
Appendix ii
16.2 LIVELIHOOD CONSTRAINTS: Order of LEAST IMPORTANT constraints to livelihood by region for 2W2103 a iculture year
Region
DodomaAmsbaKilimanjaroTangaMo ro
Dar es Salaam
LindiMtwara
RuvumaInngo
Mbeya
Tabora
Rukwa
__ .
Kigoma
Shinyanga
KageraMmnza
MaraManyara
Total
Tan7Ania Agriculture Sample Census - 20311 5
Order of LEAST important constraint ant in !wet Imd
Owner - Access to to
Himtmg
Access to
EMM=
Access to
Access
oLaM
ship of Soil Cu€bv
affonSoilFeffily
ImprovedSeed
IrrigationFacilities
MAccessForest
R r s
and
Gathering Water
otable Access
De&
HamsMg
Off FaunIncome
1 4 24 8 19 20
19 12 7 2 10 16
16 15 8 1 10 14
11 14 18 7 13 16
5 12 22 1 81 8 24 13 6 9
8 15 16 3 5 6
7 13 16 10 8 14
12 19 21 6 10 20
3 15 2 10 17
3 6• _
15 18 12 14
14 15 16 9 10 18
6 12 21 9 14 20
17 12 23 11 18
18 15 21 11 5 14
14 12 21 10 11
13 15 21 12 14 9
to 13 14 16 6 18
22 19 21 10.... 12
18 16 24 10 13
8 10 16 7 18 22
0 13 2 12 15 1

Appendix II Labour Use 119
LABOUR USE

A If endix II - Labour Use
30.1 LABOUR USE: Number of Agriculture Household by type of Household Member and activity during the 2002/03Agriculture Year
ActivityHead of
HouseholdOnly
AdultsMales
Adult FemaleBoth Male &
FemaleAdults
Boys GeisBoth Boys
& GOsAll Household
MembersHired
LabourTotal
Land cleaning 1,714,879 413,156 107,481 1,290,291 33,295 6,399 13,279 597,969 181,179 4.357,930
Hand soil preparation 895,937 172,784 174,673 2,047,412 21,831 3,897 10,326 957,396 172,087 4,456,344
Soil preparation oxen-tractor 341,613 234285 20,929 326,576 45,211 1,546 8,057 127,782 164,200 1.270,197
Planting 487,429 55,647 353,572 2,277,851 12,147 8,819 19,246 1,378,795 114,058 4,707,562
Weeding 434,512 37,969 226,200 2,315,987 9,341 7,186 14,310 1,.451,725 195,228 4,692,458
Crop protection 326,448 53,258 107,257 784,563 70,022 12,800 196,571 592,319 50,419 2,193,657
Harvesting - 415,035 38,364 253,464 2,170,350 9204 7.425 13,422 1,535,181 125,328 4,597,794
Crop processing 411,251 56,968 2,007,053 527.030 40,015 131,562 129,429 312,881 37. 8 3,653,539
Marketing 2,197,338 140,967 197,936 834,406 14,265 6,002 5,865 255,409 7,193 3,659,382
Cattle rearing 528,142 66,334 33,691 180.241 12,164 853 6,731 246,514 12,553 1,087,222
Cattle herding 171,375 115,631 17,724 136,793 243,014 9,782 118,257 141,178 69,830 1,023,584
Cattle marketing 573,903 65,112 7,878 74,381 12.134 499 5,121 28,506 1,784 769,318
Goat and sheep rearing 527,973 59,365 33,773 213,631 28.048 1,861 17,501 272,586 6,982 1,161,720
Goat and sheep herding , 171,628 75,023 29,668 177,491 279,211 14,704 170,910 188,742 51,742 1,159,120
Goat and sheep marketing 569,944 60,509 14,624 97,673 9,207 901 3,797 37,436 2,673 796,764
Milking 127,969 87,797 374,381 95,426 85,632 10.779 33,589 55,952. . _21,046 892,571
Pig rearing 101,069 8,773 46,221 98,881 6,216 1,132 3,542 99,034 3,066 367,934
Poulry keeping 565,005 26,933 526,163 571,431 22,154 11,119 52,663 936,964 5,500 2,717,931
Collecting water 432,551 73,114 2,794,731 336,880 36,439 262,147 250,145 404,099 21,384 4,611,491
Collecting firewood 561,813.. _113,019 2,861,356 358,681 53,583 194,410 137,750 325,747 38,706 4,645,065
Pole coding 1,532,357 688225 63,473 122,981 55,322 3,757 8,514 41,123 130,979 2,646,732
Timber wood cutting 165,820 76.035 5,658 12,043 4,825 714 1,706 2,902 23,499 292,602
Building maintaining houses 1,859,371 733,354 77,726 232,961 49,629 3,335 6,835 78,051 211,985 ' 3,253,246
Beer making 195,028 36.468 506,744 60,569 4,952 2,502 2,934 30,492 8,191 847,880Beekeeping 82,648 19,341 3,256 3,395 1,198 139 1,457 1,479 1,380 114,293
Fishing 218,974 32,422 - - 1,581 5,293 11,471 56 1,351 781 2,711 274,671
Fish farming 40,594 3.993 598 4,190 629 127 807 2,952 599 54,489
Off farm income generation 1,894,010 133,786 173,894 728,527 37,907 12,367 10,560 95,837 5,422 2,892,330
30.2 LABOUR USE: Percentage of Agr culture Household by type of Household Member and Activity During the 2002103 AgricultureYear
120
Both Boys All Household& Girls Members
2 34-5 9
3 7
o 2
1 1
0 2
0 41 11 0
1 5
0 3
14
21
10
Head ofActivity Household
Only
Land cleaning 39
Hand soil preparation 20
Soil preparation oxen-tractor 27
Planting I _ 10
Weeding . _ 9
Crop protection 15
Harvesting 9 1 6 47
Crop processing 11 2 , ... 14 1 4
Marketing 60 4 5 23 0 0
Milking . 14 10
Pig rearing 27 2
Poulry keeping 21 1
Collecting water 9 2
Collecting firewood 12 2
Pole cuffing 58 26 0_
Timber wood_ cutting 57 26
Building maintaining houses 57 23 2 7 2 0
Beer making 23 4 7 1 0
Beekeeping 72 17 3 3 1 0
Fishing 56 12 1 2 4 0. ,....Fish farming 74 7 1 8 1 0
Off farm income generation 59 5 6 25 1 0
HiredLabour
Total
4 100
4 100
13 100
2 100
4 100
2 100
3 100
1 100
0 100
1 100
7 100
o 100
1 100
4 100
0 100
2 100
1 100
0 100
0 100
1 100
5 100
8 100
7 100
1 100
1 100
1 100
1 1000 100
AdultsMales
9 2
4 4 46
18 2
1 8
1 5
2 5
Cattle rearing 49 17 1 0_ . __.Cattle herding 17
Cattle marketing 75
Goat and sheep rearing 45
Goat and sheep herding 15
Goat and sheep marketing 72 8
'Tanzania AgnculWre Sample Census - 2003

Appendix II Access to Services i 21
ACCESS TO SERVICES

ix 11 - Access to Services 122
33.1 ACCESS TO SERVICES-. Number of Agricultural Househods by Distance to Primary School and Region, 2002103Agricultural Year
Distance (Kilometer) to Primary School
RegionMean Distance
< 1 1 - 2.9 3-9 9 10 - 19.9 Above 20 TotalDodoma 81,704 162,551 69,646 6,931 2,888 323,719 3.2Arusha 22,275 78,479 45,792 6,317 1,995 154,857 3.2Kilimanjaro 75,475 119,654 20,059 420 564 216,173 1.5Tanga 74,029 127,973 60,319 1,579 1,298 191 2.2Morogoro 86,203 106,442 61,368 5,254 1,47 260,746 2.Pwani 39,508 57,115 39,342 5,197 367 141,530 2.4Dar es Salaam 4,051 10,416 5,546 226 15 20,394 2.7Lindi 55,048 67,912 28,789 956 468 153,173 2.3Mtwara 131,652 74,319 21,352 1,242 748 229,314 1.2Ruvuma 81,057 85,977 22,263 997 881 191,175 2.1irin ag 64,364 135,593 73,571 4,031 1,158 278,717 2.8Mbeya 107,961 185,888 73,509 3,602 1,88 372,844 3.Singida 31,280 88,137 54,621 4,064 1,813 gir 3.0Tabora 41,996 100,369 81,851 9,050 2,650 235,917 4.0Rukwa 78,629 52,906 36,880 2,456 1,389 172,261 2.1Kigoma 63,091 106,593 23,904 1,636 541 195,765 1.5Shinyanga 69,889 190,660 114,971 1,594 743 377,857 2.4Kagera 46,471 167,925 133,399 4,801 681 353,277 2.6Mwanza 91,828 175,637 70,529 609 1,481 340,085 2.5Mara 38,291 .1 06,260 41,673 893 1,08 188,203 2.5Manyara 29,500 71,746 48,705 3,138 1,10 154,194 3.1Total 1,314,299 2,272,553 1,128,091 64,995 25,376 4,805,31 2.5
33.2 ACCESS TO SERVICES: Number of Agricultural Households by Distance to SecondarySchool and Region. 2002/03 Agricultural Year
Distance (Kilometer) to Secondary School
Region <1 1 - 2.9 3 - 9 9 10 - 19.9 Above 20 TotalMean Distance
Dodoma 10,646 19,090 71,516 90,897 131,571 323,719 20,4Arusha 6,519 23,349 64,487 23,057 37,446 154,857 18.5Kilimanja 19,407 74,033 105,770 13,269 3,693 216,173 4.3Tanga 5,507 25,413 91,893 71,731 70,655 265,19 16.Morogoro 7,812 13,716 62,914 62,116 114,18 260,746 23.7Pwani 2,214 7,695 31,693 34,013 65,915 141,530 23.7Dar as Sa 1,083 1,773 6,428 6,227 4,883 20,394 14.dLindi 2,151 6,564. 25,356 39,778 79,324 153,173 28.7Mtwara 7,597 5,427 78,571 71,718 66,002 229,314 16.0Ruvuma 6,723 19,651 58,274 57,167 49,360 191,175 16.0Iringa 5,527 20,021 77,399 86,193 89,57 278,717
.... ...... .17.1
Mbeya 10,250 34,176 149,490 93,847 85,082 372,844 14.4Singida 4,566 11,225 59,542 45,881 58,701 179,915 18.2Tabora 4,482 5,845 53,082 68,218 104,289 235,917 27.0Rukwa 5,721 5,029 38,495 43,283 79,733 172,261 25.1Kigoma 10,669 14,635 46,782 36,881 86,798 195,765 22.3Shinyanga 2,527 16,603 100,591 126,451 131,684 377,857 18.6Kagera 4,057 36 844 138,370 86,144 87,862 353,277 15.8Mwanza 12,937 29,674 127,022 96,343 74,109 340 ,08 12,6Mara 6,172 22,944 92,946 49,090 17,050 188,203 10.1Manyara 8,647 18,139 52,833 29,492 45,083 154,194 21.7Total 145,212 411,847 1,533,454 1,231,797 1,483,004 4,805,31 18.
Tanzania Agriculture Sample Census • 2003

I
Mean Distance
261,462 323,719 49.3
85,063 154,857 36.9
63,343 216,173 16.8
164,720 265,198 36.1
191,172 260,74 54.2
108,817 141,530 48.2
15,060 20,394 27.6
91,615 153,173 34.9
160,797 229,314 37.4
110,008 191,17 3T4
213,974 278,717 45.4
230,742 372,844 35.9
123,556 179,915• 35.7
158.354 235,91 43.8
139,025 172,261 71.6
148,106 195,76 50.3
294,286 377,85 40.9
213,947 353,277 36.5
213,269 340,085 30.8
119,961 188,203 33.2
96,425 154,19• 36.1
3,203,702
Region <1 1 - 2.9 3-99 10 - 19.9
Dodoma 1,833 1,530 25,388 33,506Arusha 2,021 6,411 33,116 28,246Kilimanja 4,405 21,822 68,858 57,744Tanga 1,560 7,550 34,383 56,986Morogoro 4,244 5,825 31,879 27,626Pwani 677 2,075 9,000. 20,960Dar es Sa 282 178 1,738 3,136
Lindi 2,466 2,350 17,904 38,839Mtwara 1,223 161 24,502 42,631Ruvuma 4,172 7,708 29,026 40,261Iringa 972 2,447 28,578 32,746Mbeya 2,524 12,287 49,498 77,793Singida 812 1,944 23,136 30,467Tabora 3,071 1,443 26,388 46,661Rukwa 392 767 10,732 21,344
Kigoma 2,376 4,741 21,250 19,292Shinyanga 1,784 3,765 27,740 50,283Kagera 2,773 17,859 52,893 65,805
Mwanza 5,704 7,177 50,952 62,983Mara 486 1,497 20,746 45,513Manyara 2,622 3,517 17,618 34,012
Total 46,400 13,053 605,326 836,834
Distance (Kilometer) to Hospital
4,805,315 40.2
TotalAbove 20
Appendix II - Access to Services 23
33.3 ACCESS TO SERVICES: Number of Agricultural Households by Distance to Health Clinic and Region, 2002103Agricultural Year
Distance (Kilometer) to Health Clinic Mean DistanceRegion < 1 1 - 2.9 3 - 9 9 10 19.9 Above 20 Total
Dodoma 39,235 93,351 126,377 44.731 20,025 323,719 7.4.Arusha 14,018 33,622 77,139 17,150 12,928...,. 1 ,857 7.6
Kilimanja 30,189 93,941 85,437 4,377 2,273 216,215 3.8.._, Tanga 23,734 64,679 131,644 36,101 1.2,040 265.198 6.4
Morogoro 29.527 61,252 117,819 35,727 16,421 260,746 7.4
Pwani 19,399 31,310 59,221 22,500 9,100 141,530 7.0
Dar es Sa 2,100 6,194 10,722 1,141 237 20,394 5.3
Lindi 27.604 39.793 59,883 18,321 7,573 153,173 6.2
Mtwara 56,318 35,458 109,024 24,075 4.439 229,314 5.4
Ruvuma 33,396 50,790 74,107 23.745 9,137 191.175 7.0
Iringa 30,611 58,734 114.966 51,073 23,333 278,717 8.1
Mbeya 41,626 85,598 191,793 39,226 14,602 372,844 5.6
Singida 16,929 39,790 92,403 17,146 13,648 179,915 6.8
Tabora 20,894 41,423 107.666 49,881 16,052 235,917 10.1
Rukwa 34.694 23.236 69.486 31.390 13,455 172,261 8.0
Kigoma 40,302 86,142 46,147 13,594 9,581 195,765 5.6
Shinyanga 22,293 73.393 207,436 52,519 22,216 377,857 7.7
Kagera 17,881 79,306 170,421 63,978 21,691 353,277 7.5
Mwanza 38,510 91,761 174,370 28,172 7,271 340,085 6.0
Mara 12.389 51,160 101,369 18,857 4.429 188.203 7.1
Manyara 11,678 30,406 70,369 32,018 9,724 154,194 8.4
Total 563,327 1,171,338 2,197,799 624,720 248,174 4,805,35 6.9
33,4 ACCESS TO SERVICES: Number of Agricultural Households by Distance to Hospitaland Region, 2002103 Agricultural Year
Tanzania Agriculture Sample Census - 2003

x 11 - Access to Services 124
33.5 ACCESS TO SERVICES: Number of Agricultural Households by Distance to District Capital and Region, 2002103Agricultural Year
Distance (Kilometer) to District CapitalMean Distance
<1 1 - 2.9 3 - 99 10 - 19.9 Above 20 TotalRegionDodoma 956 445 10,418 23,800 288,100 323,719 54.4Arusha 1,046 1,495 21,281 17,376 113,659 154,85 57,0Kiiimanja 939 2,922 42,019 61,894 108,356 216,130 24.8Tanga 1,049 997 23,774 37,377 202,00 265,198 46.7Morogoro 1,104 2,563 12,942 7,842 236,295 260,746 81.6Pwani 440 1,574 5,565 18,795 115,15 141,530 56.9Dar es Sa 84 17 480 3,417 16,397 20,394 29.4Lindi 523 1,746 10,462 27.646 112,795 153,17 50.2Mtwara
-._ .629 161 20,163
....42,830
..._ ._......165,531 229.314 37.
Ruvuma 187 3,936 15,225 29,389 142,438 191,17 50.2lringa 1,151 885 13,910 21,800 240,971 278,717 56.5Mbeya 2,888 4,787 29,909 66,387 268,874 372,844 46.0Singida 520 183 8,821 12,765 157,625 179.915 52.1'Tabora 585 219 17,784 30,254 187,074 235,917 54.4Rukwa 432 713 7,429 18,552 145,134 172,261 75.1Kigoma 1,161 1,672 10,628 18,818 163,48 195,761 54.3Shinyanga 1,213 2,329 21,699 49,916 302,701 377,857 39.3Kagera 1,015 3,601 21,741 41,530 285,39 353,277 49.9Mwanza 2,772 952 26,653 51,187 258,521 340,085 36.0Mara 362
-._ ...... ...337 12,229 26,734 148,541 188,203
. ........_41.6
Manyare 1,207 1,721 8,714 27,539 115,014 154,194 47.Total 20,265 33,253 341,847 635,847 3,774,059 4,805,272 49.7
33.6 ACCESS TO SERVICES: Number of Agricultural Households by Distance to RegionalCapital and Region, 2002103 Agricultural Year
Distance (Kilometer) to Regional CapitalMean plstance
Region < 1 1 -2.9 3 - 9 9 10- 19.9 Above 20 TotalDodoma 1,911 1,055 4,821 10,370 305,561 323,719 113.2Arusha 2,169 412 9,930 19,314 123,032 154,857 111.9Kilimanja 1,591 1,109 22,004 34,558 156,867 216,130 52.7Tanga 2,047 345 2,414 5,662 254,730 265,198 131.1
Morogoro 2,270..
149 1,573 3,052.. _..
253,702..... - _
260,746 161.1Pwani 303 412 540 4,249 136,026 141,530 130.0Dares Sa 46 72 391 3,041 16,84 20,394 32.2Lindi 552 35 2,572 5,915 144,10 153,173 137.1Mtwara 870 0 3,375 4,422 220,646 229,314 150.1Ruvuma 1,095 505 5,102 8,306 176,168 191,17 142.5iringa 965 183 5,104 11,471 260,995 278,717 169.8Mbeya
1,246 198 4,899 14,223 352,27 372,84 97.6Singida 1,282 281 6,370 7,737 164,245 179,915 84.7Tabora 1,729 203 3,721 6,595 223,66 235,917 113.Rukwa 196 0 4,798 6,263 161,003 172,261 155.5Kigoma 518 0 3,256 5,027 186,965 195,765 129.1
Shinyanga 4,877 1,058 6,022 1 3,432 352,468 377,857 130.6Kagera 866 875 6,383 12,814 332,339 353,277 158.2Mwanza 3,224 407 7,081 9,457 319,915 340,085 88.3
Mara 724 221 1,340 12,620 173, 298 188 ,203 80.7Manyara 5,808 205 2,845 9,870 135,466 154,194 131.3Total 34,289 7,724 104,540 208,399 4,450,321 4,805,272 123.3
Tanzania Agriculture Sample Census - 2003

Appendix II - Access to Services 125
33.7 ACCESS TO SERVICES: Number of Agricultural Households by Distance to Feeder Road and Region, 202103Agricultural Year
Region
Distance (Kilometer) to Feeder RoadMean Distance
I - 2.9 3-99 10- 19-9 Above 20 Tata(
Dodoma 173,165 95,252 47,358 4,011 3,933 323,719 2,7
Arusha 105,536 32,588 11,582 3,735 1,41 154,85 1.7Kilimanja 173;682 37,529 3,259 641 1,062 216,17 1.4Tanga 167,7 67,4 26,750 2,764 47. 265,19: 1.Morogoro 175 ,053 52,422 27,519 4,287 1,465 260,746 1.7Pwani 94,006 36,050 8,684 1,157 1,632 141,530 1.3Dar es Sa 14,009 4,572 1,813 0 1 20,39. 0.;Lindi 102,822 36,788 12,142 653 769 153,173 1.5Mtwara 194.457 23,532 9,941 0 1,384 229,314 0.8Ruvuma 133,962 34 045 15,914 3,488 3,766 191,175 2..Iringa 199,012 58,948 18,186 1,050 1,521 278,717 1.7Mbeya 277.141 69,593 22,581 1,920 1,610 372,844 1.1Singida 72,882 70,750 33,358 1,528 1,397 179,915 2.0Tabora 115,910 69,435 41,213 6,205 3,1 235,917 3.1'Rukwa 122,639 27,690 18,242 3,333 357 172,261 1.1Kigorna 120,565 60.784 7,600 5,429 1,38; 195,765 2,1Shinyanga 167,236 134,517 65,849 9,226 1,029 377,857 2. AKagera 187,257 111,572 49,991 3,223 1,234 353,277 1.7Mwanza 206,111 99,595 32,529 239 1,610 340,085 1.3Mara 104,598 57,377 25,755 279 194 188,203 1.3Manyara 93,470 45,471 11,878 2,600 77 154,19. 1.Total 3,001,277 1,225,955 492,144 55,768 30,171
33.8 ACCESS TO SERVICES: Number of Agricultural Households by Distance to All WeatherRoad and Region, 2002103 Agricultural Year
Distance (Kilometer) to ALL Wealther RoadMean Distance
Region <1 1 - 2,9 3-99 10 - 19.9 Above 20 Total
Dodoma 103,622 80,145 72,473 27,409 40,071 323,719Arusha 73,682 36,935 27,186 6,955 10,098 154,857 7.5Kilimanja 125,808 54,014 28,928 4,911 2,555 216,216 2.1Tanga 107,852 55,298 70,187 18,902 12,959 265,198 5,8Morogoro 120,303 48,048 54,510 14,758 23,126 260,746 5.5Pwani 71,594 28,644 26,088 9,170 6,035 141,530 4.2Dar es Sa 9,603 6,445 3,920 83 343 20,394 2.0Lindi 74,012 29,651 23,629 12,470 13,412 153,173 6.4_ . Mtwara 127,514 38,385 44,329 15,846 3,239 229,314 3.4Ruvuma 98,892 28,269 24,271 15,564 24,179 191,175 9.7lringa 139,325 57,949 45,702 17,870 17,870 278,717 5.2Mbeya 201,459 73,428 68,178 23,640 6,139 372,844 3,1Singida 3 45,159 44,271 62,714 14,420 13,351 179,915 6.0Tabora 54,498 46,830 68,036 33,157 33,397 235,917 14.1Rukwa 86,191 23,957 31,816 15,709 14,587 172,261 5.0Kigoma 69,029 46,604 41,699 6,702 31,732 195,765 9,0Shinyanga 89,001 96,751 125,522 40,994 25,590 377,857 7.1. .Kagera 111,296 105,444 103,569 28,655 4,312 353,277 3.8Mwanza 133,363 86,043 77,976 28,687 14015 340,085 4.2Mara 70,213 55,334 51,048 6,806 4,802 188,203 3,2Manyara 40,867 47,330 39,811 17,254 8,933 154,194 5,5Total 1,953,282 1,089,775 1,091,590 359,964 310,746 4,805,358 5.8
Tanzania Agriculture Sample Census - 2003

A end^x TI -Access to Services 126
33.9 ACCESS TO SERVICES: Number of Agricultural Households by Distance to Tarmac Road and Region, 2002/03Agricultural Year
Distance (Kilometer) to Tarmac RoadMean Distance
Region < 1 1 - 2.9 3 - 99 10- 19.9 Above 20 TotalDodoma 11,573 7,901 22,750 25,948 255,547 323,71 85.8Arusha 9,550 15,369 48 815 11,863 69.260 154,857 49.2Kilimanja 16,750 24,271 58,384 42,947 73,821 216,173 18.Tanga 15,054 15,034 37,664 30,254 167,192 265,19 38.Morogoro 13,822 8,210 ...-.22,755 ..__.^-23,573 ... 192,305 260,746 69.Pwarii 14,628 11.371 32,153 23,403 59,974 - 141,530 31.5
Dares Se 2,307 2,133 8,198 5,288 2,468 20.394 9.9Lindi 10,493 5,454 12,809 10,163 114,234 153,17 56.Mtwara 18,749 5,864 16,756 29,587 158,357 229,314 49.0Ruvuma 9,362 4,548 9,838 9,607 157,821 191,175 125.5Iringa 17,393 9,370 34,400 36,551 181,002 278,717 45.4MSeya 26,607 21,339 69,086 55,348 200,464 372,844 37.1---Singida 56,597 662 1,512 1,073 120,071 179,915 154.6
Tabora 41,434 433 5,824 3,250 184,976 235,917 88.4Rukwa 1,155 -132 4,324 5,840 160, 509 172,261 185.2Ki oma9 34,603 2,340 4,242 646 153,934 195,76 87,0Shinyanga 20,585 13,898 34,734 37,271 271,370 377,857 68.3
Kagera 10,903 12,996 45,226 28,388 255,765 353,277 62.9Mwanza 24,294 14,094 48,102 30,043 223,551 340,085 52.3Mara 7,400 7,151 23 710 34,394 115,548 188,203 39.6Manyara 25,945 933 1,342 2,364 123,610 154,194 101.7
Total 389,204 153,504 542,624 447,822 3,242,161 4,805,315 68.5
33.1'1 ACCESS TO SERVICES., Number of Agricultural Households by Distance to PrimaryiviarKet ana Region, 1OU2/o3 Agricultural Year
Distance (Kilometer) to Primary MarketMean Distance
Region <1 1 -2.9 3 - 99 10 - 19.9 Above 20 TotalDodoma 67,090 44,359 108,142 64,713 39,414 323,719 9.5Arusha 12,033 18,523 75,627 27,660 21,013 154,657 10.6Kifiman'a1 22,549 57,146 111,523 18,334 6,620 216,173 6.Tanga 40,438 49,948 95,703 46,569 32,540 265,198 9.1Morogoro 35,499 31,046 89,479 46,707 58,015 260,746 19.7Fvrani 20,572 21,108 38,989 23,689 37,171 141,530 17.4Dares Se 6,886 2,061 7,717 1,630 2,100 20,394 7.6Lind' 49,710 42,450 25,863 22,773 12,378 153,173 11.2Mtwara 148,347 32,413 28,421 8,879 11,254 229,314 4.6Suvunm 46,164 31,504 62,382 32,110 19,015 191,175 8,4Irin9a 42,737 24,403 74,712 75,529 61,336 278,717 15.9MSeya
52,126 64,632 162,870 64.838 28,378 372,844 8.7Singida 35,253 24,465 80,593 17,628 21,977 179,915 7.7Tabora 26,723
..29,357
. , _.._._.102,643 47,745 29,449 235,917 11.8
Rukwa 36,844 24,373 36,192 33,513 41,338 172,261 16.3
Kigoma 52,539 62,635 50,094 13,038 17,460 195,766 6.1Shinyanga 27,176 51,760 191,985 73,835 23,102 377,857 7.9Kagera 30,320 79,752 187,745 45,852 9,609 353,277 6.1Mwanza 48,966 86,121 162,103 35,604 7,291 340,08 5.Mara 22,080 50,904 84,664 24,814 5,541 158,203 6.0Manyare 36,141 17,702 34,740 47,761 17,851 154,194 10.Tota l 860,192 856,662 1,812,386 773,223 502,852 4,805,315 9-6
Tanzania Agriculture Sample Census - 2003

Appendix II - Access to Services 127
33.11 ACCESS TO SERVICES: Number of Agricultural Households by Distance to Secondary Market and Region,2002103 Agricultural Year
33.11 ACCESS TO SERVICES: Number of Agricultural Households by Distance to SecondaryMarket and Region, 2002/03 Agricultural Year
Distance (Kilometer) to Secondary Market Mean DistanceRegion < 1 1 - 2.9 3 - 9 9 10 - 19.9 Above 20 Total
Dodoma 16,678 35.155 124,942 98,358 48,587 323,71 11.6
Arusha 6,120 10,739 64,637 32,520 40,841 154,857 18.6
Kilimanja 15,692 4,398 44,845 61,357 89,881 216,173 22.0
Tanga 22,243 13,466 38,248 67,183 124,058 265,198 28.3
Morogoro 22,360 18,556 68,713 59,634 91,482 260,7461 28.8
Pwani 12,216 7,386 31,839 24,459 65,630 141,530 31.1
Dar es Sa 6,079 1,163 2,998 6,896 3,260 20,394 1.1.1
Lind 29,382 8,111 9,719 13,118 92,843 153,173 24.8
Mtwara 115,158 16,574 12,918 45,640 39,024 229,314 15.9
Ruvuma 28,146 2,563 12,979 18,425 129,063 191,175 35.8
lringa 32,420 19,370 59,116 48,378 119,432 278,717 27.2
Mbeya 35,234 34,487 89,632 129,324 84,167 372,844 18.8
Singida 11,228 10,850 83,849 43,983 30,005 179,915 11.6
Tabora 8,048 15,068 66,176 64,487 82,137 235,917 20.1.
Rukwa 14,184 9,443 41,510 42,195 64,928 172,261 22.4
Kigoma 50,140 7,706 4,792 90,929 42,197 195,765 18.4
Shinyanga 8,347 22,637 111,380 119,751 115,742 377,857 16.5
Kagera 32,112 4,560 29,129 34,782 252,694 353,277 36.8
Mwania 15,695 12,735 85,714 94,327 131,613 340,085 21.1
Mara 4,754 10,166 78,711 61,602 32,970 188,203 13.4
Manyara 7,750 18,190 55,643 45,681 26,930 154,194 12.1
Total 493,987 283,323 1,117,492 1,203,028 1,707,485 4,805,315 21.8
33.12 ACCESS TO SERVICES: Number of Agricultural Households by Distance to TertiaryMarket and Region, 2002/03 Agricultural Year
RegionMean Distance
Dodoma 13,344 6,912 54..
Arusha 4,444 3,177 62.6
Kilimanja 12,881 2,584 28.6
Tanga 6,055 9,569 31.9
Morogoro 20,575 . 12,343 1 47.7
Pwani 7,24 5,757 64.4
Dar es Sa 835 65 t t 27.8
Lindi 14,062 12,207 38.7Mtwara 28,098 6,837 34.:Ruvuma 8,597 4,773 44.•
lringa 4,906 1,046 50.4
Mbeya 19,790 26,461 26.9Singida 9,629 3,129 42.2
Tabora 8,359 5,576 tt t 42.6
Rukwa 3,100 3,191 65
Kigoma 13.337 8,66 26,1Shinyanga 5,722 12,274 t 34.
Kagera 4,664 11,992 38.•
Mwanza 11,106 16,296 41.4
Mara 2,098 3,992 36.8Manyara 17,100 3,100 36.9
Total 215,943 159,937 41.2
Tanzania Agriculture Sample Census - 2003

II - Access to Services 128
33.13 ACCESS TO LIVESTOCK STRUCTURES: Number of Agricultural Households by Distance to Veterinary Clinic andRegion, 2002103 Agricultural Year
33.13 ACCESS TO LIVESTOCK STRUCTURES: Number of Agricultural Households by Distance to Veterinary Clinicand Region, 2002103 Agricultural Year
Distance (Kilometer) to Veterinary Clinic Mean DistanceRegion <5 5 - 9 10 - 14 15 - 19 20 - 29 30 - 49 50+ TotalDodoma 18,774 13,200 13,805 10,802 18,285 35,786 195,529 306,180 86.0Arusha 4,183 20,412 14,199 11,541 30,288 24,227 34,49 139,34 39.7K€liman'a 17,618 21,631 17,945 23,825 55,026 25,666 32.92 194,639 27.3Tanga 2,995 23,680 20,678 20,192 30,810 66,612 83,356 248,324 45,2Morogoro 16,297 9,445 5,487 9,358 18,518 32,290 162,230 253,624 91.1Pwani 1,677 1,958 2,820 3901 8,230 15,650 104,22 138,461 100.7Dares Sa 113 2,135 2.700 2,840 4,120 6.089 1,54 19,542 25.0Lind
......._ 2,744 2,359 3,951 6,500 5,737 10,443 120,616 152,350 162.5__^...... "..Mtwara 10,841
-- ......_ .....7,592
_^_ .... _.5,225
_3,569 8,988 20,778 170,491 227,48 120._.._ --Ruvuma
._...7,340 5,660 6,425 5,547 17,014 21,139
-- _ .......125,76
._..._...188,88 53,0
iringa 4,257 9,837 4,721 9551 16,960 49,630 180,968 275,923 109.Mbeya 3,478 26030 36948 17,993 46281 68,411 157,77 356,920 53.5Singida 47,368 165 143 43 0 616 1,06 49,401 2.Tabora 4,207 18,328 20,687 10,525 27,808 64,431 82.20 228,193 48.7Rukwa 3,712 7,294 8,315 10,815 9,500 35,364 95.681 170,681 83.Kigoma 21,460 5,306 5,914 1,335,1 9,992 24,097 119,627 187,732 81.1Shinyanga 17,825
-......21,767 17,641 12,617
_._ . ...28,345 57,177
- .....211,33
_... _... ....366,709 80.
Kagera 6,122 39.271 37,712 27,133 36,746 66,787 112,117 325,887 44.2Mwastza 13,659 36,718 25,648 22,817 42,285 97,152 88 ,576 326, 856 35.8Mara 1,711 8,640 10,107 17,152 26,389 61085 59,51 184,603 40.Manyara 9,182 7,644 13,298 7,699 11,350 58,454 41,66 149,289 48.3Total 215,563 289,071 274,368 235,756 452,670 841,885 2,181,71 4,491,029 66.
33.14 ACCESS TO LIVESTOCK STRUCTURES: Number of Agricultural Households by Distance to Extension Center
Distance (Kilometer) to Extension Center Mean DistanceRegion <5 5 - 9 10 - 14 15 - 19 20 - 29 30 - 49 50+ TotalDodoma 27,791 37,711 28,043 20,223 33,684 20,854 52,52 220,83 28.7Arusha 5,769 37,420 15,347 9,471 19, 197 11,435 12,03 110,67 20.Kilimanja 15,546 52,508 6,281 11,343 9,665 3 ,240 4,89 103,47 9.Tanga 11,629 48,224 33,373 22,217 20,581 34,008 41,711 211,743 27.0Morogoro 35,184 50,011 24,530 8,489 17,365 14,758 32,890 183,236 22.Pwani 10,803 11,376 10,302 7,167 10,780 16,990 46,889 114,30 40,Dares Sa 514 4,157 2,611 1,038 1,777 1,771 31 12,187 10.8Lindi 8,329 15,632 11,213 11,600 12,088 22,840 56,217 137,919 54.Mtwara 10 ,450 34,639 29,092 13,501 35,944 44,449 45,859 213,93 31.Ruvuma 14,262 23,202 19,866 18,082 21,390 12,883 28,988 138,672 22.3Iringa 8,360 25,482 17,931 13,816 23,518 67,347 94,424 250,87 47.1Mbeya 15,188 47,707 39,713 27,374 26,902 56,384 82,814 296,081 33,Singiida 49,097 244 123 266 0 371 488 50,589 2.1Tabora 11,024 59,594 30,570 19,834 18,427 16,295 14,255 169,99 16.3Rukwa 7,861 13,934 11,746 7,351 5,045 15,774 97,85 159,564 164.Kigoma 16,150 8,456 7,473 1,712 14,362 74,863 52,13 175,15 49.3Shinyanga 12,294 35,225 23,312 22,048 41,962 79,937 1 38,71 353,493 51.Kagera 5,009 74,393 66,191 61,901 38,508 35,743 18,11 299,859 17.Mwanza 16,815 66,218 36,558 24,126 57 ,21 0 33,054 50,541 284,521 24.9Mara 1,875 13,123 9,377 10,065 17,468 41,674 87,267 80,849 52,4Manyara 14,352 15,152 15,153 7,350 35,269 15,099 22,04 124,424 28-Total 298,301 674,406 438,806 318,974 461,141 619,766 980,991 3,792,384 35.3
Tanzania Agriculture Sample Census - 2003

Appendix II - Access to Services 129
33.15 ACCESS TO STRCTURES: Number of Agricultural Households by Distance to Tarmac Research Station andRegion, 2002103 Agricultural Year
Distance (Kilometer) to Research Station Mean Distance
Region <5 5 - 9 10 -14 15 -19 20 -29 30 49 50 + Total
Dodoma 7,649 6,451 5,187 12,609 6,497 30,957 248,854 318,205 144.1Arusha 3,568 5,077 20,031 7.408 19,289 16,872 79,367 151,612 107.8Kilimanp 16,041 7,690 14.169 8,332 11,101 28.025 125,689 211,047 68.7Tanga 3,066 3.583 4,797 4,972 13.306 19,415 214,362 263,499 117.7Morogoro 14,298 9,779 5,349 9.612 9,927 19,792 187,294 256,052 91.2Pwani 932 1,817 1,718 5,843 10,016 16,066 103,883 140.276 109.8Dar es Sa 1,904 1.597 1,740 1,132 4,992 7,319 1,506 20,189 25.6Lindi 1.218 2,496 4,881 4,220 5,165 10,480 122,121 150,581 168.3Mara 632 2,639 1,057 2,582 4,614 13,546 202,939 228,010 151.5Ruvuma 4,617 9,598 5,657 7,643 15,417 23,783 118.152 185,867 156.5ringa 37,616 4,221 5,644 ._. 4,825 6,667 16.587 200,788 278,348 96.7
Mbeya 3,837 15,155 5,768 10,348 25,845 38,866 267,641 367,460 89.5Singida 48,174 0 0 0 268 125 496 49,063 3.2Tabora 5.880 5,558 3,201 4,766 7,462 15,665 . 192,052 234,583 111.9Rukwa . ..... 665 1,343 5,378 5,547 1,578 13,648 143,262 171,420 314.0Kigoma 23,927 223 197 0 0 1,195 170,026 195,568 322.2Shinyanga 9.584 992 1,019 258 1,355 4,219 360,030 377,457 216.8Kagera 4,181 8,166 5,069 4,356 12,688 23,930 288,804 347,194 140.0Mwanza 8,802 9,198 3,759 4,997 11,053 34,718 264,672 337,201 90.9Mara 769 287 391 0 473 634 185,648 188,203 295.4Manyara 21,518 688 175 160 1,707 1.539 127,833 153,621 163.6Total 218,877 96,561 95,187 99,612 169.419 339,381 3,606,420 4,625,456 143.0
33.16 ACCESS TO LIVESTOCK STRUCTURES: Number of Agricultural Households by Distance to Plant ProtectionLab and Region, 2002!03 Agricultural Year
RegionDistance (Kilometer) to Plant Protection Lab Mean Distance
<5 5 - 9 • 10 -14 15 - 19 20 - 29 30 - 49 50 + Total
Dodoma 29,841 2,467 2,070 2,765 1,823 10,800 273,202 322,969 139.2Arusha 4,388 8,341 13,067 6,093 18,393 26,626 76,613 153,521' 108Kilimanja _. . . 17,863 7,203 12,500 8,843 8,094 23,124 134,090 211,71a 73.•
_ ..
Tanga 5,872 5,200 3,048 4,963 10,946 24,506 210,077 264.610 122.7Morogoro 15,338 8,131 4,611 6,184 7,224 22,715 192,958 267,160 90.'Pwani 501 673 1,864 2,512 7,723 12,761 114,536 140,570 129.Dar es Sa 2,040 1,081 2,082 1,669 5,336 6,562 1,610 20,381 26.8
lLindi 1,725 939 - 1,200 956 2,022 3,938 142,394 153,173 200.Mtwara 1,484 2,571 1,028 2,587 4,448 12,913 203,013 228,043 152.6_. .Ruvuma 12,602 0 187 76 333 500 177,238 190,936 331.4_...._.Iringa 48,685 5,441 1,834 1,394 6,896 16,062 198,171 278,484 92.Mbeya 5,543 6,626 3,596 3,984 13,509 31,322 306,702. 371,282 102.Singida 47,901 0 0 0 0 618 863 49,382 4,0Tabora 20,025 1,097 872 878 3,045 13,909 195,681 235,507 224.4Rukwa 616 34 548 2,007 482 9,933 158,640 172,261 387.3Kigoma 24,714 102 34 133 33 1,393 169,253 195,663
_ ...
312. ....Shinyanga
„9,878 1,200 711 0 1,513 4,488 359,592 377,383 214.4
Kagera. 6,154 4,887 4,237 4,202 12,297 20,869 296,437 349,082 145.Mwanza 9,470. 8,467 2,107 3,142 11,424 34,501 268,565 337.695 91.8Mara 418 0 78 284 113 - 481 186,699 188,073 296.Manyara 22,203 117 172 68 1,603 2,295 127,567 154,026 207.Total 287,263 64,598 55,846 52,738 117,257 280,316 3,793,902, 4,651,919 162.
Tanzania Agriculture Sample Census - 2003

Appendix IT-Access to Services 130
33.17 ACCESS TO LIVESTOCK STRUCTURES: Number of Agricultural Households by Distance to Land RegistrationOffice and Region, 2002103 Agricultural Year
Distance (Kilometer) to Land Registration OfficeMean Distance
<5 5 - 9 10 - 14 15 - 19 20 -29 30 - 49 50 + TotalRegion
Dodonia 2,715 8,242 11,721 11,547 34,664 92,073 161,69 322,659 55.6
Arusha 3,230 10.752 8,105 14,732 32,062 28,024 53,41 150,321 56.4Kilimanja 7,264 25,935 23,279 33,645 61.949 40,584 17,73 210,385 25.3Tanga 524 17,377 21,951 18,621 30,253 75,840 94,973 259,539 48.4
Morogoro 9,890 6.272 5,428 4,973 15,615 37,729 174,936 254,842 83.Pwani 451 4,111 8,713 10,353 17,958 22,030 75,181 54.5
Dar es Se 210 234 1,028 1,876 6.993 8,549 1,457 20,347 29.6Lindi 1,847 8,379 9,562 17,335 14,412 33.947 63,996 149471 522
Mtwara 1,310 18,877 27,197 15,959 42,149 58,404 64,419 228,314 38.Ruvuma 742 11,874 10,261 16,399 25,244 38,001 84,409 186,931 54.
lringa 2,053 12,536 7,913 12,316 21,931 65,871 153,240 275,860 54.Mbeya 1,308 24,140 37,850 27,407 55,275 80,612 133,995 360,58 47.0Singida 2,148 7,838 9,298 4,630 19,116 50,179 85,720 178,930 52.3Tabora 1,618 12,480 20,566 9,224 27,413 62,617 97,928 231,848 54.1
Rukwa 512 7,100 7.834 1 0239 9,491 32,879 102,970 171,024 75.4Kigoma 12,590 8,464 10,850 2,569 15,311 41.704 101,683 193,171 55.3Shinyanga 5,935 13,589 20,916 21,095 58,741 142,115 111,401 373,792 41.9
Kagera 639 12,641 23,119 17,643 47,298 76,087 164,290 711 50.3Mwanza 4.775 21,846 22,448 24,441 55,615 120,947 84,804 334,87 36.2Mara 701 9,995 8,368 17,271 27,160 60,164 64,015 187,67 43.Manyara 4,769 7,445 11,644 8,094 14,049 57,082 47,24 150,327 49.4Total 65,231 250,128 :308,053 300,370 632,697 1,225,438 1,939,50 4,721,424 50.5
33.18 ACCESS TO LIVESTOCK STRUCTURES: Number of Agricultural Households by Distance to LivestockDevelopment Center
Distance (Kilometer) to Livestock Development CenterMean Distance
RegionRegion <5 5 - 9 10 - 14 15 - 19 20-29 30-49 50+ Total
Dodoma 10,062 4,296 4,055 7,916 16,941 29,004 249,691 321,965 142,8Arusha 5,719 21,116 11,164 9,547 17,258 26,090 56,598 147,49 73.Kilimanja 11,569 17,476 10,951 11,101 12,432 20,369 103,00 186,901 62.7Tanga 2,498 9,269 7,949 14,913 13,059 36,830 172,56 257,08 93.1Morogoro 19,597 5,470 1,783 4,487 8,459 22,938 192,016 254,750 118.4Pwani 3,213 1,402 4,119 5,580 6,591 10,618 104,724 138,247 117.1
Dares Se 2,005 275 1,492 1,865 6,560 6,644 1,447 20,288 26.8Lindi 1,753 2548 2,280 3848 42+19 10,619 126,188 151,486 165.6Mtwara 4,700 4,224 755 11,524 15,132 46,732 145,353 228,419 75.9
Ruvuma 15,240 5,479 3,101 9,220 15,224 104,699 36,60 189,572 43.Irings 35,580 11,671 2,613 9,165 13,452 34,349 167,46 274,296 84.2Mbeya 20,637 12,912 11,161 8,759 25,428 36,180 251,052 366,128 80.Singida 46,965 2,292 2,571 5,716 2,077 83,590 35,788 179,000 39,6Tabora 24,719 11,113 5,349 3,450 11,301 23,943 149,743 229,618 1207.Rukwa 1,097 4,206 5,772 5,861 10,072 23,872 120,406 171,257 223.7
Kigoma 20,702 1,920 356 0 1,019 . 8,765 163,00 195,765 274.Shinyanga 26,320 25,205 22,181 15,917 15,871 21,578 240,972 368,045 102.Kagera 6,988 52,736 38,101 28,784 38,301 63,011 89,287 317,209 45.Mwanza 15,870 25,392 13,082 13,340 21,302 28,646 208,061 325,694 71.2Mara 4,819 8,110 7,284 6,658 15,301 41,742 103,839 187,753 55.9Manyara 20,353 3,311 6,079 2,667 3,964 8,309 106,07 150,75 114.Total 300,405 230,42.1 162,198 180,321 275,993 688,530 2,823,891 4,661,758 100.7
Tanzania Agriculture Sample Census - 2003

Appendix II - Access to Services 131
3119 ACCESS TO SERVICES: Mean Distances to Services by Type of Service and Region
RegionPrimary
SchoolSecondary
SchoolHealthClinic Hospital
DistrictCapital
RegionalCapital
FeederRoad
AllWeatherRoad
TarmacRoad
PrimaryMarket
SecondaryMarket
Tertia ry
MarketVetClinic
ExtensionCentre
ResearchStation
Plant
Protection
LandRegistrationOffice
LivestockDe vCentre
Rukwa 2.1 25.1 8.0 71.6 75,1 155.5 1.1 5.0 185.2 16.3 22.4 65.5 83.5 164.8 314.0 387.3 75.4 223.7Kigoma 1.5 22.3 5.6 50.3 54.3 129.1 2.0 9.0 87.0 6.1 18.4 26.1 81.1 49.3 322.2 312.5 55.3 274.5Lindi 2.3 28.7 6.2 34.9 50.2 137.1 1. 5 6.4 56.6 11.2 24.8 38.7 162.5 54.5 168.3 200.4 52.2 165.6Ruvuma 2.1 16.0 7.0 37.4 50.2 142.5 2.4 9.7 125.5 8.4 35.8 44.6 53.0 22.3 156.5 331.4 54.3 43.6Shinyanga 2.4 18.6 7.7 40.9 39.3 130.6 2.2 7.1 68.3 7.9 16.5 34.2 80.8 51.4 216.8 214.4 41.9 102.8Mara 2.5 10.8 7.1 33.2 41,6 80.7 1.3 3.2 39.6 6.0 13.4 36.8 40.7 52.4 295.4 296.8 43.8 55,9Manyara 3.1 21.7 8.4 36.1 47.4 , 131.3 1.5 5.5 101.7 10.5 12.1 36.9 48.3 28.9 163.6 207.5 49.4 114.8Dodoma 3.2 20.4 7.4 49.3 54.4 113.2 2.7 7.4 85.8 9.5 11.6 54.6 86.0 28.7 144.1 139.2 55.6 142.8
Tabora 4.0 27.0 10.1 43.8 54.4 113.3 3.0 14.1 88.4 11.8 20.1 42.6 48.7 16.3 111.9 224.4 54.1 120.7
Morogoro 2.5 23.7 7.4 54.2 81.6 161.1 1.7 5.5 69.8 19.7 28.8 47.7 91.1 22.9 91.2 90.4 83.6 118.4
Pwani 2.4 23.7 7.0 48.2 56.9 130.0 1.3 4.2 31.5 17.4 31.1 64.4 100.7 40.5 109.8 129.4 54.5 117.1
Iringa 2.8 17.1 8.1 45.4 56.5 169.8 1.7 5.2 45.4 15.9 27.2 50.4 109.4 47.1 96.7 92.2.... 54.3 84.2
Mtwara 1.2 16.0 5.4 37.4 37.6 150.1 0.8 3.4 49.0 4.6 15.9 34.8 120.2 31.5 151.5 152.6 38.3 75.9
Kagera 2.6 15.8 7.5 36.5 49.9 158.2 1.7 3.8 62.9 6.1 36.8 38.9 44.2 17.5 140.0 145.5 50.3 45.7Tanga 2.2 16.5 6.4 36.1 46.7 131.1 1.5 5.8 38.0 9.1 28.3 31.9 45.2 27.0 117.7 122.7 48.4 93.1Amsha
..... 3.2 18.5 7.6 36.9 57.0 111.9 1.7 7.5 49.2 10.6 16.6 62.6 39.7 20.4 107.8 108.2 56.4 73.4Mbeya 3.2 14.4 5.6 35.9 46.0 97.6 1.1 3.1 37.1 8.7 18.8 26.9 53.5 33.2 89.5 102.5 47.0 80.5Mwanza 2.5 12.6 6.0 30.8 36.0 88.3 1.3 4.2 52.3 5.3 21.1 41.4 35.8 24.9 90.9 91.8 36.2 71.2Singida 3.0 18.2 6.8 35.7 52.6 84.7 2.0 6.6 154.6 7.7 11.6 42.2 2.7 2.1 3.2L 4.0 52.3 39.6Kilimanjaro 1.5 4.3 3.8 16.8 24.8 52.7 1.4 2.1 18.7 6.0 22.0 28.6 27.3 9.8 68.7 73.4 25.3 62.7Dar es Salaam 2.7 14.8 5.3 27.6 29.4 32.2 0.8 2.0 9.9 7.6 11.1 27.8 25.0 10.8 25.6 26.8 29.6 26.8Total 2.5 18.0 6.9 402 49.7 123.3 .7 5.8 68.5 9.6 21.8 41.2 66.4 35.3 143.0 162.0 50.5 100.7
Tanzania Agriculture Sample Census

Appendix II Quality of Services 132
QUALITY OF SERVICES

Plant Protection Lab
9
4 25.7a 4.1
4
7a8
Total
9,1379,501
33.8118,414
24,5645,5002.0073,350
23,8043,557
10,96335,8592,246
19,0412,788.648
37,3749,938
31,82310,36213,535
306,2141,275
307,488
4
5
Poor
2,30614,1864,52
15,4381,437
9832,536
16,38871 1
2.81021,543
76411,7061,034,943
14,238
5,61011,7004,2623,410
142,3730
142,373
Type of Service 133
33.1 TYPE OF SERVICE: Number of Agriculture Households By Level of Satisfaction of using Plant Protection Lab andRegion During the 2002103 Agriculture Year
33.2 TYPE OF SERVICE: Num ber of Agriculture Households By Level of Satis faction of using ResearchStation and Region During the 2002103 Agriculture Year
Region Research StationVery Good •Good Average •Poor Very Poor Total
Dodoma 1,350 6.6 10,750 52.2 2732 13.3 5,172 25.1 597 20,601Arusha 932 9.6 3,481 35.8 1,651 17.0 2,552 26.2 1107 11. • 9,723Kilimanjaro 1,561 4.1 4,823 12.7 13857 36.6 13,816 36.5 3831 10.1 37,88Tanga 457 4.5 1,407 3.9 2088 20.7 5,059 50.1 10•5 10,: 10,10.Morogoro 26 0.1 4,695 17.3 2437 9.0 15,407 56. 4,523 16. 27,08:Pwani 348 6.1 940 16.5 962 16,9 1,237 21.7 2203 38.7 5,691Dar es Salaam 42 1.6 225 8.8 898 35.3 1,288 50.6 93 3.7 2,54.Lindi 49: 6. • 77 10.7 9.0 4,539 63.0 7 10. 7,20.MMara 1,477 5.6 1,332 5.0 4,••8 15.5 16,413 62.1 3103 11.7 26,423Ruuma 875 4.4 4,486 22.6 7,800 39.3 5,006 25.2 1689 8. 19,85.Iringa 380 2.7 6,545 47.2 2,474 17.8 2,81' 20. 165. 1 .• 13787•Mbeya .._ 2,365 5.9 6,179 15.3 5••3 14 21,851 54.2 418• 10.4 40,30Singida 424 63.0 0 0.0 • 0.0 249 37.0 • 0.0 674Tabora 404 1.9 939 4.5 808 3.9 13,670 65.2 5148 24 20796:,Rukwa
_ ....._78 2.0 338 8.7 862 22.3 1,204 3 1391 35,9 3,87
• 19 2.4 0 0.p 2049 25.9 5,335 67.5 332 4.4 7,90Shinyan•a 982 2.6 4,836 12.7 7,884 207 14,842 39.0 9,505 25,0 38,049Ka•era 838 5.8 2,857 19, 3,380 23.2 6,874 47.2 611 4. 14,561Mwanz
_ .
1,676 5.0 3,237 9.6 428. 12.8 13,097 39 0 11,2•0 33.. 33,58.Mara 35. 3.2 1,280 11.6 943 8.5 4,877 44.2 3,575 324 11,031Manyara 251 1.8 1,877 13.4 1913 13.7 3,360 24.0 6,606 47.2 14,007Mainland 15,542 61,0• 16,7 67.46' 158,66 43.4 63,2:. 365,95Zanzibar 294 708 55.83 266 20.95 0 0 0 0 1,268National 4.313 61.707 16.8 67,725 18.44 158,666 63,284 367,220
Tanzania Agriculture Sample Census - 2003

Type of Services 134
33.3 TYPE OF SERVICE: Number of Agriculture Households by Level of using Livestock Development Centre AndRegion During the 2002103 Agriculture Year
Region Livestock Dev CentreVery Good o /o Good % /o Average % Poor
tl /oVery Poor /a% Total
Dodoma 1,163 6.1 10,411 54.6 2,045 10.7 4.271 22.4 1,173 6.2 19,063Arusha 3 463 23.1 5,473 36.4 2,734 18.2 2,141 14,3 1,211 81 15,02Kilimanjaro 3,411 7.1 11,101 23.1 17,350 36.2 11,852 24.7 4,269 8.9 47.98Tanga 559 2.8 7,639 38.8 5,996 30.4 4,386 22.3 1,128 5. 19,70Morogoro 188 0.7 2,917 11.1 2,186 - 8.3 15,509 59.0 5,465 20.8 2.6,26Pwani 651 105 956 15.5 1,255 203 1,400 22.7 1,915 31.0 6,178Dares Salaam 14 0.7 179 84 702 33.0 1,021 48.0 210 9.9 2,12Lindi 672 19,5 298 8.6 158 4.6 2,138 61.9 188 5. 3,45Mtwara 510 2.1 1,244 5.2 4,296 18.1 14,734 62.0 2,978 12. 23,76Ruvuma 773 5.8 1,994 15.0 6,619 49.8 2,257 17.0 1,651 12.4 13,29rings 1,459 8-1 9,808 54.8 2,309 12.9 2,609 14.6 1,714 - 9. 17,898Mbeya 1,718 6.0 3 307 11.6 4,420 15.5 15,695 55.1 3,336 11. 28,47Singida 552 3.8 7,817 53.4 4,491 30.7 474 3.2 1,310 8.9 14,644Tabora 373 2,0 1,563 8.3 1,526 8.1 10,266 54.2 5,200 27.5 18,928Rukwa 0 0.0 925 22.2 1,341 32.1 1,191 28.6 713 17.1 4,170Kigoma 32 0.5 69 1.0 1,472 21.7 5,057 74.5 160 2.4 6,789Shinyanga 1 214 3.5 3,816 11.1 7,502 21.8 9,637 28.0 12,283 35.7 34,451Kagera 1,424 5.0 13,881 48.6 5,020 17.6 6,797 23.8 1,417 5.0 28,54Mwanza 879 2.6 5,021 14,7 6,523 19.0 12,340 36.0 9,502 27. 34,264Mara 2,605 18.4 3,414 24.1 2,788 19.7 1,679 11.9 3,674 25,9 14,16Manyara 597 2.9 4,196 20.7 4,716 23.3 4,007 19.8 6,729 33.2 20,24Mainland 22,257 5.6 96,028 24.0 85,448 21.4 129,463 32.4 66,224 16.6 399,42Zanzibar 269 13.4 1,171 58.4 565 28.2 0 0.0 0 0.0 2,005National 22,527 5.6 97,199 24.2 86,013 21.4 129,463 32.3 66,224 16.5 401,42
33.4 TYPE OF SERVICE: Number of Agriculture Households By Level of Satisfaction of using VeterinaryClinic and Region During the 2002/03 Agriculture Year
Region Vet ClinicVery Good % !o Good % /o Average %/o Poor a% Very Poor %/o Total
Dodoma 2,230 8.2 12,124 44.3 5,558 20.3 7,198 26.3 230 0.1 27,340Arusha 4,699 21.6 7,777 35.8 5,089 23.4 2,738 12.6 1,422 6,5 21,72Kilimanjaro 7,020 10.4 21,558 32.0 23,663 35.1 11,534 17.3 3,508 5.2 67,383Tanga 1,534 4.4 16,603 48.6 9,493 27.4 5,835 16.9 939 2.1 34,605Morogoro 359 1.4 2,364 9.2 1,846 7.2 16,195 63-4 4,800 18.8 25,56Pwani 262 4.8 908 16.5 646 11.8 1,495 27.2 2,183 39.7 5,49Dar es Salaam 214 6.1 1,314 37.7 1,034 28.7 894 25.7 29 0. 3,48Lindi 467 7.0 694 10.5 413 6.2 4,285 64.6 777 11.7 6,63Mtwara 865 3.9 964 4.3 5,762 25.6 11,762 52.4 3,112 13.9 22,46Ruvuma 820 5.7 4,461 31.0 5,893 40.9 2,040 14.2 1,181 8.2 14,394Iringa 3,387 12.8 9,466 35.9 7,265 27.5 3,832 14.5 2,446 9.3 26,39Mbeya 3,569 8.4 9,018 21.2 8,553 20.1 18,675 44.0 2,653 6.2 42,467Singida 597 38.7 0 0,0 210 13.6 620 40.2 115 7.4 1,542Tabora 1,147 4.4 5,191 20.0 3,278 12.6 10,706 41.2 5,642 21. 25,96Rukwa 269 4.1 2,171 33.0 1,440 21.9 1,111 16.9 1,582 24.1 6,57Kigoma 5,734 27.6 2,347 11.3 7,537 36.3 5,140 24.8 0 0. 20,75Shinyanga 2,299 4.6 7,174 14.4 8,470 17.0 20,029 40.3 11,785 23. 49,75Kagera 2,382 8.5 14,266 50.9 5,088 18.2 5,562 19.8 724 2.6 28,02M wanza 1 422 3.4 9,074 21.5 12,256 29.0 12,740 30.1 6,783 16.0 42,27Mara 2,80 5 15.8 3,467 19.5 3, 169 17.8 6,220 34.9 2,145 12.0 17,807Manyara 848 3.3 6,978 27.5 8,957 35.3 3,340 13.2 5,277 20.8 25,400Mainkand 42,930 8.3 138,119 26.8 125,621 24.3 152,054 29.5 57,332 11.1 516,05Zanzibar 1,146 22.7 2,629 52,2 1,119 22.2 145 2.9 0 0.0 5,040National 44,076 8.5 140,749 27.0 126,741 24.3 152,199 29.2 57,332 11.t 521,09
Tanzania Agriculture Sample Census - 2003

Type of Services 135
33.5 TYPE OF SERVICE: Number of Agriculture Households by Level of Satisfaction of using Land Registration OfficeAnd Region During The 2002/03 Agriculture Year
RegionLand Registration Office
Very Good % Good °/D Average % Poor % Very Poor % Total
Dodoma 1,112 5.6 6,502 32.5 3,030 15.1 8,067 40.3 1,309 6.5 20,020Arusha 644 3.9 _ . 5,235 31.9 5,901 35.9 3,172 19.3 1,477 9.6 16,429Kilimanjaro 1,540 4.0 6,548 16.9 17,448 44.9 9,520 24.5 3,798 9.8 38,853Tanga 347 1.7 3,271 16.2 8,834 43.8 6,029 29.9 1,680 8.3 20,16.1
Morogoro 196 0.7 2,927 11.0 3,341 12.5 15.120 56.6 5,122 19.2 26.705Pwani 731 9.2 697 8.8 2,031 25.6 1,984 25.0 2,496 31.4 7,938Dar es Salaam 210 7.2 254 8.7 770 26.3 1,313 44.9 375 12.6 2,922,Lindi 621 7.5 1,566 18.9 795 9.6 4,529 54.6 788 9.5 8,300Mtwara 925 3.2 1,844 6,3 5,306 18.2 18,586 63.8 2,483 8.5 29,143Ruvuma 2,202 8.0 4.270 15.6 12,694 46.4 5,940 21.7 2,261 8.3 27..367Iringa 734 2.8 10,744 41.3 7.133 27.4 5,084 19.5 2,334 9.0 26,029'
Mbeya 1,616 4.3 3,423 9.1 7,241 19.3 21,072 56.3 4,069 10.9 37,422Singida 899 1.6 10,275 18.2 7,845 13.9 14,888 26.3 22,686 . 40.1. . 56,593Tabora 424 1.8 669 2.9 1,698 7.3 14,059 60.2 6,521 27.9 23,372Rukwa 532 10.7 474 9.6 .150 23.2 1,470 29.6 1,332 26.9 4,958Kigoma 1,129 7.9 1,495 10.5 5,877 41.2 5.345 37.5 420 2.9 14.266Shinyanga 1,753 3.4 11,650 22.3 10,318 19.8 15.409 29.6 13,004 24.9 52,134Kagera 1,442 10.5 2,331 16.9 4,503 32.7 5,029 36.5 465 3.4 13,770Mwanza 1,948 5.0 4.628 11.8 7,723 19.6 12,132 30.9 12,881 32.8 39,312-Mara 960 5.3 2,449 13.6 2,854 15.8 6,625 36.7 5,180 28.7 18.069Manyara 775 2.7 5,153 17.8 14.277 49.3 4,416 15.2 4,363 15.1 28,983Mainland 20,738 4.0 86.406 16.9 130,769 25.5 179,790 35.1 95,041 18.5 512,745Zanzibar 208 22.1 289 30.8 349 37.1 74 7.9 19 2.0 939.National 20,947 4.1 86,695 16.9 131,118 25.5 179,864 35,0 95,060 18.5 513,685
33.6 TYPE OF SERVICE: Number of Agriculture Households By Level of Satisfaction of using ExtensionCentre And Region During the 2002/03 Agriculture Year
Extension CentreVery Good % Good % Average % Poor % Very Poor % Total
Dodoma 13,730 16.9 46,455 57.1 17,089 21.0 3,746 4,6 325 0.4 81,346Arusha 5,636 14,4 20,458 52.2 9,883 25.2 2,383 6.1 860 2.2 39,220Kilimanjaro 11,829 10.9 51,440 47.5 37,186 34.3 4,996 4.6 2,820 2.6 108,272Tanga 2,314 3.7 34,816 55.4 21,550 34.3 3,228 5.1 901 1.4 62,810Morogoro 7,227 11,1 28,940 44.4 14,783 22.7 10,924 16.7 '3,346 5.1 65,220.Pwani 2,379 9.4 .13,970 55.0 5,092 20.1 2,417 9.5 1,535 6.0 25,393Dares Salaam 194 3.7 1,930 37.3 1,921 37.1 1,106 21.4 29 0.6 5,180. _. Lindi 1,533 10.0 6,562 42.8 4,834 31.5 2,312 15.1 105 0.7 15,345Mtwara 1,574 3.6 16.323 37,0 11,279 25.6 11,459 26.0 3,423 7.8 44,058Ruvuma 4,859 7.6 44,255 69.2 10,909 17.0 3,325 5.2 647 ,0 63,994lringa 13,423 16.3 49,135 59.5 14,80 7.9 3,392 4. 1,839 2.2 82,690Mbeya 5,777 7.9 36,822 50.1 13,499 18.4 15.847 21.6 1,574 2.1 73,518Singida 556 31.6 666 37.8 414 23.5 125 7.1 0 0.0 1,761Tabora 3,696 7.5 20,293 41.2 10,605 21.5 9,144 18,6 5,506 11.2 49,243Rukwa 479 6.4 2,250 30.2 2,107 28.3 1,483 19.9 1,123 15.1 7,442Kigoma 2,535 7.2 12,807 36.2 16,396 46.3 3,460 9.8 197 0.6 35,396Shinyanga 3,094 5.2 23,780 39.7 11,883 19.9 10,203 17.1 10,877 18.2 59,838Kagera 2,815 6.3 24,055 53.8 9,583 21.4 6,064 13.6 2,212 4.9 44,729Mwanza 5,935 10.9 19,504 35.9 13,108 24.1 9,675 17.8 6,092 11.2 54.315Mara 3,735 12.6 12,494 42.2 6,673 22,5 3,554 12.0 3,164 10.7 29,619 ...Manyara 4,857 11.4 16,260 38.1 11,862 27.8 3,506 8.2 6.199 14.5 42,685Mainland 98,176 9.9 483,215 48.7 245,459 24.7 112,349 11.3 52,773 5.3 991,972
Zanzibar 390 18.2 1,367 63.71 389 18.13 0 0 0 0 2,146National 98,566 9.9 484,582 48.7 245,848 24.7 112,349 11.3 52,773 'r'5.3 994,118
Tanzania Agriculture Sample Census - 2003

Appendix II -Type of Service 136
33.7 ACCESS TO INFRASTRUCTURE: Number of Agriculture Households By Level of Satisfaction Using Infrastructure
and Service During The 2002/03 Agriculture Year
Very Good Good Average Poor Very Poor
Infrastructure No of No of No of No of No of
households % households % households % households % households % Total
Vet Clinic 42,930 8.3 1 38,119 26.8 125,621 24.3 1 52,054........ 29.5...... 57,332 11.1 516,057_._....--Extension Centre 98,176 9.9 483,2 15 48.7 245,499 24.8 112, 349 11.3 52,654 5.3 991,893
Research Station 15,542 4 .2 61,000 16.7 67,459 1 8.4 158,666 43 .3 63,479 1 7.3 366,146
20.8Plant Protection Lab 18,110 5.9 33,209 10.8...._...
48,827 1 5.9 142,373 46.5 63,695 306,214
Land Registration Office 20,738 4.0 86,531 16.9 130,729 25.5 179,790 35.1 94,966 18.5 512,755
Livestock Dev Centre 22,257 5.6 95,903 24.0 85,448 21.4 129,463 32.4 66,224 16.6 399,296
Total 217,754 897,977 1 1 703,5851 1 874,6951
398,349
Tanzania Agriculture Sample Census

Appendix II Household Facilities/Poverty 137
HOUSEHOLD FACILITIES/POVERTY

Appendix II- Household Facilities and Pove rty 138
34.1 ACCESS TO SERVICES: Number of Agricultural Households by Distance to Tarmac Road and Region, 2002103Agricultural Year
Type of toilet
Regions Traditional Pit €mproved Pitother Total number % NoNo Toilet Flush Toilet Latrine - hhLatrine
Owned Type of households Toilet
Dodorne 20,028 3,148 294.335 4,333 1,875 323,719 54Arusha 60,232 1,549 98,470 4 104 503 154,857 13.6Kilimanjaro 4143 5.538 194,950 11,310 231 216,173 1.1Tanga 20,194 1 733 229,330 4,663_._.....,_,_. 279 265.198 7.9Morogoro 6,975 3,191 •244,301 5.794 484
......_...260.746
-......1.
Pwani 8,932 4.238 125.877 2,463 23 141.530 2.4Dar es Salaam_..._. 544 1.843 17,048 848 12 20.394 0.1Linde 7.594 2,302 142,796 481 - 153.173 2.1Mtwara 6.950 4,990 215,622 1,752 - 229,314 1.9Ruvuma 2.090 4,757 181,572 2,745 191,175 0.6Iringa 2,008 8,619 263,860 4,230 278,717 05Mbeya 6.357 13,898 346,449 6,044 96 372.844 1 7Singida 12,238 7,005 159,503 794 375 179.015 3,3Tabora 39,014 2,357 191.542 1,987 116 235.917 10.8Rukwa 7.189 4,395 159,267 1.376 34 172,261 1,9Kigoma 5.396 4,119 185,014 1,237 - 195,765 1 5Shinyanga 43,503 12,666 318,745 2,450 474 377,857 11.8Kagera 16,926 11,963 315,464 6,795 129 353.277 5.1Mwanza 31,365 11,317 290,238 7,164 - 340.085 6.5Mara 39,544 3,255 141,915 3, 195 293 186,203 10.7Manyara 25,551 1,044 125,839 1,402 358 154,194 6.9
Mainland 368,675 114,053 4,242,138 75,165 5,284 4,805,315 100.07,7 2.4 88.3 1.6 0.1 100.0 0.0
Zanzibar 47,694 2,665 38,699 7.270 194 96,522 12.9National 416,369 116,718 4,280,837 82,435 5.478 4,901,837 8.5
34.2 HOUSEHOLD FACILITIES: Number of Agriculture Households by Type of Roof Construction Materials AndRegion Durina the 2002103 Agriculture Year
Number of rooms and Type of roof construction materialRegions
No. of rooms lror. Sheets Tiles Concrete AsbestosGrass I Grass 8
Ofhe Total% modern 1/
Leaves Mud roo traditionalDodoma 2 126,335 1,888 373 1,548 24,858 168,102 68 323,719 40.2 59.8Arusha 2 77,059 863 290 531 62,029 12,045 2,039 154,857 50.8 49.2KilimanjeAo 3 193,843 1.171 337 1,083 16,504 2,516 72 216,173
........90.9 9.1
Tanga 2 115628 2,671 268 2,917 130.497 12,778 44 265,19 45,8 54,2Morogoro 3 94,284 2,070 922 51 2 140,845 21,867 24 250,745 37.5 62.5Pwani 3 37,749 380 53 524 93.270 9,265 28 141,630 27,3 72.7Dar es Salaam 3 12,449 444 77 117 6,535 640 3 20,394 64,2 35,8Lindi 2 23,587 1,875 217 340 124,547 2,607 153,173 17.0 83.0Mtwara 2 49,788 1,675 440 1,056 166,629 9,726
7,566I
I
229,31
191,1723 134.3
76.9
65.7Ruvuma 3 63,946 1,150 468 73 117,971#rings 3 128,741 1,949 483 683 124,899 21,562 10 275,71 47.3 52.7Mbeya 2 157,291 2,797 231 1.733 189,856 19,119 1,81 372,844 43.5 56.5Singida 3 37,246 ..... 206 0 403 _ 9,695 131,753 61 179,91 21.0 79.0Tabora 2 32,481 1,339 243 741 166,263 35,213 63 235,917
...._.-14.8
_...85.2
Rukwa 2 32,082 962 216 2,186 129,877 6,937 I 172,261 28.6 79,4Kigoma 3 53,676 3,647 947 985 120.330 15,713 26 195,76 30.4 69.6Shinyanga 3 125,429 2.054 243 1,058 132,516 114.85 1,700 377,85 34.1 659Kagera 3 183,114 5,360 3.149 862 142,105 18,502 181 353,277 545 45.5Mwanza 3 135,648 2,257 1.412 1,809 167,594 30,779 581 340,085 41.5 58,5Mara 3 54,052 1,166 563 132 113,685 18,388 11 188,20 29.8 70.2Manyara 2 49,266 1,076 204 0 70,237 33,412 i 154,194 32.8 67-2Total 3 1,783,695 37,198 11,236 19,290 2,249,850 693,646 10,44 4,805,31
37.1 0.8 0.2 0.4 46.8 14.4 0.2 100.0
Tanzania Agriculture Sample Census - 2003

Appendix li - Household Facilities and Poverty 139
Table 34.3 HOUSEHOLD FACILITIES: Number of Agriculture Households by Type of Owned Assets And Region During The 2002/03 Agriculture Year
RegionsType of owned asset Total number
ofhouseholdsRadio %
Lan dline.phone %
Mobilephone % Iron 5t
Whee -[harrow % Bicycle % Vehicle %
TV /Video %
Dodoma 158*476 49.0 1*340 OA 1,849 0.6 41,234 12.8 8,797 2.7 105,196 32.5 2,418 0.7 1,835 0 323,719
Arusha 97,256 62.8 1.541 1.0 8,192 5.3 42.908 27.7 19,495 12.6 40,475 26.1 4,271 2.8 3,947 2.5 154,857
Kilimanjaro 168,412 77.9 3,697 1.7 21,676 10.0 104,338 48.3 44,412 20.5 61,206 28.3 7,046 3.3 9,366 4. 216,173
Tanga 162,610 61.3 1,337 0.5 5,112 1.9 49,934 18.9 8,928 3.4 85,039 32.1 2,319 0.9 2,714 265,198
Morogoro 151,106 58.0 889 0.3 ' 4,230 1.6 35,406 13.6 10,595 4.1 101,029 38.7 2,686 1.0 1,966 0.8 260,746
Pwani 98,795 69.8 415 0.3 2,542 1.8 20,394 14,5 4,371 3_1 63,644 45.0 1,354 1.0 1,754 1.2 141,530
Dar es Salaam 17.683 86.7 314 1.5 2,219 10.9 6,275 30.8 2,088 10.2 8,930 43.8 1,337 6.6 1 612, . 7 20,39 kLindi 70,952 46.3 339 0.2 693 0.5 18,981 12.4 1,531 1.0 59,535 38.9 751 0.5 964 0 . 153,173
Mtwara 97,775 42,6 256 0.1_.,.....
633 0.3 32,058 14,0 2,482 1.1 102,726 44.8 2,266 1.0 1,203. .. 229,314
Ruvuma 109,159 57.1 1,496 0.8 2,460 1.3 49,616 26.0 7,944 4.2 69,706 36.5 2,284 1.2 1,549 0. 191,175
bingo- . 138,974 49.9 182 0.1 4,823...._ 1.7 70,613 25.3 17,868 6.4 103,799 37.2 2,835 1.0 3,288 1. 278,717
1,533 5.5 130,803Mbeya 199,134 53.4 OA 6,803 1.8 88,458 23.8 20,595 35.1 5,318 1.4 4,730 1.3 372,844
Singida 69,474 38.6_._
605 0.3 1,463 0.8 21,799 12.1 8,003 4.4_._ 53,864 29.9 1,464 0.8 801 0 • 179,915
Tabora 126,723 53.7 368 0.2 2,336 1.0 42,071 17.8 12,671 5.4 164,536 69.7 3,214 1.4 2,127 0. • 235,917
Rukwa 72,043 41.8 267 0,2 784 0.5 23,642 13.7 5,199 3.0 64,577 37.5 1,070 0.6 849 0. 172,261
Kigoma 114,459 58.5 32 0.0 1,404 0.7 23,53612.0 5,450 2.8 86,895 44.4 678 0.3 1,138 0 195,765
Shinyanga 192,251 50.9 858 0.2 5,725 1.5 64,449 17.1 39,393 10.4 246,531 65.2 4,236 1.1 3,692 1.1 377.857
Kagera 179,555 50.8 1,705 0.5 8,724 2,5 58,577 16,6 20,775 5_9 138,149 39.1 2,883 0.8 3,110 0. 353,277
Mwanza 214,481 63.1 1,285 0.4 6,390 1.9 56,286 16.6 19.607 5.8 216,333 63.6 3,444 1.0 3,697 340,085
Mara 107,845 57.3 977 0.5 4.098 2.2 50,680 26.9 11,057 5.9 94,942 50.4 1,696 0.9 1,550 0.8 188,203
Manyara 74,560 48.4 662 0.4 1,930 1.3 24,366 15.8 7,312= 64,464 41.8 1,483 1.0 1,028 0.7 154,194
2.0 =.111111111.111=1=l1National = 1 4,90t 837
Tanzania Agriculture Sample Census -- 2003

Appendix 1.1 - Household Facilities and Poverty 1 40
34.4 HOUSEHOLD FACILITIES: Number of Agriculture Households by main source of enem y used for Liehtinp And Repion During the 2002/03 Agriculture Year
Main source of energy for lighting
Regions Mains Gas Hurricane PressureElectricity % Solar % €Diogas) % Lamp Lamp % wick Lamp % Candles % Firewood % Other °/ Total
Dodoma 1,993 0.6 358 0.1 792 0.2 51,941 16.0 8,009 2.5 229,190 70.8 1,317 0.4 29,585 9.1 535 0.2 323,71Arusha 5,315 3.4 816 0.5 184 0.1 53,053 34.3 2,781 1.8 76,893 49.7 122 0.1 15,632 10.1 60 0. 154,857Kilimanjaro 26,823 12.4 441 0.2 358 0.2 91,583 42.4 12.884 6.0 83,380 38.6 118 0.1 605 0.3 0 0. 216,173
Tanga 3,315 1.3 383 0.1 137 0.1 44,098 16.6 11,043 4.2 204,986 77.3 321 0.1 915 0.3 0 D 265,198
Morogoro 2,979 1.1 368 0.1 0 0.0 58,452 22.4 11,136 4.3 184,153 70.6 640 0.2 3,018 1.2 0 0_ I 260,74Pwani 2,481 1.8 263 0.2 0 0.0 21,204 15.0 4,243 3.0 111,057 78.5 395 0.3 1,856 1.3 31 0.1 141,53
Dar es Salaam 1,096 5.4 42 0.2 0 0.0 7,444 36,5 1,180 5.8 10,589 51.9 44 0,2 0 0.0 0 0.0 20,394
Lindi 560 0.4 358 0.2 152 0.1 22,413 14.6 3,50 1 2-3 122,138 79.7 616 0.4 3, 372 2.2 63 Di 153.17
Mtwara 1,782 0.8 0 0.0 260 0.1 56,138 24 .5 6,228 2.7 159,502 69.6 886 0.4 4,517 2.0 0 0.1 229,31
Ruvuma 559 0.3 438 0.2 564 0.3 84,477 44.2 5,722 3.0 97,011 50. 7 479 0.3 1, 926 1.0 0 Ui 191,17
Iringa 4,062 1.5 986 0.4 306 0.1 132,381 47.5 9,145 3.3 127,611 45.8 182 0.1 3,982 1.4 61 0.1 278,717
Mbeya 6 ,126 1.6 226 0.1 24 0.0 97,64521,581
26.2 12,174 3.3 251,142 67.4 758 0.2 4,555 1.2 196 0.1 372,844
Singida 118 0.1 269 0.1 118 0.1 12.0 4.330 2.4 143,694 79.9 0 0.0 9,499 5.3 304 0_ 179,91Tabora 1,075 0.5 346 0.1 151 0.1 23,763 10.1 8,051 34 197,211 83.6 484 0,2 4,687 2.0 149 0,1 235,91Rukwa 440 0.3 0 0.0 0 0.0 29,072 16.9 5,922 3.4 131,944 76.6 187 0.1 4.542 2.6 154 0.1 172,261Kigoma 358 0.2 133 0.1 137 0.1 23,580 12.0 8,210 4.2 153,640 78.5 0 0.0 9,707 5.0 0 0.1 195,76Shinyanga 2,485 0.7 443 0.1 498 0.1 54,233 14.4 12,214 3.2 302,123 80.0 704 0.2 5,044 1.3 113 0.1 377,857Kagera 1,777 0.5 655 0.2 0 0.0 38,061 10.8 11,534 3.3 294,182 83.3 120 0.0 6,949 2.0 0 0.1 353,277
Mwanza 2,559 0.8 761 0.2 318 0.1 69,859 20.5 13,474 4.0 250,269 73.6 496 13.1 2,090 0.6 258 0.1 340,08
Mara 936 0.5 563 0.3 252 0.1 60,361 32.1 5,705 3.0 118,703 631 376 0.2 1,307 0.7 0 0.1 188,20Manyara 1,025 0.7 146 0.1 0 0.0 26,999 17.5 5,271 3.4 112,237 72.6 69 0.0 7,522 4.9 925 0'
Mainland 67,863 1.4 7,995 0.2 4,251 0.1 1,068,340 22.2 162,737 3.4 3,361,655 70,0 8,314 0.2 121,311 2.5 2,849 0.1 4,805,31
Zanzibar 4,971 5 35 D 0 0 77,281 18 3,676 4 70,247 73 146 0 166 0 0 0 96,522National 72,833 1.5 8,031 0.2 4,251 0.1 1,085,622 221 166,413 3.4 3,431,902 70.0 8,460 0.2 121,477 2.5 2,849 0.1 4,901,837
Tanzania Agriculture Sample Census - 2003

Appendix I1 - Household Facilities and Poverty 141
Table 34.5 Number of Agriculture Households by Main Source of Energy for Cooking and Region for the 2002103 agriculture yearMains Gas Bottled Parraffin f Crop Livestock
Region Electricity % Solar % (Biegas) % Gas % Kerocine % Charcoal % Firewood % Residues % Dung % Other % TotalDodoma 423 0.1 489 0.2 448 0.1 271 0.1 482 0.1 6,955 2.1 311,415 96.2 2,731 0.8 504 02 0 0.0 323,719Arusha 573 0.4 213 0.1 72 0.0 247 0.2 1,343 0.9 2,965 1.9 147,404 95.2 859 0.6 1,181 0_8 0 0.0 154,857Kilimanja 1,613 0.7 1,131 0.5 139 0.1 244 0.1 716 9.3 3,449 1.6 206,963 95.7 1,845 0,9 74 0.0. 0 0.0 216,173Tanga 378 0.1 278 0.1 21 0.0 736 0.3 90 0.0 7,210 2_7 255,643 96.4 735 0.3 106 0.0 0 0_0 265,198Morogoro 541 0.2 513 0.2 0 0.0 562 0.2 911 0.3 16,473 6.3 240,462 92.2 1.205 0.5 77 0.0 0 0.0 260,746Pwani 0 0.0 80 0.1 81 0.1 305 0.2 197 0.1 6,374 4.5 134,132 94.8 156 0.1 204 0.1 0 0.0 141,530Dar es Salaam 62 0.3 32 0.2 34 0.2, 25 0.1 255 1.3 3,196 15.7 16.753 82.1 38 0,2 0 0.0 0 0.0 20.394Lindi 369 0.2 81 0.1 0 0.0 28 0.0 29 0.0 2,712 1.8 149,592 97.7 190 0.1 173 0.1 0 0.0 153,173Mtwara 194 0.1 97 0.0 0 0.0 189 0.1
_.....,446 0.2 2,989 1.3 224,785 98.0 615 0.3 0 0.0 0 0.0 229,314
Ruvuma 225 0.1 698 0.4 227 0.1 312 0.2 77 0.0 3,555 1.9 185.686 97_1 149 0 1 174 0.1 72 0.0 191,175Iringa 344 0.1 264 0.1 0 0.0 636 0.2 56 0.0 2,508 0.9 273.851 983 940 0,3 118 0.0 0 0,0 278,717_. ....... _ ., .Mbeya 661 0.2 608 0.2 0 G0. 467 0.1 500 0.1 9,503 2.5 357,390 95.9 3.167 0 . 8 454 0.1 93 0_0_, .. 372,844Singida 448 0_2 641 0.4
__.......0 0.0 103 0.1 143 0.1 3,104 1.7 171.131 95.1 4,202 2.3 143 0.1 0 0.0 179,915
Tabora 250 0.1 152 0.1 0 0_0 562 g.2 2,807 1.2 6,299 2.7 223.732 N.8 1.514 0.8 300 a 1 0 0_0 235,917Rukwa 5,185 385 35 0.0 00 0.0 0 0.0 0 0.0 0 0.0 0 0.0 3.0 166,657 96.7 0.2 0.0 172,261Kigoma 204 0.1 0 0.0 0 0.0 197 0.1 488 0.2 5,772
..._2.9 187,993 96.0 914 0.5 197 0.1 0 0.0 195.765
Shinyanga 562 0.1 0 0.0 178 0.0 663 0.2 379 0.1 14,650 3.9 358,020 94.8 2.413 0_6 993 0.3 0 0.0 377,857Kagera 306 0.1 241 0.1 0 0.0 139 0.0 305 0.1 5,499 1.6 345,241 97_7 1.352 0.4 195 0.1 0 0.0 353,277Mwanza 1,024 0_3 152 0.0 201 0.1 306 0.1 298 0.1 9,781 2.9 328,022 96.5 163 0.0 138 0_0 0 0.0 340.085Mara 512 0.3 68 0.0 0 0,0 419 0.2 136 0.1 3,460 1.8 183,115 97.3 333 0.2 160 0_1 0 0 0 188.203Manyara 436 0.3 0.0 0 0.0 195 O.1
.„,0 0.0 3,907 2.5 149.076 96_7 0.3 111 0.1. 0 0. 154,1940 469
Mainland 9,126 0.2 5,737 0.1 1,400 0.0 6,607 0.1 9,656 0.2 125,547 2.6 4,617,063 96 24,674 0.5 5,340 0.1 165 0.0 4.805,315Zanzibar 48 0.05 0 0 0 0 0 0 142 0.15 2,531 2.62 93,505 96.9 295 0.31 0 0 0 0 96,522Nationa
9,173 5,737 1,400 6,607 9,798 128,078 4,710,569 24,969 5,340 165 4,901,837
Tanzania Agriculture Sample Census - 2003

Appendix Sl - Household Facilities and Poverty 142
Ta€ua€n€a Agriculture Sample Census - 2003

wetseason
dryseason
wetseason
dryseason
wetseason
dryseason
9 9 8 5 0
9 11 2 8 0
22 26 1. 9. 1
26 24 17 18 0 0
9 9 23 23 0 0
3 3 12 0
7 7 1 6 1 1
8 13 1 2 0
10 13 9 18 3 1
18 18 6 8 017 18 15 15 0 0
24 24 17 17 0 0
8 9 16 14 0 0
5 9 5 0 0
10 113 20 20 0 0
17 19 19 22 0 4
4 4 15 19 1 0
25 28 16 19 2 1
11 9 5 9 1 0
16 16 20 29 1 0
11 11 22 19 1 0
14
Dodoma 36 45 8 9 2
Arusha 58 59 2 2 2
Klrimanja 58 56 3 2 4
Tanga 22 22 9 9 3
Morogoro 24 25 22 2 1
Pwani 12 14 8 1i 1
Dar es Sa 13 15 14 14 2
Lindi 10 14 14 17 2
Mtwara 26 28 7 2
Ruvuma 27 26 15 15 4
fringe 33 32 5 6 5
Mya 24 23 7 6 5
SNida 18 20 15 17 1
Tabora 2 2 8 1
Rua 17 15 25 25 2
Kigoma 24 21 15 16 14
Shinyanga 12 13 26 2Kagera __ . 11 11 14 1 11.......
Mwanza 9 11 - 24 24 3
Mara 4 4 11 10 4
Manyara 24 26 14 16 2
Total 22 24 13 1 4
RegionPiped Water
wet dryseason season
wet dryseason season
Main source of drink 9 ater as'/ of total No of agricult households
Surface Water Covered UncoveredUprotted Well
Unprotected(Lake I Dam I Rainwater Rainwater Water Vendor Tanker Truck
SpringRiver ! Stream) Catchment Catchment Total
dryseason
wetseason
dryseason
0 0 C 100
0 1 1 10C
0 0 0 100
0 0 0 100
0 0 0 100
0 1 1 100
0 0 0 100
0 0 0 100
0 2 0 100
0 0 C 100
0 0 0 100
0 1 0 100
0 1 C 100
0 2 1 100
0 a o loo
0 1 1 100
0 1 1 100
0 1. 0 100
0 0 0 1001
0 2 0 100
0 1 0 100
1 1 Ci 100
OtherBottled WaterProtected Well
2 28 27
2 4 3
5 1 1
4 20 21
1 20 19
1 55 53
3 53 50
1 37 43
2 29 29...._4 28 29
6 21 22
5 19 21
1 31 31
1 67 68
2 23 26
14 9 8
1 33 31
12 16 15
3 43 42
4 38 36
2 19 23
4 27 2
Appendix 11 - Household Facilities and Poverty 1 43
Table 34.7 Percentage of Number of Agriculture Households Reporting Main Source of Drinking Water by season (wet and dry) and Region for 2002/03 agriculture year
Tanzania Agricufture Sample Census - 2003

Appendix II - Household Facilities and Poverty 144
Tahf¢ 34-6 Number of Aariculture Households Renortinu Distance to Main Source of Drinking Water during Wet Season by Region during the 2002103 agriculture year
Distance to main source of drinking water
Less than I00m 100 - 299 rn 300 - 499 m 500 - 999 m 1 - 1.99 Km 2 2.99 Km 3 4.99 Km 5 9.99 Krn 1 OKm and above Tota!
Region89
wetseason
Dryseason wet Season Dry seaso wet season
Dryseason aet seaso Dry seaso wet season Dry season
wetseason Dry seaso wet season Dry seaso. wet season
Dryseason
wetseason
Dryseason b oth
Jodoma 33,627 24,35 35,451 2682t 15,80 13.80 56,30 46,92 95,89.. 86,16 46,578 52.48 2426t 35,93 14,91 31,742 86 5,483 323,71
Arusha 2,52t 20,41 15,00 13,866 5,80 5,55 21,98 18,735 37,864 32,221 21,43 20,365 15 ,18 22 342 7671 18 731 1,07 2,624 154,851
Kilimanja 70,526 55,797 45,90 40,758 10,28 10,84 32,91 33,331 33,185 34,07 12,23 15,848 5,542 1186 5,60. 13.291 352 216,17
Tanga 55,742 411211 3796 32597 &,29 = 8,1 44,66 39.718 77,801 69,43 25,942 33,001 11,707 23,991 3,071 15,507 1,604 265,19
Morogaro 56,927 49,92 53,73 48,31 17,072 15,114 63,904 59,32 49,317 49,37 11,85 2005', 5,186 967 2,614 8,240 13 260,74
Pwani 31,098 20,06 24,57 17,893 7,01 5,50 25,462 17,58 34,088 29,83 12,70 17,284 4,477 13.762 1,941 17 731 15 I 868 141,53
3,56 3,25 4,665 4,683 697 2,586 253 1,36Oar es Se 4,669 2,95 5,044 3,602 1,141 1,00 36 951 0 20,39
Lindi 21,41 8 9,597 27,111 20 ,554 9 ,56 6,99 36011 24,388 34,473 35,44 15,48 26144 5,809 14,6 2,632 13,937 466 1 491 153,17
Mtwara 48,458 25,22 27,81 19,063 9,99 8,526 24 ,23 17,388 47,25 35,096 2573 28,831 19,222 36 052 19841 5053 6, 757 8 592 229,31
Ruvuma 26,75 26,16 80,11 77,009 19,65 19-726 41, 40,78 18,527 21,05 2,546 2,966 1,02 1,155 524 2,231 72 191.17
Iringa 45,57 39,56 56,981 54,93 22,16 20.16 69.72 70,486 59,696 63,818 15,55 C 15,90 6,421 $ 413 2,59 5,332 0 102 278,717
Mbeya 69, 853 57,46 72,76 67,668 28,211 26,85 80,95 80,757 82,152 84,871 24 ,947 31,131 9,30 14,906 4,311 8,742 32 454 372.84
Singida 10661 5,19 18,15 14,107 9,37 6,641 43,37 30,939 65,322 61,741 22,227 27-291 7,917 21,926 25 11,206 83 871 179,91
Tabora 33 736 23.9 39,114 28,048 13,92 12,254
19,22
53,04
45,1
37.63 65,932 66,58 20,567 31,087 6,690 21,879 2551 11348 49 3,14 235,91
Rukwa 10,424 9,79 39,43 36,48 20,921 45,97 37,83 33,942 11,688 16,278 5,624 7,960 1,16 2,592 0 0 172,261
Kgoma 19,684 19,314 35,701 32,66 15,30 14,498 44,402 41,600 53,27 55,464 20.529 23,46 5,795 6,687 1,07 2,065 0 0 195,78
Shinyanga 42 ,364 30,102 28,27 20,352 15,70 13,171 78,10 58,602 136,431 130,127 52,808 64,20 20,031 35,542 4,05 24,174 8 1,585 377,85
Kagera 33,906 19,02 34,017 32,430 16,98 16,15 67,66 65 ,559 93,863 90,041 55,434 58,4 3 8,51 49,462 12,43 20,96 457 1.208 353.27
37.875 31,087 25,987 15,79 14,468 84,28 72,227 106,881 105,32 35.44 .Mwanza 54,242 48,4 12 10,393 26,5 1,66 8,992 295 295 340.08,`
Mare 27,483 11,831 20,47 14,957 7,60 4,984 36,64 28,579 58,967 57,278 24.88 36,085 8,345 23,894 1 79 9.588 0 1.007 18820
Manyara 17,982 13,24 8,725 7,888 6,00 5,556 26,17 22,308 45,31 39,557 20,355 20,381 19302 24,158 9,86 18.143 478 2.954 154,18
744,15 543,04 737,52 636,008 276,60 249,205 982,56 856,10 1,238,72 1,186,14 479,648 592,24 231,00 412,09 103,83 296,04 11.237 34,46 4,805,31
I
Mainland
Zanzibar 61,013 57,801 17,298 16,070 4,218 4,057 7,751 7,890 5,043 6,871 740 1,863 181 1,496 279 429 0 0 96,522
National 805,172 600,847 754,826 652,078 280,821 253,263 990,31 863,996 1,243771 1,193,01 480,368 594123 231,191 413,592 104,91 296,476 11,237 34,428 4.901,830
Tanzania Agriculture Sample Census - 2003

4.99 Km
Table 34.9 Percentage of Agriculture Households Reporting Distance to Main Source of Drinking Water during Wet Season and Region during the 2002103 agriculture year
distance. to main source of drinking water
wetseason Dry seasorry seas
10 8 11 8 5 4 17
19 13 10 9 4 4 14_33 2. 21 1• 5 Si 15-
321 16 14 12 3 17
22 1• 21 19 7 6 25 23
22 14 17 13 5 4 18 12
23 14 RS 18 6 S 17 16—14 6 18 13 6 5 24 16 23
. _21 11 12 8 4 4 11
.. _14 14 42 40 10 iu 22
16 14 20 20 8 7 25_ .
19 15 20 18 8 7 22
6 3 10 8 & 4 24
14 11 17 1 6 5 n6 6 23 21 12 11 26 27
19 1$ 18 17 8 7 23 21._.11 8 7 5 4 3 21 16— -10 5 10 9 & 5 19
16 11 9 8 5 4 25 21
15 6 11 8 4 3 21 15
Dodoma
kusha
Kilimanja
Tanga
Morogoro
Pwani
Dar as Sa
'ndi
Mtwara
Ruvuma
ringaMbeya
Singsda
Tabora
Rukwa
Kigoma
Shinyanga
Kagera
Mwanza
Mara
Manyara
ainland
30 27 14
12 24 21 14
1 15 15 6 7_51 29 26 10 12
19 19 5 8
24 21 9 12
23 2 3 13
23 10 17
8 21 15 11 13
21 10 11 1 2
21 23 6 6___._
22 22 ' 23 7 8
3 10 1 13 0
1 7 2 5
4 10 2 9 0
100100100100100100100100100100100100100100100100100100100100100
9 1 3 9. 1 a7 9 3 5 1 2 0
.......10 12 3 3 1 1 0 ..14 17 5 9 1 6 0
..._ „16 17 11 14 4. 6 0
10 14 3 8 0 3 0-13 19 4 13 1 5 0
__.13 13 13 16 6 12 0
8 16 9 22 3
1 1 0 1 0
2 3 1 2 0_ _.2 4 1 2 0
_.12 15 4 12 1 6 0
3 3 6-
^4 9 1 6 0
4 1 0
100 - 299 m 2 2.99 Km-1.99 Km500 - 999 m
Appendix II - Household Facilities and Poverty 145
Tanzania Agriculture Sample Census - 2003

Appendix 11 - Household .Facilities and Poverty 146
Table 34.10 Number of Agriculture Households Reporting Time Spent to and from Main Source of Drinking Water during Wet Season and Region for the 2002103actricuture year
Time spent to and from main source of drinking waterLess than 10 10 - 19 Minutes 20 - 29 Minutes 30 - 39 Minutes 40 - 49 Minutes 50-59 Minutes above one Hour Totalwe Dry Dry wet both wet
Region season season wet season Dry seasca wet season season Net season Dry seaso wet season Dry season season Dry seaso wet season Dry season and dryDodoma 9,544 7,272 60,796 41,305 28,476 18,30 86,708 57,226 19,056 16,83 12,517 11,737 106,622 171,03 323,7Arusha 21,305 14,339 28,096 23,801 9,702 7,168 28,837 26,481 6,027 5,860 4,431 2,126 56,459 75,08: i54 5k4im-anje 42,978 35,306 56,621 46,067 18,159 16,771 34,36 36,059 9,159 8,502 16,839 13,964 38,047 59,50 216,17Tanga 11,995 8,018 61,146 47,505 30,097 23,097 80,44 69,263 15,615 15,422 18,621 16,457 47,284 85,43 265,19Morogoro 23,569 21,766 77,343 66,018 37,724 33,773 55,015 47,759 13,65 16,955 21,441 19,749 31,99 54,72 260.74Pwani 8,758 6,322 39,663 23,961 15,007 11,246 34.19
---25,36..... __......
6,225.._.I.. 5,255 12,636. ---... 8,292 25,04... . 61,07........._ 141,53Dar es Se 854 782 7,558 5,211 2,09 1,40 3,44 3,088 1,120
......... ......._1,09 2,649
.... I
2,021 2,675 6.79 20,39Lind i 6 ,478 2.611' 26,926 17,72 1 3,71 38.97 28,292 11,36 9,197 8,73 5,711 29,855 65,64 153,17
8,973 86,487 139,67 229,31Mtwara 15.334 6,709 35,836 22,817 18,742 12,158 45,117 29,247 1 3,931 9,734 13,86Ruvuma _....,._... 12,040 12,223 68,953 62,942 37,377 37,719 31,252 31,67 8,832 9,152 18,682 17,81 1 4, 039 19,65 191.17Irings 22,831 18,224 78,161
--- ....73,980 46,302
-43,75 67,48 38,45 278,71
-....__.68,96
.._17,278
-18,37 16,288
........16,955
..._._..30,367
Mbeya 23,582 15,511 100,368 93,583 53,997 50.541 86,335 80,449 21, 216 23,21 27, 894 28,05 59,452 81,50 372,84Singida 4,519 2.262 34,469 21,136 14,537 10,099 61,645 40,882 12,41 11,882 7,326 4,891 45,006 88,76 179,91Tabora 11,495 7,926 53,57 37,889 32, 559 24,158 60,22 46.5 14 17.009 15,090 18.161 14,818 42,892 89,521 235,91Rukwa 2,778 2,288 41,261 39,470 24,112 22,180 45,731 44,32 12,790 12,968 12,358 11,884 33.229 39,143 172,261Kigoma 4,343 4,58 42,450 37,783 30,105 27,74 46,957 47,542 13,955 14,749 14,591 13,598 43,364 49.76 195,76Shinyanga 9,73 6,946 65,875 43,723 44,58 1 32,941 120,469 97,676 31,368 28,572 16,09 14,140 89,734 153.85 377.85Kagera 22,142 8,621 48, 22 45 ,542 32,061 30,448 83,497 - 78.122 23,1 8
..... _20,78
-21, 706 ---.
20,600 122,46 149,15 353,27Mwanza 13,214 6,32 67,954 53,457
v49,041 42,684 104,245 91,77 27.783 32,860 15,26 100,641 340,0812,325 62,583
Mara 8,643 2,546 32,456 22,673 19,365 13,007 54,42 43,614 1 7,614 17,471 9,033 6,699 46,466 82 ,19 186.20Manyara 8,242 5,190 19,243 15,554 10,254 9,04 39,434 30,522 9,141 79,41 154,197,966 7.302 6,503 60,57Mainland 284,578 195,77 1,060,09 851,34 572,020 482,03 1,208,802 1,024,84 308,74 301,961 296,43 258,31 1,074,64 1,691.05 4,805,31Zanzibar 46,113 42,63 27,847 25,92 8,565 8,41 7,041 7,91 1.89 2,31 2,142 2,06 2,918 7,26 96.52National 330,690 238,40 1 087,938 877,26 580,585 490,441 1 ; 215,84 1,032,75 310,63 304,27 298,578 260,381 1,077,567 1,698,32 4,901,83
Tanzania Agriculture Sample Census - 2003

et season
2126
Appendix 11- Household Facilities and Pove rty 147
Table 34A1 Percentage of Agriculture Households Reporting Time Spent to and from Main Source of Drinking Water during Wet Season by Region for 2002103agriculture year
Time spent to and from main source of drinking water
wet DryRegion season season wet season D Season
Drywet season season wet season Dry seaso
both wetDry seaso wet season Dry season and dry
DodomaArushaKikmaniaTangaMorogoroPwaniDar es SaLindiMtwaraRuvumalringaMbeyaSingida
TaboraRukwa
KigomaShinyanga
KageraMwanza
MaraManyaraTotal
3 19 13 9 614 9 18 15 520 16 26 21 8 8
5 3 23 18 11 930 25 1 1328 17 11 8
4 4 37 26 10 74 2 26 18 12 9
16 10 8 56 36 33 20_._
8 7 28 27 174 27 25 14
3 1 19 12 85 3 23 16 14
24 23 1422 19 117 12 12
6 2 14 13 94 2 20 16 14 13_.5 17 12 105 3 12 1 07 6
22 1 12
27 18 6 59 17 4 4
16 17 4 430 26 6 621 18 524 18 417 15 5 525 18 7 620 13 6 416 17 524 25 623 22 6
23 720 726 7 824 7 826 8 82227
25
4 33 53 10036 48 10018 28 10018 32 10012 21 100
6 18 43 10010 13 33 100
i g 43 10038 61 100
7 1 100
11 14- 10616 22 10025 49 100
18 38 100'19 23 100
22 25 100-24 41 10035 42 10018 30 10025 44 10039 52 100
22 35 100
201614
6 3410 2613 2714 249 329 24
3129
Tanzania Agriculture Sample Census - 2003

Appendix I6 - Household Facilities and Poverty 148
Table 34.12 Number of Agricutlure households by Number of meats the household
normally has per day and Region during 2002103 agriculture year
Number of meals per day
Three Four
Region One Meat % Two Meals % Meals % Meals % Total
Dodoma 14,633 4,5 226,061 69.8 82.673 25.5 352 0.1 323,71
Arusha 4.288 2,8 67,518 43.6 83,051 53. 6 0 0,1 154,857
Kllirnanjaro 8,860 4.1 72,977 33.8 133.314 61.7 1,021 0. 216,173Tan
ga 6,346 2.4 66,829 25.2 191,759 72.3 265 0.1 265,19
tvloragoro 9,199 3.5 138,726 53-2 110,985 42.6 1.835 0.7 260.74
Pwani 7,653 5.4 39,711 28.1 91,620 64.7 2,545 1.1 14153
Dares Salaam 966 4.7 6,507 31.9 12.818 62.9 103 0. 2039,
357 0. 153,17Lindi 10,854 7.1 78,561 51.3 63,402 41.4
Mtwara 19,850 8.7 131,451 57.3 77,597 33.8 416 0,2 229,31
Ruvuma 3,605 1-9 63,869 33-4 123.291 64.5 409 0.2 191,17
Iringa 6,421 2.3 168,019 60.3 103,278 37.1 999 0.4 278,717Mbeya
12414 3.3 255,926 68.6 102,924 27.6 1,580 0. 372,844
Singida 5,409 3.0 119,676 66. 5 54,469 30.3 36 1 0.2 1 79,91
Tabora 7,492 3.2 89,052 37.7 137.213 58.2 2,159 0.1 235,917
Rukwa 11,622 6:7 140,983 81.8 1 9.573 11.4 82 0.1 172,261
Kigoma 6,516 3.3 157,507 80.5 31,399 16.0 343 0.2 195,765
Shinyanga 8,173 2.2 167,046 44.2 201.603 53.4 1,035 0.3 377,857
Kagera 12,516 3.5 297,554 84.2 40,742 11.5 2,466 0.7 353,27
Mwanza 5,245 1. 5 245.676 72.2 87.622 25.8 1,54 1 01 340,08
Mara 3,794 2.0 109,939 58.4 73,838 39.2 633 0.1 188,20
Manyara 1,662 1.1 58,718 38.7 92,032 59.7 782 0.1 154,19
Mainland 167,521 3 2,703,308 56.3 1,915,201 39.9 19,285 0.4 4,805,31
Zanzibar 536 0.6 36.538 37.9 59,240 61.4 208 0.2 96,522
National 168,057 3.4 2,739,846 55.9 1,974.441 40.3 19,493 0. 4,901.837
Tanzania Agriculture Sample Census - 2003

Appendix 11- Household Facilities and Poverty 149
Table 34.13 Number of Agriculture Households by Number of days the household Consumed Meat during the Preceeding Week and Region for2002103 agriculture year
Region
Number of days the household consumed meat during the preceeding week
Not Eaten % One % Two % Three % Four % Five % Six % Seven % Total
Dodoma 115.065 35.5 115,314 35_6 62,584 19.3 21,732 6.7 6,575 2.0 1,942 0.6 101 0.0 407 0_1 323,719„ .
Arusha 51,753 33.4 58.790 38,0 31,900 20.6 8,212 5.3 1,861 1,2 783 0.5 0 0.0 1,558 1 0 154,857Kiimanjaro 30,258 14.0 84,588 39.1 63,897 29.6 27.004 12.5 6,153 2.8 1,730 0.8 1.209 0.6 1,335 0.6 216,173Tanga 87,311 32.9 86,741 32.7 60,009 22.6 18,992 7.2 8,227 2.3 2,903 1.1 1,402 0.5 1,613 0.6 265,198M oro 96,077 36.8 79,176 30.4 55,659 21.3 21,664 8.3 4,581 ta 1,603 0.& 1,377 0.5 609 0.2 260,7Pwani 74,240 52.5 34,327 24.3 19,689 13.9 6,694 4.7 2,906 2_1 2,077 1.5 1,014 0.7 582 0.4 141,530Dar es Salaam 7,383 36_2 6,731 33.0 4,038 19.8 1,364 .7 569 2.8 123 0.6 32 0.2 154 0,8 20,394
..._Lindi 83,910 54.8 35.604 23.2 21,402 14.0 7,997 5.2 1,702 1.1 . 1,889 1_2 265 0.2 404 0.3
_ . 153,173
Mtwara 117,105 51.1 52,588 22.9 34,634 15.1 12,569 5.5 6,912.„.. 3.0 2,721 1.2 1,132 0.5 1,653 0.7 229.314Ruvuma 66,028 34.5 52,566 27.5 40,294 21.1 21,074 11.0 6,741 3.5 2,702 1.4 480 0.3 1,289 0.7 191.175iringa 72,096 25.9 113,662 40.8 62,225 22.3 22,110 7.9 5,719...', 2.1 2,083 0.7 445 0_2 377 0.1 278,717Mbeya 93,244 25.4- 135,509 36.3 96,232 25.8 33,863 9.1 8,688 2.3 4,008 1.1 431 0.1 87....... 02'._ _.„Singla 61,228 34.0 62,773 34.9 37,741 21.0 12,604 7.0 3,092 1.7 1,587 0_9 262 0.1 628 0.3 179,915
Tabora 79,730 33.8 77,552 32.9 48,837 20.7 17,504 7.4 7,411,_. 3.1 2,876 1.2 825 0.3 1,182 0.5 235,9176.2 172,261Rukwa 79,156 46.0 49,584 28.8 27,198 15.8 10,671 3,848._.. 2.2 833 0.5 207 0.1 763 0.4
Kigoma 104,627 53.4 58,716 30.0 20,183 10.3 9,616 4.9 1,077-
0.6 447 0.2 752 0.4 • 346 0.2 195,765Shinyanga 163,738 43.3 121,110 32.1 66,457 17.6 18.460 4.9 4,626 12......„ 2,143 0.6 268 0.1 1,052 0.3 377,857Kagera 205,994 58.3 88,595 25_1 36,652 10.4 15,585 4.4 4,594 1,3_.. 935 0.3 344 0.1 577 0_2 353,277Mwanza 128,863 37.9 116,948 34_4 63,621 18.7 19,072 5.6 6,991 2.1 2,585 0.8 714 0.2 1,289 0.4 - 340,085......Mara 58,069 _309 63,808 33.9 41,712
_ ..22.2 16.673 8.9 4,065 2.2 2,030 1_1 825 0.4 1,022 0.5 188,203
Manyara 58,442 37.9 55,685 36.1 26,464 17.2 8,691 5.6 2,927 1.9 888 0.6 360 0.2 737 0.5 154,194- •
Mainland 1.834,317 38.2 1.550,367 32.3 921,427 . 19.2 332,152 6.9 97,268, 2.0 38,890 0.8 12,446 0.3 18,446 0.4 4,805,315
Zanzibar 58,648 60.8 26,293- 27.2 7,949 8.2 2,468 2.6 691 0_7 354 0.4 49 0.1 70 0.1 96522
National 1,892,965 38.6 1.576,660 32.2 929,377 19.0 334,621 7 97,960 2.0 39,243 0_80 12.495 0.25 18,516 0 4,901,837
Tanzania Agriculture Sample Census - 2003

Appendix II - Household Facilities and Poverty 150
Table 34.14 Number of Households by Number of days the household Consumed Fish during the Preceeding Week and Region
Region Not Eaten One Two Three Four Five Six Seven Total
Dodorna 185,158 57.2 80,064 24.7 38,764 12.0 10,314 3.2 5,339 1.6 2, 792 0.9 374 0-1 914 0- 323,71
Arusha 91,863 59-3 39,305 25.4 15,791 10.2 4,725 3.1 1,348 0.9 1,003 0.6 177 0.1 647 0.i 154,857
Kilimanja 30,583 14.1 64,222 29.7 60,885 28.2 27,178 12.6 15,873 7.3 9,705 4.5 3,462 1.6 4,266 2.1 216,17
Tanga 39,398 14 9 34,365 13.0 52,958 20.0 47,658 18.0 35,877 13.5 25,718 97 9,971 3.8 19,254 7. 265,19
Moragorn 79,990 307 68,222 26.2 55.258 21.2 31,467 12.1 1 4,448 5.5 5,984 2,3 2,875 1.1 2,503 1. 260,74
Pwani 26,843 19.0 22 ,950 16.2 26,216 18.5 17,293 12.2 14847 10.5 9,915 7.0 3814 2.7 19,653 13. 141,53
Dar es Sa 2068, 10-1 3,406 16.7 4172 20.5 4,144 20,3 2,962 14.5 1,851 9.1 1,105 5.4 687 3.4 20,39
Lindi 33,622 22.0 19,425 12.7 30,896 202 25,034 16.3 15,245 10.0 12,979 8.5 4,945 3.2 11,026 7. 153,173
Mtwara 26,303 11-5 37,785 16.5 43,818 19.1 37,595 164 28,265 12,3 20,743 9.0 8,657 3.8 26,148 11.4 229,31
Ruvuma 31,930 16,7 43,373 22.7 39,061 20.4 30,198 15,8 18,297 9.6 12,971 6.8 4,091 2.1 11,254 5.9 191,17
kinga 120,253 43.1 95,403 34.2 40,757 14.6 13,861 5.0 5,017 1.8 2,065 0.7 622 0.2 738 0.1 278 717........ ...-..._Mbeya 107,890 28.9 109,943 29.5 81,240 21.8 38,168 10.2 17,116 4.6 9,184 2.5 3,059 0.8 6,242 1. 372,844
Singida 88,270 49-1 47,096 26.2 26,710 14.8 7,767 4.3 3,833 2.1 3,416 1.9 1.143 0.6 1,681 0- 179,91
Tabora 118,722 50.3........
54,881 233 29,025 12.3 16,141 6.8 9,865 4.2 5,011 2.1 822 0.3 1,450 06 235,917
Rukwa 49,425 28.7 37,383 21.7 30,971 180 17,793 10,3 10,127 5,9 6,268 3.6 3,766 2.2 16.528 9.1 172,261
Kigorna 76,913 39.3 37,834 19.3 25,002 12.8 13,572 6.9 19,973 10-2 10,180 5.2 6,452 3.3 5,839 3.1 195,765
Shinyanga 202,328 53.5 90,113 23.8 47,04 1 12.4 22,457 5.9 8,354 2.2 4,772 1.3 1,343 0.4 1,449 0.4 377,857
Kagera 125,307 35.5 83,172 23.5 55,291 15.7 34,320 9.7 22,282 6.3 14,977 4.2 4,439 1.3 13,489 3.1 353,277
Mwanza, 36,572 10.8 59,135 17.4 59,801 17.6 51,980 15.3 40,755 12.0 35,292 10.4 21.234 6.2 35. 316 10. 340,08
Mara 23,407 12.4 33,998 181 28.780 15.3 20,841 11.1 20,036 10.6 22,03E 11.7 12,223 6.5 26,879 14.3 188,201
Manyara 81,685 53-0 33,246 21.6 19,529 12,7 8,280 5,4 5,609 3-6 3,817 2.5 859 0.6 1,169 0.1 154,19
Mainland 1,578,528 33 1,095,321 23 811,966 17 480,786 10 315,467 7 220,683 5 95,432 2 207,131 4,805,315
Zanzibar 783 0.8 1,764 1.8 5,732 5.9 8,047 8.3 17,131 17.7 16,204 16.8 12,373 12.8 34,488 35. 96,522
National 1,579.311 32.2 1,097,085 224 817,698 16.7 488,833 10.0 332,597 6.8 236,887 4.8 107,605 22 241,619 4J 4,901,837
Tanzania Agriculture Sample Census - 2003

Appendix 11 - Household Facilities and Poverty 151
34-14a: HOUSEHOLD FACILITIES: Number of Agricultural Households Reporting Number of days the household Consumed Protein Food (MeatlFish)durin the Preceedin byWeek b Region, 2002/03 Agricultural Year-Region Not Eaten One Two Three Four Five Six Seven Total
Number % Number % Number % Number % Number % Number % Number % Number % Number %
Shinyanga 122039 32 67469 18 75019 20 50557 13 33044 9 16357 4 6283 2 7089 2 377857 100
Dadoma 98973 31 58275 18 73339 23 40439 12 30467 9 12668 4 4445 1 5114 2 323719 100
Kigoma 58174 30 31273 16 27962 14 19626 10 16035 8 14669 7 10262 5 17765 9 195765 100
Arusha 45607 29 29897 19 38365 25 20345 13 11856 8 4322 3 1351 1 3114 2 154857 100
Manyara 44099 29 30212 20 28693 19 20357 13 13005 8 7123 5 4770 3 5935 4 154194 100
Kagera 93471 26 63918 18 61572 17 41764 12 31965 9 19689 6 14636 4 26261 7 353277 100
Singida 47359 26 23978 13 42779 24 29621 16 18236 10 9114 5 4045 2 4784 3 179915 100
Tabora 55855 24 42281 18 50718 21 33506 14 21191 3 13245 6 8338 4 10784 5 235917 100
Morogoro 47449 18 35299 14 50436 19 48006 18 33060 13 22096 8 12279 5 12120 5 260746 100
Lindi 26937 18 11665 8 22275 15 24474 16 19427 13 17246 11 10474 7 20675 13 153173 100
Rukwa 29817 17 24339 14 28312 16 27287 16 18494 11 12979 8 7211 4 23822 14 172261 100
lringa 45975 16 60918 22 73597 26 47111 17 26714 10 11439 4 7562 3 5401 2 278717 100.._Pwani 17716 13 13556 10 22055 16 20622 15 15772 11 13288 9 8543 6 29977 21 141530 100
Mbeya 44288 12 53820 14 82618 22 74711 20 47179 13 32656 9 15058 4 22514 6 372844 100
Mara 22522 10 20667 9 32967 14 30516 13 31924 14 23831 10 18437 8 48451 21 229314 100
Ruvuma 17021 9 20664 11 25879 14 34515 18 26929 14 25449 13 13339 7 27379 14 191175 100
Tanga 21732 8 19944 8 32069 12 41993 16 41086.. 15. „ 37322 14 23097 9 47955 18 265198 100
Dar es Salaam 1517 7 1317 6 2873 14 3375 17 2914 14 3315 16 2498 12 2584 13 20394 100
Mwanza 21153 6 27421 8 49658 15 52910 16 44175 13 39001 11 23291 7 82475 24 340085 100
Kilimanjaro 10066 5 20080 9 37930 18 45737 21 38609 18 28578 13 16805 8 18367 8 216173 100
Mara 8183 4 14952 8 25429 14 25503 14 20426 11 20599 11 17605 9 55507 29 188203 100
Total 879951 18 671945 14 884545-
18 732975 15 542507 11 384987 8 230332 5 478073 10 4805315 100
Tanzania Agriculture Sample Census - 2003

1 52Appendix If - Household Facilities and Poverty
Table 34.15 Number of Households Reporting the status of food satisfaction of the household duringthe Preceodinci Year by Realon
Status of food satisfaction
Re ion Never % Seldom % Sometimes % Oftsn % Always % Total
Dodoma 105,445 32.6 110,205 34.0 23,088 7.1 55,187 170 29,793 9. 323,71
Arusha 57,717 37.3 46,256 29.9 10,049 6.5 27,349 17.7 13,486 8.7 154,85
Kiiirrtanja 117,906 54.5 64,472 29.8 9,43 4.4 13,752 6, 10,605 4.9 216,1 7..
Tanga 92,707 35.0 111,515 42.0 20,429 7.6 22,138 8.3 18,810 71 265,19
Mofogoro 96,924 37.2 90,859 34-8 21,083 8.1 29,188 11.2 22,691 8. 260,74
Pwani 37,016 26.2 53,900 38.1 12,124 8.6 29,557 20.9 8,933 6. 141.53
Dar esSa 7,974 39.1 7,215 35.4 1,372 6.7 2,639 12.9 1,194 5.9 20,39
Undi 49,845 32.5 50,993 33.3 11,975 7.8 25.174 16.4 15,187 9. 153,173
Mtwara 94 907 41.4 75.453 32.9 18,724 8.2 25,093 11.4 14,127 6.2 229,31
Ruwrna 119.538 6-2.5 48,168 25.2 12,550 6-6 4,790 2.5 6,12 3. 191,17
lnnga 171,406 61-5 61,523 22.1 19,408 7.0 16,350 5.9 10,029 3. 278,71
Mbeya 215,048 57.7 103,757 27.8 19,378 5.2 23,149 6.2 11,512 3.1 372,84
Singida 55,062 30.6 61,025 33.9 9,646 5.4 29,705 16.5 24,478 13i 179,91
Tabora 105,659 44.8 76,446 32.4 16,953 7.2 20,610 8.7 16,249 6i 235,91
Rukwa 82,734 48.0 55,848 32.4 11,957 6.9 13,212 7.7 8,509 4. 172,261
!(igortta 124,132 63.4 42,476 21.7 14,859 7,6 6,573 3.4 7,725 3.1 195,78
Shinyanga 125,885 33.3 134,001 35.5 24,119 6.4 55,062 14.6 38,789 10. 377,85
3Cagera 146,149 41.4 114,257 32.3 46,646 13.2 27,155 7.7 19,070 5.4 353,27
Mwenza 177,692 52.2 92,100 27.1 15.950 4.7 33,808 9.9 20,534 6.1 340,0555
Mara 78,113 41.5 64,799 34.4 10,545 5.6 19,252 10.2 15,493 8. 188,20
ivtanyara 57,229 37.1 56,362 36.6 7,343 4.8 22.138 14.4 11,123 7. 154,194
Mainland 2,119,086 44.1 1,521.647 31.7 337,238 7.0 502,882 10.5 324.468 6 - 4.805.31
Zanzibar 57,553 59.6 26,174 27.1 5,404 5.6 5,136 5.3 2,255 2.3 96,522
National 2,176,639 44-4 1,547,815 31.6 342,642 7.0 508018 10,4 326,723 6.7 4,501,83
Tanzania Agriculture Sample Census - 2003

Appendix 11 - Household Facilities and Poverty 153
Table 34.16 Number of Households by Main Source of Income and Region during 2002103 agriculture yearMain source of cash income
OtherSales of Sale of Sales of Sale of Wages & Casual
Food Sale of Livestock Cash Forest Business Salaries in Cash Cash not
Region Crops % Livestock % Products % Crops % Products % Income % Cash % Earnings % Remittance % Fishing % Other % applicable % Total
Dodoma 47,670 14.7 28,513 8_8 2,608 0.8 42,284 13.1 19,593 6.1 43,854 13_5 7,246 22 114,703 35.4 15,038 4.6 1,462 0.5 748 0.2 0 0.0 323,719
Arusha 41.062 26.5 42,564 27.5 7,910 5.1 15,278 9.9 1,300 0.8 16,825 10.9 9.917 6.4 14,042 9.1 5,755 3 7 56 0.0 129 0,1 0 0.0 154,857
Kilimanja 94,916 43.9 5,889 2,7 3,050 1.4 M ,310 15.9 883 0.4 21,507 9.9 21,641 10.0 24,415 11.3 7,764 3_6 416 0.2 1.266 0.6 115 0.1 216,173
Tanga 67,531 25.5 10,655 4.0 4,465 1_7 44,491 16.8 6,758 2.5 37,795 14.3 13,308. 55,488 20.9 19,620 7.4 2.437 0.9 2,549 1.0 97 0.0 265,198
Morogoro 148,107 56.8 4,281 1.6 1,282 0.5 25,087 9.6 11,239 4.3 23,053 8.8 8,469 3.2 30.874 11.8 6,033 2,3 1,123 0.4 1.198 0.5 0 0.0 269,74_
Pwani 31,695 22.4 1,323 0.9 2,106 1.5 32,109 22/ 27,149 19.2 12,141 8.6 4,116 2_9 15,254 10.8 7.882 5_6 6.418 4.5 1,336 0.9 0 0.0 141530
Dar es Sa 4,348 21.3 142 0.7 955 4.7 4,130 2Q.2 84 0.4 3,562 17.5 2,290 11_2 2,809 13.8 916 4_5 612 3.0 548 2.7 0 0.0 20,394
Lindi 30,126 19.7 2,474 1.6 834 0.5 62,643 40.9 6,873 4.5 10,623 6.9 3.383 2.2 23,511 15.3 7,709 5.0 3,785 2.5 1,215 0.8 0 0_0 153.173
Mtwara 106,002 1,075 0,5 463 0.2 84,781 37.0 4,628 2.0 7,564 3.3 4,232 1.8 8,792 18 4,945 2.2. 3,521 1.5 3,215 1_4 96 0.0 229.314
Ruvuma 94,585 49.5 2,412 1.3 520 0.3 50,162 26.2 1,615 0.8 7,912 4.1 6,903 3.6 14,510 76 5,011 2.6 5,217 2.7 2,327 1.2 0 0.0 191,175
Iringa 130,216 46.7 4,875 1.7 1,392 0.5 10,373 3.7 7,022 2_5 36,792 13.2 15,889 5.7 49,567 17_8 15.470 5.6 1,446 0.5 5,693 2.0 183 01 278,717
Mbeya 184,754 49.6 8,337 2.2 3,619 1.0 65,222 17.5 7,753 2.1 41,478 11_1 9,661 2_6 33.093 8.9 7.981 2_1 3,103 08 6.635 1_8 1.207 0_3 372,844
Singida 16,389 9.1 29,629 16.5 1,239 0.7 29,102 16.2 11,756 6.5 19,172 10,7 5,528 3.1 53,280 29.6 11,848 6.6 1.213 0.7 760 0.4 0 0.0 179,915
Tabora
Rukwa
53,753
84,309
22,
48.9
24,229
1,864
10.3
1.1
2, 9
420
1.1
0.2
37,727
7,189
16.
4.2
17,7N
7,943
7.5
4.6
27,950
27,620
11.8
16.0
5..288
3.931
2_2
2.3
49, 9
24,488
20.9
14.2
14,177
4.331
6.0
2.5
522
9,370
0 . 2
5.4
2,236
796
09,_
0.5
451__0
0,2
0.0
235,917..... _
172,261
Kigoma 125,612 64.2 3.409 1.7 1,608 0.8 10,224 5.2 5,309 2.7 11,688 6. 6,020 3.1 18,450 9.4 4,421 2.3 6.227 3.2 1,252 0.6 1,546 0.8 195,765
Shinyanga 147,998 39.2 18,516 4.9 3.588 0.9 120,261 31.8 3,879 .1.0 18;613 4.9 7,770 2_1 46.561 . 12.3 4,133 1 1 794 0.2 3.833 1.0 1,910 0.5 377,857
Kagera 190,612 54.0 8,874 2.5 2.183 0.6 66,633 18.9 2,476 0.7 11,842 3.4 15,072 4_3 30,771 8.7 6,931 2_0 15,317 4.3 2,375 0,7 191 0_1 353,277
Mwanza 92,612 27.2 15,186 4.5 6,092 1.8 53,844 15.8 7,788 2.3 33,528 9.9 13,813 4.1 71,164 20.9 14,404 4 2 27,769 8.2 3.800 1.1 85 0.0 340,085
Mara 67,784 36.0 11,095 5.9 1,802 1.0 18,131 9.6 4,217 2.2 21,448 11.4 8,646 4_6 24,994 13.3 9,178 4.9 17,832 9.5 2,844 1 5 234 0 1 188,203
Manyara 54,336 35.2 26,775 17.4 2,417 1.6 12,917 8.4 9,718 6.3 14,214 9.2 4,381 2_8 23,070 15.0 3,000 1 9 239 0.2 3,085 2.0 42 0_0 154,194
Mainland 1,814,417 37.8 251,934 5.2 51,046 1.1 826.896 17.2 165,768 3.4 4,805.315
Zanzibar 20,036 20.8 1,982 2.1 1,866 1.9 5,525 5_8 3,779 3.9 96,522
National 1,6 ,453 37_4 253,916 5,2 52,912 1.1 832,524 17.0 169,547 3.5 4.901,8374
Tanzania Agriculture Sample Census - 2003

II Subsistence versus Noi Subsistence 1 -54
SUBSISTENCE VERSUS NON SUBSISTENCE

Appendix If - Subsistence versus Non Subsistence 1 55
32.1 SUBSISTENCE VS NON SUBSISTENCE: Number of Househods by Livelihood Activity and Percent Used for Non-
Subsistance Purposes
Percent used for Non Subsistence Purposes
ACtjvsty
0 1 - 20 76 - 50 51 - 75 76 - 100 If Thtai
Number of
Households '1,
Number of
Households °A.
Number at
Households %
Number of i
Households 30
Number of
Households
Number of
% House Sobs °/,,
Crop Prcduclion 1.429.699 301 1,785 . 981 38 1,117.210 24 238.253 5 115.348 2 4.680.4911 100
Livestock Production 757.H:2 28 616,983 23 052,822 21 307,834 12 439,606 16 2,674.327 100
Vegetable Production 363 0iM 591 63,6 10 72,265 12 39;669 o 72 705i 10 611,299 100,
Tree Loping for f= irewood 3.461 372 81 404,029 9 230,356 5 74,886 2 99.494 2 4,270,718 100
Tree Logging for Poles 1,612279 74 214,245 10 174,265 8 70,188 3 122.383 6 2,193,361 100
Tree Logging for Timber 49,262 26 29,185 16 39,423 21 23,580 12 60,029 26 191,478 100
Tree Logging for Charcoal 34,673 12 61,149 22 72,528 26 39,052 14 73,319 26 280,721 100
Fishing 15,259 9 35,523 19 45,930 25 36,486 20 49,245 27 183,144 106
Seekeeolng 13.329 12 18,073 17 24,121 22 14,562 13 36416 35 108,501 100
Permanent Employment 32,155 11 84,774 28 95,255 32 44,204 15 43,121 14 299,508 100
Temporary Employmen1 287,283, 11 582,707 23 824,681 32 442,152 17 437,768 17 2,574,591 100.
Reottanoes 127,151 21 115,052 19 '1 50,582 24 86,500 14 39,166 23 618,452 100
32.2 SUBSISTENCE VS NON SUBSISTENCE: Number of Households by Percent of Livilihood Used for NON-Subsistence
Purposes and Region
Percent used for Non Subsistence Purposes
Region
Less than 1 1 25 25 - 50 50 - 75 75 100 Total
Number of
Households %
Number of
Households °A
Number of
Households %
Number of
Households 30
Number of
Househods %
Number of
Households To
Dodoma 1,470 0 155,530 48 134,538 42 30,735 10 1,242 0 323,515. 100
Arusha 4,0643 100,166 65 46,392 26 9,095 945 1 154,662 100
Kil maniaro 8,625 4 157,367 73 44785 21 4,487 2 456 6 215,719 106
Tanga 105,932 40 132,476 50 25.186 10 1,355 1 0 0 264,949 100
Morogoro 12,080 5 135,697. .52 95,972.. . 37 14.744 2,252 1 260,746 100
Pwan 6,824,Q7,279 41 45,937.. 32...
2,150 18 5,198 4 141,388 100
Dar es Salaam 916 4 7,971 39 8,388 41 2,657 13 462 2 20,394 100
Lindi 9,808 6 86,957 57 46.305 3D 9,384 6 390 0 152,844 100
Mtwara 31.,252 14 93,766 41 84.386 37 18,445 8 .. . 1,464 229,314 100
RuvuMa 8,233 4 116,276 61 59,907 31 6,581 3 106 0 191,103 100
ringa 9,121 . 3 145,146... .. 52 98,551. .. . 35. 24,913 9 986 278,717 100
Mbeya 13,995 4 187,359 50 141,347 38 27,331 7 2,579 1 372.611 100
Singida
Tabora
x,341,
6,600
5
4
99,193
66.782,
55
28
64.971.114,673
36
49
6,087
43,323
3
18
323
..._ 2,339
0
1
179,915
235,717
100
100
Rukwa 9,600 3 96,398 56 60.705 35 8,921 5 603 0 172,226 100
Klgoma 9.933 5 104,022 54 71.369. 37. ..... ...8,392 4 482 0 194.199 100
Sh[nyanga 41,729 11 196784 52 91,404 24 38.819 10 6,284 2 376.020 100
Kagera. _
25,649 7 199,775 57 109,851 31 16,323 5 1,497 0 353,094 100
Mwanza 2,426 1 205,509 60 116,032 34 16,592 5 526 0 340,085 10
Mara 8,515 5 79,590 42 76,182 41 20,579 11 3,196 2 188,062 100
Manyara 11,355 7 71,927 47 57,439 37 13,249 9 224 0 154,194 10
Total 335,47 7 2,495,966 52 1,588,320 33 347,162 7 31,555 1 4,798,475 100
Tanzania Agriculture Sample Census - 2003

Appendix It - Subsistence versus Non Subsistence 1 56
32.3 SUBSISTENCE vs NON-SUBSISTENCE Rank of number of households b y Subsistence & Non subsistance aenerafin c1 activity by the Household and Region
Crop Production Livestock ProductionTree Loggpng for
PoresTree togging for
TimberTree Logging for
Charcoal Fishing Beekeepmq
PermanentEmptoyrnenf l oft farr
income
TemporaryEmployment 1 Ott tarn
income Remittances
Region
Used forSub-
sistance
Used forNon Sub -sistance
:SSub- for
ce
Used forNon Sub -sistance
Used foSub -
sistanceF'NonSub
Used for Sub -
sistance
Used forNon Sub -sistance
Used forSub -
sistance
Used forNan Sub -sistance
l)sed forSub -
sislance
Used forNon Sub -sistance
Used forSub -
sistance
Used forNon Sub -sistance
Used forSub -
s istance
tSseci forNon Sutr -sisfance
Used forSub -
sistance
Used forNon Sub -sistance
Used forS b -
sistance
Used forNion Su
sistance
Dodorna 2 10 B 3 1 8 5 4 3 9 410
71
10 2 6 5 7 6 93
1 _
7Arusha 2 _ 8 4 10 1 9 5 2 9 3 6
7622
8 4 7 5
Kilimanjaro 6 9 1 10 2 1 4 4 3 8 5 5 107
39
9 5 8 75Tanga 2 10 3 3 1 6 fi 1 8 4 9 B 10 5 7 4
Morogom. 2 10 3 8 1 9 6 2 5 4 8 3 10 1 4 7 9 6 7 5
Waani 2 10 4 5 1 3 8 1 9 2 102
410
5_ S6
63
8
9
7 7 3 8
Dares Sataam 1 8 5 4 4 5 10 2 9 1 7 6 7 8 3
LirrdiMtwara
2 10 7 4 1 3 5 55
3 8 4 7 1 0 'f 5 9
9
8 6 9
7 2
2 10 10 2 1 8 8 9 312
5 77
4 1 3 6 6 4
Ruvuma 2 10 4 6 1 3 7 _2 3 9 8
8 5 6 9 10 8 5
94
5Iringa 2 10 3 6 1 9 6 4 4 3 7 1 5 8 10 7
Mbeya 2 10 3 9 1 8 10 3 8 5 9 4 4 2 6 7 5 6 7 1
Singida 2 10 6 5 1 7 3 _2 9 4 5 8 IS 1 4 9 7 6 8 3
TaboraRdtcwa
1 10 8 2 2 6 7 5 4 8 10 35
9 1 3 9 5 7 6 4
2 10. 3 7 1 9 8 2 10 1 6 9 3 4 8 7 6 5 4
Kigoma 2 10 4 5 1 9 7 3 8 1 10 2 9 4 5 13 6 6 J3 T
Shinyanga 2 10 4 B 1 9 7 3 6 4 10 1 3 21
5 7 8 6 9 53Kagera 2 14 3 9 1 6 9 4 7 2 8 7 10 5 8 6 5 4
Mwanza 2 1€1 3 8 1 9 5 1 0 2 10 3 7 4 6 8 8 5 4 7
Mara 1 10 4 6 2 4 7 3 9 2 5 8 10 1 3 _ 9 6 7 8 5
Manyara 2 10 4 7 1 8 10 ^2 7 6 3 9 9 1 8 5 6 4 5 3
Tntat 2 10 3 7 1 8 5 2 8 3 9 4 10 1 4 9 7 6 6
Tanzania Agriculture Sample Census - 2003

Appendix 157
APPENDIX III. CENSUS DATA COLLECTION INSTRUMENTS
Smallholder QuestionnaireCommunity Questionnaire
Village Listing Forms
APPENDIX a Smallholder Questionnaire
Tanzania Agriculture Sample Census - 2003

Smallholder Questionaires 158
United Republic of Tanzania
CONFIDENTIAL
{ Small holder/ -all Scale Farmer Ouestionnaire
Agriculture Sample Census
2002/2003
Vim.
' RP69 :o5ti3
Enumerator Name
Date Enumerated dY Y
SignatureHour Minutes
Start time
End time L )^ ^
Field level checking by: To be completed by the
supervisor ONLY afterDistrict Supervisor: Name signature Date i I field/farm level checking of
the enufnerafion process
Regional Supervisor Name signature Date I 1 This should be
countersigned by the
National Supervisor: Name signature Dafe f enumerator.
District checking in Office: All questionnaires mostbe checked at the district
District Supervisor Name signature Date i office.
For Use at National Level only:
Data Entered by Name signature Date f ! See back page for detailsof query
Queried Name signature Date f 7
Executed by the Ministry of Agriculture and Food Security, Ministry of Water and Livestock Development,
Ministry of Cooperatives and Marketing
and
National Bureau of Statistics
Tanzania Agriculture Sample Census - 2003

Smailitoider Questiona.ires 159
Definition and working page for page 1General Definitions
Small holder hh/small scale farm:Should have betWeen 25sq metres and 20 Hectares under production, and/or between 1 and 50 head of Cattle, and/or between 5 and 100 .head . of Sheep/Goats/Plgs, and/or between 50 and 1000 chickens/turkeys/ducks/rabbits.
IHousehold: A group of people who occupy the whole or part of one or more housing units and makes joint provisions for food and/or other'essentials for living_
/Household Head: A person who is acknowledged by all other members of the household either by virtue of his age or standing in the'household as the head. He/she should be a permanent resident of the house and he/she is the main person responsible for makingtdecissions.'Agricultural Holding: This is an economic unit of agricultural production under single management.. It consists of all livestock kept andall land used for agricultural production without regard to title. For the purpose of this survey. the agricultural holdings are restricted tothose which meet one of the following conditions:
Having or operated at least 25 sq meter of arable land- Own or keep at least one head of cattle or five goats/sheep/pigs or fifty chicken/ducks/turkeys during the agricultural year
2002/03 {October 2002 to September 2003) .
Question Specific Definitions: Procedures for Questions:Type of Agriculture Holdings Codes (Q2.1):
- Crops only: A holding is referred to be a drops only holding if it hascultivated a piece of land equal or exceeding. 25 sq Meter. This also appliesto all households owning or have kept livestock whose number does not .2.1 Type of agriculture household/holdingQ qualify such hobsehold to be an agricultural holding (No cattle, less than 5goats/sheep/pigs, less than 50 chickens/turkeysiducks/rabbits)
1. Using the options under the question- LiVesfack only: A holding is referred to . be a Livestock only holding if it hasexercised Livestock hOsbandry only during the agricultural year. Thelivestock can be herded in search for areas of pastu're, but the core
classify the type of agriculture hhlholding
Note: If the hh had I acre of crops and raised 40household unit always remains ih the same place and the herder is rarely chickens during 2002/03 it is classified as 'Cropsaway from this place for long periods at a time. only' as the number of chickens do not quality the
hh as keeping livestock.- Livestock pastoralism: This refers to a household which practiceslivestock productioh as its major income generating activity and a means ofsubsistence, but moves from one place to another searching for water and .pasture for the livestock. This movement usually involves long distancesand in many cases the whole household unit moves with the livestock and Q 2.2 Important hh livelihood activitiesthey have no permanent place of residence. /source of income
For both livestock only and pastoralism , the number of livestock has to be at least 1 1. Read the list in column 1 to the respondent andhead of nettle, 5 goats/sheep/pigs or 50 chiokei'lslturkeys/ ducks/rabbits. This also ask him to rank them in order of i mpo rtance during theapplies to all households owning or have cultivated a piece of land less than 25 sqmeter, which does not qualify such household be an agricultural holding.
reference year.
2. In column 2 Indicate the imoortance of each- Both crops and livestock: A holding is referred to be a both crops and activity by placing 'V against the most important, '2'livestock if it has cultivated a piece of land equal or exceeding 25 sq meter against the second most important, etc until you reachand if such households is owning or have kept livestock whose numberqualify such household be an agricultural holding.
'7' the least important activity/source of income.
Note: You must attempt to fill in all boxes. MostImportant livelihood activities/source of income (0 2.2): households will carry out these activities to a
greater or lesser degree. You will normally have to- Crop farming: This refers to a household where crop production is .itsmajor means of subsistence and income generation. • •
probe to get remittances.
if the hh did not undertake an activity during the- Livestock farming/herding/pastoralism: This refers to a household. where 2002/2003 agriculture year then mark thelivestock farming/herding. is its major means of subsistence & incomegeneration. .
.iappropriate box in column 2 with an X.
- Off Farm Income This refers to cash generated from activities other than3. For each activity/source of income assign apercentage. The enumerator should assist the
from the households holding. This can be from permanent employment (eggovernment/other), temporary employmenUlabouring and includes cash
respondent in assigning the percentage based on theinformation provided by the farmer.
generated froM working on other farmers farms. ... •
-Remittances: Assistance from family members who are not currently part of4. After completing column 3 make sure the
100.toupaddpercentagesthe household, or from a relative or family friend. This assistance is usually inthe form of cash but it can also be in-kind (eg food, clothes, building material, Note: It is not essential to be 100% accurate. Thisfarm tools, etc). The money is a gift and is not paid back. question is just to give the relative importance of the
termsgeneralinitemsdifferent-Fishing/hunting and gathering The use of non farmed resources for foodeg fishing ., hunting wildlife and gathering mushrooms, berries, wild honeyoots from uncultivated . land.
J
Tanzania Agriculture Sample Census - 2003

Smallholder Questionaires lba
1.0
1.1
IDENTIFICATION DETAILS
Location
S/N Location Name Codes
1.1.1 Region ..............................................
1.1.2 District ........................................................
1.1.3 Ward ........................................................mETL PLq
1.1.4 Village .................................................. lei
1.2 Details of the respondent and household head
S/N Codes
1.2.1 Name & number of local leader .................... I ............ qqqq
1.2.2 Name & number of household head ... . ..... ......... . ............................ LIhLhLi
1.2.3 Sex of household head (Male = 1, Female = 2) JL
1.2.4 Name of respondent
1.2.5 Relationship of Respondent to Household Head
Relationship to household head codes (Q 1.2.5JHead of Household...... I Son/Daughter .........3 Grandson/Granddaughter ......5 Other (friend, employee, etc).. .8
Spouse ....................2 Father/Mother .........4 Other relative.......................6
2.0 ACTIVITIES OF THE HOUSEHOLD
2.1 JTypofAiculire Household
Agriculture household codes(Q2. iJCrops only ...............I Livestock only ................2 Pastoralist.................3 Crops and Livestock ................4
2.2 Rank the following livelihood activities/source of income of the household in order of importance
SIN Livelihood/source of income activity,
Rank in'order
of importance
1=most 7=least
How important are each
of these activities
expressed in percentage.(]) {2) (3)
2.2,1 Annual Crop farming q
2.2.2 Permanent crop farming i _1 %
2.2.3 Livestock keeping/herding
2.2.4 Off Farm Income q qq—Lq
2.2.5 Remittances +.—._.J
2.2.e Fishing/hunting and gathering q LihLIhli]
2.2.7 Tree/forest resources (eg honey, firewood, timber,ete) L _ LIIlhlLhhl,JhhhIi
1 D C1
Tanzania Agriculture Sample Census - 2003

Section 3.0 - Preliminary note
1. Make sure that you define the hh properly toensure that all the members of the hh areincluded. Make sure you stress that the hh is notjust the hh heads direct family and that it includesother people living and eating together with thefamily.
2. If you notice that his house is large or yousee many people around his house and he hasonly given you small number of hh membersenquire further until you are sure that you havecaptured all the hh members.
Section 3.0 - Household Information
. For each household member completecolumns 1, 2 & 3.
After completing columns 1, 2 & 3 foreach household member go back tothe first household member andcomplete the remaining columns forthat member.
. Repeat step 2 for the rest of thehousehold members
IMPORTANT NOTE:Cross check responses in columns 11 and 12with section 2 especially in relation to:
off-farm income - if a hh member was involved inoff farm income then there should be a responsein question 2.2.4 and vice versa.
Overview to section 3.0
Procedures for questions
Smallho der Questionaires 161
Definition and working page for page 2question Specific Definitions:
Relation to head (Cot 2):
- Household Head: A person who is acknowledged by all other members ofthe household either by virtue of their age or standing as the household head.
Read and Write (Col 7):
- Any other language: Must be a written language.
For someone who can read and write in Swahili and any other language apartfrom English, the correct code is 1. For one who can read and write inEnglish and any other language aped from Swahili the correct code is 2.Code 4 should only be used for another language but not English or Swahili
Education Level Reached (Col 9):
Indicate the highest level only. For those still affending school fill in the lastyear reached before the survey period. For example if a hh member iscurrently in standard 7 this year his highest grade reached is standard 6
Main Activity (Col 11):
- Crop farming: The persons main actiVitY Is crop producton: :This:can eannual crops,: vegetables, permanent crops or tree farming.
Livestock faminglherding: The :persons main : actiie.ty : is livestockfarming/herding. The liVestock can be herded in search . for areas of :pasture,but the core household unit always' remains in the same place and theherderis rarely away from:this place for long periods et : a time. This categery alsoncludeS : fish farmihg by; Pot fishing. :
Livestock pastoralism The persons main activity is in moving ilvestockfrom one place to aaother searchinP for water and basege for ithailivestock:This movement usually inveives long dista !lees and in many cases the vhole:household unit moveS with :the:':ivesleck arid they may haVe ha permanent •place of residence.
-Paid employment In full titre employment earning a cash: income
- Government Pa rastatal In fall time employmeir for: algeYerntheit Ministry, Depa ment or Ooard that is controhed Me :Government
-. PriYateiNGOIMissionlete -..employed by . Non public/governmentorgansatior
elf employee - works for own buslneea fdr cash income
- With employees - Works fer own business for cash. and employsother workers
- Without.employees Works L.r own business for Cash bUt noesnot`employ other Workers
- Not working but available to Work - Nn prOductiVe attyty but wbuld l ike tohave one
- Not werking & nor ay4ilabie for work - No productive actiVity and duos notwant to have one.
, Unable to work Ice c: d, for yeung. : retired,:dieabled, etc
Off-farm income . {Col 12) - Income made from activities NOT on the IiiIH'sfarming activities, This can be any off farm income generation activiV andincludes working for cash on other peoples farms,
indicate whether each member was involved in an off farm incomegenerating activity during 2002103
Tanzania Agriculture Sample Census - 2003

Smallholder Questionaires 162
3.0 HOUSEHOLD INFORMATION
3.1 Give details of personal particulars of all household members beginning with the head of the
household Not applicable for children under 5 years of age
SIN!NNames of household
memLers
Rela-
ion-
ship to
head
Sex
il =l
F=2
Age
(if age is above
99 years tie
write 991
Survival of
Parents
Read
&
Write
Edo.
ca-
tion
Status
Education
Level
reached
lnval-
vement
in
farming
Main
activity
(for aged 5
& above(
Off-farm
Income Yen=i
No=2
No-
flior
fa-
ther
(1) 2) {3J (4) (5) lfs} i?i O (9) (10) 111) ( 1'i
Lq i _ i q q
3.i.2 i 1 q q q q L_._:^ q D II q q l— 1
3.?.3
3.1.4 ............ . ........ ^ ^ i ^
EL-^ ^1 q iq ^..^
Li.q q L1 q q Li3.9.5 ..................... q 1 —E qq q q q q q q LEE q
3.1.6 .... q !_ qq LJ EL LiLj q Li Li LIq qq
3.9.7 ..................... L^.- ^' q L___H Li Li............... q ! _I q q q Eq q q I —1 q qq Lq
31.9 . q q i ^_ ^_J q q q •q^ q l
3.1.10 ............... L q qqq q L J q J q qq q qq q
3.1,11 ..................... q q i q q i I L q r q L i
3.1.12 _l q qq 7 L— q q qq Li3.1.43 i ._; q qqq q q q q qq q LLL LJ
3.1.14 qq LITh_1 LLL LLi L-- . l
3.,,15 .................... q LJ q1 q Eq qq L qqL3.1.16 ........... . ......... L_ J _ k Li I—..J q l ^l q 1 —a ^--.-7 q q
Relation to head Col
Head of household ..........1
Spouse .........................2
Son/daughter .................3
Father/Mother ................4
Grandson/granddaughter .5
Other Relative .................6
Others ..........................8
Survival of Parentsj
(CotYes .............................1
No.. ..........................2
Don 't know ...................3
ReaRead & Write ( L fl
Swahili ......................... ..
English ........................2
Swahili& English ...........3
Any other language ........4
Don't Read/ Write ..........5
EEducation Status (Col 8) involvement in farmingAttending School .............1 activities (Cot 10)Completed .......................2 Works full time on farm ...1
Never attended School ......3 Works part-time on farm 2
Rarely works on farm ....3
Never works on farm......4
Education Lever! Reached (Col 9)Primary Education Secondary EducationNot of school age ...........NA Form one ............................11
Under Standard One .... 00 Form two ............................12
Standard One ................01 Form three ..........................13
Standard Two ................02 Form four ............................14
Standard Three .............03 Form five ............................15
Standard FvFive ................05 Training after Secondary 16g ry
Standard Six ..................06 Education ...........................17
Standard Seven ...........07 University &other tert iary
Standard Eight ..............08 Education ............................18
Training after Primary Adult Education ...................19
Education ......................09 Not applicable ..................... 99
Main activity
Crop Farmin
Livestock Keepin
Livestock Pastoralism..........
paid employment:
- private- NG
Self employed
- with employees
- without employees
Unpaid family
Not working &
Hou emakerh
Unable to work
Fishing ...........,....................04
Governmentlparastatal....05
agriculture) .........................09
Student ...............................13
Retired/sick/disabled)..........14
Other .................................98
(Gad 791......D1
/Herding..02
/missionfetc .06
(non farming)
.,...............07
............08
helper (non
available.....,,10
ousewi
unavailable...
rte ..92
/too old/
03
2
Are Form One ..............10
Tanzania Agriculture Sample Census - 2003

NOTE: The listed resources refers tocommunal resources and not thoseindividually owned or part shared. Theresource has to be freely accessible to the
\whole village
Distance to fields (Q6.1):-fields A field is a contiguous piece of landholding which the farmer considers as a singleentity. The field may be divided into plots forgrowing different crops. A holding may consist ofone or more fields in different localities.
Use of Communal Resources (Q6.2):Communal resources - refers to the place on
which all individual households can have accessto. It is not individually owned or controlled by onehh.
Ovemew t section 4 `Section 4.0 - Preliminary noteLand Access! OwnershipAccess/Ownership refers to the area utilized by themembers of the household. This does not includecommunal land where the resources are sharedbetween households It does include official commune.land that the hh has sole access to eg a plot for cropfarming in the communal area
P • • •• -
Section 5.0 - Land Use
1. Ask the respondent the area of the differentlanduse categories the household has sole access to(05.1.1 to 5,1.12) and record in the appropriate spaces.
2. Add up the area of the different categories of andand compare it with the total area obtained in section4.0. The total area should be the same.
3. If the total area is different find out which one iscorrect and make amendments where appropriate.
Smallholder Questionaires 163
Definition and working page for page 3QU n ecific Defi •n
Section 4.1 - Land AccessiOwnershipLeaseiCertiticate of Ownership Area under tease/certificate of ownershiprefers to the area for which the household possesses a government issuedleasehold title or certificate of ownership. The land will normally be officiallysurveyed and boundaries marked. This includes leased land bought fromothers where the lease/certificate of ownership has been transferred.
Customary Law: This refers to the land which the hh does not have anofficial government title to but its right of use is granted by the traditionalleaders. This user-right agreement does not have to be granted directly bythe village leaders as right of access may be passed on' through heredity.
Bought: This refers to the area of customary land that has been bought fromothers, This land does not have an official title and therefore is not leasehold.
Rented from others: Land rented from others for Cash or for a fixed amountin crop produce (eg fixed number of bags at harvest).
Borrowed: Use granted by land owner free of charge. Land owner caneither be a lease holder or has right of access through customary law.
Share Cropping: where the hh is permitted to use land which is then paid forfrom a percentage of the haNested crop.
(Section 5.0 Land UseTempora crops: are sown and harvested during the same agricultural year
- Permanent crops: are . sown or planted once and then they occupy the landfor some years and...need not to be replanted after each annual harvest.Permanent crops are mainly. trees (e.g., apples) but also bushes' and . shrubs(e.g., berries), palms (e.g:, dates), vines (e.g., grapes), herbaceous stems(e.g., bananas) and stemless plants (e.g.; pineapples)',
- Mixed Crops: This is a mixture of two or more crops planted togetherand mixed in the same plot/field. The crops can either be randomlyplanted together or they can be planted in a particular patterm egintercropping (1 row of maize and 1 row of beans). A field that hasbeen divided into plots for different crops is not mixed. This is
subdivided into:Permanent Mixed -two or more permanent crops grown together,Permanent/Temporary Mix - permanent crop and.annual crop together,Temporary Mixed - two or more temporary, annual crops grown:together.
- .pasture Land: This is an area of owned/allocated land wnici i. is set aside forlivestock grazing.. It can be improved pasture where the farmor has plantedgrass, applied fertilized or a oplieu other production inc-- • sing :technologies toimprove the grazing. Or it Gan oe rough pasture.
-: Fallow: . .Ths is the area a' : land that :s nernary : used `or 'crap prOri.icaicn,but is not used for croo oroai.afon dur 3 ng a . yeal : o , :a : ; l umber of years, Th.:s isnormally to allow fpr Seff genersier a tertilityYSoi: Vuotu ie and :is offer anintegral part of the crop rotat , da system,:
- Natural : Bush: Lane Which is considered productive:: butcultivation or used extensively for livestock production andgrowing shrObs and trees.
-Planted trees: Land which is used for planting trees for poles or timber
- Unusable: Land that is known to be non-productive for agriculture purposes
Uncultivated Usable: This is land that was not used for reasons other thanfallow The reasons could be lack of inputs/money/rainfallietc.a.
Section 4.0 - Land Ownership
1. Ask the respondent if he knows the total area of landthe household has sole access to. If he knows make anote in the calculation space
2, Ask the respondent the area of'the different landownership categories the household has sole accessto (04.1.1 to 4.1.7) and record in the appropriatespaces.
3. Add up the area of the different categories of landand compare it with the total area obtained in step 1 (ifthe respondent provided the information).
4. If the total area is different find out which one iscorrect and make amendments where appropriate.
Section 6.2 Communal resources
Note: the code "Not available" means that theresource does not exist. The code "Not Used"means that the resource does exist but is not usedby the hh.
Tanzania Agriculture Sample Census - 2003

Smallholder Questionaires 164
LAND ACCESS/OWN RSHCPI'r URE --4. 1 Details of area "owned" by the household in the 2002103 agricultural year. Give area reported by
the respondent in "acres". Area in Acres
4.1.1 Area Leased/Certificate of ownership ) 4.2 Was all land available to the f h used
during 2002103 (Yes= 1, No=2)4.1.2 Area owned under Customary Law '.__ _..._
4.1.3 Area Bought from other I _.I
4.1.4 Area Rented froth others 4.3 Do you consider that you have
sufficient land for the hh (Yes=i, No=2) f4.1.5 Area Borrowed from others `U .L L........
4.1.6 Area Share -cropped from others I
4.1.7 Area under Other forms of tenure ......... iL j! I 4.4 Do any female members of the hh own or have
customary right to and (Yes=i, No=2) I JTotal area J^ j j i L j
5.0 jL,AND USE5.1 Area operated by household under different forms o.fband use
area reported by the respondent in "acres".during 2002/03 agriculture year. Give
Area in Acres Calculation area
5.1.1 Area under Temporary Mono-crops __^..—. 5.1.2 Area under Temporary Mixed crops (eg Maize & beans)
!u^
5.1.3 Area under Permanent Mono-crops i l ^—^
5.1.4 Area under Permanent Mixed crops (eg bananas, coffee & trees) L__.L_,i
a1.5 Area under Permanent/temporary mix (eg bananas & maize) W J1 T
5.1.6 Area under Pasture
5.1.7 Area under Fallow
5. ts Area under Natural Bush !! ^j
s. i.s Area under Planted Trees
5.1.10 Area Rented to others
L
^J
5.1.11 Area Unusable ^
5.1.12 Area of Uncultivated Usable land (excluding fallow) L ! • ` 1
Tfltal area fl IT ', ;_I6.0 ACCESS AND USE OF RESOURCES
6.t In the following table indicate the distance to the different fields used by the household
Snvheld Number
rstance In -r ometres rom ie tco; Distance codesless than 100m ............1 between 2 and 3km .... 6
between 100 and 30Cm .2 between 3 and 5km ..... 7
between 300 and 500m .3 between 5 and 10 km ..8
between 500 and lkm....4 Over 10 km ...............5
between 1 and 2km ......5
Homestead Nearest road Nearest Mart
6.1.1 1 ii6.1.2 -2 L —J _L_6.1.3 3 Li U 1
6.2 in the following table indicate the distance and use of the following communal resources
S^CommunaResource
stance to resource m ainhh use
instructions for distance to resource
(Got 2 and 3):
If under 1km, uvrite 0III
^If above 1km round to whole numbers1.5km= 2km, 1.25km= 1 km_ _
ry season wet season{ I) r2 3) (d)
6.2.1 Water for humans ^' ^ [^
6 .2.2 Water for livestock j 1^_. 7 _
eg
6.23 Communal Grazing iY { j ! i; Main hh use fCot 4)Nome or farm Consumption/utilisation.....Sold to Neighbours ..............................2Sold to trader on the term ..................... 3Soid to village market .........................4
Sold to fora! wholesale market ...............5Sold to major wholesale market ..............6
Notavarta by household......... :...... . 7
...................................... 8
6 :2.4 Communal Firewoodr
L j ~ -
j
6.2.5 Wood for Charcoal
6.2.6 Building poles i--
6.2.7 (honey)beesforForest ? s—.
6.2.8 Hunting(animal products) 1 1 ii i1^ ) i_
6.2.5 Fis€rin (+'ish) t i t j
Tanzania Agriculture Sample Census - 2403

ti
Definitions and working page for page 4 Land Clearing: Refers to removing trees/bush/grass prior to ploughing
Soil Preparation: Refers to the seedbed preparation (ploughing, harrowing, etc)Working table for the calculation Iof area occupied by annual crop Total area Ground Total no. Total ground Planned Area: Area in Acres the household planned to plant before the season started •in a mixture Crop of mix area/plant of plants area of plants Actual Planted Area: The area in Acres the household was able to plant-
Crop mixture I Name (acre) (ACRE) (ACRES) Area Harvested: The area in Acres that produced a harvest. This is the same as the area plantedminus the.area that was destroyed by maior flood/pesV animaVetc damage.
(u) (h) (c) (d) e) 0
Permanent crop i 0.00
"
•TemporalAnnual Crop:Crops which are planted and
Crop Codes (CerealsItubers/rools):
Vegetable Codes:Co Crop
Crop CodesLegumes Oil & fruit:
0.00 - 1 iPermanent crop 2
Permanent crop 3
Permanent crop 4
0 -
0
r
harvested within a period of 12months after which time theplants die, Most annual crops.are planted and harvested ona seasonal basis
8887 ICoambbaatogees
Code Crop11 Maiz
12 Paddy13 Sorghum14 Bulrush Millet
de
88 Spinach
89 Carrot
Code Crop
31 Beans
32 Cowpeas
33 Green gram
35 Chick peas
p.00.
.0.00 ' 1
Total Area of permanent crops in mi x 0I
15 Finger Millet90 Chillies 36 Bambara nuts
REMAINING AREA UNDER TEMPORARY CROPS —1116 Wheat
7 Barley91 Amaranths 37 Field peasCash Crop Codes:
Code Crop 22 Sweet Potatos 92 Pumpkins 41 Sunflower
Crop% crop are 50 Cotton 23 Irish potatos93 Cucumber 42 Simsim
Temporary/permanent crop name 1
Temporary/permanent crop name 2
r.m 51 Tobacco53 Pyrethrum62 Jute
24 Yams
25 Cocoyams26 Onions
94 Egg Plant
95 Water Mellon
96 Cauliflower
43 Groundnut
47 Soyabeans
48 Caster seedm . -•— —
M 19 Seaweed 27 GingerTemporary/permanent crop name 3
1----- .
iTotal area check Crop total check = ' r: Instructions for calculating the area of mixed crops in a mixture.
A. If the mixed crop is mixed annual only enter the total area of the field in the REMAINING AREA UNDER[ I 1
Total area Ground Total no. Total ground TEMPORARY CROPS. and gob step 1 of these instructions.
Crop of mix area/plant of plants area of plants B. If the mixed crop is mixed permanent and annual try to get the % occupied by the different crops and calculate
Crop mixture 2 Name (acre) (ACRE) (ACRES) the area of annual crops outlined in step 1. Otherwise use the number of trees method to calculate the area of
annual crops in the mix, Step C(a) @ (c) (d) (e) 0 C. Number of trees method to calculate annual crop areas in a peranent-annual crop mix!
Permanent crop 10 . 00
1 1
1
. i } (i) list each of the permanent crops in column b and enter the ground area per acre for each permanent crop
Permanent crop 20.00 I 1 01i ',
(frominstructionsfor page 6) in column V.
(ii) obtain the number of permanent trees in the mix from the respondent and enter the number in column V.
Permanent crop 3[ 0.00 0 '
(iii1 calculate the area occupied by each crop by multiplying column 'd' with column 'e' and sum these to obtain
the total area of permanent crops in the mix.0 .00.0
Permanent crop 4 0 (iv) subtract the total area of permanent crops in the mix from the total area of mix and enter the result in the total
area under temporary crops.Total Area of permanent crops in mix ' ME (v) proceed to step 1 to calculate the area under each temporary crop.
REMAINING CROPSTEMPORARYUNDERAREA - Enter the name of each annual crop in the mix & estimate the percentage of each crop.
2. Using the percentages for each crop calculate the area of each crop from the REMAINING AREA UNDERcrop% crop area TEMPORARY CROPS.
Temporary/permanent crop name 1 = M 'rn 3. After completing this exercise for all fields, sum the area of each crop in the mix plus any monocrops and enter
totals in section 7.1 cot 6.Temporary/permanent crop name 2 4. Obtain an estimate of the planned area for each crop and enter it in column 5
5. If ffie area harvested is different to the area planted estimate the harvest areaMTemporary/permanent crop name 3 1 ' 6 Once the quantity harvested is obtained calculate the Yield (Metrictonnes/acre) & compare the figure with the
Total area check = ' Crop total check_
M 'M norms given in the crop codes x If it is excessively different check the area and the amount harvested.

7.o 1ANNUAL CROP AND VEGETABLE PRODUCTION - SHORT RAINY SEASON
7.1.1 Did the his plant any crops during the `short Rain y season? Yes 1, ! o =2j ^J 1 the t'e_r n^zse rs ' V ) ' give ntnr. r'enso . Them gc in see7ion 7.2
Main Reason Above No rains.....1 Rains came too late .....2 Does not plant annual crops --....----..3/fs money 4 Don't get Vuli season ., 5 tfFnesslsocrat pro bfems ..................... 6
7.1.2 For each crop planted during 2002 1 03 Short Rainy season provide the following information 1 Has Irrigation & does not follow season (give annual production at Mast/ca) ...... ... 7
Plant ng Inputs Harr esting & Stora a ?'Vl arketinSoil °/° Srriq Fax Her Fan Pest main
Quantity Quantity Quantityharvested Stored sold
^Land^,,,e.,t j tactual ixa r -at -til -ble e- i -tic How How Area P 9Crop Clea -a Planned Planted -peed -ion ^-iser -xde :ide -ide hare three HarvestedCode -ring -ion area (accost area (acres) seed use use use use use liested bed faeresl
Total Planned?PlantedIl I (I 1 ?11 ...I LL J it Total area hs3estett
7 .1.3 Main reason for difference between Area Planned and Area Planted 7.1.4 Main reason for difference between Area Planted and Area Harvested
H0
ocry
C
N
pC)
C
Land Clearing {Co! 3) tm,roved seed Ilse
Mostly bush clearance ..1 i QLfl.Mostly hand slashing ,...-2 al[ Improved ................Mostly tractor slashing. 3 appm.x Sit improved ...2Mostly burning ...-.-,..,..4 approx 112 ±mproved-....3No land clearing...........S ap4rox 114 irnproved.....4
less E Iran 1/4 improved -.5No improved seed used.6
Soilnreparation Method Irrt oboe Use^Gof 8)Co! 4 tilled on all crop .......... ?
Mostly tractor pleoahing.f Ilsedoir 3/4 0/crop ---...2Mostly Oxen plo ughing ..2 Used on 1/2 of crop-......3Mostly Hand cultivation ..3 Used on 114 of crop --....4
^ Used on less than 1/4, 5 5Not cased ...................6
Fertiliser codes (Gat 9} [ Threshed/harvestedMo
sflyFarm Yard Manure f ^ (C^1138 f4
MestfyCompos t ........... 2 By halo ..... . ...1Mostly Inorganic f rti!iser..3 By draft an irnaf ---, 2No lted .-_-....4 By tureen powered toot ..._3^'PlL
lise
I By engine driven machine...4
1Nofapplicable ................9
roc>temicat vse codes ^ ; TNatn roduc` Got 16^_ of16
Cof90?1&f2 I IDryGrain._.....- .....1
Used err all crop ........ 1 Green cet3/green pod.. ..2
Used on 3/4 of crop ...... 2 Green leaves & Stow .. _.3
Used on 3 r2 of crop .....3 I Stre v, dry stems etc ..-....4
Used on 114 05 crop ..,....4 'Root, tuber,. etc ............5l
Used co, less than 1.14 .... 5 3 ,, Rower e4 pYrell>r rrn ..... S
Not used ................... t Fruit/hooch ..........._..7__,J Other .........................Brrt his vesiert yet ..... .,- 5
""" r °— sJ' ulu !Uleu! i I Reason fordifference befween area planned and ! Reason ror allterence
planted (Q7.1.3} between area lanted andNeighbour. 01 Drought ? harvested (Q7.1.4)
Local r arke/t 7de Deeds ... ....................................................... 2 Drought ..store .02 Access to laid preparation tools (Draft anima /tractors).3 Rain/flood damageSecondary Market,03 'i Credit 4 Fire damage .................3Tertia ry Market -...04 Access to seeds/planting mate el ..............................._: Pes( damage -.......--.....4Marketing Coop ....05 i Access to other inputs - - -- - -- --- I Animal damage - .-..5FarmerAssociafion06 l Other .,.. ....5 TheftLargescafe farm ..,.07 Not applicable ............. .......... ... .....9 fftnesslsoclal problems .--..7Trader at Farris .. 08 _ —.—. — Qfher . ...,. - 8Contract Partner-. 09 1 Not applicable ............ 2Dirt riot sell ., .,10other_ .......... ....98

Definitions and working page for page 5
Working table for the calculationof area occupied by annual cropin a mixture Crop
Crop mixture 1 Name
Total area Ground Total no. Total ground
of mix area/plant of plants area of plants
(acre)) ((ACRE) (ACRES)
Permanent crop 1
Permanent crop 2
Permanent crop 3
Permanent crop 4
Total Area of permanent crops in
REMAINING AREA UNDER TEMPORARY CROPS
Permanent/Temporary crop name 1
Permanent / Temporary crop name 2
PermanenUTemporary crop name 3
Total area check,1
Temoporary crop total check ]
Total Area of permanent crops in
REMAINING AREA UNDER TEMPORARY CROPS
Temp cro %
Temporary/permanent crop name I
Temporalpermanent crop name 2
Tempera /permanent crop name 3
Total area check —f-1 Temoporary crop total check
I X
Mn
o.00r 1
'b.00
0.00
0.00
Permanent crop I
Permanent crop 2
Permanent crop 3
Permanent crop 4
Crop Codes (Cereals
(tubers/roots):
Code Cropif11 Maize
12 Paddy13 Sorghum
14 Bulrush Millet15 Finger Millet
16 Wheat17 Barley22 Sweet Potatos
23 Irish polatos
24 Yams25 Cocoyams26 Onions
r;innor
Vegetable Codes:
Code Crop
27 Ginger
86 Cabbage
87 Tomatoes
88 Spinach
89 Carrot
90 Chillies
91 Amaranths
92 Pumpkins
93 Cucumber
94 Egg Plant
95 Water Mellon
96 Cauliflower
20 Garlic
Crop Codes
Legumes Oil & fruit:
Code Crop
3 1 Beans
32 Cowpeas
33 Green gram
35 Chick peas
36 Bambara nuts
37 Field peas
41 Sunflower
42 Sims'im
43 Groundnut
47 Soyabeans
48 Caster seed
Land Clearing: Refers to removing t ebush/grass prior to ploughingSoil Preparation: Refers to the seedbed preparation (ploughing, harrowing, etc)Planned Area: Area in Acres the household planned to plant before the season started
Actual Planted Area: The area in Acres the household was able to plant.Area Harvested: The area in Acres that the household got most of its production from. This is thesame as the area planted minus the area that was destroyed by major flood/pest animal/etc damage
ciN2
ii (h)
Crop
Crop mixture 2 Name
(c)
Tempora/Annual Crop:Crops which are planted andharvested within a period of 12months after which time theplants die, Most annual cropsare planted and hawested ona seasonal basis.
Cash Crop Codes:Code Crop50 Cotton51 Tobacco
53 Pyrethrum62 Jute19 Seaweed
nstructions for calculating the area of mixed crops in a mixture.
A. If the mixed crop is mixed annual only enter the total area of the field in the REMAINING AREA UNDER
TEMPO RY CROPS. and goto step 1 of these instructions.
S. if the mixed crop is mixed permanent and annual try to get the % occupied by the different crops and calculatethe area of annual crops outlined in step 1. Otherwise use the number of trees method to calculate the area of
annual crops in the mix (Step M-
C Number of trees method to calculate annual crop areas in a pertinent-annual crop mix
(i) list each of the permanent craps in column b and enter the ground area per acre for each permanent crop
(from instructions for page 6) in column 'd'.
(ii) obtain the number of permanent trees in the mix from the respondent and enter the number in column 'e'.
(iii) calculate the area occupied by each crop by multiplying column 'd' with column and sum these to obtain
the total area of permanent crops in the mix.
(iv) subtract the total area of permanent crops in the mix from the total area of mix and enter the result in the total
area under temporary crops.
(v) proceed to step 1 to calculate the area under each temporary crop.Enter the name of each annual crop in the mix & estimate the percentage of each crop.
2. Using the percentages for each crop calculate the area of each crop from the REMAINING AREA UNDER
TEMPORARY CROPS-
3. After completing this exercise for all Fields, sum the area of each crop in the mix plus any monocrops and enter
totals in section 7.1 col 6.
4. Obtain an estimate of the planned area for each crop and enter it in column 5
5. it the area harvested is different to the area planted estimate the harvest areaOnce the quantity harvested is obtained calculate the Yield (Metric tonnes/acre) & compare the figure with thenorms given in the crop codes box. if it is excessively different check the area and the amount harvested.
(b)
Total area
of mix
(acre)
Ground Total no.
area/plant of plants
(ACRE)
otal ground
area of plants
(ACRES)

rn
I
7.2 ANNUAL CROP AND VEGETABLE PRODUCTION - LONG AINY SEASON
7.2.1 Did the 4th plant any crops during the LONG RAINY season? (Yes--1 No = 2) j^ If dee r espnrise is WO' give main reason q Then go to .section 7.3
gain Reason Above No rains....- t Rains came too late .....2 Does not plant annual crops .....-,..3No money 4 Illness/social problems .5
7,2.2 For each crop planted during 2002/03 Long Rainy season provide the following information
Piantin Inputs Harvestin & Storage MarketinSell y Irri Her Fan Pest main
Land prep Actual impr -at -bic -gic -tic How How Area prod Quantity Quantity Quantity mostlyCrop Crop Clea -atat Planned Planted -oved -ion -id -ide -ide bare three Harvested -uct harvested Stored sold sold
Name Code -rin -ion area acres) area acres seed use use use rise tined bed (acres code J9a s to1) - (2 (3) (4) (5) (6) (7) (8) (9 (I E1) fll (12) (13) (14) 115) (16} (17) (IS (19 (?(7
L qI qiL - q._ T–: E DLIL q q qq LJ qq EJM- 1= [I L[IIIILIL qqL_I qq 1LII L q qqL^_^ J qJ Li qqLqq iqL 3 -I Li ELLIJIILI 11111 q q_
IL q C1J q III IC iq q qq [qqqq qDI Li qq ILl I III qqqq qq ,qq
I qq l q_ qqqLq^ q qq_ q qq q qqqq I q qIIqqq qqqq qq_I . J q q qqq qq1 l I q^ q ,_ q CE I_ E — q t L Jq qq IIILI qqqC q LIIq I 1- I
IL q qq qq q ELiqq_ q q'q q qqqq qqq qqII qqqqII L q qqqq ^ I qq q qqq q L ! L ILLLJLi qqIILI IL 111111 m
qq q r q qqJqq qqqq I i q qq qq qJ q qqJ q1D q q-qqq Eqq^^qq qqTotal I'tanned Planted Total harvested 7 'qarea
7.2 , 3 Main reason for difference between Area Planned and Area Planted Fq 7,2.4 Main reason for difference betw=een Area Planted and Area Harvested qi
Lands. Clearing , Cot 3 tmuroved seed Use Fet#ftfser codes LCo19) Threshedlharvested Mastty sold to ( Co! Reason far rliffarerrce between area planned arrr! Reason for difference-Mostly 7bush clearance ---1 Cvt Mostly Farm Yard Manure i (Co113 & 14) - planted (07.2.3} between area planted2p)Mostlyhand slashing ...,.2 all Improved ................I Mostly Compost ........-...2
JBy hand ....,..........-..........1 Neighbour......-.....01 Droughi ,.-.......,.....-..........-..................................I and harvested lQ7,2 4)
Mostly tractor stashing. ..3 approx 314 improved,. _.2 Mostly Inorganic fertiliser, 3 By draft animal .................2 Local market/trade Floods -.,....... ,..................................._ Drought . _.I...............2 ilrou ...................Mostly burning .......-_-.4 approx 1/2 improved..-..3 tIc fertiliser applied .......4 By human powered fool .....3 store ......................02 Access to land preparation tools (Draft animal/tractors).3 Rain/flood damage .........2No land clearing .....,..._5 approx1/4improved--...4 By engine driven machine..4 Secondary Market-03 Credit ...............................................................4 Fire damage .................3
l improved .-5 Not applicable ................ Tertiary Market -....04 Access to seeds/planting material..,................................: Pest damage ...4 seed use d6
....._. use Matrt^rciduct {Cot 1& 9 p ....Fa marAssociafin ..
age ............5Access inputs Anknai d am .t odes (Cal 14f 11 &32Soil Method Dry Gratn ....................... },orsnaration
Outer .... ..................... .......................................8 The9 .......................... - 6Nat ! akfeerlrrtaatian Use {Co! 81 I1sed on all cro 1p Green cab/green pod , _ 2
Lar escale farm ...07
gpp 9 ftlnesslsocial problems ..., 7
Usedon ;7Ocrap..........9 Usedflu3,`4 ofcrop......2 Green leaves8Stem..-.....-3Mashy fractor ploughing . t ()std on 3/4 cra 2P ... Used on half of crop..... 3
Corder t Farmr. .0Coniracf Padner ...(19
Ntter .........................8Nat applicable .. ........ ......9
M€sstl Oxen -. Straw. dry stems etc .........4
Y p
AAastlyMaud culfivat ng 2Used €rn 112 crap ... _ _.3 Used on 1/4 of crap .. -,.,..4on ..3 Used on 1/4 of crop ,.....4 Used on less than 1/4 ..... 5
Flower eg 6
Dici not sell ..........10Other ........ _.......98
i ........pyrethrumUsed on less than l'4 ...5 Nat used .....................6 JI Fruit/banch.....................7Not used -- , _..........b - - —.- - ^OfhPrs-,...-... ... 8
LNot harvested yet .... 9

Permanent Crop:Permanent crops: are sown or planted once and then , they occupy the land for some years andneed not to be replanted after each annual harvest Permanent crops are mainly trees (e.g., apples)but also bushes and shrubs (e.g,, berries) * palms (e.g., dates), vines (e.g., grapes), herbaceousstems (e.g., bananas) and stemless plants (e.g., pineapples).
Total number of plants:This includes both mature harvestable plants and immature non harvestable plants.
Number of ature plants: This is the number of plants which bared ha rvest.
Instructions for Permanent crop mono stands and mixtures
A. For fields that are monocrop permanent, ONLY enter area of plants in column 3.
B. For fields that are mixed permanent calculate the area of each crop based on the %
occupied by each crop method NOT using the number of trees method) and ONLYenter the area in column 4
C. For fields that are mixed permanent/annual either:- ONLY enter the area in column 4 if the area of the permanent crop was based on
the % occupied by each crop method
0- ONLY enter the number of trees in column 5 if the number of permanent crop plants
was provided
Permanent crops (oils):
Code Crop44 Palm Oil45 Coconut46 Cashewnut
Ground area/plant0.000490.00037
0.00062
Permanent Crops:
Code Crop Ground areaiplant70 Passion Fruit 0.0007471 Banana 0.0003772 Avocado 0.00099
73 Mango 0.0009974 Papaw 0.00037
76 Orange 0.0007477 Grapefruit 0.00074
78 Grapes 0.00012
79 Mandarin 0.0007480 Guava 0.0007481 Plums 0.0007482 Apples 0.0007483 Pears 0.0007484 PeaChes 0.00074
85 Lime/lemon 0.0007468 Pomelo 0.0009969 Jack fruit 0.0007497 IJurian 0.00074
g8 Bilimbi 0.00074
99 Rambutan 0.00074
67 Bread fruit 0.0009938 Malay apple 0.00074
39 Star fruit 0.00074
Permanent (Cash crops)
Code Crop Ground area/plant53 Sisal 0.0001254 Coffee 0.0004955 Tea 0.0003756 Cocoa 0.0004957 Rubber 0.0009958 Wattle 0.0009959 Kapok 0.0012460 Sugar Cane 0.0001261 Cardamom 0.0004963 Tamarin 0.0009964 Cinamon 0.0012465 Nutmeg 0.00099
66 Clove 0.00074
18 Black Pepper 0 0003734 Pigeon pea 0.00025
21 . Cassava 0.00019
75 Pineapple 0.00006
Working Area/calculation space
Definitions and working page for page 6

N
0
0
ry
C^N
7.3 PICRMANENTIPERENNIAL CROPS ANA FRUIT'T REE PRODUCTION
7.3.5 Iyoes your horssehold have any permanentl 2erennial crops or fruit trees (Yes=1, Nc^ 2) T
7.3.2 For each of the permanent crops and fruit trees owned by the household provide the following informationSize of production unit
VI(3lOCROI' Inputs Harvestin & Storage Nl.arketiuPerm Permaa Area of Plants/ Area eaveted b Irrig Fert Herb Fun Pest m mn iS no-anent -eat crop trees/Bushes Permanent C:o
MIXESnC
-at -ilis -ic -gte -ici Area Number o£ rod Quantity harvest Quantity Quantity mostlCrap fruit tree in MONO CHOP in a IRUED CR©P -ton -or -ide -ide -de Harvested mature -net harvested give re Stored sold soldName cro Code (acres) (acre use use use use use (acres) lants ode (k s -asou (ICs ^& s to
(I) ( 3) {4) (6 7) (Y) (9) r 1 /)) a i) (1 Z) CL)! (14) f s} (16) (17) (18)
C. Z. [ILILLI ILL f _._TI H D [I Ci L ifi ] LT__.u . -! Li LLDJ U_ Li L J _ ILI LT IILii...... C LT^^I^ ^Tl TT.T:J C ^l C^ C.^ E^ IDDI= 1 I ! t AA J___1 Li LDIILL L_ LIIL - CTI
DI CZI Z LE 1-1= Li [I 0^ L I JILL ^T.^111 !Z L:T=LS, L! ^ .E^ E—E=1 1...... _ ^..EiT^
_CLi LII ELI q Li L:::I Li q QI T-' I E ^^..T.I q r^T C ^ LIJ
I L [ID:1 ED CTT Z_.1 L j E l Eq JILT_
L: C1 Li LIIILTJL Li I .II[I _- =LIII ETIE-1 HIILIL CALL _.a CD CI Li LI q JILL LT_T Li [=__LLI Li LIII LI CULL liii II.T LULL] EU LILI DTTl El Li LiiEl JILL CCTV Li LT_ IUII Li CTTT Ll CZTT ILJIIII LLiLD 1111 LIII JT.T I ILi LI Li Li JILL] I ^.=_ 11 ^..I =E1 I- 1 Li u L :IL][TAT LL [TLiI II]I] lULL] CL :. L1L1LJLILI JLEL CLTT I Cl LL =I L 1 CZCZ::E] LAID LLI
trrioation Use !Cot 6)Used an at crop
Fertiliser codes (Go! 7)p .... ,..
^q rachetnica! use codes Co! 8 Main roducf (Co113 Main Reason for no harvest(Cot 1_ Mostly sold ro (Co! 78Neighbour . .,..,.... _...01Crop trot harvested yet t
Used on most crop ., .....2Mosfly Farm Yard Manure...,..IMostly Compost ..........2
Dry Grain9 & 101 .................t
Used on alt crop ---.....,...i Green cob/green pod.-2 Drought .. .........._
........2 Local markefltrade store.....02Used on hail crop ..................3Used on email amount of cm Qp "Not ased on crop ..... .............5
Mos fty lnorganrc /ertiliser --.....3No ferfitiser applied ..............4
Used on 3/9 of crop ., -. -.. 2 Green leaves & Stern ,. 3
Used on 1/2,-of crop-.......3 Straw. dry stems etc .4
,.......5Used on 1/4 of crop .,-.-..-4 Roof, tuber, et ........5
fiairditooddama e.._.....,.......35Fire damage ,._....................4Pest damage .. .... ....9 . . .. ... .
Secondary Market . ,03rl'Tertiary Market ..,......,..-.04Marketingg Coop . _,.....,...--05
less than 1/4of crop Flower ....................6.......5 Animal damage ................... S Fanner Assacial ion ........,.06
Net used .....................6 Fruitlbuneh,...,..,....7 Thefl ....-.----,,.............- ........7 Largescafe farm ..,.....---..-.07
^ _.. Other ...................8 Other .-.._..........- .................8 Trader at farm .................08
Not harvested yet -.-,.9 Not applicable ................ ....9 Contract Partner ..............09
Didnot sail .................... 40Other_ .................._.........98

Stnallhold r Questionaires 1 7
Definition and working page for page 7 Temporary/annual crap cod es for section 7.4 col 2
Secondary Agroprocessing & hi-products Product. Main. Products Biproduct (Sect 8.0)Question 7.4 (Section 8 ..0) 1 2Stucco: raw • Flour BranStems/straw polished rice grain huskStems,,sraw. qourStemsistraw flourStemsistraw HourStems/straw flour
temse'straw now
Oil inner : cake
shell 'loud
husks
cocoa butter
Crop,
Code 1.1. Maize
• 13 . Somhum:•::::.14 . Bulrush Kllet•15 Finger •Wlet:"
• 16 Wheat I.,• .•7 Bailey
21 : Cassava22 .S . eet •PetatOes.ii 23
.24 Yam's •••••::.... ••25
.26 Onions •••••27 Ginger •31 Beans
2 COvipeas::
Gr086g034 Pi jeers poeS, stems:35 Phic:beas:6 BeMbera:nutS : strawi^teMs
41r..Suntlower atems..0(0.
G(.0undnut• : straW:.7 SOya •beans •••. . stravi:
4.8 .Castel' saed::::•••• s',raw.•••• 75 Pneapple..•••
50 Cotton51 Tobacco ••,.. • •
...:o4.+-yretnrum1 2. :•:•""" "
•• . • • : 86 Cabbage y:•
: : •.87 :Tomatoes.... 88 'Spinach:'89 Carrot
.:•909.1 Amaranths92 Pumpkins • leaves13 • •
CuCumber.:.•• 94 :Bgg . Plant: ••..
" •95 Water Mellon •• .96.
44 Qi'. PalmCoconut
.1 46 Cashewnoi . .. Sisal
54
:
Coffee:.55 Tea..I • •56 Cocoa57.. tubber • ..58 Wattle • •
• • 59 Kapok •.•.60 Sugar Cane
: 61' Cardamom71 : : Banana . - :eavesistems •72 Avocado • • . stems •73 Mango • • sterns Juice74 Paw paw Juice76 Orange • stems Juice77 Grape fruit stems . Juice78 Grapes . stems • Juice79 Mandarin • sterns Juice80 Guava stems81 PlUms stems82 Apples stems83 Pears stems84 Pitches stems .85 LiMe/Lemon stems ]juice
General Definition for Sect ion 7.4 Secondary Products: Second mostimpoftant product from a crop. Eg ahousehold may consider the grain frommaize as the primary product and thestems/straw as the secondary product.
Note: Secondary products are NOT thesame as bi-products. By-products arethe result of a processing activity andare dealt with in section 8.0.`ar
for QuestionsQ 7.6 Details of Secondary Products:
1. From the list of crops in Q 7.1.2,7.2.2 & 7.3.2, ask the respondent if the hhused any secondary products, List thecrop names and codes in column 1 and 2for those crops that the hh usedsecondary products.
2. For the listed crops give details ofthe secondary products used.3. If no units were sold, enter "0" incolumns 8 & 9.
8.0 Agroprocessing & bi-products:1. From the list of crops in Q 7.1.2,7.2.2 & 7.3.2, ask the respondent if the hhprocessed any of these crops during the2002/03 agriculture year. List the crop
names and codes in column 1 and 2 forthose crops that were processed by thehh.2. For the listed crops give details of
the secondary crops used.
3. If no main product or bi-product was
sold enter "0" in columns 8 & 14.
4. If no bi-product was produced enter
"0" in columns 10, 11, 12, 13 &14.
Question 5 ecific DefinitionsAgroprocessing and bi-products (0 8.2)(Note: Agroprocessing refers to theprocessing of crops for hh utilisationand for sale)
Main Product (Col 5):Main Product after processing. Eg forPaddy it may be the polished grain. ForMaize it may be flour.Bi-Product code (Col 11): is thesecondary residue after processing, eg forrice it may be the husk. for maize it maybe the bran.
Mainly used for (Col 5 & 11):- Consumed by household can meaneaten or utilised in another way (eg byanimals) by the hh.
CropName
lea'resieavesinusk :Fruit ."stemsstems.stems::stemsstemsstemsstemssterns
Tanzania Agriculture Sample Census - 2003

Smallholder Questic^naires 172
7.4 Main use of Secondar
y Products
7.5 Did you use Secondary Products from any of your crops during the 2002/03 year. (Yes
=l, No=2) q....._ ..
li the response is 'NO' go to section 8.0 T f
7.6 List the main crops with secondary products and provide the following details:Crop Crop Secondary Prod Used Total no of No of units Total value
SCN name Code product code for Unit Units sold of sold units (`ash.)(1) (2) (3) •4) (5) (h) (7) (8) (9)
761
7.6.2
..,........
............ [q..................
___ ..................q
q
Liiq
E q
.qqqq
i
qqqLDEEEE-^,^ .. ,___^',^--Li
7 .6.3 ............. q J .................. q q ! _q qq L q — I^ q ..!
76.4 ............. q .................. L — ! 1 E L Lq _'7.6.5 ............. q .................. q Li q qqqq
7.6.6 ............. L. __1 ....... _.......... Li q J LiMain roduct Cot 4) Mainly used for (Cot 5)
—q—q _ E IUnif Col 6
Green leaves & Stem .1 Flower ...4 Feeding to livestock., f Consumed by hh ...........4Straw, dry stems etc ...2 Fruit ......5 Building material ......2 Sold .............................5
.....8j
F uelFtoof, tuber, etc .........3 Other .....8 j Fuel for cooking ..... 3 Did not use .....................6
Loose Bundle/bunch ........1 kg ..................5
Compressed bunch/Bell..,. 2 Stems .............6
Tin ..........................._ 3 Sack ...............7
Bucket .........................4 Other ..............8
8.0 AGROPROCESSING AND BY-PRODUCTS
s.t Did the household process any of the products harvested on the far;n during 2002/03 (Yes-1 No=2) qIf the response is 'NO' go to section 9, 0
8.2 List the main crops processed and provide the following details:MVfain By-
SlN Prac Prod Quantity Whe Prod Quantity ¢uanCropname
CropCode
-ess-ed
uctcode
Usedfor Unit
of mainproduct
QuantitySold
-resold
-uctcode
Used
for Unitof by-product
-titySold
(1) (2) (3) (4) (5) (6) (7) (8) (g) (10) (1 1) (12) (13) (14)
5.2.1 ....... q q q qqq l qq 1qqqq qq qq q q=LqI6.2.2 .. ... m_ _ L q q qqq iD qi -1t. qqq q q
8.2.3 ....... ^ — q q ii qq^q qqq q q L.q_1524 ....... mE q q q Cqq qqq.I q El q q_ qqq qq.^6.2.5 ELI I__... l L qq q L E q qq iqqq
8.2.6 i qq L_.1 qq qqqqq q —1 q q q qqq^
Processed Col 3 Marn product code used for (Col 5 & 11) Where sold (Cc! 9) By-product codeOn farm by hand............I Cof 4
Household/human consumption ..1 Neighbour .................I (Co )f 10
On farm by machine.......2 Four/meal............IFuel for cooking ......................2 Local market/trade Bran ..................01
Byneighbours nei hbours machine...3 Grain.................2Sale .....................................3 store .......................2 Cake .................02
By farmers association ...4 Oil .. ..................3 Animal consumption.................4 Seconda ry Market ...,,3 Husk .................03
By Cooperative union .....5 Juice ..................4t7id not use ...........................5 Marke ting Coop .........4 Juice .................04
By trader ............... 6 ether R Farmer Association .....5 Fiber .................05
On Large scale farm ......7 pulp ..................6 Unit Col 6 & 12) Largescale farm .........6 Pulp ..................06
Byfactory .....................9 Sheet .................7 Loose bundle/bunch ........1 Trader at farm ...........7 Oil ....................07
Other............................. other ................8 Compressed bunch/ball -..2 Did not sell ........-.......9 She)) .................08
Tin..............................3 0fher ........ _... .. R other ................98
Bucket......................... 4
kg...............................5
f(tre .............................6nrh u
Tanzania Agriculture Sample Census - 2003

Smallholder Questionaires 173
Definition and working page for page 8Question Specific definitions (Section 9.0)Crop Storage, Section 9
Procedures for Questions
Q 9.2 Details of Crop Storage:(Method of Storage (column 4)
1. For the crops listed indicate if the- Locally made structure: The structures that have been inherited household stored any during 2002/03 infrom their fore fathers column 2,
- Improved locally made structure: Traditional structures that have 2. Check that the crops correspond to thebeen improved using modern technology. . crop lists in Q 7.1.2, 7,2,2 & 7,3.2. If there is
a difference inquire on the reason why. It is- Normal duration of storage: Often there are stored stocKs troth possible that a crop was missed during thedifferent seasons and different years. The normal duration refes to: : enumeration of these questions and if sothe number of months that the most of the crop is stored:for. make necessary amendments
3. For the li sted crops give details ofstorage.
Marketing problems Q 10.2 and 10.3 col 2: Q 102 Details on Crop Marketing:
- Farmer AssoCiation: &Village or comMuhity baSed group of' : 1. For each of the crops listed indicate thefarmers who have formed an organisation to purchase : main problems in marketing during 2002/03 ininputs/sell/stote.their products in order to achieve a better pnce fortheir products.
column 2.
2. Check if the crops correspond to the- Cooperative Union : ` :Large inter-village /community . organisazion crop lists list in 0 7.1.2, 7.2.2 & 7.3.2. If thereset tiP on a districtlregional or national basis for: providing inputs,marketing and storing farmers products.
is a difference inquire on the reason why. It ispossible that a crop was missed during theenumeration of these questions and if so
- GOvernment RegUlatorylhoard: : Govemmedt control body for make necessary amendmentssetting prices arid Oontroliing eUaliV. of certain agricUlturecommodities.
i
Q 10.3 Ranking of market problems:
Rank in order of importance the 5 mostimportant marketing problems from the codesin the Market Problems code box.
/
Working Area/calculation space
Tanzania Agriculture Sample Census - 2003

lem faced by the household during 02/03Vlain 10.3 From the list of marketing
)roblem problems below, for all produce
(2) rank the five most important
problems
10.3.1 Biggest problem
10.3.2 2nd problem ...
LIEiI W3.3 3rd problem
10,3.4 4th problem
11c3.5 15th problem
Smallholder Questionaires 174
10,0 MARKETING
10.1 D€d the household sell any crops from the 2002103 agriculture year? (Yes=1, No=2) O(if the resoonse is 'YES' or 'NO' zo to section 10.2)
10.2 For each of th e following crops what was the main marketing
CropMainproblem
(1) (2)
16.2.1 Maize LIJIT1822 Rice
10.2.3 Sorghum/millet
10.2,4 Wheat L j
10.2.5 Beans, peas etc ' LIIIEIIJ
1a.2.a Cassava I LII
10.2,7 Bananas - L11111
10 2.s Coffee
10.2.9 Vegetables
10.2.10 Tree Fruits
10,2,11 Cashewnut
10.2.12 Cotton
10.2.13 Tobacco
16.2.14 Groundnuts/bamaharari
102,15 Treesltimberl oles
10.2.18 Fish
Market__ problems (Q 1O.2 & 10.3 (Col 2})
Open market price too !ow .......01 Market too far .........................05 Government Regulatory board problems...09No transport ..........................02 Farmer association problems .....06 Lack of market Information .......................10Transportcost too high ...........03 Cooperative Problems ................07 Other (specify) ..................,...................98No buyer ..............................04 Trade Union problems ...............08 Not Applicable ............................................ 99
10.4 What was the main reason }:or not selling crops during 2002/03 year .............................. . ........
Price too low .................................1 Farmer association problems .....................4 Government regulatory board problems ....7Productioninsufficient to setl...........2 Cooperative Problems .................................5 Other (spec fy) ......................................8Markettoo far ............................3 Trade Union problems ................................6 Not Applicable ......................................9
Tanzania Agriculture Sample Census - 2003

Smallholder Questionaires 175
Definition and working page for page 9'Overview of investment activities (Section MO)
investment activities:
investment activities refer to medium to fang term farm development structures and projects. This can be Irrigation structures, erosionand water harvesting structures or other permanent or semi-permanent investment made on the land that the household owns:
Question Specific Definitions (Q 11.1)Source of irrigation Water (Col 1): The main source of water from which water isobtained for irrigation.
(Q 11.1 Irrigation
Method of obtaining water (Col 2): The mechanism by which the water isextracted from the source, 1. If the hh pra ctices irrigation give
details on the main source, main method
Application Method (Col 3): How the water is applied on the field. of obtaining and applying water,- Flood - is the application of water down the slope of the land by
means of gravity 2. Cross check column 8, 0 7.1.2,- Sprinkle - is the application of pressurised water through pipes. 7.2.2 & 7.3.2 to check if irrigation was
The water passes through a device which sprays thewater onto the crop from above.
frrigatable Area (Col 4): The area the irrigation system is designed to cover iii:
used on any crops.
acres.
Area of irrigated land : this year (Col 5): Area of land under irrigation during the2002/03 agric year. This is the physical area and NOT the cumulative area of 2 ormore croopinas. J
Question S •ecific Definitions Q 11.3Erosion control/Water harvesting structure (Col 1)
Q 11.3 erosion control/water
Terraces .. Are structures constructed on the side of a hill to provide a level ground toplant crops. They are often used to trap water for paddy/lowland rice production.
Harvesting
1. Number of structures refers to the
Erosion:Control Bunds: These are banks of earth/stones built perpendicular to' the number of working/maintained structuresslope to slow down.Water and prevent erosion. They are different to terraces in that and does not include derelict orthe soil behind the banks are not level .. irreparable structures.
Gabions: A gabion is a wire mesh box filled . viln rooks/a:ones and used to:aor!trel j 2. Year of construction refers to theor prevent gully erosion
.::.year that the structures . were first
'Sandbags Used to prevent or contra gully ercS:flconstructed, It is not the year that the
structures were last maintained.
Tree belts/Wind breaks: A b..end of trees p:artec porpancicuia . lo The prevalingwind wh . .-.! SO irlir. purpose is to skm dowi" vcrid Spok:
. .Water Harvesting hunds: A ban'. of eartn constructed hcdzontal to the srepe c' thelard to trap: water.: They are isLa i ly banana shaped:-
Q 12.0 Farm Inputs:01 e hi terial %Rtich :raps riv wDam:.. A bank anma. . .::behind it.
er ater to form a caic:-irrento f water
in1. Indicate column 1 whether each
Farm Inputs (0, 12.1.1 to 12.1:7) of the inputs are used or not,
Farm yard Manure; A!I organic fortiliSor nizde ori farm ,zampoSed Of aMma dung: 2. Complete cols 3, 4, 6, and 7 for
inputs that are used and place '9' in
Compost An Organic; fell' sc , rn00 Or:tarM fr .ofn decemposed pant materia - column 5 (for not applicable).
Pestieide: Chemical ilsed:to either protect the plant froM orbiii ireaCIS, rds,molluscs, mites. et attac.,,ng te plant
3. Complete cols 5 & 7 for inputs not
used.
Fungicide: is a che • ica: that s usec to protect the ilant fmm n .- emit-or a funaaldisease,
NOTE.. Cross check column 6, 7 , 8 &9 , Q 7.1.2, 7.2.2 & 7.3.2 to check what
Herbicide: A chem tchemical used cont-c 7 w=e, inputs were used.1
Tanzania Agriculture Sample Census - 2003

Smallholder Questionaires 176
11.0 ON-FARM INVESTMENT
11.1 [does the household practice irrigation (Yes = t No=2) Hif the rec ease is 'NO' go to section 11.3
source of Method of Method of irrigatahie- Area of irrigS/N Irrigation obtaining applic area ated land this
water water -ation (acres) year (acres)(1) (2) (3) (4) (5)
11 i 1 Li Lq q q .^L^' qq.q_^
Source of irrrpation wafer !Ca! f}River........I Borehole .................5
Nlethod.ota ifcatlon Co! 3tyethod of obtainin uvater Co12 Flood .........................1Gravit
Lake.........2 Canal......_ .............6 Other hose.....,,............3..2 ,................8 water
Weft.....,....4
EfDoes the household have/any erosion control/water harvesting facilities on their land (Yes-1, No-2) trite res. rinse is 'NO' „po to section 12.0
Type of erosion control4, Number Year of Type of erosion control/ Number Year ofS/N water harvesting of con- water harvesting of con-
structure structures struction structure structures struction/I} () r3)
11.2.5
l
(1)
11.2.1 Terraces qJ . —.i Tree belts q
ql q q ^qit1. Erosion control bonds t1.2,6
11.2
11.2.8
Water harvesting
1 q — i _q Drainage ditche
iver Grass Dam _ L_..1 L .,L
12.0 ACCESS TO FARM INPUTS AND IMPLEMENTS12.1 Give details of farm inputs used during the 2002/03 agriculture year
Used Distance Source Reason Plan to use
S/N Yes=l Source to of Fin for not Quality of next yearInput name No=2 Source -ance using Input Yes =I,No=2
(/) (2) (3} (4/ (5) (G) {71 (8}
12.1,1 Chemical Fertiliser q 1 ._L_j q H H H H12,1.2 Farm Yard Manure H q LII q' q H12.1.3 Compost Li q H q q q12.1.4 Pesticide/fungicide L_] q q H E q El
12.1, Herbicide q qq qi q L i q Li
121.6 Im roved Seeds ! m H H {_ q1 H12.1.7 Other ............. I L I...—L q Li
Source (Col 31 Distance to source (Co! Source of finance (Cot Reason for not using (Co! Quaffty of input4 o- _Cooperative....................01 Co! 7
Local farmers group ..........02 Less than 1 Km .............1 Sale of farm products . / Not available ................... t Excellent .........Local market/Trade Store ...03 Between I and 3km .......2 Other income Price too high ..................2 Good ...............2Secondary Market ...............04 between 3 and 10 km.....3 generating activities ....2 No money to buy...............3 Average .........3Development project ..........05 nd 20 km ...4 Remittances ..............3 Too much labour required..4 Poor................4Crop buyers .....................06 ve.............5 Bank Loan/Credit........4 Do not know how to use......5 Does not work.5Large scale farm ...............07
L20kman
..... ......... 9 produced on farm .......5 Input is of no use ..........:..,.6 not applrcable...9Locally produced by hh .......08 Other ..................... 8 Locally produced by he ......7Neighbour .........._ ...............09 Not applicable ............ 9 Other..............................8Other (specify) ..................98 Not applicable.................9Not applicable ...................99
Tanzania Agriculture Sample Census - 2003

Smallholder Questionaires 177
Definition and working page or page 10Question S ecific Definitions Q 12.2 'Procedures for questions
Farm Implements (Col I):
Hand powered Sprayer: Knapsack or bicycle pump sprayer
Reason for not using (Col 6): Be careful about using "too much labourrequired' as this code generally refers to hand hoes only. The codes for thisshould "Nor be read out to the farmer as a prompt.
Note: If remittance is given as the main source of finance check for a
response to remittances in question 2.2.5
Q 12.0 Farm inputs
1. indicate in column 2 and 3 whether eachof the implements were used or not.
2• Complete cols 4, 5, 6, and 8 for inputs thatare used and place I' in column 7 (for notapplicable).
3. Complete cols 7 & 8 for inputs not used.Question Specific Definitions (Q 13.0)
Section 13.0 Credit for Agriculture Purposes
Credit is defined as finance in the form of cash or inAind centributions(eg direct provision of inputs, machinery, livestock or other material)for the purpose of crop and livestock production whereby the value of....the credit must be paid back to the borrower. The yalue of repaym.ent .may either be with interest or interest
Credit may be paid back in the form of cash or agriculture produce,. .
1 Section 13,2 Source of agriculture credit
if the farmer obtained credit from more thanone source then use the columns "a" , "b"and "c" for the different sources of credit.Start with the main source of credit in column"a".
NOTE: Check for use of inputs in column 7,8& 9 of questions 7.1.2, 7.22 & 7.32.
(Section 13.0 Credit for Agriculture Purposes
Value of credit is the amount i n cash received frOm the borroWer..:If ..the credit was paid inkind, estimate the valUe of this... "
Value of repayment: 'This is the amount to be repaid to the borrowerand includes the•principal amount (value: of . dredit) plus any .interest ...: ..•repayment... If the credit is paid back in agnoulture produce, then . the • •
cash valueof thiS must be estimated. • . .• •
Period of repayment: This i s the time in months theborrowerbasen for fUll repayment. •give
• • .
---working Area/calculation space
Tanzania Agricul ture Sample Census - 2003

Smallholder Questionaires 178
Give details offirnI a mp ements an assets used an( owtie y the houehdTd uring l l327Oagriculture year
SIN Equipment/Asset NameNumber Used in
2002/03Yes l,No=
Sourceof Equip
-anent
Sourceof Fin-ance
Reason fornot using
Plan to usenext year
Yes=1,No=2Ownedrent-ed
1 ?2T O (i fJ} ^f i^1 ( l
1 Hand Ho { ^ I^
12.2.2 Hand Powered Sprayer j T j___ Lif
E
12.2.3 Oxen L _3
12.2.4
12.2.5
Ox Plough
Ox Seed Planter t E fl
12.2.6 Ox Cart j
12.2.7 Tractor I n
12.2.8 Tractor Plough
12.2.9 Tractor Harrow
12.2.1 Shellerslthreshers f
Source of equipment (Co! 5)Neighbour..............................1 Development project.....5
Cooperative............................2 Government .................6
Local farmers association.......3 Large scale farm ..........7
marketiTrade store ................4 Other (specify)
Source of finance (Cot 5)Safe of farm products ..................1Other income generating activities .2Remittances .............................3
Bank Loan ...............................4
Credit.....................................5
Other.....................................8
Notapplicable ...........................9
Reason for not using (Ca! 7)Not available ......................1
Price too high .................... 2No money to buy/rent..........3
Too much labour required .4
EquipmentlAsset of no use ...5
Other..............................8
Not applicable ......................9
13.O U DIT FOR A L13.1 During the year2002/03 did any of the hh members borrow money for agriculture (Yes = 1, No = 2)
(ti the response is 'NO' go to section 13.3)
13.2 Give details of the credit obtained during the agricultural year 2002/03(if the credit was provided in kind, for example by the provision of inputs, then estimate the value in 13.2.9)
Source "a" Source "b" Source "c"use codes
to indicate source I_i tED
Provided to Male = 1, Female 2tick the boxes below to
indicate the use of the credit
tic t to oxes e ow to in scat
the use of the credit
tick t e oxes e ow to m scat
the use of credit
13.2.1 I abour n n
3.2.2 Seeds f—` 77
13.2.3 Fertilisers
13.2,4 A rochemicals
132.5 Tools/e ui rnent
132.6 Irrigation structures
13.2.7 Livestock
13 .2.8 Otter ................
13.2.9 Value of Credit (Tsh.) L _ j__ `Imo. L I ^,32.10 Value of repayment (Tsh.) Liuulila32.1^ Period of repayment (month)
Source of credit (Q 13.2-a, b and C)) Family, friend or relative... I Commercial Bank.....2 Cooperative ......3 Savings & credit Soc...... 4Trader/trade store ........5 Private individual .........6 Religious Organisation/NG0/Protect ...7 Other (Specify) ......................................8
13.3 If the answer to question 13.1 above is 'NO' what is the reason for not using Credit?
Reason for not using credit (Q13.3) Not needed ...1 Not available ...2 Did not want to go into debt.....3 interest rate/cost too high......4Did not know how to get credit.. .5 Difficult bureaucratic procedure ...6 Credit granted too late ...7 Other (specify) ...8 Dont know about credit ....9
Tanzania Agriculture Sample Census - 2003

Smallholder Questionaires 1 79
Definition and working page for page 1 1General Definitions for section 14.0
Section 14.2 Details of planted treesTree rminglAgroforestry
1. Enter the tree codes of the main speciesThis section refers to trees planted for wood (firewood, poles, planks,carving. charcoal, medicinal, etc, but NOT fruit trees). it does not includenaturally growing trees on the farm (unless special care has been given to
grown by the hh
promote their establishment) or trees growing naturally on the communal2. If no planks or poles are sold enter a "0"
areas. in columns 8, & 9.
Tree farming is the planting of trees on an area of land for which the main 3. Total value includes both value of hh
purpose is the production and regeneration of trees for wood on that land utilised trees and sold trees.
Agroforestry: is the planting of trees on land for the purpose of 4. If no trees were utilised by the hh or soldcomplementing other farming activities like crop and animal produttion. For : enter "0" in column 10
:: the purpose of this questionnaire Agroforestry trees are trees planted onboundaries and scattered throughout fields. The main productive unit in ihipcase is Crops and Livestock
Question Specific Definitions/Tree faming (Section 14.0)
Section 15.1 Crop Extension ServicesPole trees (Col . 6): These are young trees which have a maximum diameterof 6 inches at the bottom and are often used for house coiistruction. They 1. For each of the extension providers ask ifare often the thinning harvest after 3 - 5 years : the hh received extension during 2002/2003
agriculture year and indicate in column 2.Plank trees (Col 7): Trees for sawing into timber p-anks.
Animal shade: Trees grown for the purpose of providing . shade to animals.thecompleteproviderstheofeachFor2.
rest of the colUmns
,
Community tree planting scheme (Section 14.3)
Community Forest: A forest planted on the communal land Voith isplanted, replanted or spot planted by the members d' the Village.
,Crop Extension Services (Section 15.1)
COnthct Farmer: A farmer who is use by tie exti)sior . scent as'a focalpoint to demonstrate new interventions: The contact la'irior then passes et)the messageto other farmers :
Group member: MeMber of a:group under which t-')e contac t. farmerleadg
Adoption: TIT's is the upthke of an inteRren!ion for 2 or more years
Tree Name Guide Col 1
Code Local Name Botanica l Name English Name Code Local Name Botanical Name English Name
01 Senna siamea Cassod tree 16
02 Msongoma Gravellia Silver oak 17
03 Mbarika Afzelia guanzensis Pod mahogany 18
04 Mkeshia
....
Acacia spp Umbrella thorn 19
05 Msindano Pinus spp Pine ... 20
06 Mkaratusi Eucalyptus spp Red River Gum 21
07 Cyprus spp Cyprus tre . 2208 Mtandoo Calophylum inophyllum 23
09 Mvuie Melicia exceisa Iroko 24
10 Mvicji Casurina equisethlia Whistling oak 25
11 Msaji Tectona grandis Teak 26
12 Mkungu we kienyeji Terminalia catapa Sea almond 27
13 Mkungu India Terminilia ivorensis Black afara 28
14 Muhumula Maesopsis berchemoides 29
15 30
Tanzania Agriculture Sample Census - 2003

Smallholder Questionaires 180
14.0 TREE i A ® E TRY
14 1 Did your household have any Planted Trees on your land during 2.002/03 agric year? (Yes = 1. No=2)..__...1f the response is 'NO' go to section 14.3
14.2 Give details of the planted trees you have on your land,
Whe Ma Sec Number of Number of hh utiliisedS/N Tree Number re pi in -and Plank trees Pole trees Number of Total Value
Code of trees anted Use Use Sold Sold 3Poles T mber (Tsh.)(1) (2) (3) (4) (5) (6) (7) (5) (y) (10)
14.2.1 ..q q qq L^ q q q
14.2.2 q_q q q L^J qqq qq^j
14.2.3 qqq q q q LUll LIII ' 14.2.4 L_ q 1 L. ! L f q 1
Where Planted , (2 31 Ilse Colo & 51
Mostly on field/plot boun(1aries. I PfankslTimber....... ? Shade ............5Mostlyscattered in fields .......2 Poles ..................2 Medicinal.......... 6Mostly in plantation/coppice ...3 Charcoal .............3 Other .............8
Fuelwood.,..........4
14,3 Does your village have a Community tree planting scheme (Yes=1, No=2)lithe response is 'NO go to section 15. d
14.4 Household involvement in community tree planting schemeDistance to corn main Main use
S/N -munity planted lib Involve purpose during
forest (Km) -ment 2042/03
qq ' q q q
NN involvement (Cot 2) Main Purpose (Col 3) Main Use Burin ©2/U3 ColoOnly planting .......................... i Erosion control...........1 Environment rehaiblita tion .,,4 Poles .............I Not ready to use ......5Only protection and thinning.......2 j Production of poles .....2 Restoration of wildlife .........5 Timber fogs .....2 Not allowed to use ...6Only cutting ...........................3 production of firewood..3 Other (specify) ................8 Charcoal ........3 Other (specify) .......8
15.0 CROP EXTENSION SERVICES
15,1 Did your household receive extension advice for crop production during 2002/03 (Yes=1,No=2)If t panse is 'N ga 1n section 1 b. 0
_.._
S/N
Extension Provider
Source ofextension(Y=1,H=2)
if you pay for
extension, whatis the cost/yr
Contact farmer
/group member(Yes=1,No=2)
No. of visitsby extensionagency per yeas
No. of messageadopted in the
last 3 yearsQualityuali4 ofService
O (2) (3) (4) (5) (6/ (7)
15.1.1 Government extension L qqq qq qq^ Ef E
q 1111111]15.9.2 NGO/development project q L qqq q q
15.1.3 Cooperative L _7 qqq qq qq qIII]15. 1.4 Large Scale farmer q.J qqqLIqq qI q qII q }
15.9.5 Other. .................... q q q _ LIE q
uali of service Co 7
I
Very good ............. i good ............2 Average..........3 Poor............4 No Good .........5
Tanzania Agriculture Sample Census - 2003

Definitions and working page for page 12Question Specific Definitions
Crop Extension Advice (Section 15.2)
MechanisationILST: LST means Labour Saving Technology
Smallholder Questionaires 181
Section 16.0 Livelihood constraints
16.1 List the five most important problemsin order of most importance:
1. Read out the list of constraints to therespondent and ask him to select the ones thatare a problem. Place a 3 against theconstraints that are a problem.
2. Read the selected constraints and ask thefarmer to select 5 which create the largestproblems
3. Ask the farmer to list these in order ofimportance and enter in column 2
16.2 List the five least important problems inorder of least importance:
1. Read out the list of constraints to therespondent and ask him to select the ones thatare NOT a problem. Place an
x against the
constraints that are NOT a problem.
2. Read the selected constraints and ask thefarmer to select 5 which create the leastproblems
3. Ask the farmer to list these in order ofleast importance and enter in column 2
Tanzania kgriculture Sample Census - 2003

Smallholder Questionaires 182
15.2 Crop Extension Messa-es
Received Adopted 1 ource of Received Adopted Source of
S/N Advice Crop SIN Advice Crop
Yes-f Yes=1 Extension Yes= t Yes=i ExtensionExtension Message No=2 No=2 Extension Message No=2 No=2
j
i
{1J (l1 (3) (4) (I) in; (4
15.2.1 Spacing L 1_...J Efl15 , 2.s Crop Storage ____i L_ Li
15.2.2 Use of agrochemicafs L i n J Li l 15.21 Vermin cantrn! L; Li15.2.3 Erosion control Q t i_J 15.2,11 Agro-processing ? L._ i 1_i
52.a Organic fertiliser use i 15.2.12 Agro -forestry L `
182.5 Inorganic fertiliser use ! ...i 152.13 Bee Keeping iL i ! Li i
15.2.6 Use of improved seed ^._..,^ 15.21 . Fish Farming
15.2.7 MechanisationlLS i L J L 15.2.15 Other E Li Li
15.26 Irrigation Technology^
Li Linsion CoP 4
=.,,,NGO/IIev project ..2 Cooperative ...3 Large scale farmer ...,.4 Other (Specrty) ...8 Plot applicaWL .... 9
16.©1LIV)JLI$OOD CONSTRAINTS
From the list of constraints on the right select: List of constraints
181 the 5 most important problems 1 82 the 5 least important problems cess , , r
Order of most importance Constraint Order of least importance Constraint rers ,( f Lane
(Ii (2) 1)) (2) 4.. S it Ferijkt,,
161,1 most important ^ J 16.2.1 Least important i.....1..!Aur
ess.tn o vet WtpdI R ,. nation ac ar .e5
16.1.2 2nd most important 16.2.2 2nd least important L rJ 1' '' x me -to,,1,A *n eai ' pu ts
161.3 3rd most important t. ,f I 16.2.3113 ! Cost ofItpots
3rd least important ^ t. Extnslop Seryi es161 .4 4th most important 16.2.4 4th least important t^ . deals #o fo^e^ resources,
I18.1.5 5th most important 11.2.5
11' unt i ny a id Gaiheon,5th least important 4cepsS'.top taste va`
3 Fto ceSSic crPdjt=34 Har3esting1 8 Tivesning,
17.4 ANIMAL CONTRIBUTION TO CROP PRODUCTION17 Sto
pros
veslrtg.17.1 Did you use Draft animals to cultivate 1 17.2 Did you apply organic fertiliser 1 8 8fl.3 ket
-1ntgro a
1youranddunngO2/O3(Yes-1No2) Ef 1'v ,ra y nrrt^^cs'G'during 02!03 (Yes=1, Now2) ,_._ 2G n sl eton by anlm
(If no, go to question 17.2) (If no, go to question 18) 121: Stea'fig?2 rye is and Oaseases
Area S/N Area x.23. Local go•ternmer I taxator,
SIN Type of Number Number cultivated Type of orga applied4: 1- ccess to off Farm incom
Draft owned used (acres) Fertiliser (acres)
(1) 2) (3) f 4 1 (1) 2)
17.1.1 Oxen `— f [ 17.2.1 FYM _n
171.2 Bulls , 17.2.2 Compost i
17.1.3 COWS
171.4 Donkeys 1 {
Tanzania Agriculture Sample Census - 2003

Cattle Intake during 2002/03: Cattle purchased, given or t)lp which increases the nutnner of
cattle in the herd.
Cattle °Make during 2002/03:Cattle removed from the herd, either by selling. Irh consuinplion, given away or stoteli.
Section 18.0 Cattle Population, Intake & Offiake.
NOTE: Section 18.1 is for the current population (as of 1st October 2003);Section 18.2 and 18.3 is for movement in and out of the herdduring the 2002/03 agriculture year.Section 18.4 is for diseases encountered during the agricultureyear.
1. If the household has cows, you would normally expect them to have calves
in column 8
2. If calves are reported in column 2, 3, or 4 (18.2.6, 18.2.6) then there must
be at least that number repeated in column 8
Note: if the farmer reports sales of cattle the importance of this must bereflected in Q 2.2.3
Section 18.5 If cattle are repo rted to have died in Column 5 then at leastthat number should be reported in 18.4 col 4
(Cattle woe (4 18.2 & 184, Col 1)
Bull: Mature Uncastrated male rattle used for breeding
Cow: mature female cattle that has given birth at least orte
Steer: Castrated male cattle over 1 year
Heifer: Female cattle of 1 year up to the firSt calving
Calves: Young cattle under 1 year of age
Average Value pe ead (4 18.3, (Col 7 & 9) & 18.4 (Col 3, 5 & 7))Working area for page 13
Cattle vaccination (18.5 col 1)
ECF: Gast CoaSt Fever
FMO: Foot and Mouth Diseee,
CBPP: Contagious Bovine Pleura Pneumenia
Definitions and working page for page 13General definitions for page 13
Question Specific Definitions (Section 18.0)
In these columns give the average value per head during 2002103, For given, traded, consumed by
the hh &gven away/stolen estimate the value.

0
r?
aw
18.0 CATTLE POPULATION, INTAKE AN D OFFTAKm
18.1 Did the household own, raise or manage any CATTLE during 2002(03 agriculture year? =1 No(o no t© section l^.(
o rrr i 1.r frtr hQr 7€ fl i Cattle Intake during
SIN Cattle typeNumber ofIndigenous
Number of Ins roved TotalS/N
NumberPurchased
Number given/obtained
NumberBorn
Total Intakeof Cattle
Average Valueper headBeef Dairy
1 (2) ) 4 #S (G) 2L, () !9 (10)
18.2.1 8u}Is 1qq qEEl q q q 18.3.1 qq111q X X X j L J qq _q .q .1
1822 Caws qq q q qqq LEE 18.3.2 L Iq q LIII qXqx Lq qqqq_ !^! q
18.2.3 Steers L DE= qq_qq q 18.3.3 L.qqq qq [ X x [11111 1 ILL q18.2.4 Heifers [LIE Dq q qqq qq 18.3,4 q q_q LEE XI[II [lull
18.2.5 We Calves LEE] LIED qqqq qqL 18,3.5 .qqq qq_ LI I qqLILIILI18.2.6 Female Calves ELI qq i — q qqq 18.36 LED L.q 1 rII _ q E q
Grand Total q .- j Total Intake
98.5 alt a diseases
18.4 Cattle Offtake during 2()02/2003 Last Main
Number Number can Number given Number Total Cattle Average value S/N Disease/ Number Number No. Bee Number vacci Son
SIN Cattle t e Sold/traded sumed by Jib aw /stolen died €f take per head Jte Infected Treated -overed Died hated -tee
(2 t) O d) (7) (1 (2 {3 (4} 5 (5) {
184.1 Bulls q II qq qq q q_J qq qI 18.5,1 diseases lL ELI qq Fq q q
18.4.2 Cows LIII II J q _l qq 11111111111111 18.5.2 CBPP EL L qq q [1q q q
LIII] EEL] q0 LEE Lqqq 11111111111 LIII] [1111 qq [ILl] L18.4.3 St2ets _
78.4.4 Welters I qq^ J 3__,S q qq 11111 18.5.4 Dis ase l" qq [qq qD qq—f Lq q
18.4.5 Male Calves [IIII[ll [qq qqq l q1 t— [qqq 18.5.5 Helmenthinftis l L I LI_LI] t—J q LXII
18.4.6 Female Calves [JIll] qq qqqq 11q—qq 18,5.6 FMD q qi I i _ _k lq q
Total Offtake I]I]I]I] t ast Vaccinated Col B
18.6 Milk Production12003............... 1 2000...._...........4
Lltres of Na. of cattle Uda' 12002
Nei t our.18.6...,... f Lar escafe larm..5
........ ,2 before 2000 ......5
SIN Season milk/da milked/day Value/litre Sold to (Litres) Sold to Q18.5 Co! 5j 20oi .............. .3 Nof Vaccinated...6
(1) (2) (3) (4) (3) (6) Main8
ain Source of vaccine Col 7--- ^- -- Local R^tarket...........2 grader a! Farrr^ ...^^ E^ = El ^^
6 Maine16.6.1 Wet Season _ Secondary hfiarket .. 3 CJid rFat ssIl...,....7 I
C^ ^ ^_ Processing industry .4 Other ...............8 &'istnct Vet oink .2 Nota^plicable ...,3
NGQ/Project ......318.6.2 t?ry Season
LIIIII[iI] LIIILIIIIIDO

Section 19.0 Goat Population, Intake & Offtake.
NOTE: Section 19.1 is for the current population as of 1st October 2003);Section 19.2 and 18.3 is for movement in and out of the herdduring the 2002/03 agriculture year.Section 19.4 is for diseases encountered during the agricultureyear.
1. If the household has she goats, you would normally expect them to havekids in column 8
2. if kids are reported in column 2, 3, or 4 (191.6, 19.2.5) then there must beat least that number repeated in column 8
Note: If the farmer reports sales of goats the importance of this must bereflected in Q 2.2.3
Section 19.5 If goats are reported to have died in Column 5 then at leastthat number should be reported in 19.4 col 4
Working area for page 14
5
5
ro
a
Definitions and working page for page 14Gdat.defihitiOnSfO(POgell4
:Goat Intake during 2002/03: Goat purchased, given or born which increases the number of goats-1in the herd.
Goat Offtake during 2002103:Goat removed from the herd, either by selling, hh consumption, given away or stolen,
Question Specific Definitions (Section 19.0)
;Goat Woe (Q 19.2 & 19. Coi 1)
Billy Goat (he-goat): Mature Hncastrated male goat used for breeding
'Castrated goat: Male goat that has been castrated.
She Goat: Mature female goat over 9 months of age
Kid: Young goat under 9 months of. age.
Average Value per Head (Q 19.3, (Col 7 & 9) & 19.4 (Col 3, 5 & 7))
In these columns give the average value per head during 2002/03. For given, traded, consumed bythe hh & given away/stolen estimate the value.
Goat vaccination (19.5 col 1)
FMD: Foot and Mouth Disease
CCPP: Contagious Caprine Pleura Pneumonia
LSD: Lumpy Skin Disease

19.0 I GOAT POPULATION, INTAKE AND OFFTAKE
19.1 Did the household own, raise or manage _any GOATS during the 2002/03 agriculture year? (Yes =1 Na =2) q(It no go to section 20.0)
19.2 Goat Population as of 1st October 2003 19.3 Goat Intake during 2002/2003Number of Number of 3.m roved
Total Number Number given Number Total intakeS/N Coat type Indigenous for meat Dairy SIN Purchased /obtained Sore of Coats
Average Value
per head(1O)
I
19.2.1 1 Buy Goat
19.2.2 Castrated Goat
79.2.3 She Goat
19.2.4 Male Kid
19,2.5 She Kid
Grand TotalU
19.4 Goat Offtake during 2002/2003
SIN Coat typeSlumber
Sold/tradedHumber consumed by hh
Number giveraway/stolen
(1) (2) (3) (4)
19.41 Male goat LILJII 011110 {T h
19.4.2 Castrated Goat LIIII LILLL [1101019.4 .3 She Goat [1[I[ 1I [1111111]19.4.4 Male Kid — —J tL J L J L^19.4.5 She Kid 1111111111] [111101 T L1I]
Total19.6 Milk Production
t
19.3.5 l _J L .._ J-- ^ —1
J —J [:T=— ^ t^
Total Intake qqq
19.5 Goat diseases
qdiedOfftak
otal Goat Average value et head S/N llisease/
parasiteNumberInjected
NumbeTreated
No. Rae-overed
Number..._ Died(6) (7)
f i J 8 (1) () (3) 1 (4) 1 (5) (6) ( (7)[11111 [111101110 19.5.1 Foot Rot L—I [III [
11111 59.5.2 CC PA [ILL LIII [110 LIII LI [II[ILI 1953.. Hekninthiosis LIII C 11 LIII
[11111111 -1 19.5.4 Tetanus [IL] 1] LIII E0
SIN Season
Litres of
milt/da
No. of oats
milked/day Value/litre Sold to
Sold/daq
(Litres)
(1) (2) (3) (4) (5) (6)
19.6.3 Wet Season ^^ q qqq q [1110q19.6.2 Dry Season LJIILIII qqq q q q q
S old fo X13.6Col.5)_ Last Vaccinated (CoJ 61
Neighbour, ............_ 1 largescak farm ..52003 ...............1 2000 ......_.........4
LocalMarkef...........2 Trader at Farm ._.62002 ................2 he/ore 2000 ......5
Seconda ry Market ...3 Did not se ll ......... . 7 200; ............... 3Not Veccioatod... 6
Main Source of vaccine (Clo 7)Processing industry .4 Other ................8
Private Vol Clinic .. i Other ...............8District Vet Ctinic ..2 Not applicable ....9NG0/Prolecl.......3

Section 20.0 Sheep Population, Intake & Offtake.
NOTE: Section 20.1 is for the current population (as of 1st October 2003);Section 20.2 and 20.3 Is for movement in and out of the herdduring the 2002/03 agriculture year.Section 20.4 is for diseases encountered during the agricultureyear.
1. If the household has ewes, you would normally expect them to have kids incolumn 8
2. If lambs are reported in column 2, 3, or 4 (20.2.6, 20.2.5) then there mustbe at least that number repeated in column 8
Note: If the farmer reports sales of Sheep the importance of this must bereflected in Q 2.2.3
Section 20.5 If Sheep are reported to have died in Column 5 then at leastthat number should be reported in 20A col 4
Working area for page 15
Definitions and workin pa • e for page 15
Sheep Intake during 2002/03: Sheep purchased, given or born which increases the number ofSheep in the herd.
Sheep OfFtake during 2002/03:Sheep removed from the herd, either by selling, hh consumption, given away or stolen.
Question Specific Definitions (Section 20.0)
Sheep type (Q 20.2 & 20.4, Col 1)
Ram: Mature Uncastrated male goat used for breeding
Castrated sheep: Male sheep that has been castrated.
Ewe: Mature female sheep over 9 months of age
Lamb: Young sheep under 9 months of age.
Average Value per Head (Q 20.3, (Col 7 & 9) & 20.4 (Col 3, 5 & 7))
In these columns give the average value per head during 2002/03. For given, traded, consumed bythe hh & given away/stolen estimate the value.
Sheep vaccination (20.5 col 1)
FMD: Foot and Mouth Disease
CCPP: Contagious Caprine Pleura Pneumonia

^-3
,a
n'
v3
I
20.0 SHEEP' POPULATION, INTAKE AND OFFTAKE
20.1 TDid the household own, raise or manage any SHEET' during the 2002/03 agriculture year? (Yes =t Rio =2)fna o to section 21.0)
20.2 Sheep Population as of I st October 2003 20.3 Sheep Intake during 2002/2003
S/N Sheep typeNumber ofIndigenou
Number of ImprovedTotal
SINNumber
PurchasedNumber given
/obtainedNumberBorn
Total Intakeof Sheep
Average Valueer headfor Mutton Dai
1 (2 3) 4 3 {6 (7 {8 (9 (10
202.1 Ram LII] X X X 20.3.1 L h X X
J
20.2.2 Castrated Sheep EhihlhllIhi {I]IIIhII] X X XLIIIhJhI] L1IIIIJI] 20.3.2 Lih[I]Ih J X x I [hi]IIIIIII]20.2.3 She Sheep Lh[IIL] [J[]]]] [iX X ] LIII]] 20.3.3 ^^ X X X
20.2.4 pia{e Iamb q[ — EI] X X X [11111] 20.3.4 i_ i EEL] EIILJIJIILIStye Iamb LEE] [ILL] 20.3.5 [ILL i^^JI] [LIE]] .1 =
Grand Total[[I]]IJJII J11 .20.4 Sheep Ofi'tnke during 2002/2003 20.5 Sheep diseases
Number Number con Number given Number Total Sheep Average value Last Main
SIN hejtyj Sold/traded slimed by hh away/stolen died ©fftake per head SIN Disease/parasite
NumberInfected
NumberTreated
No. Rec-ov'exed
NumberDied
vaccinated
Sou1-rce(1) (2) (,3) (4) (5) (6) (7)
20.4.1 Ram EL]]] EL [lEE [IIEIJILI] (1) (2) (3) (4) (5) (6) (7)
20.4.2 Castrated Sheep [hIllEl] EL [IIEI[l IEII 201 Foot Rot LII [Ill] F_X1 1--1
W.4.3 She Sheep TElL] [1111] LEE] L ILIJ _, EI 20.5.2 CC PP El] L] EL] 0 El20.4.4 Male Iamb [11111111 ^^J uLl II[ ] 20-5.3 Metetothiosis t — —1 .1 LIII] L 1I] [l]20.4.5 She Iamb [111111] L.I] EIlI[J 20.5.4 n oma is LIE l] ELI LI] 1 —.1
TotalOfftake 20.5.5 FMD q El
Last Vaccinated Cold2003 ...............1 2000 ................4
2002 ................2 before 2000 ......5
2001 ................ 3 Not Vaccinated... 6
Main Source o€ vaccine Caf 7Private Vet Clinic ..1 Other ...............8
District Vet Clinic ..2 Not applicable ...,9NGO/Projact.......3

Section 21.0 Pig Population, Intake & Offtake.
NOTE: Section 21.1 is for the current population (as of 1st October 2003);Section 21.2 and 21.3 is for movement in and out of the herdduring the 2002103 agriculture year.Section 21.4 is for diseases encountered during the agricultureyear.
1. If the household has sows, you would normally expect them to have piglets
in column 8
2. If piglets are reported in column 2, 3, or 4 (202.6, 20.25) then there must
be at least that number repeated in column 8
Note: If the farmer reports sales of Pigs the importance of this must bereflected in Q 2.2.3
Section 20.5 if Pigs are reported to have died in Column 5 then at leastthat number should be reported in 20.4 col 4
Working area for page 16
a
O
Pi page 16 : : . :• : - -, -frig Intake during 2002/03: Pigs purchased, given or born which increases the number of Pigs in
the production unit.
Pig O ke during 2002/03:Pigs removed from the production unit, either by selling, hh consumption, given away or stolen.
Question Specific Definitions (Section 21.0)
Pigs type (Q 21.2 & 21.4, Coi 1)
Boar: Mature Uncastrated male pig used for breeding
Castrated Pig: Male pig that has been castrated.
Sow: Mature female pig that has given birth to at least one litter of pigs.
Gilt: Female pig of 9 months up to the first farrowing.
Piglet: Young pig under 3 months of age.
Average Value per Head (Q 21.3, (Col 7 & 9) & 21.4 (Col 3, 5 & 7})
In these columns give the average value per head during 2002/93. For given, traded, consumed bythe hh & given away/stolen estimate the value.
J
Pig vaccination (21.5 col 1)
ASF: African Swine Fever

the 2002/03 agriculture year (Yes =1 No =2)
21.3 Pip increase during 2002/2003
21.5
Disease/ Number Number No. Rec NumberS/N parasite Infected Treated -overed Died
22.0 LIVESTOCK PEST & PARASITE CONTROL
22.1 Did you deworm your animals during 2002103 (Yes =i,
(If the response is 'NO'go to section 22.3)
22 .5
Which animals did you deworrn? (Tick appropriate boxes)
Cattle Goats q Sheep J Pigs q 22.6
m
r
£CG
EC
:a
ro
c^0w
21 .0 P1G POPULATION AND PRODUCTION
21.1 Did the household own, raise or manage any PIGSno a o se^iori"
21.2 PIG Popuiation as of I st October 2003
SIN Pig type Number1 (2
S/N
NumberPurchased
Number given/obtained
NumberBorn
Total PigIncrease
Average Valueper head
(3 (4 (5 (9 ('v
21.3.1 qq Em X X X Em mum21.3.2 E I [— Li —q
21.3.3 Em q ^ X X X Cqqq
21.3.4 qm qJ .iJ r. qq q_Ill21.3.5 WL J Em qq LIIII] LI 111111111
21.2.1 Boar L__ _i_L..J
21.2.2 Castrated male EF=
21.2.3 SowlGilt Fqq .q
21.2.4 Male piglet [q_.]
21.2.5 She piglet q .TW-...1 I
Grand Total q .-._]
21.4 Pi decrease during 200212003Number Number con Number given Number Total Pig Average value
SIN Pia tyro Sold/traded sunted by hh away/stolen died Offtake II ner head
21.4.1 Boar L J _ L_J._J _ [_J1 L l _- ___ i-__l ! _ice i J_J (1) (2) (3) I4) O (e) ( 1)
21.4.2 Castrated male qI qq q qqqq q 1 qqqq ( _ 21 51 Anthrax [q m q qq L—I
21.4.3 Sow/Gilt qq q LET qq qq ( mi _I I 21.5.2 ASF [_,q L q q1 qLi LI21.4.4 Male piglet [qqq qqq qqq Lqq qq 21.5.3 Anemia qq qqq qq [ILIl21.4.5 She oialet I ILl I ql [IL i I I 1 I I F_ T 1 qq _I h 21.5.4 tielmenthiosis PH PIE FTi q ___ 1 [ x i
Total Offtake
you normally encounter a tick problem (Yes=1,No-2) L_.Jresponse is ( ga to sectinii )
Which methods of tick control did you use I q
ntrol method (Q 22.4J None..1 Spraying ..2 Dipping..3 Smearing ..4 Other.8
you normally encounter a tsetse tly problerim (Y^1,I3=2} q^the response is No' go to section 23.0)
Which methods of control did you use i J
ntrol method (Q22.61 None .1 Spray .2 Dipping .3 Trapp ing .4 Oher.5
.1 2000 .............4
2 berba 2000 ...-5
.. 3 Not Vaccinated .6
Main Source (Col 7JPrivate Vet Clinic ..1
District Vet Clinic ..2NGOIProject.......3
Other................. 8
Not applicable ......0
CDCD

Sma Iho der Questio aires 191
Definition and working page for page 17Question Specific Definitions Section 26.0) Procedures for questions
Section 23.0 - Other Livestock:
1. The current number includes both adult
and young animals. For example The number of
chickens in col 1 would include adults and
chicks.
Question Specific Definitions Section 27.0)
Access to functional Livestock Structures/accessories (Section27.0): nr
Section 26.0 - Outlets for livestock:
NOTE: The structures must be functional. If they are notwoing/deworking/derelict notthen they should not be included. The distance tothe next nearest funional structure should betaken.
Spray Race: A fixed spray structure on an animal race for sprayingacaricide
Using the codes enter the outlets for the sale of
different livestock in order of importance. If there
are, for example, only 2 outsets mark the rest with
a "X".
Cattle crush: Corridor structure for restraining cattle.
Abattoir: Large building designed for slaughtering a large amount ofanimals. it normally has complex structures to assist in the slaughter andstorage and a high level of hygiene is maintained.
Slaughter Slab: Concrete slab designed fos slaughtering a small amountof animals
Hides: obtained from Cattle
Skins: Obtained from sheep and goats
Hide/Skin Shed: Shed for curing/tanning animal skins and hides
Village holding Pen: Enclosure for containing large amount of livestockwhich is owned communally.
Drencher: Device for orally administering medicine to livestock.If no product was sold in 2002 enter "0" in columns 6, 7& 9.
Tanzania Agriculture Sample Census - 2003

Smallholder Questionaires 192
23r Other Livestock currently available and details of consumption and sales during the last I niont s
Animal typeCurrentNumber
Sold during 2002/03 Consumed during 2002/03Number Average Value/head Number Average Value/head
(2) (2) (3) (4) (5)
231 Indigenous Chicken qq qq q qq EEILiiIiiE212
23.3
LayerBroiler
q
qqqEq qq q
qqqqq I i
23.4 Ducks _.qqqq qqq qq I q ! fqqq
23.5 Turkeys o qq qq
23 .6 Rabbits i 3 ^q _r
1_ qqq - ,
23.7 Donkeys qi E238 Horses qqq qqqq X X X X X X X X
23.9 Other ...... ..... qq^q :c: ;____24.0 CHICKEN DISEASES Number infected Number Treated Number Died Number Recovered
24.1 Newcastle Disease E__I
24.2
24.3
G mboro
Coccidiosis
q LilLi
qqqq
24.4 Cborysa LLLJ^
24.5 Fowl typhoid L.___. =
25.0 LIVESTOCK PRODUCT Sold during 2002/03 Consumed/utilised during 2002/03
Number Average Value/unit Number Average Value/unit
25.1 Eggsq^._ L .,^ r € _ i
25.2 Hides TE qqqq qqqqq
25 .3 Skins EE 1111 I LELIILT EE Li26.0 List in order of importance the outlets for
the sale of Livestock27.0 Access to functional livestock
/accessoriesstructures
S/N
Impo-rtan-ce ofoutlet
OutletsforCattle
out-letsforGoat
Outletsfor
Shee
Outt-etsforPigs
OutletsforChick-ens
SINTypeofstructure/accessory
SourceofStructure
Distanceto struct-ure (Xm,j
(1) (2) . (3)
(ii (2) (3) (4) (5) (6) 271 Cattle Dip q fl26.1 i EEEELi 27.2 S ra Race q qq "^
2&2 2nd q q q q q 27.3 Hand powered sprayer qq qq Li26.3 3rd q qq qi q q 27.4 Cattle crush q qqq 'q
26.4 4th l_ q q I .1 27.5 Primary Market q q
28.5 5th ! I q q q L q 27.6 Secondary Market q q ' q
Outlet code (Cot 4 & 5)Trader at farm ............. i Abaitoirlfacfory...........5Local Market ......................2 Another farmer .........6Secondary market/aucton......3 Other (Specify)...........
2?.7 Abattoir Lii27.8 Slaughter Slab
q
27.9 Hide/skin shed L Li27.10 Input sup q
Source of structure (Q27.0 - Cal 2)Owns ...................... .....t NGO ..........................6Coopera tive ...........................2 Large scale farm ...........7Local farmers association ...... 3 Other ..........................8Gov extension/veterina ry .......4 Not applicable ................9Development project ............5
27.11 Veterinary Clinicqq q
27.12 Village holding round q
27.13 village waterin oint/damqq q
27.14 Drencher q qI
Tanzania Agriculture Sample Census - 2©03

Definitions and working page for page 18General definitions for Section 28.0
FiSh farming: Refers to the rearingiproductieh Adierent to fish ng ii that the f i sh :•avuto be reared and fed in fish 'a rming Fish t• 0:rally do g :Irnng fish :n nvers,lakes and the sea and a no'
Working area for page 13
7 9W filVer--f' into
Question Specific Definitions (Section 28.2). .
Production unit nuTnber (Col 1): r•pdu0on unit is a bond rivernake which is treated as aseparntoontity tor the pro6uct r I r.t1 1-sh n it rr9V be by virtue of manageable siz, maturity of fish,type •f etni Eg e fa rme
r 'Tay nav es 1 : =h pb!ds. reach :s a sepmete production unit).
O t stocking (Co! 5):ttio pc-rict eaOti p_tatt
tne the.
Fingertiligs' nrid irthifh-rti!re
Sold: {Col 10 & 11}
Ii i tto fisn Vrer'd GOid critkr "1111 .colur-ii anif
Livestock Extension Services (Settion 29.1)
Adopted (Col 3): This is the uptake of on Interventioi-, fo r 2 or more years
Livestock Extension Service providers (Section 29.2)
Contact Farmer: A farmer who is by toe extenmn services D V n ,!!'
new interventions to The co p iam 9!' passes on the metitiy cher ',:i
Adopted (COI 5): l iii
it
O

ac
C
C
n
C
tic
0
2a.o FISH FARMING
28.1 Was Fish fanning carried out by this household during 2002/2003? (Yes r=1, No=2) q (Tithe response is 'BYO' go to section 29.0)28,2 Specify details of fish farming practices
SIN ^..duct unitmbers
Fishfarmin
stem
Size ofunit (pond
{nr2)
Sourceof fing-erling
frequencyof stocking(No /ear
Numbes of stocked fish Nor of
fish harvested
weight
of fishharvested
weight
of fishsold
Mainly
sold toTila is Ca Other
(1) (2) (3) (4) (S f6 (7) (8 (9) (10) 77'U (Id'
28.1.1 El L_I = q
q
q q U qEqqq
U [111111q ^qqq
qq q qqq 9Lam q j
q28.1.2 z q qq ^- q LILL
28.1.3 3 q qqq q qq qI qqUq q q I qqq qqq qFarming System (Cal 1Natural Pond... t Natural Lake.....3 Other .....8
Dugout pond...2 Water resevoir..4
Source of fingerlings Of 4)Own pond ...................i NGO/Projecf...3 P rivate trader ...5
Government institution .. 2 Neighbour .....4 Other ...............8
Mainly sold to (Co! 1 2)Neighbour..........I Secondary Market_....3 Largesca€e farm ........5 Did not sell .._..............7
Local Market.......2 Processing industry .4 Trader at Farm .........6 Other.........................B
29.© LIVESTOCK EXTENSION
29.1 Did you receive livestock extension advice during 02/03 (Yes=t,No=2) Eq (If the response is 'NO' go to section 3(1.0)
S/N
Livestock Extension Message
ReceivedAdvice
Yos=1,N =2
AdoptedYes=1
No=2
Source ofLivestock
Extension
29.2 For the tollowing Livestock Extension Service Providers give details
SIN
Extension Provider
If you pay for
extension, whatis the costlyr
Contact far
-mer/groupmember
(Y=1,N=2)
No. of visits
by extensionagency/year
No. of mess
-ages adoptedin the last 3 yrs
Quality
of
Se rvice(1) (2) (3) (4)
29.1.1 Feed and Proper feeding q- q
29.1.2 Housing (Goat, Dairy, Poultry, Pigs) qq qq qq O (2) (3) (4) (5) (6)
29.1.3 Proper Milking qq qq qq 29.2.1 Government qqqqq qI q_ EqL q
29.1.4 Milk Hygiene H qq 29.2.2 NGO/dev project q^qq q q] q q
29.1.b Disease control (dip itig/spraying) q qq 29,2.3 Cooperative qqq q qq q q
29,1.6 Herd/Flock size and selection qq -q q 29.2.4 Large Scale farmer [qqq q q qqll q
29.1.7 Pasture Establishment q q q 29.2.5 Other ............... qi I I q _q q
29.1.8 Grou formation and strengthening q qq q uali of service Ca! 8 Very good ... t good ....2 Average...3 Aoor.. Q No Good ...5
29.1.9 Calf rearing q qq qq 30.O GOVERNMENT REGULATORY PROBLEMS
29.1.10 Use of im roved bulls q q 31.1 Did you face problems with government regu)ations during 2002/03 (Y- 1, N ' 2) L—_
List i nthe
in order of importance{lf th response is no go to section 31 0 )C 29.1.11 Other livestock extension q ,, qq
Source of livestock extension (Co1_4).....1 NGO/Dsv project ..2 Caoperafive .. 3 Large state farmer .....4 Other (Specify) ....8
Problem code Problem code
Land ownership by government ..... - 9
Restriction ofsa€e between regions .2
Impart of food hams .....................3
Govemmen€30 ' 1 ' 3
30.1.2
3 st
2nd

Smallholder Questiona res 195
Definition and working page for page 19Question specific definitions (Section 31.1) Procedures for (Section 31.1)
Section 31.1 ((Labour use)rActivi (Cal 1):1. For each listed activity in column 1, place
Land Clearing: Refers to removing trees bush/grass prior to ploughing a tick in column 2 if any member of thehousehold was involved in that activity during
Soil Preparation: Refers to the seedbed preparation (ploughing, •
harrowing, etc),the 2002/03 agriculture year.
2. After completing column 2 return to theCattle Rearing: Tending to cattle at home, eg assisting with births,castration,etc. Different livestock keeping activity to herding.
first activity in row 27.1.1 and complete column3.
Cattle Herding: 'Moving livestock from place to place for grazing andwater. If herding is carried out the respondent must also give a response to 3. Make sure you stress MAINLY
rearingthusbandry responsible.
NOTE: If an activity has been mentionedpreviously in the questionnaire eg that thehh keeps chickens, make sure a response isobtained in the appropriate place ie poultry
Question S. - i ic Definitions Section 32. .0 keeping.Activity (Col 1):
Subsistence: For the family's survival, rather than:for the generation of
If off-farm income generation is mentioned,check for responses to off farm income in
cash. This includes feeding the hh, provision of water and fuel for cooking. other parts of the questionnaireThe source of these products are usually frem the land resources avaflableto the family. Remember that not all cash earnings are for non subsistencepurposes/activities as cash can be used to purchase subsistence items egfood.
Non -subsistence: Cash used for items and activities which are not " Section Subsistence vs32.0 - Non-
crucial for the survival of the family. This includes modern medication, nonworking clothes, refined beer, school fees, etc.
subsistence
1. For each listed activity in column 1, place
a tick in column 2 if any member of thehousehold was involved in that activity duringthe 2002/03 agriculture year.
2. After completing column 2 return to thefirst activity in row 32,1.1 and complete column3 & 4. For each activity make an assessmentof the percentage used for subsistence survivaland the percent converted to cash for nonsubsistence goods and items.
3. Make sure you stress MAINLYresponsible.
NOTE: Cross check the responses withprevious sections in the questionnaire.eg if a response is given to remittancescheck for an entry in question 2.2.5
Tanzania Agriculture Sample Census - 2003

SrnaW)olefer Quesr'ionaires 196
31.i3 t.. At3F.) ift i'SI: 32.4) St?f3h14'1'1 vC I vs ()N-51113 3ti'1 t.\C; : a as31.1 Who is mainl y respousibhe lo r 32.1 Indicate if any members of the household was involved in the
^^raci^^scrtcir3= the ii)f1mviaa tssks: faiiowinr activities and assess the percentage used forsubsistencoiconsurnptian by the household
Tick i Main Tick iff i i iActivity car a Y'L'spo hh waz l Stim3te E5ttI39dte % 3
SIN out a^ -nsib SIN Activity involved °/% used for used for no Check_ hh j-ility in activit subsistant subsistence Total
1.1 1 1.aiacl €"1 .ari^ar9
.
^ i . , L. _ 3 .1.1 Cr op p oduction ,. . ^. _ .^ (^ I
31.1.2 Steil preparation ( icy' ban ) H1 p _ 32.1.2 L iviastock production _
31 l prepraration (oacnitra c# ^ ; X2.1.' Veeetiab production ^I 1
31.1 F'3as7(Yn6 ! 1.4 [r cutnngZ toi- firewo€ d -
31.1 Lyd Ld ► ng i .5 2e Toutingfor I I rI
31. i 6 Hop I'ratcctaara I I E ^ 32.9.6 ' ree lo^gi.ng for-ifaaabea ^^ ^'^ ^ ^^' ^ N i
srvE stinst 32.1.'7 7r lc^s, iaag i'o c as a oa8 Z l .
Crop3i
i 32.1 B fishin •I
^I 1/I x^ oP prncessirs 1 i t 1 E . ....
31.1.9 Crop marl etln ^.... 32.1.9 bee keeping ! i .rim. L.
31.1.10 Cattle rearing/hosbandr'y L_ J ( .j 32.1 10 employment/off farm I_.- 1Li! _J li Ii ('
3 f .1 11 L'att)e herding Iherding J I 32.1. f 1 era^iaEoyn}eat/^^€8'p r i i__J -I_ _LJiUJI
31112 2 C..atfle tnarkeiiaa ^ ^ 32.1.12 iteratittaaces
31.1 13 Goat/sheep rearing/hnmboor _
31.1.14 Goat and sleep herding 1 7 Uj
31.1.1 W Goat and sheep marketing UI i
31.1.16 Milking UI UI 33.0 ACCESS TO INFRASTRUCTURE & OTHER SERVICES
31.1.17 Pi g rearm (husbandPig ^ rY j _.^ Distance in l astance in
31.1.18 Poultry keeping _l 0 SIN Tyne of service Eiztt S/N J Type of service i
31 .1.19 Ccallect ng Water i _ U) (2) (1) (2)
31,1 .20 Collecting Fivewood LI 33.1 Primary School LLi 32.7 Feeder Road
31.1.21 Pole cutting UI q 33.2 Secondary SchooI" J J 1 j 32.$ Alf weather• roa ^ [
31.1.22 limber avo©t) cut in LI 33.3 Hea)ih Clinic C ^ 32.9 'Tarmac road I
31.1.23 Ruil ding/maintaining housePj a 33.4 Hos ital ', j L f'LJ 32.9 Primary marketL__J__j-3
31.1.24 M alting Beer I J q 33.5 Distract Capital ^ ^ 32.11 Secondary nmart4I LSecondaryi-- r !
f31.1.25 Bee keeping Li L .J 33.6 Regional Capital bLJ H 32.1 'b'ertiary marked ? J
31.9.26 Ffshing
31 .1.27 Fish farming ? I Distance No of Satisfied
31.1.2$ off-farm income geaaera.t.ion. Liii S/N Type of service in Jixn visits/ ear with service
Responsibthty (Cof 3) [^(4)
FIH head alone ....1 Girls ............................6 33.13 Vet Clinic ^^'[^ 1 t^^ Adult Males ........2 Boys & Girls ....................7
33.14 Extension CentreAdult Females.....3 All household members......8
Adults ...............4 Hired labour....................9 33.155 Research Station .._ II = _ik6yS................ 5
^'0 r L IIa i red w
77777i33.16 6 Plant protection Leta
Very gaod... No good......5 33.1? Land registration of c tfVof appficadle 8
33.18 Livestock Dev Centre L_ _ _,' __ l i_ _
Tanzania Agriculture Sample Census - 2003

Definition and working page for page 20
Smallholder Quostionaires
Number of rooms used for sleeping in the household (0 34.1)
Include sitting room, dining room, kitchen. etc if used for sleeping. It alsoincludes rooms outside the main dwelling
A room is defined as a space which is-separate from the rest of the buildingby a permanent wall or division. A building/house that is not divided intorooms is considered to.have cne room.
Household assets (0 34.2): these assets mast be foncliontinin Dd not
incitide if broken,
ACcess to drinking.water (0 34.4): if there is more thaP one source,
use the one which the nh uses most .frequently.
Main source of hh cash income:
•
Activity that provides the hh with the on at cask during 2002/03 aurictilruire
yeat
197
Tanzania Agriculture Sample Census - 2003

Smallholder Questionaires 1 gg
34.0 HOUSEHOLD FACILITIES
34.1 House Construction 34.2 Household assets
For the main dwelling, what are the main buildingmaterials used in the construction of the following
34.1.1: Roof 34.1.,, Number of rooms
RnofMaterialIron Sheets.......1
Tiles ...............2Concrete .........3Asbestos ........
GrassIleaves.....5
Grass & mud.....6Other(Specrfy) B
34.2.
34.2.34.2.34,2.
34.2.34.2.
34.2.34,2.
Does your household own the following?
AssetY- iN=2
Radio/cassette, music system)
Telephone (landline)Telephone (mobile G
IronWheelbarrow
Bicycle
Vehicle
Television
34.3 Energy use by the Household 344 Access to drinking water
Energy use and access by the householdSeason
Main sou
-rce ofdrinking
water
Distance
to source(in kin)
Time to and
from source(Hour: minute
34.3.1
Main Source of energy for (• ) (2) (3) (4)
Lighting flL 34.3.2 Cooking j1 11 34.4. Wet Season LULL34.4. Dry Season C I] j 'Cookinenercttr
Ma?ns electricity......01
Solar ...................02
Gas (hh biogas) .....03
Bottled gas ...........04
Para fn/kerocine.....05
Charcoal ...............00fi
Firewood .............. 07
Crop Residues ......08
Livestock dung ......09
Other (specify) ......98
Li ht^in nerg ryMains electticity......01
Solar...................02
Gas (biogas) .........03
llwricane Lamp .....04
Pressure LampLam ......05
Wick Lamp ............06
Candles ...............07
Firewood.............06
Other (specify) ..... 98
Main Source of drinking waterPiped wafer ............................... . ..01 Covered rainwater catchment ...07Protected well ..............................02 Uncovered rainwater catchment 06
Protected/covered spring ................03 Water Vendor ............................09Unprotected Well .................... .....04 Tanker truck ...........................10
Unprotected spring ......................05 Bottled water__.. .....,............... i 9Surface water (lake/dam/river/stream)06 Other (Specify) ..........................98
3 J to toilet facilities 34.6 Food consumption patterns
34.5.1 What type of toilet does your hh use El
34.6. Number of meals the hh normally has per dayType of toilet
No toiletlbush ............. I Improved pit latrine . hh owned.......4
Flush toilet ................2 Other type (specify) .....................5
Pit lafnne - traditional ..334,6. Number of days hh consumed meat last v ._,,..,34.6. How often did the hh have problems in
satisfying the food needs of the hh last year?34.7 Source of Household income ^.__....
Problems satisfyinq hh food needs
row 346.3Never ........................ISeldom ......................2
Sometimes .................3
Often ........................4
Always ,................,.....5
34.7.1 What is the households r—^--_..l
^
main source of cash income ^L
Source of Income codesSale of food crops ..............01 Wages or salaries in cash .....07
Sale of Livestock ...............02 Other casual cash earnings ..08
Sale of livestock products ... ©3 Cash remittances ..................09Sale of cash crops............04 Fishing ..................................10
Sale of forest products ......05 Other .....................................98
Businessincome .................06 Not appi'cabte ........................99
Tanzania Agriculture Sample Census - 2003

Pqr.officier4ae.onfy.c.aten ! ode by t t e controller on the of the ettest:onnatre
IS j, . ,e colon quit to oo laenNature of the ¢robler^r: . • . • ••.
Action Required: National su pe d::aupaiad'adon
pisOfd.:. ana'resamo:eDls and as missing daW:
Overaf Status ihe quetficonaire.:More data re(leited dd ore car- be used
Number of K.sCrop Standard Non-standardName Bag kgs
86 Cabbage 5087 Tomatoes 9088 Spinach 4589 Carrot 11090 859 1 Amaranths 5092 Pumpkins 6093 Cucumber 8094 Egg Plant 7095 Water Mellon 8096 Cauliflower 5052 Sisal 13054 Coffee 5555 Tea 6056 Cacao 8057 Rubber
58 Waffle 9059 Kapok
60 Sugar Cane 12061 Cardamom 100
71 Banana 12072 Avocado 14073 Mangoes 13074 Papaw 10076 Orange 13077 Grape fruit 12078 Grapes 8079 Mandarin/tang: 11080 Guava 11081 Plums 11082 Apples 11083 Pears 11084 Pitches 110
Non-standardNumber of K. s
Crop StandardName Ba TinMaize 100 18Paddy 75 15Sorghum 100 18Bulrush Millet 100 18Finger Millet 120 20Wheat 75 15Barley 75 15
2 Cassava 60 1222 Sweet Potatoe 80 1623 Irish potatoes 80 1624 Yams 80 1625 Cocoyams 80 1626 Onions 80 1627 Ginger 75 15
Beans 100 20Cowpeas 100 20Omen ram 100 20Pigeon pea 100 20Chick peas 100 20Bambara nut 100 20Sunflower 60 12Simem 100 20Groundnut 50 10Soyabeans 100 20Caster seed 100 20Pineapple 90 18
50 Cotton 50 1051 Tobacco 70 1453 Pyrethrum 60 126 2 Jute 50 1044 Palm Oil 10045 Coconut 7546 Cashewnut 80
kgs140
NameRumbesi
Smallholder Questionaires 199
Back Page Reference materialThis page contains reference information that may be required to complete.some of the questions in the questionnaire.
Weights and measures Conversions
1 hectare = 10,000 sq metres (100 x 100 metres) 1 hectare = 2.47 acres1 kilometre = 1000 metres 1 mile = 1.61 Kilometres1 acre = 4840 square yards (110 x 44 yards)
Kg equivalents
The following standards may be used as a guide to obtain kg if the reported unit is different. Only use these conversions ifthe respondent is unable to n rovide weights in kgs.
Tanzania Agriculture Sample Census - 2003

Smallholder Qtr -4ionaires 200
verage rnax€rnurn yre sUse this table to compare the yields calculated in sections 71, 7.2, and 7.3. They are STRICTLY to be used asguidelines only and the sole purpose is to assist in etting the correct area and harvest for each crop
kgltra kglacre kglha k Jac r^ e
Crop Crop _Name Average Max Ave rage Max Max Average Max
It MaSe 1200 6250 4126 2530 86 CabSuos C., 072 Pa.;'do 700 41100 2153; 1 8599 67 ;orrn tr)es C C1' X 11. :M 750 3500 304 1 1417 8,ESpir,uo 0 i G14 C'.irusi€ Mii,et 353 3000 142 12. i 82) Carrel G (?
ii15 Fn,GerivMm) € 300 2500 122 1012 06 C 42es 0E6 V*fh al 1200 4500 i 4812 18122 91 Amaranths 0 037 Barley 1400j 23u0 567 c3' ^; r^un^puir^s 0 02.1 C;assevs 3000 7500 1215 2834 9 3 cucumber j 0 022 Sweet Potato 600 8000 I 243 3239 94 E pf? Plant 0 023 irisS potatoes 750 4500 304 3441 cis Water Mellon 0 024 4ams I 4000 10000 1615 4049 96 Ceul ;flower 0 I25 Coeevains 2500 6000 1012 2024 52. 600 25000 324 1012126 0nsfls C. 0 55 Coffee 600 100 202 4027 Girder 0 0 55f14a 2500 10000 1012 404939 Seems 400 1300 162 526 56 Cacao 200 1000 81 40532 { ewpeas 300 1750 121 709 57 Robber 400 1400 162 56733 Green gram 0 0 } 58 Waffle 0 034 Pigeon pea 6000 2000 243 810 ( 59 Kapok 0 035 Cask peas 500 1500 202 607 60 Suigass Cane 60000 150000 24291 6072936 Bambara nut 600 4000 243 1819 Cl Carea morn 0 041 Sunflower 600 1700 243 680 73 Banana 10000 50000 4049 2024342 Simsim 300 i 1000 121 405 72 Avocado € 0 043 Groundnut 600 4000 243 1619 73 Mangos 10000 25000 ` 4049 1012147 Soyabsans 1 300 2500 . 526 € 1012 74Pauaw 00000 70000 20243 2834048 Caster seed 300 760 121 f 304 76 Orange I 20000 40000 5097 1619475 Pineapple 25000 60000 1012 1 24291 77 Grape fruit 30000 50000 12146 20243130 Cotton 305 1500 121 607 78 (2)m es 5000 30,000 2024 1214651 Tobacco 500 2000 202 810 79 vland,.rlruKang 20000 40000 I 8097 16194153 Pyrellirurr ( f1 0 80 Guava 7000 35000 f
I 2834 14.170162 Jute 300 3500 324 1417 83 Plasm E 0 !!! 0
44 Palm 011 1200 5000 486 2024 fit Apples 0 045 Crcml;l 2000 8000 810 3239 83 Pears 0 046 Cashewrrut 9 tree 4 #VALU I 84 s 0 C
iI
Fanzania Ai riculturc Sample Cen,su3 - 211113

Smallholdet Questi °mires 201
APPENDIX 111. b Community Questionnaire
Tanzania Agriculture Sample Census - 2003

Con-imuni 202
Villa l ity Level formats- Access to and use of Communal resources
- Farm Gate Prices of commodities produced by the viltage
Agriculture Sample Census
2002/2003
Region ................................. Ward
District ..................................... Village ...........................
Enumerator Name
Qate Enrmeratedd d
1 !
LILIII !mm y y
signature
Start tim
End time
Hour Minutes
T TT
Field level checking by:To be completed by thesupervisor ONLY after
District Supervisor: Name signature Date ! i field/farm level checking of
the enumeration process.Regional Supervisor: Name signature Date i. ! This should be
Countersigned by the
National Supervisor Name signature Date r i enumerator.
District checking in Office: All questionnaires must• be checked at the district
District Supervisor Name signature Date ! I office.
)r Use at National Level only:
ata Entered by Name signature Date ! !See back page for detailsof query
toned Name signature Date ! I
Executed by the Ministry of Agriculture & Food Security, Ministry of Water & Livestock Development,
Ministry of Cooperatives and Marketing
and v^
National Bureau of Statistics
Tauzzania Agriculture Sample Census -,2003

Community Questionaires 203
Definition and working page for page 1Question Specific DefinitionsUse key informants to provide answers to the questions in this booklet questions. Key informants can be the villagechairman, village extension officer or knowledgable member of community. Where possible ask these questions to a groupin order to reach a concensus.
Question Specific Definitions:
Access to Communal Resources - Section 1.0
Communal Resources: Resources in which the hh members have no individual claim to and which are shared by all the village.Area of Communal Land: Official area demarcated by the village as shared/public landArea of Seceding Farmers: area of official communal land on which individual hhs make sole claim to (eg for crop farming or fencedlivestock etc)
Remaining available: Official area of communal land minus area of squatting farmers
Community tree planting scheme
Community Forest: A forest planted on the communal land which isplanted, replanted or spot planted by the members of the village.
Plantation Planting: An area designated by the village for planting a blockof trees.
Spot Planted: Replanting an area where selective logging has beencarried out. A tree is planted to replace the one that has been cut.
indigennus Trees: Trees that are native to Tanzania
Exotic Trees: Trees that are not nai=ve to Tanzania
Non Government Organisation: is managed by people from outside thevillage and it normally covers more than one village/DistricVRegion. Its
nction is to provide development assistance to the farmer and is free fromdirect government links.
Village level organisation: is managed by members of the village. Itspurpose is normally to access/provide development assistance to thevillage,
Tanzania Agriculture Sample Census - 2003

Cornmuni Questionaires 204
1. ACCESS TO COMMUNAL RESOURCES
1.1 Does the village have an area set asside for commnal resources eg forest, grazing, etc (Yes =1 No =2j(If the response is no go to 1.2)
1.1 Area of Village Communal resource Area in Acres
1,t.1 Total Area of communal land _ _ .-._ Official figure from community leader
1.t.2 Area of squatting farmers on communal land LilliL IL_]... ..... ......... .......
Key respondent (leader/extension/etc)... .....
Key respondent (le ader/ex tension/etc)1.1.3 Remaining available as communal resource j 3. T q
1, ESSAND COMMUNAL RESOURCESCommunal
ResourceDistance to resource (km) Main
hh use
IfIf
Instructions(Cot
eg
for distance to resource2 and 3):
Distance is from the centre of the village.
under 1 km, write 0above 1km round to whole numbers
1.5km= 2km, 1.25km = 1 km
dry season wet seasonf? (2 f3i f4;
1.2.1 Water for humans 3 - f
1.22 Water for livestock q L _ !
1.2.3 Communal Grazing L __qr
q ^_— q_...!IT
1.2.4 Communal Firewood _^1 ..._ q :---- _ L_ iMain use(Co/41Home or farm Consumption/utifisafion—ISold to trader at the village ....................2Sold to village market ...........................3
Sold to local wholesale market ...............4Sold to major wholesale market .............5
Not available ..........................................6
1.2.5 Wood for Charcoal ' i^^.
-._____J,
1.2.6 Building poles [ 1 ...._.ht.Jii
LrI .._ q
L
1.2.7 Forest for bees (honey qmm ,
1.2.8 Httntiu (animal products[^__ .
t .2.9 (Fish)Fishing JiLi i f ]2.0 COMMUNITY PLANTED TREES
2.1 Does your village have a Community tree planting scheme (Yes=1, No=2) qIf the response is 'NO' go to section 14.0
Details of the community tree planting scheme
SIN
Distance to coin
-mu n,ity planted
forest (lim)
Area of
Community
Forest (aer)
Type of
planting
Type of
trees
Source of
seeds/
seedlings
Number of
years since
planting started
1Ytain use
during
2002/03
Plain use of
community
forest revenue
(1) (2) (3) (4) (5). (6) (7) (8)
2.2
Indigenous ...............
q......
• q qq i q......LL El L.q qq qT pe of planting {Cot Source of Seedlings fCol 51 Main Uses (Col 7) Main use of revenuePlantation planting..........1 Seeds collected and directly Poles ...................I Co18Spot planting ................2 planted by village.......,.......? Timber logs .........,.2 Village development fund.1
Village Nursery .................2 Charcoal ..............3 household consumption...2Type of tree (Col 4) Department of forestry ...... . 3 Household Income ........3.••
Firewood ..............4t Private nursery Other Specify ........8exotic..........................2
both ...........................3
3.0 Non Government Organisation (NGO) Contact 4.0 Community Based Organisation (CBO)3.1 Did an NGO visit tl^evilkage dur€ng tlae year(Y 1,N 2) JEll
(If no go to Section 4)4.1 Does the village have CBOs (Y=1, N-2) qq
SIN Type of NGOVisitedY=1, N=2
Numberof visits
Distance toOffice (km) SIN Type of NGO
In villageY-1, N-2
Extension/Research NGO Li qq qqqq Extension/Research CBO qq
Service/input provision NGO q q Serviceiinput provision CBO q
Community development NGO qq q q Community development CBO qq
fltherNG O Eq qq OtherCBO q
Did the village have any on-farm trials5.1 (y =1,n=2) _ 5 .2 Has there been an research prioritisation exercise (Y=1 N=2)
Tanzania Agriculture Sample Census - 2003

Procedure: Administer this form after completing all smallholder questionnaires for the village.
1. Copy the names of all crops from section 7.1, 7.2, & 7.3 in the smallholder questionaire to column1 of this form.
2. Obtain an estimate of price per kg of these products under column 5, 6, 7 and 8.
Community Questionaires 205
Average Seasonal Farm Gate Price FormUse key informants to provide answers to the following questions. Key informants can be the villagechairman, village extension officer or knowledgable member of community. Where possible ask thesequestions to a group in order to reach a concensus.
Crop name Crop Code
ProductProduct name code
Price ser kgEnd ofVuli
End ofMasika
AnnualMinimum
AnnualMaximum
(I) (2) (3) (4) (5) (6) (7) (8)
r ,
n
n
Main product (Col 15)Flower eg pyrethrum . 6Vegetables ................ 7Fruit ......................... 8Other (Specify) .......... 9
Dry Grain ................... /Green cob ................ 2Green leaves & Stem. 3Straw, dry stems etc .„4Root, tuber, etc ........ 5
Tanzania Agriculture Sample Census - 2003

Appendix III 206
APPENDIX III. c Village Listing Forms
Tanzania Agriculture Sample Census - 2003

CodeWard
District Code Village Code
Village Listing Form 207
UNITED REPUBLIC OF TANZANIA[ Confidential
Page Number ...........................
Agriculture Sample Census 2002103
ACLF 1: Sub-village leader listing form
Region Code
Name of Village Chairman....................................................................................................................................
Sub-villageleader number Name of sub-village leader
Number of householdsCommentsofficeFromFro
registerAfter
enumeration4 5
M M1111 MM:II=
IIIIIIIIIIIIIIIIIIIIIIIIIIIIIII _r _M r_rr1=rrrilsoul
11111 E=1:7111111111
1111111111111111111111111111111111imftwwito
O11 MI
m=mlift 1mmwm111m wom•
Total
Name of enumerator ............................................ Signature ..................................................................
Date
Name of supervisor ............................................. Signature ..................................................................
Date
Ministry of Agriculture and Food Security, Ministry of Water and Livestock Development, Ministry ofCooperatives and Marketing and the National Bureau of Statistics
Tanzania Agriculture Sample Census 2003

oaC
rn
Iro
0
UNITED REPUBLIC OF TANZANIA
Confidential
National Agriculture Sample Census 2002103ACLF: 3 Household listing of 15 selected farmers
Region CodeDistrict CodeWard Code Village ___________ Code
S/NSub village
leadernumber
Name of sub-village leaderAgriculturehh serialnumber
Name of selected head of householdNumber of
Fields Cale Goal Sheep Rig poultrylduGcs
Rabbits
TTBZTI (3) 1111 (4 51 F u6 9 10
02
03
6A
05
06
07
08
09
10
11
12
13
1_4 LII`15
Name of Enumerator: Signature Date
Name of Supervisor -.. Signature
Ministry of Agriculture and Food Security, Ministry of Water and Livestock Development, Ministry ofCooperatives and Marketing and the National Bureau of Statistics
Copyright © 2022 FDOKUMEN