Late quaternary paleoclimatic reconstructions for interior Alaska based on paleolake-level data and...
14
29 Journal of Paleolimnology 24: 29–41, 2000. © 2000 Kluwer Academic Publishers. Printed in The Netherlands. Late Quaternary paleoclimatic reconstructions for interior Alaska based on paleolake-level data and hydrologic models* Valerie A. Barber & Bruce P. Finney Institute of Marine Science, University of Alaska Fairbanks, Fairbanks, AK 99775, USA (E-mail: [email protected], [email protected]) Received 14 February 1999; accepted 14 July 1999 Key words: Alaska, hydrology, evapotranspiration, paleoprecipitation, paleoclimates, lakes Abstract Hydrologic models are developed for two lakes in interior Alaska to determine quantitative estimates of precipitation over the past 12,500 yrs. Lake levels were reconstructed from core transects for these basins, which probably formed prior to the late Wisconsin. Lake sediment cores indicate that these lakes were shallow prior to 12,500 yr B.P. and increased in level with some fluctuation until they reached their modern levels 4,000–8,000 yr B.P. Evaporation (E), evapotranspiration (ET), and precipitation (P) were adjusted in a water-balance model to determine solutions that would maintain the lakes at reconstructed levels at key times in the past (12,500, 9,000 and 6,000 yr B.P.). Similar paleoclimatic solutions can be obtained for both basins for these times. Results indicate that P was 35– 75% less than modern at 12,500 yr B.P., 25–45% less than modern at 9,000 yr B.P. and 10–20% less than modern at 6,000 yr B.P. Estimates for E and ET in the past were based on modern studies of vegetation types indicated by fossil pollen assemblages. Although interior Alaska is predominantly forested at the present, pollen analyses indicate tundra vegetation prior to about 12,000 yr B.P. The lakes show differing sensitivities to changing hydrologic parameters; sensitivity depends on the ratio of lake area (AL) to drainage basin (DA) size. This ratio also changed over time as lake level and lake area increased. Smaller AL to DA ratios make a lake more sensitive to ET, if all other factors are constant. Introduction General circulation models (GCM) indicate that high- latitude regions are sensitive to changes in both temperature and P and that significant changes are likely to occur due to the increase in anthropogenically- produced, radiatively-active trace gases (Houghton et al., 1990, 1996). Signs that changes are already occurring in Alaska include increases in permafrost temperature (Lachenbruch et al., 1988; Walsh & Chapman, 1990; Chapman & Walsh, 1993), increased thermokarst activity (Osterkamp & Lachenbruch, 1990; Osterkamp, 1996; Osterkamp et al., 1997) and changes in tree ring characteristics indicating increased stress over the past 20 yrs or so (Jacoby & D’Arrigo, 1995; Barber et al., 1997; Juday et al., 1997; Briffa et al., 1998). Ver- ification of GCM and regional climate models can be accomplished by comparing simulations of tem- perature and P under different boundary conditions with paleoclimate reconstruction based on the geologic record (COHMAP, 1988). Lakes are a valuable source of diverse paleoclimatic and paleohydrologic proxy data and serve as integrators for whole watersheds. Past lake-level fluctuations can be used for reconstructing and interpreting regional paleohydrologic and paleoclimatic changes on time scales from 10–10 6 yrs (Street-Perott & Harrison, 1985; Digerfeldt, 1986). Closed lakes (lacking outlets) are most sensitive to changes in climate and are generally found in arid to semi-arid regions. Lake-level fluc- tuations may be recorded by a number of proxies *This is the third in a series of eight papers published in this special issue dedicated to Arctic paleohydrology. These papers were collected by Dr. Glen MacDonald.
Transcript of Late quaternary paleoclimatic reconstructions for interior Alaska based on paleolake-level data and...
29Journal of Paleolimnology 24: 29–41, 2000.© 2000 Kluwer Academic Publishers. Printed in The Netherlands.
Late Quaternary paleoclimatic reconstructions for interior Alaska basedon paleolake-level data and hydrologic models*
Valerie A. Barber & Bruce P. FinneyInstitute of Marine Science, University of Alaska Fairbanks, Fairbanks, AK 99775, USA(E-mail: [email protected], [email protected])
Received 14 February 1999; accepted 14 July 1999
Key words: Alaska, hydrology, evapotranspiration, paleoprecipitation, paleoclimates, lakes
Abstract
Hydrologic models are developed for two lakes in interior Alaska to determine quantitative estimates of precipitationover the past 12,500 yrs. Lake levels were reconstructed from core transects for these basins, which probably formedprior to the late Wisconsin. Lake sediment cores indicate that these lakes were shallow prior to 12,500 yr B.P. andincreased in level with some fluctuation until they reached their modern levels 4,000–8,000 yr B.P. Evaporation(E), evapotranspiration (ET), and precipitation (P) were adjusted in a water-balance model to determine solutionsthat would maintain the lakes at reconstructed levels at key times in the past (12,500, 9,000 and 6,000 yr B.P.).Similar paleoclimatic solutions can be obtained for both basins for these times. Results indicate that P was 35–75% less than modern at 12,500 yr B.P., 25–45% less than modern at 9,000 yr B.P. and 10–20% less than modern at6,000 yr B.P. Estimates for E and ET in the past were based on modern studies of vegetation types indicated by fossilpollen assemblages. Although interior Alaska is predominantly forested at the present, pollen analyses indicatetundra vegetation prior to about 12,000 yr B.P. The lakes show differing sensitivities to changing hydrologicparameters; sensitivity depends on the ratio of lake area (AL) to drainage basin (DA) size. This ratio also changedover time as lake level and lake area increased. Smaller AL to DA ratios make a lake more sensitive to ET, if all otherfactors are constant.
Introduction
General circulation models (GCM) indicate that high-latitude regions are sensitive to changes in bothtemperature and P and that significant changes arelikely to occur due to the increase in anthropogenically-produced, radiatively-active trace gases (Houghton et al.,1990, 1996). Signs that changes are already occurringin Alaska include increases in permafrost temperature(Lachenbruch et al., 1988; Walsh & Chapman, 1990;Chapman & Walsh, 1993), increased thermokarstactivity (Osterkamp & Lachenbruch, 1990; Osterkamp,1996; Osterkamp et al., 1997) and changes in tree ring
characteristics indicating increased stress over the past20 yrs or so (Jacoby & D’Arrigo, 1995; Barber et al.,1997; Juday et al., 1997; Briffa et al., 1998). Ver-ification of GCM and regional climate models can beaccomplished by comparing simulations of tem-perature and P under different boundary conditionswith paleoclimate reconstruction based on the geologicrecord (COHMAP, 1988).
Lakes are a valuable source of diverse paleoclimaticand paleohydrologic proxy data and serve as integratorsfor whole watersheds. Past lake-level fluctuations canbe used for reconstructing and interpreting regionalpaleohydrologic and paleoclimatic changes on timescales from 10–106 yrs (Street-Perott & Harrison, 1985;Digerfeldt, 1986). Closed lakes (lacking outlets) aremost sensitive to changes in climate and are generallyfound in arid to semi-arid regions. Lake-level fluc-tuations may be recorded by a number of proxies
*This is the third in a series of eight papers published in thisspecial issue dedicated to Arctic paleohydrology. These papers werecollected by Dr. Glen MacDonald.
30
contained in the sediment record. Pollen, diatoms,sediment composition, sedimentary structures and levelof the sediment limit have been used to infer lake-level changes. Changes in geochemical conditionsassociated with lake volume variations can be detectedusing chemical, mineralogical, isotopic, or biologicalmethods.
Lake-level changes in response to climate changehave been well documented in the tropics and temperatelatitudes (Street-Perott & Harrison, 1985; Digerfeldt,1988; Hostetler & Benson, 1990; Digerfeldt et al.,1992) but similar studies are less common in arctic andsubarctic environments. In some regions, arctic andsubarctic lakes have the potential to provide paleo-hydrologic records if the climate is sufficiently arid andbasin configuration suitable. In order for lakes to existin semi-arid to arid climates, they must generally becontained within drainage basins that are relativelylarge compared to the lake area. In these types ofsystems, runoff is typically the most important com-ponent of the water input to the lake. If runoff approaches100% of total input to the lake, (i.e. extremely largebasin compared to lake area) the lakes are known asamplifier lakes, and when runoff approaches 0% oftotal input, lakes are atmospherically controlled (Street-Perott & Harrison, 1985). Lakes of interior Alaska fallbetween these two extremes. Here E can exceed Pfalling onto the lake, while ET from the drainage basinis close to, but less than, P falling on the basin. Thus,runoff is important in maintaining lake water balance,with spring runoff associated with snowmelt having alarge impact (Hinzman et al., 1996). The region ofAlaska between the Alaska and Brooks ranges waslargely unglaciated during the late Pleistocene andHolocene and lakes in this region have the potential toprovide long continuous records of paleohydrologicchange.
Northern regions can be classified as subarctic orarctic based on temperature and permafrost (Prowse,1990). Permafrost is discontinuous in subarctic regionsand continuous in arctic regions. Subarctic refers tothose regions where mean temperature for the coldestmonth is below freezing and the mean temperature ofthe warmest month is above 10 °C, but no more than 4months have a mean temperature exceeding 10 °C.The Arctic is classified as the region where meantemperature for the warmest month remains below10 °C and the mean annual temperature is belowfreezing. The Arctic can be subdivided into low andhigh regions based on July temperatures. Regionswhere mean July temperature falls below 5 °C are
termed High Arctic, while Low Arctic refers to thoseregions where mean July temperature falls between 5–10 °C. In Alaska, the Low Arctic is generally found northof the Brooks Range where vegetation is in the form oftussock tundra, mosses, lichens and shrubs (dwarfbirch, willow and alder). High arctic conditions are notfound in Alaska but exist, for example, in the islands ofthe Northwest Territories, Canada. Here vegetationdensity is low and there is an increasing proportion ofmosses and lichens, which do not transpire, among thetussock tundra and grasses (Prowse, 1990). Precipitationand E (including ET) generally decrease with increasinglatitude. Low arctic annual P is usually less than 250 mmwhile high arctic annual P is typically 150 mm or less.Ranges of E and ET for low arctic conditions are 260–340(Marsh & Bigras, 1988) and 130–240 mm (Hinzman, 1990;Kane et al., 1990), respectively. In the High Arctic, rangesof E are 84–180 mm (Marsh and Woo, 1979; Woo et al.,1981) and ET ranges from 50–90 mm (Ohmura, 1982a, b).
Interior Alaska (north of the Alaska Range, south ofthe Brooks Range and east of the Seward Peninsula) isclassified as subarctic and the climate is predominantlycold continental. Summers are short and hot whilewinters are long and cold. Annual temperature extremesare great (e.g., 38 to –60 °C) and permafrost exists over80% of this zone (Osterkamp et al., 1997). The regionis semi-arid, due in part to distance from the ocean andlarge topographic barriers such as the Alaska andBrooks ranges. Annual P ranges from 120–600 mm.The climate of the region encompassing the lakes in thisstudy is classified as semi-arid, cold microthermal, withlittle or no P surplus, and temperature efficiency normalto cold microthermal (Patric & Black, 1968). Potentialannual ET (PET) ranges from 400–470 mm. It ishighest during the summer, when long hours ofdaylight, warm air temperatures, and low relativehumidity create a high demand for soil moisture andproduce a net loss in water resources (Gieck & Kane,1986). Potential E, based on Thornthwaite’s equation(Patric & Black, 1968), is a function of temperature.Actual E (combined E and ET) is often less thanpotential E and is less than or equal to P (Patric & Black,1968).
Although interior Alaska is largely forested at present,paleovegetation analyses (Ager, 1975; Anderson &Brubaker, 1993; Hu et al., 1993; Hu & Brubaker, 1996)indicate tundra vegetation and suggest arctic conditionsprior to 12,000–14,000 yr B.P. (all dates are un-calibrated radiocarbon yrs). This implies that largechanges in factors important to the hydrologic cyclehave occurred in this region over this time period.
31
Synoptic climatic controls that operate at regionaland smaller spatial scales across Alaska are poorlyunderstood but could be important for understandingpast climates (Mock et al., 1998). The winter climateof Alaska is strongly affected by mid-troposphericvariations of the East Asian trough-ridge system.During winter, a strong upper-level trough is centeredto the south and traverses through central Canada(Harman, 1991). Cold air masses and cold-core high-pressure systems predominate north of the trough.Precipitation throughout interior Alaska is normally atits lowest of the annual cycle in winter, with manylocations typically receiving less than 25 mm inJanuary. Circulation associated with the Aleutian Lowcauses higher P in southern Alaska, but most of the Pis restricted to the windward side of the coastalmountain ranges (Mock et al., 1998).
Spring and fall climates are short transitions betweenwinter and summer. During summer, interior Alaska isprimarily affected by mid-tropospheric variations ofridges and troughs (Mock et al., 1998). Increased solarradiation generally explains the peak of the annualtemperature cycle for most locations and the highesttemperatures in Alaska are centered in the easterninterior. Warm and dry summers are associated withhigh pressure ridges extending across central Alaskaand the Aleutian Low lying considerably south ofAlaska (Streten, 1974). Cold and wet summers occurwhen low pressure troughs enter central Alaska fromthe North Pacific or the Arctic Ocean. Also duringsummer, the Pacific subtropical high is prevalent overmid-latitudes, at times advecting warm air from the south(Mock et al., 1998). Throughout most of interior Alaska,P exhibits a mid-late summer maximum (July andAugust), as a result of the East Asian trough steeringmid-latitude cyclones through the entire region, andalso due to a strong Pacific subtropical high advectingsome moisture from the northern Pacific Ocean andBering Sea (Mock et al., 1998).
Study area
The lakes of this study are Birch (64°18′N, 146°40′W)and Jan (63°34′N, 143°54′W) (Table 1). Birch Lake lieswithin a small east-west trending valley of the Yukon-Tanana Upland. It was probably formed by aggradationof the Tanana River and its tributaries as the dischargeand sediment load increased at the onset of the previousinterglacial, or possibly during the Wisconsin Glaciation,(Blackwell, 1965; Ager, 1975). AMS dates on seeds
from sediment cores indicate that Birch Lake is at least13,000–14,000 yrs old (Bigelow, 1997) and may be as oldas 15,000 yrs (radiocarbon dates on bulk sediment(Ager, 1975)). The lake is enclosed by bedrock andcolluvium on all but parts of the western shore, wherethe dam of outwash sand and gravel was deposited(Blackwell, 1965; Ager, 1975). Today Birch Lake is anopen basin with one surface outlet. It is surrounded byboreal forest, has discontinuous permafrost in thedrainage basins and probably receives the majority ofits water from overland runoff. The surface area of thelake is 3.01 km2 and the drainage basin area is 37.0 km2
(Table 1). The present outlet is contained by a concreteweir built by the Alaska Department of Fish and Gameto control lake level and to prevent fish migration. BirchLake consists of two basins separated by a sill 7 m belowoverflow level (Table 1). The south basin is deeper witha maximum depth of 14 m, while the north basin has amaximum depth of 12 m.
Jan Lake lies in the Tanana Valley about 220 kmsoutheast of Birch Lake and is a much smaller, closedbasin lake with a surface area of 0.143 km2 and adrainage basin area of 0.643 km2 (Table 1). It is about12 m in depth and consists of one simple, circularbasin. It probably formed in a similar manner to Birch(alluvial damming by the Tanana River) possibly priorto the Wisconsin Glaciation, but more than 12,000 yrB.P. The lake surface lies 60 m above the elevation ofthe adjacent Tanana River and is surrounded by steeplysloping boreal forest with discontinuous permafrost inits drainage basin. The basin lies on metamorphicbedrock with the alluvial dam along the NE shore.
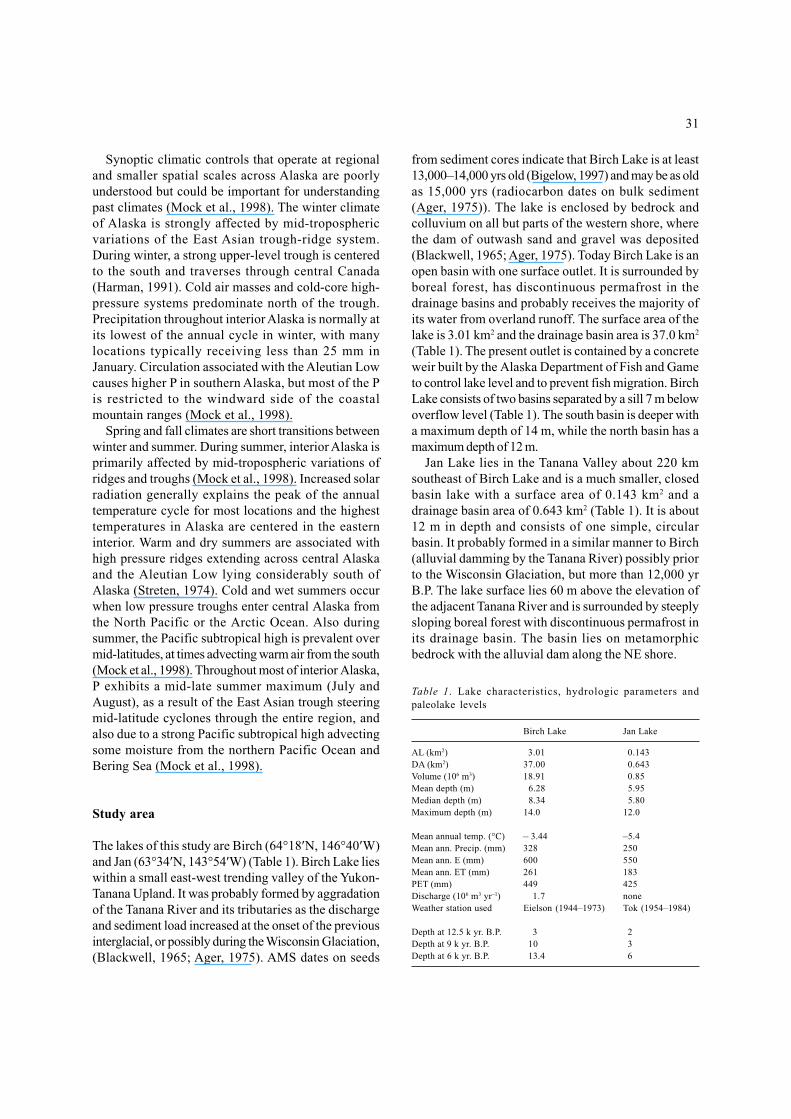
Table 1. Lake characteristics, hydrologic parameters andpaleolake levels
Birch Lake Jan Lake
AL (km2) 3.01 0.143DA (km2) 37.00 0.643Volume (106 m3) 18.91 0.85Mean depth (m) 6.28 5.95Median depth (m) 8.34 5.80Maximum depth (m) 14.0 12.0
Mean annual temp. (°C) – 3.44 –5.4Mean ann. Precip. (mm) 328 250Mean ann. E (mm) 600 550Mean ann. ET (mm) 261 183PET (mm) 449 425Discharge (106 m3 yr–1) 1.7 noneWeather station used Eielson (1944–1973) Tok (1954–1984)
Depth at 12.5 k yr. B.P. 3 2Depth at 9 k yr. B.P. 10 3Depth at 6 k yr. B.P. 13.4 6

32
Methods
A modern hydrologic budget for each lake was dev-eloped using morphometric and climatic data in awater-balance model. Mean annual water balance of alake is given by equation (1):
∆V = AL (P – E) + DA (P – ET) – D + ∆G (1)
where: ∆V = net change in lake volumeAL = lake areaDA = drainage basin areaP = precipitationE = evaporation from the lakeET = evapotranspiration from the drainagebasinD = surface discharge from the lake∆G = net flux in ground water
Lake and drainage basin areas were obtained bydigitizing outlines from topographic maps. AlaskaDepartment of Fish and Game provided lake bathy-metric maps for Birch and Jan lakes. Surveys wereconducted with a depth finder equipped with GPS toverify and modify the bathymetric maps. Lake bathy-metric contours were generated at 1 m intervals and weredigitized for area calculations to develop hypsographicrelationships. To derive depth-volume and area-volumerelations for use in the water balance model, volumeswere calculated at each 1 m contour by integrating thearea-depth curve.
In shallow lakes, sediment infill will cause depth-area-volume relationships to change with time if theconfiguration of the basin changes. For example, BirchLake is presently 14 m deep, but the central lake floorwas about 18 m below present day level at 12,500 yrB.P. The sediment-core transect and seismic data forBirch Lake (Abbott, 1996) allowed for estimation of lakemorphometry for times in the past. Based on this data,depth-area-volume relationships were established forBirch Lake at 12,500 yr B.P. Steady-state waterbalances for the modern and paleobasins using thesame combination of E, ET and P produced similarresults (within 5%) for lake area and water depth. Thusit appears that changes in lake morphometry due toinfill have little effect on the water depth-arearelationship relative to water balance calculationsbecause the shape of the basin changes little. Weassumed the same relationship for Jan Lake andtherefore have used modern hypsography for pastreconstruction.
Lake E and catchment ET are both difficult tomeasure. Our estimates for E are based on studies fromother interior Alaskan sites (Kane & Carlson, 1973;Kane et al., 1979a; Dingman et al., 1980; Nakao et al.,1981; Hinzman, 1990; Kane et al., 1990), from Patricand Black’s (1968) calculations using Thornthwaite’sequation, from Canadian studies in similar climaticregions (Landals & Gill, 1973; Marsh & Woo, 1977;Newberry et al., 1979; Roulet & Woo, 1986; Marsh &Bigras, 1988) and from empirical calculations (thisstudy) using monthly climate parameter averages(Penman, 1948, 1956; Ward & Elliot, 1995). The modelwas used to solve for catchment ET by substitutingin the remaining variables assuming steady-stateconditions.
For this study we assume the net ground-water fluxis minimal or zero. In permafrost regions, infiltrationinto deep ground-water systems is restricted and runoffassumes a much more important role than ground waterin the water balance of most watersheds (Sloan et al.,1975). Permafrost is discontinuous and probably ofminor extent in the basins of this study, although itsdistribution has not been mapped in detail. Even in theabsence of permafrost, the relatively impermeablenature of the underlying strata may indicate thatground-water fluxes are relatively small (Street-Perott& Harrison, 1985). If there is ground-water exchange,it flows into the lake in most situations and is negligiblecompared to the other flows except where spring fedor in caustic areas (Bengtsson & Malm, 1997). ForBirch Lake, the majority of the ground-water rechargecomes from runoff in the drainage basin (D. Kane, pers.comm.). Thus, the assumption of no net ground-watertransfer may be reasonable for these environmentsalthough changes in depth of the active layer over timecould affect soil water storage.
For closed-basin Jan Lake, discharge is zero. Annualdischarge was calculated for the open water season of1993 at Birch Lake by monitoring the water depth overtime in the outlet stream. Data was collected using apressure logger. Lake discharge at various stream outletheights was measured with an Epley current meter. Therelationship between depth of water in the weir andcurrent discharge was used to estimate total annualoutflow from the logged height data.
Meteorological data available for Alaska are some-what sparse. Data collection sites are located mainlyalong the coast or the few roads. Most stations aroundAlaska do not measure parameters necessary to calculateenergy budgets. Net solar radiation is rarely collectedand cloud cover, when collected, is of limited use
33
because cloud type and height are not recorded, andonly percent sky coverage is noted. Precipitation in thisregion has large spatial variability and so annual P ratesmeasured at one locality, may not necessarily berepresentative of that region. Precipitation and tem-perature data were obtained through the NationalWeather Service from stations closest to the lakes ofthis study. The nearest weather stations are 50 km(Eielson Air Force Base) and 60 km (Tok) from Birchand Jan lakes, respectively (Table 1).
A weather station was established near Birch Lakefor most of the open water period of 1993. Temperature,humidity, barometric pressure, solar radiation, windspeed and direction, and P were measured 2 m abovethe ground. A pressure-temperature (PT) sensor wasalso deployed in Birch Lake during the same period tomonitor lake-level changes and temperature at 1 mdepth. These were used to study the response of lakelevel to short term meteorological events in order toestimate ET.
Lake-level reconstructions are based on interpretationof sediment properties in terms of water depth inoffshore core transects, with age control determined byAMS 14C dating of pollen and macrofossils (Abbott,1996; Abbott et al., 1999). Seismic profiling also aidedin lake-level reconstruction of Birch (Abbott, 1996;Abbott et al., 1999). Results indicate that significantchanges in lake level occurred over the past 13,000 yrs(Table 1). Both lakes were extremely low from earliestrecords through 12,500 yr B.P. Lake levels rapidlyincreased after this time, but with significant fluc-tuations. At 9,000 yr B.P., Birch Lake was 10 m and JanLake 3 m deep. By 6,000 yr B.P., Birch Lake was nearpresent day level while Jan Lake was half as deep aspresent level (6 m). There is no evidence that pastchanges in outlet morphology had a significant influenceon lake-level reconstruction for Birch Lake. Jan Lakeappears to have always been closed.
A water balance model was developed for each lakeusing a computer spreadsheet program to solve Equation1. The model incorporated P, E and ET in conjunctionwith water depth and volume determined from hypso-graphic relationships. For each lake, we first determinedparameters necessary for steady-state at modern lakelevel. A series of steady-state solutions for differentpaleo-lake levels was then obtained by adjustingcombinations of P, E, and ET. More realistic solutionsfor P are based on constraining E and ET to values thatare likely to reflect conditions at the time determinedfrom pollen data. Calculations were made at a seriesof time steps (multiple iterations) until steady-state was
reached. To illustrate the insight provided by themodeling, we focused on three time periods (12,500,9,000 and 6,000 yr B.P.). For these solutions, P was setas a percent of modern (125, 100, 75, 50, and 25%) forindividual runs of the model.
Results
Evaporation was calculated for Harding Lake, 20 kmnorthwest of Birch Lake by Nakao et al. (1981) usinglong-term meteorological data from nearby Eielson AirForce Base. Using Penman’s formula (Penman, 1948;Penman, 1956), they calculated an annual E of 608 mmfrom the lake. This indicates that E from interior lakesis greater than annual P, which has been noted by otherresearchers as well (Marsh & Bigras, 1988). Pan E datafrom the Agricultural Experiment Station at Fairbanks,Alaska was compiled by Kane et al. (1979b). Using arecommended pan coefficient for semi-arid climates of0.8 and 0.9 (R. Jaetzold, pers. comm.), we calculatedan annual E range of 539–606 mm. Average summer(May–September) temperatures for Eielson, Fairbanksand Delta Junction vary between stations by less than0.5 °C, and since Birch Lake lies between thesestations, the use of Fairbanks pan E for Birch Lake isreasonable. Based on these results, an E of 600 mm wasused in the models for modern day E for Birch Lake.For Jan Lake, nearby Tok weather data were used.Summer as well as annual temperatures for Tok are2 °C cooler than the station data used for Birch Lake.Based on these temperature data and using Penman(1948 and 1956) and Meyer equations (Ward & Elliot,1995), we calculated annual E estimates about 5 and12%, lower, respectively, than that calculated for BirchLake. This translates to an annual E of between 540–570 mm for Jan Lake and we therefore adopted a valueof 550 mm for this site.
Estimates of ET are difficult to obtain directly fromfield measurements and are typically estimated bydifference using equation (1), the approach adoptedhere. The P, E, and discharge (Birch Lake) valuesdiscussed above were used to calculate ET in the modelassuming the lakes are now at steady-state (Table 1).The estimated ET values are 261 and 183 mm for Birchand Jan Lakes, and ET/P ratios are 0.8 and 0.73,respectively. There are different factors that couldcontribute to the lower value of ET for Jan Lake besidescooler summer temperatures. The basin that drains intoJan Lake is much steeper and has more north facing slopethan does the basin that drains into Birch Lake. This

34
would allow for lower transpiration rates and thereforemore runoff. Calculations using the Thornthwaiteequation also indicate that annual ET/P ratios are closeto 1.0 for interior Alaska sites (Patric & Black, 1968).
Another way to estimate runoff (RO) or ET is bymaking short-term measurements of lake-level rise asa result of individual P events. From equation (1), ET= P – RO (on a volumetric basis). This is a roughapproximation of overall rates because ET depends onsoil moisture and meteorological conditions at the timeof the rainfall event, as well as vegetation type and theduration and amount of rainfall. Evapotranspirationwill be greater when soils are undersaturated (ETincreases with increasing soil moisture up to the pointof saturation) and once saturated, runoff will prevail.The response of Birch Lake to a large P event is shownin Figure 1. A rapid lake-level rise of 4.5 cm (with a lagover 3.5 days from September 19–22, 1993) is concurrentwith a fairly large P event (1.65 cm over 13 h onSeptember 19, 1993). Evaporation from the lake was
assumed to be negligible (rainy, cloudy, cool tem-peratures) and discharge was zero since the weir wasclosed. Assuming that ET accounted for the differencebetween basin rainfall and runoff, and accounting forrainfall directly on the lake, the ET/P ratio for this eventwas 0.85. While this is only a single event and somesoil storage probably occurred, such high ET rates areconsistent with previous estimates (Rouse, 1990).
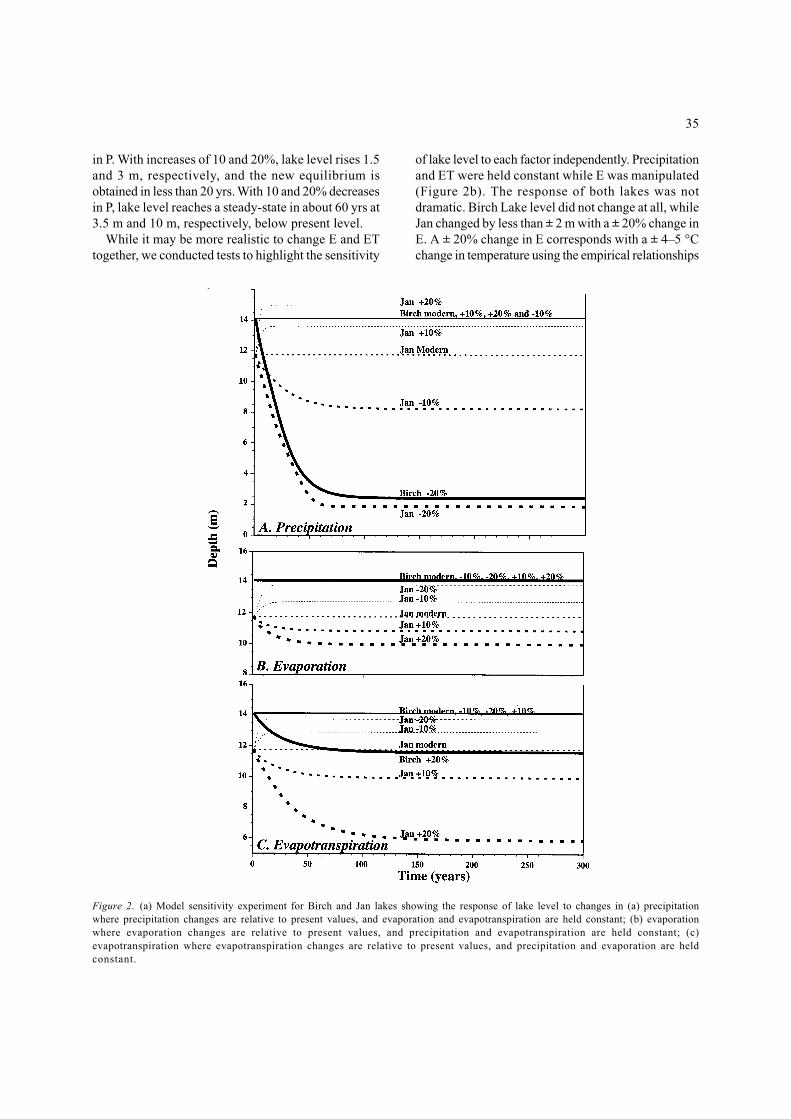
Sensitivity tests were run for each lake to determinethe response of lake level to changes in P, E and ETusing the water balance model. While E and ET wereheld constant, P was changed as a percentage relativeto present day P (Figure 2a). Since Birch is not a closedbasin, any P greater than present does not significantlychange lake level; excess water is lost as surfacedischarge. A precipitation decrease of approximately13% of modern would turn Birch Lake into a closedbasin. Lake level would drop by 10 m in 80 yrs with adrop in P of 20% less than present. Jan Lake, a closedbasin, responds to both positive and negative changes
Figure 1. Precipitation and lake-level changes at Birch Lake beginning September 17, 1993.
35
Figure 2. (a) Model sensitivity experiment for Birch and Jan lakes showing the response of lake level to changes in (a) precipitationwhere precipitation changes are relative to present values, and evaporation and evapotranspiration are held constant; (b) evaporationwhere evaporation changes are relative to present values, and precipitation and evapotranspiration are held constant; (c)evapotranspiration where evapotranspiration changes are relative to present values, and precipitation and evaporation are heldconstant.
in P. With increases of 10 and 20%, lake level rises 1.5and 3 m, respectively, and the new equilibrium isobtained in less than 20 yrs. With 10 and 20% decreasesin P, lake level reaches a steady-state in about 60 yrs at3.5 m and 10 m, respectively, below present level.
While it may be more realistic to change E and ETtogether, we conducted tests to highlight the sensitivity
of lake level to each factor independently. Precipitationand ET were held constant while E was manipulated(Figure 2b). The response of both lakes was notdramatic. Birch Lake level did not change at all, whileJan changed by less than ± 2 m with a ± 20% change inE. A ± 20% change in E corresponds with a ± 4–5 °Cchange in temperature using the empirical relationships
36
for E discussed above. Holding P and E constant andvarying ET by the same percentages resulted in greaterchange than in manipulating E (Figure 2c). Birch Lakedid not respond to a ±10% or –20% change in ET, butdropped by over 2 m with a 20% increase in ET. JanLake level rose 1 and 2 m respectively, with a decreasein ET of 10 and 20%. It fell 1.5 and 5.5 m respectively,with a 10 and 20% increase in ET. The new steady-statewas obtained within about 100 yrs. This exercise showsthat these lakes are more responsive to ET than to E.While it may be reasonable to assume that E and ETwould change concurrently, there may be a decouplingas vegetation response lags climate change.
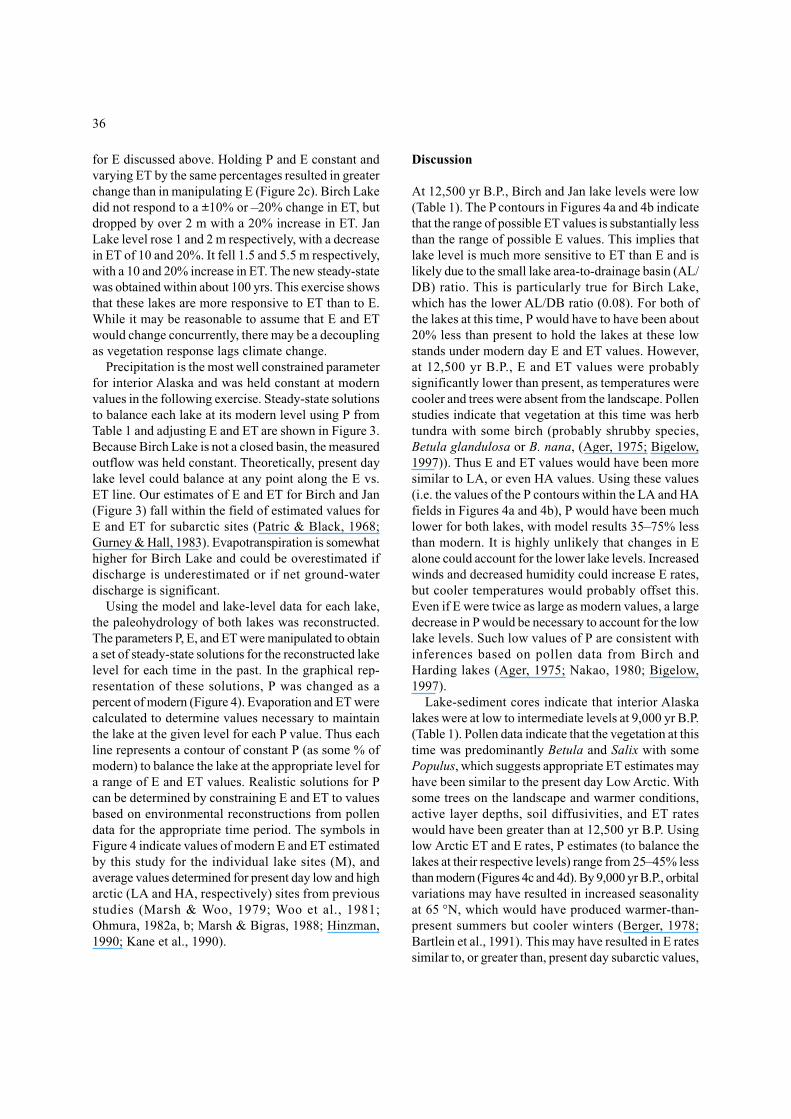
Precipitation is the most well constrained parameterfor interior Alaska and was held constant at modernvalues in the following exercise. Steady-state solutionsto balance each lake at its modern level using P fromTable 1 and adjusting E and ET are shown in Figure 3.Because Birch Lake is not a closed basin, the measuredoutflow was held constant. Theoretically, present daylake level could balance at any point along the E vs.ET line. Our estimates of E and ET for Birch and Jan(Figure 3) fall within the field of estimated values forE and ET for subarctic sites (Patric & Black, 1968;Gurney & Hall, 1983). Evapotranspiration is somewhathigher for Birch Lake and could be overestimated ifdischarge is underestimated or if net ground-waterdischarge is significant.
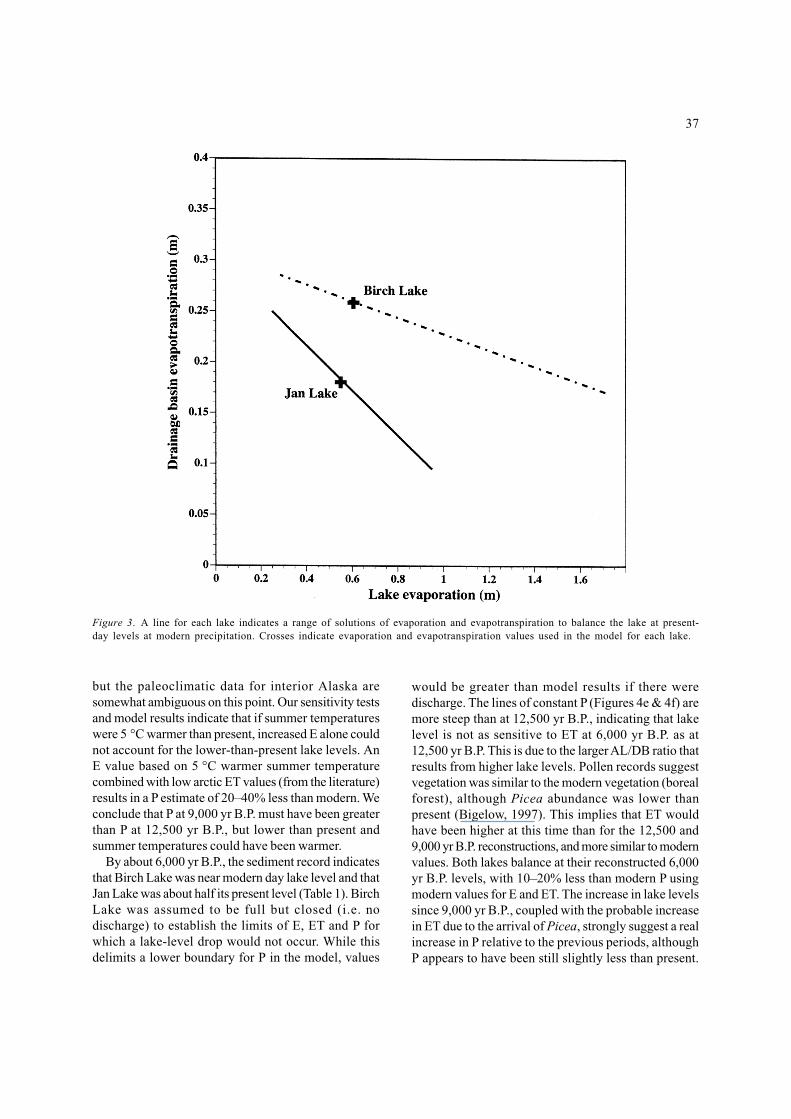
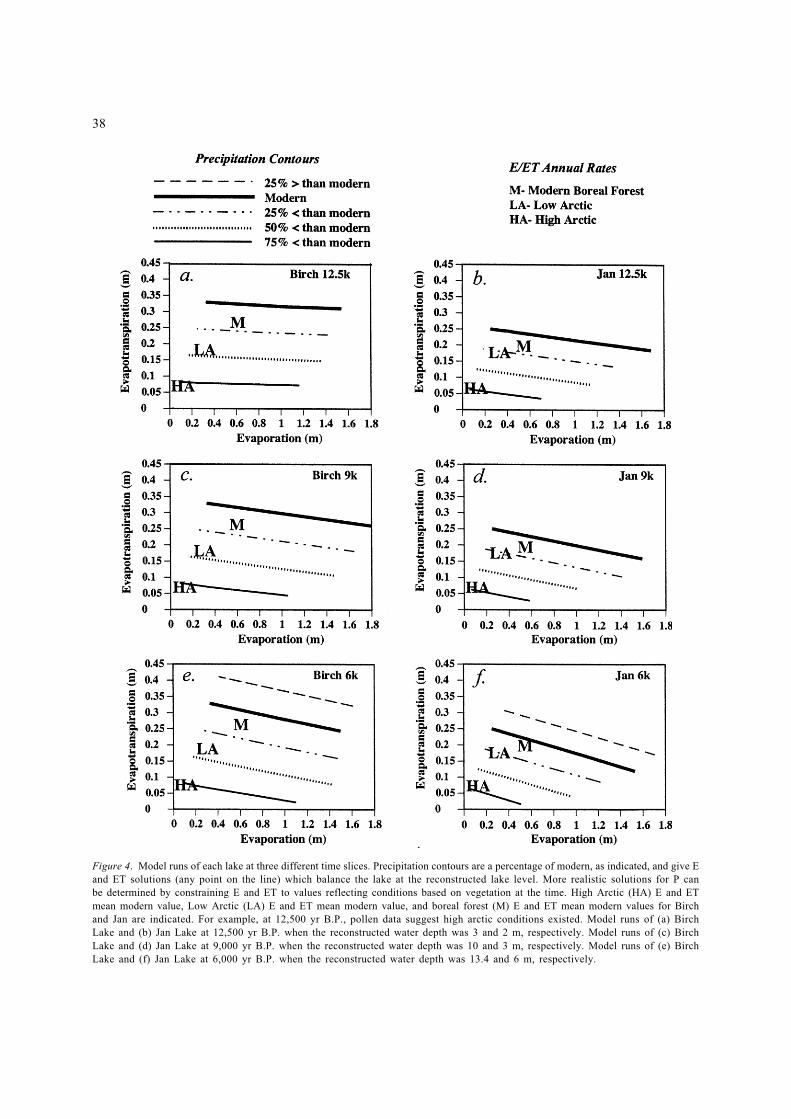
Using the model and lake-level data for each lake,the paleohydrology of both lakes was reconstructed.The parameters P, E, and ET were manipulated to obtaina set of steady-state solutions for the reconstructed lakelevel for each time in the past. In the graphical rep-resentation of these solutions, P was changed as apercent of modern (Figure 4). Evaporation and ET werecalculated to determine values necessary to maintainthe lake at the given level for each P value. Thus eachline represents a contour of constant P (as some % ofmodern) to balance the lake at the appropriate level fora range of E and ET values. Realistic solutions for Pcan be determined by constraining E and ET to valuesbased on environmental reconstructions from pollendata for the appropriate time period. The symbols inFigure 4 indicate values of modern E and ET estimatedby this study for the individual lake sites (M), andaverage values determined for present day low and higharctic (LA and HA, respectively) sites from previousstudies (Marsh & Woo, 1979; Woo et al., 1981;Ohmura, 1982a, b; Marsh & Bigras, 1988; Hinzman,1990; Kane et al., 1990).
Discussion
At 12,500 yr B.P., Birch and Jan lake levels were low(Table 1). The P contours in Figures 4a and 4b indicatethat the range of possible ET values is substantially lessthan the range of possible E values. This implies thatlake level is much more sensitive to ET than E and islikely due to the small lake area-to-drainage basin (AL/DB) ratio. This is particularly true for Birch Lake,which has the lower AL/DB ratio (0.08). For both ofthe lakes at this time, P would have to have been about20% less than present to hold the lakes at these lowstands under modern day E and ET values. However,at 12,500 yr B.P., E and ET values were probablysignificantly lower than present, as temperatures werecooler and trees were absent from the landscape. Pollenstudies indicate that vegetation at this time was herbtundra with some birch (probably shrubby species,Betula glandulosa or B. nana, (Ager, 1975; Bigelow,1997)). Thus E and ET values would have been moresimilar to LA, or even HA values. Using these values(i.e. the values of the P contours within the LA and HAfields in Figures 4a and 4b), P would have been muchlower for both lakes, with model results 35–75% lessthan modern. It is highly unlikely that changes in Ealone could account for the lower lake levels. Increasedwinds and decreased humidity could increase E rates,but cooler temperatures would probably offset this.Even if E were twice as large as modern values, a largedecrease in P would be necessary to account for the lowlake levels. Such low values of P are consistent withinferences based on pollen data from Birch andHarding lakes (Ager, 1975; Nakao, 1980; Bigelow,1997).
Lake-sediment cores indicate that interior Alaskalakes were at low to intermediate levels at 9,000 yr B.P.(Table 1). Pollen data indicate that the vegetation at thistime was predominantly Betula and Salix with somePopulus, which suggests appropriate ET estimates mayhave been similar to the present day Low Arctic. Withsome trees on the landscape and warmer conditions,active layer depths, soil diffusivities, and ET rateswould have been greater than at 12,500 yr B.P. Usinglow Arctic ET and E rates, P estimates (to balance thelakes at their respective levels) range from 25–45% lessthan modern (Figures 4c and 4d). By 9,000 yr B.P., orbitalvariations may have resulted in increased seasonalityat 65 °N, which would have produced warmer-than-present summers but cooler winters (Berger, 1978;Bartlein et al., 1991). This may have resulted in E ratessimilar to, or greater than, present day subarctic values,
37
but the paleoclimatic data for interior Alaska aresomewhat ambiguous on this point. Our sensitivity testsand model results indicate that if summer temperatureswere 5 °C warmer than present, increased E alone couldnot account for the lower-than-present lake levels. AnE value based on 5 °C warmer summer temperaturecombined with low arctic ET values (from the literature)results in a P estimate of 20–40% less than modern. Weconclude that P at 9,000 yr B.P. must have been greaterthan P at 12,500 yr B.P., but lower than present andsummer temperatures could have been warmer.
By about 6,000 yr B.P., the sediment record indicatesthat Birch Lake was near modern day lake level and thatJan Lake was about half its present level (Table 1). BirchLake was assumed to be full but closed (i.e. nodischarge) to establish the limits of E, ET and P forwhich a lake-level drop would not occur. While thisdelimits a lower boundary for P in the model, values
would be greater than model results if there weredischarge. The lines of constant P (Figures 4e & 4f) aremore steep than at 12,500 yr B.P., indicating that lakelevel is not as sensitive to ET at 6,000 yr B.P. as at12,500 yr B.P. This is due to the larger AL/DB ratio thatresults from higher lake levels. Pollen records suggestvegetation was similar to the modern vegetation (borealforest), although Picea abundance was lower thanpresent (Bigelow, 1997). This implies that ET wouldhave been higher at this time than for the 12,500 and9,000 yr B.P. reconstructions, and more similar to modernvalues. Both lakes balance at their reconstructed 6,000yr B.P. levels, with 10–20% less than modern P usingmodern values for E and ET. The increase in lake levelssince 9,000 yr B.P., coupled with the probable increasein ET due to the arrival of Picea, strongly suggest a realincrease in P relative to the previous periods, althoughP appears to have been still slightly less than present.
Figure 3. A line for each lake indicates a range of solutions of evaporation and evapotranspiration to balance the lake at present-day levels at modern precipitation. Crosses indicate evaporation and evapotranspiration values used in the model for each lake.
38
Figure 4. Model runs of each lake at three different time slices. Precipitation contours are a percentage of modern, as indicated, and give Eand ET solutions (any point on the line) which balance the lake at the reconstructed lake level. More realistic solutions for P canbe determined by constraining E and ET to values reflecting conditions based on vegetation at the time. High Arctic (HA) E and ETmean modern value, Low Arctic (LA) E and ET mean modern value, and boreal forest (M) E and ET mean modern values for Birchand Jan are indicated. For example, at 12,500 yr B.P., pollen data suggest high arctic conditions existed. Model runs of (a) BirchLake and (b) Jan Lake at 12,500 yr B.P. when the reconstructed water depth was 3 and 2 m, respectively. Model runs of (c) BirchLake and (d) Jan Lake at 9,000 yr B.P. when the reconstructed water depth was 10 and 3 m, respectively. Model runs of (e) BirchLake and (f) Jan Lake at 6,000 yr B.P. when the reconstructed water depth was 13.4 and 6 m, respectively.
39
As with 12,500 and 9,000 yr B.P., a mutually compatiblepaleohydrologic solution exists for both lakes. Aregional P gradient different from today’s is notrequired, even though each lake appears to have adifferent lake-level status.
Our results show major changes in P and effectivemoisture (potential E plus ET minus P) between the latePleistocene and the mid Holocene. Based on recordedclimate data (1909–1998), interior Alaska on averagereceives approximately 37% of the annual P as snow and63% as rain. If this ratio was similar during the latePleistocene and the early Holocene, results implydrastically reduced precipitation which would havestrongly influenced vegetation and ecosystem processes.Spring melt with accompanying runoff is probably thesingle most important source of water to arctic lakes. Amuch smaller proportion of runoff is associated withsummer rainfall, except in the case of severe storms(Kane et al., 1979b; Gieck & Kane, 1986). Therefore,changes in the proportion of rain vs. snow could affectlake levels. A long-term increase in the proportion ofwinter vs. summer P, with consequent increased springrunoff, could cause lake levels to rise. Such changesin the seasonality of P could also lead to conflictingpaleoclimatic inferences derived from different datasources. For example, in the scenario of increased winterP and decreased summer P, lake levels may be expectedto rise due to the increase in annual runoff, and wouldimply wetter conditions. However, vegetation mayrespond to drier summers and suggest more aridconditions.
Freeze-up of interior Alaskan lakes usually occursin mid to late October, and spring break-up occurs inmid to late May; the ice-free period is about 5 months.Climate changes may result in changes in the length ofthis ice-free period. Our model results suggest thatchanges in E resulting from changes in the length ofthe ice-free period would have a relatively minoreffect on lake levels (Figures 2b & 4). Changes in ETresulting from changes in climate would probably havea much greater impact on lake water budget throughimpacts on runoff. Changes in vegetation due to climatechange would also affect ET rates although there wouldlikely be a time lag.
Conclusions
Modern hydrologic models for lake basins allow for thereconstruction of regional past effective moisture whencombined with paleolake-level data. While better long-
term hydrologic and meteorologic data for calculatinglake water budgets would help refine the models, theresults presented here provide insight into past climaticconditions. Estimates of modern hydrologic balanceindicate that annual rates of E and ET for two interiorAlaskan lakes fall within a range of 420–630 mm and180–260 mm, respectively. The difference between theseestimates may be due to differing wind regimes, air andsoil temperatures, vegetation, lake and drainage basinsize, topography, aspect and patchiness of permafrost.
At 12,500 yr B.P., steady-state solutions for a set oflikely E (lake) and ET (catchment) values indicate thatP was 35–75% less than modern values. Pollen dataindicate herb tundra and imply much lower rates of ET.Evaporation rates were also probably lower than thepresent. With significant reductions in both E and ET,the conclusion of much lower P is rational. The 9,000yr B.P. steady-state solutions for lower-than-presentlake levels suggest that P was 25–45% less thanmodern. Evaporation could have been higher thanmodern due to greater summer insolation, but thisfactor alone cannot account for the lower lake levels.Evapotranspiration rates would probably not have beenas high as modern since trees were less abundant.Decreased continentality as a result of the inundationof the Bering Land Bridge may have increased nearbysources of moisture and probably would have increasedP relative to 12,500 yr B.P. Vegetation similar tomodern was established by 6,000 yr B.P. Modelsolutions suggest P 10–20% less than modern whichcan account for intermediate to high lake levelsrecorded at this time.
A different lake-level status (i.e. high, moderate, low)can occur in different basins under the same climaticconditions depending on the ratio of lake area todrainage basin as well as other factors as discussedabove. The results show that a consistent paleoclimaticsolution can be obtained for both lakes at each timeslice. A regional climatic gradient different from thepresent may have existed, but is not required by theresults. We can argue conclusively that P must havebeen less than present in interior Alaska during the latePleistocene and early Holocene. Very large changes inP are indicated across the glacial-interglacial transition.The hydrologic model presented here allows for theevaluation of changes in factors such as E and ET, andprovides quantitative estimates of P. This is the firstwork to present quantitative estimates of these changesover millennial time scales and regional spatial scalesin Alaska. Results should contribute toward theevaluation of paleoclimatic model simulations and to
40
an understanding of ecosystem response to changingclimate in Alaska.
Acknowledgements
This work was supported by National Science Foun-dation/Paleoclimates from Arctic Lakes and EstuariesProgram (PALE) grant ATM-9200600 to the Universityof Alaska (PALE Contribution #127). Field, lab-oratory, and editing assistance was provided byAndrea Krumhardt. Michelle Luoma provided help inthe field and laboratory. Gail Gardiner assisted withBirch Lake topography and mapping. Some equipmentfor the project was provided by Carol DeWitt throughNOAA in Seattle, WA, USA. Discussions with JohnFox were greatly beneficial to this work and review byMary Edwards was extremely helpful. This paper isdedicated to Jackie LaPerriere for all the inspiration sheprovided and continues to provide.
References
Abbott, M. B., 1996. Holocene climatic variability for lake sites inBolivian Andes and interior Alaska based on sedimentologyand radiocarbon dating by accelerator mass spectrometry. Ph.D.dissertation Thesis, University of Minnesota, 117 pp.
Abbott, M. B., B. P. Finney, M. E. Edwards & K. R. Kelts, 1999 (inpress). Paleohydrology of Birch Lake, Central Alaska: Lake-level reconstructions using seismic reflection profiles and coretransect approaches. Quat. Res.
Ager, T., 1975. Late Quaternary environmental history of theTanana Valley, Alaska. 54, Institute of Polar Studies, 117pp.
Anderson, P. M. & L. B. Brubaker, 1993. Holocene vegetation andclimatic histories of Alaska. In: Wright, H. E., J. E.Kutzbach, T. Webb III, W. F. Ruddiman, F. A. Street-Perrott,P. J. Bartlein (eds), Global Climate since the Last GlacialMaximum. University of Minnesota Press, Minneapolis,pp. 386–400.
Barber, V. A., G. P. Juday & B. P. Finney, 1997. Evidence ofunprecedented 20th century climatic stress to Alaskan uplandwhite spruce based on ring isotope (d13C) and density data,International Union of Forestry Research Organizations(IUFRO) All Division 5 Conference, Pullman, WA.
Bartlein, P. J., P. M. Anderson, M. E. Edwards & P. F. McDowell,1991. A framework for interpreting paleoclimatic variations ineastern Beringia. Quat. Int. 10: 73–83.
Bengtsson, L. & J. Malm, 1997. Using rainfall-runoffmodeling to interpret lake level data. J. Paleolim. 18:235–248.
Berger, A. L., 1978. Long-term variations of caloric insolationresulting from the Earth’s orbital elements. Quat. Res. 9:139–167.
Bigelow, N., 1997. Late Quaternary Vegetation and Lake LevelChanges in Central Alaska. Ph.D. Thesis, University ofAlaska, 212 pp.
Blackwell, J. M., 1965. Surficial Geology and Geomorphologyof the Harding Lake Area, Big Delta Quadrangle, Alaska.M.S. Thesis, University of Alaska Fairbanks, 91 pp.
Briffa, K. R., F. H. Schweingruber, P. D. Jones, T. J. Osborn, I. C.Harris, S. G. Shiyatov, E. A. Vaganov & H. Grudd, 1998. Treestell of past climates: but are they speaking less clearly today?Philosophical Trans. Roy. Soc. Lond., Series B – BiologicalSciences, 353: 65–73.
Chapman, W. L. & J. E. Walsh, 1993. Recent variations of sea iceand air temperature in high latitudes. Bull. Amer. Met. Soc.74: 33–47.
COHMAP, 1988. Climate changes in the last 18,000 yrs: observationsand model simulations. Science 241: 1043–1052.
Digerfeldt, G., 1986. Studies on past lake-level fluctuations. In: B.E. Berglund (ed.), Handbook of Holocene Palaeocolgy andPalaeohydrology. Chichester, U.K., John Wiley & Sons Ltd.,pp. 127–143.
Digerfeldt, G., 1988. Reconstruction and regional correlation ofHolocene lake-level fluctuations in Lake Bysjön, SouthSweden. Boreas 17: 165–182.
Digerfeldt, G., J. E. Almendinger & S. Bjorck, 1992. Reconstructionof past lake levels and their relation to groundwater hydrologyin Parkers Prairie sandplain, west-central Minnesota. Palaeo-geogr. Palaeoclimatol. Palaecol. 94: 99–118.
Dingman, S. L., R. G. Barry, G. Weller, C. Benson, E. F. LeDrew &C. W. Goodwin, 1980. Climate, snow cover, microclimate, andhydrology. In: Brown, J. et al. (eds), An Arctic Ecosystem:The Coastal Tundra at Barrow, Alaska. Dowden, Hutchinsonand Ross, Stroudsburg, PA, pp. 30–65.
Gieck, R. E. & D. L. Kane, 1986. Hydrology of two subarcticwatersheds. In: D. L. Kane (ed.), Cold Regions Hydrology.American Water Resources Association, University of Alaska-Fairbanks, pp. 283–291.
Gurney, R. J. & D. K. Hall, 1983. Satellite-derived surface energybalance estimates in the Alaskan sub-arctic. J. Clim. Appl.Meteorol. 22: 115–125.
Harman, J. R., 1991. Synoptic Climatology of the Westerlies,Process and Patterns. Association of American Geographers,Washington, D.C., 80 pp.
Hinzman, L. D., 1990. The interdependence of the thermal andhydrologic processes of an arctic watershed and their responseto climatic change. Ph.D. Thesis, University of Alaska,Fairbanks, 403 pp.
Hinzman, L. D., D. L. Kane & K. R. Everett, 1996. Energy balanceand hydrological processes in an Arctic watershed. In: J. F.Reynolds & J. D. Tenhunen (eds), Ecological Studies. Springer-Verlag, Berlin Heidelberg, pp. 131–154.
Hostetler, S. & L. V. Benson, 1990. Paleoclimatic implications ofthe high stand of Lake Lahontan derived from models ofevaporation and lake level. Clim. Dyn. 4: 207–217.
Houghton, J. J., L. G. Meiro Filho, B. A. Callander, N. Harris, A.Kattenberg & K. Maskell (eds), 1996. The Science of ClimateChange. Contribution of Working Group I to the SecondAssessment Report of the Intergovernmental Panel onClimate Change (IPCC). Climate Change 1995, 1. CambridgeUniversity Press, 584 pp.
Houghton, J. T., G. J. Jenkins & J. J. Ephraums (eds), 1990.Climate Change. The IPCC Scientific Assessment. CambridgeUniversity Press, Cambridge, 365 pp.
Hu, F. S. & L. B. Brubaker, 1996. Boreal ecosystem developmentin the northwestern Alaskan Range since 11,000 yr B.P. Quat.Res. 45: 188–201.

41
Hu, F. S., L. B. Brubaker & P. M. Anderson, 1993. A 12,000 yrrecord of vegetation change and soil development from WienLake, central Alaska. Can. J. Bot. 71: 1133–1142.
Jacoby, G. C. & R. D. D’Arrigo, 1995. Tree ring width and densityevidence of climatic and potential forest change in Alaska.Global Biogeochem. Cyc. 9(2): 227–234.
Juday, G. P., R. A. Ott, D. W. Valentine & V. A. Barber, 1997.Assessment of actual and potential global warming effects onforests of Alaska, New England Regional Climate ChangeImpacts Workshop, Durham, NH, pp. 121–126.
Kane, D. L. & R. F. Carlson, 1973. Hydrology of the central arcticriver basins of Alaska. 41, Institute of Water Resources,University of Alaska, Fairbanks, 51 pp.
Kane, D. L., P. M. Fox, J. D. Fox & R. F. Carlson, 1979a. Effect ofdiverting additional drainage area runoff into Harding Lake.DNR Account No. 10-42-1-120, IWR Project No. 79-1,Division of Land and Water Management, Department ofNatural Resources, State of Alaska, 28 pp.
Kane, D. L., P. M. Fox, J. D. Fox & R. F. Carlson, 1979b. Why doesHarding Lake’s level change? What can be done?, Instituteof Water Resources UAF, 8 pp.
Kane, D. L., R. E. Gieck & L. D. Hinzman, 1990. Evapo-transpiration from a small Alaskan arctic watershed.Nordic Hydrol. 21: 253–272.
Lachenbruch, A. H., T. T. Cladouhos & R. W. Saltus, 1988.Permafrost temperature and the changing climate. FifthInternational Conference on Permafrost, Trondheim,Norway. vol. 3, pp. 9–17.
Landals, A. L. & D. Gill, 1973. Differences in the volume of surfacerunoff during the snowmelt period: Yellowknife NorthwestTerritories, The Role of Snow and Ice in Hydrology. WorldMeteorological Organization, Geneva, pp. 927–942.
Marsh, P. & S. C. Bigras, 1988. Evaporation from Mackenzie DeltaLakes. Arctic Alpine Res. 20: 713–716.
Marsh, P. & M. K. Woo, 1977. The water balance of a small pond inthe High Arctic. Arctic 20: 109–117.
Marsh, P. & M. K. Woo, 1979. Annual water balance of small higharctic basins, Canadian Hydrology Symposium 79. NationalResearch Council of Canada, Vancouver, B.C., pp. 536–546.
Mock, C. J., P. J. Bartlein & P. M. Anderson, 1998. Atmosphericcirculation patterns and spatial climatic variations in Beringia.Int. J. Climatol. 18: 1085–1104.
Nakao, K. (ed.), 1980. Climatic changes in the interior Alaska.Laboratory of Hydrology, Hokkaido University, 77 pp.
Nakao, K., R. Tanoue, T. Oike & J. LaPerriere, 1981. Water budgetand lake-level stability of Harding Lake in the interior Alaska.J. Faculty Sci., Hokkaido University, Japan 7: 13–25.
Newberry, R. W., K. G. Beaty, J. A. Dalton & G. K.McCullough, 1979. A preliminary comparison of runoffrelationships and water budgets in three experimentallake basins in the continental, sub-arctic, and arctic
climate regions of the Precambrian shield, CanadianHydrology Symposium 79. National Research Council ofCanada, Vancouver, B.C., pp. 517–535.
Ohmura, A., 1982a. Evaporation from the surface of the arctictundra. Wat. Resource Res. 18: 291–300.
Ohmura, A., 1982b. Regional water balance on the arctic tundra insummer. Wat. Resources Res. 18: 301–305.
Osterkamp, T. E., 1996. Impacts of thawing permafrost as a resultof climatic warming. EOS Trans. Am. Geophys. Union 77(46):F188.
Osterkamp, T. E., D. C. Esch & V. E. Romanovsky, 1997. Permafrost.In: G. Weller & P. A. Anderson (eds), Implications of GlobalChange in Alaska and the Bering Sea Region. The Center forGlobal Change and Arctic-System Research, University ofAlaska Fairbanks, pp. 115–127.
Osterkamp, T. E. & A. H. Lachenbruch, 1990. Thermal regime ofpermafrost in Alaska and predicted global warming. ASCE, J.Cold Reg. Eng. 4(1): 38–42.
Patric, J. H. & P. E. Black, 1968. Potential evapotranspiration andclimate in Alaska by Thornthwaite’s classification. PNW-71,U.S.D.A. Forest Service.
Penman, H. L., 1948. Natural evaporation from open water, baresoil, and grass. Roy. Soc. London Proc. A(193): 120–145.
Penman, H. L., 1956. Estimating evaporation. Trans. Amer.Geophys. Union 37(1): 43–50.
Prowse, T. D., 1990. Northern Hydrology: An Overview. In: T. D.Prowse & C. S. L. Ommanney (Eds), Northern HydrolgyCanadian Perspectives, National Hydrology Research Institute,pp. 1–36.
Roulet, N. T. & M. K. Woo, 1986. Hydrology of a wetland in thecontinuous permafrost region. J. Hydrol. 89: 73–91.
Rouse, W. R., 1990. The regional energy balance. In: T. D. Prowse& C. S. L. Ommanney (eds), Northern Hydrology CanadianPerspectives, National Hydrology Research Institute, pp. 187–206.
Sloan, C. E., C. Zenone & L. O. Mayo, 1975. Icings along the Trans-Alaska pipeline route. 75–87, USGS, Open File Report 39pp.
Street-Perott, F. A. & S. P. Harrison, 1985. Lake levels and climatereconstruction. In: A. D. Hecht (ed.), Paleoclimate Analysisand Modeling. New York, N.Y., John Wiley & Sons Ltd., pp.291–340.
Streten, N. A., 1974. Some features of the summer climate of interiorAlaska. Arctic 27: 272–286.
Walsh, J. E. & W. L. Chapman, 1990. Short-term climatic variabilityof the Arctic. Arctic J. Clim. 3: 237–250.
Ward, A. D. & W. J. Elliot (eds), 1995. Environmental Hydrology.CRC Press Inc., Boca Raton, FL., 462 pp.
Woo, M. K., R. Heron & P. Steer, 1981. Catchmenthydrology of a high arctic lake. Cold Reg. Sci. Technol.5: 29–41.

42