Land use and climate variability amplify carbon, nutrient, and contaminant pulses: a review with...
67
For Peer Review Land use and climate variability amplify carbon, nutrient, and contaminant pulses: a review with management implications Journal: Journal of the American Water Resources Association Manuscript ID: JAWRA-13-0086-P.R1 Manuscript Type: Technical Paper Date Submitted by the Author: 29-Oct-2013 Complete List of Authors: Kaushal, Sujay; University of Maryland, Geology & ESSIC Mayer, Paul; US Environmental Protection Agency, National Health and Environmental Effects Research Lab Vidon, Philippe; SUNY - ESF, Forest and Natural Resources Management Smith, Rose; University of Maryland, Geology & ESSIC Pennino, Michael; University of Maryland, Baltimore County (UMBC), Geology & ESSIC Duan, Shuiwang; University of Maryland, Geology & ESSIC Newcomer, Tamara; University of Maryland, Geology & ESSIC Welty, Claire; University of Maryland, Baltimore County (UMBC), Department of Chemical, Biochemical and Enviormental Engineering Belt, Kenneth; U.S. Forest Service, Key Terms: eutrophication < ECOLOGY, WATER QUALITY, hypoxia, nonpoint source pollution < WATER QUALITY, methane, nitrous oxide, carbon dioxide, wetlands < GEOGRAPHY JAWRA Draft
Transcript of Land use and climate variability amplify carbon, nutrient, and contaminant pulses: a review with...

For Peer Review
Land use and climate variability amplify carbon, nutrient,
and contaminant pulses: a review with management implications
Journal: Journal of the American Water Resources Association
Manuscript ID: JAWRA-13-0086-P.R1
Manuscript Type: Technical Paper
Date Submitted by the Author: 29-Oct-2013
Complete List of Authors: Kaushal, Sujay; University of Maryland, Geology & ESSIC
Mayer, Paul; US Environmental Protection Agency, National Health and Environmental Effects Research Lab Vidon, Philippe; SUNY - ESF, Forest and Natural Resources Management Smith, Rose; University of Maryland, Geology & ESSIC Pennino, Michael; University of Maryland, Baltimore County (UMBC), Geology & ESSIC Duan, Shuiwang; University of Maryland, Geology & ESSIC Newcomer, Tamara; University of Maryland, Geology & ESSIC Welty, Claire; University of Maryland, Baltimore County (UMBC), Department of Chemical, Biochemical and Enviormental Engineering Belt, Kenneth; U.S. Forest Service,
Key Terms:
eutrophication < ECOLOGY, WATER QUALITY, hypoxia, nonpoint source
pollution < WATER QUALITY, methane, nitrous oxide, carbon dioxide, wetlands < GEOGRAPHY
JAWRA Draft

For Peer Review
1
Land use and climate variability amplify carbon, nutrient, and contaminant pulses: a 1
review with management implications 2
Sujay S. Kaushal, Paul M. Mayer, Philippe G. Vidon, Rose M. Smith, Michael J. Pennino, 3
Tamara A. Newcomer, Shuiwang Duan, Claire Welty, and Kenneth T. Belt 4
Abstract: Nonpoint source pollution from agriculture and urbanization is increasing globally at 5
the same time climate extremes have increased in frequency and intensity. We review >200 6
studies of hydrologic and gaseous fluxes and show how the interaction between land use and 7
climate variability alters magnitude and frequency of carbon, nutrient, and greenhouse gas pulses 8
in watersheds. Agricultural and urban watersheds respond similarly to climate variability due to 9
headwater alteration and loss of ecosystem services to buffer runoff and temperature changes. 10
Organic carbon concentrations/exports increase and organic carbon quality changes with runoff. 11
Nitrogen and phosphorus exports increase during floods (sometimes by an order of magnitude) 12
and decrease during droughts. Relationships between annual runoff and nitrogen and 13
phosphorus exports differ across land use. CH4 and N2O pulses in riparian zones/floodplains 14
predominantly increase with: flooding, warming, low oxygen, nutrient enrichment, and organic 15
carbon. CH4, N2O, and CO2 pulses in streams/rivers increase due to similar factors but effects of 16
floods are less known compared to baseflow/droughts. Emerging questions include: (1) what 17
factors influence lag times of contaminant pulses in response to extreme events (2) What drives 18
resistance/resilience to hydrologic and gaseous pulses? We conclude with 8 recommendations 19
for managing watershed pulses in response to interactive effects of land use and climate change. 20
(Key terms: eutrophication, water quality, hypoxia, nonpoint source pollution, methane, nitrous 21
oxide, carbon dioxide, restoration, wetlands, best management practices.) 22
Page 1 of 66 JAWRA Draft
123456789101112131415161718192021222324252627282930313233343536373839404142434445464748495051525354555657585960

For Peer Review
2
Author Titles and Affiliations: 23
Associate Professor (Kaushal), Graduate Student (Smith, Newcomer), and Research Associate 24
(Duan), Department of Geology and Earth Systems Science Interdisciplinary Center, University 25
of Maryland, College Park, Maryland 20740; Chief (Mayer), Ecological Effects Branch, 26
National Health and Environmental Effects Research Lab, US Environmental Protection Agency, 27
Corvallis, Oregon 97333; Associate Professor (Vidon), Department of Forest and Natural 28
Resources Management, SUNY-ESF, Syracuse, New York 13210; Graduate Student (Pennino) 29
Marine Estuarine Environmental Science Graduate Program, Director (Welty), Center for Urban 30
Environmental Research and Education, and Professor (Welty), Department of Chemical 31
Biochemical, and Environmental Engineering, University of Maryland Baltimore County, 32
Baltimore, MD 21250; Hydrologist (Belt), Northern Research Station, USDA Forest Service, 33
Baltimore, MD 21228 (E-mail/Kaushal: [email protected]). 34
Introduction 35
Agricultural and urban watersheds provide key ecosystem services such as food 36
production, drinking water, climate regulation, and recreational opportunities (Foley et al., 37
2005). However, agricultural and urban land use has also increased carbon, nutrient, and other 38
contaminant loads in many streams and rivers (Cooke and Prepas, 1998; McIsaac et al., 2002; 39
David and Gentry, 2000; Wagner et al., 2008). Simultaneously, increased climate variability in 40
the past few decades has altered regional runoff regimes and water temperatures (IPCC, 2007). 41
As agriculture intensifies to feed the growing human population, urban centers have grown to 42
where over 60% of the world's population now lives in urban areas and relies on urban water 43
resources (Foley et al., 2005; Grimm et al., 2008). We therefore need to better understand how 44
land use and climate interact in agricultural and urban watersheds to predict how key ecosystems 45
services in these landscapes will change in the future. 46
Previous work has shown that land use and climate variability has contributed to 47
significant degradation of regional and global water quality (Vitousek et al., 1997; Foley et al., 48
2005; Grimm et al., 2008; Suddick et al., 2012). The interaction between land use and climate 49
variability can increase the amplitude and frequency of contaminant “pulses,” or large changes in 50
Page 2 of 66JAWRA Draft
123456789101112131415161718192021222324252627282930313233343536373839404142434445464748495051525354555657585960

For Peer Review
3
concentrations or fluxes of materials over relatively short time periods (Kaushal et al., 2008; 51
Vidon et al., 2009; Kaushal et al., 2010). Pulses are important because large fluctuations in 52
concentrations can exceed thresholds for sensitive organisms and water quality regulations, and 53
pulses can deliver large contaminant loads to receiving waters (e.g. drinking water supplies, 54
estuaries, etc.). Although many studies in the literature address the impact of land use or storms 55
on water quality, few (if any) investigate the interactive impacts of land use and climate 56
variability on contaminant pulses at the watershed scale. This hinders our ability to develop 57
adaptation and mitigation strategies for managing water quality in response to future climate 58
extremes. Here, we define climate variability as deviations from a long-term average condition 59
and increased frequency of extreme events due to human activities and global change. 60
First, we review how the interaction between land use and climate variability amplifies 61
pulses of carbon, nutrients, and contaminants in agricultural and urban watersheds. In some 62
cases, we explore the effects of extreme events and weather patterns to gain insights about 63
potential impacts, in addition to examining longer-term patterns. Secondly, we discuss emerging 64
research questions regarding increasingly pulsed watersheds, and discuss monitoring 65
implications. Thirdly, we discuss how the interactive impacts of land use and climate must be 66
considered in developing management strategies for drinking water supplies and coastal zones. 67
Ultimately, we show that although there may be differences in the absolute levels of response 68
across watersheds, agricultural and urban watersheds often respond surprisingly similarly to 69
climate variability due to: (1) extensive headwater alteration, (2) increased carbon, nutrient, and 70
contaminant inputs, and (3) degradation of watershed nutrient sinks (e.g., riparian zones and 71
wetlands). 72
Page 3 of 66 JAWRA Draft
123456789101112131415161718192021222324252627282930313233343536373839404142434445464748495051525354555657585960

For Peer Review
4
Runoff and Temperature: Master Variables 73
Globally, precipitation and runoff are master variables for regulating transport and 74
transformation of carbon, nutrients, and contaminants within agricultural and urban watersheds 75
(e.g., Dosskey et al., 2010; Vidon et al., 2010). Changes in precipitation and runoff during 76
storms contribute to flushing of carbon, nutrients, and contaminants from agricultural and urban 77
landscapes. Previous work has shown that there have been large changes in exports of nitrogen in 78
urbanizing watersheds of the Chesapeake Bay and agricultural watersheds of the Gulf of Mexico 79
in response to record drought and extreme wet years (Rabalais et al., 2001; Justic et al., 2003; 80
Royer et al., 2006; Kaushal et al., 2008). There are also pulses in organic carbon export during 81
storms in agricultural and urban watersheds across different regions of the U.S. and Europe 82
(Hook and Yeakly, 2005; Royer and David, 2005; Dalzell et al., 2007; Wagner et al., 2008; 83
Ledesma et al., 2012). There is also evidence that variability in precipitation and runoff can 84
stimulate production of greenhouse gases in watershed soils and riparian zones (Harms and 85
Grimm, 2012; Jacinthe et al., 2012; Vidon et al., this issue). 86
In addition to extremes in runoff, temperature is a fundamental regulator of carbon, 87
nutrient, and contaminant transformation in watersheds. Amplified stream temperature extremes 88
are caused by extensive riparian zone alteration in agricultural and urban watersheds and 89
drainage modification. Clearing of riparian zones results in decreased shading, which can lead to 90
elevated stream temperatures. For example, water temperatures can be increased by 91
approximately 4-5◦ Celsius in stream reaches following riparian deforestation compared to 92
shaded stream reaches (e.g., Burton and Likens, 1973; Beschta et al., 1987; references in Poole 93
and Berman, 2001). Agriculture also produces significant effects on soil and stream temperature 94
extremes by removing vegetation which can shade streams or by altering land cover in ways that 95
Page 4 of 66JAWRA Draft
123456789101112131415161718192021222324252627282930313233343536373839404142434445464748495051525354555657585960

For Peer Review
5
reveal bare soil, thus changing soil albedo and contributing to radiative forcing (Quinn, 2000). 96
Urbanization can also increase temperature in streams due to urban heat island effects, and large 97
increases in runoff temperatures in urban watersheds in response to storms draining heated paved 98
surfaces (e.g., Nelson and Palmer, 2007). 99
Land Use Increases Headwater Alteration and Hydrologic Connectivity 100
In agricultural watersheds, hydrologic connectivity is often greatly enhanced by tile 101
drains and ditches (Figure 1). In small agricultural watersheds of the US Midwest, where 102
approximately 30% of cropland is tile drained, solute transport to tile drains has been shown to 103
occur quickly ( < 1 hr) following the beginning of precipitation (Zucker and Brown, 1998; Kung 104
et al., 2000). Baker et al. (2006) observed that tile-drain flow contributed between 56% and 99% 105
of stream flow depending on storm characteristics, demonstrating that tile drains effectively 106
move both water and solutes at the watershed scale. In small watersheds where up to 50% of 107
cropland is tile drained, water can move from uplands to tile drains and to streams in as little as 108
15 minutes to a few hours during storms (Vidon and Cuadra, 2010). Therefore, dense networks 109
of tile drains (Figure 1) facilitate the transfer of infiltrated precipitation to streams, quickly 110
contributing to more efficient delivery of runoff and contaminants to receiving waters. 111
In urban watersheds, headwater alteration (e.g., storm drains) have replaced more than 112
90% of headwater streams (Elmore and Kaushal, 2008; Figure 1). Storm drains have expanded 113
drainage density and have increased concentrations of carbon, nutrients, and contaminants from 114
several-fold to hundreds of times greater than forest headwater streams (Kaushal and Belt, 2012). 115
Headwater alteration and amplified runoff variability contribute to downstream degradation of 116
urban riparian zones and loss of floodplain wetlands (Walsh et al., 2005). Furthermore, the 117
Page 5 of 66 JAWRA Draft
123456789101112131415161718192021222324252627282930313233343536373839404142434445464748495051525354555657585960

For Peer Review
6
presence of buried sanitary sewers, potable water pipes, and storm drains alters the groundwater 118
flow field and provides the potential for preferential flow conduits within riparian zones, which 119
further increases efficiency of carbon, nutrient, and contaminant transport (Sharp et al., 2003). 120
All of these hydrologic changes can decrease nutrient retention capacity, increase streambank 121
erosion, and further contribute to pulses of multiple contaminants downstream (Paul and Meyer, 122
2001; Walsh et al., 2005; Allan et al., 2008). 123
Land Use and Climate Amplify Carbon and Nutrient Pulses 124
Many global climate change models predict an increase in the intensity and frequency of 125
large storm events (Karl and Knight, 1998; Milly et al., 2005). In some regions, weather patterns 126
have already become more variable across time. For example, there have been long-term 127
increases in streamflow variability for some major rivers due to changes in regional climate 128
variability (Figure 2). There is also evidence that agricultural and urban watersheds generate 129
flashier hydrographs than forested watersheds across storm sizes (Shields et al., 2008). Most 130
carbon, nutrient, and contaminant exports occur during high flow events (Shipitalo and Owens, 131
2006; Royer et al., 2006; Dalzell et al., 2007; Vidon et al., 2008, 2009). Accordingly, a growing 132
number of studies in streams and rivers demonstrate that the interaction between land use and 133
climate variability can alter the magnitude and frequency of watershed carbon and nutrient 134
pulses globally (Table 1). 135
Dissolved Organic Carbon Pulses 136
Dissolved organic carbon (DOC) can contribute to the production of disinfection by-137
products in drinking water supplies, biological oxygen demand (BOD), and adsorb metals and 138
organic contaminants in streams and rivers (e.g., Royer and David, 2005; Stanley et al., 2012). 139
DOC can also influence denitrification, yielding implications for managing nitrogen in some 140
Page 6 of 66JAWRA Draft
123456789101112131415161718192021222324252627282930313233343536373839404142434445464748495051525354555657585960
For Peer Review
7
streams (e.g., Newcomer et al., 2012). Given its potential significance for water quality, there is 141
interest in monitoring and managing organic carbon in agricultural and urban watersheds (Royer 142
and David, 2005; Stanley et al., 2012). Storms increase concentrations and fluxes of dissolved 143
organic carbon in agricultural watersheds (Table 1). For example, Dalzell et al. (2007) showed 144
that 71-85% of the annual DOC load occurred at high flow in agricultural watersheds in Indiana. 145
DOC concentrations in tile drains can be greater than streams (Warrner et al., 2009), and annual 146
DOC exports from tile drains of 1.78 to 8.61 kg/ha were positively correlated to drainflow 147
(Ruark et al., 2009). Conversely, drought conditions can cause a decline in dissolved organic 148
carbon fluxes from watersheds by 3 orders of magnitude, indicating hydrologic controls on 149
agricultural DOC export (Vidon et al., 2009). In other agricultural watersheds in Illinois, DOC 150
concentrations (ranging from 1-16 mg/L) increased rapidly during floods and droughts (Royer 151
and David, 2005). DOC export from these agricultural watersheds ranged from 3-23 kg/ha/y and 152
was strongly related to runoff (Royer and David, 2005). Similar work has shown that 153
agricultural fields designed for drainage efficiency can export 55±22% more DOC per year than 154
conventional drainage due to higher concentrations and water yield (Dalzell et al., 2011). DOC 155
may originate from crop detritus and organic rich upper soils during floods whereas algal sources 156
may dominate during baseflow and drought periods (Royer and David, 2005). Changes in the 157
sources of DOC to streams influence metabolism, oxygen demand, and alter aquatic foodwebs 158
(based on frequency, amplitude, and timing of pulses). 159
Similar to agricultural watersheds, urban watersheds show strong pulses of DOC 160
concentrations and export during storms (Table 1). DOC increased sharply during storms in 161
urban watersheds of the Chesapeake Bay and reached concentrations greater than 20 mg/L in 162
stormdrains (Kaushal and Belt, 2012). DOC export increased as a power function with 163
Page 7 of 66 JAWRA Draft
123456789101112131415161718192021222324252627282930313233343536373839404142434445464748495051525354555657585960
For Peer Review
8
increasing runoff in urban watersheds (reaching approximately 600 g/ha/day) (Newcomer et al., 164
2012). In urban watersheds of the U.S. Pacific Northwest, DOC concentrations increased during 165
stormflow where riparian areas were thought to contribute almost 75% of the DOC (Hook and 166
Yeakley, 2005). Sources of DOC can also change with increasing urbanization reflecting natural 167
sources such as upper soil horizons and leaf debris to anthropogenic sources (Newcomer et al., 168
2012). This is similar to forest catchments, which are influenced by riparian zones and wetlands, 169
and show increased DOC mobilization during storm events and highest DOC concentrations 170
during the most intense rain events (Inamdar and Mitchell, 2006). 171
Further, the chemical composition and lability of DOC can change in response to climate 172
variability. For example, the structural complexity of dissolved organic matter decreased as the 173
ratio of continuous agricultural croplands to wetlands increased across 34 watersheds in Europe 174
(Wilson and Xenopoulos, 2009). Specifically, the amount of microbially-derived dissolved 175
organic matter increased with greater agricultural land use, and drought periods were associated 176
with a decrease in the structural complexity of dissolved organic matter (Wilson and 177
Xenopoulos, 2009). Wilson and Xenopoulos (2009) suggested that interactive effects of land use 178
and climate variability could have important implications for the chemical composition of DOC, 179
microbial carbon processing, and CO2 production in agricultural streams. Similarly, more labile 180
and redox-active dissolved organic matter was found in streams draining anthropogenic land use 181
including agriculture (Williams et al., 2010). Overall, headwater alteration and modified 182
drainage in agricultural watersheds can impact DOC quality and sources (e.g., Dalzell et al., 183
2011). An increase in the frequency and intensity of storms events may further shift stream 184
DOC toward more aromatic DOC fractions in some cases (Vidon et al., 2008). An increase in 185
aromatic DOC (less labile) could potentially impact whole stream metabolism, denitrification, 186
Page 8 of 66JAWRA Draft
123456789101112131415161718192021222324252627282930313233343536373839404142434445464748495051525354555657585960
For Peer Review
9
and decrease stream productivity across multiple trophic levels directly following storms (e.g., 187
Warren et al., 1964; Royer and David, 2005; Newcomer et al., 2012). 188
Nitrogen and Phosphorus Pulses 189
The interaction between agriculture and climate variability also amplifies nitrogen and 190
phosphorus export from watersheds (Table 1). However, the impacts of storms and floods have 191
various effects on stream solute concentrations depending on agricultural management practices 192
(Sharpley et al., 1999). For example, the concentrations of particulate phosphorus and particulate 193
nitrogen increased significantly with peak water discharge among storms, while concentrations 194
of dissolved forms of phosphorus and nitrate were not correlated with peak discharge in 195
agricultural watersheds of Maryland (Correll et al., 1999). In contrast, nitrate and soluble 196
reactive phosphorus concentrations increased 7 and 10-fold, respectively in an agricultural 197
watershed of Florida during Hurricane Katrina (Zhang, J., et al., 2009). In Illinois, highest 198
concentrations of soluble reactive phosphorus in agricultural streams were associated with rain 199
events and phosphorus fertilizer applications (Gentry et al., 2007). Overall, nutrient 200
concentrations can increase or decrease in agricultural watersheds during storms depending on 201
when sampling occurs along the hydrograph (rising limb, peak, or descending limb), the types of 202
agricultural best management practices employed in the watershed, and/or antecedent conditions. 203
Typically, storms increase export of nutrients (mass transport) from agricultural 204
watersheds, however (Table 1). Based on almost 20 years of data, riverine N exports increased 205
as an exponential function of agriculture fertilizer inputs (and a power function of annual water 206
runoff) in 18 watersheds of the Lake Michigan Basin (Han et al., 2009). Similarly, N export was 207
a function of fertilizer inputs and runoff in agricultural California watersheds (Sobota et al., 208
2009). In Illinois, Royer et al., (2006) showed that more than 50% of the annual nitrate export 209
Page 9 of 66 JAWRA Draft
123456789101112131415161718192021222324252627282930313233343536373839404142434445464748495051525354555657585960

For Peer Review
10
from agricultural watersheds occurred during high flow events during less than 10% of the study 210
period over 8-12 years. In Maryland, there was a 20-fold increase in the annual N export pulse 211
in response to record drought and wet years in an agricultural watershed of the Chesapeake Bay 212
(mechanism discussed in detail further below in the section on lag times and ecosystem 213
resilience and Figure 3); a peak in export up to 40 kg nitrate-N/ha/y in an agricultural watershed 214
of the Chesapeake Bay (Kaushal et al., 2008) was comparable to peaks of ~57 kg nitrate-N/ha/y 215
in agricultural watersheds of Illinois (Royer et al., 2006). Peaks in annual export of soluble 216
reactive phosphorus can approach 1 kg/ha/y in agricultural watersheds of Illinois depending on 217
runoff conditions (Royer et al., 2006). 218
Although some studies address the impact of droughts on nutrient pulses in agricultural 219
watersheds, there is much less information than for floods (Table 1). For a late summer storm 220
(stream baseflow = 1.3 L/s) following a drought period, nitrate fluxes (kg/ha/storm) were 3 221
orders of magnitude lower than in spring for a similar size storm (stream baseflow = 40.3 L/s), 222
suggesting that drought conditions in the month preceding the storm (along with increased crop 223
water demand) had a diminishing effect on nitrate exports at the watershed scale (Vidon et al., 224
2009). During droughts, seasonal changes in antecedent moisture conditions and crop 225
development stage can also have a significant impact of stream-landscape connectivity and 226
reduce nutrient export from agricultural watersheds (Wigington et al., 2005; Poor and 227
McDonnell, 2007; Vidon et al., 2009). Wigington et al. (2005) showed that agricultural stream 228
drainage density could vary spatially by nearly two orders of magnitude in response to changes 229
in stream network expansion/contractions associated with the dry season, when riparian forests 230
can play a significant role in reducing high inputs of nitrate (Davis et al., 2011). Regardless, 231
Page 10 of 66JAWRA Draft
123456789101112131415161718192021222324252627282930313233343536373839404142434445464748495051525354555657585960

For Peer Review
11
runoff extremes (storms and droughts) are associated with strong responses in nutrient export 232
from agricultural watersheds. 233
Like agricultural watersheds, the interactive impacts of land use and climate variability 234
on stream nutrient concentrations in urbanized watersheds depend on individual watershed 235
characteristics (Table 1). Precipitation amount and the proportion of impervious surface cover in 236
watersheds can influence the "first flush" of nutrient concentrations during storms (Hathaway et 237
al., 2012). N exhibited a greater "first flush" than P across 36 storm events in two urban 238
watersheds in the Southeastern U.S. and Mid-Atlantic U.S. (Hathaway et al., 2012). The 239
relationship between streamflow and nitrogen concentrations can also show variable 240
concentration-discharge relationships in urban watersheds during record drought and wet years 241
(Shields et al., 2008). 242
Storms also clearly increase the watershed export of nutrients (mass transport) from 243
urban watersheds (Table 1). There are statistical relationships between runoff and N exports in 244
urban watersheds regionally across the U.S. (Wollheim et al., 2005; Lewis and Grimm, 2007). 245
On an annual basis, there can be more total nitrogen exported per unit runoff in agricultural and 246
urban watersheds of the Baltimore Ecosystem Study LTER site than minimally disturbed 247
reference watersheds in the U.S. (Lewis 2002) (Figure 4). In urbanized watersheds, climate 248
variability can produce substantially different levels of amplification of nitrate exports based on 249
the nature and degree of land development. For example, there were 4 to 5-fold increases in 250
nitrate exports in urban watersheds during record drought and wet years in watersheds of the 251
Baltimore Ecosystem Study LTER (Kaushal et al., 2008); nitrate pulses increased during a wet 252
year following a drought, and pulses remained high even as runoff declined suggesting a 253
hydrologic flushing of watershed nitrate (Figure 3). Similarly, there was an almost 100-fold 254
Page 11 of 66 JAWRA Draft
123456789101112131415161718192021222324252627282930313233343536373839404142434445464748495051525354555657585960
For Peer Review
12
variation in watershed N export in response to storms in an urbanized watershed in the arid 255
Southwestern U.S. (Lewis and Grimm, 2007). The high variability in watershed N export was 256
explained by watershed size and impervious surface cover, and the investigators suggested a 257
"build and flush" hypothesis where N accumulates on the land surfaces and is rapidly flushed to 258
streams during storms (Lewis and Grimm, 2007). Other work has also shown that dry and wet 259
years impact N fluxes from urban watersheds in the Northeastern U.S. in a similar way than for 260
other regions (Wollheim et al., 2005; Jordan et al., 2003; Lewis and Grimm, 2007). 261
Although less studied, phosphorus exports show pulsed exports in urban watersheds in 262
response to drought and wet conditions, but the degree of amplification of phosphorus in 263
response to climate variability was lower than nitrogen (Duan et al., 2012). Peak export of total 264
phosphorus from urban watersheds during wet years can approach 1 kg/ha/y (Duan et al., 2012). 265
There are also strong relationships between annual runoff and total phosphorus export in 266
agricultural and urban watersheds, varying significantly across land use (similar to nitrogen) 267
(Figure 4). However, more work is necessary to characterize the impacts of climate variability 268
on phosphorus pulses in urban streams (Table 1), particularly during droughts and warm periods 269
when phosphorus release from sediments may also be high due to abiotic and biotic factors. 270
Land Use and Climate Variability Amplify Watershed Greenhouse Gas Pulses 271
Greenhouse Gas Pulses (GHG) in Agricultural and Urban Riparian Zones, Wetlands, and 272
Streams 273
Land use and climate variability can also amplify pulses of greenhouse gas (CO2, CH4, 274
N2O) from watersheds due to shifting patterns in runoff and temperature. An abundance of work 275
regarding the effects of land use and climate on GHG pulses has been conducted in upland soils 276
and agricultural fields, highlighting the influence of water availability, temperature, soil 277
Page 12 of 66JAWRA Draft
123456789101112131415161718192021222324252627282930313233343536373839404142434445464748495051525354555657585960
For Peer Review
13
properties, and management practices on the timing and magnitude of GHG pulses (e.g., Mosier 278
et al., 2004, Vilain et al., 2010; Jacinthe and Dick, 1997). Therefore, we do not focus on upland 279
soils for the present review. Instead, we focus on the potential effects of land use and climate on 280
GHG pulses in riparian zones, floodplains, wetlands, streams, and rivers. 281
Riparian Zones, Floodplains, and Wetlands: Nitrous Oxide 282
Interactive effects of flooding, temperature, and nitrogen fertilization can amplify pulses 283
of nitrous oxide (N2O) from agricultural and urban riparian zones, floodplains, and wetlands 284
(Table 2). Nitrous oxide is produced in these ecosystems most commonly through denitrification, 285
and N2O pulses can be stimulated in response to increased NO3- fertilization (e.g., Vilain et al., 286
2010; Hefting et al., 2003; Burgin and Groffman, 2012); N2O emissions in riparian zones can be 287
minimal compared with agricultural fields, however (Kim et al., 2009). Warming may increase 288
N2O emissions in agricultural riparian zones and wetlands (Maag et al., 1997; Soosaar et al., 289
2011; Munoz-Leoz et al., 2011). In the UK, the effects of temperature on N2O emissions have 290
been studied in flooded and non-flooded agricultural floodplain wetlands, and this work has 291
shown that flooding and warming can synergistically increase N2O emissions (Bonnett et al., 292
2013). Increased flooding frequency led to higher emissions of N2O in an agricultural riparian 293
zone in Indiana (Jacinthe et al., 2012). Similarly, Vidon et al., (this issue) showed strong 294
responses of N2O pulses to storms and rewetting events in a restored riparian wetland. Mander 295
et al., (2011) found that a fluctuating water table significantly increased N2O emissions in a 296
constructed wetland. Ambus and Christenson (1995) found highest N2O in flooded agricultural 297
riparian soils of Denmark. Although there has been less work in urban watersheds, Groffman et 298
al., (2002) found that soils in urban riparian zones of Maryland had high potential for 299
denitrification, but were likely limited by infrequent inundation. Sovik et al., (2006) found that 300
Page 13 of 66 JAWRA Draft
123456789101112131415161718192021222324252627282930313233343536373839404142434445464748495051525354555657585960

For Peer Review
14
N2O flux rates varied from -2.1 mg N2O -N/m2/day to 1000 mg N2O -N/m
2/day in an urban 301
wetland depending on flood inundation time, temperature, and water content. In contrast, 302
Merbach et al., (1996) reported that flooding did not affect N2O emissions from an agricultural 303
peatland in Germany. Similarly, Soosaar et al., (2011) reported a negative relationship between 304
water-table height and N2O emissions. These exceptions suggest that, while flooding may 305
consistently increase anaerobic decomposition, the specific response of N2O can also be 306
complicated and depend strongly on nitrogen availability and other site-specific factors. 307
Riparian Zones, Floodplains, and Wetlands: Methane 308
Climate variability and land use also show potential to amplify methane (CH4) pulses via 309
flooding, temperature, and organic carbon availability (Table 2). CH4 fluxes from forested and 310
grassy riparian zones in agricultural watersheds are highly responsive to hydrologic pulses in the 311
form of soil moisture, water table height, and water-filled pore space (Ambus and Christensen, 312
1995; Soosaar et al., 2011). Ambus and Christensen (1995) reported rates as high as 7,877 mg C 313
/ m2 / day during flooding of a riparian zone in Denmark. Soosaar et al., (2011) reported CH4 314
emissions as high as 1 mg C / m2 / hour during high-water table periods (>20cm) compared to 315
zero or negative fluxes when groundwater was below 20 cm in a riparian alder forest in Estonia. 316
Additional work in Texas has shown that flooding had a strong effect on methane pulses in an 317
agricultural river floodplain (up to 1640 mg / m2 / day) where changes in DOC quality appeared 318
to play a major role (Bianchi et al., 1996). Temperature and organic C availability also appear to 319
be important drivers of CH4 pulses in some agricultural riparian zones (Soosaar et al., 2011) and 320
permanently inundated wetlands (Altor and Mitsch, 2008; Altor and Mitsch, 2006; Sha et al., 321
2011), and temperature can contribute to diurnal pulses of CH4 in urban wetlands (Verma et al., 322
1999). Some notable exceptions contradicting the importance of flooding and temperature are 323
Page 14 of 66JAWRA Draft
123456789101112131415161718192021222324252627282930313233343536373839404142434445464748495051525354555657585960

For Peer Review
15
also important to consider, however. In contrast, Altor and Mitsch (2008) and Sha et al., (2011) 324
studied continually inundated agricultural wetlands in Ohio and found that experimentally pulsed 325
flood flows significantly decreased CH4 emissions. There may be other abiotic and biotic factors 326
that are drivers of CH4 emissions (Sovik et al., 2006; Samaritani et al., 2011; Mander et al., 327
2011; Sha et al., 2011) including inhibition by nitrate and N2O during floods (Bonnett et al., 328
2013). Thus, the response of CH4 to flooding and temperature can also be ecosystem-specific 329
(Le Mer and Roger, 2001). 330
Riparian Zones, Floodplains, and Wetlands: Carbon Dioxide 331
Carbon dioxide (CO2) is a major component of the GHG flux from urban and agricultural 332
forests and wetlands (Soosaar et al., 2011; Mander et al., 2008; Morse et al., 2012) (Table 2). 333
CO2 is removed from the riparian zone via direct exchange between the soil and atmosphere and 334
indirect transport of dissolved CO2 from groundwater to the stream (discussed below). The 335
greatest temporal variations in soil-atmosphere CO2 flux are generally predictable based on 336
variations in temperature, nutrients, vegetation production, and soil moisture (Davidson et al., 337
1998; Phillips and Beeri, 2008). Phillips and Beeri, (2008) found that fertilizer addition led to 338
increased CO2 exchange irrespective of micro-climate and vegetation. Paludan and Blicher-339
Mathiesen (1996) also reported a significant increase in CO2 production in a nitrate-loaded 340
agricultural wetland. In temperate climates, periodic hydrologic events, such as over-bank 341
flooding and drought tend to either decrease or have no effect on soil and wetland CO2 emissions 342
whereas other GHGs might be stimulated (Altor and Mitsch, 2008; Davidson et al., 1998; Pacific 343
et al., 2008). However, arid floodplains have shown evidence of CO2 pulses following flooding 344
events (Harms and Grimm, 2012), while other studies have shown that wetlands often become 345
CO2 sources during extreme droughts or draining (Beetz et al., 2013). While soil-atmosphere 346
Page 15 of 66 JAWRA Draft
123456789101112131415161718192021222324252627282930313233343536373839404142434445464748495051525354555657585960

For Peer Review
16
CO2 exchange in riparian zones/floodplains/wetlands appear to be controlled by many of the 347
same factors as upland soils (where the literature on CO2 exchange is much richer), there may be 348
important differences in the timing of seasonal highs and lows, and sensitivity to drought 349
conditions (Pacific et al., 2008; Pacific et al., 2009). Overall, complex interactions between 350
water, temperature, and seasonality can influence CO2 pulses (Davidson et al., 1998). 351
Greenhouse Gases in Streams and Rivers 352
To date, the effects of land use and climate variability on GHG emissions from running 353
waters have been relatively less studied compared with riparian zones, floodplains, and wetlands 354
(Table 3, Figure 5). For example, fewer studies have measured N2O, CH4 or CO2 concentrations 355
and fluxes in streams and rivers in response to floods. Nonetheless, nutrient enrichment, organic 356
carbon, and hypoxia have been identified as potential controls of GHG emissions from streams, 357
which has implications regarding the interactive effects of land use and climate change on stream 358
GHG emissions (particularly during low flow periods and droughts). 359
Nitrous Oxide 360
Similar to riparian zones and wetlands, the interactive effects of temperature, 361
precipitation, and nitrogen fertilization have the potential to amplify N2O pulses from streams 362
and rivers in agricultural and urban watersheds (Table 3, Figure 5). Some of the highest reported 363
N2O emissions in aquatic environments have been reported for agricultural springs in Italy 364
receiving elevated N fertilizer inputs (Laini et al., 2011). Nitrogen fertilization by agriculture 365
has increased the potential for N2O pulses in rivers of the Baltic Sea (Silvennoinen et al., 2008). 366
Changes in weather and hydrologic variability altered the production of N2O in an agricultural 367
stream in Spain impacted by N fertilization, with greatest in-stream N2O production occurring 368
during dry baseflow conditions (Tortosa et al., 2011). Similarly, McMahon and Dennehy (1999) 369
Page 16 of 66JAWRA Draft
123456789101112131415161718192021222324252627282930313233343536373839404142434445464748495051525354555657585960

For Peer Review
17
documented that a river in the western U.S. influenced by both agricultural fertilizer and urban 370
wastewater effluent was 2500% supersaturated with N2O, and that N2O concentrations were 371
primarily related to nitrate concentration and water temperature. This is consistent with other 372
work suggesting the importance of temperature and pH for influencing diurnal pulses of N2O in a 373
river draining a suburban and agricultural watershed (Laursen and Seitzinger, 2004). In fact, a 374
growing body of work is now demonstrating that variability in hourly (-8.9 to 3236 µg N2O-N m-
375
2h
-1) and daily (-89 to 21,738 µg N2O-N m
-2 d
-1) fluxes of N2O from agricultural streams is 376
considerable, which suggests the potential importance of diurnal and/or short-term pulses 377
(Baulch et al., 2011b; Harrison et al., 2005; Beaulieu et al., 2008; Beaulieu et al., 2009; Harrison 378
and Matson, 2003; Wilcock and Sorrell, 2008; Baulch et al. 2012). Besides nitrate enrichment, 379
temperature, and precipitation, some additional controls on N2O pulses include: organic carbon 380
availability, dissolved oxygen, air-water-gas exchange rates, and groundwater upwelling 381
(Beaulieu et al., 2011; Beaulieu et al., 2008; Baulch et al., 2011b; Harrison and Matson, 2003; 382
Jones and Mulholland, 1998; Werner et al., 2012). 383
Methane 384
Methane production and emission from streams is primarily affected by organic carbon 385
availability, dissolved oxygen, temperature, and precipitation (Werner et al., 2012; Harrison et 386
al., 2005; Wilcock and Sorrell, 2008; Jones and Mulholland, 1998) (Table 3, Figure 5). Similar 387
to N2O, CH4 production requires low-O2 conditions and organic carbon (Baulch et al. 2011a; 388
Wilcock and Sorell 2008). Also similar to N2O in streams, CH4 production in streams can be 389
influenced by precipitation and warming with highest rates during dry baseflow conditions 390
(Tortosa et al., 2011). Several studies have found strong correlations between DOC and CH4 391
concentrations and/or emissions in streams (Werner et al., 2012; Harrison et al., 2005). For 392
Page 17 of 66 JAWRA Draft
123456789101112131415161718192021222324252627282930313233343536373839404142434445464748495051525354555657585960

For Peer Review
18
example, there was a 100-fold increase in methane concentration during early spring potentially 393
due to a pulse of organic carbon in agricultural chalk streams in the U.K. (Sanders et al., 2007). 394
In China, diurnal pulses of CH4 in rivers downstream of urban wastewater discharges have been 395
reported (Yang et al., 2012). Because low-O2 conditions inhibit methanotrophy and stimulate 396
methanogenesis, CH4 pulses may be especially sensitive to organic carbon loading due to 397
eutrophication and hypoxic events (Harrison et al., 2005; Naqvi et al., 2000; 2010), which may 398
be exacerbated in sediments and shallow ground water during low flow periods and droughts. 399
Carbon Dioxide 400
The interaction between anthropogenically enhanced carbon sources, precipitation, and 401
temperature can influence CO2 production and emission from agricultural and urban streams and 402
rivers (Table 3, Figure 5). For instance, variations in the partial pressure of CO2 in water (pCO2) 403
have been strongly linked to the oxidation of organic carbon, which can be modified in 404
agricultural and urban watersheds as discussed previously (Neal et al., 1998). In that study, there 405
was a marked increase in pCO2 in major rivers of the North Sea as watershed urbanization 406
increased, and this response to urbanization was primarily due to enhanced oxidation of organic 407
carbon (Jarvie et al., 1997). Supersaturation of pCO2 has been documented in an urban river due 408
to organic carbon from wastewater inputs in Viet Nam (Duc et al., 2007) and rivers draining 409
urban watersheds of the Chesapeake Bay (Prasad et al., 2013). There were diurnal pulses of CO2 410
(10 to 70 times atmospheric pressure) in response to carbon from urban sewage in a river of the 411
UK (Neal et al., 2000a). In many cases, urban streams and rivers have higher respiration rates, 412
lower dissolved oxygen, and contribute to increased pCO2 (Andrade et al., 2011). Precipitation 413
events can also alter temporal dynamics of dissolved carbon forms, which can also alter pCO2 414
dynamics in agricultural and urban streams and rivers (Andrade et al., 2011). In a river 415
Page 18 of 66JAWRA Draft
123456789101112131415161718192021222324252627282930313233343536373839404142434445464748495051525354555657585960

For Peer Review
19
influenced by agriculture in the U.K., pCO2 was supersaturated during most times of year when 416
pH was approximately 7.7, but pCO2 declined when pH increased during spring (Neal et al., 417
2000b). Similarly, there was increased supersaturation of pCO2 in a river draining a mixed land 418
use watershed coinciding with increased baseflow and oxidation of organic matter (Zhang, S. et 419
al., 2009). Finally, there may also be anthropogenic sources of carbonates in agricultural and 420
urban watersheds that can interact with climate variability and warming and further influence 421
pCO2 in streams. Work in Texas showed that high dissolution of carbonates from impervious 422
surfaces contributed to elevated pCO2 in an urban stream (Zeng and Masiello, 2010). Similar 423
work has shown that there are anthropogenic carbonate inputs from agricultural liming 424
(Raymond et al., 2008; Raymond and Oh, 2007). Dissolution of carbonates can be temperature 425
dependent and warming and acidic precipitation may accelerate chemical weathering processes 426
thereby altering pCO2 dynamics (e.g., Kaushal et al., 2013). 427
428
Emerging Questions: 429
What factors influence the lag times of contaminant pulses and ecosystem recovery? 430
Interestingly, contaminant pulses may follow different lag times in watersheds following 431
extreme events including protracted responses to extreme events or delayed responses (e.g., time 432
lags between peak precipitation and peak streamflow). These lag times can be relevant to both 433
hydrologic and gaseous fluxes. Here, we define time lags based on a return to pre-event 434
conditions. For example, some contaminant concentrations and exports can remain elevated for 435
days to decades following extreme events. Lag times of up to decades for nitrogen transport in 436
response to historic agricultural activity have been detected in the Chesapeake Bay watershed 437
due to deep groundwater flow paths with implications for long hydrologic residence times for 438
Page 19 of 66 JAWRA Draft
123456789101112131415161718192021222324252627282930313233343536373839404142434445464748495051525354555657585960

For Peer Review
20
some contaminants (Phillips et al., 2006). There can also be lag times over interannual time 439
scales. For example, total nitrogen exports declined during record drought in 2002, increased 440
during the wet year of 2003, and surprisingly continued to keep increasing in 2004 as runoff 441
declined (Kaushal et al., 2008). This pattern may have been driven by flushing of nitrate stored 442
during drought or increased N mineralization in soils and stream sediments due to drying and re-443
wetting (Borken and Matzner, 2009; Figure 3). Similarly, lag times occur over the period of 444
days to weeks for specific conductance in urban streams following winter storms due to 445
groundwater solute storage and changes in hydrologic flow paths (Figure 6). There may also be 446
pulses in GHGs during and after storms, but their duration is also less well known. Anticipating 447
changes in lag times of carbon, nutrients, and GHGs both during and after extreme events is 448
critical. Empirical data on lag times for multiple contaminants following extreme events will be 449
necessary for understanding fate and transport mechanisms in watersheds from days to decades. 450
How will warming impact hydrologic and greenhouse gas (GHG) pulses? 451
Warming has been shown to affect many aspects of biogeochemical and abiotic 452
reactions that impact C, N, and P biogeochemical cycles and GHG fluxes. Warming increases 453
microbial activity, desorption of phosphorus from sediments, and decomposition and 454
mineralization of organic matter (Conant et al., 2011). Experimental warming increases carbon 455
and nutrient fluxes from sediments in agricultural and urban streams by several-fold compared to 456
forest streams and could contribute to decreased water quality in urban streams of the 457
Chesapeake Bay watershed (Duan and Kaushal, 2013). Release of DOC from sediment due to 458
organic carbon decomposition generally increases with warming (Wilson and Williams, 2006). 459
Warming may also influence production of some greenhouse gas emissions (carbon dioxide, 460
methane, nitrous oxide) in wetlands (Inglett et al., 2012). Because temperature has an effect on 461
Page 20 of 66JAWRA Draft
123456789101112131415161718192021222324252627282930313233343536373839404142434445464748495051525354555657585960

For Peer Review
21
reaction kinetics and equilibria in streams, pulses in stream temperature have the potential to 462
impact many in-stream transformations. Temperature may increase rates of both bacterial 463
mineralization and production of GHGs in streams and rivers, depending upon the reactions 464
considered. Considerably more work has focused on impacts of runoff (floods and droughts) on 465
watershed hydrologic exports, but impacts of temperature extremes on in-stream biogeochemical 466
transformations and hydrologic and GHG emissions warrant attention. 467
How can we improve predicting watershed pulse dynamics by coupling sensor measurements 468
with experiments? 469
Quantifying diurnal variability in pulses can contribute to our understanding of the role of 470
streams and rivers in transporting and transforming contaminants. Sensors show potential for 471
characterizing watershed nitrate and the fluorescent fraction of colored dissolved organic matter 472
(FDOM) pulses in agricultural watersheds over diurnal time scales (Table 4). Heffernan and 473
Cohen, (2010) used nitrate sensors to evaluate fine-scale temporal dynamics in an agricultural 474
spring-fed watershed. They showed that diurnal variability in nitrate concentration was strongly 475
associated with diurnal changes in primary productivity. de Montety et al., (2011) measured 476
high-frequency dissolved oxygen and nitrate over two one-week periods in the same system. 477
Their observations confirmed that photosynthesis and respiration of submersed aquatic 478
vegetation are the dominant processes influencing in-stream diurnal variation. Saraceno et al., 479
(2009) also observed that FDOM showed a strong diurnal signal, which may suggest 480
groundwater and algal sources, potentially with microbial grazing and photodegradation 481
processes. 482
Besides characterizing the potential for biogeochemical transformations, there are 483
questions regarding how sensors can be used to characterize multiple contaminant pulses during 484
Page 21 of 66 JAWRA Draft
123456789101112131415161718192021222324252627282930313233343536373839404142434445464748495051525354555657585960

For Peer Review
22
storms and ecosystem recovery following storm disturbances. By characterizing ecosystem 485
recovery, we mean ecosystem retention functions (e.g., denitrification, primary production, P 486
sorption, etc.) related to attenuating concentrations of a contaminant in response to extreme 487
climate events. In urban watersheds, Henjum et al., (2010a) investigated the feasibility of using 488
in-situ turbidity, specific conductance, pH, depth, temperature, dissolved oxygen, and nitrate 489
sensors to predict concentrations of fecal coliforms, herbicides, and caffeine concentrations. 490
Linear correlations among several parameters were observed to be site specific and included: 491
nitrate - caffeine, turbidity - prometon herbicide, and discharge- prometon herbicide at one 492
location, and caffeine- specific conductance at another. The authors concluded that even weak 493
correlations could be beneficial for estimation of pollutant loads (given sensors for the specific 494
contaminants of concern are not available yet). Henjum et al., (2010b) used real-time nitrate, 495
specific conductance, and turbidity data to calculate pollutant loads during storms and compare 496
to loads calculated using traditional grab sampling. More than 90% of the pollutant load for 497
nitrate, chloride, and TSS was observed to be discharged in 20% of the observation period (i.e., 498
storm events), illustrating that grab sampling would underestimate pollutant loads and pulses. 499
Finally, VerHoef et al., (2011) deployed nitrate sensors at 6 USGS stream gaging stations in 500
nested urban watersheds ranging from 1.3 km2 to 14.3 km
2. These sensors allowed the authors to 501
show that for the watersheds studied, nitrate signals showed a sharp drop in concentration with 502
the onset of storm flow, with minimum values at peak storm flows, and gradual recovery to pre-503
storm conditions as storm flow receded, which can be helpful in refining our understanding of 504
the effect of extreme events on nitrate export at the watershed scale. This is one example of 505
storm dynamics, but we acknowledge that there is a great deal of variation in the response based 506
Page 22 of 66JAWRA Draft
123456789101112131415161718192021222324252627282930313233343536373839404142434445464748495051525354555657585960

For Peer Review
23
on antecedent conditions, sources, and spatial distribution of the contaminant (rain, groundwater, 507
streams). 508
Ultimately, an important area of research will be to integrate sensor data with rates from 509
empirical experiments to inform ecosystem models at the watershed and stream reach scale. 510
Laboratory and in situ field experiments are needed to quantify the relationship between sensor 511
parameters (e.g., temperature, dissolved oxygen, nitrate concentrations, FDOM discussed above) 512
and ecosystem scale biogeochemical processes rates influencing carbon, nutrients, and 513
contaminant pulses at the watershed scale (e.g., denitrification, phosphorus desorption, GHG 514
production). Integration of experimental data can allow us to move beyond correlations to 515
elucidating causal mechanisms at targeted sites whereas sensor measurements across multiple 516
locations will allow us to gain broader spatial perspectives relevant to watershed management. 517
Watershed Management to Mitigate Pulses 518
Although there are still emerging questions, the impacts of carbon, nutrient, and 519
contaminant pulses in watersheds now require strong management actions. Here we discuss 8 520
broader recommendations based on our review to manage the impacts of hydrologic and gaseous 521
pulses synergistically. As a caveat, we do not provide an in depth discussion of specific best 522
management practices (BMPs), and how BMPs can impact nutrient and carbon flux under 523
changing climate. Given that considerable work has been done in agricultural watersheds in 524
particular, a thorough discussion of BMPs would require a devoted review, and we refer the 525
reader to a recent review by Passeport et al., 2013 instead. While some management 526
recommendations would require new or enforced legislation and/or shifts in societal 527
actions/values, the use of these broader approaches based on current scientific understanding 528
could be implemented at local and regional scales. 529
Page 23 of 66 JAWRA Draft
123456789101112131415161718192021222324252627282930313233343536373839404142434445464748495051525354555657585960

For Peer Review
24
1. Reduce watershed carbon, nutrient, and contaminant sources - The impacts of carbon, 530
nutrient, and contaminant pulses ultimately increase as a function of watershed inputs and can 531
increase both hydrologic and GHG pulses (e.g., Figure 5). Therefore, reducing point and non-532
point sources is the most critical step to mitigating impacts. Some reductions may be elicited 533
through voluntary curtailments. However, regulatory mechanisms such as policy change, zoning 534
laws, and/or restriction of contaminants are also necessary to effectively achieve source 535
reductions. 536
2. Manage Infiltration Rates - In urban areas, impervious surfaces (including roads, bridges, 537
buildings, and other structures) reduce or prevent infiltration and increase hydrologic pulses 538
locally and regionally. Removal of impervious surfaces can be an option though it may not 539
always be feasible. Replacing paved surfaces with pervious pavement and retrofitting with green 540
infrastructure (Dietz et al., 2007) may be feasible in some urban areas. Zoning and planning can 541
reduce the need for more impervious surfaces. In agricultural watersheds, row crop agriculture 542
and/or cattle operations can also increase soil compaction, which reduces infiltration rates 543
(McKergow et al., 2003). Reduced tillage, permanent covers, and other approaches to increasing 544
infiltration are important in agricultural watersheds. 545
3. Reduce headwater alteration and stream channelization - Often streams are modified and 546
redirected through drainage structures or ditches to increase the speed and volume of water that 547
can be moved off of the landscape. In urban or agricultural settings, stream restoration can 548
proceed in fashion to reduce stream channel incision, which can allow improved hydrologic 549
connection with the stream and increase groundwater hydrologic residence time (Striz and 550
Mayer, 2008). Removing tile drains that locally redirect water from farm fields is another often 551
used, feasible means of reducing agricultural headwater alteration (Vidon and Smith, 2008). 552
Page 24 of 66JAWRA Draft
123456789101112131415161718192021222324252627282930313233343536373839404142434445464748495051525354555657585960
For Peer Review
25
Yet, subsurface drains are still being installed in many places (Franzmeier and Kladivko, 2001; 553
Franzmeier et al., 2001). An alternative to removing tile drains may be the implementation of 554
artificial headwater wetlands and denitrifying bioreactors to intercept nitrogen, or other 555
contaminants before they reach the stream (Passeport et al., 2013; Braskerud, 2002). For 556
example, there has been extensive work on nitrate removal by wetlands through targeting 557
hydrologic flowpaths in agricultural landscapes (e.g., Crumpton, 2001). 558
4. Manage hydrologic connectivity - Managing hydrologic connectivity can improve the 559
capacity of streams to process contaminants and reduce pulses, for example, by increasing 560
interactions between ground water and surface water with floodplains, oxbow wetlands, and side 561
channels (Bukaveckas, 2007; Kaushal et al., 2008; Craig et al., 2008; Harrison et al., 2011; 562
Roley et al., 2012). Contaminated water may flow through areas that foster microbial 563
transformation of contaminants and/or adsorption onto soils (Kasahara and Hill, 2006a; 2006b; 564
Mayer et al., 2010). In agricultural watersheds, soil best management practices such as 565
controlled drainage can also enhance overland flow, while reducing N losses in subsurface flow, 566
a trade-off that could impact watershed pulses. 567
5. Restore riparian buffers and their vegetation - Establishing riparian buffers often is 568
considered a best management practice (BMP) for maintaining water quality (Mayer et al., 569
2007). The extent to which riparian buffers attenuate nutrients and subsequently mitigate 570
pulses is a function of buffer width, organic matter content, and landscape and hydrogeomorphic 571
characteristics (Vidon and Hill, 2004; Hoffman et al., 2009; Zhang et al., 2010). However, 572
riparian buffers are less effective when agricultural areas are tile drained because tile drains can 573
bypass the buffer and eliminate interaction between nitrate and the riparian soils. Nevertheless, 574
riparian buffers have the potential to significantly decrease nitrogen pulses if there is: (1) 575
Page 25 of 66 JAWRA Draft
123456789101112131415161718192021222324252627282930313233343536373839404142434445464748495051525354555657585960
For Peer Review
26
efficient runoff interception and significant interaction between N-laden subsurface flow and 576
organic rich soils (Dosskey et al., 2010; Gift et al., 2010; Passeport et al., 2013) and (2) 577
vegetation cover is adequate and diverse to decrease erosion and maintain the soil organic matter 578
content (Dosskey et al., 2010; Passeport et al., 2013). 579
6. Reduce local stream and river reach temperatures - Global temperatures are increasing and 580
temperatures in streams and rivers are also rising locally due to the interactive effects of land use 581
and climate change (Kaushal et al., 2010b). In urban and agricultural watersheds, riparian zones 582
are often removed, thereby eliminating shading effects. Re-establishing riparian zones (see 583
above) can provide shading and reduce summer time stream temperatures. Reducing impervious 584
surface or thermal pollution sources that transfer heat to streams may be necessary to further 585
reduce potential temperature impacts on GHG pulses and contaminant transformations. 586
7. Managing Water Quality to Reduce GHG Pulses - Some of the key factors related to 587
greenhouse gas emissions may also be related to successfully managing water quality. For 588
example, targeted reductions in watershed nutrient inputs can reduce pulses of N2O, CH4, and 589
CO2 in aquatic systems (Figure 5). In addition, reducing nonpoint organic carbon loading from 590
crop detritus, algal blooms, sewage leaks, etc. (discussed previously) may also be important. 591
Increasing oxic conditions in streams and rivers may also inhibit anaerobic processes 592
contributing to some GHG emissions. 593
8. Preservation and Conservation: While climate and land use change may be unavoidable 594
globally, ecosystem functions can be enhanced locally. Our review suggests that land 595
development can increase vulnerability to hydrologic and greenhouse gas pulses in response to 596
climate variability (Table 1, Table 2). Infiltration and hydrologic residence times can be 597
Page 26 of 66JAWRA Draft
123456789101112131415161718192021222324252627282930313233343536373839404142434445464748495051525354555657585960

For Peer Review
27
enhanced by preserving and conserving existing natural ecosystems. Plans should address 598
reducing future development and conversion of natural lands to urban and intensively 599
agricultural systems to buffer extremes in runoff and temperature. Where watersheds have been 600
developed, ecological engineering can sometimes improve a watershed's ability to dampen 601
carbon, nutrient, and contaminant pulses, within limits based on environmental factors such as 602
runoff, temperature, nutrient enrichment, etc. as discussed in this review and elsewhere (e.g., 603
Passeport et al., 2013). 604
Conclusions 605
Our review shows that the interactive effects of land use and climate variability have 606
increased the magnitude and frequency of carbon, nutrient, and greenhouse gas pulses globally. 607
Causes include: (1) increased nutrient and organic matter loading, (2) extensive headwater 608
alteration and (3) loss of ecosystem services to buffer runoff and temperature. Continued 609
research is needed to answer emerging questions such as: What factors influence the lag times of 610
different contaminant pulses and ecosystem recovery? How will rising temperatures influence 611
carbon, nutrient, and greenhouse pulses across watersheds? How can we improve predicting 612
watershed pulse dynamics by coupling sensor measurements with manipulative experiments? 613
Filling in these knowledge gaps will be critical to improve management responses and anticipate 614
the interactive effects of land use and climate change on amplifying watershed pulses. 615
Acknowledgements 616
NSF: LTER DEB-0423476 and DEB-1027188, DEB-0948944, DBI 0640300, CBET-0854307, 617
CBET-1058038, NASA grant NASA NNX11AM28G, and Maryland Sea Grant Awards 618
SA7528085-U, R/WS-2 and NA05OAR4171042. Partial support was provided by 619
grant/cooperative agreement numbers # IWRRC 06HQGR0084 (104B) and USGS-NIWR 620
Page 27 of 66 JAWRA Draft
123456789101112131415161718192021222324252627282930313233343536373839404142434445464748495051525354555657585960
For Peer Review
28
08HQGR0052 (104 G) to P. Vidon from USGS and EPA NNEMS Award 2010-308 to T. 621
Newcomer. Additional funding was provided by an Indiana University–Purdue University, 622
Indianapolis RSGF grant to P. Vidon and a Mirsky Fellowship to P.E. Cuadra. Bill Stack 623
provided helpful suggestions. The information presented herein is solely the responsibility of the 624
authors and does not necessarily represent the official views of the USGS. This manuscript has 625
been subjected to the Environmental Protection Agency's peer and administrative review, and 626
mention of trade names or commercial products does not constitute endorsement or 627
recommendation for use. 628
629
Literature Cited 630
631
Allan, C. J., P. Vidon and R. Lowrance, 2008. Frontiers in riparian zone research in the 21st 632
century. Hydrological Processes 22:3221-3222. 633
634
Altor, A. E. and W. J. Mitsch. 2006. Methane flux from created riparian marshes: Relationship to 635
intermittent versus continuous inundation and emergent macrophytes. Ecological 636
Engineering 28:224-234. 637
638
Altor, A. E. and W. J. Mitsch. 2008. Pulsing hydrology, methane emissions and carbon dioxide 639
fluxes in created marshes: A 2-year ecosystem study. Wetlands 28:423-438. 640
641
Ambus, P. and S. Christensen, 1995. Spatial and seasonal nitrous-oxide and methane fluxes in 642
Danish forest-ecosystems, grassland-ecosystems, and agroecosystems. Journal of 643
Environment Quality 24:993-1001. 644
645
Andrade, T. M. B., P. B. Camargo, D. M. L. Silva, M. C. Piccolo, S. A. Vieira, L. F. Alves, C. A. 646
Joly and L. A. Martinelli, 2011. Dynamics of dissolved forms of carbon and inorganic 647
nitrogen in small watersheds of the coastal Atlantic forest in southeast Brazil. Water, Air, 648
& Soil Pollution 214:393-408. 649
650
Baker, M. A. and P. Vervier. 2004. Hydrological variability, organic matter supply and 651
denitrification in the Garonne River ecosystem. Freshwater Biology 49:181-190. 652
653
Baker, N. T., W. W. Stone, J. T. Wilson and M. T. Meyer, 2006. Occurrence and transport of 654
agricultural chemicals in Leary Weber Ditch Basin, Hancock County, Indiana, 2003–04. 655
U.S. Geological Survey Scientific Investigations Report 2006-5251, pp. 1-44. 656
657
Page 28 of 66JAWRA Draft
123456789101112131415161718192021222324252627282930313233343536373839404142434445464748495051525354555657585960

For Peer Review
29
Barber, L.B. and J.H. Writer, 1998. Impact of the 1993 flood on the distribution of organic 658
contaminants in bed sediments of the upper Mississippi River. Environmental Science & 659
Technology 32:2077–2083. 660
Barnes, R. T. and P. A. Raymond, 2009. The contribution of agricultural and urban activities to 661
inorganic carbon fluxes within temperate watersheds. Chemical Geology 266:318-327. 662
663
Baulch, H. M., P. J. Dillon, R. Maranger and S. L. Schiff, 2011a. Diffusive and ebullitive 664
transport of methane and nitrous oxide from streams: Are bubble-mediated fluxes 665
important? Journal of Geophysical Research 116:G04028. 666
667
Baulch, H. M., S. L. Schiff, R. Maranger and P. J. Dillon, 2011b. Nitrogen enrichment and the 668
emission of nitrous oxide from streams. Global Biogeochemical Cycles 25:GB4013. 669
670
Baulch, H. M., P. J. Dillon, R. Maranger, J. J. Venkiteswaran, H. F. Wilson and S. L. Schiff, 671
2012. Night and day: short-term variation in nitrogen chemistry and nitrous oxide 672
emissions from streams. Freshwater Biology 57:509-525. 673
674
Beaulieu, J. J., C. P. Arango, S. K. Hamilton and J. L. Tank, 2008. The production and emission 675
of nitrous oxide from headwater streams in the Midwestern United States. Global Change 676
Biology 14:878-894. 677
678
Beaulieu, J. J., C. P. Arango and J. L. Tank, 2009. The effects of season and agriculture on 679
nitrous oxide production in headwater streams. J Environ Qual 38:637-646. 680
681
Beaulieu, J. J., W. D. Shuster and J. A. Rebholz, 2010. Nitrous oxide emissions from a large, 682
impounded river: the Ohio River. Environ Sci Technol 44:7527-7533. 683
684
Beaulieu, J. J., J. L. Tank, S. K. Hamilton, W. M. Wollheim, R. O. Hall, Jr., P. J. Mulholland, B. 685
J. Peterson, L. R. Ashkenas, L. W. Cooper, C. N. Dahm, W. K. Dodds, N. B. Grimm, S. 686
L. Johnson, W. H. McDowell, G. C. Poole, H. M. Valett, C. P. Arango, M. J. Bernot, A. 687
J. Burgin, C. L. Crenshaw, A. M. Helton, L. T. Johnson, J. M. O'Brien, J. D. Potter, R. 688
W. Sheibley, D. J. Sobota and S. M. Thomas, 2011. Nitrous oxide emission from 689
denitrification in stream and river networks. Proc Natl Acad Sci U S A 108:214-219 690
691
Beighley, R. E., T. Dunne and J. M. Melack, 2008. Impacts of climate variability and land use 692
alterations on frequency distributions of terrestrial runoff loading to coastal waters in 693
southern California. Journal of the American Water Resources Association 44:62-74. 694
695
Beetz, S., H. Liebersbach, S. Glatzel, G. Jurasinski, U. Buczko, and H. Hoeper. 2013. Effects of 696
land use intensity on the full greenhouse gas balance in an Atlantic peat bog. 697
Biogeosciences 10:1067-1082. 698
699
Beschta, R.L., 1997. Riparian shade and stream temperature: an alternative perspective. 700
Rangelands 19:25–28. 701
702
Page 29 of 66 JAWRA Draft
123456789101112131415161718192021222324252627282930313233343536373839404142434445464748495051525354555657585960
For Peer Review
30
Bianchi, T. S., M. E. Freer, and R. G. Wetzel. 1996. Temporal and spatial variability, and the 703
role of dissolved organic carbon (DOC) in methane fluxes from the Sabine River 704
floodplain (southeast Texas, USA). Archiv Fur Hydrobiologie 136:261-287. 705
706
Bonnett, S. A. F., M. S. A. Blackwell, R. Leah, V. Cook, M. O'Connor, and E. Maltby. 2013. 707
Temperature response of denitrification rate and greenhouse gas production in 708
agricultural river marginal wetland soils. Geobiology 11:252-267. 709
710
Borken, W. and E. Matzner, 2009. Reappraisal of drying and wetting effects on C and N 711
mineralization and fluxes in soils. Global Change Biology 15:808-824. 712
713
Braskerud, B. C., 2002. Factors affecting nitrogen retention in small constructed wetlands 714
treating agricultural non-point source pollution. Ecological Engineering 18:351-370. 715
716
Bukaveckas, P. A., 2007. Effects of channel restoration on water velocity, transient storage, and 717
nutrient uptake in a channelized stream. Environmental Science & Technology 41:1570-718
1576. 719
720
Burgin, A. J. and P. M. Groffman, 2012. Soil O2 controls denitrification rates and N2O yield in a 721
riparian wetland. Journal of Geophysical Research-Biogeosciences 117:G01010. 722
723
Burton, T. M. and G. E. Likens, 1973. Effect of strip-cutting on stream temperatures in Hubbard 724
Brook experimental forest, New-Hampshire. Bioscience 23:433-435. 725
726
Chang, H. J., 2004. Water quality impacts of climate and land use changes in southeastern 727
Pennsylvania. The Professional Geographer 56:240-257. 728
729
Chong, S.-K., B.P. Klubek, and J.T. Weber, 1998. Herbicide contamination by the 1993 great 730
flood along the Mississippi River. JAWRA Journal of the American Water Resources 731
Association 34:687–693. 732
Conant, R. T., M. G. Ryan, G. I. Agren, H. E. Birge, E. A. Davidson, P. E. Eliasson, S. E. Evans, 733
S. D. Frey, C. P. Giardina, F. M. Hopkins, R. Hyvonen, M. U. F. Kirschbaum, J. M. 734
Lavallee, J. Leifeld, W. J. Parton, J. M. Steinweg, M. D. Wallenstein, J. A. M. 735
Wetterstedt and M. A. Bradford, 2011. Temperature and soil organic matter 736
decomposition rates - synthesis of current knowledge and a way forward. Global Change 737
Biology 17:3392-3404. 738
739
Cooke, S. E. and E. E. Prepas, 1998. Stream phosphorus and nitrogen export from agricultural 740
and forested watersheds on the Boreal Plain. Canadian Journal of Fisheries and Aquatic 741
Sciences 55:2292-2299. 742
743
Correll, D. L., T. E. Jordan and D. E. Weller, 1999. Transport of nitrogen and phosphorus from 744
Rhode River watersheds during storm events. Water Resources Research 35:2513-2521. 745
746
Craig, L. S., M. A. Palmer, D. C. Richardson, S. Filoso, E. S. Bernhardt, B. P. Bledsoe, M. W. 747
Doyle, P. M. Groffman, B. A. Hassett, S. S. Kaushal, P. M. Mayer, S. M. Smith and P. R. 748
Page 30 of 66JAWRA Draft
123456789101112131415161718192021222324252627282930313233343536373839404142434445464748495051525354555657585960

For Peer Review
31
Wilcock, 2008. Stream restoration strategies for reducing river nitrogen loads. Frontiers 749
in Ecology and the Environment 6:529-538. 750
751
Crumpton, W.G. 2001. Using wetlands for water quality improvement in agricultural 752
watersheds: the importance of a watershed scale perspective. Water Science and 753
Technology. 44: 559-564. 754
755
Cuadra, P. E. and P. Vidon, 2011. Storm nitrogen dynamics in tile-drain flow in the US Midwest. 756
Biogeochemistry 104:293-308. 757
758
Dalzell, B. J., T. R. Filley and J. M. Harbor, 2007. The role of hydrology in annual organic 759
carbon loads and terrestrial organic matter export from a midwestern agricultural 760
watershed. Geochimica Et Cosmochimica Acta 71:1448-1462. 761
762
Dalzell, B. J., J. Y. King, D. J. Mulla, J. C. Finlay and G. R. Sands, 2011. Influence of 763
subsurface drainage on quantity and quality of dissolved organic matter export from 764
agricultural landscapes. Journal of Geophysical Research-Biogeosciences 116. 765
766
David, M. B. and L. E. Gentry, 2000. Anthropogenic inputs of nitrogen and phosphorus and 767
riverine export for Illinois, USA. Journal of Environmental Quality 29:494-508. 768
769
Davidson, E. A., E. Belk, and R. D. Boone. 1998. Soil water content and temperature as 770
independent or confounded factors controlling soil respiration in a temperate mixed 771
hardwood forest. Global Change Biology 4:217-227. 772
773
Davis, J. H., S. M. Griffith and P. J. Wigington, 2011. Surface water and groundwater nitrogen 774
dynamics in a well drained riparian forest within a poorly drained agricultural landscape. 775
Journal of Environmental Quality 40:505-516. 776
777
de Montety, V., J. B. Martin, M. J. Cohen, C. Foster and M. J. Kurz, 2011. Influence of diel 778
biogeochemical cycles on carbonate equilibrium in a karst river. Chemical Geology 779
283:31-43. 780
781
DeSimone, J., M. L. Macrae, and R. A. Bourbonniere. 2010. Spatial variability in surface N2O 782
fluxes across a riparian zone and relationships with soil environmental conditions and 783
nutrient supply. Agriculture Ecosystems & Environment 138:1-9. 784
785
Dietz, M. E., 2007. Low impact development practices: A review of current research and 786
recommendations for future directions. Water Air and Soil Pollution 186:351-363. 787
788
Dosskey, M. G., P. Vidon, N. P. Gurwick, C. J. Allan, T. P. Duval and R. Lowrance, 2010. The 789
role of riparian vegetation in protecting and improving chemical water quality in streams. 790
Journal of the American Water Resources Association 46:261-277. 791
792
Duan, S. W., R. Amon, T. S. Bianchi and P. H. Santschi, 2011. Temperature control on soluble 793
reactive phosphorus in the lower Mississippi River? Estuaries and Coasts 34:78-89. 794
Page 31 of 66 JAWRA Draft
123456789101112131415161718192021222324252627282930313233343536373839404142434445464748495051525354555657585960

For Peer Review
32
795
Duan, S. W., S. S. Kaushal, P. M. Groffman, L. E. Band and K. T. Belt, 2012. Phosphorus export 796
across an urban to rural gradient in the Chesapeake Bay watershed. Journal of 797
Geophysical Research-Biogeosciences 117. 798
799
Duan, S.W., and S. S. Kaushal., 2013. Warming increases carbon and nutrient fluxes from 800
sediments in streams across land use. Biogeosciences 10:1193–1207. 801
802
Duc, T. A., G. Vachaud, M. P. Bonnet, N. Prieur, V. D. Loi, and L. L. Anh. 2007. Experimental 803
investigation and modelling approach of the impact of urban wastewater on a tropical 804
river; a case study of the Nhue River, Hanoi, Viet Nam. Journal of Hydrology 334:347-805
358. 806
807
Elmore, A. J. and S. S. Kaushal, 2008. Disappearing headwaters: patterns of stream burial due to 808
urbanization. Frontiers in Ecology and the Environment 6:308-312. 809
810
Ferrant, S., C. Laplanche, G. Durbe, A. Probst, P. Dugast, P. Durand, J. M. Sanchez-Perez and J. 811
L. Probst, 2012. Continuous measurement of nitrate concentration in a highly event-812
responsive agricultural catchment in south-west of France: is the gain of information 813
useful? Hydrological Processes. 814
815
Foley, J. A., R. DeFries, G. P. Asner, C. Barford, G. Bonan, S. R. Carpenter, F. S. Chapin, M. T. 816
Coe, G. C. Daily, H. K. Gibbs, J. H. Helkowski, T. Holloway, E. A. Howard, C. J. 817
Kucharik, C. Monfreda, J. A. Patz, I. C. Prentice, N. Ramankutty and P. K. Snyder, 2005. 818
Global consequences of land use. Science 309:570-574. 819
820
Franzmeier, D. P., W. D. Hosteter and R. E. Roeske, 2001. Drainage and wet soil management: 821
drainage recommendations for Indiana soils. Purdue Extension Publ. AY-300. 822
823
Franzmeier, D. P. and E. J. Kladivko, 2001. Drainage and wet soil management: Wet soils of 824
Indiana. Purdue Extension Publ. AY-301. 825
826
Gentry, L. E., M. B. David, T. V. Royer, C. A. Mitchell and K. M. Starks, 2007. Phosphorus 827
transport pathways to streams in tile-drained agricultural watersheds. Journal of 828
Environmental Quality 36:408-415. 829
830
Gift, D. M., P. M. Groffman, S. S. Kaushal and P. M. Mayer, 2010. Denitrification potential, root 831
biomass, and organic matter in degraded and restored urban riparian zones. Restoration 832
Ecology 18:113-120. 833
834
Grimm, N. B., S. H. Faeth, N. E. Golubiewski, C. L. Redman, J. G. Wu, X. M. Bai and J. M. 835
Briggs, 2008. Global change and the ecology of cities. Science 319:756-760. 836
837
Groffman, P. M., A. Gold, D. Q. Kellogg, and K. Addy. 2002. Mechanisms, rates and assessment 838
of N2O in groundwater, riparian zones and rivers. Pages Van Ham, Baede, Guicherit 839
&Williams-Jacobse Non-CO2 Greenhouse Gases. Millipress, Rotterdam. 840
Page 32 of 66JAWRA Draft
123456789101112131415161718192021222324252627282930313233343536373839404142434445464748495051525354555657585960

For Peer Review
33
841
Han, H., J. D. Allan and D. Scavia, 2009. Influence of climate and human activities on the 842
relationship between watershed nitrogen input and river export. Environmental Science & 843
Technology 43:1916-1922. 844
845
Harms, T. K. and N. B. Grimm, 2012. Responses of trace gases to hydrologic pulses in desert 846
floodplains. Journal of Geophysical Research-Biogeosciences 117. 847
848
Harrison, J. and P. Matson, 2003. Patterns and controls of nitrous oxide emissions from waters 849
draining a subtropical agricultural valley. Global Biogeochemical Cycles 17. 850
851
Harrison, J. A., P. A. Matson and S. E. Fendorf, 2005. Effects of a diel oxygen cycle on nitrogen 852
transformations and greenhouse gas emissions in a eutrophied subtropical stream. 853
Aquatic Sciences 67:308-315. 854
855
Harrison, M. D., P. M. Groffman, P. M. Mayer, S. S. Kaushal and T. A. Newcomer, 2011. 856
Denitrification in alluvial wetlands in an urban landscape. Journal of Environmental 857
Quality 40:634-646. 858
859
Harrison, M. D., P. M. Groffman, P. M. Mayer and S. S. Kaushal, 2012. Microbial biomass and 860
activity in geomorphic features in forested and urban restored and degraded streams. 861
Ecological Engineering 38:1-10. 862
863
Hathaway, J. M., R. S. Tucker, J. M. Spooner and W. F. Hunt, 2012. A traditional analysis of the 864
first flush effect for nutrients in stormwater runoff from two small urban catchments. 865
Water Air and Soil Pollution 223:5903-5915. 866
867
Heffernan, J. B. and M. J. Cohen, 2010. Direct and indirect coupling of primary production and 868
diel nitrate dynamics in a subtropical spring-fed river. Limnology and Oceanography 869
55:677-688. 870
871
Heffernan, J. B., M. J. Cohen, T. K. Frazer, R. G. Thomas, T. J. Rayfield, J. Gulley, J. B. Martin, 872
J. J. Delfino and W. D. Graham, 2010. Hydrologic and biotic influences on nitrate 873
removal in a subtropical spring-fed river. Limnology and Oceanography 55:249-263. 874
875
Hefting, M. M., R. Bobbink, and H. de Caluwe. 2003. Nitrous oxide emission and denitrification 876
in chronically nitrate-loaded riparian buffer zones. J Environ Qual 32:1194-1203. 877
878
Henjum, M. B., R. M. Hozalski, C. R. Wennen, W. A. Arnold and P. J. Novak, 2010a. 879
Correlations between in situ sensor measurements and trace organic pollutants in urban 880
streams. Journal of Environmental Monitoring 12:225-233. 881
882
Henjum, M. B., R. M. Hozalski, C. R. Wennen, P. J. Novak and W. A. Arnold, 2010b. A 883
comparison of total maximum daily load (TMDL) calculations in urban streams using 884
near real-time and periodic sampling data. Journal of Environmental Monitoring 12:234-885
241. 886
Page 33 of 66 JAWRA Draft
123456789101112131415161718192021222324252627282930313233343536373839404142434445464748495051525354555657585960

For Peer Review
34
887
Hernandez, M. E. and W. J. Mitsch. 2006. Influence of hydrologic pulses, flooding frequency, 888
and vegetation on nitrous oxide emissions from created riparian marshes. Wetlands 889
26:862-877. 890
891
Hernandez, M. E. and W. J. Mitsch. 2007. Denitrification in created riverine wetlands: Influence 892
of hydrology and season. Ecological Engineering 30:78-88. 893
894
Hofmann, B. S., S. M. Brouder and R. F. Turco, 2004. Tile spacing impacts on Zea mays L. 895
yield and drainage water nitrate load. Ecological Engineering 23:251-267. 896
897
Hoffman, A. R., D. E. Armstrong, R. C. Lathrop and M. R. Penn, 2009. Characteristics and 898
influence of phosphorus accumulated in the bed sediments of a stream located in an 899
agricultural watershed. Aquatic Geochemistry 15:371-389. 900
901
Hook, A. M. and J. A. Yeakley, 2005. Stormflow dynamics of dissolved organic carbon and total 902
dissolved nitrogen in a small urban watershed. Biogeochemistry 75:409-431. 903
904
Howarth, R. W., D. P. Swaney, E. W. Boyer, R. Marino, N. Jaworski and C. Goodale, 2006. The 905
influence of climate on average nitrogen export from large watersheds in the 906
Northeastern United States. Biogeochemistry 79:163-186. 907
908
Huang, X. Y., T. P. Zhang, W. J. Li, J. Q. Wan, and R. A. Dahlgren. 2013. Spatial variations in 909
the N2O emissions and denitrification potential of riparian buffer strips in a contaminated 910
urban river. Chemistry and Ecology 29:529-539. 911
912
IPCC, 2007: Climate Change 2007: The physical science basis. contribution of working group i 913
to the fourth assessment report of the intergovernmental panel on climate change 914
[Solomon, S., D. Qin, M. Manning, Z. Chen, M. Marquis, K.B. Averyt, M.Tignor and 915
H.L. Miller (eds.)]. Cambridge University Press, Cambridge, United Kingdom and New 916
York, NY, USA. 917
918
Inamdar, S. P. and M. J. Mitchell, 2006. Hydrologic and topographic controls on storm-event 919
exports of dissolved organic carbon (DOC) and nitrate across catchment scales. Water 920
Resources Research 42. 921
922
Inglett, K. S., P. W. Inglett, K. R. Reddy and T. Z. Osborne, 2012. Temperature sensitivity of 923
greenhouse gas production in wetland soils of different vegetation. Biogeochemistry 924
108:77-90. 925
926
Jacinthe, P. A. and W. A. Dick, 1997. Soil management and nitrous oxide emissions from 927
cultivated fields in southern Ohio. Soil & Tillage Research 41:221-235. 928
929
Jacinthe, P. A., J. S. Bills, L. P. Tedesco and R. C. Barr, 2012. Nitrous oxide emission from 930
riparian buffers in relation to vegetation and flood frequency. J Environ Qual 41:95-105. 931
932
Page 34 of 66JAWRA Draft
123456789101112131415161718192021222324252627282930313233343536373839404142434445464748495051525354555657585960

For Peer Review
35
Jarvie, H. P., C. Neal, D. V. Leach, G. P. Ryland, W. A. House, and A. J. Robson. 1997. Major 933
ion concentrations and the inorganic carbon chemistry of the Humber rivers. Science of 934
the Total Environment 194:285-302. 935
936
Jones, J. B. and P. J. Mulholland, 1998. Methane input and evasion in a hardwood forest stream: 937
Effects of subsurface flow from shallow and deep pathways. Limnology and 938
Oceanography 43:1243-1250. 939
940
Jordan, T. E., D. E. Weller and D. L. Correll, 2003. Sources of nutrient inputs to the Patuxent 941
River estuary. Estuaries 26:226-243. 942
943
Joyce, K., R.L. Todd, L.E. Asmussen, and R.A. Leonard, 1985. Dissolved oxygen, total organic 944
carbon and temperature relationships in southeastern us coastal plain watersheds. 945
Agricultural Water Management 9:313–324. 946
947
Justic, D., N. N. Rabalais and R. E. Turner, 2003. Simulated responses of the Gulf of Mexico 948
hypoxia to variations in climate and anthropogenic nutrient loading. Journal of Marine 949
Systems 42:115-126. 950
951
Kachenchart, B., D. L. Jones, N. Gajaseni, G. Edwards-Jones, and A. Limsakul. 2012. Seasonal 952
nitrous oxide emissions from different land uses and their controlling factors in a tropical 953
riparian ecosystem. Agriculture, Ecosystems & Environment 158:15-30. 954
955
Karl, T. R. and R. W. Knight, 1998. Secular trends of precipitation amount, frequency, and 956
intensity in the United States. Bulletin of the American Meteorological Society 79:231-957
241. 958
959
Kasahara, T. and A. R. Hill, 2006a. Effects of riffle-step restoration on hyporheic zone chemistry 960
in N-rich lowland streams. Canadian Journal of Fisheries and Aquatic Sciences 63:120-961
133. 962
963
Kasahara, T. and A. R. Hill, 2006b. Hyporheic exchange flows induced by constructed riffles 964
and steps in lowland streams in southern Ontario, Canada. Hydrological Processes 965
20:4287-4305. 966
967
Kaushal, S. S., P. M. Groffman, L. E. Band, E. M. Elliott, C. A. Shields and C. Kendall, 2011. 968
Tracking Nonpoint Source Nitrogen Pollution in Human-Impacted Watersheds. 969
Environmental Science & Technology 45:8225-8232. 970
971
Kaushal, S. S., P. M. Groffman, L. E. Band, C. A. Shields, R. P. Morgan, M. A. Palmer, K. T. 972
Belt, C. M. Swan, S. E. G. Findlay and G. T. Fisher, 2008. Interaction between 973
urbanization and climate variability amplifies watershed nitrate export in Maryland. 974
Environmental Science & Technology 42:5872-5878. 975
976
Kaushal, S. S., M. L. Pace, P. M. Groffman, L. E. Band, K. T. Belt and P. M. a. W. Mayer, C., 977
2010. Land use and climate variability amplify contaminant pulses. EOS 91. 978
Page 35 of 66 JAWRA Draft
123456789101112131415161718192021222324252627282930313233343536373839404142434445464748495051525354555657585960
For Peer Review
36
979
Kaushal, S. S. and K. T. Belt, 2012. The urban watershed continuum: evolving spatial and 980
temporal dimensions. Urban Ecosystems 15:409-435. 981
982
Kaushal, S. S., G. E. Likens, N. A. Jaworski, M. L. Pace, A. M. Sides, D. Seekell, K. T. Belt, D. 983
H. Secor and R. L. Wingate, 2010. Rising stream and river temperatures in the United 984
States. Frontiers in Ecology and the Environment 8:461-466. 985
986
Kaushal, S.S., G.E. Likens, R.M. Utz, M.L. Pace, M. Grese, and M. Yepsen, 2013. Increased 987
river alkalinization in the eastern U.S. Environmental Science & Technology 47:10302–988
10311. 989
990
Kim, D. G., T. M. Isenhart, T. B. Parkin, R. C. Schultz and T. E. Loynachan, 2009. Nitrate and 991
dissolved nitrous oxide in groundwater within cropped fields and riparian buffers. 992
Biogeosciences Discussions 6:651-685. 993
994
Kladivko, E. J., J. R. Frankenberger, D. B. Jaynes, D. W. Meek, B. J. Jenkinson and N. R. 995
Fausey, 2004. Nitrate leaching to subsurface drains as affected by drain spacing and 996
changes in crop production system. Journal of Environmental Quality 33:1803-1813. 997
998
Kung, K. J. S., T. S. Steenhuis, E. J. Kladivko, T. J. Gish, G. Bubenzer and C. S. Helling, 2000. 999
Impact of preferential flow on the transport of adsorbing and non-adsorbing tracers. Soil 1000
Science Society of America Journal 64:1290-1296. 1001
1002
Laini, A., M. Bartoli, S. Castaldi, P. Viaroli, E. Capri, and M. Trevisan. 2011. Greenhouse gases 1003
(CO2, CH4 and N2O) in lowland springs within an agricultural impacted watershed (Po 1004
River Plain, northern Italy). Chemistry and Ecology 27:177-187. 1005
1006
Laursen, A. E. and S. P. Seitzinger. 2004. Diurnal patterns of denitrification, oxygen 1007
consumption and nitrous oxide production in rivers measured at the whole-reach scale. 1008
Freshwater Biology 49:1448-1458. 1009
1010
Le Mer, J. and P. Roger, 2001. Production, oxidation, emission and consumption of methane by 1011
soils: A review. European Journal of Soil Biology 37:25-50. 1012
1013
Ledesma, J. L. J., S. J. Kohler and M. N. Futter, 2012. Long-term dynamics of dissolved organic 1014
carbon: Implications for drinking water supply. Science of the Total Environment 432:1-1015
11. 1016
1017
Lehrter, J. C., 2006. Effects of land use and. land cover, stream discharge, and interannual 1018
climate on the magnitude and timing of nitrogen, phosphorus, and organic carbon 1019
concentrations in three coastal plain watersheds. Water Environment Research 78:2356-1020
2368. 1021
1022
Lewis Jr, W.M., 2002. Yield of nitrogen from minimally disturbed watersheds of the United 1023
States. The nitrogen cycle at regional to global scales. Springer, pp. 375–385. 1024
Page 36 of 66JAWRA Draft
123456789101112131415161718192021222324252627282930313233343536373839404142434445464748495051525354555657585960
For Peer Review
37
1025
Lewis, D. B. and N. B. Grimm, 2007. Hierarchical regulation of nitrogen export from urban 1026
catchments: Interactions of storms and landscapes. Ecological Applications 17:2347-1027
2364. 1028
1029
Liu, D. Y. and C. C. Song, 2010. Effects of inorganic nitrogen and phosphorus enrichment on the 1030
emission of N2O from a freshwater marsh soil in Northeast China. Environmental Earth 1031
Sciences 60:799-807. 1032
1033
Maag, M., M. Malinovsky, and S. M. Nielsen. 1997. Kinetics and temperature dependence of 1034
potential denitrification in riparian soils. J Environ Qual 26:215-223. 1035
1036
Machefert, S. E. and N. B. Dise. 2004. Hydrological controls on denitrification in riparian 1037
ecosystems. Hydrology and Earth System Sciences 8:686-694. 1038
1039
Mander, U., K. Lohmus, S. Teiter, T. Mauring, K. Nurk, and J. Augustin. 2008. Gaseous fluxes 1040
in the nitrogen and carbon budgets of subsurface flow constructed wetlands. Science of 1041
the Total Environment 404:343-353. 1042
1043
Mander, U., M. Maddison, K. Soosaar, and K. Karabelnik. 2011. The impact of pulsing 1044
hydrology and fluctuating water table on greenhouse gas emissions from constructed 1045
wetlands. Wetlands 31:1023-1032. 1046
1047
Mattsson, T., P. Kortelainen and A. Raike, 2005. Export of DOM from boreal catchments: 1048
impacts of land use cover and climate. Biogeochemistry 76:373-394. 1049
1050
Mayer, P. M., S. K. Reynolds, M. D. McCutchen and T. J. Canfield, 2007. Meta-analysis of 1051
nitrogen removal in riparian buffers. Journal of Environmental Quality 36:1172-1180. 1052
1053
Mayer, P. M., P. M. Groffman, E. A. Striz and S. S. Kaushal, 2010. Nitrogen dynamics at the 1054
groundwater-surface water interface of a degraded urban stream. Journal of 1055
Environmental Quality 39:810-823. 1056
1057
McDiffett, W.F., A.W. Beidler, T.F. Dominick, and K.D. McCrea, 1989. Nutrient concentration-1058
stream discharge relationships during storm events in a first-order stream. Hydrobiologia 1059
179:97–102. 1060
1061
McIsaac, G. F., M. B. David, G. Z. Gertner and D. A. Goolsby, 2002. Relating net nitrogen input 1062
in the Mississippi River basin to nitrate flux in the lower Mississippi River: A 1063
comparison of approaches. Journal of Environmental Quality 31:1610-1622. 1064
1065
McKee, L. J., B. D. Eyre, S. Hossain and P. R. Pepperell, 2001. Influence of climate, geology 1066
and humans on spatial and temporal nutrient geochemistry in the subtropical Richmond 1067
River catchment, Australia. Marine and Freshwater Research 52:235-248. 1068
1069
McKergow, L. A., D. M. Weaver, I. P. Prosser, R. B. Grayson and A. E. G. Reed, 2003. Before 1070
Page 37 of 66 JAWRA Draft
123456789101112131415161718192021222324252627282930313233343536373839404142434445464748495051525354555657585960
For Peer Review
38
and after riparian management: sediment and nutrient exports from a small agricultural 1071
catchment, Western Australia. Journal of Hydrology 270:253-272. 1072
1073
McMahon, P. B. and K. F. Dennehy. 1999. N2O emissions from a nitrogen-enriched river. 1074
Environ Sci Technol 33:21-25. 1075
1076
Merbach, W., J. Augustin, T. Kalettka and H. J. Jacob, 1996. Nitrous oxide and methane 1077
emissions from riparian areas of ponded depressions of northeast Germany. Journal of 1078
Applied Botany-Angewandte Botanik 70:134-136. 1079
1080
Milly, P. C. D., K. A. Dunne and A. V. Vecchia, 2005. Global pattern of trends in streamflow 1081
and water availability in a changing climate. Nature 438:347-350. 1082
1083
Mitchell, M.J., C.T. Driscoll, J.S. Kahl, G.E. Likens, P.S. Murdoch, and L.H. Pardo, 1996. 1084
Climatic control of nitrate loss from forested watersheds in the northeast United States. 1085
Environmental Science & Technology 30:2609–2612. 1086
1087
Mitsch, W. J. and J. G. Gosselink, 2000. Wetlands. New York, John Wiley and Sons. 1088
1089
Moraetis, D., D. Efstathiou, F. Stamati, O. Tzoraki, N. P. Nikolaidis, J. L. Schnoor and K. 1090
Vozinakis, 2010. High-frequency monitoring for the identification of hydrological and 1091
bio-geochemical processes in a Mediterranean river basin. Journal of Hydrology 1092
389:127-136. 1093
1094
Morse, J. L., M. Ardon and E. S. Bernhardt, 2012. Greenhouse gas fluxes in southeastern U.S. 1095
coastal plain wetlands under contrasting land uses. Ecological Applications 22:264-280. 1096
1097
Mosier, A., R. Wassmann, L. Verchot, J. King, and C. Palm. 2004. Methane and nitrogen oxide 1098
fluxes in tropical agricultural soils: Sources, sinks and mechanisms. Environment 1099
Development and Sustainability 6:11-49. 1100
1101
Mulholland, P.J., L.A. Yarbro, R.P. Sniffen, and E.J. Kuenzler, 1981. Effects of floods on 1102
nutrient and metal concentrations in a coastal plain stream. Water Resources Research 1103
17:758–764. 1104
1105
Munoz-Leoz, B., I. Antiguedad, C. Garbisu, and E. Ruiz-Romera. 2011. Nitrogen 1106
transformations and greenhouse gas emissions from a riparian wetland soil: An 1107
undisturbed soil column study. Science of the Total Environment 409:763-770. 1108
1109
Naqvi, S. W. A., D. A. Jayakumar, P. V. Narvekar, H. Naik, V. Sarma, W. D'Souza, S. Joseph 1110
and M. D. George, 2000. Increased marine production of N2O due to intensifying anoxia 1111
on the Indian continental shelf. Nature 408:346-349. 1112
1113
Naqvi, S. W. A., H. W. Bange, L. Farías, P. M. S. Monteiro, M. I. Scranton and J. Zhang, 2010. 1114
Marine hypoxia/anoxia as a source of CH4 and N2O. Biogeosciences 7:2159-2190. 1115
1116
Page 38 of 66JAWRA Draft
123456789101112131415161718192021222324252627282930313233343536373839404142434445464748495051525354555657585960

For Peer Review
39
Neal, C., W. A. House, H. P. Jarvie, and A. Eatherall. 1998. The significance of dissolved carbon 1117
dioxide in major lowland rivers entering the North Sea. Science of the Total Environment 1118
210:187-203. 1119
1120
Neal, C., H. P. Jarvie, S. M. Howarth, P. G. Whitehead, R. J. Williams, M. Neal, M. Harrow, and 1121
H. Wickham. 2000a. The water duality of the River Kennet: initial observations on a 1122
lowland chalk stream impacted by sewage inputs and phosphorus remediation. Science of 1123
the Total Environment 251:477-495. 1124
1125
Neal, C., H. P. Jarvie, R. J. Williams, L. C. V. Pinder, G. D. Collett, M. Neal, and L. Bhardwaj. 1126
2000b. The water quality of the Great Ouse. Science of the Total Environment 251:423-1127
440. 1128
1129
Nelson, K. C. and M. A. Palmer, 2007. Stream temperature surges under urbanization and 1130
climate change: Data, models, and responses. Journal of the American Water Resources 1131
Association 43:440-452. 1132
1133
Newcomer, T. A., S. S. Kaushal, P. M. Mayer, A. R. Shields, E. A. Canuel, P. M. Groffman and 1134
A. J. Gold, 2012. Influence of natural and novel organic carbon sources on denitrification 1135
in forest, degraded urban, and restored streams. Ecological Monographs 82:449-466. 1136
1137
Noges, P., M. Kagu and T. Noges, 2007. Role of climate and agricultural practice in determining 1138
matter discharge into large, shallow Lake Vortsjarv, Estonia. Hydrobiologia 581:125-1139
134. 1140
1141
Outram, F. N. and K. M. Hiscock. 2012. Indirect nitrous oxide emissions from surface water 1142
bodies in a lowland arable catchment: a significant contribution to agricultural 1143
greenhouse gas budgets? Environ Sci Technol 46:8156-8163. 1144
1145
Pacific, V., B. McGlynn, D. Riveros-Iregui, D. Welsch, and H. Epstein. 2008. Variability in soil 1146
respiration across riparian-hillslope transitions. Biogeochemistry 91:51-70. 1147
1148
Pacific, V. J., B. L. McGlynn, D. A. Riveros-Iregui, H. E. Epstein, and D. L. Welsch. 2009. 1149
Differential soil respiration responses to changing hydrologic regimes. Water Resources 1150
Research 45. 1151
1152
Paludan, C. and G. Blicher-Mathiesen. 1996. Losses of inorganic carbon and nitrous oxide from 1153
a temperate freshwater wetland in relation to nitrate loading. Biogeochemistry 35:305-1154
326. 1155
1156
Passeport, E., P. Vidon, K. J. Forshay, L. Harris, S. S. Kaushal, D. Q. Kellogg, J. Lazar, P. 1157
Mayer and E. K. Stander, 2013. Ecological engineering practices for the reduction of 1158
excess nitrogen in human-influenced landscapes: a guide for watershed managers. 1159
Environmental Management 51:392-413. 1160
1161
Paul, M. J. and J. L. Meyer, 2001. Streams in the urban landscape. Annual Review of Ecology 1162
Page 39 of 66 JAWRA Draft
123456789101112131415161718192021222324252627282930313233343536373839404142434445464748495051525354555657585960

For Peer Review
40
and Systematics 32:333-365. 1163
1164
Pellerin, B. A., B. D. Downing, C. Kendall, R. A. Dahlgren, T. E. C. Kraus, J. Saraceno, R. G. 1165
M. Spencer and B. A. Bergamaschi, 2009. Assessing the sources and magnitude of 1166
diurnal nitrate variability in the San Joaquin River (California) with an in situ optical 1167
nitrate sensor and dual nitrate isotopes. Freshwater Biology 54:376-387. 1168
1169
Pennock, D., T. Yates, A. Bedard-Haughn, K. Phipps, R. Farrell, and R. McDougal. 2010. 1170
Landscape controls on N2O and CH4 emissions from freshwater mineral soil wetlands of 1171
the Canadian Prairie Pothole region. Geoderma 155:308-319. 1172
1173
Petrone, R. M., P. Chahil, M. L. Macrae, and M. C. English. 2008. Spatial variability of CO2 1174
exchange for riparian and open grasslands within a first-order agricultural basin in 1175
Southern Ontario. Agriculture Ecosystems & Environment 125:137-147. 1176
1177
Petrone, K. C., 2010. Catchment export of carbon, nitrogen, and phosphorus across an agro-1178
urban land use gradient, Swan-Canning River system, southwestern Australia. Journal of 1179
Geophysical Research-Biogeosciences 115. 1180
1181
Petty, J.D., B.C. Poulton, C.S. Charbonneau, J.N. Huckins, S.B. Jones, J.T. Cameron, and H.F. 1182
Prest, 1998. Determination of Bioavailable Contaminants in the Lower Missouri River 1183
Following the Flood of 1993. Environmental Science & Technology 32:837–842. 1184
1185
Phillips, S. W., Lindsey, B.D., Preston, S.D., Brakebill, J.W., Raffensperger, J.P., and Shedlock, 1186
R.J., 2006. The influence of ground water and watershed processes on nutrient delivery to 1187
the Chesapeake Bay: [abs.] in Proceedings of the Joint Assembly. Baltimore, Maryland. 1188
1189
Phillips, R. and O. Beeri. 2008. The role of hydropedologic vegetation zones in greenhouse gas 1190
emissions for agricultural wetland landscapes. Catena 72:386-394. 1191
1192
Poole, G.C. and C.H. Berman, 2001. An ecological perspective on in-stream temperature: natural 1193
heat dynamics and mechanisms of human-caused thermal degradation. Environmental 1194
Management 27:787–802. 1195
1196
Poor, C. J. and J. J. McDonnell, 2007. The effects of land use on stream nitrate dynamics. 1197
Journal of Hydrology 332:54-68. 1198
1199
Prasad, M. B. K., S. S. Kaushal and R. Murtugudde, 2013. Long-term pCO2 dynamics in rivers in 1200
the Chesapeake Bay watershed. Applied Geochemistry 31:209-215. 1201
1202
Quinn J. M. 2000. Effects of pastoral development. In New Zealand stream invertebrates: 1203
ecology and implications for management, ed. KJ Collier, MJ Winterbourn, pp. 208–29. 1204
Christchurch, NZ: Caxton. 1205
1206
Rabalais, N. N., R. E. Turner and W. J. Wiseman, 2001. Hypoxia in the Gulf of Mexico. Journal 1207
of Environmental Quality 30:320-329. 1208
Page 40 of 66JAWRA Draft
123456789101112131415161718192021222324252627282930313233343536373839404142434445464748495051525354555657585960
For Peer Review
41
1209
Raymond, P. A., N. F. Caraco and J. J. Cole, 1997. Carbon dioxide concentration and 1210
atmospheric flux in the Hudson River. Estuaries 20:381. 1211
1212
Raymond, P. A. and N.-H. Oh. 2007. An empirical study of climatic controls on riverine C 1213
export from three major U.S. watersheds. Global Biogeochemical Cycles 21. 1214
1215
Raymond, P. A., N. H. Oh, R. E. Turner, and W. Broussard. 2008. Anthropogenically enhanced 1216
fluxes of water and carbon from the Mississippi River. Nature 451:449-452. 1217
1218
Roley, S. S., J. L. Tank, M. L. Stephen, L. T. Johnson, J. J. Beaulieu and J. D. Witter, 2012. 1219
Floodplain restoration enhances denitrification and reach-scale nitrogen removal in an 1220
agricultural stream. Ecological Applications 22:281-297. 1221
1222
Rosamond, M. S., S. J. Thuss and S. L. Schiff, 2012. Dependence of riverine nitrous oxide 1223
emissions on dissolved oxygen levels. Nature Geoscience 5:715-718. 1224
1225
Royer, T. V. and M. B. David, 2005. Export of dissolved organic carbon from agricultural 1226
streams in Illinois, USA. Aquatic Sciences 67:465-471. 1227
1228
Royer, T. V., M. B. David and L. E. Gentry, 2006. Timing of riverine export of nitrate and 1229
phosphorus from agricultural watersheds in Illinois: Implications for reducing nutrient 1230
loading to the Mississippi River. Environmental Science & Technology 40:4126-4131. 1231
1232
Ruark, M. D., S. M. Brouder and R. F. Turco, 2009. Dissolved organic carbon losses from tile 1233
drained agroecosystems. Journal of Environmental Quality 38:1205-1215. 1234
1235
Samaritani, E., J. Shrestha, B. Fournier, E. Frossard, F. Gillet, C. Guenat, P. A. Niklaus, N. 1236
Pasquale, K. Tockner, E. A. D. Mitchell, and J. Luster. 2011. Heterogeneity of soil 1237
carbon pools and fluxes in a channelized and a restored floodplain section (Thur River, 1238
Switzerland). Hydrology and Earth System Sciences 15:1757-1769. 1239
1240
Sanders, I. A., C. M. Heppell, J. A. Cotton, G. Wharton, A. G. Hildrew, E. J. Flowers, and M. 1241
Trimmer. 2007. Emission of methane from chalk streams has potential implications for 1242
agricultural practices. Freshwater Biology 52:1176-1186. 1243
1244
Saraceno, J. F., B. A. Pellerin, B. D. Downing, E. Boss, P. A. M. Bachand and B. A. 1245
Bergamaschi, 2009. High-frequency in situ optical measurements during a storm event: 1246
Assessing relationships between dissolved organic matter, sediment concentrations, and 1247
hydrologic processes. Journal of Geophysical Research-Biogeosciences 114. 1248
1249
Schindler, D. W., 2001. The cumulative effects of climate warming and other human stresses on 1250
Canadian freshwaters in the new millennium. Canadian Journal of Fisheries and Aquatic 1251
Sciences 58:18-29. 1252
1253
Page 41 of 66 JAWRA Draft
123456789101112131415161718192021222324252627282930313233343536373839404142434445464748495051525354555657585960

For Peer Review
42
Schreiber, J., P. Duffy, and D. Mcclurkin, 1976. Dissolved nutrient losses in storm runoff from 5 1254
southern pine watersheds. Journal of Environmental Quality 5:201–204. 1255
1256
Sha, C., W. J. Mitsch, U. Mander, J. J. Lu, J. Batson, L. Zhang, and W. S. He. 2011. Methane 1257
emissions from freshwater riverine wetlands. Ecological Engineering 37:16-24. 1258
1259
Sharp JM Jr., K. J., Mathey JD, Garcia-Fresca B, Stewart CA, 2003. Effects of urbanization on 1260
groundwater systems. Washington, DC, In Earth Science in the City: A Reader, AGU 1261
Spec. Pub. Ser. 56. 1262
1263
Sharpley, A. N., W. J. Gburek, G. Folmar and H. B. Pionke, 1999. Sources of phosphorus 1264
exported from an agricultural watershed in Pennsylvania. Agricultural Water 1265
Management 41:77-89. 1266
1267
Shields, C.A., L.E. Band, N. Law, P.M. Groffman, S.S. Kaushal, K. Savvas, G.T. Fisher, and 1268
K.T. Belt, 2008. Streamflow distribution of non–point source nitrogen export from urban-1269
rural catchments in the Chesapeake Bay Watershed. Water Resources Research 1270
44:W09416. 1271
1272
Shipitalo, M. J. and L. B. Owens, 2006. Tillage system, application rate, and extreme event 1273
effects on herbicide losses in surface runoff. Journal of Environmental Quality 35:2186-1274
2194. 1275
1276
Silvennoinen, H., A. Liikanen, J. Rintala, and P. J. Martikainen. 2008. Greenhouse gas fluxes 1277
from the eutrophic Temmesjoki River and its Estuary in the Liminganlahti Bay (the 1278
Baltic Sea). Biogeochemistry 90:193-208. 1279
1280
Sobota, D. J., J. A. Harrison and R. A. Dahlgren, 2009. Influences of climate, hydrology, and 1281
land use on input and export of nitrogen in California watersheds. Biogeochemistry 1282
94:43-62. 1283
1284
Soosaar, K., U. Mander, M. Maddison, A. Kanal, A. Kull, K. Lohmus, J. Truu, and J. Augustin. 1285
2011. Dynamics of gaseous nitrogen and carbon fluxes in riparian alder forests. 1286
Ecological Engineering 37:40-53. 1287
1288
Sovik, A. K., J. Augustin, K. Heikkinen, J. T. Huttunen, J. M. Necki, S. M. Karjalainen, B. 1289
Klove, A. Liikanen, U. Mander, M. Puustinen, S. Teiter, and P. Wachniew. 2006. 1290
Emission of the greenhouse gases nitrous oxide and methane from constructed wetlands 1291
in Europe. J Environ Qual 35:2360-2373. 1292
1293
Stanley, E. H., S. M. Powers, N. R. Lottig, I. Buffam and J. T. Crawford, 2012. Contemporary 1294
changes in dissolved organic carbon (DOC) in human-dominated rivers: is there a role for 1295
DOC management? Freshwater Biology 57:26-42. 1296
1297
Striz, E. A. a. P. M. Mayer, 2008. Assessment of near-stream ground water-surface water 1298
interaction (gsi) of a degraded stream before restoration. EPA/600/R-07/058. U.S. 1299
Page 42 of 66JAWRA Draft
123456789101112131415161718192021222324252627282930313233343536373839404142434445464748495051525354555657585960
For Peer Review
43
Environmental Protection Agency. 1300
1301
Suddick, E.C. P. W., Townsend, A.C., Davidson, E.A. 2012. The role of nitrogen in climate 1302
change and the impacts of nitrogen–climate interactions in the United States 1303
Biogeochemistry. Biogeochemistry. 1304
1305
Tobias, C. and J. K. Böhlke, 2011. Biological and geochemical controls on diel dissolved 1306
inorganic carbon cycling in a low-order agricultural stream: Implications for reach scales 1307
and beyond. Chemical Geology 283:18-30. 1308
1309
Tortosa, G., D. Correa, A. J. Sanchez-Raya, A. Delgado, M. A. Sanchez-Monedero, and E. J. 1310
Bedmar. 2011. Effects of nitrate contamination and seasonal variation on the 1311
denitrification and greenhouse gas production in La Rocina Stream (Donana National 1312
Park, SW Spain). Ecological Engineering 37:539-548. 1313
1314
Topp, E. and E. Pattey, 1997. Soils as sources and sinks for atmospheric methane. Canadian 1315
Journal of Soil Science 77:167-178. 1316
1317
VanderZaag, A. C., R. J. Gordon, D. L. Burton, R. C. Jamieson, and G. W. Stratton. 2010. 1318
Greenhouse gas emissions from surface flow and subsurface flow constructed wetlands 1319
treating dairy wastewater. J Environ Qual 39:460-471. 1320
1321
Venterink, H. O., E. Hummelink and M. W. Van den Hoorn, 2003. Denitrification potential of a 1322
river floodplain during flooding with nitrate-rich water: grasslands versus reedbeds. 1323
Biogeochemistry 65:233-244. 1324
1325
VerHoef, J. R., C. Welty, J. Miller, M. McGuire, M. M. Grese, S. S. Kaushal, A. J. Miller, J. M. 1326
Duncan, P. M. Groffman, L. E. Band and R. M. Maxwell, 2011. Analysis of high 1327
frequency water quality data in the Baltimore ecosystem study LTER. In: Fall Meeting of 1328
the American Geophysical Union. San Francisco, CA. 1329
1330
VerHoef, J. R., 2012. Spectral analysis of weekly and high-frequency stream chemistry data in 1331
urban watersheds. In: Department of Chemical, Biochemical, and Environmental 1332
Engineering. University of Maryland Baltimore County. 1333
1334
Verma, A., V. Subramanian, and R. Ramesh. 1999. Day-time variation in methane emission 1335
from two tropical urban wetlands in Chennai, Tamil Nadu, India. Current Science 1336
76:1020-1022. 1337
Vidon, P. G. F. and A. R. Hill, 2004. Landscape controls on nitrate removal in stream riparian 1338
zones. Water Resources Research 40. 1339
1340
Vidon, P. and A. P. Smith, 2008a. Assessing the Influence of Drainage Pipe Removal on 1341
Wetland Hydrology Restoration: A Case Study. Ecological Restoration 26:33-43. 1342
1343
Vidon, P., L. E. Wagner and E. Soyeux, 2008b. Changes in the character of DOC in streams 1344
during storms in two Midwestern watersheds with contrasting land uses. Biogeochemistry 1345
Page 43 of 66 JAWRA Draft
123456789101112131415161718192021222324252627282930313233343536373839404142434445464748495051525354555657585960
For Peer Review
44
88:257-270. 1346
1347
Vidon, P., L. E. Hubbard and E. Soyeux, 2009. Seasonal solute dynamics across land uses during 1348
storms in glaciated landscape of the US Midwest. Journal of Hydrology 376:34-47. 1349
1350
Vidon, P., C. Allan, D. Burns, T. P. Duval, N. Gurwick, S. Inamdar, R. Lowrance, J. Okay, D. 1351
Scott and S. Sebestyen, 2010. Hot spots and hot moments in riparian zones: potential for 1352
improved water quality management. Journal of the American Water Resources 1353
Association 46:278-298. 1354
1355
Vidon, P. and P. E. Cuadra, 2010. Impact of precipitation characteristics on soil hydrology in 1356
tile-drained landscapes. Hydrological Processes 24:1821-1833. 1357
1358
Vidon, P. and P.E. Cuadra, 2011. Phosphorus dynamics in tile-drain flow during storms in the 1359
US Midwest. Agricultural Water Management 98:532–540. 1360
1361
Vidon, P., P.-A. Jacinthe, X. Liu, K. Fisher and M. Baker, 2013. Hydrobiogeochemical controls 1362
on riparian nutrient and greenhouse gas dynamics; 10 years post-restoration. Journal of 1363
the American Water Resources Association This Issue. 1364
1365
Vitousek, P. M., J. D. Aber, R. W. Howarth, G. E. Likens, P. A. Matson, D. W. Schindler, W. H. 1366
Schlesinger and D. Tilman, 1997. Human alteration of the global nitrogen cycle: Sources 1367
and consequences. Ecological Applications 7:737-750. 1368
1369
Vilain, G., J. Garnier, G. Tallec, and P. Cellier. 2010. Effect of slope position and land use on 1370
nitrous oxide (N2O) emissions (Seine Basin, France). Agricultural and Forest 1371
Meteorology 150:1192-1202. 1372
1373
Wagner, L. E., P. Vidon, L. P. Tedesco and M. Gray, 2008. Stream nitrate and DOC dynamics 1374
during three spring storms across land uses in glaciated landscapes of the Midwest. 1375
Journal of Hydrology 362:177-190. 1376
1377
Walker, J. T., C. D. Geron, J. M. Vose and W. T. Swank, 2002. Nitrogen trace gas emissions 1378
from a riparian ecosystem in southern Appalachia. Chemosphere 49:1389-1398. 1379
1380
Walsh, C. J., A. H. Roy, J. W. Feminella, P. D. Cottingham, P. M. Groffman and R. P. Morgan, 1381
2005. The urban stream syndrome: current knowledge and the search for a cure. Journal 1382
of the North American Benthological Society 24:706-723. 1383
1384
Ward, P. J., R. T. van Balen, G. Verstraeten, H. Renssen and J. Vandenberghe, 2009. The impact 1385
of land use and climate change on late Holocene and future suspended sediment yield of 1386
the Meuse catchment. Geomorphology 103:389-400. 1387
1388
Warren, C. E., J. H. Wales, G. E. Davis and P. Doudoroff, 1964. Trout production in an 1389
experimental stream enriched with sucrose. Journal of Wildlife Management 28:617–660. 1390
1391
Page 44 of 66JAWRA Draft
123456789101112131415161718192021222324252627282930313233343536373839404142434445464748495051525354555657585960

For Peer Review
45
Warrner, T.J., T.V. Royer, J.L. Tank, N.A. Griffiths, E.J. Rosi-Marshall, and M.R. Whiles, 2009. 1392
Dissolved organic carbon in streams from artificially drained and intensively farmed 1393
watersheds in Indiana, USA. Biogeochemistry 95:295-307. 1394
1395
Weller, D. E., T. E. Jordan, D. L. Correll and Z. J. Liu, 2003. Effects of land-use change on 1396
nutrient discharges from the Patuxent River watershed. Estuaries 26:244-266. 1397
1398
Werner, S. F., B. A. Browne and C. T. Driscoll, 2012. Three-dimensional spatial patterns of trace 1399
gas concentrations in baseflow-dominated agricultural streams: implications for surface-1400
ground water interactions and biogeochemistry. Biogeochemistry 107:319-338. 1401
1402
Wigington, P. J., T. J. Moser and D. R. Lindeman, 2005. Stream network expansion: a riparian 1403
water quality factor. Hydrological Processes 19:1715-1721. 1404
1405
Wilcock, R. J. and B. K. Sorrell, 2008. Emissions of greenhouse gases CH4 and N2O from low-1406
gradient streams in agriculturally developed catchments. Water Air and Soil Pollution 1407
188:155-170. 1408
1409
Williams, C. J., Y. Yamashita, H. F. Wilson, R. Jaffe and M. A. Xenopoulos, 2010. Unraveling 1410
the role of land use and microbial activity in shaping dissolved organic matter 1411
characteristics in stream ecosystems. Limnology and Oceanography 55:1159-1171. 1412
1413
Williamson, R.B. and J.G. Cooke, 1985. The effect of storms on nitrification rates in a small 1414
stream. Water Research 19:435–440. 1415
1416
Wilson, H. F. and M. A. Xenopoulos, 2009. Effects of agricultural land use on the composition 1417
of fluvial dissolved organic matter. Nature Geoscience 2:37-41. 1418
1419
Wollheim, W. M., B. A. Pellerin, C. J. Vorosmarty and C. S. Hopkinson, 2005. N retention in 1420
urbanizing headwater catchments. Ecosystems 8:871-884. 1421
1422
Yang, S., S. Peng, J. Xu, Y. Luo, and D. Li. 2012. Methane and nitrous oxide emissions from 1423
paddy field as affected by water-saving irrigation. Physics and Chemistry of the Earth 53-1424
54:30-37. 1425
1426
Zeng, F. W. and C. A. Masiello. 2010. Sources of CO2 evasion from two subtropical rivers in 1427
North America. Biogeochemistry 100:211-225. 1428
1429
Zhang, J. Z., C. R. Kelble, C. J. Fischer and L. Moore, 2009. Hurricane Katrina induced nutrient 1430
runoff from an agricultural area to coastal waters in Biscayne Bay, Florida. Estuarine 1431
Coastal and Shelf Science 84:209-218. 1432
1433
Zhang, S., X. X. Lu, H. Sun, J. Han and D. L. Higgitt, 2009. Major ion chemistry and dissolved 1434
inorganic carbon cycling in a human-disturbed mountainous river (the Luodingjiang 1435
River) of the Zhujiang (Pearl River), China. Sci Total Environ 407:2796-2807. 1436
1437
Page 45 of 66 JAWRA Draft
123456789101112131415161718192021222324252627282930313233343536373839404142434445464748495051525354555657585960
For Peer Review
46
Zhang, X. Y., X. M. Liu, M. H. Zhang, R. A. Dahlgren and M. Eitzel, 2010. A review of 1438
vegetated buffers and a meta-analysis of their mitigation efficacy in reducing nonpoint 1439
source pollution. Journal of Environmental Quality 39:76-84. 1440
1441
Zou, J., Y. Huang, J. Jiang, X. Zheng, and R.L. Sass, 2005. A 3-year field measurement of 1442
methane and nitrous oxide emissions from rice paddies in China: effects of water regime, 1443
crop residue, and fertilizer application. Global Biogeochemical Cycles 19. 1444
1445
Zucker, L. a. B. L., 1998. Agricultural drainage: water quality impacts and subsurface drainage 1446
studies in the Midwest. Ohio State University Extension Bulletin 871, The Ohio State 1447
University. 1448
1449
1450
Page 46 of 66JAWRA Draft
123456789101112131415161718192021222324252627282930313233343536373839404142434445464748495051525354555657585960
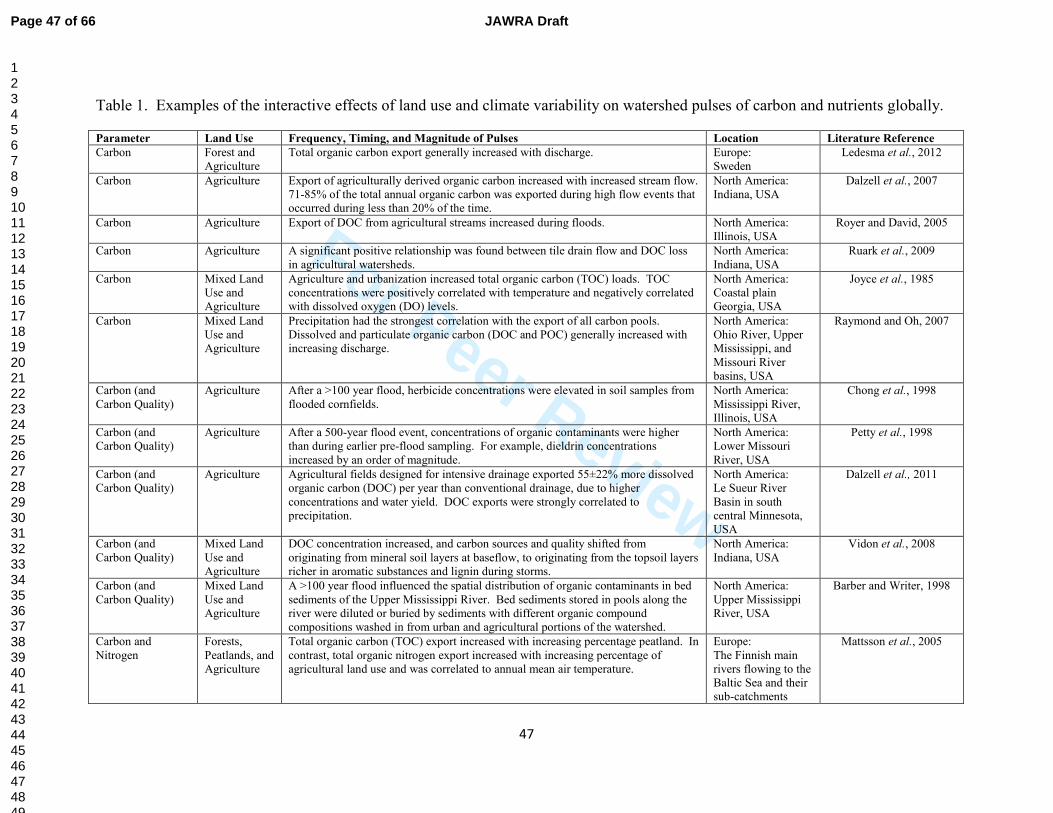
For Peer Review
47
Table 1. Examples of the interactive effects of land use and climate variability on watershed pulses of carbon and nutrients globally.
Parameter Land Use Frequency, Timing, and Magnitude of Pulses Location Literature Reference
Carbon Forest and
Agriculture
Total organic carbon export generally increased with discharge. Europe:
Sweden
Ledesma et al., 2012
Carbon Agriculture Export of agriculturally derived organic carbon increased with increased stream flow.
71-85% of the total annual organic carbon was exported during high flow events that
occurred during less than 20% of the time.
North America:
Indiana, USA
Dalzell et al., 2007
Carbon Agriculture Export of DOC from agricultural streams increased during floods. North America:
Illinois, USA
Royer and David, 2005
Carbon Agriculture A significant positive relationship was found between tile drain flow and DOC loss
in agricultural watersheds.
North America:
Indiana, USA
Ruark et al., 2009
Carbon Mixed Land
Use and
Agriculture
Agriculture and urbanization increased total organic carbon (TOC) loads. TOC
concentrations were positively correlated with temperature and negatively correlated
with dissolved oxygen (DO) levels.
North America:
Coastal plain
Georgia, USA
Joyce et al., 1985
Carbon Mixed Land
Use and
Agriculture
Precipitation had the strongest correlation with the export of all carbon pools.
Dissolved and particulate organic carbon (DOC and POC) generally increased with
increasing discharge.
North America:
Ohio River, Upper
Mississippi, and
Missouri River
basins, USA
Raymond and Oh, 2007
Carbon (and
Carbon Quality)
Agriculture After a >100 year flood, herbicide concentrations were elevated in soil samples from
flooded cornfields.
North America:
Mississippi River,
Illinois, USA
Chong et al., 1998
Carbon (and
Carbon Quality)
Agriculture After a 500-year flood event, concentrations of organic contaminants were higher
than during earlier pre-flood sampling. For example, dieldrin concentrations
increased by an order of magnitude.
North America:
Lower Missouri
River, USA
Petty et al., 1998
Carbon (and
Carbon Quality)
Agriculture Agricultural fields designed for intensive drainage exported 55±22% more dissolved
organic carbon (DOC) per year than conventional drainage, due to higher
concentrations and water yield. DOC exports were strongly correlated to
precipitation.
North America:
Le Sueur River
Basin in south
central Minnesota,
USA
Dalzell et al., 2011
Carbon (and
Carbon Quality)
Mixed Land
Use and
Agriculture
DOC concentration increased, and carbon sources and quality shifted from
originating from mineral soil layers at baseflow, to originating from the topsoil layers
richer in aromatic substances and lignin during storms.
North America:
Indiana, USA
Vidon et al., 2008
Carbon (and
Carbon Quality)
Mixed Land
Use and
Agriculture
A >100 year flood influenced the spatial distribution of organic contaminants in bed
sediments of the Upper Mississippi River. Bed sediments stored in pools along the
river were diluted or buried by sediments with different organic compound
compositions washed in from urban and agricultural portions of the watershed.
North America:
Upper Mississippi
River, USA
Barber and Writer, 1998
Carbon and
Nitrogen
Forests,
Peatlands, and
Agriculture
Total organic carbon (TOC) export increased with increasing percentage peatland. In
contrast, total organic nitrogen export increased with increasing percentage of
agricultural land use and was correlated to annual mean air temperature.
Europe:
The Finnish main
rivers flowing to the
Baltic Sea and their
sub-catchments
Mattsson et al., 2005
Page 47 of 66 JAWRA Draft
123456789101112131415161718192021222324252627282930313233343536373839404142434445464748495051525354555657585960

For Peer Review
48
Carbon and
Nitrogen
Agriculture
and Mixed
Land Use
During storms DOC concentrations increased, and DOC was transported via a
combination of overland flow and macropore flow. Nitrate concentrations increased
during storms and nitrate was exported with groundwater.
North America:
Indiana, USA
Wagner et al., 2008
Carbon and
Nitrogen
Multiple Land
Uses
There was a general pulse in C and N mineralization and export following rain events
after dry periods.
Multiple Global
Locations
Borken and Matzner, 2009
Carbon and
Nitrogen
Urban Storms caused a significant increase in DOC concentration and a significant decrease
in TDN concentration.
North America:
Portland, Oregon,
USA
Hook and Yeakley, 2005
Carbon, Nitrogen,
and Phosphorus
Agriculture There was a significant positive relationship between precipitation and annual
ammonium, phosphate, and organic matter loads, with increased loading and
concentrations during wet years.
Europe:
Lake Vortsjarv,
Estonia
Noges et al., 2007
Carbon, Nitrogen,
and Phosphorus
Agriculture
and Urban
Gradient
Areal C, N, and P export was correlated to runoff and was significantly higher in the
urban catchment, which had greater runoff from impervious surfaces, and was
significantly lower in the catchment with inland drainage.
Australia:
Perth, Western
Australia
Petrone, 2010
Carbon, Nitrogen,
and Phosphorus
Forest,
Agriculture,
and Urban
Discharge controlled the magnitude and chemical form of nutrients in streams. There
was a negative relationship between N concentrations and stream discharge in
agricultural watersheds, but a positive relationship in urban and forested watersheds.
DOC and phosphorus were also controlled by land use and season, with a positive
relationship with discharge in agricultural and urban watersheds, but a negative
relationship in forested watersheds.
North America:
3 Watersheds of
Mobile Bay,
Alabama, USA
Lehrter, 2006
Carbon, Nitrogen,
Phosphorus, and
Sulfur
Forest,
Agriculture,
and Urban
Incubation experiments showed that warming waters generally increased fluxes of
DOC, nitrate, SRP, and sulfate from sediments to overlying waters for most land
uses.
North America:
Baltimore,
Maryland, USA
Duan and Kaushal, 2013
Carbon, Nitrogen,
Phosphorus, and
Sediment
Forest,
Grassland,
Developed,
and
Agriculture
Concentrations generally increased during wet years. Concentrations also generally
increased as the proportion of developed land or cropland increased. During dry
years, point sources dominated, but during wet years non-point sources dominated.
North America:
Maryland, USA
Jordan et al., 2003
Carbon, Nitrogen,
Phosphorus, and
metals
Forest and
Agriculture
Floods increased concentrations of nitrate and dissolved organic carbon (DOC), and
they increased concentrations of filterable reactive phosphorus and ammonium at a
station downstream from hog farm wastes. Concentrations of particulate P, Si, and
most metals increased during the rising limb of the hydrograph, peaked prior to peak
stormflow, and decreased thereafter.
North America:
Coastal plain North
Carolina, USA
Mulholland et al., 1981
Carbon, Nitrogen,
and Chloride
Agriculture
and Urban
DOC, nitrate, and chloride concentrations increased during storms. The urbanized
watershed had higher export during storms, but lower concentrations of nitrate and
chloride than the agriculture watershed. While nitrate concentration increased with
discharge in the mixed land use watershed, there were no clear patterns with
discharge in the agricultural watershed.
North America:
Indiana, USA
Vidon et al., 2009
Carbon and
Multiple
Contaminants
Multiple Land
Uses
Climate warming and altered hydrology in lakes, rivers, and streams is expected to
impact contaminant flux. For example, reduced water inputs may cause increased
contaminant concentrations and increased hydrologic residence times may increase
North America:
Canada
Schindler, 2001
Page 48 of 66JAWRA Draft
123456789101112131415161718192021222324252627282930313233343536373839404142434445464748495051525354555657585960

For Peer Review
49
biological processing of contaminants.
Nitrogen Forest The coldest and driest winter of a 52-year record led to freezing and thawing of soils,
which contributed substantially to soil nitrate and subsequent record nitrate fluxes
from the watershed.
North America:
Northeastern USA
Mitchell et al., 1996
Nitrogen Forest,
Agriculture,
and Urban
Urban and agricultural watersheds showed a strong increase in concentration during
stormflow conditions. In contrast, there was minimal change in nitrate concentration
in the forested watershed during strormflow conditions.
North America:
Oregon, USA
Poor and McDonnell,
2007
Nitrogen Forest,
Agriculture,
and Urban
The magnitude and timing of watershed N export has been altered by anthropogenic
activities. 80% of N inputs were from from agriculture, and N exports correlated
with climate, precipitation, N inputs, and reservoir releases.
North America:
California, USA
Sobota et al., 2009
Nitrogen Forest,
Agriculture,
and Urban
Following the 2002 drought, N retention declined significantly during the 2003 wet
year in suburban, forest, and agricultural watersheds. The smallest decrease in
retention was in the forested watershed and the greatest drop in N retention was in a
suburban watershed.
North America:
Baltimore,
Maryland, USA
Kaushal et al., 2008
Nitrogen Forest,
Agriculture,
and Urban
There were pulses in atmospheric nitrate-N source contributions in urban watersheds
during storms. Additionally, nitrate-N concentrations decreased during storms.
North America:
Baltimore,
Maryland, USA
Kaushal et al., 2011
Nitrogen Forest and
Urban
It was estimated that urbanization increased N loading by 45% and reduced N
retention by 8-32%. Watershed N retention decreased with increasing runoff.
North America:
Massachusetts, USA
Wollheim et al., 2005
Nitrogen Agriculture Regression modeling indicated that a 10% increase in annual discharge due to
climate and heavier fertilizer use for expanded corn production could increase
riverine N export by as much as 24%.
North America:
Lake Michigan
Watersheds, USA
Han et al., 2009
Nitrogen Agriculture Most of the nitrate-N exports occurred during the fallow season, when most of the
drainage occurred.
North America:
Indiana, USA
Kladivko et al., 2004
Nitrogen Agriculture Higher nitrate concentrations were associated with higher flow volumes and no
dilution occurred even with prolonged flushing events.
North America:
Indiana, USA
Hofmann et al., 2004
Nitrogen Agriculture There was a positive relationship between precipitation amount and nitrate and
ammonia export rates, but not with DON export rates.
North America:
Indiana, USA
Cuadra and Vidon, 2011
Nitrogen Agriculture Large storms (peak flow = 5 times mean base flow) led to significant drops in
nitrification rates, probably as a result of scouring and sloughing of nitrifiers. The
recovery period for return to pre-storm nitrification rates (for 1 storm) was greater
than 14 days.
Australia and
Oceania:
New Zealand
Williamson and Cooke,
1985
Nitrogen Urban There was almost a 100-fold variation in watershed N export in response to storms,
with N build up during dry periods and flushing during wet periods.
North America:
Southwestern USA
Lewis and Grimm, 2007
Nitrogen Multiple Land
Uses
N fluxes may increase by 3 to 17% by 2030 and by 16 to 65% by 2095, with the
increase of net anthropogenic nitrogen inputs as precipitation and discharge.
North America: 16
Watersheds from
Maine to Virginia
Howarth et al., 2006
Nitrogen Mixed Land
Use
Changing land cover and stream discharge caused significant shifts in nitrogen
concentrations. Average concentrations increased with greater urban and agriculture
land use.
North America:
Patuxent River
Watershed,
Maryland, USA
Weller et al., 2003
Nitrogen and
Phosphorus
Forest and
Agriculture
Particulate organic nitrogen and phosphorus, and inorganic phosphorus
concentrations increased up to 3 orders of magnitude during storm events and
ammonia increased up to 5 times, but dissolved organic nitrogen and phosphorus and
North America:
Atlantic Coastal
Plain in Maryland,
Correll et al., 1999
Page 49 of 66 JAWRA Draft
123456789101112131415161718192021222324252627282930313233343536373839404142434445464748495051525354555657585960

For Peer Review
50
nitrate did not change significantly. USA
Nitrogen and
Phosphorus
Forest and
Agriculture
Data from 76 storms showed that concentrations of particulate N and P increased up
to 3 orders of magnitude during storms and usually peaked prior to the peak water
discharge, while concentrations of dissolved forms did not change significantly.
Ammonium had up to a 5-fold increase during storms but remained low compared to
other N forms. The N:P ratios declined during peak flows.
North America:
Maryland, USA
Correll et al., 1999
Nitrogen and
Phosphorus
Forest,
Agriculture,
and Urban
Model results estimated that mean annual N and P loads will increase due to climate
change. Additionally, N loads are expected to increase 50% further when climate
change and urbanization occur concurrently.
North America:
Conestoga River
Basin and its 5
subbasins in
southeastern
Pennsylvania, USA
Chang, 2004
Nitrogen and
Phosphorus
Agriculture More than 50% of the annual nitrate export and 80% of phosphorus export from
agricultural watersheds occurred during pulses at high flow in less than 10% of the
time.
North America:
Illinois, USA
Royer et al., 2006
Nitrogen and
Phosphorus
Formerly
Agriculture
Hourly monitoring of 7 summer thunderstorms (12.5-25 mm of precipitation)
showed that nitrate and phosphate concentrations increased during the rising limb of
storms and decreased during the falling limbs, which suggests surface runoff as their
origin.
North America:
Pennsylvania, USA
McDiffett et al., 1989
Nitrogen and
Phosphorus
Formerly
Agriculture
During a wet year nitrate export was 40% higher than during an average year.
North America:
Northern
Mississippi, USA
Schreiber et al., 1976
Nitrogen and
Phosphorus
Mixed Land
Use During the wet season there were greater proportions of inorganic nitrogen and
phosphorus than the dry season, with higher concentrations associated with higher
discharge.
Australia:
Richmond River
catchment
McKee et al., 2000
Nitrogen and
Phosphorus
Mixed Land
Use
Hurricane Katrina caused a 5.2-fold increase in nitrate and a 2-fold increase in
soluble reactive phosphorus, in Biscayne Bay, Florida.
North America:
Florida, USA
Zhang et al., 2009
Nitrogen,
Phosphorus, and
Sediment
Urban The first flush of a storm event had the strongest increase on total suspended solids,
followed by ammonia, total Kjeldahl nitrogen, nitrate, total phosphorus, and then
orthophosphate.
North America:
Raleigh, North
Carolina, USA
Hathaway et al., 2012
Nitrogen,
Phosphorus,
Sediment, and
Bacteria
Agriculture,
Urban, and
Undeveloped
Coastal watersheds deliver water and contaminants in discrete pulses. During El
Niño years, 1 in 5 events produced temporary near-shore nitrate and phosphate
concentrations that are approximately 5-10 times above ambient conditions.
North America:
Southern California,
USA
Beighley et al., 2008
Phosphorus Forested and
Agriculture
Near-stream surface runoff during storms and the amount of soil P, controls P
exports from the watershed.
North America:
Pennsylvania, USA
Sharpley et al., 1999
Phosphorus Forest,
Agriculture,
and Urban
P export increased with high flow conditions and with increased urbanization.
Additionally, a temperature dependence of SRP release from sediments was found,
with SRP concentrations being highest during summer and lowest during winter.
North America:
Baltimore,
Maryland
LTER Site, USA
Duan et al., 2012
Page 50 of 66JAWRA Draft
123456789101112131415161718192021222324252627282930313233343536373839404142434445464748495051525354555657585960

For Peer Review
51
Phosphorus Multiple Land
Uses
Soluble reactive phosphorus (SRP) concentrations were positively correlated with
water temperature and this correlation increased further downriver in the Mississippi
River.
North America:
Mississippi River
and Northern Gulf
of Mexico
Duan et al., 2011
Phosphorus Agriculture A significant positive relationship was found between soluble reactive phosphorus
(SRP) and total phosphorus (TP) with discharge. Phosphorus was transported during
storms primarily through macropores.
North America:
Indiana, USA
Vidon et al., 2011
Phosphorus Agriculture Dissolved reactive phosphorus (DRP) and particulate P (PP) concentrations in both
streams and agricultural tile drains increased with stream flow. PP concentrations
dominated during overland runoff events. The highest DRP concentrations in the
streams were associated with rain events occurring directly after phosphorus fertilizer
applications on frozen soils.
North America:
3 streams in east-
central Illinois,
USA
Gentry et al., 2007
GHG
Hydrologic and
Thermal conditions Land use Frequency, Timing and Magnitude of Pulses Watershed Position
Geographic
Location Citation
CH4
CO2
N2O
Flood pulses and
steady flow Urban
An experimentally pulsed flooding of wastewater treatment wetlands
increased N2O and CH4 emissions, but may have also been influenced
by higher biochemical oxygen demand in the flooded wetlands. CO2
emissions were negatively related to water-table depth and positively
related to temperature.
Constructed
Wetlands Estonia, Europe
Mander et al.,
2011
CH4
N2O
Variability in flow
conditions Urban
In a created wetland, N2O and CH4 were both correlated positively
with DOC in the overlying water. Constructed Wetland Norway, Europe
Sovik et al.,
2006
N2O Baseflow Urban
In a riparian buffer zone receiving wastewater, N2O emissions from
urban runoff were most highly correlated with soil moisture/sediment
water content.
Riparian Buffer China, Asia Huang et al.,
2013
CH4 Baseflow Urban Temperature is a major driver of CH4 fluxes in two degraded wetlands
receiving polluted water. There were diurnal patterns at both sites. Riparian Wetlands India, Asia
Verma et al.,
1999
Table 2. Examples of greenhouse gas (GHG) pulses and emissions in riparian zones and floodplains across watershed land use.
Page 51 of 66 JAWRA Draft
123456789101112131415161718192021222324252627282930313233343536373839404142434445464748495051525354555657585960
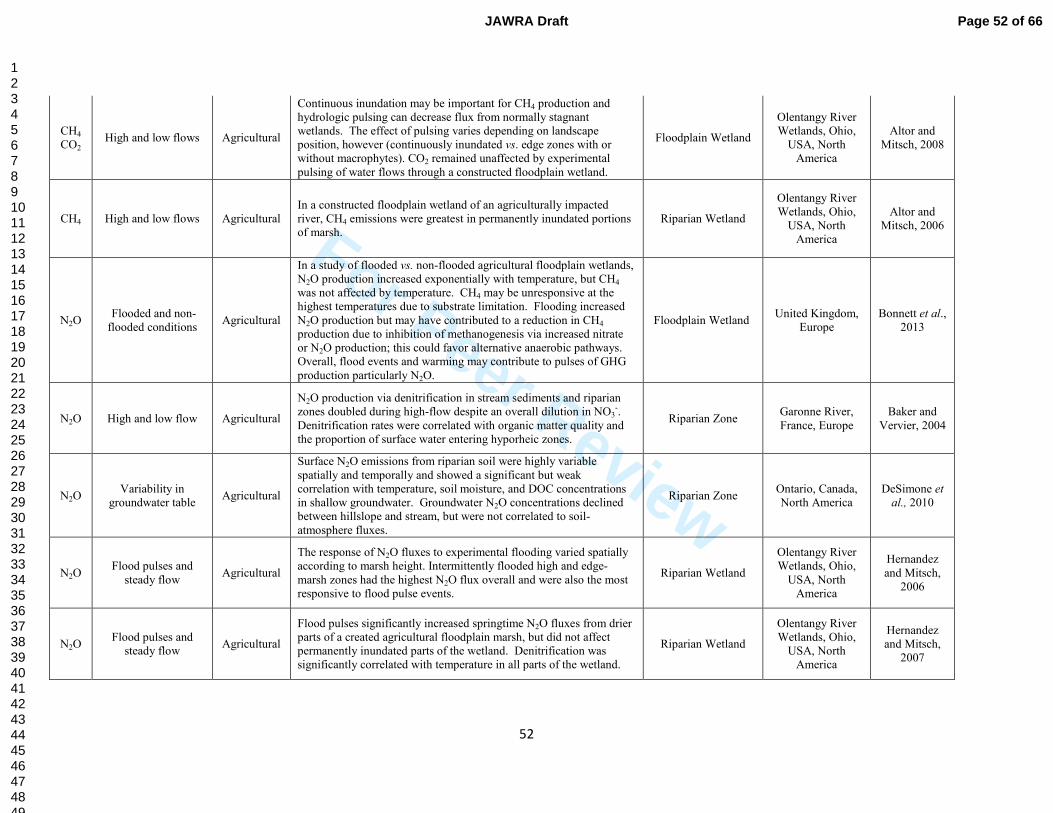
For Peer Review
52
CH4
CO2 High and low flows Agricultural
Continuous inundation may be important for CH4 production and
hydrologic pulsing can decrease flux from normally stagnant
wetlands. The effect of pulsing varies depending on landscape
position, however (continuously inundated vs. edge zones with or
without macrophytes). CO2 remained unaffected by experimental
pulsing of water flows through a constructed floodplain wetland.
Floodplain Wetland
Olentangy River
Wetlands, Ohio,
USA, North
America
Altor and
Mitsch, 2008
CH4 High and low flows Agricultural
In a constructed floodplain wetland of an agriculturally impacted
river, CH4 emissions were greatest in permanently inundated portions
of marsh.
Riparian Wetland
Olentangy River
Wetlands, Ohio,
USA, North
America
Altor and
Mitsch, 2006
N2O Flooded and non-
flooded conditions Agricultural
In a study of flooded vs. non-flooded agricultural floodplain wetlands,
N2O production increased exponentially with temperature, but CH4
was not affected by temperature. CH4 may be unresponsive at the
highest temperatures due to substrate limitation. Flooding increased
N2O production but may have contributed to a reduction in CH4
production due to inhibition of methanogenesis via increased nitrate
or N2O production; this could favor alternative anaerobic pathways.
Overall, flood events and warming may contribute to pulses of GHG
production particularly N2O.
Floodplain Wetland United Kingdom,
Europe
Bonnett et al.,
2013
N2O High and low flow Agricultural
N2O production via denitrification in stream sediments and riparian
zones doubled during high-flow despite an overall dilution in NO3-.
Denitrification rates were correlated with organic matter quality and
the proportion of surface water entering hyporheic zones.
Riparian Zone Garonne River,
France, Europe
Baker and
Vervier, 2004
N2O Variability in
groundwater table Agricultural
Surface N2O emissions from riparian soil were highly variable
spatially and temporally and showed a significant but weak
correlation with temperature, soil moisture, and DOC concentrations
in shallow groundwater. Groundwater N2O concentrations declined
between hillslope and stream, but were not correlated to soil-
atmosphere fluxes.
Riparian Zone Ontario, Canada,
North America
DeSimone et
al., 2010
N2O Flood pulses and
steady flow Agricultural
The response of N2O fluxes to experimental flooding varied spatially
according to marsh height. Intermittently flooded high and edge-
marsh zones had the highest N2O flux overall and were also the most
responsive to flood pulse events.
Riparian Wetland
Olentangy River
Wetlands, Ohio,
USA, North
America
Hernandez
and Mitsch,
2006
N2O Flood pulses and
steady flow Agricultural
Flood pulses significantly increased springtime N2O fluxes from drier
parts of a created agricultural floodplain marsh, but did not affect
permanently inundated parts of the wetland. Denitrification was
significantly correlated with temperature in all parts of the wetland.
Riparian Wetland
Olentangy River
Wetlands, Ohio,
USA, North
America
Hernandez
and Mitsch,
2007
Page 52 of 66JAWRA Draft
123456789101112131415161718192021222324252627282930313233343536373839404142434445464748495051525354555657585960

For Peer Review
53
N2O Variability in soil
water content Agricultural
In tropical agricultural soils, N2O pulses occurred during the early
wet-season. When N and C were not limiting, water-filled pore space
of soil was the dominant controller of N2O fluxes.
Riparian Forest Thailand, Asia Kachenchart
et al., 2012
N2O Variability in soil
water content Agricultural
Denitrification was controlled by water-filled pore space along a
riparian zone-hillslope transect, with the highest rates occurring
between 60-80%. N2O accounted for 10-50% of denitrification, but
the N2:N2O ratio varied with water-filled pore space and distance from
the stream surface.
Riparian Zone United Kingdom,
Europe
Machefert
and Dise,
2004
CO2
Variability in
groundwater table
and soil moisture
Agricultural
CO2 exchange is much greater in riparian areas than in the adjacent
grasslands, and land use (tilling and fertilizer applications) appeared
to be more important than differences in microclimate between sites.
Riparian Zone Ontario, Canada,
North America
Petrone et al.,
2008
CH4
CO2
N2O
Variability in
groundwater table Agricultural
Experimental water table lowering increased CO2 and N2O in
otherwise permanently wetted areas while CH4 remained the same or
decreased. The effect of drawdown on more upland parts of the
landscape was variable for each GHG.
Prairie Pothole
Wetlands
Nebraska, USA,
North America
Phillips and
Beeri, 2008
CH4
CO2
Flood pulses and
steady flow Agricultural
Seasonal sampling at a variety of sites spanning different flooding
frequency showed that CO2 and CH4 emissions from riparian and
hyporheic zones are controlled mainly by organic matter in sediments
and soil properties.
Floodplain
Thur River,
Switzerland,
Europe
Samaritani et
al., 2011
CH4 High flow and low
flow Agricultural
CH4 emissions were strongly correlated with soil temperature and
carbon content, and soil inundation in a constructed wetland. An
extreme drought led to CH4 consumption of 0.04 mg CH4-C m−2 h−1
on one sampling date. CH4 was higher in permanently flooded areas
than intermittently flooded.
Constructed Wetland
Olentangy River
Wetlands, Ohio,
USA, North
America
Sha et al.,
2011
CO2
CH4
N2O
Variability in soil
moisture conditions Agricultural
Higher groundwater level significantly increased CH4 emission and
decreased CO2 and N2O emission. All three GHGs were positively
correlated with increased temperature.
Riparian Zone Estonia, Europe Soosaar et al.,
2011
CO2
CH4
N2O
Baseflow, stormflow
(four seasons) Agricultural
Seasonal pulses were important for CH4, CO2, and N2O. Daily and
hourly fluxes in temperature and moisture led to pulses as well, and
surface flow design had more extreme pulses than subsurface flow
wetlands.
Constructed
Wetlands
Nova Scotia,
Canada
VanderZaag
et al., 2011
N2O Variability in soil
moisture conditions Agricultural
Large magnitude fluxes of N2O followed fertilizer application and
lasted for several months. Smaller pulses coincided with mid-winter
increases in soil moisture and NO3- concentrations.
Riparian Zone Seine Basin,
France), Europe
Vilain et al.,
2010
N2O
CH4
Flooded and Dry
Riparian Soil
Agriculture
and Forested
CH4 fluxes were highest in the most frequently flooded parts of the
riparian zone and related to soil organic matter and water-filled pore Riparian Zone Denmark, Europe
Ambus and
Christensen,
Page 53 of 66 JAWRA Draft
123456789101112131415161718192021222324252627282930313233343536373839404142434445464748495051525354555657585960

For Peer Review
54
space. N2O fluxes from a riparian grassland were unrelated to
flooding frequency, soil organic matter, or soil exchangeable
inorganic N, however.
1995
N2O Variability in soil
moisture conditions Agriculture
N2O fluxes in riparian grasslands with active grazing by cows were
not correlated with NO3-, temperature, or soil moisture, due to
overriding effects of soil compaction, which introduced micro-site
variability.
Riparian Zone
Georgia, United
States, North
America
Walker et al.,
2002
N2O Variability in soil
moisture conditions Agriculture
N2O emissions from two N-loaded buffer zones were correlated with
groundwater NO3- concentration.
Riparian Zone Netherlands,
Europe
Hefting et al.,
2003
CH4
N2O
Variability in
groundwater table Agriculture
In a strongly eutrophic agricultural pond in Germany, N2O was
significantly lower when the water table was high and CH4 was
significantly higher. In a weakly eutrophic pond, there was no effect
of water table on CH4 or N2O.
Riparian Wetlands Germany, Europe Merbach et
al., 1996
N2O High, medium, low
flood frequency
Agriculture
(relict) &
Forest
Measurements of N2O emissions in a floodplain showed that N2O was
highest in frequently flooded parts of the floodplain. Temporal trends,
however, showed that N2O pulses were greater after short-duration
floods than long-duration.
Riparian Buffer and
Floodplain
White River,
Indiana, USA,
North America
Jacinthe et al.,
2012
CO2
N2O
Experimental
temperature
manipulation
Agricultural
Results from a laboratory experimental increase in temperature
showed an increase in both CO2 and N2O from agricultural riparian
wetland soils.
Riparian Wetland Spain, Europe Munoz-Leoz
et al., 2011
CH4
N2O
Drained, natural and
restored water table Agricultural
Rewetting contributes considerably to mitigating GHG emission (in
CO2 equivalents) from formerly-drained agricultural peatlands by
decreasing CO2 and N2O emissions, compared to an agricultural,
drained peatland.
Agricultural Peatland Germany, Europe Beetz et al.,
2013
CH4
N2O
Variability in soil
moisture and
groundwater table
Agricultural
Major pulses of CH4 and N2O occurred during rapid water-table drop
in which water-filled pore space decreased from 80% to <60%. Both
GHGs also exhibited seasonal and spatial variability within prairie
pothole ponds.
Prairie Pothole
Wetlands
Saskatchewan,
Canada, North
America
Pennock et
al., 2010
N2O
Experimental
temperature
manipulation
Agricultural
Potential N2O production via denitrification activity is strongly related
to temperature in riparian soils. NO3- and organic C availability are
also strong drivers of denitrification kinetics.
Riparian Buffer Netherlands,
Europe
Maag et al.,
1997
Page 54 of 66JAWRA Draft
123456789101112131415161718192021222324252627282930313233343536373839404142434445464748495051525354555657585960
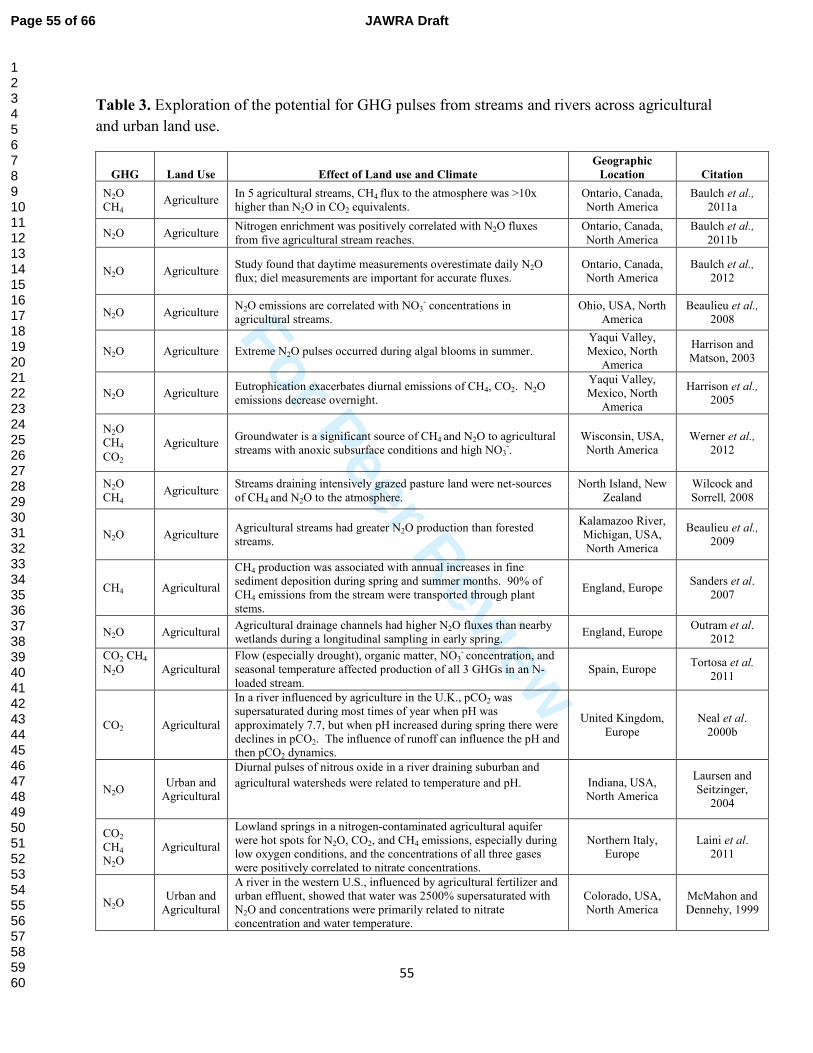
For Peer Review
55
Table 3. Exploration of the potential for GHG pulses from streams and rivers across agricultural
and urban land use.
GHG Land Use Effect of Land use and Climate
Geographic
Location Citation
N2O
CH4 Agriculture
In 5 agricultural streams, CH4 flux to the atmosphere was >10x
higher than N2O in CO2 equivalents.
Ontario, Canada,
North America
Baulch et al.,
2011a
N2O Agriculture Nitrogen enrichment was positively correlated with N2O fluxes
from five agricultural stream reaches.
Ontario, Canada,
North America
Baulch et al.,
2011b
N2O Agriculture Study found that daytime measurements overestimate daily N2O
flux; diel measurements are important for accurate fluxes.
Ontario, Canada,
North America
Baulch et al.,
2012
N2O Agriculture N2O emissions are correlated with NO3
- concentrations in
agricultural streams.
Ohio, USA, North
America
Beaulieu et al.,
2008
N2O Agriculture Extreme N2O pulses occurred during algal blooms in summer.
Yaqui Valley,
Mexico, North
America
Harrison and
Matson, 2003
N2O Agriculture Eutrophication exacerbates diurnal emissions of CH4, CO2. N2O
emissions decrease overnight.
Yaqui Valley,
Mexico, North
America
Harrison et al.,
2005
N2O
CH4
CO2
Agriculture Groundwater is a significant source of CH4 and N2O to agricultural
streams with anoxic subsurface conditions and high NO3-.
Wisconsin, USA,
North America
Werner et al.,
2012
N2O
CH4 Agriculture
Streams draining intensively grazed pasture land were net-sources
of CH4 and N2O to the atmosphere.
North Island, New
Zealand
Wilcock and
Sorrell, 2008
N2O Agriculture Agricultural streams had greater N2O production than forested
streams.
Kalamazoo River,
Michigan, USA,
North America
Beaulieu et al.,
2009
CH4 Agricultural
CH4 production was associated with annual increases in fine
sediment deposition during spring and summer months. 90% of
CH4 emissions from the stream were transported through plant
stems.
England, Europe Sanders et al.
2007
N2O Agricultural Agricultural drainage channels had higher N2O fluxes than nearby
wetlands during a longitudinal sampling in early spring. England, Europe
Outram et al.
2012
CO2 CH4
N2O
Agricultural
Flow (especially drought), organic matter, NO3- concentration, and
seasonal temperature affected production of all 3 GHGs in an N-
loaded stream.
Spain, Europe Tortosa et al.
2011
CO2 Agricultural
In a river influenced by agriculture in the U.K., pCO2 was
supersaturated during most times of year when pH was
approximately 7.7, but when pH increased during spring there were
declines in pCO2. The influence of runoff can influence the pH and
then pCO2 dynamics.
United Kingdom,
Europe
Neal et al.
2000b
N2O Urban and
Agricultural
Diurnal pulses of nitrous oxide in a river draining suburban and
agricultural watersheds were related to temperature and pH.
Indiana, USA,
North America
Laursen and
Seitzinger,
2004
CO2
CH4
N2O
Agricultural
Lowland springs in a nitrogen-contaminated agricultural aquifer
were hot spots for N2O, CO2, and CH4 emissions, especially during
low oxygen conditions, and the concentrations of all three gases
were positively correlated to nitrate concentrations.
Northern Italy,
Europe
Laini et al.
2011
N2O Urban and
Agricultural
A river in the western U.S., influenced by agricultural fertilizer and
urban effluent, showed that water was 2500% supersaturated with
N2O and concentrations were primarily related to nitrate
concentration and water temperature.
Colorado, USA,
North America
McMahon and
Dennehy, 1999
Page 55 of 66 JAWRA Draft
123456789101112131415161718192021222324252627282930313233343536373839404142434445464748495051525354555657585960
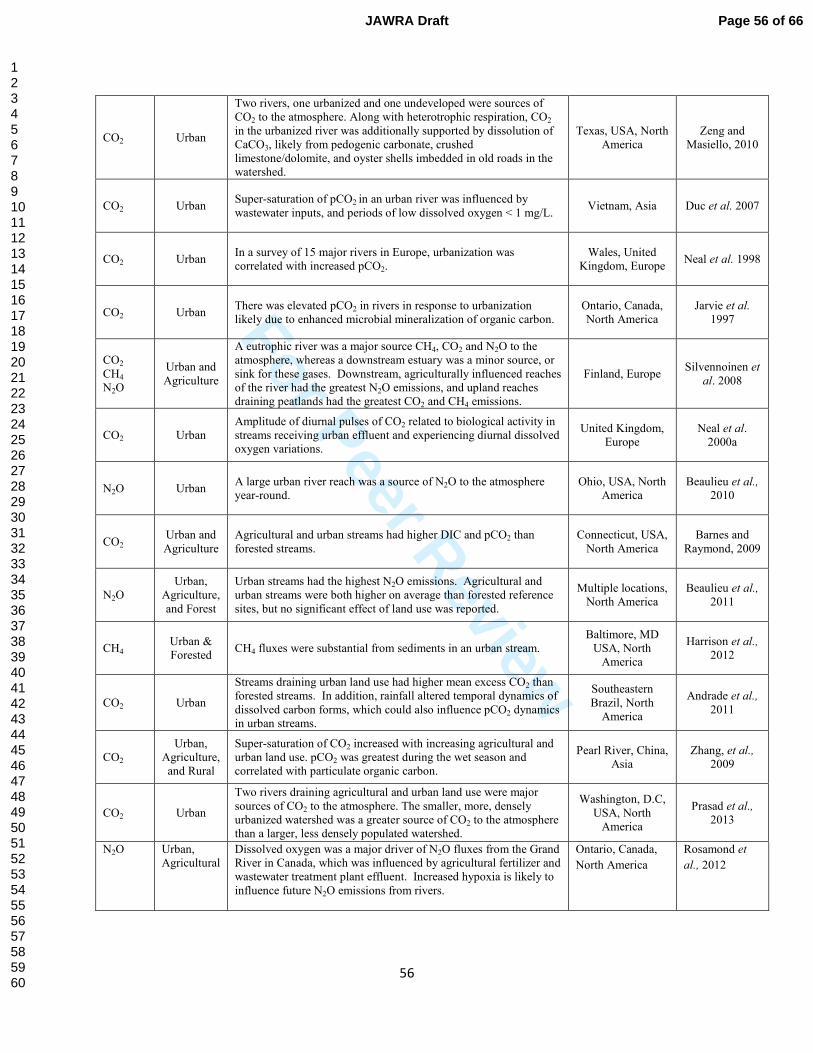
For Peer Review
56
CO2 Urban
Two rivers, one urbanized and one undeveloped were sources of
CO2 to the atmosphere. Along with heterotrophic respiration, CO2
in the urbanized river was additionally supported by dissolution of
CaCO3, likely from pedogenic carbonate, crushed
limestone/dolomite, and oyster shells imbedded in old roads in the
watershed.
Texas, USA, North
America
Zeng and
Masiello, 2010
CO2 Urban Super-saturation of pCO2 in an urban river was influenced by
wastewater inputs, and periods of low dissolved oxygen < 1 mg/L. Vietnam, Asia Duc et al. 2007
CO2 Urban In a survey of 15 major rivers in Europe, urbanization was
correlated with increased pCO2.
Wales, United
Kingdom, Europe Neal et al. 1998
CO2 Urban There was elevated pCO2 in rivers in response to urbanization
likely due to enhanced microbial mineralization of organic carbon.
Ontario, Canada,
North America
Jarvie et al.
1997
CO2
CH4
N2O
Urban and
Agriculture
A eutrophic river was a major source CH4, CO2 and N2O to the
atmosphere, whereas a downstream estuary was a minor source, or
sink for these gases. Downstream, agriculturally influenced reaches
of the river had the greatest N2O emissions, and upland reaches
draining peatlands had the greatest CO2 and CH4 emissions.
Finland, Europe Silvennoinen et
al. 2008
CO2 Urban
Amplitude of diurnal pulses of CO2 related to biological activity in
streams receiving urban effluent and experiencing diurnal dissolved
oxygen variations.
United Kingdom,
Europe
Neal et al.
2000a
N2O Urban A large urban river reach was a source of N2O to the atmosphere
year-round.
Ohio, USA, North
America
Beaulieu et al.,
2010
CO2 Urban and
Agriculture
Agricultural and urban streams had higher DIC and pCO2 than
forested streams.
Connecticut, USA,
North America
Barnes and
Raymond, 2009
N2O
Urban,
Agriculture,
and Forest
Urban streams had the highest N2O emissions. Agricultural and
urban streams were both higher on average than forested reference
sites, but no significant effect of land use was reported.
Multiple locations,
North America
Beaulieu et al.,
2011
CH4 Urban &
Forested CH4 fluxes were substantial from sediments in an urban stream.
Baltimore, MD
USA, North
America
Harrison et al.,
2012
CO2 Urban
Streams draining urban land use had higher mean excess CO2 than
forested streams. In addition, rainfall altered temporal dynamics of
dissolved carbon forms, which could also influence pCO2 dynamics
in urban streams.
Southeastern
Brazil, North
America
Andrade et al.,
2011
CO2
Urban,
Agriculture,
and Rural
Super-saturation of CO2 increased with increasing agricultural and
urban land use. pCO2 was greatest during the wet season and
correlated with particulate organic carbon.
Pearl River, China,
Asia
Zhang, et al.,
2009
CO2 Urban
Two rivers draining agricultural and urban land use were major
sources of CO2 to the atmosphere. The smaller, more, densely
urbanized watershed was a greater source of CO2 to the atmosphere
than a larger, less densely populated watershed.
Washington, D.C,
USA, North
America
Prasad et al.,
2013
N2O Urban,
Agricultural
Dissolved oxygen was a major driver of N2O fluxes from the Grand
River in Canada, which was influenced by agricultural fertilizer and
wastewater treatment plant effluent. Increased hypoxia is likely to
influence future N2O emissions from rivers.
Ontario, Canada,
North America
Rosamond et
al., 2012
Page 56 of 66JAWRA Draft
123456789101112131415161718192021222324252627282930313233343536373839404142434445464748495051525354555657585960

For Peer Review
57
CO2 Urban,
Agricultural
The Hudson River was super-saturated with CO2 on all dates
throughout a year. The more urbanized downstream section had
greater CO2 emissions than the upstream section, but only during
summer months.
New York, USA,
North America
Raymond et al.,
1997
Page 57 of 66 JAWRA Draft
123456789101112131415161718192021222324252627282930313233343536373839404142434445464748495051525354555657585960

For Peer Review
58
Table 4. Sensors show potential to detect variability in nitrate and carbon quality across storms and diurnal time scales.
Citation Land use Parameter Ranges
Source of temporal variability
Heffernan and Cohen,
2010
Agriculture Nitrate 381 - 456 µg/L
(spring); 451 -
488 µg/L (fall)
Spring water chemistry inputs to river;
primary productivity
Pellerin et al., 2009 Agriculture Nitrate 1.72 – 2.47 mg/L Riverine processes; irrigation return flow
Moraetis et al., 2010 Agriculture Nitrate 1.25 – 1.75 mg/L
(fall); 0.5 – 2.5
mg/L (summer)
In-stream biogeochemical processes
Ferrant et al., 2012 Agriculture Nitrate 5 - 35 mg/L Flood events
Heffernan et al., 2010 Agriculture Nitrate 0.38 – 0.46 mg
/L ; (spring);
0.45 – 0.49 mg /
L (fall)
Autotrophic assimilation
de Montety et al.,
2011
Agriculture Nitrate
0.032-0.036 mM Photosynthesis and respiration of subaquatic
vegetation
Saraceno et al., 2009 Agriculture FDOM (fluorescent
fraction of colored DOM)
24- 33 ppb QSE
(quinine sulfate
equivalents)
during base flow
Diurnal signals during base flow – possibly a
combination of groundwater and algal
sources, potentially with microbial grazing
and photodegradation processes; storm flow -
agricultural soil drainage.
Henjum et al.,
2010a, b
Urban Nitrate 100-450 µg/L Sewage from leaking pipes or septic into
shallow groundwater; stormwater ponds
VerHoef et al., 2011;
VerHoef, 2012
Urban Nitrate 1-2 mg/L Groundwater inputs; dilution during storms;
diurnal stream processing during base flow.
Page 58 of 66JAWRA Draft
123456789101112131415161718192021222324252627282930313233343536373839404142434445464748495051525354555657585960
For Peer Review
59
Figure Captions
Figure 1. Tile drains are pervasive in agricultural watersheds such as those in Indiana (Source
Baker et al. 2006) (left panel). Similarly, many natural streams (blue lines) have been placed
underground and there has been a vast expansion of storm drain networks in urban areas such as
Baltimore, Maryland (brown lines) (right panel) (Data Courtesy of Bill Stack and Baltimore City
Department of Public Works).
Figure 2. An example of long-term variability in streamflow for the Potomac River near
Washington D.C. Streamflow data obtained from the USGS River Input Monitoring (RIM)
Program and modified from Kaushal et al., 2010.
Figure 3. Example of an interannual pulse and a lag time in N export during a record drought
and wet year in watersheds of the Baltimore Ecosystem Study Long-Term Ecological Research
site (modified from Kaushal et al., 2008; Kaushal et al., 2011)
Figure 4. Relationships between annual runoff and total nitrogen export and total phosphorus
exports during 2000-2004 for the Baltimore Ecosystem Study Long-Term Ecological Research
site; export data based on Groffman et al., 2004, Kaushal et al., 2008, Duan et al., 2012.
*Relationships between runoff and total nitrogen export are compared to minimally disturbed
watersheds of the USGS Hydrologic Benchmark Network (Lewis 2002).
Figure 5. A conceptual model exploring potential effects of drivers related to land use and
climate change on CO2, CH4, and N2O emissions from riparian zones/floodplains and
streams/rivers. (+) denotes a general increase (-) denotes a general decrease (+/-) indicates a
variable response, and (?) denotes too few studies. References A (Flooding): Increased N2O
pulses from riparian zones/floodplains/wetlands follow flooding (Sovik et al. 2007; Baker and
Vervier 2004; Hernandez et al. 2006; Hernandez and Mitsch, 2007; Kachenchart et al. 2012;
Machefert and Dise 2004; and Huang et al. 2013). CH4 is controlled more by inundation time
than flood pulses (e.g. Altor and Mitsch, 2008, Sha et al. 2011; Zhou et al. 2005; Pennock et al.
2010). Flooding can decrease CO2 emissions temporarily (Soosaar et al. 2011; Mander et al.
2011; Beetz et al. 2013) but the overall CO2 response can be variable. There are minimal studies
examining the effect of flooding on in-stream N2O, CH4, and CO2 pulses. References B
(Temperature): Warming can increase N2O emission riparian zones/floodplains/wetlands and
streams/rivers when conditions necessary for denitrification are present (Bonnett et al. 2011;
Hernandez and Mitsch, 2007; Desimonne et al. 2010; Munoz-Leoz et al. 2011; Maag et al. 1997;
Baulch et al. 2012; Laursen and Steitzinger 2004; McMahon and Dennehy 1999). CH4 emissions
can also increase in riparian zones/floodplains/wetlands and streams/rivers with warming, but the
response is not as strong because CH4 consumption also increases (Verma et al. 1999; Sha et al.
2011; Bonnett et al. 2011; Harrison et al. 2005; Yang et al. 2012). Warming can also increase
CO2 emissions (Davidson et al. 1998; Mander et al. 2011; Munoz-Leoz et al. 2011; Verma et al.
1999). Diurnal studies such as Harrison et al. (2005) and Tobias and Bohlke, (2011) also
suggest that temperature can also play a role in stimulating CO2 production in streams/rivers.
Page 59 of 66 JAWRA Draft
123456789101112131415161718192021222324252627282930313233343536373839404142434445464748495051525354555657585960

For Peer Review
60
References C (Organic Carbon): Several studies have found strong relationships with organic
C and N2O in riparian zones/floodplains/wetlands (Sovik et al 2007; Baker and Vervier;
Desimonne et al. 2010; Kachenchart et al. 2012; Maag et al. 1997) and in streams/rivers (Tortosa
et al. 2011; Harrison and Matson 2003). Similarly, riparian wetlands and streams with increased
organic carbon availability tend to have high CH4 production (Samartiani et al. 2011; Mander et
al. 2011; Sha et al. 2011; Ambus and Christensen 1995; Bianchi et al. 1996; Tortosa et al. 2011;
Silvennoinen et al. 2008; Baulch et al. 2011b). Several studies have also found a positive
relationship between DOC and DIC/pCO2 in floodplains, streams and rivers (Samaritani et al.
2011; Andrade et al. 2011; Zhang et al. 2009; Jarvie et al. 1997; Neal et al. 2000; Tortosa et al.
2011). References D (Nutrients): Nutrient enrichment can stimulate N2O in riparian
zones/floodplains/wetlands (Kachenchart et al. 2012; Vilain et al. 2010; Hefting and Bobbink
2003; Maag et al. 1997; Liu et al. 2010) and streams/rivers (Baulch et al. 2011b; Beaulieu et al.
2008; Beaulieu et al. 2011; Outram et al. 2012; Silvennoinen, et al. 2008; McMahon and
Dennehy 1999; Harrison and Matson 2003; Werner et al. 2012; Wilcock and Sorrell, 2008). The
effect of nutrient enrichment on CH4 emissions is less studied, but nutrient addition and
eutrophic conditions tend to favor CH4 production in streams/rivers (Tortosa et al. 2011; Wilcock
and Sorrell 2008; Werner et al. 2012; Baulch et al. 2011a), however some studies have also
found inhibition of CH4 following nitrate fertilization (e.g., Topp et al. 1997). References E
(Oxygen Availability). O2 availability is generally linked to flooding frequency, inundation
time, and the biological oxygen demand (BOD) of floodwaters, and N2O and CH4 can increase in
response to low-O2 availability. N2O emissions tend to be highest when O2 availability is
‘pulsed’ in riparian zones/floodplains/wetlands (e.g. Hernandez and Mitsch 2007; Venterink et
al. 2003; Laini et al. 2011) whereas CH4 is emitted during hypoxic conditions and consumed
during oxic conditions in all ecosystems (e.g. Altor and Mitsch 2006; Sanders et al. 2007;
Harrison et al. 2005; Naqvi et al. 2000; 2010; Yang et al. 2012). CO2 emissions appear to be
generally inhibited by low-oxygen (Mander et al. 2011; Soosaar et al. 2011) in soils but can
increase in low-O2 streams/rivers contributing to a variable response (Duc et al. 2007; Neal et al.
1998; Andrade et al. 2011; Neal et al. 2000; Harrison et al. 2005).
Figure 6. Example of a relatively short-term pulse in specific conductance measured using
conductivity loggers (Solinst, Georgetown, Ontario, Canada) following road salt use during a
winter storm at Minebank Run Stream, Baltimore, MD, USA . Groundwater wells are 1.2 meters
below the ground and stream bed.
Page 60 of 66JAWRA Draft
123456789101112131415161718192021222324252627282930313233343536373839404142434445464748495051525354555657585960

For Peer Review
Figure 1. Tile drains are pervasive in agricultural watersheds such as those in Indiana (Source Baker et al. 2006) (left panel). Similarly, many natural streams (blue lines) have been placed underground and there
has been a vast expansion of storm drain networks in urban areas such as Baltimore, Maryland (brown lines) (right panel) (Data Courtesy of Bill Stack and Baltimore City Department of Public Works).
254x196mm (72 x 72 DPI)
Page 61 of 66 JAWRA Draft
123456789101112131415161718192021222324252627282930313233343536373839404142434445464748495051525354555657585960

For Peer Review
Figure 2. An example of long-term variability in streamflow for the Potomac River near Washington D.C. Streamflow data obtained from the USGS River Input Monitoring (RIM) Program and modified from
Kaushal et al., 2010. 254x196mm (72 x 72 DPI)
Page 62 of 66JAWRA Draft
123456789101112131415161718192021222324252627282930313233343536373839404142434445464748495051525354555657585960

For Peer Review
Figure 3. Example of an interannual pulse and a lag time in N export during a record drought and wet year in watersheds of the Baltimore Ecosystem Study Long-Term Ecological Research site (modified from Kaushal
et al., 2008; Kaushal et al., 2011) 254x196mm (72 x 72 DPI)
Page 63 of 66 JAWRA Draft
123456789101112131415161718192021222324252627282930313233343536373839404142434445464748495051525354555657585960

For Peer Review
Figure 4. Relationships between annual runoff and total nitrogen export and total phosphorus exports during 2000-2004 for the Baltimore Ecosystem Study Long-Term Ecological Research site; export data
based on Groffman et al., 2004, Kaushal et al., 2008, Duan et al., 2012. *Relationships between runoff and total nitrogen export are compared to minimally disturbed watersheds of the USGS Hydrologic Benchmark
Network (Lewis 2002). 254x196mm (72 x 72 DPI)
Page 64 of 66JAWRA Draft
123456789101112131415161718192021222324252627282930313233343536373839404142434445464748495051525354555657585960

For Peer Review
Figure 5.
254x196mm (72 x 72 DPI)
Page 65 of 66 JAWRA Draft
123456789101112131415161718192021222324252627282930313233343536373839404142434445464748495051525354555657585960

For Peer Review
Figure 6. Example of a relatively short-term pulse in specific conductance measured using conductivity loggers (Solinst, Georgetown, Ontario, Canada) following road salt use during a winter storm at Minebank Run Stream, Baltimore, MD, USA . Groundwater wells are 1.2 meters below the ground and stream bed.
254x196mm (72 x 72 DPI)
Page 66 of 66JAWRA Draft
123456789101112131415161718192021222324252627282930313233343536373839404142434445464748495051525354555657585960