Toxic Air Contaminant Emissions Inventory and Dispersion ...
421
DRAFT — 12/5/2007 Toxic Air Contaminant Emissions Inventory and Dispersion Modeling Report for the Dolores and ICTF Rail Yards, Long Beach, California prepared for: Union Pacific Railroad Company December 2007 prepared by: Sierra Research, Inc. 1801 J Street Sacramento, California 95811 (916) 444-6666
-
Upload
khangminh22 -
Category
Documents
-
view
1 -
download
0
Transcript of Toxic Air Contaminant Emissions Inventory and Dispersion ...
DRAFT — 12/5/2007
Toxic Air Contaminant Emissions Inventory and Dispersion Modeling Report for the Dolores and ICTF Rail Yards, Long Beach, California
prepared for:
Union Pacific Railroad Company
December 2007
prepared by: Sierra Research, Inc. 1801 J Street Sacramento, California 95811 (916) 444-6666
Toxic Air Contaminant Emission Inventory and Air Dispersion Modeling Report
for the Dolores and ICTF Rail Yards
Long Beach, California
prepared for:
Union Pacific Railroad Company
December 2007
prepared by:
Sierra Research, Inc. 1801 J Street
Sacramento, CA 95811
and
Robert G. Ireson, Ph.D. Air Quality Management Consulting
161 Vista Grande Greenbrae, CA 94904

-1-
SUMMARY In accordance with the 2005 California Air Resources Board (CARB)/Railroad Statewide
Agreement (MOU), Union Pacific Railroad Company (UPRR) has prepared a facility-
wide emission inventory for the Dolores and Intermodal Container Transfer Facility
(ICTF) Rail Yards (Yards) in Long Beach, California. The inventory quantifies emissions
of criteria pollutants and specified toxic air contaminants (TACs) (including Diesel
particulate matter [DPM]) from stationary, mobile, and portable sources at the Yards.
The Yards are physically separate facilities, but due to their close proximity to one
another, they were treated as one facility for the emission inventory and dispersion
modeling analysis. The inventory was prepared in accordance with CARB’s Rail Yard
Emission Inventory Methodology guidelines (July 2006) and UPRR’s Emission Inventory
Protocol (May 2006).
This inventory differs from those prepared for other UPRR rail yards because it is being
prepared at a time when a similar inventory has been requested for the ICTF/Dolores
yards by the Ports of Los Angeles and Long Beach. To avoid potential confusion
associated with having two, similar but different inventories circulated at the same time,
the requirements of the Ports have combined with those associated with the MOU to
create a single, comprehensive approach to the inventory.
The Dolores Yard serves two primary purposes: flat switching and locomotive servicing.
At a flat switching yard, incoming and outbound train sections are stored in different
track segments, and separated from and connected to other sections to build new trains.
Dolores serves three separate types of trains: manifest (or mixed) freight trains that are
handled within the Dolores Yard; intermodal trains that are handled at ICTF; and
intermodal and other trains that ostensibly terminate or originate in the Yard, but are in
reality handled at on-dock facilities within the Ports of Los Angeles and Long Beach.
The Dolores Yard is also a locomotive servicing facility, which includes a Service Track
and a Locomotive Shop, to provide support to ICTF and other yards in the L.A. Basin.
Operations include both basic service (refueling, sanding, cleaning, etc.) and major
planned and unscheduled maintenance for locomotives serving Dolores, ICTF, and the
-2-
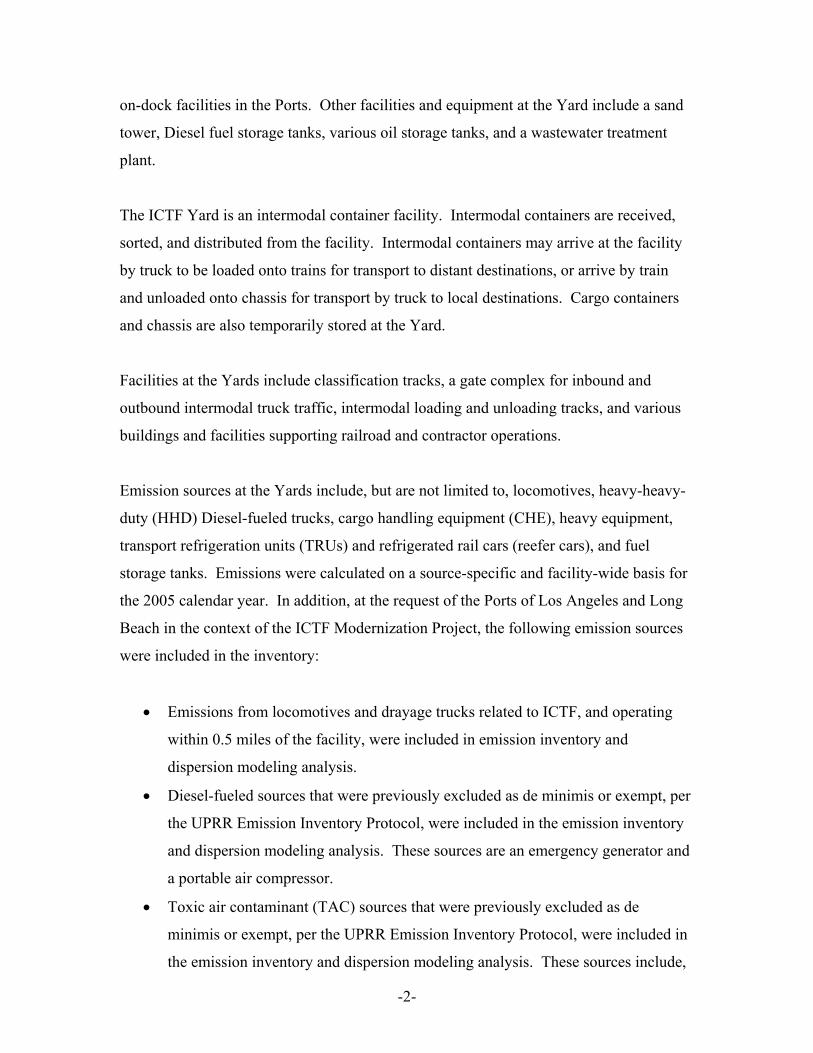
on-dock facilities in the Ports. Other facilities and equipment at the Yard include a sand
tower, Diesel fuel storage tanks, various oil storage tanks, and a wastewater treatment
plant.
The ICTF Yard is an intermodal container facility. Intermodal containers are received,
sorted, and distributed from the facility. Intermodal containers may arrive at the facility
by truck to be loaded onto trains for transport to distant destinations, or arrive by train
and unloaded onto chassis for transport by truck to local destinations. Cargo containers
and chassis are also temporarily stored at the Yard.
Facilities at the Yards include classification tracks, a gate complex for inbound and
outbound intermodal truck traffic, intermodal loading and unloading tracks, and various
buildings and facilities supporting railroad and contractor operations.
Emission sources at the Yards include, but are not limited to, locomotives, heavy-heavy-
duty (HHD) Diesel-fueled trucks, cargo handling equipment (CHE), heavy equipment,
transport refrigeration units (TRUs) and refrigerated rail cars (reefer cars), and fuel
storage tanks. Emissions were calculated on a source-specific and facility-wide basis for
the 2005 calendar year. In addition, at the request of the Ports of Los Angeles and Long
Beach in the context of the ICTF Modernization Project, the following emission sources
were included in the inventory:
• Emissions from locomotives and drayage trucks related to ICTF, and operating
within 0.5 miles of the facility, were included in emission inventory and
dispersion modeling analysis.
• Diesel-fueled sources that were previously excluded as de minimis or exempt, per
the UPRR Emission Inventory Protocol, were included in the emission inventory
and dispersion modeling analysis. These sources are an emergency generator and
a portable air compressor.
• Toxic air contaminant (TAC) sources that were previously excluded as de
minimis or exempt, per the UPRR Emission Inventory Protocol, were included in
the emission inventory and dispersion modeling analysis. These sources include,
-3-
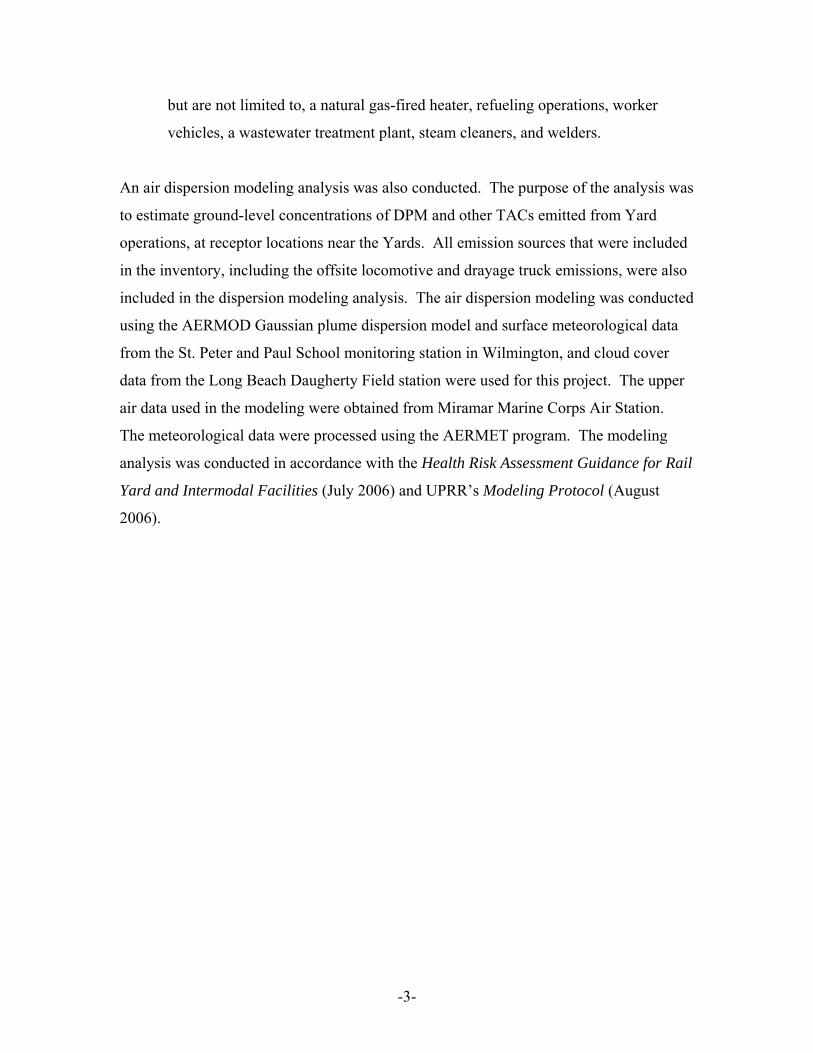
but are not limited to, a natural gas-fired heater, refueling operations, worker
vehicles, a wastewater treatment plant, steam cleaners, and welders.
An air dispersion modeling analysis was also conducted. The purpose of the analysis was
to estimate ground-level concentrations of DPM and other TACs emitted from Yard
operations, at receptor locations near the Yards. All emission sources that were included
in the inventory, including the offsite locomotive and drayage truck emissions, were also
included in the dispersion modeling analysis. The air dispersion modeling was conducted
using the AERMOD Gaussian plume dispersion model and surface meteorological data
from the St. Peter and Paul School monitoring station in Wilmington, and cloud cover
data from the Long Beach Daugherty Field station were used for this project. The upper
air data used in the modeling were obtained from Miramar Marine Corps Air Station.
The meteorological data were processed using the AERMET program. The modeling
analysis was conducted in accordance with the Health Risk Assessment Guidance for Rail
Yard and Intermodal Facilities (July 2006) and UPRR’s Modeling Protocol (August
2006).
-4-
Toxic Air Contaminant Emission Inventory
and Air Dispersion Modeling Report for the
Dolores and ICTF Rail Yards Long Beach, California
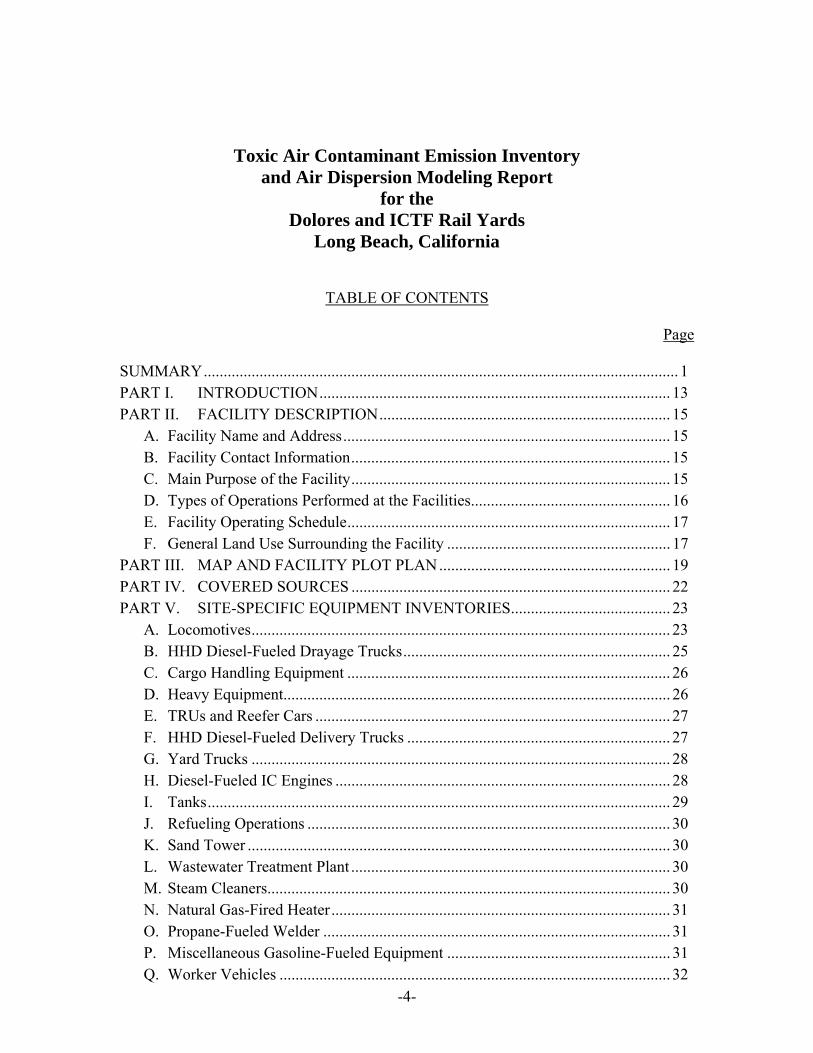
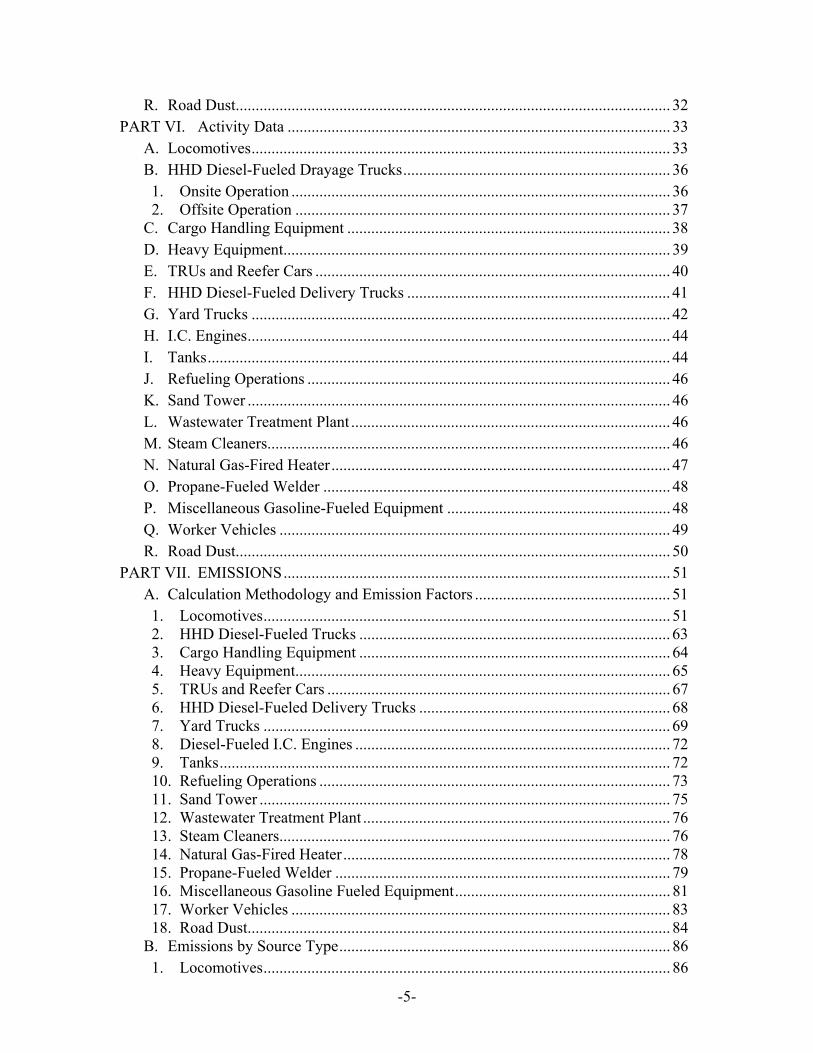
TABLE OF CONTENTS Page SUMMARY....................................................................................................................... 1 PART I. INTRODUCTION........................................................................................ 13 PART II. FACILITY DESCRIPTION......................................................................... 15
A. Facility Name and Address.................................................................................. 15 B. Facility Contact Information................................................................................ 15 C. Main Purpose of the Facility................................................................................ 15 D. Types of Operations Performed at the Facilities.................................................. 16 E. Facility Operating Schedule................................................................................. 17 F. General Land Use Surrounding the Facility ........................................................ 17
PART III. MAP AND FACILITY PLOT PLAN.......................................................... 19 PART IV. COVERED SOURCES ................................................................................ 22 PART V. SITE-SPECIFIC EQUIPMENT INVENTORIES........................................ 23
A. Locomotives......................................................................................................... 23 B. HHD Diesel-Fueled Drayage Trucks................................................................... 25 C. Cargo Handling Equipment ................................................................................. 26 D. Heavy Equipment................................................................................................. 26 E. TRUs and Reefer Cars ......................................................................................... 27 F. HHD Diesel-Fueled Delivery Trucks .................................................................. 27 G. Yard Trucks ......................................................................................................... 28 H. Diesel-Fueled IC Engines .................................................................................... 28 I. Tanks.................................................................................................................... 29 J. Refueling Operations ........................................................................................... 30 K. Sand Tower .......................................................................................................... 30 L. Wastewater Treatment Plant ................................................................................ 30 M. Steam Cleaners..................................................................................................... 30 N. Natural Gas-Fired Heater..................................................................................... 31 O. Propane-Fueled Welder ....................................................................................... 31 P. Miscellaneous Gasoline-Fueled Equipment ........................................................ 31 Q. Worker Vehicles .................................................................................................. 32
-5-
R. Road Dust............................................................................................................. 32 PART VI. Activity Data ................................................................................................ 33
A. Locomotives......................................................................................................... 33 B. HHD Diesel-Fueled Drayage Trucks................................................................... 36 1. Onsite Operation ............................................................................................... 36 2. Offsite Operation .............................................................................................. 37
C. Cargo Handling Equipment ................................................................................. 38 D. Heavy Equipment................................................................................................. 39 E. TRUs and Reefer Cars ......................................................................................... 40 F. HHD Diesel-Fueled Delivery Trucks .................................................................. 41 G. Yard Trucks ......................................................................................................... 42 H. I.C. Engines.......................................................................................................... 44 I. Tanks.................................................................................................................... 44 J. Refueling Operations ........................................................................................... 46 K. Sand Tower .......................................................................................................... 46 L. Wastewater Treatment Plant ................................................................................ 46 M. Steam Cleaners..................................................................................................... 46 N. Natural Gas-Fired Heater..................................................................................... 47 O. Propane-Fueled Welder ....................................................................................... 48 P. Miscellaneous Gasoline-Fueled Equipment ........................................................ 48 Q. Worker Vehicles .................................................................................................. 49 R. Road Dust............................................................................................................. 50
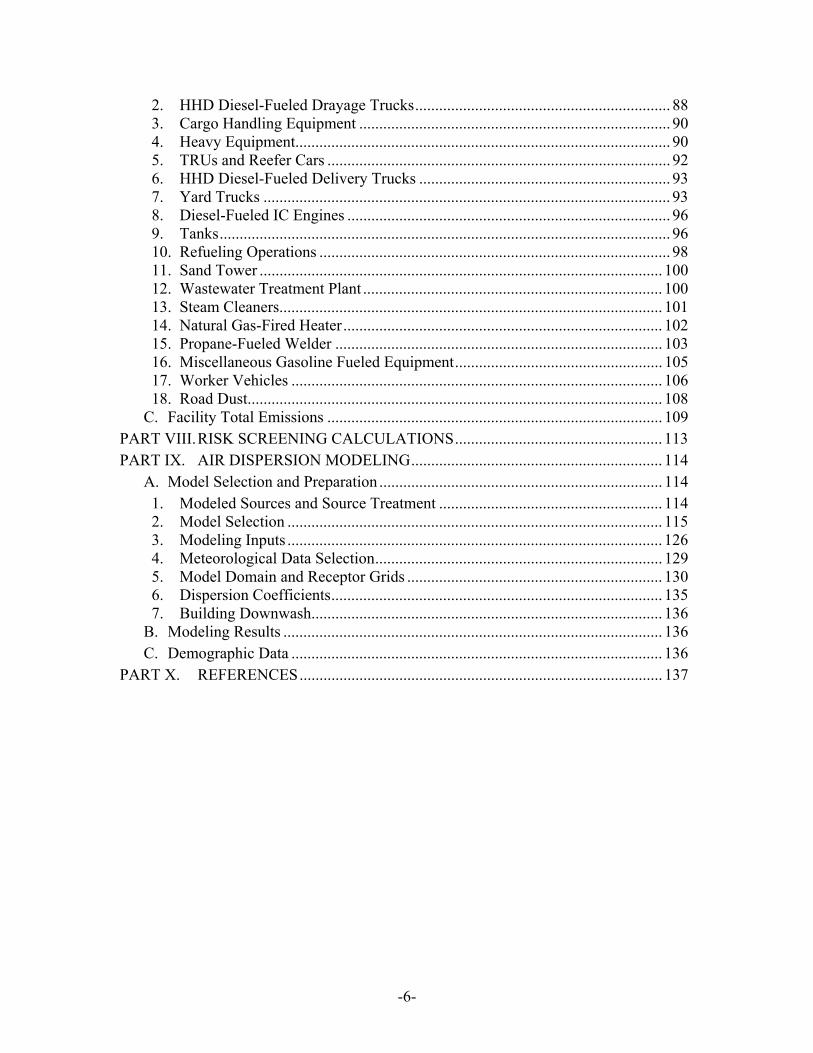
PART VII. EMISSIONS................................................................................................. 51 A. Calculation Methodology and Emission Factors ................................................. 51 1. Locomotives...................................................................................................... 51 2. HHD Diesel-Fueled Trucks .............................................................................. 63 3. Cargo Handling Equipment .............................................................................. 64 4. Heavy Equipment.............................................................................................. 65 5. TRUs and Reefer Cars ...................................................................................... 67 6. HHD Diesel-Fueled Delivery Trucks ............................................................... 68 7. Yard Trucks ...................................................................................................... 69 8. Diesel-Fueled I.C. Engines ............................................................................... 72 9. Tanks................................................................................................................. 72 10. Refueling Operations ........................................................................................ 73 11. Sand Tower ....................................................................................................... 75 12. Wastewater Treatment Plant ............................................................................. 76 13. Steam Cleaners.................................................................................................. 76 14. Natural Gas-Fired Heater.................................................................................. 78 15. Propane-Fueled Welder .................................................................................... 79 16. Miscellaneous Gasoline Fueled Equipment...................................................... 81 17. Worker Vehicles ............................................................................................... 83 18. Road Dust.......................................................................................................... 84
B. Emissions by Source Type................................................................................... 86 1. Locomotives...................................................................................................... 86
-6-
2. HHD Diesel-Fueled Drayage Trucks................................................................ 88 3. Cargo Handling Equipment .............................................................................. 90 4. Heavy Equipment.............................................................................................. 90 5. TRUs and Reefer Cars ...................................................................................... 92 6. HHD Diesel-Fueled Delivery Trucks ............................................................... 93 7. Yard Trucks ...................................................................................................... 93 8. Diesel-Fueled IC Engines ................................................................................. 96 9. Tanks................................................................................................................. 96 10. Refueling Operations ........................................................................................ 98 11. Sand Tower ..................................................................................................... 100 12. Wastewater Treatment Plant ........................................................................... 100 13. Steam Cleaners................................................................................................ 101 14. Natural Gas-Fired Heater................................................................................ 102 15. Propane-Fueled Welder .................................................................................. 103 16. Miscellaneous Gasoline Fueled Equipment.................................................... 105 17. Worker Vehicles ............................................................................................. 106 18. Road Dust........................................................................................................ 108
C. Facility Total Emissions .................................................................................... 109 PART VIII. RISK SCREENING CALCULATIONS.................................................... 113 PART IX. AIR DISPERSION MODELING............................................................... 114
A. Model Selection and Preparation ....................................................................... 114 1. Modeled Sources and Source Treatment ........................................................ 114 2. Model Selection .............................................................................................. 115 3. Modeling Inputs .............................................................................................. 126 4. Meteorological Data Selection........................................................................ 129 5. Model Domain and Receptor Grids ................................................................ 130 6. Dispersion Coefficients................................................................................... 135 7. Building Downwash........................................................................................ 136
B. Modeling Results ............................................................................................... 136 C. Demographic Data ............................................................................................. 136
PART X. REFERENCES........................................................................................... 137
-7-
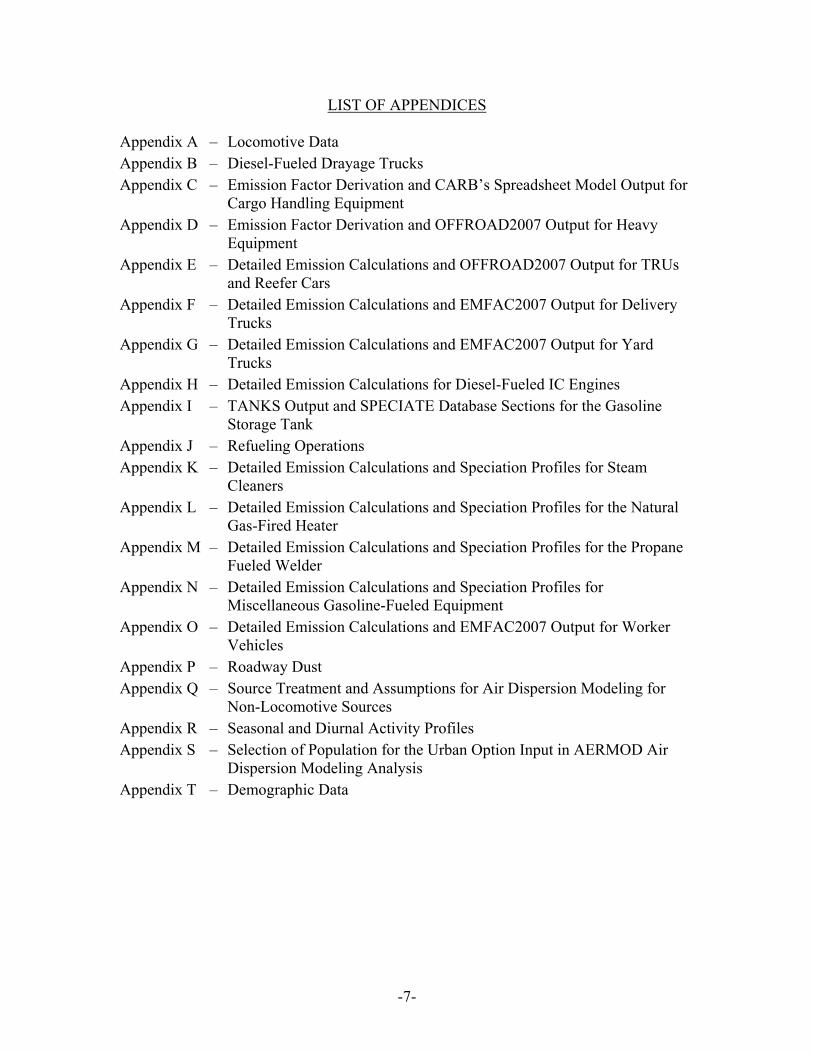
LIST OF APPENDICES
Appendix A – Locomotive Data Appendix B – Diesel-Fueled Drayage Trucks Appendix C – Emission Factor Derivation and CARB’s Spreadsheet Model Output for
Cargo Handling Equipment Appendix D – Emission Factor Derivation and OFFROAD2007 Output for Heavy
Equipment Appendix E – Detailed Emission Calculations and OFFROAD2007 Output for TRUs
and Reefer Cars Appendix F – Detailed Emission Calculations and EMFAC2007 Output for Delivery
Trucks Appendix G – Detailed Emission Calculations and EMFAC2007 Output for Yard
Trucks Appendix H – Detailed Emission Calculations for Diesel-Fueled IC Engines Appendix I – TANKS Output and SPECIATE Database Sections for the Gasoline
Storage Tank Appendix J – Refueling Operations Appendix K – Detailed Emission Calculations and Speciation Profiles for Steam
Cleaners Appendix L – Detailed Emission Calculations and Speciation Profiles for the Natural
Gas-Fired Heater Appendix M – Detailed Emission Calculations and Speciation Profiles for the Propane
Fueled Welder Appendix N – Detailed Emission Calculations and Speciation Profiles for
Miscellaneous Gasoline-Fueled Equipment Appendix O – Detailed Emission Calculations and EMFAC2007 Output for Worker
Vehicles Appendix P – Roadway Dust Appendix Q – Source Treatment and Assumptions for Air Dispersion Modeling for
Non-Locomotive Sources Appendix R – Seasonal and Diurnal Activity Profiles Appendix S – Selection of Population for the Urban Option Input in AERMOD Air
Dispersion Modeling Analysis Appendix T – Demographic Data
-8-
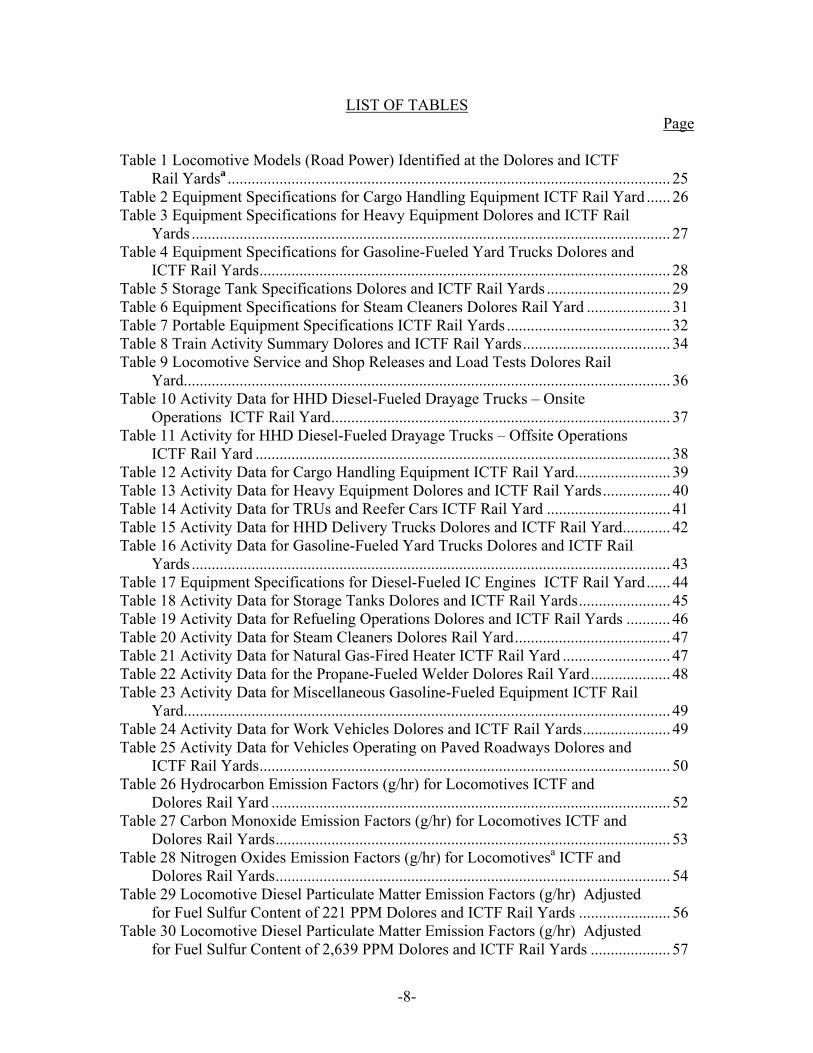
LIST OF TABLES Page Table 1 Locomotive Models (Road Power) Identified at the Dolores and ICTF
Rail Yardsa ............................................................................................................... 25 Table 2 Equipment Specifications for Cargo Handling Equipment ICTF Rail Yard ...... 26 Table 3 Equipment Specifications for Heavy Equipment Dolores and ICTF Rail
Yards ........................................................................................................................ 27 Table 4 Equipment Specifications for Gasoline-Fueled Yard Trucks Dolores and
ICTF Rail Yards....................................................................................................... 28 Table 5 Storage Tank Specifications Dolores and ICTF Rail Yards ............................... 29 Table 6 Equipment Specifications for Steam Cleaners Dolores Rail Yard ..................... 31 Table 7 Portable Equipment Specifications ICTF Rail Yards ......................................... 32 Table 8 Train Activity Summary Dolores and ICTF Rail Yards..................................... 34 Table 9 Locomotive Service and Shop Releases and Load Tests Dolores Rail
Yard.......................................................................................................................... 36 Table 10 Activity Data for HHD Diesel-Fueled Drayage Trucks – Onsite
Operations ICTF Rail Yard..................................................................................... 37 Table 11 Activity for HHD Diesel-Fueled Drayage Trucks – Offsite Operations
ICTF Rail Yard ........................................................................................................ 38 Table 12 Activity Data for Cargo Handling Equipment ICTF Rail Yard........................ 39 Table 13 Activity Data for Heavy Equipment Dolores and ICTF Rail Yards................. 40 Table 14 Activity Data for TRUs and Reefer Cars ICTF Rail Yard ............................... 41 Table 15 Activity Data for HHD Delivery Trucks Dolores and ICTF Rail Yard............ 42 Table 16 Activity Data for Gasoline-Fueled Yard Trucks Dolores and ICTF Rail
Yards ........................................................................................................................ 43 Table 17 Equipment Specifications for Diesel-Fueled IC Engines ICTF Rail Yard...... 44 Table 18 Activity Data for Storage Tanks Dolores and ICTF Rail Yards....................... 45 Table 19 Activity Data for Refueling Operations Dolores and ICTF Rail Yards ........... 46 Table 20 Activity Data for Steam Cleaners Dolores Rail Yard....................................... 47 Table 21 Activity Data for Natural Gas-Fired Heater ICTF Rail Yard ........................... 47 Table 22 Activity Data for the Propane-Fueled Welder Dolores Rail Yard.................... 48 Table 23 Activity Data for Miscellaneous Gasoline-Fueled Equipment ICTF Rail
Yard.......................................................................................................................... 49 Table 24 Activity Data for Work Vehicles Dolores and ICTF Rail Yards...................... 49 Table 25 Activity Data for Vehicles Operating on Paved Roadways Dolores and
ICTF Rail Yards....................................................................................................... 50 Table 26 Hydrocarbon Emission Factors (g/hr) for Locomotives ICTF and
Dolores Rail Yard .................................................................................................... 52 Table 27 Carbon Monoxide Emission Factors (g/hr) for Locomotives ICTF and
Dolores Rail Yards................................................................................................... 53 Table 28 Nitrogen Oxides Emission Factors (g/hr) for Locomotivesa ICTF and
Dolores Rail Yards................................................................................................... 54 Table 29 Locomotive Diesel Particulate Matter Emission Factors (g/hr) Adjusted
for Fuel Sulfur Content of 221 PPM Dolores and ICTF Rail Yards ....................... 56 Table 30 Locomotive Diesel Particulate Matter Emission Factors (g/hr) Adjusted
for Fuel Sulfur Content of 2,639 PPM Dolores and ICTF Rail Yards .................... 57
-9-
Table 31 Fuel Consumption Rates (lbs/hr) for Locomotives – ICTF and Dolores Rail Yards 2005 Baseline Year................................................................................ 60
Table 32 SOx Emission Factors for Locomotives – ICTF and Dolores Rail Yards 2005 Baseline Year .................................................................................................. 61
Table 33 Emission Factors for HHD Diesel-Fueled Drayage Trucksa – Onsite Operations ICTF Rail Yards .................................................................................... 63
Table 34 Emission Factors for HHD Diesel-Fueled Drayage Trucksa – Offsite Operations ICTF Rail Yards .................................................................................... 64
Table 35 Emission Factors for Cargo Handling Equipment ICTF Rail Yard.................. 65 Table 36 Emission Factors for Heavy Equipment Dolores and ICTF Rail Yards........... 66 Table 37 TAC Emissions from Propane-Fueled Forklifts Dolores Rail Yard................. 67 Table 38 Emission Factors for TRUs and Reefer Cars ICTF Rail Yard ......................... 68 Table 39 Emission Factors for HHD Diesel-Fueled Delivery Trucksa Dolores and
ICTF Rail Yards....................................................................................................... 69 Table 40 Emission Factors for Yard Trucks Dolores and ICTF Rail Yards.................... 70 Table 41 TAC Emissions Factors for Gasoline-Fueled Yard Trucks ICTF and
Dolores Rail Yards................................................................................................... 71 Table 42 Emission Factors for the Diesel-Fueled IC Engines ICTF Rail Yard............... 72 Table 43 TAC Emission Factors for Gasoline Storage Tank ICTF Rail Yard ................ 73 Table 44 VOC Emission Factors for Refueling Operations Dolores and ICTF Rail
Yards ........................................................................................................................ 74 Table 45 TAC Emission Factors for Gasoline Refueling Operations ICTF Rail
Yard.......................................................................................................................... 75 Table 46 Emission Factors for Sand Tower Operations Dolores Rail Yard.................... 76 Table 47 Emission Factors for the Wastewater Treatment Plant Dolores Rail Yard ...... 76 Table 48 Criteria Pollutant Emission Factors for Steam Cleaners Dolores Rail
Yard.......................................................................................................................... 77 Table 49 TAC Emission Factors for Steam Cleaner Dolores Rail Yard ......................... 78 Table 50 Emission Factors for Natural Gas-Fired Heater ICTF Rail Yard ..................... 79 Table 51 TAC Emission Factors for Natural Gas-Fired Heater ICTF Rail Yard ............ 79 Table 52 Emission Factors for Propane-Fueled Welder Dolores Rail Yard.................... 80 Table 53 TAC Emission Factors for Propane-Fueled Welder Dolores Rail Yard........... 81 Table 54 Emission Factors for Miscellaneous Gasoline Fueled Equipment ICTF
Rail Yard.................................................................................................................. 81 Table 55 TAC Emission Factors for Miscellaneous Gasoline Fueled Equipment
ICTF Rail Yard ........................................................................................................ 82 Table 56 Emission Factors for Worker Vehicles Dolores and ICTF Rail Yards............. 83 Table 57 TAC Emission Factors for Worker Vehicles Dolores and ICTF Rail
Yards ........................................................................................................................ 84 Table 58 Variable Used to Calculate PM10 Emission Factors for Roadway
Emissions ICTF and Dolores Rail Yards................................................................. 85 Table 59 Locomotive Duty Cycles Dolores and ICTF Rail Yards.................................. 86 Table 60 Summary of Emissions from Locomotives Dolores and ICTF Rail Yards ...... 87 Table 61 Summary of Emissions from HHD Diesel-Fueled Drayage Trucks –
Onsite Operations ICTF Rail Yard .......................................................................... 89 Table 62 Summary of Emissions from HHD Diesel-Fueled Drayage Trucks –
Onsite Operations ICTF Rail Yard .......................................................................... 89
-10-
Table 63 Summary of Emissions from Cargo Handling Equipment ICTF Rail Yard.......................................................................................................................... 90
Table 64 Summary of Emissions from Heavy Equipment Dolores and ICTF Rail Yards ........................................................................................................................ 91
Table 65 TAC Emissions from Propane-Fueled Forklifts Dolores Rail Yard................. 92 Table 66 Summary of Emissions from TRUs and Reefer Cars ICTF Rail Yard............. 92 Table 67 Summary of Emissions from HHD Diesel-Fueled Delivery Trucks
Dolores and ICTF Rail Yards .................................................................................. 93 Table 68 Summary of Emissions from Gasoline-Fueled Yard Trucks Dolores and
ICTF Rail Yards....................................................................................................... 94 Table 69 Summary of TAC Emissions from Gasoline-Fueled Yard Trucks
Dolores and ICTF Rail Yards .................................................................................. 95 Table 70 Summary of Emissions from Diesel-Fueled IC Engines ICTF Rail Yard........ 96 Table 71 Summary of VOC Emissions from Storage Tanks Dolores and ICTF
Rail Yards ................................................................................................................ 97 Table 72 TAC Emissions from Gasoline Storage Tank ICTF Rail Yard ........................ 98 Table 73 Summary of VOC Emissions from Refueling Operations Dolores and
ICTF Rail Yards....................................................................................................... 99 Table 74 Summary of TAC Emissions from Gasoline Refueling Operations ICTF
Rail Yard.................................................................................................................. 99 Table 75 PM10 Emission Factors and Emission Rates for Sand Tower Operations
Dolores Rail Yard .................................................................................................. 100 Table 76 TAC Emissions from the Wastewater Treatment Plant Dolores Rail
Yard........................................................................................................................ 101 Table 77 Summary of Emissions from Steam Cleaners Dolores Rail Yard .................. 101 Table 78 Summary of TAC Emissions from Steam Cleaners Dolores Rail Yard ......... 102 Table 79 Summary of Emissions from the Natural Gas-Fired Heater ICTF Rail
Yard........................................................................................................................ 103 Table 80 Summary of TAC Emissions from the Natural Gas-Fired Heater ICTF
Rail Yard................................................................................................................ 103 Table 81 Summary of Emissions from the Propane-Fueled Welder Dolores Rail
Yard........................................................................................................................ 104 Table 82 Summary of TAC Emissions from the Propane-Fueled Welder Dolores
Rail Yard................................................................................................................ 104 Table 83 Summary of Emissions from Gasoline-Fueled Equipment Dolores Rail
Yard........................................................................................................................ 105 Table 84 Summary of TAC Emissions from Gasoline-Fueled Equipment ICTF
Rail Yard................................................................................................................ 106 Table 85 Summary of Emissions from Worker Vehicles Dolores and ICTF Rail
Yards ...................................................................................................................... 107 Table 86 Summary of TAC Emissions from Worker Vehicles Dolores and ICTF
Rail Yards .............................................................................................................. 108 Table 87 Summary of Emissions from Roadways Dolores and ICTF Rail Yards ........ 109 Table 88 Facility-Wide Criteria Pollutant and DPM Emissions – Onsite
Operations Dolores and ICTF Rail Yards.............................................................. 110 Table 89 Facility-Wide TAC Emissions – Onsite Operations Dolores and ICTF
Rail Yards .............................................................................................................. 111
-11-
Table 90 Emissions from Locomotives and Drayage Trucks – Offsite Operations Dolores and ICTF Rail Yards ................................................................................ 112
Table 91 Source Treatment for Air Dispersion Modeling – ICTF and Dolores Rail Yard 2005 Baseline Year ....................................................................................... 115
Table 92 Locomotive Modeling Inputs Dolores and ICTF Rail Yards ....................... 127 Table 93 Non-Locomotive Modeling Inputs Dolores and ICTF Rail Yards ................. 128 Table 94 Sensitive Receptor Locations Dolores and ICTF Rail Yards ......................... 131
-12-
LIST OF FIGURES Page Figure 1 Location Map.................................................................................................... 19 Figure 2 Dolores Rail Yard Layout ................................................................................ 20 Figure 3 ICTF Rail Yard Layout .................................................................................... 21 Figure 4 Consist Idling, RTG Operations, and Gasoline Storage Tank......................... 117 Figure 5 Diesel Trucks, Low-Level Cargo Handling Equipment and Heavy
Equipment .............................................................................................................. 119 Figure 6 Yard Switching Operations ............................................................................. 121 Figure 7 Consist Movement and Load Testing.............................................................. 123 Figure 8 Coarse Modeling Grid Dolores and ICTF Rail Yards................................... 132 Figure 9 Fine Modeling Grid Dolores and ICTF Rail Yards......................................... 133 Figure 10 Sensitive Receptors Dolores and ICTF Rail Yards ....................................... 134
-13-
Toxic Air Contaminant Emission Inventory and Air Dispersion Modeling Report
for the Dolores and ICTF Rail Yards
Long Beach, California PART I. INTRODUCTION
In accordance with the 2005 California Air Resources Board (CARB)/Railroad Statewide
Agreement (MOU), Union Pacific Railroad Company (UPRR) has prepared a facility-
wide emission inventory for the Dolores and Intermodal Container Transfer Facility
(ICTF) Rail Yards (Yards) in Long Beach, California. The inventory quantifies emissions
of specified toxic air contaminants (TACs) (including Diesel particulate matter [DPM])
from stationary, mobile, and portable sources at the Yards. The Yards are physically
separate facilities, but due to their close proximity to one another, they were treated as
one facility for the emission inventory and dispersion modeling analysis. The inventory
was prepared in accordance with CARB’s Rail Yard Emission Inventory Methodology
guidelines (July 2006) and UPRR’s Emission Inventory Protocol (May 2006).
This inventory differs from those prepared for other UPRR rail yards because it is being
prepared at a time when a similar inventory has been requested for the ICTF/Dolores
yards by the Ports of Los Angeles and Long Beach. To avoid potential confusion
associated with having two, similar but different inventories circulated at the same time,
the requirements of the Ports have combined with those associated with the MOU to
create a single, comprehensive approach to the inventory.
Emission sources at the Yards include, but are not limited to, locomotives, heavy-heavy-
duty (HHD) Diesel-fueled trucks, cargo handling equipment (CHE), heavy equipment,
transport refrigeration units (TRUs) and refrigerated rail cars (reefer cars), and fuel
storage tanks. Emissions were calculated on a source-specific and facility-wide basis for
the 2005 calendar year. In addition, at the request of the request of the Ports of Los
Angeles and Long Beach in the context of the ICTF Modernization Project, the following
emission sources were included in the inventory.
-14-
• Emissions from locomotives and drayage trucks related to ICTF, and operating
within 0.5 miles of the facility, were included in emission inventory and
dispersion modeling analysis.
• Diesel-fueled sources that were previously excluded as de minimis or exempt, per
the UPRR Emission Inventory Protocol, were included in the emission inventory
and dispersion modeling analysis. These sources are an emergency generator and
a portable air compressor.
• Toxic air contaminant (TAC) sources that were previously excluded as de
minimis or exempt, per the UPRR Emission Inventory Protocol, were included in
the emission inventory and dispersion modeling analysis. These sources include,
but are not limited to, a natural gas-fired heater, refueling operations, worker
vehicles, a wastewater treatment plant, steam cleaners, and welders.
An air dispersion modeling analysis was also conducted for the Yards. The purpose of
the analysis was to estimate ground-level concentrations of DPM and other TACs,
emitted from Yard operations, at receptor locations near the Yards. All emission sources
that were included in the inventory, including the offsite locomotive and drayage truck
emissions, were also included in the dispersion modeling analysis. The air dispersion
modeling was conducted using the AERMOD Gaussian plume dispersion model and
surface meteorological data from the St. Peter and Paul School monitoring station in
Wilmington, and cloud cover data from the Long Beach Daugherty Field station were
used for this project. The upper air data used in the modeling were obtained from
Miramar Marine Corps Air Station. 1 The meteorological data were processed using the
AERMET program. The modeling analysis was conducted in accordance with the Health
Risk Assessment Guidance for Rail Yard and Intermodal Facilities (July 2006) and
UPRR’s Modeling Protocol (August 2006).
1 ENVIRON. Meteorological Data Selection and Processing Methodology for 2006 BNSF Designated Rail Yards, Report 06-12910J, July 25, 2006.
-15-
PART II. FACILITY DESCRIPTION A. Facility Name and Address
Union Pacific Railroad Company Dolores Rail Yard 2442 E. Carson Street Long Beach, CA 90810
Union Pacific Railroad Company Intermodal Container Transfer Facility 2401 E. Sepulveda Blvd. Long Beach, CA 90810
B. Facility Contact Information Brock Nelson Director of Environmental Operations – West Union Pacific Railroad Company 10031 Foothills Boulevard Roseville, CA 95747 Phone: (916) 789-6370 Fax: (402) 233-3162 [email protected]
C. Main Purpose of the Facility The Dolores and ICTF Yards handle both “manifest” cargo (mixed freight) and
intermodal containers. ICTF is strictly an intermodal container handling facility.
Intermodal containers may arrive at ICTF by truck to be loaded onto trains for transport
to distant destinations, or arrive by train and unloaded onto chassis for transport by truck
to local destinations. Intermodal containers and chassis are also temporarily stored at
ICTF. Facilities at the Yard include a gate complex for inbound and outbound
intermodal truck traffic, intermodal loading and unloading tracks, and various buildings
and facilities supporting railroad and contractor operations.
The Dolores Yard serves two primary purposes: flat switching and locomotive servicing.
At a flat switching yard, incoming and outbound train sections are stored in different
track segments, and separated from and connected to other sections to build new trains.
-16-
Dolores serves three separate types of trains: manifest (or mixed) freight trains that are
handled within the Dolores Yard; intermodal trains that are handled at ICTF; and
intermodal and other trains that ostensibly terminate or originate in the Yard, but are in
reality handled at on-dock facilities within the Ports of Los Angeles and Long Beach.
Intermodal rail cars and other freight cars are received, sorted, and distributed from
Dolores; containers, however, are neither loaded nor unloaded at Dolores.
The Dolores Yard is also a locomotive servicing facility, which includes a Service Track
and a Locomotive Shop, to provide support to ICTF and other yards in the L.A. Basin.
Operations include both basic service (refueling, sanding, cleaning, etc.) and major
planned and unscheduled maintenance for locomotives serving Dolores, ICTF, and the
on-dock facilities in the Ports. Other facilities and equipment at the Yard include a sand
tower, Diesel fuel storage tanks, various oil storage tanks, and a wastewater treatment
plant.
D. Types of Operations Performed at the Facilities Activities at ICTF include receiving inbound trains, loading and unloading intermodal
trains, storage of intermodal containers and chassis, building and departing outbound
trains, and repairing freight cars and intermodal containers/chassis. Activities at the
Dolores Yard include receiving inbound trains, building and departing outbound trains,
locomotive refueling, locomotive servicing, and sand tower operations. UPRR operates
yard switcher locomotives within Dolores and ICTF to support many of these activities.
In addition, Pacific Harbor Lines (PHL) operates yard switchers throughout the Ports
(although not generally within the boundaries of the ICTF or Dolores Yards). The PHL
switchers will pull train sections destined for on-dock handling from the south (or west)
end of Dolores, and push train sections that were newly built on-dock back into the south
end of Dolores.
The railroad track layout for Dolores and ICTF is primarily linear along a roughly north-
south axis, with track to the north heading to central Los Angeles and points north and
east, while track to the south heads into the Ports. The Alameda Corridor runs adjacent to
the west side of Dolores, and there are leads into and out of Dolores at each end. The
-17-
north end of the Dolores Yard contains the “900 Track,” a series of parallel tracks
approximately 1.4 miles long, as well as a lead from the Alameda Corridor into Dolores
and subsequently ICTF. The south end of Dolores contains another set of multiple
parallel tracks approximately 0.9 miles long known as the “300 Track.” Both the 900 and
300 Tracks can be used to receive terminating trains or to build originating trains. ICTF
is connected at its north end to the central section of Dolores and to the 900 Track. The
tracks within ICTF are the principal intermodal loading and unloading tracks, and are
serviced by rubber tire gantry (RTG) cranes and a variety of other cargo handling
equipment.
Facilities within ICTF include a gate complex for inbound and outbound intermodal truck
traffic, intermodal loading and unloading tracks, and various buildings and facilities
supporting railroad and contractor operations.
E. Facility Operating Schedule Both the Dolores and ICTF Yards operate 24 hours per day, 365 days per year.
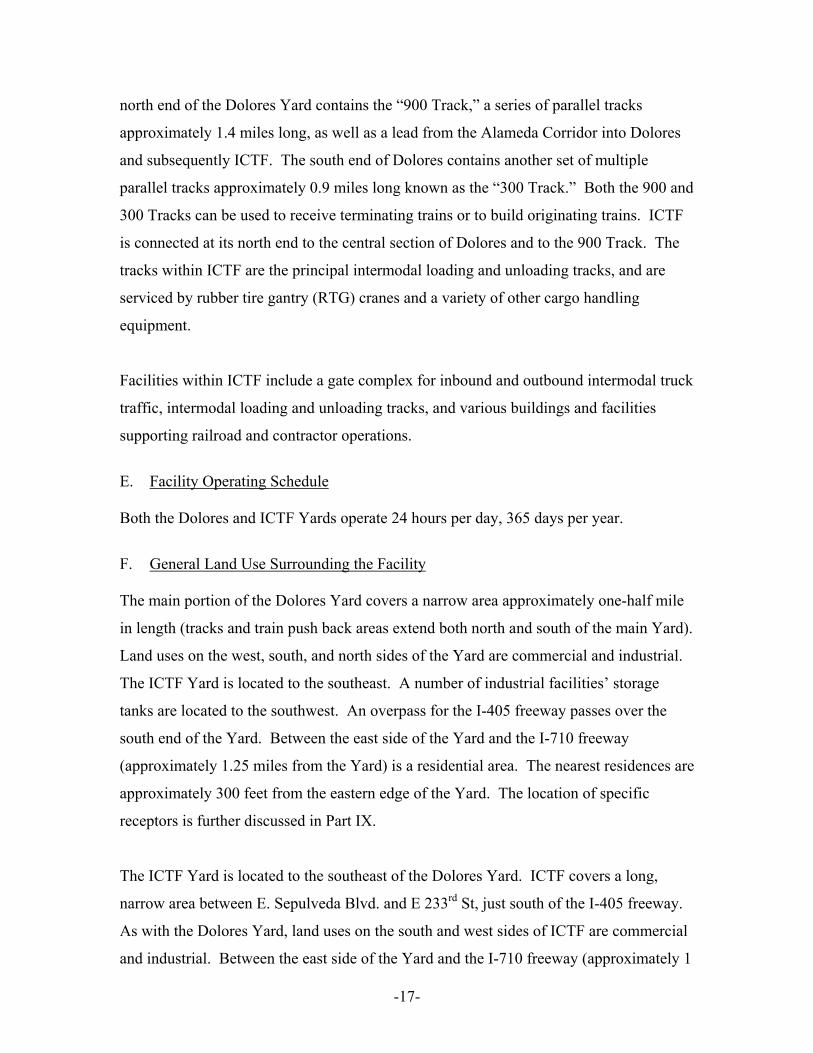
F. General Land Use Surrounding the Facility The main portion of the Dolores Yard covers a narrow area approximately one-half mile
in length (tracks and train push back areas extend both north and south of the main Yard).
Land uses on the west, south, and north sides of the Yard are commercial and industrial.
The ICTF Yard is located to the southeast. A number of industrial facilities’ storage
tanks are located to the southwest. An overpass for the I-405 freeway passes over the
south end of the Yard. Between the east side of the Yard and the I-710 freeway
(approximately 1.25 miles from the Yard) is a residential area. The nearest residences are
approximately 300 feet from the eastern edge of the Yard. The location of specific
receptors is further discussed in Part IX.
The ICTF Yard is located to the southeast of the Dolores Yard. ICTF covers a long,
narrow area between E. Sepulveda Blvd. and E 233rd St, just south of the I-405 freeway.
As with the Dolores Yard, land uses on the south and west sides of ICTF are commercial
and industrial. Between the east side of the Yard and the I-710 freeway (approximately 1

-18-
mile from the Yard) is a residential area. The nearest residences are approximately 400
feet from the eastern edge of the Yard. The location of specific receptors is further
discussed in Part IX.
-19-
PART III. MAP AND FACILITY PLOT PLAN
Figure 1 Location Map
-20-
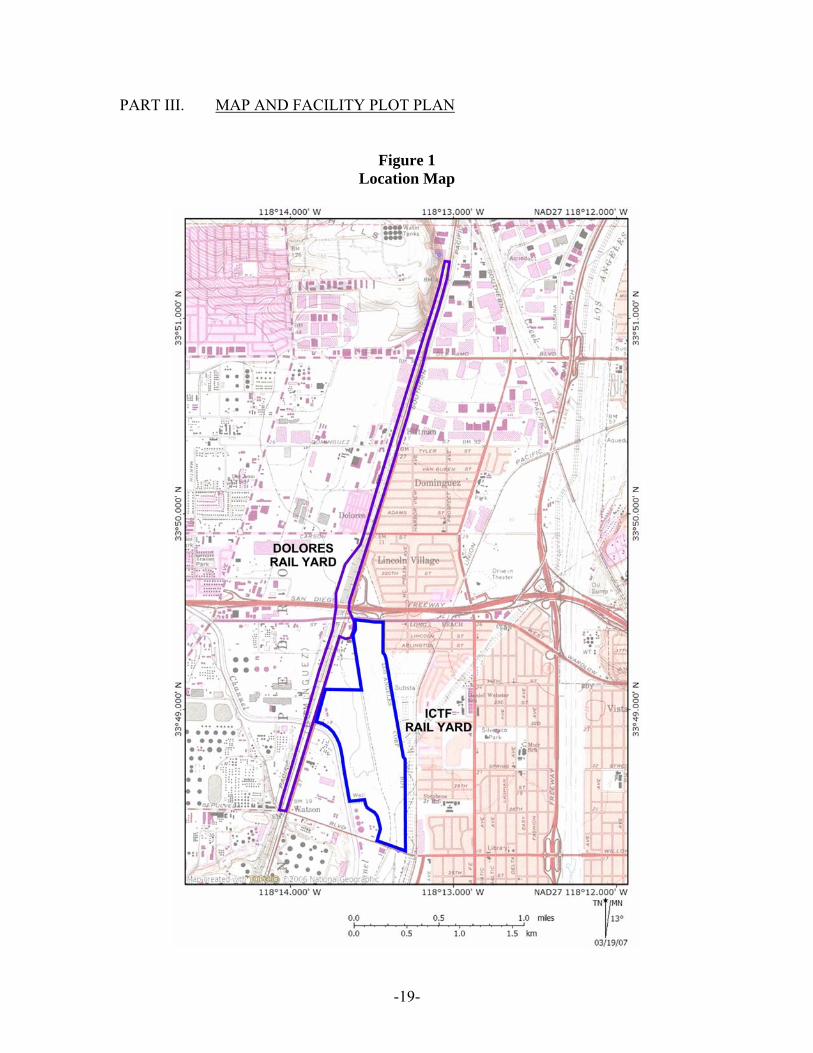
Figure 2 Dolores Rail Yard Layout
-21-
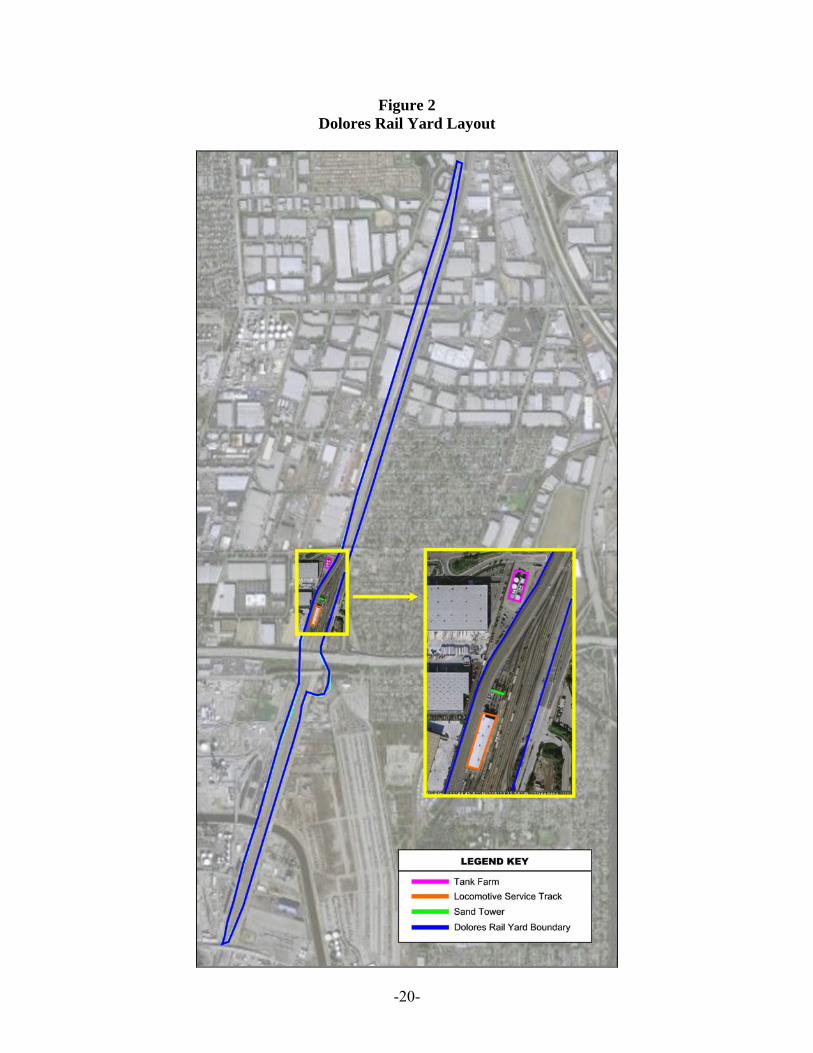
Figure 3 ICTF Rail Yard Layout
-22-
PART IV. COVERED SOURCES This emission inventory quantifies toxic air contaminant (TAC) emissions from the
stationary, mobile, and portable sources located or operating at the Dolores and ICTF
Yards. Sources include, but are not limited to, locomotives, heavy-heavy-duty (HHD)
Diesel-fueled trucks, cargo handling equipment (CHE), heavy equipment, transport
refrigeration units (TRUs) and refrigerated railcars (reefer cars), and fuel storage tanks.
Site-specific equipment inventories are included in Part V below.
At the request of the Ports of Los Angeles and Long Beach in the context of the ICTF
Modernization Project, the emission sources listed below were included in the emission
inventory and dispersion modeling analysis. These sources were included to ensure
consistency between data submitted to the Ports for the Modernization Project, and to
ARB under the MOU.
• Emissions from locomotives and drayage trucks related to ICTF, and operating
within 0.5 miles of the facility, are included in the emission inventory and
dispersion modeling analysis. Emissions for other locomotives bypassing the
Yards in the Alameda Corridor are also included for the segment of the Corridor
within 0.5 miles of the facility.
• Diesel-fueled sources that would be excluded as de minimis or exempt, per the
UPRR Emission Inventory Protocol, are included in the emission inventory and
dispersion modeling analysis. These sources are an emergency generator and a
portable air compressor.
• Toxic air contaminant (TAC) sources that would be excluded as de minimis or
exempt, per the UPRR Emission Inventory Protocol, are included in the revised
emission inventory and dispersion modeling analysis. These sources include, but
are not limited to, a natural gas-fired heater, refueling operations, worker vehicles,
a wastewater treatment plant, steam cleaners, and welders.
-23-
PART V. SITE-SPECIFIC EQUIPMENT INVENTORIES As discussed in Part IV above, there are a number of mobile, stationary, and portable
emissions sources operating at the Dolores and ICTF Rail Yards. The mobile sources
include locomotives, heavy-heavy duty (HHD) Diesel-fueled trucks, cargo handling
equipment (CHE), and other heavy equipment. The stationary emission sources include
storage tanks, a sand tower, a wastewater treatment plant, a heater/furnace, and an
emergency generator. Portable equipment operating at the Yard includes transport
refrigeration units (TRUs) and refrigerated railcars (reefer cars), welders, air
compressors, steam cleaners, a pressure washer, and a generator. Each source group is
further discussed below.
A. Locomotives
Locomotive activities at the Yards fall into two basic categories: road power and yard
operations. “Road power” units are locomotives used on inbound and outbound freight
trains and are generally larger, higher horsepower units (3,000 to 6,000 hp). Locomotives
used for operations within a rail yard are called switcher locomotives and are generally
low horsepower units (1,500 to 3,000 hp).
Road Power – “Road power” activities include hauling through trains on the main line,
pulling arriving trains into the Yard, pulling departing trains out of the Yard, and moving
locomotives to and from the Service Track. The Dolores and ICTF Yards handle both
manifest freight trains and intermodal trains. Arriving trains enter the Dolores Yard and
stop while the railcars are detached from the locomotive. Once the railcars have been
detached, the locomotives move to the Service Track for refueling and other service.
Approximately half of the manifest freight trains that terminate at Dolores use the 900
Track. The remaining half of the manifest trains arriving at Dolores use the 300 Track.
Originating manifest freight trains are most commonly built in the 900 Track and depart
from there. Power is brought to the trains from the Service Track just prior to departure.
The train departs after completion of the Federal Railroad Administration (FRA)
-24-
mandated safety inspections (e.g., air pressure and brakes) and the arrival of the train
crew.
Intermodal freight is handled at ICTF. However, due to track congestion and current
facilities, only about 20% of terminating intermodal freight trains enter ICTF directly.
The majority of the intermodal trains, about 80%, terminate in the 300 Track at Dolores
and are pushed into ICTF for handling. Some of the intermodal trains terminating at
Dolores are pulled directly from the 300 Track to on-dock facilities within the Ports of
Los Angeles and Long Beach by switcher locomotives operated by Pacific Harbor Lines
(PHL). Originating intermodal trains depart from either the 300 Track (approximately
20%) or the 900 Track (approximately 80%). The road power moves directly to service
after arrival, and consists2 for departing trains move to the trains from Service just prior
to departure. As for terminating trains, some originating trains are handled on-dock
rather than within Dolores/ICTF.
Through trains are trains that nominally bypass Dolores using the section of the Alameda
Corridor main line adjacent to and on the west side of the Dolores Yard. The Alameda
Corridor is the main rail line between the Ports of Los Angeles and Long Beach and
central Los Angeles3. Data show some through trains enter and leave the yard on the 300
and 900 Tracks, however, with some adding or dropping of rail cars or locomotives. In
these cases, the locomotive consist is not disconnected nor moved to the Service Track.
These so-called “set-outs” are counted separately from trains on the Alameda Corridor so
that the emissions specifically associated with the “set-outs” can be calculated.
Power moves are groups of locomotives that are moved between yards to provide road
power for departing trains. Although power moves may have as many as 10 or more
locomotives, typically only one or two locomotives are actually operating. For emission
2 “Consist” is the term used in the railroad industry to describe the group of coupled locomotives that pull trains. 3 UPRR does not own or operate the Alameda Corridor. The Alameda Corridor was built and is governed by the Alameda Corridor Transportation Authority. For more information on the Alameda Corridor see http://www.acta.org.
-25-
calculations, power moves were assumed to have 1.5 operating locomotives (except for
power moves involving just one locomotive).4
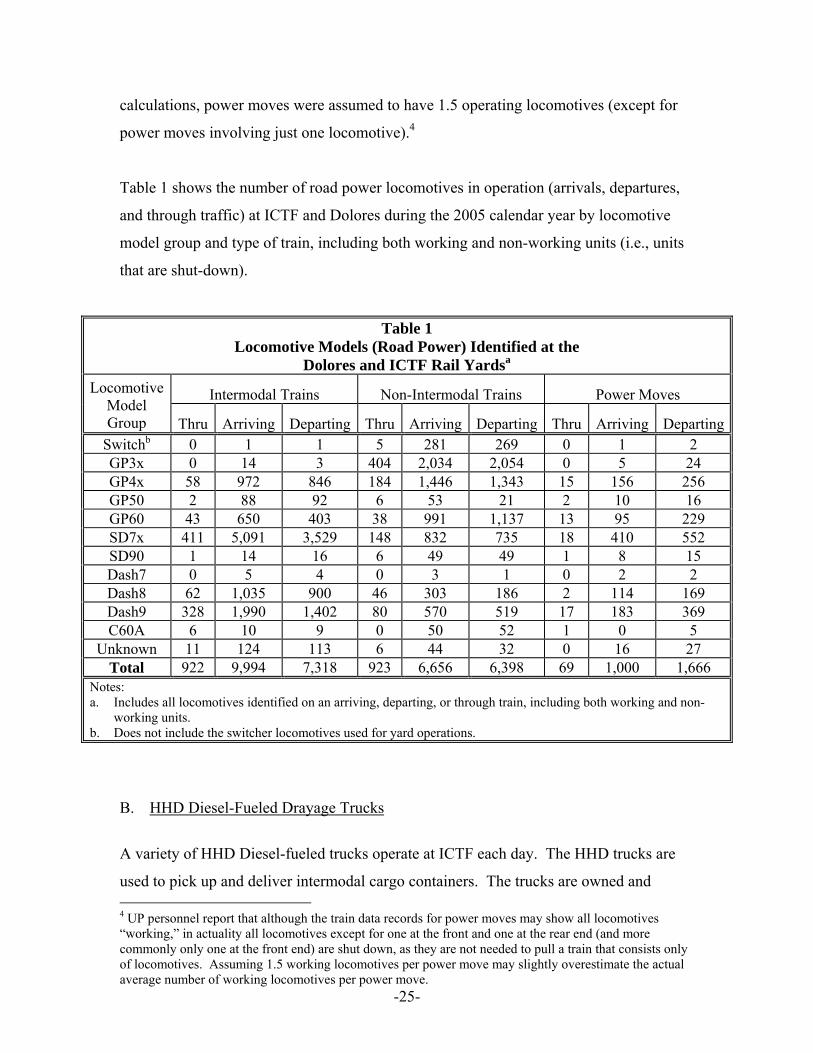
Table 1 shows the number of road power locomotives in operation (arrivals, departures,
and through traffic) at ICTF and Dolores during the 2005 calendar year by locomotive
model group and type of train, including both working and non-working units (i.e., units
that are shut-down).
Table 1 Locomotive Models (Road Power) Identified at the
Dolores and ICTF Rail Yardsa
Intermodal Trains Non-Intermodal Trains Power Moves Locomotive Model Group Thru Arriving Departing Thru Arriving Departing Thru Arriving Departing
Switchb 0 1 1 5 281 269 0 1 2 GP3x 0 14 3 404 2,034 2,054 0 5 24 GP4x 58 972 846 184 1,446 1,343 15 156 256 GP50 2 88 92 6 53 21 2 10 16 GP60 43 650 403 38 991 1,137 13 95 229 SD7x 411 5,091 3,529 148 832 735 18 410 552 SD90 1 14 16 6 49 49 1 8 15 Dash7 0 5 4 0 3 1 0 2 2 Dash8 62 1,035 900 46 303 186 2 114 169 Dash9 328 1,990 1,402 80 570 519 17 183 369 C60A 6 10 9 0 50 52 1 0 5
Unknown 11 124 113 6 44 32 0 16 27 Total 922 9,994 7,318 923 6,656 6,398 69 1,000 1,666
Notes: a. Includes all locomotives identified on an arriving, departing, or through train, including both working and non-
working units. b. Does not include the switcher locomotives used for yard operations.
B. HHD Diesel-Fueled Drayage Trucks
A variety of HHD Diesel-fueled trucks operate at ICTF each day. The HHD trucks are
used to pick up and deliver intermodal cargo containers. The trucks are owned and 4 UP personnel report that although the train data records for power moves may show all locomotives “working,” in actuality all locomotives except for one at the front and one at the rear end (and more commonly only one at the front end) are shut down, as they are not needed to pull a train that consists only of locomotives. Assuming 1.5 working locomotives per power move may slightly overestimate the actual average number of working locomotives per power move.
-26-
operated by many large trucking companies and independent operators (draymen).
Therefore, a fleet distribution is not available. For emission calculations, the
EMFAC2007 model default fleet distribution for HHD Diesel-fueled operating in Los
Angeles County was used.
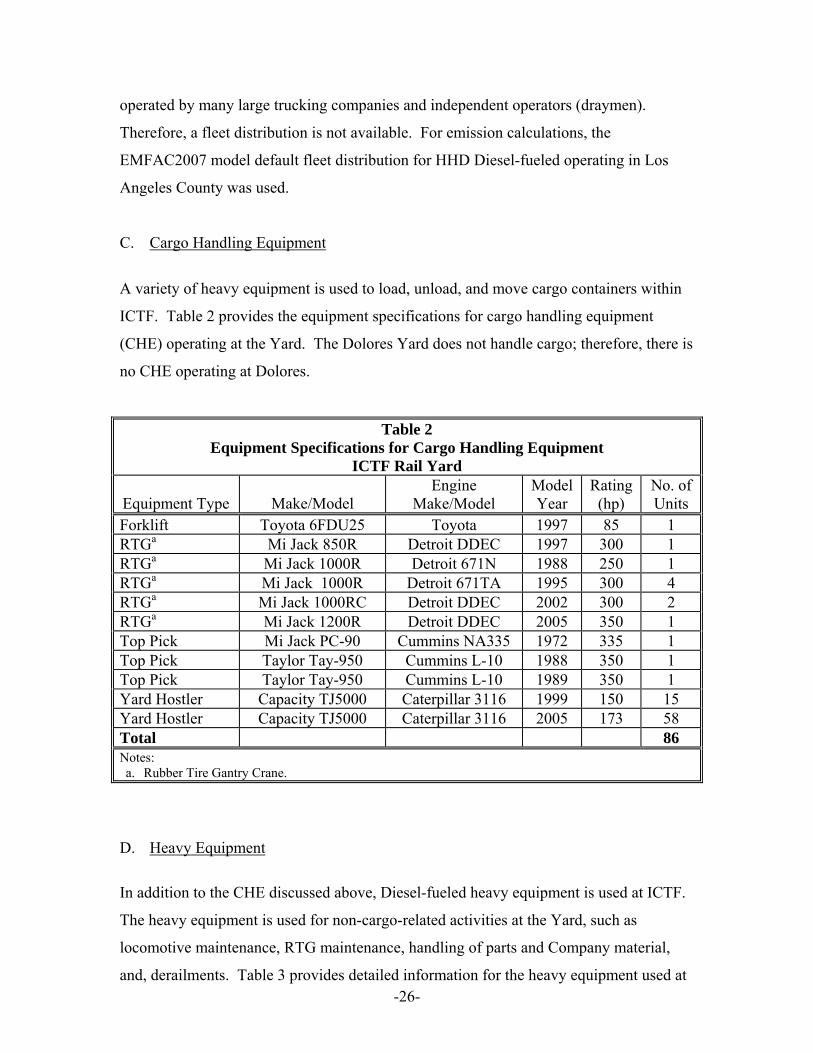
C. Cargo Handling Equipment
A variety of heavy equipment is used to load, unload, and move cargo containers within
ICTF. Table 2 provides the equipment specifications for cargo handling equipment
(CHE) operating at the Yard. The Dolores Yard does not handle cargo; therefore, there is
no CHE operating at Dolores.
Table 2 Equipment Specifications for Cargo Handling Equipment
ICTF Rail Yard
Equipment Type Make/Model Engine
Make/Model Model Year
Rating (hp)
No. of Units
Forklift Toyota 6FDU25 Toyota 1997 85 1 RTGa Mi Jack 850R Detroit DDEC 1997 300 1 RTGa Mi Jack 1000R Detroit 671N 1988 250 1 RTGa Mi Jack 1000R Detroit 671TA 1995 300 4 RTGa Mi Jack 1000RC Detroit DDEC 2002 300 2 RTGa Mi Jack 1200R Detroit DDEC 2005 350 1 Top Pick Mi Jack PC-90 Cummins NA335 1972 335 1 Top Pick Taylor Tay-950 Cummins L-10 1988 350 1 Top Pick Taylor Tay-950 Cummins L-10 1989 350 1 Yard Hostler Capacity TJ5000 Caterpillar 3116 1999 150 15 Yard Hostler Capacity TJ5000 Caterpillar 3116 2005 173 58 Total 86 Notes: a. Rubber Tire Gantry Crane.
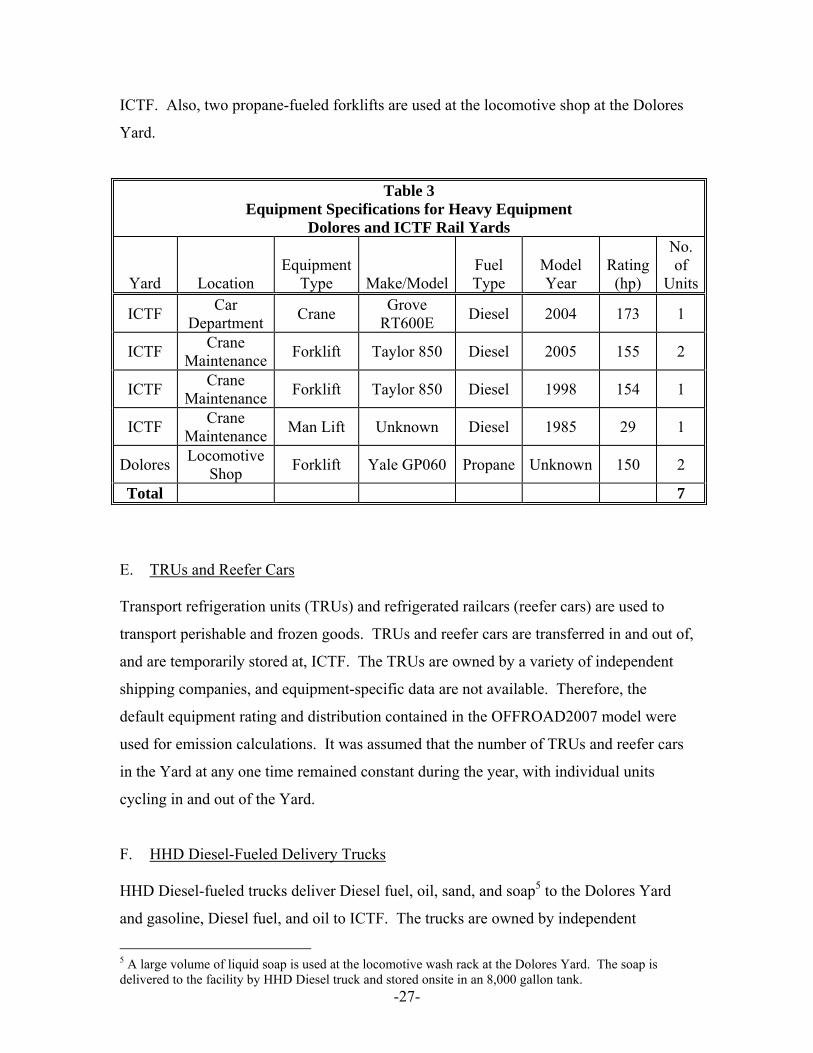
D. Heavy Equipment
In addition to the CHE discussed above, Diesel-fueled heavy equipment is used at ICTF.
The heavy equipment is used for non-cargo-related activities at the Yard, such as
locomotive maintenance, RTG maintenance, handling of parts and Company material,
and, derailments. Table 3 provides detailed information for the heavy equipment used at
-27-
ICTF. Also, two propane-fueled forklifts are used at the locomotive shop at the Dolores
Yard.
Table 3 Equipment Specifications for Heavy Equipment
Dolores and ICTF Rail Yards
Yard Location Equipment
Type Make/ModelFuel Type
Model Year
Rating (hp)
No. of
Units
ICTF Car Department Crane Grove
RT600E Diesel 2004 173 1
ICTF Crane Maintenance Forklift Taylor 850 Diesel 2005 155 2
ICTF Crane Maintenance Forklift Taylor 850 Diesel 1998 154 1
ICTF Crane Maintenance Man Lift Unknown Diesel 1985 29 1
Dolores Locomotive Shop Forklift Yale GP060 Propane Unknown 150 2
Total 7 E. TRUs and Reefer Cars Transport refrigeration units (TRUs) and refrigerated railcars (reefer cars) are used to
transport perishable and frozen goods. TRUs and reefer cars are transferred in and out of,
and are temporarily stored at, ICTF. The TRUs are owned by a variety of independent
shipping companies, and equipment-specific data are not available. Therefore, the
default equipment rating and distribution contained in the OFFROAD2007 model were
used for emission calculations. It was assumed that the number of TRUs and reefer cars
in the Yard at any one time remained constant during the year, with individual units
cycling in and out of the Yard.
F. HHD Diesel-Fueled Delivery Trucks HHD Diesel-fueled trucks deliver Diesel fuel, oil, sand, and soap5 to the Dolores Yard
and gasoline, Diesel fuel, and oil to ICTF. The trucks are owned by independent
5 A large volume of liquid soap is used at the locomotive wash rack at the Dolores Yard. The soap is delivered to the facility by HHD Diesel truck and stored onsite in an 8,000 gallon tank.
-28-
operators; therefore, a fleet distribution is not available. For emission calculations, the
EMFAC2007 model default fleet distribution for HHD Diesel-fueled operating in
Los Angeles County was used.
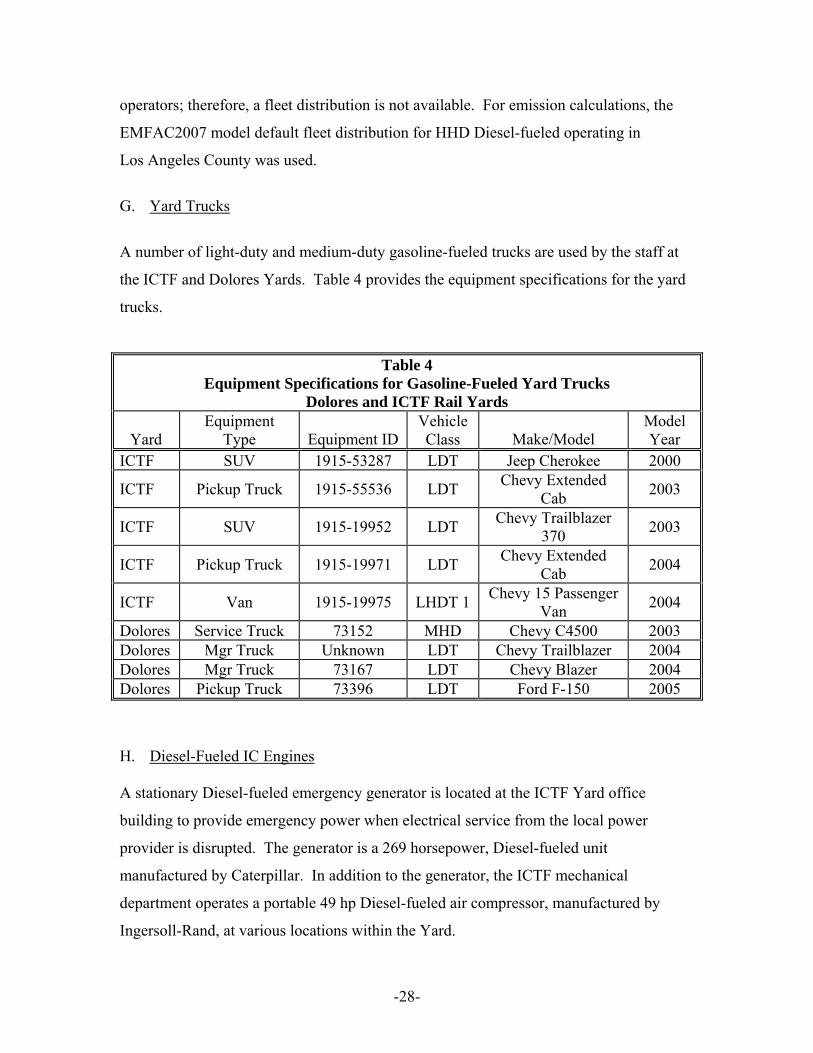
G. Yard Trucks
A number of light-duty and medium-duty gasoline-fueled trucks are used by the staff at
the ICTF and Dolores Yards. Table 4 provides the equipment specifications for the yard
trucks.
Table 4 Equipment Specifications for Gasoline-Fueled Yard Trucks
Dolores and ICTF Rail Yards
Yard Equipment
Type Equipment ID Vehicle Class Make/Model
Model Year
ICTF SUV 1915-53287 LDT Jeep Cherokee 2000
ICTF Pickup Truck 1915-55536 LDT Chevy Extended Cab 2003
ICTF SUV 1915-19952 LDT Chevy Trailblazer 370 2003
ICTF Pickup Truck 1915-19971 LDT Chevy Extended Cab 2004
ICTF Van 1915-19975 LHDT 1 Chevy 15 Passenger Van 2004
Dolores Service Truck 73152 MHD Chevy C4500 2003 Dolores Mgr Truck Unknown LDT Chevy Trailblazer 2004 Dolores Mgr Truck 73167 LDT Chevy Blazer 2004 Dolores Pickup Truck 73396 LDT Ford F-150 2005
H. Diesel-Fueled IC Engines A stationary Diesel-fueled emergency generator is located at the ICTF Yard office
building to provide emergency power when electrical service from the local power
provider is disrupted. The generator is a 269 horsepower, Diesel-fueled unit
manufactured by Caterpillar. In addition to the generator, the ICTF mechanical
department operates a portable 49 hp Diesel-fueled air compressor, manufactured by
Ingersoll-Rand, at various locations within the Yard.
-29-
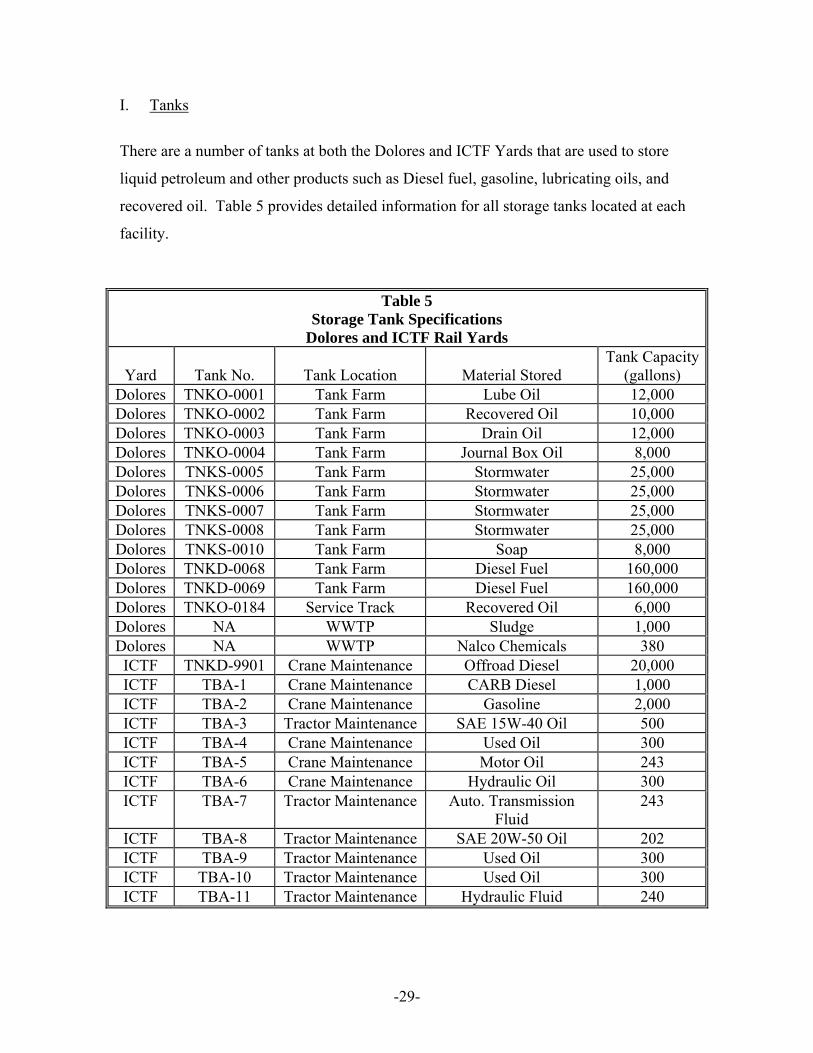
I. Tanks
There are a number of tanks at both the Dolores and ICTF Yards that are used to store
liquid petroleum and other products such as Diesel fuel, gasoline, lubricating oils, and
recovered oil. Table 5 provides detailed information for all storage tanks located at each
facility.
Table 5 Storage Tank Specifications
Dolores and ICTF Rail Yards
Yard
Tank No.
Tank Location
Material Stored Tank Capacity
(gallons) Dolores TNKO-0001 Tank Farm Lube Oil 12,000 Dolores TNKO-0002 Tank Farm Recovered Oil 10,000 Dolores TNKO-0003 Tank Farm Drain Oil 12,000 Dolores TNKO-0004 Tank Farm Journal Box Oil 8,000 Dolores TNKS-0005 Tank Farm Stormwater 25,000 Dolores TNKS-0006 Tank Farm Stormwater 25,000 Dolores TNKS-0007 Tank Farm Stormwater 25,000 Dolores TNKS-0008 Tank Farm Stormwater 25,000 Dolores TNKS-0010 Tank Farm Soap 8,000 Dolores TNKD-0068 Tank Farm Diesel Fuel 160,000 Dolores TNKD-0069 Tank Farm Diesel Fuel 160,000 Dolores TNKO-0184 Service Track Recovered Oil 6,000 Dolores NA WWTP Sludge 1,000 Dolores NA WWTP Nalco Chemicals 380 ICTF TNKD-9901 Crane Maintenance Offroad Diesel 20,000 ICTF TBA-1 Crane Maintenance CARB Diesel 1,000 ICTF TBA-2 Crane Maintenance Gasoline 2,000 ICTF TBA-3 Tractor Maintenance SAE 15W-40 Oil 500 ICTF TBA-4 Crane Maintenance Used Oil 300 ICTF TBA-5 Crane Maintenance Motor Oil 243 ICTF TBA-6 Crane Maintenance Hydraulic Oil 300 ICTF TBA-7 Tractor Maintenance Auto. Transmission
Fluid 243
ICTF TBA-8 Tractor Maintenance SAE 20W-50 Oil 202 ICTF TBA-9 Tractor Maintenance Used Oil 300 ICTF TBA-10 Tractor Maintenance Used Oil 300 ICTF TBA-11 Tractor Maintenance Hydraulic Fluid 240

-30-
J. Refueling Operations
Refueling operations occur at the crane maintenance area of ICTF and at the locomotive
shop at the Dolores Yard. Refueling emissions are based on the type of fuel and the
annual fuel throughput. The capacity of each storage tank and the type of material stored
are shown in Table 5 above.
K. Sand Tower
Locomotives use sand for traction and braking. The sand tower system located at the
Dolores Yard consists of a storage system and a transfer system to dispense sand into
locomotives. The storage system includes a pneumatic delivery system and a storage
silo. The transfer system includes a pneumatic transfer system, an elevated receiving
silo, and a moving hopper and gantry system. The system is equipped with a baghouse
for emissions control.
L. Wastewater Treatment Plant
The Dolores Yard also has a wastewater treatment plant (WWTP). Equipment at the
WWTP includes basins, two oil/water separators, a dissolved air flotation (DAF) unit,
pumps, and storage tanks. Air emission sources at the WWTP are the basins, the
oil/water separators, and the DAF.
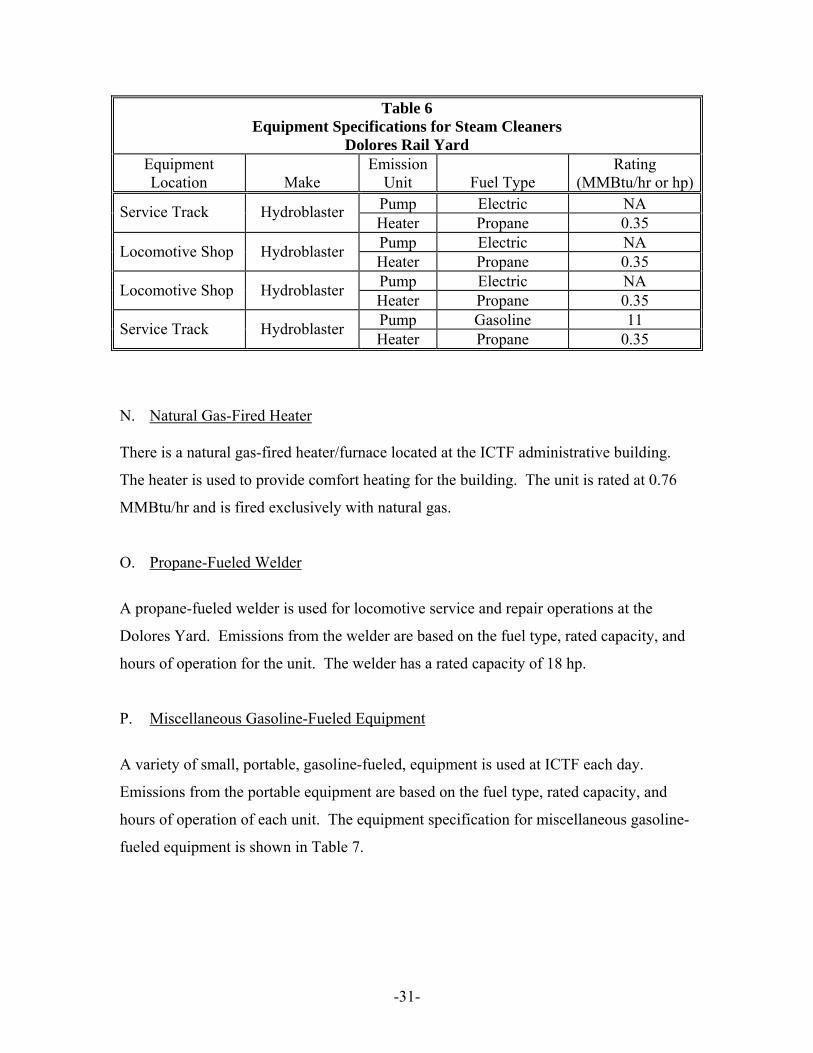
M. Steam Cleaners
Portable steam cleaners are used for a variety of activities at the Dolores Yard.
Emissions from steam cleaners are based on the hours of operation, the fuel type and
rated capacity of the heater, and the fuel type and rated capacity of the pump. The
equipment specifications for the steam cleaners operated at the Dolores Yard are shown
in Table 6. There were no steam cleaners operating at ICTF during 2005.
-31-
Table 6 Equipment Specifications for Steam Cleaners
Dolores Rail Yard Equipment Location Make
Emission Unit Fuel Type
Rating (MMBtu/hr or hp)
Pump Electric NA Service Track Hydroblaster Heater Propane 0.35 Pump Electric NA Locomotive Shop Hydroblaster Heater Propane 0.35 Pump Electric NA Locomotive Shop Hydroblaster Heater Propane 0.35 Pump Gasoline 11 Service Track Hydroblaster Heater Propane 0.35
N. Natural Gas-Fired Heater
There is a natural gas-fired heater/furnace located at the ICTF administrative building.
The heater is used to provide comfort heating for the building. The unit is rated at 0.76
MMBtu/hr and is fired exclusively with natural gas.
O. Propane-Fueled Welder
A propane-fueled welder is used for locomotive service and repair operations at the
Dolores Yard. Emissions from the welder are based on the fuel type, rated capacity, and
hours of operation for the unit. The welder has a rated capacity of 18 hp.
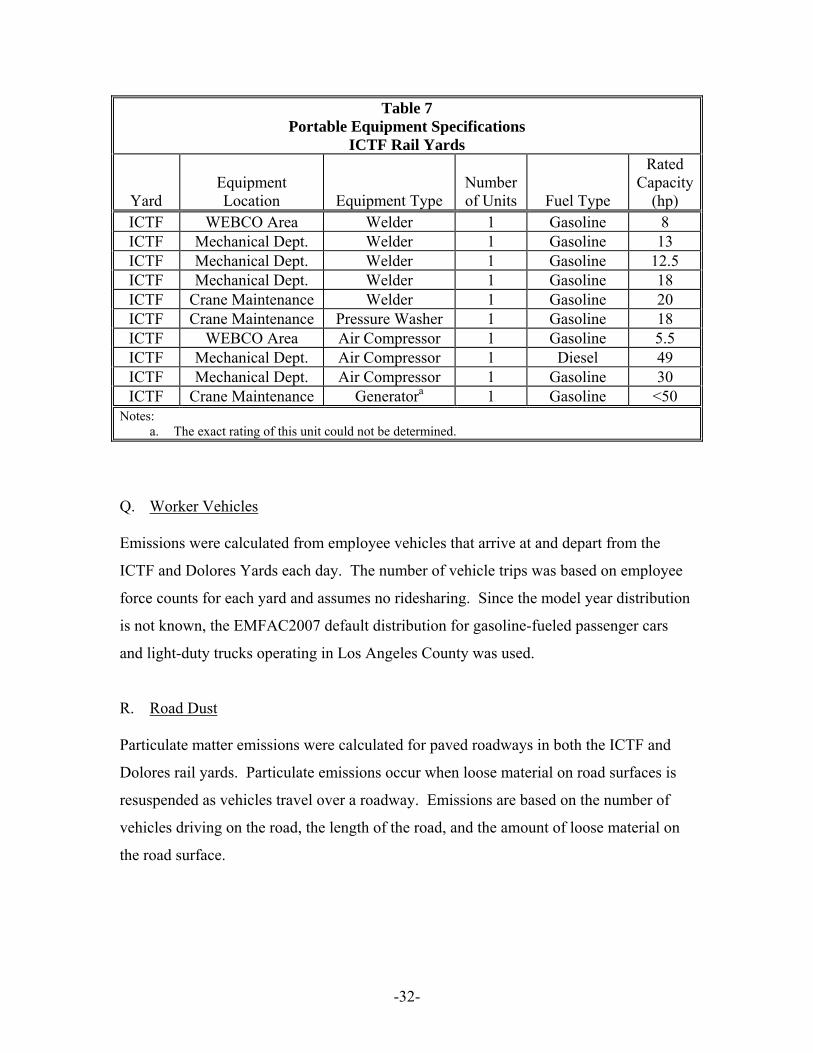
P. Miscellaneous Gasoline-Fueled Equipment
A variety of small, portable, gasoline-fueled, equipment is used at ICTF each day.
Emissions from the portable equipment are based on the fuel type, rated capacity, and
hours of operation of each unit. The equipment specification for miscellaneous gasoline-
fueled equipment is shown in Table 7.
-32-
Table 7 Portable Equipment Specifications
ICTF Rail Yards
Yard
Equipment Location
Equipment Type
Number of Units Fuel Type
Rated Capacity
(hp) ICTF WEBCO Area Welder 1 Gasoline 8 ICTF Mechanical Dept. Welder 1 Gasoline 13 ICTF Mechanical Dept. Welder 1 Gasoline 12.5 ICTF Mechanical Dept. Welder 1 Gasoline 18 ICTF Crane Maintenance Welder 1 Gasoline 20 ICTF Crane Maintenance Pressure Washer 1 Gasoline 18 ICTF WEBCO Area Air Compressor 1 Gasoline 5.5 ICTF Mechanical Dept. Air Compressor 1 Diesel 49 ICTF Mechanical Dept. Air Compressor 1 Gasoline 30 ICTF Crane Maintenance Generatora 1 Gasoline <50
Notes: a. The exact rating of this unit could not be determined.
Q. Worker Vehicles Emissions were calculated from employee vehicles that arrive at and depart from the
ICTF and Dolores Yards each day. The number of vehicle trips was based on employee
force counts for each yard and assumes no ridesharing. Since the model year distribution
is not known, the EMFAC2007 default distribution for gasoline-fueled passenger cars
and light-duty trucks operating in Los Angeles County was used.
R. Road Dust Particulate matter emissions were calculated for paved roadways in both the ICTF and
Dolores rail yards. Particulate emissions occur when loose material on road surfaces is
resuspended as vehicles travel over a roadway. Emissions are based on the number of
vehicles driving on the road, the length of the road, and the amount of loose material on
the road surface.
-33-
PART VI. Activity Data Emissions from mobile sources are based on the number and type of equipment,
equipment size, load factor, and operation during the 2005 calendar year. Since fuel
consumption data were not available, the default load factors from the OFFROAD2007
model and operating data were used for emission calculations. For sources where
operating data weren’t available, an average operating mode (AOM) was developed
based on employee interviews.
A. Locomotives
Road Power – Locomotive emissions were based on the number, model distribution, and
operating conditions (idling, throttle notch, and speeds of movements, etc). Table 8
summarizes the activity data for locomotives operating on trains at ICTF and Dolores
during the 2005 calendar year. Power moves into and out of rail yards occur under train
symbols if the regular train crew is still in the locomotives following termination of a
train. In addition, some power moves occur without train symbols if the power is being
ferried between yards by “hostlers” and not regular train crews. Such power moves do
not appear in the train database since they do not have train symbols assigned to them.
To ensure that the emissions calculations were based on the same number of locomotives
arriving and departing from the yard in a given year, the number of arriving or departing
power moves was adjusted upward by an amount such that the total number of arriving
and departing locomotives was the same.

-34-
Table 8
Train Activity Summary Dolores and ICTF Rail Yards
East Bound West Bound
Train Type No. of Trains
Locos per
Train No. of Setouts
No. of Trains
Locos per
Train No. of Setouts
Speed (mph)
Idle per Train
(hours)
Idle per Setout (hours)
Intermodal Through 74 3.365 22 215 2.916 166 10 0 0.5 Intermodal Terminating 0 -- -- 2,045 3.267 -- 10 0.5 -- Intermodal Originating 3,557 2.663 -- 0 -- -- 10 0.5 -- Non-Intermodal Through 403 1.548 384 101 2.574 79 10 0 0.5 Non-Intermodal Terminating 865 1.751 -- 1,824 2.438 -- 10 0.5 -- Non-Intermodal Originating 2,145 2.297 -- 865 1.837 -- 10 0.5 -- Power Moves Through 17 2.941 -- 7 2.286 -- 10 0 -- Power Moves Terminating 393 3.074 -- 424 3.495 -- 10 0 -- Power Moves Originating 624 3.857 -- 1,604 3.324 -- 10 0 -- Notes: a. In addition to the activities described above, ten switchers operate in the Yard.

-35-
Yard Switching – Yard operations include movements of intermodal and manifest freight
cars within the Yard. At the ICTF and Dolores Yards, the yard operations are performed
by five sets of two GP-38 switchers. Three of these sets are assigned to Dolores manifest
freight activities as well as other nearby industry jobs. These sets work within the full
length of Dolores approximately 15 hours per day each, with the remaining time spent
working outside the Yard. The other two sets serve ICTF intermodal freight exclusively.
One set works the “bottom end” or south end of the 300 Track, while the other works the
“top end” including the north end of the 300 Track, the 900 Track, and the lead from
Dolores into ICTF. These two sets are assumed to be working 23 hours per day each
within their assigned areas.
Service and Maintenance – The Locomotive servicing and maintenance activities
performed at the Dolores Yard involve both road power and yard locomotives. Service
activities include idling associated with refueling, sanding, oiling, and waiting to move to
outbound trains, with additional periods of idling and higher throttle settings during load
test events following specific maintenance tasks. Following service, locomotives are
taken as consists to departing trains. In order to be sure that the lead locomotive is facing
in the correct direction, approximately 25% of locomotives leaving service travel to the
“wye”6 at the south end of the 300 Track to “turn the power.”
A separate database provided information on each locomotive handled by the Service
Track and Shop at Dolores. These data show service events for all locomotives,
including Dolores manifest freight units, ICTF intermodal units, and other units serviced
for “on-dock” trains and other yards. Based on detailed information on the reason and
type of service or maintenance performed, separate counts of service and maintenance
activities were developed. Routine service of locomotives involves idling and short
movements in the service area associated with sanding, refueling, oiling, and other
service activities prior to their movement to the Ready Track where locomotives are
consisted for outbound trains. Some locomotive service events occur elsewhere in the
Yard, with little or no idling, as only simple service items and refueling are involved. 6 A “wye” is a set of track segments arranged in a triangular configuration with a lead at each corner. A consist can enter the “wye” from one lead, exit from another, then back up through the “wye” and out the other lead, and then return through the third leg of the triangle with the direction of the consist reversed.
-36-
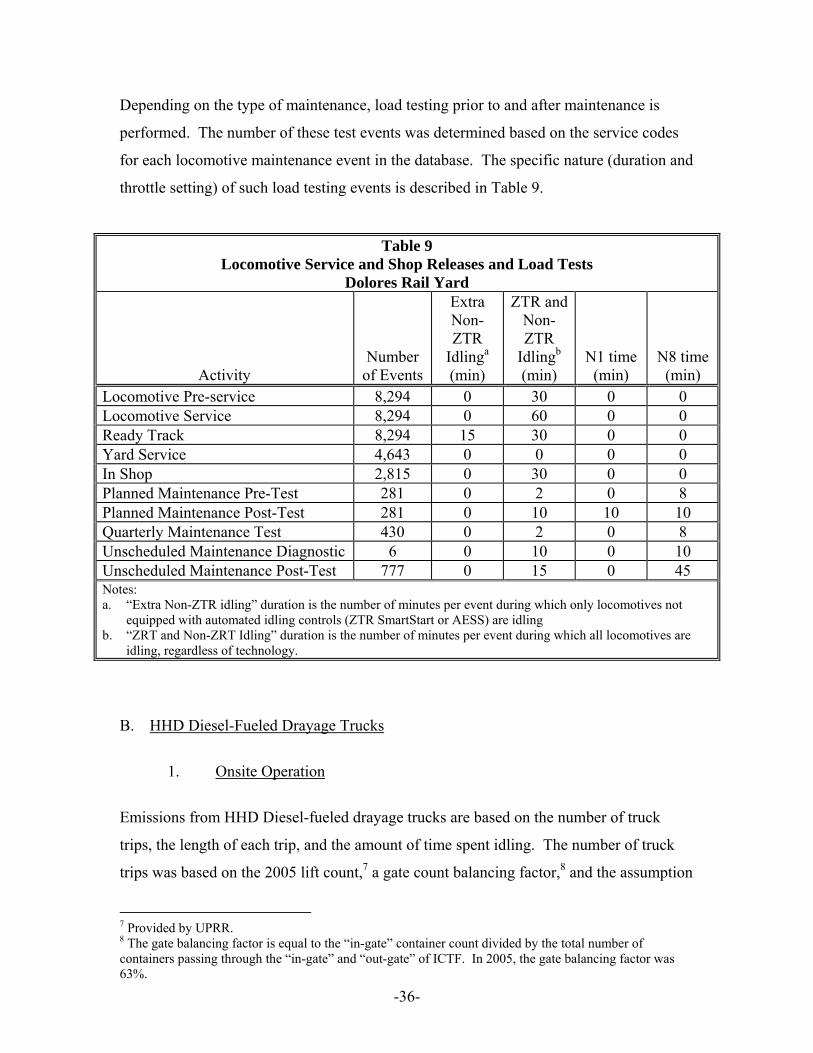
Depending on the type of maintenance, load testing prior to and after maintenance is
performed. The number of these test events was determined based on the service codes
for each locomotive maintenance event in the database. The specific nature (duration and
throttle setting) of such load testing events is described in Table 9.
Table 9 Locomotive Service and Shop Releases and Load Tests
Dolores Rail Yard
Activity
Number of Events
Extra Non-ZTR
Idlinga (min)
ZTR and Non-ZTR
Idlingb (min)
N1 time (min)
N8 time (min)
Locomotive Pre-service 8,294 0 30 0 0 Locomotive Service 8,294 0 60 0 0 Ready Track 8,294 15 30 0 0 Yard Service 4,643 0 0 0 0 In Shop 2,815 0 30 0 0 Planned Maintenance Pre-Test 281 0 2 0 8 Planned Maintenance Post-Test 281 0 10 10 10 Quarterly Maintenance Test 430 0 2 0 8 Unscheduled Maintenance Diagnostic 6 0 10 0 10 Unscheduled Maintenance Post-Test 777 0 15 0 45 Notes: a. “Extra Non-ZTR idling” duration is the number of minutes per event during which only locomotives not
equipped with automated idling controls (ZTR SmartStart or AESS) are idling b. “ZRT and Non-ZRT Idling” duration is the number of minutes per event during which all locomotives are
idling, regardless of technology.
B. HHD Diesel-Fueled Drayage Trucks
1. Onsite Operation
Emissions from HHD Diesel-fueled drayage trucks are based on the number of truck
trips, the length of each trip, and the amount of time spent idling. The number of truck
trips was based on the 2005 lift count,7 a gate count balancing factor,8 and the assumption
7 Provided by UPRR. 8 The gate balancing factor is equal to the “in-gate” container count divided by the total number of containers passing through the “in-gate” and “out-gate” of ICTF. In 2005, the gate balancing factor was 63%.
-37-
that 40% of the trucks entering ICTF with a container also leave the facility with a
container.9 See Appendix B-1 for a detailed discussion on the calculation methodology.
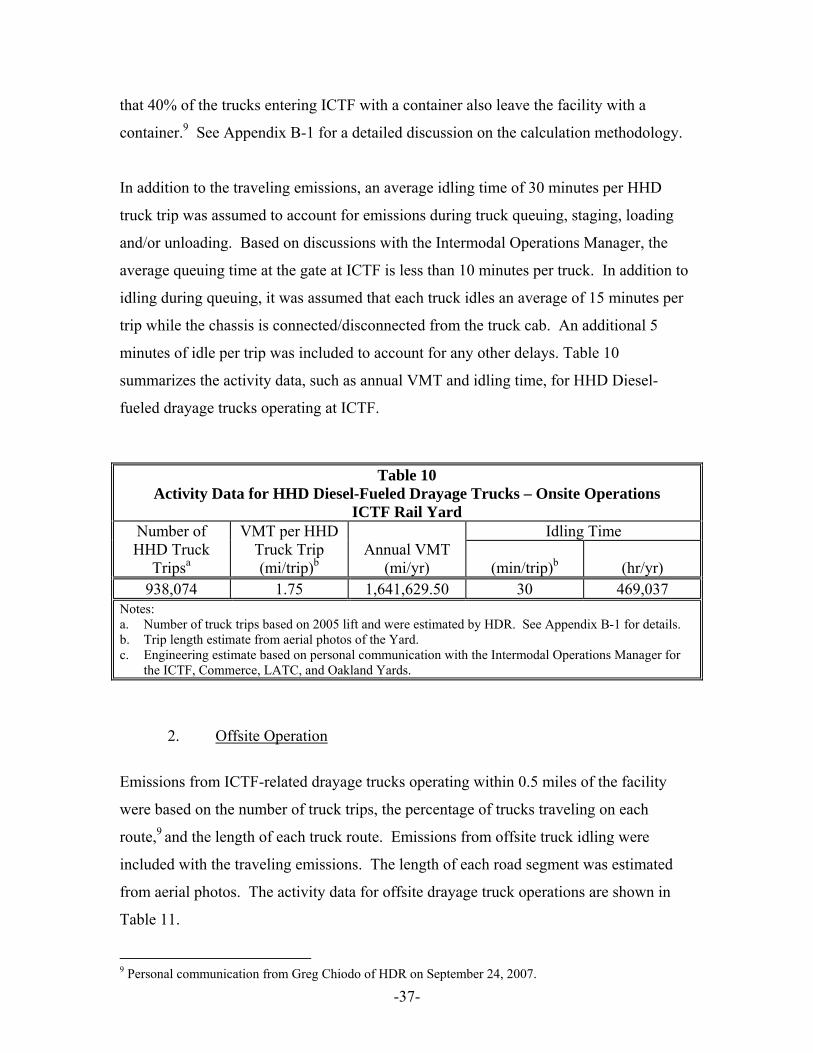
In addition to the traveling emissions, an average idling time of 30 minutes per HHD
truck trip was assumed to account for emissions during truck queuing, staging, loading
and/or unloading. Based on discussions with the Intermodal Operations Manager, the
average queuing time at the gate at ICTF is less than 10 minutes per truck. In addition to
idling during queuing, it was assumed that each truck idles an average of 15 minutes per
trip while the chassis is connected/disconnected from the truck cab. An additional 5
minutes of idle per trip was included to account for any other delays. Table 10
summarizes the activity data, such as annual VMT and idling time, for HHD Diesel-
fueled drayage trucks operating at ICTF.
Table 10 Activity Data for HHD Diesel-Fueled Drayage Trucks – Onsite Operations
ICTF Rail Yard Idling Time Number of
HHD Truck Tripsa
VMT per HHD Truck Trip (mi/trip)b
Annual VMT
(mi/yr) (min/trip)b (hr/yr) 938,074 1.75 1,641,629.50 30 469,037
Notes: a. Number of truck trips based on 2005 lift and were estimated by HDR. See Appendix B-1 for details. b. Trip length estimate from aerial photos of the Yard. c. Engineering estimate based on personal communication with the Intermodal Operations Manager for
the ICTF, Commerce, LATC, and Oakland Yards.
2. Offsite Operation
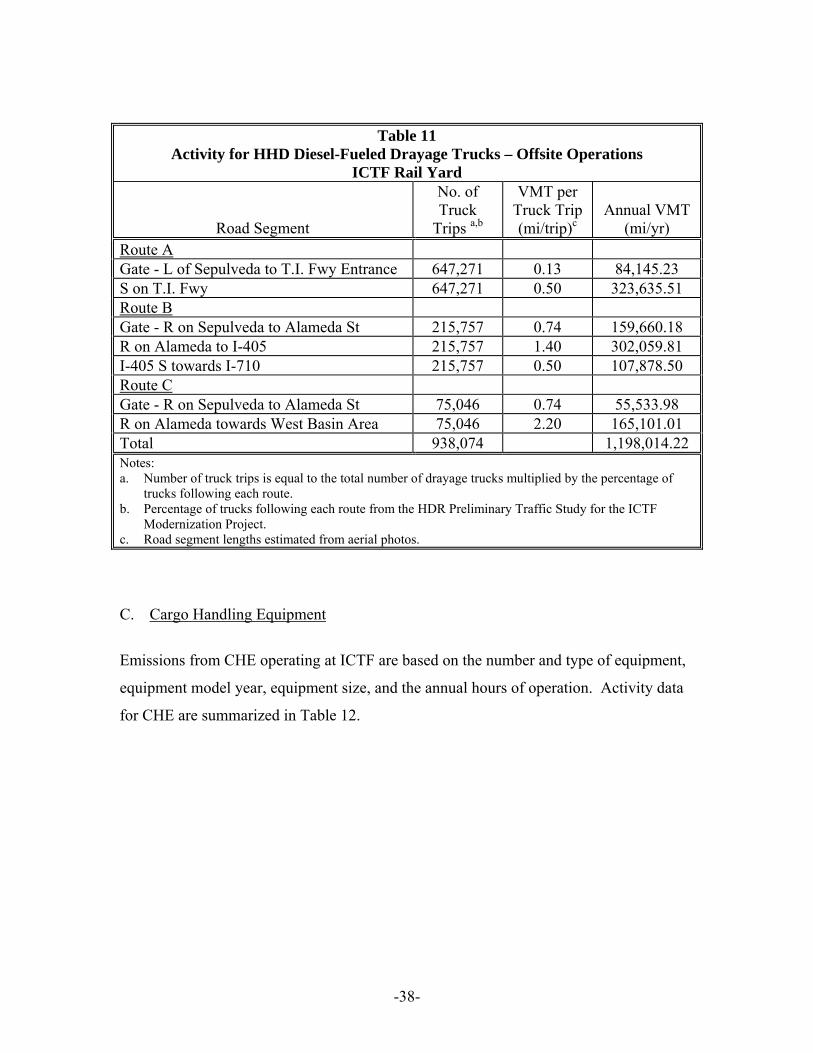
Emissions from ICTF-related drayage trucks operating within 0.5 miles of the facility
were based on the number of truck trips, the percentage of trucks traveling on each
route,9 and the length of each truck route. Emissions from offsite truck idling were
included with the traveling emissions. The length of each road segment was estimated
from aerial photos. The activity data for offsite drayage truck operations are shown in
Table 11.
9 Personal communication from Greg Chiodo of HDR on September 24, 2007.
-38-
Table 11 Activity for HHD Diesel-Fueled Drayage Trucks – Offsite Operations
ICTF Rail Yard
Road Segment
No. of Truck
Trips a,b
VMT per Truck Trip (mi/trip)c
Annual VMT (mi/yr)
Route A Gate - L of Sepulveda to T.I. Fwy Entrance 647,271 0.13 84,145.23 S on T.I. Fwy 647,271 0.50 323,635.51 Route B Gate - R on Sepulveda to Alameda St 215,757 0.74 159,660.18 R on Alameda to I-405 215,757 1.40 302,059.81 I-405 S towards I-710 215,757 0.50 107,878.50 Route C Gate - R on Sepulveda to Alameda St 75,046 0.74 55,533.98 R on Alameda towards West Basin Area 75,046 2.20 165,101.01 Total 938,074 1,198,014.22 Notes: a. Number of truck trips is equal to the total number of drayage trucks multiplied by the percentage of
trucks following each route. b. Percentage of trucks following each route from the HDR Preliminary Traffic Study for the ICTF
Modernization Project. c. Road segment lengths estimated from aerial photos. C. Cargo Handling Equipment
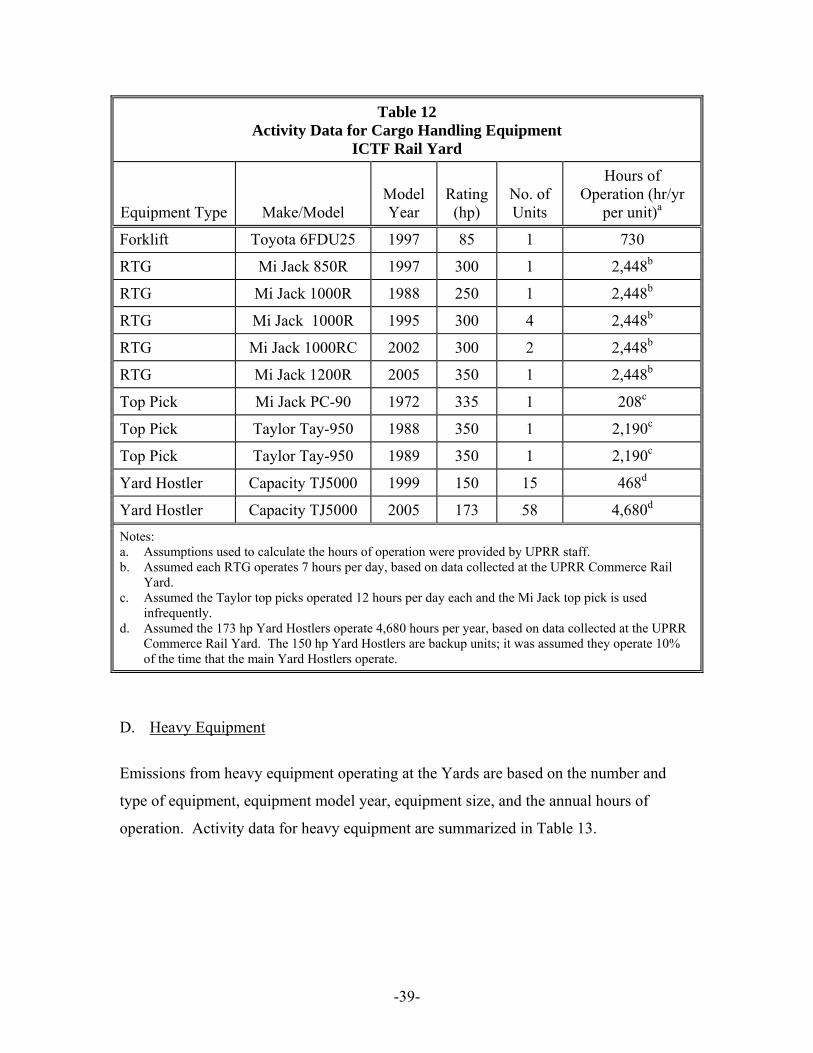
Emissions from CHE operating at ICTF are based on the number and type of equipment,
equipment model year, equipment size, and the annual hours of operation. Activity data
for CHE are summarized in Table 12.
-39-
Table 12 Activity Data for Cargo Handling Equipment
ICTF Rail Yard
Equipment Type Make/Model Model Year
Rating (hp)
No. of Units
Hours of Operation (hr/yr
per unit)a
Forklift Toyota 6FDU25 1997 85 1 730
RTG Mi Jack 850R 1997 300 1 2,448b
RTG Mi Jack 1000R 1988 250 1 2,448b
RTG Mi Jack 1000R 1995 300 4 2,448b
RTG Mi Jack 1000RC 2002 300 2 2,448b
RTG Mi Jack 1200R 2005 350 1 2,448b
Top Pick Mi Jack PC-90 1972 335 1 208c
Top Pick Taylor Tay-950 1988 350 1 2,190c
Top Pick Taylor Tay-950 1989 350 1 2,190c
Yard Hostler Capacity TJ5000 1999 150 15 468d
Yard Hostler Capacity TJ5000 2005 173 58 4,680d Notes: a. Assumptions used to calculate the hours of operation were provided by UPRR staff. b. Assumed each RTG operates 7 hours per day, based on data collected at the UPRR Commerce Rail
Yard. c. Assumed the Taylor top picks operated 12 hours per day each and the Mi Jack top pick is used
infrequently. d. Assumed the 173 hp Yard Hostlers operate 4,680 hours per year, based on data collected at the UPRR
Commerce Rail Yard. The 150 hp Yard Hostlers are backup units; it was assumed they operate 10% of the time that the main Yard Hostlers operate.
D. Heavy Equipment
Emissions from heavy equipment operating at the Yards are based on the number and
type of equipment, equipment model year, equipment size, and the annual hours of
operation. Activity data for heavy equipment are summarized in Table 13.
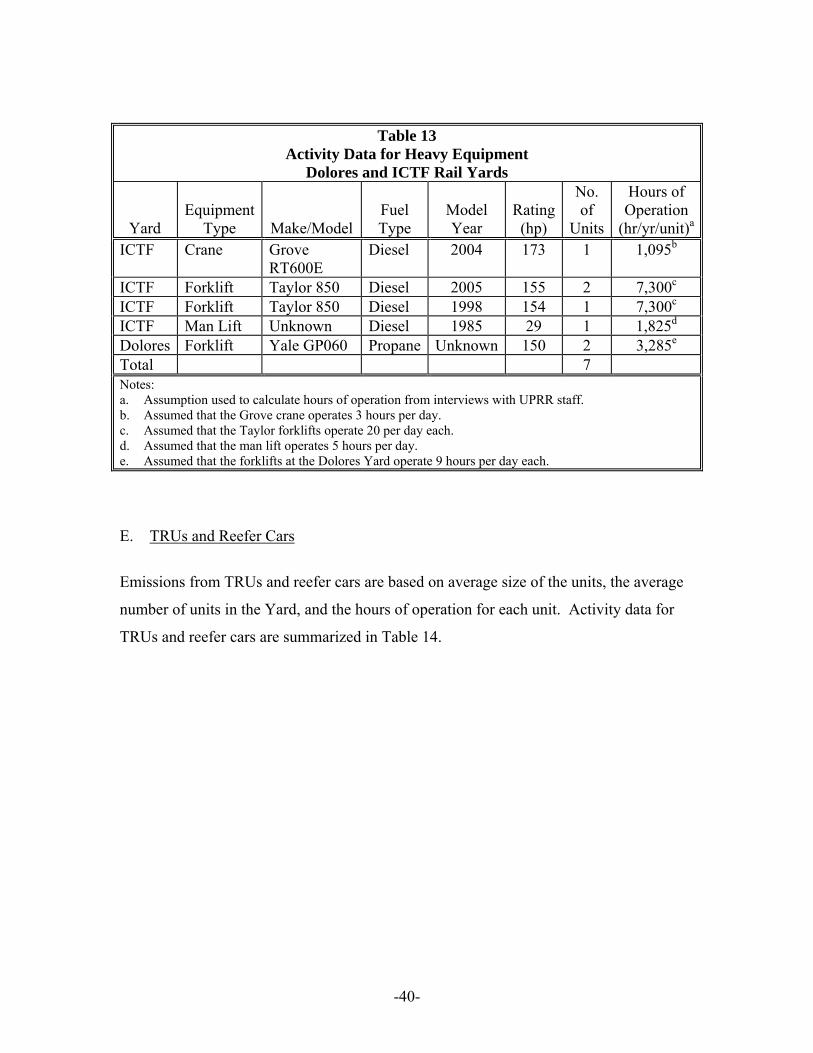
-40-
Table 13 Activity Data for Heavy Equipment
Dolores and ICTF Rail Yards
Yard Equipment
Type Make/Model Fuel Type
Model Year
Rating(hp)
No. of
Units
Hours of Operation
(hr/yr/unit)a
ICTF Crane Grove RT600E
Diesel 2004 173 1 1,095b
ICTF Forklift Taylor 850 Diesel 2005 155 2 7,300c ICTF Forklift Taylor 850 Diesel 1998 154 1 7,300c ICTF Man Lift Unknown Diesel 1985 29 1 1,825d Dolores Forklift Yale GP060 Propane Unknown 150 2 3,285e Total 7 Notes: a. Assumption used to calculate hours of operation from interviews with UPRR staff. b. Assumed that the Grove crane operates 3 hours per day. c. Assumed that the Taylor forklifts operate 20 per day each. d. Assumed that the man lift operates 5 hours per day. e. Assumed that the forklifts at the Dolores Yard operate 9 hours per day each.
E. TRUs and Reefer Cars
Emissions from TRUs and reefer cars are based on average size of the units, the average
number of units in the Yard, and the hours of operation for each unit. Activity data for
TRUs and reefer cars are summarized in Table 14.
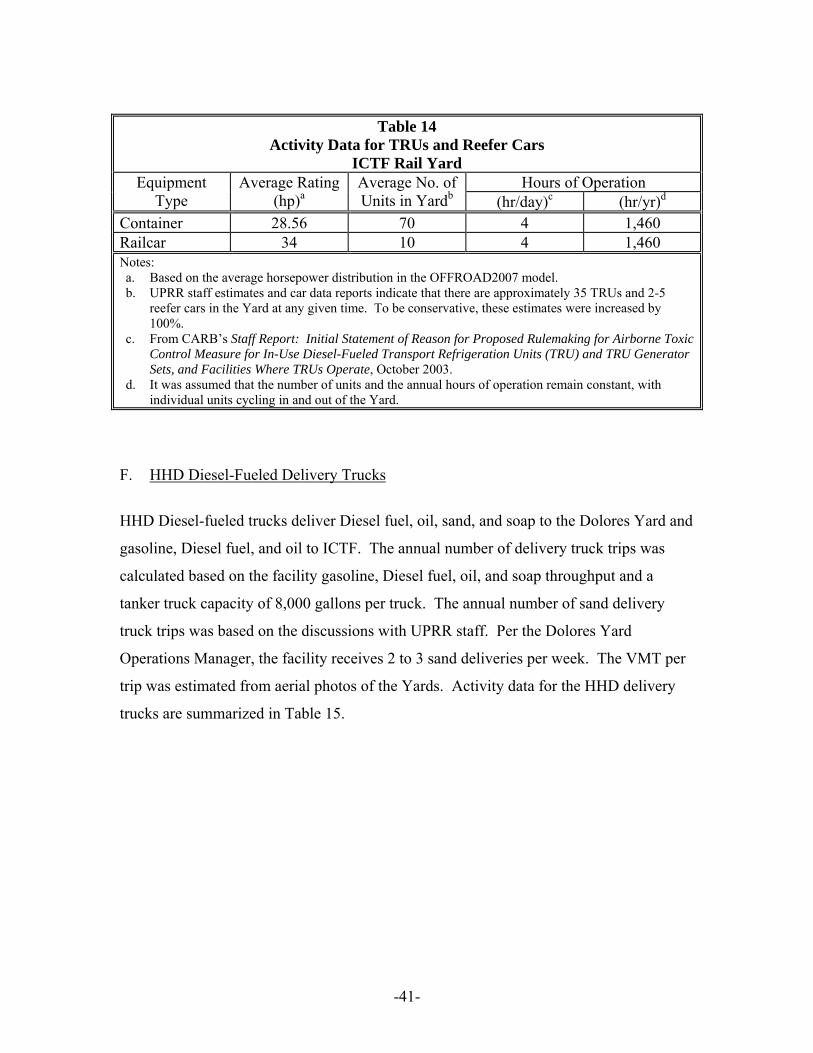
-41-
Table 14
Activity Data for TRUs and Reefer Cars ICTF Rail Yard
Hours of Operation Equipment Type
Average Rating (hp)a
Average No. of Units in Yardb (hr/day)c (hr/yr)d
Container 28.56 70 4 1,460 Railcar 34 10 4 1,460 Notes: a. Based on the average horsepower distribution in the OFFROAD2007 model. b. UPRR staff estimates and car data reports indicate that there are approximately 35 TRUs and 2-5
reefer cars in the Yard at any given time. To be conservative, these estimates were increased by 100%.
c. From CARB’s Staff Report: Initial Statement of Reason for Proposed Rulemaking for Airborne Toxic Control Measure for In-Use Diesel-Fueled Transport Refrigeration Units (TRU) and TRU Generator Sets, and Facilities Where TRUs Operate, October 2003.
d. It was assumed that the number of units and the annual hours of operation remain constant, with individual units cycling in and out of the Yard.
F. HHD Diesel-Fueled Delivery Trucks
HHD Diesel-fueled trucks deliver Diesel fuel, oil, sand, and soap to the Dolores Yard and
gasoline, Diesel fuel, and oil to ICTF. The annual number of delivery truck trips was
calculated based on the facility gasoline, Diesel fuel, oil, and soap throughput and a
tanker truck capacity of 8,000 gallons per truck. The annual number of sand delivery
truck trips was based on the discussions with UPRR staff. Per the Dolores Yard
Operations Manager, the facility receives 2 to 3 sand deliveries per week. The VMT per
trip was estimated from aerial photos of the Yards. Activity data for the HHD delivery
trucks are summarized in Table 15.
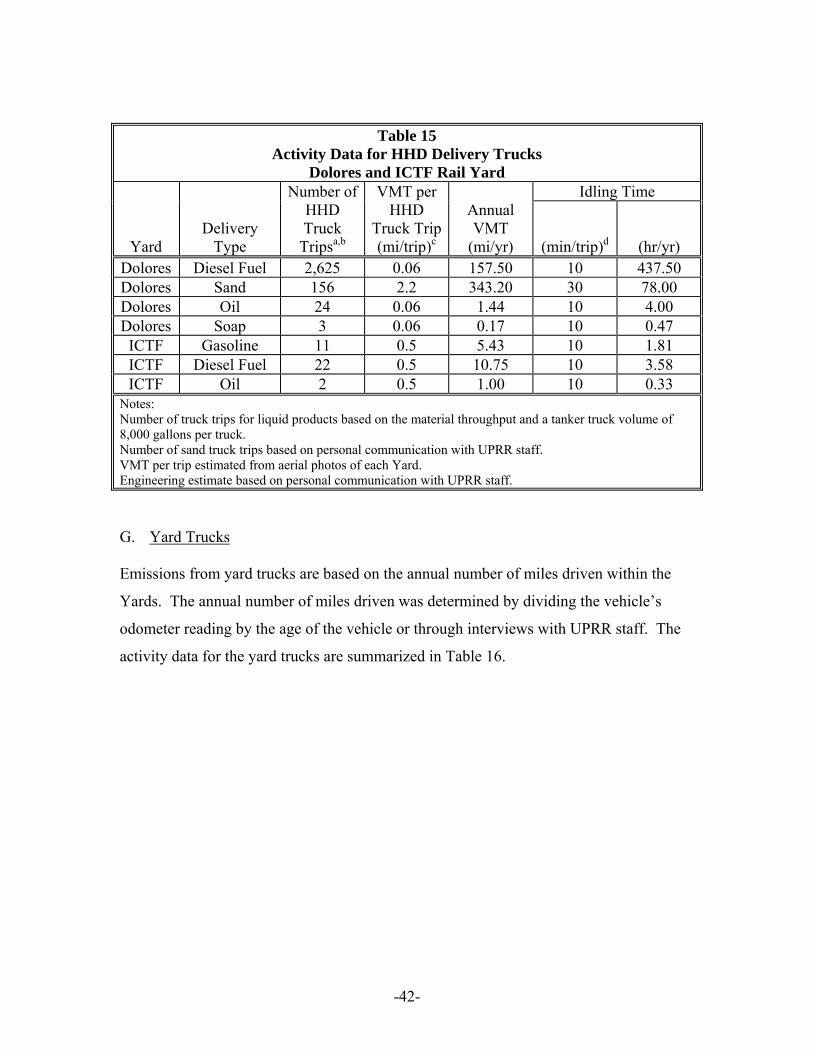
-42-
Table 15 Activity Data for HHD Delivery Trucks
Dolores and ICTF Rail Yard Idling Time
Yard
Delivery Type
Number of HHD Truck
Tripsa,b
VMT per HHD
Truck Trip(mi/trip)c
Annual VMT
(mi/yr) (min/trip)d (hr/yr) Dolores Diesel Fuel 2,625 0.06 157.50 10 437.50 Dolores Sand 156 2.2 343.20 30 78.00 Dolores Oil 24 0.06 1.44 10 4.00 Dolores Soap 3 0.06 0.17 10 0.47
ICTF Gasoline 11 0.5 5.43 10 1.81 ICTF Diesel Fuel 22 0.5 10.75 10 3.58 ICTF Oil 2 0.5 1.00 10 0.33
Notes: Number of truck trips for liquid products based on the material throughput and a tanker truck volume of 8,000 gallons per truck. Number of sand truck trips based on personal communication with UPRR staff. VMT per trip estimated from aerial photos of each Yard. Engineering estimate based on personal communication with UPRR staff. G. Yard Trucks Emissions from yard trucks are based on the annual number of miles driven within the
Yards. The annual number of miles driven was determined by dividing the vehicle’s
odometer reading by the age of the vehicle or through interviews with UPRR staff. The
activity data for the yard trucks are summarized in Table 16.
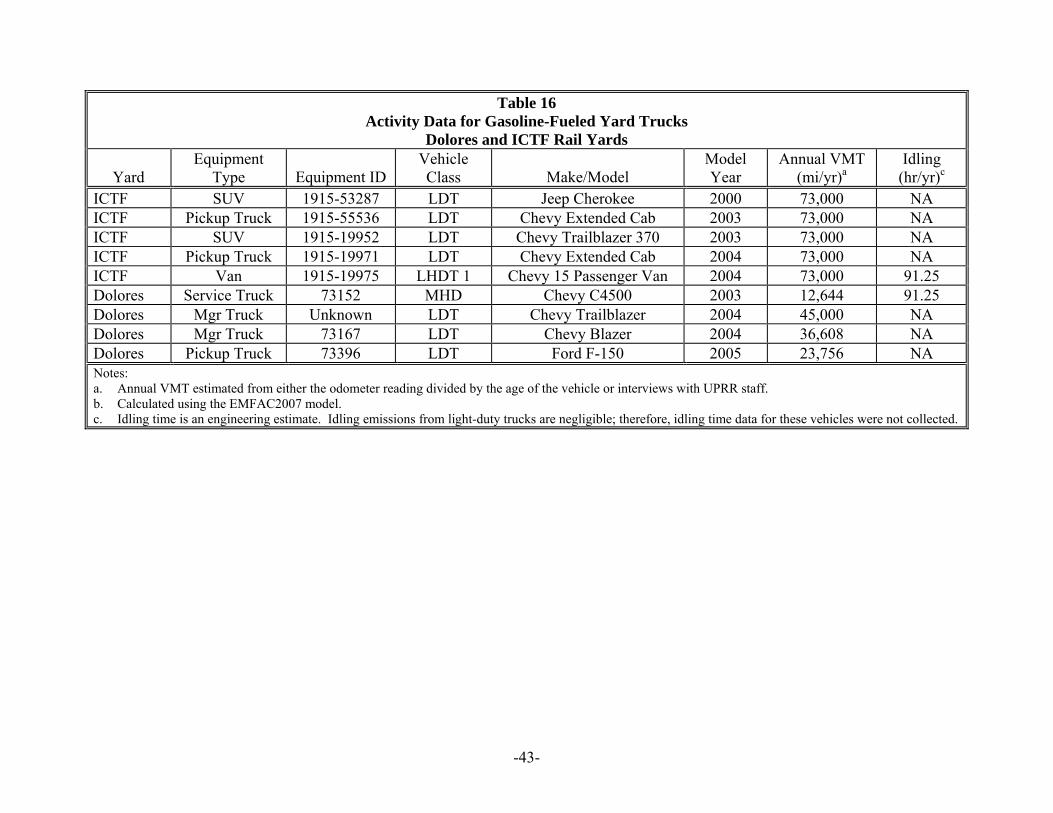
-43-
Table 16
Activity Data for Gasoline-Fueled Yard Trucks Dolores and ICTF Rail Yards
Yard
Equipment Type Equipment ID
Vehicle Class Make/Model
Model Year
Annual VMT (mi/yr)a
Idling (hr/yr)c
ICTF SUV 1915-53287 LDT Jeep Cherokee 2000 73,000 NA ICTF Pickup Truck 1915-55536 LDT Chevy Extended Cab 2003 73,000 NA ICTF SUV 1915-19952 LDT Chevy Trailblazer 370 2003 73,000 NA ICTF Pickup Truck 1915-19971 LDT Chevy Extended Cab 2004 73,000 NA ICTF Van 1915-19975 LHDT 1 Chevy 15 Passenger Van 2004 73,000 91.25 Dolores Service Truck 73152 MHD Chevy C4500 2003 12,644 91.25 Dolores Mgr Truck Unknown LDT Chevy Trailblazer 2004 45,000 NA Dolores Mgr Truck 73167 LDT Chevy Blazer 2004 36,608 NA Dolores Pickup Truck 73396 LDT Ford F-150 2005 23,756 NA Notes: a. Annual VMT estimated from either the odometer reading divided by the age of the vehicle or interviews with UPRR staff. b. Calculated using the EMFAC2007 model. c. Idling time is an engineering estimate. Idling emissions from light-duty trucks are negligible; therefore, idling time data for these vehicles were not collected.
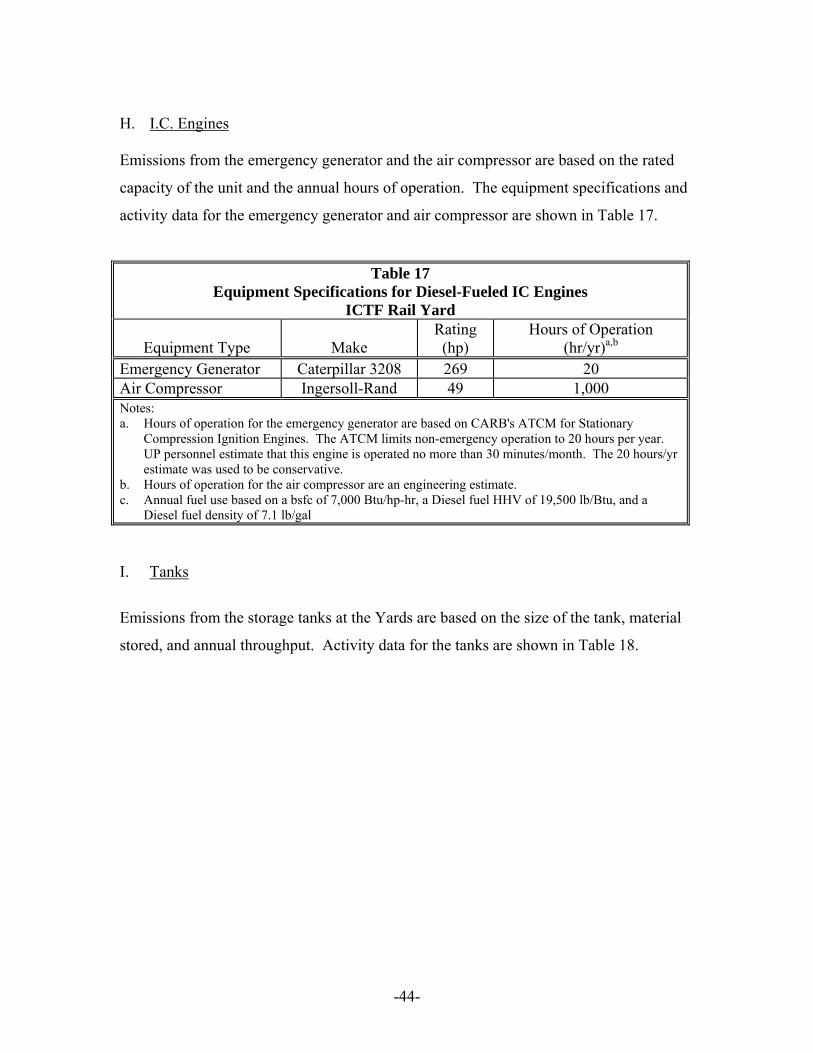
-44-
H. I.C. Engines Emissions from the emergency generator and the air compressor are based on the rated
capacity of the unit and the annual hours of operation. The equipment specifications and
activity data for the emergency generator and air compressor are shown in Table 17.
Table 17 Equipment Specifications for Diesel-Fueled IC Engines
ICTF Rail Yard
Equipment Type Make Rating (hp)
Hours of Operation (hr/yr)a,b
Emergency Generator Caterpillar 3208 269 20 Air Compressor Ingersoll-Rand 49 1,000 Notes: a. Hours of operation for the emergency generator are based on CARB's ATCM for Stationary
Compression Ignition Engines. The ATCM limits non-emergency operation to 20 hours per year. UP personnel estimate that this engine is operated no more than 30 minutes/month. The 20 hours/yr estimate was used to be conservative.
b. Hours of operation for the air compressor are an engineering estimate. c. Annual fuel use based on a bsfc of 7,000 Btu/hp-hr, a Diesel fuel HHV of 19,500 lb/Btu, and a
Diesel fuel density of 7.1 lb/gal I. Tanks
Emissions from the storage tanks at the Yards are based on the size of the tank, material
stored, and annual throughput. Activity data for the tanks are shown in Table 18.
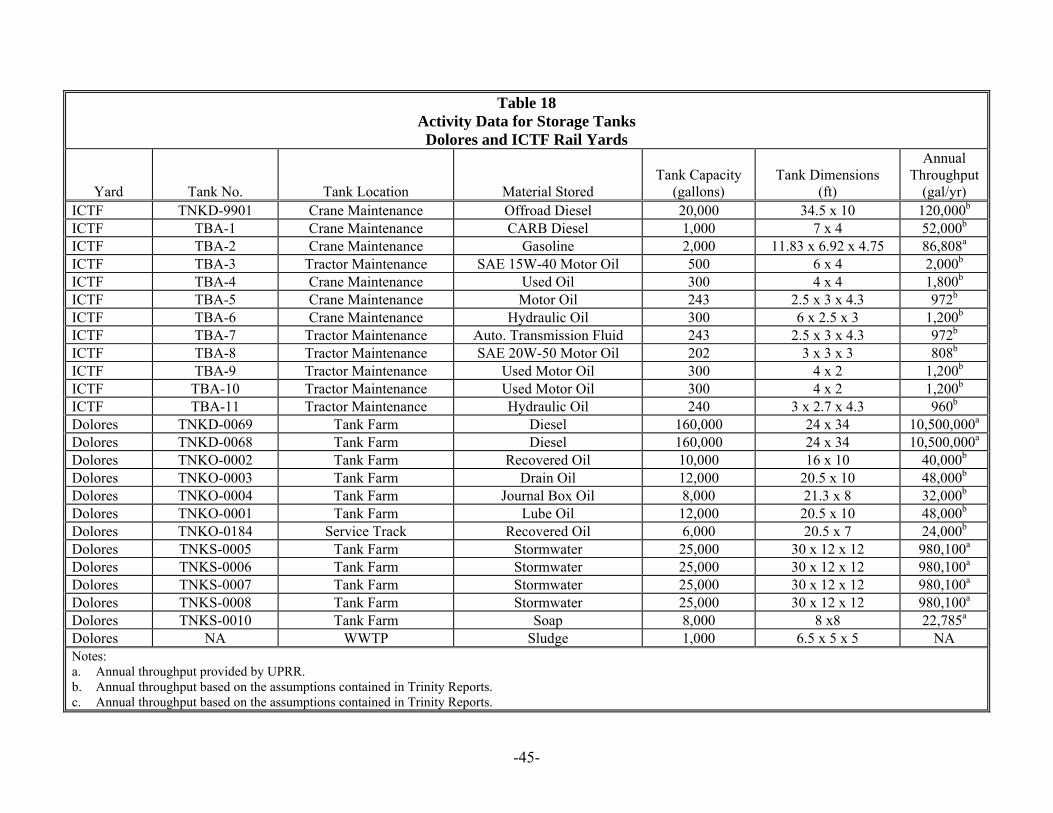
-45-
Table 18
Activity Data for Storage Tanks Dolores and ICTF Rail Yards
Yard Tank No. Tank Location Material Stored Tank Capacity
(gallons) Tank Dimensions
(ft)
Annual Throughput
(gal/yr) ICTF TNKD-9901 Crane Maintenance Offroad Diesel 20,000 34.5 x 10 120,000b ICTF TBA-1 Crane Maintenance CARB Diesel 1,000 7 x 4 52,000b ICTF TBA-2 Crane Maintenance Gasoline 2,000 11.83 x 6.92 x 4.75 86,808a ICTF TBA-3 Tractor Maintenance SAE 15W-40 Motor Oil 500 6 x 4 2,000b ICTF TBA-4 Crane Maintenance Used Oil 300 4 x 4 1,800b ICTF TBA-5 Crane Maintenance Motor Oil 243 2.5 x 3 x 4.3 972b ICTF TBA-6 Crane Maintenance Hydraulic Oil 300 6 x 2.5 x 3 1,200b ICTF TBA-7 Tractor Maintenance Auto. Transmission Fluid 243 2.5 x 3 x 4.3 972b ICTF TBA-8 Tractor Maintenance SAE 20W-50 Motor Oil 202 3 x 3 x 3 808b ICTF TBA-9 Tractor Maintenance Used Motor Oil 300 4 x 2 1,200b ICTF TBA-10 Tractor Maintenance Used Motor Oil 300 4 x 2 1,200b ICTF TBA-11 Tractor Maintenance Hydraulic Oil 240 3 x 2.7 x 4.3 960b Dolores TNKD-0069 Tank Farm Diesel 160,000 24 x 34 10,500,000a Dolores TNKD-0068 Tank Farm Diesel 160,000 24 x 34 10,500,000a Dolores TNKO-0002 Tank Farm Recovered Oil 10,000 16 x 10 40,000b Dolores TNKO-0003 Tank Farm Drain Oil 12,000 20.5 x 10 48,000b Dolores TNKO-0004 Tank Farm Journal Box Oil 8,000 21.3 x 8 32,000b Dolores TNKO-0001 Tank Farm Lube Oil 12,000 20.5 x 10 48,000b Dolores TNKO-0184 Service Track Recovered Oil 6,000 20.5 x 7 24,000b Dolores TNKS-0005 Tank Farm Stormwater 25,000 30 x 12 x 12 980,100a Dolores TNKS-0006 Tank Farm Stormwater 25,000 30 x 12 x 12 980,100a Dolores TNKS-0007 Tank Farm Stormwater 25,000 30 x 12 x 12 980,100a Dolores TNKS-0008 Tank Farm Stormwater 25,000 30 x 12 x 12 980,100a Dolores TNKS-0010 Tank Farm Soap 8,000 8 x8 22,785a Dolores NA WWTP Sludge 1,000 6.5 x 5 x 5 NA Notes: a. Annual throughput provided by UPRR. b. Annual throughput based on the assumptions contained in Trinity Reports. c. Annual throughput based on the assumptions contained in Trinity Reports.
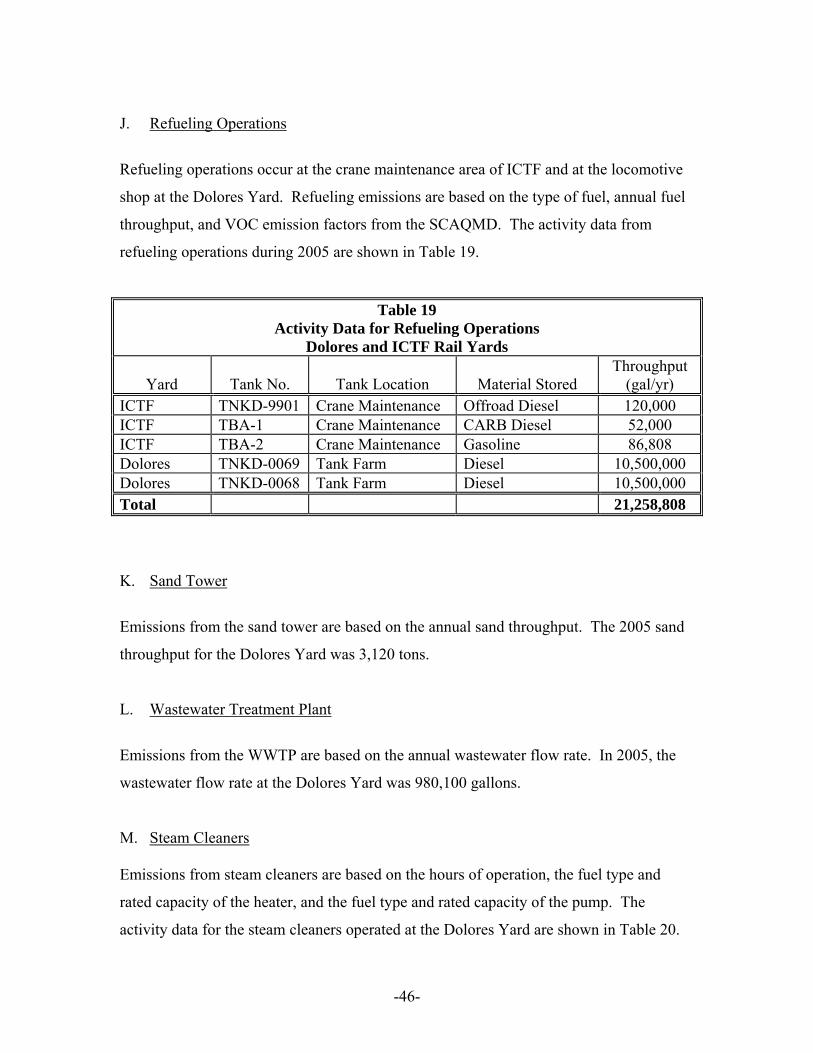
-46-
J. Refueling Operations
Refueling operations occur at the crane maintenance area of ICTF and at the locomotive
shop at the Dolores Yard. Refueling emissions are based on the type of fuel, annual fuel
throughput, and VOC emission factors from the SCAQMD. The activity data from
refueling operations during 2005 are shown in Table 19.
Table 19 Activity Data for Refueling Operations
Dolores and ICTF Rail Yards
Yard Tank No. Tank Location Material Stored Throughput
(gal/yr) ICTF TNKD-9901 Crane Maintenance Offroad Diesel 120,000 ICTF TBA-1 Crane Maintenance CARB Diesel 52,000 ICTF TBA-2 Crane Maintenance Gasoline 86,808 Dolores TNKD-0069 Tank Farm Diesel 10,500,000 Dolores TNKD-0068 Tank Farm Diesel 10,500,000 Total 21,258,808 K. Sand Tower
Emissions from the sand tower are based on the annual sand throughput. The 2005 sand
throughput for the Dolores Yard was 3,120 tons.
L. Wastewater Treatment Plant
Emissions from the WWTP are based on the annual wastewater flow rate. In 2005, the
wastewater flow rate at the Dolores Yard was 980,100 gallons.
M. Steam Cleaners Emissions from steam cleaners are based on the hours of operation, the fuel type and
rated capacity of the heater, and the fuel type and rated capacity of the pump. The
activity data for the steam cleaners operated at the Dolores Yard are shown in Table 20.
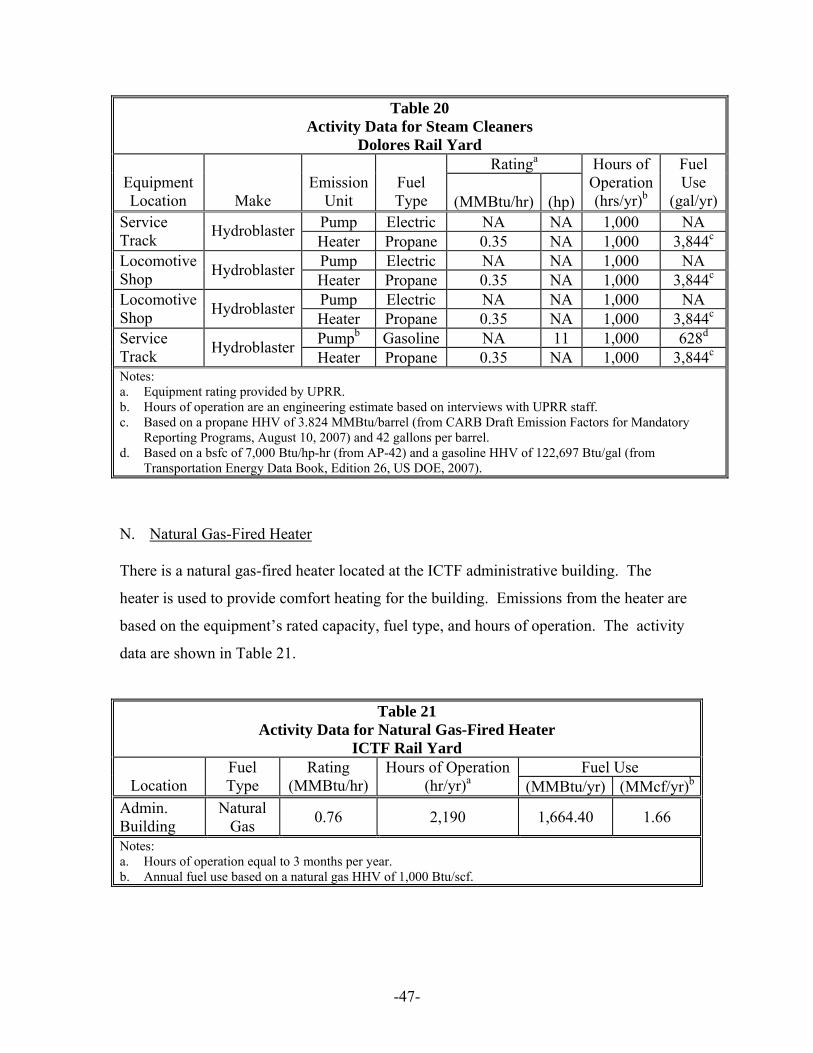
-47-
Table 20 Activity Data for Steam Cleaners
Dolores Rail Yard Ratinga
Equipment Location Make
Emission Unit
Fuel Type (MMBtu/hr)
(hp)
Hours of Operation (hrs/yr)b
Fuel Use
(gal/yr) Pump Electric NA NA 1,000 NA Service
Track Hydroblaster Heater Propane 0.35 NA 1,000 3,844c Pump Electric NA NA 1,000 NA Locomotive
Shop Hydroblaster Heater Propane 0.35 NA 1,000 3,844c Pump Electric NA NA 1,000 NA Locomotive
Shop Hydroblaster Heater Propane 0.35 NA 1,000 3,844c Pumpb Gasoline NA 11 1,000 628d Service
Track Hydroblaster Heater Propane 0.35 NA 1,000 3,844c Notes: a. Equipment rating provided by UPRR. b. Hours of operation are an engineering estimate based on interviews with UPRR staff. c. Based on a propane HHV of 3.824 MMBtu/barrel (from CARB Draft Emission Factors for Mandatory
Reporting Programs, August 10, 2007) and 42 gallons per barrel. d. Based on a bsfc of 7,000 Btu/hp-hr (from AP-42) and a gasoline HHV of 122,697 Btu/gal (from
Transportation Energy Data Book, Edition 26, US DOE, 2007).
N. Natural Gas-Fired Heater There is a natural gas-fired heater located at the ICTF administrative building. The
heater is used to provide comfort heating for the building. Emissions from the heater are
based on the equipment’s rated capacity, fuel type, and hours of operation. The activity
data are shown in Table 21.
Table 21 Activity Data for Natural Gas-Fired Heater
ICTF Rail Yard Fuel Use
Location Fuel Type
Rating (MMBtu/hr)
Hours of Operation (hr/yr)a (MMBtu/yr) (MMcf/yr)b
Admin. Building
Natural Gas 0.76 2,190 1,664.40 1.66
Notes: a. Hours of operation equal to 3 months per year. b. Annual fuel use based on a natural gas HHV of 1,000 Btu/scf.
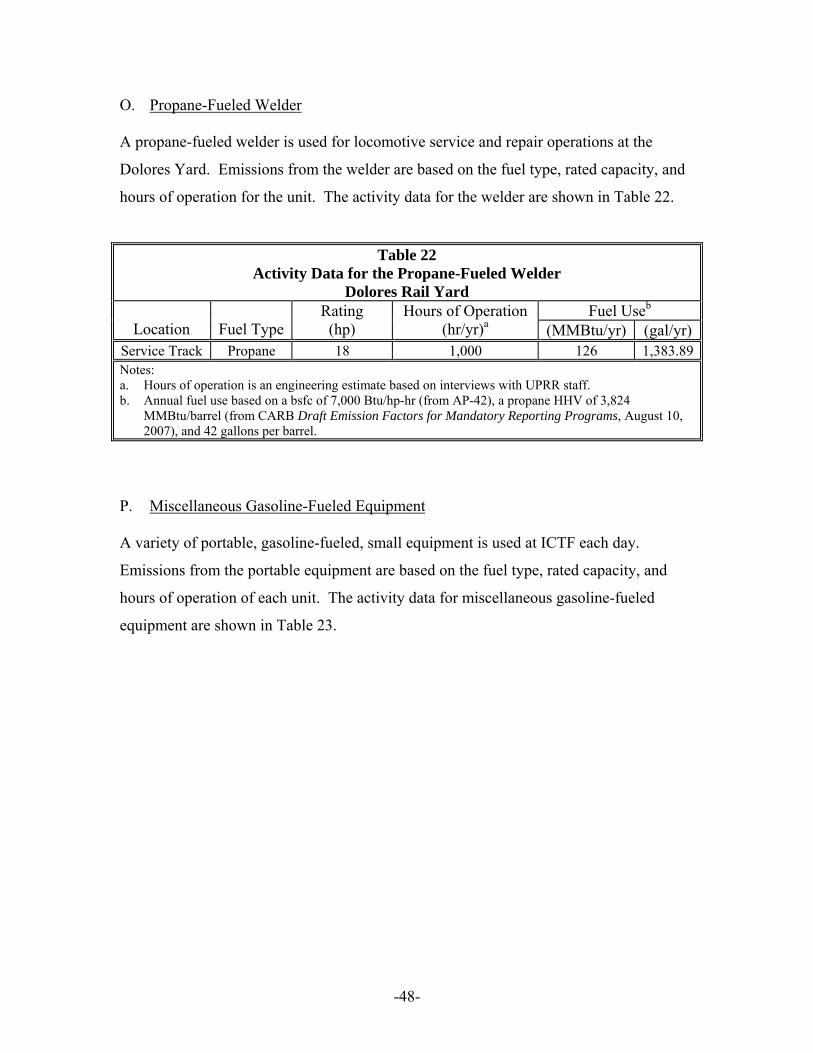
-48-
O. Propane-Fueled Welder A propane-fueled welder is used for locomotive service and repair operations at the
Dolores Yard. Emissions from the welder are based on the fuel type, rated capacity, and
hours of operation for the unit. The activity data for the welder are shown in Table 22.
Table 22 Activity Data for the Propane-Fueled Welder
Dolores Rail Yard Fuel Useb
Location Fuel Type Rating (hp)
Hours of Operation (hr/yr)a (MMBtu/yr) (gal/yr)
Service Track Propane 18 1,000 126 1,383.89Notes: a. Hours of operation is an engineering estimate based on interviews with UPRR staff. b. Annual fuel use based on a bsfc of 7,000 Btu/hp-hr (from AP-42), a propane HHV of 3,824
MMBtu/barrel (from CARB Draft Emission Factors for Mandatory Reporting Programs, August 10, 2007), and 42 gallons per barrel.
P. Miscellaneous Gasoline-Fueled Equipment A variety of portable, gasoline-fueled, small equipment is used at ICTF each day.
Emissions from the portable equipment are based on the fuel type, rated capacity, and
hours of operation of each unit. The activity data for miscellaneous gasoline-fueled
equipment are shown in Table 23.
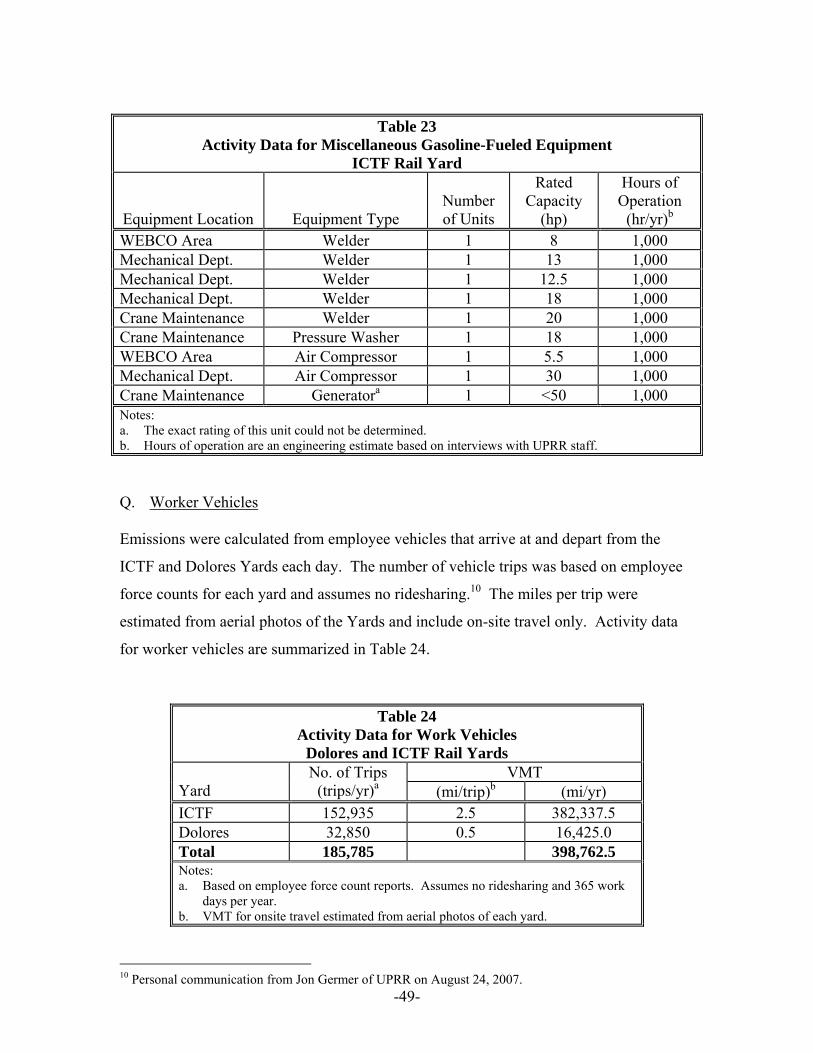
-49-
Table 23
Activity Data for Miscellaneous Gasoline-Fueled Equipment ICTF Rail Yard
Equipment Location Equipment Type
Number of Units
Rated Capacity
(hp)
Hours of Operation
(hr/yr)b WEBCO Area Welder 1 8 1,000 Mechanical Dept. Welder 1 13 1,000 Mechanical Dept. Welder 1 12.5 1,000 Mechanical Dept. Welder 1 18 1,000 Crane Maintenance Welder 1 20 1,000 Crane Maintenance Pressure Washer 1 18 1,000 WEBCO Area Air Compressor 1 5.5 1,000 Mechanical Dept. Air Compressor 1 30 1,000 Crane Maintenance Generatora 1 <50 1,000 Notes: a. The exact rating of this unit could not be determined. b. Hours of operation are an engineering estimate based on interviews with UPRR staff. Q. Worker Vehicles
Emissions were calculated from employee vehicles that arrive at and depart from the
ICTF and Dolores Yards each day. The number of vehicle trips was based on employee
force counts for each yard and assumes no ridesharing.10 The miles per trip were
estimated from aerial photos of the Yards and include on-site travel only. Activity data
for worker vehicles are summarized in Table 24.
Table 24 Activity Data for Work Vehicles
Dolores and ICTF Rail Yards VMT
Yard No. of Trips
(trips/yr)a (mi/trip)b (mi/yr) ICTF 152,935 2.5 382,337.5 Dolores 32,850 0.5 16,425.0 Total 185,785 398,762.5 Notes: a. Based on employee force count reports. Assumes no ridesharing and 365 work
days per year. b. VMT for onsite travel estimated from aerial photos of each yard.
10 Personal communication from Jon Germer of UPRR on August 24, 2007.

-50-
R. Road Dust Particulate matter emissions were calculated for paved roadways in both the ICTF and
Dolores rail yards. Particulate emissions occur when loose material on road surfaces is
resuspended as vehicles travel over a roadway. Emissions are based on the number of
vehicles driving on the road, the length of the road, and the amount of loose material on
the road surface. Activity data for vehicles driving on paved roadways at the Yards are
summarized in Table 25.
Table 25 Activity Data for Vehicles Operating on Paved Roadways
Dolores and ICTF Rail Yards
Yard Vehicle Type Annual VMT
(mi/yr)a ICTF Drayage Trucks 1,641,629.38 ICTF Delivery Trucks 17.18 ICTF Yard Truck 365,000.00 ICTF Worker Vehicles 382,337.50
Dolores Delivery Trucks 502.31 Dolores Yard Truck 118,007.00 Dolores Worker Vehicles 16,425.00
Total 2,523,918.37 Notes: a. See source-specific sections for discussions on the calculation of annual VMT.
-51-
PART VII. EMISSIONS
A. Calculation Methodology and Emission Factors Emission calculations were based on the site-specific equipment inventory, equipment
activity data, and the source-specific emission factors. The calculation methodology and
emission factors for each specific source type are further discussed below. Emissions
were calculated in accordance with CARB Guidelines (July 2006) and the UPRR
Emission Inventory Protocol (May 2006).
1. Locomotives
Emission Factors
Notch-specific criteria pollutant emission factors were assembled from a number of
sources. These included emission factors presented in CARB’s Roseville Rail Yard Study
(October, 2004), as well as EPA certification data and other testing by Southwest
Research Institute of newer-technology locomotives. Emission factors for HC and CO
are shown in Tables 26 and 27. Emissions of HC and CO are not sensitive to the fuel
characteristics discussed here.
Nitrogen oxides emissions are sensitive to the aromatic fraction of fuel, which is lower in
all California fuel (regardless of and independent of sulfur content) than 47-state fuel. As
discussed in Appendix A-7, the lower aromatic content of California fuel since the
mid-1990s results in NOx emission rates approximately 6% lower than those for 47-state
fuel. This factor was applied to the emission rates reported in locomotive testing using
47-state fuel to obtain emission factors for California fuel. The NOx emission factors for
locomotives are shown in Table 28.
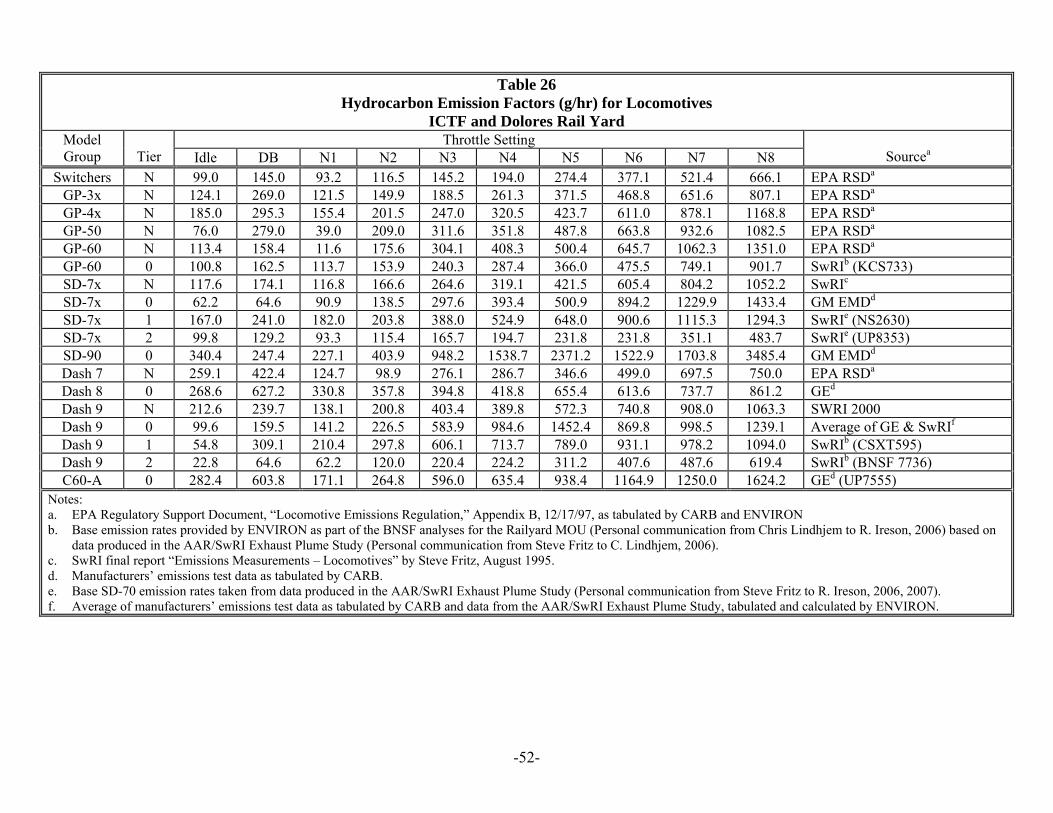
-52-
Table 26 Hydrocarbon Emission Factors (g/hr) for Locomotives
ICTF and Dolores Rail Yard Throttle Setting Model
Group
Tier Idle DB N1 N2 N3 N4 N5 N6 N7 N8
Sourcea
Switchers N 99.0 145.0 93.2 116.5 145.2 194.0 274.4 377.1 521.4 666.1 EPA RSDa GP-3x N 124.1 269.0 121.5 149.9 188.5 261.3 371.5 468.8 651.6 807.1 EPA RSDa GP-4x N 185.0 295.3 155.4 201.5 247.0 320.5 423.7 611.0 878.1 1168.8 EPA RSDa GP-50 N 76.0 279.0 39.0 209.0 311.6 351.8 487.8 663.8 932.6 1082.5 EPA RSDa GP-60 N 113.4 158.4 11.6 175.6 304.1 408.3 500.4 645.7 1062.3 1351.0 EPA RSDa GP-60 0 100.8 162.5 113.7 153.9 240.3 287.4 366.0 475.5 749.1 901.7 SwRIb (KCS733) SD-7x N 117.6 174.1 116.8 166.6 264.6 319.1 421.5 605.4 804.2 1052.2 SwRIc SD-7x 0 62.2 64.6 90.9 138.5 297.6 393.4 500.9 894.2 1229.9 1433.4 GM EMDd SD-7x 1 167.0 241.0 182.0 203.8 388.0 524.9 648.0 900.6 1115.3 1294.3 SwRIe (NS2630) SD-7x 2 99.8 129.2 93.3 115.4 165.7 194.7 231.8 231.8 351.1 483.7 SwRIe (UP8353) SD-90 0 340.4 247.4 227.1 403.9 948.2 1538.7 2371.2 1522.9 1703.8 3485.4 GM EMDd Dash 7 N 259.1 422.4 124.7 98.9 276.1 286.7 346.6 499.0 697.5 750.0 EPA RSDa Dash 8 0 268.6 627.2 330.8 357.8 394.8 418.8 655.4 613.6 737.7 861.2 GEd Dash 9 N 212.6 239.7 138.1 200.8 403.4 389.8 572.3 740.8 908.0 1063.3 SWRI 2000 Dash 9 0 99.6 159.5 141.2 226.5 583.9 984.6 1452.4 869.8 998.5 1239.1 Average of GE & SwRIf Dash 9 1 54.8 309.1 210.4 297.8 606.1 713.7 789.0 931.1 978.2 1094.0 SwRIb (CSXT595) Dash 9 2 22.8 64.6 62.2 120.0 220.4 224.2 311.2 407.6 487.6 619.4 SwRIb (BNSF 7736) C60-A 0 282.4 603.8 171.1 264.8 596.0 635.4 938.4 1164.9 1250.0 1624.2 GEd (UP7555)
Notes: a. EPA Regulatory Support Document, “Locomotive Emissions Regulation,” Appendix B, 12/17/97, as tabulated by CARB and ENVIRON b. Base emission rates provided by ENVIRON as part of the BNSF analyses for the Railyard MOU (Personal communication from Chris Lindhjem to R. Ireson, 2006) based on
data produced in the AAR/SwRI Exhaust Plume Study (Personal communication from Steve Fritz to C. Lindhjem, 2006). c. SwRI final report “Emissions Measurements – Locomotives” by Steve Fritz, August 1995. d. Manufacturers’ emissions test data as tabulated by CARB. e. Base SD-70 emission rates taken from data produced in the AAR/SwRI Exhaust Plume Study (Personal communication from Steve Fritz to R. Ireson, 2006, 2007). f. Average of manufacturers’ emissions test data as tabulated by CARB and data from the AAR/SwRI Exhaust Plume Study, tabulated and calculated by ENVIRON.
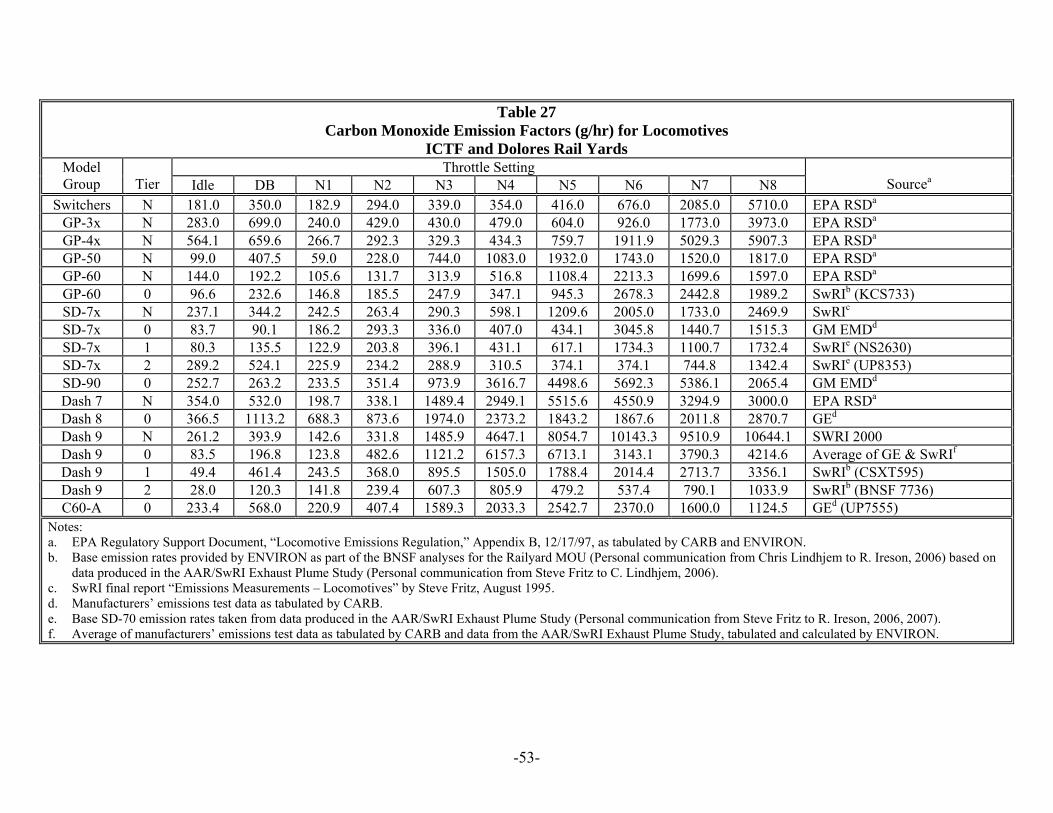
-53-
Table 27 Carbon Monoxide Emission Factors (g/hr) for Locomotives
ICTF and Dolores Rail Yards Throttle Setting Model
Group
Tier Idle DB N1 N2 N3 N4 N5 N6 N7 N8
Sourcea
Switchers N 181.0 350.0 182.9 294.0 339.0 354.0 416.0 676.0 2085.0 5710.0 EPA RSDa GP-3x N 283.0 699.0 240.0 429.0 430.0 479.0 604.0 926.0 1773.0 3973.0 EPA RSDa GP-4x N 564.1 659.6 266.7 292.3 329.3 434.3 759.7 1911.9 5029.3 5907.3 EPA RSDa GP-50 N 99.0 407.5 59.0 228.0 744.0 1083.0 1932.0 1743.0 1520.0 1817.0 EPA RSDa GP-60 N 144.0 192.2 105.6 131.7 313.9 516.8 1108.4 2213.3 1699.6 1597.0 EPA RSDa GP-60 0 96.6 232.6 146.8 185.5 247.9 347.1 945.3 2678.3 2442.8 1989.2 SwRIb (KCS733) SD-7x N 237.1 344.2 242.5 263.4 290.3 598.1 1209.6 2005.0 1733.0 2469.9 SwRIc SD-7x 0 83.7 90.1 186.2 293.3 336.0 407.0 434.1 3045.8 1440.7 1515.3 GM EMDd SD-7x 1 80.3 135.5 122.9 203.8 396.1 431.1 617.1 1734.3 1100.7 1732.4 SwRIe (NS2630) SD-7x 2 289.2 524.1 225.9 234.2 288.9 310.5 374.1 374.1 744.8 1342.4 SwRIe (UP8353) SD-90 0 252.7 263.2 233.5 351.4 973.9 3616.7 4498.6 5692.3 5386.1 2065.4 GM EMDd Dash 7 N 354.0 532.0 198.7 338.1 1489.4 2949.1 5515.6 4550.9 3294.9 3000.0 EPA RSDa Dash 8 0 366.5 1113.2 688.3 873.6 1974.0 2373.2 1843.2 1867.6 2011.8 2870.7 GEd Dash 9 N 261.2 393.9 142.6 331.8 1485.9 4647.1 8054.7 10143.3 9510.9 10644.1 SWRI 2000 Dash 9 0 83.5 196.8 123.8 482.6 1121.2 6157.3 6713.1 3143.1 3790.3 4214.6 Average of GE & SwRIf Dash 9 1 49.4 461.4 243.5 368.0 895.5 1505.0 1788.4 2014.4 2713.7 3356.1 SwRIb (CSXT595) Dash 9 2 28.0 120.3 141.8 239.4 607.3 805.9 479.2 537.4 790.1 1033.9 SwRIb (BNSF 7736) C60-A 0 233.4 568.0 220.9 407.4 1589.3 2033.3 2542.7 2370.0 1600.0 1124.5 GEd (UP7555)
Notes: a. EPA Regulatory Support Document, “Locomotive Emissions Regulation,” Appendix B, 12/17/97, as tabulated by CARB and ENVIRON. b. Base emission rates provided by ENVIRON as part of the BNSF analyses for the Railyard MOU (Personal communication from Chris Lindhjem to R. Ireson, 2006) based on
data produced in the AAR/SwRI Exhaust Plume Study (Personal communication from Steve Fritz to C. Lindhjem, 2006). c. SwRI final report “Emissions Measurements – Locomotives” by Steve Fritz, August 1995. d. Manufacturers’ emissions test data as tabulated by CARB. e. Base SD-70 emission rates taken from data produced in the AAR/SwRI Exhaust Plume Study (Personal communication from Steve Fritz to R. Ireson, 2006, 2007). f. Average of manufacturers’ emissions test data as tabulated by CARB and data from the AAR/SwRI Exhaust Plume Study, tabulated and calculated by ENVIRON.
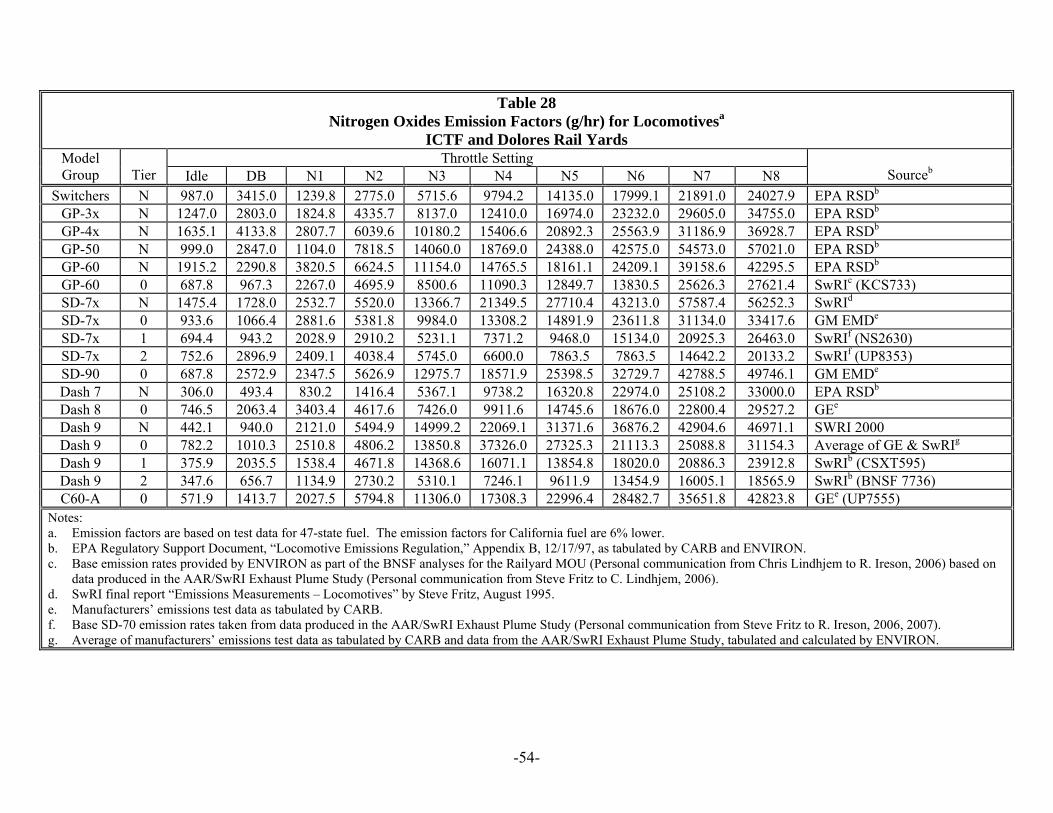
-54-
Table 28
Nitrogen Oxides Emission Factors (g/hr) for Locomotivesa ICTF and Dolores Rail Yards
Throttle Setting Model Group
Tier Idle DB N1 N2 N3 N4 N5 N6 N7 N8
Sourceb
Switchers N 987.0 3415.0 1239.8 2775.0 5715.6 9794.2 14135.0 17999.1 21891.0 24027.9 EPA RSDb GP-3x N 1247.0 2803.0 1824.8 4335.7 8137.0 12410.0 16974.0 23232.0 29605.0 34755.0 EPA RSDb GP-4x N 1635.1 4133.8 2807.7 6039.6 10180.2 15406.6 20892.3 25563.9 31186.9 36928.7 EPA RSDb GP-50 N 999.0 2847.0 1104.0 7818.5 14060.0 18769.0 24388.0 42575.0 54573.0 57021.0 EPA RSDb GP-60 N 1915.2 2290.8 3820.5 6624.5 11154.0 14765.5 18161.1 24209.1 39158.6 42295.5 EPA RSDb GP-60 0 687.8 967.3 2267.0 4695.9 8500.6 11090.3 12849.7 13830.5 25626.3 27621.4 SwRIc (KCS733) SD-7x N 1475.4 1728.0 2532.7 5520.0 13366.7 21349.5 27710.4 43213.0 57587.4 56252.3 SwRId SD-7x 0 933.6 1066.4 2881.6 5381.8 9984.0 13308.2 14891.9 23611.8 31134.0 33417.6 GM EMDe SD-7x 1 694.4 943.2 2028.9 2910.2 5231.1 7371.2 9468.0 15134.0 20925.3 26463.0 SwRIf (NS2630) SD-7x 2 752.6 2896.9 2409.1 4038.4 5745.0 6600.0 7863.5 7863.5 14642.2 20133.2 SwRIf (UP8353) SD-90 0 687.8 2572.9 2347.5 5626.9 12975.7 18571.9 25398.5 32729.7 42788.5 49746.1 GM EMDe Dash 7 N 306.0 493.4 830.2 1416.4 5367.1 9738.2 16320.8 22974.0 25108.2 33000.0 EPA RSDb Dash 8 0 746.5 2063.4 3403.4 4617.6 7426.0 9911.6 14745.6 18676.0 22800.4 29527.2 GEe Dash 9 N 442.1 940.0 2121.0 5494.9 14999.2 22069.1 31371.6 36876.2 42904.6 46971.1 SWRI 2000 Dash 9 0 782.2 1010.3 2510.8 4806.2 13850.8 37326.0 27325.3 21113.3 25088.8 31154.3 Average of GE & SwRIg Dash 9 1 375.9 2035.5 1538.4 4671.8 14368.6 16071.1 13854.8 18020.0 20886.3 23912.8 SwRIb (CSXT595) Dash 9 2 347.6 656.7 1134.9 2730.2 5310.1 7246.1 9611.9 13454.9 16005.1 18565.9 SwRIb (BNSF 7736) C60-A 0 571.9 1413.7 2027.5 5794.8 11306.0 17308.3 22996.4 28482.7 35651.8 42823.8 GEe (UP7555)
Notes: a. Emission factors are based on test data for 47-state fuel. The emission factors for California fuel are 6% lower. b. EPA Regulatory Support Document, “Locomotive Emissions Regulation,” Appendix B, 12/17/97, as tabulated by CARB and ENVIRON. c. Base emission rates provided by ENVIRON as part of the BNSF analyses for the Railyard MOU (Personal communication from Chris Lindhjem to R. Ireson, 2006) based on
data produced in the AAR/SwRI Exhaust Plume Study (Personal communication from Steve Fritz to C. Lindhjem, 2006). d. SwRI final report “Emissions Measurements – Locomotives” by Steve Fritz, August 1995. e. Manufacturers’ emissions test data as tabulated by CARB. f. Base SD-70 emission rates taken from data produced in the AAR/SwRI Exhaust Plume Study (Personal communication from Steve Fritz to R. Ireson, 2006, 2007). g. Average of manufacturers’ emissions test data as tabulated by CARB and data from the AAR/SwRI Exhaust Plume Study, tabulated and calculated by ENVIRON.
-55-
Fuel sulfur content affects the emission rates for Diesel particulate matter from
locomotives. To develop emission inventories for locomotive activity, an initial
collection of locomotive model- and notch-specific DPM emissions data were adjusted
based on sulfur content. Although there is no official guidance available for calculating
this effect, a draft CARB document provides equations to calculate the effect of sulfur
content on DPM emission rates at specific throttle settings, and for 2-stroke and 4-stroke
engines (Wong, undated). These equations can be used to calculate adjustment factors
for different fuels as described in Appendix A-7. The adjustment factors are linear with
sulfur content, allowing emission rates for a specific mixture of California and non-
California fuels to be calculated as a weighted average of the emission rates for each of
the fuels. Adjustment factors were developed and used to prepare tables of emission
factors for two different fuel sulfur levels: 221 ppm for locomotives operated on
California fuel; and 2,639 ppm for locomotives operating on non-California fuel. These
results are shown in Tables 29 and 30. Sample emission calculations are shown in
Appendices A-3 and A-4. The calculations of sulfur adjustments and the Wong
Technical Memo are shown in Appendix A-7.
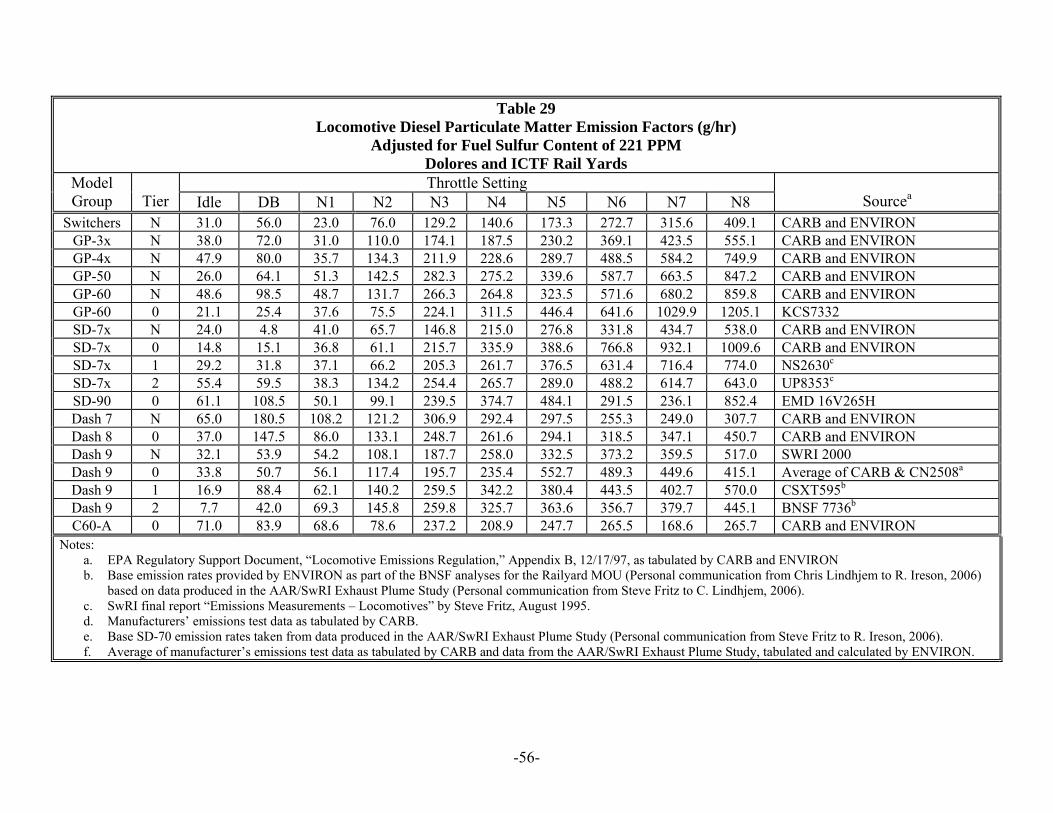
-56-
Table 29 Locomotive Diesel Particulate Matter Emission Factors (g/hr)
Adjusted for Fuel Sulfur Content of 221 PPM Dolores and ICTF Rail Yards Throttle Setting Model
Group
Tier Idle DB N1 N2 N3 N4 N5 N6 N7 N8
Sourcea
Switchers N 31.0 56.0 23.0 76.0 129.2 140.6 173.3 272.7 315.6 409.1 CARB and ENVIRON GP-3x N 38.0 72.0 31.0 110.0 174.1 187.5 230.2 369.1 423.5 555.1 CARB and ENVIRON GP-4x N 47.9 80.0 35.7 134.3 211.9 228.6 289.7 488.5 584.2 749.9 CARB and ENVIRON GP-50 N 26.0 64.1 51.3 142.5 282.3 275.2 339.6 587.7 663.5 847.2 CARB and ENVIRON GP-60 N 48.6 98.5 48.7 131.7 266.3 264.8 323.5 571.6 680.2 859.8 CARB and ENVIRON GP-60 0 21.1 25.4 37.6 75.5 224.1 311.5 446.4 641.6 1029.9 1205.1 KCS7332 SD-7x N 24.0 4.8 41.0 65.7 146.8 215.0 276.8 331.8 434.7 538.0 CARB and ENVIRON SD-7x 0 14.8 15.1 36.8 61.1 215.7 335.9 388.6 766.8 932.1 1009.6 CARB and ENVIRON SD-7x 1 29.2 31.8 37.1 66.2 205.3 261.7 376.5 631.4 716.4 774.0 NS2630c SD-7x 2 55.4 59.5 38.3 134.2 254.4 265.7 289.0 488.2 614.7 643.0 UP8353c SD-90 0 61.1 108.5 50.1 99.1 239.5 374.7 484.1 291.5 236.1 852.4 EMD 16V265H Dash 7 N 65.0 180.5 108.2 121.2 306.9 292.4 297.5 255.3 249.0 307.7 CARB and ENVIRON Dash 8 0 37.0 147.5 86.0 133.1 248.7 261.6 294.1 318.5 347.1 450.7 CARB and ENVIRON Dash 9 N 32.1 53.9 54.2 108.1 187.7 258.0 332.5 373.2 359.5 517.0 SWRI 2000 Dash 9 0 33.8 50.7 56.1 117.4 195.7 235.4 552.7 489.3 449.6 415.1 Average of CARB & CN2508a Dash 9 1 16.9 88.4 62.1 140.2 259.5 342.2 380.4 443.5 402.7 570.0 CSXT595b Dash 9 2 7.7 42.0 69.3 145.8 259.8 325.7 363.6 356.7 379.7 445.1 BNSF 7736b C60-A 0 71.0 83.9 68.6 78.6 237.2 208.9 247.7 265.5 168.6 265.7 CARB and ENVIRON
Notes: a. EPA Regulatory Support Document, “Locomotive Emissions Regulation,” Appendix B, 12/17/97, as tabulated by CARB and ENVIRON b. Base emission rates provided by ENVIRON as part of the BNSF analyses for the Railyard MOU (Personal communication from Chris Lindhjem to R. Ireson, 2006)
based on data produced in the AAR/SwRI Exhaust Plume Study (Personal communication from Steve Fritz to C. Lindhjem, 2006). c. SwRI final report “Emissions Measurements – Locomotives” by Steve Fritz, August 1995. d. Manufacturers’ emissions test data as tabulated by CARB. e. Base SD-70 emission rates taken from data produced in the AAR/SwRI Exhaust Plume Study (Personal communication from Steve Fritz to R. Ireson, 2006). f. Average of manufacturer’s emissions test data as tabulated by CARB and data from the AAR/SwRI Exhaust Plume Study, tabulated and calculated by ENVIRON.
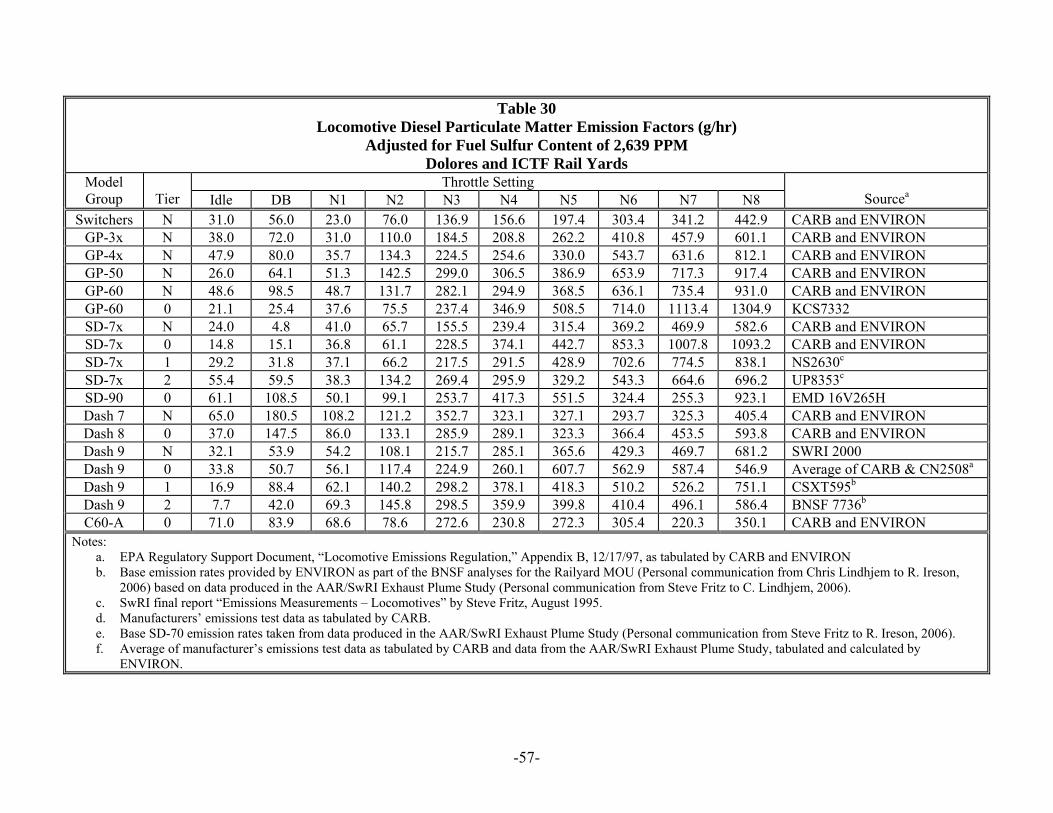
-57-
Table 30 Locomotive Diesel Particulate Matter Emission Factors (g/hr)
Adjusted for Fuel Sulfur Content of 2,639 PPM Dolores and ICTF Rail Yards
Throttle Setting Model Group
Tier Idle DB N1 N2 N3 N4 N5 N6 N7 N8
Sourcea
Switchers N 31.0 56.0 23.0 76.0 136.9 156.6 197.4 303.4 341.2 442.9 CARB and ENVIRON GP-3x N 38.0 72.0 31.0 110.0 184.5 208.8 262.2 410.8 457.9 601.1 CARB and ENVIRON GP-4x N 47.9 80.0 35.7 134.3 224.5 254.6 330.0 543.7 631.6 812.1 CARB and ENVIRON GP-50 N 26.0 64.1 51.3 142.5 299.0 306.5 386.9 653.9 717.3 917.4 CARB and ENVIRON GP-60 N 48.6 98.5 48.7 131.7 282.1 294.9 368.5 636.1 735.4 931.0 CARB and ENVIRON GP-60 0 21.1 25.4 37.6 75.5 237.4 346.9 508.5 714.0 1113.4 1304.9 KCS7332 SD-7x N 24.0 4.8 41.0 65.7 155.5 239.4 315.4 369.2 469.9 582.6 CARB and ENVIRON SD-7x 0 14.8 15.1 36.8 61.1 228.5 374.1 442.7 853.3 1007.8 1093.2 CARB and ENVIRON SD-7x 1 29.2 31.8 37.1 66.2 217.5 291.5 428.9 702.6 774.5 838.1 NS2630c SD-7x 2 55.4 59.5 38.3 134.2 269.4 295.9 329.2 543.3 664.6 696.2 UP8353c SD-90 0 61.1 108.5 50.1 99.1 253.7 417.3 551.5 324.4 255.3 923.1 EMD 16V265H Dash 7 N 65.0 180.5 108.2 121.2 352.7 323.1 327.1 293.7 325.3 405.4 CARB and ENVIRON Dash 8 0 37.0 147.5 86.0 133.1 285.9 289.1 323.3 366.4 453.5 593.8 CARB and ENVIRON Dash 9 N 32.1 53.9 54.2 108.1 215.7 285.1 365.6 429.3 469.7 681.2 SWRI 2000 Dash 9 0 33.8 50.7 56.1 117.4 224.9 260.1 607.7 562.9 587.4 546.9 Average of CARB & CN2508a Dash 9 1 16.9 88.4 62.1 140.2 298.2 378.1 418.3 510.2 526.2 751.1 CSXT595b Dash 9 2 7.7 42.0 69.3 145.8 298.5 359.9 399.8 410.4 496.1 586.4 BNSF 7736b C60-A 0 71.0 83.9 68.6 78.6 272.6 230.8 272.3 305.4 220.3 350.1 CARB and ENVIRON
Notes: a. EPA Regulatory Support Document, “Locomotive Emissions Regulation,” Appendix B, 12/17/97, as tabulated by CARB and ENVIRON b. Base emission rates provided by ENVIRON as part of the BNSF analyses for the Railyard MOU (Personal communication from Chris Lindhjem to R. Ireson,
2006) based on data produced in the AAR/SwRI Exhaust Plume Study (Personal communication from Steve Fritz to C. Lindhjem, 2006). c. SwRI final report “Emissions Measurements – Locomotives” by Steve Fritz, August 1995. d. Manufacturers’ emissions test data as tabulated by CARB. e. Base SD-70 emission rates taken from data produced in the AAR/SwRI Exhaust Plume Study (Personal communication from Steve Fritz to R. Ireson, 2006). f. Average of manufacturer’s emissions test data as tabulated by CARB and data from the AAR/SwRI Exhaust Plume Study, tabulated and calculated by
ENVIRON.
-58-
Data regarding the sulfur content of 2005 UPRR Diesel fuel deliveries within and outside
of California were not available. To develop locomotive emission factors for different
types of activities, estimates of fuel sulfur content were developed, and base case
emission factors from the primary information sources (e.g., EPA certification data, with
an assumed nominal fuel sulfur content of 3,000 ppm) were adjusted based on the
estimated sulfur content of in-use fuels. The sulfur content of Diesel fuel varies with the
type of fuel produced (e.g., California on-road fuel, 49-state off-road fuel, 49-state on-
road fuel), the refinery configuration where it is produced, the sulfur content of the crude
oil being refined, and the extent to which it may be mixed with fuel from other sources
during transport. As a result, it is extremely difficult to determine with precision the
sulfur content of the fuel being used by any given locomotive at a specific time, and
assumptions were made to estimate sulfur content for different types of activities.
To estimate the fuel sulfur content for UPRR locomotives in California during 2005, the
following assumptions were made:
• “Captive” locomotives and consists in use on local trains (e.g., commuter rail) use
only Diesel fuel produced in California.
• Trains arriving and terminating at California rail yards (with the exception of
local trains) use fuel produced outside of California, and arrive with remaining
fuel in their tanks at 10 percent of capacity.
• On arrival, consists are refueled with California Diesel fuel, resulting in a 90:10
mixture of California and non-California fuel, and this mixture is representative of
fuel on departing trains as well as trains undergoing load testing (if conducted at a
specific yard).
• The average composition of fuel used in through trains bypassing a yard, and in
trains both arriving and departing from a yard on the same day, is 50 percent
California fuel and 50 percent non-California fuel.
In 2005, Chevron was Union Pacific Railroad’s principal supplier of Diesel fuel in
California. Chevron’s California refineries produced only one grade (“low sulfur Diesel”
or LSD) in 2005. Quarterly average sulfur content for these refineries ranged from 59
-59-
ppm to 400 ppm, with an average of 221 ppm.11 This value is assumed to be
representative of California fuel used by UPRR. Non-California Diesel fuel for 2005 is
assumed to have a sulfur content of 2,639 ppm. This is the estimated 49-state average
fuel sulfur content used by the U.S. Environmental Protection Agency in its 2004
regulatory impact analysis in support of regulation of nonroad Diesel engines (EPA,
2004).
The locomotive test data also report horsepower and fuel consumption rates by notch for
each locomotive tested. The fuel consumption rates were used to calculate total fuel
consumption by fuel type. Sulfur oxides emissions were calculated from fuel
consumption and fuel sulfur content, assuming a constant factor of 8.83x10⁻⁴ grams of
sulfur oxides per ppm sulfur in fuel per pound of fuel (e.g., a fuel rate of 100 lbs/hr of
100 ppm S fuel yields an emission rate of 8.83 g/hr of sulfur oxides).12 SOx emission
calculations include consideration of the fraction of fuel burned by sulfur content.
Table 31 shows the fuel consumption rates in pounds per hour, and the SOx emission
factors are shown in Table 32.
11 Personal communication from Theron Hinckley of Chevron Products Company to Jon Germer of UPRR and Rob Ireson, December 13, 2006. 12 This factor is calculated from the 2005 locomotive fuel usage, sulfur content and total emissions in Table 3.1-6a of the 2004 EPA regulatory impact analysis for non-road Diesel engine emissions regulations (EPA420-R-04-007), assuming a fuel density of 7.13 lbs/gallon, the density observed by SwRI for California low sulfur fuel in the CARB locomotive fuel effects study.
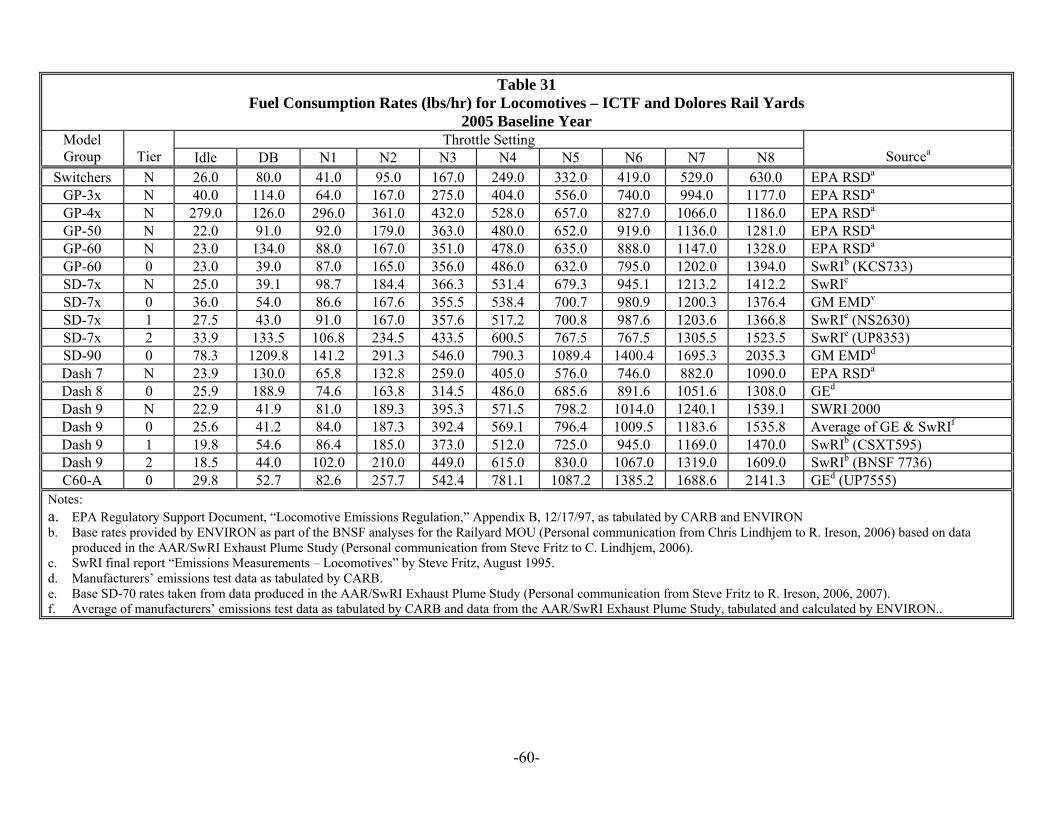
-60-
Table 31 Fuel Consumption Rates (lbs/hr) for Locomotives – ICTF and Dolores Rail Yards
2005 Baseline Year Throttle Setting Model
Group
Tier Idle DB N1 N2 N3 N4 N5 N6 N7 N8
Sourcea
Switchers N 26.0 80.0 41.0 95.0 167.0 249.0 332.0 419.0 529.0 630.0 EPA RSDa GP-3x N 40.0 114.0 64.0 167.0 275.0 404.0 556.0 740.0 994.0 1177.0 EPA RSDa GP-4x N 279.0 126.0 296.0 361.0 432.0 528.0 657.0 827.0 1066.0 1186.0 EPA RSDa GP-50 N 22.0 91.0 92.0 179.0 363.0 480.0 652.0 919.0 1136.0 1281.0 EPA RSDa GP-60 N 23.0 134.0 88.0 167.0 351.0 478.0 635.0 888.0 1147.0 1328.0 EPA RSDa GP-60 0 23.0 39.0 87.0 165.0 356.0 486.0 632.0 795.0 1202.0 1394.0 SwRIb (KCS733) SD-7x N 25.0 39.1 98.7 184.4 366.3 531.4 679.3 945.1 1213.2 1412.2 SwRIc SD-7x 0 36.0 54.0 86.6 167.6 355.5 538.4 700.7 980.9 1200.3 1376.4 GM EMDv SD-7x 1 27.5 43.0 91.0 167.0 357.6 517.2 700.8 987.6 1203.6 1366.8 SwRIe (NS2630) SD-7x 2 33.9 133.5 106.8 234.5 433.5 600.5 767.5 767.5 1305.5 1523.5 SwRIe (UP8353) SD-90 0 78.3 1209.8 141.2 291.3 546.0 790.3 1089.4 1400.4 1695.3 2035.3 GM EMDd Dash 7 N 23.9 130.0 65.8 132.8 259.0 405.0 576.0 746.0 882.0 1090.0 EPA RSDa Dash 8 0 25.9 188.9 74.6 163.8 314.5 486.0 685.6 891.6 1051.6 1308.0 GEd Dash 9 N 22.9 41.9 81.0 189.3 395.3 571.5 798.2 1014.0 1240.1 1539.1 SWRI 2000 Dash 9 0 25.6 41.2 84.0 187.3 392.4 569.1 796.4 1009.5 1183.6 1535.8 Average of GE & SwRIf Dash 9 1 19.8 54.6 86.4 185.0 373.0 512.0 725.0 945.0 1169.0 1470.0 SwRIb (CSXT595) Dash 9 2 18.5 44.0 102.0 210.0 449.0 615.0 830.0 1067.0 1319.0 1609.0 SwRIb (BNSF 7736) C60-A 0 29.8 52.7 82.6 257.7 542.4 781.1 1087.2 1385.2 1688.6 2141.3 GEd (UP7555)
Notes: a. EPA Regulatory Support Document, “Locomotive Emissions Regulation,” Appendix B, 12/17/97, as tabulated by CARB and ENVIRON b. Base rates provided by ENVIRON as part of the BNSF analyses for the Railyard MOU (Personal communication from Chris Lindhjem to R. Ireson, 2006) based on data
produced in the AAR/SwRI Exhaust Plume Study (Personal communication from Steve Fritz to C. Lindhjem, 2006). c. SwRI final report “Emissions Measurements – Locomotives” by Steve Fritz, August 1995. d. Manufacturers’ emissions test data as tabulated by CARB. e. Base SD-70 rates taken from data produced in the AAR/SwRI Exhaust Plume Study (Personal communication from Steve Fritz to R. Ireson, 2006, 2007). f. Average of manufacturers’ emissions test data as tabulated by CARB and data from the AAR/SwRI Exhaust Plume Study, tabulated and calculated by ENVIRON..

-61-
Table 32 SOx Emission Factors for Locomotives – ICTF and Dolores Rail Yards
2005 Baseline Year Fuel Sulfur Content (ppm) SOx Emission Factor (g/lb of fuel)a
CA Diesel 47-State Diesel CA Diesel 47-State Diesel 221 2,639 0.195 2.33
Notes: a. Based on 8.83 x 10⁻⁴ g of SOx per ppm-lb of fuel.
Emissions
Emissions were calculated for both UPRR-owned and -operated locomotives, as well as
“foreign” locomotives13 operating in the rail yard, and through trains on the main line.
Procedures for calculating in-yard emissions followed the methods described in Ireson et
al. (2005).14 A copy of Ireson et al. is contained in Appendix A-6.
Emissions from locomotive activities were calculated based on the number of working
locomotives, time spent in each notch setting, and locomotive model-group distributions,
with model groups defined by manufacturer and engine type.15 A separate calculation
was performed for each type of locomotive activity, including line-haul or switcher
locomotive operations, consist movements, locomotive refueling, and pre- and
post-locomotive service and maintenance testing.
For road power locomotives, speed, movement duration, and throttle notch values were
obtained from UPRR personnel for the ICTF and Dolores Yards for different types of
activities. Movement durations were calculated from distance traveled and speed.
Detailed counts of locomotive by model, technology tier, and train type are shown in
13 Foreign locomotives are locomotives not owned by UPRR, including passenger trains and locomotives owned by other railroads that are brought onto the UPRR system via interchange. 14 Ireson, R.G., M.J. Germer, L.A. Schmid (2005). “Development of Detailed Railyard Emissions to Capture Activity, Technology, and Operational Changes.” Proceedings of the USEPA 14th Annual Emission Inventory Conference, http://www.epa.gov/ttn/chief/conference/ei14/session8/ireson.pdf, Las Vegas NV, April 14, 2006. 15 Emission estimates are based on the total number of working locomotives. Therefore, the total number of locomotives used in the emission calculations will be slightly lower than the total number of locomotives shown in Table 1. See Appendix A for detailed emission calculations
-62-
Appendices A-1 and A-2. Maps detailing the principal locomotive routes at the Yards
are contained in Appendix A-5.
For line haul operations, yard-specific average consist composition (number of units,
number of units operating, model distribution, locomotive tier distribution, fraction
equipped with auto start/stop technology16) was developed from UPRR data for different
train types. The data showed that intermodal trains and power moves used
predominately newer, high-horsepower SD-70 and Dash 9 locomotives, while
non-intermodal trains used a mix of older medium- and high-horsepower and newer
high-horsepower locomotives. Average horsepower was lowest among “dockside” non-
intermodal trains (arriving from or departing toward the Ports of Los Angeles and Long
Beach), with average horsepower for “landside” non-intermodal trains (arriving from or
departing toward central Los Angeles) being somewhat higher. Therefore, locomotive
model distributions were developed for these three separate groups for use in the
emission calculations.
Movement speed, duration, and notch estimates were developed for arriving, departing,
through train, and in-yard movements. All road power movements within the Yard were
assumed to be at 10 mph in throttle notches 1 and 2 (50% each). Idle duration was
estimated based on UPRR operator estimates for units not equipped with auto start/stop.
Units that were equipped with AESS/ZTR technology were assumed to idle for 30
minutes per extended idle event, with other locomotives idling for the remaining duration
of the event. Numbers of arrivals and departures were developed from UPRR data.
Emissions were calculated separately for through intermodal trains; originating and
terminating intermodal trains; non-intermodal trains through, originating, and
terminating; and power moves through, originating, and terminating.
16 There are two primary types of auto start/stop technology—“Auto Engine Start Stop” (AESS), which is factory-installed on recent model high horsepower units; and the ZTR “SmartStart” system (ZTR), which is a retrofit option for other locomotives. Both are programmed to turn off the Diesel engine after 15 to 30 minutes of idling, provided that various criteria (air pressure, battery charge, and others) are met. The engine automatically restarts if required by one of the monitored parameters. We assume that an AESS/ZTR-equipped locomotive will shut down after 30 minutes of idling in an extended idle event.
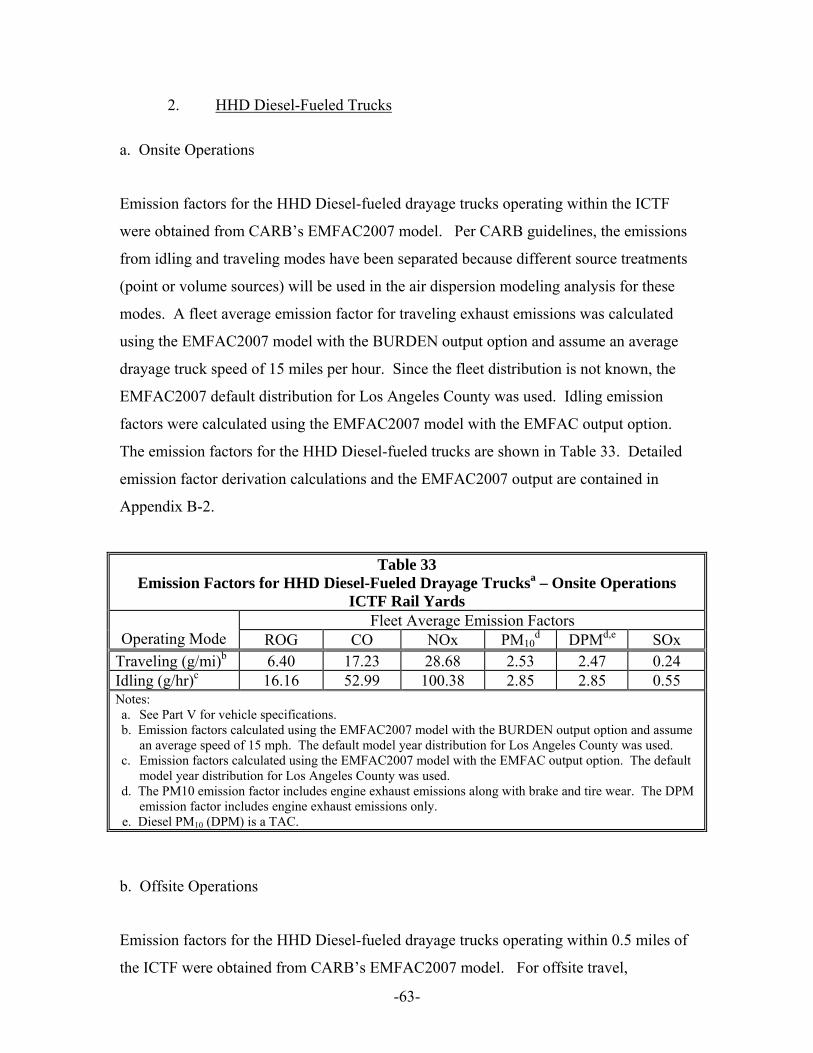
-63-
2. HHD Diesel-Fueled Trucks
a. Onsite Operations
Emission factors for the HHD Diesel-fueled drayage trucks operating within the ICTF
were obtained from CARB’s EMFAC2007 model. Per CARB guidelines, the emissions
from idling and traveling modes have been separated because different source treatments
(point or volume sources) will be used in the air dispersion modeling analysis for these
modes. A fleet average emission factor for traveling exhaust emissions was calculated
using the EMFAC2007 model with the BURDEN output option and assume an average
drayage truck speed of 15 miles per hour. Since the fleet distribution is not known, the
EMFAC2007 default distribution for Los Angeles County was used. Idling emission
factors were calculated using the EMFAC2007 model with the EMFAC output option.
The emission factors for the HHD Diesel-fueled trucks are shown in Table 33. Detailed
emission factor derivation calculations and the EMFAC2007 output are contained in
Appendix B-2.
Table 33 Emission Factors for HHD Diesel-Fueled Drayage Trucksa – Onsite Operations
ICTF Rail Yards Fleet Average Emission Factors
Operating Mode ROG CO NOx PM10d DPMd,e SOx
Traveling (g/mi)b 6.40 17.23 28.68 2.53 2.47 0.24 Idling (g/hr)c 16.16 52.99 100.38 2.85 2.85 0.55 Notes: a. See Part V for vehicle specifications. b. Emission factors calculated using the EMFAC2007 model with the BURDEN output option and assume
an average speed of 15 mph. The default model year distribution for Los Angeles County was used. c. Emission factors calculated using the EMFAC2007 model with the EMFAC output option. The default
model year distribution for Los Angeles County was used. d. The PM10 emission factor includes engine exhaust emissions along with brake and tire wear. The DPM
emission factor includes engine exhaust emissions only. e. Diesel PM10 (DPM) is a TAC.
b. Offsite Operations
Emission factors for the HHD Diesel-fueled drayage trucks operating within 0.5 miles of
the ICTF were obtained from CARB’s EMFAC2007 model. For offsite travel,
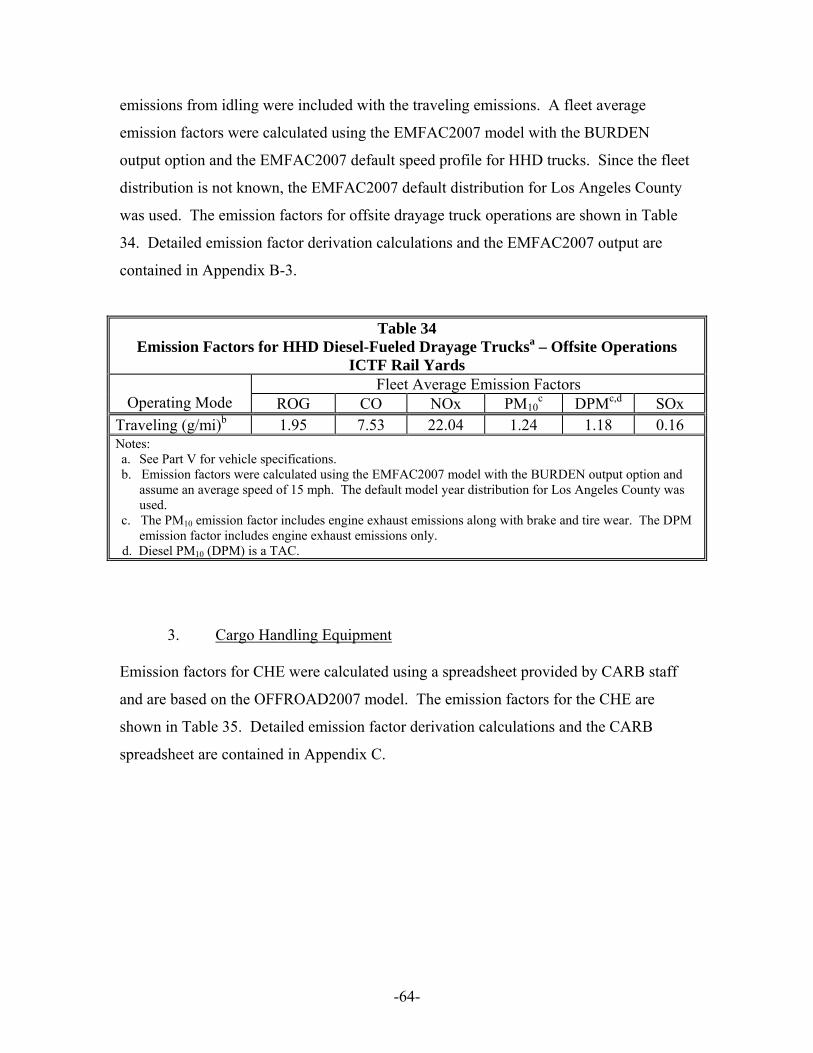
-64-
emissions from idling were included with the traveling emissions. A fleet average
emission factors were calculated using the EMFAC2007 model with the BURDEN
output option and the EMFAC2007 default speed profile for HHD trucks. Since the fleet
distribution is not known, the EMFAC2007 default distribution for Los Angeles County
was used. The emission factors for offsite drayage truck operations are shown in Table
34. Detailed emission factor derivation calculations and the EMFAC2007 output are
contained in Appendix B-3.
Table 34 Emission Factors for HHD Diesel-Fueled Drayage Trucksa – Offsite Operations
ICTF Rail Yards Fleet Average Emission Factors
Operating Mode ROG CO NOx PM10c DPMc,d SOx
Traveling (g/mi)b 1.95 7.53 22.04 1.24 1.18 0.16 Notes: a. See Part V for vehicle specifications. b. Emission factors were calculated using the EMFAC2007 model with the BURDEN output option and
assume an average speed of 15 mph. The default model year distribution for Los Angeles County was used.
c. The PM10 emission factor includes engine exhaust emissions along with brake and tire wear. The DPM emission factor includes engine exhaust emissions only.
d. Diesel PM10 (DPM) is a TAC.
3. Cargo Handling Equipment Emission factors for CHE were calculated using a spreadsheet provided by CARB staff
and are based on the OFFROAD2007 model. The emission factors for the CHE are
shown in Table 35. Detailed emission factor derivation calculations and the CARB
spreadsheet are contained in Appendix C.
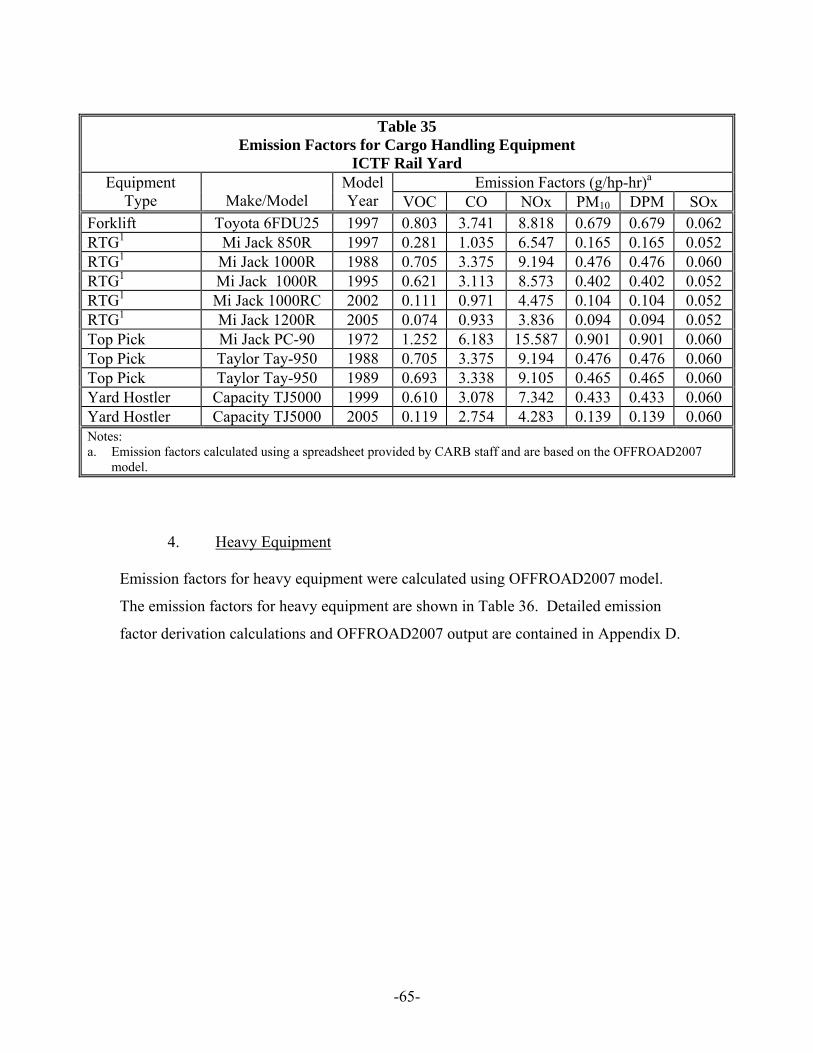
-65-
Table 35
Emission Factors for Cargo Handling Equipment ICTF Rail Yard
Emission Factors (g/hp-hr)a Equipment Type Make/Model
Model Year VOC CO NOx PM10 DPM SOx
Forklift Toyota 6FDU25 1997 0.803 3.741 8.818 0.679 0.679 0.062 RTG1 Mi Jack 850R 1997 0.281 1.035 6.547 0.165 0.165 0.052 RTG1 Mi Jack 1000R 1988 0.705 3.375 9.194 0.476 0.476 0.060 RTG1 Mi Jack 1000R 1995 0.621 3.113 8.573 0.402 0.402 0.052 RTG1 Mi Jack 1000RC 2002 0.111 0.971 4.475 0.104 0.104 0.052 RTG1 Mi Jack 1200R 2005 0.074 0.933 3.836 0.094 0.094 0.052 Top Pick Mi Jack PC-90 1972 1.252 6.183 15.587 0.901 0.901 0.060 Top Pick Taylor Tay-950 1988 0.705 3.375 9.194 0.476 0.476 0.060 Top Pick Taylor Tay-950 1989 0.693 3.338 9.105 0.465 0.465 0.060 Yard Hostler Capacity TJ5000 1999 0.610 3.078 7.342 0.433 0.433 0.060 Yard Hostler Capacity TJ5000 2005 0.119 2.754 4.283 0.139 0.139 0.060 Notes: a. Emission factors calculated using a spreadsheet provided by CARB staff and are based on the OFFROAD2007
model.
4. Heavy Equipment
Emission factors for heavy equipment were calculated using OFFROAD2007 model.
The emission factors for heavy equipment are shown in Table 36. Detailed emission
factor derivation calculations and OFFROAD2007 output are contained in Appendix D.
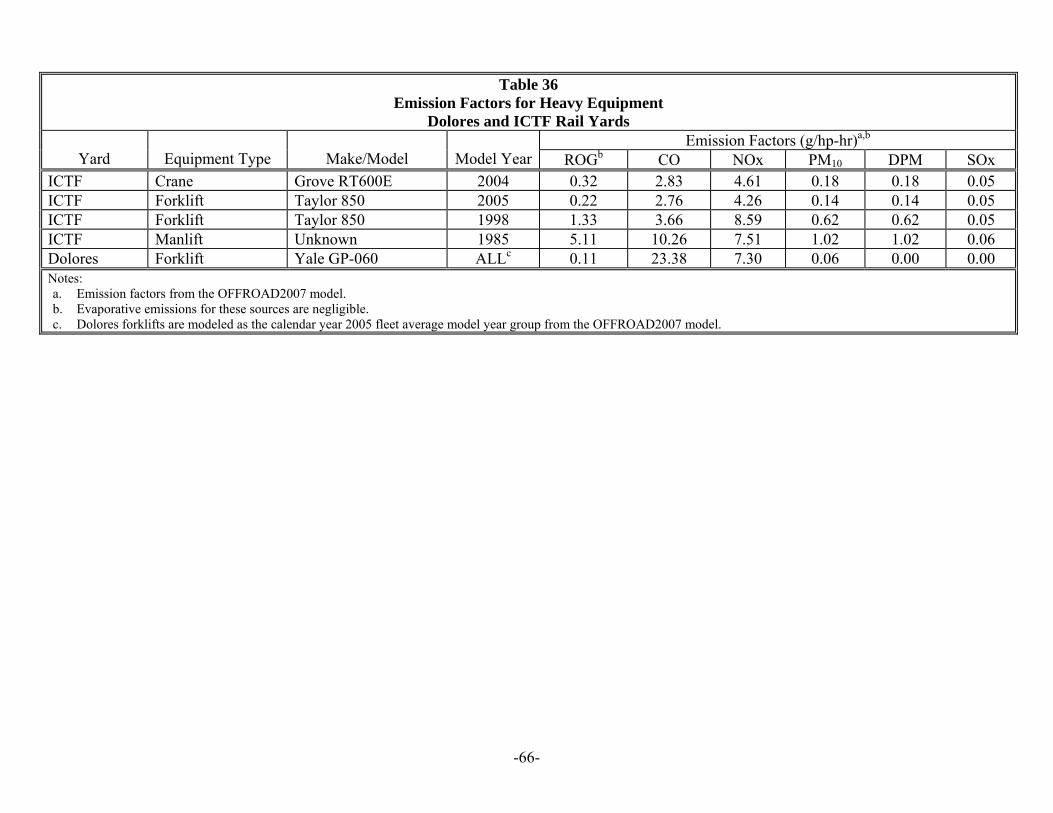
-66-
Table 36 Emission Factors for Heavy Equipment
Dolores and ICTF Rail Yards Emission Factors (g/hp-hr)a,b
Yard Equipment Type Make/Model Model Year ROGb CO NOx PM10 DPM SOx ICTF Crane Grove RT600E 2004 0.32 2.83 4.61 0.18 0.18 0.05 ICTF Forklift Taylor 850 2005 0.22 2.76 4.26 0.14 0.14 0.05 ICTF Forklift Taylor 850 1998 1.33 3.66 8.59 0.62 0.62 0.05 ICTF Manlift Unknown 1985 5.11 10.26 7.51 1.02 1.02 0.06 Dolores Forklift Yale GP-060 ALLc 0.11 23.38 7.30 0.06 0.00 0.00 Notes: a. Emission factors from the OFFROAD2007 model. b. Evaporative emissions for these sources are negligible. c. Dolores forklifts are modeled as the calendar year 2005 fleet average model year group from the OFFROAD2007 model.
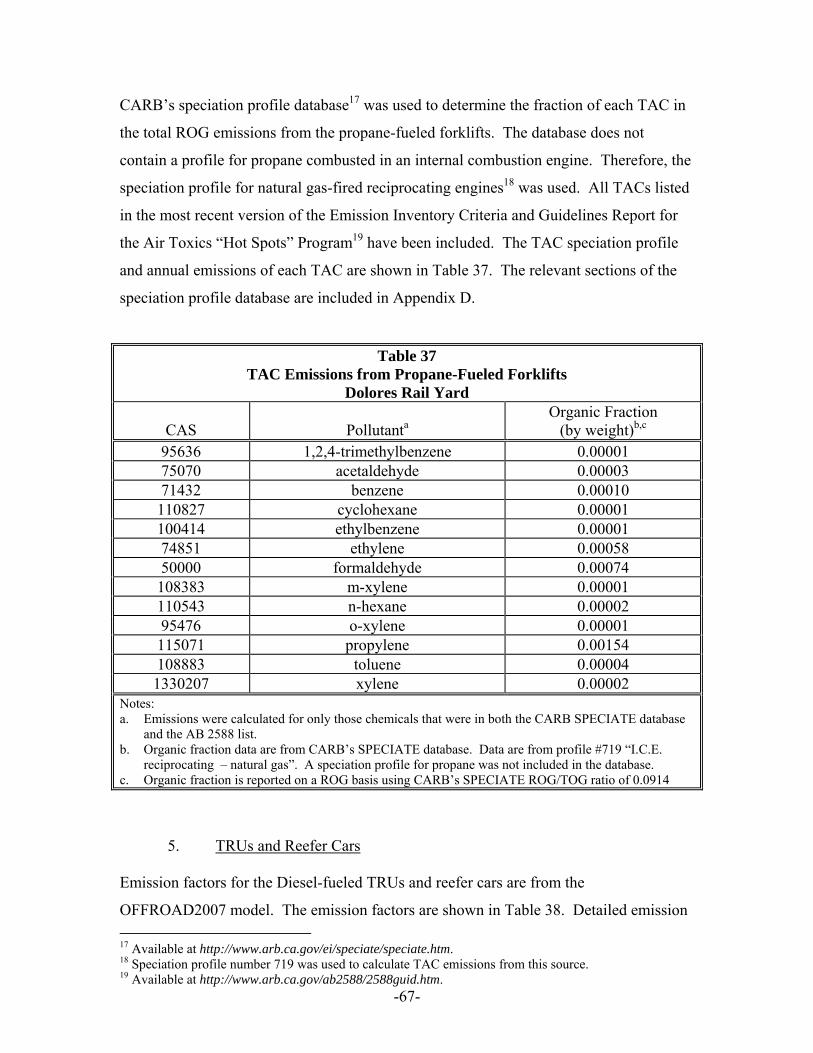
-67-
CARB’s speciation profile database17 was used to determine the fraction of each TAC in
the total ROG emissions from the propane-fueled forklifts. The database does not
contain a profile for propane combusted in an internal combustion engine. Therefore, the
speciation profile for natural gas-fired reciprocating engines18 was used. All TACs listed
in the most recent version of the Emission Inventory Criteria and Guidelines Report for
the Air Toxics “Hot Spots” Program19 have been included. The TAC speciation profile
and annual emissions of each TAC are shown in Table 37. The relevant sections of the
speciation profile database are included in Appendix D.
Table 37 TAC Emissions from Propane-Fueled Forklifts
Dolores Rail Yard
CAS Pollutanta Organic Fraction
(by weight)b,c 95636 1,2,4-trimethylbenzene 0.00001 75070 acetaldehyde 0.00003 71432 benzene 0.00010 110827 cyclohexane 0.00001 100414 ethylbenzene 0.00001 74851 ethylene 0.00058 50000 formaldehyde 0.00074 108383 m-xylene 0.00001 110543 n-hexane 0.00002 95476 o-xylene 0.00001 115071 propylene 0.00154 108883 toluene 0.00004 1330207 xylene 0.00002
Notes: a. Emissions were calculated for only those chemicals that were in both the CARB SPECIATE database
and the AB 2588 list. b. Organic fraction data are from CARB’s SPECIATE database. Data are from profile #719 “I.C.E.
reciprocating – natural gas”. A speciation profile for propane was not included in the database. c. Organic fraction is reported on a ROG basis using CARB’s SPECIATE ROG/TOG ratio of 0.0914
5. TRUs and Reefer Cars
Emission factors for the Diesel-fueled TRUs and reefer cars are from the
OFFROAD2007 model. The emission factors are shown in Table 38. Detailed emission 17 Available at http://www.arb.ca.gov/ei/speciate/speciate.htm. 18 Speciation profile number 719 was used to calculate TAC emissions from this source. 19 Available at http://www.arb.ca.gov/ab2588/2588guid.htm.

-68-
factor derivation calculations and the OFFROAD2007 output are contained in
Appendix E.
Table 38
Emission Factors for TRUs and Reefer Cars ICTF Rail Yard
Emissions (g/hp-hr-unit)a Equipment Type HCb CO NOx PM10 DPM SOxc
TRU 2.85 6.78 6.43 0.71 0.71 0.07 Reefer Car 3.23 7.49 6.71 0.79 0.79 0.07 Notes: a. Emission factors from OFFROAD2007 model. b. Evaporative emissions from this source are negligible. c. Emission factor based on a Diesel fuel sulfur content of 130 ppm.
6. HHD Diesel-Fueled Delivery Trucks
Emission factors for the HHD Diesel-fueled delivery trucks were obtained from CARB’s
EMFAC2007 model. Per CARB guidelines, the emissions from idling and traveling
modes have been separated because different source treatments (point or volume sources)
will be used in the air dispersion modeling analysis for these modes. A fleet average
emission factor for traveling exhaust emissions was calculated using the EMFAC2007
model with the BURDEN output option. Since the fleet distribution is not known, the
EMFAC2007 default distribution for Los Angeles County was used. Idling emission
factors were calculated using the EMFAC2007 model with the EMFAC output option.
The emission factors for the HHD Diesel-fueled trucks are shown in Table 39. Detailed
emission factor derivation calculations and the EMFAC2007 output are contained in
Appendix F.
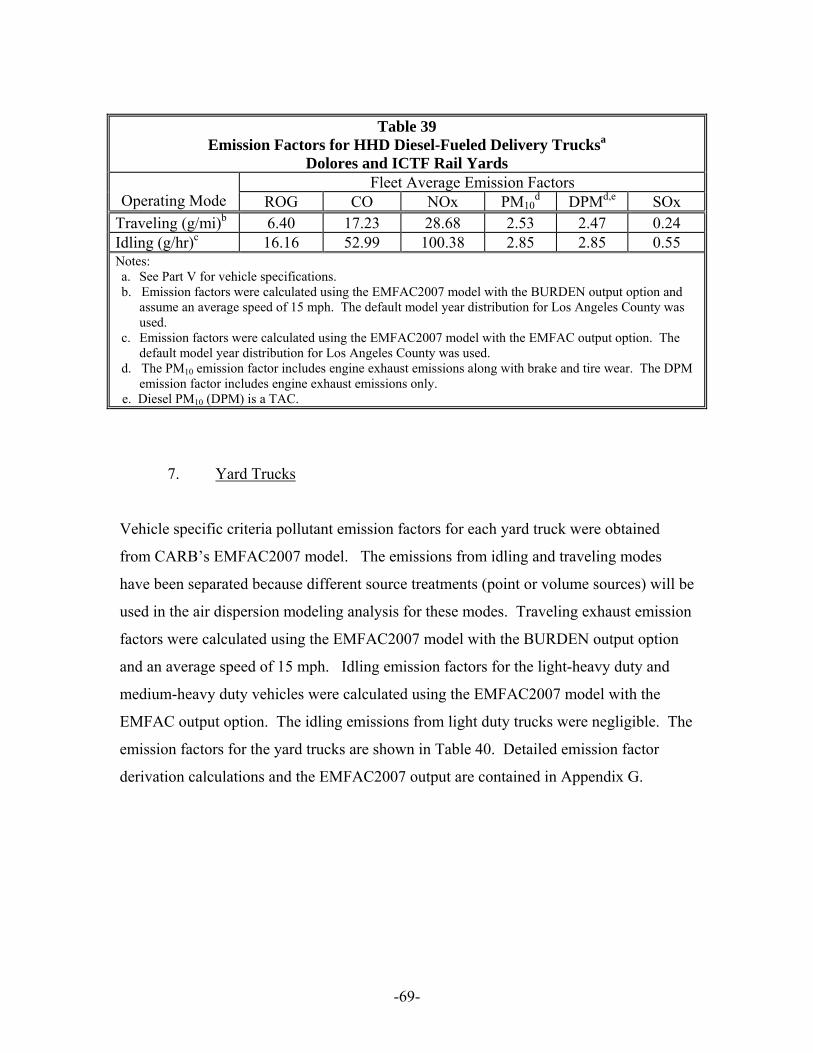
-69-
Table 39
Emission Factors for HHD Diesel-Fueled Delivery Trucksa Dolores and ICTF Rail Yards
Fleet Average Emission Factors Operating Mode ROG CO NOx PM10
d DPMd,e SOx Traveling (g/mi)b 6.40 17.23 28.68 2.53 2.47 0.24 Idling (g/hr)c 16.16 52.99 100.38 2.85 2.85 0.55 Notes: a. See Part V for vehicle specifications. b. Emission factors were calculated using the EMFAC2007 model with the BURDEN output option and
assume an average speed of 15 mph. The default model year distribution for Los Angeles County was used.
c. Emission factors were calculated using the EMFAC2007 model with the EMFAC output option. The default model year distribution for Los Angeles County was used.
d. The PM10 emission factor includes engine exhaust emissions along with brake and tire wear. The DPM emission factor includes engine exhaust emissions only.
e. Diesel PM10 (DPM) is a TAC.
7. Yard Trucks
Vehicle specific criteria pollutant emission factors for each yard truck were obtained
from CARB’s EMFAC2007 model. The emissions from idling and traveling modes
have been separated because different source treatments (point or volume sources) will be
used in the air dispersion modeling analysis for these modes. Traveling exhaust emission
factors were calculated using the EMFAC2007 model with the BURDEN output option
and an average speed of 15 mph. Idling emission factors for the light-heavy duty and
medium-heavy duty vehicles were calculated using the EMFAC2007 model with the
EMFAC output option. The idling emissions from light duty trucks were negligible. The
emission factors for the yard trucks are shown in Table 40. Detailed emission factor
derivation calculations and the EMFAC2007 output are contained in Appendix G.
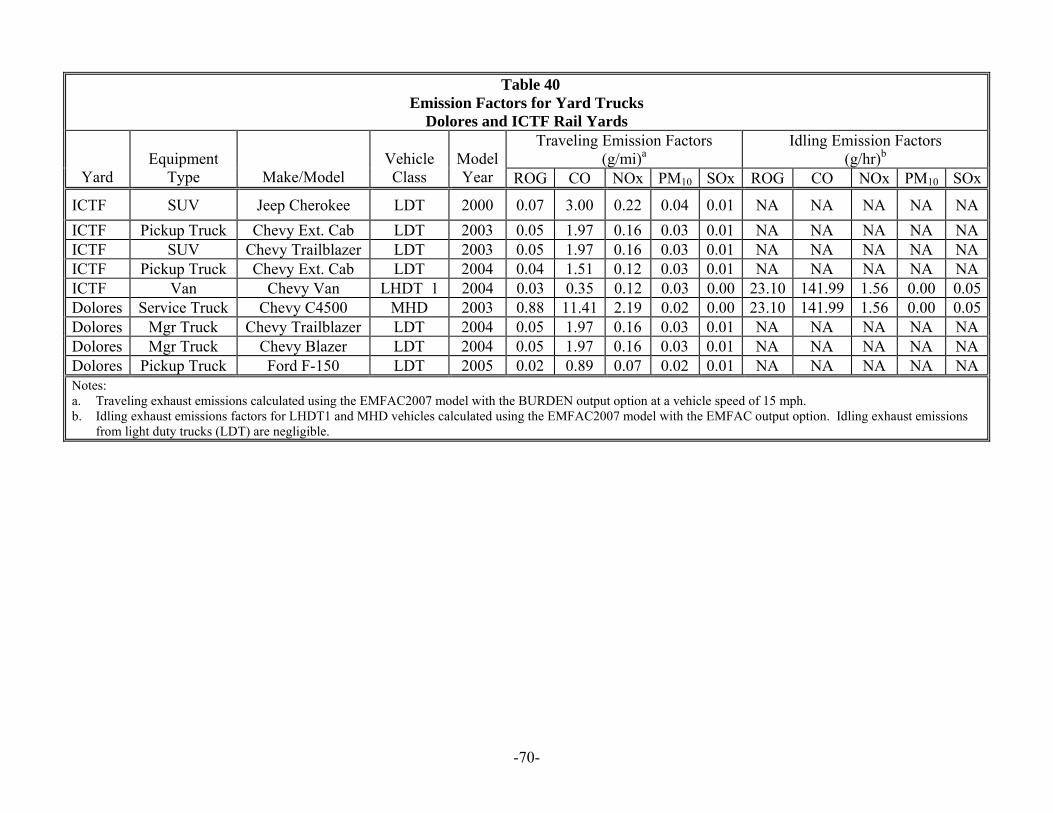
-70-
Table 40 Emission Factors for Yard Trucks
Dolores and ICTF Rail Yards Traveling Emission Factors
(g/mi)a Idling Emission Factors
(g/hr)b Yard
Equipment Type Make/Model
Vehicle Class
Model Year ROG CO NOx PM10 SOx ROG CO NOx PM10 SOx
ICTF SUV Jeep Cherokee LDT 2000 0.07 3.00 0.22 0.04 0.01 NA NA NA NA NA ICTF Pickup Truck Chevy Ext. Cab LDT 2003 0.05 1.97 0.16 0.03 0.01 NA NA NA NA NA ICTF SUV Chevy Trailblazer LDT 2003 0.05 1.97 0.16 0.03 0.01 NA NA NA NA NA ICTF Pickup Truck Chevy Ext. Cab LDT 2004 0.04 1.51 0.12 0.03 0.01 NA NA NA NA NA ICTF Van Chevy Van LHDT 1 2004 0.03 0.35 0.12 0.03 0.00 23.10 141.99 1.56 0.00 0.05 Dolores Service Truck Chevy C4500 MHD 2003 0.88 11.41 2.19 0.02 0.00 23.10 141.99 1.56 0.00 0.05 Dolores Mgr Truck Chevy Trailblazer LDT 2004 0.05 1.97 0.16 0.03 0.01 NA NA NA NA NA Dolores Mgr Truck Chevy Blazer LDT 2004 0.05 1.97 0.16 0.03 0.01 NA NA NA NA NA Dolores Pickup Truck Ford F-150 LDT 2005 0.02 0.89 0.07 0.02 0.01 NA NA NA NA NA Notes: a. Traveling exhaust emissions calculated using the EMFAC2007 model with the BURDEN output option at a vehicle speed of 15 mph. b. Idling exhaust emissions factors for LHDT1 and MHD vehicles calculated using the EMFAC2007 model with the EMFAC output option. Idling exhaust emissions
from light duty trucks (LDT) are negligible.
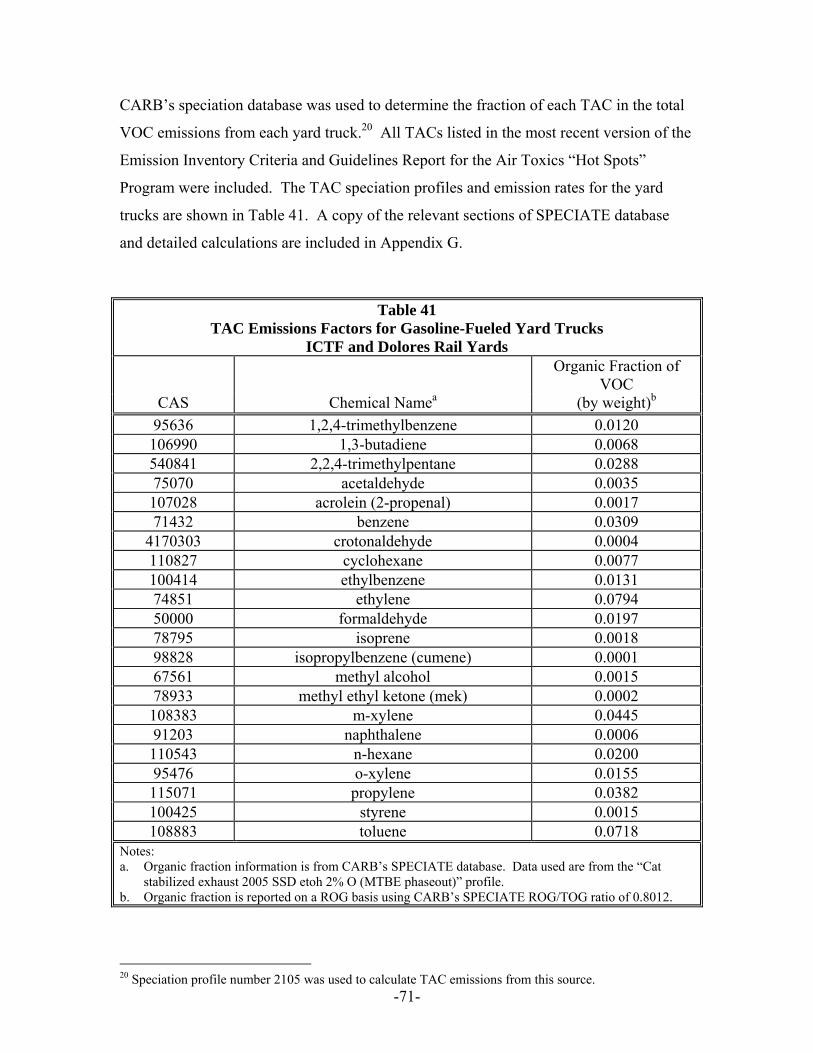
-71-
CARB’s speciation database was used to determine the fraction of each TAC in the total
VOC emissions from each yard truck.20 All TACs listed in the most recent version of the
Emission Inventory Criteria and Guidelines Report for the Air Toxics “Hot Spots”
Program were included. The TAC speciation profiles and emission rates for the yard
trucks are shown in Table 41. A copy of the relevant sections of SPECIATE database
and detailed calculations are included in Appendix G.
Table 41 TAC Emissions Factors for Gasoline-Fueled Yard Trucks
ICTF and Dolores Rail Yards
CAS Chemical Namea
Organic Fraction of VOC
(by weight)b 95636 1,2,4-trimethylbenzene 0.0120 106990 1,3-butadiene 0.0068 540841 2,2,4-trimethylpentane 0.0288 75070 acetaldehyde 0.0035 107028 acrolein (2-propenal) 0.0017 71432 benzene 0.0309
4170303 crotonaldehyde 0.0004 110827 cyclohexane 0.0077 100414 ethylbenzene 0.0131 74851 ethylene 0.0794 50000 formaldehyde 0.0197 78795 isoprene 0.0018 98828 isopropylbenzene (cumene) 0.0001 67561 methyl alcohol 0.0015 78933 methyl ethyl ketone (mek) 0.0002 108383 m-xylene 0.0445 91203 naphthalene 0.0006 110543 n-hexane 0.0200 95476 o-xylene 0.0155 115071 propylene 0.0382 100425 styrene 0.0015 108883 toluene 0.0718
Notes: a. Organic fraction information is from CARB’s SPECIATE database. Data used are from the “Cat
stabilized exhaust 2005 SSD etoh 2% O (MTBE phaseout)” profile. b. Organic fraction is reported on a ROG basis using CARB’s SPECIATE ROG/TOG ratio of 0.8012.
20 Speciation profile number 2105 was used to calculate TAC emissions from this source.
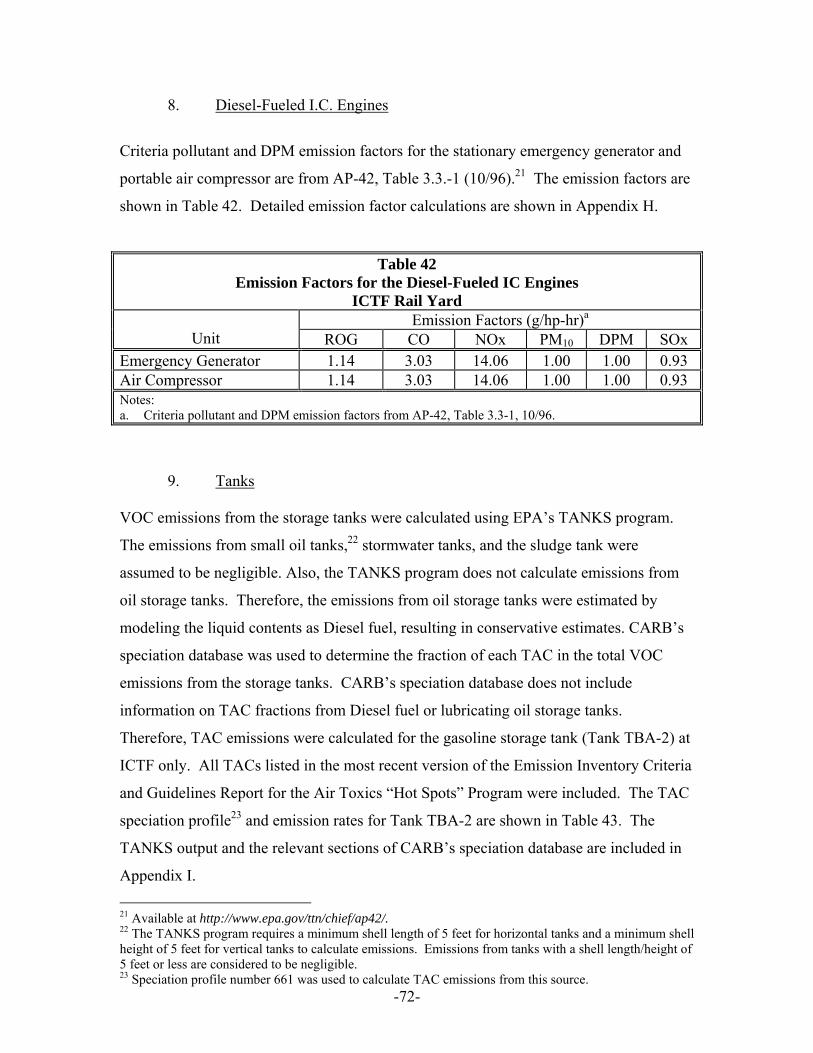
-72-
8. Diesel-Fueled I.C. Engines
Criteria pollutant and DPM emission factors for the stationary emergency generator and
portable air compressor are from AP-42, Table 3.3.-1 (10/96).21 The emission factors are
shown in Table 42. Detailed emission factor calculations are shown in Appendix H.
Table 42 Emission Factors for the Diesel-Fueled IC Engines
ICTF Rail Yard Emission Factors (g/hp-hr)a
Unit ROG CO NOx PM10 DPM SOx Emergency Generator 1.14 3.03 14.06 1.00 1.00 0.93 Air Compressor 1.14 3.03 14.06 1.00 1.00 0.93 Notes: a. Criteria pollutant and DPM emission factors from AP-42, Table 3.3-1, 10/96.
9. Tanks
VOC emissions from the storage tanks were calculated using EPA’s TANKS program.
The emissions from small oil tanks,22 stormwater tanks, and the sludge tank were
assumed to be negligible. Also, the TANKS program does not calculate emissions from
oil storage tanks. Therefore, the emissions from oil storage tanks were estimated by
modeling the liquid contents as Diesel fuel, resulting in conservative estimates. CARB’s
speciation database was used to determine the fraction of each TAC in the total VOC
emissions from the storage tanks. CARB’s speciation database does not include
information on TAC fractions from Diesel fuel or lubricating oil storage tanks.
Therefore, TAC emissions were calculated for the gasoline storage tank (Tank TBA-2) at
ICTF only. All TACs listed in the most recent version of the Emission Inventory Criteria
and Guidelines Report for the Air Toxics “Hot Spots” Program were included. The TAC
speciation profile23 and emission rates for Tank TBA-2 are shown in Table 43. The
TANKS output and the relevant sections of CARB’s speciation database are included in
Appendix I. 21 Available at http://www.epa.gov/ttn/chief/ap42/. 22 The TANKS program requires a minimum shell length of 5 feet for horizontal tanks and a minimum shell height of 5 feet for vertical tanks to calculate emissions. Emissions from tanks with a shell length/height of 5 feet or less are considered to be negligible. 23 Speciation profile number 661 was used to calculate TAC emissions from this source.

-73-
Table 43 TAC Emission Factors for Gasoline Storage Tank
ICTF Rail Yard
CAS
Chemical Nameb Organic Fraction of VOC
(by weight)a,c 540841 2,2,4-trimethylpentane 0.0130 71432 Benzene 0.0036 110827 Cyclohexane 0.0103 100414 Ethylbenzene 0.0012 78784 Isopentane 0.3747 98828 Isopropylbenzene (cumene) 0.0001 108383 m-Xylene 0.0034 110543 n-Hexane 0.0155 95476 o-Xylene 0.0013 106423 p-Xylene 0.0011 108883 Toluene 0.0171 Total 0.44 Notes: a. The organic fraction information is from CARB’s speciation database. Data are from the "Headspace
vapors 1996 SSD etoh 2.0% (MTBE phaseout)" option. b. Emissions were calculated only for chemicals that were in both CARB’s speciation database and the
AB 2588 list. c. Organic fraction reported on a ROG basis using ARB's Speciate ROG/TOG ratio (0.9963).
10. Refueling Operations
Refueling emissions are based on the type of fuel, annual fuel throughput, and VOC
emission factors from Supplemental Instructions for Liquid Organic Storage Tanks
document of the South Coast Air Quality Management District’s (SCAQMD) General
Instruction Book for the AQMD 2006-2007 Annual Emissions Reporting Program.24 The
VOC emission factors from refueling operations are shown in Table 44. A copy of the
relevant section of the SCAQMD document is contained in Appendix J-1 and detailed
emission calculations are shown in Appendix J-2.
24 Available at http://www.ecotek.com/aqmd/download.htm.
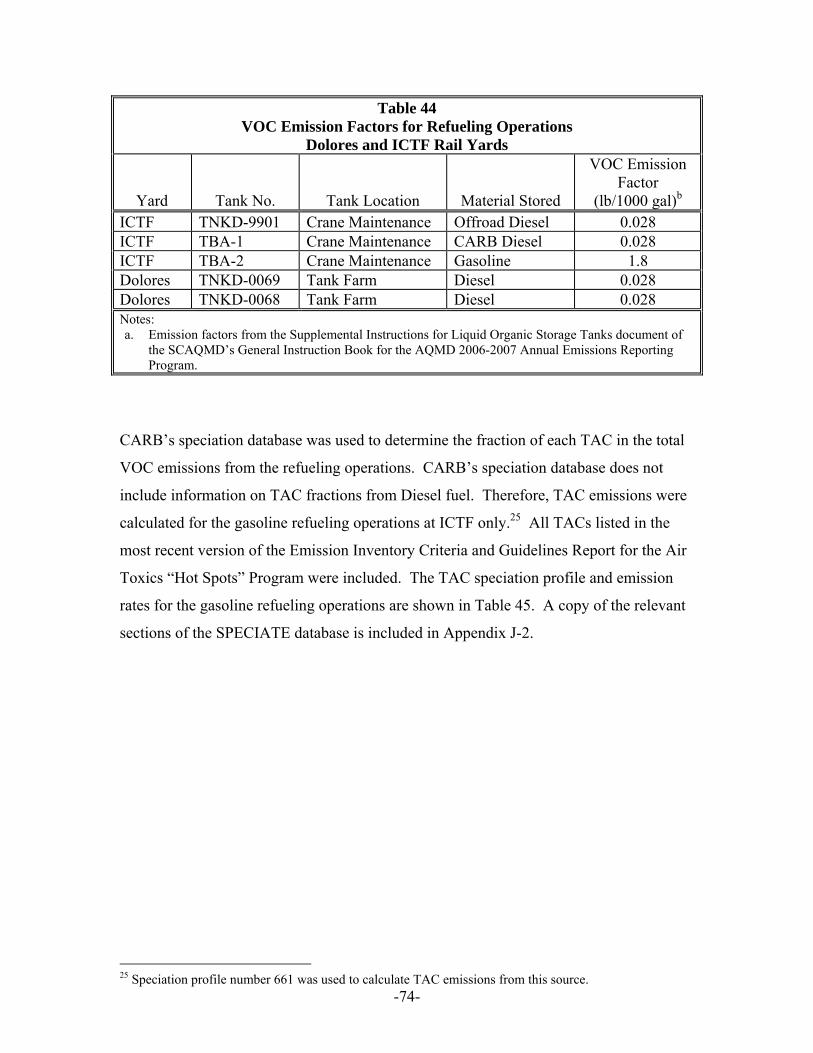
-74-
Table 44 VOC Emission Factors for Refueling Operations
Dolores and ICTF Rail Yards
Yard Tank No. Tank Location Material Stored
VOC Emission Factor
(lb/1000 gal)b ICTF TNKD-9901 Crane Maintenance Offroad Diesel 0.028 ICTF TBA-1 Crane Maintenance CARB Diesel 0.028 ICTF TBA-2 Crane Maintenance Gasoline 1.8 Dolores TNKD-0069 Tank Farm Diesel 0.028 Dolores TNKD-0068 Tank Farm Diesel 0.028 Notes: a. Emission factors from the Supplemental Instructions for Liquid Organic Storage Tanks document of
the SCAQMD’s General Instruction Book for the AQMD 2006-2007 Annual Emissions Reporting Program.
CARB’s speciation database was used to determine the fraction of each TAC in the total
VOC emissions from the refueling operations. CARB’s speciation database does not
include information on TAC fractions from Diesel fuel. Therefore, TAC emissions were
calculated for the gasoline refueling operations at ICTF only.25 All TACs listed in the
most recent version of the Emission Inventory Criteria and Guidelines Report for the Air
Toxics “Hot Spots” Program were included. The TAC speciation profile and emission
rates for the gasoline refueling operations are shown in Table 45. A copy of the relevant
sections of the SPECIATE database is included in Appendix J-2.
25 Speciation profile number 661 was used to calculate TAC emissions from this source.
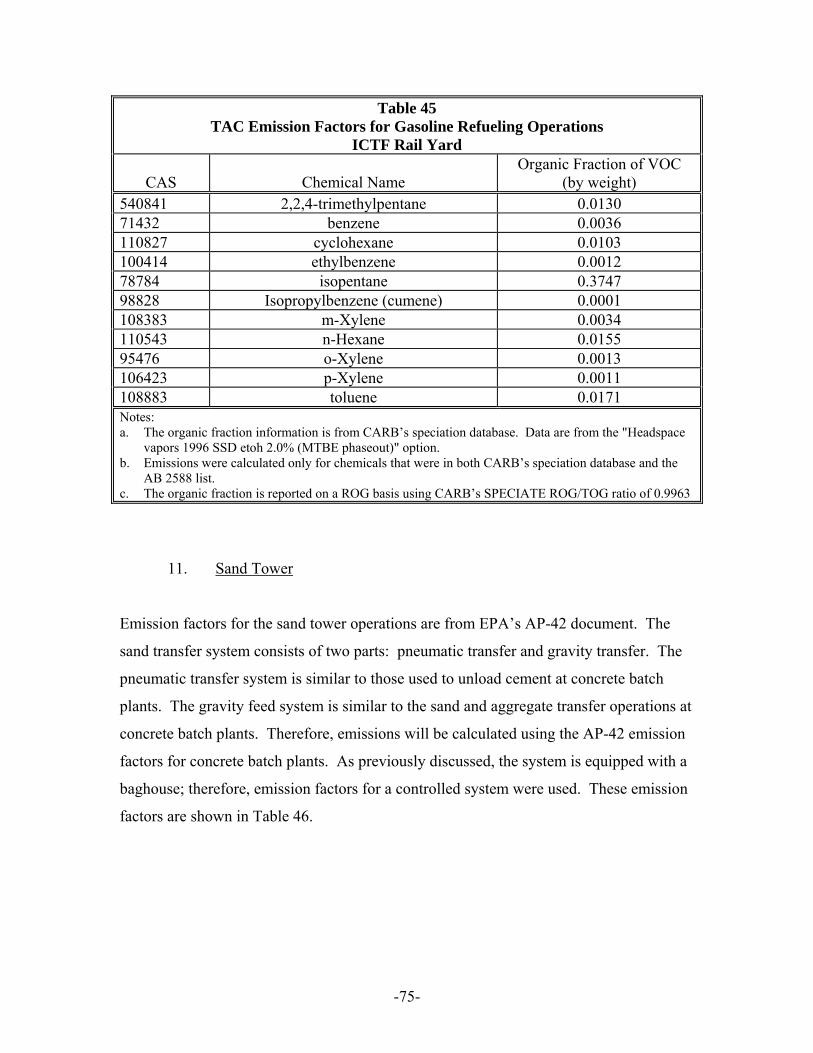
-75-
Table 45 TAC Emission Factors for Gasoline Refueling Operations
ICTF Rail Yard
CAS Chemical Name Organic Fraction of VOC
(by weight) 540841 2,2,4-trimethylpentane 0.0130 71432 benzene 0.0036 110827 cyclohexane 0.0103 100414 ethylbenzene 0.0012 78784 isopentane 0.3747 98828 Isopropylbenzene (cumene) 0.0001 108383 m-Xylene 0.0034 110543 n-Hexane 0.0155 95476 o-Xylene 0.0013 106423 p-Xylene 0.0011 108883 toluene 0.0171 Notes: a. The organic fraction information is from CARB’s speciation database. Data are from the "Headspace
vapors 1996 SSD etoh 2.0% (MTBE phaseout)" option. b. Emissions were calculated only for chemicals that were in both CARB’s speciation database and the
AB 2588 list. c. The organic fraction is reported on a ROG basis using CARB’s SPECIATE ROG/TOG ratio of 0.9963
11. Sand Tower Emission factors for the sand tower operations are from EPA’s AP-42 document. The
sand transfer system consists of two parts: pneumatic transfer and gravity transfer. The
pneumatic transfer system is similar to those used to unload cement at concrete batch
plants. The gravity feed system is similar to the sand and aggregate transfer operations at
concrete batch plants. Therefore, emissions will be calculated using the AP-42 emission
factors for concrete batch plants. As previously discussed, the system is equipped with a
baghouse; therefore, emission factors for a controlled system were used. These emission
factors are shown in Table 46.
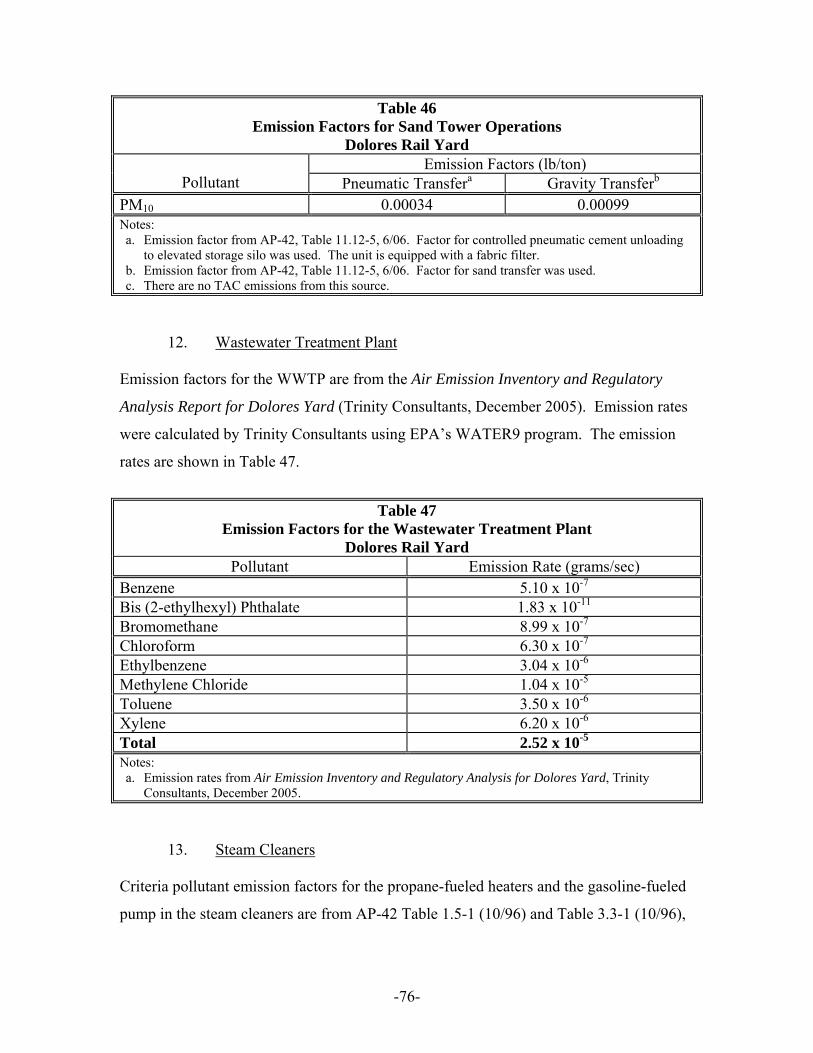
-76-
Table 46 Emission Factors for Sand Tower Operations
Dolores Rail Yard Emission Factors (lb/ton)
Pollutant Pneumatic Transfera Gravity Transferb PM10 0.00034 0.00099 Notes: a. Emission factor from AP-42, Table 11.12-5, 6/06. Factor for controlled pneumatic cement unloading
to elevated storage silo was used. The unit is equipped with a fabric filter. b. Emission factor from AP-42, Table 11.12-5, 6/06. Factor for sand transfer was used. c. There are no TAC emissions from this source.
12. Wastewater Treatment Plant
Emission factors for the WWTP are from the Air Emission Inventory and Regulatory
Analysis Report for Dolores Yard (Trinity Consultants, December 2005). Emission rates
were calculated by Trinity Consultants using EPA’s WATER9 program. The emission
rates are shown in Table 47.
Table 47
Emission Factors for the Wastewater Treatment Plant Dolores Rail Yard
Pollutant Emission Rate (grams/sec) Benzene 5.10 x 10⁻⁷ Bis (2-ethylhexyl) Phthalate 1.83 x 10⁻¹¹ Bromomethane 8.99 x 10⁻⁷ Chloroform 6.30 x 10⁻⁷ Ethylbenzene 3.04 x 10⁻⁶ Methylene Chloride 1.04 x 10⁻⁵ Toluene 3.50 x 10⁻⁶ Xylene 6.20 x 10⁻⁶ Total 2.52 x 10⁻⁵ Notes: a. Emission rates from Air Emission Inventory and Regulatory Analysis for Dolores Yard, Trinity
Consultants, December 2005.
13. Steam Cleaners
Criteria pollutant emission factors for the propane-fueled heaters and the gasoline-fueled
pump in the steam cleaners are from AP-42 Table 1.5-1 (10/96) and Table 3.3-1 (10/96),

-77-
respectively.26 The emission factors are shown in Table 48. Detailed emission
calculations are shown in Appendix K.
Table 48 Criteria Pollutant Emission Factors for Steam Cleaners
Dolores Rail Yard Emission Factors
Emission Unit ROG CO NOx PM10 SOxc Heater (lb/mgal)a 0.5 1.9 14.0 0.4 0.002 Pump (g/hp-hr)b 9.79 199.13 4.99 0.33 0.27 Notes: a. Emission factors from AP-42, Table 1.5-1 (10/96). b. Emission factors from AP-42, Table 3.3-1 (10/96). c. Based on a propane sulfur content of 185 ppm and a density of 4.24 lb propane per gallon.
CARB’s speciation database was used to determine the fraction of each TAC in the total
VOC emissions from the steam cleaning operations.27 The SPECIATE database does not
include a profile for propane-fueled boilers. Therefore, the speciation profile for natural
gas-fired boilers was used to determine the TAC emissions from the steam cleaner
heaters. All TACs listed in the most recent version of the Emission Inventory Criteria
and Guidelines Report for the Air Toxics “Hot Spots” Program were included. The TAC
speciation profiles and emission rates for the steam cleaning operations are shown in
Table 49. A copy of the relevant sections of the SPECIATE database is included in
Appendix K.
26 Available at http://www.epa.gov/ttn/chief/ap42/. 27 Speciation profile number 3 was used to calculate TAC emissions from the heaters and profile number 665 was used to calculate the TAC emissions from the pump.
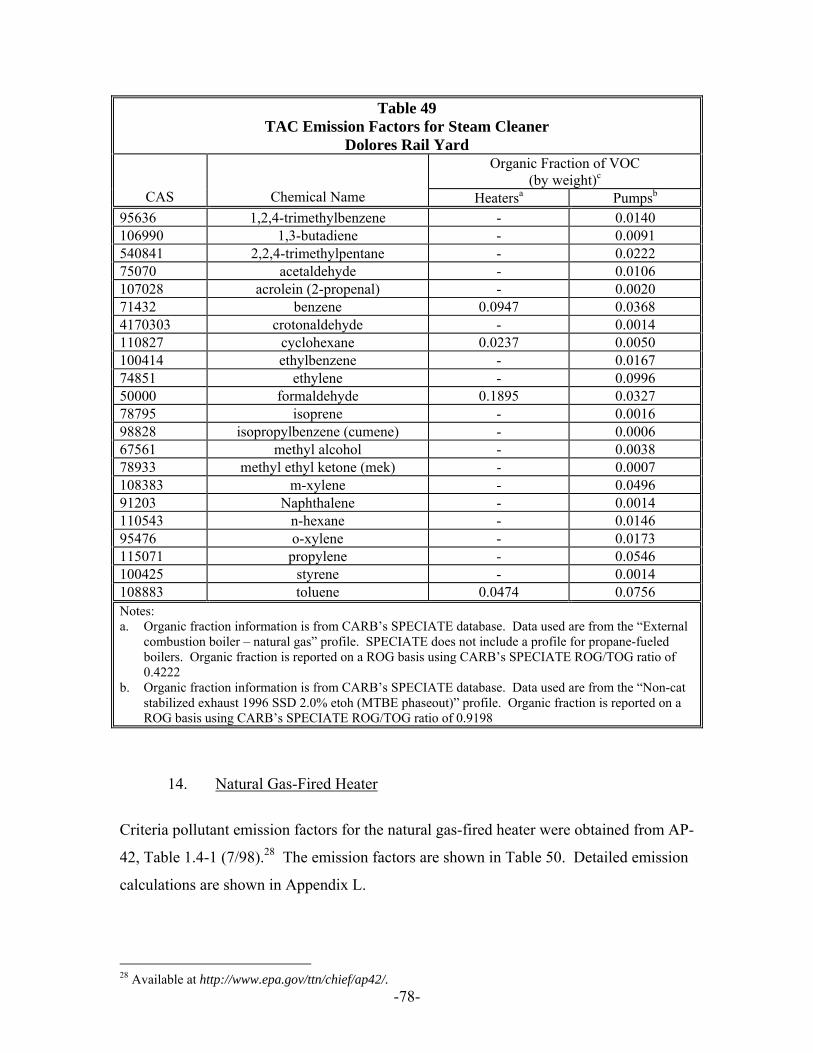
-78-
Table 49 TAC Emission Factors for Steam Cleaner
Dolores Rail Yard Organic Fraction of VOC
(by weight)c CAS Chemical Name Heatersa Pumpsb
95636 1,2,4-trimethylbenzene - 0.0140 106990 1,3-butadiene - 0.0091 540841 2,2,4-trimethylpentane - 0.0222 75070 acetaldehyde - 0.0106 107028 acrolein (2-propenal) - 0.0020 71432 benzene 0.0947 0.0368 4170303 crotonaldehyde - 0.0014 110827 cyclohexane 0.0237 0.0050 100414 ethylbenzene - 0.0167 74851 ethylene - 0.0996 50000 formaldehyde 0.1895 0.0327 78795 isoprene - 0.0016 98828 isopropylbenzene (cumene) - 0.0006 67561 methyl alcohol - 0.0038 78933 methyl ethyl ketone (mek) - 0.0007 108383 m-xylene - 0.0496 91203 Naphthalene - 0.0014 110543 n-hexane - 0.0146 95476 o-xylene - 0.0173 115071 propylene - 0.0546 100425 styrene - 0.0014 108883 toluene 0.0474 0.0756 Notes: a. Organic fraction information is from CARB’s SPECIATE database. Data used are from the “External
combustion boiler – natural gas” profile. SPECIATE does not include a profile for propane-fueled boilers. Organic fraction is reported on a ROG basis using CARB’s SPECIATE ROG/TOG ratio of 0.4222
b. Organic fraction information is from CARB’s SPECIATE database. Data used are from the “Non-cat stabilized exhaust 1996 SSD 2.0% etoh (MTBE phaseout)” profile. Organic fraction is reported on a ROG basis using CARB’s SPECIATE ROG/TOG ratio of 0.9198
14. Natural Gas-Fired Heater
Criteria pollutant emission factors for the natural gas-fired heater were obtained from AP-
42, Table 1.4-1 (7/98).28 The emission factors are shown in Table 50. Detailed emission
calculations are shown in Appendix L.
28 Available at http://www.epa.gov/ttn/chief/ap42/.
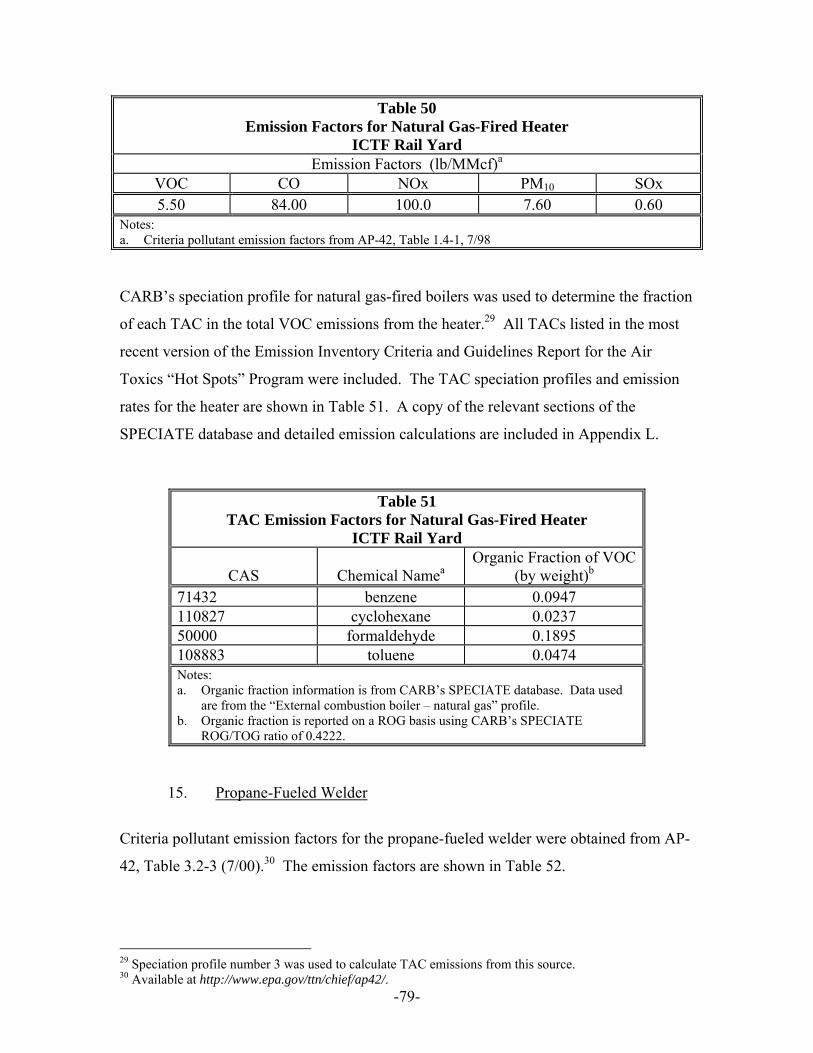
-79-
Table 50 Emission Factors for Natural Gas-Fired Heater
ICTF Rail Yard Emission Factors (lb/MMcf)a
VOC CO NOx PM10 SOx 5.50 84.00 100.0 7.60 0.60
Notes: a. Criteria pollutant emission factors from AP-42, Table 1.4-1, 7/98
CARB’s speciation profile for natural gas-fired boilers was used to determine the fraction
of each TAC in the total VOC emissions from the heater.29 All TACs listed in the most
recent version of the Emission Inventory Criteria and Guidelines Report for the Air
Toxics “Hot Spots” Program were included. The TAC speciation profiles and emission
rates for the heater are shown in Table 51. A copy of the relevant sections of the
SPECIATE database and detailed emission calculations are included in Appendix L.
Table 51 TAC Emission Factors for Natural Gas-Fired Heater
ICTF Rail Yard
CAS Chemical Namea Organic Fraction of VOC
(by weight)b 71432 benzene 0.0947 110827 cyclohexane 0.0237 50000 formaldehyde 0.1895 108883 toluene 0.0474 Notes: a. Organic fraction information is from CARB’s SPECIATE database. Data used
are from the “External combustion boiler – natural gas” profile. b. Organic fraction is reported on a ROG basis using CARB’s SPECIATE
ROG/TOG ratio of 0.4222. 15. Propane-Fueled Welder
Criteria pollutant emission factors for the propane-fueled welder were obtained from AP-
42, Table 3.2-3 (7/00).30 The emission factors are shown in Table 52.
29 Speciation profile number 3 was used to calculate TAC emissions from this source. 30 Available at http://www.epa.gov/ttn/chief/ap42/.
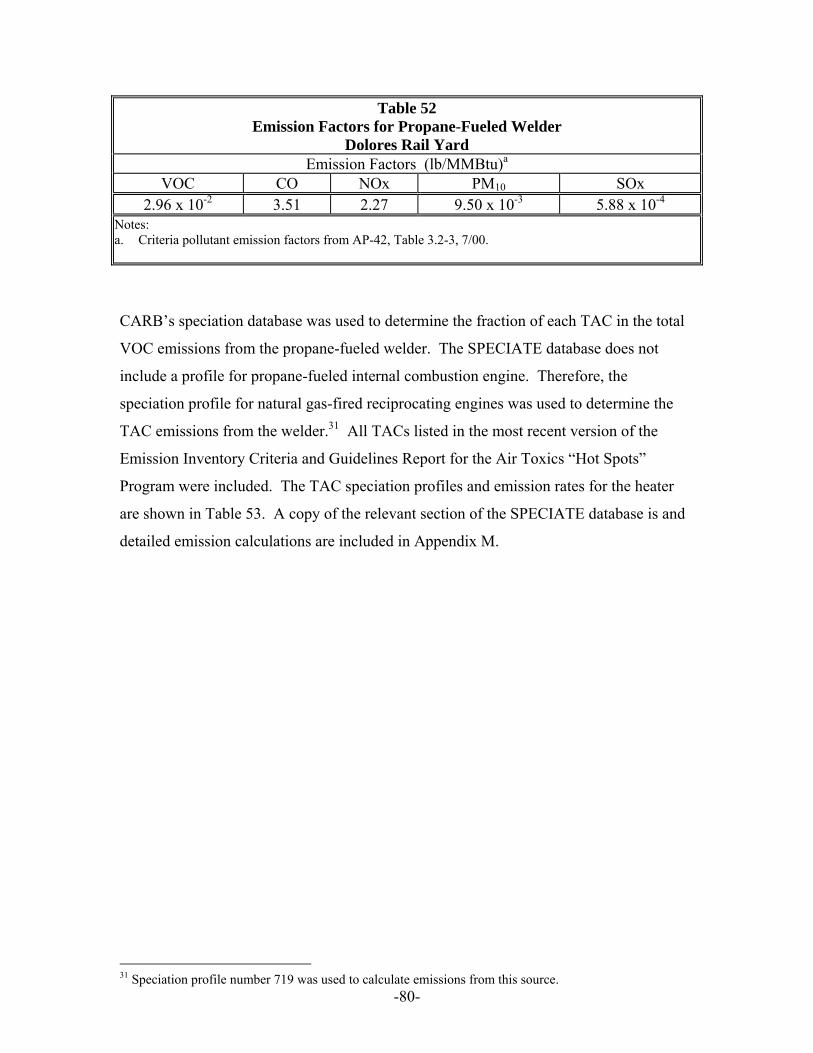
-80-
Table 52 Emission Factors for Propane-Fueled Welder
Dolores Rail Yard Emission Factors (lb/MMBtu)a
VOC CO NOx PM10 SOx 2.96 x 10-2 3.51 2.27 9.50 x 10⁻³ 5.88 x 10⁻⁴
Notes: a. Criteria pollutant emission factors from AP-42, Table 3.2-3, 7/00.
CARB’s speciation database was used to determine the fraction of each TAC in the total
VOC emissions from the propane-fueled welder. The SPECIATE database does not
include a profile for propane-fueled internal combustion engine. Therefore, the
speciation profile for natural gas-fired reciprocating engines was used to determine the
TAC emissions from the welder.31 All TACs listed in the most recent version of the
Emission Inventory Criteria and Guidelines Report for the Air Toxics “Hot Spots”
Program were included. The TAC speciation profiles and emission rates for the heater
are shown in Table 53. A copy of the relevant section of the SPECIATE database is and
detailed emission calculations are included in Appendix M.
31 Speciation profile number 719 was used to calculate emissions from this source.
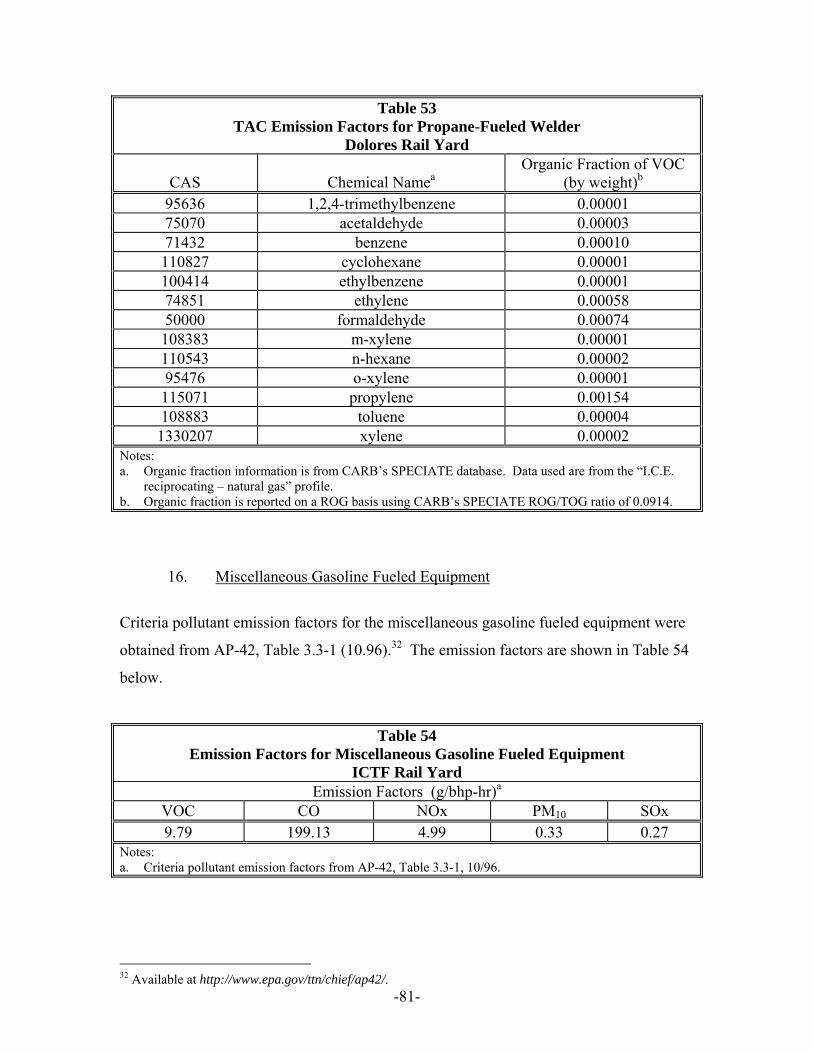
-81-
Table 53 TAC Emission Factors for Propane-Fueled Welder
Dolores Rail Yard
CAS Chemical Namea Organic Fraction of VOC
(by weight)b 95636 1,2,4-trimethylbenzene 0.00001 75070 acetaldehyde 0.00003 71432 benzene 0.00010 110827 cyclohexane 0.00001 100414 ethylbenzene 0.00001 74851 ethylene 0.00058 50000 formaldehyde 0.00074 108383 m-xylene 0.00001 110543 n-hexane 0.00002 95476 o-xylene 0.00001 115071 propylene 0.00154 108883 toluene 0.00004 1330207 xylene 0.00002
Notes: a. Organic fraction information is from CARB’s SPECIATE database. Data used are from the “I.C.E.
reciprocating – natural gas” profile. b. Organic fraction is reported on a ROG basis using CARB’s SPECIATE ROG/TOG ratio of 0.0914.
16. Miscellaneous Gasoline Fueled Equipment
Criteria pollutant emission factors for the miscellaneous gasoline fueled equipment were
obtained from AP-42, Table 3.3-1 (10.96).32 The emission factors are shown in Table 54
below.
Table 54 Emission Factors for Miscellaneous Gasoline Fueled Equipment
ICTF Rail Yard Emission Factors (g/bhp-hr)a
VOC CO NOx PM10 SOx 9.79 199.13 4.99 0.33 0.27
Notes: a. Criteria pollutant emission factors from AP-42, Table 3.3-1, 10/96.
32 Available at http://www.epa.gov/ttn/chief/ap42/.
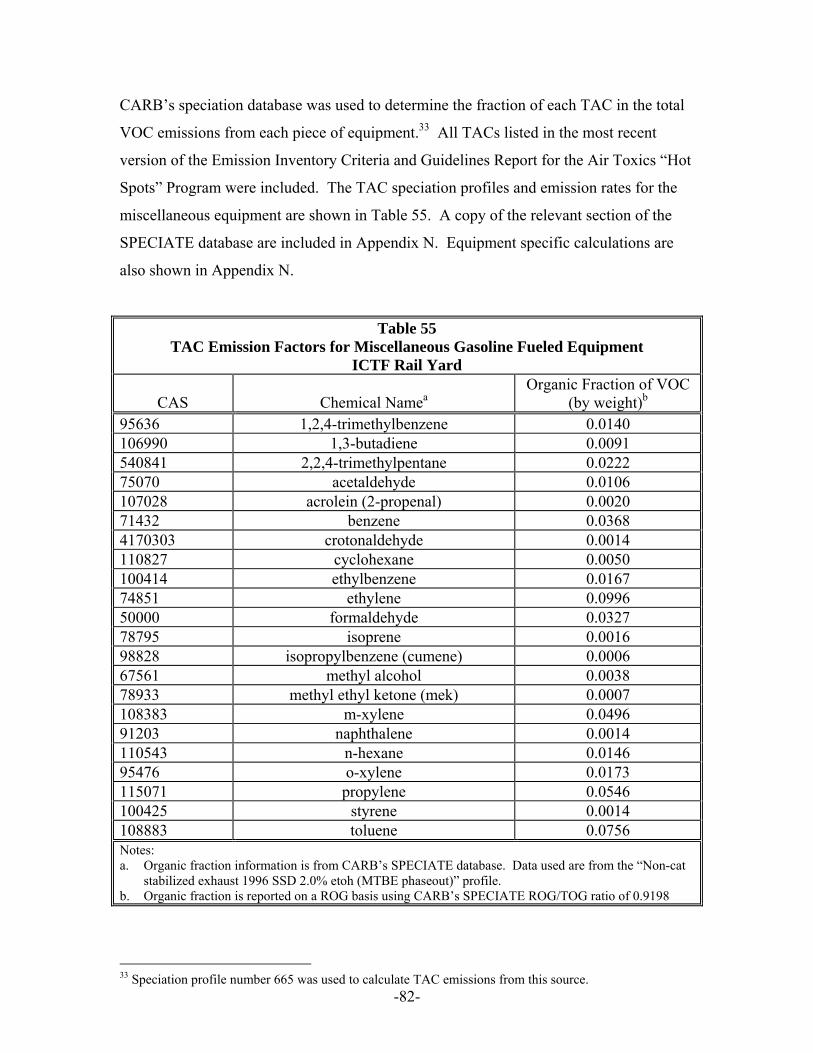
-82-
CARB’s speciation database was used to determine the fraction of each TAC in the total
VOC emissions from each piece of equipment.33 All TACs listed in the most recent
version of the Emission Inventory Criteria and Guidelines Report for the Air Toxics “Hot
Spots” Program were included. The TAC speciation profiles and emission rates for the
miscellaneous equipment are shown in Table 55. A copy of the relevant section of the
SPECIATE database are included in Appendix N. Equipment specific calculations are
also shown in Appendix N.
Table 55 TAC Emission Factors for Miscellaneous Gasoline Fueled Equipment
ICTF Rail Yard
CAS Chemical Namea Organic Fraction of VOC
(by weight)b 95636 1,2,4-trimethylbenzene 0.0140 106990 1,3-butadiene 0.0091 540841 2,2,4-trimethylpentane 0.0222 75070 acetaldehyde 0.0106 107028 acrolein (2-propenal) 0.0020 71432 benzene 0.0368 4170303 crotonaldehyde 0.0014 110827 cyclohexane 0.0050 100414 ethylbenzene 0.0167 74851 ethylene 0.0996 50000 formaldehyde 0.0327 78795 isoprene 0.0016 98828 isopropylbenzene (cumene) 0.0006 67561 methyl alcohol 0.0038 78933 methyl ethyl ketone (mek) 0.0007 108383 m-xylene 0.0496 91203 naphthalene 0.0014 110543 n-hexane 0.0146 95476 o-xylene 0.0173 115071 propylene 0.0546 100425 styrene 0.0014 108883 toluene 0.0756 Notes: a. Organic fraction information is from CARB’s SPECIATE database. Data used are from the “Non-cat
stabilized exhaust 1996 SSD 2.0% etoh (MTBE phaseout)” profile. b. Organic fraction is reported on a ROG basis using CARB’s SPECIATE ROG/TOG ratio of 0.9198
33 Speciation profile number 665 was used to calculate TAC emissions from this source.
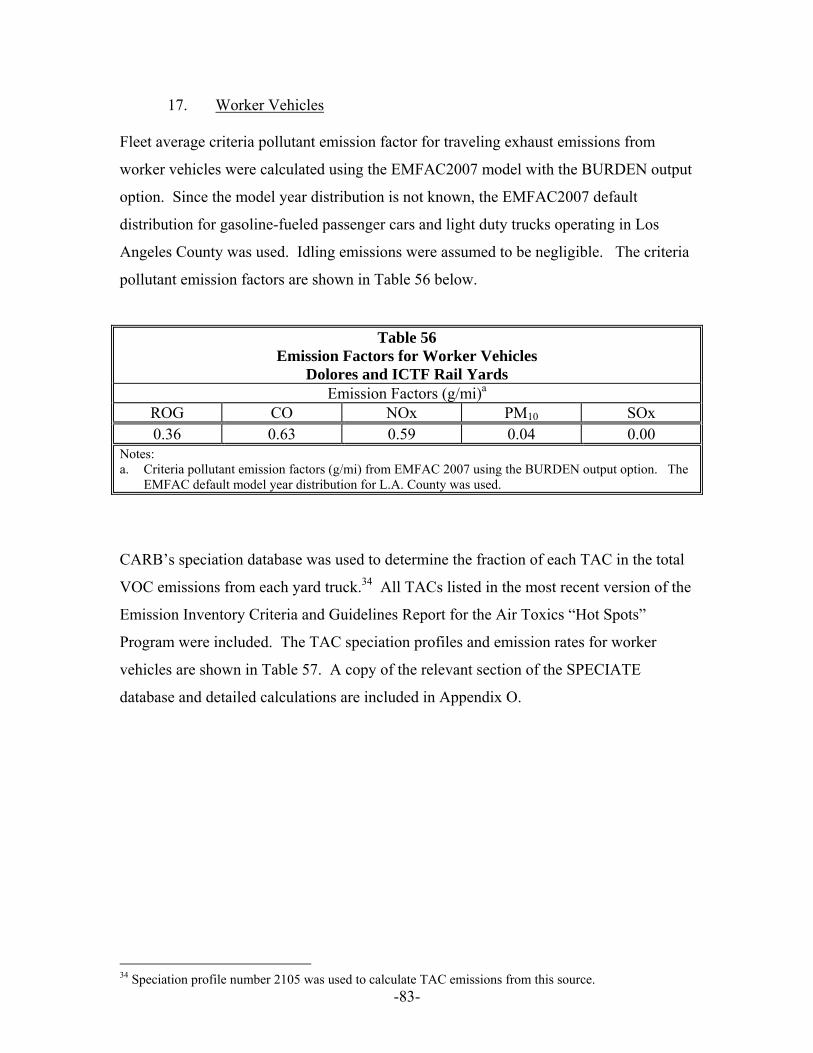
-83-
17. Worker Vehicles
Fleet average criteria pollutant emission factor for traveling exhaust emissions from
worker vehicles were calculated using the EMFAC2007 model with the BURDEN output
option. Since the model year distribution is not known, the EMFAC2007 default
distribution for gasoline-fueled passenger cars and light duty trucks operating in Los
Angeles County was used. Idling emissions were assumed to be negligible. The criteria
pollutant emission factors are shown in Table 56 below.
Table 56 Emission Factors for Worker Vehicles
Dolores and ICTF Rail Yards Emission Factors (g/mi)a
ROG CO NOx PM10 SOx 0.36 0.63 0.59 0.04 0.00
Notes: a. Criteria pollutant emission factors (g/mi) from EMFAC 2007 using the BURDEN output option. The
EMFAC default model year distribution for L.A. County was used.
CARB’s speciation database was used to determine the fraction of each TAC in the total
VOC emissions from each yard truck.34 All TACs listed in the most recent version of the
Emission Inventory Criteria and Guidelines Report for the Air Toxics “Hot Spots”
Program were included. The TAC speciation profiles and emission rates for worker
vehicles are shown in Table 57. A copy of the relevant section of the SPECIATE
database and detailed calculations are included in Appendix O.
34 Speciation profile number 2105 was used to calculate TAC emissions from this source.
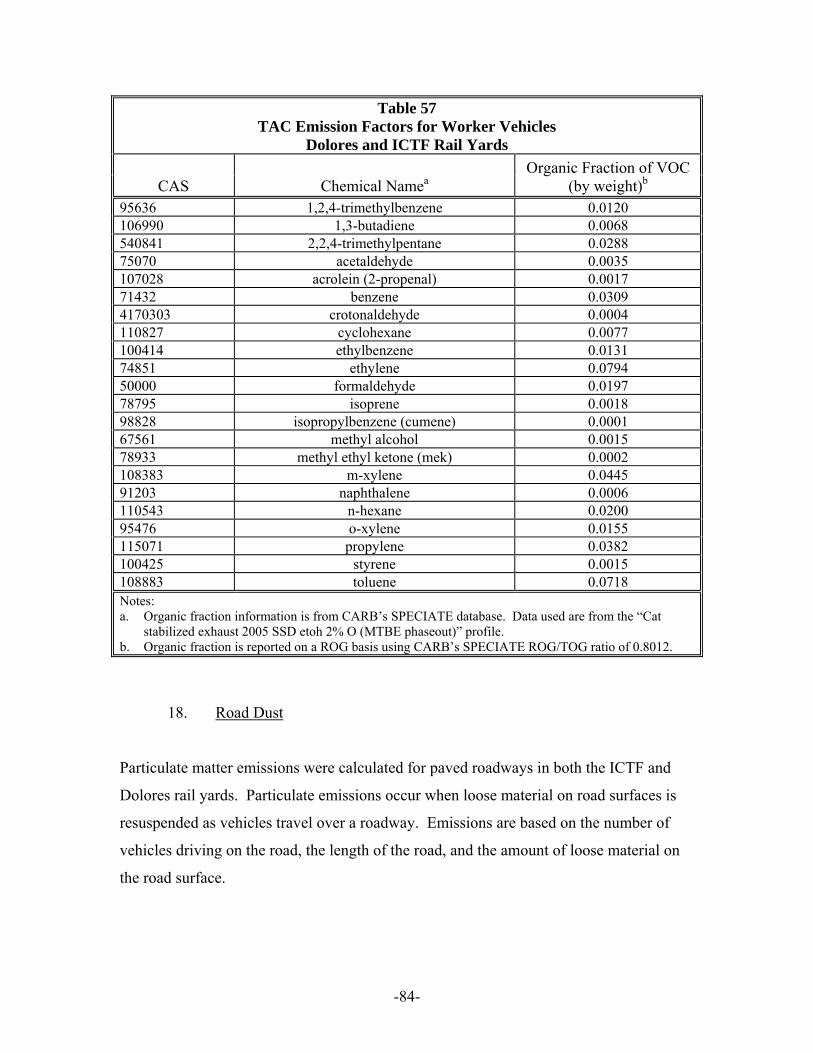
-84-
Table 57 TAC Emission Factors for Worker Vehicles
Dolores and ICTF Rail Yards
CAS Chemical Namea Organic Fraction of VOC
(by weight)b 95636 1,2,4-trimethylbenzene 0.0120 106990 1,3-butadiene 0.0068 540841 2,2,4-trimethylpentane 0.0288 75070 acetaldehyde 0.0035 107028 acrolein (2-propenal) 0.0017 71432 benzene 0.0309 4170303 crotonaldehyde 0.0004 110827 cyclohexane 0.0077 100414 ethylbenzene 0.0131 74851 ethylene 0.0794 50000 formaldehyde 0.0197 78795 isoprene 0.0018 98828 isopropylbenzene (cumene) 0.0001 67561 methyl alcohol 0.0015 78933 methyl ethyl ketone (mek) 0.0002 108383 m-xylene 0.0445 91203 naphthalene 0.0006 110543 n-hexane 0.0200 95476 o-xylene 0.0155 115071 propylene 0.0382 100425 styrene 0.0015 108883 toluene 0.0718 Notes: a. Organic fraction information is from CARB’s SPECIATE database. Data used are from the “Cat
stabilized exhaust 2005 SSD etoh 2% O (MTBE phaseout)” profile. b. Organic fraction is reported on a ROG basis using CARB’s SPECIATE ROG/TOG ratio of 0.8012.
18. Road Dust
Particulate matter emissions were calculated for paved roadways in both the ICTF and
Dolores rail yards. Particulate emissions occur when loose material on road surfaces is
resuspended as vehicles travel over a roadway. Emissions are based on the number of
vehicles driving on the road, the length of the road, and the amount of loose material on
the road surface.
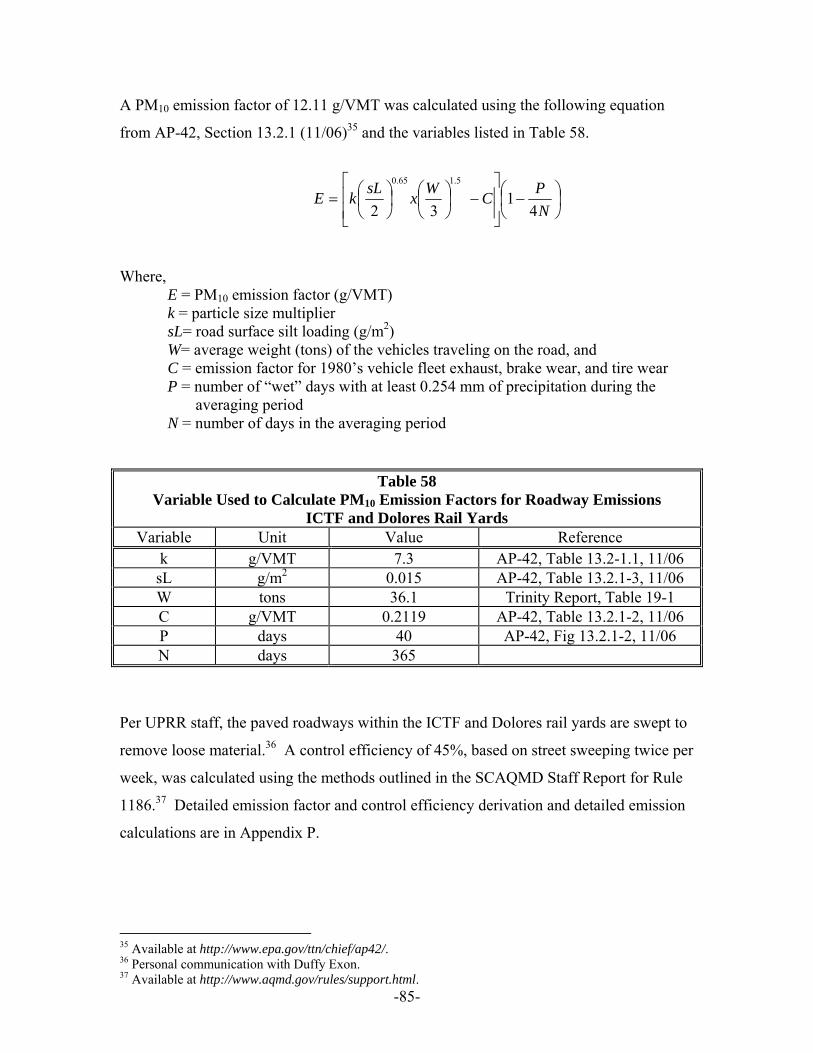
-85-
A PM10 emission factor of 12.11 g/VMT was calculated using the following equation
from AP-42, Section 13.2.1 (11/06)35 and the variables listed in Table 58.
⎟⎠⎞
⎜⎝⎛ −⎥⎥⎦
⎤
⎢⎢⎣
⎡−⎟
⎠⎞
⎜⎝⎛
⎟⎠⎞
⎜⎝⎛=
NPCWxsLkE
41
32
5.165.0
Where, E = PM10 emission factor (g/VMT) k = particle size multiplier sL= road surface silt loading (g/m2) W= average weight (tons) of the vehicles traveling on the road, and C = emission factor for 1980’s vehicle fleet exhaust, brake wear, and tire wear P = number of “wet” days with at least 0.254 mm of precipitation during the
averaging period N = number of days in the averaging period
Table 58 Variable Used to Calculate PM10 Emission Factors for Roadway Emissions
ICTF and Dolores Rail Yards Variable Unit Value Reference
k g/VMT 7.3 AP-42, Table 13.2-1.1, 11/06 sL g/m2 0.015 AP-42, Table 13.2.1-3, 11/06 W tons 36.1 Trinity Report, Table 19-1 C g/VMT 0.2119 AP-42, Table 13.2.1-2, 11/06 P days 40 AP-42, Fig 13.2.1-2, 11/06 N days 365
Per UPRR staff, the paved roadways within the ICTF and Dolores rail yards are swept to
remove loose material.36 A control efficiency of 45%, based on street sweeping twice per
week, was calculated using the methods outlined in the SCAQMD Staff Report for Rule
1186.37 Detailed emission factor and control efficiency derivation and detailed emission
calculations are in Appendix P.
35 Available at http://www.epa.gov/ttn/chief/ap42/. 36 Personal communication with Duffy Exon. 37 Available at http://www.aqmd.gov/rules/support.html.
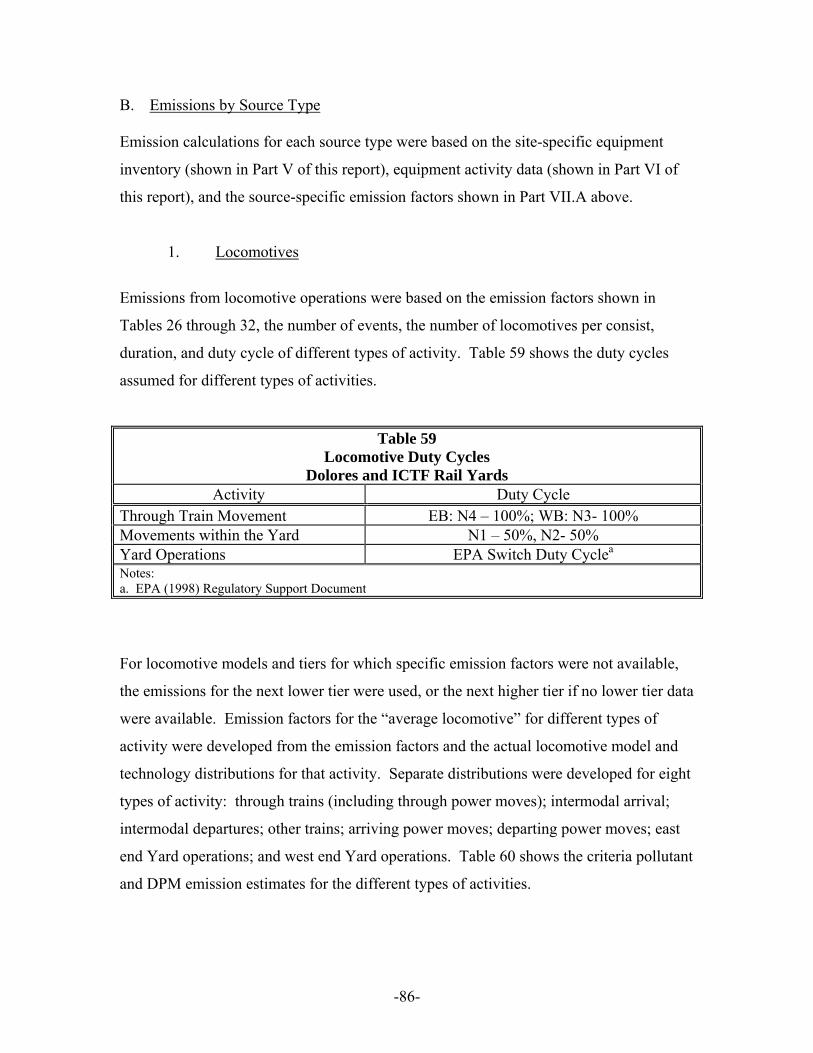
-86-
B. Emissions by Source Type Emission calculations for each source type were based on the site-specific equipment
inventory (shown in Part V of this report), equipment activity data (shown in Part VI of
this report), and the source-specific emission factors shown in Part VII.A above.
1. Locomotives
Emissions from locomotive operations were based on the emission factors shown in
Tables 26 through 32, the number of events, the number of locomotives per consist,
duration, and duty cycle of different types of activity. Table 59 shows the duty cycles
assumed for different types of activities.
Table 59 Locomotive Duty Cycles
Dolores and ICTF Rail Yards Activity Duty Cycle
Through Train Movement EB: N4 – 100%; WB: N3- 100% Movements within the Yard N1 – 50%, N2- 50% Yard Operations EPA Switch Duty Cyclea
Notes: a. EPA (1998) Regulatory Support Document
For locomotive models and tiers for which specific emission factors were not available,
the emissions for the next lower tier were used, or the next higher tier if no lower tier data
were available. Emission factors for the “average locomotive” for different types of
activity were developed from the emission factors and the actual locomotive model and
technology distributions for that activity. Separate distributions were developed for eight
types of activity: through trains (including through power moves); intermodal arrival;
intermodal departures; other trains; arriving power moves; departing power moves; east
end Yard operations; and west end Yard operations. Table 60 shows the criteria pollutant
and DPM emission estimates for the different types of activities.
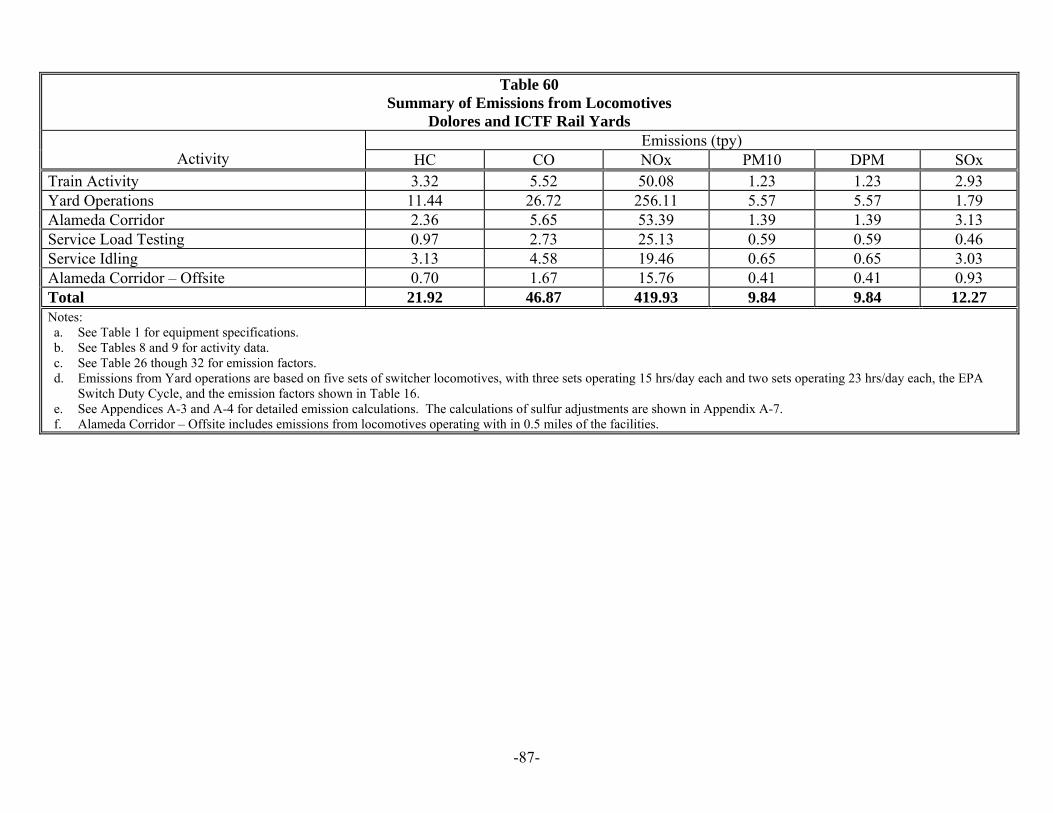
-87-
Table 60 Summary of Emissions from Locomotives
Dolores and ICTF Rail Yards Emissions (tpy)
Activity HC CO NOx PM10 DPM SOx Train Activity 3.32 5.52 50.08 1.23 1.23 2.93 Yard Operations 11.44 26.72 256.11 5.57 5.57 1.79 Alameda Corridor 2.36 5.65 53.39 1.39 1.39 3.13 Service Load Testing 0.97 2.73 25.13 0.59 0.59 0.46 Service Idling 3.13 4.58 19.46 0.65 0.65 3.03 Alameda Corridor – Offsite 0.70 1.67 15.76 0.41 0.41 0.93 Total 21.92 46.87 419.93 9.84 9.84 12.27 Notes: a. See Table 1 for equipment specifications. b. See Tables 8 and 9 for activity data. c. See Table 26 though 32 for emission factors. d. Emissions from Yard operations are based on five sets of switcher locomotives, with three sets operating 15 hrs/day each and two sets operating 23 hrs/day each, the EPA
Switch Duty Cycle, and the emission factors shown in Table 16. e. See Appendices A-3 and A-4 for detailed emission calculations. The calculations of sulfur adjustments are shown in Appendix A-7. f. Alameda Corridor – Offsite includes emissions from locomotives operating with in 0.5 miles of the facilities.
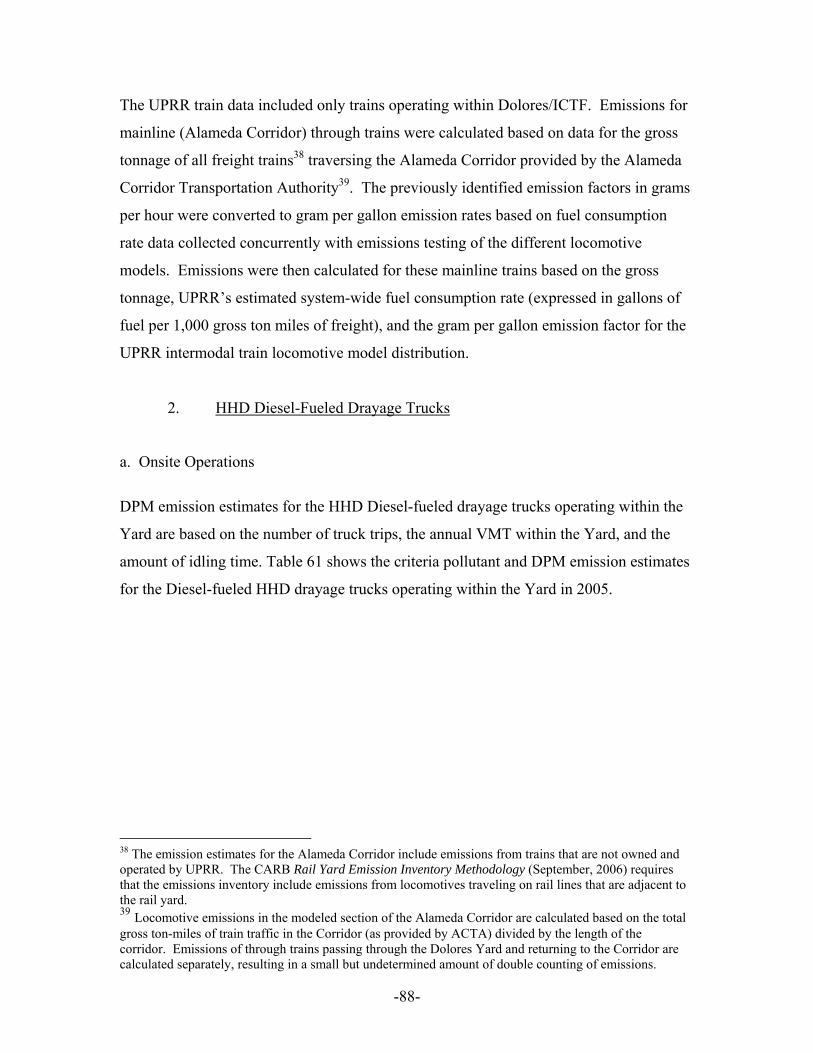
-88-
The UPRR train data included only trains operating within Dolores/ICTF. Emissions for
mainline (Alameda Corridor) through trains were calculated based on data for the gross
tonnage of all freight trains38 traversing the Alameda Corridor provided by the Alameda
Corridor Transportation Authority39. The previously identified emission factors in grams
per hour were converted to gram per gallon emission rates based on fuel consumption
rate data collected concurrently with emissions testing of the different locomotive
models. Emissions were then calculated for these mainline trains based on the gross
tonnage, UPRR’s estimated system-wide fuel consumption rate (expressed in gallons of
fuel per 1,000 gross ton miles of freight), and the gram per gallon emission factor for the
UPRR intermodal train locomotive model distribution.
2. HHD Diesel-Fueled Drayage Trucks
a. Onsite Operations
DPM emission estimates for the HHD Diesel-fueled drayage trucks operating within the
Yard are based on the number of truck trips, the annual VMT within the Yard, and the
amount of idling time. Table 61 shows the criteria pollutant and DPM emission estimates
for the Diesel-fueled HHD drayage trucks operating within the Yard in 2005.
38 The emission estimates for the Alameda Corridor include emissions from trains that are not owned and operated by UPRR. The CARB Rail Yard Emission Inventory Methodology (September, 2006) requires that the emissions inventory include emissions from locomotives traveling on rail lines that are adjacent to the rail yard. 39 Locomotive emissions in the modeled section of the Alameda Corridor are calculated based on the total gross ton-miles of train traffic in the Corridor (as provided by ACTA) divided by the length of the corridor. Emissions of through trains passing through the Dolores Yard and returning to the Corridor are calculated separately, resulting in a small but undetermined amount of double counting of emissions.
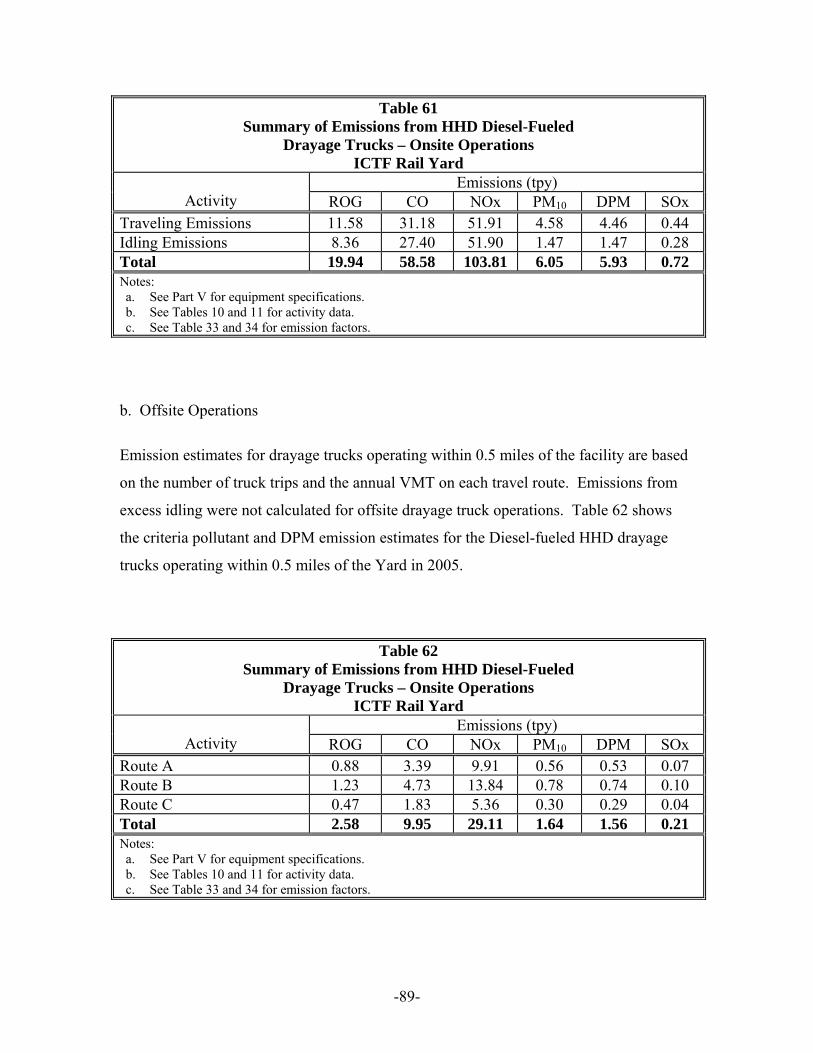
-89-
Table 61 Summary of Emissions from HHD Diesel-Fueled
Drayage Trucks – Onsite Operations ICTF Rail Yard
Emissions (tpy) Activity ROG CO NOx PM10 DPM SOx
Traveling Emissions 11.58 31.18 51.91 4.58 4.46 0.44 Idling Emissions 8.36 27.40 51.90 1.47 1.47 0.28 Total 19.94 58.58 103.81 6.05 5.93 0.72 Notes: a. See Part V for equipment specifications. b. See Tables 10 and 11 for activity data. c. See Table 33 and 34 for emission factors.
b. Offsite Operations
Emission estimates for drayage trucks operating within 0.5 miles of the facility are based
on the number of truck trips and the annual VMT on each travel route. Emissions from
excess idling were not calculated for offsite drayage truck operations. Table 62 shows
the criteria pollutant and DPM emission estimates for the Diesel-fueled HHD drayage
trucks operating within 0.5 miles of the Yard in 2005.
Table 62 Summary of Emissions from HHD Diesel-Fueled
Drayage Trucks – Onsite Operations ICTF Rail Yard
Emissions (tpy) Activity ROG CO NOx PM10 DPM SOx
Route A 0.88 3.39 9.91 0.56 0.53 0.07 Route B 1.23 4.73 13.84 0.78 0.74 0.10 Route C 0.47 1.83 5.36 0.30 0.29 0.04 Total 2.58 9.95 29.11 1.64 1.56 0.21 Notes: a. See Part V for equipment specifications. b. See Tables 10 and 11 for activity data. c. See Table 33 and 34 for emission factors.
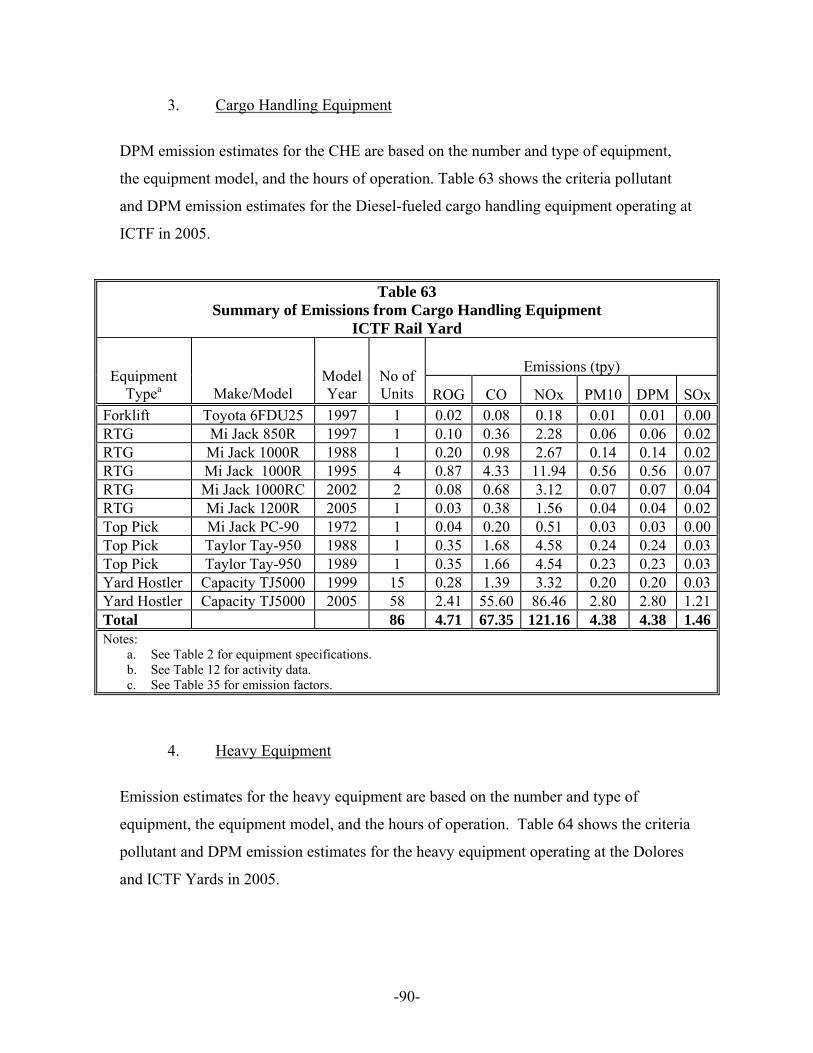
-90-
3. Cargo Handling Equipment
DPM emission estimates for the CHE are based on the number and type of equipment,
the equipment model, and the hours of operation. Table 63 shows the criteria pollutant
and DPM emission estimates for the Diesel-fueled cargo handling equipment operating at
ICTF in 2005.
Table 63 Summary of Emissions from Cargo Handling Equipment
ICTF Rail Yard
Emissions (tpy) Equipment
Typea
Make/Model Model Year
No of Units ROG CO NOx PM10 DPM SOx
Forklift Toyota 6FDU25 1997 1 0.02 0.08 0.18 0.01 0.01 0.00RTG Mi Jack 850R 1997 1 0.10 0.36 2.28 0.06 0.06 0.02RTG Mi Jack 1000R 1988 1 0.20 0.98 2.67 0.14 0.14 0.02RTG Mi Jack 1000R 1995 4 0.87 4.33 11.94 0.56 0.56 0.07RTG Mi Jack 1000RC 2002 2 0.08 0.68 3.12 0.07 0.07 0.04RTG Mi Jack 1200R 2005 1 0.03 0.38 1.56 0.04 0.04 0.02Top Pick Mi Jack PC-90 1972 1 0.04 0.20 0.51 0.03 0.03 0.00Top Pick Taylor Tay-950 1988 1 0.35 1.68 4.58 0.24 0.24 0.03Top Pick Taylor Tay-950 1989 1 0.35 1.66 4.54 0.23 0.23 0.03Yard Hostler Capacity TJ5000 1999 15 0.28 1.39 3.32 0.20 0.20 0.03Yard Hostler Capacity TJ5000 2005 58 2.41 55.60 86.46 2.80 2.80 1.21Total 86 4.71 67.35 121.16 4.38 4.38 1.46Notes:
a. See Table 2 for equipment specifications. b. See Table 12 for activity data. c. See Table 35 for emission factors.
4. Heavy Equipment
Emission estimates for the heavy equipment are based on the number and type of
equipment, the equipment model, and the hours of operation. Table 64 shows the criteria
pollutant and DPM emission estimates for the heavy equipment operating at the Dolores
and ICTF Yards in 2005.
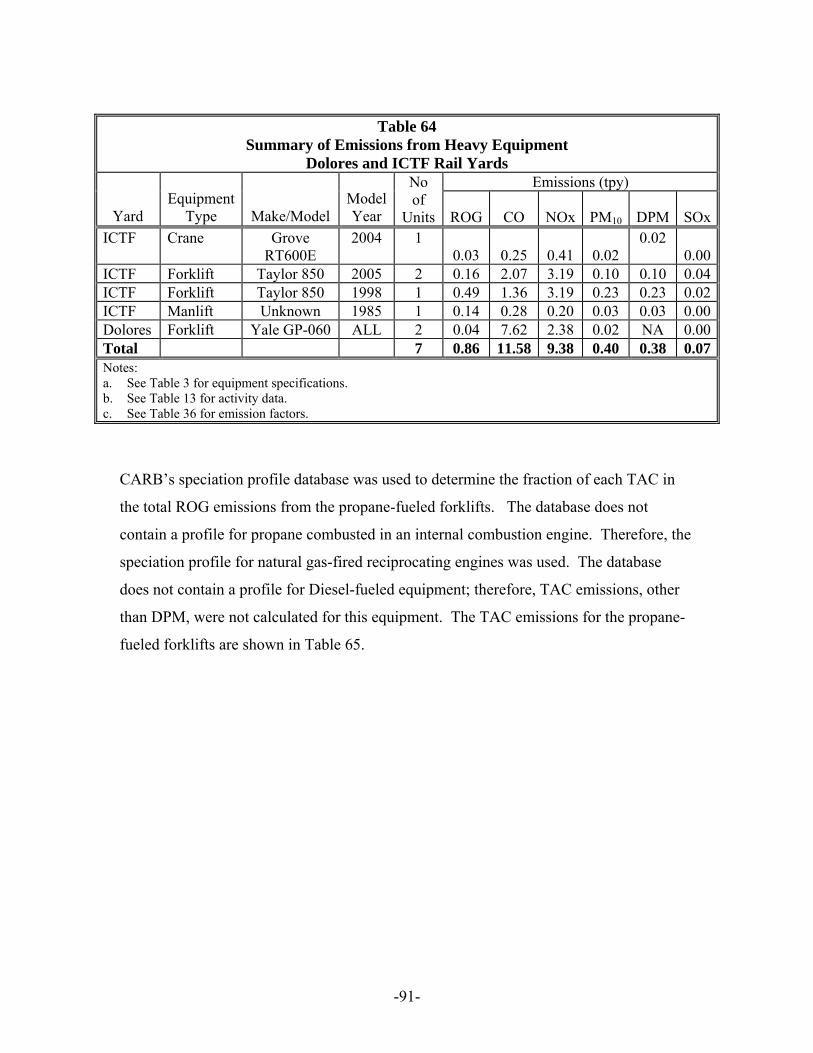
-91-
Table 64
Summary of Emissions from Heavy Equipment Dolores and ICTF Rail Yards
Emissions (tpy)
Yard Equipment
Type Make/Model Model Year
No of
Units ROG CO NOx PM10 DPM SOxICTF Crane Grove
RT600E 2004 1
0.03 0.25 0.41 0.02 0.02
0.00ICTF Forklift Taylor 850 2005 2 0.16 2.07 3.19 0.10 0.10 0.04ICTF Forklift Taylor 850 1998 1 0.49 1.36 3.19 0.23 0.23 0.02ICTF Manlift Unknown 1985 1 0.14 0.28 0.20 0.03 0.03 0.00Dolores Forklift Yale GP-060 ALL 2 0.04 7.62 2.38 0.02 NA 0.00Total 7 0.86 11.58 9.38 0.40 0.38 0.07Notes: a. See Table 3 for equipment specifications. b. See Table 13 for activity data. c. See Table 36 for emission factors.
CARB’s speciation profile database was used to determine the fraction of each TAC in
the total ROG emissions from the propane-fueled forklifts. The database does not
contain a profile for propane combusted in an internal combustion engine. Therefore, the
speciation profile for natural gas-fired reciprocating engines was used. The database
does not contain a profile for Diesel-fueled equipment; therefore, TAC emissions, other
than DPM, were not calculated for this equipment. The TAC emissions for the propane-
fueled forklifts are shown in Table 65.
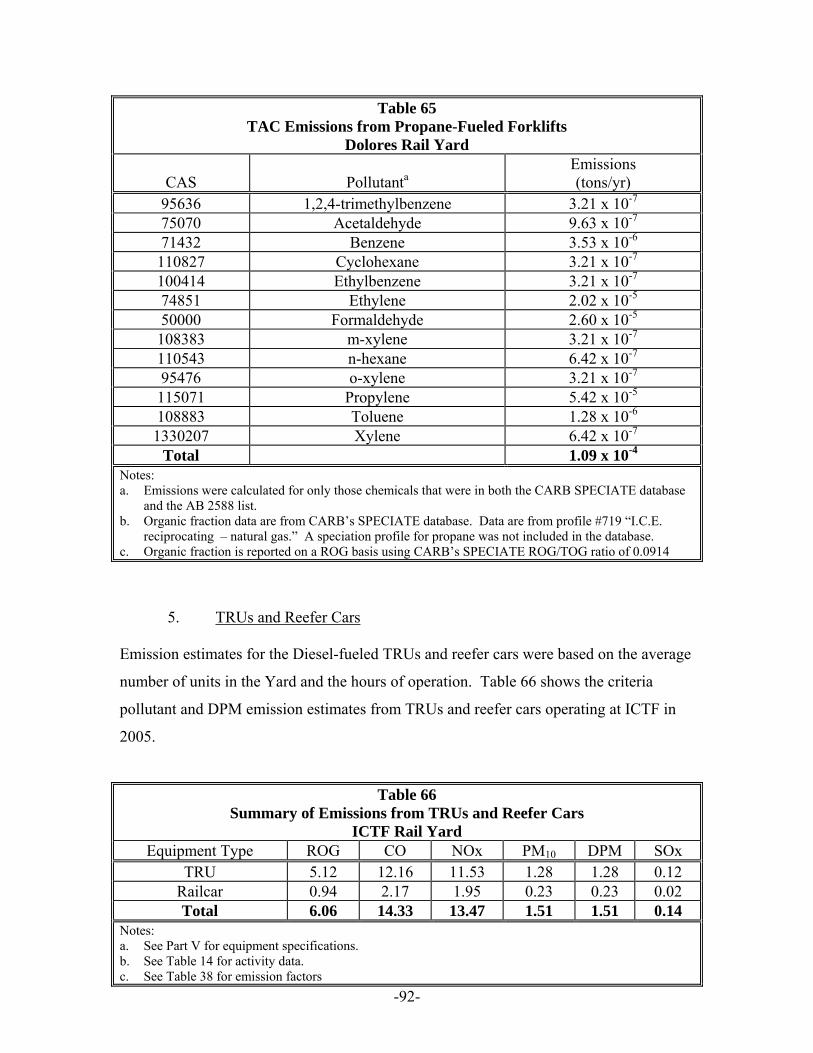
-92-
Table 65 TAC Emissions from Propane-Fueled Forklifts
Dolores Rail Yard
CAS Pollutanta Emissions (tons/yr)
95636 1,2,4-trimethylbenzene 3.21 x 10⁻⁷ 75070 Acetaldehyde 9.63 x 10⁻⁷ 71432 Benzene 3.53 x 10⁻⁶ 110827 Cyclohexane 3.21 x 10⁻⁷ 100414 Ethylbenzene 3.21 x 10⁻⁷ 74851 Ethylene 2.02 x 10⁻⁵ 50000 Formaldehyde 2.60 x 10⁻⁵ 108383 m-xylene 3.21 x 10⁻⁷ 110543 n-hexane 6.42 x 10⁻⁷ 95476 o-xylene 3.21 x 10⁻⁷ 115071 Propylene 5.42 x 10⁻⁵ 108883 Toluene 1.28 x 10⁻⁶ 1330207 Xylene 6.42 x 10⁻⁷
Total 1.09 x 10⁻⁴ Notes: a. Emissions were calculated for only those chemicals that were in both the CARB SPECIATE database
and the AB 2588 list. b. Organic fraction data are from CARB’s SPECIATE database. Data are from profile #719 “I.C.E.
reciprocating – natural gas.” A speciation profile for propane was not included in the database. c. Organic fraction is reported on a ROG basis using CARB’s SPECIATE ROG/TOG ratio of 0.0914
5. TRUs and Reefer Cars
Emission estimates for the Diesel-fueled TRUs and reefer cars were based on the average
number of units in the Yard and the hours of operation. Table 66 shows the criteria
pollutant and DPM emission estimates from TRUs and reefer cars operating at ICTF in
2005.
Table 66 Summary of Emissions from TRUs and Reefer Cars
ICTF Rail Yard Equipment Type ROG CO NOx PM10 DPM SOx
TRU 5.12 12.16 11.53 1.28 1.28 0.12 Railcar 0.94 2.17 1.95 0.23 0.23 0.02 Total 6.06 14.33 13.47 1.51 1.51 0.14
Notes: a. See Part V for equipment specifications. b. See Table 14 for activity data. c. See Table 38 for emission factors

-93-
6. HHD Diesel-Fueled Delivery Trucks
Emission estimates for Diesel-fueled delivery trucks are based on the number of truck
trips, the length of each trip, and the amount of time spent idling. The criteria pollutant
and DPM emissions from delivery trucks calling at the ICTF and Dolores Yards in 2005
are summarized in Table 67.
Table 67 Summary of Emissions from HHD Diesel-Fueled
Delivery Trucks Dolores and ICTF Rail Yards
Emission (tpy) Operating Mode ROG CO NOx PM10 DPM SOx
Traveling 0.00 0.01 0.02 0.00 0.001 0.00 Idling 0.01 0.03 0.06 0.00 0.002 0.00 Total 0.01 0.04 0.08 0.00 0.00 0.00 Notes:
a. See Part V for equipment specifications. b. See Table 15 for activity data. c. See Table 39 for emission factors.
7. Yard Trucks
Emissions from the gasoline fueled yard trucks were based on the age of the vehicle and
the annual miles traveled. The criteria pollutant emissions from yard trucks are
summarized in Table 68.
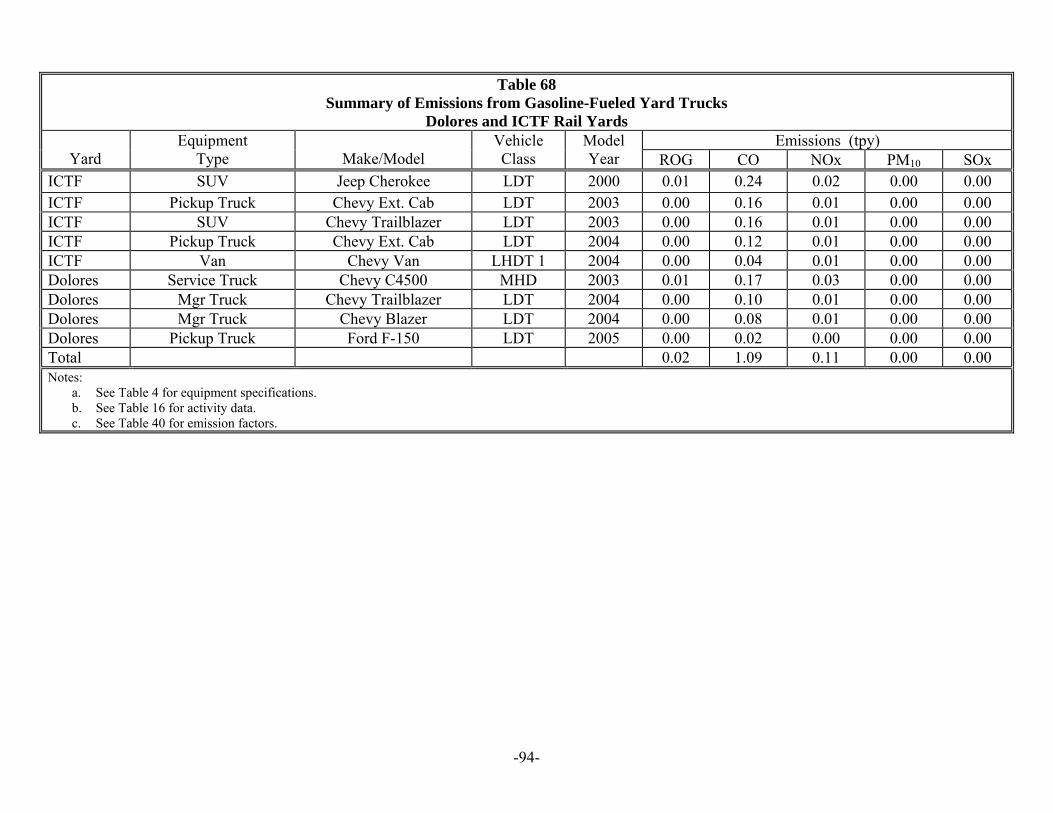
-94-
Table 68 Summary of Emissions from Gasoline-Fueled Yard Trucks
Dolores and ICTF Rail Yards Emissions (tpy)
Yard Equipment
Type Make/Model Vehicle Class
Model Year ROG CO NOx PM10 SOx
ICTF SUV Jeep Cherokee LDT 2000 0.01 0.24 0.02 0.00 0.00 ICTF Pickup Truck Chevy Ext. Cab LDT 2003 0.00 0.16 0.01 0.00 0.00 ICTF SUV Chevy Trailblazer LDT 2003 0.00 0.16 0.01 0.00 0.00 ICTF Pickup Truck Chevy Ext. Cab LDT 2004 0.00 0.12 0.01 0.00 0.00 ICTF Van Chevy Van LHDT 1 2004 0.00 0.04 0.01 0.00 0.00 Dolores Service Truck Chevy C4500 MHD 2003 0.01 0.17 0.03 0.00 0.00 Dolores Mgr Truck Chevy Trailblazer LDT 2004 0.00 0.10 0.01 0.00 0.00 Dolores Mgr Truck Chevy Blazer LDT 2004 0.00 0.08 0.01 0.00 0.00 Dolores Pickup Truck Ford F-150 LDT 2005 0.00 0.02 0.00 0.00 0.00 Total 0.02 1.09 0.11 0.00 0.00 Notes:
a. See Table 4 for equipment specifications. b. See Table 16 for activity data. c. See Table 40 for emission factors.
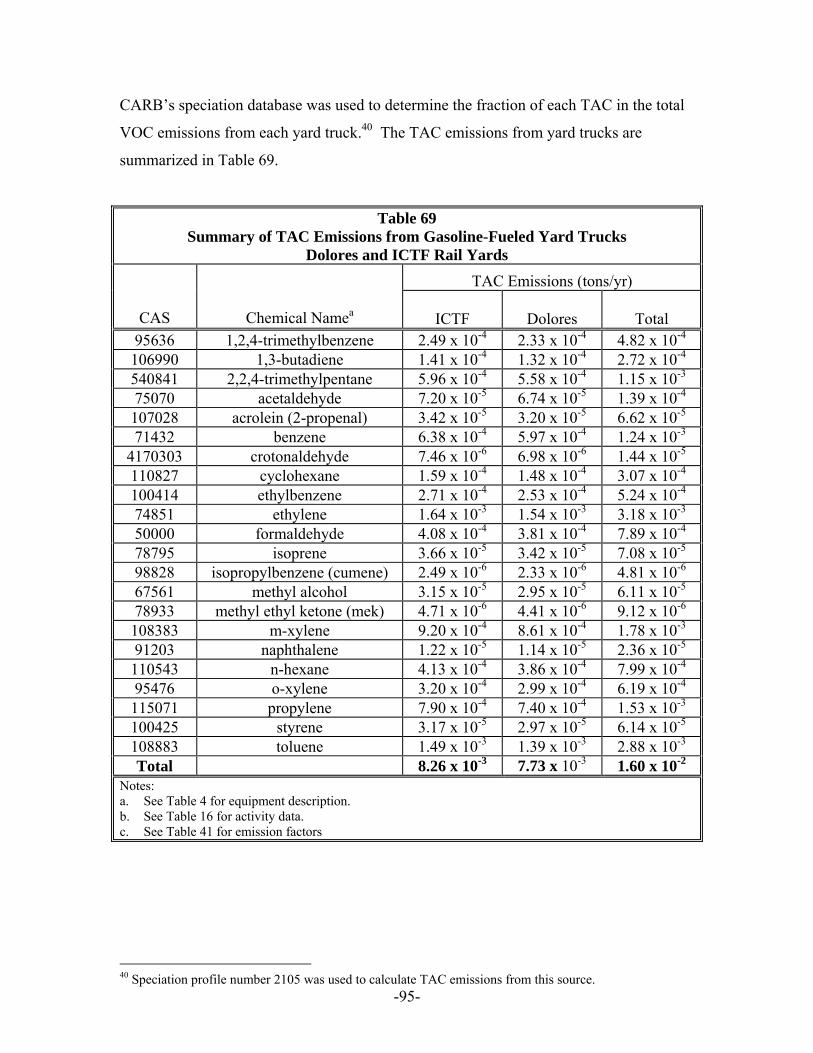
-95-
CARB’s speciation database was used to determine the fraction of each TAC in the total
VOC emissions from each yard truck.40 The TAC emissions from yard trucks are
summarized in Table 69.
Table 69 Summary of TAC Emissions from Gasoline-Fueled Yard Trucks
Dolores and ICTF Rail Yards TAC Emissions (tons/yr)
CAS Chemical Namea ICTF Dolores Total 95636 1,2,4-trimethylbenzene 2.49 x 10⁻⁴ 2.33 x 10⁻⁴ 4.82 x 10⁻⁴ 106990 1,3-butadiene 1.41 x 10⁻⁴ 1.32 x 10⁻⁴ 2.72 x 10⁻⁴ 540841 2,2,4-trimethylpentane 5.96 x 10⁻⁴ 5.58 x 10⁻⁴ 1.15 x 10⁻³ 75070 acetaldehyde 7.20 x 10⁻⁵ 6.74 x 10⁻⁵ 1.39 x 10⁻⁴ 107028 acrolein (2-propenal) 3.42 x 10⁻⁵ 3.20 x 10⁻⁵ 6.62 x 10⁻⁵ 71432 benzene 6.38 x 10⁻⁴ 5.97 x 10⁻⁴ 1.24 x 10⁻³
4170303 crotonaldehyde 7.46 x 10⁻⁶ 6.98 x 10⁻⁶ 1.44 x 10⁻⁵ 110827 cyclohexane 1.59 x 10⁻⁴ 1.48 x 10⁻⁴ 3.07 x 10⁻⁴ 100414 ethylbenzene 2.71 x 10⁻⁴ 2.53 x 10⁻⁴ 5.24 x 10⁻⁴ 74851 ethylene 1.64 x 10⁻³ 1.54 x 10⁻³ 3.18 x 10⁻³ 50000 formaldehyde 4.08 x 10⁻⁴ 3.81 x 10⁻⁴ 7.89 x 10⁻⁴ 78795 isoprene 3.66 x 10⁻⁵ 3.42 x 10⁻⁵ 7.08 x 10⁻⁵ 98828 isopropylbenzene (cumene) 2.49 x 10⁻⁶ 2.33 x 10⁻⁶ 4.81 x 10⁻⁶ 67561 methyl alcohol 3.15 x 10⁻⁵ 2.95 x 10⁻⁵ 6.11 x 10⁻⁵ 78933 methyl ethyl ketone (mek) 4.71 x 10⁻⁶ 4.41 x 10⁻⁶ 9.12 x 10⁻⁶ 108383 m-xylene 9.20 x 10⁻⁴ 8.61 x 10⁻⁴ 1.78 x 10⁻³ 91203 naphthalene 1.22 x 10⁻⁵ 1.14 x 10⁻⁵ 2.36 x 10⁻⁵ 110543 n-hexane 4.13 x 10⁻⁴ 3.86 x 10⁻⁴ 7.99 x 10⁻⁴ 95476 o-xylene 3.20 x 10⁻⁴ 2.99 x 10⁻⁴ 6.19 x 10⁻⁴ 115071 propylene 7.90 x 10⁻⁴ 7.40 x 10⁻⁴ 1.53 x 10⁻³ 100425 styrene 3.17 x 10⁻⁵ 2.97 x 10⁻⁵ 6.14 x 10⁻⁵ 108883 toluene 1.49 x 10⁻³ 1.39 x 10⁻³ 2.88 x 10⁻³ Total 8.26 x 10⁻³ 7.73 x 10⁻³ 1.60 x 10⁻²
Notes: a. See Table 4 for equipment description. b. See Table 16 for activity data. c. See Table 41 for emission factors
40 Speciation profile number 2105 was used to calculate TAC emissions from this source.

-96-
8. Diesel-Fueled IC Engines
Emissions from the Diesel-fueled IC engines are based on the rated capacity of the engine
and the annual hours of operation. The criteria pollutant and DPM emissions are
summarized in Table 70.
Table 70 Summary of Emissions from Diesel-Fueled IC Engines
ICTF Rail Yard Emissions (tons/yr)
Unit ROG CO NOx PM10 DPM SOx Emergency Generator 0.01 0.02 0.08 0.01 0.01 0.01 Air Compressor 0.06 0.16 0.76 0.05 0.05 0.05 Total 0.07 0.18 0.84 0.06 0.06 0.06 Notes:
a. See Part V for equipment specifications b. See Table 17 for activity data. c. See Table 42 for emission factors.
9. Tanks
VOC emissions from the storage tanks were calculated using EPA’s TANKS program.
The VOC emissions from each storage tank are shown in Table 71.
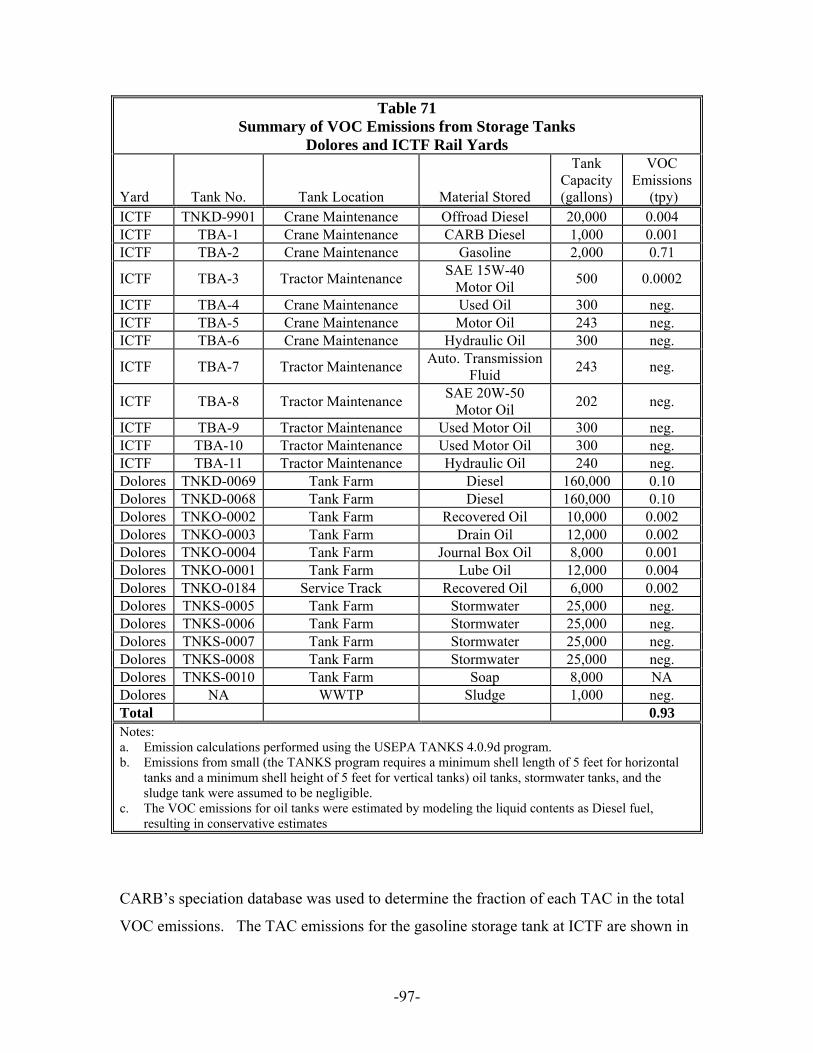
-97-
Table 71 Summary of VOC Emissions from Storage Tanks
Dolores and ICTF Rail Yards
Yard Tank No. Tank Location Material Stored
Tank Capacity (gallons)
VOC Emissions
(tpy) ICTF TNKD-9901 Crane Maintenance Offroad Diesel 20,000 0.004 ICTF TBA-1 Crane Maintenance CARB Diesel 1,000 0.001 ICTF TBA-2 Crane Maintenance Gasoline 2,000 0.71
ICTF TBA-3 Tractor Maintenance SAE 15W-40 Motor Oil 500 0.0002
ICTF TBA-4 Crane Maintenance Used Oil 300 neg. ICTF TBA-5 Crane Maintenance Motor Oil 243 neg. ICTF TBA-6 Crane Maintenance Hydraulic Oil 300 neg.
ICTF TBA-7 Tractor Maintenance Auto. Transmission Fluid 243 neg.
ICTF TBA-8 Tractor Maintenance SAE 20W-50 Motor Oil 202 neg.
ICTF TBA-9 Tractor Maintenance Used Motor Oil 300 neg. ICTF TBA-10 Tractor Maintenance Used Motor Oil 300 neg. ICTF TBA-11 Tractor Maintenance Hydraulic Oil 240 neg. Dolores TNKD-0069 Tank Farm Diesel 160,000 0.10 Dolores TNKD-0068 Tank Farm Diesel 160,000 0.10 Dolores TNKO-0002 Tank Farm Recovered Oil 10,000 0.002 Dolores TNKO-0003 Tank Farm Drain Oil 12,000 0.002 Dolores TNKO-0004 Tank Farm Journal Box Oil 8,000 0.001 Dolores TNKO-0001 Tank Farm Lube Oil 12,000 0.004 Dolores TNKO-0184 Service Track Recovered Oil 6,000 0.002 Dolores TNKS-0005 Tank Farm Stormwater 25,000 neg. Dolores TNKS-0006 Tank Farm Stormwater 25,000 neg. Dolores TNKS-0007 Tank Farm Stormwater 25,000 neg. Dolores TNKS-0008 Tank Farm Stormwater 25,000 neg. Dolores TNKS-0010 Tank Farm Soap 8,000 NA Dolores NA WWTP Sludge 1,000 neg. Total 0.93 Notes: a. Emission calculations performed using the USEPA TANKS 4.0.9d program. b. Emissions from small (the TANKS program requires a minimum shell length of 5 feet for horizontal
tanks and a minimum shell height of 5 feet for vertical tanks) oil tanks, stormwater tanks, and the sludge tank were assumed to be negligible.
c. The VOC emissions for oil tanks were estimated by modeling the liquid contents as Diesel fuel, resulting in conservative estimates
CARB’s speciation database was used to determine the fraction of each TAC in the total
VOC emissions. The TAC emissions for the gasoline storage tank at ICTF are shown in
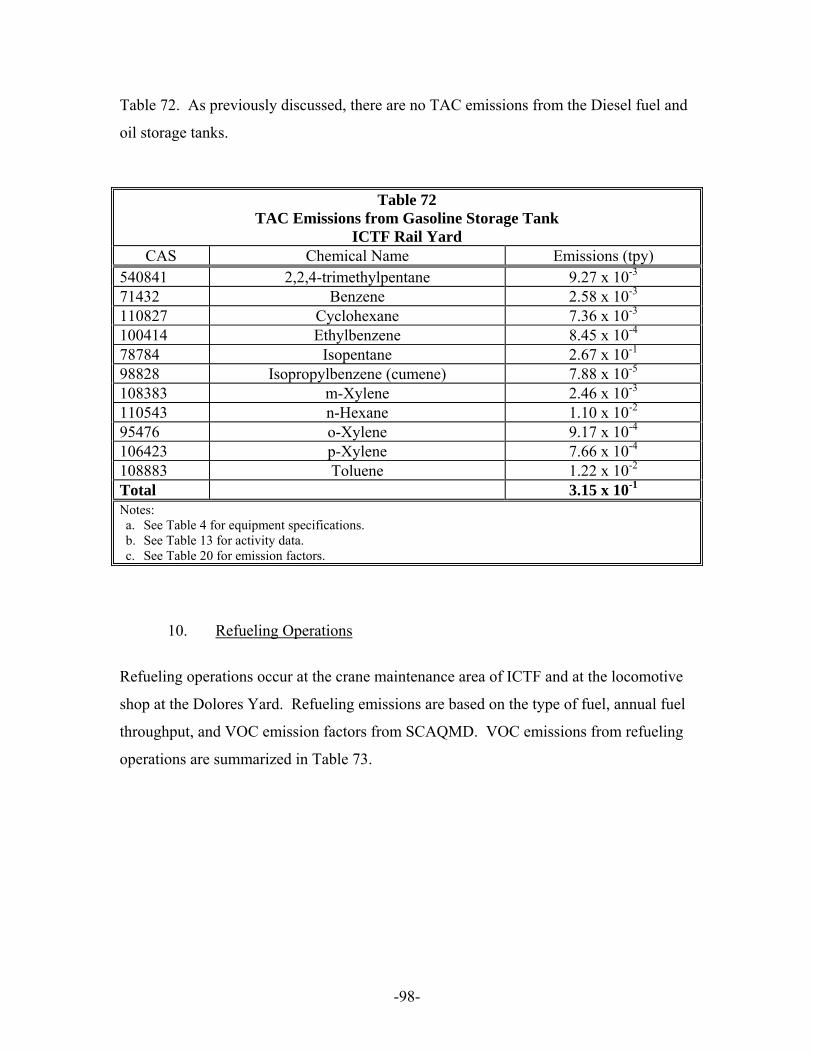
-98-
Table 72. As previously discussed, there are no TAC emissions from the Diesel fuel and
oil storage tanks.
Table 72 TAC Emissions from Gasoline Storage Tank
ICTF Rail Yard CAS Chemical Name Emissions (tpy)
540841 2,2,4-trimethylpentane 9.27 x 10⁻³ 71432 Benzene 2.58 x 10⁻³ 110827 Cyclohexane 7.36 x 10⁻³ 100414 Ethylbenzene 8.45 x 10⁻⁴ 78784 Isopentane 2.67 x 10⁻¹ 98828 Isopropylbenzene (cumene) 7.88 x 10⁻⁵ 108383 m-Xylene 2.46 x 10⁻³ 110543 n-Hexane 1.10 x 10⁻² 95476 o-Xylene 9.17 x 10⁻⁴ 106423 p-Xylene 7.66 x 10⁻⁴ 108883 Toluene 1.22 x 10⁻² Total 3.15 x 10⁻¹ Notes: a. See Table 4 for equipment specifications. b. See Table 13 for activity data. c. See Table 20 for emission factors.
10. Refueling Operations
Refueling operations occur at the crane maintenance area of ICTF and at the locomotive
shop at the Dolores Yard. Refueling emissions are based on the type of fuel, annual fuel
throughput, and VOC emission factors from SCAQMD. VOC emissions from refueling
operations are summarized in Table 73.
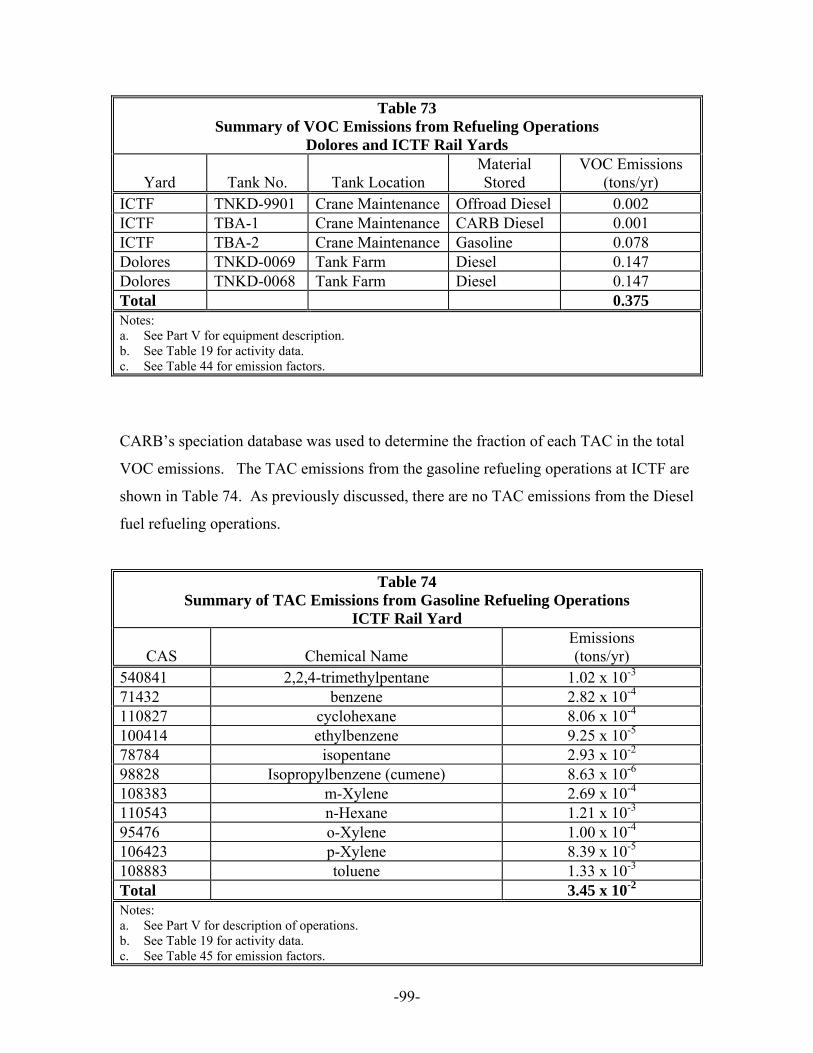
-99-
Table 73 Summary of VOC Emissions from Refueling Operations
Dolores and ICTF Rail Yards
Yard Tank No. Tank Location Material Stored
VOC Emissions (tons/yr)
ICTF TNKD-9901 Crane Maintenance Offroad Diesel 0.002 ICTF TBA-1 Crane Maintenance CARB Diesel 0.001 ICTF TBA-2 Crane Maintenance Gasoline 0.078 Dolores TNKD-0069 Tank Farm Diesel 0.147 Dolores TNKD-0068 Tank Farm Diesel 0.147 Total 0.375 Notes: a. See Part V for equipment description. b. See Table 19 for activity data. c. See Table 44 for emission factors.
CARB’s speciation database was used to determine the fraction of each TAC in the total
VOC emissions. The TAC emissions from the gasoline refueling operations at ICTF are
shown in Table 74. As previously discussed, there are no TAC emissions from the Diesel
fuel refueling operations.
Table 74 Summary of TAC Emissions from Gasoline Refueling Operations
ICTF Rail Yard
CAS Chemical Name Emissions (tons/yr)
540841 2,2,4-trimethylpentane 1.02 x 10⁻³ 71432 benzene 2.82 x 10⁻⁴ 110827 cyclohexane 8.06 x 10⁻⁴ 100414 ethylbenzene 9.25 x 10⁻⁵ 78784 isopentane 2.93 x 10⁻² 98828 Isopropylbenzene (cumene) 8.63 x 10⁻⁶ 108383 m-Xylene 2.69 x 10⁻⁴ 110543 n-Hexane 1.21 x 10⁻³ 95476 o-Xylene 1.00 x 10⁻⁴ 106423 p-Xylene 8.39 x 10⁻⁵ 108883 toluene 1.33 x 10⁻³ Total 3.45 x 10⁻² Notes: a. See Part V for description of operations. b. See Table 19 for activity data. c. See Table 45 for emission factors.
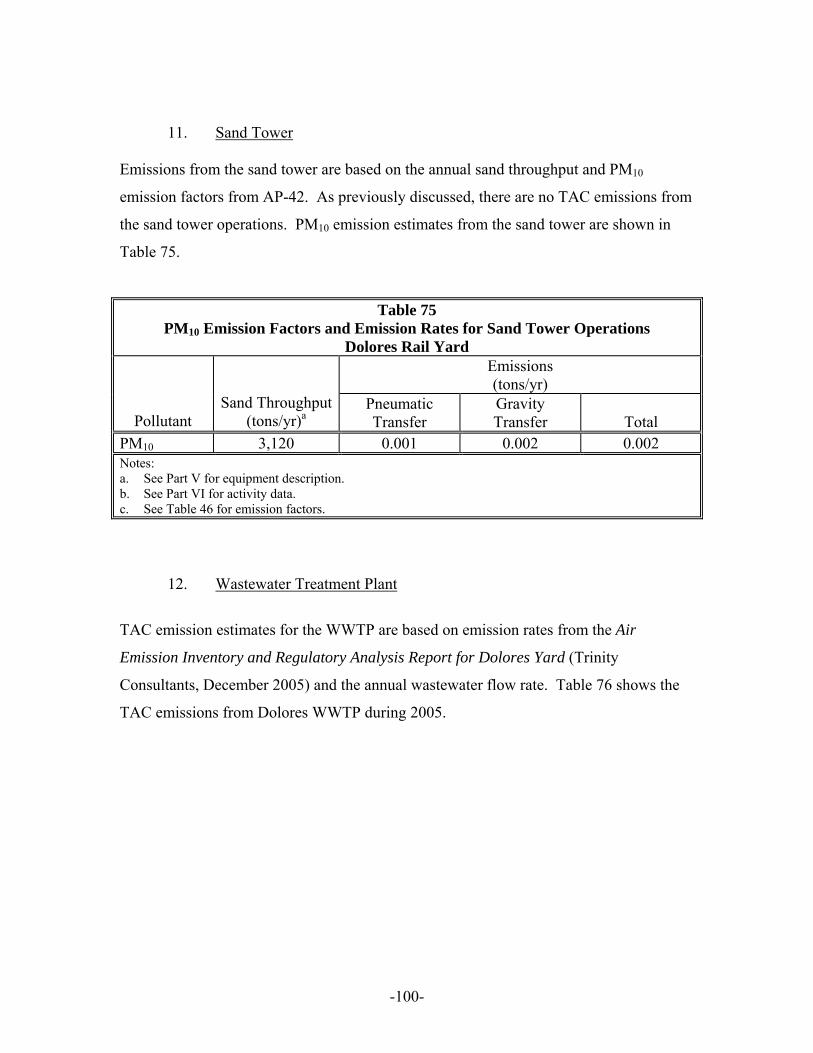
-100-
11. Sand Tower Emissions from the sand tower are based on the annual sand throughput and PM10
emission factors from AP-42. As previously discussed, there are no TAC emissions from
the sand tower operations. PM10 emission estimates from the sand tower are shown in
Table 75.
Table 75 PM10 Emission Factors and Emission Rates for Sand Tower Operations
Dolores Rail Yard Emissions (tons/yr)
Pollutant
Sand Throughput
(tons/yr)a Pneumatic Transfer
Gravity Transfer Total
PM10 3,120 0.001 0.002 0.002 Notes: a. See Part V for equipment description. b. See Part VI for activity data. c. See Table 46 for emission factors.
12. Wastewater Treatment Plant
TAC emission estimates for the WWTP are based on emission rates from the Air
Emission Inventory and Regulatory Analysis Report for Dolores Yard (Trinity
Consultants, December 2005) and the annual wastewater flow rate. Table 76 shows the
TAC emissions from Dolores WWTP during 2005.
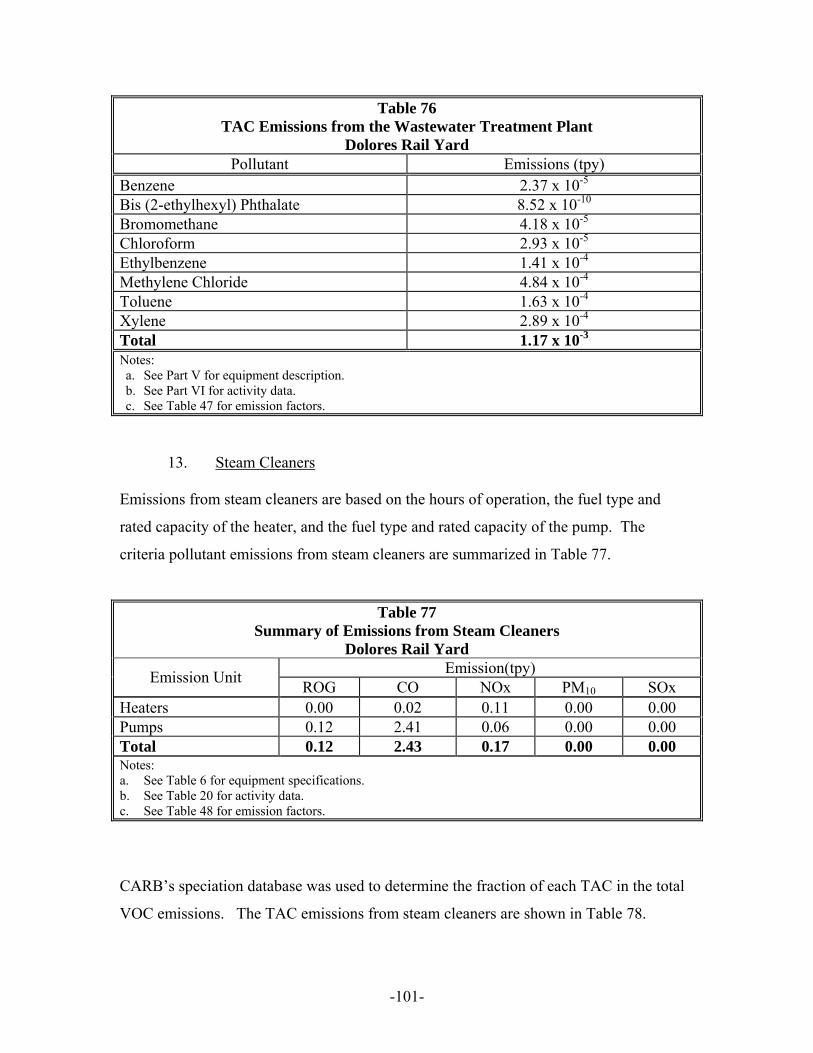
-101-
Table 76 TAC Emissions from the Wastewater Treatment Plant
Dolores Rail Yard Pollutant Emissions (tpy)
Benzene 2.37 x 10⁻⁵ Bis (2-ethylhexyl) Phthalate 8.52 x 10⁻¹⁰ Bromomethane 4.18 x 10⁻⁵ Chloroform 2.93 x 10⁻⁵ Ethylbenzene 1.41 x 10⁻⁴ Methylene Chloride 4.84 x 10⁻⁴ Toluene 1.63 x 10⁻⁴ Xylene 2.89 x 10⁻⁴ Total 1.17 x 10⁻³ Notes: a. See Part V for equipment description. b. See Part VI for activity data. c. See Table 47 for emission factors.
13. Steam Cleaners Emissions from steam cleaners are based on the hours of operation, the fuel type and
rated capacity of the heater, and the fuel type and rated capacity of the pump. The
criteria pollutant emissions from steam cleaners are summarized in Table 77.
Table 77 Summary of Emissions from Steam Cleaners
Dolores Rail Yard Emission(tpy) Emission Unit ROG CO NOx PM10 SOx
Heaters 0.00 0.02 0.11 0.00 0.00 Pumps 0.12 2.41 0.06 0.00 0.00 Total 0.12 2.43 0.17 0.00 0.00 Notes: a. See Table 6 for equipment specifications. b. See Table 20 for activity data. c. See Table 48 for emission factors.
CARB’s speciation database was used to determine the fraction of each TAC in the total
VOC emissions. The TAC emissions from steam cleaners are shown in Table 78.
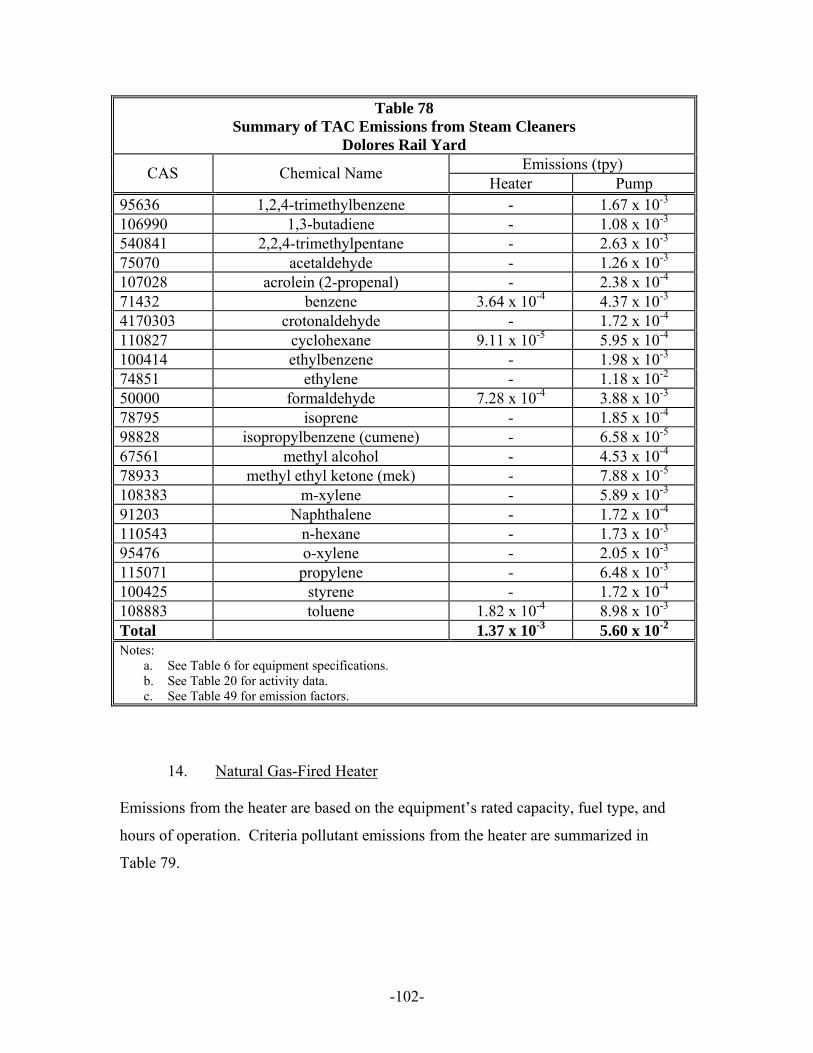
-102-
Table 78 Summary of TAC Emissions from Steam Cleaners
Dolores Rail Yard Emissions (tpy) CAS Chemical Name Heater Pump
95636 1,2,4-trimethylbenzene - 1.67 x 10⁻³ 106990 1,3-butadiene - 1.08 x 10⁻³ 540841 2,2,4-trimethylpentane - 2.63 x 10⁻³ 75070 acetaldehyde - 1.26 x 10⁻³ 107028 acrolein (2-propenal) - 2.38 x 10⁻⁴ 71432 benzene 3.64 x 10⁻⁴ 4.37 x 10⁻³ 4170303 crotonaldehyde - 1.72 x 10⁻⁴ 110827 cyclohexane 9.11 x 10⁻⁵ 5.95 x 10⁻⁴ 100414 ethylbenzene - 1.98 x 10⁻³ 74851 ethylene - 1.18 x 10⁻² 50000 formaldehyde 7.28 x 10⁻⁴ 3.88 x 10⁻³ 78795 isoprene - 1.85 x 10⁻⁴ 98828 isopropylbenzene (cumene) - 6.58 x 10⁻⁵ 67561 methyl alcohol - 4.53 x 10⁻⁴ 78933 methyl ethyl ketone (mek) - 7.88 x 10⁻⁵ 108383 m-xylene - 5.89 x 10⁻³ 91203 Naphthalene - 1.72 x 10⁻⁴ 110543 n-hexane - 1.73 x 10⁻³ 95476 o-xylene - 2.05 x 10⁻³ 115071 propylene - 6.48 x 10⁻³ 100425 styrene - 1.72 x 10⁻⁴ 108883 toluene 1.82 x 10⁻⁴ 8.98 x 10⁻³ Total 1.37 x 10⁻³ 5.60 x 10⁻² Notes:
a. See Table 6 for equipment specifications. b. See Table 20 for activity data. c. See Table 49 for emission factors.
14. Natural Gas-Fired Heater Emissions from the heater are based on the equipment’s rated capacity, fuel type, and
hours of operation. Criteria pollutant emissions from the heater are summarized in
Table 79.
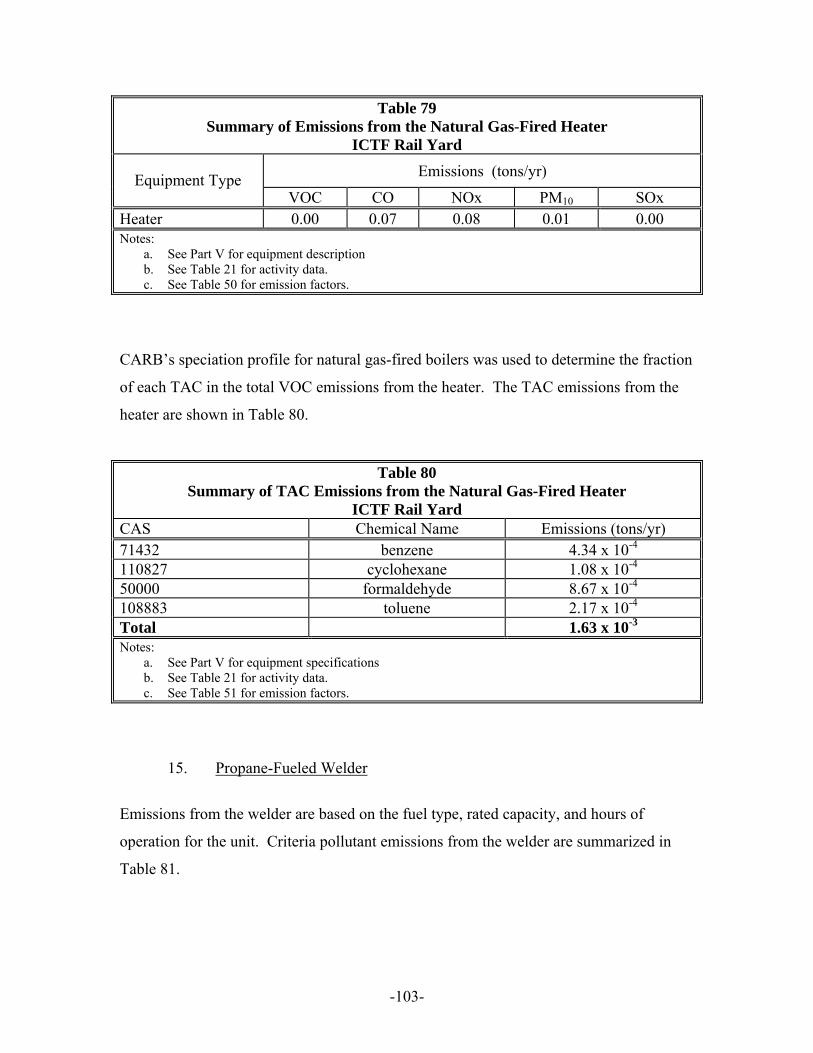
-103-
Table 79 Summary of Emissions from the Natural Gas-Fired Heater
ICTF Rail Yard Emissions (tons/yr) Equipment Type
VOC CO NOx PM10 SOx Heater 0.00 0.07 0.08 0.01 0.00 Notes:
a. See Part V for equipment description b. See Table 21 for activity data. c. See Table 50 for emission factors.
CARB’s speciation profile for natural gas-fired boilers was used to determine the fraction
of each TAC in the total VOC emissions from the heater. The TAC emissions from the
heater are shown in Table 80.
Table 80 Summary of TAC Emissions from the Natural Gas-Fired Heater
ICTF Rail Yard CAS Chemical Name Emissions (tons/yr) 71432 benzene 4.34 x 10⁻⁴ 110827 cyclohexane 1.08 x 10⁻⁴ 50000 formaldehyde 8.67 x 10⁻⁴ 108883 toluene 2.17 x 10⁻⁴ Total 1.63 x 10⁻³ Notes:
a. See Part V for equipment specifications b. See Table 21 for activity data. c. See Table 51 for emission factors.
15. Propane-Fueled Welder
Emissions from the welder are based on the fuel type, rated capacity, and hours of
operation for the unit. Criteria pollutant emissions from the welder are summarized in
Table 81.
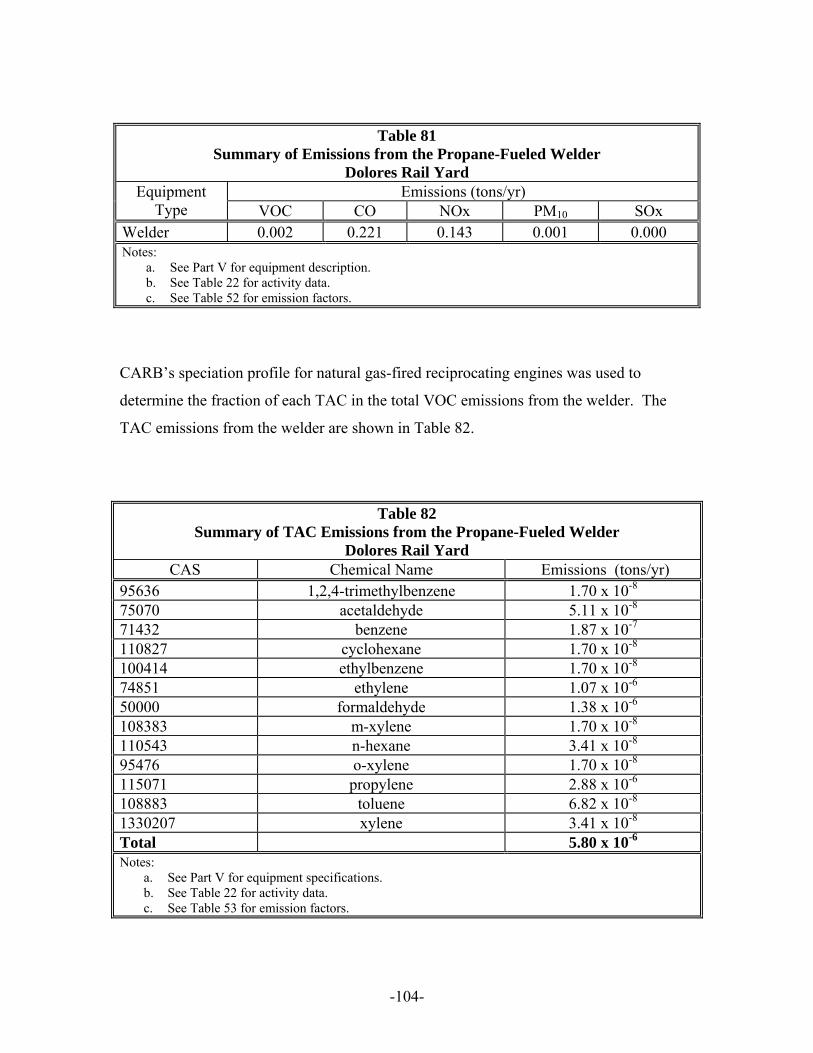
-104-
Table 81 Summary of Emissions from the Propane-Fueled Welder
Dolores Rail Yard Emissions (tons/yr) Equipment
Type VOC CO NOx PM10 SOx Welder 0.002 0.221 0.143 0.001 0.000 Notes:
a. See Part V for equipment description. b. See Table 22 for activity data. c. See Table 52 for emission factors.
CARB’s speciation profile for natural gas-fired reciprocating engines was used to
determine the fraction of each TAC in the total VOC emissions from the welder. The
TAC emissions from the welder are shown in Table 82.
Table 82 Summary of TAC Emissions from the Propane-Fueled Welder
Dolores Rail Yard CAS Chemical Name Emissions (tons/yr)
95636 1,2,4-trimethylbenzene 1.70 x 10⁻⁸ 75070 acetaldehyde 5.11 x 10⁻⁸ 71432 benzene 1.87 x 10⁻⁷ 110827 cyclohexane 1.70 x 10⁻⁸ 100414 ethylbenzene 1.70 x 10⁻⁸ 74851 ethylene 1.07 x 10⁻⁶ 50000 formaldehyde 1.38 x 10⁻⁶ 108383 m-xylene 1.70 x 10⁻⁸ 110543 n-hexane 3.41 x 10⁻⁸ 95476 o-xylene 1.70 x 10⁻⁸ 115071 propylene 2.88 x 10⁻⁶ 108883 toluene 6.82 x 10⁻⁸ 1330207 xylene 3.41 x 10⁻⁸ Total 5.80 x 10⁻⁶ Notes:
a. See Part V for equipment specifications. b. See Table 22 for activity data. c. See Table 53 for emission factors.
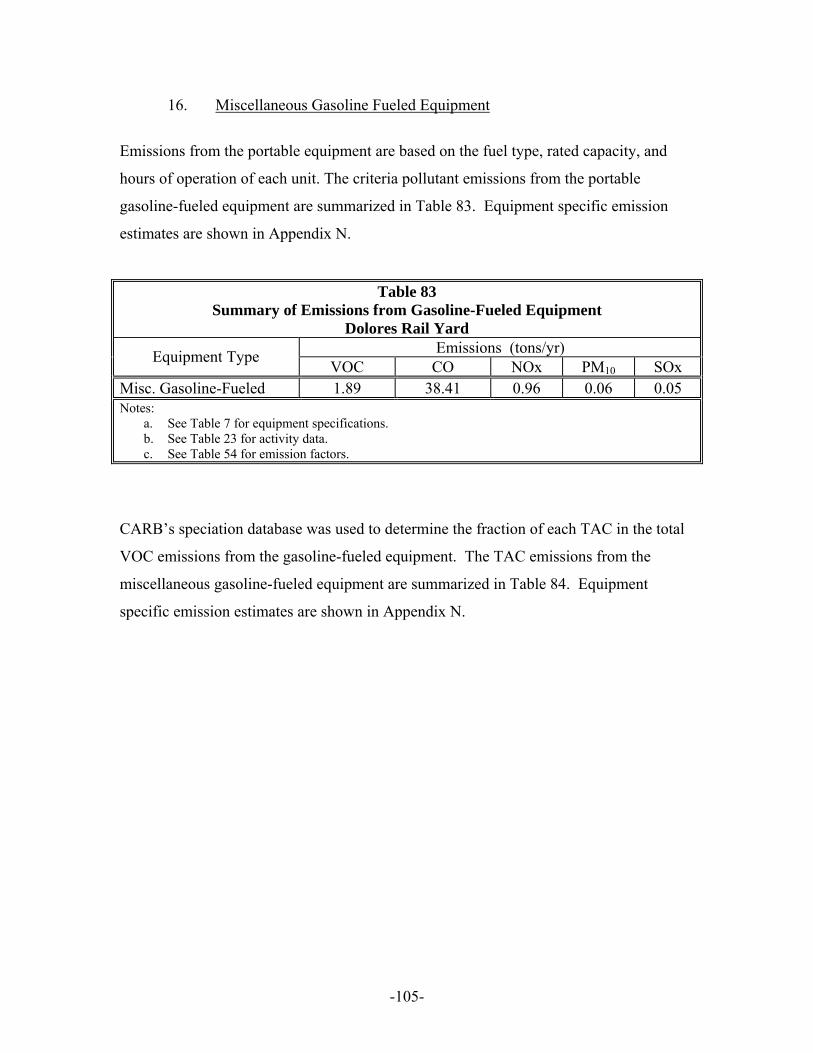
-105-
16. Miscellaneous Gasoline Fueled Equipment
Emissions from the portable equipment are based on the fuel type, rated capacity, and
hours of operation of each unit. The criteria pollutant emissions from the portable
gasoline-fueled equipment are summarized in Table 83. Equipment specific emission
estimates are shown in Appendix N.
Table 83 Summary of Emissions from Gasoline-Fueled Equipment
Dolores Rail Yard Emissions (tons/yr) Equipment Type VOC CO NOx PM10 SOx
Misc. Gasoline-Fueled 1.89 38.41 0.96 0.06 0.05 Notes:
a. See Table 7 for equipment specifications. b. See Table 23 for activity data. c. See Table 54 for emission factors.
CARB’s speciation database was used to determine the fraction of each TAC in the total
VOC emissions from the gasoline-fueled equipment. The TAC emissions from the
miscellaneous gasoline-fueled equipment are summarized in Table 84. Equipment
specific emission estimates are shown in Appendix N.
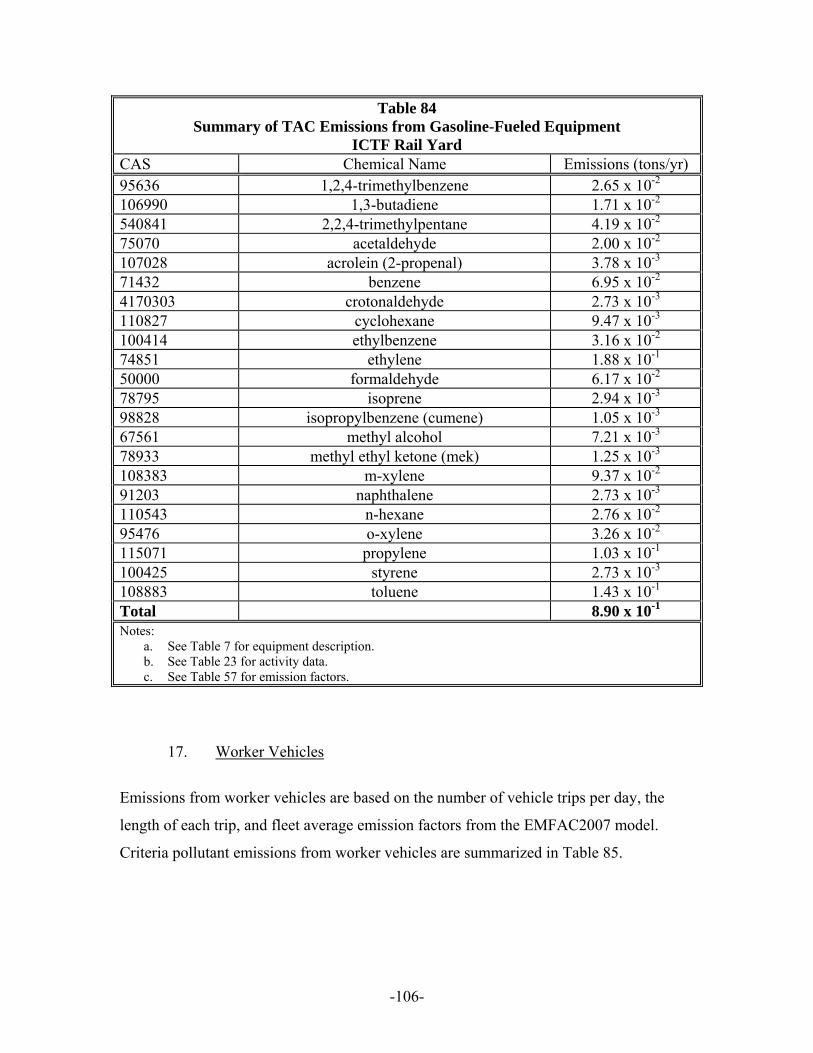
-106-
Table 84 Summary of TAC Emissions from Gasoline-Fueled Equipment
ICTF Rail Yard CAS Chemical Name Emissions (tons/yr) 95636 1,2,4-trimethylbenzene 2.65 x 10⁻² 106990 1,3-butadiene 1.71 x 10⁻² 540841 2,2,4-trimethylpentane 4.19 x 10⁻² 75070 acetaldehyde 2.00 x 10⁻² 107028 acrolein (2-propenal) 3.78 x 10⁻³ 71432 benzene 6.95 x 10⁻² 4170303 crotonaldehyde 2.73 x 10⁻³ 110827 cyclohexane 9.47 x 10⁻³ 100414 ethylbenzene 3.16 x 10⁻² 74851 ethylene 1.88 x 10⁻¹ 50000 formaldehyde 6.17 x 10⁻² 78795 isoprene 2.94 x 10⁻³ 98828 isopropylbenzene (cumene) 1.05 x 10⁻³ 67561 methyl alcohol 7.21 x 10⁻³ 78933 methyl ethyl ketone (mek) 1.25 x 10⁻³ 108383 m-xylene 9.37 x 10⁻² 91203 naphthalene 2.73 x 10⁻³ 110543 n-hexane 2.76 x 10⁻² 95476 o-xylene 3.26 x 10⁻² 115071 propylene 1.03 x 10⁻¹ 100425 styrene 2.73 x 10⁻³ 108883 toluene 1.43 x 10⁻¹ Total 8.90 x 10⁻¹ Notes:
a. See Table 7 for equipment description. b. See Table 23 for activity data. c. See Table 57 for emission factors.
17. Worker Vehicles
Emissions from worker vehicles are based on the number of vehicle trips per day, the
length of each trip, and fleet average emission factors from the EMFAC2007 model.
Criteria pollutant emissions from worker vehicles are summarized in Table 85.
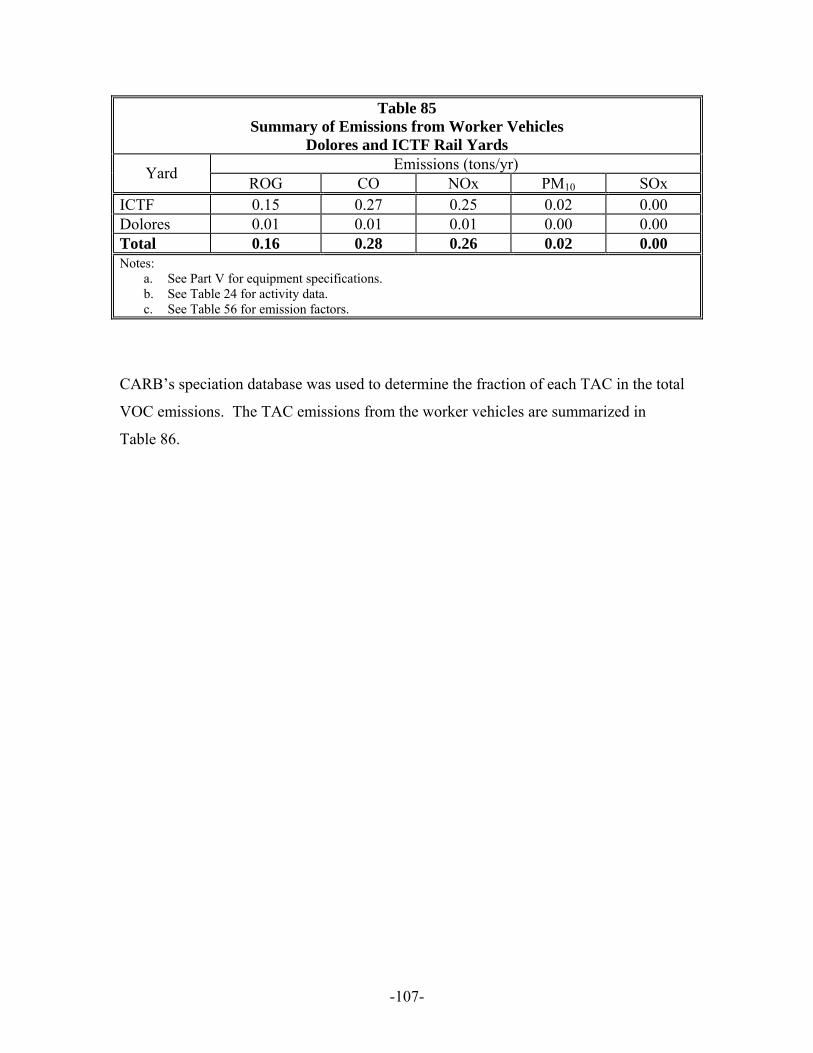
-107-
Table 85 Summary of Emissions from Worker Vehicles
Dolores and ICTF Rail Yards Emissions (tons/yr) Yard ROG CO NOx PM10 SOx
ICTF 0.15 0.27 0.25 0.02 0.00 Dolores 0.01 0.01 0.01 0.00 0.00 Total 0.16 0.28 0.26 0.02 0.00 Notes:
a. See Part V for equipment specifications. b. See Table 24 for activity data. c. See Table 56 for emission factors.
CARB’s speciation database was used to determine the fraction of each TAC in the total
VOC emissions. The TAC emissions from the worker vehicles are summarized in
Table 86.
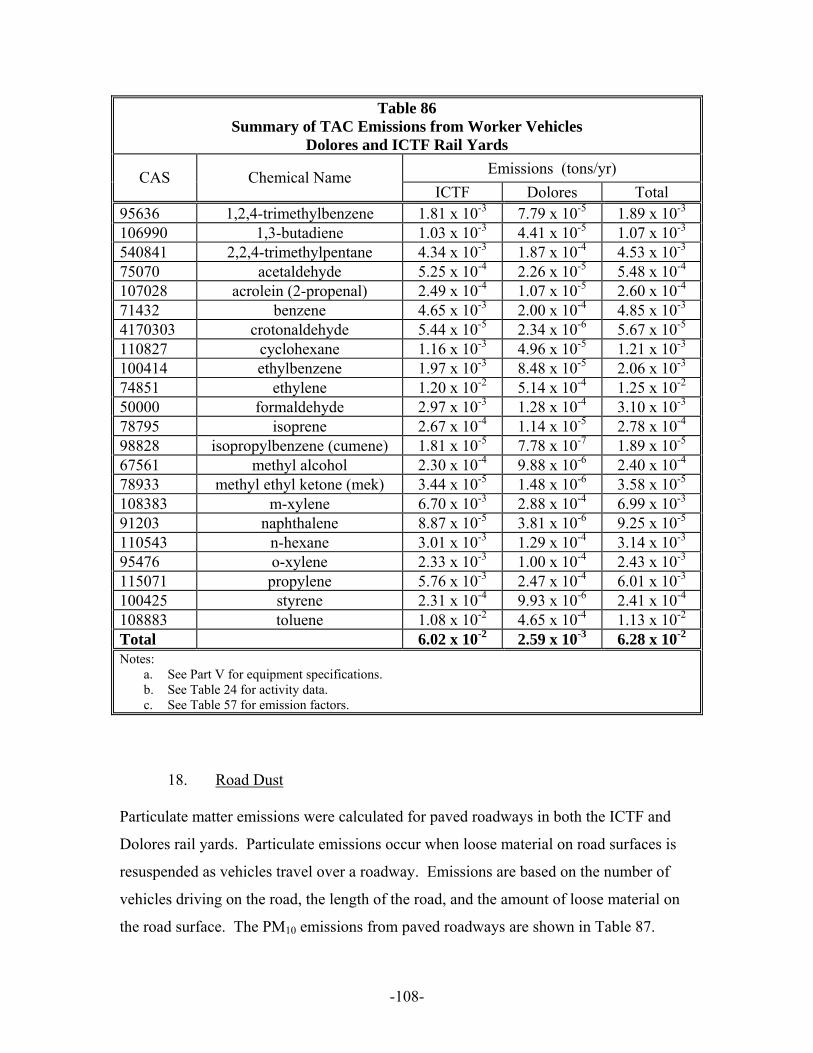
-108-
Table 86 Summary of TAC Emissions from Worker Vehicles
Dolores and ICTF Rail Yards Emissions (tons/yr) CAS Chemical Name
ICTF Dolores Total 95636 1,2,4-trimethylbenzene 1.81 x 10⁻³ 7.79 x 10⁻⁵ 1.89 x 10⁻³ 106990 1,3-butadiene 1.03 x 10⁻³ 4.41 x 10⁻⁵ 1.07 x 10⁻³ 540841 2,2,4-trimethylpentane 4.34 x 10⁻³ 1.87 x 10⁻⁴ 4.53 x 10⁻³ 75070 acetaldehyde 5.25 x 10⁻⁴ 2.26 x 10⁻⁵ 5.48 x 10⁻⁴ 107028 acrolein (2-propenal) 2.49 x 10⁻⁴ 1.07 x 10⁻⁵ 2.60 x 10⁻⁴ 71432 benzene 4.65 x 10⁻³ 2.00 x 10⁻⁴ 4.85 x 10⁻³ 4170303 crotonaldehyde 5.44 x 10⁻⁵ 2.34 x 10⁻⁶ 5.67 x 10⁻⁵ 110827 cyclohexane 1.16 x 10⁻³ 4.96 x 10⁻⁵ 1.21 x 10⁻³ 100414 ethylbenzene 1.97 x 10⁻³ 8.48 x 10⁻⁵ 2.06 x 10⁻³ 74851 ethylene 1.20 x 10⁻² 5.14 x 10⁻⁴ 1.25 x 10⁻² 50000 formaldehyde 2.97 x 10⁻³ 1.28 x 10⁻⁴ 3.10 x 10⁻³ 78795 isoprene 2.67 x 10⁻⁴ 1.14 x 10⁻⁵ 2.78 x 10⁻⁴ 98828 isopropylbenzene (cumene) 1.81 x 10⁻⁵ 7.78 x 10⁻⁷ 1.89 x 10⁻⁵ 67561 methyl alcohol 2.30 x 10⁻⁴ 9.88 x 10⁻⁶ 2.40 x 10⁻⁴ 78933 methyl ethyl ketone (mek) 3.44 x 10⁻⁵ 1.48 x 10⁻⁶ 3.58 x 10⁻⁵ 108383 m-xylene 6.70 x 10⁻³ 2.88 x 10⁻⁴ 6.99 x 10⁻³ 91203 naphthalene 8.87 x 10⁻⁵ 3.81 x 10⁻⁶ 9.25 x 10⁻⁵ 110543 n-hexane 3.01 x 10⁻³ 1.29 x 10⁻⁴ 3.14 x 10⁻³ 95476 o-xylene 2.33 x 10⁻³ 1.00 x 10⁻⁴ 2.43 x 10⁻³ 115071 propylene 5.76 x 10⁻³ 2.47 x 10⁻⁴ 6.01 x 10⁻³ 100425 styrene 2.31 x 10⁻⁴ 9.93 x 10⁻⁶ 2.41 x 10⁻⁴ 108883 toluene 1.08 x 10⁻² 4.65 x 10⁻⁴ 1.13 x 10⁻² Total 6.02 x 10⁻² 2.59 x 10⁻³ 6.28 x 10⁻² Notes:
a. See Part V for equipment specifications. b. See Table 24 for activity data. c. See Table 57 for emission factors.
18. Road Dust Particulate matter emissions were calculated for paved roadways in both the ICTF and
Dolores rail yards. Particulate emissions occur when loose material on road surfaces is
resuspended as vehicles travel over a roadway. Emissions are based on the number of
vehicles driving on the road, the length of the road, and the amount of loose material on
the road surface. The PM10 emissions from paved roadways are shown in Table 87.
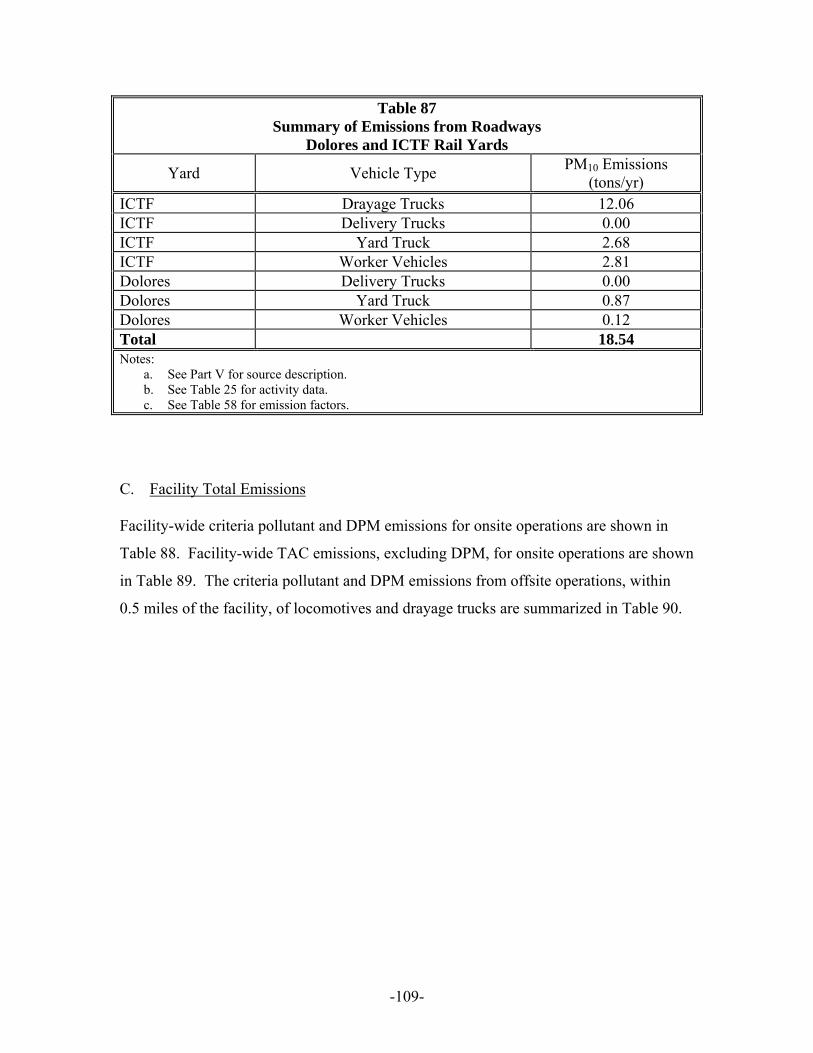
-109-
Table 87 Summary of Emissions from Roadways
Dolores and ICTF Rail Yards
Yard Vehicle Type PM10 Emissions (tons/yr)
ICTF Drayage Trucks 12.06 ICTF Delivery Trucks 0.00 ICTF Yard Truck 2.68 ICTF Worker Vehicles 2.81 Dolores Delivery Trucks 0.00 Dolores Yard Truck 0.87 Dolores Worker Vehicles 0.12 Total 18.54 Notes:
a. See Part V for source description. b. See Table 25 for activity data. c. See Table 58 for emission factors.
C. Facility Total Emissions Facility-wide criteria pollutant and DPM emissions for onsite operations are shown in
Table 88. Facility-wide TAC emissions, excluding DPM, for onsite operations are shown
in Table 89. The criteria pollutant and DPM emissions from offsite operations, within
0.5 miles of the facility, of locomotives and drayage trucks are summarized in Table 90.
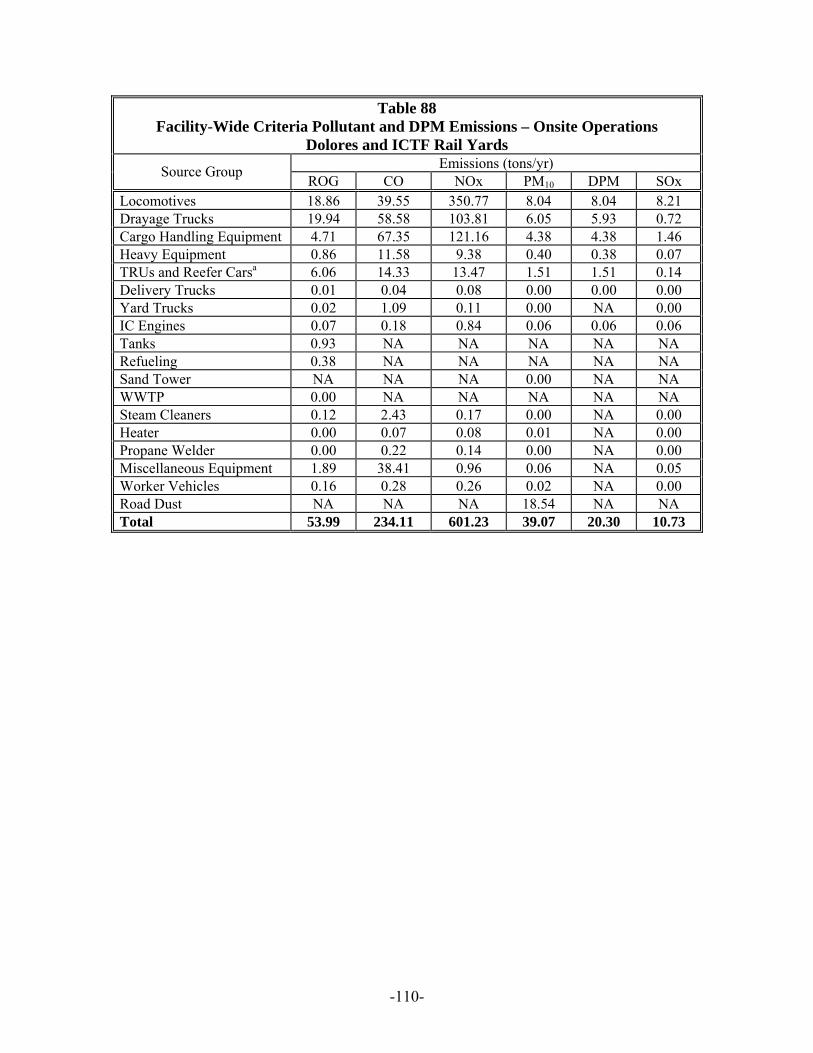
-110-
Table 88 Facility-Wide Criteria Pollutant and DPM Emissions – Onsite Operations
Dolores and ICTF Rail Yards Emissions (tons/yr) Source Group ROG CO NOx PM10 DPM SOx
Locomotives 18.86 39.55 350.77 8.04 8.04 8.21 Drayage Trucks 19.94 58.58 103.81 6.05 5.93 0.72 Cargo Handling Equipment 4.71 67.35 121.16 4.38 4.38 1.46 Heavy Equipment 0.86 11.58 9.38 0.40 0.38 0.07 TRUs and Reefer Carsa 6.06 14.33 13.47 1.51 1.51 0.14 Delivery Trucks 0.01 0.04 0.08 0.00 0.00 0.00 Yard Trucks 0.02 1.09 0.11 0.00 NA 0.00 IC Engines 0.07 0.18 0.84 0.06 0.06 0.06 Tanks 0.93 NA NA NA NA NA Refueling 0.38 NA NA NA NA NA Sand Tower NA NA NA 0.00 NA NA WWTP 0.00 NA NA NA NA NA Steam Cleaners 0.12 2.43 0.17 0.00 NA 0.00 Heater 0.00 0.07 0.08 0.01 NA 0.00 Propane Welder 0.00 0.22 0.14 0.00 NA 0.00 Miscellaneous Equipment 1.89 38.41 0.96 0.06 NA 0.05 Worker Vehicles 0.16 0.28 0.26 0.02 NA 0.00 Road Dust NA NA NA 18.54 NA NA Total 53.99 234.11 601.23 39.07 20.30 10.73
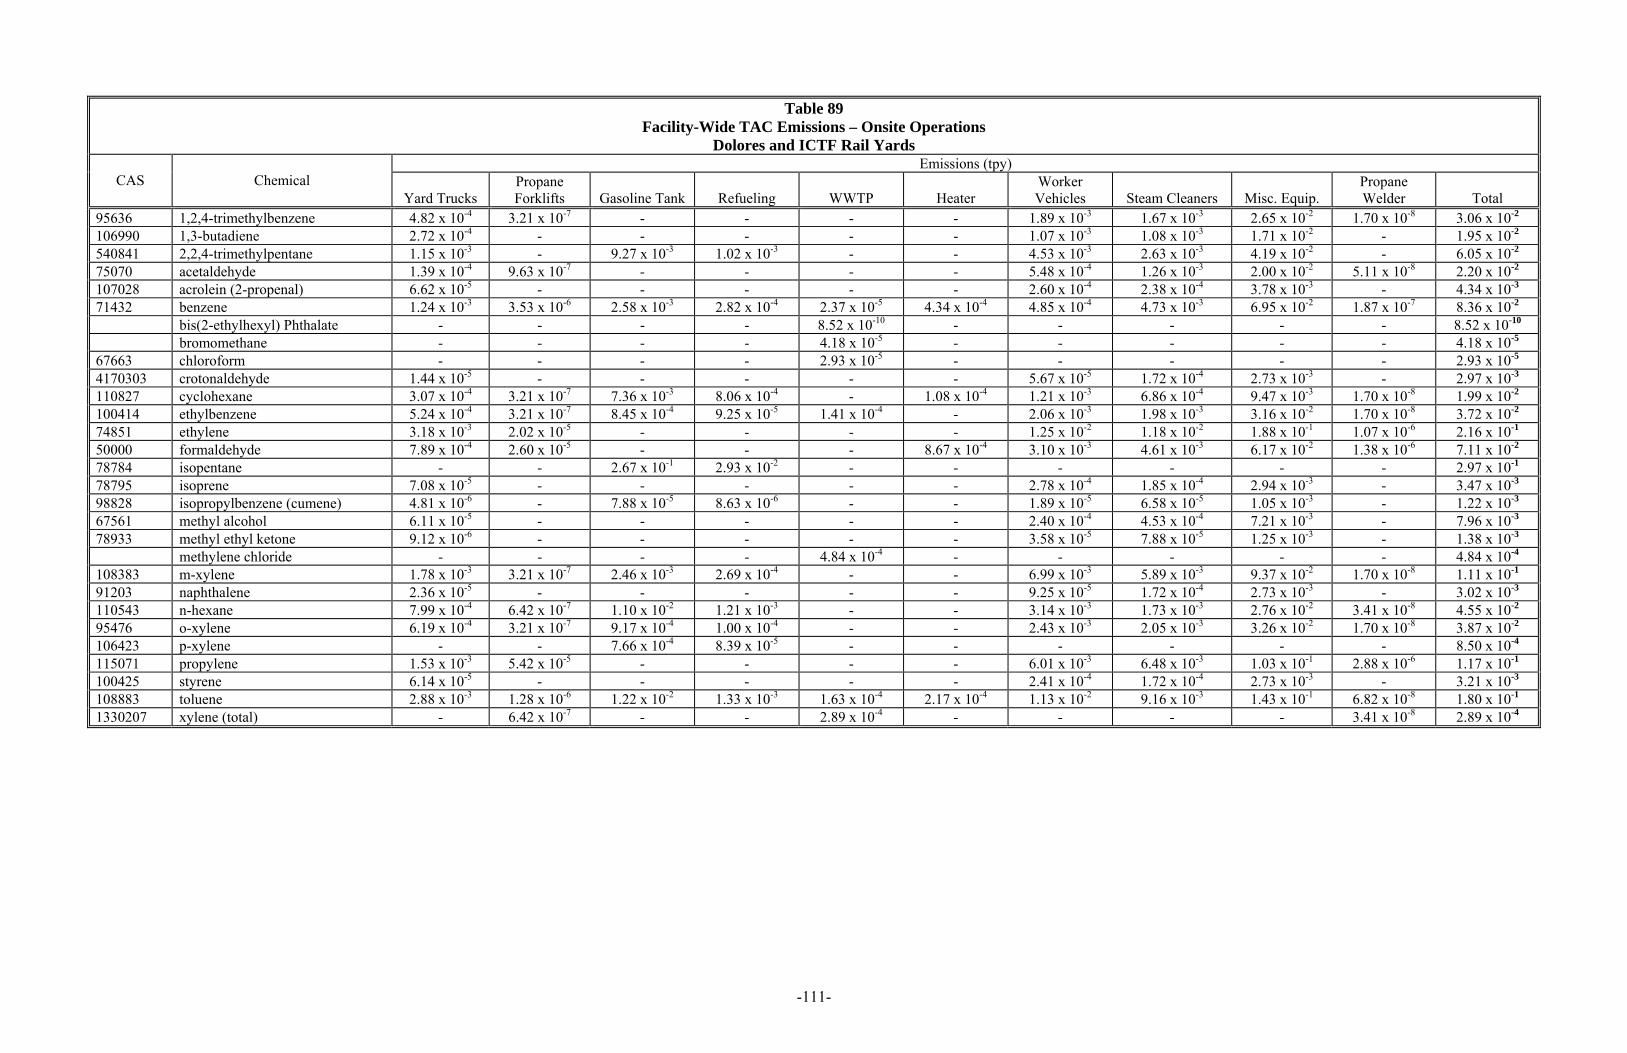
-111-
Table 89 Facility-Wide TAC Emissions – Onsite Operations
Dolores and ICTF Rail Yards Emissions (tpy)
CAS Chemical Yard Trucks
Propane Forklifts Gasoline Tank Refueling WWTP Heater
Worker Vehicles Steam Cleaners Misc. Equip.
Propane Welder Total
95636 1,2,4-trimethylbenzene 4.82 x 10⁻⁴ 3.21 x 10⁻⁷ - - - - 1.89 x 10⁻³ 1.67 x 10⁻³ 2.65 x 10⁻² 1.70 x 10⁻⁸ 3.06 x 10⁻² 106990 1,3-butadiene 2.72 x 10⁻⁴ - - - - - 1.07 x 10⁻³ 1.08 x 10⁻³ 1.71 x 10⁻² - 1.95 x 10⁻² 540841 2,2,4-trimethylpentane 1.15 x 10⁻³ - 9.27 x 10⁻³ 1.02 x 10⁻³ - - 4.53 x 10⁻³ 2.63 x 10⁻³ 4.19 x 10⁻² - 6.05 x 10⁻² 75070 acetaldehyde 1.39 x 10⁻⁴ 9.63 x 10⁻⁷ - - - - 5.48 x 10⁻⁴ 1.26 x 10⁻³ 2.00 x 10⁻² 5.11 x 10⁻⁸ 2.20 x 10⁻² 107028 acrolein (2-propenal) 6.62 x 10⁻⁵ - - - - - 2.60 x 10⁻⁴ 2.38 x 10⁻⁴ 3.78 x 10⁻³ - 4.34 x 10⁻³ 71432 benzene 1.24 x 10⁻³ 3.53 x 10⁻⁶ 2.58 x 10⁻³ 2.82 x 10⁻⁴ 2.37 x 10⁻⁵ 4.34 x 10⁻⁴ 4.85 x 10⁻⁴ 4.73 x 10⁻³ 6.95 x 10⁻² 1.87 x 10⁻⁷ 8.36 x 10⁻² bis(2-ethylhexyl) Phthalate - - - - 8.52 x 10⁻¹⁰ - - - - - 8.52 x 10⁻¹⁰ bromomethane - - - - 4.18 x 10⁻⁵ - - - - - 4.18 x 10⁻⁵ 67663 chloroform - - - - 2.93 x 10⁻⁵ - - - - - 2.93 x 10⁻⁵ 4170303 crotonaldehyde 1.44 x 10⁻⁵ - - - - - 5.67 x 10⁻⁵ 1.72 x 10⁻⁴ 2.73 x 10⁻³ - 2.97 x 10⁻³ 110827 cyclohexane 3.07 x 10⁻⁴ 3.21 x 10⁻⁷ 7.36 x 10⁻³ 8.06 x 10⁻⁴ - 1.08 x 10⁻⁴ 1.21 x 10⁻³ 6.86 x 10⁻⁴ 9.47 x 10⁻³ 1.70 x 10⁻⁸ 1.99 x 10⁻² 100414 ethylbenzene 5.24 x 10⁻⁴ 3.21 x 10⁻⁷ 8.45 x 10⁻⁴ 9.25 x 10⁻⁵ 1.41 x 10⁻⁴ - 2.06 x 10⁻³ 1.98 x 10⁻³ 3.16 x 10⁻² 1.70 x 10⁻⁸ 3.72 x 10⁻² 74851 ethylene 3.18 x 10⁻³ 2.02 x 10⁻⁵ - - - - 1.25 x 10⁻² 1.18 x 10⁻² 1.88 x 10⁻¹ 1.07 x 10⁻⁶ 2.16 x 10⁻¹ 50000 formaldehyde 7.89 x 10⁻⁴ 2.60 x 10⁻⁵ - - - 8.67 x 10⁻⁴ 3.10 x 10⁻³ 4.61 x 10⁻³ 6.17 x 10⁻² 1.38 x 10⁻⁶ 7.11 x 10⁻² 78784 isopentane - - 2.67 x 10⁻¹ 2.93 x 10⁻² - - - - - - 2.97 x 10⁻¹ 78795 isoprene 7.08 x 10⁻⁵ - - - - - 2.78 x 10⁻⁴ 1.85 x 10⁻⁴ 2.94 x 10⁻³ - 3.47 x 10⁻³ 98828 isopropylbenzene (cumene) 4.81 x 10⁻⁶ - 7.88 x 10⁻⁵ 8.63 x 10⁻⁶ - - 1.89 x 10⁻⁵ 6.58 x 10⁻⁵ 1.05 x 10⁻³ - 1.22 x 10⁻³ 67561 methyl alcohol 6.11 x 10⁻⁵ - - - - - 2.40 x 10⁻⁴ 4.53 x 10⁻⁴ 7.21 x 10⁻³ - 7.96 x 10⁻³ 78933 methyl ethyl ketone 9.12 x 10⁻⁶ - - - - - 3.58 x 10⁻⁵ 7.88 x 10⁻⁵ 1.25 x 10⁻³ - 1.38 x 10⁻³ methylene chloride - - - - 4.84 x 10⁻⁴ - - - - - 4.84 x 10⁻⁴ 108383 m-xylene 1.78 x 10⁻³ 3.21 x 10⁻⁷ 2.46 x 10⁻³ 2.69 x 10⁻⁴ - - 6.99 x 10⁻³ 5.89 x 10⁻³ 9.37 x 10⁻² 1.70 x 10⁻⁸ 1.11 x 10⁻¹ 91203 naphthalene 2.36 x 10⁻⁵ - - - - - 9.25 x 10⁻⁵ 1.72 x 10⁻⁴ 2.73 x 10⁻³ - 3.02 x 10⁻³ 110543 n-hexane 7.99 x 10⁻⁴ 6.42 x 10⁻⁷ 1.10 x 10⁻² 1.21 x 10⁻³ - - 3.14 x 10⁻³ 1.73 x 10⁻³ 2.76 x 10⁻² 3.41 x 10⁻⁸ 4.55 x 10⁻² 95476 o-xylene 6.19 x 10⁻⁴ 3.21 x 10⁻⁷ 9.17 x 10⁻⁴ 1.00 x 10⁻⁴ - - 2.43 x 10⁻³ 2.05 x 10⁻³ 3.26 x 10⁻² 1.70 x 10⁻⁸ 3.87 x 10⁻² 106423 p-xylene - - 7.66 x 10⁻⁴ 8.39 x 10⁻⁵ - - - - - - 8.50 x 10⁻⁴ 115071 propylene 1.53 x 10⁻³ 5.42 x 10⁻⁵ - - - - 6.01 x 10⁻³ 6.48 x 10⁻³ 1.03 x 10⁻¹ 2.88 x 10⁻⁶ 1.17 x 10⁻¹ 100425 styrene 6.14 x 10⁻⁵ - - - - - 2.41 x 10⁻⁴ 1.72 x 10⁻⁴ 2.73 x 10⁻³ - 3.21 x 10⁻³ 108883 toluene 2.88 x 10⁻³ 1.28 x 10⁻⁶ 1.22 x 10⁻² 1.33 x 10⁻³ 1.63 x 10⁻⁴ 2.17 x 10⁻⁴ 1.13 x 10⁻² 9.16 x 10⁻³ 1.43 x 10⁻¹ 6.82 x 10⁻⁸ 1.80 x 10⁻¹ 1330207 xylene (total) - 6.42 x 10⁻⁷ - - 2.89 x 10⁻⁴ - - - - 3.41 x 10⁻⁸ 2.89 x 10⁻⁴
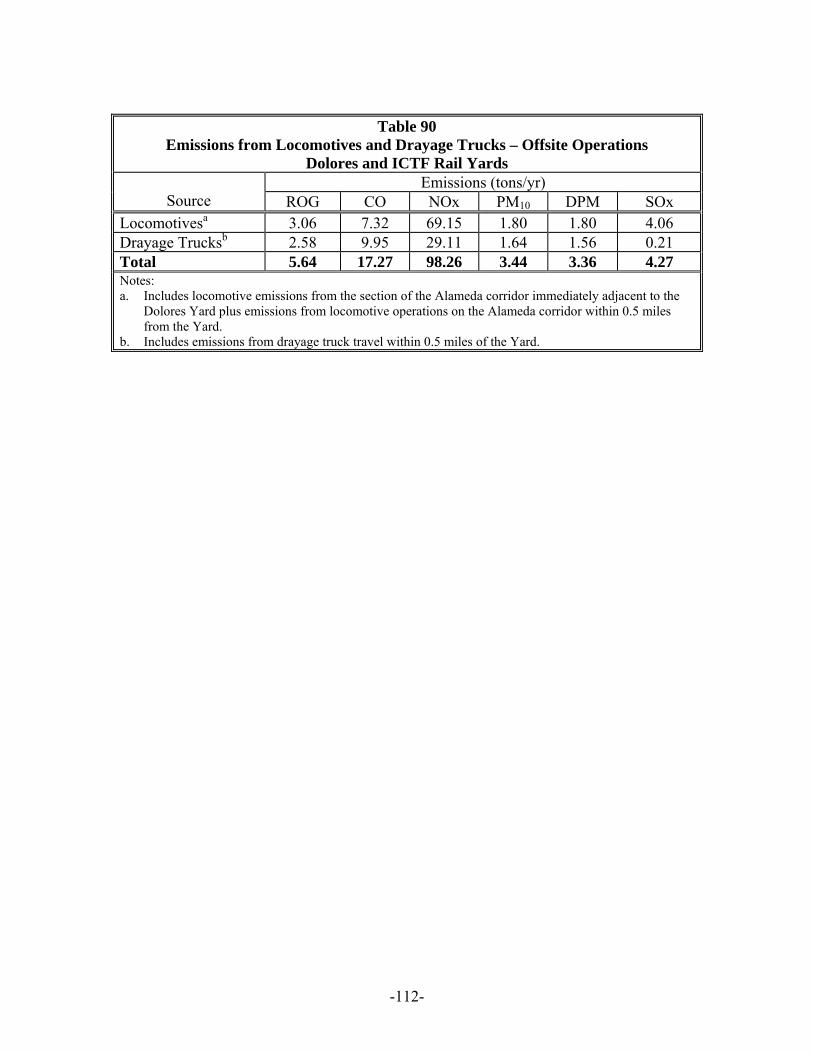
-112-
Table 90
Emissions from Locomotives and Drayage Trucks – Offsite Operations Dolores and ICTF Rail Yards
Emissions (tons/yr) Source ROG CO NOx PM10 DPM SOx
Locomotivesa 3.06 7.32 69.15 1.80 1.80 4.06 Drayage Trucksb 2.58 9.95 29.11 1.64 1.56 0.21 Total 5.64 17.27 98.26 3.44 3.36 4.27 Notes: a. Includes locomotive emissions from the section of the Alameda corridor immediately adjacent to the
Dolores Yard plus emissions from locomotive operations on the Alameda corridor within 0.5 miles from the Yard.
b. Includes emissions from drayage truck travel within 0.5 miles of the Yard.
-113-
PART VIII. RISK SCREENING CALCULATIONS As previously discussed, at the request of the Ports of Los Angeles and Long Beach in
the context of the ICTF Modernization Project, emission sources that would have been
excluded and exempt or de minimis, per the UPRR Protocol, were included in the
inventory and air dispersion modeling analysis. Therefore, a risk screening analysis to
determine de minimis risk sources was not performed for this report.
-114-
PART IX. AIR DISPERSION MODELING An air dispersion modeling analysis was conducted for the Dolores and ICTF Yards. The
Yards are physically separate facilities, but due to their close proximity to one another,
they were treated as one facility for the emission inventory and dispersion modeling
analysis. The purpose of the analysis was to estimate ground-level concentrations of
DPM and other TACs, emitted from Yard operations, at receptor locations near the
Yards. Air dispersion modeling was conducted in accordance with the Health Risk
Assessment Guidance for Rail Yard and Intermodal Facilities (July 2006) and UPRR’s
Modeling Protocol (August 2006). Each aspect of the modeling is further described
below.
A. Model Selection and Preparation
1. Modeled Sources and Source Treatment As discussed previously, all emission sources that were included in the inventory,
including the offsite locomotive and drayage truck emissions, were also included in the
dispersion modeling analysis. Emissions from mobile sources, low-level cargo handling
equipment, heavy equipment, and moving locomotives were simulated as a series of
volume sources along their corresponding travel routes and work areas. Idling and load
testing of locomotives and elevated cargo handling equipment (RTGs) were simulated as
a series of point sources within the areas where these events occur. The elevation for
each source was interpolated from a 50 m grid of USGS terrain elevations. Table 91
shows the sources that were included in the modeling analysis and treatment used for
each source. Assumptions used to spatially allocate emissions from locomotive
operations within the Yard are included in Appendix A-4. Assumptions used to spatially
allocate emissions from non-locomotive sources are contained in Appendix Q. Figures 4
through 7 show the location of each source.

-115-
Table 91 Source Treatment for Air Dispersion Modeling – ICTF and Dolores Rail Yard
2005 Baseline Year Sourcea,b Source Treatment
Locomotives (idling) Point Locomotives (traveling) Volume Drayage Trucks (idling) Volume Drayage Trucks (traveling) Volume Cargo Handling Equipment (low level) Volume Cargo Handling Equipment (RTGs) Point Heavy Equipment (idling) Volume Heavy Equipment (traveling) Volume TRUs and reefer cars Volume Delivery Trucks (idling and traveling) Volume Yard Trucks Volume Diesel-Fueled Emergency Generator Volume Diesel-Fueled Air Compressor Volume Storage Tanks Point Refueling Point WWTP Volume Steam Cleaners Volume Heater Volume Propane-Fueled Welder Volume Miscellaneous Gasoline-Fueled Equipment Volume Worker Vehicles Volume Notes: a. See Figures 4 through 7 for source locations. b. There are no TAC emissions from the sand tower or in road dust. Therefore, these sources were not
included in the dispersion modeling analysis.
2. Model Selection Selection of air dispersion models depends on many factors, including the type of
emissions source (point, line, or volume) and type of terrain surrounding the emission
source. The USEPA-approved guideline air dispersion model, AERMOD, was selected
for this project. AERMOD is recommended by EPA as the preferred air dispersion
model, and is the recommended model in the CARB’s Health Risk Assessment Guidance
for Rail Yard and Intermodal Facilities (July 2006).
-116-
AERMOD is a steady-state,41 multiple-source, Gaussian dispersion model designed for
use with emission sources situated in terrain where ground elevations can exceed the
release heights of the emission sources (i.e., complex terrain).42 AERMOD was used
with surface meteorological data from the St. Peter and Paul School in Wilmington, cloud
cover from Long Beach Daugherty Field, and upper air data from the Miramar Marine
Corps Air Station. AERMOD used these data to calculate the appropriate dispersion
coefficients.
41 The term “steady-state” means that the model assumes no spatial variability in meteorological parameters over a one-hour time period. 42 Federal Register, November 9, 2005; Volume 70, Number 216, Pages 68218-68261.
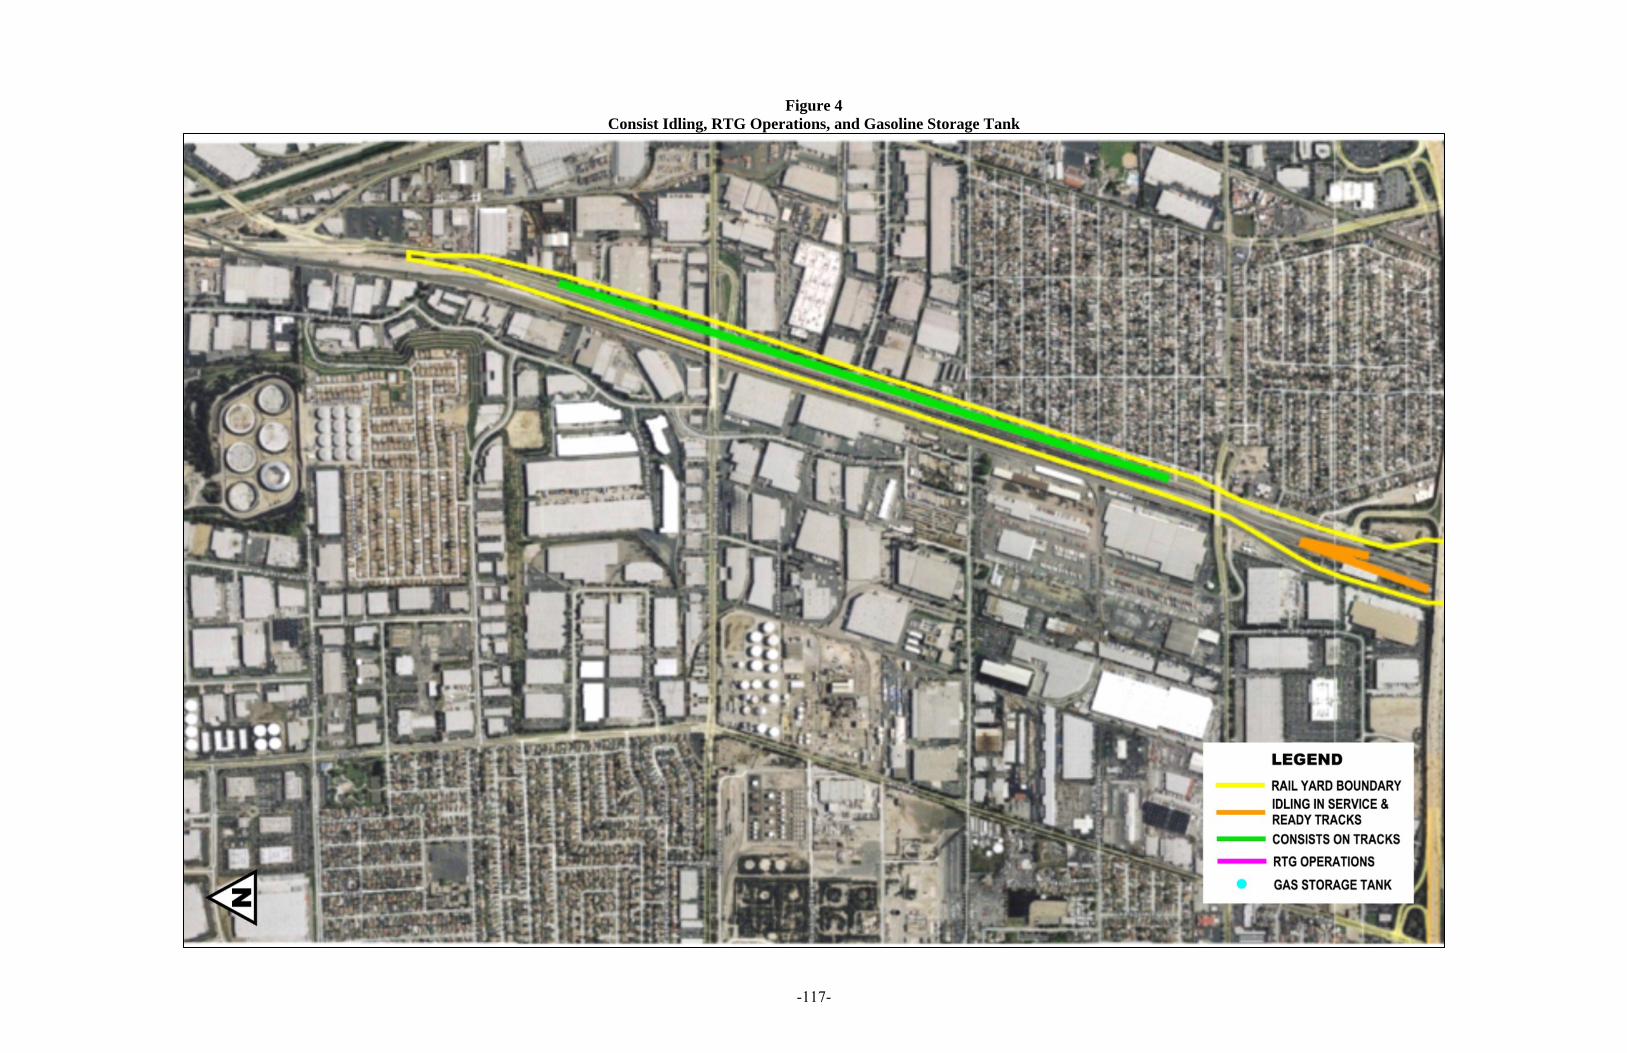
-117-
Figure 4 Consist Idling, RTG Operations, and Gasoline Storage Tank
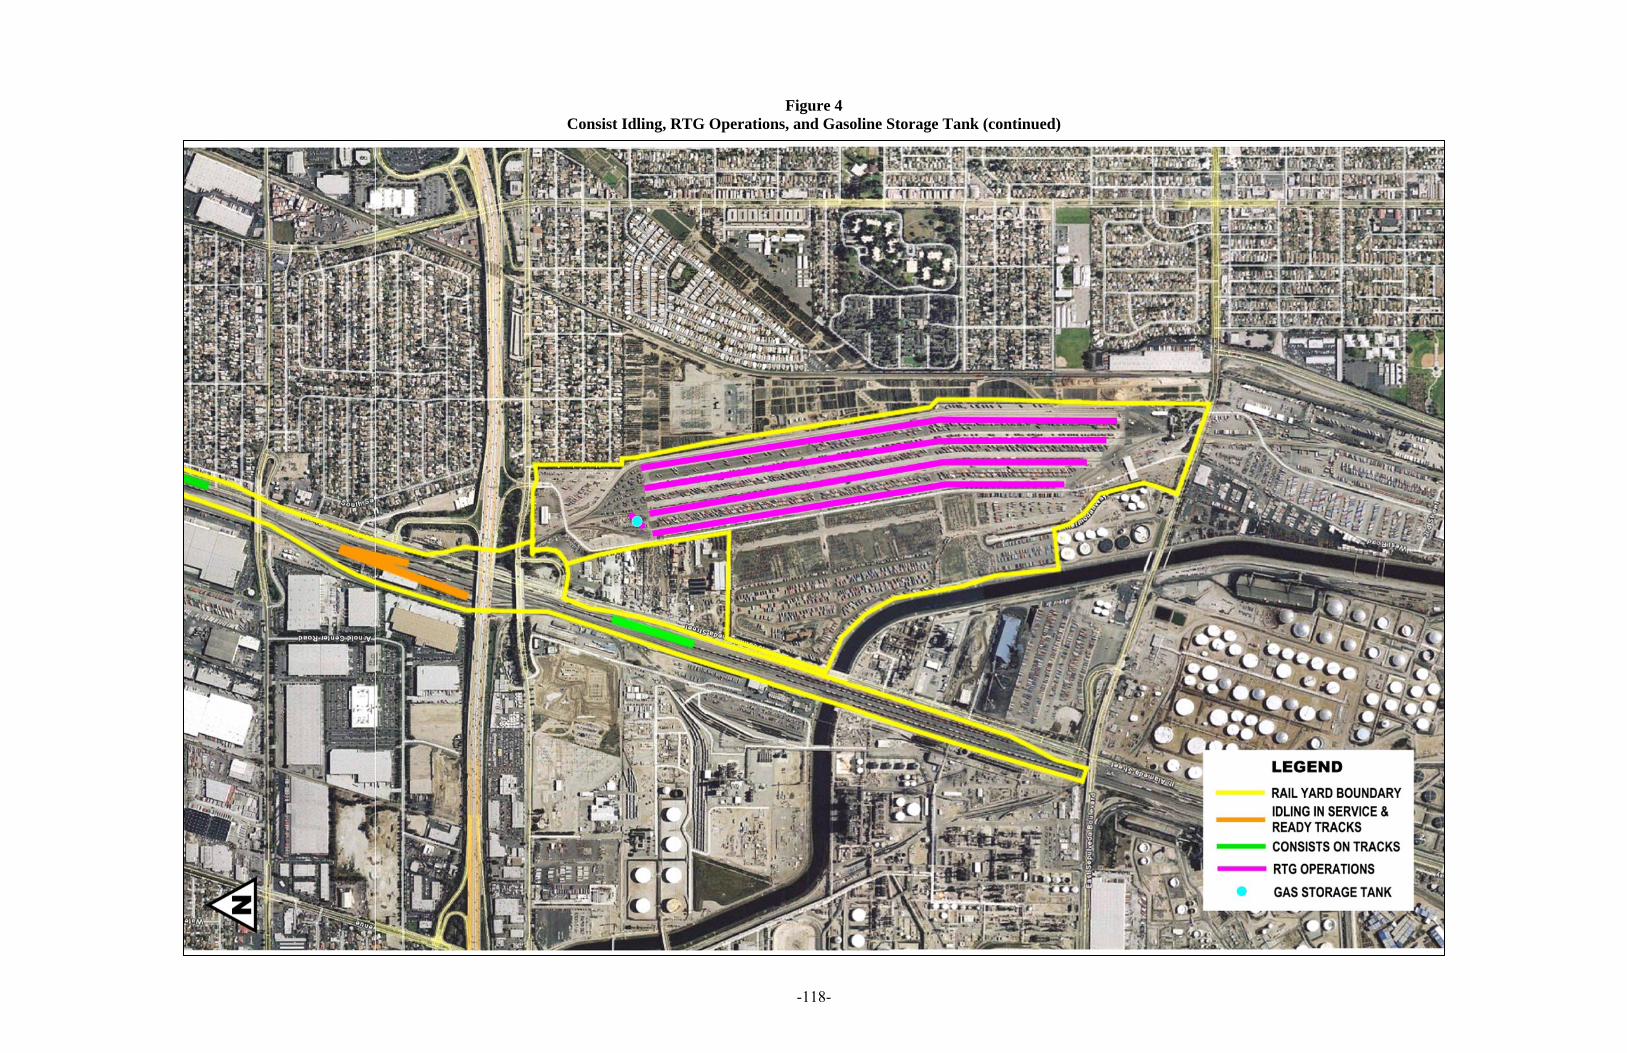
-118-
Figure 4 Consist Idling, RTG Operations, and Gasoline Storage Tank (continued)
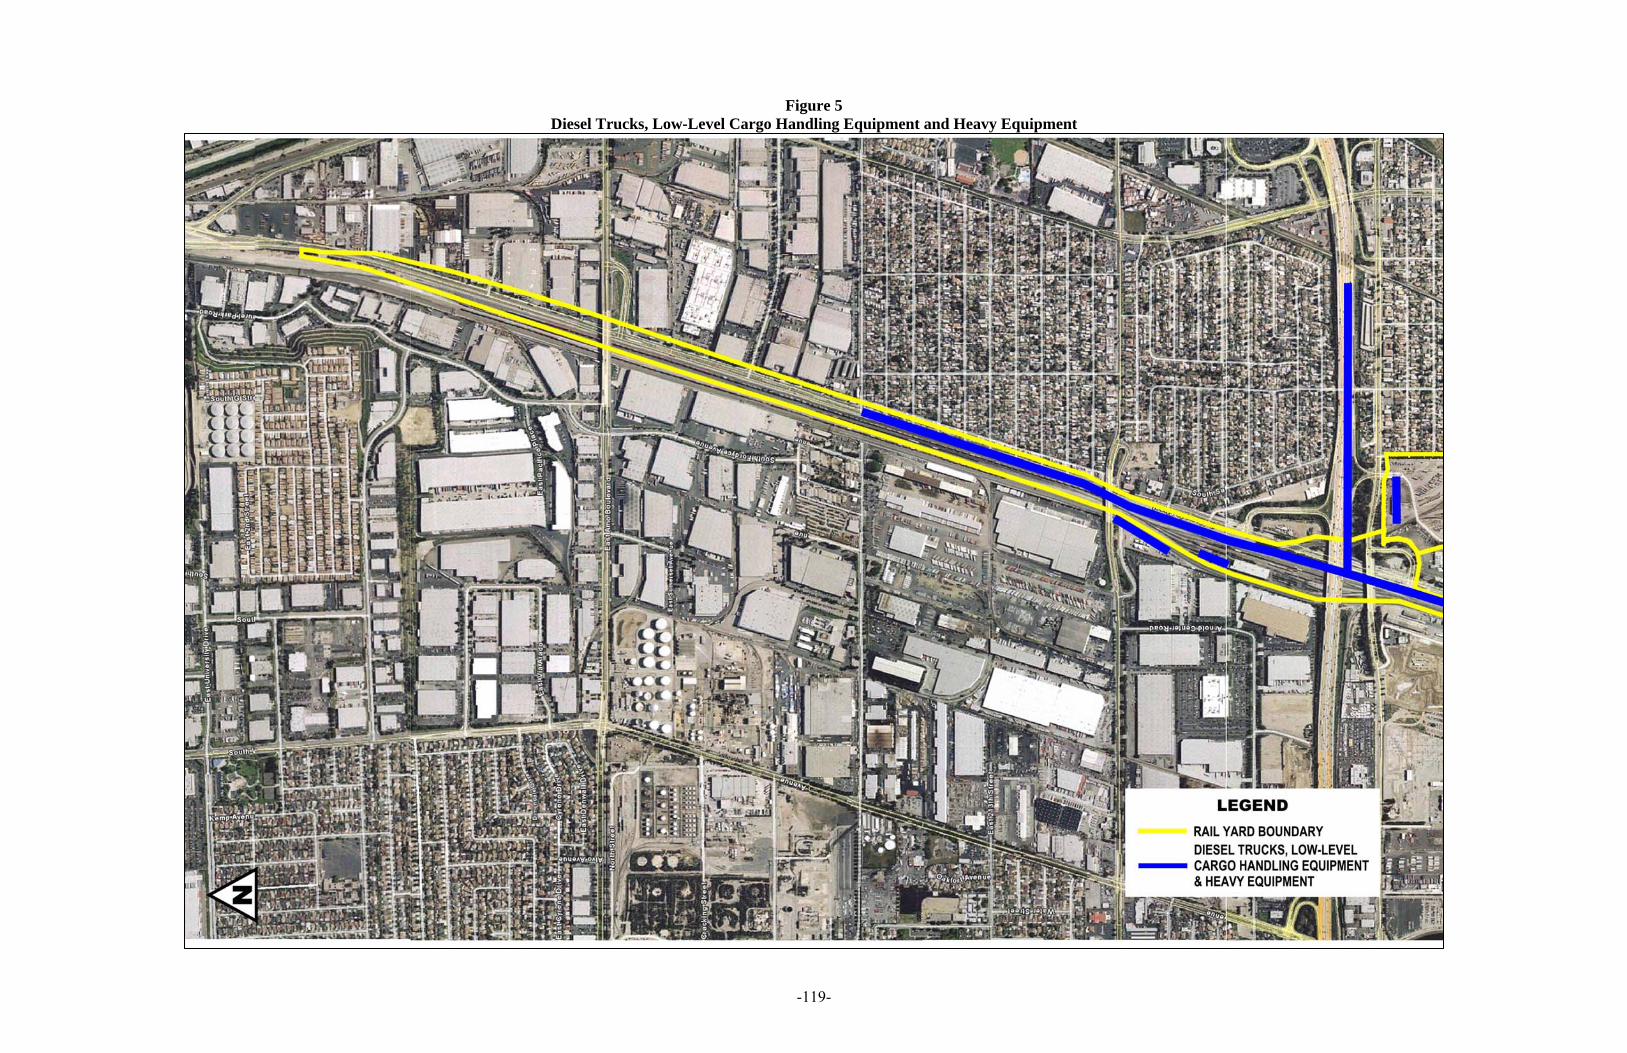
-119-
Figure 5 Diesel Trucks, Low-Level Cargo Handling Equipment and Heavy Equipment
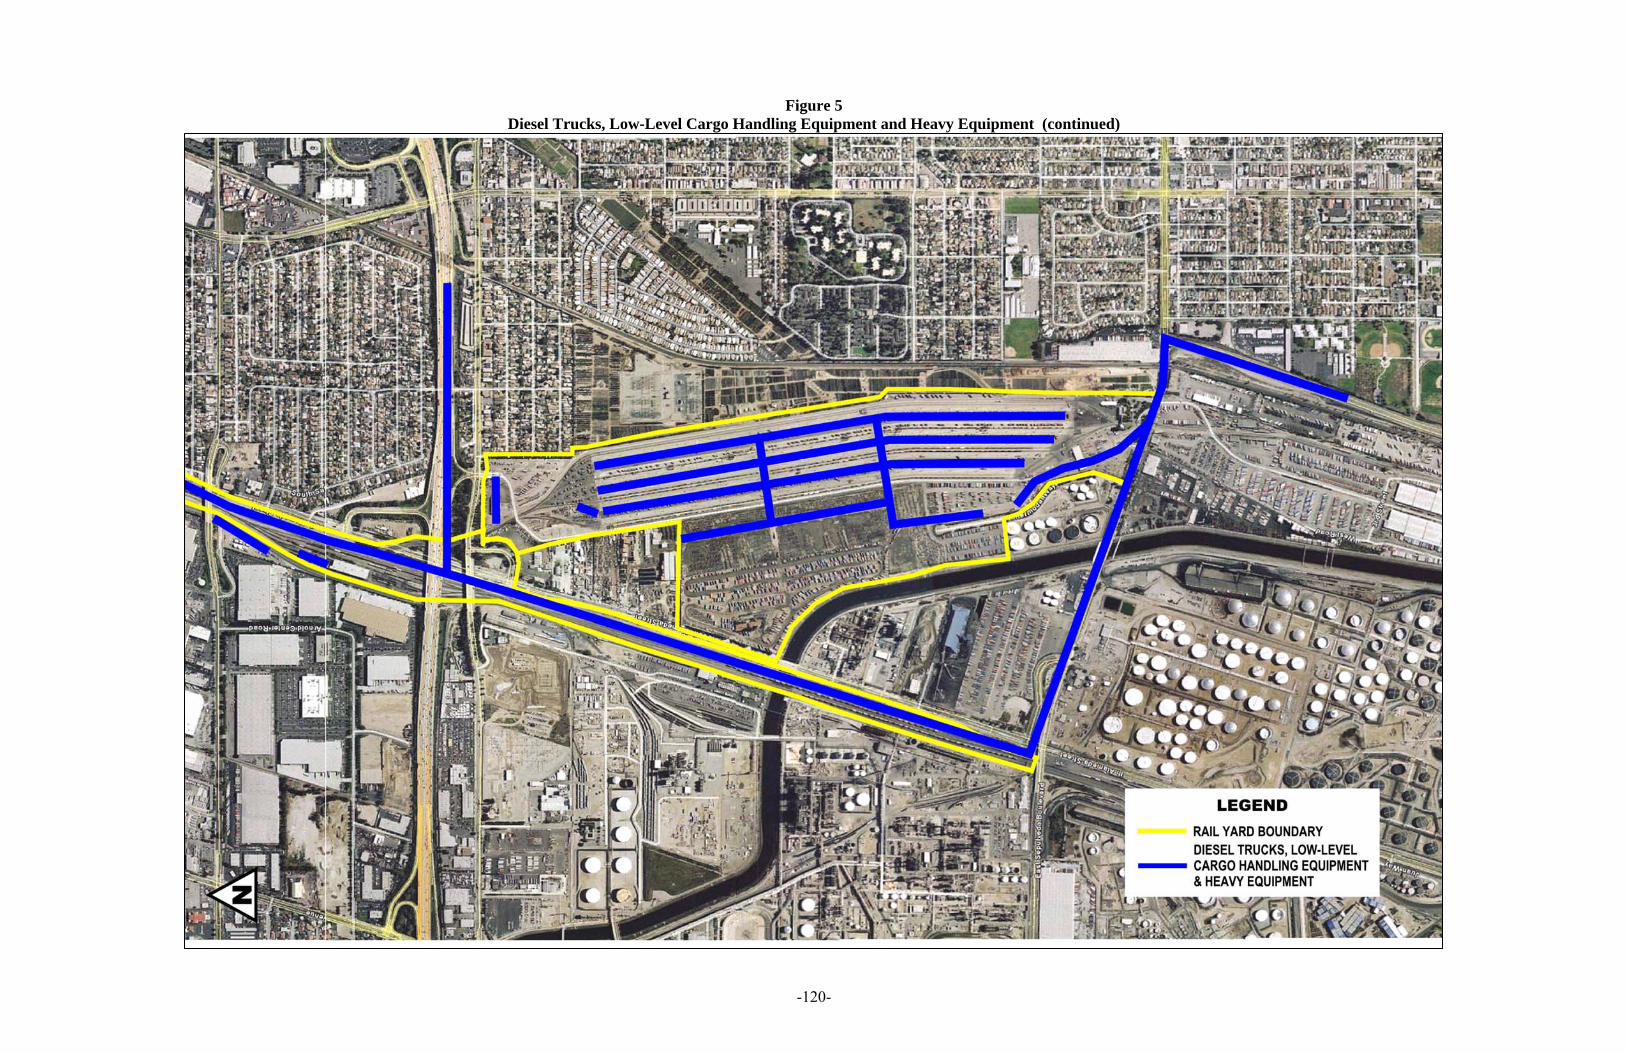
-120-
Figure 5 Diesel Trucks, Low-Level Cargo Handling Equipment and Heavy Equipment (continued)
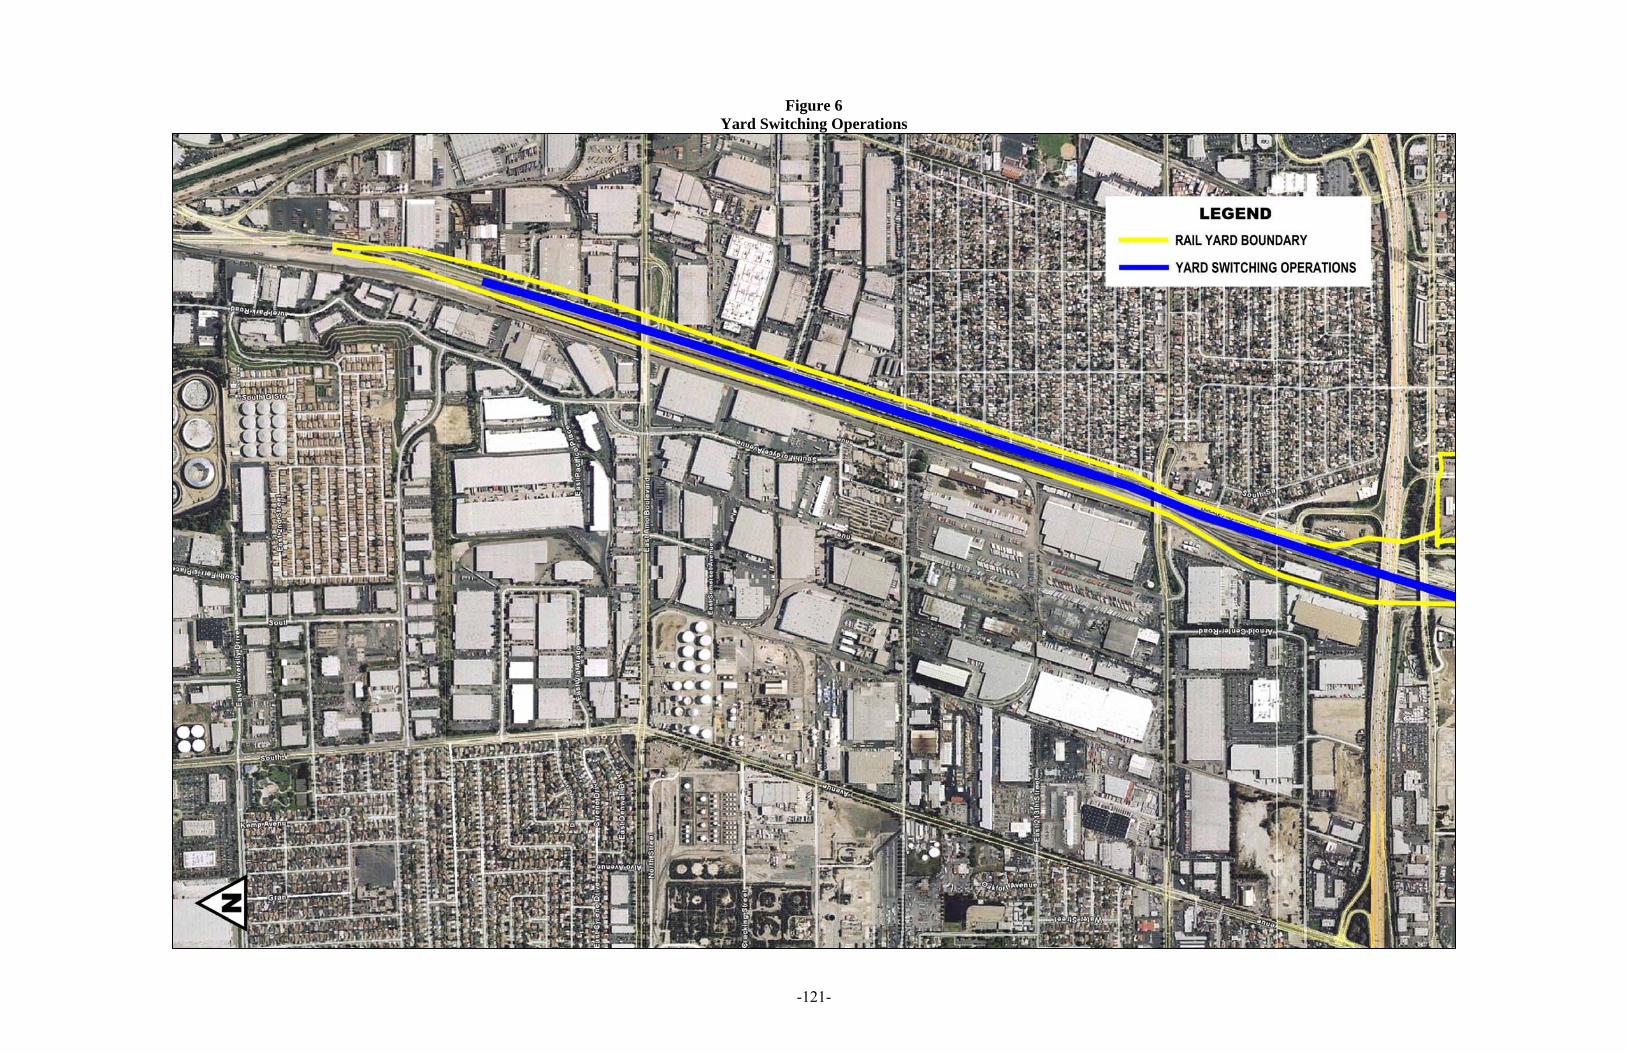
-121-
Figure 6 Yard Switching Operations
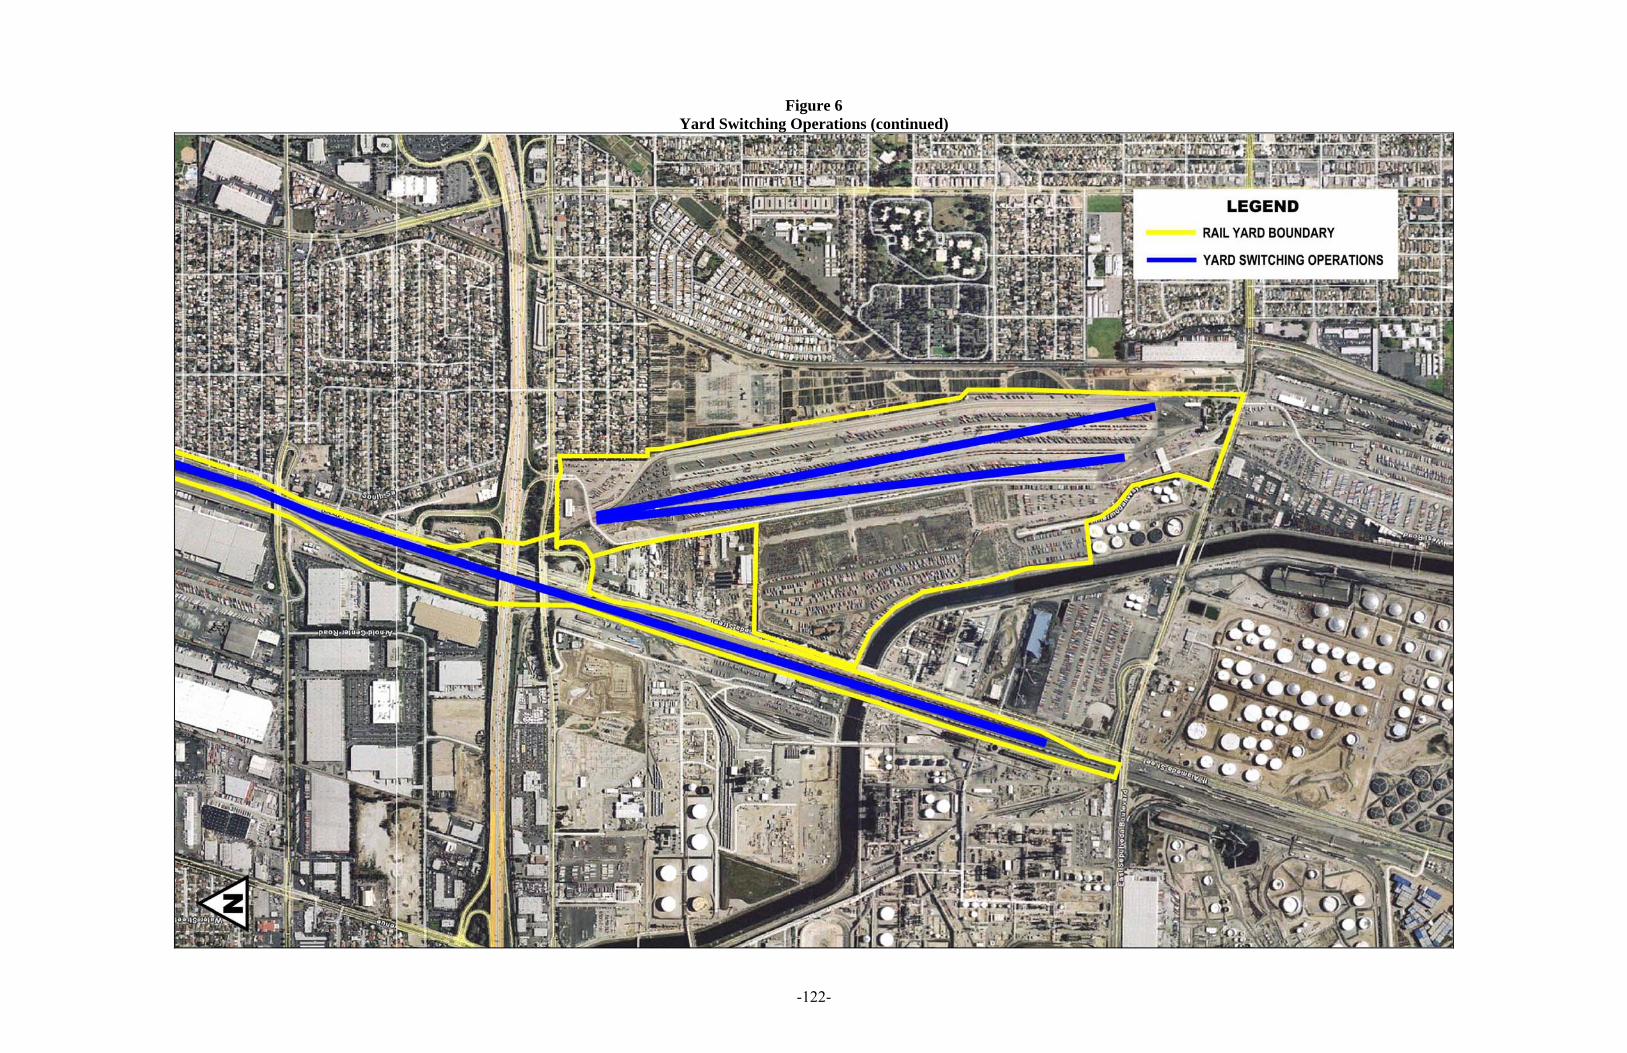
-122-
Figure 6 Yard Switching Operations (continued)
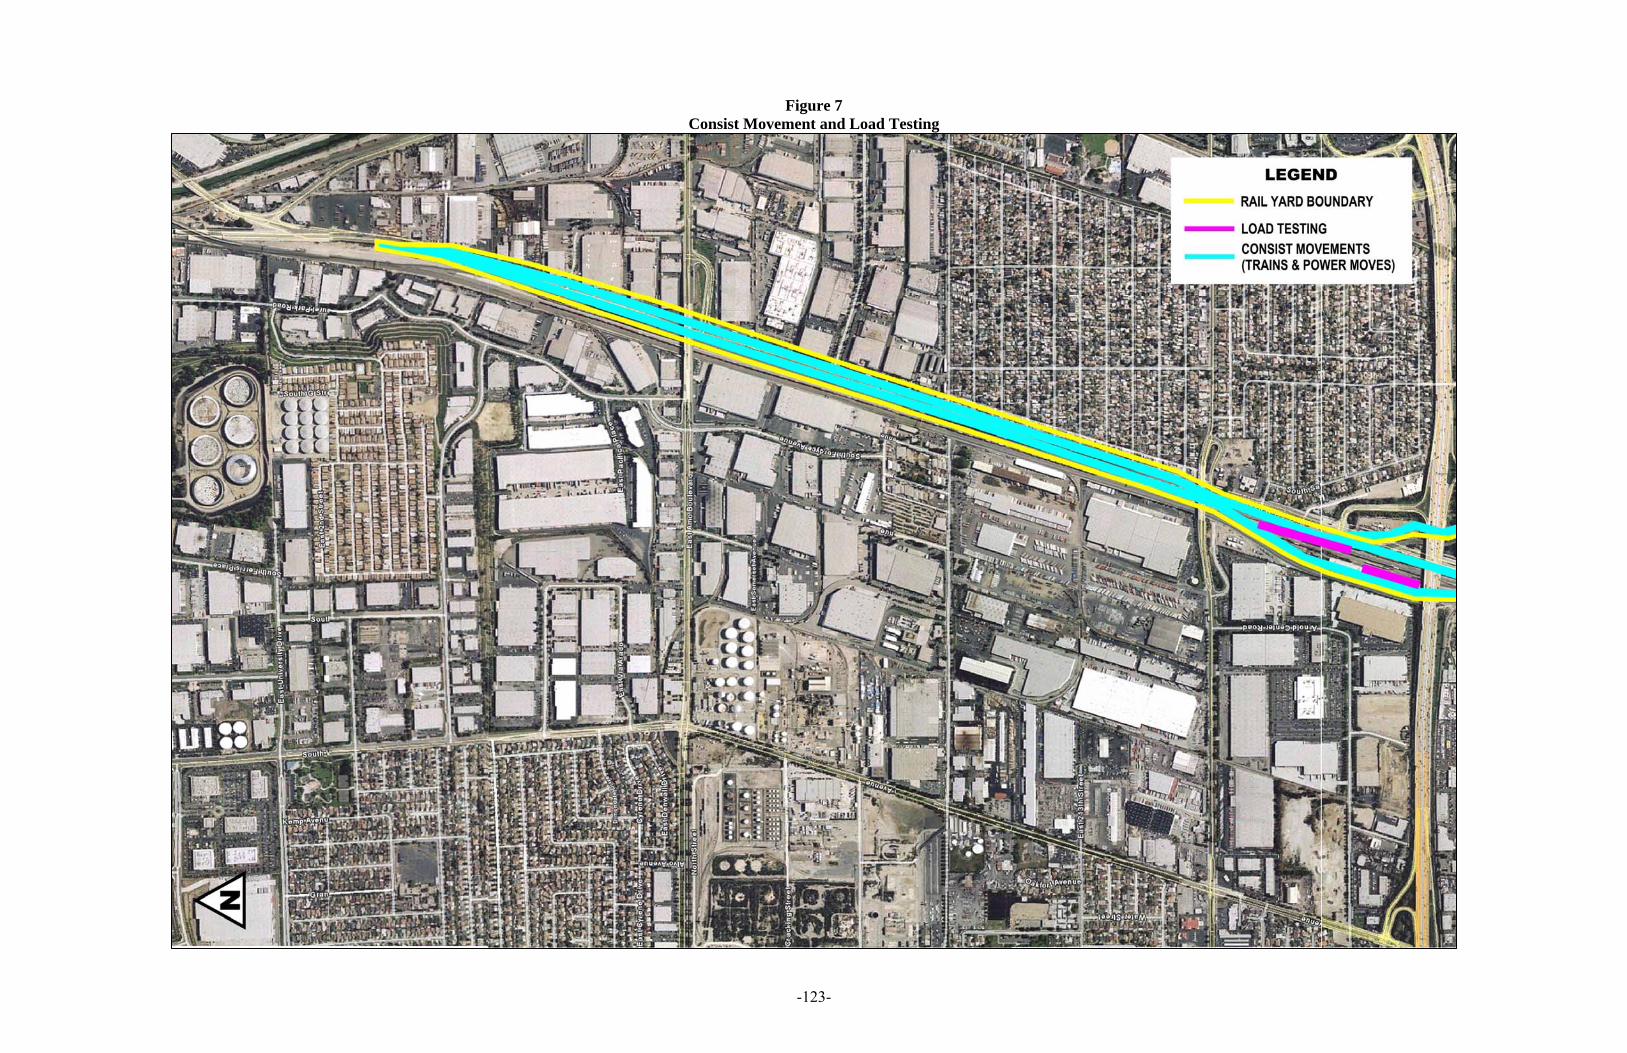
-123-
Figure 7 Consist Movement and Load Testing
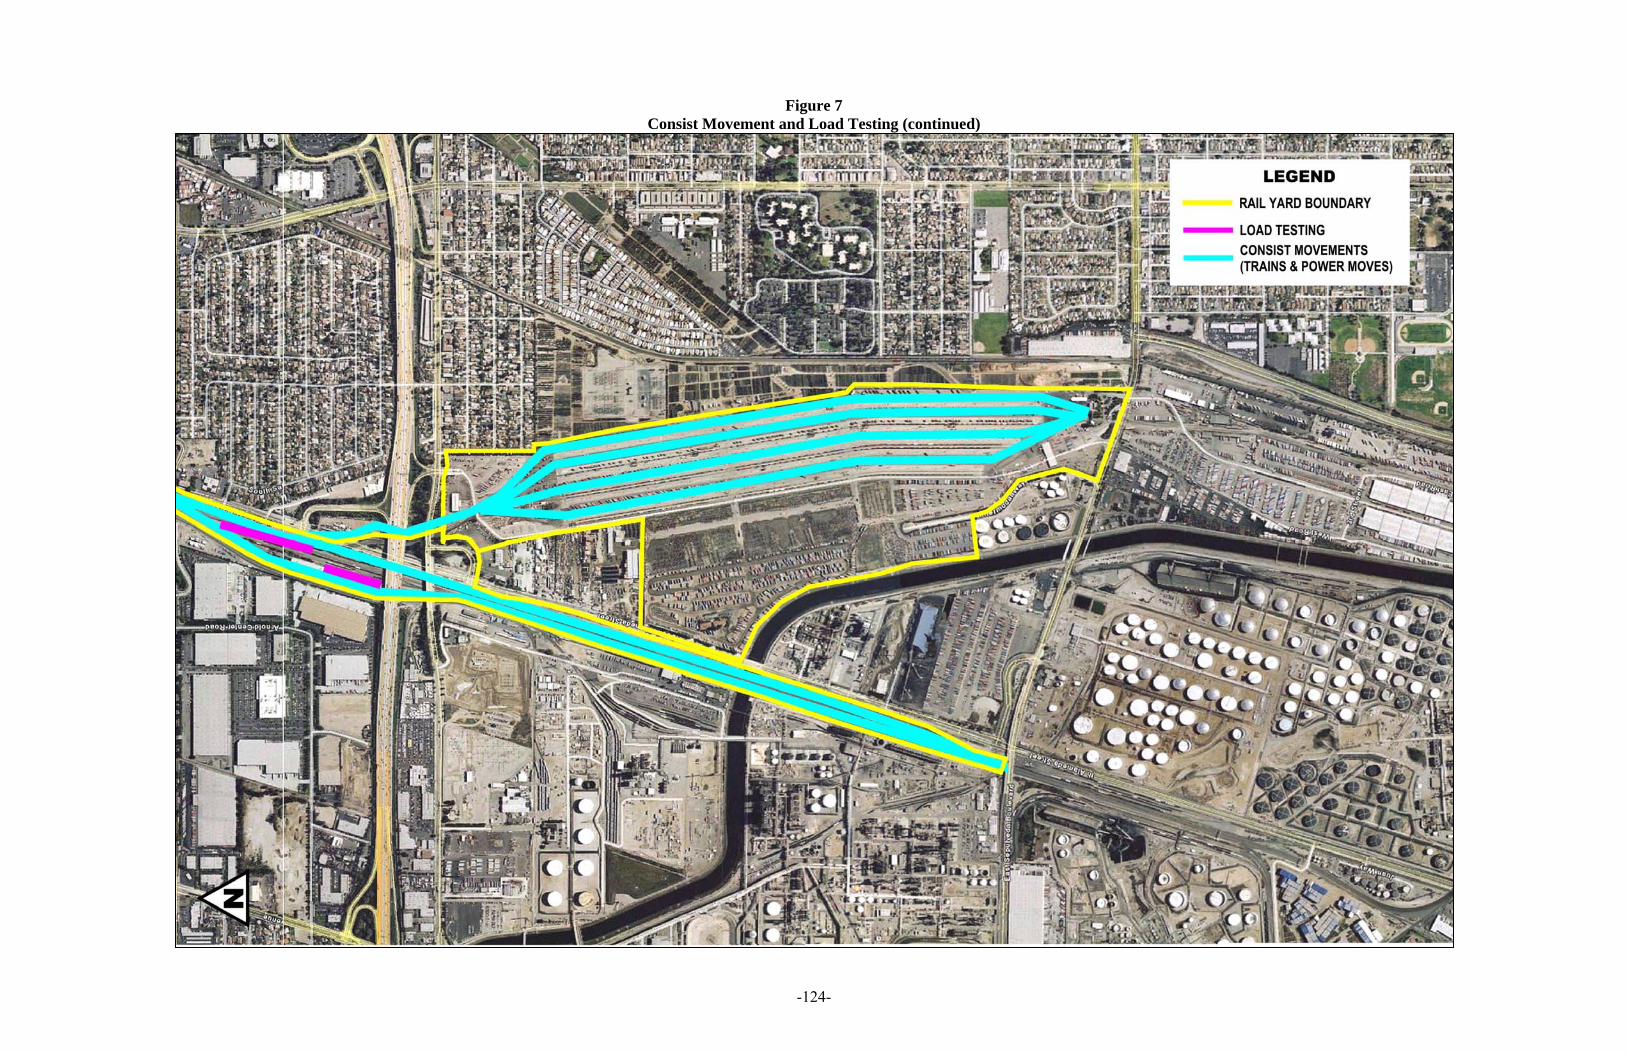
-124-
Figure 7 Consist Movement and Load Testing (continued)
-125-
Standard AERMOD control parameters were used, including stack-tip downwash, non-
screening mode, non-flat terrain, and sequential meteorological data check. Following
USEPA guidance, the stack-tip downwash option adjusted the effective stack height
downward following the methods of Briggs (1972) for stack exit velocities less than 1.5
times the wind speed at stack top.
Two AERMET preprocessors (Stages 1 and 2, and Stage 3) were used by ENVIRON 43
to prepare meteorological data for use in AERMOD. Albedo, surface roughness, and
Bowen ratio44 were estimated in multiple wind direction sectors surrounding the Yard.
As suggested by USEPA (2000), for purposes of determining albedo and Bowen ratio the
surface characteristics were specified in sectors no smaller than a 30-degree arc.
Specifying surface characteristics in narrower sectors becomes less meaningful because
of expected wind direction variability during an hour, as well as the encroachment of
characteristics from the adjacent sectors with a one-hour travel time. Use of weighted-
average45 characteristics by surface area within a 30-degree (or wider) sector made it
possible to have a unique portion of the surface significantly influence the properties of
the sector that it occupies. The length of the upwind fetch for defining the nature of the
turbulent characteristics of the atmosphere in each sector surrounding the source location
was 3 kilometers as recommended by Irwin (1978) and USEPA’s Guideline on Air
Quality Models.46
43 Because of the relative proximity of the ICTF to BNSF’s Watson/Wilmington rail yard, the same Wilmington meteorological data are being used in the air dispersion modeling conducted for both rail yards under the 2005 CARB MOU. A detailed description of the methodology used to develop the meteorological data are available in the following document: ENVIRON. Meteorological Data Selection and Processing Methodology for 2006 BNSF Designated Rail Yards, July 25, 2006. 44 The albedo of a specified surface is the ratio of the radiative flux reflected from the surface to the radiative flux incident on the surface. Flux is the amount of energy per unit time incident upon or crossing a unit area of a defined flat plane. For example, the albedo for snow and ice varies from 80% to 85% and the albedo for bare ground from 10% to 20%. Bowen ratio is the ratio of heat energy used for sensible heating (conduction and convection) of the air above a specified surface to the heat energy used for latent heating (evaporation of water or sublimation of snow) at the surface. The Bowen ratio ranges from 0.1 for the ocean surface to more than 2.0 for deserts; negative values are also possible. 45 Weighting was based on wind direction frequency, as determined from a wind rose. 46 USEPA (1986), and published as Appendix W to 40 CFR Part 51 (as revised).
-126-
3. Modeling Inputs Modeling was based on the annual average emissions for each source as discussed in
Part V.A.1 above. Diurnal and/or seasonal activity scalars were applied to locomotive
activities. The following profiles were used in the modeling. See Appendix A-4 for the
profiles used and Appendix R for a description of the methods used to develop them.
• A seasonal/diurnal activity profile was calculated for locomotive idling based on
the number of arrivals and departures in each hour of the day and the number of
arriving and departing trains in each season. Each hourly factor was based on the
number of arrivals and departures in that hour and the average number of
departures in that hour and the following hour. This approach captures the idling
times for consists prior to departure. These factors were applied to consist idling
for arriving and departing trains.
• A seasonal/diurnal activity profile was calculated for in-yard locomotive
movements of road power using the same approach as for idling. In this case,
however, only the number of arriving and departing trains in a single hour was
used for that hour’s factor.
• A seasonal profile was used for switching operations based on the same seasonal
profile developed for train activity. No diurnal profile was used as yard switching
operations continue throughout the day.
• A seasonal profile was applied to locomotive service and load test emissions
based on monthly service release data.
The volume source release heights and vertical dispersion parameters (σz) were those
used by CARB for the Truck Stop Scenario in Appendix VII of the Diesel Risk
Reduction Plan for mobile vehicles and equipment other than locomotives. For
locomotives, the release height and σz values used were those developed by CARB for
daytime and nighttime locomotive movements in the Roseville Risk Assessment
modeling. Stack parameters used to create the AERMOD input file for locomotive
operations are shown in Table 92. Table 93 summarizes the modeling inputs used to
create the AERMOD input file for each non-locomotive source at the Yard.
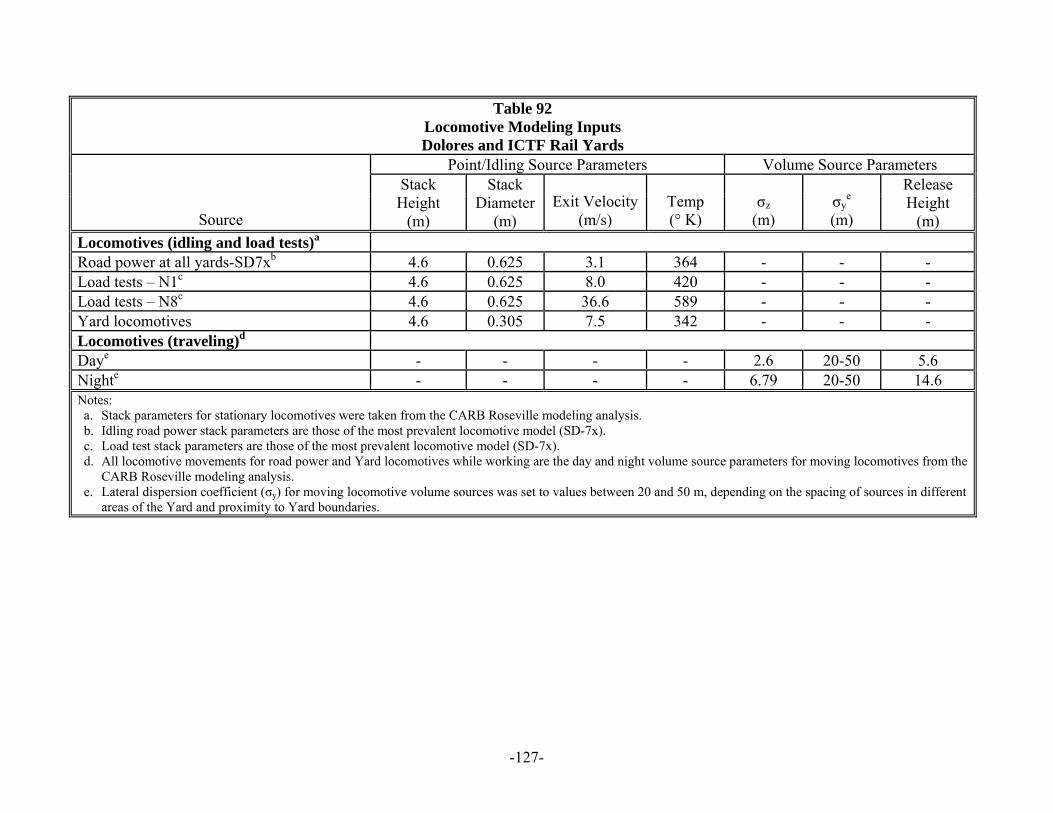
-127-
Table 92 Locomotive Modeling Inputs Dolores and ICTF Rail Yards
Point/Idling Source Parameters Volume Source Parameters
Source
Stack Height
(m)
Stack Diameter
(m) Exit Velocity
(m/s) Temp (° K)
σz (m)
σye
(m)
Release Height
(m) Locomotives (idling and load tests)a Road power at all yards-SD7xb 4.6 0.625 3.1 364 - - - Load tests – N1c 4.6 0.625 8.0 420 - - - Load tests – N8c 4.6 0.625 36.6 589 - - - Yard locomotives 4.6 0.305 7.5 342 - - - Locomotives (traveling)d Daye - - - - 2.6 20-50 5.6 Nighte - - - - 6.79 20-50 14.6 Notes: a. Stack parameters for stationary locomotives were taken from the CARB Roseville modeling analysis. b. Idling road power stack parameters are those of the most prevalent locomotive model (SD-7x). c. Load test stack parameters are those of the most prevalent locomotive model (SD-7x). d. All locomotive movements for road power and Yard locomotives while working are the day and night volume source parameters for moving locomotives from the
CARB Roseville modeling analysis. e. Lateral dispersion coefficient (σy) for moving locomotive volume sources was set to values between 20 and 50 m, depending on the spacing of sources in different
areas of the Yard and proximity to Yard boundaries.
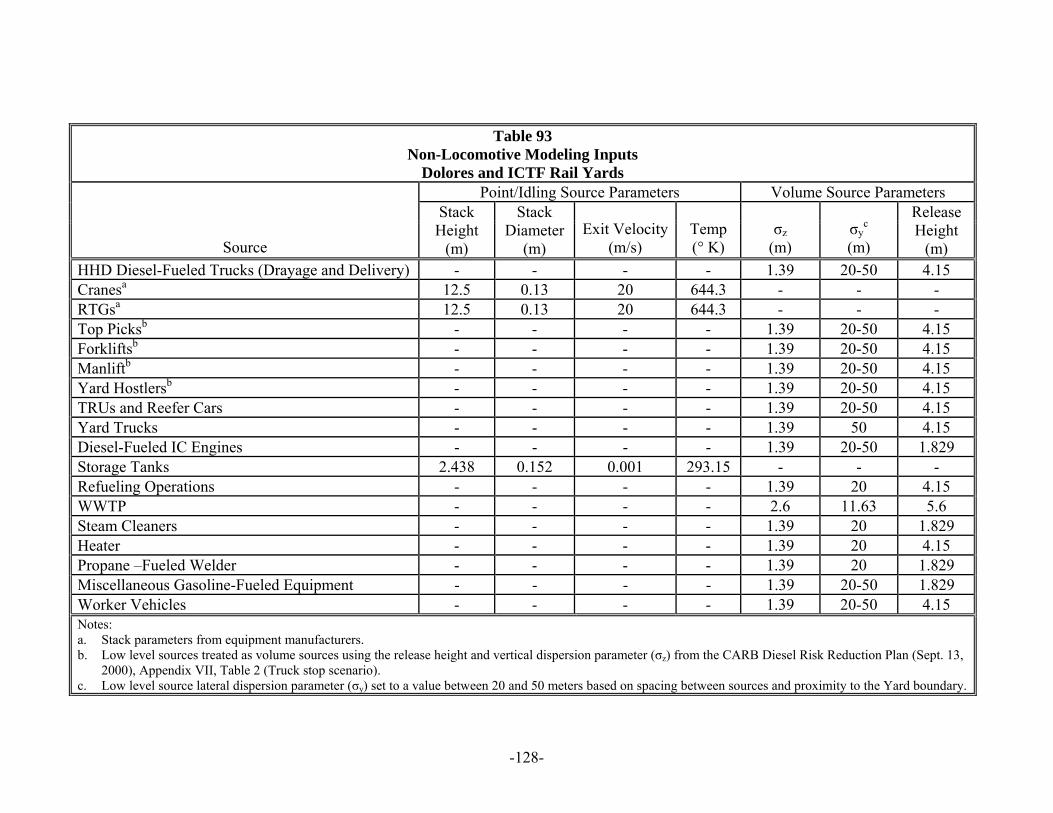
-128-
Table 93 Non-Locomotive Modeling Inputs
Dolores and ICTF Rail Yards Point/Idling Source Parameters Volume Source Parameters
Source
Stack Height
(m)
Stack Diameter
(m) Exit Velocity
(m/s) Temp (° K)
σz (m)
σyc
(m)
Release Height
(m) HHD Diesel-Fueled Trucks (Drayage and Delivery) - - - - 1.39 20-50 4.15 Cranesa 12.5 0.13 20 644.3 - - - RTGsa 12.5 0.13 20 644.3 - - - Top Picksb - - - - 1.39 20-50 4.15 Forkliftsb - - - - 1.39 20-50 4.15 Manliftb - - - - 1.39 20-50 4.15 Yard Hostlersb - - - - 1.39 20-50 4.15 TRUs and Reefer Cars - - - - 1.39 20-50 4.15 Yard Trucks - - - - 1.39 50 4.15 Diesel-Fueled IC Engines - - - - 1.39 20-50 1.829 Storage Tanks 2.438 0.152 0.001 293.15 - - - Refueling Operations - - - - 1.39 20 4.15 WWTP - - - - 2.6 11.63 5.6 Steam Cleaners - - - - 1.39 20 1.829 Heater - - - - 1.39 20 4.15 Propane –Fueled Welder - - - - 1.39 20 1.829 Miscellaneous Gasoline-Fueled Equipment - - - - 1.39 20-50 1.829 Worker Vehicles - - - - 1.39 20-50 4.15 Notes: a. Stack parameters from equipment manufacturers. b. Low level sources treated as volume sources using the release height and vertical dispersion parameter (σz) from the CARB Diesel Risk Reduction Plan (Sept. 13,
2000), Appendix VII, Table 2 (Truck stop scenario). c. Low level source lateral dispersion parameter (σy) set to a value between 20 and 50 meters based on spacing between sources and proximity to the Yard boundary.

-129-
4. Meteorological Data Selection The Yard does not monitor meteorological variables on site. Surface data from the St.
Peter and Paul School monitoring station in Wilmington, and cloud cover data from the
Long Beach Daugherty Field station were used for this project.47 The upper air data used
in the modeling were obtained from Miramar Marine Corps Air Station.
Because rail yards, and therefore emissions from locomotives, tend to be aligned linearly
along the main track routes, the directions of prevailing surface winds were important to
achieve representativeness of model predictions in the near field. For longer transport
distances (e.g., 1 to 10 km), surface winds were still the primary consideration, with
atmospheric stability also playing an important role. Due to the relatively low release
heights and limited plume rise of rail yard sources, modeled concentrations are relatively
insensitive to mixing heights, temperatures, and vertical temperature and wind profiles
Based on an evaluation of available meteorological data,48 including the above criteria for
representativeness, wind speed and direction and temperature data from St. Peter and
Paul School in Wilmington, cloud cover data from the Long Beach Daugherty Field
station, and upper air data from Miramar Marine Corps Air Station were processed in
AERMET, the meteorological preprocessor for AERMOD.
As the only one-year sequence of satisfactory surface data available, twelve months from
July 1, 2005 through June 30, 2006, of meteorological data from St. Peter and Paul
School were processed with AERMET. It is not expected that year-to-year variability
would cause significant differences in the modeled air quality impacts. This conclusion is
based on modeling sensitivity analyses that were carried out using five years of
meteorological data for the Stockton area. The five annual average concentration
patterns were compared with one another and with the average predictions for the full
five year period. Differences between these were found to be negligible in terms of
spatial concentration patterns, locations of highest concentrations, and absolute
concentrations. A similar result would be expected for meteorological conditions at 47 ENVIRON. Meteorological Data Selection and Processing Methodology for 2006 BNSF Designated Rail Yards, Report 06-12910J, July 25, 2006. 48 Ibid.
-130-
ICTF. At coastal locations such as ICTF, air flow patterns over the course of a year are
expected to be at least as consistent as an inland location such as Stockton.
5. Model Domain and Receptor Grids
A domain size of 20 km by 20 km and coarse receptor grid of 500 m x 500 m was used
for the modeling analysis. A fine grid of 50 m x 50 m surrounding the Yard was used for
modeling within 300 m of the fence line. A medium-fine grid of 100 m x 100 m was
used for receptors between 300 and 600 m of the fence line around the fine grid network,
and a medium grid of 200 m x 200 m was used for receptor distances between 600 and
1000 m.
All receptors were identified by UTM coordinates. United States Geological Survey
(USGS) 7.5 Minute digital elevation model (DEM) data were used to identify terrain
heights at each receptor. Figures 8 and 9 show the outline of the Yard along with the
coarse and fine receptor grids.
Sensitive receptors, consisting of hospitals, schools, day-care centers, and elder care
facilities, within a 1-mile radius of the Yard, were identified. Table 94 lists the address,
elevations, and UTM coordinates for each sensitive receptor. Figure 10 shows the outline
of the Yard and the location of each sensitive receptor identified in Table 94.
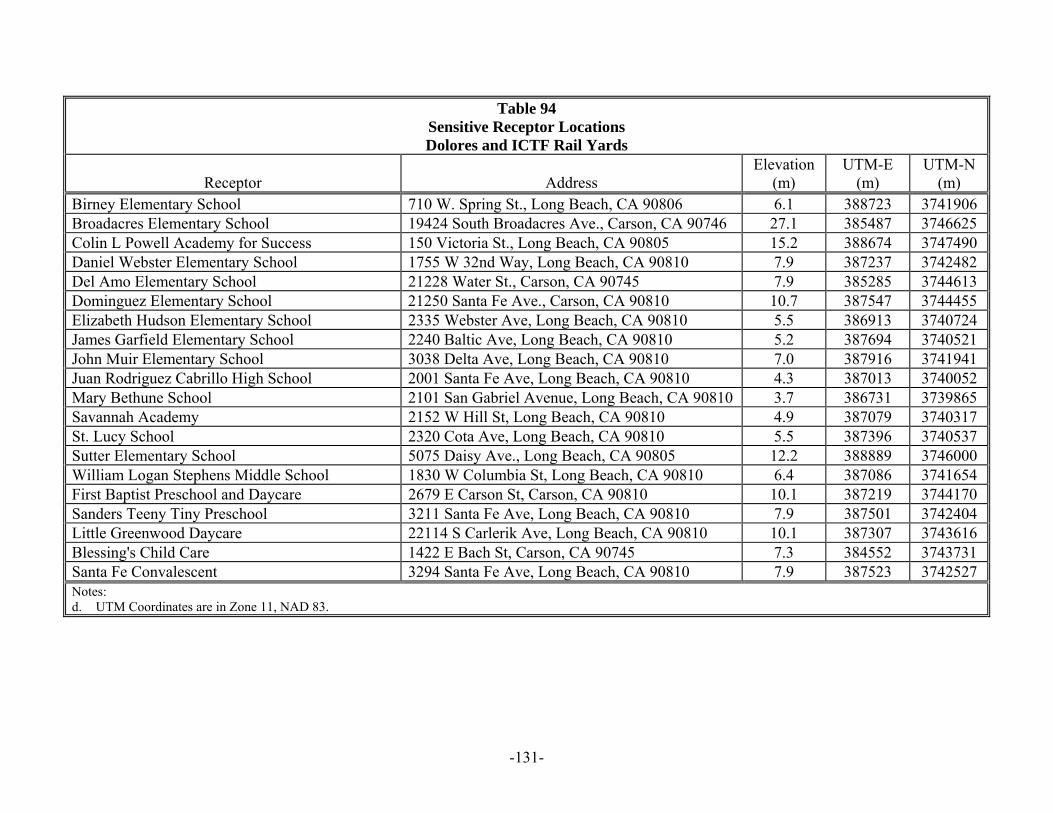
-131-
Table 94 Sensitive Receptor Locations Dolores and ICTF Rail Yards
Receptor Address Elevation
(m) UTM-E
(m) UTM-N
(m) Birney Elementary School 710 W. Spring St., Long Beach, CA 90806 6.1 388723 3741906 Broadacres Elementary School 19424 South Broadacres Ave., Carson, CA 90746 27.1 385487 3746625 Colin L Powell Academy for Success 150 Victoria St., Long Beach, CA 90805 15.2 388674 3747490 Daniel Webster Elementary School 1755 W 32nd Way, Long Beach, CA 90810 7.9 387237 3742482 Del Amo Elementary School 21228 Water St., Carson, CA 90745 7.9 385285 3744613 Dominguez Elementary School 21250 Santa Fe Ave., Carson, CA 90810 10.7 387547 3744455 Elizabeth Hudson Elementary School 2335 Webster Ave, Long Beach, CA 90810 5.5 386913 3740724 James Garfield Elementary School 2240 Baltic Ave, Long Beach, CA 90810 5.2 387694 3740521 John Muir Elementary School 3038 Delta Ave, Long Beach, CA 90810 7.0 387916 3741941 Juan Rodriguez Cabrillo High School 2001 Santa Fe Ave, Long Beach, CA 90810 4.3 387013 3740052 Mary Bethune School 2101 San Gabriel Avenue, Long Beach, CA 90810 3.7 386731 3739865 Savannah Academy 2152 W Hill St, Long Beach, CA 90810 4.9 387079 3740317 St. Lucy School 2320 Cota Ave, Long Beach, CA 90810 5.5 387396 3740537 Sutter Elementary School 5075 Daisy Ave., Long Beach, CA 90805 12.2 388889 3746000 William Logan Stephens Middle School 1830 W Columbia St, Long Beach, CA 90810 6.4 387086 3741654 First Baptist Preschool and Daycare 2679 E Carson St, Carson, CA 90810 10.1 387219 3744170 Sanders Teeny Tiny Preschool 3211 Santa Fe Ave, Long Beach, CA 90810 7.9 387501 3742404 Little Greenwood Daycare 22114 S Carlerik Ave, Long Beach, CA 90810 10.1 387307 3743616 Blessing's Child Care 1422 E Bach St, Carson, CA 90745 7.3 384552 3743731 Santa Fe Convalescent 3294 Santa Fe Ave, Long Beach, CA 90810 7.9 387523 3742527 Notes: d. UTM Coordinates are in Zone 11, NAD 83.
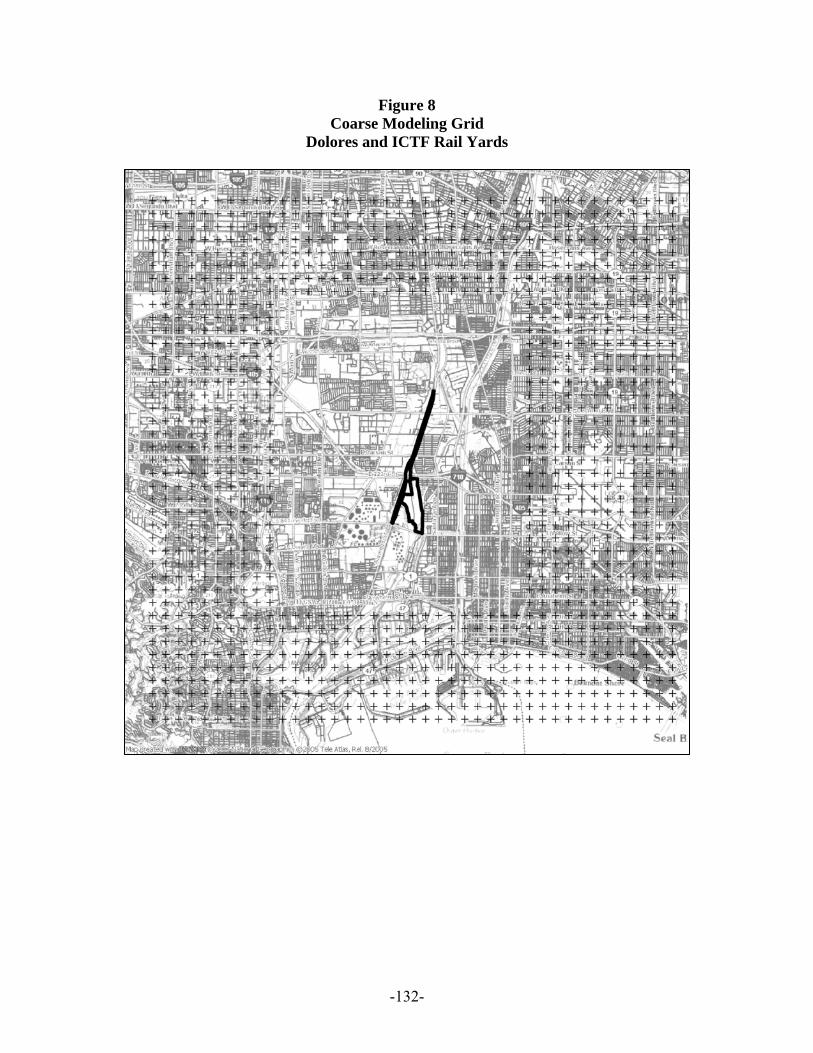
-132-
Figure 8 Coarse Modeling Grid
Dolores and ICTF Rail Yards
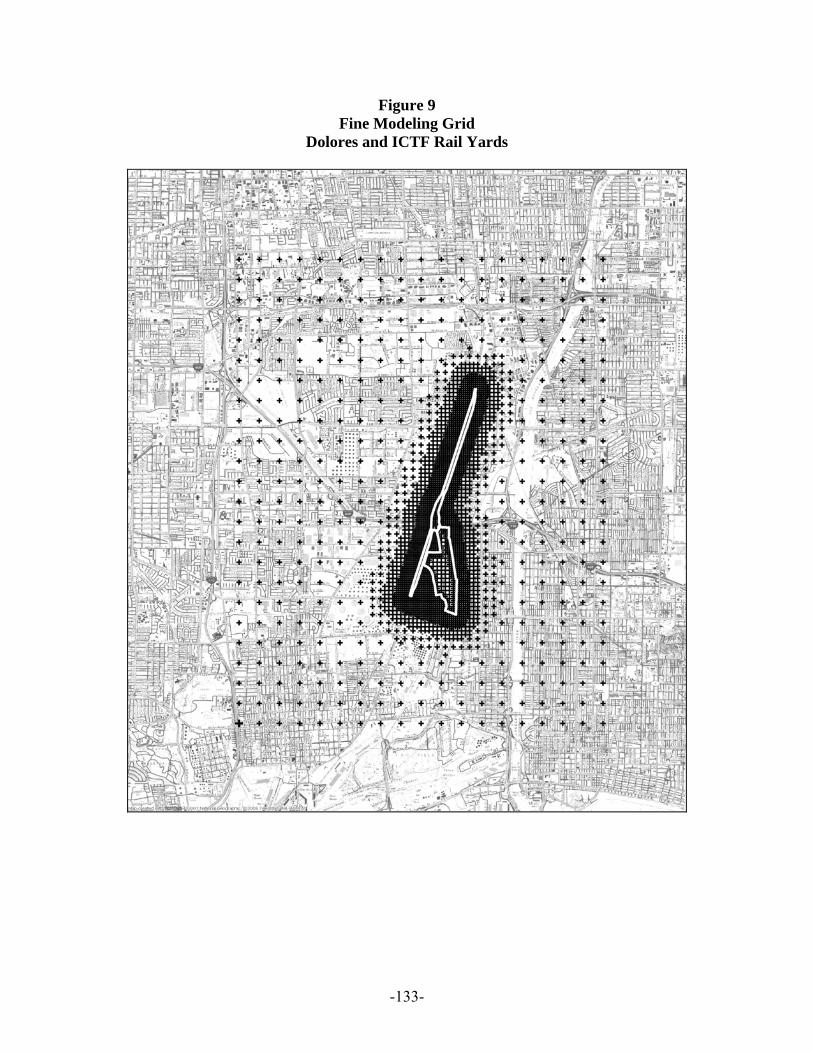
-133-
Figure 9 Fine Modeling Grid
Dolores and ICTF Rail Yards
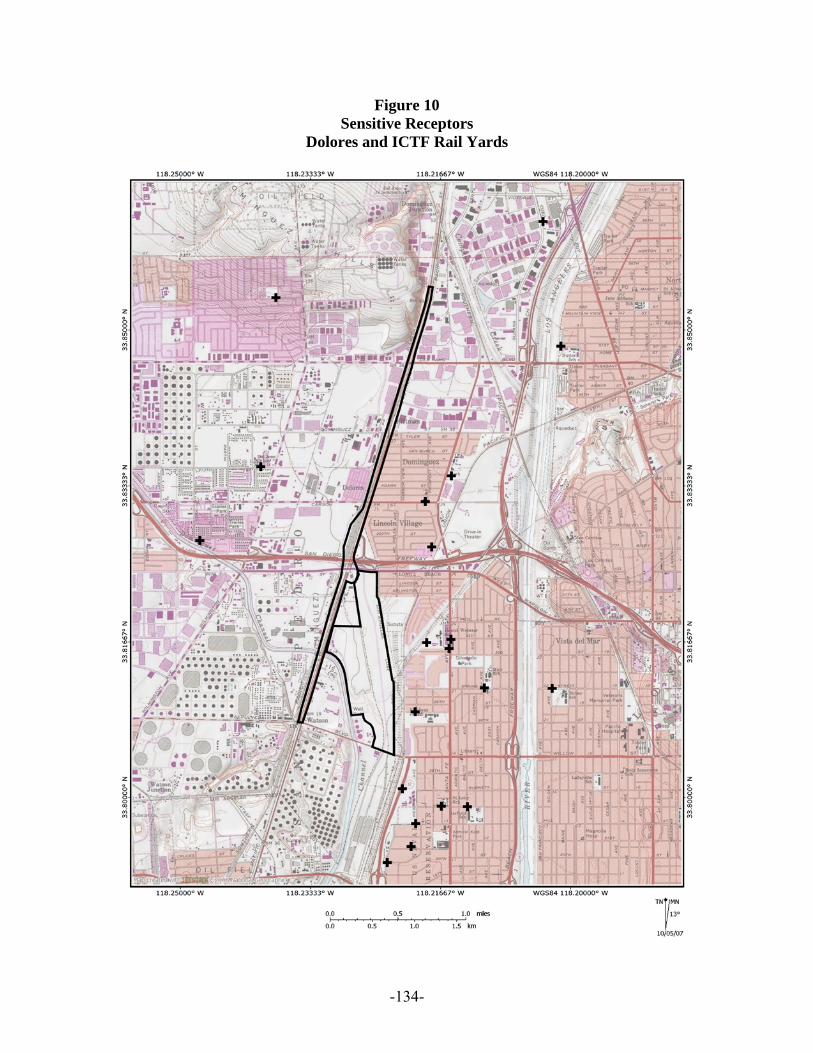
-134-
Figure 10 Sensitive Receptors
Dolores and ICTF Rail Yards

-135-
6. Dispersion Coefficients
Dispersion coefficients are used in air dispersion models to reflect the land use over
which the pollutants are transported. The area surrounding the nearby BNSF
Watson/Wilmington Rail Yard was divided into sectors to characterize the albedo,
surface roughness and Bowen ratio49. These parameters were provided along with the
meteorological data to the AERMET software. The resulting meteorological input file
allowed AERMOD to select appropriate dispersion coefficients during its simulation of
air dispersion. AERMOD also provides an urban input option to use the overall size of
the Standard Metropolitan Statistical Area that contains the emission source (i.e., the
Yard) in accounting for the urban heat island effect on the nocturnal convective boundary
layer height. If the option is not selected, AERMOD defaults to rural dispersion
coefficients. If the urban option is selected, but no surface roughness is specified (not to
be confused with the surface roughness parameters already specified for sectors around
the meteorological monitoring station and input to AERMET), AERMOD assigns a
default “urban” surface roughness of 1 meter. For Dolores/ICTF, AERMOD was run
with the urban option. If Dolores/ICTF were located further inland, based on CARB and
USEPA guidance,50 namely “For urban areas adjacent to or near other urban areas, or
part of urban corridors, the user should attempt to identify that part of the urban area
that will contribute to the urban heat island plume affecting the source,” the population
of the Los Angeles Standard Metropolitan Statistical Area (SMSA) would have been
considered appropriate for determining the urban heat island effect on the nocturnal
convective boundary layer height. Due to the proximity of San Pedro Bay, however, a
lower population was selected to avoid overestimation of the urban heat island effect.
The population of this SMSA is approximately 14,000,000, so in this case, a population
of one half this value, 7,000,000 was used. The surface roughness that characterizes this
area was set to the URBANOPT default of 1 m. See Appendix S for additional
discussion of this issue.
49 As previously discussed, a meteorological data set, prepared by ENVIRON, for the BNSF Watson/Wilmington Yard was used for this project. The albedo, surface roughness, and Bowen ratio were characterized for the area surrounding the Watson/Wilmington Yard. The albedo, surface roughness, and Bowen ratio for the ICTF will be similar to those calculated for Watson/Wilmington Yard, due to the close proximity of Yards. Therefore, the parameters for the Watson/Wilmington Yard were used for this project. 50 AERMOD Implementation Guide, September 27, 2005, http://www.epa.gov/scram001/7thconf/aermod/aermod_implmtn_guide.pdf
-136-
7. Building Downwash
Building downwash effects were considered for the Yards. Stack-tip downwash adjusted
the effective stack height downward following the methods of Briggs (1972) when the
stack exit velocity was less than 1.5 times the wind speed at stack top. The locomotives
are the only structures in the Yards of sufficiently large size and close enough proximity
to the modeled emission sources (i.e., their own stacks) to be entered into the Building
Profile Input Program (BPIP) with one set of dimensions for a “standard” locomotive
(24.2 m. long x 4.0 m. wide x 4.6 m. high).
B. Modeling Results
The AERMOD input and output files have been provided to CARB in an electronic format. C. Demographic Data Demographic data files have been provided to CARB in an electronic format. See
Appendix T for a description of the data.
-137-
PART X. REFERENCES Briggs, G.A. (1972). Discussion on Chimney Plumes in Neutral and Stable Surroundings. Atmos. Environ. 6:507-510. CARB (2000). Risk Reduction Plan to Reduce Particulate Matter Emissions from Diesel-Fueled Engines and Vehicles. (Available at www.arb.ca.gov/diesel/documents/rrpapp.htm) CARB (2003). Staff Report: Initial Statement of Reasons for Proposed Rule Making for the Airborne Toxic Control Measure for In-use Diesel-Fueled Transport Refrigeration Units (TRU) and TRU Generator Sets, and Facilities Where TRUs Operate. (Available at www.arb.ca.gov/regact/trude03/isor.pdf) CARB (2004). Roseville Rail Yard Study. (Available at www.arb.ca.gov/diesel/documents/rrstudy/rrstudy101404.pdf) CARB (2006). Health Risk Assessment Guidance for Rail Yards and Intermodal Facilities. (Available at www.arb.ca.gov/railyard/hra/071806hra_guideline.pdf) CARB (2006). EMFAC 2007Model. (Available at www.arb.ca.gov/msei/onroad/latest_version.htm) CARB (2006). OFFROAD2007 Model. (Available at www.arb.ca.gov/msei/offroad/offroad.htm) CARB (2006). Rail Yard Emission Inventory Methodology. (Available at http://www.arb.ca.gov/railyard/hra/0906ei_guideline.pdf) Ireson, R.G., M.J. Germer, L.A. Schmid (2005). Development of Detailed Rail yard Emissions to Capture Activity, Technology, and Operational Changes. Proceedings of the USEPA 14th Annual Emission Inventory Conference, Las Vegas NV, April 14, 2006. (Available at www.epa.gov/ttn/chief/conference/ei14/session8/ireson.pdf) Irwin, J.S. (1978). Proposed Criteria for Selection of Urban Versus Rural Dispersion Coefficients. Staff Report. Meteorology and Assessment Division, U.S. Environmental Protection Agency, Research Triangle Park, NC. (Air Docket Reference No. II-B-8 for the Fourth Conference on Air Quality Modeling). Nappo, C. J. et al. (1982). The Workshop on the Representativeness of Meteorological Observations, June 1981, Boulder, CO. Bulletin Amer. Meteor. Soc., Vol. 63, No. 7, pp. 761-764. American Meteorological Society, Boston, MA. Trinity Consultants (2005). Air Emission Inventory and Regulatory Analysis for Dolores Yard. Trinity Consultants (2005). Air Emission Inventory and Regulatory Analysis for ICTF Yard.
-138-
USEPA (1986). Guideline on Air Quality Models (Revised). U.S. EPA-45/2-78-027R, Office of Air Quality Planning and Standards, Research Triangle Park, NC. USEPA (1987a). Supplement A to the Guideline on Air Quality Models (Revised). Office of Air Quality Planning and Standards, Research Triangle Park, NC. USEPA (1987b). Ambient Monitoring Guidelines for Prevention of Significant Deterioration (PSD). Office of Air Quality Planning and Standards, and Office of Research and Development, Research Triangle Park, NC. USEPA (1995). Compilation of Air Pollutant Emission Factors, Volume 1: Stationary Point and Area Sources. (Available at www.epa.gov/ttn/chief/ap42/) USEPA (1998). Locomotive Emission Standards -- Regulatory Support Document. (Available at www.epa.gov/otaq/regs/nonroad/locomotv/frm/locorsd.pdf). USEPA (2000). Meteorological Monitoring Guidance for Regulatory Modeling Applications. Publication No. EPA-454/R-99-005. Office of Air Quality Planning & Standards, Research Triangle Park, NC. (PB 2001-103606) (Available at www.epa.gov/scram001/) USEPA (2004). Final Regulatory Impact Analysis: Control of Emissions from Non-Road Diesel Engines. U.S. EPA 420-R-04-007. Office of Air Quality Planning and Standards, Assessment and Standards Division, Research Triangle Park, NC. USEPA (2005). AERMOD Implementation Guide. (Available at www.epa.gov/scram001/7thconf/aermod/aermod_implmtn_guide.pdf). Wong, W (undated). Changes to the Locomotive Inventory. Draft OFFROAD Modeling Change Technical Memo.

APPENDIX A
LOCOMOTIVE DATA
APP-1

APPENDIX A-1
LOCOMOTIVE MODEL, TIER, AND AUTO-START/STOP TECHNOLOGY
FREQUENCY BY TRAIN TYPE
APP-2
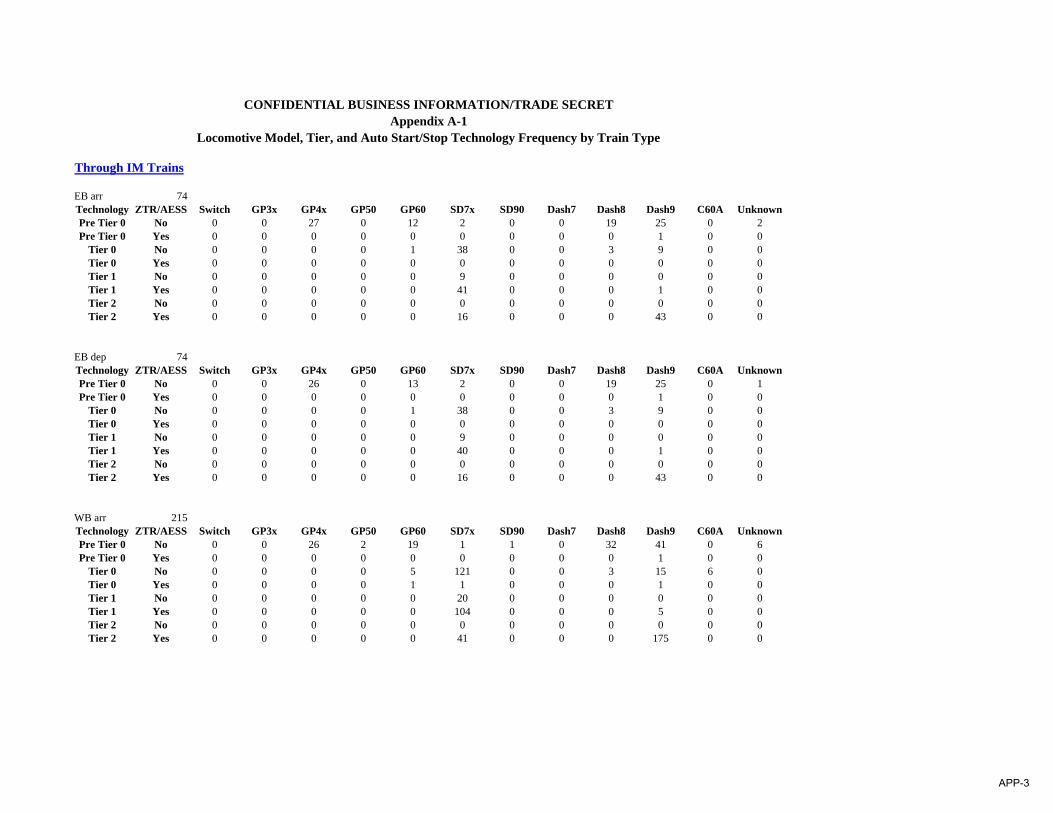
Through IM Trains
EB arr 74Technology ZTR/AESS Switch GP3x GP4x GP50 GP60 SD7x SD90 Dash7 Dash8 Dash9 C60A UnknownPre Tier 0 No 0 0 27 0 12 2 0 0 19 25 0 2Pre Tier 0 Yes 0 0 0 0 0 0 0 0 0 1 0 0
Tier 0 No 0 0 0 0 1 38 0 0 3 9 0 0Tier 0 Yes 0 0 0 0 0 0 0 0 0 0 0 0Tier 1 No 0 0 0 0 0 9 0 0 0 0 0 0Tier 1 Yes 0 0 0 0 0 41 0 0 0 1 0 0Tier 2 No 0 0 0 0 0 0 0 0 0 0 0 0Tier 2 Yes 0 0 0 0 0 16 0 0 0 43 0 0
EB dep 74Technology ZTR/AESS Switch GP3x GP4x GP50 GP60 SD7x SD90 Dash7 Dash8 Dash9 C60A UnknownPre Tier 0 No 0 0 26 0 13 2 0 0 19 25 0 1Pre Tier 0 Yes 0 0 0 0 0 0 0 0 0 1 0 0
Tier 0 No 0 0 0 0 1 38 0 0 3 9 0 0Tier 0 Yes 0 0 0 0 0 0 0 0 0 0 0 0Tier 1 No 0 0 0 0 0 9 0 0 0 0 0 0Tier 1 Yes 0 0 0 0 0 40 0 0 0 1 0 0Tier 2 No 0 0 0 0 0 0 0 0 0 0 0 0Tier 2 Yes 0 0 0 0 0 16 0 0 0 43 0 0
WB arr 215Technology ZTR/AESS Switch GP3x GP4x GP50 GP60 SD7x SD90 Dash7 Dash8 Dash9 C60A UnknownPre Tier 0 No 0 0 26 2 19 1 1 0 32 41 0 6Pre Tier 0 Yes 0 0 0 0 0 0 0 0 0 1 0 0
Tier 0 No 0 0 0 0 5 121 0 0 3 15 6 0Tier 0 Yes 0 0 0 0 1 1 0 0 0 1 0 0Tier 1 No 0 0 0 0 0 20 0 0 0 0 0 0Tier 1 Yes 0 0 0 0 0 104 0 0 0 5 0 0Tier 2 No 0 0 0 0 0 0 0 0 0 0 0 0Tier 2 Yes 0 0 0 0 0 41 0 0 0 175 0 0
CONFIDENTIAL BUSINESS INFORMATION/TRADE SECRETAppendix A-1
Locomotive Model, Tier, and Auto Start/Stop Technology Frequency by Train Type
APP-3
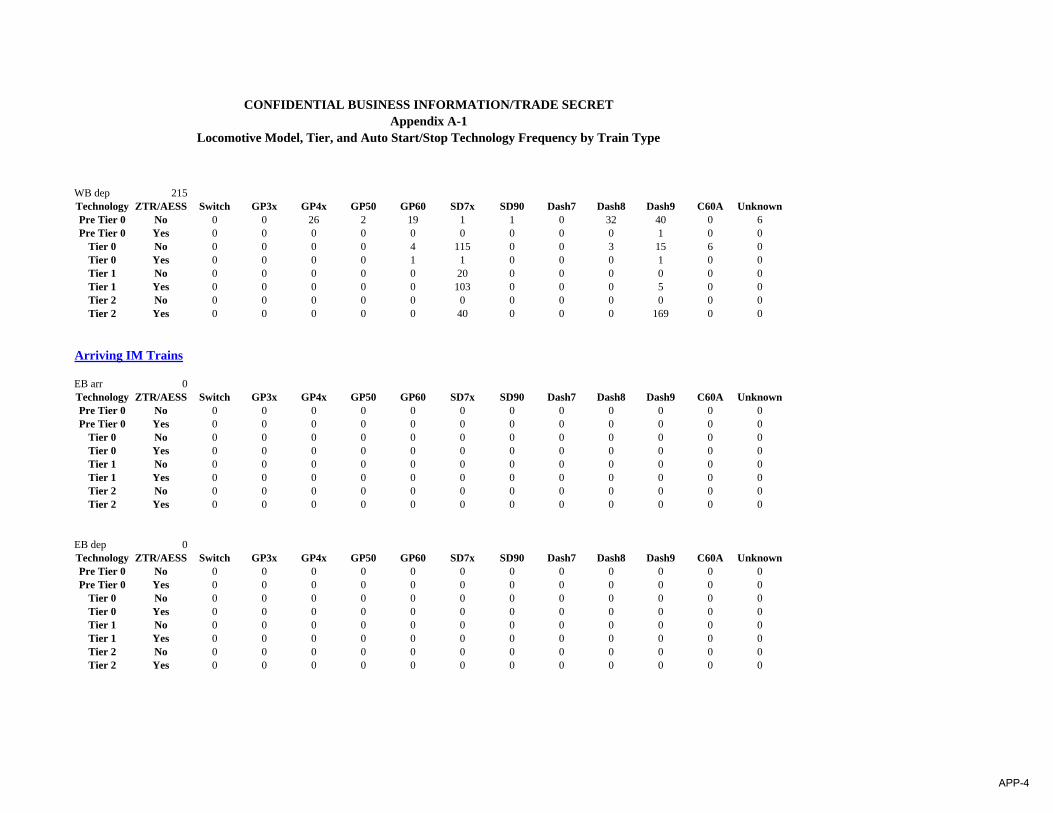
CONFIDENTIAL BUSINESS INFORMATION/TRADE SECRETAppendix A-1
Locomotive Model, Tier, and Auto Start/Stop Technology Frequency by Train Type
WB dep 215Technology ZTR/AESS Switch GP3x GP4x GP50 GP60 SD7x SD90 Dash7 Dash8 Dash9 C60A UnknownPre Tier 0 No 0 0 26 2 19 1 1 0 32 40 0 6Pre Tier 0 Yes 0 0 0 0 0 0 0 0 0 1 0 0
Tier 0 No 0 0 0 0 4 115 0 0 3 15 6 0Tier 0 Yes 0 0 0 0 1 1 0 0 0 1 0 0Tier 1 No 0 0 0 0 0 20 0 0 0 0 0 0Tier 1 Yes 0 0 0 0 0 103 0 0 0 5 0 0Tier 2 No 0 0 0 0 0 0 0 0 0 0 0 0Tier 2 Yes 0 0 0 0 0 40 0 0 0 169 0 0
Arriving IM Trains
EB arr 0Technology ZTR/AESS Switch GP3x GP4x GP50 GP60 SD7x SD90 Dash7 Dash8 Dash9 C60A UnknownPre Tier 0 No 0 0 0 0 0 0 0 0 0 0 0 0Pre Tier 0 Yes 0 0 0 0 0 0 0 0 0 0 0 0
Tier 0 No 0 0 0 0 0 0 0 0 0 0 0 0Tier 0 Yes 0 0 0 0 0 0 0 0 0 0 0 0Tier 1 No 0 0 0 0 0 0 0 0 0 0 0 0Tier 1 Yes 0 0 0 0 0 0 0 0 0 0 0 0Tier 2 No 0 0 0 0 0 0 0 0 0 0 0 0Tier 2 Yes 0 0 0 0 0 0 0 0 0 0 0 0
EB dep 0Technology ZTR/AESS Switch GP3x GP4x GP50 GP60 SD7x SD90 Dash7 Dash8 Dash9 C60A UnknownPre Tier 0 No 0 0 0 0 0 0 0 0 0 0 0 0Pre Tier 0 Yes 0 0 0 0 0 0 0 0 0 0 0 0
Tier 0 No 0 0 0 0 0 0 0 0 0 0 0 0Tier 0 Yes 0 0 0 0 0 0 0 0 0 0 0 0Tier 1 No 0 0 0 0 0 0 0 0 0 0 0 0Tier 1 Yes 0 0 0 0 0 0 0 0 0 0 0 0Tier 2 No 0 0 0 0 0 0 0 0 0 0 0 0Tier 2 Yes 0 0 0 0 0 0 0 0 0 0 0 0
APP-4
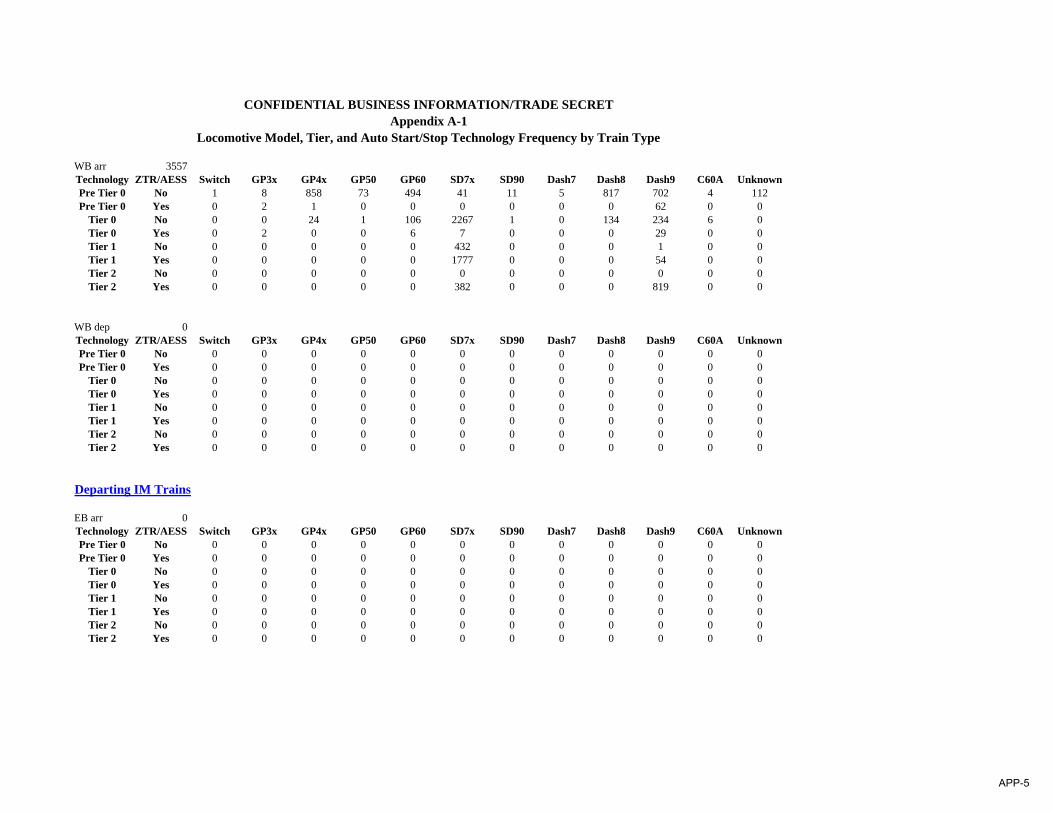
CONFIDENTIAL BUSINESS INFORMATION/TRADE SECRETAppendix A-1
Locomotive Model, Tier, and Auto Start/Stop Technology Frequency by Train Type
WB arr 3557Technology ZTR/AESS Switch GP3x GP4x GP50 GP60 SD7x SD90 Dash7 Dash8 Dash9 C60A UnknownPre Tier 0 No 1 8 858 73 494 41 11 5 817 702 4 112Pre Tier 0 Yes 0 2 1 0 0 0 0 0 0 62 0 0
Tier 0 No 0 0 24 1 106 2267 1 0 134 234 6 0Tier 0 Yes 0 2 0 0 6 7 0 0 0 29 0 0Tier 1 No 0 0 0 0 0 432 0 0 0 1 0 0Tier 1 Yes 0 0 0 0 0 1777 0 0 0 54 0 0Tier 2 No 0 0 0 0 0 0 0 0 0 0 0 0Tier 2 Yes 0 0 0 0 0 382 0 0 0 819 0 0
WB dep 0Technology ZTR/AESS Switch GP3x GP4x GP50 GP60 SD7x SD90 Dash7 Dash8 Dash9 C60A UnknownPre Tier 0 No 0 0 0 0 0 0 0 0 0 0 0 0Pre Tier 0 Yes 0 0 0 0 0 0 0 0 0 0 0 0
Tier 0 No 0 0 0 0 0 0 0 0 0 0 0 0Tier 0 Yes 0 0 0 0 0 0 0 0 0 0 0 0Tier 1 No 0 0 0 0 0 0 0 0 0 0 0 0Tier 1 Yes 0 0 0 0 0 0 0 0 0 0 0 0Tier 2 No 0 0 0 0 0 0 0 0 0 0 0 0Tier 2 Yes 0 0 0 0 0 0 0 0 0 0 0 0
Departing IM Trains
EB arr 0Technology ZTR/AESS Switch GP3x GP4x GP50 GP60 SD7x SD90 Dash7 Dash8 Dash9 C60A UnknownPre Tier 0 No 0 0 0 0 0 0 0 0 0 0 0 0Pre Tier 0 Yes 0 0 0 0 0 0 0 0 0 0 0 0
Tier 0 No 0 0 0 0 0 0 0 0 0 0 0 0Tier 0 Yes 0 0 0 0 0 0 0 0 0 0 0 0Tier 1 No 0 0 0 0 0 0 0 0 0 0 0 0Tier 1 Yes 0 0 0 0 0 0 0 0 0 0 0 0Tier 2 No 0 0 0 0 0 0 0 0 0 0 0 0Tier 2 Yes 0 0 0 0 0 0 0 0 0 0 0 0
APP-5
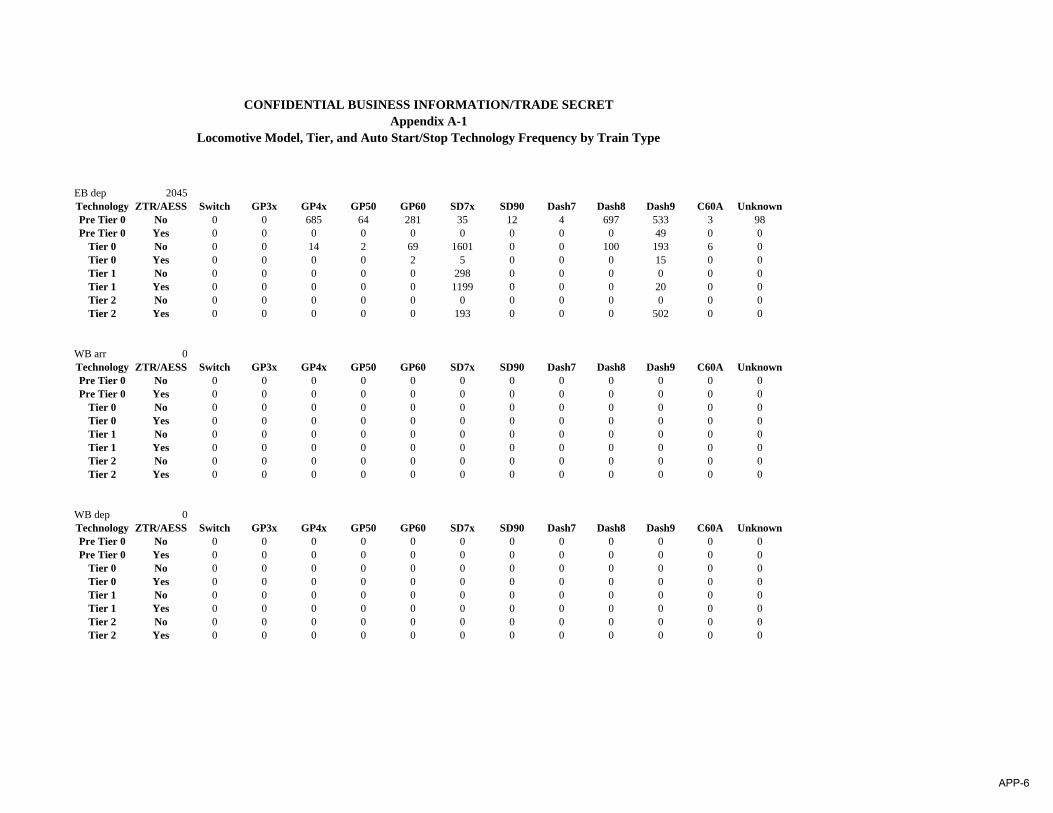
CONFIDENTIAL BUSINESS INFORMATION/TRADE SECRETAppendix A-1
Locomotive Model, Tier, and Auto Start/Stop Technology Frequency by Train Type
EB dep 2045Technology ZTR/AESS Switch GP3x GP4x GP50 GP60 SD7x SD90 Dash7 Dash8 Dash9 C60A UnknownPre Tier 0 No 0 0 685 64 281 35 12 4 697 533 3 98Pre Tier 0 Yes 0 0 0 0 0 0 0 0 0 49 0 0
Tier 0 No 0 0 14 2 69 1601 0 0 100 193 6 0Tier 0 Yes 0 0 0 0 2 5 0 0 0 15 0 0Tier 1 No 0 0 0 0 0 298 0 0 0 0 0 0Tier 1 Yes 0 0 0 0 0 1199 0 0 0 20 0 0Tier 2 No 0 0 0 0 0 0 0 0 0 0 0 0Tier 2 Yes 0 0 0 0 0 193 0 0 0 502 0 0
WB arr 0Technology ZTR/AESS Switch GP3x GP4x GP50 GP60 SD7x SD90 Dash7 Dash8 Dash9 C60A UnknownPre Tier 0 No 0 0 0 0 0 0 0 0 0 0 0 0Pre Tier 0 Yes 0 0 0 0 0 0 0 0 0 0 0 0
Tier 0 No 0 0 0 0 0 0 0 0 0 0 0 0Tier 0 Yes 0 0 0 0 0 0 0 0 0 0 0 0Tier 1 No 0 0 0 0 0 0 0 0 0 0 0 0Tier 1 Yes 0 0 0 0 0 0 0 0 0 0 0 0Tier 2 No 0 0 0 0 0 0 0 0 0 0 0 0Tier 2 Yes 0 0 0 0 0 0 0 0 0 0 0 0
WB dep 0Technology ZTR/AESS Switch GP3x GP4x GP50 GP60 SD7x SD90 Dash7 Dash8 Dash9 C60A UnknownPre Tier 0 No 0 0 0 0 0 0 0 0 0 0 0 0Pre Tier 0 Yes 0 0 0 0 0 0 0 0 0 0 0 0
Tier 0 No 0 0 0 0 0 0 0 0 0 0 0 0Tier 0 Yes 0 0 0 0 0 0 0 0 0 0 0 0Tier 1 No 0 0 0 0 0 0 0 0 0 0 0 0Tier 1 Yes 0 0 0 0 0 0 0 0 0 0 0 0Tier 2 No 0 0 0 0 0 0 0 0 0 0 0 0Tier 2 Yes 0 0 0 0 0 0 0 0 0 0 0 0
APP-6
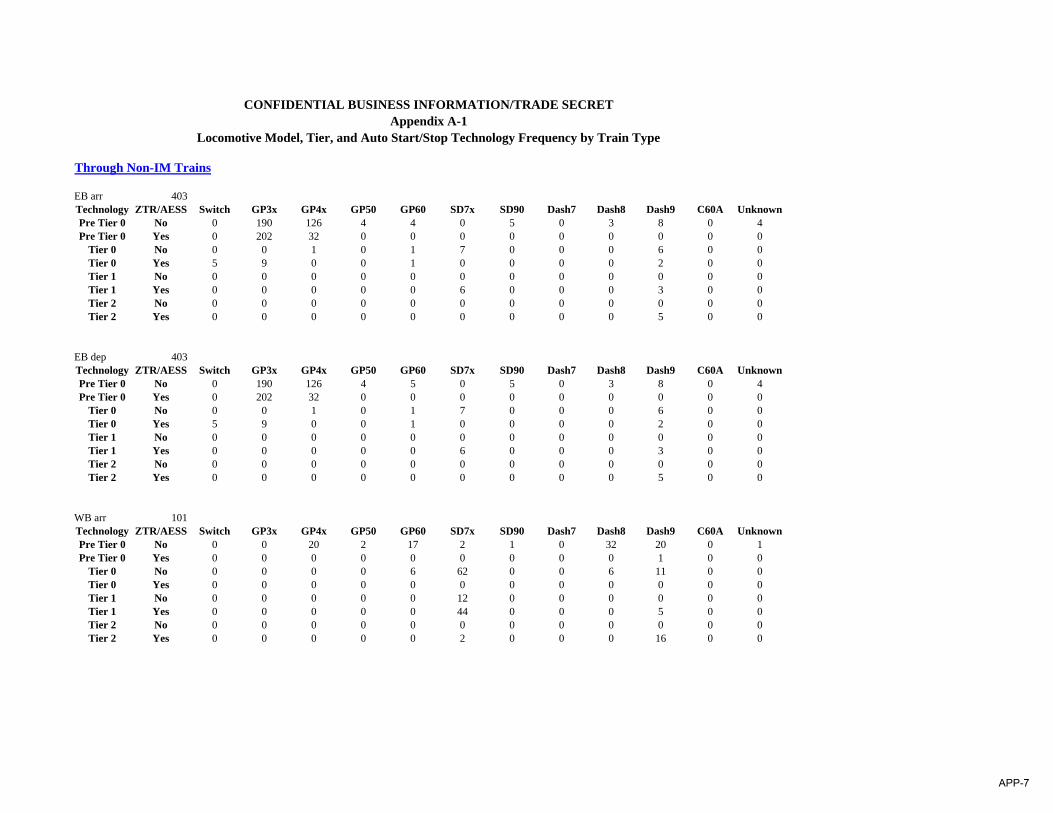
CONFIDENTIAL BUSINESS INFORMATION/TRADE SECRETAppendix A-1
Locomotive Model, Tier, and Auto Start/Stop Technology Frequency by Train Type
Through Non-IM Trains
EB arr 403Technology ZTR/AESS Switch GP3x GP4x GP50 GP60 SD7x SD90 Dash7 Dash8 Dash9 C60A UnknownPre Tier 0 No 0 190 126 4 4 0 5 0 3 8 0 4Pre Tier 0 Yes 0 202 32 0 0 0 0 0 0 0 0 0
Tier 0 No 0 0 1 0 1 7 0 0 0 6 0 0Tier 0 Yes 5 9 0 0 1 0 0 0 0 2 0 0Tier 1 No 0 0 0 0 0 0 0 0 0 0 0 0Tier 1 Yes 0 0 0 0 0 6 0 0 0 3 0 0Tier 2 No 0 0 0 0 0 0 0 0 0 0 0 0Tier 2 Yes 0 0 0 0 0 0 0 0 0 5 0 0
EB dep 403Technology ZTR/AESS Switch GP3x GP4x GP50 GP60 SD7x SD90 Dash7 Dash8 Dash9 C60A UnknownPre Tier 0 No 0 190 126 4 5 0 5 0 3 8 0 4Pre Tier 0 Yes 0 202 32 0 0 0 0 0 0 0 0 0
Tier 0 No 0 0 1 0 1 7 0 0 0 6 0 0Tier 0 Yes 5 9 0 0 1 0 0 0 0 2 0 0Tier 1 No 0 0 0 0 0 0 0 0 0 0 0 0Tier 1 Yes 0 0 0 0 0 6 0 0 0 3 0 0Tier 2 No 0 0 0 0 0 0 0 0 0 0 0 0Tier 2 Yes 0 0 0 0 0 0 0 0 0 5 0 0
WB arr 101Technology ZTR/AESS Switch GP3x GP4x GP50 GP60 SD7x SD90 Dash7 Dash8 Dash9 C60A UnknownPre Tier 0 No 0 0 20 2 17 2 1 0 32 20 0 1Pre Tier 0 Yes 0 0 0 0 0 0 0 0 0 1 0 0
Tier 0 No 0 0 0 0 6 62 0 0 6 11 0 0Tier 0 Yes 0 0 0 0 0 0 0 0 0 0 0 0Tier 1 No 0 0 0 0 0 12 0 0 0 0 0 0Tier 1 Yes 0 0 0 0 0 44 0 0 0 5 0 0Tier 2 No 0 0 0 0 0 0 0 0 0 0 0 0Tier 2 Yes 0 0 0 0 0 2 0 0 0 16 0 0
APP-7
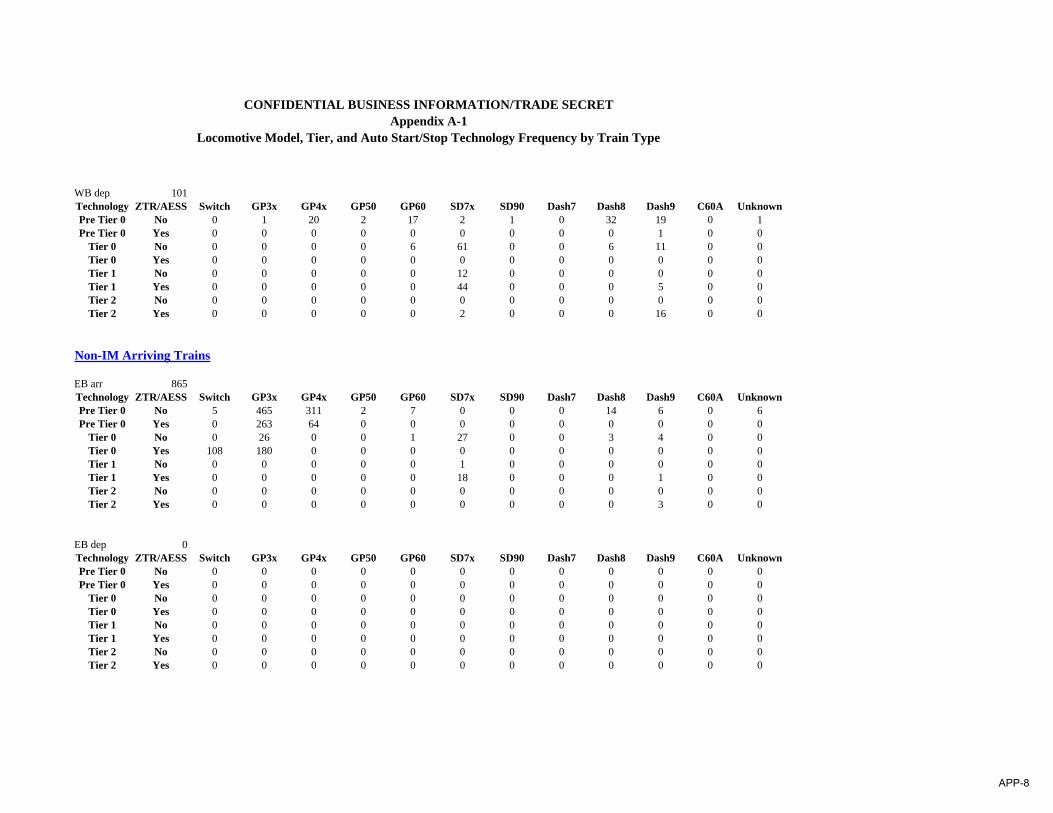
CONFIDENTIAL BUSINESS INFORMATION/TRADE SECRETAppendix A-1
Locomotive Model, Tier, and Auto Start/Stop Technology Frequency by Train Type
WB dep 101Technology ZTR/AESS Switch GP3x GP4x GP50 GP60 SD7x SD90 Dash7 Dash8 Dash9 C60A UnknownPre Tier 0 No 0 1 20 2 17 2 1 0 32 19 0 1Pre Tier 0 Yes 0 0 0 0 0 0 0 0 0 1 0 0
Tier 0 No 0 0 0 0 6 61 0 0 6 11 0 0Tier 0 Yes 0 0 0 0 0 0 0 0 0 0 0 0Tier 1 No 0 0 0 0 0 12 0 0 0 0 0 0Tier 1 Yes 0 0 0 0 0 44 0 0 0 5 0 0Tier 2 No 0 0 0 0 0 0 0 0 0 0 0 0Tier 2 Yes 0 0 0 0 0 2 0 0 0 16 0 0
Non-IM Arriving Trains
EB arr 865Technology ZTR/AESS Switch GP3x GP4x GP50 GP60 SD7x SD90 Dash7 Dash8 Dash9 C60A UnknownPre Tier 0 No 5 465 311 2 7 0 0 0 14 6 0 6Pre Tier 0 Yes 0 263 64 0 0 0 0 0 0 0 0 0
Tier 0 No 0 26 0 0 1 27 0 0 3 4 0 0Tier 0 Yes 108 180 0 0 0 0 0 0 0 0 0 0Tier 1 No 0 0 0 0 0 1 0 0 0 0 0 0Tier 1 Yes 0 0 0 0 0 18 0 0 0 1 0 0Tier 2 No 0 0 0 0 0 0 0 0 0 0 0 0Tier 2 Yes 0 0 0 0 0 0 0 0 0 3 0 0
EB dep 0Technology ZTR/AESS Switch GP3x GP4x GP50 GP60 SD7x SD90 Dash7 Dash8 Dash9 C60A UnknownPre Tier 0 No 0 0 0 0 0 0 0 0 0 0 0 0Pre Tier 0 Yes 0 0 0 0 0 0 0 0 0 0 0 0
Tier 0 No 0 0 0 0 0 0 0 0 0 0 0 0Tier 0 Yes 0 0 0 0 0 0 0 0 0 0 0 0Tier 1 No 0 0 0 0 0 0 0 0 0 0 0 0Tier 1 Yes 0 0 0 0 0 0 0 0 0 0 0 0Tier 2 No 0 0 0 0 0 0 0 0 0 0 0 0Tier 2 Yes 0 0 0 0 0 0 0 0 0 0 0 0
APP-8
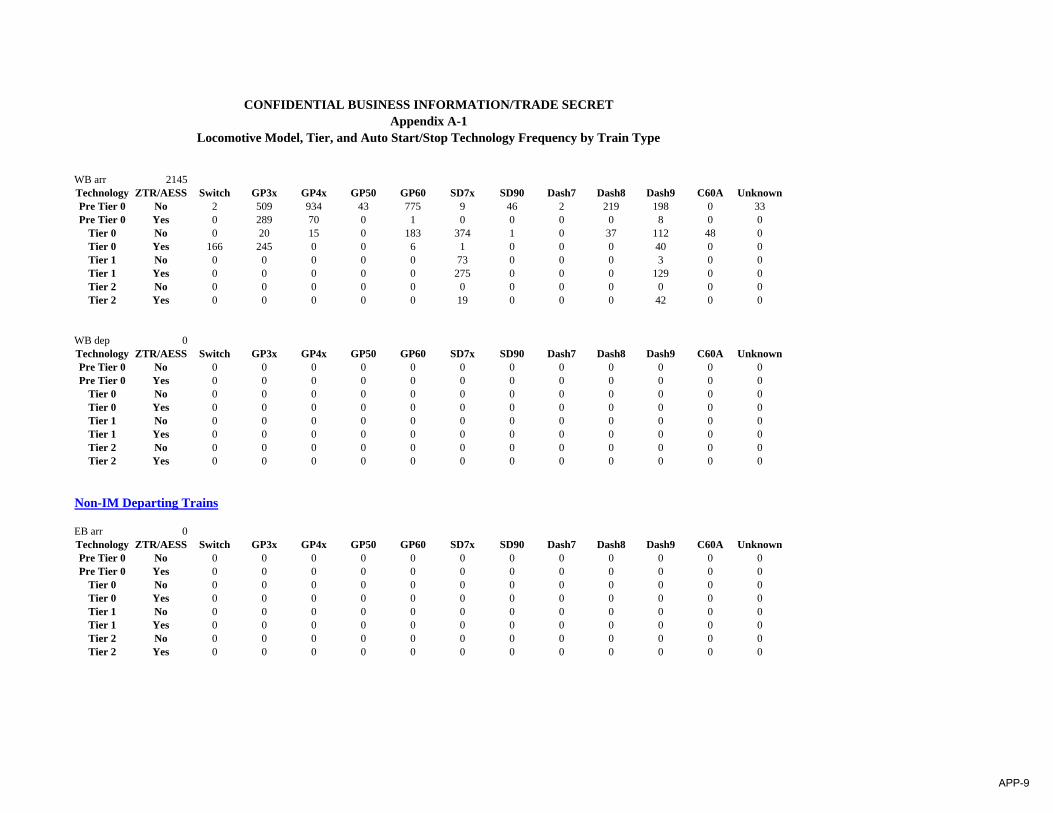
CONFIDENTIAL BUSINESS INFORMATION/TRADE SECRETAppendix A-1
Locomotive Model, Tier, and Auto Start/Stop Technology Frequency by Train Type
WB arr 2145Technology ZTR/AESS Switch GP3x GP4x GP50 GP60 SD7x SD90 Dash7 Dash8 Dash9 C60A UnknownPre Tier 0 No 2 509 934 43 775 9 46 2 219 198 0 33Pre Tier 0 Yes 0 289 70 0 1 0 0 0 0 8 0 0
Tier 0 No 0 20 15 0 183 374 1 0 37 112 48 0Tier 0 Yes 166 245 0 0 6 1 0 0 0 40 0 0Tier 1 No 0 0 0 0 0 73 0 0 0 3 0 0Tier 1 Yes 0 0 0 0 0 275 0 0 0 129 0 0Tier 2 No 0 0 0 0 0 0 0 0 0 0 0 0Tier 2 Yes 0 0 0 0 0 19 0 0 0 42 0 0
WB dep 0Technology ZTR/AESS Switch GP3x GP4x GP50 GP60 SD7x SD90 Dash7 Dash8 Dash9 C60A UnknownPre Tier 0 No 0 0 0 0 0 0 0 0 0 0 0 0Pre Tier 0 Yes 0 0 0 0 0 0 0 0 0 0 0 0
Tier 0 No 0 0 0 0 0 0 0 0 0 0 0 0Tier 0 Yes 0 0 0 0 0 0 0 0 0 0 0 0Tier 1 No 0 0 0 0 0 0 0 0 0 0 0 0Tier 1 Yes 0 0 0 0 0 0 0 0 0 0 0 0Tier 2 No 0 0 0 0 0 0 0 0 0 0 0 0Tier 2 Yes 0 0 0 0 0 0 0 0 0 0 0 0
Non-IM Departing Trains
EB arr 0Technology ZTR/AESS Switch GP3x GP4x GP50 GP60 SD7x SD90 Dash7 Dash8 Dash9 C60A UnknownPre Tier 0 No 0 0 0 0 0 0 0 0 0 0 0 0Pre Tier 0 Yes 0 0 0 0 0 0 0 0 0 0 0 0
Tier 0 No 0 0 0 0 0 0 0 0 0 0 0 0Tier 0 Yes 0 0 0 0 0 0 0 0 0 0 0 0Tier 1 No 0 0 0 0 0 0 0 0 0 0 0 0Tier 1 Yes 0 0 0 0 0 0 0 0 0 0 0 0Tier 2 No 0 0 0 0 0 0 0 0 0 0 0 0Tier 2 Yes 0 0 0 0 0 0 0 0 0 0 0 0
APP-9
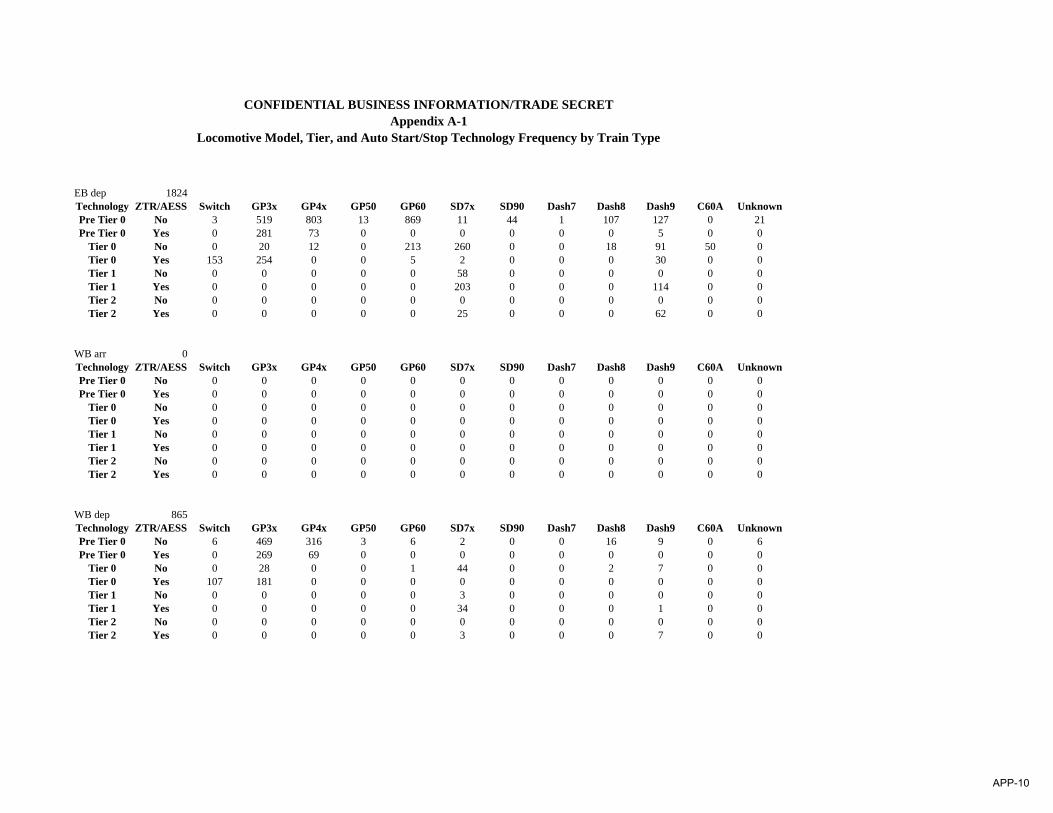
CONFIDENTIAL BUSINESS INFORMATION/TRADE SECRETAppendix A-1
Locomotive Model, Tier, and Auto Start/Stop Technology Frequency by Train Type
EB dep 1824Technology ZTR/AESS Switch GP3x GP4x GP50 GP60 SD7x SD90 Dash7 Dash8 Dash9 C60A UnknownPre Tier 0 No 3 519 803 13 869 11 44 1 107 127 0 21Pre Tier 0 Yes 0 281 73 0 0 0 0 0 0 5 0 0
Tier 0 No 0 20 12 0 213 260 0 0 18 91 50 0Tier 0 Yes 153 254 0 0 5 2 0 0 0 30 0 0Tier 1 No 0 0 0 0 0 58 0 0 0 0 0 0Tier 1 Yes 0 0 0 0 0 203 0 0 0 114 0 0Tier 2 No 0 0 0 0 0 0 0 0 0 0 0 0Tier 2 Yes 0 0 0 0 0 25 0 0 0 62 0 0
WB arr 0Technology ZTR/AESS Switch GP3x GP4x GP50 GP60 SD7x SD90 Dash7 Dash8 Dash9 C60A UnknownPre Tier 0 No 0 0 0 0 0 0 0 0 0 0 0 0Pre Tier 0 Yes 0 0 0 0 0 0 0 0 0 0 0 0
Tier 0 No 0 0 0 0 0 0 0 0 0 0 0 0Tier 0 Yes 0 0 0 0 0 0 0 0 0 0 0 0Tier 1 No 0 0 0 0 0 0 0 0 0 0 0 0Tier 1 Yes 0 0 0 0 0 0 0 0 0 0 0 0Tier 2 No 0 0 0 0 0 0 0 0 0 0 0 0Tier 2 Yes 0 0 0 0 0 0 0 0 0 0 0 0
WB dep 865Technology ZTR/AESS Switch GP3x GP4x GP50 GP60 SD7x SD90 Dash7 Dash8 Dash9 C60A UnknownPre Tier 0 No 6 469 316 3 6 2 0 0 16 9 0 6Pre Tier 0 Yes 0 269 69 0 0 0 0 0 0 0 0 0
Tier 0 No 0 28 0 0 1 44 0 0 2 7 0 0Tier 0 Yes 107 181 0 0 0 0 0 0 0 0 0 0Tier 1 No 0 0 0 0 0 3 0 0 0 0 0 0Tier 1 Yes 0 0 0 0 0 34 0 0 0 1 0 0Tier 2 No 0 0 0 0 0 0 0 0 0 0 0 0Tier 2 Yes 0 0 0 0 0 3 0 0 0 7 0 0
APP-10

CONFIDENTIAL BUSINESS INFORMATION/TRADE SECRETAppendix A-1
Locomotive Model, Tier, and Auto Start/Stop Technology Frequency by Train Type
Power Moves Through
EB arr 17Technology ZTR/AESS Switch GP3x GP4x GP50 GP60 SD7x SD90 Dash7 Dash8 Dash9 C60A UnknownPre Tier 0 No 0 0 14 2 8 0 0 0 1 2 0 0Pre Tier 0 Yes 0 0 0 0 0 0 0 0 0 0 0 0
Tier 0 No 0 0 0 0 1 8 1 0 0 3 1 0Tier 0 Yes 0 0 0 0 0 0 0 0 0 0 0 0Tier 1 No 0 0 0 0 0 1 0 0 0 0 0 0Tier 1 Yes 0 0 0 0 0 3 0 0 0 0 0 0Tier 2 No 0 0 0 0 0 0 0 0 0 0 0 0Tier 2 Yes 0 0 0 0 0 0 0 0 0 5 0 0
EB dep 17Technology ZTR/AESS Switch GP3x GP4x GP50 GP60 SD7x SD90 Dash7 Dash8 Dash9 C60A UnknownPre Tier 0 No 0 0 13 2 8 0 0 0 1 2 0 0Pre Tier 0 Yes 0 0 0 0 0 0 0 0 0 0 0 0
Tier 0 No 0 0 0 0 0 6 1 0 0 3 1 0Tier 0 Yes 0 0 0 0 0 0 0 0 0 0 0 0Tier 1 No 0 0 0 0 0 0 0 0 0 0 0 0Tier 1 Yes 0 0 0 0 0 3 0 0 0 0 0 0Tier 2 No 0 0 0 0 0 0 0 0 0 0 0 0Tier 2 Yes 0 0 0 0 0 0 0 0 0 5 0 0
WB arr 7Technology ZTR/AESS Switch GP3x GP4x GP50 GP60 SD7x SD90 Dash7 Dash8 Dash9 C60A UnknownPre Tier 0 No 0 0 0 0 4 0 0 0 1 4 0 0Pre Tier 0 Yes 0 0 0 0 0 0 0 0 0 0 0 0
Tier 0 No 0 0 0 0 0 3 0 0 0 0 0 0Tier 0 Yes 0 0 0 0 0 0 0 0 0 0 0 0Tier 1 No 0 0 0 0 0 0 0 0 0 0 0 0Tier 1 Yes 0 0 0 0 0 2 0 0 0 0 0 0Tier 2 No 0 0 0 0 0 0 0 0 0 0 0 0Tier 2 Yes 0 0 0 0 0 0 0 0 0 2 0 0
APP-11
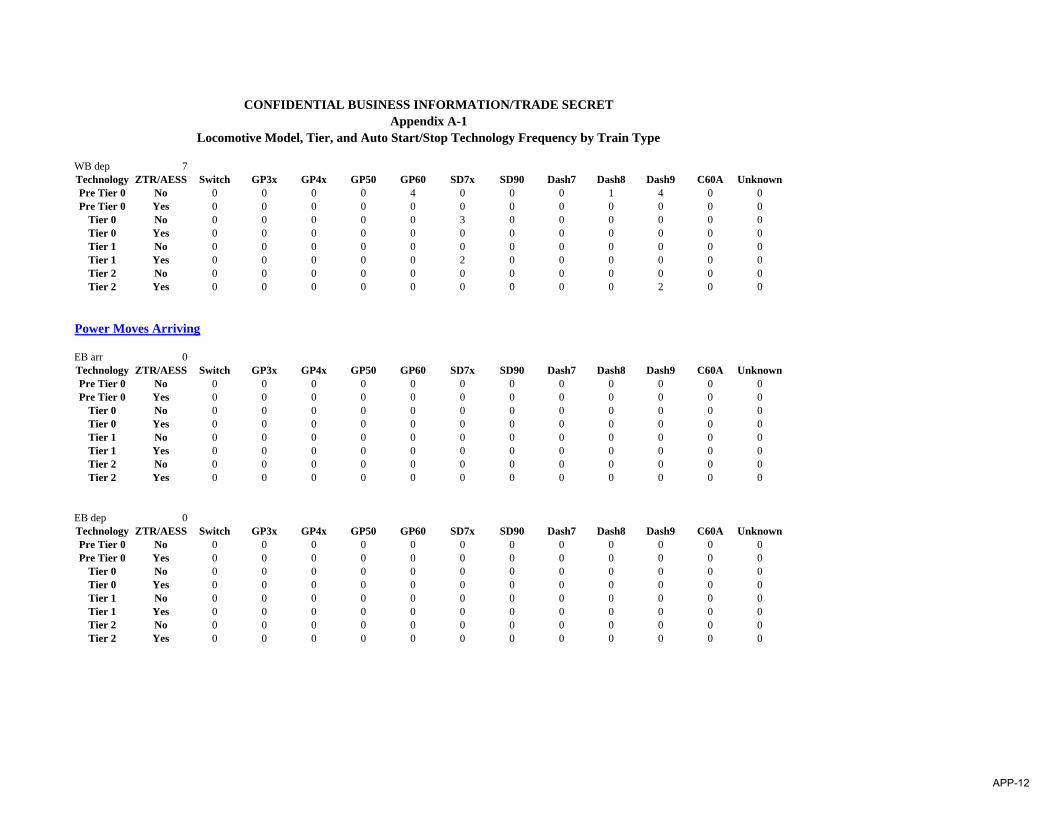
CONFIDENTIAL BUSINESS INFORMATION/TRADE SECRETAppendix A-1
Locomotive Model, Tier, and Auto Start/Stop Technology Frequency by Train Type
WB dep 7Technology ZTR/AESS Switch GP3x GP4x GP50 GP60 SD7x SD90 Dash7 Dash8 Dash9 C60A UnknownPre Tier 0 No 0 0 0 0 4 0 0 0 1 4 0 0Pre Tier 0 Yes 0 0 0 0 0 0 0 0 0 0 0 0
Tier 0 No 0 0 0 0 0 3 0 0 0 0 0 0Tier 0 Yes 0 0 0 0 0 0 0 0 0 0 0 0Tier 1 No 0 0 0 0 0 0 0 0 0 0 0 0Tier 1 Yes 0 0 0 0 0 2 0 0 0 0 0 0Tier 2 No 0 0 0 0 0 0 0 0 0 0 0 0Tier 2 Yes 0 0 0 0 0 0 0 0 0 2 0 0
Power Moves Arriving
EB arr 0Technology ZTR/AESS Switch GP3x GP4x GP50 GP60 SD7x SD90 Dash7 Dash8 Dash9 C60A UnknownPre Tier 0 No 0 0 0 0 0 0 0 0 0 0 0 0Pre Tier 0 Yes 0 0 0 0 0 0 0 0 0 0 0 0
Tier 0 No 0 0 0 0 0 0 0 0 0 0 0 0Tier 0 Yes 0 0 0 0 0 0 0 0 0 0 0 0Tier 1 No 0 0 0 0 0 0 0 0 0 0 0 0Tier 1 Yes 0 0 0 0 0 0 0 0 0 0 0 0Tier 2 No 0 0 0 0 0 0 0 0 0 0 0 0Tier 2 Yes 0 0 0 0 0 0 0 0 0 0 0 0
EB dep 0Technology ZTR/AESS Switch GP3x GP4x GP50 GP60 SD7x SD90 Dash7 Dash8 Dash9 C60A UnknownPre Tier 0 No 0 0 0 0 0 0 0 0 0 0 0 0Pre Tier 0 Yes 0 0 0 0 0 0 0 0 0 0 0 0
Tier 0 No 0 0 0 0 0 0 0 0 0 0 0 0Tier 0 Yes 0 0 0 0 0 0 0 0 0 0 0 0Tier 1 No 0 0 0 0 0 0 0 0 0 0 0 0Tier 1 Yes 0 0 0 0 0 0 0 0 0 0 0 0Tier 2 No 0 0 0 0 0 0 0 0 0 0 0 0Tier 2 Yes 0 0 0 0 0 0 0 0 0 0 0 0
APP-12
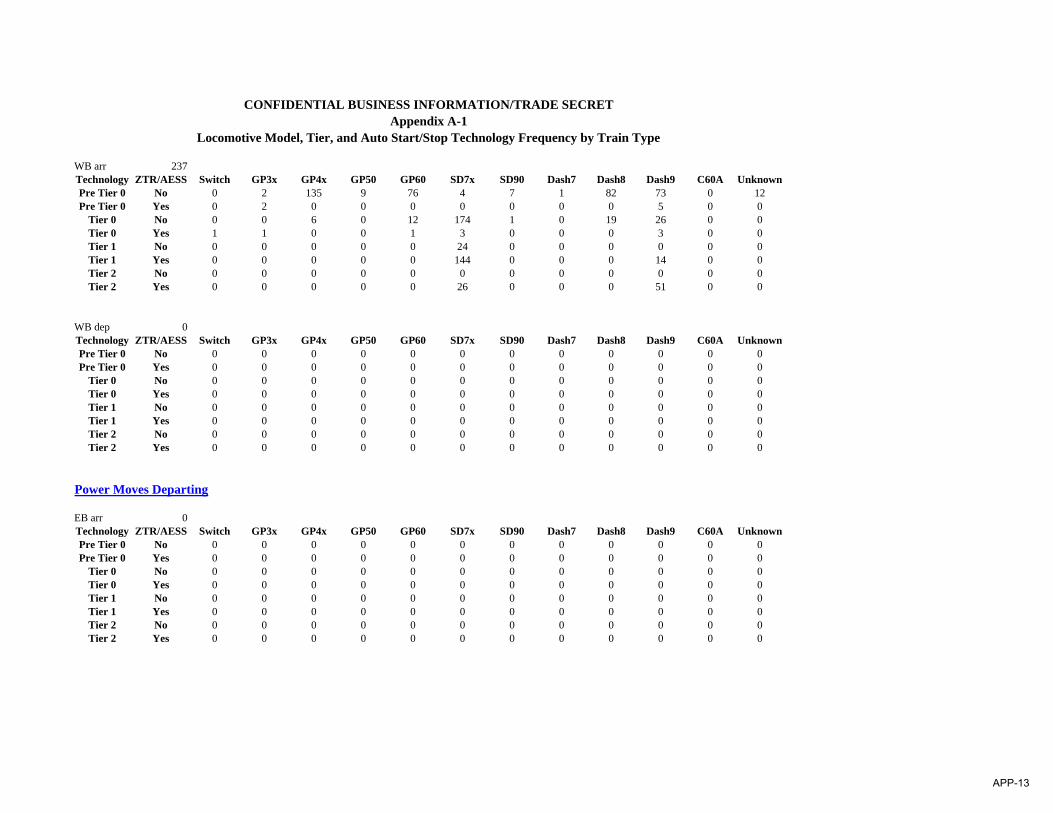
CONFIDENTIAL BUSINESS INFORMATION/TRADE SECRETAppendix A-1
Locomotive Model, Tier, and Auto Start/Stop Technology Frequency by Train Type
WB arr 237Technology ZTR/AESS Switch GP3x GP4x GP50 GP60 SD7x SD90 Dash7 Dash8 Dash9 C60A UnknownPre Tier 0 No 0 2 135 9 76 4 7 1 82 73 0 12Pre Tier 0 Yes 0 2 0 0 0 0 0 0 0 5 0 0
Tier 0 No 0 0 6 0 12 174 1 0 19 26 0 0Tier 0 Yes 1 1 0 0 1 3 0 0 0 3 0 0Tier 1 No 0 0 0 0 0 24 0 0 0 0 0 0Tier 1 Yes 0 0 0 0 0 144 0 0 0 14 0 0Tier 2 No 0 0 0 0 0 0 0 0 0 0 0 0Tier 2 Yes 0 0 0 0 0 26 0 0 0 51 0 0
WB dep 0Technology ZTR/AESS Switch GP3x GP4x GP50 GP60 SD7x SD90 Dash7 Dash8 Dash9 C60A UnknownPre Tier 0 No 0 0 0 0 0 0 0 0 0 0 0 0Pre Tier 0 Yes 0 0 0 0 0 0 0 0 0 0 0 0
Tier 0 No 0 0 0 0 0 0 0 0 0 0 0 0Tier 0 Yes 0 0 0 0 0 0 0 0 0 0 0 0Tier 1 No 0 0 0 0 0 0 0 0 0 0 0 0Tier 1 Yes 0 0 0 0 0 0 0 0 0 0 0 0Tier 2 No 0 0 0 0 0 0 0 0 0 0 0 0Tier 2 Yes 0 0 0 0 0 0 0 0 0 0 0 0
Power Moves Departing
EB arr 0Technology ZTR/AESS Switch GP3x GP4x GP50 GP60 SD7x SD90 Dash7 Dash8 Dash9 C60A UnknownPre Tier 0 No 0 0 0 0 0 0 0 0 0 0 0 0Pre Tier 0 Yes 0 0 0 0 0 0 0 0 0 0 0 0
Tier 0 No 0 0 0 0 0 0 0 0 0 0 0 0Tier 0 Yes 0 0 0 0 0 0 0 0 0 0 0 0Tier 1 No 0 0 0 0 0 0 0 0 0 0 0 0Tier 1 Yes 0 0 0 0 0 0 0 0 0 0 0 0Tier 2 No 0 0 0 0 0 0 0 0 0 0 0 0Tier 2 Yes 0 0 0 0 0 0 0 0 0 0 0 0
APP-13
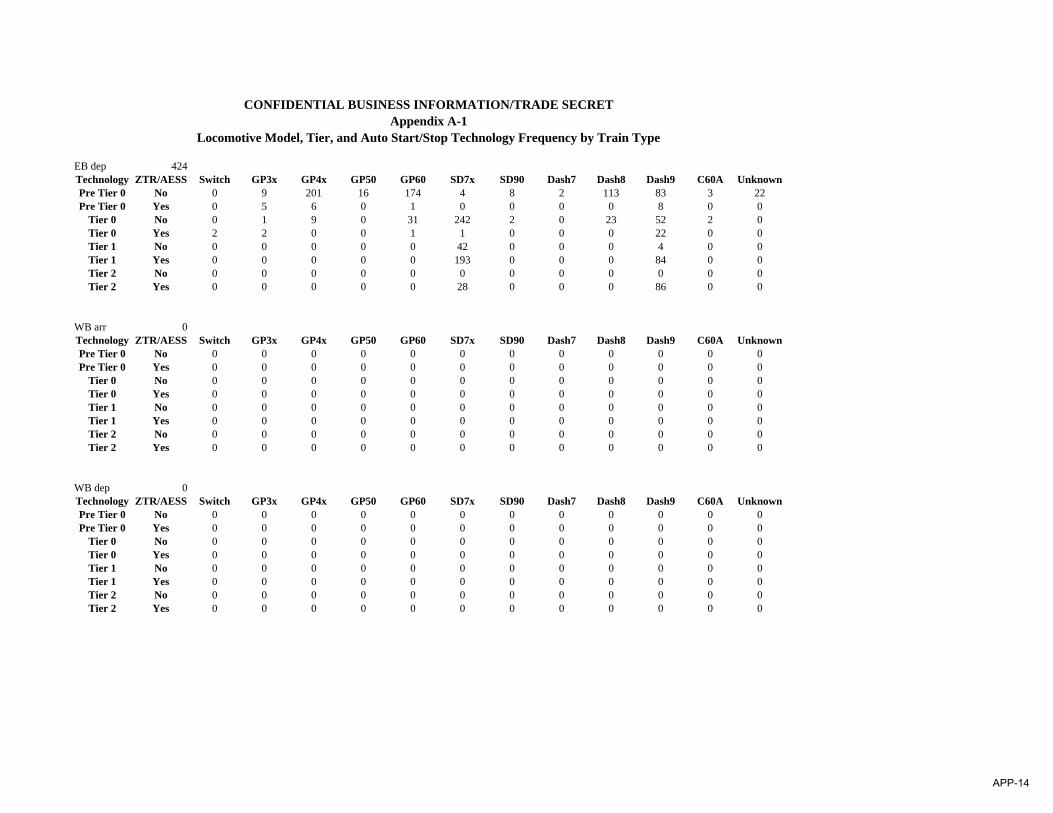
CONFIDENTIAL BUSINESS INFORMATION/TRADE SECRETAppendix A-1
Locomotive Model, Tier, and Auto Start/Stop Technology Frequency by Train Type
EB dep 424Technology ZTR/AESS Switch GP3x GP4x GP50 GP60 SD7x SD90 Dash7 Dash8 Dash9 C60A UnknownPre Tier 0 No 0 9 201 16 174 4 8 2 113 83 3 22Pre Tier 0 Yes 0 5 6 0 1 0 0 0 0 8 0 0
Tier 0 No 0 1 9 0 31 242 2 0 23 52 2 0Tier 0 Yes 2 2 0 0 1 1 0 0 0 22 0 0Tier 1 No 0 0 0 0 0 42 0 0 0 4 0 0Tier 1 Yes 0 0 0 0 0 193 0 0 0 84 0 0Tier 2 No 0 0 0 0 0 0 0 0 0 0 0 0Tier 2 Yes 0 0 0 0 0 28 0 0 0 86 0 0
WB arr 0Technology ZTR/AESS Switch GP3x GP4x GP50 GP60 SD7x SD90 Dash7 Dash8 Dash9 C60A UnknownPre Tier 0 No 0 0 0 0 0 0 0 0 0 0 0 0Pre Tier 0 Yes 0 0 0 0 0 0 0 0 0 0 0 0
Tier 0 No 0 0 0 0 0 0 0 0 0 0 0 0Tier 0 Yes 0 0 0 0 0 0 0 0 0 0 0 0Tier 1 No 0 0 0 0 0 0 0 0 0 0 0 0Tier 1 Yes 0 0 0 0 0 0 0 0 0 0 0 0Tier 2 No 0 0 0 0 0 0 0 0 0 0 0 0Tier 2 Yes 0 0 0 0 0 0 0 0 0 0 0 0
WB dep 0Technology ZTR/AESS Switch GP3x GP4x GP50 GP60 SD7x SD90 Dash7 Dash8 Dash9 C60A UnknownPre Tier 0 No 0 0 0 0 0 0 0 0 0 0 0 0Pre Tier 0 Yes 0 0 0 0 0 0 0 0 0 0 0 0
Tier 0 No 0 0 0 0 0 0 0 0 0 0 0 0Tier 0 Yes 0 0 0 0 0 0 0 0 0 0 0 0Tier 1 No 0 0 0 0 0 0 0 0 0 0 0 0Tier 1 Yes 0 0 0 0 0 0 0 0 0 0 0 0Tier 2 No 0 0 0 0 0 0 0 0 0 0 0 0Tier 2 Yes 0 0 0 0 0 0 0 0 0 0 0 0
APP-14

APPENDIX A-2
LOCOMOTIVE MODEL DISTRIBUTION BY TRAIN TYPE GROUPS
APP-15
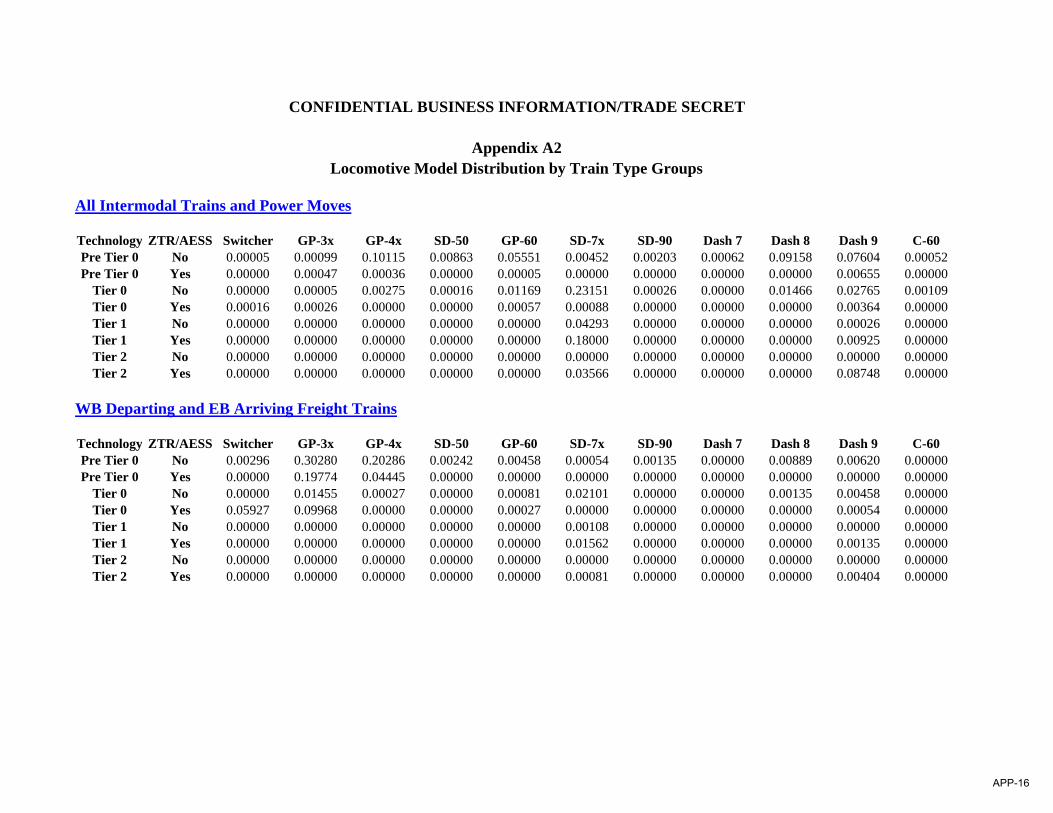
All Intermodal Trains and Power Moves
Technology ZTR/AESS Switcher GP-3x GP-4x SD-50 GP-60 SD-7x SD-90 Dash 7 Dash 8 Dash 9 C-60Pre Tier 0 No 0.00005 0.00099 0.10115 0.00863 0.05551 0.00452 0.00203 0.00062 0.09158 0.07604 0.00052Pre Tier 0 Yes 0.00000 0.00047 0.00036 0.00000 0.00005 0.00000 0.00000 0.00000 0.00000 0.00655 0.00000
Tier 0 No 0.00000 0.00005 0.00275 0.00016 0.01169 0.23151 0.00026 0.00000 0.01466 0.02765 0.00109Tier 0 Yes 0.00016 0.00026 0.00000 0.00000 0.00057 0.00088 0.00000 0.00000 0.00000 0.00364 0.00000Tier 1 No 0.00000 0.00000 0.00000 0.00000 0.00000 0.04293 0.00000 0.00000 0.00000 0.00026 0.00000Tier 1 Yes 0.00000 0.00000 0.00000 0.00000 0.00000 0.18000 0.00000 0.00000 0.00000 0.00925 0.00000Tier 2 No 0.00000 0.00000 0.00000 0.00000 0.00000 0.00000 0.00000 0.00000 0.00000 0.00000 0.00000Tier 2 Yes 0.00000 0.00000 0.00000 0.00000 0.00000 0.03566 0.00000 0.00000 0.00000 0.08748 0.00000
WB Departing and EB Arriving Freight Trains
Technology ZTR/AESS Switcher GP-3x GP-4x SD-50 GP-60 SD-7x SD-90 Dash 7 Dash 8 Dash 9 C-60Pre Tier 0 No 0.00296 0.30280 0.20286 0.00242 0.00458 0.00054 0.00135 0.00000 0.00889 0.00620 0.00000Pre Tier 0 Yes 0.00000 0.19774 0.04445 0.00000 0.00000 0.00000 0.00000 0.00000 0.00000 0.00000 0.00000
Tier 0 No 0.00000 0.01455 0.00027 0.00000 0.00081 0.02101 0.00000 0.00000 0.00135 0.00458 0.00000Tier 0 Yes 0.05927 0.09968 0.00000 0.00000 0.00027 0.00000 0.00000 0.00000 0.00000 0.00054 0.00000Tier 1 No 0.00000 0.00000 0.00000 0.00000 0.00000 0.00108 0.00000 0.00000 0.00000 0.00000 0.00000Tier 1 Yes 0.00000 0.00000 0.00000 0.00000 0.00000 0.01562 0.00000 0.00000 0.00000 0.00135 0.00000Tier 2 No 0.00000 0.00000 0.00000 0.00000 0.00000 0.00000 0.00000 0.00000 0.00000 0.00000 0.00000Tier 2 Yes 0.00000 0.00000 0.00000 0.00000 0.00000 0.00081 0.00000 0.00000 0.00000 0.00404 0.00000
CONFIDENTIAL BUSINESS INFORMATION/TRADE SECRET
Appendix A2Locomotive Model Distribution by Train Type Groups
APP-16
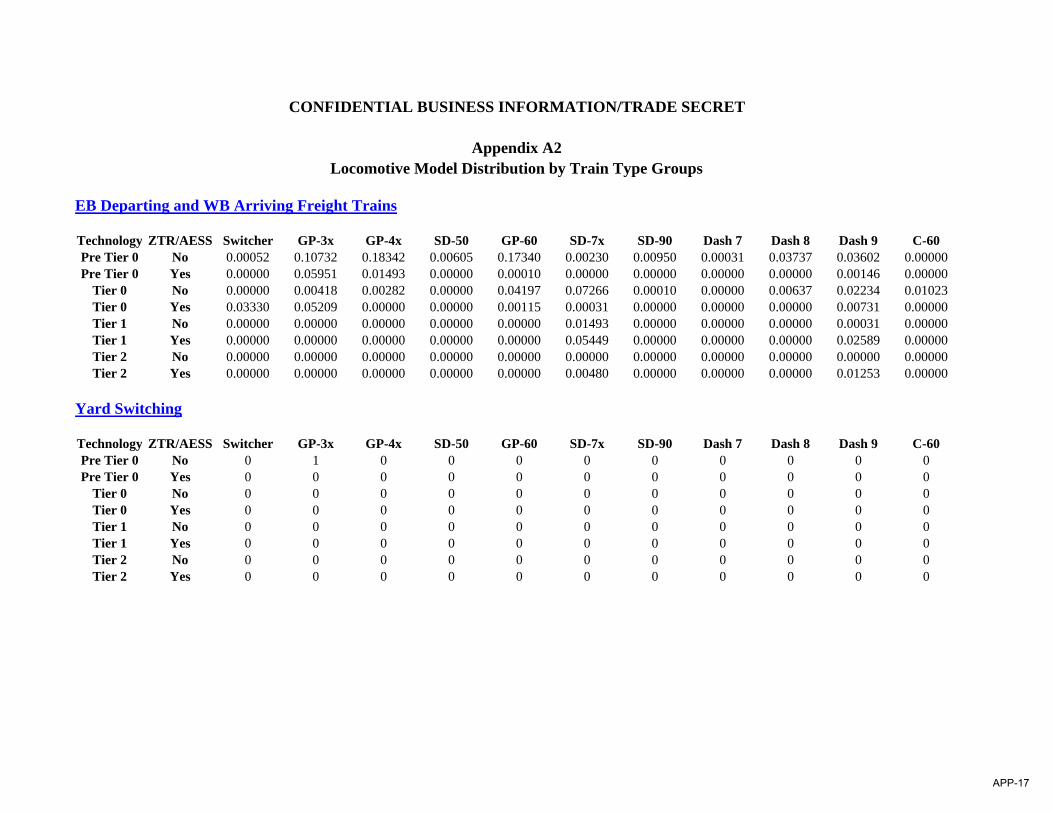
CONFIDENTIAL BUSINESS INFORMATION/TRADE SECRET
Appendix A2Locomotive Model Distribution by Train Type Groups
EB Departing and WB Arriving Freight Trains
Technology ZTR/AESS Switcher GP-3x GP-4x SD-50 GP-60 SD-7x SD-90 Dash 7 Dash 8 Dash 9 C-60Pre Tier 0 No 0.00052 0.10732 0.18342 0.00605 0.17340 0.00230 0.00950 0.00031 0.03737 0.03602 0.00000Pre Tier 0 Yes 0.00000 0.05951 0.01493 0.00000 0.00010 0.00000 0.00000 0.00000 0.00000 0.00146 0.00000
Tier 0 No 0.00000 0.00418 0.00282 0.00000 0.04197 0.07266 0.00010 0.00000 0.00637 0.02234 0.01023Tier 0 Yes 0.03330 0.05209 0.00000 0.00000 0.00115 0.00031 0.00000 0.00000 0.00000 0.00731 0.00000Tier 1 No 0.00000 0.00000 0.00000 0.00000 0.00000 0.01493 0.00000 0.00000 0.00000 0.00031 0.00000Tier 1 Yes 0.00000 0.00000 0.00000 0.00000 0.00000 0.05449 0.00000 0.00000 0.00000 0.02589 0.00000Tier 2 No 0.00000 0.00000 0.00000 0.00000 0.00000 0.00000 0.00000 0.00000 0.00000 0.00000 0.00000Tier 2 Yes 0.00000 0.00000 0.00000 0.00000 0.00000 0.00480 0.00000 0.00000 0.00000 0.01253 0.00000
Yard Switching
Technology ZTR/AESS Switcher GP-3x GP-4x SD-50 GP-60 SD-7x SD-90 Dash 7 Dash 8 Dash 9 C-60Pre Tier 0 No 0 1 0 0 0 0 0 0 0 0 0Pre Tier 0 Yes 0 0 0 0 0 0 0 0 0 0 0
Tier 0 No 0 0 0 0 0 0 0 0 0 0 0Tier 0 Yes 0 0 0 0 0 0 0 0 0 0 0Tier 1 No 0 0 0 0 0 0 0 0 0 0 0Tier 1 Yes 0 0 0 0 0 0 0 0 0 0 0Tier 2 No 0 0 0 0 0 0 0 0 0 0 0Tier 2 Yes 0 0 0 0 0 0 0 0 0 0 0
APP-17

CONFIDENTIAL BUSINESS INFORMATION/TRADE SECRET
Appendix A2Locomotive Model Distribution by Train Type Groups
Locomotives Services
Technology ZTR/AESS Switcher GP-3x GP-4x SD-50 GP-60 SD-7x SD-90 Dash 7 Dash 8 Dash 9 C-60Pre Tier 0 No 0.00000 0.00544 0.13099 0.01379 0.03507 0.00556 0.00411 0.00085 0.10256 0.07886 0.00024Pre Tier 0 Yes 0.00000 0.00895 0.00460 0.00000 0.00000 0.00000 0.00000 0.00000 0.00000 0.00581 0.00000
Tier 0 No 0.00000 0.00024 0.00339 0.00024 0.00955 0.21601 0.00036 0.00000 0.02008 0.03157 0.00411Tier 0 Yes 0.00169 0.00218 0.00000 0.00000 0.00060 0.00109 0.00000 0.00000 0.00000 0.00266 0.00000Tier 1 No 0.00000 0.00000 0.00000 0.00000 0.00000 0.03205 0.00000 0.00000 0.00000 0.00000 0.00000Tier 1 Yes 0.00000 0.00000 0.00000 0.00000 0.00000 0.17816 0.00000 0.00000 0.00000 0.00556 0.00000Tier 2 No 0.00000 0.00000 0.00000 0.00000 0.00000 0.00000 0.00000 0.00000 0.00000 0.00012 0.00000Tier 2 Yes 0.00000 0.00000 0.00000 0.00000 0.00000 0.03084 0.00000 0.00000 0.00000 0.06265 0.00000
Locomotives Load Tested
Technology ZTR/AESS Switcher GP-3x GP-4x SD-50 GP-60 SD-7x SD-90 Dash 7 Dash 8 Dash 9 C-60Pre Tier 0 No 0.00000 0.00715 0.12470 0.01033 0.03813 0.00794 0.00556 0.00079 0.13503 0.07943 0.00000Pre Tier 0 Yes 0.00000 0.01033 0.00715 0.00000 0.00000 0.00000 0.00000 0.00000 0.00000 0.00635 0.00000
Tier 0 No 0.00000 0.00000 0.00397 0.00079 0.01191 0.20492 0.00079 0.00000 0.02621 0.03574 0.00397Tier 0 Yes 0.00000 0.00318 0.00000 0.00000 0.00000 0.00000 0.00000 0.00000 0.00000 0.00238 0.00000Tier 1 No 0.00000 0.00000 0.00000 0.00000 0.00000 0.02303 0.00000 0.00000 0.00000 0.00000 0.00000Tier 1 Yes 0.00000 0.00000 0.00000 0.00000 0.00000 0.16362 0.00000 0.00000 0.00000 0.00635 0.00000Tier 2 No 0.00000 0.00000 0.00000 0.00000 0.00000 0.00000 0.00000 0.00000 0.00000 0.00000 0.00000Tier 2 Yes 0.00000 0.00000 0.00000 0.00000 0.00000 0.03098 0.00000 0.00000 0.00000 0.04925 0.00000
APP-18
APPENDIX A-3
SAMPLE CALCULATIONS
APP-19
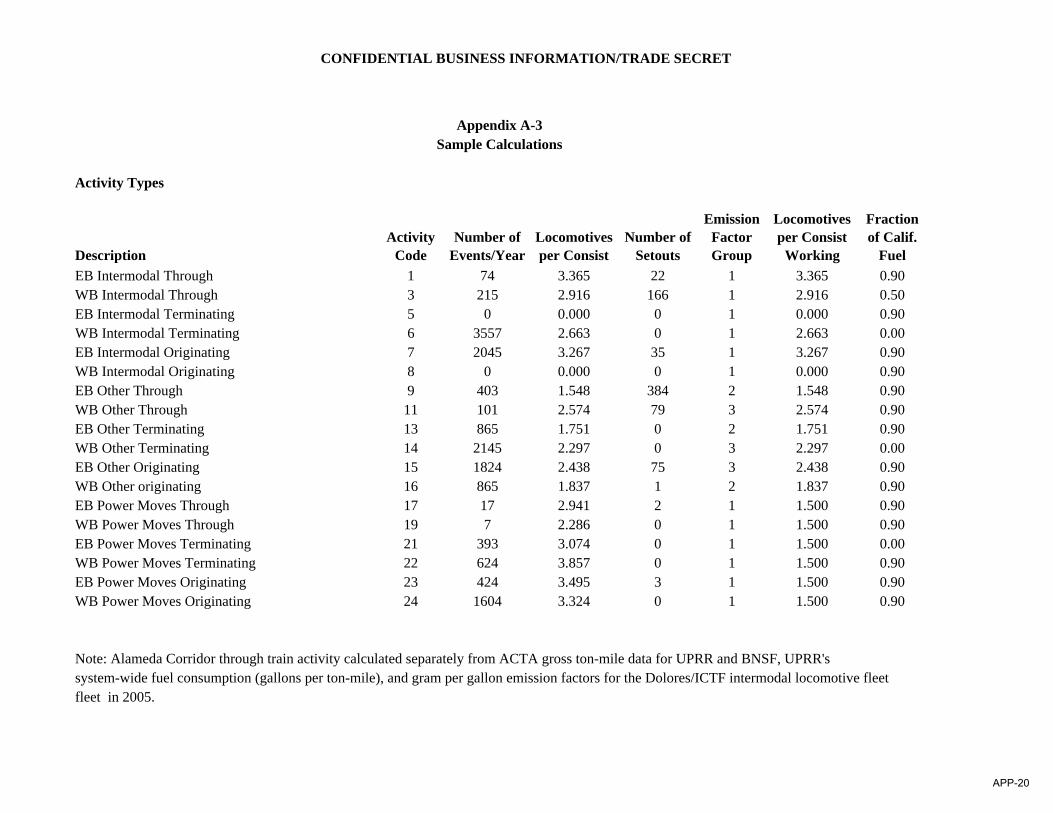
CONFIDENTIAL BUSINESS INFORMATION/TRADE SECRET
Activity Types
DescriptionActivity
CodeNumber of
Events/YearLocomotives per Consist
Number of Setouts
Emission Factor Group
Locomotives per Consist
Working
Fraction of Calif.
FuelEB Intermodal Through 1 74 3.365 22 1 3.365 0.90WB Intermodal Through 3 215 2.916 166 1 2.916 0.50EB Intermodal Terminating 5 0 0.000 0 1 0.000 0.90WB Intermodal Terminating 6 3557 2.663 0 1 2.663 0.00EB Intermodal Originating 7 2045 3.267 35 1 3.267 0.90WB Intermodal Originating 8 0 0.000 0 1 0.000 0.90EB Other Through 9 403 1.548 384 2 1.548 0.90WB Other Through 11 101 2.574 79 3 2.574 0.90EB Other Terminating 13 865 1.751 0 2 1.751 0.90WB Other Terminating 14 2145 2.297 0 3 2.297 0.00EB Other Originating 15 1824 2.438 75 3 2.438 0.90WB Other originating 16 865 1.837 1 2 1.837 0.90EB Power Moves Through 17 17 2.941 2 1 1.500 0.90WB Power Moves Through 19 7 2.286 0 1 1.500 0.90EB Power Moves Terminating 21 393 3.074 0 1 1.500 0.00WB Power Moves Terminating 22 624 3.857 0 1 1.500 0.90EB Power Moves Originating 23 424 3.495 3 1 1.500 0.90WB Power Moves Originating 24 1604 3.324 0 1 1.500 0.90
Note: Alameda Corridor through train activity calculated separately from ACTA gross ton-mile data for UPRR and BNSF, UPRR'ssystem-wide fuel consumption (gallons per ton-mile), and gram per gallon emission factors for the Dolores/ICTF intermodal locomotive fleetfleet in 2005.
Appendix A-3Sample Calculations
APP-20
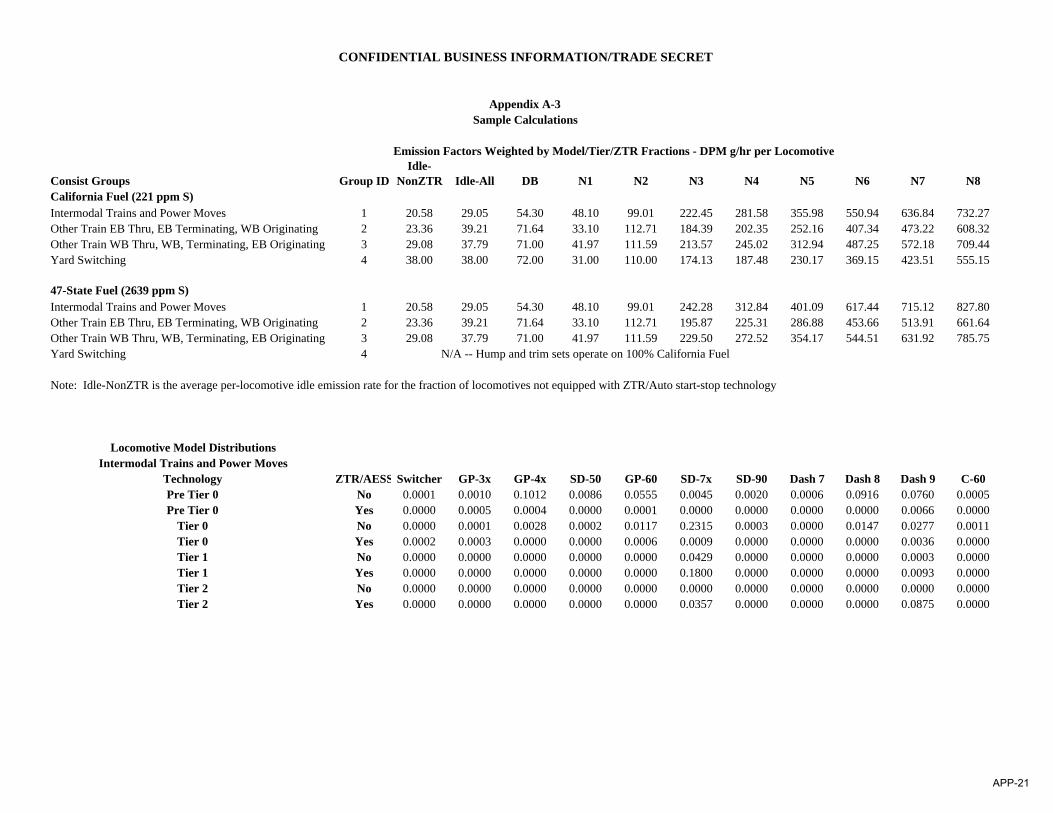
CONFIDENTIAL BUSINESS INFORMATION/TRADE SECRET
Emission Factors Weighted by Model/Tier/ZTR Fractions - DPM g/hr per Locomotive
Consist Groups Group IDIdle-
NonZTR Idle-All DB N1 N2 N3 N4 N5 N6 N7 N8California Fuel (221 ppm S)Intermodal Trains and Power Moves 1 20.58 29.05 54.30 48.10 99.01 222.45 281.58 355.98 550.94 636.84 732.27Other Train EB Thru, EB Terminating, WB Originating 2 23.36 39.21 71.64 33.10 112.71 184.39 202.35 252.16 407.34 473.22 608.32Other Train WB Thru, WB, Terminating, EB Originating 3 29.08 37.79 71.00 41.97 111.59 213.57 245.02 312.94 487.25 572.18 709.44Yard Switching 4 38.00 38.00 72.00 31.00 110.00 174.13 187.48 230.17 369.15 423.51 555.15
47-State Fuel (2639 ppm S)Intermodal Trains and Power Moves 1 20.58 29.05 54.30 48.10 99.01 242.28 312.84 401.09 617.44 715.12 827.80Other Train EB Thru, EB Terminating, WB Originating 2 23.36 39.21 71.64 33.10 112.71 195.87 225.31 286.88 453.66 513.91 661.64Other Train WB Thru, WB, Terminating, EB Originating 3 29.08 37.79 71.00 41.97 111.59 229.50 272.52 354.17 544.51 631.92 785.75Yard Switching 4 N/A -- Hump and trim sets operate on 100% California Fuel
Note: Idle-NonZTR is the average per-locomotive idle emission rate for the fraction of locomotives not equipped with ZTR/Auto start-stop technology
Locomotive Model DistributionsIntermodal Trains and Power Moves
Technology ZTR/AESS Switcher GP-3x GP-4x SD-50 GP-60 SD-7x SD-90 Dash 7 Dash 8 Dash 9 C-60Pre Tier 0 No 0.0001 0.0010 0.1012 0.0086 0.0555 0.0045 0.0020 0.0006 0.0916 0.0760 0.0005Pre Tier 0 Yes 0.0000 0.0005 0.0004 0.0000 0.0001 0.0000 0.0000 0.0000 0.0000 0.0066 0.0000
Tier 0 No 0.0000 0.0001 0.0028 0.0002 0.0117 0.2315 0.0003 0.0000 0.0147 0.0277 0.0011Tier 0 Yes 0.0002 0.0003 0.0000 0.0000 0.0006 0.0009 0.0000 0.0000 0.0000 0.0036 0.0000Tier 1 No 0.0000 0.0000 0.0000 0.0000 0.0000 0.0429 0.0000 0.0000 0.0000 0.0003 0.0000Tier 1 Yes 0.0000 0.0000 0.0000 0.0000 0.0000 0.1800 0.0000 0.0000 0.0000 0.0093 0.0000Tier 2 No 0.0000 0.0000 0.0000 0.0000 0.0000 0.0000 0.0000 0.0000 0.0000 0.0000 0.0000Tier 2 Yes 0.0000 0.0000 0.0000 0.0000 0.0000 0.0357 0.0000 0.0000 0.0000 0.0875 0.0000
Appendix A-3Sample Calculations
APP-21
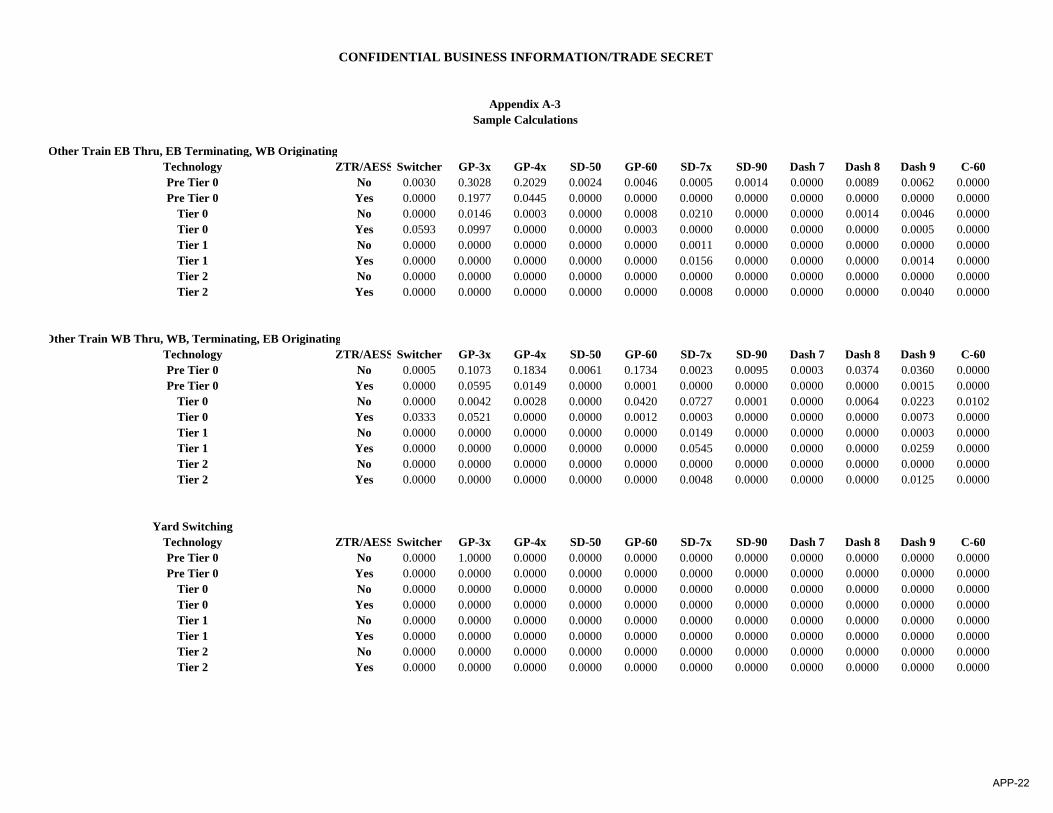
CONFIDENTIAL BUSINESS INFORMATION/TRADE SECRET
Appendix A-3Sample Calculations
Other Train EB Thru, EB Terminating, WB OriginatingTechnology ZTR/AESS Switcher GP-3x GP-4x SD-50 GP-60 SD-7x SD-90 Dash 7 Dash 8 Dash 9 C-60Pre Tier 0 No 0.0030 0.3028 0.2029 0.0024 0.0046 0.0005 0.0014 0.0000 0.0089 0.0062 0.0000Pre Tier 0 Yes 0.0000 0.1977 0.0445 0.0000 0.0000 0.0000 0.0000 0.0000 0.0000 0.0000 0.0000
Tier 0 No 0.0000 0.0146 0.0003 0.0000 0.0008 0.0210 0.0000 0.0000 0.0014 0.0046 0.0000Tier 0 Yes 0.0593 0.0997 0.0000 0.0000 0.0003 0.0000 0.0000 0.0000 0.0000 0.0005 0.0000Tier 1 No 0.0000 0.0000 0.0000 0.0000 0.0000 0.0011 0.0000 0.0000 0.0000 0.0000 0.0000Tier 1 Yes 0.0000 0.0000 0.0000 0.0000 0.0000 0.0156 0.0000 0.0000 0.0000 0.0014 0.0000Tier 2 No 0.0000 0.0000 0.0000 0.0000 0.0000 0.0000 0.0000 0.0000 0.0000 0.0000 0.0000Tier 2 Yes 0.0000 0.0000 0.0000 0.0000 0.0000 0.0008 0.0000 0.0000 0.0000 0.0040 0.0000
Other Train WB Thru, WB, Terminating, EB OriginatingTechnology ZTR/AESS Switcher GP-3x GP-4x SD-50 GP-60 SD-7x SD-90 Dash 7 Dash 8 Dash 9 C-60Pre Tier 0 No 0.0005 0.1073 0.1834 0.0061 0.1734 0.0023 0.0095 0.0003 0.0374 0.0360 0.0000Pre Tier 0 Yes 0.0000 0.0595 0.0149 0.0000 0.0001 0.0000 0.0000 0.0000 0.0000 0.0015 0.0000
Tier 0 No 0.0000 0.0042 0.0028 0.0000 0.0420 0.0727 0.0001 0.0000 0.0064 0.0223 0.0102Tier 0 Yes 0.0333 0.0521 0.0000 0.0000 0.0012 0.0003 0.0000 0.0000 0.0000 0.0073 0.0000Tier 1 No 0.0000 0.0000 0.0000 0.0000 0.0000 0.0149 0.0000 0.0000 0.0000 0.0003 0.0000Tier 1 Yes 0.0000 0.0000 0.0000 0.0000 0.0000 0.0545 0.0000 0.0000 0.0000 0.0259 0.0000Tier 2 No 0.0000 0.0000 0.0000 0.0000 0.0000 0.0000 0.0000 0.0000 0.0000 0.0000 0.0000Tier 2 Yes 0.0000 0.0000 0.0000 0.0000 0.0000 0.0048 0.0000 0.0000 0.0000 0.0125 0.0000
Yard SwitchingTechnology ZTR/AESS Switcher GP-3x GP-4x SD-50 GP-60 SD-7x SD-90 Dash 7 Dash 8 Dash 9 C-60Pre Tier 0 No 0.0000 1.0000 0.0000 0.0000 0.0000 0.0000 0.0000 0.0000 0.0000 0.0000 0.0000Pre Tier 0 Yes 0.0000 0.0000 0.0000 0.0000 0.0000 0.0000 0.0000 0.0000 0.0000 0.0000 0.0000
Tier 0 No 0.0000 0.0000 0.0000 0.0000 0.0000 0.0000 0.0000 0.0000 0.0000 0.0000 0.0000Tier 0 Yes 0.0000 0.0000 0.0000 0.0000 0.0000 0.0000 0.0000 0.0000 0.0000 0.0000 0.0000Tier 1 No 0.0000 0.0000 0.0000 0.0000 0.0000 0.0000 0.0000 0.0000 0.0000 0.0000 0.0000Tier 1 Yes 0.0000 0.0000 0.0000 0.0000 0.0000 0.0000 0.0000 0.0000 0.0000 0.0000 0.0000Tier 2 No 0.0000 0.0000 0.0000 0.0000 0.0000 0.0000 0.0000 0.0000 0.0000 0.0000 0.0000Tier 2 Yes 0.0000 0.0000 0.0000 0.0000 0.0000 0.0000 0.0000 0.0000 0.0000 0.0000 0.0000
APP-22
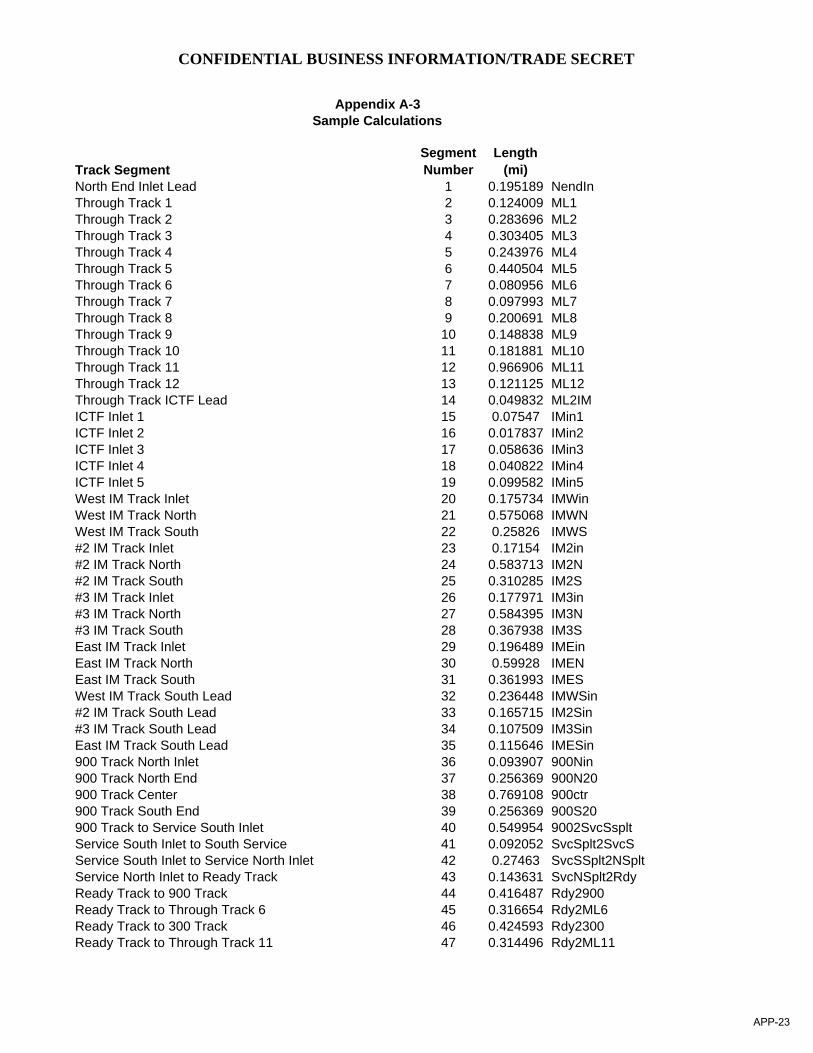
CONFIDENTIAL BUSINESS INFORMATION/TRADE SECRET
Track SegmentSegment Number
Length (mi)
North End Inlet Lead 1 0.195189 NendInThrough Track 1 2 0.124009 ML1Through Track 2 3 0.283696 ML2Through Track 3 4 0.303405 ML3Through Track 4 5 0.243976 ML4Through Track 5 6 0.440504 ML5Through Track 6 7 0.080956 ML6Through Track 7 8 0.097993 ML7Through Track 8 9 0.200691 ML8Through Track 9 10 0.148838 ML9Through Track 10 11 0.181881 ML10Through Track 11 12 0.966906 ML11Through Track 12 13 0.121125 ML12Through Track ICTF Lead 14 0.049832 ML2IMICTF Inlet 1 15 0.07547 IMin1ICTF Inlet 2 16 0.017837 IMin2ICTF Inlet 3 17 0.058636 IMin3ICTF Inlet 4 18 0.040822 IMin4ICTF Inlet 5 19 0.099582 IMin5West IM Track Inlet 20 0.175734 IMWinWest IM Track North 21 0.575068 IMWNWest IM Track South 22 0.25826 IMWS#2 IM Track Inlet 23 0.17154 IM2in#2 IM Track North 24 0.583713 IM2N#2 IM Track South 25 0.310285 IM2S#3 IM Track Inlet 26 0.177971 IM3in#3 IM Track North 27 0.584395 IM3N#3 IM Track South 28 0.367938 IM3SEast IM Track Inlet 29 0.196489 IMEinEast IM Track North 30 0.59928 IMENEast IM Track South 31 0.361993 IMESWest IM Track South Lead 32 0.236448 IMWSin#2 IM Track South Lead 33 0.165715 IM2Sin#3 IM Track South Lead 34 0.107509 IM3SinEast IM Track South Lead 35 0.115646 IMESin900 Track North Inlet 36 0.093907 900Nin900 Track North End 37 0.256369 900N20900 Track Center 38 0.769108 900ctr900 Track South End 39 0.256369 900S20900 Track to Service South Inlet 40 0.549954 9002SvcSspltService South Inlet to South Service 41 0.092052 SvcSplt2SvcSService South Inlet to Service North Inlet 42 0.27463 SvcSSplt2NSpltService North Inlet to Ready Track 43 0.143631 SvcNSplt2RdyReady Track to 900 Track 44 0.416487 Rdy2900Ready Track to Through Track 6 45 0.316654 Rdy2ML6Ready Track to 300 Track 46 0.424593 Rdy2300Ready Track to Through Track 11 47 0.314496 Rdy2ML11
Appendix A-3Sample Calculations
APP-23
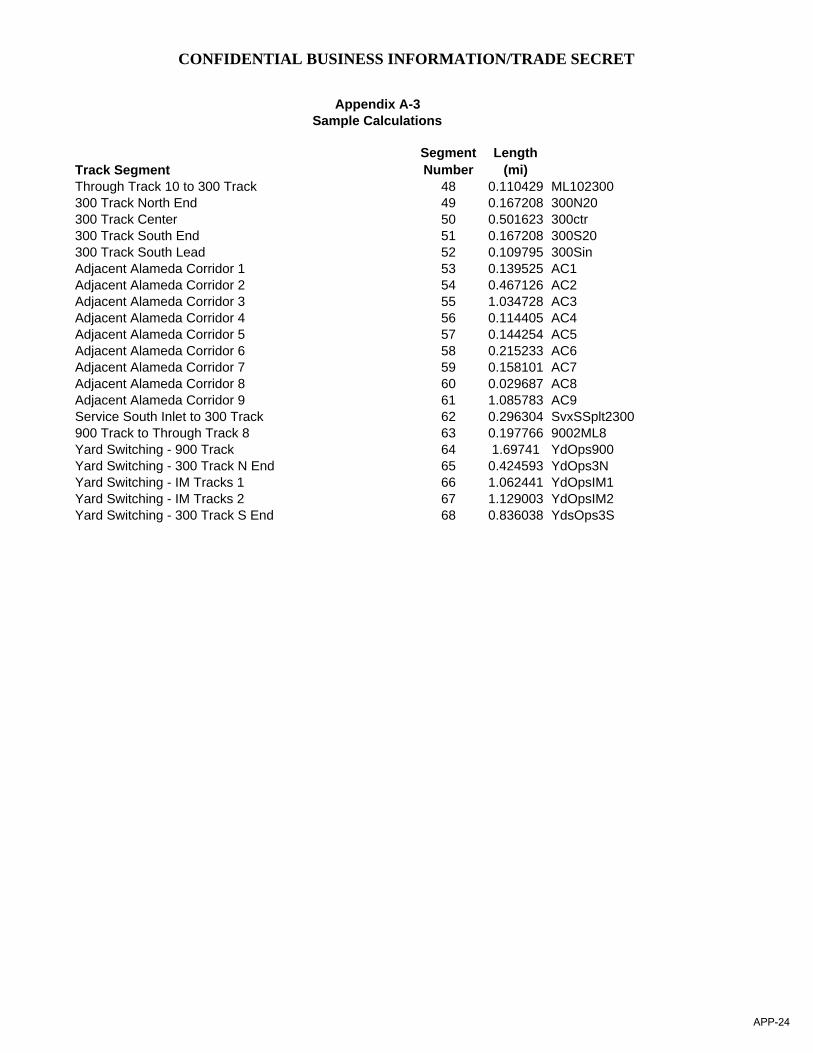
CONFIDENTIAL BUSINESS INFORMATION/TRADE SECRET
Track SegmentSegment Number
Length (mi)
Appendix A-3Sample Calculations
Through Track 10 to 300 Track 48 0.110429 ML102300300 Track North End 49 0.167208 300N20300 Track Center 50 0.501623 300ctr300 Track South End 51 0.167208 300S20300 Track South Lead 52 0.109795 300SinAdjacent Alameda Corridor 1 53 0.139525 AC1Adjacent Alameda Corridor 2 54 0.467126 AC2Adjacent Alameda Corridor 3 55 1.034728 AC3Adjacent Alameda Corridor 4 56 0.114405 AC4Adjacent Alameda Corridor 5 57 0.144254 AC5Adjacent Alameda Corridor 6 58 0.215233 AC6Adjacent Alameda Corridor 7 59 0.158101 AC7Adjacent Alameda Corridor 8 60 0.029687 AC8Adjacent Alameda Corridor 9 61 1.085783 AC9Service South Inlet to 300 Track 62 0.296304 SvxSSplt2300900 Track to Through Track 8 63 0.197766 9002ML8Yard Switching - 900 Track 64 1.69741 YdOps900Yard Switching - 300 Track N End 65 0.424593 YdOps3NYard Switching - IM Tracks 1 66 1.062441 YdOpsIM1Yard Switching - IM Tracks 2 67 1.129003 YdOpsIM2Yard Switching - 300 Track S End 68 0.836038 YdsOps3S
APP-24
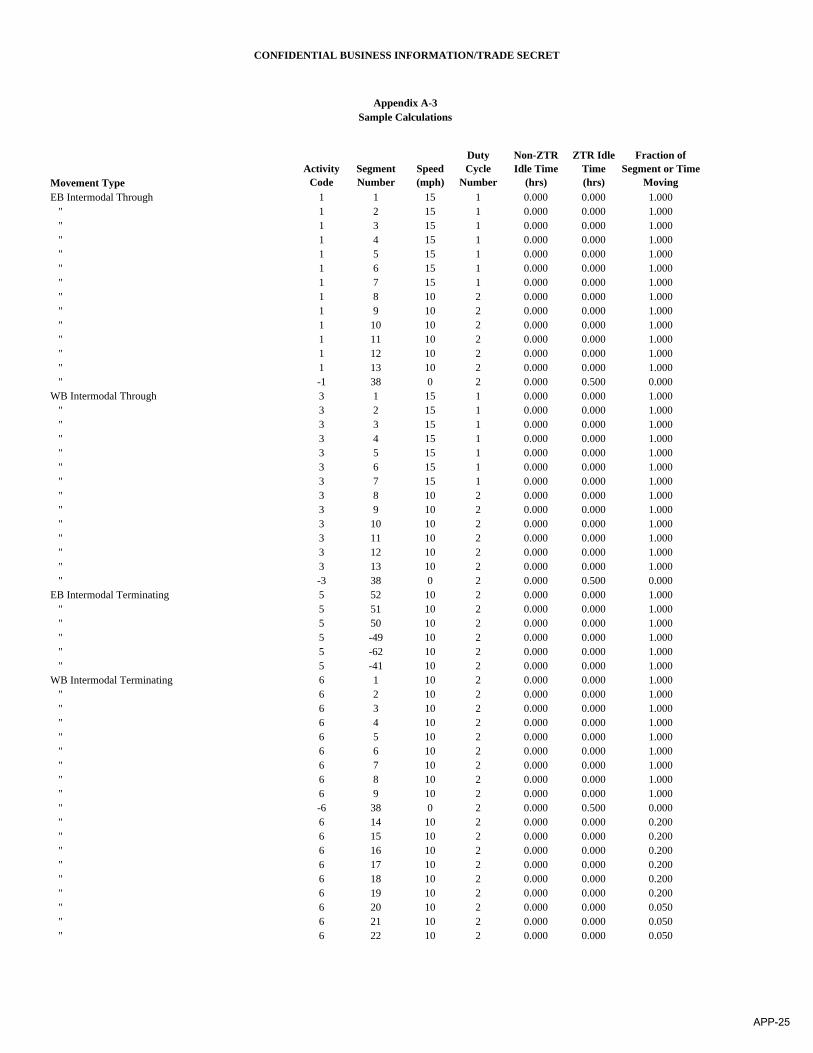
CONFIDENTIAL BUSINESS INFORMATION/TRADE SECRET
Movement TypeActivity
CodeSegment Number
Speed (mph)
Duty Cycle
Number
Non-ZTR Idle Time
(hrs)
ZTR Idle Time (hrs)
Fraction of Segment or Time
MovingEB Intermodal Through 1 1 15 1 0.000 0.000 1.000 " 1 2 15 1 0.000 0.000 1.000 " 1 3 15 1 0.000 0.000 1.000 " 1 4 15 1 0.000 0.000 1.000 " 1 5 15 1 0.000 0.000 1.000 " 1 6 15 1 0.000 0.000 1.000 " 1 7 15 1 0.000 0.000 1.000 " 1 8 10 2 0.000 0.000 1.000 " 1 9 10 2 0.000 0.000 1.000 " 1 10 10 2 0.000 0.000 1.000 " 1 11 10 2 0.000 0.000 1.000 " 1 12 10 2 0.000 0.000 1.000 " 1 13 10 2 0.000 0.000 1.000 " -1 38 0 2 0.000 0.500 0.000WB Intermodal Through 3 1 15 1 0.000 0.000 1.000 " 3 2 15 1 0.000 0.000 1.000 " 3 3 15 1 0.000 0.000 1.000 " 3 4 15 1 0.000 0.000 1.000 " 3 5 15 1 0.000 0.000 1.000 " 3 6 15 1 0.000 0.000 1.000 " 3 7 15 1 0.000 0.000 1.000 " 3 8 10 2 0.000 0.000 1.000 " 3 9 10 2 0.000 0.000 1.000 " 3 10 10 2 0.000 0.000 1.000 " 3 11 10 2 0.000 0.000 1.000 " 3 12 10 2 0.000 0.000 1.000 " 3 13 10 2 0.000 0.000 1.000 " -3 38 0 2 0.000 0.500 0.000EB Intermodal Terminating 5 52 10 2 0.000 0.000 1.000 " 5 51 10 2 0.000 0.000 1.000 " 5 50 10 2 0.000 0.000 1.000 " 5 -49 10 2 0.000 0.000 1.000 " 5 -62 10 2 0.000 0.000 1.000 " 5 -41 10 2 0.000 0.000 1.000WB Intermodal Terminating 6 1 10 2 0.000 0.000 1.000 " 6 2 10 2 0.000 0.000 1.000 " 6 3 10 2 0.000 0.000 1.000 " 6 4 10 2 0.000 0.000 1.000 " 6 5 10 2 0.000 0.000 1.000 " 6 6 10 2 0.000 0.000 1.000 " 6 7 10 2 0.000 0.000 1.000 " 6 8 10 2 0.000 0.000 1.000 " 6 9 10 2 0.000 0.000 1.000 " -6 38 0 2 0.000 0.500 0.000 " 6 14 10 2 0.000 0.000 0.200 " 6 15 10 2 0.000 0.000 0.200 " 6 16 10 2 0.000 0.000 0.200 " 6 17 10 2 0.000 0.000 0.200 " 6 18 10 2 0.000 0.000 0.200 " 6 19 10 2 0.000 0.000 0.200 " 6 20 10 2 0.000 0.000 0.050 " 6 21 10 2 0.000 0.000 0.050 " 6 22 10 2 0.000 0.000 0.050
Appendix A-3Sample Calculations
APP-25
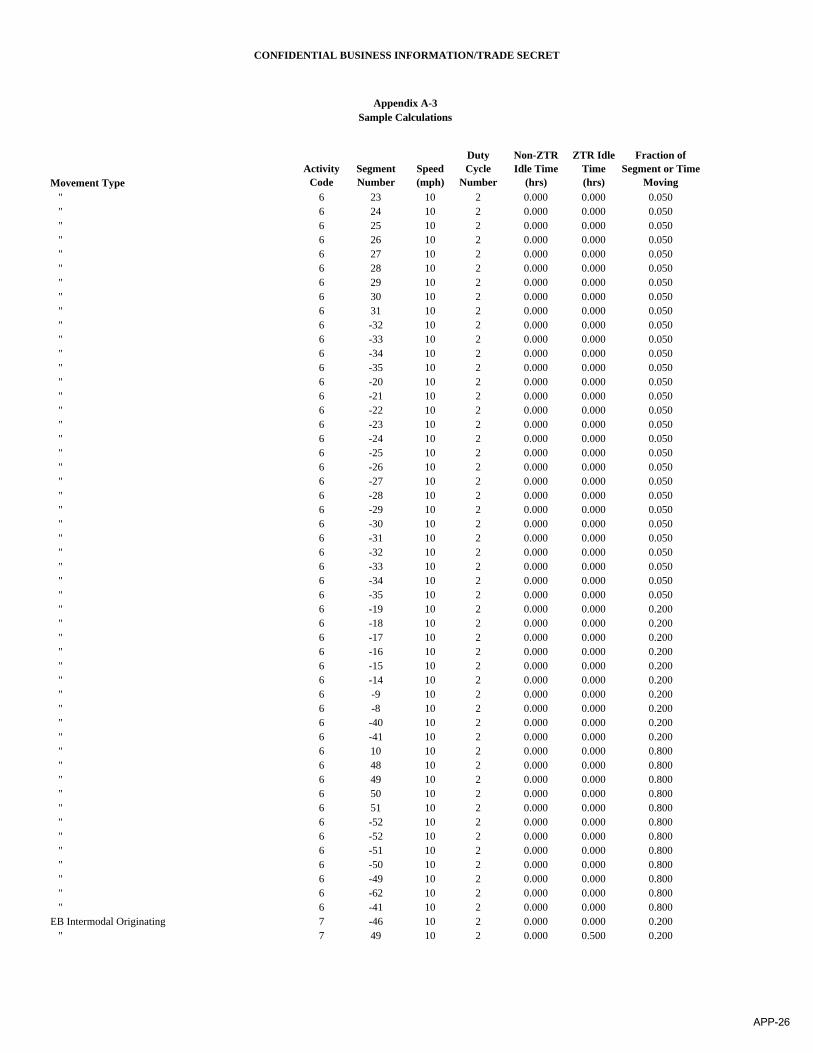
CONFIDENTIAL BUSINESS INFORMATION/TRADE SECRET
Movement TypeActivity
CodeSegment Number
Speed (mph)
Duty Cycle
Number
Non-ZTR Idle Time
(hrs)
ZTR Idle Time (hrs)
Fraction of Segment or Time
Moving
Appendix A-3Sample Calculations
" 6 23 10 2 0.000 0.000 0.050 " 6 24 10 2 0.000 0.000 0.050 " 6 25 10 2 0.000 0.000 0.050 " 6 26 10 2 0.000 0.000 0.050 " 6 27 10 2 0.000 0.000 0.050 " 6 28 10 2 0.000 0.000 0.050 " 6 29 10 2 0.000 0.000 0.050 " 6 30 10 2 0.000 0.000 0.050 " 6 31 10 2 0.000 0.000 0.050 " 6 -32 10 2 0.000 0.000 0.050 " 6 -33 10 2 0.000 0.000 0.050 " 6 -34 10 2 0.000 0.000 0.050 " 6 -35 10 2 0.000 0.000 0.050 " 6 -20 10 2 0.000 0.000 0.050 " 6 -21 10 2 0.000 0.000 0.050 " 6 -22 10 2 0.000 0.000 0.050 " 6 -23 10 2 0.000 0.000 0.050 " 6 -24 10 2 0.000 0.000 0.050 " 6 -25 10 2 0.000 0.000 0.050 " 6 -26 10 2 0.000 0.000 0.050 " 6 -27 10 2 0.000 0.000 0.050 " 6 -28 10 2 0.000 0.000 0.050 " 6 -29 10 2 0.000 0.000 0.050 " 6 -30 10 2 0.000 0.000 0.050 " 6 -31 10 2 0.000 0.000 0.050 " 6 -32 10 2 0.000 0.000 0.050 " 6 -33 10 2 0.000 0.000 0.050 " 6 -34 10 2 0.000 0.000 0.050 " 6 -35 10 2 0.000 0.000 0.050 " 6 -19 10 2 0.000 0.000 0.200 " 6 -18 10 2 0.000 0.000 0.200 " 6 -17 10 2 0.000 0.000 0.200 " 6 -16 10 2 0.000 0.000 0.200 " 6 -15 10 2 0.000 0.000 0.200 " 6 -14 10 2 0.000 0.000 0.200 " 6 -9 10 2 0.000 0.000 0.200 " 6 -8 10 2 0.000 0.000 0.200 " 6 -40 10 2 0.000 0.000 0.200 " 6 -41 10 2 0.000 0.000 0.200 " 6 10 10 2 0.000 0.000 0.800 " 6 48 10 2 0.000 0.000 0.800 " 6 49 10 2 0.000 0.000 0.800 " 6 50 10 2 0.000 0.000 0.800 " 6 51 10 2 0.000 0.000 0.800 " 6 -52 10 2 0.000 0.000 0.800 " 6 -52 10 2 0.000 0.000 0.800 " 6 -51 10 2 0.000 0.000 0.800 " 6 -50 10 2 0.000 0.000 0.800 " 6 -49 10 2 0.000 0.000 0.800 " 6 -62 10 2 0.000 0.000 0.800 " 6 -41 10 2 0.000 0.000 0.800EB Intermodal Originating 7 -46 10 2 0.000 0.000 0.200 " 7 49 10 2 0.000 0.500 0.200
APP-26
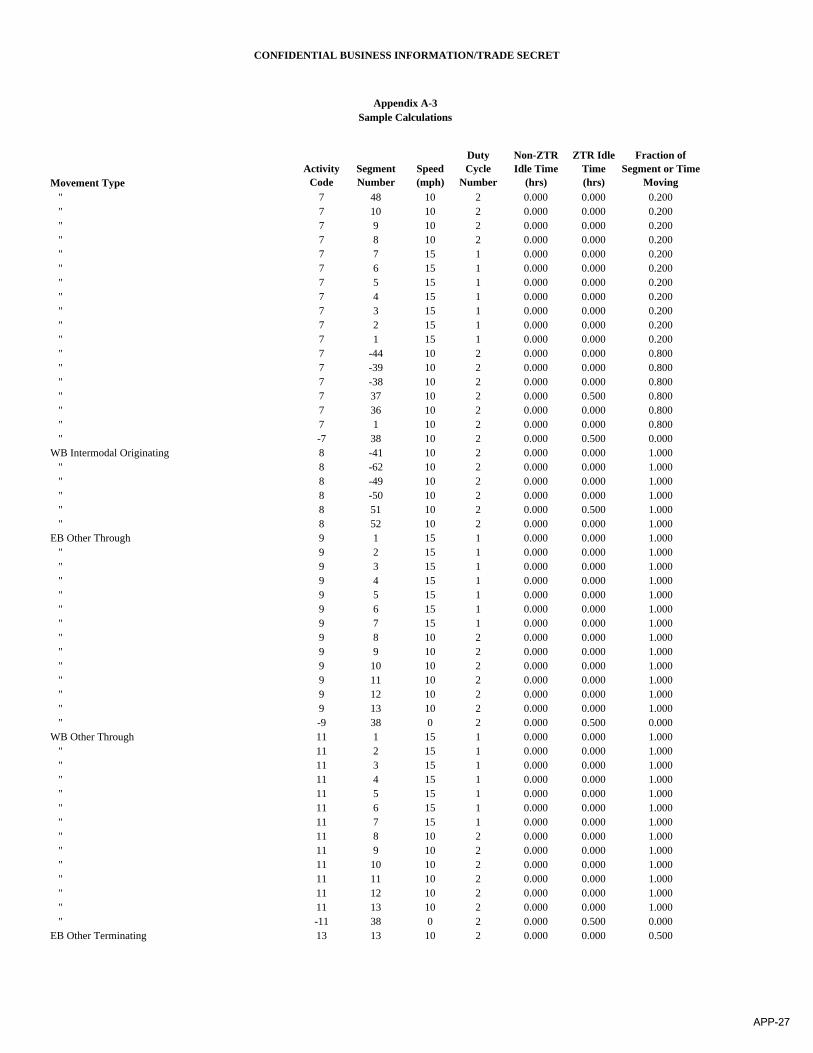
CONFIDENTIAL BUSINESS INFORMATION/TRADE SECRET
Movement TypeActivity
CodeSegment Number
Speed (mph)
Duty Cycle
Number
Non-ZTR Idle Time
(hrs)
ZTR Idle Time (hrs)
Fraction of Segment or Time
Moving
Appendix A-3Sample Calculations
" 7 48 10 2 0.000 0.000 0.200 " 7 10 10 2 0.000 0.000 0.200 " 7 9 10 2 0.000 0.000 0.200 " 7 8 10 2 0.000 0.000 0.200 " 7 7 15 1 0.000 0.000 0.200 " 7 6 15 1 0.000 0.000 0.200 " 7 5 15 1 0.000 0.000 0.200 " 7 4 15 1 0.000 0.000 0.200 " 7 3 15 1 0.000 0.000 0.200 " 7 2 15 1 0.000 0.000 0.200 " 7 1 15 1 0.000 0.000 0.200 " 7 -44 10 2 0.000 0.000 0.800 " 7 -39 10 2 0.000 0.000 0.800 " 7 -38 10 2 0.000 0.000 0.800 " 7 37 10 2 0.000 0.500 0.800 " 7 36 10 2 0.000 0.000 0.800 " 7 1 10 2 0.000 0.000 0.800 " -7 38 10 2 0.000 0.500 0.000WB Intermodal Originating 8 -41 10 2 0.000 0.000 1.000 " 8 -62 10 2 0.000 0.000 1.000 " 8 -49 10 2 0.000 0.000 1.000 " 8 -50 10 2 0.000 0.000 1.000 " 8 51 10 2 0.000 0.500 1.000 " 8 52 10 2 0.000 0.000 1.000EB Other Through 9 1 15 1 0.000 0.000 1.000 " 9 2 15 1 0.000 0.000 1.000 " 9 3 15 1 0.000 0.000 1.000 " 9 4 15 1 0.000 0.000 1.000 " 9 5 15 1 0.000 0.000 1.000 " 9 6 15 1 0.000 0.000 1.000 " 9 7 15 1 0.000 0.000 1.000 " 9 8 10 2 0.000 0.000 1.000 " 9 9 10 2 0.000 0.000 1.000 " 9 10 10 2 0.000 0.000 1.000 " 9 11 10 2 0.000 0.000 1.000 " 9 12 10 2 0.000 0.000 1.000 " 9 13 10 2 0.000 0.000 1.000 " -9 38 0 2 0.000 0.500 0.000WB Other Through 11 1 15 1 0.000 0.000 1.000 " 11 2 15 1 0.000 0.000 1.000 " 11 3 15 1 0.000 0.000 1.000 " 11 4 15 1 0.000 0.000 1.000 " 11 5 15 1 0.000 0.000 1.000 " 11 6 15 1 0.000 0.000 1.000 " 11 7 15 1 0.000 0.000 1.000 " 11 8 10 2 0.000 0.000 1.000 " 11 9 10 2 0.000 0.000 1.000 " 11 10 10 2 0.000 0.000 1.000 " 11 11 10 2 0.000 0.000 1.000 " 11 12 10 2 0.000 0.000 1.000 " 11 13 10 2 0.000 0.000 1.000 " -11 38 0 2 0.000 0.500 0.000EB Other Terminating 13 13 10 2 0.000 0.000 0.500
APP-27

CONFIDENTIAL BUSINESS INFORMATION/TRADE SECRET
Movement TypeActivity
CodeSegment Number
Speed (mph)
Duty Cycle
Number
Non-ZTR Idle Time
(hrs)
ZTR Idle Time (hrs)
Fraction of Segment or Time
Moving
Appendix A-3Sample Calculations
" 13 12 10 2 0.000 0.000 0.500 " 13 11 10 2 0.000 0.000 0.500 " 13 10 10 2 0.000 0.000 0.500 " 13 9 10 2 0.000 0.000 0.500 " 13 63 10 2 0.000 0.000 0.500 " 13 39 10 2 0.000 0.000 0.500 " 13 38 10 2 0.000 0.000 0.500 " 13 -37 10 2 0.000 0.000 0.500 " 13 -37 10 2 0.000 0.000 0.500 " 13 -38 10 2 0.000 0.000 0.500 " 13 -39 10 2 0.000 0.000 0.500 " 13 -40 10 2 0.000 0.000 0.500 " 13 -41 10 2 0.000 0.000 0.500 " 13 52 10 2 0.000 0.000 0.500 " 13 51 10 2 0.000 0.000 0.500 " 13 50 10 2 0.000 0.000 0.500 " 13 -49 10 2 0.000 0.000 0.500 " 13 -62 10 2 0.000 0.000 0.500 " 13 -41 10 2 0.000 0.000 0.500WB Other Terminating 14 1 15 1 0.000 0.000 0.500 " 14 2 15 1 0.000 0.000 0.500 " 14 3 15 1 0.000 0.000 0.500 " 14 4 15 1 0.000 0.000 0.500 " 14 5 15 1 0.000 0.000 0.500 " 14 6 15 1 0.000 0.000 0.500 " 14 7 15 1 0.000 0.000 0.500 " 14 8 10 2 0.000 0.000 0.500 " 14 9 10 2 0.000 0.000 0.500 " 14 10 10 2 0.000 0.000 0.500 " 14 11 10 2 0.000 0.000 0.500 " 14 48 10 2 0.000 0.000 0.500 " 14 49 10 2 0.000 0.000 0.500 " 14 50 10 2 0.000 0.000 0.500 " 14 -51 10 2 0.000 0.000 0.500 " 14 -52 10 2 0.000 0.000 0.500 " 14 -52 10 2 0.000 0.000 0.500 " 14 -51 10 2 0.000 0.000 0.500 " 14 -50 10 2 0.000 0.000 0.500 " 14 -49 10 2 0.000 0.000 0.500 " 14 -62 10 2 0.000 0.000 0.500 " 14 -41 10 2 0.000 0.000 0.500 " 14 1 10 2 0.000 0.000 0.500 " 14 36 10 2 0.000 0.000 0.500 " 14 37 10 2 0.000 0.000 0.500 " 14 38 10 2 0.000 0.000 0.500 " 14 -39 10 2 0.000 0.000 0.500 " 14 -40 10 2 0.000 0.000 0.500 " 14 -41 10 2 0.000 0.000 0.500EB Other Originating 15 -44 10 2 0.000 0.000 1.000 " 15 -39 10 2 0.000 0.000 1.000 " 15 -38 10 2 0.000 0.000 1.000 " 15 37 10 2 0.000 0.500 1.000 " 15 1 10 2 0.000 0.000 1.000
APP-28

CONFIDENTIAL BUSINESS INFORMATION/TRADE SECRET
Movement TypeActivity
CodeSegment Number
Speed (mph)
Duty Cycle
Number
Non-ZTR Idle Time
(hrs)
ZTR Idle Time (hrs)
Fraction of Segment or Time
Moving
Appendix A-3Sample Calculations
" -15 38 10 2 0.000 0.500 0.000WB Other originating 16 -44 10 2 0.000 0.000 1.000 " 16 -39 10 2 0.000 0.000 1.000 " 16 39 10 2 0.000 0.500 1.000 " 16 63 10 2 0.000 0.000 1.000 " 16 9 10 2 0.000 0.000 1.000 " 16 10 10 2 0.000 0.000 1.000 " 16 11 10 2 0.000 0.000 1.000 " 16 12 10 2 0.000 0.000 1.000 " 16 13 10 2 0.000 0.000 1.000EB Power Moves Through 17 1 15 1 0.000 0.000 1.000 " 17 2 15 1 0.000 0.000 1.000 " 17 3 15 1 0.000 0.000 1.000 " 17 4 15 1 0.000 0.000 1.000 " 17 5 15 1 0.000 0.000 1.000 " 17 6 15 1 0.000 0.000 1.000 " 17 7 15 1 0.000 0.000 1.000 " 17 8 10 2 0.000 0.000 1.000 " 17 9 10 2 0.000 0.000 1.000 " 17 10 10 2 0.000 0.000 1.000 " 17 11 10 2 0.000 0.000 1.000 " 17 12 10 2 0.000 0.000 1.000 " 17 13 10 2 0.000 0.000 1.000 " -17 38 0 2 0.000 0.500 0.000WB Power Moves Through 19 1 15 1 0.000 0.000 1.000 " 19 2 15 1 0.000 0.000 1.000 " 19 3 15 1 0.000 0.000 1.000 " 19 4 15 1 0.000 0.000 1.000 " 19 5 15 1 0.000 0.000 1.000 " 19 6 15 1 0.000 0.000 1.000 " 19 7 15 1 0.000 0.000 1.000 " 19 8 10 2 0.000 0.000 1.000 " 19 9 10 2 0.000 0.000 1.000 " 19 10 10 2 0.000 0.000 1.000 " 19 11 10 2 0.000 0.000 1.000 " 19 12 10 2 0.000 0.000 1.000 " 19 13 10 2 0.000 0.000 1.000EB Power Moves Terminating 21 -52 10 2 0.000 0.000 1.000 " 21 -51 10 2 0.000 0.000 1.000 " 21 -50 10 2 0.000 0.000 1.000 " 21 -49 10 2 0.000 0.000 1.000 " 21 -62 10 2 0.000 0.000 1.000 " 21 -41 10 2 0.000 0.000 1.000WB Power Moves Terminating 22 -1 15 1 0.000 0.000 1.000
APP-29
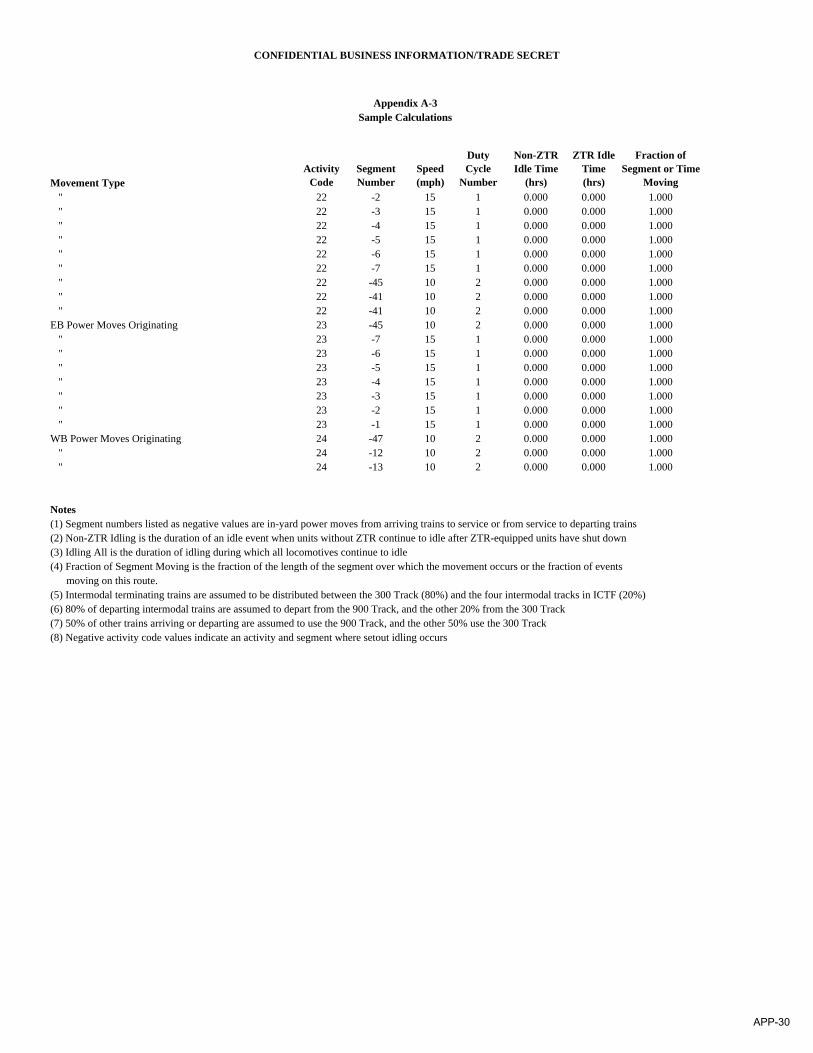
CONFIDENTIAL BUSINESS INFORMATION/TRADE SECRET
Movement TypeActivity
CodeSegment Number
Speed (mph)
Duty Cycle
Number
Non-ZTR Idle Time
(hrs)
ZTR Idle Time (hrs)
Fraction of Segment or Time
Moving
Appendix A-3Sample Calculations
" 22 -2 15 1 0.000 0.000 1.000 " 22 -3 15 1 0.000 0.000 1.000 " 22 -4 15 1 0.000 0.000 1.000 " 22 -5 15 1 0.000 0.000 1.000 " 22 -6 15 1 0.000 0.000 1.000 " 22 -7 15 1 0.000 0.000 1.000 " 22 -45 10 2 0.000 0.000 1.000 " 22 -41 10 2 0.000 0.000 1.000 " 22 -41 10 2 0.000 0.000 1.000EB Power Moves Originating 23 -45 10 2 0.000 0.000 1.000 " 23 -7 15 1 0.000 0.000 1.000 " 23 -6 15 1 0.000 0.000 1.000 " 23 -5 15 1 0.000 0.000 1.000 " 23 -4 15 1 0.000 0.000 1.000 " 23 -3 15 1 0.000 0.000 1.000 " 23 -2 15 1 0.000 0.000 1.000 " 23 -1 15 1 0.000 0.000 1.000WB Power Moves Originating 24 -47 10 2 0.000 0.000 1.000 " 24 -12 10 2 0.000 0.000 1.000 " 24 -13 10 2 0.000 0.000 1.000
Notes(1) Segment numbers listed as negative values are in-yard power moves from arriving trains to service or from service to departing trains(2) Non-ZTR Idling is the duration of an idle event when units without ZTR continue to idle after ZTR-equipped units have shut down(3) Idling All is the duration of idling during which all locomotives continue to idle(4) Fraction of Segment Moving is the fraction of the length of the segment over which the movement occurs or the fraction of events moving on this route.(5) Intermodal terminating trains are assumed to be distributed between the 300 Track (80%) and the four intermodal tracks in ICTF (20%)(6) 80% of departing intermodal trains are assumed to depart from the 900 Track, and the other 20% from the 300 Track(7) 50% of other trains arriving or departing are assumed to use the 900 Track, and the other 50% use the 300 Track(8) Negative activity code values indicate an activity and segment where setout idling occurs
APP-30
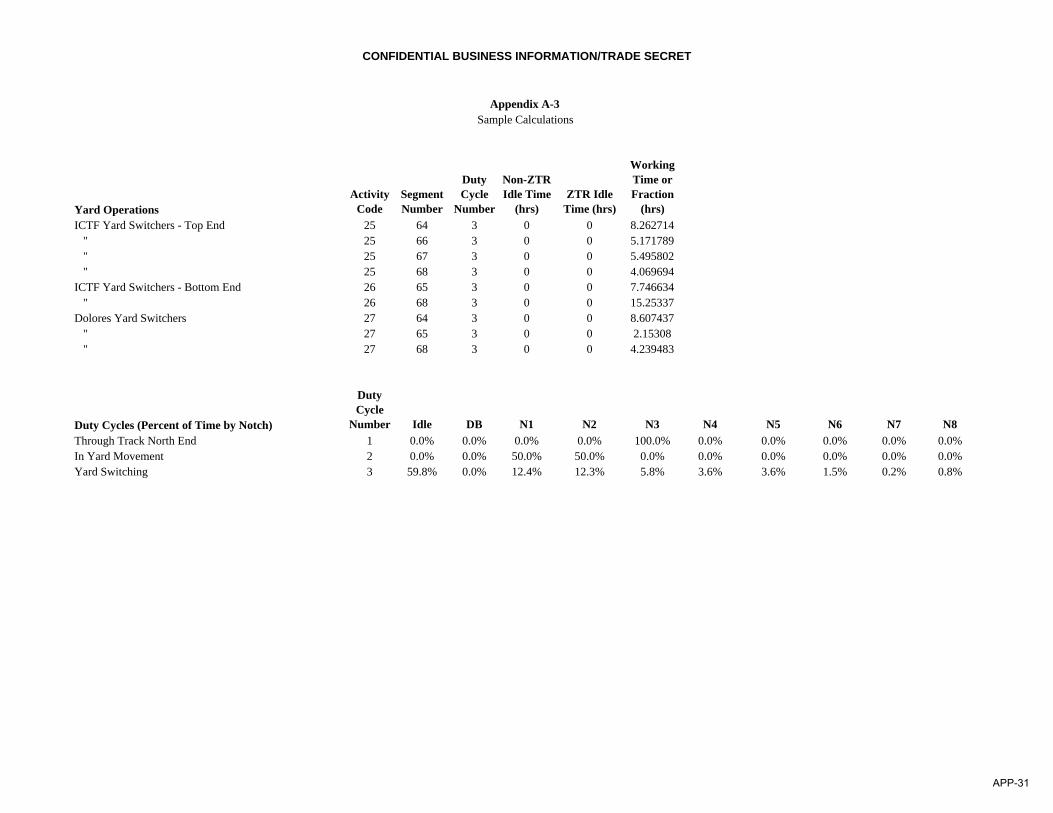
CONFIDENTIAL BUSINESS INFORMATION/TRADE SECRET
Yard OperationsActivity
CodeSegment Number
Duty Cycle
Number
Non-ZTR Idle Time
(hrs)ZTR Idle
Time (hrs)
Working Time or Fraction
(hrs)ICTF Yard Switchers - Top End 25 64 3 0 0 8.262714 " 25 66 3 0 0 5.171789 " 25 67 3 0 0 5.495802 " 25 68 3 0 0 4.069694ICTF Yard Switchers - Bottom End 26 65 3 0 0 7.746634 " 26 68 3 0 0 15.25337Dolores Yard Switchers 27 64 3 0 0 8.607437 " 27 65 3 0 0 2.15308 " 27 68 3 0 0 4.239483
Duty Cycles (Percent of Time by Notch)
Duty Cycle
Number Idle DB N1 N2 N3 N4 N5 N6 N7 N8Through Track North End 1 0.0% 0.0% 0.0% 0.0% 100.0% 0.0% 0.0% 0.0% 0.0% 0.0%In Yard Movement 2 0.0% 0.0% 50.0% 50.0% 0.0% 0.0% 0.0% 0.0% 0.0% 0.0%Yard Switching 3 59.8% 0.0% 12.4% 12.3% 5.8% 3.6% 3.6% 1.5% 0.2% 0.8%
Appendix A-3Sample Calculations
APP-31

CONFIDENTIAL BUSINESS INFORMATION/TRADE SECRET
Emission Factors Weighted by Model/Tier/ZTR Fractions - DPM g/hr per Locomotive
Locomotive Model Group Group IDIdle-
NonZTR Idle-All DB N1 N2 N3 N4 N5 N6 N7 N8California Fuel (221 ppm S)Service 1 21.96 30.45 57.39 47.9 100.03 220.03 275.96 350.59 540.4 623.27 722.81LoadTest 2 23.16 31.29 62.18 49.49 101.9 220.72 274.35 348.2 528.2 608.47 710.52
47-State Fuel (2639 ppm S)Service 1 21.96 30.45 57.39 47.9 100.03 239.56 306.61 395.05 605.63 699.85 816.91LoadTest 2 23.16 31.29 62.18 49.49 101.9 240.94 304.75 391.96 592.43 686.25 806.85
Note: Idle-NonZTR is the average per-locomotive idle emission rate for the fraction of locomotives not equipped with ZTR/Auto start-stop technology
Service and Shop ActivityDuration of Activity per Locomotive (minutes)
ActivityNumber of
Locomotives
Fraction of Calif.
FuelIdle-
NonZTR Idle-All DB N1 N2 N3 N4 N5 N6 N7 N8Service - Inbound 8294 0.00 0 30 0 0 0 0 0 0 0 0 0In Service 8294 0.00 0 60 0 0 0 0 0 0 0 0 0Service - Post Service 8294 0.90 15 30 0 0 0 0 0 0 0 0 0Pre-Shop Idling 2815 0.90 0 30 0 0 0 0 0 0 0 0 0Pre-Maintenance Load Test 281 0.90 0 2 0 0 0 0 0 0 0 0 8Post-Maintenance Load Test 281 0.90 0 10 0 10 0 0 0 0 0 0 10Quarterly Maintenance Load Test 430 0.90 0 2 0 0 0 0 0 0 0 0 8Unscheduled Mtc Diagnostic Test 6 0.90 0 10 0 0 0 0 0 0 0 0 10Unscheduled Mtc Post Test 777 0.90 0 15 0 0 0 0 0 0 0 0 45
Appendix A-3Sample Calculations
APP-32

CONFIDENTIAL BUSINESS INFORMATION/TRADE SECRET
Appendix A-3Sample Calculations
Locomotive Model DistributionsLocomotives Serviced
Technology ZTR/AESS Switcher GP-3x GP-4x SD-50 GP-60 SD-7x SD-90 Dash 7 Dash 8 Dash 9 C-60Pre Tier 0 No 0.0000 0.0054 0.1310 0.0138 0.0351 0.0056 0.0041 0.0009 0.1026 0.0789 0.0002Pre Tier 0 Yes 0.0000 0.0090 0.0046 0.0000 0.0000 0.0000 0.0000 0.0000 0.0000 0.0058 0.0000
Tier 0 No 0.0000 0.0002 0.0034 0.0002 0.0096 0.2160 0.0004 0.0000 0.0201 0.0316 0.0041Tier 0 Yes 0.0017 0.0022 0.0000 0.0000 0.0006 0.0011 0.0000 0.0000 0.0000 0.0027 0.0000Tier 1 No 0.0000 0.0000 0.0000 0.0000 0.0000 0.0321 0.0000 0.0000 0.0000 0.0000 0.0000Tier 1 Yes 0.0000 0.0000 0.0000 0.0000 0.0000 0.1782 0.0000 0.0000 0.0000 0.0056 0.0000Tier 2 No 0.0000 0.0000 0.0000 0.0000 0.0000 0.0000 0.0000 0.0000 0.0000 0.0001 0.0000Tier 2 Yes 0.0000 0.0000 0.0000 0.0000 0.0000 0.0308 0.0000 0.0000 0.0000 0.0627 0.0000
Locomotives Load TestedTechnology ZTR/AESS Switcher GP-3x GP-4x SD-50 GP-60 SD-7x SD-90 Dash 7 Dash 8 Dash 9 C-60Pre Tier 0 No 0.0000 0.0072 0.1247 0.0103 0.0381 0.0079 0.0056 0.0008 0.1350 0.0794 0.0000Pre Tier 0 Yes 0.0000 0.0103 0.0072 0.0000 0.0000 0.0000 0.0000 0.0000 0.0000 0.0064 0.0000
Tier 0 No 0.0000 0.0000 0.0040 0.0008 0.0119 0.2049 0.0008 0.0000 0.0262 0.0357 0.0040Tier 0 Yes 0.0000 0.0032 0.0000 0.0000 0.0000 0.0000 0.0000 0.0000 0.0000 0.0024 0.0000Tier 1 No 0.0000 0.0000 0.0000 0.0000 0.0000 0.0230 0.0000 0.0000 0.0000 0.0000 0.0000Tier 1 Yes 0.0000 0.0000 0.0000 0.0000 0.0000 0.1636 0.0000 0.0000 0.0000 0.0064 0.0000Tier 2 No 0.0000 0.0000 0.0000 0.0000 0.0000 0.0000 0.0000 0.0000 0.0000 0.0000 0.0000Tier 2 Yes 0.0000 0.0000 0.0000 0.0000 0.0000 0.0310 0.0000 0.0000 0.0000 0.0493 0.0000
APP-33
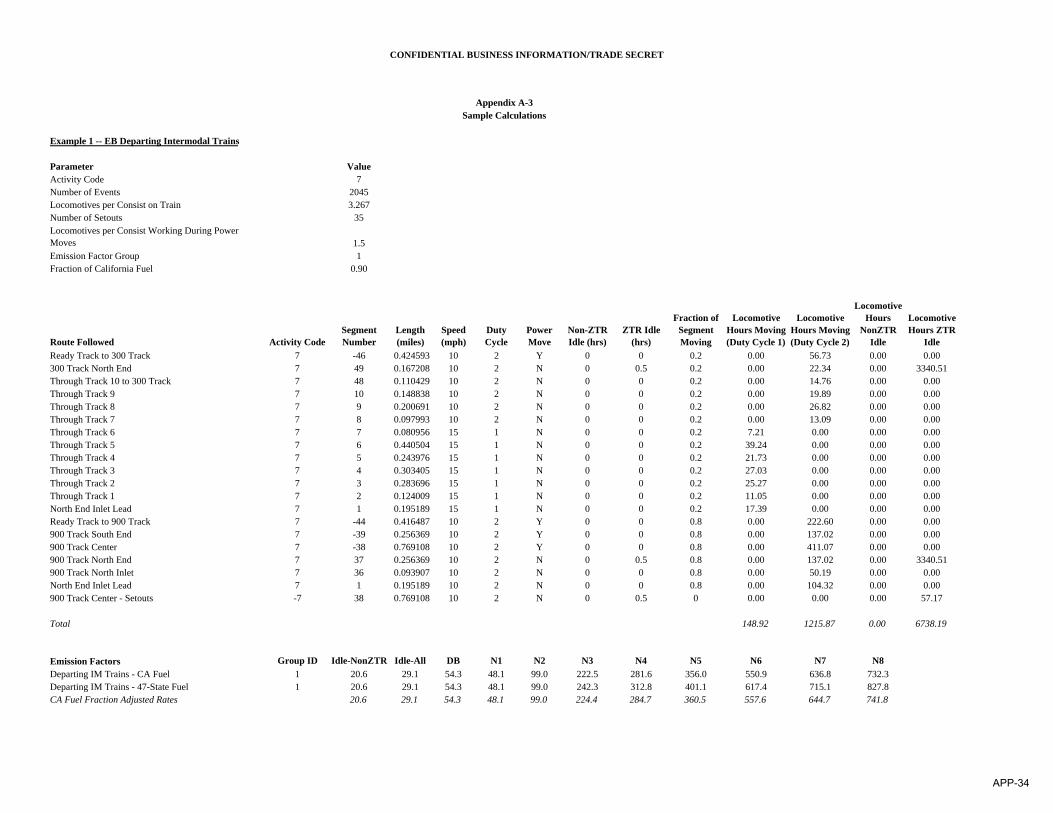
CONFIDENTIAL BUSINESS INFORMATION/TRADE SECRET
Example 1 -- EB Departing Intermodal Trains
Parameter ValueActivity Code 7Number of Events 2045Locomotives per Consist on Train 3.267Number of Setouts 35Locomotives per Consist Working During Power Moves 1.5Emission Factor Group 1Fraction of California Fuel 0.90
Route Followed Activity CodeSegment Number
Length (miles)
Speed (mph)
Duty Cycle
Power Move
Non-ZTR Idle (hrs)
ZTR Idle (hrs)
Fraction of Segment Moving
Locomotive Hours Moving (Duty Cycle 1)
Locomotive Hours Moving (Duty Cycle 2)
Locomotive Hours
NonZTR Idle
Locomotive Hours ZTR
IdleReady Track to 300 Track 7 -46 0.424593 10 2 Y 0 0 0.2 0.00 56.73 0.00 0.00300 Track North End 7 49 0.167208 10 2 N 0 0.5 0.2 0.00 22.34 0.00 3340.51Through Track 10 to 300 Track 7 48 0.110429 10 2 N 0 0 0.2 0.00 14.76 0.00 0.00Through Track 9 7 10 0.148838 10 2 N 0 0 0.2 0.00 19.89 0.00 0.00Through Track 8 7 9 0.200691 10 2 N 0 0 0.2 0.00 26.82 0.00 0.00Through Track 7 7 8 0.097993 10 2 N 0 0 0.2 0.00 13.09 0.00 0.00Through Track 6 7 7 0.080956 15 1 N 0 0 0.2 7.21 0.00 0.00 0.00Through Track 5 7 6 0.440504 15 1 N 0 0 0.2 39.24 0.00 0.00 0.00Through Track 4 7 5 0.243976 15 1 N 0 0 0.2 21.73 0.00 0.00 0.00Through Track 3 7 4 0.303405 15 1 N 0 0 0.2 27.03 0.00 0.00 0.00Through Track 2 7 3 0.283696 15 1 N 0 0 0.2 25.27 0.00 0.00 0.00Through Track 1 7 2 0.124009 15 1 N 0 0 0.2 11.05 0.00 0.00 0.00North End Inlet Lead 7 1 0.195189 15 1 N 0 0 0.2 17.39 0.00 0.00 0.00Ready Track to 900 Track 7 -44 0.416487 10 2 Y 0 0 0.8 0.00 222.60 0.00 0.00900 Track South End 7 -39 0.256369 10 2 Y 0 0 0.8 0.00 137.02 0.00 0.00900 Track Center 7 -38 0.769108 10 2 Y 0 0 0.8 0.00 411.07 0.00 0.00900 Track North End 7 37 0.256369 10 2 N 0 0.5 0.8 0.00 137.02 0.00 3340.51900 Track North Inlet 7 36 0.093907 10 2 N 0 0 0.8 0.00 50.19 0.00 0.00North End Inlet Lead 7 1 0.195189 10 2 N 0 0 0.8 0.00 104.32 0.00 0.00900 Track Center - Setouts -7 38 0.769108 10 2 N 0 0.5 0 0.00 0.00 0.00 57.17
Total 148.92 1215.87 0.00 6738.19
Emission Factors Group ID Idle-NonZTR Idle-All DB N1 N2 N3 N4 N5 N6 N7 N8Departing IM Trains - CA Fuel 1 20.6 29.1 54.3 48.1 99.0 222.5 281.6 356.0 550.9 636.8 732.3Departing IM Trains - 47-State Fuel 1 20.6 29.1 54.3 48.1 99.0 242.3 312.8 401.1 617.4 715.1 827.8CA Fuel Fraction Adjusted Rates 20.6 29.1 54.3 48.1 99.0 224.4 284.7 360.5 557.6 644.7 741.8
Appendix A-3Sample Calculations
APP-34

CONFIDENTIAL BUSINESS INFORMATION/TRADE SECRET
Appendix A-3Sample Calculations
Duty CycleDuty Cycle Moving 1 0.00 0.00 0.00 0.00 0.00 1.00 0.00 0.00 0.00 0.00 0.00
2 0.00 0.00 0.00 0.50 0.50 0.00 0.00 0.00 0.00 0.00 0.00
Weighted g/hr emissions 1 0.00 0.00 0.00 0.00 0.00 224.43 0.00 0.00 0.00 0.00 0.002 0.00 0.00 0.00 24.05 49.51 0.00 0.00 0.00 0.00 0.00 0.00
Moving (Duty Cycle 1)
Moving (Duty Cycle
2)Idle-
NonZTR Idle-AllEmission Rate (g/hr) 224.43 73.56 20.58 29.05Locomotive Hours 148.92 1215.87 0.00 6738.19Total Emissions (g/yr) 33422 89434 0 195744
Example 2 -- Quarterly Maintenance Load Testing
Number of Quarterly Maintenance Load Tests 430Fraction of Calif. Fuel 0.9
Emission Factors (g/hr) Group ID Idle-NonZTR Idle-All DB N1 N2 N3 N4 N5 N6 N7 N8Load Test - CA Fuel 2 23.16 31.29 62.18 49.49 101.90 220.72 274.35 348.20 528.20 608.47 710.52Load Test - 47-State Fuel 2 23.16 31.29 62.18 49.49 101.9 240.94 304.75 391.96 592.43 686.25 806.85CA Fuel Fraction Adjusted Rates 23.16 31.29 62.18 49.49 101.90 222.74 277.39 352.58 534.62 616.25 720.15
ActivityNumber of
Locomotives Idle-NonZTR Idle-All DB N1 N2 N3 N4 N5 N6 N7 N8Quarterly Maintenance Load Test 430 0 2 0 0 0 0 0 0 0 0 8
Emissions (g)Notch-Specific 0.0 448.5 0.0 0.0 0.0 0.0 0.0 0.0 0.0 0.0 41288.8
Total Emissions (g/yr) 41737
Duration (minutes)
APP-35
APPENDIX A-4
METHODOLOGY FOR ESTIMATING LOCOMOTIVE EMISSIONS AND GENERATING AERMOD EMISSION INPUTS
APP-36
CONFIDENTIAL BUSINESS INFORMATION/TRADE SECRET
Appendix A-4
Methodology for Estimating Locomotive Emissions and Generating AERMOD Emission Inputs
Overview This appendix describes the general procedures followed for developing locomotive emission inventories for the Union Pacific Railroad (UPRR) rail yards under the Memorandum of Understanding with the California Air Resources Board. It also describes the procedure by which the emission inputs are prepared for both locomotive and non-locomotive sources are used in AERMOD dispersion modeling.
EMISSION CALCULATIONS This section describes the details of the development of activity inputs, emission factors, and emission estimates for locomotive operations. Separate procedures are followed for estimating activity associated with locomotives on trains, locomotive consist movements within a yard, service and shop activity (if occurring at a specific yard), and yard switching operations within a yard. Emission factors are developed for each of the types of locomotive activity based on the model and technology distribution of locomotives involved in each activity. Emission estimates are then developed for the activities and specific areas of a yard in which each activity occurs. The data used to calculate these emissions are included in the Appendix A-3 Excel workbook, which includes a “Sample Calculations” worksheet showing the linkages between the various activities, emission factors, and operating characteristics data.
Train Activity Train activity data for emissions calculations include a number of separate components:
• The number of trains arriving, departing, or passing through a yard, broken down by type of train;
• The average composition of working locomotives in each consist1, including the fraction of locomotives of different models, emissions technology tier, and automatic idling control equipment2;
• The identification of routes followed for different types of train activities; and
1 The term “consist” refers to the group of locomotives (typically between one and four) that provide power for a specific train. 2 Two types of automatic idling control equipment are in use, known as ZTR SmartStart (typically retrofit equipment on low horsepower units) and AESS (typically factory installed on newer high horsepower units). Both are programmed to automatically shut off the engines of parked idling locomotives after a specified period of time, and to restart the unit if any of a number of operating parameters (battery state, air pressure, coolant temperature, etc.) reach specified thresholds.
APP-37
CONFIDENTIAL BUSINESS INFORMATION/TRADE SECRET
• Identification of the speeds and throttle settings for different types of train activities in different locations.
The primary source of information for estimating train activity is a database identifying the arrival and departure of locomotives at a specific yard. This database identifies locomotives by their ID numbers and models, the status on the train (working or not working), and the specific train to which they are connected. From these data, the total numbers of trains of different types are identified based on train symbols, train dates, train origination and termination indicators, and dates and times of arrival and departure. For each type of train and activity, the average number of locomotives per consist is calculated along with the distribution of locomotive models, emission technology tiers, and automatic idling control equipment. A separate database of UPRR locomotives is consulted based on locomotive ID to determine the tier and date of any retrofits of automatic idling controls to complete the development of these model distributions. The activity data so derived are shown on the “Activities” worksheet in the Appendix A-3 Excel workbook, and the model and technology distributions are shown on the “Consist Emissions” worksheet. The types of trains to be identified can vary from yard to yard. For all yards, through trains (which bypass the yard itself on mainline tracks adjacent to the yard) are identified. Depending on the yard, trains entering or departing from the yard can be of several types, including:
• Intermodal trains; • Automobile trains; • “Manifest” or freight trains; • Local trains; and • Power moves.
Power moves are trains consisting only of locomotives that are either arriving at the yard to be serviced or used for departing trains, or departing from the yard to be serviced at another location or used for trains departing from another location. The routes followed by each type of train on arrival and departure are identified in consultation with UPRR yard personnel, along with estimates of average speeds and duty cycles (fraction of time spent at different throttle settings) for different areas. Specific track subsections are identified by UTM coordinates digitized from georeferenced aerial photographs. The segments identified and their lengths are shown on the “Track Segments” worksheet of Appendix A-3. For each train type, direction, and route, a listing of track segments, segment lengths, and duty cycles is developed. Duty cycles are shown on the “Consist Emissions” worksheet of Appendix A-3, and the segment speeds, duty cycles, idling durations are shown on the “Movements and Yard Operations” worksheet. This listing, along with the number of locomotives per consist and number of trains of each type, allows the number of locomotive hours in each duty cycle to be calculated for each section of track. For arriving and departing trains, estimates of the duration of idling were developed in consultation with UPRR personnel.
APP-38
CONFIDENTIAL BUSINESS INFORMATION/TRADE SECRET
These idling periods were divided into two parts: the assumed amount of time that all locomotives in a consist would idle on arrival or departure, and the amount of time that only locomotives not equipped with automatic idle controls would idle. Idling periods were assigned to a segment of the arrival or departure track one fifth of the length of the track at the appropriate end.
Service and Shop Activity If there is a service track and/or shop at a yard, locomotives (including both road power from trains as well as yard switchers) undergo a variety of activities at these locations. If present at a yard, details of the service and shop activity, model distributions, and emission factors are shown on the “Service and Shop” worksheet of Appendix A-3. Specific locomotive activities involve idling while awaiting or undergoing routine service (cleaning, refueling, oiling, sanding, and other minor maintenance), movement and idling between service and maintenance areas, and stationary load testing associated with specific types of maintenance events. A database of service events at individual yards identifies the number of service events during the year, the locomotive ID and model, and the nature of servicing performed. Routine servicing involves periods of idling prior to and during service, and additional idling prior to movement of consists to departing trains in the yard. Estimates of the duration of idling associated with servicing are developed in consultation with UPRR personnel. As was done for trains, these idling periods were separated into two parts: the average total duration of idling by all locomotives, and the average duration of additional idling by locomotives not equipped with automatic idling controls. The database also specifically identifies load test events and the type of maintenance with which the load testing is associated. These types include planned maintenance at different intervals (e.g., quarterly, semiannual) as well as unscheduled maintenance that may involve both diagnostic load testing prior to maintenance and post-maintenance load testing. The duration of load test events in each throttle setting depends on the equipment available and types of maintenance performed at the yard. Estimates of these durations, as well as the identification of load testing activity by type of load test and the time and duration of any additional idling and movements, are developed in consultation with UPRR personnel. A total number of events (servicing and load testing by location and type) are developed from these data, as are locomotive model and technology distributions for all locomotives serviced and for those specific locomotives undergoing load testing (if applicable). From these event counts and durations, the total number of hours of locomotive idling and higher throttle setting operation in different portions of the service areas are calculated for each of the two model distributions.
Yard Switcher Activity
In each yard, there are routine jobs assigned to individual switchers or sets of switchers. These activities are generally not tracked from hour to hour, but they occur routinely within yard boundaries during specified work shifts. Similarly, the specific yard switcher
APP-39
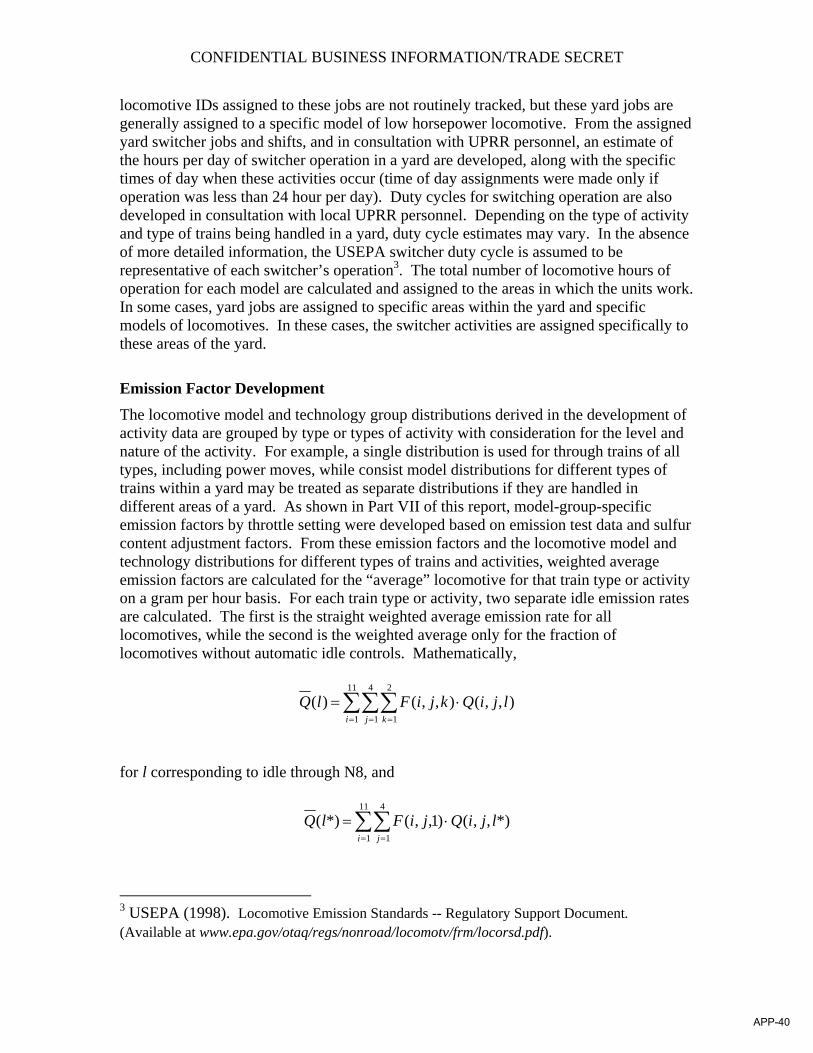
CONFIDENTIAL BUSINESS INFORMATION/TRADE SECRET
locomotive IDs assigned to these jobs are not routinely tracked, but these yard jobs are generally assigned to a specific model of low horsepower locomotive. From the assigned yard switcher jobs and shifts, and in consultation with UPRR personnel, an estimate of the hours per day of switcher operation in a yard are developed, along with the specific times of day when these activities occur (time of day assignments were made only if operation was less than 24 hour per day). Duty cycles for switching operation are also developed in consultation with local UPRR personnel. Depending on the type of activity and type of trains being handled in a yard, duty cycle estimates may vary. In the absence of more detailed information, the USEPA switcher duty cycle is assumed to be representative of each switcher’s operation3. The total number of locomotive hours of operation for each model are calculated and assigned to the areas in which the units work. In some cases, yard jobs are assigned to specific areas within the yard and specific models of locomotives. In these cases, the switcher activities are assigned specifically to these areas of the yard.
Emission Factor Development The locomotive model and technology group distributions derived in the development of activity data are grouped by type or types of activity with consideration for the level and nature of the activity. For example, a single distribution is used for through trains of all types, including power moves, while consist model distributions for different types of trains within a yard may be treated as separate distributions if they are handled in different areas of a yard. As shown in Part VII of this report, model-group-specific emission factors by throttle setting were developed based on emission test data and sulfur content adjustment factors. From these emission factors and the locomotive model and technology distributions for different types of trains and activities, weighted average emission factors are calculated for the “average” locomotive for that train type or activity on a gram per hour basis. For each train type or activity, two separate idle emission rates are calculated. The first is the straight weighted average emission rate for all locomotives, while the second is the weighted average only for the fraction of locomotives without automatic idle controls. Mathematically,
∑∑∑= = =
⋅=11
1
4
1
2
1
),,(),,()(i j k
ljiQkjiFlQ
for l corresponding to idle through N8, and
∑∑= =
⋅=11
1
4
1
*),,()1,,(*)(i j
ljiQjiFlQ
3 USEPA (1998). Locomotive Emission Standards -- Regulatory Support Document. (Available at www.epa.gov/otaq/regs/nonroad/locomotv/frm/locorsd.pdf).
APP-40
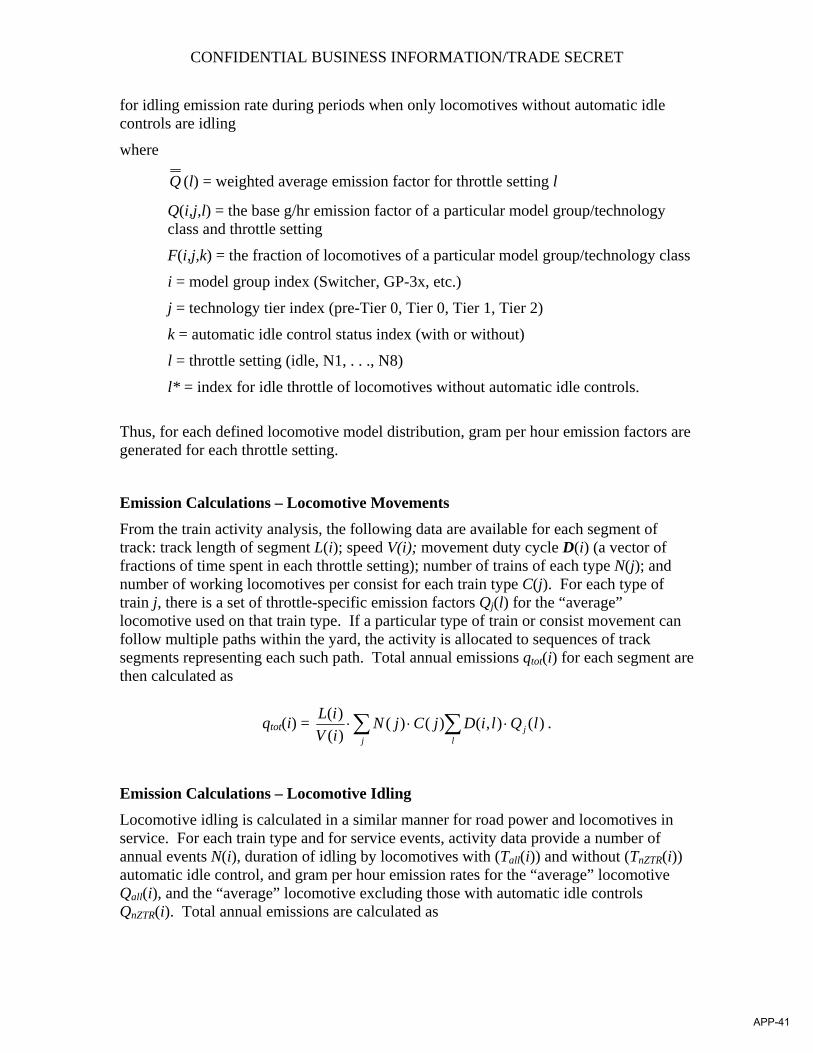
CONFIDENTIAL BUSINESS INFORMATION/TRADE SECRET
for idling emission rate during periods when only locomotives without automatic idle controls are idling
where
Q (l) = weighted average emission factor for throttle setting l
Q(i,j,l) = the base g/hr emission factor of a particular model group/technology class and throttle setting
F(i,j,k) = the fraction of locomotives of a particular model group/technology class
i = model group index (Switcher, GP-3x, etc.)
j = technology tier index (pre-Tier 0, Tier 0, Tier 1, Tier 2)
k = automatic idle control status index (with or without)
l = throttle setting (idle, N1, . . ., N8)
l* = index for idle throttle of locomotives without automatic idle controls.
Thus, for each defined locomotive model distribution, gram per hour emission factors are generated for each throttle setting.
Emission Calculations – Locomotive Movements From the train activity analysis, the following data are available for each segment of track: track length of segment L(i); speed V(i); movement duty cycle D(i) (a vector of fractions of time spent in each throttle setting); number of trains of each type N(j); and number of working locomotives per consist for each train type C(j). For each type of train j, there is a set of throttle-specific emission factors Qj(l) for the “average” locomotive used on that train type. If a particular type of train or consist movement can follow multiple paths within the yard, the activity is allocated to sequences of track segments representing each such path. Total annual emissions qtot(i) for each segment are then calculated as
qtot(i) = )(),()()()()( lQliDjCjN
iViL
j lj∑ ∑ ⋅⋅⋅ .
Emission Calculations – Locomotive Idling Locomotive idling is calculated in a similar manner for road power and locomotives in service. For each train type and for service events, activity data provide a number of annual events N(i), duration of idling by locomotives with (Tall(i)) and without (TnZTR(i)) automatic idle control, and gram per hour emission rates for the “average” locomotive Qall(i), and the “average” locomotive excluding those with automatic idle controls QnZTR(i). Total annual emissions are calculated as
APP-41
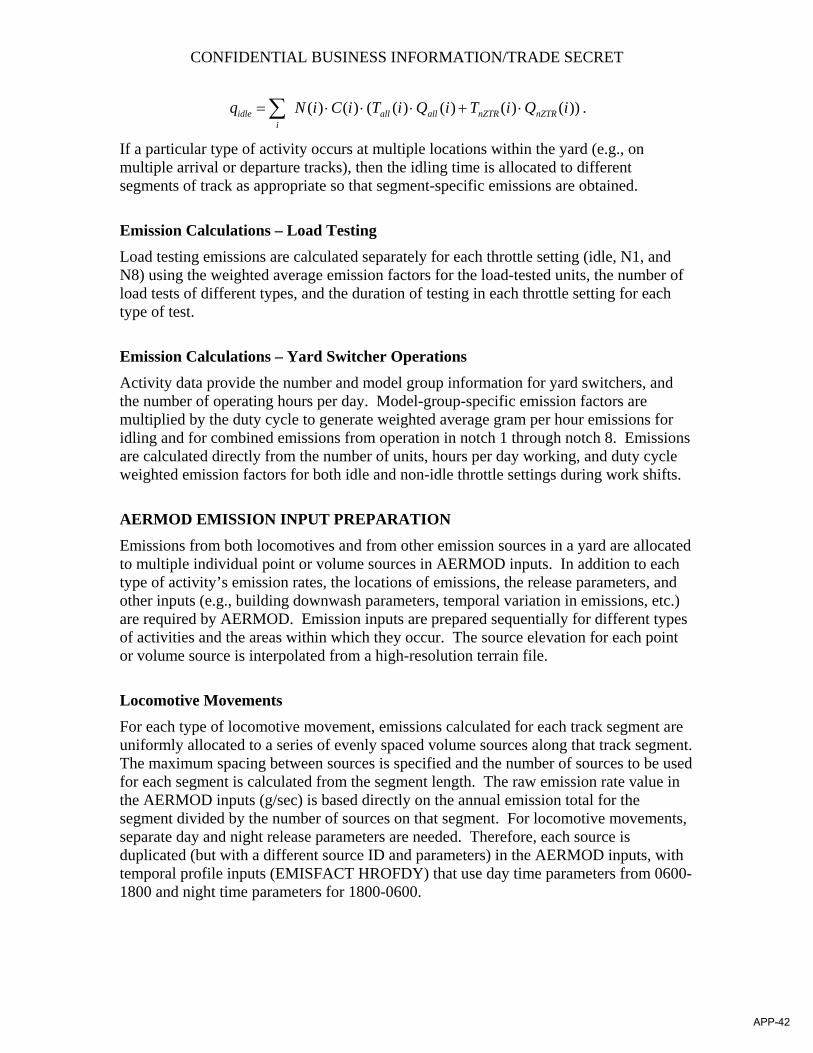
CONFIDENTIAL BUSINESS INFORMATION/TRADE SECRET
))()()()(()()( iQiTiQiTiCiNq nZTRnZTRallalli
idle ⋅+⋅⋅⋅=∑ .
If a particular type of activity occurs at multiple locations within the yard (e.g., on multiple arrival or departure tracks), then the idling time is allocated to different segments of track as appropriate so that segment-specific emissions are obtained.
Emission Calculations – Load Testing Load testing emissions are calculated separately for each throttle setting (idle, N1, and N8) using the weighted average emission factors for the load-tested units, the number of load tests of different types, and the duration of testing in each throttle setting for each type of test.
Emission Calculations – Yard Switcher Operations Activity data provide the number and model group information for yard switchers, and the number of operating hours per day. Model-group-specific emission factors are multiplied by the duty cycle to generate weighted average gram per hour emissions for idling and for combined emissions from operation in notch 1 through notch 8. Emissions are calculated directly from the number of units, hours per day working, and duty cycle weighted emission factors for both idle and non-idle throttle settings during work shifts.
AERMOD EMISSION INPUT PREPARATION Emissions from both locomotives and from other emission sources in a yard are allocated to multiple individual point or volume sources in AERMOD inputs. In addition to each type of activity’s emission rates, the locations of emissions, the release parameters, and other inputs (e.g., building downwash parameters, temporal variation in emissions, etc.) are required by AERMOD. Emission inputs are prepared sequentially for different types of activities and the areas within which they occur. The source elevation for each point or volume source is interpolated from a high-resolution terrain file.
Locomotive Movements For each type of locomotive movement, emissions calculated for each track segment are uniformly allocated to a series of evenly spaced volume sources along that track segment. The maximum spacing between sources is specified and the number of sources to be used for each segment is calculated from the segment length. The raw emission rate value in the AERMOD inputs (g/sec) is based directly on the annual emission total for the segment divided by the number of sources on that segment. For locomotive movements, separate day and night release parameters are needed. Therefore, each source is duplicated (but with a different source ID and parameters) in the AERMOD inputs, with temporal profile inputs (EMISFACT HROFDY) that use day time parameters from 0600-1800 and night time parameters for 1800-0600.
APP-42
CONFIDENTIAL BUSINESS INFORMATION/TRADE SECRET
Locomotive Idling and Load Testing Locomotive idling and load testing emissions are allocated to track segments in the same manner as locomotive movements, but as point, rather than volume, sources. Each source location may have up to three separate sources identified, with different stack parameters used for idle, notch 1, and notch 8. Building downwash inputs are assigned from a pre-prepared set of records for a typical locomotive’s dimensions and the orientation of the track segment on which the emissions occur.
Yard Switcher Operations Yard switcher operations are allocated to areas within the yard based on the estimated time spent working in each area. As for locomotive movements, yard switcher emissions for a specific area are allocated uniformly to a number of volume sources on defined segments. Day and night operations are handled similarly to train and consist movements, with EMISFACT HROFDY records used to switch day and night volume source release parameters. Depending on their magnitude and distance from yard boundaries, the “working idling” emissions for yard switching may be added to the non-idle emissions from volume sources, or treated as a series of point sources, using stack parameters for the specific model group being used. If treated as point sources, building downwash inputs are prepared as for other locomotive idling and load testing.
APP-43

APPENDIX A-5
PRINCIPLE LOCOMOTIVE ROUTES
APP-44
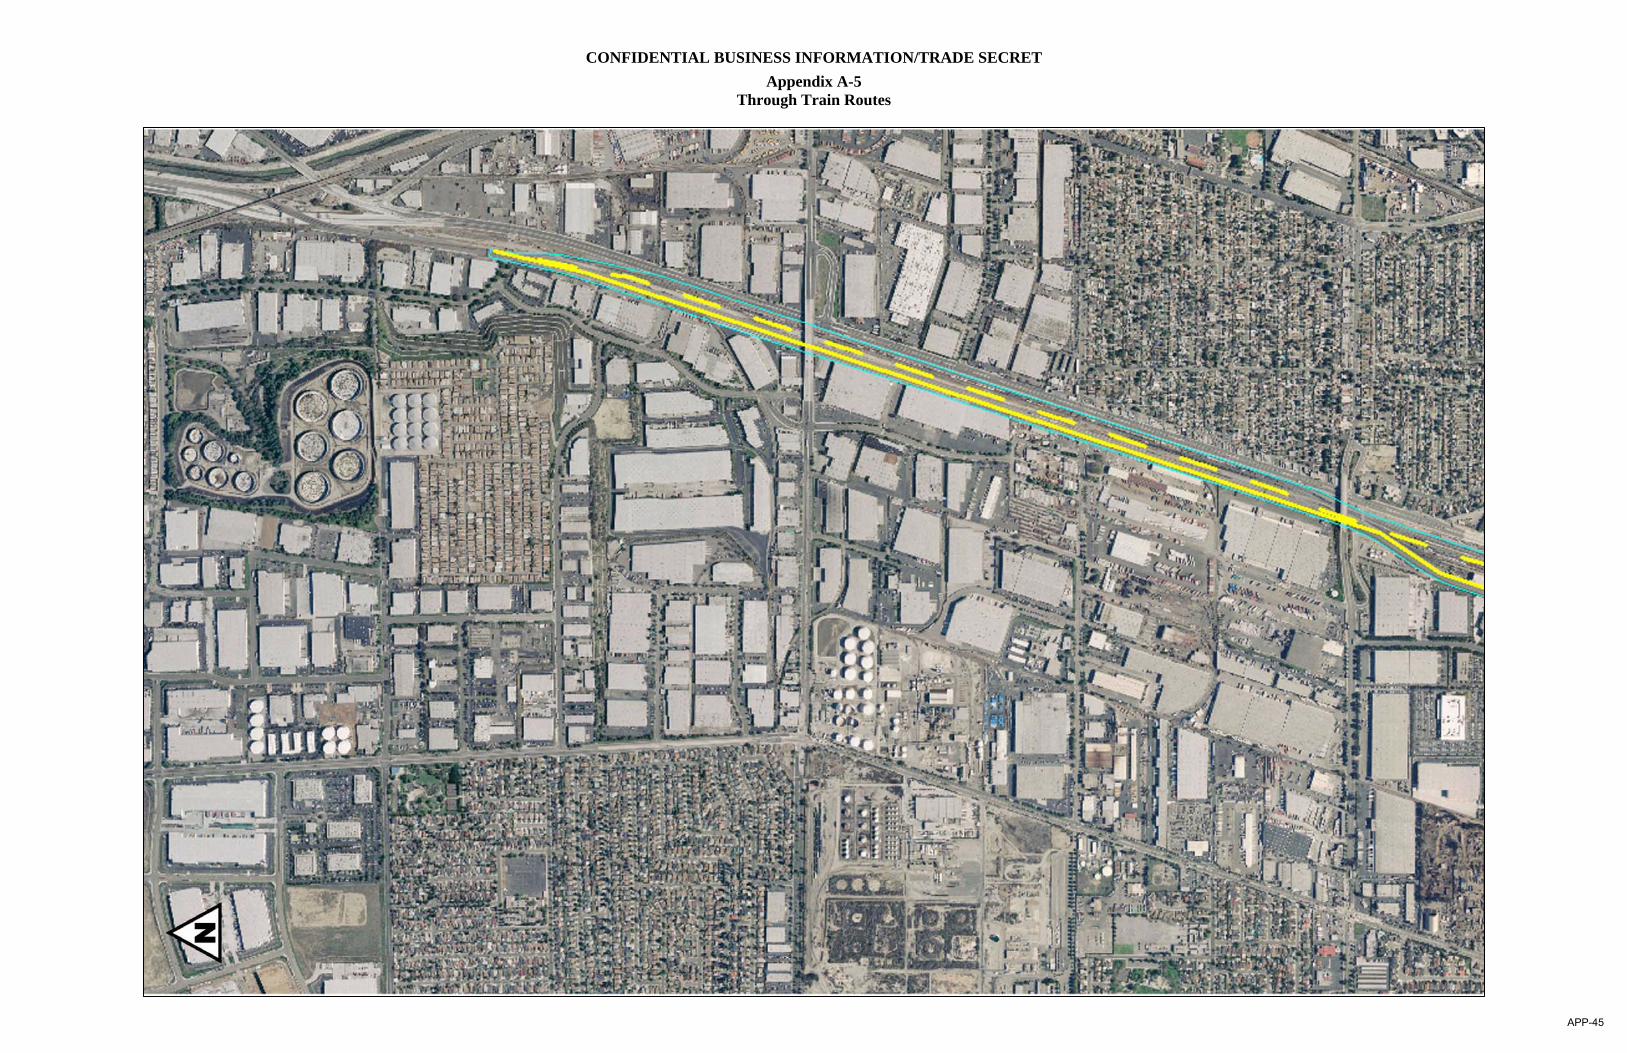
CONFIDENTIAL BUSINESS INFORMATION/TRADE SECRET Appendix A-5
Through Train Routes
APP-45
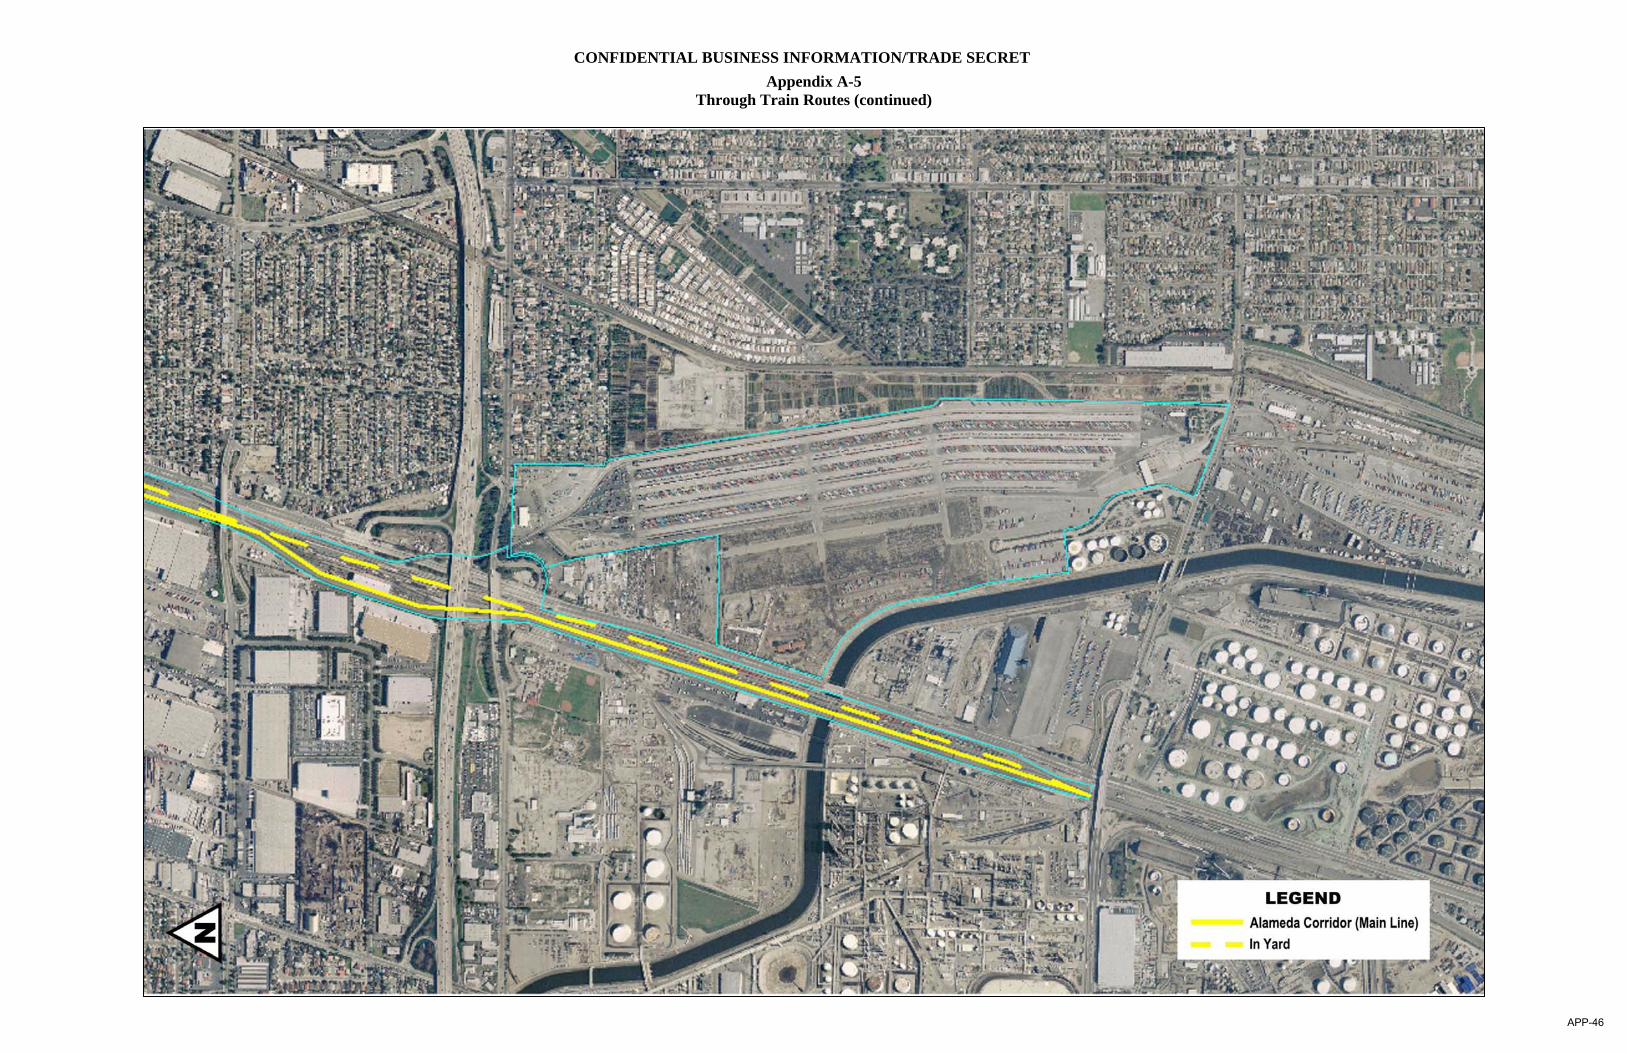
CONFIDENTIAL BUSINESS INFORMATION/TRADE SECRET Appendix A-5
Through Train Routes (continued)
APP-46
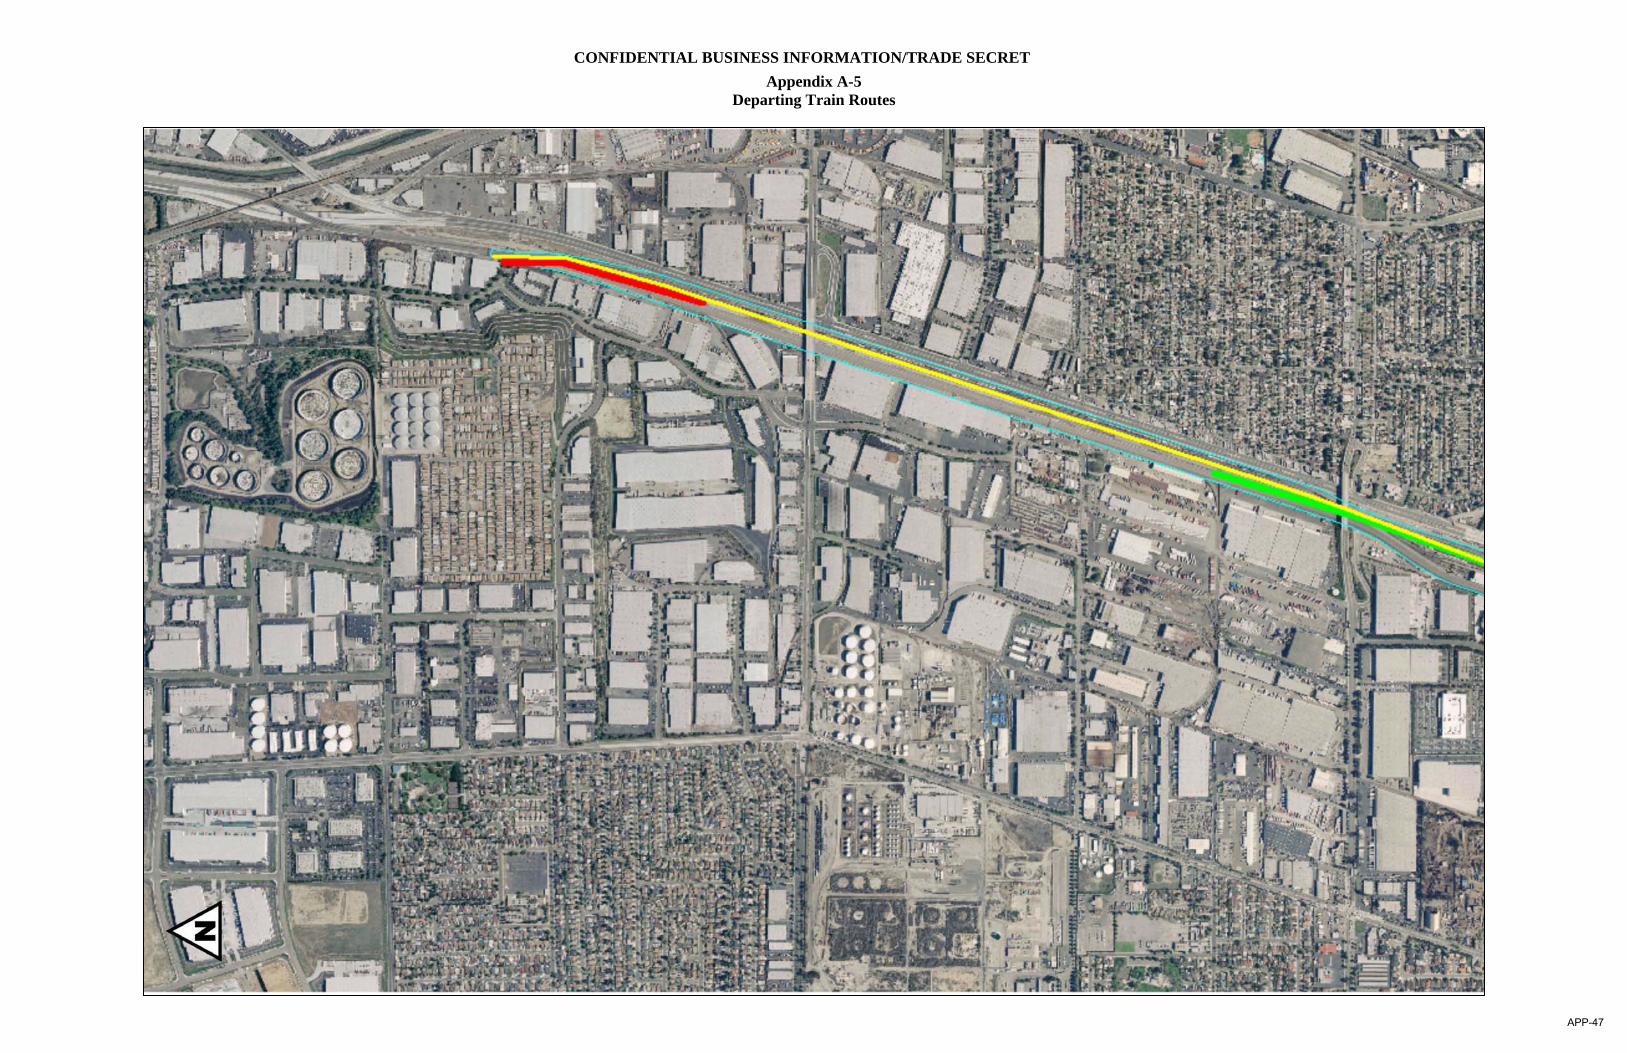
CONFIDENTIAL BUSINESS INFORMATION/TRADE SECRET Appendix A-5
Departing Train Routes
APP-47
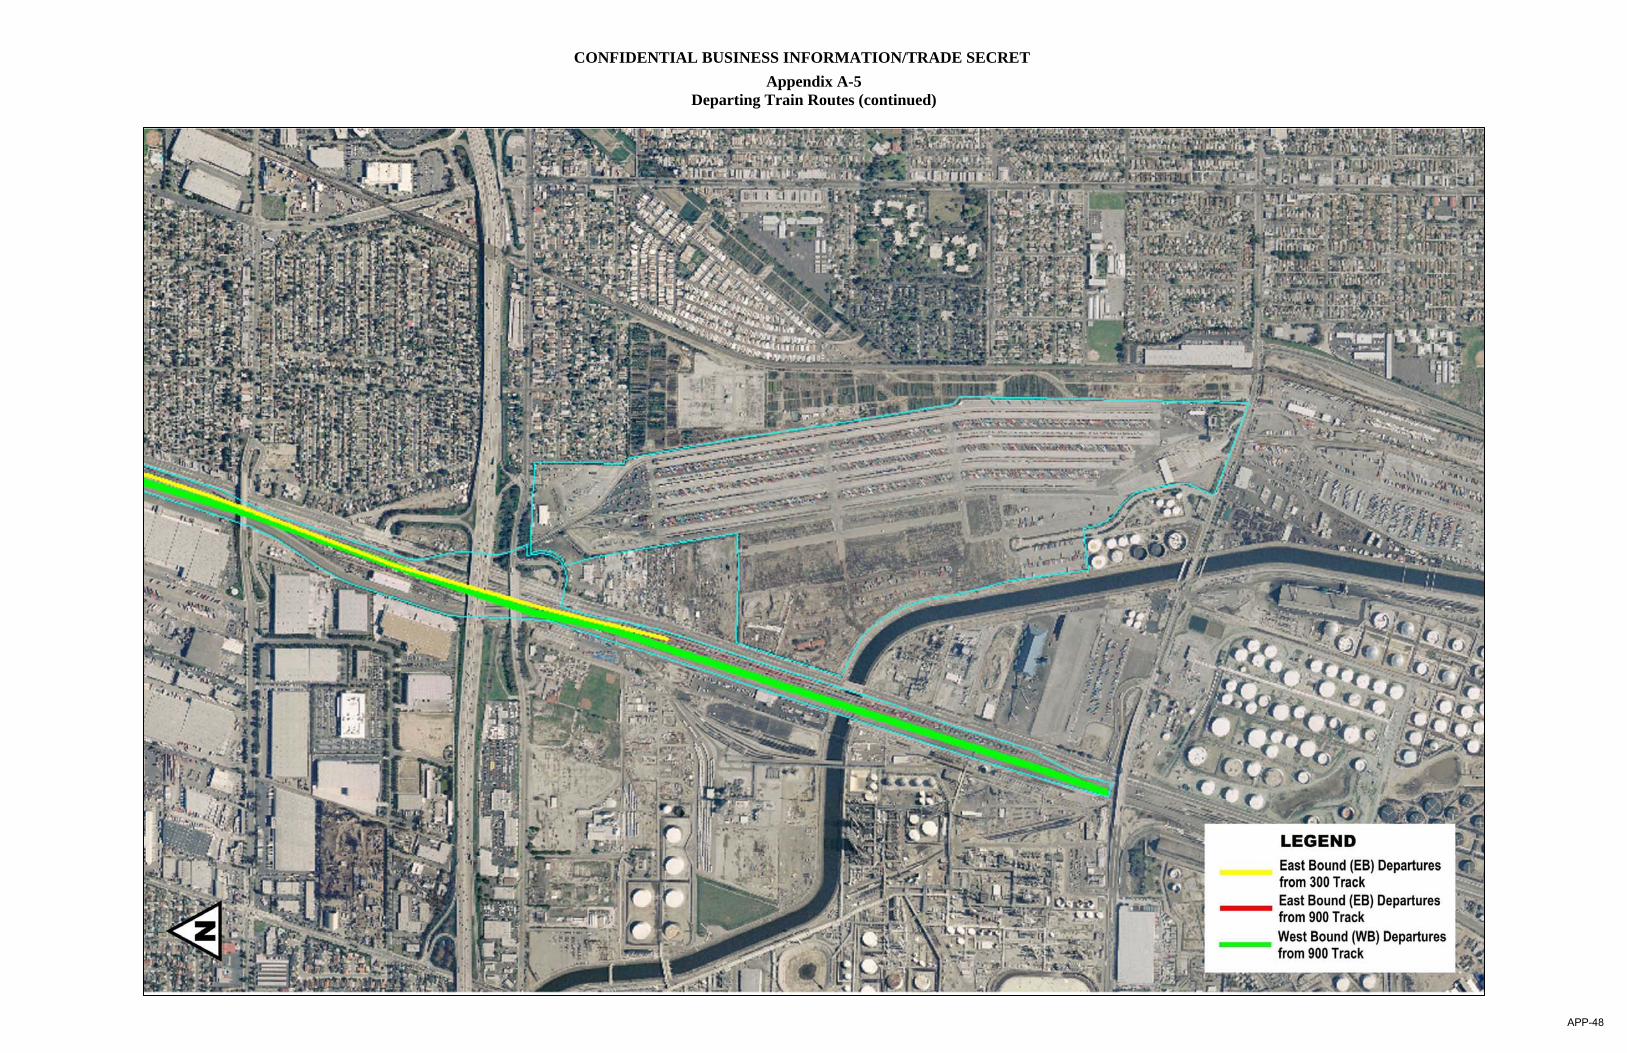
CONFIDENTIAL BUSINESS INFORMATION/TRADE SECRET Appendix A-5
Departing Train Routes (continued)
APP-48
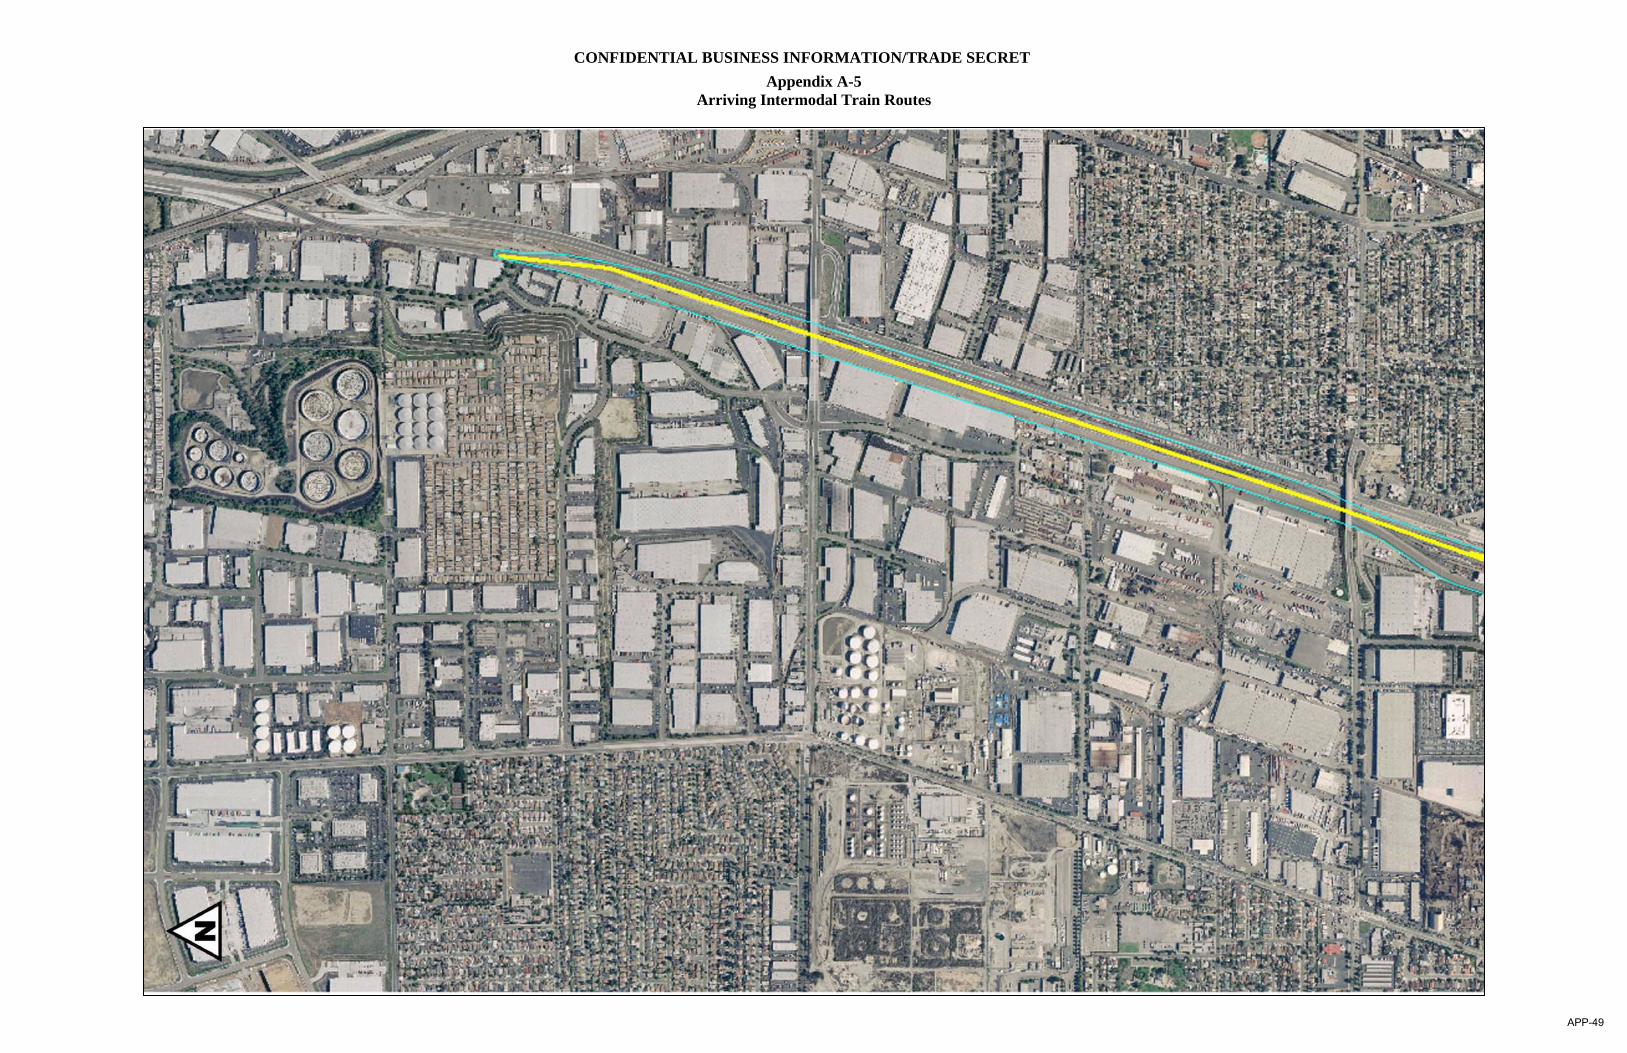
CONFIDENTIAL BUSINESS INFORMATION/TRADE SECRET Appendix A-5
Arriving Intermodal Train Routes
APP-49
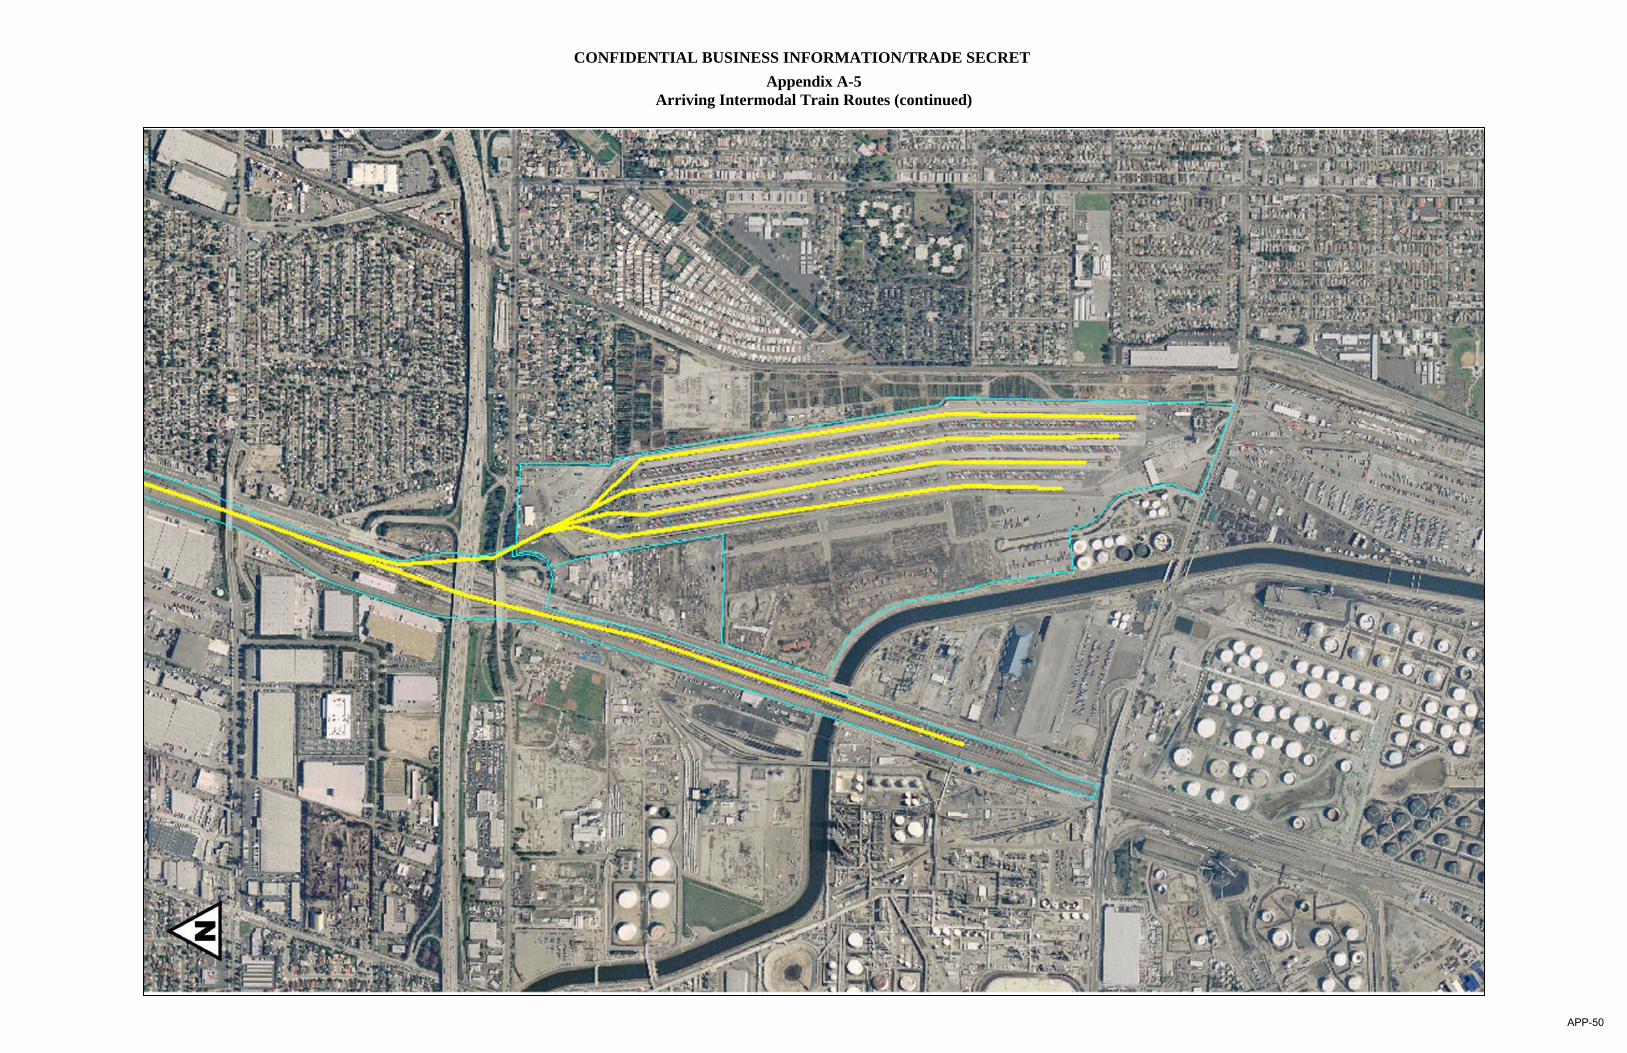
CONFIDENTIAL BUSINESS INFORMATION/TRADE SECRET Appendix A-5
Arriving Intermodal Train Routes (continued)
APP-50
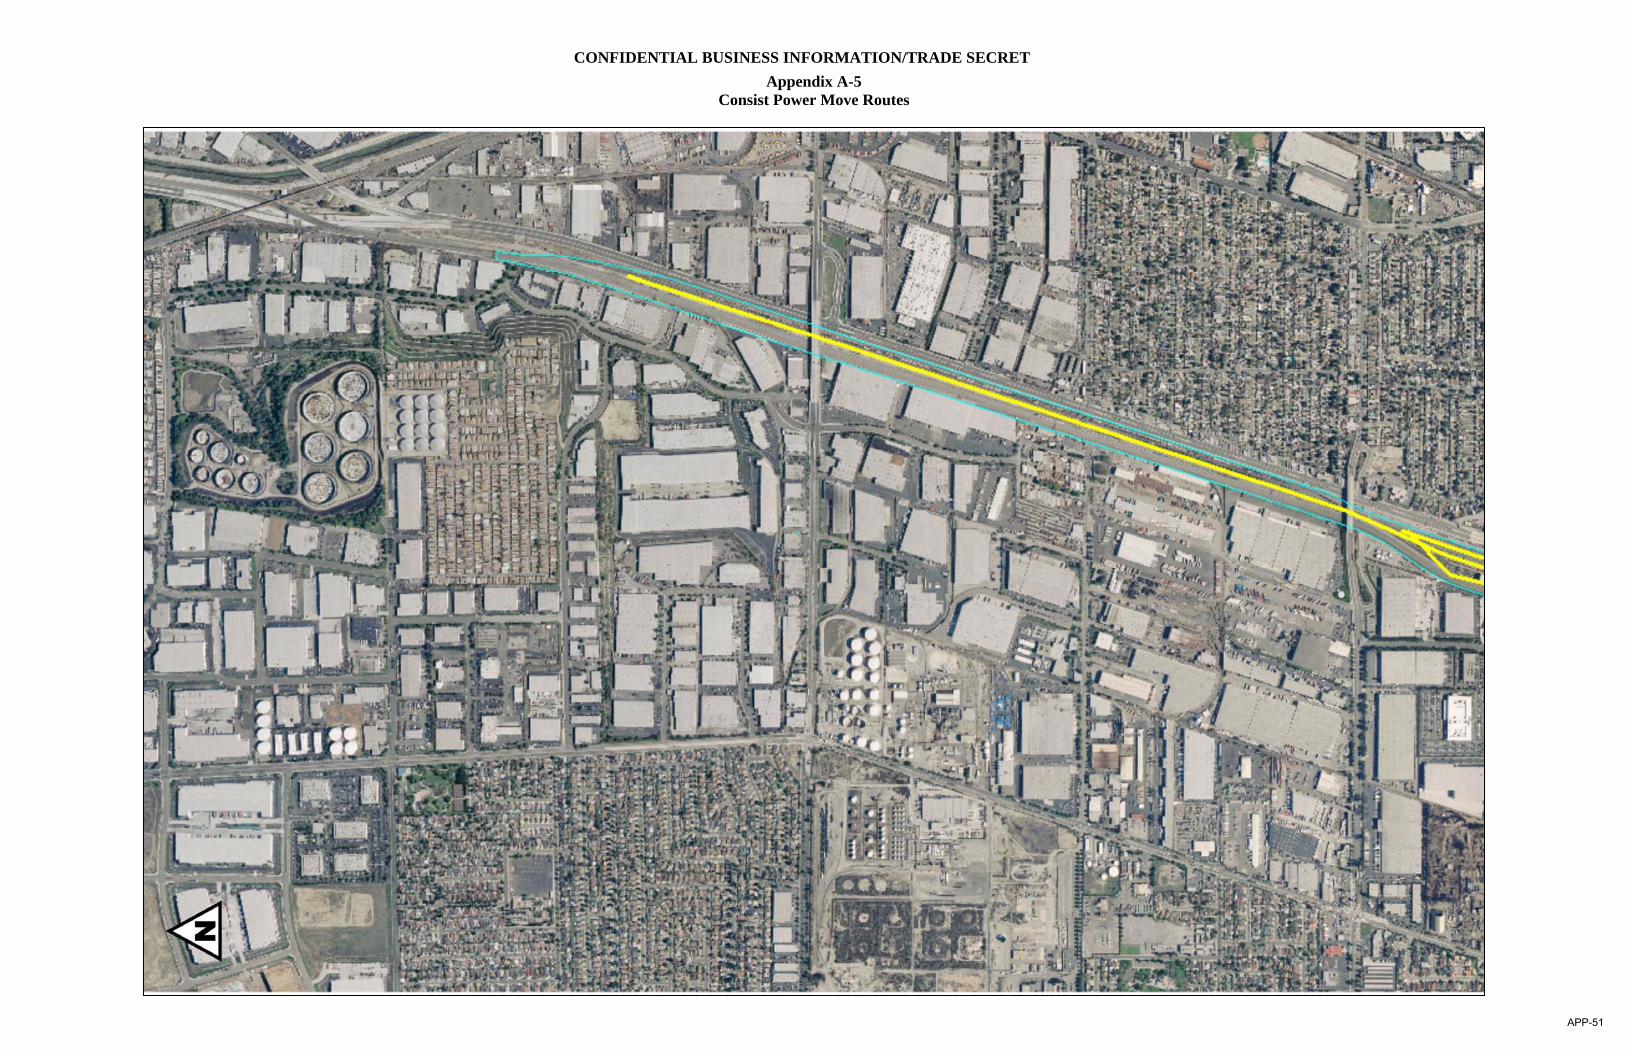
CONFIDENTIAL BUSINESS INFORMATION/TRADE SECRET Appendix A-5
Consist Power Move Routes
APP-51

CONFIDENTIAL BUSINESS INFORMATION/TRADE SECRET Appendix A-5
Consist Power Move Routes (continued)
APP-52
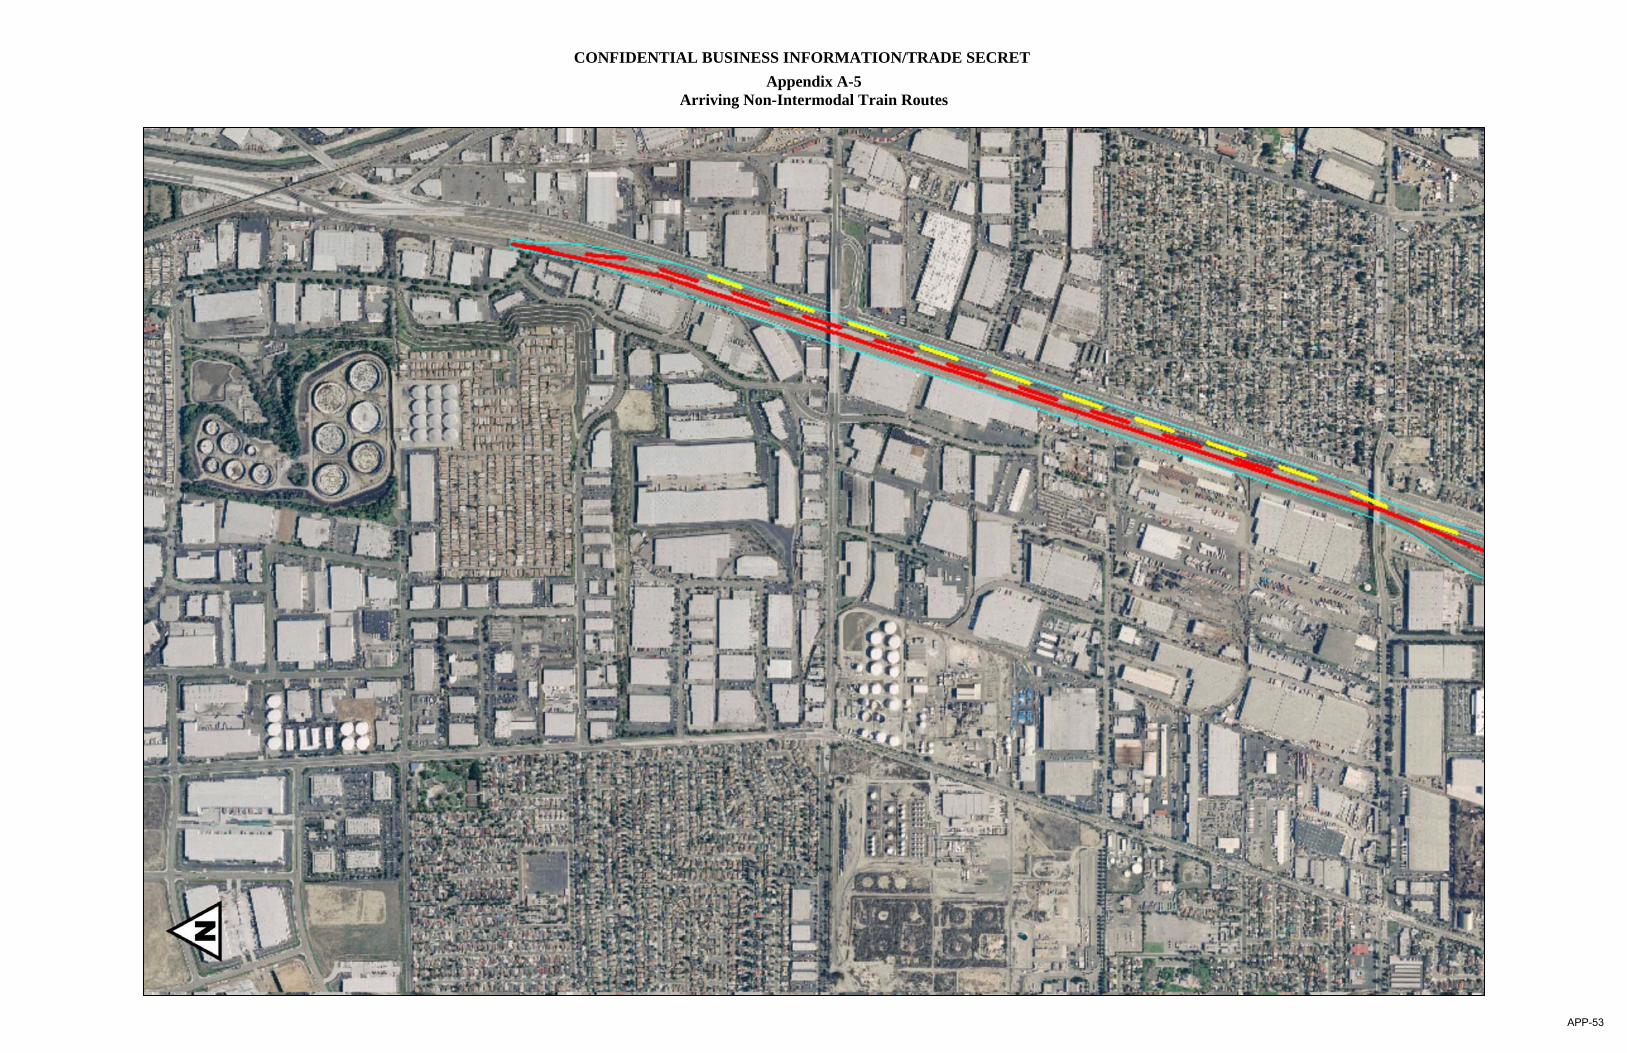
CONFIDENTIAL BUSINESS INFORMATION/TRADE SECRET Appendix A-5
Arriving Non-Intermodal Train Routes
APP-53
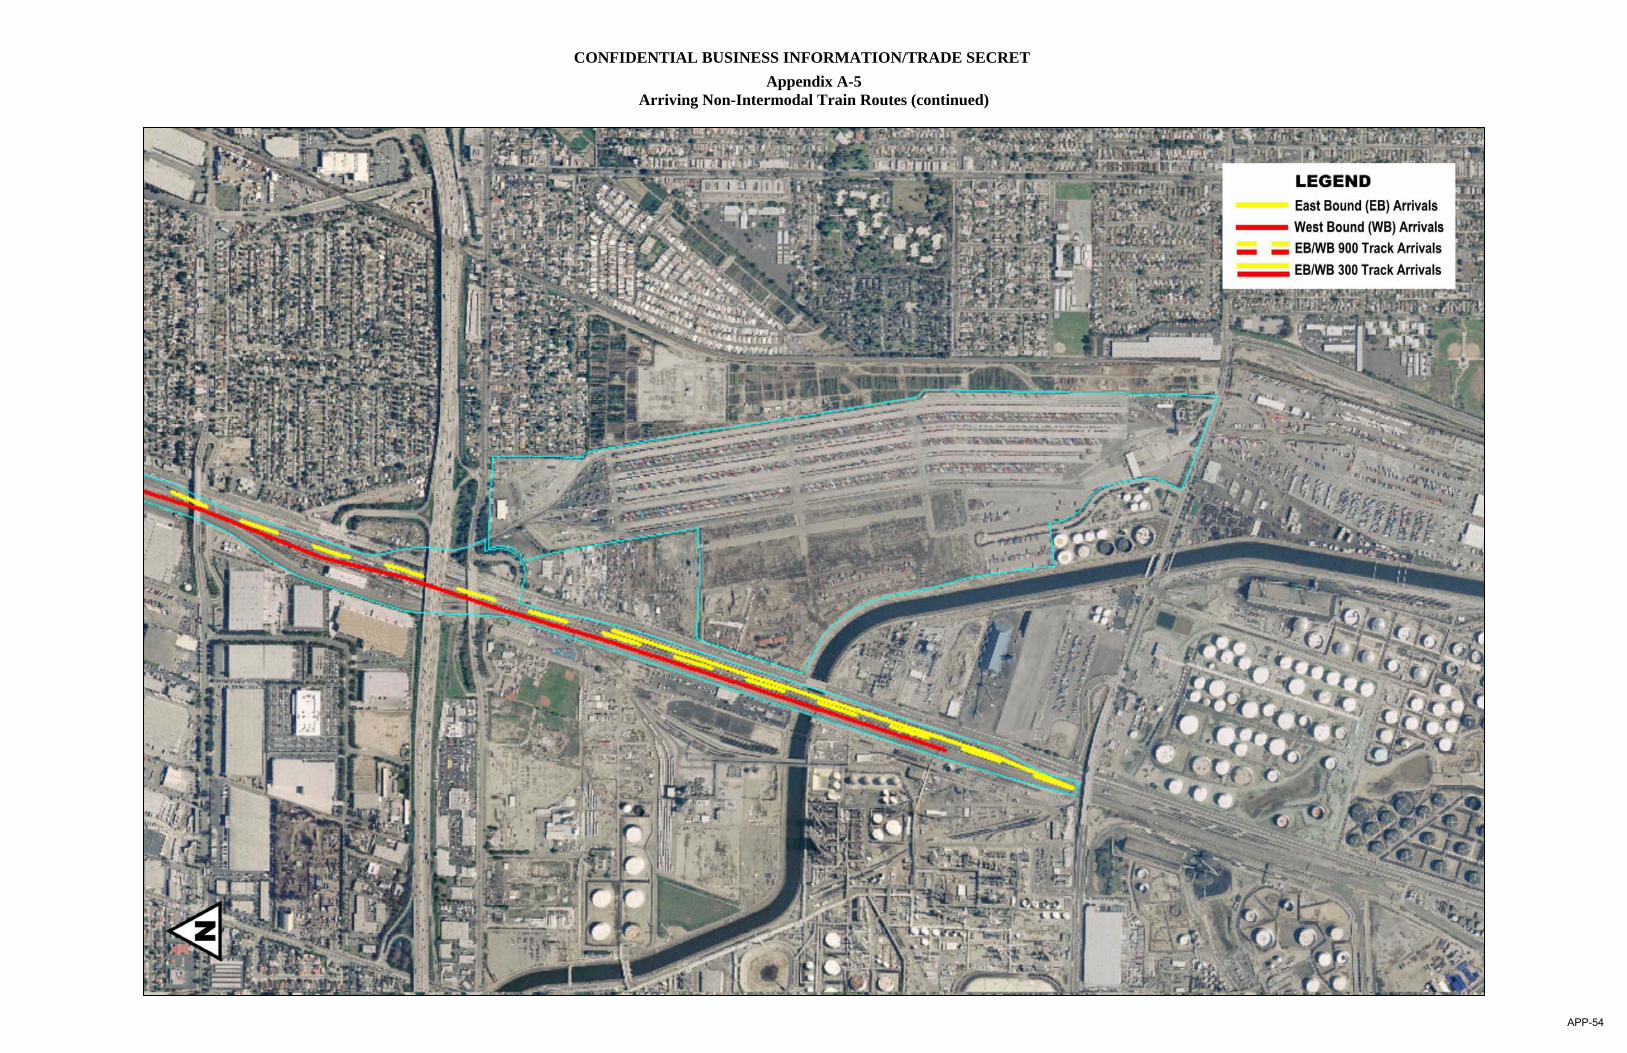
CONFIDENTIAL BUSINESS INFORMATION/TRADE SECRET Appendix A-5
Arriving Non-Intermodal Train Routes (continued)
APP-54

APPENDIX A-6
IRESON ET AL
APP-55
RailyardEI-r2.doc 1
Development of Detailed Railyard Emissions to Capture Activity, Technology and Operational Changes
Robert G. Ireson
Air Quality Management Consulting, 161 Vista Grande, Greenbrae, CA 94904 [email protected]
M. J. (Jon) Germer and Lanny A. Schmid
Union Pacific Railroad Company, 1416 Dodge St., Omaha NE 68179 [email protected]
ABSTRACT
Railyard operations involve a variety of complex activities, including inbound and outbound train movements, classification (i.e., separating cars from inbound trains for redirection to multiple destinations, and building new trains), and servicing locomotives. Standard locomotive duty cycles provide long-term average activity patterns for locomotive operations, but they are not appropriate for the specialized activities that occur within railyards or at locations such as ports, and emission densities in such areas can be high relative to those of line haul activities. There are significant emission rate differences between locomotive models, and differences in the types of service for which specific models are used. Data for throttle-specific emissions, activity levels, and locomotive models and operating practices can be used to provide more accurate emissions estimates for such operations. Such data are needed to quantify actual emissions changes in these high activity areas. A calculation scheme has been developed to generate detailed emission inventories based on the types of data that are collected for managing rail operations. This scheme allows improved accuracy in emissions estimation, and also provides a more reliable basis for bottom-up tracking of emissions changes over time. Factors that can be addressed include: changes in the distribution of locomotive models and control technology levels (e.g., increasing fractions of Tier 0, 1, and 2 locomotives) for both line haul and local operations; actual in-yard idling duration and reductions associated with auto-start-stop technologies; fuel quality effects; and detailed operating practices for switching and train-building operations. By providing detailed disaggregation of activity and emissions data, the method also makes it possible to quantify and evaluate the effects of specific emission reduction alternatives. INTRODUCTION
Freight movement by rail is a key component of the U.S. transportation infrastructure. The combination of rail’s low rolling resistance and the fuel-efficient turbocharged diesel engines used in modern locomotives make rail the most efficient mode of transport from both an emissions and economic perspective. Railyards located strategically through the nation’s rail network are used to assemble and direct goods movement to their destinations. Railyards may handle dozens of trains per day, each powered by a “consist” of several locomotives. While in railyards, these locomotives are serviced and regrouped into new consists as needed for specific departing trains. In addition to train arrivals and departures and locomotive servicing, so-called “classification” yards separate rail cars in inbound trains into segments with different destinations, and build new trains with a common destination. This work is accomplished by switcher locomotives (typically of lower horsepower than the locomotives used for “line-haul” operations). Some railyards also have major locomotive repair facilities whose activities include load testing of locomotives prior to or after maintenance. Collectively, the locomotive operations associated with these activities can result in relatively high localized emission densities.
APP-56
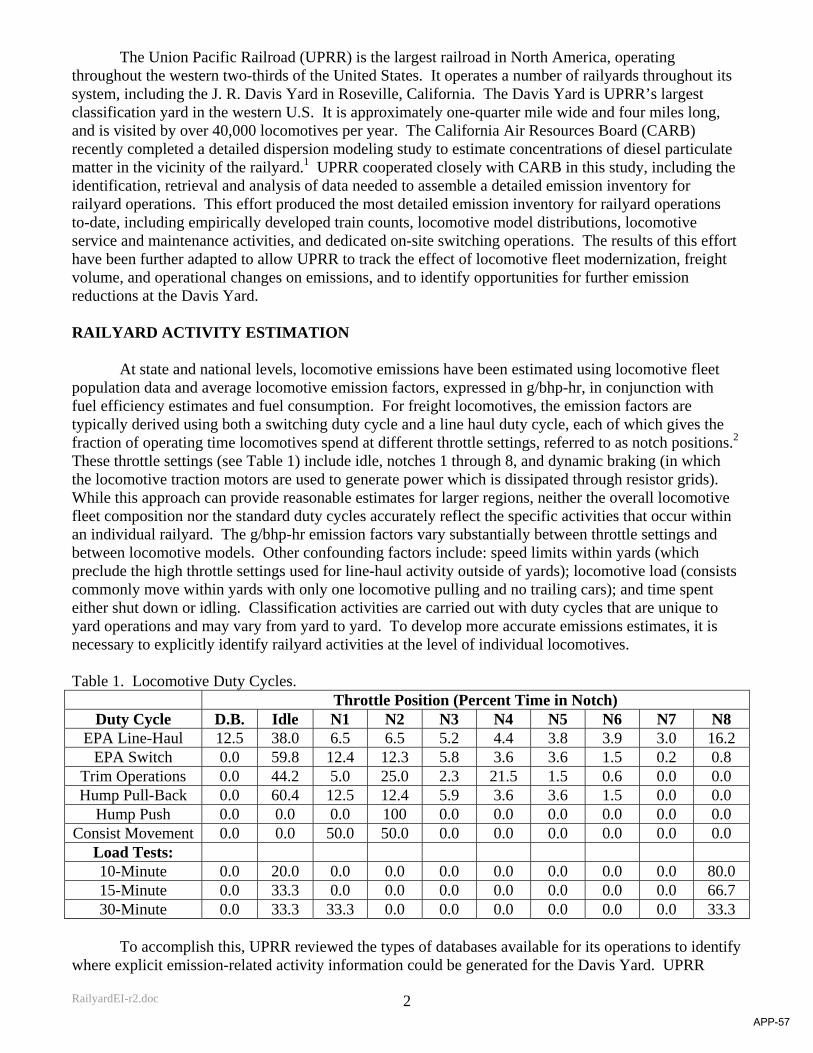
RailyardEI-r2.doc 2
The Union Pacific Railroad (UPRR) is the largest railroad in North America, operating throughout the western two-thirds of the United States. It operates a number of railyards throughout its system, including the J. R. Davis Yard in Roseville, California. The Davis Yard is UPRR’s largest classification yard in the western U.S. It is approximately one-quarter mile wide and four miles long, and is visited by over 40,000 locomotives per year. The California Air Resources Board (CARB) recently completed a detailed dispersion modeling study to estimate concentrations of diesel particulate matter in the vicinity of the railyard.1 UPRR cooperated closely with CARB in this study, including the identification, retrieval and analysis of data needed to assemble a detailed emission inventory for railyard operations. This effort produced the most detailed emission inventory for railyard operations to-date, including empirically developed train counts, locomotive model distributions, locomotive service and maintenance activities, and dedicated on-site switching operations. The results of this effort have been further adapted to allow UPRR to track the effect of locomotive fleet modernization, freight volume, and operational changes on emissions, and to identify opportunities for further emission reductions at the Davis Yard. RAILYARD ACTIVITY ESTIMATION
At state and national levels, locomotive emissions have been estimated using locomotive fleet population data and average locomotive emission factors, expressed in g/bhp-hr, in conjunction with fuel efficiency estimates and fuel consumption. For freight locomotives, the emission factors are typically derived using both a switching duty cycle and a line haul duty cycle, each of which gives the fraction of operating time locomotives spend at different throttle settings, referred to as notch positions.2 These throttle settings (see Table 1) include idle, notches 1 through 8, and dynamic braking (in which the locomotive traction motors are used to generate power which is dissipated through resistor grids). While this approach can provide reasonable estimates for larger regions, neither the overall locomotive fleet composition nor the standard duty cycles accurately reflect the specific activities that occur within an individual railyard. The g/bhp-hr emission factors vary substantially between throttle settings and between locomotive models. Other confounding factors include: speed limits within yards (which preclude the high throttle settings used for line-haul activity outside of yards); locomotive load (consists commonly move within yards with only one locomotive pulling and no trailing cars); and time spent either shut down or idling. Classification activities are carried out with duty cycles that are unique to yard operations and may vary from yard to yard. To develop more accurate emissions estimates, it is necessary to explicitly identify railyard activities at the level of individual locomotives. Table 1. Locomotive Duty Cycles.
Throttle Position (Percent Time in Notch) Duty Cycle D.B. Idle N1 N2 N3 N4 N5 N6 N7 N8
EPA Line-Haul 12.5 38.0 6.5 6.5 5.2 4.4 3.8 3.9 3.0 16.2 EPA Switch 0.0 59.8 12.4 12.3 5.8 3.6 3.6 1.5 0.2 0.8
Trim Operations 0.0 44.2 5.0 25.0 2.3 21.5 1.5 0.6 0.0 0.0 Hump Pull-Back 0.0 60.4 12.5 12.4 5.9 3.6 3.6 1.5 0.0 0.0
Hump Push 0.0 0.0 0.0 100 0.0 0.0 0.0 0.0 0.0 0.0 Consist Movement 0.0 0.0 50.0 50.0 0.0 0.0 0.0 0.0 0.0 0.0
Load Tests: 10-Minute 0.0 20.0 0.0 0.0 0.0 0.0 0.0 0.0 0.0 80.0 15-Minute 0.0 33.3 0.0 0.0 0.0 0.0 0.0 0.0 0.0 66.7 30-Minute 0.0 33.3 33.3 0.0 0.0 0.0 0.0 0.0 0.0 33.3
To accomplish this, UPRR reviewed the types of databases available for its operations to identify
where explicit emission-related activity information could be generated for the Davis Yard. UPRR
APP-57
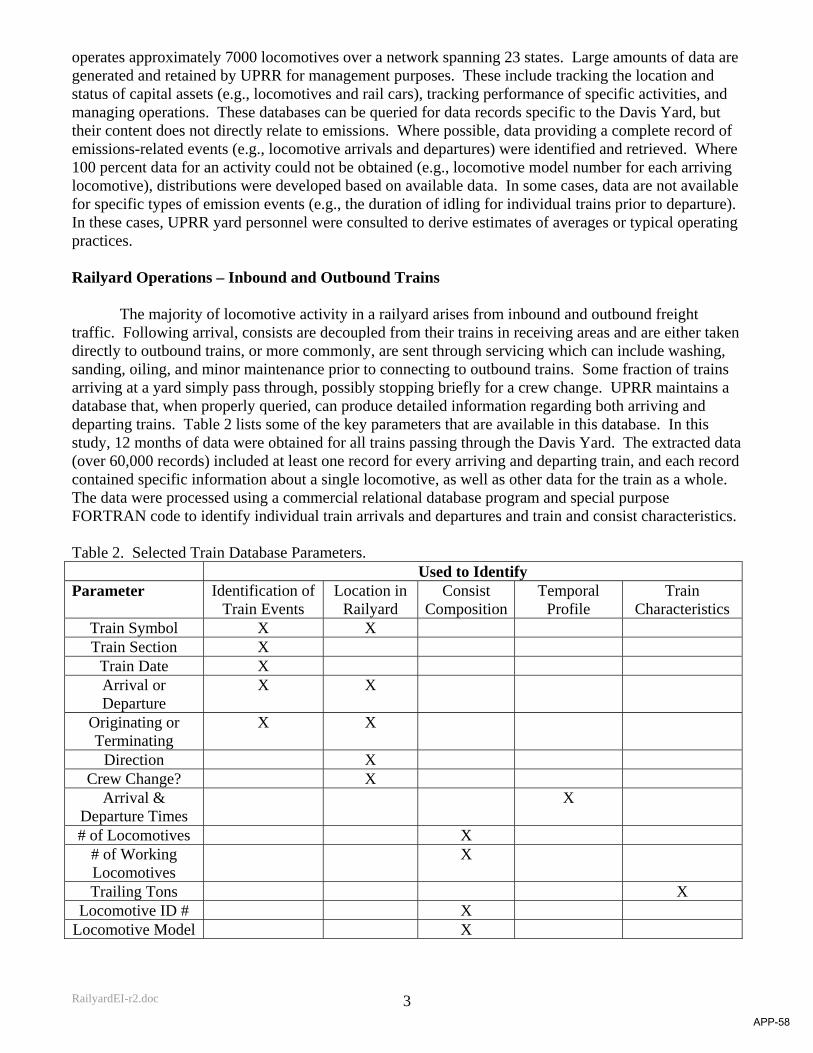
RailyardEI-r2.doc 3
operates approximately 7000 locomotives over a network spanning 23 states. Large amounts of data are generated and retained by UPRR for management purposes. These include tracking the location and status of capital assets (e.g., locomotives and rail cars), tracking performance of specific activities, and managing operations. These databases can be queried for data records specific to the Davis Yard, but their content does not directly relate to emissions. Where possible, data providing a complete record of emissions-related events (e.g., locomotive arrivals and departures) were identified and retrieved. Where 100 percent data for an activity could not be obtained (e.g., locomotive model number for each arriving locomotive), distributions were developed based on available data. In some cases, data are not available for specific types of emission events (e.g., the duration of idling for individual trains prior to departure). In these cases, UPRR yard personnel were consulted to derive estimates of averages or typical operating practices.
Railyard Operations – Inbound and Outbound Trains
The majority of locomotive activity in a railyard arises from inbound and outbound freight traffic. Following arrival, consists are decoupled from their trains in receiving areas and are either taken directly to outbound trains, or more commonly, are sent through servicing which can include washing, sanding, oiling, and minor maintenance prior to connecting to outbound trains. Some fraction of trains arriving at a yard simply pass through, possibly stopping briefly for a crew change. UPRR maintains a database that, when properly queried, can produce detailed information regarding both arriving and departing trains. Table 2 lists some of the key parameters that are available in this database. In this study, 12 months of data were obtained for all trains passing through the Davis Yard. The extracted data (over 60,000 records) included at least one record for every arriving and departing train, and each record contained specific information about a single locomotive, as well as other data for the train as a whole. The data were processed using a commercial relational database program and special purpose FORTRAN code to identify individual train arrivals and departures and train and consist characteristics. Table 2. Selected Train Database Parameters. Used to Identify Parameter Identification of
Train Events Location in
Railyard Consist
CompositionTemporal
Profile Train
Characteristics Train Symbol X X Train Section X
Train Date X Arrival or Departure
X X
Originating or Terminating
X X
Direction X Crew Change? X
Arrival & Departure Times
X
# of Locomotives X # of Working Locomotives
X
Trailing Tons X Locomotive ID # X
Locomotive Model X
APP-58

RailyardEI-r2.doc 4
The parameters listed in Table 2 were used to calculate the number of trains by time of day arriving or departing from each area of the yard, as well as average composition of their consists (number of locomotives and distribution of locomotive models). The combination of train symbol, train segment, and train date provided a unique identifier for a single arrival or departure, and the individual locomotive models were tabulated to generate model distributions. Where necessary, working horsepower and total horsepower were used to estimate the number of working locomotives in the consist.
Emission calculations associated with inbound and outbound trains included both periods of movement within the yard boundaries and locomotive idling while consists we connected to their trains. Based on train direction and the location of its arrival or departure, moving emissions were based on calculations of time at different throttle settings based on distance traveled and estimated speed profiles, considering speed limits on different tracks. Yard operators provided estimates for the average duration of such idling for both inbound and outbound trains. Railyard Operations – Classification
On arrival, inbound trains are “broken” into sections of rail cars destined for different outgoing trains. Figure 1 shows a schematic diagram of the Davis Yard including a large central “bowl” consisting of a large number of parallel tracks connected by automated switching controls to a single track to the west. Trains are pulled back to the west and then pushed to the “hump,” a slightly elevated portion of track just west of the bowl. As cars pass over the hump, they are disconnected and roll by gravity into the appropriate track in the bowl. Dedicated special purpose locomotives, known as “hump sets,” are used in this operation. Unlike most locomotives, these units have continuously variable throttles, rather than discrete throttle notch settings, to allow precise control of speed approaching the hump. Switching locomotives, known as “trim sets” are responsible for retrieving the train segments or trains being “built” in the bowl and moving them to the appropriate outbound track. The Davis Yard operates a fixed number of hump sets and trim sets at any given time, with backup sets standing by for shift changes and possible breakdowns. Figure 1. Schematic of the J. R. Davis Yard.
Emission calculations for hump and trim operations were based on the number of working hump and trim sets at any given time, plus assumed idling times of standby units. For the hump sets, yard operators provided estimates of average pull-back and pushing times, and the duty cycles associated with these operations. For pull-back, based on distance and speed limits, the EPA switcher duty cycle,
APP-59
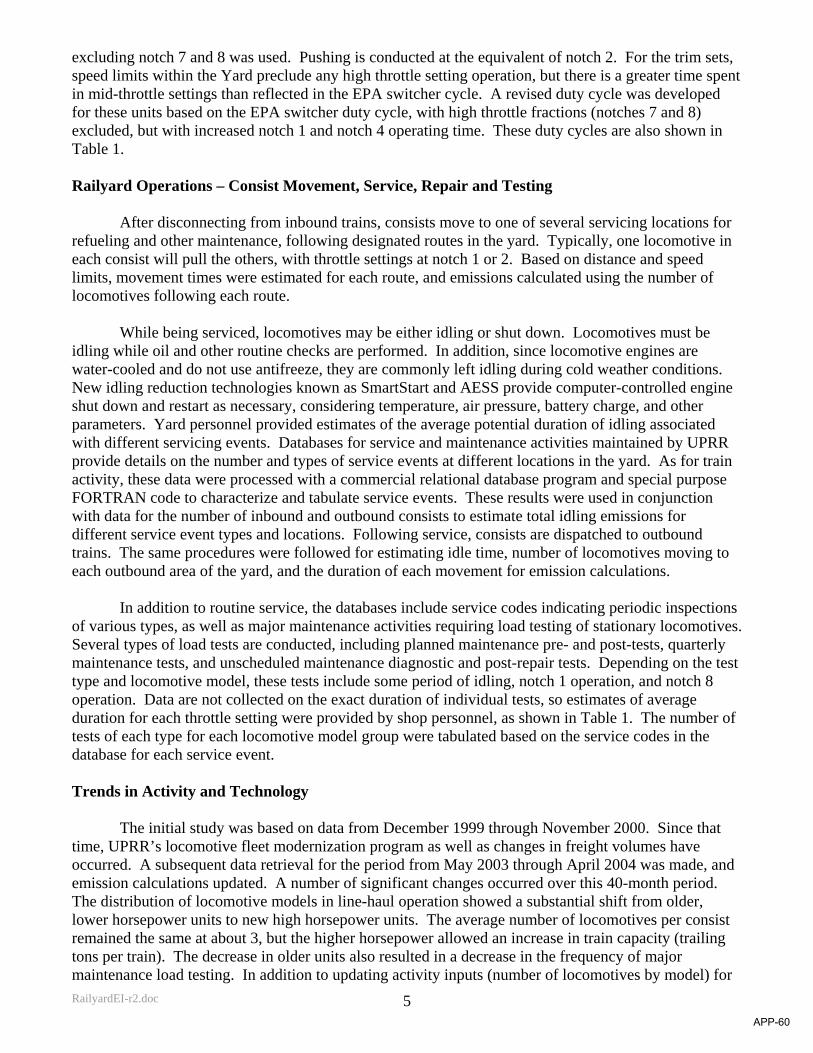
RailyardEI-r2.doc 5
excluding notch 7 and 8 was used. Pushing is conducted at the equivalent of notch 2. For the trim sets, speed limits within the Yard preclude any high throttle setting operation, but there is a greater time spent in mid-throttle settings than reflected in the EPA switcher cycle. A revised duty cycle was developed for these units based on the EPA switcher duty cycle, with high throttle fractions (notches 7 and 8) excluded, but with increased notch 1 and notch 4 operating time. These duty cycles are also shown in Table 1. Railyard Operations – Consist Movement, Service, Repair and Testing
After disconnecting from inbound trains, consists move to one of several servicing locations for refueling and other maintenance, following designated routes in the yard. Typically, one locomotive in each consist will pull the others, with throttle settings at notch 1 or 2. Based on distance and speed limits, movement times were estimated for each route, and emissions calculated using the number of locomotives following each route.
While being serviced, locomotives may be either idling or shut down. Locomotives must be idling while oil and other routine checks are performed. In addition, since locomotive engines are water-cooled and do not use antifreeze, they are commonly left idling during cold weather conditions. New idling reduction technologies known as SmartStart and AESS provide computer-controlled engine shut down and restart as necessary, considering temperature, air pressure, battery charge, and other parameters. Yard personnel provided estimates of the average potential duration of idling associated with different servicing events. Databases for service and maintenance activities maintained by UPRR provide details on the number and types of service events at different locations in the yard. As for train activity, these data were processed with a commercial relational database program and special purpose FORTRAN code to characterize and tabulate service events. These results were used in conjunction with data for the number of inbound and outbound consists to estimate total idling emissions for different service event types and locations. Following service, consists are dispatched to outbound trains. The same procedures were followed for estimating idle time, number of locomotives moving to each outbound area of the yard, and the duration of each movement for emission calculations.
In addition to routine service, the databases include service codes indicating periodic inspections
of various types, as well as major maintenance activities requiring load testing of stationary locomotives. Several types of load tests are conducted, including planned maintenance pre- and post-tests, quarterly maintenance tests, and unscheduled maintenance diagnostic and post-repair tests. Depending on the test type and locomotive model, these tests include some period of idling, notch 1 operation, and notch 8 operation. Data are not collected on the exact duration of individual tests, so estimates of average duration for each throttle setting were provided by shop personnel, as shown in Table 1. The number of tests of each type for each locomotive model group were tabulated based on the service codes in the database for each service event. Trends in Activity and Technology
The initial study was based on data from December 1999 through November 2000. Since that time, UPRR’s locomotive fleet modernization program as well as changes in freight volumes have occurred. A subsequent data retrieval for the period from May 2003 through April 2004 was made, and emission calculations updated. A number of significant changes occurred over this 40-month period. The distribution of locomotive models in line-haul operation showed a substantial shift from older, lower horsepower units to new high horsepower units. The average number of locomotives per consist remained the same at about 3, but the higher horsepower allowed an increase in train capacity (trailing tons per train). The decrease in older units also resulted in a decrease in the frequency of major maintenance load testing. In addition to updating activity inputs (number of locomotives by model) for
APP-60
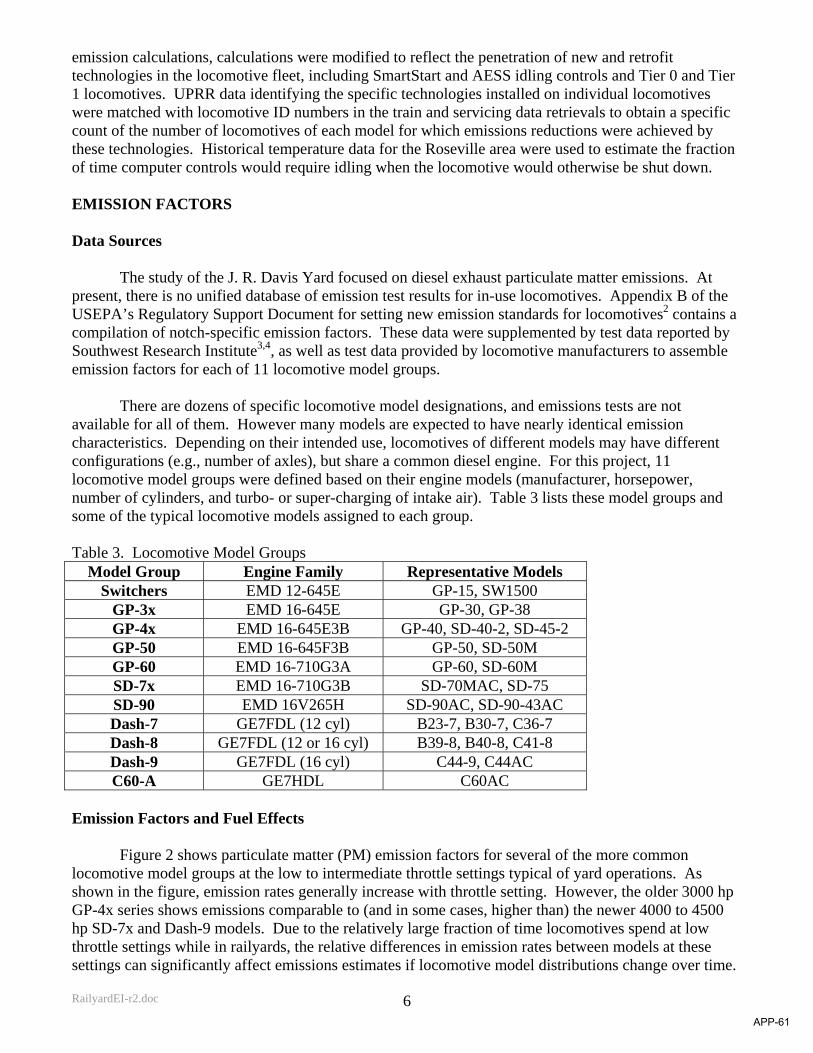
RailyardEI-r2.doc 6
emission calculations, calculations were modified to reflect the penetration of new and retrofit technologies in the locomotive fleet, including SmartStart and AESS idling controls and Tier 0 and Tier 1 locomotives. UPRR data identifying the specific technologies installed on individual locomotives were matched with locomotive ID numbers in the train and servicing data retrievals to obtain a specific count of the number of locomotives of each model for which emissions reductions were achieved by these technologies. Historical temperature data for the Roseville area were used to estimate the fraction of time computer controls would require idling when the locomotive would otherwise be shut down. EMISSION FACTORS Data Sources
The study of the J. R. Davis Yard focused on diesel exhaust particulate matter emissions. At present, there is no unified database of emission test results for in-use locomotives. Appendix B of the USEPA’s Regulatory Support Document for setting new emission standards for locomotives2 contains a compilation of notch-specific emission factors. These data were supplemented by test data reported by Southwest Research Institute3,4, as well as test data provided by locomotive manufacturers to assemble emission factors for each of 11 locomotive model groups.
There are dozens of specific locomotive model designations, and emissions tests are not available for all of them. However many models are expected to have nearly identical emission characteristics. Depending on their intended use, locomotives of different models may have different configurations (e.g., number of axles), but share a common diesel engine. For this project, 11 locomotive model groups were defined based on their engine models (manufacturer, horsepower, number of cylinders, and turbo- or super-charging of intake air). Table 3 lists these model groups and some of the typical locomotive models assigned to each group. Table 3. Locomotive Model Groups
Model Group Engine Family Representative Models Switchers EMD 12-645E GP-15, SW1500
GP-3x EMD 16-645E GP-30, GP-38 GP-4x EMD 16-645E3B GP-40, SD-40-2, SD-45-2 GP-50 EMD 16-645F3B GP-50, SD-50M GP-60 EMD 16-710G3A GP-60, SD-60M SD-7x EMD 16-710G3B SD-70MAC, SD-75 SD-90 EMD 16V265H SD-90AC, SD-90-43AC Dash-7 GE7FDL (12 cyl) B23-7, B30-7, C36-7 Dash-8 GE7FDL (12 or 16 cyl) B39-8, B40-8, C41-8 Dash-9 GE7FDL (16 cyl) C44-9, C44AC C60-A GE7HDL C60AC
Emission Factors and Fuel Effects
Figure 2 shows particulate matter (PM) emission factors for several of the more common locomotive model groups at the low to intermediate throttle settings typical of yard operations. As shown in the figure, emission rates generally increase with throttle setting. However, the older 3000 hp GP-4x series shows emissions comparable to (and in some cases, higher than) the newer 4000 to 4500 hp SD-7x and Dash-9 models. Due to the relatively large fraction of time locomotives spend at low throttle settings while in railyards, the relative differences in emission rates between models at these settings can significantly affect emissions estimates if locomotive model distributions change over time.
APP-61
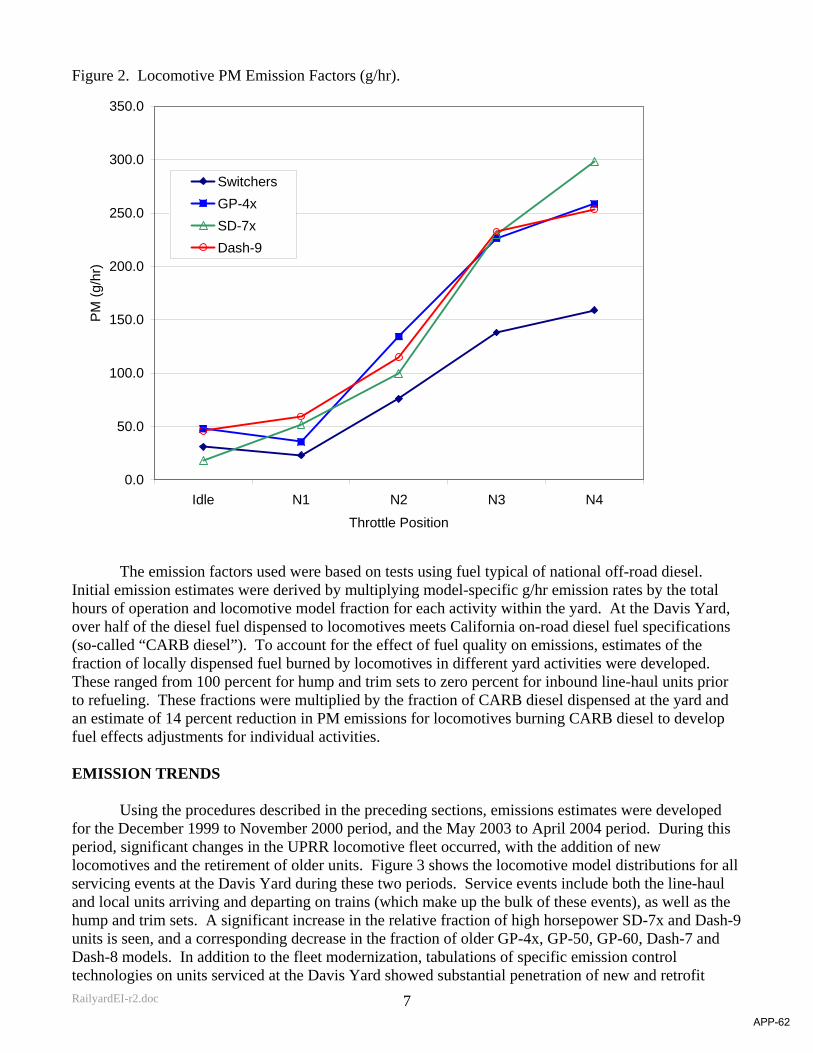
RailyardEI-r2.doc 7
Figure 2. Locomotive PM Emission Factors (g/hr).
0.0
50.0
100.0
150.0
200.0
250.0
300.0
350.0
Idle N1 N2 N3 N4
Throttle Position
PM
(g/h
r)
SwitchersGP-4xSD-7xDash-9
The emission factors used were based on tests using fuel typical of national off-road diesel.
Initial emission estimates were derived by multiplying model-specific g/hr emission rates by the total hours of operation and locomotive model fraction for each activity within the yard. At the Davis Yard, over half of the diesel fuel dispensed to locomotives meets California on-road diesel fuel specifications (so-called “CARB diesel”). To account for the effect of fuel quality on emissions, estimates of the fraction of locally dispensed fuel burned by locomotives in different yard activities were developed. These ranged from 100 percent for hump and trim sets to zero percent for inbound line-haul units prior to refueling. These fractions were multiplied by the fraction of CARB diesel dispensed at the yard and an estimate of 14 percent reduction in PM emissions for locomotives burning CARB diesel to develop fuel effects adjustments for individual activities.
EMISSION TRENDS
Using the procedures described in the preceding sections, emissions estimates were developed for the December 1999 to November 2000 period, and the May 2003 to April 2004 period. During this period, significant changes in the UPRR locomotive fleet occurred, with the addition of new locomotives and the retirement of older units. Figure 3 shows the locomotive model distributions for all servicing events at the Davis Yard during these two periods. Service events include both the line-haul and local units arriving and departing on trains (which make up the bulk of these events), as well as the hump and trim sets. A significant increase in the relative fraction of high horsepower SD-7x and Dash-9 units is seen, and a corresponding decrease in the fraction of older GP-4x, GP-50, GP-60, Dash-7 and Dash-8 models. In addition to the fleet modernization, tabulations of specific emission control technologies on units serviced at the Davis Yard showed substantial penetration of new and retrofit
APP-62
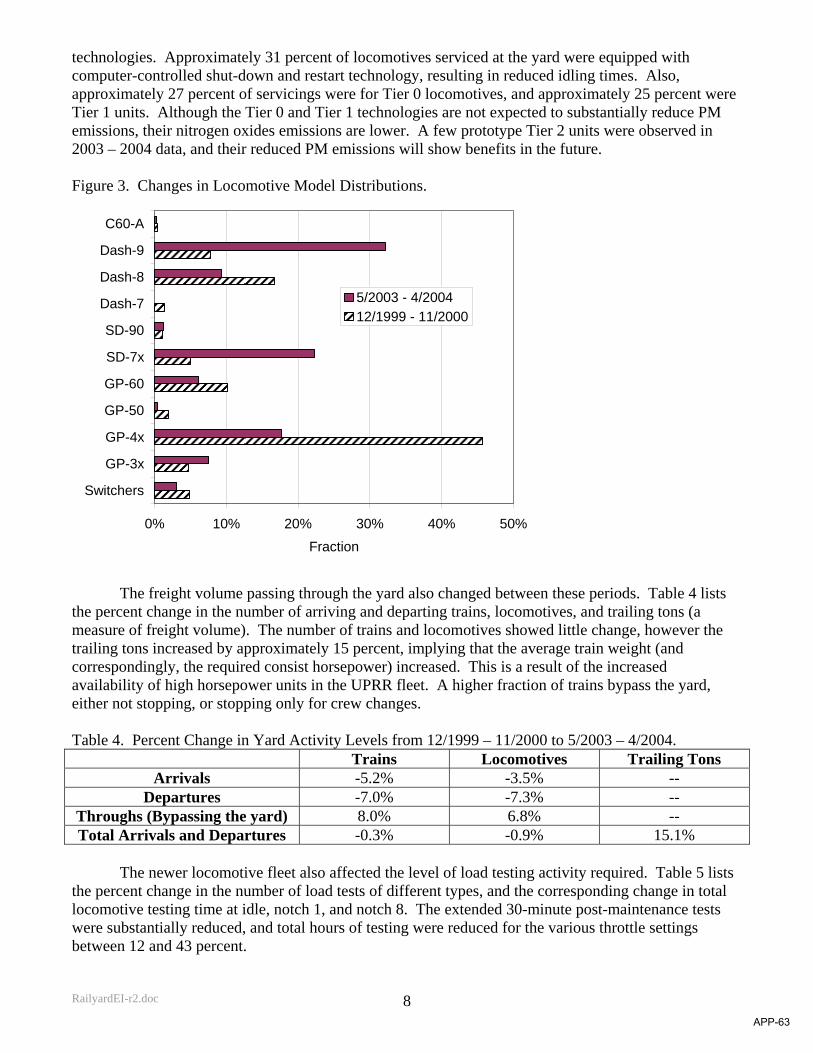
RailyardEI-r2.doc 8
technologies. Approximately 31 percent of locomotives serviced at the yard were equipped with computer-controlled shut-down and restart technology, resulting in reduced idling times. Also, approximately 27 percent of servicings were for Tier 0 locomotives, and approximately 25 percent were Tier 1 units. Although the Tier 0 and Tier 1 technologies are not expected to substantially reduce PM emissions, their nitrogen oxides emissions are lower. A few prototype Tier 2 units were observed in 2003 – 2004 data, and their reduced PM emissions will show benefits in the future. Figure 3. Changes in Locomotive Model Distributions.
0% 10% 20% 30% 40% 50%
Switchers
GP-3x
GP-4x
GP-50
GP-60
SD-7x
SD-90
Dash-7
Dash-8
Dash-9
C60-A
Fraction
5/2003 - 4/200412/1999 - 11/2000
The freight volume passing through the yard also changed between these periods. Table 4 lists
the percent change in the number of arriving and departing trains, locomotives, and trailing tons (a measure of freight volume). The number of trains and locomotives showed little change, however the trailing tons increased by approximately 15 percent, implying that the average train weight (and correspondingly, the required consist horsepower) increased. This is a result of the increased availability of high horsepower units in the UPRR fleet. A higher fraction of trains bypass the yard, either not stopping, or stopping only for crew changes. Table 4. Percent Change in Yard Activity Levels from 12/1999 – 11/2000 to 5/2003 – 4/2004.
Trains Locomotives Trailing Tons Arrivals -5.2% -3.5% --
Departures -7.0% -7.3% -- Throughs (Bypassing the yard) 8.0% 6.8% -- Total Arrivals and Departures -0.3% -0.9% 15.1%
The newer locomotive fleet also affected the level of load testing activity required. Table 5 lists
the percent change in the number of load tests of different types, and the corresponding change in total locomotive testing time at idle, notch 1, and notch 8. The extended 30-minute post-maintenance tests were substantially reduced, and total hours of testing were reduced for the various throttle settings between 12 and 43 percent.
APP-63
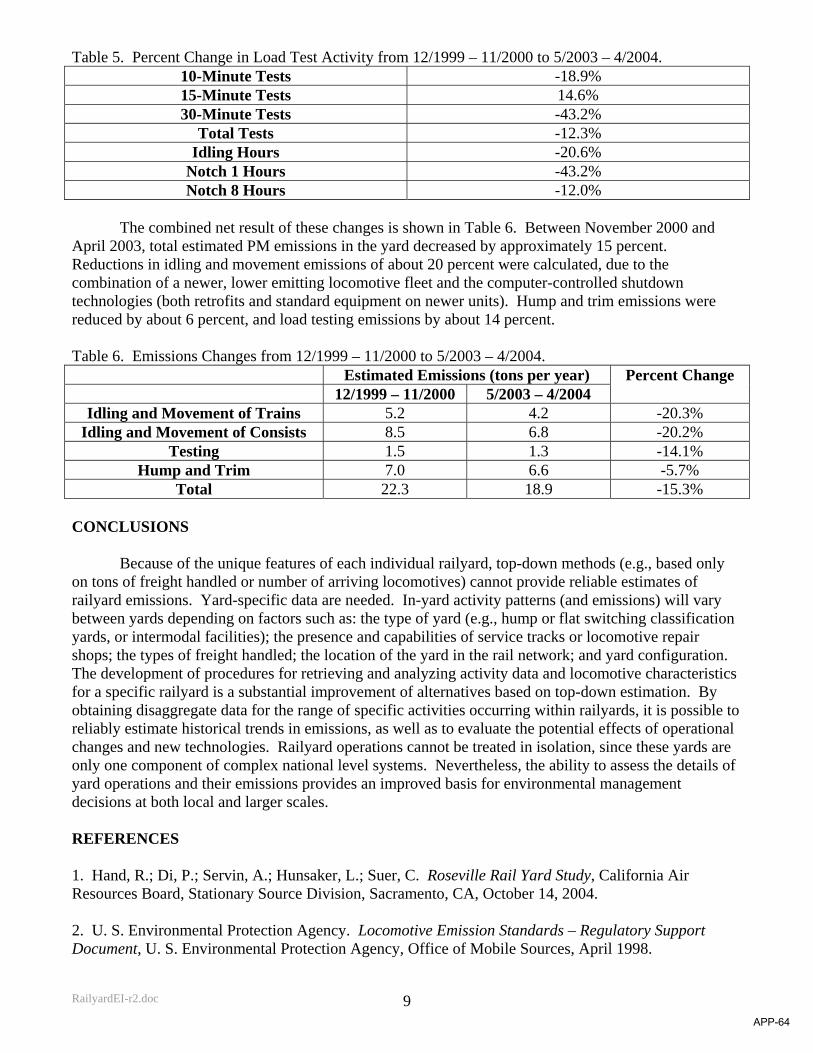
RailyardEI-r2.doc 9
Table 5. Percent Change in Load Test Activity from 12/1999 – 11/2000 to 5/2003 – 4/2004. 10-Minute Tests -18.9% 15-Minute Tests 14.6% 30-Minute Tests -43.2%
Total Tests -12.3% Idling Hours -20.6%
Notch 1 Hours -43.2% Notch 8 Hours -12.0%
The combined net result of these changes is shown in Table 6. Between November 2000 and
April 2003, total estimated PM emissions in the yard decreased by approximately 15 percent. Reductions in idling and movement emissions of about 20 percent were calculated, due to the combination of a newer, lower emitting locomotive fleet and the computer-controlled shutdown technologies (both retrofits and standard equipment on newer units). Hump and trim emissions were reduced by about 6 percent, and load testing emissions by about 14 percent. Table 6. Emissions Changes from 12/1999 – 11/2000 to 5/2003 – 4/2004.
Estimated Emissions (tons per year) 12/1999 – 11/2000 5/2003 – 4/2004
Percent Change
Idling and Movement of Trains 5.2 4.2 -20.3% Idling and Movement of Consists 8.5 6.8 -20.2%
Testing 1.5 1.3 -14.1% Hump and Trim 7.0 6.6 -5.7%
Total 22.3 18.9 -15.3%
CONCLUSIONS
Because of the unique features of each individual railyard, top-down methods (e.g., based only on tons of freight handled or number of arriving locomotives) cannot provide reliable estimates of railyard emissions. Yard-specific data are needed. In-yard activity patterns (and emissions) will vary between yards depending on factors such as: the type of yard (e.g., hump or flat switching classification yards, or intermodal facilities); the presence and capabilities of service tracks or locomotive repair shops; the types of freight handled; the location of the yard in the rail network; and yard configuration. The development of procedures for retrieving and analyzing activity data and locomotive characteristics for a specific railyard is a substantial improvement of alternatives based on top-down estimation. By obtaining disaggregate data for the range of specific activities occurring within railyards, it is possible to reliably estimate historical trends in emissions, as well as to evaluate the potential effects of operational changes and new technologies. Railyard operations cannot be treated in isolation, since these yards are only one component of complex national level systems. Nevertheless, the ability to assess the details of yard operations and their emissions provides an improved basis for environmental management decisions at both local and larger scales.
REFERENCES 1. Hand, R.; Di, P.; Servin, A.; Hunsaker, L.; Suer, C. Roseville Rail Yard Study, California Air Resources Board, Stationary Source Division, Sacramento, CA, October 14, 2004. 2. U. S. Environmental Protection Agency. Locomotive Emission Standards – Regulatory Support Document, U. S. Environmental Protection Agency, Office of Mobile Sources, April 1998.
APP-64
RailyardEI-r2.doc 10
3. Fritz, S. “Emissions Measurements – Locomotives”, SwRI Project No. 08-5374-024, Prepared for the U.S. Environmental Protection Agency by Southwest Research Institute, San Antonio, TX, August 1995. 4. Fritz, S. “Diesel Fuel Effects on Locomotive Exhaust Emissions”, SwRI Proposal No. 08-23088C, Prepared for the California Air Resources Board by Southwest Research Institute, San Antonio, TX, October 2000. KEY WORDS Emission inventories Locomotives Railyards Diesel ACKNOWLEDGEMENTS
The authors gratefully acknowledge the assistance of numerous UPRR staff who assisted in data retrieval and interpretation, and in providing information on operating practices, including Deb Schafer, Punky Poff, Rob Cohee, Jim Diel, and Brock Nelson. In addition we acknowledge the contributions of Ron Hand of the California Air Resources Board.
APP-65

APPENDIX A-7
SULFUR ADJUSTMENT CALCULATIONS
APP-66

CONFIDENTIAL BUSINESS INFORMATION/TRADE SECRET
Appendix A-7
Development of Adjustment Factors for Locomotive DPM Emissions Based on Sulfur Content
Wong (undated) provides equations for estimating g/bhp-hr emission rates for 4-Stroke (GE) and 2-Stroke (EMD) locomotives. Rather than using these statistically derived estimates for absolute emissions when model- and notch-specific emission factors are available, we used these equations to develop relative emission rate changes for different sulfur levels. The basic form of the equation is
bSaq +⋅=
Where,
q is the predicted g/bhp-hr emission rate of a locomotive at a specific throttle setting and sulfur content;
a and b are coefficients specific to a locomotive type (2- or 4-stroke) and throttle notch; and
S is the fuel sulfur content in ppm.
Thus, to calculate the emission adjustment factor for a specific fuel sulfur content, it is necessary to calculate the nominal emission rate q0 for the baseline fuel sulfur content S0, and the emission rate qi for the fuel of interest with sulfur content Si. This adjustment factor ki is simply
qqqk i
i0
)0(1 −−= ,
Where, q0 and qi are calculated using the equation above. Tables 1 and 2 give the values of the a and b coefficients for 4-stroke and 2-stroke locomotives. For throttle settings below notch 3, sulfur content is not expected to affect emission rates. The baseline emission rates from which actual emissions are estimated were derived from emission tests of different locomotive models. Although full documentation of fuels is not available for all of these tests, they are assumed to be representative of actual emissions of the different models running on 3,000 ppm sulfur EPA non-road Diesel fuel. For the purposes of modeling 2005 emissions, these factors are needed to adjust the baseline emission factors to emission factors representative of two fuels – 221 ppm and 2639 ppm. Table 3 shows the resulting correction factors for these two fuels by notch and engine type. To generate locomotive model-, throttle-, tier-, and fuel-specific emission factors, the base case (nominal 3,000 ppm S) emission factors in Table 4 were multiplied by the corresponding correction factors for throttle settings between notch 3 and notch 8.
APP-67
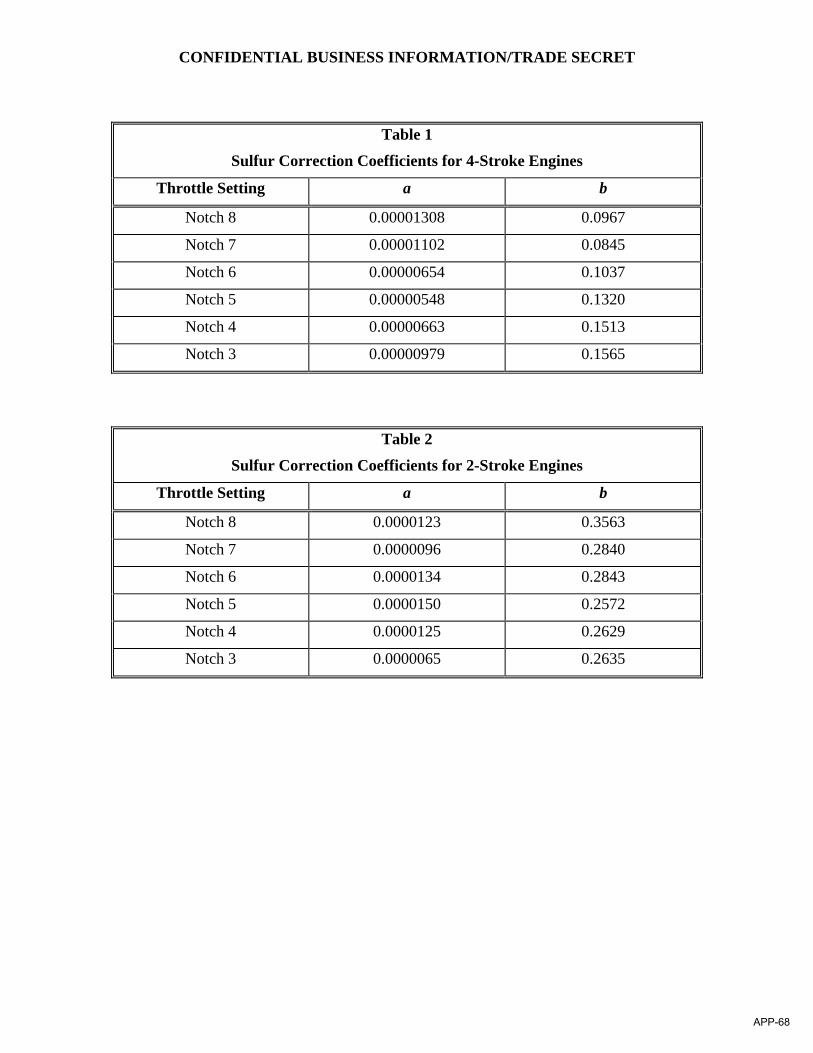
CONFIDENTIAL BUSINESS INFORMATION/TRADE SECRET
Table 1
Sulfur Correction Coefficients for 4-Stroke Engines
Throttle Setting a b
Notch 8 0.00001308 0.0967
Notch 7 0.00001102 0.0845
Notch 6 0.00000654 0.1037
Notch 5 0.00000548 0.1320
Notch 4 0.00000663 0.1513
Notch 3 0.00000979 0.1565
Table 2
Sulfur Correction Coefficients for 2-Stroke Engines
Throttle Setting a b
Notch 8 0.0000123 0.3563
Notch 7 0.0000096 0.2840
Notch 6 0.0000134 0.2843
Notch 5 0.0000150 0.2572
Notch 4 0.0000125 0.2629
Notch 3 0.0000065 0.2635
APP-68
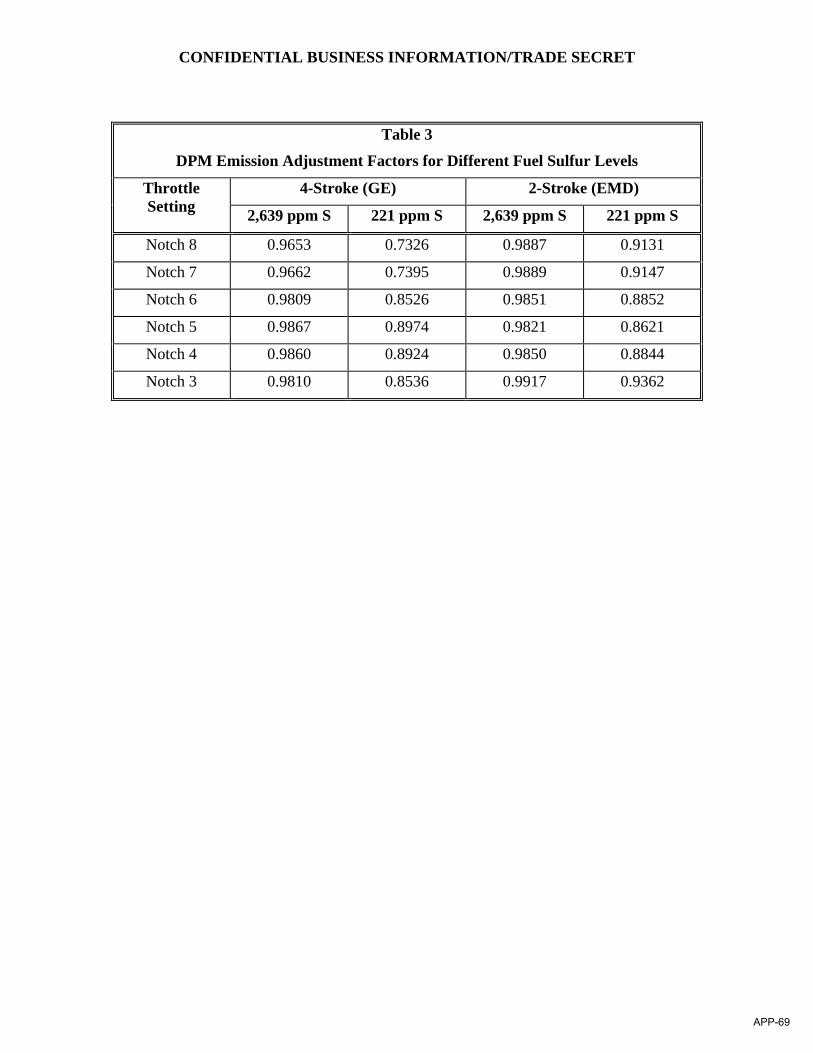
CONFIDENTIAL BUSINESS INFORMATION/TRADE SECRET
Table 3
DPM Emission Adjustment Factors for Different Fuel Sulfur Levels
4-Stroke (GE) 2-Stroke (EMD) Throttle Setting 2,639 ppm S 221 ppm S 2,639 ppm S 221 ppm S
Notch 8 0.9653 0.7326 0.9887 0.9131
Notch 7 0.9662 0.7395 0.9889 0.9147
Notch 6 0.9809 0.8526 0.9851 0.8852
Notch 5 0.9867 0.8974 0.9821 0.8621
Notch 4 0.9860 0.8924 0.9850 0.8844
Notch 3 0.9810 0.8536 0.9917 0.9362
APP-69
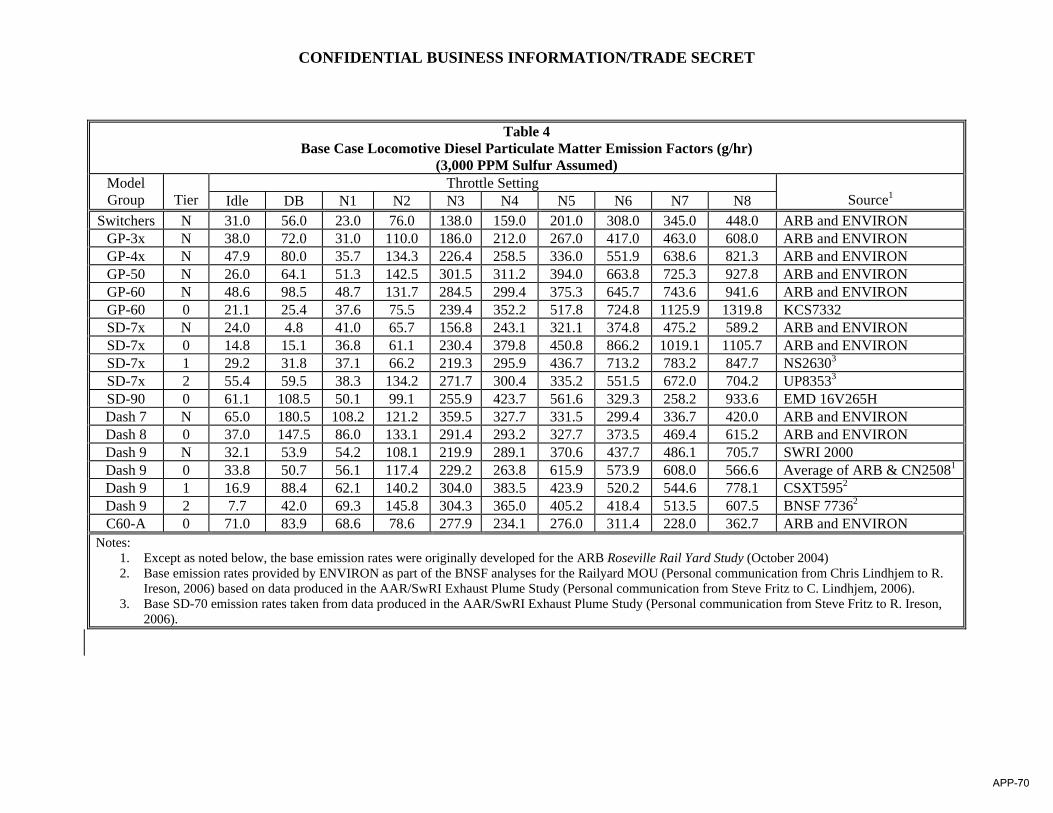
CONFIDENTIAL BUSINESS INFORMATION/TRADE SECRET
Table 4 Base Case Locomotive Diesel Particulate Matter Emission Factors (g/hr)
(3,000 PPM Sulfur Assumed) Throttle Setting Model
Group
Tier Idle DB N1 N2 N3 N4 N5 N6 N7 N8
Source1
Switchers N 31.0 56.0 23.0 76.0 138.0 159.0 201.0 308.0 345.0 448.0 ARB and ENVIRON GP-3x N 38.0 72.0 31.0 110.0 186.0 212.0 267.0 417.0 463.0 608.0 ARB and ENVIRON GP-4x N 47.9 80.0 35.7 134.3 226.4 258.5 336.0 551.9 638.6 821.3 ARB and ENVIRON GP-50 N 26.0 64.1 51.3 142.5 301.5 311.2 394.0 663.8 725.3 927.8 ARB and ENVIRON GP-60 N 48.6 98.5 48.7 131.7 284.5 299.4 375.3 645.7 743.6 941.6 ARB and ENVIRON GP-60 0 21.1 25.4 37.6 75.5 239.4 352.2 517.8 724.8 1125.9 1319.8 KCS7332 SD-7x N 24.0 4.8 41.0 65.7 156.8 243.1 321.1 374.8 475.2 589.2 ARB and ENVIRON SD-7x 0 14.8 15.1 36.8 61.1 230.4 379.8 450.8 866.2 1019.1 1105.7 ARB and ENVIRON SD-7x 1 29.2 31.8 37.1 66.2 219.3 295.9 436.7 713.2 783.2 847.7 NS26303 SD-7x 2 55.4 59.5 38.3 134.2 271.7 300.4 335.2 551.5 672.0 704.2 UP83533 SD-90 0 61.1 108.5 50.1 99.1 255.9 423.7 561.6 329.3 258.2 933.6 EMD 16V265H Dash 7 N 65.0 180.5 108.2 121.2 359.5 327.7 331.5 299.4 336.7 420.0 ARB and ENVIRON Dash 8 0 37.0 147.5 86.0 133.1 291.4 293.2 327.7 373.5 469.4 615.2 ARB and ENVIRON Dash 9 N 32.1 53.9 54.2 108.1 219.9 289.1 370.6 437.7 486.1 705.7 SWRI 2000 Dash 9 0 33.8 50.7 56.1 117.4 229.2 263.8 615.9 573.9 608.0 566.6 Average of ARB & CN25081 Dash 9 1 16.9 88.4 62.1 140.2 304.0 383.5 423.9 520.2 544.6 778.1 CSXT5952 Dash 9 2 7.7 42.0 69.3 145.8 304.3 365.0 405.2 418.4 513.5 607.5 BNSF 77362 C60-A 0 71.0 83.9 68.6 78.6 277.9 234.1 276.0 311.4 228.0 362.7 ARB and ENVIRON
Notes: 1. Except as noted below, the base emission rates were originally developed for the ARB Roseville Rail Yard Study (October 2004) 2. Base emission rates provided by ENVIRON as part of the BNSF analyses for the Railyard MOU (Personal communication from Chris Lindhjem to R.
Ireson, 2006) based on data produced in the AAR/SwRI Exhaust Plume Study (Personal communication from Steve Fritz to C. Lindhjem, 2006). 3. Base SD-70 emission rates taken from data produced in the AAR/SwRI Exhaust Plume Study (Personal communication from Steve Fritz to R. Ireson,
2006).
APP-70
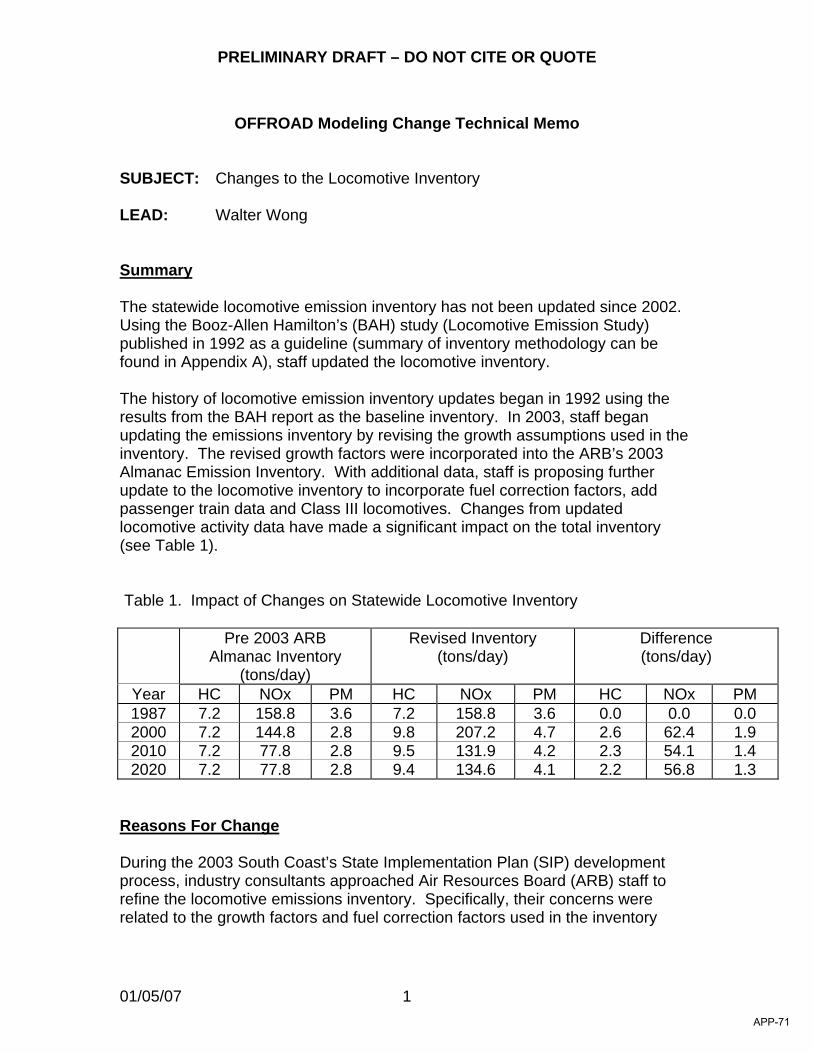
PRELIMINARY DRAFT – DO NOT CITE OR QUOTE
01/05/07 1
OFFROAD Modeling Change Technical Memo
SUBJECT: Changes to the Locomotive Inventory LEAD: Walter Wong Summary The statewide locomotive emission inventory has not been updated since 2002. Using the Booz-Allen Hamilton’s (BAH) study (Locomotive Emission Study) published in 1992 as a guideline (summary of inventory methodology can be found in Appendix A), staff updated the locomotive inventory. The history of locomotive emission inventory updates began in 1992 using the results from the BAH report as the baseline inventory. In 2003, staff began updating the emissions inventory by revising the growth assumptions used in the inventory. The revised growth factors were incorporated into the ARB’s 2003 Almanac Emission Inventory. With additional data, staff is proposing further update to the locomotive inventory to incorporate fuel correction factors, add passenger train data and Class III locomotives. Changes from updated locomotive activity data have made a significant impact on the total inventory (see Table 1). Table 1. Impact of Changes on Statewide Locomotive Inventory Pre 2003 ARB
Almanac Inventory (tons/day)
Revised Inventory (tons/day)
Difference (tons/day)
Year HC NOx PM HC NOx PM HC NOx PM 1987 7.2 158.8 3.6 7.2 158.8 3.6 0.0 0.0 0.0 2000 7.2 144.8 2.8 9.8 207.2 4.7 2.6 62.4 1.9 2010 7.2 77.8 2.8 9.5 131.9 4.2 2.3 54.1 1.4 2020 7.2 77.8 2.8 9.4 134.6 4.1 2.2 56.8 1.3
Reasons For Change During the 2003 South Coast’s State Implementation Plan (SIP) development process, industry consultants approached Air Resources Board (ARB) staff to refine the locomotive emissions inventory. Specifically, their concerns were related to the growth factors and fuel correction factors used in the inventory
APP-71
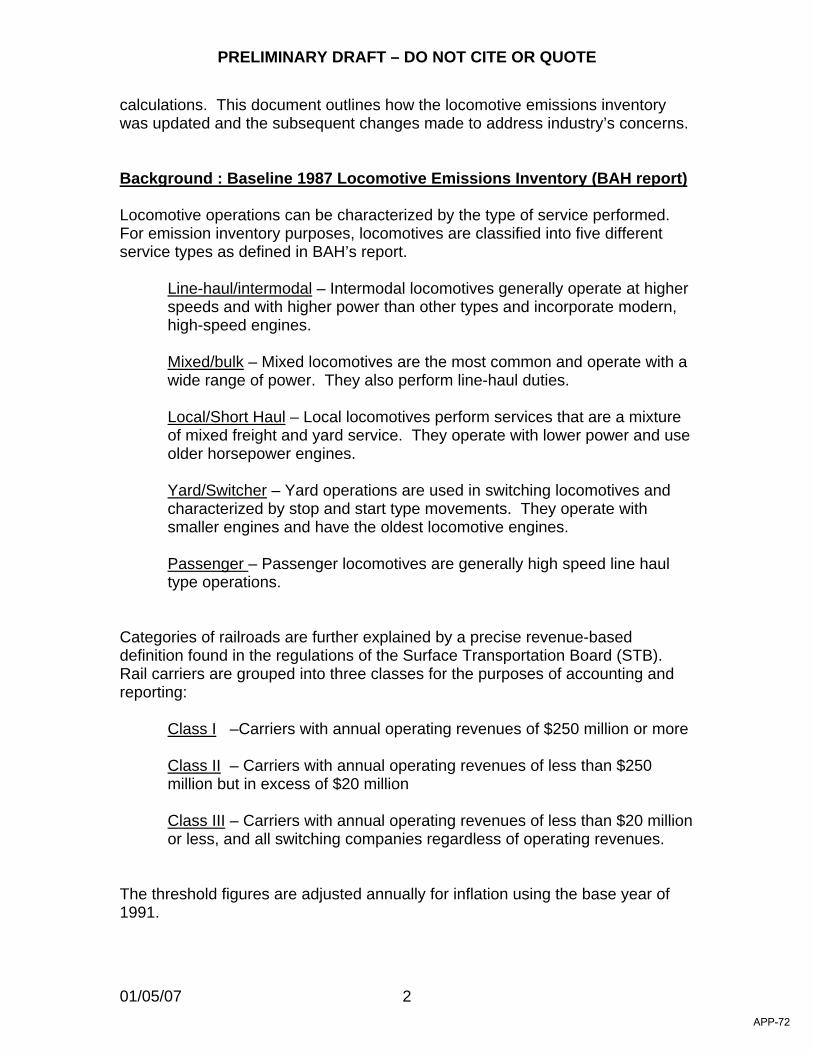
PRELIMINARY DRAFT – DO NOT CITE OR QUOTE
01/05/07 2
calculations. This document outlines how the locomotive emissions inventory was updated and the subsequent changes made to address industry’s concerns. Background : Baseline 1987 Locomotive Emissions Inventory (BAH report) Locomotive operations can be characterized by the type of service performed. For emission inventory purposes, locomotives are classified into five different service types as defined in BAH’s report.
Line-haul/intermodal – Intermodal locomotives generally operate at higher speeds and with higher power than other types and incorporate modern, high-speed engines.
Mixed/bulk – Mixed locomotives are the most common and operate with a wide range of power. They also perform line-haul duties.
Local/Short Haul – Local locomotives perform services that are a mixture of mixed freight and yard service. They operate with lower power and use older horsepower engines.
Yard/Switcher – Yard operations are used in switching locomotives and characterized by stop and start type movements. They operate with smaller engines and have the oldest locomotive engines.
Passenger – Passenger locomotives are generally high speed line haul type operations.
Categories of railroads are further explained by a precise revenue-based definition found in the regulations of the Surface Transportation Board (STB). Rail carriers are grouped into three classes for the purposes of accounting and reporting:
Class I –Carriers with annual operating revenues of $250 million or more Class II – Carriers with annual operating revenues of less than $250 million but in excess of $20 million Class III – Carriers with annual operating revenues of less than $20 million or less, and all switching companies regardless of operating revenues.
The threshold figures are adjusted annually for inflation using the base year of 1991.
APP-72

PRELIMINARY DRAFT – DO NOT CITE OR QUOTE
01/05/07 3
The 1987 locomotive inventory as shown in Table 2 is taken from the BAH report prepared for the ARB entitled “Locomotive Emission Study” completed in 1992 (http://www.arb.ca.gov/app/library/libcc.php). Information was gathered from many sources including ARB, the South Coast Air Quality Management District, the California Energy Commission, the Association of American Railroads (AAR), locomotive and large engine manufacturers, and Southwest Research Institute. Railroad companies, such as Southern Pacific, Union Pacific, and Atchison, Topeka and Santa Fe (ATSF), provided emission factors, train operation data, and throttle position profiles for trains operating in their respective territories. Southwest Research Institute provided emission test data. Table 2. 1987 Locomotive Inventory in Tons Per Day, Statewide, BAH report TYPE HC CO NOX PM SOX Line-Haul/Intermodal 3.97 12.89 86.21 1.97 6.36 Short-Haul/Local 0.96 3.06 21.30 0.46 1.59 Mixed 1.51 4.85 37.34 0.81 2.76 Passenger 0.10 0.22 3.24 0.07 0.30 Yard/Switcher 0.62 1.57 10.69 0.24 0.58 Total 7.16 22.59 158.78 3.55 11.59 The assumed average fuel sulfur content is 2700 parts per million (ppm) obtained from the BAH report. Current Growth Estimates Prior to the 2003 South Coast SIP update, growth factors were based on employment data in the railroad industry. Staff believes that the use of historic employment data, which translates to a decline in emissions in future years, may be masking actual positive growth in locomotive operations. It may be assumed that the number of employees is declining due to increased efficiency. Changes to the Locomotive Inventory Summary of Growth in Emission Based on BAH Report Growth is estimated based on train operation type and by several operating characteristics.
Increased Rail Lube and Aerodynamics – this arises from reduction in friction and will help reduce power requirements.
APP-73
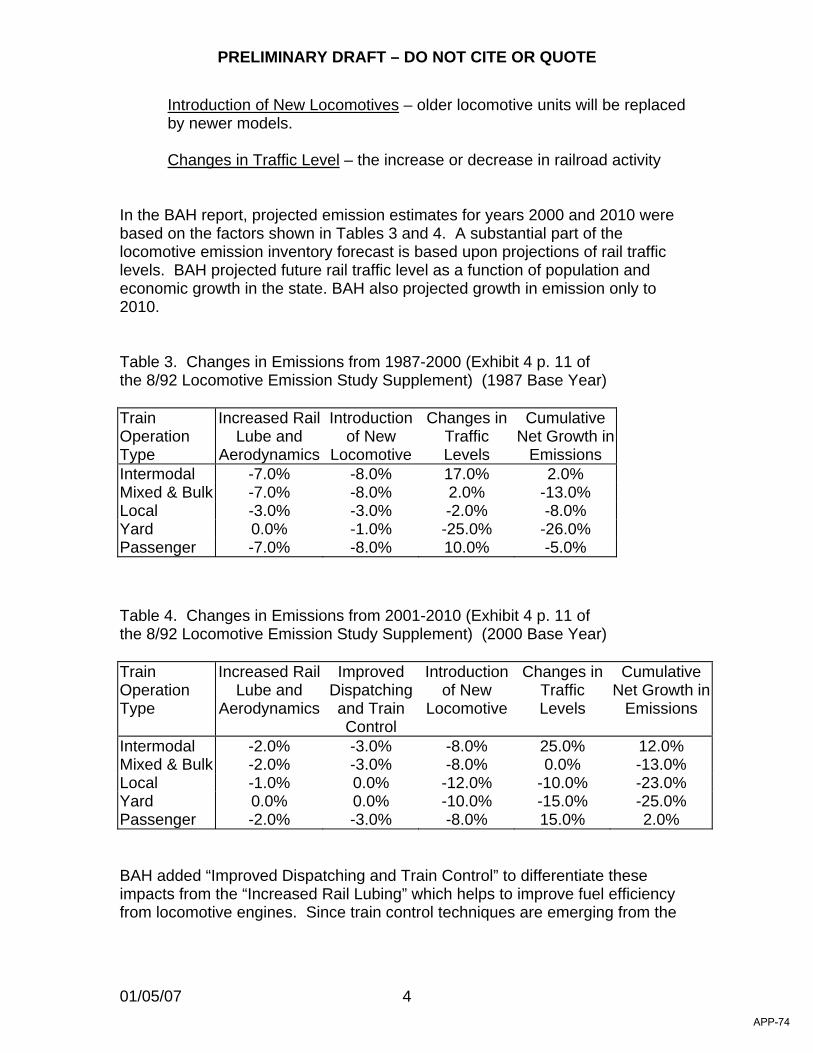
PRELIMINARY DRAFT – DO NOT CITE OR QUOTE
01/05/07 4
Introduction of New Locomotives – older locomotive units will be replaced by newer models. Changes in Traffic Level – the increase or decrease in railroad activity
In the BAH report, projected emission estimates for years 2000 and 2010 were based on the factors shown in Tables 3 and 4. A substantial part of the locomotive emission inventory forecast is based upon projections of rail traffic levels. BAH projected future rail traffic level as a function of population and economic growth in the state. BAH also projected growth in emission only to 2010. Table 3. Changes in Emissions from 1987-2000 (Exhibit 4 p. 11 of the 8/92 Locomotive Emission Study Supplement) (1987 Base Year)
Train Operation Type
Increased Rail Lube and
Aerodynamics
Introduction of New
Locomotive
Changes in Traffic Levels
Cumulative Net Growth in
Emissions Intermodal -7.0% -8.0% 17.0% 2.0% Mixed & Bulk -7.0% -8.0% 2.0% -13.0% Local -3.0% -3.0% -2.0% -8.0% Yard 0.0% -1.0% -25.0% -26.0% Passenger -7.0% -8.0% 10.0% -5.0% Table 4. Changes in Emissions from 2001-2010 (Exhibit 4 p. 11 of the 8/92 Locomotive Emission Study Supplement) (2000 Base Year)
Train Operation Type
Increased Rail Lube and
Aerodynamics
Improved Dispatching and Train Control
Introduction of New
Locomotive
Changes in Traffic Levels
Cumulative Net Growth in
Emissions
Intermodal -2.0% -3.0% -8.0% 25.0% 12.0% Mixed & Bulk -2.0% -3.0% -8.0% 0.0% -13.0% Local -1.0% 0.0% -12.0% -10.0% -23.0% Yard 0.0% 0.0% -10.0% -15.0% -25.0% Passenger -2.0% -3.0% -8.0% 15.0% 2.0% BAH added “Improved Dispatching and Train Control” to differentiate these impacts from the “Increased Rail Lubing” which helps to improve fuel efficiency from locomotive engines. Since train control techniques are emerging from the
APP-74
PRELIMINARY DRAFT – DO NOT CITE OR QUOTE
01/05/07 5
signal company research work, these assumed changes will not impact emission until year 2000. Based on industry’s input, staff recommends several changes to the locomotive emissions inventory. These include modifying growth factors, making adjustments to control factors reflecting the U. S. EPA regulations that went into effect in year 2000, incorporating fuel correction factors, adding smaller class III railroad and industrial locomotive, and updating passenger data. Revised Growth in Emissions Staff revised the growth factors for locomotives based on new data that better reflect locomotive operations. This includes U.S. industrial production and various railroad statistics available from the AAR. Based on historic data recently obtained from U.S. industrial productions and the AAR, the changes in traffic levels were revised. A better estimate for changes in traffic levels for locomotives can be made to the line-haul class of railroad, which are the intermodal and mixed and bulk type of locomotives, using industrial production and AAR’s data. Industrial production data is considered to be a surrogate for changes in traffic levels of the line-haul locomotive. It is assumed that railroad activity would increase in order to accommodate the need to move more product. Industrial production is the total output of U.S. factories and mines, and is a key economic indicator released monthly by the Federal Reserve Board. U.S. industrial production historical data from 1920 to 2002 was obtained and analyzed from government sources. Figure 1 shows the historical industrial production trend (Source : http://www.research.stlouisfed.org/fred2/series/INDPRO/3/Max). Statistical analysis was used to derive a polynomial equation to fit the data.
APP-75
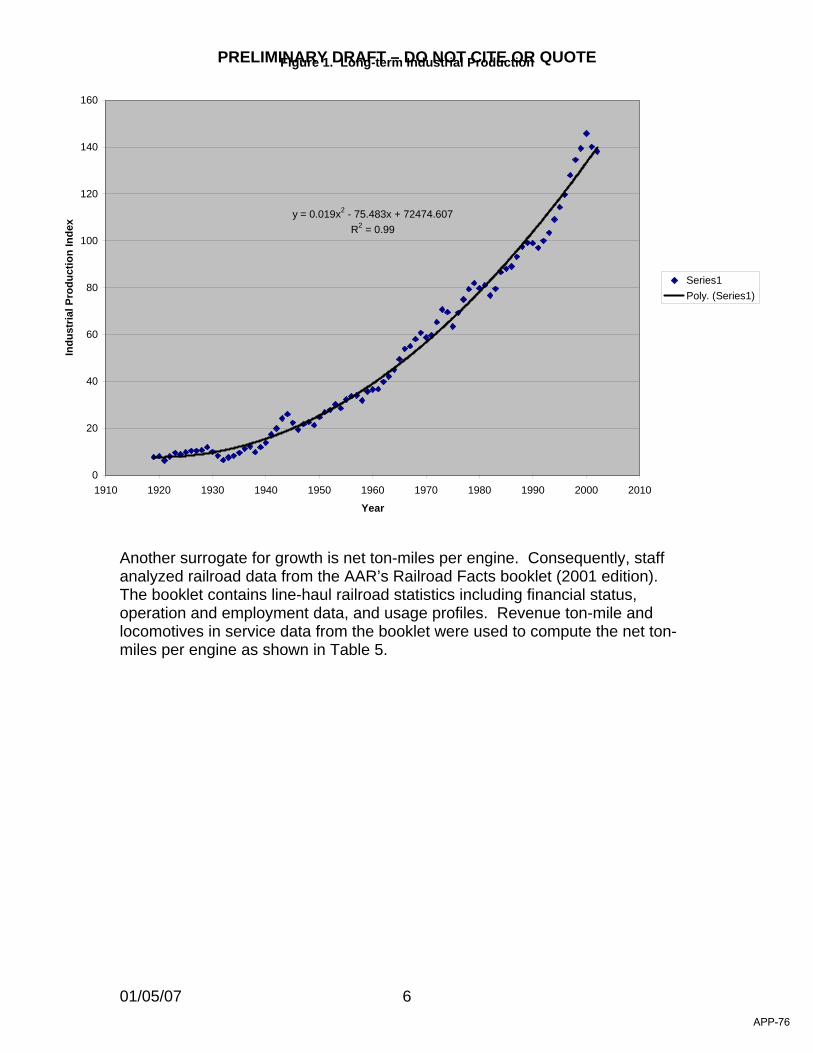
PRELIMINARY DRAFT – DO NOT CITE OR QUOTE
01/05/07 6
Another surrogate for growth is net ton-miles per engine. Consequently, staff analyzed railroad data from the AAR’s Railroad Facts booklet (2001 edition). The booklet contains line-haul railroad statistics including financial status, operation and employment data, and usage profiles. Revenue ton-mile and locomotives in service data from the booklet were used to compute the net ton-miles per engine as shown in Table 5.
Figure 1. Long-term Industrial Production
y = 0.019x2 - 75.483x + 72474.607R2 = 0.99
0
20
40
60
80
100
120
140
160
1910 1920 1930 1940 1950 1960 1970 1980 1990 2000 2010
Year
Indu
stria
l Pro
duct
ion
Inde
x
Series1Poly. (Series1)
APP-76
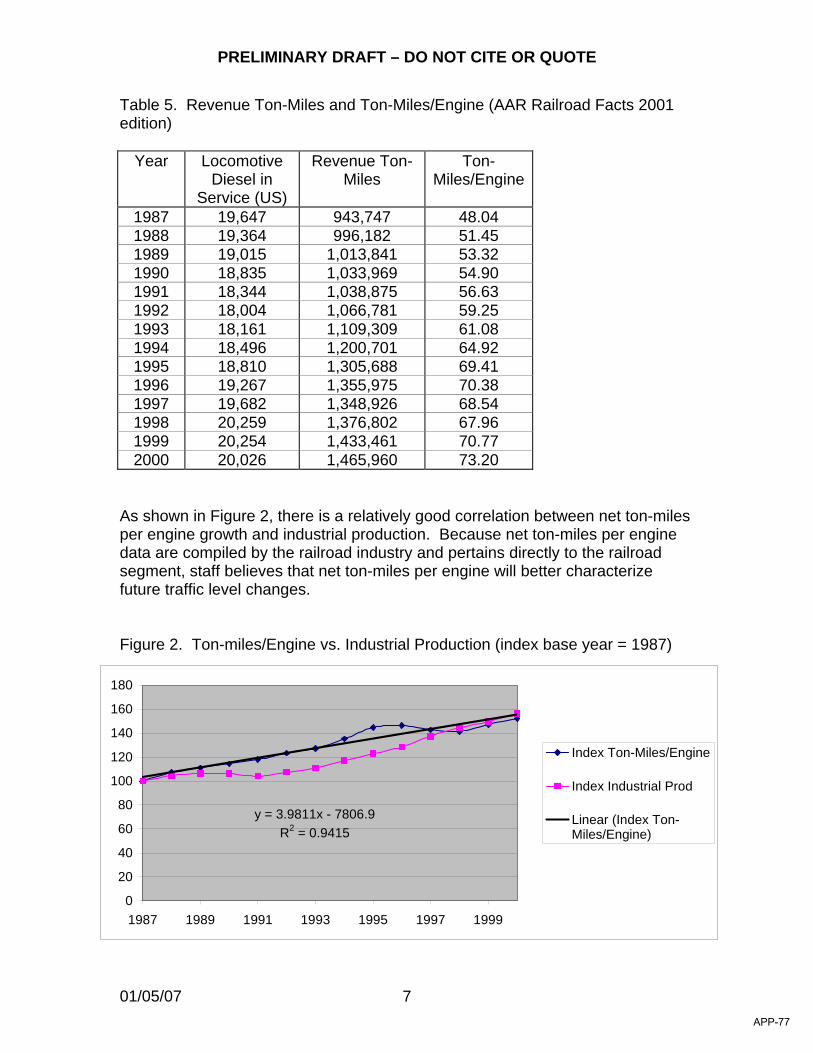
PRELIMINARY DRAFT – DO NOT CITE OR QUOTE
01/05/07 7
Table 5. Revenue Ton-Miles and Ton-Miles/Engine (AAR Railroad Facts 2001 edition)
Year Locomotive Diesel in
Service (US)
Revenue Ton-Miles
Ton-Miles/Engine
1987 19,647 943,747 48.04 1988 19,364 996,182 51.45 1989 19,015 1,013,841 53.32 1990 18,835 1,033,969 54.90 1991 18,344 1,038,875 56.63 1992 18,004 1,066,781 59.25 1993 18,161 1,109,309 61.08 1994 18,496 1,200,701 64.92 1995 18,810 1,305,688 69.41 1996 19,267 1,355,975 70.38 1997 19,682 1,348,926 68.54 1998 20,259 1,376,802 67.96 1999 20,254 1,433,461 70.77 2000 20,026 1,465,960 73.20
As shown in Figure 2, there is a relatively good correlation between net ton-miles per engine growth and industrial production. Because net ton-miles per engine data are compiled by the railroad industry and pertains directly to the railroad segment, staff believes that net ton-miles per engine will better characterize future traffic level changes. Figure 2. Ton-miles/Engine vs. Industrial Production (index base year = 1987)
y = 3.9811x - 7806.9R2 = 0.9415
0
20
40
60
80
100
120
140
160
180
1987 1989 1991 1993 1995 1997 1999
Index Ton-Miles/Engine
Index Industrial Prod
Linear (Index Ton-Miles/Engine)
APP-77
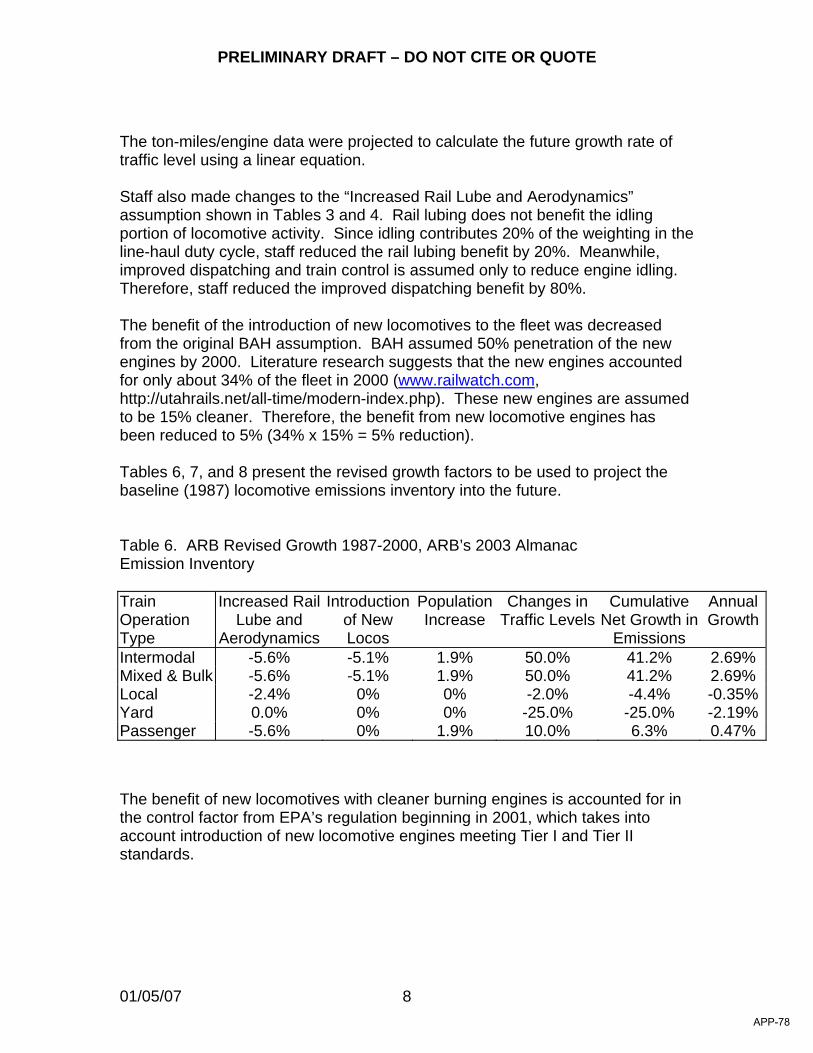
PRELIMINARY DRAFT – DO NOT CITE OR QUOTE
01/05/07 8
The ton-miles/engine data were projected to calculate the future growth rate of traffic level using a linear equation. Staff also made changes to the “Increased Rail Lube and Aerodynamics” assumption shown in Tables 3 and 4. Rail lubing does not benefit the idling portion of locomotive activity. Since idling contributes 20% of the weighting in the line-haul duty cycle, staff reduced the rail lubing benefit by 20%. Meanwhile, improved dispatching and train control is assumed only to reduce engine idling. Therefore, staff reduced the improved dispatching benefit by 80%. The benefit of the introduction of new locomotives to the fleet was decreased from the original BAH assumption. BAH assumed 50% penetration of the new engines by 2000. Literature research suggests that the new engines accounted for only about 34% of the fleet in 2000 (www.railwatch.com, http://utahrails.net/all-time/modern-index.php). These new engines are assumed to be 15% cleaner. Therefore, the benefit from new locomotive engines has been reduced to 5% (34% x 15% = 5% reduction). Tables 6, 7, and 8 present the revised growth factors to be used to project the baseline (1987) locomotive emissions inventory into the future. Table 6. ARB Revised Growth 1987-2000, ARB’s 2003 Almanac Emission Inventory
Train Operation Type
Increased Rail Lube and
Aerodynamics
Introduction of New Locos
Population Increase
Changes in Traffic Levels
Cumulative Net Growth in
Emissions
Annual Growth
Intermodal -5.6% -5.1% 1.9% 50.0% 41.2% 2.69% Mixed & Bulk -5.6% -5.1% 1.9% 50.0% 41.2% 2.69% Local -2.4% 0% 0% -2.0% -4.4% -0.35%Yard 0.0% 0% 0% -25.0% -25.0% -2.19%Passenger -5.6% 0% 1.9% 10.0% 6.3% 0.47% The benefit of new locomotives with cleaner burning engines is accounted for in the control factor from EPA’s regulation beginning in 2001, which takes into account introduction of new locomotive engines meeting Tier I and Tier II standards.
APP-78
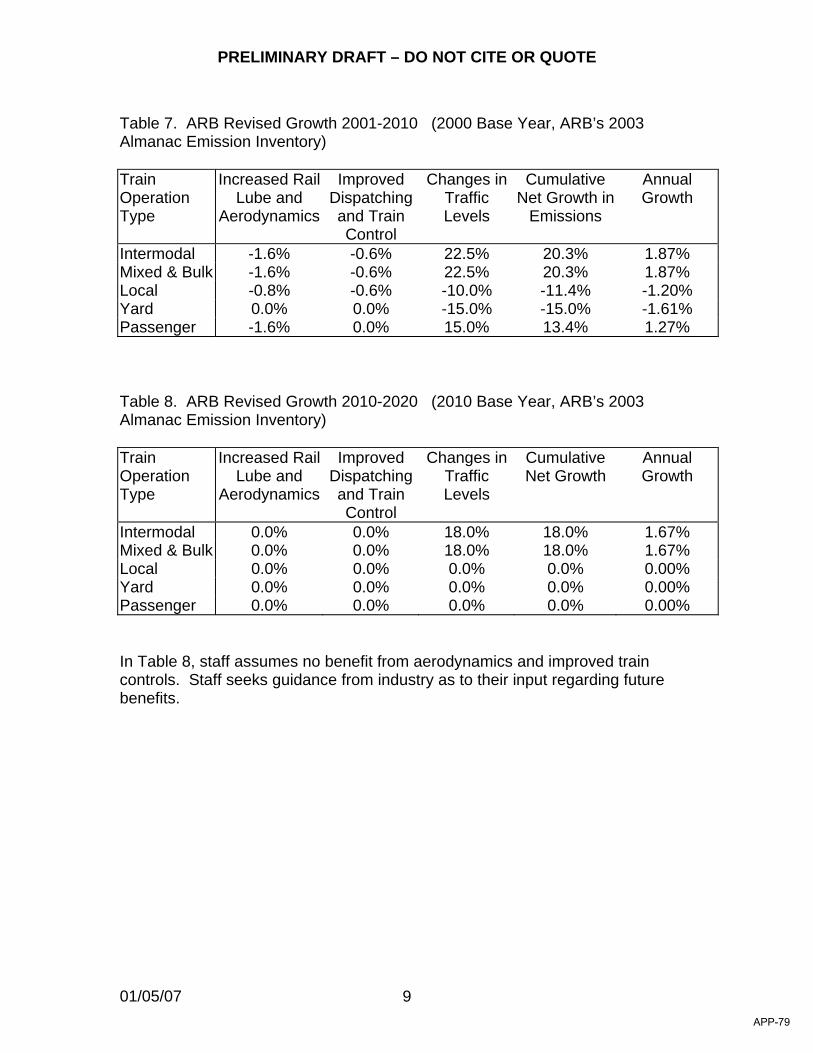
PRELIMINARY DRAFT – DO NOT CITE OR QUOTE
01/05/07 9
Table 7. ARB Revised Growth 2001-2010 (2000 Base Year, ARB’s 2003 Almanac Emission Inventory)
Train Operation Type
Increased Rail Lube and
Aerodynamics
Improved Dispatching and Train Control
Changes in Traffic Levels
Cumulative Net Growth in
Emissions
Annual Growth
Intermodal -1.6% -0.6% 22.5% 20.3% 1.87% Mixed & Bulk -1.6% -0.6% 22.5% 20.3% 1.87% Local -0.8% -0.6% -10.0% -11.4% -1.20% Yard 0.0% 0.0% -15.0% -15.0% -1.61% Passenger -1.6% 0.0% 15.0% 13.4% 1.27% Table 8. ARB Revised Growth 2010-2020 (2010 Base Year, ARB’s 2003 Almanac Emission Inventory)
Train Operation Type
Increased Rail Lube and
Aerodynamics
Improved Dispatching and Train Control
Changes in Traffic Levels
Cumulative Net Growth
Annual Growth
Intermodal 0.0% 0.0% 18.0% 18.0% 1.67% Mixed & Bulk 0.0% 0.0% 18.0% 18.0% 1.67% Local 0.0% 0.0% 0.0% 0.0% 0.00% Yard 0.0% 0.0% 0.0% 0.0% 0.00% Passenger 0.0% 0.0% 0.0% 0.0% 0.00% In Table 8, staff assumes no benefit from aerodynamics and improved train controls. Staff seeks guidance from industry as to their input regarding future benefits.
APP-79
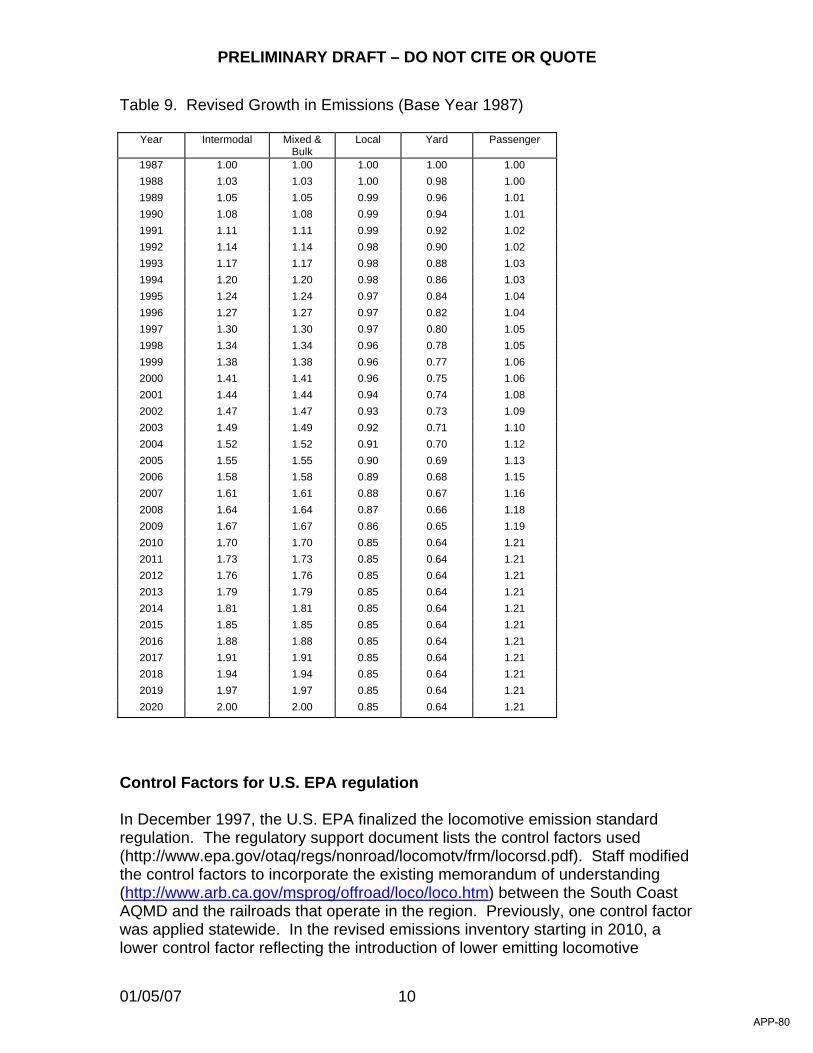
PRELIMINARY DRAFT – DO NOT CITE OR QUOTE
01/05/07 10
Table 9. Revised Growth in Emissions (Base Year 1987)
Year Intermodal Mixed & Bulk
Local Yard Passenger
1987 1.00 1.00 1.00 1.00 1.00 1988 1.03 1.03 1.00 0.98 1.00 1989 1.05 1.05 0.99 0.96 1.01 1990 1.08 1.08 0.99 0.94 1.01 1991 1.11 1.11 0.99 0.92 1.02 1992 1.14 1.14 0.98 0.90 1.02 1993 1.17 1.17 0.98 0.88 1.03 1994 1.20 1.20 0.98 0.86 1.03 1995 1.24 1.24 0.97 0.84 1.04 1996 1.27 1.27 0.97 0.82 1.04 1997 1.30 1.30 0.97 0.80 1.05 1998 1.34 1.34 0.96 0.78 1.05 1999 1.38 1.38 0.96 0.77 1.06 2000 1.41 1.41 0.96 0.75 1.06 2001 1.44 1.44 0.94 0.74 1.08 2002 1.47 1.47 0.93 0.73 1.09 2003 1.49 1.49 0.92 0.71 1.10 2004 1.52 1.52 0.91 0.70 1.12 2005 1.55 1.55 0.90 0.69 1.13 2006 1.58 1.58 0.89 0.68 1.15 2007 1.61 1.61 0.88 0.67 1.16 2008 1.64 1.64 0.87 0.66 1.18 2009 1.67 1.67 0.86 0.65 1.19 2010 1.70 1.70 0.85 0.64 1.21 2011 1.73 1.73 0.85 0.64 1.21 2012 1.76 1.76 0.85 0.64 1.21 2013 1.79 1.79 0.85 0.64 1.21 2014 1.81 1.81 0.85 0.64 1.21 2015 1.85 1.85 0.85 0.64 1.21 2016 1.88 1.88 0.85 0.64 1.21 2017 1.91 1.91 0.85 0.64 1.21 2018 1.94 1.94 0.85 0.64 1.21 2019 1.97 1.97 0.85 0.64 1.21 2020 2.00 2.00 0.85 0.64 1.21
Control Factors for U.S. EPA regulation In December 1997, the U.S. EPA finalized the locomotive emission standard regulation. The regulatory support document lists the control factors used (http://www.epa.gov/otaq/regs/nonroad/locomotv/frm/locorsd.pdf). Staff modified the control factors to incorporate the existing memorandum of understanding (http://www.arb.ca.gov/msprog/offroad/loco/loco.htm) between the South Coast AQMD and the railroads that operate in the region. Previously, one control factor was applied statewide. In the revised emissions inventory starting in 2010, a lower control factor reflecting the introduction of lower emitting locomotive
APP-80
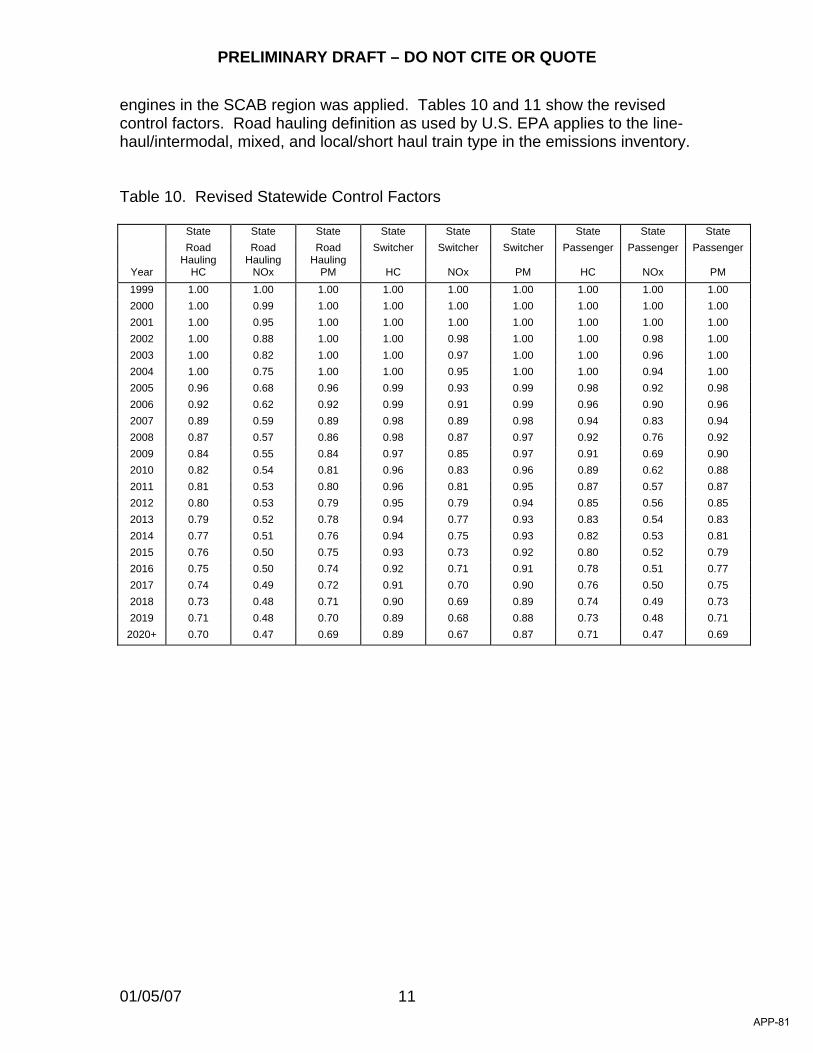
PRELIMINARY DRAFT – DO NOT CITE OR QUOTE
01/05/07 11
engines in the SCAB region was applied. Tables 10 and 11 show the revised control factors. Road hauling definition as used by U.S. EPA applies to the line-haul/intermodal, mixed, and local/short haul train type in the emissions inventory. Table 10. Revised Statewide Control Factors
State State State State State State State State State Road
Hauling Road
Hauling Road
Hauling Switcher Switcher Switcher Passenger Passenger Passenger
Year HC NOx PM HC NOx PM HC NOx PM 1999 1.00 1.00 1.00 1.00 1.00 1.00 1.00 1.00 1.00 2000 1.00 0.99 1.00 1.00 1.00 1.00 1.00 1.00 1.00 2001 1.00 0.95 1.00 1.00 1.00 1.00 1.00 1.00 1.00 2002 1.00 0.88 1.00 1.00 0.98 1.00 1.00 0.98 1.00 2003 1.00 0.82 1.00 1.00 0.97 1.00 1.00 0.96 1.00 2004 1.00 0.75 1.00 1.00 0.95 1.00 1.00 0.94 1.00 2005 0.96 0.68 0.96 0.99 0.93 0.99 0.98 0.92 0.98 2006 0.92 0.62 0.92 0.99 0.91 0.99 0.96 0.90 0.96 2007 0.89 0.59 0.89 0.98 0.89 0.98 0.94 0.83 0.94 2008 0.87 0.57 0.86 0.98 0.87 0.97 0.92 0.76 0.92 2009 0.84 0.55 0.84 0.97 0.85 0.97 0.91 0.69 0.90 2010 0.82 0.54 0.81 0.96 0.83 0.96 0.89 0.62 0.88 2011 0.81 0.53 0.80 0.96 0.81 0.95 0.87 0.57 0.87 2012 0.80 0.53 0.79 0.95 0.79 0.94 0.85 0.56 0.85 2013 0.79 0.52 0.78 0.94 0.77 0.93 0.83 0.54 0.83 2014 0.77 0.51 0.76 0.94 0.75 0.93 0.82 0.53 0.81 2015 0.76 0.50 0.75 0.93 0.73 0.92 0.80 0.52 0.79 2016 0.75 0.50 0.74 0.92 0.71 0.91 0.78 0.51 0.77 2017 0.74 0.49 0.72 0.91 0.70 0.90 0.76 0.50 0.75 2018 0.73 0.48 0.71 0.90 0.69 0.89 0.74 0.49 0.73 2019 0.71 0.48 0.70 0.89 0.68 0.88 0.73 0.48 0.71
2020+ 0.70 0.47 0.69 0.89 0.67 0.87 0.71 0.47 0.69
APP-81
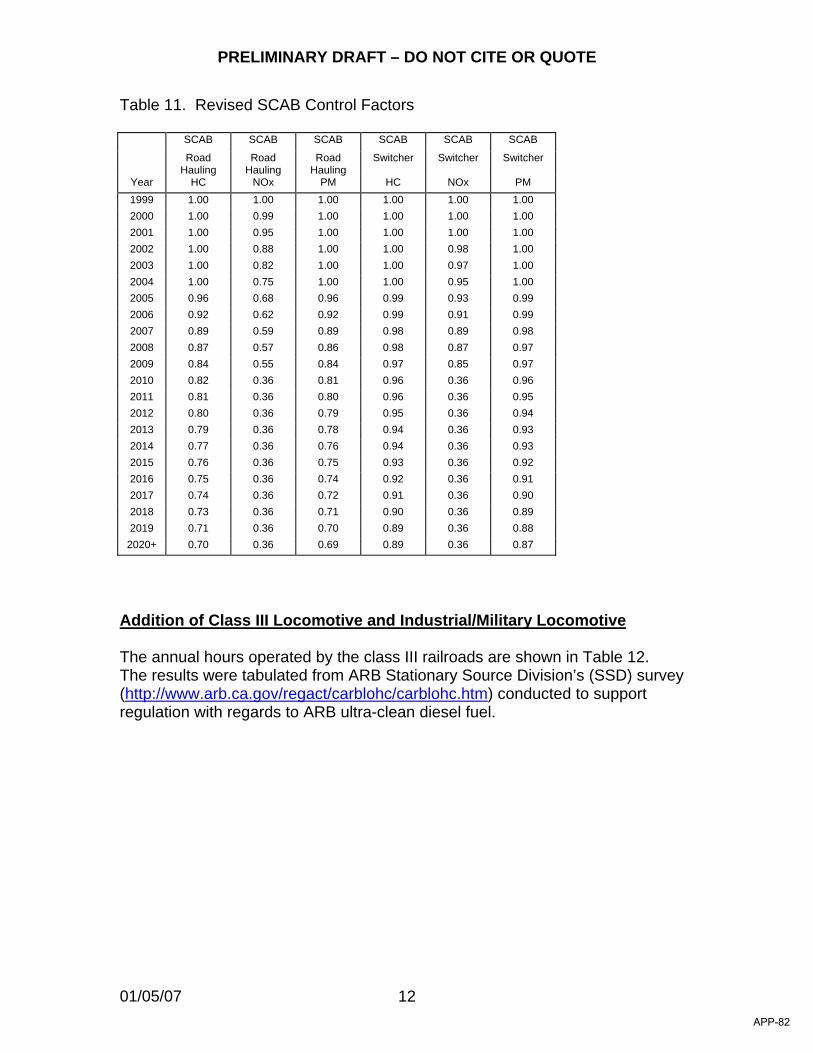
PRELIMINARY DRAFT – DO NOT CITE OR QUOTE
01/05/07 12
Table 11. Revised SCAB Control Factors
SCAB SCAB SCAB SCAB SCAB SCAB
Road Hauling
Road Hauling
Road Hauling
Switcher Switcher Switcher
Year HC NOx PM HC NOx PM 1999 1.00 1.00 1.00 1.00 1.00 1.00 2000 1.00 0.99 1.00 1.00 1.00 1.00 2001 1.00 0.95 1.00 1.00 1.00 1.00 2002 1.00 0.88 1.00 1.00 0.98 1.00 2003 1.00 0.82 1.00 1.00 0.97 1.00 2004 1.00 0.75 1.00 1.00 0.95 1.00 2005 0.96 0.68 0.96 0.99 0.93 0.99 2006 0.92 0.62 0.92 0.99 0.91 0.99 2007 0.89 0.59 0.89 0.98 0.89 0.98 2008 0.87 0.57 0.86 0.98 0.87 0.97 2009 0.84 0.55 0.84 0.97 0.85 0.97 2010 0.82 0.36 0.81 0.96 0.36 0.96 2011 0.81 0.36 0.80 0.96 0.36 0.95 2012 0.80 0.36 0.79 0.95 0.36 0.94 2013 0.79 0.36 0.78 0.94 0.36 0.93 2014 0.77 0.36 0.76 0.94 0.36 0.93 2015 0.76 0.36 0.75 0.93 0.36 0.92 2016 0.75 0.36 0.74 0.92 0.36 0.91 2017 0.74 0.36 0.72 0.91 0.36 0.90 2018 0.73 0.36 0.71 0.90 0.36 0.89 2019 0.71 0.36 0.70 0.89 0.36 0.88
2020+ 0.70 0.36 0.69 0.89 0.36 0.87
Addition of Class III Locomotive and Industrial/Military Locomotive The annual hours operated by the class III railroads are shown in Table 12. The results were tabulated from ARB Stationary Source Division’s (SSD) survey (http://www.arb.ca.gov/regact/carblohc/carblohc.htm) conducted to support regulation with regards to ARB ultra-clean diesel fuel.
APP-82
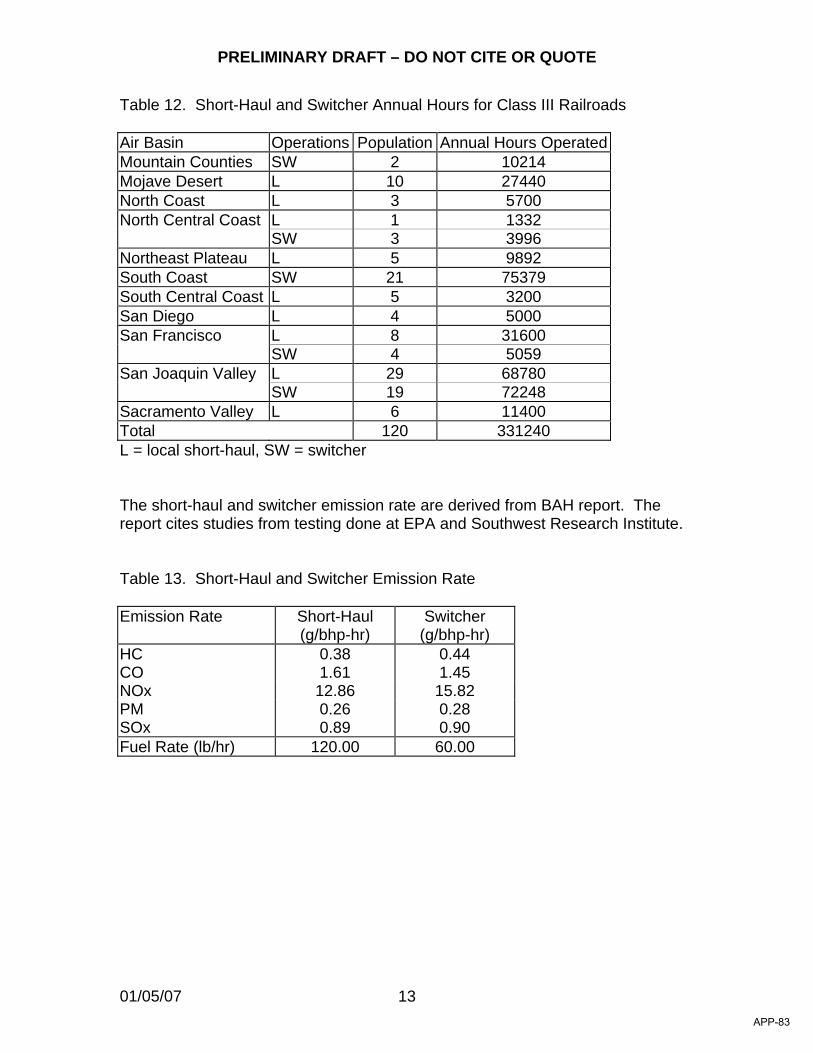
PRELIMINARY DRAFT – DO NOT CITE OR QUOTE
01/05/07 13
Table 12. Short-Haul and Switcher Annual Hours for Class III Railroads Air Basin Operations Population Annual Hours Operated Mountain Counties SW 2 10214 Mojave Desert L 10 27440 North Coast L 3 5700 North Central Coast L 1 1332
SW 3 3996 Northeast Plateau L 5 9892 South Coast SW 21 75379 South Central Coast L 5 3200 San Diego L 4 5000 San Francisco L 8 31600
SW 4 5059 San Joaquin Valley L 29 68780
SW 19 72248 Sacramento Valley L 6 11400 Total 120 331240 L = local short-haul, SW = switcher The short-haul and switcher emission rate are derived from BAH report. The report cites studies from testing done at EPA and Southwest Research Institute. Table 13. Short-Haul and Switcher Emission Rate Emission Rate
Short-Haul (g/bhp-hr)
Switcher (g/bhp-hr)
HC 0.38 0.44 CO 1.61 1.45 NOx 12.86 15.82 PM 0.26 0.28 SOx 0.89 0.90 Fuel Rate (lb/hr) 120.00 60.00
APP-83
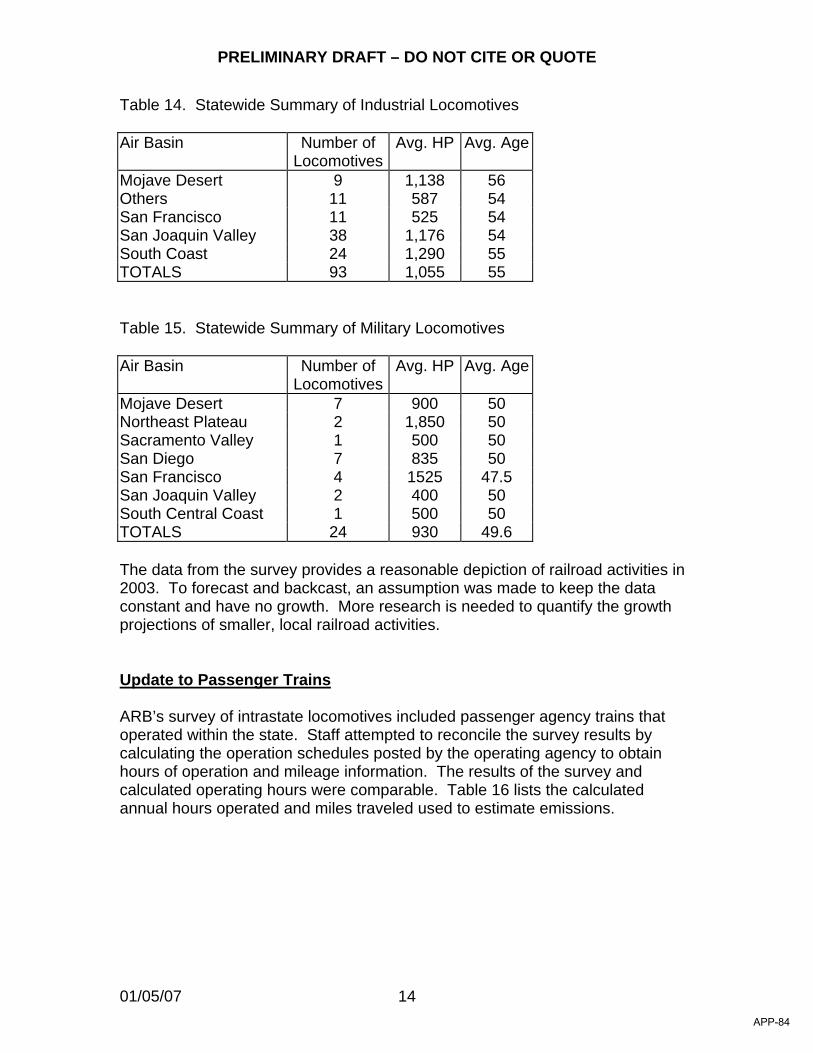
PRELIMINARY DRAFT – DO NOT CITE OR QUOTE
01/05/07 14
Table 14. Statewide Summary of Industrial Locomotives Air Basin Number of
LocomotivesAvg. HP Avg. Age
Mojave Desert 9 1,138 56 Others 11 587 54 San Francisco 11 525 54 San Joaquin Valley 38 1,176 54 South Coast 24 1,290 55 TOTALS 93 1,055 55 Table 15. Statewide Summary of Military Locomotives Air Basin Number of
LocomotivesAvg. HP Avg. Age
Mojave Desert 7 900 50 Northeast Plateau 2 1,850 50 Sacramento Valley 1 500 50 San Diego 7 835 50 San Francisco 4 1525 47.5 San Joaquin Valley 2 400 50 South Central Coast 1 500 50 TOTALS 24 930 49.6 The data from the survey provides a reasonable depiction of railroad activities in 2003. To forecast and backcast, an assumption was made to keep the data constant and have no growth. More research is needed to quantify the growth projections of smaller, local railroad activities. Update to Passenger Trains ARB’s survey of intrastate locomotives included passenger agency trains that operated within the state. Staff attempted to reconcile the survey results by calculating the operation schedules posted by the operating agency to obtain hours of operation and mileage information. The results of the survey and calculated operating hours were comparable. Table 16 lists the calculated annual hours operated and miles traveled used to estimate emissions.
APP-84
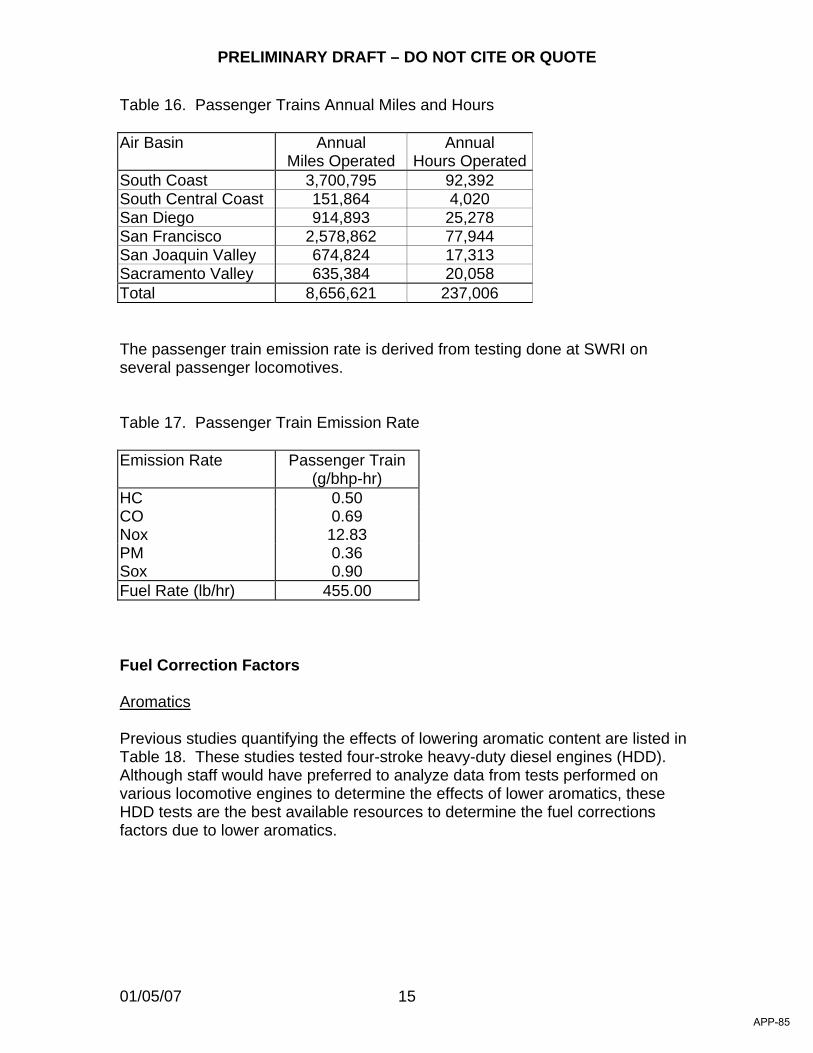
PRELIMINARY DRAFT – DO NOT CITE OR QUOTE
01/05/07 15
Table 16. Passenger Trains Annual Miles and Hours Air Basin Annual
Miles Operated Annual
Hours OperatedSouth Coast 3,700,795 92,392 South Central Coast 151,864 4,020 San Diego 914,893 25,278 San Francisco 2,578,862 77,944 San Joaquin Valley 674,824 17,313 Sacramento Valley 635,384 20,058 Total 8,656,621 237,006 The passenger train emission rate is derived from testing done at SWRI on several passenger locomotives. Table 17. Passenger Train Emission Rate Emission Rate
Passenger Train (g/bhp-hr)
HC 0.50 CO 0.69 Nox 12.83 PM 0.36 Sox 0.90 Fuel Rate (lb/hr) 455.00 Fuel Correction Factors Aromatics Previous studies quantifying the effects of lowering aromatic content are listed in Table 18. These studies tested four-stroke heavy-duty diesel engines (HDD). Although staff would have preferred to analyze data from tests performed on various locomotive engines to determine the effects of lower aromatics, these HDD tests are the best available resources to determine the fuel corrections factors due to lower aromatics.
APP-85
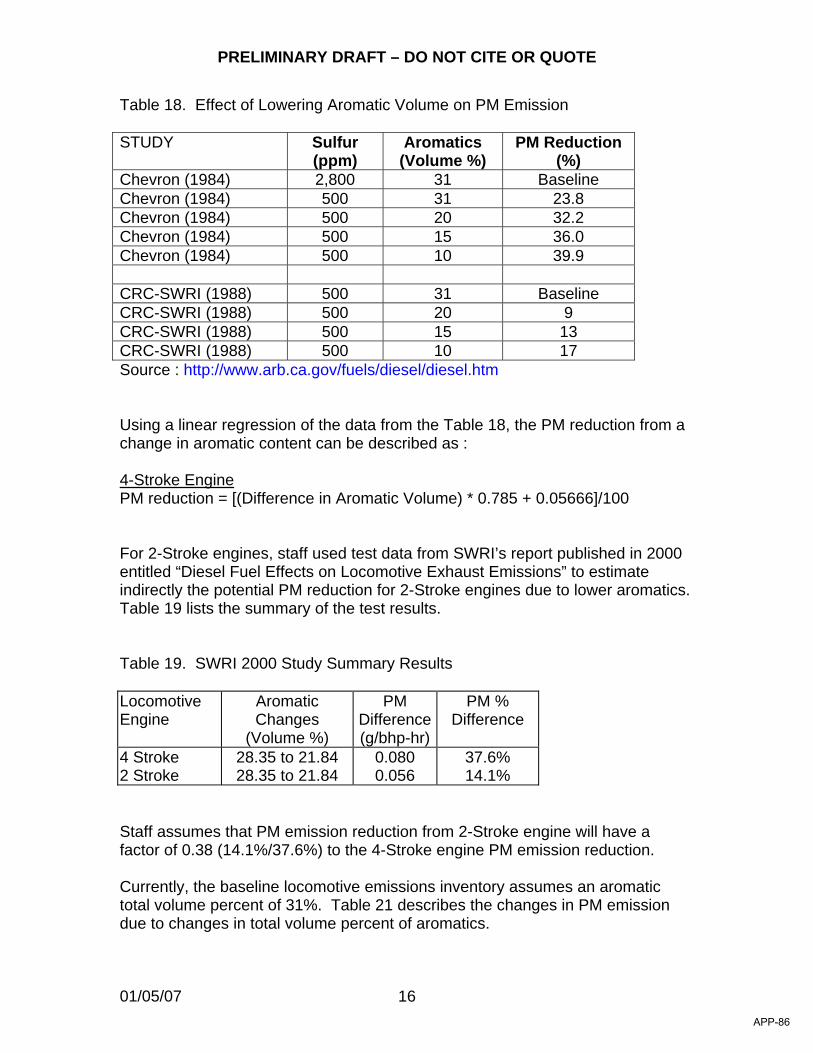
PRELIMINARY DRAFT – DO NOT CITE OR QUOTE
01/05/07 16
Table 18. Effect of Lowering Aromatic Volume on PM Emission STUDY Sulfur
(ppm) Aromatics
(Volume %) PM Reduction
(%) Chevron (1984) 2,800 31 Baseline Chevron (1984) 500 31 23.8 Chevron (1984) 500 20 32.2 Chevron (1984) 500 15 36.0 Chevron (1984) 500 10 39.9 CRC-SWRI (1988) 500 31 Baseline CRC-SWRI (1988) 500 20 9 CRC-SWRI (1988) 500 15 13 CRC-SWRI (1988) 500 10 17 Source : http://www.arb.ca.gov/fuels/diesel/diesel.htm Using a linear regression of the data from the Table 18, the PM reduction from a change in aromatic content can be described as : 4-Stroke Engine PM reduction = [(Difference in Aromatic Volume) * 0.785 + 0.05666]/100 For 2-Stroke engines, staff used test data from SWRI’s report published in 2000 entitled “Diesel Fuel Effects on Locomotive Exhaust Emissions” to estimate indirectly the potential PM reduction for 2-Stroke engines due to lower aromatics. Table 19 lists the summary of the test results. Table 19. SWRI 2000 Study Summary Results Locomotive Engine
Aromatic Changes
(Volume %)
PM Difference (g/bhp-hr)
PM % Difference
4 Stroke 28.35 to 21.84 0.080 37.6% 2 Stroke 28.35 to 21.84 0.056 14.1% Staff assumes that PM emission reduction from 2-Stroke engine will have a factor of 0.38 (14.1%/37.6%) to the 4-Stroke engine PM emission reduction. Currently, the baseline locomotive emissions inventory assumes an aromatic total volume percent of 31%. Table 21 describes the changes in PM emission due to changes in total volume percent of aromatics.
APP-86
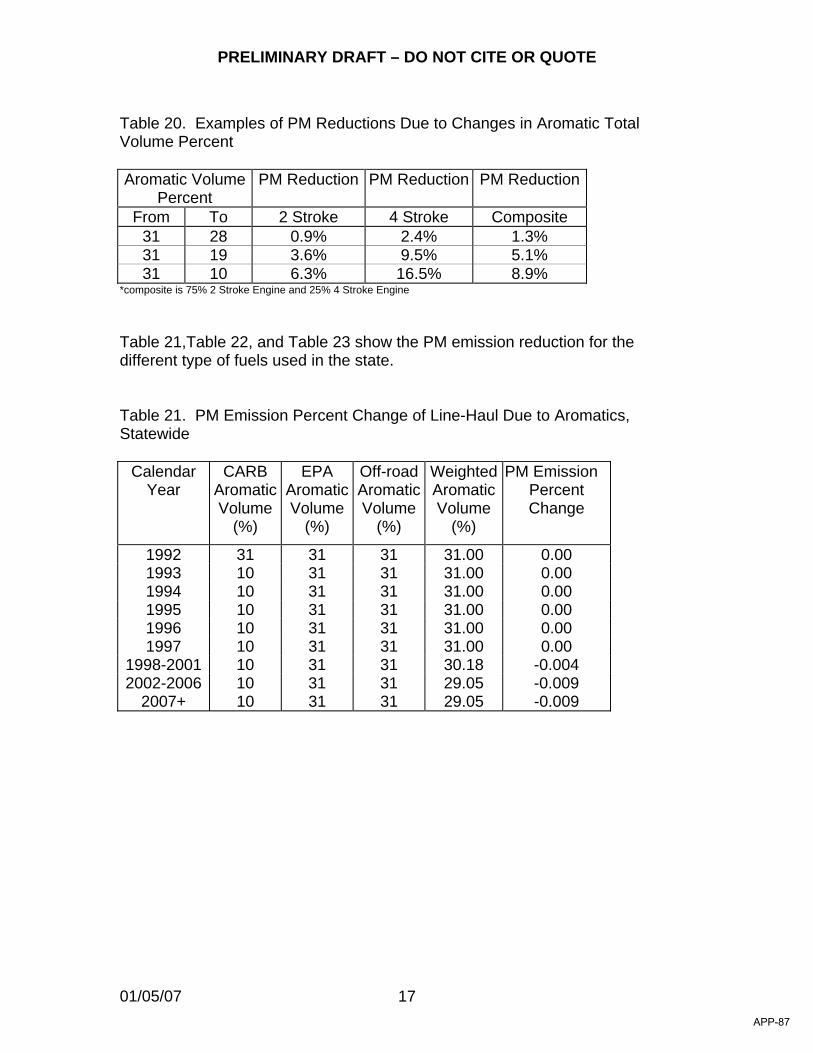
PRELIMINARY DRAFT – DO NOT CITE OR QUOTE
01/05/07 17
Table 20. Examples of PM Reductions Due to Changes in Aromatic Total Volume Percent Aromatic Volume
Percent PM Reduction PM Reduction PM Reduction
From To 2 Stroke 4 Stroke Composite 31 28 0.9% 2.4% 1.3% 31 19 3.6% 9.5% 5.1% 31 10 6.3% 16.5% 8.9%
*composite is 75% 2 Stroke Engine and 25% 4 Stroke Engine Table 21,Table 22, and Table 23 show the PM emission reduction for the different type of fuels used in the state. Table 21. PM Emission Percent Change of Line-Haul Due to Aromatics, Statewide
Calendar Year
CARB Aromatic Volume
(%)
EPA Aromatic Volume
(%)
Off-road Aromatic Volume
(%)
Weighted Aromatic Volume
(%)
PM Emission Percent Change
1992 31 31 31 31.00 0.00 1993 10 31 31 31.00 0.00 1994 10 31 31 31.00 0.00 1995 10 31 31 31.00 0.00 1996 10 31 31 31.00 0.00 1997 10 31 31 31.00 0.00
1998-2001 10 31 31 30.18 -0.004 2002-2006 10 31 31 29.05 -0.009
2007+ 10 31 31 29.05 -0.009
APP-87
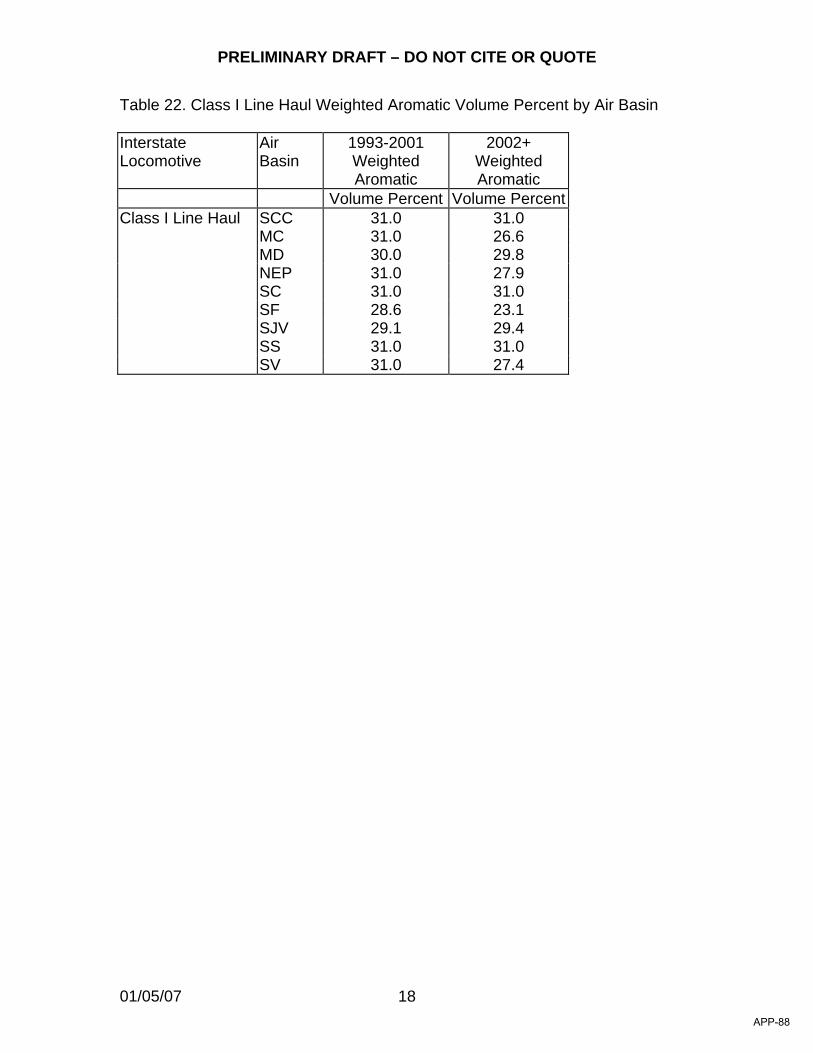
PRELIMINARY DRAFT – DO NOT CITE OR QUOTE
01/05/07 18
Table 22. Class I Line Haul Weighted Aromatic Volume Percent by Air Basin Interstate Locomotive
Air Basin
1993-2001 Weighted Aromatic
2002+ Weighted Aromatic
Volume Percent Volume PercentClass I Line Haul SCC 31.0 31.0
MC 31.0 26.6 MD 30.0 29.8 NEP 31.0 27.9 SC 31.0 31.0 SF 28.6 23.1 SJV 29.1 29.4 SS 31.0 31.0 SV 31.0 27.4
APP-88

PRELIMINARY DRAFT – DO NOT CITE OR QUOTE
01/05/07 19
Table 23. PM Emission Reduction from Intrastate Locomotives Due to Aromatics by Air Basin, 1993+ Intrastate Locomotive
Air Basin
CARB Aromatic
EPA Aromatic
Nonroad Aromatic
Weighted Aromatic
PM Emission Reduction
Volume Percent
Volume Percent
Volume Percent
Volume Percent
Percent
Class I Local/Switcher
SC 10 31 31 29.0 -0.9%
SJV 10 31 31 25.2 -2.4% MD 10 31 31 31.0 0.0% BA 10 31 31 13.9 -7.2% SD 10 31 31 13.2 -7.5% SV 10 31 31 13.2 -7.5% SCC 10 31 31 13.2 -7.5%
Class III Local/Switcher
SC 10 31 31 31.0 0.0%
SJV 10 31 31 18.6 -5.2% MD 10 31 31 10.0 -8.8% BA 10 31 31 10.0 -8.8% SD 10 31 31 10.0 -8.8% SV 10 31 31 10.0 -8.8% SCC 10 31 31 10.0 -8.8% NEP 10 31 31 26.6 -1.9% MC 10 31 31 31.0 0.0% NC 10 31 31 10.0 -8.8% NCC 10 31 31 10.0 -8.8%
Industrial/Military SC 10 31 31 24.0 -3.0% SJV 10 31 31 24.0 -3.0% MD 10 31 31 24.0 -3.0% BA 10 31 31 24.0 -3.0% NEP 10 31 31 24.0 -3.0% SD 10 31 31 24.0 -3.0% SV 10 31 31 24.0 -3.0% SCC 10 31 31 24.0 -3.0%
Passenger SC 10 31 31 10.8 -8.5% SJV 10 31 31 10.0 -8.8% BA 10 31 31 10.0 -8.8% SD 10 31 31 10.0 -8.8% SV 10 31 31 10.0 -8.8% SCC 10 31 31 12.1 -8.0%
Source : Fuel Estimate from http://www.arb.ca.gov/regact/carblohc/carblohc.htm Sulfur Currently, the baseline locomotive emissions inventory assumes an average fuel sulfur content of 2700 ppm. Industry has provided information on the sulfur content of the fuel that is currently being used by intrastate locomotives. Together with industry data and prior locomotive tests, staff believes a fuel correction factor should be incorporated into the model.
APP-89
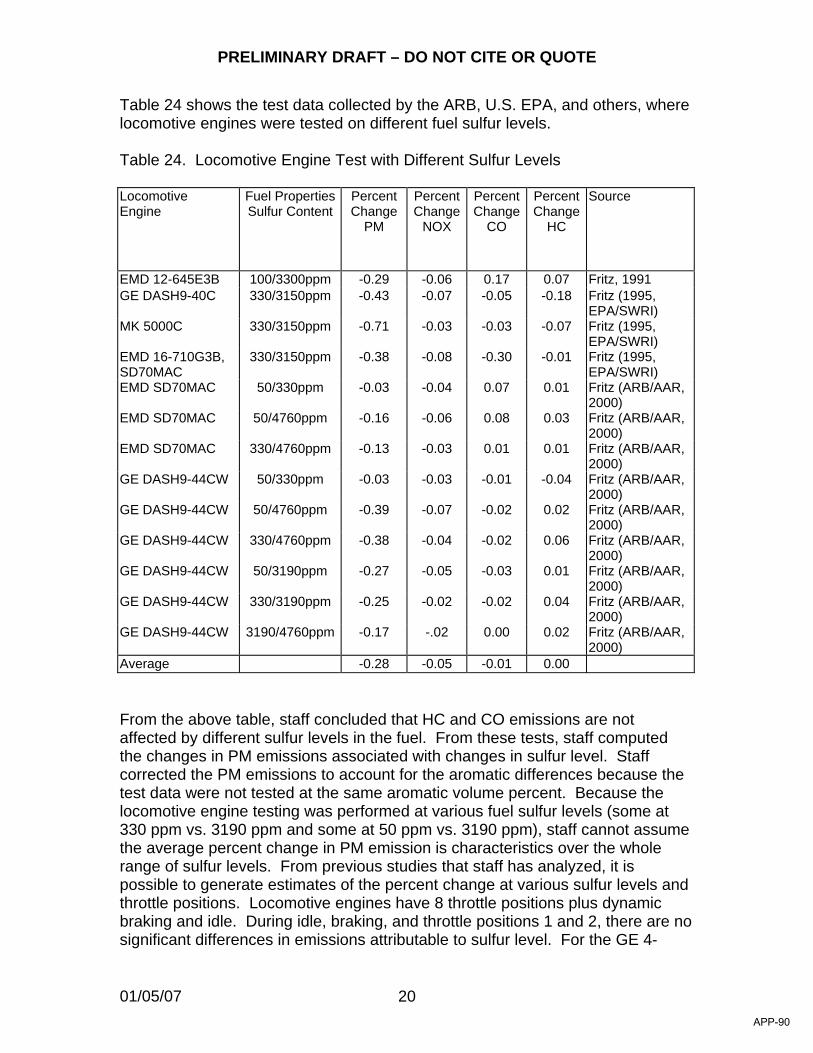
PRELIMINARY DRAFT – DO NOT CITE OR QUOTE
01/05/07 20
Table 24 shows the test data collected by the ARB, U.S. EPA, and others, where locomotive engines were tested on different fuel sulfur levels. Table 24. Locomotive Engine Test with Different Sulfur Levels Locomotive Engine
Fuel Properties Sulfur Content
Percent Change
PM
Percent Change
NOX
Percent Change
CO
Percent Change
HC
Source
EMD 12-645E3B 100/3300ppm -0.29 -0.06 0.17 0.07 Fritz, 1991 GE DASH9-40C 330/3150ppm -0.43 -0.07 -0.05 -0.18 Fritz (1995,
EPA/SWRI) MK 5000C 330/3150ppm -0.71 -0.03 -0.03 -0.07 Fritz (1995,
EPA/SWRI) EMD 16-710G3B, SD70MAC
330/3150ppm -0.38 -0.08 -0.30 -0.01 Fritz (1995, EPA/SWRI)
EMD SD70MAC 50/330ppm -0.03 -0.04 0.07 0.01 Fritz (ARB/AAR, 2000)
EMD SD70MAC 50/4760ppm -0.16 -0.06 0.08 0.03 Fritz (ARB/AAR, 2000)
EMD SD70MAC 330/4760ppm -0.13 -0.03 0.01 0.01 Fritz (ARB/AAR, 2000)
GE DASH9-44CW 50/330ppm -0.03 -0.03 -0.01 -0.04 Fritz (ARB/AAR, 2000)
GE DASH9-44CW 50/4760ppm -0.39 -0.07 -0.02 0.02 Fritz (ARB/AAR, 2000)
GE DASH9-44CW 330/4760ppm -0.38 -0.04 -0.02 0.06 Fritz (ARB/AAR, 2000)
GE DASH9-44CW 50/3190ppm -0.27 -0.05 -0.03 0.01 Fritz (ARB/AAR, 2000)
GE DASH9-44CW 330/3190ppm -0.25 -0.02 -0.02 0.04 Fritz (ARB/AAR, 2000)
GE DASH9-44CW 3190/4760ppm -0.17 -.02 0.00 0.02 Fritz (ARB/AAR, 2000)
Average -0.28 -0.05 -0.01 0.00 From the above table, staff concluded that HC and CO emissions are not affected by different sulfur levels in the fuel. From these tests, staff computed the changes in PM emissions associated with changes in sulfur level. Staff corrected the PM emissions to account for the aromatic differences because the test data were not tested at the same aromatic volume percent. Because the locomotive engine testing was performed at various fuel sulfur levels (some at 330 ppm vs. 3190 ppm and some at 50 ppm vs. 3190 ppm), staff cannot assume the average percent change in PM emission is characteristics over the whole range of sulfur levels. From previous studies that staff has analyzed, it is possible to generate estimates of the percent change at various sulfur levels and throttle positions. Locomotive engines have 8 throttle positions plus dynamic braking and idle. During idle, braking, and throttle positions 1 and 2, there are no significant differences in emissions attributable to sulfur level. For the GE 4-
APP-90
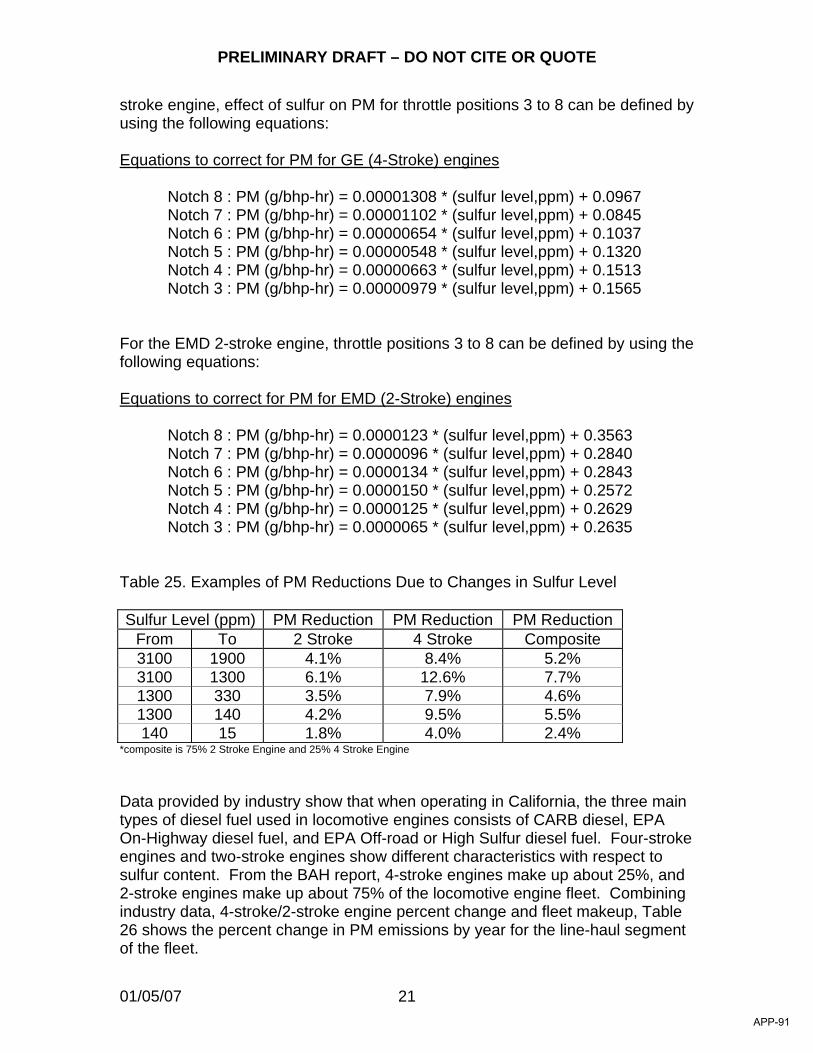
PRELIMINARY DRAFT – DO NOT CITE OR QUOTE
01/05/07 21
stroke engine, effect of sulfur on PM for throttle positions 3 to 8 can be defined by using the following equations: Equations to correct for PM for GE (4-Stroke) engines Notch 8 : PM (g/bhp-hr) = 0.00001308 * (sulfur level,ppm) + 0.0967
Notch 7 : PM (g/bhp-hr) = 0.00001102 * (sulfur level,ppm) + 0.0845 Notch 6 : PM (g/bhp-hr) = 0.00000654 * (sulfur level,ppm) + 0.1037 Notch 5 : PM (g/bhp-hr) = 0.00000548 * (sulfur level,ppm) + 0.1320 Notch 4 : PM (g/bhp-hr) = 0.00000663 * (sulfur level,ppm) + 0.1513 Notch 3 : PM (g/bhp-hr) = 0.00000979 * (sulfur level,ppm) + 0.1565
For the EMD 2-stroke engine, throttle positions 3 to 8 can be defined by using the following equations: Equations to correct for PM for EMD (2-Stroke) engines Notch 8 : PM (g/bhp-hr) = 0.0000123 * (sulfur level,ppm) + 0.3563
Notch 7 : PM (g/bhp-hr) = 0.0000096 * (sulfur level,ppm) + 0.2840 Notch 6 : PM (g/bhp-hr) = 0.0000134 * (sulfur level,ppm) + 0.2843 Notch 5 : PM (g/bhp-hr) = 0.0000150 * (sulfur level,ppm) + 0.2572 Notch 4 : PM (g/bhp-hr) = 0.0000125 * (sulfur level,ppm) + 0.2629 Notch 3 : PM (g/bhp-hr) = 0.0000065 * (sulfur level,ppm) + 0.2635
Table 25. Examples of PM Reductions Due to Changes in Sulfur Level Sulfur Level (ppm) PM Reduction PM Reduction PM Reduction
From To 2 Stroke 4 Stroke Composite 3100 1900 4.1% 8.4% 5.2% 3100 1300 6.1% 12.6% 7.7% 1300 330 3.5% 7.9% 4.6% 1300 140 4.2% 9.5% 5.5% 140 15 1.8% 4.0% 2.4%
*composite is 75% 2 Stroke Engine and 25% 4 Stroke Engine Data provided by industry show that when operating in California, the three main types of diesel fuel used in locomotive engines consists of CARB diesel, EPA On-Highway diesel fuel, and EPA Off-road or High Sulfur diesel fuel. Four-stroke engines and two-stroke engines show different characteristics with respect to sulfur content. From the BAH report, 4-stroke engines make up about 25%, and 2-stroke engines make up about 75% of the locomotive engine fleet. Combining industry data, 4-stroke/2-stroke engine percent change and fleet makeup, Table 26 shows the percent change in PM emissions by year for the line-haul segment of the fleet.
APP-91
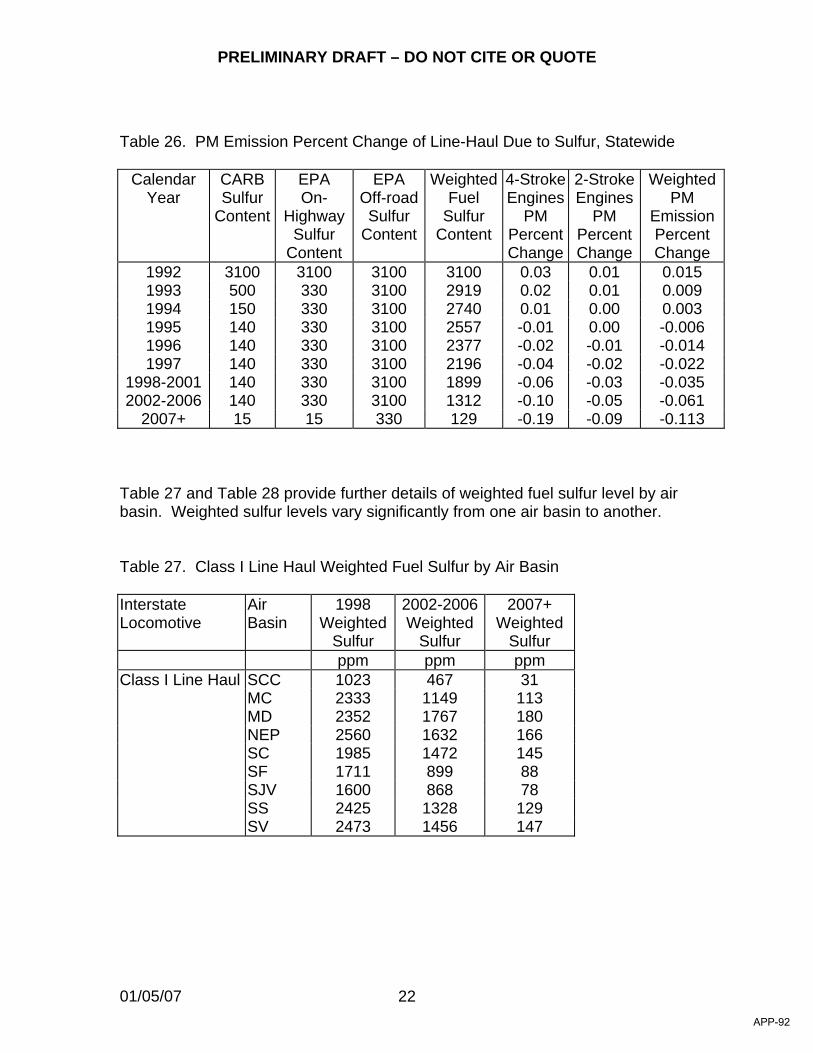
PRELIMINARY DRAFT – DO NOT CITE OR QUOTE
01/05/07 22
Table 26. PM Emission Percent Change of Line-Haul Due to Sulfur, Statewide
Calendar Year
CARB Sulfur
Content
EPA On-
Highway Sulfur
Content
EPA Off-road Sulfur
Content
Weighted Fuel
Sulfur Content
4-Stroke Engines
PM Percent Change
2-Stroke Engines
PM Percent Change
Weighted PM
Emission Percent Change
1992 3100 3100 3100 3100 0.03 0.01 0.015 1993 500 330 3100 2919 0.02 0.01 0.009 1994 150 330 3100 2740 0.01 0.00 0.003 1995 140 330 3100 2557 -0.01 0.00 -0.006 1996 140 330 3100 2377 -0.02 -0.01 -0.014 1997 140 330 3100 2196 -0.04 -0.02 -0.022
1998-2001 140 330 3100 1899 -0.06 -0.03 -0.035 2002-2006 140 330 3100 1312 -0.10 -0.05 -0.061
2007+ 15 15 330 129 -0.19 -0.09 -0.113 Table 27 and Table 28 provide further details of weighted fuel sulfur level by air basin. Weighted sulfur levels vary significantly from one air basin to another. Table 27. Class I Line Haul Weighted Fuel Sulfur by Air Basin Interstate Locomotive
Air Basin
1998 Weighted
Sulfur
2002-2006 Weighted
Sulfur
2007+ Weighted
Sulfur ppm ppm ppm
Class I Line Haul SCC 1023 467 31 MC 2333 1149 113 MD 2352 1767 180 NEP 2560 1632 166 SC 1985 1472 145 SF 1711 899 88 SJV 1600 868 78 SS 2425 1328 129 SV 2473 1456 147
APP-92
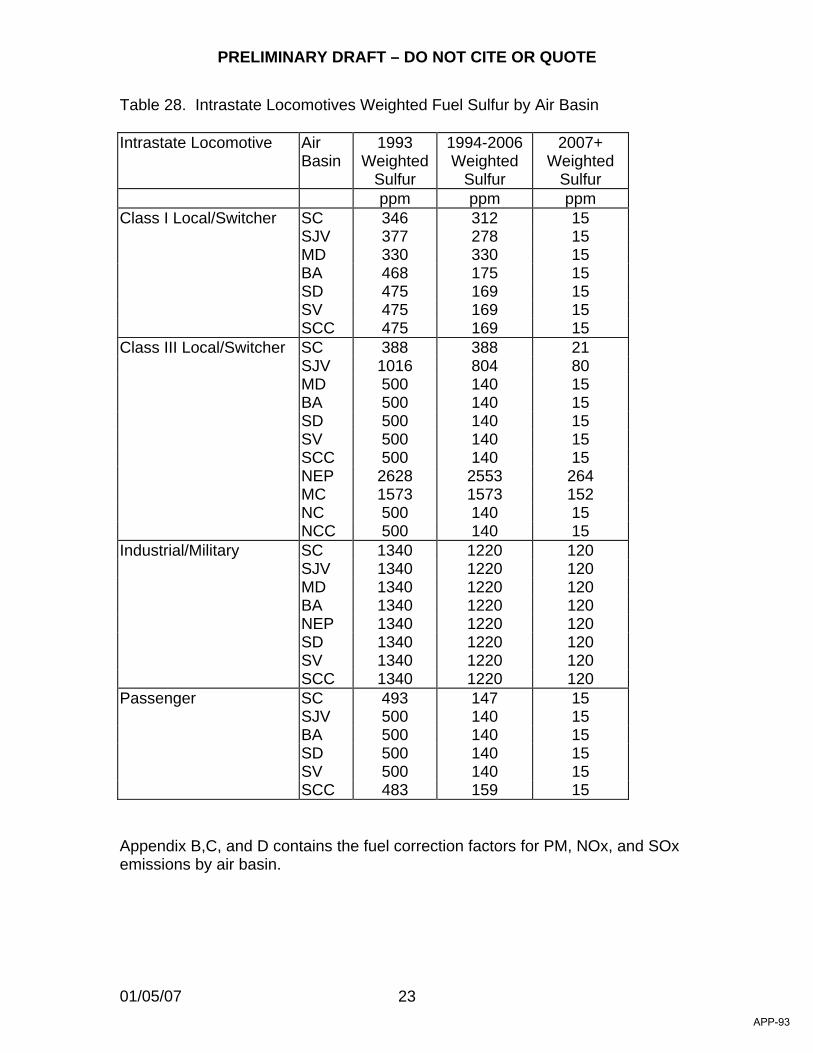
PRELIMINARY DRAFT – DO NOT CITE OR QUOTE
01/05/07 23
Table 28. Intrastate Locomotives Weighted Fuel Sulfur by Air Basin Intrastate Locomotive Air
Basin 1993
Weighted Sulfur
1994-2006 Weighted
Sulfur
2007+ Weighted
Sulfur ppm ppm ppm
Class I Local/Switcher SC 346 312 15 SJV 377 278 15 MD 330 330 15 BA 468 175 15 SD 475 169 15 SV 475 169 15 SCC 475 169 15
Class III Local/Switcher SC 388 388 21 SJV 1016 804 80 MD 500 140 15 BA 500 140 15 SD 500 140 15 SV 500 140 15 SCC 500 140 15 NEP 2628 2553 264 MC 1573 1573 152 NC 500 140 15 NCC 500 140 15
Industrial/Military SC 1340 1220 120 SJV 1340 1220 120 MD 1340 1220 120 BA 1340 1220 120 NEP 1340 1220 120 SD 1340 1220 120 SV 1340 1220 120 SCC 1340 1220 120
Passenger SC 493 147 15 SJV 500 140 15 BA 500 140 15 SD 500 140 15 SV 500 140 15 SCC 483 159 15
Appendix B,C, and D contains the fuel correction factors for PM, NOx, and SOx emissions by air basin.
APP-93
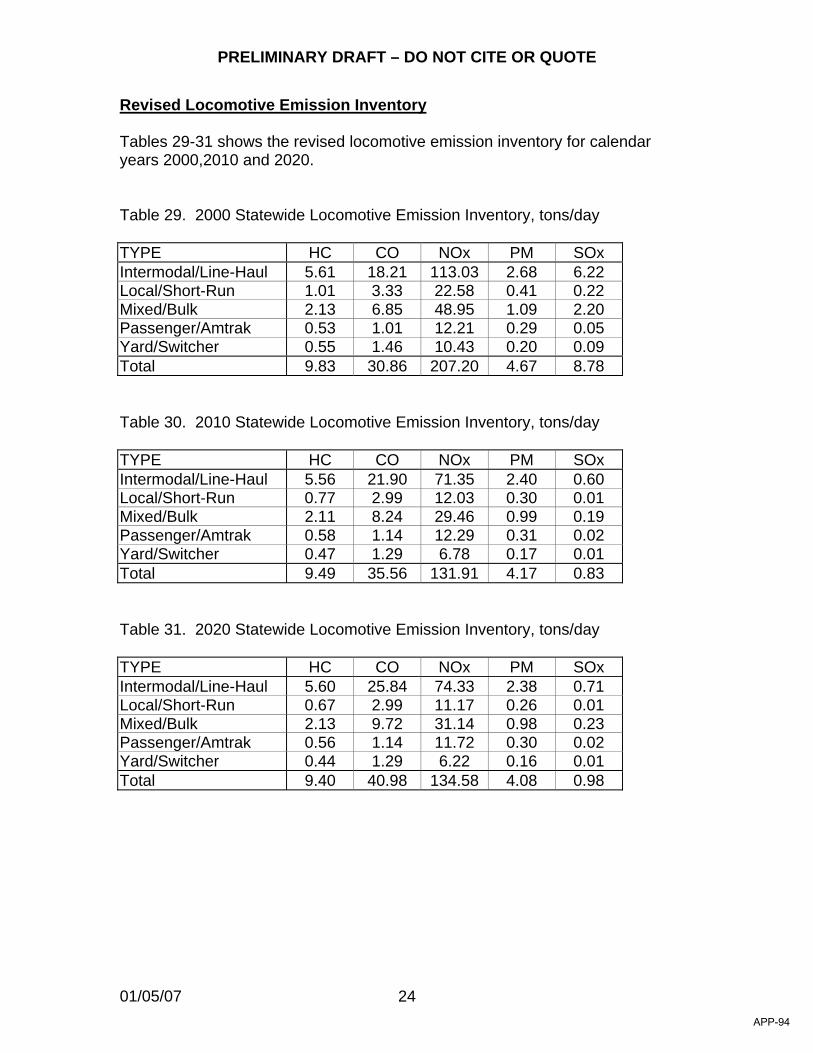
PRELIMINARY DRAFT – DO NOT CITE OR QUOTE
01/05/07 24
Revised Locomotive Emission Inventory Tables 29-31 shows the revised locomotive emission inventory for calendar years 2000,2010 and 2020. Table 29. 2000 Statewide Locomotive Emission Inventory, tons/day TYPE HC CO NOx PM SOx Intermodal/Line-Haul 5.61 18.21 113.03 2.68 6.22 Local/Short-Run 1.01 3.33 22.58 0.41 0.22 Mixed/Bulk 2.13 6.85 48.95 1.09 2.20 Passenger/Amtrak 0.53 1.01 12.21 0.29 0.05 Yard/Switcher 0.55 1.46 10.43 0.20 0.09 Total 9.83 30.86 207.20 4.67 8.78 Table 30. 2010 Statewide Locomotive Emission Inventory, tons/day TYPE HC CO NOx PM SOx Intermodal/Line-Haul 5.56 21.90 71.35 2.40 0.60 Local/Short-Run 0.77 2.99 12.03 0.30 0.01 Mixed/Bulk 2.11 8.24 29.46 0.99 0.19 Passenger/Amtrak 0.58 1.14 12.29 0.31 0.02 Yard/Switcher 0.47 1.29 6.78 0.17 0.01 Total 9.49 35.56 131.91 4.17 0.83 Table 31. 2020 Statewide Locomotive Emission Inventory, tons/day TYPE HC CO NOx PM SOx Intermodal/Line-Haul 5.60 25.84 74.33 2.38 0.71 Local/Short-Run 0.67 2.99 11.17 0.26 0.01 Mixed/Bulk 2.13 9.72 31.14 0.98 0.23 Passenger/Amtrak 0.56 1.14 11.72 0.30 0.02 Yard/Switcher 0.44 1.29 6.22 0.16 0.01 Total 9.40 40.98 134.58 4.08 0.98
APP-94
PRELIMINARY DRAFT – DO NOT CITE OR QUOTE
01/05/07 A- 1
Appendix A
Methodology to Calculate Locomotive Inventory Methodology The methodology and assumptions used for estimating locomotive emissions consists of several steps taken from the Booz-Allen Hamilton’s Locomotive Emission Study report (http://www.arb.ca.gov/app/library/libcc.php). First, emission factor data from various engine manufacturers such as EMD and General Electric (GE) must be gathered to calculate average emission factors for locomotives operated by the railroad companies. Second, train operations data, including throttle position profiles and time spent on various types of operations from different railroad companies needs to be estimated. Finally, the locomotive emission inventory can be calculated using train operations data, emission factors, and throttle position profiles. Step 1 – Average Emission Factors Engine emission factors are required for the different locomotive engines manufactured by the major locomotive suppliers EMD or GE. Emission factors are obtained from testing done by either the engine manufacturers or by Southwest Research Institute, a consulting company that has performed many tests on locomotive engines. Table A-1 lists the available emission factors.
APP-95
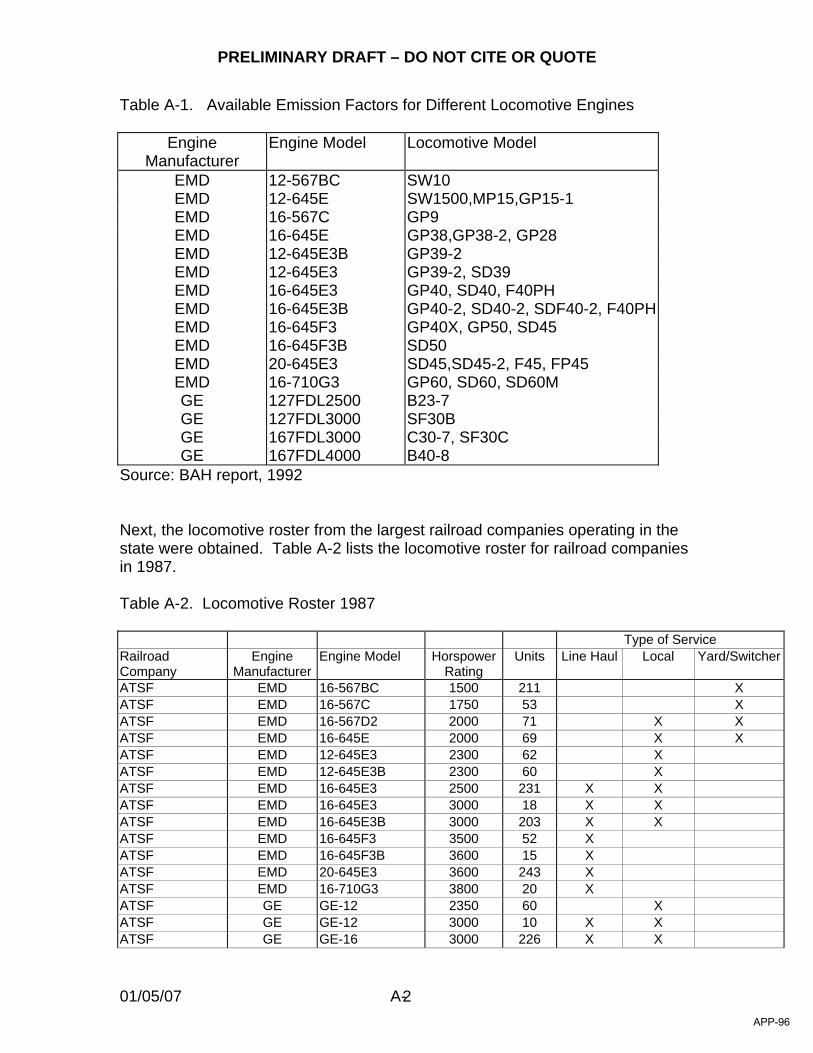
PRELIMINARY DRAFT – DO NOT CITE OR QUOTE
01/05/07 A- 2
Table A-1. Available Emission Factors for Different Locomotive Engines
Engine Manufacturer
Engine Model Locomotive Model
EMD 12-567BC SW10 EMD 12-645E SW1500,MP15,GP15-1 EMD 16-567C GP9 EMD 16-645E GP38,GP38-2, GP28 EMD 12-645E3B GP39-2 EMD 12-645E3 GP39-2, SD39 EMD 16-645E3 GP40, SD40, F40PH EMD 16-645E3B GP40-2, SD40-2, SDF40-2, F40PHEMD 16-645F3 GP40X, GP50, SD45 EMD 16-645F3B SD50 EMD 20-645E3 SD45,SD45-2, F45, FP45 EMD 16-710G3 GP60, SD60, SD60M GE 127FDL2500 B23-7 GE 127FDL3000 SF30B GE 167FDL3000 C30-7, SF30C GE 167FDL4000 B40-8
Source: BAH report, 1992 Next, the locomotive roster from the largest railroad companies operating in the state were obtained. Table A-2 lists the locomotive roster for railroad companies in 1987. Table A-2. Locomotive Roster 1987
Type of Service Railroad Company
Engine Manufacturer
Engine Model Horspower Rating
Units Line Haul Local Yard/Switcher
ATSF EMD 16-567BC 1500 211 X ATSF EMD 16-567C 1750 53 X ATSF EMD 16-567D2 2000 71 X X ATSF EMD 16-645E 2000 69 X X ATSF EMD 12-645E3 2300 62 X ATSF EMD 12-645E3B 2300 60 X ATSF EMD 16-645E3 2500 231 X X ATSF EMD 16-645E3 3000 18 X X ATSF EMD 16-645E3B 3000 203 X X ATSF EMD 16-645F3 3500 52 X ATSF EMD 16-645F3B 3600 15 X ATSF EMD 20-645E3 3600 243 X ATSF EMD 16-710G3 3800 20 X ATSF GE GE-12 2350 60 X ATSF GE GE-12 3000 10 X X ATSF GE GE-16 3000 226 X X
APP-96
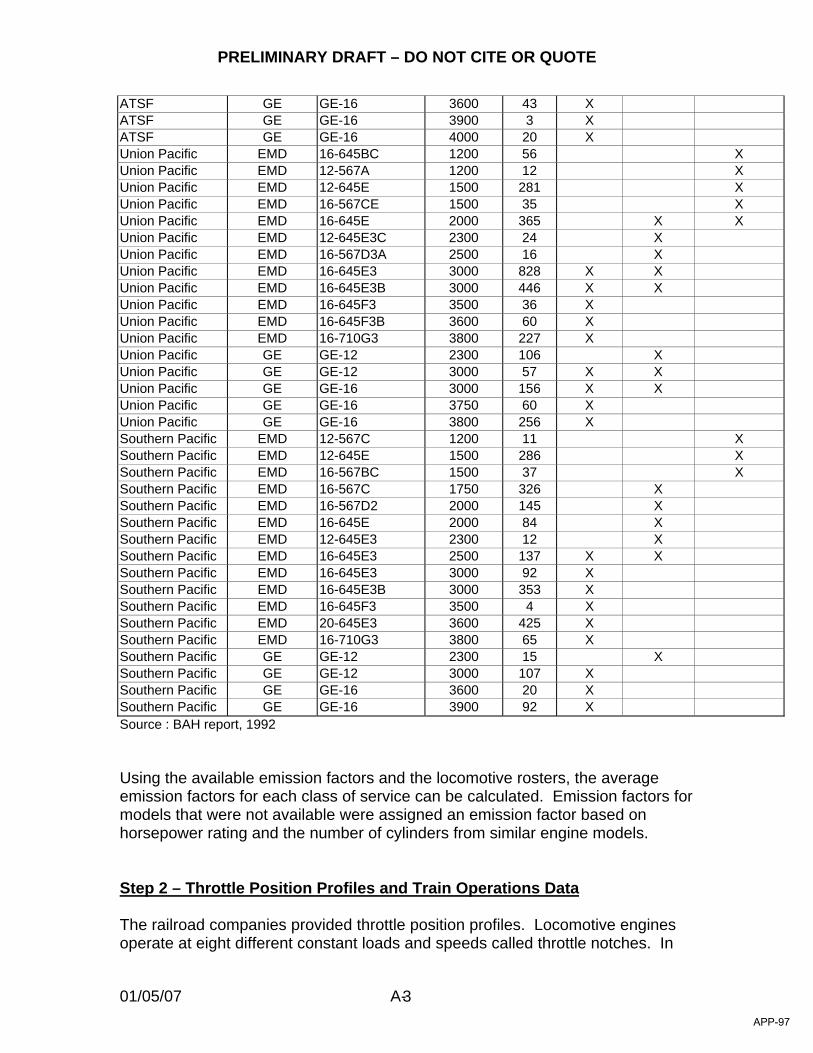
PRELIMINARY DRAFT – DO NOT CITE OR QUOTE
01/05/07 A- 3
ATSF GE GE-16 3600 43 X ATSF GE GE-16 3900 3 X ATSF GE GE-16 4000 20 X Union Pacific EMD 16-645BC 1200 56 X Union Pacific EMD 12-567A 1200 12 X Union Pacific EMD 12-645E 1500 281 X Union Pacific EMD 16-567CE 1500 35 X Union Pacific EMD 16-645E 2000 365 X X Union Pacific EMD 12-645E3C 2300 24 X Union Pacific EMD 16-567D3A 2500 16 X Union Pacific EMD 16-645E3 3000 828 X X Union Pacific EMD 16-645E3B 3000 446 X X Union Pacific EMD 16-645F3 3500 36 X Union Pacific EMD 16-645F3B 3600 60 X Union Pacific EMD 16-710G3 3800 227 X Union Pacific GE GE-12 2300 106 X Union Pacific GE GE-12 3000 57 X X Union Pacific GE GE-16 3000 156 X X Union Pacific GE GE-16 3750 60 X Union Pacific GE GE-16 3800 256 X Southern Pacific EMD 12-567C 1200 11 X Southern Pacific EMD 12-645E 1500 286 X Southern Pacific EMD 16-567BC 1500 37 X Southern Pacific EMD 16-567C 1750 326 X Southern Pacific EMD 16-567D2 2000 145 X Southern Pacific EMD 16-645E 2000 84 X Southern Pacific EMD 12-645E3 2300 12 X Southern Pacific EMD 16-645E3 2500 137 X X Southern Pacific EMD 16-645E3 3000 92 X Southern Pacific EMD 16-645E3B 3000 353 X Southern Pacific EMD 16-645F3 3500 4 X Southern Pacific EMD 20-645E3 3600 425 X Southern Pacific EMD 16-710G3 3800 65 X Southern Pacific GE GE-12 2300 15 X Southern Pacific GE GE-12 3000 107 X Southern Pacific GE GE-16 3600 20 X Southern Pacific GE GE-16 3900 92 X Source : BAH report, 1992 Using the available emission factors and the locomotive rosters, the average emission factors for each class of service can be calculated. Emission factors for models that were not available were assigned an emission factor based on horsepower rating and the number of cylinders from similar engine models. Step 2 – Throttle Position Profiles and Train Operations Data The railroad companies provided throttle position profiles. Locomotive engines operate at eight different constant loads and speeds called throttle notches. In
APP-97
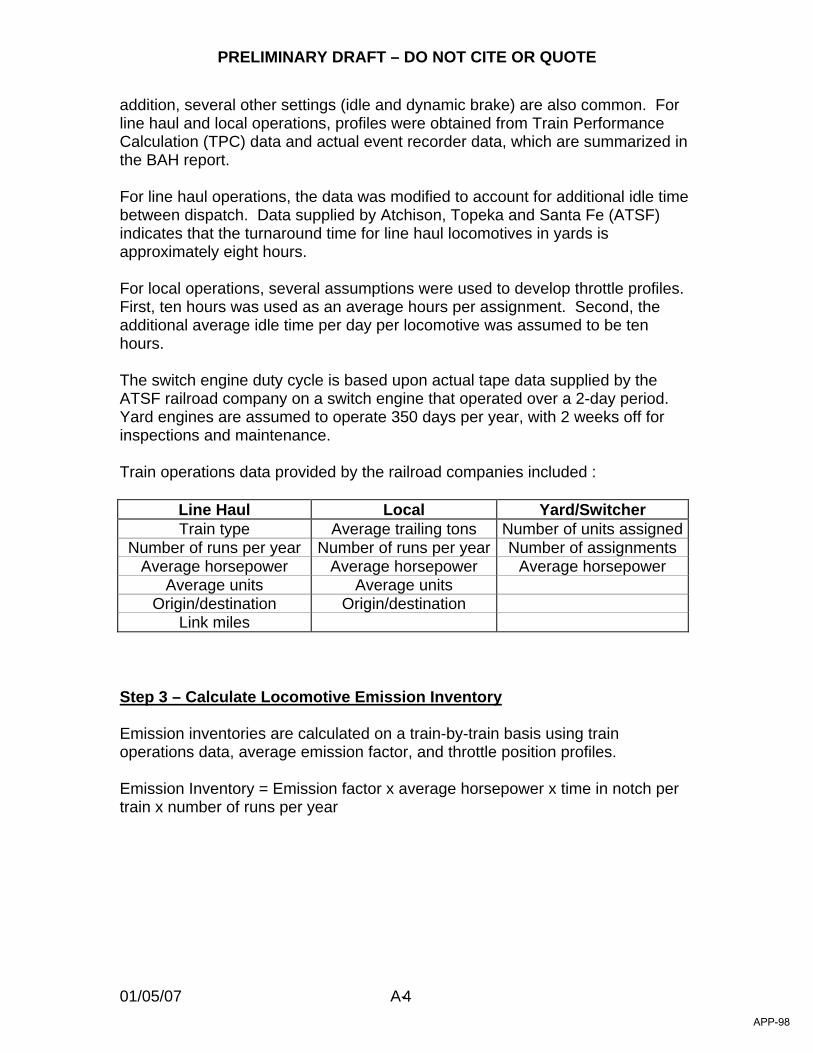
PRELIMINARY DRAFT – DO NOT CITE OR QUOTE
01/05/07 A- 4
addition, several other settings (idle and dynamic brake) are also common. For line haul and local operations, profiles were obtained from Train Performance Calculation (TPC) data and actual event recorder data, which are summarized in the BAH report. For line haul operations, the data was modified to account for additional idle time between dispatch. Data supplied by Atchison, Topeka and Santa Fe (ATSF) indicates that the turnaround time for line haul locomotives in yards is approximately eight hours. For local operations, several assumptions were used to develop throttle profiles. First, ten hours was used as an average hours per assignment. Second, the additional average idle time per day per locomotive was assumed to be ten hours. The switch engine duty cycle is based upon actual tape data supplied by the ATSF railroad company on a switch engine that operated over a 2-day period. Yard engines are assumed to operate 350 days per year, with 2 weeks off for inspections and maintenance. Train operations data provided by the railroad companies included :
Line Haul Local Yard/Switcher Train type Average trailing tons Number of units assigned
Number of runs per year Number of runs per year Number of assignments Average horsepower Average horsepower Average horsepower
Average units Average units Origin/destination Origin/destination
Link miles Step 3 – Calculate Locomotive Emission Inventory Emission inventories are calculated on a train-by-train basis using train operations data, average emission factor, and throttle position profiles. Emission Inventory = Emission factor x average horsepower x time in notch per train x number of runs per year
APP-98
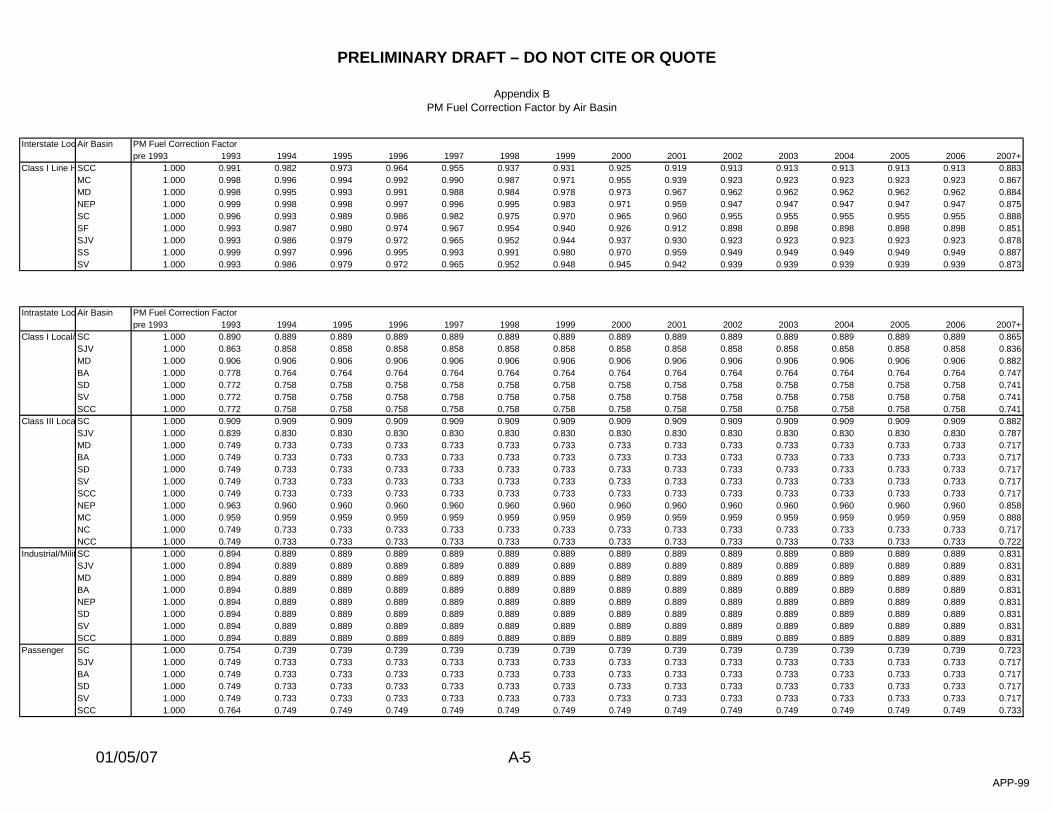
PRELIMINARY DRAFT – DO NOT CITE OR QUOTE
01/05/07 A- 5
Interstate Loc Air Basin PM Fuel Correction Factorpre 1993 1993 1994 1995 1996 1997 1998 1999 2000 2001 2002 2003 2004 2005 2006 2007+
Class I Line HSCC 1.000 0.991 0.982 0.973 0.964 0.955 0.937 0.931 0.925 0.919 0.913 0.913 0.913 0.913 0.913 0.883MC 1.000 0.998 0.996 0.994 0.992 0.990 0.987 0.971 0.955 0.939 0.923 0.923 0.923 0.923 0.923 0.867MD 1.000 0.998 0.995 0.993 0.991 0.988 0.984 0.978 0.973 0.967 0.962 0.962 0.962 0.962 0.962 0.884NEP 1.000 0.999 0.998 0.998 0.997 0.996 0.995 0.983 0.971 0.959 0.947 0.947 0.947 0.947 0.947 0.875SC 1.000 0.996 0.993 0.989 0.986 0.982 0.975 0.970 0.965 0.960 0.955 0.955 0.955 0.955 0.955 0.888SF 1.000 0.993 0.987 0.980 0.974 0.967 0.954 0.940 0.926 0.912 0.898 0.898 0.898 0.898 0.898 0.851SJV 1.000 0.993 0.986 0.979 0.972 0.965 0.952 0.944 0.937 0.930 0.923 0.923 0.923 0.923 0.923 0.878SS 1.000 0.999 0.997 0.996 0.995 0.993 0.991 0.980 0.970 0.959 0.949 0.949 0.949 0.949 0.949 0.887SV 1.000 0.993 0.986 0.979 0.972 0.965 0.952 0.948 0.945 0.942 0.939 0.939 0.939 0.939 0.939 0.873
Intrastate Loc Air Basin PM Fuel Correction Factorpre 1993 1993 1994 1995 1996 1997 1998 1999 2000 2001 2002 2003 2004 2005 2006 2007+
Class I Local/ SC 1.000 0.890 0.889 0.889 0.889 0.889 0.889 0.889 0.889 0.889 0.889 0.889 0.889 0.889 0.889 0.865SJV 1.000 0.863 0.858 0.858 0.858 0.858 0.858 0.858 0.858 0.858 0.858 0.858 0.858 0.858 0.858 0.836MD 1.000 0.906 0.906 0.906 0.906 0.906 0.906 0.906 0.906 0.906 0.906 0.906 0.906 0.906 0.906 0.882BA 1.000 0.778 0.764 0.764 0.764 0.764 0.764 0.764 0.764 0.764 0.764 0.764 0.764 0.764 0.764 0.747SD 1.000 0.772 0.758 0.758 0.758 0.758 0.758 0.758 0.758 0.758 0.758 0.758 0.758 0.758 0.758 0.741SV 1.000 0.772 0.758 0.758 0.758 0.758 0.758 0.758 0.758 0.758 0.758 0.758 0.758 0.758 0.758 0.741SCC 1.000 0.772 0.758 0.758 0.758 0.758 0.758 0.758 0.758 0.758 0.758 0.758 0.758 0.758 0.758 0.741
Class III Loca SC 1.000 0.909 0.909 0.909 0.909 0.909 0.909 0.909 0.909 0.909 0.909 0.909 0.909 0.909 0.909 0.882SJV 1.000 0.839 0.830 0.830 0.830 0.830 0.830 0.830 0.830 0.830 0.830 0.830 0.830 0.830 0.830 0.787MD 1.000 0.749 0.733 0.733 0.733 0.733 0.733 0.733 0.733 0.733 0.733 0.733 0.733 0.733 0.733 0.717BA 1.000 0.749 0.733 0.733 0.733 0.733 0.733 0.733 0.733 0.733 0.733 0.733 0.733 0.733 0.733 0.717SD 1.000 0.749 0.733 0.733 0.733 0.733 0.733 0.733 0.733 0.733 0.733 0.733 0.733 0.733 0.733 0.717SV 1.000 0.749 0.733 0.733 0.733 0.733 0.733 0.733 0.733 0.733 0.733 0.733 0.733 0.733 0.733 0.717SCC 1.000 0.749 0.733 0.733 0.733 0.733 0.733 0.733 0.733 0.733 0.733 0.733 0.733 0.733 0.733 0.717NEP 1.000 0.963 0.960 0.960 0.960 0.960 0.960 0.960 0.960 0.960 0.960 0.960 0.960 0.960 0.960 0.858MC 1.000 0.959 0.959 0.959 0.959 0.959 0.959 0.959 0.959 0.959 0.959 0.959 0.959 0.959 0.959 0.888NC 1.000 0.749 0.733 0.733 0.733 0.733 0.733 0.733 0.733 0.733 0.733 0.733 0.733 0.733 0.733 0.717NCC 1.000 0.749 0.733 0.733 0.733 0.733 0.733 0.733 0.733 0.733 0.733 0.733 0.733 0.733 0.733 0.722
Industrial/Milit SC 1.000 0.894 0.889 0.889 0.889 0.889 0.889 0.889 0.889 0.889 0.889 0.889 0.889 0.889 0.889 0.831SJV 1.000 0.894 0.889 0.889 0.889 0.889 0.889 0.889 0.889 0.889 0.889 0.889 0.889 0.889 0.889 0.831MD 1.000 0.894 0.889 0.889 0.889 0.889 0.889 0.889 0.889 0.889 0.889 0.889 0.889 0.889 0.889 0.831BA 1.000 0.894 0.889 0.889 0.889 0.889 0.889 0.889 0.889 0.889 0.889 0.889 0.889 0.889 0.889 0.831NEP 1.000 0.894 0.889 0.889 0.889 0.889 0.889 0.889 0.889 0.889 0.889 0.889 0.889 0.889 0.889 0.831SD 1.000 0.894 0.889 0.889 0.889 0.889 0.889 0.889 0.889 0.889 0.889 0.889 0.889 0.889 0.889 0.831SV 1.000 0.894 0.889 0.889 0.889 0.889 0.889 0.889 0.889 0.889 0.889 0.889 0.889 0.889 0.889 0.831SCC 1.000 0.894 0.889 0.889 0.889 0.889 0.889 0.889 0.889 0.889 0.889 0.889 0.889 0.889 0.889 0.831
Passenger SC 1.000 0.754 0.739 0.739 0.739 0.739 0.739 0.739 0.739 0.739 0.739 0.739 0.739 0.739 0.739 0.723SJV 1.000 0.749 0.733 0.733 0.733 0.733 0.733 0.733 0.733 0.733 0.733 0.733 0.733 0.733 0.733 0.717BA 1.000 0.749 0.733 0.733 0.733 0.733 0.733 0.733 0.733 0.733 0.733 0.733 0.733 0.733 0.733 0.717SD 1.000 0.749 0.733 0.733 0.733 0.733 0.733 0.733 0.733 0.733 0.733 0.733 0.733 0.733 0.733 0.717SV 1.000 0.749 0.733 0.733 0.733 0.733 0.733 0.733 0.733 0.733 0.733 0.733 0.733 0.733 0.733 0.717SCC 1.000 0.764 0.749 0.749 0.749 0.749 0.749 0.749 0.749 0.749 0.749 0.749 0.749 0.749 0.749 0.733
Appendix BPM Fuel Correction Factor by Air Basin
APP-99
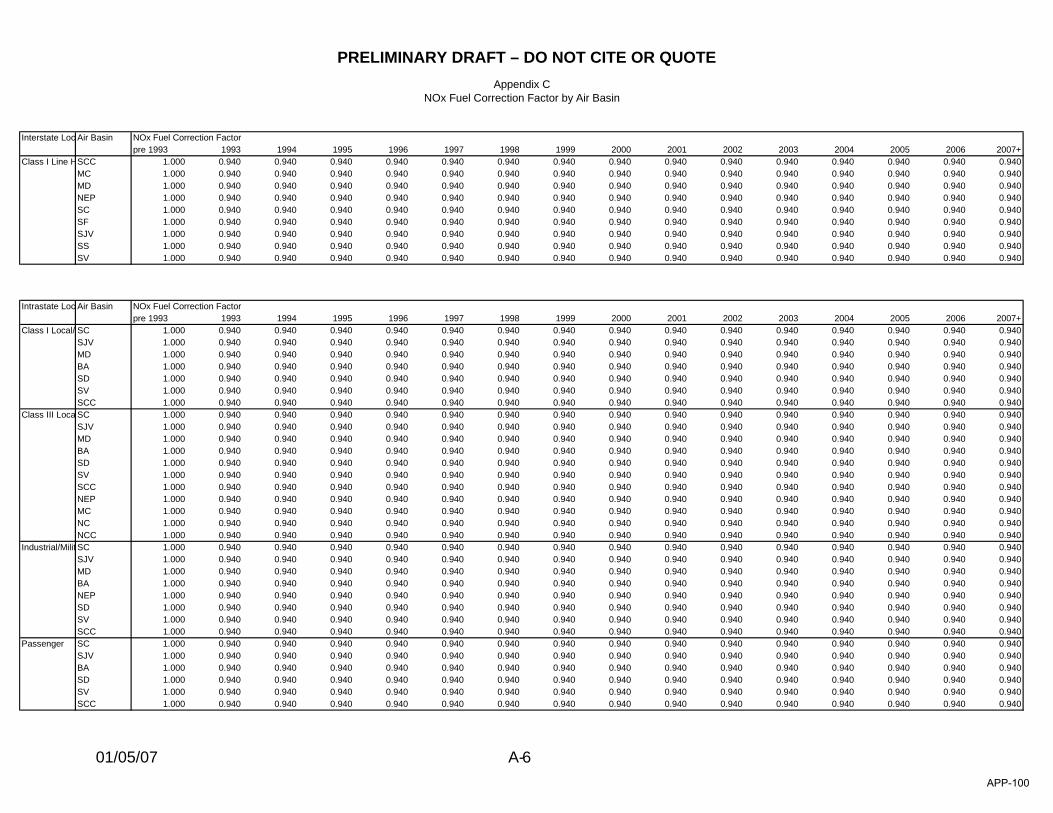
PRELIMINARY DRAFT – DO NOT CITE OR QUOTE
01/05/07 A- 6
Interstate Loc Air Basin NOx Fuel Correction Factorpre 1993 1993 1994 1995 1996 1997 1998 1999 2000 2001 2002 2003 2004 2005 2006 2007+
Class I Line HSCC 1.000 0.940 0.940 0.940 0.940 0.940 0.940 0.940 0.940 0.940 0.940 0.940 0.940 0.940 0.940 0.940MC 1.000 0.940 0.940 0.940 0.940 0.940 0.940 0.940 0.940 0.940 0.940 0.940 0.940 0.940 0.940 0.940MD 1.000 0.940 0.940 0.940 0.940 0.940 0.940 0.940 0.940 0.940 0.940 0.940 0.940 0.940 0.940 0.940NEP 1.000 0.940 0.940 0.940 0.940 0.940 0.940 0.940 0.940 0.940 0.940 0.940 0.940 0.940 0.940 0.940SC 1.000 0.940 0.940 0.940 0.940 0.940 0.940 0.940 0.940 0.940 0.940 0.940 0.940 0.940 0.940 0.940SF 1.000 0.940 0.940 0.940 0.940 0.940 0.940 0.940 0.940 0.940 0.940 0.940 0.940 0.940 0.940 0.940SJV 1.000 0.940 0.940 0.940 0.940 0.940 0.940 0.940 0.940 0.940 0.940 0.940 0.940 0.940 0.940 0.940SS 1.000 0.940 0.940 0.940 0.940 0.940 0.940 0.940 0.940 0.940 0.940 0.940 0.940 0.940 0.940 0.940SV 1.000 0.940 0.940 0.940 0.940 0.940 0.940 0.940 0.940 0.940 0.940 0.940 0.940 0.940 0.940 0.940
Intrastate Loc Air Basin NOx Fuel Correction Factorpre 1993 1993 1994 1995 1996 1997 1998 1999 2000 2001 2002 2003 2004 2005 2006 2007+
Class I Local/ SC 1.000 0.940 0.940 0.940 0.940 0.940 0.940 0.940 0.940 0.940 0.940 0.940 0.940 0.940 0.940 0.940SJV 1.000 0.940 0.940 0.940 0.940 0.940 0.940 0.940 0.940 0.940 0.940 0.940 0.940 0.940 0.940 0.940MD 1.000 0.940 0.940 0.940 0.940 0.940 0.940 0.940 0.940 0.940 0.940 0.940 0.940 0.940 0.940 0.940BA 1.000 0.940 0.940 0.940 0.940 0.940 0.940 0.940 0.940 0.940 0.940 0.940 0.940 0.940 0.940 0.940SD 1.000 0.940 0.940 0.940 0.940 0.940 0.940 0.940 0.940 0.940 0.940 0.940 0.940 0.940 0.940 0.940SV 1.000 0.940 0.940 0.940 0.940 0.940 0.940 0.940 0.940 0.940 0.940 0.940 0.940 0.940 0.940 0.940SCC 1.000 0.940 0.940 0.940 0.940 0.940 0.940 0.940 0.940 0.940 0.940 0.940 0.940 0.940 0.940 0.940
Class III Loca SC 1.000 0.940 0.940 0.940 0.940 0.940 0.940 0.940 0.940 0.940 0.940 0.940 0.940 0.940 0.940 0.940SJV 1.000 0.940 0.940 0.940 0.940 0.940 0.940 0.940 0.940 0.940 0.940 0.940 0.940 0.940 0.940 0.940MD 1.000 0.940 0.940 0.940 0.940 0.940 0.940 0.940 0.940 0.940 0.940 0.940 0.940 0.940 0.940 0.940BA 1.000 0.940 0.940 0.940 0.940 0.940 0.940 0.940 0.940 0.940 0.940 0.940 0.940 0.940 0.940 0.940SD 1.000 0.940 0.940 0.940 0.940 0.940 0.940 0.940 0.940 0.940 0.940 0.940 0.940 0.940 0.940 0.940SV 1.000 0.940 0.940 0.940 0.940 0.940 0.940 0.940 0.940 0.940 0.940 0.940 0.940 0.940 0.940 0.940SCC 1.000 0.940 0.940 0.940 0.940 0.940 0.940 0.940 0.940 0.940 0.940 0.940 0.940 0.940 0.940 0.940NEP 1.000 0.940 0.940 0.940 0.940 0.940 0.940 0.940 0.940 0.940 0.940 0.940 0.940 0.940 0.940 0.940MC 1.000 0.940 0.940 0.940 0.940 0.940 0.940 0.940 0.940 0.940 0.940 0.940 0.940 0.940 0.940 0.940NC 1.000 0.940 0.940 0.940 0.940 0.940 0.940 0.940 0.940 0.940 0.940 0.940 0.940 0.940 0.940 0.940NCC 1.000 0.940 0.940 0.940 0.940 0.940 0.940 0.940 0.940 0.940 0.940 0.940 0.940 0.940 0.940 0.940
Industrial/Milit SC 1.000 0.940 0.940 0.940 0.940 0.940 0.940 0.940 0.940 0.940 0.940 0.940 0.940 0.940 0.940 0.940SJV 1.000 0.940 0.940 0.940 0.940 0.940 0.940 0.940 0.940 0.940 0.940 0.940 0.940 0.940 0.940 0.940MD 1.000 0.940 0.940 0.940 0.940 0.940 0.940 0.940 0.940 0.940 0.940 0.940 0.940 0.940 0.940 0.940BA 1.000 0.940 0.940 0.940 0.940 0.940 0.940 0.940 0.940 0.940 0.940 0.940 0.940 0.940 0.940 0.940NEP 1.000 0.940 0.940 0.940 0.940 0.940 0.940 0.940 0.940 0.940 0.940 0.940 0.940 0.940 0.940 0.940SD 1.000 0.940 0.940 0.940 0.940 0.940 0.940 0.940 0.940 0.940 0.940 0.940 0.940 0.940 0.940 0.940SV 1.000 0.940 0.940 0.940 0.940 0.940 0.940 0.940 0.940 0.940 0.940 0.940 0.940 0.940 0.940 0.940SCC 1.000 0.940 0.940 0.940 0.940 0.940 0.940 0.940 0.940 0.940 0.940 0.940 0.940 0.940 0.940 0.940
Passenger SC 1.000 0.940 0.940 0.940 0.940 0.940 0.940 0.940 0.940 0.940 0.940 0.940 0.940 0.940 0.940 0.940SJV 1.000 0.940 0.940 0.940 0.940 0.940 0.940 0.940 0.940 0.940 0.940 0.940 0.940 0.940 0.940 0.940BA 1.000 0.940 0.940 0.940 0.940 0.940 0.940 0.940 0.940 0.940 0.940 0.940 0.940 0.940 0.940 0.940SD 1.000 0.940 0.940 0.940 0.940 0.940 0.940 0.940 0.940 0.940 0.940 0.940 0.940 0.940 0.940 0.940SV 1.000 0.940 0.940 0.940 0.940 0.940 0.940 0.940 0.940 0.940 0.940 0.940 0.940 0.940 0.940 0.940SCC 1.000 0.940 0.940 0.940 0.940 0.940 0.940 0.940 0.940 0.940 0.940 0.940 0.940 0.940 0.940 0.940
Appendix CNOx Fuel Correction Factor by Air Basin
APP-100
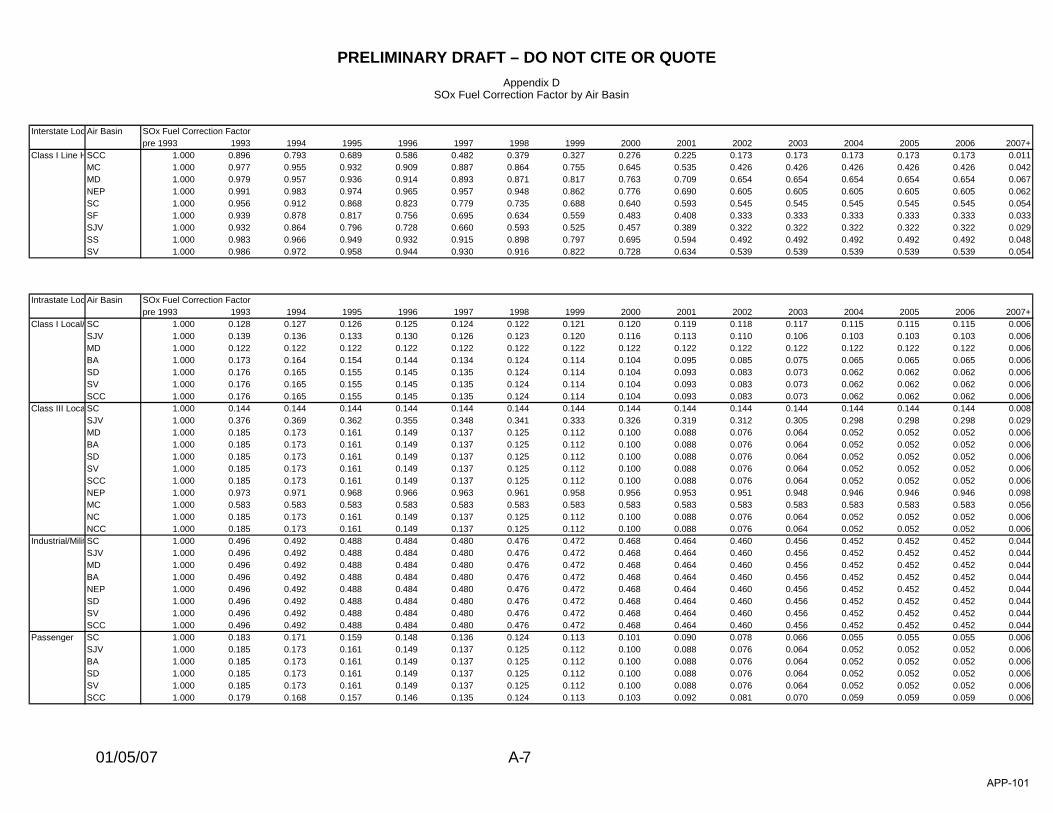
PRELIMINARY DRAFT – DO NOT CITE OR QUOTE
01/05/07 A- 7
Interstate Loc Air Basin SOx Fuel Correction Factorpre 1993 1993 1994 1995 1996 1997 1998 1999 2000 2001 2002 2003 2004 2005 2006 2007+
Class I Line HSCC 1.000 0.896 0.793 0.689 0.586 0.482 0.379 0.327 0.276 0.225 0.173 0.173 0.173 0.173 0.173 0.011MC 1.000 0.977 0.955 0.932 0.909 0.887 0.864 0.755 0.645 0.535 0.426 0.426 0.426 0.426 0.426 0.042MD 1.000 0.979 0.957 0.936 0.914 0.893 0.871 0.817 0.763 0.709 0.654 0.654 0.654 0.654 0.654 0.067NEP 1.000 0.991 0.983 0.974 0.965 0.957 0.948 0.862 0.776 0.690 0.605 0.605 0.605 0.605 0.605 0.062SC 1.000 0.956 0.912 0.868 0.823 0.779 0.735 0.688 0.640 0.593 0.545 0.545 0.545 0.545 0.545 0.054SF 1.000 0.939 0.878 0.817 0.756 0.695 0.634 0.559 0.483 0.408 0.333 0.333 0.333 0.333 0.333 0.033SJV 1.000 0.932 0.864 0.796 0.728 0.660 0.593 0.525 0.457 0.389 0.322 0.322 0.322 0.322 0.322 0.029SS 1.000 0.983 0.966 0.949 0.932 0.915 0.898 0.797 0.695 0.594 0.492 0.492 0.492 0.492 0.492 0.048SV 1.000 0.986 0.972 0.958 0.944 0.930 0.916 0.822 0.728 0.634 0.539 0.539 0.539 0.539 0.539 0.054
Intrastate Loc Air Basin SOx Fuel Correction Factorpre 1993 1993 1994 1995 1996 1997 1998 1999 2000 2001 2002 2003 2004 2005 2006 2007+
Class I Local/ SC 1.000 0.128 0.127 0.126 0.125 0.124 0.122 0.121 0.120 0.119 0.118 0.117 0.115 0.115 0.115 0.006SJV 1.000 0.139 0.136 0.133 0.130 0.126 0.123 0.120 0.116 0.113 0.110 0.106 0.103 0.103 0.103 0.006MD 1.000 0.122 0.122 0.122 0.122 0.122 0.122 0.122 0.122 0.122 0.122 0.122 0.122 0.122 0.122 0.006BA 1.000 0.173 0.164 0.154 0.144 0.134 0.124 0.114 0.104 0.095 0.085 0.075 0.065 0.065 0.065 0.006SD 1.000 0.176 0.165 0.155 0.145 0.135 0.124 0.114 0.104 0.093 0.083 0.073 0.062 0.062 0.062 0.006SV 1.000 0.176 0.165 0.155 0.145 0.135 0.124 0.114 0.104 0.093 0.083 0.073 0.062 0.062 0.062 0.006SCC 1.000 0.176 0.165 0.155 0.145 0.135 0.124 0.114 0.104 0.093 0.083 0.073 0.062 0.062 0.062 0.006
Class III Loca SC 1.000 0.144 0.144 0.144 0.144 0.144 0.144 0.144 0.144 0.144 0.144 0.144 0.144 0.144 0.144 0.008SJV 1.000 0.376 0.369 0.362 0.355 0.348 0.341 0.333 0.326 0.319 0.312 0.305 0.298 0.298 0.298 0.029MD 1.000 0.185 0.173 0.161 0.149 0.137 0.125 0.112 0.100 0.088 0.076 0.064 0.052 0.052 0.052 0.006BA 1.000 0.185 0.173 0.161 0.149 0.137 0.125 0.112 0.100 0.088 0.076 0.064 0.052 0.052 0.052 0.006SD 1.000 0.185 0.173 0.161 0.149 0.137 0.125 0.112 0.100 0.088 0.076 0.064 0.052 0.052 0.052 0.006SV 1.000 0.185 0.173 0.161 0.149 0.137 0.125 0.112 0.100 0.088 0.076 0.064 0.052 0.052 0.052 0.006SCC 1.000 0.185 0.173 0.161 0.149 0.137 0.125 0.112 0.100 0.088 0.076 0.064 0.052 0.052 0.052 0.006NEP 1.000 0.973 0.971 0.968 0.966 0.963 0.961 0.958 0.956 0.953 0.951 0.948 0.946 0.946 0.946 0.098MC 1.000 0.583 0.583 0.583 0.583 0.583 0.583 0.583 0.583 0.583 0.583 0.583 0.583 0.583 0.583 0.056NC 1.000 0.185 0.173 0.161 0.149 0.137 0.125 0.112 0.100 0.088 0.076 0.064 0.052 0.052 0.052 0.006NCC 1.000 0.185 0.173 0.161 0.149 0.137 0.125 0.112 0.100 0.088 0.076 0.064 0.052 0.052 0.052 0.006
Industrial/Milit SC 1.000 0.496 0.492 0.488 0.484 0.480 0.476 0.472 0.468 0.464 0.460 0.456 0.452 0.452 0.452 0.044SJV 1.000 0.496 0.492 0.488 0.484 0.480 0.476 0.472 0.468 0.464 0.460 0.456 0.452 0.452 0.452 0.044MD 1.000 0.496 0.492 0.488 0.484 0.480 0.476 0.472 0.468 0.464 0.460 0.456 0.452 0.452 0.452 0.044BA 1.000 0.496 0.492 0.488 0.484 0.480 0.476 0.472 0.468 0.464 0.460 0.456 0.452 0.452 0.452 0.044NEP 1.000 0.496 0.492 0.488 0.484 0.480 0.476 0.472 0.468 0.464 0.460 0.456 0.452 0.452 0.452 0.044SD 1.000 0.496 0.492 0.488 0.484 0.480 0.476 0.472 0.468 0.464 0.460 0.456 0.452 0.452 0.452 0.044SV 1.000 0.496 0.492 0.488 0.484 0.480 0.476 0.472 0.468 0.464 0.460 0.456 0.452 0.452 0.452 0.044SCC 1.000 0.496 0.492 0.488 0.484 0.480 0.476 0.472 0.468 0.464 0.460 0.456 0.452 0.452 0.452 0.044
Passenger SC 1.000 0.183 0.171 0.159 0.148 0.136 0.124 0.113 0.101 0.090 0.078 0.066 0.055 0.055 0.055 0.006SJV 1.000 0.185 0.173 0.161 0.149 0.137 0.125 0.112 0.100 0.088 0.076 0.064 0.052 0.052 0.052 0.006BA 1.000 0.185 0.173 0.161 0.149 0.137 0.125 0.112 0.100 0.088 0.076 0.064 0.052 0.052 0.052 0.006SD 1.000 0.185 0.173 0.161 0.149 0.137 0.125 0.112 0.100 0.088 0.076 0.064 0.052 0.052 0.052 0.006SV 1.000 0.185 0.173 0.161 0.149 0.137 0.125 0.112 0.100 0.088 0.076 0.064 0.052 0.052 0.052 0.006SCC 1.000 0.179 0.168 0.157 0.146 0.135 0.124 0.113 0.103 0.092 0.081 0.070 0.059 0.059 0.059 0.006
Appendix DSOx Fuel Correction Factor by Air Basin
APP-101

APPENDIX A-8
DEATILED EMISSION CALCULATIONS, FOR OFFSITE LOCOMOTIVE EMISSIONS
APP-102
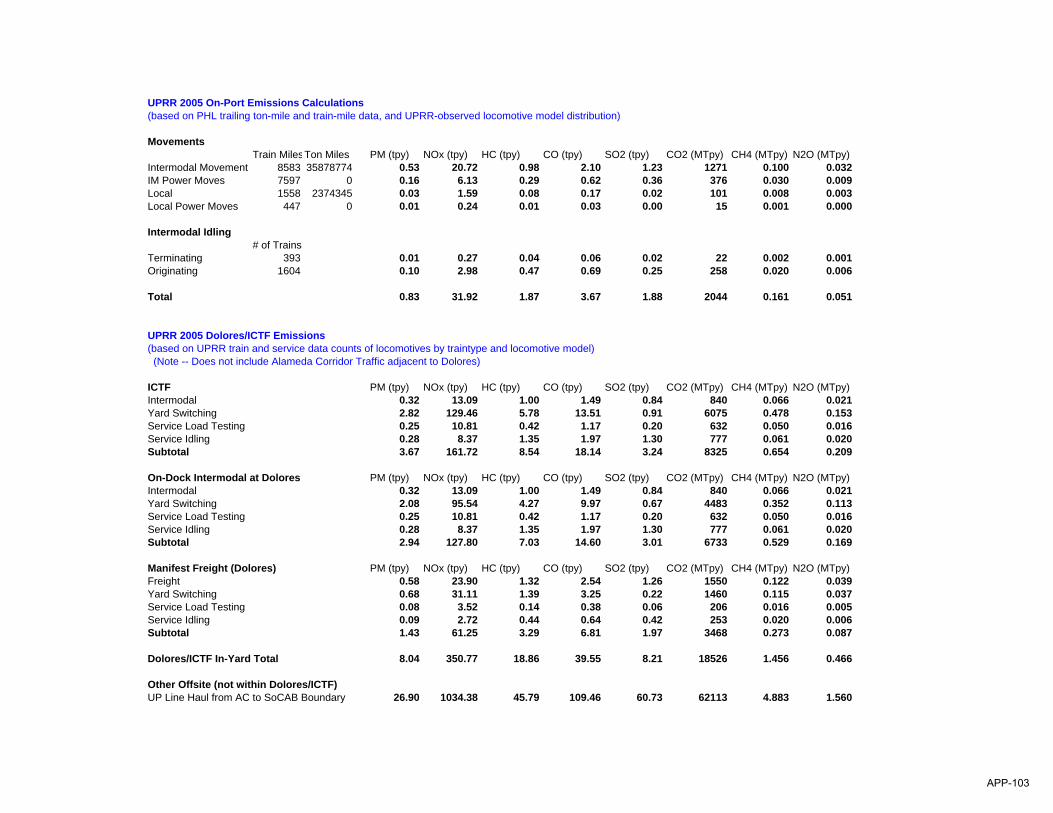
UPRR 2005 On-Port Emissions Calculations (based on PHL trailing ton-mile and train-mile data, and UPRR-observed locomotive model distribution)
MovementsTrain MilesTon Miles PM (tpy) NOx (tpy) HC (tpy) CO (tpy) SO2 (tpy) CO2 (MTpy) CH4 (MTpy) N2O (MTpy)
Intermodal Movement 8583 35878774 0.53 20.72 0.98 2.10 1.23 1271 0.100 0.032IM Power Moves 7597 0 0.16 6.13 0.29 0.62 0.36 376 0.030 0.009Local 1558 2374345 0.03 1.59 0.08 0.17 0.02 101 0.008 0.003Local Power Moves 447 0 0.01 0.24 0.01 0.03 0.00 15 0.001 0.000
Intermodal Idling# of Trains
Terminating 393 0.01 0.27 0.04 0.06 0.02 22 0.002 0.001Originating 1604 0.10 2.98 0.47 0.69 0.25 258 0.020 0.006
Total 0.83 31.92 1.87 3.67 1.88 2044 0.161 0.051
UPRR 2005 Dolores/ICTF Emissions (based on UPRR train and service data counts of locomotives by traintype and locomotive model) (Note -- Does not include Alameda Corridor Traffic adjacent to Dolores)
ICTF PM (tpy) NOx (tpy) HC (tpy) CO (tpy) SO2 (tpy) CO2 (MTpy) CH4 (MTpy) N2O (MTpy)Intermodal 0.32 13.09 1.00 1.49 0.84 840 0.066 0.021Yard Switching 2.82 129.46 5.78 13.51 0.91 6075 0.478 0.153Service Load Testing 0.25 10.81 0.42 1.17 0.20 632 0.050 0.016Service Idling 0.28 8.37 1.35 1.97 1.30 777 0.061 0.020Subtotal 3.67 161.72 8.54 18.14 3.24 8325 0.654 0.209
On-Dock Intermodal at Dolores PM (tpy) NOx (tpy) HC (tpy) CO (tpy) SO2 (tpy) CO2 (MTpy) CH4 (MTpy) N2O (MTpy)Intermodal 0.32 13.09 1.00 1.49 0.84 840 0.066 0.021Yard Switching 2.08 95.54 4.27 9.97 0.67 4483 0.352 0.113Service Load Testing 0.25 10.81 0.42 1.17 0.20 632 0.050 0.016Service Idling 0.28 8.37 1.35 1.97 1.30 777 0.061 0.020Subtotal 2.94 127.80 7.03 14.60 3.01 6733 0.529 0.169
Manifest Freight (Dolores) PM (tpy) NOx (tpy) HC (tpy) CO (tpy) SO2 (tpy) CO2 (MTpy) CH4 (MTpy) N2O (MTpy)Freight 0.58 23.90 1.32 2.54 1.26 1550 0.122 0.039Yard Switching 0.68 31.11 1.39 3.25 0.22 1460 0.115 0.037Service Load Testing 0.08 3.52 0.14 0.38 0.06 206 0.016 0.005Service Idling 0.09 2.72 0.44 0.64 0.42 253 0.020 0.006Subtotal 1.43 61.25 3.29 6.81 1.97 3468 0.273 0.087
Dolores/ICTF In-Yard Total 8.04 350.77 18.86 39.55 8.21 18526 1.456 0.466
Other Offsite (not within Dolores/ICTF)UP Line Haul from AC to SoCAB Boundary 26.90 1034.38 45.79 109.46 60.73 62113 4.883 1.560
APP-103

UPRR 2005 Line-Haul Off-Port Emissions Calculations (based on UPRR MGT data, emission factors for 2005 UPRR intermodal fleet distribution, and EPA line-haul duty cycle)(GHG emissions based on UPRR fuel consumption and CARB emission factors)
Entry/Exit Point from SoCAB Yuma Cajon Palmdale CoastFraction of Port Traffic 78.6% 17.8% 3.5% 0.1% 100%Distance from Port to Exit Point (add 3.9 mi. to ICTF number) 103.1 101.6 72.9 57.9Distance from ICTF to Exit Point 99.2 97.7 69.0 54.0
UPRR Only -- Does not include BNSF MGT-MilesMGT originating and terminating in Port terminals 11.00 891 199 28 1MGT originating and terminating at Dolores/ICTF 36.83 2872 641 89 2
Total Port-Related Off Port MGT-Miles in Basin 4722
2005 HCFuel C-Rate Gal/Ton Mile 0.001296
Emission factor using EPA line-haul duty cycle and HC Emfac (g/gal) 6.792005 UPRR ICTF/Port intermodal lcomotive fleet Total Port-Related Off Port Emissions in Basin 41537933 g/yr
45.79 TPY
2005 COFuel C-Rate Gal/Ton Mile 0.001296
Emission factor using EPA line-haul duty cycle and CO Emfac (g/gal) 16.232005 UPRR ICTF/Port intermodal lcomotive fleet Total Port-Related Off Port Emissions in Basin 99302388 g/yr
109.46 TPY
2005 NOxFuel C-Rate Gal/Ton Mile 0.001296
Emission factor using EPA line-haul duty cycle and NOx Emfac (g/gal) 153.342005 UPRR ICTF/Port intermodal lcomotive fleet Total Port-Related Off Port Emissions in Basin 938392975 g/yr
1034.38 TPY
2005 PMFuel C-Rate Gal/Ton Mile 0.001296
Emission factor using EPA line-haul duty cycle and PM Emfac (g/gal) 3.992005 UPRR ICTF/Port intermodal lcomotive fleet Total Port-Related Off Port Emissions in Basin 24406080 g/yr
26.90 TPY
2005 SO2Fuel C-Rate Gal/Ton Mile 0.001296
Emission factor using EPA line-haul duty cycle and SO2 Emfac (g/gal) 9.002005 UPRR ICTF/Port intermodal lcomotive fleet Total Port-Related Off Port Emissions in Basin 55092723 g/yr
60.73 TPY
APP-104

APPENDIX B
DIESEL-FUELED DRAYAGE TRUCKS
APP-105

APPENDIX B-1
METHODOLOGY FOR DETERMINING THE NUMBER OF DRAYAGE TRUCK TRIPS PER YEAR
APP-106

Appendix B
Methodology for Estimating the Number of Drayage Truck Trips per Year
Activity data is used to calculate emissions from HHD Diesel-fueled drayage trucks. Emissions were estimated based on the number of truck trips, the length of each trip, and the amount of time spent idling. The number of truck trips at ICTF for the 2005 calendar year were based on historic actual lift counts, gate counts for the facility, and forecasts of future lifts. The following terms are used in this assessment:
• Lift: This is the transfer of a container or trailer (empty or loaded) from a rail car to a truck chassis, or from a truck chassis to a rail car. This count does not include flips.
• Gate Count: This is the count of trailers (empty or loaded) and chassis with containers (empty or loaded) going past the plant gate. This count does not include bobtails (truck without a chassis) or trucks with an empty chassis (no container).
The 2005 lift count was multiplied by the gate balancing factor (GBF) to determine the number of containers that should have passed through the “in gate” (CI) in 2005. The container lift count for 2005 was 626,339 lifts.
GBFxCountLiftCI = The GBF was calculating by dividing the number of containers passing through the “in gate” by the total gate count as follows:
100""""
""x
countgateoutcountgateincountgatein
GBF ⎟⎟⎠
⎞⎜⎜⎝
⎛+
=
The GBF for 2005 was 62.8%, which means that roughly 63% of the total container passing though an ICTF gate passed though the “in gate”. The calculated “in gate” (CI) value was subtracted from the total number of lifts to determine the number of containers that should have passed through the “out gate” (CO) in 2005.
IO CCountLiftC −= The calculated gate counts were compared with the actual facility gate counts to verify accuracy.
APP-107
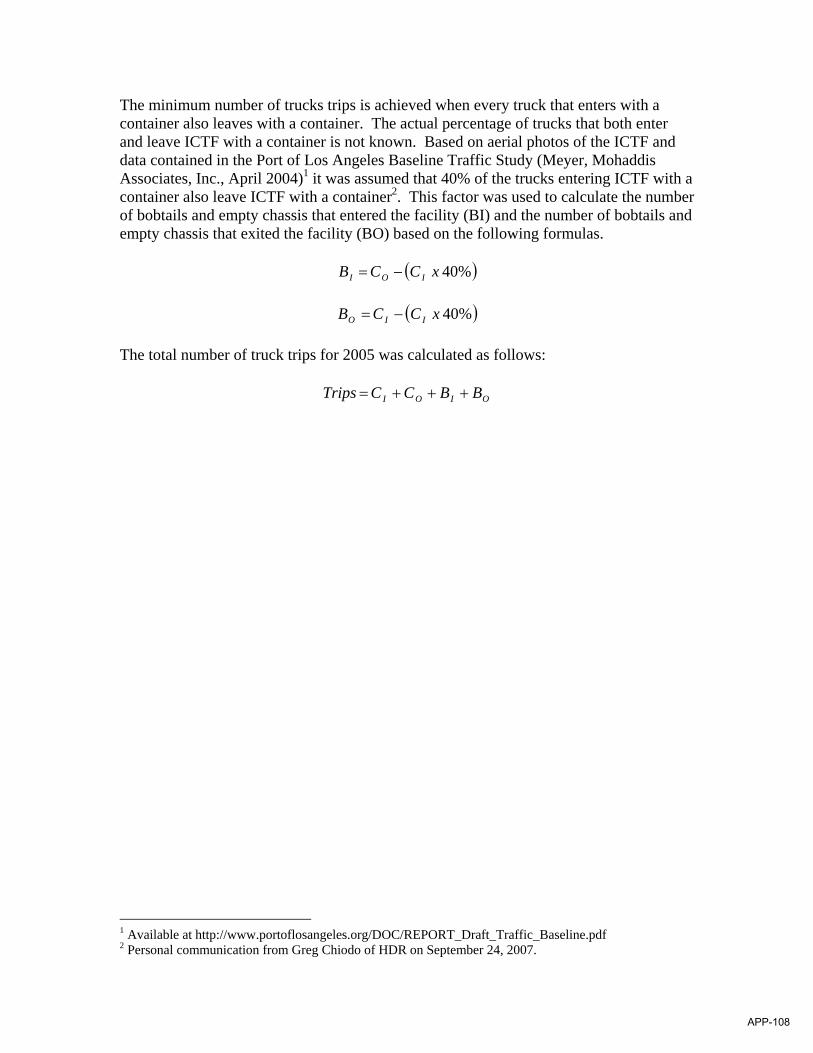
The minimum number of trucks trips is achieved when every truck that enters with a container also leaves with a container. The actual percentage of trucks that both enter and leave ICTF with a container is not known. Based on aerial photos of the ICTF and data contained in the Port of Los Angeles Baseline Traffic Study (Meyer, Mohaddis Associates, Inc., April 2004)1 it was assumed that 40% of the trucks entering ICTF with a container also leave ICTF with a container2. This factor was used to calculate the number of bobtails and empty chassis that entered the facility (BI) and the number of bobtails and empty chassis that exited the facility (BO) based on the following formulas.
( )%40xCCB IOI −= ( )%40xCCB IIO −=
The total number of truck trips for 2005 was calculated as follows:
OIOI BBCCTrips +++=
1 Available at http://www.portoflosangeles.org/DOC/REPORT_Draft_Traffic_Baseline.pdf 2 Personal communication from Greg Chiodo of HDR on September 24, 2007.
APP-108

APPENDIX B-2
DEATILED EMISSION CALCULATIONS, EMISSION FACTOR DERIVATION AND EMFAC2007 OUTPUT
APP-109
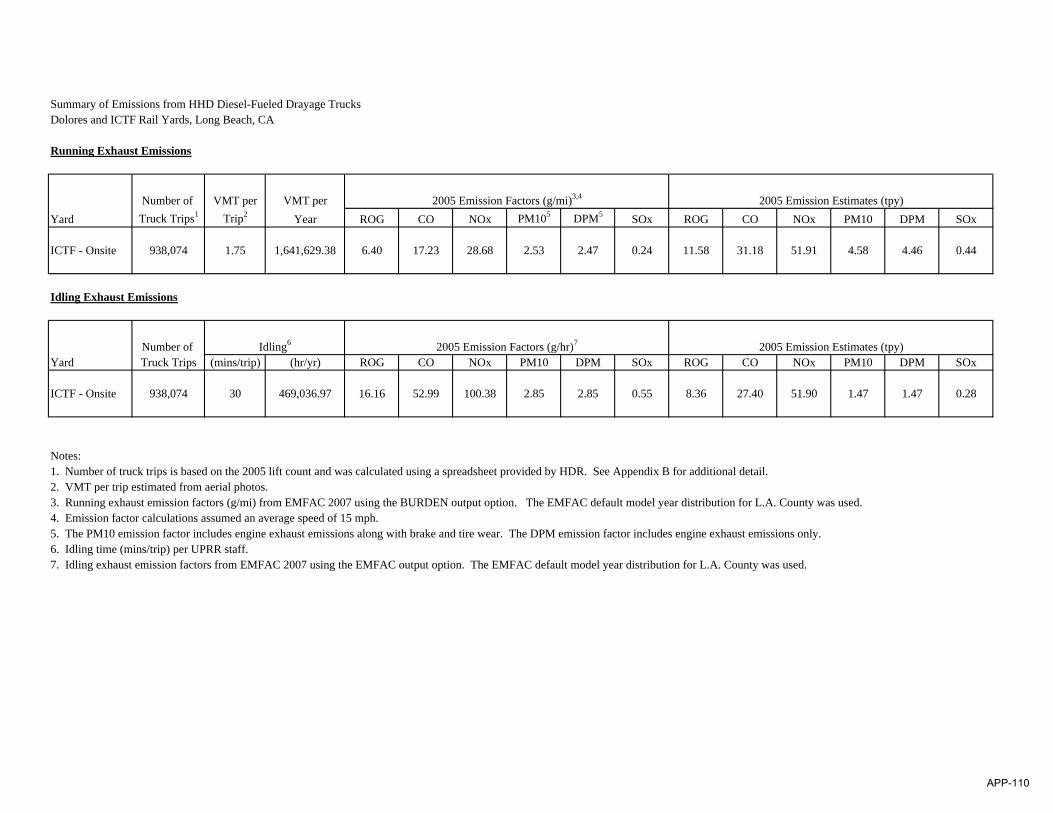
Summary of Emissions from HHD Diesel-Fueled Drayage TrucksDolores and ICTF Rail Yards, Long Beach, CA
Running Exhaust Emissions
Number of VMT per VMT perYard Truck Trips1 Trip2 Year ROG CO NOx PM105 DPM5 SOx ROG CO NOx PM10 DPM SOx
ICTF - Onsite 938,074 1.75 1,641,629.38 6.40 17.23 28.68 2.53 2.47 0.24 11.58 31.18 51.91 4.58 4.46 0.44
Idling Exhaust Emissions
Number of Yard Truck Trips (mins/trip) (hr/yr) ROG CO NOx PM10 DPM SOx ROG CO NOx PM10 DPM SOx
ICTF - Onsite 938,074 30 469,036.97 16.16 52.99 100.38 2.85 2.85 0.55 8.36 27.40 51.90 1.47 1.47 0.28
Notes:1. Number of truck trips is based on the 2005 lift count and was calculated using a spreadsheet provided by HDR. See Appendix B for additional detail.2. VMT per trip estimated from aerial photos.3. Running exhaust emission factors (g/mi) from EMFAC 2007 using the BURDEN output option. The EMFAC default model year distribution for L.A. County was used.4. Emission factor calculations assumed an average speed of 15 mph.5. The PM10 emission factor includes engine exhaust emissions along with brake and tire wear. The DPM emission factor includes engine exhaust emissions only.6. Idling time (mins/trip) per UPRR staff.7. Idling exhaust emission factors from EMFAC 2007 using the EMFAC output option. The EMFAC default model year distribution for L.A. County was used.
Idling6 2005 Emission Factors (g/hr)7 2005 Emission Estimates (tpy)
2005 Emission Estimates (tpy)2005 Emission Factors (g/mi)3,4
APP-110

Title : Los Angeles County Avg Annual CYr 2005 Default TitleVersion : Emfac2007 V2.3 Nov 1 2006 ** WIS Enabled **Run Date : 2006/12/14 07:57:01Scen Year: 2005 -- All model years in the range 1965 to 2005 selectedSeason : AnnualArea : Los Angeles County AverageI/M Stat : Enhanced Interim (2005) -- Using I/M schedule for area 59 Los Angeles (SC)Emissions: Tons Per Day**********************************************************************************************************
HHDT-DSLVehicles 27425VMT/1000 5538Trips 138783Reactive Organic Gas EmissionsRun Exh 39.07Idle Exh 0.82Start Ex 0
-------Total Ex 39.9
Diurnal 0Hot Soak 0Running 0Resting 0
-------Total 39.9Carbon Monoxide Emissions Run Exh 105.2Idle Exh 2.7Start Ex 0
-------Total Ex 107.91Oxides of Nitrogen Emissions Run Exh 175.11Idle Exh 5.12Start Ex 0
-------Total Ex 180.23Carbon Dioxide Emissions (000)Run Exh 17.5Idle Exh 0.34Start Ex 0
-------Total Ex 17.84PM10 Emissions Run Exh 15.05Idle Exh 0.15Start Ex 0
-------Total Ex 15.19
TireWear 0.22BrakeWr 0.17
-------Total 15.59Lead 0SOx 1.48Fuel Consumption (000 gallons)Gasoline 0Diesel 1605.41
APP-111

Title : Los Angeles County Avg Annual CYr 2005 Default TitleVersion : Emfac2007 V2.3 Nov 1 2006Run Date : 2006/12/14 08:09:32Scen Year: 2005 -- All model years in the range 1965 to 2005 selectedSeason : AnnualArea : Los Angeles*****************************************************************************************Year: 2005 -- Model Years 1965 to 2005 Inclusive -- Emfac2007 Emission Factors: V2.3 Nov 1 2006
County Average Los Angeles
Table 1: Running Exhaust Emissions (grams/mile; grams/idle-hour)
Pollutant Name: Reactive Org Gases Temperature: 65F Relative Humidity: 60%
Speed HHD HHD HHD HHD MPH NCAT CAT DSL ALL
0 0 0 16.163 15.188
Pollutant Name: Carbon Monoxide Temperature: 65F Relative Humidity: 60%
Speed HHD HHD HHD HHD MPH NCAT CAT DSL ALL
0 0 0 52.988 49.792
Pollutant Name: Oxides of Nitrogen Temperature: 65F Relative Humidity: 60%
Speed HHD HHD HHD HHD MPH NCAT CAT DSL ALL
0 0 0 100.382 94.327
Pollutant Name: Carbon Dioxide Temperature: 65F Relative Humidity: 60%
Speed HHD HHD HHD HHD MPH NCAT CAT DSL ALL
0 0 0 6617.134 6192.269
Pollutant Name: Sulfur Dioxide Temperature: 65F Relative Humidity: 60%
Speed HHD HHD HHD HHD MPH NCAT CAT DSL ALL
0 0 0 0.55 0.517
Pollutant Name: PM10 Temperature: 65F Relative Humidity: 60%
Speed HHD HHD HHD HHD MPH NCAT CAT DSL ALL
0 0 0 2.845 2.674
Pollutant Name: PM10 - Tire Wear Temperature: 65F Relative Humidity: 60%
Speed HHD HHD HHD HHD MPH NCAT CAT DSL ALL
0 0 0 0 0
Pollutant Name: PM10 - Break Wear Temperature: 65F Relative Humidity: 60%
Speed HHD HHD HHD HHD MPH NCAT CAT DSL ALL
0 0 0 0 0
APP-112
APPENDIX B-3
DEATILED EMISSION CALCULATIONS, EMISSION FACTOR DERIVATION AND EMFAC2007 OUTPUT FOR OFFSITE DRAYAGE TRUCK EMISSIONS
APP-113
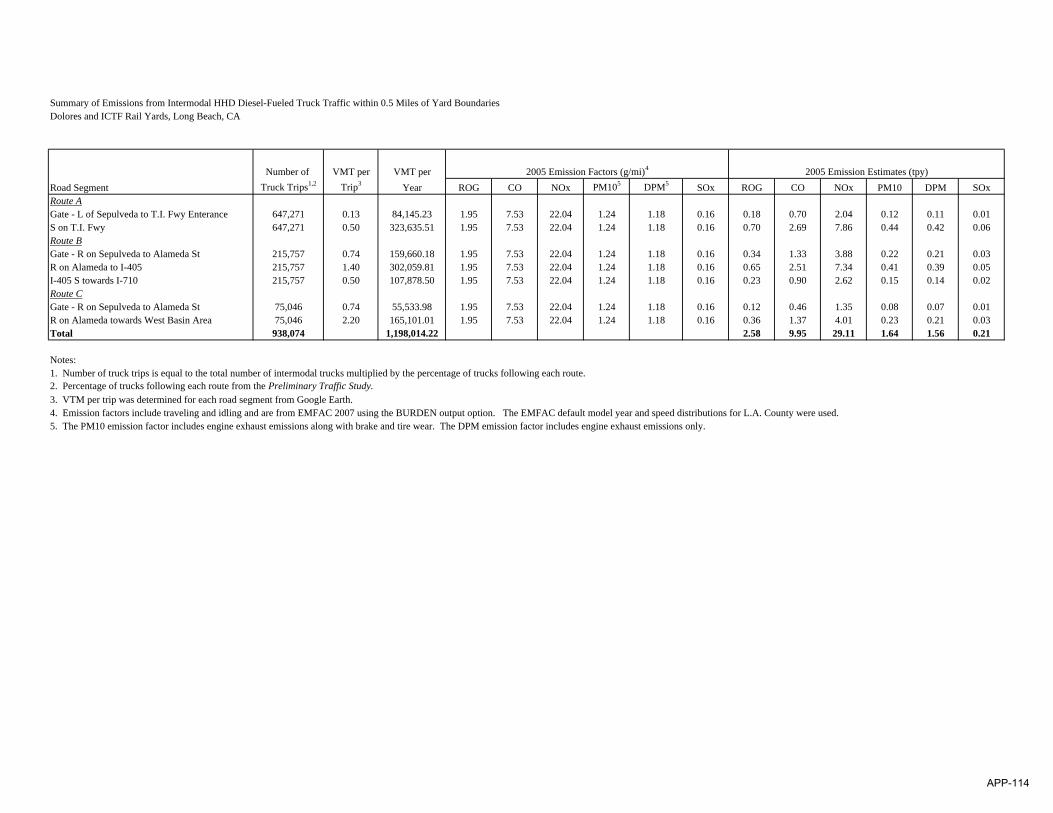
Summary of Emissions from Intermodal HHD Diesel-Fueled Truck Traffic within 0.5 Miles of Yard BoundariesDolores and ICTF Rail Yards, Long Beach, CA
Number of VMT per VMT perRoad Segment Truck Trips1,2 Trip3 Year ROG CO NOx PM105 DPM5 SOx ROG CO NOx PM10 DPM SOxRoute AGate - L of Sepulveda to T.I. Fwy Enterance 647,271 0.13 84,145.23 1.95 7.53 22.04 1.24 1.18 0.16 0.18 0.70 2.04 0.12 0.11 0.01S on T.I. Fwy 647,271 0.50 323,635.51 1.95 7.53 22.04 1.24 1.18 0.16 0.70 2.69 7.86 0.44 0.42 0.06Route BGate - R on Sepulveda to Alameda St 215,757 0.74 159,660.18 1.95 7.53 22.04 1.24 1.18 0.16 0.34 1.33 3.88 0.22 0.21 0.03R on Alameda to I-405 215,757 1.40 302,059.81 1.95 7.53 22.04 1.24 1.18 0.16 0.65 2.51 7.34 0.41 0.39 0.05I-405 S towards I-710 215,757 0.50 107,878.50 1.95 7.53 22.04 1.24 1.18 0.16 0.23 0.90 2.62 0.15 0.14 0.02Route CGate - R on Sepulveda to Alameda St 75,046 0.74 55,533.98 1.95 7.53 22.04 1.24 1.18 0.16 0.12 0.46 1.35 0.08 0.07 0.01R on Alameda towards West Basin Area 75,046 2.20 165,101.01 1.95 7.53 22.04 1.24 1.18 0.16 0.36 1.37 4.01 0.23 0.21 0.03Total 938,074 1,198,014.22 2.58 9.95 29.11 1.64 1.56 0.21
Notes:1. Number of truck trips is equal to the total number of intermodal trucks multiplied by the percentage of trucks following each route.2. Percentage of trucks following each route from the Preliminary Traffic Study.3. VTM per trip was determined for each road segment from Google Earth.4. Emission factors include traveling and idling and are from EMFAC 2007 using the BURDEN output option. The EMFAC default model year and speed distributions for L.A. County were used.5. The PM10 emission factor includes engine exhaust emissions along with brake and tire wear. The DPM emission factor includes engine exhaust emissions only.
2005 Emission Estimates (tpy)2005 Emission Factors (g/mi)4
APP-114
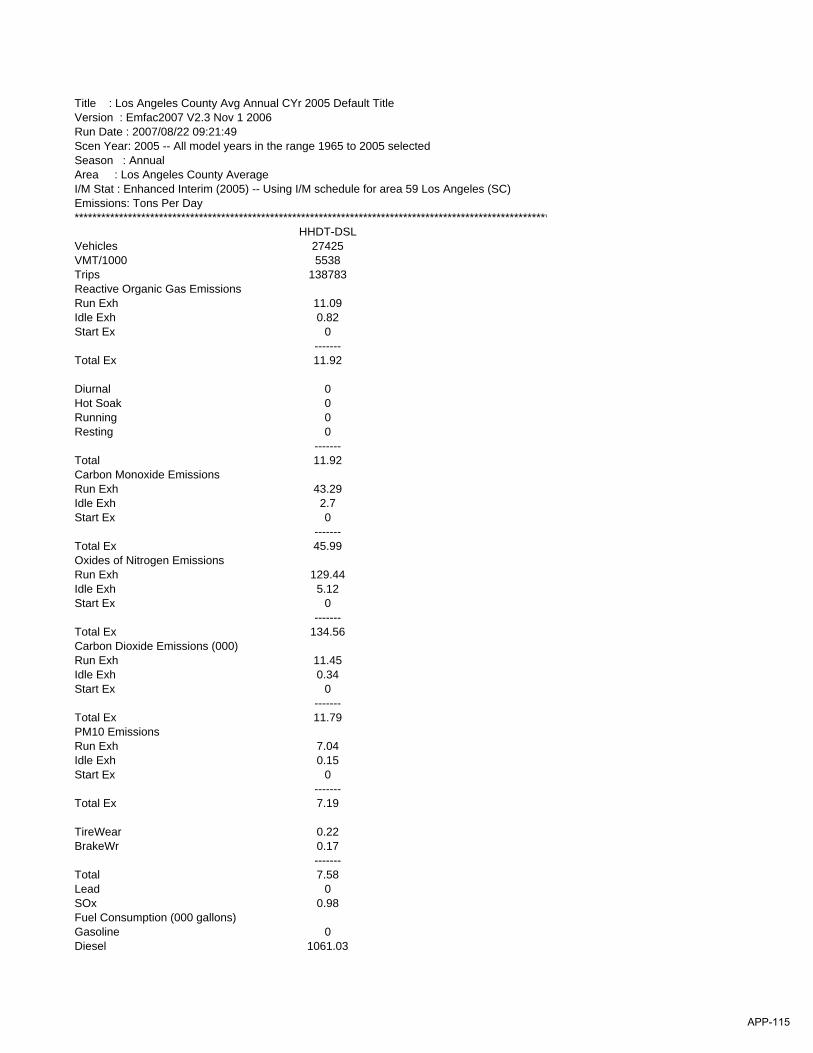
Title : Los Angeles County Avg Annual CYr 2005 Default TitleVersion : Emfac2007 V2.3 Nov 1 2006Run Date : 2007/08/22 09:21:49Scen Year: 2005 -- All model years in the range 1965 to 2005 selectedSeason : AnnualArea : Los Angeles County AverageI/M Stat : Enhanced Interim (2005) -- Using I/M schedule for area 59 Los Angeles (SC)Emissions: Tons Per Day***********************************************************************************************************
HHDT-DSLVehicles 27425VMT/1000 5538Trips 138783Reactive Organic Gas EmissionsRun Exh 11.09Idle Exh 0.82Start Ex 0
-------Total Ex 11.92
Diurnal 0Hot Soak 0Running 0Resting 0
-------Total 11.92Carbon Monoxide Emissions Run Exh 43.29Idle Exh 2.7Start Ex 0
-------Total Ex 45.99Oxides of Nitrogen Emissions Run Exh 129.44Idle Exh 5.12Start Ex 0
-------Total Ex 134.56Carbon Dioxide Emissions (000)Run Exh 11.45Idle Exh 0.34Start Ex 0
-------Total Ex 11.79PM10 Emissions Run Exh 7.04Idle Exh 0.15Start Ex 0
-------Total Ex 7.19
TireWear 0.22BrakeWr 0.17
-------Total 7.58Lead 0SOx 0.98Fuel Consumption (000 gallons)Gasoline 0Diesel 1061.03
APP-115
APPENDIX C
DEATILED EMISSION CALCULATIONS, EMISSION FACTOR DERIVATION AND OFFROAD2007 OUTPUT FOR
CARGO HANDLING EQUIPMENT
APP-116
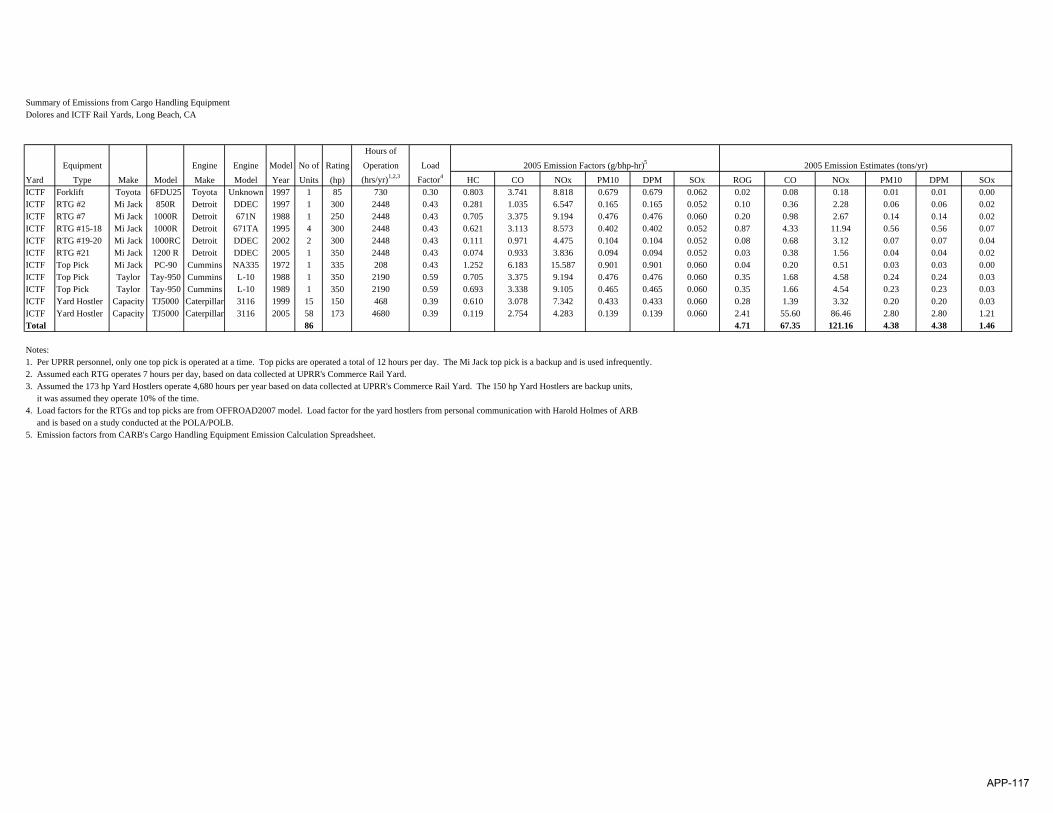
Summary of Emissions from Cargo Handling EquipmentDolores and ICTF Rail Yards, Long Beach, CA
Hours ofEquipment Engine Engine Model No of Rating Operation Load
Yard Type Make Model Make Model Year Units (hp) (hrs/yr)1,2,3 Factor4 HC CO NOx PM10 DPM SOx ROG CO NOx PM10 DPM SOxICTF Forklift Toyota 6FDU25 Toyota Unknown 1997 1 85 730 0.30 0.803 3.741 8.818 0.679 0.679 0.062 0.02 0.08 0.18 0.01 0.01 0.00ICTF RTG #2 Mi Jack 850R Detroit DDEC 1997 1 300 2448 0.43 0.281 1.035 6.547 0.165 0.165 0.052 0.10 0.36 2.28 0.06 0.06 0.02ICTF RTG #7 Mi Jack 1000R Detroit 671N 1988 1 250 2448 0.43 0.705 3.375 9.194 0.476 0.476 0.060 0.20 0.98 2.67 0.14 0.14 0.02ICTF RTG #15-18 Mi Jack 1000R Detroit 671TA 1995 4 300 2448 0.43 0.621 3.113 8.573 0.402 0.402 0.052 0.87 4.33 11.94 0.56 0.56 0.07ICTF RTG #19-20 Mi Jack 1000RC Detroit DDEC 2002 2 300 2448 0.43 0.111 0.971 4.475 0.104 0.104 0.052 0.08 0.68 3.12 0.07 0.07 0.04ICTF RTG #21 Mi Jack 1200 R Detroit DDEC 2005 1 350 2448 0.43 0.074 0.933 3.836 0.094 0.094 0.052 0.03 0.38 1.56 0.04 0.04 0.02ICTF Top Pick Mi Jack PC-90 Cummins NA335 1972 1 335 208 0.43 1.252 6.183 15.587 0.901 0.901 0.060 0.04 0.20 0.51 0.03 0.03 0.00ICTF Top Pick Taylor Tay-950 Cummins L-10 1988 1 350 2190 0.59 0.705 3.375 9.194 0.476 0.476 0.060 0.35 1.68 4.58 0.24 0.24 0.03ICTF Top Pick Taylor Tay-950 Cummins L-10 1989 1 350 2190 0.59 0.693 3.338 9.105 0.465 0.465 0.060 0.35 1.66 4.54 0.23 0.23 0.03ICTF Yard Hostler Capacity TJ5000 Caterpillar 3116 1999 15 150 468 0.39 0.610 3.078 7.342 0.433 0.433 0.060 0.28 1.39 3.32 0.20 0.20 0.03ICTF Yard Hostler Capacity TJ5000 Caterpillar 3116 2005 58 173 4680 0.39 0.119 2.754 4.283 0.139 0.139 0.060 2.41 55.60 86.46 2.80 2.80 1.21Total 86 4.71 67.35 121.16 4.38 4.38 1.46
Notes:1. Per UPRR personnel, only one top pick is operated at a time. Top picks are operated a total of 12 hours per day. The Mi Jack top pick is a backup and is used infrequently.2. Assumed each RTG operates 7 hours per day, based on data collected at UPRR's Commerce Rail Yard.3. Assumed the 173 hp Yard Hostlers operate 4,680 hours per year based on data collected at UPRR's Commerce Rail Yard. The 150 hp Yard Hostlers are backup units, it was assumed they operate 10% of the time.4. Load factors for the RTGs and top picks are from OFFROAD2007 model. Load factor for the yard hostlers from personal communication with Harold Holmes of ARB and is based on a study conducted at the POLA/POLB.5. Emission factors from CARB's Cargo Handling Equipment Emission Calculation Spreadsheet.
2005 Emission Factors (g/bhp-hr)5 2005 Emission Estimates (tons/yr)
APP-117
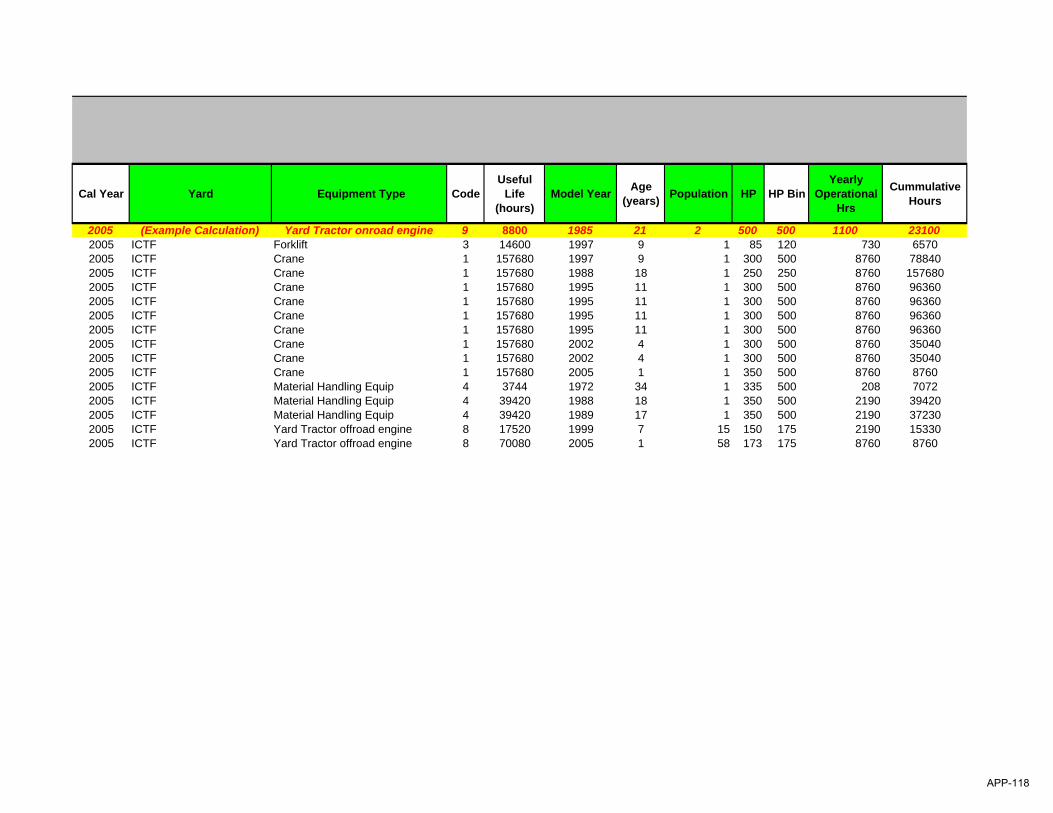
Cal Year Yard Equipment Type CodeUseful
Life (hours)
Model Year Age (years) Population HP HP Bin
Yearly Operational
Hrs
Cummulative Hours
2005 (Example Calculation) Yard Tractor onroad engine 9 8800 1985 21 2 500 500 1100 231002005 ICTF Forklift 3 14600 1997 9 1 85 120 730 65702005 ICTF Crane 1 157680 1997 9 1 300 500 8760 788402005 ICTF Crane 1 157680 1988 18 1 250 250 8760 1576802005 ICTF Crane 1 157680 1995 11 1 300 500 8760 963602005 ICTF Crane 1 157680 1995 11 1 300 500 8760 963602005 ICTF Crane 1 157680 1995 11 1 300 500 8760 963602005 ICTF Crane 1 157680 1995 11 1 300 500 8760 963602005 ICTF Crane 1 157680 2002 4 1 300 500 8760 350402005 ICTF Crane 1 157680 2002 4 1 300 500 8760 350402005 ICTF Crane 1 157680 2005 1 1 350 500 8760 87602005 ICTF Material Handling Equip 4 3744 1972 34 1 335 500 208 70722005 ICTF Material Handling Equip 4 39420 1988 18 1 350 500 2190 394202005 ICTF Material Handling Equip 4 39420 1989 17 1 350 500 2190 372302005 ICTF Yard Tractor offroad engine 8 17520 1999 7 15 150 175 2190 153302005 ICTF Yard Tractor offroad engine 8 70080 2005 1 58 173 175 8760 8760
APP-118
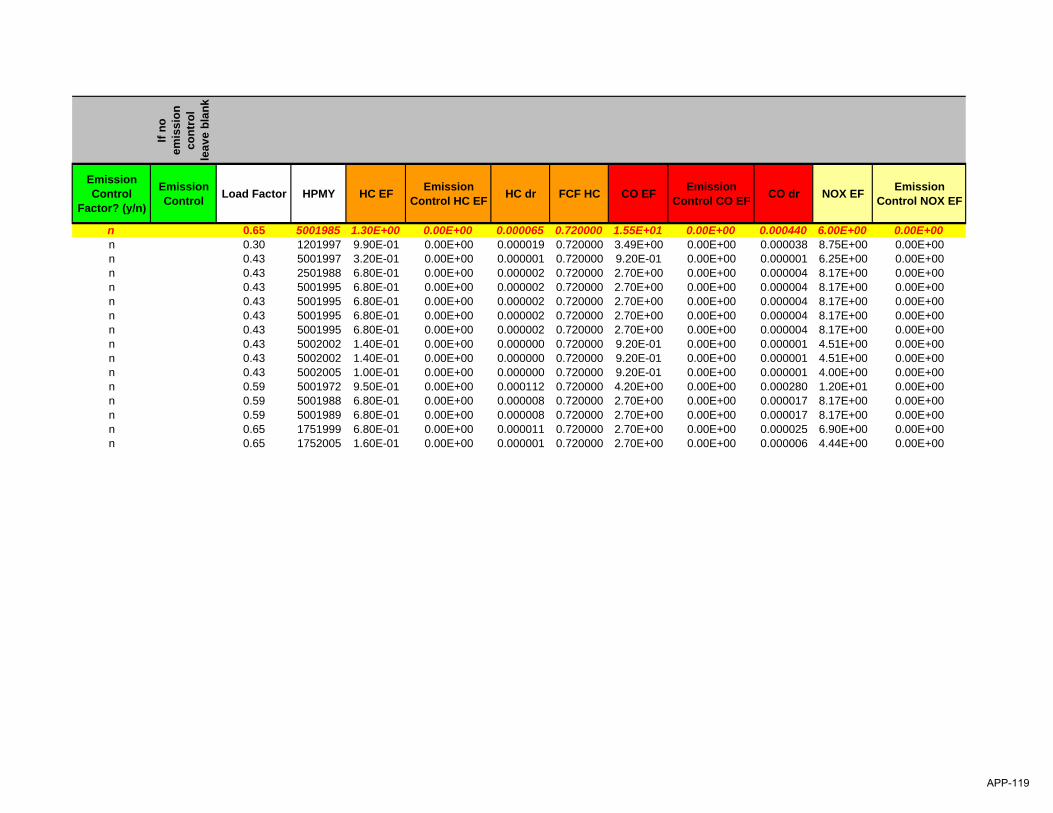
If no
em
issi
on
cont
rol
leav
e bl
ank
Emission Control
Factor? (y/n)
Emission Control Load Factor HPMY HC EF Emission
Control HC EF HC dr FCF HC CO EF Emission Control CO EF CO dr NOX EF Emission
Control NOX EF
n 0.65 5001985 1.30E+00 0.00E+00 0.000065 0.720000 1.55E+01 0.00E+00 0.000440 6.00E+00 0.00E+00n 0.30 1201997 9.90E-01 0.00E+00 0.000019 0.720000 3.49E+00 0.00E+00 0.000038 8.75E+00 0.00E+00n 0.43 5001997 3.20E-01 0.00E+00 0.000001 0.720000 9.20E-01 0.00E+00 0.000001 6.25E+00 0.00E+00n 0.43 2501988 6.80E-01 0.00E+00 0.000002 0.720000 2.70E+00 0.00E+00 0.000004 8.17E+00 0.00E+00n 0.43 5001995 6.80E-01 0.00E+00 0.000002 0.720000 2.70E+00 0.00E+00 0.000004 8.17E+00 0.00E+00n 0.43 5001995 6.80E-01 0.00E+00 0.000002 0.720000 2.70E+00 0.00E+00 0.000004 8.17E+00 0.00E+00n 0.43 5001995 6.80E-01 0.00E+00 0.000002 0.720000 2.70E+00 0.00E+00 0.000004 8.17E+00 0.00E+00n 0.43 5001995 6.80E-01 0.00E+00 0.000002 0.720000 2.70E+00 0.00E+00 0.000004 8.17E+00 0.00E+00n 0.43 5002002 1.40E-01 0.00E+00 0.000000 0.720000 9.20E-01 0.00E+00 0.000001 4.51E+00 0.00E+00n 0.43 5002002 1.40E-01 0.00E+00 0.000000 0.720000 9.20E-01 0.00E+00 0.000001 4.51E+00 0.00E+00n 0.43 5002005 1.00E-01 0.00E+00 0.000000 0.720000 9.20E-01 0.00E+00 0.000001 4.00E+00 0.00E+00n 0.59 5001972 9.50E-01 0.00E+00 0.000112 0.720000 4.20E+00 0.00E+00 0.000280 1.20E+01 0.00E+00n 0.59 5001988 6.80E-01 0.00E+00 0.000008 0.720000 2.70E+00 0.00E+00 0.000017 8.17E+00 0.00E+00n 0.59 5001989 6.80E-01 0.00E+00 0.000008 0.720000 2.70E+00 0.00E+00 0.000017 8.17E+00 0.00E+00n 0.65 1751999 6.80E-01 0.00E+00 0.000011 0.720000 2.70E+00 0.00E+00 0.000025 6.90E+00 0.00E+00n 0.65 1752005 1.60E-01 0.00E+00 0.000001 0.720000 2.70E+00 0.00E+00 0.000006 4.44E+00 0.00E+00
APP-119
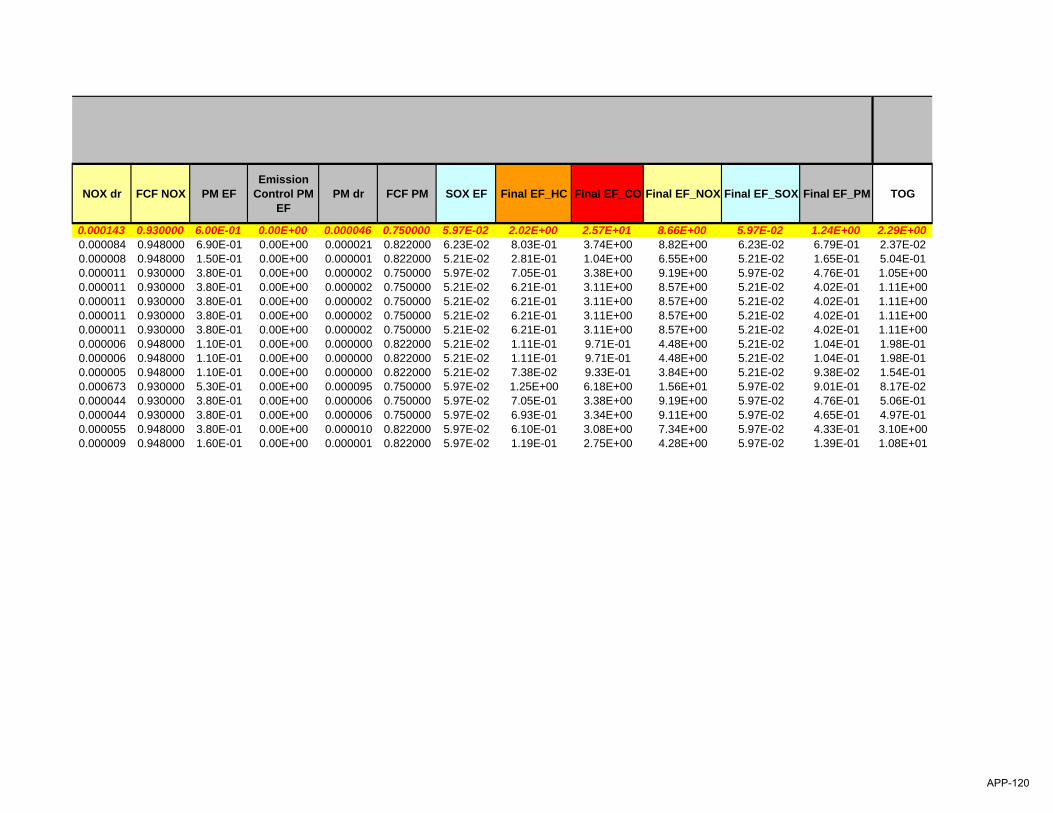
NOX dr FCF NOX PM EF Emission
Control PM EF
PM dr FCF PM SOX EF Final EF_HC Final EF_CO Final EF_NOX Final EF_SOX Final EF_PM TOG
0.000143 0.930000 6.00E-01 0.00E+00 0.000046 0.750000 5.97E-02 2.02E+00 2.57E+01 8.66E+00 5.97E-02 1.24E+00 2.29E+000.000084 0.948000 6.90E-01 0.00E+00 0.000021 0.822000 6.23E-02 8.03E-01 3.74E+00 8.82E+00 6.23E-02 6.79E-01 2.37E-020.000008 0.948000 1.50E-01 0.00E+00 0.000001 0.822000 5.21E-02 2.81E-01 1.04E+00 6.55E+00 5.21E-02 1.65E-01 5.04E-010.000011 0.930000 3.80E-01 0.00E+00 0.000002 0.750000 5.97E-02 7.05E-01 3.38E+00 9.19E+00 5.97E-02 4.76E-01 1.05E+000.000011 0.930000 3.80E-01 0.00E+00 0.000002 0.750000 5.21E-02 6.21E-01 3.11E+00 8.57E+00 5.21E-02 4.02E-01 1.11E+000.000011 0.930000 3.80E-01 0.00E+00 0.000002 0.750000 5.21E-02 6.21E-01 3.11E+00 8.57E+00 5.21E-02 4.02E-01 1.11E+000.000011 0.930000 3.80E-01 0.00E+00 0.000002 0.750000 5.21E-02 6.21E-01 3.11E+00 8.57E+00 5.21E-02 4.02E-01 1.11E+000.000011 0.930000 3.80E-01 0.00E+00 0.000002 0.750000 5.21E-02 6.21E-01 3.11E+00 8.57E+00 5.21E-02 4.02E-01 1.11E+000.000006 0.948000 1.10E-01 0.00E+00 0.000000 0.822000 5.21E-02 1.11E-01 9.71E-01 4.48E+00 5.21E-02 1.04E-01 1.98E-010.000006 0.948000 1.10E-01 0.00E+00 0.000000 0.822000 5.21E-02 1.11E-01 9.71E-01 4.48E+00 5.21E-02 1.04E-01 1.98E-010.000005 0.948000 1.10E-01 0.00E+00 0.000000 0.822000 5.21E-02 7.38E-02 9.33E-01 3.84E+00 5.21E-02 9.38E-02 1.54E-010.000673 0.930000 5.30E-01 0.00E+00 0.000095 0.750000 5.97E-02 1.25E+00 6.18E+00 1.56E+01 5.97E-02 9.01E-01 8.17E-020.000044 0.930000 3.80E-01 0.00E+00 0.000006 0.750000 5.97E-02 7.05E-01 3.38E+00 9.19E+00 5.97E-02 4.76E-01 5.06E-010.000044 0.930000 3.80E-01 0.00E+00 0.000006 0.750000 5.97E-02 6.93E-01 3.34E+00 9.11E+00 5.97E-02 4.65E-01 4.97E-010.000055 0.948000 3.80E-01 0.00E+00 0.000010 0.822000 5.97E-02 6.10E-01 3.08E+00 7.34E+00 5.97E-02 4.33E-01 3.10E+000.000009 0.948000 1.60E-01 0.00E+00 0.000001 0.822000 5.97E-02 1.19E-01 2.75E+00 4.28E+00 5.97E-02 1.39E-01 1.08E+01
APP-120
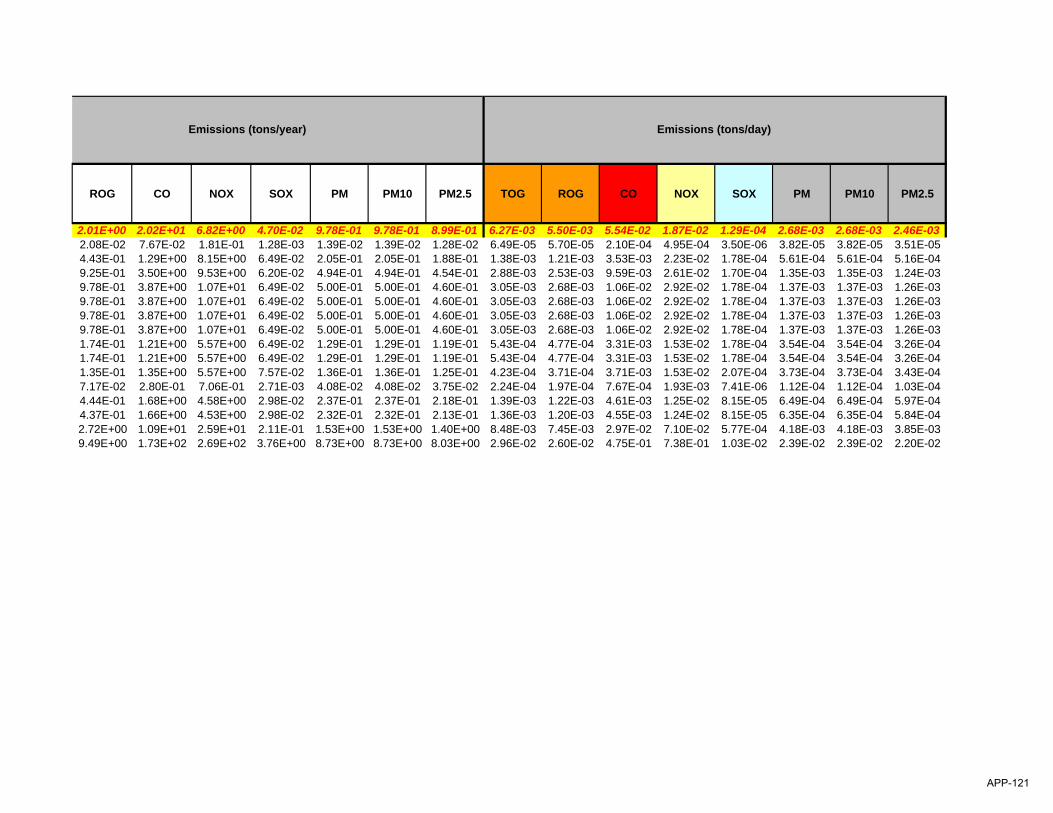
ROG CO NOX SOX PM PM10 PM2.5 TOG ROG CO NOX SOX PM PM10 PM2.5
2.01E+00 2.02E+01 6.82E+00 4.70E-02 9.78E-01 9.78E-01 8.99E-01 6.27E-03 5.50E-03 5.54E-02 1.87E-02 1.29E-04 2.68E-03 2.68E-03 2.46E-03
Emissions (tons/year) Emissions (tons/day)
2.08E-02 7.67E-02 1.81E-01 1.28E-03 1.39E-02 1.39E-02 1.28E-02 6.49E-05 5.70E-05 2.10E-04 4.95E-04 3.50E-06 3.82E-05 3.82E-05 3.51E-054.43E-01 1.29E+00 8.15E+00 6.49E-02 2.05E-01 2.05E-01 1.88E-01 1.38E-03 1.21E-03 3.53E-03 2.23E-02 1.78E-04 5.61E-04 5.61E-04 5.16E-049.25E-01 3.50E+00 9.53E+00 6.20E-02 4.94E-01 4.94E-01 4.54E-01 2.88E-03 2.53E-03 9.59E-03 2.61E-02 1.70E-04 1.35E-03 1.35E-03 1.24E-039.78E-01 3.87E+00 1.07E+01 6.49E-02 5.00E-01 5.00E-01 4.60E-01 3.05E-03 2.68E-03 1.06E-02 2.92E-02 1.78E-04 1.37E-03 1.37E-03 1.26E-039.78E-01 3.87E+00 1.07E+01 6.49E-02 5.00E-01 5.00E-01 4.60E-01 3.05E-03 2.68E-03 1.06E-02 2.92E-02 1.78E-04 1.37E-03 1.37E-03 1.26E-039.78E-01 3.87E+00 1.07E+01 6.49E-02 5.00E-01 5.00E-01 4.60E-01 3.05E-03 2.68E-03 1.06E-02 2.92E-02 1.78E-04 1.37E-03 1.37E-03 1.26E-039.78E-01 3.87E+00 1.07E+01 6.49E-02 5.00E-01 5.00E-01 4.60E-01 3.05E-03 2.68E-03 1.06E-02 2.92E-02 1.78E-04 1.37E-03 1.37E-03 1.26E-031.74E-01 1.21E+00 5.57E+00 6.49E-02 1.29E-01 1.29E-01 1.19E-01 5.43E-04 4.77E-04 3.31E-03 1.53E-02 1.78E-04 3.54E-04 3.54E-04 3.26E-041.74E-01 1.21E+00 5.57E+00 6.49E-02 1.29E-01 1.29E-01 1.19E-01 5.43E-04 4.77E-04 3.31E-03 1.53E-02 1.78E-04 3.54E-04 3.54E-04 3.26E-041.35E-01 1.35E+00 5.57E+00 7.57E-02 1.36E-01 1.36E-01 1.25E-01 4.23E-04 3.71E-04 3.71E-03 1.53E-02 2.07E-04 3.73E-04 3.73E-04 3.43E-047.17E-02 2.80E-01 7.06E-01 2.71E-03 4.08E-02 4.08E-02 3.75E-02 2.24E-04 1.97E-04 7.67E-04 1.93E-03 7.41E-06 1.12E-04 1.12E-04 1.03E-044.44E-01 1.68E+00 4.58E+00 2.98E-02 2.37E-01 2.37E-01 2.18E-01 1.39E-03 1.22E-03 4.61E-03 1.25E-02 8.15E-05 6.49E-04 6.49E-04 5.97E-044.37E-01 1.66E+00 4.53E+00 2.98E-02 2.32E-01 2.32E-01 2.13E-01 1.36E-03 1.20E-03 4.55E-03 1.24E-02 8.15E-05 6.35E-04 6.35E-04 5.84E-042.72E+00 1.09E+01 2.59E+01 2.11E-01 1.53E+00 1.53E+00 1.40E+00 8.48E-03 7.45E-03 2.97E-02 7.10E-02 5.77E-04 4.18E-03 4.18E-03 3.85E-039.49E+00 1.73E+02 2.69E+02 3.76E+00 8.73E+00 8.73E+00 8.03E+00 2.96E-02 2.60E-02 4.75E-01 7.38E-01 1.03E-02 2.39E-02 2.39E-02 2.20E-02
APP-121
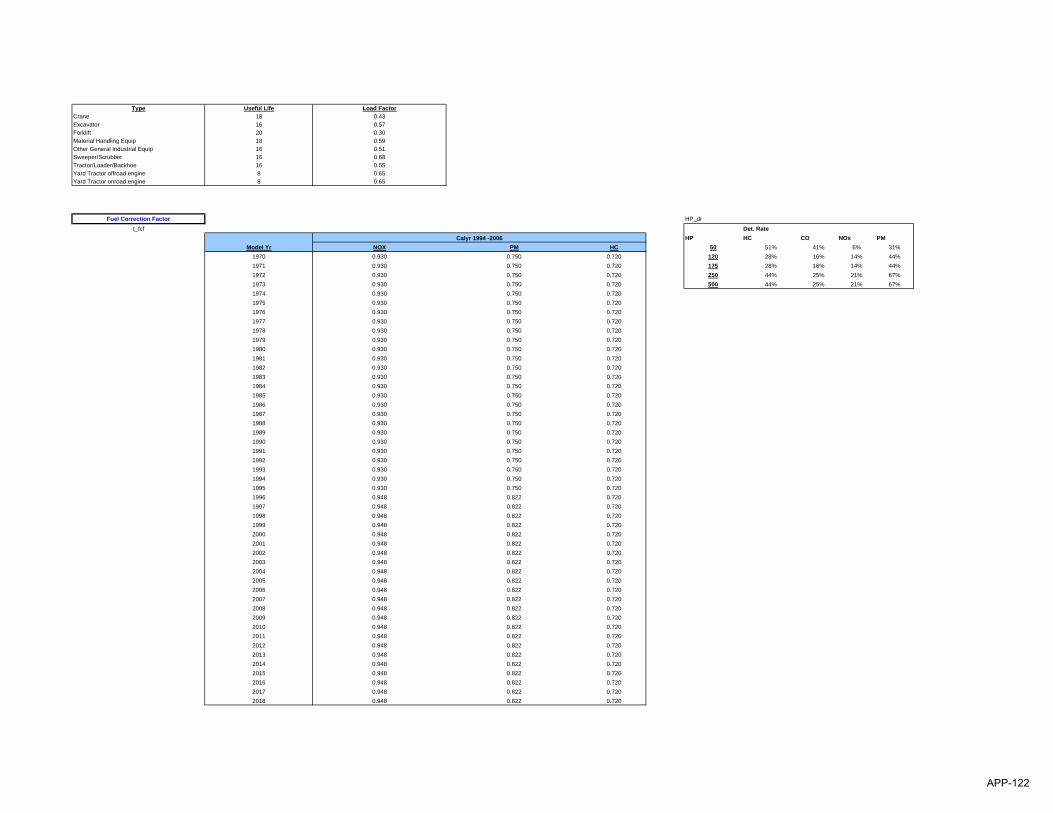
Type Useful Life Load FactorCrane 18 0.43Excavator 16 0.57Forklift 20 0.30Material Handling Equip 18 0.59Other General Industrial Equip 16 0.51Sweeper/Scrubber 16 0.68Tractor/Loader/Backhoe 16 0.55Yard Tractor offroad engine 8 0.65Yard Tractor onroad engine 8 0.65
Fuel Correction Factor HP_dr
t_fcf Det. RateHP HC CO NOx PM
Model Yr NOX PM HC 50 51% 41% 6% 31%1970 0.930 0.750 0.720 120 28% 16% 14% 44%1971 0.930 0.750 0.720 175 28% 16% 14% 44%1972 0.930 0.750 0.720 250 44% 25% 21% 67%1973 0.930 0.750 0.720 500 44% 25% 21% 67%1974 0.930 0.750 0.7201975 0.930 0.750 0.7201976 0.930 0.750 0.7201977 0.930 0.750 0.7201978 0.930 0.750 0.7201979 0.930 0.750 0.7201980 0.930 0.750 0.7201981 0.930 0.750 0.7201982 0.930 0.750 0.7201983 0.930 0.750 0.7201984 0.930 0.750 0.7201985 0.930 0.750 0.7201986 0.930 0.750 0.7201987 0.930 0.750 0.7201988 0.930 0.750 0.7201989 0.930 0.750 0.7201990 0.930 0.750 0.7201991 0.930 0.750 0.7201992 0.930 0.750 0.7201993 0.930 0.750 0.7201994 0.930 0.750 0.7201995 0.930 0.750 0.7201996 0.948 0.822 0.7201997 0.948 0.822 0.7201998 0.948 0.822 0.7201999 0.948 0.822 0.7202000 0.948 0.822 0.7202001 0.948 0.822 0.7202002 0.948 0.822 0.7202003 0.948 0.822 0.7202004 0.948 0.822 0.7202005 0.948 0.822 0.7202006 0.948 0.822 0.7202007 0.948 0.822 0.7202008 0.948 0.822 0.7202009 0.948 0.822 0.7202010 0.948 0.822 0.7202011 0.948 0.822 0.7202012 0.948 0.822 0.7202013 0.948 0.822 0.7202014 0.948 0.822 0.7202015 0.948 0.822 0.7202016 0.948 0.822 0.7202017 0.948 0.822 0.7202018 0.948 0.822 0.720
Calyr 1994 -2006
APP-122
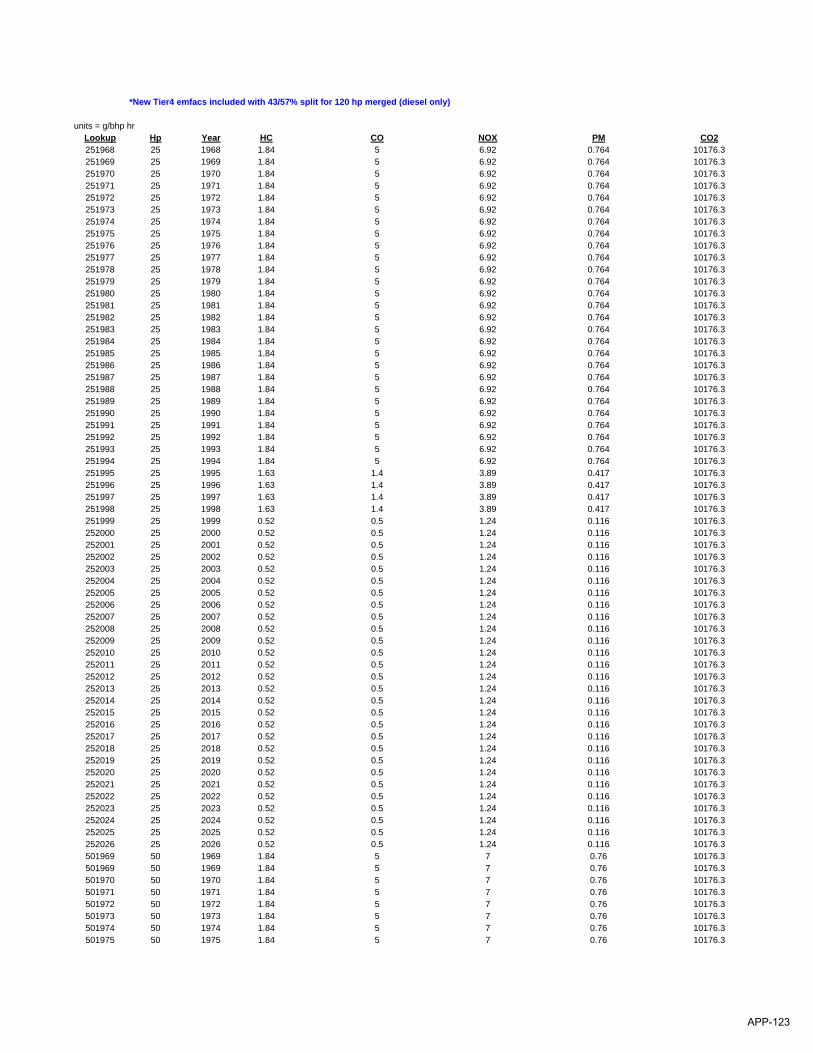
*New Tier4 emfacs included with 43/57% split for 120 hp merged (diesel only)
units = g/bhp hrLookup Hp Year HC CO NOX PM CO2251968 25 1968 1.84 5 6.92 0.764 10176.3251969 25 1969 1.84 5 6.92 0.764 10176.3251970 25 1970 1.84 5 6.92 0.764 10176.3251971 25 1971 1.84 5 6.92 0.764 10176.3251972 25 1972 1.84 5 6.92 0.764 10176.3251973 25 1973 1.84 5 6.92 0.764 10176.3251974 25 1974 1.84 5 6.92 0.764 10176.3251975 25 1975 1.84 5 6.92 0.764 10176.3251976 25 1976 1.84 5 6.92 0.764 10176.3251977 25 1977 1.84 5 6.92 0.764 10176.3251978 25 1978 1.84 5 6.92 0.764 10176.3251979 25 1979 1.84 5 6.92 0.764 10176.3251980 25 1980 1.84 5 6.92 0.764 10176.3251981 25 1981 1.84 5 6.92 0.764 10176.3251982 25 1982 1.84 5 6.92 0.764 10176.3251983 25 1983 1.84 5 6.92 0.764 10176.3251984 25 1984 1.84 5 6.92 0.764 10176.3251985 25 1985 1.84 5 6.92 0.764 10176.3251986 25 1986 1.84 5 6.92 0.764 10176.3251987 25 1987 1.84 5 6.92 0.764 10176.3251988 25 1988 1.84 5 6.92 0.764 10176.3251989 25 1989 1.84 5 6.92 0.764 10176.3251990 25 1990 1.84 5 6.92 0.764 10176.3251991 25 1991 1.84 5 6.92 0.764 10176.3251992 25 1992 1.84 5 6.92 0.764 10176.3251993 25 1993 1.84 5 6.92 0.764 10176.3251994 25 1994 1.84 5 6.92 0.764 10176.3251995 25 1995 1.63 1.4 3.89 0.417 10176.3251996 25 1996 1.63 1.4 3.89 0.417 10176.3251997 25 1997 1.63 1.4 3.89 0.417 10176.3251998 25 1998 1.63 1.4 3.89 0.417 10176.3251999 25 1999 0.52 0.5 1.24 0.116 10176.3252000 25 2000 0.52 0.5 1.24 0.116 10176.3252001 25 2001 0.52 0.5 1.24 0.116 10176.3252002 25 2002 0.52 0.5 1.24 0.116 10176.3252003 25 2003 0.52 0.5 1.24 0.116 10176.3252004 25 2004 0.52 0.5 1.24 0.116 10176.3252005 25 2005 0.52 0.5 1.24 0.116 10176.3252006 25 2006 0.52 0.5 1.24 0.116 10176.3252007 25 2007 0.52 0.5 1.24 0.116 10176.3252008 25 2008 0.52 0.5 1.24 0.116 10176.3252009 25 2009 0.52 0.5 1.24 0.116 10176.3252010 25 2010 0.52 0.5 1.24 0.116 10176.3252011 25 2011 0.52 0.5 1.24 0.116 10176.3252012 25 2012 0.52 0.5 1.24 0.116 10176.3252013 25 2013 0.52 0.5 1.24 0.116 10176.3252014 25 2014 0.52 0.5 1.24 0.116 10176.3252015 25 2015 0.52 0.5 1.24 0.116 10176.3252016 25 2016 0.52 0.5 1.24 0.116 10176.3252017 25 2017 0.52 0.5 1.24 0.116 10176.3252018 25 2018 0.52 0.5 1.24 0.116 10176.3252019 25 2019 0.52 0.5 1.24 0.116 10176.3252020 25 2020 0.52 0.5 1.24 0.116 10176.3252021 25 2021 0.52 0.5 1.24 0.116 10176.3252022 25 2022 0.52 0.5 1.24 0.116 10176.3252023 25 2023 0.52 0.5 1.24 0.116 10176.3252024 25 2024 0.52 0.5 1.24 0.116 10176.3252025 25 2025 0.52 0.5 1.24 0.116 10176.3252026 25 2026 0.52 0.5 1.24 0.116 10176.3501969 50 1969 1.84 5 7 0.76 10176.3501969 50 1969 1.84 5 7 0.76 10176.3501970 50 1970 1.84 5 7 0.76 10176.3501971 50 1971 1.84 5 7 0.76 10176.3501972 50 1972 1.84 5 7 0.76 10176.3501973 50 1973 1.84 5 7 0.76 10176.3501974 50 1974 1.84 5 7 0.76 10176.3501975 50 1975 1.84 5 7 0.76 10176.3
APP-123
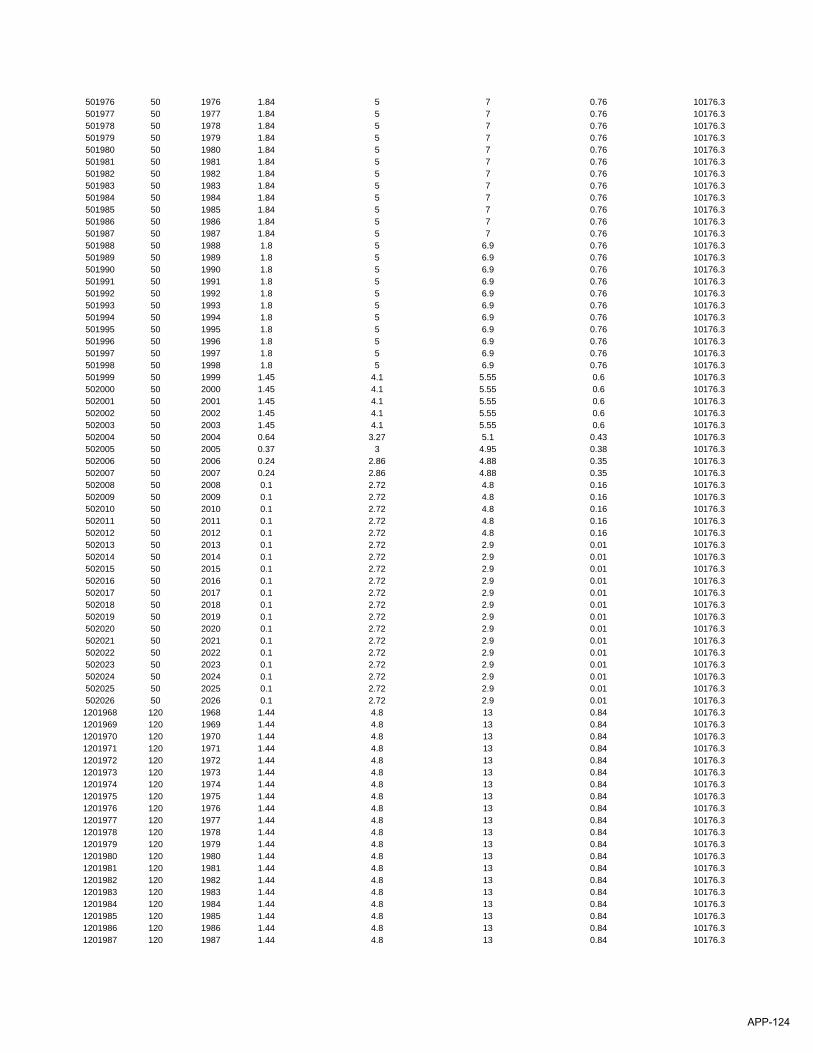
501976 50 1976 1.84 5 7 0.76 10176.3501977 50 1977 1.84 5 7 0.76 10176.3501978 50 1978 1.84 5 7 0.76 10176.3501979 50 1979 1.84 5 7 0.76 10176.3501980 50 1980 1.84 5 7 0.76 10176.3501981 50 1981 1.84 5 7 0.76 10176.3501982 50 1982 1.84 5 7 0.76 10176.3501983 50 1983 1.84 5 7 0.76 10176.3501984 50 1984 1.84 5 7 0.76 10176.3501985 50 1985 1.84 5 7 0.76 10176.3501986 50 1986 1.84 5 7 0.76 10176.3501987 50 1987 1.84 5 7 0.76 10176.3501988 50 1988 1.8 5 6.9 0.76 10176.3501989 50 1989 1.8 5 6.9 0.76 10176.3501990 50 1990 1.8 5 6.9 0.76 10176.3501991 50 1991 1.8 5 6.9 0.76 10176.3501992 50 1992 1.8 5 6.9 0.76 10176.3501993 50 1993 1.8 5 6.9 0.76 10176.3501994 50 1994 1.8 5 6.9 0.76 10176.3501995 50 1995 1.8 5 6.9 0.76 10176.3501996 50 1996 1.8 5 6.9 0.76 10176.3501997 50 1997 1.8 5 6.9 0.76 10176.3501998 50 1998 1.8 5 6.9 0.76 10176.3501999 50 1999 1.45 4.1 5.55 0.6 10176.3502000 50 2000 1.45 4.1 5.55 0.6 10176.3502001 50 2001 1.45 4.1 5.55 0.6 10176.3502002 50 2002 1.45 4.1 5.55 0.6 10176.3502003 50 2003 1.45 4.1 5.55 0.6 10176.3502004 50 2004 0.64 3.27 5.1 0.43 10176.3502005 50 2005 0.37 3 4.95 0.38 10176.3502006 50 2006 0.24 2.86 4.88 0.35 10176.3502007 50 2007 0.24 2.86 4.88 0.35 10176.3502008 50 2008 0.1 2.72 4.8 0.16 10176.3502009 50 2009 0.1 2.72 4.8 0.16 10176.3502010 50 2010 0.1 2.72 4.8 0.16 10176.3502011 50 2011 0.1 2.72 4.8 0.16 10176.3502012 50 2012 0.1 2.72 4.8 0.16 10176.3502013 50 2013 0.1 2.72 2.9 0.01 10176.3502014 50 2014 0.1 2.72 2.9 0.01 10176.3502015 50 2015 0.1 2.72 2.9 0.01 10176.3502016 50 2016 0.1 2.72 2.9 0.01 10176.3502017 50 2017 0.1 2.72 2.9 0.01 10176.3502018 50 2018 0.1 2.72 2.9 0.01 10176.3502019 50 2019 0.1 2.72 2.9 0.01 10176.3502020 50 2020 0.1 2.72 2.9 0.01 10176.3502021 50 2021 0.1 2.72 2.9 0.01 10176.3502022 50 2022 0.1 2.72 2.9 0.01 10176.3502023 50 2023 0.1 2.72 2.9 0.01 10176.3502024 50 2024 0.1 2.72 2.9 0.01 10176.3502025 50 2025 0.1 2.72 2.9 0.01 10176.3502026 50 2026 0.1 2.72 2.9 0.01 10176.31201968 120 1968 1.44 4.8 13 0.84 10176.31201969 120 1969 1.44 4.8 13 0.84 10176.31201970 120 1970 1.44 4.8 13 0.84 10176.31201971 120 1971 1.44 4.8 13 0.84 10176.31201972 120 1972 1.44 4.8 13 0.84 10176.31201973 120 1973 1.44 4.8 13 0.84 10176.31201974 120 1974 1.44 4.8 13 0.84 10176.31201975 120 1975 1.44 4.8 13 0.84 10176.31201976 120 1976 1.44 4.8 13 0.84 10176.31201977 120 1977 1.44 4.8 13 0.84 10176.31201978 120 1978 1.44 4.8 13 0.84 10176.31201979 120 1979 1.44 4.8 13 0.84 10176.31201980 120 1980 1.44 4.8 13 0.84 10176.31201981 120 1981 1.44 4.8 13 0.84 10176.31201982 120 1982 1.44 4.8 13 0.84 10176.31201983 120 1983 1.44 4.8 13 0.84 10176.31201984 120 1984 1.44 4.8 13 0.84 10176.31201985 120 1985 1.44 4.8 13 0.84 10176.31201986 120 1986 1.44 4.8 13 0.84 10176.31201987 120 1987 1.44 4.8 13 0.84 10176.3
APP-124
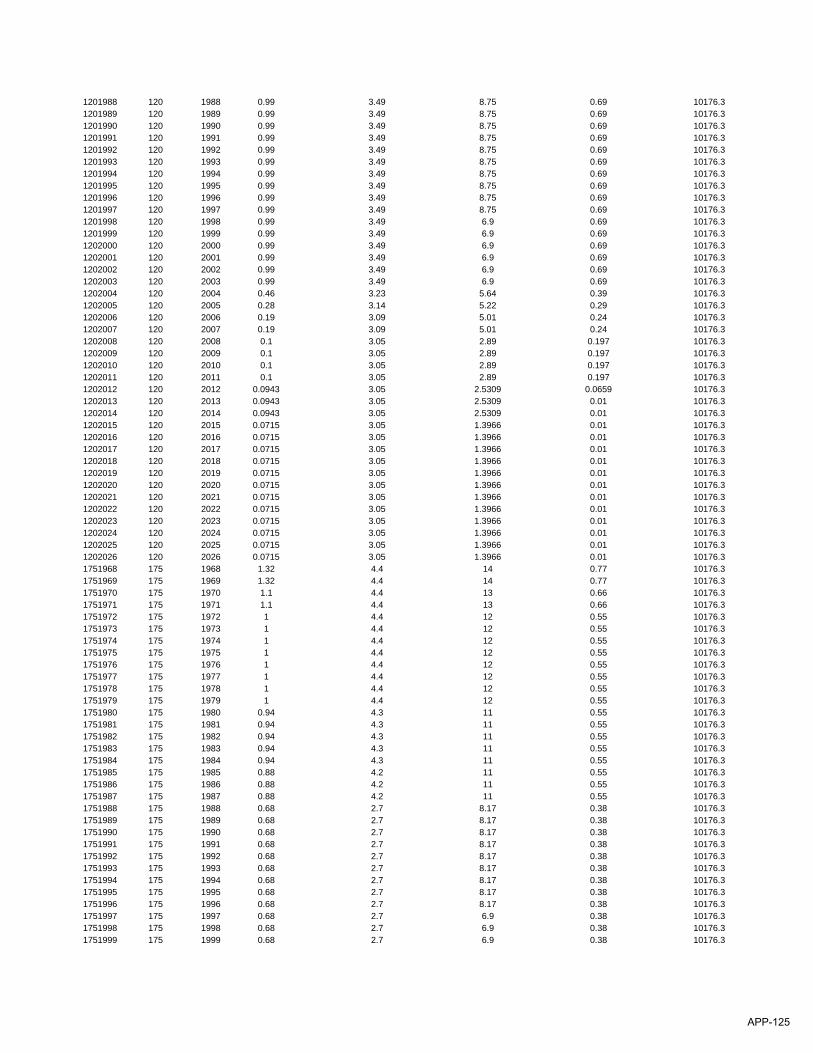
1201988 120 1988 0.99 3.49 8.75 0.69 10176.31201989 120 1989 0.99 3.49 8.75 0.69 10176.31201990 120 1990 0.99 3.49 8.75 0.69 10176.31201991 120 1991 0.99 3.49 8.75 0.69 10176.31201992 120 1992 0.99 3.49 8.75 0.69 10176.31201993 120 1993 0.99 3.49 8.75 0.69 10176.31201994 120 1994 0.99 3.49 8.75 0.69 10176.31201995 120 1995 0.99 3.49 8.75 0.69 10176.31201996 120 1996 0.99 3.49 8.75 0.69 10176.31201997 120 1997 0.99 3.49 8.75 0.69 10176.31201998 120 1998 0.99 3.49 6.9 0.69 10176.31201999 120 1999 0.99 3.49 6.9 0.69 10176.31202000 120 2000 0.99 3.49 6.9 0.69 10176.31202001 120 2001 0.99 3.49 6.9 0.69 10176.31202002 120 2002 0.99 3.49 6.9 0.69 10176.31202003 120 2003 0.99 3.49 6.9 0.69 10176.31202004 120 2004 0.46 3.23 5.64 0.39 10176.31202005 120 2005 0.28 3.14 5.22 0.29 10176.31202006 120 2006 0.19 3.09 5.01 0.24 10176.31202007 120 2007 0.19 3.09 5.01 0.24 10176.31202008 120 2008 0.1 3.05 2.89 0.197 10176.31202009 120 2009 0.1 3.05 2.89 0.197 10176.31202010 120 2010 0.1 3.05 2.89 0.197 10176.31202011 120 2011 0.1 3.05 2.89 0.197 10176.31202012 120 2012 0.0943 3.05 2.5309 0.0659 10176.31202013 120 2013 0.0943 3.05 2.5309 0.01 10176.31202014 120 2014 0.0943 3.05 2.5309 0.01 10176.31202015 120 2015 0.0715 3.05 1.3966 0.01 10176.31202016 120 2016 0.0715 3.05 1.3966 0.01 10176.31202017 120 2017 0.0715 3.05 1.3966 0.01 10176.31202018 120 2018 0.0715 3.05 1.3966 0.01 10176.31202019 120 2019 0.0715 3.05 1.3966 0.01 10176.31202020 120 2020 0.0715 3.05 1.3966 0.01 10176.31202021 120 2021 0.0715 3.05 1.3966 0.01 10176.31202022 120 2022 0.0715 3.05 1.3966 0.01 10176.31202023 120 2023 0.0715 3.05 1.3966 0.01 10176.31202024 120 2024 0.0715 3.05 1.3966 0.01 10176.31202025 120 2025 0.0715 3.05 1.3966 0.01 10176.31202026 120 2026 0.0715 3.05 1.3966 0.01 10176.31751968 175 1968 1.32 4.4 14 0.77 10176.31751969 175 1969 1.32 4.4 14 0.77 10176.31751970 175 1970 1.1 4.4 13 0.66 10176.31751971 175 1971 1.1 4.4 13 0.66 10176.31751972 175 1972 1 4.4 12 0.55 10176.31751973 175 1973 1 4.4 12 0.55 10176.31751974 175 1974 1 4.4 12 0.55 10176.31751975 175 1975 1 4.4 12 0.55 10176.31751976 175 1976 1 4.4 12 0.55 10176.31751977 175 1977 1 4.4 12 0.55 10176.31751978 175 1978 1 4.4 12 0.55 10176.31751979 175 1979 1 4.4 12 0.55 10176.31751980 175 1980 0.94 4.3 11 0.55 10176.31751981 175 1981 0.94 4.3 11 0.55 10176.31751982 175 1982 0.94 4.3 11 0.55 10176.31751983 175 1983 0.94 4.3 11 0.55 10176.31751984 175 1984 0.94 4.3 11 0.55 10176.31751985 175 1985 0.88 4.2 11 0.55 10176.31751986 175 1986 0.88 4.2 11 0.55 10176.31751987 175 1987 0.88 4.2 11 0.55 10176.31751988 175 1988 0.68 2.7 8.17 0.38 10176.31751989 175 1989 0.68 2.7 8.17 0.38 10176.31751990 175 1990 0.68 2.7 8.17 0.38 10176.31751991 175 1991 0.68 2.7 8.17 0.38 10176.31751992 175 1992 0.68 2.7 8.17 0.38 10176.31751993 175 1993 0.68 2.7 8.17 0.38 10176.31751994 175 1994 0.68 2.7 8.17 0.38 10176.31751995 175 1995 0.68 2.7 8.17 0.38 10176.31751996 175 1996 0.68 2.7 8.17 0.38 10176.31751997 175 1997 0.68 2.7 6.9 0.38 10176.31751998 175 1998 0.68 2.7 6.9 0.38 10176.31751999 175 1999 0.68 2.7 6.9 0.38 10176.3
APP-125
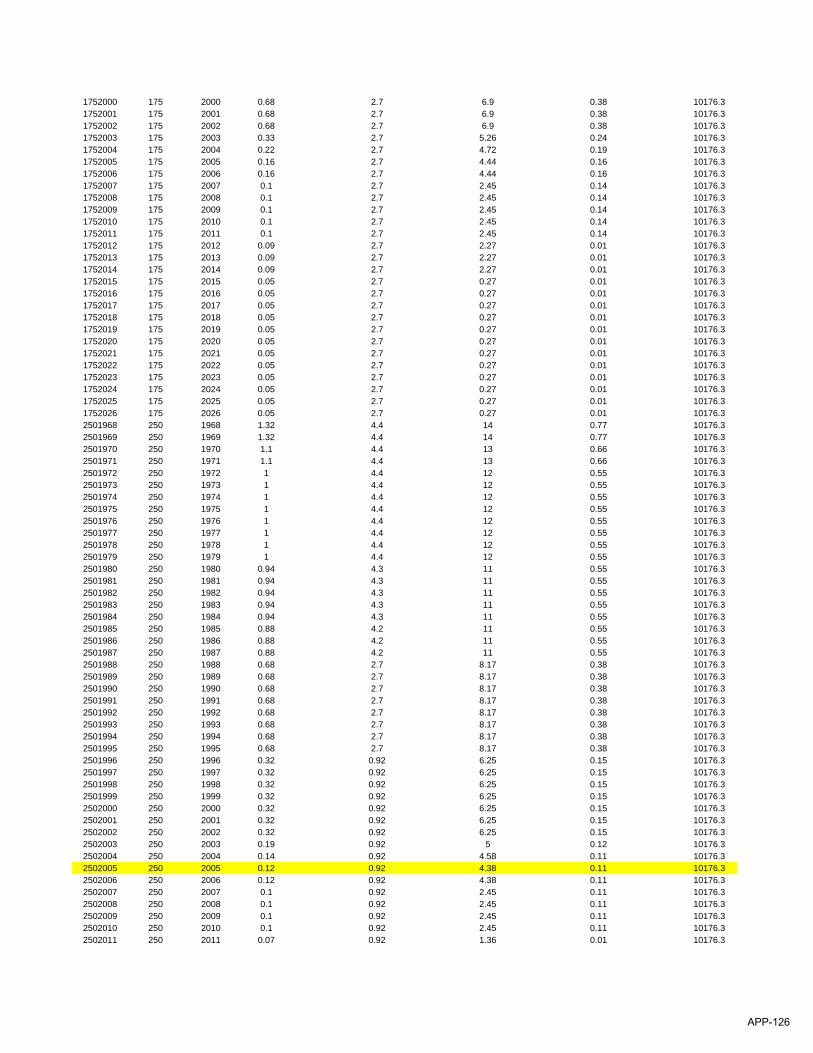
1752000 175 2000 0.68 2.7 6.9 0.38 10176.31752001 175 2001 0.68 2.7 6.9 0.38 10176.31752002 175 2002 0.68 2.7 6.9 0.38 10176.31752003 175 2003 0.33 2.7 5.26 0.24 10176.31752004 175 2004 0.22 2.7 4.72 0.19 10176.31752005 175 2005 0.16 2.7 4.44 0.16 10176.31752006 175 2006 0.16 2.7 4.44 0.16 10176.31752007 175 2007 0.1 2.7 2.45 0.14 10176.31752008 175 2008 0.1 2.7 2.45 0.14 10176.31752009 175 2009 0.1 2.7 2.45 0.14 10176.31752010 175 2010 0.1 2.7 2.45 0.14 10176.31752011 175 2011 0.1 2.7 2.45 0.14 10176.31752012 175 2012 0.09 2.7 2.27 0.01 10176.31752013 175 2013 0.09 2.7 2.27 0.01 10176.31752014 175 2014 0.09 2.7 2.27 0.01 10176.31752015 175 2015 0.05 2.7 0.27 0.01 10176.31752016 175 2016 0.05 2.7 0.27 0.01 10176.31752017 175 2017 0.05 2.7 0.27 0.01 10176.31752018 175 2018 0.05 2.7 0.27 0.01 10176.31752019 175 2019 0.05 2.7 0.27 0.01 10176.31752020 175 2020 0.05 2.7 0.27 0.01 10176.31752021 175 2021 0.05 2.7 0.27 0.01 10176.31752022 175 2022 0.05 2.7 0.27 0.01 10176.31752023 175 2023 0.05 2.7 0.27 0.01 10176.31752024 175 2024 0.05 2.7 0.27 0.01 10176.31752025 175 2025 0.05 2.7 0.27 0.01 10176.31752026 175 2026 0.05 2.7 0.27 0.01 10176.32501968 250 1968 1.32 4.4 14 0.77 10176.32501969 250 1969 1.32 4.4 14 0.77 10176.32501970 250 1970 1.1 4.4 13 0.66 10176.32501971 250 1971 1.1 4.4 13 0.66 10176.32501972 250 1972 1 4.4 12 0.55 10176.32501973 250 1973 1 4.4 12 0.55 10176.32501974 250 1974 1 4.4 12 0.55 10176.32501975 250 1975 1 4.4 12 0.55 10176.32501976 250 1976 1 4.4 12 0.55 10176.32501977 250 1977 1 4.4 12 0.55 10176.32501978 250 1978 1 4.4 12 0.55 10176.32501979 250 1979 1 4.4 12 0.55 10176.32501980 250 1980 0.94 4.3 11 0.55 10176.32501981 250 1981 0.94 4.3 11 0.55 10176.32501982 250 1982 0.94 4.3 11 0.55 10176.32501983 250 1983 0.94 4.3 11 0.55 10176.32501984 250 1984 0.94 4.3 11 0.55 10176.32501985 250 1985 0.88 4.2 11 0.55 10176.32501986 250 1986 0.88 4.2 11 0.55 10176.32501987 250 1987 0.88 4.2 11 0.55 10176.32501988 250 1988 0.68 2.7 8.17 0.38 10176.32501989 250 1989 0.68 2.7 8.17 0.38 10176.32501990 250 1990 0.68 2.7 8.17 0.38 10176.32501991 250 1991 0.68 2.7 8.17 0.38 10176.32501992 250 1992 0.68 2.7 8.17 0.38 10176.32501993 250 1993 0.68 2.7 8.17 0.38 10176.32501994 250 1994 0.68 2.7 8.17 0.38 10176.32501995 250 1995 0.68 2.7 8.17 0.38 10176.32501996 250 1996 0.32 0.92 6.25 0.15 10176.32501997 250 1997 0.32 0.92 6.25 0.15 10176.32501998 250 1998 0.32 0.92 6.25 0.15 10176.32501999 250 1999 0.32 0.92 6.25 0.15 10176.32502000 250 2000 0.32 0.92 6.25 0.15 10176.32502001 250 2001 0.32 0.92 6.25 0.15 10176.32502002 250 2002 0.32 0.92 6.25 0.15 10176.32502003 250 2003 0.19 0.92 5 0.12 10176.32502004 250 2004 0.14 0.92 4.58 0.11 10176.32502005 250 2005 0.12 0.92 4.38 0.11 10176.32502006 250 2006 0.12 0.92 4.38 0.11 10176.32502007 250 2007 0.1 0.92 2.45 0.11 10176.32502008 250 2008 0.1 0.92 2.45 0.11 10176.32502009 250 2009 0.1 0.92 2.45 0.11 10176.32502010 250 2010 0.1 0.92 2.45 0.11 10176.32502011 250 2011 0.07 0.92 1.36 0.01 10176.3
APP-126
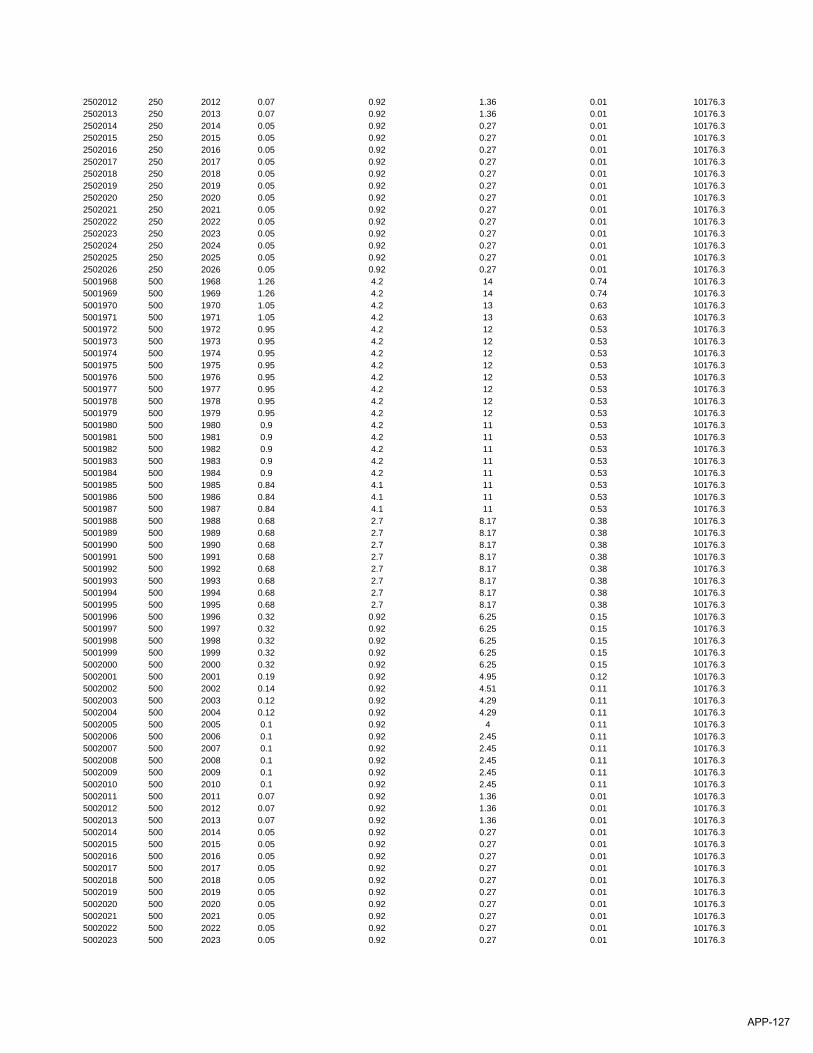
2502012 250 2012 0.07 0.92 1.36 0.01 10176.32502013 250 2013 0.07 0.92 1.36 0.01 10176.32502014 250 2014 0.05 0.92 0.27 0.01 10176.32502015 250 2015 0.05 0.92 0.27 0.01 10176.32502016 250 2016 0.05 0.92 0.27 0.01 10176.32502017 250 2017 0.05 0.92 0.27 0.01 10176.32502018 250 2018 0.05 0.92 0.27 0.01 10176.32502019 250 2019 0.05 0.92 0.27 0.01 10176.32502020 250 2020 0.05 0.92 0.27 0.01 10176.32502021 250 2021 0.05 0.92 0.27 0.01 10176.32502022 250 2022 0.05 0.92 0.27 0.01 10176.32502023 250 2023 0.05 0.92 0.27 0.01 10176.32502024 250 2024 0.05 0.92 0.27 0.01 10176.32502025 250 2025 0.05 0.92 0.27 0.01 10176.32502026 250 2026 0.05 0.92 0.27 0.01 10176.35001968 500 1968 1.26 4.2 14 0.74 10176.35001969 500 1969 1.26 4.2 14 0.74 10176.35001970 500 1970 1.05 4.2 13 0.63 10176.35001971 500 1971 1.05 4.2 13 0.63 10176.35001972 500 1972 0.95 4.2 12 0.53 10176.35001973 500 1973 0.95 4.2 12 0.53 10176.35001974 500 1974 0.95 4.2 12 0.53 10176.35001975 500 1975 0.95 4.2 12 0.53 10176.35001976 500 1976 0.95 4.2 12 0.53 10176.35001977 500 1977 0.95 4.2 12 0.53 10176.35001978 500 1978 0.95 4.2 12 0.53 10176.35001979 500 1979 0.95 4.2 12 0.53 10176.35001980 500 1980 0.9 4.2 11 0.53 10176.35001981 500 1981 0.9 4.2 11 0.53 10176.35001982 500 1982 0.9 4.2 11 0.53 10176.35001983 500 1983 0.9 4.2 11 0.53 10176.35001984 500 1984 0.9 4.2 11 0.53 10176.35001985 500 1985 0.84 4.1 11 0.53 10176.35001986 500 1986 0.84 4.1 11 0.53 10176.35001987 500 1987 0.84 4.1 11 0.53 10176.35001988 500 1988 0.68 2.7 8.17 0.38 10176.35001989 500 1989 0.68 2.7 8.17 0.38 10176.35001990 500 1990 0.68 2.7 8.17 0.38 10176.35001991 500 1991 0.68 2.7 8.17 0.38 10176.35001992 500 1992 0.68 2.7 8.17 0.38 10176.35001993 500 1993 0.68 2.7 8.17 0.38 10176.35001994 500 1994 0.68 2.7 8.17 0.38 10176.35001995 500 1995 0.68 2.7 8.17 0.38 10176.35001996 500 1996 0.32 0.92 6.25 0.15 10176.35001997 500 1997 0.32 0.92 6.25 0.15 10176.35001998 500 1998 0.32 0.92 6.25 0.15 10176.35001999 500 1999 0.32 0.92 6.25 0.15 10176.35002000 500 2000 0.32 0.92 6.25 0.15 10176.35002001 500 2001 0.19 0.92 4.95 0.12 10176.35002002 500 2002 0.14 0.92 4.51 0.11 10176.35002003 500 2003 0.12 0.92 4.29 0.11 10176.35002004 500 2004 0.12 0.92 4.29 0.11 10176.35002005 500 2005 0.1 0.92 4 0.11 10176.35002006 500 2006 0.1 0.92 2.45 0.11 10176.35002007 500 2007 0.1 0.92 2.45 0.11 10176.35002008 500 2008 0.1 0.92 2.45 0.11 10176.35002009 500 2009 0.1 0.92 2.45 0.11 10176.35002010 500 2010 0.1 0.92 2.45 0.11 10176.35002011 500 2011 0.07 0.92 1.36 0.01 10176.35002012 500 2012 0.07 0.92 1.36 0.01 10176.35002013 500 2013 0.07 0.92 1.36 0.01 10176.35002014 500 2014 0.05 0.92 0.27 0.01 10176.35002015 500 2015 0.05 0.92 0.27 0.01 10176.35002016 500 2016 0.05 0.92 0.27 0.01 10176.35002017 500 2017 0.05 0.92 0.27 0.01 10176.35002018 500 2018 0.05 0.92 0.27 0.01 10176.35002019 500 2019 0.05 0.92 0.27 0.01 10176.35002020 500 2020 0.05 0.92 0.27 0.01 10176.35002021 500 2021 0.05 0.92 0.27 0.01 10176.35002022 500 2022 0.05 0.92 0.27 0.01 10176.35002023 500 2023 0.05 0.92 0.27 0.01 10176.3
APP-127
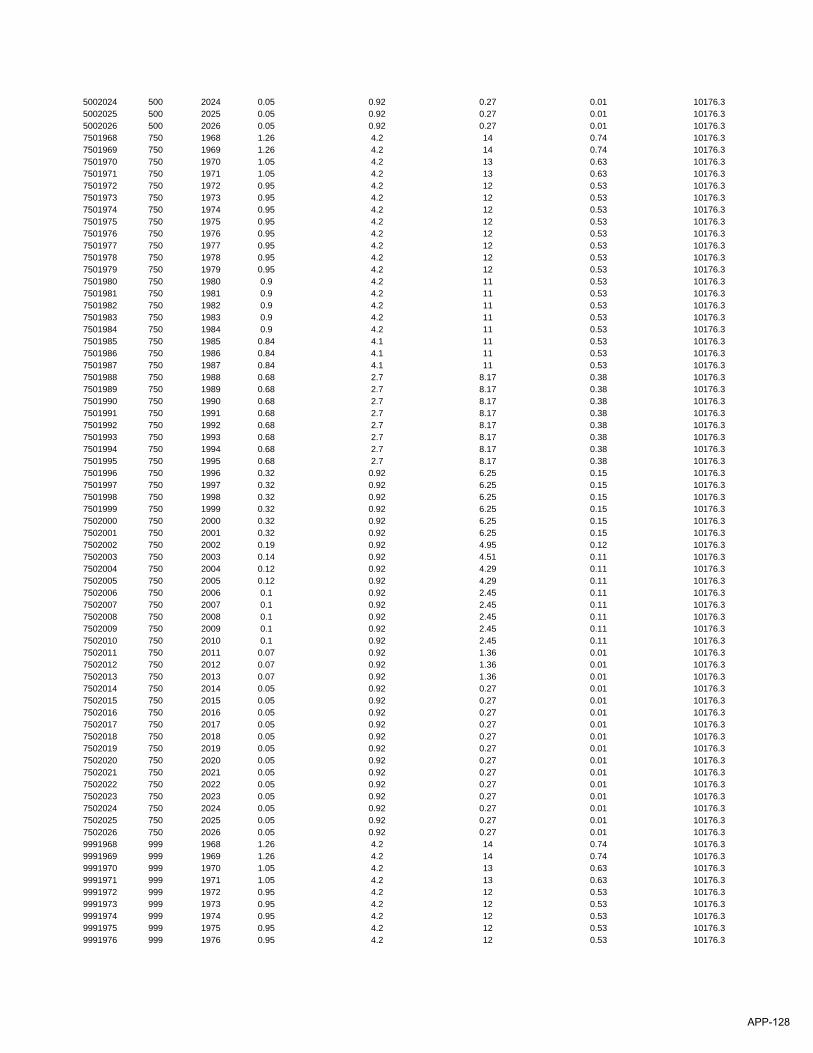
5002024 500 2024 0.05 0.92 0.27 0.01 10176.35002025 500 2025 0.05 0.92 0.27 0.01 10176.35002026 500 2026 0.05 0.92 0.27 0.01 10176.37501968 750 1968 1.26 4.2 14 0.74 10176.37501969 750 1969 1.26 4.2 14 0.74 10176.37501970 750 1970 1.05 4.2 13 0.63 10176.37501971 750 1971 1.05 4.2 13 0.63 10176.37501972 750 1972 0.95 4.2 12 0.53 10176.37501973 750 1973 0.95 4.2 12 0.53 10176.37501974 750 1974 0.95 4.2 12 0.53 10176.37501975 750 1975 0.95 4.2 12 0.53 10176.37501976 750 1976 0.95 4.2 12 0.53 10176.37501977 750 1977 0.95 4.2 12 0.53 10176.37501978 750 1978 0.95 4.2 12 0.53 10176.37501979 750 1979 0.95 4.2 12 0.53 10176.37501980 750 1980 0.9 4.2 11 0.53 10176.37501981 750 1981 0.9 4.2 11 0.53 10176.37501982 750 1982 0.9 4.2 11 0.53 10176.37501983 750 1983 0.9 4.2 11 0.53 10176.37501984 750 1984 0.9 4.2 11 0.53 10176.37501985 750 1985 0.84 4.1 11 0.53 10176.37501986 750 1986 0.84 4.1 11 0.53 10176.37501987 750 1987 0.84 4.1 11 0.53 10176.37501988 750 1988 0.68 2.7 8.17 0.38 10176.37501989 750 1989 0.68 2.7 8.17 0.38 10176.37501990 750 1990 0.68 2.7 8.17 0.38 10176.37501991 750 1991 0.68 2.7 8.17 0.38 10176.37501992 750 1992 0.68 2.7 8.17 0.38 10176.37501993 750 1993 0.68 2.7 8.17 0.38 10176.37501994 750 1994 0.68 2.7 8.17 0.38 10176.37501995 750 1995 0.68 2.7 8.17 0.38 10176.37501996 750 1996 0.32 0.92 6.25 0.15 10176.37501997 750 1997 0.32 0.92 6.25 0.15 10176.37501998 750 1998 0.32 0.92 6.25 0.15 10176.37501999 750 1999 0.32 0.92 6.25 0.15 10176.37502000 750 2000 0.32 0.92 6.25 0.15 10176.37502001 750 2001 0.32 0.92 6.25 0.15 10176.37502002 750 2002 0.19 0.92 4.95 0.12 10176.37502003 750 2003 0.14 0.92 4.51 0.11 10176.37502004 750 2004 0.12 0.92 4.29 0.11 10176.37502005 750 2005 0.12 0.92 4.29 0.11 10176.37502006 750 2006 0.1 0.92 2.45 0.11 10176.37502007 750 2007 0.1 0.92 2.45 0.11 10176.37502008 750 2008 0.1 0.92 2.45 0.11 10176.37502009 750 2009 0.1 0.92 2.45 0.11 10176.37502010 750 2010 0.1 0.92 2.45 0.11 10176.37502011 750 2011 0.07 0.92 1.36 0.01 10176.37502012 750 2012 0.07 0.92 1.36 0.01 10176.37502013 750 2013 0.07 0.92 1.36 0.01 10176.37502014 750 2014 0.05 0.92 0.27 0.01 10176.37502015 750 2015 0.05 0.92 0.27 0.01 10176.37502016 750 2016 0.05 0.92 0.27 0.01 10176.37502017 750 2017 0.05 0.92 0.27 0.01 10176.37502018 750 2018 0.05 0.92 0.27 0.01 10176.37502019 750 2019 0.05 0.92 0.27 0.01 10176.37502020 750 2020 0.05 0.92 0.27 0.01 10176.37502021 750 2021 0.05 0.92 0.27 0.01 10176.37502022 750 2022 0.05 0.92 0.27 0.01 10176.37502023 750 2023 0.05 0.92 0.27 0.01 10176.37502024 750 2024 0.05 0.92 0.27 0.01 10176.37502025 750 2025 0.05 0.92 0.27 0.01 10176.37502026 750 2026 0.05 0.92 0.27 0.01 10176.39991968 999 1968 1.26 4.2 14 0.74 10176.39991969 999 1969 1.26 4.2 14 0.74 10176.39991970 999 1970 1.05 4.2 13 0.63 10176.39991971 999 1971 1.05 4.2 13 0.63 10176.39991972 999 1972 0.95 4.2 12 0.53 10176.39991973 999 1973 0.95 4.2 12 0.53 10176.39991974 999 1974 0.95 4.2 12 0.53 10176.39991975 999 1975 0.95 4.2 12 0.53 10176.39991976 999 1976 0.95 4.2 12 0.53 10176.3
APP-128
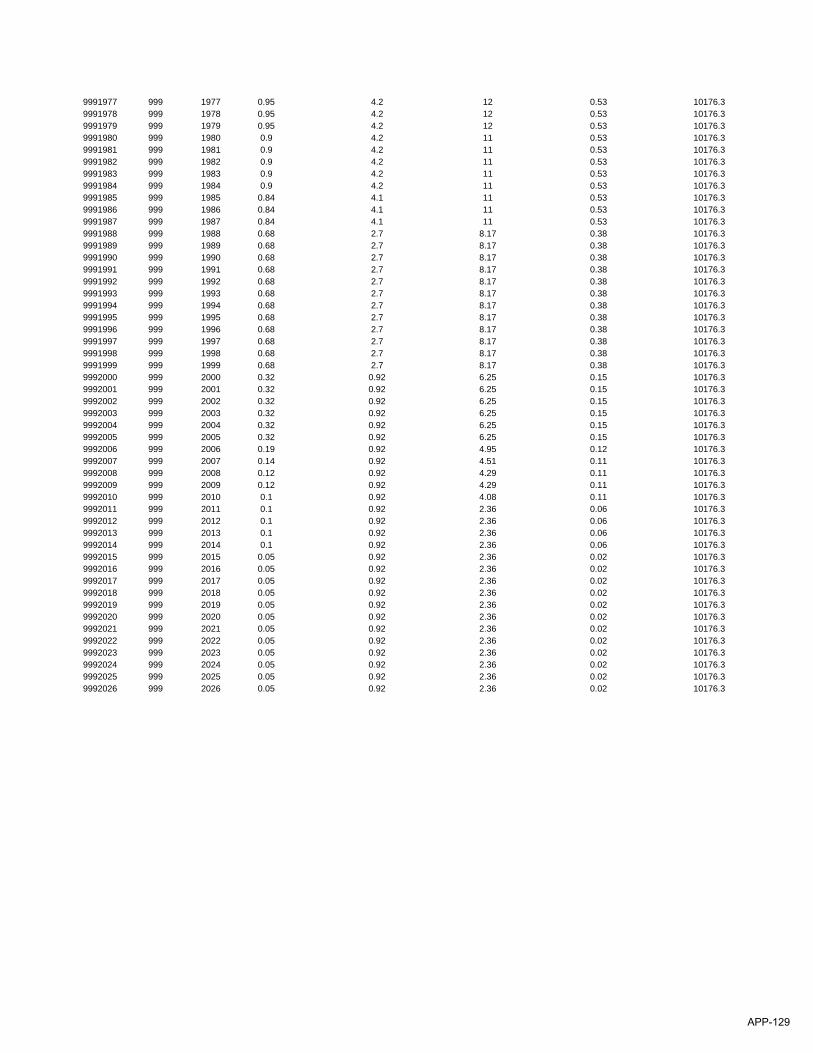
9991977 999 1977 0.95 4.2 12 0.53 10176.39991978 999 1978 0.95 4.2 12 0.53 10176.39991979 999 1979 0.95 4.2 12 0.53 10176.39991980 999 1980 0.9 4.2 11 0.53 10176.39991981 999 1981 0.9 4.2 11 0.53 10176.39991982 999 1982 0.9 4.2 11 0.53 10176.39991983 999 1983 0.9 4.2 11 0.53 10176.39991984 999 1984 0.9 4.2 11 0.53 10176.39991985 999 1985 0.84 4.1 11 0.53 10176.39991986 999 1986 0.84 4.1 11 0.53 10176.39991987 999 1987 0.84 4.1 11 0.53 10176.39991988 999 1988 0.68 2.7 8.17 0.38 10176.39991989 999 1989 0.68 2.7 8.17 0.38 10176.39991990 999 1990 0.68 2.7 8.17 0.38 10176.39991991 999 1991 0.68 2.7 8.17 0.38 10176.39991992 999 1992 0.68 2.7 8.17 0.38 10176.39991993 999 1993 0.68 2.7 8.17 0.38 10176.39991994 999 1994 0.68 2.7 8.17 0.38 10176.39991995 999 1995 0.68 2.7 8.17 0.38 10176.39991996 999 1996 0.68 2.7 8.17 0.38 10176.39991997 999 1997 0.68 2.7 8.17 0.38 10176.39991998 999 1998 0.68 2.7 8.17 0.38 10176.39991999 999 1999 0.68 2.7 8.17 0.38 10176.39992000 999 2000 0.32 0.92 6.25 0.15 10176.39992001 999 2001 0.32 0.92 6.25 0.15 10176.39992002 999 2002 0.32 0.92 6.25 0.15 10176.39992003 999 2003 0.32 0.92 6.25 0.15 10176.39992004 999 2004 0.32 0.92 6.25 0.15 10176.39992005 999 2005 0.32 0.92 6.25 0.15 10176.39992006 999 2006 0.19 0.92 4.95 0.12 10176.39992007 999 2007 0.14 0.92 4.51 0.11 10176.39992008 999 2008 0.12 0.92 4.29 0.11 10176.39992009 999 2009 0.12 0.92 4.29 0.11 10176.39992010 999 2010 0.1 0.92 4.08 0.11 10176.39992011 999 2011 0.1 0.92 2.36 0.06 10176.39992012 999 2012 0.1 0.92 2.36 0.06 10176.39992013 999 2013 0.1 0.92 2.36 0.06 10176.39992014 999 2014 0.1 0.92 2.36 0.06 10176.39992015 999 2015 0.05 0.92 2.36 0.02 10176.39992016 999 2016 0.05 0.92 2.36 0.02 10176.39992017 999 2017 0.05 0.92 2.36 0.02 10176.39992018 999 2018 0.05 0.92 2.36 0.02 10176.39992019 999 2019 0.05 0.92 2.36 0.02 10176.39992020 999 2020 0.05 0.92 2.36 0.02 10176.39992021 999 2021 0.05 0.92 2.36 0.02 10176.39992022 999 2022 0.05 0.92 2.36 0.02 10176.39992023 999 2023 0.05 0.92 2.36 0.02 10176.39992024 999 2024 0.05 0.92 2.36 0.02 10176.39992025 999 2025 0.05 0.92 2.36 0.02 10176.39992026 999 2026 0.05 0.92 2.36 0.02 10176.3
APP-129
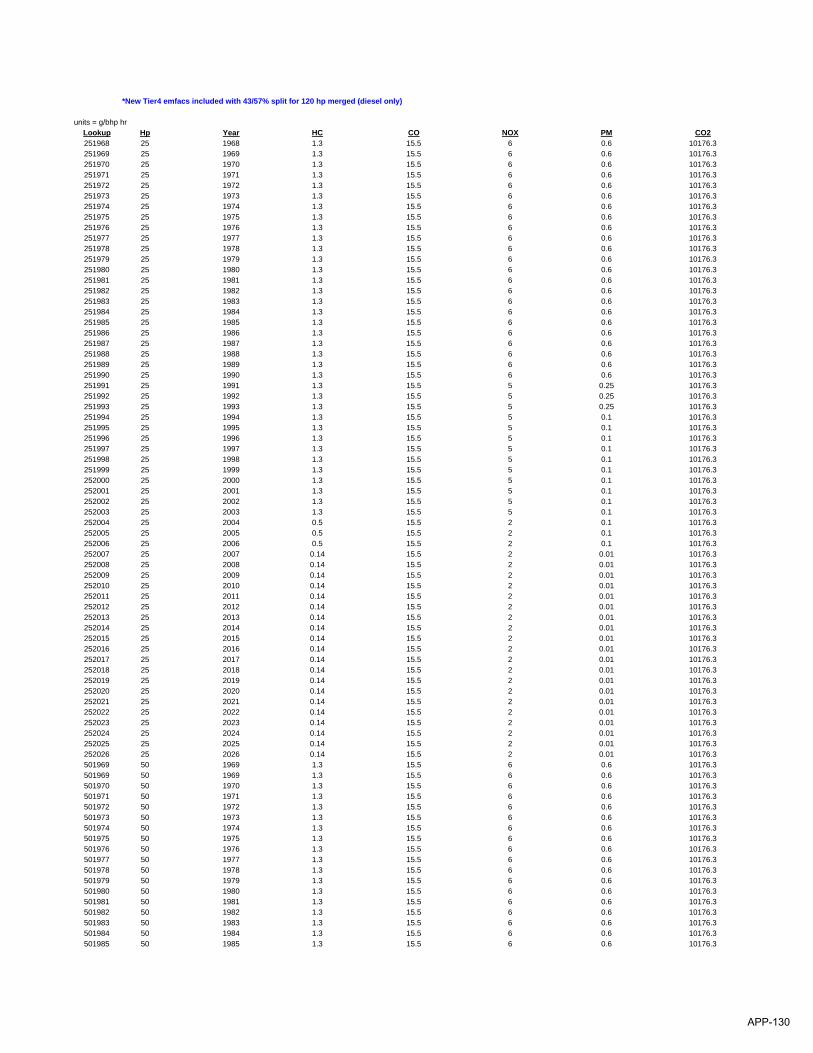
*New Tier4 emfacs included with 43/57% split for 120 hp merged (diesel only)
units = g/bhp hrLookup Hp Year HC CO NOX PM CO2251968 25 1968 1.3 15.5 6 0.6 10176.3251969 25 1969 1.3 15.5 6 0.6 10176.3251970 25 1970 1.3 15.5 6 0.6 10176.3251971 25 1971 1.3 15.5 6 0.6 10176.3251972 25 1972 1.3 15.5 6 0.6 10176.3251973 25 1973 1.3 15.5 6 0.6 10176.3251974 25 1974 1.3 15.5 6 0.6 10176.3251975 25 1975 1.3 15.5 6 0.6 10176.3251976 25 1976 1.3 15.5 6 0.6 10176.3251977 25 1977 1.3 15.5 6 0.6 10176.3251978 25 1978 1.3 15.5 6 0.6 10176.3251979 25 1979 1.3 15.5 6 0.6 10176.3251980 25 1980 1.3 15.5 6 0.6 10176.3251981 25 1981 1.3 15.5 6 0.6 10176.3251982 25 1982 1.3 15.5 6 0.6 10176.3251983 25 1983 1.3 15.5 6 0.6 10176.3251984 25 1984 1.3 15.5 6 0.6 10176.3251985 25 1985 1.3 15.5 6 0.6 10176.3251986 25 1986 1.3 15.5 6 0.6 10176.3251987 25 1987 1.3 15.5 6 0.6 10176.3251988 25 1988 1.3 15.5 6 0.6 10176.3251989 25 1989 1.3 15.5 6 0.6 10176.3251990 25 1990 1.3 15.5 6 0.6 10176.3251991 25 1991 1.3 15.5 5 0.25 10176.3251992 25 1992 1.3 15.5 5 0.25 10176.3251993 25 1993 1.3 15.5 5 0.25 10176.3251994 25 1994 1.3 15.5 5 0.1 10176.3251995 25 1995 1.3 15.5 5 0.1 10176.3251996 25 1996 1.3 15.5 5 0.1 10176.3251997 25 1997 1.3 15.5 5 0.1 10176.3251998 25 1998 1.3 15.5 5 0.1 10176.3251999 25 1999 1.3 15.5 5 0.1 10176.3252000 25 2000 1.3 15.5 5 0.1 10176.3252001 25 2001 1.3 15.5 5 0.1 10176.3252002 25 2002 1.3 15.5 5 0.1 10176.3252003 25 2003 1.3 15.5 5 0.1 10176.3252004 25 2004 0.5 15.5 2 0.1 10176.3252005 25 2005 0.5 15.5 2 0.1 10176.3252006 25 2006 0.5 15.5 2 0.1 10176.3252007 25 2007 0.14 15.5 2 0.01 10176.3252008 25 2008 0.14 15.5 2 0.01 10176.3252009 25 2009 0.14 15.5 2 0.01 10176.3252010 25 2010 0.14 15.5 2 0.01 10176.3252011 25 2011 0.14 15.5 2 0.01 10176.3252012 25 2012 0.14 15.5 2 0.01 10176.3252013 25 2013 0.14 15.5 2 0.01 10176.3252014 25 2014 0.14 15.5 2 0.01 10176.3252015 25 2015 0.14 15.5 2 0.01 10176.3252016 25 2016 0.14 15.5 2 0.01 10176.3252017 25 2017 0.14 15.5 2 0.01 10176.3252018 25 2018 0.14 15.5 2 0.01 10176.3252019 25 2019 0.14 15.5 2 0.01 10176.3252020 25 2020 0.14 15.5 2 0.01 10176.3252021 25 2021 0.14 15.5 2 0.01 10176.3252022 25 2022 0.14 15.5 2 0.01 10176.3252023 25 2023 0.14 15.5 2 0.01 10176.3252024 25 2024 0.14 15.5 2 0.01 10176.3252025 25 2025 0.14 15.5 2 0.01 10176.3252026 25 2026 0.14 15.5 2 0.01 10176.3501969 50 1969 1.3 15.5 6 0.6 10176.3501969 50 1969 1.3 15.5 6 0.6 10176.3501970 50 1970 1.3 15.5 6 0.6 10176.3501971 50 1971 1.3 15.5 6 0.6 10176.3501972 50 1972 1.3 15.5 6 0.6 10176.3501973 50 1973 1.3 15.5 6 0.6 10176.3501974 50 1974 1.3 15.5 6 0.6 10176.3501975 50 1975 1.3 15.5 6 0.6 10176.3501976 50 1976 1.3 15.5 6 0.6 10176.3501977 50 1977 1.3 15.5 6 0.6 10176.3501978 50 1978 1.3 15.5 6 0.6 10176.3501979 50 1979 1.3 15.5 6 0.6 10176.3501980 50 1980 1.3 15.5 6 0.6 10176.3501981 50 1981 1.3 15.5 6 0.6 10176.3501982 50 1982 1.3 15.5 6 0.6 10176.3501983 50 1983 1.3 15.5 6 0.6 10176.3501984 50 1984 1.3 15.5 6 0.6 10176.3501985 50 1985 1.3 15.5 6 0.6 10176.3
APP-130
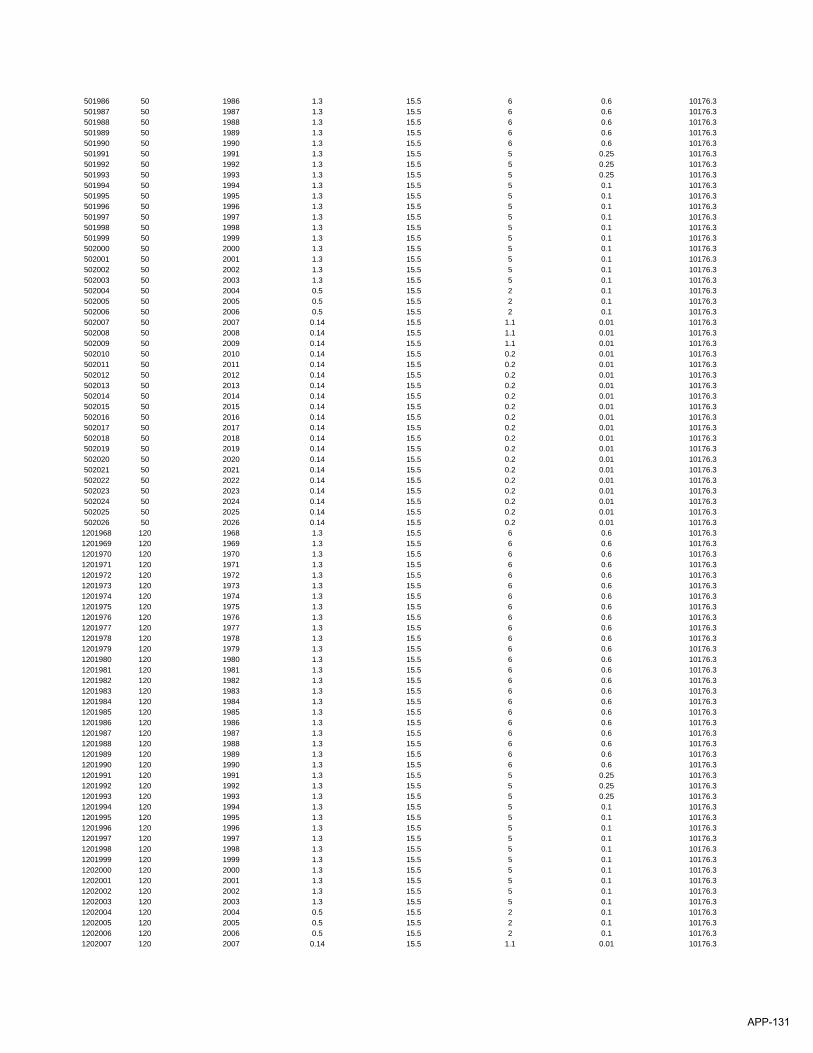
501986 50 1986 1.3 15.5 6 0.6 10176.3501987 50 1987 1.3 15.5 6 0.6 10176.3501988 50 1988 1.3 15.5 6 0.6 10176.3501989 50 1989 1.3 15.5 6 0.6 10176.3501990 50 1990 1.3 15.5 6 0.6 10176.3501991 50 1991 1.3 15.5 5 0.25 10176.3501992 50 1992 1.3 15.5 5 0.25 10176.3501993 50 1993 1.3 15.5 5 0.25 10176.3501994 50 1994 1.3 15.5 5 0.1 10176.3501995 50 1995 1.3 15.5 5 0.1 10176.3501996 50 1996 1.3 15.5 5 0.1 10176.3501997 50 1997 1.3 15.5 5 0.1 10176.3501998 50 1998 1.3 15.5 5 0.1 10176.3501999 50 1999 1.3 15.5 5 0.1 10176.3502000 50 2000 1.3 15.5 5 0.1 10176.3502001 50 2001 1.3 15.5 5 0.1 10176.3502002 50 2002 1.3 15.5 5 0.1 10176.3502003 50 2003 1.3 15.5 5 0.1 10176.3502004 50 2004 0.5 15.5 2 0.1 10176.3502005 50 2005 0.5 15.5 2 0.1 10176.3502006 50 2006 0.5 15.5 2 0.1 10176.3502007 50 2007 0.14 15.5 1.1 0.01 10176.3502008 50 2008 0.14 15.5 1.1 0.01 10176.3502009 50 2009 0.14 15.5 1.1 0.01 10176.3502010 50 2010 0.14 15.5 0.2 0.01 10176.3502011 50 2011 0.14 15.5 0.2 0.01 10176.3502012 50 2012 0.14 15.5 0.2 0.01 10176.3502013 50 2013 0.14 15.5 0.2 0.01 10176.3502014 50 2014 0.14 15.5 0.2 0.01 10176.3502015 50 2015 0.14 15.5 0.2 0.01 10176.3502016 50 2016 0.14 15.5 0.2 0.01 10176.3502017 50 2017 0.14 15.5 0.2 0.01 10176.3502018 50 2018 0.14 15.5 0.2 0.01 10176.3502019 50 2019 0.14 15.5 0.2 0.01 10176.3502020 50 2020 0.14 15.5 0.2 0.01 10176.3502021 50 2021 0.14 15.5 0.2 0.01 10176.3502022 50 2022 0.14 15.5 0.2 0.01 10176.3502023 50 2023 0.14 15.5 0.2 0.01 10176.3502024 50 2024 0.14 15.5 0.2 0.01 10176.3502025 50 2025 0.14 15.5 0.2 0.01 10176.3502026 50 2026 0.14 15.5 0.2 0.01 10176.3
1201968 120 1968 1.3 15.5 6 0.6 10176.31201969 120 1969 1.3 15.5 6 0.6 10176.31201970 120 1970 1.3 15.5 6 0.6 10176.31201971 120 1971 1.3 15.5 6 0.6 10176.31201972 120 1972 1.3 15.5 6 0.6 10176.31201973 120 1973 1.3 15.5 6 0.6 10176.31201974 120 1974 1.3 15.5 6 0.6 10176.31201975 120 1975 1.3 15.5 6 0.6 10176.31201976 120 1976 1.3 15.5 6 0.6 10176.31201977 120 1977 1.3 15.5 6 0.6 10176.31201978 120 1978 1.3 15.5 6 0.6 10176.31201979 120 1979 1.3 15.5 6 0.6 10176.31201980 120 1980 1.3 15.5 6 0.6 10176.31201981 120 1981 1.3 15.5 6 0.6 10176.31201982 120 1982 1.3 15.5 6 0.6 10176.31201983 120 1983 1.3 15.5 6 0.6 10176.31201984 120 1984 1.3 15.5 6 0.6 10176.31201985 120 1985 1.3 15.5 6 0.6 10176.31201986 120 1986 1.3 15.5 6 0.6 10176.31201987 120 1987 1.3 15.5 6 0.6 10176.31201988 120 1988 1.3 15.5 6 0.6 10176.31201989 120 1989 1.3 15.5 6 0.6 10176.31201990 120 1990 1.3 15.5 6 0.6 10176.31201991 120 1991 1.3 15.5 5 0.25 10176.31201992 120 1992 1.3 15.5 5 0.25 10176.31201993 120 1993 1.3 15.5 5 0.25 10176.31201994 120 1994 1.3 15.5 5 0.1 10176.31201995 120 1995 1.3 15.5 5 0.1 10176.31201996 120 1996 1.3 15.5 5 0.1 10176.31201997 120 1997 1.3 15.5 5 0.1 10176.31201998 120 1998 1.3 15.5 5 0.1 10176.31201999 120 1999 1.3 15.5 5 0.1 10176.31202000 120 2000 1.3 15.5 5 0.1 10176.31202001 120 2001 1.3 15.5 5 0.1 10176.31202002 120 2002 1.3 15.5 5 0.1 10176.31202003 120 2003 1.3 15.5 5 0.1 10176.31202004 120 2004 0.5 15.5 2 0.1 10176.31202005 120 2005 0.5 15.5 2 0.1 10176.31202006 120 2006 0.5 15.5 2 0.1 10176.31202007 120 2007 0.14 15.5 1.1 0.01 10176.3
APP-131
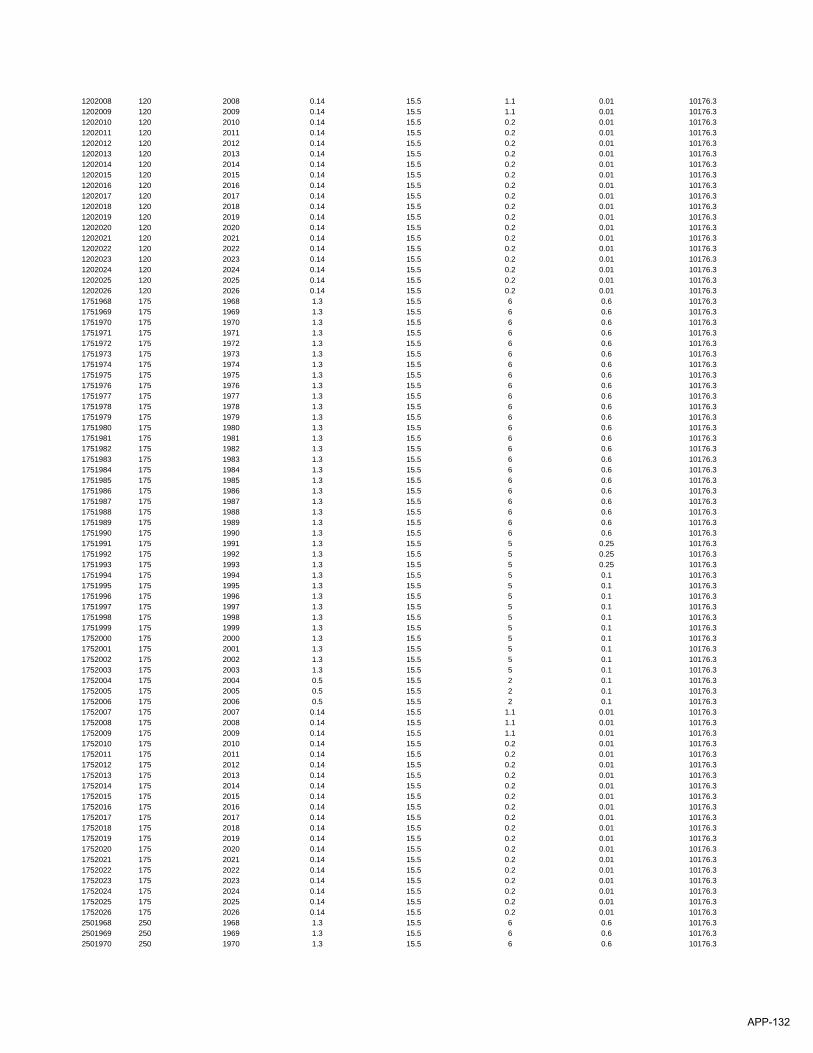
1202008 120 2008 0.14 15.5 1.1 0.01 10176.31202009 120 2009 0.14 15.5 1.1 0.01 10176.31202010 120 2010 0.14 15.5 0.2 0.01 10176.31202011 120 2011 0.14 15.5 0.2 0.01 10176.31202012 120 2012 0.14 15.5 0.2 0.01 10176.31202013 120 2013 0.14 15.5 0.2 0.01 10176.31202014 120 2014 0.14 15.5 0.2 0.01 10176.31202015 120 2015 0.14 15.5 0.2 0.01 10176.31202016 120 2016 0.14 15.5 0.2 0.01 10176.31202017 120 2017 0.14 15.5 0.2 0.01 10176.31202018 120 2018 0.14 15.5 0.2 0.01 10176.31202019 120 2019 0.14 15.5 0.2 0.01 10176.31202020 120 2020 0.14 15.5 0.2 0.01 10176.31202021 120 2021 0.14 15.5 0.2 0.01 10176.31202022 120 2022 0.14 15.5 0.2 0.01 10176.31202023 120 2023 0.14 15.5 0.2 0.01 10176.31202024 120 2024 0.14 15.5 0.2 0.01 10176.31202025 120 2025 0.14 15.5 0.2 0.01 10176.31202026 120 2026 0.14 15.5 0.2 0.01 10176.31751968 175 1968 1.3 15.5 6 0.6 10176.31751969 175 1969 1.3 15.5 6 0.6 10176.31751970 175 1970 1.3 15.5 6 0.6 10176.31751971 175 1971 1.3 15.5 6 0.6 10176.31751972 175 1972 1.3 15.5 6 0.6 10176.31751973 175 1973 1.3 15.5 6 0.6 10176.31751974 175 1974 1.3 15.5 6 0.6 10176.31751975 175 1975 1.3 15.5 6 0.6 10176.31751976 175 1976 1.3 15.5 6 0.6 10176.31751977 175 1977 1.3 15.5 6 0.6 10176.31751978 175 1978 1.3 15.5 6 0.6 10176.31751979 175 1979 1.3 15.5 6 0.6 10176.31751980 175 1980 1.3 15.5 6 0.6 10176.31751981 175 1981 1.3 15.5 6 0.6 10176.31751982 175 1982 1.3 15.5 6 0.6 10176.31751983 175 1983 1.3 15.5 6 0.6 10176.31751984 175 1984 1.3 15.5 6 0.6 10176.31751985 175 1985 1.3 15.5 6 0.6 10176.31751986 175 1986 1.3 15.5 6 0.6 10176.31751987 175 1987 1.3 15.5 6 0.6 10176.31751988 175 1988 1.3 15.5 6 0.6 10176.31751989 175 1989 1.3 15.5 6 0.6 10176.31751990 175 1990 1.3 15.5 6 0.6 10176.31751991 175 1991 1.3 15.5 5 0.25 10176.31751992 175 1992 1.3 15.5 5 0.25 10176.31751993 175 1993 1.3 15.5 5 0.25 10176.31751994 175 1994 1.3 15.5 5 0.1 10176.31751995 175 1995 1.3 15.5 5 0.1 10176.31751996 175 1996 1.3 15.5 5 0.1 10176.31751997 175 1997 1.3 15.5 5 0.1 10176.31751998 175 1998 1.3 15.5 5 0.1 10176.31751999 175 1999 1.3 15.5 5 0.1 10176.31752000 175 2000 1.3 15.5 5 0.1 10176.31752001 175 2001 1.3 15.5 5 0.1 10176.31752002 175 2002 1.3 15.5 5 0.1 10176.31752003 175 2003 1.3 15.5 5 0.1 10176.31752004 175 2004 0.5 15.5 2 0.1 10176.31752005 175 2005 0.5 15.5 2 0.1 10176.31752006 175 2006 0.5 15.5 2 0.1 10176.31752007 175 2007 0.14 15.5 1.1 0.01 10176.31752008 175 2008 0.14 15.5 1.1 0.01 10176.31752009 175 2009 0.14 15.5 1.1 0.01 10176.31752010 175 2010 0.14 15.5 0.2 0.01 10176.31752011 175 2011 0.14 15.5 0.2 0.01 10176.31752012 175 2012 0.14 15.5 0.2 0.01 10176.31752013 175 2013 0.14 15.5 0.2 0.01 10176.31752014 175 2014 0.14 15.5 0.2 0.01 10176.31752015 175 2015 0.14 15.5 0.2 0.01 10176.31752016 175 2016 0.14 15.5 0.2 0.01 10176.31752017 175 2017 0.14 15.5 0.2 0.01 10176.31752018 175 2018 0.14 15.5 0.2 0.01 10176.31752019 175 2019 0.14 15.5 0.2 0.01 10176.31752020 175 2020 0.14 15.5 0.2 0.01 10176.31752021 175 2021 0.14 15.5 0.2 0.01 10176.31752022 175 2022 0.14 15.5 0.2 0.01 10176.31752023 175 2023 0.14 15.5 0.2 0.01 10176.31752024 175 2024 0.14 15.5 0.2 0.01 10176.31752025 175 2025 0.14 15.5 0.2 0.01 10176.31752026 175 2026 0.14 15.5 0.2 0.01 10176.32501968 250 1968 1.3 15.5 6 0.6 10176.32501969 250 1969 1.3 15.5 6 0.6 10176.32501970 250 1970 1.3 15.5 6 0.6 10176.3
APP-132
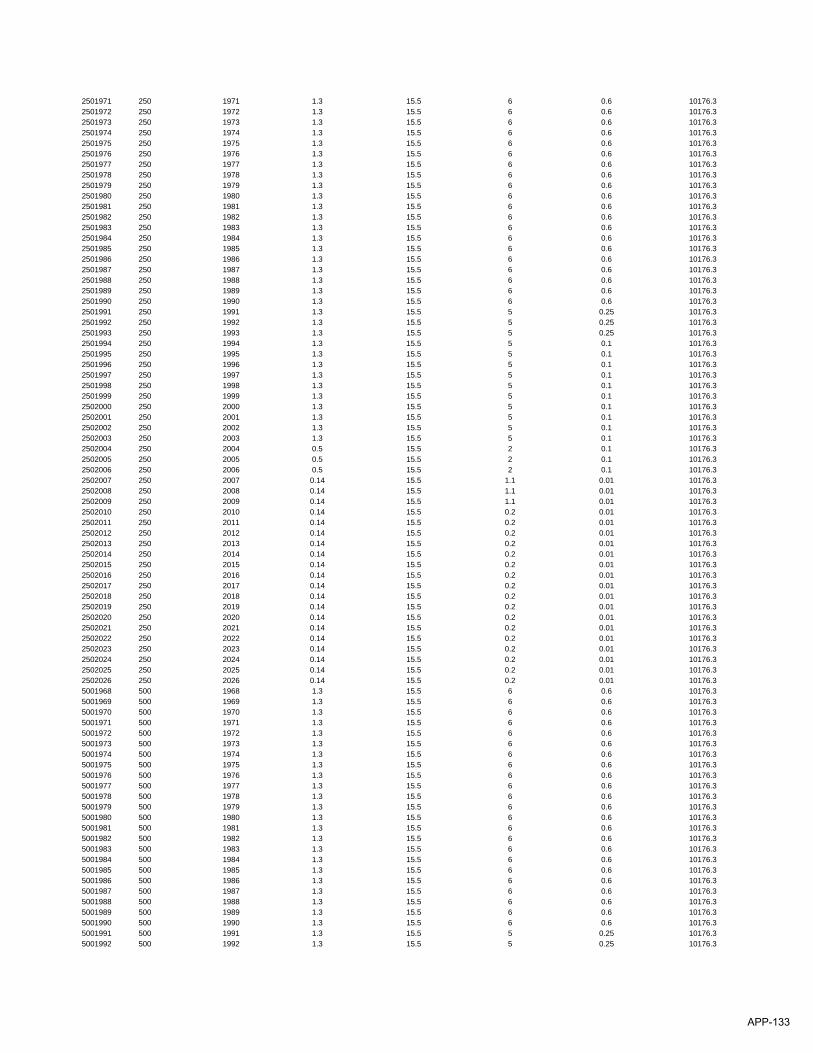
2501971 250 1971 1.3 15.5 6 0.6 10176.32501972 250 1972 1.3 15.5 6 0.6 10176.32501973 250 1973 1.3 15.5 6 0.6 10176.32501974 250 1974 1.3 15.5 6 0.6 10176.32501975 250 1975 1.3 15.5 6 0.6 10176.32501976 250 1976 1.3 15.5 6 0.6 10176.32501977 250 1977 1.3 15.5 6 0.6 10176.32501978 250 1978 1.3 15.5 6 0.6 10176.32501979 250 1979 1.3 15.5 6 0.6 10176.32501980 250 1980 1.3 15.5 6 0.6 10176.32501981 250 1981 1.3 15.5 6 0.6 10176.32501982 250 1982 1.3 15.5 6 0.6 10176.32501983 250 1983 1.3 15.5 6 0.6 10176.32501984 250 1984 1.3 15.5 6 0.6 10176.32501985 250 1985 1.3 15.5 6 0.6 10176.32501986 250 1986 1.3 15.5 6 0.6 10176.32501987 250 1987 1.3 15.5 6 0.6 10176.32501988 250 1988 1.3 15.5 6 0.6 10176.32501989 250 1989 1.3 15.5 6 0.6 10176.32501990 250 1990 1.3 15.5 6 0.6 10176.32501991 250 1991 1.3 15.5 5 0.25 10176.32501992 250 1992 1.3 15.5 5 0.25 10176.32501993 250 1993 1.3 15.5 5 0.25 10176.32501994 250 1994 1.3 15.5 5 0.1 10176.32501995 250 1995 1.3 15.5 5 0.1 10176.32501996 250 1996 1.3 15.5 5 0.1 10176.32501997 250 1997 1.3 15.5 5 0.1 10176.32501998 250 1998 1.3 15.5 5 0.1 10176.32501999 250 1999 1.3 15.5 5 0.1 10176.32502000 250 2000 1.3 15.5 5 0.1 10176.32502001 250 2001 1.3 15.5 5 0.1 10176.32502002 250 2002 1.3 15.5 5 0.1 10176.32502003 250 2003 1.3 15.5 5 0.1 10176.32502004 250 2004 0.5 15.5 2 0.1 10176.32502005 250 2005 0.5 15.5 2 0.1 10176.32502006 250 2006 0.5 15.5 2 0.1 10176.32502007 250 2007 0.14 15.5 1.1 0.01 10176.32502008 250 2008 0.14 15.5 1.1 0.01 10176.32502009 250 2009 0.14 15.5 1.1 0.01 10176.32502010 250 2010 0.14 15.5 0.2 0.01 10176.32502011 250 2011 0.14 15.5 0.2 0.01 10176.32502012 250 2012 0.14 15.5 0.2 0.01 10176.32502013 250 2013 0.14 15.5 0.2 0.01 10176.32502014 250 2014 0.14 15.5 0.2 0.01 10176.32502015 250 2015 0.14 15.5 0.2 0.01 10176.32502016 250 2016 0.14 15.5 0.2 0.01 10176.32502017 250 2017 0.14 15.5 0.2 0.01 10176.32502018 250 2018 0.14 15.5 0.2 0.01 10176.32502019 250 2019 0.14 15.5 0.2 0.01 10176.32502020 250 2020 0.14 15.5 0.2 0.01 10176.32502021 250 2021 0.14 15.5 0.2 0.01 10176.32502022 250 2022 0.14 15.5 0.2 0.01 10176.32502023 250 2023 0.14 15.5 0.2 0.01 10176.32502024 250 2024 0.14 15.5 0.2 0.01 10176.32502025 250 2025 0.14 15.5 0.2 0.01 10176.32502026 250 2026 0.14 15.5 0.2 0.01 10176.35001968 500 1968 1.3 15.5 6 0.6 10176.35001969 500 1969 1.3 15.5 6 0.6 10176.35001970 500 1970 1.3 15.5 6 0.6 10176.35001971 500 1971 1.3 15.5 6 0.6 10176.35001972 500 1972 1.3 15.5 6 0.6 10176.35001973 500 1973 1.3 15.5 6 0.6 10176.35001974 500 1974 1.3 15.5 6 0.6 10176.35001975 500 1975 1.3 15.5 6 0.6 10176.35001976 500 1976 1.3 15.5 6 0.6 10176.35001977 500 1977 1.3 15.5 6 0.6 10176.35001978 500 1978 1.3 15.5 6 0.6 10176.35001979 500 1979 1.3 15.5 6 0.6 10176.35001980 500 1980 1.3 15.5 6 0.6 10176.35001981 500 1981 1.3 15.5 6 0.6 10176.35001982 500 1982 1.3 15.5 6 0.6 10176.35001983 500 1983 1.3 15.5 6 0.6 10176.35001984 500 1984 1.3 15.5 6 0.6 10176.35001985 500 1985 1.3 15.5 6 0.6 10176.35001986 500 1986 1.3 15.5 6 0.6 10176.35001987 500 1987 1.3 15.5 6 0.6 10176.35001988 500 1988 1.3 15.5 6 0.6 10176.35001989 500 1989 1.3 15.5 6 0.6 10176.35001990 500 1990 1.3 15.5 6 0.6 10176.35001991 500 1991 1.3 15.5 5 0.25 10176.35001992 500 1992 1.3 15.5 5 0.25 10176.3
APP-133
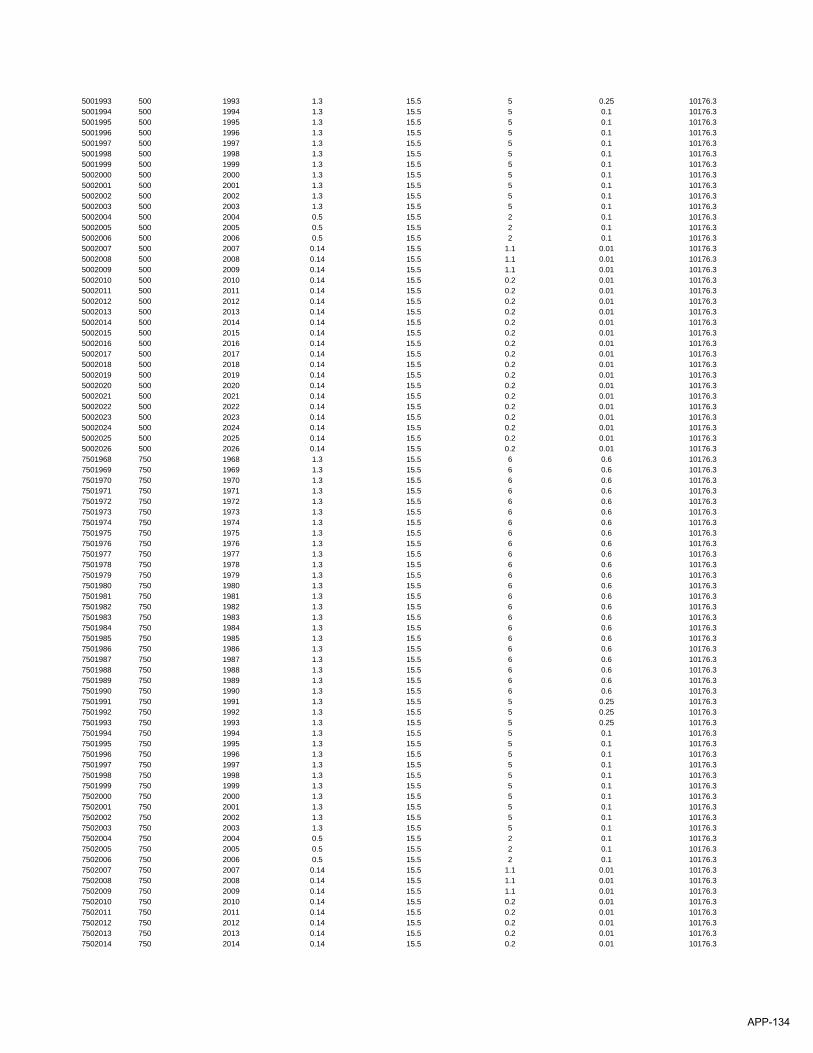
5001993 500 1993 1.3 15.5 5 0.25 10176.35001994 500 1994 1.3 15.5 5 0.1 10176.35001995 500 1995 1.3 15.5 5 0.1 10176.35001996 500 1996 1.3 15.5 5 0.1 10176.35001997 500 1997 1.3 15.5 5 0.1 10176.35001998 500 1998 1.3 15.5 5 0.1 10176.35001999 500 1999 1.3 15.5 5 0.1 10176.35002000 500 2000 1.3 15.5 5 0.1 10176.35002001 500 2001 1.3 15.5 5 0.1 10176.35002002 500 2002 1.3 15.5 5 0.1 10176.35002003 500 2003 1.3 15.5 5 0.1 10176.35002004 500 2004 0.5 15.5 2 0.1 10176.35002005 500 2005 0.5 15.5 2 0.1 10176.35002006 500 2006 0.5 15.5 2 0.1 10176.35002007 500 2007 0.14 15.5 1.1 0.01 10176.35002008 500 2008 0.14 15.5 1.1 0.01 10176.35002009 500 2009 0.14 15.5 1.1 0.01 10176.35002010 500 2010 0.14 15.5 0.2 0.01 10176.35002011 500 2011 0.14 15.5 0.2 0.01 10176.35002012 500 2012 0.14 15.5 0.2 0.01 10176.35002013 500 2013 0.14 15.5 0.2 0.01 10176.35002014 500 2014 0.14 15.5 0.2 0.01 10176.35002015 500 2015 0.14 15.5 0.2 0.01 10176.35002016 500 2016 0.14 15.5 0.2 0.01 10176.35002017 500 2017 0.14 15.5 0.2 0.01 10176.35002018 500 2018 0.14 15.5 0.2 0.01 10176.35002019 500 2019 0.14 15.5 0.2 0.01 10176.35002020 500 2020 0.14 15.5 0.2 0.01 10176.35002021 500 2021 0.14 15.5 0.2 0.01 10176.35002022 500 2022 0.14 15.5 0.2 0.01 10176.35002023 500 2023 0.14 15.5 0.2 0.01 10176.35002024 500 2024 0.14 15.5 0.2 0.01 10176.35002025 500 2025 0.14 15.5 0.2 0.01 10176.35002026 500 2026 0.14 15.5 0.2 0.01 10176.37501968 750 1968 1.3 15.5 6 0.6 10176.37501969 750 1969 1.3 15.5 6 0.6 10176.37501970 750 1970 1.3 15.5 6 0.6 10176.37501971 750 1971 1.3 15.5 6 0.6 10176.37501972 750 1972 1.3 15.5 6 0.6 10176.37501973 750 1973 1.3 15.5 6 0.6 10176.37501974 750 1974 1.3 15.5 6 0.6 10176.37501975 750 1975 1.3 15.5 6 0.6 10176.37501976 750 1976 1.3 15.5 6 0.6 10176.37501977 750 1977 1.3 15.5 6 0.6 10176.37501978 750 1978 1.3 15.5 6 0.6 10176.37501979 750 1979 1.3 15.5 6 0.6 10176.37501980 750 1980 1.3 15.5 6 0.6 10176.37501981 750 1981 1.3 15.5 6 0.6 10176.37501982 750 1982 1.3 15.5 6 0.6 10176.37501983 750 1983 1.3 15.5 6 0.6 10176.37501984 750 1984 1.3 15.5 6 0.6 10176.37501985 750 1985 1.3 15.5 6 0.6 10176.37501986 750 1986 1.3 15.5 6 0.6 10176.37501987 750 1987 1.3 15.5 6 0.6 10176.37501988 750 1988 1.3 15.5 6 0.6 10176.37501989 750 1989 1.3 15.5 6 0.6 10176.37501990 750 1990 1.3 15.5 6 0.6 10176.37501991 750 1991 1.3 15.5 5 0.25 10176.37501992 750 1992 1.3 15.5 5 0.25 10176.37501993 750 1993 1.3 15.5 5 0.25 10176.37501994 750 1994 1.3 15.5 5 0.1 10176.37501995 750 1995 1.3 15.5 5 0.1 10176.37501996 750 1996 1.3 15.5 5 0.1 10176.37501997 750 1997 1.3 15.5 5 0.1 10176.37501998 750 1998 1.3 15.5 5 0.1 10176.37501999 750 1999 1.3 15.5 5 0.1 10176.37502000 750 2000 1.3 15.5 5 0.1 10176.37502001 750 2001 1.3 15.5 5 0.1 10176.37502002 750 2002 1.3 15.5 5 0.1 10176.37502003 750 2003 1.3 15.5 5 0.1 10176.37502004 750 2004 0.5 15.5 2 0.1 10176.37502005 750 2005 0.5 15.5 2 0.1 10176.37502006 750 2006 0.5 15.5 2 0.1 10176.37502007 750 2007 0.14 15.5 1.1 0.01 10176.37502008 750 2008 0.14 15.5 1.1 0.01 10176.37502009 750 2009 0.14 15.5 1.1 0.01 10176.37502010 750 2010 0.14 15.5 0.2 0.01 10176.37502011 750 2011 0.14 15.5 0.2 0.01 10176.37502012 750 2012 0.14 15.5 0.2 0.01 10176.37502013 750 2013 0.14 15.5 0.2 0.01 10176.37502014 750 2014 0.14 15.5 0.2 0.01 10176.3
APP-134
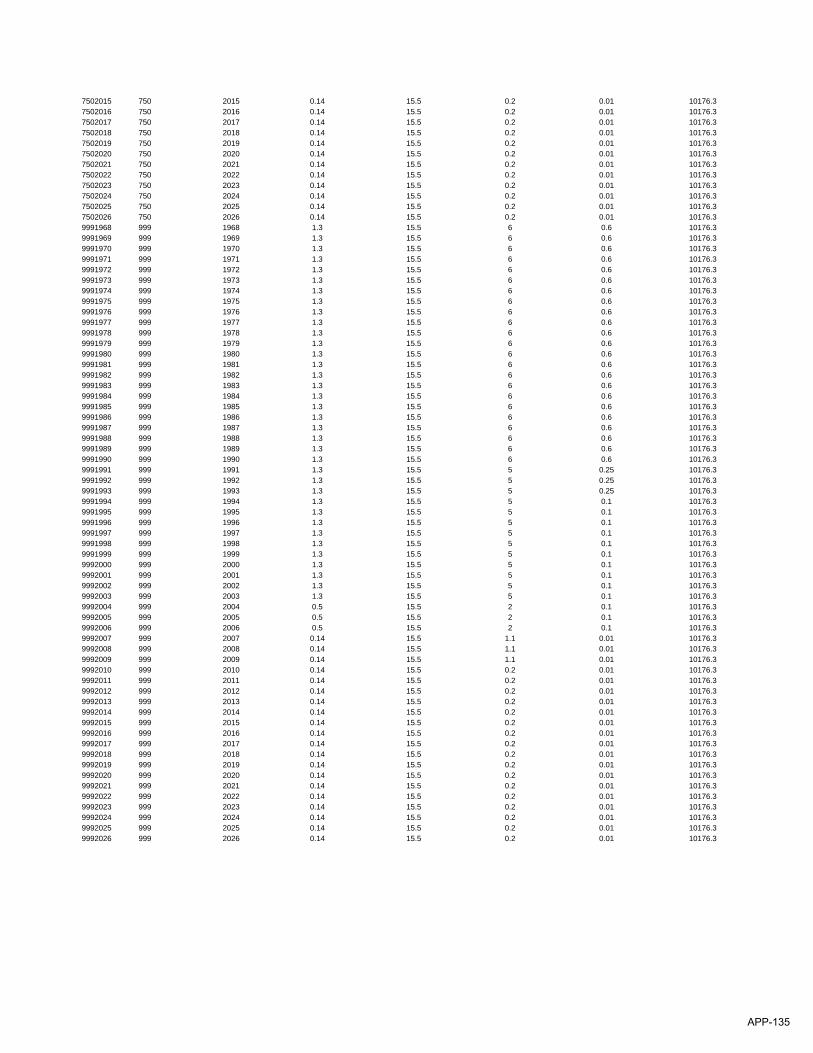
7502015 750 2015 0.14 15.5 0.2 0.01 10176.37502016 750 2016 0.14 15.5 0.2 0.01 10176.37502017 750 2017 0.14 15.5 0.2 0.01 10176.37502018 750 2018 0.14 15.5 0.2 0.01 10176.37502019 750 2019 0.14 15.5 0.2 0.01 10176.37502020 750 2020 0.14 15.5 0.2 0.01 10176.37502021 750 2021 0.14 15.5 0.2 0.01 10176.37502022 750 2022 0.14 15.5 0.2 0.01 10176.37502023 750 2023 0.14 15.5 0.2 0.01 10176.37502024 750 2024 0.14 15.5 0.2 0.01 10176.37502025 750 2025 0.14 15.5 0.2 0.01 10176.37502026 750 2026 0.14 15.5 0.2 0.01 10176.39991968 999 1968 1.3 15.5 6 0.6 10176.39991969 999 1969 1.3 15.5 6 0.6 10176.39991970 999 1970 1.3 15.5 6 0.6 10176.39991971 999 1971 1.3 15.5 6 0.6 10176.39991972 999 1972 1.3 15.5 6 0.6 10176.39991973 999 1973 1.3 15.5 6 0.6 10176.39991974 999 1974 1.3 15.5 6 0.6 10176.39991975 999 1975 1.3 15.5 6 0.6 10176.39991976 999 1976 1.3 15.5 6 0.6 10176.39991977 999 1977 1.3 15.5 6 0.6 10176.39991978 999 1978 1.3 15.5 6 0.6 10176.39991979 999 1979 1.3 15.5 6 0.6 10176.39991980 999 1980 1.3 15.5 6 0.6 10176.39991981 999 1981 1.3 15.5 6 0.6 10176.39991982 999 1982 1.3 15.5 6 0.6 10176.39991983 999 1983 1.3 15.5 6 0.6 10176.39991984 999 1984 1.3 15.5 6 0.6 10176.39991985 999 1985 1.3 15.5 6 0.6 10176.39991986 999 1986 1.3 15.5 6 0.6 10176.39991987 999 1987 1.3 15.5 6 0.6 10176.39991988 999 1988 1.3 15.5 6 0.6 10176.39991989 999 1989 1.3 15.5 6 0.6 10176.39991990 999 1990 1.3 15.5 6 0.6 10176.39991991 999 1991 1.3 15.5 5 0.25 10176.39991992 999 1992 1.3 15.5 5 0.25 10176.39991993 999 1993 1.3 15.5 5 0.25 10176.39991994 999 1994 1.3 15.5 5 0.1 10176.39991995 999 1995 1.3 15.5 5 0.1 10176.39991996 999 1996 1.3 15.5 5 0.1 10176.39991997 999 1997 1.3 15.5 5 0.1 10176.39991998 999 1998 1.3 15.5 5 0.1 10176.39991999 999 1999 1.3 15.5 5 0.1 10176.39992000 999 2000 1.3 15.5 5 0.1 10176.39992001 999 2001 1.3 15.5 5 0.1 10176.39992002 999 2002 1.3 15.5 5 0.1 10176.39992003 999 2003 1.3 15.5 5 0.1 10176.39992004 999 2004 0.5 15.5 2 0.1 10176.39992005 999 2005 0.5 15.5 2 0.1 10176.39992006 999 2006 0.5 15.5 2 0.1 10176.39992007 999 2007 0.14 15.5 1.1 0.01 10176.39992008 999 2008 0.14 15.5 1.1 0.01 10176.39992009 999 2009 0.14 15.5 1.1 0.01 10176.39992010 999 2010 0.14 15.5 0.2 0.01 10176.39992011 999 2011 0.14 15.5 0.2 0.01 10176.39992012 999 2012 0.14 15.5 0.2 0.01 10176.39992013 999 2013 0.14 15.5 0.2 0.01 10176.39992014 999 2014 0.14 15.5 0.2 0.01 10176.39992015 999 2015 0.14 15.5 0.2 0.01 10176.39992016 999 2016 0.14 15.5 0.2 0.01 10176.39992017 999 2017 0.14 15.5 0.2 0.01 10176.39992018 999 2018 0.14 15.5 0.2 0.01 10176.39992019 999 2019 0.14 15.5 0.2 0.01 10176.39992020 999 2020 0.14 15.5 0.2 0.01 10176.39992021 999 2021 0.14 15.5 0.2 0.01 10176.39992022 999 2022 0.14 15.5 0.2 0.01 10176.39992023 999 2023 0.14 15.5 0.2 0.01 10176.39992024 999 2024 0.14 15.5 0.2 0.01 10176.39992025 999 2025 0.14 15.5 0.2 0.01 10176.39992026 999 2026 0.14 15.5 0.2 0.01 10176.3
APP-135
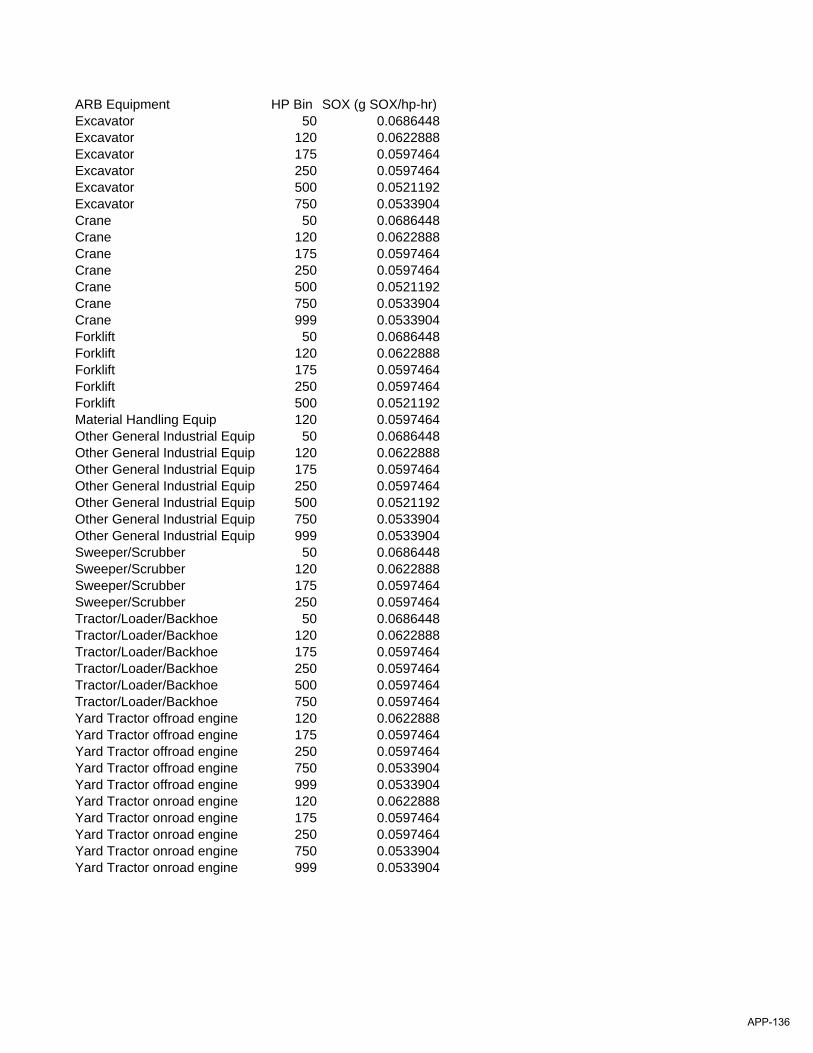
ARB Equipment HP Bin SOX (g SOX/hp-hr)Excavator 50 0.0686448Excavator 120 0.0622888Excavator 175 0.0597464Excavator 250 0.0597464Excavator 500 0.0521192Excavator 750 0.0533904Crane 50 0.0686448Crane 120 0.0622888Crane 175 0.0597464Crane 250 0.0597464Crane 500 0.0521192Crane 750 0.0533904Crane 999 0.0533904Forklift 50 0.0686448Forklift 120 0.0622888Forklift 175 0.0597464Forklift 250 0.0597464Forklift 500 0.0521192Material Handling Equip 120 0.0597464Other General Industrial Equip 50 0.0686448Other General Industrial Equip 120 0.0622888Other General Industrial Equip 175 0.0597464Other General Industrial Equip 250 0.0597464Other General Industrial Equip 500 0.0521192Other General Industrial Equip 750 0.0533904Other General Industrial Equip 999 0.0533904Sweeper/Scrubber 50 0.0686448Sweeper/Scrubber 120 0.0622888Sweeper/Scrubber 175 0.0597464Sweeper/Scrubber 250 0.0597464Tractor/Loader/Backhoe 50 0.0686448Tractor/Loader/Backhoe 120 0.0622888Tractor/Loader/Backhoe 175 0.0597464Tractor/Loader/Backhoe 250 0.0597464Tractor/Loader/Backhoe 500 0.0597464Tractor/Loader/Backhoe 750 0.0597464Yard Tractor offroad engine 120 0.0622888Yard Tractor offroad engine 175 0.0597464Yard Tractor offroad engine 250 0.0597464Yard Tractor offroad engine 750 0.0533904Yard Tractor offroad engine 999 0.0533904Yard Tractor onroad engine 120 0.0622888Yard Tractor onroad engine 175 0.0597464Yard Tractor onroad engine 250 0.0597464Yard Tractor onroad engine 750 0.0533904Yard Tractor onroad engine 999 0.0533904
APP-136
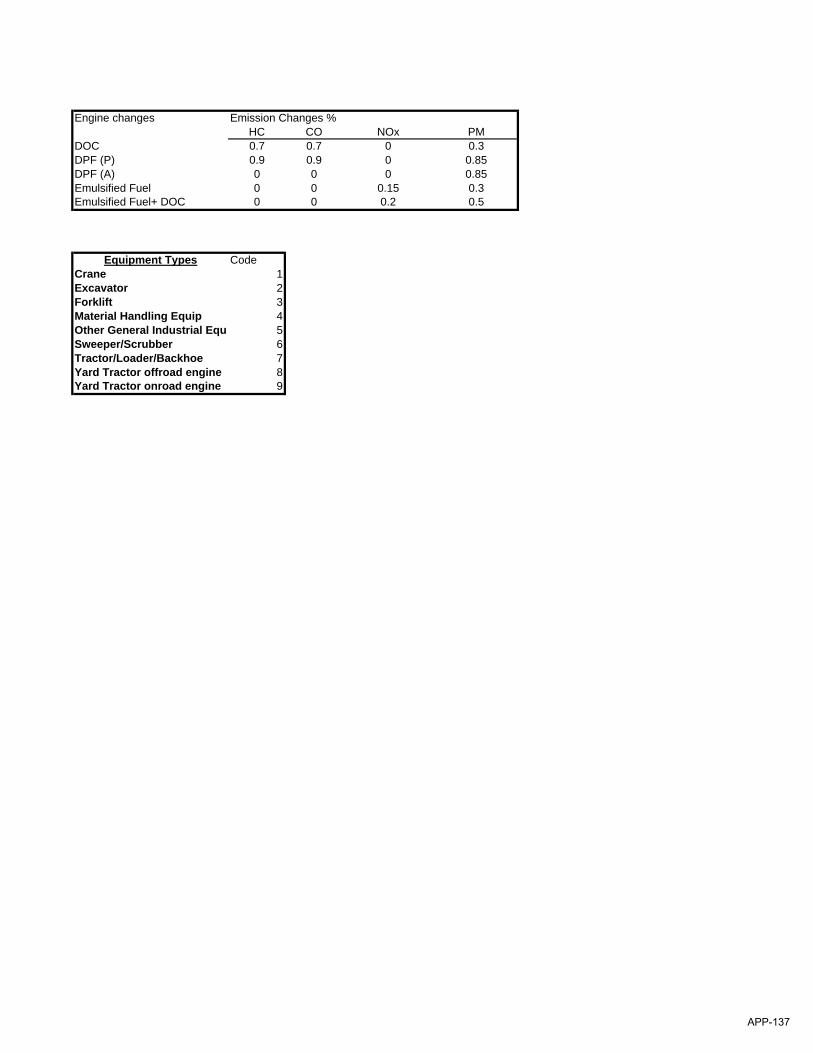
Engine changes Emission Changes %HC CO NOx PM
DOC 0.7 0.7 0 0.3DPF (P) 0.9 0.9 0 0.85DPF (A) 0 0 0 0.85Emulsified Fuel 0 0 0.15 0.3Emulsified Fuel+ DOC 0 0 0.2 0.5
Equipment Types CodeCrane 1Excavator 2Forklift 3Material Handling Equip 4Other General Industrial Equi 5Sweeper/Scrubber 6Tractor/Loader/Backhoe 7Yard Tractor offroad engine 8Yard Tractor onroad engine 9
APP-137
APPENDIX D
DEATILED EMISSION CALCULATIONS, EMISSION FACTOR DERIVATION, OFFROAD2007 OUTPUT, AND SPECIATION
PROFILE FOR HEAVY EQUIPMENT
APP-138

Summary of Emissions from Heavy EquipmentDolores and ICTF Rail Yards, Long Beach, CA
Hours ofEquipment Fuel No of Rating Operation Load
Yard Location Type Make Model Year Type Units (hp) (hr/yr)1 Factor2 ROG CO NOx PM10 DPM SOx Part 1 (lb/hr) Part 2 (lb/yr) ROG CO NOx PM10 DPM SOxICTF Car Dept. Crane Grove RT600E 2004 Diesel 1 173 1095 0.43 0.32 2.83 4.61 0.18 0.18 0.05 - - 0.03 0.25 0.41 0.02 0.02 0.00ICTF Crane Maint Forklift Taylor 850 2005 Diesel 2 155 7300 0.30 0.22 2.76 4.26 0.14 0.14 0.05 - - 0.16 2.07 3.19 0.10 0.10 0.04ICTF Crane Maint Forklift Taylor 850 1998 Diesel 1 154 7300 0.30 1.33 3.66 8.59 0.62 0.62 0.05 - - 0.49 1.36 3.19 0.23 0.23 0.02ICTF Crane Maint. Man Lift Unknown Unknown 1985 Diesel 1 29 1825 0.46 5.11 10.26 7.51 1.02 1.02 0.06 - - 0.14 0.28 0.20 0.03 0.03 0.00
Dolores Locomotive Shop Forklift Yale GP-060 ALL5 Propane 2 150 3285 0.30 0.11 23.38 7.30 0.06 0.00 0.00 - - 0.04 7.62 2.38 0.02 0.00 0.00Total 7 0.86 11.58 9.38 0.40 0.38 0.07
Notes1. Hours of operation provided by UPRR personnel.2. Default load factors from OFFROAD 2007 model.3. Emission factors (g/bhp-hr) from the OFFROAD2007 model.4. Evaporative emissions were calculated from the OFFROAD 2007 model and are negligible.5. Dolores forklifts are modeled as the calendar year 2005 fleet average model year group from the OFFROAD2007 model.
2005 Emission Factors (g/bhp-hr)3 2005 Emission Estimates (tpy)VOC Evaporative Emissions4
APP-139

Toxic Air Contaminant Emissions from the Propane-Fueled ForkliftsDolores and ICTF Rail Yards, Long Beach, CA
Organic EmissionsProfile1 CAS Chemical Name Fraction (tpy)719 95636 1,2,4-trimethylbenzene 0.00001 3.21E-07719 75070 acetaldehyde 0.00003 9.63E-07719 71432 benzene 0.00010 3.53E-06719 110827 cyclohexane 0.00001 3.21E-07719 100414 ethylbenzene 0.00001 3.21E-07719 74851 ethylene 0.00058 2.02E-05719 50000 formaldehyde 0.00074 2.60E-05719 108383 m-xylene 0.00001 3.21E-07719 110543 n-hexane 0.00002 6.42E-07719 95476 o-xylene 0.00001 3.21E-07719 115071 propylene 0.00154 5.42E-05719 108883 toluene 0.00004 1.28E-06719 1330207 xylene 0.00002 6.42E-07Total 1.09E-04
Notes:1. Organic fraction from ARBs SPECIATE database. Data is from "ICE-reciprocating - natural gas" option. The SPECIATE database does not include a profile for propane-fueled engines.2. Emissions were calculated for only chemicals that were in both the SPECIATE database and the AB2588 list.3. Organic fraction reported on a ROG basis using ARB's Speciate ROG/TOG ratio (0.0914)
APP-140
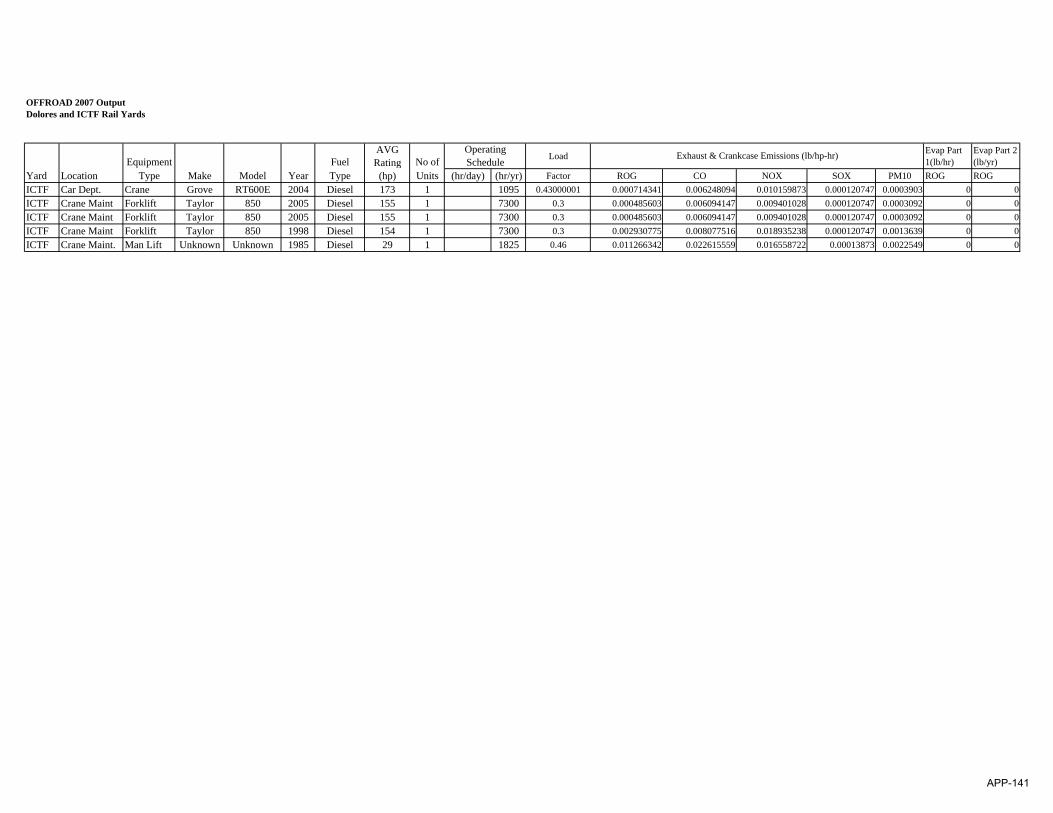
OFFROAD 2007 OutputDolores and ICTF Rail Yards
Equipment FuelAVG
Rating No of Load Evap Part 1(lb/hr)
Evap Part 2 (lb/yr)
Yard Location Type Make Model Year Type (hp) Units (hr/day) (hr/yr) Factor ROG CO NOX SOX PM10 ROG ROGICTF Car Dept. Crane Grove RT600E 2004 Diesel 173 1 1095 0.43000001 0.000714341 0.006248094 0.010159873 0.000120747 0.0003903 0 0ICTF Crane Maint Forklift Taylor 850 2005 Diesel 155 1 7300 0.3 0.000485603 0.006094147 0.009401028 0.000120747 0.0003092 0 0ICTF Crane Maint Forklift Taylor 850 2005 Diesel 155 1 7300 0.3 0.000485603 0.006094147 0.009401028 0.000120747 0.0003092 0 0ICTF Crane Maint Forklift Taylor 850 1998 Diesel 154 1 7300 0.3 0.002930775 0.008077516 0.018935238 0.000120747 0.0013639 0 0ICTF Crane Maint. Man Lift Unknown Unknown 1985 Diesel 29 1 1825 0.46 0.011266342 0.022615559 0.016558722 0.00013873 0.0022549 0 0
Operating Schedule
Exhaust & Crankcase Emissions (lb/hp-hr)
APP-141
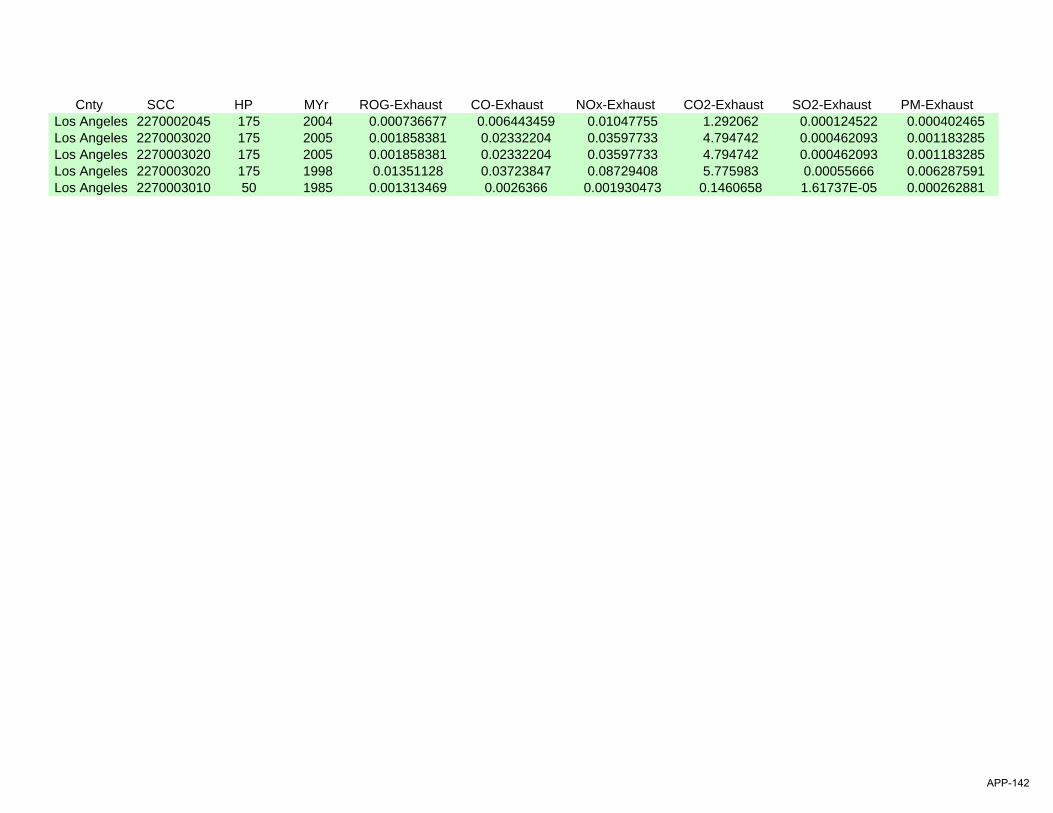
Cnty SCC HP MYr ROG-Exhaust CO-Exhaust NOx-Exhaust CO2-Exhaust SO2-Exhaust PM-Exhaust Los Angeles 2270002045 175 2004 0.000736677 0.006443459 0.01047755 1.292062 0.000124522 0.000402465Los Angeles 2270003020 175 2005 0.001858381 0.02332204 0.03597733 4.794742 0.000462093 0.001183285Los Angeles 2270003020 175 2005 0.001858381 0.02332204 0.03597733 4.794742 0.000462093 0.001183285Los Angeles 2270003020 175 1998 0.01351128 0.03723847 0.08729408 5.775983 0.00055666 0.006287591Los Angeles 2270003010 50 1985 0.001313469 0.0026366 0.001930473 0.1460658 1.61737E-05 0.000262881
APP-142
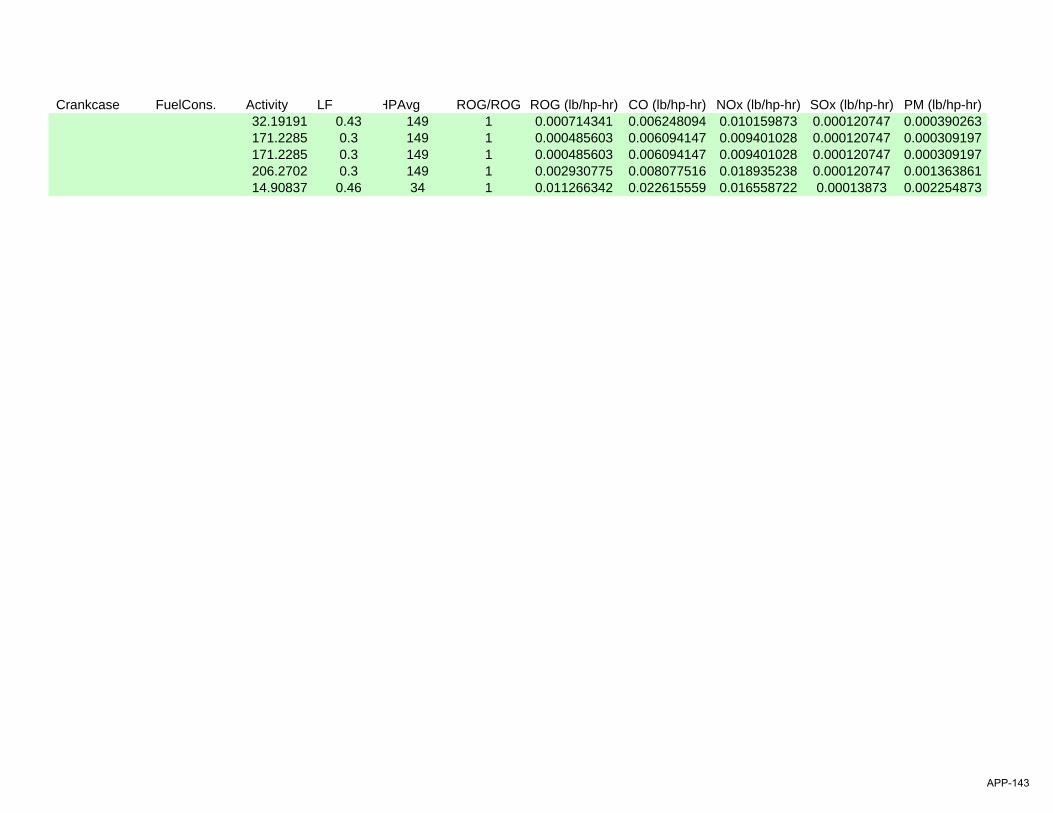
Crankcase FuelCons. Activity LF HPAvg ROG/ROG ROG (lb/hp-hr) CO (lb/hp-hr) NOx (lb/hp-hr) SOx (lb/hp-hr) PM (lb/hp-hr)32.19191 0.43 149 1 0.000714341 0.006248094 0.010159873 0.000120747 0.000390263171.2285 0.3 149 1 0.000485603 0.006094147 0.009401028 0.000120747 0.000309197171.2285 0.3 149 1 0.000485603 0.006094147 0.009401028 0.000120747 0.000309197206.2702 0.3 149 1 0.002930775 0.008077516 0.018935238 0.000120747 0.00136386114.90837 0.46 34 1 0.011266342 0.022615559 0.016558722 0.00013873 0.002254873
APP-143
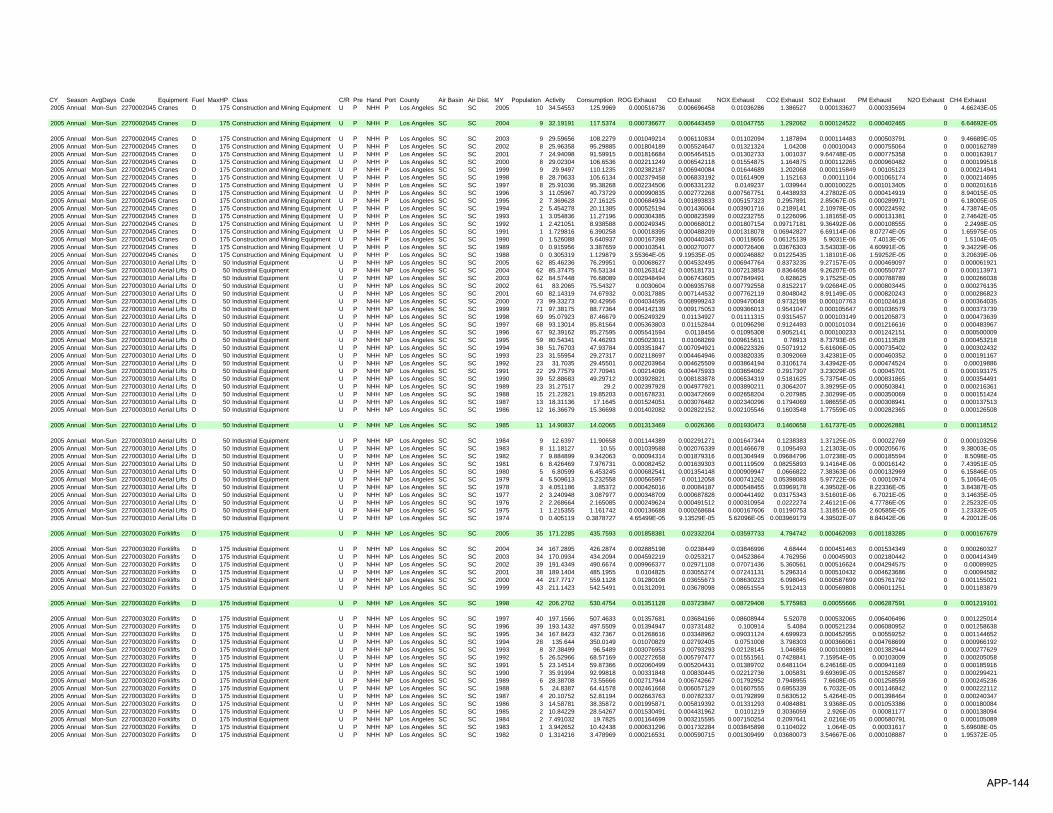
CY Season AvgDays Code Equipment Fuel MaxHP Class C/R Pre Hand Port County Air Basin Air Dist. MY Population Activity Consumption ROG Exhaust CO Exhaust NOX Exhaust CO2 Exhaust SO2 Exhaust PM Exhaust N2O Exhaust CH4 Exhaust2005 Annual Mon-Sun 2270002045 Cranes D 175 Construction and Mining Equipment U P NHH P Los Angeles SC SC 2005 10 34.54553 125.9969 0.000516736 0.006696458 0.01036286 1.386527 0.000133627 0.000335694 0 4.66243E-05
2005 Annual Mon-Sun 2270002045 Cranes D 175 Construction and Mining Equipment U P NHH P Los Angeles SC SC 2004 9 32.19191 117.5374 0.000736677 0.006443459 0.01047755 1.292062 0.000124522 0.000402465 0 6.64692E-05
2005 Annual Mon-Sun 2270002045 Cranes D 175 Construction and Mining Equipment U P NHH P Los Angeles SC SC 2003 9 29.59656 108.2279 0.001049214 0.006110834 0.01102094 1.187894 0.000114483 0.000503791 0 9.46689E-052005 Annual Mon-Sun 2270002045 Cranes D 175 Construction and Mining Equipment U P NHH P Los Angeles SC SC 2002 8 25.96358 95.29885 0.001804189 0.005524647 0.01321324 1.04208 0.00010043 0.000755064 0 0.0001627892005 Annual Mon-Sun 2270002045 Cranes D 175 Construction and Mining Equipment U P NHH P Los Angeles SC SC 2001 7 24.94098 91.59915 0.001816684 0.005464515 0.01302733 1.001037 9.64748E-05 0.000775358 0 0.0001639172005 Annual Mon-Sun 2270002045 Cranes D 175 Construction and Mining Equipment U P NHH P Los Angeles SC SC 2000 8 29.02304 106.6536 0.002211249 0.006542118 0.01554875 1.164875 0.000112265 0.000960482 0 0.0001995182005 Annual Mon-Sun 2270002045 Cranes D 175 Construction and Mining Equipment U P NHH P Los Angeles SC SC 1999 9 29.9497 110.1235 0.002382187 0.006940084 0.01644689 1.202068 0.000115849 0.00105123 0 0.0002149412005 Annual Mon-Sun 2270002045 Cranes D 175 Construction and Mining Equipment U P NHH P Los Angeles SC SC 1998 8 28.70633 105.6134 0.002379458 0.006833192 0.01614909 1.152163 0.00011104 0.001065174 0 0.0002146952005 Annual Mon-Sun 2270002045 Cranes D 175 Construction and Mining Equipment U P NHH P Los Angeles SC SC 1997 8 25.91036 95.38268 0.002234506 0.006331232 0.0149237 1.039944 0.000100225 0.001013405 0 0.0002016162005 Annual Mon-Sun 2270002045 Cranes D 175 Construction and Mining Equipment U P NHH P Los Angeles SC SC 1996 3 11.05967 40.73729 0.000990835 0.002772268 0.007567751 0.4438933 4.27802E-05 0.000414919 0 8.94015E-052005 Annual Mon-Sun 2270002045 Cranes D 175 Construction and Mining Equipment U P NHH P Los Angeles SC SC 1995 2 7.369628 27.16125 0.000684934 0.001893833 0.005157323 0.2957891 2.85067E-05 0.000289971 0 6.18005E-052005 Annual Mon-Sun 2270002045 Cranes D 175 Construction and Mining Equipment U P NHH P Los Angeles SC SC 1994 2 5.454278 20.11385 0.000525194 0.001436064 0.003901716 0.2189141 2.10978E-05 0.000224592 0 4.73874E-052005 Annual Mon-Sun 2270002045 Cranes D 175 Construction and Mining Equipment U P NHH P Los Angeles SC SC 1993 1 3.054836 11.27196 0.000304385 0.000823599 0.002232755 0.1226096 1.18165E-05 0.000131381 0 2.74642E-052005 Annual Mon-Sun 2270002045 Cranes D 175 Construction and Mining Equipment U P NHH P Los Angeles SC SC 1992 1 2.421051 8.938588 0.000249345 0.000668012 0.001807154 0.09717181 9.36492E-06 0.000108555 0 2.2498E-052005 Annual Mon-Sun 2270002045 Cranes D 175 Construction and Mining Equipment U P NHH P Los Angeles SC SC 1991 1 1.729816 6.390258 0.00018395 0.000488209 0.001318078 0.06942827 6.69114E-06 8.07274E-05 0 1.65975E-052005 Annual Mon-Sun 2270002045 Cranes D 175 Construction and Mining Equipment U P NHH P Los Angeles SC SC 1990 0 1.526088 5.640937 0.000167398 0.000440345 0.00118656 0.06125139 5.9031E-06 7.4013E-05 0 1.5104E-052005 Annual Mon-Sun 2270002045 Cranes D 175 Construction and Mining Equipment U P NHH P Los Angeles SC SC 1989 0 0.915956 3.387659 0.000103541 0.000270077 0.000726408 0.03676303 3.54303E-06 4.60991E-05 0 9.34229E-062005 Annual Mon-Sun 2270002045 Cranes D 175 Construction and Mining Equipment U P NHH P Los Angeles SC SC 1988 0 0.305319 1.129879 3.55364E-05 9.19535E-05 0.000246882 0.01225435 1.18101E-06 1.59252E-05 0 3.20639E-062005 Annual Mon-Sun 2270003010 Aerial Lifts D 50 Industrial Equipment U P NHH NP Los Angeles SC SC 2005 62 85.46236 76.29951 0.00068627 0.004532495 0.006947764 0.8373235 9.27157E-05 0.000469097 0 0.0000619212005 Annual Mon-Sun 2270003010 Aerial Lifts D 50 Industrial Equipment U P NHH NP Los Angeles SC SC 2004 62 85.37475 76.53134 0.001263142 0.005181731 0.007213853 0.8364658 9.26207E-05 0.000550737 0 0.0001139712005 Annual Mon-Sun 2270003010 Aerial Lifts D 50 Industrial Equipment U P NHH NP Los Angeles SC SC 2003 62 84.57448 76.68089 0.002948494 0.006743605 0.007849491 0.828625 9.17525E-05 0.000788789 0 0.0002660382005 Annual Mon-Sun 2270003010 Aerial Lifts D 50 Industrial Equipment U P NHH NP Los Angeles SC SC 2002 61 83.2065 75.54327 0.0030604 0.006935768 0.007792558 0.8152217 9.02684E-05 0.000803445 0 0.0002761352005 Annual Mon-Sun 2270003010 Aerial Lifts D 50 Industrial Equipment U P NHH NP Los Angeles SC SC 2001 60 82.14319 74.67932 0.00317885 0.007144532 0.007762119 0.8048042 8.91149E-05 0.000820243 0 0.0002868232005 Annual Mon-Sun 2270003010 Aerial Lifts D 50 Industrial Equipment U P NHH NP Los Angeles SC SC 2000 73 99.33273 90.42956 0.004034595 0.008999243 0.009470048 0.9732198 0.000107763 0.001024618 0 0.0003640352005 Annual Mon-Sun 2270003010 Aerial Lifts D 50 Industrial Equipment U P NHH NP Los Angeles SC SC 1999 71 97.38175 88.77364 0.004142139 0.009175053 0.009366013 0.9541047 0.000105647 0.001036579 0 0.0003737392005 Annual Mon-Sun 2270003010 Aerial Lifts D 50 Industrial Equipment U P NHH NP Los Angeles SC SC 1998 69 95.07923 87.46679 0.005249329 0.01134927 0.01111315 0.9315457 0.000103149 0.001205873 0 0.0004736392005 Annual Mon-Sun 2270003010 Aerial Lifts D 50 Industrial Equipment U P NHH NP Los Angeles SC SC 1997 68 93.13014 85.81564 0.005363803 0.01152844 0.01096298 0.9124493 0.000101034 0.001216616 0 0.0004839672005 Annual Mon-Sun 2270003010 Aerial Lifts D 50 Industrial Equipment U P NHH NP Los Angeles SC SC 1996 67 92.39162 85.27595 0.005541594 0.0118456 0.01095308 0.9052141 0.000100233 0.001242151 0 0.0005000092005 Annual Mon-Sun 2270003010 Aerial Lifts D 50 Industrial Equipment U P NHH NP Los Angeles SC SC 1995 59 80.54341 74.46293 0.005023011 0.01068269 0.009615611 0.78913 8.73793E-05 0.001113528 0 0.0004532182005 Annual Mon-Sun 2270003010 Aerial Lifts D 50 Industrial Equipment U P NHH NP Los Angeles SC SC 1994 38 51.76703 47.93784 0.003351847 0.007094921 0.006223326 0.5071912 5.61606E-05 0.000735402 0 0.0003024322005 Annual Mon-Sun 2270003010 Aerial Lifts D 50 Industrial Equipment U P NHH NP Los Angeles SC SC 1993 23 31.55954 29.27317 0.002118697 0.004464946 0.003820335 0.3092069 3.42381E-05 0.000460352 0 0.0001911672005 Annual Mon-Sun 2270003010 Aerial Lifts D 50 Industrial Equipment U P NHH NP Los Angeles SC SC 1992 23 31.7035 29.45501 0.002203964 0.004625509 0.003864194 0.3106174 3.43942E-05 0.000474524 0 0.000198862005 Annual Mon-Sun 2270003010 Aerial Lifts D 50 Industrial Equipment U P NHH NP Los Angeles SC SC 1991 22 29.77579 27.70941 0.00214096 0.004475933 0.003654062 0.2917307 3.23029E-05 0.00045701 0 0.0001931752005 Annual Mon-Sun 2270003010 Aerial Lifts D 50 Industrial Equipment U P NHH NP Los Angeles SC SC 1990 39 52.88683 49.29712 0.003928821 0.008183878 0.006534319 0.5181625 5.73754E-05 0.000831865 0 0.0003544912005 Annual Mon-Sun 2270003010 Aerial Lifts D 50 Industrial Equipment U P NHH NP Los Angeles SC SC 1989 23 31.27517 29.2 0.002397928 0.004977921 0.003890211 0.3064207 3.39295E-05 0.000503841 0 0.0002163612005 Annual Mon-Sun 2270003010 Aerial Lifts D 50 Industrial Equipment U P NHH NP Los Angeles SC SC 1988 15 21.22821 19.85203 0.001678231 0.003472669 0.002658204 0.207985 2.30299E-05 0.000350069 0 0.0001514242005 Annual Mon-Sun 2270003010 Aerial Lifts D 50 Industrial Equipment U P NHH NP Los Angeles SC SC 1987 13 18.31136 17.1645 0.001524051 0.003076482 0.002340296 0.1794069 1.98655E-05 0.000308941 0 0.0001375132005 Annual Mon-Sun 2270003010 Aerial Lifts D 50 Industrial Equipment U P NHH NP Los Angeles SC SC 1986 12 16.36679 15.36698 0.001402082 0.002822152 0.002105546 0.1603548 1.77559E-05 0.000282365 0 0.000126508
2005 Annual Mon-Sun 2270003010 Aerial Lifts D 50 Industrial Equipment U P NHH NP Los Angeles SC SC 1985 11 14.90837 14.02065 0.001313469 0.0026366 0.001930473 0.1460658 1.61737E-05 0.000262881 0 0.000118512
2005 Annual Mon-Sun 2270003010 Aerial Lifts D 50 Industrial Equipment U P NHH NP Los Angeles SC SC 1984 9 12.6397 11.90658 0.001144389 0.002291271 0.001647344 0.1238383 1.37125E-05 0.00022769 0 0.0001032562005 Annual Mon-Sun 2270003010 Aerial Lifts D 50 Industrial Equipment U P NHH NP Los Angeles SC SC 1983 8 11.18127 10.55 0.001039588 0.002076339 0.001466678 0.1095493 1.21303E-05 0.000205676 0 9.38003E-052005 Annual Mon-Sun 2270003010 Aerial Lifts D 50 Industrial Equipment U P NHH NP Los Angeles SC SC 1982 7 9.884899 9.342063 0.00094314 0.001879316 0.001304949 0.09684796 1.07238E-05 0.000185594 0 8.5098E-052005 Annual Mon-Sun 2270003010 Aerial Lifts D 50 Industrial Equipment U P NHH NP Los Angeles SC SC 1981 6 8.426469 7.976731 0.00082452 0.001639303 0.001119509 0.08255893 9.14164E-06 0.00016142 0 7.43951E-052005 Annual Mon-Sun 2270003010 Aerial Lifts D 50 Industrial Equipment U P NHH NP Los Angeles SC SC 1980 5 6.80599 6.453245 0.000682541 0.001354148 0.000909947 0.0666822 7.38363E-06 0.000132969 0 6.15846E-052005 Annual Mon-Sun 2270003010 Aerial Lifts D 50 Industrial Equipment U P NHH NP Los Angeles SC SC 1979 4 5.509613 5.232558 0.000565957 0.00112058 0.000741262 0.05398083 5.97722E-06 0.00010974 0 5.10654E-052005 Annual Mon-Sun 2270003010 Aerial Lifts D 50 Industrial Equipment U P NHH NP Los Angeles SC SC 1978 3 4.051186 3.85372 0.000426016 0.00084187 0.000548455 0.03969178 4.39502E-06 8.22336E-05 0 3.84387E-052005 Annual Mon-Sun 2270003010 Aerial Lifts D 50 Industrial Equipment U P NHH NP Los Angeles SC SC 1977 2 3.240948 3.087977 0.000348709 0.000687828 0.000441492 0.03175343 3.51601E-06 6.7021E-05 0 3.14635E-052005 Annual Mon-Sun 2270003010 Aerial Lifts D 50 Industrial Equipment U P NHH NP Los Angeles SC SC 1976 2 2.268664 2.165085 0.000249624 0.000491512 0.000310954 0.0222274 2.46121E-06 4.77786E-05 0 2.25232E-052005 Annual Mon-Sun 2270003010 Aerial Lifts D 50 Industrial Equipment U P NHH NP Los Angeles SC SC 1975 1 1.215355 1.161742 0.000136688 0.000268684 0.000167606 0.01190753 1.31851E-06 2.60585E-05 0 1.23332E-052005 Annual Mon-Sun 2270003010 Aerial Lifts D 50 Industrial Equipment U P NHH NP Los Angeles SC SC 1974 0 0.405119 0.3878727 4.65499E-05 9.13529E-05 5.62096E-05 0.003969179 4.39502E-07 8.84042E-06 0 4.20012E-06
2005 Annual Mon-Sun 2270003020 Forklifts D 175 Industrial Equipment U P NHH NP Los Angeles SC SC 2005 35 171.2285 435.7593 0.001858381 0.02332204 0.03597733 4.794742 0.000462093 0.001183285 0 0.000167679
2005 Annual Mon-Sun 2270003020 Forklifts D 175 Industrial Equipment U P NHH NP Los Angeles SC SC 2004 34 167.2895 426.2874 0.002885198 0.0238449 0.03846996 4.68444 0.000451463 0.001534349 0 0.0002603272005 Annual Mon-Sun 2270003020 Forklifts D 175 Industrial Equipment U P NHH NP Los Angeles SC SC 2003 34 170.0934 434.2094 0.004592219 0.0253217 0.04523864 4.762956 0.00045903 0.002180442 0 0.0004143492005 Annual Mon-Sun 2270003020 Forklifts D 175 Industrial Equipment U P NHH NP Los Angeles SC SC 2002 39 191.4349 490.6674 0.009966377 0.02971108 0.07071436 5.360561 0.000516624 0.004294575 0 0.000899252005 Annual Mon-Sun 2270003020 Forklifts D 175 Industrial Equipment U P NHH NP Los Angeles SC SC 2001 38 189.1404 485.1955 0.0104825 0.03055274 0.07241131 5.296314 0.000510432 0.004623686 0 0.000945822005 Annual Mon-Sun 2270003020 Forklifts D 175 Industrial Equipment U P NHH NP Los Angeles SC SC 2000 44 217.7717 559.1128 0.01280108 0.03655673 0.08630223 6.098045 0.000587699 0.005761792 0 0.0011550212005 Annual Mon-Sun 2270003020 Forklifts D 175 Industrial Equipment U P NHH NP Los Angeles SC SC 1999 43 211.1423 542.5491 0.01312091 0.03678098 0.08651554 5.912413 0.000569808 0.006011251 0 0.001183879
2005 Annual Mon-Sun 2270003020 Forklifts D 175 Industrial Equipment U P NHH NP Los Angeles SC SC 1998 42 206.2702 530.4754 0.01351128 0.03723847 0.08729408 5.775983 0.00055666 0.006287591 0 0.001219101
2005 Annual Mon-Sun 2270003020 Forklifts D 175 Industrial Equipment U P NHH NP Los Angeles SC SC 1997 40 197.1566 507.4633 0.01357681 0.03684166 0.08608944 5.52078 0.000532065 0.006406496 0 0.0012250142005 Annual Mon-Sun 2270003020 Forklifts D 175 Industrial Equipment U P NHH NP Los Angeles SC SC 1996 39 193.1432 497.5509 0.01394947 0.03731482 0.100914 5.4084 0.000521234 0.006080952 0 0.0012586382005 Annual Mon-Sun 2270003020 Forklifts D 175 Industrial Equipment U P NHH NP Los Angeles SC SC 1995 34 167.8423 432.7367 0.01268616 0.03348962 0.09031124 4.699923 0.000452955 0.00559252 0 0.0011446522005 Annual Mon-Sun 2270003020 Forklifts D 175 Industrial Equipment U P NHH NP Los Angeles SC SC 1994 28 135.644 350.0149 0.01070829 0.02792405 0.0751008 3.798303 0.000366061 0.004768699 0 0.0009661922005 Annual Mon-Sun 2270003020 Forklifts D 175 Industrial Equipment U P NHH NP Los Angeles SC SC 1993 8 37.38499 96.5489 0.003076953 0.00793293 0.02128145 1.046856 0.000100891 0.001382944 0 0.0002776292005 Annual Mon-Sun 2270003020 Forklifts D 175 Industrial Equipment U P NHH NP Los Angeles SC SC 1992 5 26.52966 68.57169 0.002272658 0.005797477 0.01551561 0.7428841 7.15954E-05 0.00103009 0 0.0002050582005 Annual Mon-Sun 2270003020 Forklifts D 175 Industrial Equipment U P NHH NP Los Angeles SC SC 1991 5 23.14514 59.87366 0.002060499 0.005204431 0.01389702 0.6481104 6.24616E-05 0.000941169 0 0.0001859162005 Annual Mon-Sun 2270003020 Forklifts D 175 Industrial Equipment U P NHH NP Los Angeles SC SC 1990 7 35.91994 92.99818 0.00331848 0.00830445 0.02212736 1.005831 9.69369E-05 0.001526587 0 0.0002994212005 Annual Mon-Sun 2270003020 Forklifts D 175 Industrial Equipment U P NHH NP Los Angeles SC SC 1989 6 28.38708 73.55666 0.002717944 0.006742667 0.01792952 0.7948955 7.6608E-05 0.001258559 0 0.0002452362005 Annual Mon-Sun 2270003020 Forklifts D 175 Industrial Equipment U P NHH NP Los Angeles SC SC 1988 5 24.8387 64.41578 0.002461668 0.006057129 0.01607555 0.6955339 6.7032E-05 0.001146842 0 0.0002221122005 Annual Mon-Sun 2270003020 Forklifts D 175 Industrial Equipment U P NHH NP Los Angeles SC SC 1987 4 20.10752 52.81194 0.002663763 0.00782337 0.01792899 0.5630512 5.4264E-05 0.001398464 0 0.0002403472005 Annual Mon-Sun 2270003020 Forklifts D 175 Industrial Equipment U P NHH NP Los Angeles SC SC 1986 3 14.58781 38.35872 0.001995871 0.005819392 0.01331293 0.4084881 3.9368E-05 0.001053386 0 0.0001800842005 Annual Mon-Sun 2270003020 Forklifts D 175 Industrial Equipment U P NHH NP Los Angeles SC SC 1985 2 10.84229 28.54267 0.001530491 0.004431962 0.0101219 0.3036059 2.926E-05 0.00081177 0 0.0001380942005 Annual Mon-Sun 2270003020 Forklifts D 175 Industrial Equipment U P NHH NP Los Angeles SC SC 1984 2 7.491032 19.7825 0.001164699 0.003215595 0.007150254 0.2097641 2.0216E-05 0.000580791 0 0.0001050892005 Annual Mon-Sun 2270003020 Forklifts D 175 Industrial Equipment U P NHH NP Los Angeles SC SC 1983 1 3.942652 10.42438 0.000631296 0.001732284 0.003845898 0.1104022 1.064E-05 0.00031617 0 5.69608E-052005 Annual Mon-Sun 2270003020 Forklifts D 175 Industrial Equipment U P NHH NP Los Angeles SC SC 1982 0 1.314216 3.478969 0.000216531 0.000590715 0.001309499 0.03680073 3.54667E-06 0.000108887 0 1.95372E-05
APP-144

OFFROAD Output for Propane-Fueled Fork Lifts
Cnty SubR SCC HP TechType MYr Population ROG-Exhaust CO-Exhaust NOx-Exhaust CO2-Exhaust SO2-Exhaust PM-Exhaust Los Angeles SC 2266003020 175 ALL 7.49E-03 1.63E+00 5.08E-01 4.69E+01 0.00E+00 4.17E-03Los Angeles SC 2266003020 175 >=2006 3.19E-03 6.80E-01 1.47E-01 1.62E+01 0.00E+00 1.45E-03Los Angeles SC 2266003020 175 >=2006 1.36E-03 2.76E-01 5.91E-02 5.95E+00 0.00E+00 5.29E-04Los Angeles SC 2266003020 175 >=2006 6.89E-04 1.30E-01 2.60E-02 2.61E+00 0.00E+00 2.32E-04Los Angeles SC 2266003020 175 >=2006 2.73E-04 4.48E-02 9.16E-03 8.43E-01 0.00E+00 7.50E-05
APP-145
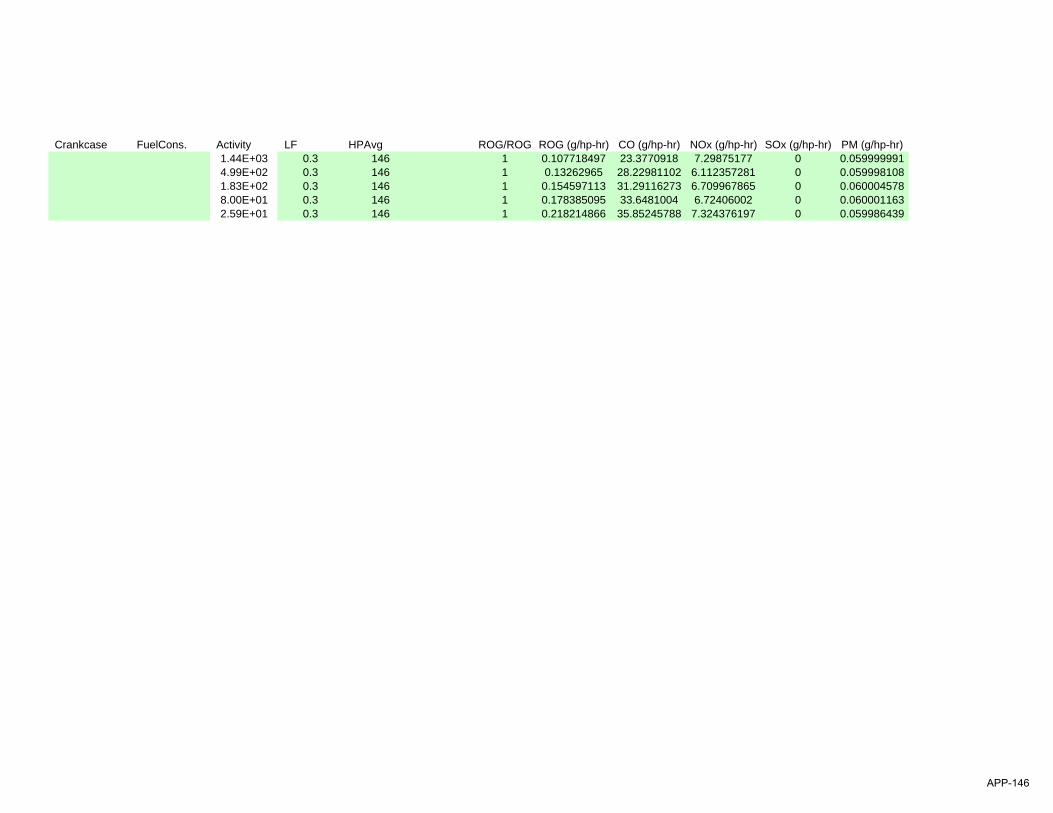
Crankcase FuelCons. Activity LF HPAvg ROG/ROG ROG (g/hp-hr) CO (g/hp-hr) NOx (g/hp-hr) SOx (g/hp-hr) PM (g/hp-hr)1.44E+03 0.3 146 1 0.107718497 23.3770918 7.29875177 0 0.0599999914.99E+02 0.3 146 1 0.13262965 28.22981102 6.112357281 0 0.0599981081.83E+02 0.3 146 1 0.154597113 31.29116273 6.709967865 0 0.0600045788.00E+01 0.3 146 1 0.178385095 33.6481004 6.72406002 0 0.0600011632.59E+01 0.3 146 1 0.218214866 35.85245788 7.324376197 0 0.059986439
APP-146
APPENDIX E
DEATILED EMISSION CALCULATIONS, EMISSION FACTOR DERIVATION, AND OFFROAD2007
OUTPUT, FOR TRUs AND REEFER CARS
APP-147
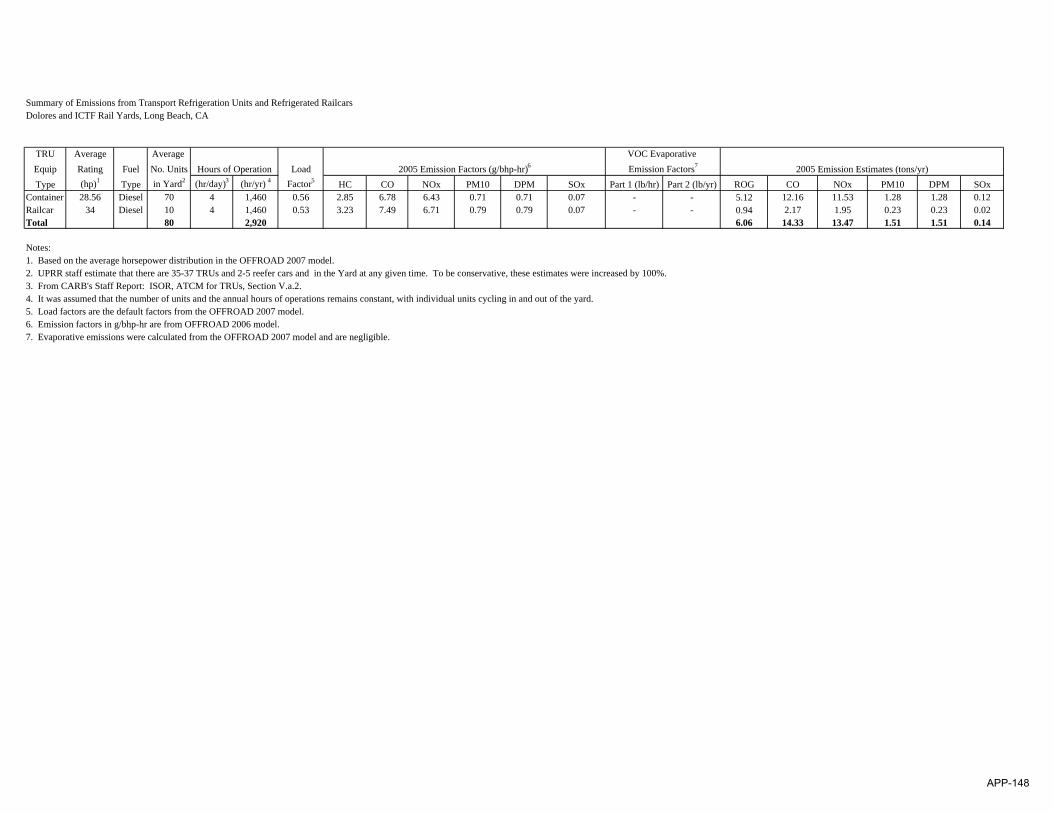
Summary of Emissions from Transport Refrigeration Units and Refrigerated RailcarsDolores and ICTF Rail Yards, Long Beach, CA
TRU Average Average Equip Rating Fuel No. Units LoadType (hp)1 Type in Yard2 (hr/day)3 (hr/yr) 4 Factor5 HC CO NOx PM10 DPM SOx Part 1 (lb/hr) Part 2 (lb/yr) ROG CO NOx PM10 DPM SOx
Container 28.56 Diesel 70 4 1,460 0.56 2.85 6.78 6.43 0.71 0.71 0.07 - - 5.12 12.16 11.53 1.28 1.28 0.12Railcar 34 Diesel 10 4 1,460 0.53 3.23 7.49 6.71 0.79 0.79 0.07 - - 0.94 2.17 1.95 0.23 0.23 0.02Total 80 2,920 6.06 14.33 13.47 1.51 1.51 0.14
Notes:1. Based on the average horsepower distribution in the OFFROAD 2007 model.2. UPRR staff estimate that there are 35-37 TRUs and 2-5 reefer cars and in the Yard at any given time. To be conservative, these estimates were increased by 100%.3. From CARB's Staff Report: ISOR, ATCM for TRUs, Section V.a.2.4. It was assumed that the number of units and the annual hours of operations remains constant, with individual units cycling in and out of the yard.5. Load factors are the default factors from the OFFROAD 2007 model.6. Emission factors in g/bhp-hr are from OFFROAD 2006 model.7. Evaporative emissions were calculated from the OFFROAD 2007 model and are negligible.
VOC Evaporative Emission Factors7 2005 Emission Estimates (tons/yr)Hours of Operation 2005 Emission Factors (g/bhp-hr)6
APP-148
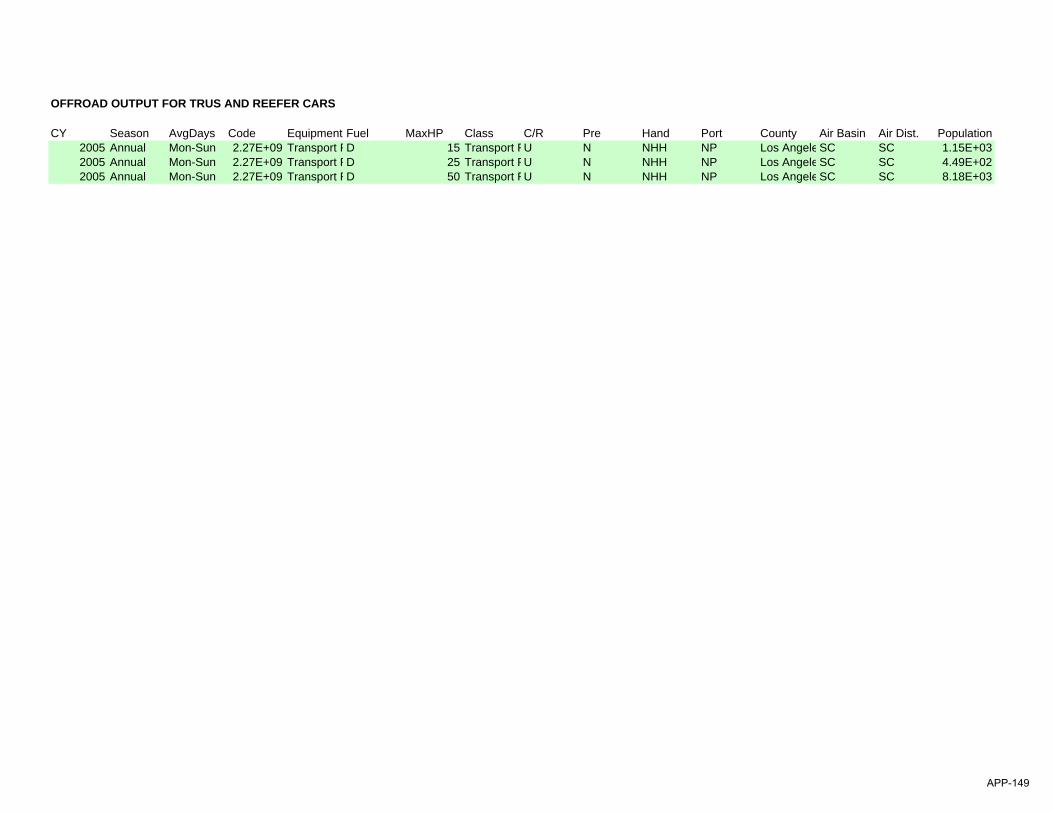
OFFROAD OUTPUT FOR TRUS AND REEFER CARS
CY Season AvgDays Code Equipment Fuel MaxHP Class C/R Pre Hand Port County Air Basin Air Dist. Population2005 Annual Mon-Sun 2.27E+09 Transport RD 15 Transport RU N NHH NP Los AngeleSC SC 1.15E+032005 Annual Mon-Sun 2.27E+09 Transport RD 25 Transport RU N NHH NP Los AngeleSC SC 4.49E+022005 Annual Mon-Sun 2.27E+09 Transport RD 50 Transport RU N NHH NP Los AngeleSC SC 8.18E+03
APP-149
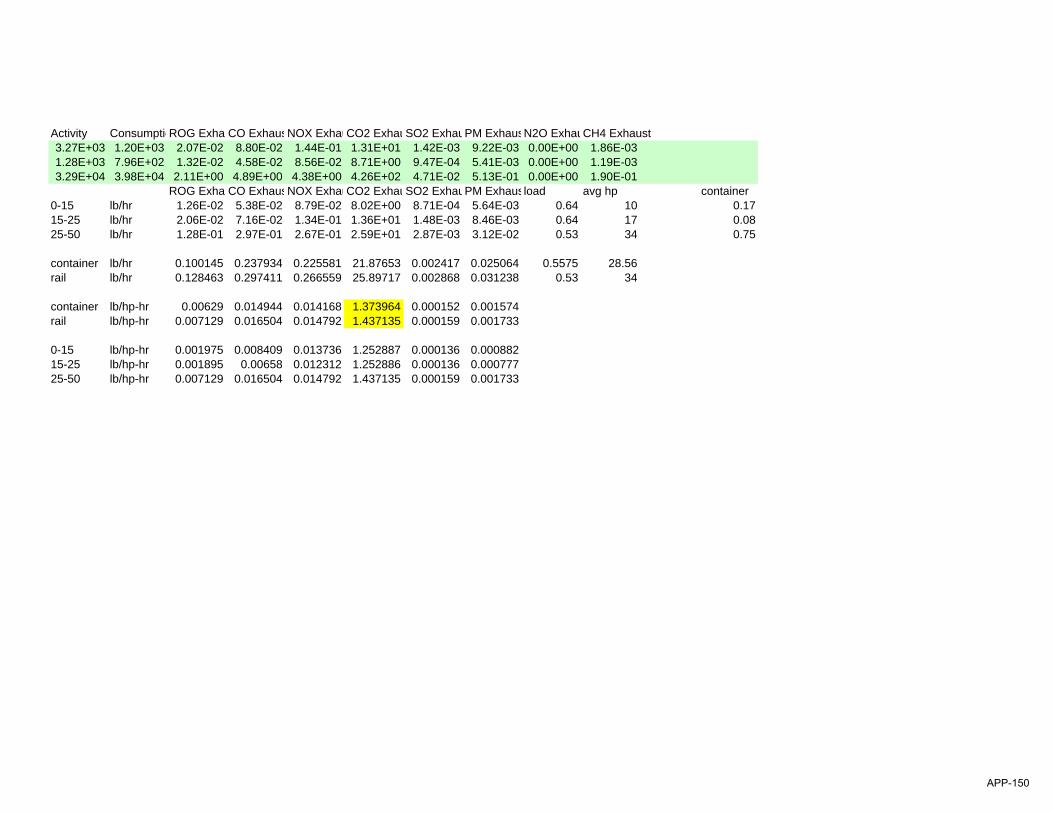
Activity ConsumptioROG Exha CO ExhausNOX ExhauCO2 ExhauSO2 ExhauPM ExhausN2O ExhauCH4 Exhaust3.27E+03 1.20E+03 2.07E-02 8.80E-02 1.44E-01 1.31E+01 1.42E-03 9.22E-03 0.00E+00 1.86E-031.28E+03 7.96E+02 1.32E-02 4.58E-02 8.56E-02 8.71E+00 9.47E-04 5.41E-03 0.00E+00 1.19E-033.29E+04 3.98E+04 2.11E+00 4.89E+00 4.38E+00 4.26E+02 4.71E-02 5.13E-01 0.00E+00 1.90E-01
ROG Exha CO ExhausNOX ExhauCO2 ExhauSO2 ExhauPM Exhausload avg hp container0-15 lb/hr 1.26E-02 5.38E-02 8.79E-02 8.02E+00 8.71E-04 5.64E-03 0.64 10 0.1715-25 lb/hr 2.06E-02 7.16E-02 1.34E-01 1.36E+01 1.48E-03 8.46E-03 0.64 17 0.0825-50 lb/hr 1.28E-01 2.97E-01 2.67E-01 2.59E+01 2.87E-03 3.12E-02 0.53 34 0.75
container lb/hr 0.100145 0.237934 0.225581 21.87653 0.002417 0.025064 0.5575 28.56rail lb/hr 0.128463 0.297411 0.266559 25.89717 0.002868 0.031238 0.53 34
container lb/hp-hr 0.00629 0.014944 0.014168 1.373964 0.000152 0.001574rail lb/hp-hr 0.007129 0.016504 0.014792 1.437135 0.000159 0.001733
0-15 lb/hp-hr 0.001975 0.008409 0.013736 1.252887 0.000136 0.00088215-25 lb/hp-hr 0.001895 0.00658 0.012312 1.252886 0.000136 0.00077725-50 lb/hp-hr 0.007129 0.016504 0.014792 1.437135 0.000159 0.001733
APP-150

APPENDIX F
DEATILED EMISSION CALCULATIONS, EMISSION FACTOR DERIVATION AND EMFAC2007 OUTPUT FOR
DIESEL-FUELED DELIVERY TRUCKS
APP-151
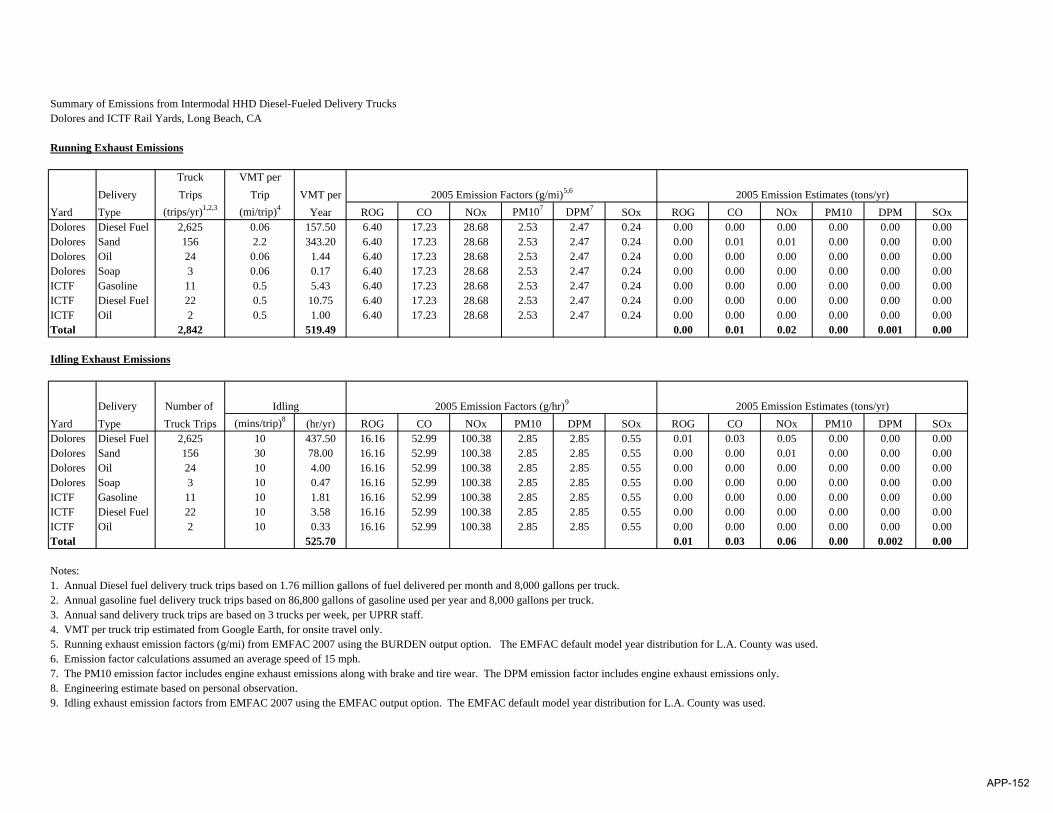
Summary of Emissions from Intermodal HHD Diesel-Fueled Delivery TrucksDolores and ICTF Rail Yards, Long Beach, CA
Running Exhaust Emissions
Truck VMT perDelivery Trips Trip VMT per
Yard Type (trips/yr)1,2,3 (mi/trip)4 Year ROG CO NOx PM107 DPM7 SOx ROG CO NOx PM10 DPM SOxDolores Diesel Fuel 2,625 0.06 157.50 6.40 17.23 28.68 2.53 2.47 0.24 0.00 0.00 0.00 0.00 0.00 0.00Dolores Sand 156 2.2 343.20 6.40 17.23 28.68 2.53 2.47 0.24 0.00 0.01 0.01 0.00 0.00 0.00Dolores Oil 24 0.06 1.44 6.40 17.23 28.68 2.53 2.47 0.24 0.00 0.00 0.00 0.00 0.00 0.00Dolores Soap 3 0.06 0.17 6.40 17.23 28.68 2.53 2.47 0.24 0.00 0.00 0.00 0.00 0.00 0.00ICTF Gasoline 11 0.5 5.43 6.40 17.23 28.68 2.53 2.47 0.24 0.00 0.00 0.00 0.00 0.00 0.00ICTF Diesel Fuel 22 0.5 10.75 6.40 17.23 28.68 2.53 2.47 0.24 0.00 0.00 0.00 0.00 0.00 0.00ICTF Oil 2 0.5 1.00 6.40 17.23 28.68 2.53 2.47 0.24 0.00 0.00 0.00 0.00 0.00 0.00Total 2,842 519.49 0.00 0.01 0.02 0.00 0.001 0.00
Idling Exhaust Emissions
Delivery Number of Yard Type Truck Trips (mins/trip)8 (hr/yr) ROG CO NOx PM10 DPM SOx ROG CO NOx PM10 DPM SOxDolores Diesel Fuel 2,625 10 437.50 16.16 52.99 100.38 2.85 2.85 0.55 0.01 0.03 0.05 0.00 0.00 0.00Dolores Sand 156 30 78.00 16.16 52.99 100.38 2.85 2.85 0.55 0.00 0.00 0.01 0.00 0.00 0.00Dolores Oil 24 10 4.00 16.16 52.99 100.38 2.85 2.85 0.55 0.00 0.00 0.00 0.00 0.00 0.00Dolores Soap 3 10 0.47 16.16 52.99 100.38 2.85 2.85 0.55 0.00 0.00 0.00 0.00 0.00 0.00ICTF Gasoline 11 10 1.81 16.16 52.99 100.38 2.85 2.85 0.55 0.00 0.00 0.00 0.00 0.00 0.00ICTF Diesel Fuel 22 10 3.58 16.16 52.99 100.38 2.85 2.85 0.55 0.00 0.00 0.00 0.00 0.00 0.00ICTF Oil 2 10 0.33 16.16 52.99 100.38 2.85 2.85 0.55 0.00 0.00 0.00 0.00 0.00 0.00Total 525.70 0.01 0.03 0.06 0.00 0.002 0.00
Notes:1. Annual Diesel fuel delivery truck trips based on 1.76 million gallons of fuel delivered per month and 8,000 gallons per truck.2. Annual gasoline fuel delivery truck trips based on 86,800 gallons of gasoline used per year and 8,000 gallons per truck.3. Annual sand delivery truck trips are based on 3 trucks per week, per UPRR staff.4. VMT per truck trip estimated from Google Earth, for onsite travel only.5. Running exhaust emission factors (g/mi) from EMFAC 2007 using the BURDEN output option. The EMFAC default model year distribution for L.A. County was used.6. Emission factor calculations assumed an average speed of 15 mph.7. The PM10 emission factor includes engine exhaust emissions along with brake and tire wear. The DPM emission factor includes engine exhaust emissions only.8. Engineering estimate based on personal observation.9. Idling exhaust emission factors from EMFAC 2007 using the EMFAC output option. The EMFAC default model year distribution for L.A. County was used.
Idling 2005 Emission Factors (g/hr)9 2005 Emission Estimates (tons/yr)
2005 Emission Factors (g/mi)5,6 2005 Emission Estimates (tons/yr)
APP-152
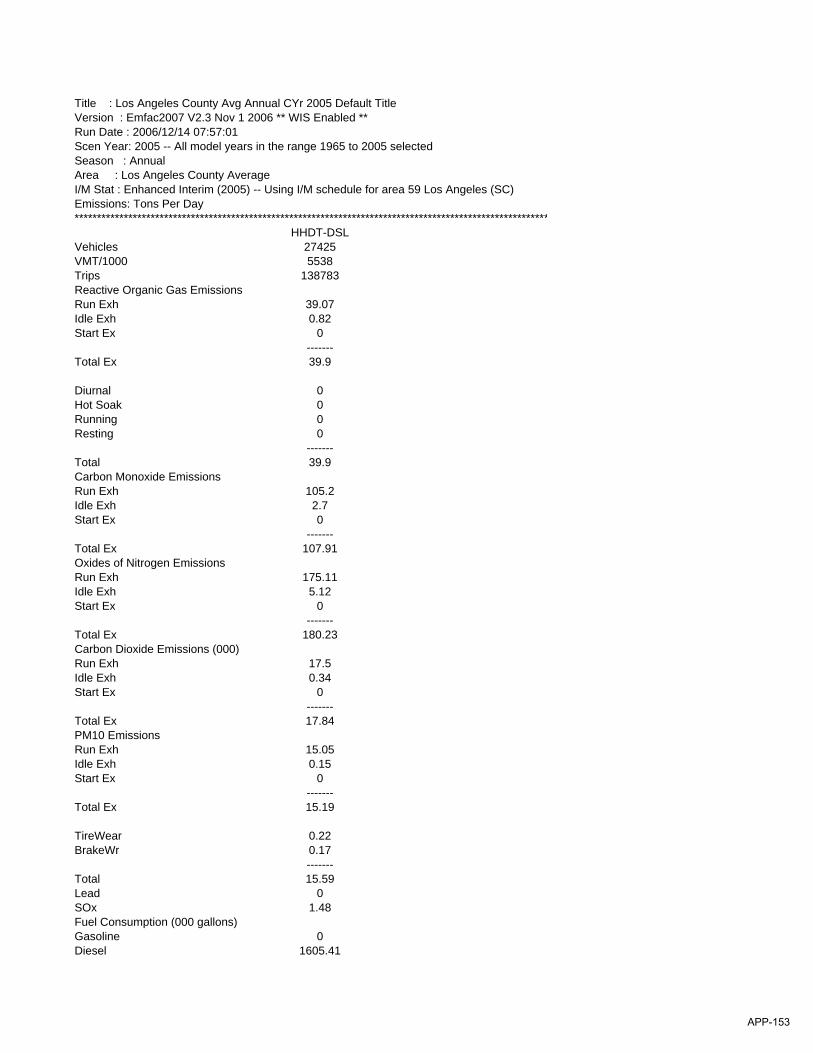
Title : Los Angeles County Avg Annual CYr 2005 Default TitleVersion : Emfac2007 V2.3 Nov 1 2006 ** WIS Enabled **Run Date : 2006/12/14 07:57:01Scen Year: 2005 -- All model years in the range 1965 to 2005 selectedSeason : AnnualArea : Los Angeles County AverageI/M Stat : Enhanced Interim (2005) -- Using I/M schedule for area 59 Los Angeles (SC)Emissions: Tons Per Day**********************************************************************************************************
HHDT-DSLVehicles 27425VMT/1000 5538Trips 138783Reactive Organic Gas EmissionsRun Exh 39.07Idle Exh 0.82Start Ex 0
-------Total Ex 39.9
Diurnal 0Hot Soak 0Running 0Resting 0
-------Total 39.9Carbon Monoxide Emissions Run Exh 105.2Idle Exh 2.7Start Ex 0
-------Total Ex 107.91Oxides of Nitrogen Emissions Run Exh 175.11Idle Exh 5.12Start Ex 0
-------Total Ex 180.23Carbon Dioxide Emissions (000)Run Exh 17.5Idle Exh 0.34Start Ex 0
-------Total Ex 17.84PM10 Emissions Run Exh 15.05Idle Exh 0.15Start Ex 0
-------Total Ex 15.19
TireWear 0.22BrakeWr 0.17
-------Total 15.59Lead 0SOx 1.48Fuel Consumption (000 gallons)Gasoline 0Diesel 1605.41
APP-153
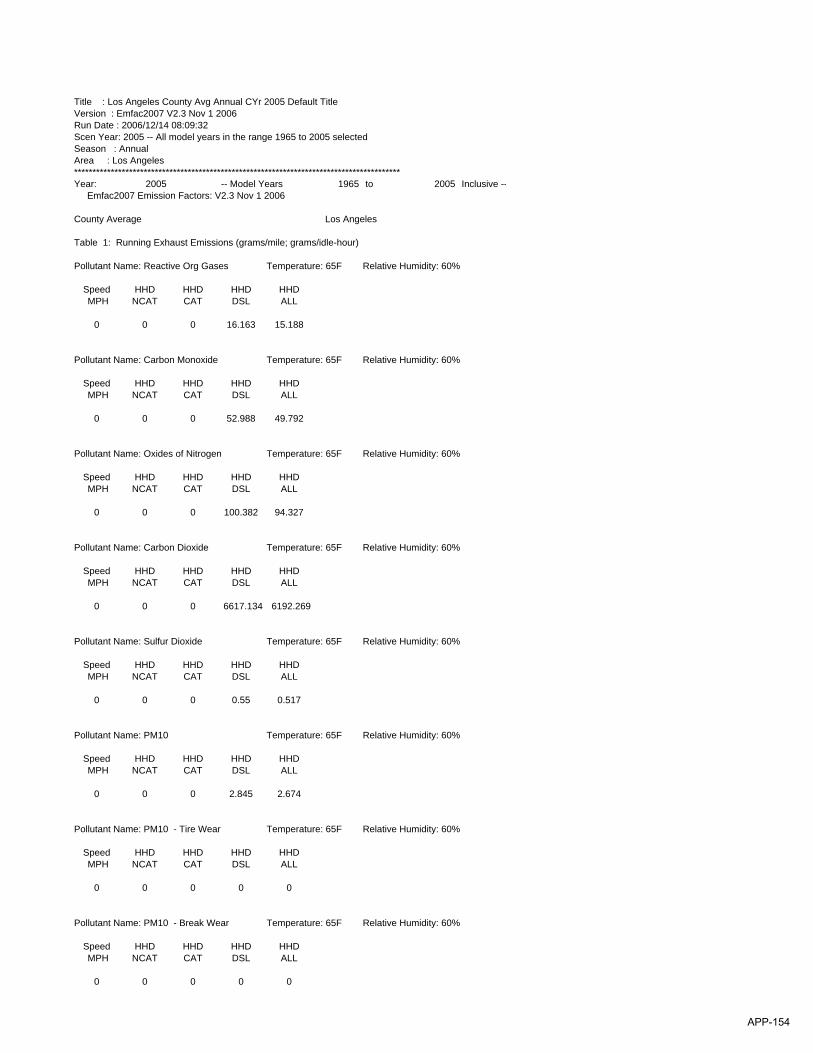
Title : Los Angeles County Avg Annual CYr 2005 Default TitleVersion : Emfac2007 V2.3 Nov 1 2006Run Date : 2006/12/14 08:09:32Scen Year: 2005 -- All model years in the range 1965 to 2005 selectedSeason : AnnualArea : Los Angeles*****************************************************************************************Year: 2005 -- Model Years 1965 to 2005 Inclusive -- Emfac2007 Emission Factors: V2.3 Nov 1 2006
County Average Los Angeles
Table 1: Running Exhaust Emissions (grams/mile; grams/idle-hour)
Pollutant Name: Reactive Org Gases Temperature: 65F Relative Humidity: 60%
Speed HHD HHD HHD HHD MPH NCAT CAT DSL ALL
0 0 0 16.163 15.188
Pollutant Name: Carbon Monoxide Temperature: 65F Relative Humidity: 60%
Speed HHD HHD HHD HHD MPH NCAT CAT DSL ALL
0 0 0 52.988 49.792
Pollutant Name: Oxides of Nitrogen Temperature: 65F Relative Humidity: 60%
Speed HHD HHD HHD HHD MPH NCAT CAT DSL ALL
0 0 0 100.382 94.327
Pollutant Name: Carbon Dioxide Temperature: 65F Relative Humidity: 60%
Speed HHD HHD HHD HHD MPH NCAT CAT DSL ALL
0 0 0 6617.134 6192.269
Pollutant Name: Sulfur Dioxide Temperature: 65F Relative Humidity: 60%
Speed HHD HHD HHD HHD MPH NCAT CAT DSL ALL
0 0 0 0.55 0.517
Pollutant Name: PM10 Temperature: 65F Relative Humidity: 60%
Speed HHD HHD HHD HHD MPH NCAT CAT DSL ALL
0 0 0 2.845 2.674
Pollutant Name: PM10 - Tire Wear Temperature: 65F Relative Humidity: 60%
Speed HHD HHD HHD HHD MPH NCAT CAT DSL ALL
0 0 0 0 0
Pollutant Name: PM10 - Break Wear Temperature: 65F Relative Humidity: 60%
Speed HHD HHD HHD HHD MPH NCAT CAT DSL ALL
0 0 0 0 0
APP-154
APPENDIX G
DEATILED EMISSION CALCULATIONS, EMISSION FACTOR DERIVATION, EMFAC2007 OUTPUT, AND SPECIATION PROFILE FOR
GASOLINE-FUELED YARD TRUCKS
APP-155

Summary of Emissions from Yard TrucksDolores and ICTF Rail Yards, Long Beach, CA
Running Exhaust Emissions
Annual
Equipment Equipment Vehicle Fuel Model VMT
Yard Type Owner/ID Class Make Model Type Year (mi/yr)1 ROG CO NOx PM10 SOx ROG CO NOx PM10 SOxICTF SUV 1915-53287 LDT Jeep Cherokee XHTH74 Gasoline 2000 73,000 0.07 3.00 0.22 0.04 0.01 0.01 0.24 0.02 0.00 0.00ICTF Pickup Truck 1915-55536 LDT Chevy Extended Cab Gasoline 2003 73,000 0.05 1.97 0.16 0.03 0.01 0.00 0.16 0.01 0.00 0.00ICTF SUV 1915-19952 LDT Chevy Trailblazer 370 Gasoline 2003 73,000 0.05 1.97 0.16 0.03 0.01 0.00 0.16 0.01 0.00 0.00ICTF Pickup Truck 1915-19971 LDT Chevy Extended Cab Gasoline 2004 73,000 0.04 1.51 0.12 0.03 0.01 0.00 0.12 0.01 0.00 0.00ICTF Van 1915-19975 LHDT 1 Chevy 15 Passenger Van Gasoline 2004 73,000 0.03 0.35 0.12 0.03 0.00 0.00 0.03 0.01 0.00 0.00Dolores Service Truck 73152 MHD Chevy Chevy C4500 Gasoline 2003 12,644 0.88 11.41 2.19 0.02 0.00 0.01 0.16 0.03 0.00 0.00Dolores Mgr Truck Unknown LDT Chevy Trailblazer Gasoline 2004 45,000 0.05 1.97 0.16 0.03 0.01 0.00 0.10 0.01 0.00 0.00Dolores Mgr Truck 73167 LDT Chevy Blazer Gasoline 2004 36,608 0.05 1.97 0.16 0.03 0.01 0.00 0.08 0.01 0.00 0.00Dolores Pickup Truck 73396 LDT Ford F-150 Gasoline 2005 23,756 0.02 0.89 0.07 0.02 0.01 0.00 0.02 0.00 0.00 0.00Total 483,007 0.04 1.07 0.11 0.02 0.00
Idling Exhaust Emissions
Equipment Equip. Vehicle Fuel Model Idling 4
Yard Type Owner/ID Class Make Model Type Year (hr/yr) ROG CO NOx PM10 SOx ROG CO NOx PM10 SOxICTF Van 1915-19975 LHDT 1 Chevy 15 Passenger Van Gasoline 2004 91.25 23.10 141.99 1.56 0.00 0.05 0.00 0.01 0.00 0.00 0.00
Dolores Service Truck 73152 MHD Chevy Chevy C4500 Gasoline 2003 91.25 23.10 141.99 1.56 0.00 0.05 0.00 0.01 0.00 0.00 0.00Total 0.00 0.03 0.00 0.00 0.00
Notes:1. Annual VMT estimated by UPRR personnel.2. Running exhaust emissions calculated using the EMFAC2007 model with the BURDEN output option.3. Running exhaust emission factor calculations assumed an average speed of 15 mph.4. Idling time (hr/yr) is an engineering estimate.5. Idling exhaust emissions factors for LHDT1 and MHD vehicles calculated using the EMFAC2007 model with the EMFAC output option.6. Idling exhaust emissions from LDT vehicles are negligible.
2005 Emission Factors (g/hr)5,6
2005 Emission Factors (g/mi)2,3
2005 Emission Estimates (tons/yr)
2005 Emission Estimates (tons/yr)
APP-156
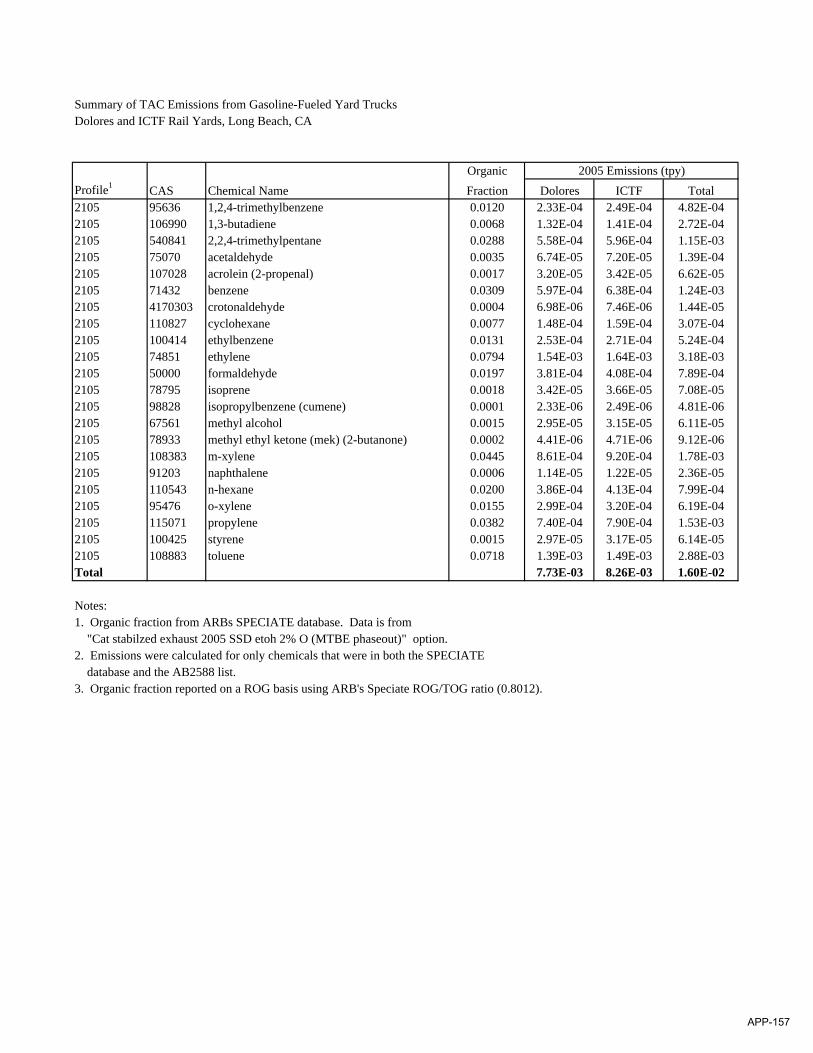
Summary of TAC Emissions from Gasoline-Fueled Yard TrucksDolores and ICTF Rail Yards, Long Beach, CA
OrganicProfile1 CAS Chemical Name Fraction Dolores ICTF Total2105 95636 1,2,4-trimethylbenzene 0.0120 2.33E-04 2.49E-04 4.82E-042105 106990 1,3-butadiene 0.0068 1.32E-04 1.41E-04 2.72E-042105 540841 2,2,4-trimethylpentane 0.0288 5.58E-04 5.96E-04 1.15E-032105 75070 acetaldehyde 0.0035 6.74E-05 7.20E-05 1.39E-042105 107028 acrolein (2-propenal) 0.0017 3.20E-05 3.42E-05 6.62E-052105 71432 benzene 0.0309 5.97E-04 6.38E-04 1.24E-032105 4170303 crotonaldehyde 0.0004 6.98E-06 7.46E-06 1.44E-052105 110827 cyclohexane 0.0077 1.48E-04 1.59E-04 3.07E-042105 100414 ethylbenzene 0.0131 2.53E-04 2.71E-04 5.24E-042105 74851 ethylene 0.0794 1.54E-03 1.64E-03 3.18E-032105 50000 formaldehyde 0.0197 3.81E-04 4.08E-04 7.89E-042105 78795 isoprene 0.0018 3.42E-05 3.66E-05 7.08E-052105 98828 isopropylbenzene (cumene) 0.0001 2.33E-06 2.49E-06 4.81E-062105 67561 methyl alcohol 0.0015 2.95E-05 3.15E-05 6.11E-052105 78933 methyl ethyl ketone (mek) (2-butanone) 0.0002 4.41E-06 4.71E-06 9.12E-062105 108383 m-xylene 0.0445 8.61E-04 9.20E-04 1.78E-032105 91203 naphthalene 0.0006 1.14E-05 1.22E-05 2.36E-052105 110543 n-hexane 0.0200 3.86E-04 4.13E-04 7.99E-042105 95476 o-xylene 0.0155 2.99E-04 3.20E-04 6.19E-042105 115071 propylene 0.0382 7.40E-04 7.90E-04 1.53E-032105 100425 styrene 0.0015 2.97E-05 3.17E-05 6.14E-052105 108883 toluene 0.0718 1.39E-03 1.49E-03 2.88E-03Total 7.73E-03 8.26E-03 1.60E-02
Notes:1. Organic fraction from ARBs SPECIATE database. Data is from "Cat stabilzed exhaust 2005 SSD etoh 2% O (MTBE phaseout)" option.2. Emissions were calculated for only chemicals that were in both the SPECIATE database and the AB2588 list.3. Organic fraction reported on a ROG basis using ARB's Speciate ROG/TOG ratio (0.8012).
2005 Emissions (tpy)
APP-157
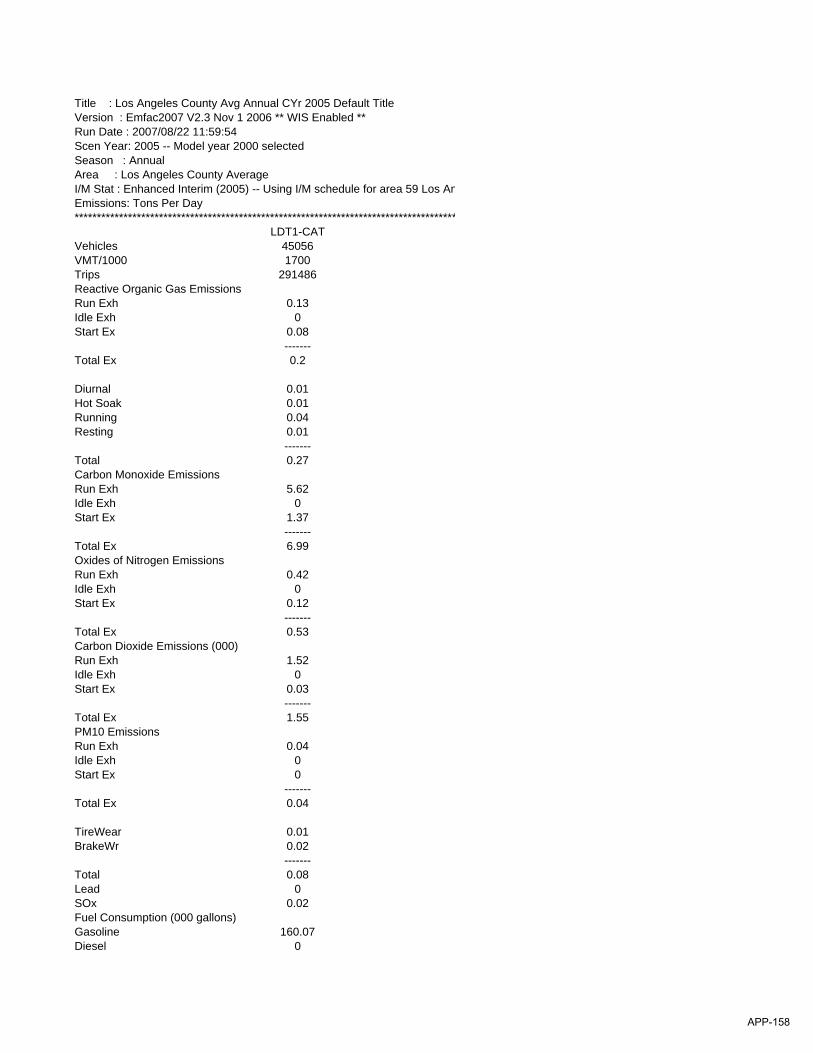
Title : Los Angeles County Avg Annual CYr 2005 Default TitleVersion : Emfac2007 V2.3 Nov 1 2006 ** WIS Enabled **Run Date : 2007/08/22 11:59:54Scen Year: 2005 -- Model year 2000 selectedSeason : AnnualArea : Los Angeles County AverageI/M Stat : Enhanced Interim (2005) -- Using I/M schedule for area 59 Los AnEmissions: Tons Per Day**************************************************************************************
LDT1-CATVehicles 45056VMT/1000 1700Trips 291486Reactive Organic Gas EmissionsRun Exh 0.13Idle Exh 0Start Ex 0.08
-------Total Ex 0.2
Diurnal 0.01Hot Soak 0.01Running 0.04Resting 0.01
-------Total 0.27Carbon Monoxide Emissions Run Exh 5.62Idle Exh 0Start Ex 1.37
-------Total Ex 6.99Oxides of Nitrogen Emissions Run Exh 0.42Idle Exh 0Start Ex 0.12
-------Total Ex 0.53Carbon Dioxide Emissions (000)Run Exh 1.52Idle Exh 0Start Ex 0.03
-------Total Ex 1.55PM10 Emissions Run Exh 0.04Idle Exh 0Start Ex 0
-------Total Ex 0.04
TireWear 0.01BrakeWr 0.02
-------Total 0.08Lead 0SOx 0.02Fuel Consumption (000 gallons)Gasoline 160.07Diesel 0
APP-158
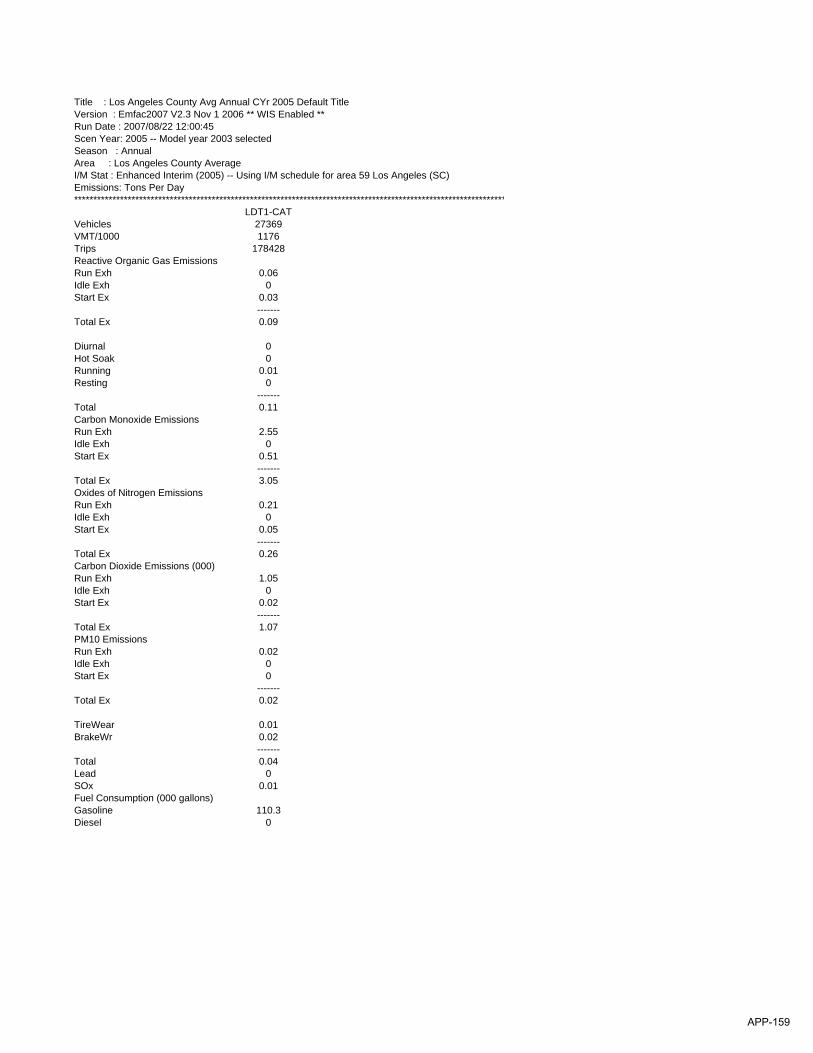
Title : Los Angeles County Avg Annual CYr 2005 Default TitleVersion : Emfac2007 V2.3 Nov 1 2006 ** WIS Enabled **Run Date : 2007/08/22 12:00:45Scen Year: 2005 -- Model year 2003 selectedSeason : AnnualArea : Los Angeles County AverageI/M Stat : Enhanced Interim (2005) -- Using I/M schedule for area 59 Los Angeles (SC)Emissions: Tons Per Day*****************************************************************************************************************
LDT1-CATVehicles 27369VMT/1000 1176Trips 178428Reactive Organic Gas EmissionsRun Exh 0.06Idle Exh 0Start Ex 0.03
-------Total Ex 0.09
Diurnal 0Hot Soak 0Running 0.01Resting 0
-------Total 0.11Carbon Monoxide Emissions Run Exh 2.55Idle Exh 0Start Ex 0.51
-------Total Ex 3.05Oxides of Nitrogen Emissions Run Exh 0.21Idle Exh 0Start Ex 0.05
-------Total Ex 0.26Carbon Dioxide Emissions (000)Run Exh 1.05Idle Exh 0Start Ex 0.02
-------Total Ex 1.07PM10 Emissions Run Exh 0.02Idle Exh 0Start Ex 0
-------Total Ex 0.02
TireWear 0.01BrakeWr 0.02
-------Total 0.04Lead 0SOx 0.01Fuel Consumption (000 gallons)Gasoline 110.3Diesel 0
APP-159

Title : Los Angeles County Avg Annual CYr 2005 Default TitleVersion : Emfac2007 V2.3 Nov 1 2006 ** WIS Enabled **Run Date : 2007/09/06 11:14:27Scen Year: 2005 -- Model year 2003 selectedSeason : AnnualArea : Los Angeles County AverageI/M Stat : Enhanced Interim (2005) -- Using I/M schedule for area 59 Los Angeles (SC)Emissions: Tons Per Day***********************************************************************************************************
MHDT-CATVehicles 834VMT/1000 62Trips 38088Reactive Organic Gas EmissionsRun Exh 0.06Idle Exh 0Start Ex 0.04
-------Total Ex 0.1
Diurnal 0Hot Soak 0Running 0Resting 0
-------Total 0.1Carbon Monoxide Emissions Run Exh 0.78Idle Exh 0.01Start Ex 0.68
-------Total Ex 1.47Oxides of Nitrogen Emissions Run Exh 0.15Idle Exh 0Start Ex 0.09
-------Total Ex 0.24Carbon Dioxide Emissions (000)Run Exh 0.1Idle Exh 0Start Ex 0
-------Total Ex 0.1PM10 Emissions Run Exh 0Idle Exh 0Start Ex 0
-------Total Ex 0
TireWear 0BrakeWr 0
-------Total 0Lead 0SOx 0Fuel Consumption (000 gallons)Gasoline 10.28Diesel 0
APP-160
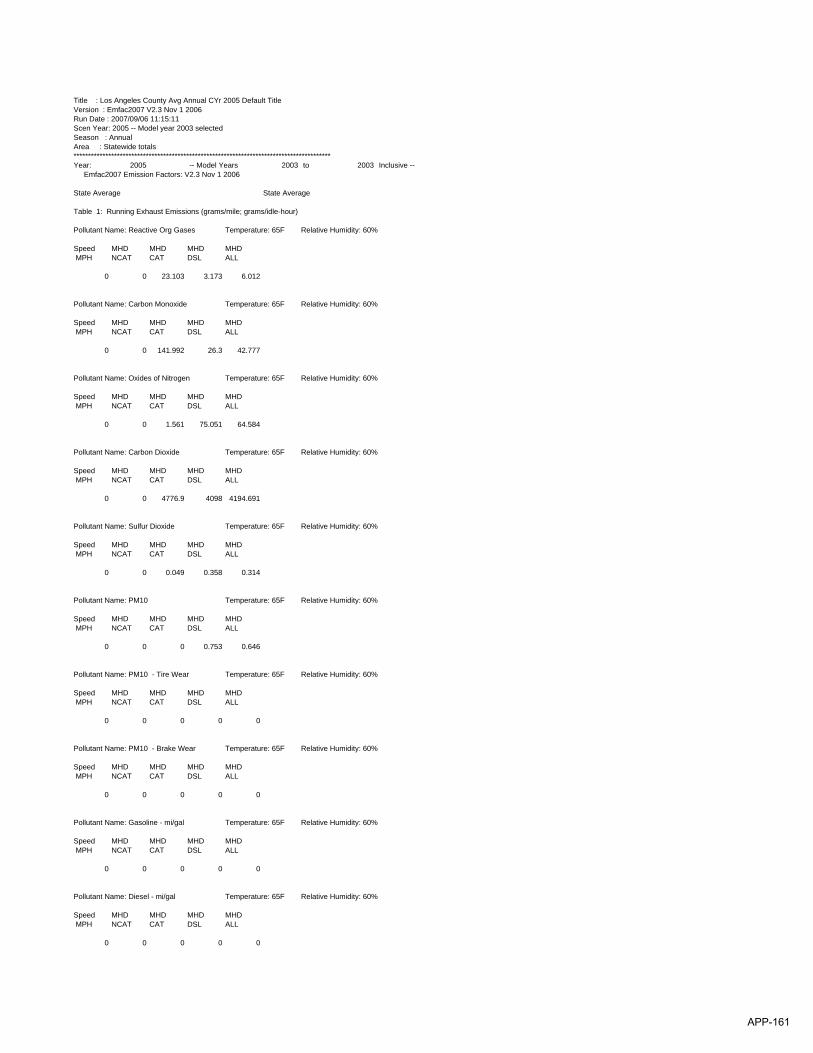
Title : Los Angeles County Avg Annual CYr 2005 Default TitleVersion : Emfac2007 V2.3 Nov 1 2006Run Date : 2007/09/06 11:15:11Scen Year: 2005 -- Model year 2003 selectedSeason : AnnualArea : Statewide totals*****************************************************************************************Year: 2005 -- Model Years 2003 to 2003 Inclusive -- Emfac2007 Emission Factors: V2.3 Nov 1 2006
State Average State Average
Table 1: Running Exhaust Emissions (grams/mile; grams/idle-hour)
Pollutant Name: Reactive Org Gases Temperature: 65F Relative Humidity: 60%
Speed MHD MHD MHD MHD MPH NCAT CAT DSL ALL
0 0 23.103 3.173 6.012
Pollutant Name: Carbon Monoxide Temperature: 65F Relative Humidity: 60%
Speed MHD MHD MHD MHD MPH NCAT CAT DSL ALL
0 0 141.992 26.3 42.777
Pollutant Name: Oxides of Nitrogen Temperature: 65F Relative Humidity: 60%
Speed MHD MHD MHD MHD MPH NCAT CAT DSL ALL
0 0 1.561 75.051 64.584
Pollutant Name: Carbon Dioxide Temperature: 65F Relative Humidity: 60%
Speed MHD MHD MHD MHD MPH NCAT CAT DSL ALL
0 0 4776.9 4098 4194.691
Pollutant Name: Sulfur Dioxide Temperature: 65F Relative Humidity: 60%
Speed MHD MHD MHD MHD MPH NCAT CAT DSL ALL
0 0 0.049 0.358 0.314
Pollutant Name: PM10 Temperature: 65F Relative Humidity: 60%
Speed MHD MHD MHD MHD MPH NCAT CAT DSL ALL
0 0 0 0.753 0.646
Pollutant Name: PM10 - Tire Wear Temperature: 65F Relative Humidity: 60%
Speed MHD MHD MHD MHD MPH NCAT CAT DSL ALL
0 0 0 0 0
Pollutant Name: PM10 - Brake Wear Temperature: 65F Relative Humidity: 60%
Speed MHD MHD MHD MHD MPH NCAT CAT DSL ALL
0 0 0 0 0
Pollutant Name: Gasoline - mi/gal Temperature: 65F Relative Humidity: 60%
Speed MHD MHD MHD MHD MPH NCAT CAT DSL ALL
0 0 0 0 0
Pollutant Name: Diesel - mi/gal Temperature: 65F Relative Humidity: 60%
Speed MHD MHD MHD MHD MPH NCAT CAT DSL ALL
0 0 0 0 0
APP-161

Title : Los Angeles County Avg Annual CYr 2005 Default TitleVersion : Emfac2007 V2.3 Nov 1 2006 ** WIS Enabled **Run Date : 2007/08/22 12:02:11Scen Year: 2005 -- Model year 2004 selectedSeason : AnnualArea : Los Angeles County AverageI/M Stat : Enhanced Interim (2005) -- Using I/M schedule for area 59 Los Angeles (SC)Emissions: Tons Per Day************************************************************************************************************
LDT1-CAT LHDT1-CATVehicles 26388 4585VMT/1000 1214 315Trips 172560 151611Reactive Organic Gas EmissionsRun Exh 0.05 0.01Idle Exh 0 0.01Start Ex 0.02 0.02
------- -------Total Ex 0.07 0.04
Diurnal 0 0Hot Soak 0 0Running 0.01 0Resting 0 0
------- -------Total 0.09 0.04Carbon Monoxide Emissions Run Exh 2.02 0.12Idle Exh 0 0.04Start Ex 0.38 0.39
------- -------Total Ex 2.4 0.55Oxides of Nitrogen Emissions Run Exh 0.16 0.04Idle Exh 0 0Start Ex 0.03 0.25
------- -------Total Ex 0.18 0.29Carbon Dioxide Emissions (000)Run Exh 1.09 0.48Idle Exh 0 0Start Ex 0.02 0.01
------- -------Total Ex 1.11 0.49PM10 Emissions Run Exh 0.01 0Idle Exh 0 0Start Ex 0 0
------- -------Total Ex 0.01 0
TireWear 0.01 0BrakeWr 0.02 0
------- -------Total 0.04 0.01Lead 0 0SOx 0.01 0Fuel Consumption (000 gallons)Gasoline 113.65 50.53Diesel 0 0
APP-162

Title : Statewide totals Avg Annual CYr 2005 Default TitleVersion : Emfac2007 V2.3 Nov 1 2006Run Date : 2007/08/22 12:37:17Scen Year: 2005 -- Model year 2004 selectedSeason : AnnualArea : Statewide totals*****************************************************************************************Year: 2005 -- Model Years 2004 to 2004 Inclusive -- Emfac2007 Emission Factors: V2.3 Nov 1 2006
State Average State Average
Table 1: Running Exhaust Emissions (grams/mile; grams/idle-hour)
Pollutant Name: Reactive Org Gases Temperature: 65F Relative Humidity: 60%
Speed LHD1 LHD1 LHD1 LHD1 MPH NCAT CAT DSL ALL
0 0 23.103 3.173 10.704
Pollutant Name: Carbon Monoxide Temperature: 65F Relative Humidity: 60%
Speed LHD1 LHD1 LHD1 LHD1 MPH NCAT CAT DSL ALL
0 0 141.992 26.3 70.016
Pollutant Name: Oxides of Nitrogen Temperature: 65F Relative Humidity: 60%
Speed LHD1 LHD1 LHD1 LHD1 MPH NCAT CAT DSL ALL
0 0 1.561 75.051 47.281
Pollutant Name: Carbon Dioxide Temperature: 65F Relative Humidity: 60%
Speed LHD1 LHD1 LHD1 LHD1 MPH NCAT CAT DSL ALL
0 0 4776.9 4098 4354.536
Pollutant Name: Sulfur Dioxide Temperature: 65F Relative Humidity: 60%
Speed LHD1 LHD1 LHD1 LHD1 MPH NCAT CAT DSL ALL
0 0 0.049 0.358 0.241
Pollutant Name: PM10 Temperature: 65F Relative Humidity: 60%
Speed LHD1 LHD1 LHD1 LHD1 MPH NCAT CAT DSL ALL
0 0 0 0.753 0.468
Pollutant Name: PM10 - Tire Wear Temperature: 65F Relative Humidity: 60%
Speed LHD1 LHD1 LHD1 LHD1 MPH NCAT CAT DSL ALL
0 0 0 0 0
Pollutant Name: PM10 - Brake Wear Temperature: 65F Relative Humidity: 60%
Speed LHD1 LHD1 LHD1 LHD1 MPH NCAT CAT DSL ALL
0 0 0 0 0
Pollutant Name: Gasoline - mi/gal Temperature: 65F Relative Humidity: 60%
Speed LHD1 LHD1 LHD1 LHD1 MPH NCAT CAT DSL ALL
0 0 0 0 0
Pollutant Name: Diesel - mi/gal Temperature: 65F Relative Humidity: 60%
Speed LHD1 LHD1 LHD1 LHD1 MPH NCAT CAT DSL ALL
0 0 0 0 0
APP-163
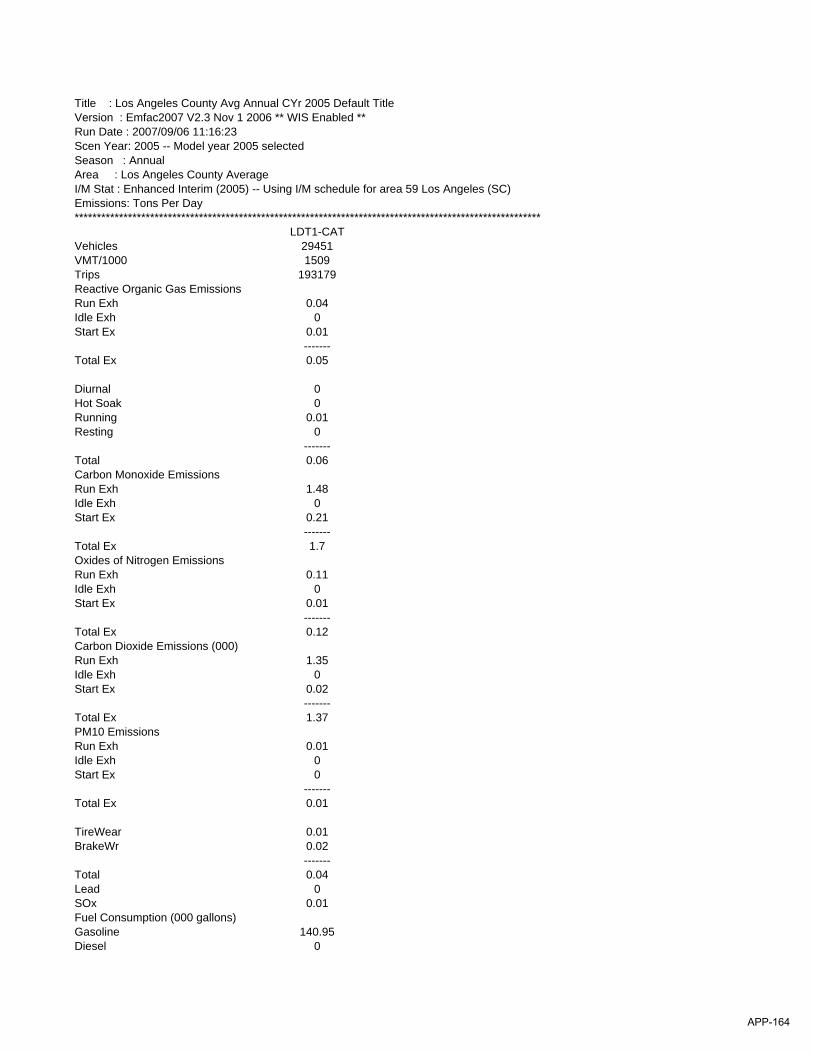
Title : Los Angeles County Avg Annual CYr 2005 Default TitleVersion : Emfac2007 V2.3 Nov 1 2006 ** WIS Enabled **Run Date : 2007/09/06 11:16:23Scen Year: 2005 -- Model year 2005 selectedSeason : AnnualArea : Los Angeles County AverageI/M Stat : Enhanced Interim (2005) -- Using I/M schedule for area 59 Los Angeles (SC)Emissions: Tons Per Day*********************************************************************************************************
LDT1-CATVehicles 29451VMT/1000 1509Trips 193179Reactive Organic Gas EmissionsRun Exh 0.04Idle Exh 0Start Ex 0.01
-------Total Ex 0.05
Diurnal 0Hot Soak 0Running 0.01Resting 0
-------Total 0.06Carbon Monoxide Emissions Run Exh 1.48Idle Exh 0Start Ex 0.21
-------Total Ex 1.7Oxides of Nitrogen Emissions Run Exh 0.11Idle Exh 0Start Ex 0.01
-------Total Ex 0.12Carbon Dioxide Emissions (000)Run Exh 1.35Idle Exh 0Start Ex 0.02
-------Total Ex 1.37PM10 Emissions Run Exh 0.01Idle Exh 0Start Ex 0
-------Total Ex 0.01
TireWear 0.01BrakeWr 0.02
-------Total 0.04Lead 0SOx 0.01Fuel Consumption (000 gallons)Gasoline 140.95Diesel 0
APP-164
APPENDIX H
DEATILED EMISSION CALCULATIONS FOR DIESEL-FUELED IC ENGINES
APP-165
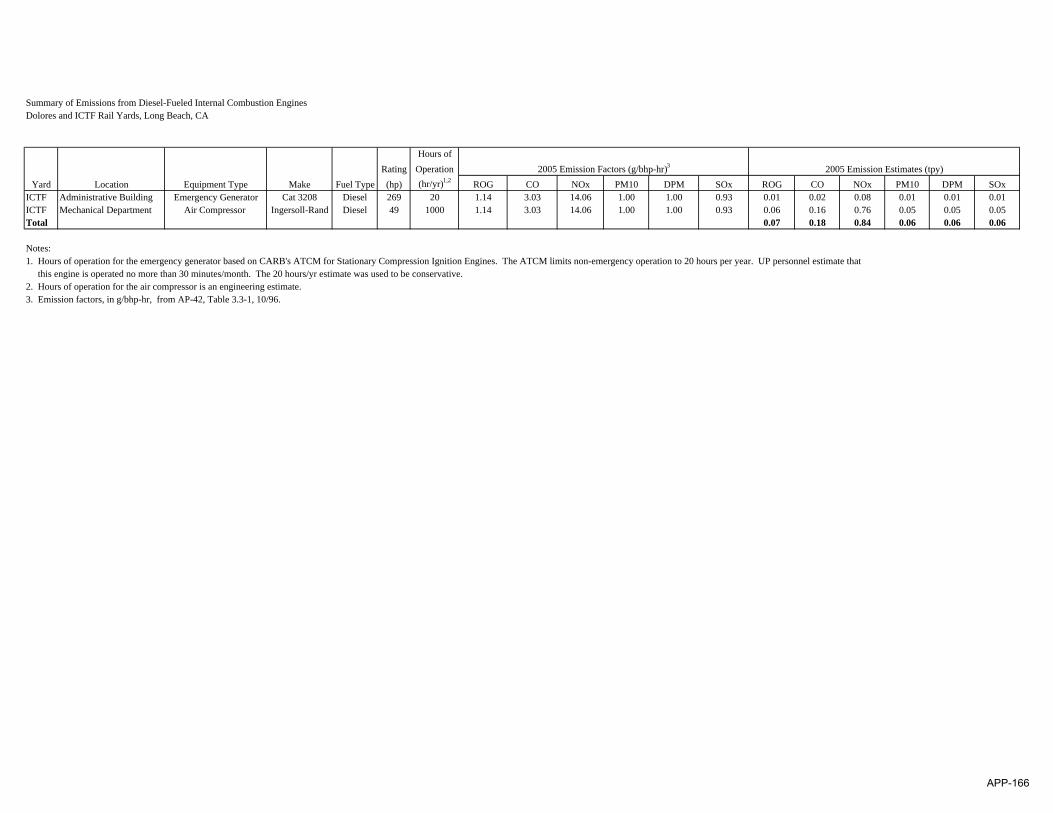
Summary of Emissions from Diesel-Fueled Internal Combustion EnginesDolores and ICTF Rail Yards, Long Beach, CA
Hours ofRating Operation
Yard Location Equipment Type Make Fuel Type (hp) (hr/yr)1,2 ROG CO NOx PM10 DPM SOx ROG CO NOx PM10 DPM SOxICTF Administrative Building Emergency Generator Cat 3208 Diesel 269 20 1.14 3.03 14.06 1.00 1.00 0.93 0.01 0.02 0.08 0.01 0.01 0.01ICTF Mechanical Department Air Compressor Ingersoll-Rand Diesel 49 1000 1.14 3.03 14.06 1.00 1.00 0.93 0.06 0.16 0.76 0.05 0.05 0.05Total 0.07 0.18 0.84 0.06 0.06 0.06
Notes:1. Hours of operation for the emergency generator based on CARB's ATCM for Stationary Compression Ignition Engines. The ATCM limits non-emergency operation to 20 hours per year. UP personnel estimate that this engine is operated no more than 30 minutes/month. The 20 hours/yr estimate was used to be conservative.2. Hours of operation for the air compressor is an engineering estimate.3. Emission factors, in g/bhp-hr, from AP-42, Table 3.3-1, 10/96.
2005 Emission Factors (g/bhp-hr)3 2005 Emission Estimates (tpy)
APP-166
APPENDIX I
TANKS OUTPUT, SPECIATION PROFILE, AND DETAILED EMISSION CALCULATIONS FOR
STORAGE TANKS
APP-167
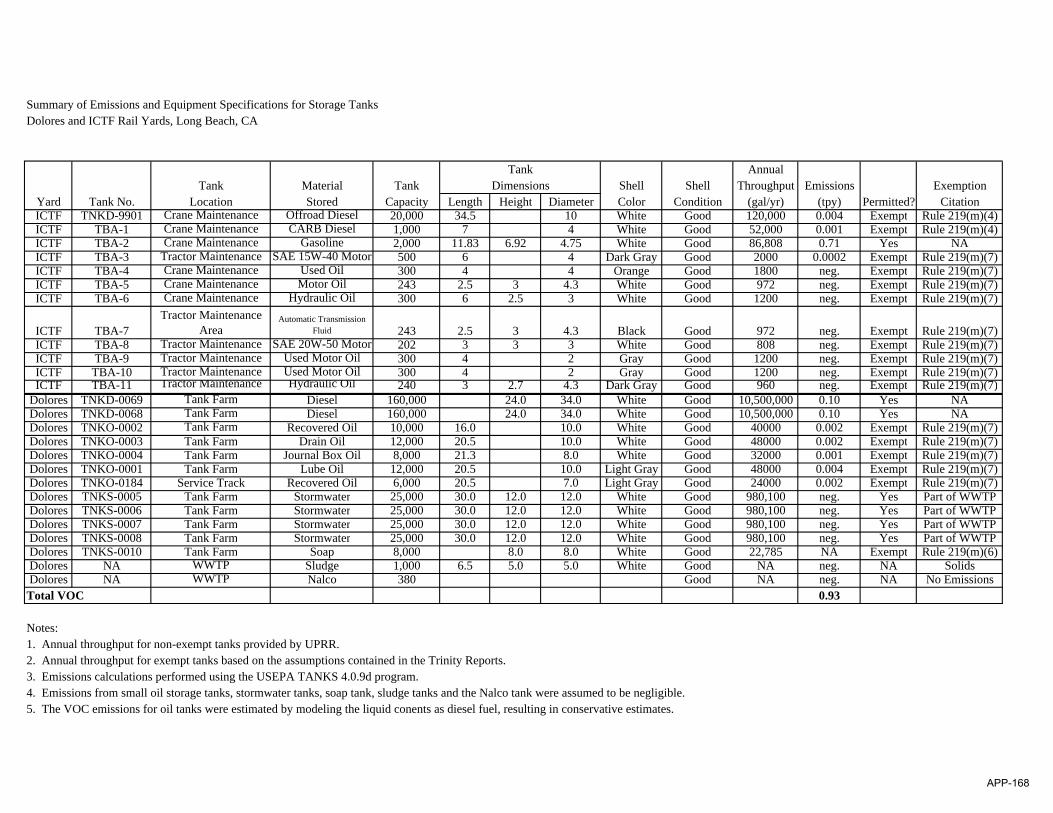
Summary of Emissions and Equipment Specifications for Storage TanksDolores and ICTF Rail Yards, Long Beach, CA
AnnualTank Material Tank Shell Shell Throughput Emissions Exemption
Yard Tank No. Location Stored Capacity Length Height Diameter Color Condition (gal/yr) (tpy) Permitted? CitationICTF TNKD-9901 Crane Maintenance Offroad Diesel 20,000 34.5 10 White Good 120,000 0.004 Exempt Rule 219(m)(4)ICTF TBA-1 Crane Maintenance CARB Diesel 1,000 7 4 White Good 52,000 0.001 Exempt Rule 219(m)(4)ICTF TBA-2 Crane Maintenance Gasoline 2,000 11.83 6.92 4.75 White Good 86,808 0.71 Yes NAICTF TBA-3 Tractor Maintenance SAE 15W-40 Motor 500 6 4 Dark Gray Good 2000 0.0002 Exempt Rule 219(m)(7)ICTF TBA-4 Crane Maintenance Used Oil 300 4 4 Orange Good 1800 neg. Exempt Rule 219(m)(7)ICTF TBA-5 Crane Maintenance Motor Oil 243 2.5 3 4.3 White Good 972 neg. Exempt Rule 219(m)(7)ICTF TBA-6 Crane Maintenance Hydraulic Oil 300 6 2.5 3 White Good 1200 neg. Exempt Rule 219(m)(7)
ICTF TBA-7Tractor Maintenance
AreaAutomatic Transmission
Fluid 243 2.5 3 4.3 Black Good 972 neg. Exempt Rule 219(m)(7)ICTF TBA-8 Tractor Maintenance SAE 20W-50 Motor 202 3 3 3 White Good 808 neg. Exempt Rule 219(m)(7)ICTF TBA-9 Tractor Maintenance Used Motor Oil 300 4 2 Gray Good 1200 neg. Exempt Rule 219(m)(7)ICTF TBA-10 Tractor Maintenance Used Motor Oil 300 4 2 Gray Good 1200 neg. Exempt Rule 219(m)(7)ICTF TBA-11 Tractor Maintenance Hydraulic Oil 240 3 2.7 4.3 Dark Gray Good 960 neg. Exempt Rule 219(m)(7)
Dolores TNKD-0069 Tank Farm Diesel 160,000 24.0 34.0 White Good 10,500,000 0.10 Yes NADolores TNKD-0068 Tank Farm Diesel 160,000 24.0 34.0 White Good 10,500,000 0.10 Yes NADolores TNKO-0002 Tank Farm Recovered Oil 10,000 16.0 10.0 White Good 40000 0.002 Exempt Rule 219(m)(7)Dolores TNKO-0003 Tank Farm Drain Oil 12,000 20.5 10.0 White Good 48000 0.002 Exempt Rule 219(m)(7)Dolores TNKO-0004 Tank Farm Journal Box Oil 8,000 21.3 8.0 White Good 32000 0.001 Exempt Rule 219(m)(7)Dolores TNKO-0001 Tank Farm Lube Oil 12,000 20.5 10.0 Light Gray Good 48000 0.004 Exempt Rule 219(m)(7)Dolores TNKO-0184 Service Track Recovered Oil 6,000 20.5 7.0 Light Gray Good 24000 0.002 Exempt Rule 219(m)(7)Dolores TNKS-0005 Tank Farm Stormwater 25,000 30.0 12.0 12.0 White Good 980,100 neg. Yes Part of WWTPDolores TNKS-0006 Tank Farm Stormwater 25,000 30.0 12.0 12.0 White Good 980,100 neg. Yes Part of WWTPDolores TNKS-0007 Tank Farm Stormwater 25,000 30.0 12.0 12.0 White Good 980,100 neg. Yes Part of WWTPDolores TNKS-0008 Tank Farm Stormwater 25,000 30.0 12.0 12.0 White Good 980,100 neg. Yes Part of WWTPDolores TNKS-0010 Tank Farm Soap 8,000 8.0 8.0 White Good 22,785 NA Exempt Rule 219(m)(6)Dolores NA WWTP Sludge 1,000 6.5 5.0 5.0 White Good NA neg. NA SolidsDolores NA WWTP Nalco 380 Good NA neg. NA No EmissionsTotal VOC 0.93
Notes:1. Annual throughput for non-exempt tanks provided by UPRR.2. Annual throughput for exempt tanks based on the assumptions contained in the Trinity Reports.3. Emissions calculations performed using the USEPA TANKS 4.0.9d program.4. Emissions from small oil storage tanks, stormwater tanks, soap tank, sludge tanks and the Nalco tank were assumed to be negligible.5. The VOC emissions for oil tanks were estimated by modeling the liquid conents as diesel fuel, resulting in conservative estimates.
TankDimensions
APP-168

Summary of TAC Emissions from Gasoline-Fueled Yard TrucksDolores and ICTF Rail Yards, Long Beach, CA
OrganicProfile1 CAS Chemical Name Fraction Dolores ICTF Total2105 95636 1,2,4-trimethylbenzene 0.0120 2.33E-04 2.49E-04 4.82E-042105 106990 1,3-butadiene 0.0068 1.32E-04 1.41E-04 2.72E-042105 540841 2,2,4-trimethylpentane 0.0288 5.58E-04 5.96E-04 1.15E-032105 75070 acetaldehyde 0.0035 6.74E-05 7.20E-05 1.39E-042105 107028 acrolein (2-propenal) 0.0017 3.20E-05 3.42E-05 6.62E-052105 71432 benzene 0.0309 5.97E-04 6.38E-04 1.24E-032105 4170303 crotonaldehyde 0.0004 6.98E-06 7.46E-06 1.44E-052105 110827 cyclohexane 0.0077 1.48E-04 1.59E-04 3.07E-042105 100414 ethylbenzene 0.0131 2.53E-04 2.71E-04 5.24E-042105 74851 ethylene 0.0794 1.54E-03 1.64E-03 3.18E-032105 50000 formaldehyde 0.0197 3.81E-04 4.08E-04 7.89E-042105 78795 isoprene 0.0018 3.42E-05 3.66E-05 7.08E-052105 98828 isopropylbenzene (cumene) 0.0001 2.33E-06 2.49E-06 4.81E-062105 67561 methyl alcohol 0.0015 2.95E-05 3.15E-05 6.11E-052105 78933 methyl ethyl ketone (mek) (2-butanone) 0.0002 4.41E-06 4.71E-06 9.12E-062105 108383 m-xylene 0.0445 8.61E-04 9.20E-04 1.78E-032105 91203 naphthalene 0.0006 1.14E-05 1.22E-05 2.36E-052105 110543 n-hexane 0.0200 3.86E-04 4.13E-04 7.99E-042105 95476 o-xylene 0.0155 2.99E-04 3.20E-04 6.19E-042105 115071 propylene 0.0382 7.40E-04 7.90E-04 1.53E-032105 100425 styrene 0.0015 2.97E-05 3.17E-05 6.14E-052105 108883 toluene 0.0718 1.39E-03 1.49E-03 2.88E-03Total 7.73E-03 8.26E-03 1.60E-02
Notes:1. Organic fraction from ARBs SPECIATE database. Data is from "Cat stabilzed exhaust 2005 SSD etoh 2% O (MTBE phaseout)" option.2. Emissions were calculated for only chemicals that were in both the SPECIATE database and the AB2588 list.3. Organic fraction reported on a ROG basis using ARB's Speciate ROG/TOG ratio (0.8012).
2005 Emissions (tpy)
APP-169

TANKS 4.0.9dEmissions Report - Detail Format
Tank Indentification and Physical Characteristics
Identification User Identification: TNKD-9901 City: Long Beach State: California Company: UPRR Type of Tank: Horizontal Tank Description:
Tank Dimensions Shell Length (ft): 34.50 Diameter (ft): 10.00 Volume (gallons): 20,000.00 Turnovers: 6.00 Net Throughput(gal/yr): 120,000.00 Is Tank Heated (y/n): N Is Tank Underground (y/n): N
Paint Characteristics Shell Color/Shade: White/White Shell Condition Good
Breather Vent Settings Vacuum Settings (psig): -0.03 Pressure Settings (psig) 0.03
Meterological Data used in Emissions Calculations: Long Beach, California (Avg Atmospheric Pressure = 14.7 psia)
Page 1 of 6TANKS 4.0 Report
8/22/2007file://C:\Program Files\Tanks409d\summarydisplay.htmAPP-170

TNKD-9901 - Horizontal Tank Long Beach, California
TANKS 4.0.9dEmissions Report - Detail Format Liquid Contents of Storage Tank
Daily Liquid Surf.
Temperature (deg F)
LiquidBulk
Temp Vapor Pressure (psia)Vapor
Mol. Liquid Mass
VaporMass Mol. Basis for Vapor Pressure
Mixture/Component Month Avg. Min. Max. (deg F) Avg. Min. Max. Weight. Fract. Fract. Weight Calculations
Distillate fuel oil no. 2 All 66.43 60.99 71.87 64.33 0.0081 0.0067 0.0096 130.0000 188.00 Option 1: VP60 = .0065 VP70 = .009
Page 2 of 6TANKS 4.0 Report
8/22/2007file://C:\Program Files\Tanks409d\summarydisplay.htmAPP-171

TNKD-9901 - Horizontal Tank Long Beach, California
TANKS 4.0.9dEmissions Report - Detail Format
Detail Calculations (AP-42)
Annual Emission Calcaulations
Standing Losses (lb): 4.3947 Vapor Space Volume (cu ft): 1,725.8749 Vapor Density (lb/cu ft): 0.0002 Vapor Space Expansion Factor: 0.0374 Vented Vapor Saturation Factor: 0.9979 Tank Vapor Space Volume: Vapor Space Volume (cu ft): 1,725.8749 Tank Diameter (ft): 10.0000 Effective Diameter (ft): 20.9640 Vapor Space Outage (ft): 5.0000 Tank Shell Length (ft): 34.5000 Vapor Density Vapor Density (lb/cu ft): 0.0002 Vapor Molecular Weight (lb/lb-mole): 130.0000 Vapor Pressure at Daily Average Liquid Surface Temperature (psia): 0.0081 Daily Avg. Liquid Surface Temp. (deg. R): 526.1003 Daily Average Ambient Temp. (deg. F): 64.3083 Ideal Gas Constant R (psia cuft / (lb-mol-deg R)): 10.731 Liquid Bulk Temperature (deg. R): 523.9983 Tank Paint Solar Absorptance (Shell): 0.1700 Daily Total Solar Insulation Factor (Btu/sqft day): 1,571.6498 Vapor Space Expansion Factor Vapor Space Expansion Factor: 0.0374 Daily Vapor Temperature Range (deg. R): 21.7491 Daily Vapor Pressure Range (psia): 0.0028 Breather Vent Press. Setting Range(psia): 0.0600 Vapor Pressure at Daily Average Liquid Surface Temperature (psia): 0.0081 Vapor Pressure at Daily Minimum Liquid Surface Temperature (psia): 0.0067 Vapor Pressure at Daily Maximum Liquid Surface Temperature (psia): 0.0096 Daily Avg. Liquid Surface Temp. (deg R): 526.1003 Daily Min. Liquid Surface Temp. (deg R): 520.6630 Daily Max. Liquid Surface Temp. (deg R): 531.5375 Daily Ambient Temp. Range (deg. R): 19.8167 Vented Vapor Saturation Factor Vented Vapor Saturation Factor: 0.9979 Vapor Pressure at Daily Average Liquid: Surface Temperature (psia): 0.0081 Vapor Space Outage (ft): 5.0000 Working Losses (lb): 3.0114 Vapor Molecular Weight (lb/lb-mole): 130.0000 Vapor Pressure at Daily Average Liquid Surface Temperature (psia): 0.0081 Annual Net Throughput (gal/yr.): 120,000.0000
Page 3 of 6TANKS 4.0 Report
8/22/2007file://C:\Program Files\Tanks409d\summarydisplay.htmAPP-172

Annual Turnovers: 6.0000 Turnover Factor: 1.0000 Tank Diameter (ft): 10.0000 Working Loss Product Factor: 1.0000 Total Losses (lb): 7.4061
Page 4 of 6TANKS 4.0 Report
8/22/2007file://C:\Program Files\Tanks409d\summarydisplay.htmAPP-173

Emissions Report for: Annual
TNKD-9901 - Horizontal Tank Long Beach, California
TANKS 4.0.9dEmissions Report - Detail Format Individual Tank Emission Totals
Losses(lbs)
Components Working Loss Breathing Loss Total Emissions
Distillate fuel oil no. 2 3.01 4.39 7.41
Page 5 of 6TANKS 4.0 Report
8/22/2007file://C:\Program Files\Tanks409d\summarydisplay.htmAPP-174
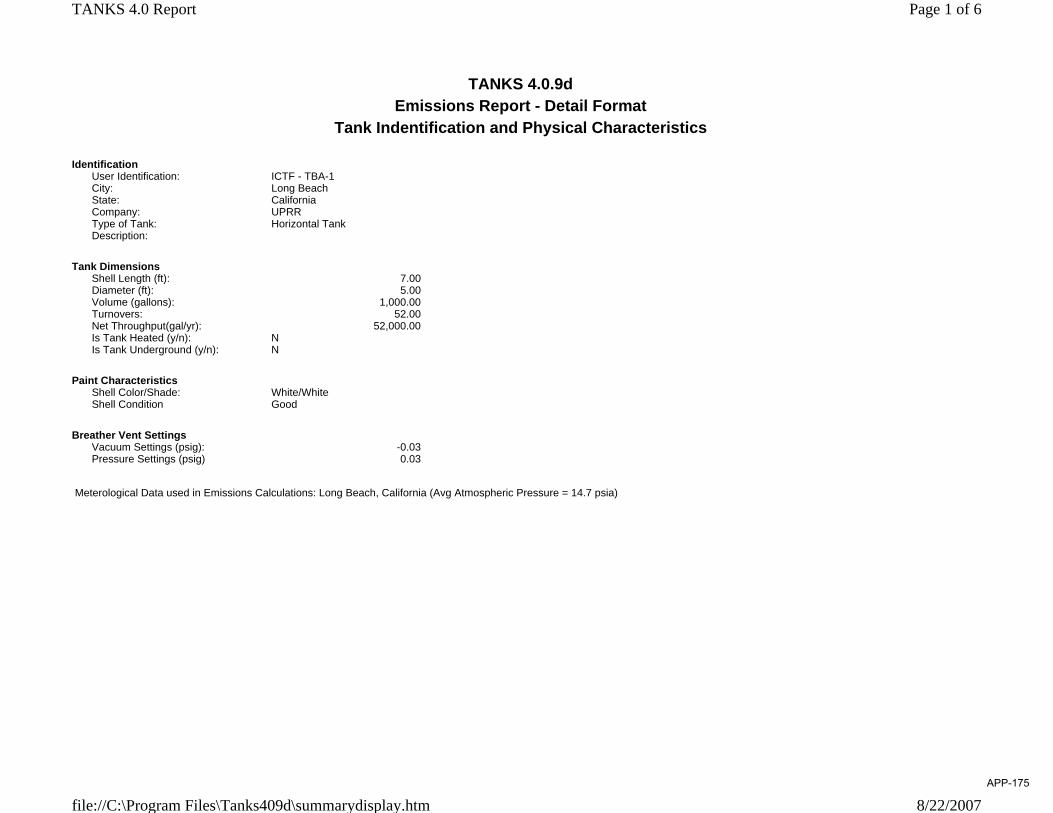
TANKS 4.0.9dEmissions Report - Detail Format
Tank Indentification and Physical Characteristics
Identification User Identification: ICTF - TBA-1 City: Long Beach State: California Company: UPRR Type of Tank: Horizontal Tank Description:
Tank Dimensions Shell Length (ft): 7.00 Diameter (ft): 5.00 Volume (gallons): 1,000.00 Turnovers: 52.00 Net Throughput(gal/yr): 52,000.00 Is Tank Heated (y/n): N Is Tank Underground (y/n): N
Paint Characteristics Shell Color/Shade: White/White Shell Condition Good
Breather Vent Settings Vacuum Settings (psig): -0.03 Pressure Settings (psig) 0.03
Meterological Data used in Emissions Calculations: Long Beach, California (Avg Atmospheric Pressure = 14.7 psia)
Page 1 of 6TANKS 4.0 Report
8/22/2007file://C:\Program Files\Tanks409d\summarydisplay.htmAPP-175

ICTF - TBA-1 - Horizontal Tank Long Beach, California
TANKS 4.0.9dEmissions Report - Detail Format Liquid Contents of Storage Tank
Daily Liquid Surf.
Temperature (deg F)
LiquidBulk
Temp Vapor Pressure (psia)Vapor
Mol. Liquid Mass
VaporMass Mol. Basis for Vapor Pressure
Mixture/Component Month Avg. Min. Max. (deg F) Avg. Min. Max. Weight. Fract. Fract. Weight Calculations
Distillate fuel oil no. 2 All 66.43 60.99 71.87 64.33 0.0081 0.0067 0.0096 130.0000 188.00 Option 1: VP60 = .0065 VP70 = .009
Page 2 of 6TANKS 4.0 Report
8/22/2007file://C:\Program Files\Tanks409d\summarydisplay.htmAPP-176

ICTF - TBA-1 - Horizontal Tank Long Beach, California
TANKS 4.0.9dEmissions Report - Detail Format
Detail Calculations (AP-42)
Annual Emission Calcaulations
Standing Losses (lb): 0.2232 Vapor Space Volume (cu ft): 87.5444 Vapor Density (lb/cu ft): 0.0002 Vapor Space Expansion Factor: 0.0374 Vented Vapor Saturation Factor: 0.9989 Tank Vapor Space Volume: Vapor Space Volume (cu ft): 87.5444 Tank Diameter (ft): 5.0000 Effective Diameter (ft): 6.6773 Vapor Space Outage (ft): 2.5000 Tank Shell Length (ft): 7.0000 Vapor Density Vapor Density (lb/cu ft): 0.0002 Vapor Molecular Weight (lb/lb-mole): 130.0000 Vapor Pressure at Daily Average Liquid Surface Temperature (psia): 0.0081 Daily Avg. Liquid Surface Temp. (deg. R): 526.1003 Daily Average Ambient Temp. (deg. F): 64.3083 Ideal Gas Constant R (psia cuft / (lb-mol-deg R)): 10.731 Liquid Bulk Temperature (deg. R): 523.9983 Tank Paint Solar Absorptance (Shell): 0.1700 Daily Total Solar Insulation Factor (Btu/sqft day): 1,571.6498 Vapor Space Expansion Factor Vapor Space Expansion Factor: 0.0374 Daily Vapor Temperature Range (deg. R): 21.7491 Daily Vapor Pressure Range (psia): 0.0028 Breather Vent Press. Setting Range(psia): 0.0600 Vapor Pressure at Daily Average Liquid Surface Temperature (psia): 0.0081 Vapor Pressure at Daily Minimum Liquid Surface Temperature (psia): 0.0067 Vapor Pressure at Daily Maximum Liquid Surface Temperature (psia): 0.0096 Daily Avg. Liquid Surface Temp. (deg R): 526.1003 Daily Min. Liquid Surface Temp. (deg R): 520.6630 Daily Max. Liquid Surface Temp. (deg R): 531.5375 Daily Ambient Temp. Range (deg. R): 19.8167 Vented Vapor Saturation Factor Vented Vapor Saturation Factor: 0.9989 Vapor Pressure at Daily Average Liquid: Surface Temperature (psia): 0.0081 Vapor Space Outage (ft): 2.5000 Working Losses (lb): 0.9703 Vapor Molecular Weight (lb/lb-mole): 130.0000 Vapor Pressure at Daily Average Liquid Surface Temperature (psia): 0.0081 Annual Net Throughput (gal/yr.): 52,000.0000
Page 3 of 6TANKS 4.0 Report
8/22/2007file://C:\Program Files\Tanks409d\summarydisplay.htmAPP-177
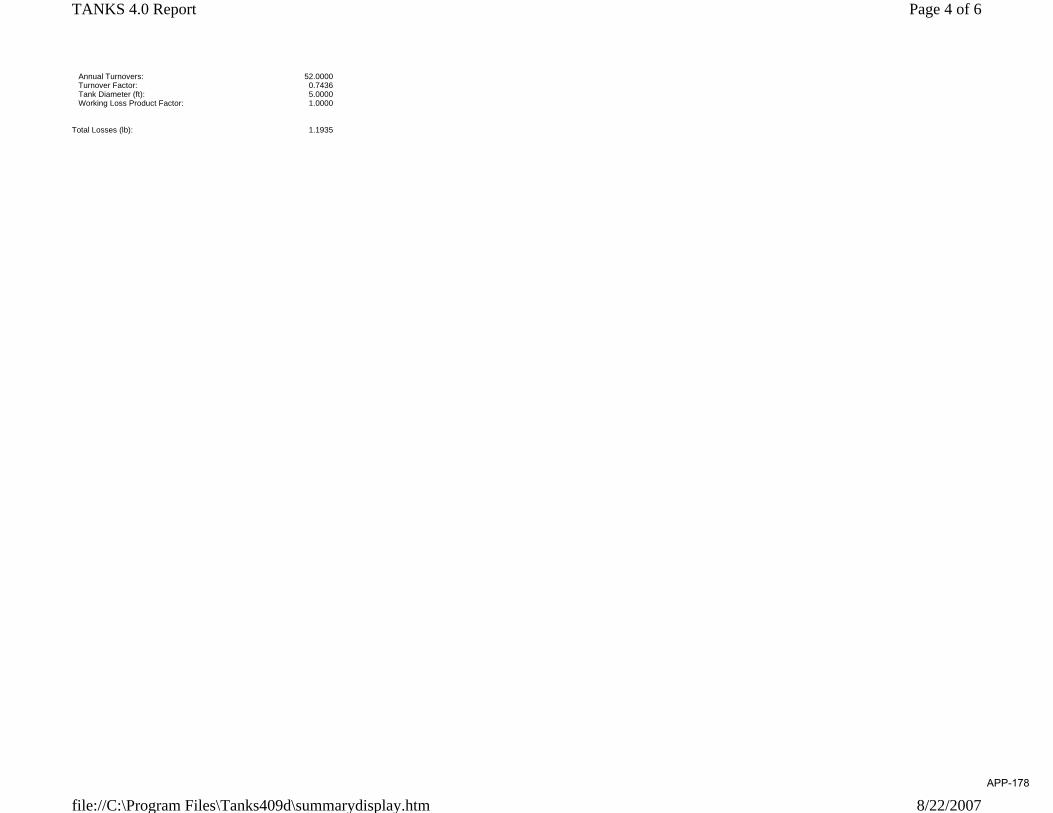
Annual Turnovers: 52.0000 Turnover Factor: 0.7436 Tank Diameter (ft): 5.0000 Working Loss Product Factor: 1.0000 Total Losses (lb): 1.1935
Page 4 of 6TANKS 4.0 Report
8/22/2007file://C:\Program Files\Tanks409d\summarydisplay.htmAPP-178

Emissions Report for: Annual
ICTF - TBA-1 - Horizontal Tank Long Beach, California
TANKS 4.0.9dEmissions Report - Detail Format Individual Tank Emission Totals
Losses(lbs)
Components Working Loss Breathing Loss Total Emissions
Distillate fuel oil no. 2 0.97 0.22 1.19
Page 5 of 6TANKS 4.0 Report
8/22/2007file://C:\Program Files\Tanks409d\summarydisplay.htmAPP-179

TANKS 4.0.9dEmissions Report - Detail Format
Tank Indentification and Physical Characteristics
Identification User Identification: ICTF - TBA 2 City: Long Beach State: California Company: UPRR Type of Tank: Horizontal Tank Description:
Tank Dimensions Shell Length (ft): 12.00 Diameter (ft): 7.00 Volume (gallons): 2,000.00 Turnovers: 0.00 Net Throughput(gal/yr): 86,808.00 Is Tank Heated (y/n): N Is Tank Underground (y/n): N
Paint Characteristics Shell Color/Shade: White/White Shell Condition Good
Breather Vent Settings Vacuum Settings (psig): -0.03 Pressure Settings (psig) 0.03
Meterological Data used in Emissions Calculations: Long Beach, California (Avg Atmospheric Pressure = 14.7 psia)
Page 1 of 6TANKS 4.0 Report
10/10/2007file://C:\Program Files\Tanks409d\summarydisplay.htmAPP-180

ICTF - TBA 2 - Horizontal Tank Long Beach, California
TANKS 4.0.9dEmissions Report - Detail Format Liquid Contents of Storage Tank
Daily Liquid Surf.
Temperature (deg F)
LiquidBulk
Temp Vapor Pressure (psia)Vapor
Mol. Liquid Mass
VaporMass Mol. Basis for Vapor Pressure
Mixture/Component Month Avg. Min. Max. (deg F) Avg. Min. Max. Weight. Fract. Fract. Weight Calculations
Gasoline (RVP 10) All 66.43 60.99 71.87 64.33 5.8655 5.2864 6.4943 66.0000 92.00 Option 4: RVP=10, ASTM Slope=3
Page 2 of 6TANKS 4.0 Report
10/10/2007file://C:\Program Files\Tanks409d\summarydisplay.htmAPP-181
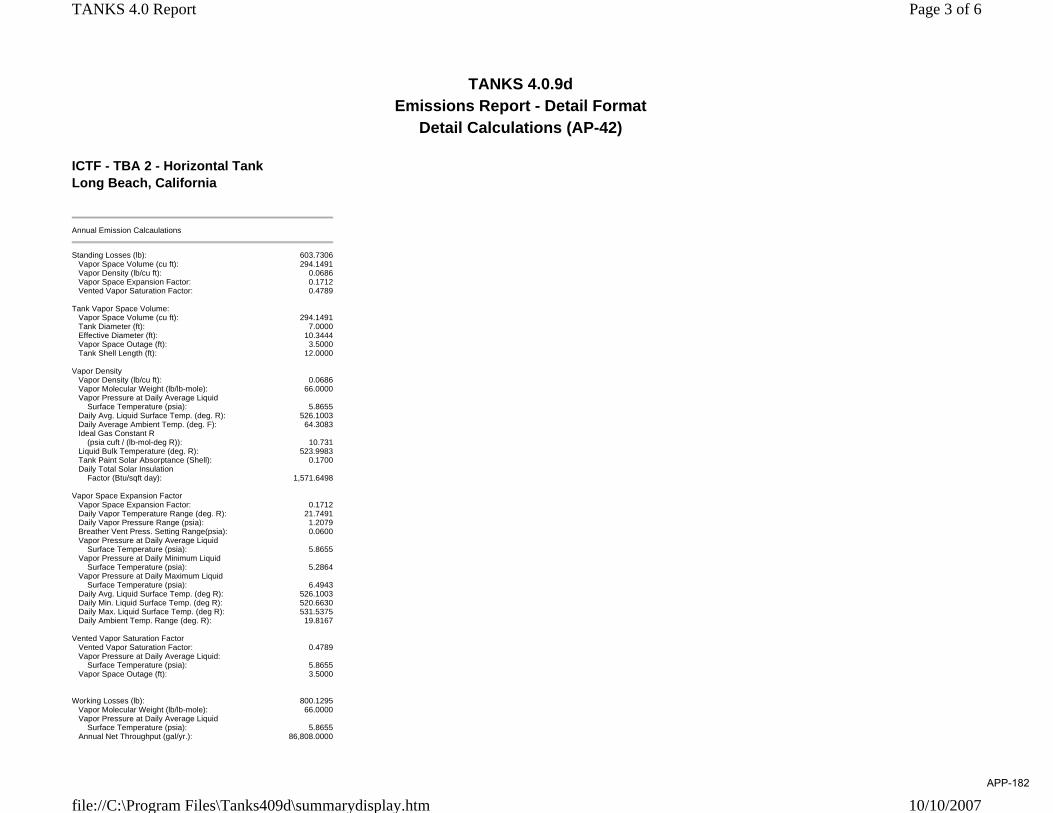
ICTF - TBA 2 - Horizontal Tank Long Beach, California
TANKS 4.0.9dEmissions Report - Detail Format
Detail Calculations (AP-42)
Annual Emission Calcaulations
Standing Losses (lb): 603.7306 Vapor Space Volume (cu ft): 294.1491 Vapor Density (lb/cu ft): 0.0686 Vapor Space Expansion Factor: 0.1712 Vented Vapor Saturation Factor: 0.4789 Tank Vapor Space Volume: Vapor Space Volume (cu ft): 294.1491 Tank Diameter (ft): 7.0000 Effective Diameter (ft): 10.3444 Vapor Space Outage (ft): 3.5000 Tank Shell Length (ft): 12.0000 Vapor Density Vapor Density (lb/cu ft): 0.0686 Vapor Molecular Weight (lb/lb-mole): 66.0000 Vapor Pressure at Daily Average Liquid Surface Temperature (psia): 5.8655 Daily Avg. Liquid Surface Temp. (deg. R): 526.1003 Daily Average Ambient Temp. (deg. F): 64.3083 Ideal Gas Constant R (psia cuft / (lb-mol-deg R)): 10.731 Liquid Bulk Temperature (deg. R): 523.9983 Tank Paint Solar Absorptance (Shell): 0.1700 Daily Total Solar Insulation Factor (Btu/sqft day): 1,571.6498 Vapor Space Expansion Factor Vapor Space Expansion Factor: 0.1712 Daily Vapor Temperature Range (deg. R): 21.7491 Daily Vapor Pressure Range (psia): 1.2079 Breather Vent Press. Setting Range(psia): 0.0600 Vapor Pressure at Daily Average Liquid Surface Temperature (psia): 5.8655 Vapor Pressure at Daily Minimum Liquid Surface Temperature (psia): 5.2864 Vapor Pressure at Daily Maximum Liquid Surface Temperature (psia): 6.4943 Daily Avg. Liquid Surface Temp. (deg R): 526.1003 Daily Min. Liquid Surface Temp. (deg R): 520.6630 Daily Max. Liquid Surface Temp. (deg R): 531.5375 Daily Ambient Temp. Range (deg. R): 19.8167 Vented Vapor Saturation Factor Vented Vapor Saturation Factor: 0.4789 Vapor Pressure at Daily Average Liquid: Surface Temperature (psia): 5.8655 Vapor Space Outage (ft): 3.5000 Working Losses (lb): 800.1295 Vapor Molecular Weight (lb/lb-mole): 66.0000 Vapor Pressure at Daily Average Liquid Surface Temperature (psia): 5.8655 Annual Net Throughput (gal/yr.): 86,808.0000
Page 3 of 6TANKS 4.0 Report
10/10/2007file://C:\Program Files\Tanks409d\summarydisplay.htmAPP-182

Annual Turnovers: 0.0000 Turnover Factor: 1.0000 Tank Diameter (ft): 7.0000 Working Loss Product Factor: 1.0000 Total Losses (lb): 1,403.8601
Page 4 of 6TANKS 4.0 Report
10/10/2007file://C:\Program Files\Tanks409d\summarydisplay.htmAPP-183

Emissions Report for: Annual
ICTF - TBA 2 - Horizontal Tank Long Beach, California
TANKS 4.0.9dEmissions Report - Detail Format Individual Tank Emission Totals
Losses(lbs)
Components Working Loss Breathing Loss Total Emissions
Gasoline (RVP 10) 800.13 603.73 1,403.86
Page 5 of 6TANKS 4.0 Report
10/10/2007file://C:\Program Files\Tanks409d\summarydisplay.htmAPP-184

TANKS 4.0.9dEmissions Report - Detail Format
Tank Indentification and Physical Characteristics
Identification User Identification: ICTF - TBA-3 City: Long Beach State: California Company: UPRR Type of Tank: Horizontal Tank Description:
Tank Dimensions Shell Length (ft): 6.00 Diameter (ft): 4.00 Volume (gallons): 500.00 Turnovers: 4.00 Net Throughput(gal/yr): 2,000.00 Is Tank Heated (y/n): N Is Tank Underground (y/n): N
Paint Characteristics Shell Color/Shade: Gray/Medium Shell Condition Good
Breather Vent Settings Vacuum Settings (psig): -0.03 Pressure Settings (psig) 0.03
Meterological Data used in Emissions Calculations: Long Beach, California (Avg Atmospheric Pressure = 14.7 psia)
Page 1 of 6TANKS 4.0 Report
8/22/2007file://C:\Program Files\Tanks409d\summarydisplay.htmAPP-185
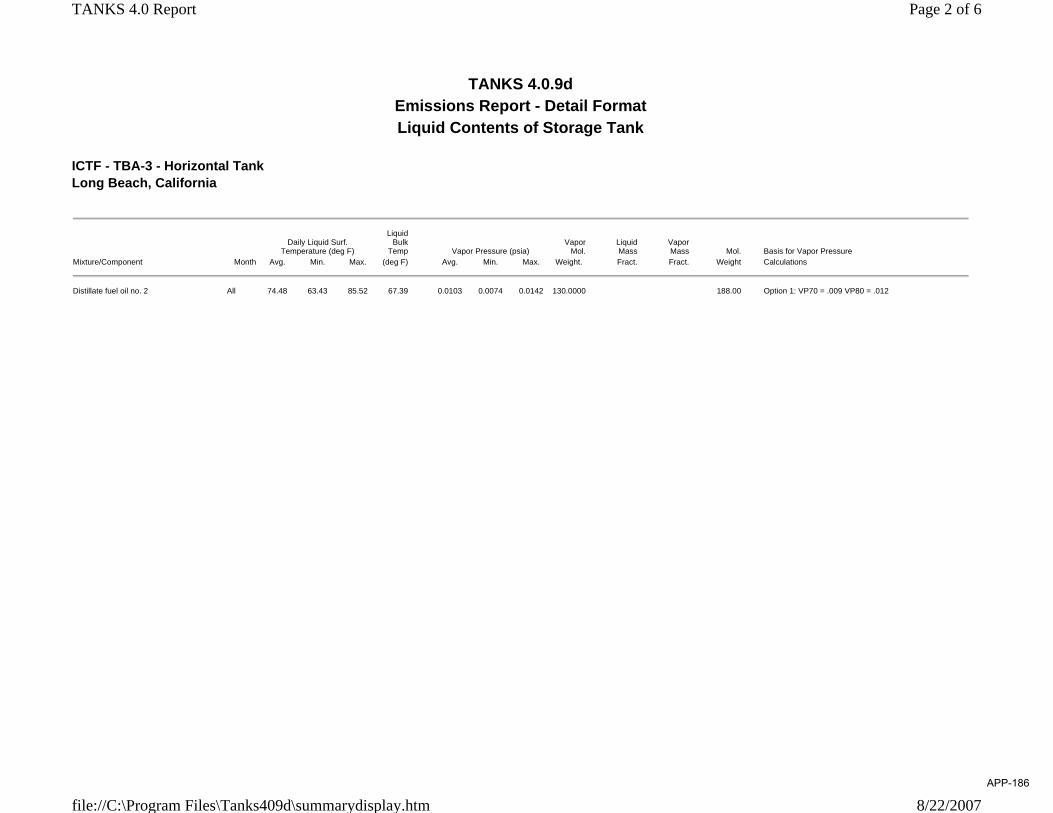
ICTF - TBA-3 - Horizontal Tank Long Beach, California
TANKS 4.0.9dEmissions Report - Detail Format Liquid Contents of Storage Tank
Daily Liquid Surf.
Temperature (deg F)
LiquidBulk
Temp Vapor Pressure (psia)Vapor
Mol. Liquid Mass
VaporMass Mol. Basis for Vapor Pressure
Mixture/Component Month Avg. Min. Max. (deg F) Avg. Min. Max. Weight. Fract. Fract. Weight Calculations
Distillate fuel oil no. 2 All 74.48 63.43 85.52 67.39 0.0103 0.0074 0.0142 130.0000 188.00 Option 1: VP70 = .009 VP80 = .012
Page 2 of 6TANKS 4.0 Report
8/22/2007file://C:\Program Files\Tanks409d\summarydisplay.htmAPP-186

ICTF - TBA-3 - Horizontal Tank Long Beach, California
TANKS 4.0.9dEmissions Report - Detail Format
Detail Calculations (AP-42)
Annual Emission Calcaulations
Standing Losses (lb): 0.3250 Vapor Space Volume (cu ft): 48.0243 Vapor Density (lb/cu ft): 0.0002 Vapor Space Expansion Factor: 0.0791 Vented Vapor Saturation Factor: 0.9989 Tank Vapor Space Volume: Vapor Space Volume (cu ft): 48.0243 Tank Diameter (ft): 4.0000 Effective Diameter (ft): 5.5293 Vapor Space Outage (ft): 2.0000 Tank Shell Length (ft): 6.0000 Vapor Density Vapor Density (lb/cu ft): 0.0002 Vapor Molecular Weight (lb/lb-mole): 130.0000 Vapor Pressure at Daily Average Liquid Surface Temperature (psia): 0.0103 Daily Avg. Liquid Surface Temp. (deg. R): 534.1460 Daily Average Ambient Temp. (deg. F): 64.3083 Ideal Gas Constant R (psia cuft / (lb-mol-deg R)): 10.731 Liquid Bulk Temperature (deg. R): 527.0583 Tank Paint Solar Absorptance (Shell): 0.6800 Daily Total Solar Insulation Factor (Btu/sqft day): 1,571.6498 Vapor Space Expansion Factor Vapor Space Expansion Factor: 0.0791 Daily Vapor Temperature Range (deg. R): 44.1922 Daily Vapor Pressure Range (psia): 0.0069 Breather Vent Press. Setting Range(psia): 0.0600 Vapor Pressure at Daily Average Liquid Surface Temperature (psia): 0.0103 Vapor Pressure at Daily Minimum Liquid Surface Temperature (psia): 0.0074 Vapor Pressure at Daily Maximum Liquid Surface Temperature (psia): 0.0142 Daily Avg. Liquid Surface Temp. (deg R): 534.1460 Daily Min. Liquid Surface Temp. (deg R): 523.0980 Daily Max. Liquid Surface Temp. (deg R): 545.1941 Daily Ambient Temp. Range (deg. R): 19.8167 Vented Vapor Saturation Factor Vented Vapor Saturation Factor: 0.9989 Vapor Pressure at Daily Average Liquid: Surface Temperature (psia): 0.0103 Vapor Space Outage (ft): 2.0000 Working Losses (lb): 0.0640 Vapor Molecular Weight (lb/lb-mole): 130.0000 Vapor Pressure at Daily Average Liquid Surface Temperature (psia): 0.0103 Annual Net Throughput (gal/yr.): 2,000.0000
Page 3 of 6TANKS 4.0 Report
8/22/2007file://C:\Program Files\Tanks409d\summarydisplay.htmAPP-187

Annual Turnovers: 4.0000 Turnover Factor: 1.0000 Tank Diameter (ft): 4.0000 Working Loss Product Factor: 1.0000 Total Losses (lb): 0.3890
Page 4 of 6TANKS 4.0 Report
8/22/2007file://C:\Program Files\Tanks409d\summarydisplay.htmAPP-188
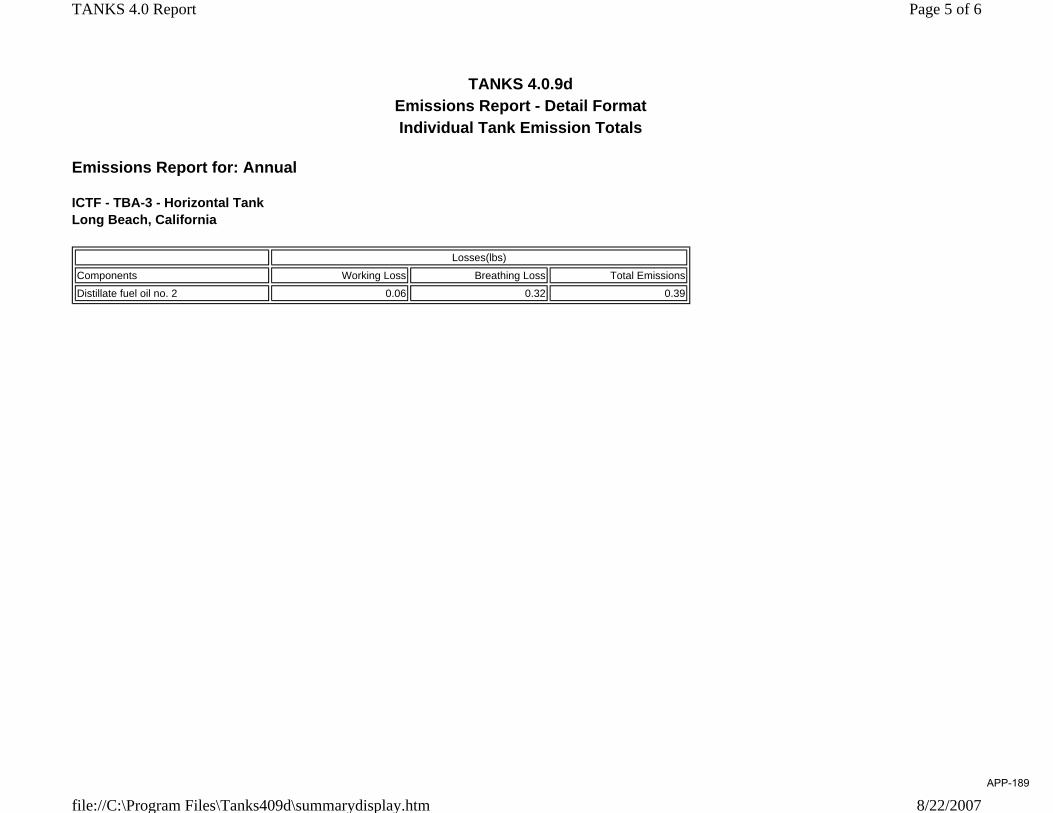
Emissions Report for: Annual
ICTF - TBA-3 - Horizontal Tank Long Beach, California
TANKS 4.0.9dEmissions Report - Detail Format Individual Tank Emission Totals
Losses(lbs)
Components Working Loss Breathing Loss Total Emissions
Distillate fuel oil no. 2 0.06 0.32 0.39
Page 5 of 6TANKS 4.0 Report
8/22/2007file://C:\Program Files\Tanks409d\summarydisplay.htmAPP-189

TANKS 4.0Emissions Report - Detail Format
Tank Identification and Physical Characteristics
IdentificationUser Identification: TNKD-0068City: Los Angeles C.O.State: CaliforniaCompany: UPRRType of Tank: Vertical Fixed Roof TankDescription: Diesel Storage Tank - Dolores
Tank DimensionsShell Height (ft): 24.00Diameter (ft): 34.00Liquid Height (ft): 24.00Avg. Liquid Height (ft): 12.00Volume (gallons): 160,000.00Turnovers: 65.63Net Throughput (gal/yr): 10,500,000.00Is Tank Heated (y/n): N
Paint CharacteristicsShell Color/Shade: White/WhiteShell Condition: GoodRoof Color/Shade: White/WhiteRoof Condition: Good
Roof CharacteristicsType: ConeHeight (ft): 0.00Slope (ft/ft) (Cone Roof): 0.00
Breather Vent SettingsVacuum Settings (psig): -0.03Pressure Settings (psig): 0.03
Meteorological Data used in Emissions Calculations: Los Angeles C.O., California (Avg Atmospheric Pressure = 14.67 psia)
9/13/2006 8:06:49 AM Page 1
TNKD-0068UPRR
Vertical Fixed Roof TankLos Angeles C.O., California
APP-190
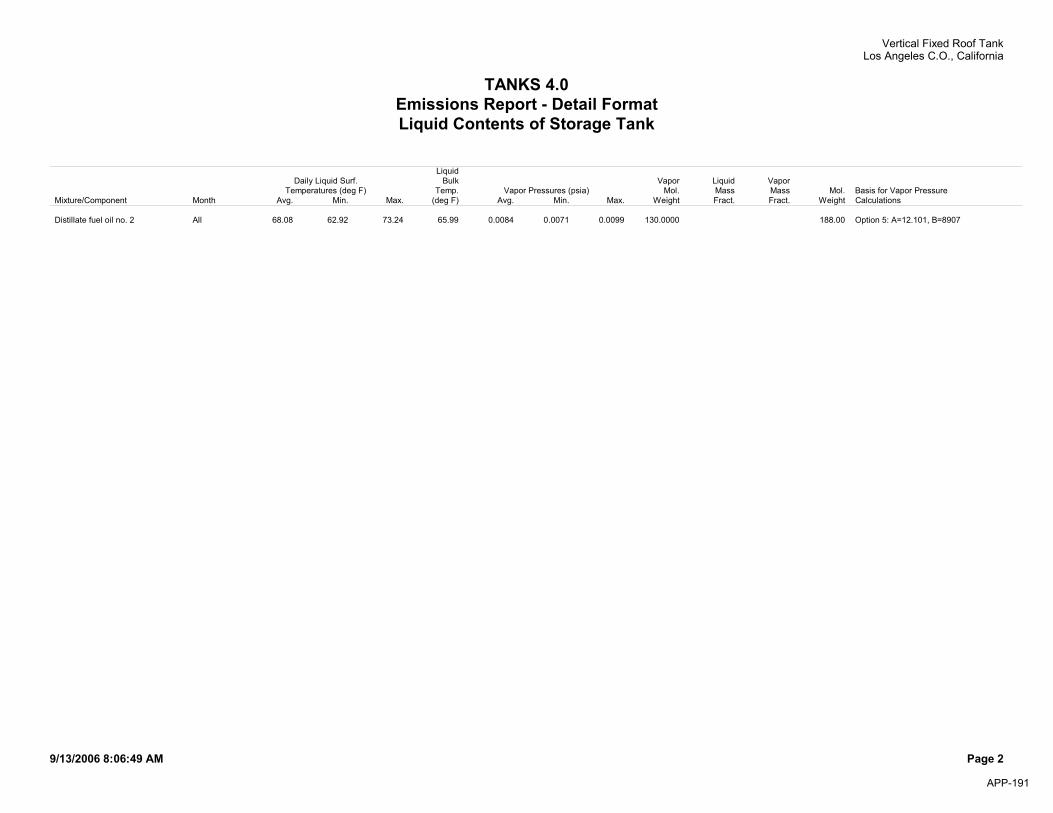
TANKS 4.0Emissions Report - Detail FormatLiquid Contents of Storage Tank
LiquidDaily Liquid Surf. Bulk Vapor Liquid Vapor
Temperatures (deg F) Temp. Vapor Pressures (psia) Mol. Mass Mass Mol. Basis for Vapor PressureMixture/Component Month Avg. Min. Max. (deg F) Avg. Min. Max. Weight Fract. Fract. Weight Calculations
Distillate fuel oil no. 2 All 68.08 62.92 73.24 65.99 0.0084 0.0071 0.0099 130.0000 188.00 Option 5: A=12.101, B=8907
9/13/2006 8:06:49 AM Page 2
TNKD-0068UPRR
Vertical Fixed Roof TankLos Angeles C.O., California
APP-191
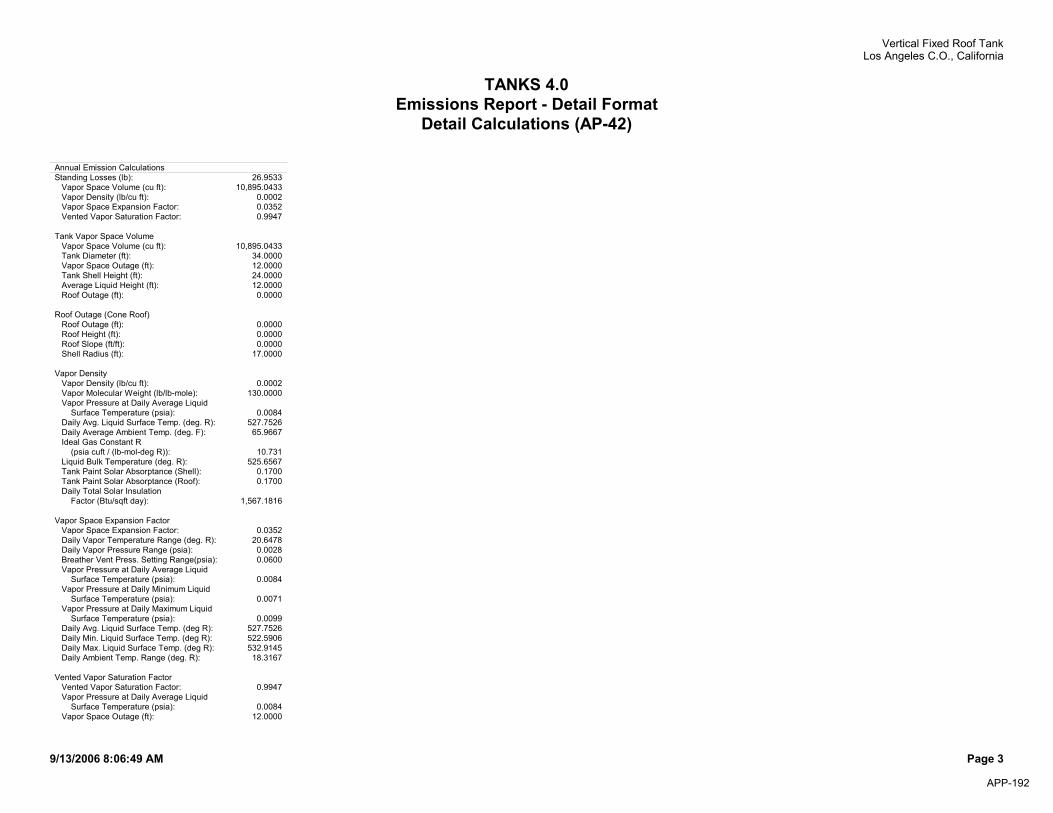
TANKS 4.0Emissions Report - Detail Format
Detail Calculations (AP-42)
Annual Emission CalculationsStanding Losses (lb): 26.9533 Vapor Space Volume (cu ft): 10,895.0433 Vapor Density (lb/cu ft): 0.0002 Vapor Space Expansion Factor: 0.0352 Vented Vapor Saturation Factor: 0.9947
Tank Vapor Space Volume Vapor Space Volume (cu ft): 10,895.0433 Tank Diameter (ft): 34.0000 Vapor Space Outage (ft): 12.0000 Tank Shell Height (ft): 24.0000 Average Liquid Height (ft): 12.0000 Roof Outage (ft): 0.0000
Roof Outage (Cone Roof) Roof Outage (ft): 0.0000 Roof Height (ft): 0.0000 Roof Slope (ft/ft): 0.0000 Shell Radius (ft): 17.0000
Vapor Density Vapor Density (lb/cu ft): 0.0002 Vapor Molecular Weight (lb/lb-mole): 130.0000 Vapor Pressure at Daily Average Liquid Surface Temperature (psia): 0.0084 Daily Avg. Liquid Surface Temp. (deg. R): 527.7526 Daily Average Ambient Temp. (deg. F): 65.9667 Ideal Gas Constant R (psia cuft / (lb-mol-deg R)): 10.731 Liquid Bulk Temperature (deg. R): 525.6567 Tank Paint Solar Absorptance (Shell): 0.1700 Tank Paint Solar Absorptance (Roof): 0.1700 Daily Total Solar Insulation Factor (Btu/sqft day): 1,567.1816
Vapor Space Expansion Factor Vapor Space Expansion Factor: 0.0352 Daily Vapor Temperature Range (deg. R): 20.6478 Daily Vapor Pressure Range (psia): 0.0028 Breather Vent Press. Setting Range(psia): 0.0600 Vapor Pressure at Daily Average Liquid Surface Temperature (psia): 0.0084 Vapor Pressure at Daily Minimum Liquid Surface Temperature (psia): 0.0071 Vapor Pressure at Daily Maximum Liquid Surface Temperature (psia): 0.0099 Daily Avg. Liquid Surface Temp. (deg R): 527.7526 Daily Min. Liquid Surface Temp. (deg R): 522.5906 Daily Max. Liquid Surface Temp. (deg R): 532.9145 Daily Ambient Temp. Range (deg. R): 18.3167
Vented Vapor Saturation Factor Vented Vapor Saturation Factor: 0.9947 Vapor Pressure at Daily Average Liquid Surface Temperature (psia): 0.0084 Vapor Space Outage (ft): 12.0000
9/13/2006 8:06:49 AM Page 3
TNKD-0068UPRR
Vertical Fixed Roof TankLos Angeles C.O., California
APP-192

TANKS 4.0Emissions Report - Detail Format
Detail Calculations (AP-42)- (Continued)
Working Losses (lb): 170.8624 Vapor Molecular Weight (lb/lb-mole): 130.0000 Vapor Pressure at Daily Average Liquid Surface Temperature (psia): 0.0084 Annual Net Throughput (gal/yr.): 10,500,000.00
00 Annual Turnovers: 65.6250 Turnover Factor: 0.6238 Maximum Liquid Volume (gal): 160,000.0000 Maximum Liquid Height (ft): 24.0000 Tank Diameter (ft): 34.0000 Working Loss Product Factor: 1.0000
Total Losses (lb): 197.8157
9/13/2006 8:06:49 AM Page 4
TNKD-0068UPRR
Vertical Fixed Roof TankLos Angeles C.O., California
APP-193

TANKS 4.0Emissions Report - Detail FormatIndividual Tank Emission Totals
Annual Emissions Report
Losses(lbs)Components Working Loss Breathing Loss Total EmissionsDistillate fuel oil no. 2 170.86 26.95 197.82
9/13/2006 8:06:49 AM Page 5
TNKD-0068UPRR
Vertical Fixed Roof TankLos Angeles C.O., California
APP-194
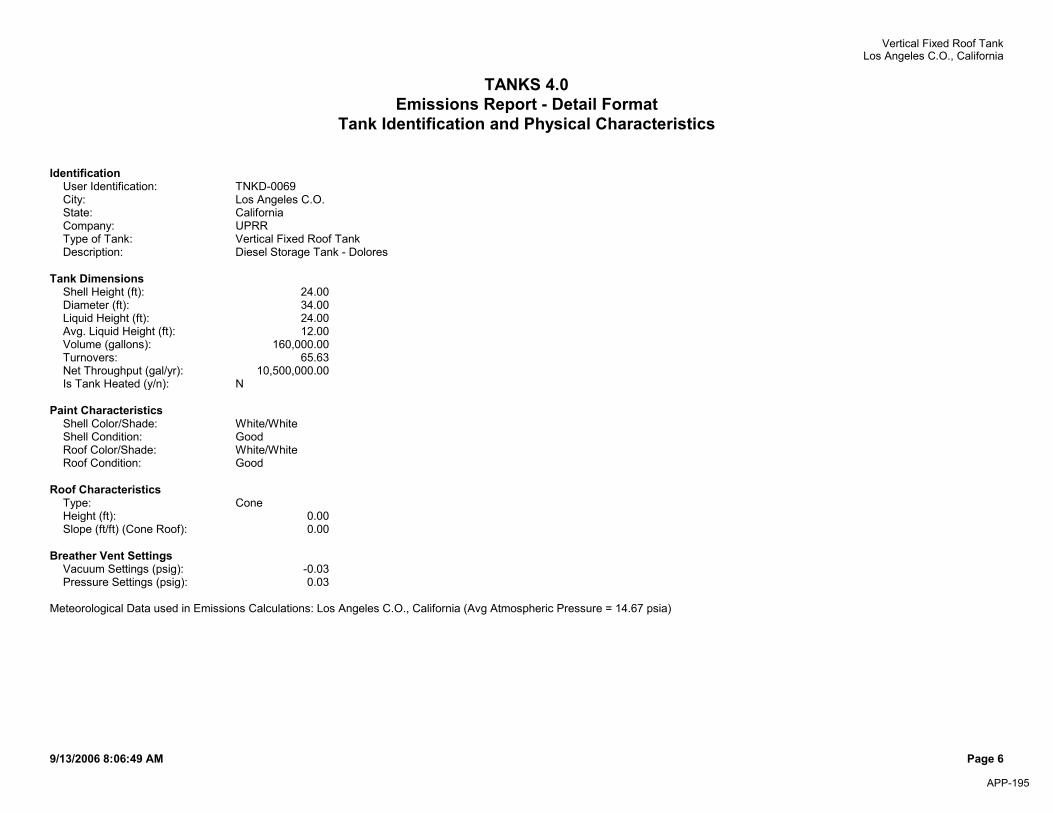
TANKS 4.0Emissions Report - Detail Format
Tank Identification and Physical Characteristics
IdentificationUser Identification: TNKD-0069City: Los Angeles C.O.State: CaliforniaCompany: UPRRType of Tank: Vertical Fixed Roof TankDescription: Diesel Storage Tank - Dolores
Tank DimensionsShell Height (ft): 24.00Diameter (ft): 34.00Liquid Height (ft): 24.00Avg. Liquid Height (ft): 12.00Volume (gallons): 160,000.00Turnovers: 65.63Net Throughput (gal/yr): 10,500,000.00Is Tank Heated (y/n): N
Paint CharacteristicsShell Color/Shade: White/WhiteShell Condition: GoodRoof Color/Shade: White/WhiteRoof Condition: Good
Roof CharacteristicsType: ConeHeight (ft): 0.00Slope (ft/ft) (Cone Roof): 0.00
Breather Vent SettingsVacuum Settings (psig): -0.03Pressure Settings (psig): 0.03
Meteorological Data used in Emissions Calculations: Los Angeles C.O., California (Avg Atmospheric Pressure = 14.67 psia)
9/13/2006 8:06:49 AM Page 6
TNKD-0069UPRR
Vertical Fixed Roof TankLos Angeles C.O., California
APP-195

TANKS 4.0Emissions Report - Detail FormatLiquid Contents of Storage Tank
LiquidDaily Liquid Surf. Bulk Vapor Liquid Vapor
Temperatures (deg F) Temp. Vapor Pressures (psia) Mol. Mass Mass Mol. Basis for Vapor PressureMixture/Component Month Avg. Min. Max. (deg F) Avg. Min. Max. Weight Fract. Fract. Weight Calculations
Distillate fuel oil no. 2 All 68.08 62.92 73.24 65.99 0.0084 0.0071 0.0099 130.0000 188.00 Option 5: A=12.101, B=8907
9/13/2006 8:06:49 AM Page 7
TNKD-0069UPRR
Vertical Fixed Roof TankLos Angeles C.O., California
APP-196

TANKS 4.0Emissions Report - Detail Format
Detail Calculations (AP-42)
Annual Emission CalculationsStanding Losses (lb): 26.9533 Vapor Space Volume (cu ft): 10,895.0433 Vapor Density (lb/cu ft): 0.0002 Vapor Space Expansion Factor: 0.0352 Vented Vapor Saturation Factor: 0.9947
Tank Vapor Space Volume Vapor Space Volume (cu ft): 10,895.0433 Tank Diameter (ft): 34.0000 Vapor Space Outage (ft): 12.0000 Tank Shell Height (ft): 24.0000 Average Liquid Height (ft): 12.0000 Roof Outage (ft): 0.0000
Roof Outage (Cone Roof) Roof Outage (ft): 0.0000 Roof Height (ft): 0.0000 Roof Slope (ft/ft): 0.0000 Shell Radius (ft): 17.0000
Vapor Density Vapor Density (lb/cu ft): 0.0002 Vapor Molecular Weight (lb/lb-mole): 130.0000 Vapor Pressure at Daily Average Liquid Surface Temperature (psia): 0.0084 Daily Avg. Liquid Surface Temp. (deg. R): 527.7526 Daily Average Ambient Temp. (deg. F): 65.9667 Ideal Gas Constant R (psia cuft / (lb-mol-deg R)): 10.731 Liquid Bulk Temperature (deg. R): 525.6567 Tank Paint Solar Absorptance (Shell): 0.1700 Tank Paint Solar Absorptance (Roof): 0.1700 Daily Total Solar Insulation Factor (Btu/sqft day): 1,567.1816
Vapor Space Expansion Factor Vapor Space Expansion Factor: 0.0352 Daily Vapor Temperature Range (deg. R): 20.6478 Daily Vapor Pressure Range (psia): 0.0028 Breather Vent Press. Setting Range(psia): 0.0600 Vapor Pressure at Daily Average Liquid Surface Temperature (psia): 0.0084 Vapor Pressure at Daily Minimum Liquid Surface Temperature (psia): 0.0071 Vapor Pressure at Daily Maximum Liquid Surface Temperature (psia): 0.0099 Daily Avg. Liquid Surface Temp. (deg R): 527.7526 Daily Min. Liquid Surface Temp. (deg R): 522.5906 Daily Max. Liquid Surface Temp. (deg R): 532.9145 Daily Ambient Temp. Range (deg. R): 18.3167
Vented Vapor Saturation Factor Vented Vapor Saturation Factor: 0.9947 Vapor Pressure at Daily Average Liquid Surface Temperature (psia): 0.0084 Vapor Space Outage (ft): 12.0000
9/13/2006 8:06:49 AM Page 8
TNKD-0069UPRR
Vertical Fixed Roof TankLos Angeles C.O., California
APP-197
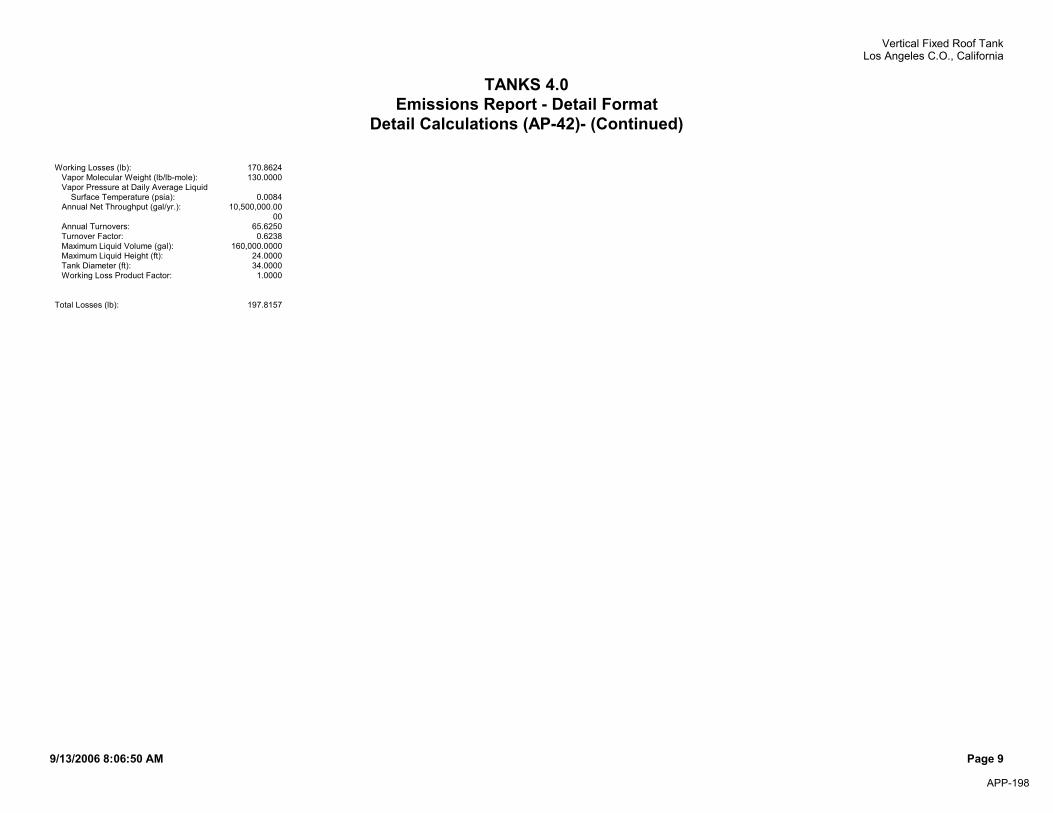
TANKS 4.0Emissions Report - Detail Format
Detail Calculations (AP-42)- (Continued)
Working Losses (lb): 170.8624 Vapor Molecular Weight (lb/lb-mole): 130.0000 Vapor Pressure at Daily Average Liquid Surface Temperature (psia): 0.0084 Annual Net Throughput (gal/yr.): 10,500,000.00
00 Annual Turnovers: 65.6250 Turnover Factor: 0.6238 Maximum Liquid Volume (gal): 160,000.0000 Maximum Liquid Height (ft): 24.0000 Tank Diameter (ft): 34.0000 Working Loss Product Factor: 1.0000
Total Losses (lb): 197.8157
9/13/2006 8:06:50 AM Page 9
TNKD-0069UPRR
Vertical Fixed Roof TankLos Angeles C.O., California
APP-198
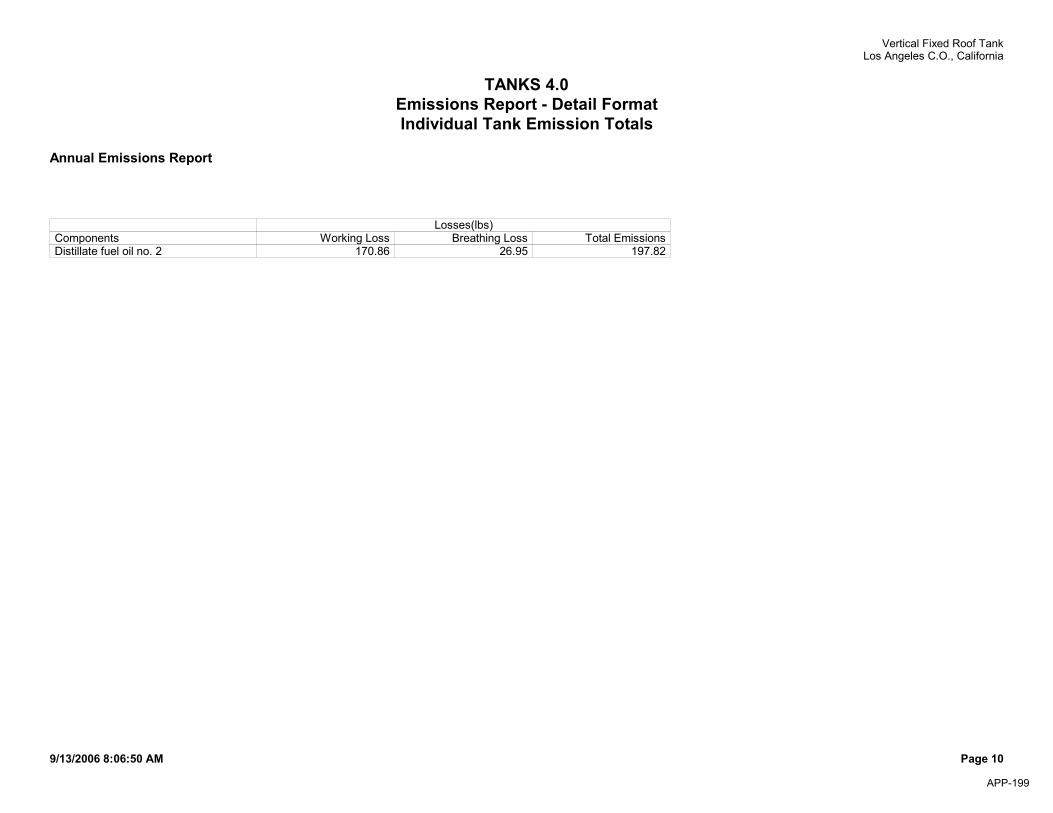
TANKS 4.0Emissions Report - Detail FormatIndividual Tank Emission Totals
Annual Emissions Report
Losses(lbs)Components Working Loss Breathing Loss Total EmissionsDistillate fuel oil no. 2 170.86 26.95 197.82
9/13/2006 8:06:50 AM Page 10
TNKD-0069UPRR
Vertical Fixed Roof TankLos Angeles C.O., California
APP-199

TANKS 4.0Emissions Report - Detail Format
Total Emissions Summaries - All Tanks in Report
Annual Emissions Report
Tank Identification Losses (lbs)TNKD-0068 UPRR Vertical Fixed Roof Tank Los Angeles C.O., California 197.82TNKD-0069 UPRR Vertical Fixed Roof Tank Los Angeles C.O., California 197.82Total Emissions for all Tanks: 395.63
9/13/2006 8:06:50 AM Page 11
APP-200

TANKS 4.0.9dEmissions Report - Detail Format
Tank Indentification and Physical Characteristics
Identification User Identification: TNKO-0002 City: Long Beach State: California Company: UPRR Type of Tank: Horizontal Tank Description:
Tank Dimensions Shell Length (ft): 16.00 Diameter (ft): 10.00 Volume (gallons): 10,000.00 Turnovers: 4.00 Net Throughput(gal/yr): 40,000.00 Is Tank Heated (y/n): N Is Tank Underground (y/n): N
Paint Characteristics Shell Color/Shade: White/White Shell Condition Good
Breather Vent Settings Vacuum Settings (psig): -0.03 Pressure Settings (psig) 0.03
Meterological Data used in Emissions Calculations: Long Beach, California (Avg Atmospheric Pressure = 14.7 psia)
Page 1 of 6TANKS 4.0 Report
8/22/2007file://C:\Program Files\Tanks409d\summarydisplay.htmAPP-201

TNKO-0002 - Horizontal Tank Long Beach, California
TANKS 4.0.9dEmissions Report - Detail Format Liquid Contents of Storage Tank
Daily Liquid Surf.
Temperature (deg F)
LiquidBulk
Temp Vapor Pressure (psia)Vapor
Mol. Liquid Mass
VaporMass Mol. Basis for Vapor Pressure
Mixture/Component Month Avg. Min. Max. (deg F) Avg. Min. Max. Weight. Fract. Fract. Weight Calculations
Distillate fuel oil no. 2 All 66.43 60.99 71.87 64.33 0.0081 0.0067 0.0096 130.0000 188.00 Option 1: VP60 = .0065 VP70 = .009
Page 2 of 6TANKS 4.0 Report
8/22/2007file://C:\Program Files\Tanks409d\summarydisplay.htmAPP-202

TNKO-0002 - Horizontal Tank Long Beach, California
TANKS 4.0.9dEmissions Report - Detail Format
Detail Calculations (AP-42)
Annual Emission Calcaulations
Standing Losses (lb): 2.0381 Vapor Space Volume (cu ft): 800.4058 Vapor Density (lb/cu ft): 0.0002 Vapor Space Expansion Factor: 0.0374 Vented Vapor Saturation Factor: 0.9979 Tank Vapor Space Volume: Vapor Space Volume (cu ft): 800.4058 Tank Diameter (ft): 10.0000 Effective Diameter (ft): 14.2766 Vapor Space Outage (ft): 5.0000 Tank Shell Length (ft): 16.0000 Vapor Density Vapor Density (lb/cu ft): 0.0002 Vapor Molecular Weight (lb/lb-mole): 130.0000 Vapor Pressure at Daily Average Liquid Surface Temperature (psia): 0.0081 Daily Avg. Liquid Surface Temp. (deg. R): 526.1003 Daily Average Ambient Temp. (deg. F): 64.3083 Ideal Gas Constant R (psia cuft / (lb-mol-deg R)): 10.731 Liquid Bulk Temperature (deg. R): 523.9983 Tank Paint Solar Absorptance (Shell): 0.1700 Daily Total Solar Insulation Factor (Btu/sqft day): 1,571.6498 Vapor Space Expansion Factor Vapor Space Expansion Factor: 0.0374 Daily Vapor Temperature Range (deg. R): 21.7491 Daily Vapor Pressure Range (psia): 0.0028 Breather Vent Press. Setting Range(psia): 0.0600 Vapor Pressure at Daily Average Liquid Surface Temperature (psia): 0.0081 Vapor Pressure at Daily Minimum Liquid Surface Temperature (psia): 0.0067 Vapor Pressure at Daily Maximum Liquid Surface Temperature (psia): 0.0096 Daily Avg. Liquid Surface Temp. (deg R): 526.1003 Daily Min. Liquid Surface Temp. (deg R): 520.6630 Daily Max. Liquid Surface Temp. (deg R): 531.5375 Daily Ambient Temp. Range (deg. R): 19.8167 Vented Vapor Saturation Factor Vented Vapor Saturation Factor: 0.9979 Vapor Pressure at Daily Average Liquid: Surface Temperature (psia): 0.0081 Vapor Space Outage (ft): 5.0000 Working Losses (lb): 1.0038 Vapor Molecular Weight (lb/lb-mole): 130.0000 Vapor Pressure at Daily Average Liquid Surface Temperature (psia): 0.0081 Annual Net Throughput (gal/yr.): 40,000.0000
Page 3 of 6TANKS 4.0 Report
8/22/2007file://C:\Program Files\Tanks409d\summarydisplay.htmAPP-203

Annual Turnovers: 4.0000 Turnover Factor: 1.0000 Tank Diameter (ft): 10.0000 Working Loss Product Factor: 1.0000 Total Losses (lb): 3.0419
Page 4 of 6TANKS 4.0 Report
8/22/2007file://C:\Program Files\Tanks409d\summarydisplay.htmAPP-204

Emissions Report for: Annual
TNKO-0002 - Horizontal Tank Long Beach, California
TANKS 4.0.9dEmissions Report - Detail Format Individual Tank Emission Totals
Losses(lbs)
Components Working Loss Breathing Loss Total Emissions
Distillate fuel oil no. 2 1.00 2.04 3.04
Page 5 of 6TANKS 4.0 Report
8/22/2007file://C:\Program Files\Tanks409d\summarydisplay.htmAPP-205

TANKS 4.0.9dEmissions Report - Detail Format
Tank Indentification and Physical Characteristics
Identification User Identification: TNKO-0003 City: Long Beach State: California Company: UPRR Type of Tank: Horizontal Tank Description:
Tank Dimensions Shell Length (ft): 20.50 Diameter (ft): 10.00 Volume (gallons): 12,000.00 Turnovers: 4.00 Net Throughput(gal/yr): 48,000.00 Is Tank Heated (y/n): N Is Tank Underground (y/n): N
Paint Characteristics Shell Color/Shade: White/White Shell Condition Good
Breather Vent Settings Vacuum Settings (psig): -0.03 Pressure Settings (psig) 0.03
Meterological Data used in Emissions Calculations: Long Beach, California (Avg Atmospheric Pressure = 14.7 psia)
Page 1 of 6TANKS 4.0 Report
8/22/2007file://C:\Program Files\Tanks409d\summarydisplay.htmAPP-206

TNKO-0003 - Horizontal Tank Long Beach, California
TANKS 4.0.9dEmissions Report - Detail Format Liquid Contents of Storage Tank
Daily Liquid Surf.
Temperature (deg F)
LiquidBulk
Temp Vapor Pressure (psia)Vapor
Mol. Liquid Mass
VaporMass Mol. Basis for Vapor Pressure
Mixture/Component Month Avg. Min. Max. (deg F) Avg. Min. Max. Weight. Fract. Fract. Weight Calculations
Distillate fuel oil no. 2 All 66.43 60.99 71.87 64.33 0.0081 0.0067 0.0096 130.0000 188.00 Option 1: VP60 = .0065 VP70 = .009
Page 2 of 6TANKS 4.0 Report
8/22/2007file://C:\Program Files\Tanks409d\summarydisplay.htmAPP-207

TNKO-0003 - Horizontal Tank Long Beach, California
TANKS 4.0.9dEmissions Report - Detail Format
Detail Calculations (AP-42)
Annual Emission Calcaulations
Standing Losses (lb): 2.6113 Vapor Space Volume (cu ft): 1,025.5199 Vapor Density (lb/cu ft): 0.0002 Vapor Space Expansion Factor: 0.0374 Vented Vapor Saturation Factor: 0.9979 Tank Vapor Space Volume: Vapor Space Volume (cu ft): 1,025.5199 Tank Diameter (ft): 10.0000 Effective Diameter (ft): 16.1600 Vapor Space Outage (ft): 5.0000 Tank Shell Length (ft): 20.5000 Vapor Density Vapor Density (lb/cu ft): 0.0002 Vapor Molecular Weight (lb/lb-mole): 130.0000 Vapor Pressure at Daily Average Liquid Surface Temperature (psia): 0.0081 Daily Avg. Liquid Surface Temp. (deg. R): 526.1003 Daily Average Ambient Temp. (deg. F): 64.3083 Ideal Gas Constant R (psia cuft / (lb-mol-deg R)): 10.731 Liquid Bulk Temperature (deg. R): 523.9983 Tank Paint Solar Absorptance (Shell): 0.1700 Daily Total Solar Insulation Factor (Btu/sqft day): 1,571.6498 Vapor Space Expansion Factor Vapor Space Expansion Factor: 0.0374 Daily Vapor Temperature Range (deg. R): 21.7491 Daily Vapor Pressure Range (psia): 0.0028 Breather Vent Press. Setting Range(psia): 0.0600 Vapor Pressure at Daily Average Liquid Surface Temperature (psia): 0.0081 Vapor Pressure at Daily Minimum Liquid Surface Temperature (psia): 0.0067 Vapor Pressure at Daily Maximum Liquid Surface Temperature (psia): 0.0096 Daily Avg. Liquid Surface Temp. (deg R): 526.1003 Daily Min. Liquid Surface Temp. (deg R): 520.6630 Daily Max. Liquid Surface Temp. (deg R): 531.5375 Daily Ambient Temp. Range (deg. R): 19.8167 Vented Vapor Saturation Factor Vented Vapor Saturation Factor: 0.9979 Vapor Pressure at Daily Average Liquid: Surface Temperature (psia): 0.0081 Vapor Space Outage (ft): 5.0000 Working Losses (lb): 1.2046 Vapor Molecular Weight (lb/lb-mole): 130.0000 Vapor Pressure at Daily Average Liquid Surface Temperature (psia): 0.0081 Annual Net Throughput (gal/yr.): 48,000.0000
Page 3 of 6TANKS 4.0 Report
8/22/2007file://C:\Program Files\Tanks409d\summarydisplay.htmAPP-208

Annual Turnovers: 4.0000 Turnover Factor: 1.0000 Tank Diameter (ft): 10.0000 Working Loss Product Factor: 1.0000 Total Losses (lb): 3.8159
Page 4 of 6TANKS 4.0 Report
8/22/2007file://C:\Program Files\Tanks409d\summarydisplay.htmAPP-209

Emissions Report for: Annual
TNKO-0003 - Horizontal Tank Long Beach, California
TANKS 4.0.9dEmissions Report - Detail Format Individual Tank Emission Totals
Losses(lbs)
Components Working Loss Breathing Loss Total Emissions
Distillate fuel oil no. 2 1.20 2.61 3.82
Page 5 of 6TANKS 4.0 Report
8/22/2007file://C:\Program Files\Tanks409d\summarydisplay.htmAPP-210

TANKS 4.0.9dEmissions Report - Detail Format
Tank Indentification and Physical Characteristics
Identification User Identification: TNKO-0004 City: Long Beach State: California Company: UPRR Type of Tank: Horizontal Tank Description:
Tank Dimensions Shell Length (ft): 21.30 Diameter (ft): 8.00 Volume (gallons): 8,000.00 Turnovers: 4.00 Net Throughput(gal/yr): 32,000.00 Is Tank Heated (y/n): N Is Tank Underground (y/n): N
Paint Characteristics Shell Color/Shade: White/White Shell Condition Good
Breather Vent Settings Vacuum Settings (psig): -0.03 Pressure Settings (psig) 0.03
Meterological Data used in Emissions Calculations: Long Beach, California (Avg Atmospheric Pressure = 14.7 psia)
Page 1 of 6TANKS 4.0 Report
8/22/2007file://C:\Program Files\Tanks409d\summarydisplay.htmAPP-211

TNKO-0004 - Horizontal Tank Long Beach, California
TANKS 4.0.9dEmissions Report - Detail Format Liquid Contents of Storage Tank
Daily Liquid Surf.
Temperature (deg F)
LiquidBulk
Temp Vapor Pressure (psia)Vapor
Mol. Liquid Mass
VaporMass Mol. Basis for Vapor Pressure
Mixture/Component Month Avg. Min. Max. (deg F) Avg. Min. Max. Weight. Fract. Fract. Weight Calculations
Distillate fuel oil no. 2 All 66.43 60.99 71.87 64.33 0.0081 0.0067 0.0096 130.0000 188.00 Option 1: VP60 = .0065 VP70 = .009
Page 2 of 6TANKS 4.0 Report
8/22/2007file://C:\Program Files\Tanks409d\summarydisplay.htmAPP-212
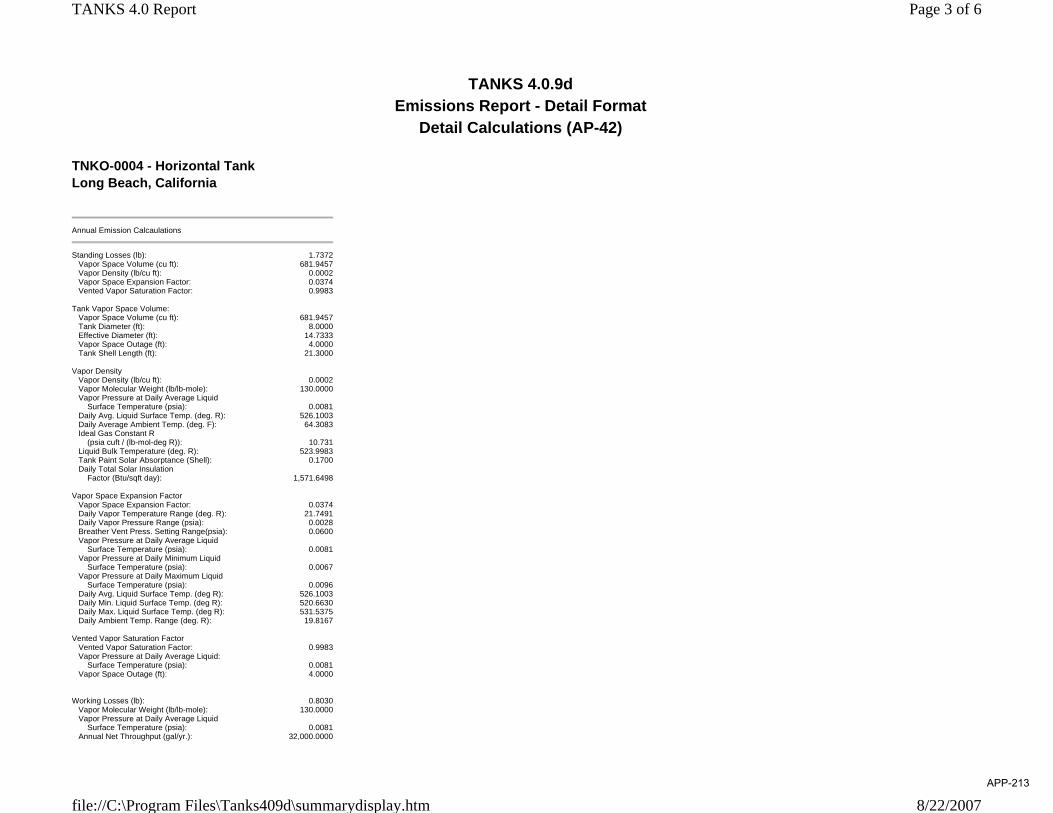
TNKO-0004 - Horizontal Tank Long Beach, California
TANKS 4.0.9dEmissions Report - Detail Format
Detail Calculations (AP-42)
Annual Emission Calcaulations
Standing Losses (lb): 1.7372 Vapor Space Volume (cu ft): 681.9457 Vapor Density (lb/cu ft): 0.0002 Vapor Space Expansion Factor: 0.0374 Vented Vapor Saturation Factor: 0.9983 Tank Vapor Space Volume: Vapor Space Volume (cu ft): 681.9457 Tank Diameter (ft): 8.0000 Effective Diameter (ft): 14.7333 Vapor Space Outage (ft): 4.0000 Tank Shell Length (ft): 21.3000 Vapor Density Vapor Density (lb/cu ft): 0.0002 Vapor Molecular Weight (lb/lb-mole): 130.0000 Vapor Pressure at Daily Average Liquid Surface Temperature (psia): 0.0081 Daily Avg. Liquid Surface Temp. (deg. R): 526.1003 Daily Average Ambient Temp. (deg. F): 64.3083 Ideal Gas Constant R (psia cuft / (lb-mol-deg R)): 10.731 Liquid Bulk Temperature (deg. R): 523.9983 Tank Paint Solar Absorptance (Shell): 0.1700 Daily Total Solar Insulation Factor (Btu/sqft day): 1,571.6498 Vapor Space Expansion Factor Vapor Space Expansion Factor: 0.0374 Daily Vapor Temperature Range (deg. R): 21.7491 Daily Vapor Pressure Range (psia): 0.0028 Breather Vent Press. Setting Range(psia): 0.0600 Vapor Pressure at Daily Average Liquid Surface Temperature (psia): 0.0081 Vapor Pressure at Daily Minimum Liquid Surface Temperature (psia): 0.0067 Vapor Pressure at Daily Maximum Liquid Surface Temperature (psia): 0.0096 Daily Avg. Liquid Surface Temp. (deg R): 526.1003 Daily Min. Liquid Surface Temp. (deg R): 520.6630 Daily Max. Liquid Surface Temp. (deg R): 531.5375 Daily Ambient Temp. Range (deg. R): 19.8167 Vented Vapor Saturation Factor Vented Vapor Saturation Factor: 0.9983 Vapor Pressure at Daily Average Liquid: Surface Temperature (psia): 0.0081 Vapor Space Outage (ft): 4.0000 Working Losses (lb): 0.8030 Vapor Molecular Weight (lb/lb-mole): 130.0000 Vapor Pressure at Daily Average Liquid Surface Temperature (psia): 0.0081 Annual Net Throughput (gal/yr.): 32,000.0000
Page 3 of 6TANKS 4.0 Report
8/22/2007file://C:\Program Files\Tanks409d\summarydisplay.htmAPP-213

Annual Turnovers: 4.0000 Turnover Factor: 1.0000 Tank Diameter (ft): 8.0000 Working Loss Product Factor: 1.0000 Total Losses (lb): 2.5403
Page 4 of 6TANKS 4.0 Report
8/22/2007file://C:\Program Files\Tanks409d\summarydisplay.htmAPP-214

Emissions Report for: Annual
TNKO-0004 - Horizontal Tank Long Beach, California
TANKS 4.0.9dEmissions Report - Detail Format Individual Tank Emission Totals
Losses(lbs)
Components Working Loss Breathing Loss Total Emissions
Distillate fuel oil no. 2 0.80 1.74 2.54
Page 5 of 6TANKS 4.0 Report
8/22/2007file://C:\Program Files\Tanks409d\summarydisplay.htmAPP-215

TANKS 4.0.9dEmissions Report - Detail Format
Tank Indentification and Physical Characteristics
Identification User Identification: TNKO-0001 City: Long Beach State: California Company: UPRR Type of Tank: Horizontal Tank Description:
Tank Dimensions Shell Length (ft): 20.50 Diameter (ft): 10.00 Volume (gallons): 12,000.00 Turnovers: 4.00 Net Throughput(gal/yr): 48,000.00 Is Tank Heated (y/n): N Is Tank Underground (y/n): N
Paint Characteristics Shell Color/Shade: Gray/Light Shell Condition Good
Breather Vent Settings Vacuum Settings (psig): -0.03 Pressure Settings (psig) 0.03
Meterological Data used in Emissions Calculations: Long Beach, California (Avg Atmospheric Pressure = 14.7 psia)
Page 1 of 6TANKS 4.0 Report
8/22/2007file://C:\Program Files\Tanks409d\summarydisplay.htmAPP-216

TNKO-0001 - Horizontal Tank Long Beach, California
TANKS 4.0.9dEmissions Report - Detail Format Liquid Contents of Storage Tank
Daily Liquid Surf.
Temperature (deg F)
LiquidBulk
Temp Vapor Pressure (psia)Vapor
Mol. Liquid Mass
VaporMass Mol. Basis for Vapor Pressure
Mixture/Component Month Avg. Min. Max. (deg F) Avg. Min. Max. Weight. Fract. Fract. Weight Calculations
Distillate fuel oil no. 2 All 72.27 62.76 81.78 66.55 0.0097 0.0072 0.0127 130.0000 188.00 Option 1: VP70 = .009 VP80 = .012
Page 2 of 6TANKS 4.0 Report
8/22/2007file://C:\Program Files\Tanks409d\summarydisplay.htmAPP-217

TNKO-0001 - Horizontal Tank Long Beach, California
TANKS 4.0.9dEmissions Report - Detail Format
Detail Calculations (AP-42)
Annual Emission Calcaulations
Standing Losses (lb): 5.5796 Vapor Space Volume (cu ft): 1,025.5199 Vapor Density (lb/cu ft): 0.0002 Vapor Space Expansion Factor: 0.0678 Vented Vapor Saturation Factor: 0.9974 Tank Vapor Space Volume: Vapor Space Volume (cu ft): 1,025.5199 Tank Diameter (ft): 10.0000 Effective Diameter (ft): 16.1600 Vapor Space Outage (ft): 5.0000 Tank Shell Length (ft): 20.5000 Vapor Density Vapor Density (lb/cu ft): 0.0002 Vapor Molecular Weight (lb/lb-mole): 130.0000 Vapor Pressure at Daily Average Liquid Surface Temperature (psia): 0.0097 Daily Avg. Liquid Surface Temp. (deg. R): 531.9374 Daily Average Ambient Temp. (deg. F): 64.3083 Ideal Gas Constant R (psia cuft / (lb-mol-deg R)): 10.731 Liquid Bulk Temperature (deg. R): 526.2183 Tank Paint Solar Absorptance (Shell): 0.5400 Daily Total Solar Insulation Factor (Btu/sqft day): 1,571.6498 Vapor Space Expansion Factor Vapor Space Expansion Factor: 0.0678 Daily Vapor Temperature Range (deg. R): 38.0313 Daily Vapor Pressure Range (psia): 0.0055 Breather Vent Press. Setting Range(psia): 0.0600 Vapor Pressure at Daily Average Liquid Surface Temperature (psia): 0.0097 Vapor Pressure at Daily Minimum Liquid Surface Temperature (psia): 0.0072 Vapor Pressure at Daily Maximum Liquid Surface Temperature (psia): 0.0127 Daily Avg. Liquid Surface Temp. (deg R): 531.9374 Daily Min. Liquid Surface Temp. (deg R): 522.4296 Daily Max. Liquid Surface Temp. (deg R): 541.4452 Daily Ambient Temp. Range (deg. R): 19.8167 Vented Vapor Saturation Factor Vented Vapor Saturation Factor: 0.9974 Vapor Pressure at Daily Average Liquid: Surface Temperature (psia): 0.0097 Vapor Space Outage (ft): 5.0000 Working Losses (lb): 1.4382 Vapor Molecular Weight (lb/lb-mole): 130.0000 Vapor Pressure at Daily Average Liquid Surface Temperature (psia): 0.0097 Annual Net Throughput (gal/yr.): 48,000.0000
Page 3 of 6TANKS 4.0 Report
8/22/2007file://C:\Program Files\Tanks409d\summarydisplay.htmAPP-218

Annual Turnovers: 4.0000 Turnover Factor: 1.0000 Tank Diameter (ft): 10.0000 Working Loss Product Factor: 1.0000 Total Losses (lb): 7.0178
Page 4 of 6TANKS 4.0 Report
8/22/2007file://C:\Program Files\Tanks409d\summarydisplay.htmAPP-219

Emissions Report for: Annual
TNKO-0001 - Horizontal Tank Long Beach, California
TANKS 4.0.9dEmissions Report - Detail Format Individual Tank Emission Totals
Losses(lbs)
Components Working Loss Breathing Loss Total Emissions
Distillate fuel oil no. 2 1.44 5.58 7.02
Page 5 of 6TANKS 4.0 Report
8/22/2007file://C:\Program Files\Tanks409d\summarydisplay.htmAPP-220

TANKS 4.0.9dEmissions Report - Detail Format
Tank Indentification and Physical Characteristics
Identification User Identification: TNKO-0184 City: Long Beach State: California Company: UPRR Type of Tank: Horizontal Tank Description:
Tank Dimensions Shell Length (ft): 20.50 Diameter (ft): 7.00 Volume (gallons): 6,000.00 Turnovers: 4.00 Net Throughput(gal/yr): 24,000.00 Is Tank Heated (y/n): N Is Tank Underground (y/n): N
Paint Characteristics Shell Color/Shade: Gray/Light Shell Condition Good
Breather Vent Settings Vacuum Settings (psig): -0.03 Pressure Settings (psig) 0.03
Meterological Data used in Emissions Calculations: Long Beach, California (Avg Atmospheric Pressure = 14.7 psia)
Page 1 of 6TANKS 4.0 Report
8/22/2007file://C:\Program Files\Tanks409d\summarydisplay.htmAPP-221

TNKO-0184 - Horizontal Tank Long Beach, California
TANKS 4.0.9dEmissions Report - Detail Format Liquid Contents of Storage Tank
Daily Liquid Surf.
Temperature (deg F)
LiquidBulk
Temp Vapor Pressure (psia)Vapor
Mol. Liquid Mass
VaporMass Mol. Basis for Vapor Pressure
Mixture/Component Month Avg. Min. Max. (deg F) Avg. Min. Max. Weight. Fract. Fract. Weight Calculations
Distillate fuel oil no. 2 All 72.27 62.76 81.78 66.55 0.0097 0.0072 0.0127 130.0000 188.00 Option 1: VP70 = .009 VP80 = .012
Page 2 of 6TANKS 4.0 Report
8/22/2007file://C:\Program Files\Tanks409d\summarydisplay.htmAPP-222

TNKO-0184 - Horizontal Tank Long Beach, California
TANKS 4.0.9dEmissions Report - Detail Format
Detail Calculations (AP-42)
Annual Emission Calcaulations
Standing Losses (lb): 2.7361 Vapor Space Volume (cu ft): 502.5047 Vapor Density (lb/cu ft): 0.0002 Vapor Space Expansion Factor: 0.0678 Vented Vapor Saturation Factor: 0.9982 Tank Vapor Space Volume: Vapor Space Volume (cu ft): 502.5047 Tank Diameter (ft): 7.0000 Effective Diameter (ft): 13.5204 Vapor Space Outage (ft): 3.5000 Tank Shell Length (ft): 20.5000 Vapor Density Vapor Density (lb/cu ft): 0.0002 Vapor Molecular Weight (lb/lb-mole): 130.0000 Vapor Pressure at Daily Average Liquid Surface Temperature (psia): 0.0097 Daily Avg. Liquid Surface Temp. (deg. R): 531.9374 Daily Average Ambient Temp. (deg. F): 64.3083 Ideal Gas Constant R (psia cuft / (lb-mol-deg R)): 10.731 Liquid Bulk Temperature (deg. R): 526.2183 Tank Paint Solar Absorptance (Shell): 0.5400 Daily Total Solar Insulation Factor (Btu/sqft day): 1,571.6498 Vapor Space Expansion Factor Vapor Space Expansion Factor: 0.0678 Daily Vapor Temperature Range (deg. R): 38.0313 Daily Vapor Pressure Range (psia): 0.0055 Breather Vent Press. Setting Range(psia): 0.0600 Vapor Pressure at Daily Average Liquid Surface Temperature (psia): 0.0097 Vapor Pressure at Daily Minimum Liquid Surface Temperature (psia): 0.0072 Vapor Pressure at Daily Maximum Liquid Surface Temperature (psia): 0.0127 Daily Avg. Liquid Surface Temp. (deg R): 531.9374 Daily Min. Liquid Surface Temp. (deg R): 522.4296 Daily Max. Liquid Surface Temp. (deg R): 541.4452 Daily Ambient Temp. Range (deg. R): 19.8167 Vented Vapor Saturation Factor Vented Vapor Saturation Factor: 0.9982 Vapor Pressure at Daily Average Liquid: Surface Temperature (psia): 0.0097 Vapor Space Outage (ft): 3.5000 Working Losses (lb): 0.7191 Vapor Molecular Weight (lb/lb-mole): 130.0000 Vapor Pressure at Daily Average Liquid Surface Temperature (psia): 0.0097 Annual Net Throughput (gal/yr.): 24,000.0000
Page 3 of 6TANKS 4.0 Report
8/22/2007file://C:\Program Files\Tanks409d\summarydisplay.htmAPP-223

Annual Turnovers: 4.0000 Turnover Factor: 1.0000 Tank Diameter (ft): 7.0000 Working Loss Product Factor: 1.0000 Total Losses (lb): 3.4552
Page 4 of 6TANKS 4.0 Report
8/22/2007file://C:\Program Files\Tanks409d\summarydisplay.htmAPP-224

Emissions Report for: Annual
TNKO-0184 - Horizontal Tank Long Beach, California
TANKS 4.0.9dEmissions Report - Detail Format Individual Tank Emission Totals
Losses(lbs)
Components Working Loss Breathing Loss Total Emissions
Distillate fuel oil no. 2 0.72 2.74 3.46
Page 5 of 6TANKS 4.0 Report
8/22/2007file://C:\Program Files\Tanks409d\summarydisplay.htmAPP-225

APPENDIX J
REFUELING OPERATIONS
APP-226
APPENDIX J-1
SCAQMD EMISSION FACTOR DOCUMENT
APP-227

General Instruction Book for the AQMD 2006-2007 Annual Emissions Reporting Program
38
APPENDIX K - VOC EMISSIONS CALCULATIONS FOR FUEL DISPENSING AND SMALL LIQUID ORGANIC STORAGE TANKS (<10,000 GALLONS) Small liquid storage tank is defined as a tank with a storage capacity of less than 10,000 gallons and operated at ambient temperature and pressure. VOC emissions can be calculated using the following equation:
where: E = VOC emissions (lb/year) Q = annual throughput (Mgal/year or 1,000 gallons/year) EF = emission factor (lb/Mgal)
Throughput is the amount of the liquid loaded in the tank during the reporting period.
A. Fuel Dispensing and Storage Tanks (including non-retail service stations)
Gasoline (use Activity Code 2A): EF = 1.8 lb/Mgal (controlled) Diesel (use Activity Code 2B): EF = 0.028 lb/Mgal
NOTE: Report BENZENE emission from gasoline tank loss on Form TAC using a default factor of 1% or 0.018 lb/Mgal of throughput. Diesel tank benzene loss is negligible and does not have to be reported.
B. Small Fuel and Other Liquid Organic Storage Tanks (< 10,000 gallons) (use Activity Code 2D) Under-Ground tank: EF (lb/Mgal) = loss factor f Above-Ground tank
where: C = tank size or capacity (Mgal or 1,000 gallons) Q = annual throughput (Mgal/year or 1,000 gallons/year) H = tank height (feet) a,b,f = loss factors a, b, f (see attached table "Loss Factors for Small Storage Tanks")
NOTE: If you need assistance with tank calculation, please contact Help Hotline at (714) 596-7456.
* Gasoline (RVP 6) is the most common type of gasoline in SCAQMD jurisdiction.
TOXIC AIR CONTAMINANT (TAC) CALCULATION Toxic air contaminant emissions associated with storage tanks must be calculated and reported. In general, the emission factor and emission rate for each component can be estimated by:
where: EFTAC = emission factor for TAC component, lbs/1,000 gallons EF = VOC emission factor, lbs/1,000 gallons ZTAC = weight fraction of TAC component ETAC = emission rate of TAC component, lbs/yr ET = total tank VOC emissions, lbs/yr
Emissions for each TAC component must be calculated and reported individually on Form TAC.
QEFE *=
( )f
Hb
QCaMgallbEF +
+=
)]*(1[
/*)/(
EFZEF TACTAC *= TTACTAC EZEand *=
APP-228
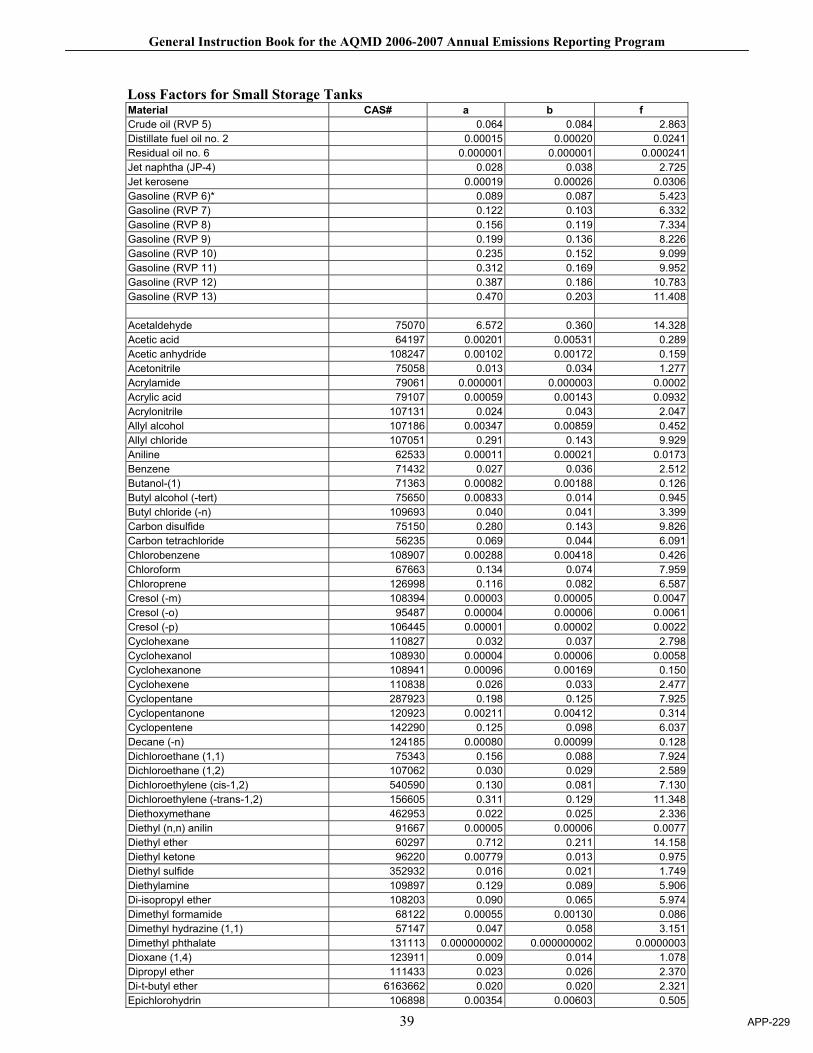
General Instruction Book for the AQMD 2006-2007 Annual Emissions Reporting Program
39
Loss Factors for Small Storage Tanks Material CAS# a b f Crude oil (RVP 5) 0.064 0.084 2.863Distillate fuel oil no. 2 0.00015 0.00020 0.0241Residual oil no. 6 0.000001 0.000001 0.000241Jet naphtha (JP-4) 0.028 0.038 2.725Jet kerosene 0.00019 0.00026 0.0306Gasoline (RVP 6)* 0.089 0.087 5.423Gasoline (RVP 7) 0.122 0.103 6.332Gasoline (RVP 8) 0.156 0.119 7.334Gasoline (RVP 9) 0.199 0.136 8.226Gasoline (RVP 10) 0.235 0.152 9.099Gasoline (RVP 11) 0.312 0.169 9.952Gasoline (RVP 12) 0.387 0.186 10.783Gasoline (RVP 13) 0.470 0.203 11.408 Acetaldehyde 75070 6.572 0.360 14.328Acetic acid 64197 0.00201 0.00531 0.289Acetic anhydride 108247 0.00102 0.00172 0.159Acetonitrile 75058 0.013 0.034 1.277Acrylamide 79061 0.000001 0.000003 0.0002Acrylic acid 79107 0.00059 0.00143 0.0932Acrylonitrile 107131 0.024 0.043 2.047Allyl alcohol 107186 0.00347 0.00859 0.452Allyl chloride 107051 0.291 0.143 9.929Aniline 62533 0.00011 0.00021 0.0173Benzene 71432 0.027 0.036 2.512Butanol-(1) 71363 0.00082 0.00188 0.126Butyl alcohol (-tert) 75650 0.00833 0.014 0.945Butyl chloride (-n) 109693 0.040 0.041 3.399Carbon disulfide 75150 0.280 0.143 9.826Carbon tetrachloride 56235 0.069 0.044 6.091Chlorobenzene 108907 0.00288 0.00418 0.426Chloroform 67663 0.134 0.074 7.959Chloroprene 126998 0.116 0.082 6.587Cresol (-m) 108394 0.00003 0.00005 0.0047Cresol (-o) 95487 0.00004 0.00006 0.0061Cresol (-p) 106445 0.00001 0.00002 0.0022Cyclohexane 110827 0.032 0.037 2.798Cyclohexanol 108930 0.00004 0.00006 0.0058Cyclohexanone 108941 0.00096 0.00169 0.150Cyclohexene 110838 0.026 0.033 2.477Cyclopentane 287923 0.198 0.125 7.925Cyclopentanone 120923 0.00211 0.00412 0.314Cyclopentene 142290 0.125 0.098 6.037Decane (-n) 124185 0.00080 0.00099 0.128Dichloroethane (1,1) 75343 0.156 0.088 7.924Dichloroethane (1,2) 107062 0.030 0.029 2.589Dichloroethylene (cis-1,2) 540590 0.130 0.081 7.130Dichloroethylene (-trans-1,2) 156605 0.311 0.129 11.348Diethoxymethane 462953 0.022 0.025 2.336Diethyl (n,n) anilin 91667 0.00005 0.00006 0.0077Diethyl ether 60297 0.712 0.211 14.158Diethyl ketone 96220 0.00779 0.013 0.975Diethyl sulfide 352932 0.016 0.021 1.749Diethylamine 109897 0.129 0.089 5.906Di-isopropyl ether 108203 0.090 0.065 5.974Dimethyl formamide 68122 0.00055 0.00130 0.086Dimethyl hydrazine (1,1) 57147 0.047 0.058 3.151Dimethyl phthalate 131113 0.000000002 0.000000002 0.0000003Dioxane (1,4) 123911 0.009 0.014 1.078Dipropyl ether 111433 0.023 0.026 2.370Di-t-butyl ether 6163662 0.020 0.020 2.321Epichlorohydrin 106898 0.00354 0.00603 0.505
APP-229
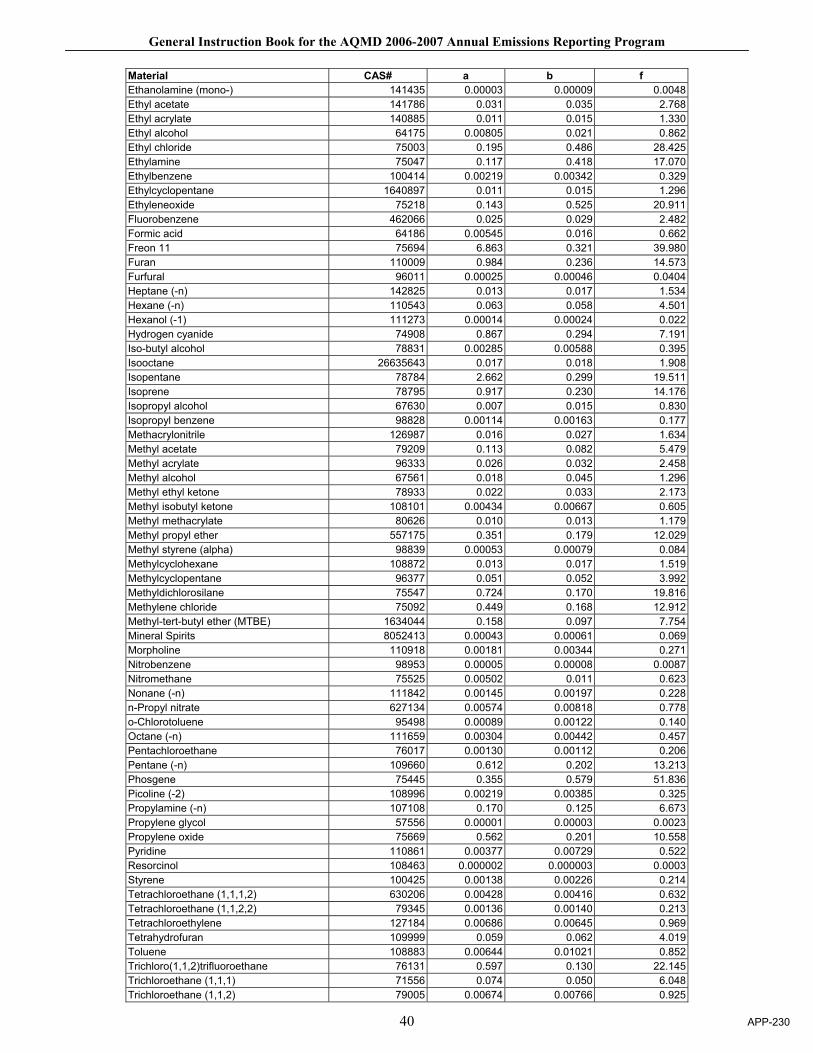
General Instruction Book for the AQMD 2006-2007 Annual Emissions Reporting Program
40
Material CAS# a b f Ethanolamine (mono-) 141435 0.00003 0.00009 0.0048Ethyl acetate 141786 0.031 0.035 2.768Ethyl acrylate 140885 0.011 0.015 1.330Ethyl alcohol 64175 0.00805 0.021 0.862Ethyl chloride 75003 0.195 0.486 28.425Ethylamine 75047 0.117 0.418 17.070Ethylbenzene 100414 0.00219 0.00342 0.329Ethylcyclopentane 1640897 0.011 0.015 1.296Ethyleneoxide 75218 0.143 0.525 20.911Fluorobenzene 462066 0.025 0.029 2.482Formic acid 64186 0.00545 0.016 0.662Freon 11 75694 6.863 0.321 39.980Furan 110009 0.984 0.236 14.573Furfural 96011 0.00025 0.00046 0.0404Heptane (-n) 142825 0.013 0.017 1.534Hexane (-n) 110543 0.063 0.058 4.501Hexanol (-1) 111273 0.00014 0.00024 0.022Hydrogen cyanide 74908 0.867 0.294 7.191Iso-butyl alcohol 78831 0.00285 0.00588 0.395Isooctane 26635643 0.017 0.018 1.908Isopentane 78784 2.662 0.299 19.511Isoprene 78795 0.917 0.230 14.176Isopropyl alcohol 67630 0.007 0.015 0.830Isopropyl benzene 98828 0.00114 0.00163 0.177Methacrylonitrile 126987 0.016 0.027 1.634Methyl acetate 79209 0.113 0.082 5.479Methyl acrylate 96333 0.026 0.032 2.458Methyl alcohol 67561 0.018 0.045 1.296Methyl ethyl ketone 78933 0.022 0.033 2.173Methyl isobutyl ketone 108101 0.00434 0.00667 0.605Methyl methacrylate 80626 0.010 0.013 1.179Methyl propyl ether 557175 0.351 0.179 12.029Methyl styrene (alpha) 98839 0.00053 0.00079 0.084Methylcyclohexane 108872 0.013 0.017 1.519Methylcyclopentane 96377 0.051 0.052 3.992Methyldichlorosilane 75547 0.724 0.170 19.816Methylene chloride 75092 0.449 0.168 12.912Methyl-tert-butyl ether (MTBE) 1634044 0.158 0.097 7.754Mineral Spirits 8052413 0.00043 0.00061 0.069Morpholine 110918 0.00181 0.00344 0.271Nitrobenzene 98953 0.00005 0.00008 0.0087Nitromethane 75525 0.00502 0.011 0.623Nonane (-n) 111842 0.00145 0.00197 0.228n-Propyl nitrate 627134 0.00574 0.00818 0.778o-Chlorotoluene 95498 0.00089 0.00122 0.140Octane (-n) 111659 0.00304 0.00442 0.457Pentachloroethane 76017 0.00130 0.00112 0.206Pentane (-n) 109660 0.612 0.202 13.213Phosgene 75445 0.355 0.579 51.836Picoline (-2) 108996 0.00219 0.00385 0.325Propylamine (-n) 107108 0.170 0.125 6.673Propylene glycol 57556 0.00001 0.00003 0.0023Propylene oxide 75669 0.562 0.201 10.558Pyridine 110861 0.00377 0.00729 0.522Resorcinol 108463 0.000002 0.000003 0.0003Styrene 100425 0.00138 0.00226 0.214Tetrachloroethane (1,1,1,2) 630206 0.00428 0.00416 0.632Tetrachloroethane (1,1,2,2) 79345 0.00136 0.00140 0.213Tetrachloroethylene 127184 0.00686 0.00645 0.969Tetrahydrofuran 109999 0.059 0.062 4.019Toluene 108883 0.00644 0.01021 0.852Trichloro(1,1,2)trifluoroethane 76131 0.597 0.130 22.145Trichloroethane (1,1,1) 71556 0.074 0.050 6.048Trichloroethane (1,1,2) 79005 0.00674 0.00766 0.925
APP-230
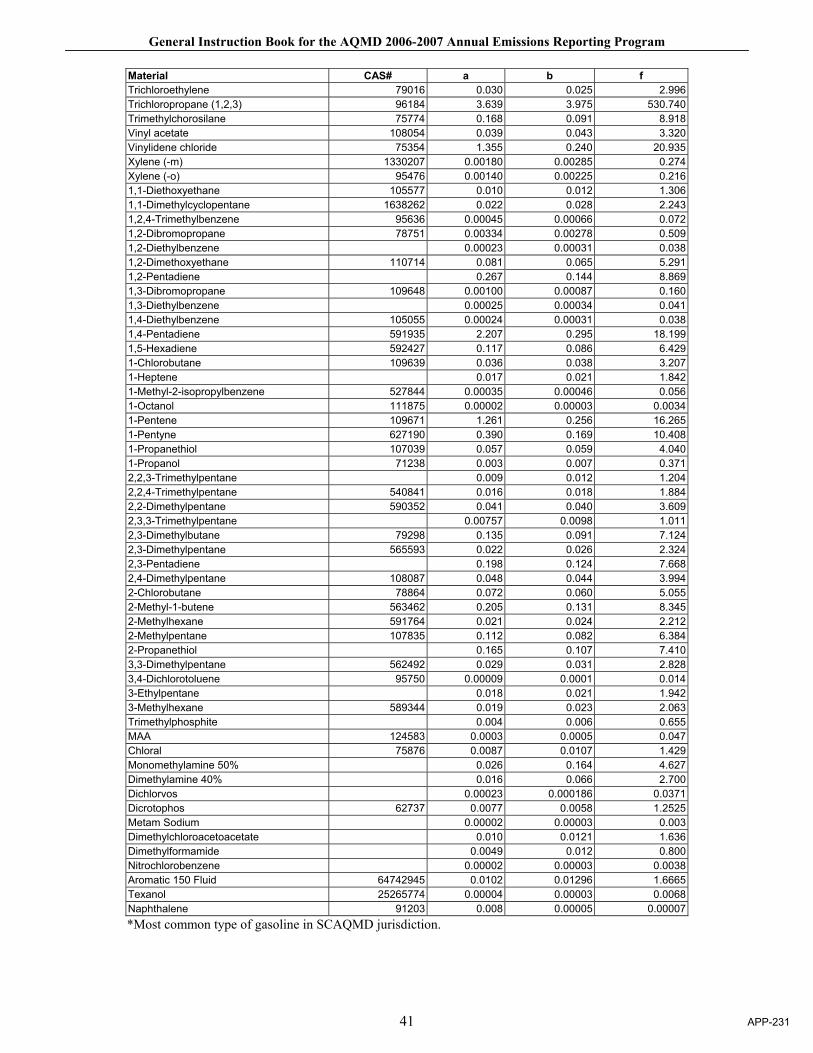
General Instruction Book for the AQMD 2006-2007 Annual Emissions Reporting Program
41
Material CAS# a b f Trichloroethylene 79016 0.030 0.025 2.996Trichloropropane (1,2,3) 96184 3.639 3.975 530.740Trimethylchorosilane 75774 0.168 0.091 8.918Vinyl acetate 108054 0.039 0.043 3.320Vinylidene chloride 75354 1.355 0.240 20.935Xylene (-m) 1330207 0.00180 0.00285 0.274Xylene (-o) 95476 0.00140 0.00225 0.2161,1-Diethoxyethane 105577 0.010 0.012 1.3061,1-Dimethylcyclopentane 1638262 0.022 0.028 2.2431,2,4-Trimethylbenzene 95636 0.00045 0.00066 0.0721,2-Dibromopropane 78751 0.00334 0.00278 0.5091,2-Diethylbenzene 0.00023 0.00031 0.0381,2-Dimethoxyethane 110714 0.081 0.065 5.2911,2-Pentadiene 0.267 0.144 8.8691,3-Dibromopropane 109648 0.00100 0.00087 0.1601,3-Diethylbenzene 0.00025 0.00034 0.0411,4-Diethylbenzene 105055 0.00024 0.00031 0.0381,4-Pentadiene 591935 2.207 0.295 18.1991,5-Hexadiene 592427 0.117 0.086 6.4291-Chlorobutane 109639 0.036 0.038 3.2071-Heptene 0.017 0.021 1.8421-Methyl-2-isopropylbenzene 527844 0.00035 0.00046 0.0561-Octanol 111875 0.00002 0.00003 0.00341-Pentene 109671 1.261 0.256 16.2651-Pentyne 627190 0.390 0.169 10.4081-Propanethiol 107039 0.057 0.059 4.0401-Propanol 71238 0.003 0.007 0.3712,2,3-Trimethylpentane 0.009 0.012 1.2042,2,4-Trimethylpentane 540841 0.016 0.018 1.8842,2-Dimethylpentane 590352 0.041 0.040 3.6092,3,3-Trimethylpentane 0.00757 0.0098 1.0112,3-Dimethylbutane 79298 0.135 0.091 7.1242,3-Dimethylpentane 565593 0.022 0.026 2.3242,3-Pentadiene 0.198 0.124 7.6682,4-Dimethylpentane 108087 0.048 0.044 3.9942-Chlorobutane 78864 0.072 0.060 5.0552-Methyl-1-butene 563462 0.205 0.131 8.3452-Methylhexane 591764 0.021 0.024 2.2122-Methylpentane 107835 0.112 0.082 6.3842-Propanethiol 0.165 0.107 7.4103,3-Dimethylpentane 562492 0.029 0.031 2.8283,4-Dichlorotoluene 95750 0.00009 0.0001 0.0143-Ethylpentane 0.018 0.021 1.9423-Methylhexane 589344 0.019 0.023 2.063Trimethylphosphite 0.004 0.006 0.655MAA 124583 0.0003 0.0005 0.047Chloral 75876 0.0087 0.0107 1.429Monomethylamine 50% 0.026 0.164 4.627Dimethylamine 40% 0.016 0.066 2.700Dichlorvos 0.00023 0.000186 0.0371Dicrotophos 62737 0.0077 0.0058 1.2525Metam Sodium 0.00002 0.00003 0.003Dimethylchloroacetoacetate 0.010 0.0121 1.636Dimethylformamide 0.0049 0.012 0.800Nitrochlorobenzene 0.00002 0.00003 0.0038Aromatic 150 Fluid 64742945 0.0102 0.01296 1.6665Texanol 25265774 0.00004 0.00003 0.0068Naphthalene 91203 0.008 0.00005 0.00007*Most common type of gasoline in SCAQMD jurisdiction.
APP-231
APPENDIX J-2
SPECIATION PROFILE AND DEATILED EMISSION CALCULATIONS FOR REFUELING OPERATIONS
APP-232

Summary of Emissions from Refueling OperationsDolores and ICTF Rail Yards, Long Beach, CA
2005 VOC EmissionTank Material Throughput Factor 2005 VOC Emissions
Yard Tank No. Location Stored (gal/yr) (lb/1000 gal)1 (tpy)ICTF TNKD-9901 Crane Maintenance Area Offroad Diesel 120,000 0.028 0.002ICTF TBA-1 Crane Maintenance Area CARB Diesel 52,000 0.028 0.001ICTF TBA-2 Crane Maintenance Area Gasoline 86,808 1.8 0.078Dolores TNKD-0069 Tank Farm Diesel 10,500,000 0.028 0.147Dolores TNKD-0068 Tank Farm Diesel 10,500,000 0.028 0.147Total 0.375
Notes:1. Emission factors from SCAQMD General Instruction Book for the AQMD 2006-2007 Annual Emissions Reporting Program , Supplemental Instructions for Liquid Organic Storage Tanks and References.
APP-233
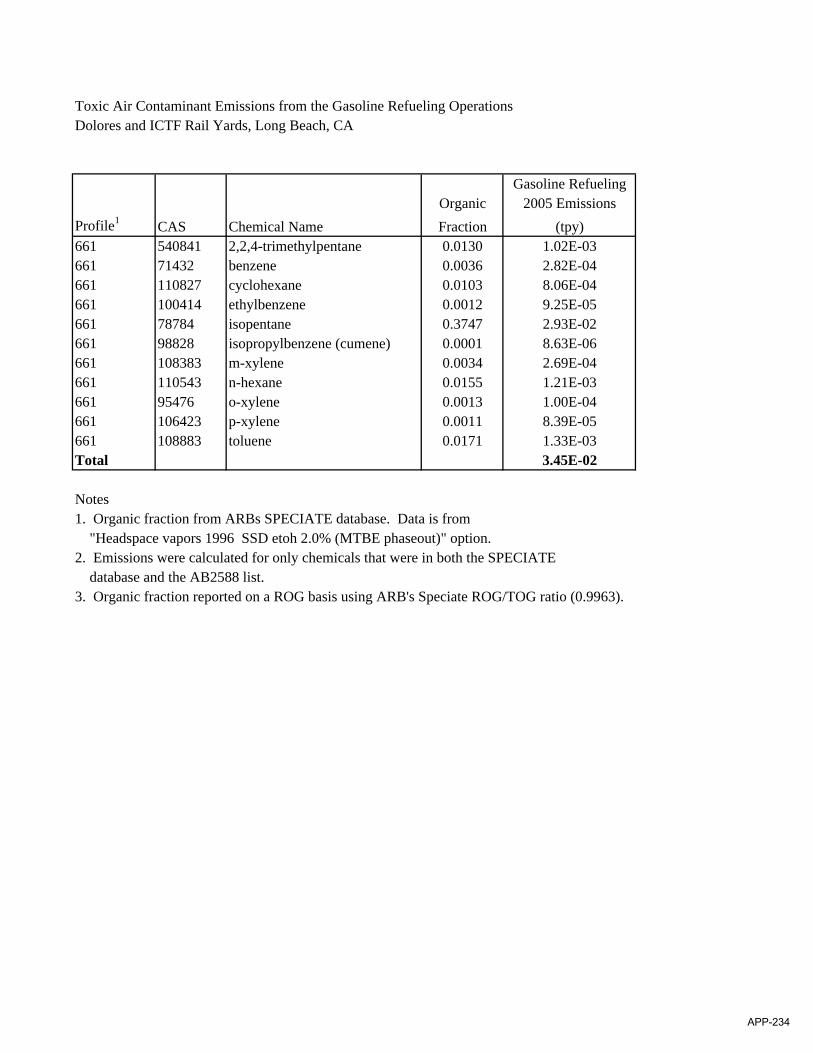
Toxic Air Contaminant Emissions from the Gasoline Refueling Operations Dolores and ICTF Rail Yards, Long Beach, CA
Gasoline RefuelingOrganic 2005 Emissions
Profile1 CAS Chemical Name Fraction (tpy)661 540841 2,2,4-trimethylpentane 0.0130 1.02E-03661 71432 benzene 0.0036 2.82E-04661 110827 cyclohexane 0.0103 8.06E-04661 100414 ethylbenzene 0.0012 9.25E-05661 78784 isopentane 0.3747 2.93E-02661 98828 isopropylbenzene (cumene) 0.0001 8.63E-06661 108383 m-xylene 0.0034 2.69E-04661 110543 n-hexane 0.0155 1.21E-03661 95476 o-xylene 0.0013 1.00E-04661 106423 p-xylene 0.0011 8.39E-05661 108883 toluene 0.0171 1.33E-03Total 3.45E-02
Notes1. Organic fraction from ARBs SPECIATE database. Data is from "Headspace vapors 1996 SSD etoh 2.0% (MTBE phaseout)" option.2. Emissions were calculated for only chemicals that were in both the SPECIATE database and the AB2588 list.3. Organic fraction reported on a ROG basis using ARB's Speciate ROG/TOG ratio (0.9963).
APP-234
APPENDIX K
DEATILED EMISSION CALCULATIONS AND SPECIATION PROFILES FOR STEAM CLEANERS
APP-235
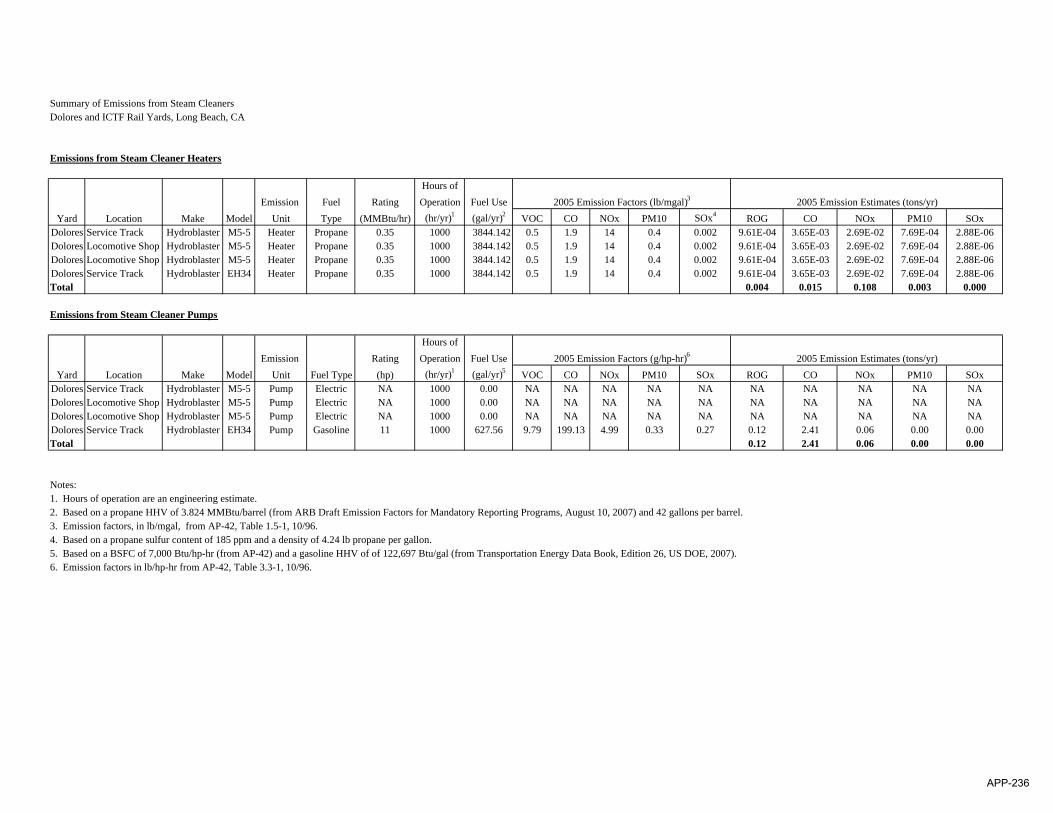
Summary of Emissions from Steam CleanersDolores and ICTF Rail Yards, Long Beach, CA
Emissions from Steam Cleaner Heaters
Hours ofEmission Fuel Rating Operation Fuel Use
Yard Location Make Model Unit Type (MMBtu/hr) (hr/yr)1 (gal/yr)2 VOC CO NOx PM10 SOx4 ROG CO NOx PM10 SOxDolores Service Track Hydroblaster M5-5 Heater Propane 0.35 1000 3844.142 0.5 1.9 14 0.4 0.002 9.61E-04 3.65E-03 2.69E-02 7.69E-04 2.88E-06Dolores Locomotive Shop Hydroblaster M5-5 Heater Propane 0.35 1000 3844.142 0.5 1.9 14 0.4 0.002 9.61E-04 3.65E-03 2.69E-02 7.69E-04 2.88E-06Dolores Locomotive Shop Hydroblaster M5-5 Heater Propane 0.35 1000 3844.142 0.5 1.9 14 0.4 0.002 9.61E-04 3.65E-03 2.69E-02 7.69E-04 2.88E-06Dolores Service Track Hydroblaster EH34 Heater Propane 0.35 1000 3844.142 0.5 1.9 14 0.4 0.002 9.61E-04 3.65E-03 2.69E-02 7.69E-04 2.88E-06Total 0.004 0.015 0.108 0.003 0.000
Emissions from Steam Cleaner Pumps
Hours ofEmission Rating Operation Fuel Use
Yard Location Make Model Unit Fuel Type (hp) (hr/yr)1 (gal/yr)5 VOC CO NOx PM10 SOx ROG CO NOx PM10 SOxDolores Service Track Hydroblaster M5-5 Pump Electric NA 1000 0.00 NA NA NA NA NA NA NA NA NA NADolores Locomotive Shop Hydroblaster M5-5 Pump Electric NA 1000 0.00 NA NA NA NA NA NA NA NA NA NADolores Locomotive Shop Hydroblaster M5-5 Pump Electric NA 1000 0.00 NA NA NA NA NA NA NA NA NA NADolores Service Track Hydroblaster EH34 Pump Gasoline 11 1000 627.56 9.79 199.13 4.99 0.33 0.27 0.12 2.41 0.06 0.00 0.00Total 0.12 2.41 0.06 0.00 0.00
Notes:1. Hours of operation are an engineering estimate.2. Based on a propane HHV of 3.824 MMBtu/barrel (from ARB Draft Emission Factors for Mandatory Reporting Programs, August 10, 2007) and 42 gallons per barrel.3. Emission factors, in lb/mgal, from AP-42, Table 1.5-1, 10/96.4. Based on a propane sulfur content of 185 ppm and a density of 4.24 lb propane per gallon.5. Based on a BSFC of 7,000 Btu/hp-hr (from AP-42) and a gasoline HHV of of 122,697 Btu/gal (from Transportation Energy Data Book, Edition 26, US DOE, 2007).6. Emission factors in lb/hp-hr from AP-42, Table 3.3-1, 10/96.
2005 Emission Estimates (tons/yr)2005 Emission Factors (g/hp-hr)6
2005 Emission Factors (lb/mgal)3 2005 Emission Estimates (tons/yr)
APP-236
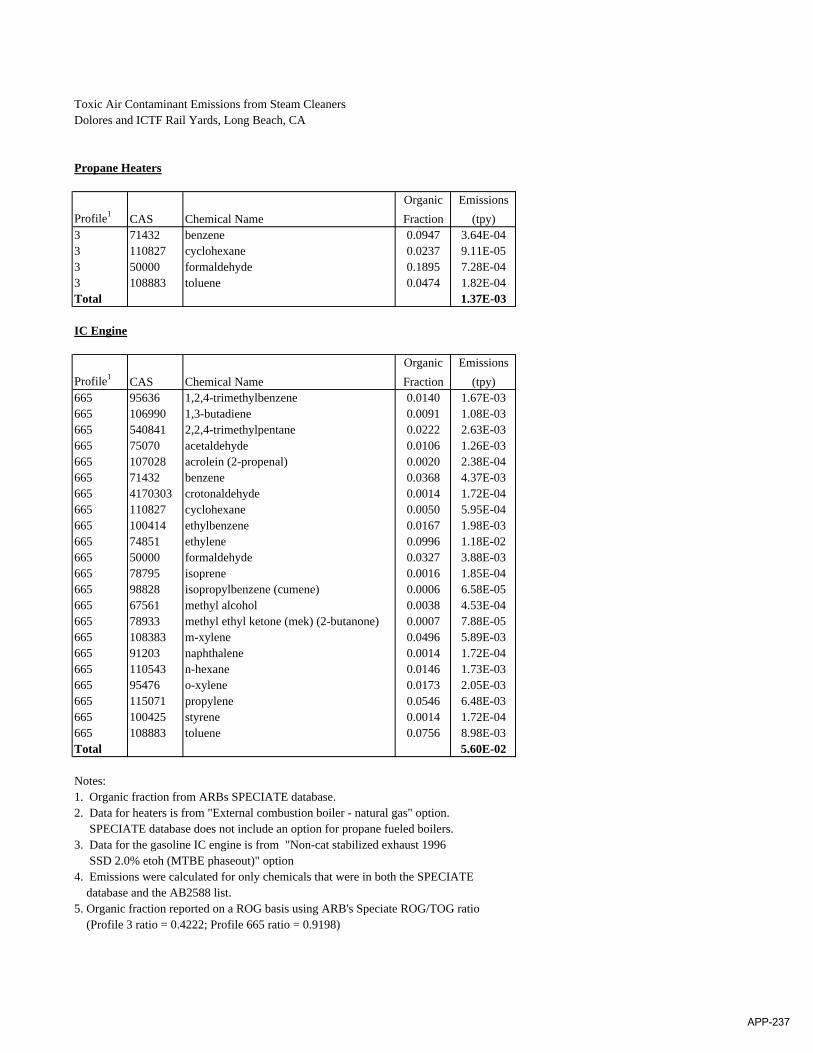
Toxic Air Contaminant Emissions from Steam CleanersDolores and ICTF Rail Yards, Long Beach, CA
Propane Heaters
Organic EmissionsProfile1 CAS Chemical Name Fraction (tpy)3 71432 benzene 0.0947 3.64E-043 110827 cyclohexane 0.0237 9.11E-053 50000 formaldehyde 0.1895 7.28E-043 108883 toluene 0.0474 1.82E-04Total 1.37E-03
IC Engine
Organic EmissionsProfile1 CAS Chemical Name Fraction (tpy)665 95636 1,2,4-trimethylbenzene 0.0140 1.67E-03665 106990 1,3-butadiene 0.0091 1.08E-03665 540841 2,2,4-trimethylpentane 0.0222 2.63E-03665 75070 acetaldehyde 0.0106 1.26E-03665 107028 acrolein (2-propenal) 0.0020 2.38E-04665 71432 benzene 0.0368 4.37E-03665 4170303 crotonaldehyde 0.0014 1.72E-04665 110827 cyclohexane 0.0050 5.95E-04665 100414 ethylbenzene 0.0167 1.98E-03665 74851 ethylene 0.0996 1.18E-02665 50000 formaldehyde 0.0327 3.88E-03665 78795 isoprene 0.0016 1.85E-04665 98828 isopropylbenzene (cumene) 0.0006 6.58E-05665 67561 methyl alcohol 0.0038 4.53E-04665 78933 methyl ethyl ketone (mek) (2-butanone) 0.0007 7.88E-05665 108383 m-xylene 0.0496 5.89E-03665 91203 naphthalene 0.0014 1.72E-04665 110543 n-hexane 0.0146 1.73E-03665 95476 o-xylene 0.0173 2.05E-03665 115071 propylene 0.0546 6.48E-03665 100425 styrene 0.0014 1.72E-04665 108883 toluene 0.0756 8.98E-03Total 5.60E-02
Notes:1. Organic fraction from ARBs SPECIATE database. 2. Data for heaters is from "External combustion boiler - natural gas" option. SPECIATE database does not include an option for propane fueled boilers.3. Data for the gasoline IC engine is from "Non-cat stabilized exhaust 1996 SSD 2.0% etoh (MTBE phaseout)" option4. Emissions were calculated for only chemicals that were in both the SPECIATE database and the AB2588 list.5. Organic fraction reported on a ROG basis using ARB's Speciate ROG/TOG ratio (Profile 3 ratio = 0.4222; Profile 665 ratio = 0.9198)
APP-237

APPENDIX L
DEATILED EMISSION CALCULATIONS AND SPECIATION PROFILE FOR THE NATURAL GAS-FIRED HEATER
APP-238
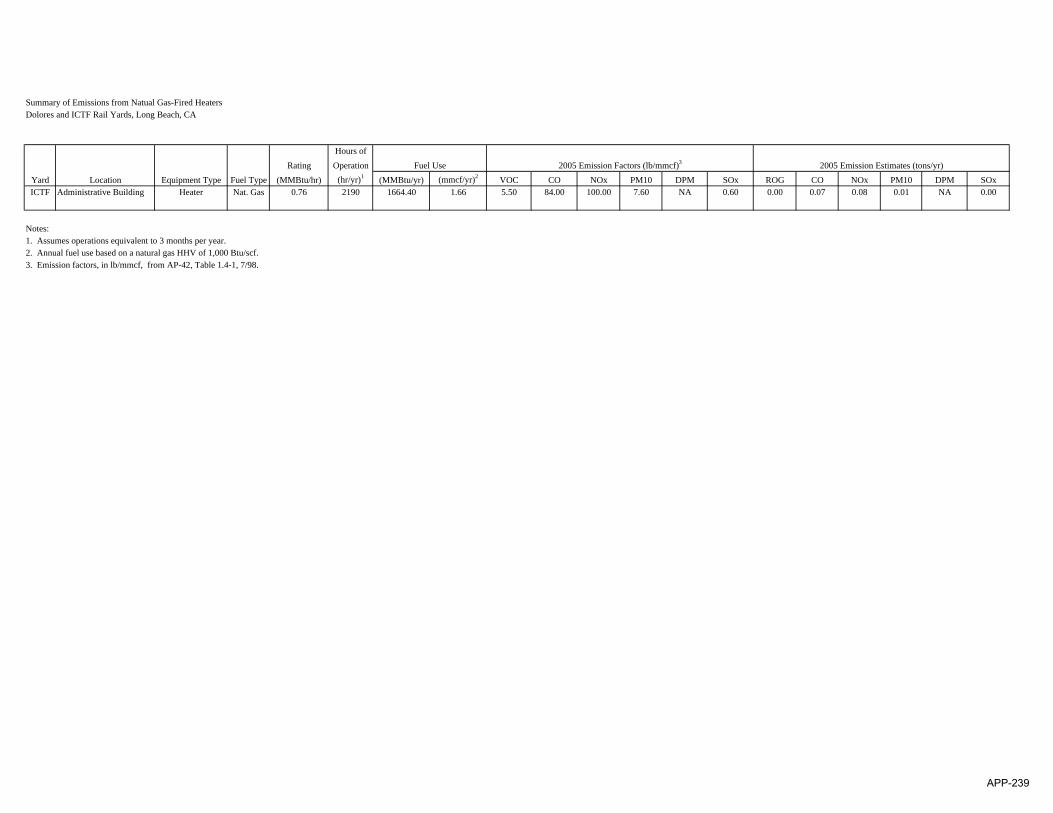
Summary of Emissions from Natual Gas-Fired HeatersDolores and ICTF Rail Yards, Long Beach, CA
Hours ofRating Operation
Yard Location Equipment Type Fuel Type (MMBtu/hr) (hr/yr)1 (MMBtu/yr) (mmcf/yr)2 VOC CO NOx PM10 DPM SOx ROG CO NOx PM10 DPM SOxICTF Administrative Building Heater Nat. Gas 0.76 2190 1664.40 1.66 5.50 84.00 100.00 7.60 NA 0.60 0.00 0.07 0.08 0.01 NA 0.00
Notes:1. Assumes operations equivalent to 3 months per year.2. Annual fuel use based on a natural gas HHV of 1,000 Btu/scf.3. Emission factors, in lb/mmcf, from AP-42, Table 1.4-1, 7/98.
Fuel Use 2005 Emission Factors (lb/mmcf)3 2005 Emission Estimates (tons/yr)
APP-239
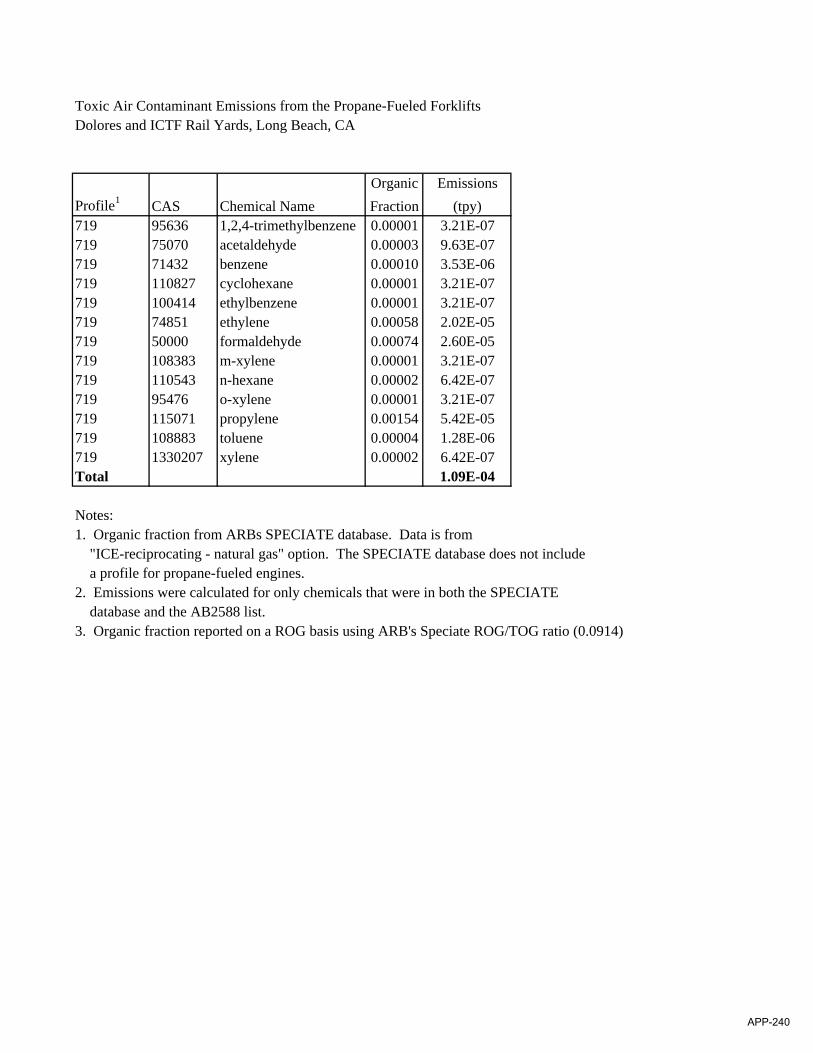
Toxic Air Contaminant Emissions from the Propane-Fueled ForkliftsDolores and ICTF Rail Yards, Long Beach, CA
Organic EmissionsProfile1 CAS Chemical Name Fraction (tpy)719 95636 1,2,4-trimethylbenzene 0.00001 3.21E-07719 75070 acetaldehyde 0.00003 9.63E-07719 71432 benzene 0.00010 3.53E-06719 110827 cyclohexane 0.00001 3.21E-07719 100414 ethylbenzene 0.00001 3.21E-07719 74851 ethylene 0.00058 2.02E-05719 50000 formaldehyde 0.00074 2.60E-05719 108383 m-xylene 0.00001 3.21E-07719 110543 n-hexane 0.00002 6.42E-07719 95476 o-xylene 0.00001 3.21E-07719 115071 propylene 0.00154 5.42E-05719 108883 toluene 0.00004 1.28E-06719 1330207 xylene 0.00002 6.42E-07Total 1.09E-04
Notes:1. Organic fraction from ARBs SPECIATE database. Data is from "ICE-reciprocating - natural gas" option. The SPECIATE database does not include a profile for propane-fueled engines.2. Emissions were calculated for only chemicals that were in both the SPECIATE database and the AB2588 list.3. Organic fraction reported on a ROG basis using ARB's Speciate ROG/TOG ratio (0.0914)
APP-240
APPENDIX M
DEATILED EMISSION CALCULATIONS AND SPECIATION PROFILE FOR THE PROPANE-FUELED WELDER
APP-241
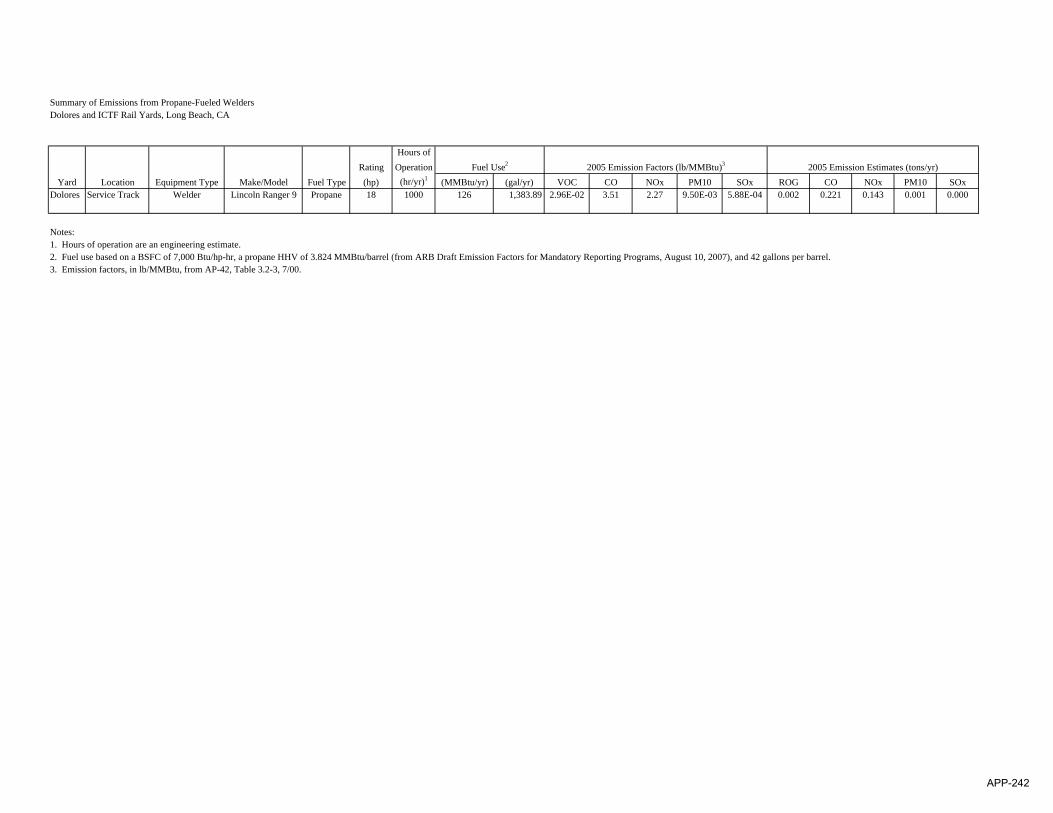
Summary of Emissions from Propane-Fueled WeldersDolores and ICTF Rail Yards, Long Beach, CA
Hours ofRating Operation
Yard Location Equipment Type Make/Model Fuel Type (hp) (hr/yr)1 (MMBtu/yr) (gal/yr) VOC CO NOx PM10 SOx ROG CO NOx PM10 SOxDolores Service Track Welder Lincoln Ranger 9 Propane 18 1000 126 1,383.89 2.96E-02 3.51 2.27 9.50E-03 5.88E-04 0.002 0.221 0.143 0.001 0.000
Notes:1. Hours of operation are an engineering estimate.2. Fuel use based on a BSFC of 7,000 Btu/hp-hr, a propane HHV of 3.824 MMBtu/barrel (from ARB Draft Emission Factors for Mandatory Reporting Programs, August 10, 2007), and 42 gallons per barrel.3. Emission factors, in lb/MMBtu, from AP-42, Table 3.2-3, 7/00.
Fuel Use2 2005 Emission Factors (lb/MMBtu)3 2005 Emission Estimates (tons/yr)
APP-242
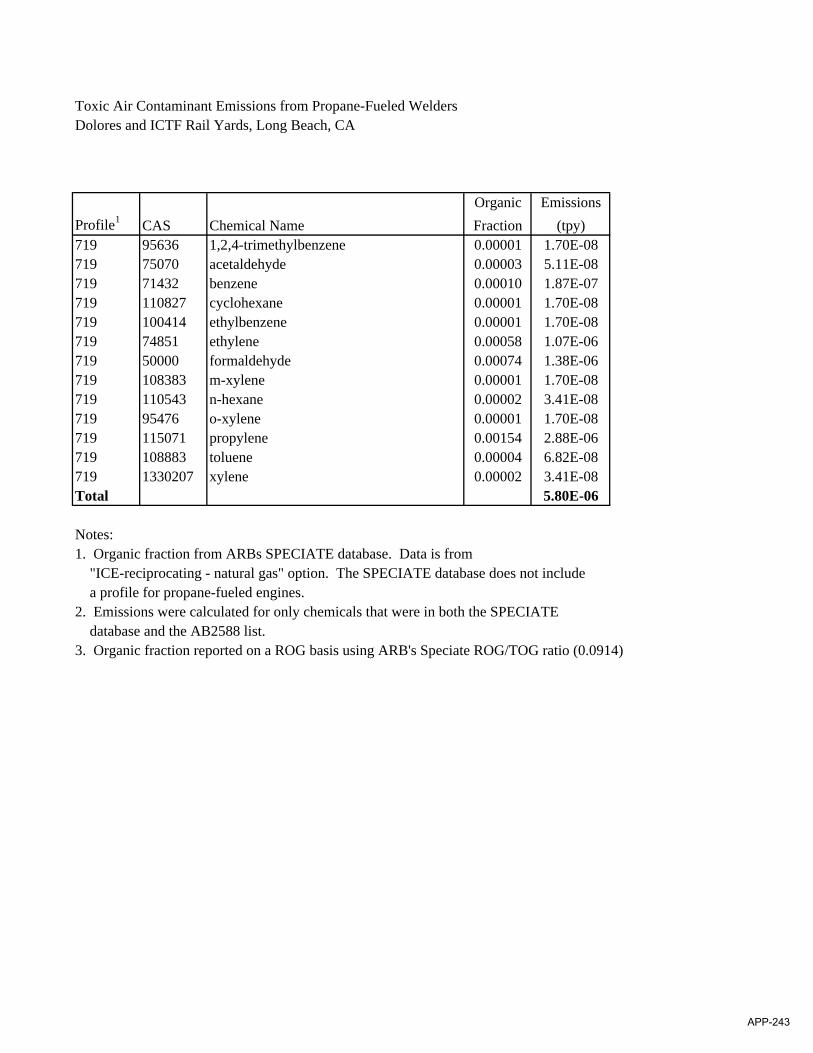
Toxic Air Contaminant Emissions from Propane-Fueled WeldersDolores and ICTF Rail Yards, Long Beach, CA
Organic EmissionsProfile1 CAS Chemical Name Fraction (tpy)719 95636 1,2,4-trimethylbenzene 0.00001 1.70E-08719 75070 acetaldehyde 0.00003 5.11E-08719 71432 benzene 0.00010 1.87E-07719 110827 cyclohexane 0.00001 1.70E-08719 100414 ethylbenzene 0.00001 1.70E-08719 74851 ethylene 0.00058 1.07E-06719 50000 formaldehyde 0.00074 1.38E-06719 108383 m-xylene 0.00001 1.70E-08719 110543 n-hexane 0.00002 3.41E-08719 95476 o-xylene 0.00001 1.70E-08719 115071 propylene 0.00154 2.88E-06719 108883 toluene 0.00004 6.82E-08719 1330207 xylene 0.00002 3.41E-08Total 5.80E-06
Notes:1. Organic fraction from ARBs SPECIATE database. Data is from "ICE-reciprocating - natural gas" option. The SPECIATE database does not include a profile for propane-fueled engines.2. Emissions were calculated for only chemicals that were in both the SPECIATE database and the AB2588 list.3. Organic fraction reported on a ROG basis using ARB's Speciate ROG/TOG ratio (0.0914)
APP-243
APPENDIX N
DEATILED EMISSION CALCULATIONS AND SPECIATION PROFILE FOR MISCELLANEOUS GASOLINE-FUELED EQUIPMENT
APP-244
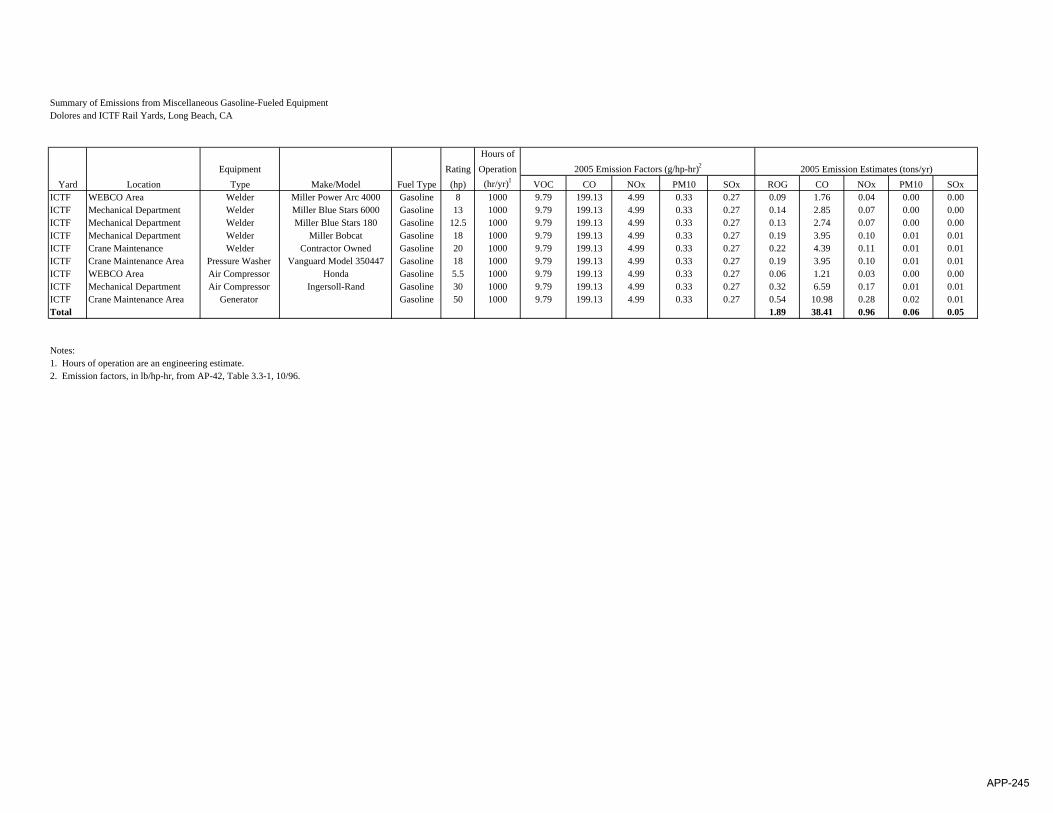
Summary of Emissions from Miscellaneous Gasoline-Fueled EquipmentDolores and ICTF Rail Yards, Long Beach, CA
Hours ofEquipment Rating Operation
Yard Location Type Make/Model Fuel Type (hp) (hr/yr)1 VOC CO NOx PM10 SOx ROG CO NOx PM10 SOxICTF WEBCO Area Welder Miller Power Arc 4000 Gasoline 8 1000 9.79 199.13 4.99 0.33 0.27 0.09 1.76 0.04 0.00 0.00ICTF Mechanical Department Welder Miller Blue Stars 6000 Gasoline 13 1000 9.79 199.13 4.99 0.33 0.27 0.14 2.85 0.07 0.00 0.00ICTF Mechanical Department Welder Miller Blue Stars 180 Gasoline 12.5 1000 9.79 199.13 4.99 0.33 0.27 0.13 2.74 0.07 0.00 0.00ICTF Mechanical Department Welder Miller Bobcat Gasoline 18 1000 9.79 199.13 4.99 0.33 0.27 0.19 3.95 0.10 0.01 0.01ICTF Crane Maintenance Welder Contractor Owned Gasoline 20 1000 9.79 199.13 4.99 0.33 0.27 0.22 4.39 0.11 0.01 0.01ICTF Crane Maintenance Area Pressure Washer Vanguard Model 350447 Gasoline 18 1000 9.79 199.13 4.99 0.33 0.27 0.19 3.95 0.10 0.01 0.01ICTF WEBCO Area Air Compressor Honda Gasoline 5.5 1000 9.79 199.13 4.99 0.33 0.27 0.06 1.21 0.03 0.00 0.00ICTF Mechanical Department Air Compressor Ingersoll-Rand Gasoline 30 1000 9.79 199.13 4.99 0.33 0.27 0.32 6.59 0.17 0.01 0.01ICTF Crane Maintenance Area Generator Gasoline 50 1000 9.79 199.13 4.99 0.33 0.27 0.54 10.98 0.28 0.02 0.01Total 1.89 38.41 0.96 0.06 0.05
Notes:1. Hours of operation are an engineering estimate.2. Emission factors, in lb/hp-hr, from AP-42, Table 3.3-1, 10/96.
2005 Emission Factors (g/hp-hr)2 2005 Emission Estimates (tons/yr)
APP-245
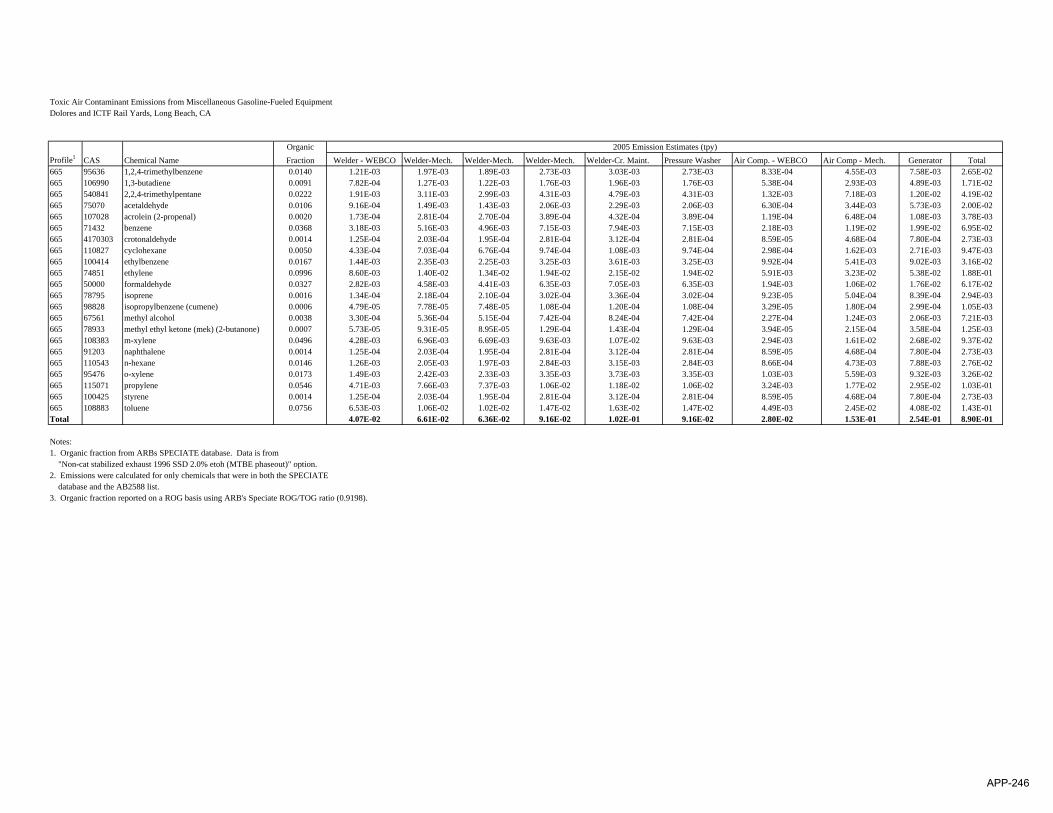
Toxic Air Contaminant Emissions from Miscellaneous Gasoline-Fueled EquipmentDolores and ICTF Rail Yards, Long Beach, CA
OrganicProfile1 CAS Chemical Name Fraction Welder - WEBCO Welder-Mech. Welder-Mech. Welder-Mech. Welder-Cr. Maint. Pressure Washer Air Comp. - WEBCO Air Comp - Mech. Generator Total665 95636 1,2,4-trimethylbenzene 0.0140 1.21E-03 1.97E-03 1.89E-03 2.73E-03 3.03E-03 2.73E-03 8.33E-04 4.55E-03 7.58E-03 2.65E-02665 106990 1,3-butadiene 0.0091 7.82E-04 1.27E-03 1.22E-03 1.76E-03 1.96E-03 1.76E-03 5.38E-04 2.93E-03 4.89E-03 1.71E-02665 540841 2,2,4-trimethylpentane 0.0222 1.91E-03 3.11E-03 2.99E-03 4.31E-03 4.79E-03 4.31E-03 1.32E-03 7.18E-03 1.20E-02 4.19E-02665 75070 acetaldehyde 0.0106 9.16E-04 1.49E-03 1.43E-03 2.06E-03 2.29E-03 2.06E-03 6.30E-04 3.44E-03 5.73E-03 2.00E-02665 107028 acrolein (2-propenal) 0.0020 1.73E-04 2.81E-04 2.70E-04 3.89E-04 4.32E-04 3.89E-04 1.19E-04 6.48E-04 1.08E-03 3.78E-03665 71432 benzene 0.0368 3.18E-03 5.16E-03 4.96E-03 7.15E-03 7.94E-03 7.15E-03 2.18E-03 1.19E-02 1.99E-02 6.95E-02665 4170303 crotonaldehyde 0.0014 1.25E-04 2.03E-04 1.95E-04 2.81E-04 3.12E-04 2.81E-04 8.59E-05 4.68E-04 7.80E-04 2.73E-03665 110827 cyclohexane 0.0050 4.33E-04 7.03E-04 6.76E-04 9.74E-04 1.08E-03 9.74E-04 2.98E-04 1.62E-03 2.71E-03 9.47E-03665 100414 ethylbenzene 0.0167 1.44E-03 2.35E-03 2.25E-03 3.25E-03 3.61E-03 3.25E-03 9.92E-04 5.41E-03 9.02E-03 3.16E-02665 74851 ethylene 0.0996 8.60E-03 1.40E-02 1.34E-02 1.94E-02 2.15E-02 1.94E-02 5.91E-03 3.23E-02 5.38E-02 1.88E-01665 50000 formaldehyde 0.0327 2.82E-03 4.58E-03 4.41E-03 6.35E-03 7.05E-03 6.35E-03 1.94E-03 1.06E-02 1.76E-02 6.17E-02665 78795 isoprene 0.0016 1.34E-04 2.18E-04 2.10E-04 3.02E-04 3.36E-04 3.02E-04 9.23E-05 5.04E-04 8.39E-04 2.94E-03665 98828 isopropylbenzene (cumene) 0.0006 4.79E-05 7.78E-05 7.48E-05 1.08E-04 1.20E-04 1.08E-04 3.29E-05 1.80E-04 2.99E-04 1.05E-03665 67561 methyl alcohol 0.0038 3.30E-04 5.36E-04 5.15E-04 7.42E-04 8.24E-04 7.42E-04 2.27E-04 1.24E-03 2.06E-03 7.21E-03665 78933 methyl ethyl ketone (mek) (2-butanone) 0.0007 5.73E-05 9.31E-05 8.95E-05 1.29E-04 1.43E-04 1.29E-04 3.94E-05 2.15E-04 3.58E-04 1.25E-03665 108383 m-xylene 0.0496 4.28E-03 6.96E-03 6.69E-03 9.63E-03 1.07E-02 9.63E-03 2.94E-03 1.61E-02 2.68E-02 9.37E-02665 91203 naphthalene 0.0014 1.25E-04 2.03E-04 1.95E-04 2.81E-04 3.12E-04 2.81E-04 8.59E-05 4.68E-04 7.80E-04 2.73E-03665 110543 n-hexane 0.0146 1.26E-03 2.05E-03 1.97E-03 2.84E-03 3.15E-03 2.84E-03 8.66E-04 4.73E-03 7.88E-03 2.76E-02665 95476 o-xylene 0.0173 1.49E-03 2.42E-03 2.33E-03 3.35E-03 3.73E-03 3.35E-03 1.03E-03 5.59E-03 9.32E-03 3.26E-02665 115071 propylene 0.0546 4.71E-03 7.66E-03 7.37E-03 1.06E-02 1.18E-02 1.06E-02 3.24E-03 1.77E-02 2.95E-02 1.03E-01665 100425 styrene 0.0014 1.25E-04 2.03E-04 1.95E-04 2.81E-04 3.12E-04 2.81E-04 8.59E-05 4.68E-04 7.80E-04 2.73E-03665 108883 toluene 0.0756 6.53E-03 1.06E-02 1.02E-02 1.47E-02 1.63E-02 1.47E-02 4.49E-03 2.45E-02 4.08E-02 1.43E-01Total 4.07E-02 6.61E-02 6.36E-02 9.16E-02 1.02E-01 9.16E-02 2.80E-02 1.53E-01 2.54E-01 8.90E-01
Notes:1. Organic fraction from ARBs SPECIATE database. Data is from "Non-cat stabilized exhaust 1996 SSD 2.0% etoh (MTBE phaseout)" option.2. Emissions were calculated for only chemicals that were in both the SPECIATE database and the AB2588 list.3. Organic fraction reported on a ROG basis using ARB's Speciate ROG/TOG ratio (0.9198).
2005 Emission Estimates (tpy)
APP-246

APPENDIX O
DEATILED EMISSION CALCULATIONS, EMISSION FACTOR DERIVATION, EMFAC2007 OUTPUT, AND SPECIATION PROFILE FOR
WORKER VEHICLES
APP-247
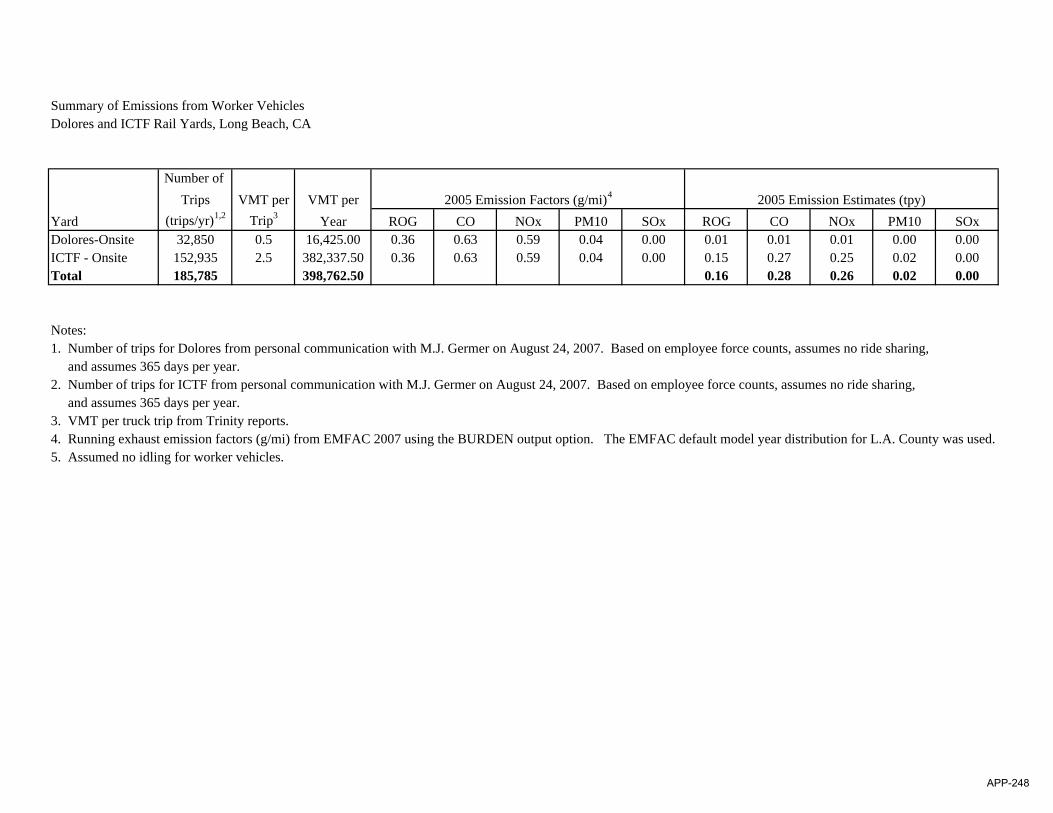
Summary of Emissions from Worker VehiclesDolores and ICTF Rail Yards, Long Beach, CA
Number of Trips VMT per VMT per
Yard (trips/yr)1,2 Trip3 Year ROG CO NOx PM10 SOx ROG CO NOx PM10 SOxDolores-Onsite 32,850 0.5 16,425.00 0.36 0.63 0.59 0.04 0.00 0.01 0.01 0.01 0.00 0.00ICTF - Onsite 152,935 2.5 382,337.50 0.36 0.63 0.59 0.04 0.00 0.15 0.27 0.25 0.02 0.00Total 185,785 398,762.50 0.16 0.28 0.26 0.02 0.00
Notes:1. Number of trips for Dolores from personal communication with M.J. Germer on August 24, 2007. Based on employee force counts, assumes no ride sharing, and assumes 365 days per year.2. Number of trips for ICTF from personal communication with M.J. Germer on August 24, 2007. Based on employee force counts, assumes no ride sharing, and assumes 365 days per year.3. VMT per truck trip from Trinity reports.4. Running exhaust emission factors (g/mi) from EMFAC 2007 using the BURDEN output option. The EMFAC default model year distribution for L.A. County was used.5. Assumed no idling for worker vehicles.
2005 Emission Estimates (tpy)2005 Emission Factors (g/mi)4
APP-248
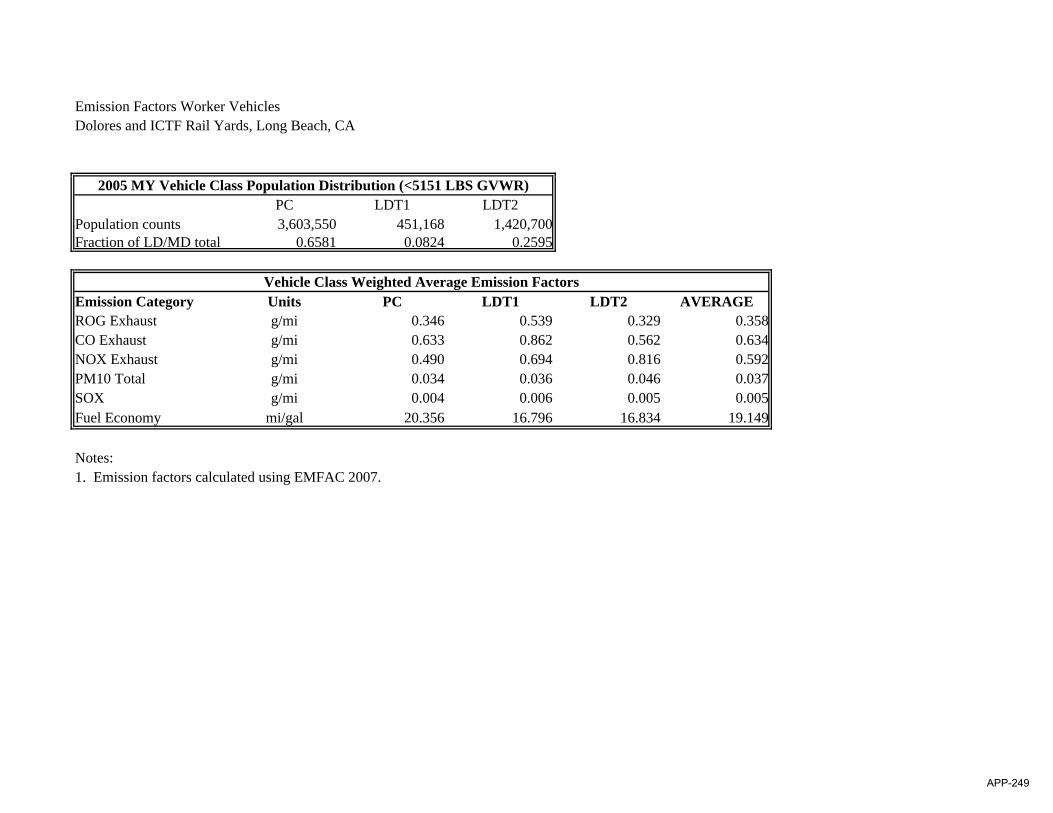
Emission Factors Worker VehiclesDolores and ICTF Rail Yards, Long Beach, CA
PC LDT1 LDT2Population counts 3,603,550 451,168 1,420,700Fraction of LD/MD total 0.6581 0.0824 0.2595
Emission Category Units PC LDT1 LDT2 AVERAGEROG Exhaust g/mi 0.346 0.539 0.329 0.358CO Exhaust g/mi 0.633 0.862 0.562 0.634NOX Exhaust g/mi 0.490 0.694 0.816 0.592PM10 Total g/mi 0.034 0.036 0.046 0.037SOX g/mi 0.004 0.006 0.005 0.005Fuel Economy mi/gal 20.356 16.796 16.834 19.149
Notes:1. Emission factors calculated using EMFAC 2007.
Vehicle Class Weighted Average Emission Factors
2005 MY Vehicle Class Population Distribution (<5151 LBS GVWR)
APP-249
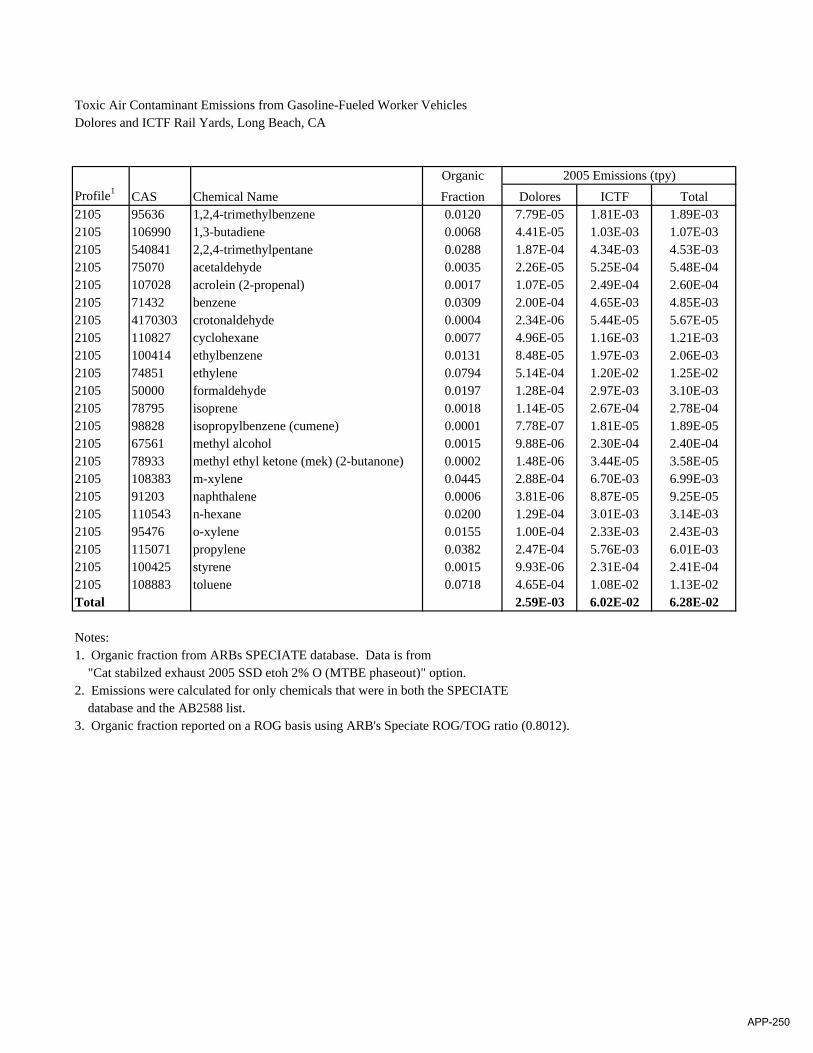
Toxic Air Contaminant Emissions from Gasoline-Fueled Worker VehiclesDolores and ICTF Rail Yards, Long Beach, CA
OrganicProfile1 CAS Chemical Name Fraction Dolores ICTF Total2105 95636 1,2,4-trimethylbenzene 0.0120 7.79E-05 1.81E-03 1.89E-032105 106990 1,3-butadiene 0.0068 4.41E-05 1.03E-03 1.07E-032105 540841 2,2,4-trimethylpentane 0.0288 1.87E-04 4.34E-03 4.53E-032105 75070 acetaldehyde 0.0035 2.26E-05 5.25E-04 5.48E-042105 107028 acrolein (2-propenal) 0.0017 1.07E-05 2.49E-04 2.60E-042105 71432 benzene 0.0309 2.00E-04 4.65E-03 4.85E-032105 4170303 crotonaldehyde 0.0004 2.34E-06 5.44E-05 5.67E-052105 110827 cyclohexane 0.0077 4.96E-05 1.16E-03 1.21E-032105 100414 ethylbenzene 0.0131 8.48E-05 1.97E-03 2.06E-032105 74851 ethylene 0.0794 5.14E-04 1.20E-02 1.25E-022105 50000 formaldehyde 0.0197 1.28E-04 2.97E-03 3.10E-032105 78795 isoprene 0.0018 1.14E-05 2.67E-04 2.78E-042105 98828 isopropylbenzene (cumene) 0.0001 7.78E-07 1.81E-05 1.89E-052105 67561 methyl alcohol 0.0015 9.88E-06 2.30E-04 2.40E-042105 78933 methyl ethyl ketone (mek) (2-butanone) 0.0002 1.48E-06 3.44E-05 3.58E-052105 108383 m-xylene 0.0445 2.88E-04 6.70E-03 6.99E-032105 91203 naphthalene 0.0006 3.81E-06 8.87E-05 9.25E-052105 110543 n-hexane 0.0200 1.29E-04 3.01E-03 3.14E-032105 95476 o-xylene 0.0155 1.00E-04 2.33E-03 2.43E-032105 115071 propylene 0.0382 2.47E-04 5.76E-03 6.01E-032105 100425 styrene 0.0015 9.93E-06 2.31E-04 2.41E-042105 108883 toluene 0.0718 4.65E-04 1.08E-02 1.13E-02Total 2.59E-03 6.02E-02 6.28E-02
Notes:1. Organic fraction from ARBs SPECIATE database. Data is from "Cat stabilzed exhaust 2005 SSD etoh 2% O (MTBE phaseout)" option.2. Emissions were calculated for only chemicals that were in both the SPECIATE database and the AB2588 list.3. Organic fraction reported on a ROG basis using ARB's Speciate ROG/TOG ratio (0.8012).
2005 Emissions (tpy)
APP-250
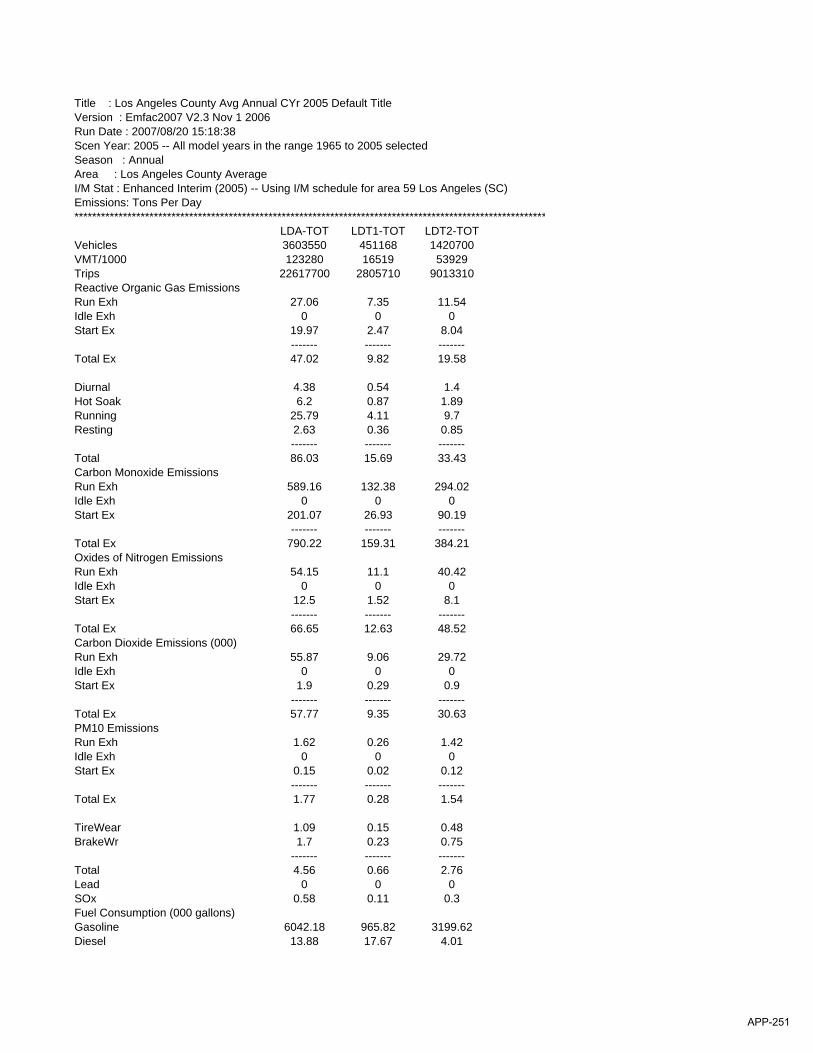
Title : Los Angeles County Avg Annual CYr 2005 Default TitleVersion : Emfac2007 V2.3 Nov 1 2006Run Date : 2007/08/20 15:18:38Scen Year: 2005 -- All model years in the range 1965 to 2005 selectedSeason : AnnualArea : Los Angeles County AverageI/M Stat : Enhanced Interim (2005) -- Using I/M schedule for area 59 Los Angeles (SC)Emissions: Tons Per Day***********************************************************************************************************
LDA-TOT LDT1-TOT LDT2-TOTVehicles 3603550 451168 1420700VMT/1000 123280 16519 53929Trips 22617700 2805710 9013310Reactive Organic Gas EmissionsRun Exh 27.06 7.35 11.54Idle Exh 0 0 0Start Ex 19.97 2.47 8.04
------- ------- -------Total Ex 47.02 9.82 19.58
Diurnal 4.38 0.54 1.4Hot Soak 6.2 0.87 1.89Running 25.79 4.11 9.7Resting 2.63 0.36 0.85
------- ------- -------Total 86.03 15.69 33.43Carbon Monoxide Emissions Run Exh 589.16 132.38 294.02Idle Exh 0 0 0Start Ex 201.07 26.93 90.19
------- ------- -------Total Ex 790.22 159.31 384.21Oxides of Nitrogen Emissions Run Exh 54.15 11.1 40.42Idle Exh 0 0 0Start Ex 12.5 1.52 8.1
------- ------- -------Total Ex 66.65 12.63 48.52Carbon Dioxide Emissions (000)Run Exh 55.87 9.06 29.72Idle Exh 0 0 0Start Ex 1.9 0.29 0.9
------- ------- -------Total Ex 57.77 9.35 30.63PM10 Emissions Run Exh 1.62 0.26 1.42Idle Exh 0 0 0Start Ex 0.15 0.02 0.12
------- ------- -------Total Ex 1.77 0.28 1.54
TireWear 1.09 0.15 0.48BrakeWr 1.7 0.23 0.75
------- ------- -------Total 4.56 0.66 2.76Lead 0 0 0SOx 0.58 0.11 0.3Fuel Consumption (000 gallons)Gasoline 6042.18 965.82 3199.62Diesel 13.88 17.67 4.01
APP-251

APPENDIX P
ROADWAY DUST
APP-252

APPENDIX P-1
AP-42 SECTION 13.2 AND EXERPT FROM THE SCAQMD STAFF REPORT FOR RULE 1186
APP-253
11/06 Miscellaneous Sources 13.2.1-1
13.2.1 Paved Roads
13.2.1.1 General
Particulate emissions occur whenever vehicles travel over a paved surface such as a road orparking lot. Particulate emissions from paved roads are due to direct emissions from vehicles in the formof exhaust, brake wear and tire wear emissions and resuspension of loose material on the road surface. Ingeneral terms, resuspended particulate emissions from paved roads originate from, and result in thedepletion of, the loose material present on the surface (i.e., the surface loading). In turn, that surfaceloading is continuously replenished by other sources. At industrial sites, surface loading is replenished byspillage of material and trackout from unpaved roads and staging areas. Figure 13.2.1-1 illustrates severaltransfer processes occurring on public streets.
Various field studies have found that public streets and highways, as well as roadways atindustrial facilities, can be major sources of the atmospheric particulate matter within an area.1-9 Ofparticular interest in many parts of the United States are the increased levels of emissions from publicpaved roads when the equilibrium between deposition and removal processes is upset. This situation canoccur for various reasons, including application of granular materials for snow and ice control, mud/dirtcarryout from construction activities in the area, and deposition from wind and/or water erosion ofsurrounding unstabilized areas. In the absence of continuous addition of fresh material (through localizedtrackout or application of antiskid material), paved road surface loading should reach an equilibriumvalue in which the amount of material resuspended matches the amount replenished. The equilibriumsurface loading value depends upon numerous factors. It is believed that the most important factors are:mean speed of vehicles traveling the road; the average daily traffic (ADT); the number of lanes and ADTper lane; the fraction of heavy vehicles (buses and trucks); and the presence/absence of curbs, stormsewers and parking lanes.10
The particulate emission factors presented in the previous version of this section of AP-42, datedOctober 2002, implicitly included the emissions from vehicles in the form of exhaust, brake wear, and tirewear as well as resuspended road surface material. EPA included these sources in the emission factorequation for paved roads since the field testing data used to develop the equation included both the directemissions from vehicles and emissions from resuspension of road dust.
This version of the paved road emission factor equation only estimates particulate emissions fromresuspended road surface material 28. The particulate emissions from vehicle exhaust, brake wear, and tirewear are now estimated separately using EPA’s MOBILE6.2 27. This approach eliminates the possibilityof double counting emissions. Double counting results when employing the previous version of theemission factor equation in this section and MOBILE6.2 to estimate particulate emissions from vehicletraffic on paved roads. It also incorporates the decrease in exhaust emissions that has occurred since thepaved road emission factor equation was developed. The previous version of the paved road emissionfactor equation includes estimates of emissions from exhaust, brake wear, and tire wear based on emissionrates for vehicles in the 1980 calendar year fleet. The amount of PM released from vehicle exhaust hasdecreased since 1980 due to lower new vehicle emission standards and changes in fuel characteristics.
APP-254
13.2.1-2 EMISSION FACTORS 11/06
13.2.1.2 Emissions And Correction Parameters
Dust emissions from paved roads have been found to vary with what is termed the "silt loading"present on the road surface as well as the average weight of vehicles traveling the road. The term siltloading (sL) refers to the mass of silt-size material (equal to or less than 75 micrometers [µm] in physicaldiameter) per unit area of the travel surface. The total road surface dust loading consists of loose materialthat can be collected by broom sweeping and vacuuming of the traveled portion of the paved road. Thesilt fraction is determined by measuring the proportion of the loose dry surface dust that passes through a200-mesh screen, using the ASTM-C-136 method. Silt loading is the product of the silt fraction and thetotal loading, and is abbreviated "sL". Additional details on the sampling and analysis of such materialare provided in AP-42 Appendices C.1 and C.2.
The surface sL provides a reasonable means of characterizing seasonal variability in a paved roademission inventory. In many areas of the country, road surface loadings 11-21 are heaviest during the latewinter and early spring months when the residual loading from snow/ice controls is greatest. As notedearlier, once replenishment of fresh material is eliminated, the road surface loading can be expected toreach an equilibrium value, which is substantially lower than the late winter/early spring values.
APP-255
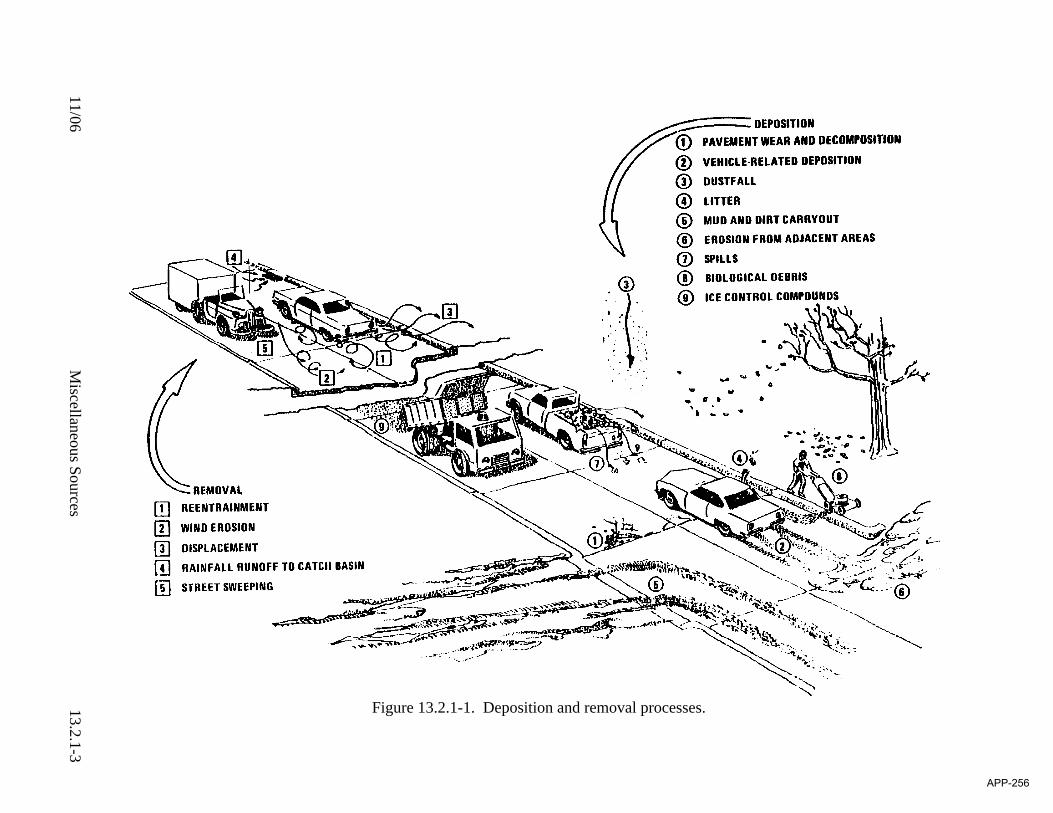
11/06M
iscellaneous Sources13.2.1-3
Figure 13.2.1-1. Deposition and removal processes.
APP-256
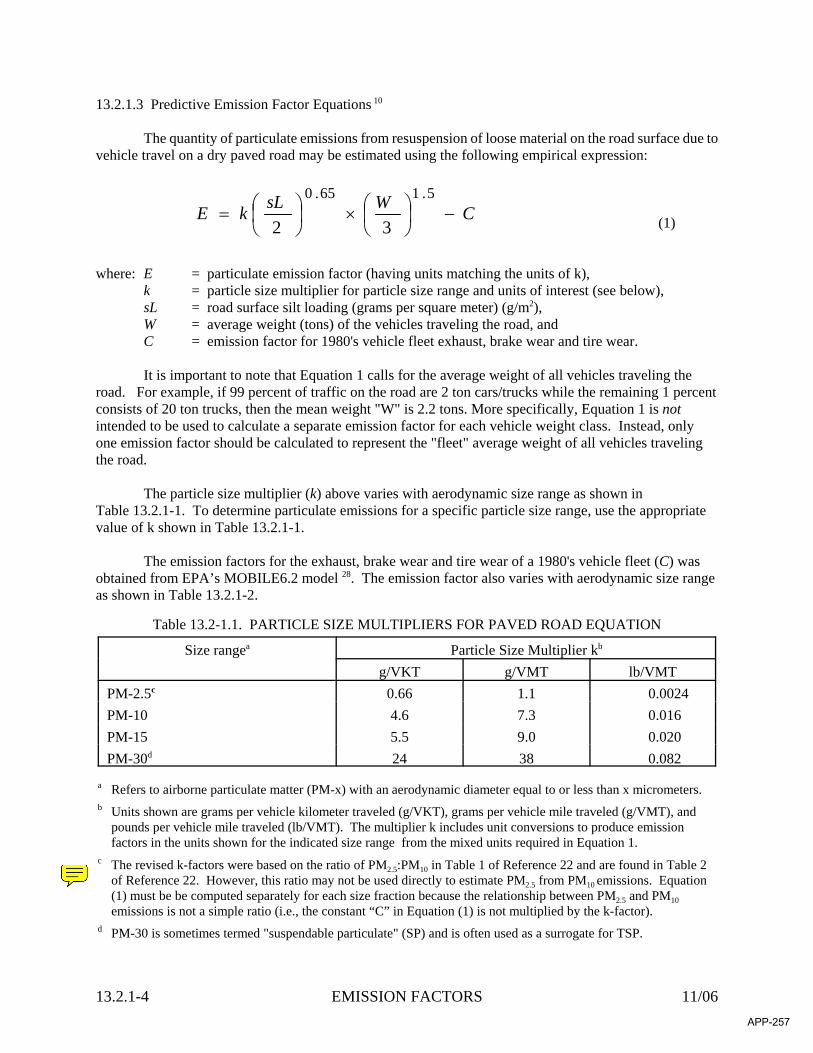
13.2.1-4 EMISSION FACTORS 11/06
CWsLkE −⎟⎠⎞
⎜⎝⎛×⎟
⎠⎞
⎜⎝⎛=
5.165.0
32
Table 13.2-1.1. PARTICLE SIZE MULTIPLIERS FOR PAVED ROAD EQUATION
Size rangea Particle Size Multiplier kb
g/VKT g/VMT lb/VMTPM-2.5c 0.66 1.1 0.0024PM-10 4.6 7.3 0.016PM-15 5.5 9.0 0.020PM-30d 24 38 0.082
a Refers to airborne particulate matter (PM-x) with an aerodynamic diameter equal to or less than x micrometers.b Units shown are grams per vehicle kilometer traveled (g/VKT), grams per vehicle mile traveled (g/VMT), and
pounds per vehicle mile traveled (lb/VMT). The multiplier k includes unit conversions to produce emissionfactors in the units shown for the indicated size range from the mixed units required in Equation 1.
c The revised k-factors were based on the ratio of PM2.5:PM10 in Table 1 of Reference 22 and are found in Table 2of Reference 22. However, this ratio may not be used directly to estimate PM2.5 from PM10 emissions. Equation(1) must be be computed separately for each size fraction because the relationship between PM2.5 and PM10emissions is not a simple ratio (i.e., the constant “C” in Equation (1) is not multiplied by the k-factor).
d PM-30 is sometimes termed "suspendable particulate" (SP) and is often used as a surrogate for TSP.
13.2.1.3 Predictive Emission Factor Equations 10
The quantity of particulate emissions from resuspension of loose material on the road surface due tovehicle travel on a dry paved road may be estimated using the following empirical expression:
(1)
where: E = particulate emission factor (having units matching the units of k),k = particle size multiplier for particle size range and units of interest (see below),sL = road surface silt loading (grams per square meter) (g/m2),W = average weight (tons) of the vehicles traveling the road, andC = emission factor for 1980's vehicle fleet exhaust, brake wear and tire wear.
It is important to note that Equation 1 calls for the average weight of all vehicles traveling the
road. For example, if 99 percent of traffic on the road are 2 ton cars/trucks while the remaining 1 percentconsists of 20 ton trucks, then the mean weight "W" is 2.2 tons. More specifically, Equation 1 is notintended to be used to calculate a separate emission factor for each vehicle weight class. Instead, onlyone emission factor should be calculated to represent the "fleet" average weight of all vehicles travelingthe road.
The particle size multiplier (k) above varies with aerodynamic size range as shown inTable 13.2.1-1. To determine particulate emissions for a specific particle size range, use the appropriatevalue of k shown in Table 13.2.1-1.
The emission factors for the exhaust, brake wear and tire wear of a 1980's vehicle fleet (C) wasobtained from EPA’s MOBILE6.2 model 28. The emission factor also varies with aerodynamic size rangeas shown in Table 13.2.1-2.
APP-257
US EPA
Sticky Note
Tom Pace updated footnote 'C' on March 7, 2007.
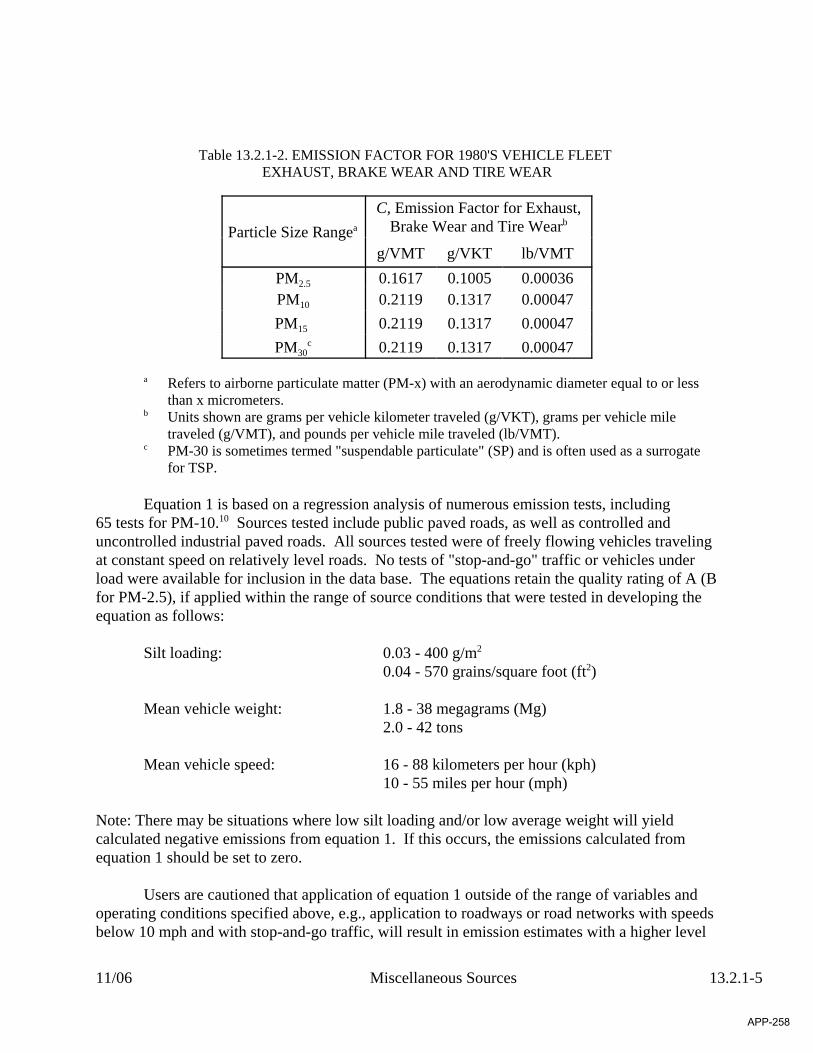
11/06 Miscellaneous Sources 13.2.1-5
Table 13.2.1-2. EMISSION FACTOR FOR 1980'S VEHICLE FLEET EXHAUST, BRAKE WEAR AND TIRE WEAR
Particle Size Rangea
C, Emission Factor for Exhaust,Brake Wear and Tire Wearb
g/VMT g/VKT lb/VMTPM2.5 0.1617 0.1005 0.00036PM10 0.2119 0.1317 0.00047PM15 0.2119 0.1317 0.00047PM30
c 0.2119 0.1317 0.00047
a Refers to airborne particulate matter (PM-x) with an aerodynamic diameter equal to or lessthan x micrometers.
b Units shown are grams per vehicle kilometer traveled (g/VKT), grams per vehicle miletraveled (g/VMT), and pounds per vehicle mile traveled (lb/VMT).
c PM-30 is sometimes termed "suspendable particulate" (SP) and is often used as a surrogatefor TSP.
Equation 1 is based on a regression analysis of numerous emission tests, including65 tests for PM-10.10 Sources tested include public paved roads, as well as controlled anduncontrolled industrial paved roads. All sources tested were of freely flowing vehicles travelingat constant speed on relatively level roads. No tests of "stop-and-go" traffic or vehicles underload were available for inclusion in the data base. The equations retain the quality rating of A (Bfor PM-2.5), if applied within the range of source conditions that were tested in developing theequation as follows:
Silt loading: 0.03 - 400 g/m2
0.04 - 570 grains/square foot (ft2)
Mean vehicle weight: 1.8 - 38 megagrams (Mg)2.0 - 42 tons
Mean vehicle speed: 16 - 88 kilometers per hour (kph)10 - 55 miles per hour (mph)
Note: There may be situations where low silt loading and/or low average weight will yieldcalculated negative emissions from equation 1. If this occurs, the emissions calculated fromequation 1 should be set to zero.
Users are cautioned that application of equation 1 outside of the range of variables andoperating conditions specified above, e.g., application to roadways or road networks with speedsbelow 10 mph and with stop-and-go traffic, will result in emission estimates with a higher level
APP-258
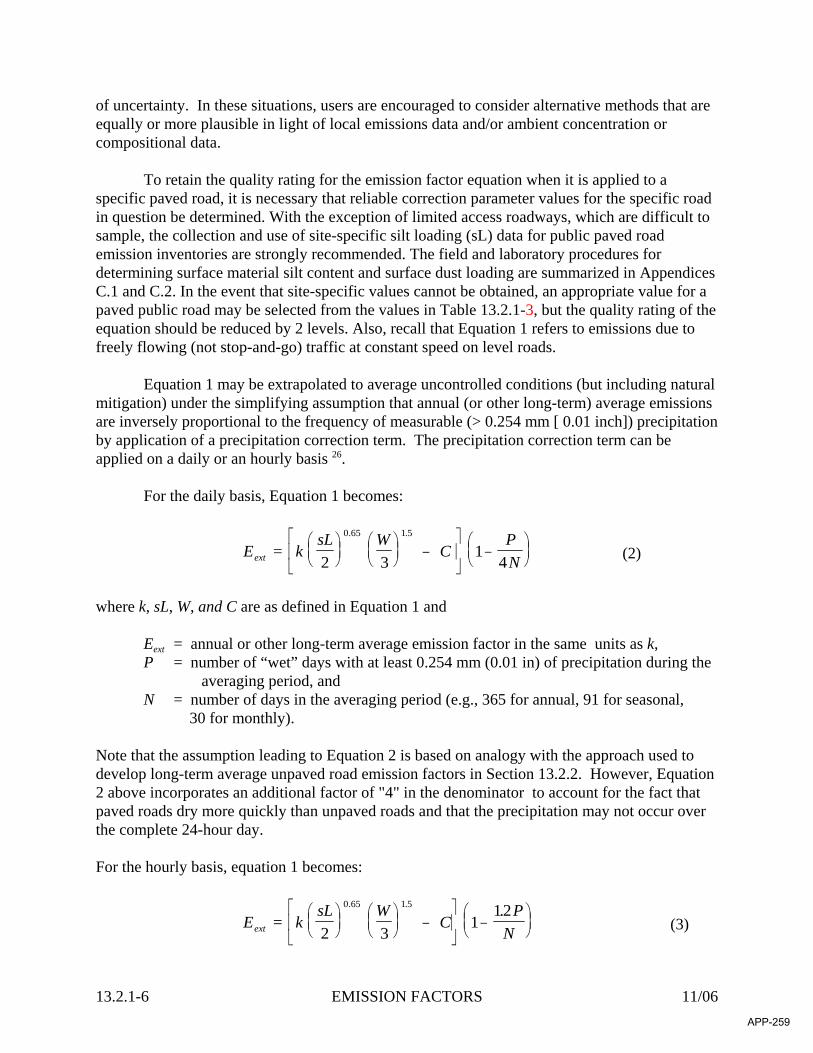
13.2.1-6 EMISSION FACTORS 11/06
of uncertainty. In these situations, users are encouraged to consider alternative methods that areequally or more plausible in light of local emissions data and/or ambient concentration orcompositional data.
To retain the quality rating for the emission factor equation when it is applied to aspecific paved road, it is necessary that reliable correction parameter values for the specific roadin question be determined. With the exception of limited access roadways, which are difficult tosample, the collection and use of site-specific silt loading (sL) data for public paved roademission inventories are strongly recommended. The field and laboratory procedures fordetermining surface material silt content and surface dust loading are summarized in AppendicesC.1 and C.2. In the event that site-specific values cannot be obtained, an appropriate value for apaved public road may be selected from the values in Table 13.2.1-3, but the quality rating of theequation should be reduced by 2 levels. Also, recall that Equation 1 refers to emissions due tofreely flowing (not stop-and-go) traffic at constant speed on level roads.
Equation 1 may be extrapolated to average uncontrolled conditions (but including naturalmitigation) under the simplifying assumption that annual (or other long-term) average emissionsare inversely proportional to the frequency of measurable (> 0.254 mm [ 0.01 inch]) precipitationby application of a precipitation correction term. The precipitation correction term can beapplied on a daily or an hourly basis 26.
For the daily basis, Equation 1 becomes:
(2)E = k sL
W
CPNext 2 3
14
0 65 1 5⎛⎝⎜
⎞⎠⎟
⎛⎝⎜
⎞⎠⎟ −
⎡
⎣⎢
⎤
⎦⎥ −⎛⎝⎜
⎞⎠⎟
. .
where k, sL, W, and C are as defined in Equation 1 and
Eext = annual or other long-term average emission factor in the same units as k,P = number of “wet” days with at least 0.254 mm (0.01 in) of precipitation during the
averaging period, and N = number of days in the averaging period (e.g., 365 for annual, 91 for seasonal,
30 for monthly).
Note that the assumption leading to Equation 2 is based on analogy with the approach used todevelop long-term average unpaved road emission factors in Section 13.2.2. However, Equation2 above incorporates an additional factor of "4" in the denominator to account for the fact thatpaved roads dry more quickly than unpaved roads and that the precipitation may not occur overthe complete 24-hour day.
For the hourly basis, equation 1 becomes:
(3)E = k sL
W
CP
Next 2 31
120 65 1 5⎛⎝⎜
⎞⎠⎟
⎛⎝⎜
⎞⎠⎟ −
⎡
⎣⎢
⎤
⎦⎥ −⎛⎝⎜
⎞⎠⎟
. . .
APP-259
11/06 Miscellaneous Sources 13.2.1-7
where k, sL, and W, and C are as defined in Equation 1 and
Eext = annual or other long-term average emission factor in the same units as k,P = number of hours with at least 0.254 mm (0.01 in) of precipitation during the
averaging period, and N = number of hours in the averaging period (e.g., 8760 for annual, 2124 for season
720 for monthly).
Note: In the hourly moisture correction term (1-1.2P/N) for equation 3, the 1.2 multiplier isapplied to account for the residual mitigative effect of moisture. For most applications, thisequation will produce satisfactory results. However, if the time interval for which the equationis applied is short, e.g., for one hour or one day, the application of this multiplier makes itpossible for the moisture correction term to become negative. This will result in calculatednegative emissions which is not realistic. Users should expand the time interval to includesufficient “dry” hours such that negative emissions are not calculated. For the special casewhere this equation is used to calculate emissions on an hour by hour basis, such as would bedone in some emissions modeling situations, the moisture correction term should be modified sothat the moisture correction “credit” is applied to the first hours following cessation ofprecipitation. In this special case, it is suggested that this 20% “credit” be applied on a basis ofone hour credit for each hour of precipitation up to a maximum of 12 hours.
Note that the assumption leading to Equation 3 is based on analogy with the approachused to develop long-term average unpaved road emission factors in Section 13.2.2.
Figure 13.2.1-2 presents the geographical distribution of "wet" days on an annual basisfor the United States. Maps showing this information on a monthly basis are available in theClimatic Atlas of the United States23 . Alternative sources include other Department ofCommerce publications (such as local climatological data summaries). The National ClimaticData Center (NCDC) offers several products that provide hourly precipitation data. In particular, NCDC offers Solar and Meteorological Surface Observation Network 1961-1990 (SAMSON)CD-ROM, which contains 30 years worth of hourly meteorological data for first-order NationalWeather Service locations. Whatever meteorological data are used, the source of that data andthe averaging period should be clearly specified.
It is emphasized that the simple assumption underlying Equations 2 and 3 has not beenverified in any rigorous manner. For that reason, the quality ratings for Equations 2 and 3 shouldbe downgraded one letter from the rating that would be applied to Equation 1.
APP-260
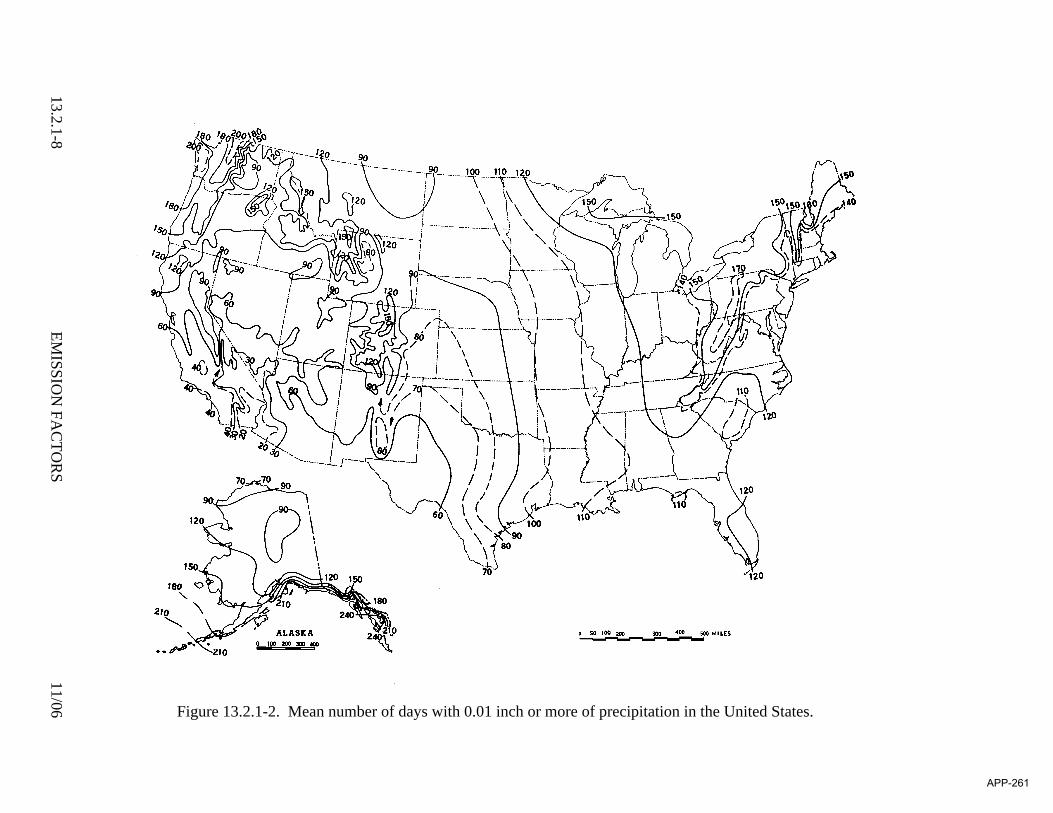
13.2.1-8EM
ISSION
FAC
TOR
S11/06 Figure 13.2.1-2. Mean number of days with 0.01 inch or more of precipitation in the United States.
APP-261
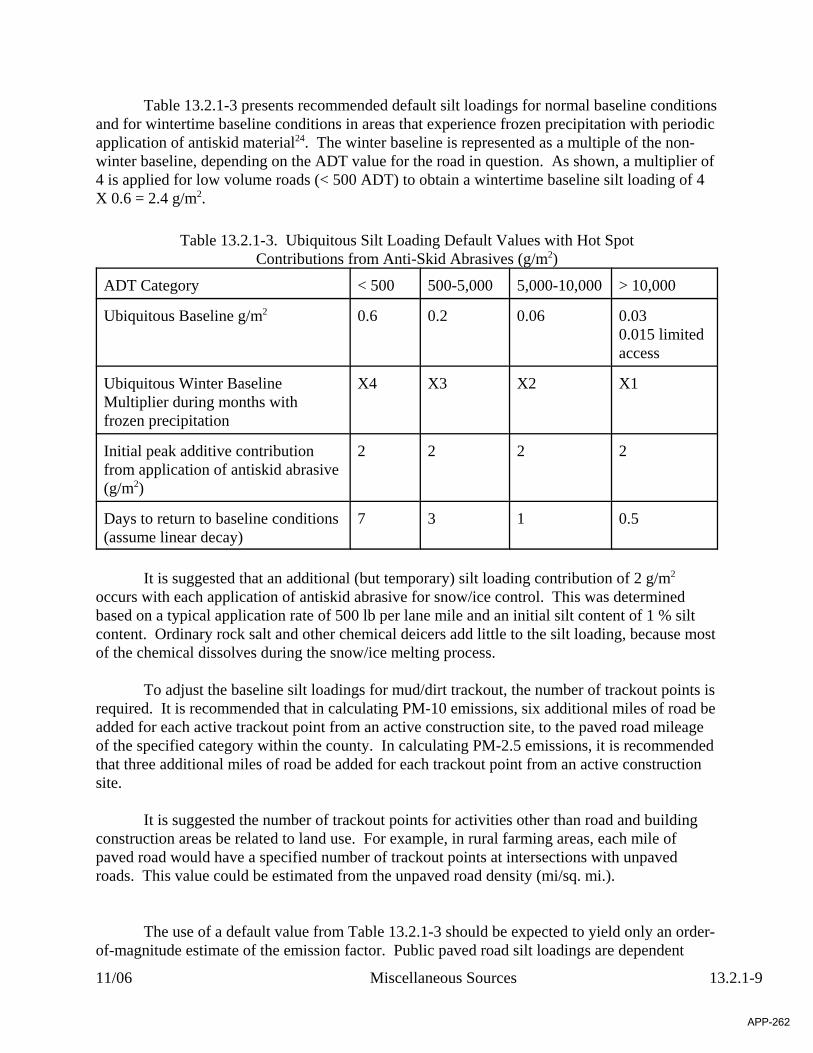
11/06 Miscellaneous Sources 13.2.1-9
Table 13.2.1-3 presents recommended default silt loadings for normal baseline conditionsand for wintertime baseline conditions in areas that experience frozen precipitation with periodicapplication of antiskid material24. The winter baseline is represented as a multiple of the non-winter baseline, depending on the ADT value for the road in question. As shown, a multiplier of4 is applied for low volume roads (< 500 ADT) to obtain a wintertime baseline silt loading of 4X 0.6 = 2.4 g/m2.
Table 13.2.1-3. Ubiquitous Silt Loading Default Values with Hot SpotContributions from Anti-Skid Abrasives (g/m2)
ADT Category < 500 500-5,000 5,000-10,000 > 10,000
Ubiquitous Baseline g/m2 0.6 0.2 0.06 0.030.015 limitedaccess
Ubiquitous Winter BaselineMultiplier during months withfrozen precipitation
X4 X3 X2 X1
Initial peak additive contributionfrom application of antiskid abrasive(g/m2)
2 2 2 2
Days to return to baseline conditions(assume linear decay)
7 3 1 0.5
It is suggested that an additional (but temporary) silt loading contribution of 2 g/m2
occurs with each application of antiskid abrasive for snow/ice control. This was determinedbased on a typical application rate of 500 lb per lane mile and an initial silt content of 1 % siltcontent. Ordinary rock salt and other chemical deicers add little to the silt loading, because mostof the chemical dissolves during the snow/ice melting process.
To adjust the baseline silt loadings for mud/dirt trackout, the number of trackout points isrequired. It is recommended that in calculating PM-10 emissions, six additional miles of road beadded for each active trackout point from an active construction site, to the paved road mileageof the specified category within the county. In calculating PM-2.5 emissions, it is recommendedthat three additional miles of road be added for each trackout point from an active constructionsite.
It is suggested the number of trackout points for activities other than road and buildingconstruction areas be related to land use. For example, in rural farming areas, each mile ofpaved road would have a specified number of trackout points at intersections with unpavedroads. This value could be estimated from the unpaved road density (mi/sq. mi.).
The use of a default value from Table 13.2.1-3 should be expected to yield only an order-of-magnitude estimate of the emission factor. Public paved road silt loadings are dependent
APP-262
13.2.1-10 EMISSION FACTORS 11/06
upon: traffic characteristics (speed, ADT, and fraction of heavy vehicles); road characteristics(curbs, number of lanes, parking lanes); local land use (agriculture, new residential construction)and regional/seasonal factors (snow/ice controls, wind blown dust). As a result, the collectionand use of site-specific silt loading data is highly recommended. In the event that default siltloading values are used, the quality ratings for the equation should be downgraded 2 levels.
Limited access roadways pose severe logistical difficulties in terms of surface sampling,and few silt loading data are available for such roads. Nevertheless, the available data do notsuggest great variation in silt loading for limited access roadways from one part of the country toanother. For annual conditions, a default value of 0.015 g/m2 is recommended for limited accessroadways.9,22 Even fewer of the available data correspond to worst-case situations, and elevatedloadings are observed to be quickly depleted because of high traffic speeds and high ADT rates. A default value of 0.2 g/m2 is recommended for short periods of time following application ofsnow/ice controls to limited access roads.22
The limited data on silt loading values for industrial roads have shown as muchvariability as public roads. Because of the variations of traffic conditions and the use ofpreventive mitigative controls, the data probably do not reflect the full extent of the potentialvariation in silt loading on industrial roads. However, the collection of site specific silt loadingdata from industrial roads is easier and safer than for public roads. Therefore, the collection anduse of site-specific silt loading data is preferred and is highly recommended. In the event thatsite-specific values cannot be obtained, an appropriate value for an industrial road may beselected from the mean values given in Table 13.2.1-4, but the quality rating of the equationshould be reduced by 2 levels.
APP-263
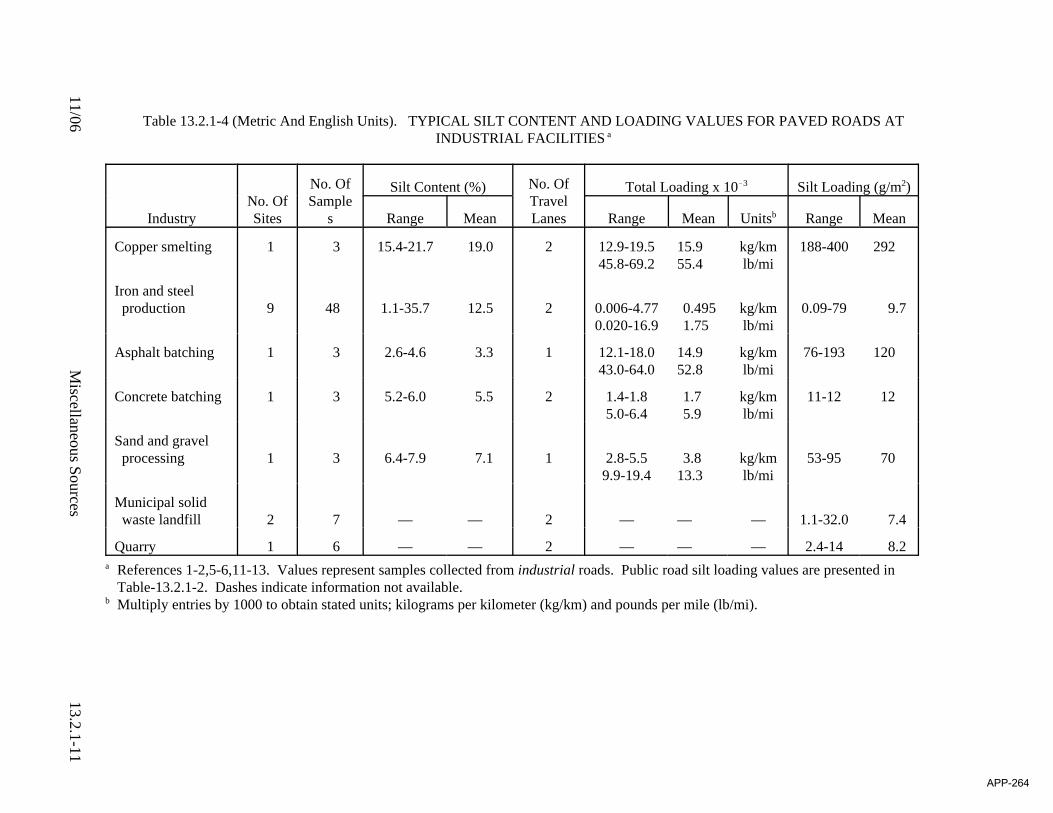
11/06M
iscellaneous Sources13.2.1-11
Table 13.2.1-4 (Metric And English Units). TYPICAL SILT CONTENT AND LOADING VALUES FOR PAVED ROADS ATINDUSTRIAL FACILITIES a
IndustryNo. OfSites
No. OfSample
s
Silt Content (%) No. OfTravelLanes
Total Loading x 10!3 Silt Loading (g/m2)
Range Mean Range Mean Unitsb Range Mean
Copper smelting 1 3 15.4-21.7 19.0 2 12.9-19.545.8-69.2
15.955.4
kg/kmlb/mi
188-400 292
Iron and steel production 9 48 1.1-35.7 12.5 2 0.006-4.77
0.020-16.90.4951.75
kg/kmlb/mi
0.09-79 9.7
Asphalt batching 1 3 2.6-4.6 3.3 1 12.1-18.043.0-64.0
14.952.8
kg/kmlb/mi
76-193 120
Concrete batching 1 3 5.2-6.0 5.5 2 1.4-1.85.0-6.4
1.75.9
kg/kmlb/mi
11-12 12
Sand and gravel processing 1 3 6.4-7.9 7.1 1 2.8-5.5
9.9-19.43.8
13.3kg/kmlb/mi
53-95 70
Municipal solid waste landfill 2 7 — — 2 — — — 1.1-32.0 7.4
Quarry 1 6 — — 2 — — — 2.4-14 8.2a References 1-2,5-6,11-13. Values represent samples collected from industrial roads. Public road silt loading values are presented in
Table-13.2.1-2. Dashes indicate information not available.b Multiply entries by 1000 to obtain stated units; kilograms per kilometer (kg/km) and pounds per mile (lb/mi).
APP-264
13.2.1-12 EMISSION FACTORS 11/06
13.2.1.4 Controls6,25
Because of the importance of the silt loading, control techniques for paved roads attempteither to prevent material from being deposited onto the surface (preventive controls) or toremove from the travel lanes any material that has been deposited (mitigative controls). Covering of loads in trucks, and the paving of access areas to unpaved lots or construction sites,are examples of preventive measures. Examples of mitigative controls include vacuumsweeping, water flushing, and broom sweeping and flushing. Actual control efficiencies for anyof these techniques can be highly variable. Locally measured silt loadings before and after theapplication of controls is the preferred method to evaluate controls. It is particularly important tonote that street sweeping of gutters and curb areas may actually increase the silt loading on thetraveled portion of the road. Redistribution of loose material onto the travel lanes will actuallyproduce a short-term increase in the emissions.
In general, preventive controls are usually more cost effective than mitigative controls. The cost-effectiveness of mitigative controls falls off dramatically as the size of an area to betreated increases. The cost-effectiveness of mitigative measures is also unfavorable if only ashort period of time is required for the road to return to equilibrium silt loading condition. Thatis to say, the number and length of public roads within most areas of interest preclude anywidespread and routine use of mitigative controls. On the other hand, because of the morelimited scope of roads at an industrial site, mitigative measures may be used quite successfully(especially in situations where truck spillage occurs). Note, however, that public agencies couldmake effective use of mitigative controls to remove sand/salt from roads after the winter ends.
Because available controls will affect the silt loading, controlled emission factors may beobtained by substituting controlled silt loading values into the equation. (Emission factors fromcontrolled industrial roads were used in the development of the equation.) The collection ofsurface loading samples from treated, as well as baseline (untreated), roads provides a means totrack effectiveness of the controls over time.
13.2.1.5 Changes since Fifth Edition
The following changes were made since the publication of the Fifth Edition of AP-42:
1) The particle size multiplier was reduced by approximately 55% as a result ofemission testing specifically to evaluate the PM-2.5 component of theemissions.
2) Default silt loading values were included in Table 13.2.1-2 replacing theTables and Figures containing silt loading statistical information.
3) Editorial changes within the text were made indicating the possible causesof variations in the silt loading between roads within and among differentlocations. The uncertainty of using the default silt loading value wasdiscussed.
APP-265
11/06 Miscellaneous Sources 13.2.1-13
4) Section 13.2.1.1 was revised to clarify the role of dust loading inresuspension. Additional minor text changes were made.
5) Equations 2 and 3, Figure 13.2.1-2, and text were added to incorporatenatural mitigation into annual or other long-term average emission factors.
6) The emission factor equation was adjusted to remove the component ofparticulate emissions from exhaust, brake wear, and tire wear. The parameter Cin the new equation varies with aerodynamic size range of the particulatematter. Table 13.2.1-2 was added to present the new coefficients.
7) The default silt loading values in Table 13.2.1-3 were revised to incorporatethe results from a recent analysis of silt loading data.
8) The PM-2.5 particle size multiplier was reduced by 40% as the resultof wind tunnel studies of a variety of dust emitting surface materials.
9) References were rearranged and renumbered.
References For Section 13.2.1
1. D. R. Dunbar, Resuspension Of Particulate Matter, EPA-450/2-76-031, U. S.Environmental Protection Agency, Research Triangle Park, NC, March 1976.
2. R. Bohn, et al., Fugitive Emissions From Integrated Iron And Steel Plants,EPA-600/2-78-050, U. S. Environmental Protection Agency, Cincinnati, OH, March 1978.
3. C. Cowherd, Jr., et al., Iron And Steel Plant Open Dust Source Fugitive EmissionEvaluation, EPA-600/2-79-103, U. S. Environmental Protection Agency, Cincinnati, OH,May 1979.
4. C. Cowherd, Jr., et al., Quantification Of Dust Entrainment From Paved Roadways,EPA-450/3-77-027, U. S. Environmental Protection Agency, Research Triangle Park, NC,July 1977.
5. Size Specific Particulate Emission Factors For Uncontrolled Industrial And Rural Roads,EPA Contract No. 68-02-3158, Midwest Research Institute, Kansas City, MO, September1983.
6. T. Cuscino, Jr., et al., Iron And Steel Plant Open Source Fugitive Emission ControlEvaluation, EPA-600/2-83-110, U. S. Environmental Protection Agency, Cincinnati, OH,October 1983.
APP-266
13.2.1-14 EMISSION FACTORS 11/06
7. J. P. Reider, Size-specific Particulate Emission Factors For Uncontrolled Industrial AndRural Roads, EPA Contract 68-02-3158, Midwest Research Institute, Kansas City, MO,September 1983.
8. C. Cowherd, Jr., and P. J. Englehart, Paved Road Particulate Emissions,EPA-600/7-84-077, U. S. Environmental Protection Agency, Cincinnati, OH, July 1984.
9. C. Cowherd, Jr., and P. J. Englehart, Size Specific Particulate Emission Factors ForIndustrial And Rural Roads, EPA-600/7-85-038, U. S. Environmental Protection Agency,Cincinnati, OH, September 1985.
10. Emission Factor Documentation For AP-42, Sections 11.2.5 and 11.2.6 — Paved Roads,EPA Contract No. 68-D0-0123, Midwest Research Institute, Kansas City, MO, March 1993.
11. Evaluation Of Open Dust Sources In The Vicinity Of Buffalo, New York, EPA ContractNo. 68-02-2545, Midwest Research Institute, Kansas City, MO, March 1979.
12. PM-10 Emission Inventory Of Landfills In The Lake Calumet Area, EPA ContractNo. 68-02-3891, Midwest Research Institute, Kansas City, MO, September 1987.
13. Chicago Area Particulate Matter Emission Inventory — Sampling And Analysis, ContractNo. 68-02-4395, Midwest Research Institute, Kansas City, MO, May 1988.
14. Montana Street Sampling Data, Montana Department Of Health And EnvironmentalSciences, Helena, MT, July 1992.
15. Street Sanding Emissions And Control Study, PEI Associates, Inc., Cincinnati, OH,October 1989.
16. Evaluation Of PM-10 Emission Factors For Paved Streets, Harding Lawson Associates,Denver, CO, October 1991.
17. Street Sanding Emissions And Control Study, RTP Environmental Associates, Inc., Denver,CO, July 1990.
18. Post-storm Measurement Results — Salt Lake County Road Dust Silt Loading Winter1991/92 Measurement Program, Aerovironment, Inc., Monrovia, CA, June 1992.
19. Written communication from Harold Glasser, Department of Health, Clark County (NV).
20. PM-10 Emissions Inventory Data For The Maricopa And Pima Planning Areas, EPAContract No. 68-02-3888, Engineering-Science, Pasadena, CA, January 1987.
21. Characterization Of PM-10 Emissions From Antiskid Materials Applied To Ice- And Snow-Covered Roadways, EPA Contract No. 68-D0-0137, Midwest Research Institute, KansasCity, MO, October 1992.
APP-267
11/06 Miscellaneous Sources 13.2.1-15
22. C. Cowherd, Background Document for Revisions to Fine Fraction Ratios &sed for AP-42Fugitive Dust Emission Factors. Prepared by Midwest Research Institute for WesternGovernors Association, Western Regional Air Partnership, Denver, CO, February 1, 2006.
23. Climatic Atlas Of The United States, U.S. Department of Commerce, Washington, D.C.,June 1968.
24. C. Cowherd, Jr., et al., Improved Activity Levels for National Emission Inventories ofFugitive Dust from Paved and Unpaved Roads, Presented at the 11th International EmissionInventory Conference, Atlanta, Georgia, April 2002.
25. C. Cowherd, Jr., et al., Control Of Open Fugitive Dust Sources, EPA-450/3-88-008,U. S. Environmental Protection Agency, Research Triangle Park, NC, September 1988.
26. Written communication (Technical Memorandum) from G. Muleski, Midwest ResearchInstitute, Kansas City, MO, to B. Kuykendal, U. S. Environmental Protection Agency,Research Triangle Park, NC, September 27, 2001.
27. EPA, 2002b. MOBILE6 User Guide, United States Environmental Protection Agency,Office of Transportation and Air Quality. EPA420-R-02-028, October 2002.
28. Written communication (Technical Memorandum) from P. Hemmer, E.H. Pechan &Associates, Inc., Durham, NC to B. Kuykendal, U. S. Environmental Protection Agency,Research Triangle Park, NC, August, 21, 2003.
APP-268

APPENDIX P-2
DEATILED EMISSION CALCULATIONS FOR ROADWAY DUST
APP-269
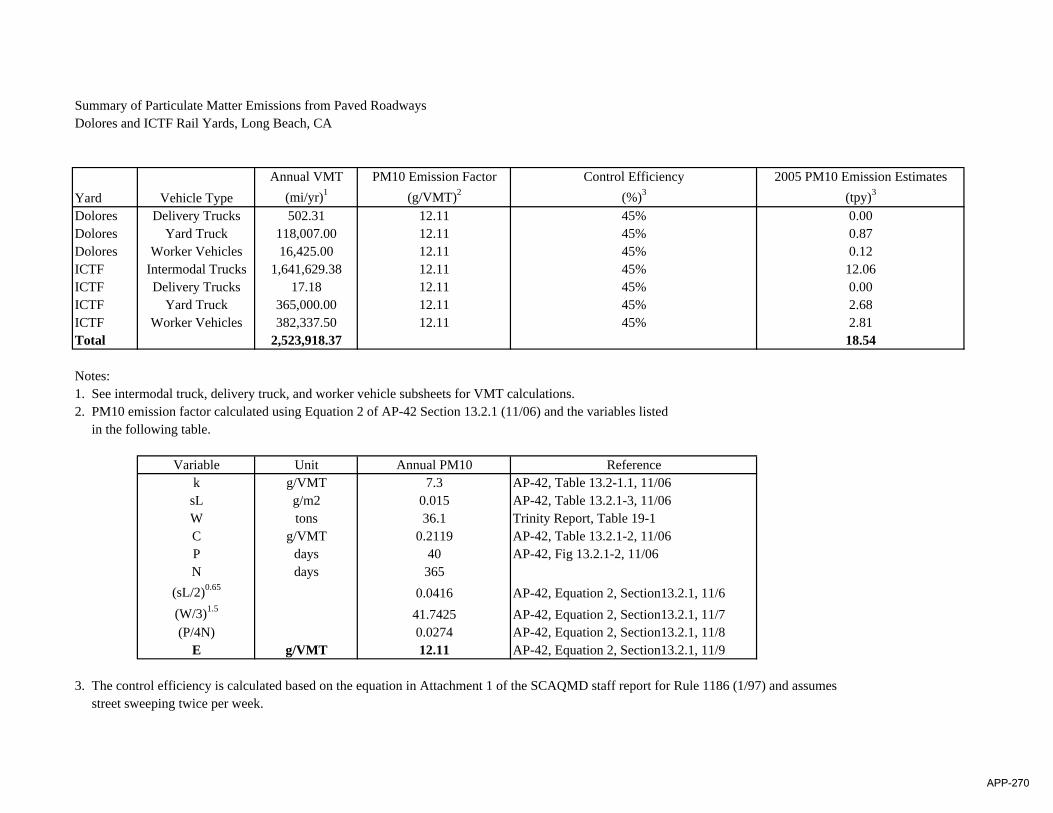
Summary of Particulate Matter Emissions from Paved RoadwaysDolores and ICTF Rail Yards, Long Beach, CA
Annual VMT PM10 Emission Factor Control Efficiency 2005 PM10 Emission EstimatesYard Vehicle Type (mi/yr)1 (g/VMT)2 (%)3 (tpy)3
Dolores Delivery Trucks 502.31 12.11 45% 0.00Dolores Yard Truck 118,007.00 12.11 45% 0.87Dolores Worker Vehicles 16,425.00 12.11 45% 0.12ICTF Intermodal Trucks 1,641,629.38 12.11 45% 12.06ICTF Delivery Trucks 17.18 12.11 45% 0.00ICTF Yard Truck 365,000.00 12.11 45% 2.68ICTF Worker Vehicles 382,337.50 12.11 45% 2.81Total 2,523,918.37 18.54
Notes:1. See intermodal truck, delivery truck, and worker vehicle subsheets for VMT calculations.2. PM10 emission factor calculated using Equation 2 of AP-42 Section 13.2.1 (11/06) and the variables listed in the following table.
Variable Unit Annual PM10 Referencek g/VMT 7.3 AP-42, Table 13.2-1.1, 11/06sL g/m2 0.015 AP-42, Table 13.2.1-3, 11/06W tons 36.1 Trinity Report, Table 19-1C g/VMT 0.2119 AP-42, Table 13.2.1-2, 11/06P days 40 AP-42, Fig 13.2.1-2, 11/06N days 365
(sL/2)0.65 0.0416 AP-42, Equation 2, Section13.2.1, 11/6(W/3)1.5 41.7425 AP-42, Equation 2, Section13.2.1, 11/7(P/4N) 0.0274 AP-42, Equation 2, Section13.2.1, 11/8
E g/VMT 12.11 AP-42, Equation 2, Section13.2.1, 11/9
3. The control efficiency is calculated based on the equation in Attachment 1 of the SCAQMD staff report for Rule 1186 (1/97) and assumes street sweeping twice per week.
APP-270
APPENDIX Q
SOURCE TREATMENT AND ASSUMPTIONS FOR AIR DISPERSION MODELING FOR NON-LOCOMOTIVE SOURCES
APP-271
Appendix Q
Source Treatment and Assumptions for Air Dispersion Modeling for Non-Locomotive Sources
As shown in Figures 4-8, emissions were allocated spatially throughout the Yard in the areas where each source type operates or is most likely to operate. Emissions from mobile sources, low-level cargo handling equipment, heavy equipment, and moving locomotives were simulated as a series of volume sources along their corresponding travel routes and work areas. Yard hostlers, heavy-duty trucks, and other low-level emission sources were first allocated to the areas of the yard where their activity occurs, and were then allocated uniformly to a series of sources within the defined areas. Depending on their magnitude and proximity to yard boundaries, idling emissions for heavy-duty trucks may be treated as point sources rather than being included in the non-idling volume sources used to characterize moving vehicles. Idling of locomotives and elevated cargo handling equipment (cranes) were simulated as a series of point sources within the areas where these events occur. Large sources such as RTGs and cranes that are stationary or slow moving were treated as point sources with appropriate stack parameters.
Emissions from stationary sources, such as fuel tanks, were simulated as a point source corresponding to the actual equipment location within the Yard. Assumptions used spatially to allocate emissions for each source group are shown in the Table below. See Figures 2 and 3 for the source locations. See Appendix A-4 for assumptions regarding the spatial allocation of locomotive emissions.
APP-272

Source Treatment and Assumptions for Air Dispersion Modeling for Non-Locomotive Sources
ICTF and Dolores Rail Yards 2005 Baseline Year
Source Source Treatment Assumptions for Spatial Allocation of Emissions HHD Diesel-Fueled Drayage Trucks Point (idling)
Volume (traveling) Onsite - Assumed 10% of the traveling emissions and 1/3 of the idling occurred at the intermodal gate. The remaining emissions (traveling and idling) were modeled in the trailer parking area. Offsite – emissions were placed along the various truck travel routes.
HHD Diesel-Fueled Delivery Trucks Volume Emissions from delivery trucks were allocated to the areas near the storage tanks served by the trucks. Due to the relatively small emission rates, emissions from idling and traveling were not separated.
Cargo Handling Equipment (low level) Volume Top Picks – all emissions were modeled in the chassis stacking area. Yard Hostlers – assumed 10% of the total emissions from yard hostlers occurred at the tractor maintenance area and the remaining emissions occurred in the trailer parking area.
Cargo Handling Equipment (RTGs) Point Assumed 10% of the total emissions from RTGs occurred at the crane maintenance area and the remaining emissions occurred in the areas around the unloading tracks.
Heavy Equipment (idling and traveling) Point or Volume Taylor Forklifts – assumed all operation occurred in the RTG maintenance area. Man Lift – assumed all operation occurred in the RTG maintenance area. Grove Crane and Forklift – were modeled as yard-wide sources.
TRUs and Reefer Cars Volume Assumed all emissions from TRUs and reefer cars occurred in the trailer parking area
Gasoline-Fueled Yard Trucks Volume Yard trucks were modeled as yard-wide sources.
APP-273
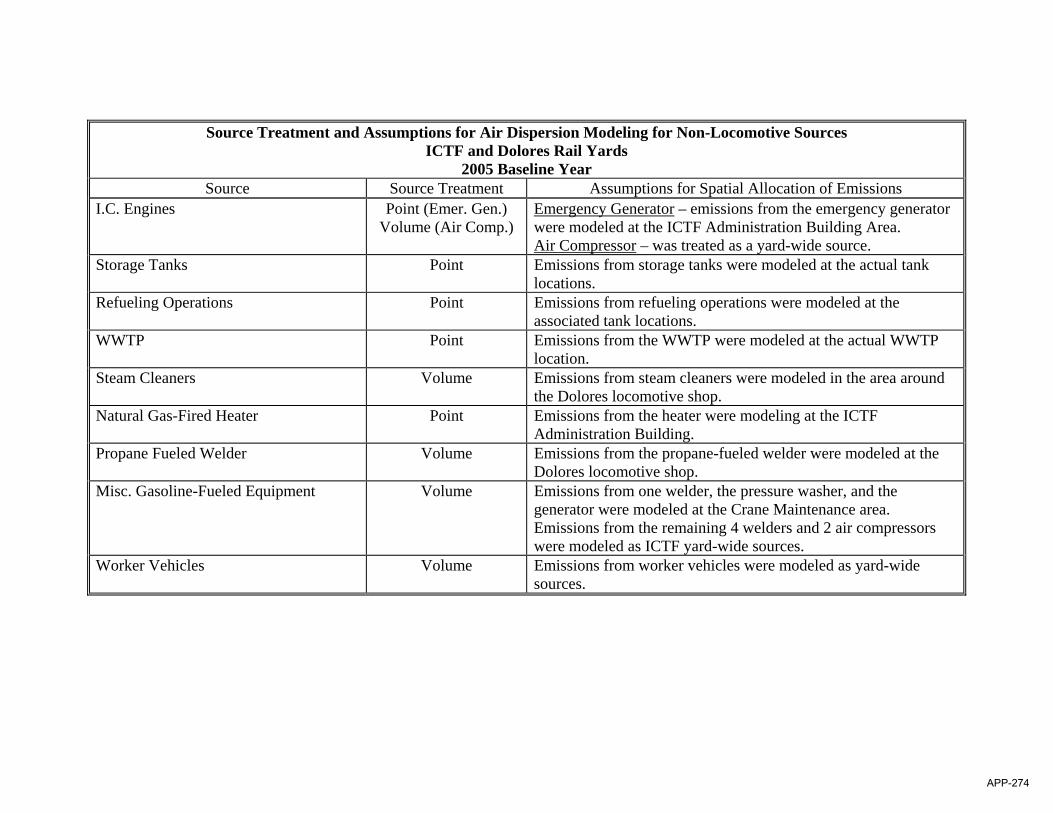
Source Treatment and Assumptions for Air Dispersion Modeling for Non-Locomotive Sources ICTF and Dolores Rail Yards
2005 Baseline Year Source Source Treatment Assumptions for Spatial Allocation of Emissions
I.C. Engines Point (Emer. Gen.) Volume (Air Comp.)
Emergency Generator – emissions from the emergency generator were modeled at the ICTF Administration Building Area. Air Compressor – was treated as a yard-wide source.
Storage Tanks Point Emissions from storage tanks were modeled at the actual tank locations.
Refueling Operations Point Emissions from refueling operations were modeled at the associated tank locations.
WWTP Point Emissions from the WWTP were modeled at the actual WWTP location.
Steam Cleaners Volume Emissions from steam cleaners were modeled in the area around the Dolores locomotive shop.
Natural Gas-Fired Heater Point Emissions from the heater were modeling at the ICTF Administration Building.
Propane Fueled Welder Volume Emissions from the propane-fueled welder were modeled at the Dolores locomotive shop.
Misc. Gasoline-Fueled Equipment Volume Emissions from one welder, the pressure washer, and the generator were modeled at the Crane Maintenance area. Emissions from the remaining 4 welders and 2 air compressors were modeled as ICTF yard-wide sources.
Worker Vehicles Volume Emissions from worker vehicles were modeled as yard-wide sources.
APP-274
APPENDIX R
SEASONAL AND DIURNAL ACTIVITY PROFILES
APP-275
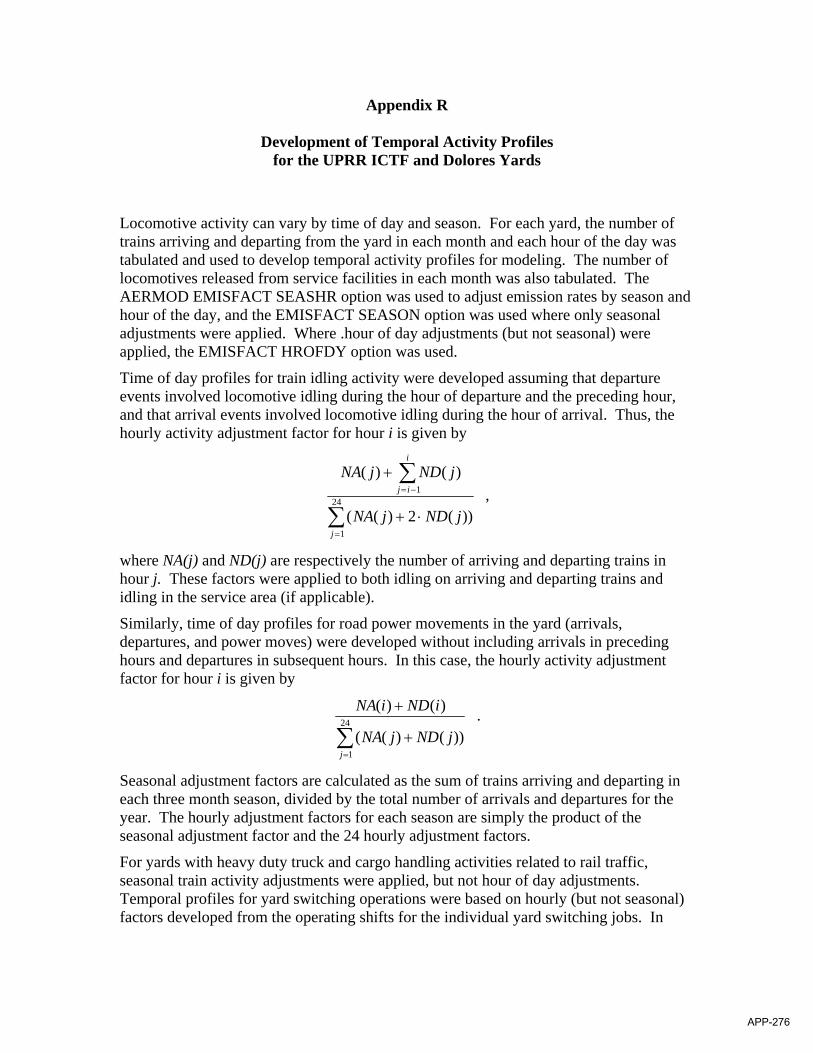
Appendix R
Development of Temporal Activity Profiles for the UPRR ICTF and Dolores Yards
Locomotive activity can vary by time of day and season. For each yard, the number of trains arriving and departing from the yard in each month and each hour of the day was tabulated and used to develop temporal activity profiles for modeling. The number of locomotives released from service facilities in each month was also tabulated. The AERMOD EMISFACT SEASHR option was used to adjust emission rates by season and hour of the day, and the EMISFACT SEASON option was used where only seasonal adjustments were applied. Where .hour of day adjustments (but not seasonal) were applied, the EMISFACT HROFDY option was used.
Time of day profiles for train idling activity were developed assuming that departure events involved locomotive idling during the hour of departure and the preceding hour, and that arrival events involved locomotive idling during the hour of arrival. Thus, the hourly activity adjustment factor for hour i is given by
∑
∑
=
−=
⋅+
+
24
1
1
))(2)((
)()(
j
i
ij
jNDjNA
jNDjNA ,
where NA(j) and ND(j) are respectively the number of arriving and departing trains in hour j. These factors were applied to both idling on arriving and departing trains and idling in the service area (if applicable).
Similarly, time of day profiles for road power movements in the yard (arrivals, departures, and power moves) were developed without including arrivals in preceding hours and departures in subsequent hours. In this case, the hourly activity adjustment factor for hour i is given by
∑=
+
+24
1
))()((
)()(
j
jNDjNA
iNDiNA .
Seasonal adjustment factors are calculated as the sum of trains arriving and departing in each three month season, divided by the total number of arrivals and departures for the year. The hourly adjustment factors for each season are simply the product of the seasonal adjustment factor and the 24 hourly adjustment factors.
For yards with heavy duty truck and cargo handling activities related to rail traffic, seasonal train activity adjustments were applied, but not hour of day adjustments. Temporal profiles for yard switching operations were based on hourly (but not seasonal) factors developed from the operating shifts for the individual yard switching jobs. In
APP-276

some cases, locomotive load testing diurnal profiles were developed based on the specific times of day when load testing is conducted.
Table V-1 lists the hourly activity factors derived for train movements, train and service idling, and yard switching at the UPRR ICTF and Dolores Yards. Separate temporal profiles are listed for day and night moving emissions as different volume source parameters are used for day and night. Table V-2 lists the seasonal activity factors for train and service activity.
Table V-1. Hourly Activity Factors for Train Activity at the UPRR ICTF and Dolores Yards
Hour Train and
Service Idling
Train Movements (Daytime)
Train Movements (Nighttime)
Yard Switching (Daytime(
Yard Switching
(Nighttime) 1 0.831 0.000 0.778 0.000 1.000 2 0.805 0.000 0.796 0.000 1.000 3 0.724 0.000 0.787 0.000 1.000 4 0.834 0.000 0.934 0.000 1.000 5 0.989 0.000 0.952 0.000 1.000 6 1.137 0.000 1.135 0.000 1.000 7 1.077 0.961 0.000 1.000 0.000 8 1.095 1.010 0.000 1.000 0.000 9 1.024 0.890 0.000 1.000 0.000
10 1.238 1.082 0.000 1.000 0.000 11 1.247 0.831 0.000 1.000 0.000 12 1.301 1.547 0.000 1.000 0.000 13 1.043 1.194 0.000 1.000 0.000 14 0.949 1.113 0.000 1.000 0.000 15 0.828 0.854 0.000 1.000 0.000 16 0.836 0.943 0.000 1.000 0.000 17 0.724 0.715 0.000 1.000 0.000 18 0.711 0.769 0.000 1.000 0.000 19 0.751 0.000 0.679 0.000 1.000 20 1.244 0.000 0.930 0.000 1.000 21 1.424 0.000 1.010 0.000 1.000 22 1.389 0.000 1.873 0.000 1.000 23 0.946 0.000 1.180 0.000 1.000 24 0.851 0.000 1.037 0.000 1.000
Table V-2. Seasonal Activity Factors for the UPRR ICTF and Dolores Yards
Activity Type Winter Spring Summer Fall Trains 0.914 1.047 1.052 0.987 Service 1.122 1.101 0.918 0.860
APP-277
APPENDIX S
SELECTION OF POPULATION FOR THE URBAN OPTION INPUT IN AERMOD AIR DISPERSION MODELING ANALYSIS
APP-278

Appendix S
Selection of Population for the Urban Option Input in AERMOD Air Dispersion Modeling Analysis
Urban heat islands and the thermal domes generated by them extend over an entire urbanized area1. Hot spots within the urban heat island are associated with roads and roofs, which surround each Union Pacific (UP) rail yard in high density. Following guidance cited by the ARB (“For urban areas adjacent to or near other urban areas, or part of urban corridors, the user should attempt to identify that part of the urban area that will contribute to the urban heat island plume affecting the source.”), it is the entire metropolitan area that contributes to the urban heat island plume affecting the rail yard. For metropolitan areas containing substantial amounts of open water, the area of water should not be included. To simulate the effect of the urban heat island on turbulence in the boundary layer, especially at night, when the effect is substantial, AERMOD adjusts the height of the nighttime urban boundary layer for the heat flux emitted into the boundary layer by the urban surface, which is warmer than surrounding rural areas2,3. The difference between the urban and rural boundary layer temperatures is proportional to the maximum temperature difference of 12 Celsius degrees observed in a study of several Canadian cities, and directly related to the logarithm of the ratio of the urban population to a reference population of 2,000,000 (i.e., Montreal, the Canadian city with the maximum urban-rural temperature difference)4. The adjusted height of the nocturnal urban boundary layer is proportional to the one-fourth power of the ratio of the population of the city of interest to the reference population, based on the observation that the convective boundary layer depth is proportional to the square root of the city size, and city size is roughly proportional to the square root of its population, assuming constant population density5. Regardless of wind direction during any specific hour used by AERMOD, it is the entire metropolitan area, minus bodies of water, which moves additional heat flux into the atmosphere and affects its dispersive properties, not just the 400 km2 area of the air dispersion modeling domain that surrounds the each rail yard, which was chosen purely for modeling convenience. Continuing to follow the guidance cited by the ARB (“If this approach results in the identification of clearly defined MSAs, then census data may be used as above to determine the appropriate population for input to AERMOD”), the population of each Metropolitan Statistical Area is being used in the modeling run for each rail yard.
1 USEPA. Thermally-Sensed Image of Houston, http://www.epa.gov/heatisland/pilot/houston_thermal.htm, included in Heat Island Effect website, http://www.epa.gov/heatisland/about/index.html, accessed November 8, 2006. 2 USEPA. AERMOD: Description of Model Formulation, Section 5.8 – Adjustments for the Urban Boundary Layer, pages 66-67, EPA-454/R-03-004, September 2004, accessed at http://www.epa.gov/scram001/7thconf/aermod/aermod_mfd.pdf on November 9, 3 Oke, T.R. City Size and the Urban Heat Island, Atmospheric Environment, Volume 7, pp. 769-779, 1973. 4 Ibid for References 3 and 4. 5 Ibid.
APP-279

APPENDIX T
DEMOGRAPHIC DATA
APP-280
Appendix T
Population Shape Files for UPRR Rail Yards
The accompanying shape files include census boundaries as polygons and the corresponding residential populations from the 2000 U.S. Census. Separate shape files are included at the tract, block group, and block levels. The primary ID for each polygon begins with ssccctttttt, where ss is the FIPS state code (06 for California), cc is the county code, and tttttt is the tract code. The primary IDs for block groups have a single additional digit which is the block group number within each tract. Those for blocks have four additional digits identifying the block number. The population for each polygon are included as both the secondary ID and as attribute 1. Polygon coordinates are UTM zone 10 (Oakland and Stockton) or 11 (southern California yards), NAD83, in meters. The files contain entire tracts, block groups, or blocks that are completely contained within a specified area. For all yards except Stockton, the area included extends 10 kilometers beyond the 20 x 20 kilometer modeling domains. For Stockton, this area was extended to 20 kilometers beyond the modeling domain boundaries to avoid excluding some very large blocks.
In merging the population data1 with the corresponding boundaries2, it was noted that at all locations, there are defined census areas (primarily blocks, but in some cases block groups and tracts) for which there are no population records listed in the population files. Overlaying these boundaries on georeferenced aerial photos indicates that these are areas that likely have no residential populations (e.g., industrial areas and parks). The defined areas without population data have been excluded from these files. Areas with an identified population of zero have been included. It was also observed that some blocks, block groups and tracts with residential populations cover both residential areas and significant portions of the rail yards themselves. For this reason, any analysis of population exposures based on dispersion modeling should exclude receptors that are within the yard boundaries or within 20 meters of any modeled emission source locations.
To facilitate the exclusion of non-representative receptors, separate shape files have been generated that define the area within 20 meters of the yard boundaries for each yard. These files are also included with the accompanying population files. It should also be noted that the spatial extent of individual polygons can vary widely, even within the same type. For example, single blocks may be as small as 20 meters or as large as 10,000 meters or more in length. To estimate populations contained within specific areas, it may prove most useful to generate populations on a regular grid (e.g., 250 x 250 m cells) rather than attempting to process irregularly shaped polygons.
1 Population data were extracted from the Census 2000 Summary File 1 DVD, issued by the U.S. Department of Commerce, September 2001. 2 Boundaries were extracted from ESRI shapefiles (*.shp) created from the U.S. Census TIGER Line Files downloaded from ESRI (http://arcdata.esri.com/data/tiger2000/tiger_download.cfm).
APP-281