Land System Change Modelling - gms-eoc.org
100
Land System Change Modelling Why, What and How? Peter Verburg
-
Upload
khangminh22 -
Category
Documents
-
view
0 -
download
0
Transcript of Land System Change Modelling - gms-eoc.org
Land System Change ModellingWhy, What and How?
Peter Verburg

2
2000190018001700
Anthromes 2How did the biosphere become anthropogenic?
Ellis et al. 2010
Urban Densesettlements
DenseSettlements
Woodlands Treeless& Barren
WildlandsSeminaturalRangelands
Residential PopulatedRemote
Croplands
Rice
Irrigated
Rainfed Pastoral
Villages
Irrigated Rainfed
ResidentialPopulated
Remote Treeless& Barren
ResidentialPopulated
Remote
Woodlands
SeminaturalUsed WildSeminaturalUsed WildSeminatural WildUsed Seminatural WildUsed

3
Description of ‘model’
Simplified, idealized representation of a part of the real world
Learning tool
Experimental tool
Simulation tool

4
Use of models
Tool to structure information, test hypothesis and validatenarrative models
• tool to provide more insights in the driving factorsand dynamics of LUCC (stakeholder: mainlyscientists)

5
Complexity in land use studies
6
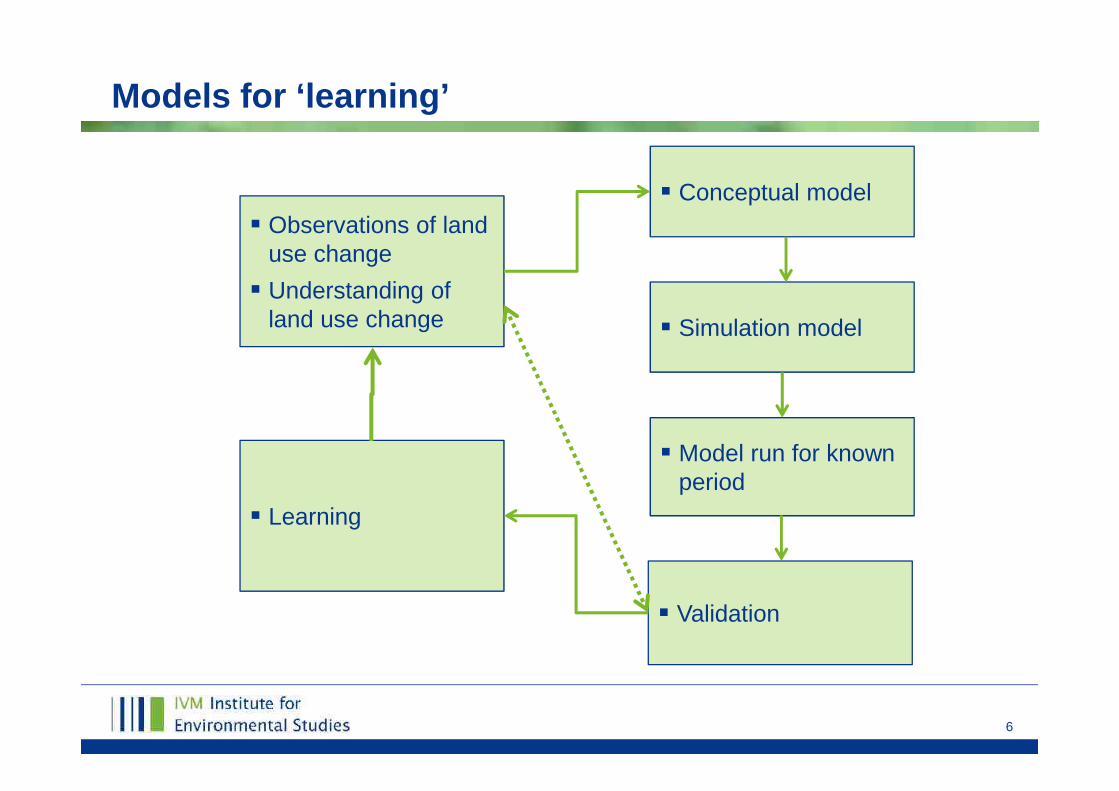
Models for ‘learning’
Observations of landuse change Understanding of
land use change
Conceptual model
Simulation model
Model run for knownperiod
Validation
Learning

7
Use of models
Tool to structure information, test hypothesis and validatenarrative models
• tool to provide more insights in the driving factorsand dynamics of LUCC (stakeholder: mainlyscientists)
Ex-ante assessment• tool to evaluate impact of alternative land use
policies or indirect impacts of other policies Discussion support system
• tool to explore alternative futures to triggerdiscussion among stakeholders and createawareness of issues in land use and/or naturalresource management
8
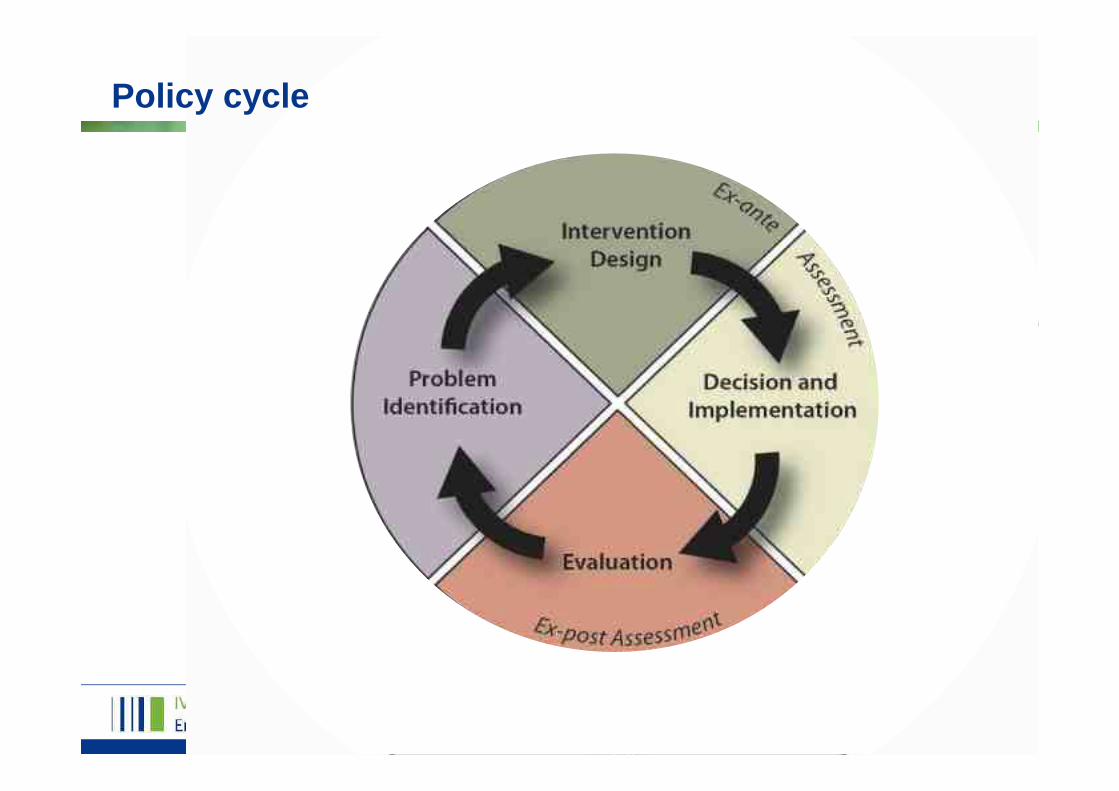
Policy cycle

9
Explore ‘futures’ and ‘identify possible problems’

10
A2 B2
B1A1Less
Intervention
Global
MoreIntervention
Local
V-A1
V-A2
V-B1
V-B2
Scenarios

11
Scenarios

12
Policy cycle
13
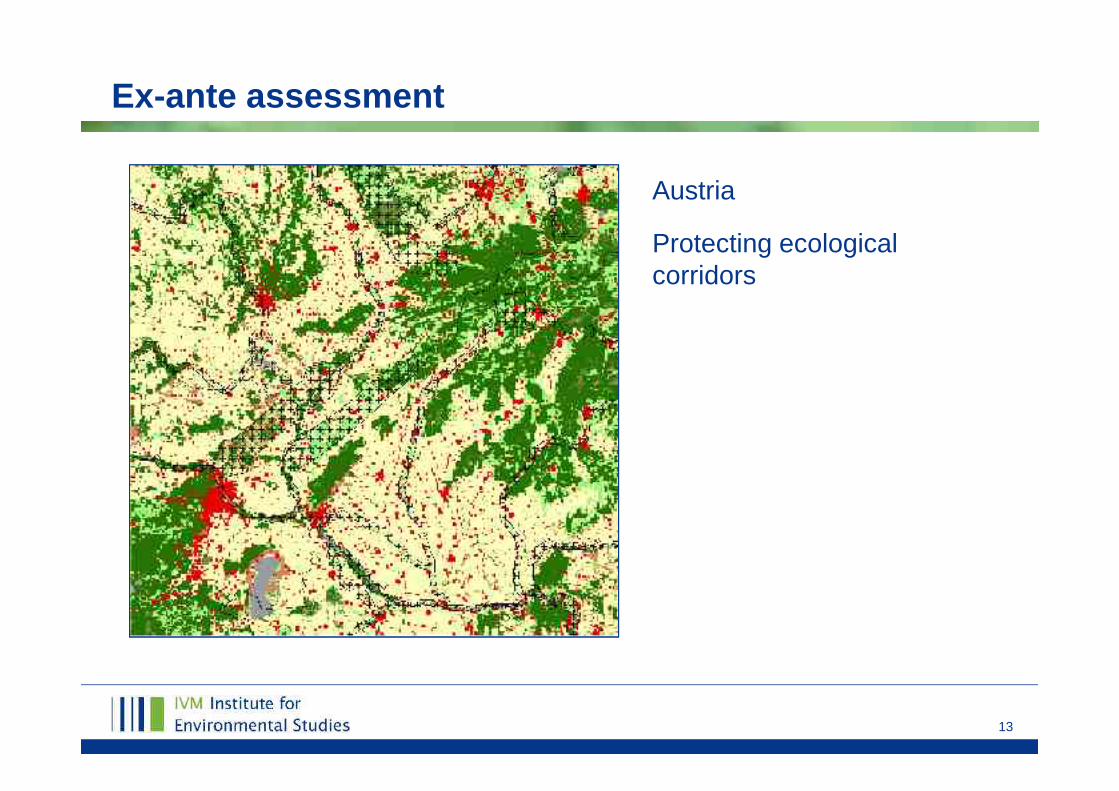
Ex-ante assessment
Austria
Protecting ecologicalcorridors

14
Policy cycle
15
Ex-post assessments
Monitoring
Modelling based on observations to identify patterns (ofteneconometric models testing significance of findings/policyimpact) (e.g.: are protected areas effective)

16
Use of models
Tool to structure information, test hypothesis and validatenarrative models
• tool to provide more insights in the driving factorsand dynamics of LUCC (stakeholder: mainlyscientists)
Ex-ante assessment• tool to evaluate impact of alternative land use
policies or indirect impacts of other policies Discussion support system
• tool to explore alternative futures to triggerdiscussion among stakeholders and createawareness of issues in land use and/or naturalresource management

17
Different roles of modelling connected
Observations andunderstanding
Model building andimplementation
Validation
Scenario analysis Alternative
policies/management options
Ex-ante analysis
Policy/magementimplementation

18
Model types
Spatial vs. non-spatial
Dynamic vs. static
Descriptive vs. prescriptive
Deductive vs. inductive
Agent-based vs. pixel-based

19
Model types
Spatial vs. non-spatial
Dynamic vs. static
Descriptive vs. prescriptive
Deductive vs. inductive
Agent-based vs. pixel-based

20
Model types
• Non-spatial model:– How much land use
change?– Why does land use
change?• Spatial model:
– How much land usechange?
– Why does land usechange?
– Where will land usechange happen?
0.00
50000.00
100000.00
150000.00
200000.00
250000.00
2000
2004
2008
2012
2016
2020
2024
2028
built-up areanon-irrigated arablepastureforest/natureinland wetlandsstatic LUT'sirrigated arableabandoned land

21
Model types
Spatial vs. non-spatial
Dynamic vs. static
Descriptive vs. prescriptive
Deductive vs. inductive
Agent-based vs. pixel-based

22
Model types
Static model• Analysis of driving factors, linear extrapolation (no time steps)
Dynamic model• Explicit attention for temporal dynamics, feedback, path-
dependence (discrete time steps)
23
Model types
Spatial vs. non-spatial
Dynamic vs. static
Descriptive vs. prescriptive
Deductive vs. inductive
Agent-based vs. pixel-based

24
Types of land use models
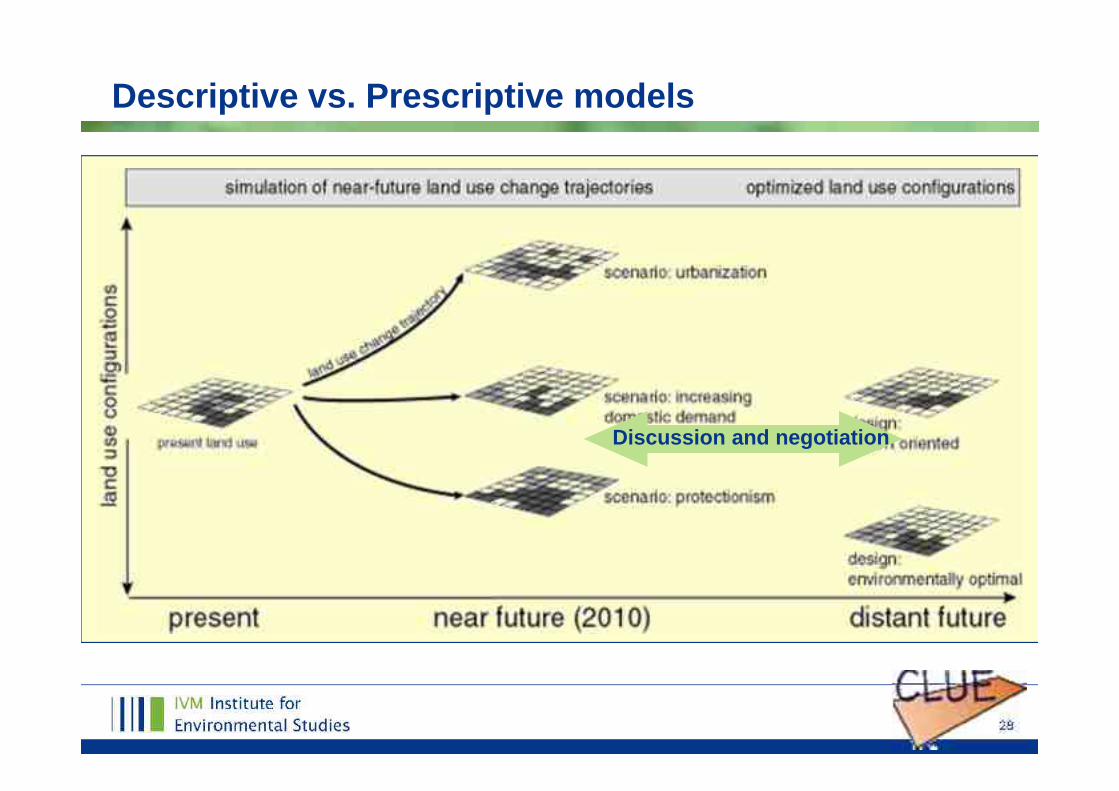
Descriptive models aim at simulating thefunctioning of the land use system andgenerate spatially explicit explorations ofnear future land use patterns
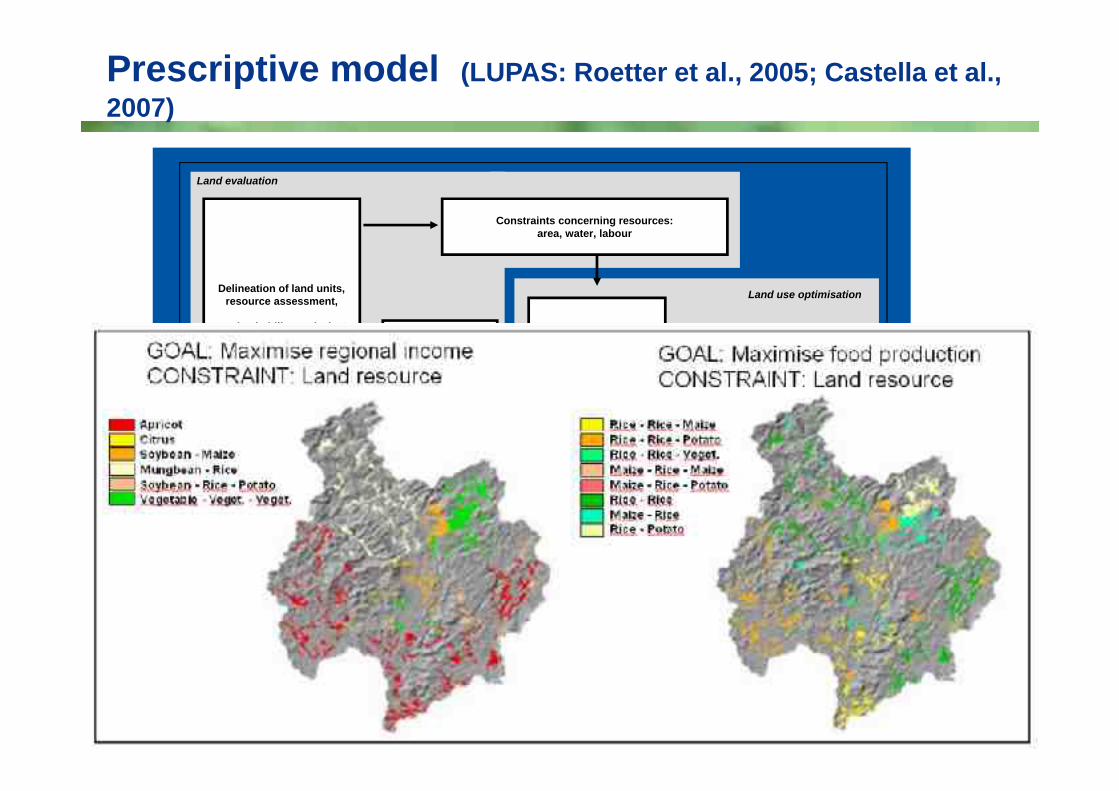
Prescriptive models aim at the calculation ofoptimised land use configurations that bestmatch a set of goals and objectives

25
Descriptive vs. Prescriptive models
020406080
100120140160
1980 1990 2000 2010 2020 2030 2040
Scen A
Scen B
Explorative
NormativeBack-casting
Policyintervention
26
Scenario construction
Land use optimisation
Land evaluation
OptimizationModel
Interactive Multiple GoalLinear Programming
Objective functions
Land use options &Goal achievements
Data Maps
Policy views
Input/outputtables of
productionactivities
Constraints concerning resources:area, water, labour
Delineation of land units,resource assessment,
Land suitability analysis &Yield estimation
Prescriptive model (LUPAS: Roetter et al., 2005; Castella et al.,2007)

27
Descriptive model(CLUE; Castella et al., 2007)
28
Descriptive vs. Prescriptive models
Discussion and negotiation

29
Model types
Spatial vs. non-spatial
Dynamic vs. static
Descriptive vs. prescriptive
Deductive vs. inductive
Agent-based vs. pixel-based
30
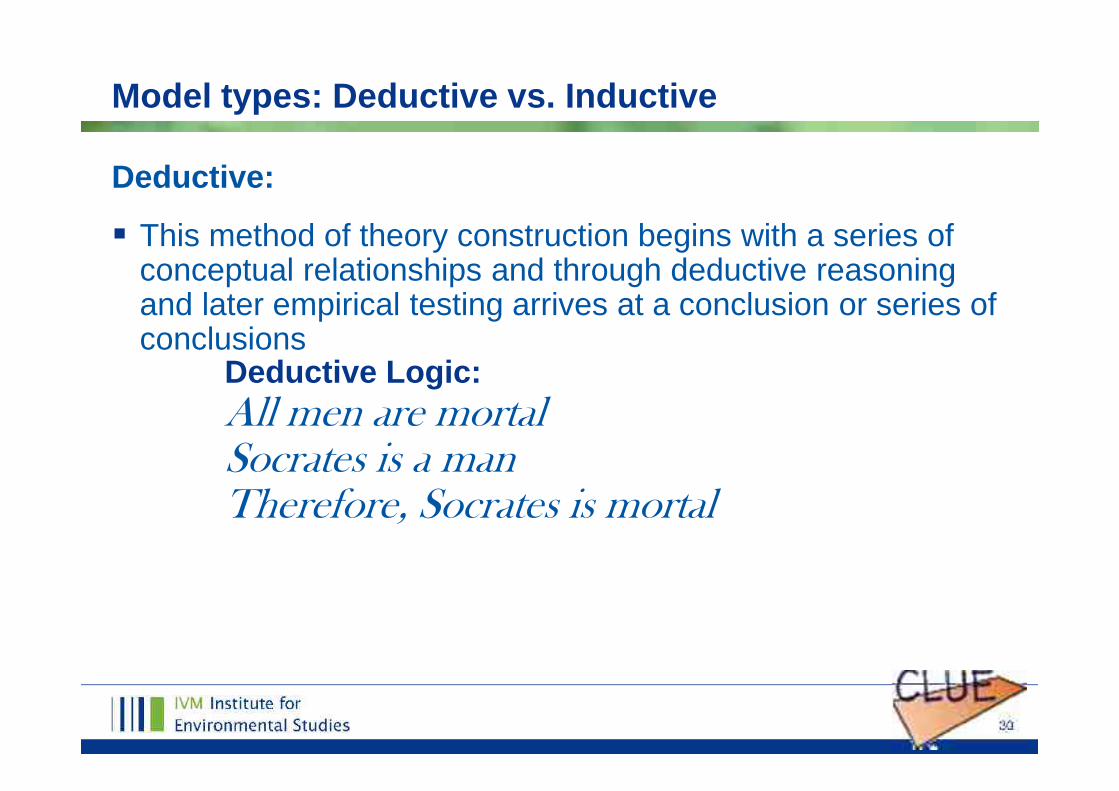
Model types: Deductive vs. Inductive
Deductive:
This method of theory construction begins with a series ofconceptual relationships and through deductive reasoningand later empirical testing arrives at a conclusion or series ofconclusions
Deductive Logic:All men are mortalSocrates is a manTherefore, Socrates is mortal

31
Model types: Deductive vs. Inductive
Inductive: Inductive modelling relies on the use of a series of observations, in order to
reach a conclusion
Inductive Logic:The sun came up September 1The sun came up September 2The sun came up September 30The sun will come up tomorrow

32
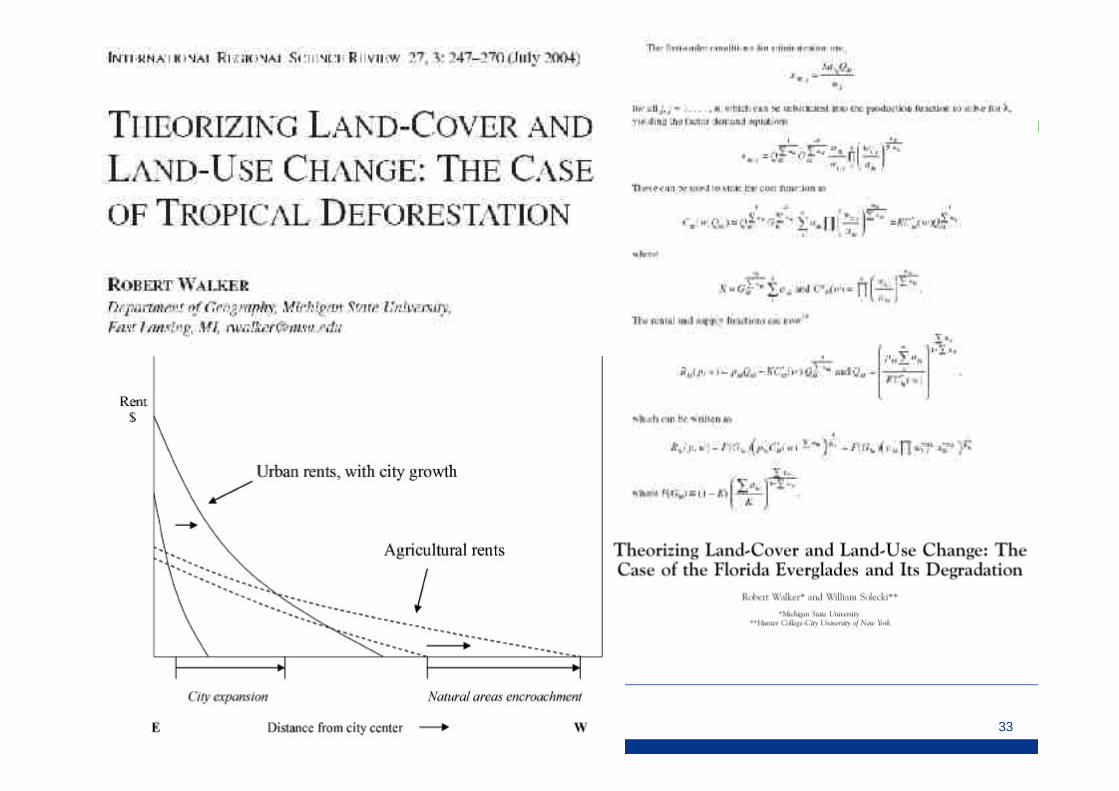
Example of a deductive model: the Von Thünen model
Economic theory:• People optimize profit• Land rent determines land use• Land rent is determined by the market price and transport
costs• Land use is therefore determined by market conditions and
the distance to the market
33

34
Model types
Spatial vs. non-spatial
Dynamic vs. static
Descriptive vs. prescriptive
Deductive vs. inductive
Agent-based vs. pixel-based

35
Pixel based modelling
Land is unit of simulation
Decision rules determine howdecision making influences the landunit
No explicit agents: 1 agent canmanage multiple land units ormultiple units can be managed by 1agent
Often attention for spatial interaction
Closely linked to spatial datacollection (remote sensing)
Pijanowski et al., 2001
Parker et al., 2003

36
Agent-based modelling• Individuals or groups are units of
simulation• Explicit simulation of agent
decision making• Attention for interactions between
agents (‘emergent behavior’ –‘collective action’)

37
Environment Objects
Representations
Goal
ActionPerception
Communication
Communication
Agent-based modelling
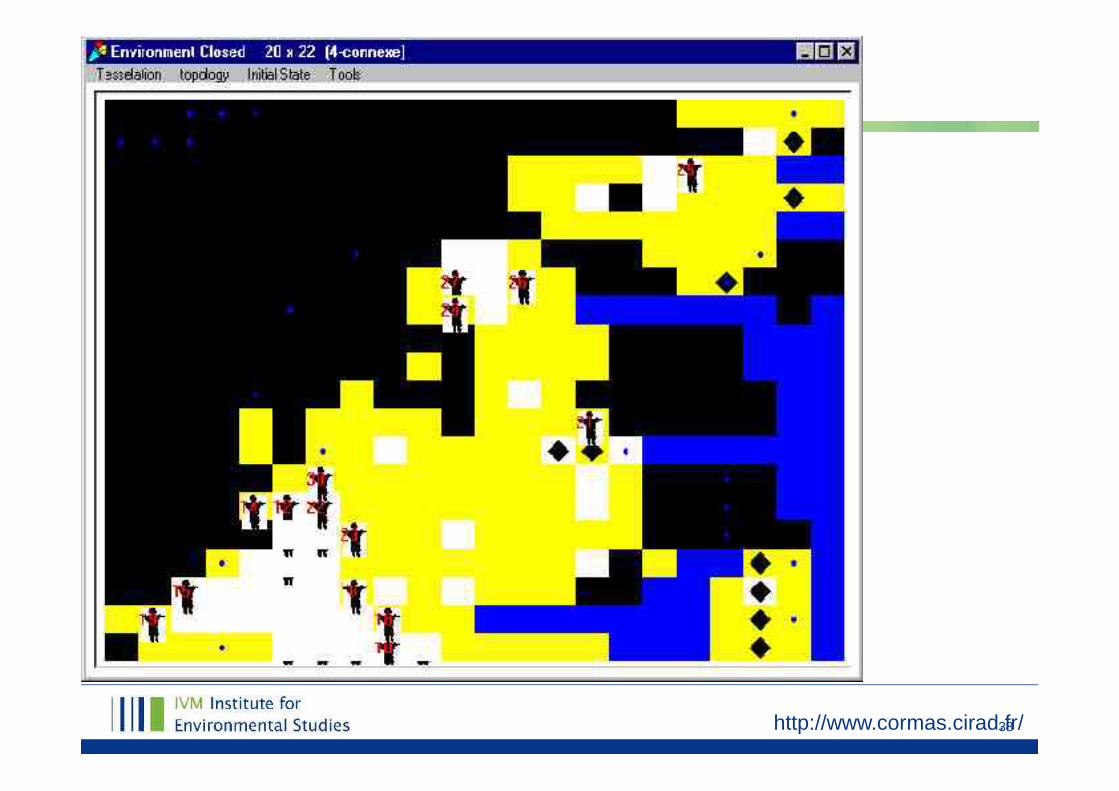
38http://www.cormas.cirad.fr/
39
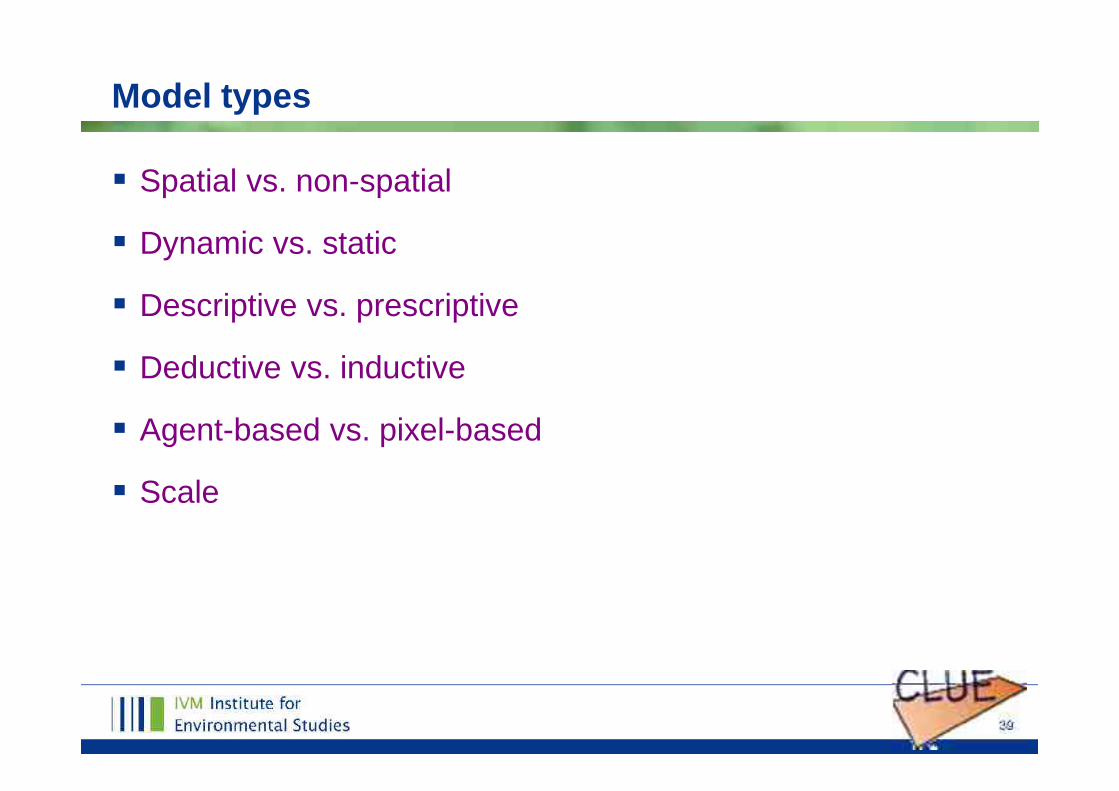
Model types
Spatial vs. non-spatial
Dynamic vs. static
Descriptive vs. prescriptive
Deductive vs. inductive
Agent-based vs. pixel-based
Scale
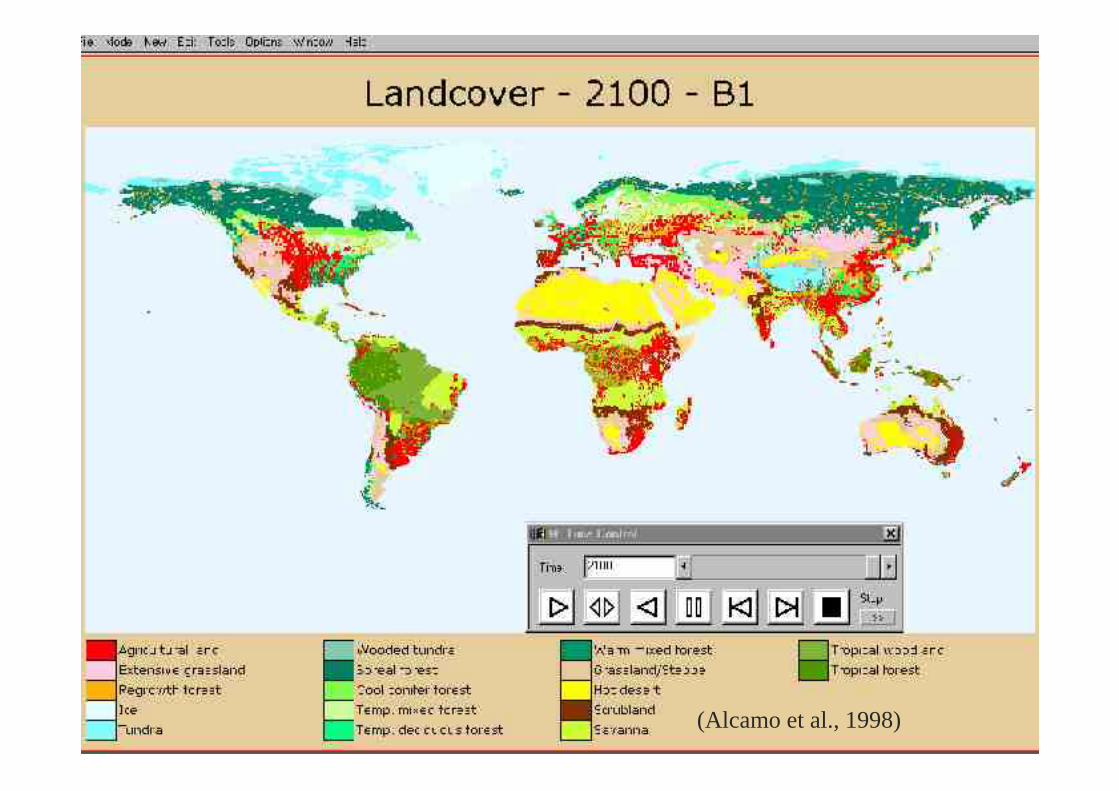
40(Alcamo et al., 1998)

41
Scale
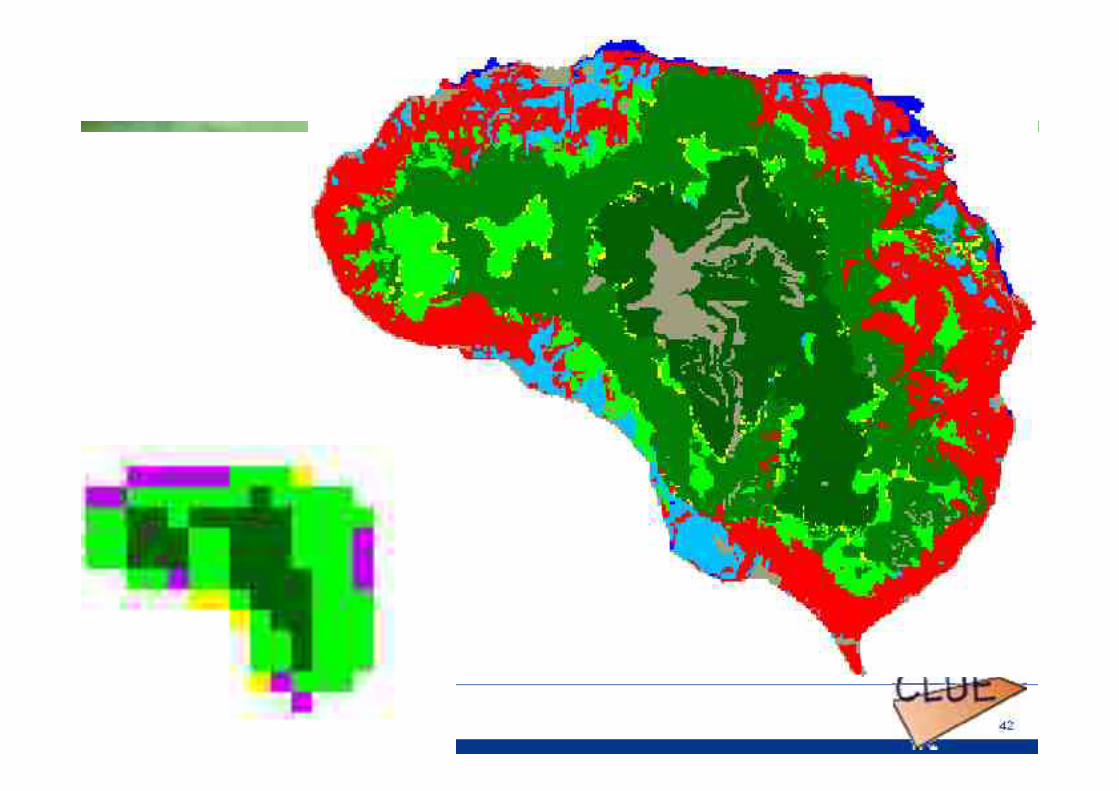
42

43
Brown et al., 2013
44
This project
Objective of modelling:Support land management/policy decisions at regional scaleEnable both scenario and ex-ante assessment of
policies/projectsAccount for the demand for multiple ecosystem services
Choice of model:• Pixel-based (scale / data requirements)• Dynamic modelling (account for complex land use
patterns/competing claims)• Validated/tested model environment

45
CLUE model family
CLUE
CLUE-s
Dyna-CLUE
CLUMondo
1996
-200
020
01-2
010
Land cover (%)
Land cover (dominant)
Land systemsMultiple demand types
2012
-
46
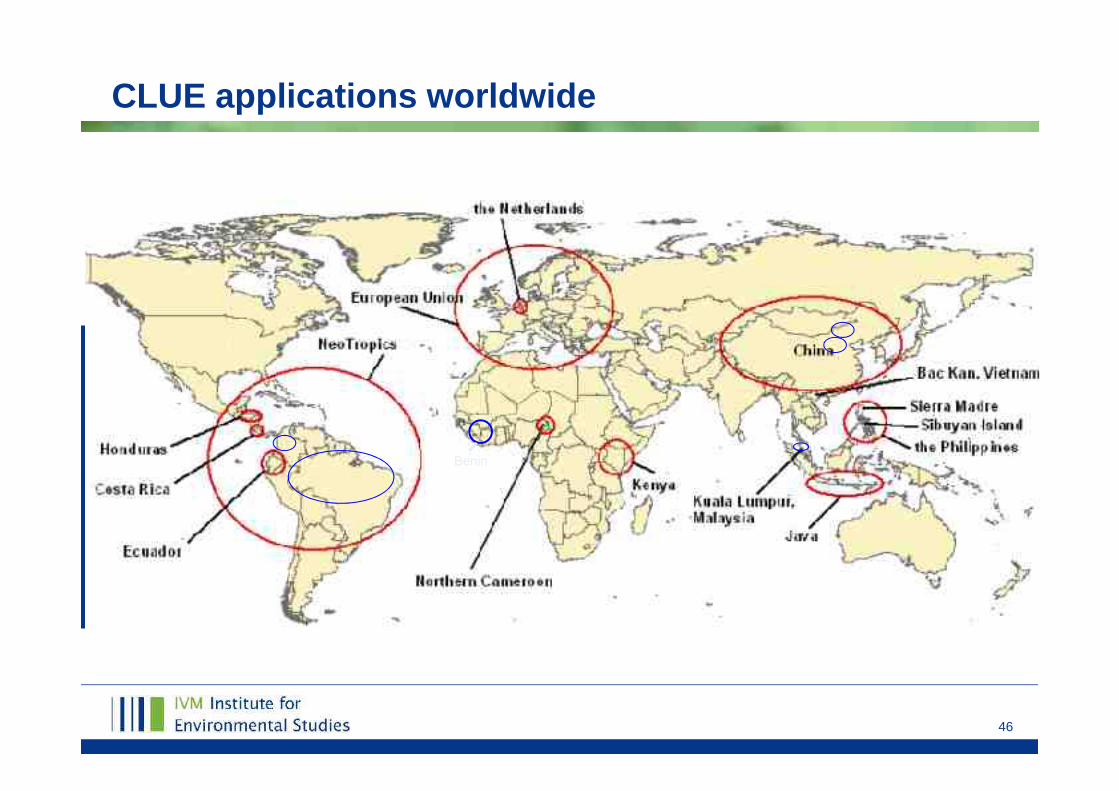
CLUE applications worldwide
Benin
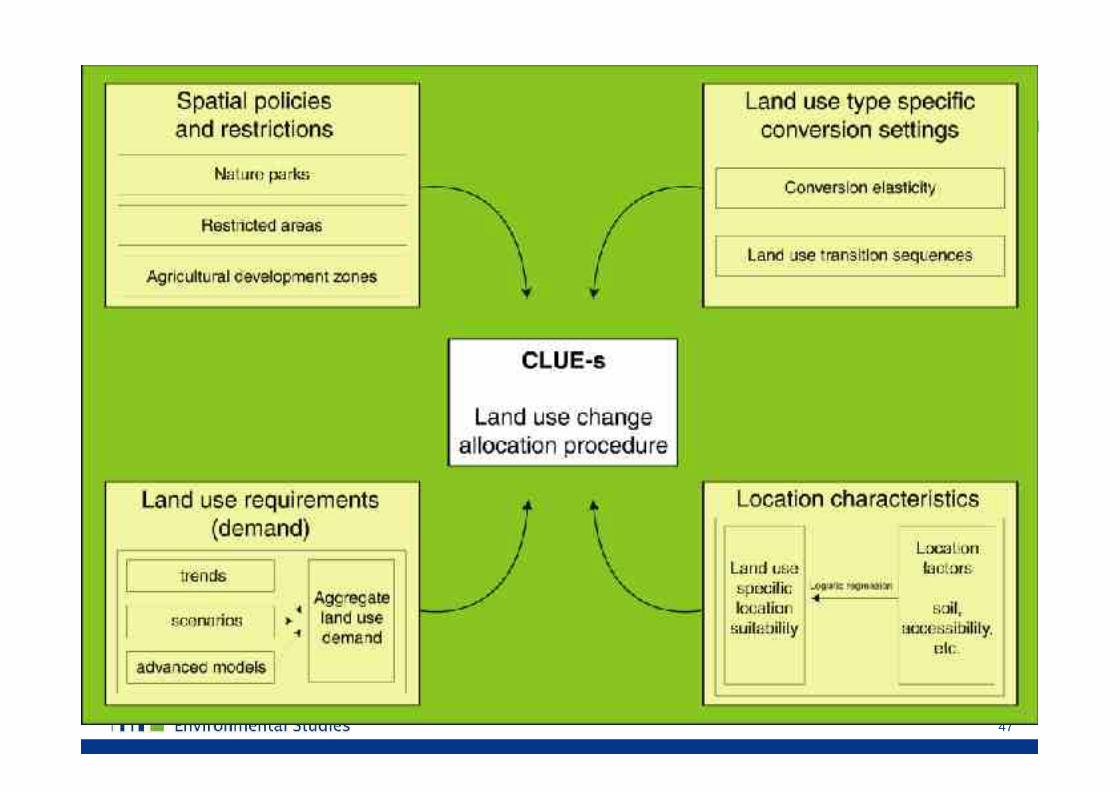
47

48

49
Land use demand France: A1 scenario
0.00
50000.00
100000.00
150000.00
200000.00
250000.00
2000
2004
2008
2012
2016
2020
2024
2028
time (years)
dem
and(
km2)
built-up areanon-irrigated arablepastureforest/natureinland wetlandsstatic LUT'sirrigated arableabandoned land
Scenario 2
0
10002000
30004000
5000
60007000
8000
2000 2005 2010 2015 2020
Year
land
are
a (h
a)
wet ricearablebananagrassforestwater bodiesfruit trees
• Wet Rice: +6%• Arable (corn): +1%• Banana: +1%• Grass: decreases• Forest: -1%• Fruit trees: 2001, +150 ha, other years+3%

50
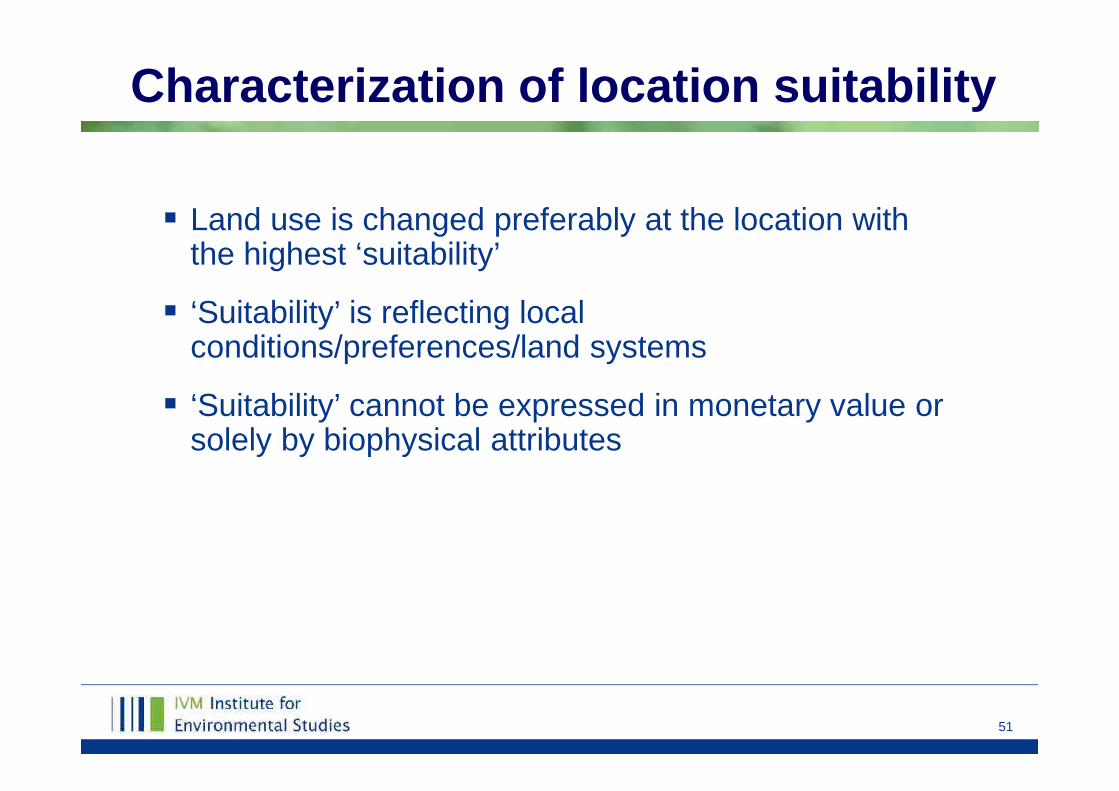
51
Characterization of location suitability
Land use is changed preferably at the location withthe highest ‘suitability’
‘Suitability’ is reflecting localconditions/preferences/land systems
‘Suitability’ cannot be expressed in monetary value orsolely by biophysical attributes

52
Standard method based on regression(if no information on land use preferencesIs available)
Method if detailed information ofLocation preferences is available
Specification of suitability maps is dependent on study area andland use type
If neighborhood processes are important(Cellular Automata based method)
Calculation ofsuitability maps

53
inniii
i XXXP
PLog ,,22,110 ......
1
Statistical analysis
This image cannot currently be displayed.
Variable Beta1 Exp(Beta)ConstantGeology
Ultramafic sedimentsUltramafic rock
Metamorphic rock DioriteErosion vulnerability Small MediumElevationDistance to roadDistance to townDistance to coastAspectPopulation density
-2.4701
1.42232.1128
-0.78891.3164
1.2066-0.53550.00220.00020.00010.00020.0023
-0.0065
4.14688.27150.45433.7302
3.34220.58541.00221.00021.00011.00021.00230.9936
Driving factors,e.g. population
Probability ofoccurrence ofland use type

54
Standard method based on regression(if no information on land use preferencesIs available)
Method if detailed information ofLocation preferences is available
Specification of suitability maps is dependent on study area andland use type
If neighborhood processes are important(Cellular Automata based method)
Calculation ofsuitability maps

55
Decision rules / expert knowledge
‘Suitability’ for corn

56
Standard method based on regression(if no information on land use preferencesIs available)
Method if detailed information ofLocation preferences is available
Specification of suitability maps is dependent on study area andland use type
If neighborhood processes are important(Cellular Automata based method)
Calculation ofsuitability maps

57

58

59
Conversion elasticity
Not all land use conversions are reversible:• Urban area and residential area• Deforestation of primary rain forest
Other conversions are very costly:• Fruit tree plantations

60
Transition sequences
Spatio-temporal dynamics arise through:• Fixed land use conversion sequences• Fixed timing of land use practices throughtemporal feedbacks> Fallow periods with minimum length> Maximum length of cultivation in shifting
cultivation systems through soil depletion> Re-growth rate (non-forest => forest)

61
Additional options:
Give minimum time under sameland use before conversionpossible (e.g. fallow; regrowth offorest)
Give maximum time under sameland use
Provide specific areas for certainconversions (e.g. protectedareas, buffer zones, projects)
Spatio-temporal dynamics
After 10 yearsgrassland
conversion toforest
possible
After 3 yearsof cultivation
the soil isdepleted, canno longer beagriculture
Logging onlyallowed indesignated
areas

62

63
Grassland
Built-up area
Mixed cropping
Others
Forest
Arable land
Plantations
SimulatedLand use changestarting in 1990
Resolution:
2.5*2.5 km
Temporaldynamics
Verburg et al., 2004

64
Indentificationof hot ‘zones’

65
Scenario study of deforestation threat ofprotected areas
Verburg et al., 2006

66
San Mariano MunicipalityIsabella ProvinceThe Philippines
Overmars et al., 2005

67

68
Map
of p
redi
cted
agr
icul
tura
l exp
ansi
on in
to fo
rest

69
Validation (?)In
tere
stin
g co
inci
denc
es a
nd d
iffe
renc
es w
ith
JRC’
s TR
EES
hot
spot
s ..
.
70

71

72
Validation
Multiple years of (consistent) land use data areneeded
Performance depends on landscape and casestudy
Data quality major problem for validation
Multiple validation criteria needed
Performance at coarser scales generally better thanat fine scales

73
0.6
0.65
0.7
0.75
0.8
0.85
0 20 40 60 80
Window Size
Fit
Validation
Klang-Langat watershed, Malaysia
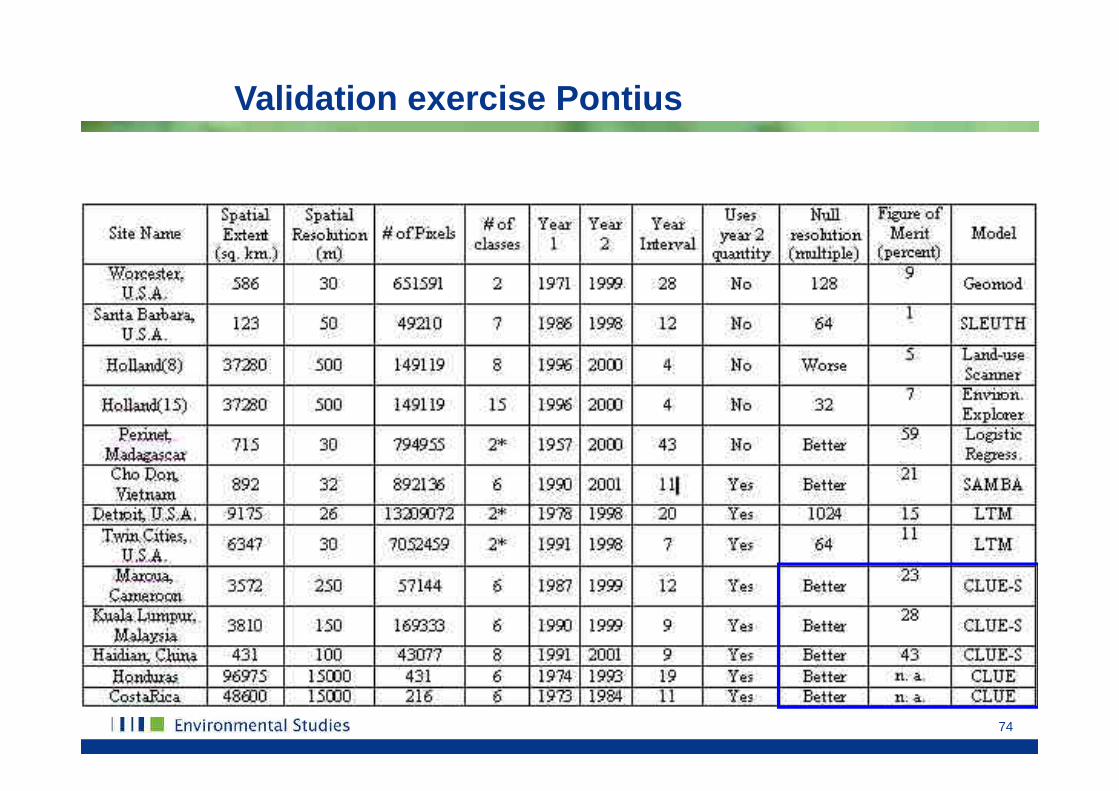
74
Validation exercise Pontius
75
CLUMondo-from land cover to land system representations
-from food demand to demand for multipleecosystem services

76
Representing land use:
FROM LAND COVER TO LAND SYSTEMS

77

78
Landscape structure

79
Land system change
Food/Feed/Fibre/Energydemand
Expansion of agricultural area
Intensification of land usesystems
Import from other areas
Change in consumptionpattern

80

81
Land system change
Food/Feed/Fibre/Energydemand
Expansion of agricultural area
Intensification of land usesystems
Import from other areas
Change in consumptionpattern

82
Forest transition: changing forest/population relations
Kauppi et al., 2006

83
Land systems
Composition (fractional cover of different land cover/use types)
Intensity of human use (harvesting, input/output, disturbance)
Configuration (spatial structure, configuration of landscapeelements)

84
Asselen & Verburg, 2012 GCB

85
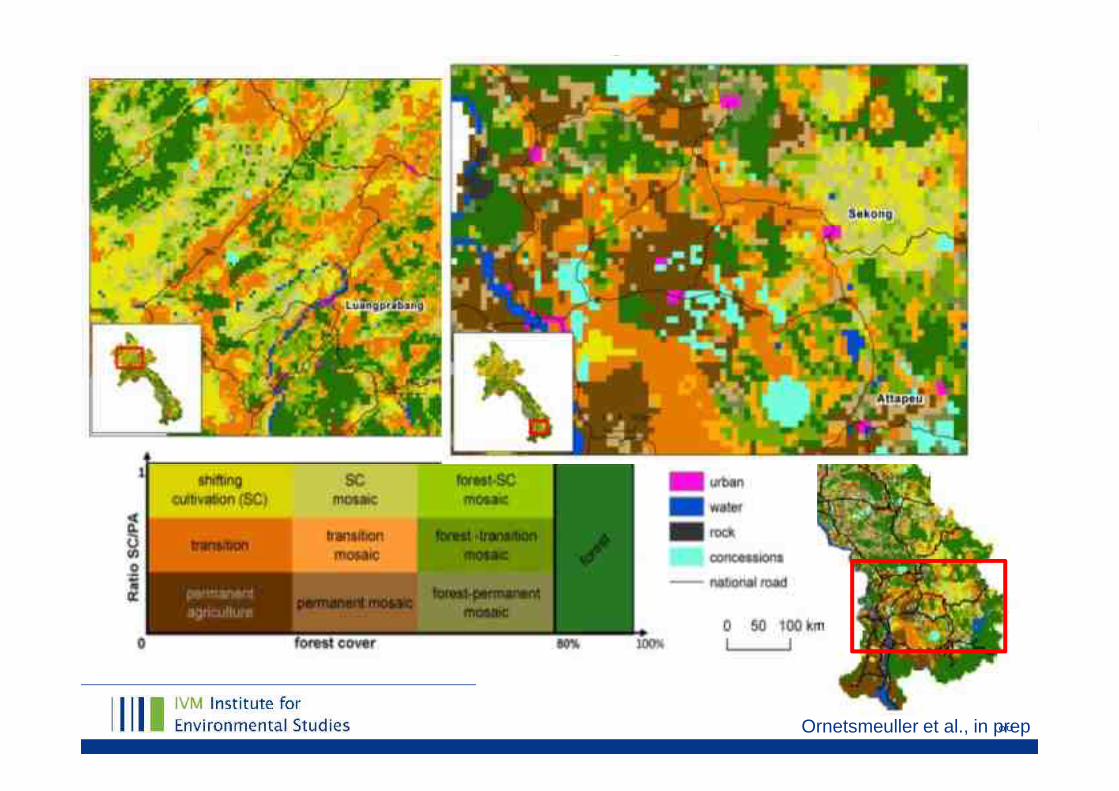
Shifting cultivation
86
Results
Ornetsmeuller et al., in prep

87
Modelling land system changes
Demand Supply Agric. commodities
Forest (wood/fuel)
Housing
Agriculture
Forest
Urban
Rest (nature)
Demand Supply Agric. commodities
Forest (wood/fuel)
Housing
Intensive Agricultural landscape
Mosaic landscape
Peri-urban mosaic
Nature
Extensive Agricultural lands.
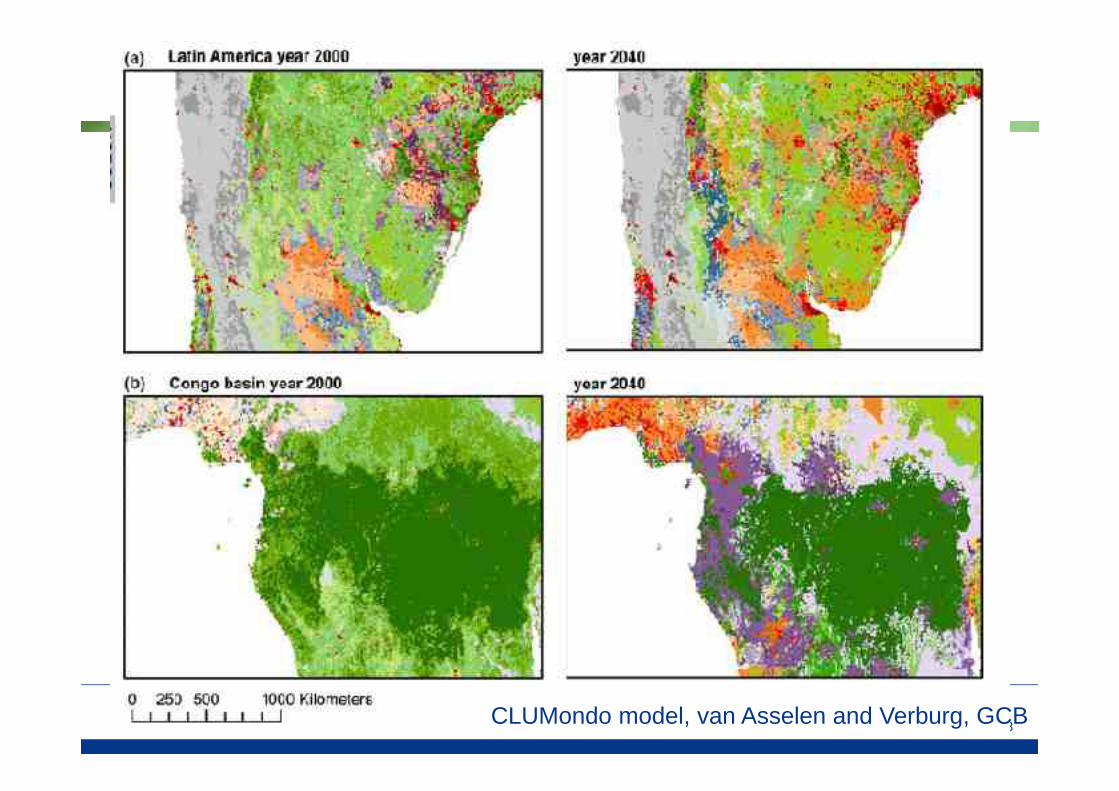
88CLUMondo model, van Asselen and Verburg, GCB

89
Model result: expansion/intensification vs land availability
Eitelberg et al., in press. Global Change Biology

90
Multiple demands for ecosystem services
Biomass production for food, feed, fiber and energy
Wood production
Climate regulation (e.g., carbon storage)
Regulation of rivers and soil dynamics (e.g., flood regulation)
Tourism and recreation
Biodiversity
Land systems provide different supply of ecosystemservices
Demand for ecosystem services drives land change
Demand operates at different spatial scales

91
What can the model simulate?
Scenarios with different pressures/competing claims
Scenarios with different spatial policies (protected area,regional incentives)
Spatial tradeoffs and displacement of impact within the studyregions
Changing location factors, e.g. improved accessibility,climate change impacts on land use pattern

92
What can the model NOT simulate?
Macro-economic change
Global interactions through trade (link to global economicmodels)
Changes in demand for services
Impacts (link to impact models)

93
Model Chain of the VOLANTE project

94
Climate regulation
2000 2030 Reference 2030 Biofuel policies
CurrentC-sequestration
LULUFC
Method based on:
Schulp et al., 2008 Agriculture, Ecosystems and Environment
95
Why model?

96
Brown et al., in press

97
Science-practice/policy linkage
Participation
Joint-learning
Trans-disciplinarity
Co-design
Co-production
Action-research
Cornell et al., 2013

98
Roles in model building, implementation, evaluation
Scientists / Academic
Research / Policy support /Planning Support
Planners / Policy makers /NGO / other stakeholders
Spec
ifica
tion
of q
uest
ions
/sc
enar
ios
/ pol
icy
optio
ns
Modelbuilding
As
sess
men
t and
inte
rpre
tatio
n
Ev
alua
tion
Co-design

99
Questions about modelling
Who to support?
Support with what?
What are the model requirements for the questions?
Can we model the questions?
What roles of what stakeholders in the modelling process?
What capacity is needed to enable the modelimplementation?

100
Thank you!!!