
L Y N N H A V E N , F L
24
THE VOICE FOR REAL ESTATE IN NORTHWEST FLORIDA WWW.CPAR.REALTOR 3RD QUARTER 2020 DEMOGRAPHIC & REAL ESTATE MARKET REPORT LYNN HAVEN, FL
-
Upload
khangminh22 -
Category
Documents
-
view
1 -
download
0
Transcript of L Y N N H A V E N , F L
T H E V O I C E F O R R E A L E S T A T E I NN O R T H W E S T F L O R I D AW W W . C P A R . R E A L T O R
3 R D Q U A R T E R 2 0 2 0D E M O G R A P H I C & R E A L E S T A T E
M A R K E T R E P O R T
L Y N N H A V E N , F L

V I S I TW W W . C P A R . R E A L T O R
Y O U R H O M E I S H E R E ,L E T ' S F I N D I T T O G E T H E R
A d v a n c e d P r o p e r t y S e a r c hf e a t u r e c o v e r i n g B a y ,H o l m e s , W a s h i n g t o n ,C a l h o u n & J a c k s o nC o u n t i e s .C o m m u n i t y R e s o u r c e sF i n d a R E A L T O R ®C u r r e n t m a r k e t s t a t i s t i c s
& d e m o g r a p h i c sE v e n t c e n t e r a v a i l a b l e f o rb o o k i n gE d u c a t i o n , l o c a l e v e n t s &m o r e
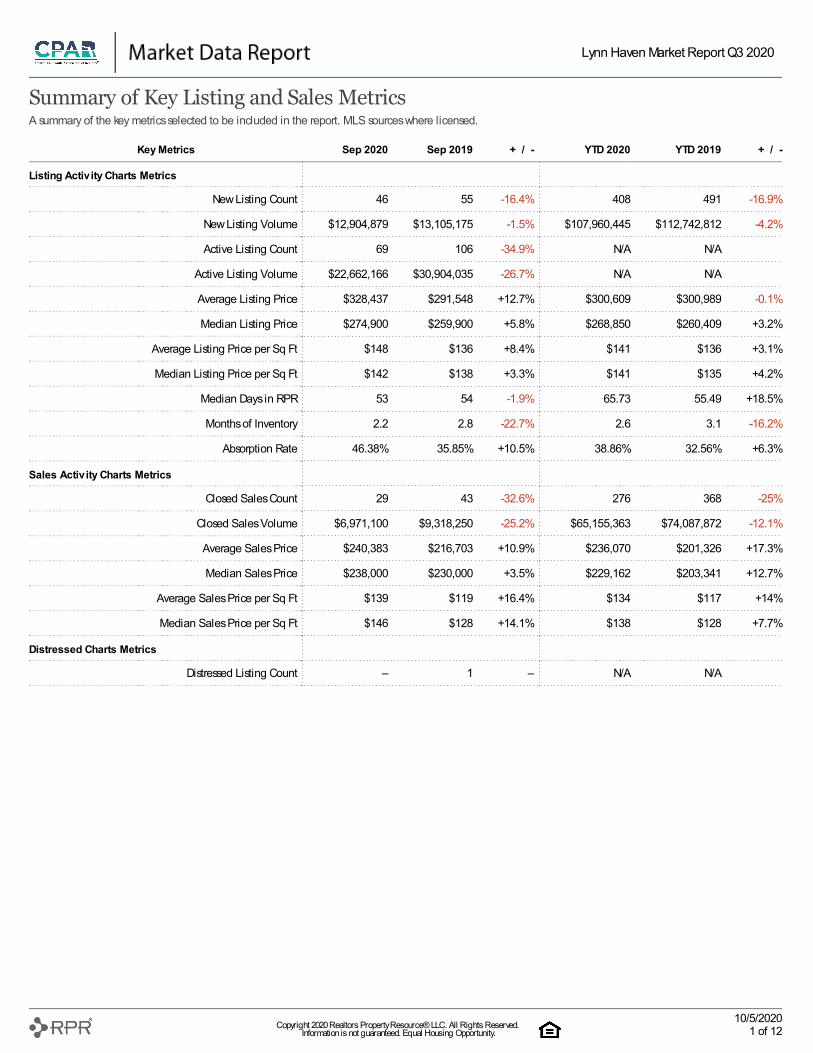
Summary of Key Listing and Sales MetricsA summary of the key metrics selected to be included in the report. MLS sources where licensed.
Key Metrics Sep 2020 Sep 2019 + / - YTD 2020 YTD 2019 + / -
Listing Activity Charts Metrics
New Listing Count 46 55 -16.4% 408 491 -16.9%
New Listing Volume $12,904,879 $13,105,175 -1.5% $107,960,445 $112,742,812 -4.2%
Active Listing Count 69 106 -34.9% N/A N/A
Active Listing Volume $22,662,166 $30,904,035 -26.7% N/A N/A
Average Listing Price $328,437 $291,548 +12.7% $300,609 $300,989 -0.1%
Median Listing Price $274,900 $259,900 +5.8% $268,850 $260,409 +3.2%
Average Listing Price per Sq Ft $148 $136 +8.4% $141 $136 +3.1%
Median Listing Price per Sq Ft $142 $138 +3.3% $141 $135 +4.2%
Median Days in RPR 53 54 -1.9% 65.73 55.49 +18.5%
Months of Inventory 2.2 2.8 -22.7% 2.6 3.1 -16.2%
Absorption Rate 46.38% 35.85% +10.5% 38.86% 32.56% +6.3%
Sales Activity Charts Metrics
Closed Sales Count 29 43 -32.6% 276 368 -25%
Closed Sales Volume $6,971,100 $9,318,250 -25.2% $65,155,363 $74,087,872 -12.1%
Average Sales Price $240,383 $216,703 +10.9% $236,070 $201,326 +17.3%
Median Sales Price $238,000 $230,000 +3.5% $229,162 $203,341 +12.7%
Average Sales Price per Sq Ft $139 $119 +16.4% $134 $117 +14%
Median Sales Price per Sq Ft $146 $128 +14.1% $138 $128 +7.7%
Distressed Charts Metrics
Distressed Listing Count – 1 – N/A N/A
Lynn Haven Market Report Q3 2020
Copyright 2020 Realtors Property Resource® LLC. All Rights Reserved. Information is not guaranteed. Equal Housing Opportunity.
10/5/20201 of 12
Current Year
Prior Year
Percent Change from Prior Year
Current Year
Prior Year
Percent Change from Prior Year
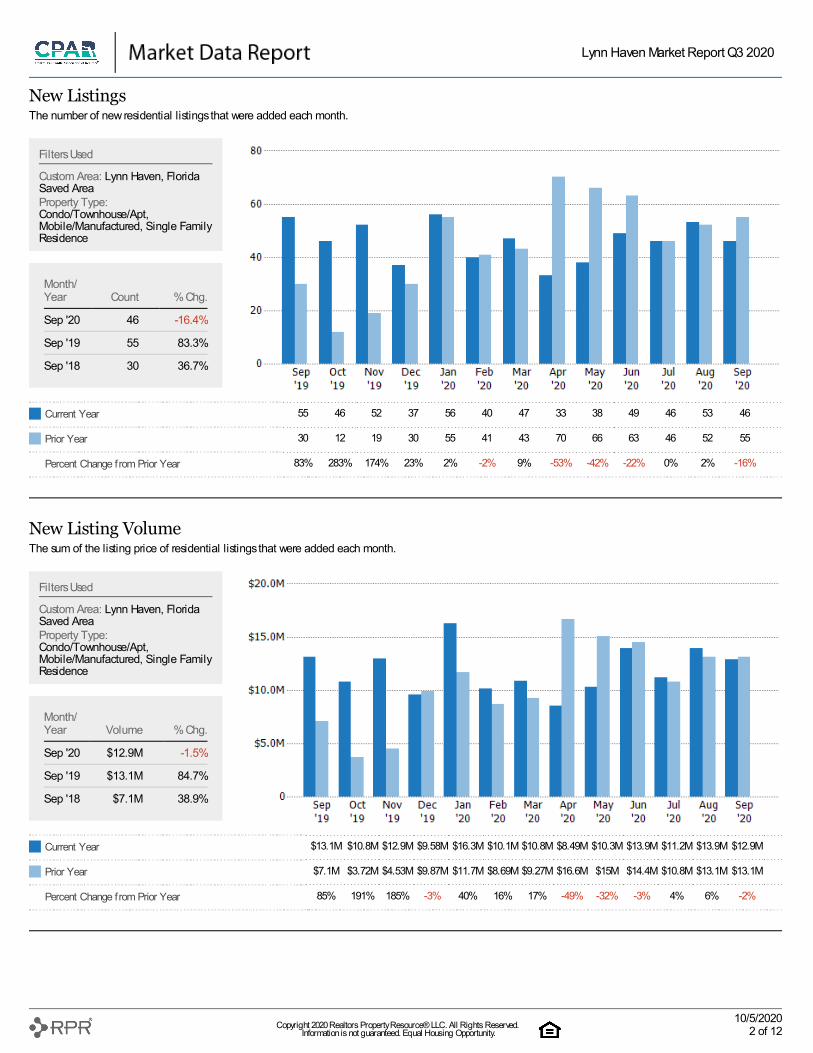
New ListingsThe number of new residential listings that were added each month.
55 46 52 37 56 40 47 33 38 49 46 53 46
30 12 19 30 55 41 43 70 66 63 46 52 55
83% 283% 174% 23% 2% -2% 9% -53% -42% -22% 0% 2% -16%
New Listing VolumeThe sum of the listing price of residential listings that were added each month.
$13.1M $10.8M $12.9M $9.58M $16.3M $10.1M $10.8M $8.49M $10.3M $13.9M $11.2M $13.9M $12.9M
$7.1M $3.72M $4.53M $9.87M $11.7M $8.69M $9.27M $16.6M $15M $14.4M $10.8M $13.1M $13.1M
85% 191% 185% -3% 40% 16% 17% -49% -32% -3% 4% 6% -2%
Filters Used
Custom Area: Lynn Haven, FloridaSaved AreaProperty Type:Condo/Townhouse/Apt,Mobile/Manufactured, Single FamilyResidence
Month/Year Count % Chg.
Sep '20 46 -16.4%
Sep '19 55 83.3%
Sep '18 30 36.7%
Filters Used
Custom Area: Lynn Haven, FloridaSaved AreaProperty Type:Condo/Townhouse/Apt,Mobile/Manufactured, Single FamilyResidence
Month/Year Volume % Chg.
Sep '20 $12.9M -1.5%
Sep '19 $13.1M 84.7%
Sep '18 $7.1M 38.9%
Lynn Haven Market Report Q3 2020
Copyright 2020 Realtors Property Resource® LLC. All Rights Reserved. Information is not guaranteed. Equal Housing Opportunity.
10/5/20202 of 12
Current Year
Prior Year
Percent Change from Prior Year
Current Year
Prior Year
Percent Change from Prior Year
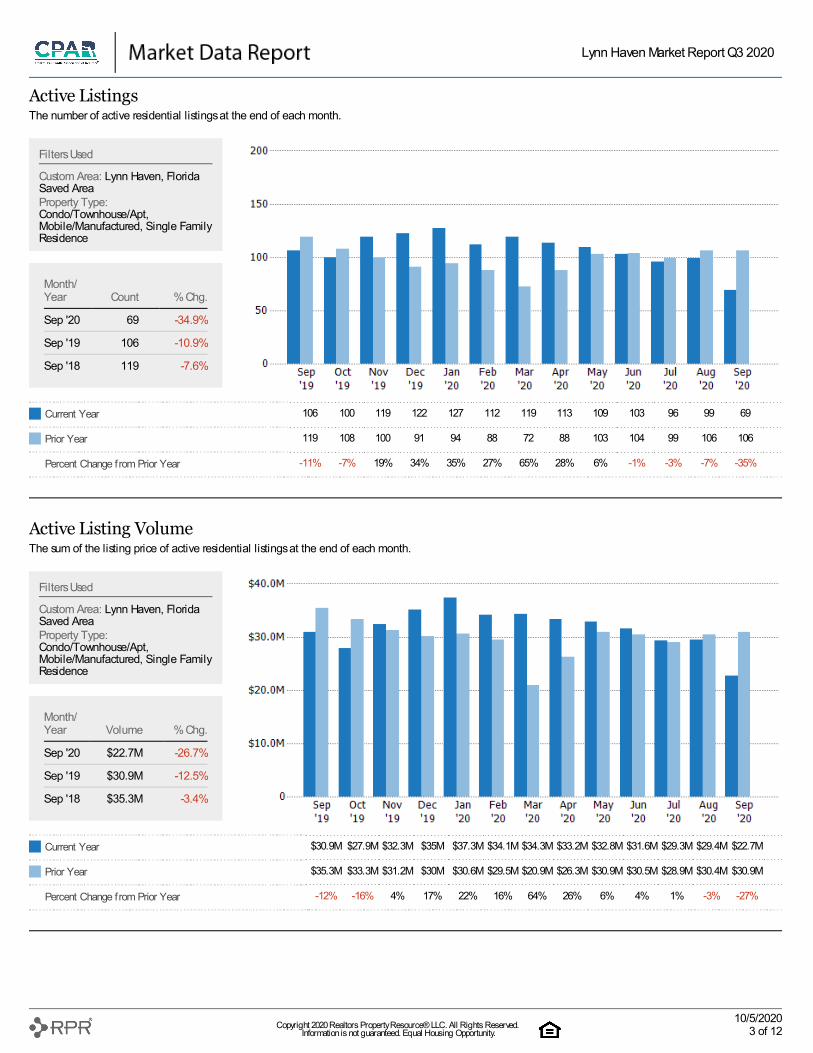
Active ListingsThe number of active residential listings at the end of each month.
106 100 119 122 127 112 119 113 109 103 96 99 69
119 108 100 91 94 88 72 88 103 104 99 106 106
-11% -7% 19% 34% 35% 27% 65% 28% 6% -1% -3% -7% -35%
Active Listing VolumeThe sum of the listing price of active residential listings at the end of each month.
$30.9M $27.9M $32.3M $35M $37.3M $34.1M $34.3M $33.2M $32.8M $31.6M $29.3M $29.4M $22.7M
$35.3M $33.3M $31.2M $30M $30.6M $29.5M $20.9M $26.3M $30.9M $30.5M $28.9M $30.4M $30.9M
-12% -16% 4% 17% 22% 16% 64% 26% 6% 4% 1% -3% -27%
Filters Used
Custom Area: Lynn Haven, FloridaSaved AreaProperty Type:Condo/Townhouse/Apt,Mobile/Manufactured, Single FamilyResidence
Month/Year Count % Chg.
Sep '20 69 -34.9%
Sep '19 106 -10.9%
Sep '18 119 -7.6%
Filters Used
Custom Area: Lynn Haven, FloridaSaved AreaProperty Type:Condo/Townhouse/Apt,Mobile/Manufactured, Single FamilyResidence
Month/Year Volume % Chg.
Sep '20 $22.7M -26.7%
Sep '19 $30.9M -12.5%
Sep '18 $35.3M -3.4%
Lynn Haven Market Report Q3 2020
Copyright 2020 Realtors Property Resource® LLC. All Rights Reserved. Information is not guaranteed. Equal Housing Opportunity.
10/5/20203 of 12
Current Year
Prior Year
Percent Change from Prior Year
Current Year
Prior Year
Percent Change from Prior Year
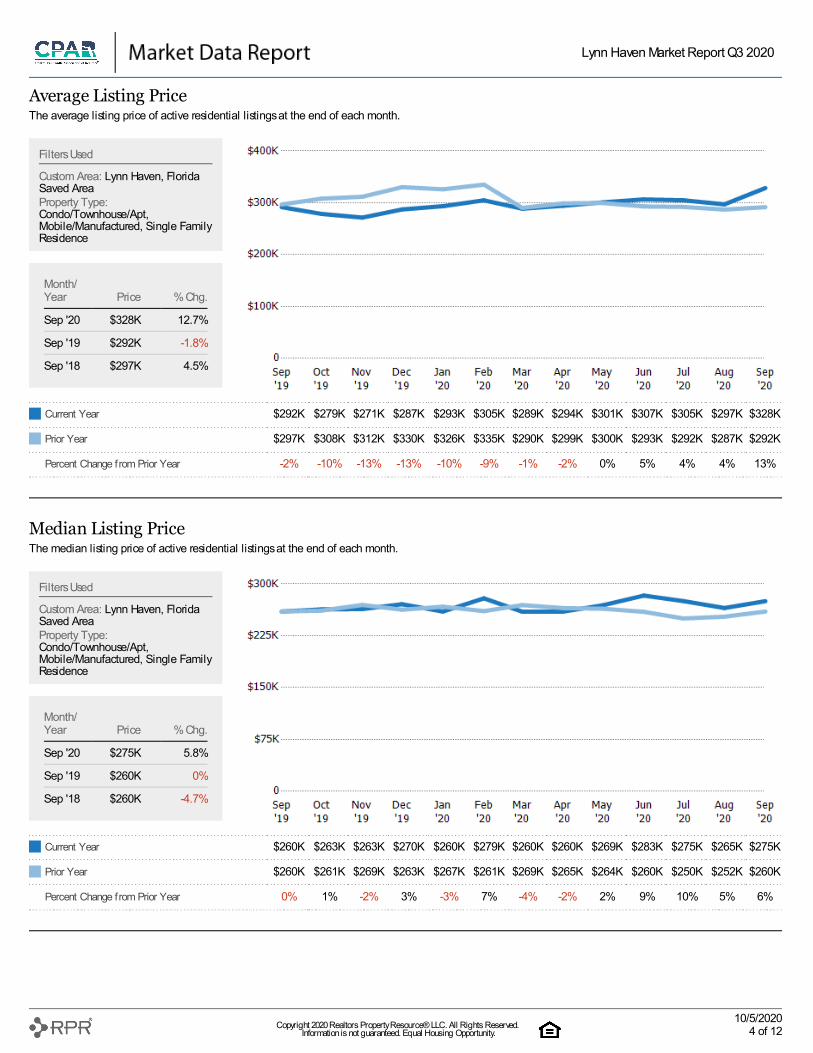
Average Listing PriceThe average listing price of active residential listings at the end of each month.
$292K $279K $271K $287K $293K $305K $289K $294K $301K $307K $305K $297K $328K
$297K $308K $312K $330K $326K $335K $290K $299K $300K $293K $292K $287K $292K
-2% -10% -13% -13% -10% -9% -1% -2% 0% 5% 4% 4% 13%
Median Listing PriceThe median listing price of active residential listings at the end of each month.
$260K $263K $263K $270K $260K $279K $260K $260K $269K $283K $275K $265K $275K
$260K $261K $269K $263K $267K $261K $269K $265K $264K $260K $250K $252K $260K
0% 1% -2% 3% -3% 7% -4% -2% 2% 9% 10% 5% 6%
Filters Used
Custom Area: Lynn Haven, FloridaSaved AreaProperty Type:Condo/Townhouse/Apt,Mobile/Manufactured, Single FamilyResidence
Month/Year Price % Chg.
Sep '20 $328K 12.7%
Sep '19 $292K -1.8%
Sep '18 $297K 4.5%
Filters Used
Custom Area: Lynn Haven, FloridaSaved AreaProperty Type:Condo/Townhouse/Apt,Mobile/Manufactured, Single FamilyResidence
Month/Year Price % Chg.
Sep '20 $275K 5.8%
Sep '19 $260K 0%
Sep '18 $260K -4.7%
Lynn Haven Market Report Q3 2020
Copyright 2020 Realtors Property Resource® LLC. All Rights Reserved. Information is not guaranteed. Equal Housing Opportunity.
10/5/20204 of 12
Current Year
Prior Year
Percent Change from Prior Year
Current Year
Prior Year
Percent Change from Prior Year
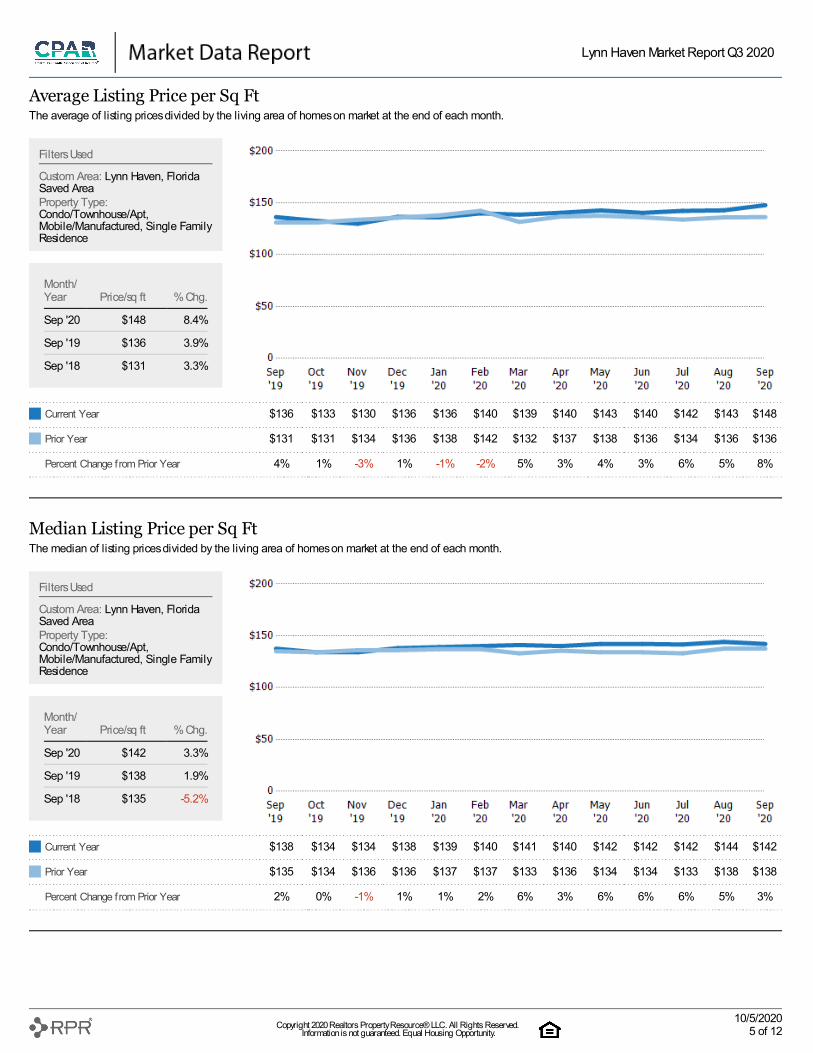
Average Listing Price per Sq FtThe average of listing prices divided by the living area of homes on market at the end of each month.
$136 $133 $130 $136 $136 $140 $139 $140 $143 $140 $142 $143 $148
$131 $131 $134 $136 $138 $142 $132 $137 $138 $136 $134 $136 $136
4% 1% -3% 1% -1% -2% 5% 3% 4% 3% 6% 5% 8%
Median Listing Price per Sq FtThe median of listing prices divided by the living area of homes on market at the end of each month.
$138 $134 $134 $138 $139 $140 $141 $140 $142 $142 $142 $144 $142
$135 $134 $136 $136 $137 $137 $133 $136 $134 $134 $133 $138 $138
2% 0% -1% 1% 1% 2% 6% 3% 6% 6% 6% 5% 3%
Filters Used
Custom Area: Lynn Haven, FloridaSaved AreaProperty Type:Condo/Townhouse/Apt,Mobile/Manufactured, Single FamilyResidence
Month/Year Price/sq ft % Chg.
Sep '20 $148 8.4%
Sep '19 $136 3.9%
Sep '18 $131 3.3%
Filters Used
Custom Area: Lynn Haven, FloridaSaved AreaProperty Type:Condo/Townhouse/Apt,Mobile/Manufactured, Single FamilyResidence
Month/Year Price/sq ft % Chg.
Sep '20 $142 3.3%
Sep '19 $138 1.9%
Sep '18 $135 -5.2%
Lynn Haven Market Report Q3 2020
Copyright 2020 Realtors Property Resource® LLC. All Rights Reserved. Information is not guaranteed. Equal Housing Opportunity.
10/5/20205 of 12
Current Year
Prior Year
Percent Change from Prior Year
Current Year
Prior Year
Percent Change from Prior Year
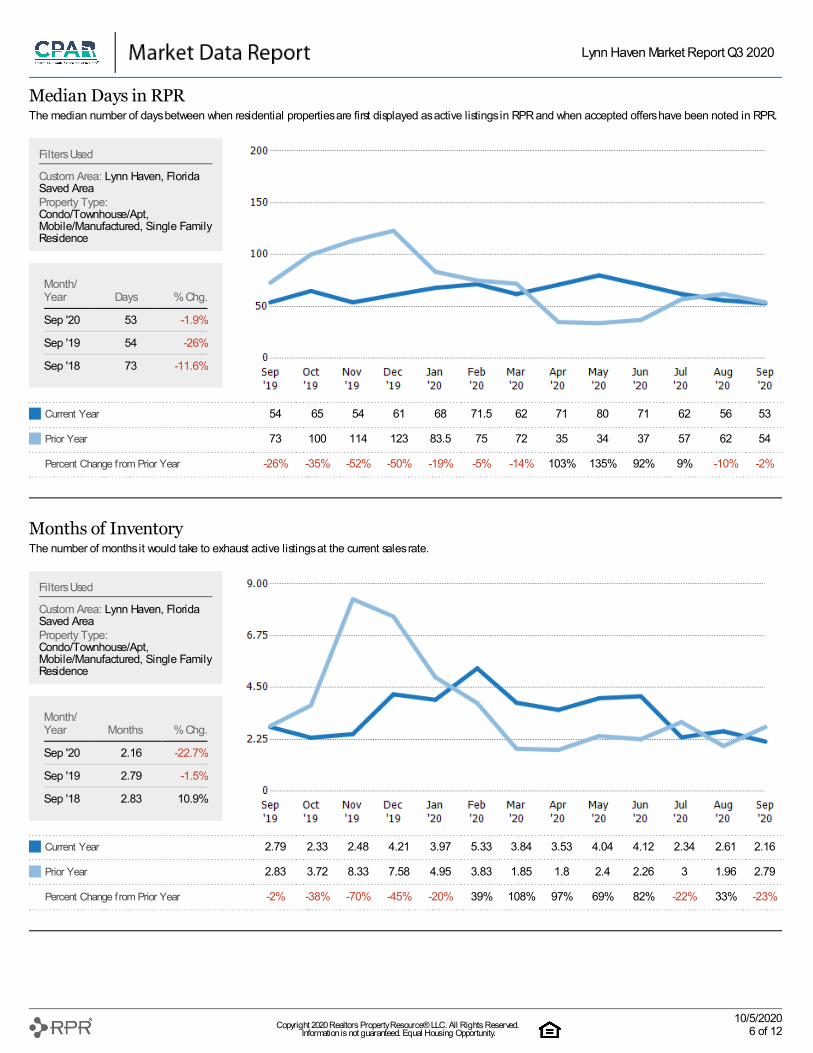
Median Days in RPRThe median number of days between when residential properties are first displayed as active listings in RPR and when accepted offers have been noted in RPR.
54 65 54 61 68 71.5 62 71 80 71 62 56 53
73 100 114 123 83.5 75 72 35 34 37 57 62 54
-26% -35% -52% -50% -19% -5% -14% 103% 135% 92% 9% -10% -2%
Months of InventoryThe number of months it would take to exhaust active listings at the current sales rate.
2.79 2.33 2.48 4.21 3.97 5.33 3.84 3.53 4.04 4.12 2.34 2.61 2.16
2.83 3.72 8.33 7.58 4.95 3.83 1.85 1.8 2.4 2.26 3 1.96 2.79
-2% -38% -70% -45% -20% 39% 108% 97% 69% 82% -22% 33% -23%
Filters Used
Custom Area: Lynn Haven, FloridaSaved AreaProperty Type:Condo/Townhouse/Apt,Mobile/Manufactured, Single FamilyResidence
Month/Year Days % Chg.
Sep '20 53 -1.9%
Sep '19 54 -26%
Sep '18 73 -11.6%
Filters Used
Custom Area: Lynn Haven, FloridaSaved AreaProperty Type:Condo/Townhouse/Apt,Mobile/Manufactured, Single FamilyResidence
Month/Year Months % Chg.
Sep '20 2.16 -22.7%
Sep '19 2.79 -1.5%
Sep '18 2.83 10.9%
Lynn Haven Market Report Q3 2020
Copyright 2020 Realtors Property Resource® LLC. All Rights Reserved. Information is not guaranteed. Equal Housing Opportunity.
10/5/20206 of 12
Current Year
Prior Year
Change from Prior Year
Current Year
Prior Year
Percent Change from Prior Year
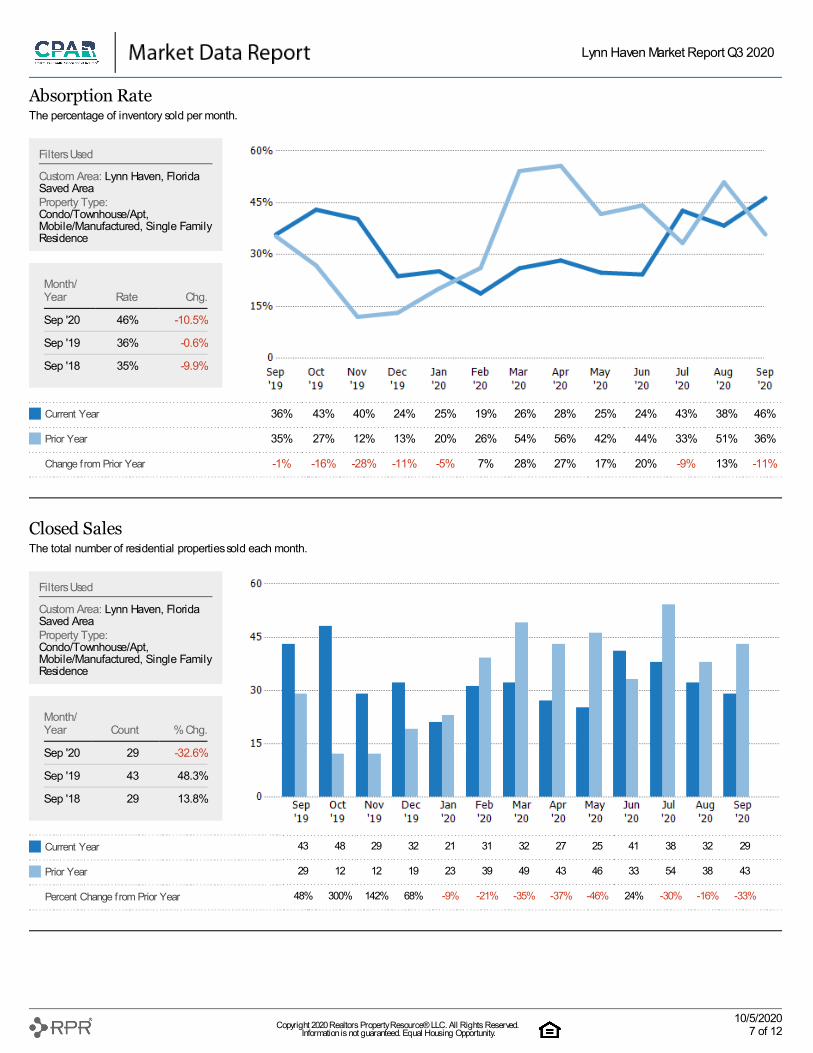
Absorption RateThe percentage of inventory sold per month.
36% 43% 40% 24% 25% 19% 26% 28% 25% 24% 43% 38% 46%
35% 27% 12% 13% 20% 26% 54% 56% 42% 44% 33% 51% 36%
-1% -16% -28% -11% -5% 7% 28% 27% 17% 20% -9% 13% -11%
Closed SalesThe total number of residential properties sold each month.
43 48 29 32 21 31 32 27 25 41 38 32 29
29 12 12 19 23 39 49 43 46 33 54 38 43
48% 300% 142% 68% -9% -21% -35% -37% -46% 24% -30% -16% -33%
Filters Used
Custom Area: Lynn Haven, FloridaSaved AreaProperty Type:Condo/Townhouse/Apt,Mobile/Manufactured, Single FamilyResidence
Month/Year Rate Chg.
Sep '20 46% -10.5%
Sep '19 36% -0.6%
Sep '18 35% -9.9%
Filters Used
Custom Area: Lynn Haven, FloridaSaved AreaProperty Type:Condo/Townhouse/Apt,Mobile/Manufactured, Single FamilyResidence
Month/Year Count % Chg.
Sep '20 29 -32.6%
Sep '19 43 48.3%
Sep '18 29 13.8%
Lynn Haven Market Report Q3 2020
Copyright 2020 Realtors Property Resource® LLC. All Rights Reserved. Information is not guaranteed. Equal Housing Opportunity.
10/5/20207 of 12
Current Year
Prior Year
Percent Change from Prior Year
Single Family Residence
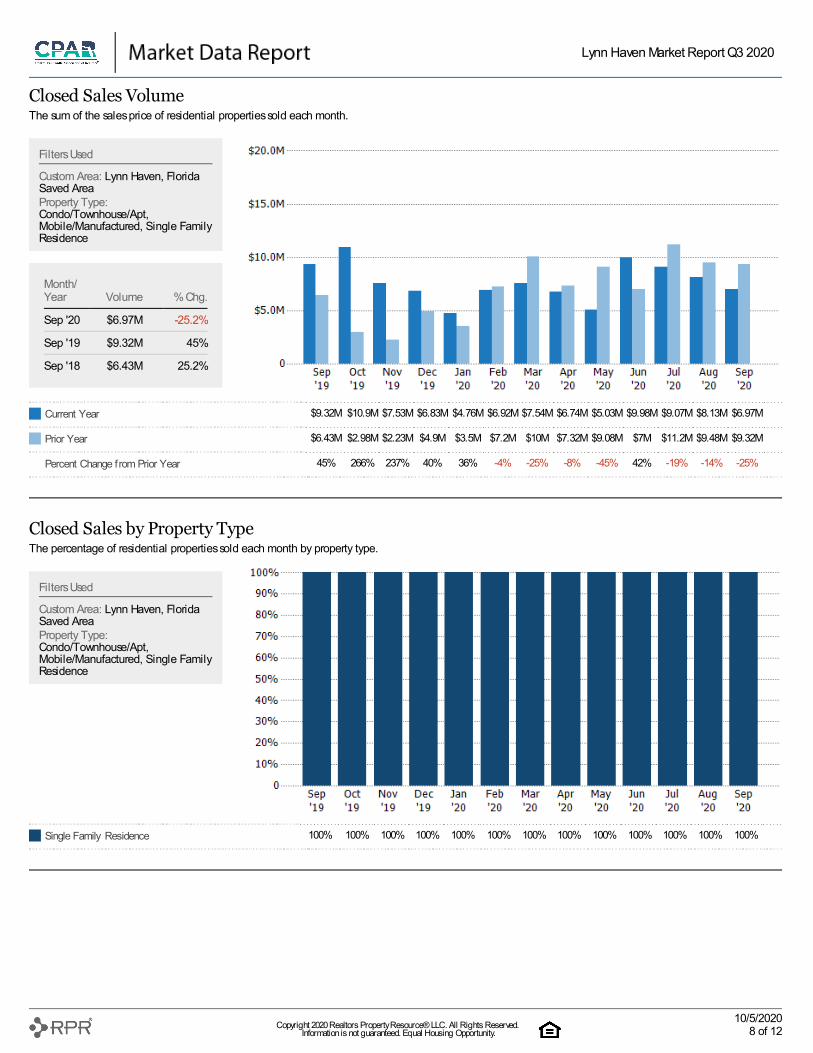
Closed Sales VolumeThe sum of the sales price of residential properties sold each month.
$9.32M $10.9M $7.53M $6.83M $4.76M $6.92M $7.54M $6.74M $5.03M $9.98M $9.07M $8.13M $6.97M
$6.43M $2.98M $2.23M $4.9M $3.5M $7.2M $10M $7.32M $9.08M $7M $11.2M $9.48M $9.32M
45% 266% 237% 40% 36% -4% -25% -8% -45% 42% -19% -14% -25%
Closed Sales by Property TypeThe percentage of residential properties sold each month by property type.
100% 100% 100% 100% 100% 100% 100% 100% 100% 100% 100% 100% 100%
Filters Used
Custom Area: Lynn Haven, FloridaSaved AreaProperty Type:Condo/Townhouse/Apt,Mobile/Manufactured, Single FamilyResidence
Month/Year Volume % Chg.
Sep '20 $6.97M -25.2%
Sep '19 $9.32M 45%
Sep '18 $6.43M 25.2%
Filters Used
Custom Area: Lynn Haven, FloridaSaved AreaProperty Type:Condo/Townhouse/Apt,Mobile/Manufactured, Single FamilyResidence
Lynn Haven Market Report Q3 2020
Copyright 2020 Realtors Property Resource® LLC. All Rights Reserved. Information is not guaranteed. Equal Housing Opportunity.
10/5/20208 of 12
Current Year
Prior Year
Percent Change from Prior Year
Current Year
Prior Year
Percent Change from Prior Year
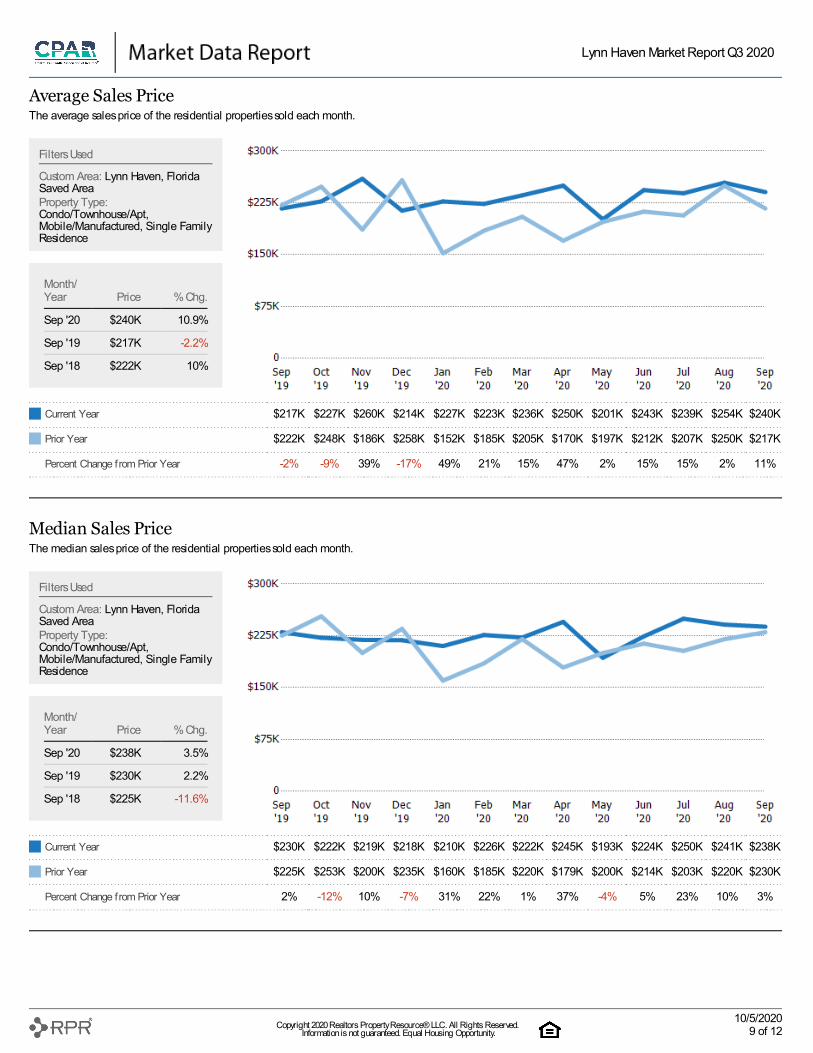
Average Sales PriceThe average sales price of the residential properties sold each month.
$217K $227K $260K $214K $227K $223K $236K $250K $201K $243K $239K $254K $240K
$222K $248K $186K $258K $152K $185K $205K $170K $197K $212K $207K $250K $217K
-2% -9% 39% -17% 49% 21% 15% 47% 2% 15% 15% 2% 11%
Median Sales PriceThe median sales price of the residential properties sold each month.
$230K $222K $219K $218K $210K $226K $222K $245K $193K $224K $250K $241K $238K
$225K $253K $200K $235K $160K $185K $220K $179K $200K $214K $203K $220K $230K
2% -12% 10% -7% 31% 22% 1% 37% -4% 5% 23% 10% 3%
Filters Used
Custom Area: Lynn Haven, FloridaSaved AreaProperty Type:Condo/Townhouse/Apt,Mobile/Manufactured, Single FamilyResidence
Month/Year Price % Chg.
Sep '20 $240K 10.9%
Sep '19 $217K -2.2%
Sep '18 $222K 10%
Filters Used
Custom Area: Lynn Haven, FloridaSaved AreaProperty Type:Condo/Townhouse/Apt,Mobile/Manufactured, Single FamilyResidence
Month/Year Price % Chg.
Sep '20 $238K 3.5%
Sep '19 $230K 2.2%
Sep '18 $225K -11.6%
Lynn Haven Market Report Q3 2020
Copyright 2020 Realtors Property Resource® LLC. All Rights Reserved. Information is not guaranteed. Equal Housing Opportunity.
10/5/20209 of 12
Current Year
Prior Year
Percent Change from Prior Year
Current Year
Prior Year
Percent Change from Prior Year
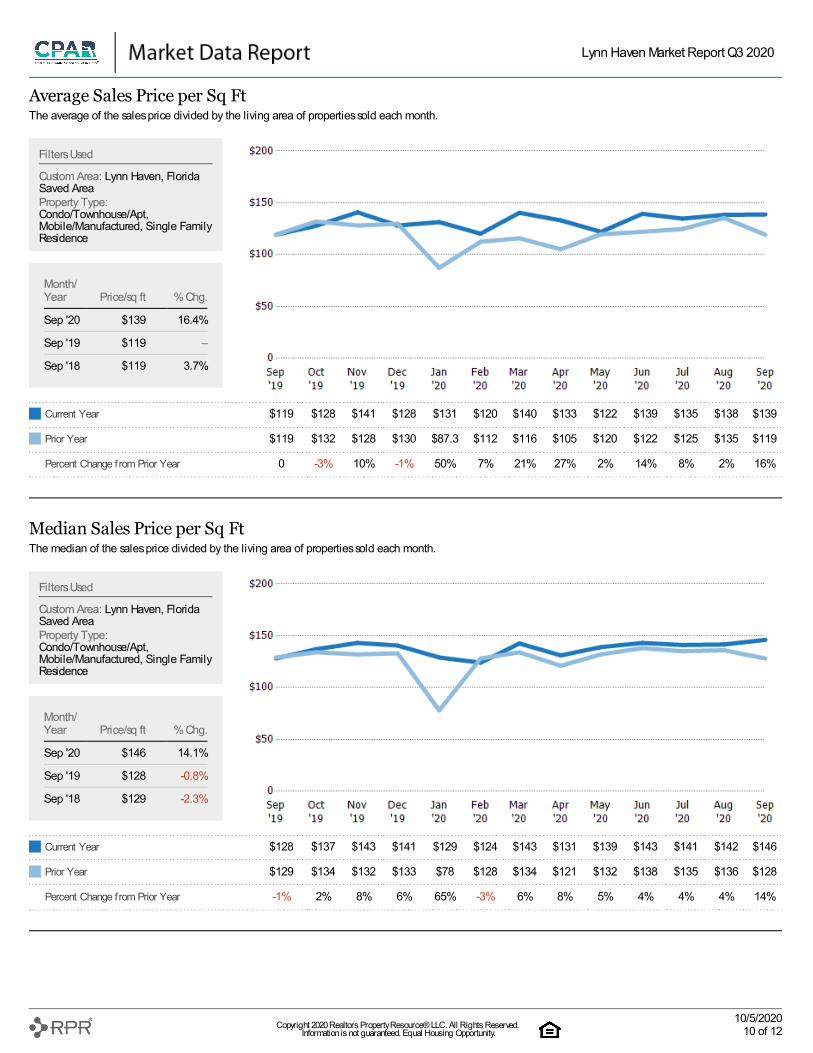
Average Sales Price per Sq FtThe average of the sales price divided by the living area of properties sold each month.
$119 $128 $141 $128 $131 $120 $140 $133 $122 $139 $135 $138 $139
$119 $132 $128 $130 $87.3 $112 $116 $105 $120 $122 $125 $135 $119
0 -3% 10% -1% 50% 7% 21% 27% 2% 14% 8% 2% 16%
Median Sales Price per Sq FtThe median of the sales price divided by the living area of properties sold each month.
$128 $137 $143 $141 $129 $124 $143 $131 $139 $143 $141 $142 $146
$129 $134 $132 $133 $78 $128 $134 $121 $132 $138 $135 $136 $128
-1% 2% 8% 6% 65% -3% 6% 8% 5% 4% 4% 4% 14%
Filters Used
Custom Area: Lynn Haven, FloridaSaved AreaProperty Type:Condo/Townhouse/Apt,Mobile/Manufactured, Single FamilyResidence
Month/Year Price/sq ft % Chg.
Sep '20 $139 16.4%
Sep '19 $119 –
Sep '18 $119 3.7%
Filters Used
Custom Area: Lynn Haven, FloridaSaved AreaProperty Type:Condo/Townhouse/Apt,Mobile/Manufactured, Single FamilyResidence
Month/Year Price/sq ft % Chg.
Sep '20 $146 14.1%
Sep '19 $128 -0.8%
Sep '18 $129 -2.3%
Lynn Haven Market Report Q3 2020
Copyright 2020 Realtors Property Resource® LLC. All Rights Reserved. Information is not guaranteed. Equal Housing Opportunity.
10/5/202010 of 12
Avg List Price
Avg Sales Price
Avg Sales Price as a % of Avg List Price
Median List Price
Median Sales Price
Med Sales Price as a % of Med List Price
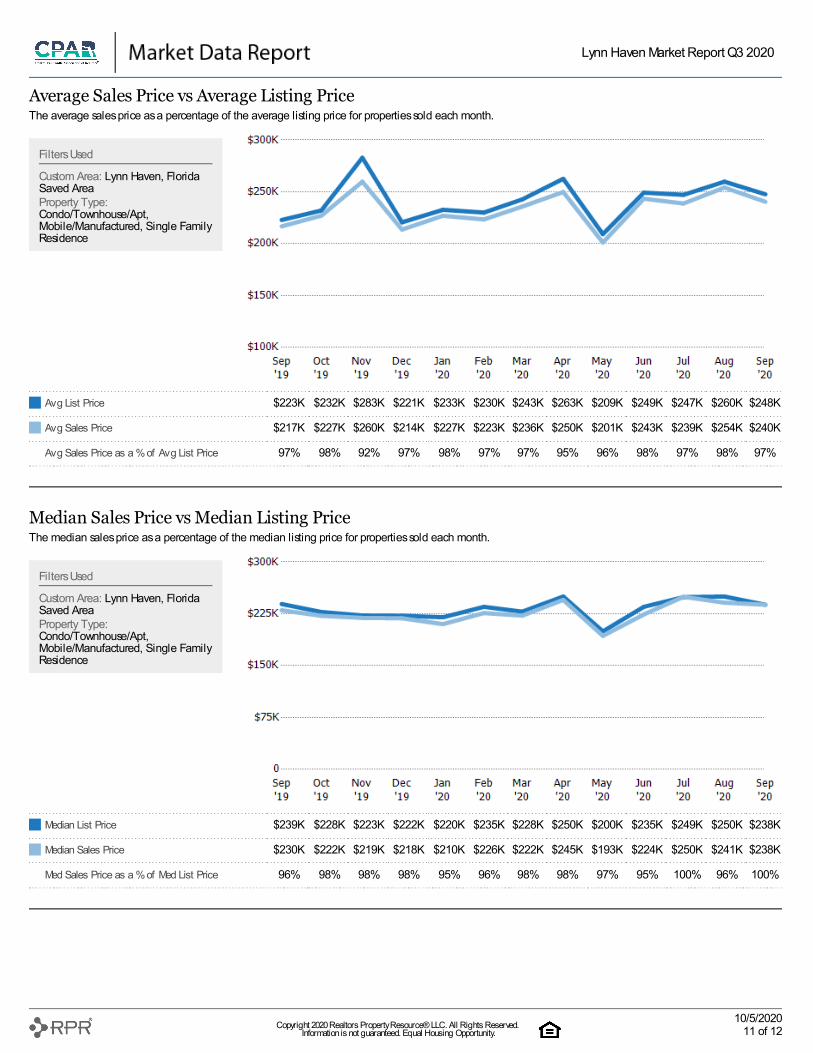
Average Sales Price vs Average Listing PriceThe average sales price as a percentage of the average listing price for properties sold each month.
$223K $232K $283K $221K $233K $230K $243K $263K $209K $249K $247K $260K $248K
$217K $227K $260K $214K $227K $223K $236K $250K $201K $243K $239K $254K $240K
97% 98% 92% 97% 98% 97% 97% 95% 96% 98% 97% 98% 97%
Median Sales Price vs Median Listing PriceThe median sales price as a percentage of the median listing price for properties sold each month.
$239K $228K $223K $222K $220K $235K $228K $250K $200K $235K $249K $250K $238K
$230K $222K $219K $218K $210K $226K $222K $245K $193K $224K $250K $241K $238K
96% 98% 98% 98% 95% 96% 98% 98% 97% 95% 100% 96% 100%
Filters Used
Custom Area: Lynn Haven, FloridaSaved AreaProperty Type:Condo/Townhouse/Apt,Mobile/Manufactured, Single FamilyResidence
Filters Used
Custom Area: Lynn Haven, FloridaSaved AreaProperty Type:Condo/Townhouse/Apt,Mobile/Manufactured, Single FamilyResidence
Lynn Haven Market Report Q3 2020
Copyright 2020 Realtors Property Resource® LLC. All Rights Reserved. Information is not guaranteed. Equal Housing Opportunity.
10/5/202011 of 12
Current Year
Prior Year
Percent Change from Prior Year
Current Year
Prior Year
Percent Change from Prior Year
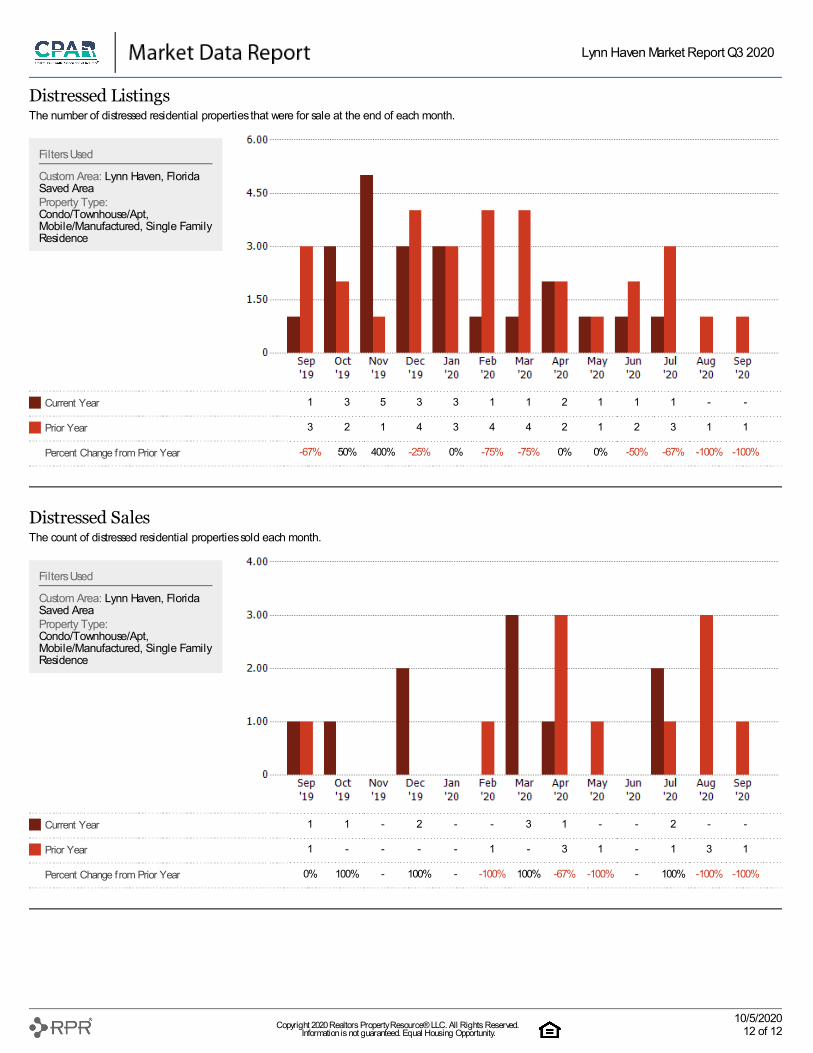
Distressed ListingsThe number of distressed residential properties that were for sale at the end of each month.
1 3 5 3 3 1 1 2 1 1 1 - -
3 2 1 4 3 4 4 2 1 2 3 1 1
-67% 50% 400% -25% 0% -75% -75% 0% 0% -50% -67% -100% -100%
Distressed SalesThe count of distressed residential properties sold each month.
1 1 - 2 - - 3 1 - - 2 - -
1 - - - - 1 - 3 1 - 1 3 1
0% 100% - 100% - -100% 100% -67% -100% - 100% -100% -100%
Filters Used
Custom Area: Lynn Haven, FloridaSaved AreaProperty Type:Condo/Townhouse/Apt,Mobile/Manufactured, Single FamilyResidence
Filters Used
Custom Area: Lynn Haven, FloridaSaved AreaProperty Type:Condo/Townhouse/Apt,Mobile/Manufactured, Single FamilyResidence
Lynn Haven Market Report Q3 2020
Copyright 2020 Realtors Property Resource® LLC. All Rights Reserved. Information is not guaranteed. Equal Housing Opportunity.
10/5/202012 of 12
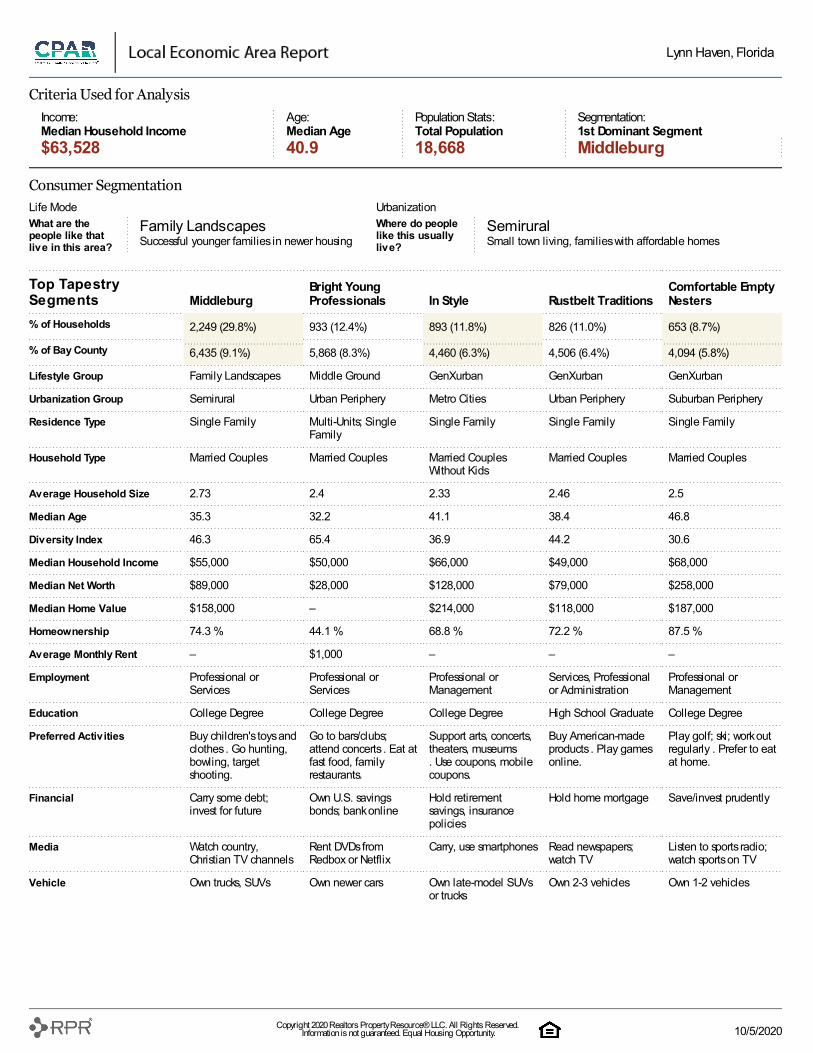
Criteria Used for AnalysisIncome:Median Household Income
Age:Median Age
Population Stats:Total Population
Segmentation:1st Dominant Segment
$63,528 40.9 18,668 Middleburg
Consumer SegmentationLife Mode UrbanizationWhat are thepeople like thatlive in this area?
Family LandscapesSuccessful younger families in newer housing
Where do peoplelike this usuallylive?
SemiruralSmall town living, families with affordable homes
Top TapestrySegments Middleburg
Bright YoungProfessionals In Style Rustbelt Traditions
Comfortable EmptyNesters
% of Households 2,249 (29.8%) 933 (12.4%) 893 (11.8%) 826 (11.0%) 653 (8.7%)
% of Bay County 6,435 (9.1%) 5,868 (8.3%) 4,460 (6.3%) 4,506 (6.4%) 4,094 (5.8%)
Lifestyle Group Family Landscapes Middle Ground GenXurban GenXurban GenXurban
Urbanization Group Semirural Urban Periphery Metro Cities Urban Periphery Suburban Periphery
Residence Type Single Family Multi-Units; SingleFamily
Single Family Single Family Single Family
Household Type Married Couples Married Couples Married CouplesWithout Kids
Married Couples Married Couples
Average Household Size 2.73 2.4 2.33 2.46 2.5
Median Age 35.3 32.2 41.1 38.4 46.8
Diversity Index 46.3 65.4 36.9 44.2 30.6
Median Household Income $55,000 $50,000 $66,000 $49,000 $68,000
Median Net Worth $89,000 $28,000 $128,000 $79,000 $258,000
Median Home Value $158,000 – $214,000 $118,000 $187,000
Homeownership 74.3 % 44.1 % 68.8 % 72.2 % 87.5 %
Average Monthly Rent – $1,000 – – –
Employment Professional orServices
Professional orServices
Professional orManagement
Services, Professionalor Administration
Professional orManagement
Education College Degree College Degree College Degree High School Graduate College Degree
Preferred Activities Buy children's toys andclothes . Go hunting,bowling, targetshooting.
Go to bars/clubs;attend concerts . Eat atfast food, familyrestaurants.
Support arts, concerts,theaters, museums. Use coupons, mobilecoupons.
Buy American-madeproducts . Play gamesonline.
Play golf; ski; work outregularly . Prefer to eatat home.
Financial Carry some debt;invest for future
Own U.S. savingsbonds; bank online
Hold retirementsavings, insurancepolicies
Hold home mortgage Save/invest prudently
Media Watch country,Christian TV channels
Rent DVDs fromRedbox or Netflix
Carry, use smartphones Read newspapers;watch TV
Listen to sports radio;watch sports on TV
Vehicle Own trucks, SUVs Own newer cars Own late-model SUVsor trucks
Own 2-3 vehicles Own 1-2 vehicles
Lynn Haven, Florida
Copyright 2020 Realtors Property Resource® LLC. All Rights Reserved. Information is not guaranteed. Equal Housing Opportunity. 10/5/2020
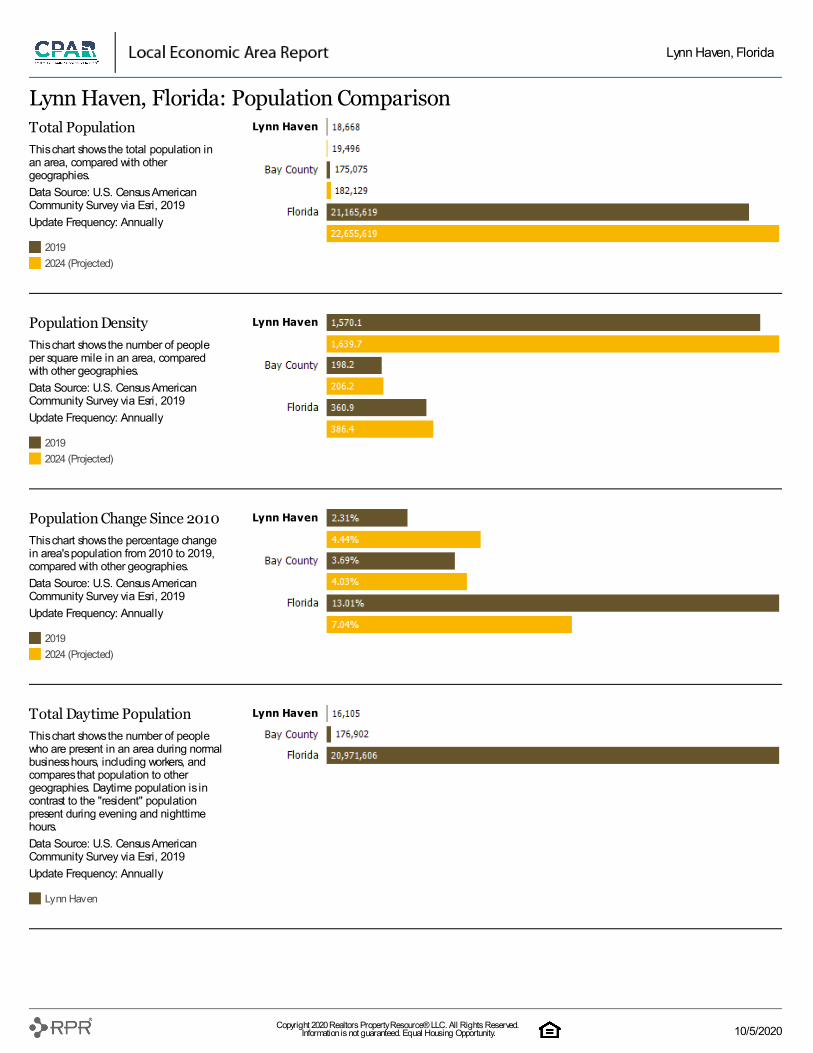
20192024 (Projected)
Total PopulationThis chart shows the total population inan area, compared with othergeographies.Data Source: U.S. Census AmericanCommunity Survey via Esri, 2019Update Frequency: Annually
20192024 (Projected)
Population DensityThis chart shows the number of peopleper square mile in an area, comparedwith other geographies.Data Source: U.S. Census AmericanCommunity Survey via Esri, 2019Update Frequency: Annually
20192024 (Projected)
Population Change Since 2010This chart shows the percentage changein area's population from 2010 to 2019,compared with other geographies.Data Source: U.S. Census AmericanCommunity Survey via Esri, 2019Update Frequency: Annually
Lynn Haven
Total Daytime PopulationThis chart shows the number of peoplewho are present in an area during normalbusiness hours, including workers, andcompares that population to othergeographies. Daytime population is incontrast to the "resident" populationpresent during evening and nighttimehours.Data Source: U.S. Census AmericanCommunity Survey via Esri, 2019Update Frequency: Annually
Lynn Haven, Florida: Population ComparisonLynn Haven
Lynn Haven
Lynn Haven
Lynn Haven
Lynn Haven, Florida
Copyright 2020 Realtors Property Resource® LLC. All Rights Reserved. Information is not guaranteed. Equal Housing Opportunity. 10/5/2020
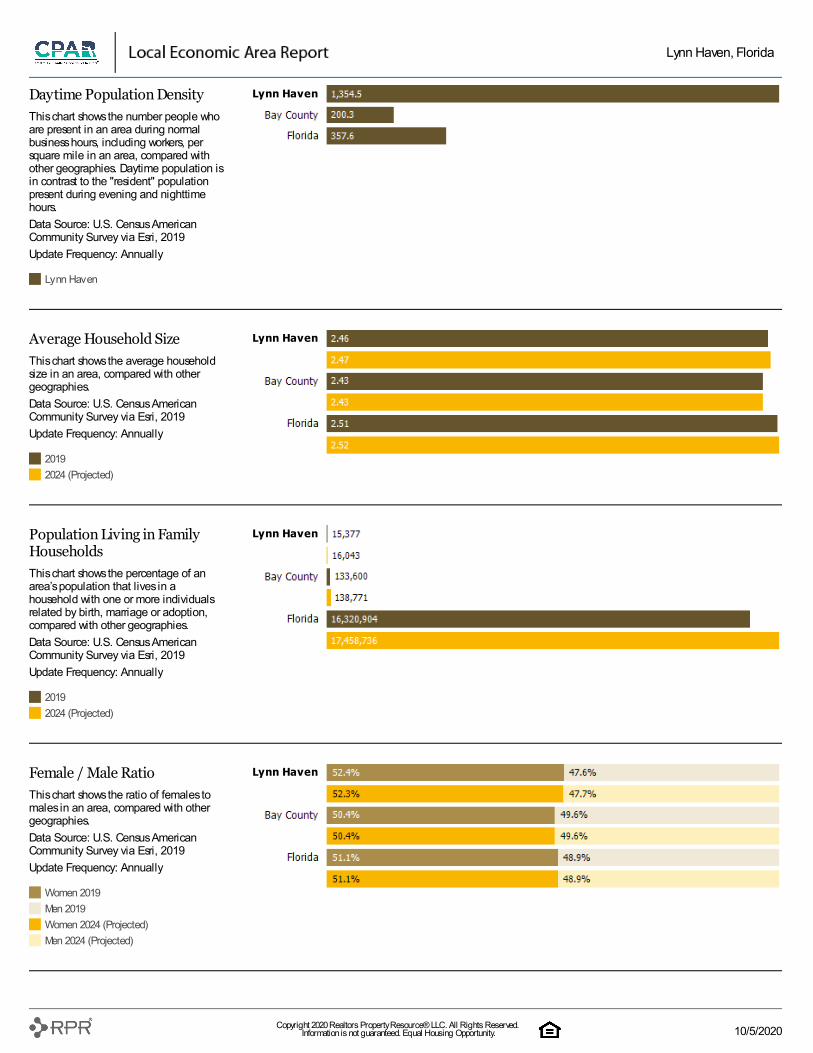
Lynn Haven
Daytime Population DensityThis chart shows the number people whoare present in an area during normalbusiness hours, including workers, persquare mile in an area, compared withother geographies. Daytime population isin contrast to the "resident" populationpresent during evening and nighttimehours.Data Source: U.S. Census AmericanCommunity Survey via Esri, 2019Update Frequency: Annually
20192024 (Projected)
Average Household SizeThis chart shows the average householdsize in an area, compared with othergeographies.Data Source: U.S. Census AmericanCommunity Survey via Esri, 2019Update Frequency: Annually
20192024 (Projected)
Population Living in FamilyHouseholdsThis chart shows the percentage of anarea’s population that lives in ahousehold with one or more individualsrelated by birth, marriage or adoption,compared with other geographies.Data Source: U.S. Census AmericanCommunity Survey via Esri, 2019Update Frequency: Annually
Women 2019Men 2019Women 2024 (Projected)Men 2024 (Projected)
Female / Male RatioThis chart shows the ratio of females tomales in an area, compared with othergeographies.Data Source: U.S. Census AmericanCommunity Survey via Esri, 2019Update Frequency: Annually
Lynn Haven
Lynn Haven
Lynn Haven
Lynn Haven
Lynn Haven, Florida
Copyright 2020 Realtors Property Resource® LLC. All Rights Reserved. Information is not guaranteed. Equal Housing Opportunity. 10/5/2020
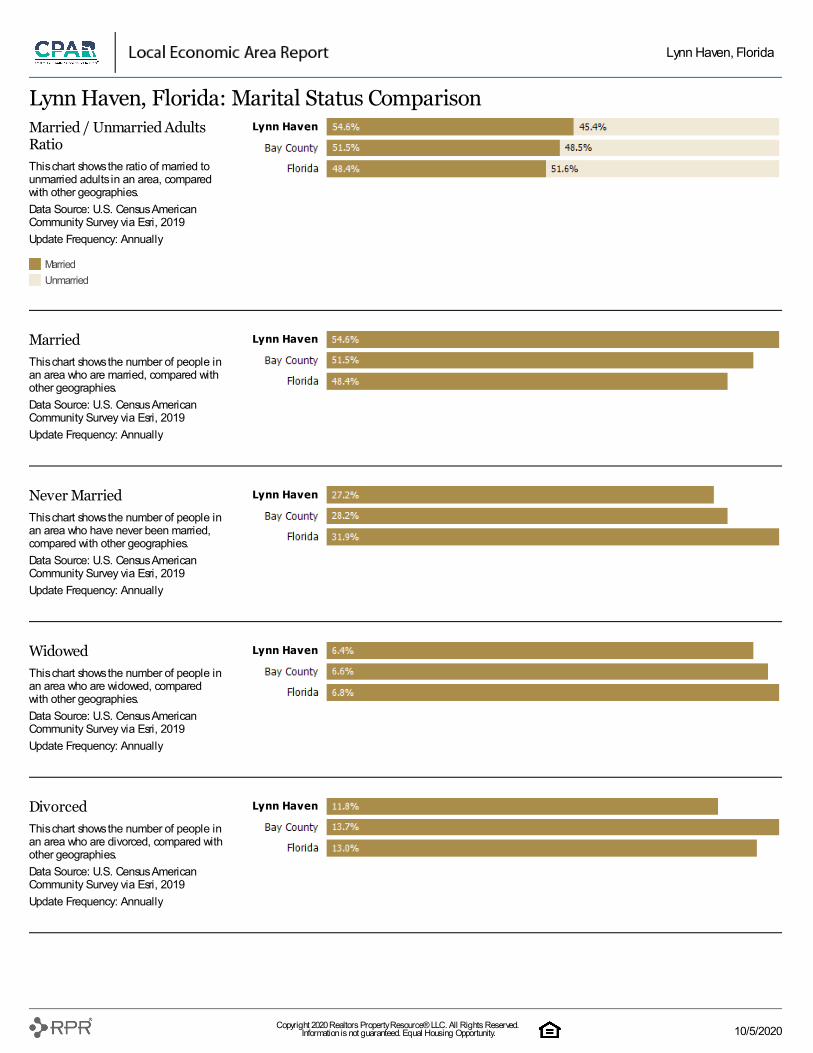
MarriedUnmarried
Married / Unmarried AdultsRatioThis chart shows the ratio of married tounmarried adults in an area, comparedwith other geographies.Data Source: U.S. Census AmericanCommunity Survey via Esri, 2019Update Frequency: Annually
MarriedThis chart shows the number of people inan area who are married, compared withother geographies.Data Source: U.S. Census AmericanCommunity Survey via Esri, 2019Update Frequency: Annually
Never MarriedThis chart shows the number of people inan area who have never been married,compared with other geographies.Data Source: U.S. Census AmericanCommunity Survey via Esri, 2019Update Frequency: Annually
WidowedThis chart shows the number of people inan area who are widowed, comparedwith other geographies.Data Source: U.S. Census AmericanCommunity Survey via Esri, 2019Update Frequency: Annually
DivorcedThis chart shows the number of people inan area who are divorced, compared withother geographies.Data Source: U.S. Census AmericanCommunity Survey via Esri, 2019Update Frequency: Annually
Lynn Haven, Florida: Marital Status ComparisonLynn Haven
Lynn Haven
Lynn Haven
Lynn Haven
Lynn Haven
Lynn Haven, Florida
Copyright 2020 Realtors Property Resource® LLC. All Rights Reserved. Information is not guaranteed. Equal Housing Opportunity. 10/5/2020
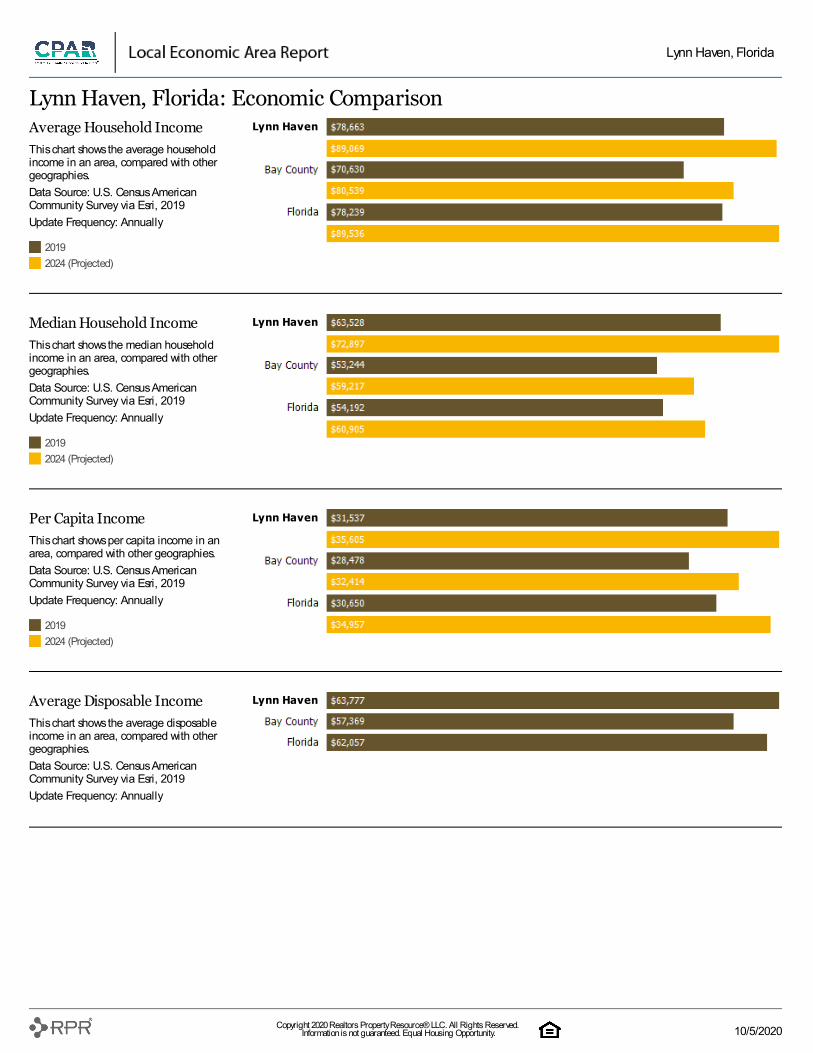
20192024 (Projected)
Average Household IncomeThis chart shows the average householdincome in an area, compared with othergeographies.Data Source: U.S. Census AmericanCommunity Survey via Esri, 2019Update Frequency: Annually
20192024 (Projected)
Median Household IncomeThis chart shows the median householdincome in an area, compared with othergeographies.Data Source: U.S. Census AmericanCommunity Survey via Esri, 2019Update Frequency: Annually
20192024 (Projected)
Per Capita IncomeThis chart shows per capita income in anarea, compared with other geographies.Data Source: U.S. Census AmericanCommunity Survey via Esri, 2019Update Frequency: Annually
Average Disposable IncomeThis chart shows the average disposableincome in an area, compared with othergeographies.Data Source: U.S. Census AmericanCommunity Survey via Esri, 2019Update Frequency: Annually
Lynn Haven, Florida: Economic ComparisonLynn Haven
Lynn Haven
Lynn Haven
Lynn Haven
Lynn Haven, Florida
Copyright 2020 Realtors Property Resource® LLC. All Rights Reserved. Information is not guaranteed. Equal Housing Opportunity. 10/5/2020
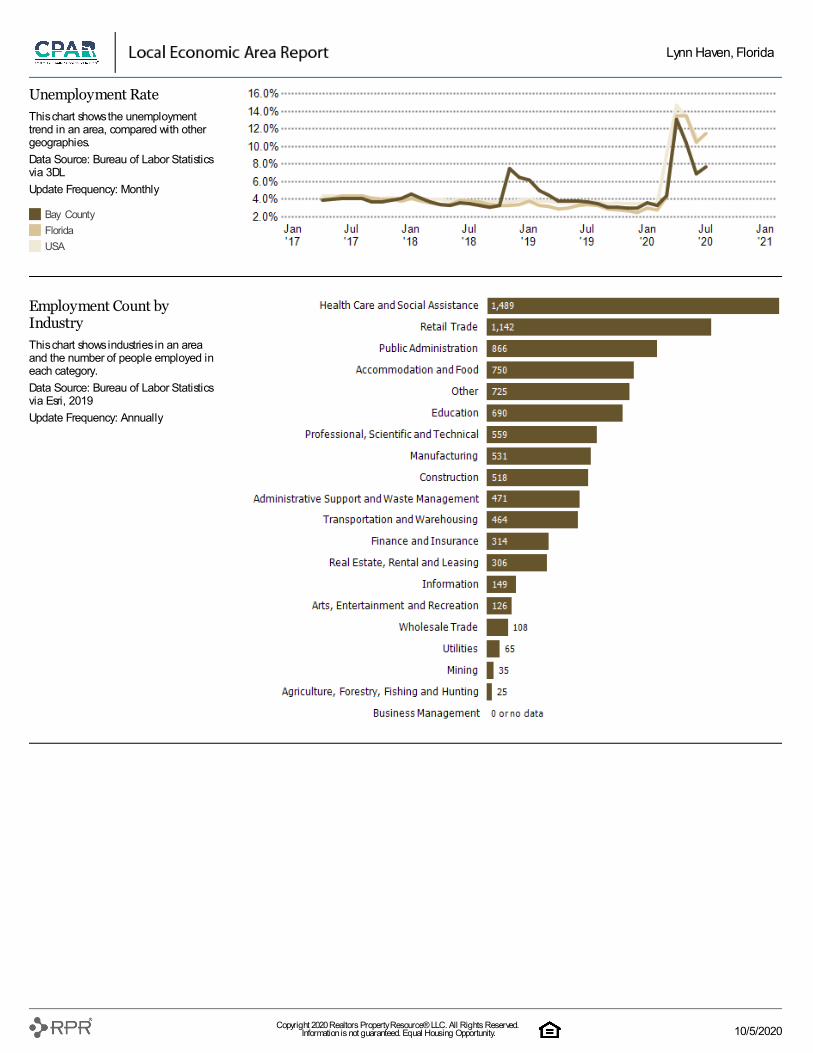
Bay CountyFloridaUSA
Unemployment RateThis chart shows the unemploymenttrend in an area, compared with othergeographies.Data Source: Bureau of Labor Statisticsvia 3DLUpdate Frequency: Monthly
Employment Count byIndustryThis chart shows industries in an areaand the number of people employed ineach category.Data Source: Bureau of Labor Statisticsvia Esri, 2019Update Frequency: Annually
Lynn Haven, Florida
Copyright 2020 Realtors Property Resource® LLC. All Rights Reserved. Information is not guaranteed. Equal Housing Opportunity. 10/5/2020
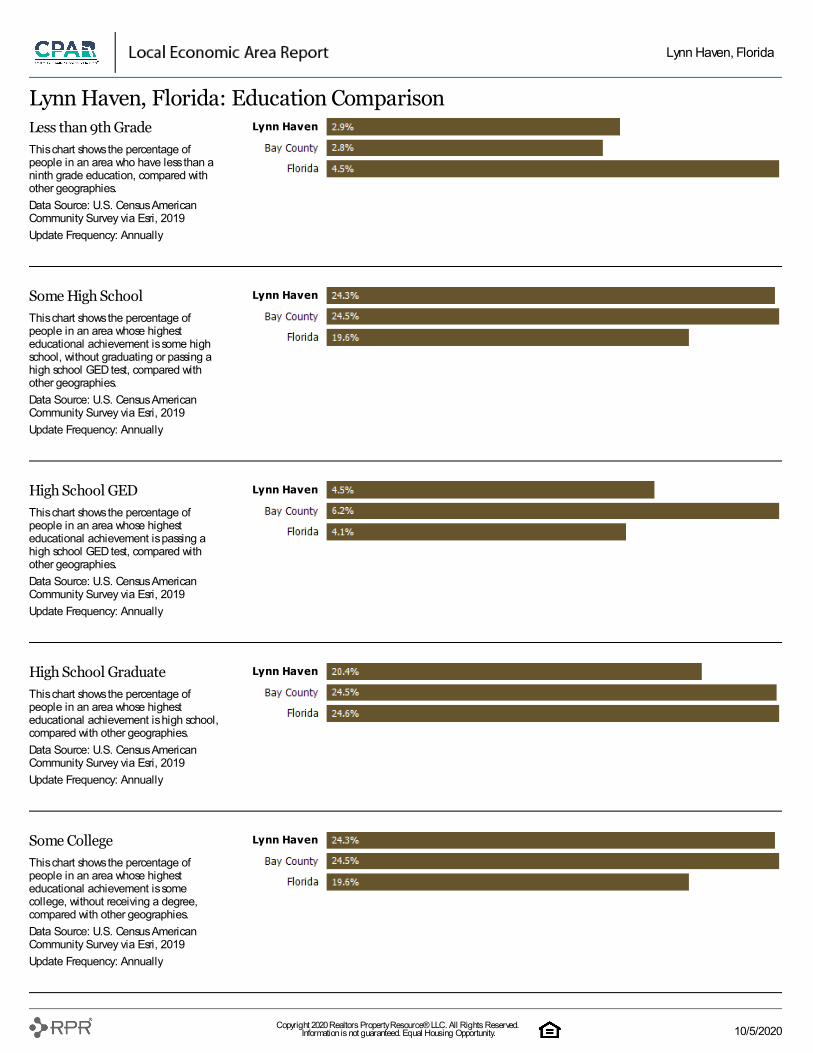
Less than 9th GradeThis chart shows the percentage ofpeople in an area who have less than aninth grade education, compared withother geographies.Data Source: U.S. Census AmericanCommunity Survey via Esri, 2019Update Frequency: Annually
Some High SchoolThis chart shows the percentage ofpeople in an area whose highesteducational achievement is some highschool, without graduating or passing ahigh school GED test, compared withother geographies.Data Source: U.S. Census AmericanCommunity Survey via Esri, 2019Update Frequency: Annually
High School GEDThis chart shows the percentage ofpeople in an area whose highesteducational achievement is passing ahigh school GED test, compared withother geographies.Data Source: U.S. Census AmericanCommunity Survey via Esri, 2019Update Frequency: Annually
High School GraduateThis chart shows the percentage ofpeople in an area whose highesteducational achievement is high school,compared with other geographies.Data Source: U.S. Census AmericanCommunity Survey via Esri, 2019Update Frequency: Annually
Some CollegeThis chart shows the percentage ofpeople in an area whose highesteducational achievement is somecollege, without receiving a degree,compared with other geographies.Data Source: U.S. Census AmericanCommunity Survey via Esri, 2019Update Frequency: Annually
Lynn Haven, Florida: Education ComparisonLynn Haven
Lynn Haven
Lynn Haven
Lynn Haven
Lynn Haven
Lynn Haven, Florida
Copyright 2020 Realtors Property Resource® LLC. All Rights Reserved. Information is not guaranteed. Equal Housing Opportunity. 10/5/2020
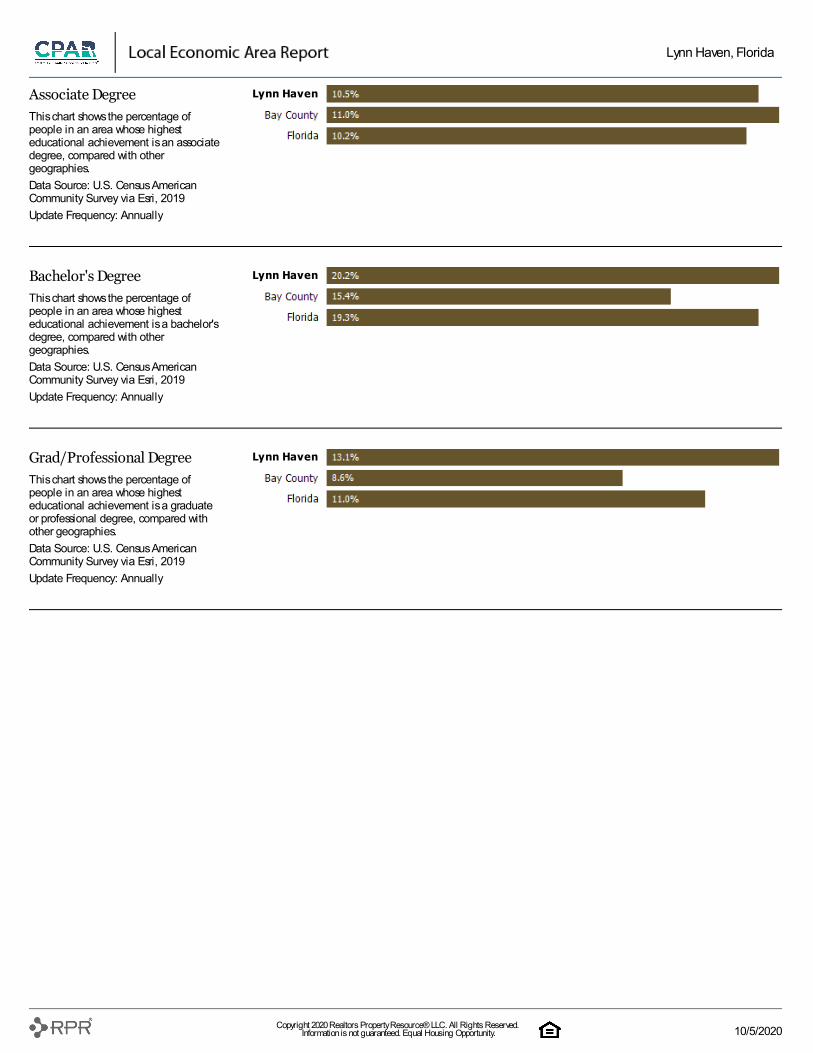
Associate DegreeThis chart shows the percentage ofpeople in an area whose highesteducational achievement is an associatedegree, compared with othergeographies.Data Source: U.S. Census AmericanCommunity Survey via Esri, 2019Update Frequency: Annually
Bachelor's DegreeThis chart shows the percentage ofpeople in an area whose highesteducational achievement is a bachelor'sdegree, compared with othergeographies.Data Source: U.S. Census AmericanCommunity Survey via Esri, 2019Update Frequency: Annually
Grad/Professional DegreeThis chart shows the percentage ofpeople in an area whose highesteducational achievement is a graduateor professional degree, compared withother geographies.Data Source: U.S. Census AmericanCommunity Survey via Esri, 2019Update Frequency: Annually
Lynn Haven
Lynn Haven
Lynn Haven
Lynn Haven, Florida
Copyright 2020 Realtors Property Resource® LLC. All Rights Reserved. Information is not guaranteed. Equal Housing Opportunity. 10/5/2020

WHO WEARET H E V O I C E F O R R E A L E S T A T E I N N O R T H W E S T F L O R I D A
C O N T A C T U S Central Panhandle
Association of
REALTORS®
4952 US-98
Panama City, FL 32401
(850)763-8078
MLS Questions -
Event Booking -
Membership -
C P A R i s a n o t - f o r - p r o f i t c o r p o r a t i o n w i t h a v a r i e t yo f s e r v i c e s . W e a r e a M e m b e r b a s e d a s s o c i a t i o nc o m p r i s e d o f R e a l t o r s ® , B r o k e r s & P o w e r P a r t n e r s .W e p r o v i d e a c c e s s a n d t e c h n i c a l s u p p o r t t o o u r M L Sa n d p u b l i s h r e a l e s t a t e m a r k e t d a t a . W e a l s o p r o v i d ec o n t i n u i n g e d u c a t i o n , p r o f e s s i o n a l d e v e l o p m e n t ,f a c i l i t y a c c e s s & n e t w o r k i n g o p p o r t u n i t i e s . W e c o n d u c t c l a s s e s , m e e t i n g s a n d e v e n t s t h a tb e n e f i t o u r M e m b e r s a n d o u r s u r r o u n d i n gc o m m u n i t i e s . W e s t a y i n v o l v e d p o l i t i c a l l y o n b e h a l fo f R e a l t o r ® i s s u e s a n d p r i v a t e p r o p e r t y r i g h t s . C P A R s e r v e s a r o u n d 1 , 7 0 0 R e a l t o r ® M e m b e r s a n d2 0 0 P o w e r P a r t n e r s i n 5 c o u n t i e s : B a y , C a l h o u n ,W a s h i n g t o n , H o l m e s & J a c k s o n . A d d i t i o n a l l y , w ec o n s i s t e n t l y c o n t r i b u t e t o l o c a l c h a r i t y o r g a n i z a t i o n s& p h i l a n t h r o p i c w o r k s .
CEO
Debbie Ashbrook

The Voice for RealEstate in NorthwestFlorida www.CPAR.realtor
F O L L O W U S O NS O C I A L M E D I A