2 0 0 9 F I N A N C I A L ANALySTS BRIEFING - Aflac
102
2009 FINANCIAL ANALYSTS BRIEFING
-
Upload
khangminh22 -
Category
Documents
-
view
1 -
download
0
Transcript of 2 0 0 9 F I N A N C I A L ANALySTS BRIEFING - Aflac

2 0 0 9 F i n a n c i a l a n a l y s t s B r i e F i n g

1
Table of ContentsSection I - Aflac IncorporatedStrategic Overview of Aflac ...............................................................................Daniel P. Amos................................ 2Aflac Incorporated Financial Results .................................................................Kriss Cloninger III ............................. 5Investments .....................................................................................................W. Jeremy “Jerry” Jeffery................. 12Product Pricing and Reserving..........................................................................Susan R. Blanck .............................. 19
Section II - Aflac JapanIntroduction to Aflac Japan...............................................................................Tohru Tonoike ................................. 24Japan’s Regulatory Environment ......................................................................Charles D. Lake II ............................ 29Aflac Japan Marketing ......................................................................................Takaaki Matsumoto ......................... 34Aflac Japan Sales.............................................................................................Koji Ariyoshi..................................... 38Aflac Japan Bank Channel Sales ......................................................................Hisayuki Shinkai............................... 43Aflac Japan Administration ...............................................................................Hiroshi Yamauchi............................. 51
Section III - Aflac U.S.Introduction to Aflac U.S. .................................................................................Paul S. Amos II ................................ 54Aflac U.S Marketing..........................................................................................M. Jeffrey “Jeff” Charney ................. 59Aflac U.S. Sales ...............................................................................................Ronald S. Sanders........................... 65Aflac U.S. Training............................................................................................Eric J. Leger .................................... 70Aflac U.S. Internal Operations ...........................................................................Teresa L. White ............................... 76
Section IV - Other InformationThe Management Team ........................................................................................................................................... 82Index of Tables and Charts ...................................................................................................................................... 99
About This BookThis book primarily contains presentations on Aflac that were given at the company’s 2009 Financial Analysts Briefing
held on May 19-20, 2009, at the Mandarin Oriental Hotel in New York, New York. All are intended to provide acomprehensive discussion and analysis of Aflac’s operations. The information contained in the presentations was basedon conditions that existed at the time the material was presented. Circumstances may have changed materially sincethose presentations were made. The company undertakes no obligation to update the presentations. The enclosedinformation was prepared as a supplement to the company’s annual and quarterly reports, 10-Ks and 10-Qs. This bookdoes not include footnotes to the financial statements and certain items that appear in reports or registration statementsfiled with the Securities and Exchange Commission. We believe the information presented in this book was accurate at thetime of the presentations, but its accuracy cannot be guaranteed.
Forward-Looking InformationThe Private Securities Litigation Reform Act of 1995 provides a "safe harbor" to encourage companies to provide
prospective information, so long as those informational statements are identified as forward-looking and are accompaniedby meaningful cautionary statements identifying important factors that could cause actual results to differ materially fromthose included in the forward-looking statements. We desire to take advantage of these provisions. This documentcontains cautionary statements identifying important factors that could cause actual results to differ materially from thoseprojected herein, and in any other statements made by company officials in communications with the financial communityand contained in documents filed with the Securities and Exchange Commission (SEC).Forward-looking statements are not based on historical information and relate to future operations, strategies, financial
results or other developments. Furthermore, forward-looking information is subject to numerous assumptions, risks anduncertainties. In particular, statements containing words such as "expect," "anticipate," "believe," "goal," "objective,""may," "should," "estimate," "intends," "projects," "will," "assumes," "potential," "target" or similar words as well asspecific projections of future results, generally qualify as forward-looking. Aflac undertakes no obligation to update suchforward-looking statements. We caution readers that the following factors, in addition to other factors mentioned fromtime to time, could cause actual results to differ materially from those contemplated by the forward-looking statements:difficult conditions in global capital markets and the economy generally; governmental actions for the purpose of stabilizingthe financial markets; defaults and downgrades in certain securities in our investment portfolio; impairment of financialinstitutions; credit and other risks associated with Aflac’s investment in perpetual securities; differing judgments applied toinvestment valuations; subjective determinations of amount of impairments taken on our investments; realization ofunrealized losses; limited availability of acceptable yen-denominated investments; concentration of our investments in anyparticular sector; concentration of business in Japan; ongoing changes in our industry; exposure to significant financialand capital markets risk; fluctuations in foreign currency exchange rates; significant changes in investment yield rates;deviations in actual experience from pricing and reserving assumptions; subsidiaries’ ability to pay dividends to the ParentCompany; changes in regulation by governmental authorities; ability to attract and retain qualified sales associates andemployees; ability to continue to develop and implement improvements in information technology systems; changes inU.S. and/or Japanese accounting standards; decreases in our financial strength or debt ratings; level and outcome oflitigation; ability to effectively manage key executive succession; catastrophic events; and failure of internal controls orcorporate governance policies and procedures.
August 2009

2
I’d like to offer an overview of our business, our strategyfor continued growth, as well as our balance sheet andcapital position. I’ll also comment on our earnings outlookfor this year and next. But let me begin with somecomments on our operations and our earnings outlook fornext year and beyond. Perhaps the best starting point is ourbusiness model itself. Although Aflac is by no meansimmune to economic downturns, particularly one aspronounced as the current recession, I bel ieve ouroperations are on a solid footing. Our business is growingand generally meeting our expectations. Not only are we notlaying off workers, we are continuing to grow our businessand hiring necessary administrative staff in both Japan andthe United States to serve our customers. Of course, we arecontinually hiring new sales associates, which we aregrowing in great numbers in both markets. I continue tobelieve the resiliency of our model is directly related to theunderlying need for our products in both markets.
In Japan, the need for our products is directly related tothe aging population and the financial stress on the nationalhealth care system caused by the aging demographic. Aswe have discussed for many years, Japanese consumersface significant financial risks from serious health events.Over time, consumers have recognized that potential risk,and insurance preferences have changed from traditionaldeath benefit coverage to products that offer living benefits.Aflac is the leader in providing living benefits because of ourdominant positions in the cancer and medical markets.However, at the same time, we have identif ied anddeveloped a market niche in Japan for not-so-traditional lifeinsurance coverage that is growing.
You’ll hear more details about the unique life insurancemarket, or first sector products we recently introduced. Webelieve these new products will be appealing to consumers.Furthermore, they will help build on Aflac’s reputation forproduct innovation. And most importantly, we believe theywill increase our policyholder base and will serve as door-openers for adding our supplemental health products, whichremain our primary product focus. Our product specialtycontinues to concentrate on protecting wealth, not buildingwealth. As the market leader, we want to make sure wecontinue to meet the varied and changing needs ofconsumers by continually enhancing our product line.Product development remains one of the cornerstones ofour model and a key element of our strategy for salesgrowth.
The other vital element of our business model is a focuson building distribution. Although there is a strong need forthe insurance we provide, our products are generally “sold”
and not “bought.” That has become even truer ascompetition in Japan’s insurance market has increased overthe last several years. As a result, it has become importantfor our distribution system to evolve to better position us inthe marketplace. In the mid 1990s, we began to greatlyexpand our capabilities for making face-to-face sales byincreasing our number of individual sales associates. Sincethe insurance market was liberalized in 2001, we havefurther diversified our distribution system to gain even betterreach in the market. In addition to our long-establishedtraditional affiliated corporate and independent agencies, wecontinue to add new agencies and individual associates. In2008 and into this year, we have had strong recruitingnumbers, and I believe our new associate training programis more effective than ever. We also have developed severalother avenues to reach consumers. The strategic marketingalliance with Dai-ichi Mutual Life since 2001 remainsproductive and strong. We continue to enhance ourtelemarketing capabilities with non-traditional agencies. Inaddition, we now offer our products through nearly 270different banks in Japan, which far exceeds any otherinsurer in Japan. And we have just begun our initial salesefforts through Japan’s vast postal network.
Although we only have one quarter under our belt, I’mpleased with Aflac Japan’s start this year. Our first quartersales, while roughly flat with a year ago, were still slightlybetter than our expectations. Additionally, sales through thebank channel appear to have turned the corner after a veryweak fourth quarter. Since the end of the first quarter, Iremain encouraged. In the past, I have frequentlycommented at this meeting on how sales are looking for thesecond quarter. In that regard, I was pleased with Aprilsales. Although the year is young, I still believe Aflac Japan’sgoal of flat sales to a 5% increase for this year is attainable.
When facing past recessions in Japan, our message toour agents and consumers has been pretty consistent.Consumer incomes may be down, investment returns maybe lower, and the possibility of job loss may have increased.But the financial risks that arise due to a serious health eventhaven’t changed in any recession. In fact, one could arguethat the need for our product is actually greater in times ofeconomic weakness because illnesses and accidents simplydon’t go away. To help consumers mitigate possiblefinancial calamity, Aflac helps provide financial security whenserious illnesses or accidents arise. We provide that peaceof mind for a premium that is usually no more than $50 permonth. I believe strongly in that message, and I believe itapplies to our U.S. business as well. But so far, thatmessage seems to have resonated better in Japan.
Strategic Overview of AflacDaniel P. Amos
Chairman and Chief Executive Officer
Section IAflac Incorporated

3
We remain absolutely convinced the United States is stilla vast and attractive market for our products. Yet there is nodoubt this recession has taken its toll on consumers in theUnited States. As I have said before, we believe ourcoverage is affordable for the average American family. Butwe realize that in these times of hardship, families have tomake difficult choices. When we see some stability in theenvironment, we believe we will see stronger demand forour products because the need has not changed. However,I want to make one important point very clear: We are notsimply standing around waiting for the economy to recover.While many companies may be pulling back due to expensepressures, we continue to invest heavily and efficiently in ourbusiness and our brand.
Although the recession has made it more challenging tosell our products in the United States, the current labormarket has provided a good opportunity to expand ourcommissioned sales force because salaried jobs are harderto come by. Our new agent recruitment was strong in thefirst quarter, and we continue to believe we can attract new,qualified people to our sales organization. Like Japan, webelieve our training programs are more effective than everbefore. That effectiveness is evidenced by strong increasesin new payroll accounts and sales by our associates whoare in their first year with Aflac.
Some of you may have read our press release or newsarticles about Aflac’s new U.S. marketing initiative. Jeff’spresentation provides more details about what we refer toas Aflac Wingspan and our new tag line: “We’ve got youunder our wing.” I’m excited about how we will build on ourbrand using the iconic Aflac Duck. I think you are going tofind that our approach is fresher, more upbeat and fun.Importantly, I believe Aflac Wingspan will make our productsmuch more relevant to employers and consumers alike. Asthis new approach takes hold, we expect our sales resultsto be positively impacted as well.
We remain convinced that we have a strong businessmodel in the United States. We are equally confident thatthere are tremendous opportunities to grow our businesswhile at the same time, helping people when they need itmost. As the market leader, we believe we are bestpositioned to capitalize on those opportunities. In the shortrun, we expect our U.S. sales and persistency will continueto be influenced by weak economic conditions. However, Iwould like to point out that our persistency did stabilize inApril. As we told you last quarter, sales in the secondquarter will be our toughest comparison. The downwardtrend we saw in the first quarter has continued, but we doexpect the second half of the year to improve due to ourmarketing initiatives. However, we are striving to achieve flatto 5% sales growth for the year, as it is part of our bonus.We still believe the long-term potential is enormous in theUnited States.
From an earnings perspective, we are again affirming ourobjective of a 13% to 15% increase in operating earningsper diluted share in 2009, excluding the impact of the yen.As I mentioned on our first quarter conference call, it isunlikely we will repurchase any shares in 2009. That meanswe expect earnings growth will be at the low end of therange this year.
I realize you have heard me say for the last few years thatit is my personal goal to increase operating earnings per
share by at least 15% excluding foreign currency for my first20 years as CEO. Well, this happens to be my 20th year. Ihave to admit I’m disappointed that I won’t likely reach thatgoal. But the intent behind establishing my personal goalwas always to enhance shareholder value. Clearly, in thiscurrent market, earnings are not as important as statutorycapital. Therefore, my primary focus has shifted tomaintaining a strong RBC ratio, and then growing ourearnings per share.
I also commented that beyond this year, we did notexpect our earnings growth to fall off sharply. Instead, webelieved our growth rates would grade down over time. Wealso said we thought it was possible to generate double-digit earnings-per-share growth for another 10 years. I stillthink that’s a reasonable expectation. However, implicit inmy past remarks was an assumption that we wouldcontinue to deploy capital through share repurchases toenhance our per-share results and produce consistentdouble-digit growth over a long period of time.
I st i l l bel ieve that prudent and methodical sharerepurchases are effective for enhancing shareholder value.When we return to normalcy, I expect to deploy capital in asimilar fashion to again enhance our per-share earningsgrowth. But understand that before we resume therepurchase of our shares, we’ll need solid evidence that thecredit market has stabilized and the economy is recovering.As such, we will remain very cautious on the deployment ofexcess capital for shareholder purposes. In fact, right nowit’s impossible for me to associate the word “excess” withthe word “capital.” I know Kriss agrees, and we both believeit is best to keep our powder very dry.
We have spent a lot of time analyzing and assessing ouropportunities for earnings growth in 2010. Assuming nochange in the economic environment, we have established arange of 9% to 12% growth on a currency-neutral basis for2010. Kriss will review the assumptions we used to modelour earnings objectives. Within the 9% to 12% range, we willbe focused on achieving a 10% increase next year.
In the foreseeable future, my primary interest wil lcontinue to be maintaining a strong capital position toprotect this company in a very uncertain environment. As Idiscussed a couple of weeks ago, we have focused ourentire officer group on maintaining a strong capital positionas measured by our risk-based capital ratio. Every officer’sincentive compensation for 2009 has a component linkedto maintaining a target RBC ratio of 375%. But I don’twant them to lose sight of running our business, so we arestill using other important bonus criteria, such as ourtraditional premium, earnings, sales and expense growth.Additionally, we used the RBC ratio as the only measurefor all performance-based restricted stock awards thatwere granted to Section 16 insiders this year. To earnthese equity awards when they vest in three years, we willhave had to maintain targeted RBC levels.
Ultimately, our objective is to maintain a high risk-basedcapital ratio that supports our financial strength ratings andprovides an adequate cushion for possible investmentlosses. At the end of 2008, our RBC ratio was 476.5%. Atthe end of the first quarter, we estimated that the RBCratio was 479%. We expect our capital generation to bestrong in 2009 and our RBC rat io to remain high.Importantly, our entire officer team is motivated to keep it

that way. We also expect our solvency margin in Japan toremain strong.
Let me continue with the balance sheet and comment abit on our investments. As I have said repeatedly, I remainpleased with the overall quality of our assets. Despite globalcredit downgrades over the last several months, the creditprofile of our holdings is still quite high. At the end of March,95% of our fixed maturities and perpetual securities wereinvestment grade. Our global investment approach is time-tested and I continue to believe that it is the best course ofaction for Aflac. The reason is straightforward: We purchasesecurities that best match the characteristics of our policyl iabil it ies. That is especial ly true with Aflac Japan’soperations. For more than 15 years, our greatest challengehas been investing huge cash flows in appropriatesecurities. We need to purchase long-duration, yen-denominated, investment grade securities to fund our long-duration, yen-denominated policy liabilities. It’s that simple.Because Japan does not have a developed corporate bondmarket, we turned to securities issued by many non-Japanese entities in yen, including the perpetuals we firstpurchased more than 16 years ago. Perpetual securitiesprovided us with the returns and the long durations we needto support our policy liabilities. That hasn’t changed.
Obviously, subordinated, perpetual securities have beenthe primary area of investor focus within our portfolio overthe last several months. When we first began purchasingperpetual securities in the early 1990s, they were neverviewed as risky. Although we have not purchased anyperpetuals since 2005, they have served their purpose verywell over the years. Except for the Icelandic banks that wewrote off in the fourth quarter, every one of the perpetualsecurities we own was current on interest at the end of thefirst quarter. In addition, we have not experienced anyextensions of principal at this point. In the fourth quarter of2008, we had three separate perpetual securities redeemed.On April 22 of this year, KBC Bank redeemed the Upper TierII securities we owned. On May 19, 2009, HSBC redeemedour Upper Tier II holdings. Because of our long-term view ofthese investments, we have both the ability and intent tohold those securities until they mature. Our current creditanalysis suggests it is probable that we will receive bothinterest and principal on a timely basis. As such, it makessense to us that we retain them in our portfolio.
Our ability to hold securities to maturity is due, in greatpart, to the fact that we do not face any liquidity issues. Aswe have discussed, some of our products in Japan offer asmall cash surrender value, particularly with our old block ofcancer insurance. However, we do not have a similar benefitfeature in our U.S. health products. That means that ourreserves exist for the benefit of our persisting policyholders.As a rule, our customers do not have a claim on thoseassets if they lapse. As a result, we do not face the risk ofliquidating invested assets to pay surrender values.
As you are aware, our only short-term liquidity need in2009 was the repayment of our senior notes in April. It wasalways our preference to refinance our recently maturedsenior notes in the debt market, preferably the Samuraimarket in Japan. However, when the financial crisisemerged late in 2008, the Samurai market basically shutdown for financial names, especially those without agovernment guarantee. At the same time, we are sensitiveto interest costs, and we’re not willing to issue debt with
excessive coupons. This prompted us to secure a loan fromour principal life insurance subsidiary, American Family LifeAssurance of Columbus, to the parent, Aflac Incorporated.I’ll remind you that the loan is an admitted asset on ourinsurance subsidiary’s books under statutory accountingprinciples. As a result, it did not negatively impact our RBCratio. Despite its three-year term, we view it as short-termfinancing until credit markets improve.
Fortunately, there has been substantial improvement inthe debt markets. Over the last few weeks, spreads havetightened significantly and there has been a sharp increasein issuance. On May 18th, we were able to execute a debttransaction in the U.S. dollar market. We issued $850 millionof senior notes with a ten-year maturity. The coupon on thisdebt is 8.5%. As we announced, we primarily intend to usethe proceeds of this issuance to repay the intra-companyloan we originated in April when we repaid our maturingsenior notes. With this debt in place, we will maintain ourconservative capital structure and we are pleased to havethis financing in place. This also positions us to take care ofour obligations that mature in 2010.
I realize that many of you have given thought to ourshareholder dividend recently. Last October, our board ofdirectors raised the quarterly cash dividend by 16.7%effective with the first quarter of 2009, which amounts to$.28 per quarter. The board’s action marked the 27th
consecutive year in which we have increased the dividend.Historically, we have generally increased our dividend in linewith the earnings growth excluding currency. We are proudof our lengthy track record of dividend increases. We realizethat for the roughly 30% of our shares that are owned byindividual investors, dividends are very important. We alsounderstand the argument for reducing or eliminating thedividend, which has been expressed not only to Aflac, butmany other publicly owned companies as well.
Our decision to pay a dividend and if so, at whatamount, will ultimately come down to the strength of ourRBC ratio. As I mentioned, our priority is maintaining acapital position that supports our financial strength ratingsand provides an adequate cushion for possible investmentlosses. While we do not expect any changes to this year’squarterly dividend of $.28, if we experience significantdeterioration in the investment portfolio that producesstress on our capital position, we will consider a modifieddividend as a means of conserving capital. And like sharerepurchases, we are not prepared to commit to an increasein the dividend in 2010 until we have more clarity in boththe economy and credit markets.
I want to point out that stock prices and investmentconsiderations may have changed, but what hasn’tchanged is our business model. Despite wildly volatilefinancial markets, we have maintained our focus oncontrolling the things that we have the power to control.We can and will control our efforts to build our businessand take care of our customers, employees, and salesassociates. By doing this, I believe we will continue toenhance shareholder value. I am confident that we will getthrough the difficult times that we’re facing here and aroundthe globe, and I believe Aflac will emerge as the strongcompany you have followed or owned for many years. Solet me conclude by saying, as I have said before and willsay many more times, I wouldn’t trade places with anyother CEO.
4

This presentation focuses on Aflac’s financials, includingour consolidated capital structure and the assumptionsused in modeling our future operating earnings-per-sharegrowth.
Aflac’s Principal Operating Units
I know you are likely aware that our two major operatingunits are Af lac U.S., which includes our New Yorksubsidiary, and Aflac Japan, which operates as a branchof Aflac U.S. American Family Life Assurance Company ofColumbus, or Aflac, is domiciled in Nebraska. Aflac NewYork is subject to the insurance laws of the state of NewYork, where it is domiciled.
Aflac Japan is primarily regulated by Japan’s FinancialServices Agency, or FSA. However, as a branch of ourU.S. business, the various insurance laws and regulationspromulgated by the state of Nebraska also apply to AflacJapan. The regulatory rules address matters related tooperations and marketing, as well as to investments andminimum capital levels. It’s important to understand thatAflac Japan’s branch status influences the manner inwhich we manage our business, especially as it relates tocapital matters.
Aflac Incorporated Capitalization(In Millions)
Let me begin with a comment on our overall capitalstructure. We analyze total capitalization including long-term debt, but excluding the unrealized gains and losses inshareholders’ equity. On that basis, our debt-to-totalcapital ratio has been fairly stable in the last few years.
However, remember that our debt is yen-denominated,whereas most of our equity is dol lar-denominated.Therefore, a strengthening in the yen increases ourreported debt balance in dollar terms as it did in 2008. As aresult, our debt-to-total capital ratio increases. Of course,the opposite occurs when the yen weakens. We view theupper limit of our debt-to-total capital ratio as 25%.
Parent Company Loan Maturities*(March 31, 2009)
At the end of March 2009, the average interest rateassociated with Aflac Incorporated’s borrowings was afixed rate of 1.44% after interest rate swaps. The first lineitem on this table relates to the senior notes we issued in1999, which matured in April 2009. As we have discussed,it would have been our preference to refinance the notes inthe debt market, preferably the Samurai market in Japan.However, following the financial crisis, debt markets havebeen essentially closed to financial names. As a result, werepaid that maturing obligation through a loan from ourprincipal life insurance subsidiary. The loan is an admittedasset on the insurance subsidiary’s books under statutoryaccounting principles. As such, it does not negativelyimpact our risk-based capital, or RBC, ratio. The loan hasan annual interest rate of 7.13% and a term of three yearswith a provision for early repayment. Although the loan hasa three-year term, we view it as short-term financing untilcredit markets improve, which for us was mid-May. Weissued $850 million of 10-year notes with a fixed 8.5%coupon. We will first repay the intra-company loan and usethe balance of the funds for general corporate purposes.
The other outstanding debt obligations on this chart areall yen-denominated issues. Since October 2000, we haveissued five series of Samurai notes, the first three of whichwere paid off from 2005 through 2007. Samurai bonds areyen-denominated securities issued by non-Japanesecompanies in Japan. Our most recent Samurai bondissuance was ¥30 billion of five-year notes that we issuedin June 2007.
Additionally, we have outstanding Uridashi notes, whichare very similar to Samurai notes, except they are issued inthe Euroyen market rather than in Japan’s Samurai market.In September 2006, we issued three tranches of Uridashinotes totaling ¥45 billion. One of the tranches has a five-year variable coupon, which we swapped into a fixed rate.
Aflac Incorporated Financial ResultsKriss Cloninger III
President; Chief Financial Officer
AAffllaacc NNeeww YYoorrkk
((NNeeww YYoorrkk lliiffee iinnssuurraannccee ccoo..))
AAffllaacc UU..SS..
((NNeebbrraasskkaa lliiffee
iinnssuurraannccee ccoo..))
AAffllaaccJJaappaann
((bbrraanncchh))
AAffllaacc IInnccoorrppoorraatteedd
((GGeeoorrggiiaa ccoorrppoorraattiioonn))
AAmmeerriiccaann FFaammiillyy LLiiffee AAssssuurraannccee CCoommppaannyy ((AAffllaacc))
5
TToottaall lloonngg--tteerrmm ddeebbtt $$11,,446655 $$11,,772211 $$11,,557733
SShhaarreehhoollddeerrss’’ eeqquuiittyy** 77,,992211 77,,885500 88,,118855
TToottaall ccaappiittaalliizzaattiioonn $$99,,338866 $$99,,557711 $$99,,775588
DDeebbtt ttoo ttoottaallccaappiittaalliizzaattiioonn 1155..66 1188..00 1166..11
33//009922000077 22000088
**EExxcclluuddeess uunnrreeaalliizzeedd ggaaiinnss//lloosssseess oonn iinnvveessttmmeenntt sseeccuurriittiieess aanndd ddeerriivvaattiivveess
%%%% %%
22000099 2288..77%% $$ 445500 ¥¥ 5555..66 11..6677%%
22001100 2266..00 440077 4400..00 ..7711
22001111 99..88 115533 1155..00 11..5522
22001111 1133..00 220044 2200..00 11..3322
22001122 1177..33 227711 2266..66 11..8877
22001166 55..22 8811 88..00 22..2266
TToottaall 110000..00%% $$11,,556666 ¥¥116655..22 11..4444%%
CCoonnttrraaccttuuaallMMaattuurriittiieess
PPeerrcceennttooff TToottaall
AAmmoouunntt((MMiilllliioonnss))
IInntteerreessttRRaattee
AAmmoouunntt((BBiilllliioonnss))
**EExxcclluuddeess ccaappiittaalliizzeedd lleeaasseess ooff $$77 mmiilllliioonn aatt MMaarrcchh 3311,, 22000099

6
Capital Adequacy Ratios(In Millions, Except Ratios)
During the last six months, investors have focusedmuch more on the capital adequacy of companies withinour sector. The capital levels of our operating units areinfluenced by our desire to maintain satisfactory RBCratios. The risk-based capital formula applies to Aflac on acombined basis for Aflac U.S. and Aflac Japan. Becauseof Aflac Japan’s branch status, we don’t report separateRBC ratios for Aflac Japan and Aflac U.S. However, ourratio is basically a combined ratio of the two operations.Aflac New York has to meet its own risk-based capitalrequirements on a stand-alone basis because it is asubsidiary of Aflac U.S. Aflac New York’s RBC ratio hasbeen improving recently due to its strong statutoryearnings.
Our goal is to maintain a ratio that supports our ratingsand compares favorably to our peers. In the current creditenvironment, we also want to maintain a strong RBC ratioto accommodate potential risks in our investment portfolio.To emphasize the importance we are placing on achievingour RBC objective, we added it to our managementcompensation plan, both in the annual incentive bonusprogram and the vesting requirement for performance-based restricted stock.
In recent years, Aflac’s RBC ratio has been very strong.Our RBC ratio declined from its high in 2006 as wedeployed capital in late 2007 and mid-2008 for therepurchase of our shares. In addition, our 2008 RBC ratiowas negatively affected by $698 mil l ion of real izedinvestment losses. The ratio was also negatively influencedby the 25% strengthening of the yen in 2008.
RBC Ratio Sensitivity toYen/Dollar Exchange Rates
(December 31, 2008)
The required capital, which is the denominator of theRBC ratio, is proportionately more sensitive to changes inthe exchange rate than the adjusted capital and surpluscomponent because a higher percentage of our statutorycapital and surplus is backed by our dollar-denominatedbond portfolio. Therefore, as the yen strengthens to thedollar, our RBC ratio declines because our required capitalincreases at a greater rate than changes to our totaladjusted capital. Had the yen ended 2008 at 115 yen tothe dollar, which was close to the 2007 year-end rate, weestimate our RBC ratio would have been approximately561%, instead of 476%.
The dollar-denominated portfolio acts as a hedge ofAflac Japan’s GAAP equity. We have looked at the costsof unwinding this hedge as a means of insulating our RBCratio against currency swings. However, at an annual costof approximately $125 million in reduced investmentincome, we do not believe it makes sense to liquidate thedollar portfolio and reinvest in yen, or to hedge the hedge.In addition, the yen has weakened by approximately 5%since the end of 2008, suggesting it is not likely that ourRBC ratio will be significantly and adversely affected thisyear due to currency changes.
In addition to U.S regulatory requirements, Aflac Japanmust also meet capital requirements of the Japanese FSAon a stand-alone basis. Japan’s solvency margin is similarto the risk-based capital concept. However, Japan’ssolvency margin contains a component for unrealizedgains and losses that the RBC ratio does not. Oursolvency margin in Japan was a solid 881% based onyear-end 2008 data, and I’ll be showing comparisons.
Sensitivity of FSA Solvency Margin Ratio
This graph illustrates the sensitivity of the solvencymargin to interest rate changes as measured by the yieldof 10-year JGBs. Starting with our December 31 solvencymargin, this graph shows that every 100 basis pointchange in yen yields would change our solvency margin byabout 176 percentage points. However, Aflac Japan’sinvestment income would obviously benefit by investing athigher rates.
220000
330000
440000
550000
660000
770000%%
112255 111155 110055 9955 9911..0033** 8855 7755
**AAccttuuaall 22000088 ppeerriioodd--eenndd eexxcchhaannggee rraattee
TToottaall aaddjjuusstteeddccaappiittaall $$44,,441155 $$44,,446644 $$44,,662233
RRBBCC rraattiiooss::
AAffllaacc 660011 557744 447766
AAffllaacc NNeeww YYoorrkk 222288 227777 228888
SSoollvveennccyy mmaarrggiinn 11,,007788 993377 888811
22000066 22000077 22000088
**AAss ooff MMaarrcchh 3311 ffiissccaall yyeeaarr eenndd
%% %% %%
** **
00
220000
440000
660000
880000
11,,000000
11,,220000
11,,440000%%
00..6688%%--..5500%%
11..1188%%++..0000%%**
11..6688%%++..5500%%
22..1188%%++11..0000%%
22..6688%%++11..5500%%
33..1188%%++22..0000%%
552288..99%%
998811..00%%
YYiieelldd
**BBaasseedd oonn iinnffoorrmmaattiioonn aass ooff 1122//3311//0088
888800..55%%

7
Comparison of Solvency Margins(FSA Basis, 12/08)
In the past, our solvency margin has benefited fromsizeable unrealized gains on our yen-denominated, fixed-income securities. However, as credit spreads widened,th is rat io has decl ined. Other insurers with largerconcentrations of equity holdings have also experienceddeclining solvency margins. As a result, our solvencymargin still ranks fairly high among our peers. In addition tointerest rate changes, our solvency margin is alsoimpacted by profit repatriation to Aflac U.S. Over the pastfive years, for example, we have repatriated profits of ¥247billion, which would otherwise have increased our solvencymargin by 586.8%.
2009 Estimated Flow of Funds(In Millions)
This chart shows the estimated flow of funds from ouroperating units to the parent company. Our plan calls forAflac Japan to send approximately $242 million to AflacU.S. in 2009. Of that, we estimate that profit repatriationwill be about $200 million this year. We have elected toremit a reduced amount of profits this year in order tomaintain and promote a strong solvency margin. AflacJapan will also remit $42 million for allocated expenses toAflac U.S. and another $26 million of management feesdirectly to Aflac Incorporated. Aflac U.S. will send $630million to the parent company this year, which includesdividends, management fees and allocated expenses.
Aflac Incorporated Liquidity Analysis(In Millions)
This chart, which shows the ant ic ipated cashrequirements of Aflac Incorporated, gives you some ideaabout the amount of uncommitted cash flow. AlthoughNebraska’s statute references the dividend restriction asthe larger of operating income or 10% of the prior yearstatutory surplus, the Nebraska Department of Insurancehas interpreted the income test to be the larger ofoperating income less realized losses for the prior year ona statutory basis. Based on that interpretation and ourstatutory results in 2008, the maximum we can dividend in2009 without regulatory approval is approximately $1.2billion. As you saw from the previous chart, we do not planon dividending the maximum amount this year.
In addition to the dividend, management fees andallocated expenses, Aflac Incorporated also receives cashfrom the exercise of stock options along with someinvestment income, which is included in the “other” line.Aflac Incorporated uses these funds to pay operatingexpenses, interest expense, principal payments on debt,and dividends to shareholders. Our 2009 plan calls for anuncommitted cash flow of roughly $154 million; however,that plan assumed that we repaid our maturing seniornotes rather than refinancing them.
Projected Statutory Items*(In Millions)
Our ability to provide liquidity to the parent company isdirectly related to our statutory results. We expect anotherstrong year of capital generation in 2009. Based on ourcurrent outlook for the year we expect to produce 2009income of approximately $1.9 billion. We also estimate ourtotal adjusted capital will be approximately $5.8 billion thisyear.
MMaaxx.. ddiivviiddeenndd ttoo ppaarreenntt $$11,,667799 $$11,,779900 $$11,,220099
MMaannaaggeemmeenntt ffeeeess 8800 7711 9911
AAllllooccaatteedd eexxppeennsseess 3377 3388 3377
OOtthheerr iinnccoommee 3388 2244 2200
LLeessss:: OOppeerr.. eexxppeennsseess ((5566 ((6611 ((6644
LLeessss:: IInntt.. eexxppeennssee ((2200 ((2244 ((7744
LLeessss:: LLooaann rreeppaayymmeenntt ((224422 ((553377
LLeessss:: SShhaarreehhoollddeerr ddiivv.. ((337733 ((443344 ((552288
UUnnccoommmmiitttteedd ccaasshh ffllooww $$11,,114433 $$11,,440044 $$ 115544
22000088AAccttuuaall
22000099PPllaann
22000077AAccttuuaall
))
))
))
))
))
))
))
))
))
))
))
FFuukkookkuu 11,,226622..44%%MMeeiijjii YYaassuuddaa 11,,009911..55NNiippppoonn 992299..55AAffllaacc JJaappaann 888800..55SSuummiittoommoo 885588..11TTaaiiyyoo 882200..44DDaaiiddoo 880000..66AAlliiccoo 779922..77DDaaii--iicchhii 775566..33MMiittssuuii 662255..11AAssaahhii 555511..66
SSoollvveennccyy MMaarrggiinn
SSoouurrccee:: PPrreessss rreeppoorrttss aanndd ccoommppaannyy ddiisscclloossuurree ssttaatteemmeennttss
AAffllaacc UU..SS..
AAffllaacc JJaappaann((BBrraanncchh ooff AAffllaacc UU..SS..))
AAffllaacc IInnccoorrppoorraatteedd
DDiivviiddeenndd $$552288
MMaannaaggeemmeenntt ffeeeess 6655
AAllllooccaatteedd eexxppeennsseess 3377
TToottaall $$663300
PPrrooffiitt rreeppaattrriiaattiioonn $$220000
AAllllooccaatteedd eexxppeennsseess 4422
TToottaall $$224422
MMaannaaggeemmeenntt ffeeeess $$2266
22000066 $$11,,771155 $$44,,441155
22000077 11,,779900 44,,446644
22000088 11,,220099 44,,662233
22000099 eesstt.. 11,,885500 55,,880000
**22000099 eessttiimmaatteess aassssuummee 22000088 yyeeaarr--eenndd eexxcchhaannggee rraattee ooff 9911..0033
NNeett IInnccoommeeTToottaall
AAddjjuusstteedd CCaappiittaall

Estimated “Excess” Capital Position(In Millions)
Under these assumptions, we estimate that our excesscapital position will improve from its year-end level to arange of $1.8 to $2.3 billion at the end of this year. I putexcess in quotes, because quite frankly, it’s very difficultfor me to consider any capital as excess in the traditionalsense of the word. In the past, investors have referred toexcess capital as funds available for shareholder activitiessuch as share repurchase and cash dividends. Today, theconcept of excess capital is much more defensive innature and relates to our ability to absorb potential realizedlosses in our investment portfolio. In that regard, wecurrently have a much stronger bias toward conservingcapital rather than deploying it.
Now let me turn to our income statement and oursegments’ contributions to Aflac’s consolidated financialresults.
Segment Contributions to Operating Earnings(In Millions)
Aflac Japan remains the primary contributor to ouroverall operations. In the first quarter of 2009, Aflac Japanrepresented approximately 77% of pretax insuranceearnings.
Aflac Japan Total Revenues(Yen in Billions)
As you know, the main components of total revenuesare premium income and investment income. The largest
component, premium income, has benefited from apredictable and stable source of renewal revenues. In fact,we estimate that 90% of Aflac Japan’s premium incomewill be derived from renewal premiums this year, with thebalance coming from new sales.
As you can see, total revenues have steadily increased,although the rate of growth has declined somewhat. Oneof the primary reasons for the slowing of revenue growthstems from lower new sales. In addition, the yen caninfluence the rate of investment income growth as reportedin yen, as it did in 2008 and so far this year. Becausedollar-denominated investment income accounts for about35% of Aflac Japan’s total investment income, when theyen strengthens to the dol lar, the growth rates ofinvestment income, revenues and earnings are suppressedin yen terms. Of course, the opposite occurs when the yenweakens. However, there is no impact on a consolidatedbasis as reported in dollars.
Aflac Japan Operating Ratios(To Total Revenues)
Over time, our operating ratios have remained quitestable. The benefit ratio to total revenues peaked in 1996at 73.4%, and has trended downward ever since. Onemajor factor behind this decrease in our benefit ratio inrecent years has been the steady change in our businessmix. As a result of product broadening, the mix of our in-force business has changed significantly. For instance, in1992 cancer life accounted for 94.1% of premiums inforce. At the end of the first quarter, cancer life premiumsin force represented 51.3% of total premiums in force. Thegreatest contributors to in-force business in the last fiveyears have been products with lower benefit ratios, suchas riders to our cancer products and our medical productcategory. This change in mix is significant because thebenefit ratios vary quite a bit by product.
Expected Benefit Ratios by Product
TTrraaddiittiioonnaall ccaanncceerr lliiffee –– ffuullll CCSSVV 6688%% -- 7733%%
CCaanncceerr lliiffee –– rreedduucceedd CCSSVV 6633%% -- 6688%%
2211sstt CCeennttuurryy CCaanncceerr lliiffee –– ffuullll CCSSVV 5555%% -- 6600%%
2211sstt CCeennttuurryy CCaanncceerr lliiffee –– rreedduucceedd CCSSVV 5500%% -- 5555%%
CCaanncceerr FFoorrttee –– ffuullll CCSSVV 5555%% -- 6600%%
CCaanncceerr FFoorrttee –– rreedduucceedd CCSSVV 4488%% -- 5533%%
RRiiddeerrss ttoo ccaanncceerr aanndd mmeeddiiccaall 4400%% -- 5555%%
OOrrddiinnaarryy lliiffee pprroodduuccttss 6600%% -- 7755%%
EEVVEERR 5500%% -- 5577%%
8
AAffllaacc JJaappaann $$11,,882211 $$22,,225500 $$555544 $$668811
22000077 22000088 33//009933//0088
00
220000
440000
660000
880000
11,,000000
11,,220000
22000044 33//009933//0088
%% IInncc..
¥¥11,,440000¥¥11,,331144..77
22000055 22000066
¥¥11,,007755..66
44..99
22000077
66..00 66..66 66..33
¥¥11,,114466..11¥¥11,,221188..88
22..77
¥¥332244..00
22..88
22000088
¥¥11,,227799..00
33..33
¥¥333344..88
00
1100
2200
3300
4400
5500
6600
7700%%
BBeenn.. && ccllaaiimmss EExxppeennsseess PPrreettaaxx eeaarrnniinnggss
33//0088 33//0099
1199..33 1199..44
1166..881144..55
1199..66
1188..00
22000077220000662200005522000044 22000088
1177..77
1199..88 1199..55
1199..00
1188..99
1133..99
1188..88
1155..88
6677..226633..88 6622..44
6666..22 6655..446611..556622..55
22000088 $$ 774422 $$11,,220000
22000099** 11,,880000 22,,330000
RRBBCCRRaattiioo
ooff 440000%%
RRBBCCRRaattiioo
ooff 335500%%
**22000099 eessttiimmaatteess aassssuummee:: nnoo sshhaarree rreeppuurrcchhaassee;; nnoo iimmppaaiirrmmeenntt cchhaarrggeess;;aanndd tthhee 22000088 yyeeaarr--eenndd eexxcchhaannggee rraattee ooff 9911..0033

9
Our traditional cancer life product that we were sellingthrough the 1990s had a full cash surrender value, or CSV,and a benefit ratio in the area of 68% to 73%. To offsetsome of the effect of the 1999 rate increase on newlyissued cancer life policies caused by a lower assumedinterest rate, we elected to reduce the cash surrendervalue. This product modification was well-received byconsumers looking to maximize their premium value.Reducing the CSV brought down both the premium andthe benefit ratio as well. Currently, our cancer insuranceproducts have benefit ratios that range from 48% to 60%.The benefit ratios of our medical products are 50% to57%, and the riders to our cancer and medical productsrange from 40% to 55%.
Overall, the addition to our in-force premiums frommedical products, cancer policies with reduced cashsurrender values and several riders has de-emphasized theimpact of death benefits in the mix of benefits. Althoughlife insurance sales have increased over the last severalyears, we still expect the benefit mix to continue to trendtoward health and medical benefits. In addition, we haveseen favorable claims experience for most of our majorproduct lines. This has also positively impacted the rangeof our expected benefit ratios. As Japan’s national healthcare system continues to be under severe pressure toreduce costs through such means as shorter hospitalstays, we expect that favorable claim trend to continue.
Total annual operating expenses as a percentage ofrevenues have remained in a narrow range for the last fiveyears. Aflac Japan’s low expense ratio reflects efficientoperations, lower net-commission expense, and a strongand fairly stable persistency rate. The higher expenseratios in the last two years primarily reflect investments inestablishing the foundation for the new bank channel andour IT infrastructure. We believe the investments we madeto support the bank channel wil l be instrumental inmaximizing our potential in this new and vast distributionopportunity. Addit ional ly, we bel ieve our recentinvestments in the IT infrastructure wil l improve ourongoing business operations and further accelerate newproduct introductions for years to come.
Although low interest rates and profit repatriationsuppress our margins, this has been more than offset bythe improvement in the benefit ratio, which has significantlyenhanced the overall profit margin in recent years.
Aflac Japan Pretax Operating Earnings(Yen in Billions)
With the expanded profit margin, pretax earningsincreased 9.3% to ¥63.6 billion in the first quarter of 2009.Excluding the impact of the stronger yen on Aflac Japan’sdol lar-denominated income and expenses, pretaxoperating earnings were up 11.2% in the quarter.
Segment Contributions toOperating Earnings
(In Millions)
Our other reportable segment, Aflac U.S., accounted forthe remaining 23% of pretax insurance earnings in the firstquarter.
Aflac U.S. Total Revenues(In Millions)
After returning to double-digit growth in 2007, AflacU.S. revenue growth slowed in 2008, and into the firstquarter of 2009. The growth rate in total revenues is largelydriven by the growth rate in premium income, which hasalso slowed in recent years. The slowdown in premiumincome has resulted from weaker new sales over the lastfive quarters, as well as lower renewal rates. As we havediscussed, we believe the rates of sales growth and thelower persistency rate over the last several quarters aredirectly tied to the weaker economy.
In addition, investment income growth has slowed since2007. The slower growth of net investment incomeresulted from the transfer of capital to the parent company.As we have discussed, we are also paying out return-of-premium benefits on a major cancer insurance plan wesold in the mid 1980s. We have reserved for these payoutsand estimate they will be approximately $365 million overthe next four years.
00
11,,000000
22,,000000
33,,000000
44,,000000
22000044 22000055 22000066 22000077 22000088 33//0088 33//0099
$$33,,667766
$$44,,778877
$$11,,117766
77..771122..66 1100..00 99..55 1100..44 88..44 44..77%% IInncc..
$$55,,000000
$$11,,223300
$$33,,334400
$$44,,002277$$44,,444466
00
5500
110000
115500
220000
22000044
%% IInncc.. 1144..77
¥¥225500 ¥¥221144..77
¥¥114499..33
22000055
¥¥116666..44
1111..55
22000066
1155..44
33//0088 33//0099
44..88
22000077
¥¥223322..88
1111..88
22000088
¥¥119922..11
¥¥5588..22
88..44 99..33
¥¥6633..66

10
Aflac U.S. Operating Ratios(To Total Revenues)
Over a long period of time, the operating ratios of AflacU.S. have consistently been very stable. However, in thefirst quarter of this year, the benefit and expense ratioswere influenced by the decline in U.S. persistency. As aresult of increased lapsation, the benefit ratio declinedsharply, reflecting the release of the benefit reservesassociated with the lapsed policies. The expense ratio wasalso higher due to the increased amortization of deferredacquisit ion costs, or DAC, for the lapsed pol ic ies.However, the net impact of the reserve release and DACamortization was a modest benefit to the bottom line in thequarter.
Aflac U.S. Pretax Operating Earnings(In Millions)
Based upon our operating trends and margins, weexpect pretax operating earnings and revenues to grow ata fairly parallel rate. Although Aflac Japan is the dominantcomponent of our total company results, Aflac U.S. stillremains a significant and important contributor to ourgrowth.
Segment Contributions to Operating Earnings(In Millions)
The increase in interest expense in 2008 was due to theeffect of the stronger yen on our yen-denominated debt.Parent company and other unallocated expenses werehigher in 2008 primarily because of a decline in parentcompany investment income that was netted againstcorporate operating expenses. Our consolidated tax ratehas been very stable over the last several years.
Operating Earnings Per Share(Diluted Basis)
At the bottom of this chart, you’ll see the per-shareimpact from the changes in average yen/dollar exchangerates for last five years. Over the long run, the impact fromcurrency fluctuations tends to be smoothed. In 2008 ourresults benefited significantly from the strengthening of theyen on a per-share basis. Our sensitivity to currencychanges on a per-share basis increased last year due to agreater portion of our consolidated earnings being derivedfrom yen-denominated sources and the effects of sharerepurchase.
Reconciliation of Operating toNet Earnings Per Diluted Share
In addition to net earnings, we believe that an analysisof operating earnings, a non-GAAP financial measure, isvitally important to an understanding of Aflac’s underlyingprofitability drivers. We define operating earnings as theprofits we derive from our operations before realizedinvestment gains and losses, the change in the fair value ofthe interest rate component of cross-currency swaps asrequired by SFAS 133, and nonrecurring items.
We use operating earnings to evaluate our financialperformance because realized gains and losses, theimpact from SFAS 133, and nonrecurring items tend to bedriven by general economic conditions and events, andtherefore can obscure the underlying fundamentals andtrends in Aflac’s insurance operations.
OOppeerraattiinngg eeaarrnniinnggss $$33..2277 $$33..9999 $$..9988 $$11..2222
RReeccoonncciilliinngg iitteemmss**::
IInnvv.. ggaaiinnss ((lloosssseess)) ..0044 ((11..3377)) ((..0011)) ((..0011))
SSFFAASS 113333 ..0011 ((..0011))
DDeebbtt eexxttiinngguuiisshhmmeenntt ..0022
NNeett eeaarrnniinnggss $$33..3311 $$22..6622 $$..9988 $$11..2222
22000077 22000088 33//0088 33//0099
**NNeett ooff ttaaxx
00
110000
220000
330000
440000
550000
660000
770000
22000044 22000055 22000066 22000077 22000088 33//0088 33//0099
55..661111..77 77..661111..44 1188..33 1122..66 77..22
$$449977
$$119911
%% IInncc..
$$880000
$$220044
$$669922$$774455
$$552255$$558855
00..0000
11..0000
22..0000
33..0000
EEPPSS eexx.. YYeennRReeppoorrtteedd EEPPSS
$$44..0000
22000044 22000055
22..2233
((..0022))$$..0088YYeenn iimmppaacctt
%% iinncc.. eexx.. ¥¥ 1166..88 1144..88
22..554422..8855
22000066((..0088))
1155..44
33..2277
22000077((..0022))
1155..44
22000088
33..9999
..2233
1155..00
33//0099..0099
1155..33
11..2222
00
1100
2200
3300
4400
5500
6600%%
BBeenn.. && ccllaaiimmss EExxppeennsseess PPrreettaaxx eeaarrnniinnggss
33//0088 33//0099
5544..22 5522..99
3311..55 3311..55
1155..661144..33
5522..44
3311..44
1166..22
22000077220000662200005522000044 22000088
5522..88
1155..66
3311..66
4499..55
3333..99
1166..66
5544..00
3311..11
1144..99
5533..99
3311..66
1144..55

11
However, in the current environment we are also well-aware of the focus on net earnings as a means for growingshareholders’ equity. In 2008, we realized significantinvestment losses. Those losses were primarily attributableto the sale of our Lehman Bros. holdings, in addition toimpairments of Ford Motor Co., our holdings in threeIcelandic banks and several collateralized debt obligations(CDOs). In the first quarter of this year, we realized after-tax investment gains of $146 mil l ion for federal taxpurposes to offset previously incurred investment losses.Offsetting those gains were $152 mill ion of realizedinvestment losses, which were primarily attributable toimpairments on certain CDOs, two corporate securitiesand perpetual secur i t ies of two issuers. We alsorepurchased some of our outstanding yen-denominateddebt in the first quarter of this year. We purchased ¥5.4billion of bonds at a price of ¥3.86 billion, or about 71% ofpar. The extinguishment of this debt resulted in a $10million gain in the quarter, or $.02 per diluted share.
EPS Growth Objectives
Taking all of this into account, we continue to focus onmaintaining strong fundamentals in our core businessesand building on our record of strong earnings growth. Ourgoal for 2009 is to increase operating earnings per share13% to 15%, excluding the yen. As we have discussed, itis unlikely we will repurchase shares in 2009 given thedistressed nature of financial markets, even though we findthe current valuation very attractive. With no sharerepurchases, we would expect earnings growth to be atthe low end of the 13% to 15% range this year. Ourobjective for 2010 is to increase operating earnings pershare 9% to 12%, excluding the impact of the yen. Webelieve these targets represent realistic underlying financialassumptions. I want to remind you, that the data I willshow you represent modeling assumptions and notnecessarily our official operating objectives.
Aflac Japan Assumptions
For Japan, our assumption is that sales will be flat to up5%, which is in line with our incentive compensationtarget. We are assuming the same range for 2010. Ourassumption for new money yields is a range of 2.75% to3.00%, which we believe is conservative. Our financial
modeling assumes that our persistency declines slightly in2009 due in part to a signif icant number of cancerpolicyholders reaching the primary retirement ages wheretermination rates are highest. Additionally, in 2010, weassume our persistency will remain fairly stable, comparedwith 2009. As we have discussed for many years, weexpect continued improvement in the benefit ratio due tothe ongoing change in business mix and improving claimstrends. We believe the benefit ratio will improve by roughly150 to 200 basis points in 2009 and another 125 to 175basis points in 2010. Our general expectation is that theexpense ratio will remain relatively stable.
Aflac U.S. Assumptions
For Af lac U.S., just l ike for Af lac Japan, we areassuming sales will be flat to up 5% this year. Again, thatnumber happens to be in line with our official sales targetfor this year. Like Japan, it is too soon to set a 2010 salestarget; however, we have assumed sales are again flat toup 5% for modeling purposes. In terms of new moneyyields, we have assumed we will invest in the 5.50% to6.00% range. We anticipate the benefit ratio will be 100 to200 basis points better in 2009, compared with last year,which is influenced by our persistency assumption. In2010, we expect the benefit ratio to be 50 to 150 basispoints better than 2009. We’re assuming that persistencywill decline in 2009 and stabilize in 2010. We did seestabilized U.S. persistency at the end of April, comparedwith the first quarter of 2009. Overall, we expect to seesome margin expansion at Aflac U.S. this year and next.
Corporate Assumptions
I already mentioned that we are assuming no sharerepurchases in 2009. For 2010 we have assumed no sharerepurchases to as many as 12 million shares. We willcontinue to closely monitor the financial markets and ourcapital position before going forward with purchases nextyear. As I previously mentioned, our current bias is toretain capital due to the uncertain environment. If we seeclarity and then improvement in the environment, we willconsider resuming repurchases to enhance our per-shareresults.
Historically, it has been our policy to increase cashdividends generally in line with operating earnings per
• IInnccrreeaassee ooppeerraattiinngg eeaarrnniinnggss ppeerr ddiilluutteedd sshhaarree 1133%% ttoo
1155%% iinn 22000099,, eexxcclluuddiinngg tthhee iimmppaacctt ooff ffoorreeiiggnn ccuurrrreennccyy
• IInnccrreeaassee ooppeerraattiinngg eeaarrnniinnggss ppeerr ddiilluutteedd sshhaarree 99%% ttoo
1122%% iinn 22001100,, eexxcclluuddiinngg tthhee iimmppaacctt ooff ffoorreeiiggnn ccuurrrreennccyy
SSaalleess ggrroowwtthh 00%% ttoo 55%% 00%% ttoo 55%%
NNeeww mmoonneeyy 22..7755%% ttoo 33..0000%% 22..7755%% ttoo 33..0000%%
BBeenneeffiitt rraattiioo ddoowwnn 11..55%% ttoo 22..00%% ddoowwnn 11..2255%% ttoo 11..7755%%
PPeerrssiisstteennccyy ddoowwnn sslliigghhttllyy ssttaabbllee
22000099 22001100
SSaalleess ggrroowwtthh 00%% ttoo 55%% 00%% ttoo 55%%
NNeeww mmoonneeyy 55..5500%% ttoo 66..0000%% 55..5500%% ttoo 66..0000%%
BBeenneeffiitt rraattiioo ddoowwnn 11..00%% ttoo 22..00%% ddoowwnn ..55%% ttoo 11..55%%
PPeerrssiisstteennccyy ddoowwnn ssttaabbllee
22000099 22001100
SShhaarree rreeppuurrcchhaassee nnoonnee 00 ttoo 1122 mmiilllliioonn
CCaasshh ddiivviiddeenndd $$..2288 qquuaarrtteerrllyy uupp 00%% ttoo 1100%%
CCaappiittaall ssttrruuccttuurree uunncchhaannggeedd uunncchhaannggeedd
TTaaxx rraattee uunncchhaannggeedd uunncchhaannggeedd
22000099 22001100

diluted share before the effect of foreign currency. Overall,that view has basically not changed. We expect no changein our quarterly cash dividend this year, which is 16.7%higher than last year’s dividend. We have assumed a 0%to 10% increase in the cash dividend for next year.However, like share repurchases, we believe it is prudentto avoid committing to a dividend increase next year untilwe have a better feel for the economic outlook and ourcapital position based on our RBC ratio.
In addition, we are also assuming no significant changeto our capital structure. As I previously stated, we view a25% debt-to-capital rat io as a cei l ing, and we areassuming we will not raise additional equity capital. Wealso have assumed the 2008 tax rates will remain in effectthrough 2010. All of these assumptions reflect our bestestimates of factors that can impact future results. Webelieve they are reasonable, if not conservative. But I wantto remind you again that there are risks that can affect ourfuture financial performance. We regularly assess thoserisks and describe them in our SEC fi l ings, and I’dencourage you to review them as well.
2009 Operating EPS Scenarios
The highl ighted l ine on this chart represents ourearnings target for 2009 of a 13% to 15% increase over2008. Assuming we produce earnings growth at the lowend of the range this year, we would expect to report$4.51 in operating earnings per diluted share this yearbefore the effect of the yen. Although the yen hasweakened since the end of the year, the average so farthis year is still stronger than 2008’s average exchangerate of 103.46. If we achieve the low end of the objectiveand the yen averages 100 for the full year, reportedoperating EPS should come in around $4.59. We estimatethat a one yen change in the average exchange rateshould impact EPS by about 2.5 cents per share this year.
I hope that the discussion of Aflac’s operations in Japanand the United States has provided you with a solidunderstanding about how we approach our business. Ialso hope you have a strong sense about our commitmentto thorough and transparent disclosure. We believe it’simportant to present information to investors in the samemanner in which we actually manage our operations. And Iwant to assure you that as we always have, we willmaintain the highest degree of integrity in the way wemanage Aflac and report its financial results.
8855 $$55..0044 –– 55..1122 2266..33 –– 2288..33%% $$..5533
9900 44..8877 –– 44..9966 2222..11 –– 2244..33 ..3377
9955 44..7733 –– 44..8811 1188..55 –– 2200..66 ..2222
110000 44..5599 –– 44..6688 1155..00 –– 1177..33 ..0099
110033..4466** 44..5511 –– 44..5599 1133..00 –– 1155..00
110055 44..4477 –– 44..5555 1122..00 –– 1144..00 ((..0044))
111100 44..3377 –– 44..4444 99..55 –– 1111..33 ((..1155))
AAvveerraaggeeEExxcchhaannggee
RRaattee
AAnnnnuuaallOOppeerraattiinngg
EEPPSS%% GGrroowwtthhOOvveerr 22000088
YYeennIImmppaacctt
**AAccttuuaall 22000088 eexxcchhaannggee rraattee
Markets are never in perfect equilibrium. We havemoved from the “irrational exuberance” of the Greenspanera, where risk tolerance was virtually infinite, to thespecter of a global financial crisis this year, where riskavoidance has carried the day. Aflac has not been immuneto the dramatic revaluations of global credit markets, andas a result, we have examined our investing disciplinemore rigorously than ever. But the principles that guide ourinvestment decisions have not changed.
Investment Considerations
As we have discussed for many years, product needsstill drive our investment process. Our high persistencyrate in Japan causes long liability durations. We supportthese l iabi l i t ies by purchasing long-durat ion, yen-denominated assets. Since the Japanese credit markethas virtually no sponsorship beyond ten years, we havedeveloped our own strategy of long-dated investing that isunique among Japanese life insurers. Our U.S. policyliabilities have far shorter durations, but they have no cashvalues if they lapse. So our business model tends toinsulate us from any sudden liquidity needs. We invest forthe long term, and our strong liquidity position gives us theability to continue to invest that way.
Intensive credit analysis is the core of our investmentdiscipline. Every investment we make receives a thoroughcredit review prior to approval. Our global investmentpolicy, established by Aflac’s Board of Directors, governsevery investment decision we make. This policy prohibitstransactions deemed “speculative in nature.” Therefore, we
InvestmentsW. Jeremy “Jerry” Jeffery
Senior Vice President; Chief Investment Officer
• AAffllaacc iinnvveessttmmeenntt ppoolliiccyy
• PPrroodduucctt nneeeeddss -- JJaappaann
» LLoonngg lliiaabbiilliittyy dduurraattiioonnss
» YYeenn--ddeennoommiinnaatteedd ppoolliiccyy lliiaabbiilliittiieess
• PPrroodduucctt nneeeeddss -- UU..SS..
» SShhoorrtteerr lliiaabbiilliittyy dduurraattiioonnss
• CCrreeddiitt rriisskk
• AAffllaacc IInnccoorrppoorraatteedd oobbjjeeccttiivveess
12

do not purchase securities rated below investment grade,even if our regulations permit such purchases. Inasmuchas net investment income is a primary driver of ourconsol idated earnings performance, our speci f icinvestment activities are formulated while consideringAflac’s corporate objectives.
Aflac’s Investment Portfolios(March 31, 2009, In Millions)
As this table shows, we have five separate investmentportfolios, each of which has a specific purpose. Althoughour overall management style is consistent throughoutportfolios, we manage each portfolio separately based oncash flows, product and regulatory requirements andobjectives. Our Global Investment Policy governs alltransactions in both the United States and Japan.
Clearly our largest portfolio is the yen-denominatedportfolio that supports Aflac Japan’s policy liabilities. GivenAflac Japan’s persistent business and our pursuit ofasset/liability matching, the yen portfolio is marked by long-dated instruments. The average maturity of this portfolio is17.3 years and the average duration is 11.7 years. As Isuggested, Japan does not have a long-dated corporatebond market. As such, approximately 77% of our yen-denominated investments are from non-Japanese issuers,predominantly Euroyen issuers. As you know, many ofthese non-Japanese issuers have privately issued yen-denominated securities to Aflac Japan. A high percentageof our privately issued securities employ standard medium-term note documentation and are completely fungible intosmaller denominations should the need arise.
The Aflac U.S. portfolio supports the policy liabilities forour U.S. insurance operation, excluding our New Yorksubsidiary. We continue to invest primarily in corporatebonds to achieve our U.S. investment object ives.Corporate bonds represented 87.3% of the portfolio at theend of the first quarter. The average rating on this portfoliowas ‘A’ at the end of March. Given the different policycharacteristics of our U.S. business, our duration is shorterthan Aflac Japan’s yen portfolio. At the end of March, theduration of the U.S. portfolio was eight and the maturitywas 17.4 years.
For more than 20 years, Aflac Japan has maintained aportfolio of dollar-denominated investments. The rationalebehind this portfolio was to take advantage of moreattractive yields and for many years, lower tax rates. Inaddition, by investing a portion of Aflac Japan’s equity indollars, we have helped mitigate the currency impact onAflac’s consolidated GAAP equity. At the end of March,Aflac Japan’s dollar-denominated portfolio represented5.3% of our consolidated investments, yet it accounted for9.0% of total net investment income. Because we havealso hedged a portion of shareholders’ equity through theissuance of yen-denominated debt, we have not made
significant additions to the dollar-denominated portfolio forthe past several years.
The Aflac New York portfolio is for the book of businessof our New York subsidiary. The investment guidelines aredifferent for this portfolio than those of the general AflacU.S. account, and as a result, the assets of the New Yorkaccount are invested differently. As you can see from thegraph, the New York portfolio had $242 million of investedassets at the end of March. The average rating was ‘A’,and the yield to worst was 6.65% at the end of the firstquarter of this year. The average maturity was 21.8 years.
We also maintain a small portfol io at the holdingcompany level. The primary purpose of this portfolio is totemporarily hold capital until it is deployed for othercorporate purposes.
Consolidated Portfolio Composition(March 31, 2009, In Millions)
Let me comment on the overal l structure of ourportfolio. As you can see, our portfolio is dominated byfixed maturity securities, followed by perpetual securities.Our exposures to collateralized mortgage obligations andcollateralized debt obligations remain relatively small. Wealso have a very small position in equities, which isprimarily for business relationship purposes in Japan.
Ten Largest Investment Positions(March 31, 2009, In Millions)
Within the fixed maturity category we have several largeposit ions. Our largest holding remains Japanesegovernment bonds, or JGBs, which accounted for 14.4%of investments at the end of March. As a part of ourroutine credit work, we have frequent contact with themanagement of our credit exposures, especially our largerconcentrations. We pay particular attention to these larger
13
AAffllaacc JJaappaann -- yyeenn $$5544,,880000 8844..00%%
AAffllaacc UU..SS.. 66,,557799 1100..11
AAffllaacc JJaappaann -- ddoollllaarr 33,,550077 55..33
AAffllaacc NNeeww YYoorrkk 224422 ..44
AAffllaacc IInnccoorrppoorraatteedd 111111 ..22
TToottaall $$6655,,223399 110000..00%%
BBooookk VVaalluuee %% ooff TToottaall
DDeebbtt sseeccuurriittiieess::
FFiixxeedd mmaattuurriittyy sseeccuurriittiieess $$5544,,883355 8844..11%%
PPeerrppeettuuaall sseeccuurriittiieess 88,,337711 1122..88
RRMMBBSS 11,,003322 11..66
CCMMBBSS 113322 ..22
AAsssseett bbaacckkeedd 110000 ..22
CCDDOOss 774477 11..11
EEqquuiittyy sseeccuurriittiieess 2222
TToottaall $$6655,,223399 110000..00%%
BBooookk VVaalluuee %% ooff TToottaall
GGoovveerrnnmmeenntt ooff JJaappaann $$99,,441100 1144..44%%IIssrraaeell EElleeccttrriicc CCoorrpp.. 884411 11..33LLllooyyddss BBaannkkiinngg GGrroouupp** 881177 11..33RReeppuubblliicc ooff TTuunniissiiaa 881155 11..33HHSSBBCC HHoollddiinnggss PPLLCC 779999 11..22RReeppuubblliicc ooff SSoouutthh AAffrriiccaa 662255 11..00CCoommmmeerrzzbbaannkk AAGG**** 660033 ..99TTaakkeeffuujjii CCoorrpp.. 557777 ..99BBaannkk ooff AAmmeerriiccaa****** 555555 ..99KKiinnggddoomm ooff BBeellggiiuumm******** 554433 ..88
BBooookk VVaalluuee %% ooff TToottaall
**IInncclluuddeess HHBBOOSS && BBaannkk ooff SSccoottllaanndd****IInncclluuddeess DDrreessddnneerr
******IInncclluuddeess MMeerrrriillll LLyynncchh********IInncclluuddeess FFoorrttiiss

concentrat ions and remain comfortable with thecreditworthiness of all of them.
I’d like to share a few other observations about ourconcentrations. It is worth noting that our largest exposureby far is to the Government of Japan through theirgovernment bond issuance. To put this in perspective, ourexposure to JGBs is four times higher than the averageexposure of U.S. life companies to U.S. Treasuries as apercentage of admitted assets. Both our Lloyds BankingGroup and Commerzbank AG exposures reached theircurrent size as the result of large bank mergers. The seniordebt ratings of both are single A; however 34% of ourCommerzbank exposure and all of our Lloyds exposureare rated below investment grade due to the subordinatedstatus of our holdings. All of our top ten holdings arecurrent on all obligations to Aflac. With the exception ofmergers, we have not added to these concentrationsexcept for JGBs. We remain committed to a strategy ofdiversification. As a result we do not add to any exposureor establish a new position when it would exceed 5% oftotal adjusted capital on a statutory basis.
Subordination Distribution(March 31, 2009, In Millions)
I thought it would be helpful to provide a detaileddescription of the capital classes of our investments. Asyou can see, senior debt comprises the majority of ourdebt exposure, and that remains our bias for portfolioaddit ions. Since the end of 2007, senior debt hasincreased from 70.6% of total investments to 73.8% at theend of March. The Lower Tier II securities are all fixedmaturity securities that are ranked higher than everythingbut senior debt. Within the Upper Tier II and Tier I areas,the majority of our holdings are perpetual securities.
Perpetual Security Holdings(March 31, 2009, In Millions)
Clearly the perpetual portion of our portfolio is thesector that has attracted the most scrutiny and comment.
As you know, these secur i t ies do not have statedmaturities. Instead, they have an interest rate step-upprovision and a strong market expectation that they will beredeemed at their step-up dates, thereby creating aneconomic maturity. Of our total perpetual holdings, 96%are yen-denominated and the average economic maturityis 14 years. The average coupon on the perpetuals is4.32%. Among our holdings, 72.3% were Upper Tier IIsecurities, which are senior to equity and preferred shares.The coupons for all of our Upper Tier II holdings aredeferrable and cumulative. As we discussed on our firstquarter conference call, we did have one issuer of a fixedmaturity Upper Tier II defer its coupon this year. However,at the end of the first quarter, all of our perpetual holdingswere current on interest with the exception of the Icelandicbanks we wrote off in the fourth quarter.
Our primary investment premise when purchasingsecur i t ies of banks and other f inancia ls was thatgovernments would take extraordinary efforts to supportthe financial institutions that underpin their respectiveeconomies. To date, I believe the behavior of bankregulators worldwide has supported our premise. I’lladdress impairments in this area.
Residential Mortgage-Backed Securities(March 31, 2009, In Millions)
Our residential mortgage backed securities in Japan arealmost entirely invested in securities issued by governmentsponsored entities, which are rated ‘AAA’. In the dollar-denominated portfolios our RMBS exposures consist ofboth agency and non-agency CMOs. Our non-agencyCMOs have an average loan-to-value ratio of 68.4 and anaverage FICO score of 742. We are constantly performingextensive loss analysis on every holding, and we haveimpaired any holding where we anticipate any materialprincipal loss anytime during the expected life of the CMO.At the end of the first quarter, this amounted to $4 millionof after-tax impairments on a total exposure of $1.0 billion.
Commercial Mortgage-Backed andAsset-Backed Securities
(March 31, 2009, In Millions)
Asset-backed securities make up an immaterial part ofour dollar holdings. Aflac Japan’s dollar-denominatedportfolio has a small exposure to this class, and all areinvestment grade rated. Our U.S. commercial mortgagebacked securities, or CMBS, exposure totaled $132million, $105 million of which were rated ‘AAA’ at the end
14
SSeenniioorr $$4488,,112200 7733..88%%
SSuubboorrddiinnaatteedd::
LLoowweerr TTiieerr IIII 77,,225522 1111..11
UUppppeerr TTiieerr IIII** 66,,332299 99..77
TTiieerr II**** 33,,004400 44..66
SSuurrpplluuss nnootteess 333399 ..55
TTrruusstt pprreeffeerrrreedd ((nnoonn--bbaannkk)) 8866 ..22
OOtthheerr 5511 ..11
EEqquuiittiieess 2222
TToottaall $$6655,,223399 110000..00%%
BBooookk VVaalluuee %% ooff TToottaall
**IInncclluuddeess $$66,,005544 mmiilllliioonn ooff ppeerrppeettuuaall UUppppeerr TTiieerr IIII sseeccuurriittiieess****IInncclluuddeess $$22,,331177 mmiilllliioonn ooff ppeerrppeettuuaall TTiieerr II sseeccuurriittiieess
UUppppeerr TTiieerr IIII $$66,,005533 $$44,,888888 $$((11,,116655))
TTiieerr II 22,,331188 11,,332211 ((999977))
TToottaall $$88,,337711 $$66,,220099 $$((22,,116622))
UUnnrreeaalliizzeeddGGaaiinn//((LLoossss))
BBooookkVVaalluuee
MMaarrkkeettVVaalluuee
AAggeennccyy $$ 664433 $$664488 AAAAAA
NNoonn--aaggeennccyy 338899 224499 AAAA
TToottaall $$11,,003322 $$889977
AAvvgg..RRaattiinngg
BBooookkVVaalluuee
MMaarrkkeettVVaalluuee
CCMMBBSS $$113322 $$110022 AAAA
AAsssseett bbaacckkeedd 110000 9988 AA
RRaattiinnggBBooookkVVaalluuee
MMaarrkkeettVVaalluuee

15
of March. All benefit from substantial subordination andpass our most severe stress tests with comfortablesubordination cushions. At the end of the first quarter, wehad no exposure to Japanese CMBS.
Collateralized Debt Obligations(March 31, 2009, In Millions)
Although our exposure is relatively small, CDOs areanother area of increased investor attention. Theseinstruments were all rated AA or higher at the time ofpurchase, although some are now rated below investmentgrade. The pricing on this asset class has been severelydistressed since last fall. While we have aggressivelyimpaired some CDOs, it is worth noting that all weremeeting their obligations in full as of March 31, 2009. All ofour CDOs could withstand a minimum of four defaultsamong the reference entities before they would experienceany loss of principal. And for most of our CDOs, thenumber of defaults would be much higher beforeexperiencing a loss. We are not making any additions toour CDO holdings.
Investment Pricing Methods*(March 31, 2009, In Millions)
We spend a great deal of time refining the precision ofour portfolio pricing, as today’s market conditions makeproper valuations more challenging than ever. Let mebriefly walk you through our process. The FinancialAccounting Standards Board (FASB) has directed that weclassify our pricing in three levels for those assetsclassi f ied as avai lable-for-sale. Level 1 pr ic ingencompasses the most readily observable quoted prices inactive markets for our holdings or identical securities. Thiswould include our holdings of JGBs and U.S. Treasuries.This amounts to approximately 23% of our available-for-sale holdings.
Level 2 pricing employs quoted prices for assets similarto ours, or inputs derived from observable market data. Inour case this includes pricing feeds from our custodianbank, specific single name quotes from participant dealers,and model pricing of our single name holdings. Our pricingfeeds are used primarily to evaluate our public U.S.corporate bond holdings, while our model pricing is usedto evaluate most of our investment grade yen-denominated privately issued holdings. Our model pricingderives its inputs from dealers who generate spreadinformation based on rating, maturity, and specific level ofsubordination. Level 2 pricing is used for 68% of ourconsolidated AFS holdings.
Level 3 pricing uses what the accounting professiondescribes as “unobservable inputs” to value securities.Unobservable inputs mean that there are few if anyobservable transactions for a security or security class. Insuch a case we are directed to use the best informationavailable to derive reasonable assumptions about the valueof our holdings. We use Level 3 pricing for our CDOholdings, for example, since there is little or no activity inthe sector at other than liquidation levels. In this case weemploy an outside evaluation firm to provide pricing. Wealso designate all our below investment grade valuations asLevel 3, along with all our callable RDC securities. Level 3values are used for 9% of our consolidated available-for-sale (AFS) holdings.
Unrealized Gains and Losses(In Millions)
The unrealized losses in our portfolio have increasedsignificantly since the financial crisis emerged last fall.Although we have not been immune to credit downgrades,the primary reason for the unrealized loss has been theglobal widening of credit spreads. The impact of thiswidening is magnified for Aflac due to the very longduration nature of our invested assets. However, becausewe have the ability and intent to hold securities to maturity,we would not expect to realize these losses unless ourcredit analysis concludes the issuer will not be able tomeet its obligations for interest and principal payments.
Split-Rated Securities(March 31, 2009, In Millions)
Now I’d like to discuss our view on split-rated securities.We classify split-rated securities as investment grade orbelow investment grade on a case-by-case basis. Whendetermining the appropriate classification, we first look tothe rating assigned by the majority of the various ratingagencies. For example, if two of three agencies have anissue rated as below investment grade, we automaticallyput i t in that category. However, we also giveconsideration to the NAIC rating, along with other factors,such as a watch list for upgrade or downgrade by one ofthe major rating agencies. At the end of March 2009, Aflachad $4.2 billion of split-rated securities, which represented6.8% of Aflac’s total investments and cash.
CCDDOOss $$774477 $$553300 BBBBBB
RRaattiinnggBBooookkVVaalluuee
MMaarrkkeettVVaalluuee
FFiixxeedd mmaattuurriittiieess $$88,,776677 $$1199,,991188 $$22,,665544 $$3311,,333399
PPeerrppeettuuaall sseeccuurriittiieess 55,,557733 663366 66,,220099
EEqquuiittiieess 1155 1100 2255
TToottaall $$88,,778822 $$2244,,449911 $$33,,330000 $$3377,,557733
LLeevveell 11 LLeevveell 22 LLeevveell 33 TToottaall
**AApppplliieess ttoo aavvaaiillaabbllee--ffoorr--ssaallee sseeccuurriittiieess oonnllyy
AAvvaaiillaabbllee ffoorr ssaallee::
GGaaiinnss $$ 11,,448822 $$ 22,,004499 $$ 11,,111133
LLoosssseess ((33,,006699 ((44,,009955 ((55,,990022
TToottaall AAFFSS $$((11,,558877 $$((22,,004466 $$((44,,778899
HHeelldd ttoo mmaattuurriittyy::
GGaaiinnss $$ 118877 $$ 557711 $$ 221199
LLoosssseess ((11,,998811 ((11,,992233 ((22,,442299
TToottaall HHTTMM $$((11,,779944 $$((11,,335522 $$((22,,221100
99//3300//0088 33//3311//00991122//3311//0088
))
))
))
))
))
))
))
))
))
))
))
))
IInnvveessttmmeenntt ggrraaddee 2233 $$22,,661144 $$11,,998855
BBeellooww iinnvveessttmmeenntt ggrraaddee 99 11,,558888 887744
TToottaall 3322 $$44,,220022 $$22,,885599
BBooookkVVaalluuee
MMaarrkkeettVVaalluuee
NNuummbbeerrooff IIssssuueess

Largest Split-Rated Holdings(March 31, 2009)
This chart shows our ten largest split-rated holdings,which represented 90% of our total split-rated holdings ona book value basis at the end of the first quarter. Therecent increase in split-rated securities for Aflac hasprimarily arisen from our holdings of perpetual securities.As you can see, seven of our ten largest split-ratedpositions at the end of March were perpetual securities.
Credit Ratings*
Credit quality remains a primary focus of our investmentapproach. At the end of March, 2009, 76.7% of ourholdings were rated ‘A’ or better. Of our ‘BBB’ ratedsecurities, 18.3% were rated ‘BBB+’ or ‘BBB’ comparedwith 17.5% a year ear l ier . I f a secur i ty we hold isdowngraded to below investment grade, we immediatelyclassify that security as available for sale if it is not alreadyso classified. The unrealized gain or loss on the securitythen becomes reflected in shareholders’ equity. As youcan see, our below-investment-grade exposure rose from1.8% at the end of the year to 5.0% at the end of the firstquarter of th is year. Let me cover some of thereclassifications that caused that increase.
Largest Below-Investment-Grade Holdings(March 31, 2009, In Millions)
The increase in our below-investment-grade holdingssince year-end 2008 was primarily attributable to thedowngrades of Lloyds, Upm-Kymmene, Royal Bank ofScotland, Hella and Dresdner Funding Bank. Combined,those issuers represented 2.8% of total debt and perpetualsecurities at amortized cost. Among all below-investment-grade holdings at the end of March, 55.9% were corporatesecurities, 35.8% were perpetuals, 8.2% were CDOs, and.1% were CMOs.
Designating a security as below investment grade doesnot mean we immediately impair the security and write offthe difference between fair value and carrying value. Wefirst reference independent pricing sources to assess thevalue of the security. If the fair value is below our amortizedcost, our analysis focuses on whether the decline is otherthan temporary. Let’s review the Aflac impairment policiesthat guide our decisions.
Aflac’s Debt Impairment Policy
When considering whether or not to impair any debtsecurity we start with a very straightforward question: willthe issuer pay their principal and interest under the statedterms? We then apply a far more detailed analysis, as youcan see. This impairment policy applies to our debtinvestments on a GAAP and statutory basis. We believethe recent changes to SFAS 115 support the notion oftaking a longer view on the recovery of the fair value of aninvestment, which is consistent with the long-durationnature of our business. As such, just because a debtsecurity is in an unrealized loss position, it does notautomat ical ly mean that an impairment charge iswarranted. Although price is a consideration in ouranalysis, it is by no means the primary determinant of thetiming of a debt impairment. As you are probably aware,the evaluat ion of perpetual secur i t ies for possibleimpairment is much different based on current accountingguidance.
Aflac’s Equity Impairment Policy
The appropriate impairment approach is under reviewby the accounting profession because of the hybrid natureof perpetual securities. I would point out that we continue
16
IIGG//BBIIGGBBooookk VVaalluuee
LLllooyyddss BBaannkkiinngg GGrroouupp** $$881177 BBIIGGFFoorrttiiss** 550099 IIGGDDeexxiiaa BBaannkk BBeellggiiuumm** 445588 IIGGIIrriisshh LLiiffee aanndd PPeerrmmaanneenntt** 337777 IIGGSSiiggnnuumm ((AAhhoolldd)) 332266 IIGGUUppmm--KKyymmmmeennee 331166 BBIIGGSSwweeddbbaannkk** 227799 IIGGSSEEBB AABB** 225555 IIGGRRooyyaall BBaannkk ooff SSccoottllaanndd** 222277 BBIIGGDDrreessddnneerr FFuunnddiinngg TTrruusstt 44 && 11 220088 BBIIGG
**PPeerrppeettuuaall sseeccuurriittyy
• RReeccoovveerraabbiilliittyy ooff pprriinncciippaall aanndd iinntteerreesstt
• PPeerrcceennttaaggee ddeecclliinnee iinn vvaalluuee aanndd lleennggtthh ooff ttiimmee dduurriinnggwwhhiicchh ddeecclliinnee hhaass ooccccuurrrreedd
• MMaarrkkeett ccoonnddiittiioonnss
• AAbbiilliittyy aanndd iinntteenntt ttoo hhoolldd iinnvveessttmmeenntt
• PPaatttteerrnn ooff ccoonnttiinnuuiinngg ooppeerraattiinngg lloosssseess ooff iissssuueerr
• RRaattiinngg aaggeennccyy aaccttiioonnss
• AAddvveerrssee cchhaannggeess iinn pprroodduuccttiioonn oorr rreevveennuuee ssoouurrcceess,, oorrtteecchhnnoollooggiiccaall ccoonnddiittiioonnss
• AAddvveerrssee cchhaannggeess iinn iissssuueerr’’ss eeccoonnoommiicc,, rreegguullaattoorryy oorrppoolliittiiccaall eennvviirroonnmmeenntt
1100%% 1122
2200 99
3355 66
PPeerrcceennttaaggee DDeecclliinnee FFrroomm CCoosstt CCoonnsseeccuuttiivvee MMoonntthhss iinn DDeecclliinnee

17
to view the perpetual securities we own as more debt-likethan equity like. They are rated like debt, priced like debt,and pay coupons like debt. Furthermore, we have noownership interest and Upper Tier II and Tier I perpetualsecurities are senior to common equity. However, becausethey have no contractual maturity, they are classified asequities for GAAP purposes. For statutory accountingpurposes, these secur i t ies are considered debtinstruments.
On October 14, 2008, the Securities and ExchangeCommission (SEC) issued a letter to the Financia lAccounting Standards Board (FASB) on the topic ofperpetual securities. The SEC’s letter noted that due totheir debt characteristics, perpetuals could be evaluatedusing a debt impairment model until the FASB furtheraddresses whether a debt or equity impairment approachis most appropriate. Because the FASB has yet to act onthis issue, we continue to follow the guidance in the SEC’sletter. As a result, we are evaluating our holdings ofperpetual securities using a debt impairment methodunless a security is downgraded to below investmentgrade. At that time, SEC guidance requires us to use anequity impairment method.
As you can see, the equity impairment model is basedon an aging schedule of unrealized losses. Following adowngrade to below investment grade, we will apply thismodel for GAAP purposes regardless of our credit analysisof the issuer’s ability to meet its contractual obligations.
After-tax Realized Investment Gains/Losses(March 31, 2009, In Millions)
In the first quarter of 2009, we generated $146 million ofafter-tax gains to offset the losses on a tax basis we hadincurred through the sale of our Lehman Brothers holdingsin 2008. It’s important to note that the gains on a statutorybasis do not have an immediate benefit to our results.Instead, these gains are amortized over the remaining lifeof the securities that were sold.
Our debt impairment losses in the first quarter totaled$110 million on a GAAP basis. Of that total, $74 millionwere the result of CDO impairments, $32 million resultedfrom the impairment of the corporate bonds of two issuers:Security Benefit Life and Ford Motor Co. and $4 millioncame from CMOs. In addition, on a GAAP-only basis werecognized $42 mil l ion of impairment losses on theperpetuals of the Lloyds Banking Group and Royal Bank ofScotland. Again, because we evaluate the perpetuals asdebt instruments for statutory accounting and because ouranalysis continues to suggest the issuers will continue toservice their obligations, we did not impair them on a
statutory basis. As we discussed on our first quarterconference call, assuming March 31 pricing and assumingno additional perpetuals downgraded to below investmentgrade, we would expect to incur $295 million of additionalafter-tax impairments under the equity method for thebalance of the year. The major i ty of these GAAPimpairments would occur in the third quarter.
Now, let me turn to our investment activities, startingwith our investment cash flow.
Investment Cash Flow(In Millions)
The vast majority of cash f low to investments isallocated to Aflac Japan. As we have discussed, cash flowfrom Aflac U.S. has been constrained in recent years. Inlate 2007 and in 2008, we funded share repurchaseactivities with U.S. cash flow. This year the U.S. operationalso loaned $500 mil l ion to the parent company torefinance its maturing senior notes. In addition, we will bepaying anticipated claims for the next few years for areturn-of-premium benefit that was included on the cancerpolicy we wrote in the United States during the 1980s. Asa result, our investment activities in the United States arelargely limited to re-investing income and redemptions andexecuting bond swaps when market conditions permit.
Our cash flow in 2008 amounted to $5.1 billion. Theprimary contributor to cash flow is operations, followed byinvestment income and redemptions. Our 2009 cash flowprojection is $4.4 billion, assuming calls and redemptionstake place as scheduled. Because most of our cash flow isattributable to Aflac Japan, we must invest primarily inlong-dated, yen-denominated debt securities to meet thecharacteristics of Aflac Japan’s policy liabilities.
Purchases by Asset Class
GGaaiinnss $$ 114466 $$ 222244
LLoosssseess::
DDeebbtt mmooddeell iimmppaaiirrmmeennttss ((111100 ((116666
EEqquuiittyy mmooddeell iimmppaaiirrmmeennttss ((4422
TToottaall rreeaalliizzeedd ggaaiinn ((lloossss)) $$ ((115522 $$ 5588
GGaaiinnss ttrraannssffeerrrreedd ttoo IIMMRR 222244
NNeett rreeaalliizzeedd lloossss $$ ((66 $$ ((116666
GGAAAAPP SSttaatt
))
))
))
))
))
))
00
11,,000000
22,,000000
33,,000000
44,,000000
55,,000000
$$66,,000000
AAffllaacc UU..SS..
AAffllaacc JJaappaann
22000044 22000055 22000066 22000077
$$55,,119955
$$44,,661166$$44,,559944
22000088
$$44,,994477 $$55,,005500

Fixed maturity securities from single corporate issuershave dominated our purchases over the past severalquarters. We are not purchasing perpetual securities dueto the uncertain regulatory cl imate and accountinguncertainty. In fact, we last purchased perpetuals in 2005.Our RMBS and CMBS purchases have been infrequentand typically only the highest credit quality. In these areas,we cont inue to look for interest ing opportunit ies.Additionally, we have not purchased any CDOs during thelast two quarters due to poor liquidity and uncertain creditconditions. And we do not anticipate adding materially toour small equity position.
Composition of Purchases by Sector
We are committed to diversification when making newinvestments. What you see in this chart certainly bears thatout. Our bank purchases have fallen as purchases ofutilities and other corporate names have risen. While wedo feel that the senior debt of many banks offers excellentvalue, so too does the debt of many non-financial issuers.We believe we have a rare opportunity to make long-terminvestments in high quality non-financial names that areseldom offered at such attractive terms. We are alsoseeing opportunities in high-quality sovereign and quasi-sovereign opportunities. I should note that roughly 30% ofthe bank exposure that we purchased in 2008 wasgovernment owned or government sponsored institutions.
Debt Purchases by Subordination
As you can see, we have not purchased Upper Tier II orTier I capital securities of any description since prior to2007. Lower Tier II securities, while subordinated, do nothave loss absorpt ion features. Therefore, we haveoccasionally purchased them when we thought theyoffered attractive relative value versus the senior debt ofthe same issuer. But our overwhelming preference hasbeen, and continues to be, senior debt.
Credit Ratings on Purchases
The credit ratings on our purchases remain high and arein keeping with our conservative investment philosophy.There has been a decline in ‘AAA’ purchases primarilybecause we have deemphasized CDOs and CMOs, whichcomprised most of our ‘AAA’ purchases. Any ‘BBB’purchases were either through bond swaps in the U.S.portfolio, or if purchased outright came with robustcovenants. We continue to aggressively seek protectivecovenants in any non-bank investments we make.
Net Investment Income(In Millions)
Aflac’s consolidated net investment income growth hasaveraged 7.6% per year over the last f ive years.Translation of the stronger yen to the dollar benefited ourgrowth rates in 2008 and so far in 2009. Excluding thecurrency, the steady growth of our operations has led toincreased invested assets. Growth in the asset base,combined with improved new money yields, has assistedAflac Incorporated in reaching its corporate earningstargets.
Although we have had some sense of marginalimprovements in global credit markets, it’s clear that weremain in a very uncertain and turbulent period. In thisenvironment, we believe it is as important as ever toremain focused on our core investment discipline ofinvesting in securities that will help us ensure we meet ourpolicyholder obligations, while mitigating risk. We believeour investment approach has been a prudent course ofaction for many years, and we believe it will continue toserve us well in the future.
18
BBaannkkss//ffiinnaanncciiaallss 3322..99%% 2244..11%% ..88%%GGoovv''tt//ggoovv''tt gguuaarraanntteeeedd 2211..00 1111..99 7722..33MMuunniicciippaalliittiieess ..44 22..44PPuubblliicc uuttiilliittiieess 77..88 2233..66 55..44CCDDOOss 44..77 66..66SSoovveerreeiiggnn//ssuupprraannaattiioonnaall 33..00 1122..00MMoorrttggaaggee//aasssseett--bbaacckkeedd 33..88 77..11 ..55OOtthheerr ccoorrppoorraattee 2266..44 2266..77 66..66
TToottaall 110000..00%% 110000..00%% 110000..00%%
22000077 22000088 33//3311//0099
SSeenniioorr 9900..00%% 9966..00%% 110000..00%%
SSuubboorrddiinnaatteedd::
LLoowweerr TTiieerr IIII 1100..00 44..00
UUppppeerr TTiieerr IIII
TTiieerr II
SSuurrpplluuss nnootteess
TTrruusstt pprreeffeerrrreedd -- nnoonn--bbaannkk
OOtthheerr
TToottaall 110000..00%% 110000..00%% 110000..00%%
22000077 22000088 33//3311//0099
AAAAAA 1188..44%% 99..99%% 77..22%%
AAAA 4444..11 3366..44 8800..11
AA 3300..22 4422..00 1100..11
BBBBBB 77..33 1111..77 22..66
110000..00%% 110000..00%% 110000..00%%
22000088 33//3311//009922000077
00
11,,000000
22,,000000
AAffllaacc JJaappaann AAffllaacc UU..SS..
$$33,,000000
22000044 22000055 22000066 22000077
$$22,,117711$$22,,333333
$$11,,995577
22000088
$$22,,007711
$$22,,557788
33//0088 33//0099
$$662277 $$668888

19
This presentation contains information regardingproduct pricing and reserving, as well as claim experiencetrends. It also includes information that illustrates profitemergence under GAAP.
Pricing Assumptions(U.S. and Japan)
Product pricing includes assumptions for morbidity,mortality, persistency, expenses and investment returns. InJapan, the product pricing assumptions are approved bythe FSA. Premiums are calculated using assumptions thatinclude provisions for adverse deviation, or PAD. Thesemay be greater than those used for GAAP. No explicitmargin for profit is added. Instead, profit margins arisefrom the pricing PAD.
The interest rate assumption for product pricing isestablished by each company and must be justified to theFSA. The rate may vary depending on the type of product.For example, we use a lower interest rate for pricing firstsector products than for third sector products. Otherpricing assumptions such as morbidity and persistency arealso reviewed and approved by the FSA. Theseassumptions may be developed based on Af lacexperience, industry experience, national statistics or ablend of data.
The persistency assumptions are generally higher thanour actual persistency. For products with cash values, wegenerally assume no voluntary lapses. When the cashvalues are not present in the product, we use a low level ofvoluntary lapse in each year. In the first part of 2007, wemodified our first sector premium rates to reflect therevised standard mortality table that was promulgated bythe FSA. In September 2007, we reflected the newstandard mortality table for third sector products in ourproduct pricing. This table has lower mortality rates thanthe previous table, and generally adds to the conservatismin our overall pricing persistency assumptions for thirdsector products.
The expense assumptions reflect our actual operationalcosts. Aflac’s cost structure per policy is favorable whencompared to other life insurance companies in Japan.Reflecting the efficiency of our operations in our productpricing allows us to maintain a competitive edge in ourpremium rates.
In the United States, the pricing assumptions tend to bebased on our own experience, including some provisionsfor adverse deviation. In addition, it is our practice to target
an explicit profit margin, expressed as a percentage ofpremium. Because most of our products do not consumesignificant amounts of statutory capital for a long period oftime, we do not price on a return-on-invested-capitalbasis. We do, however, monitor invested capital patternson a regulatory basis and may include an invested surpluscharge if necessary.
FSA Reserve Assumptions(Japan)
In Japan, we are required to use specific reservingmethods, as well as certain minimum assumptions for ourFSA reporting. The net level premium reserving approachrequired by the FSA is similar to what we use for GAAPreporting. Benefit reserves begin building from the firstpolicy year. However, unlike GAAP reporting, where we areallowed to defer certain costs of acquiring business, FSAreporting doesn’t make any allowance for the first-yearprofit strain of issuing a policy. For this reason, there canbe significant surplus strain associated with new business.In addition, the interest rates, lapse assumptions, mortalitytables and morbidity rates required for the reservecalculation generally result in reserves that are larger thanthose calculated using the pricing assumptions.
FSA Reserving Strain(Japan Representative Plan)
This has an influence on our product pricing, becausethere can be significant FSA surplus strain when theproduct pricing assumptions result in lower premiums thanthose based on FSA reserving assumptions. This chartshows the FSA surplus strain for a representative medicalproduct. As shown, the surplus strain is fairly minimalwhen the product premiums use the same assumptions asthe FSA reserving with a breakeven period of five years.However, when the premiums are lower than thosecalculated using FSA reserv ing assumptions, thebreakeven period lengthens dramatically. Using premiumsthat are 90% of the FSA basis premiums, the breakeven
Product Pricing and ReservingSusan R. Blanck
Senior Vice President; Corporate Actuary; First Senior Vice President, Aflac Japan
• MMoorrbbiiddiittyy
• MMoorrttaalliittyy
• PPeerrssiisstteennccyy
• EExxppeennsseess
• IInnvveessttmmeenntt rreettuurrnnss• NNeett LLeevveell MMeetthhoodd
• IInntteerreesstt RRaattee –– 11..5500%%
• LLaappssee RRaattee –– lloowweerr tthhaann pprriicciinngg bbaassiiss
• MMoorrttaalliittyy –– ssttaannddaarrdd mmoorrttaalliittyy ttaabbllee
• MMoorrbbiiddiittyy –– pprriicciinngg bbaassiiss wwiitthh ssttrreessss tteessttiinngg
110000%% 55
9900 88
8800 1188
PPrreemmiiuumm RRaatteeaass aa PPeerrcceennttaaggee ooffFFSSAA BBaassiiss PPrreemmiiuumm
FFSSAA RReeppoorrttiinngg BBaassiissBBrreeaakkeevveenn YYeeaarr

20
period lengthens to eight years. And, at an 80% premiumlevel, the breakeven period lengthens to 18 years. Thisdiscourages the use of pricing assumptions that are moreliberal than FSA reserving assumptions.
U.S. Statutory Reserve Assumptions
In the United States, premium rates are filed with eachstate’s Department of Insurance. We must demonstratethat premiums are reasonable in relation to the benefitsprovided by the policy. Many states also require that wedemonstrate the product experience will meet or exceed aminimum loss ratio requirement. For most of our U.S.health products, we use a two-year preliminary termmethod for calculating statutory benefit reserves. With thismethod, benefit reserves begin building from the thirdpolicy year. This feature helps mitigate the surplus straincaused by new business. Statutory reporting prescribesthe maximum interest rates that can be used in the reservecalculation. The lapse assumptions, mortality tables andmorbidity rates are general ly based on our pricingassumptions with an added margin for conservatism.
GAAP Reserve Assumptions
Once the premium rates are established, we determineappropriate assumptions to use in calculating GAAPreserves. The calculation of GAAP reserves requiresassumptions for morbidi ty, morta l i ty, pers istency,expenses and investment returns.
Aflac Japan Investment Return Assumptions
As the chart shows, for our major product lines inJapan, GAAP reserve assumptions generally use higherinvestment return rates than the pricing or FSA reservingassumptions. GAAP assumptions generally use claim andpersistency assumptions that are derived from our actualexperience, or from assumptions used in the product
pricing when we don’t have enough of our own credibleexperience.
Aflac U.S. Investment Return Assumptions
In the United States, all of our currently issued productsuse a 5.50% investment return for GAAP reserves. That isgenerally in line with our pricing assumptions. However,some products that were priced several years ago usedhigher or lower investment assumptions when they werepriced. For statutory accounting purposes, we use a 4.0%interest assumption for all new business.
GAAP Reporting
GAAP reserves are computed using the net levelpremium method. Under this approach, benefit reservesbegin to build in the first policy year. Certain expensesassociated with the cost of acquiring new business arecapitalized and amortized over the premium paying periodof a policy. The combination of the net level premiumreserve methodology and the capitalization of acquisitioncosts results in an expected profit emergence pattern thatis fair ly level over time. However, there are variousacquisition costs we are not allowed to defer, so theexpected profit in the first policy year is usually much lowerthan in other policy years.
Claims vs. Reserves
This simplified schematic shows why benefit reservesare provided and illustrates the relationship betweenincurred claims and benefit reserves. The policyholder
LLiiffee//HHeeaalltthh 55..5500%% 44..5500%% -- 77..0000%% 44..0000%%GGAAAAPP PPrriicciinngg SSttaattuuttoorryy
LLiiffee//HHeeaalltthh 11..5500%% -- 33..0000%% 11..5500%% -- 22..3355%% 11..5500%%
AAnnnnuuiittyy 11..6655%% 11..6655%% 11..5500%%
GGAAAAPP PPrriicciinngg FFSSAA
• MMoorrbbiiddiittyy
• MMoorrttaalliittyy
• PPeerrssiisstteennccyy
• EExxppeennsseess
• IInnvveessttmmeenntt rreettuurrnnss
00%%
2200%%
4400%%
6600%%
8800%%
110000%%
112200%%
114400%%
116600%%
00 55 1100 1155 2200 2255 3300 3355 4400
PPoolliiccyy YYeeaarrss
AAdddd ttoorreesseerrvveess
DDeedduucctt ffrroommrreesseerrvveessPPrreemmiiuumm
PPrreemmiiuummIInnccuurrrreeddccllaaiimmss
IInnccuurrrreeddccllaaiimmss
• BBeenneeffiitt rreesseerrvvee uusseess nneett lleevveell pprreemmiiuumm mmeetthhoodd
• CCeerrttaaiinn aaccqquuiissiittiioonn ccoossttss aarree ccaappiittaalliizzeedd aanndd ppuutt iinnttoo aaddeeffeerrrreedd ppoolliiccyy aaccqquuiissiittiioonn ccoosstt aasssseett
• TThhee ddeeffeerrrreedd ppoolliiccyy aaccqquuiissiittiioonn ccoosstt aasssseett iiss aammoorrttiizzeeddoovveerr tthhee pprreemmiiuumm ppaayyiinngg ppeerriioodd ooff aa ppoolliiccyy
• RReeqquuiirreess aa pprroovviissiioonn ffoorr aaddvveerrssee ddeevviiaattiioonn ((PPAADD)) iinn tthheebbeenneeffiitt rreesseerrvvee ccaallccuullaattiioonn

21
pays a level premium each year. In early years, incurredclaims are lower than the premium. The differencebetween the premium paid and claims incurred is added tothe benefit reserve. In later years, incurred claims exceedthe premium and the benefit reserves are released toaccommodate the higher claims.
In theory, GAAP benefit reserves are derived in such away that gross profits would emerge in a fairly level patternover time. However, GAAP benefit reserves are required toinclude a provision for adverse deviation, or PAD, whichsuppresses the profit somewhat in the early years of apolicy and magnifies the profit in later years.
GAAP Experience Emergence Parameters
To demonstrate this, we have developed someillustrations using a representative health product whereclaim costs are expected to increase by policy year. Thisrepresentative product has an expected lifetime loss ratioof 60% as measured using the present values of futureclaims and future premiums. All ratios shown in thesegraphs are to earned premium. And the margins that areillustrated are gross margins. The gross margin is thepercentage of premium in each year that is available forexpenses and profit. Finally, required interest is excludedfor this demonstration.
GAAP Experience Emergence without PAD(Ratios to Earned Premium)
The first chart shows the expected incurred claimsratios and expected total benefit ratios assuming that theGAAP benefit reserves are calculated without the requiredprovision for adverse deviation. This chart demonstratesthat if actual experience exactly matches expectedexperience in all years, the total benefit ratio would be thesame 60% in each year, which is the expected lifetime lossratio for the product.
GAAP Experience Emergence with PAD(Ratios to Earned Premium)
This chart shows the same expected incurred claimsratios. But this time, the GAAP benefit reserves have beencalculated with the required PAD. As you can see, theexpected total benefit ratio is no longer flat and is higherthan the expected lifetime loss ratio of 60% in early policyyears. The margins are captured in the GAAP benefitreserve in early policy years when the reserve is buildingand incurred claims ratios are low. They are released overtime as reserves are used to fund the higher level ofincurred claims anticipated in later policy years. Again, thischart assumes that the actual experience emerges exactlyas expected.
GAAP Experience Emergence(Ratios to Earned Premium, 90% Actual-to-Expected Claims)
Now, we move on to a demonstration where the actualexperience emergence differs from what was expected.This chart includes the original expected total benefit ratioswith PAD and incurred claims ratios, but also illustrates thepatterns if the actual claim costs emerge at 90% ofexpected. While the incurred claims ratios are 90% of theoriginal expected incurred claims ratios in each policy year,the total benefit ratios decline slightly in the early policyyears, and by an increasing amount in later years whenprovisions for adverse deviations are released and theincurred claims are a larger portion of the total benefitratio.
• AAssssuummeess rreepprreesseennttaattiivvee hheeaalltthh ppllaann wwhheerree ccllaaiimm ccoossttssaarree eexxppeecctteedd ttoo iinnccrreeaassee bbyy ppoolliiccyy yyeeaarr
• TThhee eexxppeecctteedd lliiffeettiimmee lloossss rraattiioo ffoorr tthhee rreepprreesseennttaattiivveeppllaann iiss 6600%%
• AAllll rraattiiooss sshhoowwnn aarree ttoo eeaarrnneedd pprreemmiiuumm
• TThhee mmaarrggiinnss sshhoowwnn aarree ggrroossss mmaarrggiinnss
• DDeemmoonnssttrraattiioonn eexxcclluuddeess rreeqquuiirreedd iinntteerreesstt
00%%
2200%%
4400%%
6600%%
8800%%
110000%%
11 33 55 77 99 1111 1133 1155 1177 1199 2211 2233 2255
EExxppeecctteedd ttoottaall bbeenneeffiittrraattiioo wwiitthhoouutt PPAADD
EExxppeecctteedd iinnccuurrrreedd ccllaaiimmss rraattiioo
YYeeaarrss
00%%
2200%%
4400%%
6600%%
8800%%
110000%%
11 33 55 77 99 1111 1133 1155 1177 1199 2211 2233 2255
EExxppeecctteedd ttoottaall bbeenneeffiittrraattiioo wwiitthh PPAADD
EExxppeecctteedd iinnccuurrrreedd ccllaaiimmss rraattiioo
YYeeaarrss
00%%
2200%%
4400%%
6600%%
8800%%
110000%%
11 33 55 77 99 1111 1133 1155 1177 1199 2211 2233 2255
TToottaall bbeenneeffiitt rraattiioo110000%% AA//EE
IInnccuurrrreedd ccllaaiimmss rraattiioo110000%% AA//EE
TToottaall bbeenneeffiitt rraattiioo9900%% AA//EE
IInnccuurrrreedd ccllaaiimmss rraattiioo9900%% AA//EE
YYeeaarrssTToottaall bbeenneeffiitt rraattiiooss iinncclluuddee PPAADD

22
GAAP Experience Emergence(Ratios to Earned Premium, 90% Actual-to-Expected Claims)
Here, I’ve added a line showing the ratio of the totalbenefit ratios under the 90% actual to expected claimemergence to the original expected total benefit ratios. Inearly policy years, the ratio is between 90% and 100%.However, in later policy years, the ratio is less than 90%.As discussed previously, this demonstrates the build up ofmargins in early policy years followed by the release ofthose margins in later policy years.
GAAP Experience Emergence(Ratios to Earned Premium, 80% Actual-to-Expected Claims)
Next, I’ll show the same presentation but with claims at80% actual to expected. As the chart illustrates, thedifference in profit emergence in early years versus lateryears is even more pronounced, with a ratio between 85%and 95% in early years, falling well below 75% in lateryears.
GAAP Gross Margin Scenarios
Finally, let’s look at how gross margins emerge undereach scenario. While the gross margins under eachscenario have relatively small differences in early years, thedifference expands with each policy year as provisions foradverse deviation are released and the difference betweenactual and expected total benefits grows larger.
Now, let me take that theoretical discussion and apply itto our operations in Japan.
Aflac Japan Actual vs. Tabular Claims(Tabular = 100%)
The characterist ics of GAAP reserving that I justdescribed are reflected in the trend of our total benefit ratioin Japan. In recent years, we have experienced favorableclaim trends for our major product lines in Japan. RiderMAX claims have been better than our original expectationsince that product’s introduction in 1998. Actual cancer lifeclaims as a percentage of tabular claims have declinedsince 1993 and were about 78% as of September 2008.EVER claims have also been lower than our originalexpectation since that product’s introduction in 2002.
The ordinary product line also shows favorable ratios,but we expect these ratios will show some variability overtime until our block reaches a critical mass.
As we have shown you previously, our experience inJapan related to the average length of stay in the hospitalfor cancer treatment has declined steadily for some timenow. The Ministry of Health, Labor and Welfare has tried tocontrol escalating national health care costs by limitingreimbursements to hospitals for longer hospital stays. At
00%%
2200%%
4400%%
6600%%
8800%%
110000%%
11 33 55 77 99 1111 1133 1155 1177 1199 2211 2233 2255
TToottaall bbeenneeffiitt rraattiioo110000%% AA//EE TToottaall bbeenneeffiitt rraattiioo
9900%% AA//EE
RRaattiioo ooff ttoottaall bbeenneeffiitt rraattiioo 9900%% AA//EEttoo ttoottaall bbeenneeffiitt rraattiioo 110000%% AA//EE
YYeeaarrssTToottaall bbeenneeffiitt rraattiiooss iinncclluuddee PPAADD
00%%
2200%%
4400%%
6600%%
8800%%
110000%%
11 33 55 77 99 1111 1133 1155 1177 1199 2211 2233 2255
RRaattiioo ooff ttoottaall bbeenneeffiitt rraattiioo 8800%% AA//EEttoo ttoottaall bbeenneeffiitt rraattiioo 110000%% AA//EE
TToottaall bbeenneeffiitt rraattiioo8800%% AA//EE
TToottaall bbeenneeffiitt rraattiioo110000%% AA//EE
YYeeaarrssTToottaall bbeenneeffiitt rraattiiooss iinncclluuddee PPAADD
4400%%
6600%%
8800%%
110000%%
11999933 11999944 11999955 11999966 11999977 11999988 11999999 22000000 22000011 22000022 22000033 22000044 22000055 22000066 99//0077 99//0088
OOrrddiinnaarryy
RRiiddeerr MMAAXX
EEVVEERR
CCaanncceerr
00%%
2200%%
4400%%
6600%%
8800%%
110000%%
11 33 55 77 99 1111 1133 1155 1177 1199 2211 2233 2255
GGrroossss mmaarrggiinn aatt 8800%% AA//EE
GGrroossss mmaarrggiinn aatt 110000%% AA//EE
GGrroossss mmaarrggiinn aatt 9900%% AA//EE
YYeeaarrss

23
this time, the amount of reimbursement a hospital receivesvaries depending on the aggregate average length of stayfor the hospital. Prior to July 2006, the variation betweenthe highest re imbursement rate and the lowestreimbursement rate was just under 25%, with the highestlevel paying ¥12,090 per day if stays averaged 21 days orless and the lowest level paying ¥9,740 per day if staysaverage more than 28 days. In July 2006, thereimbursement scale was modified. Now, the highestreimbursement rate is ¥15,550 per day if stays average 19days or less and the lowest reimbursement rate is ¥9,540per day if stays average more than 24 days. With a morethan 60% increase in the reimbursement rate for theshortest length of stay category compared to the longestlength of stay category, there is a great deal of financialincentive for hospitals to shorten the length of hospitalstays.
Aflac Japan Trends in SicknessAverage Length of Stay
We have seen the effect of these actions in our actualexperience. For example, with the sickness hospitalizationbenefit, we have seen a generally downward trend in theaverage length of hospital stays for Rider MAX and EVER.The next slide shows the hospitalization trends for cancer.
Aflac Japan Trends in Cancer Hospitalization(Cancer Only, 24-Month Runoff)
Cancer treatment patterns in Japan are being influencedby significant advances in early-detection techniques andby the increased use of pathological diagnosis rather thanclinical exams. Follow-up radiation and chemotherapytreatments are occurring more often on an outpatientbasis. Such changes in treatment not only increase thequality of life and initial outcomes for the patients, but alsodecrease the average length of each hospital stay. In
short, more people are surviving cancer, and those whocontinue in treatment are generally living longer.
Despite the significant decline in the average length ofstay per hospitalization, we have also noted that thenumber of hospital stays per claimant has been increasing.Our analysis of claims data shows that the total number ofdays hospitalized per claimant is declining, but at a muchslower rate than the average length of stay perhospitalization. We anticipate that more hospital stays ofshorter durations will continue going forward.
Aflac U.S. Trends in Cancer Hospitalization(Cancer Only, 24-Month Runoff)
In the United States, we are seeing a trend towardgreater use of outpatient treatments for cancer. Theaverage days per hospital stay for cancer treatment hasleveled off in the last few years. The average number ofhospital stays per claimant and the total hospitalizationdays per claimant had a slight uptick in 2005, but bothhave declined considerably in recent years.
Aflac U.S. Trends in Average Length of Stay
Finally, we look at our hospital indemnity products in theU.S. For the past several years, we have seen a downwardtrend in the average length of stay per hospitalization.
I hope that this information provides a strong foundationfor understanding how our products are priced as well ashow the profit from those products emerges. While wegenerally do not project future improvements in claimtrends in our pricing, the impact of lower- than-expectedclaim costs over time and the emergence of the profit fromthe better-than- expected experience has a strong impacton our projections and our outlook for Aflac’s future profitgrowth.
8800
8855
9900
9955
110000%%
22000000 22000011 22000022 22000033 22000044 22000055 22000066 22000077
RRiiddeerr MMAAXX
EEVVEERR
2200
4400
6600
8800
110000
112200
114400%%
11999944 11999955 11999966 11999977 11999988 11999999 22000000 22000011 22000022 22000033 22000044 22000055 22000066
SSttaayyss ppeerr ccllaaiimmaanntt
DDaayyss ppeerr ccllaaiimmaanntt
DDaayyss ppeerr ssttaayy
8800
8855
9900
9955
110000%%
11999999 22000000 22000011 22000022 22000033 22000044 22000055 22000066 22000077
HHoossppiittaall IInnddeemmnniittyy
5500
6600
7700
8800
9900
110000
111100%%
11999955 11999966 11999977 11999988 11999999 22000000 22000011 22000022 22000033 22000044 22000055 22000066
SSttaayyss ppeerr ccllaaiimmaanntt
DDaayyss ppeerr ccllaaiimmaanntt
DDaayyss ppeerr ssttaayy

Introduction to Aflac JapanTohru Tonoike
President; Chief Operating Officer, Aflac Japan
I will be providing an overview of the Japanese lifeinsurance market and our operations at Aflac Japan.
Life Insurance Policies in Force(FSA Basis, In Millions)
Let me start off by updating you on the current status ofthe life insurance market in Japan and the positioning ofAf lac Japan within that market. The number of l i feinsurance policies in force in Japan increased in 2008 inline with the increase of third sector products, representedby cancer and medical insurance. The number of policiesin force at the end of December 2008 increased by 2.4million, compared with the end of March 2008. And thirdsector products accounted for 1.7 million of the increase.
The Number One Life Insurer in Japan(Policies in Force, FSA Basis, In Millions)
As you can see in this graph, Aflac Japan’s number ofpolicies in force has been steadily increasing over the past34 years. Since the end of fiscal 2003, we have beenJapan’s number one company in terms of the number ofpolicies in force. The number of policies in force at the endof December 2008 was 19.3 million, accounting for 17.2%of the total number of all insurance policies in force inJapan.
We will be commemorating our 35th anniversary inJapan later this year, and we expect to achieve a majormilestone of 20 million policies in force at that time.
New Business in Policies(FSA Basis, In Thousands)
The total number of new life insurance policies in Japanhas gradually declined since 2001. However, the numberincreased in 2007 because of the addition of the numberof new policies sold by Kampo Life following the start ofthe privatization process in October 2007. On the otherhand, because Kampo Life only sells first sector products,during the period of April to December of 2008, the shareof third sector products in new business declined to40.6%, slightly lower than in 2007. At first glance, this mayseem to imply a change in consumers’ preference for thethird sector products. However, a closer look tells us that,excluding Kampo Life, the share of third sector productswould have been a record high of 49.1%. This indicatesthat the trend of consumers’ shift from life insurance toliving benefits such as medical, care and injury, has notchanged.
Section IIAflac Japan
00
22
44
66
88
1100
1122
1144
1166
1188
2200 1199..33
33//7755 33//8800 33//8855 33//9900 33//9955 33//0000 1122//0088
AAffllaacc == NNoo.. 11
33//0055
SSoouurrccee:: LLiiffee IInnssuurraannccee AAssssoocciiaattiioonn ooff JJaappaann,, IInnssuurraannccee RReesseeaarrcchh IInnssttiittuuttee
00
22,,000000
44,,000000
66,,000000
88,,000000
1100,,000000
1122,,000000
22000033 22000044 22000055 22000066 22000077 22000088
LLiiffee iinndduussttrryy TThhiirrdd sseeccttoorr
4444..22%% 4477..77%%4444..99%%4477..44%%4411..44%%
((AApprr.. –– DDeecc..))
4400..66%%
24
SSoouurrccee:: LLiiffee IInnssuurraannccee AAssssoocciiaattiioonn ooff JJaappaann
00
2200
4400
6600
8800
110000
112200
33//0044 33//0055 33//0066 33//0077 33//0088 1122//0088
FFiirrsstt sseeccttoorr TThhiirrdd sseeccttoorr
110099..33 110099..66 110099..88111100..00 111100..00 111122..44

Japan’s Aging Population andDeclining Birthrate
(In Thousands)
One major cause for the increased preference of livingbenef i ts is Japan’s rapidly aging society. Japan’spopulation reached its peak in October 2005 at 127.8million. Since that time, the number of deaths has basicallybeen exceeding the number of births, resulting in apopulation decline. Japan’s population is anticipated todrop below 100 million in 2050.
The primary reason for the shrinking population is alower birthrate. The total fertility rate in Japan went downas low as 1.34 in 2007, which is far below the level of 2.08that is required to maintain a stable population size. As aresult, the population age 65 and above will furtherincrease, while the population aged 64 and below willcontinue to decline.
National Medical Expenses(Yen in Trillions)
It is clear that national medical expenses will increasealong with the rapidly aging population. Medical expensesfor the elderly, as shown in the shaded portion of thegraph, will increase overall national medical expenses.Fortunately, Japan does have a universal national healthcare system that covers all Japanese citizens. However,fiscal resources are tight in all areas, including medical,care and pension, and it is clear that the difficult fiscalsituation is likely to persist going forward. This situation ledto the passage of health care reform in 2006, whichincreased the copayment borne by elderly patients in April2008.
Because of the rapidly aging population and highercopayments for medical expenses, the market for thirdsector products is expanding at a solid pace and isexpected to further expand in the future. As a naturalconsequence, the competition among private insurers inthis market has intensified. However, we believe marketexpansion will also become the key source for AflacJapan’s growth.
Competitors in the Third Sector(Number of Life and Non-life Insurance Companies)
At the time Aflac Japan began its operation in 1974,Aflac was the only company selling cancer insurance inJapan. However, mid-sized insurers and other foreigninsurers followed suit and entered the market. In addition,the market was opened to all life and non-life insurers in2001. As a result, at the end of March 2009, there were 47life and non-life companies that were marketing stand-alone medical and 29 companies marketing cancerinsurance products
Number of Medical Products
At the end of March of 2009, the number of medicalproducts sold by life and non-l ife insurers was 139including riders and 93 excluding riders. Those numbersdeclined a little bit compared with the year-end of 2008because some insurance companies tried to streamlinetheir product l ineups in an effort to prevent claimsnonpayments or underpayments from occurring again. Butas seen in the introduction of new medical riders byNippon Life and Kampo in the second half of 2008,competition in the medical market remains severe.
00
1100
2200
3300
4400
5500
6600
7700
8800
9900
¥¥110000
22000077 22001100 22002255
00
22
44
66
88
1100
1122
1144%%
MMeeddiiccaall eexxppeennsseess FFoorr eellddeerrllyy NNaattiioonnaall mmeeddiiccaall eexxppeennsseess ttoo nnaattiioonnaall iinnccoommee
SSoouurrccee:: MMiinniissttrryy ooff HHeeaalltthh,, LLaabboorr aanndd WWeellffaarree,, 77//0088
¥¥3333¥¥4411
¥¥669988..99%%
99..99%%
1133..22%%
00
1100
2200
3300
4400
5500
1122//0011 1122//0022 1122//0033 1122//0044 1122//0055 1122//0066 1122//0077 1122//0088 33//0099
SSttaanndd--aalloonnee ccaanncceerr SSttaanndd--aalloonnee mmeeddiiccaall
RReefflleeccttss rreessuullttss ooff ccoommppaannyy mmeerrggeerrss aanndd ccoommppaanniieess tthhaatt hhaavvee ddiissccoonnttiinnuueedd ssaalleessSSoouurrccee:: WWeebb ssiitteess ooff eeaacchh ccoommppaannyy
3377
3333
4400
3300
4433
3311
4444
3300
4466
3311
44884477
3311
22552299
4477
2255
4455
25
00
2200,,000000
4400,,000000
6600,,000000
8800,,000000
110000,,000000
112200,,000000
114400,,000000
11995500 11996600 11997700 11998800 11999900 22000000 22001100 22002200 22003300 22004400 22005500
JJuuvveenniillee ((00--1144)) PPrroodduuccttiivvee ((1155--6644)) RReettiirreemmeenntt ((6655++))
SSoouurrccee:: NNaattiioonnaall IInnssttiittuuttee ooff PPooppuullaattiioonn aanndd SSoocciiaall SSeeccuurriittyy RReesseeaarrcchh,,FFuuttuurree EEssttiimmaatteedd PPooppuullaattiioonn ooff JJaappaann,, 1122//0066
AAccttuuaall EEssttiimmaattee
00
2200
4400
6600
8800
110000
112200
114400
116600
1122//0011 1122//0022 1122//0033 1122//0044 1122//0055 1122//0066 1122//0077 1122//0088 33//0099
SSttaanndd--aalloonnee mmeeddiiccaall SSttaanndd--aalloonnee mmeeddiiccaall aanndd rriiddeerrss
RReefflleeccttss rreessuullttss ooff ccoommppaannyy mmeerrggeerrss aanndd ccoommppaanniieess tthhaatt hhaavvee ddiissccoonnttiinnuueedd ssaalleessSSoouurrccee:: WWeebb ssiitteess ooff eeaacchh ccoommppaannyy
44995566
66997777
8888 9933 9944110022
9933110022 110077
111199112255
113355 114400 114411115500
113399

26
Aflac’s Share of In-Force Business: Cancer(FSA Basis, Stand-alone, Life Industry Only)
Next, I would like to show you some data related toAflac Japan’s market share for our primary products.These charts reflect FSA-based fiscal year data, whichruns from April through March and include products soldonly by life insurers. The data here incorporates the latestfigures based on each insurer’s financial statements for thefirst nine months of the fiscal year of 2008. And as youknow, some property and casualty insurers also sellmedical insurance products. Because this detail of salesdata is not disclosed by non-life companies, we were notable to include them in the statistics shown on this chart.
The graph on the left side shows that the number ofpolicies in force for cancer stand-alone products in the lifeinsurance industry is growing each year. Aflac Japan has77% of the stand-alone cancer insurance market, and ourshare has been stable over the past few years.
Aflac’s Share of New Business: Cancer(FSA Basis, Stand-alone, Life Industry Only)
As a result of launching Cancer Forte in 2007 and afocus on driving cancer sales, Aflac’s share of newbusiness in terms of the number of policies in the cancerinsurance market rose slightly to 63% during the periodfrom April to December of 2008.
On the other hand, Japan Post Life Insurance, namelyKampo, which was inaugurated as a part of theprivatization process of Japan Post, announced itsintention to launch cancer insurance through post offices
before the end of fiscal year 2009. There have beenobjections from the American Council of Life Insurers(ACLI) and other organizations concerning this move,claiming that because Japan Post Group is solely held bythe Japanese government, it is not on the same levelplaying field as other private insurers. If Kampo Life beginsselling its own cancer insurance, there is no doubt thatAflac’s sales both in the retail market and through JapanPost Network will be impacted. As such, we will closelymonitor the situation and take appropriate measures asneeded.
Aflac’s Share of In-Force Business: Medical(FSA Basis, Stand-alone, Life Industry Only)
These graphs illustrate the growth of policies in force forstand-alone medical insurance and Aflac Japan’s share.Although we were not the first insurer to enter the medicalinsurance market, our share of policies in force rose to20% at the end of December 2008, as a result ofaggressively and successfully launching EVER in 2002 totap into the market.
Aflac’s Share of New Business: Medical(FSA Basis, Stand-alone, Life Industry Only)
Aflac Japan’s share of new business for stand-alonemedical insurance was 20% for the period of April toDecember 2008. As we have discussed, a large number ofinsurers have entered the medical market over the last fewyears and the competition has intensified. Despite thiscompetition, in fiscal 2008, our market share remainsstable with fiscal 2007, and we are still the number onecompany in terms of medical policy sales.

27
Insurance Product Penetration(Individual Basis)
This chart shows market penetration rates for variousinsurance products in Japan. In 2007, 79.9% of Japanesecitizens were enrolled in some kind of life insurance.Although the market penetration for cancer insuranceshown in the yellow line has been steadily increasing, it isstill only at 31.2%. Medical insurance penetration is high at71.3%. But most of the policies purchased are assumed tobe term policies. We believe the potential for switching to awhole life medical policy is large. Given the aging ofJapan’s population, we also believe the opportunity forincreasing cancer insurance penetration is sizable.
Economic Indicators(Composite Indices)
Next, I would like to touch upon the recent marketenvironment. As a way to measure the state of thedomestic economy, the Cabinet Office of Japan releasesthe diffusion index every month. The diffusion indexactually has two components: a coincident indicator forthe current state of the economy and a leading indicatorfor the economic outlook. Each indicator is calculated fromeleven to twelve indices such as production and sales. Thecoincident indicator of February 2009 announced by theCabinet Office declined from January by 2.6 percentagepoints to 86.0. This marked the seventh consecutivemonth of decline of this indicator and the lowest level sinceApril 2002. At the same time, the leading indicator is alsoon the decline, suggesting that the Japanese domesticeconomy will continue to face a difficult situation for sometime. As a result of the decline in individual income growth
caused by the rapid deterioration of the economy, as wellas the impact from the decline of population I discussedearlier, the total premium revenues of the 44 life insurers inJapan during the period of April to December 2008 weredown 2.6%, compared with the same period of theprevious year. Many insurance companies areexperiencing a decline not only in the volume of newbusinesses, but also in the number of policies in force.
Furthermore, due to the sharp decline in stock pricesand the appreciation of yen against major currencies,unrealized gains on insurers’ investment portfolios aredrastically shrinking, and solvency margin ratios across theindustry are at lower levels. In addition, with the collapse ofYamato Life and the difficult financial situation of AIG, thepublic is now paying more attention to the financial stabilityof life insurance companies.
In order for Aflac Japan to beat the competition andachieve sustainable growth in this chal lengingenvironment, we need to fortify the competitive strengthswe have built so far. I also think it important to build a newstrategy that enables us to respond to any changes thatare likely to occur in the future.
Aflac Japan’s Competitive Strengths
The five points shown on this chart are the areas wherewe believe Aflac Japan is strongly positioned within theindustry. They are: products, distribution, internal controls,financial strength and administrative efficiency. Theseadvantages have not changed and we believe they willremain intact going forward.
Mr. Matsumoto and Mr. Ar iyoshi wi l l of fer someinformation about products and distribution channels intheir presentations. However, I’d like to mention that inaddition to the new products we recently launched inMarch of this year, we are preparing to launch other newproducts in the second half of 2009. These new productswill have the features that we believe accurately reflectcustomers’ needs as well as changes in medical treatmenttechnology and costs. We are also providing support tonew channels such as banks and the Japan Post NetworkCo., Ltd., while at the same time reinforcing support to ourtraditional channels.
Based on the J-SOX act, which is the Japanese versionof the Sarbanes-Oxley in the United States, all Japanese
00
2200
4400
6600
8800
110000%%
22000011 22000044 22000077
LLiiffee iinnssuurraannccee MMeeddiiccaall iinnssuurraannccee CCaanncceerr iinnssuurraannccee
SSoouurrccee:: JJaappaann IInnssttiittuuttee ooff LLiiffee IInnssuurraannccee
7777..77 7777..99 7799..99
7733..006699..33 7711..33
2211..222255..33
3311..22
7700
7755
8800
8855
9900
9955
110000
110055
11//0000 11//0011 11//0022 11//0033 11//0044 11//0055 11//0066 11//0077 11//0088 11//0099
LLeeaaddiinngg IInnddiiccaattoorr CCooiinncciiddeenntt IInnddiiccaattoorr
SSoouurrccee:: CCaabbiinneett OOffffiiccee
SShhaaddeedd ccoolluummnnss iinnddiiccaattee eeccoonnoommiicc rreecceessssiioonnss
22//0099
22//0099
PPrroodduuccttss
DDiissttrriibbuuttiioonn
IInntteerrnnaall CCoonnttrroollss
AAddmmiinniissttrraattiivvee EEffffiicciieennccyy
FFiinnaanncciiaall SSttrreennggtthh

28
publ ic companies introduced an internal controlsevaluation system at the end of March 2009 for financialreporting. At Aflac Japan, we proactively established acorporate governance system based on the U.S. lawahead of others, which we bel ieve has given us acompetitive advantage.
Although we have not been immune to the financialcrisis, we still maintain a strong solvency margin. Oursolvency margin ratio was 880.5% at the end of December2008, close to our September 2008 ratio of 871.9%. Thedecline in the solvency margin between March andSeptember 2008 reflected the global financial market’slower fair values of our investments. We will continue tofocus on producing stable earnings and a strong financialcondition.
As competition in the third sector market intensifies, it isa great strength of Aflac Japan to be able to provideproducts at competitive premiums. In order to achieve this,we will move forward with efficient and accurate policyadministration operations through improvements in bothbusiness processes improvements and IT infrastructure.
Key Themes of Aflac Japan’s2009 Management Plan
Last year, Af lac Japan establ ished “MidtermManagement Policy 2008-2010,” as a basic managementstrategy to maintain the number one position in themedical and cancer insurance markets. This “MidtermManagement Policy” indicates the direction of our midtermstrategy for each of the following nine categories; market,products, distribution channel, business operation, IT,finance, HR/HR development, internal control system, andCSR and corporate brand. We regard 2009, the secondyear of the Midterm Policy, as a critical year in building asolid foundation for the business that is necessary forsustainable growth in the future.
As a part of our Midterm Management Policy, we puttogether the “2009 Management Plan.” Let me take youthrough the key themes of the Management Plan. Theyinclude: Strengthening capabilities to respond to a rapidlychanging market environment; implementing strategicsales specif ic to each channel attr ibute; increasingoperational efficiency and effectiveness; strengtheningproducts and services from the perspective of customers;continued investment income growth; reinforced businessinfrastructures; engaging and motivating employees andenhancing consumer perception of the brand.
The entire management of Aflac Japan and employeesshare the significance of these themes and are executinghighly effective measures for achieving the themes atdepartments that are in charge of each of these themes. Ifirmly believe that Aflac Japan’s sales target and earningstarget can be achieved by thoroughly completing theseries of these programs.
Amid the global financial turmoil, intensified competitionand diversification of customers’ needs, the changes in theenvironment surrounding our company are becoming moreand more chal lenging. Af lac Japan is st i l l in anadvantageous position in terms of competitiveness. But forus to continue to have sustainable growth, we must takethe ever-evolving environmental change as an opportunity,and not fear it, but act on it.
• RRaappiidd rreessppoonnssee ttoo aa cchhaannggiinngg mmaarrkkeett
• CCuussttoommiizzeedd ssuuppppoorrtt ttoo eeaacchh ddiissttrriibbuuttiioonn cchhaannnneell
• IImmpprroovveedd ooppeerraattiioonnaall eeffffiicciieennccyy aanndd eeffffeeccttiivveenneessss
• CCuussttoommeerr--ddrriivveenn pprroodduuccttss aanndd sseerrvviicceess
• CCoonnttiinnuueedd iinnvveessttmmeenntt iinnccoommee ggrroowwtthh
• RReeiinnffoorrcceedd bbuussiinneessss iinnffrraassttrruuccttuurree
• EEnnggaaggeedd aanndd mmoottiivvaatteedd eemmppllooyyeeeess
• EEnnhhaanncceedd ccoonnssuummeerr ppeerrcceeppttiioonn ooff bbrraanndd

The global financial and economic crisis has had aprofound impact on Japan. As Minister of Finance KaoruYosano noted recently, the current situation in Japanrepresents the “worst economic crisis since World War II.The once-in-a-hundred-years crisis has become a reality.”But the Government of Japan is taking steps to respond tothe crisis. This presentation will provide a brief overview ofthat response as well as a discussion of the Japaneseregulatory environment, including an update on keydevelopments in Japan’s financial and social securitysystems and how we believe these changes will impact theinsurance industry in Japan.
Changes in Japan’s GDP(Quarterly Estimates of GDP)
As the impact of the global financial and economic crisisreverberates around the world, it is clear that Japan'sexport-driven economy has been particularly hard hit. Infact, the Government of Japan reported that the Japaneseeconomy shrank 12.1% on an annualized basis in thefourth quarter of 2008 and has continued to contractsince. That represented the greatest decline in
Japan’s GDP in 35 years. The Government of Japan isprojecting a 3.3% decline in economic growth for fiscalyear 2009. Japan's exports, meanwhile, are expected tofall 27.6% in fiscal year 2009 as other economies aroundthe world also experienced negative growth.
Against this background, the Government of Japan, ledby Prime Minister Taro Aso, has implemented a number ofmeasures designed to limit the damage to the economyand put growth back on track. As of March 31 (the end offiscal 2008), economic stimulus measures totaled ¥75trillion, including ¥12 trillion in new fiscal spending. Thegovernment passed two supplemental budgets for fiscal2008, representing a combined ¥6.6 tr i l l ion in newspending. The second supplemental budget paved theway for the government to implement its much debated“fixed-sum stipend” program to distribute a total of ¥2trillion directly to Japanese citizens and residents. Further,in late March 2009, the Diet enacted a record ¥88.5 trillionordinary budget for fiscal 2009. In addition, a supplemental
budget totaling ¥13.93 trillion is now before the Diet and isexpected to be enacted into law within the current Dietsession, scheduled to end June 3, 2009.
Additional measures taken by the Government of Japaninclude expanding the role of government-aff i l iatedfinancial institutions in low-interest corporate lending andimplementing other initiatives to boost corporate liquidity,¬including a ¥2 trillion program for direct commercialpaper purchases. Prime Minister Aso has also assembled– in a very public manner – a panel of 84 economic policyexperts to discuss finance, social security, and othereconomic measures. The panel’s recommendations areslotted to be developed into the above-mentioned fiscal2009 supplemental budget, which is expected to pass theDiet by June 2009. On the whole, the government’sresponse to the global financial and economic crisis hasbeen robust, and Japan has been an important contributortoward meet ing the Internat ional Monetary Fund’seconomic stimulus target of 2% of global GDP.
“Divided Diet” Has Impacted Policymaking
The Government of Japan’s response to the globalf inancial crisis has been complicated somewhat bydomestic politics. As a result of its overwhelming victory inthe September 2005 lower house election, the rulingcoalition made up of Liberal Democratic Party (LDP) andKomeito, holds a two-thirds majority in the lower house,the more powerful of the two Diet chambers. However, theruling coalition suffered a major defeat in the July 2007upper house election, putting the opposition DemocraticParty of Japan (DPJ) in charge of the upper house for thefirst time since the LDP first came to power in 1955. Thisdefeat created a “divided Diet.” Under the Japaneseconstitution, both houses of the Diet must pass mostlegislation before it can be enacted into law, making adivided Diet a formula for gridlock. Indeed, the rulingcoalition’s efforts to stimulate the economy, includingthrough passage of supplemental budgets, have beenslowed and, in some cases, blocked by the DPJ and itsopposition coalition partners.
29
Japan’s Regulatory EnvironmentCharles D. Lake II
Chairman, Aflac Japan
--1144
--1122
--1100
--88
--66
--44
--22
00
22
44
66%%
11QQ 22QQ 33QQ 44QQ 11QQ 22QQ 33QQ 44QQ 11QQ 22QQ 33QQ 44QQ 11QQ 22QQ 33QQ 44QQ
2005 2006 2007 2008SSoouurrccee:: CCaabbiinneett OOffffiiccee,, QQuuaarrtteerrllyy EEssttiimmaatteess ooff GGDDPP
1122..11%%

However, Japan’s constitution also provides that thelower house can override an upper house vote with a two-thirds majority. This provision makes the LDP’s super-majority in the lower house exceedingly important. Thissuper-majority, however, is unprecedented and the resultof former Prime Minister Koizumi’s unique political skills,popularity, and ability to capture the public’s imaginationwith his reform drive. It is highly unlikely to be repeated inthe next election, which is constitutionally required to beheld by September 2009.
Until a recent arrest of a staff member of the DPJ’sleader for political funding violations, that party was wellahead in the polls and appeared poised to win control ofthe lower house and, with it, the overall government.Current ly, the gap between the DPJ and LDP hasnarrowed, and it is unclear which party or parties would beable to assemble a majority in the lower house if anelection were held today. However, based on an analysisof LDP and DPJ policy platforms, regardless of the electionoutcome, we do not envision any material impact on ouroperations at this time.
Progress in Financial Regulatory Reform
The challenges posed by the global financial crisis andthe domestic political environment have resulted in a slowdown, to some extent, of ef forts by the JapaneseGovernment, particularly the Financial Services Agency(FSA), to take aggressive steps aimed at strengtheningJapan’s competitiveness as an international financialcenter. Nevertheless, the FSA’s work is ongoing and issummarized below.
As I have noted in previous briefings, Japan’s financialsystem has changed dramatically in recent years. The oldMinistry of Finance emphasized maximum control, industryprotection, and the use of informal administrative guidancebased on its “convoy system” philosophy. The FSAreplaced this philosophy with a rules-based regulatoryapproach, which relies on transparency and the notion ofself-responsibility by financial institutions. In recent years,the FSA has taken further steps to achieve the best mix ofprinciples-based regulation and rules-based regulation,calling this the “Better Regulation” initiative. The FSAcontinues to work closely with other regulatory authorities,and through the G-20 and Financial Stability Board, to
ensure that Japan’s financial regulatory approaches areconsistent with policy measures agreed to globally.
As noted before, the Financia l Instruments andExchange Law came into effect in September 2007,replacing the old Securities Exchange Law. The new lawaims to reduce over-regulation and establish a flexible,across-the-board framework for market conduct rulespertaining to investment products. Specifically, the newlaw was designed to: 1) improve customer protection andconvenience; 2) strengthen market functions throughenhanced transparency and reduction of red tape so as tofacilitate the shift of individual financial assets from savingsto investment; and 3) further internationalize financial andcapital markets.
Consistent with the policy direction of this law, the FSAtook further steps to modernize Japan’s financial services-related laws last year. The Financial Instruments andExchange Law was amended in June 2008, among otherthings, to establish streamlined markets exclusively for"professional" investors and ease firewall regulations thatseparate banks, insurance companies, and securitiescompanies. Taking advantage of this new environment, theTokyo Stock Exchange, in a joint venture with the LondonStock Exchange, plans to establish a new market called“Tokyo AIM” in Spring 2009. The new market, which isdesigned for “growing” companies and specif ical lytargeted at professional investors, offers a f lexibleregulatory approach, including through permitt ingdisclosure in Japanese or English and according toInternational Accounting Standards, U.S. GAAP, orJapanese GAAP.
On October 14, 2008, as the global financial crisiscontinued to unfold, Japan’s Minister for FinancialServices, as part of an announcement regarding a far-reaching financial stabilization package, stated that Japanwould extend the government’s current temporaryprogram of support for the life insurance safety net pastthe March 31, 2009, expiration date. Consistent with theminister’s statement, new legis lat ion was passedextending the temporary program for three more yearsbeginning April 1, 2010, and expiring March 31, 2012.
The details, in relevant part, are that the industry isrequired to fund any failures requiring the Life InsurancePolicyholder Protection Corporation (LIPPC) to borrow upto ¥460 billion, with the Government covering any failuresrequiring funds exceeding that amount. The new legislationreestablishes the prior legislation’s requirement to reviewthe overall LIPPC system within three years of enactment(i.e., before March 31, 2012).
The LIPPC decided to provide approximately ¥27.7bil l ion for the bailout of Yamato Life, which filed forbankruptcy protection last October. Yamato was the firstJapanese life insurer to file for bankruptcy since March2001. This action will be the first time that the LIPPC hasprovided funding to bail out a failed life insurer since thefailure of Taisho Life in 2000 (although Yamato Life is thefifth life insurance company to require LIPPC funds). As aresult of the LIPPC’s decision, life insurance companieswill be required to contribute additional funds to theLIPPC. However, given the relat ively smal l amountinvolved, the additional assessment will not have a materialimpact.
MMOOFF
FFSSAA
““CCoonnvvooyy ssyysstteemm””
RRuulleess--bbaasseedd aapppprrooaacchh
““BBeetttteerr RReegguullaattiioonn”” ppoolliiccyy
((TThhee bbeesstt mmiixx ooff pprriinncciipplleess--bbaasseeddrreegguullaattiioonn aanndd rruulleess--bbaasseedd rreegguullaattiioonn))
JJuullyy 22000077--
11999988 -- JJuunnee 22000077
PPrree--11999988
30

31
Japan’s Regulatory Environment Overview –Consumer Affairs Agency
Legislation to create a new consumer agency that wasfirst submitted to the Diet in September 2008 has passedthe lower house and is likely to be enacted into law withinthe current legislative session, which is scheduled to endJune 3, 2009. The new agency will be required to startoperations within one year of the law’s passage, but coulddo so ear l ier . I t would consol idate many of thegovernment’s consumer protection functions under asingle agency. The legislation does not include theInsurance Business Law or Banking Law in the plannedconsolidation. At this time, we do not believe that thisdevelopment will have an immediate material impact onour operations.
Postal Privatization:Current Status and Before IPO
The Government of Japan’s efforts to reform its postalsystem is seen by the domestic and international policycommunity as a key test of Japan’s commitment tostrengthening the competitiveness of its financial andcapital markets and promoting a robust economic growthstrategy. As we have discussed in the past, on October 1,2007, Japan Post was divided into four entities: JapanPost Insurance Co., Ltd. (the insurance entity), Japan PostBank Co., Ltd. (the bank entity), the Japan Post NetworkCo., Ltd (the post office entity), and Japan Post ServiceCo., Ltd. (the delivery entity).
Postal Privatization: After IPO and by 2017
These four ent i t ies are subsidiar ies of a holdingcompany, Japan Post Holdings Co., Ltd. According to theJapan Post’s business plan, the current plans call for initialpublic offerings of the holding company as well as JapanPost Insurance and Japan Post Bank in 2010 or 2011.Japan Post Holdings will retain 100% ownership of theJapan Post Network and Japan Post Service corporations,but is required by the Privatization Law to be fully divestedof its shares of Japan Post Insurance and Japan PostBank by September 2017.
Eight-Step Approval Process for JapanPost Insurance’s New Insurance Products
The Postal Privatization Law includes a commitment toimplement “measures to ensure equivalent conditions ofcompetition” between the four privatized Japan Postcompanies and other companies “engaged in like businessoperat ions.” The law also requires that the postalinsurance ent i ty be subject to the same tax andpolicyholder safety-net contribution requirements as itsprivate competitors, as well as to the Insurance BusinessLaw and FSA supervision. Further, the Postal PrivatizationLaw establishes a special process to approve any newbusiness by Japan Post Insurance or Japan Post Bank,which involves a special review by the Postal PrivatizationCommission and approval from the Prime Minister(delegated to the FSA Commissioner) and Ministry ofInternal Affairs and Communications (MIC) Minister (incharge of postal services), in addition to the ordinary FSAproduct approval process.
• PPrrooppoosseedd CCoonnssuummeerr AAffffaaiirrss AAggeennccyy
» CCoonnssoolliiddaattee mmaannyy ooff tthhee ggoovveerrnnmmeenntt’’ss ccoonnssuummeerrpprrootteeccttiioonn ffuunnccttiioonnss uunnddeerr aa ssiinnggllee aaggeennccyy
» CCuurrrreenntt ppllaann eexxeemmppttss tthhee IInnssuurraannccee BBuussiinneessss LLaaww
PPoossttaall SSeerrvviiccee;;DDoommeessttiicc aannddIInntteerrnnaattiioonnaallLLooggiissttiiccSSeerrvviicceess
MMiisscceellllaanneeoouussRReettaaiill SSeerrvviicceess;;BBaannkk AAggeennccyy;;IInnssuurraannccee AAggeennccyy
BBaannkkiinnggBBuussiinneessss
LLiiffee IInnssuurraanncceeBBuussiinneessss
JJaappaann PPoossttSSeerrvviiccee
JJaappaann PPoossttNNeettwwoorrkk
JJaappaann PPoossttBBaannkk
((YYuucchhoo))
JJaappaann PPoossttIInnssuurraannccee((KKaammppoo))
HHoollddiinngg CCoommppaannyy((110000%% ooff sshhaarreess hheelldd bbyy tthhee ggoovveerrnnmmeenntt))
HHoollddiinngg CCoommppaannyy((aatt lleeaasstt 11//33 hheelldd bbyy tthhee GGoovv’’tt))
PPoossttaall SSeerrvviiccee;;DDoommeessttiicc aannddIInntteerrnnaattiioonnaallLLooggiissttiiccSSeerrvviicceess
MMiisscceellllaanneeoouussRReettaaiill SSeerrvviicceess;;BBaannkk AAggeennccyy;;IInnssuurraannccee AAggeennccyy
BBaannkkiinnggBBuussiinneessss
LLiiffee IInnssuurraanncceeBBuussiinneessss
JJaappaann PPoossttSSeerrvviiccee
JJaappaann PPoossttNNeettwwoorrkk
JJaappaann PPoossttBBaannkk
((YYuucchhoo))
JJaappaann PPoossttIInnssuurraannccee((KKaammppoo))
JJaappaann PPoosstt IInnssuurraannccee
66)) PPrroodduucctt aapppprroovvaall aapppplliiccaattiioonnttoo FFSSAA CCoommmmiissssiioonneerraanndd MMiinniisstteerr ooff MMIICC
88)) AApppprroovvaall bbyyFFSSAA CCoommmmiissssiioonneerraanndd MMiinniisstteerr ooff MMIICC
77)) EExxpprreessssiioonn ooff ooppiinniioonnss bbyyPPoossttaall PPrriivvaattiizzaattiioonn CCoommmmiissssiioonn
44)) AApppprroovvaall bbyy CCaabbiinneett DDeecciissiioonn
55)) RReevviissiioonn ooff rreegguullaattiioonnss
22)) EExxpprreessssiioonn ooff ooppiinniioonnss bbyyPPoossttaall PPrriivvaattiizzaattiioonn CCoommmmiissssiioonn
11)) RReeqquueesstt ttoo FFSSAACCoommmmiissssiioonneerr,, MMiinniisstteerr ooff MMIICC,,
aanndd PPoossttaall PPrriivvaattiizzaattiioonnPPrroommoottiioonn OOffffiiccee ttoo rreevviissee
rreelleevvaanntt rreegguullaattiioonnss
33)) PPuubblliicc ccoommmmeenntt pprroocceessss

32
On March 19, 2009, Japan Post Insurance submitted aformal request to the Government of Japan to amendregulations that currently limit the amount of coverage to¥10 million that the postal life insurance company couldprovide in any standalone cancer insurance it might offer.The next step would be for the Postal PrivatizationCommission to take up the request for deliberation, whichwould likely involve the Commission soliciting opinionsfrom a wide range of interested part ies. Once itsdeliberations are completed, the Commission would thensubmit its opinion regarding the proposed revisions to theFSA Commissioner and the MIC Minister, who would thenapprove or deny the request, taking into account theCommission’s opinion.
If the regulatory revisions are approved, before JapanPost Insurance could offer a standalone cancer product, itwould stil l have to undergo the normal FSA productapproval process as well as submit once more to theadditional process of having the Postal PrivatizationCommission deliberate the product approval request andrender its opinions to the FSA Commissioner and the MICMinister, who would then approve or deny the request.
The FSA has been clear in its commitment to thisprocess. For example, FSA Commissioner Takafumi Satostated as recently as March 23, 2009, that if a Japan Postfinancial institution were to make a new product approvalrequest, the FSA would: “consider such factors as theimpact of [the new product] on competitive relationshipswith other financial institutions as well as the managementconditions of the two postal financial companies, which Ibelieve should probably include such factors as the degreeto which [the postal financial companies’] operationalsystems are in good repair. The law requires these pointsto be taken into consideration as we evaluate a newproduct approval request, which we would do inappropriate accordance with the purpose and frameworkset forth under the [Postal Privatization] Law.”
As the Privatization Commission takes up Japan PostInsurance’s request, this constitutes a clear statement ofcommitment to a level playing field.
Rapidly Increasing Social Security Benefits(Yen in Trillions)
A declining birthrate and aging population are amongthe most difficult challenges that Japan faces on the pathto continued growth and prosperity. As these trends
progress, Japan’s publicly funded social insuranceprograms will continue to come under ever-increasingfinancial pressure. The Ministry of Health, Labor andWelfare estimates that medical insurance benefits willreach as high as ¥48 trillion in 2025, a 74% increase fromthose budgeted for 2006.
Against this backdrop, former Prime Minister Fukudaestablished the National Conference on Social Security inJanuary 2008, which issued its final report in November2008. The Conference focused its efforts on discussingways to meet the many challenges ahead for Japan’ssocial security system, including future costs associatedwith pensions, medical care, nursing, the declining birthrate, and other issues. In its report, the Conference calledfor reform aimed at quickly securing stable funding for thesocial security system as well as robust engagement withthe public on these issues.
In February 2009, in order to further promote this reformdialogue, a social security reform promotion group wasestablished in the Cabinet Office to follow through on therecommendations of the Conference. The group is workingtoward compil ing a concrete reform proposal to bereflected in the Government of Japan’s Basic EconomicPolicies (“Honebuto”), which is slotted for Cabinet approvalin June 2009. We expect that continued media coverageof the issues covered in the report will stimulate consumerinterest in the health care sector, including supplementalmedical and cancer insurance products.
Major Changes inCopayments for the Employed
(Age 69 or Under)
Japan has a compulsory and universal public healthcare insurance system. The system’s costs are covered bypremiums paid by the insured and their employers, as wellas taxes and copayments paid by patients. Given Japan’saging population and declining birthrate, however, thesystem has been under great f inancia l stra in, andcopayments have been rising. A 10% copayment wasintroduced for salaried workers under 70 in 1984. In 1997,it was raised to 20%, and in April 2003 to 30%.
Major Changes in Copayments for the Elderly(Age 70 or Over)
**HHuussbbaanndd aanndd wwiiffee oorr iinnddiivviidduuaall wwiitthh aannnnuuaall iinnccoommee eexxcceeeeddiinngg ¥¥66..3377 mmiilllliioonn oorr ¥¥44..55 mmiilllliioonn,, rreessppeeccttiivveellyy,,iinncclluuddiinngg ppeennssiioonn
****HHuussbbaanndd aanndd wwiiffee oorr iinnddiivviidduuaall wwiitthh aannnnuuaall iinnccoommee eexxcceeeeddiinngg ¥¥55..22 mmiilllliioonn oorr ¥¥33..88 mmiilllliioonn,, rreessppeeccttiivveellyy,,iinncclluuddiinngg ppeennssiioonn
******AAddvvaanncceedd EEllddeerrllyy HHeeaalltthh SSyysstteemm wwaass iinnttrroodduucceedd ffrroomm AApprriill 22000088
1100%%IInnttrroo--dduuccttiioonnooff ffiixxeedd
rraattee1100%%
JJaann.. 22000011
OOcctt.. 22000022
FFiixxeeddaammoouunntt
hhiikkee
SSeepp.. 11999977
FFiixxeeddaammoouunntt
hhiikkeeIInnttrroodduuccttiioonn ooff ssmmaallllffiixxeedd--aammoouunntt
FFeebb.. 11998833JJaann.. 11999922
2200%%**
AAggee7700--7744::2200%%AAggee7755++::
1100%%******
OOcctt.. 22000066
3300%%****
1100%%
3300%%****
AApprr.. 22000099
00
4400
8800
112200
116600
FFYY 22000066 FFYY 22001111 FFYY 22001155 FFYY 22002255
PPeennssiioonn MMeeddiiccaall WWeellffaarree¥¥
¥¥111166¥¥110055
¥¥8899..88
¥¥114411
((BBuuddggeett))SSoouurrccee:: MMiinniissttrryy ooff HHeeaalltthh,, LLaabboorr aanndd WWeellffaarree,, 55//0066
CCooppaayymmeenntt hhiikkeettoo 2200%%
CCooppaayymmeenntt hhiikkeettoo 3300%%IInnttrroodduuccttiioonn ooff
1100%% ccooppaayymmeenntt
AApprr.. 22000033
OOcctt.. 11998844SSeepp.. 11999977

33
Those over 70 have been required to pay a fixed-amount-per-visit copayment since 1983 for outpatient andinpat ient services. Since then, the copayment hasincreased several times. In October 2006, the copaymentfor high-income seniors was raised to 30% and, in April2010, the copayments for other seniors age 70 to 74 willrise from 10 percent to 20%.
In addition, recognizing that the national health caresystem will be unsustainable as the costs of providingmedical care for the elderly swell given current trends, inApr i l 2008, the Government of Japan introducedAdvanced Elderly Health, a system that separates medicaltreatment fees for advanced elderly from that of theyounger population. The Advanced Elderly Health systemaims to reduce medical costs by preventing unnecessarylong-term hospitalization and over-treatment and over-medication of patients. We believe such changes will leadto enhanced consumer interest in the health care sector,including supplemental medical and cancer insuranceproducts.
Daily Out-of-Pocket Hospitalization Expenses
Much of the need for our products arises because manyexpenses are not covered by Japan’s health care system.Patients must bear these expenses, which can includeextra charges for private or semi-private hospital rooms,special treatments or medicines not covered by thenational health care system, transportation costs for familymembers traveling to the hospital, and daily necessitieswhile in the hospital. According to the most recentDecember 2007 survey by the Japan Institute of LifeInsurance, nearly one-third of patients had more than
¥20,000 of daily out-of-pocket hospitalization expenses,compared with 21.7% just three years earlier.
The Public’s View on theNational Health Care System
Given Japan’s aging population and declining birthrate,the Government of Japan faces tight financial conditions,and many people worry that additional increases in out-of-pocket expenses will be necessary. Some worry not onlythat their burden will increase, but that the scope ofgovernment coverage may be reduced as well.
The percentage of people who believe that the cost oftheir medical care will be covered entirely by public healthcare insurance has been decreasing every year. The mostrecent survey in December 2007 shows that since 1993,those who believe public health care insurance will beinadequate to cover medical expenses has increased from41% to over 65% of the population.
Japan’s rapidly aging population and low birthrate isputt ing the country’s social security system underincreasing strain, which is forcing Japanese consumers tobear an ever-growing share of the burden. Despite theelection campaign environment in Japanese politics, thepolitical consensus is that the current system cannot besustained without significant changes. In this rapidlychanging environment, the companies that prevail will bethose that are customer-centric. Accordingly, Aflac is well-posit ioned to take advantage of the opportunit iespresented and we believe will continue to be a successfulcompany in the Japanese market.
2004 2007
15.9%
11.8%
21.7%
25.9%
Less than ¥5,000
¥5,000 to ¥7,000
¥7,000 to ¥10,000
¥10,000 to ¥15,000
¥15,000 to ¥20,000
More than ¥20,000
13.0%
11.6%
Source: Japan Institute of Life Insurance, 12/07
10.8%
7.3%
32.0%
28.0%
14.3%
7.5%

34
I will be sharing with you Aflac Japan’s marketingactivities as well as recent changes in our businessenvironment.
Shares of Third Sector New Sales*(FSA Premium Basis, Life Industry Only)
Let me start with the market shares for major insurers interms of new annualized premium sales in the third sector,which includes cancer and health-related products suchas EVER. Based on the FSA data from April to December2008, which is the most up-to-date information available,Aflac’s share of third sector sales was 15.1%. Our sharehas improved since 2007. And as you can see, we stillretain the number one position in the industry in terms ofnew sales of third sector products.
Third Sector New Sales(March 2006=100, FSA Premium Basis, Life Industry Only)
This chart shows the trends in third sector new sales forsome of our principal competitors on an FSA basis withMarch 2006 as the base year. As you can see, new salesof third sector products for the industry as a whole havebeen almost flat since September of 2006.
In addition, due to the intensifying competition, theclaims nonpayment issue and the challenging market forf irst sector insurance products, new sales at large
domestic insurers such as Nippon and Sumitomo havebeen on the decline across the board. However, even inthe more competitive environment, Aflac was able toachieve better sales results than the industry as a whole.
Share of In-force Third Sector Business*(FSA Premium Basis, Life Industry Only)
This chart shows the share of annualized premium inforce for third sector products for various companies. Aflachad a 21.2% share of the in-force business as ofDecember 2008 and this measure has remained verystable.
New Sales of Cancer Insurance(New Annualized Premium, Yen in Billions)
Now, let me give you an overview of the sales of ourfounding product, cancer life.
Sales of cancer insurance in 2008 grew 3.6% over theprior year. One of the reasons for this growth was robustsales of our upgrade policy that allows existing cancerpolicyholders to increase their benefit levels to equal thatof Cancer Forte, our latest cancer product. This upgradepolicy was introduced in January 2008. In the first quarterof 2009, cancer insurance sales were up 7.4% over thefirst quarter of 2008. The upgrade policy accounted for26% of cancer sales in the first quarter. Since its January2008 introduction, we have sold 430,000 upgrade policies.
**EExxcclluuddeess KKaammppoo
2211..44 2211..00 2211..11 2211..22 2211..22
00
2200
4400
6600
8800
110000%%
33//0055 33//0066 33//0077 33//0088 1122//0088
OOtthheerrss
DDaaii--iicchhii
SSuummiittoommoo
NNiippppoonn
AAlliiccoo
AAffllaacc
Aflac Japan MarketingTakaaki Matsumoto
First Senior Vice President; Director of Marketing and Sales, Aflac Japan
6600
7700
8800
9900
110000
33//0066 99//0066 33//0077 99//0077 33//0088 99//0088
AAffllaacc NNiippppoonnSSuummiittoommoo DDaaii--iicchhiiAAlliiccoo IInndduussttrryy TToottaall
00
1100
2200
3300
¥¥4400
22000044 22000055 22000066 22000077 22000088 33//0088 33//0099
%% IInncc.. 1122..99..55 33..66 22..88 77..44
¥¥3333..33
¥¥3377..66¥¥3399..00
¥¥88..88 ¥¥99..44
¥¥3333..11
((1111..99)) 1166..33
¥¥2288..55

However, we st i l l have approximately 13.6 mi l l ioncustomers who are eligible to purchase the upgradeproduct.
As Tonoike-san mentioned, we believe the cancerinsurance market still has considerable room for growth.The market penetration for cancer insurance is relativelylow, yet expensive treatment costs and the agingpopulation mean the need will only continue to climb.Therefore, we will continue to strongly promote cancerinsurance sales.
Now let me move on to medical insurance.
New Sales of Medical Insurance(New Annualized Premium, Yen in Billions)
Following the introduction of EVER in 2002, Aflacbecame the top seller of stand-alone medical polices andhas remained in that position ever since. However, dueprimari ly to the claims nonpayment issue, and theintensifying competition in the medical insurance market,our medical insurance sales have remained virtually flatsince 2006.
Medical insurance sales in 2008 rose 2.7% over theprior year. One of the factors driving that growth was theintroduction of new markets obtained through GentleEVER, a nonstandard medical product we launched inAugust 2007. This product allowed us to extend ourmarket reach to new customers. In the first quarter of2009, however, as sales of Gentle EVER had peaked,medical insurance sales were down 5.4% year on year.
We will seek to increase medical insurance sales bydeveloping products that can meet the needs of a broaderrange of customers.
Selection Factors for Medical Insurance
Next, I would like to touch upon key factors consumersconsider when purchasing medical insurance. There areseveral factors that influence a consumer’s decision aboutthe most appropriate company to buy medical insurancefrom. However, a survey by an independent organizationshows that the most important criteria when selecting aninsurance company for medical products is “proper claimspayments,” followed by responsiveness and coverage.
Consumer Perceptions of Insurers
This chart shows consumers’ perceptions of Aflac, andtwo top competitors, Nippon Life and Alico for keypurchase considerations. As you can see, Aflac rankedhigher than the other two companies in four out of the topf ive factors, which suggests we are supported byconsumers not only because we provide favorable productfeatures such as coverage and affordable prices, but alsobecause we are more responsive and our products areeasier to understand.
The Most Preferred Insurer forCancer and Medical Insurance
This chart indicates the results of a survey conductedby another independent research f irm on the mostpreferred company for purchasing cancer and medicalinsurance. Consumer preference for both Aflac’s medicaland cancer insurance has declined somewhat sinceAugust 2008 due primarily to consumers’ concerns aboutthe financial strength of foreign insurers in the wake of theextensive Japanese media coverage on AIG. However, theresult of the latest survey, which was conducted lastmonth, continues to show that Aflac remains the “mostpreferred insurer” for both cancer and medical insurance.
00
1100
2200
3300
4400
¥¥5500
22000044 22000055 22000066 22000077 22000088 33//0088 33//0099
%% IInncc.. ((33..88))((1188..88)) 22..77 1177..66 ((55..44))
¥¥3399..00 ¥¥3377..66 ¥¥3388..66
¥¥99..99 ¥¥99..33
¥¥4488..11
2277..111100..77
¥¥3377..88
SSoouurrccee:: YYaahhoooo VVaalluuee IInnssiigghhtt CCoorrppoorraattiioonn,, 44//0099
8800
8822
8844
8866
8888
9900%%
PPrrooppeerr ccllaaiimmssppaayymmeennttss CCoovveerraaggee LLooww pprreemmiiuummRReessppoonnssiivveenneessss
EEaassyy ttoo uunnddeerrssttaannddmmaatteerriiaallss
8888..11%%8877..55%% 8877..22%%
8866..44%%8855..88%%
SSoouurrccee:: YYaahhoooo VVaalluuee IInnssiigghhtt CCoorrppoorraattiioonn,, 44//0099
00
55
1100
1155
2200
2255%% AAffllaacc NNiippppoonn AAlliiccoo
PPrrooppeerr ccllaaiimmssppaayymmeennttss CCoovveerraaggee LLooww pprreemmiiuummRReessppoonnssiivveenneessss
EEaassyy ttoo uunnddeerrssttaannddmmaatteerriiaallss
00 55 1100 1155 2200%%
AAffllaacc
AAlliiccoo
NNiippppoonn
88//0088 1122//0088 44//0099
00 1100 2200 3300 4400%%
AAffllaacc
AAlliiccoo
NNiippppoonn
88//0088 1122//0088 44//0099
MMeeddiiccaallCCaanncceerr
SSoouurrccee:: CCrroossss MMaarrkkeettiinngg CCoorrppoorraattiioonn
99
1111
7733
33883344 1144
1177
3388
11221111
1155
44
1133
3311
55
1100
35

We firmly believe this shows that Aflac is offeringcompetitive products that best meet consumers’ needs. Inaddition, we are widely accepted by consumers, thanks ingreat part to our effective branding. Later, I will talk aboutsome of our initiatives aimed at reinforcing our branding.
Policyholders’ Review of Insurance Portfolio
Because of the uncertain economic outlook, manyconsumers are reviewing their existing insurance portfoliomainly in an effort to try to reduce premium payments. Infact, a recent survey indicated that 18% of therespondents said that they reviewed their existing policiesover the past year. On top of that, 45% replied that theyare considering or intend to review their existing policies.
Purchases FollowingPolicyholders’ Portfolio Review
Of those who reviewed their insurance portfolio over thepast year, about 80% actually decided to purchase a newmedical insurance pol icy as a result of the review.Furthermore, 52% even chose to buy life insurancecoverage on top of the medical insurance. This suggeststhat if Aflac can offer an appropriate life insurance policy tothose customers when selling medical insurance, wewould better service them by catering to their needs forboth medical and life coverage.
Product Structure of “GIFT”
Based on this observation, we enhanced our l i feproduct offerings. In March 2009, we introduced a newfirst-sector product called “GIFT.” Typically, a life insurancepolicy pays a death benefit in a lump sum. By contrast,GIFT provides beneficiaries, typically family members, witha monthly annuity until the insured would have turned 60.For example, a male who purchases the product at age 30pays a monthly premium of ¥6,140. If he dies at age 40 or50, the beneficiary of the plan will receive ¥200,000 everymonth for 240 months or 120 months, respectively.Because of the affordability of Gift, compared with otherl i fe insurance products, we believe it wil l appeal toconsumers who want to review their insurance portfolio toreduce premium payments.
GIFT is a door-opener for our agents, and we believe itwill result in cross-selling opportunities of our two pillarproducts. Although it has only been about a month sincewe introduced GIFT, two thirds of GIFT purchasers so farhave also bought some other insurance products such asEVER or cancer at the same time.
Aflac’s Child Endowment Product
Aflac also launched a new child endowment product inMarch. Despite the decl in ing birthrate and agingpopulation, about one million babies are born every year inJapan. The birth of a child is a big event that prompts thefamily to consider and review their family members’insurance. This product contains several features that webelieve consumers will like. It provides a death benefit untilthe child reaches age 18. It also pays a lump-sum benefitat the time of the child’s entry into high school as well asan educational annuity for each of the four years during hisor her college education. When considering the purchaseof a child endowment product, many consumers look tothe product’s return ratio. With the launch of our newproduct, we now offer the highest return ratio in theindustry.
AAggee 3300 AAggee 66004400 5500
AAggee aatt DDeeaatthh:: BBeenneeffiitt
4400--yyrr:: ¥¥220000,,000000 ×× 224400 mmoonntthhss == ¥¥4488 mmiilllliioonn
5500--yyrr:: ¥¥220000,,000000 ×× 112200 mmoonntthhss == ¥¥2244 mmiilllliioonn
3300--yyrr.. mmaallee,, ppaaiidd uupp bbyy aaggee 6600““GGiifftt”” aannnnuuiittyy ppaayymmeenntt aammoouunntt ooff ¥¥220000,,000000 ppeerr mmoonntthh
RReevviieewweedd oovveerr tthheeppaasstt yyeeaarr –– 1188%%
CCoonnssiiddeerriinngg oorrhhaavvee iinntteennttiioonn ttoo
rreevviieeww –– 4455%%
DDoo nnoott iinntteenndd ttoorreevviieeww –– 3377%%
SSoouurrccee:: MMaaccrroommiillll,, 1122//0088
36
MMeeddiiccaall aanndd lliiffeeiinnssuurraannccee
ccoovveerraaggee –– 5522%%
MMeeddiiccaalliinnssuurraannccee –– 2266%%
OOtthheerr –– 2222%%
SSoouurrccee:: MMaaccrroommiillll,, 1122//0088

37
Other Products Owned byChild Endowment Policyholders
Many consumers who purchased child endowmentinsurance also bought, or considered buying, otherpolicies such as life, medical and cancer insurance at thesame time.
Therefore, we believe that child endowment insurance isan effective product for creating new opportunities tocontact customers in order to sell them cancer andmedical insurance products.
We believe the Child Endowment Insurance, as well asGIFT, perfectly match the needs of consumers who are intheir thirties and want to think about taking out a newpolicy or reviewing their existing policies due to the birth ofa child. In Japan, these consumers are called “Babyboomer junior” and constitute a large portion of theJapanese population pyramid. We believe by selling thesenew products, we can effectively approach this bracket ofthe population. Combining these new products with ouralready popular cancer and medical insurance will help usstrengthen our relationship with customers as well asimprove sales.
Number of Agencies andShare of New Sales by Type of Agency
In addition to such traditional channels as affiliatedcorporate agencies, independent corporate agencies, andindividual agencies, Af lac has added diverse saleschannels over the years, including Dai-ichi Life, banks andJapan Post Network Co., Ltd. To support sales throughour various channels, we are also focusing on effectivepromotion activities.
Promotion: “Duck Insurance Consultation”
In the second half of 2008, Aflac introduced a newpromotional campaign cal led “Duck InsuranceConsultation.” This campaign is reaching consumersthrough television commercials and the Internet.
We use the Aflac Duck to convey the message thatconsumers can purchase our products at convenientlocations with face-to-face consultations. We let themknow that our agents listen to each person’s needs andcustomize coverage to respond to those needs.
Television Commercial
Following the recent financial crisis, insurers have comeunder increasing public scrutiny about their financialstrength. In such an environment, Aflac has focused ondeveloping a stronger brand image as a “reliable insurerwith which customers can sustain a relationship for alifetime.”
Aflac Japan New Annualized Premium Sales(Yen in Billions)
This chart shows the trend in the total new annualizedpremium sales of Aflac Japan. We were not able toachieve our sales target in 2008. As you all know, theJapanese economy has been deteriorating drastically sincethe second half of 2008. Japan’s GDP in the fourth quarterof 2008 shrank at an annualized rate of 12.1%, and
00
2200
4400
6600
8800
110000
112200
¥¥114400
22000044 22000055 22000066 22000077 22000088 33//0088 33//0099
%% IInncc.. ((88..88)) ((22..44))55..11 55..00 ((..44))11..11
¥¥112222..55¥¥112288..88
¥¥111177..55 ¥¥111144..66 ¥¥111144..77
¥¥2277..66 ¥¥2277..55
• TTeelleevviissiioonn ccoommmmeerrcciiaallss aannddIInntteerrnneett pprroommoottiioonn
• MMeessssaaggee ttoo ccoonnssuummeerrss::
» CCoonnvveenniieenntt llooccaattiioonnss
» FFaaccee--ttoo--ffaaccee ccoonnssuullttaattiioonn

38
everyone expects further and significant contraction in thefirst quarter of this year. In addition, GDP is expected todecline for the full year of fiscal 2009. In this environment,we are encouraged to see that Aflac Japan’s new sales inthe fourth quarter of 2008 and the first quarter of 2009were basically flat from a year ago, down just .1% and.4%, respectively. For the second quarter, although wehave one fewer production day than a year ago, we arecomfortable with how new sales have been doing so far inthe quarter.
Marketing Objectives for 2009
As you already know, Aflac Japan’s goal is to produceflat sales to a 5% increase in 2009. In order to achieve thisobjective, we will provide more effective support to ourvarious distribution channels by customizing our efforts tobest meet the unique attributes of each channel. On thedistribution side, we will continue to implement agencysegmentation, strengthen recruiting and training andfurther promote bank channel sales. At the same time, webelieve we will benefit from our newly introduced productssuch as GIFT and new child endowment, and will carry outpromotional campaigns to reinforce our corporate brand.By implementing all of these initiatives, we believe we willbe able to achieve the sales target.
Aflac Japan remains in a strong competitive position inthe fastest growing sector of Japan’s insurance market.Despite the uncertainty of consumer sentiment from theglobal economic crisis, consumers continue to need thethird sector insurance. The aging population and low birthrate continue to put pressure on the public health caresystem. Therefore, we believe we can achieve sustainablegrowth in this market.
I will be providing you with an overview of Aflac Japan’ssales channels, the sales teams support ing thesechannels, and the sales activities created to enhance theefforts of our agents.
Number of Agencies by Type
Let me begin with our sales channels.
The graph shows the growth in the number of Aflac’ssales agencies. Although the number of affiliated corporateagencies has increased sl ight ly, the number ofindependent/individual agencies has grown tremendously.This growth is largely attr ibutable to two targetedrecruitment activities. First, we established recruitmentobjectives for our sales office staff. And second, wedeployed personnel to our retail market sales offices whoare dedicated to agency recruitment.
It is not uncommon for affiliated corporate agencies torepresent many insurance companies. In fact, at the end oflast year, only 21% were exclusive to Aflac. However,among independent corporate and individual agencies,67% were exclusive.
Aflac Japan SalesKoji Ariyoshi
Senior Vice President; Deputy Director of Marketing and Sales, Aflac Japan
00
55,,000000
1100,,000000
1155,,000000
2200,,000000
11999988 11999999 22000000 22000011 22000022 22000033 22000044 22000055 22000066 22000077 22000088
IInnddeeppeennddeenntt//IInnddiivviidduuaall
AAffffiilliiaatteedd 1188,,888822

Communication Preferencesfor Insurance Purchases
We believe the increase in the number of sales agenciesreflects Aflac’s goal of being responsive to consumers andtheir changing needs. In the past, domestic life insurancecompanies deployed a signif icant number of salesemployees and counted mainly on one-on-one sales atboth consumers’ homes and worksites, which is still thecase today. By comparison, Aflac previously focused onaffiliated corporate agencies, which used a mass-salesapproach, relying on solicitation materials that weredistributed at worksites. We began to change that focus inthe mid 1990s as the deteriorating Japanese economylowered the response rates to our worksi te salescampaigns.
In addition, consumers’ desire to communicate directlywith insurance agents has become more varied andinteractive. As shown on this chart, some people preferface-to-face approaches at home, at agencies or atservice shops, while others prefer to take out an insurancepolicy by using the Internet.
To accommodate the changing needs of ourcustomers, we have been recruiting a lot of independentand individual agencies. These agencies use the face-to-face consultative approaches that many consumers want.As such, we are being more responsive to potentialconsumers. For those who prefer to go online, they canmake an inquiry or get a brochure of our insuranceproducts through Aflac Japan’s Web site.
Historical Transition of Sales Channels(New Annualized Premium Sales)
As consumers’ needs have changed, the salescontributions by agency type have also changed. From themid-1970s, when we first established our operations inJapan, through the mid-1990s, aff i l iated corporateagencies served as the most vital sales channel for us.However, in the wake of Japan’s sharp economicdownturn in the 1990s, many office employees were laidoff and workers’ disposal incomes were on the decline. Inaddition, more and more consumers wanted to choosefrom a variety of insurance products, rather than just thoseprovided by their employers. As a result, people began topurchase insurance products at locations other than theworksi te. Addit ional ly, due to heightened secur i tyrequirements and the enforcement of Japan’s PersonalInformation Law, limitations on worksite insurance saleshave become stricter in many cases.
Against this backdrop, we have implemented supportivemeasures to help affiliated agencies, which are responsiblefor a large number of policies in force. For example, weimplemented direct mail campaigns to help affil iatedagencies boost their cancer sales through our cancerupgrade product. A strong complement to our traditionaldistribution is our alliance with Dai-ichi Life. This alliancewas formed in 2001 and gives us access to customers wewere not reaching through our traditional channels. Mostrecently, the addition of the bank channel and the JapanPost Network Co., Ltd. has provided more avenues for usto reach additional consumers.
The impact of the changes to our distribution systemhas been significant. In 1992, affiliated corporate agenciesrepresented 61% of our sales. In 2008, affiliated agenciesmade up 35.5% of our sales, with independent andindividual agencies accounting for 55%. Aflac Japan isfirmly committed to exploring various potential saleschannels, while still offering necessary support to ourtraditional sales channels.
Number of Banks Selling Aflac Products(Third Sector Products Only)
As you know, insurance sales at banks were fullyderegulated in December 2007, and banks have becomean important channel for insurance sales. This chartindicates changes in the number of banks selling Aflac’sthird sector products. By the end of April, the number hadgrown to 267 banks representing Aflac. Our products aresold by many more banks than any of our competitors,and we expect Aflac to continue to increase sales throughthe bank-channel.
00
2200
4400
6600
8800
110000%%
11999922 22000000 22000088
BBaannkk
DDaaii--iicchhii
IInnddiivviidduuaall//IInnddeeppeenn--ddeenntt
AAffffiilliiaatteeddccoorrppoorraattee
00
2200
4400
6600
8800
110000
¥¥112200
11999922 22000000 22000088
((YYeenn iinn BBiilllliioonnss))
¥¥9999..88
¥¥111144..77
¥¥6688..44
39
00 1100 2200 3300 4400%%
FFaaccee--ttoo--ffaaccee ssaalleessaatt hhoommee
OOnn tthhee IInntteerrnneett
FFaaccee--ttoo--ffaaccee ssaalleessaatt aaggeenncciieess//sshhooppss
FFaaccee--ttoo--ffaaccee ssaalleessaatt wwoorrkkssiittee
SSoouurrccee:: CCrroossss MMaarrkkeettiinngg CCoorrppoorraattiioonn,, 44//0099
3322%%
2288%%
1177%%
99%%
00
5500
110000
115500
220000
225500
330000
1122//0077 33//0088 66//0088 99//0088 1122//0088 44//0099
MMeeggaa bbaannkkss,, rreeggiioonnaall bbaannkkss SShhiinnkkiinn bbaannkkss
3344
115544
5555
119966
224422226677

40
New Sales through the Bank Channel(Yen in Millions)
Sales through banks experienced strong sequentialgrowth through the first three quarters of 2008. When thefinancial crisis emerged, the downturn dealt a heavy blowto banks’ insurance sales, and sales of Aflac’s productswere no exception. In the fourth quarter, we saw a drop innew sales, compared with the third quarter. As we havediscussed, banks had to spend most of their time followingup with customers who had purchased investment trustsor variable annuities from them. Customers have alsobecome extremely cautious about purchasing investmentproducts, which reduced the number of branch visitorsand thus lessened opportunities for third sector sales.
Additionally, in the first quarter of 2009, banks began toconcentrate on generating profits by using a government-sponsored loan program for smal l and mediumbusinesses, thus limiting the time available for insurancesales. However, bank sales in the first quarter of this yearimproved over the fourth quarter of last year. And weexpect bank sales to do even better in the second quarterwhen Japan’s banks begin their new fiscal year in April.We bel ieve banks wil l pay attention to third sectorproducts as a potential means to make up the shortfall inrevenues caused by decl in ing commissions frominvestment trusts and variable annuities. Additionally, manybanks have set specific targets for insurance sales. Once asales target is set, it allows us to work with the bank toclosely monitor sales activities in the field and quicklyrespond to market changes by implementing new effectiveinitiatives. Further, we believe banks are motivated to sellSanjuso, the single-premium, critical disease product welaunched last year, as well as the new child endowmentproduct Matsumoto-san discussed. As we look to thefuture of bank sales, we expect the number of banks thatwill adopt Aflac products to increase and we expect salesby banks that already offer our products to further expand.
Sales Organization
As another facet to enhance our abi l i ty to reachconsumers, we restructured our sales support organizationin January 2009 to more effectively support our varioussales channels. This chart shows both the previous andcurrent structure of Aflac Japan’s sales organization. Lastyear, within 10 territories, 99 sales offices were in chargeof local agencies and 13 sales offices were responsible forbank channel sales. This year, we have classified agenciesinto three divisions: Large Corporate Marketing, Retail andMid-Corporate Marketing, and Bank Channel Marketing.We believe grouping agencies according to their functionrather than strictly by their location allows us to moredirectly meet each agency’s needs with the most relevantand specialized support.
Specifically, the Large Corporate Marketing Division has11 sales departments that look after affiliated agencies inthe Tokyo, Osaka and Nagoya areas. The Retail & Mid-Corporate Marketing Division has 61 sales offices aroundJapan and provides support to independent/individualagencies throughout Japan as well as affiliated agencies inareas excluding Tokyo, Osaka and Nagoya. The BankChannel Marketing Division has 10 sales offices andsupports all banks throughout Japan, as it did last year.These changes allow us to provide more effective supportto dif ferent distr ibution channels that have diversecharacter ist ics and needs whi le focusing theresponsibilities of each marketing division internally.
Recruitment of New Agencies
LLaarrggeeCCoorrppoorraatteeMMaarrkkeettiinngg
1111 CCoorrppoorraatteessaalleess ooffffiicceess
AAffffiilliiaatteeddCCoorrppoorraattee
aaggeenncciieess iinnTTookkyyoo,, OOssaakkaa,,
NNaaggooyyaaddiissttrriicctt
9999 AArreeaassaalleess ooffffiicceess
IInnddeeppeennddeenntt,,IInnddiivviidduuaall,,AAffffiilliiaatteedd
CCoorrppoorraattee,,DDaaii--iicchhii,, JJaappaann
PPoosstt
22000088 22000099
RReettaaiill &&MMiidd--CCoorrppoorraattee
MMaarrkkeettiinngg
6611 RReettaaiillssaalleess ooffffiicceess
IInnddeeppeennddeenntt,,IInnddiivviidduuaall,,
OOtthheerrAAffffiilliiaatteedd
CCoorrppoorraattee,,DDaaii--iicchhii,,
JJaappaann PPoosstt
BBaannkk CChhaannnneellMMaarrkkeettiinngg
1100 FFiinnaanncciiaallccoorrppoorraattee
ssaalleess ooffffiicceess
BBaannkk
1133 FFiinnaanncciiaallccoorrppoorraattee
ssaalleess ooffffiicceess
BBaannkk
1100 TTeerrrriittoorriieess
00
220000
440000
660000
880000
11,,000000
11,,220000
¥¥11,,440000
33//0088 66//0088 99//0088 1122//0088 33//0099
¥¥227766
¥¥668800
¥¥11,,331111
¥¥995599¥¥11,,000099
00
11,,000000
22,,000000
33,,000000
44,,000000
55,,000000
22000044 22000055 22000066 22000077 22000088 33//0088 33//0099
33,,994444
33,,119955
777711
33,,446633
44,,33888844,,116644
11,,004411

41
Although recruitment of new agencies declined from2005 through 2007, agency recruitment is a renewedpriority for us. In 2008, we had a significant improvementin recruiting, which was up 23.4%, compared with 2007.We believe this was a result of the weak labor market inJapan due to this economic downturn as well as certainimprovements we have made in our recruitment activities.For instance, we increased the opportunity for potentialagents to attend group recruit meetings.
Previously, we held one-on-one meetings with thosewho wanted to talk about becoming our associates. Nowwe hold group meetings once or twice each month at oursales offices around the country, where those who areinterested in becoming a sales agent get together to getexplanat ions on Aflac and its business. The groupmeetings make the recruiting process far more efficientthan before from an Aflac standpoint. From the point ofview of potential agents, group meetings have lesspressure than a one-on-one meeting.
When making group presentations, we give an overviewof the company, how the agency system works, howcommissions are paid and how our training programprepares agencies for a successful career at Aflac. Thisoverview is followed by a face-to-face meeting with eachinterested candidate. We began testing this recruitingapproach in limited territories last year. Based on theirposit ive results, we are now using this approachthroughout Japan as we continue to intensify our efforts toeffectively recruit new agencies. We recruited 1,041 newagencies in the first quarter, which was up 35% comparedwith a year ago.
Aflac’s Support for New Agencies
Now, let me share some important ways we providesupport to newly recruited agencies. We believe that earlysuccess at Aflac is an important indicator of future andlong-term success. For this reason, we have implementedvarious initiatives to increase the number of producingagencies.
For example, new agencies attend New AssociatesBasic Training (ABT), a six-month training program thatuses repeated group training sessions and visits withpotential customers to improve their sales skills. Traineesfocus on improving face-to-face consultation skills andlearn how to proactively identify potential customers in thedirect market and in small- to medium-sized companies.
We are also employing other methods to provideincentives and help new recruits. For example, our “RookieChallenge” bonus program is designed to motivate newagencies to produce sales at a specified level within thefirst three months. Additionally, new agencies may chooseto enroll in an advance commission system that allows
them to receive a one-year portion of commissions in alump sum prior to the actual payment of premiums, whichhelps them get their business on track more quickly andcover some of their own necessary expenses. We alsooffer another type of incentive to those making use of ouronline application system, e-App, in their sales. Using e-App reduces application documentation errors andenhances the overall efficiency of policy issuance.
Growth of Newly RecruitedProducing Agencies
We believe our supportive efforts for newly recruitedagencies are paying off. During the early stage of training,our goal is to increase the number of agencies thatproduce new sales of at least ¥200,000 or more withinthree months after registration. Based on that measure, wehad a 13.9% increase in newly recruited producingagencies in 2008.
Promotion of “Light Consulting” Training
To further improve new agencies’ productivity, welaunched an advanced training program called “LightConsulting” for New ABT graduates who have producednew sales of ¥2.4 million to ¥10 million. This advancedtraining program is designed to enhance agencies’ abilitiesto assess customers’ current needs, propose solutionsthat respond to those needs, and ultimately provide acustomized and comprehensive portfolio of Aflac healthand life products. In addition, veteran agencies withexperience and skills will be eligible for the support systembased on their growth stage.
We will continue to enhance the program content toachieve better agency productivity.
00
550000
11,,000000
11,,550000
22,,000000
22,,550000
22000066 22000077 22000088
11,,771155
22,,000088
11,,558800
• NNeeww AAssssoocciiaatteess BBaassiicc TTrraaiinniinngg -- AABBTT
• RRooookkiiee CChhaalllleennggee BBoonnuuss
• AAddvvaanncceedd ccoommmmiissssiioonnss
• ee--AApppp iinncceennttiivvee
22--33--yyeeaarr aaggeenncciieess
““LLiigghhtt CCoonnssuullttiinngg””
VVeetteerraannaaggeenncciieess
NNeewwllyy rreeggiisstteerreedd aaggeenncciieess
““NNeeww AABBTT””
FFrroomm ¥¥22,,440000 ttoo ¥¥1100,,000000
LLeessss tthhaann ¥¥22,,440000
¥¥1100,,000000 oorr mmoorree
NNeeww AAnnnnuuaalliizzeeddPPrreemmiiuumm SSaalleess
((YYeenn iinn tthhoouussaannddss))

42
Agency Segmentation
This year, we will complete the rollout of our agencysegmentation initiative we began last year. From thebeginning of 2008, we started a system to identify andtrack low performing agencies and manage those agenciesat our headquarters in Tokyo. Additionally, we began tosegment higher-performing agencies by size, growthpotential, and whether they do business exclusively withAflac or not, as well as various indices including the degreeof contribution to Aflac’s sales growth.
Support Stance According toAgency Growth Stage
We have segmented agencies that have two years’experience as our sales agencies. We ranked them from“AA” to “C,” according to their stage, and will review theirranks on an annual basis based on their salesperformance. Agencies categorized as “AA” are extremelyimportant to Aflac because they tend to be big in size andhave high potential for further growth. As a result, theyreceive more preferential support. It’s important to notethat we will actively support those agencies categorized as“C” that are highly motivated to expand their business sothat they can move up to a higher rank. However, we willonly provide limited support to other agencies that areranked as “C.” By providing differential support based onthe growth stage of each agency, we will seek to realizefair and preferential allocation of marketing resources andachieve maximum results.
Agency Composition by Stage
This chart shows the number of agencies and theirshare in new sales at each level. Although agencies ranked“AA” and “A” together only account for about 9% of thetotal number of agencies, their combined share of 2008new annualized premium sales was 61%. We believe it isimportant to continue preferential support to “AA” and “A”level agencies to ensure our top agencies are motivatedand productive.
Support Measures by Stage
We use a variety of measures to support agencies ateach level. One area of support is for sales of our mainstayproducts, cancer and medical. To high-stage agencies, wepay an extra bonus fee in addition to regular commissions.In addition, high-stage agencies receive financial supportfor recruiting new agencies. For example, we pay them aone-time fee when they recruit an agent, and will continueto pay them an incentive bonus based on the amount ofnew sales produced by that specific new agent during thefirst six months after the recruitment. Also, our official Website only lists the names of high-stage agencies. Webelieve agency segmentation allows us to effectivelyallocate our marketing resources and achieve maximumresults.
As I mentioned, so far, Aflac’s distribution system hasevolved over many years to meet the needs of our existingand potential customers. We continue to believe our vastdistribution network is one of our primary competitivestrengths in the Japanese insurance market. Goingforward, we will continue to expand this agency networkand enhance service quality in order to realize sustainablegrowth of Aflac Japan.
As you already know, Aflac Japan’s goal for the year2009 is increasing its new sales from flat to 5%. AsMatsumoto-san mentioned, we are gearing up to developproducts and promotions that will further differentiate usfrom our competitors. At the same time, we will effectivelystep up our support to banks and other new channels inaddition to our traditional channels. Through these efforts, Ibelieve we are positioned to achieve our sales goal for 2009.
NNuummbbeerr ooffAAggeenncciieess
SShhaarree ooff NNeewwAAnnnnuuaalliizzeedd PPrreemmiiuumm
SSaalleess iinn 22000088
AAggeennccyy’’ssSSttaaggee
PPeerrcceennttaaggee ooffTToottaall AAggeenncciieess
**EExxcclluuddiinngg DDaaii--iicchhii,, SSppeecciiaall CCoorrppoorraattee SSaalleess DDeepptt..,, ssuubbssiiddiiaarriieess,, bbaannkkss,, JJaappaann PPoossttNNeettwwoorrkk CCoo..,, LLttdd.. aanndd aaggeenncciieess tthhaatt wwiillll bbee ddee--lliicceennsseedd
AAAA 446600 33 4400
AA 11,,115500 66 2211
BB 22,,776600 1155 1177
CC 88,,110000 4455 1133NNeewwllyy
RReeccrruuiitteeddAAggeenncciieess 55,,444400 3311 99
TToottaall 1177,,991100 110000 110000
%% %%
%% %%
MMaarrkkeettiinnggRReessoouurrccee
AAAA
AA
BB
CC
GGrroowwtthh SSttaaggee
hhiigghhllyypprreeffeerrrreedd
pprreeffeerrrreedd
sseelleecctteedd
lliimmiitteedd
• AAddddiittiioonnaall bboonnuusseess ffoorr hhiigghh--ssttaaggee aaggeenncciieess
• FFiinnaanncciiaall ssuuppppoorrtt ffoorr aaggeenntt rreeccrruuiittmmeenntt
• AAggeennccyy lliissttiinngg oonn AAffllaacc JJaappaann’’ss WWeebb ssiittee

43
I would like to explain the sale of insurance productsthrough the bank channel, which was fully deregulated onDecember 22, 2007.
History of Bank Sales
Let me begin with a brief regulatory history of bankchannel sales. Sales of financial products through the bankchannel began in December 1998 when the sale ofinvestment trust products was allowed. Since then, thepace of deregulation has accelerated. The sales ofmortgage-related, long-term fire insurance and individualannuity products were deregulated in April 2001 andOctober 2002, respectively. Then, in December 2005, theban on the sale of s ingle premium whole l i fe andendowment insurance was lifted. Finally, on December 22,2007, the remaining restrictions were fully eliminated,including third sector products.
Financial Institutions in Japan
As you can see, Japan has a total of 405 banks,including mega banks, major banks, regional banks andshinkin banks. These banks have a total of approximately21,000 branches and 390,000 employees in Japan, andthey represent our target market. In addition, there also aresome credit associations and agricultural cooperatives,which tend to be very small in size.
The mega banks typically include Mizuho, Tokyo-Mitsubishi UFJ and Sumitomo Mitsui. We have alsoincluded Resona as a mega bank due to its large-scaleand extensive nationwide sales network. With an average
of 548 branches, these four banks offer a wide range ofbanking services throughout the nation, from investmentbanking and wholesale to retail and private banking. Inaddition to over-the-counter sales, the mega banks alsoprovide direct sales over the phone and the Internet. Themega banks are also increasing the number of financialplanners they employ and opening branches to providenew types of services.
There are 108 regional banks in Japan, includingsecond-tier regional banks, which were originally mutualbanks and converted to ordinary banks in 1989. In theretail banking division, door-to-door sales now representthe second-largest channel after over-the-counter sales.Some regional banks based in the Tokyo metropolitan areaoffer retail banking businesses similar in scale to megabanks.
Shinkin banks are cooperative financial institutionsspecializing in services for small to medium businessesand individuals. Their sales activities are deeply rooted inlocal communities, and door-to-door sales make up asignificant part of their retail business. They have a vastnetwork of nearly 7,700 branches, which accounts formore than one-third of all bank branches. The NationalAssociation of Shinkin Banks selects industry-standardproducts and provides an administrative framework to itsmembers. With the association’s selection of Aflac’scancer and medical insurance, sales by shinkin bankshave been expanding, and we expect further success atshinkin banks.
Sales Power of Banks(Outstanding Market Value, Yen in Trillions)
Banks have had great success in selling investmenttrusts and annuity products. At the end of 1999, the totalmarket value of investment trust products sold by banksstood at ¥3.3 trillion. This amount jumped to ¥54.8 trillionin March 2007. Due to market turbulence under thefinancial crisis, the market value of investment trust sold bybanks shrank to ¥39.4 trillion as of March 2009. However,this amount is still huge and accounts for 51.6% of thetotal.
Aflac Japan Bank Channel SalesHisayuki Shinkai
First Senior Vice President, Financial Institutions, Aflac Japan
DDeecceemmbbeerr 11999988 IInnvveessttmmeenntt ttrruussttss ffiirrsstt ooffffeerreedd
AApprriill 22000011 LLoonngg--tteerrmm ffiirree iinnssuurraannccee rreellaatteeddttoo hhoouussiinngg llooaannss,, eettcc..
OOccttoobbeerr 22000022 IInnddiivviidduuaall aannnnuuiittyy,, ssaavviinnggss--ttyyppeeaacccciiddeenntt iinnssuurraannccee wwiitthh aannnnuuiittyy,, eettcc..
DDeecceemmbbeerr 22000055 SSiinnggllee pprreemmiiuumm wwhhoollee--lliiffee,, ssiinnggllee--pprreemmiiuumm eennddoowwmmeenntt iinnssuurraannccee,, eettcc..
DDeecceemmbbeerr 22000077 AAllll rreemmaaiinniinngg iinnssuurraannccee pprroodduuccttss
MMeeggaa bbaannkkss 44 22,,119922 554488 7799,,112299 1199,,778822
MMaajjoorr bbaannkkss 77 446666 6677 2255,,999966 33,,771133
RReeggiioonnaall bbaannkkss 6644 77,,444422 111166 112266,,663344 11,,997799
SSeeccoonndd--ttiieerrrreeggiioonnaall bbaannkkss 4444 33,,225522 7744 4488,,119944 11,,009955
SShhiinnkkiinn bbaannkkss 227799 77,,668844 2288 111122,,444455 440033
OOtthheerr bbaannkkss 77 110044 1155 11,,448833 221122
TToottaall 440055 2211,,114400 5522 339933,,888811 997733
NNoo.. ooffIInnssttiittuuttiioonnss TToottaall
AAvvgg.. ppeerrIInnssttiittuuttiioonn TToottaall
AAvvgg.. ppeerrIInnssttiittuuttiioonn
NNoo.. ooff BBrraanncchheess NNoo.. ooff EEmmppllooyyeeeessIInnvveessttmmeenntt TTrruusstt
00
1100
2200
3300
4400
5500
¥¥6600
1122//9999 33//0000 33//0011 33//0022 33//0033 33//0044 33//0055 33//0066 33//0077 33//0088 99//0088 33//0099SSoouurrccee:: IInnvveessttmmeenntt TTrruussttss AAssssoocciiaattiioonn ooff JJaappaann
¥¥33..33 ¥¥44..55¥¥88..88
¥¥1111..11 ¥¥1122..66
¥¥1177..99
¥¥2255..66
¥¥3399..33
¥¥5544..88¥¥5522..88
¥¥4499..44
¥¥3399..44

Sales Power of Banks(Outstanding Market Value, Yen in Trillions)
The same is true with variable annuities, which are nowthe mainstay products in the bank channel. Market valueof these products sold by banks increased from ¥1.1trillion at the end of March 2003 to ¥16.4 trillion at the endof September 2008.
Characteristics of Banks in Japan
Japan’s banks have several characteristics that explainwhy we believe this channel will be good for insurancesales. First, consumers are very comfortable doingbusiness at banks. For instance, 55% of householdfinancial assets were cash and deposits at year-end of2008. This is almost four times that of the United States,which was 15%. Also, when customers purchase afinancial product, they often transfer the funds from theiraccounts at the bank’s counter.
Second, customers’ confidence in banks is high ingeneral. Accordingly, there are many who prefer topurchase a financial product at the same time they make adeposit at the bank, so they can take care of bothtransactions collectively.
Third, door-to-door sales are unique to Japan androoted in the Japanese markets. Through this approach,shinkin banks and other local financial institutions buildstrong relationships with their customers.
Fourth, there are not many independent financialplanners in Japan. An October 2007 survey conducted byJapan Association for Financial Planners showed that 85%
of qual i f ied f inancia l p lanners belong to f inancia linstitutions. As a result, many consumers tend to seekfinancial advice from banks.
Relationships with Banks
Historically, Aflac has strong business ties with banks.For more than 30 years, Aflac has been selling third sectorinsurance products to bank employees and others throughbank-affiliated corporate agencies. As a result, we haveextensive relationships with all mega banks and mostmajor, regional and second-tier regional banks. These longstanding business ties have positively influenced productselect ion as wel l as sales promotion after the ful lderegulation.
Banks’ Points of View
There are several decisive factors banks consider whenselecting an insurer or a product, as well as driving sales.The first factor is the products. Banks seek products thatare well-recognized by consumers. Aflac Japan hasachieved a strong brand and consumer recognition largelythrough its television commercials. Customer surveysshow Aflac is the most preferred insurer for third sectorproducts. It is also important that a product has easy-to-understand features so that the bank staff can easilyexplain the coverage. Aflac’s products clearly meet theneeds of banks.
The second factor is commission level. Commissionspaid by Aflac are among the highest in the industry. Thethird factor is training and support. In order to respond tothese three considerations, Aflac Japan is now operating10 bank sales offices nationwide with a total of 250employees who are dedicated to servicing both banks’headquarters and branches. And we operate a dedicatedcall center for banks to promptly handle daily inquiries frombanks.
44
• LLaarrggee aallllooccaattiioonn ooff hhoouusseehhoolldd ffiinnaanncciiaall aasssseettss ttooddeeppoossiittss
• CCoonnssuummeerrss rreelliiaannccee oonn bbaannkkss» HHiigghh ccrreeddiibbiilliittyy» CCoonnssoolliiddaatteedd ttrraannssaaccttiioonnss
• DDoooorr--ttoo--ddoooorr ssaalleess» UUnniiqquuee iinn JJaappaann» RReeggiioonnaall bbaannkkss,, sshhiinnkkiinn bbaannkkss bbuuiilldd ssttrroonngg
rreellaattiioonnsshhiippss
• FFeewweerr iinnddeeppeennddeenntt ffiinnaanncciiaall ppllaannnneerrss ((FFPP))» 8855%% ooff FFPPss bbeelloonngg ttoo ffiinnaanncciiaall iinnssttiittuuttiioonnss
00
22
44
66
88
1100
1122
1144
1166
¥¥1188
33//0033 33//0044 33//0055 33//0066 33//0077 33//0088 99//0088
VVaarriiaabbllee AAnnnnuuiittyy
SSoouurrccee:: IInnssuurraannccee DDaaiillyy
¥¥11..11
¥¥33..11
¥¥55..77
¥¥1111..00
¥¥1144..88¥¥1155..88
¥¥1166..44
MMeeggaa bbaannkkss 44 11,,334466 4499 7799 6622%%
MMaajjoorr bbaannkkss 77 228833 66 2266 2233
RReeggiioonnaall bbaannkkss 6622 449977 7766 112277 6600
SSeeccoonndd--ttiieerrrreeggiioonnaall bbaannkkss 4422 222222 2277 4488 5566
SShhiinnkkiinn bbaannkkss 114455 118866 4444 111122 3399
TToottaall 226600 22,,553344 220022 339922 5522%%
NNoo.. ooff AAffffiilliiaatteeddCCoorrppoorraatteeAAggeenncciieess
NNoo.. ooff CCaanncceerrPPoolliiccyy--
HHoollddeerrss**NNoo.. ooff BBaannkkEEmmppllooyyeeeess** CCoovveerraaggee
BBuussiinneessss wwiitthh AAffffiilliiaatteeddCCoorrppoorraattee AAggeenncciieess
BBaannkk EEmmppllooyyeeeessRReellaatteedd BBuussiinneessss
NNoo.. ooff CCaanncceerrPPoolliicciieess
iinn FFoorrccee**
**IInn tthhoouussaannddss
• HHiigghhllyy rreeccooggnniizzeedd ccoommppaannyy aanndd pprroodduuccttss bbyyccoonnssuummeerrss
» SSiimmppllee aanndd eeaassyy--ttoo--eexxppllaaiinn pprroodduuccttss
• HHiigghh ccoommmmiissssiioonnss
• SSaalleess ssuuppppoorrtt aanndd ttrraaiinniinngg» 1100 ssppeecciiaalliizzeedd ooffffiicceess aanndd 225500 eemmppllooyyeeeess» SSppeecciiaalliizzeedd ccaallll cceenntteerr ffoorr ddaayy--ttoo--ddaayy
ooppeerraattiioonn

Number of Banks Selling Aflac Products(Third Sector Products Only)
We have always bel ieved that our long-standingrelationships with banks would translate into agreementsto sell our products. Since the end of December 2007, thenumber of banks selling Aflac’s products has been steadilyincreasing. At the end of April 2009, 267 banks wereselling Aflac’s products, which represent nearly two thirdsof all the banks and we expect that number to increase toapproximately 300 in the near future. We also believe wehave significantly more selling agreements with banks thanour competitors.
The Shinkin Industry
All 279 shinkin banks are members of the NationalAssociation of Shinkin Banks. The association has beenselect ing insurance products and developingadministrative workflows for its members.
Until April 2008, the association had recommendedannuit ies and non-l i fe insurance products of eightJapanese insurance companies. At that time, foreigncompanies were excluded. Anticipating full bank channelderegulation, we quickly approached the association toask them to recommend our products. Aflac was the onlyforeign company among the four that were selected forthird sector products and was the only insurance companythat is allowed to sell both cancer and medical products.This situation remains unchanged to date.
Regulatory Concerns
The FSA has added some very detailed regulations toprevent banks from abusing their strong market positions.One of the major regulations includes a restriction on salesto executives and employees of corporate borrowers as alending condition. Banks are not allowed to sell insuranceproducts if the number of employees of the corporateborrower is less than 51. Shinkin banks and other regionalbanks dealing with small sized enterprises are permitted tosell to executives and employees of corporate borrowerswith at least 21 employees. However, in this case, dailybenefit will be limited to ¥10,000 for cancer and ¥5,000 formedical insurance.
There is a three year monitoring period for the FSA toreview any abusive conduct by banks with respect toinsurance sales. This period will end in December 2010and if there proves to be no significant problems duringthis period, the aforementioned regulations will be lifted atthat time.
Another issue is the impact of the Financial Instrumentsand Exchange Law that became effective in September2007. This law imposes restrictions on products such asinvestment trusts and variable annuities, the value of whichfluctuates in accordance with market conditions. Thirdsector products are exempt from the provisions of this law.However, most regional and second-tier regional banksare considering the law when selling third sector productsbecause the same employees are also handling investmenttrusts, variable annuities and third sector products.
In order to respond to these regulations, it is necessarynot only to establish a solid management organizationwithin a bank, but also to make sure that its sales forcehas thorough knowledge of relevant laws and regulations.This is one of the reasons, along with the fact that theyalso need to get accustomed to totally new products,which is generally considered to be several months, for thebank channel sales to start running in full swing. Inresponse, Aflac has been providing banks not only witheffective training, but also with sales and administrativeprocesses in accordance with relevant regulations, therebyhelping banks address all these needs and eventuallycontributing to their swift sales expansion.
00
5500
110000
115500
220000
225500
330000
1122//0077 33//0088 66//0088 99//0088 1122//0088 33//0099 44//0099
SShhiinnkkiinn bbaannkkss MMeeggaa bbaannkkss,, rreeggiioonnaall bbaannkkss,, eettcc..
3344
115544
5555117777
9900119966
224422 225500226677
IInnssuurraanncceeccoommppaanniieess
NNaattiioonnaall AAssssoocciiaattiioonnooff SShhiinnkkiinn BBaannkkss
SSeelleeccttiioonn
227799 SShhiinnkkiinn bbaannkkssnnaattiioonnwwiiddee
77,,770000 bbrraanncchheess
• SSaalleess ppoolliiccyy• RReeccoommmmeennddaattiioonn ooff pprroodduuccttss• AAddmmiinniissttrraattiioonn ssyysstteemm
AApppplliiccaattiioonn ffoorrsseelleeccttiioonn
CCoonnttrraaccttss
45
• DDeettaaiilleedd rreegguullaattiioonn iimmppoosseedd
» AAddmmiinniissttrraattiivvee ffrraammeewwoorrkk aatt bbaannkkss» KKnnoowwlleeddggee aanndd sskkiillllss ooff ssaalleess ppeerrssoonn
CCaauuttiioouuss bbeehhaavviioorr aatt tthhee bbeeggiinnnniinnggTThhrreeee yyeeaarr mmoonniittoorriinngg ppeerriioodd wwiillll eenndd iinn 22001100
• FFiinnaanncciiaall IInnssttrruummeennttss aanndd EExxcchhaannggee LLaaww» EEnnffoorrcceedd iinn SSeepptteemmbbeerr 22000077» AApppplliieedd ttoo iinnvveessttmmeenntt iinnssttrruummeennttss» TThhiirrdd sseeccttoorr pprroodduuccttss nnoott ccoovveerreedd» AAffffeecctteedd iinn ccaassee ooff ccoommbbiinneedd ssaalleess» RReeqquuiirree lleeaadd ttiimmee
RReeqquuiirreess::• AAddmmiinniissttrraattiivvee ffrraammeewwoorrkk aatt bbaannkkss• KKnnoowwlleeddggee aanndd sskkiillllss ooff ssaalleessppeerrssoonn

Bank Channel New Sales(Yen in Millions)
Next, let me comment on new sales results through thebank channel. As I mentioned, it takes several months fora bank to start running its sales activities in full scale.During the first three quarters of 2008, as the number ofbanks selling our products increased, we also experiencedstrong sequential growth in bank channel sales for the firstthree quarters of 2008. New sales were ¥276 million forthe first quarter, followed by ¥680 million and ¥1,311million for the second and third quarter, respectively.Although these numbers did not meet our or ig inalexpectation, we were still pleased with the growth for thefirst nine months of last year. In the fourth quarter,however, sales through the bank channel fell sharply to¥959 million following the onset of the financial crisis.
Emergence of Financial Crisis
As the financial crisis emerged in September last yearfollowing the collapse of Lehman Brothers, sales at bankssuffered signi f icant ly. In many cases, the value ofinvestment trust and variable annuity products fell belowthe paid-in amount and banks were extremely busydealing with inquiries from customers who bought theseproducts from the banks. In addition, the banks voluntarilyexplained to all of the relevant customers about thesituation of their financial assets. Customers also becamevery cautious about investment type products, resulting ina significant drop in customer traffic at bank branches.Accordingly, opportunities and time allowed for insurancesales at banks declined, and the sales of third sectorproducts decreased, even though third-sector productshad nothing to do with market fluctuation.
The third sector products are not the only ones whosenew sales had suffered. New sales of both investmenttrust and annuity products were also significantly lower in
2008 compared with in 2007, which means banks arefacing new challenges as they see their commissions fromselling these products decline.
Result in the First Quarter 2009
The impact of the financial crisis continued in the firstquarter 2009. And, on top of that, there appeared to be anew factor affecting bank sales: the emergency loan-guarantee program sponsored by the Japanesegovernment. This program was introduced in October2008 and will be valid through March 2010 as a mainmeasure for economic recovery. Initially, the total budgetfor this program was ¥6 trillion, but it has since beenexpanded to ¥30 trillion. Under this program, banks areable to extend a loan to small and medium enterprises(SMEs) with virtually no risk because of the governmentguarantee. Therefore, regional banks and shinkin bankshave placed top priority on this business. As of March thisyear, which is the fiscal year end for most companies inJapan, approximately ¥10 trill ion of loans have beenexecuted under this program. At banks such as shinkinbanks whose business is mostly done through door-to-door sales, the same sales person typically handles bothinsurance products and loans. Thus, time that can beallocated to insurance sales was understandably reduced.Partly due to this new factor, new sales in the first quarterof 2009 were ¥1.0 billion, which, although not a significantone, still marked a nice increase of 5.2% sequentially fromthe fourth quarter of 2008.
Outlook for 2009
As I mentioned before, after the full deregulation, banksneeded some time to ramp up in terms of selling thirdsector products because these products were totally newto them, and also because intensive training was neededto enhance skills and knowledge of sales person at banks,including compliance issues. Despite these factors, untilthe global financial crisis emerged, by and large, bankshad been able to gradually work through these issues.
Although the aftereffect of the financial crisis possiblywill continue to take hold throughout 2009 and banks willbe busy executing the government guarantee lendingprogram, we believe sales will turn around and grow in2009. There are several reasons behind this belief.
46
• CCoollllaappssee ooff LLeehhmmaann aanndd mmaarrkkeett ttuurrbbuulleennccee
• DDeepprreecciiaattiioonn ooff iinnvveessttmmeenntt ttrruusstt,, vvaarriiaabbllee aannnnuuiittyy((bbeellooww ppaarr))
• BBaannkkss eexxttrreemmeellyy bbuussyy iinn hhaannddlliinngg ccuussttoommeerriinnqquuiirriieess aanndd ffoollllooww uuppss
• CCuussttoommeerr ccoonncceerrnnss oovveerr iinnvveessttmmeenntt pprroodduuccttss
• TTrraaffffiicc ssiiggnniiffiiccaannttllyy rreedduucceedd
• LLeessss ooppppoorrttuunniittiieess ttoo sseellll tthhiirrdd sseeccttoorr pprroodduuccttss
00
220000
440000
660000
880000
11,,000000
11,,220000
¥¥11,,440000
11QQTT 22QQTT 33QQTT 44QQTT
¥¥227766
¥¥668800
¥¥11,,331111
¥¥995599
• IImmppaacctt ooff ffiinnaanncciiaall ccrriissiiss rreemmaaiinneedd
• BBaannkkss’’ ffooccuuss oonn ““EEmmeerrggeennccyy LLooaann GGuuaarraanntteeeePPrrooggrraamm”” ssppoonnssoorreedd bbyy ggoovveerrnnmmeenntt
• NNeeww ssaalleess ssttoooodd aatt ¥¥11..00 bbiilllliioonn
• SSaalleess ttaarrggeettss iinnssttaalllleedd iinnssiiddee bbaannkkss
• PPrroovviissiioonn ooff ddiivveerrssee pprroodduuccttss
• PPuurrssuuiitt ooff ssttaabbllee ffeeee iinnccoommee ssoouurrcceess
• SStteeaaddyy ggrroowwtthh eexxppeecctteedd ffoorr 22000099 aanndd bbeeyyoonndd

47
First, many Japanese banks have set their sales targetsfor the new fiscal year, which starts in April. However, asfar as 2008 is concerned, banks had never handled thirdsector products before and therefore they were extremelycautious about compliance issues. In fact, most of themwere too busy in preparing relevant sales training as wellas arranging administrative frameworks prior to setting upappropriate sales targets. As a result, the number of bankssetting sales targets was smaller than our estimate. Forfiscal 2009, therefore, we started aggressively negotiatingwith banks from the end of 2008, and succeeded ingetting many banks to set a specific sales target for Aflacproducts. Now, banks and Aflac are working together inclosely checking sales trends against these specific salestarget and implementing effective measures necessary forachieving relevant goals.
Second, the products we are offering for sale at banksare becoming increasingly more diverse. Shortly after thefull deregulation of insurance sales, banks’ top priority wasa clear-cut product and simple administration. In responseto this requirement, Aflac came up with a package productcalled the EVER Select Plan (with long-term hospitalizationrider) and Cancer Forte 300 (total diagnosis and survivingbenefit is ¥3 million) as the standard third-sector products.These products were widely accepted by both banks andbank customers and as the best plans. In the meantime,however, the need for less expensive insurance productshas been increasing under worsening economicconditions. To offer a solution, we started offering SimpleEVER (without riders) with lady’s rider as an option andCancer Forte 140 (total diagnosis and surviving benefit of¥1.4 million) in April of 2009.
Sales of Sanjuso have steadily increased since itslaunch in October 2008. However, due to the emergenceof the financial crisis, there have been some delays atbanks in adopting the sale of Sanjuso because thisproduct is a single-payment product, which is classified inthe same category as investment trust or variable annuity.Yet, this product is particularly supported by wealthycustomers, who are generally more sensitive to riskassociated with single-payment investment products andtherefore tend to seek for safer products. In addition, welaunched a new educational endowment product in April2009. This product has proven to match the needs ofbanks seeking to promote sales of third sector insuranceproducts for bank customers’ family members by makingconsultation over child’s education as a trigger. Thiseducational endowment product was adopted by theNational Association of Shinkin Banks, and shinkin banksstarted selling this product in May 2009. By leveraging thisproduct, we expect an increase in revenue from crossselling of cancer and medical products to bank customers’family members.
Third, banks are seeking stable fee income sources. AsI mentioned before, sales of investment trusts and annuityproducts have decreased since the emergence of thefinancial crisis, and banks are now facing the need tomake up the shortfall of conventional fee incomes. Bankshave been busy with generating profits on loans leveragingthe emergency government guarantee program. However,this is a tentative measure; in order to secure a stableprofit source, banks are increasingly aware of the potentialof third-sector products in an expectation that third-sectorproducts will become a stable income base in the longterm, although each transactional amount is relativelysmall.
In addit ion to al l of these factors, fundamentalconditions for stronger bank sales are being established. Inthe 18 months since ful l deregulat ion, both themanagement and sales force of banks are gett ingaccustomed to sales of third sector products, and theskills of sales person are enhanced, which gives themconfidence in facing customers. In fact, the mega banks,who were the most cautious players, are now expandingtheir sales channels and drastically increasing humanresources. For example, Mitsubishi Tokyo UFJ Bankstarted with 200 branches and 400 salespersons, but nowit plans to expand the number of branches to 400branches and increase the number of sales peopleaccordingly by the end of this year. Mitsui Sumitomo Bankstarted with 90 branches and 300 sales people and is alsoeager to boost its insurance sales by increasing thenumber of insurance-avai lable branches to al l 400branches equipped with an appropriate number ofsalespeople by March next year.
The bank-sales market has been steadily growingdespite such a huge negative impact of the currentfinancial crisis. Banks needed time to get their sales ontrack, because they were becoming accustomed todealing totally new products, strictly observing compliancerequirements, increasing customers’ awareness that banksare selling insurance products, and establishing new salesmethods.
Now, banks have successfully included third-sectorproducts into their core retail-banking product portfolio aspart of their strategy aiming to make third-sector productsearn stable sales commissions and prompt additional feeincomes from banks’ conventional products as part of theirlife-planning consultation services that include insurance.
In light of these favorable factors, we continue to believethe bank channel is a great opportunity for the distributionof our products and we expect further improvement in thischannel all through 2009 and in years to come.

48
Cancer Forte (No CSV)
Benefits: Sample Premium (Monthly Group Rate):First occurrence ¥ 1,000,000 $ 10,000 30-year-old male ¥ 2,781 $ 27.81First occurrence annuity* 100,000 1,000 40-year-old male 3,900 39.00Hospitalization/day 10,000 100 50-year-old male 5,448 54.48Surgical 200,000 2,000Outpatient/day 10,000 100Special outpatient/day 10,000 100Advanced medical treatment Up to 500,000 Up to 5,000Lump-sum advanced medical treatment 150,000 1,500Cancer death 100,000 1,000*Paid in years two through five following diagnosis.
EVER (Stand-alone whole life medical)
Benefits: Sample Premium (Monthly Group Rate):Hospitalization/day ¥ 10,000* $ 100 30-year-old male ¥ 3,440 $ 34.40Surgical 100,000 to 400,000 1,000 to 4,000 40-year-old male 4,320 43.20
50-year-old male 5,790 57.90*Covers overnight hospital stay. Maximum days per hospital stay is 60. Maximum lifetime days is 1,095.
EVER Half (Stand-alone whole life medical)
Benefits: Sample Premium (Monthly Group Rate):
Hospitalization/day ¥ 10,000* $ 100 Premium cut in half from age 60**Surgical 100,000 to 400,000 1,000 to 4,000 30-year-old male ¥ 3,820 $ 38.20
40-year-old male 5,120 51.2050-year-old male 7,900 79.00
Premium cut in half from age 65**30-year-old male ¥ 3,720 $ 37.2040-year-old male 4,860 48.6050-year-old male 7,100 71.00
*Covers overnight hospital stay. Maximum days per hospital stay is 60. Maximum lifetime days is 1,095.**Benefits remain the same over the life of the policy.
EVER Paid Up (Stand-alone whole life medical)
Benefits: Premium paid up at age 60 (Monthly Group Rate):Hospitalization/day ¥ 10,000* $ 100 30-year-old male ¥ 4,850 $ 48.50Surgical 100,000 to 400,000 1,000 to 4,000 40-year-old male 7,550 75.50
50-year-old male 16,230 162.30
Premium paid up at age 65 (Monthly Group Rate):30-year-old male ¥ 4,360 $ 43.6040-year-old male 6,270 62.7050-year-old male 11,030 110.30
*Covers overnight hospital stay. Maximum days per hospital stay is 60. Maximum lifetime days is 1,095.
Gentle EVER
Benefits*: Sample Premium (Monthly Group Rate):Sickness or accident hospitalization/day ¥ 10,000** $ 100 40-year-old male ¥ 8,390 $ 83.90Surgical 100,000 1,000 50-year-old male 11,260 112.60
60-year-old male 14,760 147.60*Cut in half for occurrences within one year after issue date.**Covers overnight hospital stay. Maximum days per hospital stay is 60. Maximum lifetime days is 1,095.
Aflac Japan’s Product Line(as of 4/30/09)

49
Care Master(One Unit, Individual Coverage)
Benefits: Sample Premium (Monthly Group Rate):Care annuity/year ¥ 240,000 $ 2,400 30-year-old male ¥ 1,248 $ 12.48Lump-sum care benefit* 50,000 500 40-year-old male 1,728 17.28
50-year-old male 2,424 24.24*First year only
Ordinary Life (Basic plan)
Benefits: Sample Premium (Monthly Direct Rate):WAYS 30-year-old male ¥ 8,715 $ 87.15
Payment through age 60 ¥ 5,000,000 $ 50,000 40-year-old male 14,105 141.0550-year-old male 29,995 299.95
Whole Life Sample Premium (Monthly Direct Rate):Payment through age 60 ¥ 5,000,000 $ 50,000 30-year-old male ¥ 9,575 $ 95.75
40-year-old male 15,125 151.2550-year-old male 31,210 312.10
GIFT
Benefit: Sample Premium*(Monthly Direct Rate):Annuity/month ¥ 200,000 $ 2,000 30-year-old male ¥ 6,140 $ 61.40
35-year-old male 6,560 65.6040-year-old male 7,000 70.00
*Payment through age 60
Child Endowment
Benefits: Sample Premium** (Monthly Direct Rate):Lump-sum education ¥ 500,000 $ 5,000 30-year-old male ¥12,470 $124.70Education annuities* 2,500,000 25,000 40-year-old male 12,630 126.30
50-year-old male 13,010 130.10*Paid over four years**Payment through age 18 of the child
Note: Premiums in dollars reflect exchange rate of ¥100=$1.
Aflac Japan’s Product Line (con’t)(as of 4/30/09)

50
Corporations Supporting Aflac Japan(as of 4/30/09)
Construction# Taisei Corporation# Kajima Corporation# Takenaka Corp.* Shimizu Corp.# Obayashi Corp.# Tokyu Construction Co. Ltd.
Foods# Sapporo Breweries, Ltd.# Kirin Holdings Co., Ltd.* Coca-Cola Japan Company, Ltd.# Ajinomoto Co., Inc.# Nissin Food Products Co., Ltd.# Snow Brand Milk Products Co., Ltd.# Asahi Breweries, Ltd.# Nichirei Corp.# Yamazaki Baking Co., Ltd.# Fujiya Co., Ltd.* Kikkoman Corp.
Textiles# Toyobo Co., Ltd.# Kracie Holdings, Ltd.# Renown, Inc.# The Japan Wool Textile Co., Ltd.# Wacoal Holdings Corp.# Teijin Ltd.# Mitsubishi Rayon Co., Ltd.# Kuraray Co., Ltd.
Paper & Pulp# Oji Paper Co., Ltd.# Nippon Paper Group, Inc.# Mitsubishi Paper Mills, Ltd.
Chemicals# Mitsui Chemicals, Inc.* Showa Denko K.K.# Sumitomo Chemical Co., Ltd.# Ube Industries, Ltd.# Kao Corporation# Dai-ichi Sankyo Co., Ltd.# Takeda Pharmaceutical Co., Ltd.# Sionogi & Co., Ltd.* Astellas Pharma, Inc.# Shiseido Co., Ltd.# Otsuka Pharmaceutical Co., Ltd.# Mitsubishi Chemical Holdings Corp.# Daicel Chemical Industries, Ltd.# Sekisui Chemical Co., Ltd.# Asahi Kagaku Kogyo Co., Ltd.
Oil & Coal Products# Cosmo Oil Co., Ltd.# Nippon Oil Corporation# Showa Shell Sekiyu K.K.* Tonen General Sekiyu K.K.
Rubber Goods# Bridgestone Corp.
Glass & Chemicals# Asahi Glass Co., Ltd.# Nippon Sheet Glass Co., Ltd.
Iron & Steel# Nippon Steel Corporation# JFE Holdings# Sumitomo Metal Industries, Ltd.# Kobe Steel, Ltd.
Non-ferrous Metals# Mitsubishi Materials Corporation
Machinery# Komatsu, Ltd.# Sumitomo Heavy Industries, Ltd.# Kubota Corp.# Tsubakimoto Chain Co.# Ebara Corp.* Shibuya Kogyo Co., Ltd.# Brother Industries, Ltd.
Electric Appliances# Hitachi, Ltd.# Toshiba Corporation# Mitsubishi Electric Corporation# Fuji Electric Holdings Co., Ltd.# Fujitsu, Ltd.# Panasonic Corporation# Sharp Corporation# Sony Corporation# Sanyo Electric Co., Ltd.# Pioneer Corporation# Victor Co. of Japan, Ltd.# NEC Corporation* Ikegami Tsushinki Co., Ltd.# IBM Japan, Ltd.* TDK Corp.
Transport Equipment# Denso Corporation# Mitsui Engineering &
Shipbuilding Co., Ltd.# Hitachi Zosen Corporation# Mitsubishi Heavy Industries, Ltd.# Kawasaki Heavy Industries, Ltd.# IHI Corporation# Nissan Motor Co., Ltd.# Toyota Motor Corp.# Mazda Motor Corp.# Yamaha Motor Co., Ltd.# Honda Motor Co., Ltd.# Isuzu Motors, Ltd.
Precision Machinery# Canon, Inc.# Konica Minolta Holdings, Inc.# Nikon Corp.# Citizen Holdings Co., Ltd.* Seiko Holdings Corp.# Ricoh Co., Ltd.
Miscellaneous Mfg.# Yamaha Corp.# Dai Nippon Printing Co., Ltd.# Toppan Printing Co., Ltd.* ASICS Corp.# YKK Corp.
Commerce# Mitsui & Co., Ltd.# Itochu Corporation
# Marubeni Corporation# Toyota Tsusho Corporation# Sumitomo Corporation# Mitsubishi Corporation# Sojitz Corporation# Isetan Mitsukoshi Holdings# J. Front Retailing Co., Ltd.# The Daiei, Inc.# AEON Co., Ltd.# Skylark Co., Ltd.# Takashimaya Co., Ltd.# Tokyu Department Store Co., Ltd.
Long-Term Credit Banks, City Banks# The Shinsei Bank, Ltd.# Mizuho Financial Group, Inc.# Mitsubishi UFJ Financial Group, Inc.# The Sumitomo Mitsui Banking Corporation# Resona Holdings, Inc.
Securities, Non-life Insurance# Daiwa Securities Group, Inc.# Nikko Cordial Corporation# Nomura Holdings, Inc.# Mitsui Sumitamo Insurance
Group Holdings, Inc.# Tokio Marine Holdings, Inc.* Nippon Koa Insurance Co., Ltd.# The SMBC Friend Securities Co., Ltd.
Transportation# Nippon Yusen K.K.# Japan Airlines Co., Ltd.# All Nippon Airways Co., Ltd.# Tobu Railway Co., Ltd.# Tokyu Corp.# East Japan Railways Co.# Odakyu Electric Railway Co., Ltd.* Nippon Konpo Unyu Soko Co., Ltd.# Seibu Railway Co., Ltd.
Communications# Nikkei, Inc.# The Asahi Shimbun Co.# Dentsu Incorporated# Hakuhodo Incorporated# The Yomiuri Shimbun Holdings# The Mainichi Newspapers Co., Ltd.# Nippon Telegraph & Telephone Corp.
Electricity & Gas# The Tokyo Electric Power Co., Inc.# The Kansai Electric Power Co., Inc.# Chubu Electric Power Co., Inc.
Life Insurance# The Dai-ichi Mutual Life Insurance Co.# Nippon Life Insurance Co.* Asahi Mutual Life Insurance Co.
��
��
��
��
�
�
�
��
�
�
# Corporate agent and payroll group* Payroll group
Not listed on Tokyo Stock Exchange
�
Legend
��
�
�

I would like to share information with you regardingAflac Japan’s efforts to provide the best customer service,while at the same time maintaining low-cost operationsfrom an administrative perspective.
Let me start with Aflac Japan’s low-cost operations byshowing you a couple of statistical comparisons betweenAflac Japan and our competitors.
Maintenance Expenses Per Policy in Force(FSA Basis, 3/08)
As you can see, our maintenance expenses per policy inforce are considerably lower than those of any of ourcompetitors. These costs refer to general administrativecosts, excluding renewal commissions paid to salesagencies.
It is worth noting that Aflac Japan continues to rank asthe number one life insurance company in Japan in termsof the number of individual policies in force. Furthermore,the number of policies in force used to calculate AflacJapan’s operating cost per policy does not include thenumber of riders, which makes the figure of ¥5,234 forAflac Japan even more remarkable.
Number of PoliciesPer Administrative Employee
(FSA Basis, 3/08)
This chart shows the number of policies in force peradministrative employee. As you can see, Aflac Japan also
achieves eff ic ient operat ions through employeeproductivity. This measure shows that our employeesadminister about five times the number of policies in force,compared with various large domestic life insurancecompanies. This difference in productivity helps explainhow we maintain a low-cost-operation advantage.
Efficiency Improvement Measuresby Leveraging IT
One key to efficient business operations is reducingcosts without negatively affecting quality. In order toachieve this goal, Aflac Japan and Aflac U.S. have beensharing best practices for many years and implementingspecific initiatives by leveraging IT solutions. Let me giveyou an idea of how some of our actions are benefitingAflac Japan’s operations.
AANET is a system Aflac developed and launched in2000 that provides information and services to Aflac salesassociates via the Internet. AANET generates premiumquotes, verif ies the policyholders’ policy status anddownloads policy maintenance related documents, alongwith many other services. By enabling us to extract andsort customer data by various categories such as product,age, address, or group attributes, AANET is also used as asales support tool for activities like suggesting suitableadditional policies or riders.
In March 2008 we enhanced AANET to allow thestatement of premiums remitted from an associate to besent electronically to Aflac via AANET instead of on paper.As a result, associates no longer need to stock forms intheir offices. This function also eliminates human error frommanually calculating the amount of the statement.
In addition, associates can now also use AANET to printforms and give them to a policyholder who would prefer topay directly into Aflac’s bank account. This function ismuch more convenient for the policyholders because theycan now pay premiums at places such as Seven-Elevenstores, whereas before, they could only make payments atbanks.
Since 2001, we have been using “eco,” a tool designedto download application forms from AANET. This is aflexible and convenient tool that can be used even for non-face-to-face applications. By the end of March 2009,9,534 associates were using eco, and it accounted for31.2% of the applications that are eligible for the ecosystem in the first quarter of this year.
51
**EExxcclluuddiinngg rreenneewwaall ccoommmmiissssiioonnssSSoouurrccee:: DDiisscclloossuurree ssttaatteemmeenntt ffrroomm eeaacchh ccoommppaannyy
CCoossttPPeerr PPoolliiccyy
GGeenneerraall OOppeerraattiinnggEExxppeennsseess
((IInn MMiilllliioonnss))RRaannkk bbyyAAsssseettss
PPoolliicciieessiinn FFoorrccee
((IInn TThhoouussaannddss))
11 NNiippppoonn ¥¥225588,,660099 1122,,445588 ¥¥2200,,77558822 DDaaii--iicchhii 220011,,888833 1111,,222211 1177,,99991133 MMeeiijjii YYaassuuddaa 117700,,774400 88,,999944 1188,,99883344 SSuummiittoommoo 117722,,559900 88,,666666 1199,,99115566 AAlliiccoo 6633,,991188 55,,661166 1111,,33881177 TTaaiiyyoo 5522,,990000 22,,997700 1177,,881111
1111 AAffllaacc** 9988,,446666 1188,,881122 55,,2233441155 SSoonnyy 3355,,003399 44,,339922 77,,9977771199 TTookkiioo AAnnsshhiinn 3377,,773366 22,,118899 1177,,223388
• AAAANNEETT
• eeccoo
• ee--AApppp
• AAffllaacc NNeett BBiilllliinngg
AAddmmiinniissttrraattiivveeEEmmppllooyyeeeess
RRaannkk bbyyAAsssseettss
PPoolliicciieess ppeerrEEmmppllooyyeeee
PPoolliicciieessiinn FFoorrccee
((IInn TThhoouussaannddss))
SSoouurrccee:: DDiisscclloossuurree ssttaatteemmeenntt ffrroomm eeaacchh ccoommppaannyy
11 NNiippppoonn 1111,,770000 1122,,445588 11,,00664422 DDaaii--iicchhii 1100,,332222 1111,,222211 11,,00887733 MMeeiijjii YYaassuuddaa 88,,660033 88,,999944 11,,00445544 SSuummiittoommoo 88,,770066 88,,666666 99995566 AAlliiccoo 33,,774411 55,,661166 11,,55001177 TTaaiiyyoo 22,,992277 22,,997700 11,,001144
1111 AAffllaacc 33,,553333 1188,,881122 55,,3322441155 SSoonnyy 11,,112244 44,,339922 33,,9900771199 TTookkiioo AAnnsshhiinn 11,,444411 22,,118899 11,,551199
Aflac Japan AdministrationHiroshi Yamauchi
First Senior Vice President; Chief Administrative Officer, Aflac Japan

It is easier for customers to fill out the application formusing eco because only limited sections, such as thedeclaration form, along with a few other sections need tobe completed and signed. For associates, eco alleviatesthe burden of mainta in ing an inventory of forms.Furthermore, data entered upon application is stored inAflac’s servers and can be accessed at a later point, whichleads to efficient processing of subsequent applicationsafter receiving the first application from the customer.
The next initiative I would like to touch upon is e-App®, asystem that faci l i tates the electronic submission ofapplications instead of using traditional paper-basedforms. This system, which is modeled after Aflac U.S.’sSmartApp®, was launched in 2003 as a pilot programfollowed by a full-scale promotion to all sales agencies. Atthe end of March 2009, 4,746 agencies were using e-App,and 34.1% of the applications that are eligible for the e-App software were submitted through this electronicsystem in the first quarter of 2009. Last year, we made iteven more convenient by adding a function that allows ourassociates to accommodate applications of multi-productsat one time.
The fourth initiative I will highlight is the Aflac Net Billingsystem. This system was developed to replace themonthly paper bills we send to our payroll accounts. At theend of the first quarter, more than 15,400 payroll accountshad adopted the Net Bil l ing system, compared with14,500 a year ago. In addition, starting January this year, anew function has been added to this system. Using thisfunction, an administrator at a payroll account can enterdata into the Net Billing system related to upcomingret i rement of certa in employees, thus al lowing forapplication forms for continuing a policy even afterret i rement to be sent out automat ical ly to thoseemployees.
Aflac’s Inbound Call Centers
Next, let me discuss Aflac’s Call Centers, which play anextremely important role in serving our customers andagencies.
We have three centers for inbound calls. One is theAflac Call Center, which receives inquiries from existingand prospect ive pol icyholders. The second is theAssociates Support Center, which takes calls from ourassociates. And the third is the Alliance Support Center,which takes calls from our large sales channels such asbanks, the Japan Post Network Co., Ltd. and Dai-ichi Life.
Aflac Call Center operators can now respond morequickly and accurately to customers’ inquiries as well assuggest sending brochures to customers for new policies.Through AANET, the Aflac Call Center also provides ourassociates with information about any inquiries made bytheir customers who had directly called into the Aflac CallCenter. That way, they can follow up with those inquiriesproperly, which in some cases leads to new sales.
We believe offering high-quality service through the callcenter is a very important element in building strongrelat ionships with al l stake holders, including ourcustomers, sales associates and banks.
Surrender and Lapse Rates(Individual Insurance Only, FSA Policy Basis)
We are continually working to preserve our in-forcebusiness. This graph shows our surrender and lapse ratesfor individual insurance policies. Although Aflac Japan’ssurrender and lapse rates have for many years been muchbetter when compared with the industry average, theygradually increased from 1998 through 2002. We startedseeing improvement in 2003, and the rate of 4.1% in both2007 and 2006 was the lowest since 2000.
Ratio of Not-Taken Policies(Percentage of All New Applications)
We are making a concerted effort to reduce not-takenpolicies, which is a policy that we are unable to issue forvarious reasons. In order for our sales agencies to get abetter sense of what financial impact not-taken policiescould have on their business, we have been providingthem with materials on estimated profit losses on not-
52
AAffllaacc CCaallll CCeenntteerr((IInnqquuiirriieess ffrroomm eexxiissttiinngg ppoolliiccyyhhoollddeerrss))((IInnqquuiirriieess ffrroomm pprroossppeeccttiivvee ccuussttoommeerrss))
AAssssoocciiaatteess SSuuppppoorrtt CCeenntteerr((IInnqquuiirriieess ffrroomm ssaalleess aaggeenncciieess))
AAlllliiaannccee SSuuppppoorrtt CCeenntteerr((IInnqquuiirriieess ffrroomm bbaannkkss,, JJaappaann PPoosstt aanndd DDaaii--iicchhii LLiiffee))
SSoouurrccee:: JJaappaann IInnssttiittuuttee ooff LLiiffee IInnssuurraannccee
00
11
22
33
44
55
66
77
88
99
1100%%
11999988 11999999 22000000 22000011 22000022 22000033 22000044 22000055 22000066 22000077
LLiiffee iinnssuurraanncceeiinndduussttrryy
AAffllaacc
77..5577..99 88..11
99..11
88..22 88..11
33..77 33..88 44..11 44..4455..00 44..99
66..99
44..44 44..44
66..6666..22
44..1144..11
55..99
00
22
44
66
88
1100%%
22000000 22000011 22000022 22000033 22000044 22000055 22000066 22000077 22000088
77..22
88..22
99..22
88..0077..66 77..66 77..88 77..77
66..99
SSoouurrccee:: IInntteerrnnaall ddaattaa

53
taken policies. Sharing this information with agencies hasproven to be very beneficial to their efforts at reducing not-taken pol ic ies because agencies understand theimportance of reducing this number even from theirperspective. The not-taken rate had been increasing until2002. However, since focusing on this measure, we havehad a fairly stable rate from 2003 through 2007. In 2008,the rate improved by .8% due to the introduction of the“bridge” cancer policy that allows existing policyholders toupgrade their coverage to match that of Cancer Forte.Because this br idge pol icy targets our exist ingpolicyholders, fewer customers tend to be declined formedical conditions. And for the same reason, it is mucheasier for Aflac Japan to collect first-time premiums fromthose customers. All these led to a lower ratio of not-takenpolicies.
Key Points to Improving Persistency Rates
We believe the key to improving persistency rates is toenable our sales agencies, who tend to have more directcontact with customers than our headquarters, to takeappropriate follow-up actions. In order to encourageagencies to take such actions, we have been emphasizingthe importance of improving persistency. We do this byproviding agencies with information such as not-takenpolicy rates, surrender and lapse rates, and successfulinitiatives of other agencies. By doing so, we can create anenvironment where agencies can easily follow up with theircustomers and improve persistency. Ultimately, theagencies benef i t because persistency generates acontinuation of commission payments.
Claims Payments(Yen in Billions)
This chart shows the actual claims payments in yenbetween 1998 and 2008. As you can see, the actualpayment amount has been growing steadily. In 2008, wepaid about ¥305 billion on 260,000 cancer claims. Thetotal amount of yen paid on medical policies in 2008 wasabout ¥79 bi l l ion by comparison, but we made
approximately 430,000 payments, which was greater thanthe number of cancer insurance payments.
We receive a lot of feedback and appreciation from ourcustomers who have received benefits from us. Here aresome of those words.
• I always take out a medical policy with someconcerns about if I really would be paid later on.But I was surprised by how quickly Aflac Japanmade the payments. Thank you.
• I felt relieved by the kind response from yourcompany, and I was satisfied with everything youdid for me, from the reception of my claim filingand the handling of claim forms to the promptbenefit payments.
• You didn’t treat me in a matter-of-fact way, and Iwas pleased to receive very thoughtful words fromyou. I actually thought I might need to fight for thepayments. But it turned out that you paid soquickly. Thank you very much.
The most important service an insurance company canprovide is to pay benefits promptly when policyholdersneed them the most. And we remain dedicated toproviding quick and accurate claims payments. To ensureour payments are made even more accurately, we carriedout an important initiative last year to consolidate ouroperations of receiving claim filings by phone and claimdata entry work. We now bring these operations to twolocations in Tokyo and Osaka, as opposed to sevenlocations across the nation before, in an effort to narrow oreliminate discrepancies in levels of accuracy betweenthose locations. As such, we strive to make fundamentalchanges to our organization and pursue even moreaccurate payments.
Last ly, I would l ike to explain the companywidebusiness operations improvement efforts we have beenpromoting since 1983. Dozens of intra- and inter-departmental teams are set up every year, to work onvarious business operation improvement init iat ives.Currently, the effort is called “Change and Create” and allparticipating teams compete against each other for award.These types of activities foster innovative thinking andnurture a culture that continually considers improvingefficiency as an important objective. The improvementactivities are also conducted at an individual level. We havea companywide database for register ing one’simprovements, or “kaizen,” that all employees can access.One improvement builds on another by obtaining hintsfrom ideas in the database.
We continue to believe a low-cost operation is one ofAflac Japan’s greatest competitive strengths. Our low-costoperation is a source of pride for our employees at AflacJapan, and they are all dedicated to pursuing ways toimprove our business operation and better serve ourcustomers. Aflac Japan will continually make effortstowards maintaining its low-cost operations while alsoenhancing services to customers.
• SSaalleess aaggeenncciieess ttaakkee ffoollllooww--uupp aaccttiioonn
• CCoommmmuunniiccaattee tthhee iimmppoorrttaannccee ooff iimmpprroovviinngg
ppeerrssiisstteennccyy rraatteess ttoo ssaalleess aaggeenncciieess
00
110000
220000
330000
¥¥440000
11999988 11999999 22000000 22000011 22000022 22000033 22000044 22000055 22000066 22000077 22000088
CCaanncceerr MMeeddiiccaall//RRiiddeerr MMAAXX
SSoouurrccee:: IInntteerrnnaall ddaattaa

My presentation will provide you with an overall look atour business operation in the United States. Amid thecurrent economic environment, I’ll first take just a fewmoments to address how that environment relates toAflac.
State of the Economy
Over the last century, the United States, along with theworld, has certainly experienced quite an imposing list ofeconomic downturns. The second half of 2008 ushered inan era that will likely claim its place in history toward thetop of that list. In one way or another, virtually everybusiness sector was touched. First, the housing bubbleburst with a vengeance. At the same time, it has beenshocking and difficult for consumers to watch companiesonce thought of as impervious succumb to the reality offailure. The stock market turmoil that ensued tested theresolve of even the most seasoned investors, adding yetanother layer of unease, distrust, and financial hardship tothe mix.
National Top Priorities
This backdrop has left the American public skeptical,wary, and financially vulnerable as they make difficult
choices and look for new solutions. Two of the greatestpublic concerns these days are the state of the economyand the broad topic of health care. In fact, in February2009, the Kaiser Family Foundation’s health care trackingpoll indicated that the economy dominates the public’spriorities for the president and Congress, followed byconcerns about Medicare and Social Security. Thirty-ninepercent of consumers felt that health care was also a toppriority. That same survey indicated that as economiccondit ions decline, public concern escalates aboutaffordability and availability of health care. These concernsdon’t even address out-of-pocket expenses or fixedhousehold costs such as mortgage payments, food,gasoline, and other bills that must be paid in sickness andin health. Fortunately, Aflac is uniquely positioned toaddress these concerns. We are try ing to bettersynchronize al l aspects of our business to reachconsumers who need our affordable products.
Research that supports the need for our products iseverywhere. With health care and general household costson the r ise, we bel ieve that now more than ever,consumers can benefit from the financial protection Aflacproducts can provide.
Health Care Cost Trends
A February 2009 report issued by Watson WyattWorldwide noted the following: “With the recession in fullswing and health care costs continuing to rise at 6% peryear, many companies are looking for ways to contain theirhealth care benefit costs. As a result, a majority ofcompanies will revamp their health care strategies, andmany intend to implement consumer directed health plans.While companies remain positive about their ability to offerhealth care benefits in the future, their confidence isdeclining.” In fact, 34% of employers have already takenaction to increase employee cost sharing. Additionally,
54
• HHoouussiinngg bbuubbbbllee bbuurrsstt
• CCoommppaannyy ffaaiilluurreess
• SSttoocckk mmaarrkkeett ttuurrmmooiill
Introduction to Aflac U.S.Paul S. Amos II
President, Aflac; Chief Operating Officer, Aflac U.S.
Section IIIAflac U.S.
SSoouurrccee:: KKaaiisseerr FFaammiillyy FFoouunnddaattiioonn HHeeaalltthh CCaarree TTrraacckkiinngg PPoollll;; 22//0099
00%% 2200%% 4400%% 6600%% 8800%%
EEccoonnoommyy
MMeeddiiccaarree aannddSSoocciiaall SSeeccuurriittyy
TTeerrrroorriissmm
HHeeaalltthh CCaarree 3399%%
4422%%
4499%%
7711%%
PPeerrcceennttaaggee SSaayyiinngg EEaacchh SShhoouulldd bbee aa TToopp PPrriioorriittyy
• HHeeaalltthh ccaarree ccoossttss rriissiinngg 66%% ppeerr yyeeaarr
• 3344%% ooff eemmppllooyyeerrss hhaavvee iinnccrreeaasseedd eemmppllooyyeeeeccoosstt sshhaarriinngg
• 1166%% ooff eemmppllooyyeerrss hhaavvee iinnccrreeaasseedd eemmppllooyyeeeeccooppaayymmeennttss//ccooiinnssuurraannccee
• 1188%% ooff eemmppllooyyeerrss hhaavvee iinnccrreeaasseeddddeedduuccttiibblleess iinn aallll//mmoosstt ppllaannss
SSoouurrccee:: TThhee EEffffeecctt ooff tthhee EEccoonnoommiicc CCrriissiiss oonn HHeeaalltthh CCaarree PPrrooggrraammss;;WWaattssoonn WWyyaatttt WWoorrllddwwiiddee,, NNaattiioonnaall BBuussiinneessss GGrroouupp oonn HHeeaalltthh,, 22//0099

16% of employers have already taken act ion tosigni f icant ly increase employee copayments orcoinsurance and 18% of employers have already takenaction to significantly increase deductibles in all/most planoptions.
Health Care Spending Projections
According to a report published by the National HealthStatistics Group researchers at the Centers for Medicareand Medicaid Services, “Public payers are expected tobecome the largest source of funding for health care in2016 and are projected to pay for more than half of allnational health spending in 2018.” Additionally, they foundthat the United States can expect to experience a 6.2%annual climb in health care spending through 2018,compared with a 4.1% increase in the gross domesticproduct.
Health Care Cost Trends – Cancer
An example of the huge financial impact a seriousmedical event can have is exemplified by another surveyby the Kaiser Family Foundation and The American CancerSociety. It found that, “10% of Americans say they oranother family member in their household has beendiagnosed or treated for cancer in the past years.” And25% of those with cancer reported using all or most oftheir savings as a result of the financial cost of dealing withcancer.
Additionally, another Kaiser Family Foundation surveyhighlights the issues cancer patients and survivors face asthey try to find and maintain coverage which enables themto access the care they need. The report said, “Havingprivate health insurance at the time of their cancerdiagnosis did not protect patients from high out-of-pocketcosts – leaving them with large debts to cover theirtreatment costs and forcing some to skip or delaynecessary treatments.”
Decreased ConfidenceAmong Small Businesses
According to economists, small business optimism hasbeen trending downward since the third quarter of 2007.By December 2008, small business optimism had fallen to85.2, and by March 2009, it had dropped to 81.0, thelowest level ever reported in its more than two-decadehistory. We expect this lack of confidence in the currenteconomic environment to drive employers, especially atsmall businesses, to look for solutions that help offset theever-escalating cost of providing employee benefits.Because Aflac provides benefit solutions companies canoffer to their employees at little or no cost, we believe thatdemand for our products will also continue to increaseamong U.S. businesses.
The pessimism found at employers is also shared byconsumers, as consumer confidence reached a two-decade low of 29.4 in January 2009. Clearly, this downturnhas forced consumers to make difficult choices about howto allocate their hard-earned money. In times like these,there is a natural inclination to categorize “wants” and“needs” when consumers al locate their money. Weabsolutely believe our products fall in the “needs” categorynow more than ever, particularly keeping the affordability ofour products in mind. For example, one of our accidentpol ic ies costs about $16.00 per month. Whenpolicyholders encounter medical and financial hardship,the “bang for their buck” our products provide is very realand tangible. This coverage can be maintained at thesame rate even if the policyholder loses his or her job.
Health events like a car accident, diagnosis of cancer,or heart attack are just as likely to occur in challengingeconomic times as they are to occur in times of prosperity.
55
00
22,,000000
44,,000000
66,,000000
88,,000000
1100,,000000
1122,,000000
$$1144,,000000
22000077 22000088 22000099 22001100 22001111 22001122 22001133 22001144 22001155 22001166 22001177 22001188
$$77,,006622
$$1133,,110000
SSoouurrccee:: CCeenntteerr ffoorr MMeeddiiccaarree aanndd MMeeddiiccaaiidd SSeerrvviicceess,, NNaattiioonnaall HHeeaalltthh EExxppeennddiittuurreess PPrroojjeeccttiioonnss,, 22//0099
• 1100%% ddiiaaggnnoosseedd oorr ttrreeaatteedd ffoorr ccaanncceerr
• 2255%% ooff ccaanncceerr ppaattiieennttss uusseedd aallll oorr mmoosstt oofftthheeiirr ssaavviinnggss
SSoouurrccee:: NNaattiioonnaall SSuurrvveeyy ooff HHoouusseehhoollddss AAffffeecctteedd BByy CCaanncceerr;; tthheeKKaaiisseerr FFaammiillyy FFoouunnddaattiioonn aanndd tthhee AAmmeerriiccaann CCaanncceerr SSoocciieettyy;; 1111//0066
110033..77110011..11
9988..99
9911..88
SSoouurrccee:: BBlloooommbbeerrgg
8800
8844
8888
9922
9966
110000
110044
110088
22000055 22000066 22000077 22000088 33//0099
SSmmaallll BBuussiinneessss OOppttiimmiissmm IInnddeexx
8811..00

The cash benefits from Aflac products offer policyholdersgreat value, financial protection, peace of mind, and asense of control, particularly during this time. Each andevery day, we hear from consumers who tell us how cashbenefits from our products have meant the differencebetween paying their mortgage or losing their house;between maintaining their lifestyle or interrupting theircustomary activities; between paying their car note orfinding alternate transportation; and in many cases, mostchilling of all, forgoing necessary medical treatment due toits expense, as the Kaiser study showed. And now morethan ever, our products are essential to protectingconsumers’ financial well-being.
The Small Business Market(2006)
We continue to reach both consumers and businessdecision-makers with targeted messages about therelevance of our products. Jeff will be giving you moreinsight into our advertising directed at businesses andbenefits decision makers. Businesses are the gatekeepersto consumers, and marketing our products at the worksiteis our focus because that’s where most Americans buytheir insurance. According to the most recent data fromthe Small Business Administration, there are approximatelysix million businesses in the United States with fewer than500 workers. Based on U.S. Census data, our 431,985payroll accounts at the end of the first quarter onlyrepresent about 7.2% of the small-business market,making the U.S. a very sizeable and attractive market.
Competitive Environment
Over the last five-plus decades, we have competed withvarious companies, both large and small. Some of thesecompanies stood the test of t ime, and some havewithdrawn from the supplemental/voluntary market. Butthe fact that others show strong interest in this market only
serves to bolster our assertion that there is a strong needfor the type of products we sell and a bright future forworksite, or payroll, marketing. But I do want to point outone major difference between Aflac and all the rest of thecompeting companies: For Aflac, voluntary insurance soldat the worksite represents virtually al l of our focus,whereas our competitors tend to offer voluntary productsas a peripheral line of business. Streamlining this focustoward one insurance category has given us an edge thathas contributed to our market-leading position. Accordingto the 2007 U.S. Worksite Sales Report from Eastbridge,Aflac is the market leader with 31% of the market share.All of our competitors have market share in the singledigits.
Aflac’s Competitive Strengths – Products
Within the supplemental insurance market, we believewe have established several competitive advantages overthe last five decades that have fortified our market-leadingstatus. One such advantage is our product portfolio. Overthe years, our portfolio has also evolved to include a widerange of supplemental products with benefits designed tobe easy to understand and easy to file a claim upon. Weare committed to meet ing the changing needs ofconsumers in a changing environment. Jeff will cover ourcurrent product portfolio and provide some texture aboutareas we are considering. I believe our portfolio couldn’tbe more relevant to today’s market, and I’m excited aboutthe chance to make a difference in people’s lives withproducts they really need.
Aflac’s Competitive Strengths –Advertising and Brand Awareness
It’s hard for any company to reach consumers throughal l of the clutter in the marketplace. The currentenvironment makes it even harder. But we are makinglemonade out of lemons. Most companies have pulledback their advert is ing due to the weak economicenvironment. By contrast, we’ve taken advantage of theopportunity to pick up media buys at a fraction of theiroriginal cost. In this regard, we believe we have put ourdollars to the best, most efficient use.
56
• AAeeggoonn• AAIIGG• AAllllssttaattee• AAmmeerriiccaann FFiiddeelliittyy• AAoonn• AAssssuurraanntt• CCoolloonniiaall• CCoonnsseeccoo• MMeettLLiiffee• UUnnuumm GGrroouupp• CCeerrttaaiinn RReeggiioonnaall CCaarrrriieerrss
NNuummbbeerr ooffFFiirrmmss((000000))
NNuummbbeerr ooffEEmmppllooyyeeeess((MMiilllliioonnss))
%% ooff TToottaallEEmmppllooyyeeeess
00 -- 1199 WWoorrkkeerrss 55,,337788 2211..66 1188..00%%
2200 -- 9999 WWoorrkkeerrss 553366 2211..11 1177..66
110000 -- 449999 WWoorrkkeerrss 9911 1177..55 1144..66
TToottaall 66,,000044 6600..22 5500..22%%
SSiizzee ooffFFiirrmm
SSoouurrccee:: UU..SS.. CCeennssuuss BBuurreeaauu TTaabbuullaattiioonnss bbyy EEnntteerrpprriissee SSiizzee,, 22000066
• PPrroodduuccttss
• PPrroodduuccttss
• AAddvveerrttiissiinngg aanndd bbrraanndd aawwaarreenneessss

Brand Awareness(Aided and Unaided)
Over the last eight years, commercials featuring theAflac Duck have catapulted our brand awareness to 93%,making Aflac into a household name and transforming theAflac Duck into a pop icon and a celebrity.
With an intangible product like ours, brand awareness isonly part of the picture. Consumers will only be moved tobuy a policy if they truly understand how the policy worksand then envision how it can add value to their lives. Jeffwil l give you the rundown on how we’re developingadvertising and sponsorships that are continuing toprompt consumers and businesses into action.
Aflac’s Competitive Strengths – Distribution
Aflac’s advertising is designed to warm the door for ourgreatest asset and major competitive strength – our salesforce. While Ron Sanders will be covering this topic ingreater detail, I will tell you that we believe that the modelwe use to bui ld our distr ibut ion is working in thischallenging environment. Our recruiting has actuallybenefited from rising unemployment, as has the number ofour payroll accounts. We also believe our training isbenefiting our growing field force and resulting in increasesin producing sales associates.
Broker Control
On the topic of distribution, I want to cover our newbroker in i t iat ive. We bel ieve we have a signi f icant
opportunity to stimulate future growth by pursuingpartnerships with insurance brokers. According to the U.S.Census Bureau, 64.4% of employees work at payrollaccounts with more than 100 employees. As the graphdemonstrates, the vast majority of these accounts usebrokers to help identify the products that best suit theirinsurance needs. We have already experienced somesuccess in the small and local broker market with 12.4% ofour overall sales attributable to broker sales in 2008. Ourefforts to build new and better relationships in the regionaland large-account broker market will undoubtedly allow usto expand our presence in a market where there’s a lot ofroom to grow. I believe brokers will not only bring us newbusiness, they will give us access to businesses wehaven’t had before.
There are approximately 129,000 brokers in the UnitedStates. The majority of these brokers are new to Aflac, andwe are creating relationships with them which we believewill bring in substantial business for many years to come.We are also leveraging and building relationships throughinsurance associations and also sponsoring many localevents across the country to connect with brokers.
Aflac for Brokers
In January 2009, we officially launched our brokerinitiative, Aflac for Brokers. Our message to brokers issimple: We want to compete for broker business andprovide value for their clients in four basic areas. First, wewill provide brokers with quality service. One importantchange we made was to create our new BrokerDevelopment Coordinator position – a single point ofcontact for brokers. Second, we will offer brokers 10value-added services, the most vis ible of which is“Wingspan,” Aflac’s new core benefits enrollment system.This is a software program that allows Aflac to interfacewith existing broker systems and can stand alone as well.Third, we will offer several streamlined and relevantproducts in 2009. And finally, we will offer three consistentbroker compensation packages without increasingexpenses related to the total commissions paid.
Aflac’s Competitive Strengths – Technology
Technology is another one of Aflac’s strengths in theUnited States. We cont inual ly adopt cutt ing edgetechnology solutions to streamline transactions for
%% UUssiinnggaa BBrrookkeerr
110011 -- 550000 8877%%
550011 -- 22000000 8844
22000011 -- 55000000 7700
EEmmppllooyyeeee SSiizzee((EEmmppllooyyeeeess))
SSoouurrccee:: 22000077 EEaassttbbrriiddggee SSttuuddyy
57
• PPrroodduuccttss
• AAddvveerrttiissiinngg aanndd bbrraanndd aawwaarreenneessss
• DDiissttrriibbuuttiioonn
• BBrrookkeerr mmeessssaaggee::
» QQuuaalliittyy sseerrvviicceess
» VVaalluuee--aaddddeedd sseerrvviicceess
» SSttrreeaammlliinneedd pprroodduuccttss
» TThhrreeee ccoommppeennssaattiioonn ppaacckkaaggeess
• LLeevveerraaggiinngg//bbuuiillddiinngg ccoonnnneeccttiioonnss wwiitthh aassssoocciiaattiioonnss
• PPrroodduuccttss
• AAddvveerrttiissiinngg aanndd bbrraanndd aawwaarreenneessss
• DDiissttrriibbuuttiioonn
• TTeecchhnnoollooggyy
00
2255
5500
7755
110000%%
11999999 22000000 22000011 22000022 220000331199998811999977
2233
4411
44884444
6677
8877
22000044
8855
22000055
8866
22000066 22000077
9900 88889933
22000088
9933

58
policyholders and sales associates. Effectively employingnew technologies allows us to improve our products,attract new sales associates, and allocate more resourcesto advertising.
Our sales associates have used our unique SmartAppsystem to sell electronically for more than 15 years.SmartApp allows our sales associates to electronicallytransmit new business from the f ie ld direct ly toheadquarters. Our newest version of SmartApp, calledSmartApp Next Generation, or SNG, further reduces thetime sales agents must spend on administrative issues,freeing their time up to focus on selling. In 2008, 91% ofour applications for coverage were electronically submittedusing SNG and other Internet-based programs. And wewere able to process more than 68% of policy applicationslast year without any human intervention.
Customer Retention
Often technology is helpfu l in streaml in ing ourinteractions with policyholders and payroll accounts, whichimproves our policy persistency and customer retention.The tangibility of our products comes into question only atspecific touch points, such as when a consumer becomesa policyholder, when a policyholder becomes a claimant,or when a customer looks to us to help solve an issue.
It is especially important for us to be responsive to ourcustomers during an economic downturn that promptsconsumers to make difficult choices about where to spendtheir money. The economy’s effect was reflected in ourfirst quarter persistency, which declined to 66.9% from71.9% in the first quarter of 2008 on an annualized basis.We cannot afford to let payroll accounts and policyholdersslip away from us, and we are taking decisive actions to bethere in the tangible way customers deserve with proactivemeasures, including our customer retention initiative. Thisinitiative focuses on what we can do after we make thesale to keep a policyholder’s business on our books. Thisinitiative was created to identify key customer and accounttouch points and intervene through proactive, reactive, andwin-back measures. We are beginning to see positiveresults.
Perhaps the most obvious touch point is when apolicyholder leaves his or her job. We found that often,they don’t realize they can keep their Aflac payroll-deducted policies through direct billing. In July of 2008, weintroduced Aflac Always, a protection plan in which thepolicyholder gives us permission during enrollment to drafttheir bank account or charge their credit card should theircompany stop forwarding their premiums to us for anyreason. From August 2008 through the end of the firstquarter of 2009, we have enrolled approximately 20,000policies in our Aflac Always program. For the first quarterof 2009, Aflac Always has allowed us to retain 700policies.
Additionally, in our service center, we are savingaccounts and policies through inbound and outbound callefforts. When accounts or policyholders call to cancel, wemake every attempt to retain their business. We also callall lapsed accounts in an effort to bring them back to Aflac.Between AflacAlways and these calls, we conserved morethan $11 million in annualized premium during the firstquarter of 2009.
For the ever-expanding number of consumers whoprefer to handle their transactions with us over the Internet,we enhanced our Pol icyholder Serv ice Center ataflac.com. The new, more user-friendly site enables ourcustomers to update personal information, find answers toquestions about their policy, learn how to expedite theclaims process, and check the status of their claims. In thefirst quarter of 2009, more than 376,000 policyholdersaccessed their information using this Web site.
Aflac is well-positioned to offer solutions consumersneed, and there are millions of people out there who wantand need our products. Despite the dynamic health careenvironment and the possibility of health care reforms, theneed for our products does not change. We know there isno “silver bullet” solution that any one plan can offer tocover all medical and non-medical expenses stemmingfrom a major health event. We believe that now more thanever, and regardless of any potential changes on thehealthcare landscape, our products are positioned to offerconsumers much-needed financial help. That said, wecontinue to monitor the issue of national health care veryclosely and continue to ensure Aflac is positioned forsuccess in this environment.
We are innovative in how we approach our productsand marketing, but we don’t view progress in our businessas a sprint – we view it as a marathon, and we aremethodical ly prepar ing to go the distance for ourpolicyholders, field force, employees, shareholders,philanthropies, and everyone whose lives we touch.
• CCrruucciiaall ttoouucchh ppooiinnttss
» AAffllaacc AAllwwaayyss
• EEnnrroolllleedd 2200,,000000 ppoolliicciieess
• RReettaaiinneedd 770000 ppoolliicciieess
» OOuuttbboouunndd ccaallllss ttoo llaappsseedd aaccccoouunnttss
• CCoonnsseerrvveedd mmoorree tthhaann $$88 mmiilllliioonniinn nneeww aannnnuuaalliizzeedd pprreemmiiuumm

I joined Aflac about six months ago. During that time,I’ve had a chance to take a good look at Aflac’s products,distribution, and creative marketing programs. It has beenincreasingly clear that today’s economic realities areforcing many consumers to make very difficult decisions,and at Aflac we are adapting our products and advertisingto ensure we remain relevant.
Aflac’s Strategy
All aspects our marketing and advertising support thetwo-part strategy we’ve focused on for more than twodecades: First, we offer a portfolio of relevant productsconsumers both want and need. Second, we take theseproducts to market through an extensive and dedicateddistribution system comprised of independent salesagents. Ron’s presentation covers more about ourdistribution, and I’ll discuss our products. I’ll also talkabout how our advertising and branding efforts supportboth products and distribution.
Aflac’s U.S. Product Line
I t doesn’t matter how creat ive, appeal ing, orstraightforward our marketing is if our products don’tprovide real solutions that fill an essential and tangibleneed. Remaining in step with those needs means wecontinually review and refine our current product portfolioto assess whether we’re on target and what adjustmentswe might need to make. This is especia l ly true inchallenging times like these when people must makedifficult choices, yet they’re the most financially vulnerable
and need the financial protection more than ever. Billscontinue to roll in even when someone is sick or injured,and Aflac products protect policyholders with cashbenefits to pay for those bills. Aflac products also givepeace of mind, which is very hard to come by in today’sworld.
We also believe our premiums are affordable and offerexcellent value to the average consumer, with averagepremiums ranging from $400 to $600 per year. At the endof April, we introduced a new lump sum critical illness planand a lump sum cancer plan that can be sold separately oras a package. We also introduced a new accident plan aswell as a new short-term disability product. Our new lump-sum products provide the simplified benefits customerswant with upfront benefits that help in these difficult times.The streamlined product structure is also very appealing tobrokers, and there are special rates and underwriting forlarge accounts with more than 500 workers.
New Sales Product Mix
While we remain focused on supplemental insurance,we have had great success in segmenting the market andappealing to consumers we haven’t reached before. Thisis exemplified by our decision to broaden our product linein the early 1990s. As you can see, we have significantlychanged the mix of our new sales. For many years, cancerinsurance dominated new sales. In 2008, it accounted forless than 19% of new annualized premium sales. Ouraccident/disability line has been our best-selling categoryfor 15 consecutive years and in 2000 became our numberone product in terms of in-force premium. Last year, theaccident/disability line represented 30% of sales and 28%of in-force premium. The introduction of our newerproducts, including our specified health event, fixed-benefitdental and vision plans have broadened our product mix.These plans, together with our hospita l indemnitycategory, which we have focused on recently, accountedfor about one-quarter of new sales in 2008.
Aflac U.S. MarketingM. Jeffrey “Jeff” Charney
Senior Vice President; Chief Marketing Officer, Aflac U.S.
AAcccciiddeenntt//ddiissaabbiilliittyy TTeerrmm lliiffee
CCaanncceerr iinnddeemmnniittyy WWhhoollee lliiffee
SShhoorrtt--tteerrmm ddiissaabbiilliittyy JJuuvveenniillee lliiffee
HHoossppiittaall iinnddeemmnniittyy
IInntteennssiivvee ccaarree
SSiicckknneessss iinnddeemmnniittyy
SSppeecciiffiieedd hheeaalltthh eevveenntt
FFiixxeedd--bbeenneeffiitt ddeennttaall
PPaayyrroollll lloonngg--tteerrmm ccaarree
VViissiioonn
SSuupppplleemmeennttaall IInnssuurraanncceePPrroodduuccttss,, IInncclluuddiinngg::
LLiiffee IInnssuurraanncceePPrroodduuccttss,, IInncclluuddiinngg::
• PPrroodduuccttss
» RReelleevvaanntt
» WWaanntteedd
» NNeeeeddeedd
• DDiissttrriibbuuttiioonn
» DDeeddiiccaatteedd
» EExxtteennssiivvee
59
11999922 11999977 22000088
AAcccc//DDiissaabb
CCaanncceerr
HHIIPP
SSTTDD
IInntt.. CCaarree
LLiiffee
MMeedd SSuupp
LL--TT CCaarree
SSppeecc.. EEvveenntt
DDeennttaall
VViissiioonn
110000%%
8800
00
6600
4400
2200

One of our newest product line enhancements was ourJanuary 2006 expansion of our life insurance portfolio, withlife policies that respond to consumers’ requests for higherface value amounts and longer terms. To support ourefforts in selling life products, we initiated internal salescampaigns and training designed to encourage our salesassociates to offer life as a complement to the productsconsumers are already purchasing. We also streamlinedthe application process for life insurance when consumerspurchase short-term disabi l i ty by only asking twoadditional questions. As a result of these initiatives, we’reseeing more consumers choosing to add life insurancewhen they purchase other Aflac products. In 2008, weincreased life insurance sales by 12.9%, and in the firstquarter of 2009, the growth rate has jumped to 16.1%.
Basics of New Product Development
The creation of new products like the life insuranceenhancements start with our agents. These salesassociates are the public face of the company – our eyesand ears. They deal with payroll accounts and consumerson a daily basis, and they know firsthand the kinds ofproducts and benefits that consumers want and need. Toleverage this valuable knowledge, we assemble a FieldForce Advisory Group for each product developmentundertaking. These advisory groups are made up of abroad range of the sales force from various levels anddifferent geographic areas.
We supplement the Advisory Group’s insight with datagathered by surveying a wider field audience, as welldecision makers at payroll accounts and consumers. TheMarket ing, Actuar ia l , Compl iance, New Business,Underwrit ing, Claims and IT Departments are alsoinstrumental in ensuring we follow the guiding principles
that help us remain focused on creating relevant products.For example, the fact that many small employers can’tafford to offer company-paid benefits is one reason ourvoluntary products are so popular. All of our products aredesigned to be “simplified issue,” which means that if thelimited underwriting questions in the application areanswered favorably, the agent can commit to issuing thepolicy to the applicant. When an applicant’s answersreveal a health condit ion, we require addit ionalunderwriting to proceed with any coverage. Because wesell individually issued policies at the worksite, we often areonly able to spend 10 or 15 minutes with an applicant, sowe are not in a position to explain complicated products.We try to make our products simple with a fixed-benefitdesign. It’s important to offer products that are easy toexplain, easy to understand at the point of sale, and easyto file a claim upon.
Aflac Wingspan
With economic concerns at the forefront of consumers’and business decision-makers’ minds, we took a goodlook at how Aflac’s image is holding up in today’senvironment and found ways we could help invigoratesales. To leverage these opportunities, we kicked off anew market ing in i t iat ive in Apr i l 2009 cal led Af lacWingspan. Aflac Wingspan is a proactive, multi-facetedand comprehensive set of marketing initiatives designed toexpand our reach to consumers, extend the Aflac brand,energize our agents, and ultimately, stimulate sales.
Aflac Wingspan Goals
This initiative has five goals: The first goal is to increasethe relevancy of our brand in this new economic reality.Second, we want to define who we are and how ourproducts can help people. Third, we will continue toexpand our brand with sponsorships that tie in to whereour customers are. Fourth, we want to use our brand to
60
• IInnppuutt ffrroomm tthhee AAffllaacc FFiieelldd FFoorrccee,, MMaarrkkeettiinngg,, AAccttuuaarriiaall,,CCoommpplliiaannccee,, NNeeww BBuussiinneessss,, UUnnddeerrwwrriittiinngg,, CCllaaiimmss aanndd IITT
• GGeenneerraall pprroodduucctt ppaarraammeetteerrss
» NNoo eemmppllooyyeerr ccoonnttrriibbuuttiioonn
» SSiimmpplliiffiieedd iissssuuee
» SSiimmppllee,, iinnddeemmnniittyy pprroodduucctt ddeessiiggnn
• IInnccrreeaassee bbrraanndd rreelleevvaannccyy
• DDeeffiinnee wwhhoo wwee aarree aanndd hhooww oouurr pprroodduuccttss hheellpp
• EExxppaanndd oouurr bbrraanndd tthhrroouugghh ssppoonnssoorrsshhiippss
• UUssee oouurr bbrraanndd ttoo iinnssppiirree ppeeooppllee
• SSttiimmuullaattee ssaalleess

inspire people, including our customers and our own salesforce and employees. Finally, these first four goals aredesigned to ultimately stimulate our sales.
Through Aflac Wingspan, the changes to our productportfolio are opening new markets and opportunities forAflac and for the people who need our protection. Welooked for ways to offer those who need protection andpeace of mind by welcoming more people under our wing.
Aflac Wingspan
Aflac products will be offered to a segment of additionalconsumers that were not previously eligible. Our existingshort-term disability product was previously offered topayroll accounts with a minimum of five employees. Now,we have lowered the minimum to payroll accounts withthree applications submitted.
Additionally, our new short-term disability product isalso now available to union members. And in response tothe challenging economy that has prompted a reduction inworking hours, we have created a new short-term disabilityproduct that lowers the full-time hourly requirement foremployees to 19 hours per week from 30 hours. Further,th is new short-term disabi l i ty pol icy offers a new“transitional benefit” for a policyholder who loses his or herjob or works less than 19 hours at a full-time job andbecomes disabled.
Brand
With a foundation of relevant products and a dedicatedsales force to bring them to those who need them themost, our brand message is critical. My job at Aflac is torefresh an already-successful marketing program – to takewhat I’ve learned and use it to supplement the strongfoundation that’s already in place. To refresh, not reinvent.To be evolutionary, not revolutionary.
In these challenging economic times, many companieshave cut back on marketing. At Aflac, however, we aretaking these challenging times and turning them into anopportunity. We’re leveraging the newly emerging non-traditional cost-effective mediums to increase awarenessof our brand.
Successful Branding
We’re creating a feeling and an understanding of ourbrand. When those two elements are combined, I believeour sales can be posit ively impacted. Obviously, i fsomeone doesn’t like a brand, they’re not going to takethe time to learn more about that brand and they’recertainly not going to buy products associated with thatbrand. What does it mean to have a feeling for a brand?Think about your favorite products and why you want toown them. We are using our marketing to create a brandthat consumers connect with on an emotional level as wellas one that fosters an understanding of exactly how ourproducts can help. This will open more doors for our salesassociates. After creating a feeling with our brand, our nextgoal is to create understanding. Understanding takesbrand awareness, or the simple recognition of the Aflacname, and extends it to the definition of what the companydoes. I believe that successfully inspiring feeling andcreating understanding will ultimately lead to more sales.
People who are aware of Af lac – and, as Paulmentioned, that’s a mind-boggling 93% of individuals – willsay: “Aflac is the company with the duck.” But those whoreally understand Aflac will say: “That’s the company withthe duck, and that’s the company that pays you cash ifyou’re too sick or hurt to work.” It is critical for people tounderstand what we do.
It’s a Duck’s World, We Just Live in It
Aflac is an iconic brand – one that speaks to people ofall ages and all demographics. That brand – that feeling –can be summed up in three words: the Aflac Duck. I’msure many of you wonder if the Aflac Duck has lost hisluster. We’ve done a lot of research on the duck, andwhen all is said and done, we couldn’t have a better icon.The duck will celebrate his 10th birthday at the end of2009. I’m here to tell you his appeal is as strong as ever.Since the Aflac Duck was introduced in 2000, virtually all ofour commercials have been tested with consumers todetermine their likeability. When consumers are askedabout what they like most about our commercials, theAflac Duck has consistently ranked as the number onething! I believe it will become even stronger as we positionour marketing pieces to be more relevant in today’seconomic climate.
61
• RReeffrreesshhiinngg,, nnoott rreeiinnvveennttiinngg
• LLeevveerraaggiinngg nneewwllyy eemmeerrggiinngg ccoosstt--eeffffeeccttiivvee mmeeddiiuummss
FFeeeelliinngg UUnnddeerrssttaannddiinngg SSaalleess
• BBrraanndd mmuusstt bbee lliikkeedd bbyy ccoonnssuummeerrss
• CCoonnssuummeerrss mmuusstt uunnddeerrssttaanndd wwhhaatt ccoommppaannyy ddooeess
• SSaalleess wwiillll ffoollllooww
• SShhoorrtt--tteerrmm DDiissaabbiilliittyy nnooww aavvaaiillaabbllee ttoo::
» BBuussiinneesssseess wwiitthh tthhrreeee eemmppllooyyeeeess((ddoowwnn ffrroomm ffiivvee))
» UUnniioonnss
» EEmmppllooyyeeeess wwhhoo wwoorrkk aatt lleeaasstt 1199 hhoouurrssppeerr wweeeekk

62
Let me break down how we approached the challengeof maintaining freshness and creating relevancy in achanging economic marketplace that is also causingpeople to struggle.
Aflac’s New Tagline
We looked at the tagline we’ve been using for morethan seven years: “Ask About it At Work.” We found it hadrun its course – it wasn’t hitting the emotional chord weneeded to hit and was no longer relevant or timely.
We tested a lot of potential new taglines on payrollaccount decision-makers and consumers, and the clearwinner that emerged from both groups was six simplewords: “We’ve Got You Under Our Wing.” It is ownable,current, emotive and has the potential to be timeless.
Now More than Ever Video
Our “We’ve Got You Under Our Wing” tag also ties in toour “Aflac Wingspan” campaign. As part of this campaign,we created a video for our employees and field force thatshows how “Now More than Ever” we are spreading theirwings to protect our policyholders when they need it most.
We wanted to build on this new tagline and looked forways to inject a feeling that resonates with consumers intoan already-strong portfol io of powerful, memorablecommercials. We had recently released a series of high-performing national spots. A couple of these are targetedto businesses and business decision-makers, and twoothers speak to the NASCAR nation. We complementedthose spots with two new commercials. Only this time, inaddition to the Aflac Duck’s traditional humor, we added atimely message about the financial security our productshelp provide. Most importantly, all are designed to buildrelevancy.
The first, called “Soccer,” is real, conversational andrelatable. I t ’s not showy or f lashy; i t ’s a real ist icconversation between two moms that will play well in ano-nonsense advertising market.
The next is “Farm.” The concept is simple, but thecutting edge, computer-generated animation takes it to anew level. And, while “Soccer” is true-to-life, “Farm” is fun,disruptive, conversational and highly memorable.
PPrriioorr TTaagglliinnee
NNeeww TTaagglliinnee

63
Get the Aflacts
In addition to the “We’ve Got You Under Our Wing”tagline, we’re adding a clever, fresh and memorablecampaign that will be used in our advertising efforts both inprint and on the Internet. The campaign is called “Get theAflacts.” “Aflacts” are print and online factoids or simpletruths about the company presented in an entertaining andsometimes interactive format. Each communication piececaptures the consumer’s attention and educates themabout our products in a fun way.
Aflac is also using new media to spread our messageand create greater awareness of what we do: The AflacDuck has recently launched a Facebook page to directlycommunicate with a large and growing fan base. ThroughFacebook, we’re harnessing the growing power of socialnetworking to spread our message. Plus, we’re taking thatpower to the next level: The Aflac Duck’s Facebook pageis the first to allow back-and-forth conversation betweenconsumers and a company icon. Duck fans leavecomments and the duck responds, creating a pop cultureexperience that is interactive, fun and contemporary. Weestablished the Aflac Duck’s Facebook page on April 21,2009. As of May 7, the Aflac Duck has amassed morethan 85,000 Facebook fans. In fact, the Aflac DuckFacebook page has been the number one fastest-growingpage with less than one million fans for two weeks in arow.
Business-to-Business
Last year, Aflac introduced a new component to itsmarketing strategy: business-to-business advertising. Itwas – and is – our goal to speak directly to benefitsdecision makers through television, print, radio and onlineads; and to support our agents with collateral material, toolkits and an information center.
Aflac for Business focuses on five key reasons businessowners should offer Aflac insurance to their employees:
Business-to-Business
First, there is no direct cost to employers if they elect tooffer Aflac products. The premiums are paid by thepolicyholder, not the employer. Second, we strive to keepthings simple for employers by handling the details ofenrol lment and also by offering streamlined invoicetechnology. Third and fourth, we illustrate to employers
• NNoo ddiirreecctt ccoosstt ttoo eemmppllooyyeerrss
• EEaassee ooff aaddmmiinniissttrraattiioonn
• HHeellppss aattttrraacctt aanndd rreettaaiinn eemmppllooyyeeeess
• CCoommpplleemmeennttss ootthheerr bbeenneeffiittss
• PPoossssiibbllee eemmppllooyyeerr ttaaxx ssaavviinnggss
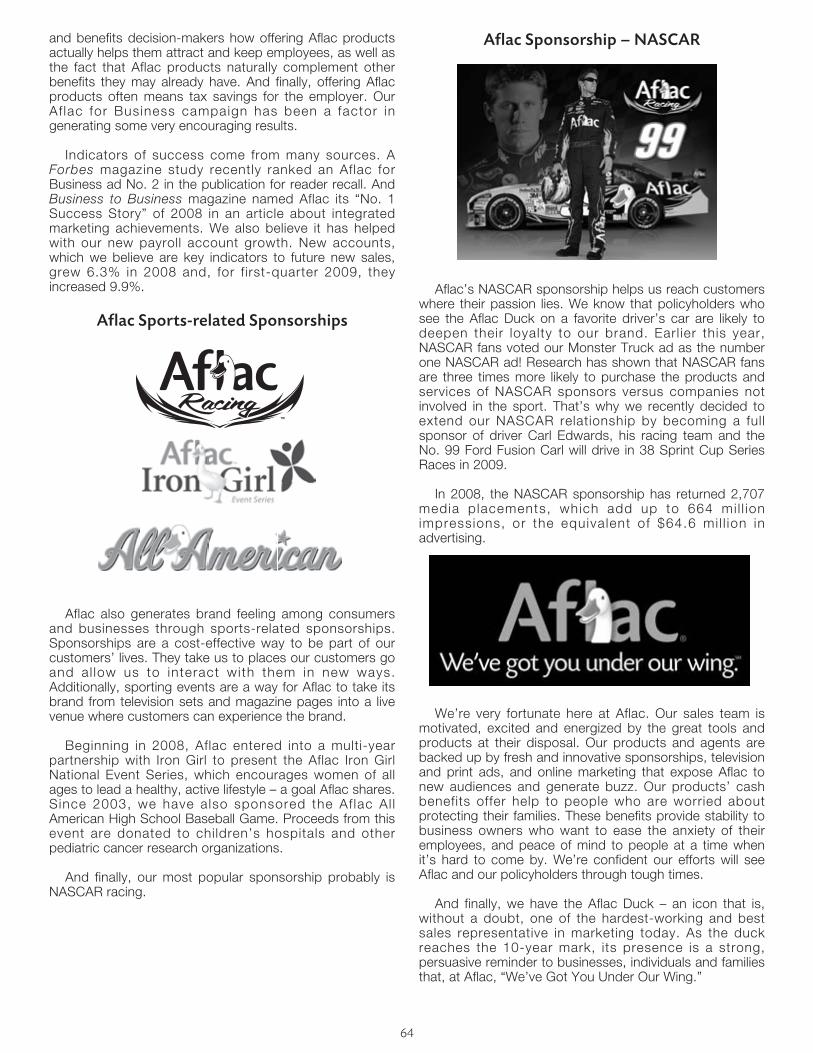
64
and benefits decision-makers how offering Aflac productsactually helps them attract and keep employees, as well asthe fact that Aflac products naturally complement otherbenefits they may already have. And finally, offering Aflacproducts often means tax savings for the employer. OurAf lac for Business campaign has been a factor ingenerating some very encouraging results.
Indicators of success come from many sources. AForbes magazine study recently ranked an Aflac forBusiness ad No. 2 in the publication for reader recall. AndBusiness to Business magazine named Aflac its “No. 1Success Story” of 2008 in an article about integratedmarketing achievements. We also believe it has helpedwith our new payroll account growth. New accounts,which we believe are key indicators to future new sales,grew 6.3% in 2008 and, for first-quarter 2009, theyincreased 9.9%.
Aflac Sports-related Sponsorships
Aflac also generates brand feeling among consumersand businesses through sports-related sponsorships.Sponsorships are a cost-effective way to be part of ourcustomers’ lives. They take us to places our customers goand al low us to interact with them in new ways.Additionally, sporting events are a way for Aflac to take itsbrand from television sets and magazine pages into a livevenue where customers can experience the brand.
Beginning in 2008, Aflac entered into a multi-yearpartnership with Iron Girl to present the Aflac Iron GirlNational Event Series, which encourages women of allages to lead a healthy, active lifestyle – a goal Aflac shares.Since 2003, we have also sponsored the Af lac Al lAmerican High School Baseball Game. Proceeds from thisevent are donated to children’s hospitals and otherpediatric cancer research organizations.
And finally, our most popular sponsorship probably isNASCAR racing.
Aflac Sponsorship – NASCAR
Aflac’s NASCAR sponsorship helps us reach customerswhere their passion lies. We know that policyholders whosee the Aflac Duck on a favorite driver’s car are likely todeepen their loyalty to our brand. Earl ier this year,NASCAR fans voted our Monster Truck ad as the numberone NASCAR ad! Research has shown that NASCAR fansare three times more likely to purchase the products andservices of NASCAR sponsors versus companies notinvolved in the sport. That’s why we recently decided toextend our NASCAR relationship by becoming a fullsponsor of driver Carl Edwards, his racing team and theNo. 99 Ford Fusion Carl will drive in 38 Sprint Cup SeriesRaces in 2009.
In 2008, the NASCAR sponsorship has returned 2,707media placements, which add up to 664 mi l l ionimpressions, or the equivalent of $64.6 mi l l ion inadvertising.
We’re very fortunate here at Aflac. Our sales team ismotivated, excited and energized by the great tools andproducts at their disposal. Our products and agents arebacked up by fresh and innovative sponsorships, televisionand print ads, and online marketing that expose Aflac tonew audiences and generate buzz. Our products’ cashbenefits offer help to people who are worried aboutprotecting their families. These benefits provide stability tobusiness owners who want to ease the anxiety of theiremployees, and peace of mind to people at a time whenit’s hard to come by. We’re confident our efforts will seeAflac and our policyholders through tough times.
And finally, we have the Aflac Duck – an icon that is,without a doubt, one of the hardest-working and bestsales representative in marketing today. As the duckreaches the 10-year mark, its presence is a strong,persuasive reminder to businesses, individuals and familiesthat, at Aflac, “We’ve Got You Under Our Wing.”

65
Aflac U.S. SalesRonald S. Sanders
Senior Vice President, Director of Sales
Aflac’s continued success is directly attributable to oneof our most unique assets – our distribution system. Ourpolicies are sold by members of our field force. Theseindividuals do not work for Aflac; they work with Aflac. Butmost importantly, to our clients and policyholders, they areAflac.
Aflac U.S. Sales Territories(December 2008)
Each is an entrepreneur working independently todevelop his or her own business, essentially serving aspresident and CEO of his or her own company. Thisresults in a distinctive drive and impetus for achievement.We believe our sales system – in which our field forcemembers serve as the primary point of contact betweenAflac and its customers – and our close relationship insupport ing their success – sets us apart from ourcompetitors and positions us for continued success.
Number of State Operations Per Territory(December 31, 2008)
Aflac has divided its U.S. market into eight distinct salesterritories. The territories range in population from 20million to 51 million, and each is managed by an Aflac U.S.officer known as a territory director.
Each territory is further divided into state operations,with some encompassing more than one state. Our state
operations are not necessarily always identified by stand-alone geographic U.S. states. For example, Colorado is anAflac state operation, as is Alabama/West Florida. At theclose of 2008, Aflac had 93 state sales operations.
Field Force Organization
Our commission-based, independent sales associatesare entrepreneurs using their personal initiative and drive tomake their business successful. The field force has severallevels, starting with our sales associates and culminatingwith our state sales coordinators, who report directly to aterritory director.
Sales associates are the “face” of Aflac. They sell ourproducts primarily to employees of payroll accounts andthen service those accounts. The next level in the Aflachierarchy is the coordinator in training, or CIT. At this level,the duties of the sales associate are combined with thoseof a district sales coordinator. CITs have the opportunity tolearn management skills without the added pressure ofmeeting sales quotas.
Our district sales coordinators, or DSCs, train andmanage sales associates and act as mentors to ourcoordinators in training. They have both personal anddistrict sales goals, while managing the sales associateson their teams. DSCs are managed by the men andwomen who’ve reached the next level of Aflac salesmanagement: regional sales coordinators, or RSCs. Theseindividuals assist with training, but their primary role isrecruiting new sales associates. RSCs are managed bystate sales coordinators, or SSCs, who lead stateoperations. Additionally, each state has up to two statetra in ing coordinators, or STCs, who support andcoordinate headquarters and field training efforts on astatewide basis. STCs are compensated by state salescoordinators.
As the focus of our business changes, so must ourorganization. As Paul mentioned, to support our expansioninto the broker market, we recently added a new positionto our field force organization: broker developmentcoordinators. Broker development coordinators work withstate sales coordinators. They bui ld and developrelationships with brokers to provide voluntary benefits,benefit education, and enrollment methods for accountsthat typical ly consist of more than 100 employees.
SSoouutthh 1144CCeennttrraall 88NNoorrtthheeaasstt 1144NNoorrtthh 1133EEaasstt 1111SSoouutthhwweesstt 1100WWeesstt 1111PPaacciiffiicc 1122
TToottaall 9933
SSaalleess TTeerrrriittoorryyNNuummbbeerr ooff SSttaattee
OOppeerraattiioonnss
BBuussiinneessss DDeevveellooppmmeenntt MMaannaaggeerrMMaarrkkeettiinngg CCoooorrddiinnaattoorr
BBrrookkeerr DDeevveellooppmmeenntt CCoooorrddiinnaattoorrSSttaattee TTrraaiinniinngg CCoooorrddiinnaattoorr
RReeggiioonnaallSSaalleess CCoooorrddiinnaattoorr
CCIITT
DDiissttrriiccttSSaalleess CCoooorrddiinnaattoorr
CCIITT
AAssssoocc.. AAssssoocc.. AAssssoocc.. AAssssoocc..
DDiissttrriiccttSSaalleess CCoooorrddiinnaattoorr
CCIITT
DDiissttrriiccttSSaalleess CCoooorrddiinnaattoorr
RReeggiioonnaallSSaalleess CCoooorrddiinnaattoorr
RReeggiioonnaallSSaalleess CCoooorrddiinnaattoorr
SSttaattee SSaalleess CCoooorrddiinnaattoorr
VVPP // TTeerrrriittoorryy DDiirreeccttoorr

66
Business development managers act as liaisons betweenterritory offices, field force training and our various stateoperations. Their primary goal is to help drive initiativesthroughout our territories.
Compensation Structure
Once the sale is made, Aflac’s compensation structurecombines sales commissions with other desirablecompensation opportunities designed to attract, retain andreward our sales force and drive growth. In addition tofirst-year and renewal commissions, we offer lucrativebonus programs and special incentives. These incentivesinclude Aflac Honor Clubs and corporate and field-basedcontests that motivate and reward superior performanceand provide high achievers with more ways to besuccessful. As employees of the company, territorydirectors are the only level of the field force that has anelement of their total compensation that is salary-based.
Commission Structure Example*(Accident Policy)
To simultaneously encourage individual efforts andpromote teamwork, Aflac’s field force representatives arecommission-based with no limit as to how much they canearn. Each level of the field force is intertwined withrespect to commission earnings, encouraging a built-insupport system that drives success at all levels.
Although the commissions paid on each product variesslightly, this chart illustrates an example of our accidentpolicy. As you can see, the total field force payout is nearly52% of first-year year premium, and just over 12% insubsequent years. The bulk of the commission is paid tothe associate directly responsible for selling the policy, withhigher-level coordinators receiving varying levels ofcommissions. Broker development coordinators are nowincluded in the commission structure.
Often, our sales coordinators have financial obligationsto meet as they support their families while building theirbusinesses. For that reason, once the policy is issued,Aflac offers them the opportunity to receive a portion oftheir anticipated first-year commissions in advance of
collection of the premium – an offer that most associatesaccept. We believe advance commissions promote therecruitment and retention of new sales associates becausecommissions put money in their pockets when they need itmost. For most l ines of business, 63% of first-yearcommissions may be paid in advance, with the remaining37% paid as premium payments are applied.
We also began offering a new option for new associateslast year called the Advanced Payment Option, or APO.Under this new commission plan, new associates can optto receive higher first-year commission amounts, withreduced renewal commission and a reduced stock bonus.If an agent opts for the APO commission plan, theyautomatically revert back to standard plan after two years.This plan, which is for new associates only and is notavailable to brokers or coordinators, was designed to getmore cash in associates’ pockets upfront to reduce newagent turnover.
Bonus Compensation
In addition to motivating commissions, Aflac offersvarious bonuses. Aflac’s bonus programs include theMarket Potential Index, or MPI Bonus, the Stock Bonusand the Recruiter Bonus. These are designed to motivatethe field force and promote retention of our valued andindependent sales team members and augment thecommissions paid.
The MPI Bonus measures the sales potential of Aflacstate and regional operations. MPI targets are set for eachregion and state, taking into account the number of in-force policies, the estimated potential employee base ineach state, and gross production in prior years. Less-penetrated states typically have higher MPI target goals.
When regional or state sales coordinators reach orexceed their target MPIs, they receive cash bonusesbased upon the additional production. It’s important tonote that bonuses for DSCs are not MPI-based. Instead,they are based on the number of associates on their teamswho qualify for particular Honor Club award programs. Theassociates qualify for these programs based on meetingcertain production quotas.
The Stock Bonus provides Af lac stock to salesassociates and coordinators. This bonus is triggered whena policy’s premium is paid in the 13th month. At that point,we award sales associates 3.5% of the first year’spremium as a stock bonus. District, regional and statessales coordinators receive .7% of the first-year premium instock bonuses. For policies written by associates paidunder the APO program, associates receive a stock bonuspaid at a rate of 2%, and the coordinator commissionremains the same at .7%.
The final incentive is the Recruiter Bonus, which is paidonly to sales associates, not coordinators. It is an
• MMPPII BBoonnuuss
• SSttoocckk BBoonnuuss
• RReeccrruuiitteerr BBoonnuuss
• FFiirrsstt--yyeeaarr aanndd rreenneewwaall ccoommmmiissssiioonnss
• BBoonnuuss pprrooggrraammss
• OOtthheerr ssppeecciiaall iinncceennttiivveess
AAssssoocciiaattee 3344..55%% 66..11%%
DDSSCC 66..99 33..33
RRSSCC 44..88 11..55
BBDDCC ..88 ..22
SSTTCC ..88 ..22
SSSSCC 44..00 11..00
TToottaall 5511..88%% 1122..33%%
FFiirrsstt--YYeeaarrRRaattee
RReenneewwaallRRaattee
**SSttaannddaarrdd ccoommmmiissssiioonn ssttrruuccttuurree

67
important incentive, because many of our best newrecruits join Aflac as a result of referrals by existing agents.As compensation for recruit ing a new agent, salesassociates receive a 5% override from business written bythat agent for one year. The bonus is calculated and paidquarterly as a one-time payment of 5% for each applicablepolicy’s annual premium. The Recruiter Bonus slightlyreduces the commission percentages paid to state,regional and district sales coordinators for that particularyear.
Honor Clubs
Honor Clubs offer associates and coordinators accessto yet another pool of prestigious and lucrative incentivesthat increase morale and generate recognition that drivessales. These clubs also serve to increase average monthlyproducer growth and payroll account growth, all of whichare essential to growing Aflac’s business.
Awards include cash bonuses and world-classvacations to domestic and international locations.
Incentive Contests
Contests have also proven to be motivators. They havea track record of encouraging associates and coordinatorsto focus on specific skills and activities that support allaspects of Aflac’s business. Thousands of Aflac contestsare run at each year, ranging from state, regional anddistrict challenges to companywide challenges organizedat the corporate level. I believe contests have contributedto premium growth, payroll account growth, averageweekly producer growth and new recruits in recent years.
Companywide contests planned for 2009 include theAf lac Goes to Hol lywood and Spread Your WingsAdventure contests. Aflac Goes to Hollywood is a nationalaccount referral challenge that gives sales associates,district sales coordinators and their current accountcontacts the chance to rub elbows with the stars in sunnyCalifornia. The contest began January 1 and ends May 31.The Spread Your Wings Adventure Contest allows winnersto choose their own destination, whether it’s the famedLas Vegas Strip or a stretch of sand on a secluded beach.The contest, which began April 25 and will continue to
early July, challenges all levels of the Aflac field force toboost their sales numbers.
Recruiting
These contests are for sales associates andcoordinators who have reached various levels of success.But before they can excel at Aflac, we have to identify andrecruit talented and driven associates. Recruiting hasalways been, and wil l cont inue to be, an essentia lcomponent of Aflac’s distribution growth. We recruitpotential members of our field force in two primary ways:through recommendations from current sales agents andvia two of the leading national Internet resources –Monster.com and CareerBuilder.com. Other recruits jointhe Aflac team after learning about opportunities throughother sources, such as job fairs and print ads.
In 2009, Aflac’s continued focus is on the training andretention of new associates. After all, increasing the size ofour field force allows us to effectively reach out to newcustomers and expanding markets. At the same time, weare committed to increasing the effectiveness of the fieldforce by developing, tracking and building upon thenumber of average weekly producers.
Average Weekly Producers
We believe that the average weekly producer metric is abetter measure of our success than simply recruitment.We are continually working to improve the capabilities ofour field force in order to drive the growth of averageweekly producers.
In the first quarter of 2009, the number of averageweekly producers rose by 2.4%. Sixty-nine percent ofthose producers were veteran members of the Aflac salesforce, while 31% were new weekly producers, or thosewho are in their first year at Aflac.
Coordinator Expansion
• PPrriimmaarryy mmeetthhooddss
» RReeccoommmmeennddaattiioonnss ffrroomm ffiieelldd ffoorrccee
» IInntteerrnneett
• FFooccuuss oonn iinnccrreeaassiinngg ssiizzee aanndd eeffffeeccttiivveenneessssooff ffiieelldd ffoorrccee
• TTrraacckk aavveerraaggee wweeeekkllyy pprroodduucceerrss ((AAWWPPss))
• CCoommppaannyywwiiddee,, ssttaattee,, rreeggiioonnaall aanndd ddiissttrriiccttccoonntteessttss
• AAffllaacc GGooeess ttoo HHoollllyywwoooodd ccoonntteesstt
• SSpprreeaadd YYoouurr WWiinnggss AAddvveennttuurree ccoonntteesstt
• FFiirreebbaallll aanndd SSttaarr AAwwaarrdd SSeerriieess
• KKeeyy CClluubbss
• GGrroowwtthh EEnntteerrpprriissee MMaannaaggeemmeenntt ((GGEEMM))
• FFAAMMEE
• FFoouunnddeerrss WWeeeekk
• CCoonnvveennttiioonn
• PPrreessiiddeenntt''ss CClluubb
• LLiiffee GGuuiilldd
• TToopp TTeenn
• AAWWPP mmeettrriicc mmoorree aaccccuurraatteellyy mmeeaassuurreess ssuucccceessss
• AAWWPPss iinnccrreeaasseedd 22..44%% iinn ffiirrsstt qquuaarrtteerr 22000099
» 6699%% wweerree vveetteerraann aaggeennttss
» 3311%% wweerree ffiirrsstt--yyeeaarr aaggeennttss
SSSSCC 5544 6633 9933 9933
RRSSCC 332211 443300 555544 552266
DDSSCC 11,,554433 22,,009955 22,,332211 22,,225544
TToottaall 11,,991188 22,,558888 22,,996688 22,,887733
11999999 22000022 22000088 33//0099

68
In terms of building our sales force, the success of theAflac Duck advertising campaign in early 2000 led totremendous growth of recruits, which ultimately challengedour sales management infrastructure. We have commonlyreferred to this time period as the “duck bubble.” Thegrowth of our sales force simply outpaced the growth ofour coordinator base.
Today, the picture is different. Since 2002, we haveeffectively expanded our coordinator base, which hasallowed us to enhance both our recruiting and trainingcapacity. Part of that success is attributable to the additionof coordinators in training, who help associates transitionbetween sales and the DSC who is responsible for on-the-job field training.
Payroll Account Growth
Despite the challenges of the economy, Aflac is showingimprovement in some key areas. Our overall growth of newpayroll accounts has been solid. The number of new Aflacpayroll accounts rose 6.3% in 2008 and 9.9% in the firstquarter of 2009. Importantly, payroll accounts opened bynew associates have been strong, which we attribute tothe New Associate Training Cycle that was implementedseveral years ago. We believe growth in payroll accountsgives us important “shelf space” that will help future sales.
Despite the economic downturn, in the first quarter of2009, we continued to grow the number of payrol laccounts and also our block of business at existingaccounts. With respect to our new business in the firstquarter of 2009, we saw a slightly lower percentage ofpeople purchase Aflac products, and those who arebuying are buying about the same amount in terms ofpremium. Therefore, our new producers are beingchallenged to “step up their game” and meet with morepotential policyholders to achieve the same number ofsales they achieved before the economy began tostruggle.
New Associate Premium Growth
Another area that reflects the success of our trainingefforts is the increase in new annualized premium writtenby new associates. We continue to focus on training anddeveloping our new recruits, and that focus has paid off insolid results. Although new sales declined .6% in the firstquarter of 2009, production from new associates rose6.9%.
Aflac U.S. New Premium Sales(In Millions)
Following the explosive sales growth of 2000 through2002, growth slowed from 2003 to 2005 as we focused onenhancing our sales force infrastructure. Sales improved in2006 and 2007. However, the steadily deterioratingeconomy last year had an impact on our sales results.Although sales were down .4% for the year, annualizedpremiums in force were up 6.2%. Sales in the first quarterof this year were down slightly. However, we picked up sixadditional production days in the first quarter due tomovement in the production calendar. Without thoseadded days, sales would have been down approximately6.5%.
2008 Sales Results by Territory
This chart breaks out sales results by territory. TheSouth Territory is the largest contributor to Aflac sales,accounting for to 21.9% of new annualized premium in2008.
--1100
--55
00
55
1100
1155
2200
2255
3300%%
11QQTT 22QQTT 33QQTT 44QQTT 11QQTT 22QQTT 33QQTT 44QQTT 11QQTT22000077 22000088 22000099
1188..99 1188..99
88..33
1155..11
44..22
1122..0099..33
11..55
66..99
• NNuummbbeerr ooff nneeww ppaayyrroollll aaccccoouunnttss rroossee 66..33%% iinn22000088 aanndd 99..99%% iinn ffiirrsstt qquuaarrtteerr 22000099
• PPaayyrroollll aaccccoouunntt ggrroowwtthh ggiivveess uuss ""sshheellff ssppaaccee""
• FFeewweerr eemmppllooyyeeeess aarree ppuurrcchhaassiinngg pprroodduuccttss
• PPrroodduucceerrss mmuusstt ""sstteepp uupp tthheeiirr ggaammee"" aanndd mmeeeettwwiitthh mmoorree eemmppllooyyeeeess
00
220000
440000
660000
880000
11,,000000
11,,220000
11,,440000
$$11,,660000
%% IInncc.. 55..11
22000044
$$11,,118866
66..11
22000055
$$11,,225599
$$11,,442233
22000066
1133..11
22000077
99..55
$$11,,555588 $$11,,555511
22000088
((..44))
$$335511
33//0099
((..66))
SSoouutthh 2211..99%% ((11..66))%%NNoorrtthh 1144..00 ((22..88))EEaasstt 1133..55 22..66SSoouutthhwweesstt 1122..00 44..00NNoorrtthheeaasstt 1111..55 ((22..00))WWeesstt 99..88 ((22..66))CCeennttrraall 88..55 33..22PPaacciiffiicc 88..66 ((22..55))
TToottaall 110000..00%% ((..44))%%
SSaalleess TTeerrrriittoorryyPPeerrcceennttaaggeeCCoonnttrriibbuuttiioonn
PPeerrcceennttaaggeeIInnccrreeaassee

69
Sales Growth by State Operation(Twelve Months Ended 2008)
Last year, 43 Aflac state organizations showed positivesales growth. Among those, 10 states had increases of10% or more. That’s down from 2007 when 86 states hadsales increases, with 45 states producing double-digitsales growth. In the first quarter of this year, 40 statesproduced growth in sales. Among those, 19 were up 10%or higher.
Key Indicators
Although sales have been negatively impacted by theweak economy, we remain encouraged by the underlyingkey indicators of future sales. Average weekly producersand average weekly new producers are up. New payrollaccounts are increasing, and payroll accounts opened bynew associates continue to grow at a faster rate. Inaddition, we are experiencing strong recruitment of newassociates. We believe this suggests that the underlyingcondition of our business model is healthy and that we willbe well-positioned when the economic environmentimproves.
2009 Sales Objective
In the meantime, there is no doubt that 2009 will be adiff icult year for American businesses across everyindustry. Insurers are no different – and, in some ways, ourchallenges are greater due to the perception that coverageis a “nice to have” but not a “need to have” whenconsumers are not optimistic about the future. Our 2009sales objective is to generate flat to 5% sales growth.However, as we have previously mentioned, we may needto revisit and modify that target if we see continueddeterioration of the economy.
Penetration by Sales Territory(In thousands)
As the U.S. economy declines, we believe the consumerneed for the protection provided by Aflac’s products isgrowing. However, it is up to our field force to turn thatneed into demand.
We believe our sales territory distribution model is ontrack to meet growing consumer needs. There is a vast,untapped market available to us in the United States. Asthat market realizes the need for Aflac’s products andservices, we will be here to meet those needs.
Even our most penetrated territory, the Central territory,has a penetrat ion rate of just 9.7%. Our mostunderpenetrated territory, Pacific, is at just 4.2%. Thissuggests that there are tremendous opportunities for Aflacin all territories.
We believe our highly motivated and trained sales forceand new marketing campaign “We’ve Got You Under OurWing” will show employers and employees why now, morethan ever, Americans need the peace of mind Aflacproducts provide. The campaign wi l l re inforce themessage that we will be here for our policyholders andpayroll accounts during their greatest times of need – andthat need is enormous today. Money is tight, everyfinancial decision is a source of worry, jobs are being lostand too many Americans are afra id of losing thepaychecks they so urgently depend upon. Consumers arelooking for peace of mind, and Aflac is here to provide thatpeace of mind.
--2200
--1100
00
1100
2200
3300
4400%%
1100%% oorr ggrreeaatteerr iinnccrreeaasseeZZeerroo ttoo 1100%% iinnccrreeaasseeNNeeggaattiivvee ppeerrcceennttaaggee cchhaannggee
00
220000
440000
660000
880000
11,,000000
11,,220000
11,,440000
PPaacciiffiicc NNoorrtthheeaasstt WWeesstt NNoorrtthh SSoouutthhwweesstt SSoouutthh CCeennttrraall EEaasstt
TToottaall bbuussiinneesssseess**AAffllaacc ppaayyrroollll aaccccoouunnttss ((1122//3311//0088))
PPeenneettrraattiioonn 44..22%% 44..66%% 55..77%% 77..88%% 99..11%%
**SSoouurrccee:: UU..SS.. CCeennssuuss BBuurreeaauu TTaabbuullaattiioonnss bbyy EEnntteerrpprriissee SSiizzee,, 22000066
88..33%% 99..77%% 88..88%%
• KKeeyy iinnddiiccaattoorrss aarree uupp
» AAvveerraaggee WWeeeekkllyy PPrroodduucceerrss ((AAWWPP))
» AAvveerraaggee WWeeeekkllyy NNeeww PPrroodduucceerrss ((AAWWNNPP))
» PPaayyrroollll aaccccoouunnttss
» PPaayyrroollll aaccccoouunnttss ooppeenneedd bbyy nneeww aassssoocciiaatteess
» RReeccrruuiittiinngg
• TToo ggeenneerraattee ffllaatt ttoo 55%% ssaalleess ggrroowwtthh

For more than two decades, our growth strategy hasbeen to create and deliver relevant products that offervalue to consumers. We’ve provided information about theproduct side of this equation. I’ll focus on the secondaspect of our strategy – the development of ourdistr ibution system that del ivers these products toconsumers.
In 2005, we restructured the Field Force DevelopmentDepartment to place greater emphasis and resources ontraining our distribution system. Since the restructure, wehave continued to develop innovative training programs forall levels of the field force. We believe our 2008 resultsprove this has been a success. Our programs aredelivered by a dedicated team of trainers who began theirAflac careers as associates and sales coordinators in thefield. Let’s take a look at how we’ve structured our trainingarea to maximize our ability to deliver the appropriatetraining programs where they are needed.
Field Force Sales Training
Within Field Force Development, a senior manager ofTerritory Training supervises five territory training managersand one technology training manager, each of whom isresponsible for training within dedicated geographicterritories. Under each territory training manager aretrainers. Each training manager works closely with his orher designated territory directors, state sales coordinators,and state training coordinators to assess each stateoperation’s specific training and developmental needs andthen coordinate programs to meet those needs.
These assessments use current and historical data toanalyze recruiting, retention and sales performance. Theyalso take into consideration the state’s current trainingprograms, training calendar, and the experience of thestate training coordinator. Based on the assessment, theterritory training manager may select appropriate classesand seminars from a corporate catalog. If necessary, atra in ing team from headquarters can be used tosupplement the training provided by the state. Bycapitalizing on the longstanding working relationshipsbetween the tra in ing personnel in the f ie ld and atheadquarters, we feel we enable our state operations tomaximize new recruits’ potential throughout the UnitedStates. The coordination between field trainers and our
headquarters training teams helps us deliver an inventoryof programs in a timely, effective and customized manner.
We have various methods of measuring our success indeveloping our field force. One such method is the MarketPotential Index, or MPI. MPI is a metric that measures thesales potent ia l of Af lac state, regional and distr ictoperations. This metric takes into account in-force policynumbers, the estimated potential employee base in eachstate, and prior years’ gross production. Over the years,we have identified a handful of “pre-MPI” metrics thatshow a high correlation to whether or not a state willachieve their MPI. To proactively identify areas in which acertain state operation may be struggling, and thereforeare likely to miss achieving MPI, we began using a newassessment tool called the State Operation Sales Analysisin the second quarter of 2008. This tool helps identifycertain critical metrics and then predicts positive ornegative trends. Once this is accomplished, we can thenproactively and methodically deliver training and supportwhere needed to help turn things around in that state.
To apply this tool, we f irst group together stateoperations that have similar population and geographic-size characteristics. The State Operation Sales Analysistool then makes an apples-to-apples comparison ofnumerous metrics, including the number of new recruits,how much business those recruits are producing in newand existing accounts, what products are being sold inaccounts, how many products of business are beingoffered, and numerous other key indicators. If, aftercomparison and analysis, we determine that a state isfalling short of achieving these important metrics, we thenstrategical ly determine when and where to del ivercustomized training to help that state get back on track.
Field Force Philosophy
In Field Force Development, we are also focused ongetting our recruits on the right track. We center our effortson our philosophy of recruit, train and retain. While thismay sound like a simple philosophy, it reflects the logicalsteps we must take to ensure we are secur ing,empowering, and enabling our sales force to have asuccessful and long-term career with Aflac.
Recruiting Methods
Aflac U.S. TrainingEric J. Leger
Vice President, Field Force Development
70
• RReeccrruuiitt
• TTrraaiinn
• RReettaaiinn
SSeenniioorr MMaannaaggeerrTTeerrrriittoorryy TTrraaiinniinngg
TTrraaiinniinnggMMaannaaggeerrPPaacciiffiicc
TTrraaiinniinnggMMaannaaggeerr
WWeesstt
TTrraaiinniinnggMMaannaaggeerr
NNoorrtthh//NNoorrtthheeaasstt
TTrraaiinniinnggMMaannaaggeerrCCeennttrraall//
SSoouutthhwweesstt
TTrraaiinniinnggMMaannaaggeerr
EEaasstt//SSoouutthh
TTrraaiinniinnggMMaannaaggeerr
TTeecchhnnoollooggyy
EErriicc LLeeggeerrVViiccee PPrreessiiddeenntt
FFiieelldd FFoorrccee DDeevveellooppmmeenntt
• NNoommiinnaattiioonnss
• IInntteerrnneett
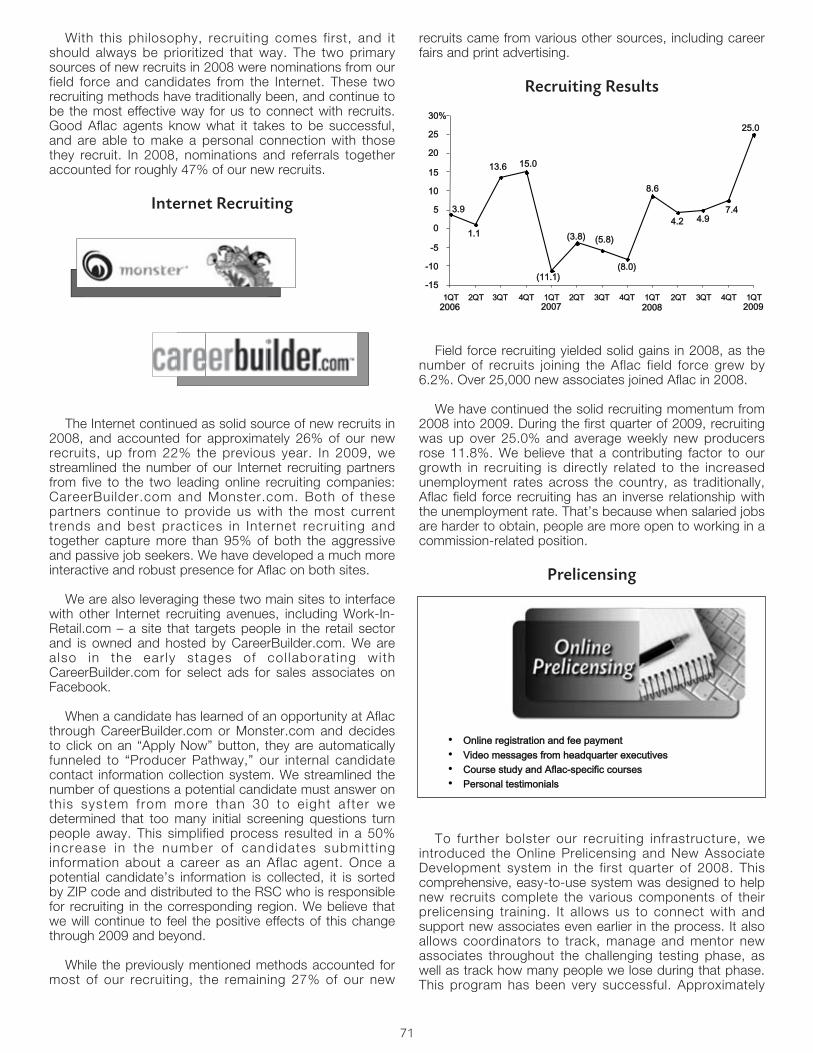
With this philosophy, recruiting comes first, and itshould always be prioritized that way. The two primarysources of new recruits in 2008 were nominations from ourfield force and candidates from the Internet. These tworecruiting methods have traditionally been, and continue tobe the most effective way for us to connect with recruits.Good Aflac agents know what it takes to be successful,and are able to make a personal connection with thosethey recruit. In 2008, nominations and referrals togetheraccounted for roughly 47% of our new recruits.
Internet Recruiting
The Internet continued as solid source of new recruits in2008, and accounted for approximately 26% of our newrecruits, up from 22% the previous year. In 2009, westreamlined the number of our Internet recruiting partnersfrom five to the two leading online recruiting companies:CareerBuilder.com and Monster.com. Both of thesepartners continue to provide us with the most currenttrends and best practices in Internet recruit ing andtogether capture more than 95% of both the aggressiveand passive job seekers. We have developed a much moreinteractive and robust presence for Aflac on both sites.
We are also leveraging these two main sites to interfacewith other Internet recruiting avenues, including Work-In-Retail.com – a site that targets people in the retail sectorand is owned and hosted by CareerBuilder.com. We arealso in the ear ly stages of col laborat ing withCareerBuilder.com for select ads for sales associates onFacebook.
When a candidate has learned of an opportunity at Aflacthrough CareerBuilder.com or Monster.com and decidesto click on an “Apply Now” button, they are automaticallyfunneled to “Producer Pathway,” our internal candidatecontact information collection system. We streamlined thenumber of questions a potential candidate must answer onthis system from more than 30 to eight after wedetermined that too many initial screening questions turnpeople away. This simplified process resulted in a 50%increase in the number of candidates submitt inginformation about a career as an Aflac agent. Once apotential candidate’s information is collected, it is sortedby ZIP code and distributed to the RSC who is responsiblefor recruiting in the corresponding region. We believe thatwe will continue to feel the positive effects of this changethrough 2009 and beyond.
While the previously mentioned methods accounted formost of our recruiting, the remaining 27% of our new
recruits came from various other sources, including careerfairs and print advertising.
Recruiting Results
Field force recruiting yielded solid gains in 2008, as thenumber of recruits joining the Aflac field force grew by6.2%. Over 25,000 new associates joined Aflac in 2008.
We have continued the solid recruiting momentum from2008 into 2009. During the first quarter of 2009, recruitingwas up over 25.0% and average weekly new producersrose 11.8%. We believe that a contributing factor to ourgrowth in recruiting is directly related to the increasedunemployment rates across the country, as traditionally,Aflac field force recruiting has an inverse relationship withthe unemployment rate. That’s because when salaried jobsare harder to obtain, people are more open to working in acommission-related position.
Prelicensing
To further bolster our recruiting infrastructure, weintroduced the Online Prelicensing and New AssociateDevelopment system in the first quarter of 2008. Thiscomprehensive, easy-to-use system was designed to helpnew recruits complete the various components of theirprelicensing training. It allows us to connect with andsupport new associates even earlier in the process. It alsoallows coordinators to track, manage and mentor newassociates throughout the challenging testing phase, aswell as track how many people we lose during that phase.This program has been very successful. Approximately
71
--1155
--1100
--55
00
55
1100
1155
2200
2255
3300%%
11QQTT 22QQTT 33QQTT 44QQTT 11QQTT 22QQTT 33QQTT 44QQTT 11QQTT 22QQTT 33QQTT 44QQTT 11QQTT
77..44
2255..00
44..22 44..9933..99
11..11
1133..66 1155..00
((1111..11))
((33..88)) ((55..88))
((88..00))
88..66
22000077 22000088 2200009922000066
22,000 recruits completed the pre-licensing in the firstyear.
Recruiting Strategies
We began testing a new strategy in 2008: industry-,company-, and geographic-specific recruiting that uses e-mai l , direct mai l , industry events and chambers ofcommerce to specifically target certain industry sectors.This has allowed us to reach out to potential recruits andcommunicate the opportunities an Aflac agent career canoffer.
Our init ial “testing” of this new strategy targetedestablished salespeople who shared commonalities withour existing sales force. This initial campaign resulted inmore than 600 new Aflac associates during the secondhalf of 2008.
As 2008 came to a close, we targeted employees inother segments of the workforce. This industry-,geographic-, and company-specific strategy accounted foralmost 7.0% of our new associate recruitment in the fourthquarter 2008 new associates. During 2009, we wil lcontinue to be both proactive and reactive in strategicallytargeting geographies, industries, and companies.
After recruiting, training is next in our philosophy ofrecruit, train and retain. And training will become evenmore important as we continue to build on our productportfolio. Learning starts in the classroom, but the reallearning and development happens once associates applyit to actual sales situations. Although “rookie” agents andveteran associates are at different places in their careers,both can benefit from training.
LEASE
In January 2004, Aflac introduced a new trainingprogram called LEASE, which stands for Larger EarningsAcquire Small Employers. LEASE is a selling systemdeveloped especially for our new associates. It teachesassociates to open and focus on businesses with five to20 employees. Our goal is to help the new agent achievesuccess ear ly on by making the program simple,straightforward, and easily transferable. Also, the smalleraccounts that LEASE targets tend to be more accessibleto sales agents, faster to execute on decisions and moreopen to the one-on-one enrollment system that allows ourassociates to fully explain Aflac products. In early 2006,our team in Field Force Development redesigned LEASE,to make it even easier for DSCs to consume, and thereforedeliver, when training new associates in the field. This new
approach to LEASE effectively bridges the disconnect weencountered between classroom training and field trainingin the earlier version of LEASE.
New Associate Training Cycle Level One
The New Associate Training Cycle, which incorporatesLEASE training, is divided into two levels of classes. Thefirst level starts the associate off learning six fundamentaltopics.
New Associate Training Cycle Level Two
Once associates have mastered Level One, Level Twodelves deeper to equip new associates with advancedknowledge and skills they’ll need to succeed. This isconsistent with our belief that training should be sequentialand help new associates address topics as they arise.
Winner’s Edge
In April of 2009, we incorporated a new element into ourNew Associate Blueprint for Success – it’s called Winner’sEdge. Winner’s Edge will afford associates the ability tolive, learn, and test their knowledge of Aflac’s proven salestraining in an all-inclusive, 13-week, hands-on trainingtrack that uses a curriculum adapted specifically foraccelerated learning. We know that the first 13 weeks inthe life of a new associate are critical. They need toexperience success and experience it quickly. In this 13-week program, we break down the new associate’scalendar into an accountability system lasting 13 weeks.Each week, the associate meets with his/her coordinator
• OOwwnniinngg YYoouurr OOwwnn BBuussiinneessss
• GGooaall SSeettttiinngg aanndd BBuussiinneessss PPllaannnniinngg
• TTaarrggeett && RReeffeerrrraall MMaarrkkeettiinngg
• CCoonnssuullttaattiivvee SSeelllliinngg
• CCoonndduuccttiinngg aa GGrroouupp MMeeeettiinngg
• AAddvvaanncceedd PPrroodduucctt KKnnoowwlleeddggee
• UUnnddeerrssttaannddiinngg CCoommmmiissssiioonnss aanndd SSttaatteemmeennttss
• VVaalluuee--aaddddeedd SSeerrvviicceess//AAddvvaanncceedd FFlleexx
• NNeettwwoorrkkiinngg iinn YYoouurr CCoommmmuunniittyy
• UUnnddeerrssttaannddiinngg tthhee CCllaaiimmss PPrroocceessss
• PPaarrtt ooff tthhee NNeeww AAssssoocciiaattee BBlluueepprriinntt ffoorr SSuucccceessss• IInntteennssee 1133--wweeeekk aacccceelleerraatteedd ttrraaiinniinngg• WWeeeekkllyy mmeeeettiinnggss wwiitthh ccoooorrddiinnaattoorr• SSuuppppoorrttss aassssoocciiaattee ffoorr ffuuttuurree ssuucccceessss
72
• BBaassiicc PPrroodduuccttss
• NNeeww AAssssoocciiaattee SSaalleess SScchhooooll ffeeaattuurriinngg LLEEAASSEE
• NNeeww AAssssoocciiaattee SSaalleess SScchhooooll FFoollllooww--uupp
• SSmmaarrttAApppp NNeexxtt GGeenneerraattiioonn ((SSNNGG))
• EEnnrroollllmmeenntt && AAccccoouunntt MMaannaaggeemmeenntt
• BBaassiicc FFlleexx
LLaarrggeerr EEaarrnniinnggss AAccqquuiirree SSmmaallll EEmmppllooyyeerrss
SSppeecciiffiicc,, TTaarrggeetteedd RReeccrruuiittiinngg::
• IInndduussttrryy
• CCoommppaannyy
• GGeeooggrraapphhiicc

to review the previous week’s objectives and discuss theupcoming week’s objectives. Each weekly meeting helpsthe associate stay on track.
New Payroll Account Growth
We are showing significant improvement in several keycategories. The New Associate Training Cycle wasintroduced in the fourth quarter of 2005. A little more thana year after its introduction, payroll accounts opened bynew associates increased at double-digit rates and havestayed there ever since. For the first quarter of 2009,payrol l account growth from new associates wassignificantly up, posting growth of 18.1%.
New Associate Premium Growth
In addition to payroll account growth, we believe thesuccess of our training efforts is also reflected in theincrease in new annualized premium written by newassociates. As we continue to focus on not just thequantity of recruits we bring into the business, but thequality and education of those recruits, we have generallyexper ienced sol id growth in new associates’ newannualized premium sales. Although new sales were down.6% in the first quarter of this year, production from newassociates made reasonable gains, with sales from newassociates rising 6.9% in the first quarter.
Average Weekly New andVeteran Producer Growth
As we have discussed, we have successfully shifted thefocus of our field force management from one of simplyrecruiting to recruiting with the intent of growing averageweekly producers. To effect this change, we adjusted thecriteria of a contest from simply recruiting to focus onrecruit ing and developing those recruits to becomeproducers. We then provided bonuses to the DSC basedon the new criteria. An increase in average weeklyproducers is the combined result of effective recruiting,solid training for new associates, and veteran associateswho are “on their game.” The number of average weeklyproducers increased by 2.4% for first quarter 2009.However, the number of new average weekly producers,or those who are in their first year, rose 11.8% in the firstquarter of this year.
Coordinator in Training Growth
For the last few years we have discussed ourcoordinator in training program as a means for betterdeveloping field management. The mission of the CITprogram is to provide every prospective district salescoordinator with the tools and training needed to besuccessful. As our CITs progress in the training, they willbe educated on leadership, nominating, education andfield training, team building, planning, time managementand much more. There are speci f ic guidel ines,requirements and qualifications to which our CITs mustadhere.
By focusing on coordinator expansion, we can createan atmosphere of success by offering associates the
73
--55
00
55
1100
1155
2200
2255
3300%%
11QQTT 22QQTT 33QQTT 44QQTT 11QQTT 22QQTT 33QQTT 44QQTT 11QQTT22000077 22000088 22000099
1111..001133..99
1111..88
((..88))
1188..11
33..00 33..77 33..44
66..11
1144..88
99..2277..00
22..77
NNeeww PPrroodduucceerrss
VVeetteerraann PPrroodduucceerrss
55..4433..22
..88((11..66)) ((11..44))
00
220000
440000
660000
880000
11,,000000
11,,220000
11,,440000
11QQTT 22QQTT 33QQTT 44QQTT 11QQTT 22QQTT 33QQTT 44QQTT 11QQTT
884433990011
99884411,,003366
11,,115544
22000077 22000088 22000099
11,,22332211,,228855 11,,229911 11,,229922
--1100
--55
00
55
1100
1155
2200
2255
3300%%
11QQTT 22QQTT 33QQTT 44QQTT 11QQTT 22QQTT 33QQTT 44QQTT 11QQTT
22000077
66..33
2233..00
2200009922000088
2277..99
2222..77
1155..11
99..77
1155..001133..33
1177..99
22..11
VVeetteerraannaassssoocciiaatteess
FFiirrsstt--yyeeaarraassssoocciiaatteess
1188..11
1100..77 99..771111..99
22..7711..22
((11..33))((77..77))
--1100
--55
00
55
1100
1155
2200
2255
3300%%
11QQTT 22QQTT 33QQTT 44QQTT 11QQTT 22QQTT 33QQTT 44QQTT 11QQTT22000077 22000088 22000099
99..33
11..55
66..99
1122..00
1188..99 1188..99
88..33
1155..11
44..22

74
opportunity to move up through the ranks, following a setof predetermined standards prior to promotion. Thisprogram gives the CIT an opportunity to experience salesmanagement without having to make a full commitment tothe district sales coordinator position.
Coordinator in Training Performance(1/01/07 - 12/31/08)
On a weekly basis, CITs with four or more modulesopened 87% more new payroll accounts than those withless than four modules. These same CITs have alsoproduced 87% more new annualized premium than thosewith less than four modules. These results are significantand suggest our CIT program is effective.
District Sales Coordinator Performance(1/01/07 - 12/31/08)
District sales coordinators who participated in the CITprogram are also outperforming DSCs who did not haveCIT training. It is our plan to have coordinators at everylevel better prepared in every necessary skill set to executetheir own design for success. A culture of learning must becreated and reinforced for our entire field force – for allcoordinators and all associates.
Aflac National Training Day
For the f i rst t ime in Af lac’s 50-year history, theeconomic downturn is impacting our sales. Clearly, thisdownturn has forced consumers to rethink how theyallocate their finances. It is the job of our sales force toconvey to consumers how Aflac products can help them
now more than ever. And it is our job at headquarters toempower our sales force with the tools they need to getthis message through.
In keeping with our philosophy of providing relevant andtimely training, we conducted the second Aflac NationalTraining Day on Friday, April 24, 2009. This training wasmade available to all levels of our field force and isespecially important because of the economic uncertaintythat has filled consumers with fear, anxiety and confusionabout their financial situations. This nationwide training daywas created as a specialized training forum where ourstate training coordinators train the sales force witheffective techniques and relevant approaches that willspread the message about how now more than ever, ourproducts are valuable. Leading up to the Aflac NationalTraining Day, state sales coordinators and state trainingcoordinators attended a webcast event on April 21 called“All Access.” This live “All Access” webcast event wasbroadcast to the Aflac field force in cities throughout thecountry to help build awareness and momentum for theensuing Nat ional Train ing Day as wel l as engageparticipation from the field force. The feedback wereceived was phenomenal.
Coordinator Accreditation Program Series
In terms of a focus on training at al l levels, as Idiscussed last year, Field Force Development has beendeveloping coordinator accreditation programs for all levelsof coordinators. We believe our District CoordinatorAccreditation Program (DCAP) and Regional CoordinatorAccreditat ion Program (RCAP) cont inued to betremendously successful. All of our DSCs and RSCsattended the classes in 2008.
SCAP Curriculum
For the f i rst t ime ever, we conducted a StateCoordinator Accreditation Program (SCAP) in June of2008. This curriculum focused on key areas of leadership:
OOnn aa wweeeekkllyy bbaassiiss,, DDSSCCss wwhhoo ppaarrttiicciippaatteedd iinn tthhee CCIITTpprrooggrraamm::
• OOppeenneedd aann aavveerraaggee ooff 2299..22%% mmoorree nneeww ppaayyrroollllaaccccoouunnttss tthhaann DDSSCCss wwiitthh nnoo CCIITT ttrraaiinniinngg
• PPrroodduucceedd 1188..88%% mmoorree nneeww aannnnuuaalliizzeedd pprreemmiiuummssaalleess tthhaann DDSSCCss wwiitthh nnoo CCIITT ttrraaiinniinngg
AAllll lleeaaddeerrsshhiipp lleevveellss ––
• TTeerrrriittoorryy
• SSttaattee
• RReeggiioonn
• DDiissttrriicctt
• EEssttaabblliisshhiinngg ccrreeddiibbiilliittyy
• CClliimmaattee,, lleeaaddeerrsshhiipp aanndd ppeerrffoorrmmaannccee
• DDeecciissiioonn mmaakkiinngg
• SSkkiillllffuull ccoonnvveerrssaattiioonn
• CCoonnfflliicctt mmaannaaggeemmeenntt
OOnn aa wweeeekkllyy bbaassiiss,, CCIITTss wwhhoo ccoommpplleetteedd ffoouurr oorr mmoorree CCIITTttrraaiinniinngg mmoodduulleess::
• OOppeenneedd aann aavveerraaggee ooff 8866..99%% mmoorree nneeww ppaayyrroollllaaccccoouunnttss tthhaann CCIITTss wwiitthh lleessss tthhaann ffoouurr CCIITT ttrraaiinniinnggmmoodduulleess
• PPrroodduucceedd 8877..22%% mmoorree nneeww aannnnuuaalliizzeedd pprreemmiiuummtthhaann CCIITTss wwiitthh lleessss tthhaann ffoouurr CCIITT ttrraaiinniinngg mmoodduulleess

75
establ ishing credibi l i ty, c l imate, leadership andperformance, decision making, skillful conversation andconflict management. Our SCAP was enthusiasticallyreceived by our SSCs, and we will continue this program in2009.
TCAP Curriculum
New for 2009 is our Territory Director CoordinatorAccreditation Program, or TCAP. The focus of TCAP willbe on business leadership, entrepreneurship and climatewithin the organization. The leadership message to allother levels of coordinators challenges them to embracetheir leadership role fully. As a result of their participation inprogram act iv i t ies and discussions, TDs come toappreciate that they are part of a leadership team whosemembers are not only responsible for their immediateareas of responsibi l i ty but also for bui ld ing andstrengthening the Aflac organization as a whole. Woveninto the TD learning experience will be creating a positivework climate, leading sales performance, sales coaching,managing sales di lemmas and leading and arr iv ingbusiness at Aflac.
Finally, to the “retain” portion of our recruit, train andretain philosophy. Retention is the ultimate culmination ofeffective recruiting and training.
First-Year Associate Retention
As you likely know, commission-only positions tend tohave high turnover, and that has always been the casewith Aflac. However, in looking at this chart, it is importantto understand that there is a lag between the time anassociate is recruited and when we measure retention. Wecount associates as retained when they produce businessanytime during the 10th to 12th month of their tenure withAflac. For example, because we are measuring theassociate in the 12th month of tenure, our retention of 2007recruits is actually reflected in the 2008 retention number.The improvement of 19.5% in 2008 reflects benefits of therevised tra in ing program that started in 2006 andcontinues today. We also expect further improvement asour training efforts continue to pay off.
Each year we strive to improve upon the last year inevery measurable category. We remain steadfast in ourcommitment to focus not only on expanding our fieldforce, but doing it the r ight way. We want qual i tyassociates who are motivated to participate in our trainingsystems and sell products people want and need. Asassociates succeed in the early stages of their career, theopportunity for advancement is theirs for the taking. Aflac’sentire Field Force Development team is committed toadvancing our f ield force efforts through improvedrecruiting support, enhancing skills sets through moreeffective training, and motivating our sales force withcreative incentive programs.
• CCrreeaattiinngg aa ppoossiittiivvee wwoorrkk cclliimmaattee
• MMaannaaggiinngg bbuussiinneessss lleeaaddeerrsshhiipp ddiilleemmmmaass
• IImmpprroovviinngg ppeerrffoorrmmaannccee tthhrroouugghh bbuussiinneessss ccooaacchhiinngg
• LLeeaaddiinngg aatt tteerrrriittoorryy mmeeeettiinnggss 00
55
1100
1155
2200
2255
3300%%
22000033 22000044 22000055 22000066 22000077 22000088
1188..991177..881199..99
2211..00
2255..00
1199..55

76
Aflac U.S. Internal OperationsTeresa L. White
Executive Vice President; Chief Administrative Officer
Internal Operations includes many distinct administrativedepartments that provide service support to Aflac’s payrollaccounts, policyholders, and sales associates. More than2,600 employees work in these areas. To provideperspective on the scale of operations: In 2008 wehandled over 10.9 million calls to our service center,completed over 5.2 million requests for policy service,established more than 100,000 new payroll accounts andissued over 3.2 million new policies.
Our focus within Internal Operations has remainedconsistent: to effectively balance operating efficiency withoutstanding service delivery. 2008 was a year of strongservice performance, with further advances in servicerel iabi l i ty, introduction and adoption of technologysolutions that make it easy to do business with Aflac, aswell as delivery of specialized service to key customersegments. These investments are reaping rewards withrespect to perception of the Aflac brand among allemployers and satisfaction levels among Aflac’s existingpayroll accounts.
Service Factors DrivingBrand Perception Among Employers
Research conducted in 2008 by Mil lward Brownindicates that employers within the marketplace aresignificantly more likely to describe Aflac as “serviceoriented” and “having a good reputation” versus otherhealth, life, and supplemental insurance companies. Keyservice areas where Aflac has a distinct advantage inbrand perception within the general marketplace are1) effective and efficient claims handling, 2) easy-to-understand information, 3) knowledgeable call centeremployees, 4) caring about clients and their needs, and5) overall dependability.
Aflac Account Satisfaction with Service
Favorable perception of Aflac’s service capabilities alsotranslates to high levels of satisfaction among companiescurrently offering Aflac products to their employees.Research performed by an independent third partyindicates that 78% of Aflac’s payroll accounts are either“extremely satisfied” or “very satisfied” with our service. Toprovide you with perspective on just how favorable theseresults are, this same research indicates that accountsatisfaction among our three top competitors is muchlower, ranging from 59% to 66%. In addition, over 46% ofAflac’s payroll accounts are very willing to refer Aflac to afriend or colleague, compared with a range of 19% to 30%for our top competitors. Aflac’s service capabilities remaina competitive advantage that is leveraged to open doors,close sales, and retain customers.
Core Administration Expense per Policy in Force
Administration expense per policy is one of the mostfundamental metrics we use to evaluate our efficiencywithin Internal Operations. The trend line shown on thischart represents our core administration expense perpolicy in force, excluding renewal commissions paid to ourfield force associates. While these expenses show agradual increase over time, the rate of change continues tobe modest. This performance has been accomplisheddespite expense pressures that include rising consumerexpectations regarding service delivery, increasing productcomplexity, the need for differentiated service levels forspecific customer segments, and the continued growth ofour business.
Percent Change in Core AdministrationExpense and Earned Premium
• EEffffeeccttiivvee//eeffffiicciieenntt ccllaaiimmss hhaannddlliinngg
• EEaassyy ttoo uunnddeerrssttaanndd iinnffoorrmmaattiioonn
• KKnnoowwlleeddggeeaabbllee ccaallll cceenntteerr eemmppllooyyeeeess
• CCaarriinngg aabboouutt cclliieennttss aanndd tthheeiirr nneeeeddss
• OOvveerraallll ddeeppeennddaabbiilliittyy
SSoouurrccee:: AAffllaacc MMiillllwwaarrdd BBrroowwnn RReeppoorrtt,, 1111//0088
$$1144..3388
$$1133..8833
$$1133..4411
$$1122..8877$$1122..6633
1100
1111
1122
1133
1144
$$1155
22000044 22000055 22000066 22000077 22000088
99..6688..77
66..77
77..77
99..99
1133..11
88..55
1100..881100..66
99..55
66
77
88
99
1100
1111
1122
1133
1144%%
22000044 22000055 22000066 22000077 22000088
EEaarrnneedd pprreemmiiuumm
CCoorree aaddmmiinniissttrraattiioonn eexxppeennssee

77
One of our high-level objectives each year is to ensurethat our expense growth for core administration remainsbelow the growth in earned premium. In 2008, our percentchange in expenses compared very favorably to the pasttwo years and tracked closely with earned premiumgrowth. Our service investments in 2008 were focused onfurther enhancing rel iabi l i ty, leveraging technologysolutions to make it even easier to do business with us,and increasing our capability to deliver differentiatedservice to key customer segments such as brokers, largeaccounts, and Hispanic consumers.
Key Service Interactions
Research among Aflac customers indicates that reliableservice, which means being fast and effective in handlingcustomer requests, is a key driver of market perceptionand customer satisfaction. We continue to experienceoutstanding performance across the board on the keyservice interactions of enrollment, claims, and customerservice center inquiries.
Enrollment Reliability:New Business Automation
From an enrollment perspective, our average time toprocess new policy applications in the first quarter of 2009is 1.3 days, which is well within our service turnaroundtime commitment of two days. This performance isenabled in part by the fact that over 89% of our policyapplications now come via SmartApp or SNG. When wealso include submissions via our web-based enrollmentsolutions, over 90% of submissions are received in anelectronic format. In addition, approximately 67% ofapplications received are processed without manualintervention. This eff icient processing means fasterdecisions for our customers, faster commission paymentsfor our field force associates, and lower processingexpenses for Aflac.
We have also made delivery of our policies simpler andmore cost effective, with the implementation of E-Policy in2008. With this service, our policyholders can elect toreceive an electronic copy of their policy rather than aprinted version via mail. Through March 2009, over 18% ofour policies are offered in the new format, making the
process faster and easier for many customers and savingprocessing and handling expenses for Aflac. As an addedbenefit, E-Policy clearly aligns with our support of a“greener” approach to business.
Aflac Wingspan
We are continuing to build on our enrollment successwith the recent introduction of Wingspan, our core andvoluntary enrollment solution. Wingspan allows employersto offer one of several professional, integrated platforms toenroll core, Aflac and ancillary benefits. This solutionequips employers with tools to effectively manage theenrollment process, while providing employees with clearbenefit communication and a comprehensive summary oftheir enrollment selections. Wingspan yields a simplified,smooth and easy enrollment process for both employersand employees. It also allows brokers to offer leadingedge, marketplace-driven solutions to their clients at nodirect cost for open enrol lment. In developing oursolutions, we have partnered with leading enrollmentsolution providers so that Wingspan will remain on thecutting edge of enrollment technology.
Claims Reliability(Turnaround Time in Days)
With respect to claims, our most critical interaction, ouraverage handling time through March 2009 is just 3.5days. This performance significantly exceeds the servicecommitment of five days we have consistently held forclaims processing. We recognize that in tough economictimes, fast payment of claims becomes even morevaluable to our pol icyholders and a more dist inctcompetitive advantage for Aflac.
We have increased our percentage of claims that areautomated, or handled without manual processing, to over45%. This helps us continue to control costs whileproviding great claims service. In addition, we recently
• EEnnrroollllmmeenntt• CCllaaiimmss• SSeerrvviiccee CCeenntteerr
8877..66 8888..998844..55 8866..11 8877..22 8899..99
6677..77 6677..005588..005566..335566..44
6655..88
00
1100
2200
3300
4400
5500
6600
7700
8800
9900
110000%%
22000044 22000055 22000066 22000077 22000088 33//0099
JJeett--iissssuuee rraattee
TTrraannssaaccttiioonnss vviiaa SSmmaarrttAApppp//SSNNGG
For the EmployerIntegrated benefits enrollmentEnrollment process management
For the EmployeeClear benefit communicationComprehensive summary of benefit
selections
For the BrokerLeading edge, market-driven solutions for
their clientsNo direct cost to broker or employer for
open enrollment
33..5533..55
44..0033..55
55..11
44..66
11
22
33
44
55
66
22000044 22000055 22000066 22000077 22000088 33//0099

78
introduced the capability for our policyholders to submitclaims electronically for select claim types, making theclaims filing process faster, easier and more efficient.
With the continued introduction of new and revisedproducts, effectively managing claims complexity will beimportant to maintaining claims efficiency and reliableservice delivery. To ensure our success, we have staffdedicated to structuring and simplifying business rules forhandling claims.
Aflac’s 2008 claimant satisfaction study indicated that93% of paid respondents said that Aflac met or exceededtheir expectations, up from 92% in 2007. Aflac’s payrollaccount administrators also have a very favorableperception of our performance on claims handling.Independent research conducted in 2008 indicated 80% ofour accounts are extremely or very satisfied with handlingof claims for their employees, versus an average of 63.6%for our top three competitors. Outstanding claims servicecontinues to be a selling point and competitive advantagefor our field force and brokers.
Service Center Reliability(Percentage of Inquiries Handled via IVR)
Aflac’s most frequent customer contact is through ourservice center, and we have continued to build ourcapabilities to effectively manage this interaction. Werecently introduced an enhanced desktop system for ourservice center representatives, providing improved accessto important information and faster and better resolution ofcustomer service requests. We also continued to refineand promote use of our Interactive Voice ResponseSystem, or IVR, which currently handles over 37% of allservice inquiries. While IVR usage remains high, we haveexperienced slight declines due to adoption of the webchannel for simple service inquiries. These technologysolutions helped us reduce our Average Speed of Answeryear-to-date to 1 minute, 32 seconds, an 8% improvementover the same time period in 2008.
Technology solutions are critical to the performance ofour service center. However, we also recognize theimportance of having highly skilled and knowledgeablepeople resources. As daily life becomes more challengingand stressful for our customers, our service centerrepresentatives work even harder to reinforce the feelingthat our customers can count on Aflac now more thanever. Our on-going training on Aflac products and servicesis complemented by soft skill training and reinforcementthat ensures we consistently provide the caring servicethat differentiates Aflac from our competition.
Online Services(Online Billing Adoption Rate)
To complement Aflac’s phone services, we haveexpanded service capabilities via the web for associates,policyholders and payroll accounts. These web servicesgive our customers more choice and flexibility and free ourservice center representative to handle more complexcustomer inquiries.
On-line Billing and Service has become the standardmeans of interacting with Aflac for the majority of our newpayroll accounts. In 2008, we began a significant focus onadoption of online billing for new accounts with a rate ofover 78% through March 2009. This represents anincrease of 52% over prior year, bringing our total accountadoption rate to 35%. This web-based solution is targetedtoward our small to mid-size accounts and allows them toreconcile their invoices, view account information andmake select changes on-line.
For our large accounts, we offer Express Services tosimplify the billing and invoice reconciliation process. Thissuite of tools enables the electronic exchange of billing andpolicy change files between Aflac and the account. Thisfrees the account from having to manually reconcileinvoices and automates the reconciliation and paymentapplication process for Aflac. This solution is also veryattractive to brokers as a time-saving tool they can offer toaccounts at no cost.
For policyholders, we introduced our online policyholderservices in 2008. This web portal provides policyholderswith a variety of self-service options, including access topolicy information, claims status, and the ability to updatepersonal contact information. We will continue to offerchoice of service channels to our customers, whileencouraging the use of self-service capabilities.
Segmented Service
Employers and consumers continue to emphasize theimportance of insurance companies being “easy to dobusiness with.” While our investments in streamlinedservice processes and technical capabilities have given usa compet i t ive edge in the broad marketplace, werecognize the need to provide specialized solutions forselect business segments.
3377..55
4400..994400..00
3355..883388..66
3366..88
1155
2255
3355
4455%%
22000044 22000055 22000066 22000077 22000088 33//0099
1133..223344..33
3388..00
7788..33
5500..99
00
1100
2200
3300
4400
5500
6600
7700
8800%%
22000055 22000066 22000077 22000088 33//0099
NNeeww aaccccoouunnttss
• LLaarrggee aaccccoouunntt eexxeeccuuttiivveess
• BBrrookkeerr sseerrvviiccee mmaannaaggeerrss
• HHiissppaanniicc ccuussttoommeerr ssuuppppoorrtt

79
One area of focus for segmented service has been forAflac’s largest payroll accounts. In late 2008, we developeda large account relations team, with account relationsexecutives assigned to our highest revenue accounts. Theirrole is to manage relationships, monitor key indicators toensure the health and stability of the account, and toprovide service support in partnership with the fieldassociate. Through March of 2009, our account executivesmanage 1,381 large accounts, with large accounts beingdefined as those with 500 or more employees. In addition,this team actively researches industry trends and providesvaluable insights to the field force that assist them inpreserving and building key accounts.
A second area of focus for segmented service has beenin support of Aflac’s broker initiative. Broker ServiceManagers have been assigned to serve as a single point ofcontact with Af lac’s serv ice operat ions for brokercoordinators. This translates to a simple and easy processfor brokers from initial account set-up and enrollmentthrough on-going customer support.
Our third area of segmented service has been forHispanic consumers. To support this segment of themarket, we offer IVR and dedicated phone lines forSpanish-speaking customers, key customercorrespondence in Spanish, and back-office support forhandling of Spanish correspondence. We provide Spanishcommunication for 1.5% of our policies in force, and thatpercentage is steadily growing. Our Spanish languagecapabilities integrate seamlessly with our mainstreamprocessing, which translates to minimal additional expenseand the ability to easily expand or contract our supportbased on market demands.
As these segments of the market grow in size andinfluence, Aflac’s Internal Operations has the foundationalcapabilities in place to expand with the market and providehigh-quality, specialized service.
Field Service Capabilities
Delivery of service to Aflac’s customers is a partnershipbetween Aflac’s headquarters staff and our field salesassociates. We have provided tools to our associates thatallow them to be highly effective in servicing existingcustomers while continuing to network, prospect and growtheir book of business. Introduction and adoption for thesetechnologies continued to expand in 2008.
AflacAlways was introduced in response to researchindicating many of our policyholders forget that their Aflacpolicies are portable and can be taken with them at noadditional cost when they leave their place of employment.When customers enroll in AflacAlways, they agree to havetheir policy automatically switched to direct payment bycredit card or bank debit when they leave the employer.
The change in billing occurs automatically with no lapse incoverage or change in premium for the customer. ThroughMarch of 2009, we have over 20,000 policies with AflacAlways coverage protection. We are increasing promotionof this service in 2009, as it gives our customers peace ofmind in a more volatile job market and simplifies theprocess of converting policies from payroll to direct billingfor our associates.
Af lacAnywhere al lows our associates to receiveelectronic notification of important customer events whilethey are in the field. Field adoption of this tool hasincreased to 39,000 unique subscribers through March2009. Af lacAnywhere is complemented by anothersolution, MobileAflac, which provides our associates with awireless connection to access items such as policy orclaims information. This tool allows the associate to quicklyhandle customer inquiries and needs, without requiring acall to the service center. Adoption of MobileAflac hasincreased to over 4,300 users through March of 2009, a67% increase over the prior year. Together, these toolsprovide our associates with both subscription-based andon-demand access to information. This increases theefficiency of our sales force, while enabling them to provideoutstanding service to our customers.
Field Reporting and Management
In 2008, we introduced a new Aflac Reporting andPerformance Management tool (RPM) to our field force.RPM is a standardized corporate reporting tool that assiststhe field in formulating sales strategies, determiningtraining opportunities, and monitoring daily, weekly,quarterly, and yearly sales performance. This tool providesenhanced tracking of key metrics such as recruitingresults, new associate premium, and new account activity.Information is displayed in an easy to use scorecard formatfor our state and territory operations. The most significantbenefit of RPM is that it makes planning and managementof field activities and performance simpler and moreefficient for our field force.
We also continue to add functionality to our LeadsManagement solution to provide our field with the ability toeffectively manage account and policyholder leads, and totrack and drive closure rates. For 2008, the rate of leadsclosed with sales was 10.9% for payroll account leads and3.8% for direct policyholder leads.
Now more than ever, customers want to do businesswith insurance companies that are reliable, trustworthy,and “easy to do business with.” In a turbulent market,consistent service delivery that is complemented by acaring, personal touch becomes even more of a positivedifferentiator for Aflac. Leading-edge technology solutionsunderpin our model and allow us to offer outstandingservice at a low cost of operation. We have built afoundation that ensures we continue to deliver on ourpromise of great service while aggressively managingefficiency and expenses.
• AAffllaacc RReeppoorrttiinngg aanndd PPeerrffoorrmmaanncceeMMaannaaggeemmeenntt TTooooll ((RRPPMM))
• LLeeaaddss mmaannaaggeemmeenntt
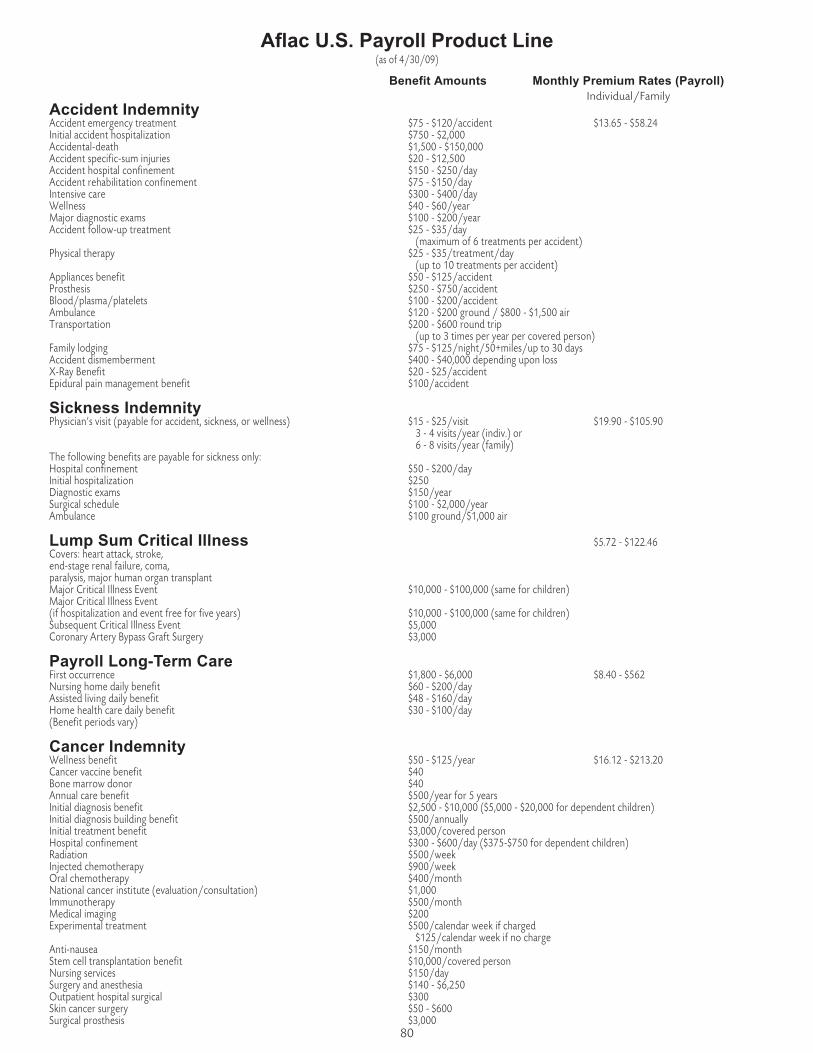
Aflac U.S. Payroll Product Line(as of 4/30/09)
80
Benefit Amounts Monthly Premium Rates (Payroll)Individual/Family
Accident IndemnityAccident emergency treatment $75 - $120/accident $13.65 - $58.24Initial accident hospitalization $750 - $2,000Accidental-death $1,500 - $150,000Accident specific-sum injuries $20 - $12,500Accident hospital confinement $150 - $250/dayAccident rehabilitation confinement $75 - $150/dayIntensive care $300 - $400/dayWellness $40 - $60/yearMajor diagnostic exams $100 - $200/yearAccident follow-up treatment $25 - $35/day
(maximum of 6 treatments per accident)Physical therapy $25 - $35/treatment/day
(up to 10 treatments per accident)Appliances benefit $50 - $125/accidentProsthesis $250 - $750/accidentBlood/plasma/platelets $100 - $200/accidentAmbulance $120 - $200 ground / $800 - $1,500 airTransportation $200 - $600 round trip
(up to 3 times per year per covered person)Family lodging $75 - $125/night/50+miles/up to 30 daysAccident dismemberment $400 - $40,000 depending upon lossX-Ray Benefit $20 - $25/accidentEpidural pain management benefit $100/accident
Sickness IndemnityPhysician’s visit (payable for accident, sickness, or wellness) $15 - $25/visit $19.90 - $105.90
3 - 4 visits/year (indiv.) or6 - 8 visits/year (family)
The following benefits are payable for sickness only:Hospital confinement $50 - $200/dayInitial hospitalization $250Diagnostic exams $150/yearSurgical schedule $100 - $2,000/yearAmbulance $100 ground/$1,000 air
Lump Sum Critical Illness $5.72 - $122.46Covers: heart attack, stroke,end-stage renal failure, coma,paralysis, major human organ transplantMajor Critical Illness Event $10,000 - $100,000 (same for children)Major Critical Illness Event(if hospitalization and event free for five years) $10,000 - $100,000 (same for children)Subsequent Critical Illness Event $5,000Coronary Artery Bypass Graft Surgery $3,000
Payroll Long-Term CareFirst occurrence $1,800 - $6,000 $8.40 - $562Nursing home daily benefit $60 - $200/dayAssisted living daily benefit $48 - $160/dayHome health care daily benefit $30 - $100/day(Benefit periods vary)
Cancer IndemnityWellness benefit $50 - $125/year $16.12 - $213.20Cancer vaccine benefit $40Bone marrow donor $40Annual care benefit $500/year for 5 yearsInitial diagnosis benefit $2,500 - $10,000 ($5,000 - $20,000 for dependent children)Initial diagnosis building benefit $500/annuallyInitial treatment benefit $3,000/covered personHospital confinement $300 - $600/day ($375-$750 for dependent children)Radiation $500/weekInjected chemotherapy $900/weekOral chemotherapy $400/monthNational cancer institute (evaluation/consultation) $1,000Immunotherapy $500/monthMedical imaging $200Experimental treatment $500/calendar week if charged
$125/calendar week if no chargeAnti-nausea $150/monthStem cell transplantation benefit $10,000/covered personNursing services $150/daySurgery and anesthesia $140 - $6,250Outpatient hospital surgical $300Skin cancer surgery $50 - $600Surgical prosthesis $3,000

81
Benefit Amounts Monthly Premium Rates (Payroll)Individual/Family
Cancer Indemnity (con’t)Prosthesis nonsurgical $250Reconstructive surgery $350 - $3,000Blood and plasma $150/dayAdditional surgical opinion $300/opinion/dayAmbulance $250 ground, $2,000 airTransportation $0.50/mileLodging $80/dayBone marrow transplant $10,000, donor $1,000Extended-care facility $150/dayHospice $1,000 day one, $50/day thereafterHome health care $150/day
Lump Sum Cancer $7.54 - $164.58Internal Cancer $10,000 - $100,000 (same for children)Carcinoma In Situ $2,000Cancer Related Death $5,000
Short-Term Disability (individual coverage)Disability benefits for sickness and off-the-job injury $500 - $5,000 $14.95 - $266.50Elimination periods 0-180 days. Benefit periods 3-24 months
Hospital Indemnity*Hospital confinement $100/day $27.95 - $138.32Annual confinement benefit (first 5 days) $400 - $500/day/policy/yearSurgical $100 - $1,000Wellness $50/once per year/policyOutpatient surgical room charge $300 general/$100 w/o for surgery or invasive diagnostic examInvasive diagnostic exams $100/person/dayRehabilitation $100/day 15 days/confinement 30 days/yearMedical diagnostic imaging $150/exam/person per yearAmbulance $100 ground/$1,000 airInitial hospitalization (rider) $250, $500, $750, $1,000*Three levels available with benefits added at each level. Level 1 compatible with Health Savings Accounts (HSAs).
Payroll LifeWhole-life face amounts $10,000 - $200,000 $1.04 - $70.7210-, 20-, and 30-year term face amounts $10,000 - $200,000Optional return of premium on 20- and 30-year term policiesAccelerated death benefitWaiver of premiumOptional accidental-death benefit riderDependent coverage availableSimplified-issue, rates guaranteed
Hospital Intensive CareHospital intensive care unit $700 - 800/day (days 1-7) $10.40 - $24.57
$1,200 - $1,300/day (days 8-15)Sub-acute intensive care unit benefit $350/day (days 1-15)Organ transplant $25,000 - $50,000Ambulance $250 ground, $2,000 air
Specified Health Event $9.10 - $15.08Covers: heart attack, stroke, coronary artery bypass surgery,coma, paralysis, major third-degree burns, end-stage renalfailure, major human organ transplant, persistent vegetative stateFirst occurrence $5,000 ($7,500 children)Reoccurrence $2,500Secondary specified events $250/procedureHospitalization $300/dayContinuing care $125Ambulance $250 ground, $2,000 airLodging $75/dayTransportation $.50/mile up to $1,500 per occurrence
DentalDental wellness (Preventive) $25 - $75/year $23.40 - Individual (Basic)Scheduled benefits $15 - $1,100 $159.50 - Two-parent family (Premier Plus)
VisionVision correction materials $50 - $210 $13.90 - $49.90Refractive error correction $100 - $420Eye exam $35Permanent visual impairment Up to $20,000Specific eye diseases/disorders $1,000Eye surgery $50 - $1,500
Aflac U.S. Payroll Product Line (con’t)(as of 4/30/09)

82
Daniel P. AmosChairman and Chief Executive Officer,Aflac, Aflac Incorporated
Dan Amos, 57, graduated from theUniversity of Georgia with a bachelor’sdegree in insurance and r isk
management. He first joined Aflac as a sales associatewhile in his teens. He served as state manager of Aflac’sAlabama/West Florida Territory for 10 years. Under hisleadership, his sales territory was the number oneproducing area in 1981 and 1982. He was electedpresident of Aflac in 1983 and chief operating officer ofAflac in 1987. He became chief executive officer in 1990and was named chairman in 2001. Dan serves on theboard of directors of Synovus Financial Corporation andis a member of the boards of trustees of Children’sHealthcare of Atlanta and House of Mercy of Columbus.He is a past recipient of the Dr. Martin Luther King Jr.Unity Award and the Anti-Defamation League’s Torch ofLiberty Award, and has been named by CNN as CEO ofthe Week. In 2009, Dan was named America's BestCEO for Life Insurance by Institutional Investor magazine.He is the former chairman of the boards of The Japan-America Society of Georgia and the University of GeorgiaFoundation.
Kriss Cloninger IIIPresident and Chief Financial Officer,Aflac Incorporated
Kriss Cloninger, 61, jo ined Af lacIncorporated in March 1992 as seniorvice president and chief financial officer.
He was promoted to executive vice president in 1993and president in May 2001. Since joining Aflac, he hashad primary responsibility for overseeing the financialmanagement of all company operations. In March 2006,he was named Best CFO in the insurance/life category inAmerica by Institutional Investor magazine for the thirdyear in a row. He is a member of the boards of directorsof Aflac Incorporated, Tupperware Brands Corporation,and Total Systems Services, Inc. He holds bachelor’sand master’s degrees in business administration fromthe University of Texas at Austin and is a Fellow of theSociety of Actuaries.
Paul S. Amos IIPresident, Aflac;Chief Operating Officer, Aflac U.S.
Paul Amos, 33, holds a bachelor’sdegree in economics from DukeUniversity and a master’s degree in
business administration from Emory University. He alsoholds a juris doctor degree from Tulane University. Hejoined Aflac in 2002 as the state sales coordinator for theGeorgia-North sales territory. Under his leadership, theGeorgia-North sales territory grew to become thecompany’s No. 1 state operation. He was promoted toexecutive vice president, Aflac U.S. in January 2005 andassumed the additional responsibilities of chief operatingofficer in February 2006. He was promoted to his currentposit ion as president of Af lac in 2007, and he isresponsible for the development and implementation of acomprehensive strategic plan designed to increase U.S.sales, enhance recruiting and training, and maximizeoperational efficiencies. He is responsible for centralizingthe recruiting and training functions for Aflac’s 70,000+sales associates, creating a new broker channel, andbroadening the company’s marketing plan to includediversification of both media and messages. Prior tojoining Aflac, he worked in the corporate legal division ofthe merger and acquisition firm, Skadden, Arps, Slate,Meagher and Flom, in Washington, D.C. He is a memberof the boards of directors of Aflac Incorporated, theWinship Cancer Center at Emory University, the TurnerSchool of Business at Columbus State University andthe Make-a-Wish Foundation of Southwest Georgia.
Martin A. Durant IIIExecutive Vice President;Deputy Chief Financial Officer,Aflac Incorporated
Martin Durant, 60, graduated from theUnivers i ty of West Flor ida with a
bachelor’s degree in accounting. Immediately aftercollege, he gained experience with a venture capital firmand as an accountant with KPMG/Peat Marwick. Heoriginally joined Aflac in 1990 as vice president andcomptroller of Aflac Incorporated and remained withAflac for 10 years, during which time he was promotedto senior vice president, Corporate Services. In 1999, heaccepted a position as senior vice president and CFO ofCarmike Cinemas, Inc., from which he retired in April2006. He became senior vice president; CorporateFinance in July 2006 and was promoted to executivevice president; deputy chief financial officer in June2008. In his new posit ion as deputy CFO, he wil lcontinue to work closely on capital management, riskmanagement and other financial matters.
Section IVThe Management Team

Joey M. LoudermilkExecutive Vice President;General Counsel;Corporate Secretary
Joey Loudermi lk, 56, earned abachelor’s degree with honors from
Georgia State University and a juris doctorate degreefrom the University of Georgia School of Law. He workedin private law practice before joining Aflac in 1983 ashead of the company’s then newly formed LegalDepartment. In 1988, he assumed responsibility forgovernmental relations. In February 1989, he becametreasurer for Af lac Incorporated’s pol it ical actioncommittee (Aflac-PAC) and was appointed senior vicepresident, corporate counsel, for Aflac Incorporated in1989. In 1991 he was promoted to general counsel ofAflac Incorporated and Aflac, and in 2000 he waspromoted to his current position as executive vicepresident. He is a member of the State Bar of Georgia,the American Corporate Counsel Association and theAmerican Society of Corporate Secretaries. He alsoserves on the boards of the Georgia Humanities Council,the Georgia Military Affairs Coordinating Committee, andthe Columbus Regional Medical Foundation. He isformer president of the Rotary Club of Columbus.
Audrey Boone TillmanExecutive Vice President;Corporate Services
Audrey Boone Tillman, 44, received abachelor of arts degree from theUniversity of North Carolina at Chapel
Hill and a juris doctorate from the University of GeorgiaSchool of Law. Before joining Aflac in 1996, shecompleted a federal judicial clerkship, worked in privatepractice, and was a law school professor. She holds lawlicenses in Georgia, North Carolina, and the District ofColumbia. Her main areas of responsibility are: HumanResources, Facilities, Corporate Training and HealthServices. She was promoted to second vice president in1997 and to vice president in 2000, where sheconcentrated on employment law. She was promoted tosenior vice president of Human Resources in 2001, andto her current position in 2008. She currently serves as adirector-at-large for the Society for Human ResourceManagement (SHRM).
Teresa L. WhiteExecutive Vice President,Chief Administrative Officer
Teresa White, 42, earned a bachelor’sdegree in business administration fromthe University of Texas at Arlington and a
master’s degree in management from Troy StateUniversity. She joined Aflac in 1998 as second vicepresident, Client Services; was promoted to vice presidentof Client Services in 2000; to senior vice president,director of Sales Support and Administration, in October2004; to deputy chief administrative officer in March 2007,and to her current position in March 2008. In her currentrole, Teresa oversees administrative functions in ClientServices, Claims, Aflac New York Administrat ion,Administrative Services, New Account Set-Up, NewBusiness, Field Contracting and Compensation, SupportServices, Shared Services, Payment Services, AccountRelations, Field Liaison Office and Corporate Travel andEvents. She also oversees Sales Support andAdministrat ion and Sales Financial Managementdepartments. Teresa is an alumnus of LeadershipColumbus, and is a Fellow of the Life ManagementInstitute. She currently serves on the board of directors forColumbus NeighborWorks, SIFE and Communicorp.She’s also a member of Delta Sigma Theta Sorority, Inc.
Peter T. Adams, CPASenior Vice President, FinancialReporting; Assistant Treasurer
Peter Adams, 53, earned a bachelor’sdegree in business from the University ofSouth Alabama. He joined Aflac in August
1999 and has responsibilities for Treasury, FinancialReporting and Compliance, and Investments Accounting.Before joining Aflac, he was a senior manager with KPMGLLP, where he specialized in audit and accountingconsulting services for publicly held insurance companies.He is a certified public accountant and a member of theAmerican Institute of Certified Public Accountants and theAlabama Society of Certified Public Accountants.
Janet P. Baker, ACSSenior Vice President, Corporate Learning
Janet Baker, 48, completed a master’sdegree in human resources managementat Troy State University in 1995 andgraduated magna cum laude in 1994 with
a bachelor’s of science degree in management from TroyState. She joined Aflac in 1982 and has held variouspositions, including second vice president, HumanResources, and second vice president, Client Services.She was appointed vice president, Marketing Services, in1999, was named vice president, Account Implementationand Management, in July 2002, to senior vice president,Client Services in October 2004, and was appointed to hercurrent position in December 2007. She has held boardpositions with the YMCA; serving as past president forColumbus’ Golden K Kiwanis Club and AltrusaInternational – a community organization directed atbuilding leadership skills for women and addressing literaryissues within the city. Other boards include the AmericanRed Cross, Easter Seals and the Historic Liberty Theatre.
83

84
Susan R. BlanckSenior Vice President; Corporate Actuary;First Senior Vice President, Aflac Japan
Sue Blanck, 42, graduated from theUniversity of Missouri-Columbia with abachelor’s degree in education. She
joined Aflac’s Actuarial Department in the U.S. pricingarea in 1993. She was promoted to second vicepresident and assistant actuary in 1998. In 2000 shewas promoted to vice president, and in 2002 sheassumed responsibility for developing Aflac’s businessand financial plans. She was promoted to senior vicepresident and deputy corporate actuary in March 2004,to corporate actuary in January 2006, and additionally tofirst senior vice president, Aflac Japan, in June 2008. Inthis capacity, she will continue to work on productdevelopment and strategic marketing initiatives in Japan.She is a fellow of the Society of Actuaries and a memberof the American Academy of Actuaries.
M. Jeffrey “Jeff” CharneySenior Vice President;Chief Marketing Officer
Jeff Charney, 50, earned a bachelor ofarts degree from the University of SouthCarolina and a master’s degree from The
Ohio State University. He joined Aflac in December 2008in his current position, and comes to Aflac from QVC,Inc., where he served as senior vice president and CMO.Prior to his career at QVC, he was a founder of FringeVentures, LLC, a creative marketing consulting companyin Santa Monica, California, and served as senior vicepresident at Washington Mutual, Homestore and KBHome. Additionally, he has held senior level positions atRockwell International and Raytheon Company. Hisprofessional honors and distinctions include beingnamed one of Advertising Age magazine’s “Marketing100” Top Marketers of the Year.
Laree R. DanielSenior Vice President, CustomerAssurance Organization
Laree Daniel, 47, holds bachelor ofscience degrees in business andpsychology from Nebraska Wesleyan
University and a master of science degree in organizationalpsychology from the University of Nebraska at Omaha.She joined Aflac in September 2007 as a CustomerExperience Consultant for Internal Operations, waspromoted to vice president of Client Services in December2007, and in March 2009 was promoted to her currentposit ion as senior vice president of the CustomerAssurance Organization for Aflac, which includes ClientServices, Claims, Aflac Benefit Services, & New YorkAdministration. Laree is an insurance industry veteran withmore than 17 years of leadership, having joined Aflac fromtwo of the nation’s largest insurers – Assurant Health andMutual of Omaha. She most recently served as chiefadministrative officer for Assurant Health in Milwaukee, andprior to that held various leadership positions at Mutual ofOmaha. Her professional designations include the HealthInsurance Association of America (HIAA) and theAccredited Customer Service (ACS).
Phillip J. “Jack” FriouSenior Vice President;Director of Governmental Relations
Jack Friou, 59, graduated from theUniversity of Georgia in 1971 with abachelor’s degree in political science and
served in the Army for two years. He joined Aflac in 1973and has served in various capacities in administrationand marketing, including Agency Administration, thePolicyholder Service Department and the ComplianceDepartment. He also served as president of Aflac NewYork and senior vice president, Marketing and AgencyDevelopment. His current area of responsibility includesstate legislative and regulatory relations.
Kenneth S. Janke Jr.Senior Vice President,Investor Relations
Ken Janke, 51, attended Michigan StateUniversity and received a bachelor’sdegree in pol it ical science from the
University of Michigan in 1981 and a master’s degreefrom Oakland University’s School of Economics andManagement in 1985. Before joining Aflac Incorporatedas manager of Investor Relations in 1985, he wasdirector of Corporate Services for the Nat ionalAssociation of Investors Corporation (NAIC) in MadisonHeights, Michigan. He also chairs Aflac’s DisclosureCommittee.
W. Jeremy “Jerry” JefferySenior Vice President;Chief Investment Officer
Jerry Jeffery, 58, graduated from YaleUniversity with a bachelor of arts inpolitical science. He joined Aflac in 2005
as senior vice president and deputy chief investmentofficer. Prior to joining Aflac, Jerry had a 23-year careerwith Morgan Stanley, where he focused on diverse fixedincome strategies affecting a wide range of industries.Over the last 10 years there, he served as executivedirector of Fixed Income Institutional Sales.
Robert M. OttmanSenior Vice PresidentSales Operations Management
Bob Ottman, 53, is senior vice presidentover Sales Operations Management. Bobbegan his management career at Aflac in
1999 and has served in several leadership positions,including second vice president, Aflac AdministrativeServices and vice president, AIM and Aflac BenefitServices. He was promoted to senior vice president;Claims, Shared Services, Hispanic Services, BenefitServices and New York Administration in 2005 and to hiscurrent position as senior vice president over SalesOperations Management in 2009. Bob holds a bachelor’sdegree from Eastern Connecticut State University. Beforejoining Aflac, he held the position of vice president atFrank Gates USA (formerly Acordia of Dallas). He is amember of the ECFC and holds a CFCI designation.

85
David L. PringleSenior Vice President,Federal Relations
David Pr ingle, 53, graduated fromMississippi State University, where hereceived a bachelor of arts degree in
insurance and risk management. He has worked forAflac for more than 29 years. For nine of those years,David worked with the Aflac sales force in Mississippi,North Carolina and West Virginia, where he worked hisway from the posit ion of associate to state salescoordinator. During his career with Aflac, David has alsoworked at Af lac Worldwide Headquarters as theassistant agency director for the West Territory, anddirector of Training, where he was responsible forhelping develop the concept for Aflac’s state trainingprograms. He assumed his current position in 2006. Hispr imary responsibi l i ty is to coordinate Af lac’sgovernment relations and lobbying efforts in Washington,D.C. He also serves as secretary and principal fundraiserfor Aflac’s Political Action Committee (Aflac PAC), whichis the largest political action committee among allinsurance companies.
Ralph A. Rogers Jr.Senior Vice President,Financial Services;Chief Accounting Officer
Ralph Rogers, 60, graduated fromTennessee Technological University in
1970 with a bachelor’s of business administrationdegree in accounting. He joined Aflac in 2000 as seniorvice president, Financial Services. He assumed the roleof chief accounting officer in 2002. Before coming toAflac, he was a senior vice president at another largeinsurance company. He is a member of the AmericanInstitute of Certified Public Accountants, the TennesseeSociety of Certif ied Public Accountants, FinancialExecut ives Internat ional , and the Inst i tute ofManagement Accountants.
Ronald S. SandersSenior Vice President; Director of Sales
Ron Sanders, 54, received a bachelor’sdegree in environmental science fromLamar University. He joined Aflac in 1983as an associate in Beaumont, Texas. He
was promoted to district sales coordinator in 1984 andto regional sales coordinator in 1986. In 1988 Ron tooka marketing position with Aflac headquarters and in1990 became director of Field Force Development forrecruiting and training. In 1990, he was named statesales coordinator of Arizona/New Mexico. Ron waspromoted to vice president, Southwest Territory Directorin April 2005, to senior vice president, deputy director ofAflac U.S. sales in November 2008, and to his currentposition as senior vice president; director of sales inMarch 2009.
Gerald W. ShieldsSenior Vice President,Chief Information Officer
Gerald W. Shields, 51, graduated fromBaylor University with bachelors’ ofbusiness administration in accounting
and computer sciences. He began his managementcareer at Aflac in 2002 as vice president, InformationTechnology-Enterprise Services and was promoted tochief information officer for Aflac Incorporated in July2005. In his current position, he oversees all aspects ofAflac’s U.S. Information Technology division and is alsoresponsible for the division’s project management andcustomer relationship management efforts. During histenure, Computerworld and Information Week magazinehave consistently named Aflac as one of the Best Placesto Work in IT. He was also selected by Computerworldas one of the 100 Premier CIOs for 2006. In March2007, he was honored as one of Computerworld’sPremier 100 IT Leaders. Before joining Aflac, he heldsenior IT positions at Electronic Data Systems (EDS) andserved as the chief technology officer, director ofInformation Services for LifeWay Christian Resources inNashville, Tennessee. He is a member of the inauguralgoverning body for the Atlanta CIO Executive Summit, aswell as a Fellow of the Life Management Institute.
James C. WoodallPresident and CEO,Communicorp, Inc.
James Woodall, 62, received his BBAfrom Columbus State University, AbbottTurner School of Business. Prior to
joining Communicorp in 1991, he was president andCEO of The Print House, Inc., a Communicorp affiliate. Inhis current posit ion, he is responsible for al lCommunicorp administration and operations, includingboth the Columbus and Atlanta facilities. He currentlyserves on the boards of directors of Communicorp, Inc.,the Youth Orchestra of Greater Columbus, theColumbus State University Friends of Art, the Printingand Imaging Association of Georgia, and as chairman ofthe Aflac Credit Union board.

86
Brian L. AbeytaVice President,IT Project Management Office
Brian Abeyta, 42, holds a bachelor’sdegree from the Air Force Academyand a master’s degree from the Florida
Institute of Technology. He holds another master’sdegree earned while studying at both the University ofNevada – Las Vegas and the University of Phoenix.Brian is a military veteran having served eight years ofAir Force active duty. Brian joined Aflac in 2001 as asenior corporate project manager and has served inseveral positions in IT, most recently serving as secondvice president, Project Management Office. He waspromoted to his current position as vice president, ITProject Management Office, in July 2007. As vicepresident, Brian guides the overall direction of theProject Management Office by managing all aspects ofthe design, development, and implementation ofprojects within the IT division and for IT’s internalcustomers. He also actively participates in long-rangestrategy planning and manages policy development toaddress complex business issues.
Ronald G. AgyptVice President, U.S. Broker Sales
Ron Agypt, 52, joined Aflac in 2008 tolead the team for Broker Sales. Ronspent over 34 years with CombinedInsurance, an Aon Company, where he
started as a sales representative and became theyoungest regional manager and vice president in thehistory of the company. During his previous career, heled 12 different organizations ranging from 22employees to 4,000. His latest project was building anddeveloping a worksite company for CombinedInsurance. Ron is responsible for setting corporatestrategy, operational performance, professional andmanagement development, value-added services,technical resources, and national marketing relationshipsall within the U.S. broker arena for Aflac. Ron has servedon the Better Business Bureau of Northern Illinois, theboard of directors for Sterling Life Insurance, and theboard of directors for Legal Club of America.
J. Brian AngelVice President,Counsel
Brian Angel, 43, received his bachelorof business administration degree fromthe University of Texas at Austin. He
joined Aflac’s Legal Department in 1992 after earninghis juris doctor degree from the University of TexasSchool of Law. In 1996 he was promoted to secondvice president, regulatory counsel, and transferred toAlbany, New York, where he assumed day-to-dayresponsibility for Aflac New York’s legal, regulatory,and government re lat ions matters. In 2001 herelocated back to Columbus to serve as Aflac’s privacyofficer. In 2003 he joined the Government Relationsdepartment as counsel and was promoted to hiscurrent position in 2006. He is a member of the statebars of Texas and Georgia.
Carol E. AustensenVice President,U.S. Business Innovation and Solutions
Carol Austensen, 46, graduated fromMercer University with a bachelor’sdegree in marketing and received her
MBA from Emory University’s Goizueta School ofBusiness. She has also completed the GeorgiaInst i tute of Technology’s Six Sigma black Beltcertification program. Carol has more than 20 years ofinsurance and management experience and joinedAflac in 2002 as a business consultant in the ProjectManagement Office. Most recently, she served as vicepresident, U.S. Strategic Planning Office. Her previousroles at Aflac include second vice president of ClientServices, vice president of U.S. Strategy and Planning,and vice president of Business Innovat ion andSolutions. In her current role, Carol and her teamdevelop and execute comprehensive service strategiesand provide quality and risk management services forU.S. Internal Operations. Before joining Aflac, Carolserved as a director at Allstate Insurance Companyand as a business strategy consultant with severalsmall, boutique firms. She has more than 17 years ofleadership experience.
Lynn G. BarnsonVice President;Territory Director, Southwest Territory
Lynn Barnson, 53, jo ined Af lac inFebruary, 1981, as an associate insouthern Utah. Eight months after
joining Aflac, he was promoted to a district salescoordinator, and spent three years bui ld ing asuccessful district organization. In January 1985, hewas promoted to regional sales coordinator in Ft.Worth, Texas, and in 1987, he was promoted todirector of metro development at Aflac WorldwideHeadquarters. In 1988, Lynn was promoted to vicepresident, agency director of the newly formedMountain Territory. In 1990, he was promoted toterritory director of a newly expanded West Territory,where he met and/or exceeded his sales quota twelveout of sixteen years and successfully helped build theWest Territory to ultimately spin off two territories – thePacific and Southwest Territories. Lynn assumed therole as the state sales coordinator of Nevada in 2004,and in 2009 was promoted to Territory Director,Southwest Territory in 2009.
Michael E. BartowVice President,Financial Control
Mike Bartow, 54, received a bachelor’sof business administration degree inaccount ing from the Univers i ty of
Wisconsin at Oshkosh. He became a Fellow of the LifeManagement Institute in 1981 and earned a CPAdesignation in 1983. Before joining Aflac in 1986, hewas a manager at Sentry Insurance. He was promotedto second vice president in 1995 and to vice presidentin 2001. He is a member of the American Institute ofCertified Public Accountants.

Debra H. BeckleyVice President,Sales Financial Management
Debra Beckley, 51, attended MercerUniversity and graduated from WestGeorgia College with a bachelor’s of
business administration degree in accounting. She joinedAflac’s Accounting Department in 1979, and since thattime she has held various positions in the FinancialDivision. She became a supervisor in Financial Reportingin 1984 and was later promoted to manager of thePayroll Department in 1986. In 1988 she was appointedassistant vice president, General Accounting, and in1990, she was named second vice president, GeneralAccount ing. In 1994, she was promoted to vicepresident, Agents’ Accounting/Remittance ProcessingServices. She was named vice president, Sales FinancialManagement in 2005.
Alfred O. Blackmar, FLMIVice President,Facilities Support
Alfred Blackmar, 47, graduated fromPresbyterian College with a bachelor’sdegree in business administration. He
joined Aflac in 1984 and has been in his current positionsince 1999. He previously served as vice president,deputy director, Compliance. He is past executivechairman of the Life and Health Compliance Association.
Mary M. Chapman, CFAVice President,Investments
Mary Chapman, 47, graduated fromHarvard University with a bachelor’sdegree in European history, and she
received her master’s of business administration degreefrom Cornell University. Before joining Aflac in 1993, sheworked in investment banking and bond analysis. In1997 she was promoted to her current position withresponsibility for credit analysis of Aflac’s dollar- andyen-denominated portfolios. She is a chartered financialanalyst and a member of the CFA Institute.
Michael S. ChilleVice President;Territory Director, Northeast Territory
Michael Chille, 38, earned a bachelor’sdegree in f inance from the StateUniversity of New York at New Paltz. He
joined Aflac in March 1995 as a personal producer, andin November of that year, he was promoted to districtsales coordinator. He was named regional salescoordinator in April 1996 and state sales coordinator ofMetro New York/New Jersey in June 1998. He waspromoted to his present position in November 2003.
Nikka N. CopelandVice President, U.S. Strategy,Planning & Analysis
Nikka Copeland, 41, earned a bachelor’sdegree in economics from the Universityof Macedonia and an MBA in Finance
and International Business from the University ofOklahoma. Nikka joined Aflac in 2007 in her currentposit ion, and is responsible for coordinat ing thecontinued development of a comprehensive strategy andbusiness plan for Aflac’s U.S. operations. Prior to joiningAflac, she worked for the Burger King Corporation (BKC)in Miami, where she held the role of senior director,Global Strategy, Planning and Business Finance. AtBKC, she led a team responsible for developing thecompany’s global strategy, and oversaw the company’splanning, forecasting and performance analysis process.Before her tenure at BKC, Nikka served as seniormanager, Asset Strategy and M&A for PepsiCo,Inc./YUM! Brands. Earlier in her career, she held roles ofvarying responsibility in strategy and business planningat Omega Environmental, Inc., Amoco Corporation andMacosped Export/Import, Inc.
Timothy J. CraigVice President:Territory Director, West Territory
Tim, 49, began his career with Aflac in1981 as an associate in Utah.Throughout his career with Aflac he has
held the positions of district, regional and state salescoordinator. As district sales coordinator, he was therecipient of the #2 companywide DSC award and heldthe Aflac record for the most production for month,quarter and year in 1987. He was an RSC in Texas andassumed a marketing coordinator position for the WestTerritory in 1991. He was promoted to SSC of Utah in1995. As an SSC, one of his most importantcontributions to Aflac was achieving and exceedingmarket potential index for 12 out of 13 years. He hasqualified for 34 FAMEs, 23 Conventions and numerousother Aflac awards and recognitions. Tim was promotedto his current position as Vice President, TerritoryDirector, West Territory in December of 2008.
Lynn B. FryVice President,Sales Support and Administration
Lynn Fry, 50, joined Aflac in March 1982in the Information Technology Division. In1993 she was promoted to second vice
president, Information Systems, and in 1997 she waspromoted to vice president. In 2000 she moved to theMarket ing Div is ion to serve as vice president ofMarketing Technology Support, focusing on technologyfor the company’s field force. In 2002 she assumedadditional responsibilities in Sales Support, and currentlyis responsible for Sales Administration and Support, andcurrent ly is responsible for Sales Support andAdministration, Field Contracting and Compensation,and the Field Liaison Office.
87

Brett J. Gant, FSA, MAAAVice President;Actuarial Pricing
Brett Gant, 51, received a bachelor’sdegree in mathematics from MariettaCol lege and a master’s degree in
statistics from Miami University of Ohio. He joined Aflacin the Actuarial Department in 1981. In 1993 he waspromoted to vice president overseeing pr ic ingdevelopment for Aflac U.S. products. In 2003 hereceived additional responsibilities supporting AflacJapan business. In 2008 he assumed his currentposit ion of overseeing U.S. actuarial involvementsupporting profitability analysis and components ofvaluat ion and f inancia l report ing for Af lac Japanbusiness, as well as responsibilities for re-rating andmonitoring analysis for Aflac U.S. products. He is amember of the Society of Actuaries and the AmericanAcademy of Actuaries.
Gregory J. Gantt, CFAVice President,Fixed Income Investments
Greg Gantt, 50, received his bachelor’sdegree in accounting from Georgia StateUniversity. He joined Aflac in 1982 as a
member of the Financial Planning Department. Hemoved to the Investment Department in 1987, where hewas in charge of investment accounting. In 1991 he waspromoted to his current position with responsibility formanaging Aflac Japan’s U.S. dol lar f ixed-incomeportfo l io. He is also a part of the Af lac GlobalInvestments team that oversees management of Aflacassets worldwide. He is a member of the Association forInvestment Management and Research.
Kenneth L. “Casey” GravesVice President,Human Resources Support
Casey Graves, 52, received a bachelorof science degree in market ing/management and an associate of arts
degree in computer science from Southeast MissouriState University. He joined Aflac in 2002 as manager ofHuman Resources Information Systems (HRIS) andPayroll. He was promoted to second vice president inOctober 2004 and then to vice president in August2006. Casey is responsible for Compensation, Benefits,Human Resources Information Systems, HR Finance andthe Payroll Departments within Human Resources, andhas more than 25 years of exper ience in humanresources and information systems. He also played akey role in the implementation of the SAP HCM modulein 2007. Before joining Aflac, he worked for DardenRestaurants as director of IT in support of humanresources, and as director of HRIS. He also spent 15years with the McDonnell Douglas Corporation, where heserved in various human resources-related roles.
June Howard, CPA, CFAVice President,Financial Services, IFRS
June Howard, 43, graduated from theUniversity of Alabama in Huntsville with abachelor’s degree in business
administration. She joined Aflac in June 2009 and isresponsible for SEC reporting and IFRS implementation.Before joining Aflac, she held financial reporting positionsof increasing responsibility at ING and The Hartford.Additionally, she worked as an auditor with Ernst & Youngfor nearly ten years. June is a member of the AmericanInstitute of Certified Public Accountants, the AlabamaSociety of Certified Public Accountants, the CFA Instituteand the Atlanta Society of Financial Analysts.
John A. “Al” JohnsonVice President, Marketing Services;Director of Branding and Advertising
Al Johnson, 41, holds a bachelor'sdegree in English literature from theUniversity of North Carolina at Chapel Hill.
He joined Aflac in September 2000 as manager ofCorporate Advert ising, and in January 2003 waspromoted to second vice president, director of Brandingand Advertising. In January 2007, he became second vicepresident of Marketing Services with the reorganization ofAflac’s Marketing division, and was promoted to hiscurrent position in December 2007. In his current role, Aloversees Aflac’s national advertising program, whichincludes the Aflac Duck campaign, as well as online mediaefforts, incentives and merchandising, philanthropy, thedevelopment of Aflac’s corporate and business-to-business sponsorship initiatives, and Aflac’s NASCARadvertising and sponsorship. Prior to joining Aflac, he wasthe advertising and marketing manager for ContinentalTire North America. Al has more than 18 years ofexperience in advertising, branding and marketing.
Bradley S. JonesVice President;Territory Director, North Territory
Brad Jones, 50, joined Aflac as a salesassociate in 1984. He became a districtsales coordinator in 1986, a regional
sales coordinator in 1989, and a recruiting coordinatorfor Aflac in 1992. In 1993, he was appointed to statesales coordinator for Maryland/Delaware/Philadelphia.During Brad’s 6 ½ years in this capacity, sales increasedmore than 1,100%. In 2000 Brad was promoted toTerritory Director for the Northeast Territory. Under hisleadership, the Northeast Territory’s sales increased byalmost 100%, from $47.3 million in 2000 to $94.4 millionin 2003. Brad also increased recruiting by 49% and thenumber of writing agents 48% in the Northeast Territory.He was appointed senior vice president, director ofSales in 2003, was named vice president, territorydirector, East Territory in January 2005, and wasappointed to his current posit ion in Apr i l 2007.Throughout his career, he has earned numerous awards,including the coveted FAME award 31 times.
88

89
John R. KeddyVice President, IT Application Services
John Keddy, 44, holds a master’sdegree in business administration fromColumbia University and a bachelor’sdegree in economics from Rutgers
College. He joined Aflac in 2008 as vice president, ITApplication Services, where he oversees the day-to-dayoperations of Application Services and ProfessionalServices organizations, to include enrollment, imaging,management informat ion systems, and f inancia lservices. He has nearly 20 years of experience in theinsurance industry. Before joining Aflac he also served asa vice president at Conseco and at ING.
Laura Kane MullahyVice President, ExternalCommunications
Laura Kane, 47, holds a bachelor’sdegree from Michigan State University incommunications. She joined Aflac in
2003 and was promoted to vice president of externalcommunications in 2008. Laura serves as Aflac’sprimary spokesperson and oversees communicationsinitiatives that enhance and protect the corporatereputation. In 2008, Kane was inducted into the PRNews PR Hall of Fame at the National Press Club. Priorto jo in ing Af lac, she developed and executedcommunicat ions programs for the Metro At lantaChamber of Commerce, Disney ABC, Euro RSCG andWNYC.
Mary Ellen KeimVice President,Fixed Income Investments
Mary Ellen Keim, 53, holds a bachelor ofscience degree from the University ofAlabama. Before jo in ing Af lac, she
worked in the Trust Department of First National Bank ofTuscaloosa as a port fo l io manager and trustadministrator. She successfully completed the NationalAssociation of Security Dealers Series 7 and Series 63exams in 1986. She is a member of the Association ofInvestment Management and Research.
Robert C. LandiVice President,Corporate Tax
Robert Landi, 47, received a bachelor’sdegree in business administration fromthe University of Tennessee at Knoxville.
He joined Aflac in 1988 as a tax and financial analyst andwas promoted to second vice president, Corporate Tax,in 1993. He was promoted to his current position in1999 and is responsible for corporate taxes, includingfederal and state income taxes, premium taxes, payrolltaxes, and other state and local taxes. He is a memberof the American Institute of CPAs and the TennesseeSociety of CPAs.
John G. LaughbaumVice President,Channel Marketing and SalesDevelopment
John Laughbaum, 40, graduated fromGeorge Mason Univers i ty with a
bachelor’s degree in political science and received amaster’s of business administration in marketing,strategy, and finance from the Kel logg School ofManagement at Northwestern University. Prior tograduate school, he worked in various capacities atFederal Legislative Associates, a Washington, D.C.,government relations firm. Since joining Aflac in 1997,John has served as an analyst, director, second vicepresident, and vice president, and he was appointed tohis current position in 2007. His responsibilities as vicepresident, Channel Marketing and Sales Development,include business-to-business marketing, industrymarketing, social and digital marketing, and key accountdevelopment. He is a Fellow of the Life ManagementInstitute.
Eric J. LegerVice President, Field Force Development
Eric Leger, 46, joined Aflac in 2002 inLubbock, Texas, as an associate andqual i f ied for al l the Firebal l Ser iesawards, plus Rookie Associate Key Club
and the State and National Conventions in his first year.He was subsequent ly promoted to distr ict salescoordinator, state training coordinator in Texas SouthCentral, state sales coordinator of New Mexico, and thento his current role as vice president, Field ForceDevelopment in 2008. In his current role, he overseesthe development and implementation of all field forcetraining, recruiting and coordinator development.
Jeffery A. LinkVice President, Compliance
Jeff Link, 46, graduated from ColumbusState Univers i ty in 1987 with abachelor’s degree in businessadministration. Before joining Aflac, he
held various marketing positions with Pascoe BuildingSystems and Premier Industrial. He joined Aflac’sCompliance Department in 1988 as an analyst. In 1996he became a second vice president, responsible forforms filings. He was promoted to his current position in2001. He is a member of the Executive Committee of theLife and Health Compliance Association.

G. Bryant McKeeVice President, Special Investigations
Bryant McKee, 56, graduated fromVanderbilt University with a bachelor’sdegree in economics and businessadministration. He served as regional
accounting coordinator for a national food servicecompany and held management positions in claims andinternal audit with Life of Georgia. Bryant became aFellow of the Life Management Institute in 1978 andobtained his Certified Internal Auditor (CIA) designation in1987. He joined Aflac in 1988 and was promoted tosecond vice president in 1991 and vice president in2000. He is a member of the Institute of Internal Auditors,The Information Systems Audit and Control Association,and the Association of Certified Fraud Examiners.
Thomas P. McKennaVice President; Deputy General Counsel
Tom McKenna, 43, received hisbachelor’s degree in political sciencefrom Columbus State University. Hejoined the Legal Department in 1993
after receiving his juris doctor degree from the Walter F.George School of Law at Mercer University. He becamea second vice president in 2001 and was promoted tohis current position in 2006. His primary responsibilitiesare to manage and direct the operations of the AflacU.S. Legal Department, and to provide advice andcounsel on legal matters that impact U.S. businessoperations. He is a member of the State Bar of Georgiaand the Defense Research Institute.
Virgil R. MillerVice President,Client Services
Virgil Miller, 40, holds a master's degreein business management from WesleyanCol lege, a bachelor's degree in
accounting from Georgia College and a Six Sigmagreenbelt for Villanova University. He joined Aflac'smanagement team in 2004 in the Policy Service’sDepartment after having a successful leadership careerin the property and casualty industry. In 2006, he waspromoted to second vice president of Policy Serviceswhere he drove key metrics and process innovation. Helater became second vice president of the customerservice center where he championed technologyinnovation and conservation strategies. In 2009, he waspromoted to Vice President of Client Services where hewas responsible for the customer service centers, policyservice and process innovation and control, and thenwas promoted to vice president of Client Services,where he is responsible for the Policy Services andCustomer Service Center operations. He served as aU.S. Marine and veteran of Operation Desert Storm. Hewas a member of the United Way Board of Trustees,Leadership Macon and the Community ImpactLeadership Team of Central Georgia.
John A. MoorefieldSenior Vice President, StrategicManagement, Aflac International; SeniorVice President, Portfolio Coordination,Aflac Japan
John A. Moorefield, 47, graduated fromNorth Carolina State University in 1986. He joined Aflacin 2005 and has worked in various positions, includingas chief information officer of Aflac Japan, where hemanaged Aflac Japan’s technology service delivery anddirected the completion of several key init iat ives,including the branch’s mainframe transformation, LANredesign and rebuilding, and the upgrading of al lsoftware packages. In that role, he was also responsiblefor the development of short-term and long-term AflacJapan Information Technology strategic plans. In hiscurrent role as senior v ice president, strategicmanagement for Aflac International, John overseesvarious strategic initiatives and planning activities, alongwith coordination between Aflac’s U.S. and Japanoperations. Prior to joining Aflac, he served as a Principalin ApproxiCom, LLC and as a managing director atBear ingPoint. He also held execut ive leadershippositions at Cap Gemini Ernst & Young LLP, FidelityInvestments, and Nat ionsBank, where he wasresponsible for technology strategy and delivery ofinformation architecture and systems.
Thomas O. Morey, FSA, MAAAVice President, U.S. Products andBusiness Planning
Tom Morey, 47, earned bachelor’s andmaster’s degrees in mathematics fromthe Univers i ty of West Flor ida. He
became a member of the American Academy ofActuaries in 1998 and a Fel low of the Society ofActuar ies in 2000. He joined Af lac in 1995, waspromoted to senior manager, Pricing, in 2000; to secondvice president, Pricing and Rerating, in 2003; to vicepresident, U.S. Products and Business Planning, in2005; and to vice president, U.S. Product Developmentand Financial Planning for Aflac Incorporated. Prior tojoining Aflac, he spent 11 years as a weapon systemcost estimator for the United States Air Force.
Perry J. MullinsVice President,Expense Management
Perry Mullins, 51, graduated from theUniversity of Wisconsin at Eau Claire in1980 with a bachelor's degree in
accounting. He passed the Certified Public Accountingexamination in 1981 and became a Fellow of the LifeManagement Institute in 1984. Perry worked at SentryInsurance in Stevens Point, Wisconsin, before joiningAflac's Financial Reporting department in 1987. Hemoved to the Budget Department manager position in1992 and was promoted to a second vice president in1998. He was promoted to his current position in 2007,and his primary responsibility is the budget and analysisof Aflac expenses in the United States. He is a memberof the American Institute of Certified Public Accountants.
90

91
David A. NelsonVice President,Travel, Meetings and Incentives
David Nelson, 55, joined Aflac in 1988 asa travel analyst after working in the airlineindustry for 16 years. In 1995 he was
promoted to director of Travel, Meetings and Incentives.He was promoted to his current position in 1997 and isresponsible for all aspects of Aflac’s corporate travelprogram, the planning of all business meetings, and theplanning of all sales force incentive travel programs. Heis a member of the National Business Travel Association,the Georgia Business Travel Association, and theFinancia l and Insurance Conference PlannersAssociation.
Bahija Fouad NoellVice President,IT Business Partnership Management
Bahija Noell, 44, is vice president of theBusiness Partnership ManagementOffice in the Information Technology
Division. She joined Aflac in 1987 and held severalleadership positions in Client Services and Administrationand in the Information Technology Division. She holds abachelor’s degree in computer science and accountingfrom Eureka College in Eureka, Illinois, a master’s degreein management from Troy State University and theInformation Technology Management Program fromGeorgia Institute of Technology. She provides the overalldirection of the Business Partnership ManagementOffice, the Software Testing Services organization, andthe IT Service Center. She directs the strategic alignmentof the overal l IT strategy and the Af lac businessorganizations’ strategies. She participates in strategicplanning and decision-making at the executive anddivision level and facilitates the development of well-integrated IT initiatives and a business implementationroadmap to support the business strategy. She workswith the Aflac leadership to form all iances at thestrategic and operat ional levels and leads keymanagement activities and committees to maintainappropriate communications at all levels.
Thomas A. OKrayVice President,Financial Planning & Controls
Tom OKray, 54, received his bachelor’sdegree in accounting, risk managementand insurance from the University of
Wisconsin. Before joining Aflac in 1988, he was a staffaccountant with Wausau Insurance Company. Hebecame a second vice president in 1995 and waspromoted to his current position in 2001. He is amember of the board of directors, investment committeeand audit committee of the Georgia Life and HealthInsurance Guaranty Association.
J. Lance OsborneVice President;Territory Director, Pacific Territory
Lance Osborne, 47, joined Aflac in July1988 as an associate, and in August1991, after being promoted to district
sales coordinator, he established a scratch district in theAtlanta/Northwest Georgia region, where he served inthat capacity for five years. In 1997 he was promoted toregional sales coordinator, and in 2002, he was asked toaccept a leadership role supporting Georgia-North asstate training coordinator. In January 2005, Lance waspromoted to vice president, Field Force Development,and in December 2008, he assumed his current positionas vice president, terr itory director of the Pacif icTerritory.
Daniel M. QuigleyVice President, IT Enterprise Services
Dan Quigley, 50, holds a bachelor of artsdegree in political science from BostonUniversity. He joined Aflac in 2007 as vicepresident, Enterprise Services, and is
responsible for all technology infrastructure, operations,and data security in the Information Technology division.Prior to joining Aflac in 2007, Dan spent more than 20years in IT working for major Fortune 500 companiesacross dif ferent industr ies implementing globaltechnology solutions. Most recently, he was at NovartisA.G., where he held multiple positions such as head ofNetwork Services and head of IT Infrastructure for theNovartis Consumer Health Division. Dan is a member ofthe Society for Information Management. He is a certifiedMaster Certified Novell Engineer (CNE) and is a memberof the Society for Information Management and theInstitute of Electrical and Electronics Engineers, Inc. Hehas completed executive education and leadershipprograms at the Wharton School and Harvard BusinessSchool’s MIT- Novartis “IT Excellence Program.”

92
Vilma I. Salaverria, HIA, MHPVice President,Multicultural Marketing
Vilma Salaverria, 51, serves as vicepresident of Multicultural Marketing. Sheholds a bachelor’s degree in business
administration with a major in accounting and a minor inmanagement from the University of Puerto Rico. Vilma isfully bilingual (English/Spanish). She has earned herHealth Insurance Associate (HIA) and ManagedHealthcare Professional (MHP) designations. Vilma joinedAflac in 1992 and has held various positions, includingadministrator for the Caribbean Territory, Hispanicmarket ing coordinator, operat ions manager forrecruitment and multicultural markets, manager ofmarketing services overhead, director of marketingassociate administration, second vice president of NewBusiness/Underwriting and vice president of ClientServices. She served on the board of directors of theAtlanta chapter of Women in Insurance and FinancialServices (WLUC) in 2000. Vilma is a 2007 graduate ofthe Leadership of Columbus program.
Eric B. SeldonVice President, AIM & Support Services
Eric B. Seldon, 40, received a bachelor’sdegree in business administration fromMadison University. Before joining Aflacin 1999 as an operations manager in
Client Services, he was vice president of Card Servicesat Total System Services Inc. After joining Aflac, he tookthe helm of Payroll Account Service Billing, where hemanaged the reconciling and billing activities for thecompany’s payroll accounts, and was promoted todirector of New Business. He has held several leadershippositions within Aflac, most recently serving as secondvice president, Support Services, and was promoted tohis current position in 2006. In his current role, he isresponsible for the strategic direction of SupportServ ices, Payment Serv ices, Account Relat ions,Strategic Partnerships, New Account Set-Up, and NewBusiness/Underwriting. He has more than 17 years ofleadership experience, including more than nine yearswith Aflac. He is a member of the Georgia MinoritySupplier Development Council and is certified by theU.S. Postal Service as a Mail Center Professional and byMailcom for Mail Center Security Training.
Daniel F. Skelley, FSA, MAAAVice President;Actuarial Valuation
Dan Skelley, 60, received bachelor’s andmaster’s degrees in appl iedmathematics from Georgia Tech. Before
joining Aflac in 1983, he taught mathematics on the highschool and college levels. He became an assistant vicepresident in 1986, a second vice president in 1990, andwas promoted to his current position in 1993. Hisprimary responsibilities are the actuarial items in financialreporting for all Aflac U.S. products. He is a member ofthe Society of Actuaries and the American Academy ofActuaries.
Alexander W. StephanoukVice President, Internal Audit,Aflac Incorporated
Alex Stephanouk, 39, holds a bachelor’sdegree in market ing from AuburnUniversity and a master of business
administration degree in internal audit and humanresources from Louisiana State University. He joinedAflac in 2009 as vice president, Internal Audit, for AflacIncorporated. Before joining Aflac, he was managingdirector of Advisory Services at KPMG in Atlanta and healso worked as manager of Business Process RiskConsulting at Arthur Andersen, LLP. He holds theCert i f ied Internal Auditor (CIA) and the Cert i f iedInformation Systems Auditor (CISA) designations. Alex isresponsible for all corporate Internal Audit activities andworks directly with management on business processimprovement recommendat ions, as wel l as thecoordination of Internal Audit’s role within companywideenterprise risk management activities.
Arthur L. Smith IIIVice President;Senior Associate Counsel,Legal Division
Art Smith, 53, holds a bachelor’s degreein political science from Columbus State
University and a juris doctorate from the SamfordUniversity School of Law. He also graduated with amaster of laws (taxation) degree from the University ofAlabama School of Law. He was engaged in private lawpractice in Columbus, Georgia, from 1979 until he joinedAflac as associate counsel in January 1989. He wasappointed second vice president and senior associatecounsel in the Legal Division in 1993 and was promotedto vice president in 1996. He is a member of the StateBar of Georgia and the American Bar Association.
Michael J. TomlinsonVice President;Territory Director, Central Territory
Mike Tomlinson, 51, joined Aflac in 1980as a sales associate in Detroit Lakes,Minnesota. Mike progressed through the
Aflac coordinator ranks of district sales coordinator andregional sales coordinator in Minnesota. He assumed therole of SSC of North and South Dakota in 1989. Northand South Dakota is current ly the leading stateorganization in Aflac for sales per capita and in forcepremium per capita. Mike accepted the position of vicepresident, territory director for the Central Territory inMay 2008.

93
David R. TurnerVice President,IT Advanced Technology Group
David Turner, 56, graduated with abachelor’s degree in mathematicseducation from Columbus State
University. His entire 22-year career in the informationtechnology field has been at Aflac. As a member of theInformation Technology Division, he has written software,managed software development projects, and managedboth the software development and software testingdepartments within IT. He had primary planning andmanagement responsibility for the three-year Y2K (year2000) project. His primary areas of responsibility currentlyinclude advanced technology research, softwarearchitecture, and technology strategy development.
Blakely H. Voltz, ACSVice President,Claims
Blake Voltz, 39, received a bachelor’sdegree in finance from the University ofGeorgia. He joined Aflac in 1992 and has
held several management positions in Client Services.Prior to his current posit ion, he was second vicepresident in the Strategic Planning Office, where heworked with the administrative business units to developinnovative process changes to improve efficiency andquality. Blake also has served as second vice presidentin the Customer Service Center and Policy Service. Hehas almost 15 years of leadership experience at Aflac.He was promoted to his current position in November2006. Blake holds the Li fe Off ice ManagementAssociat ion (LOMA) Associate Customer Servicedesignation.
William D. WenbergVice President;Territory Director, South Territory
Bi l l Wenberg, 60, graduated fromMoorhead State University with a degreein accounting. He started his career with
Aflac in October 1983 in Minneapolis, Minnesota, andspent 12 years as a regional sales coordinator. In 1998he was promoted to state sales coordinator of Arkansas,a position he held until October 2003 when he waspromoted to vice president; territory director, NorthTerritory. He was appointed to vice president; territorydirector, Central Territory in February 2005. In April2008, Bill accepted the position of vice president;territory director, South Territory.
Larry “Al” WestonVice President;Territory Director, East Territory
Al Weston, 56, graduated with abachelor’s degree from the University ofNorth Carolina at Chapel Hill. He started
his career with Aflac shortly thereafter in 1976. He hasenjoyed success at every field position; associate,district sales coordinator, regional sales coordinator, andstate sales coordinator all in his hometown of Greenville,North Carolina. In his current position, he is responsiblefor developing, managing, and guiding sales andrecruiting activities for the East Territory.
Robin Y. Wilkey, CPAVice President,Investor Relations
Robin Wilkey, 51, graduated from theUniversity of Georgia with a bachelor’sdegree in finance and went on to receive
her designation as a certified public accountant. Shejoined Aflac in 1990 as an accountant in Financial, waspromoted to senior auditor in Internal Auditing and tomanager of Information Systems and Payroll in theHuman Resources Division. She joined the InvestorRelations Department in 1998 as senior director, waspromoted to second vice president in 2002 and to hercurrent position as vice president, Investor Relations in2003. Prior to working at Aflac, she worked in auditingand accounting in the banking and medical industries.
Jefferson W. WillisVice President,Senior Associate Counsel,Legal Division
Jeff Willis, 60, holds a bachelor’s degreein economics and history from
Hampden-Sydney College in Virginia. He received a jurisdoctorate from the Walter F. George School of Law atMercer University in 1975 and is a licensed member ofthe state bars of Georgia and Virginia. Before joiningAflac in 1988, he was a partner in a Gainesville, Georgia,law firm specializing in insurance litigation.

94
Tohru TonoikePresident and Chief Operating Officer,Aflac Japan
Tohru Tonoike, 59, graduated fromHitotsubashi University and worked forDai- ichi Kangyo Bank, which later
merged with two other banks to form the MizuhoFinancial Group, prior to joining Aflac Japan as vicepresident in February 2007. In 2005 he becamepresident and representative director of Dai-ichi KangyoAsset Management Company, another division of theMizuho Financial Group. Tonoike served on the Aflacboard of directors from November 2004 through January2007. He was promoted to president of Aflac Japan inJuly 2007.
Charles D. Lake IIChairman,Aflac Japan
Charles Lake, 47, received a bachelor’sdegree in Asian studies and politicalscience from the University of Hawaii at
Manoa in 1985 and a juris doctorate from the GeorgeWashington University School of Law in 1990. He joinedAflac International in February 1999 and Aflac Japan inJune 1999. He became deputy vice president in 2001,president in 2003, vice chairman in 2005 and chairman in2008. Before joining Aflac, he practiced law with DeweyBallantine LLP in Washington, D.C. He also served asdirector of Japan affairs and special counsel at the officeof the U.S. Trade representative in the executive office ofthe President. He currently serves as vice chairman of theMaureen and Mike Mansfield Foundation and as adirector on the board of the Tokyo Stock ExchangeGroup, Inc. He is also President Emeritus of the AmericanChamber of Commerce in Japan (ACCJ).
Eizo KobayashiVice Chairman
Eizo Kobayashi, 60, graduated fromTokyo University in 1972 and joined theBank of Japan that same year. Prior tojoining Aflac as senior advisor in May
2006, he served as executive director for Bank of Japan.He became vice chairman in July 2007.
Takaaki MatsumotoFirst Senior Vice President;Director of Marketing and Sales
Takaaki Matsumoto, 60, graduated fromMeij i Gakuin University in 1974 andjoined Af lac in 1975. He served as
general manager of the Tohoku Sales Department andthe Sales Promotion Department. After serving asgeneral manager of East Japan Claims Department, hewas promoted to vice president in 2005, to senior vicepresident in 2006 and to his current position in 2007.
Hisayuki ShinkaiFirst Senior Vice President;Financial Institutions, Financial InstitutionSupport, Bank Sales Offices,Public Relations, Investor Relations
Hisayuki Shinkai, 58, joined Aflac in 1999as general manager of the Public Relations Departmentand was promoted to vice president in 2000 and tosenior vice president in 2002. In February 2006, he wasnamed to his current position. He graduated fromTohoku University in 1974 and previously worked for theLong Term Credit Bank of Japan, Ltd.
Hiroshi YamauchiFirst Senior Vice President;Chief Administrative Officer
Hiroshi Yamauchi, 57, graduated fromSaitama University in 1976 and joinedAflac that same year. He served in the
Actuarial Department as section manager and assistantgeneral manager. He was promoted to general managerin the Policy Maintenance Department in 1998 and tovice president in 1999. He was promoted to first seniorvice president in 2002 and to his current position aschief administrative officer in January 2005.
Yuji Arai, CFASenior Vice President,Investments, Investment Analysis,Asset Management;Principal Financial Officer
Yuj i Arai , 46, graduated from KeioUniversity in 1986 and joined Aflac that same year. Hebecame assistant general manager of the InvestmentDepartment in 2001, and he began supervising theInvestment Department and the Investment AnalysisOffice in 2002. He was promoted to his current positionin January 2005. He is a chartered financial analystcertified by the CFA Institute and a charter member ofthe CFA Society of Japan.
Koji AriyoshiSenior Vice President;Deputy Director of Marketing and Sales
Koj i Ar iyoshi , 55, graduated fromRitsumeikan University in 1953. Hejoined Aflac as Senior Vice President
responsible for sales planning in October 2008. FromJanuary through March 2009, he was directly in chargeof the Retail Marketing, All iance Management andHojinkai Promotion Departments, and since April 2009,he has been overseeing all the marketing and salesdepartments as Deputy Director of Marketing and Sales.Before joining Aflac, he worked for Alico Japan as VicePresident and AXA Life Insurance as Senior VicePresident.
Aflac Japan Management

95
Andrew J. ConradSenior Vice President and Counsel;Director of Governmentaland Legal Affairs,Aflac International Incorporated
Andy Conrad, 45, holds a law degreefrom Harvard Law School and a master’s degree fromthe Fletcher School of Law & Diplomacy at TuftsUniversity. Before joining Aflac, he practiced law atDewey Ballantine LLP in Washington, D.C. He joinedAflac International in 2001, serving as second vicepresident, associate counsel and director ofGovernmental and Legal Affairs. He was promoted to hiscurrent position in March 2006.
Yukio FukushimaSenior Vice President; Chief InformationOfficer for Aflac JapanStrategic Project Promotion,System Development,Infrastructure Services, IT Architect
Yukio Fukushima, 57, joined Aflac as vice president andgeneral manager of the System Development SupportOffice and System Development Office 3 in 2006. Hegraduated from Tokyo Denki University in 1975 andpreviously worked for IBM Japan, Ltd. He was promotedto his current position in September 2008.
Jun IsonakaSenior Vice President,Deputy Chief Administrative Officer
Jun Isonaka, 51, graduated fromKwansei Gakuin University in 1980 andjoined Aflac that same year. He served
as general manager of the Group Market ing andMarketing and Sales Promotion Departments from 1999through 2001. He was promoted to vice president in2002 and to his current position in January 2007.
Masatoshi KoideSenior Vice President, General Counsel,Compliance Officer;Legal, Compliance/Inspection
Masatoshi Koide, 48, graduated fromTokyo Univers i ty in 1984 and from
Cornell Law School in 1989. He originally joined Aflac inApril 2000 and stayed with Aflac until March 2006. Heworked for Citibank, N.A. and Nissei Asset Managementbefore he joined Aflac again in December 2008 as VicePresident. He is a member of the New York State Bar.
Tomomichi ItoSenior Vice President, Planning,Government Affairs and Research, Legal,Compliance/Inspection, RiskManagement
Tomomichi Ito, 59, a graduate of TokyoUniversity, joined Aflac in 1976 and served as generalmanager of Research and Corporate Planning. He waspromoted to vice president in 1997 and to senior vicepresident in 2001.
Yosuke MiwaSenior Vice President, HumanResources,Human Resources Support,General Affairs
Yosuke Miwa, 57, graduated from KeioUniversity in 1976 and joined Aflac in 1979. From 1998to 2005, he served as general manager in variousdepartments. In November 2005, he was promoted tovice president and to his current position in January2008.
Kazumi AtsutaVice President; Chief ActuaryActuarial Product Development,Corporate Actuarial
Kazumi Atsuta, 47, graduated fromChiba University in 1984 and joined Aflac
that same year. Before being promoted to his currentposition in January 2007, he served as general managerof the Product Development, Actuar ia l ProductDevelopment and Corporate Actuarial Departments. In1992, he gained full membership in the Institute ofActuaries of Japan.
Toru EharaVice President,Kinki Corporate Sales
Toru Ehara, 48, graduated from RikkyoUniversity in 1983 and joined Aflac thatsame year. He served as general
manager of Tokyo Sales Department 2 and the SalesPromotion Department and was promoted to his currentposition in 2005.
Masahiro HoshinoVice President,Tokyo General Sales Office
Masahiro Hoshino, 50, graduated fromChuo University in 1984 and joined Aflacin the fol lowing year. He served as
general manager for the Hokkaido Sales Departmentfrom 2002 through 2004 and for the Shutoken SalesDepartment 3 in 2005 and 2006. In January 2007, hewas promoted to his current position.

96
Osamu IshiiVice President;Planning, Risk Management
Osamu Ishi i , 52, graduated fromHitotsubashi University in 1979. Prior tojoining Aflac in April 2008, he worked for
Dai-ichi Kangyo Bank and also served as vice presidentand president at DKB Financial Products Inc. andgeneral manager at Mizuho Corporate Bank. He earneda master’s degree in business administration fromMassachusetts Institute of Technology in 1995.
Takashi KadonoVice President,New Business, Underwriting
Takashi Kadono, 54, graduated fromRikkyo University in 1978 and joinedAflac in 1980. He served as general
manager of Osaka Sales Department 1 and waspromoted to vice president in January, 2005.
Anthony KotasVice President, IT Project Promotion
Tony Kotas, 40, received a bachelor ofarts and sciences degree from VirginiaTech. He joined Aflac International as avice president in 2002. He has served as
director of large IT initiatives as well as general managerof various IT departments before being named to hiscurrent position in April 2009.
Makoto KurumazukaVice President;IT Administration, Infrastructure Services
Makoto Kurumazuka, 44, graduatedfrom Tokyo Metropolitan University in1987 and joined Aflac that same year.
After serving as general manager of the SystemsOperations, User Service and Infrastructure ServicesDepartments, he was promoted to his current position inJanuary 2009.
Takashi MiyajimaVice President;Marketing Strategy Planning,Business Promotion, AllianceManagement
Takashi Miyajima, 45, graduated fromRikkyo University in 1986 and joined Aflac that sameyear. Before being promoted to his current position inJanuary 2007, he served as general manager in theShutoken Sales 1 and Sales Promotion Departments.
Ken MiyauchiVice President,Solicitation Management, SalesInspection
Ken Miyauchi, 55, graduated fromKansai University in 1978 and joined
Aflac in 1979. He served as general manager in KinkiSales Department 1 and Tokyo Sales Department 1. In2002 he was promoted to vice president.
Yoshifumi MurayamaVice President;Corporate Marketing Promotion;Market Development; Aflac NationalAssociation of Agencies Office; SpecialCorporate Sales; All Sales Departments
Yoshifumi Murayama, 50, graduated from Meiji Universityin 1982 and joined Aflac that same year. After serving asgeneral manager of the Osaka Sales Department 1 in2005 and 2006, he was named to his current position inJanuary 2007.
Iwao NemotoVice President;Bank Sales Offices
Iwao Nemoto, 46, graduated from ChuoUniversity in 1985 and joined Aflac thatsame year. Before being promoted to his
current position in January 2007, he served as generalmanager in the Associates Development Departmentand the Shutoken Sales Department 2.
Hiromi NiidaVice President, General Sales and SalesOffices (East Japan)
Hiromi Niida, 53, graduated from KeioUniversity in 1980 and joined Aflac thatsame year. After serving as general
manager of the Sales Promotion and Tohoku SalesDepartments, he was promoted to vice president in2006.
Yasuki OkawaVice President;Financial Institutions, FinancialInstitutions Support
Yasuki Okawa, 49, graduated fromMusashi University in 1983 and joined
Aflac that same year. After serving as general managerof the Tokyo Sales Dept.1 and the Human ResourcesDept. for about three years respectively, he waspromoted to his current position in January 2009.

97
Masahiko OkitsuVice President;Tokai Corporate Sales
Masahiko Okitsu, 49, graduated fromTokyo Keizai University in 1984 andjoined Aflac in the following year. Before
being promoted to his current position in January 2007,he served as general manager of the Shikoku SalesDepartment for three years.
Koichi OnoVice President;Product Development, MarketingTool Support, Advertising,Customer Relations Support
Koichi Ono, 47, graduated from WasedaUniversity in 1984 and joined Aflac that same year.Before being promoted to his current position in January2007, he served as general manager in two salesdepartments and in the Market ing PromotionDepartment.
Takashi OsakoVice President,Alliance Management
Takashi Osako, 47, graduated fromKwansei Gakuin University in 1985 andjoined Aflac that same year. Before being
promoted to vice president in 2004, he served asgeneral manager of the Human Resource SystemPlanning Department in 2001 and as head of the Officeof the President in 2002.
Chikako SakuraiVice President,Premium Accounting 1 and 2,Policy Maintenance
Chikako Sakurai, 55, graduated fromTokyo Women’s Christian University in
1976 and joined Aflac that same year. She served asgeneral manager of the Underwrit ing Departmentfrom1998 through 2001. She was named to her currentposition in January 2003.
Kayoko SugimotoVice President,Claims, Kinki Administration
Kayoko Sugimoto, 57, graduated fromSophia University in 1975 and joinedAflac that same year. After serving as
general manager of the West Japan Claims Department,she was promoted to vice president in charge of thePersonnel and Human Resources Departments in 2001.She is currently responsible for the East and West JapanClaims Departments and the Kinki AdministrationDepartment.
Isao SumikawaVice President, Retail MarketingPromotion, Hojinkai Promotion, AllGeneral Sales Offices, All Sales Offices
Isao Sumikawa, 54, graduated fromAkita University in 1977 and joined Aflac
in 1980. He served as general manager of the HokurikuSales Department and Tokyo Sales Department 4. Hewas promoted to vice president in 2002.
Hiroshi TakeuchiVice President;President; Aflac Insurance Service
Hiroshi Takeuchi, 41, graduated fromOsaka University in 1991 and earned amaster’s degree in management
engineering from Rensselaer Polytechnic Institute in1999. He joined Aflac in 2003. In July 2004, he becamepresident of aflacdirect.com and in August 2005, hebecame second vice president of Aflac Japan. He waspromoted to vice president in January 2007. Currently,he also serves as president of Aflac Insurance Service.
Kenji Usui, CIAVice President, Internal Audit Officer;Internal Audit
Kenji Usui, 50, graduated from MeijiUniversity in 1984 and joined Aflac thatsame year. He served as general
manager of the Internal Audit Department and waspromoted to vice president in 2002. He is a licensed CIAand a member of the Institute of Internal Auditors.
Tomoya UtsudeVice President;Executive Medical Director,Administration Planning
Tomoya Utsude MD, 47, graduated fromthe Medical School of Tokyo University in
1986 and joined Aflac in 1994. Before he became vicepresident in 2003, he worked as medical director andmanaged the Medical Underwriting Department from1996 to 2000. Before joining Aflac, he was trained andhad practical experience as a surgeon at the TokyoUniversity Hospital and as a surgical pathologist at theCancer Institute, Japanese Foundation for CancerResearch.

98
Koichi WakasugiVice President, Sales;General Sales and Sales Offices(West Japan)
Koichi Wakasugi, 53, graduated fromRyukoku University in 1979 and joined
Aflac that same year. After serving as general managerof the Finance Institution, Chugoku Sales and Kinki SalesDepartments, he was promoted to his current position in2005.
Chiharu WatanabeVice President;Government Affairs and Research
Chiharu Watanabe, 48, graduated fromTohoku University in 1983 and joinedAflac that same year. She served as
general manager for the Government Affairs andResearch Dept. from 2002 through 2008 and waspromoted to her current position in January 2009.
Kazuhiro YamazakiVice President,Financial Management
Kazuhiro Yamazaki, 54, earnedbachelor’s and master’s degrees fromWaseda University and joined Aflac in
1982. After serving as general manager of the FinancialManagement and Internal Audit Departments, he waspromoted to his current position in 2006. He is amember of the American Institute of Certified PublicAccountants, the Institute of Management Accountantsand the Institute of Internal Auditors.
Kenji YasudaVice President, Solicitation Management,Sales Inspection
Kenji Yasuda, 60, graduated from KeioUniversity in 1972 and joined Aflac in1975. After serving as general manager
of Corporate Planning, Agency Training, and several salesdepartments, he was promoted to vice president in 2000.
Yoshiki “Paul” OtakeFounder,Executive Advisor
Paul Otake, 70, is the founder and retiredchairman of Aflac Japan. A graduate ofHiroshima Prefectural University, he
joined American International Underwriters (AIU) in 1967.He established the International Insurance Agency Group(IAG) in 1972. He was a representative to Aflac’s Tokyooffice before the establishment of the Japan branch in1974 and served as vice president, marketing, from 1974until he was promoted to president of Aflac Japan in1986. He was named chairman of Aflac Japan in 1995,and he became executive advisor in January 2003 afterretiring as chairman.
Hachiro MesakiSenior Advisor
Hachiro Mesaki, 66, joined Aflac in 2002as a senior advisor. He graduated fromTokyo University and joined the Ministryof Finance (MOF) in 1967. He previously
served as deputy director-general of the MOF’sInternational Finance Bureau, executive director forJapan of the International Monetary Fund (IMF), andspecial advisor to the Ministry of Foreign Affairs. He alsopreviously served as vice president for the JapanInternational Cooperation Agency (JICA).
Ken KyoGeneral Manager,Investor Relations Support Department,Aflac Japan
Ken Kyo, 48, holds a bachelor’s degreein literature from Shandong University of
China and a master’s degree in economics from thepostgraduate school at Tokyo University of Japan. Hejoined Aflac in 1993. Before he was promoted to hiscurrent position in January 2003, he served as assistantmanager of the Claims Department and the UnderwritingDepartment and as section manager of the PublicRelations Department.

99
Index of Tables and Charts
Section I – Aflac Incorporated2009 Estimated Flow of Funds .........................................................72009 Operating EPS Scenarios ......................................................12Aflac Incorporated Capitalization ......................................................5Aflac Incorporated Liquidity Analysis.................................................7Aflac Japan Actual vs. Tabular Claims ............................................22Aflac Japan Assumptions ...............................................................11Aflac Japan Investment Return Assumptions ..................................20Aflac Japan Operating Ratios ...........................................................8Aflac Japan Operating Ratios ...........................................................8Aflac Japan Pretax Operating Earnings.............................................9Aflac Japan Total Revenues .............................................................8Aflac Japan Trends in Cancer Hospitalization..................................23Aflac Japan Trends in Sickness Average Length of Stay .................23Aflac U.S. Assumptions ..................................................................11Aflac U.S. Investment Return Assumptions .....................................20Aflac U.S. Operating Ratios ............................................................10Aflac U.S. Pretax Operating Earnings..............................................10Aflac U.S. Total Revenues ................................................................9Aflac U.S. Trends in Average Length of Stay...................................23Aflac U.S. Trends in Cancer Hospitalization ....................................23Aflac’s Debt Impairment Policy .......................................................16Aflac’s Equity Impairment Policy .....................................................16Aflac’s Investment Portfolios...........................................................13Aflac’s Principal Operating Units .......................................................5After-tax Realized Investment Gains/Losses ...................................17Capital Adequacy Ratios ..................................................................6Claims vs. Reserves .......................................................................20Collateralized Debt Obligations .......................................................15Commercial Mortgage-Backed and Asset-Backed Securities .........14Comparison of Solvency Margins .....................................................7Composition of Purchases by Sector..............................................18Consolidated Portfolio Composition................................................13Corporate Assumptions..................................................................11Credit Ratings ................................................................................16Credit Ratings on Purchases ..........................................................18Debt Purchases by Subordination ..................................................18EPS Growth Objectives ..................................................................11Estimated “Excess” Capital Position .................................................8Expected Benefit Ratios by Product .................................................8FSA Reserve Assumptions .............................................................19FSA Reserving Strain......................................................................19GAAP Experience Emergence ..................................................21, 22GAAP Experience Emergence Parameters......................................21GAAP Experience Emergence with PAD .........................................21GAAP Experience Emergence without PAD ....................................21GAAP Gross Margin Scenarios .......................................................22GAAP Reporting.............................................................................20GAAP Reserve Assumptions ..........................................................20Investment Cash Flow ....................................................................17Investment Considerations .............................................................12Investment Pricing Methods ...........................................................15Largest Below-Investment-Grade Holdings.....................................16Largest Split-Rated Holdings ..........................................................16Net Investment Income...................................................................18Operating Earnings Per Share ........................................................10Parent Company Loan Maturities......................................................5Perpetual Security Holdings............................................................14Pricing Assumptions.......................................................................19
Projected Statutory Items .................................................................7Purchases by Asset Class ..............................................................17RBC Ratio Sensitivity to Yen/Dollar Exchange Rates.........................6Reconciliation of Operating to Net Earnings Per Diluted Share ........10Residential Mortgage-Backed Securities.........................................14Segment Contributions to Operating Earnings ................................10Segment Contributions to Operating Earnings ..................................8Segment Contributions to Operating Earnings ..................................9Sensitivity of FSA Solvency Margin Ratio ..........................................6Split-Rated Securities .....................................................................15Subordination Distribution ..............................................................14Ten Largest Investment Positions ...................................................13U.S. Statutory Reserve Assumptions ..............................................20Unrealized Gains and Losses..........................................................15
Section II – Aflac JapanAflac Japan New Annualized Premium Sales ..................................37Aflac Japan’s Competitive Strengths ..............................................27Aflac Japan’s Product Line.............................................................48Aflac’s Child Endowment Product ..................................................36Aflac’s Inbound Call Centers...........................................................52Aflac’s Share of In-Force Business: Cancer ....................................26Aflac’s Share of In-Force Business: Medical ...................................26Aflac’s Share of New Business: Cancer ..........................................26Aflac’s Share of New Business: Medical .........................................26Aflac’s Support for New Agencies ..................................................41Agency Composition by Stage .......................................................42Agency Segmentation ....................................................................42Bank Channel New Sales ...............................................................46Banks’ Points of View.....................................................................44Changes in Japan’s GDP ...............................................................29Characteristics of Banks in Japan...................................................44Claims Payments............................................................................53Communication Preferences for Insurance Purchases ....................39Competitors in the Third Sector ......................................................25Consumer Perceptions of Insurers..................................................35Corporations Supporting Aflac Japan .............................................50Daily Out-of-Pocket Hospitalization Expenses.................................33Divided Diet Has Impacted Policymaking ........................................29Economic Indicators.......................................................................27Efficiency Improvement Measures by Leveraging IT ........................51Eight-Step Approval Process for JapanPost Insurance’s New Insurance Products...................................31
Emergence of Financial Crisis .........................................................46Financial Institutions in Japan .........................................................43Growth of Newly Recruited Producing Agencies .............................41Historical Transition of Sales Channels............................................39History of Bank Sales .....................................................................43Insurance Product Penetration .......................................................27Japan’s Aging Population and Declining Birthrate ...........................25Japan’s Regulatory Environment Overview –Consumer Affairs Agency ............................................................31
Key Points to Improving Persistency Rates .....................................53Key Themes of Aflac Japan’s 2009 Management Plan....................28Life Insurance Policies in Force.......................................................24Maintenance Expenses Per Policy in Force .....................................51Major Changes in Copayments for the Elderly.................................32Major Changes in Copayments for the Employed............................32

100
Marketing Objectives for 2009 ........................................................38National Medical Expenses.............................................................25New Business in Policies ................................................................24New Sales of Cancer Insurance......................................................34New Sales of Medical Insurance .....................................................35New Sales through the Bank Channel.............................................40Number of Agencies and Share of New Sales by Type of Agency ...37Number of Agencies by Type..........................................................38Number of Banks Selling Aflac Products...................................39, 45Number of Medical Products ..........................................................25Number of Policies Per Administrative Employee ............................51Number One Life Insurer in Japan ..................................................24Other Products Owned by Child Endowment Policyholders ............37Outlook for 2009 ............................................................................46Policyholders’ Review of Insurance Portfolio ...................................36Postal Privatization: After IPO and by 2017.....................................31Postal Privatization: Current Status and Before IPO ........................31Product Structure of “GIFT”............................................................36Progress in Financial Regulatory Reform.........................................30Promotion of “Light Consulting” Training.........................................41Promotion: “Duck Insurance Consultation” .....................................37Purchases Following Policyholders’ Portfolio Review ......................36Rapidly Increasing Social Security Benefits .....................................32Ratio of Not-Taken Policies ............................................................52Recruitment of New Agencies.........................................................40Regulatory Concerns......................................................................45Relationships with Banks................................................................44Result in the First Quarter 2009 ......................................................46Sales Organization .........................................................................40Sales Power of Banks ..............................................................43, 44Selection Factors for Medical Insurance..........................................35Share of In-force Third Sector Business..........................................34Shares of Third Sector New Sales ..................................................34Shinkin Industry..............................................................................45Support Measures by Stage ...........................................................42Support Stance According to Agency Growth Stage ......................42Surrender and Lapse Rates ............................................................52The Most Preferred Insurer for Cancer and Medical Insurance ........35The Public’s View on the National Health Care System ...................33Third Sector New Sales ..................................................................34
Section III – Aflac U.S.2008 Sales Results by Territory ......................................................682009 Sales Objective......................................................................69Aflac for Brokers.............................................................................57Aflac Account Satisfaction with Service ..........................................76Aflac National Training Day .............................................................74Aflac U.S. New Premium Sales.......................................................68Aflac U.S. Sales Territories .............................................................65Aflac Wingspan – Goals..................................................................60Aflac Wingspan ..................................................................60, 61, 77Aflac’s Competitive Strengths – Advertising andBrand Awareness ........................................................................56
Aflac’s Competitive Strengths – Distribution....................................57Aflac’s Competitive Strengths – Products .......................................56Aflac’s Competitive Strengths – Technology ...................................57Aflac’s New Tagline ........................................................................62Aflac’s Strategy ..............................................................................59Aflac’s U.S. Product Line..........................................................59, 80Average Weekly New and Veteran Producer Growth ......................73Average Weekly Producers.............................................................67
Basics of New Product Development..............................................60Bonus Compensation.....................................................................66Brand.............................................................................................61Brand Awareness ...........................................................................57Broker Control................................................................................57Business-to-Business.....................................................................63Claims Reliability.............................................................................77Commission Structure Example......................................................66Compensation Structure.................................................................66Competitive Environment................................................................56Coordinator Accreditation Program Series ......................................74Coordinator Expansion ...................................................................67Coordinator in Training Growth.......................................................73Coordinator in Training Performance ..............................................74Core Administration Expense per Policy in Force ............................76Customer Retention .......................................................................58Decreased Confidence Among Small Businesses ...........................55District Sales Coordinator Performance ..........................................74Enrollment Reliability: New Business Automation ............................77Field Force Organization .................................................................65Field Force Philosophy ...................................................................70Field Force Sales Training...............................................................70Field Reporting and Management ...................................................79Field Service Capabilities ................................................................79Health Care Cost Trends – Cancer .................................................55Health Care Cost Trends ................................................................54Health Care Spending Projections ..................................................55Honor Clubs...................................................................................67Incentive Contests..........................................................................67Internet Recruiting ..........................................................................71Key Indicators ................................................................................69Key Service Interactions .................................................................77LEASE ...........................................................................................72National Top Priorities ....................................................................54New Associate Premium Growth ....................................................68New Associate Premium Growth ....................................................73New Associate Training Cycle Level One ........................................72New Associate Training Cycle Level Two ........................................72New Payroll Account Growth..........................................................73New Sales Product Mix ..................................................................59Number of State Operations Per Territory .......................................65Online Services ..............................................................................78Payroll Account Growth..................................................................68Penetration by Sales Territory .........................................................69Percent Change in Core Administration Expense andEarned Premium .........................................................................76
Prelicensing....................................................................................71Recruiting.......................................................................................67Recruiting Methods ........................................................................70Recruiting Results ..........................................................................71Recruiting Strategies ......................................................................72Sales Growth by State Operation....................................................69SCAP Curriculum ...........................................................................74Segmented Service ........................................................................78Service Center Reliability ................................................................78Service Factors Driving Brand Perception Among Employers..........76Small Business Market ...................................................................56State of the Economy.....................................................................54Successful Branding.......................................................................61TCAP Curriculum ...........................................................................75Winner’s Edge................................................................................72

If you would like more information or copies of other Aflac publications, please call or write:
In the United States:Kenneth S. Janke Jr.Senior Vice President,Investor RelationsAflac Incorporated 1932 Wynnton RoadColumbus, Georgia 31999Phone: 800.235.2667 – option 3or 706.596.3264Fax: [email protected]
In Japan:Ken KyoGeneral ManagerInvestor Relations Support OfficeShinjuku Mitsui Building2-1-1, Nishishinjuku,Shinjuku-ku, Tokyo163-0456, JapanPhone: 03.3344.0481Fax: 03.3344.0485
© 2009 Aflac Incorporated. All rights reserved. Aflac®, Aflac Always® and SmartApp® are registered trademarks of American Family Life Assurance Company of Columbus. Aflac for BrokersSM, Aflac for BusinessSM, SmartApp Next GenerationTM and “We’ve got you under our wing.SM” are trademarks of American Family Life Assurance Company of Columbus.