F I L E D - CA.gov
153
BEFORE THE PUBLIC UTILITIES COMMISSION OF THE STATE OF CALIFORNIA Application of Suburban Water Systems (U339W) for Authority to Increase Rates Charged for Water Service by $19,234,576 or 35.85% in 2012, by $3,032,827 or 4.18% in 2013, and by $1,973,200 or 2.61% in 2014. SUBURBAN WATER SYSTEMS EXHIBITS A - F FINAL APPLICATION LORI ANNE DOLQUEIST MANATT, PHELPS & PHILLIPS, LLP One Embarcadero Center, 30th Floor San Francisco, CA 94111 Telephone: (415) 291-7400 Facsimile: (415) 291-7474 Email: [email protected] Attorneys for Applicant Suburban Water Systems February i, 2011 300507030 .I A1102002 F I L E D 02-01-11 04:59 PM
-
Upload
khangminh22 -
Category
Documents
-
view
0 -
download
0
Transcript of F I L E D - CA.gov
BEFORE THE PUBLIC UTILITIES COMMISSION
OF THE STATE OF CALIFORNIA
Application of Suburban WaterSystems (U339W) for Authority toIncrease Rates Charged for WaterService by $19,234,576 or 35.85% in2012, by $3,032,827 or 4.18% in2013, and by $1,973,200 or 2.61% in2014.
SUBURBAN WATER SYSTEMS
EXHIBITS A - F
FINAL APPLICATION
LORI ANNE DOLQUEIST
MANATT, PHELPS & PHILLIPS, LLPOne Embarcadero Center, 30thFloorSan Francisco, CA 94111Telephone: (415) 291-7400Facsimile: (415) 291-7474Email: [email protected]
Attorneys for ApplicantSuburban Water Systems
February i, 2011
300507030 .I
A1102002
F I L E D02-01-1104:59 PM

Before the
PUBLIC UTILITIES COMI{ISSION OF THE STATE OF CALIFORNIA
EXHIBIT A
SUBURBAN WATER SYSTEMS (U 339-W)
RESULTS OF OPERATIONS
TEST YEARS ENDING DECEMBER 31,2012 AND 2013
Covina, California
TABLE OF CONTENTS
CHAPTER
i.I1.21.31.4
INTRODUCTION 1-1
PURPOSE OF EXHIBIT ................................................. i-i
SCOPE OF EXHIBIT ................................................... i-i
OVERVIEW OF EXHIBIT ................................................ i-i
WATER MANAGEMENT PLAN ............................................... 1-2
2 CHAPTER - COMPANY HISTORY ......................................... 2-1
2.1 HISTORICAL BACKGROUND ............................................... 2-1
2.2 PROCEEDINGS BEFORE THE COMMISSION ..................................... 2-2
3 CHAPTER - COMPANY OPERATIONS ...................................... 3-1
7
8
3.1 MAIN AND SERVICE AREA OFFICES ........................................ 3-1
NET ADDITIONAL POSITIONS REQUESTED = 14 ..................................... 3-23.2 MAIN OFFICE FUNCTIONS ............................................... 3-33.3 SAN JOSE HILLS SERVICE AREA OPERATIONS ................................ 3-5
3.4 WHITTIER/LA MIRADA SERVICE AREA OPERATIONS ............................. 3-6
CHAPTER - WATER SALES AND OPERATING REVENUES ...................... 4-1
4.1 PROJECTED WATER SALES AND METERED CUSTOMERS ............................ 4-34.2 REVENUES AT PRESENT RATES ........................................... 4-4
CHAPTER - OPERATING EXPENSES ...................................... 5-1
555555555
1 VOLUME RELATED EXPENSES ............................................. 5-12 PAYROLL EXPENSES ................................................... 5-3
3 OPERATING EXPENSES OTHER THAN PAYROLL AND VOLUME RELATED ................. 5-34 PARENT COMPANY EXPENSES ............................................. 5-6
5 UTILITY GROUP EXPENSES .............................................. 5-6
6 ALLOCATION OF PARENT COMPANY EXPENSES ................................. 5-77 INSURANCE ......................................................... 5-7
8 ALTERNATIVE METHODOLOGY ............................................. 5-7
9 SHARED SERVICES .................................................... 5-7
CHAPTER - UTILITY PLANT .......................................... 6-1
6.1 COMPARISON OF COMPANY FUNDED CAPITAL EXPENDITURES AUTHORIZED IN LAST GRC ToAMOUNTS ACTUALLY SPENT ................................................... 6-16.2 UTILITY PLANT CAPITAL BUDGET, ESTIMATED YEARS ENDING DECEMBER 31, 2012 AND 2013
.......................................... . ..................... 6-1
CHAPTER - DEPRECIATION ACCRUALS, RESERVE FOR DEPRECIATION ........ 7-1
888888
CHAPTER - RATE BASE .............................................. 8-1
1 UTILITY PLANT ..................................................... 8-12 MATERIALS AND SUPPLIES .............................................. 8-i3 WORKING CASH ...................................................... 8-14 RESERVE FOR DEPRECIATION ............................................ 8-i5 ADVANCES FOR CONSTRUCTION ........................................... 8-i6 CONTRIBUTIONS IN AID OF CONSTRUCTION .................................. 8-2
9
8.7 DEFERRED INCOME TAXES, DEPRECIATION DIFFERENCES T ........... ’ ............ 8-2
8.8 DEFERRED FEDERAL INCOME TAXES ASSOCIATED WITH TAXABLE ADVANCES AND CONTRIBUTIONS
8.9 INVESTMENT TAX CREDIT ADJUSTMENT ..................................... 8-2
8.10 DEFERRED REVENUES ASSOCIATED WITH TAXABLE CONTRIBUTIONS IN AID OFCONSTRUCTION ............................................................ 8-3
8. ii PENSION RESERVE .................................................. 8-3
CHAPTER - RESULTS OF OPERATIONS, TAXES ............................ 9-1
9.1 AD VALOREM TAXES ................................................... 9-1
9.2 PAYROLL TAXES ..................................................... 9 - 19.3 TAXES ON INCOME .................................................... 9-1
i0 CHAPTER - SUMMARY OF EARNINGS ................................... i0-i
ii CHAPTER - REVENUE REQUIREMENTS .................................. 11-1
11.1 RATE OF RETURN .................................................. 1 i- 1ii. 2 REVENUE REQUIREMENTS ............................................. ii-I
12 CHAPT~.R - RAT~.S ................................................. 12-1
12.1 RATE DESIGN RE: SERVICE CHARGES VS. QUANTITY CHARGES ................. 12-112.2 THE NECESSITY TO MAINTAIN THE CURRENT RESIDENTIAL AND NON-RESIDENTIAL RATEDESIGNS AND WR~ ....................................................... 12-212 312 412 512 612 712 812 912 i012 ii12.1212.13
RATE DESIGN RE: RESIDENTIAL CUSTOMERS .............................. 12-2RATE DESIGN RE: NON-RESIDENTIAL CUSTOMERS .......................... 12-3RATE DESIGN RE: FIRE SERVICE CHARGES ............................... 12-3PROPOSED RATES .................................................. 12-3REVENUE AT PROPOSED RATES ........................................ 12-3
REVENUE COMPARISONS .............................................. 12-3BILL COMPARISONS - NON-RESIDENTIAL CUSTOMERS ........................ 12-4BILL COMPARISONS - RESIDENTIAL CUSTOMERS ........................... 12-4WATER REVENUE ADJUSTMENT MECHANISM (WRA_~) ......................... 12-4LOW INCOME RATEPAYER ASSISTANCE PROGRAM (LIRA) ..................... 12-4Fire Flow Testing Fee ........................................ 12-5
13 CHAPTER - WATER QUALITY ISSUES .................................. 13-1
14 CHAPTER - QUALIFICATIONS AND PREPARED TESTIMONY .................. 14-1
15 CHAPTER - PROPOSED SCHEDULE FOR THE CASE ........................ 15-1
1 Chapter Introduction
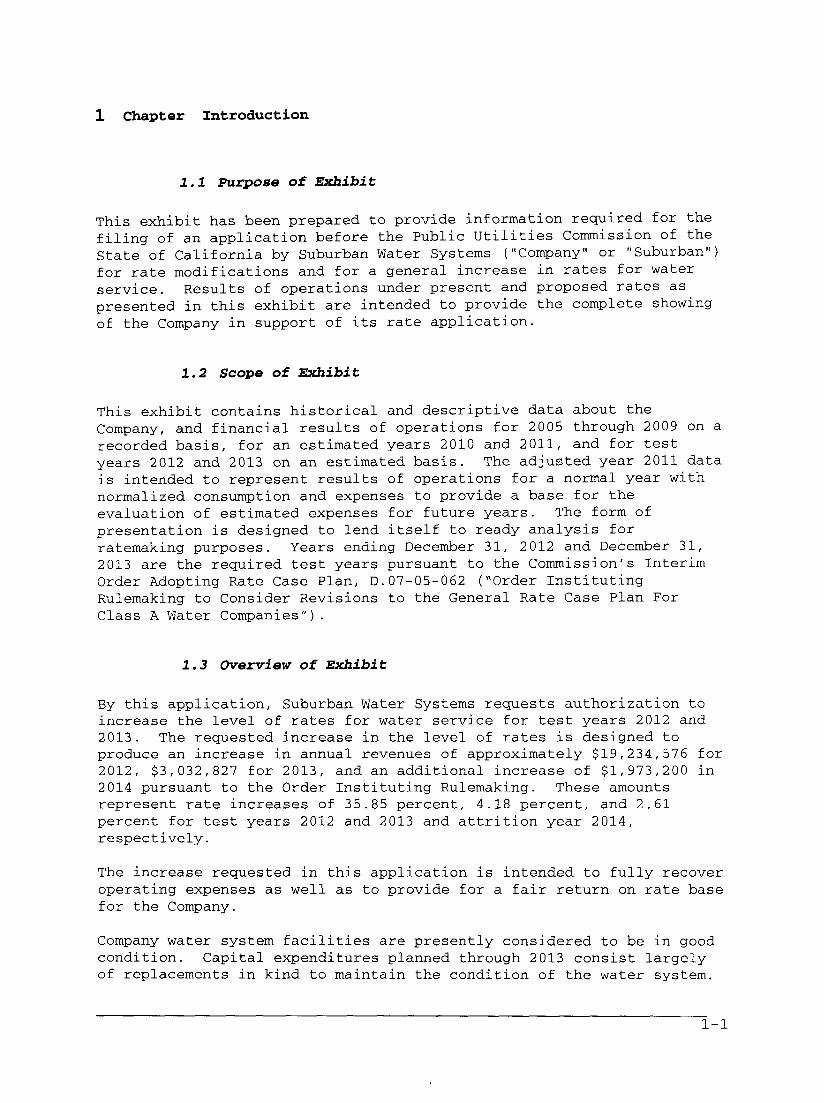
1.1 Purpose of Exhibit
This exhibit has been prepared to provide information required for thefiling of an application before the Public Utilities Commission of theState of California by Suburban Water Systems ("Company" or "Suburban")for rate modifications and for a general increase in rates for waterservice. Results of operations under present and proposed rates aspresented in this exhibit are intended to provide the complete showingof the Company in support of its rate application.
1.2 Scope of Exhibit
This exhibit contains historical and descriptive data about theCompany, and financial results of operations for 2005 through 2009 on arecorded basis, for an estimated years 2010 and 2011, and for testyears 2012 and 2013 on an estimated basis. The adjusted year 2011 datais intended to represent results of operations for a normal year withnormalized consumption and expenses to provide a base for theevaluation of estimated expenses for future years. The form ofpresentation is designed to lend itself to ready analysis forratemaking purposes. Years ending December 31, 2012 and December 31,2013 are the required test years pursuant to the Commission’s InterimOrder Adopting Rate Case Plan, D.07-05-062 (~Order InstitutingRulemaking to Consider Revisions to the General Rate Case Plan ForClass A Water Companies").
1.3 Overview of Exhibit
By this application, Suburban Water Systems requests authorization toincrease the level of rates for water service for test years 2012 and2013. The requested increase in the level of rates is designed toproduce an increase in annual revenues of approximately $19,234,576 for2012, $3,032,827 for 2013, and an additional increase of $1,973,200 in2014 pursuant to the Order Instituting Rulemaking. These amountsrepresent rate increases of 35.85 percent, 4.18 percent, and 2.61percent for test years 2012 and 2013 and attrition year 2014,respectively.
The increase requested in this application is intended to fully recoveroperating expenses as well as to provide for a fair return on rate basefor the Company.
Company water system facilities are presently considered to be in goodcondition. Capital expenditures planned through 2013 consist largelyof replacements in kind to maintain the condition of the water system.
i-I
Projected capital additions and retirements are shown in Chapter 6 ofthis Exhibit.
In summary, Suburban believes that the increase requested in thisapplication is necessary and justified. The Company has providedreliable water service with adequate resources through prudentinvestment and responsible operation and maintenance, and will be ableto continue to do so with the rate levels proposed in this application.
1.4 Water Management Plan
In accordance with the California Water Code, Division 6, the Companywas required to file an Urban Water Management Plan with the CaliforniaDepartment of Water Resources by December 31, 2005. Additionally, inaccordance with Commission Decision 94-02-043, dated February 16, 2001,it was ordered that:
"Water management programs established by utilitiespursuant to D. 90-08-55 shall be updated andevaluated as ordered in D. 92-09-084, as follows:
Effective January i, 2001, each Class A water company shall aspart of its next general rate case (i) file an updated watermanagement program, and (ii) evaluate the performance of itswater management program."
It is the Company’s intent that its 2005 Urban Water Management Plan,which is submitted as part of this filing, will meet both requirements.
1-2
2 Chapter - Company History
2.1 Historical Background
Suburban, a California corporation, was originally formed on April 15,1907 as the San Jose Hills Water Company and intended to function as amutual water company providing water service for agricultural use. SanJose Hills Water Company was incorporated under the laws of the Stateof California on June 27, 1944 as a public utility. In 1953, San JoseHills Water Company purchased Whittier Water Company. The name wasofficially changed to Suburban Water Systems on October 23, 1953. OnMay 28, 1975, the Commission authorized SouthWest to acquire the issuedand outstanding capital stock and resultant control of Suburban WaterSystems. Suburban Water Systems continued to operate under the nameSuburban Water Systems. On July 7, 1976, the Commission authorizedSouthWest to transfer plant in service serving customers in LosAngeles, Orange and San Bernardino Counties to Suburban Water Systems,thus consolidating all California utility operations into one company.On September 23, 1976, the Board of Directors for Suburban WaterSystems voted to change the name of the company to Southwest SuburbanWater. On July 22, 1982, Southwest Suburban Water’s Board of Directorsvoted to change its name back to Suburban Water Systems (Suburbaninformed the Commission of these name changes via Advice Letters Iiiand 156, respectively). Today, Suburban serves approximately 75,000customers in its San Jose Hills and Whittier/La Mirada Service Areas.
In 1998, Suburban Water Systems purchased the assets of Maple WaterCompany, a small mutual water company located in Valinda. In 2000,Suburban Water Systems purchased the assets of the 7,000 customermunicipal water system owned by the City of West Covina.
In its history, Suburban Water Systems under this name and others hasserved many cities in the Southern California area. Today, it servesapproximately 75,000 customers in its San Jose Hills and Whittier/LaMirada Service Areas. Communities served are Glendora, Covina, WestCovina, La Puente, Hacienda Heights, Walnut, Whittier, La Mirada, LaHabra, and Buena Park as well as unincorporated Los Angeles andOrange County areas. With the exception of the acquisitions of thesmall Maple Water Company in 1998 and the West Covina water system in2000, since the late 1960’s Suburban Water Systems has grown littlebeyond its saturated areas of certification. Additional growth hascome through extensions into new subdivisions along the periphery ofthe Company’s widespread service area, or through redevelopment inexisting service areas from single to multi-user services. Futureexpansion of the service areas on a large scale is improbable.
In D.I0-09-012, the CPUC approved the transfer of indirect control ofSuburban to SW Merger Acquisition Corp., IIF Subway Investment LP, andUSA Water Services, LLC. The CPUC determined that the transaction
2-1
would not adversely affect the public interest as a matter of law, andtherefore should be approved. The CPUC also determined that theSettlement that had been reached with DRA was reasonable in light ofthe whole record, consistent with law, and in the public interest as amatter of law, and therefore should be adopted.
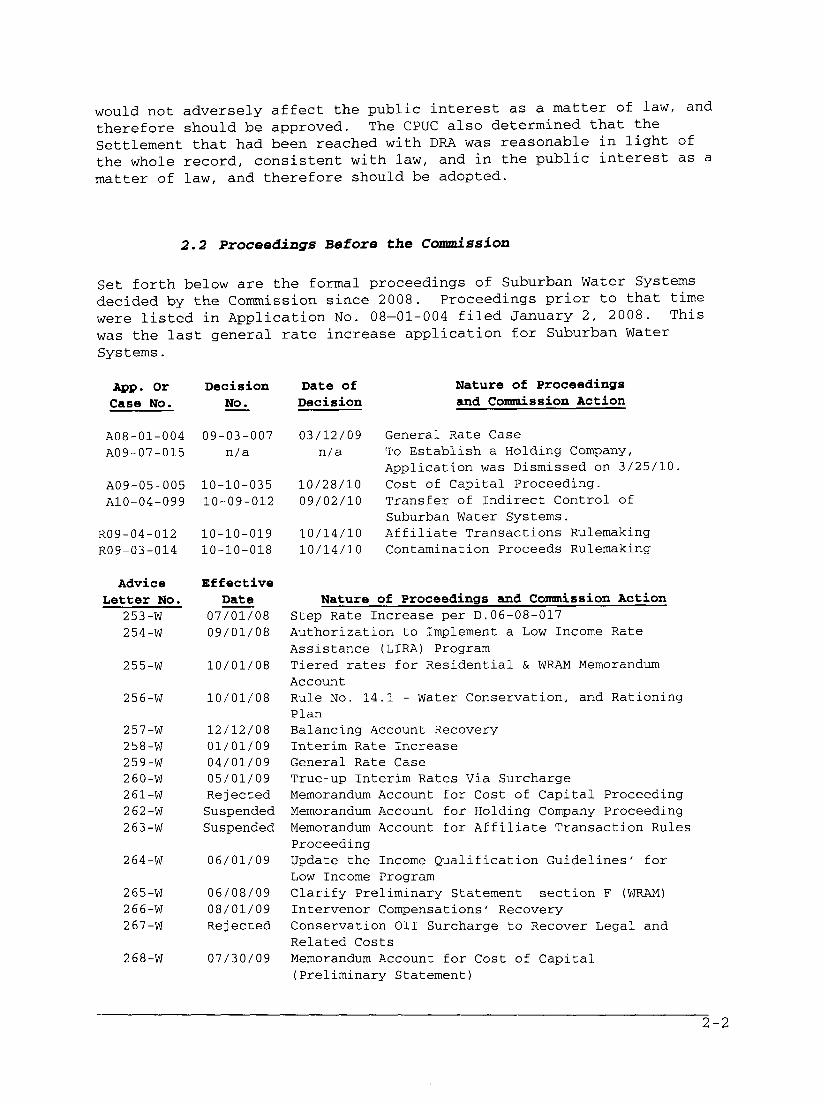
2.2 Proceedings Before the Commission
Set forth below are the formal proceedings of Suburban Water Systemsdecided by the Con<mission since 2008. Proceedings prior to that timewere listed in Application No. 08-01-004 filed January 2, 2008. Thiswas the last general rate increase application for Suburban WaterSystems.
App. Or Decision Date ofCase No. No. Decision
A08-01-004 09-03-007 03/12/09A09-07-015 n/a n/a
A09-05-005 10-10-035 10/28/10AI0-04-099 10-09-012 09/02/10
R09-04-012 10-10-019 10/14/10R09-03-014 10-10-018 10/14/10
Nature of Proceedingsand Commission Action
General Rate CaseTo Establish a Holding Company,Application was Dismissed on 3/25/10.Cost of Capital Proceeding.Transfer of Indirect Control ofSuburban Water Systems.Affiliate Transactions RulemakingContamination Proceeds Rulemaking
Advice EffectiveLetter No. Date
253-W 07/01/08254-W 09/01/08
255-W 10/01/08
256-W 10/01/08
257-W 12/12/08258-W 01/01/09259-W 04/01/09260-W 05/01/09261-W Rejected262-W263-W
264-W
265-W266-W267-W
268-W
Nature of Proceedings and Commission ActionStep Rate Increase per D.06-08-017Authorization to Implement a Low Income RateAssistance (LIRA) ProgramTiered rates for Residential & WRAM MemorandumAccountRule No. 14.1 - Water Conservation, and RationingPlanBalancing Account RecoveryInterim Rate IncreaseGeneral Rate CaseTrue-up Interim Rates Via SurchargeMemorandum Account for Cost of Capital Proceeding
Suspended Memorandum Account for Holding Company ProceedingSuspended Memorandum Account for Affiliate Transaction Rules
Proceeding06/01/09 Update the Income Qualification Guidelines’ for
Low Income Program06/08/09 Clarify Preliminary Statement section F (WRAM)08/01/09 Intervenor Compensations’ RecoveryRejected Conservation 0II Surcharge to Recover Legal and
Related Costs07/30/09 Memorandum Account for Cost of Capital
(Preliminary Statement)
2-2
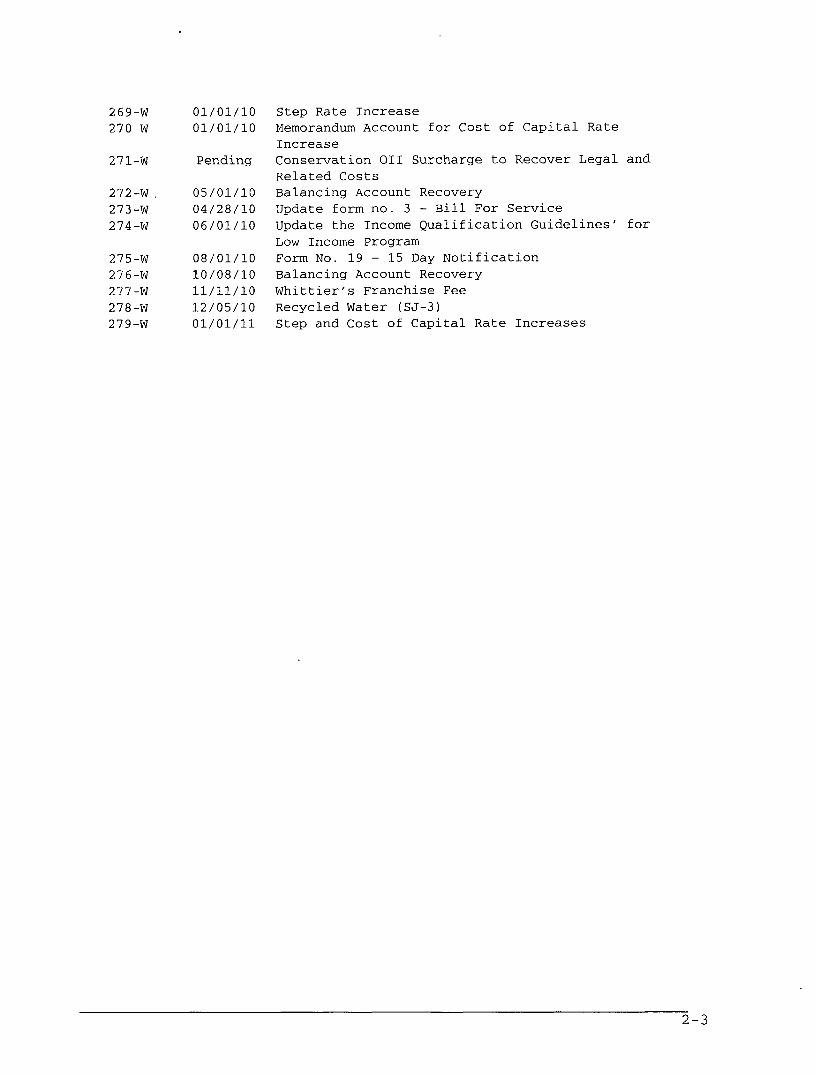
269-W270-W
271-W
272-W.273-W274-W
275-W276-W277-W278-W279-W
01/01/i001/01/i0
Pending
05 01/1004 28/1006 01/i0
08 01/i0i0 08/10ii ii/i012 05/1001/01/ii
Step Rate IncreaseMemorandum Account for Cost of Capital RateIncreaseConservation OII Surcharge to Recover Legal andRelated CostsBalancing Account RecoveryUpdate form no. 3 - Bill For ServiceUpdate the Income Qualification Guidelines’ forLow Income ProgramForm No. 19 - 15 Day NotificationBalancing Account RecoveryWhittier’s Franchise FeeRecycled Water (SJ-3)Step and Cost of Capital Rate Increases
2-3
3 Chapter - Company O~erations
3.1 Main and Service Area Offices
The company has two service areas. There is the Whittier/La MiradaService Area, with offices at 15088 Rosecrans Avenue, La Mirada. TheSan Jose Hills Service Area, with office at 2235 E. Garvey AvenueNorth, Suite A, West Covina. For ratemaking purposes both serviceareas combined are recognized as one district.
The Whittier/La Mirada Service Area and San Jose Hills Service Areahave the same service charge but differing quantity charges based ontheir unique sources and costs of water supply.
The company has a main office located in leased facilities at 1211East Center Court Drive, Covina.
With currently planned personnel additions, the Company now requiresapproximately 132 employees to effectively manage and operate thesystem. The following table shows current staffing needs in the SanJose Hills and Whittier/La Mirada Service Areas and at the MainOffice:
3-1
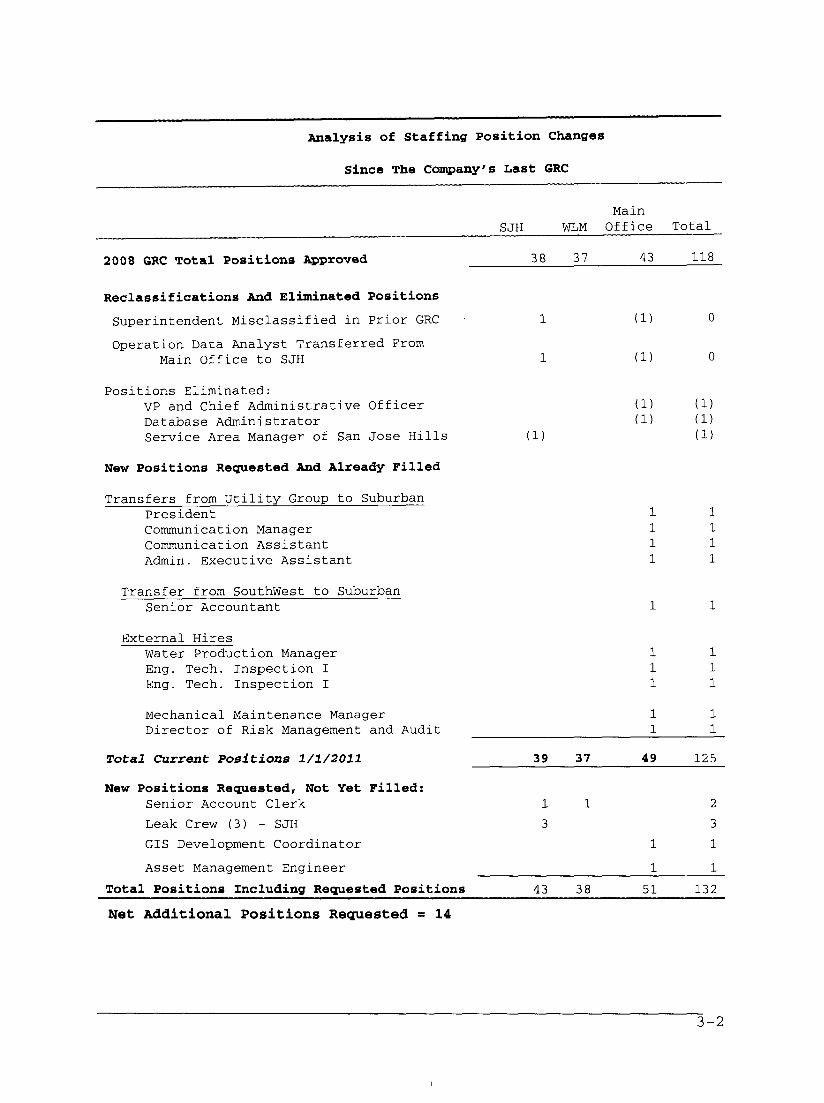
Analysis of Staffing Position Changes
Since The Company’s Last GRC
2008 GRC Total Positions Approved
SJH WLM
38 37
MainOffice
43
Total
118
Reclassifications And Eliminated Positions
Superintendent Misclassified in Prior GRC
Operation Data Analyst Transferred FromMain Office to SJH
i)
i)
Positions Eliminated:VP and Chief Administrative OfficerDatabase AdministratorService Area Manager of San Jose Hills (i)
i)i)
New Positions Requested And Already Filled
Transfers from Utility Group to SuburbanPresidentCommunication ManagerCommunication AssistantAdmin. Executive Assistant
1111
Transfer from SouthWest to SuburbanSenior Accountant
External HiresWater Production ManagerEng. Tech. Inspection IEng. Tech. Inspection I
1ii
Mechanical Maintenance ManagerDirector of Risk Management and Audit
11
Total Current Positions 1/1/2011
(i)(i)(i)
New Positions Requested, Not Yet Filled:Senior Account Clerk
Leak Crew (3) - SJHGIS Development Coordinator
Asset Management Engineer
Total Positions Including Requested Positions
Net Additional Positions Requested = 14
11i1
Iii
11
39 37 49 125
1
3
1
1
5143 38
2
3
i
i
132
3-2
3.2 Main Office Functions
New Positions Created And Filled Since Last Rate Case.A Water Production Manager position has been added to support thecomplex operation of water supply production and distribution. Thisposition ensures the most efficient use of energy and water sources inorder to efficiently run the system. This individual is responsiblefor identifying and prioritizing the most efficient mix of watersources and determines pumping schedules.
The Engineering Technician I and III positions have been added tosupport increased construction activity.
These two positions are required due to the expanse of Suburban’s servicearea and the volume of projects scheduled each year. Following are theirprimary functions:
¯ Perform project communication and project coordination;¯ Perform public works inspection;¯ Ensure quality control of materials and methods;¯ Maintain construction records and perform reporting;¯ Manage construction contracts;¯ Perform field investigation and system testing;¯ Maintain a safe workplace;¯ Maintain Environmental and Water Quality controls.
A Senior Accountant has been added to the accounting department to supportcost accounting. In the past, administration of capital spending, accountingfor construction work in process and the closing of capital work orders wereall performed by clerical employees. Increases in work volume caused adeficiency in this area. The complexity of the work in addition to the largedollar volume caused Suburban to hire a senior accountant in July of 2009.
A Mechanical Maintenance Manager position has been added to ensure the safetyof personnel at water production and distribution facilities, and tocoordinate preventative maintenance programs, repair of failed or damagedmechanical equipment, and maintenance and upgrade of telemetry andinstrumentation equipment.
Suburban’s Director of Risk Management and Audit (auditor) is critical inensuring there are adequate processes, controls and oversight for managingthe risks inherent in a control environment. The auditor will performregular risk assessment to determine Suburban’s operational and financialreporting processes and controls risk profiles and develop, implement andmanage a risk mitigation program in order to reduce identified risks.The risk areas determined by management and results from the risk assessmentare the key drivers for designing adequate processes and controls to mitigatehigh-risk processes and controls.
Positions Eliminated and Transferred Since Last Rate Case. An organizationalchange occurred in 2009 resulting in the elimination of Vice President ChiefAdministrative Officer position, the Database Administrator position and theService Area Manager of San Jose Hills position. Beginning in 2010 fourpersonnel from the Utility Service Group were transferred to Suburban - i)the President, 2) the President’s secretary, 3) Director of Communications
3-3
and 4) the Communications Assistant. These transfers made sense becausethese employees had been spending all their time on Suburban matters, andwith the elimination of the VP CAO position, it became necessary for thepresident to spend all of his time on Suburban matters.
New Positions Not Yet Filled.
One three-person leak crew in the San Jose Hills Service Area.The two service areas currently prioritize all leaks, placing the largestpriority on leaks that threaten to damage property or public safety andsmaller leaks as a lower priority. Due to a lack of manpower and theincreased number of leaks, the Service Areas have had to wait several daysbefore they can repair some of the lower priority leaks in the system. Thispractice is no longer tolerable and more effective handling of leaks can onlybe accomplished with an additional leak crew in the San Jose Hills ServiceArea.This new leak crew will consist of one equipment operator, one Utility WorkerII or III, and one Utility Worker I. A Senior Utility Worker assists thecrew by marking and calling in spots for the area to be repaired ahead of thecrew’s arrival. The Senior Utility Worker then moves to the next repairscheduled for later that day in order to help ensure that little time is lostby the crew. We expect this leak crew will save $62,373 a year as comparedto the current practice of outsourcing to contractors. That savings has beenreflected in this filing.
Asset Management EngineerSuburban is an aging water system with the majority of facilities installedin the middle of the last century. Suburban has a GIS system that identifiesthe locations of underground pipelines, but the GIS system provides littleinformation about the condition, life expectancy, or replacement requirementsof these facilities.
There are no centralized and complete records of the components of Suburban’smajor plant facilities including reservoirs, pump and valve stations andwells. There are currently no coordinated planning efforts to identify andperform condition assessments of assets. The Asset Management Engineer willinvestigate and implement a software application to track and analyze theutility’s assets.
GIS Development CoordinatorThis position will provide the engineering department with a resource that isknowledgeable in developing a modern, useful and useable GIS system that willprovide valuable information to users. This individual will be knowledgeableconcerning hardware and network matters. They will coordinate the migrationof the utility’s heritage records (hard and electronic copies) to the GIS.They will be responsible for proliferating use of the system throughout thecompany. They will select and coordinate vendors to supply software andperform specialized services that are not available in-house. They willensure the necessary software is upgraded on a timely basis, and they willparticipate in GIS industry to ensure that the utility is kept abreast ofcontemporary GIS developments.
Senior Account Clerk (2 Positions)The purposes of these positions are as follows:
LIRA (Low Income Rate Payer Assistance Program)
3-4
This program continues to grow for Suburban Water Systems. As more andmore residents sign up for this program, more time and communication isrequired to reach out to not only new applicants, but also those whowill need to requalify for the program. More monthly communication isrequired as the utilization of this program continues to increase(i.e.; letters for reapplying and tracking all associated information).
CUSTOMER SERVICEof The new Senior Account positions allow for current customer servicerepresentatives who currently multi-task (have customer service,procurement and LIRA duties) to focus solely on their customer serviceroles, thus allowing them to fully devote their time to customerservice.. The Senior Accounting Clerks will have some light customerservice responsibilities as they will be a back up for customer servicerepresentatives when needed for breaks, etc.
PROCUREMENTCurrently, a customer service representative handles supplier invoiceaccruals, the ordering of products and services. By moving thesefunctions over to the new Senior Accounting Clerks, the customerservice representative will be able to give customers their undividedattention and improved customer service.
Utility Group - Manager of Regulatory AffairsA Manager of Regulatory Affairs position has been added and filled inthe Utility Group. Rounding out a complement of three regulatorypositions in Utility Group, this position was necessary because of thesubstantial increase in regulatory activity at the CPUC, which hasplaced immensely greater regulatory-related demands on Utility Group.
3.3 San Jose Hills Service Area Operations
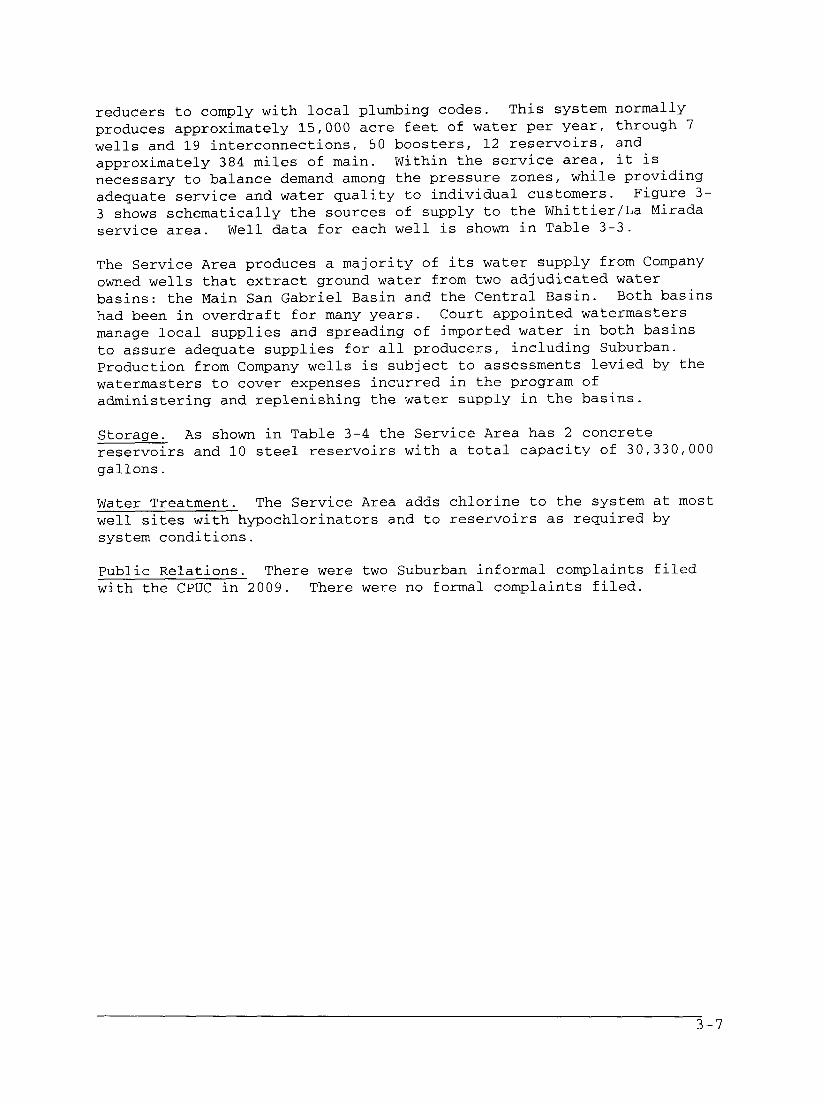
The Company’s San Jose Hills Service Area consists of the red areashown to the upper right on Exhibit 3-1.
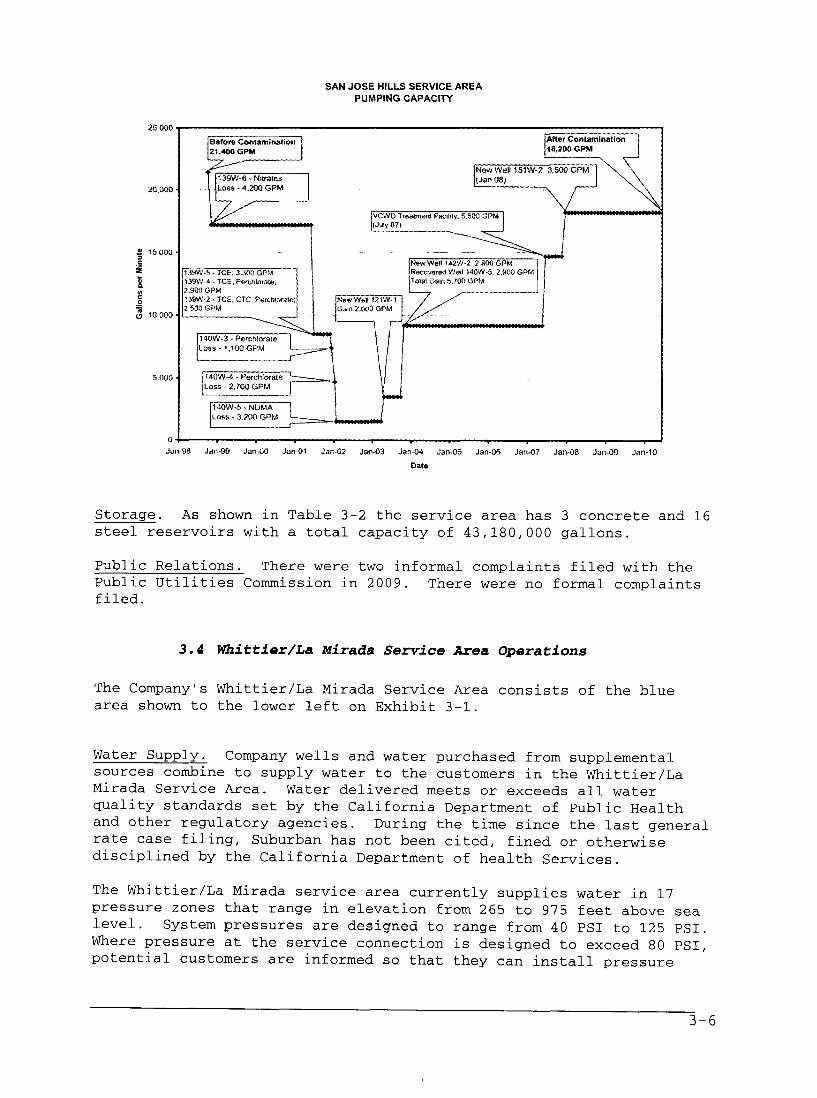
Water Supply. Water delivered meets or exceeds all water qualitystandards set by the California Department of Public Health and otherregulatory agencies. During the time since the last general rate casefiling, Suburban has not been cited, fined or otherwise disciplined bythe California Department of Public Health.
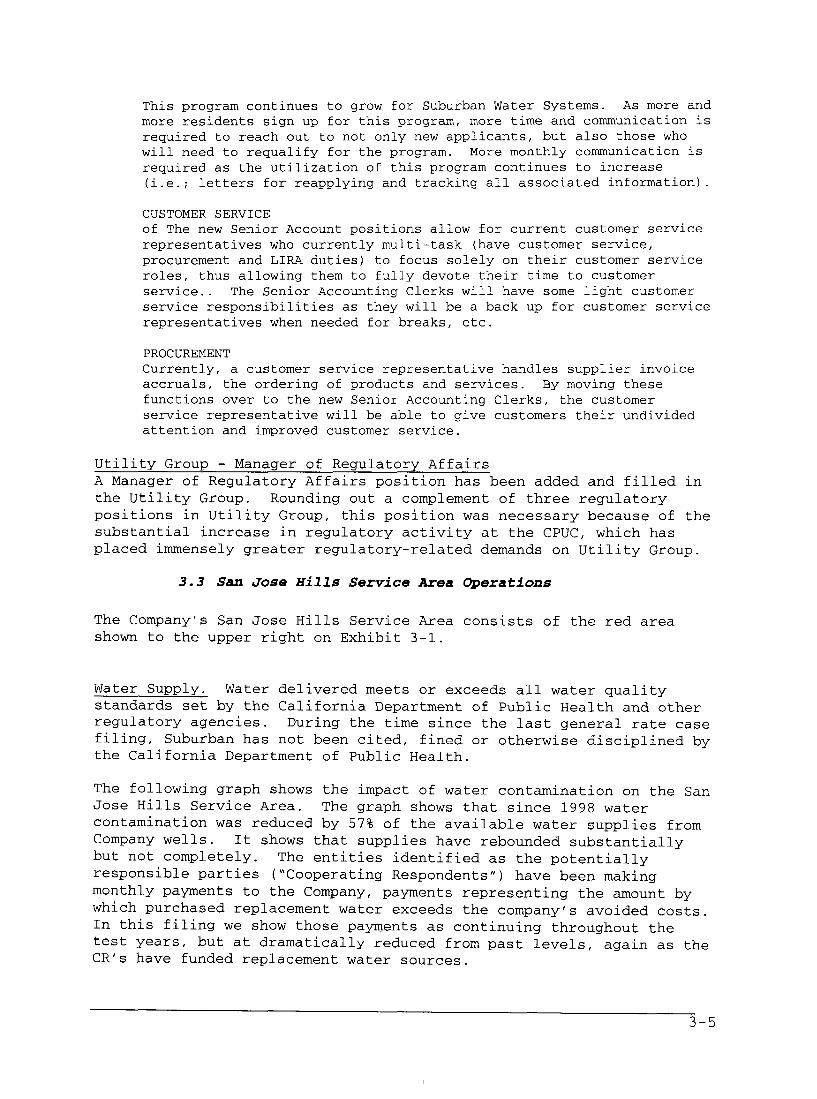
The following graph shows the impact of water contamination on the SanJose Hills Service Area. The graph shows that since 1998 watercontamination was reduced by 57% of the available water supplies fromCompany wells. It shows that supplies have rebounded substantiallybut not completely. The entities identified as the potentiallyresponsible parties ("Cooperating Respondents") have been makingmonthly payments to the Company, payments representing the amount bywhich purchased replacement water exceeds the company’s avoided costs.In this filing we show those payments as continuing throughout thetest years, but at dramatically reduced from past levels, again as theCR’s have funded replacement water sources.
3-5
25 000
e~ ~5 ooo,
~ 10 000,
SAN JOSE HILLS SERVICE AREAPUMPING CAPACITY
[Before Contamination ]After Contamination
Los~ - 2~7~ GPMF
[140W-5. NDMA
~ ~
Jam98 Jan-99 Jan-00 Jan-01 Jan-02 Jan-03 Jan.04 Jam06 Jan-06 Jan J37 Jao-08 Ja~*09 Jan-10Date
Storage. As shown in Table 3-2 the service area has 3 concrete and 16steel reservoirs with a total capacity of 43,180,000 gallons.
Public Relations. There were two informal complaints filed with thePublic Utilities Commission in 2009. There were no formal complaintsfiled.
3.4 Whittier/La Mirada Service Area Operations
The Company’s Whittier/La Mirada Service Area consists of the bluearea shown to the lower left on Exhibit 3-1.
Water Supply. Company wells and water purchased from supplementalsources combine to supply water to the customers in the Whittier/LaMirada Service Area. Water delivered meets or exceeds all waterquality standards set by the California Department of Public Healthand other regulatory agencies. During the time since the last generalrate case filing, Suburban has not been cited, fined or otherwisedisciplined by the California Department of health Services.
The Whittier/La Mirada service area currently supplies water in 17pressure zones that range in elevation from 265 to 975 feet above sealevel. System pressures are designed to range from 40 PSI to 125 PSI.Where pressure at the service connection is designed to exceed 80 PSI,potential customers are informed so that they can install pressure
3-6
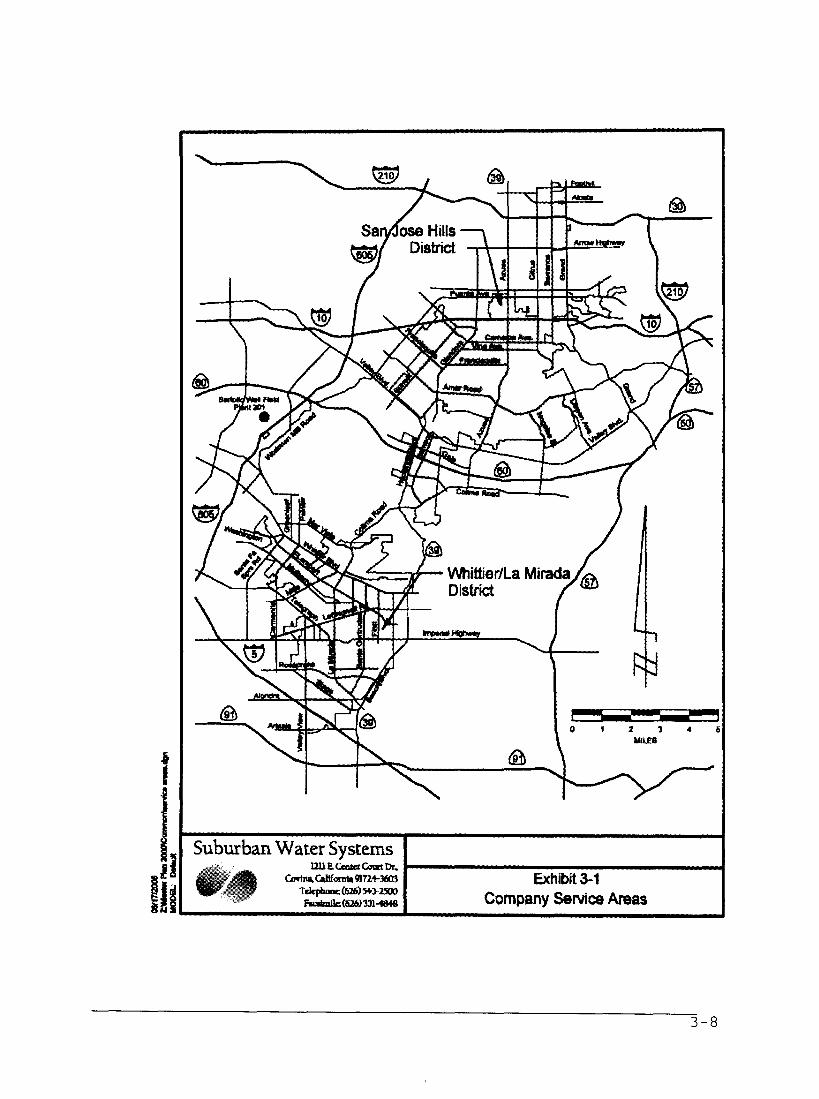
reducers to comply with local plumbing codes. This system normallyproduces approximately 15,000 acre feet of water per year, through 7wells and 19 interconnections, 50 boosters, 12 reservoirs, andapproximately 384 miles of main. Within the service area, it isnecessary to balance demand among the pressure zones, while providingadequate service and water quality to individual customers. Figure 3-3 shows schematically the sources of supply to the Whittier/La Miradaservice area. Well data for each well is shown in Table 3-3.
The Service Area produces a majority of its water supply from Companyowned wells that extract ground water from two adjudicated waterbasins: the Main San Gabriel Basin and the Central Basin. Both basinshad been in overdraft for many years. Court appointed watermastersmanage local supplies and spreading of imported water in both basinsto assure adequate supplies for all producers, including Suburban.Production from Company wells is subject to assessments levied by thewatermasters to cover expenses incurred in the program ofadministering and replenishing the water supply in the basins.
Storage. As shown in Table 3-4 the Service Area has 2 concretereservoirs and i0 steel reservoirs with a total capacity of 30,330,000gallons.
Water Treatment. The Service Area adds chlorine to the system at mostwell sites with hypochlorinators and to reservoirs as required bysystem conditions.
Public Relations. There were two Suburban informal complaints filedwith the CPUC in 2009. There were no formal complaints filed.
3-7
Whittier/La MiradaDistrict
oi
Table 3-1
SUBURBAN WATER SYSTEMS SAN JOSE HILLS
SERVICE AREA WELL DATA
WELL NO.125W-2"121W-I126W-2"139W-2"139W-4139W-5"139W-6"140W-3"140W-4"140W-5"142W-2147W-3151W-2
RASF W-I
DIAMETERIN INCHES
181616182O181818181816181616
DEPTHFT.
SWLFT.189211185147151152153115126124170128
MOTORHP.
11901132660408846
12201220562
121013401390102014001170 190
1502OO2002OO3652503507525030040045050O200
CAPACITYG.P.M.
78O240082O
2600150029003500ii00330032003000120035002400
* Temporarily out of service.
3-9
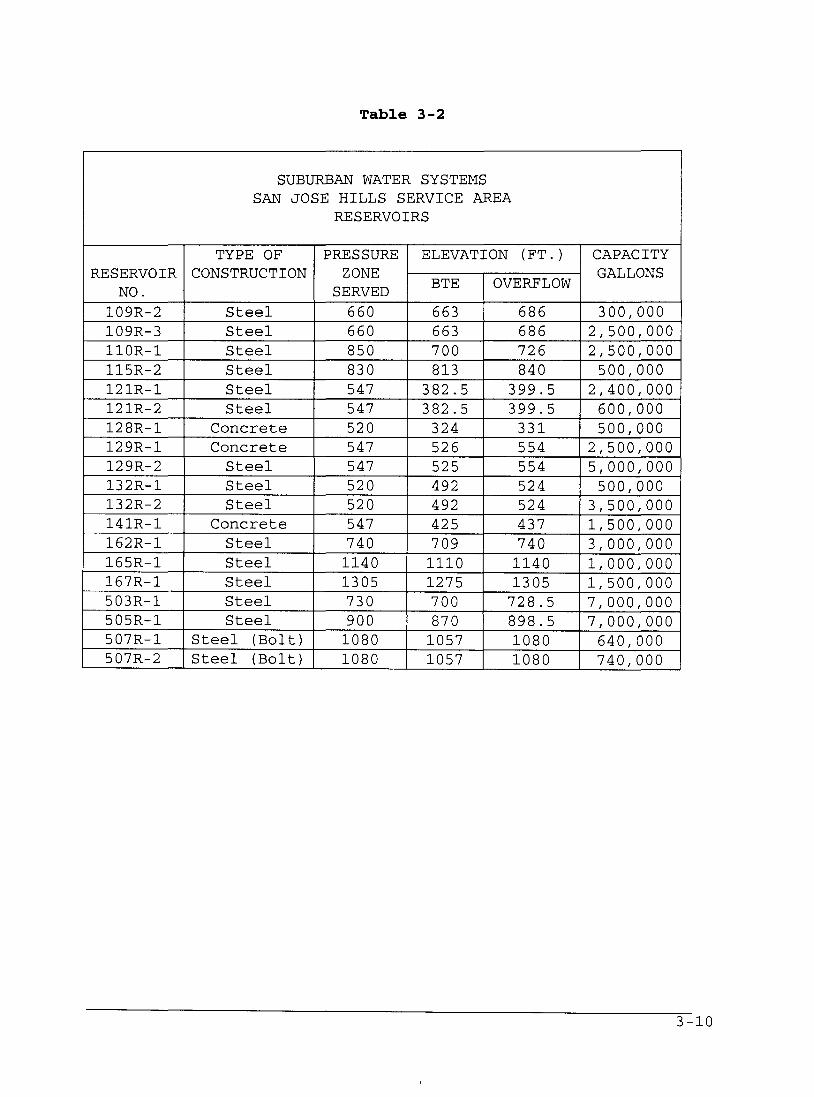
Table 3-2
SUBURBAN WATER SYSTEMSSAN JOSE HILLS SERVICE AREA
RESERVOIRS
RESERVOIRNO.
I09R-2I09R-3
TYPE OFCONSTRUCTION
SteelSteel
PRESSUREZONE
SERVED660660
ELEVATION (FT.)
BTE OVERFLOW
663 686663 686
CAPACITYGALLONS
300,0002,500,000
IIOR-II15R-2121R-I121R-2128R-I129R-I129R-2132R-I132R-2141R-I162R-I165R-I167R-I503R-I505R-I507R-I507R-2
SteelSteelSteelSteel
ConcreteConcrete
SteelSteelSteel
ConcreteSteelSteelSteelSteelSteel
Steel (Bolt)Steel (Bolt)
85O830547547520547547520520547740114013057309OO10801080
33
7OO81382.582.5324526525492492425709
iii012757OO87O
10571057
72684O
399.5399.5
331554554524524437740
11401305
728.5898.510801080
2,500,0005O0,0OO
2,400,000600,000500,000
2,500,0005,000,000
500,0003,500,0001,500,0003,000,0001,000,0001,500,0007,000,0007,000,00O
640,000740,000
3 -i0
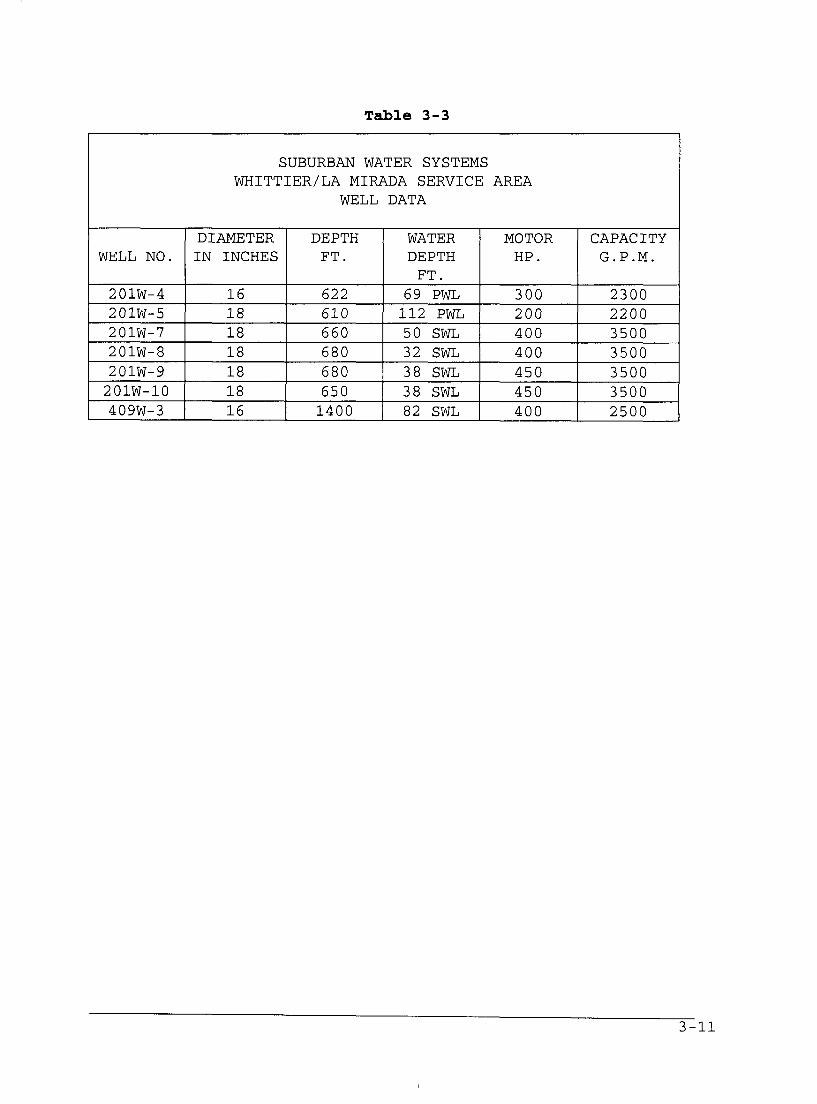
Table 3-3
SUBURBAN WATER SYSTEMSWHITTIER/LA MIRADA SERVICE AREA
WELL DATA
DIAMETER DEPTH WATER MOTOR CAPACITYWELL NO. IN INCHES FT. DEPTH HP. G.P.M.
FT.201W-4 16 622 69 PWL 300 2300201W-5 18 610 112 PWL 200 2200201W-7 18 660 50 SWL 400 3500201W-8 18 680 32 SWL 400 3500201W-9 18 680 38 SWL 450 3500
201W-10 18 650 38 SWL 450 3500409W-3 16 1400 82 SWL 400 2500
3 -ii
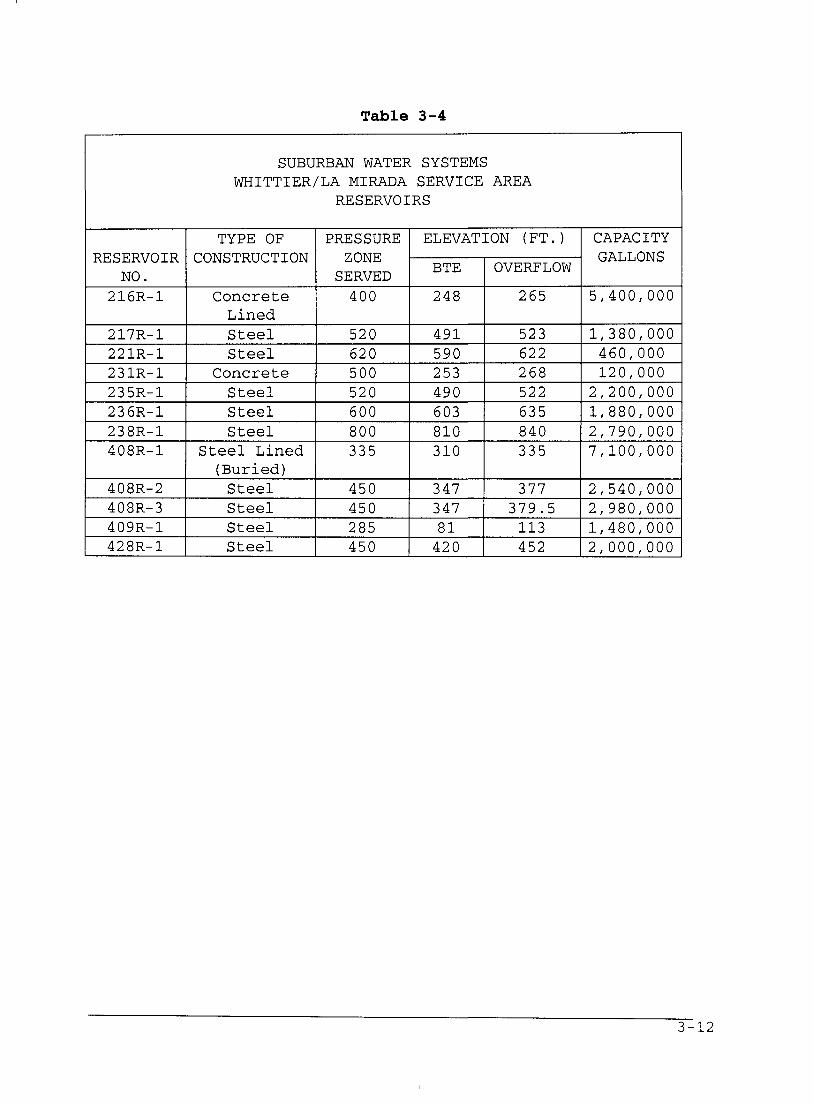
Table 3-4
SUBURBAN WATER SYSTEMSWHITTIER/LA MIRADA SERVICE AREA
RESERVOIRS
RESERVOIRNO.
216R-I
TYPE OFCONSTRUCTION
PRESSUREZONE
SERVED4OO
ELEVATION (FT.)
BTE
248
OVERFLOW
265
CAPACITYGALLONS
Concrete 5,400,000Lined
217R-I Steel 520 491 523 1,380,000221R-I Steel 620 590 622 460,000231R-I Concrete 500 253 268 120,000235R-I Steel 520 490 522 2,200,000236R-I Steel 600 603 635 1,880,000238R-I Steel 800 810 840 2,790,000408R-I Steel Lined 335 310 335 7,100,000
(Buried)408R-2 Steel 450 347 377 2,540,000408R-3 Steel 450 347 379.5 2,980,000409R-I Steel 285 81 113 1,480,000428R-I Steel 450 420 452 2,000,000
3-12
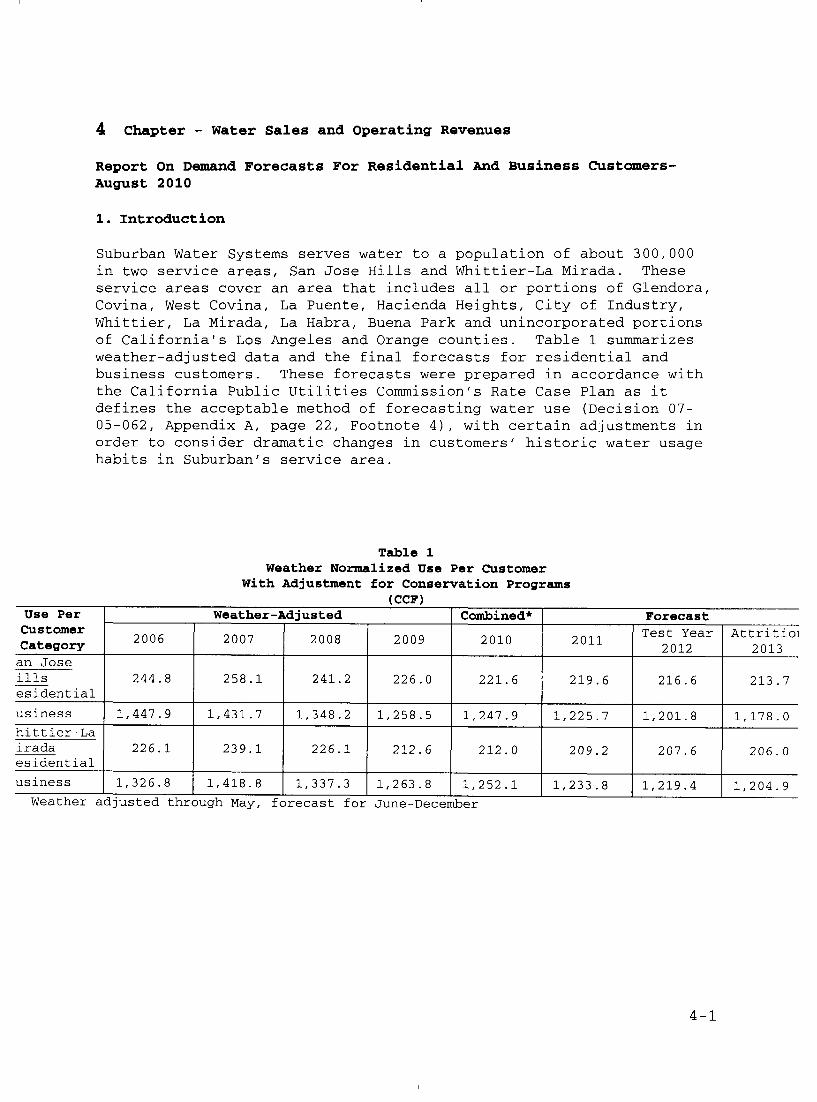
Chapter - Water Sales and Operating Revenues
Report On Demand Forecasts For Residential And Business Customers-August 2010
I. Introduction
Suburban Water Systems serves water to a population of about 300,000in two service areas, San Jose Hills and Whittier-La Mirada. Theseservice areas cover an area that includes all or portions of Glendora,Covina, West Covina, La Puente, Hacienda Heights, City of Industry,Whittier, La Mirada, La Habra, Buena Park and unincorporated portionsof California’s Los Angeles and Orange counties. Table 1 summarizesweather-adjusted data and the final forecasts for residential andbusiness customers. These forecasts were prepared in accordance withthe California Public Utilities Commission’s Rate Case Plan as itdefines the acceptable method of forecasting water use (Decision 07-05-062, Appendix A, page 22, Footnote 4), with certain adjustments inorder to consider dramatic changes in customers’ historic water usagehabits in Suburban’s service area.
Use PerCustomerCategory
an Joseillsesidential
usinesshittier-Lairadaesidentialusiness
2006
244.8
1,447.9
226.1
1,326.8
Table 1Weather Normalized Use Per Customer
With Adjustment for Conservation Programs(CCF)
Weather-Adjusted
2007
258.1
1,431.7
239.1
1,418.8
2OO8
241.2
1,348.2
226.1
1,337.3
2009
226.0
1,258.5
212.6
1,263.8
Combined*
2010
221.6
1,247.9
212.0
1,252.1
2011
219.6
1,225.7
209.2
1,233.8
ForecastTest Year
2012
216.6
1,201.8
207.6
1,219.4Weather adjusted through May, forecast for June-December
Attritio2013
213.7
1,178.0
206.0
1,204.9
4-1
Report On Demand Forecasts For Industrial, Public Authority andConstruction Water Customers
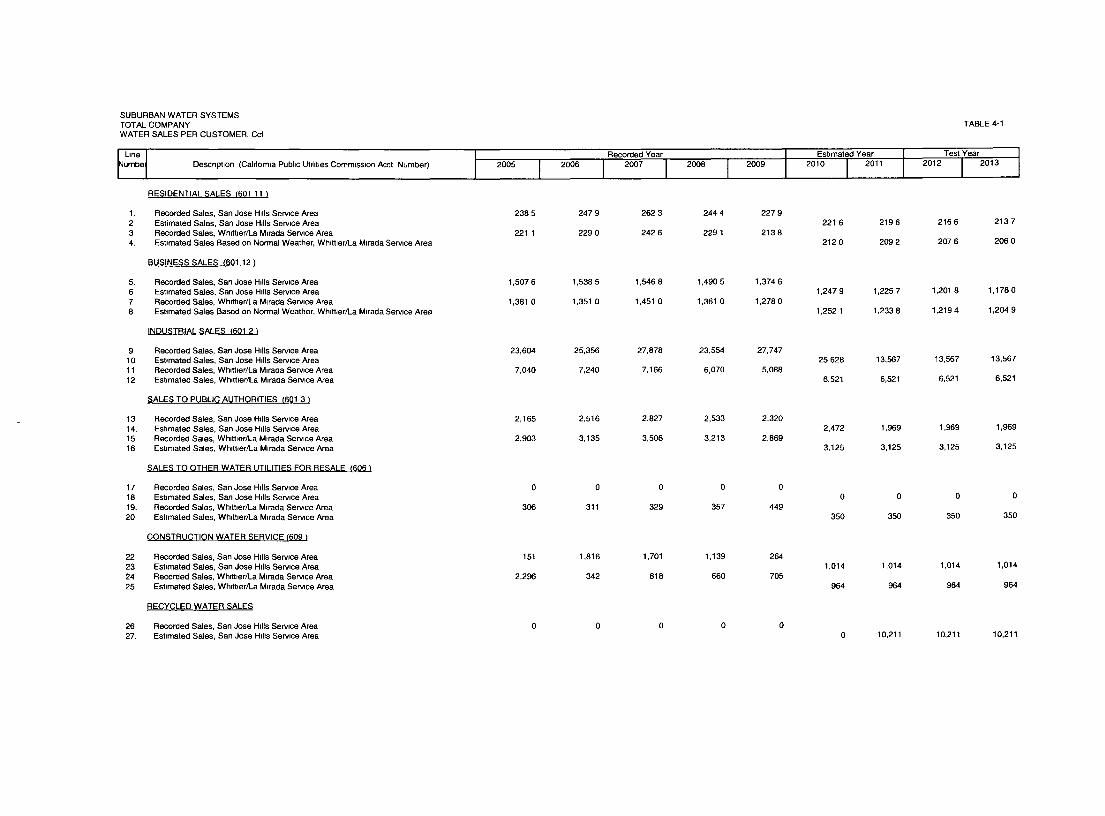
San Jose Hills Service Area industrial water usage is shown on Table4-1 with the last recorded water sales per customer equal to 27,747Ccf. The 2010 adjusted year sales is the average of the last fiverecorded years, which is 25,628 Ccf. Thereafter industrial waterusage is projected to decline to 13,567 to reflect the impact of someindustrial water customers switching to recycled water.
San Jose Hills Service Area sales to public authorities water usage isshown on Table 4-1 with the last recorded water sales per customerequal to 2,320 Ccf. The 2010 adjusted year sales is the average ofthe last five recorded years, which is 1,969 Ccf. No change in salesper customer is foreseen through December 31, 2013.
San Jose Hills Service Area construction water sales is shown on Table4-2 with the last recorded water sales per customer equal to 264 Ccf.The 2010 adjusted year sales is the average of the last five recordedyears, which is 1,014 Ccf. No change in sales per customer isforeseen through December 31, 2013.
Whittier/La Mirada Service Area industrial sales is shown on Table 4-1with the last recorded water sales per customer equal to 5,088 Ccf.The 2010 adjusted year sales is the average of the last five recordedyears, which is 6,521 Ccf. No change in sales per customer isforeseen through December 31, 2013.
Whittier/La Mirada Service Area sales to public authorities is shownon Table 4-1 with the last recorded water sales per customer equal to2,869 Ccf. The 2010 adjusted year sales is the average of the lastfive recorded years, which is 3,125 Ccf. No change in sales percustomer is foreseen through December 31, 2013.
Whittier/La Mirada Service Area sales to other utilities for resale isshown on Table 4-1 with the last recorded water sales per customerequal to 449 Ccf. The 2010 adjusted year sales is the average of thelast five recorded years, which is 350 Ccf. No change in sales percustomer is foreseen through December 31, 2013.
Whittier/La Mirada Service Area construction water sales is shown onTable 4-1 with the last recorded water sales per customer equal to 705Ccf. The 2010 adjusted year sales is the average of the last fiverecorded years, which is 964 Ccf. No change in sales per customer isforeseen through December 31, 2013.
4-2
4.1 Projected Water Sales and Metered Customers
Projected metered customer growth for all areas was estimatedconsistent with the requirements of the Revised Rate Case Plan forClass A Water Utilities. The five-year average change in customers bycustomer class was added to the test year customers (subtracted in thecase of San Jose Hills and Whittier/La Mirada residential customerssince the five-year average showed a small reduction in customers).The second escalation year customers were estimated by adding thefive-year average change in customers by customer class to the firstescalation year customers.
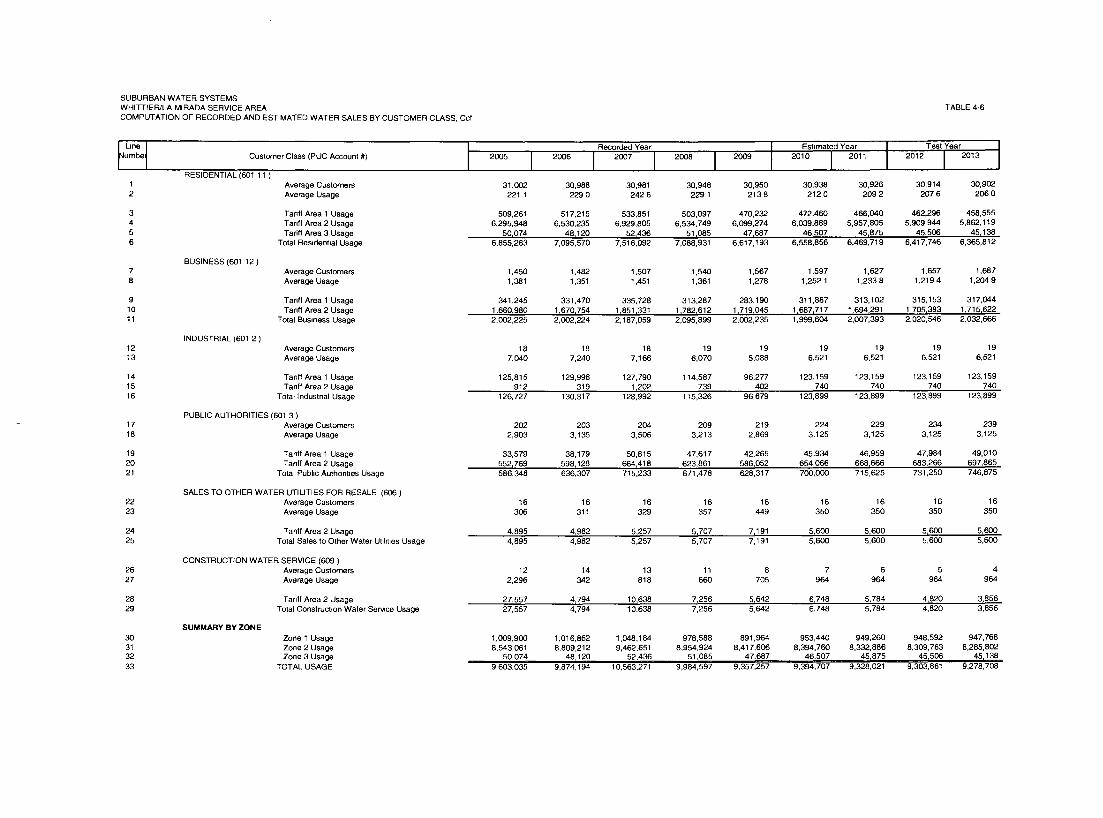
Water sales by customer class for each year through estimated yearDecember 31, 2013 are shown in Table 4-7. Residential, business, andpublic authorities sales shown in this table were computed using theaverage number of customers from Tables 4-2 and 4-3 and the averagewater usage per customer from Tables 4-1.
Unmetered Customers
Additions of new unmetered customers (private fire protection serviceand fire hydrant service on private property) are based on five-yearhistorical average.
Recycled Water
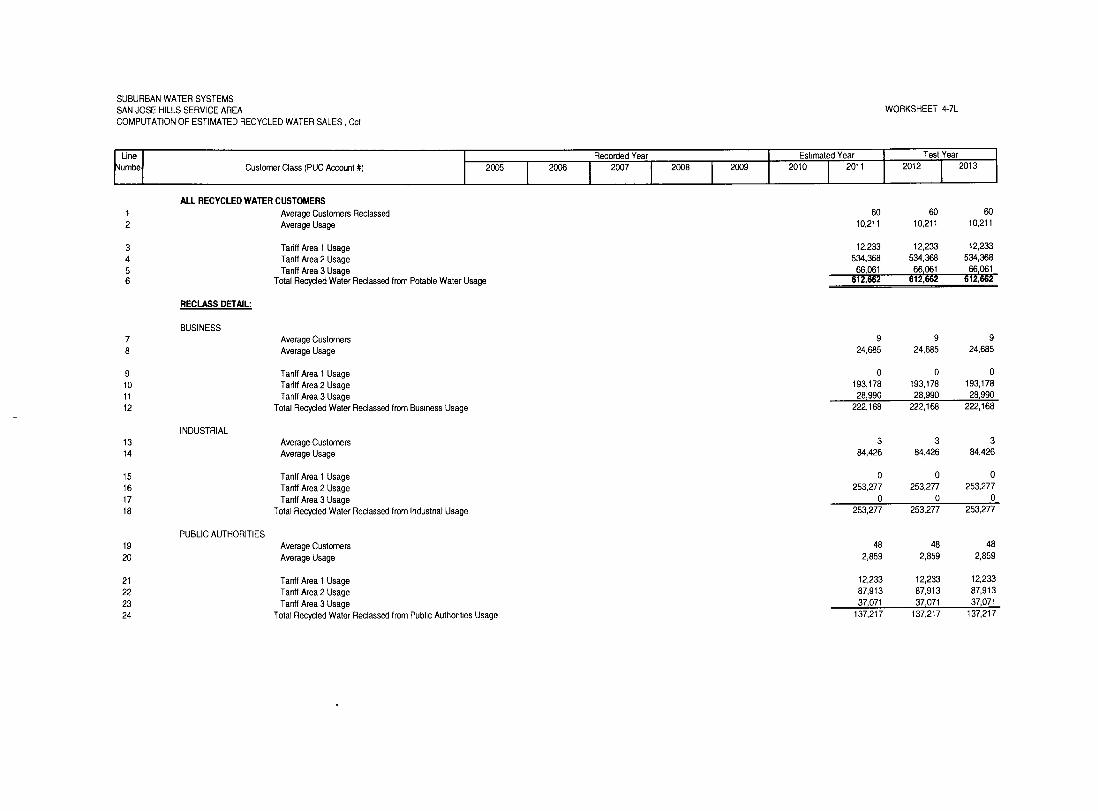
On November 3, 2010, Suburban entered into an agreement with the UpperSan Gabriel Valley Municipal Water District (~Upper District") topurchase recycled water. Recycled water represents a new resourcethat will benefit all San Jose Hills Service Area customers bylessening Suburban’s dependence on potable water supplies. Recycledwater will be made available to current high-use non-residential watercustomers such as golf courses that will be switching to recycledwater. Suburban proposes to price recycled water in the same manneras potable water. The only difference is the quantity rate forrecycled water, which is discounted 15% from potable quantity rates.Other than the obvious water quality differences, Suburban iscommitted to providing the same high level of service to all San JoseHills Service Area customers. Recycled water sales are shown on Table4-1 beginning in 2011 with annual sales of 10,211 Ccf. No change insales per customer is foreseen through December 31, 2013. Computationof recycled water sales is shown on Table 4-7L, including theprojected reclass of customers from potable water to recycled water.
Non-Tariffed Services
In 2001, the Company implemented a new non-tariffed service pursuantto the Commission’s Privatization and Excess Capacity Decision 00-07-018. Decision 00-07-018 was subsequently revised by Decision 03-04-028, which has since been revised by Decision 04-12-023, and morerecently by the affiliate transactions rulemaking R.09-04-012 in
4-3
Decision 10-10-019. This program offers customers houselinemaintenance services. Minimal utility resources are involved in theprogram. Revenue sharing is accounted for in accordance with theaffiliate transactions decision. See Table 4-10 for revenue sharingthrough December 31, 2013.
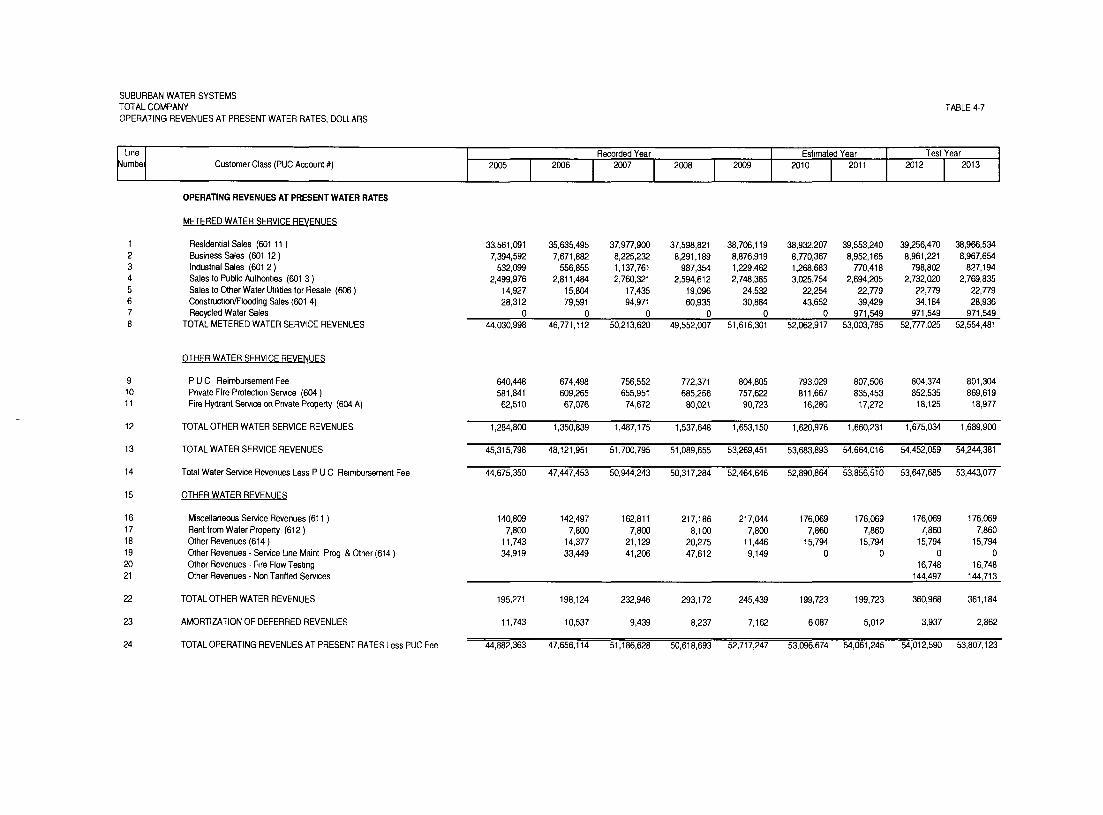
4.2 Revenues at Present Rates
Present rate revenues through estimated year December 31, 2013 atpresent water rates were calculated as shown in Table 4-7 based on thecustomer and water sales data shown in Tables 4-1 through 4-6. Theamortization of deferred revenues associated with taxablecontributions in aid of construction is computed in Table 8-8.
4-4
SUBURBAN WATER SYSTEMSTOTAL COMPANYWATER SALES PER CUSTOMER, Ccf
~L=ne~umbaI
Descnptlon (California Pubhc Utlht~es Commission Acct Number)
RESIDENTIAL ~;ALES ~601 11 )
1. Recorded Sales, San Jose H~lls Serwce Area2 Estimated Sales, San Jose Hdls Service Area3 Recorded Sales, Wh~tt~er/I._a M~rada Ser~ce Area4. Est=mated Sales Based on Normal Weather, Wh=ttler/La Mlrada Serv=ce Area
I 2006
BUSINESS SALES ~601 12 I
5. Recorded Sales, San Jose Hdls Serwce Area6 Estimated Sales, San Jose Hdls Service Area7 Recorded Sales, Wh=tt~er/La M~rada Serv=ce Area8 Estimated Sales Based on Normal Weather, Wh=tt~er/La M~rada Serv=ce Area
Recorded Year
I2007
I2008
I2009
INDUSTRIAL SALES (601 2 )
9 Recorded Sales, San Jose H=lls Serv=ce Area10 Estimated Sales, San Jose H=IIs Serwce Area11 Recorded Sales, Wh=tt=er/La M=rada Ser~ce Area12 Est=mated Sales, Wh~tt=er/La Mirada Service Area
SALES TO PUBLIC AUTHORITIES ~601 3 I
13 Recorded Sales, San Jose Hdls Serv=ce Area14. Est=mated Sales, San Jose Hdls Serwce Area15 Recorded Sales, Wh~tt~er/La M=rada Service Area16 Estimated Sales, Wh~tt=er/La Mlrada Service Area
238 5 247 9 262 3 244 4 227 9
221 1 229 0 242 6 229 1 213 8
1,507 6 1,538 5 1,546 8 1,490 5 1,374 6
1,381 0 1,351 0 1,451 0 1,361 0 1,278 0
SALES TO OTHER WATER UTILITIES FOR RESALE (’(~06)
17 Recorded Sales, San Jose Hills Serwce Area18 Estimated Sales, San Jose H~lls Serv=ce Area19. Recorded Sales, Wh~ttler/La M=rada Service Area20 Estimated Sales, Wh~ttler/La M~rada Service Area
23,604 25,356 27,878 23,554 27,747
7,040 7,240 7,166 6,070 5,088
CONSTRUCTION WATER SERVICE (609)
22 Recorded Sales, San Jose H~lls Serv=ce Area23 Est=mated Sales, San Jose Hdls Serv=ce Area24 Recorded Sales, Wh=tt=edLa M~rada Service Area25 Estimated Sales, Wh~tt~er/La M=rada Service Area
2,165 2,516 2,827 2,533 2,320
2,903 3,135 3,506 3,213 2,869
RECY(~LED WATER SALES
Recorded Sales, San Jose Hdls Serv=ce AreaEstimated Sales, San Jose Hdls Service Area
2005
0 0 0 0 0
306 311 329 357 449
151 1,816 1,701 1,139 264
2,296 342 818 660 705
Est~m~ed Year2010 I 2011
TABLE 4-1
2012 2013
221 6 219 6 216 6 2137
212 0 2092 207 6 2060
1,247 9 1,225 7 1,201 8 1,178 0
1,252 1 1,233 8 1,219 4 1,204 9
25,628 13,567 13,567 13,567
6,521 6,521 6,521 6,521
2,472 1,969 1,969 1,969
3,125 3,125 3,125 3,125
0 0 0 0
350 350 350 350
1,014 1,014 1,014 1,014
964 964 964 964
26 0 0 0 0 027. 0 10,211 10,211 10,211
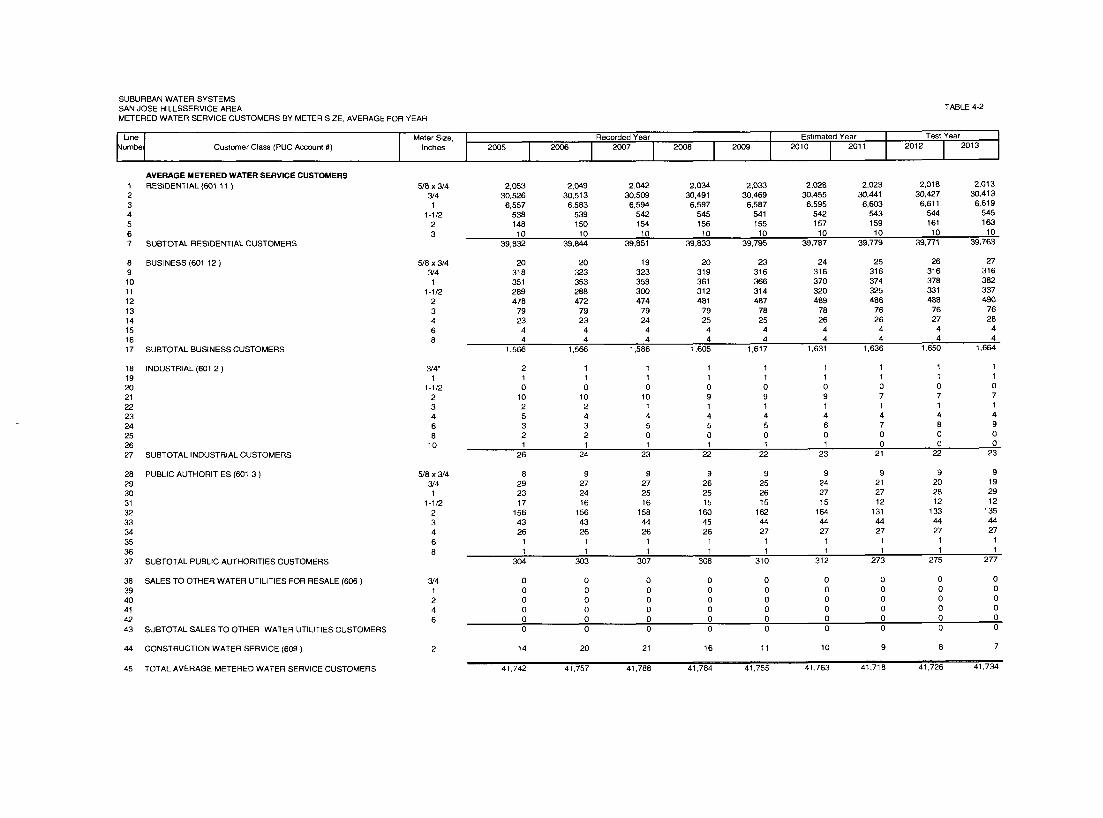
SUBURBAN WATER SYSTEMSSAN JOSE HILLSSERVICE AREAMETERED WATER SERVICE CUSTOMERS BY METER SIZE, AVERAGE FOR YEAR
~lJne I
um~1 Customer Class (PUC Account #)Meter S~ze,
Inches
1234567
1011121314151617
18192021222324252627
28293031323334353637
383940414243
2005
AVERAGE METERED WATER SERVICE CUSTOMERSRESIDENTIAL (601 11 )
SUBTOTAL RESIDENT~AL CUSTOMERS
Recorded Year I
TABLE 4-2
Estimated Year Test Year20132010 2011 2012
I
BUSINESS (601 12 )
SUBTOTAL BUSINESS CUSTOMERS
INDUSTRIAL (601 2 )
SUBTOTAL INDUSTRIAL CUSTOMERS
PUBLIC AUTHORITIES (601 3 )
SUBTOTAL PUBLIC AUTHORITIES CUSTOMERS
SALES TO OTHER WATER UTILITIES FOR RESALE (606)
SUBTOTAL SALES TO OTHER WATER UTILITIES CUSTOMERS
44 CONSTRUCTION WATER SERVICE (609)
45 TOTAL AVERAGE METERED WATER SERVICE CUSTOMERS
5/8 x 3/4 2,053 2,049 2,042 2,034 2,033 2,028 2,023 2,018 2,0133/4 30,526 30,513 30,509 30,491 30,469 30,455 30,441 30,427 30,413
1 6,557 6,583 6,594 6,597 6,587 6,595 6,603 6,611 6,6191-1/2 538 539 542 545 541 542 543 544 5452 148 150 154 156 155 157 159 161 1633 10 10 10 10 10 10 10 10 t0
39,832 39,844 39,851 39,833 39,795 39,787 39,779 39,771 39,763
5/8 x 3/4 20 20 19 20 23 24 25 26 273/4 318 323 323 319 316 316 316 316 316
1 351 353 359 361 366 370 374 378 3821-1/2 289 288 300 312 314 320 325 331 337
2 478 472 474 481 487 489 486 488 4903 79 79 79 79 78 78 76 76 764 23 23 24 25 25 26 26 27 286 4 4 4 4 4 4 4 4 48 4 4 4 4 4 4 4 4 4
1,566 1,566 1,586 1,605 1,617 1,631 1,636 1,650 1,664
3/4" 2 1 1 1 1 1 1 1 11 1 1 1 1 1 1 1 1 1
1-1/2 0 0 0 0 0 0 0 0 02 10 10 10 9 9 9 7 7 73 2 2 1 1 1 1 1 1 14 5 4 4 4 4 4 4 4 46 3 3 5 5 5 6 7 8 98 2 2 0 0 0 0 0 0 0
10 1 1 1 1 1 1 0 0 026 24 23 22 22 23 21 22 23
5/8x3/4 8 9 9 9 9 9 9 9 93/4 29 27 27 26 25 24 21 20 19
1 23 24 25 25 26 27 27 28 291-1/2 17 16 16 15 15 15 12 12 122 156 156 t58 160 162 164 131 133 1353 43 43 44 45 44 44 44 44 444 26 26 26 26 27 27 27 27 276 1 1 1 1 1 1 1 1 18 1 1 1 1 1 1 1 1 1
304 303 307 308 310 312 273 275 277
000000
000000
000000
000000
000000
000000
000000
0 00 00 00 00 00 0
3/41246
14 20 21 16 11 10 9 8 7
41,742 41,757 41,788 41,784 41,755 41,763 41,718 41,726 41,734
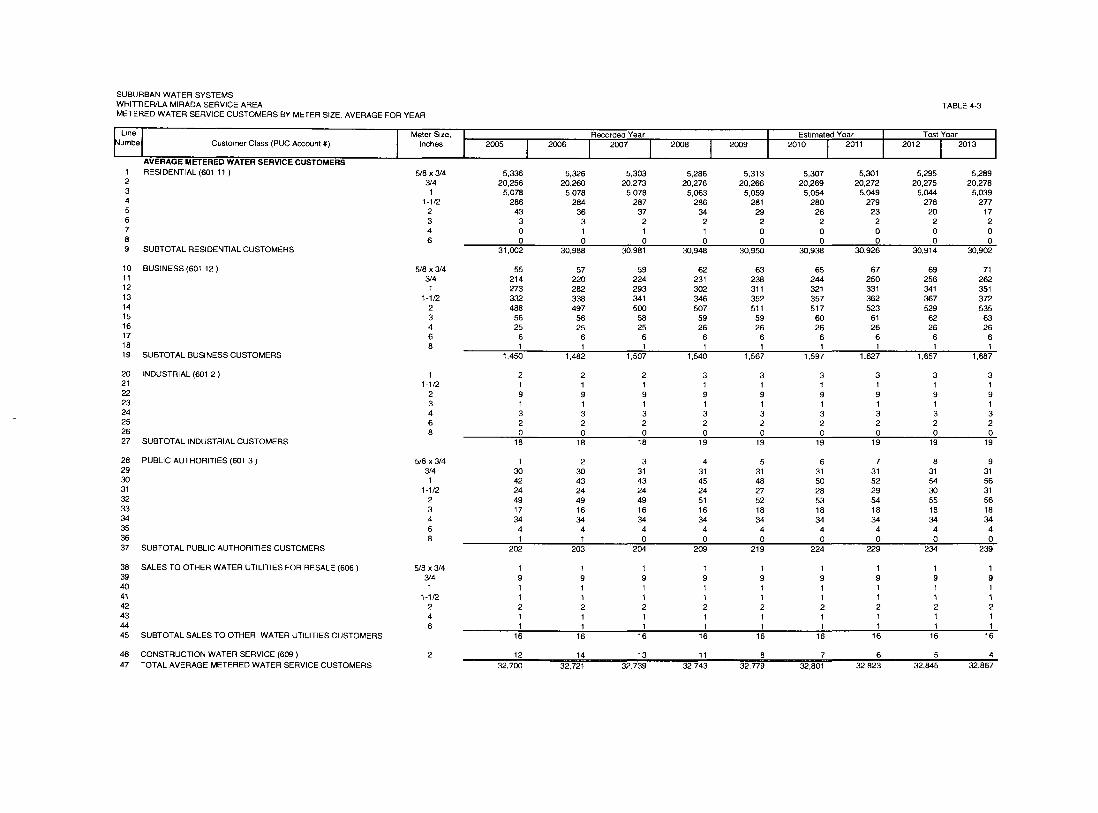
SUBURBAN WATER SYSTEMSWHITTIER/LA MIRADA SERVICE AREAMETERED WATER SERVICE CUSTOMERS BY METER SIZE, AVERAGE FOR YEAR
~lJne Jumbe1
Customer Class (PUC Account #)Meter Size,
Inches
123456789
10111213141516171819
2O21222324252627
28293031323334353637
3839404142434445
2OO5
AVERAGE METERED WATER SERVICE CUSTOMERSRESIDENTIAL (601 11 )
SUBTOTAL RESIDENTIAL CUSTOMERS
Recorded Year2008 2OO9
Estimated Year2010 2011
TABLE 4-3
BUSINESS (601 12 )
SUBTOTAL BUSINESS CUSTOMERS
INDUSTRIAL (601 2 )
SUBTOTAL INDUSTRIAL CUSTOMERS
PUBLIC AUTHORITIES (601 3 )
SUBTOTAL PUBLIC AUTHORITIES CUSTOMERS
SALES TO OTHER WATER UTILITIES FOR RESALE (606)
SUBTOTAL SALES TO OTHER WATER UTILITIES CUSTOMERS
CONSTRUCTION WATER SERVICE (609)TOTAL AVERAGE METERED WATER SERVICE CUSTOMERS
2012 Test iear2013
1 2 2 2 3 3 3 3 3 31-1~ 1 1 1 1 1 1 1 1 12 9 9 9 9 9 9 9 9 93 1 1 1 1 1 1 1 1 14 3 3 3 3 3 3 3 3 36 2 2 2 2 2 2 2 2 28 0 0 0 0 0 0 0 0 0
18 18 18 19 19 19 19 19 19
~8 x3/4 1 2 3 4 5 6 7 8 93/4 30 30 31 31 31 31 31 31 31
1 42 43 43 45 48 50 52 54 561-1~ 24 24 24 24 27 28 29 30 312 49 49 49 51 52 53 54 55 563 17 16 16 16 18 18 18 18 18
6 4 4 4 4 4 4 4 4 48 1 1 0 0 0 0 0 0 0
202 203 204 209 219 224 229 234 239
~8x3~ 1 1 1 1 1 1 1 1 13/4 9 9 9 9 9 9 9 9 9
1 1 1 1 1 1 1 1 1 11-1~ 1 1 1 1 1 1 1 1 12 2 2 2 2 2 2 2 2 24 1 1 1 1 1 1 1 1 16 1 1 1 1 1 1 1 1 1
16 16 16 16 16 16 16 16 16
12 14 13 11 8 7 6 5 432,700 32,721 32,739 32,743 32,779 32,801 32,823 32,845 32,867
~8 x 3~ 55 57 59 62 63 65 67 69 713/4 214 220 224 231 238 244 250 256 262
1 273 282 293 302 311 321 331 341 3511-1~ 332 338 341 346 352 357 362 367 3722 488 497 500 507 511 517 523 529 5353 56 56 58 59 59 60 61 62 634 25 25 25 26 26 26 26 26 266 6 6 6 6 6 6 6 6 68 1 1 1 1 1 1 1 1 1
1,450 1,482 1,507 1,540 1,567 1,597 1,627 1,657 1,687
~8 x3/4 5,336 5,326 5,303 5,286 5,313 5,307 5,301 5,295 5,2893/4 20,256 20,260 20,273 20,276 20,266 20,269 20,272 20,275 20,278
1 5,078 5,078 5,078 5,063 5,059 5,054 5,049 5,044 5,0391-1~ 286 284 287 286 281 280 279 278 2772 43 36 37 34 29 26 23 20 173 3 3 2 2 2 2 2 2 24 0 1 1 1 0 0 0 0 06 0 0 0 0 0 0 0 0 0
31,002 30,988 30,981 30,948 30,950 30,938 30,926 30,914 30,902
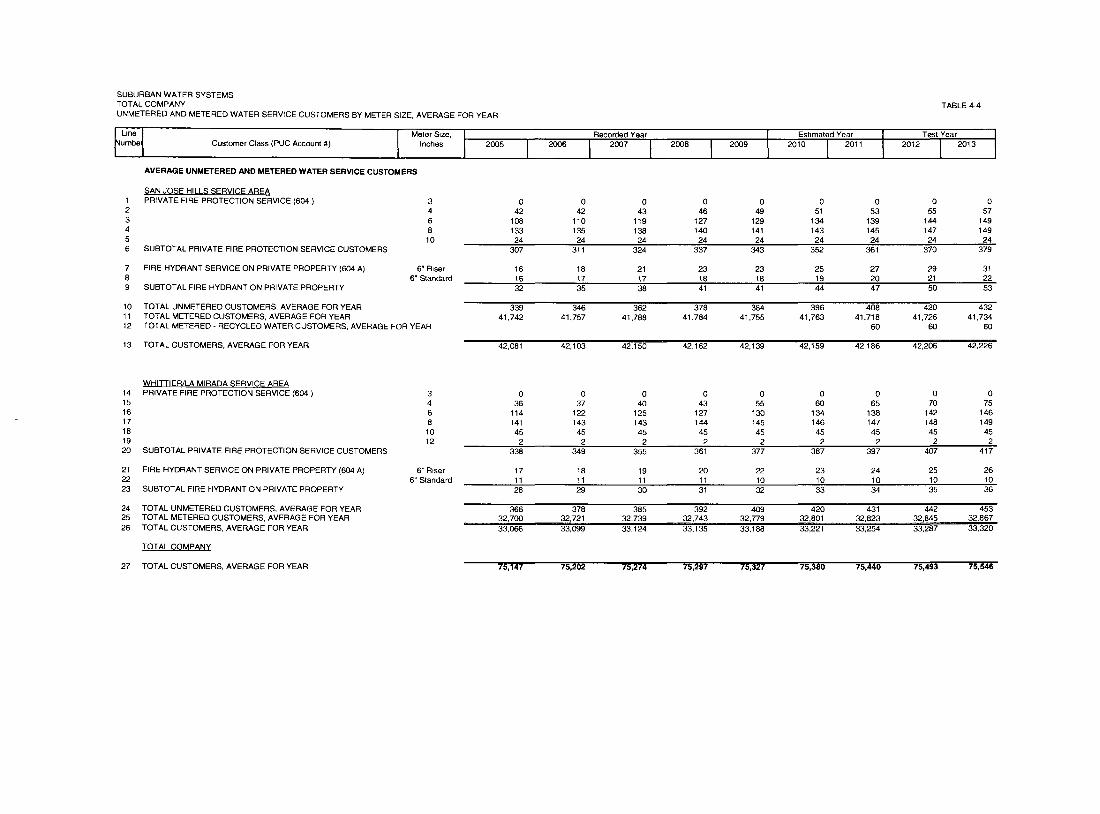
SUBURBAN WATER SYSTEMSTOTALCOMPANYUNMETERED AND METERED WATER SERVICE CUSTOMERS BY METER SIZE, AVERAGE FOR YEAR
~lJne~ I Meter S{ze,umbe1 Customer Class (PUC Account #) Inches
AVERAGE UNMETERED AND METERED WATER SERVICE CUSTOMERS
2005
TABLE 4-4
Estimated Year Test iear2013
IRecorded Year 2010 2011 I 2012
SAN JOSE HILLS SERVICE AREA1 PRIVATE FIRE PROTECTION SERVICE (604)23456 SUBTOTAL PRIVATE FIRE PROTECTION SERVICE CUSTOMERS
7 FIRE HYDRANT SERVICE ON PRIVATE PROPERTY (604 A) 6" R~ser8 6" Standard9 SUBTOTAL FIRE HYDRANT ON PRIVATE PROPERTY
3 0 0 0 0 0 0 0 0 04 42 42 43 46 49 51 53 55 576 108 110 119 127 129 134 139 144 1498 133 135 138 140 141 143 145 147 14910 24 24 24 24 24 24 24 24 24
307 311 324 337 343 352 361 370 379
10 TOTAL UNMETERED CUSTOMERS, AVERAGE FOR YEAR11 TOTAL METERED CUSTOMERS, AVERAGE FOR YEAR12 TOTAL METERED -RECYCLED WATER CUSTOMERS, AVERAGE FOR YEAR
13 TOTAL CUSTOMERS, AVERAGE FOR YEAR
16 18 21 23 23 25 27 29 3116 17 17 18 18 19 20 21 2232 35 38 41 41 44 47 50 53
339 346 362 378 384 396 408 420 43241,742 41,757 41,788 41,784 41,755 41,763 41,718 41,726 41,734
60 60 60
42,081 42,103 42,150 42,162 42,139 42,159 42,186 42,206 42,226
WHITTIER/LA MIRADA SERVICE AREA14 PRIVATE EIRE PROTECTION SERVICE (604) 315 416 617 818 1019 1220 SUBTOTAL PRIVATE FIRE PROTECTION SERVICE CUSTOMERS
21 FIRE HYDRANT SERVICE ON PRIVATE PROPERTY (604 A) 6" R~ser22 6" Standard23 SUBTOTAL FIRE HYDRANT ON PRIVATE PROPERTY
24 TOTAL UNMETERED CUSTOMERS, AVERAGE FOR YEAR25 TOTAL METERED CUSTOMERS, AVERAGE FOR YEAR26 TOTAL CUSTOMERS, AVERAGE FOR YEAR
TOTAL COMPANY
27 TOTAL CUSTOMERS, AVERAGE FOR YEAR
0 0 0 0 0 0 0 0 036 37 40 43 55 60 65 70 75114 122 125 127 130 134 138 142 146141 143 143 144 145 146 147 148 14945 45 45 45 45 45 45 45 45
2 2 2 2 2 2 2 2 2338 349 355 361 377 387 397 407 417
17 18 19 20 22 23 24 25 2611 11 11 11 10 10 10 10 1028 29 30 31 32 33 34 35 36
366 378 385 392 409 420 431 442 45332,700 32,721 32,739 32,743 32,779 32,801 32,823 32,845 32,86733,066 33,099 33,124 33,135 33,188 33,221 33,254 33,287 33,320
75,147 75,202 75,274 75,297 76,327 75,380 75,440 75,493 75,546
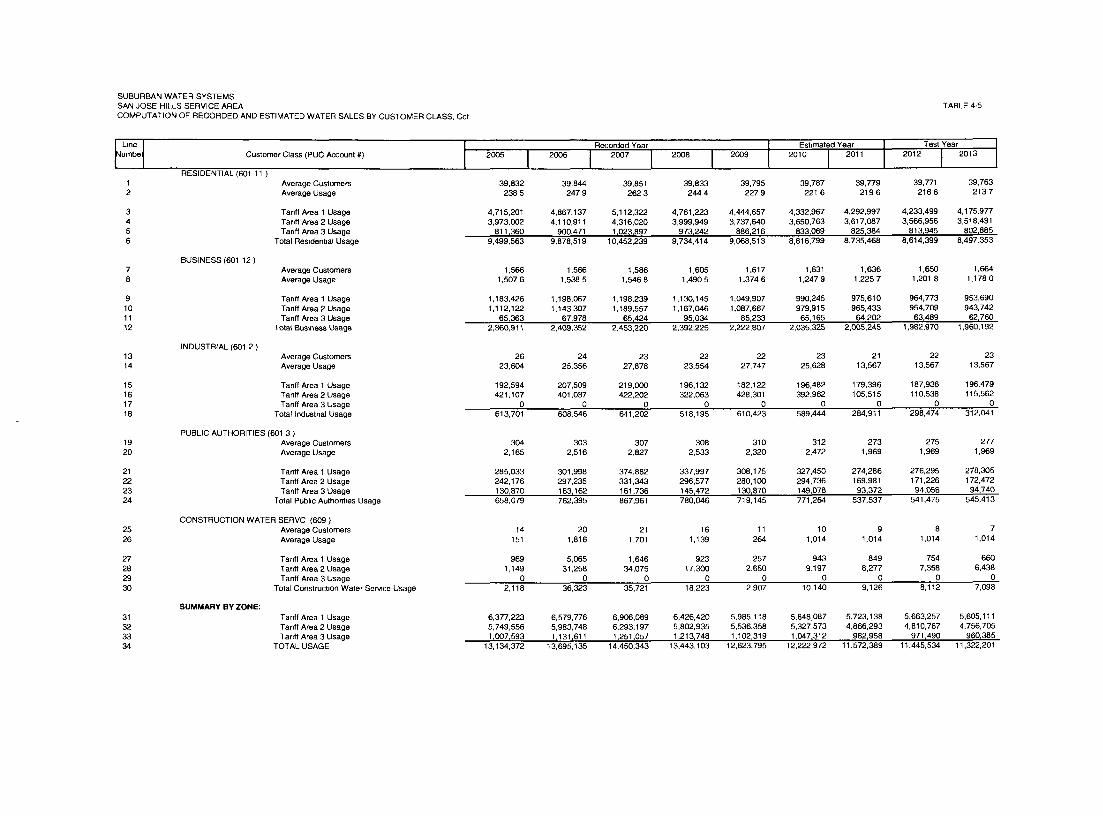
SUBURBAN WATER SYSTEMSSAN JOSE HILLS SERVICE AREACOMPUTATION OF RECORDED AND ESTIMATED WATER SALES BY CUSTOMER CLASS, Ccf
TABLE 4-5
~L~ne Iumbe1 Customer Class (PUC Account #)
RESIDENTIAL (601 11 )1 Average Customers2 Average Usage
3456
BUSINESS (601 12 )
I I IRecOrded Year2005 2006 2007 2008 I
Estlmatid Year I2009 2010 2011Test Year
2012 I 2013
CONSTRUCTION WATER SERVC (609)25 Average Customers26 Average Usage
27 Tariff Area 1 Usage28 Tariff Area 2 Usage29 Tanfl Area 3 Usage30 Total Construcbon Water Serwce Usage
31 Tariff Area 1 Usage32 Tariff Area 2 Usage33 Tariff Area 3 Usage34 TOTAL USAGE
21 Tanff Area 1 Usage22 Tanfl Area 2 Usage23 Tanff Area 3 Usage24 TotalPubhc Authonbes Usage
PUBLIC AUTHORITIES (601 3 )19 Average Customers20 Average Usage
15 Tanff Area 1 Usage16 Tanff Ama 2 Usage17 Tanff Ama 3 Usage18 Totallndustnal Usage
13 Average Customers14 Average Usage
9 Tariff Area 1 Usage10 Tanff Area 2 Usage11 Tanff Area 3 Usage12 Tota{ Bus~ness Usage
Tanff Area 1 Usage 4,715,201 4,867,137 5,112,322 4,761,223 4,444,657 4,332,967 4,292,997 4,233,499 4,175,977Tanff Area 2 Usage 3,973,002 4,110,911 4,316,020 3,999,949 3,737,640 3,650,763 3,617,087 3,566,956 3,518,491Tanff Area 3 Usage 811 ~360 900~471 1 ~023~897 973~242 886~216 833~069 825~384 813~945 802~885
Total Res{dent=al Usage 9,499,563 9,878,519 10,452,239 9,734,414 9,068,513 8,816,799 8,735,468 8,614,399 8,497,353
INDUSTRIAL (601 2 )
Average Customers 1,566 1,566 1,586 1,605 1,617 1,631 1,636 1,650 1,664Average Usage 1,507 6 1,538 5 1,546 8 1,490 5 1,374 6 1,247 9 1,225 7 1,201 8 1,178 0
1,183,426 1,198,067 1,198,239 1,130,145 1,049,907 990,245 975,610 964,773 953,6901,112,122 1,143,307 1,189,557 1,167,046 1,087,667 979,915 965,433 954,709 943,742
65~363 67~978 65~424 95~034 85~233 65~165 64~202 63~489 62~7602,360,911 2,409,362 2,453,220 2,392,225 2,222,807 2,035,325 2,005,245 1,982,970 1,960,192
26 24 23 22 22 23 21 22 2323,604 25,356 27,878 23,554 27,747 25,628 13,567 13,567 13,567
192,594 207,509 219,000 196,132 182,122 196,482 179,396 187,936 196,479421,107 401,037 422,202 322,063 428,301 392,962 105,515 110,538 115,562
0 0 0 0 0 0 0 0 0613,701 608,546 641,202 518,195 610,423 589,444 284,911 298,474 312,041
304 303 307 308 310 312 273 275 2772,165 2,516 2,827 2,533 2,320 2,472 1,969 1,969 1,969
285,033 301,998 374,882 337,997 308,175 327,450 274,286 276,295 278,305242,176 297,235 331,343 296,577 280,100 294,736 169,981 171,226 172,472130,870 163~162 161~736 145~472 130~870 149,078 93~372 94~056 94~740658,079 762,395 867,961 780,046 719,145 771,264 537,537 541,475 545,413
SUMMARY BY ZONE:
14 20 21 16 11 10 9 8 7151 1,816 1,701 1,139 264 1,014 1,014 1,014 1,014
969 5,065 1,646 923 257 943 849 754 6601,149 31,258 34,075 17,300 2,650 9,197 8,277 7,358 6,438
0 0 0 0 0 0 0 0 02,118 36,323 35,721 18,223 2,907 10,140 9,126 8,112 7,098
6,377,223 6,579,776 6,906,089 6,426,420 5,985,118 5,848,087 5,723,138 5,663,257 5,605,1115,749,556 5,983,748 6,293,197 5,802,935 5,536,358 5,327,573 4,866,293 4,810,787 4,756,7051~007~593 1~131~611 1~251~057 1~213~748 1~102~319 1~047~312 982~958 971~490 960~385
13,134,372 13,695,135 14,450,343 13,443,103 12,623,795 12,222,972 11,572,389 11,445,534 11,322,201
39,832 39,844 39,851 39,833 39,795 39,787 39,779 39,771 39,7632385 247 9 2623 2444 227 9 221 6 219 6 216 6 213 7
SUBURBAN WATER SYSTEMSWHITFIER/LA MIRADA SERVICE AREACOMPUTATION OF RECORDED AND ESTIMATED WATER SALES BY CUSTOMER CLASS, Ccf
TABLE 4-6
~bne Jumbe1 Customer Class (PUC Account #)
|RESIDENTIAL (601 11 )
I Average Customers2 Average Usage
3
BUSINESS (601 12 )
2005 J 2006Recorded Year
I Estlmatid Yeari 2007 i 2008 i 20092010 2011
Test Year2012 J 2013
2223
24 Tanff Area 2 Usage25 Total Sales to Other Water Utilities Usage
CONSTRUCTION WATER SERVICE (609)26 Average Customers27 Average Usage
28 Tanff Area 2 Usage29 Total Construction Water Ser~ce Usage
30 Zone 1 Usage31 Zone 2 Usage32 Zone 3 Usage33 TOTALUSAGE
19 Tanff Area 1 Usage20 Tanff Area 2 Usage21 Total Pubhc Authont=es Usage
PUBLIC AUTHORITIES (601 3 )17 Average Customers18 Average Usage
14 Tanff Area 1 Usage15 Tan# Area 2 Usage16 Totallndustnal Usage
12 Average Cu~omers13 Average Usage
9 Tanff Area 1 Usage10 Tanff Area 2 Usage11 Total Bus=hess Usage
Tanfl Area 1 Usage 509,261 517,215 533,851 503,097 470,232 472,460 466,040 462,296 458,555Tanff Area 2 Usage 6,295,948 6,530,235 6,929,805 6,534,749 6,099,274 6,039,889 5,957,805 5,909,944 5,862,119Tadff Area 3 Usage 50~074 48~120 52=436 51~085 47~687 46~507 45~875 45~506 45~138
TotaIRes~dem~alUsage 6,855,283 7,095,570 7,516,092 7,088,931 6,617,193 6,558,856 6,469,719 6,417,746 6,365,812
INDUSTRIAL (601 2 )
Avenge Customers 1,450 1,462 1,507 !,540 1,567 1,597 1,627 1,657 1,687Average Usage 1,381 1,351 1,451 1,361 1,278 1,252 1 1,233 8 1,219 4 1,2049
341,245 331,470 335,728 313,287 283,190 311,887 313,102 315,153 317,0441~660~980 1~670~754 1=851~331 1~782~612 1~719~045 1~687~717 1~694~291 1~705~393 1=715~6222,002,225 2,002,224 2,187,059 2,095,899 2,002,235 1,999,604 2,007,393 2,020,546 2,032,666
16 18 18 19 19 19 19 19 197,040 7,240 7,166 6,070 5,088 6,521 6,521 6,521 6,521
125,815 129,998 127,790 114,587 96,277 123,159 123,159 123,159 123,159912 319 1,202 739 402 740 740 740 740
126,727 130,317 128,992 115,326 96,679 123,899 123,899 123,899 123,899
202 203 204 209 219 224 229 234 2392,903 3,135 3,506 3,213 2,869 3,125 3,125 3,125 3,125
33,579 38,179 50,815 47,617 42,265 45,934 46,959 47,984 49,010552~769 598~128 664~418 623~861 586,052 654~066 668,666 683~266 697~865586,348 636,307 715,233 671,478 628,317 700,000 715,625 731,250 746,875
SALES TO OTHER WATER UTILITIES FOR RESALE (606)Average CustomersAverage Usage
SUMMARY BY ZONE
16 16 16 16 16 16 16 16 16306 311 329 357 449 350 350 350 350
4,895 4,982 5t257 5~707 7~191 5,600 5~600 5,600 5~6004,895 4,982 5,257 5,707 7,191 5,600 5,600 5,600 5,600
12 14 13 11 8 7 6 5 42,296 342 818 660 705 964 964 964 964
27,557 4t794 10,638 7,256 5t642 6,748 5,784 4,820 3,85627,557 4,794 10,638 7,256 5,642 6,748 5,784 4,820 3,856
1,009,900 1,016,862 1,048,184 978,588 891,964 953,440 949,260 948,592 947,7688,543,061 8,809,212 9,462,651 8,954,924 8,417,606 8,394,760 8,332,886 8,309,763 8,285,802
50,074 48,120 52,436 51,085 47,687 46,507 45,875 45,506 45,1389,603,035 9,874,194 10,563,271 9,984,597 9,357,257 9,394,707 9,328,021 9,303,861 9,278,708
31,002 30,988 30,981 30,948 30,950 30,938 30,926 30,914 30,902221 1 229 0 2426 229 1 213 8 212 0 209 2 207 6 206 0
SUBURBAN WATER SYSTEMSTOTAL COMPANYOPERATING REVENUES AT PRESENT WATER RATES, DOLLARS
TABLE 4-7
hne I1
12345678
Customer Class (PUC Account #) 2005 2006 2007 2008 2010 2011 2012 2013
OPERATING REVENUES ATPRESENTWATER RATES
METERED WATER SERVICE REVENUES
Residential Sales (601 11 )Business Sales (601 12 )Industnal Sales (601 2 )Sales to Public Authontes (601 3 )Sales to Other Water Utilities for Resale (606)Construction/Flooding Sales (601 4)Recycled Water Sales
TOTAL METERED WATER SERVICE REVENUES
33,561,091 35,635,495 37,977,900 37,598,821 38,706,119 38,932,207 39,553,240 39,256,470 38,966,5347,394,592 7,671,882 8,225,232 8,291,189 8,876,919 8,770,367 8,952,165 8,961,221 8,967,654
532,099 556,855 1,137,761 987,354 1,229,462 1,268,683 770,418 798,802 827,1942,499,976 2,811,484 2,760,321 2,594,612 2,748,385 3,025,754 2,694,205 2,732,020 2,769,835
14,927 15,804 17,435 19,096 24,532 22,254 22,779 22,779 22,77928,312 79,591 94,971 60,935 30,884 43,652 39,429 34,184 28,936
0 0 0 0 0 0 971 ~549 971,549 971 r54944,030,998 46,771,112 50,213,620 49,552,007 51,616,301 52,062,917 53,003,785 52,777,025 52,554,481
91011
12
13
t4
15
161718192021
22
23
24
OTHER WATER SERVICE REVENUES
P U C Reimbursement FeePnvate Fire Protection Se~ce (604)Fire Hydrant Service on Private Property (604 A)
TOTAL OTHER WATER SERVICE REVENUES
TOTAL WATER SERVICE REVENUES
Total Water Service Revenues Less P U C Re=mbursement Fee
OTHER WATER REVENUES
Miscellaneous Service Revenues (611 )Rent from Water Property (612)Other Revenues (614)Other Revenues - Service bne Maint Prog & Other (614)Other Revenues - Rre Flow TestingOther Revenues - Non Tanffed Serv=ces
TOTAL OTHER WATER REVENUES
AMORTIZATION OF DEFERRED REVENUES
TOTAL OPERATING REVENUES AT PRESENT RATES Less PUC Fee
640,448 674,498 756,552 772,371 804,805 793,029 807,506 804,374 801,304581,841 609,265 655,951 685,256 757,622 811,667 835,453 852,535 869,61962, 510 67,076 74,672 80,021 90,723 16,280 17,272 18,125 18,977
1,284,800 1,350,839 1,487,175 1,537,648 1,653,150 1,620,976 1,660,231 1,675,034 1,689,900
45,315,798 48,121,951 51,700,795 51,089,655 53,269,451 53,683,893 54,664,016 54,452,059 54,244,381
44,675,350 47,447,453 50,944,243 50,317,284 52,464,646 52,890,864 53,856,510 53,647,685 53,443,077
140,809 142,497 162,811 217,186 217,044 176,069 176,069 176,069 176,0697,800 7,800 7,800 8,100 7,800 7,860 7,860 7,860 7,860
11,743 14,377 21,129 20,275 11,446 15,794 15,794 15,794 15,79434,919 33,449 41,206 47,612 9,149 0 0 0 0
16,748 16,748144,497 144,713
195,271 198,124 232,946 293,172 245,439 199,723 199,723 360,968 361,184
11,743 10,537 9,439 8,237 7,162 6,087 5,012 3,937 2,862
44,882,363 47,656,114 51,186,628 50,618,693 52,717,247 53,096,674 54,061,245 54,012,590 53,807,123
SUBURBAN WATER SYSTEMSSAN JOSE HILLS SERVICE AREACOMPUTATION OF ESTIMATED RECYCLED WATER SALES, Ccf
WORKSHEET 4-7L
~Line~umbe1
3456
9101112
1314
15161718
192O
21222324
Customer Class (PUC Account #) 2005I
2006
RECYCLED WATER CUSTOMERSAverage Customers ReclassedAverage Usage
60 6O 6O10,211 10,211 10,211
Tadff Area 1 UsageTanff Area 2 UsageTanff Area 3 Usage
Total Recycled Water Reclassedfmm Potable WaterUsage
12,233 12,233 12,233534,368 534,368 534,368
66,061 66,061 66~061612,662 612,662 612,662
RECLASS DETAIL:
BUSINESSAverage CustomersAverage Usage
9 9 924,685 24,685 24,685
Tanff Area 1 UsageTariff Area 2 UsageTanff Area 3 Usage
Total Recycled Water Reclassed from Bus~ness Usage
0 0 0193,178 193,178 193,17828,990 28,990 28,990
222,168 222,168 222,168
INDUSTRIALAverage Cudome~Average Usage
3 3 384,426 84,426 84,426
Tardf Area 1 UsageTardf Area 2 UsageTardf Area 3 Usage
Total Recycled Water Reclassed from Industrial Usage
0 0 0253,277 253,277 253,277
0 0 0253,277 253,277 253,277
PUBLIC AUTHORITIESAverage CustomersAverage Usage
48 48 482,859 2,859 2,859
Tanff Area 1 UsageTariff Area 2 UsageTanff Area 3 Usage
Total Recycled W~er Reclassedfrom Pubhc Authont~es Usage
12,233 12,233 12,23387,913 87,913 87,91337~071 37,071 37~071
137,217 137,217 137,217
5 Chapter - Operating Expenses
Summary of Suburban Water Systems’ payroll, operation and maintenanceexpenses and administrative and general expenses for recorded years2005 through 2009, estimated years 2010 and 2011, and test years 2012and 2013, are presented in Table 5. Summary of Parent Companyexpenses are presented in Table 5-2, and Summary of Utility Group’sexpenses are presented in Table 5-2C. The development of estimatedand test years expenses for years ending December 31, 2010 through2013 is discussed in this chapter.
5.1 Volume Related Expenses
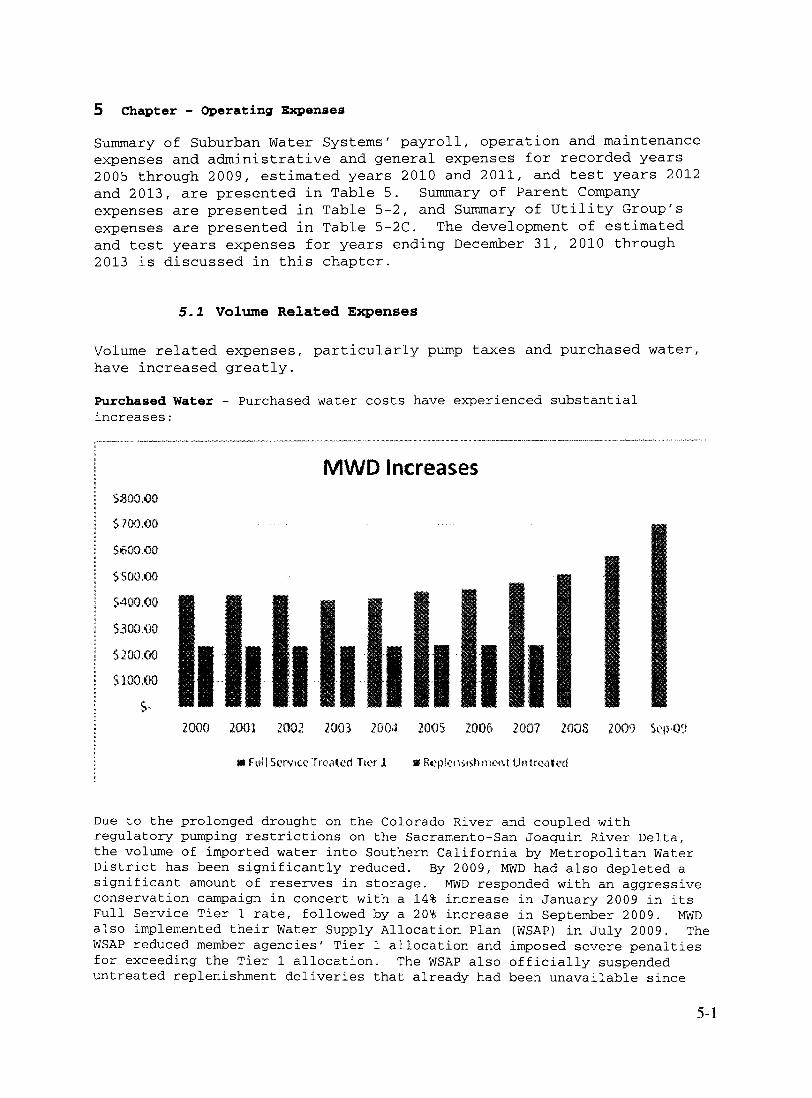
Volume related expenses, particularly pump taxes and purchased water,have increased greatly.
~urchased Water - Purchased water costs have experienced substantialincreases:
MWD Increases
2000 1001 2002 2003 200,~ 2005 2006 2007 2008 2009
Due to the prolonged drought on the Colorado River and coupled withregulatory pumping restrictions on the Sacramento-San Joaquin River Delta,the volume of imported water into Southern California by Metropolitan WaterDistrict has been significantly reduced. By 2009, MWD had also depleted asignificant amount of reserves in storage. MWD responded with an aggressiveconservation campaign in concert with a 14% increase in January 2009 in itsFull Service Tier 1 rate, followed by a 20% increase in September 2009. MWDalso implemented their Water Supply Allocation Plan (WSAP) in July 2009. TheWSAP reduced member agencies’ Tier 1 allocation and imposed severe penaltiesfor exceeding the Tier 1 allocation. The WSAP also officially suspendeduntreated replenishment deliveries that already had been unavailable since
5-!
2007. MWD now believes that they will only have replenishment wateravailable three out of every ten years.
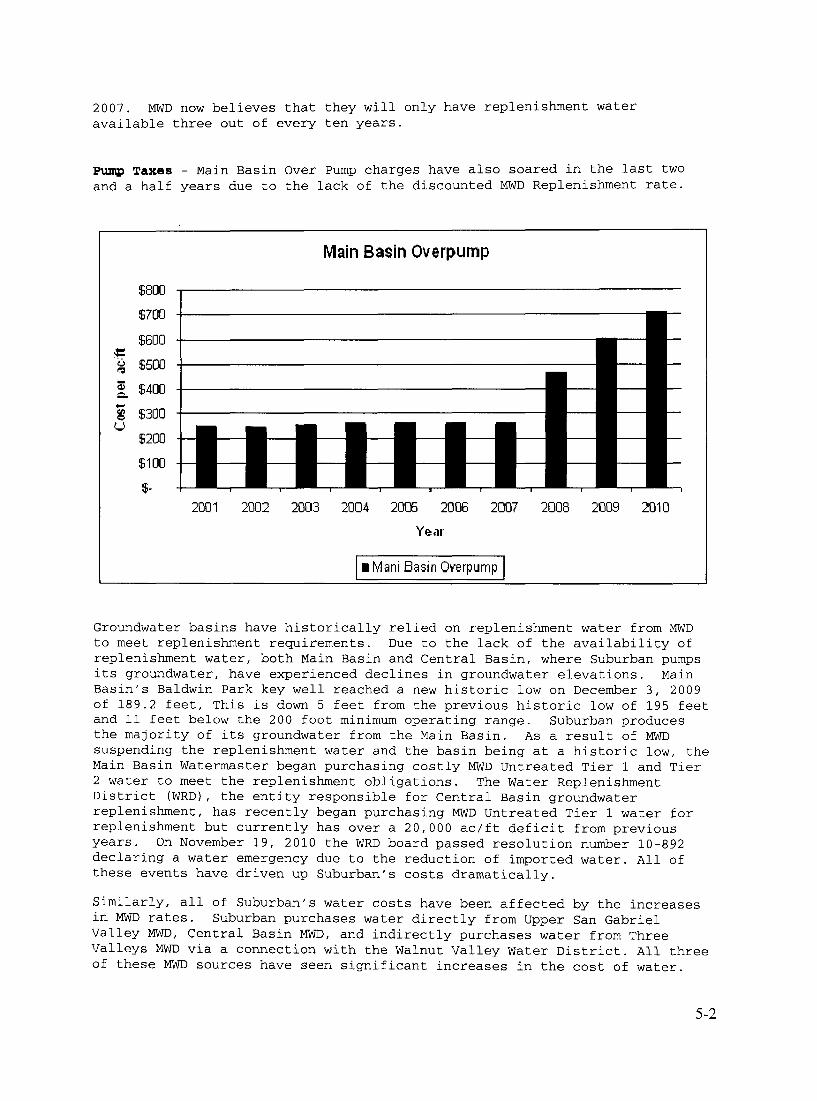
~ Taxes - Main Basin Over Pump charges have also soared in the last twoand a half years due to the lack of the discounted MWD Replenishment rate.
$800
$700
$600
SilO0
$400
$300
$200
$100
$-
Main Basin Overpump
2001 2002 2003 2004 2005 2006 2007 2008 2009 2010
Year
I Mani Basin Overpump I
Groundwater basins have historically relied on replenishment water from MWDto meet replenishment requirements. Due to the lack of the availability ofreplenishment water, both Main Basin and Central Basin, where Suburban pumpsits groundwater, have experienced declines in groundwater elevations. MainBasin’s Baldwin Park key well reached a new historic low on December 3, 2009of 189.2 feet, This is down 5 feet from the previous historic low of 195 feetand ii feet below the 200 foot minimum operating range. Suburban producesthe majority of its groundwater from the Main Basin. As a result of MWDsuspending the replenishment water and the basin being at a historic low, theMain Basin Watermaster began purchasing costly MWD Untreated Tier 1 and Tier2 water to meet the replenishment obligations. The Water ReplenishmentDistrict (WRD), the entity responsible for Central Basin groundwaterreplenishment, has recently began purchasing MWD Untreated Tier 1 water forreplenishment but currently has over a 20,000 ac/ft deficit from previousyears. On November 19, 2010 the WRD board passed resolution number 10-892declaring a water emergency due to the reduction of imported water. All ofthese events have driven up Suburban’s costs dramatically.
Similarly, all of Suburban’s water costs have been affected by the increasesin MWD rates. Suburban purchases water directly from Upper San GabrielValley MWD, Central Basin MWD, and indirectly purchases water from ThreeValleys MWD via a connection with the Walnut Valley Water District. All threeof these MWD sources have seen significant increases in the cost of water.
5-2
In the Main San Gabriel Basin we have seen leases, cyclic storage andreplenishment water costs increasing due to the lack of replenishment waterand increases in MWD’s cost of water. At Covina Irrigating Company, a mutualwater company where Suburban is a minority shareholder, leases are based onthe MWD Tier 1 rate and as a result the cost of water we purchase from CIChas been significantly impacted.
Suburban has previously supported these substantial cost increases by reserveaccount offset advice letter filings with the Commission covering periodsJune 2007 through June 2010 (Suburban Advice Letters 257-W, $2,442,825,Advice Letter 272-W, $6,185,804 and Advice Letter 276-W, $3,960,228).
Based on the assumption that these higher pump taxes and purchased watercosts will be allowed to be recovered in general rates, we have assumed thatbalancing accounts for Pumped, Purchased Water and Power will be zero forestimated and test years 2010 through 2013.
5.2 Payroll Expenses
For test years December 31, 2012 and 2013, amounts were based on 2010salaries at full employment escalated using DRA’s Wage Escalation Factor asof October 31, 2010, plus seven new proposed positions as discussed inChapter Three. One of those new positions, a Director of Risk Management andAudit, will be transferred from Parent Company to Suburban effective Januaryi, 2011. In addition to the future new positions, since the last rate case,some restructuring has already occurred, resulting in a net addition of sevenpositions (five new positions added, three positions eliminated, fourpositions transferred from Utility Group, and one position transferred formParent Company).
Payroll expenses for overtime, standby, vacation sold, no meal penalty,incentive compensations, and capitalized payroll for test years 2012 and 2013are calculated based on 2009 experience. Those percentages of total payrollexpenses are estimated to be representative of the levels that will beincurred in the test years.
5.3 Operating Expenses Other Than Payroll and Volume Related
Expenses for Transmission and Distribution Line Repair, Field Supplies andService Line Repair are calculated based on five-year average escalated forother expenses, and reduced by $51,979 for test year 2012 under theassumption that Suburban’s request to add a three-person leak crew will beapproved. If the leak crew is not approved, this $51,979 amount should berestored to cost of service.
Travel/Expense Report, Meal, Entertainment, and Training/Seminars expenseswere projected based on a 5-year average recorded experience escalated. For2011, the escalated amount includes expenses for the employees that havealready been hired and requested for approval in this rate case, andemployees that were transferred to Suburban from Parent Company and UtilityGroup, which are also being requested in this proceeding as discussed inChapter 3.
5-3
Safety Incentives were calculated based on escalated amount of 2010 estimatedcosts.
Leased vehicles for renewals were projected based on average lease cost forequivalent model specifications.
Net proceeds from sales of formerly leased vehicles were projected to bezero, the sale prices approximating the cost of purchasing the vehicles atthe end of the leases.
Building utilities expenses have been projected based on 2009 expenseescalated by DRA’s other expenses escalation factor.
Claims paid were projected based on escalation of 2009 expenses.
Legal fees were projected based on the escalated 2010 amount annualized as ofJuly 2010. The expenses mainly are for California Public UtilitiesCommission proceedings where the legal costs were not allowed to be deferredin a memorandum account.
Professional dues have been projected based on the 2009 amount escalated.
Postage - General postage has been projected based on the 2009 amountescalated. Postage - A/R bills was projected based on 2009 postage used forcustomer mailings compared to the number of customers served by Suburban.Postage rates are based on January i, 2010 for 5-Digit, 3-Digit, and FirstClass mail.
For Water Conservation expense, Suburban requests $450,000 annually toinclude the following:
¯ $400,000 for High Efficiency Toilets (HETs) for 2,000 customers (at$200 per HET).
¯ $50,000 for public outreach and information, including educationalmaterials and conservation kits. Suburban will also provide wateraudits for non-residential customers.
Effective 2010, Metropolitan Water District has eliminated HET rebates forcustomers. Suburban believes there is still a need within our service areasto offer HETs to customers to encourage more efficient water use in theirhomes and businesses.
Consistent with the decision in a recent San Gabriel Valley Water CompanyGRC, D.08-06-022, Suburban agrees to track its actual conservationexpenditures associated with its yearly conservation budget approved in thisproceeding. Suburban further agrees to also report the results of itsconservation tracking as part of its next GRC application. Suburban furtherrequests to continue its present practice as authorized in D.09-03-007 ofincluding conservation expenses as part of its overall operating budget andnot subjecting conservation expenses to one-way balancing account treatment.This is identical to the treatment provided in the San Gabriel decision.
As discussed in Chapter 4, Suburban has signed an agreement with UpperDistrict to provide recycled water service to several large non-residentialwater users in Suburban’s San Jose Hills Service Area.
5-4
Suburban is not requesting amortization of balancing account balances in thisfiling, but will request the amortization by advice letter filing in 2011.However, Suburban is requesting approval of a new balancing account, one forrecycled water which will be an incremental balancing account similar toSuburban’s current purchased water balancing account; that is, the balancingaccount will be limited to tracking variances from the adopted price level ofrecycled water.
Pumped water assessment charges are based on projected production that can beobtained from the Main San Gabriel Basin and the Central Basin. Purchasedwater expenses are based on specifically identified purchases of water from anumber of sources including the Metropolitan Water District, CovinaIrrigating Company, California Domestic Water Company, Walnut Valley WaterDistrict, and others. The quantities produced and purchased are based onprojected sales levels computed in Chapter 4.
In the past Suburban has lost a significant amount of pumping capacity in itsnorthern service area due to well contamination. Suburban and its ratepayershave been made whole by monthly cost reimbursements from the entities thatcaused the contamination (the Cooperating Respondents or "CRs"). Much of thelost pumping capacity has been regained. Nevertheless, Suburban expects tocontinue receiving cost reimbursements in the test years as reflected inTable 5-3. On May 18, 2010 Suburban signed an agreement settling areplacement water dispute and an Azusa connection dispute with the CRs. GivenSuburban’s potential exposure in the mediation, the mediation resulted in asatisfactory outcome for Suburban. For example, the CRs waived all claims forpast damages. Nevertheless, the mediation outcome will result in reducedfuture cost reimbursements by the CRs.
Suburban expects to provide recycled water service in the San Jose HillsService Area beginning December 2010, provided that the Commission approvesSuburban’s pending Advice Letter No. 278-W that was filed on November 5,2010. Suburban’s revenue requirement in this application assumes that thatrecycled water will become part of Suburban’s supply mix and that strandedcosts brought about by potable water customers switching to recycled waterwill be recovered in Suburban’s revenue requirement.
Purchased power expenses for test years December 31, 2012 and 2013 werecomputed on the basis of water quantities to be pumped using the most currentSouthern California Edison Company rates which is as of June i, 2010.Southern California Gas Company rates are calculated based on the averagecost for year 2009.
Uncollectible expenses are based upon projected revenues. Five-year averageof historical percentage rates are applied to projected revenues to arrive atthe expense level.
Franchise fees expenses are based upon projected revenues. Five-year averageof historical percentage rates are applied to projected revenues to arrive atthe expense level. It is assumed that recovery of excess franchise feescharged by the City of Whittier, defined as franchise fees greater than 2% ofrevenue, will continue to be recovered as a surcharge, a Local GovernmentFee, directly from Whittier customers as recently approved by Suburban AdviceLetter 277-W.
5-5
Regulatory Commission expenses for 2009 and 2010.were based on CPUC findingsin prior rate case decisions that refer to regulatory expenses as aprojection or an estimate. For test years 2012 and 2013 the costs are basedon the summation of estimated outside services for 2011 rate case, 2014 ratecase, 2009 and 2012 cost of capital litigations amortized over a three yearperiod. We have assumed this issue remains unsettled, despite the decisionin the recent Golden State Region II and III proceeding, Decision 10-11-035.
Employee benefits capitalized are computed in proportion to payrollcapitalized as a percent of total payroll.
Administrative expenses transferred are computed at a level of 9% of workorder capital expenditures.
Transportation capitalized is computed at a level of 21% of total capitalizedpayroll.
5.4 Parent Company Expenses
Southwest Water Company (Southwest) is the Parent Company of a number ofoperating subsidiaries including Suburban. The primary services performed bySouthwest on behalf of Suburban include oversight responsibility for allfinancial aspects of the Company, including all reporting to the shareholdersand taxing authorities; maintenance of banking and corporate attorneyrelationships; administration of liability insurance programs; long-termstrategic planning and execution of these plans for debt and equityofferings. The projected indirect expenses related to these services for2012 and 2013 are shown on Table 5-2.
5.5 Utility Group Expenses
In 2003 Southwest created a new entity to provide management, regulatory andcommunications services to Suburban and Southwest’s other utilities that arecurrently all located in other states: Texas, Mississippi, Alabama andOklahoma. Staffing for this new entity was drawn primarily from existingemployees of Suburban.
In 2010 four Utility Group employees were transferred to Suburban. TheUtility Group Controller position was eliminated. Remaining in Utility Groupare the Vice President of Regulatory Affairs, the Regulatory Analyst, and anew position that has already been filled and which is discussed in Chapter3, the Manager of Regulatory Affairs.
We request continued application of the conventional 4-factor formula thatthe CPUC approved in Suburban’s last rate proceeding and which will result inapproximately 49% of Utility Group costs being allocated to other entities.
Utility Group Regular Payroll for 2010 is calculated based on annualizedrecorded costs year-to-date July 2010. Test years 2012 and 2013 werecalculated based on escalation of estimated 2011 payroll.
Health Insurance is projected to increase by 9% for Medical and 1.2% forDental Insurance from current levels commencing on the next insurance renewaldate, July i. See Walter Bench’s testimony.
5-6
Premiums for Workers’ Compensation, directors and officers insurance, travel& accident insurance, and other insurance were projected to increase fromcurrent levels by CPI-U index of 1.2% as of October 2010.
Rent, Building Utilities and Janitorial/Service Supplies expenses wereprojected based on the new allocation square footage building betweenSuburban and Utility Group:
All other expenses were projected based on escalation of 2010 annualizedamount as of July 2010.
5.6 Allocation of Parent Company Expenses
Allocation of Parent Company expenses to Suburban is based on a four-factor computation shown in Table 5-2. This factor is believed tofairly represent the scope of services provided to Suburban by itsparent, SouthWest. The calculation was performed in accordance withthe Commission’s July 26, 1956 four-factor procedure ~Allocation ofAdministrative and General Expenses and Common Utility Plant." Thedecision in Suburban’s last General Rate Case, D.09-03-007, approvedthis allocation methodology for Utility Group expenses.
5.7 Insurance
Overall premiums for Property/Earthquake Insurance, Workers’ Compensation,Umbrella Pollution, Umbrella Insurance, General Liability/Crime, EmployeePractices, Brokers Fee, Auto Insurance, Fiduciary Insurance, D&O Insurance,are projected to increase from current levels by CPI-U index of 1.2% as ofOctober 2010.
Medical Insurance is projected to increase by 9% and Dental Insurance isprojected to increase by 1.2% per CPI-U as of October 2010 from currentlevels commencing on the next insurance renewal date, July io See -filedtestimony of Walter Bench.
5.8 Alternative Methodology
We have provided calculations of operating expenses based on alternativemethodology (simple five-year average escalated) described in Table 5-4.1
5.9 Shared Services
In 2009, Suburban incurred costs for shared services from affiliatestotaling $1.2 million. Fol!owing is the detail of those costs:
Information TechnologyFinancial Services CenterEnvironmental Health And SafetyCustomer Services Center
2009$863,922$172,465$120,484
$39,140$1,196,011
5-7
Suburban is not requesting recovery of these costs in this proceedinginasmuch as this shared services structure is relatively new and the costsharing methodologies are still in the trial stage. However, Suburbanreserves the option to request recovery of shared services costs in futurerate proceedings.
5-8
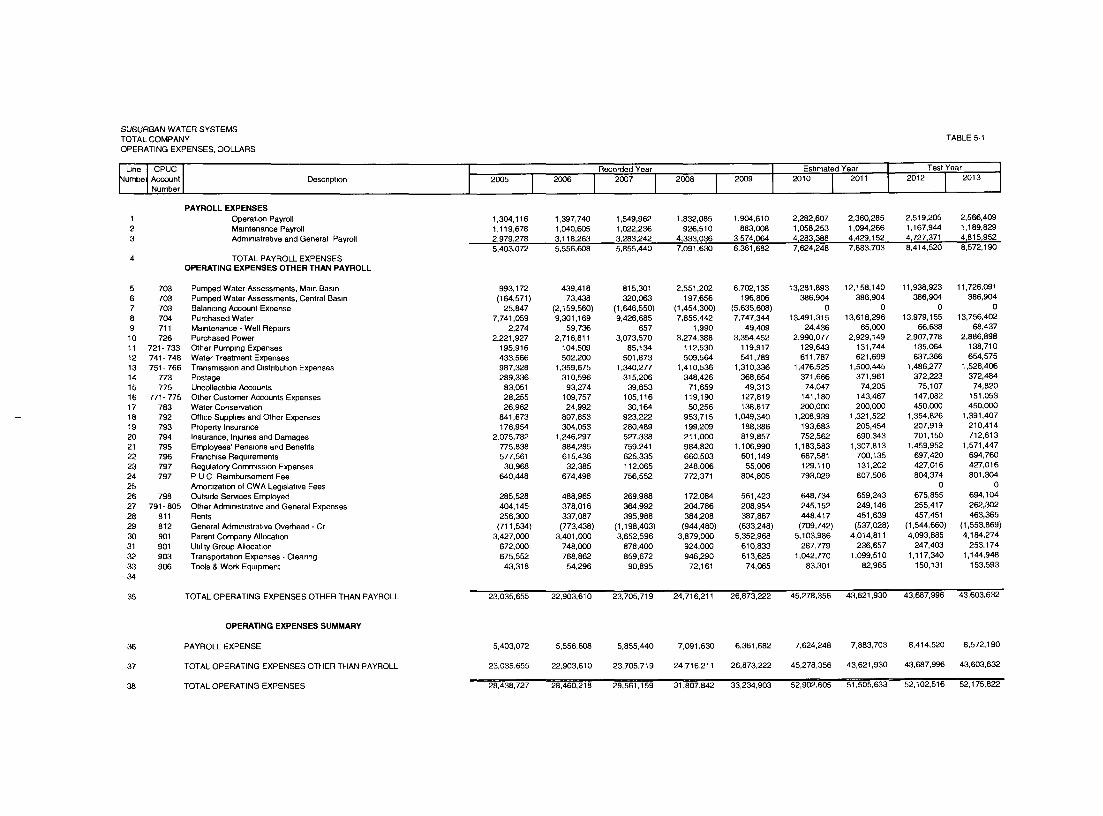
SU~UREANWATER SYSTEMSTOTALCOMPANYOPERATING EXPENSES, DOLLARS
cPuc IAccountNumber
123
5 7036 7037 7038 7049 71110 72611 721-73312 741-74813 751-76614 77315 77516 771-77517 78318 79219 79320 79421 79522 79623 79724 7972526 79827 791-80528 81129 81230 90131 90132 90333 90634
35
36
37
38
Description 2005 2006Recorded Year Estimated Year
IPAYROLL EXPENSES
Operation Payroll 1,304,116 1,397,740 1,549,962 1,832,085 1,904,610 2,282,607 2,360,285 2,519,205Maintenance Payroll 1,119,678 1,040,605 1,022,236 926,510 883,008 1,058,253 1,094,266 1,167,944Administrative and General Payroll 2,979,278 3,118,263 3,2831242 4,3331036 3,574,064 4,283t388 41429,152 41727,371
5,403,072 5,556,608 5,855,440 7,091,630 6,361,682 7,624,248 7,883,703 8,414,520TOTALPAYROLLEXPENSES
OPERATING EXPENSES OTHER THAN PAYROLL
TABLE 5-1
Test Year2013
2,566,4091,189,8294~815~9528,572,190
OPERATING EXPENSES SUMMARY
PAYROLL EXPENSE
TOTAL OPERATING EXPENSES OTHER THAN PAYROLL
TOTAL OPERATING EXPENSES
TOTAL OPERATING EXPENSES OTHER THAN PAYROLL 23,035,655 22,903,610 23,705,719 24,716,211 26,873,222 45,278,356 43,621,930 43,687,996 43,603,632
5,403,072 5,556,608 5,855,440 7,091,630 6,361,682 7,624,248 7,883,703 8,414,520 8,572,190
23,035,655 22,903,610 23,705,719 24,716,211 26,873,222 45,278,356 43,621,930 43,687,996 43,603,632
28,438,727 28,460,218 29,561,159 31,807,842 33,234,903 52,902,605 51,505,633 52,102,516 52,175,822
Pumped Water Assessments, Mare Basra 993,172 439,418 815,301 2,551,202 6,702,135 13,281,893 12,158,140 11,938,923 11,726,091Pumped Water Assessments, Central Basin (164,571 ) 73,438 320,063 197,656 196,806 386,904 386,904 386,904 386,904Balancing Acco~lnt Expense 25,847 (2,159,560) (1,646,550) (1,454,300) (5,635,608) 0 0 0 0Purchased Water 7,741,059 9,301,169 9,426,685 7,855,442 7,747,344 13,491,315 13,618,296 13,979,155 13,756,402Maintenance - Well Repairs 2,274 59,736 657 1,990 49,409 24,436 65,000 66,638 68,437Purchased Power 2,221,927 2,716,811 3,073,570 3,274,388 3,354,452 2,990,077 2,929,149 2,907,778 2,886,898Other Pumping Expenses 195,916 104,509 85,t34 112,530 119,917 129,643 131,744 135,064 138,710Water Treatment Expenses 433,566 502,200 501,873 509,564 541,789 611,787 621,699 637,366 654,575Transmission and Dlstnbut=on Expenses 987,328 1,359,675 1,340,277 1,410,536 1,310,336 1,476,525 1,500,445 1,486,277 1,526,406Postage 289,336 310,596 315,206 348,426 368,654 371,666 371,961 372,223 372,484Uncollectible Accounts 83,051 93,274 39,853 71,659 49,313 74,047 74,205 75,107 74,820Other Customer Accounts Expenses 28,255 109,757 105,116 119,190 127,819 141,180 143,467 147,082 151,053Water Conservation 26,962 24,992 30,164 50,256 138,817 200,000 200,000 450,000 450,000Office Supphes and Other Expenses 841,673 807,853 923,222 953,715 1,049,340 1,208,939 1,321,522 1,354,826 1,391,407Property Insurance 176,954 304,053 280,489 199,209 188,386 193,683 205,454 207,919 210,414Insurance, Injuries and Damages 2,075,782 1,246,297 527,338 211,000 819,857 752,562 690,343 701,150 712,613Employees’ Pensions and Benefits 775,838 884,285 759,241 984,820 1,106,990 1,183,583 1,307,813 1,459,952 1,571,447Franchise Requirements 577,561 615,436 625,335 660,503 601,149 687,581 700,135 697,420 694,760Regulatory Commission Expenses 30,968 32,385 112,065 248,000 55,006 129,110 131,202 427,016 427,016P U C Reimbursement Fee 640,448 674,498 756,552 772,371 804,805 793,029 807,506 804,374 801,304Amortization of CWA Legislative Fees 0 0Outside Ser~ces Employed 285,528 488,965 269,988 172,084 561,423 648,734 659,243 675,855 694,104Other Administrative and General Expenses 404,145 378,016 364,992 204,786 208,954 245,152 249,146 255,417 262,302Rents 256,300 337,087 395,988 384,208 387,887 448,417 451,639 457,451 463,365General Administrative Overhead - Cr (711,534) (773,438) (1,198,403) (944,480) (633,248) (709,742) (537,028) (1,544,660) (1,553,869)Parent Company Allocation 3,427,000 3,401,000 3,652,596 3,879,000 5,352,968 5,103,986 4,014,811 4,093,885 4,184,274Utd~ty Group Allocation 672,000 748,000 878,400 924,000 610,833 287,779 236,657 247,403 253,174Transportation E~penses - Cleanng 675,552 768,862 859,672 946,290 613,625 1,042,770 1,099,510 1,117,340 1,144,948Tools & Wod( Equipment 43,318 54,296 90,895 72,161 74,065 83,301 82,965 150,131 153,593
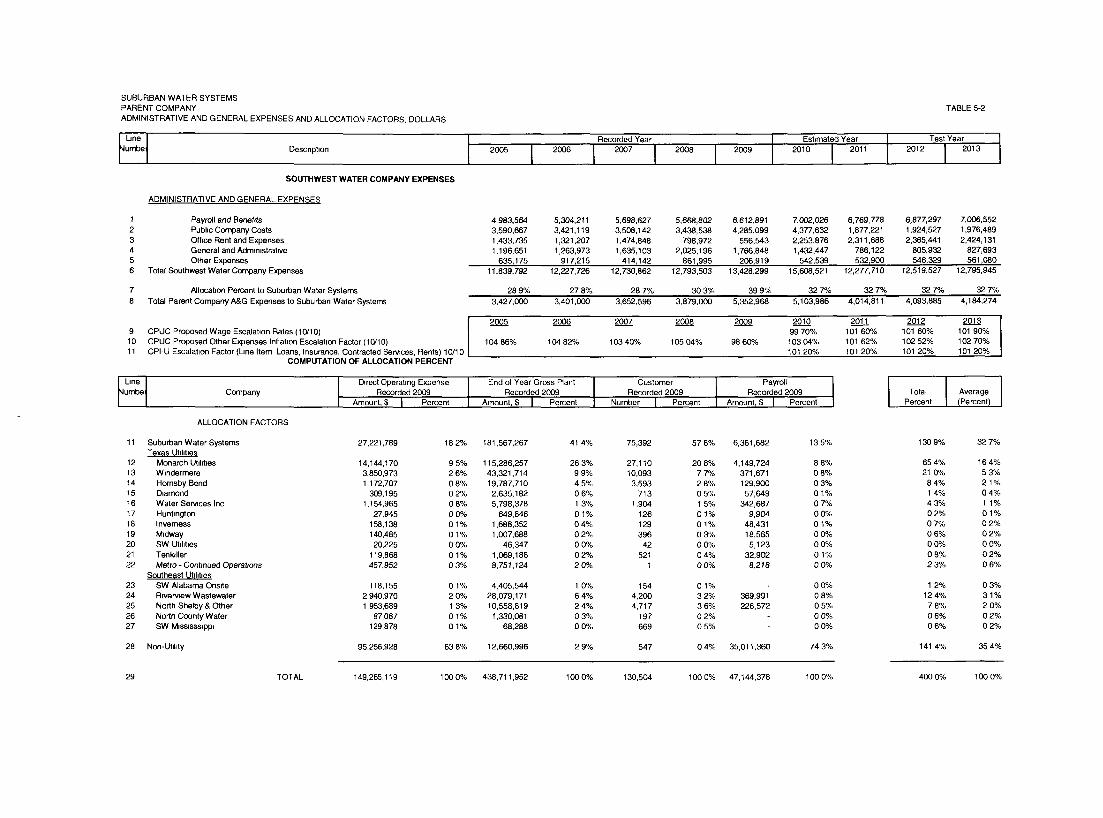
SUBURBAN WATER SYSTEMSPARENT COMPANYADMINISTRATIVE AND GENERAL EXPENSES AND ALLOCATION FACTORS, DOLLARS
~l,ne ~
umbe1Descnptlon
SOUTHWEST WATER COMPANY EXPENSES
TABLE 5-2
Estimated Year Test Year2005I 2006 IRec°;do~7dYearl~*o
12009 2010 2011 i 20122013
ADMINISTRATIVE AND GENERAL EXPENSES
Payroll and BenehtsPubkc Company CostsOtf~ce Rent and ExpensesGeneral and AdmlnlstratweOther Expenses
Total Southwest Water Company Expenses
7 Allocation Percent to Suburban Water Systems8 Total Parent Company A&G Expenses to Suburban Water Systems
9 CPUC Proposed Wage Escalation Rates (10/10)10 CPUC Proposed Other Expenses Inflation Escalation Factor (10/10)11 CPI-U Escalation Factor (IJne Item Loans, Insurance, Contracted Services, Rents) 10/10
COMPUTATION OF ALLOCATION PERCENT
4,983,564 5,304,211 5,698,627 5,668,802 6,612,891 7,002,026 6,769,778 6,877,297 7,006,5523,590,667 3,421,119 3,508,142 3,438,538 4,285,099 4,377,632 1,877,221 1,924,527 1,976,4891,433,735 1,321,207 1,474,848 798,972 556,543 2,253,876 2,311,688 2,365,441 2,424,1311,196,651 1,263,973 1,635,103 2,025,196 1,766,848 1,432,447 786,122 805,932 827,693
635~ 175 917,215 414,142 861,995 206~919 542,539 532~900 546,329 561 ~08011,839,792 12,227,726 12,730,862 12,793,503 13,428,299 15,608,521 12,277,710 12,519,527 12,795,945
28 9% 27 8% 28 7% 30 3% 39 9% 32 7% 32 7% 32 7% 32 7%3,427,000 3,401,000 3,652,596 3,879,000 5,352,968 5,103,986 4,014,811 4,093,885 4,184,274
200~5 2006 200.~_Z7 200..~8 200~9 201.._~0 201.~1 201.~2 20139970% 101 60% 101 60% 101 90%
104 86% 104 82% 103 40% 105 04% 98 60°/o 103 04% 101 62% 102 52% 102 70%101 20% 101 20% 101 20% 101 20%
~Dne I D~rect Operating Expenseumbe~ Company Recorded 2009
I Amount, $ I Percent
ALLOCATION FACTORS
End of Year Gross PlantRecorded 2009
Amount, $ I Percent
Customer PayrollI AverageRecorded 2009 Recorded 2009 Total
Number I Percent Amount~ $ I Percent I Percent (Percent)
11 Suburban Water Systems 27,221,789Texas Utilities
12 Monarch Ut~ld~es 14,144,17013 Windermere 3,850,97314 Hornsby Bend 1,172,70715 D~amond 309,19516 Water Services Inc 1,154,96517 Huntington 27,94518 Inverness 158,13819 M~dway 140,48520 SW Utd~t~es 20,22521 Tenkdler 119,86822 Metro - Continued Operations 457,952
Southeast Ut~ld~es23 SW Alabama Ons~te 118,15524 R~vervlew Wastewater 2,940,97025 North Shelby & Other 1,953,68926 North County Water 87,08727 SW M~ss~sss~pp~ 129,878
18 2% 181,567,267 41 4% 75,392 57 8% 6,361,682 13 5% 130 9% 32 7%
9 5% 115,286,257 26 3% 27,110 20 8% 4,149,724 8 8% 65 4% 16 4%2 6% 43,321,714 9 9% 10,093 7 7% 371,671 0 8% 21 0% 5 3%08% 19,787,710 45% 3,593 28% 129,900 03% 84% 21%0 2% 2,635,182 0 6% 713 0 5% 57,649 0 1% 1 4% 0 4%0 8% 5,798,378 1 3% 1,904 1 5% 342,687 0 7% 4 3% 1 1%0 0% 649,846 0 1% 126 0 1% 9,904 0 0% 0 2% 0 1%0 1% 1,688,352 0 4% 129 0 1% 48,431 0 1% 0 7% 0 2%0 1% 1,007,688 0 2% 396 0 3% 18,565 0 0% 0 6% 0 2%0 0% 46,347 0 0% 42 0 0% 5,123 0 0% 0 0% 0 0%0 1% 1,069,188 0 2% 521 0 4% 32,902 0 1% 0 8% 0 2%03% 8,751,124 20% 1 00% 8,218 00% 23% 06%
0 1% 4,405,544 1 0% 154 0 1% 00% 1 2% 03%2 0% 28,079,171 6 4% 4,200 3 2% 369,991 0 8% 12 4% 3 1%1 3% 10,558,819 2 4% 4,717 3 6% 226,572 0 5% 7 8% 2 0%0 1% 1,3.30,081 0 3% ~ 97 0 2% 0 0% 0 6% 0 2%0 1% 68,288 0 0% 669 0 5% 0 0% 0 6% 0 2%
28 Non-Uhllty 95,256,928 63 8% 12,660,996 2 9% 547 0 4% 35,011,360 74 3% 141 4% 35 4%
29 TOTAL 149,265,119 100 0% 438,711,952 100 0% 130,504 100 0% 47, t 44,378 100 0% 400 0% 100 0%
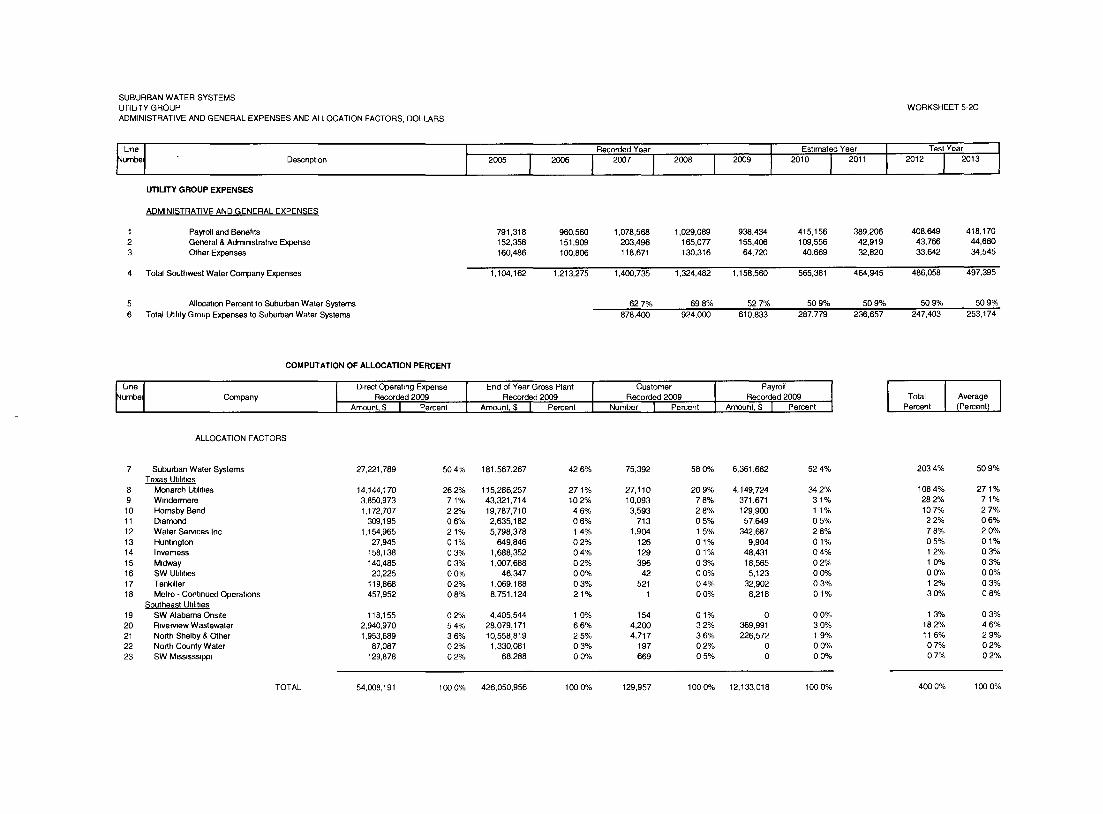
SUBURBAN WATER SYSTEMSUTILITY GROUPADMINISTRATIVE AND GENERAL EXPENSES AND ALLOCATION FACTORS, DOLLARS
WORKSHEET 5-2C
IJne Iumbe1
123
Descnptlon 2005Recorded Year
I EsbmatidYear I Tes) Year
UTILITY GROUP EXPENSES
ADMINISTRATIVE AND GENERAL EXPENSES
Payroll and Benefits 791,318 960,560 1,078,568 1,029.089 938,434 415,156 389,206 408,649 418,170General & Adm~n~strabve Expense 152,358 151,909 203,496 165,077 155.406 109.556 42.919 43,766 44,680Other Expenses 160,486 100,806 118,671 130,316 64,720 40,669 32,820 33,642 34,545
4 Total Southwest Water Company Expenses 1,104,162 1.213.275 1,400.735 1,324.482 1,158.560 565.381 464,945 486,058 497,395
62 7% 69 8% 52 7% 50 9% 50 9% 50 9% 50 9%878,400 924,000 610,833 287,779 236,657 247,403 253,174
5 Allocation Percent to Suburban Water Systems6 Total Utlhty Group Expenses to Suburban Water Systerr.s
~L~ne I
umbe1
COMPUTATION OF ALLOCATION PERCENT
Company I D~rect Operating Expense I End o1 Year Gross PlantRecorded 2009
IRecorded 2009
Amount, $ I Percent Amount, $ I PercentRecorded 2009 Recorded 2009 Total Average
Number I Percent Amount, $ I Percent Percent ~
ALLOCATION FACTORS
7 Suburban Water SystemsTexas Utlht~es
8 Monarch Uhl~bes9 Wmderrnere10 Homsby Bend11 D~amond12 Water Sent~ces Inc13 Hunbngton14 Inverness15 M~dway16 SW Ut~hbes17 Tenk~ller18 Metro - Conbnued Operabons
Southeast Ubht~es19 SW Alabama Ons~te20 R~ven~ew Wastewater21 North Shelby & Other22 Nodh County Water23 SW M~ss~sss~pp~
27,221,789 50 4% 181,567,267 42 6%
14,144,170 262% 115,266,257 271%3,850,973 7 1% 43,321,714 10 2%1,172,707 2 2% 19,787,710 4 6%
309,195 0 6% 2,635.182 0 6%1,154,965 2 1% 5.798.378 1 4%
27,945 0 1% 649,846 0 2%158,138 0 3% 1,688,352 0 4%140,485 0 3% 1,007,688 0 2%20,225 0 0% 46,347 0 0%
119,868 02% 1,069,188 03%457,952 0 8% 8,751,124 2 1%
118,155 02% 4,405,544 1 0%2,940,970 5 4% 28,079,171 6 6%1,953,689 3 6% 10,558,819 2 5%
87,087 0 2% 1,330,081 0 3%129,878 0 2% 68,288 0 0%
75,392 58 0% 6,361,682 52 4% 203 4% 50 9%
27,110 209% 4,149,724 342% 1084% 271%10,093 7 8% 371,671 3 1% 28 2% 7 1%3,593 28% 129,900 1 1% 107% 27%
713 0 5% 57,649 0 5% 2 2% 0 6%1,904 1 5% 342,687 2 8% 7 8% 2 0%
126 0 1% 9,904 0 1% 0 5% 0 1%129 0 1% 48,431 0 4% 1 2% 0 3%396 0 3% 18.565 0 2% 1 0% 0 3%42 0 0% 5,123 0 0% 0 0% 0 0%
521 0 4% 32,902 0 3% 1 2% 0 3%1 0 0% 8,218 0 1% 3 0% 0 8%
154 01% 0 00% 1 3% 03%4,200 3 2% 369,991 3 0% 18 2% 4 6%4,717 3 6% 226,572 1 9% 11 6% 2 9%
197 0 2% 0 0 0% 0 7% 0 2%669 0 5% 0 0 0% 0 7% 0 2%
TOTAL 54,008,191 100 0% 426,050,956 100 0% 129,957 100 0% 12,133,018 100 0% 400 0% 100 0%
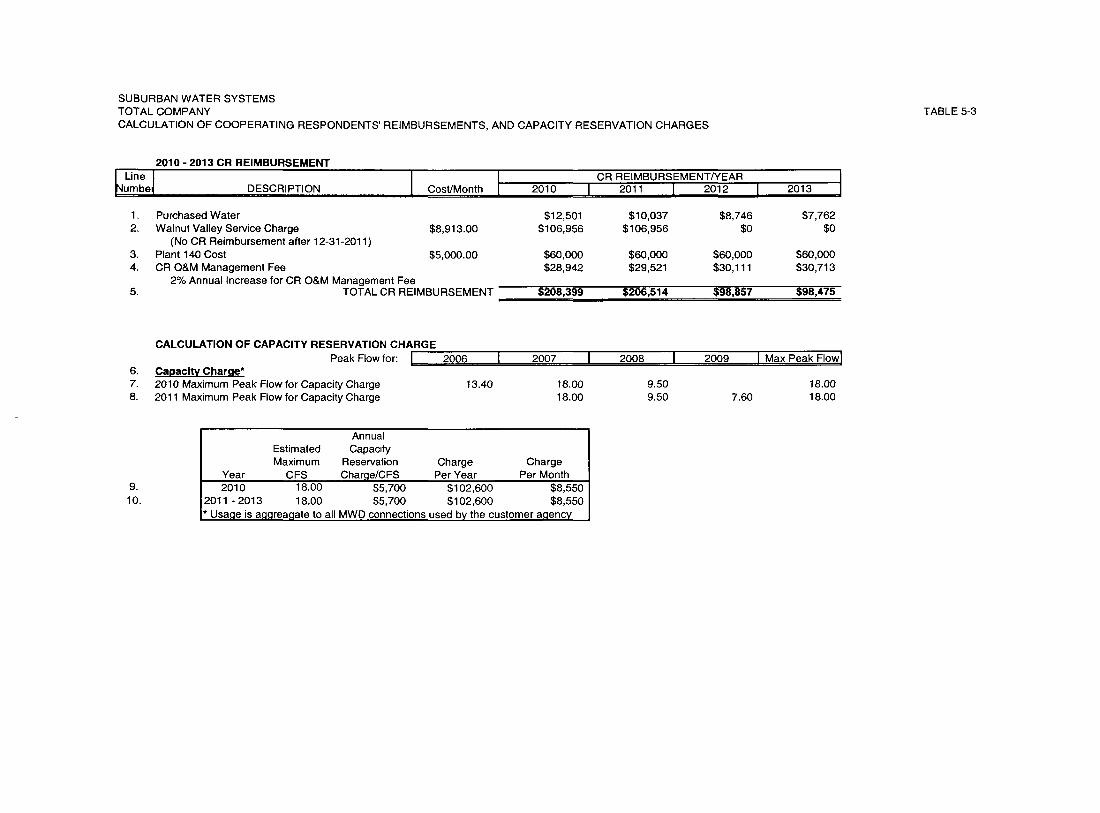
SUBURBAN WATER SYSTEMSTOTAL COMPANYCALCULATION OF COOPERATING RESPONDENTS’ REIMBURSEMENTS, AND CAPACITY RESERVATION CHARGES
TABLE 5-3
2010 - 2013 CR REIMBURSEMENT
umbeI DESCRIPTION I ICR REIMBURSEMENT/YEAR
CostJMonth 2010 ! 2011 J 2012
1. Purchased Water2. Walnut Valley Service Charge $8,913.00
(No CR Reimbursement after 12-31-2011)3. Plant 140 Cost $5,000.004. CR O&M Management Fee
2% Annual Increase for CR O&M Management Fee5. TOTAL CR REIMBURSEMENT
$12,501 $10,037 $8,746$106,956 $106,956 $0
2013
$7,762$0
$60,000 $60,000 $60,000 $60,000$28,942 $29,521 $30,111 $30,713
$208,399 $206,514 $98,857 $98,475
CALCULATION OF CAPACITY RESERVATION CHARGEPeak Flow for: I 2006 I 2007
6. Capacity Charge*7. 2010 Maximum Peak Flow for Capacity Charge 13.40 18.008. 2011 Maximum Peak Flow for Capacity Charge 18.00
2008
9.509.50
2009 I Max Peak FlowI
18.007.60 18.00
AnnualEstimated CapacityMaximum Reservation Charge Charge
Year CFS Char~e/CFS Per Year Per Month2010 18.00 $5,700 $102,600 $8,550
2011 - 2013 18.00 $5,700 $102,600 $8,550* Usa.qe is a~q.qreagate to all MWD connections used by the customer agency
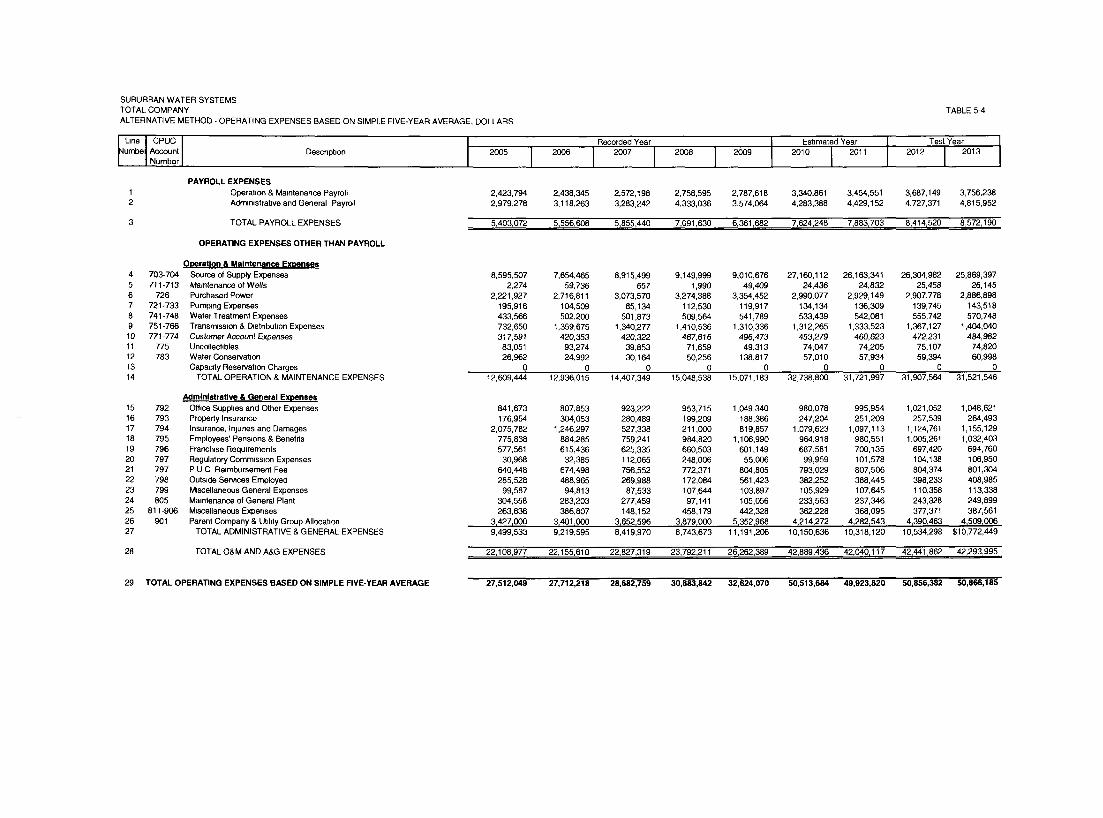
SUBURBAN WATER SYSTEMSTOTAL COMPANYALTERNATIVE METHOD - OPERATING EXPENSES BASED ON SIMPLE FIVE-YEAR AVERAGE, DOLLARS
~Une I CPUC Iumbe~l AccountNumber
Descnpbon 2005 IPAYROLL EXPENSES
1 Operation & Maintenance Payroll 2,423,7942 Adm~n=stratlve and General Payroll 2,979,278
3 TOTAL PAYROLL EXPENSES 5,403,072
OPERATING EXPENSES OTHER THAN PAYROLL
TABLE 5-4
Recorded Year Estimated Year Test Year
2,438,345 2,572,198 2,758,595 2,787,618 3,340,861 3,454,551 3,687,149 3,756,2383,118,263 3,283,242 4,333,036 3,574,064 4,283,388 4,429,152 4,727,371 4,815,952
5,556,608 5,855,440 7,091,630 6,361,682 7,624,248 7,883,703 8,414,520 8,572,190
O~eratlon & Maintenance Expenses4 703-704 Source of Supply Expenses 8,595,5075 711-713 Maintenance of Wells 2,2746 726 Purchased Power 2,221,9277 721-733 Pumping Expenses 195,9168 741-748 Water Treatment Expenses 433,5669 751-766 Transmission & D~stnbut~on Expenses 732,65010 771-774 Customer Account Expenses 317,59111 775 Uncollect~bles 83,05112 783 Water Conservation 26,96213 Capacity Reservation Charges 014 TOTAL OPERATION & MAINTENANCE EXPENSES 12,609,444
Administrative & General Expenses15 792 Office Suppl=es and Other Expenses 841,67316 793 Property Insurance 176,95417 794 Insurance, Injunes and Damages 2,075,78218 795 Employees’ Pensions & Benefits 775,83819 796 Franchise Requirements 577,56120 797 Regulatory Commission Expenses 30,96821 797 P U C Reimbursement Fee 640,44822 798 Outside Senaces Employed 285,52823 799 Miscellaneous General Expenses 99,58724 805 Maintenance of General Plant 304,55825 811-906 Miscellaneous Expenses 263,63626 901 Parent Company & Utlhty Group AIIccat~on 3~427~00027 TOTAL ADMINISTRATIVE & GENERAL EXPENSES 9,499,533
28 TOTAL O&M AND A&G EXPENSES 22,108,977
7,654,465 8,915,499 9,149,999 9,010,676 27,160,112 26,163,341 26,304,982 25,869,39759, 736 657 1,990 49,409 24,436 24,832 25,458 26,145
2,716,811 3,073,570 3,274,388 3,354,452 2,990,077 2,929,149 2,907,778 2,886,898104,509 85,134 112,530 119,917 134,134 136,309 139,745 143,518502,200 501,873 509,564 541,789 533,439 542,081 555,742 570,748
1,359,675 1,340,277 1,410,536 1,310,336 1,312,265 1,333,523 1,367,127 1,404,040420,353 420,322 467,616 496,473 453,279 460,623 472,231 484,982
93,274 39,853 71,659 49,313 74,047 74,205 75,107 74,82024,992 30,164 50,256 138,817 57,010 57,934 59,394 60,998
0 0 0 0 0 0 0 012,936,015 14,407,349 15,048,538 15,071,183 32,738,800 31,721,997 31,907,564 31,521,546
807,853 923,222 953,715 1,049,340 980,078 995,954 1,021,052 1,048,621304,053 280,489 199,209 188,386 247,204 251,209 257,539 264,493
1,246,297 527,338 211,000 819,857 1,079,623 1,097,113 1,124,761 1,155,129884,285 759,241 984,820 1,106,990 964,918 980,551 1,005,261 1,032,403615,436 625,335 660,503 601,149 687,581 700,135 697,420 694,760
32,385 112,065 248,006 55,006 99,959 101,578 104,138 106,950674,498 756,552 772,371 804,805 793,029 807,506 804,374 801,304488,965 269,988 172,084 561,423 382,252 388,445 398,233 408,985
94,813 87,533 107,644 103,897 105,929 107,645 110,358 113,338283,203 277,459 97,141 105,056 233,563 237,346 243,328 249,899386,807 148,152 458,179 442,328 362,228 368,095 377,371 387,561
3~40t~000 3~652~596 3~879~000 5~352~968 4~214~272 4~282~543 4~390~463 4~509~0069,219,595 8,419,970 8,743,673 t1,191,206 10,150,636 10,318,120 10,534,298 $10,772,449
22,155,610 22,827,319 23,792,211 26,262,389 42,889,436 42,040,117 42,441,862 42,293,995
29 TOTAL OPERATING EXPENSES BASED ON SIMPLE FIVE-YEAR AVERAGE 27,512,049 27,712,218 28,682,759 30,883,842 32,624,070 50,513,684 49,923,820 50,856,382 50,866,185
6 Chapter - Utility Plant
Presented in this chapter are utility plant balances for recordedyears 2005 through 2009, for adjusted year 2010 and for estimatedyears ending December 31, 2012 and 2013. Also included are utilityplant budgets for estimated years ending December 31, 2012 and 2013.
6.1 Comparison of Company Funded Capital ExpendituresAuthorized In Last GRC To Amounts Actually Spent
In response to Master Data Request item II A. i, we have providedinformation comparing Suburban’s recorded company funded capitalexpenditures as compared to the amounts authorized for each of theyears 2007, 2008 and 2009. Suburban recorded expenditures exceededthe levels authorized by $411,840.
Authorized Recorded2007 $10,210,000 $11,446,303
2008 $8,774,239 $9,918,8542009 $9,010,897 $7,041,819Total $27,995,136 $28,406,976
6.2 Utility Plant Capital Budget, Estimated Years EndingDecember 31, 2012 and 2013
Shown in Table 6-1 are the Company’s proposed utility plant capitalexpenditure budgets for estimated years December 31, 2012 and 2013.The budget for new business capital additions is consistent withcustomer growth projections as presented in Chapter 4 of this exhibit.These proposed capital additions shown in Table 6-2 are believed to beconsistent with requirements to maintain the physical integrity of thewater system to enable the Company to continue to provide asatisfactory level of water service.
Utility Plant Balances, Estimated Years Ending December 31, 2012 and2013
Balances for years ending December 31, 2012 and 2013 are shown inTables 6-2 through 6-7. Utility plant balances by account for end ofyear 2010 are based on recorded end of year 2009 balances, which wereincreased by budgeted capital additions for 2010 from Table 6-1 andreduced by estimated normal retirements. Balances for end of yearsending December 31, 2012 and 2013 were computed in the same manner,assuming capital expenditures in the years 2011, 2012 and 2013 will beinstalled evenly throughout each of the years. Total utility plantfor rate base was computed as the average of the beginning and end oftest year plant balances as shown in Table 6-7. Two large projects,Plant 224 Reservoir Replacement and Plant 408 Reservoir Replacement,
6-!
are multi-year projects. Due to these projects extending into theattrition year 2014, the testimony of Craig Gott the Company’s VicePresident of Engineering, discusses 2014 projects in detail.
Alternative Methodology
We have provided calculations of utility plant in service based onalternative methodology described in the Interim Order (Table 6-8).
6-2
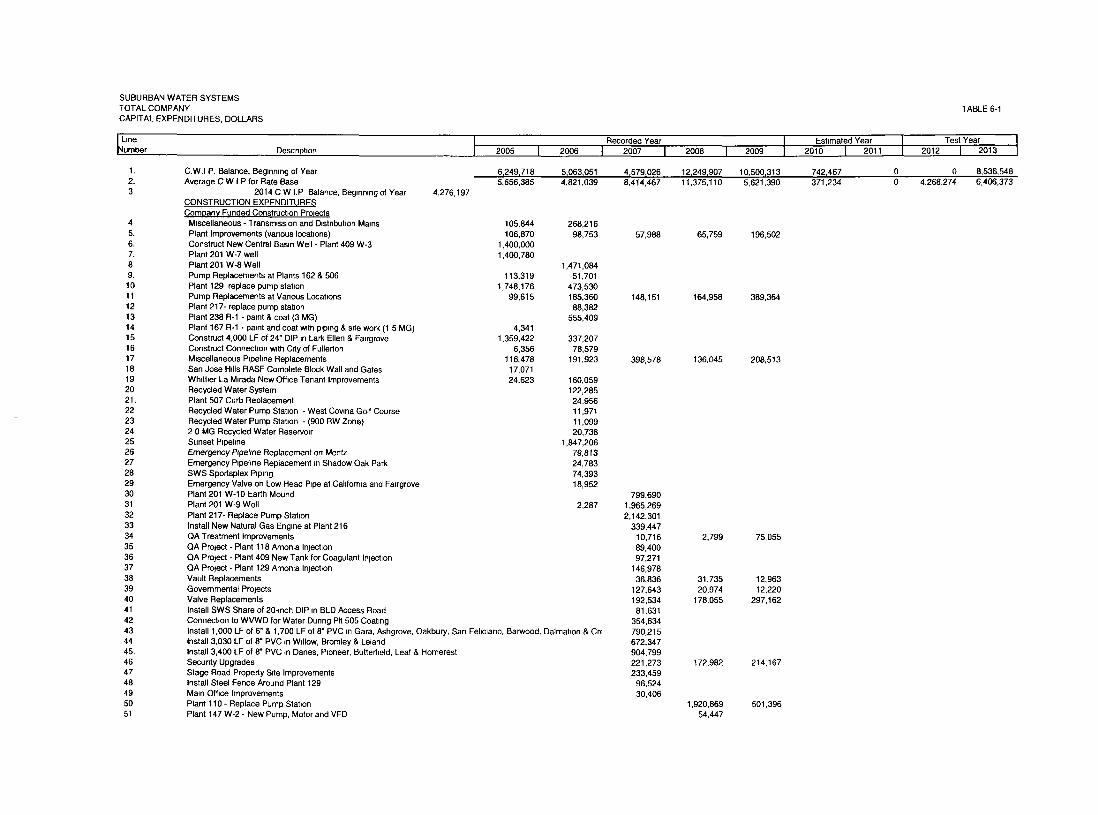
SUBURBAN WATER SYSTEMSTOTALCOMPANYCAPITAL EXPENDITURES, DOLLARS
TABLE 6-1
~qLineumber
Recorded YearDescnpt~on 2005 I 2006 I 2007 I 2008 I Est=mated Year
I 2o09 2010 I 2011Test Year12012120131
45.6.7.8.9.101112131415161718192021.2223242526272829303132333435363738394O4142434445.464748495051
C.W.I P. Balance, Beg=nn~ng of Year 6~249,718 5,063,051 41579t026 12~249,907 10,500r313Average C W I P for Rate Base 5,656,385 4,821,039 8,414,467 11,375,110 5,621,390
2014 C W I.P Balance, Begmn=ng of Year 4,276,197CONSTRUCTION EXPENDITURESCompany Funded Construction ProlectsM~scellaneous - Transmission and D~stnbut~on Mains 105,844 268,216Plant Improvements (vanous locations) 106,870 98,753 57,988 65,759 196,502Construct New Central Basin Well - Plant 409 W-3 1,400,000Plant 201 W-7 well 1,400,780Plant 201 W-8 Well 1,471,084Pump Replacements at Plants 162 & 506 113,319 51,701Plant 129 replace pump stat=on 1,748,176 473,530Pump Replacements at Vanous Locat=ons 99,615 185,360 148,151 164,958 389,364Plant 217- replace pump stat=on 88,382Plant 238 R-1 - paint & coat (3 MG) 555,409Plant 167 R-1 - pa=nt and coat wth p~pmg & szte work (1 5 MG) 4,341Construct 4,000 LF of 24" DIP =n Lark Ellen & Fa=rgrove 1,359,422 337,207Construct Connection with City of Fullerton 6,356 78,579M=scellaneous P=pehne Replacements 116,478 191,923 398,578 136,045 208,513San Jose Hdls RASF Complete Block Wall and Gates 17.071Wh~tt=er La M=rada New Office Tenant Improvements 24,623 160,059Recycled Water System 122,285Plant 507 Curb Replacement 24,956Recycled Water Pump Station - West Cowna Golf Course 11,971Recycled Water Pump Stat=on - (900 RW Zone) 11,0992 0 MG Recycled Water Reservo=r 20,738Sunset P=pehne 1,847,206Emergency P~pel~ne Replacement on Mentz 79,813Emergency P~pehne Replacement =n Shadow Oak Park 24,783SWS Sportsplex P=p~ng 74,393Emergency Valve on Low Head Pipe at Cahfom~a and Fa=rgrove 18,952Plant 201 W-10 Earth Mound 799,690Plant 201 W-9 Well 2,287 1,965,269Plant 217- Replace Pump Station 2,142,301Install New Natural Gas Engine at Plant 216 339,447QA Treatment Improvements 10,716 2,799 75,055QA Project - Plant 118 Amon~a Injection 89,400QA Project - Plant 409 New Tank for Coagulant Inject=on 97,271QA Project - Plant 129 Amoma Injection 146,978Vault Replacements 36,836 31,735 12,963Governmental Projects 127,643 20,974 12,220Valve Replacements 192,534 178,055 297,162Install SWS Shara of 20-inch DIP =n BLD Access Road 81,631Connection to WVWD for Water Dunng Pit 505 Coating 354,634Install 1,000 LF of 6" & 1,700 LF of 8" PVC in Gara, Ashgrove, Oakbury, San Fel~c~ano, Barwood, Dalmat~on & CrE 790,2!5Install 3,030 LF of 8" PVC =n W=llow, Bromley & Leland 672,347Install 3,400 LF of 8" PVC m Danes, P=oneer, Butterfield, Leaf & Homerest 904,799Secunty Upgrades 221,273 172,982 214,167Stage Road Property S=te Improvements 233,459Install Steel Fence Around Plant 129 96,524Ma~n Office Improvements 30,406Plant 110 - Replace Pump Stat=on 1,920,869 501,396Plant 147 W-2 - New Pump, Motor and VFD 54,447
742,467371,234
0 8,536~5484,268,274 6,406,373
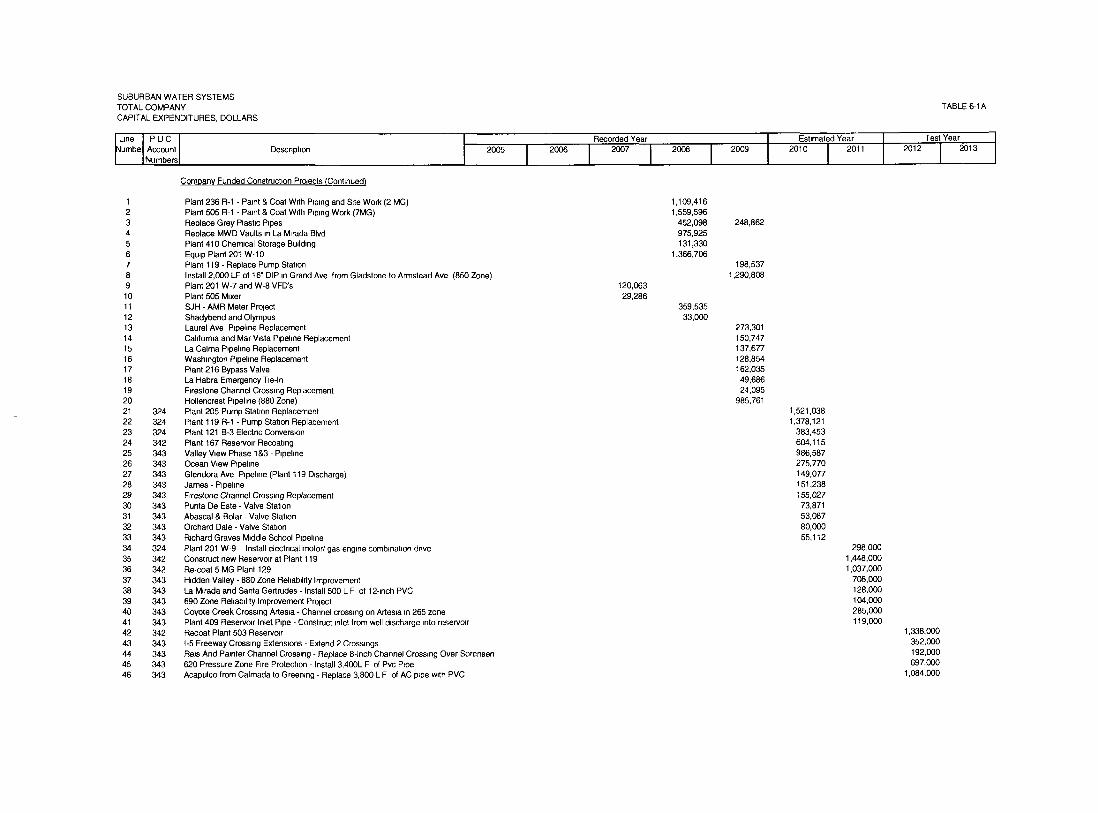
SUBURBAN WATER SYSTEMSTOTALCOMPANYCAPITAL EXPENDITURES, DOLLARS
~Llne I PUCIumbe~ Account
I NumbersDescnpt~on 2005
Company Funded Construction PrOleCts (Continued)
Recorded Year2OO8 2009
Estimated Year
2010 I 2011
1 Plant 236 R-1 - Paint & Coat W~th P~p~ng and S~te Work (2 MG)2 Plant 505 R-1 - Paint & Coat W~th P~p~ng Work (7MG)3 Replace Grey Plastic P~pes4 Replace MWD Vaults ~n La M~rada BIvd5 Plant 410 Chemical Storage Building6 Equip Plant 201 W-107 Plant 119 - Replace Pump Station8 Install 2,000 LF ot t6" DIP ~n Grand Ave from Gladstone to Armstead Ave (850 Zone)9 Plant 201 W-7 and W-8 VFD’s10 Plant 505 M~xer11 SJH - AMR Meter Project12 Shadybend and Olympus13 Laurel Ave P~pehne Replacement14 California and Mar Wsta P~pel~ne Replacement15 La Calma P~pel~ne Replacement16 Washington P~pelme Replacement17 Plant 216 Bypass Valve18 La Habra Emergency T~e-ln19 F~restone Channel Crossing Replacement20 Hollencrest P~pellne (880 Zone)21 324 Plant 205 Pump Station Replacement22 324 Plant 119 R-1 - Pump Station Replacement23 324 Plant 121 B-3 Electnc Conversion24 342 Plant 167 Reservoir Recoat~ng25 343 Valley Wew Phase 1 &3 - P~pel~ne26 343 Ocean Wew P~pehne27 343 Glendora Ave P~pelme (Plant 119 D~scharge)28 343 Jan~s - P~pel~ne29 343 F{restone Channet Cross~ng Replacement30 343 Punta De Este - Valve Station31 343 Abascal & Bo~ar - Valve Station32 343 Orchard Dale - Valve Station33 343 R~chard Graves M~ddle School Pipeline34 324 Plant 201 W-9 - Install electncal motor/gas engine combination dnve35 342 Construct new Reservoir at Plant 11936 342 Re-coat 5 MG Plant 12937 343 H~dden Valley - 880 Zone Rehab~l~ty Improvement38 343 La M~rada and Santa Gertrudes - Install 500 L F of 12-~nch PVC39 343 690 Zone Reliability Improvement Prolect40 343 Coyote Creek Crossing Artes~a - Channel crossing on Artes~a m 265 zone41 343 Plant 409 Reservoir Inlet P~pe - Construct ~nlet from well d~scharge ~nto reservoir42 342 Recoat Plant 503 Reservoir43 343 I-5 Freeway Crossing Extensions - Extend 2 Crossings44 343 Reds And Painter Channel Crossing - Replace 8-Inch Channel Crossing Over Sorensen45 343 620 Pressure Zone Fire Protection - Install 3,400L F of Pvc P~pe46 343 Acapulco from Calmada to Greening - Replace 3,800 L F of AC p~pe w~th PVC
120,06329,286
1,109,4161,559,596
452,098975,925131,330
1,366,706
359,53533,000
248,862
198,5371,290,808
273,301150,747137,677128,854162,03549,68624,095
985,7611,521,0381,378,121
383,453604,1t5986,587275,770149,077151,238155,02773,87153,08780,00055,112
298,0001,448,0001,037,000
708,000128,000104,000285,000119,000
TABLE 6-1A
2012 Tesi Year2013 I
1,338,000352,000192,000697,000
1,084,000
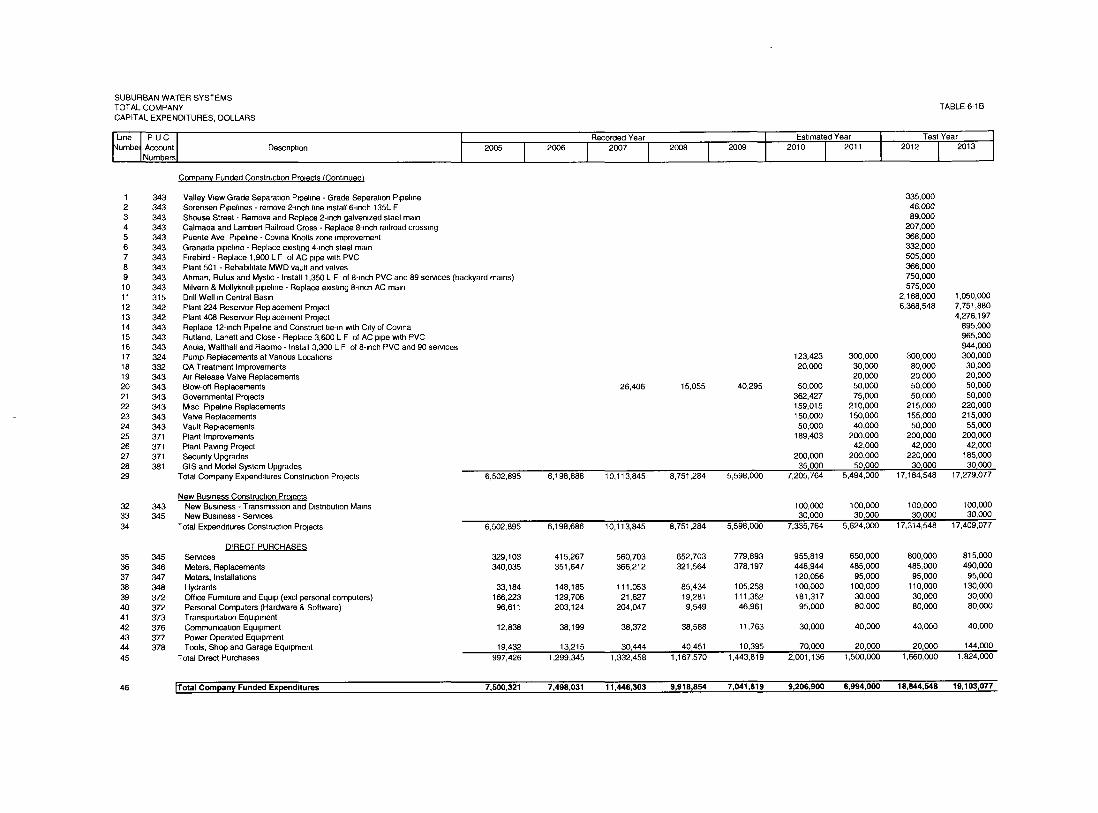
SUBURBAN WATER SYSTEMSTOTAL COMPANYCAPITAL EXPENDITURES, DOLLARS
~L’ne I Puc I
Iumbe~ Account Descnpt~on 2005I Numbers
Comoanv Funded Construction Protects IContmuedl
I 2006Recorded Year
IEstimated Year
I2007
I2008
I2000 2010 2011
1 343 Valley Wew Grade Separation P~pellne - Grade Seperatlon P~pehne2 343 Sorensen Pipelines - rerr~ve 2-inch I~ne install 6-inch I35L F3 343 Shouse Street - Remove and Replace 2-inch galven~zed steel mmn4 343 Calmade and Lambert Railroad Cross - Replace 8-~nch railroad crossing5 343 Puente Ave P~pelme - Cowna Knolls zone improvement6 343 Granada p~pehne - Replace existing 4-inch steel main7 343 Firebird - Replace 1,900 L F of AC p~pe vath PVC8 343 Plant 501 - Rehab~htate MWD vault and valves9 343 Ahman, Rufus and Mystic - Install 1,350 L F of 8-inch PVC and 89 services (backyard mains)10 343 MiIvern & Mollyknoll p~pehne - Replace existing 8-~nch AC mare11 315 Dnll Well ~n Central Basra12 342 Plant 224 Reservotr Replacement Project13 342 Plant 408 Reservoir Replacement Project14 343 Replace 12-inch Pipeline and Construct tie-in ~th Cdy of Cowna15 343 Rutland, Lanett and Close - Replace 3,600 L F of AC p~pe w~th PVC16 343 Anola, Walthalt and Rac~mo - Install 3,300 L F of 8-~nch PVC and 90 services17 324 Pump Replacements at Yahoos Locations18 332 QA Treatment Improvements19 343 A~r Release Valve Replacements20 343 Blow-off Replacements21 343 Governmental Projects22 343 M~sc Pipeline Replacements23 343 Valve Replacements24 343 Vault Replacements25 371 Plant Improvements26 371 Plant Pawng Project27 371 Secunty Upgrades28 38t GIS and Model System Upgrades29 Total Company Expenddures Construction Projects 6,502,895
32 34333 34534
New Business Construction ProlectsNew E~slness - Transmission and Distribution MainsNew Business - Services
Total Expenditures Construction Projects
6,198,686
123,423 300,00020,000 30,000
20,00026,406 15,055 40,295 50,000 50,000
362,427 75,000159,015 210,000150,000 150,00050,000 40,000
189,403 200,00042,000
200,000 200,00035~000 50~000
10,113,845 8,751,284 5,598,000 7,205,764 5,494,000
6,502,895 6,198,686 10,113,845 8,751,284 5,598,000
DIRE(~T PURCHASES35 345 Services 329,10336 346 Meters, Replacements 340,03537 347 Meters, Installations38 348 Hydrants 33,18439 372 Office Furniture and Equip (excl personal computers) 166,22340 372 Personal Computers (Hardware & Software) 96,61141 373 Transportation Equipment42 376 Commuotcet~on Equipment 12,83843 377 Power Operated Equipment44 378 Tools, Sho£ and Garage Equipment 19,43245 Total D~ract Purchases 997,426
TABLE 6-1B
2012 TesiYea~013 I
335,00046,00089,000
207,000368,000332,000505,000366,000750,000575,00O
2,168,000 1,050,0006,368,548 7,751,880
4,276,197895,000965,000
300,000 300,0O080,000 30,00020,000 20,00050,000 50,00050,000 50,000
215,000 220,000155,000 215,00050,000 55,000
200,000 200,00042,000 42,000
220,000 185,00030~000 30~000
17,184,548 17,279,077
1 00,000 1 00,000 100,000 100,00030,000 30,000 30,000 30,000
7,335,764 5,624,000 17,314,548 17,409,077
415,267 560,703 652,703 779,893 955,819 650,000 800,000 815,000351,647 366,212 321,564 378,197 448,944 485,000 485,000 490,000
120,056 95,000 95,000 95,000148,185 111,053 85,434 105,258 100,000 100,000 110,000 130,000129,708 21,627 19,281 111,352 181,317 30,000 30,000 30,000203,124 204,047 9,549 46,961 95,000 80,000 80,000 80,000
38,199 38,372 38,588 11,763 30,000 40,000 40,000 40,000
13,215 30,444 40,451 10,395 70,000 20,000 20,000 144,0001,299,345 1,332,458 1,167,570 1,443,819 2,001,136 1,500,000 1,660,000 1,824,000
46 ITotal Company Funded Expenditures 7,500,321 7,498,031 11,446,303 9,918,854 7,041,819 9,206,900 6,994,000 18,844,548 19,103,077
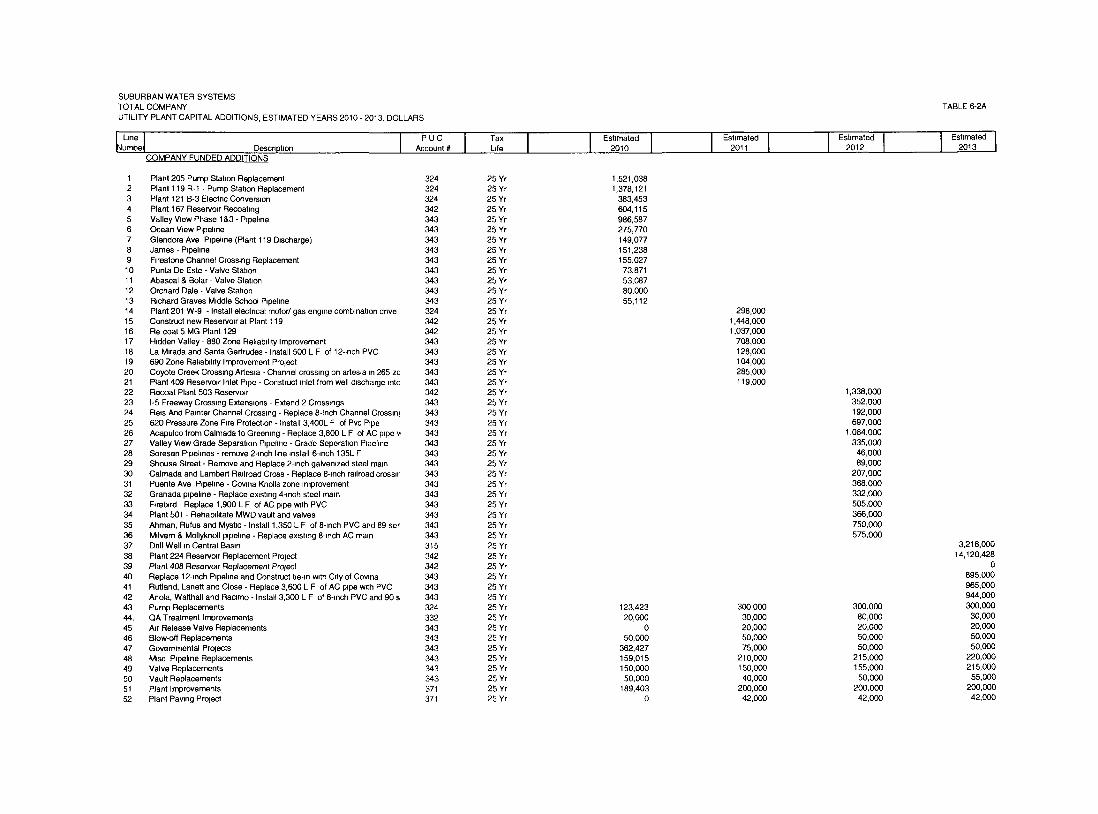
SUBURBAN WATER SYSTEMSTOTAL COMPANYUTILITY PLANT CAPITAL ADDITIONS, ESTIMATED YEARS 2010 - 2013, DOLLARS
LIne Iumbe~P U C I Tax
Account # I L~feDescnpbonCOMPANY FUNDED ADDITIONS
I1 Plant 205 Pump Stabon Replacement2 Plant 119 R-1 - Pump Station Replacement3 Plant 121 B-3 Electnc Conversion4 Plant 167 Reservoir Recoatmg5 Valley View Phase I&3 - P~pel~ne6 Ocean View P~pehne7 Glendora Ave P~pel~ne (Plant 119 D~scharge)8 James - P~pehne9 F~restone Channel Crossing Replacement10 Punta De Este - Valve Stabon11 Abascal & Bolar - Valve Station12 Orchard Dale - Valve Station13 R~chard Graves M~ddle School P~pehne14 Plant 201 W-9 - Install electncal motor/gas engine combination dnve15 Construct new Reservoir at Plant 11916 Re-coat 5 MG Plant 12917 H~dden Valley - 880 Zone Reliability Improvement18 La M~rada and Santa Gertrudes - Install 500 L F of 12-~nch PVC19 690 Zone Rehab~l~ty Improvement Prolect20 Coyote Creek Crossing Artes~a - Channel crossing on artes~a m 265 zc21 Plant 409 Reservoir Inlet P~pe - Construct inlet from well d~scharge ~nto22 Recoat Plant 503 Reservoir23 I-5 Freeway Crossing Extens~oos - Extend 2 Crossings24 Reds And Painter Channel Crossing - Replace 8-Inch Channel Cross~n!25 620 Pressure Zone F~re Protection - Install 3,400L F of Pvc Pipe26 Acapulco from Calmada to Greening - Replace 3,800 L F of AC p~pe ~,27 Valley V~ew Grade Separation P~pehne - Grade SeperaI~on Pipeline28 Soresen P~pelmes - remove 2-inch hne ~nstall 6-~nch 135L F29 Shouse Street - Remove and Replace 2-Inch galvenlzed steel main30 Calmada and Lambert Railroad Cross - Replace 8-inch radroad crosser31 Puente Ave P~pehne - Covlna Knolls zone improvement32 Granada pipeline - Replace existing 4-~nch steel main33 F~rab~rd - Replace 1,900 L F of AC p~pe w~th PVC34 Plant 501 - Rehabd~tate MWD vault and valves35 Ahman, Rufus and Mystic - Install 1,350 L F of 8-inch PVC and 89 set36 Mdvern & Mollyknoll p~pelme - Replace existing 8-inch AC main37 Dnll Well ~n Central Basra38 Plant 224 Reserver Replacement Prolect39 Plant 408 Reservoir Replacement Prolect40 Replace 12-~nch P~pel~ne and Construct t=e-m w=th C=ty of Cowna41 Rutland, Lanett and Close - Replace 3,600 L F of AC pipe w~h PVC42 Anola, Walthall and Rac~mo - Install 3,300 L F of 8-inch PVC and 90 s4344.45464748495O5152
324324324342343343343343343343343343343324342342343343343343343342343343343343343343343343343343343343343343315342342343343343
25 Yr25 Yr25 Yr25 Yr25 Yr25 Yr25 Yr25 Yr25 Yr25 Yr25 Yr25 Yr25 Yr25 Yr25 Yr25 Yr25 Yr25 Yr25 Yr25 Yr25 Yr25 Yr25 Yr25 Yr25 Yr25 Yr25 Yr25 Yr25 Yr25 Yr25 Yr25 Yr25 Yr25 Yr25 Yr25 Yr25 Yr25 Yr25 Yr25Yr25 Yr25 Yr
Estimated2010 I
1,521,0381,378,121
383,453604,115986,587275,77O149,077151,238155,02773,87153,08780,00055,112
Estimated2011 I
Pump ReplacementsQA Treatment ImprovementsA~r Release Valve ReplacementsBlow-off ReplacementsGovernmental ProtectsM~sc P~pel~ne ReplacementsValve ReplacementsVault ReplacementsPlant ImprovementsPlant Pawng Project
324332343343343343343343371371
25 Yr25 Yr25 Yr25 Yr25 Yr25 Yr25 Yr25 Yr25 Yr25 Yr
123,42320,000
050,000
362,427159,015150,00050,000
189,4030
298,0001,448,0001,037,000
708,000128,000104,000285,000119,000
300,00030,00020,00050,00075,000
210,000150,00040,000
200,00042,000
TABLE 6-2A
Estimated12012 I Estimated I 2013
1,338,000352,000192,000697,000
1,084,000335,00046,00089,000
207,000368,000332,000505,000366,000750,000575,000
300,00080,00020,00050,00050,000
215,000155,00050,000
200,00042,000
3,218,00014,120,428
0895,000965,000944,000300,000
30,00020,00050,00050,000
220,000215,00055,000
200,00042,000
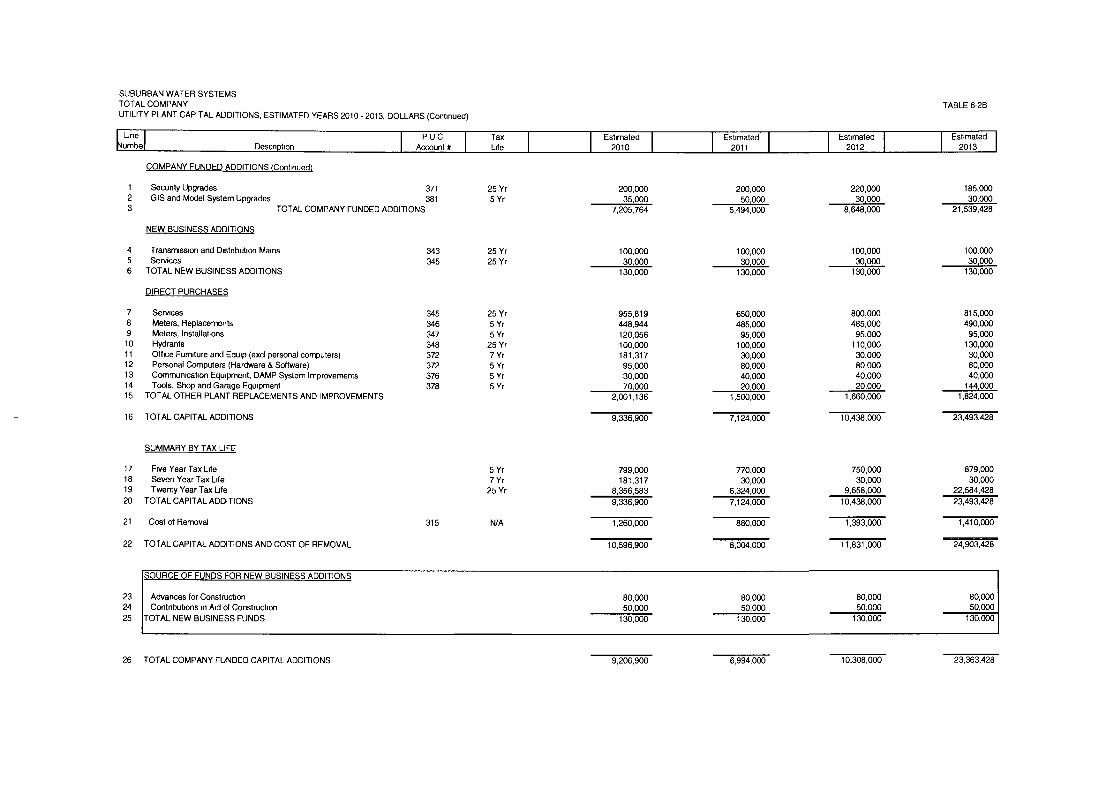
SUBURBAN WATER SYSTEMSTOTAL COMPANYUTILITY PLANT CAPITAL ADDITIONS, ESTIMATED YEARS 2010 - 2013, DOLLARS (Continued)
lJne Iumbe~ I PUCDescnpt~on Account #
COMPANY FUNDED ADDITIONS (Continued)
Secunty Upgrades 371GIS and Model System Upgrades 381
TOTAL COMPANY FUNDED ADDITIONS
123
NEW BUSINESS ADDITIONS
4 TransmlsSlOt3 and Dlstnbutlon Mains 3435 Services 3456 TOTAL NEW BUSINESS ADDITIONS
16
DIRECTPURCHASES
7 Serwces 3458 Meters, Replacements 3469 Meters, Installations 34710 Hydrants 34811 Office Furniture and Equip (excl personal computers) 37212 Personal Computers (Hardware & Software) 37213 Communication Equ{pment, DAMP System Improvements 37614 Tools, Shop and Garage Equipment 37815 TOTAL OTHER PLANT REPLACEMENTS AND IMPROVEMENTS
TOTAL CAPITAL ADDITIONS
SUMMARY BY TAX LiFE
17 F~ve Year Tax L~fe18 Seven Year Tax Life19 Twenty Year Tax IJfe20 TOTAL CAPITAL ADDITIONS
Tax ILife
Estimated2010
25 Yr5 Yr
200,00035,000
7,205,764
25 Yr25 Yr
100,00030,000
130,000
25 Yr5 Yr5 Yr
25 Yr7 Yr5 Yr5 Yr5 Yr
955,819448,944120,056100,000181,31795,00030,00070~000
Estimated2011
200,00050,000
5,494,000
1 00,00030,000
130,000
650,000485,00095,000
1 00,00030,00080,00040,00020,000
Estimated2012 I
220,00030~000
8,648,000
100,00030r000
130,000
800,000485,000
95,000110,00030,00080,00040,00020,000
21 Cost of Removal
22 TOTAL CAPITAL ADDITIONS AND COST OF REMOVAL
5 Yr7 Yr
25 Yr
315 N/A
2,001,136
9,336,900
799,000181,317
8,356,5839,336,900
1,260,000
10,596,900
7,124,0~
770,0~~,0~
6,324,0007,124,000
232425
SOURCE OF FUNDS FOR NEW BUSINESS ADDITIONS
Advances for ConstnJct~onContnbut~ons ~n A~d of Construction
TOTAL NEW BUSINESS FUNDS
80,00050,000
130,000
750,000~,0~
9,658,00010,436,000
50,000130,000
TABLE 6-2B
Estimated2013
185,00030~000
21,539,428
100,00030~000
130,000
815,000490,00095,000
130,00030,00080,00040,000
144~0001,824,000
23,493,428
879,00030,000
22,584,42823,493,428
1,410,000
24,903,428
80,00050,000
130,000
26 TOTAL COMPANY FUNDED CAPITAL ADDITIONS 9,206,900 6,994,000 10,308,000 23,363,428
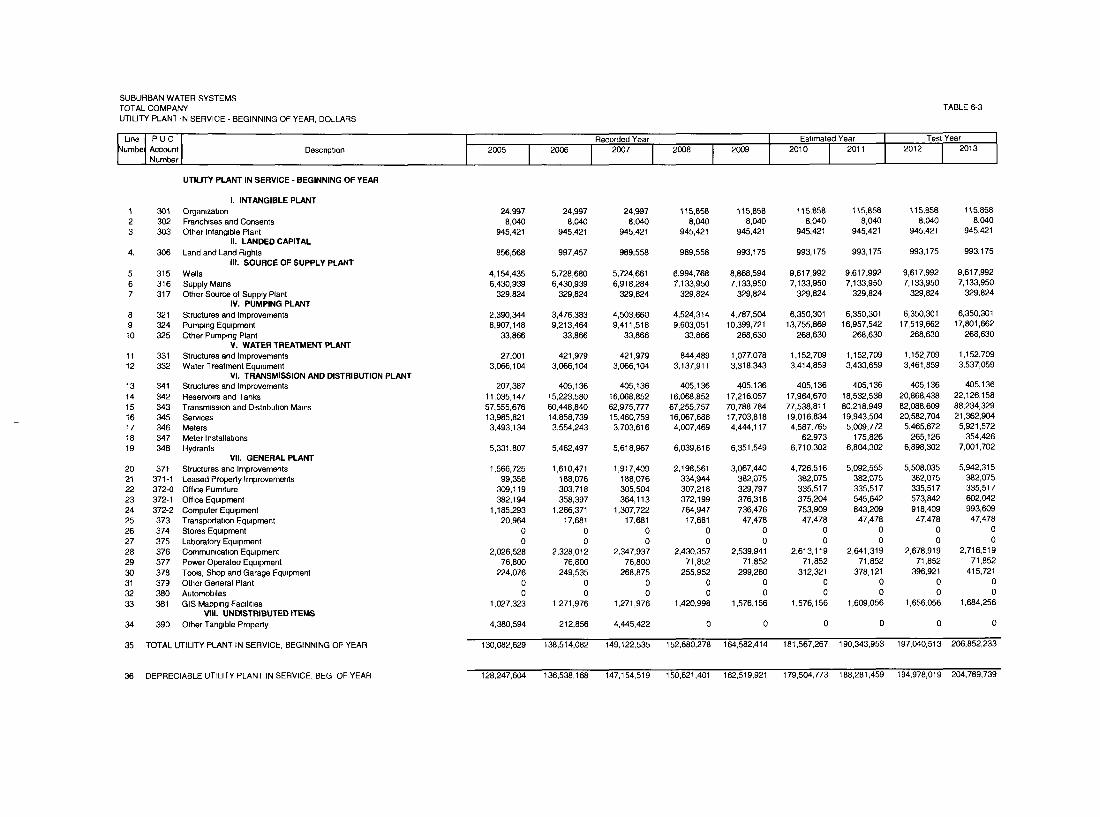
SUBURBAN WATER SYSTEMSTOTAL COMPANYUTILITY PLANT IN SERVICE - BEGINNING OF YEAR, DOLLARS
~Llne I PUC Iumbe~ Account
| NumberDescnptlon
UTILITY PLANT IN SERVICE - BEGINNING OF YEAR
TABLE 6-3
Recorded Year Eshmated Year ~ Test Year
I. INTANGIBLE PLANT1 301 Organization2 302 Franchises and Consents3 303 Other Intang=ble Plant
I1. L/~IDED CAPITAL4. 306 Land and Land R~ghts
III. SOURCE OF SUPPLY PLANT5 315 Wells6 316 Supply Mares7 317 Other Source of Supply Plant
IV. PUMPING PLANT8 321 Structures and Improvements9 324 Pumping Equipment10 325 Other Pumping Plant
V. WATER TREATMENT PLANT11 331 Structures and Improvements12 332 Water Treatment Equipment
VI. TRANSMISSION AND DISTRIBUTION PLANT13 341 Structures and Improvements14 342 Reserv~rs and Tanks15 343 Transmission and D~strlbut~on Mares16 345 Se rv=ces17 346 Meters18 347 Meter Installat=ons19 348 Hydrants
VII. GENERAL PLANT20 371 Structures and Improvements21 371-1 Leased Propertylmprovements22 372-0 Off=ce Furniture23 372-1 Off=ce Equ=pment24 372-2 Computer Equipment25 373 Transportation Equ=pment26 374 Stores Equ=pment27 375 Laboratory Equ=pment28 376 Commun=cat=on Equ=pment29 377 Power Operated Equ=pment30 378 Tools, Shop and Garage Equ=pment31 379 Other General Plant32 380 Automobiles33 381 GIS Mapping Faclht~es
VIII. UNDISTRIBUTED ITEMS34 390 Other Tang=ble Properly
24,997 24,997 24,997 115,858 115,858 115,858 115,858 115,858 115,8588,040 8,040 8,040 8,040 8,040 8,040 8,040 8,040 8,040
945,421 945,421 945,421 945,421 945,421 945,421 945,421 945,421 945,421
856,568 997,457 989,558 989,558 993,175 993,175 993,175 993,175 993,175
4,154,435 5,728,680 5,724,661 6,994,768 8,868,594 9,617,992 9,617,992 9,617,992 9,6t7,9926,430,939 6,430,939 6,918,284 7,133,950 7,133,950 7,133,950 7,133,950 7,133,950 7,133,950
329,824 329,824 329,824 329,824 329,824 329,824 329,824 329,824 329,824
2,390,344 3,476,383 4,503,660 4,524,314 4,787,504 6,350,301 6,350,301 6,350,301 6,350,3018,907,148 9,213,464 9,411,518 9,603,051 10,399,721 13,755,869 16,957,542 17,519,662 17,801,662
33,866 33,866 33,866 33,866 268,630 268,630 268,630 268,630 268,630
27,001 421,979 421,979 844,489 1,077,078 1,152,709 1,152,709 1,152,709 1,152,7093,066,104 3,066,104 3,066,104 3,137,911 3,318,343 3,414,859 3,433,659 3,461,859 3,537,059
207,387 405,136 405,136 405,136 405,136 405,136 405,136 405,136 405,13611,035,147 15,223,580 16,068,852 16,068,852 17,216,057 17,964,670 18,532,538 20,868,438 22,126,15857,555,676 60,448,840 62,975,777 67,255,757 70,788,784 77,538,811 80,218,949 82,088,609 88,234,32913,985,821 14,858,739 15,460,759 16,067,688 17,703,818 19,016,834 19,943,504 20,582,704 21,362,9043,493,134 3,554,243 3,703,616 4,007,469 4,444,117 4,587,765 5,009,772 5,465,672 5,921,572
62,973 175,826 265,126 354,4265,331,807 5,462,497 5,618,967 6,039,616 6,351,549 6,710,302 6,804,302 6,898,302 7,001,702
1,566,725 1,610,471 1,917,409 2,198,561 3,067,440 4,726,516 5,092,555 5,508,035 5,942,31599,356 188,076 188,076 334,944 382,075 382,075 382,075 362,075 382,075
309,119 303,718 305,504 307,218 329,797 335,517 335,517 335,517 335,517382,194 358,397 364,113 372,199 376,318 375,204 545,642 573,842 602,042
1,185,293 1,266,371 1,307,722 764,947 736,476 753,909 843,209 918,409 993,60920,964 17,681 17,681 17,681 47,478 47,478 47,478 47,478 47,478
0 0 0 0 0 0 0 0 00 0 0 0 0 0 0 0 0
2,026,528 2,328,012 2,347,937 2,430,357 2,539,941 2,613,119 2,641,319 2,678,919 2,716,51976,800 76,800 76,800 71,852 71,852 71,852 71,852 71,852 71,852
224,076 249,535 268,875 255,952 299,280 312,321 378,121 396,921 415,7210 0 0 0 0 0 0 0 00 0 0 0 0 0 0 0 0
1,027,323 1,271,976 1,271,976 1,420,998 1,576,156 1,576,156 1,609,056 1,656,056 1,684,256
4,380,594 212,856 4,445,422 0 0 0 0 0 0
130,082,629 138,514,082 149,122,535 152,680,278 164,582,414 181,567,267 190,343,953 197,040,513 206,852,233
128,247,604. 136,538,168 147,154,519 150,621,401 162,519,921 179,504,773 188,281,459 194,978,019 204,789,739
35 TOTAL UTILITY PLANT tN SERVICE, BEGINNING OF YEAR
36 DEPRECIABLE UTILITY PLANT IN SERVICE, BEG OF YEAR
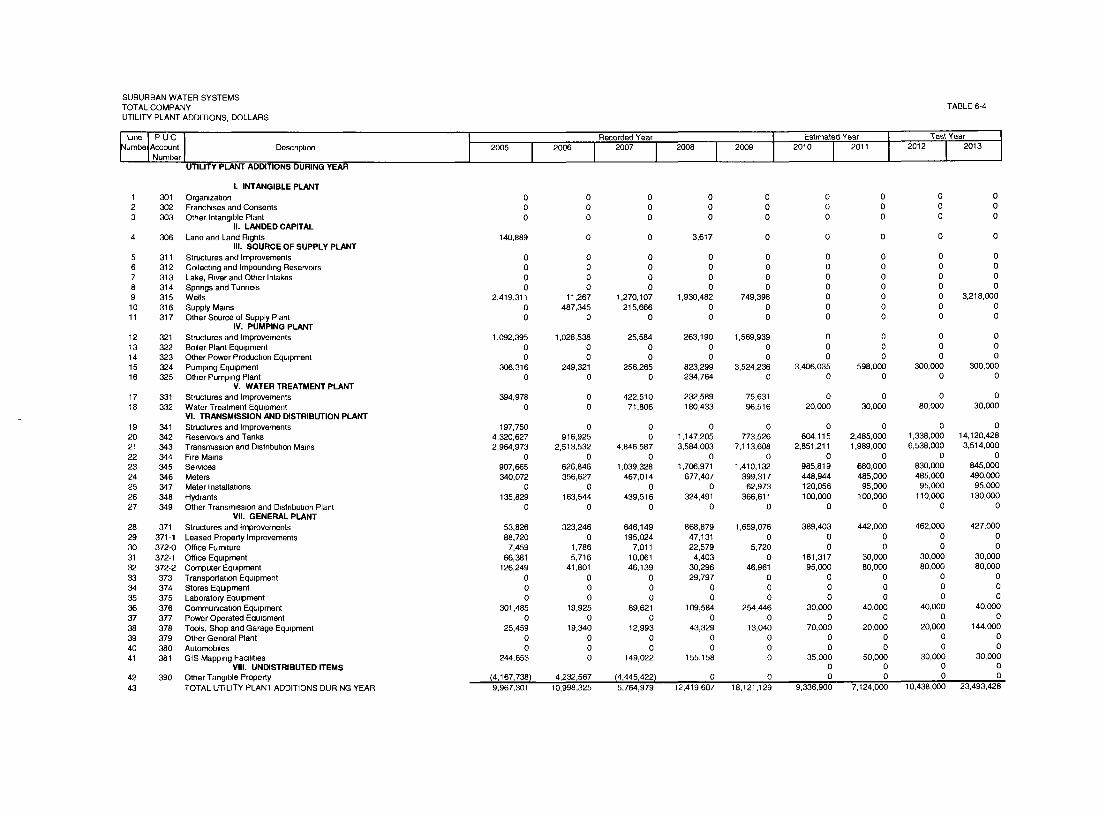
SUBURBAN WATER SYSTEMSTOTAL COMPANYUTILITY PLANT ADDITIONS, DOLLARS
PUC Iumbe~Acco~nt INumber I
Description
UTILITY PLANT ADDITIONS DURING YEAR
000
000
Recorded Year
I
Estimated Year
I2007
I2008
I2009 2010 2011
000
000
2012
I. INTANGIBLE PLANT1 301 Organ~zabon2 302 Franchises and Consents3 303 Other Intangible Plant
II. LANDED CAPITAL4 306 Land and Land R~ghts
III. SOURCE Of SUPPLY PLANT5 311 Structures and Improvements6 312 Collecting and Impounding Reservoirs7 313 Lake, R~ver and Other Intakes8 314 Spnngs and Tunnels9 315 We!ls10 316 Supply Mares11 317 Other Source of Supply Plant
IV. PUMPING PL/~rl"12 321 Structures and Improvements13 322 Boder Plant Equipment14 323 Other Power Producbon Equipment15 324 Pumping Equipment16 325 Other Pumping Plant
V. WATER TREATMENT PLANT17 331 Structures and Improvements18 332 Water Treatment Equipment
Vl. TRANSMISSION AND DISTRIBUTION PLANT19 341 Structures and Improvements20 342 Reservoirs and Tanks21 343 Transmission and D~stnbutlon Mares22 344 F~re Mains23 345 Services24 346 Meters25 347 Meter Installabons26 348 Hydrants27 349 Other Transmission and D~stnbutlon Plant
VII. GENERAL PLANT28 371 Structures and Improvemects29 371-1 Leased Property Improvements30 372-0 Office Fum~ture31 372-1 Office Equ=pment32 372-2 Computer Equipment33 373 Transportabon Equipment34 374 Stores Equipment35 375 Laboratory Equipment36 376 Communication Equipment37 377 Power Operated Equipment38 378 Tools, Shop and Garage Equipment39 379 Other General Plant40 380 Automobiles41 381 GIS Mapping Facd~bes
VIII. UNDISTRIBUI’ED ITEMS42 390 Other Tangible Property43 TOTAL UTILITY PLANT ADDITIONS DURING YEAR
I 2005 2O06
ooo
140,889 0 0
0 0 0 0 00 0 0 0 00 0 0 0 00 0 0 0 0
2,419,311 11,267 1,270,107 1,930,482 749.3980 487,345 215,666 0 00 0 0 0 0
1,092,395 1,028,538 25.584 263,190 1,569,9390 0 0 0 00 0 0 0 0
306,316 249,321 256,265 823,299 3,524,2360 0 0 234,764 0
394,978 0 422,510 232,589 75,6310 0 71,806 180,433 96,516
197,750 0 0 0 04,320,627 916,925 0 1,147,205 773,5262,964,973 2,513,532 4,846,587 3,584,003 7,113,608
0 0 0 0 0907,665 626,846 1,039,328 1,706,971 1,410,132340,072 356,627 467,014 677,407 399,317
0 0 0 0 62,973135,829 163,544 439,516 324,491 366,611
0 0 0 0 0
53.826 323,246 646,149 868,879 1,659,07688,720 0 195,024 47,131 07,459 1,786 7,011 22,579 5,720
66,381 5,716 10,001 4,403 0126,249 41,801 46,139 30,296 46,961
0 0 0 29,797 00 0 0 0 00 0 0 0 0
301,485 19,925 89.621 109,584 254,4460 0 0 0 0
25,459 19,340 12,993 43,329 13,0400 0 0 0 00 0 0 0 0
244,653 0 149,022 155,158 0
(4,167,738) 4,232,567 (4,445,422) 0 09,967,301 10,998,325 5,764,979 12,419,607 18,121,129
TABLE 6-4
Test Year
I 2013
0 0 0 00 0 0 00 0 0 00 0 0 00 0 0 3,218,0000 0 0 00 0 0 0
0 0 0 00 0 0 00 0 0 0
3,406,035 598,000 300,000 300,0000 0 0 0
0 0 0 020,000 30,000 80,000 30,000
0 0 0 0604,115 2,485,000 1,338,000 14,120,428
2,851,211 1,989,000 6,538,000 3,514.0000 0 0 0
985,819 680,000 830,000 845,000448,944 485,000 485,000 490,000120,056 95,000 95,000 95,000100,000 100,000 110,000 130,000
0 0 0 0
389,403 442,000 462,000 427,0000 0 0 00 0 0 0
181,317 30,000 30,000 30,00095,000 80,000 80,000 80,000
0 0 0 00 0 0 00 0 0 0
30,000 40,000 40,000 40,0000 0 0 0
70,000 20,000 20,000 144,0000 0 0 00 0 0 0
35,000 50,000 30,000 30,0000 0 0 00 0 0 0
9,336,900 7,124,000 10,438,000 23,493,428
3,617 0 0 0 0 0
0 0 0 00 0 0 00 0 0 0
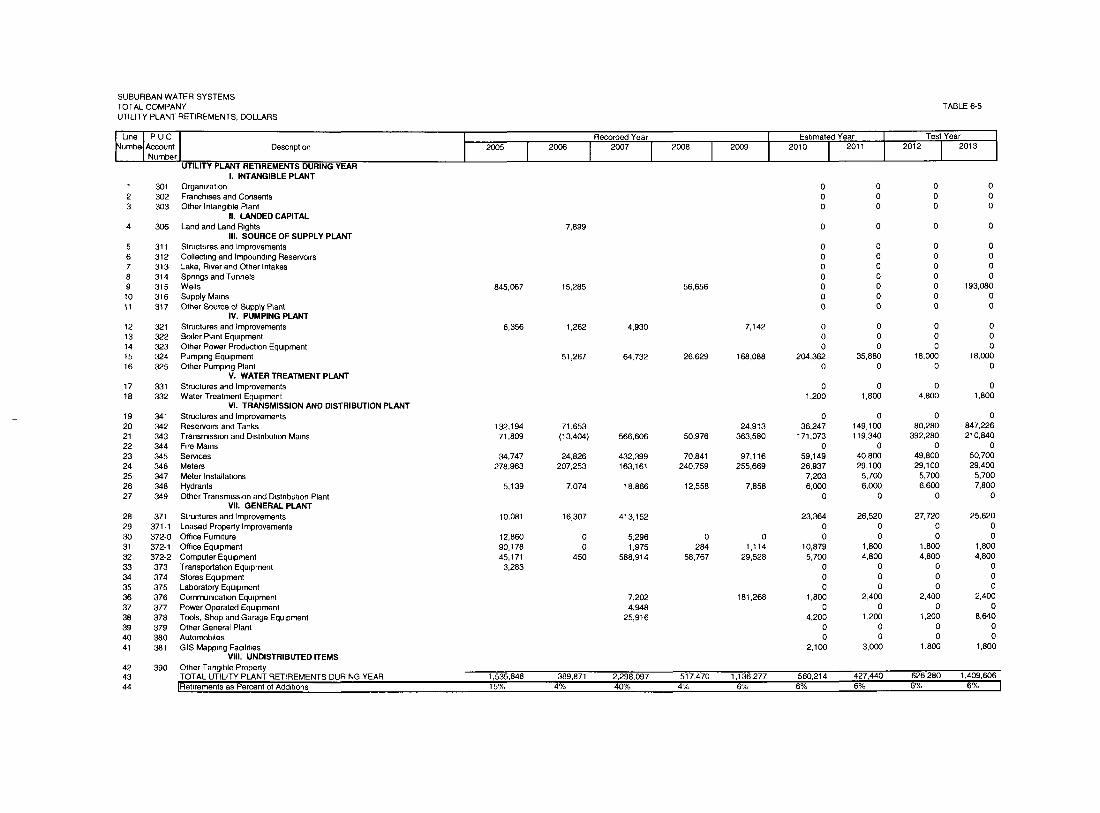
SUBURBAN WATER SYSTEMSTOTAL COMPANYUTILITY PLANT RETIREMENTS, DOLLARS
~Llne I PUCumbe~Account
| NumberDescnptlon
123
567891011
1213141516
1718
301302303
306
UTILITY PLANT RETIREMENTS DURING YEARI. INTANGIBLE PLANT
Organ~zat=onFranchises and ConsentsOther Intang=ble Plant
II. LANDED CAPITALLand and Land R~ghts
IlL SOURCE OF SUPPLY PLANTStructures and ImprovementsCollecbng and Impounding Reservoirs
2005 I 2006
7,899
Recorded Year
II2007
I2008 2009 2010
Esbmated Year
I 2011
311312313 Lake, R~ver and Other Intakes314 Spnngs and Tunnels315 Wells316 Supply Mares317 Other Source ol Supply P~ant
IV. PUMPING PLANT321 Structures and Improvements322 Bo~ler Plant Equipment323 Other Power Producbon Equipment324 Pumping Equipment325 Other Pumping Plant
V. WATER TREATMENT PLANT331 Structures and Improvements332 Water Treatment Equipment
VI. TRANSMISSION AND DISTRIBUTION PLANT
845,067 15,285 56,656
6,356
000
00000
000
2012
0000000
19 341 Structures and Improvements20 342 Reservo=rs and Tanks21 343 Transm=ss=on and D~stnbubon Mares22 344 F~re Mains23 345 Services24 346 Meters25 347 Meter Installabons26 348 Hydrants27 349 Other Transmission and D~stnbutlon Plant
VII. GENERAL PLANT28 371 Structures and Improvements29 371-1 Leased Property Improvements30 372-0 Ofhce Furniture31 372-1 Off=ce Equ=pment32 372-2 Computer Equipment33 373 Transportation Equipment34 374 Stores Equipment35 375 Laboratory Equipment36 376 Commumcabon Equipment37 377 Power Operated Equipment38 378 Tools, Shop and Garage Equipment39 379 Other General Plant40 380 Automobiles41 381 GIS Mapping Fac~hbes
VIII. UNDISTRIBUTED ITEMS42 390 Other Tangible Property43 TOTAL UTILITY PLANT RETIREMENTS DURING YEAR44 IRet~rements as Percent of Addd~ons
TABLE 6-5
Test Year
I 2013
0 00 00 0
0 0
0 00 00 00 00 193,0800 00 0
1,535,848 389,871 2,298,097 517,470 1,136,277 560,214 427,440 626,280 1,409,60615% 4% 40% 4% 6% 6% 6% 6% 6% I
12,860 0 5,296 0 090,178 0 1,975 284 1,11445,171 450 588,914 58,767 29,528
3,283
7,2024,948
25,916
181,268
23,364 26,520 27,720 25,6200 0 0 00 0 0 0
10,879 1,800 1,800 1,8005,700 4,800 4,800 4,800
0 0 0 00 0 0 00 0 0 0
1,800 2,400 2,400 2,4000 0 0 0
4,200 1,200 1,200 8,6400 0 0 00 0 0 0
2,100 3,000 1,800 1,800
10,081 16,307 413,152
5,139 7,074
34,747 24,826278,963 207,253
132,194 71,65371,809 (13,404)
0 0 0 024,913 36,247 149,100 80,280 847,226
566,606 50,976 363,580 171,073 119,340 392,280 210,8400 0 0 0
432,399 70,841 97,116 59,149 40,800 49,800 50,700163,161 240,759 255,669 26,937 29,100 29,100 29,400
7,203 5,700 5,700 5,70018,866 12,558 7,858 6,000 6,000 6,600 7,800
0 0 0 0
0 0 0 0t ,200 1,800 4,800 1,800
1,262 4,930 7,142 0 0 0 00 0 0 00 0 0 0
51,267 64,732 26,629 168,088 204,362 35,880 18,000 18,0000 0 0 0
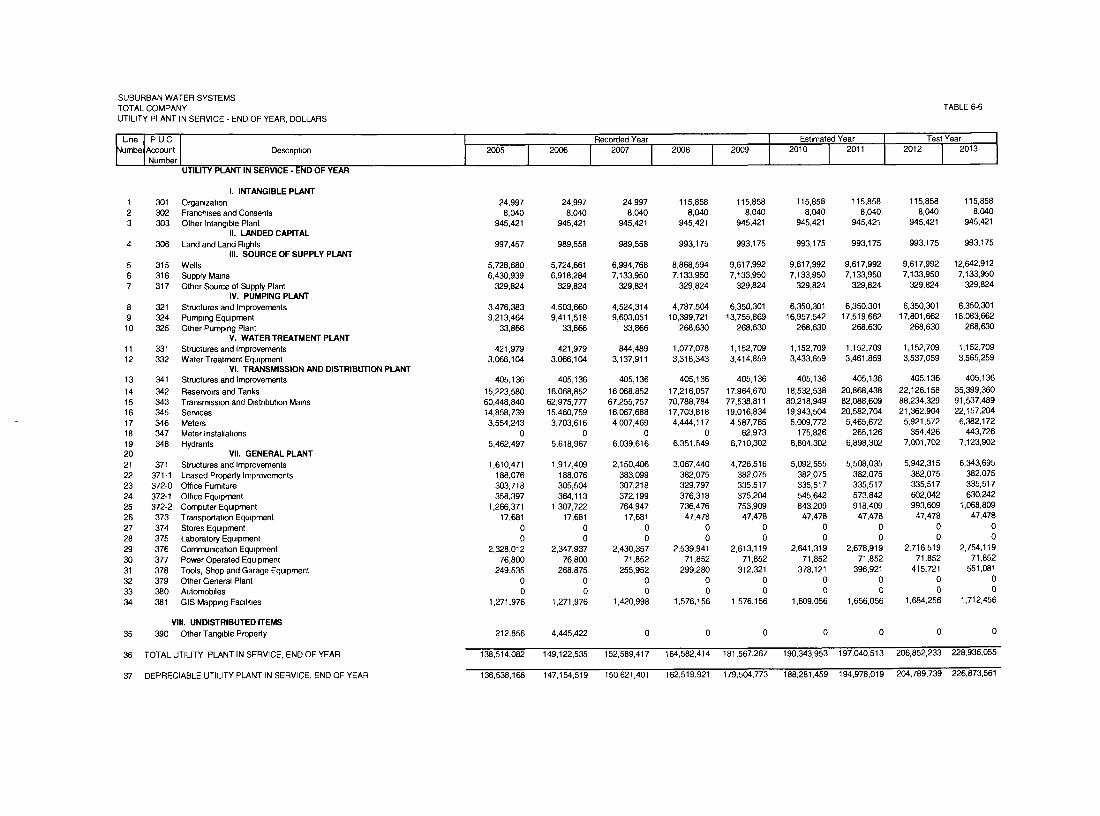
SUBURBAN WATER SYSTEMSTOTALCOMPANYUTILITY PLANTIN SERVICE-END OF YEAR, DOLLARS
~lJne I PUC I
umbe~Acco~ntI Number
Descnptlon
UTILITY PLANT IN SERVICE - END OF YEAR
I. INTANGIBLE PLANT1 301 Organ~zabon2 302 Franchises and Consents3 303 Other Intangible Plant
II. LANDED CAPITAL4 306 Land and Land R=ghts
III. SOURCE OF SUPPLY PLANT5 315 Wells6 316 Supply Mares7 317 Other Source of Supply Plant
IV. PUMPING PLANT8 321 Structures and Improvements9 324 Pumping Equ=pment10 325 Other Pumping Plant
V. WATER TREATMENT PLANT11 331 Structures and Improvements12 332 Water Treatment Equ=pment
Vl. TRANSMISSION AND DISTRIBUTION PLANT13 341 Structures and Improvements14 342 Reservoirs and Tanks15 343 Transm=ss~on and D=stnbut=on Ma=ns16 345 Services17 346 Meters18 347 Meter Installat=ons19 348 Hydrants20 VII. GENERAL PLANT21 371 Structures and Improvements22 371-1 Leased Property Improvements23 372-0 Office Fum=ture24 372-1 Office Equipment25 372-2 Computer Equ=pment26 373 Transportat=on Equipment27 374 Stores Equipment28 375 Laboratory Equipment29 376 Commun~cabon Equipment30 377 Power Operated Equipment31 378 Tools, Shop and Garage Equipment32 379 Other General Plant33 380 Automobiles34 381 GIS Mapping Facd~t~es
39O35
36
37
VIII. UNDISTRIBUTED ITEMSOther Tangible Property
TOTAL UTILITY PLANT IN SERVICE, END OF YEAR
DEPRECIABLE UTILITY PLANT IN SERVICE, END OF YEAR
2005Recorded Year Est=mated Year
TABLE 6-6
Test Year2012 I 2013
24,997 24,997 24,997 115,858 115,858 115,858 115,858 115,858 115,8588,040 8,040 8,040 8,040 8,040 8,040 8,040 8,040 8,040
945,421 945,421 945,421 945,421 945,421 945,421 945,421 945,421 945,421
997,457 989,558 989,558 993,175 993,175 993,175 993,175 993,175 993,175
5,728,680 5,724,661 6,994,768 8,868,594 9,617,992 9,617,992 9,617,992 9,617,992 12,642,9126,430,939 6,918,284 7,133,950 7,133,950 7,133,950 7,133,950 7,133,950 7,133,950 7,133,950
329,824 329,824 329,824 329,824 329,824 329,824 329,824 329,824 329,824
3,476,383 4,503,660 4,524,314 4,787,504 6,350,301 6,350,301 6,350,301 6,350,301 6,350,3019,213,464 9,411,518 9,603,051 10,399,721 13,755,869 16,957,542 17,519,662 17,801,662 18,083,662
33,866 33,866 33,866 268,630 268,630 268,630 268,630 268,630 268,630
421,979 421,979 844,489 1,077,078 1,152,709 1,152,709 1,152,709 1,152,709 1,152,7093,066,104 3,066,104 3,137,911 3,318,343 3,414,859 3,433,659 3,461,859 3,537,059 3,565,259
405,136 405,136 405,136 405,136 405,136 405,136 405,136 405,136 405,13615,223,580 16,068,852 16,068,852 17,216,057 17,964,670 18,532,538 20,868,438 22,126,158 35,399,36060,448,840 62,975,777 67,255,757 70,788,784 77,538,811 80,218,949 82,088,609 88,234,329 91,537,48914,858,739 15,460,759 16,067,688 17,703,818 19,016,834 19,943,504 20,582,704 21,362,904 22,157,2043,554,243 3,703,616 4,007,469 4,444,117 4,587,765 5,009,772 5,465,672 5,921,572 6,382,172
0 0 0 0 62,973 175,826 265,126 354,426 443,7265,462,497 5,618,967 6,039,616 6,351,549 6,710,302 6,804,302 6,898,302 7,001,7(~2 7,123,902
1,610,471 1,917,409 2,150,406 3,067,440 4,726,516 5,092,555 5,508,035 5,942,315 6,343,695188,076 188,076 383,099 382,075 382,075 382,075 382,075 382,075 382,075303,718 305,504 307,218 329,797 335,517 335,517 335,517 335,517 335,517358,397 364,113 372,199 376,318 375,204 545,642 573,842 602,042 630,242
1,266,371 1,307,722 764,947 736,476 753,909 843,209 918,409 993,609 1,068,80917,681 17,681 17,681 47,478 47,478 47,478 47,478 47,478 47,478
0 0 0 0 0 0 0 0 00 0 0 0 0 0 0 0 0
2,328,012 2,347,937 2,430,357 2,539,941 2,613,119 2,641,319 2,678,919 2,716,519 2,754,11976,800 76,800 71,852 71,852 71,852 71,852 71,852 71,852 71,852
249,535 268,875 255,952 299,280 312,321 378,121 396,921 415,721 551,0810 0 0 0 0 0 0 0 00 0 0 0 0 0 0 0 0
1,271,976 1,271,976 1,420,998 1,576,156 1,576,156 1,609,056 1,656,056 1,684,256 1,712,456
212,856 4,445,422 0 0 0 0 0
138,514,082 149,122,535 152,589,417 164,582,414 181,567,267 190,343,953 197,040,513
136,538,168 147,154,519 150,621,401 162,519,921 179,504,773 188,281,459 194,978,019
0 0
206,852,233 228,936,055
204,789,739 226,873,561
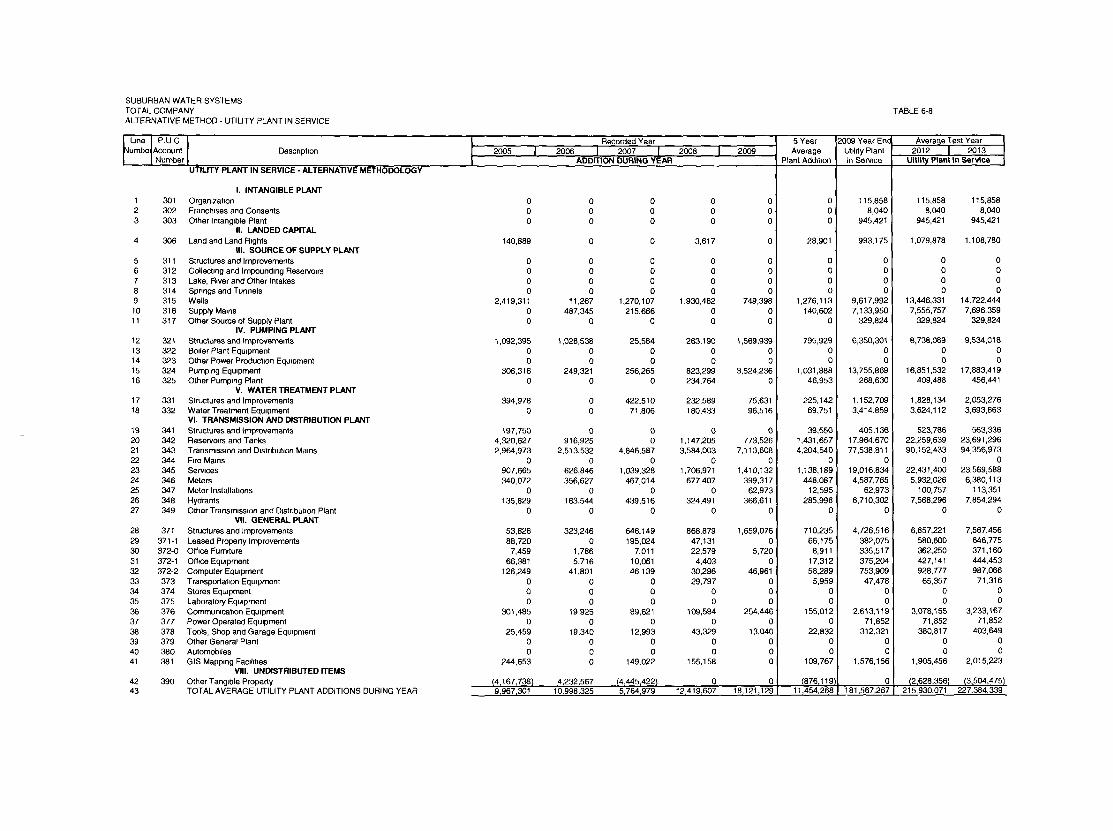
SUBURBAN WATER SYSTEMSTOTAL COMPANYALTERNATIVE METHOD - UTILITY PLANT IN SERVICE
Line ~ P.UClumbe~Account
NumberDescnphon
UTILITY PLANT IN SERVICE - ALTERNATIVE METHODOLOGY
I. INTANGIBLE PLANT1 301 Organ~zahon2 302 Franchises and Consents3 303 Other Intangible Plant
II, LANDED CAPITAL4 306 Land and Land R=ghts
Ill. SOURCE OF SUPPLY PLAN]"5 311 Structures and Improvements6 312 Collecting and Impounding Reservoirs7 313 Lake, R~ver and Other Intakes8 314 Spnngs and Tunnels9 315 Wells10 316 Supply Mares11 317 Other Source of Supply Plant
IV. PUMPING PLANT12 321 Structures and Improvements13 322 Boder Plant Equ=pment14 323 Other Power Producbon Equ=pment15 324 Pumping Equ=pment16 325 Other Pump=ng Plant
V. WATER TREATMENT PLANT17 331 Structures and Improvements18 332 Water Treatment Equ=pment
Vl. TRANSMISSION AND DISTRIBUTION PLANT19 341 Structures and ~mprovements20 342 Reservoirs and Tanks21 343 Transm=ss=on and Dlstnbubon Mains22 344 F~re Mares23 345 Senaces24 346 Meters25 347 Meter Installahons26 348 Hydrants27 349 Other Transm~ss!on and Dlstnbut~on Plant
VII, GENERAL PLANT28 371 Structures and Improvements29 371-1 Leased Property improvements30 372-0 Otfice Fum~ture31 372-1 Office Equipment32 372-2 Computer Equipment33 373 Transportahon Equipment34 374 Stores Equipment35 375 Laboralory Equ~prnent36 376 Commun~cabon Equipment37 377 Power Operated Equ=pment38 378 Tools, Shop and Garage Equipment39 379 Other General Plant40 380 Automobiles41 381 GIS Mapping Faclhbes
VIII. UNDISTRIBUTED ITEMS42 390 Other Tangible Properly43 TOTAL AVERAGE UTILITY PLANT ADDITIONS DURING YEAR
000
2OO5Recorded Year
2006 I 2007 I 2oo8 IADDITION DURING YEAR
0 00 00 0
000
000
2O09
140,889 0 0 3,617 0
0 0 0 0 00 0 0 0 00 0 0 0 00 0 0 0 0
2,419,311 11,267 1,270,107 1,930,482 749,3980 487,345 215,666 0 00 0 0 0 0
1,092,395 1,028,538 25,584 263,190 1,569,9390 0 0 0 00 0 0 0 0
306,316 249,321 256,265 823,299 3,524,2360 0 0 234,764 0
394,978 0 422,510 232,589 75,6310 0 71,806 180,433 96,516
197,750 0 0 0 04,320,627 916,925 0 1,147,205 773,5262,964,973 2,513,532 4,846,587 3,584,003 7,113,608
0 0 0 0 0907,665 626,846 1,039,328 1,706,971 1,410,132340,072 356,627 467,014 677,407 399,317
0 0 0 0 62,973135,829 163,544 439,516 324,491 366,611
0 0 0 0 0
53,826 323,246 646,149 868,879 1,659,07688,720 0 195,024 47,131 07,459 1,786 7,011 22,579 5,720
66,381 5,716 10,061 4,403 0126,249 41,801 46,139 30,296 46,961
0 0 0 29,797 00 0 0 0 00 0 0 0 0
301,485 19,925 89,621 109,584 254,4460 0 0 0 0
25,459 19,340 12,993 43,329 13,0400 0 0 0 00 0 0 0 0
244,653 0 149,022 155,158 0
14,167~738) 4,232,567 /4,445,422) 0 09,967,301 10,998,325 5,764,979 12~419,607 18~121~129
5 YearAverage
Plant Addtbon
000
28,901
0000
1,276,113140,602
0
795,92900
1,031,88846,953
225,14269,751
39,5501,431,6574,204,540
01,138,189
448,08712,595
285,9980
710,23566,1758,911
17,31258,2895,959
00
155,0120
22,83200
109,767
(876~119111~454,268
TABLE 6-8
2009 Year EndUtQty PlantIn Servtce
115,8588,040
945,421
993,175
0000
9,617,9927,133,950
329,824
6,350,30100
13,755,869268,630
1,152,7093,414,859
405,13617,964,67077,538,811
019,016,8344,587,765
62,9736,710,302
0
4,726,516382,075335,517375,204753,90947,478
00
2,613,11971,852
312,32100
1,576,156
0181,567,267
Average Test Year2012 I 2013
Uitllb/PlantlnSer~ce
115,858 115,8588,04O 8,040
945,421 945,421
1,079,878 1,108,780
0 00 00 00 0
13,446,331 14,722,4447,555,757 7,696,359
329,824 329,824
8,738,089 9,534,0180 00 0
16,851,532 17,883,419409,488 456,441
1,828,134 2,053,2763,624,112 3,693,863
523,766 563,33622,259,639 23,691,29690,152,433 94,356,973
0 022,431,400 23,569,588
5,932,026 6,380,113100,757 113,351
7,568,296 7,854,2940 0
6,857,221 7,567,456580,600 646,775362,250 371,160427,141 444,453928,777 987,066
65,357 71,3160 00 0
3,078,155 3,233,16771,852 71,852
380,817 403,6490 00 0
1,905,456 2,015,223
(2~628~356) (3~504~475}215,930,071 227,384,339
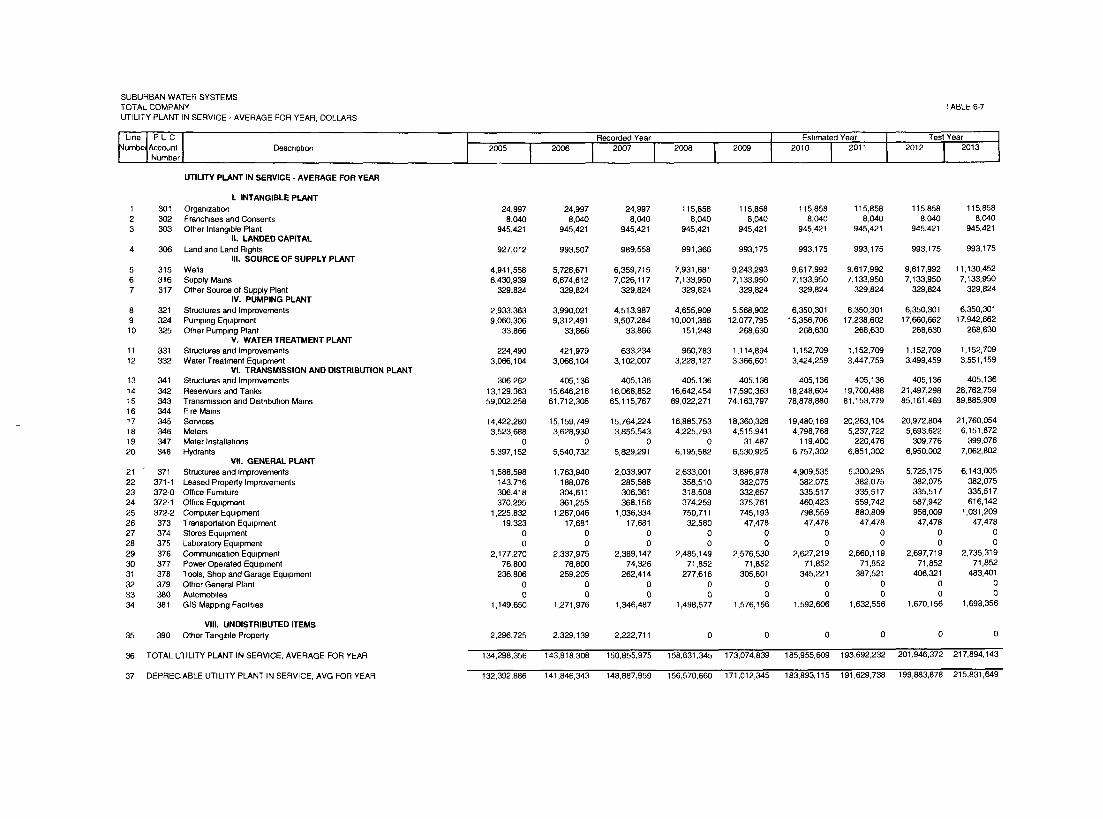
SUBURBAN WATER SYSTEMSTOTALCOMPANYUTILITY PLANTIN SERVICE-AVERAGEFOR YEAR, DOLLARS
~Llne I PUCumbe~Acoount
| NumberDescnptlOn
123
UTILITY PLANT IN SERVICE - AVERAGE FOR YEAR
2005Recorded Year
I Estlmatid Year
TABLE 6-7
Test Year ~2012 I 2013I
I. INTANGIBLE PLANT301 Organization 24,997 24,997 24,997 115,858 115,858 115,858 115,858 115,858 115,858302 Franchises and Consents 8,040 8,040 8,040 8,040 8,040 8,040 8,040 8,040 8,040303 Other Intangible Plant 945,421 945,421 945,421 945,421 945,421 945,421 945,421 945,421 945,421
II. LANDED CAPITAL306 Land and Land R~ghts 927,012 993,507 989,558 991,366 993,175 993,175 993,175 993,175 993,175
III. SOURCE OF SUPPLY PLANT5 315 Wells6 316 Supply Mains7 317 Other Source of Supply Plant
IV. PUMPING PLANT8 321 Structures and Improvements9 324 Pumping Equ~prnent10 325 Other Pumping Plant
V. WATER TREATMENT PLANT11 331 Structures and Improvements12 332 Water Treatment Equipment
4,941,558 5,726.671 6,359,715 7,931,681 9,243,293 9,617,992 9,617,992 9,617,992 11,130,4526,430,939 6,674,612 7,026,t17 7,133,950 7,133,950 7,133,950 7,133,950 7,133,950 7,133,950
329,824 329,824 329,824 329,824 329,824 329,824 329,824 329,824 329,824
2,933,363 3,990,021 4,513,987 4,655,909 5,568,902 6,350,301 6,350,301 6,350,301 6,350,3019,060,306 9,312,491 9,507,284 10,001,386 12,077,795 15,356,706 17,238,602 17,660,662 17,942,662
33,866 33,866 33,866 151,248 268,630 268,630 268,630 268,630 268,630
224,490 421,979 633,234 960,783 1,114,894 1,152,709 1,152,709 1,152,709 1,152,7093,066,104 3,066,104 3,102,007 3,228,127 3,366,601 3,424,259 3,447,759 3,499,459 3,551,159
Vl. TRANSMISSION AND DISTRIBUTION PLANT306,262 405,136 405,136 405,136 405,136 405,136 405,136 405,136 405,136
13,129,363 15,646,216 16,068,852 16,642,454 17,590,363 18,248,604 19,700,488 21,497,298 28,762,75959,002,258 61,712,308 65,115,767 69,022,271 74,163,797 78,878,880 81,153,779 85,161,469 89,885,909
14,422,280 15,159,749 15,764,224 16,885,753 18,360,326 19,480,169 20,263,104 20,972,804 21,760,0543,523,688 3,628,930 3,855,543 4,225,793 4,515,941 4,798,768 5,237,722 5,693,622 6,151,872
0 0 0 0 31,487 119,400 220,476 309,776 399,0765,397,t52 5,540,732 5,829,291 6,195,582 6,530,925 6,757,302 6,851,302 6,950,002 7,062,602
1,588,598 1,763,940 2,033,907 2,633,001 3,896,978 4,909,535 5,300,295 5,725,175 6,143,005143,716 188,076 285,588 358,510 382,075 382,075 382,075 382,075 382,075306,418 304,611 306,361 318,508 332,657 335,517 335,517 335,517 335,517370,295 361,255 368,156 374,259 375,761 460,423 559,742 587,942 616,142
1,225,832 1,287,046 1,036,334 750,711 745,193 798,559 880,809 956,009 1,031,20919,323 17,681 17,681 32,580 47,478 47,478 47,478 47,478 47,478
0 0 0 0 0 0 0 0 00 0 0 0 0 0 0 0 0
2,177,270 2,337,975 2,389,147 2,485,149 2,576,530 2,627,219 2,660,119 2,697,719 2,735,31976,800 76,800 74,326 71,852 71,852 71,852 71,852 71,852 71,852
236,806 259,205 262,414 277,616 305,801 345,221 387,521 406,321 483,4010 0 0 0 0 0 0 0 00 0 0 0 0 0 0 0 0
1,149,650 1,271,976 1,346,487 1,498,577 1,576,156 1,592,606 1,632,556 1,670,156 1,698,356
13 341 Structures and Improvements14 342 Reservoirs and Tanks15 343 Transmission and Dlstnbut~on Mains16 344 F~re Mains17 345 Senaces18 346 Meters19 347 Meter Installations20 348 Hydrants
VII. GENERAL PLANT21 371 Structures and Improvements22 371-1 Leased Property Improvements23 372-0 Office Fumdure24 372-1 Office Equipment25 372-2 Computer Equipment26 373 Transportation Equipment27 374 Stores Equipment28 375 Laboratory Equipment29 376 Communication Equtpment30 377 Power Operated Equipment31 378 Tools, Shop and Garage Equipment32 379 Other General Plant33 380 Automobiles34 381 GIS Mapping Facdlt~es
VIII. UNDISTRIBUTED ITEMSOther Tang=ble Property 2,296,725 2,329,139 2,222,711 0 0 0 0
134,298,356 143,818.308 150,855,975 158,631,345 173,074,839 185,955,609 193,692,232
132,392,886 141,846,343 148,887,959 156,570,660 171,012,345 183,893,115 191,629,738
35 390
36 TOTAL UTILITY PLANT IN SERVICE, AVERAGE FOR YEAR
37 DEPRECIABLE UTILITY PLANT IN SERVICE, AVG FOR YEAR
0 0
201,946,372 217,894,143
199,883,878 215,831,649
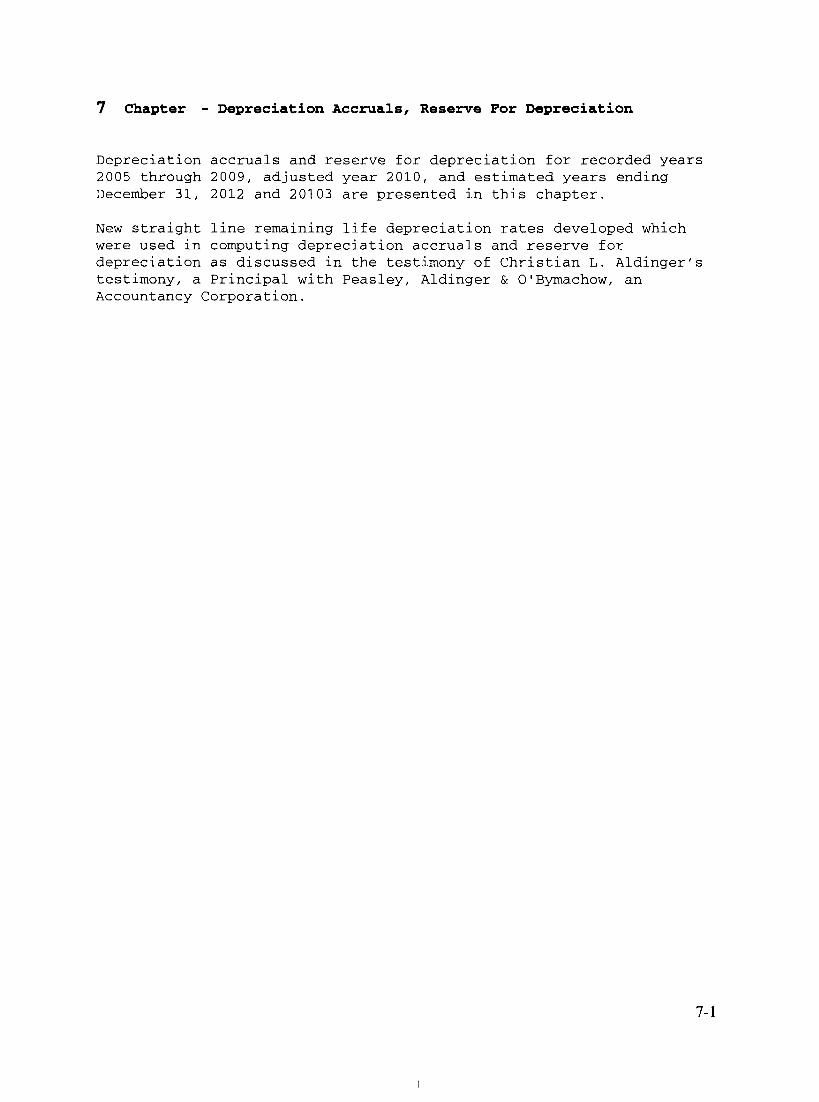
7 Chapter - Depreciation Accruals, Reserve For Depreciation
Depreciation accruals and reserve for depreciation for recorded years2005 through 2009, adjusted year 2010, and estimated years endingDecember 31, 2012 and 20103 are presented in this chapter.
New straight line remaining life depreciation rates developed whichwere used in computing depreciation accruals and reserve fordepreciation as discussed in the testimony of Christian L. Aldinger’stestimony, a Principal with Peasley, Aldinger & O’Bymachow, anAccountancy Corporation.
7-!
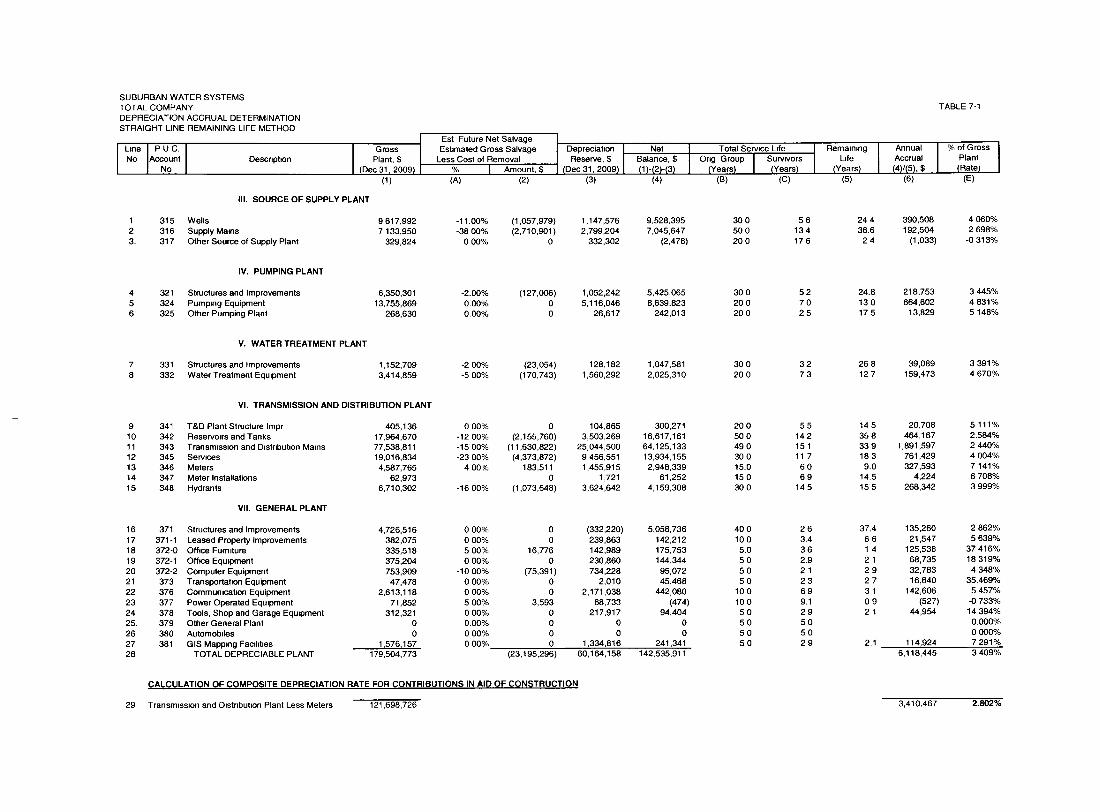
SUBURBAN WATER SYSTEMSTOTAL COMPANYDEPRECIATION ACCRUAL DETERMINATIONSTRAIGHT LINE REMAINING LIFE METHOD
IL=ne P U C.No Account
NoDescription
GrossPlant, $
IDec 31,2009)(1)
II1. SOURCE OF SUPPLY PLANT
Est Future Net Salvage IEshmated Gross Salvage
J Depreciabon I
NetLess Cost of Removal Reserve, $ Balance, $
% I Amount, $ {Dec 31,2009) (1(A) (2) (3) (4)
1 315 Wells 9,617,992 -11.00% (1,057,979) 1,147,576 9,528,3952 316 Supply Mains 7,133,950 -3800% (2,710,901) 2,799,204 7,045,6473. 317 Other Source of Supply Plant 329,824 0 00% 0 332,302 (2,478)
TABLE 7-1
Orig Group Survivors L=fe Accrual Plant(Years) {Years) (Years) {4)/15), $ {Rate)
(B) (C) (5) (6) (E)
30 0 5 6 24 4 390,508 4 060%50 0 13 4 36.6 192,504 2 698%20 0 17 6 2 4 (1,033) -0 313%
456
IV. PUMPING PLANT
321 Structures and Improvements 6,350,301 -2.00% (127,006) 1,052,242 5,425,065324 Pumping Equipment 13,755,869 0.00% 0 5,116,046 8,639,823325 Other Pumping Plant 268,630 0.00% 0 26,617 242,013
30 0 5 2 24.8 218,753 3 445%20 0 7 0 130 664,602 4 831%20 0 2 5 17 5 13,829 5 148%
V. WATER TREATMENT PLANT
331 Structures and Improvements 1,152,709 -2 00% (23,054) 128,182 1,047,581332 Water Treatment Equipment 3,414,859 -500% (170,743) 1,560,292 2,025,310
30 0 3 2 268 39,089 3 391%20 0 7 3 12 7 159,473 4 670%
VIo TRANSMISSION AND DISTRIBUTION PLANT
9 341 T&D Plant Structure Impr 405,136 0 00% 0 104,865 300,27110 342 Reservoirs and Tanks 17,964,670 -12 00% (2,155,760) 3,503,269 16,617,16111 343 Transmission and D~str=but=on Ma=ns 77,538,811 -15 00% (11,630,822) 25,044,500 64.125,13312 345 Serwces 19,016,834 -23 00% (4,373,872) 9,456,551 13,934,15513 346 Meters 4,587,765 4 00% 183,511 1,455,915 2,948,33914 347 Meter Installations 62,973 0 1,721 61,25215 348 Hydrants 6,710,302 -16 00% (1,073,648) 3,624,642 4,159,308
VII. GENERAL PLANT
16 371 Structures and Improvements 4,726,516 0 00% 0 (332,220) 5,058,73617 371-1 Leased Properly Improvements 382,075 0 00% 0 239,863 142,21218 372-0 Office Fum=ture 335,518 5 00% 16,776 142,989 175,75319 372-1 Office Equipment 375,204 0 00% 0 230,860 144,34420 372-2 Computer Equipment 753,909 -10 00% (75,391) 734,228 95,07221 373 Transportation Equipment 47,478 0 00% 0 2,010 45,46822 376 Commumcat=on Equipment 2,613,118 0 00% 0 2,171,038 442,08023 377 Power Operated Equipment 71,852 5 00% 3,593 68,733 (474)24 378 Tools, Shop and Garage Equipment 312,321 0 00% 0 217,917 94,40425. 379 Other General Plant 0 0.00% 0 0 026 380 Automobdes 0 0 00% 0 0 027 381 GIS Mapping Facd~t~es 1,576,157 0 00% 0 1 ~334,816 241,34128 TOTAL DEPREClABLE PLANT 179,504,773 (23,195,296) 60,164,158 142,535,911
20 0 5 5 14 5 20,708 5 111%50 0 14 2 35 8 464,167 2.584%49 0 15 1 33 9 1,891,597 2 440%30 0 11 7 18 3 761,429 4 004%15.0 6 0 9.0 327,593 7 141%15 0 6 9 14.5 4,224 6 708%30 0 14 5 15 5 268,342 3 999%
40 0 2 6 37.4 135,260 2 862%10 0 3.4 6 6 21,547 5 639%5.0 3 6 1 4 125,538 37 416%5 0 2.9 2 1 68,735 18 319%5 0 2 1 2 9 32,783 4 348%5 0 2 3 2 7 16,840 35.469%
10 0 6 9 3 1 142,606 5 457%10 0 9.1 0 9 (527) -0 733%5 0 2 9 2 1 44,954 14 394%5 0 5 0 0.000%50 50 0000%5 0 2 9 2.1 114,924 7 291%
6,118,445 3 409%
CALCULATION OF COMPOSITE DEPRECIATION RATE FOR CONTRIBUTIONS IN AID OF CONSTRUCTION
29 Transm=ss~on and D~stnbut=on Plant Less Meters 121,698.726 3,410,467 2.802%
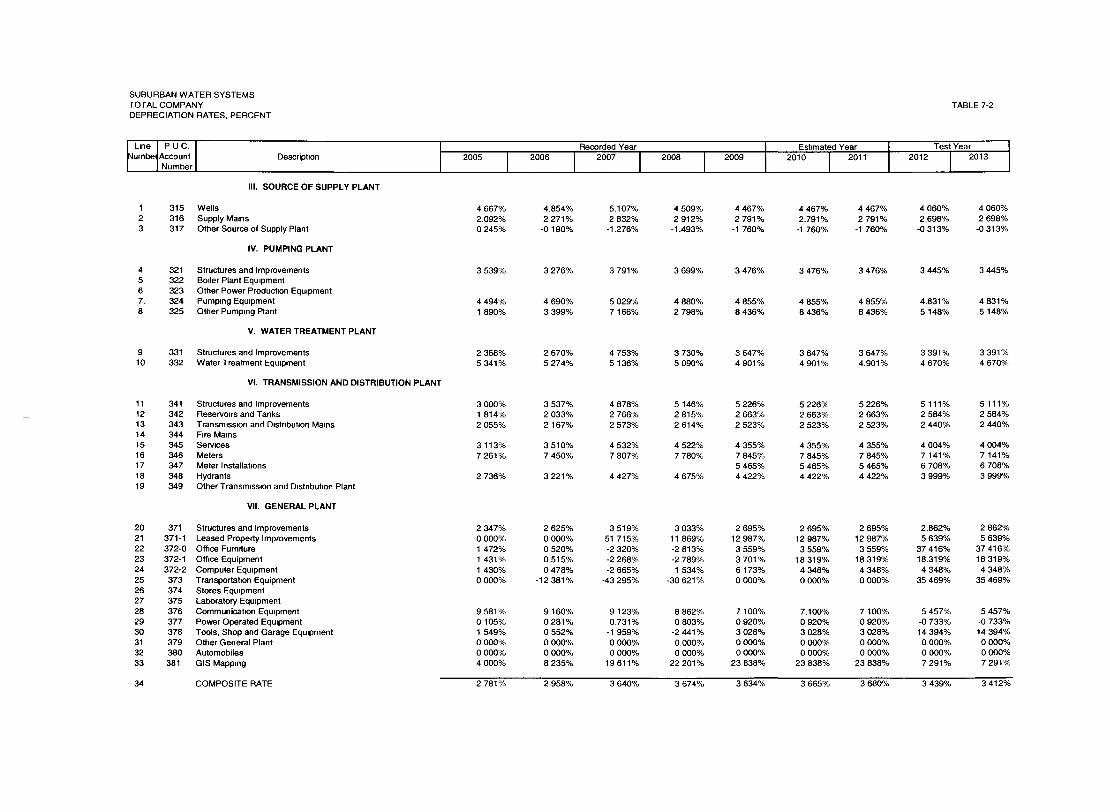
SUBURBAN WATER SYSTEMSTOTAL COMPANYDEPRECIATION RATES, PERCENT
TABLE 7-2
~Llne / PUC. Iumbe~Account
| NumberDescriphon
IlL SOURCE OF SUPPLY PLANT
123
315 Wells 4 667% 4.854% 5.107% 4.509% 4 467% 4 467% 4 467% 4 060% 4 060%316 Supply Mains 2.092% 2 271% 2 832% 2 912% 2 791% 2.791% 2 791% 2.698% 2 698%317 Other Source of Supply Plant 0 245% -0 190% -1.276% -1.493% -1 760% -1.760% -1 760% -0 313% -0 313%
IV. PUMPING PLANT
4567.8
910
321 Structures and Improvements 3 539% 3 276% 3 791% 3 699% 3 476% 3 476% 3 476% 3 445% 3 445%322 Bo~ler Plant Equipment323 Other Power Production Equ=pment324 Pumping Equipment 4 494% 4 690% 5 029% 4 880% 4 855% 4 855% 4 855% 4.831% 4 831%325 Other Pump=ng Plant 1 890% 3 399% 7 166% 2 798% 8 436% 8 436% 8 436% 5 148% 5 148%
V. WATER TREATMENT PLANT
331 Structures and Improvements 2 368% 2 670% 4 753% 3 730% 3 647% 3 647% 3 647% 3 391% 3 391%332 Water Treatment Equipment 5 34!% 5 274% 5 136% 5 090% 4 901% 4 901% 4.901% 4 670% 4 670%
VI. TRANSMISSION AND DISTRIBUTION PLANT
11 341 Structures and Improvements12 342 Reservoirs and Tanks13 343 Transmission and Dlstrlbuhon Mains14 344 F~re Mains15 345 Services16 346 Meters17 347 Meter Installations18 348 Hydrants19 349 Other Transmission and D~stnbut~on Plant
VII. GENERAL PLANT
20 371 Structures and Improvements21 371-1 Leased Property Improvements22 372-0 Off=ce Fumrture23 372-1 Office Equipment24 372°2 Computer Equipment25 373 Transportahon Equipment26 374 Stores Equ=pment27 375 Laboratory Equ=pment28 376 Communication Equ=pment29 377 Power Operated Equ=pment30 378 Tools, Shop and Garage Equ=pment31 379 Other General Plant32 380 Automobiles33 381 GIS Mapping
3 000% 3 537% 4 878% 5 146% 5 226% 5 226% 5 226% 5 111% 5 111%1 814% 2 033% 2 766% 2 815% 2 663% 2 663% 2 663% 2 584% 2 584%2 055% 2 167% 2 573% 2 614% 2 523% 2 523% 2 523% 2 440% 2 440%
3 113% 3 510% 4 532% 4 522% 4 355% 4 355% 4 355% 4 004% 4 004%7 261% 7 450% 7 807% 7 780% 7 845% 7 845% 7 845% 7 141% 7 141%
5 465% 5 465% 5 465% 6 708% 6 708%2 736% 3 221% 4 427% 4 675% 4 422% 4 422% 4 422% 3 999% 3 999%
2 347% 2 625% 3 519% 3 033% 2 695% 2 695% 2 695% 2.862% 2 862%0 000% 0 000% 51 715% 11 869% 12 987% 12 987% 12 987% 5 639% 5 639%1 472% 0 520% -2 320% -2 813% 3 559% 3 559% 3 559% 37 416% 37 416%1 431% 0 515% -2 268% -2789% 3 701% 18 319% 18 319% 18.319% 18 319%1 430% 0 478% -2 665% 1 534% 6 173% 4 348% 4 348% 4 348% 4 348%0 000% -12 381% -43 295% -30 621% 0 000% 0 000% 0 000% 35 469% 35 469%
9 581% 9 160% 9 123% 8 862% 7 100% 7.100% 7 100% 5 457% 5 457%0 105% 0 281% 0.731% 0 803% 0 920% 0 920% 0 920% -0 733% -0733%1 549% 0 552% -1 959% -2 441% 3 028% 3 028% 3 028% 14 394% 14 394%0 000% 0 000% 0 000% 0.000% 0 000% 0 000% 0.000% 0.000% 0 000%0 000% 0 000% 0 000% 0 000% 0 000% 0 000% 0 000% 0 000% 0 000%4 000% 8 235% 19 611% 22 201% 23 838% 23 838% 23 838% 7 291% 7 291%
34 COMPOSITE RATE 2 781% 2 958% 3 640% 3 674% 3 634% 3 665% 3 680% 3 439% 3 412%
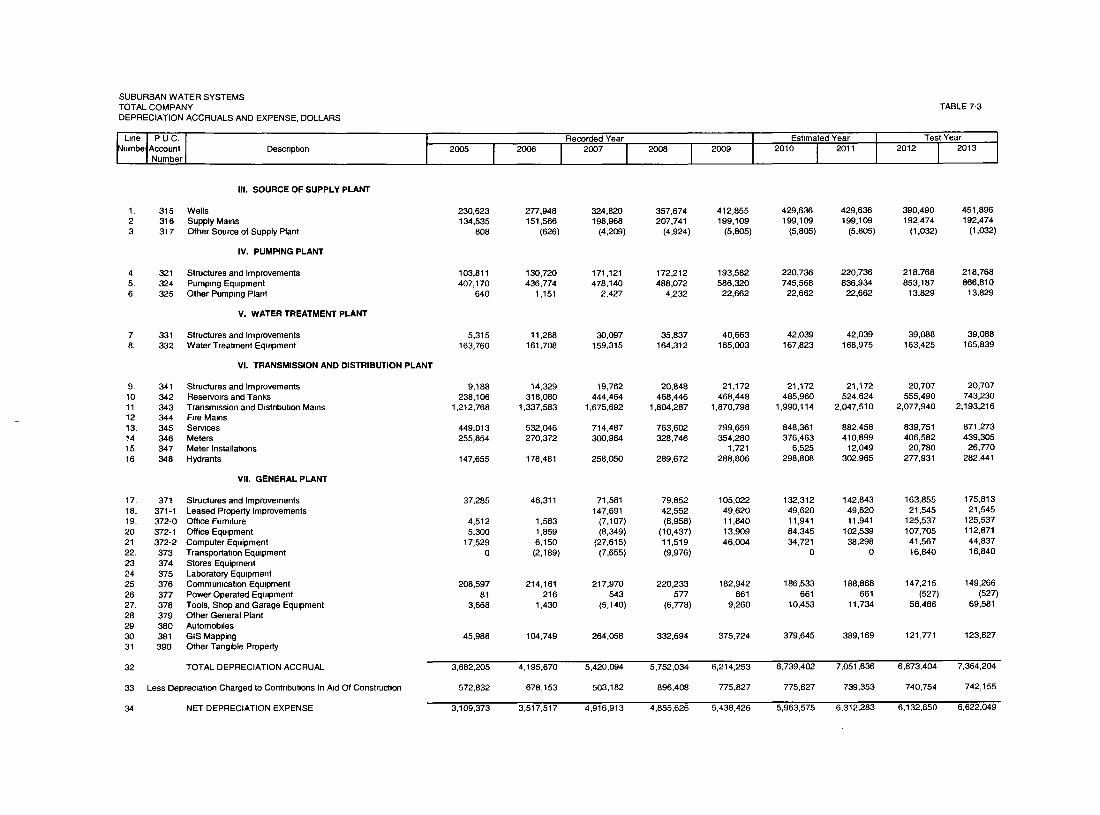
SUBURBAN WATER SYSTEMSTOTALCOMPANYDEPRECIATION ACCRUALS AND EXPENSE, DOLLARS
~L,ne I PUC. Iumbe~Account
| NumberDescnptton 20O5
TABLE 7-3
Recorded Year I Estimated Year Test Year
IlL SOURCE OF SUPPLY PLANT
315 Wells 230,623 277,948 324,820 357,674 412,855 429,636 429,636 390,490 451,896316 Supply Mmns 134,535 151,566 196,968 207,741 199,109 199,109 199,109 192,474 192,474317 Other Source of Supply Plant 808 (626) (4,209) (4,924) (5,805) (5,805) (5,805) (1,032) (1,032)
IV. PUMPING PLANT
321 Structures and Improvements 103,811 130,720 171,121 172,212 193,582 220,736 220,736 218,768 218,768324 Pumping Equipment 407,170 436,774 478,140 488,072 586,320 745,568 836,934 853,187 866,810325 Other Pumping Plant 640 1,151 2,427 4,232 22,662 22,662 22,662 13,829 13,829
V. WATER TREATMENT PLANT
331 Structures and Improvements 5,315 11,268 30,097 35,837 40,663 42,039 42,039 39,088 39,088332 Water Treatment Equipment 163,760 161,708 159,315 164,312 165,003 167,823 168,975 163,425 165,839
Vl. TRANSMISSION AND DISTRIBUTION PLANT
9. 341 Structures and Improvements10 342 Reservoirs and Tanks11 343 Transrn~ssion and D~stnbut~on Ma=ns12 344 F=re Mares13. 345 Services14 346 Meters15 347 Meter Installahons16 348 Hydrants
VII. GENERAL PLANT
17. 371 Structures and Improvements18. 371-1 Leased Property Improvements19. 372-0 Office Fum~ure20 372-1 Office Equipment21 372-2 Computer Equipment22. 373 Transportat=on Eqmpment23 374 Stores Equipment24 375 Laboratory Equ=pment25 376 Comm umcabon Equipment26 377 Power Operated Equ=pment27. 378 Tools, Shop and Garage Equipment28 379 Other General Plant29 380 Automobdes30 381 GIS Mapping31 390 Other Tangible Property
32 TOTAL DEPRECIATION ACCRUAL
33 Less Depreciation Charged to Contnbuhons In A=d Of Construchon
NET DEPRECIATION EXPENSE
9,188 14,329 19,762 20,848 21,172 21,172 21,172 20,707 20,707238,106 318,080 444,464 468,446 468,448 485,960 524,624 555,490 743,230
1,212,768 1,337,583 1,675,692 1,804,287 1,870,798 1,990,114 2,047,510 2,077,940 2,193,216
449,013 532,046 714,487 763,602 799,659 848,361 882,458 839,751 871,273255,854 270,372 300,984 328,746 354,280 376,463 410,899 406,582 439,305
1,721 6,525 12,049 20,780 26,770147,655 178,481 258,050 289,672 288,806 298,808 302,965 277,931 282,441
37,285 46,311 71,581 79,852 105,022 132,312 142,843 163,855 175,813147,691 42,552 49,620 49,620 49,620 21,545 21,545
4,512 1,583 (7,107) (8,958) 11,840 11,941 11,941 125,537 125,5375,300 1,859 (8,349) (10,437) 13,909 84,345 102,539 107,705 112,871
17,529 6,150 (27,615) 11,519 46,004 34,721 38,298 41,567 44,8370 ~,189) (7,655) ~,976) 0 0 16,840 16,840
208,597 214,161 217,970 220,233 182,942 186,533 188,868 147,215 149,26681 216 543 577 661 661 661 (527) (527)
3,668 1,430 (5,140) (6,778) 9,260 10,453 11,734 58,486 69,581
45,988 104,749 264,058 332,694 375,724 379,645 389,169 121,771 123,827
3,682,205 4,195,670 5,420,094 5,752,034 6,214,253 6,739,402 7,051,636 6,873,404 7,364,204
572,832 678,153 503,182 896,408 775,827 775,827 739,353 740,754 742,155
3,109,373 3,517,517 4,916,913 4,855,626 5,438,426 5,963,575 6,312,283 6,132,650 6,622,049
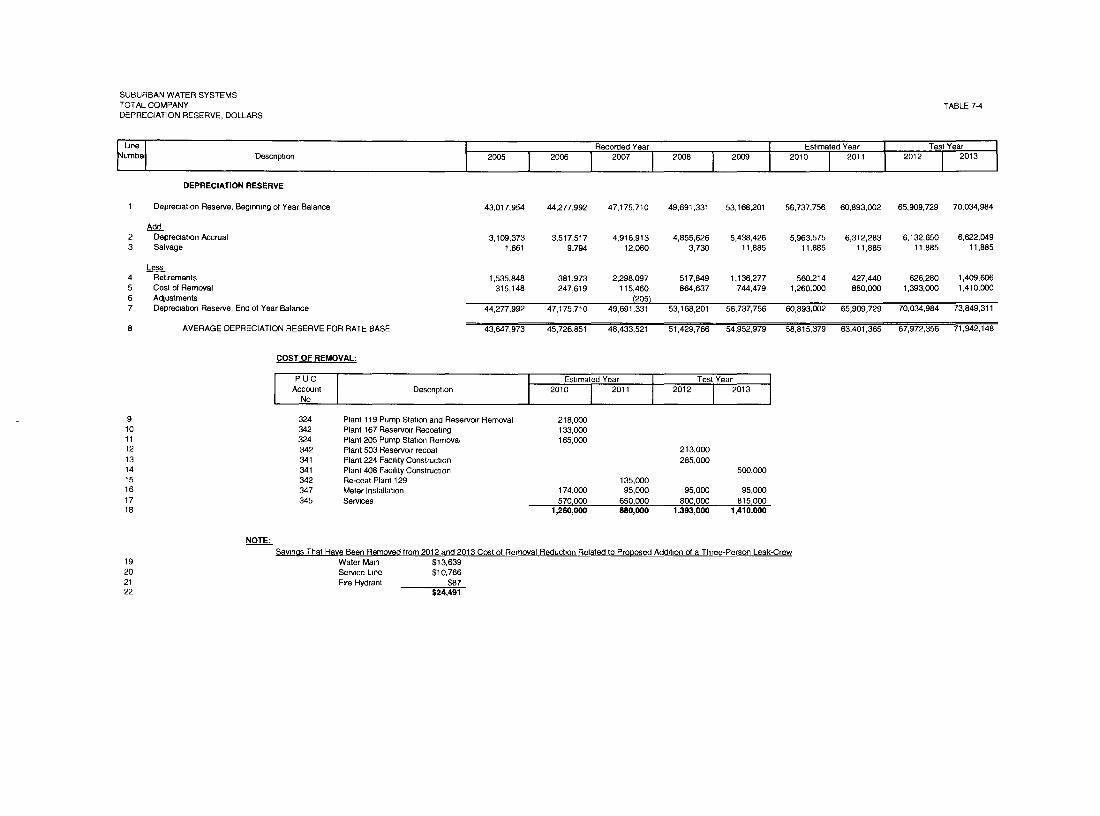
SUBURBAN WATER SYSTEMSTOTAL COMPANYDEPRECIATION RESERVE, DOLLARS
~bne I
umba1 Descnpt~on
DEPRECIATION RESERVE
Depreciation Reserve, Beginning of Year Balance
2005Recorded Year Estimated Year
Add2 Depreclabon Accrual3 Salvage
Less4 Retirements5 Cost of Removal6 Adlustments7 Depreciation Reserve, End of Year Balance
TABLE 7-4
AVERAGE DEPRECIATION RESERVE FOR RATE BASE
COST OF REMOVAL:
PUCAccount
No
9 32410 34211 32412 34213 34114 34115 34216 34717 34518
Descrlpt}on
Test Year2012 I 2013
Plant 119 Pump Station and Reservoir RemovalPlant 167 Reservoir RecoatmgPlant 205 Pump Station RemovalPlant 503 Reservoir recoatPlant 224 Facility ConstructionPlant 408 Facility ConstructionRe-coat Plant 129Meter InstallationServices
43,017,954 44,277,992 47,175,710 49,691,331 53,168,201 56,737,756 60,893,002 65,909,729 70,034,984
3,109,373 3,517,517 4,916,913 4,855,626 5,438,426 5,963,575 6,312,283 6,132,650 6,622,0491,661 9,794 12,060 3,730 11,885 11,885 11,885 11,885 11,885
1,535,848 381,973 2,298,097 517,849 1,136,277 560,214 427,440 626,280 1,409,606315,148 247,619 115,460 864,637 744,479 1,260,000 880,000 1,393,000 1,410,000
/205)44,277,992 47,175,710 49,691,331 53,168,201 56,737,756 60,893,002 65,909,729 70,034,984 73,849,311
43,647,973 45,726,851 48,433,521 51,429,766 54,952,979 58,815,379 63,401,365 67,972,356 71,942,148
Estlmatid Year TestI Year2010 2011 2012 2013
500,000
218,000133,000165,000
213,000285,000
135,000174,000 95,000 95,000 95,000570,000 650~000 800,000 815,000
1,260,000 880,000 1,393,000 1,410,000
19202122
NOTE:Savmds That Have Been Removed from 2012 and 2013 Cost of Removal Reduction Related to Proposed Addition of a Three-Person Leak-Crew
Water Main $13,639Service Line $10,766Fire Hydrant $87
$24,491
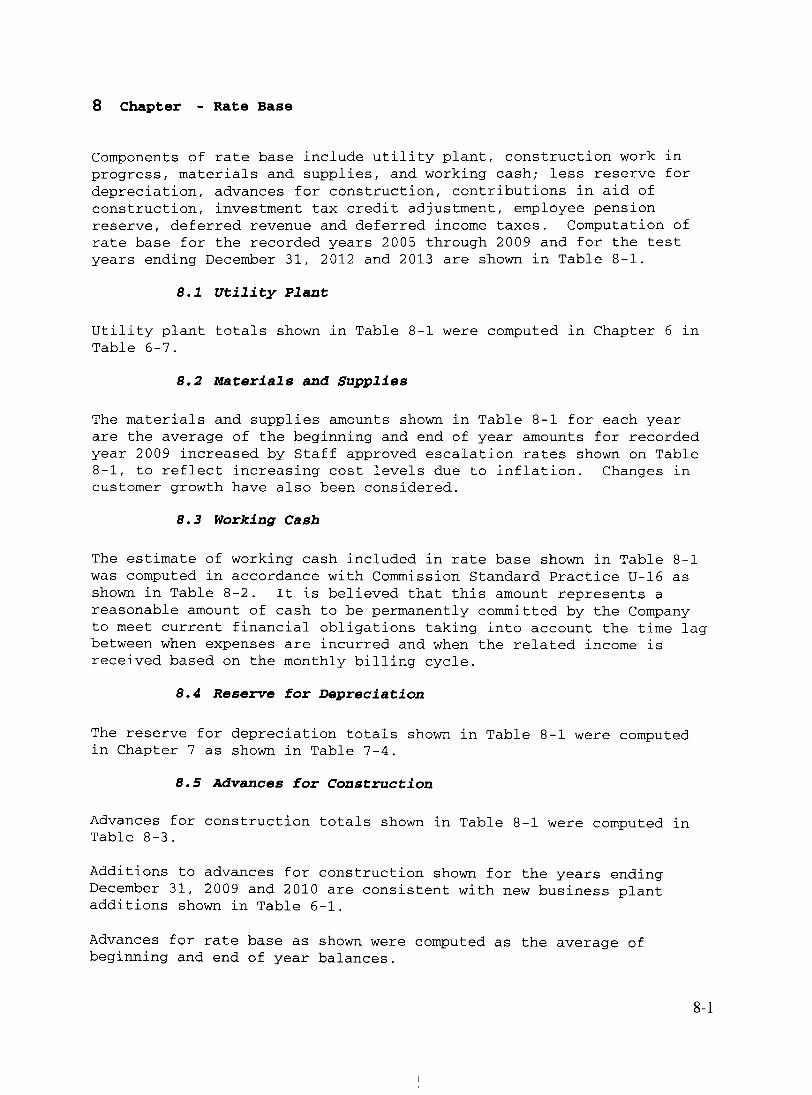
8 Chapter - Rate Base
Components of rate base include utility plant, construction work inprogress, materials and supplies, and working cash; less reserve fordepreciation, advances for construction, contributions in aid ofconstruction, investment tax credit adjustment, employee pensionreserve, deferred revenue and deferred income taxes. Computation ofrate base for the recorded years 2005 through 2009 and for the testyears ending December 31, 2012 and 2013 are shown in Table 8-1.
8.1 Utility Plant
Utility plant totals shown in Table 8-1 were computed in Chapter 6 inTable 6-7.
8.2 Materials and Supplies
The materials and supplies amounts shown in Table 8-1 for each yearare the average of the beginning and end of year amounts for recordedyear 2009 increased by Staff approved escalation rates shown on Table8-1, to reflect increasing cost levels due to inflation. Changes incustomer growth have also been considered.
8.3 Working Cash
The estimate of working cash included in rate base shown in Table 8-1was computed in accordance with Commission Standard Practice U-16 asshown in Table 8-2. It is believed that this amount represents areasonable amount of cash to be permanently committed by the Companyto meet current financial obligations taking into account the time lagbetween when expenses are incurred and when the related income isreceived based on the monthly billing cycle.
8.4 Reserve for Depreciation
The reserve for depreciation totals shown in Table 8-1 were computedin Chapter 7 as shown in Table 7-4.
8.5 Advances for Construction
Advances for construction totals shown in Table 8-1 were computed inTable 8-3.
Additions to advances for construction shown for the years endingDecember 31, 2009 and 2010 are consistent with new business plantadditions shown in Table 6-1.
Advances for rate base as shown were computed as the average ofbeginning and end of year balances.
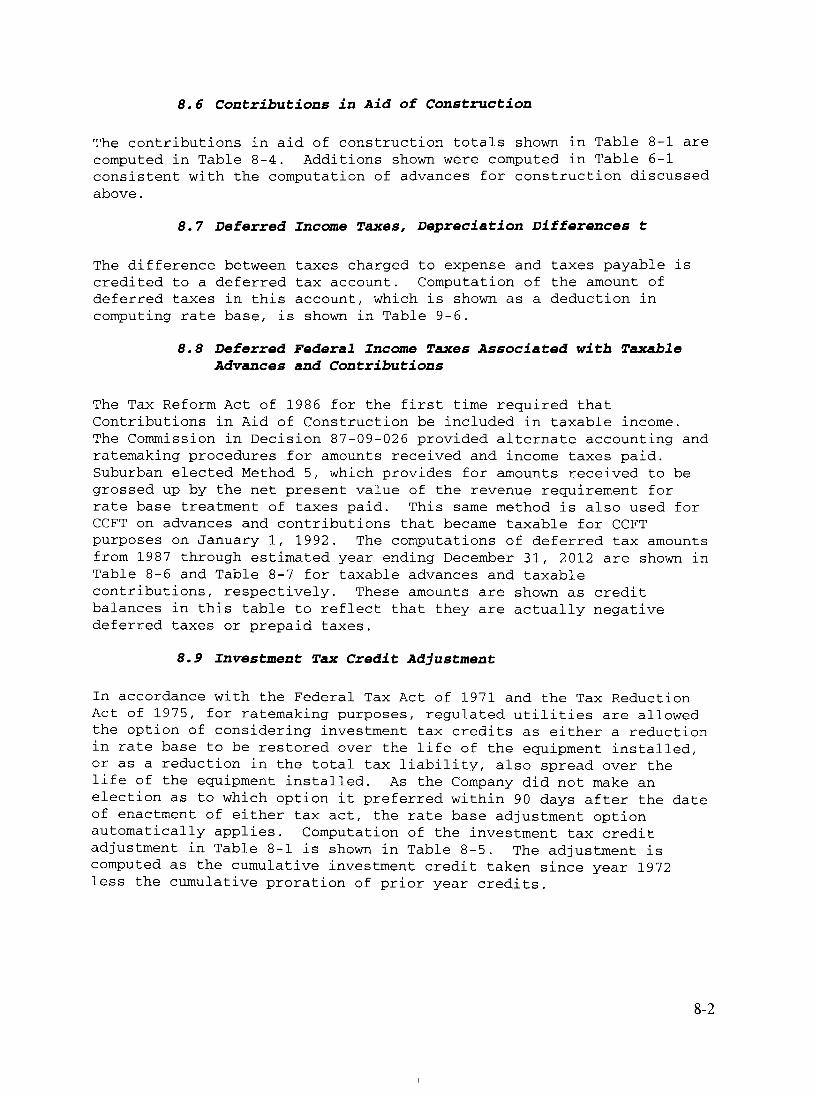
8.6 Contributions in Aid of Construction
The contributions in aid of construction totals shown in Table 8-1 arecomputed in Table 8-4. Additions shown were computed in Table 6-1consistent with the computation of advances for construction discussedabove.
8.7 Deferred Income Taxes, Depreciation Differences t
The difference between taxes charged to expense and taxes payable iscredited to a deferred tax account. Computation of the amount ofdeferred taxes in this account, which is shown as a deduction incomputing rate base, is shown in Table 9-6.
8.8 Deferred Federal Income Taxes Associated with TaxableAdvances and Contributions
The Tax Reform Act of 1986 for the first time required thatContributions in Aid of Construction be included in taxable income.The Commission in Decision 87-09-026 provided alternate accounting andratemaking procedures for amounts received and income taxes paid.Suburban elected Method 5, which provides for amounts received to begrossed up by the net present value of the revenue requirement forrate base treatment of taxes paid. This same method is also used forCCFT on advances and contributions that became taxable for CCFTpurposes on January i, 1992. The computations of deferred tax amountsfrom 1987 through estimated year ending December 31, 2012 are shown inTable 8-6 and Table 8-7 for taxable advances and taxablecontributions, respectively. These amounts are shown as creditbalances in this table to reflect that they are actually negativedeferred taxes or prepaid taxes.
8.9 Investment Tax Credit Adjustment
In accordance with the Federal Tax Act of 1971 and the Tax ReductionAct of 1975, for ratemaking purposes, regulated utilities are allowedthe option of considering investment tax credits as either a reductionin rate base to be restored over the life of the equipment installed,or as a reduction in the total tax liability, also spread over thelife of the equipment installed. As the Company did not make anelection as to which option it preferred within 90 days after the dateof enactment of either tax act, the rate base adjustment optionautomatically applies. Computation of the investment tax creditadjustment in Table 8-1 is shown in Table 8-5. The adjustment iscomputed as the cumulative investment credit taken since year 1972less the cumulative proration of prior year credits.
8.10 Deferred Revenues Associated with TaxableContributions in Aid of Construction
Method 5 of the Commission procedures for accounting and ratemakingfor taxable contribution also provided for a deferred revenuecomponent associated with the gross up on amounts received. Thecomputation of resulting deferred revenues generated and theamortization of deferred revenues for year 1987 through estimated year2010 is shown in Table 8-8.
8.11 Pension Reserve
Effective December 30, 1999 Suburban terminated its pension plan.Final settlement of the plan was made in February 2002 when the planassets were distributed to the participants. Surplus assets weretransferred to the Company’s 401(k) Plan concurrently with thedistribution to participants in February 2002. As a result, Suburbanno longer had a pension reserve.
8-3
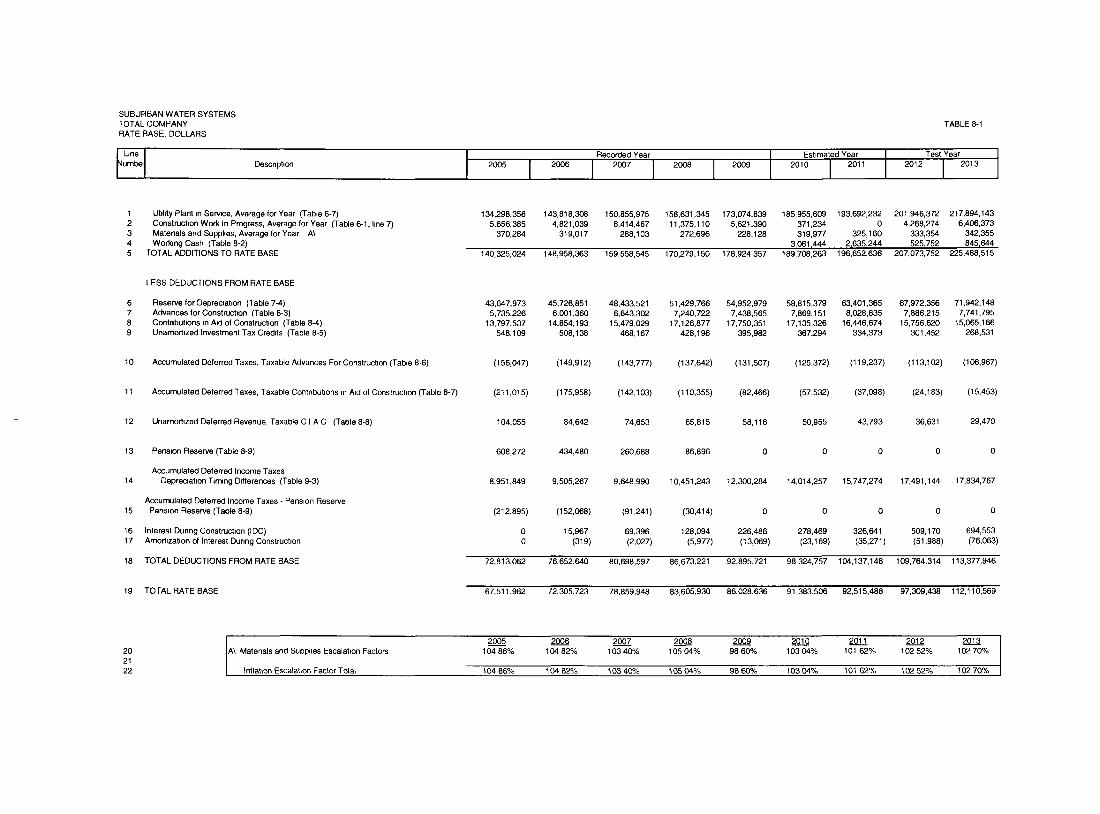
SUBURBAN WATER SYSTEMSTOTAL COMPANYRATE BASE, DOLLARS
~[Jne ~umbe1
DescrlptlOrl
TABLE 8-1
Estimated Year Test Year2013Recorded Year 2010 2011 2012
1 Ut=llty Plant =n Serv=ce, Average for Year (Table 6-7)2 Construction Work in Progress, Average for Year (Table 6-1, I=ne 7)3 Materials and Supplies, Average for Year A\4 Working Cash (Table 8-2)5 TOTAL ADDITIONS TO RATE BASE
LESS DEDUCTIONS FROM RATE BASE
6 Reserve for Deprec~at=on (Table 7-4)7 Advances for Construct=on (Table 8-3)8 Contnbutions in A=d of Construct=on (Table 8-4)9 Unamort~zed Investment Tax Credits (Table 8-5)
10 Accumulated Deferred Taxes, Taxable Advances For Construct=on (Table 8-6)
11 Accumulated Deferred Taxes, Taxable Contnbut=ons in Aid of Construct=on (Table 8-7)
12 Unamort~zed Deferred Revenue, Taxable C I A C (Table 8-8)
13 Pens=on Reserve (Table 8-9)
Accumulated Deferred Income Taxes14 Deprec~aben Timing D~fferences (Table 9-3)
Accumulated Deferred Income Taxes - Pension Reserve15 Pens=on Reserve (Table 8-9)
16 Interest Dunng Construct=on (IDC)17 Amortization of interest Dunng Construction
18 TOTAL DEDUCTIONS FROM RATE BASE
19 TOTAL RATE BASE
134,298,356 143,818,308 150,855,975 t58,631,345 173,074,839 185,955,609 193,692,232 201,946,372 217,894,1435,656,385 4,821,039 8,414,467 11,375,110 5,62t,390 371,234 0 4,268,274 6,406,373
370,284 319,017 288,103 272,696 228,128 319,977 325,160 333,354 342,3553~061 ~444 2~635~244 525~752 845~644
140,325,024 148,958,363 159,558,545 170,279,150 178,924,357 189,708,263 196,652,636 207,073,752 225,488,515
43,647,9735,735,226
13,797,537548,109
(156,047)
(211,015)
104,055
608,272
8,951,849
45,726,851 48,433,521 51,429,766 54,952,979 58,815,379 63,401,365 67,972,356 71,942,1486,001,360 6,643,302 7,240,722 7,438,565 7,869,151 8,028,635 7,886,215 7,741,795
14,854,193 15,479,029 17,126,877 17,750,351 17,135,326 16,446,674 15,756,620 15,065,166508,138 468,167 428,196 395,982 367,294 334,373 301,452 268,531
(149,912) (143,777) (137,642) (131,507) (125,372) (119,237) (113,102) (106,967)
(175,958) (142,103) (110,355) (82,466) (57,532) (37,098) (24,183) (15,453)
84,642 74,653 65,815 58,116 50,955 43,793 36,631 29,470
434,480 260,688 86,896 0 0 0 0 0
9,505,267 9,648,990 10,451,243 12,300,284 14,014,257 15,747,274 17,491,144 17,834,767
(212,895) (152,068) (91,241) (30,414) 0 0 0 0 0
0 15,967 69,396 128,094 226,486 278,469 326,641 509,170 694,5530 (319) (2,027) (5,977) (13,069) (23,169) (35,271) (51,988) (76,063)
72,813,062 76,652,640 80,698,597 86,673,221 92,895,721 98,324,757 104,137,148 109,764,314 113,377,946
67,511,962 72,305,723 78,859,948 83,605,930 86,028,636 91,383,506 92,515,488 97,309,438 112,110,569
202122
A\ Matenals and Suppl=es Escalat=on Factors
Inflation Escalation Factor Total
2005 2006 2007 2008 200.__.~9 2010 201"1 2012 201310486% 10482% 10340% 10504% 9860% 10304% 101.62% 10252% 10270%
104 86% 104 82% 103 40% 105 04% 98 60% 103 04% 101 62% 102 52% 102 70%
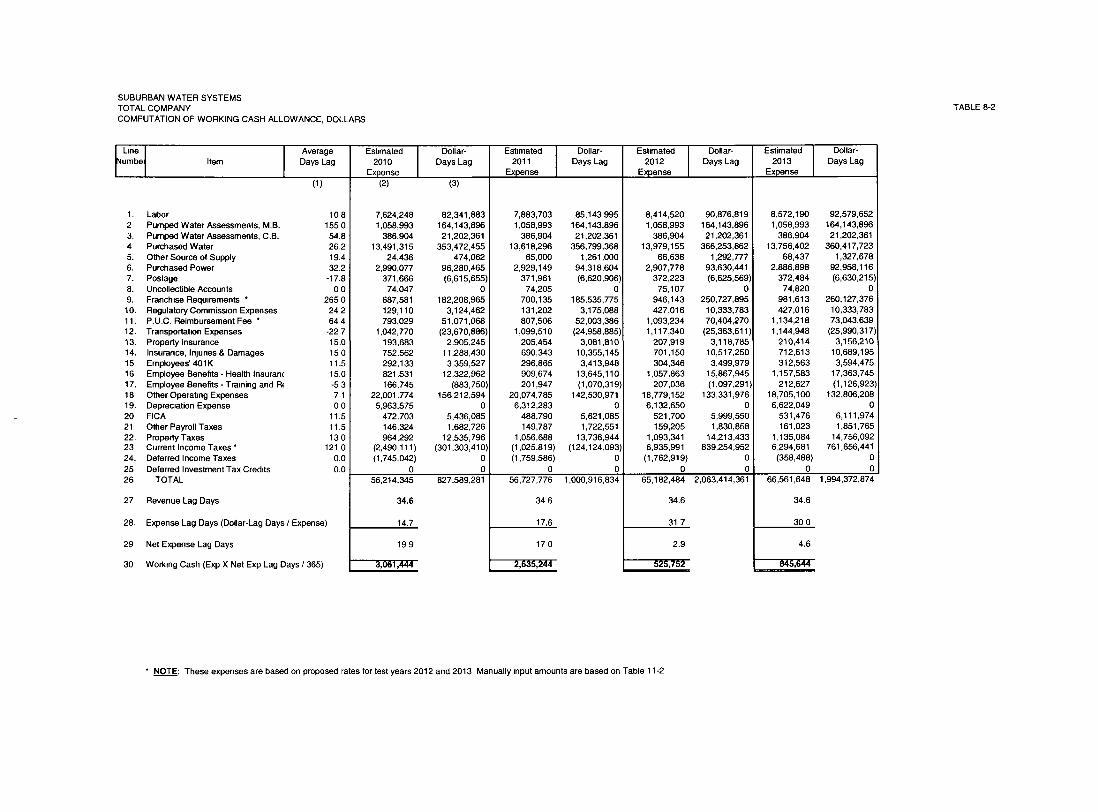
SUBURBAN WATER SYSTEMSTOTAL COMPANYCOMPUTATION OF WORKING CASH ALLOWANCE, DOLLARS
~L~ne I Averageumbe| Item Days Lag
I(1)
1. Labor 10 82 Pumped Water Assessments, M.B. 155 03. Pumped Water Assessments, C.B. 54.84 Purchased Water 26.25. Other Source of Supply 19.46. Purchased Power 32.27. Postage -17.88. Uncollectible Accounts 0 09. Franch=ss Reqmrements * 265 010. Regulatonj Commission Expenses 24 211. P.U.C. Reimbursement Fee * 64 412. Transportation Expenses -22 713. Property insurance 15.014. Insurance, Injuces & Damages 15 015 Employees’ 401K 11.516 Employee Benefits - Health Insuran< 15.017. Employee Benefits o Tra=ning and R* -5 318 Other Operating Expenses 7 119. Depremation Expense 0 020 FICA 11.521 Other Payroll Taxes 11.522. PmpertyTaxes 13 023. Current Income Taxes* 121 024. Deferred Income Taxes 0.025 Deferred Investment Tax Credits 0.026 TOTAL
27 Revenue Lag Days
28. Expense Lag Days (Dollar-Lag Days / Expense)
29 Net Expense Lag Days
30 Working Cash (Exp X Net Exp Lag Days / 365)
Est=mated2010
Expense(2)
7,624,2481,058,993
386,90413,491,315
24,4362,990,077
371,66674,047
687,581129,110793,029
1,042,770193,683752,562292,133821,531166,745
22,001,7745,963,575
472,703146,324964,292
(2,490,111)(1,745,042)
056,214,345
34.6
14.7
199
3,061,444
Dollar-Days Lag
(3)
82,341,883164,143,89621,202,361
353,472,455474,062
96,280,465(6,615,655)
0182,208,965
3,124,46251,071,068
(23,670,886)2,905,245
11,288,4303,359,527
12,322,962(883,750)
156,212,5940
5,436,0851,682,726
12,535,796(301,303,410)
00
827,589,281
EstimatedExpense2011
7,883,7031,058,993
386,90413,618,296
65,0002,929,149
371,96174,205
700,135131,202807,506
1,099,510205,454690,343296,865909,674201,947
20,074,7856,312,283
488,790149,787
1,066,688(1,025,819)(1,759,586)
056,727,776
34 6
17.6
17 0
2,635,244
Dollar-Days Lag
85,143,995164,143,89621,202,361
356,799,3681,261,000
94,318,604(6,620,906)
0185,535,775
3,175,08852,003,386
(24,958,885)3,081,810
10,355,1453,413,948
13,645,110(1,070,3191
142,530,9710
5,621,0851,722,551
13,736,944(124,124,0931
00
1,000,916,834
Eshmated Dollar-2012 Days Lag
Expense
8,414,520 90,876,8191,058,993 164,143,896
386,904 21,202,36113,979,155 366,253,862
66,638 1,292,7772,907,778 93,630,441
372,223 (6,625,569)75,107 0
946,143 250,727,895427,016 10,333,783
1,093,234 70,404,2701,117,340 (25,363,611)
207,919 3,118,785701,150 10,517,250304,346 3,499,979
1,057,863 15,867,945207,036 (1,097,2911
18,779,152 133,331,9766,132,650 0
521,700 5,999,550159,205 1,830,858
1,093,341 14,213,4336,935,991 839,254,952
(1,762,9!9) 00 0
65,182,484 2,063,414,361
34.6
31 7
2.9
525,752
Estimated2013
Expense
8,572,1901,058,993
386,90413,756,402
68,4372,886,898
372,48474,820
981,613427,016
1,134,2181,144,948
210,414712,613312,563
1,!57,583212,627
18,705,1006,622,049
531,476161,023
1,135,0846,294,681(358,488)
066,561,648
34.6
30 0
4.6
845,644
Dollar-Days Lag
92,579,652164,143,89621,202,361
360,417,7231,327,678
92,958,116(6,630,215)
0260,127,376
10,333,78373,043,639(25,990,317)
3,156,21010,689,195
3,594,47517,363,745(1,126,9231
132,806,2080
6,111,9741,851,765
14,756,092761,656,441
00
1,994,372,874
TABLE 8-2
* NOTE: These expenses are based on proposed rates for test years 2012 and 2013 Manually =nput amounts are based on Table 11-2
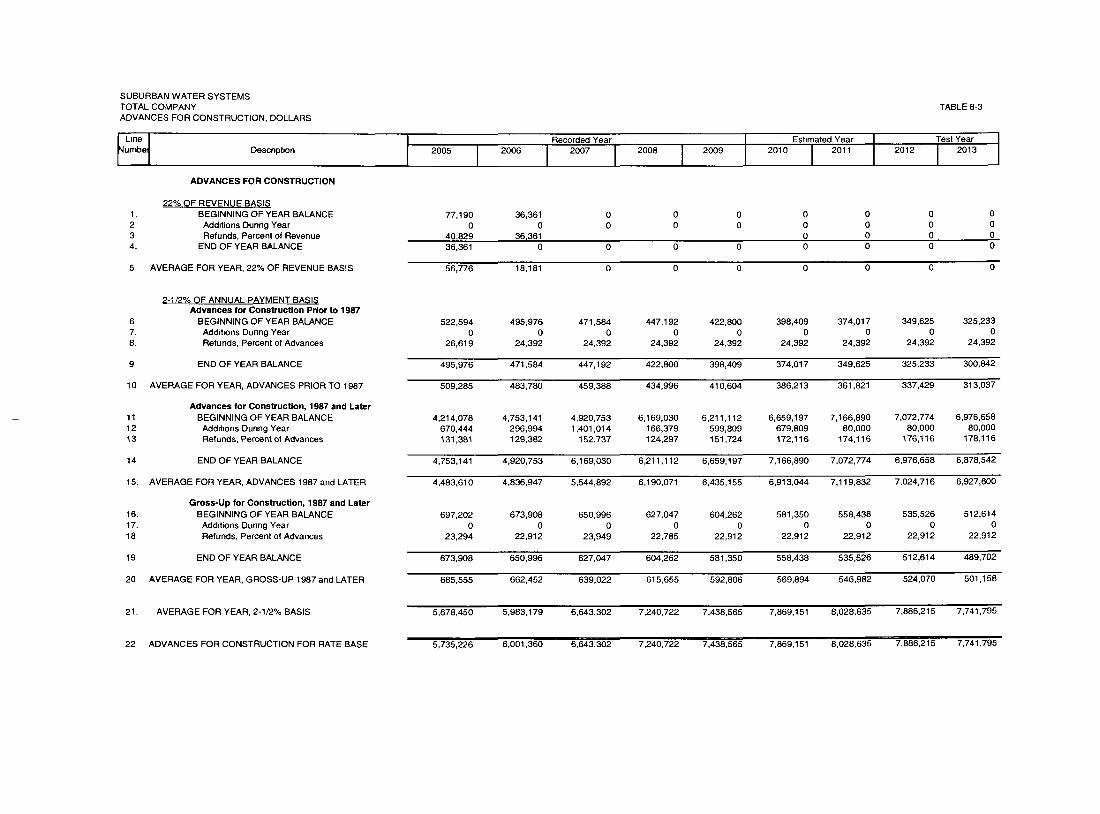
SUBURBAN WATER SYSTEMSTOTAL COMPANYADVANCES FOR CONSTRUCTION, DOLLARS
bne Iumbe1
Descnptlon
ADVANCES FOR CONSTRUCTION
20O5 I 2006Recorded Year
2O08 I 2009Esbmated Year
2010 I 2011 2012
TABLE 8-3
TestYear
I 2013
22% OF REVENUE BASIS1. BEGINNING OF YEAR BALANCE2 Additions Dunng Year3 Refunds, Percent of Revenue4. END OF YEAR BALANCE
5 AVERAGE FOR YEAR, 22% OF REVENUE BASIS
77,190 36,3610 0
40~829 36~36136,361 0
56,776 18,181
oo
o
o
oo
o
o
oo
o
o
oooo
oooo
oooo
oooo
67.8.
9
10
111213
2-1/2% OF ANNUAL PAYMENT BASISAdvances for Construction Prior to 1987
BEGINNING OF YEAR BALANCEAdd=bons During YearRefunds, Percent of Advances
END OF YEAR BALANCE
AVERAGE FOR YEAR, ADVANCES PRIOR TO 1987
Advances for Construction, 1987 and LaterBEGINNING OF YEAR BALANCEAdd~bons During YearRefunds, Percent of Advances
14 END OF YEAR BALANCE
15. AVERAGE FOR YEAR, ADVANCES 1987 and LATER
16.17.18
Gross-Up for Construction, 1987 and LaterBEGINNING OF YEAR BALANCE
Additions During YearRefunds, Percent of Advances
19 END OF YEAR BALANCE
20 AVERAGE FOR YEAR, GROSS-UP 1987 and LATER
522,594 495,976 471,584 447,192 422,800 398,409 374,017 349,625 325,2330 0 0 0 0 0 0 0 0
26,619 24,392 24,392 24,392 24,392 24,392 24,392 24,392 24,392
495,976 471,584 447,192 422,800 398,409 374,017 349,625 325,233 300,842
509,285 483,780 459,388 434,996 410,604 386,213 361,821 337,429 313,037
4,214,078 4,753,141 4,920,753 6,169,030 6,211,112 6,659,197 7,166,890 7,072,774 6,976,658670,444 296,994 1,401,014 166,379 599,809 679,809 80,000 80,000 80,000131,381 129,382 152,737 124,297 151,724 172,116 174,116 176,116 178,116
4,753,141 4,920,753 6,169,030 6,211,112 6,659,197 7,166,890 7,072,774 6,976,658 6,878,542
4,483,610 4,836,947 5,544,892 6,190,071 6,435,155 6,913,044 7,1!9,832 7,024,716 6,927,600
697,202 673,908 650,996 627,047 604,262 581,350 558,438 535,526 512,6140 0 0 0 0 0 0 0 0
23,294 22,912 23,949 22,785 22,912 22,912 22,912 22,912 22,912
673,908 650,996 627,047 604,262 581,350 558,438 535,526 512,614 489,702
685,555 662,452 639,022 615,655 592,806 569,894 546,962 524,070 501,158
5,678,450 5,983,179 6,643,302 7,240,722 7,438,565 7,869,151 8,028,635 7,886,215 7,741,795
5,735,226 6,001,360 6,643,302 7,240,722 7,438,565 7,869,151 8,028,635 7,886,215 7,741,795
21. AVERAGE FOR YEAR, 2-1/2% BASIS
22 ADVANCES FOR CONSTRUCTION FOR RATE BASE
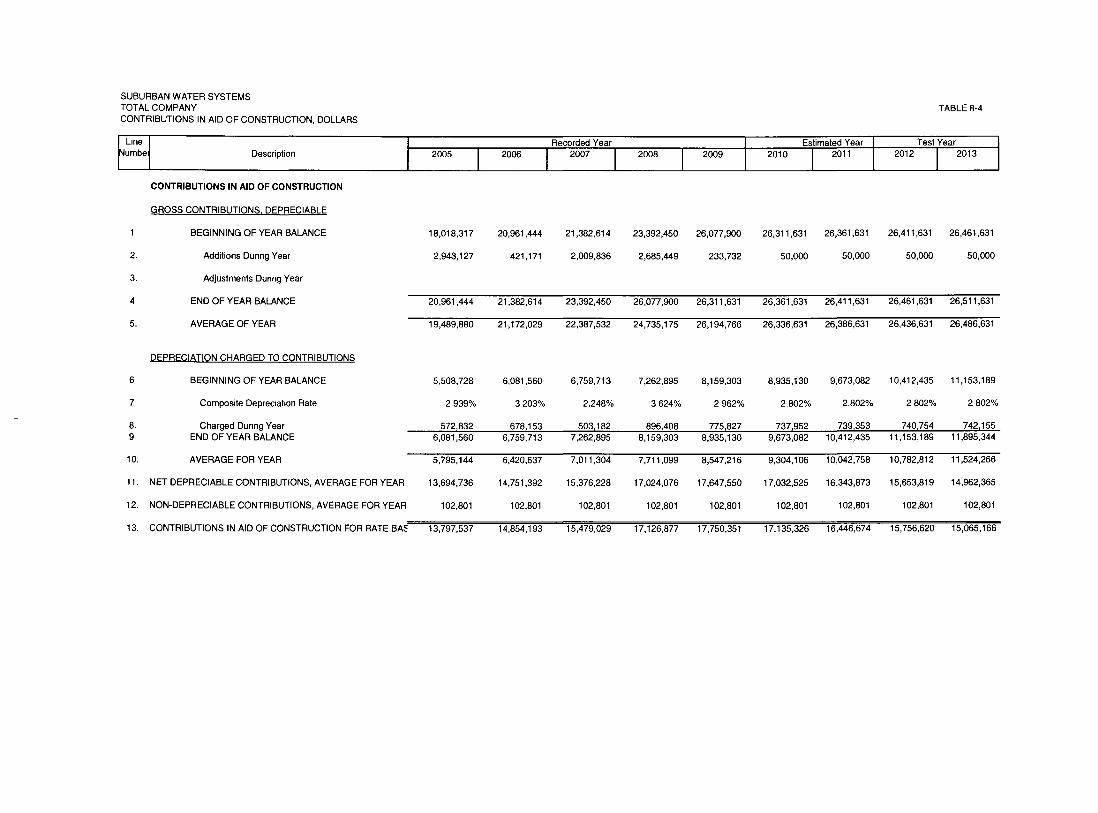
SUBURBAN WATER SYSTEMSTOTAL COMPANYCONTRIBUTIONS IN AID OF CONSTRUCTION, DOLLARS
~L~ne ~umbe1
Description
CONTRIBUTIONS IN AID OF CONSTRUCTION
GROSS CONTRIBUTIONS DEPRECIABLE
TABLE 8-4
Recorded Year
I Estimated Year I TestYear I
1 BEGINNING OF YEAR BALANCE
2. Additions Dur=ng Year
3. Adjustments During Year
4 END OF YEAR BALANCE
5. AVERAGE OF YEAR
18,018,317 20,961,444 21,382,614 23,392,450 26,077,900 26,311,631 26,361,631 26,411,631 26,461,631
2,943,127 421,171 2,009,836 2,685,449 233,732 50,000 50,000 50,000 50,000
20,961,444 21,382,614 23,392,450 26,077,900 26,311,631 26,361,631 26,411,631 26,461,631 26,511,631
19,489,880 21,172,029 22,387,532 24,735,175 26,194,766 26,336,631 26,386,631 26,436,631 26,486,631
DEPRECIATION CHARGED TO CONTRIBUTIONS
6 BEGINNING OF YEAR BALANCE 5,508,728 6,081,560 6,759,713 7,262,895 8,159,303 8,935,130 9,673,082
7 Composite Deprec~at=on Rate 2.939% 3 203% 2.248% 3 624% 2 962% 2.802% 2.802%
8. Charged During Year 572~832 678~153 503~182 896~408 775~827 737~952 739~3539 END OF YEAR BALANCE 6,081,560 6,759,713 7,262,895 8,159,303 8,935,130 9,673,082 10,412,435
10. AVERAGE FOR YEAR 5,795,144 6,420,637 7,011,304 7,711,099 8,547,216 9,304,106 10,042,758
11. NET DEPRECIABLE CONTRIBUTIONS, AVERAGE FOR YEAR 13,694,736 14,751,392 15,376,228 17,024,076 17,647,550 17,032,525 16,343,873
12. NON-DEPRECIABLE CONTRIBUTIONS, AVERAGE FOR YEAR 102,801 102,801 102,801 102,801 102,801 102,801 102,801
13. CONTRIBUTIONS IN AID OF CONSTRUCTION FOR RATE BA~ 13,797,537 14,854,193 15,479,029 17,126,877 17,750,351 17,135,326 16,446,674
10,412,435 11,153,189
2 802% 2 802%
740~754 742~15511,153,189 11,895,344
10,782,812 11,524,266
15,653,819 14,962,365
102,801 102,801
15,756,620 15,065,166
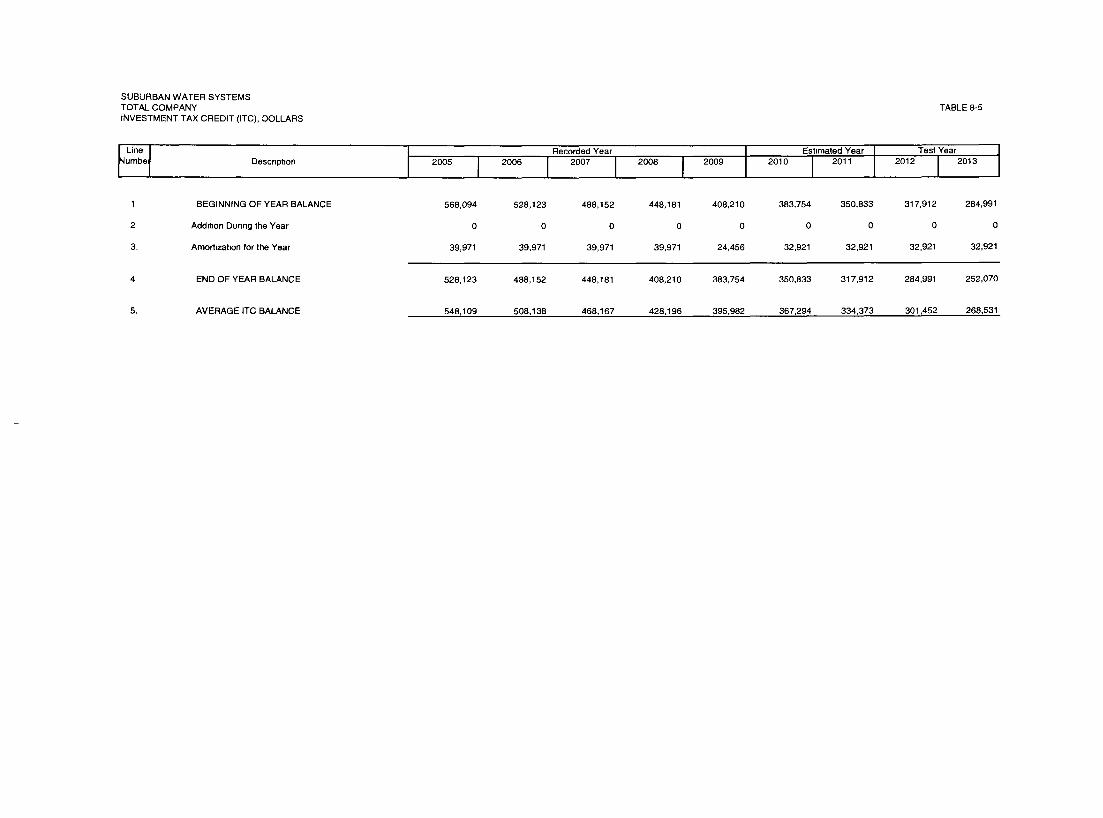
SUBURBAN WATER SYSTEMSTOTALCOMPANYINVESTMENT TAX CREDIT(ITC),DOLLARS
~Line~umbe1
Description 2005Recorded Year
I
Estimated Year
1
2
3.
BEGINNING OF YEAR BALANCE 568,094 528,123 488,152 448,181 408,210 383,754 350,833
Addition Dunng the Year 0 0 0 0 0 0 0
Amort~zat=on for the Year 39,971 39,971 39,971 39,971 24,456 32,921 32,921
END OF YEAR BALANCE 528,123 488,152 448,181 408,210 383,754 350,833 317,912
AVERAGE ITC BALANCE 548 109 508,138 468,167 428,196 395 982 367,294 334,373
TABLE 8-5
Test Year2012 I 2013
317,912 284,991
0 0
32,921 32,921
284,991 252,070
301,452 268,531
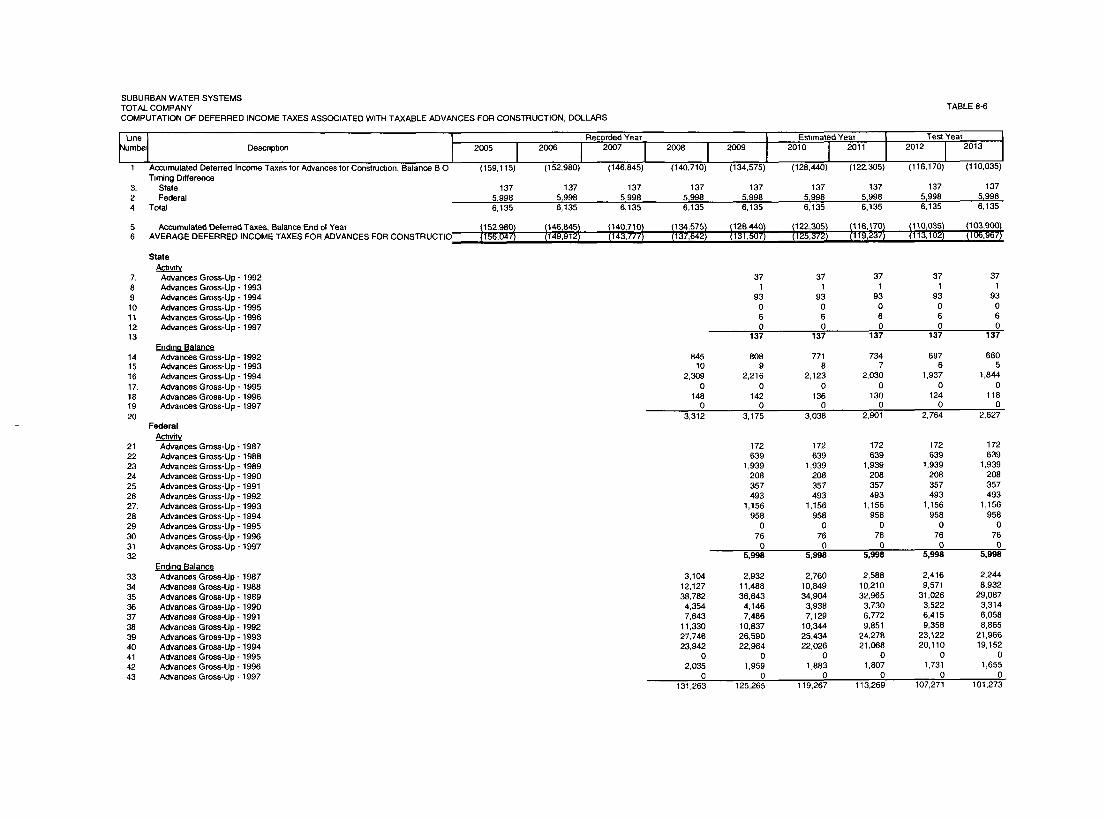
SUBURBAN WATER SYSTEMSTOTAL COMPANYCOMPUTATION OF DEFERRED INCOME TAXES ASSOCIATED WITH TAXABLE ADVANCES FOR CONSTRUCTION, DOLLARS
TABLE 8-6
1 Accumulated Deferred Income Taxes for Advances for Construct=on, Balance B O (159,115) (152,980) (146,845) (140,710) (134,575) (128,440) (122,305) (116,170) (110,035)T~mlng Drfference
3. State 137 137 137 137 137 137 137 137 1372 Federal 5~998 5~998 5,998 5~998 5~998 5~998 5~998 5~998 5~9984 Total 6,135 6,135 6,135 6,135 6,135 6,135 6,135 6,135 6,135
5 Accumulated Deterred Taxes, Balance End ol Year !152,980) /146,845) 1140,710) /134,575) !128,440) 1122,305/ ~116,170) ~110,035) ~103,900)6 AVERAGE DEFERRED INCOME TAXES FOR ADVANCES FOR CONSTRUCTIO /156,047! /149,912t /143,’F/7! t137,642t 1131,507! !125,372! ~119,237t /113,102/ ~106,967!
State
7. Advances Gross-Up - 1992 37 37 37 37 378 Advances Gross-Up - 1993 1 1 1 1 19 Advances Gross-Up - 1994 93 93 93 93 9310 Advances Gross-Up - 1995 0 0 0 0 011 Advances Gross-Up - 1996 6 6 6 6 612. Advances Gross-Up - 1997 0 0 0 0 013 137 137 137 137 137
14151617.18192O
21222324252627.2829303132
End~na BalanceAdvances Gross-Up 1992Advances Gross-Up 1993Advances Gross-Up 1994Advances Gross-Up 1995Advances Gross-Up 1996Advances Gross-Up 1997
Federal
Advances Gross-Up 1987Advances Gross-Up 1988Advances Gross-Up 1989Advances Gross-Up 1990Advances Gross-Up 1991Advances Gross-Up 1992Advances Gross-Up 1993Advances Gross-Up 1994Advances Gross-Up 1995Advances G ross-Up - 1996Advances Gross-Up - 1997
End~no Balance33 Advances Gross-Up - 198734 Advances Gross-Up - 198835 Advances Gross-Up - 198936 Advances Gross-Up - 199037 Advances Gross-Up - 199138 Advances Gross-Up - 199239 Advances Gross-Up - 199340 Advances Gross-Up - 199441 Advances Gross-Up - 199542 Advances Gross-Up - 199643 Advances Gross-Up - 1997
845 808 771 734 697 66010 9 8 7 6 5
2,309 2,216 2,123 2,030 1,937 1,8440 0 0 0 0 0
148 142 136 130 124 1180 0 0 0 0 0
3,312 3,175 3,038 2,901 2,764 2,627
172 172 172 172 172639 639 639 639 639
1,939 1,939 1,939 1,939 1,939208 208 208 208 208357 357 357 357 357493 493 493 493 493
1,156 1,156 1,156 1,156 1,156958 958 958 958 958
0 0 0 0 076 76 76 76 76
0 0 0 0 05,998 5,998 5,998 5,998 5,998
3,104 2,932 2,760 2,588 2,416 2,24412,127 11,488 10,849 10,210 9,571 8,93238,782 36,843 34,904 32,965 31,026 29,0874,354 4,146 3,938 3,730 3,522 3,3147,843 7,486 7,129 6,772 6,415 6,058
11,330 10,837 10,344 9,851 9,358 8,86527,746 26,590 25,434 24,278 23,122 21,96623,942 22,984 22,026 21,068 20,110 19,152
0 0 0 0 0 02,035 1,959 1,883 1,807 1,731 1,655
0 0 0 0 0 0131,263 125,265 119,267 113,269 107,271 101,273
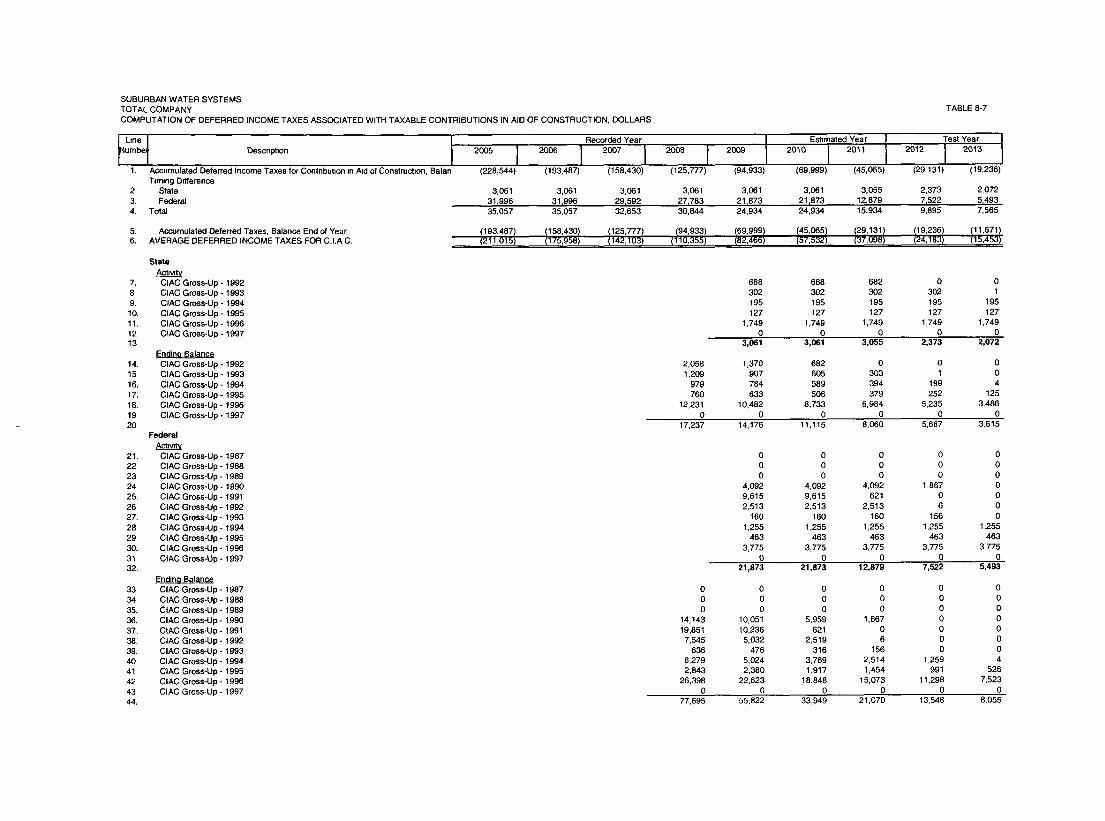
SUBURBAN WATER SYSTEMSTOTALCOMPANYCOMPUTATION OF DEFERREDINCOMETAXESASSOCIATED WlTH TAXABLE CONTRIBUTIONSIN AID OF CONSTRUCTION, DOLLARS
~hneI
I
Recorded YearumbeI Descnpt,on 2005
I2006
I2007
I1. Accumulated Deferred Income Taxes for Contnbutlon m A=d of Construction, Balan (228,544) (193,487) (158,430)
T~mmg Difference2 State 3,061 3,061 3,0613. Federal 31~996 31~996 29~5924. Total 35,057 35,057 32,653
2o0 (125,777)
3,06127~78330,844
TABLES-7
(94,933) (69,999) (45,065) (29,131) (19,236)
3,061 3.061 3,055 2,373 2,07221~873 21 ~873 12~879 7~522 5~49324,934 24,934 15,934 9,895 7,565
5. Accumulated Deferred Taxes, Balance End of Year6. AVERAGE DEFERRED INCOME TAXES FOR C.I.A C. I193,487 !158,430! /125,777! /94,933) /69,999!
211,015) (175,958) (142,103) (110,355) (82,466)45,0651 129,1311 !19,236! !11,671t57,532) (37,098) (24,183) (15,453)
StateAct=wtv
7. ClAC Gross-Up - 19928 CIAC Gross-Up - 19939. CIAC Gross-Up - 199410. CIAC Gross-Up - 199511. CIAC Gross-Up - 199612 CIAC Gross-Up - 199713
Endino B~lance14. CIAC Gross-Up - 199215 ClAC Gross-Up - 199316. CIAC Gross-Up - 199417. CIAC Gross-Up - 199518. CIAC Gross-Up - 199619 CIAC Gross-Up - 19972O
FederalActtwt~
21. ClAC Gross-Up - 198722 ClAC Gross-Up - 198823 CIAC Gross-Up - 198924 CIAC Gross-Up - 199025. CIAC Gross-Up - 199126 CIAC Gross-Up - 199227. ClAC Gross-Up - 199328 CIAC Gross-Up - 199429 CIAC Gross-Up- 199530. CIAC Gross-Up - 199631 CIAC Gross-Up - 199732.
Endln~ Balance33 CIAC Gross-Up - 198734 CIAC Gross-Up- 198835. ClAC Gross-Up - 198936. CIAC Gross-Up - 199037. CIAC Gross-Up - 199138. CIAC Gross-Up o 199239. CIAC Gross-Up - 199340 ClAC Gross-Up - 199441 CIAC Gross-Up - 199542 CIAC Gross-Up - 199643 ClAC Gross-Up - 199744.
688 688 682 0 0302 302 302 302 1195 195 195 195 195127 127 127 127 127
1,749 1,749 1,749 1,749 1,7490 0 0 0 0
3,061 3,061 3,055 2,373 2,072
2,058 1,370 682 0 0 01,209 907 605 303 1 0
979 784 589 394 199 4760 633 506 379 252 125
12,231 10,482 8,733 6,984 5,235 3,4860 0 0 0 0 0
17,237 14,176 11,115 8,060 5,687 3,615
0 0 0 0 00 0 0 0 00 0 0 0 0
4,092 4,092 4,092 1,867 09,615 9,615 621 0 02,513 2,513 2,513 6 0
160 160 160 156 01,255 1.255 1,255 1,255 1,255
463 463 463 463 4633,775 3,775 3,775 3,775 3,775
0 0 0 0 021,873 21,873 12,879 7,522 5,493
0 0 0 0 0 00 0 0 0 0 00 0 0 0 0 0
14,!43 10,051 5,959 1,867 0 019,851 10,236 621 0 0 07,545 5.032 2,519 6 0 0
636 476 316 156 0 06,279 5,024 3,769 2,514 1,259 42,843 2,380 1,917 1,454 991 528
26,398 22,623 18,848 15,073 11.298 7,5230 0 0 0 0 0
77,695 55,822 33,949 21,070 13,548 8,055
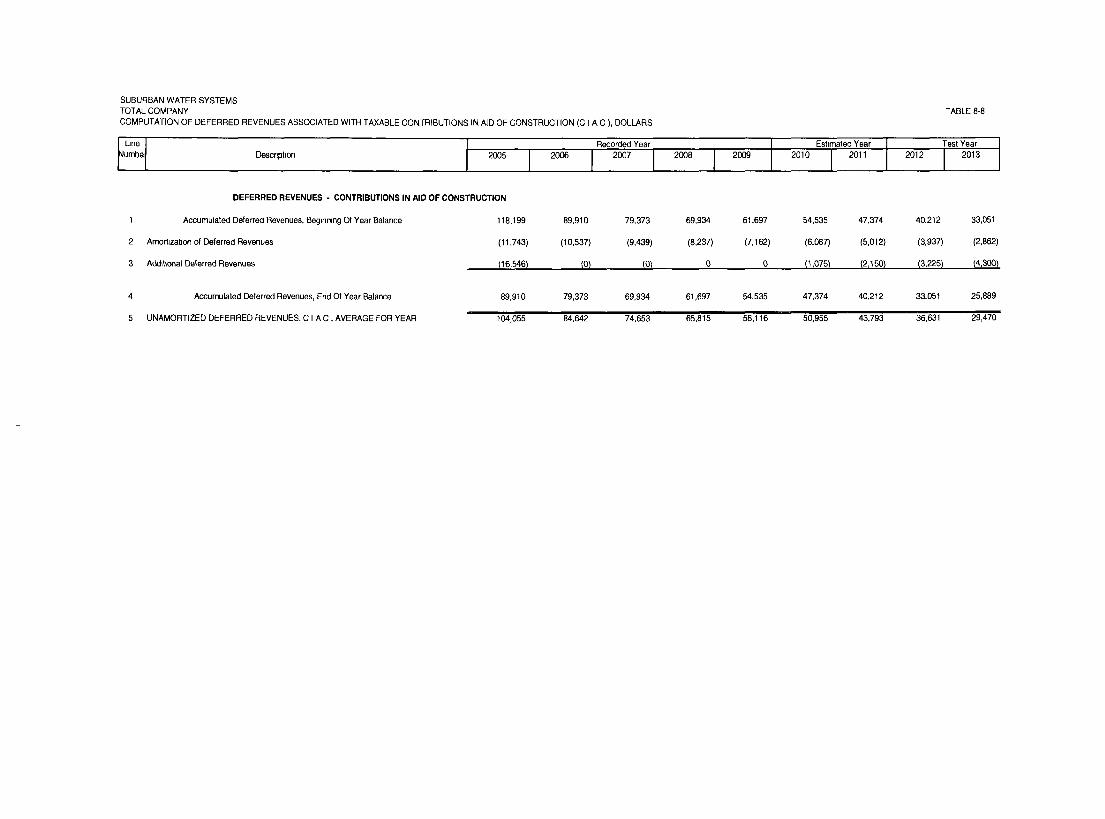
SUBURBAN WATER SYSTEMSTOTALCOMPANYCOMPUTATION OF DEFERRED REVENUES ASSOCIATED WITH TAXABLE CONTRIBUTIONSIN AID OF CONSTRUCTION(CIA C),DOLLARS
~tJneI
I
Recorded YearumbeI Descr,pt,on 200s
I 2006 I 20072008 I Estimated Year
I 20092010
I 2011
TABLE 8-8
DEFERRED REVENUES - CONTRIBUTIONS IN AID OF CONSTRUCTION
1 Accumulated Deferred Revenues, Beginning (31 Year Balance 118,199
2 Arnort~zat=on of Deferred Revenues (11,743)
3 Addtttona~ Delerred Revenues /16~546)
TestYear2012 I 2013
89,910 79,373 69,934 61,697 54,535 47,374 40,212 33,051
(10,537) (9,439) (8,237) (7,162) (6,087) (5,012) (3,937) (2,862)
(0) (0) 0 0 11,075) (2,150) (31225) /4,300}
4 Accumulated Deferred Revenues, End Of Year Balance
5 UNAMORTIZED DEFERRED REVENUES, C I A C, AVERAGE FOR YEAR
89,910 79,373 69,934 61,697 54,535 47,374 40,212 33,051 25,889
104,055 84,642 74,653 65,815 58,116 50,955 43,793 36,631 29,470
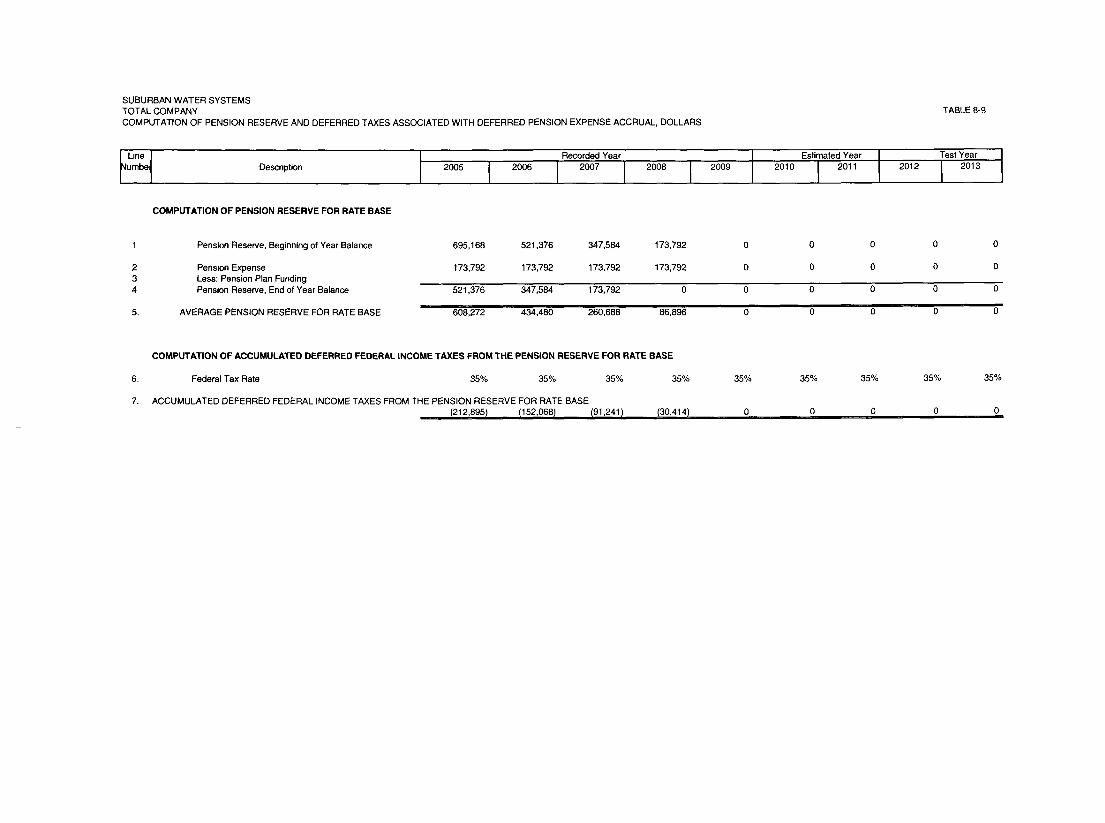
SUBURBAN WATER SYSTEMSTOTAL COMPANYCOMPUTATION OF PENSION RESERVE AND DEFERRED TAXES ASSOCIATED WITH DEFERRED PENSION EXPENSE ACCRUAL, DOLLARS
~L~neI Recorded Yearum~e1 Descr,ption20051200612007 I
2008 2009Estimated Year
2010 I 2011 2012
COMPUTATION OF PENSION RESERVE FOR RATE BASE
TABLE 8-9
Test Year
I 2013
Pension Reserve, Beginning of Year Balance 695,168 521,376 347,584
Pension Expense 173,792 173,792 173,792Less: Pension Plan FundingPens=on Reserve, End of Year Balance 521,376 347,584 173,792
AVERAGE PENSION RESERVE FOR RATE BASE 608,272 434,480 260,688
173,792
173,792
0
86,896
0
0
0
0
o
o
o
o
0
0
0
0
o
o
o
o
o
o
0
o
COMPUTATION OF ACCUMULATED DEFERRED FEDERAL INCOME TAXES FROM THE PENSION RESERVE FOR RATE BASE
Federal Tax Rate 35% 35% 35% 35%
ACCUMULATED DEFERRED FEDERAL INCOME TAXES FROM THE PENSION RESERVE FOR RATE BASE1212,8951 1152,0681 (91,241) (30,414)
35%
0
35%
0
35%
0
35%
0
35%
0
9 Chapter - Results of Operations, Taxes
Taxes include ad valorem taxes, payroll taxes, and state and federaltaxes on income. Taxes for recorded years 2005 through 2009 andestimated years ending December 31, 2012 and 2013 as computed in thischapter are shown in Table 9-1.
9.1 Ad Valorem Taxes
Ad valorem taxes shown in Table 9-1 are tax payments to be made duringthe calendar year indicated as computed in Table 9-2. Thiscomputation is based on the procedure used for water utilities by theLos Angeles County Tax Assessor.
Utility plant figures used in Table 9-2 were developed in Chapter 6.Depreciation reserve figures used were computed in Chapter 7.Advances for construction, contributions in aid of construction,construction work in progress, and materials and supplies figures usedin this Table were developed in Chapter 8.
9.2 Payroll Taxes
Payroll taxes include state unemployment insurance, federalunemployment insurance, and federal social security taxes.
9.3 Taxes on Income
State and Federal income taxes at present rates as shown in Table 9-1were computed as shown in Table 9-3 using tax rates and provisionseffective in the years shown.
9-!
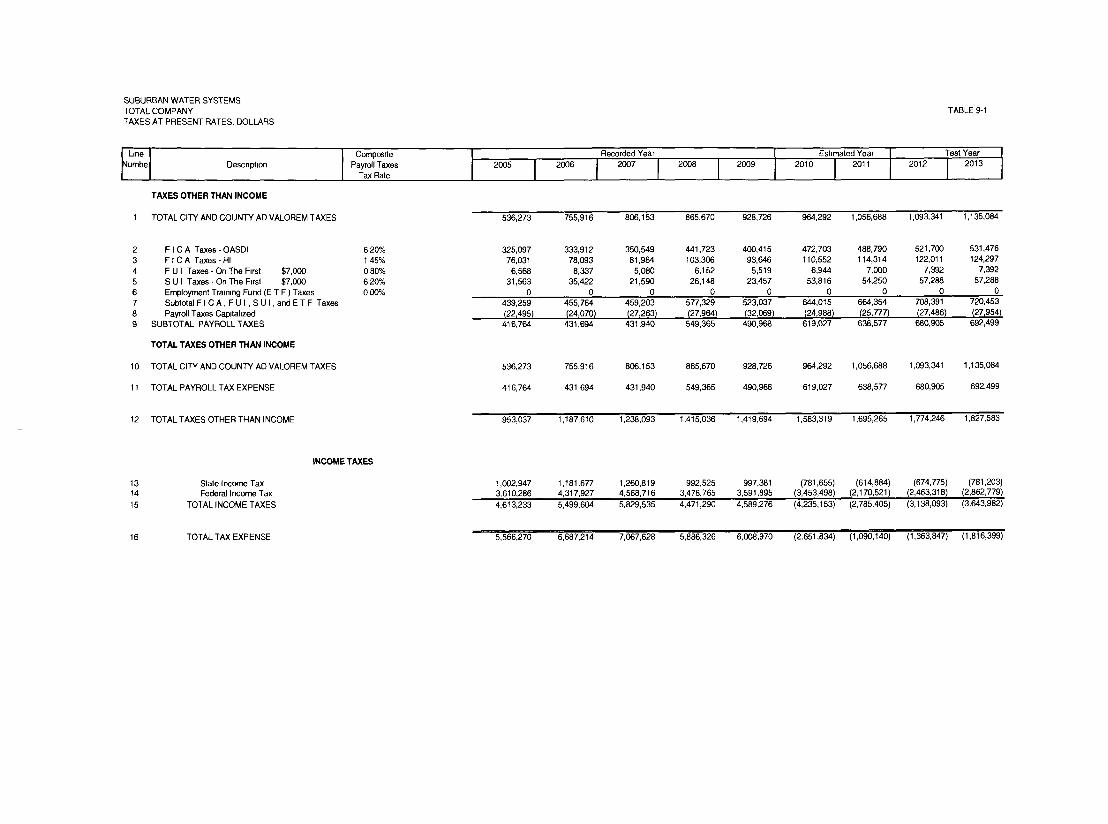
SUBURBAN WATER SYSTEMSTOTAL COMPANYTAXES AT PRESENT RATES, DOLLARS
~Line~umbe1
Description
TAXES OTHER THAN INCOME
1 TOTAL CITY AND COUNTY AD VALOREM TAXES
CompositePayroll Taxes
Tax Rate2005
Recorded Year Estimated Year
TABLE 9-1
23456
F I C A Taxes - OASDIF I C A Taxes - HIF U I Taxes - On The F~rst $7,000S U I Taxes - On The F~rst $7,000Employment Training Fund (E T F ) Taxes
6 2O%1 45%0 80%6 20%0 00%
Test Year2012 2013
7 SubtotaIFICA,FUI,SUI,andETF Taxes8 Payroll Taxes Cap~tal=zed9 SUBTOTAL PAYROLL TAXES
TOTAL TAXES OTHER THAN INCOME
10 TOTAL CITY AND COUNTY AD VALOREM TAXES
11 TOTAL PAYROLL TAX EXPENSE
12 TOTAL TAXES OTHER THAN INCOME
13 State Income Tax14 Federal Income Tax15 TOTAL INCOME TAXES
INCOME TAXES
536,273 755,916 806,153 865,670 928,726 9~4,292 1,056,688 1,093,341 1,135,084
325,097 333,912 350,549 441,723 400,415 472,703 488,790 521,700 531,47676,031 78,093 81,984 103,306 93,646 110,552 114,314 122,011 124,2976,568 8,337 5,080 6,152 5,519 6,944 7,000 7,392 7,392
31,563 35,422 21,590 26,148 23,457 53,816 54,250 57,288 57,2880 0 0 0 0 0 0 0 0
439,259 455,764 459,203 577,329 523,037 644,015 664,354 708,391 720,453(22,495) (24,070) (27,263) (27,964) (32,069) (24,988) (25,777) (27,486/ (27,954/416,764 431,694 431,940 549,365 490,968 619,027 638,577 680,905 692,499
536,273 755,916 806,153 865,670 928,726 964,292 1,056,688 1,093,341 1,135,084
416,764 431,694 431,940 549,365 490,968 619,027 638,577 680,905 692,499
953,037 1,187,610 1,238,093 1,415,036 1,419,694 1,583,319 1,695,265 1,774,246 1,827,583
1,002,947 1,181,677 1,260,819 992,525 997,381 (781,655) (614,884)3,610,286 4,317,927 4,568,716 3,478,765 3,591,895 (3,453,498) (2,170,521)4,613,233 5,499,604 5,829,535 4,471,290 4,589,276 (4,235,153) (2,785,405)
(674,775) (781,203)(2,463,318) (2,862,779)(3,138,093) (3,643,982)
16 TOTAL TAX EXPENSE 5,566,270 6,687,214 7,067,628 5,886,326 6,008,970 (2,651,834) (1,090,140) (1,363,847) (1,816,399)
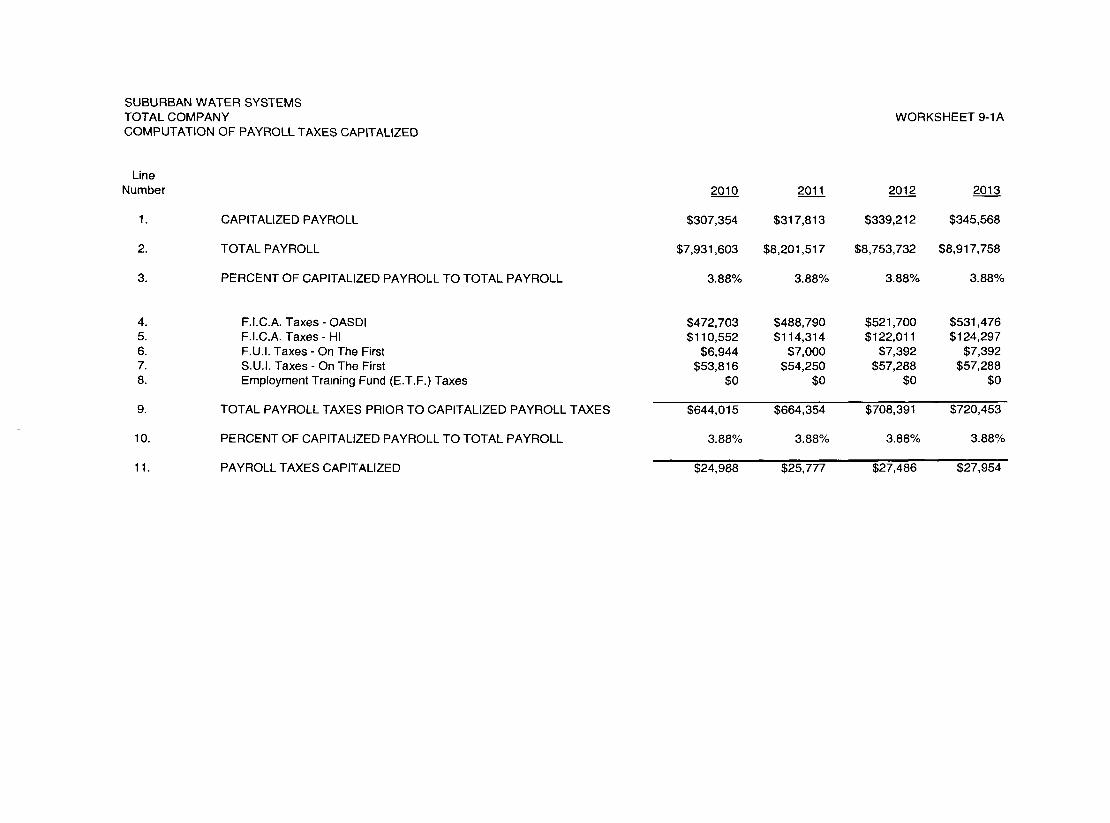
SUBURBAN WATER SYSTEMSTOTAL COMPANYCOMPUTATION OF PAYROLL TAXES CAPITALIZED
LineNumber
1.
2.
3.
CAPITALIZED PAYROLL
TOTAL PAYROLL
PERCENT OF CAPITALIZED PAYROLL TO TOTAL PAYROLL
5.6.7.8.
10.
F.I.C.A. Taxes - OASDIF.I.C.A. Taxes - HIF.U.I. Taxes - On The FirstS.U.I. Taxes - On The FirstEmployment Training Fund (E.T.F.) Taxes
TOTAL PAYROLL TAXES PRIOR TO CAPITALIZED PAYROLL TAXES
PERCENT OF CAPITALIZED PAYROLL TO TOTAL PAYROLL
WORKSHEET 9-1A
2010 2011 2012
$307,354 $317,813 $339,212
$7,931,603 $8,201,517 $8,753,732
3.88% 3.88% 3.88%
2013
$345,568
$8,917,758
3.88%
$472,703 $488,790 $521,700 $531,476$110,552 $114,314 $122,011 $124,297
$6,944 $7,000 $7,392 $7,392$53,816 $54,250 $57,288 $57,288
$o $o $o $o
$644,015 $664,354 $708,391 $720,453
3.88% 3.88% 3.88% 3.88%
11. PAYROLL TAXES CAPITALIZED $24,988 $25,777 $27,486 $27,954
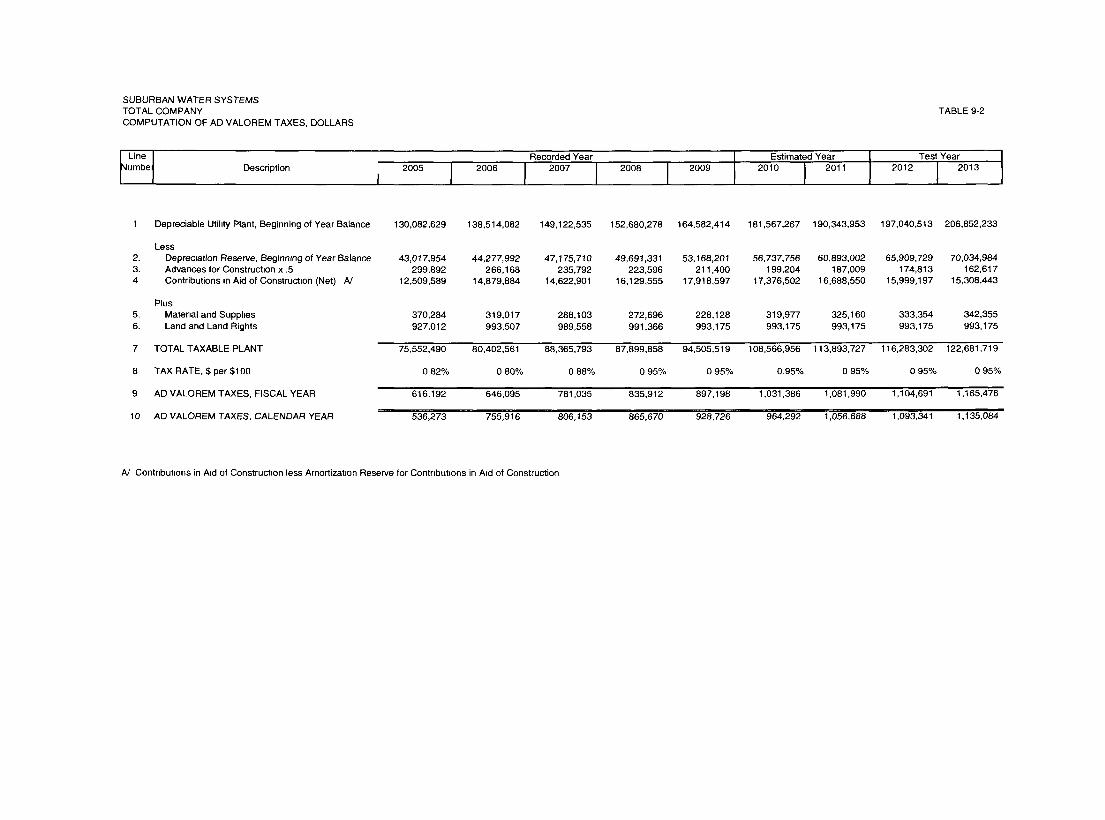
SUBURBAN WATER SYSTEMSTOTAL COM PANYCOMPUTATION OF AD VALOREM TAXES, DOLLARS
TABLE 9-2
LineIumbe1
Description 2005I I
Recorded Year Estimated Year)
TesiYear
1 Depreciable Utihty Plant, Beginning of Year Balance 130,082,629 138,514,082 149,122,535 152,680,278 164,582,414 181,567,267 190,343,953 197,040,513 206,852,233
Less2. Depreciation Reserve, Beginning of Year Balance3. Advances for Construction x .54 Contributions ~n Aid of Construction (Net) A/
43,017,954 44,277,992 47,175,710 49,691,331 53,168,201 56,737,756 60,893,002 65,909,729 70,034,984299,892 266,168 235,792 223,596 211,400 199,204 187,009 174,813 162,617
12,509,589 14,879,884 14,622,901 16,129,555 17,918,597 17,376,502 16,688,550 15,999,197 15,308,443
Plus5. Material and Supplies 370,2846. Land and Land Rights 927,012
7 TOTAL TAXABLE PLANT 75,552,490
8 TAX RATE, $ per $100 082%
9 AD VALOREM TAXES, FISCAL YEAR 616,192
10 AD VALOREM TAXES, CALENDAR YEAR 536,273
319,017 288,103 272,696 228,128 319,977 325,160 333,354 342,355993,507 989,558 991,366 993,175 993,175 993,175 993,175 993,175
80,402,561 88,365,793 87,899,858 94,505,519 108,566,956 113,893,727 116,283,302 122,681,719
0 80% 0 88% 0 95% 0 95% 0.95% 0 95% 0 95% 0 95%
646,095 781,035 835,912 897,198 1,031,386 1,081,990 1,104,691 1,165,476
755,916 806,153 865,670 928,726 964,292 1,056,688 1,093,341 1,135,084
A/ Contnbut~ons in A~d of Construction less Amortization Reserve for Contnbut~ons in A~d of Construction
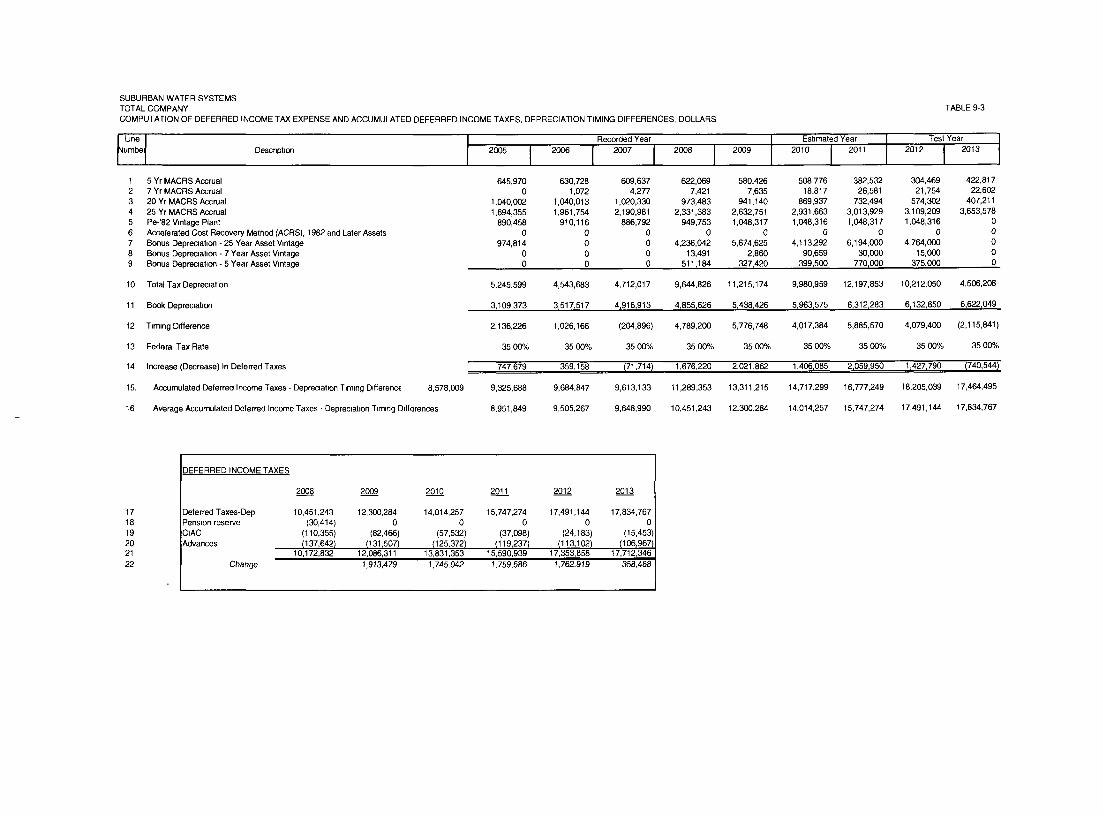
SUBURBAN WATER SYSTEMSTOTAL COMPANYCOMPUTATION OF DEFERRED INCOME TAX EXPENSE AND ACCUMULATED DEFERRED INCOME TAXES, DEPRECIATION TIMING DIFFERENCES, DOLLARS
TABLE 9-3
Test Year2012 I 2013
I1 5 Yr I~tACRS Accrual 645,970 630,728 609,637 622,069 580,426 508,776 382,532 304,469 422,8172 7 Yr MACRS Accrual 0 1,072 4,277 7,421 7,635 18,817 26,581 21,754 22,6023 20 Yr MACRS Accrual 1,040,002 1,040,013 1,020,330 973,483 941,140 869,937 732,494 574,302 407,2114 25 Yr MACRS Accrual 1,694,355 1,961,754 2,190,981 2,331,383 2,632,751 2,931,663 3,013,929 3,109,209 3,653,5785 Pe-’82 Wntage Plant 890,458 910,116 886,792 949,753 1,048,317 1,048,316 1,048,317 1,048,316 06 Accelerated Cost RecoveP/Method (ACRS}, f 982 and Later Assefs 0 0 0 0 0 0 0 0 07 Bonus Depreciation - 25 Year Asset Wntage 974,814 0 0 4,236,042 5,674,625 4,113,292 6,194,000 4,764,000 08 Bonus Depreciation - 7 Year Asset Wntage 0 0 0 13,491 2,860 90,659 30,000 15,000 09 Bonus Deprec~at{on - 5 Year Asset Wntage 0 0 0 511 ~184 327~420 399,500 770~000 375,000 0
10 Totat Tax Depreciation 5,245,599 4,543,683 4,712,017 9,644,826 11,215,174 9,980,959 12,197,853 10,212,050 4,506,208
11 Book Depreciation 3~109~373 3~517~517 4~916~913 4~855,626 5~438,426 5,963,575 6,312~283 6~132,650 6,622,049
12 T~m~ng Difference 2,136,226 1,026,166 (204,896) 4,789,200 5,776,748 4,017,384 5,885,570 4,079,400 (2,115,841 )
13 Federal Tax Rate 35 00% 35 00% 35 00% 35 00% 35 00% 35 00% 35 00% 35 00% 35 00%
14 Increase (Decrease) In Deferred Taxes 747 679 359,158 {71,714) 1,676,220 2,021,862 1,406,085 2,059,950 1,427,790 (740,544)
15. Accumulated Deferred Income Taxes - Depreciation T~m~ng D{fferenc~ 8,578,009 9,325,688 9,684,847 9,613,133 11,289,353 13,311,215 14,717,299 16,777,249 18,205,039 17,464,495
16 Average Accumulated Deferred Income Taxes - Depreciation T~m~ng D~fferences 8,951,849 9,505,267 9,648,990 10,451,243 12,300,284 14,014,257 15,747,274 17,491,144 17,834,767
1718192O2122
3EFERRED INCOME TAXES
200~8 2009 2010 201~1 2012 2013
3eferred Taxes-Dep 10,451,243 12,300,284 14,014,257 15,747,274 17,491,144 17,834,767Pension reserve (30,414) 0 0 0 0 0
iCIAC (110,355) (82,466) (57,532) (37,098) (24,183) (15,453)~,dvances {137,642) {131,507) {125,372) {119,237) {113,102) {106,967)
10,172,832 12,086,311 13,831,353 15,590,939 17,353,858 17,712,346Change 1,913,479 1,745,042 1,759,586 1,762, 919 358,488
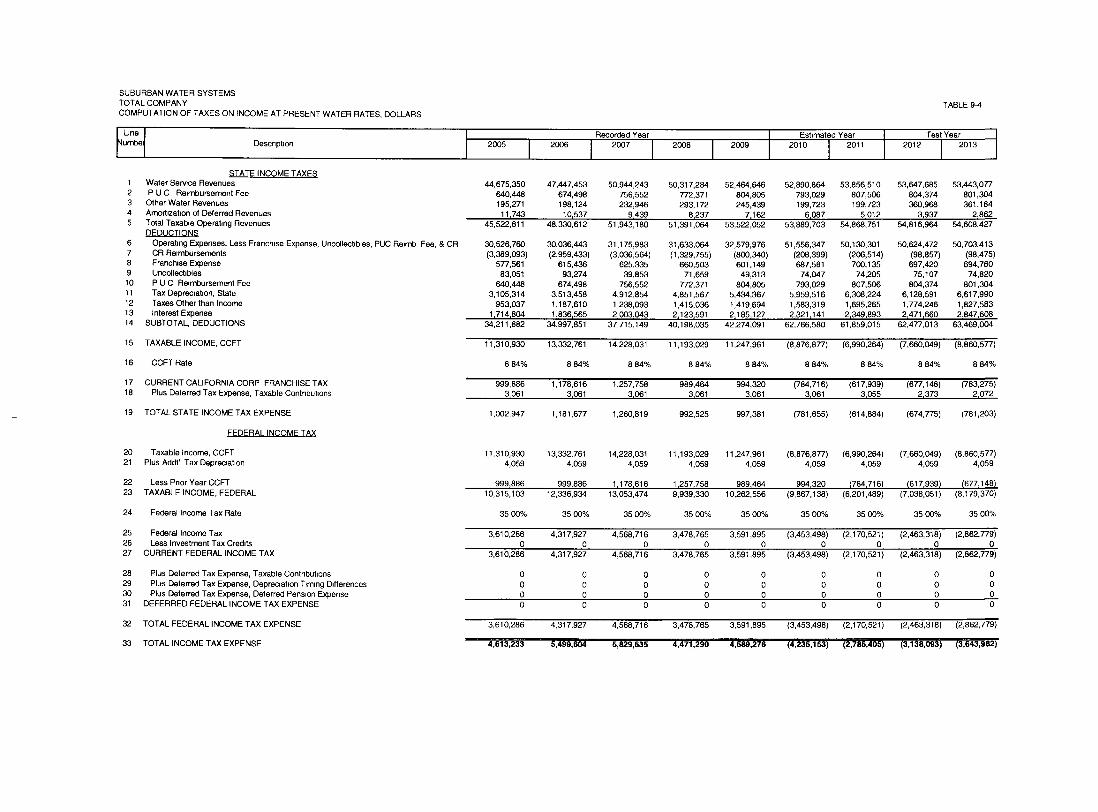
SUBURBAN WATER SYSTEMSTOTALCOMPANYCOMPUTATION OF TAXES ONINCOME AT PRESENT WATER RATES, DOLLARS
~J,ne I
umbe1Descnptlon 2005
Recorded Year Estimated Year
STATE INCOME TAXES1 Water Se~ce Revenues2 P U C Reimbursement Fee3 Other Water Revenues4 Amortlzabon of Deferred Revenues5 Total Taxable Operating Revenues
DEDUCTIONS6 Operating Expenses, Less Franchise Expense, Uncollecbbles, PUC Re=rob Fee, & CR7 CR Reimbursements8 Franchise Expense9 Uncotlecbbles10 P U C Reimbursement Fee11 Tax Depreciation, State12 Taxes Other than Income13 Interest Expense14 SUBTOTAL, DEDUCTIONS
2012
15 TAXABLE INCOME, CCFT
TABLE 9-4
CCFT Rate
17 CURRENT CALIFORNIA CORP FRANCHISE TAX18 Plus Deferred Tax Expense, Taxable Contrlbubons
Test Year2013
44,675,350 47,447,453 50,944,243 50,317,284 52,464,646 52,890,864 53,856,510 53,647,685 53,443,077640,448 674,498 756,552 772,371 804,805 793,029 807,506 804,374 801,304195,271 198,124 232,946 293,172 245,439 199,723 199, 723 360,968 361,184
11 ~743 10~537 9~439 8~237 7~162 6~087 5~012 3~937 2~86245,522,811 48,330,612 51,943,180 51,391,064 53,522,052 53,889,703 54,868,751 54,816,964 54,608,427
30,526,760 30,036,443 31,175,983 31,633,064 32,579,976 51,556,347 50,130,301 50,624,472 50,703,413(3,389,093) (2,959,433) (3,036,564) (1,329,755) (800,340) (208,399) (206,514) (98,857) (98,475)
577,561 615,436 625,335 660,503 601,149 687,581 700,135 697,420 694,76083,051 93,274 39,853 71,659 49,313 74,047 74,205 75,107 74,820
640,448 674,498 756,552 772,371 804,805 793,029 807,506 804,374 801,3043,105,314 3,513,458 4,912,854 4,851,567 5,434,367 5,959,516 6,308,224 6,128,591 6,617,990
953,037 1,187,610 1,238,093 1,415,036 t,419,694 1,583,319 1,695,265 1,774,246 1,827,5831~714~804 1~836~565 2~003~043 2~123~591 2~185~127 2~321~141 2~349~893 2~471~660 2~847~608
34,211,882 34,997,851 37,715,149 40,198,035 42,274,091 62,766,580 61,859,015 62,477,013 63,469,004
19 TOTAL STATE INCOME TAX EXPENSE
11,310,930 13,332,761 14,228,031 11,193,029 11,247,961 (8,876,877) (6,990,264) (7,660,049) (8,860,577)
8 84% 8 84% 8 84% 8 84% 8 84% 8 84% 8 84% 8 84% 8 84%
FEDERAL INCOME TAX
20 Taxable Income, CCFT21 Plus Addt’l Tax Depreciation
22 Less Pnor Year CCFT23 TAXABLE INCOME, FEDERAL
24 Federal Income Tax Rate
25 Federal Income Tax26 Less Investment Tax Credits27 CURRENT FEDERAL INCOME TAX
28 Plus Deferred Tax Expense, Taxable Contnbut~ons29 Plus Deferred Tax Expense, Depreoabon Timing Ddferences30 Plus Deferred Tax Expense, Deferred Penmon Expense31 DEFERRED FEDERAL INCOME TAX EXPENSE
(784,716) (617,939) (677,148) (783,275)3~061 3~055 2~373 2~072
999,886 1,178,616 1,257,758 989,464 994,3203~061 3~001 3~061 3~061 3~061
1,002,947 1,181,677 1,260,819 992,525 997,381 (781,655) (614,884) (674,775) (781,203)
(8,876,877) (6,990,264) (7,660,049) (8,860,577)4,059 4,059 4,059 4,059
11,310,930 13,332,761 14,228,031 11,193,029 11,247,9614,059 4,059 4,059 4,059 4,059
999~886 999~886 1~178~616 1~257~758 989~46410,315,103 12,336,934 13,053,474 9,939,330 10,262,556
994,320 (784,716) {617,939) (677,148)(9,867,138) (6,201,489) (7,038,051) (8,179,370)
35 00% 35 00% 35 00% 35 00% 35 00% 35 00% 35 00% 35 00% 35 00%
3,610,286 4,317,927 4,568,716 3,478,765 3,591,8950 0 0 0 0
3,610,286 4,317,927 4,568,716 3,478,765 3,591,895
0000
0000
0000
(3,453,498) (2,170,521) (2,463,318) (2,862,779)0 0 0 0
(3,453,498) (2,170,521) (2,463,318) (2,862,779)
0000
0000
oooo
0000
0000
0000
32 TOTAL FEDERAL INCOME TAX EXPENSE 3,610,286 4,317,927 4,568,716 3,478,765 3,591,895 (3,453,498) (2,170,521) (2,463,318) (2,862,779)
33 TOTAL INCOME TAX EXPENSE 4,613,233 5,499,604 5,829,535 4,471,290 4,589,276 (4,235,153) (2,785,405) (3,138,093) (3,643,982)
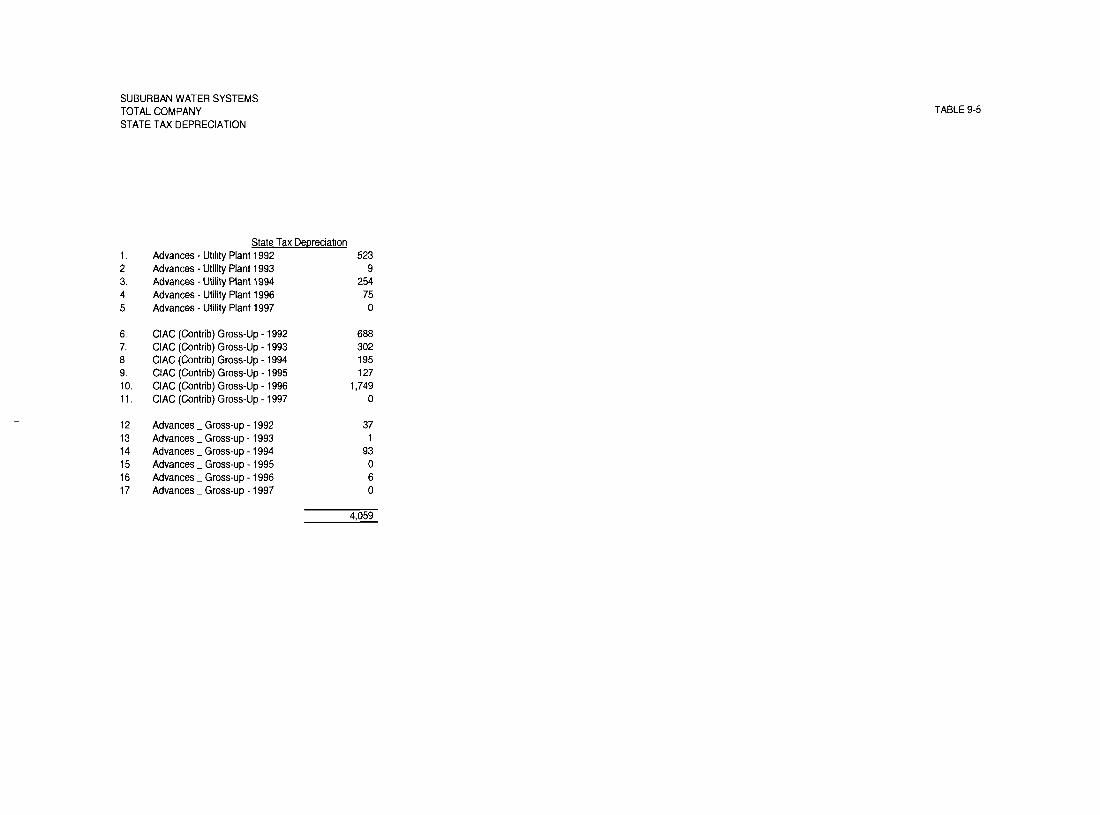
SUBURBAN WATER SYSTEMSTOTAL COMPANYSTATE TAX DEPRECIATION
TABLE 9-5
23.45
State Tax DepreciationAdvances - Utd~ty Plant 1992 523Advances- Utility Plant 1993 9Advances- Utility Plant 1994 254Advances - Utility Plant 1996 75Advances - Utility Plant 1997 0
6. CIAC (Contrib) Gross-Up - 19927. CIAC (Contrib) Gross-Up - 19938 CIAC (Contrib) Gross-Up- 19949. CIAC (Contrib) Gross-Up - 199510. CIAC (Contrib) Gross-Up - 199611. CIAC (Contrib) Gross-Up - 1997
6883O2195127
1,7490
12 Advances _ Gross-up-199213 Advances _ Gross-up-199314 Advances _ Gross-up-199415 Advances _ Gross-up-199516 Advances _ Gross-up-199617 Advances _ Gross-up-1997
371
93060
4,059
I0 Chapter - Summary of Earnings
Operating revenues, operating expenses, and rate base computed inprevious chapters are brought together in Table i0-i for computationof operating income and rate of return for each year. Revenuesrequired to provide a fair return on rate base for estimated years2012 and 2013 are developed in the following chapter.
lO-1
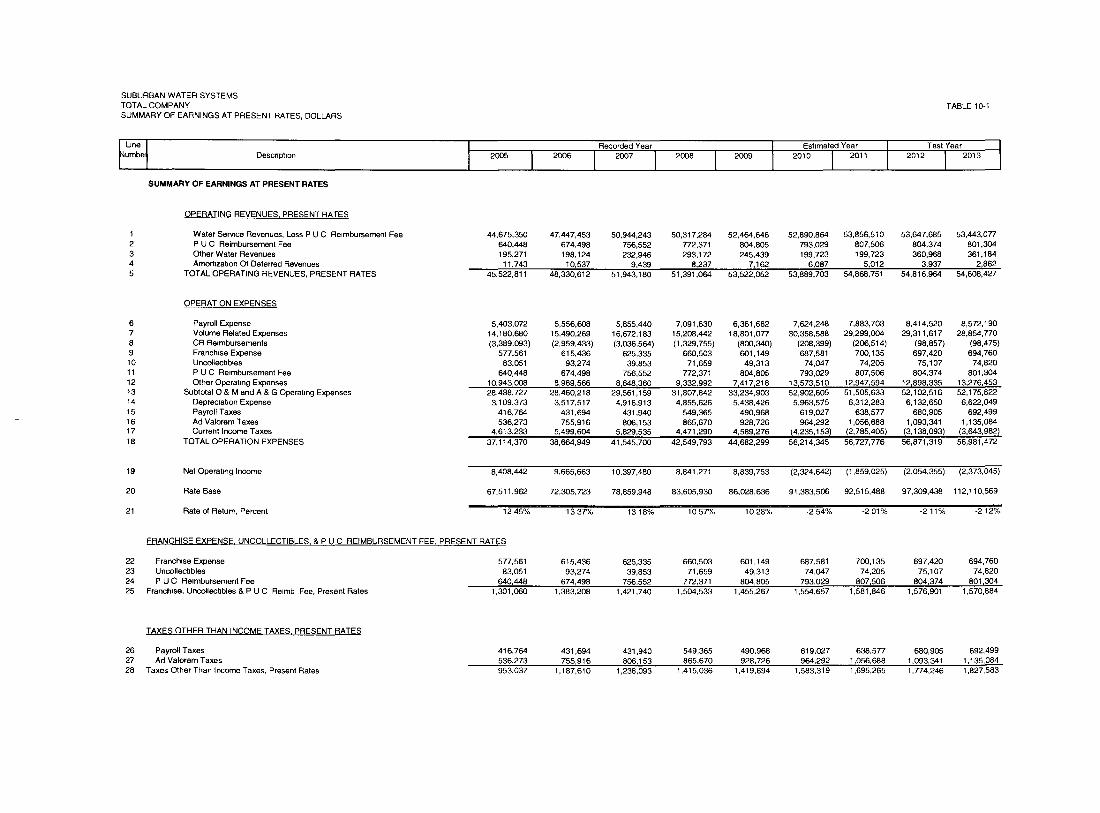
SUBURBAN WATER SYSTEMSTOTALCOMPANYSUMMARY OF EARNINGS AT PRESENT RATES, DOLLARS
FL~neIumbe1 Descnptlon
SUMMARY OF EARNINGS AT PRESENT RATES
2005
TABLE10-1
Estimated Year
Test iear 2013 I
Recorded Year2010 2011 2012
12345
OPERATING REVENUES, PRESENT RATES
Water Service Revenues, Less P U C Reimbursement FeeP U C Reimbursement FeeOther Water RevenuesAmortization Of Deferred Revenues
TOTAL OPERATING REVENUES, PRESENT RATES
OPERATION EXPENSES
6 Payroll Expense7 Volume Related Expenses8 CR Reimbursements9 Franch=se Expense10 Uncoltect=bles11 P U C Rmmbursement Fee12 Other Operat=ng Expenses13 Subtotal O & M and A & G Operating Expenses14 Deprec~at=on Expense15 Payroll Taxes16 Ad Valorem Taxes17 Current Income Taxes18 TOTAL OPERATION EXPENSES
19 Net Operating Income
20 Rate Base
21 Rate of Return, Percent
44,675,350 47,447,453 50,944,243 50,317,284 52,464,646 52,890,864 53,856,510 53,647,685 53,443,077640,448 674,498 756,552 772,371 804,805 793,029 807,506 804,374 801,304195, 271 198,124 232,946 293,172 245,439 199,723 199,723 360,968 361,18411,743 10,537 9,439 8,237 7,162 6,087 5,012 3,937 2,862
45,522,811 48,330,612 51,943,180 51,391,064 53,522,052 53,889,703 54,868,751 54,816,964 54,608,427
5,403,072 5,556,608 5,855,440 7,091,630 6,361,682 7,624,248 7,883,703 8,414,520 8,572,19014,180,680 15,490,269 16,672,183 15,208,442 18,801,077 30,358,588 29,299,004 29,311,617 28,854,770(3,389,093) (2,959,433) (3,036,564) (1,329,755) (800,340) (208,399) (206,514) (98,857) (98,475)
577,561 615,436 625,335 660,503 601,149 687,581 700,135 697,420 694,76083,051 93,274 39,853 71,659 49,313 74,047 74,205 75,107 74,820
640,448 674,498 756,552 772,371 804,805 793,029 807,506 804,374 801,30410~943,008 8,989,566 8,648,360 9,332~992 7t417~218 131573,510 12,947~594 12~898,335 13,276,45328,438,727 28,460,218 29,561,159 31,807,842 33,234,903 52,902,605 51,505,633 52,102,516 52,175,822
3,109,373 3,517,517 4,916,913 4,855,626 5,438,426 5,963,575 6,312,283 6,132,650 6,622,049416,764 431,694 431,940 549,365 490,968 619,027 638,577 680,905 692,499536,273 755,916 806,153 865,670 928,726 964,292 1,056,688 1,093,341 1,135,084
4,613,233 5,499,604 5,829,535 4,471,290 4,589,276 (4,235,153) (2,785,405) (3,138,093) (3,643,982)37,114,370 38,664,949 41,545,700 42,549,793 44,682,299 56,214,345 56,727,776 56,871,319 56,981,472
8,408,442 9,665,663 10,397,480 8,841,271 8,839,753 (2,324,642) (1,859,025) (2,054,355) (2,373,045)
67,511,962 72,305,723 78,859,948 83,605,930 86,028,636 91,383,506 92,515,488 97,309,438 112,110,569
12 45% 13 37% 13 18% 10 57% 10 28% -2 54% -2 01% -2 11% -2 12%
FRANCHISE EXPENSE, UNCOLLECTIBLES, & P U C REIMBURSEMENT FEE, PRESENT RATES
22 Franchise Expense23 Uncollect=bles24 P U C Reimbursement Fee25 Franchise, Uneo|lectlbles & P U C Relmb Fee, Present Rates
577,561 615,436 625,335 660,503 601,149 687,581 700,135 697,420 694,76083,051 93,274 39,853 71,659 49,313 74,047 74,205 75,107 74,820
640,448 674,498 756,552 772,371 804~805 793,029 807,506 804,374 801,3041,301,060 1,383,208 1,421,740 1,504,533 1,455,267 1,554,657 1,581,846 1,576,901 1,570,884
TAXES OTHER THAN INCOME TAXES, PRESENT RATES
26 Payroll Taxes27 Ad Valorem Taxes28 Taxes Other Than Income Taxes, Present Rates
416,764 431,694 431,940 549,365 490,968 619,027 638,577 680,905 692,499536,273 755,916 806,153 865,670 928,726 964,292 1,056,688 1,093,341 1,135,084953,037 1,187,610 1,238,093 1,415,036 1,419,694 1,583,319 1,695,265 1,774,246 1,827,583
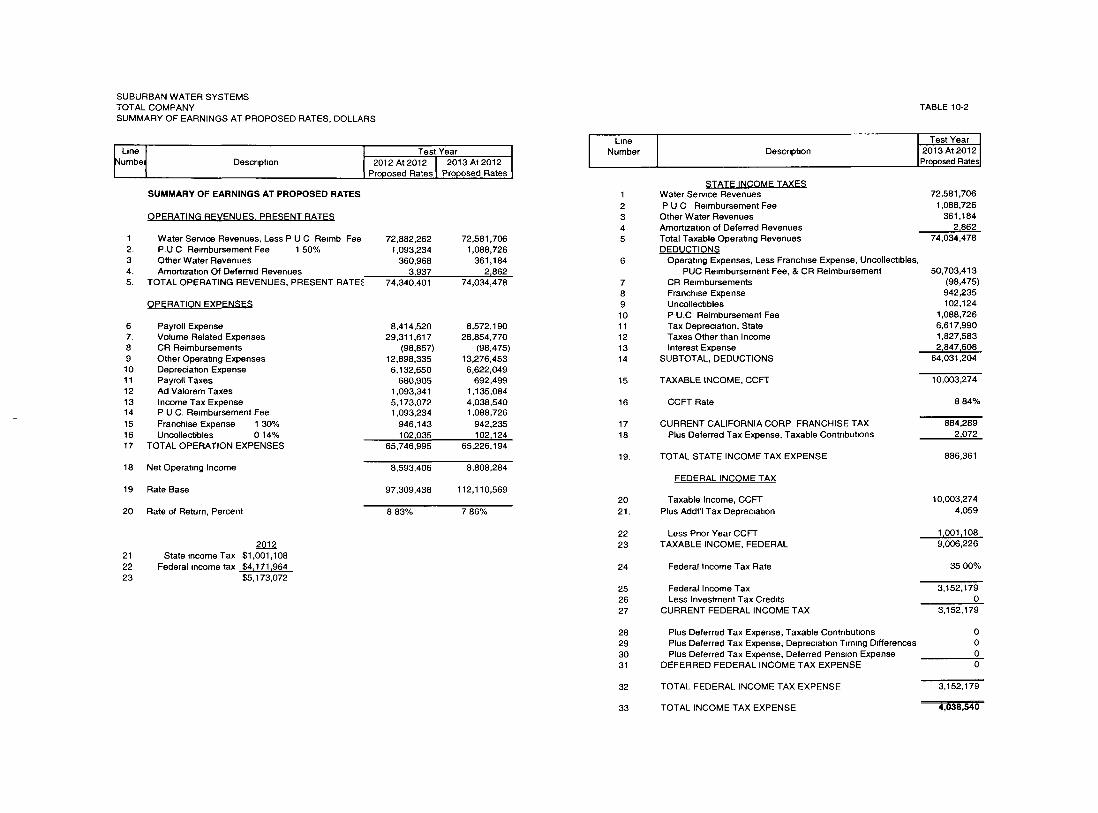
SUBURBAN WATER SYSTEMSTOTAL COMPANYSUMMARY OF EARNINGS AT PROPOSED RATES, DOLLARS
umbeI Descnpt~on 2012 At 2012 2013 At 2012I Proposed Rates Proposed Rates
SUMMARY OF EARNINGS AT PROPOSED RATES
OPERATING REVENUES. PRESENT RATES
1 Water Service Revenues, Less P U C Relmb Fee2. P.U C Re=mbursement Fee 1 50%3 Other Water Revenues4. Amortization Of Deferred Revenues5. TOTAL OPERATING REVENUES, PRESENT RATE~
OPERATION EXPENSES
72,882,262 72,581,7061,093,234 1,088,726
360,968 361,1843~937 2~862
74,340,401 74,034,478
6 Payroll Expense7. Volume Related Expenses8 CR Reimbursements9 Other Operating Expenses10 Depreciation Expense11 Payro~ Taxes12 Ad Valorem Taxes13 Income Tax Expense14 P U C. Reimbursement Fee15 Franchise Expense 1 30%16 Uncollectibles 0 14%17 TOTAL OPERATION EXPENSES
18 Net Operat=ng Income
19 Rate Base
20 Rate of Return, Percent
8,414,520 8,572,19029,311,617 28,854,770
(98,857) (98,475)12,898,335 13,276,4536,132,650 6,622,049
680,905 692,4991,093,341 1,135,0845,173,072 4,038,5401,093,234 1,088,726
946,143 942,235102~035 102~124
65,746,995 65,226,194
8,593,406 8,808,284
97,309,438 112,110,569
8 83% 7 86%
201221 State=ncome Tax $1,001,10822 Federalincome tax $4~171t96423 $5,173,072
LineNumber
12345
789
1011121314
15
16
1718
19.
2021.
2223
24
252627
28293031
32
33
TABLE 10-2
Descnpt~onTest Year I
2013 At 2012Proposed Rates
~;TATE INCOME TAXESWater Serv=ce RevenuesP U C Reimbursement Fee
Other Water RevenuesAmortization of Deferred RevenuesTotal Taxable Operating RevenuesDEDUCTIONS
Operating Expenses, Less Franchise Expense, Uncollect~bles,PUC Reimbursement Fee, & CR Reimbursement
CR ReimbursementsFranch=se ExpenseUncollect=blesP U.C Reimbursement FeeTax Deprec~at=on, StateTaxes Other than IncomeInterest Expense
SUBTOTAL, DEDUCTIONS
72,581,7061,088,726
361,1842~862
74,034,478
50,703,413(98,475)942,235102,124
1,088,7266,617,9901,827,5832~847t608
64,031,204
TAXABLE ~NCOME, CCFT 10,003,274
8 84%
884,2892~072
CCFT Rate
CURRENT CALIFORNIA CORP FRANCHISE TAXPlus Deferred Tax Expense, Taxable Contnbut~ons
TOTAL STATE INCOME TAX EXPENSE 886,361
FEDERAL INCOME TAX
Taxable Income, CCFTPlus Addt’l Tax Depreciation
10,003,2744,059
Less Pnor Year CCFTTAXABLE INCOME, FEDERAL
1~001~1089,006,226
Federal Income Tax Rate 35 00%
3,152,1790
3,152,179
0000
3,152,179
4,038,540
Federal Income TaxLess Investment Tax Credits
CURRENT FEDERAL INCOME TAX
Plus Deferred Tax Expense, Taxable Contnbut=onsPlus Deferred Tax Expense, Deprec=at~on T=m~ng D~fferencesPlus Deferred Tax Expense, Deferred Pension Expense
DEFERRED FEDERAL INCOME TAX EXPENSE
TOTAL FEDERAL INCOME TAX EXPENSE
TOTAL INCOME TAX EXPENSE
ii Chapter - Revenue Requirements
In this chapter revenue requirements are calculated which are intendedto provide a fair rate of return on rate base computed in Chapter 8.
ii.I Rate of Return
Rate of return was determined for Suburban in Decision D.I0-I0-035that resulted from the CPUC’s recent consolidated cost of capitalproceeding:
15. Suburban Water Systems’ cost of capital for its base year
2010 operations is as follows:
Suburban Water Systems Adopted Base Year 2010--A.09-05-005
WeightedRatio Cost Cost
Debt 36% 7.05% 2.54%
Preferred 4% 4.24% 0.17%
Equity 60% 10.20% 6.12%
100% 8.83%
16. Suburban Water Systems must file a Tier 1 advice letter to
implement the rate changes to reflect the change in the 2010 cost
of capital of 8.83%.
17. Suburban Water Systems must file a new cost of capital
application on or before May i, 2012 for a new 2013 base year.
11.2 Revenue Requirements
Revenues required to provide the above-developed return on rate basewith normal water usage for estimated years December 31, 2012 and 2013have been calculated as shown in Table ii-i.
11-1
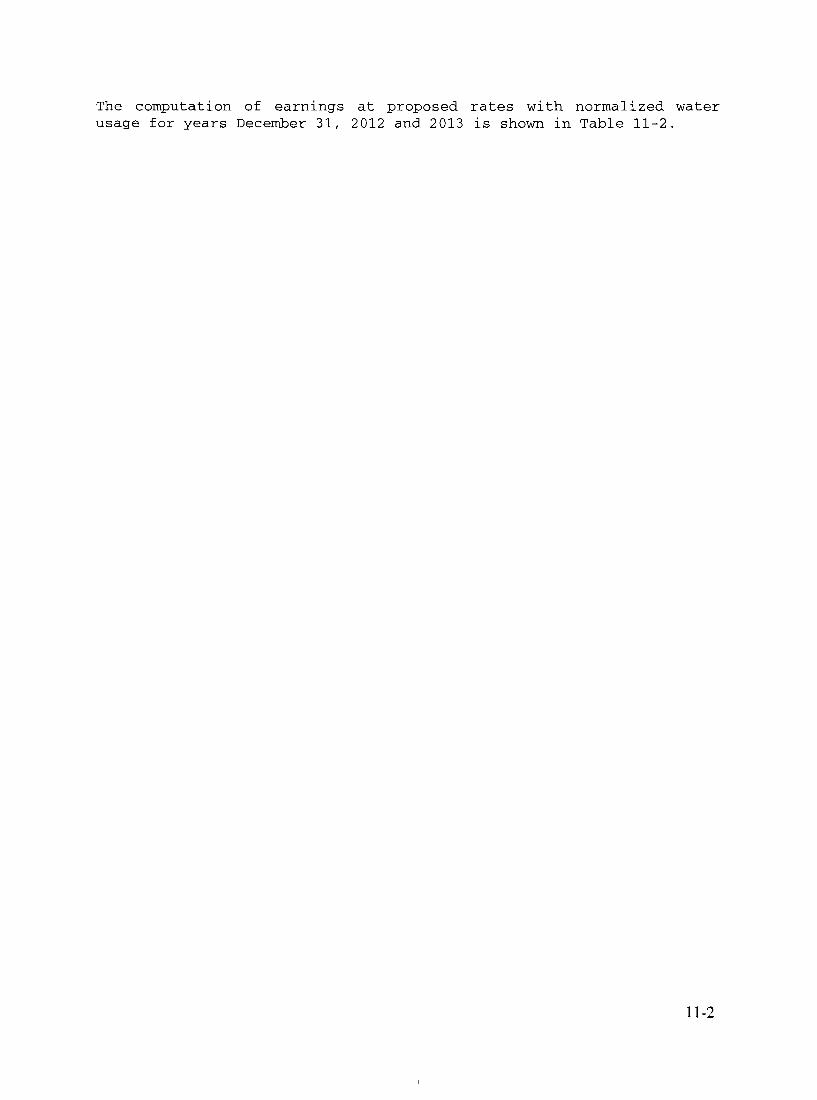
The computation of earnings at proposed rates with normalized waterusage for years December 31, 2012 and 2013 is shown in Table 11-2.
11-2
SUBURBAN WATER SYSTEMSTOTAL COMPANYCOMPUTATION OF REVENUE REQUIREMENTS, DOLLARS
LineNumber REVENUE REQUIREMENTS
1
2.
34.
5
6
Weighted Average Rate Base
Rate of Return Requested
Utd=ty Operabng Income RequiredUtility Operabng Income At Present Rates
Gross Revenues Additional Required
Net-To-Gross Mult~pher
Gross RevenuesAdditional RequiredAt Present Rates
TOTAL
1011
12.
Percent Increase CumulativePercent Increase Annually
PUC Re~mbureement Fee 1 50%
13.1415.
16
17
Net To Gross Mult~pher.Uncollectible AccountsState Corporate Franchise TaxFederal Income Tax
Net-To-Gross Mulhpher
PUC Reimbursement Rate
18.192021.
2012
97,309,438
8.83%
8,592,423(2,054,355)
10,646,779
1.80661
19,234,57753,647,685
72,882,262
35.85%35.85%
$1,093,234
0.14%8.84%
35.00%
1 80661
1 50%
2013
112,110,569
8.83%
9,899,363(2,373,045)
12,272,408
1 80661
22,171,45653,443,077
75,614,533
41 49%4.15%
$1,134,218
0 14%8.84%
35.00%
1 80661
1 50%
Attrition201._.~4
24,144,65553,443,077
77,587,732
45 18%2 61%
$1,163,816
TABLE 11-1
Attrition Calculations for 2014
Flnanclals2014 Proposed Rate of Return2013 Proposed Rate of Return
Difference
8.83%8.83%
0 00%
Operational2013 Rate of Return at 2012 Proposed Rates2012 Rate of Return at 2012 Proposed Rates
Difference
Total Attnt~on
Net to Gross Multlpher
2013 Rate Base
2014 Attrition = Total Attrition X 2013 Rate Base X N T G.Escalation Year 2014 Expense Increase
Operating Revenues for 2014 =(2013 Operat=ng Revenue + 2014 Attnt~on)
Operating Revenue for 2013
Operating Revenue for 2014
Total Increase from 2013 to 2014
7.857%8.831%
0.974%
0.974%
1 80661
$ 112,110,569
$ 1,973,200
$75,978,579
$77,951,778
2.60%
Operating Revenues 2013 2014Water $75,614,533 $77,587,732Other Revenues $361,184 $361,184DefeEed $2~862 $2~862
$75 978,579 $77,951,778
Increase2 61%

SUBURBAN WATER SYSTEMSTOTAL COMPANYSUMMARY OF EARNINGS AT PROPOSED RATES, DOLLARS
TABLE 11-2
L~ne Estimated EstimatedNumber Description Test201 Year 2 Test 201 Year 3
(1) (2)SUMMARY OF EARNINGS AT PROPOSED RATES
OPERATING REVENUES PROPOSED RATES
1 Water Service Revenues, Excludes P U C Reimbursement Fee $72,882,262 $75,614,5332. P U C Reimbursement Fee $1,093,234 1,134,2183 Other Water Revenues $360,968 $361,1844 Amortization Of Deferred Revenues $3,937 $2,8625. TOTAL OPERATI NG REVENUES $74,340,401 $77,112,797
OPERATION EXPENSES
6. Payroll Expense $8,414,520 $8,572,1907 Volume Related Expenses $29,311,617 $28,854,7708. CR Reimbursements ($98,857) ($98,475)9. Other Operating Expenses $12,898,335 $13,276,45310 Depreciation Expense $6,132,650 $6,622,04911 Payroll Taxes $680,905 $692,49912 Ad Valorem Taxes $1,093,341 $1,135,08413 Income Tax Expense $5,173,072 $5,936,19414 P U C Reimbursement Fee $1,093,234 $1,134,21815 Franchise Expense $946,143 981,61316 Uncollectibles $102,035 $105,86017 TOTAL OPERATION EXPENSES $65,746,995 $67,212,455
18 NET OPERATING INCOME $8,593,406 $9,900,342
t9. RATE BASE $97,309,438 $112,110,569
20 RETURN ON RATE BASE, PERCENT 8.83% 8 83%
2012 201321 Stateincome Tax $1,001,108 $1,150,56622. Federalincometax $4,171,964 ,$4,785,62823 $5,173,072 5,936,194
12 Chapter - Rates
The increased rates to provide revenues required as computed inChapter ii are consistent with the two-tier inclining block ratestructure approved for Suburban in 1.07-01-022. We recommendcontinuing that same rate structure Following is a discussion abouthow those rates were designed.
12.1 Rate Design Re: Service Charges Vs. Quantity Charges
The computation of proposed usage rates to recover the usage chargerevenue requirement computed in Table 12-2 is shown in Table 12-3 withseparate rates for each service area.
First of all, service charge type rates were designed in accordancewith the California Urban Water Conservation Council’s (CUWCC) BestManagement Practice (BMP) ii. To encourage conservation, BMP iisuggested a maximum 30 percent threshold for recovery of revenuerequirement from service charge revenue.
Next on Table 12-2 we have to consider the difference in the computedwater production costs computed and the incremental zone ratedifferences intended to recover additional pumping expenses fromcustomers at higher elevations. The first step in the calculation ofproposed zone 1 usage rates is the computation of revenues to begenerated by the difference between service area rates to reflectdifferences in production costs as discussed above. These revenueswere subtracted from the zone 1 revenue requirement with the resultdivided by total water sales to compute the proposed zone 1 usagerate.
The third step was to determine revenues to be generated byincremental zone rates for rate zones 2 and 3, which represent serviceat higher elevations. In this computation, incremental zone revenueswere increased at the same percentage as proposed for total generalservice rates.
The design of proposed service charge rates is shown in Table 12-4.The first step in this computation was to subtract fire servicecharges from the 30 percent of total costs computed in Table 12-2.That amount is then divided by the total number of meter equivalentsto determine the average service charge rate for a 5/8 x 3/4 inchmeter. Average service charges for other meter sizes were computed bymultiplying the service charge for the 5/8 x 3/4 inch meter by thecapacity ratio for each meter size with the 5/8 x 3/4 inch meterassigned a meter capacity ratio of i. Capacity ratios used were thoseprovided to all water utilities by the Commission Water Branch onJanuary 18, 1991.
12-1
12.2 The Necessity To Maintain The Current Residential AndNon-Residential Rate Designs And WRAM
On April 24, 2007 Suburban and the Division of Ratepayer Advocatesfiled a settlement agreement with the Commission (~Settlement") whichwas approved by Decision 08-02-036. The Settlement established atrial program consisting of an increasing block rate design forresidential customers, a uniform rate design for non-residentialcustomers and a related Water Revenue Adjustment Mechanism ("WRAM").
In this proceeding, Suburban proposes that the design of the ratestructure, the customer classes to which the rate structures apply,and the WRAM provided for in that earlier approved Settlement be keptin place during the test years. D.08-02-036, Ordering Paragraph 3,determined that "The Suburban WRAM best meets Suburban’s uniquecircumstances." In addition, Suburban strongly recommends that thecurrent uniform rate structure for Non-Residential customers beretained. The current combination of inclining block residential ratestructure and uniform non-residential rate structure has proven to behighly effective in reducing water demand. The twelve-month movingaverage residential water demand has declined dramatically, 12% in theSan Jose Hills Service Area and an equivalent amount in theWhittier/La Mirada Service Area, since conservation rates wereintroduced on October i, 2008.
Regarding non-residential customers, some of those users are highlywater intensive, such as juice manufacturers, where water is a largecomponent of their cost structure. Again, given the current state ofthe economy, Suburban strongly recommends that for purposes of thisproceeding that the trial program of inclining block rates not beexpanded beyond the current residential customer class.
12.3 Rate Design Re: Residential Customers
The current rate design for residential customers includes two blockswith the break points between blocks set based on historic consumptionpatterns by meter size and zones. The upper level of Block 1 is setat the midpoint between average monthly (annual) consumption andaverage summer consumption. Block 2 is for all usage beyond the topof Block i. A two-block rate design was selected because thedifference between summer and winter usage is not significant enoughto make a third block necessary or meaningful. Seasonality has beenconsidered in the calculation of the usage breakpoints for the variousmeter sizes.
The residential rate design also assigns differing usage breakpointsfor the blocks for different meter sizes (with the exception of 5/8-inch and ¾-inch meters, which have the same break points). This two-tier rate structure with break points by meter size, we are able tominimize the rate impact on large households. This is particularlyrelevant for larger meters that serve multi-unit residentialbuildings, which often house low-lncome tenants. Although Suburbandoes not track multi-unit residential buildings separately, thesebuildings tend to have larger meters. This helps to prevent customerswith larger meters that serve multi-unit residential buildings from
12 -2
being disproportionately affected by moving too quickly to the secondblock and thus facing inordinately high conservation rates in thesecond block.
This residential rate design maintains the same breakpoints by metersize across the three zones in each service area (i.e., breakpointsare the same for every 5/8-inch meter whether it is located in Zone 1or Zone 2 or Zone 3). We have also maintained the same unit ratesacross all meter sizes within an individual zone (i.e. every customerin Block 1 in Zone 2 pays the same rate, which is different from thatpaid in Zones 1 or 3).
Depending on the service area, San Jose Hills and Whittier/La Mirada,the Block 1 price provides a 2% - 2.5% discount from the authorizedsingle quantity rate. The Block 2 rate has been set to encouragewater conservation, taking into account the consumption patterns ofeach meter size, and with the goal of achieving revenue neutrality ascompared with the revenue that would have been collected using thesingle quantity rate. The rates for Block 2 were set at 8% to 14%above the Block 1 rate.
12.4 Rate Design Re: Non-Residential Customers
Suburban recommends that the current uniform rate structure for non-residential customers be maintained for the reasons previously stated.
12.5 Rate Design Re: Fire Service Charges
The design of proposed fire service charges is shown on Table 12-5.In these computations, private fire service revenues in total wereincreased the same percentage as general service revenues.
12.6 Proposed Rates
Proposed rates, as computed above, are shown in simplified form inTable 12-6.
12.7 Revenue at Proposed Rates
Revenues at proposed rates are shown in Table 12-7.
12.8 Revenue Comparisons
Comparisons of revenues at present and proposed rates by customerclass are shown in Table 12-8.
12-3
Differences shown in the revenue comparisons result from differencesin the present San Jose Hills and Whittier/La Mirada Service Arearates, as well as from different usage patterns by the differentcustomer classes.
12.9 Bill Comparisons - Non-Residential Customers
Shown in Tables 12-10 through 12-19 are non-residential billcomparisons for several meter sizes and various usages with proposedrates as compared to present rates.
12.10 Bill Comparisons - Residential Customers
Shown in Tables 12-22 through 12-27 are residential customer billcomparisons for several meter sizes and various usages with proposedrates as compared to present rates.
12.11 Water Revenue Adjustment Mechanism (WRAM)
Proposed rates include a Water Revenue Adjustment Mechanism (WRAM)based on the WRAM established for California-American Water’s MontereyDistrict. The selection of this style WRAM is driven by Suburban’smost recent GRC decision, which specified that this type of WRAM wouldbe used (D.06-08-017, p. ii).
12.12 Low Income Ratepayer Assistance Program (LIRA)
Decision 08-02-032 also approved the low-income ratepayer assistanceprogram memorialized in an April 24, 2007 Settlement between Suburbanand the Division of Ratepayer Advocates. That LIRA program has beenimplemented.
The Low Income Ratepayer Assistance Settlement provides that the LIRAprogram will provide low income assistance to all eligible residentialcustomers with 5/8" x ¾" and 3/4 " metered service who meet the incomelevel for the California Alternate Rates For Energy (CARE) Program.
Eligible customers will receive a flat monthly credit of $6.50. Thisamount was chosen because it represents approximately 15 percent ofthe average monthly customer bill. Credits will be adjusted onlyduring general rate case proceedings if necessary. Non-profit groupliving facilities, agricultural employee housing facilities, andmigrant farm worker housing centers will receive a flat monthly creditof $20.00.
Suburban funds the LIRA program with a monthly volumetric surcharge onevery unit of water sold. The volumetric surcharge is $.031 per
12 -4
hundred cubic feet (Ccf) of water billed per month. Differencesbetween amounts collected and disbursed are recorded in a balancingaccount.
12.13 Fire Flow Testing Fee
Suburban requests a Fire Flow Testing Fee of $212.00 per test. Thisfee will apply to tests performed on distribution systems in theentire territory served by Suburban. Currently Suburban does notcharge a fee for performing fire-flow tests. Consequently, the costof performing the service is passed on to the ratepayers. Those whorequest a fire-flow test should pay the cost of performing the test.A similar charge has been approved for California Water Service (CalWater Advice Letter No. 1960-A)
12-5
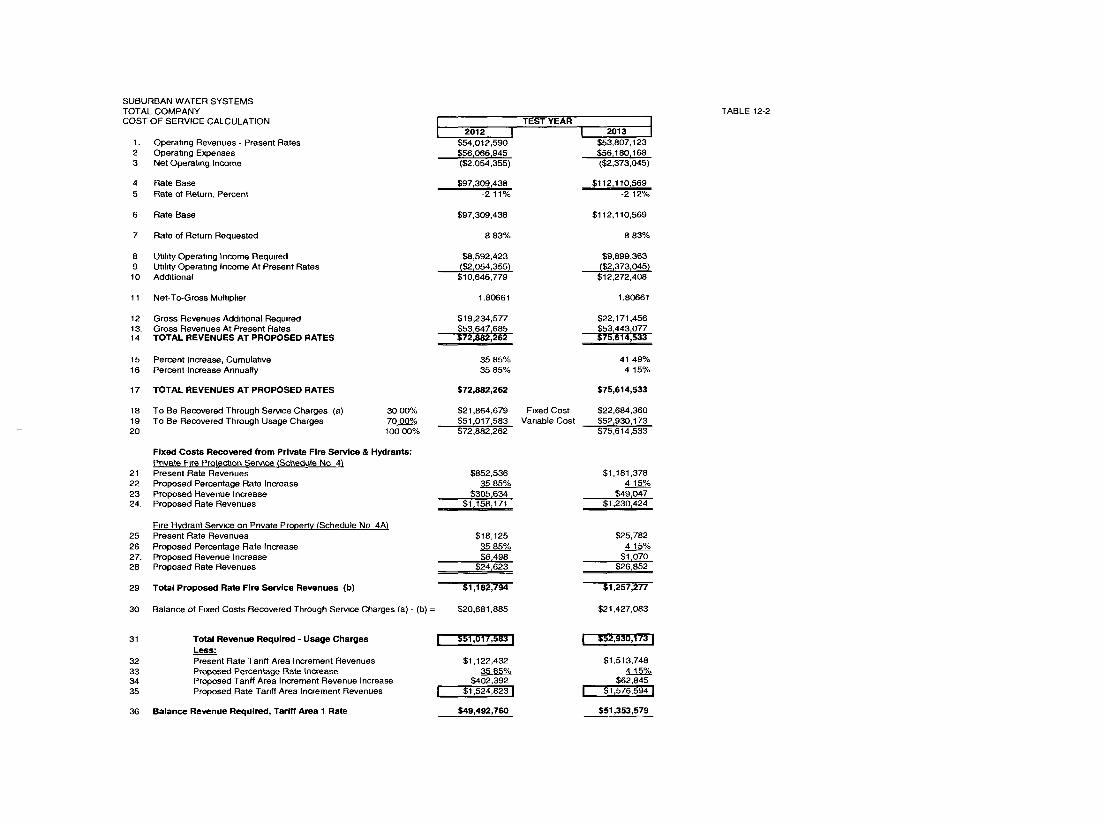
SUBURBAN WATER SYSTEMSTOTAL COMPANYCOST OF SERVICE CALCULATION
1. Operating Revenues - Present Rates2 Operating Expenses3 Net Operating Income
4 Rate Base5 Rate ot Return, Percent
2012$54,012,590$56~066~945($2,054,355)
TEST YEAR2013
$53,807,123$56~180~168($2,373,045)
$97,309,438-2 11%
$112,110,569-2 12%
6 Rate Base $97,309,438 $112,110,569
7 Rate of Return Requested 8 83% 8 83%
8 Utd~ty Operating Income Requ=red9 Utlhty Operating Income At Present Rates10 Additional
$8,592,423($2~054~355)
$10,646,779
$9,899,363($2~373~045)
$12,272,408
11 Net-To-Gross Mulbpher 1.80661 1.80661
12 Gross Revenues Additional Requ=red13. Gross Revenues At Present Rates14 TOTAL REVENUES AT PROPOSED RATES
$19,234,577$53~647~685$72,882,262
$22,171,456$53~443~077$75,614,533
15 Percent Increase, Cumulative16 Percent Increase Annually
17 TOTAL REVENUES AT PROPOSED RATES
3585%3585%
$72,882,262
41 49%4 15%
$75,614,533
18 To Be Recovered Through Serwce Charges (a) 30 00%19 To Be Recovered Through Usage Charges 70 00%20 100 00%
$21,864,679 F=xed Cost $22,684,360$51,017,583 Vanable Cost $52,930,173$72,882,262 $75,614,533
Fixed Costs Recovered from Private Fire Service & Hydrants:Prwate F~re Protection Service (Schedule No 4’~
21 Present Rate Revenues $852,53622 Proposed Percentage Rate Increase 35 85%23 Proposed Revenue Increase $305,63424. Proposed Rate Revenues $1,158,171
$1,181,3784 15%
$49~047$1,230,424
F~re Hydrant Service on Private Property (Schedule No 4A)25 Present Rate Revenues $18,125 $25,78226 Proposed Percentage Rate Increase 35 85% 4 15%27. Proposed Revenue Increase $6~498 $1~07028 Proposed Rate Revenues $24,623 $26,852
29 Total Proposed Rate Fire Service Revenues (b) $1,182,794 $1,257,277
$21,427,083
$52,930,173
30 Balance of F=xed Costs Recovered Through Serv~se Charges (a) - (b) = $20,681,885
TABLE 12-2
31 Total Revenue Required - Usage Charges [ $51,017,583Less:
32 Present Rate Tanff Area Increment Revenues $1,122,43233 Proposed Percentage Rate h~crease 35 85%34 Proposed Tariff Area Increment Revenue Increase $402,39235 Proposed Rate Tariff Area Increment Revenues I $1,524,823
36 Balance Revenue Required, Tariff Area 1 Rate $49,492,760
$1,513,7484 15%
$62,845I $1,576,5941
$51,353,579
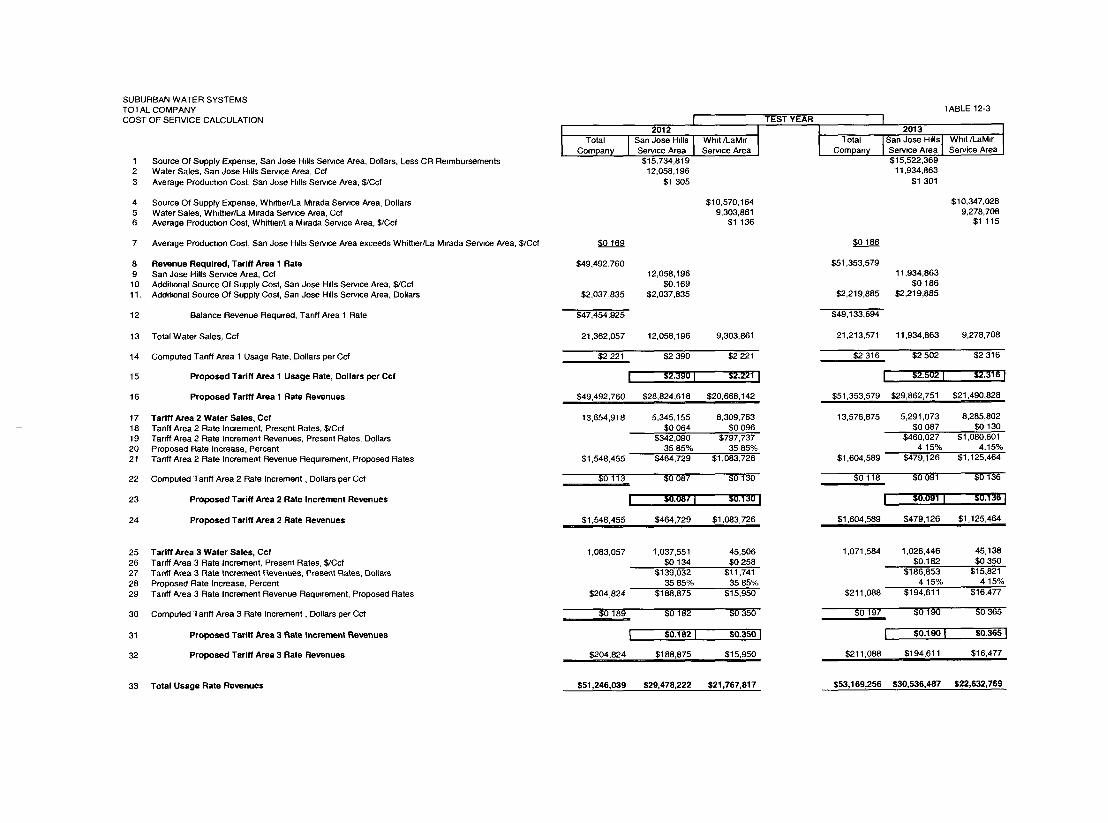
SUBURBAN WATER SYSTEMSTOTAL COMPANYCOST OF SERVICE CALCULATION
1 Source Of Supply Expense, San Jose Hdls Serv=ce Area, Dollars, Less CR Reimbursements2 Water Sales, San Jose Hdls Service Area, Ccf3 Average Product=on Cost, San Jose Hdls Serv=ce Area, $/Ccf
4 Source Of Supply Expense, Whdt~er/La M~rada Sen/~ce Area, Dollars5 Water Sales, Whdt~er/La M~rada Serwce Area, Ccf6 Average Product=on Cost, Whitl=er/La M=rada Serv=ce Area, $/Ccf
7 Average Preduct=on Cost, San Jose Hdls Service Area exceeds Whitt=er/La M~rada Service Area, $/Ccf
8 Revenue Required, Tariff Area I Rate9 San Jose Hills Serv=ce Area, Ccf10 Additmnal Source Of Supply Cost, San Jose Hdls Serv=ce Area, $/Ccf11. Addd=onal Source Of Supply Cost, San Jose Hdls Service Area, Dollars
12
13
14
15
16
Balance Revenue Required, Tarrff Area 1 Rate
Total Water Sales, Ccf
Computed Tariff Area 1 Usage Rate, Dollars per Ccf
Proposed Tariff Area I Usage Rate, Dollars per Ccf
Proposed Tariff Area 1 Rate Revenues
17 Tariff Area 2 Water Sales, Ccf18 Tariff Area 2 Rate Increment, Present Rates, $/Ccf19 Tanff Area 2 Rate Increment Revenues, Present Rates, Dollars20 Proposed Rate Increase, Percent21 Tarrff Area 2 Rate Increment Revenue Requ=rement, Proposed Rates
22 Computed Tariff Area 2 Rate Increment, Dollars per Ccf
23
24
Proposed Tariff Area 2 Rate Increment Revenues
Proposed Tariff Area 2 Rate Revenues
ITotal San Jose Hdls Wh=t/LaMer
Compan}, Serwce Area Service Area$15,734,819
12,058,196$1 305
TEST YEARTABLE 12-3
ITotal San Jose HdlsJ Wh~t/LaMer
Company Se~me Area J Se~ice Area$15,522,369
11,934,863$1 301
$10,570,1649,303,861
$1 136
$10,347,0289,278,708
$1 115
$49,492,76012,058,196
$0.169$2,037,835 $2,037,835
$47,454,925
21,362,057 12,058,196 9,303,861
$2 221 $2 390 $2 221
I $2"3901 $2.221
$49,492,760 $28,824,618 $20,668,142
13,654,918 5,345,155 8,309,763$0 064 $0 096
$342,090 $797,73735 85% 35 85%
$1,548,455 $464,729 $1,083,726
$0 113 $0 087 $0 130
I =°’°871 =°’1~°1$1,548,455 $464,729 $1,083,726
$51,353,57911,934,863
$0 186$2,219,885 $2,219,885
$49,133,694
13,576,875
$1,604,589
$0118
$1,604,589
5,291,073 8,285,802$0 087 $0 130
$460,027 $1,080,6014 15% 4.15%
$479,126 $1,125,464
$0 091 $0136
$0.0911 $°’1~1$479,126 $1,125,464
25 Tariff Area 3 Water Sales, Ccf26 Tariff Area 3 Rate Increment, Present Rates, $/Ccf27 Tardf Area 3 Rate Increment Revenues, Present Rates, Dollars28 Proposed Rate Increase, Percent29 Tanff Area 3 Rate Increment Revenue Requ=rement, Proposed Rates
30 Computed Tariff Area 3 Rate Increment, Dollars per Ccf
31
32
Proposed Tariff Area 3 Rate Increment Revenues
Proposed Tariff Area 3 Rate Revenues
1,083,057 1,037,551 45,506$0 134 $0 258
$139,032 $11,74135 85% 35 85%
$204,824 $188,875 $15,950
$0 189 $0 182 $0350
I $°.~821 $o.35o1
$204,824 $188,875 $15,950
$51,246,039 $29,478,222 $21,767,817
1,071,584 1,026,446 45,138$0.182 $0350
$186,853 $15,8214 15% 4 15%
$211,088 $194,611 $16,477
$0 197 $0 190 $0 365
[ S0.190 I S0.365 [
$211,088 $194,611 $16,477
$53,169,256 $30,536,487 $22,632,76933 Total Usage Rate Revenues
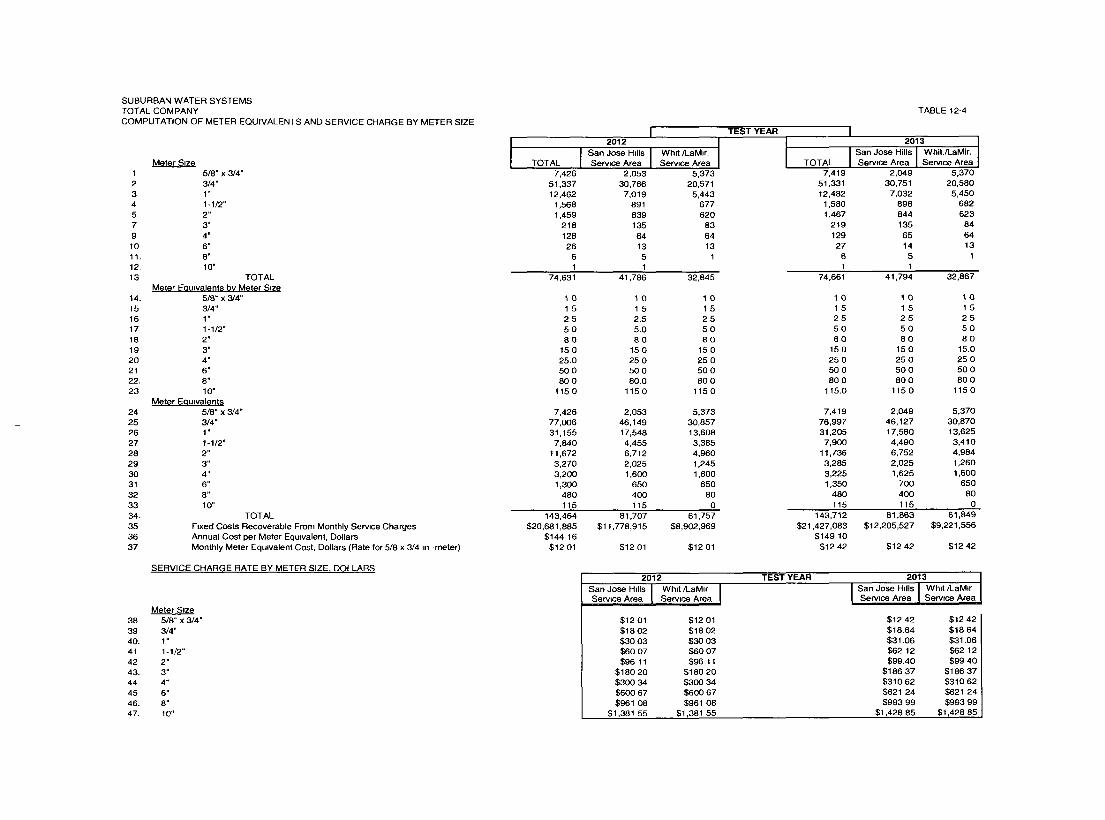
SUBURBAN WATER SYSTEMSTOTAL COM PANYCOMPUTATION OF METER EQUIVALENTS AND SERVICE CHARGE BY METER SIZE
Meter S~ze1 5/8" x 3/4"2 3/4"3 1"4 1-1/2"5 2"7 3"9 4"10 6"11. 8"12. 10"13 TOTAL
Meter Equivalents by Meter S=ze14. 5/8" x 3/4"15 3/4"16 1"17 1-1/2"18 2"19 3"20 4"21 6"22. 8"23 10"
Meter Eau=valents24 5/8" x 3/4"25 3/4"26 1"27 1-1/2"28 2"29 3"30 4"31 6"32 8"33 10"34. TOTAL35 Fixed Costs Recoverable From Monthly Service Charges36 Annual Cost per Meter Equivalent, Dollars37 Monthly Meter Equivalent Cost, Dollars (Rate for 5/8 x 3/4 in -meter)
SERVICE CHARGE RATE BY METER SIZE DOLLARS
Meter Size38 5/8" x 3/4"39 3/4"40. 1"41 1-1/2"42 2"43. 3"44 4"45 6"46. 8"47. 10"
TABLE12-4
TOTAL7,426
51,33712,462
1,5681,459
2181282661
74,631
2012San Jose HdlsService Area
2,05330,7667,019
891839135
641351
41,786
Wh~t ~aM~r.Se~ceA~a
5,37320,571
5,443677620
836413
1
32,845
TEST YEAR I2013 I
I San Jose Hills Whit./LaMir.ITOTAL Serv~ceArea Se~ceArea
7,419 2,049 5,37051,331 30,751 20,58012,482 7,032 5,4501,580 898 6821,467 844 623
219 135 84129 65 64
27 14 136 5 11 1
74,661 41,794 32,867
10 10 1015 15 1525 2.5 2550 5.0 5080 80 80
150 150 15025.0 25 0 25 050 0 50 0 50 080 0 80.0 80 0
1150 1150 1150
7,426 2,053 5,37377,006 46,149 30,85731,155 17,548 13,608
7,840 4,455 3,38511,672 6,712 4,9603,270 2,025 1,2453,200 1,600 1,6001,300 650 650
480 400 80115 115 0
143,464 81,707 61,757$20,681,885 $11,778,915 $8,902,969
$144 16$12 01 $12 01 $12 01
10 10 1015 15 1525 25 2550 50 5080 80 80
15 0 15 0 15.025 0 25 0 25 050 0 50 0 50 080 0 80 0 80 0
115.0 1150 1150
7,419 2,049 5,37076,997 46,127 30,87031,205 17,580 13,625
7,900 4,490 3,41011,736 6,752 4,9843,285 2,025 1,2603,225 1,625 1,6001,350 700 650
480 400 80115 115 0
143,712 81,863 61,849$21,427,083 $12,205,527 $9,221,556
$149 10$12 42 $12 42 $12 42
2012San Jose Hllls ! Wh,t/LaMlrIService Area Service Area
$12 01 $12 01$18 02 $18 02$30 03 $30O3$6O O7 $60 07$96 11 $96 11
$180 20 $180 20$30034 $30034$600 67 $60067$961 08 $961 08
$1,381 55 $1,381 55
TEST YEAR 2013ISanJoseHlllsl Whlt/LaM,r
Service Area Service Area
$12 42 $12 42$18.64 $18 64$31.06 $31.06$62.12 $62 12$99.40 $99 40
$186 37 $186 37$310 62 $310 62$621 24 $621 24$993 99 $993 99
$1,428 85 $1,428 85
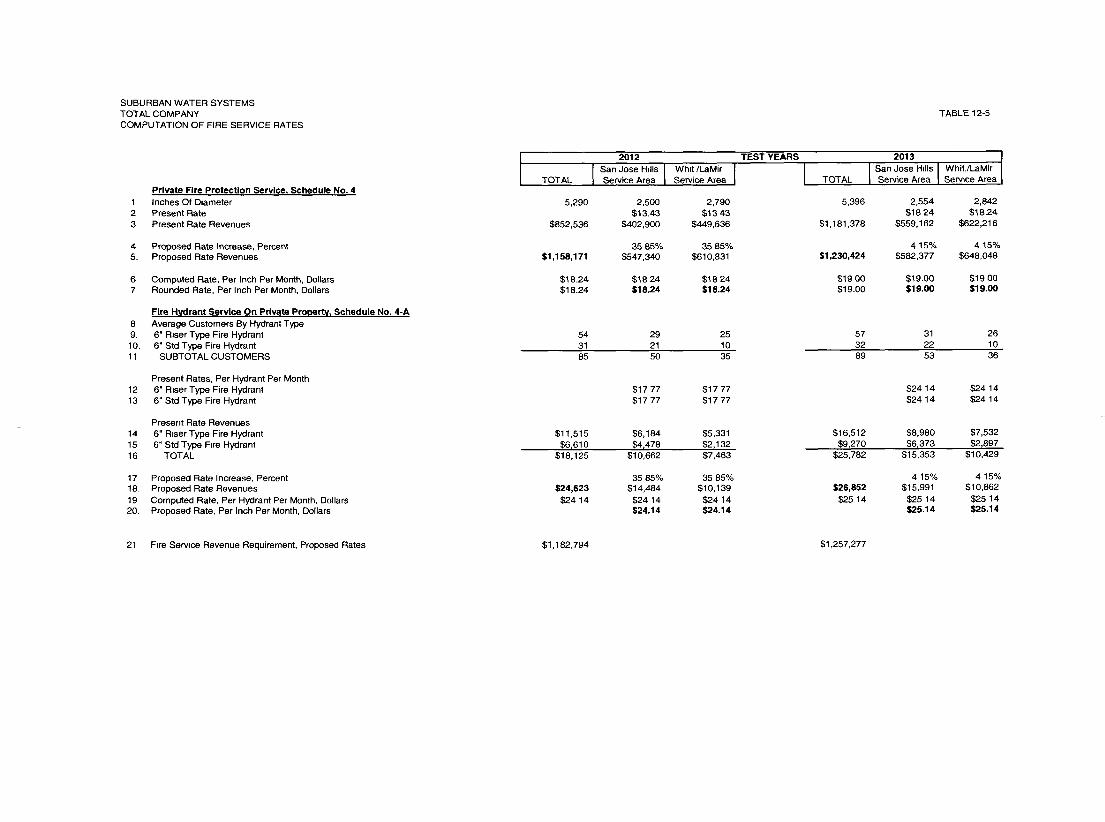
SUBURBAN WATER SYSTEMSTOTAL COMPANYCOMPUTATION OF FIRE SERVICE RATES
Private Fire Protection Service~ Schedule No. 41 Inches Of D~ameter2 Present Rate3 Present Rate Revenues
4 Proposed Rate Increase, Percent5. Proposed Rate Revenues
6 Computed Rate, Per Inch Per Month, Dollars7 Rounded Rate, Per Inch Per Month, Dollars
Fire Hydrant Service On Private Property1 Schedule No. 4-A8 Average Customers By Hydrant Type9. 6" R~ser Type Fire Hydrant10. 6" Std Type Fire Hydrant11 SUBTOTAL CUSTOMERS
Present Rates, Per Hydrant Per Month12 6" R~ser Type Fire Hydrant13 6" Std Type Fire Hydrant
Present Rate Revenues14 6" Riser Type Fire Hydrant15 6" Std Type Fire Hydrant16 TOTAL
17 Proposed Rate Increase, Percent18. Proposed Rate Revenues19 Computed Rate, Per Hydrant Per Month, Dollars20. Proposed Rate, Per Inch Per Month, Dollars
TABLE 12-5
TOTAL
5,290
$852,536
2012San Jose HdlsService Area
2,500$13.43
$402,900
Wh~t/LaMirService Area
2,790$13 43
$449,636
TEST YEARS
TOTAL
5,396
$1,181,378
2013
ISan Jose HdlsService Area
2,554$18 24
$559,162
IWhit./LaMir IServtce Area
2,842$18.24
$622,216
$1,158,17135 85%
$547,34035 85%
$610,631 $1,230,4244 15%
$582,3774 15%
$648,048
$18.24$18.24
$18 24$18.24
$18 24$18.24
$19 00$19.00
$19.00$19,00
$19 00$19.00
543185
29215O
251035
573289
312253
261036
$17 77$17 77
$17 77$17 77
$24 14$24 14
$24 14$2414
$11,515$6,610
$18,125
$6,184$4~478
$10,662
$5,331$2,132$7,463
$24,623$24 14
3585%$14,484
$24 14$24,14
35 85%$10,139$24 14$24.14
$16,512$9t270
$25,782
$8,980$6~373
$15,353
$7,532$2,897
$10,429
$26,852$25 14
4 15%$15,991
$25 14$25.14
4 15%$10,862
$25 14$25.14
21 F~re Servme Revenue Requirement, Proposed Rates $1,182,794 $1,257,277
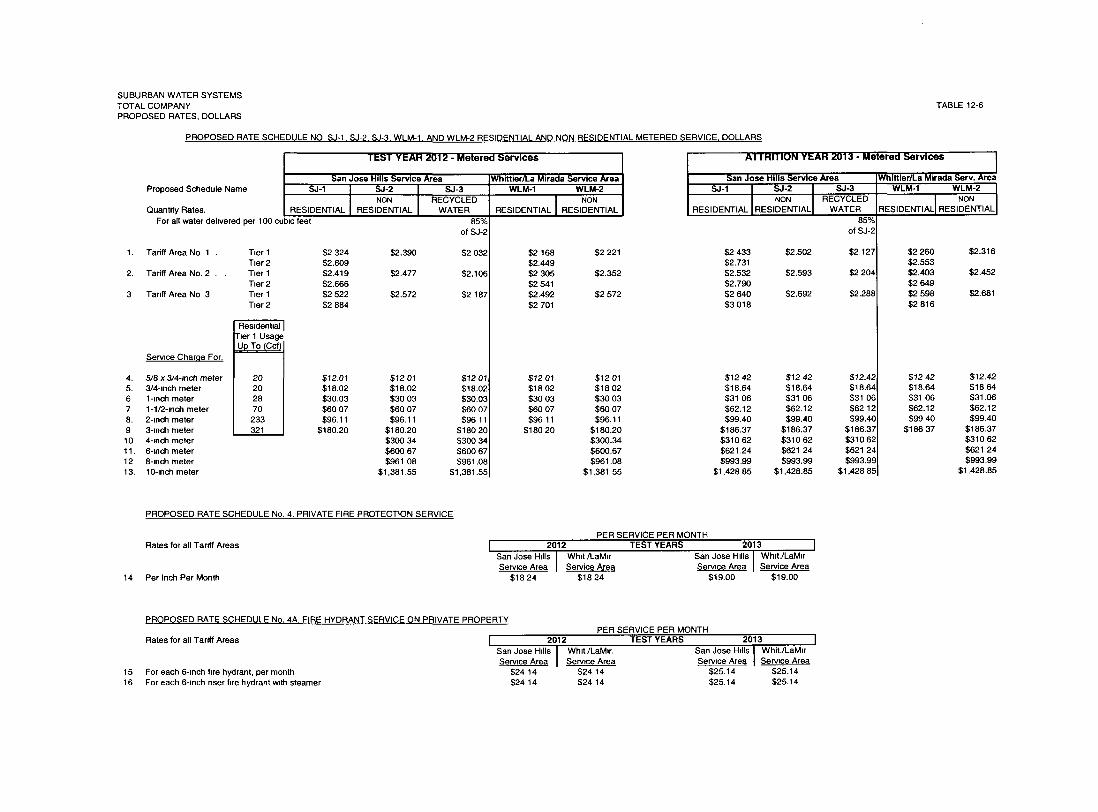
SUBURBAN WATER SYSTEMSTOTAL COMPANYPROPOSED RATES, DOLLARS
TABLE 12-6
PROPOSED RATE SCHEDULE NO S J-l, S J-2, S J-3, WLM-1, AND WLM-2 RESIDENTIAL AND NON RESIDENTIAL METERED SERVICE DOLLARS
TEST YEAR 2012 - Metered Services
San Jose Hills Service AreaSJ-1 S J-2 I SJ-3
RESIDENTIALNON
IRECYCLED
RESIDENTIAL WATER
Proposed Schedule Name
Quantity Rates.For all water dehvered per 100 cubic feet 85%
of S J-2
1. Tariff Area No 1 . T~er I $2 324 $2.390 $2 032T~er 2 $2.609
2. Tariff Area No. 2 . . T~er I $2.419 $2.477 $2.106T~er 2 $2.666
3 Tariff Area No 3 T~er I $2 522 $2.572 $2 187T~er 2 $2 884
T~er 1 Usage
2028
321 I
Serv=ce Charqe For.
4. 5/8 x 3/4-inch meter $12.0! $12 01 $12 015. 3/4-inch meter $!8.02 $18.02 $18.026 1-=nch meter $30.03 $30 03 $30.037 1-1/2-inch meter $60 07 $60 07 $60 078. 2-tnch meter $96.11 $96.11 $96 119 3-inch meter $180.20 $180.20 $180 2010 4-inch meter $300 34 $300 3411. 6-inch meter $600 67 $600 6712 8-Inch meter $961 08 $961.0813. 10-inch meter $1,381.55 $1,381.55
Whittier/La Mirada Service AreaWLM-1 WLM-2
NONRESIDENTIAL RESIDENTIAL
$2 168 $2 221$2.449$2 305 $2.352$2 541$2.492 $2 572$2 701
ATI-RITION YEAR 2013 - Metered Services JI
San Jose Hills Service Area Whittier/La Mirada Serv. AreaS J-1 SJ-2 S J-3 WLM-1 WLM-2
NON RECYCLED NONRESIDENTIAL RES DENT AL WATER RESIDENT AL RES DENT AL
85%of S J-2
$2 433 $2.502 $2.127$2.731$2.532 $2.593 $2 204$2.790$2 640 $2.692 $2.288$3 018
$12 01 $12 01 $12 42 $12 42 $12.42$18 02 $18 02 $18.64 $18.64 $18.64$30 03 $30 03 $31 06 $31 06 $31 06$60 07 $60 07 $62.12 $62.12 $62 12$96 11 $96.11 $99.40 $99.40 $99.40
$180 20 $180.20 $186.37 $186.37 $186.37$300.34 $310 62 $310 62 $310 62$600.67 $621.24 $621 24 $621 24$961.08 $993.99 $993.99 $993.99
$1,381 55 $1,428 85 $1,428.85 $1,428 85
$2 260 $2.316$2.553$2.403 $2.452$2649$2.598 $2.681$2 816
$12 42$18.64$3106$62.12$99 40
$186 37
$12.42$1864$31.06$62.12$99.40
$186.37$310 62$621 24$993.99
$1,428.85
14
PROPOSED RATE SCHEDULE No. 4, PRIVATE FIRE PROTECTION SERVICE
Rates for all Tariff Areas
Per Inch Per Month
PER SERVICE PER MONTH2012 TEST YEARS 2013
San Jose Hdls I Wh~t/LaMer San Jose Hdls Wh~t./LaM~rService AreaI Service Area Service Area Service Area
$18 24 $18 24 $19.00 $19.00
1516
PROPOSED RATE SCHEDULE No. 4A FIRE HYDRANT SERVICE ON PRIVATE PROPERTYPER SERVICE PER MONTH
Rates for all Tariff Areas I 2012 TEST YEARS 2013San Jose Hills I Wh~t/LaM=r. San Jose Hdls I Whit./LaM~rService Area I Service Area Service AreaI Service Area
For each 6-inch fire hydrant, per month $24 14 $24 14 $25.14 $25.14For each 6-Inch r~ser fire hydrant w~th steamer $24 14 $24 14 $25.14 $25.14
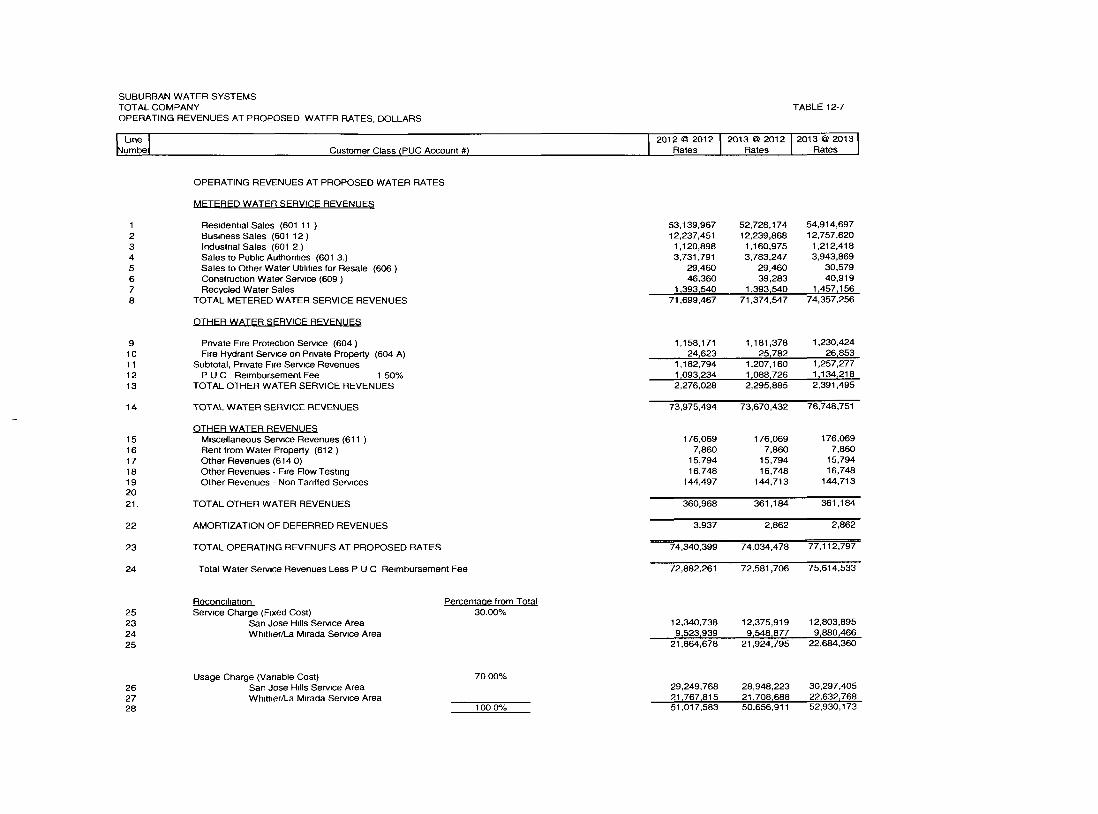
SUBURBAN WATER SYSTEMSTOTAL COMPANYOPERATING REVENUES AT PROPOSED WATER RATES, DOLLARS
umbeI
12345678
910111213
14
15161718192021.
22
23
24
TABLE12-7
Customer Class (PUC Account #) 12012@201212013@201212013@2013Rates Rates Rates
OPERATING REVENUES AT PROPOSED WATER RATES
METERED WATER SERVICE REVENUES
Residential Sales (601 11 )Bus=ness Sales (601 12)Industr=al Sales (601 2.)Sales to Public Authont~es (601 3.)Sales to Other Water Ut=l=t~es for Resale (606)Construct=on Water Serv=ce (609)Recycled Water Sales
TOTAL METERED WATER SERVICE REVENUES
OTHER WATER ~ERVICE REVENt,JE~
Private F~re Protect=on Serv=ce (604)F~re Hydrant Serwce on Private Property (604 A)
Subtotal, Pr~vate F=re Service RevenuesP U C Reimbursement Fee 1 50%
TOTAL OTHER WATER SERVICE REVENUES
53,139,967 52,728,174 54,914,69712,237,451 12,239,868 12,757,620
1,120,898 1,160,975 1,212,4183,731,791 3,783,247 3,943,869
29,460 29,460 30,57946,360 39,283 40,919
1 ~393~540 1 ~393~540 1 ~457~15671,699,467 71,374,547 74,357,256
1,158,171 1,181,378 1,230,42424~623 25~782 26~853
1,182,794 1,207,160 1,257,2771 ~093~234 1 ~088~726 1 ~134~2182,276,028 2,295,885 2,391,495
TOTAL WATER SERVICE REVENUES
OTHER WATER REVENUESM=scellaneous Serv=ce Revenues (611 )Rent from Water Property (612)Other Revenues (614 0)Other Revenues - F~re Flow TestingOther Revenues - Non Tar=ffed Services
TOTAL OTHER WATER REVENUES
AMORTIZATION OF DEFERRED REVENUES
TOTAL OPERATING REVENUES AT PROPOSED RATES
Total Water Serv=ce Revenues Less P U C Re=mbursement Fee
73,975,494 73,670,432 76,748,751
176,069 176,069 176,0697,860 7,860 7,860
15,794 15,794 15,79416,748 16,748 16,748
144,497 144,713 144,713
360,968 361,184 361,184
3,937 2,862 2,862
74,340,399 74,034,478 77,112,797
72,882,261 72,581,706 75,614,533
25232425
Reconcd=at=onService Charge (F~xed Cost)
San Jose H=lts Service AreaWh=tt~er/La M=rada Service Area
Percentaae from Total30.00%
12,340,738 12,375,919 12,803,8959~523t939 9~548~877 9~880~466
21,864,678 21,924,795 22,684,360
262728
Usage Charge (Var=able Cost)San Jose H=lls Serv=ce AreaWh~tt~er/La M~rada Service Area
70 00%
100 0%
29,249,768 28,948,223 30,297,40521~767~815 21~708~688 22~632~76851,017,583 50,656,911 52,930,173
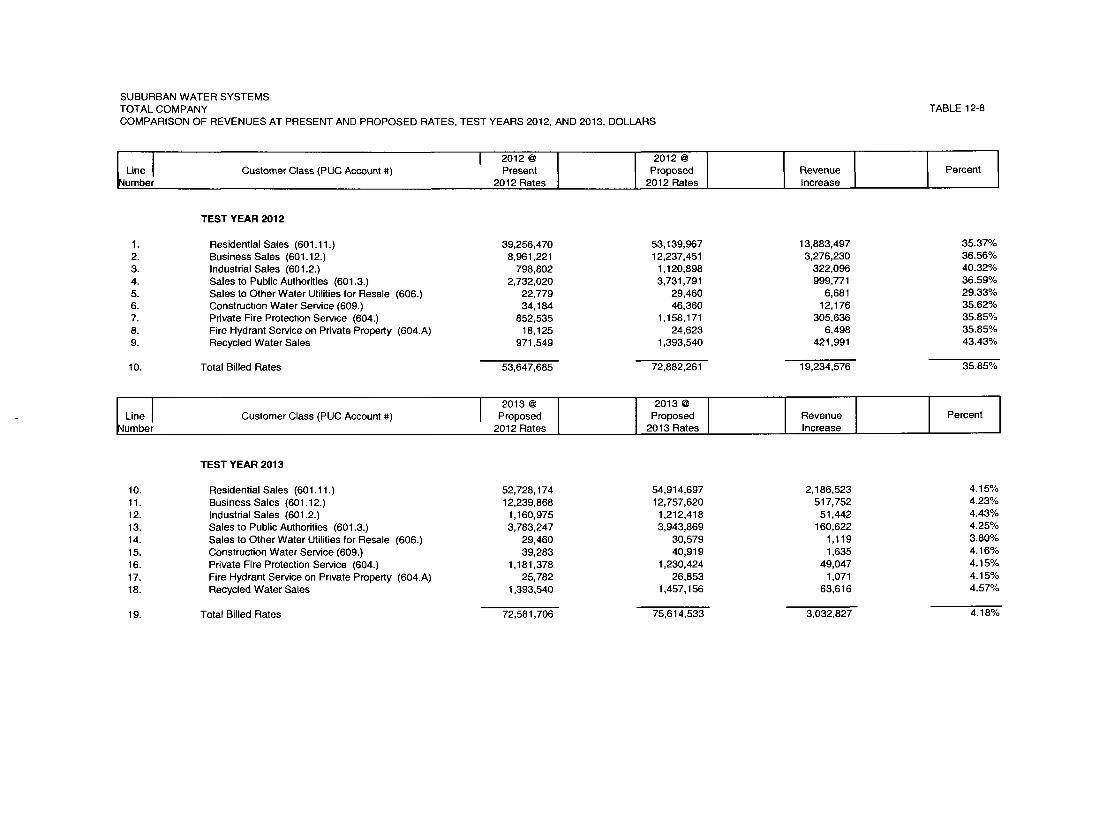
SUBURBAN WATER SYSTEMSTOTAL COMPANYCOMPARISON OF REVENUES AT PRESENT AND PROPOSED RATES, TEST YEARS 2012, AND 2013, DOLLARS
TABLE 12-8
I I 2012 @Line Customer Class (PUC Account #) Present
INumber 2012 RatesProposed Revenue
2012 Rates IncreasePercent
TEST YEAR 2012
1. Residential Sales (601.11.) 39,256,4702. Business Sales (601.12.) 8,961,2213. Industrial Sales (601.2.) 798,8024. Sales to Public Authorities (601.3.) 2,732,0205. Sales to Other Water Utilities for Resale (606.) 22,7796. Construction Water Service (609.) 34,1847. Private Fire Protection Service (604.) 852,5358. Fire Hydrant Service on Private Property (604.A) 18,1259. Recycled Water Sales 971,549
53,139,967 13,883,497 35.37%12,237,451 3,276,230 36.56%1,120,898 322,096 40.32%3,731,791 999,771 36.59%
29,460 6,681 29.33%46,360 12,176 35.62%
1,158,171 305,636 35.85%24,623 6,498 35.85%
1,393,540 421,991 43.43%
10. Total Billed Rates 53,647,685 72,882,261 19,234,576 35.85%
Line Customer Class (PUC Account #) Proposed Proposed Revenue Percent~Number 2012 Rates 2013 Rates Increase
TEST YEAR 2013
10. Residential Sales (601.11.) 52,728,17411. Business Sales (601.12.) 12,239,86812. Industrial Sales (601.2.) 1,160,97513. Sales to Public Authorities (601.3.) 3,783,24714. Sales to Other Water Utilities for Resale (606.) 29,46015. Construction Water Service (609.) 39,28316. Private Fire Protection Service (604.) 1,181,37817. Fire Hydrant Service on Pnvate Property (604.A) 25,78218. Recycled Water Sales 1,393,540
54,914,697 2,186,523 4.15%12,757,620 517,752 4.23%1,212,418 51,442 4.43%3,943,869 160,622 4.25%
30,579 1,119 3.80%40,919 1,635 4.16%
1,230,424 49,047 4.15%26,853 1,071 4.15%
1,457,156 63,616 4.57%
19. Total Billed Rates 72,581,706 75,614,533 3,032,827 4.18%
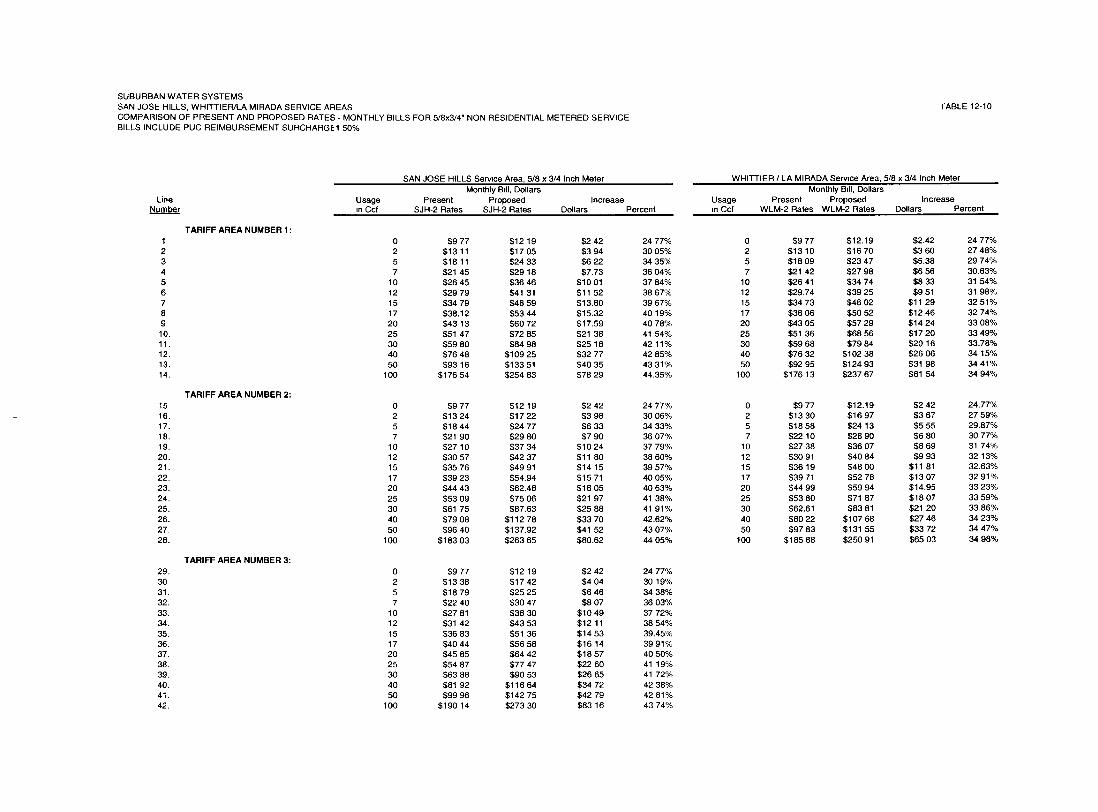
SUBURBAN WATER SYSTEMSSAN JOSE HILLS, WHITTIER/LA MIRADA SERVICE AREASCOMPARISON OF PRESENT AND PROPOSED RATES - MONTHLY BILLS FOR 5/8x3/4" NON RESIDENTIAL METERED SERVICEBILLS INCLUDE PUC REIMBURSEMENT SURCHARGE1 50%
TABLE12-10
SAN JOSE HILLS Service Area, 5/8 x 3/4 Inch MeterMonthly B~II, Dollars
Line Usage Present Proposed IncreaseNumber ~n Ccf SJH-2 Rates SJH-2 Rates Dollars Percent
TARIFF AREA NUMBER I :1 0 $9 77 $12 19 $2 42 24 77%2 2 $13 11 $17 05 $3 94 30 05%3 5 $18 11 $24 33 $6 22 34 35%4 7 $21 45 $29 18 $7.73 36 04%5 10 $26 45 $36 46 $10 01 37 84%6 12 $29 79 $41 31 $11 52 38 67%7 15 $34 79 $48 59 $13.80 39 67%8 17 $38.12 $53 44 $15.32 40 19%9 20 $43 13 $60 72 $17.59 40 78%10. 25 $51 47 $72 85 $21 38 41 54%11. 30 $59 80 $84 98 $25 18 42 11%12. 40 $76 48 $109 25 $32 77 42 85%13. 50 $93 16 $133 51 $40 35 43 31%14. 100 $176 54 $254 83 $78 29 44.35%
TARIFF AREA NUMBER 2:15 0 $9 77 $12 19 $2 42 24 77%16. 2 $13 24 $17 22 $3 98 30 06%17. 5 $18 44 $24 77 $6 33 34 33%18. 7 $21 90 $29 80 $7 90 36 07%19. 10 $27 10 $3734 $10 24 37 79%20. 12 $30 57 $42 37 $11 80 38 60%21. 15 $35 76 $49 91 $14 15 39 57%22. 17 $39 23 $54.94 $15 71 40 05%23. 20 $44 43 $62.48 $18 05 40 63%24. 25 $53 09 $75 06 $21 97 41 38%25. 30 $61 75 $87.63 $25 88 41 91%26. 40 $79 08 $112 78 $33 70 42.62%27. 50 $96 40 $137.92 $41 52 43 07%28. 100 $183 03 $263 65 $80.62 44 05%
TARIFF AREA NUMBER 3:29. 0 $977 $12 19 $2 42 24 77%30 2 $13 38 $17 42 $4 04 30 19%31. 5 $18 79 $25 25 $6 46 34 38%32. 7 $22 40 $30 47 $8 07 36 03%33. 10 $27 81 $38 30 $10 49 37 72%34. 12 $31 42 $43 53 $12 11 38 54%35. 15 $36 83 $51 36 $14 53 39.45%36. 17 $40 44 $56 58 $16 14 39 91%37. 20 $45 85 $64 42 $18 57 40 50%38. 25 $54 87 $77 47 $22 60 41 19%39. 30 $63 88 $90 53 $26 65 41 72%40. 40 $81 92 $116 64 $34 72 42 38%41. 50 $99 96 $142 75 $42 79 42 81%42. 100 $190 14 $273 30 $83 16 43 74%
WHITTLER / LA MIRADA Service Area, 5/8 x 3/4 Inch MeterMonthly B~II, Dollars
Usage Present Proposed Increasem Ccf WLM-2 Rates WLM-2 Rates Dollars Percent
0 $977 $12.19 $2.42 24 77%2 $13 10 $16 70 $3 60 27 48%5 $18 09 $23 47 $5.38 29 74%7 $21 42 $27 98 $6 56 30.63%
10 $26 41 $34 74 $8 33 31 54%12 $29.74 $39 25 $9 51 31 98%15 $34 73 $46 02 $11 29 32 51%17 $38 06 $50 52 $12.46 32 74%20 $43 05 $57 29 $14 24 33 08%25 $51 36 $68 56 $17 20 33 49%30 $59 68 $79 84 $20 16 33.78%40 $76 32 $102 38 $26 06 34 15%50 $92 95 $124 93 $31 98 34 41%
100 $176 13 $237 67 $61 54 34 94%
0 $9 772 $13 305 $18 587 $22 10
10 $27 3812 $30 9115 $361917 $39 7120 $44 9925 $53 8030 $62.6140 $80 2250 $97 83
100 $185 88
;12.19 $2 42 24.77%116 97 $3 67 27 59%;24 13 $5 55 29.87%~28 90 $6 80 30 77%~36 07 $8 69 31 74%;40 84 $9 93 32 13%;48 00 $11 81 32.63%;52 78 $13 07 32 91%;59 94 $14.95 33 23%;71 87 $18 07 33 59%83 81 $21 20 33.86%
107 68 $27 46 34 23%131 55 $33 72 34 47%250 91 $65 03 34 98%

SUBURBAN WATER SYSTEMSSAN JOSE HILLS, WHITTIER/LA MIRADA SERVICE AREASCOMPARISON OF PRESENT AND PROPOSED RATES - MONTHLY BILLS FOR 3/4" NON RESIDENTIAL METERED SERVICEBILLS INCLUDE PUC REIMBURSEMENT SURCHARGE 1 50%
TABLE 12-11
SAN JOSE HILLS Service Area, 3/4 Inch MeterMonthly B~II, Dollars
L~ne Usage Present Proposed IncreaseNumber m Ccf SJH-2 Rates SJH-2 Rates Dollars Percent
TARIFF AREA NUMBER 1 :1 0 $14 67 $18.29 $3 62 24 68%2 2 $18 00 $23 14 $5 14 28 56%3. 5 $23.00 $30.42 $7 42 32 26%4. 7 $26.34 $35 27 $8 93 33 90%5 10 $31 34 $42 55 $11 21 35 77%6 12 $34.68 $47 41 $12 73 36 71%7. 15 $39 68 $54 69 $15.01 37 83%8. 17 $43 02 $59 54 $16.52 38 40%9. 20 $48 02 $66 82 $18 80 39 15%10 25 $56 36 $78 95 $22 69 40 08%11 30 $64 70 $91 08 $26 38 40 77%12 40 $81 37 $115 34 $33 97 41 75%13 50 $98 05 $139 61 $41 56 42 39%14 100 $181 43 $260 92 $79 49 43 81%
TARIFF AREA NUMBER 2:15 0 $14 67 $18 29 $3 62 24 68%16 2 $18 13 $23 32 $5 19 28 63%17 5 $2333 $30 86 $7 53 32 28%18 7 $2679 $35.89 $9 10 33 97%19 10 $31 99 $43 44 $11 45 35 79%29 12 $35 46 $48 47 $13 01 36.69%21 15 $40 66 $56 01 $15 35 37.75%22. 17 $44 12 $61 04 $16 92 38 35%23 20 $49 32 $68 58 $19 26 39 05%24 25 $57.98 $81 15 $23 17 39 96%25 30 $66 64 $93 73 $27 09 40 65%26. 40 $83 97 $118.87 $34 90 41 56%27. 50 $101 30 $144.02 $42 72 42 17%28 100 $187 93 $269 75 $81 82 43 54%
TARIFF AREA NUMBER 3:29 0 $14 67 $18 29 $3.62 24 68%30 2 $18 27 $23 51 $5 24 28 68%31. 5 $23 69 $31.35 $7.66 32 33%32 7 $27 29 $36 57 $9 28 34 01%33 10 $32.70 $44 40 $11 70 35 78%34 12 $36 31 $49 62 $13.31 36 66%35 15 $41.72 $57 46 $15.74 37 73%36. 17 $45.33 $52.68 $17 35 38.27%37. 20 $50 74 $70 51 $19 77 38 96%38. 25 $59 76 $83 57 $2381 39.84%39 30 $68 78 $96 62 $2784 40 48%40 40 $86 81 $122 73 $35 92 41.38%41 50 $104 85 $148 84 $43 99 41 96%42 100 $195 03 $279 40 $84 37 43 26%
WHITTIER / LA MIRADA Service Area, 3/4 Inch MeterMonthly Bill, Dollars
Usage Present Proposed Increasem Ccf WLM-2 Rates WLM-2 Rates Dollars Pement
0 $14 67 $18 29 $3 62 24 68%2 $17.99 $22 80 $4 81 26 74%5 $22.98 $29 56 $6.58 28 63%7 $26.31 $34 07 $7.76 29 49%
10 $31.30 $40 84 $9.54 30 48%12 $34 63 $45 35 $10.72 30 96%15 $39 62 $52 11 $12 49 31 52%17 $42 95 $56 62 $13 67 31 83%20 $47 94 $63 39 $15 45 32 23%25 $56 26 $74 66 $18 40 32 71%30 $64 57 $85 93 $21 36 33 08%40 $81 21 $108 48 $27 27 33 58%50 $97 85 $131 03 $33 18 33 91%100 $181 03 $243 77 $62 74 34 66%
0 $1467 $18.29 $3 62 24 68%2 $18 19 $23 06 $4.87 26 77%5 $23 47 $30 23 $6 76 28 80%7 $26 99 $35 00 $8 01 29 68%
10 $32 28 $42 16 $9.88 30 61%12 $35 80 $46 94 $11 14 31 12%15 $41.08 $54 10 $13 02 31 69%17 $44.60 $58 87 $14 27 32 00%20 $49.89 $66 03 $16 14 32 35%25 $58.69 $77 97 $19 28 32 85%30 $67.50 $89 91 $22 41 33 20%40 $85 11 $113 78 $28 67 33 69%50 $102 72 $137.65 $34 93 34 01%
100 $190.77 $257.01 $66 24 34 72%
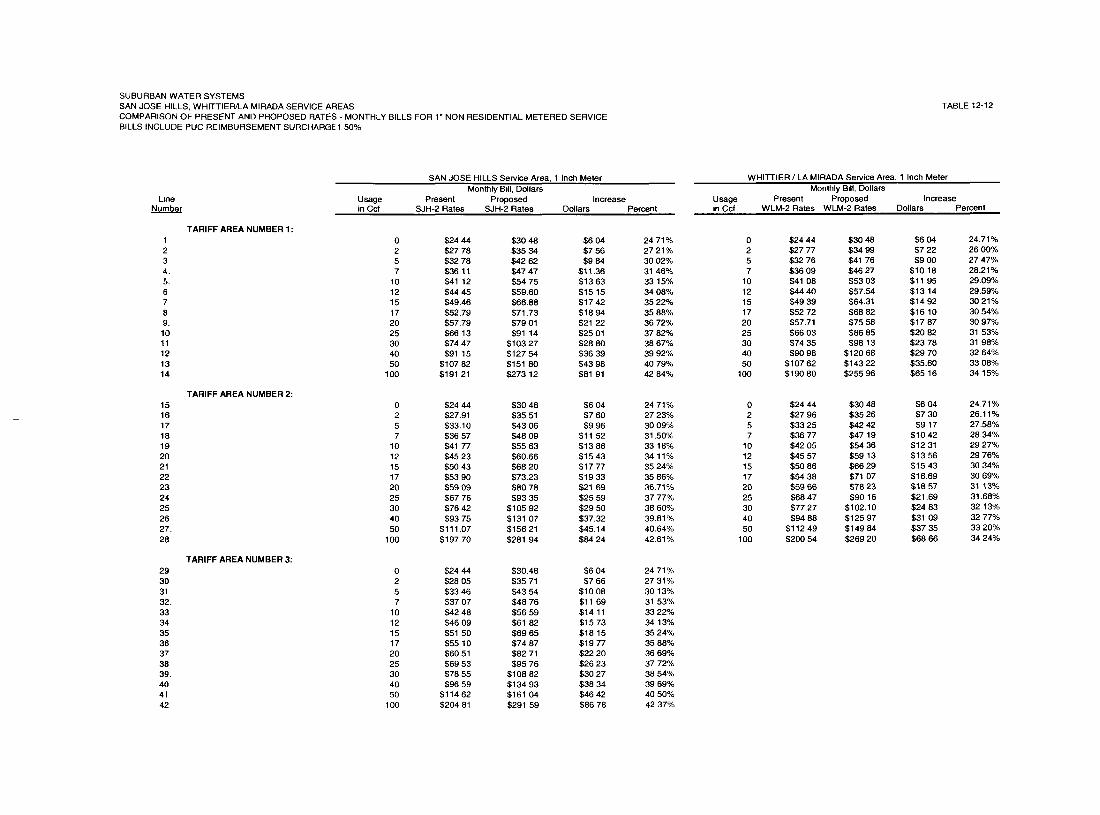
SUBURBAN WATER SYSTEMSSAN JOSE HILLS, WHITTIER/LA MIRADA SERVICE AREASCOMPARISON OF PRESENT AND PROPOSED RATES - MONTHLY BILLS FOR 1" NON RESIDENTIAL METERED SERVICEBILLS INCLUDE PUC REIMBURSEMENT SURCHARGE 1 50%
TABLE 12-12
SAN JOSE HILLS Service Area, 1 Inch MeterMonthly B~II, Dollars
L~ne Usage Present Proposed IncreaseNumber in Ccf SJH-2 Rates SJH-2 Rates Dollars Percent
TARIFF AREA NUMBER 1 :1 0 $24 44 $30 48 $6 04 24 71%2 2 $27 78 $35 34 $7 56 27 21%3 5 $32 78 $42 62 $9 84 30 02%4. 7 $36 11 $47 47 $11.36 31 46%5. 10 $41 12 $54 75 $13 63 33 15%6 12 $44 45 $59.60 $15 15 34 08%7 15 $49.46 $66.88 $17 42 35 22%8 17 $52.79 $71.73 $18 94 35 88%9. 20 $57.79 $79 01 $21 22 36 72%10 25 $66 13 $91 14 $25 01 37 82%11 30 $74 47 $103 27 $28 80 38 67%12 40 $91 15 $127 54 $36 39 39 92%13 50 $107 82 $151 80 $43 98 40 79%14 100 $191 21 $273 12 $81 91 42 84%
TARIFF AREA NUMBER 2:15 0 $24 44 $30 48 $6 04 24 71%16 2 $27.91 $35 51 $7 60 27 23%17 5 $33.10 $43 06 $9 96 30 09%18 7 $36 57 $48 09 $11 52 31.50%19 10 $41 77 $55 63 $13 86 33 18%20 12 $45 23 $60.66 $15 43 34 11%21 15 $50 43 $68 20 $17 77 35 24%22 17 $53 90 $73.23 $19 33 35 86%23 20 $59 09 $80 78 $21 69 36.71%24 25 $67 76 $93 35 $25 59 37 77%25 30 $76 42 $105 92 $29 50 38 60%26 40 $93 75 $131 07 $37.32 39.81%27, 50 $111.07 $156 21 $45.14 40.64%28 100 $197 70 $281 94 $84 24 42.61%
TARIFF AREA NUMBER 3:29 0 $24 44 $30,48 $6 04 24 71%30 2 $28 05 $35 71 $7 66 27 31%31 5 $33 46 $43 54 $10 08 3013%32. 7 $37 07 $48 76 $11 69 31 53%33 10 $42 48 $56 59 $14 11 33 22%34 12 $46 09 $61 82 $16 73 34 13%35 15 $51 50 $69 65 $18 15 35 24%36 17 $55 10 $74 87 $19 77 35 88%37 20 $60 51 $8271 $22 20 36 69%38 25 $69 53 $95 76 $26 23 37 72%39. 30 $78 55 $108 82 $30 27 38 54%40 40 $96 59 $13493 $38 34 39 69%41 50 $114 62 $161 04 $46 42 40 50%42 100 $204 81 $291 59 $86 78 42 37%
WHITTIER / LA MIRADA Service Area, 1 Inch MeterMonthly Bdl, Dollars
Usage Present Proposed Increase=n Ccf WLM-2 Rates WLM-2 Rates Dollars Percent
0 $24 44 $30 48 $6 04 24,71%2 $27 77 $34 99 $7 22 26 00%5 $32 76 $41 76 $9 00 27 47%7 $36 09 $46 27 $10 18 28.21%
10 $41 08 $53 03 $11 95 29.09%12 $44 40 $57.54 $13 14 29.59%15 $49 39 $64.31 $14 92 30 21%17 $52 72 $68 82 $16 10 30 54%20 $57.71 $75 58 $17 87 30 97%25 $66 03 $86 85 $20 82 31 53%30 $74 35 $98 13 $23 78 31 98%40 $90 98 $120 68 $29.70 32 64%50 $107 62 $143 22 $35.60 33 08%
100 $190 80 $255 96 $65 16 34 15%
0 $24 44 $30 48 $6 04 24.71%2 $27 96 $35 26 $7 30 26.11%5 $33 25 $42 42 $9 17 27,58%7 $36 77 $4719 $10 42 28,34%
10 $42 05 $54 36 $12 31 29 27%12 $45 57 $59 13 $13 56 29 76%15 $50 86 $66 29 $15 43 30 34%17 $54 38 $71 07 $16.69 30 69%20 $59 66 $78 23 $18 57 31 13°/o25 $68 47 $90 16 $21.69 31.68%30 $77.27 $102.10 $24 83 32 13%40 $94 88 $125 97 $31 09 32 77%50 $112 49 $149 84 $37 35 33 20%
100 $200 54 $269 20 $68 66 34 24%

SUBURBAN WATER SYSTEMSSAN JOSE HILLS, WHITrlER/LA MIRADA SERVICE AREASCOMPARISON OF PRESENT AND PROPOSED RATES - MONTHLY BILLS FOR 1-1/2" NON RESIDENTIAL METERED SERVICEBILLS INCLUDE PUC REIMBURSEMENT SURCHARGE 1 50%
TABLE 12-13
SAN JOSE HILLS Service Area, 1-1/2 Inch MeterMonthly Bdl, Dollars
Line Usage Present Proposed IncreaseNumber m Ccf SJH-2 Rates SJH-2 Rates Dollars Percent
TARIFF AREA NUMBER 1:1 0 $48 88 $60.97 $12 09 24 73%2 3 $53 89 $68 25 $14 36 26 65%3 5 $57 22 $73.10 $15 88 27.75%4 10 $65 56 $85 23 $19 67 30 00%5 25 $90 57 $121 63 $31 06 34.29%6 50 $132 26 $182 28 $50 02 37.82%7. 75 $173 96 $242 94 $68 98 39 65%8 100 $215.65 $303 60 $87 95 40 78%9 125 $257 34 $364 26 $106 92 41 55%10 150 $299.03 $424 92 $125 89 42 10%11 200 $382 41 $546 23 $163 82 42 84%12 250 $465 79 $667 55 $201.76 43 32%13 375 $674 25 $970 84 $296 59 43 99%14 500 $882 70 $1,274 13 $391 43 44 34%
TARIFF AREA NUMBER 2:15 0 $48.88 $60 97 $12 09 24 73%16 3 $54 08 $68 51 $14 43 26 68%17 5 $57 55 $73 54 $15 99 27 78%18 10 $66 21 $86 11 $19 90 36 06%19 25 $92 20 $123 83 $31 63 34 31%20 50 $135 51 $186 70 $51 19 37 78%21 75 $178 83 $249 56 $70 73 39 55%22 100 $222 14 $312 42 $90 28 40.64%23 125 $265 46 $375 29 $109 83 41 37%24 150 $308 77 $438 15 $129 38 41 90%25 200 $395.40 $563 88 $168 48 42 61%26 250 $482 03 $689.61 $207 58 43 06%27 375 $698 61 $1.003 93 $305 32 43 70%28 500 $915 18 $1,318 25 $403 07 44 04%
TARIFF AREA NUMBER 3:29 0 $48 88 $6O 9730 3 $5429 $68 8031 5 $57 90 $74 0232 10 $66 92 $87 0833. 25 $93 97 $126 2534 50 $139 07 $1915235 75 $184 16 $256 8036 100 $229.25 $322.0837 125 $274 34 $3873538 150 $319 43 $452 6339 200 $409 61 $583 1940 250 $499 80 $713 7441 375 $725 25 $1,040 1342 500 $950 71 $1,366 51
;12 09 24 73%;14 51 26 73%;16 12 27 84%;20 16 30 13%;32 28 34 35%;52 45 37 71%;72 64 39 44%;92 83 40 49%
;11301 41 19%;133 20 41 70%;173 58 42 38%;213 94 42 81%;314 88 43 42%;415 80 43 74%
WHITTIER/LA MIRADA Service Area, 1-1/2 Inch MeterMonthly B~II, Dollars
Usage Present Proposed Increasem Ccf WLM-2 Rates WLM-2 Rates Dollars Percent
0 $48 88 $60 97 $12 09 24.73%3 $53 87 $67 73 $13 66 25 73%5 $57 20 $72 24 $15 04 26 29%
10 $65 52 $83 52 $18 O0 27 47%25 $90 47 $117 34 $26 87 29 70%50 $132 06 $173 71 $41.65 31 54%75 $173 66 $230 08 $56 43 32 50%
100 $215 24 $286 45 $71 21 33 08%125 $256 83 $342 82 $85 99 33 48%150 $298 42 $399 19 $100 77 33 77%200 $381 60 $511 92 $130.32 34 15%250 $464.78 $624 66 $159 88 34 40%375 $672 73 $906 51 $233 78 34 75%500 $880 67 $1,188 36 $307 69 34 94%
0 $48 88 $60.97 $12 09 24 73%3 $54 17 $68 13 $13.96 2577%5 $57 69 $72 90 $15 21 26 37%
10 $66 49 $84 84 $18 35 27 60%25 $92 91 $120 65 $27 74 29 86%50 $136 93 $180 33 $43 40 3170%75 $180 96 $240 00 $59 04 32 63%
100 $224 98 $299 68 $74 70 33 20%125 $269 01 $359 36 $90 35 33 59%150 $313 04 $419 04 $106 00 33 86%200 $401 09 $538 40 $137 31 34.23%250 $489 14 $657 76 $168.62 34 47%375 $709 27 $956 15 $246 88 34 81%500 $929 39 $1,254 54 $325.15 34 99%

SUBURBAN WATER SYSTEMSSAN JOSE HILLS, WHITTIER/LA MIRADA SERVICE AREASCOMPARISON OF PRESENT AND PROPOSED RATES - MONTHLY BILLS FOR 2" NON RESIDENTIAL METERED SERVICEBILLS INCLUDE PUC REIMBURSEMENT SURCHARGE 1 50%
TABLE 12-14
SAN JOSE HILLS Service Area, 2 Inch MeterMonthly Bdl, Dollars
L~r~e Usage Present Proposed IncreaseNumber m Ccf SJH-2 Rates SJH-2 Rates Dollars Percent
TARIFF AREA NUMBER 1 :1 0 $78 22 $97 55 $19 33 24 71%2. 3 $83 22 $104 83 $21 61 25 97%3 5 $86 55 $109 68 $23 13 26 72%4 10 $94 89 $121 81 $26 92 28 37%5 25 $119 91 $158 21 $38 30 31 94%6 50 $161 60 $218 86 $57 26 35 43%7 75 $203 29 $279 52 $76 23 37 50%8 100 $244 98 $340 18 $95 20 38 86%9 125 $286 67 $400 84 $114 17 39 83%10 150 $328 36 $461 50 $133 14 40.55%11 200 $411 74 $582 81 $171 07 41 55%12 250 $495 13 $704 13 $209.00 42 21%13 375 $703 58 $1,007 42 $303 84 43 18%14 500 $912 04 $1,310 71 $398 67 43 71%
TARIFF AREA NUMBER 2:15 0 $78 22 $97 5516 3 $83 41 $105 0917 5 $86 88 $110 1218 10 $95 54 $122 6919 25 $121 53 $160 4120 50 $16485 $223 2821 75 $208 16 $286 1422 100 $251.48 $349 0123 125 $294 79 $411 8724 150 $338 11 $474 7325 200 $424 74 $600 4628 250 $511 37 $726 1927 375 $727 94 $1,040 5128 500 $944 52 $1,354 83
TARIFF AREA NUMBER 3:
$19 33 24 71%$21 68 25 99%;23 24 26 75%;27 15 28 42%;38 88 31 99%;58 43 35 44%;77 98 37 46%;97.53 38 78%
;117 08 39 72%;136 62 40 41%;175 72 41 37%;214 82 42 01%;312 57 42 94%;410 31 43 44%
29 0 $78 22 $97.55 $19 33 24 71%30 3 $83 63 $105 38 $21 75 26 01%31. 5 $87 23 $11060 $23.37 26 79%32 10 $96 25 $123 66 $27.41 28 48%33 25 $123 31 $162 83 $39 52 32 05%34 50 $168 40 $22810 $5970 35 45%35 75 $213 49 $293 38 $79 89 37 42%36 100 $258 58 $358 66 $100 08 38 70%37. 125 $303 67 $423 93 $120 26 39 60%38 150 $348 76 $489 21 $140 45 40 27%39 200 $438 95 $619 77 $180 82 41 19%40 250 $529 13 $750 32 $221 19 41 80%41 376 $754 59 $1,076 71 $322 12 42 69%42 500 $980 04 $1,403 09 $423 05 43 17%
WHITTIER / LA MIRADA Service Area 2 Inch MeterMonthly B=II, Dollars
Usage Present Proposed Increasem Ccf WLM-2 Rates WLMo2 Rates Dollars Percent
0 $78 22 $97 55 $19.33 24.71%3 $83 21 $104 31 $21.10 25 36%5 $86 53 $108 82 $22 29 25 76%
10 $94 85 $120 10 $25 25 26 62%25 $119 81 $153 92 $34 11 28 47%50 $161 40 $210 29 $48 89 30 29%75 $202 98 $266 66 $63 68 31.37%
100 $244 57 $323 03 $78 46 32.08%125 $286 16 $379 40 $93 24 32.58%150 $327 75 $435 77 $108 02 32.96%200 $410 93 $548 51 $137 58 33 48%250 $494 11 $661 24 $167 13 33 82%375 $702 06 $943 09 $241 03 34 33%500 $910 01 $1,224 94 $314 93 34 61%
0 $78 22 $97 55 $19 33 24 71%3 $83 50 $104 71 $21 21 25 40%5 $87 02 $109 48 $22 46 25.81%
10 $95 83 $121 42 $25 59 26 70%25 $122 24 $157 23 $34 99 28 62%50 $166 27 $216 91 $50 64 30 46%75 $210 29 $276 59 $66 30 31 53%100 $254 32 $336.26 $81 94 3222%125 $298 34 $395 94 $97 60 32 71%150 $342 37 $455.62 $113 25 33 08%200 $430 42 $57498 $144 56 33 59%250 $518 47 $694 34 $175 87 33 92%375 $738 60 $992 73 $254 13 34 41%500 $958.73 $1,291 13 $332 40 34 67%
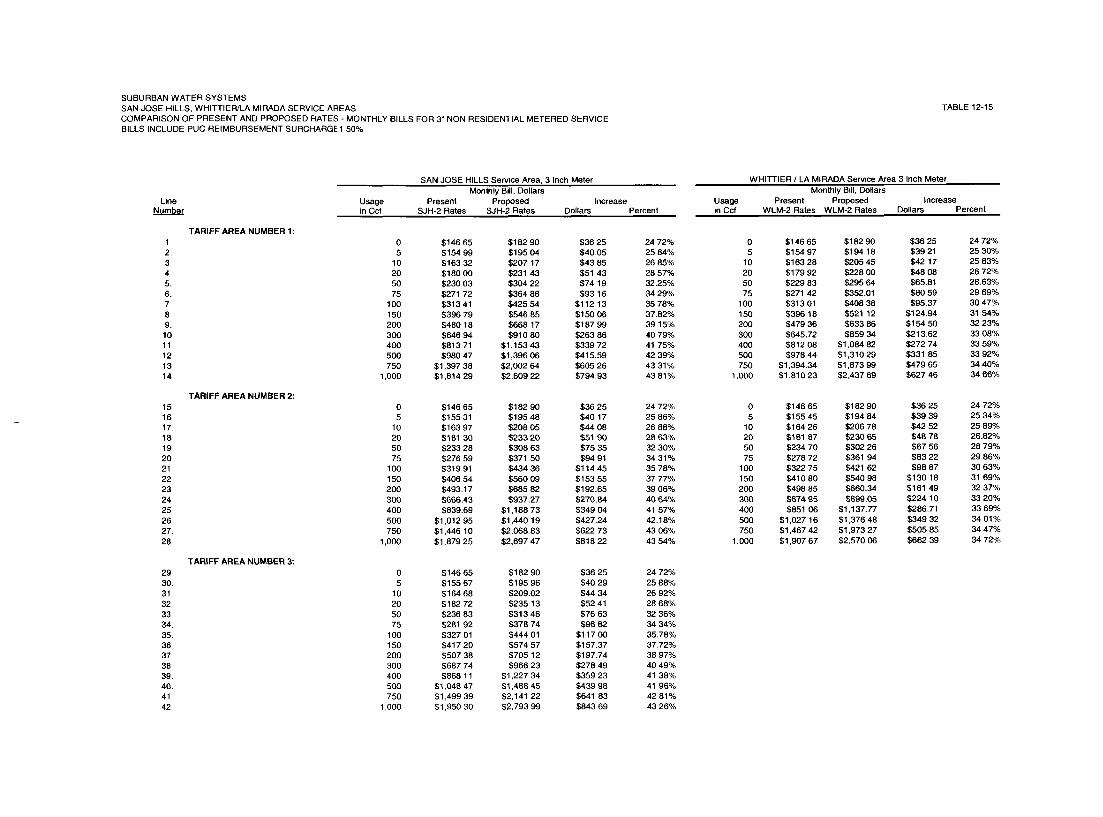
SUBURBAN WATER SYSTEMSSAN JOSE HILLS, WHITTIER/LA MIRADA SERVICE AREASCOMPARISON OF PRESENT AND PROPOSED RATES - MONTHLY BILLS FOR 3" NON RESIDENTIAL METERED SERVICEBILLS INCLUDE PUC REIMBURSEMENT SURCHARGE 1 50%
TABLE 12-15
SAN JOSE HILLS Serwce Area, 3 Inch MeterMonthly Bill, Dollars
L~ne Usage Present Proposed IncreaseNumber in Ccf SJH-2 Rates SJH-2 Rates Dollars Percent
TARIFF AREA NUMBER 1:1 0 $146 65 $182 90 $36 25 24 72%2. 5 $1.5499 $195 04 $40.05 25 84%3 10 $163 32 $207 17 $43 85 26 85%4 20 $180 00 $231 43 $51 43 28 57%5. 50 $230 03 $304 22 $74 19 32.25%6. 75 $271 72 $364 88 $9316 34 29%7 100 $313 41 $425 54 $112 13 35 78%8 150 $396 79 $546.85 $150 06 37.82%9. 200 $480 18 $668 17 $187 99 39 15%10 300 $646 94 $910 80 $263 86 40 79%11 400 $813 71 $1,153 43 $339 72 41 75%12 500 $980 47 $1,396 06 $415.59 42 39%13 750 $1,397 38 $2,002 64 $605 26 43 31%14 1,000 $1,814 29 $2,609 22 $794.93 43 81%
TARIFF AREA NUMBER 2:15 0 $146 65 $182 90 $36 25 24 72%16 5 $155 31 $195 48 $40 17 25 86%17. 10 $163 97 $208 05 $44 08 26 88%18 20 $181 30 $233 20 $51 90 28 63%19 50 $233 28 $308 63 $75 35 32 30%20 75 $276 59 $371 50 $94 91 34 31%21 100 $319 91 $434 36 $114 45 35 78%22 150 $406 54 $560 09 $153 55 37 77%23 200 $493.17 $685 82 $192.65 39 06%24 300 $666.43 $937.27 $270.84 40 64%25 400 $839.69 $1,188 73 $349 04 41 57%26 500 $1,012 95 $1,440 19 $427.24 42.18%27. 750 $1,446 10 $2,068.83 $622 73 43 06%28 1,000 $1,879 25 $2,697 47 $818 22 43 54%
TARIFF AREA NUMBER 3:29 0 $146 65 $182 90 $36 25 24 72%30. 5 $155 67 $195 96 $40 29 25 88%31. 10 $164 68 $209.02 $44 34 26 92%32 20 $182 72 $235 13 $52 41 28 68%33 50 $236 83 $313 46 $76 63 32 36%34. 75 $281 92 $378 74 $96 B2 34 34%35. 100 $327 01 $444 01 $117 00 35.78%36 150 $417 20 $574 57 $157.37 37.72%37 200 $507 38 $705 12 $197.74 38 97%38 300 $687 74 $966 23 $278 49 40 49%39. 400 $868 11 $1,227 34 $359 23 41 38%40. 500 $1,048 47 $1,488 45 $439 98 4196%41 750 $1,499 39 $2,141 22 $641 83 42 81%42 1,000 $1,950 30 $2,793 99 $843 69 43 26%
WHITTIER / LA MIRADA Service Area 3 Inch MeterMonthly B~II, Dollars
Usage Present Proposed Increasem Ccf WLM-2 Rates WLM-2 Rates Dollars Percent
0 $146 65 $182 90 $36 25 24 72%5 $154 97 $194 18 $39 21 25 30%
10 $163 28 $205 45 $42 17 25 83%20 $179 92 $228 00 $48 08 26 72%50 $229 83 $295 64 $65.81 28.63%75 $271 42 $352.01 $80 59 29 69%
100 $313 01 $408 38 $95.37 30 47%150 $396 18 $521 12 $124.94 31 54%200 $479 36 $633 86 $154 50 32 23%300 $645.72 $859 34 $213.62 33 08%400 $812 08 $1,084 82 $272 74 33 59%500 $978 44 $1,310 29 $331 85 33 92%750 $1,394.34 $1,873 99 $479 65 34 40%
1,000 $1,810 23 $2,437 69 $627 46 34 66%
05
10205075
1001502003O0400500750
1,000
;146 65;155 45;164 26;181 87;234 70;278 72;322 75;410 80;498 85674 95
$851 06$1,027 16$1,467 42$1,907 67
$182 90 $36 25 24 72%$194 84 $39 39 25 34%$206 78 $42 52 25 89%$230 65 $48 78 26.82%$302 26 $67 56 28 79%$361 94 $83 22 29 86%$421.62 $98 87 30 63%$540 98 $130 18 31 69%$660.34 $161 49 32 37%$899.05 $224 10 33 20%
$1,137.77 $286.71 33 69%$1,376 48 $349 32 34 01%$1,973 27 $505 85 34 47%$2,570 06 $662 39 34 72%
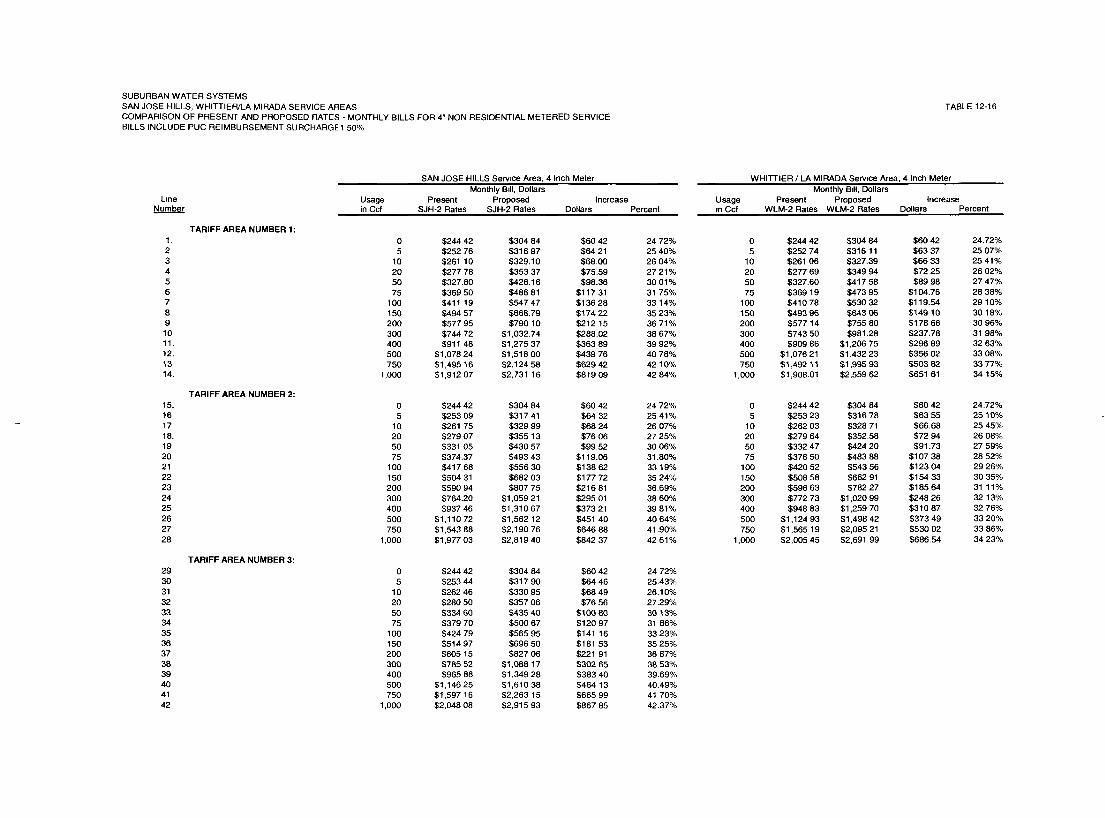
SUBURBAN WATER SYSTEMSSAN JOSE HILLS, WHITTIER/LA MIRADA SERVICE AREASCOMPARISON OF PRESENT AND PROPOSED RATES - MONTHLY BILLS FOR 4" NON RESIDENTIAL METERED SERVICEBILLS INCLUDE PUC REIMBURSEMENT SURCHARGE 1 50%
TABLE 12-16
SAN JOSE HILLS Serwce Area, 4 Inch MeterMonthly B~II, Dollars
Line Usage Present Proposed IncreaseNumber in Ccf SJH-2 Rates SJH-2 Rates Dollars Percent
TARIFF AREA NUMBER 1 :1. 0 $244 42 $304 84 $60 42 24 72%2 5 $25276 $316 97 $64 21 25 40%3 10 $261 10 $329.10 $68.00 26 04%4 20 $277 78 $353 37 $75.59 27 21%5 50 $327.80 $426.16 $98.36 30 01%6 75 $369 50 $486 81 $117 31 31 75%7 100 $411 19 $547 47 $136 28 33 14%8 150 $494 57 $668.79 $174 22 35 23%9 200 $577 95 $790 10 $212 15 36 71%
10 300 $744 72 $1,032.74 $288.02 38 67%11. 400 $911 48 $1,275 37 $363 89 39 92%12. 500 $1,078 24 $1,518 00 $439 76 40 78%13 750 $1,495 16 $2,124 58 $629 42 42 10%14. 1,000 $1,912 07 $2,731 16 $819 09 42 84%
TARIFF AREA NUMBER 2:15. 0 $244 42 $304 84 $60 42 24 72%16 5 $253 09 $317 41 $64 32 25 41%17 10 $261 75 $329 99 $68 24 26 07%18. 20 $279 07 $355 13 $76 06 27 25%19 50 $331 05 $430 57 $99.52 30 06%20 75 $374.37 $493 43 $119.06 31.80%21 100 $417 68 $556 30 $138 62 33 19%22 150 $504 31 $682 03 $177 72 35 24%23 200 $590 94 $807 75 $216 81 36.69%24 300 $764.20 $1,059 21 $295 01 38 60%25 400 $937 46 $1,310 67 $373 21 39 81%26 500 $1,110 72 $1,562 12 $451 40 40 64%27 750 $1,543 88 $2,190 76 $646 88 41.90%28 1,000 $1,977 03 $2,819 40 $842 37 42 61%
TARIFF AREA NUMBER 3:29 03O 531 1032 2033 5034 7535 10036 15037 20038 30039 40040 50041 75042 1,000
;244 42;253 44;262 46;280 50;33460;379 70;424 79;514 97;605 15;785 52;965 88
$1,146 25$1,597 16$2,048 08
$304 84 $60 42 24 72%$317 90 $64 46 25.43%$330 95 $68 49 26.10%$357 06 $76 56 27.29%$435 40 $100 80 30 13%$500 67 $120 97 31 86%$565 95 $141 16 33 23%$696 50 $181 53 35 25%$827 06 $221 91 36 67%
$1,088 17 $302 65 38 53%$1,349 28 $383 40 39.69%$1,610 38 $46413 40.49%$2,263 15 $665 99 41 70%$2,915 93 $867 85 42.37%
WHITTIER / LA MIRADA Serv=ce Area, 4 Inch MeterMonthly B~II, Dollars
Usage Present Proposed Increase=n Ccf WLM-2 Rates WLM-2 Rates Dollars Percent
0 $244 42 $304 84 $60 42 24.72%5 $252 74 $316 11 $63 37 25 07%
10 $261 06 $327.39 $66 33 25 41%20 $277 69 $349 94 $72 25 26 02%50 $327.60 $417 58 $89 98 27 47%75 $369 19 $473 95 $104.76 28 38%
100 $410 78 $530 32 $119.54 29 10%150 $493 96 $643 06 $149 10 30 18%200 $577 14 $755 80 $178 66 30 96%300 $743 50 $981.28 $237.78 31 98%400 $909 86 $1,206 75 $296 89 32 63%500 $1,076 21 $1,432 23 $356 02 33 08%750 $1,492 11 $1,995 93 $503 82 33 77%
1,000 $1,908.01 $2,559 62 $651 61 34 15%
0 $244 42 $304 84 $60 42 24.72%5 $253 23 $316 78 $63 55 25 10%
10 $262 03 $328 71 $66.68 25 45%20 $279 64 $352.58 $72 94 26 08%50 $332 47 $424 20 $91.73 27 59%75 $376 50 $463 88 $107 38 28 52%
100 $420 52 $543 56 $123 04 29 26%150 $508 58 $662 91 $154 33 30 35%200 $596 63 $782 27 $185 64 31 11%300 $772 73 $1,020 99 $248 26 32 13%400 $948 83 $1,259 70 $310 87 32 76%500 $1,124 93 $1,498 42 $373 49 33 20%750 $1,565 19 $2,095 21 $530 02 33 86%
1,000 $2,005 45 $2,691 99 $686.54 34 23%
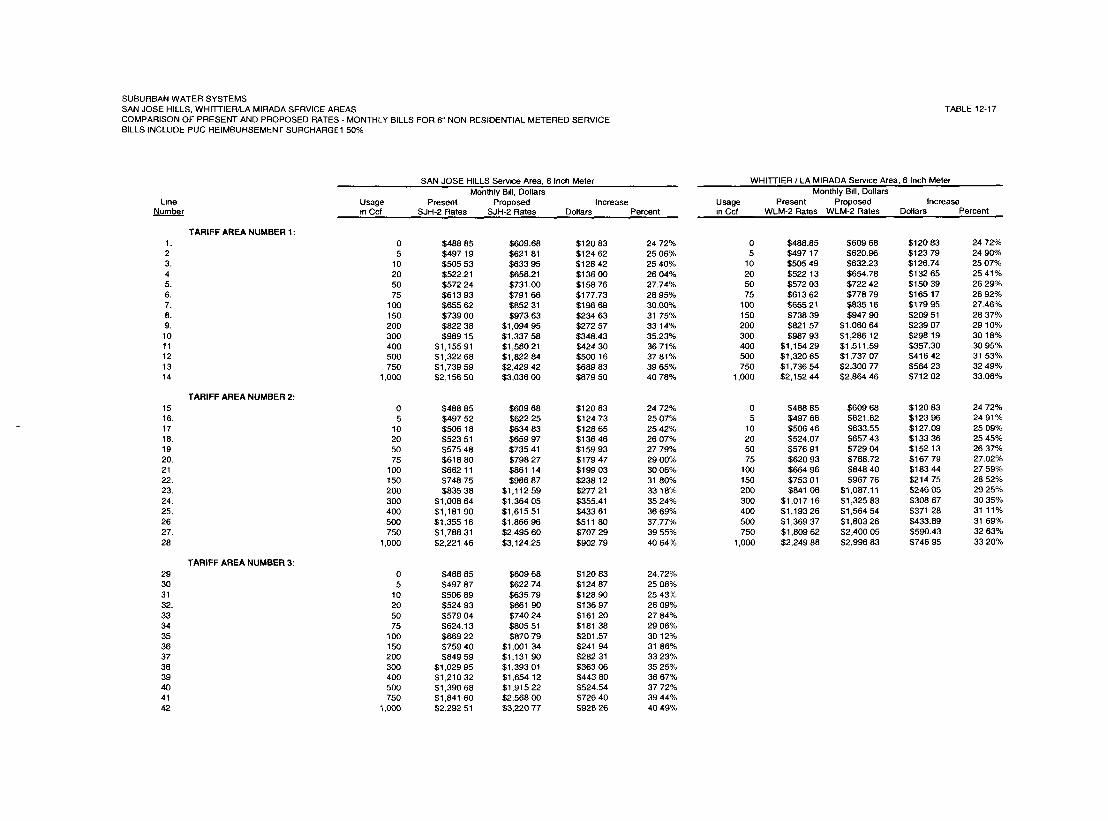
SUBURBAN WATER SYSTEMSSAN JOSE HILLS, WHI’I-]-IER/LA MIRADA SERVICE AREASCOMPARISON OF PRESENT AND PROPOSED RATES - MONTHLY BILLS FOR 6" NON RESIDENTIAL METERED SERVICEBILLS INCLUDE PUC REIMBURSEMENT SURCHARGE 1 50%
TABLE 12-17
SAN JOSE HILLS Serwce Area, 6 Inch MeterMonthly Bdl, Dollars
Line Usage Present Proposed IncreaseNumber m Ccf SJH-2 Rates SJH-2 Rates Dollars Percent
TARIFF AREA NUMBER 1:1. 0 $488 85 $609.68 $120 83 24 72%2 5 $497 19 $621 81 $124 62 25 06%3. 10 $505 53 $633 95 $128 42 25 40%4 20 $522.21 $658.21 $136 00 26 04%5. 50 $572 24 $731.00 $158 76 27.74%6. 75 $613 93 $791 66 $177.73 28 95%7. 1(30 $655 62 $852 31 $196 69 30.00%8. 150 $739 00 $973.63 $234 63 31 75%9. 200 $82238 $1,094 95 $272 57 33 14%10 300 $989 15 $1,337 58 $348.43 35.23%11 400 $1,155 91 $1,580 21 $42430 36 71%12 500 $1,322 68 $1,822 84 $500 16 37 81%13. 750 $1,739 59 $2,429 42 $689 83 39 65%14 1,000 $2,156 50 $3,036 00 $879 50 40 78%
TARIFF AREA NUMBER 2:15 0 $488 85 $609 68 $120 83 24 72%16. 5 $497 52 $622 25 $124 73 25 07%17 10 $506 18 $634 83 $128 65 25 42%18. 20 $523 51 $659 97 $136 46 26 07%19 50 $575 48 $735 41 $159 93 27 79%20. 75 $618 80 $798 27 $179 47 29 00%21 100 $662 11 $861 14 $199 03 30 06%22. 150 $748 75 $986 87 $238 12 31 80%23. 200 $835 38 $1,112 59 $277 21 33 18%24. 300 $1,008 64 $1,364 05 $355.41 35 24%25. 400 $1,181 90 $1,615 51 $433 61 36 69%26 500 $1,355 16 $1,866 96 $511 80 37.77%27. 750 $1,788 31 $2,495 60 $707 29 39 55%28 1,000 $2,221 46 $3,124.25 $902.79 40 64%
TARIFF AREA NUMBER 3:29 0 $488 85 $609 68 $120 83 24.72%30 5 $497 87 $622 74 $124 87 25 06%31 10 $506 89 $635.79 $128.90 25 43%32. 20 $524 93 $661 90 $136 97 26 09%33 50 $579 04 $740 24 $161 20 27 84%34 75 $624.13 $805 51 $181 38 29 06%35 100 $669 22 $870 79 $201.57 30 12%36 150 $759 40 $1,00134 $241 94 31 86%37 200 $849 59 $1,13190 $28231 33 23%38 300 $1,029 95 $1,393 01 $363 06 35 25%39 400 $1,210 32 $1,654 12 $443 80 36 67%40 500 $1,390 68 $1,915 22 $524.54 37 72%41 750 $1,841 60 $2,568 00 $726 40 39 44%42 1,000 $2,292 51 $3,220 77 $928 26 40 49%
WHI’I-I’IER / LA MIRADA Service Area, 6 Inch MeterMonthly Bdl, Dollars
Usage Present Proposed Increase=n Ccf WLM-2 Rates WLM-2 Rates Dollars Percent
0 $488.855 $49717
10 $505 4920 $522 1350 $572 0375 $613 62
100 $655 21150 $738 392OO $821 57300 $987 93400 $1,15429500 $1,320 65750 $1,736 54
1,000 $2,152 44
;609 68~620.96;632.23;654.78;722 42;778 79~835 16;947 90
$1 06064$1 286 12$1,511.59$1,737 07$2,300 77$2,86446
$120 83 24 72%$123 79 24 90%$126.74 25 07%$132 65 25 41%$150 39 26 29%$165 17 26 92%$179 95 27.46%$209 51 28 37%$239 07 29 10%$298 19 30 18%$357.30 30 95%$416 42 31 53%$56423 32 49%$712 02 33.08%
0 $488 85 $609 68 $120 83 24 72%5 $497 66 $621.62 $123 96 24 91%
10 $506 46 $633.55 $127.09 25 09%20 $524.07 $657 43 $133 36 25 45%50 $576 91 $729 04 $15213 26 37%75 $620 93 $788.72 $167 79 27.02%
100 $664 96 $848 40 $183 44 27 59%150 $753 01 $967 76 $214 75 28 52%200 $841 06 $1,087.11 $246 05 29 25%300 $1,017 16 $1,325 83 $308 67 30 35%400 $1,193 26 $1,564 54 $371 28 31 11%500 $1,369 37 $1,803 26 $433.89 31 69%750 $1,809 62 $2,400 05 $590.43 32 63%
1,000 $2,249 88 $2,996 83 $746 95 33 20%

SUBURBAN WATER SYSTEMSSAN JOSE HILLS, WHITTIER/LA MIRADA SERVICE AREASCOMPARISON OF PRESENT AND PROPOSED RATES - MONTHLY BILLS FOR 8" NON RESIDENTIAL METERED SERVICEBILLS INCLUDE PUC REIMBURSEMENT SURCHARGE 1 50%
TABLE 12-18
SAN JOSE HILLS Sen/me Area, 8 Inch MeterMonthly B~II, Dollars
Line Usage Present Proposed IncreaseNumber =n Ccf SJH-2 Rates SJH-2 Rates Dollars Percent
TARIFF AREA NUMBER 1 :1 0 $782 15 $975 49 $193 34 24 72%2. 5 $790 49 $987.62 $197.13 24 94%3 10 $798 83 $999 75 $200 92 25 15%4 20 $815 50 $1,024 02 $208 52 25 57%5 50 $865 53 $1,096 81 $231 28 26 72%6 75 $907 22 $1,157 47 $250 25 27.58%7 100 $948 91 $1,218 12 $269 21 28 37%8 150 $1,032 30 $1,339 44 $307.14 29 75%9 200 $1,115 68 $1,460 75 $345 07 30 93%10 300 $1,282 44 $1,703 39 $420 95 32 82%11. 400 $1,449 21 $1,948 02 $496 81 34 28%12 500 $1,615 97 $2,188 65 $572 68 35 44%13. 750 $2,032 88 $2,795 23 $762 35 37 50%14. 1,000 $2,449 79 $3,401 81 $952.02 38 86%
TARIFF AREA NUMBER 2:15. 0 $782.15 $975 49 $193 34 24 72%16. 5 $790 81 $988 06 $197 25 24 94%17. 10 $799 47 $1,000 64 $201.17 25 16%18 20 $816 80 $1,025 78 $208 98 25 59%19. 50 $868 78 $1,101 22 $232 44 26 75%20. 75 $912 09 $1,164 08 $251 99 27 63%21 100 $955 41 $1,226 95 $271 54 28 42%22. 150 $1,042 04 $1,352 68 $310 64 29 81%23 200 $1,128 67 $1,478 40 $349 73 30 99%24 300 $1,301.93 $1,729 86 $427 93 32 87%25. 400 $1,475 19 $1,981 32 $506 13 34 31%26 500 $1,648 45 $2,232 77 $584 32 35 45%27 750 $2,081 60 $2,861 41 $779 81 37 46%28 1,000 $2,514 75 $3,490 06 $975 31 38 78%
TARIFF AREA NUMBER 3:29 0 $78215 $975 49 $19334 24.72%30 5 $791 17 $988 55 $197 38 24 95%31 10 $800 19 $1,00160 $201 41 25 17%32 20 $818 22 $1,027 71 $209 49 25 60%33 50 $872 33 $1,10605 $233 72 26 79%34 75 $917 42 $1,17132 $253 90 27 68%35 100 $962 51 $1,236 60 $274 09 28 48%36 150 $1,052 70 $1,367 15 $314.45 29 87%37 200 $1,142 88 $1,497 71 $354 83 31 05%38 300 $1,323.25 $1,758 82 $435 57 32 92%39 400 $1,503 61 $2,019 93 $516 32 34 34%40 500 $1,68398 $2,281 03 $597 05 35 45%41 750 $2,134 89 $2,933 81 $798 92 37 42%42 1,000 $2,585 80 $3,586 58 $1,000 78 38 70%
WHITTLER / LA MIRADA Serv=ce Area, 8 Inch MeterMonthly Bdl, Dollars
Usage Present Proposed Increasem Ccf WLM-2 Rates WLM-2 Rates Dollars Percent
0 $782 15 $975 49 $193 34 24 72%5 $790 47 $986.77 $196 30 24 83%
10 $798 78 $998.04 $199 26 24.95%20 $815 42 $1,020 59 $205 17 25.16%50 $86533 $1,088 23 $222 90 25.76%75 $906 92 $1,144 60 $237 68 26.21%
100 $948 51 $1,200 97 $252 46 26.62%150 $1,031 69 $1,313 71 $282 02 27.34%200 $1,114 87 $1,426 45 $311 58 27.95%300 $1,281.22 $1,651 93 $370 71 28.93%400 $1,447 58 $1,877 40 $429 82 29 69%500 $1,613.94 $2,102 88 $488 94 30.29°/o750 $2,029 84 $2,666 58 $636 74 31 37%
1,000 $2,445 73 $3,230 27 $784 54 32 08%
0 $78215 $975 49 $193 34 24 72%5 $79095 $987 43 $196.48 24 84%
10 $799 76 $999.36 $199 60 24 96%20 $817 37 $1,023.23 $205 86 2519%50 $870 20 $1,094.85 $224 65 25 82%75 $914 23 $1,154 53 $240 30 26 28%
100 $958.25 $1,214 21 $255 96 26 71%150 $1,046.30 $1,333 56 $287 26 27 45%200 $1,134 35 $1,452 92 $318 57 28.08%300 $1,310 46 $1,691 64 $381 18 29 09%400 $1,486 56 $1,930 35 $443 79 29 85%500 $1,662 66 $2,169 07 $506 41 30 46%750 $2,102 92 $2,765 86 $662 94 31 52%
1,000 $2,543 17 $3,362 64 $819 47 32 22%
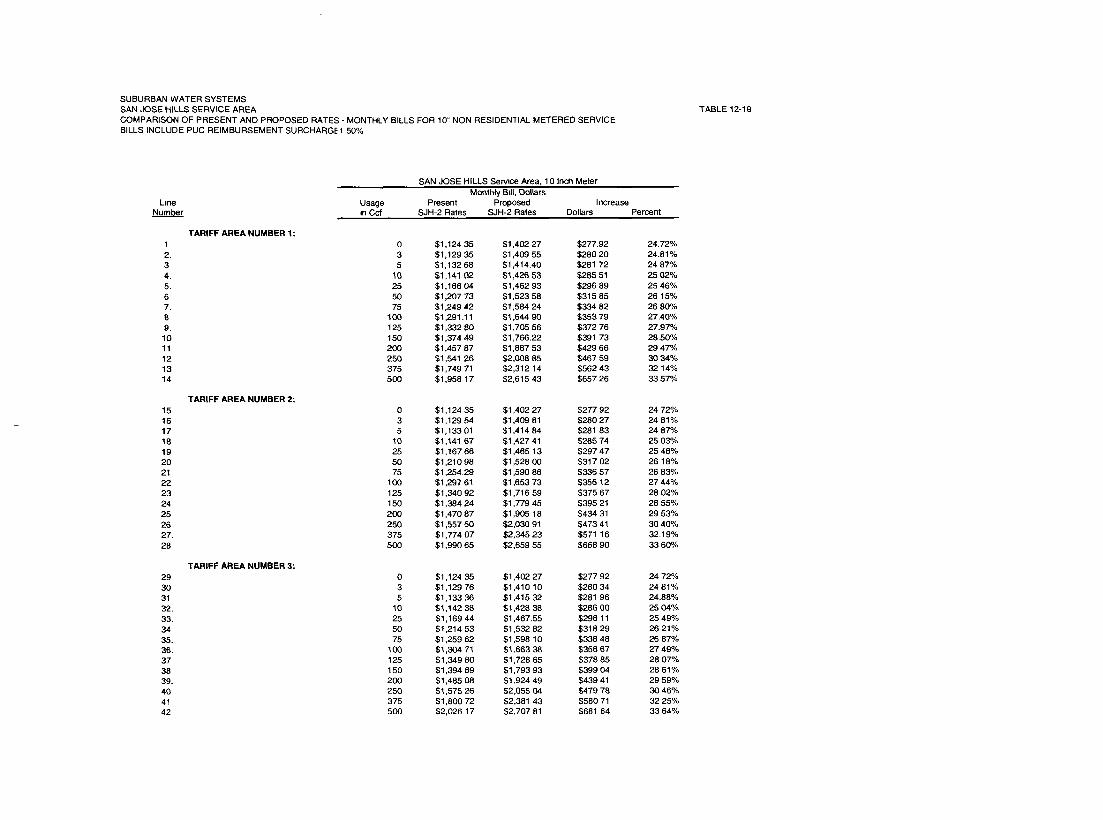
SUBURBAN WATER SYSTEMSSAN JOSE HILLS SERVICE AREACOMPARISON OF PRESENT AND PROPOSED RATES - MONTHLY BILLS FOR 10" NON RESIDENTIAL METERED SERVICEBILLS INCLUDE PUC REIMBURSEMENT SURCHARGE1 50%
TABLE 12-19
SAN JOSE HILLS Se~wce Area, 10 Inch MeterMonthly B~II, Dollars
L=ne Usage Present Proposed IncreaseNumber =n Ccf SJH-2 Rates SJH-2 Rates Dollars Percent
TARIFF AREA NUMBER 1:1 0 $1,124 35 $1,402 27 $277.92 24.72%2. 3 $1,129 35 $1,409 55 $280 20 24.81%3 5 $1,132 68 $1,414.40 $281 72 24 87%4. 10 $1,141 02 $1,426 53 $285 51 25 02%5. 25 $1,166 04 $1,462 93 $296 89 25 46%6 50 $1,207 73 $1,523 58 $315 85 26 15%7. 75 $1,249 42 $1,584 24 $334 82 26 80%B 100 $1,291.11 $1,644 90 $353 79 27.40%9. 125 $1,332 60 $1,705 56 $372 76 27.97%10 150 $1,374 49 $1,766.22 $391 73 28.50%11 200 $1,457 87 $1,887 53 $429 66 29 47%12 250 $1,541 26 $2,O08 85 $467 59 30 34%13 375 $1,749 71 $2,312 14 $562 43 32 14%14 500 $1,958 17 $2,615 43 $657 26 33 57%
TARIFF AREA NUMBER 2:15 0 $1,124 35 $1,402 27 $277 92 24 72%16 3 $1,129 54 $1,409 81 $280 27 24 81%17 5 $1,133 01 $1,414 84 $281 83 24 87%18 10 $1,141 67 $1,427 41 $285 74 25 03%19 25 $1,167 66 $1,465 13 $297 47 25 48%20 50 $1,210 98 $1,528 O0 $317 02 26 18%21 75 $1,254.29 $1,590 86 $336 57 26 83%22 1 O0 $1,297 61 $1,653 73 $356 12 27 44%23 125 $1,340 92 $1,716 59 $375 67 28 02%24 150 $1,384 24 $1,779 45 $395 21 28 55%25 200 $1,470 87 $1,905 18 $434 31 29 53%26 250 $1,557 50 $2,030 91 $473 41 30 40%27. 375 $1,774 07 $2,345 23 $571 16 32.19%28 500 $1,990 65 $2,659 55 $668 90 33 60%
TARIFF AREA NUMBER 3:29 0 $1,124 35 $1,402 27 $277 9230 3 $1,129 76 $1,410 10 $280 3431 5 $1,133 36 $1,415 32 $281 9632. 10 $1,142 38 $1,428 38 $286 O033. 25 $1,169 44 $1,467.55 $298 1134 50 $1,214 53 $1,532 82 $318 2935. 75 $1,259 62 $1,598 10 $338 4836. 1 (30 $1,304 71 $1,663 38 $358 6737 125 $1,349 80 $1,72865 $378 8538 150 $1,394 89 $1,793 93 $399 0439. 200 $1,485 08 $1,924 49 $439 4140 250 $1,575 26 $2,055 04 $479 7841 375 $1,800 72 $2,381 43 $580 7142 500 $2,026 17 $2,707 81 $681 64
24 72%24 81%24.88%25 04%25 49%26 21%26 87%27 49%28 07%28 61%29 59%30 46%32 25%33 64%
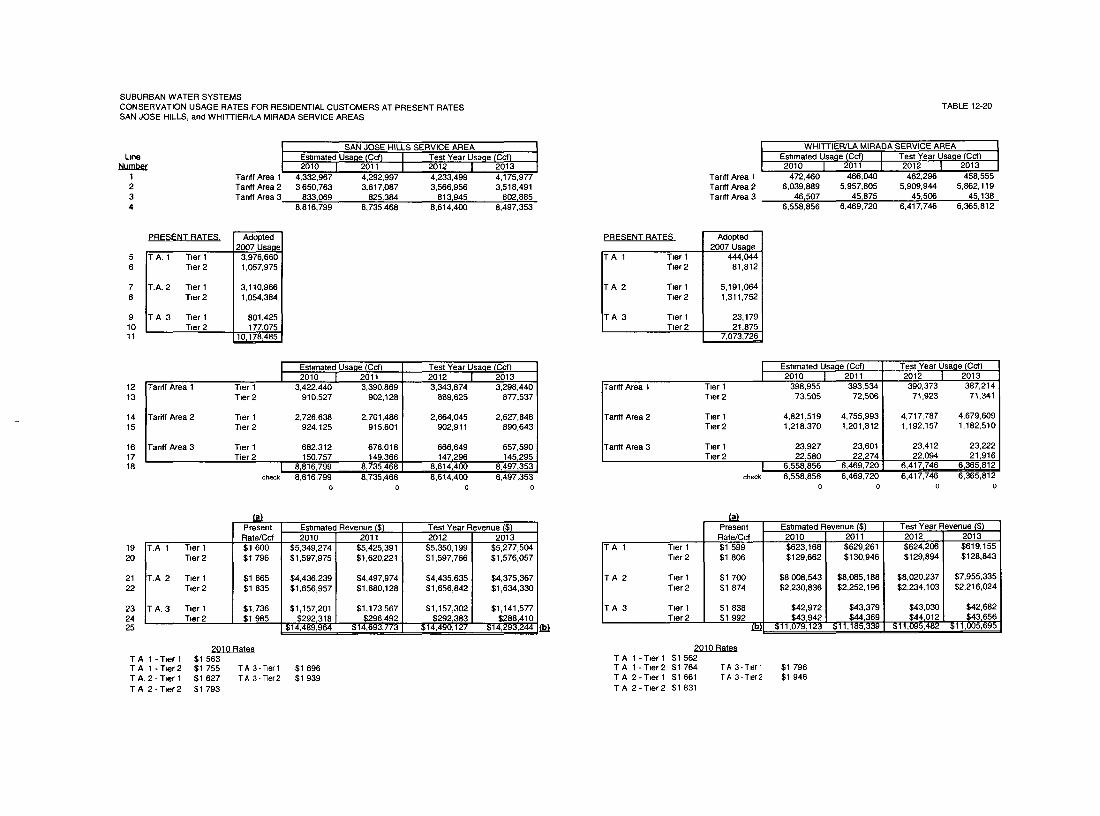
SUBURBAN WATER SYSTEMSCONSERVATION USAGE RATES FOR RESIDENTIAL CUSTOMERS AT PRESENT RATESSAN JOSE HILLS, and WHITTIER/LA MIRADA SERVICE AREAS
I SAN JOSE HILLS SERVICE AREAIJne Estimated Usage (Ccf) I Test Year Usage (Ccf)
Number I 2010 I 2011 I 2012 I 20131 Tariff Area 1 4,332,967 4,292,997 4,233,499 4,175,9772 Tariff Area 2 3,650,763 3,617,087 3,566,956 3,518,4913 Tanff Area 3 833,069 825~384 813,945 802,8854 8,816,799 8,735,468 8,614,400 8,497,353
Adol~ted I2007 Usage
5 IT A. 1 T~er 1 3,976,6606
IT~er 2 1,057,975 I
7 ~T.A. 2 T=er 1 3,110,966 I8
IT~er 2 1,054,384 I
9 JT A 3 T=er 1 801.425 I10 J T=er 2 177~075 I
PRESENT RATES.
1312Tariff Area 1
T~er2T~er 1
14 lTariff Area 2 T~er 115
IT~er 2
16 ~Tanff Area 3 T~er 117 ~ Tier 218
Estimated Usage(C~)2010 2011
3,422,440 3,390,869910,527 902,128
2,726,638 2,701,486924,125 915,601
682,312 676,018150~757 149~366
I 8,816,799 817351468chex:k 8,816,799 8,735,468
0 0
Test Year Usage (C~)2012 ~ 20!33,343,874 3,298,440
889,625 877,537
2,664,045 2,627,848902,911 890,643
666,649 657,590147,296 145~295
8,614t400 8,497,3538,614,400 8,497,353
o o
192O
2122
232425
T.A 1 T~er 1T=er 2
IT.A 2 T~er 1Tier 2
T A. 3 T~er 1T~er 2
PresentRate/Cd$16OO$1796
$1 665$1 835
$1.736$1 985
TA 1-T=er 1TA 1-T~er2T A. 2 - T~er 1TA 2 - T~er 2
2010 R~es$1 563$1 755 TA 3-T~rl$1 627 TA 3-~er2$1 793
E==mated Revenue(S)2010 2011
$5,349,274 $5,425,391$1,597,975 $1,620,221
$4,436,239 $4,497,974$1,656,957 $1,680,128
$1,157,201 $1,173,567$292~318 $296~492
$14,489,964 $14,693,773
Test Year Revenue ($)2012 2013
$5,350,199 $5,277,504$1,597,766 $1,576,057
$4,435,635 $4,375,367$1,656,842 $1,634,330
$1,157,302 $1,141,577$292~383 $288~410
$14,490,127 $14,293,244
$1 696$1 939
TABLE 12-20
Tanff Area 1Tanff Area 2Tariff Area 3
WH~TTIER/LAMIRADA SERVICE AREAEstimated Usage(C~) I Test Year Usage(C~)2010 I 2011I 2012 I 2013
472,460 466,040 462,296 458,5556,039,889 5,957,805 5,909,944 5,862,119
46=507 45~875 45~506 45~1386,558,856 6,469,720 6,417,746 6,365,812
PRESENT RATES
IT A 1 T~er 1
T=er 2
T A 2 T~er 1T~er 2
T A 3 T~er 1T=er 2
Adored2007 Usage
444,04481,812
5,191,0641,311,752
23,17921,875
7,073,72~6
Tariff Area 1
Tariff Area 2
Tardt Area 3
T~er 1Tier 2
T~er 1T=er2
T=er 1T=er2
Icheck
Estimated Usage (C~)2010 I 2011
398,955 393,53473,505 72,506
4,821,519 4,755,9931,218,370 1,201,812
Tea Year Usage(Cd)2012 I 2013
390,373 387,21471,923 71,341
4,717,787 4,679,6091,192,157 1,182,510
23,927 23,601 23,412 23,22222~580 22,274 22~094 21t916
6,558,856 6,469,720 6,417,746 6,365,8126,558,856 6,469,720 6,417,746 6,365,812
0 0 0 0
ITA 1 T~er 1
T~er2
T A 2 T=er 1T=er2
A 3 T=er 1T=er2
PresentRate/C~$1599$1.806
$1 700$1 874
$1 838$1 992
Estimated Revenue ($)2010 2011$623,168 $629,261$129,662 $130,946
$8,008,543 $8,085,188$2,230,836 $2,252,196
Test Year Revenue ($)2012 2013$624,206 $619,155$129,894 $128,843
$8,020,237 $7,955,335$2,234,103 $2,216,024
$43,030 $42,682$44,012 $43,656
$11,095,482 $11,005,695
$42,972 $43,379!$43,942 $44~369
$11,079,123 $11,185,339
2010 RatesTA 1-T=erl $1562TA t-T~er2 $1764 TA3-T~erlTA 2-T=erl $1661 TA3-T=er2TA 2-T~er2 $1831
$1 796$1 946
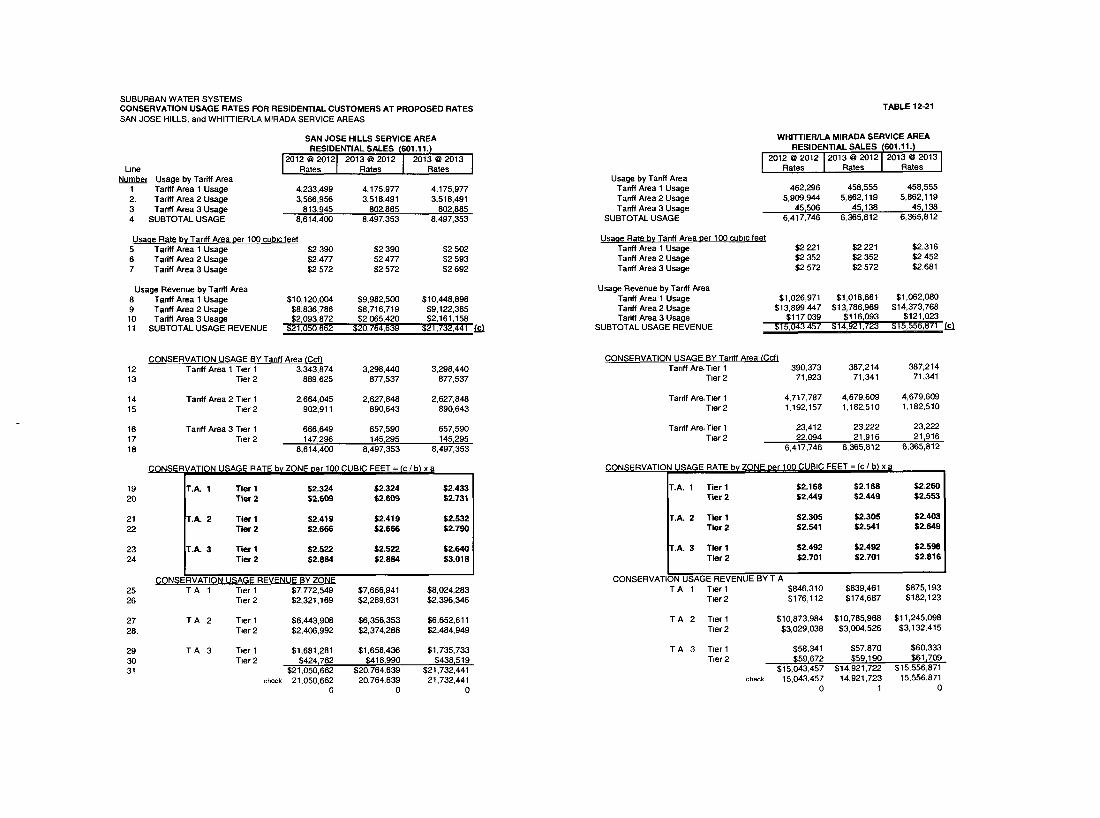
SUBURBAN WATER SYSTEMSCONSERVATION USAGE RATES FOR RESIDENTIAL CUSTOMERS AT PROPOSED RATESSAN JOSE HILLS, and WHITTIER/LA MIRADA SERVICE AREAS
SAN JOSE HILLS SERVICE AREARESIDENTIAL SALES (601.11.7
2012 @ 2012 2013 @ 2012 I 2013 @ 2013Line Rates Rates I Rates
Numbe~ Usage byTariff Area1 Tariff Area 1 Usage 4,233,499 4,175,977 4,175,9772. Tariff Area 2 Usage 3,566,956 3,518,491 3,518,4913 Tariff Area 3 Usage 813~945 802~885 802~8854 SUBTOTAL USAGE 8,614,400 8,497,353 8,497,353
Usaae Rate by Tanff Area per 100 cubic feet5 Tariff Area 1 Usage $2 390 $2 390 $2 5026 Tariff Area 2 Usage $2.477 $2 477 $2 5937 Tariff Area 3 Usage $2 572 $2 572 $2 692
Usage Revenue by Tanff Area8 Tariff Area 1 Usage $10,120,004 $9,982,500 $10,448,8989 Tanff Area 2 Usage $8,836,786 $8,716,719 $9,122,38510 Tariff Area 3 Usage $2,093,872 $2,065,420 $2,161,15811 SUBTOTAL USAGE REVENUE $21,050,662 $20,764,639 $21,732,441 ~c)
CONSERVATION USAGE BY Tariff Area (Ccf)12 Tariff Area 1 T~er 1 3,343,874 3,298,440 3,298,44013 Tier 2 889,625 877,537 877,537
14 Tanff Area 2 T~er 1 2,664,045 2,627,848 2,627,84815 T~er 2 902,911 890,643 890,643
16 Tanff Area 3 T~er 1 666,649 657.590 657,59017 T~er 2 147~296 145~295 145~29518 8,614,400 8,497,353 8,497,353
19
21
2324
~/ATI(~N USAGE RATE bv ZONE eer 100 CUBIC FEET = ~c / b) x a
T.A. 1 Tier I $2.324 $2.324 $2.433Tier 2 $2.609 $2.609 $2.731
T.A. 2 Tier I $2.419 $2.419 $2.532Tier 2 $2.666 $2.666 $2.790
T.A. 3 Tier I $2.522 $2.522 $2.640Tier 2 $2.884 $2.884 $3.018
(~ONSERVATION USAGE REVENUE BY ZONE25 T A 1 T~er 1 $7,772,549 $7,666,941 $8,024,28326 T~er 2 $2,321,169 $2,289,631 $2,396,346
27 T A 2 T~er 128. Tzer 2
29 T A 3 T~er 130 T~er 231
check
$6,443,908 $6,356,353 $6,652,611$2,406,992 $2,374,288 $2,484,949
$1,681,281 $1,658,436 $1,735,733$424~762 $418~990 $438~519
$21,050,662 $20,764,639 $21,732,44121,050,662 20,764,639 21,732,441
0 0 0
TABLE 12-21
WHI’I~IER/LA MIRADA SERVICE AREARESIDENTIAL SALES 1601.11.1
Rates Rates RatesUsage by Tariff Area
Tariff Area 1 Usage 462,296 458,555 458,555Tanff Area 2 Usage 5,909,944 5,862,119 5,862,119Tanff Area 3 Usage 45~506 45~ 138 45~ 138
SUBTOTAL USAGE 6,417,746 6,365,812 6,365,812
Usaqe Rate by Tanff Area perl00cub~cfeetTanff Ama 1 Usage $2 221 $2 221 $2.316Tanff Ama 2 Usage $2 352 $2 352 $2 452Tanff Area 3 Usage $2 572 $2 572 $2.681
Usage Revenue by Tariff AreaTanff Area 1 Usage $1,026,971 $1,018,661 $1,062,080Tariff Area 2 Usage $13,899,447 $13,786,969 $14,373,768Tariff Area 3 Usage $117,039 $116,093 $121,023
SUBTOTAL USAGE REVENUE $15,043,457 $14,921,723 $15,556,871 c~
CONSERVATION USAGE BY Tariff Area (Ccf)Tanff Are, T~er I 390,373 387,214 387,214
T~er 2 71,923 71,341 71,341
Tariff Are, T~er 1 4,717,787 4,679,609 4,679,609T~er2 1,192,157 1,182,510 1,182,510
Tariff Are, Tier 1 23,412 23,222 23,222T~er2 22~094 21t916 21~916
6,417,746 6,365,812 6,365,812
(~QNSERVATIO 4 ~A~E RATE by ZONE per 100 CUBIC FEET = (c / b) x a
T.A. 1 Tier I $2.168 $2.168 $2,260Tier 2 $2.449 $2,449 $2.553
T.A. 2 Tier I $2.305 $2.305 $2.403Tier 2 $2.541 $2.541 $2.649
T,A, 3 Tier I $2.492 $2.492 $2.598Tier 2 $2.701 $2.701 $2.816
CONSERVATION USAGE REVENUE BY T AT A 1 T~er 1 $846,310
T~er2 $176,112
T A 2 T~er 1T~er2
T A 3 T~er 1T=er2
check
$839,461 $875,193$174,687 $182,123
$10,873,984 $10,785,988 $11,245,098$3,029,038 $3,004,526 $3,132,415
$58,341 $57,870 $60,333$59~672 $59~190 $61~709
$15,043,457 $14,921,722 $15,556,87115,043,457 14,921,723 15,556,871
0 1 0
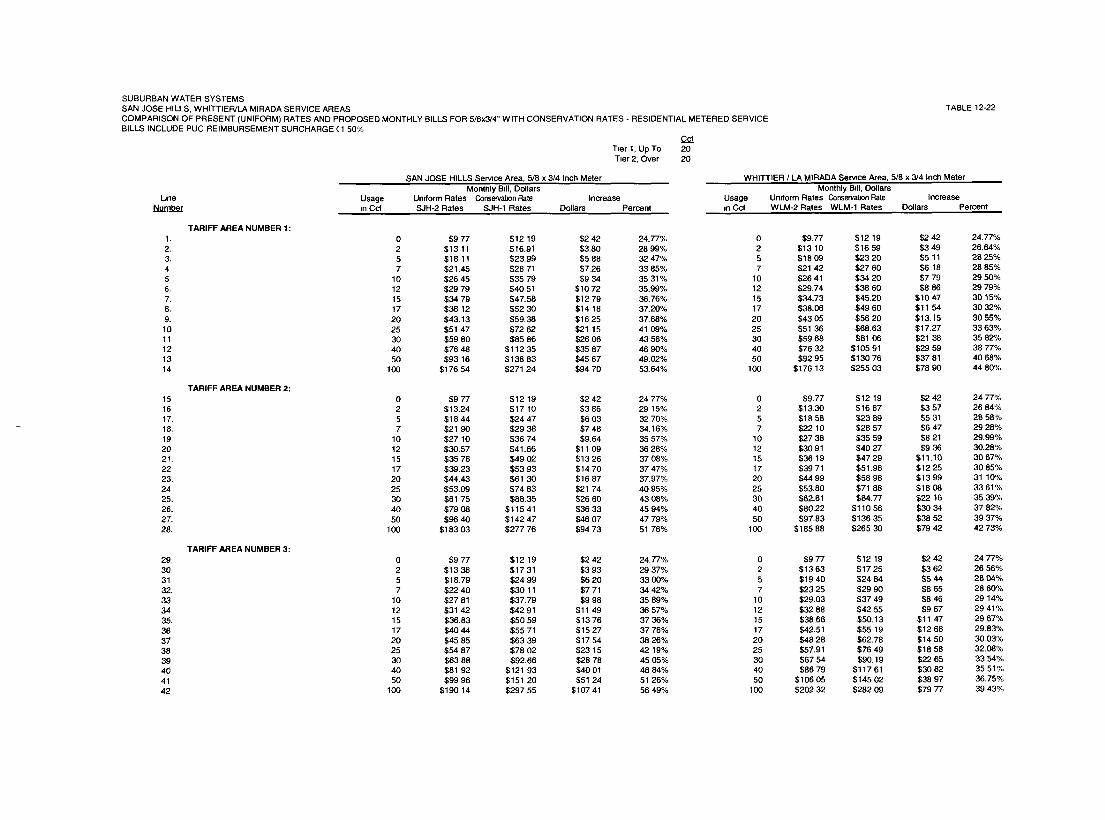
SUBURBAN WATER SYSTEMSSAN JOSE HILLS, WHITTIER/LA MIRADA SERVICE AREASCOMPARISON OF PRESENT (UNIFORM) RATES AND PROPOSED MONTHLY BILLS FOR 5/8x3/4" WITH CONSERVATION RATES - RESIDENTIAL METERED SERVICEBILLS INCLUDE PUC REIMBURSEMENT SURCHARGE ( 1 50%
CcfT~er I, Up To 20T~er 2, Over 20
TABLE 12-22
SAN JOSE HILLS Serwce Area, 5/8 x 3/4 Inch MeterMonthly Bdl, Dollars
IJne Usage Uniform Rates Conservation Rate IncreaseNumber in Ccf SJH-2 Rates SJH-1 Rates Dollars Percent
WHITTLER / LA MIRADA Sennce Area, 5/8 x 3~4 Inch MeterMonthly Bdl, Dollars
Usage Un=form Rates Consewa~n Rate Increase~n Ccf WLM-2 Rates WLM÷I Rates Dollars Percent
TARIFF AREA NUMBER 1 :1. 0 $9 77 $12 19 $2 42 24.77%2. 2 $13 11 $16.91 $3.80 28 99%3. 5 $18 11 $23.99 $5 88 32 47%4- 7 $21.45 $28 71 $7.26 33 85%5 10 $26 45 $35 79 $9 34 35 31%6. 12 $29 79 $40 51 $10 72 35.99%7. 15 $34 79 $47.58 $12 79 36.76%8. 17 $38 12 $52 30 $14 18 37.20%9. 20 $43.13 $59.38 $16 25 37.68%10 25 $51 47 $72 62 $21 15 41 09%11 30 $59 80 $85 86 $26 06 43 58%12 40 $76 48 $112 35 $35 87 46 90%13 50 $93 16 $138 83 $45 67 49.02%14 100 $176 54 $271 24 $94 70 53.64%
TARIFF AREA NUMBER 2:15 0 $9 77 $12 19 $2 42 24 77%16 2 $13.24 $17 10 $3 86 29 15%17. 5 $18 44 $24 47 $6 03 32 70%18. 7 $21 90 $29 38 $7 48 34.16%lg 10 $27 10 $36 74 $9.64 35 57%20 12 $30.57 $41.66 $11 09 36 28%21. 15 $35 76 $49 02 $13 26 37 08%22 17 $39.23 $53 93 $14 70 37 47%23. 20 $44.43 $61 30 $16 87 37.97%24 25 $53.09 $74 83 $21 74 40 95%25. 30 $61 75 $88.35 $26 60 43 08%26. 40 $79 08 $115 41 $36 33 45 94%27. 50 $96 40 $142 47 $46 07 47 79%28. 100 $183 03 $277 76 $94 73 51 76%
TARIFF AREA NUMBER 3:29. 0 $9 77 $12 19 $2 42 24.77%30 2 $13 38 $17 31 $3 93 29 37%31 5 $18.79 $24 99 $6 20 33 00%32. 7 $22 40 $30 11 $7 71 34 42%33 10 $27 81 $37.79 $9 98 35 89%34 12 $31 42 $42 91 $11 49 36 57%35. 15 $36.83 $50 59 $13 76 37 36%36 17 $40 44 $55 71 $15 27 37 76%37 20 $45 85 $63 39 $17 54 38 26%38 25 $54 87 $78 02 $23 15 42 19%39 30 $63 88 $92.66 $28 78 45 05%40 40 $81 92 $121 93 $40 01 48 84%41 50 $99 96 $151 20 $51 24 51 26%42 100 $190 14 $297 55 $107 41 56 49%
0 $9.772 $13 105 $18 097 $21 42
10 $26 4112 $29.7415 $34.7317 $38.0620 $43 0525 $51 3630 $59 6840 $76 3250 $92 95
100 $176 13
;12 19;16 59;23 20;27 60;34 20;38 60;45.20;49 60356 20;68.63
$81o6$105 91$130 76$255 03
$2 42 24.77%$3 49 26.64%$5 11 28 25%$6 18 28 85%$7 79 29 5O%$8 86 29 79%
$1047 30 15%$1154 3032%$13.15 30 55%$17.27 33 63%$2138 35 82%$29 59 38 77%$37 81 40 68%$7890 44 80%
0 $9 77 $12 19 $2 42 2477%2 $13 63 $17 25 $3 62 26 56%5 $19 40 $24 84 $544 2804%7 $23 25 $29 90 $6 65 28 60%
10 $29.03 $37 49 $8 46 29 14%12 $32 88 $42 55 $9 67 29 41%15 $38 66 $50.13 $1147 2967%17 $42.51 $55 19 $12 68 29.83%20 $48 28 $62.78 $14 50 30.03%25 $57.91 $76 49 $18 58 32.08%30 $67 54 $90.19 $22 65 3354%40 $86 79 $117 61 $3082 35 51%50 $106 05 $14502 $3897 36.75%
100 $202 32 $28209 $79 77 39 43%
0 $9.77 $12 19 $2 42 2477%2 $13.30 $16 87 $3 57 26 84%5 $18 58 $23 89 $5 31 28 58%7 $22 10 $28 57 $6 47 29 28%
10 $27 38 $35 59 $8 21 29.99%12 $30 91 $40 27 $936 30.28%15 $36 19 $4729 $11.10 3067%17 $39 71 $51.96 $12 25 30 85%20 $44 99 $58 98 $13 99 31 10%25 $53.80 $71 88 $1808 33 61%30 $62.61 $84.77 $2216 3539%40 $80.22 $110 56 $3034 37 82%50 $97.83 $136 35 $3852 39 37%
100 $185 88 $26530 $79 42 42 73%
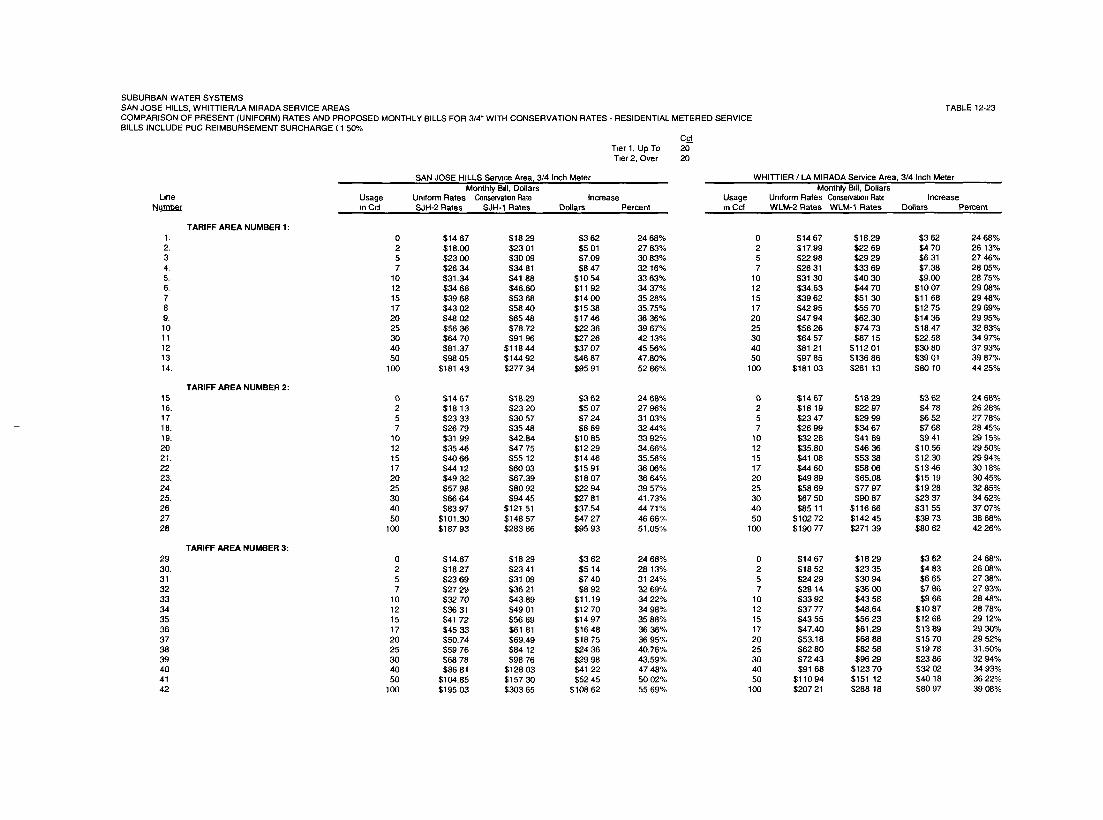
SUBURBAN WATER SYSTEMSSAN JOSE HILLS, WHITTIER/LA MIRADA SERVICE AREASCOMPARISON OF PRESENT (UNIFORM) RATES AND PROPOSED MONTHLY BILLS FOR 3/4" WITH CONSERVATION RATES - RESIDENTIAL METERED SERVICEBILLS INCLUDE PUC REIMBURSEMENT SURCHARGE ( 1 50%
[JneNtJmber
c_~_~T~er 1, Up To 20T=er 2, Over 20
TABLE 12-23
SAN JOSE HILLS Service Area, 3/4 Inch MeterMonthly Bdl, Dollars
Usage Uniform Rates Conservation Rate Increasein Col SJH-2 Rates SJH-1 Rates Dollars Percent
WHITTIER / LA MIRADA Service Area, 3/4 Inch MeterMonthly Bdl, Dollars
Usage Uniform Rates Conservation Rate Increasein Ccf WLM-2 Rates WLM-1 Rates D(dlars Percent
2.34.
6.789.1011121314.
1516.1718.19.2021.2223.2425.262728
2930.313233343536373839404142
TARIFF AREA NUMBER 1 :
TARIFF AREA NUMBER 2:
TARIFF AREA NUMBER 3:
0 $14 67 $18 29 $3 62 24 68%2 $18.00 $23 01 $5 01 27 83%5 $23 00 $30 09 $7.09 30 83%7 $26 34 $34 81 $8 47 32 16%
10 $31.34 $41 88 $10 54 33 63%12 $34 68 $46.60 $11 92 34 37%15 $39 68 $53 68 $14 00 35 28%17 $43 02 $58 40 $15 38 35.75%20 $48 02 $65 48 $17 46 36 36%25 $56 36 $78.72 $22 36 39 67%30 $64 70 $91 96 $27 26 42 13%40 $81.37 $118 44 $37 07 45 56%50 $98 05 $144 92 $46 87 47.80%
100 $181 43 $277 34 $95 91 52 86%
0 $14 67 $18.29 $3 62 24 68%2 $18 13 $23 20 $5 07 27 96%5 $23 33 $30 57 $7 24 31 03%7 $26 79 $35 48 $8 69 32 44%
10 $31 99 $42.84 $10 85 33 92%12 $35 46 $47 75 $12 29 34.66%15 $40 68 $55 12 $14 46 35.56%17 $44 12 $60 03 $15 91 36 06%20 $49 32 $67.39 $18 07 36 64%25 $57.98 $80 92 $22 94 39 57%30 $66 64 $94 45 $27 81 41.73%40 $83 97 $121 51 $37.54 44 71%50 $101.30 $148 57 $47 27 46 66%
100 $187 93 $283 86 $95 93 51.05%
0 $14.67 $18 29 $3 62 24 68%2 $18 27 $23 41 $5 14 28 13%5 $23 69 $31 09 $7 40 31 24%7 $27 29 $36 21 $8 92 32 69%
10 $3270 $43.89 $11.19 34 22%12 $36 31 $49 01 $12 70 34 98%15 $41 72 $56 69 $14 97 35 88%17 $45 33 $61 81 $16 48 36 36%20 $50.74 $69.49 $18 75 36 95%25 $59 76 $84 12 $24 36 40.76%30 $68 78 $98 76 $29 98 43.59%40 $86 81 $128 03 $41 22 47 48%50 $ 104.85 $ 157 30 $52 45 50 02%
100 $195 03 $303 65 $108 62 55 69%
0 $14 67 $18.29 $3 62 24 68%2 $17.99 $22 69 $4 70 26 13%5 $22.98 $29 29 $6 31 27 46%7 $26 31 $33 69 $7,38 28 05%
10 $31 30 $40 30 $9.00 28 75%12 $34.63 $44 70 $10 07 29 08%15 $39 62 $51 30 $11 68 29 48%17 $42 95 $55 70 $12 75 29 69%20 $47 94 $62.30 $14 36 29 95%25 $56 26 $74 73 $18.47 32 83%30 $64 57 $87 15 $22.58 34 97%40 $81 21 $112 01 $30 80 37 93%50 $97 85 $136 86 $39 01 39 87%
100 $181 03 $261 13 $80 10 44 25%
0 $14 67 $18 29 $3 62 24 68%2 $18 19 $22 97 $4 78 26 28%5 $23 47 $29 99 $6 52 27 78%7 $26 99 $34 67 $7 68 28 45%
10 $32 28 $41 69 $9 41 29 15%12 $35.80 $46 36 $ 10.56 29 50%15 $41 08 $53 38 $ 12.30 29 94%17 $44 60 $58 06 $13 46 30 18%20 $49 89 $65.08 $15 19 30.45%25 $58 69 $77 97 $19 28 32 85%30 $67 50 $90 87 $23 37 34 62%40 $85 11 $116 66 $31 55 37 07%50 $102 72 $142 45 $39 73 38 68%
100 $190 77 $271 39 $80 62 42 26%
0 $14 672 $18 525 $24 297 $28 14
10 $33 9212 $37 7715 $43 5517 $47.4020 $53.1825 $62 8030 $72 4340 $91 6850 $110 94
100 $207 21
;18 29 $3 62 24 68%;23 35 $483 2608%;3094 $6 65 2738%;3600 $786 27 93%;43 58 $9 66 2848%;48.64 $10 87 28 78%;56 23 $12 68 29 12%;61.29 $13 89 29;6888 $15 70 29 52%;82 58 $19 78 31.50%;96 29 $23 86 32 94%123 70 $3202 3493%
$151 12 $4018 3622%$288 18 $80 97 3908%
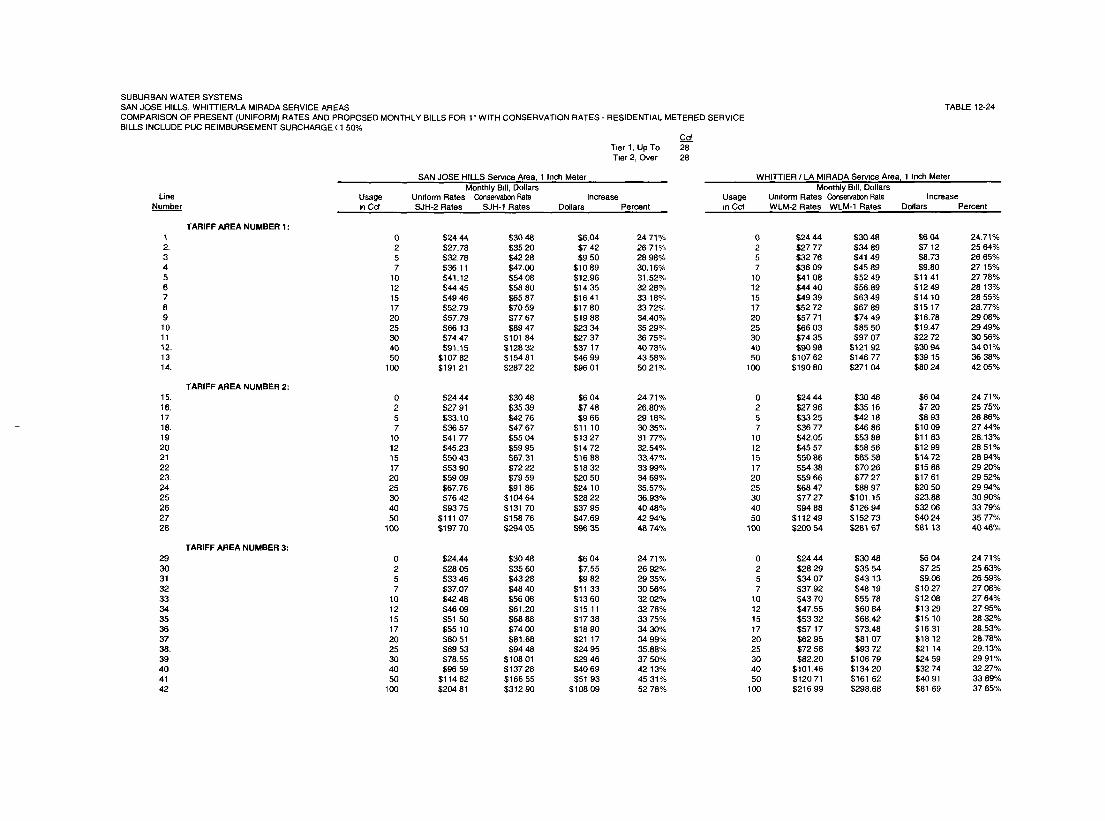
SUBURBAN WATER SYSTEMSSAN JOSE HILLS, WHITTIER/LA MIRADA SERVICE AREASCOMPARISON OF PRESENT (UNIFORM) RATES AND PROPOSED MONTHLY BILLS FOR 1" WITH CONSERVATION RATES - RESIDENTIAL METERED SERVICEBILLS INCLUDE PUC REIMBURSEMENT SURCHARGE ( 1 50%
ccfT~er 1, Up To 28T~er 2, Over 28
SAN JOSE HILLS Service Area, 1 Inch MeterMonthly B~II, Dollars
Line Usage Uniform Rates Conse~vabon Rate IncreaseNumber in Ccf SJH-2 Rates SJH-1 Rates Dollars Percent
TABLE 12-24
TARIFF AREA NUMBER 1 :1 0 $24 44 $30 48 $6.04 24 71%2. 2 $27.78 $35 20 $7 42 26 71%3 5 $32.78 $42 28 $9 50 28 98%4 7 $36 11 $47.00 $10 89 30.16%5 10 $41.12 $54 08 $12.96 31.52%6 12 $44 45 $58 80 $14 35 32 28%7 15 $49 46 $65 87 $16 41 33 18%8 17 $52.79 $70 59 $17 80 33 72%9 20 $57.79 $77 67 $19 88 34.40%10. 25 $66 13 $89 47 $23 34 35 29%11 30 $74 47 $101 84 $27 37 36 75%12. 40 $91.15 $128 32 $37 17 40 78%13 50 $107 82 $154 81 $46 99 43 58%14. 100 $191 21 $287 22 $96 01 50 21%
TARIFF AREA NUMBER 2:15. 0 $24 44 $30 48 $6 04 24.71%16. 2 $27 91 $35 39 $7 48 26.80%17 5 $33.10 $42 76 $9 66 29 18%18. 7 $36 57 $47 67 $11 10 30 35%19 10 $41 77 $55 04 $13 27 31 77%20 12 $45.23 $59 95 $14 72 32.54%21 15 $50 43 $67.31 $16 88 33.47%22 17 $53 90 $72 22 $18 32 33 99%23. 20 $59 09 $79 59 $20 50 34 69%24 25 $67.76 $91 86 $24 10 35.57%25 30 $76 42 $104 64 $28 22 36.93%26 40 $93 75 $131 70 $37 95 40 48%27 50 $111 07 $158 76 $47.69 42 94%28 100 $197 70 $294 05 $96 35 48 74%
TARIFF AREA NUMBER 3:29 0 $24.44 $30 48 $6 04 24 71%30 2 $28 05 $35 60 $7.55 26 92%31 5 $33 46 $43 28 $9 82 29 35%32 7 $37.07 $48 40 $11 33 30 56%33 10 $42 48 $56 08 $13 60 32 02%34 12 $46 09 $61.20 $15 11 32 78%35 15 $51 50 $68 88 $17 38 33 75%36 17 $55 10 $74 00 $18 90 34 30%37 20 $60 51 $81.68 $21 17 34 99%38. 25 $69 53 $94 48 $24 95 35.88%39 30 $78.55 $108 01 $29 46 37 50%40 40 $96 59 $ 137 28 $40 69 42 13%41 50 $114 62 $186 55 $51 93 45 31%42 100 $204 81 $312 90 $108 09 52 78%
WHITTLER / LA MIRADA Service Area, 1 Inch MeterMonthly B~II, Dollars
Usage Umform Rates Consewat~on Rate Increasem Ccf WLM-2 Rates WLM-1 Rates Dollars Percent
0 $24 44 $30 48 $6 04 24.71%2 $27 77 $34 89 $7 12 25 64%5 $32 76 $41 49 $8.73 26 65%7 $36 09 $45 89 $9.80 27 15%
10 $41 08 $52 49 $11 41 27 78%12 $44 40 $56.89 $12 49 28 13%15 $49 39 $63 49 $14 10 28 55%17 $52 72 $67 89 $15 17 28.77%20 $57 71 $74 49 $16.78 29 08%25 $66 03 $85 50 $19.47 29 49%30 $74 35 $97 07 $22 72 30 56%40 $90 98 $121 92 $30 94 34 01%50 $107 62 $146 77 $39 15 36 38%
100 $190 80 $271 04 $80 24 42 05%
0257
101215172025304050
100
;24 44 $30 48 $6 04 24 71%;27 96 $35 16 $7 20 25 75%;33 25 $42 18 $8 93 26 86%;36 77 $46 86 $10 09 27 44%42.05 $53 88 $11 83 28.13%
;45 57 $58 56 $12 99 28 51%;50 86 $65 58 $14 72 28 94%;54 38 $70 26 $15 88 29 20%;59 66 $77 27 $17 61 29 52%;68.47 $88 97 $20 50 29 94%;77 27 $101.15 $23.88 30 90%;94 88 $126 94 $32 06 33 79%112 49 $152 73 $40 24 35 77%200 54 $281 67 $81 13 40 46%
0 $24 44 $30 48 $6 04 24 71%2 $28 29 $35 54 $7 25 25 63%5 $34 07 $43 13 $9.06 26 59%7 $37.92 $48 19 $10 27 27 08%
10 $43 70 $55 78 $12 08 27 64%12 $47.55 $60 84 $13 29 27 95%15 $53 32 $68.42 $15 10 28 32%17 $57 17 $73.48 $16 31 28.53%20 $62 95 $81 07 $18 12 28.78%25 $72 58 $93 72 $21 14 29.13%30 $82.20 $106 79 $24 59 29 91%40 $101.46 $134 20 $32 74 32 27%50 $120 71 $161 62 $40 91 33 89%
100 $216 99 $298.66 $81 69 37 65%
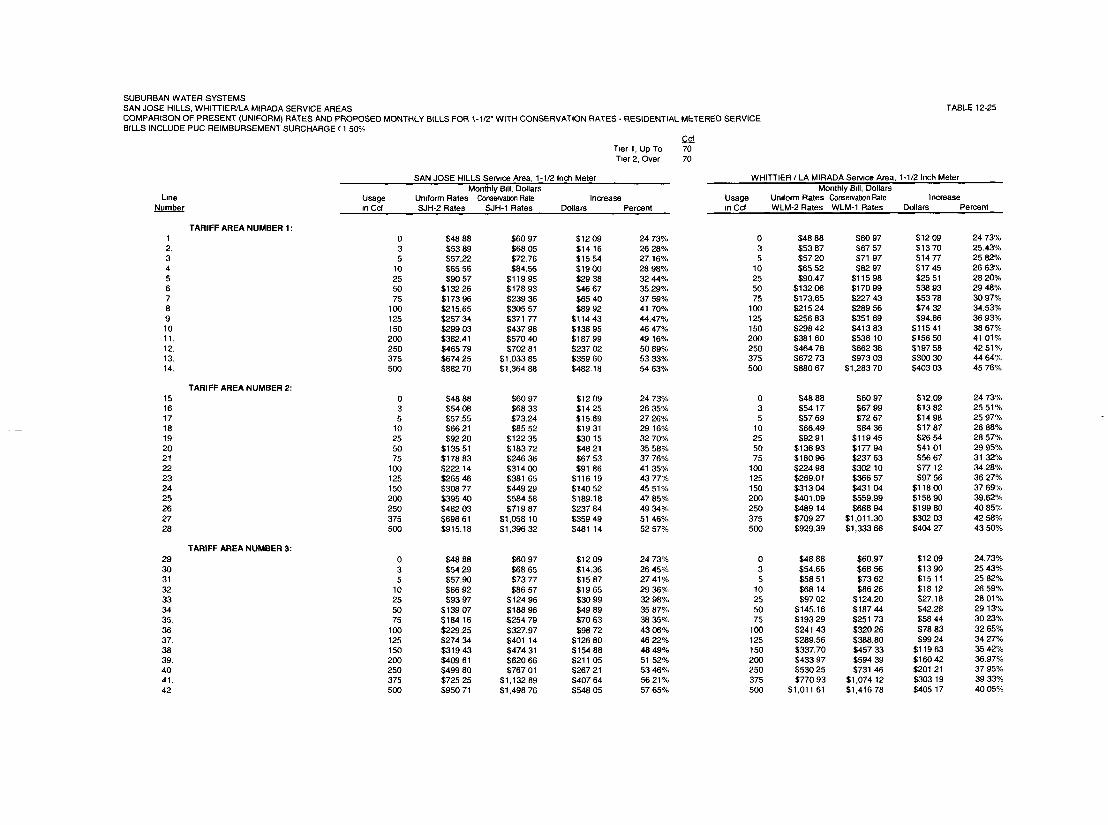
SUBURBAN WATER SYSTEMSSAN JOSE HILLS, WHITTIER/LA MIRADA -SERVICE AREASCOMPARISON OF PRESENT (UNIFORM) RATES AND PROPOSED MONTHLY BILLS FOR 1-1/2" WITH CONSERVATION RATES - RESIDENTIAL METERED SERVICEBILLS INCLUDE PUC REIMBURSEMENT SURCHARGE ( 1 50%
c._~T=er 1, Up To 70T~er 2, Over 70
TABLE 12-25
SAN JOSE HILLS Serv=ce Area, 1-1/2 Inch MeterMonthly Bdl, Dollars
Usage Uniform Rates Conservation Rate Increasem Ccf SJH-2 Rates SJH-1 Rates Dollars Percent
WHITTLER / LA MIRADA Service Area, 1-1/2 Inch MeterMonthly Bdl, Dollars
Usage Umform Rates Conservat~n Rate Increase~n Ccf WLM-2 Rates WLM-1 Rates Dollars Percent
12.34567891011.12.13.14.
15161718192O2122232425262728
29303132333435.3637.3839.4041.42
TARIFF AREA NUMBER I :
TARIFF AREA NUMBER 2:
TARIFF AREA NUMBER 3:
0 $4888 $60 97 $12 09 24 73%3 $53 89 $68 05 $14 16 26 28%5 $57.22 $72.76 $15.54 27.16%
10 $65 56 $84.56 $1900 28 98%25 $9057 $119 95 $29 38 3244%50 $132 26 $178 93 $4667 35.29%75 $173 96 $239 36 $65 40 37 59%100 $215.65 $305 57 $89 92 41 70%125 $257 34 $371 77 $114 43 44.47%150 $299 03 $437 98 $138 95 46 47%200 $382.41 $570 40 $187.99 49 16%250 $465 79 $702 81 $237 02 50 89%375 $674 25 $1,033 85 $359 60 5333%500 $882 70 $1,364 88 $482.18 54 63%
0 $48 68 $60 97 $12 09 24 73%3 $54 08 $68 33 $14 25 26 35%5 $57.55 $73.24 $15.69 27 26%
10 $66 21 $85 52 $19 31 29 16%25 $92 20 $122 35 $30 15 32 70%50 $135 51 $183 72 $48 21 35 58%75 $178 83 $24636 $67 53 37 76%
100 $22214 $31400 $91 86 4135%125 $265.46 $381 65 $116 19 43 77%150 $308 77 $449 29 $140 52 45 51%200 $395 40 $584 58 $189.18 4785%250 $482 03 $719 87 $237 84 4934%375 $698 61 $1,058 10 $359 49 51 46%500 $915.18 $1,396 32 $481 14 52 57%
0 $48 88 $60 973 $5429 $68 655 $57.90 $7377
10 $66 92 $86 5725 $93 97 $124 9650 $139 07 $188 9675 $18416 $254 79
100 $229.25 $327.97125 $27434 $401 14150 $319 43 $474 31200 $40961 $620 66250 $499 80 $767 01375 $725 25 $1,132 89500 $950 71 $1,498 76
$12 09 24 73%$14.36 26 45%$15 87 27 41%$19 65 2936%;3099 3298%;49 89 35 87%;70 63 3835%;98 72 4306%
;126 80 4622%; 154 88 48 49%;211 05 51 52%;267 21 53 46%;407 64 56 21%;54805 57 65%
0 $48 88 $60 97 $1209 24 73%3 $53 87 $67 57 $1370 25.43%5 $57 20 $71 97 $1477 25 82%
10 $65 52 $82 97 $17 45 26 63%25 $90.47 $115 98 $25 51 28 20%50 $132 06 $17099 $3893 2948%75 $173.65 $227 43 $53 78 30 9?%
100 $215 24 $289 56 $74 32 34.53%125 $256 83 $351 69 $94.86 36 93%150 $298 42 $413 83 $115 41 38 67%200 $381 60 $538 10 $156 50 41 01%250 $464 78 $66236 $19758 42 51%375 $672 73 $973 03 $30030 4464%500 $880 67 $1,283 70 $40303 45 76%
0 $48 88 $60 97 $12.09 24 73%3 $54 17 $67 99 $13 82 25 51%5 $57 69 $72 67 $14 98 25 97%
10 $66.49 $8436 $17 87 26 88%25 $92 91 $119 45 $2654 28 57%50 $136 93 $177 94 $41 01 29 95%75 $180 96 $237 63 $56 67 3132%100 $224 98 $302 10 $77 12 34.28%125 $269.01 $366 57 $97.56 36 27%150 $31304 $43104 $11800 3769%200 $401.09 $559.99 $15890 39.62%250 $489 14 $68894 $199 80 40 85%375 $709 27 $1,011.30 $30203 42 58%500 $929,39 $1,333 66 $40427 43 50%
0 $48 88 $60.97 $1209 24.73%3 $54.66 $68 56 $13 90 25 43%5 $58 51 $73 62 $15 11 25 82%
10 $68 14 $86 26 $18 12 26 59%25 $97 02 $124.20 $27.16 28 01%50 $145.16 $18744 $42.28 29 13%75 $193 29 $251 73 $5844 30 23%
100 $241 43 $320 26 $78 83 32 65%125 $289.56 $388.80 $99 24 3427%150 $337.70 $457 33 $119 63 3542%200 $433 97 $594 39 $160 42 36.97%250 $530 25 $731 46 $201 21 37 95%375 $770 93 $1,074 12 $303 19 39 33%500 $1,011 61 $!,416 78 $405 17 40 05%
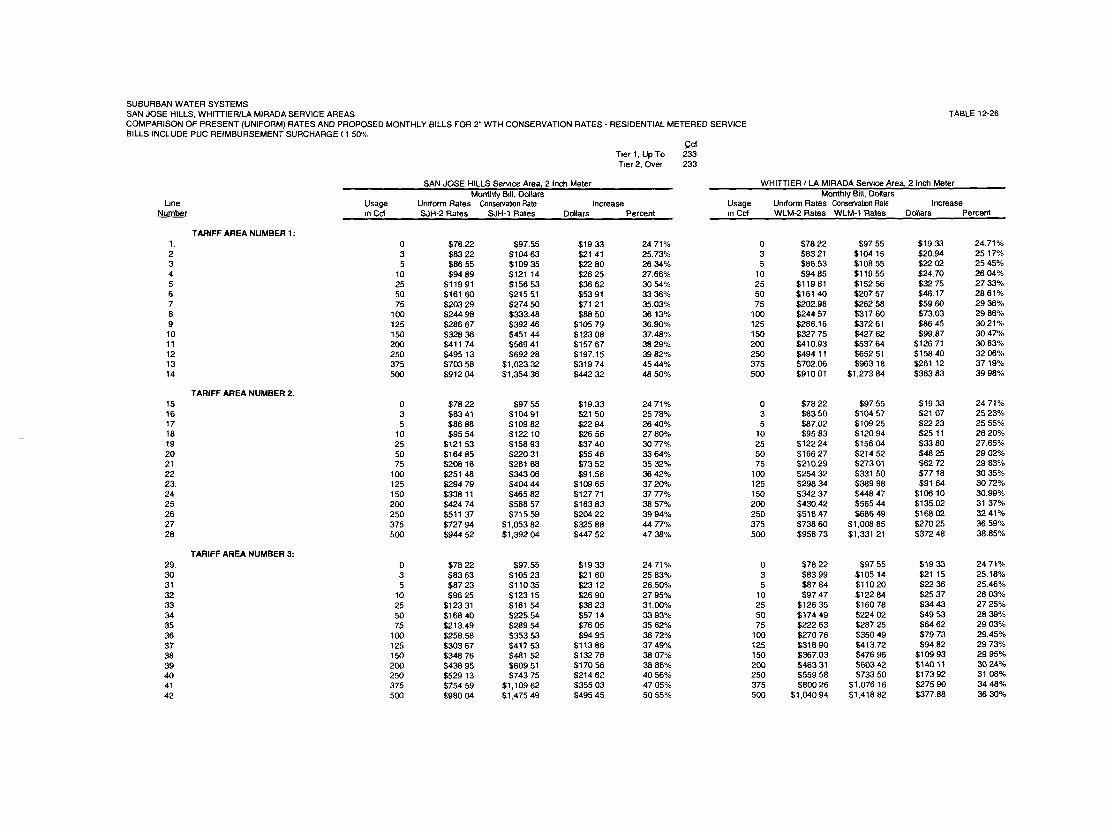
SUBURBAN WATER SYSTEMSSAN JOSE HILLS, WHITTIER/LA MIRADA SERVICE AREASCOMPARISON OF PRESENT (UNIFORM) RATES AND PROPOSED MONTHLY BILLS FOR 2" WTH CONSERVATION RATES - RESIDENTIAL METERED SERVICEBILLS INCLUDE PUC REIMBURSEMENT SURCHARGE ( 1 50%
c._~_~Tier 1, Up To 233T~er 2, Over 233
SAN JOSE HILLS Service Area, 2 Inch MeterMonthly B~{, Dollars
Usage Uniform Rates Consefva~n Rate Increase=n Cd SJH-2 Rates SJH-1 Rates Dollars Percent
I,neNumber
TABLE 12-26
234567891011121314
151617181920212223.2425262728
29.30313233343536.373839404142
TARIFF AREA NUMBER 1 :
TARIFF AREA NUMBER 2.
TARIFF AREA NUMBER 3:
0 $78.22 $97.55 $19 33 24 71%3 $83 22 $104 63 $21 41 25.73%5 $86 55 $109 35 $22 80 26 34%
10 $94 89 $121 14 $26 25 27.66%25 $119 91 $156 53 $36 62 30 54%50 $161 60 $215 51 $53 91 33 36%75 $203 29 $274 50 $71 21 35.03%
100 $244 98 $333.48 $88 50 36 13%125 $286 67 $392 46 $105 79 36.90%150 $328 36 $451 44 $123 08 37.48%200 $411 74 $569 41 $157 67 38 29%250 $495 13 $692 28 $197.15 39 82%375 $703 58 $1,023.32. $319 74 45 44%500 $912 04 $1,354 36 $442 32 48 50%
0 $78 22 $97 55 $19.33 24 71%3 $83 41 $104 91 $21 50 25 78%5 $86 88 $109 82 $22 94 26 40%
10 $95 54 $122 10 $26 56 27 80%25 $121 53 $158 93 $37 40 30 77%50 $164 85 $220 31 $55 46 33 64%75 $208 16 $281 68 $73 52 35 32%
100 $251 48 $343 06 $91.58 36 42%125 $294 79 $404 44 $109 65 37 20%150 $338 11 $465 82 $127 71 37 77%200 $424 74 $588 57 $163 83 38 57%250 $511 37 $715 59 $204 22 39 94%375 $727 94 $1,053 82 $325 88 44 77%500 $944 52 $1,392 04 $447 52 47 38%
0 $78 22 $97.55 $19 33 24 71%3 $83 63 $105 23 $21 60 25 83%5 $87 23 $110 35 $23 12 26.50%
10 $96 25 $123 15 $26 90 27 95%25 $123 31 $161 54 $38 23 31.00%50 $168 40 $225.54 $57 14 33 93%75 $213.49 $289 54 $76 05 35 62%100 $258.58 $353 53 $94 95 36 72%125 $303 67 $417 53 $113 86 37 49%150 $348 76 $481 52 $132 76 38 07%200 $438 95 $609 51 $170 56 38 86%250 $529 13 $743 75 $214 62 40 56%375 $754 59 $1,109 62 $355 03 47 05%500 $980 04 $1,475 49 $495 45 50 55%
WHITTIER / LA MIRADA Service Area, 2 Inch MeterMonthly Bill, Dollars
Usage Uniform Rates Conserva~on Rate Increasem Ccf WLM-2 Rates WLM-1 Rates Dollars Percent
0 $78 22 $97 55 $19 33 24.71%3 $83 21 $104 15 $20.94 25 17%5 $86.53 $108 55 $22 02 25 45%
10 $94 85 $119 55 $24.70 26 04%25 $119 81 $152 56 $32 75 27 33%50 $161 40 $207 57 $46.17 28 61%75 $202.98 $262 58 $59 60 29 36%100 $244 57 $317 60 $73.03 29 86%125 $286.16 $372 61 $86 45 30 21%150 $327 75 $427 62 $99.87 30.47%200 $410.93 $537 64 $126 71 30 83%250 $494 11 $652 51 $158 40 32 06%375 $702.06 $963 18 $261 12 37 19%500 $910 01 $1,273 84 $363 83 39 98%
0 $78 22 $97 55 $19 33 24 71%3 $83 50 $104 57 $21 07 25 23%5 $87.02 $109 25 $22 23 25 55%
10 $95 83 $120 94 $25 11 26 20%25 $122 24 $156 04 $33 80 27.65%50 $166 27 $214 52 $48 25 29 02%75 $210.29 $273 01 $62 72 29 83%
100 $254 32 $331 50 $77 18 30 35%125 $298 34 $389 98 $91 64 30 72%150 $342 37 $448 47 $106 10 30,99%200 $430.42 $565 44 $135.02 31 37%250 $518 47 $686 49 $168 02 32 41%375 $738 60 $1,008 85 $270 25 36.59%500 $958 73 $1,331 21 $372 48 38.85%
0 $78.223 $83 995 $87 84
10 $97 4725 $126 3550 $174 4975 $222 63
100 $270 76125 $318 90150 $367.03200 $46331250 $559 58375 $80026500 $1,040 94
;97 55;105 14;110 20;122 84;160 78;22402;287 25~350 49413.724769660342
~733 50$1,076 16$1,418 82
$1933 24 71%$21 15 25.18%$2236 25.46%$25 37 26 03%$34 43 27 25%$49 53 28 39%$64 62 29 03%$79 73 29.45%$94.82 29 73%
$10993 29 95%$14011 30 24%$173 92 3108%$275 90 3448%$377.88 3630%
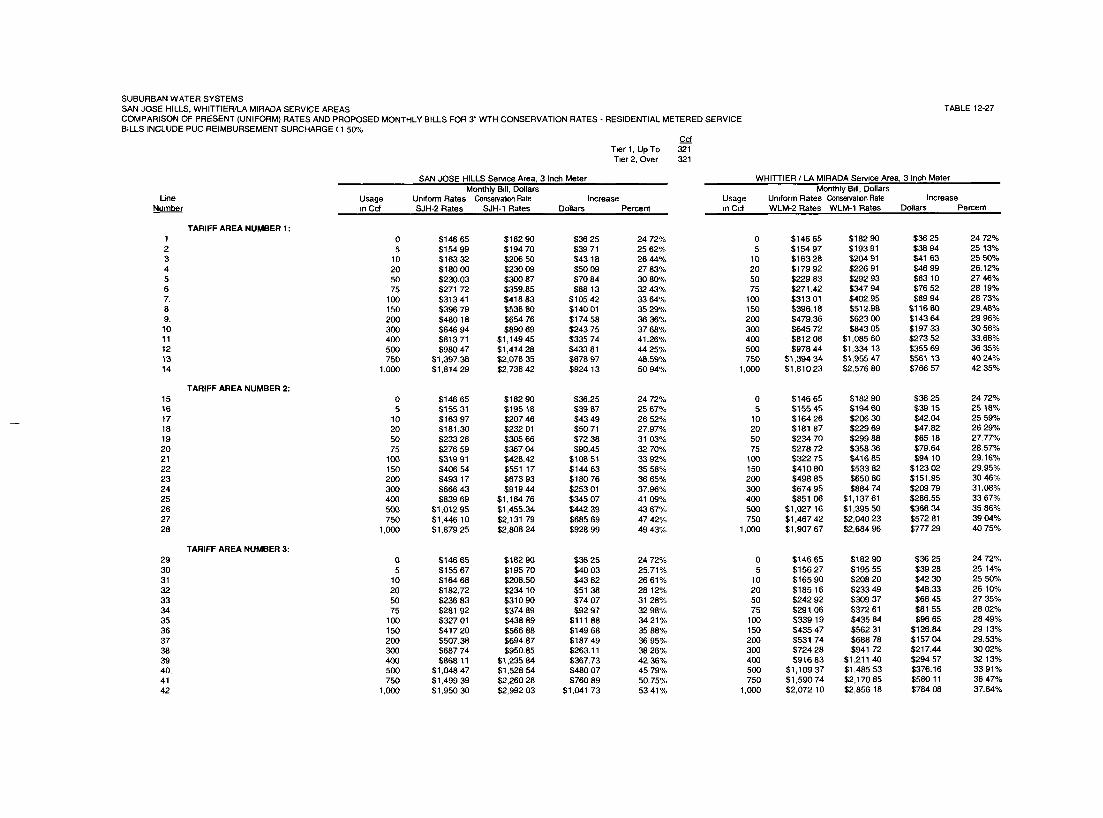
SUBURBAN WATER SYSTEMSSAN JOSE HILLS, WHITTIER/LA MIRADA SERVICE AREASCOMPARISON OF PRESENT (UNIFORM) RATES AND PROPOSED MONTHLY BILLS FOR 3" WTH CONSERVATION RATES - RESIDENTIAL METERED SERVICEBILLS INCLUDE PUC REIMBURSEMENT SURCHARGE ( 1 50%
CcfT~er 1, Up To 321T~er 2, Over 32.1
SAN JOSE HILLS Service Area, 3 Inch MeterMonthly Bdl, Dollars
Usage Uniform Rates Conservabon Rate Increase~n Ccf SJH-2 Rates SJH-1 Rates Dollars Percent
UneNumber
TABLE 12-27
567.89.1011121314
1516171819202122232425262728
293031323334353637383940.4142
1234
TARIFF AREA NUMBER 1 :
TARIFF AREA NUMBER 2:
TARIFF AREA NUMBER 3:
0 $146 65 $182 90 $36 25 24 72%5 $154 99 $194 70 $39 71 25 62%
10 $163 32 $206 50 $43 18 26 44%20 $180 00 $230 09 $50 09 27 83%50 $230.03 $300 87 $70 84 30 80%75 $271 72 $359.85 $88 13 32 43%
100 $313 41 $418 83 $105 42 33 64%150 $396 79 $536 80 $140 01 35 29%200 $480 18 $654 76 $174 58 36 36%300 $646 94 $890 69 $243 75 37 68%400 $813 71 $1,149 45 $335 74 41.26%500 $980 47 $1,414 28 $433 81 44 25%750 $1,397.38 $2,076 35 $678 97 48.59%
1,0(30 $1,814 29 $2,738 42 $924 13 50 94%
0 $146 65 $182 905 $155 31 $195 18
10 $163 97 $207 4620 $181.30 $232 0150 $233 28 $305 6675 $276 59 $367 04100 $319 91 $428.42150 $406 54 $551 17200 $493 17 $673 93300 $666 43 $919 44400 $839 69 $1,184 76500 $1,012 95 $1,455.34750 $1,446 10 $2,131 79
1,000 $1,879 25 $2,808 24
0 $146 65 $182 90 $36 25 24 72%5 $155 67 $195 70 $40 03 25.71%
10 $164 68 $208.50 $43 82 26 61%20 $182.72 $234 10 $51 38 28 12%50 $236 83 $310 90 $74 07 31 28%75 $281.92 $374 89 $92 97 32 98%
100 $327 01 $438 89 $ 111 88 34 21%150 $417 20 $566 88 $149 68 3588%200 $507.38 $694.87 $187 49 36 95%300 $687 74 $950.85 $263.11 38 26%400 $868 11 $1,235 84 $367.73 42.36%500 $1,048 47 $1,528 54 $480 07 45 79%750 $ 1,499 39 $2,260 28 $760 89 50.75%
1,000 $1,950 30 $2,992 03 $1,041 73 53 41%
;36.25 24 72%~39 67 25 67%;43 49 26 52%;50 71 27.97%;72 38 31 03%;90.45 32 70%
;108 51 33 92%;144 63 35 58%;180 76 36 65%;253 01 37.96%;345 07 41 09%;442 39 43 67%;685 69 47 42%;928 99 49 43%
0 $146 65 $182 90 $36 25 24 72%5 $154 97 $193 91 $38 94 25 13%
10 $163 28 $204 91 $41 63 25 50%20 $179 92 $226 91 $46 99 26.12%50 $229 83 $292 93 $63 10 27 46%75 $271.42 $347 94 $76 52 28 19%
100 $313 01 $402.95 $89 94 28 73%150 $396.18 $512.98 $116 80 29.48%200 $479.36 $623 00 $143 64 29 96%300 $645 72 $843 05 $197 33 30 56%400 $812 08 $1,085 60 $273 52 33.68%500 $978 44 $1,334 13 $355 69 36 35%750 $1,394 34 $1,955 47 $561 13 40 24%
1,000 $1,810 23 $2,576 80 $766 57 42 35%
0 $146 65 $182 90 $36 25 24 72%5 $155 45 $194 60 $39 15 25 18%
10 $164 26 $206 30 $42.04 25 59%20 $181 87 $229 69 $47.82 26 29%50 $234 70 $299 88 $65 18 27.77%75 $278 72 $358 36 $79.64 28.57%100 $322 75 $416 85 $94 10 29.16%150 $410 80 $533 82 $123 02 29.95%200 $498 85 $650 80 $151.95 30 46%300 $674 95 $884 74 $209 79 31.08%400 $851 06 $1,137 61 $286.55 33 67%500 $1,027 16 $1,395 50 $368 34 35 86%750 $1,467 42 $2,040 23 $572 81 39 04%
1,000 $1,907 67 $2,684 96 $777 29 40 75%
0 $146 65 $182 90 $36 25 24 72%5 $156 27 $195 55 $39 28 2514%
10 $165 90 $208 20 $42 30 25 50%20 $185 16 $233 49 $48.33 26 10%50 $242 92 $309 37 $66 45 27 35%75 $291 06 $372 61 $81 55 28 02%
100 $339 19 $435 84 $96 65 28 49%150 $435 47 $562 31 $126.84 29 13%200 $531 74 $688 78 $157 04 29.53%300 $724 28 $941 72 $217.44 30 02%400 $916 83 $1,211 40 $294 57 32 13%500 $1,109 37 $1,485 53 $376.16 33 91%750 $1,590 74 $2,170 85 $580 11 36 47%
1,000 $2,072 10 $2,856 18 $784 08 37.84%
WHITTIER / LA MIRADA Service Area, 3 Inch MeterMonthly Bdl, Dollars
Usage Uniform Rates Conservation Rate Increase~n Cct WLM-2 Rates WLM-1 Rates Dollars Percent

13 Chapter - Water Quality Issues
See testimony of S.B. Johnson
13-1
Chapter - Qualifications and Prepared Testimony
Because testimony is served but not filed, it will be providedseparately.
14-1
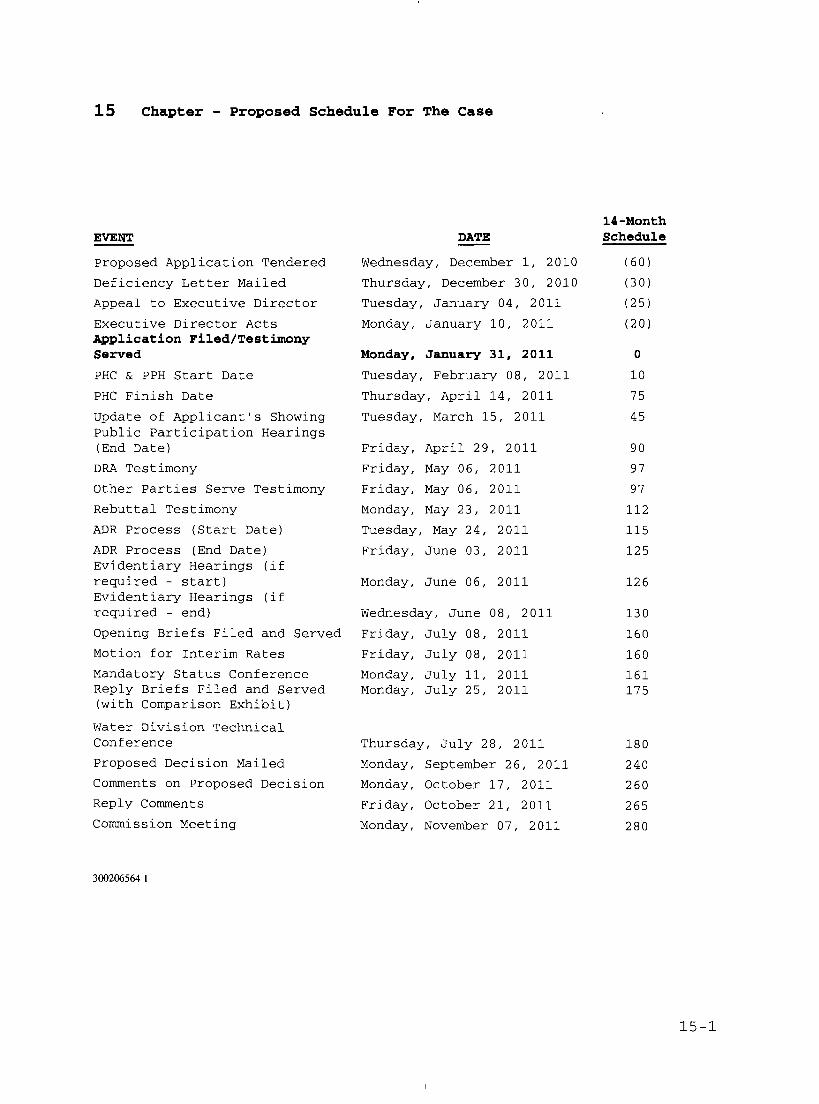
15 Chapter - Proposed Schedule For The Case
EVENT
Proposed Application Tendered
Deficiency Letter Mailed
Appeal to Executive Director
Executive Director ActsA~plication Filed/TestimonyServed
PHC & PPH Start Date
PHC Finish Date
Update of Applicant’s ShowingPublic Participation Hearings(End Date)DRA Testimony
Other Parties Serve Testimony
Rebuttal Testimony
ADR Process (Start Date)
ADR Process (End Date)Evidentiary Hearings (ifrequired - start)Evidentiary Hearings ifrequired - end)
Opening Briefs Filed and Served
Motion for Interim Rates
Mandatory Status ConferenceReply Briefs Filed and Served(with Comparison Exhibit)
Water Division TechnicalConference
Proposed Decision MailedComments on Proposed Decision
Reply Comments
Commission Meeting
DATE
Wednesday, December i, 2010
Thursday, December 30, 2010
Tuesday, January 04, 2011
Monday, January i0, 2011
Monday, January 31, 2011
Tuesday, February 08, 2011
Thursday, April 14, 2011
Tuesday, March 15, 2011
Friday, April 29, 2011
Friday, May 06, 2011
Friday, May 06, 2011
Monday, May 23, 2011
Tuesday, May 24, 2011
Friday, June 03, 2011
Monday, June 06, 2011
Wednesday, June 08, 2011
Friday, July 08 2011
Friday, July 08 2011Monday, July ii 2011Monday, July 25 2011
Thursday, July 28, 2011
Monday, September 26, 2011
Monday, October 17, 2011
Friday, October 21, 2011
Monday, November 07, 2011
l& -MonthSchedule
(60)
(30)(25)(2O)
0
i075
45
9O
97
97
112
115
125
126
130
160
160
161175
180
240
260
265
280
3~2~5641
15-1

B
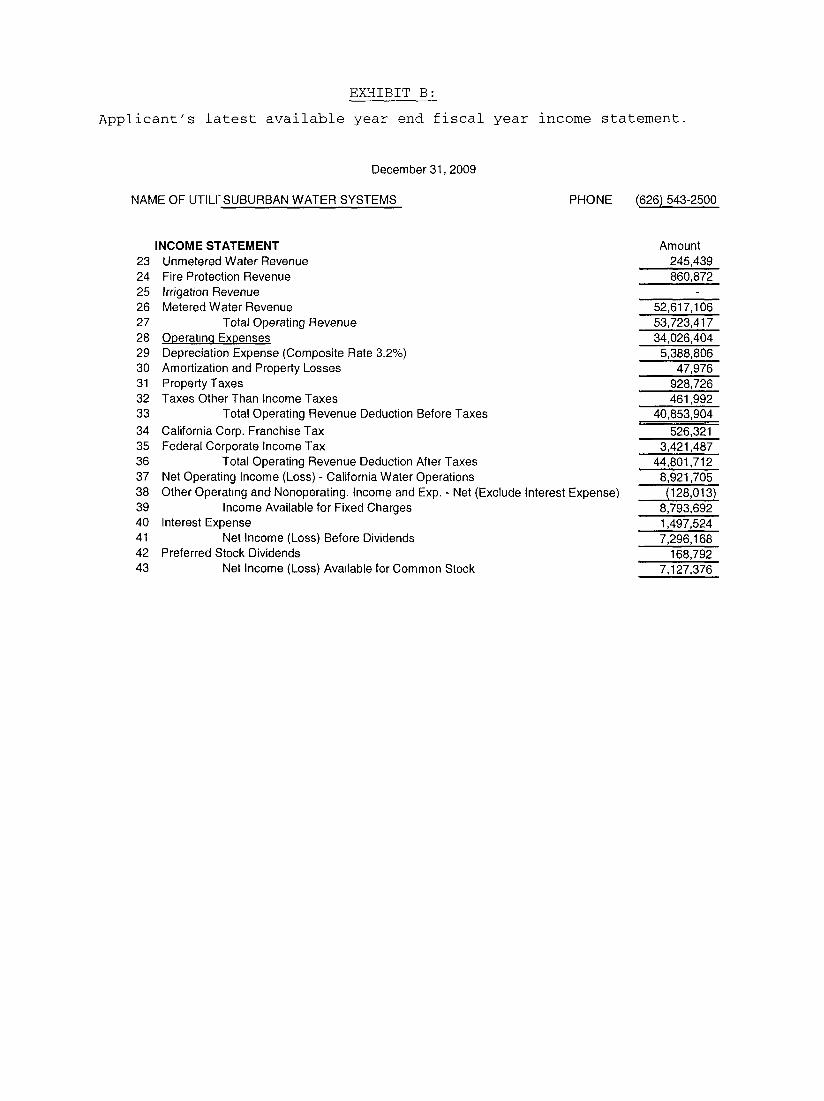
EXHIBIT B:
Applicant’s latest available year end fiscal year income statement.
December 31,2009
NAME OF UTILI SUBURBAN WATER SYSTEMS PHONE (626) 543-2500
INCOI~I E STATELY1ENT23 Unmetered Water Revenue24 Fire Protection Revenue25 Irrigation Revenue26 Metered Water Revenue27 Total Operating Revenue28 Operatln.q Expenses29 Depreciation Expense (Composite Rate 3.2%)30 Amortization and Property Losses31 Property Taxes32 Taxes Other Than Income Taxes33 Total Operating Revenue Deduction Before Taxes34 California Corp. Franchise Tax35 Federal Corporate Income Tax36 Total Operating Revenue Deduction After Taxes37 Net Operating Income (Loss) - California Water Operations38 Other Operating and Nonoperating. Income and Exp. - Net (Exclude Interest Expense)39 Income Available for Fixed Charges40 Interest Expense41 Net Income (Loss) Before Dividends42 Preferred Stock Dividends43 Net Income (Loss) Available for Common Stock
Amount245,439860,872
52,617,10653,723,41734,026,404
5,388,8O647,976
928,726461,992
40,853,904526,321
3,421,48744,801,7128,921,705(128,013)
8,793,6921,497,5247,296,168
168,7927,127,376
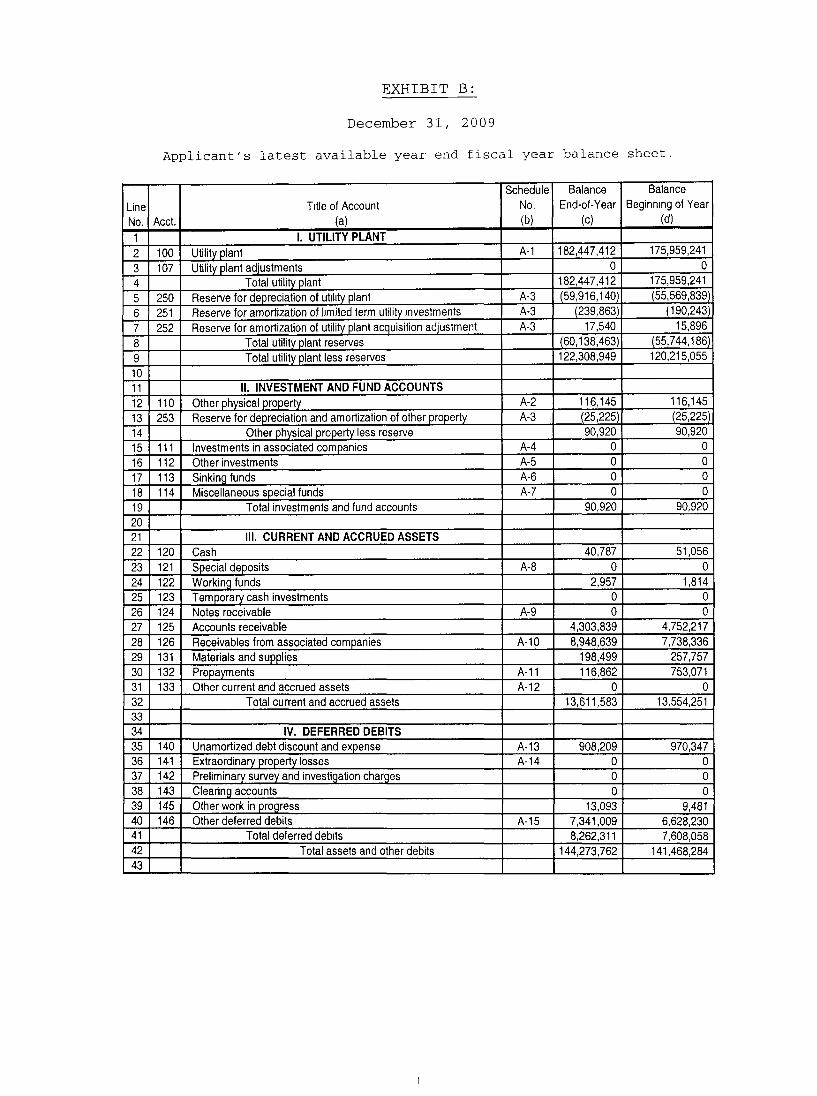
EXHIBIT B:
LineNo.
1234567891011121314151617181920212223242526272829303132333435363738394O414243
December 31, 2009
Applicant’s latest available year end fiscal year balance sheet.
T~tle of AccountAcct. (a)
I. UTILITY PLANT100 Utility plant A-1107 Utility plant adjustments
Total utility plant250 Reserve for depreciation of utlhty plant A-3251 Reserve for amortization of I~mited term utility ~nvestments A-3252 Reserve for amortization of utility plant acquisition adjustment A-3
Total utility plant reservesTotal utility plant less reserves
Schedule Balance BalanceNo. End-of-Year Beginmng of Year(b) (c) (d)
182,447,412 175,959,2410 0
182,447,412 175,959,241(59,916,140) (55,569,839)
(239,863) (190,243)17,540 15,896
(60,138,463) (55,744,186)122,308,949 120,215,055
II. INVESTMENT AND FUND ACCOUNTS110 Other physical property A-2253 Reserve for depreciation and amortization of other property A-3
Other physical property less reserve111 Investments in associated companies A-4112 Other investments A-5113 Sinking funds A-6114 Miscellaneous special funds A-7
Total investments and fund accounts
116,145 116,145(25,225) (25,22590,920 90,920
0 00 00 00 0
90,920 90,920
III. CURRENT AND ACCRUED ASSETS120 Cash121 Special deposits A-8122 Working funds123 Temporary cash investments124 Notes receivable A-9125 Accounts receivable126 Receivables from associated companies A-10131 Materials and supplies132 Prepayments A-11133 Other current and accrued assets A-12
Total current and accrued assets
40,787 51,0560 0
2,957 1,8140 00 0
4,303,839 4,752,2178,948,639 7,738,336
198,499 257,757116,862 753,071
0 013,611,583 13,554,251
IV. DEFERRED DEBITS140 Unamortized debt discount and expense141 Extraordinary property losses142 Preliminan/survey and investigation char~es143 Clearing accounts145 Other work in progress146 Other deferred debits
Total deferred debtsTotal assets and other debits
A-13 908,209 970,347A-14 0 0
0 00 0
13,093 9,481A-15 7,341,009 6,628,230
8,262,311 7,608,058144,273,762 141,468,284
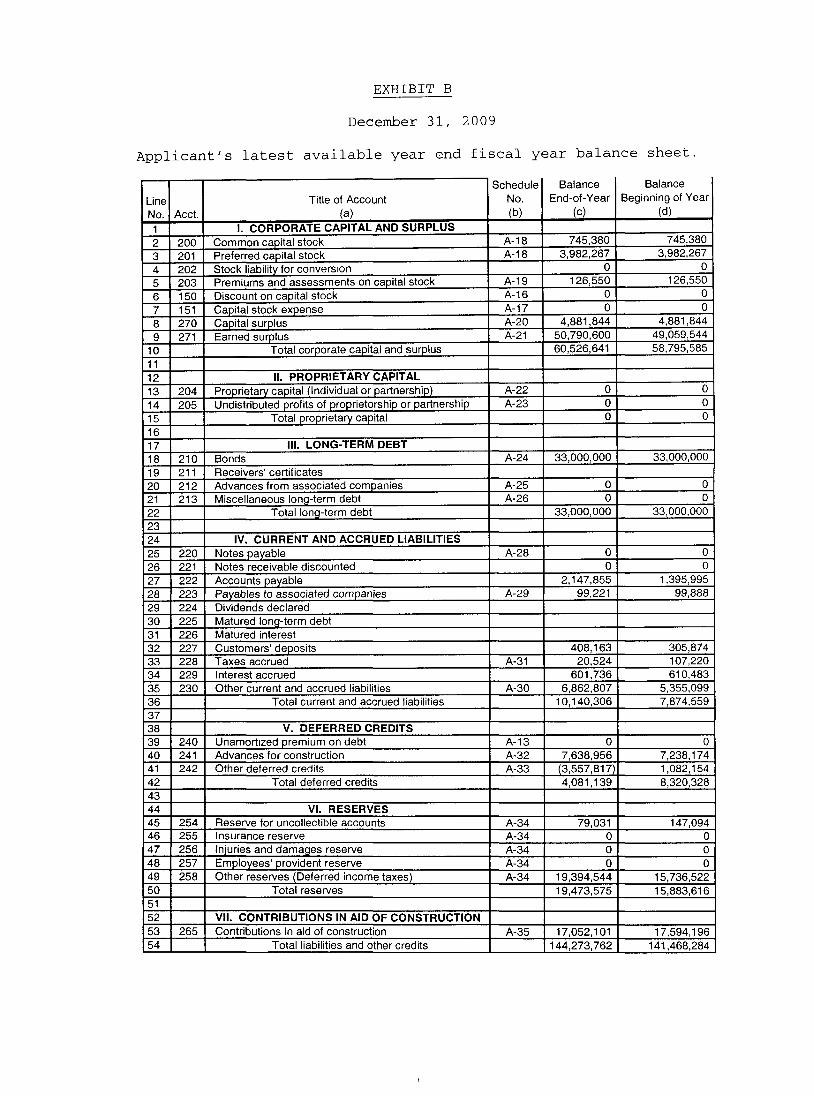
Applicant’s
LineNo. Acct.
12 2003 2014 2025 2036 1507 1518 2709 271
IlO
3 20414 20515161718 21019 21120 21221 21322232425 22026 22127 22228 22329 22430 22531 22632 22733 22834 22935 23036373839 24040 24141 24242434445 25446 25547 25648 25749 2585O515253 26554
EXHIBIT B
December 31, 2009
latest available year end fiscal year balance sheet.
Title of Account(a)
I. CORPORATE CAPITAL AND SURPLUSCommon capital stock A- 18 745,380 745,380Preferred capital stock A-18 3,982,267 3,982,267Stock liability for conversion 0 0Premiums and assessments on capital stock A-19 126,550 126,550Discount on capital stock A-16 0 0Capital stock expense A-17 0 0Capital surplus A-20 4,881,844 4,881,844Earned surplus A-21 50,790,600 49,059,544
Total corporate capital and surplus 60,526,641 58,795,585
Schedule Balance I BalanceNo. End-of-YearI Beginning of Year
(b) (c) (d)
I1. PROPRIETARY CAPITALProprietary capital (Individual or partnership)Undistributed profits of proprietorship or partnership
Total proprietary capital
A-22 0A-23 0
0
000
III. LONG-TERM DEBTBondsReceivers’ certificatesAdvances from associated companiesMiscellaneous Ion~-term debt
Total Ioncj-term debt
A-24
A-25A-26
33,000,000 33,000,000
0 00 0
33,000,000 33,000,000
IV. CURRENT AND ACCRUED LIABILITIESNotes payableNotes receivable discountedAccounts payablePayables to associated companiesDividends declaredMatured long-term debtMatured interestCustomers’ depositsTaxes accruedInterest accruedOther current and accrued liabilities
Total current and accrued liabilities
A-28 0 00 0
2,147,855 1,395,995A-29 99,221 99,888
408,163 305,874A-31 20,524 107,220
601,736 610,483A-30 6,862,807 5,355,099
10,140,306 7,874,559
V. DEFERRED CREDITSUnamortlzed premium on debtAdvances for constructionOther deferred credits
Total deferred credits
A-13 0 0A-32 7,638,956 7,238,174A-33 (3,557,817) 1,082,154
4,081,139 8,320,328
VI. RESERVESReserve for uncollectible accountsInsurance reserveInjuries and damages reserveEmployees’ provident reserveOther reserves/Deferred income taxes)
Total reserves
A-34 79,031 147,094A-34 0 0A-34 0 0A-34 0 0A-34 19,394,544 15,736,522
19,473,575 15,883,616
VII. CONTRIBUTIONS IN AID OF CONSTRUCTIONContributions in aid of construction
Total liabilities and other creditsA-35 17,052,101 17,594,196
144,273,762 141,468,284

C
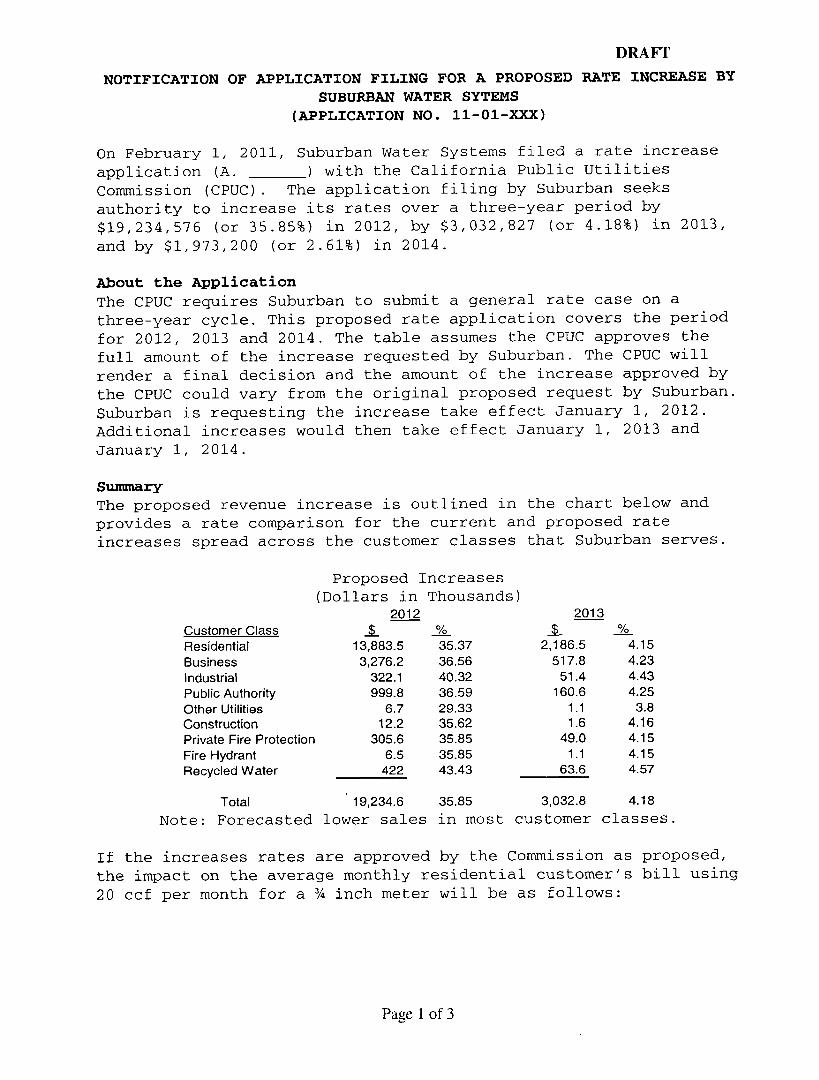
DRAFTNOTIFICATION OF APPLICATION FILING FOR A PROPOSED RATE INCREASE BY
SUBURBAN WATER SYTEMS(APPLICATION NO. II-01-XXX)
On February i, 2011, Suburban Water Systems filed a rate increaseapplication (A. ) with the California Public UtilitiesCommission (CPUC). The application filing by Suburban seeksauthority to increase its rates over a three-year period by$19,234,576 (or 35.85%) in 2012, by $3,032,827 (or 4.18%) in 2013,and by $1,973,200 (or 2.61%) in 2014.
About the ApplicationThe CPUC requires Suburban to submit a general rate case on athree-year cycle. This proposed rate application covers the periodfor 2012, 2013 and 2014. The table assumes the CPUC approves thefull amount of the increase requested by Suburban. The CPUC willrender a final decision and the amount of the increase approved bythe CPUC could vary from the original proposed request by Suburban.Suburban is requesting the increase take effect January i, 2012.Additional increases would then take effect January i, 2013 andJanuary i, 2014.
S~ryThe proposed revenue increase is outlined in the chart below andprovides a rate comparison for the current and proposed rateincreases spread across the customer classes that Suburban serves.
Proposed Increases(Dollars in Thousands)
2012 2013Customer Class _$_ % i %Residential 13,883.5 35.37 2,186.5 4.15Business 3,276.2 36.56 517.8 4.23Industrial 322.1 40.32 51.4 4.43Public Authority 999.8 36.59 160.6 4.25Other Utilities 6.7 29.33 1.1 3.8Construction 12.2 35.62 1.6 4.16Private Fire Protection 305.6 35.85 49.0 4.15Fire Hydrant 6.5 35.85 1.1 4.15Recycled Water 422 43.43 63.6 4.57
Total 19,234.6 35.85 3,032.8 4.18Note: Forecasted lower sales in most customer classes.
If the increases rates are approved by the Commission as proposed,the impact on the average monthly residential customer’s bill using20 ccf per month for a ¾ inch meter will be as follows:
Page 1 of 3
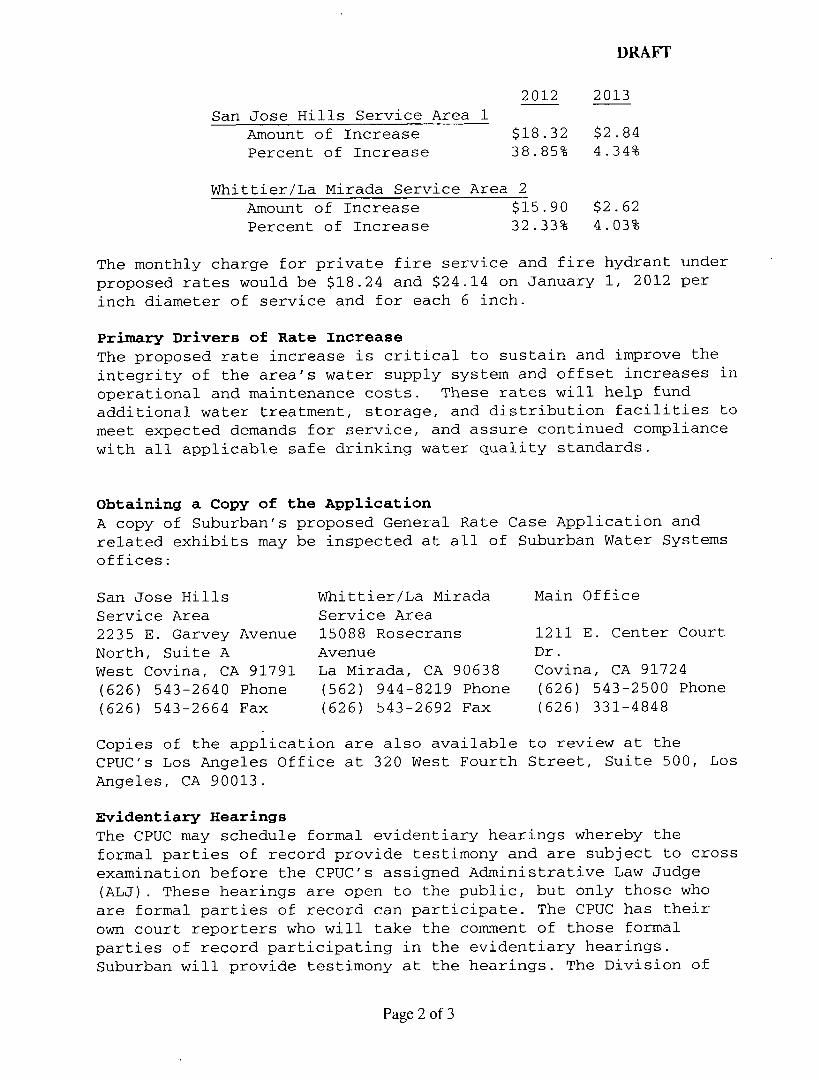
DRAFT
San Jose Hills Service Area 1Amount of IncreasePercent of Increase
2012
$18.3238.85%
2013
$2.844.34%
Whittier/La Mirada Service Area 2Amount of Increase $15.90Percent of Increase 32.33%
$2.624.03%
The monthly charge for private fire service and fire hydrant underproposed rates would be $18.24 and $24.14 on January i, 2012 perinch diameter of service and for each 6 inch.
Primary Drivers of Rate IncreaseThe proposed rate increase is critical to sustain and improve theintegrity of the area’s water supply system and offset increases inoperational and maintenance costs. These rates will help fundadditional water treatment, storage, and distribution facilities tomeet expected demands for service, and assure continued compliancewith all applicable safe drinking water quality standards.
Obtaining a Copy of the ApplicationA copy of Suburban’s proposed General Rate Case Application andrelated exhibits may be inspected at all of Suburban Water Systemsoffices:
San Jose HillsService Area2235 E. Garvey AvenueNorth, Suite AWest Covina, CA 91791(626) 543-2640 Phone(626) 543-2664 Fax
Whittier/La MiradaService Area15088 RosecransAvenueLa Mirada, CA 90638(562) 944-8219 Phone(626) 543-2692 Fax
Main Office
1211 E. Center CourtDr.Covina, CA 91724(626) 543-2500 Phone(626) 331-4848
Copies of the application are also available to review at theCPUC’s Los Angeles Office at 320 West Fourth Street, Suite 500, LosAngeles, CA 90013.
Evidentiary HearingsThe CPUC may schedule formal evidentiary hearings whereby theformal parties of record provide testimony and are subject to crossexamination before the CPUC’s assigned Administrative Law Judge(ALJ). These hearings are open to the public, but only those whoare formal parties of record can participate. The CPUC has theirown court reporters who will take the comment of those formalparties of record participating in the evidentiary hearings.Suburban will provide testimony at the hearings. The Division of
Page 2 of 3
DRAFT
Ratepayer Advocates (DRA) consists of engineers, accountants,economists and attorneys who independently evaluate the proposalsof utilities for rate changes and present their analyses andrecommendations for the CPUC at evidentiary hearings. Once hearingsare completed, the ALJ will consider all of the evidence presentedand release the draft decision. The CPUC may approve the proposedrequests for Suburban, approve the draft decision by the ALJ, ormay approve an alternate decision filed by a CPUC Commissioner. Thefinal decision may differ from Suburban’s original proposedrequest.
Protesting the ApplicationIf you are a formal party to this proceeding, formal protests tothis application must be filed with the CPUC’s Docket Office.
Public CommentIf you wish to comment on or informally protest this filing as acustomer of Suburban, you may do so by contacting the PublicAdvisor’s Office (PAO) via phone or e-mail. Written public commentby Suburban customers is very much desired by the CPUC and may besent to the PAO at the address shown below. These comments willbecome part of the formal correspondence file for this proceedingand will be circulated to the assigned ALJ, the assignedCommissioner and appropriate CPUC staff.
Public Advisor’s OfficeThe PAO was established to assist members of the public who wish toprotest or participate as a formal party of record in CPUCproceedings. For assistance in filing comments or protests with theCPUC or to participate in this proceeding, please contact the PAO,320 West Fourth Street, Suite 500, Los Angeles, CA 90013 or [email protected]. (213) 576-7055 or toll free at 866-849-8391. Please refer to this proceeding application number whenwriting or e-mailing the PAO on all correspondences.
300206576.3
Page 3 of 3

D
SUBURBAN WATER SYSTEMS
2011 FINAL GENERAL RATE CASE APPLICATION SERVICE LIST
Via Federal Express*With Exhibits
STATE SERVICE LIST
*Victor ChanDivision of Ratepayer Advocates320 West 4th Street, Room 500Los Angeles, CA 90013
*Lisa BilirDivision of Ratepayer AdvocatesCalifornia Public UtilitiesCommission505 Van Ness AvenueSan Francisco, CA 94102
*Karen CloptonChief Administrative Law JudgeCalifornia Public UtilitiesCommission505 Van Ness Ave, Room 5118San Francisco, CA 94102
*Frank Rich Lindh, General CounselCalifornia Public UtilitiesCommission505 Van Ness AvenueSan Francisco, CA 94102
*Rami Kahlon, DirectorCalifornia Public UtilitiesCommission Division of Waterand Audits505 Van Ness AvenueSan Francisco, CA 94102
Via U.S. Mail
Ms. Kamala D. HarrisAttorney GeneralState of CaliforniaDepartment of JusticeP.O. Box 944255Sacramento, CA 94244-2550
Mr. Scott Harvey, Acting DirectorDepartment of General ServicesExecutive Office707 Third StreetWest Sacramento, CA 95605-2811
Mr. Toby Douglas, DirectorCalifornia Department of HealthServicesDirector’s OfficeMS 0000P.O. Box 997413Sacramento, CA 95899-7413
Dr. Mark Horton, DirectorCalifornia Department of PublicHealth Division of Drinking Waterand Environmental ManagementMS 7400P.O. Box 997413Sacramento, CA 95899-7413

SUBURBAN WATER SYSTEMS
2011 FINAL GENERAL RATE CASE APPLICATION SERVICE LIST
WHITTIER/LAMIRADA and SAN JOSE HILLS DISTRICTS
All Via U.S. MailAnne HaraksinCity ClerkCity of La Mirada13700 La Mirada BlvdLa Mirada, CA 90638
James L. MarkmanCity AttorneyCity of La Mirada13700 La Mirada BlvdLa Mirada, CA 90638
Alejandra AvilaCity ClerkCity of Baldwin Park14406 E. Pacific Ave.Baldwin Park, CA 91706
Joseph W. PannoneCity AttorneyCity of Baldwin Park14406 E. Pacific Ave.Baldwin Park, CA 91706
Jodi ScrivensCity ClerkCity of Industry15625 Stafford StreetSuite i00Industry, CA 91744
Michele VadonCity AttorneyCity of Industry15625 Stafford StreetSuite i00Industry, CA 91744
Tom DalyCounty ClerkOrange County333 W. Santa Ana Blvd., 3rdFloorSanta Ana, CA 92701
Nicholas ChrisosCounty CounselOrange County333 W. Santa Ana Blvd., 3rd FloorSanta Ana, CA 92701
Toni TaberCity ClerkCity of Covina125 East College Blvd.Covina, CA 91723
Edward W. LeeCity AttorneyCity of Covina125 East College Blvd.Covina, CA 91723
Director of Public WorksCity of Buena Park6650 Beach Blvd.Buena Park, CA 90621
City of Santa Fe SpringsDepartment of Public Works11710 E. Telegraph RoadSanta Fe Springs, CA 90670
Royall K. Brown2153 Aroma Dr.West Covina, CA 91791
Sunset Gardens-West9094 Las Tunas DriveTemple City, CA 91780
SUBURBAN WATER SYSTEMS
2011 FINAL GENERAL RATE CASE APPLICATION SERVICE LIST
Tamara D. MasonCity ClerkCity of La Habra201 East La Habra BoulevardLa Habra, CA 90631-0337
Richard "Dick" JonesCity AttorneyCity of La Habra201 East La Habra BoulevardLa Habra, CA 90631-0337
The Prinden CorporationP.O. Box 712Park Ridge, NJ 07656-0712
Orchard Dale County Water District13819 East Telegraph RoadWhittier, CA 90604
William T. FujiokaExecutive Officer/County ClerkLos Angeles County500 West Temple Street, Room358, Kenneth Hahn Hall ofAdministrationLos Angeles, CA 90012
Andrea Sheridan OrdinCounty CounselLos Angeles County500 West Temple Street, Room 358,Kenneth Hahn Hall of AdministrationLos Angeles, CA 90012
Frank T. MartinezCity ClerkCity of Los Angeles200 North Spring StLos Angeles, CA 90012
Rockard J. DegadilloCity AttorneyCity of Los Angeles200 North Spring StLos Angeles, CA 90012
Bill RobinsonUpper San Gabriel Valley M.W.D.1146 East Louisa AvenueWest Covina, CA 91790-1346
Director Of Public WorksCity of Whittier13230 E. Penn StreetWhittier, CA 90602
Amy M. TurnerCity ClerkCity of La Puente15900 East Main St.La Puente, CA 91744
Rick OlivarezCity AttorneyCity of La Puente15900 East Main St.La Puente, CA 91744
Teresa De Dios, CMCCity ClerkCity of Walnut21201 La Puente RoadWalnut, CA 91789
Michael B. MontgomeryCity AttorneyCity of Walnut21201 La Puente RoadWalnut, CA 91789
SUBURBAN WATER SYSTEMS
2011 FINAL GENERAL RATE CASE APPLICATION SERVICE LIST
Laurie CarricoCity ClerkCity of West Covina1444 West Garvey AvenueWest Covina, CA 91790
Arnold Alvarez-GlasmanCity AttorneyCity of West Covina1444 West Garvey AvenueWest Covina, CA 91790
Culver Heaton, Jr.City ClerkCity of Glendora116 East Foothill Blvd.Glendora, CA 91741
D. Wayne LeechCity AttorneyCity of Glendora116 East Foothill Blvd.Glendora, CA 91741
Kathryn A. MarshallCity ClerkCity of Whittier13230 E. Penn StreetWhittier, CA 90602
Richard JonesCity AttorneyCity of Whittier13230 E. Penn StreetWhittier, CA 90602
Shalice ReynosoCity ClerkCity of Buena Park6650 Beach Blvd.Buena Park, CA 90621
Steven L. DorseyCity AttorneyCity of Buena Park6650 Beach Blvd.Buena Park, CA 90621
Michael GualtieriLa Habra Heights County WaterDistrictP.O. Box 628La Habra, CA 90633-0628
300207069.1

E
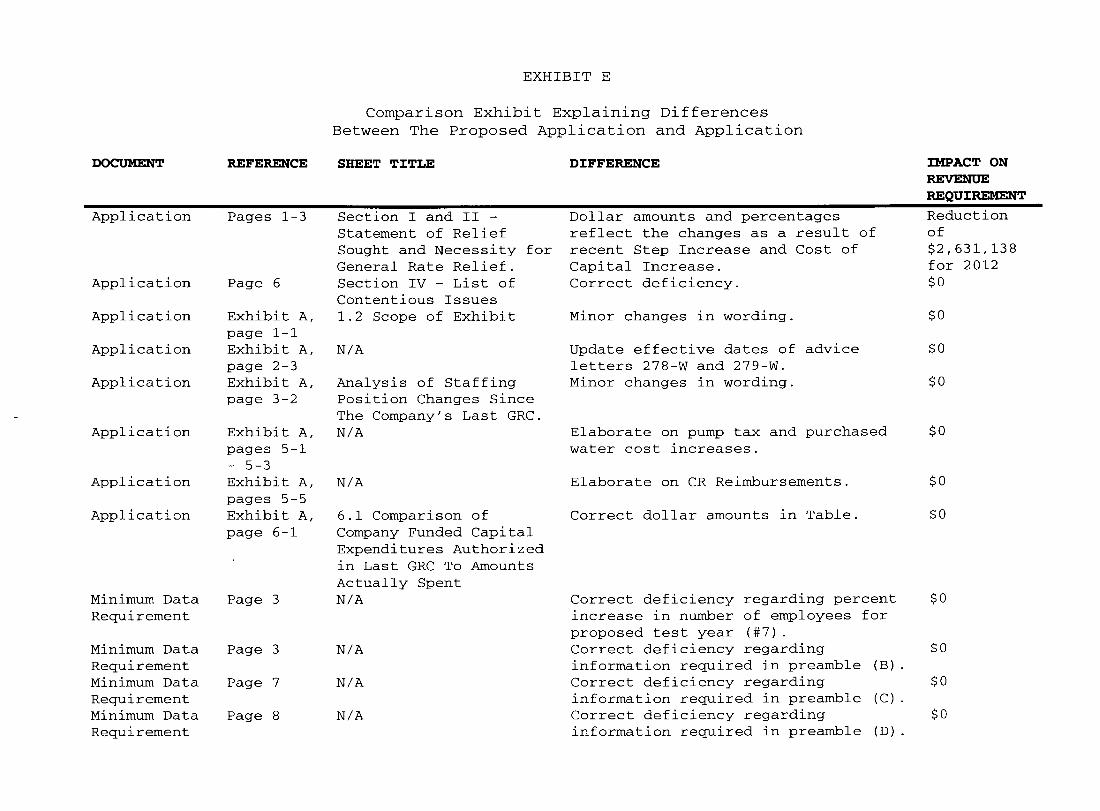
EXHIBIT E
Application
Application
Application
Application
Application
Application
Application
Application
Minimum DataRequirement
Minimum DataRequirementMinimum DataRequirementMinimum DataRequirement
REFERENCE
Pages 1-3
Page 6
Exhibit A,page i-iExhibit A,page 2-3Exhibit A,page 3-2
Exhibit A,pages 5-1- 5-3Exhibit A,pages 5-5Exhibit A,page 6-i
Page 3
Page 3
Page 7
Page 8
Comparison Exhibit Explaining DifferencesBetween The Proposed Application and Application
SHEET TITLE DIFFERENCE
Section I and II -Statement of ReliefSought and Necessity forGeneral Rate Relief.Section IV - List ofContentious Issues1.2 Scope of Exhibit
N/A
Analysis of StaffingPosition Changes SinceThe Company’s Last GRC.N/A
N/A
6.1 Comparison ofCompany Funded CapitalExpenditures Authorizedin Last GRC To AmountsActually SpentN/A
N/A
N/A
N/A
Dollar amounts and percentagesreflect the changes as a result ofrecent Step Increase and Cost ofCapital Increase.Correct deficiency.
Minor changes in wording.
Update effective dates of adviceletters 278-W and 279-W.Minor changes in wording.
Elaborate on pump tax and purchasedwater cost increases.
Elaborate on CR Reimbursements.
Correct dollar amounts in Table.
Correct deficiency regarding percentincrease in number of employees forproposed test year (#7).Correct deficiency regardinginformation required in preamble (B) .Correct deficiency regardinginformation required in preamble (C) .Correct deficiency regardinginformation required in preamble (D) .
IMPACT ON
R~QUIR~NTReductionof$2,631,138for 2012$0
$0
$0
$0
$0
$0
$0
$0
$o
$o
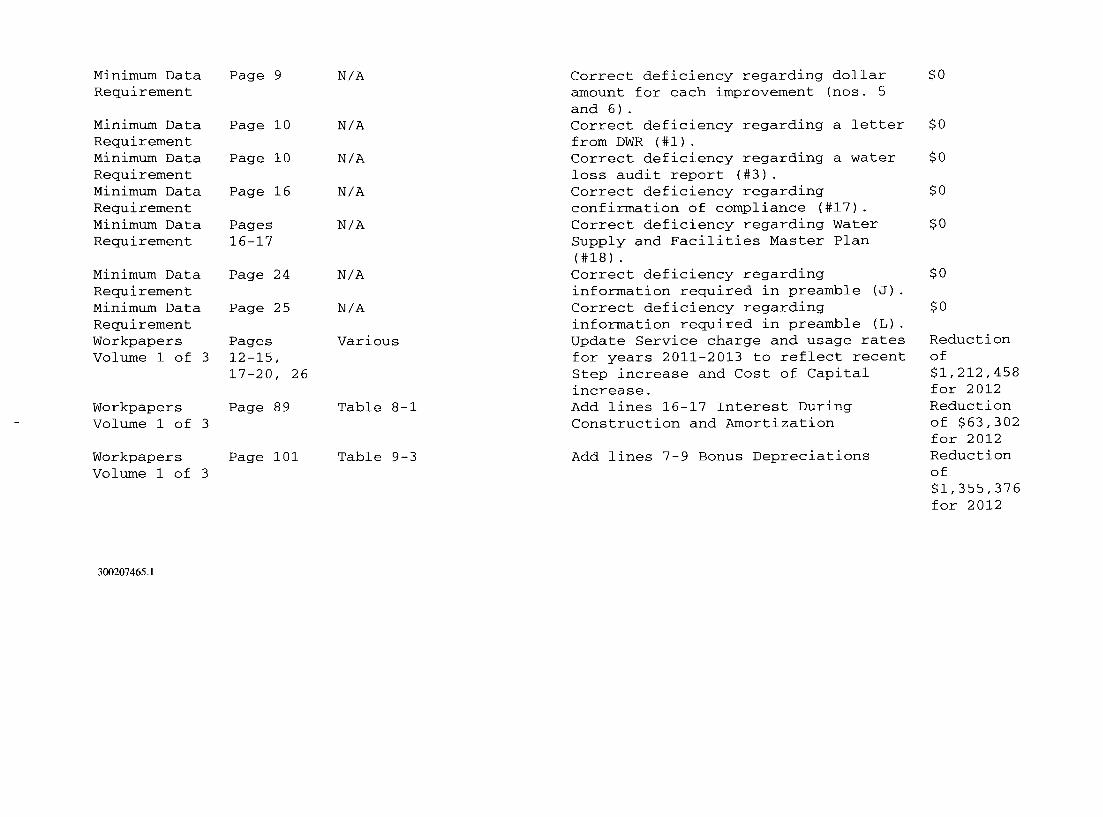
Minimum DataRequirement
Minimum DataRequirementMinimum DataRequirementMinimum DataRequirementMinimum DataRequirement
Minimum DataRequirementMinimum DataRequirementWorkpapersVolume 1 of 3
WorkpapersVolume 1 of 3
WorkpapersVolume 1 of 3
300207465.1
Page 9
Page i0
Page i0
Page 16
Pages16-17
Page 24
Page 25
Pages12-15,17-20, 26
Page 89
Page i01
N/A
N/A
N/A
N/A
N/A
N/A
N/A
Various
Table 8-1
Table 9-3
Correct deficiency regarding dollar $0amount for each improvement (nos. 5and 6).Correct deficiency regarding a letter $0from DWR (#i).Correct deficiency regarding a water $0loss audit report (#3).Correct deficiency regarding $0confirmation of compliance (#17).Correct deficiency regarding Water $0Supply and Facilities Master Plan(#18).Correct deficiency regarding $0information required in preamble (J).Correct deficiency regarding $0information required in preamble (L).Update Service charge and usage ratesfor years 2011-2013 to reflect recentStep increase and Cost of Capitalincrease.Add lines 16-17 Interest DuringConstruction and Amortization
Add lines 7-9 Bonus Depreciations
Reductionof$1,212,458for 2012Reductionof $63,302for 2012Reductionof$1,355,376for 2012

F
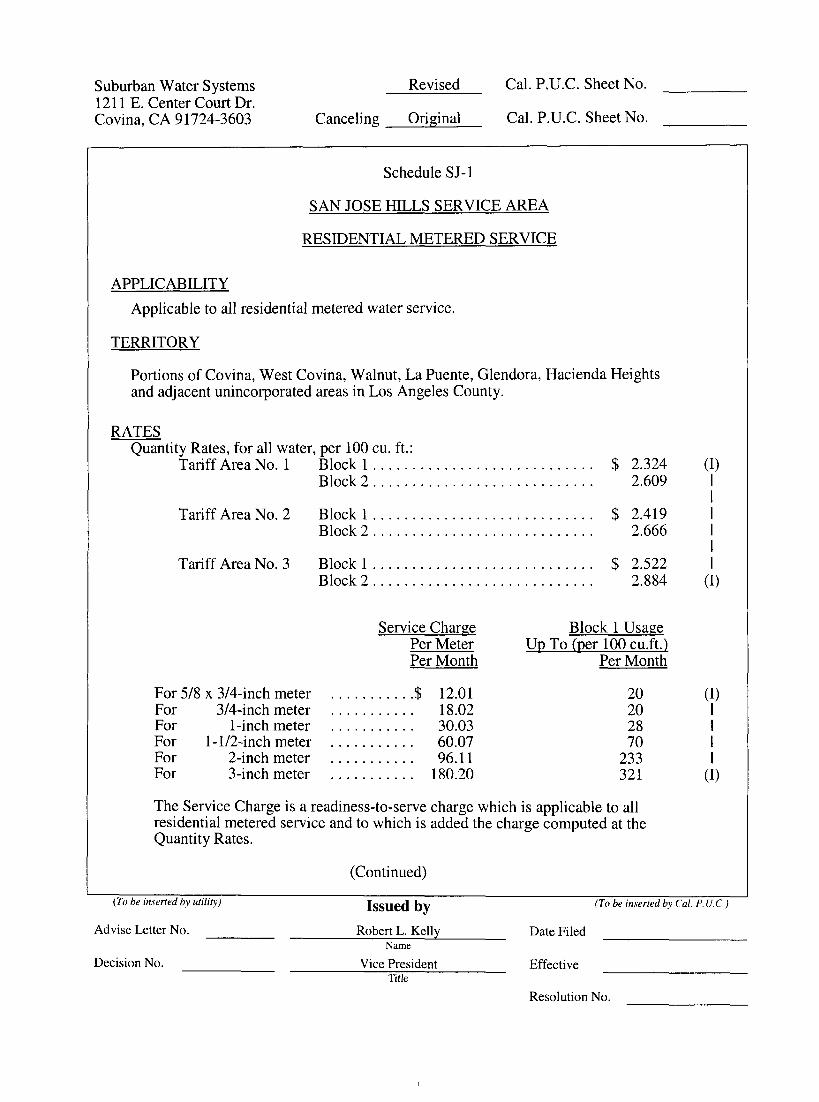
Suburban Water Systems1211 E. Center Court Dr.Covina, CA 91724-3603 Canceling
Revised
Original
Cal. P.U.C. Sheet No.
Cal. P.U.C. Sheet No.
Schedule S J- 1
SAN JOSE HILLS SERVICE AREA
RESIDENTIAL METERED SERVICE
APPLICABILITYApplicable to all residential metered water service.
TERRITORY
Portions of Covina, West Covina, Walnut, La Puente, Glendora, Hacienda Heightsand adjacent unincorporated areas in Los Angeles County.
RATESQuantity Rates, for all water, per 100 cu. ft.:
Tariff Area No. 1 Block 1 ............................ $Block 2 ............................
Tariff Area No. 2
2.3242.609
Tariff Area No. 3
Block 1 ............................ $ 2.419Block 2 ............................ 2.666
Block 1 ............................ $ 2.522Block 2 ............................ 2.884
(I)
(I)
Service ChargePer MeterPer Month
Block 1 UsageUp To (per 100 cu.ft.)
Per Month
For 5/8 x 3/4-inch meter ...........$ 12.01For 3/4-inch meter ........... 18.02For 1-inch meter ...........30.03For 1-1/2-inch meter ...........60.07For 2-inch meter ...........96.11For 3-inch meter ...........180.20
20202870233321
The Service Charge is a readiness-to-serve charge which is applicable to allresidential metered service and to which is added the charge computed at theQuantity Rates.
(I)IIII
(I)
(Continued)
(To be inserted by utility) Issued byAdvise Letter No. Robert L. Kelly
Name
Decision No. Vice PresidentTitle
(To be inserted by Cal. P.U.C )
Date Filed
Effective
Resolution No.
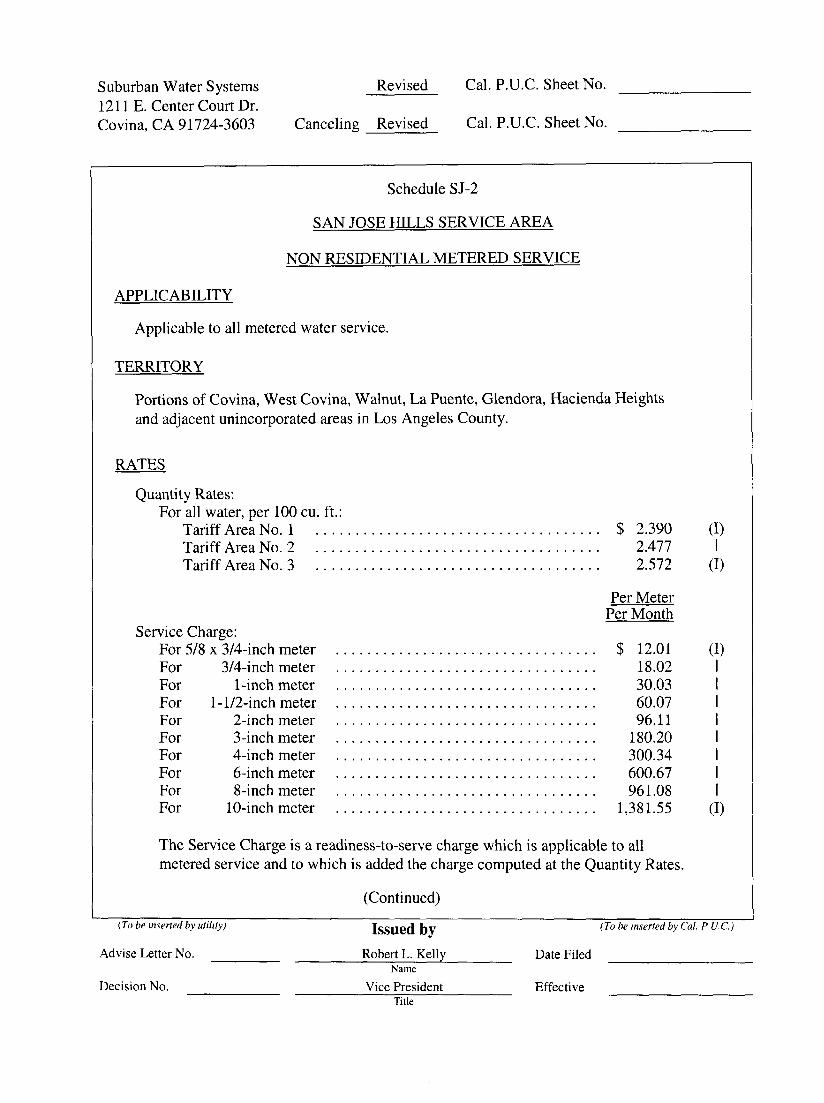
Suburban Water Systems1211 E. Center Court Dr.Covina, CA 91724-3603 Canceling
Revised
Revised
Cal. P.U.C. Sheet No.
Cal. P.U.C. Sheet No.
Schedule S J-2
SAN JOSE HILLS SERVICE AREA
NON RESIDENTIAL METERED SERVICE
APPLICABILITY
Applicable to all metered water service.
TERRITORY
Portions of Covina, West Covina, Walnut, La Puente, Glendora, Hacienda Heightsand adjacent unincorporated areas in Los Angeles County.
RATES
Quantity Rates:For all water, per 100 cu. ft.:
Tariff Area No. 1 .................................... $ 2.390Tariff Area No. 2 .................................... 2.477Tariff Area No. 3 .................................... 2.572
Service Charge:For 5/8 x 3/4-inch meterFor 3/4-inch meterFor 1-inch meterFor 1-1/2-inch meterFor 2-inch meterFor 3-inch meterFor 4-inch meterFor 6-inch meterFor 8-inch meterFor 10-inch meter
Per MeterPer Month
................................. $ 12.01
................................. 18.02
................................. 30.03
................................. 60.07
................................. 96.11
................................. 180.20
................................. 300.34
................................. 600.67
................................. 961.08
................................. 1,381.55
(i)I
(i)
(I)
(I)
The Service Charge is a readiness-to-serve charge which is applicable to allmetered service and to which is added the charge computed at the Quantity Rates.
(Continued)
(To be inserted by utility) Issued byAdvise Letter No. Robert L. Kelly
Name
Decision No. Vice PresidentTitle
Date Filed
Effective
(To be inserted by Cal. P U.C.)

Resolution No.
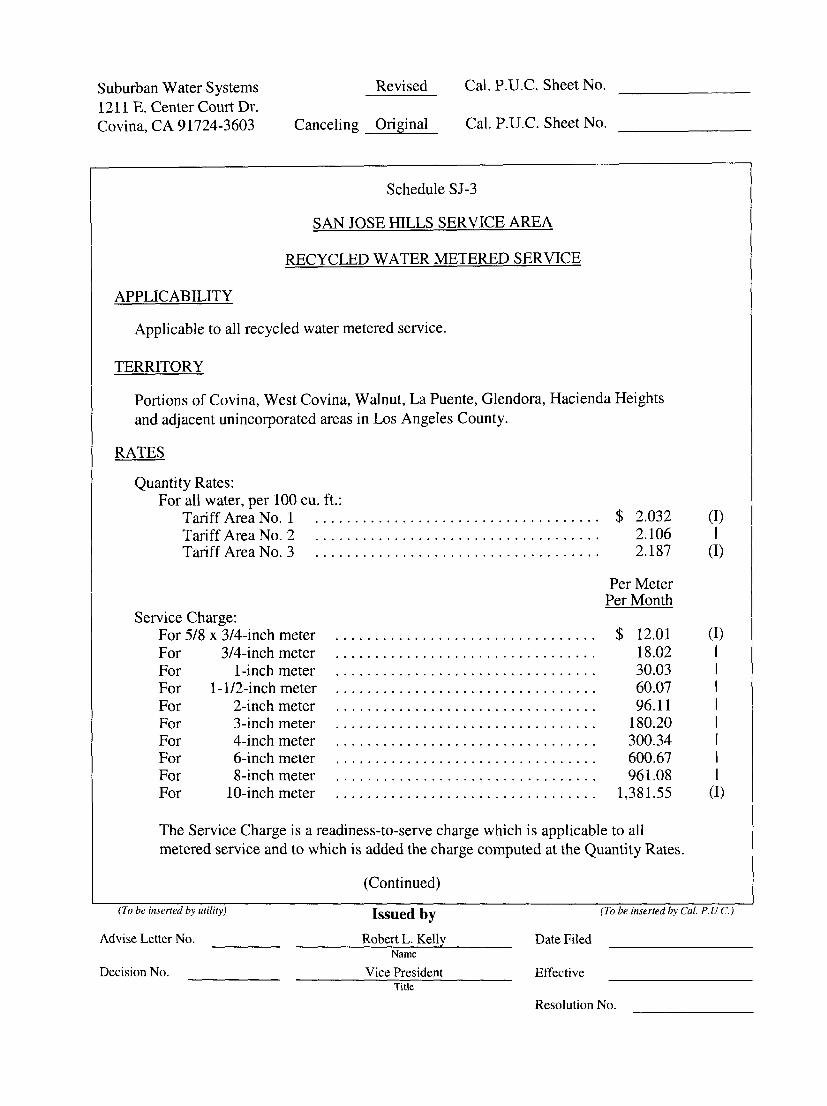
Suburban Water Systems1211 E. Center Court Dr.Covina, CA 91724-3603 Canceling
Revised
Original
Cal. P.U.C. Sheet No.
Cal. P.U.C. Sheet No.
Schedule S J-3
SAN JOSE I~LLS SERVICE AREA
RECYCLED WATER METERED SERVICE
APPLICABILITY
Applicable to all recycled water metered service.
TERRITORY
Portions of Covina, West Covina, Walnut, La Puente, Glendora, Hacienda Heightsand adjacent unincorporated areas in Los Angeles County.
RATES
Quantity Rates:For all water, per 100 cu. ft.:
Tariff Area No. 1 .................................... $ 2.032Tariff Area No. 2 .................................... 2.106Tariff Area No. 3 .................................... 2.187
Service Charge:For 5/8 x 3/4-inch meterFor 3/4-inch meterFor 1-inch meterFor 1-1/2-inch meterFor 2-inch meterFor 3-inch meterFor 4-inch meterFor 6-inch meterFor 8-inch meterFor 10-inch meter
Per MeterPer Month
................................. $ 12.01
................................. 18.02
................................. 30.03
................................. 60.07
................................. 96.11
................................. 180.20
................................. 300.34
................................. 600.67
................................. 961.08
................................. 1,381.55
(I)
O)
(I)
(I)
The Service Charge is a readiness-to-serve charge which is applicable to allmetered service and to which is added the charge computed at the Quantity Rates.
(Continued)
(To be inserted by utility) Issued byAdvise Letter No. Robert L. Kelly
Name
Decision No. Vice PresidentTitle
(To be inserted by Cal. P.U C.)
Date Filed
Effective
Resolution No.
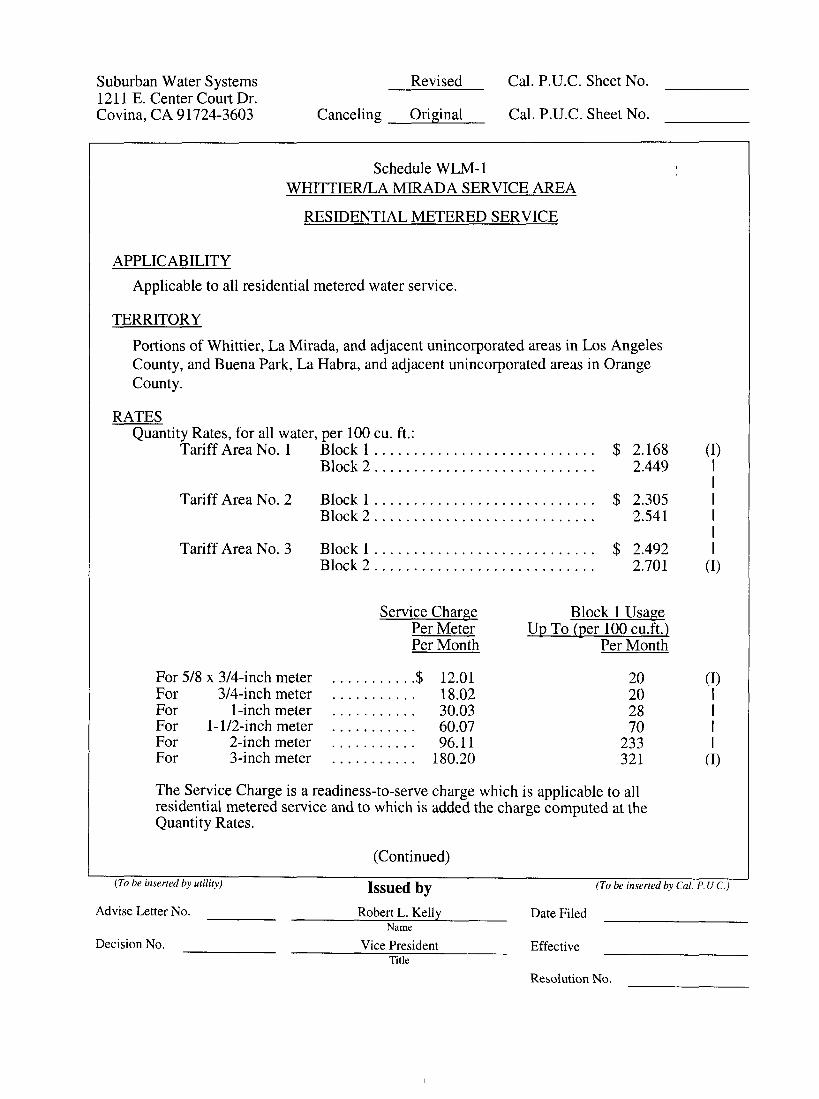
Suburban Water Systems1211 E. Center Court Dr.Covina, CA 91724-3603 Canceling
Revised
Original
Cal. P.U.C. Sheet No.
Cal. P.U.C. Sheet No.
Schedule WLM- 1WHITTIER/LA MIRADA SERVICE AREA
RESIDENTIAL METERED SERVICE
APPLICABILITYApplicable to all residential metered water service.
TERRITORY
Portions of Whittier, La Mirada, and adjacent unincorporated areas in Los AngelesCounty, and Buena Park, La Habra, and adjacent unincorporated areas in OrangeCounty.
RATESQuantity Rates, for all water, per 100 cu. ft.:
Tariff Area No. 1 Block 1 ............................ $Block 2 ............................
2.1682.449
Tariff Area No. 2 Block 1 ............................ $ 2.305Block 2 ............................ 2.541
Tariff Area No. 3 Block 1 ............................ $ 2.492Block 2 ............................ 2.701
(I)
(I)
Service ChargePer MeterPer Month
Block 1 UsageUp To (per 100 cu.ft.)
Per Month
For 5/8 x 3/4-inch meter ...........$ 12.01For 3/4-inch meter ...........18.02For 1-inch meter ...........30.03For 1- l/2-inch meter ...........60.07For 2-inch meter ...........96.11For 3-inch meter ...........180.20
20202870233321
The Service Charge is a readiness-to-serve charge which is applicable to allresidential metered service and to which is added the charge computed at theQuantity Rates.
(I)IIII
(I)
(To be inserted by utility)
Advise Letter No.
Decision No.
(Continued)
Issued byRobert L. Kelly
Name
Vice PresidentTitle
(To be inserted by Cal. P. U C.)
Date Filed
Effective
Resolution No.
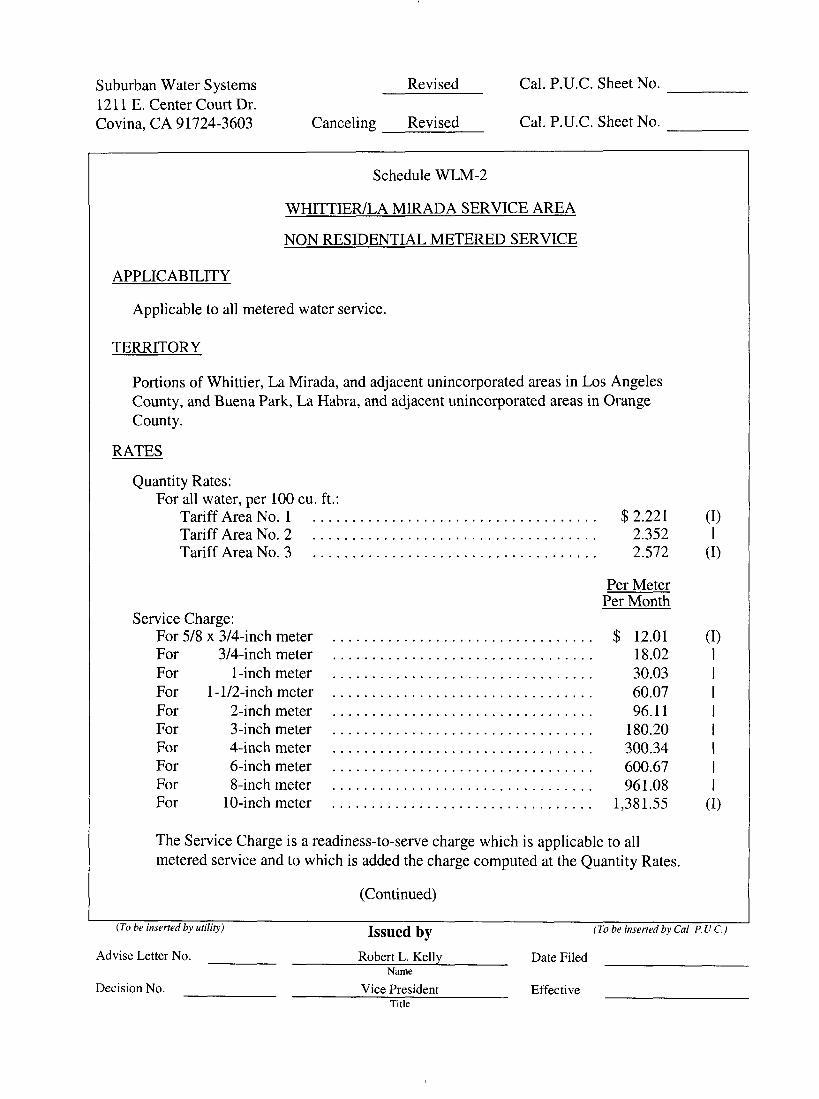
Suburban Water Systems1211 E. Center Court Dr.Covina, CA 91724-3603 Canceling
Revised
Revised
Cal. P.U.C. Sheet No.
Cal. P.U.C. Sheet No.
Schedule WLM-2
WHITTIER/LA MIRADA SERVICE AREA
NON RESIDENTIAL METERED SERVICE
APPLICABILITY
Applicable to all metered water service.
TERRITORY
Portions of Whittier, La Mirada, and adjacent unincorporated areas in Los AngelesCounty, and Buena Park, La Habra, and adjacent unincorporated areas in OrangeCounty.
RATES
Quantity Rates:For all water, per 100 cu. ft.:
Tariff Area No. 1 .................................... $ 2.221Tariff Area No. 2 .................................... 2.352Tariff Area No. 3 .................................... 2.572
Service Charge:For 5/8 x 3/4-inch meterFor 3/4-inch meterFor 1-inch meterFor 1-1/2-inch meterFor 2-inch meterFor 3-inch meterFor 4-inch meterFor 6-inch meterFor 8-inch meterFor 10-inch meter
Per MeterPer Month
................................. $ 12.01
................................. 18.02
................................. 30.03
................................. 60.07
................................. 96.11
................................. 180.20
................................. 300.34
................................. 600.67................................. 961.08................................. 1,381.55
(I)I
(i)
(I)
(i)
The Service Charge is a readiness-to-serve charge which is applicable to allmetered service and to which is added the charge computed at the Quantity Rates.
(Continued)
(To be inserted by utility) Issued byAdvise Letter No. Robert L. Kelly
Name
Decision No. Vice PresidentTitle
Date Filed
Effective
(To be inserted by Cal P. U C. )

Resolution No.
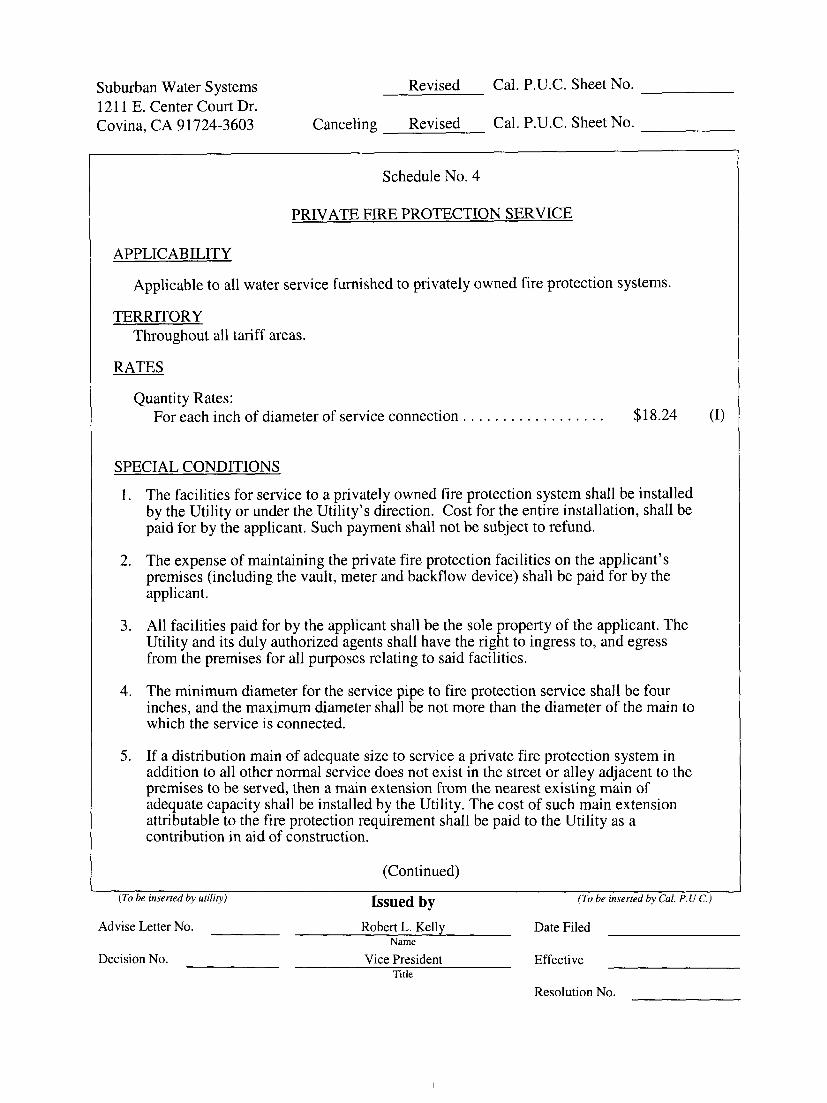
Suburban Water Systems1211 E. Center Court Dr.Covina, CA 91724-3603 Canceling
Revised
Revised
Cal. P.U.C. Sheet No.
Cal. P.U.C. Sheet No.
Schedule No. 4
PRIVATE FIRE PROTECTION SERVICE
APPLICABILITY
Applicable to all water service furnished to privately owned fire protection systems.
TERRITORYThroughout all tariff areas.
RATES
Quantity Rates:For each inch of diameter of service connection ..................$18.24
SPECIAL CONDITIONS
1. The facilities for service to a privately owned fire protection system shall be installedby the Utility or under the Utility’s direction. Cost for the entire installation, shall bepaid for by the applicant. Such payment shall not be subject to refund.
2. The expense of maintaining the private fire protection facilities on the applicant’spremises (including the vault, meter and backflow device) shall be paid for by theapplicant.
3. All facilities paid for by the applicant shall be the sole property of the applicant. TheUtility and its duly authorized agents shall have the right to ingress to, and egressfrom the premises for all purposes relating to said facilities.
4. The minimum diameter for the service pipe to fire protection service shall be fourinches, and the maximum diameter shall be not more than the diameter of the main towhich the service is connected.
If a distribution main of adequate size to service a private fire protection system inaddition to all other normal service does not exist in the street or alley adjacent to thepremises to be served, then a main extension from the nearest existing main ofadequate capacity shall be installed by the Utility. The cost of such main extensionattributable to the fire protection requirement shall be paid to the Utility as acontribution in aid of construction.
(To be inserted by utility)
Advise Letter No.
Decision No.
(Continued)
Issued by ~T,, be inserted by Cal. P. U C.)
Robert L. Kelly Date FiledName
Vice President EffectiveTitle
Resolution No.
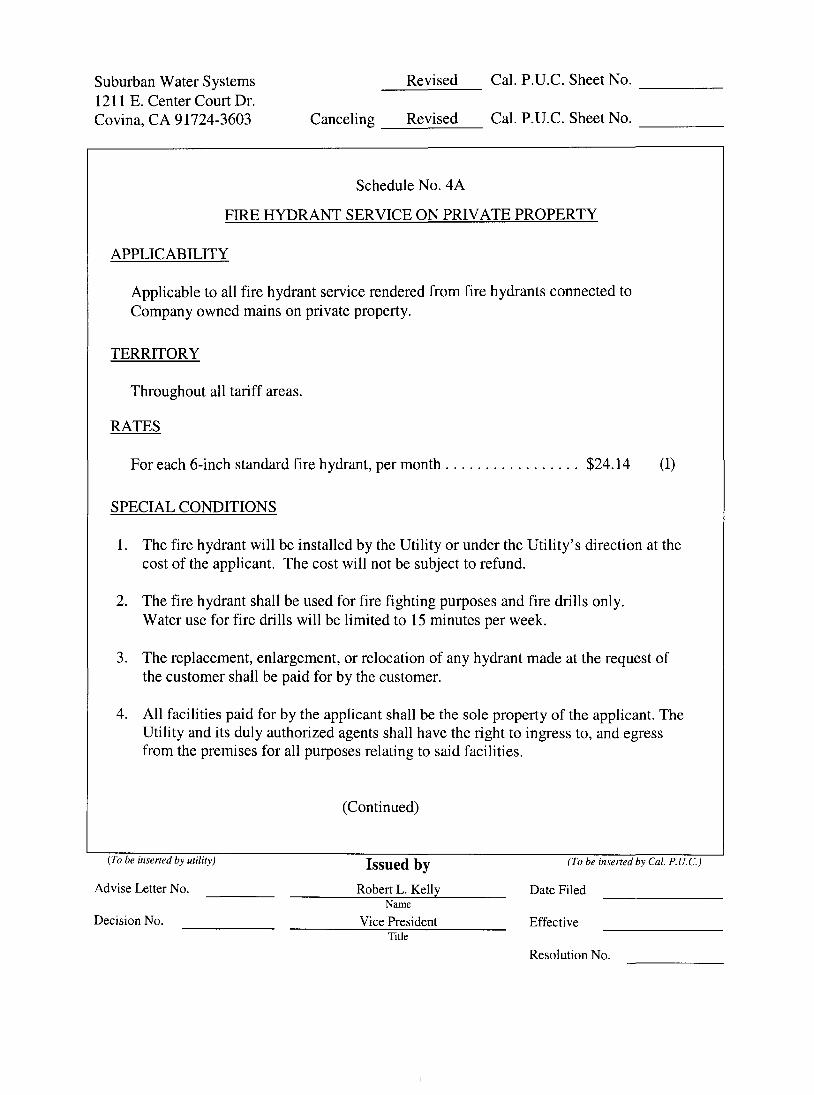
Suburban Water Systems1211 E. Center Court Dr.Covina, CA 91724-3603 Canceling
Revised
Revised
Cal. P.U.C. Sheet No.
Cal. P.U.C. Sheet No.
Schedule No. 4A
FIRE HYDRANT SERVICE ON PRIVATE PROPERTY
APPLICABILITY
Applicable to all fire hydrant service rendered from fire hydrants connected toCompany owned mains on private property.
TERRITORY
Throughout all tariff areas.
RATES
For each 6-inch standard fire hydrant, per month .................$24.14 (I)
SPECIAL CONDITIONS
The fire hydrant will be installed by the Utility or under the Utility’s direction at thecost of the applicant. The cost will not be subject to refund.
The fire hydrant shall be used for fire fighting purposes and fire drills only.Water use for fire drills will be limited to 15 minutes per week.
The replacement, enlargement, or relocation of any hydrant made at the request ofthe customer shall be paid for by the customer.
All facilities paid for by the applicant shall be the sole property of the applicant. TheUtility and its duly authorized agents shall have the right to ingress to, and egressfrom the premises for all purposes relating to said facilities.
(Continued)
(To be inserted by utility) Issued by (To be inserted by Cal. P. U. C.)
Advise Letter No. Robert L. Kell~� Date FiledName
Decision No. Vice President EffectiveTitle
Resolution No.
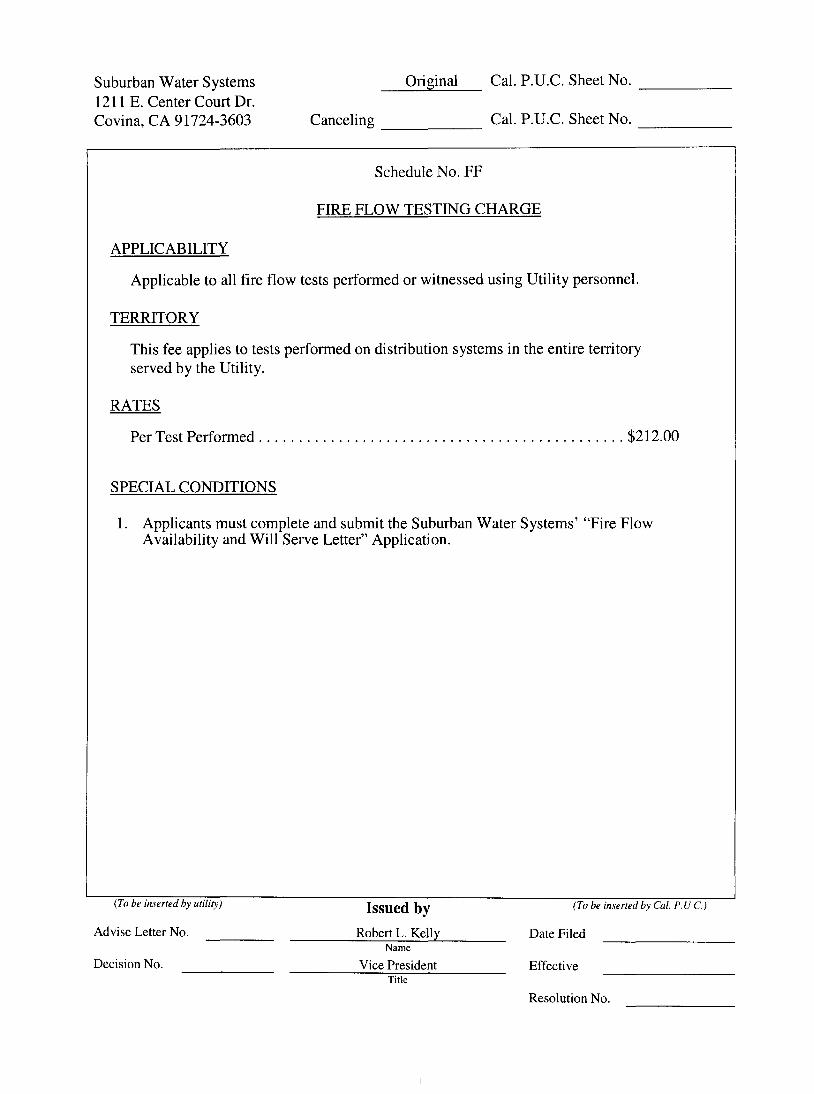
Suburban Water Systems1211 E. Center Court Dr.Covina, CA 91724-3603 Canceling
Original Cal. P.U.C. Sheet No.
Cal. P.U.C. Sheet No.
Schedule No. FF
FIRE FLOW TESTING CHARGE
APPLICABILITY
Applicable to all fire flow tests performed or witnessed using Utility personnel.
TERRITORY
This fee applies to tests performed on distribution systems in the entire territoryserved by the Utility.
RATES
Per Test Performed .............................................. $212.00
SPECIAL CONDITIONS
1. Applicants must complete and submit the Suburban Water Systems’ "Fire FlowAvailability and Will Serve Letter" Application.
(To be inserted by utility) Issued by (to be inserted by Cal. P. U C.)
Advise Letter No. Robert L. Kelly Date FiledName
Decision No. Vice President EffectiveTitle
Resolution No.
Suburban Water Systems1211 E. Center Court Dr.Covina, CA 91724-3603 Canceling
Original Cal. P.U.C. Sheet No.
Cal. P.U.C. Sheet No.
Form No. 20Fire Flow Availability and Will Serve Letter
Application Form
(To be inserted by utility)
Advise Letter No.
Decision No.
Issued by
Robert L. KellyName
Vice PresidentTitle
(To be inserted by Cal. P.U.C.)
Date Filed
Effective
Resolution No.
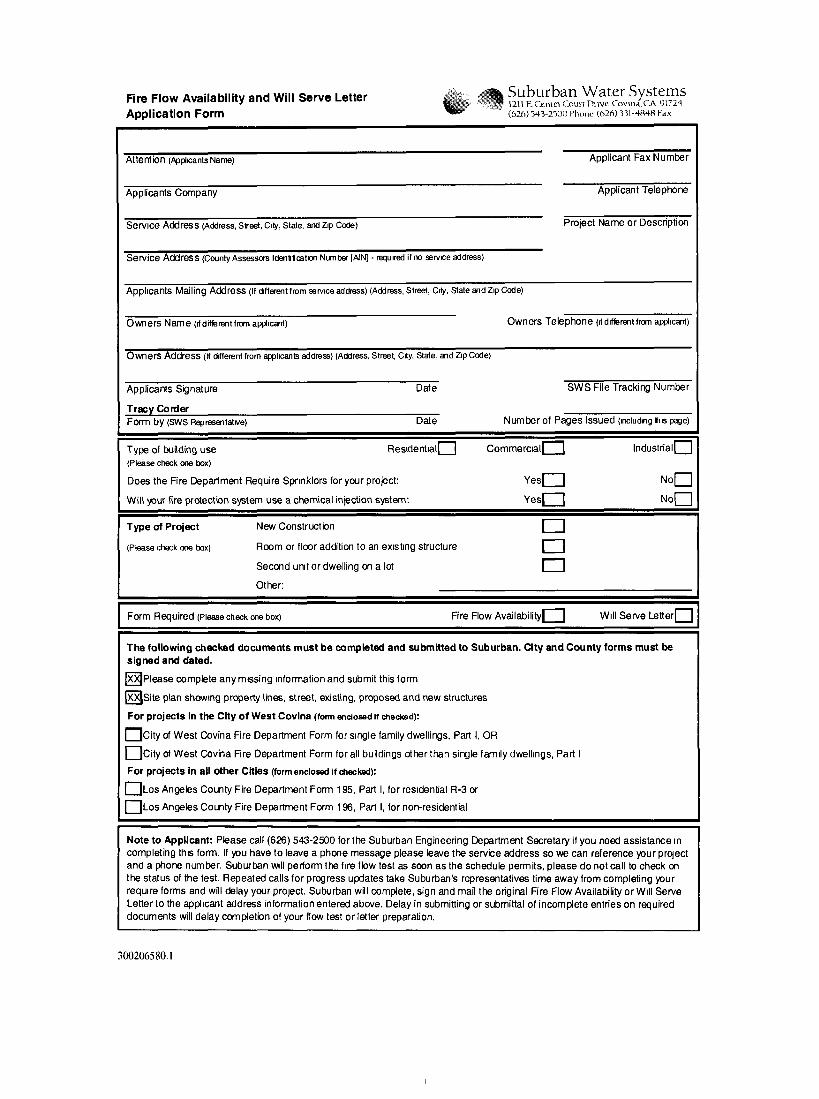
Fire Flow Availability and Will Serve LetterApplication Form
Suburban Water Systems1211 E Centre Court D~ we Covma, CA 91724
Attention (.z~ppi~cants Name)
Applicants Company
Service Address (Address, S~’eet, Oty, State, and Z~p Code)
Service Address (County Assessors Idee~ficat~n Number [NN] - reqmred if no service address)
Applicant Fax Number
Applicant Telephone
Project Name or Description
Applicants Mailing Address (If d~fferant from ssrv~ce address) (Address, Street, Cdy, State and Z=p Code)
Owners Name (=f different from apphcant) Owners Telephone 0f d~flerent from applicant)
Owners Address (If d~erent from apphcants address) (Address, Street, C~ty, State, and Z~p Code)
Applicants Signature Date
Tracy CorderForm by (SWS Represantat=ve) Date
Type of building use Res~dent~al["’l(Please check one box)
Does the Fire Department Require Spr=nklers for your project:
Will your fire protection system use a chemical injection system:
Type of Project
(Please check one box)
New Construction
Room or floor addition to an exlst=ng structure
Second un=t or dweUing on a lot
Commerclalr-"l
SWS File Tracking Number
Number of Pages Issued 0nclud=ng ~=s page)
Industrialr"l
Other:
YesF-"-I
Yes[~
Form Required (Please check o~e box) Fire Flow Availability[~ W=ll Serve Letterl~l
The following checked documents must be completed and submitted to Suburban. City and County forms must besigned and dated.
~""XIPlease complete any m~ssing =nformation and submit this form
[~Site plan shewing property lines, street, existing, proposed and new structures
For projects in the City of West Covina (form enclosed if checked):
r"--ICity of West Covina Fire Department Form for single family dwellings, Part I, OR
OCity of West Covina Fire Department Form for all buildings other than single fam=ly dwelhngs, Part IFor projects in all other Cities (formenclosed if checked):
[~]Los Angeles County Fire Department Form 195, Part I, for residential R-3 or[---ILos Angeles County Fire Department Form 196, Part I, for non-residential
Note to Applicant: Please call (626) 543-2500 for the Suburban Engineering Department Secretary if you need assistance =ncompleting th=s form. If you have to leave a phone message please leave the service address so we can reference your projectand a phone number. Suburban will perform the fire flow test as soon as the schedule permits, please do not call to check onthe status of the test. Repeated calls for progress updates take Suburban’s representatives time away from completing yourrequ=re forms and will delay your project. Suburban will complete, sign and mail the original Fire Flow Availability or Wdl ServeLetter to the applicant address information entered above. Delay in submitting or submittal of incomplete entries on requireddocuments will delay completion of your flow test or letter preparation.
3~2~580.1