F I N A N C I A L S TA B I L I T Y R E V I E W
242
FINANCIAL STABILITY REVIEW DECEMBER 2007 EUROPEAN CENTRAL BANK FINANCIAL STABILITY REVIEW DECEMBER 2007
Transcript of F I N A N C I A L S TA B I L I T Y R E V I E W
F INANC IAL STAB I L I TY REV IEWDECEMBER 2007
EURO
PEA
NCE
NTR
ALBAN
KFI
NAN
CIAL
STAB
ILIT
YREV
IEW
DEC
EMBER
2007
In 2007 all ECB publications
feature a motif taken from the €20 banknote.
FINANCIAL STABILITY REVIEW
DECEMBER 2007

© European Central Bank, 2007
Address Kaiserstrasse 29 60311 Frankfurt am Main Germany
Postal address Postfach 16 03 19 60066 Frankfurt am Main Germany
Telephone +49 69 1344 0
Website http://www.ecb.europa.eu
Fax +49 69 1344 6000
Telex 411 144 ecb d
All rights reserved. Reproduction for educational and non-commercial purposes is permitted provided that the source is acknowledged.
Unless otherwise stated, this document uses data available as at 9 November 2007.
ISSN 1830-2017 (print) ISSN 1830-2025 (online)
3ECB
Financial Stability ReviewDecember 2007
CONTENTS
PREFACE 9
I OVERVIEW 11
II THE MACRO-FINANCIAL ENVIRONMENT 19
1 THE EXTERNAL ENVIRONMENT 19
1.1 Risks and fi nancial imbalances in the external environment 19
1.2 Key developments in international fi nancial markets 30
1.3 Conditions of global fi nancial institutions 43
2 THE EURO AREA ENVIRONMENT 61
2.1 Economic outlook and risks 61
2.2 Balance sheet conditions of non-fi nancial corporations 62
2.3 Commercial property markets 68
2.4 Balance sheet conditions of the household sector 71
III THE EURO AREA FINANCIAL SYSTEM 81
3 EURO AREA FINANCIAL MARKETS 81
3.1 Key developments in the money market 81
3.2 Key developments in capital markets 91
4 THE EURO AREA BANKING SECTOR 97
4.1 Financial conditions of large and complex banking groups 97
4.2 Banking sector outlook and risks 103
4.3 Shock-absorption capacity of the banking sector 124
4.4 Overall assessment 130
5 OTHER EURO AREA FINANCIAL
INSTITUTIONS 131
5.1 The euro area insurance sector 131
6 STRENGTHENING FINANCIAL SYSTEM
INFRASTRUCTURES 145
6.1 Payment infrastructures and infrastructure services 145
IV SPECIAL FEATURES 155
A BANK CAPITAL IN EUROPE AND
THE US 155
B THE IMPACT OF SHORT-TERM
INTEREST RATES ON BANK CREDIT
RISK-TAKING 163
C COMMERCIAL PROPERTY INVESTMENT
AND FINANCIAL STABILITY 168
D MEASURING FINANCIAL MARKET
LIQUIDITY AND RISK AVERSION
INTERDEPENDENCE 176
E NET ASSET VALUE TRIGGERS AS EARLY
WARNING INDICATORS OF HEDGE
FUND LIQUIDATION 182
GLOSSARY 189
STATISTICAL ANNEX S1
BOXES
Sovereign wealth funds - a new 1 class of investors 21
Causes and consequences of the 2 recent market turmoil 32
Measuring the crowding of hedge 3 fund trades 49
Hedge fund investor redemption 4 restrictions and the risk of runs by investors 56
Potential implications of recent credit 5 market stress on the euro area credit cycle 65
An overview of developments in 6 euro area housing and mortgage markets 76
A “barometer” for fi nancial market 7 turmoil 84
Understanding asset backed 8 commercial paper structures 86
Recent issues in the euro area 9 money market: causes, consequences and proposed mitigating measures 89
4ECBFinancial Stability ReviewDecember 2007
Identifying large and complex banking 10 groups for fi nancial system stability assessment: an update 98
Assessing the impact of recent 11 market turmoil on euro area large and complex banking groups: a stress test of potential balance sheet expansion 104
Assessing credit risk in the loan 12 portfolios of euro area large and complex banking groups 108
The “originate and distribute” banking 13 business model and recent credit market turmoil: some tentative lessons 112
Model risk: an overview of the 14 issues 114
Market liquidity risk measurement 15 117
A market-based indicator of the 16 probability of adverse systemic events involving large and complex banking groups 125
E17 uro area insurers’ direct exposures to the structured US sub-prime mortgage market 135
Terrorism insurance: who insures 18 and who is insured 138
More than thirty years after the 19 “Herstatt” case, foreign exchange settlement risk is still an issue 149
CHARTS
1.1 The US current account defi cit and its counterparts 19
1.2 Cross-border fi nancial fl ows to the US 20
1.3 US corporate sector profi ts 23
1.4 US commercial banks: charge-off and delinquency rates on commercial and industrial loans 24
1.5 US banks’ credit standards on loans to fi rms 24
1.6 US house price infl ation 25
1.7 Personal bankruptcy fi lings in the US 25
1.8 Delinquency rates for residential sub-prime mortgage-backed securities rated by Fitch Ratings 26
1.9 US banks’ credit standards on mortgages to individuals 26
1.10 Charge-offs and delinquencies on consumer loans 27
1.11 Private sector credit growth in non-euro area EU countries 27
1.12 Net infl ows into dedicated emerging market economy funds 29
1.13 Selected indicators of potential overheating in large emerging economies 29
1.14 USD three-month money market spreads 30
1.15 US commercial paper market: outstanding amounts by market segment 31
1.16 Maturing ABCP volumes in maturity buckets, normalised 31
1.17 Conditional correlation between daily US government bond and stock returns 36
1.18 Implied volatility in US bond markets 37
1.19 Moody’s Baa-Aaa corporate bond spread in the US 37
1.20 Monthly value of new public bond issuance in the US domestic market 37
1.21 Amount of debt of fallen angels vis-à-vis rising stars among US fi nancial issuers 38
1.22 US non-farm non-fi nancial corporate business internal funds and recessions 38
1.23 Recent evolution of selected equity indices 39
1.24 Investor discrimination across selected emerging sovereign issuers 39
1.25 Sharpe ratios for selected bilateral carry trades and equity indices 40
1.26 Speculative positions in JPY/USD futures and the JPY/USD exchange rate 40
1.27 Tolerance for risk implied in the differential between implied and expectations of realised volatilities 41
1.28 Risk reversal for the USD/EUR and the JPY/EUR exchange rates 41
5ECB
Financial Stability ReviewDecember 2007
CONTENTS
1.29 Unwinding of carry trades involving selected emerging market currencies 41
1.30 Speculative positions on oil futures and oil prices 42
1.31 Options-implied risk-neutral densities of oil prices 42
1.32 Price of gold and amounts invested in exchange-traded funds (ETFs) 43
1.33 Return on equity for global large and complex banking groups 44
1.34 Fee and commission revenues and trading revenues for global large and complex banking groups 44
1.35 Change in Value at Risk levels as a percentage of share holder equity for global large and complex banking groups 45
1.36 Change in fi ve-year CDS spreads for US securities fi rms and euro area LCBGs 46
1.37 Global hedge fund returns 47
1.38 Distribution of historical global hedge fund returns by investment holding period 47
1.39 Medians of pairwise correlation coeffi cients of monthly hedge fund returns within strategies 48
1.40 Global hedge fund average leverage by strategy 54
1.41 Hedge fund leverage 54
1.42 Comparison of returns of single-manager hedge funds and funds of hedge funds 54
1.43 Global hedge fund aggregate quarterly net redemptions and net investments across strategies 55
1.44 Share of global single-manager hedge fund capital under management provided by funds of hedge funds 55
1.45 Global hedge fund launch, liquidation and attrition rates 60
2.1 Indebtedness of the euro area non-fi nancial corporate sector 62
2.2 Share of gross issues of euro area non-fi nancial corporate bonds by rating 63
2.3 OTC interest rate swaps in euro where non-fi nancial corporations are counterparties 63
2.4 Gross operating surplus of euro area non-fi nancial corporations 63
2.5 Corporate earnings growth in the euro area: actual and expected 64
2.6 Non-fi nancial corporate sector rating changes in the euro area 64
2.7 Direct commercial property investment volumes in the euro area 68
2.8 Growth in direct commercial property investment volumes in the euro area 68
2.9 Euro area commercial property company stock prices and the Dow Jones EURO STOXX 50 index 70
2.10 Cumulative changes in euro area commercial property company stock prices relative to the Dow Jones EURO STOXX 50 index 70
2.11 Annualised historical stock price volatility for euro area commercial property companies and the Dow Jones EURO STOXX 50 index 70
2.12 Loans for house purchase and house price infl ation in the euro area 72
2.13 Household sector net worth in the euro area 72
2.14 The fi nancial situation and employment expectations of euro area households over the next 12 months 75
3.1 Five-year credit default swap indices for the European and US fi nancial sectors 81
3.2 Three-month EUR money market spreads 82
3.3 Average maturity of newly issued paper in the euro-commercial paper (ECP) market 83
3.4 Average maturity of newly issued paper in the asset backed euro-commercial paper (ABECP) market 83
3.5 Outstanding volumes of euro-commercial paper (ECP) 83
6ECBFinancial Stability ReviewDecember 2007
3.6 Decomposition of fi nancial market liquidity indicator for the euro area 92
3.7 Euro area implied bond market volatility 92
3.8 Euro area long-term government bond yields and nominal GDP growth expectations 92
3.9 Investment-grade corporate bond credit curves in the euro area 93
3.10 Euro area non-fi nancial corporate bond spreads 93
3.11 Gross bond issuance by euro area non-fi nancial corporations by rating 93
3.12 Global structured credit rating downgrades by rating 94
3.13 Leveraged loan agreements in the euro area 94
3.14 Leveraged loan agreements in the euro area 94
3.15 iTraxx main and senior fi nancials indices 95
3.16 ZEW euro area near-term stock market outlook 96
3.17 Dow Jones EURO STOXX earnings revisions ratio 96
4.1 Frequency distribution of return on equity for large and complex banking groups in the euro area 97
4.2 Frequency distribution of return on risk-weighted assets for large and complex banking groups in the euro area 100
4.3 Distribution of net interest income as a percentage of risk-weighted assets for large and complex banking groups in the euro area 100
4.4 Distribution of trading revenue as a percentage of Tier 1 capital for large and complex banking groups in the euro area 101
4.5 Frequency distribution of net loan impairment charges for large and complex banking groups in the euro area 102
4.6 Frequency distribution of cost-to-income ratios for large and complex banking groups in the euro area 102
4.7 Frequency distribution of Tier 1 ratios for large and complex banking groups in the euro area 102
4.8 Earnings and earnings forecasts for large and complex banking groups in the euro area 103
4.9 Net easing of bank lending standards on loans to households 107
4.10 Net easing of bank lending standards and annual growth in MFI loans to non-fi nancial corporations 110
4.11 Euro area loan securitisation issuance per country of collateral 111
4.12 Interest rate Value-at-Risk (VaR) for large and complex banking groups in the euro area 119
4.13 Exchange rate Value at Risk (VaR) for large and complex banking groups in the euro area 120
4.14 Equity market Value at Risk (VaR) for large and complex banking groups in the euro area 121
4.15 Distribution of global hedge fund returns 122
4.16 Share of hedge funds breaching triggers of total NAV cumulative decline 122
4.17 Returns of different asset classes after the June 2007 FSR data cut-off date 124
4.18 Indicators of the likelihood of greater-than-normal changes in the Dow Jones EURO STOXX total market and bank indices 128
4.19 Option-implied risk-neutral density bands for the Dow Jones EURO STOXX bank index 128
5.1 Distribution of gross premium written growth for euro area insurers 131
5.2 Distribution of return on equity (ROE) for euro area insurers 132
5.3 Distribution of gross premium written growth for a sample of large euro area insurers 132
7ECB
Financial Stability ReviewDecember 2007
CONTENTS
5.4 Distribution of combined, loss and expense ratios for a sample of large euro area insurers 133
5.5 Distribution of return on equity, net income and investment income for a sample of large euro area insurers 133
5.6 Distribution of gross premium written growth for a sample of large euro area reinsurers 133
5.7 Distribution of combined, loss and expense ratios for a sample of large euro area reinsurers 134
5.8 Distribution of return on equity, net income and investment income for a sample of large euro area reinsurers 134
5.9 Capital raised by reinsurers and insurance securitisation volumes since 2005 141
5.10 Stock price developments for euro area banks and insurers relative to the Dow Jones EURO STOXX 50 index 142
5.11 Cumulative changes in insurance stock indices relative to the Dow Jones EURO STOXX index 143
TABLES
1.1 Mapping hedge fund activities by strategy 48
5.1 Number of Atlantic hurricanes and storms recorded and forecast for the 2007 season 137

9ECB
Financial Stability ReviewDecember 2007
PREFACE
Financial stability can be defi ned as a condition in which the fi nancial system – comprising of fi nancial intermediaries, markets and market infrastructures – is capable of withstanding shocks and the unravelling of fi nancial imbalances, thereby mitigating the likelihood of disruptions in the fi nancial intermediation process which are severe enough to signifi cantly impair the allocation of savings to profi table investment opportunities. Understood this way, the safeguarding of fi nancial stability requires identifying the main sources of risk and vulnerability such as ineffi ciencies in the allocation of fi nancial resources from savers to investors and the mis-pricing or mismanagement of fi nancial risks. This identifi cation of risks and vulnerabilities is necessary because the monitoring of fi nancial stability must be forward looking: ineffi ciencies in the allocation of capital or shortcomings in the pricing and management of risk can, if they lay the foundations for vulnerabilities, compromise future fi nancial system stability and therefore economic stability. This Review assesses the stability of the euro area fi nancial system both with regard to the role it plays in facilitating economic processes, and to its ability to prevent adverse shocks from having inordinately disruptive impacts.
The purpose of publishing this review is to promote awareness in the fi nancial industry and among the public at large of issues that are relevant for safeguarding the stability of the euro area fi nancial system. By providing an overview of sources of risk and vulnerability for fi nancial stability, the review also seeks to play a role in preventing fi nancial crises.
The analysis contained in this review was prepared with the close involvement of, and contribution by, the Banking Supervision Committee (BSC). The BSC is a forum for cooperation among the national central banks and supervisory authorities of the European Union (EU) and the European Central Bank (ECB).

11ECB
Financial Stability ReviewDecember 2007
The shock-absorbing capacities of the euro area and other mature economy fi nancial systems were severely tested over a protracted period in the six months after the last Financial Stability Review (FSR) was fi nalised. By the cut-off date for including information and data in this issue, 9 November 2007, tensions remained. An increasingly aggressive search for yield by investors over several years – characterised by a relentless and mutually reinforcing spiral of growing fi nancial market liquidity, increasing investor risk appetite and rising leverage both in investor strategies and fi nancial products – was abruptly thrown into reversal by an eruption of strains in global structured credit markets in the course of July. The catalyst for the sudden retrenchment from risk-taking and towards de-leveraging was an earlier sharp rise in the delinquency rates on US sub-prime mortgages and growing concerns that delinquencies could rise to unprecedented levels. This ultimately led some rating agencies to announce both the imminent downgrading of hundreds of asset-backed securities (ABSs) that were backed by portfolios of these mortgages and plans to revise their methodologies for assigning new ratings.
As the nature and scale of deterioration in the credit quality of US sub-prime mortgages became clearer, a broad consensus seemed to form that the cumulative credit losses facing the universe of investors in these loans were likely to be relatively small. Indeed, most estimates indicated that the nominal amount involved was unlikely to have an order of magnitude much larger than a one percent decline in the value of the US stock market, which is well within the bounds of typical daily experience. At the same time, the balance sheets of large and complex banking groups (LCBGs) were generally strong and resilient before the tensions emerged. Hence, on the face of it, the most probable outcome seemed to be that the effects of the shock would be limited. However, the effects on fi nancial systems were amplifi ed considerably for two main reasons. First, several vulnerabilities – many of which had been identifi ed previously in this Review and elsewhere – arising from the ways in which
risks were assessed, valued and distributed within fi nancial systems where the “originate and distribute” banking model has increasingly taken hold were brought to light. Second, these vulnerabilities combined in unanticipated ways, causing risks that some large banking groups in several mature economies had seemingly transferred off their balance sheets to unexpectedly fl ow back onto them. As a result there were disruptions in some of the largest and most liquid fi nancial markets in the world, including the core interbank money markets. These unprecedented circumstances called for commensurate action to be taken by central banks in order to restore orderly conditions in the money markets. The ECB, as well as other major central banks around the world, did this by acting swiftly to meet the increased liquidity needs of the banking system.
This section examines the vulnerabilities that ultimately led to, propagated and amplifi ed the stresses on the euro area and other mature economy fi nancial systems. It then discusses how the market turmoil spread from the US sub-prime mortgage market. This is followed by a recapitulation of some of the key lessons that market participants and authorities have learnt so far, and the section concludes with an overall assessment of the euro area fi nancial system stability outlook.
SOURCES OF RECENT STRESS
IN THE FINANCIAL SYSTEM
In order to draw the right lessons from the recent market turmoil, it is important to identify the factors that apparently rendered the stability of the global fi nancial system vulnerable to an initial shock that was, prima facie, relatively small in magnitude. The principal reason appears to have been that several intertwined vulnerabilities were created by a mutually reinforcing interplay between strengthening investor risk appetite, a relentless deepening of fi nancial market liquidity from mid-2003 onwards and the widening adoption by banks of an “originate and distribute” business model.
I OVERVIEW
12ECBFinancial Stability ReviewDecember 2007
Several past FSRs have called attention to risks associated with a hunt for yield that had been set in motion in the course of 2003 when investors with strengthening risk appetites were faced with historically low long-term government bond yields and relatively cheap and abundant sources of credit. Investors had responded by seeking out alternative instruments with higher yields but also greater risk. The search began with investment grade corporate bonds. As spreads narrowed on these securities and as market volatility dropped across a host of asset classes, greater infl ows across a widening investor base were attracted by the possibility of higher risk-adjusted returns. However, to maintain expected returns at previous levels, it became necessary for investors to search for alternative investments with less market liquidity or lower credit quality. Alternatively, it was possible to generate similar expected returns by leveraging-up the same positions. This created demand for increasingly complex structured fi nance products such as collateralised debt obligations (CDOs) and collateralised loan obligations (CLOs) which embed leverage within their structures. This spiral of increasing market liquidity, leverage and narrowing spreads was able to continue as long as market volatility remained low and the underlying fundamentals of credit-based securities were strong.
There were growing concerns among the global central bank community that the search for yield was pushing the prices of the affected securities above their intrinsic values, thereby leaving them vulnerable to a reappraisal and repricing of risk. At the same time, however, the capacity of the fi nancial system to absorb shocks had apparently been improving. The effects of four fi nancial market disturbances over two years – including the credit market turbulence of May 2005, large declines in mature equity markets in May/June 2006, the failure of Amaranth Advisers in September 2006 and the “fl ight to quality” of late-February/early-March 2007 – all proved remarkably contained, short-lived and self-correcting. However, these episodes may have left investors too complacent about
their risk management. This, in turn, may have contributed to the postponement of an overdue repricing of risk.
Application of the “originate and distribute” model of banking – whereby banks originate loans, repackage the cash-fl ows generated by these loans into ABSs, often via so-called Special Purpose Vehicles (SPVs), and sell-on the securities to investors – has a decades-long history. The model offers banks a choice of whether to bear or mitigate the credit risks they normally incur through lending. When credit risks are distributed, this frees up capital and allows banks to further increase their lending. At the same time, it opens up opportunities for pension funds, insurance companies, mutual funds and hedge funds to acquire credit risk exposures and diversify their portfolios. Spurred by advances in the risk management techniques of banks and remarkable innovation in the design and structuring – including tranching – of credit-based products, the model has been catering for a growing diversity of credit risk appetites.
The effectiveness of the “originate and distribute” model relies on the “distribute” leg of it working well. Hence, with an aggressive hunt for yield underway over several years, banks found a growing base of highly receptive investors willing to absorb increasingly complex structured credit products into their portfolios. One indication of the growing investor appetite for credit derivatives over this period was a tenfold increase in the global amount outstanding of credit default swaps (CDS) to around USD 30 trillion between the end of 2002 and the end of 2006.
The “originate and distribute” model facilitated a wider distribution of risks within and across fi nancial systems. This meant that as long as the risk assessment, pricing and management systems of the fi nancial institutions who were taking on the risk were able to keep pace with the systems used by the banks who constructed the securities, the model had the capacity to make a positive contribution to fi nancial system stability. By facilitating the distribution of credit
13ECB
Financial Stability ReviewDecember 2007 13
I OVERV IEW
risk to fi nancial institutions which had not in the past managed such risks, it also contributed to raising the potential credit risk-bearing capacity of the fi nancial system more generally, thereby fostering new and possibly growth-enhancing economic activities. However, there were growing concerns among the global central banking community that the model was reducing the degree of transparency concerning where the risks in the fi nancial system were ending up. Questions were also raised by authorities about the capacity of the institutions that held the risks to manage them adequately and, against the background of a boom in leveraged buyout (LBO) activity that was partly facilitated by the growth of the CLO market, about the risks that the model might be facilitating a misallocation of capital. Moreover, as complexity grew so did the number of degrees of separation between the originators and the ultimate investors. Investors in complex credit products had considerably less information at their disposal to assess the underlying credit quality of the assets they held in their portfolios than the originators. As a result, end-investors often came to rely heavily on the risk assessments of rating agencies. When the CDO market began to take off, there were some safeguards for ensuring the monitoring of credit risk. These included the discipline of reputation risks facing the originators who often also kept the exposures to the riskiest tranches (the “equity” tranches) of CDOs on their balance sheets. Holding the equity tranche provided them with an incentive to monitor the risks, thereby leaving the end-investors with some comfort about the underlying credit quality. However, as the hunt for yield intensifi ed with shrinking investment possibilities, banks increasingly found investors willing to take exposures to the equity tranches as well, thereby eroding an important mechanism of market discipline.
PROPAGATION OF THE STRESS
THROUGH THE FINANCIAL SYSTEM
Delinquency rates on US sub-prime mortgages increased markedly after mid-2005 for two main reasons. First, sub-prime mortgages are
so-called short-reset loans: the interest rate initially charged on them is much lower than for a standard mortgage but it is typically reset to a much higher rate, usually after a two to three year period. Because of this, although short-term market interest rates began increasing in the United States from mid-2004 onwards, resets did not begin to translate into higher mortgage repayment burdens until sometime later. Second, high rates of house price infl ation since the early 1990s encouraged some households to borrow for house purchases with the intention of refi nancing or repaying the mortgage before the reset date. Once interest rates on these mortgages started to rise, and with falling house prices, many borrowers became delinquent on their loans sometimes even before the reset. This quickly translated into falling values of residential mortgage-backed securities (RMBSs), especially for those backed by the most recently originated vintages of loans.
Several factors appear to explain why the risks of credit losses on US sub-prime mortgages had such wide-ranging effects on broader fi nancial markets and core fi nancial fi rms. First, claims on the cash-fl ows generated by these loans were embedded in a broad array of structured credit products, often layered on top of one another, beginning with RMBS, followed by CDOs containing some exposure to these RMBS, and even CDOs of CDOs, which are commonly referred to as CDO-squared. This partly explained why indirect exposures to the US sub-prime market through ABSs subsequently turned out to be much more widespread than initially thought by authorities and fi nancial fi rms.
Second, the announcement by some rating agencies in early July that they would be downgrading ABSs backed by pools of sub-prime mortgages and revising their methodologies for assigning new ratings caused investors to fundamentally question their underlying assumptions about the distribution of returns on a wide variety of ABSs. This was indicated by the fact that the consequences of these downgrades spread far beyond a risk reappraisal and surge of spreads on sub-prime
14ECBFinancial Stability ReviewDecember 2007
mortgage portfolios. ABSs secured by portfolios of other assets, including corporate bonds, bank loans, automobile loans and credit cards, all saw abrupt increases in their spreads following the announcement. This contagion occurred, at least in part, because these different ABSs were structured similarly and rated by the agencies using a similar methodology. The result was that investors who had been assuming that the ratings for structured credit products had similar statistical properties to those for corporate bonds – where long statistical track-records existed, rating transition probabilities were well known and where market liquidity was deep – discovered that their properties were quite different. This was essentially because a suffi ciently long “through-the cycle” track record of these securities was lacking but also because other dimensions of risk, such as market liquidity risk which is not factored into credit ratings, may have been overlooked. As a result, investors could no longer reliably assign appropriate probabilities to different outcomes. In other words, investors could no longer quantify the risks in these products with any degree of confi dence. The effect was that market liquidity for these products, which is usually not very deep, dried up: bid-ask spreads widened further and became “indicative” and many investors exited from ABS markets altogether. At the same time, so-called bespoke CDOs became impossible to value. This was because these products, which are tailor-made to the risk-return preferences of buy-and-hold investors, are illiquid by design and must be valued using models. As these valuation models require market prices for ABS indices, which were either not available or unreliable, the models no longer worked.
Increased risk aversion and declining liquidity in structured credit markets resulted in a sharp drop in CDO issuance volumes. Issuance in leveraged loan markets also came to a virtual standstill as managers of CLO portfolios withdrew from the market. This intensifi ed pre-existing concerns about the ability of the market to absorb a large (USD 200 to 350 billion) pipeline of LBO-related debt that had built up over the year and which
was awaiting distribution to CLO investors, thereby leaving the banks which had originated the loans exposed to rising “warehousing risk”. As a result, a number of LBO deals were delayed, restructured or even withdrawn from the market.
Money-market fund managers eventually became embroiled in the process of divesting portfolios of US sub-prime exposure. Seemingly they had underestimated or were not aware of the exposure they were incurring towards the risks in US sub-prime mortgages by investing in asset-backed commercial paper (ABCP) issued by conduits or structured investment vehicles (SIVs) holding ABSs which contained such exposure. Even though their ultimate exposure was often minimal, there was widespread refusal by these investors to maintain their ABCP positions once they matured.
The ABCP vehicles relied on being able to continuously roll over their short-term funding and, even though they were “bankruptcy remote” from their sponsors, those that were unable to achieve this were able to turn to their sponsoring banks which had undertaken to provide them with backstop liquidity via credit lines in such situations. This intensifi ed concerns about the nature and extent of the risks facing banks relating to contingent credit provision more generally. This was especially the case in the fi rst half of August when two German banks, IKB and Sachsen LB, proved unable to honour liquidity and credit commitments. The call to deliver on these commitments to their sponsors had resulted from unexpected funding needs of ABCP vehicles. As these needs were very large relative to the size of the sponsoring banks’ balance sheets, emergency rescues by a variety of other German banks had to be arranged. Diffi culties of a similar nature to those faced by ABCP vehicles were encountered by some money-market funds with exposure to structured credit products: BNP Paribas, for instance, temporarily suspended redemptions from several money-market funds, citing diffi culties in valuing their assets.
15ECB
Financial Stability ReviewDecember 2007
I OVERV IEW
15
Market participants responded to the escalating tensions by upping the premiums they required on credit default swaps in order to provide protection against the default risk of euro area and, in particular, global large and complex banking groups (LCBGs). Eventually a liquidity squeeze was triggered in the unsecured interbank money markets because of the larger-than-expected funding liquidity needs, or perceived needs, of some banks, while those fi nancial institutions that had liquidity balances tended to hoard them. There were three main reasons for this hoarding behaviour. The fi rst was an adverse selection problem: counterparties with liquid balances potentially available for trading in the interbank markets found themselves unable to distinguish between fi nancial institutions that had exposure to structured credit products and those who did not. Fearful that they might create unwanted counterparty credit risk exposure through interbank trading, they either refrained from lending in the market or sought unusually large spreads to compensate for the risk. Second, banks hoarded liquidity for precautionary reasons because of heightened uncertainty about their own potential funding liquidity needs. Among the factors creating this uncertainty was the risk that they might have had to provide liquidity to ABCP vehicles they had sponsored or fund potential expansion of their balance sheets in the event that the functioning of structured credit markets remained impaired for a considerable period. Third, and related to this, money-market funds, who are also active interbank money market participants, built up precautionary liquid balances to cover the risk of potential redemption requests by investors.
The hoarding of liquidity made it diffi cult for institutions to obtain funding in the interbank money markets for terms beyond a week or two. With the usual process of liquidity redistribution within the interbank money markets impaired, short-term interest rates at maturities beyond overnight remained persistently high relative to market expectations for future short-term rates across the interbank money markets of several mature economies. This was despite
several fi ne-tuning operations conducted by the Eurosystem and other central banks at overnight maturities. In order to support a normalisation in the market for term liquidity, the Governing Council decided to provide additional liquidity in the regular Eurosystem main refi nancing operations (MROs), and to implement longer-term refi nancing operations with maturities of three months.
SOME LESSONS LEARNT FROM THIS EPISODE
Recent turmoil has shown that there are weaknesses in at least four broad and rudimentary areas of risk management within the “originate and distribute” banking model as currently practiced. These concern: the management, assessment and monitoring of credit risk; the management and pricing of funding liquidity risk; the assessment of counterparty risk; and the role that non-regulated entities play within this model. Many of these individual weaknesses were already well known to authorities around the world. However, they combined in such an unexpected way that few had anticipated the potential severity of the impact they could have on the core interbank money markets.
As regards the management, assessment and monitoring of credit risk within the “originate and distribute” model, an important concern is that the bulk of the off-balance sheet vehicles which were affected by the turmoil did not have suffi cient capital buffers built into their structures to account for the perceived or actual increase in the credit risk of their asset portfolios. They were able to do this and fund themselves to varying degrees, depending on the set-up, in the high-quality ABCP market, given the high credit quality these assets were perceived to have ex ante and because the liquidity commitments they had in place mitigated their funding liquidity risks. The recent events also resulted in a loss of confi dence in the ratings produced by rating agencies for structured products, and they highlighted the drawbacks associated with excessive reliance on ratings in credit risk assessment. Before

16ECBFinancial Stability ReviewDecember 2007
the turmoil began, banks had been able to sell off the high-risk equity tranches of structured credit products. As they had little or no remaining exposure to the underlying credit risk on their balance sheets, this left them with little or no incentive to monitor the borrowers – a weakness that subsequently turned out to have been of signifi cance in explaining the rapid rise in delinquencies on the most recently originated US sub-prime mortgages. At the same time, as evidenced by the market reactions to rating agency downgrades and announced methodology changes, non-bank investors had clearly become heavily reliant on credit ratings, as opposed to carrying out their own due diligence, in managing the risk in their credit portfolios. Questions have also been raised about the potential confl icts of interest in the activities of rating agencies.
Concerning funding liquidity risk, an important ingredient in the turmoil was a maturity mismatch on the balance sheets of ABCP conduits. These entities were funding medium-term and hard-to-value assets, such as structured credit products, with short-term money market securities. The risks associated with these funding mismatches were further aggravated when market liquidity evaporated from the markets for complex structured credit products, making their assets impossible to value or trade. In addition, it became clear that banks often did not have adequate contingency plans in place to deal with unexpected funding liquidity needs arising from the contingent liquidity facilities they had provided to conduits or for the risk that they would face diffi culty in syndicating the bridge loans they had extended to fi nance leveraged buyouts. More generally, the episode revealed the high dependence of the funding side of the “originate and distribute” model on the smooth functioning of capital markets.
With respect to the assessment of counterparty risks, an important feature of the turmoil was that inadequate transparency about the fi nal location of risk exposures led to signifi cant, often excessive, increases in concerns about the creditworthiness of highly rated fi nancial
fi rms with sound balance sheets. Although many fi nancial fi rms did make disclosures concerning their exposures, latitude provided by the accounting framework for discretion in the valuation of assets created some uncertainty about the reliability and comparability of disclosures which may not be resolved before audited fi nancial statements are published. By creating an adverse selection problem, inadequate transparency also contributed to the squeeze in the interbank money markets. Authorities had often seen lower transparency as an inevitable consequence of having a more effi cient market-based fi nancial system that facilitated a broader distribution of risks, thereby enhancing shock-absorption capacity by reducing concentrations of credit risk in bank balance sheets. However, inadequate transparency meant that risk exposures began to turn up in unexpected places, thereby aggravating the tensions by fuelling uncertainty and even creating confusion about the extent of the risks and their location. This undoubtedly contributed to the prolongation of the tensions.
Finally, regarding non-regulated entities, the main channels of propagation and amplifi cation of the turbulence ran through so-called conduits and special investment vehicles. Although they were bankruptcy remote from their sponsors, banks had also underestimated their true exposure to the credit risk in the portfolios managed by these entities and had underpriced the back-stop liquidity lines they had provided to them. As a result, banks ended up with the prospect of sizeable, involuntary and uncertain expansion of their balance sheets related to the possibility of having to take the underlying assets back onto their balance sheets and because of the risk of being unable to distribute already originated loans to investors.
All in all, recent events highlight the importance of further improving fi nancial sector surveillance by the responsible authorities and enhancing the risk management practices of fi nancial fi rms, especially concerning funding liquidity risks where there appear to have been signifi cant, systemically relevant,
17ECB
Financial Stability ReviewDecember 2007
I OVERV IEW
17
weaknesses. The challenge for policy-makers will be to design responses that enhance the stability of the fi nancial system – including improving the detection and understanding of risks and vulnerabilities – without imposing restrictions that would unnecessarily hamper innovation and reduce the effi ciency of the system. The new Basel II Capital Accord, which is currently being implemented, should address several of the weaknesses that have been unearthed by the market turmoil. Indeed, the new accord strongly relies on signifi cantly improved risk management in determining the appropriate capital buffers for banks. Despite these improvements, the degree of sophistication of fi nancial markets also calls for constant investment in stress-testing methods and practices in order to ensure that banks are aware of the potential losses they might incur in highly unlikely but plausible scenarios.
OVERALL ASSESSMENT AND FINANCIAL STABILITY
OUTLOOK FOR THE EURO AREA
Before the fi nancial market turmoil began, euro area LCBGs generally had strong and resilient balance sheets. By early November the indications were that no major fi nancial institution had been confronted with a serious challenge to its soundness by recent fi nancial sector stresses. Moreover, there were signs that the turbulence in money and credit markets were subsiding and that some of the markets that had seized up were beginning to recover. This included somewhat easier, albeit more discriminating, fi nancing conditions in the ABCP markets, but insuffi ciently to prevent further shrinkage of the market in terms of the amount of paper outstanding. At the same time, there was some evidence that the LBO pipeline was being cleared, although it still remained large. Importantly, conditions in the longer-term segment of interbank money markets had improved albeit only moderately with interbank rates at maturities beyond one month remaining elevated.
With fi nancial systems undergoing a process of de-leveraging and re-intermediation, the
uncertainty surrounding the fi nancial system stability outlook for the euro area had heightened by the time of fi nalisation of this issue of the FSR. This uncertainty could persist for a considerable period until it becomes clearer how the total valuation and income losses, which could be sizeable, facing the euro area fi nancial system will be spread across individual fi nancial institutions. Clarity will also be needed on how liquidity providers intend to deal with their commitments to off-balance sheet investment vehicles and how much risk will eventually fl ow back onto the balance sheets of banks. In addition, there is uncertainty about how banks will respond to the losses they face and about the spillover effects on other asset markets and the real economy as well as the possibility of feedback effects. Moreover, until conditions in the US housing market show signs of improvement, the possibility of further tensions surfacing in structured credit markets cannot be excluded especially if credit quality were to deteriorate in the broader US mortgage market.
As the adjustment process in the fi nancial sector over the coming months is likely to prove challenging, the system could be more vulnerable than before to the crystallisation of other risks that were identifi ed in previous issues of the FSR and which remain relevant. Within the euro area, the substantial increase in household sector indebtedness together with signs of vulnerability in some housing markets adds to the credit risk facing euro area banks in the short to medium term. At the same time, the surge of leverage in some parts of the corporate sector, especially that related to LBO activity, raises the possibility of an adverse turn in the credit cycle involving a rise in the default rates of the most heavily indebted fi rms. The indications so far are that the hedge fund sector was relatively unaffected by the recent market turmoil. Nevertheless, some uncertainties remain regarding hedge funds’ exposures, leverage and liquidity risk. In addition, the scale of activity of this sector in credit markets is gauged to be sizeable and, consequently, a turn in the credit cycle could present an important
18ECBFinancial Stability ReviewDecember 2007
challenge for this sector. Outside the euro area and looking further ahead, persistently wide global imbalances continue to pose a risk that they will be unwound in a disorderly manner. This could bring about further tensions in global capital markets and if this risk were to materialise it could pose a challenging test for the risk management and loss-absorption capacities of key fi nancial institutions.
All in all, at the time of fi nalisation of this issue of the FSR, the risks to euro area fi nancial system stability had materially increased compared to the assessment made six months before. There are, however, several mitigating factors: the economic outlook remains broadly favourable and, although pockets of vulnerability can be identifi ed, the balance sheets of households and fi rms are largely in good shape, supporting the overall creditworthiness of the non-fi nancial sector. Moreover, the capital positions of core fi nancial fi rms are also generally sound. This overall positive assessment of shock-absorbing capacity should not provide any grounds for complacency given the heightened uncertainties facing the fi nancial system in the short-term. In such an environment of uncertainty where balance sheet conditions could unexpectedly change, vigilance is of the essence and fi nancial fi rms in particular should step up their efforts and improve their practices to manage effectively the risks that may lie ahead. In this respect, the full implementation of the Basel II Capital Accord as well as initiatives and measures that are being taken, both by policy-makers and by the fi nancial industry, aimed at restoring confi dence and addressing the weaknesses that have been revealed by the recent market turbulence should contribute to strengthening the resilience of the fi nancial system.
19ECB
Financial Stability ReviewDecember 2007
1 THE EXTERNAL ENVIRONMENT
Developments after the fi nalisation of the June 2007 FSR underscored the fact that vulnerabilities in the external environment have remained a signifi cant source of risk for euro area fi nancial stability. Fragilities in the US sub-prime mortgage market, which were highlighted in the June 2007 FSR as being a possible source of risk, materialised and triggered generalised market turmoil and unexpected deterioration in fi nancial market liquidity over a protracted period. Several large and complex global banking groups endured large losses as a result of these events. However, by the cut-off date of this edition of the FSR the losses did not appear to be suffi ciently material to challenge the fi nancial soundness of any major fi nancial institution. Looking ahead, the possibility of further tensions surfacing in the global structured credit markets cannot be excluded, especially if credit quality were to deteriorate further in the broader US mortgage market. The main source of uncertainty relates to the second-round effects of the repricing of risk on the real economy, both in the US and in other economies. Looking further ahead, persistently wide global imbalances continue to pose a risk that they will be unwound in a disorderly manner.
1.1 RISKS AND FINANCIAL IMBALANCES IN THE
EXTERNAL ENVIRONMENT
GLOBAL FINANCIAL IMBALANCES
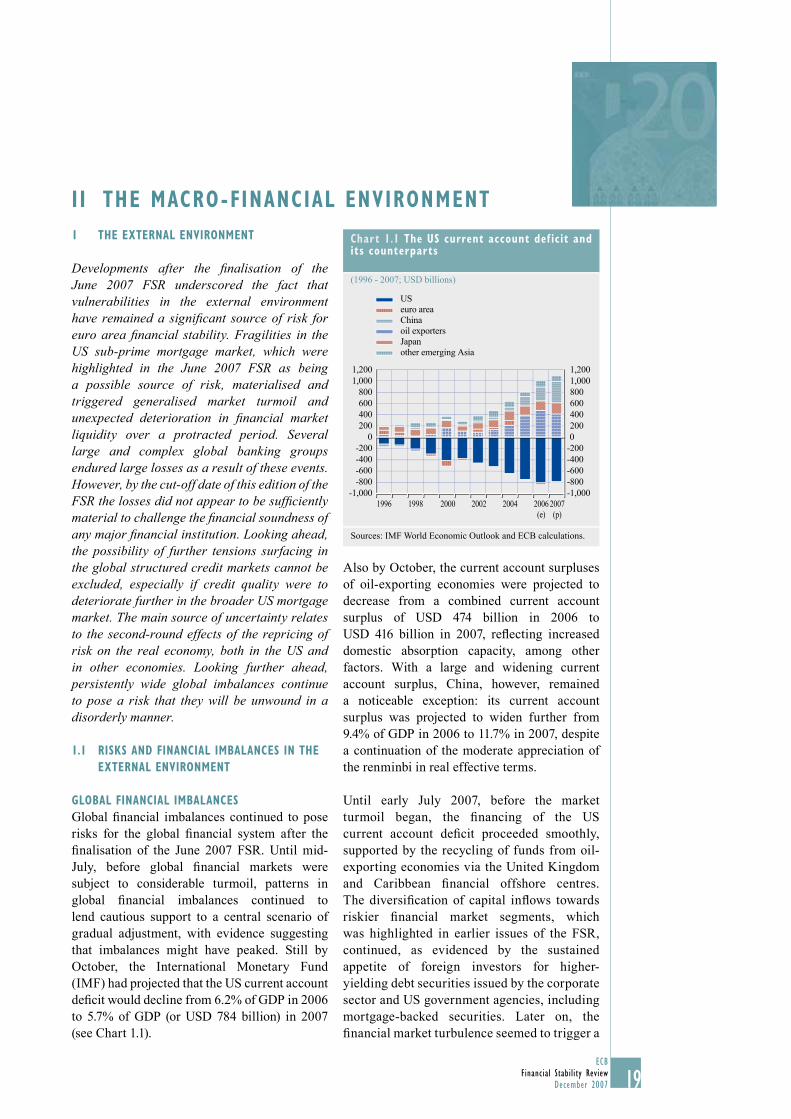
Global fi nancial imbalances continued to pose risks for the global fi nancial system after the fi nalisation of the June 2007 FSR. Until mid-July, before global fi nancial markets were subject to considerable turmoil, patterns in global fi nancial imbalances continued to lend cautious support to a central scenario of gradual adjustment, with evidence suggesting that imbalances might have peaked. Still by October, the International Monetary Fund (IMF) had projected that the US current account defi cit would decline from 6.2% of GDP in 2006 to 5.7% of GDP (or USD 784 billion) in 2007 (see Chart 1.1).
Also by October, the current account surpluses of oil-exporting economies were projected to decrease from a combined current account surplus of USD 474 billion in 2006 to USD 416 billion in 2007, refl ecting increased domestic absorption capacity, among other factors. With a large and widening current account surplus, China, however, remained a noticeable exception: its current account surplus was projected to widen further from 9.4% of GDP in 2006 to 11.7% in 2007, despite a continuation of the moderate appreciation of the renminbi in real effective terms.
Until early July 2007, before the market turmoil began, the fi nancing of the US current account defi cit proceeded smoothly, supported by the recycling of funds from oil-exporting economies via the United Kingdom and Caribbean fi nancial offshore centres. The diversifi cation of capital infl ows towards riskier fi nancial market segments, which was highlighted in earlier issues of the FSR, continued, as evidenced by the sustained appetite of foreign investors for higher-yielding debt securities issued by the corporate sector and US government agencies, including mortgage-backed securities. Later on, the fi nancial market turbulence seemed to trigger a
I I THE MACRO-FINANCIAL ENVIRONMENT
Chart 1.1 The US current account def icit and its counterparts
(1996 - 2007; USD billions)
-1,000-800-600-400-200
0200400600800
1,0001,200
-1,000-800-600-400-20002004006008001,0001,200
US
oil exporters
euro area
Japan
China
other emerging Asia
1996 1998 2000 2002 2004 2006(e)
2007(p)
Sources: IMF World Economic Outlook and ECB calculations.
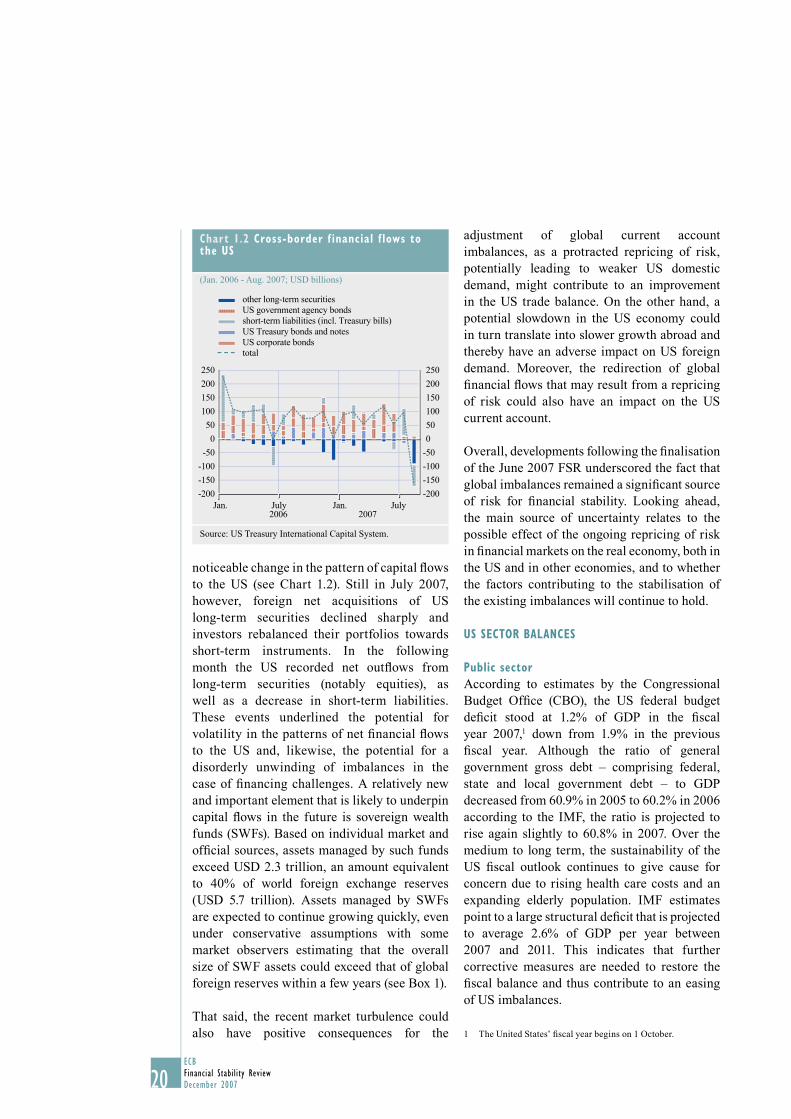
20ECBFinancial Stability ReviewDecember 2007
noticeable change in the pattern of capital fl ows to the US (see Chart 1.2). Still in July 2007, however, foreign net acquisitions of US long-term securities declined sharply and investors rebalanced their portfolios towards short-term instruments. In the following month the US recorded net outfl ows from long-term securities (notably equities), as well as a decrease in short-term liabilities. These events underlined the potential for volatility in the patterns of net fi nancial fl ows to the US and, likewise, the potential for a disorderly unwinding of imbalances in the case of fi nancing challenges. A relatively new and important element that is likely to underpin capital fl ows in the future is sovereign wealth funds (SWFs). Based on individual market and offi cial sources, assets managed by such funds exceed USD 2.3 trillion, an amount equivalent to 40% of world foreign exchange reserves (USD 5.7 trillion). Assets managed by SWFs are expected to continue growing quickly, even under conservative assumptions with some market observers estimating that the overall size of SWF assets could exceed that of global foreign reserves within a few years (see Box 1).
That said, the recent market turbulence could also have positive consequences for the
adjustment of global current account imbalances, as a protracted repricing of risk, potentially leading to weaker US domestic demand, might contribute to an improvement in the US trade balance. On the other hand, a potential slowdown in the US economy could in turn translate into slower growth abroad and thereby have an adverse impact on US foreign demand. Moreover, the redirection of global fi nancial fl ows that may result from a repricing of risk could also have an impact on the US current account.
Overall, developments following the fi nalisation of the June 2007 FSR underscored the fact that global imbalances remained a signifi cant source of risk for fi nancial stability. Looking ahead, the main source of uncertainty relates to the possible effect of the ongoing repricing of risk in fi nancial markets on the real economy, both in the US and in other economies, and to whether the factors contributing to the stabilisation of the existing imbalances will continue to hold.
US SECTOR BALANCES
Public sector
According to estimates by the Congressional Budget Offi ce (CBO), the US federal budget defi cit stood at 1.2% of GDP in the fi scal year 2007,1 down from 1.9% in the previous fi scal year. Although the ratio of general government gross debt – comprising federal, state and local government debt – to GDP decreased from 60.9% in 2005 to 60.2% in 2006 according to the IMF, the ratio is projected to rise again slightly to 60.8% in 2007. Over the medium to long term, the sustainability of the US fi scal outlook continues to give cause for concern due to rising health care costs and an expanding elderly population. IMF estimates point to a large structural defi cit that is projected to average 2.6% of GDP per year between 2007 and 2011. This indicates that further corrective measures are needed to restore the fi scal balance and thus contribute to an easing of US imbalances.
The United States’ fi scal year begins on 1 October.1
Chart 1.2 Cross-border f inancial f lows to the US
(Jan. 2006 - Aug. 2007; USD billions)
0
-200
-150
-100
-50
50
100
150
200
250
-200
-150
-100
-50
0
50
100
150
200
250
other long-term securities
US Treasury bonds and notes
US government agency bonds
US corporate bondstotal
short-term liabilities (incl. Treasury bills)
Jan. July Jan. July2006 2007
Source: US Treasury International Capital System.
21ECB
Financial Stability ReviewDecember 2007
I I THE MACRO -F INANC IAL
ENVIRONMENT
21
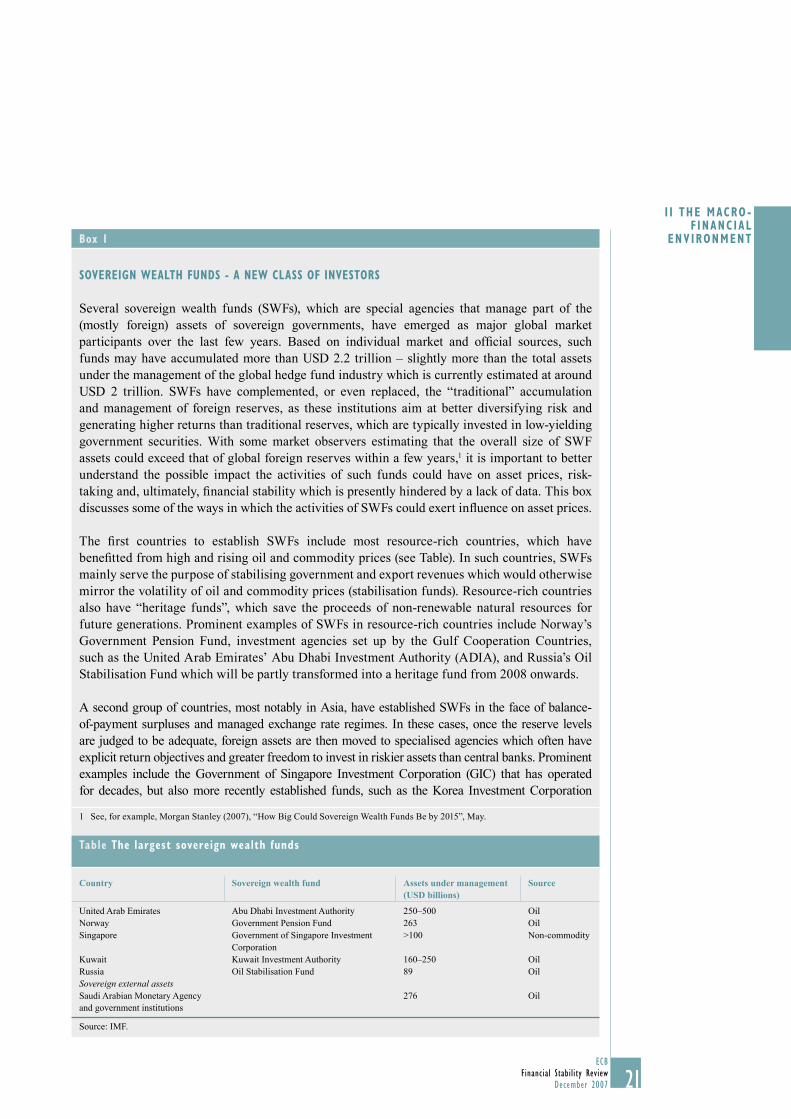
Table The largest sovereign wealth funds
Country Sovereign wealth fund Assets under management (USD billions)
Source
United Arab Emirates Abu Dhabi Investment Authority 250–500 OilNorway Government Pension Fund 263 OilSingapore Government of Singapore Investment >100 Non-commodity
CorporationKuwait Kuwait Investment Authority 160–250 OilRussia Oil Stabilisation Fund 89 OilSovereign external assetsSaudi Arabian Monetary Agency and government institutions
276 Oil
Source: IMF.
Box 1
SOVEREIGN WEALTH FUNDS - A NEW CLASS OF INVESTORS
Several sovereign wealth funds (SWFs), which are special agencies that manage part of the (mostly foreign) assets of sovereign governments, have emerged as major global market participants over the last few years. Based on individual market and offi cial sources, such funds may have accumulated more than USD 2.2 trillion – slightly more than the total assets under the management of the global hedge fund industry which is currently estimated at around USD 2 trillion. SWFs have complemented, or even replaced, the “traditional” accumulation and management of foreign reserves, as these institutions aim at better diversifying risk and generating higher returns than traditional reserves, which are typically invested in low-yielding government securities. With some market observers estimating that the overall size of SWF assets could exceed that of global foreign reserves within a few years,1 it is important to better understand the possible impact the activities of such funds could have on asset prices, risk-taking and, ultimately, fi nancial stability which is presently hindered by a lack of data. This box discusses some of the ways in which the activities of SWFs could exert infl uence on asset prices.
The fi rst countries to establish SWFs include most resource-rich countries, which have benefi tted from high and rising oil and commodity prices (see Table). In such countries, SWFs mainly serve the purpose of stabilising government and export revenues which would otherwise mirror the volatility of oil and commodity prices (stabilisation funds). Resource-rich countries also have “heritage funds”, which save the proceeds of non-renewable natural resources for future generations. Prominent examples of SWFs in resource-rich countries include Norway’s Government Pension Fund, investment agencies set up by the Gulf Cooperation Countries, such as the United Arab Emirates’ Abu Dhabi Investment Authority (ADIA), and Russia’s Oil Stabilisation Fund which will be partly transformed into a heritage fund from 2008 onwards.
A second group of countries, most notably in Asia, have established SWFs in the face of balance-of-payment surpluses and managed exchange rate regimes. In these cases, once the reserve levels are judged to be adequate, foreign assets are then moved to specialised agencies which often have explicit return objectives and greater freedom to invest in riskier assets than central banks. Prominent examples include the Government of Singapore Investment Corporation (GIC) that has operated for decades, but also more recently established funds, such as the Korea Investment Corporation
1 See, for example, Morgan Stanley (2007), “How Big Could Sovereign Wealth Funds Be by 2015”, May.
22ECBFinancial Stability ReviewDecember 2007
(KIC) and the Hong Kong Monetary Authority Exchange Fund. Recently, the Chinese authorities announced the establishment of a new investment agency that will be responsible for the management of a portion of Chinese foreign reserves, with the principal aim of seeking higher returns on a still-to-be-determined part of China’s foreign reserves. In Japan, the second largest holder of foreign reserves, the appropriateness of traditional reserve management is still under debate. Furthermore, South Korea has announced plans to double the proportion of its foreign reserves managed by SWFs by 2010, and similar steps are being considered in a number of other economies in the region, such as Taiwan, Vietnam and India.
With a few exceptions, SWFs do not disclose any details on their asset and currency composition. However, anecdotal evidence suggests that such investments are usually more diversifi ed than traditional reserves invested by central banks, as they include equities, corporate bonds and real estate. In this context, it is worth noting that the disclosure requirements for traditional reserves set out by the IMF are very broad so that a proper comparison of central bank reserve portfolios to those of SWFs is hampered by data availability. Whether SWFs assume more risk than traditional funds depends on the main purpose of each fund. A stabilisation fund set up primarily for macroeconomic stabilisation purposes, for example, is likely to have a different asset allocation from a heritage fund with a longer investment horizon.
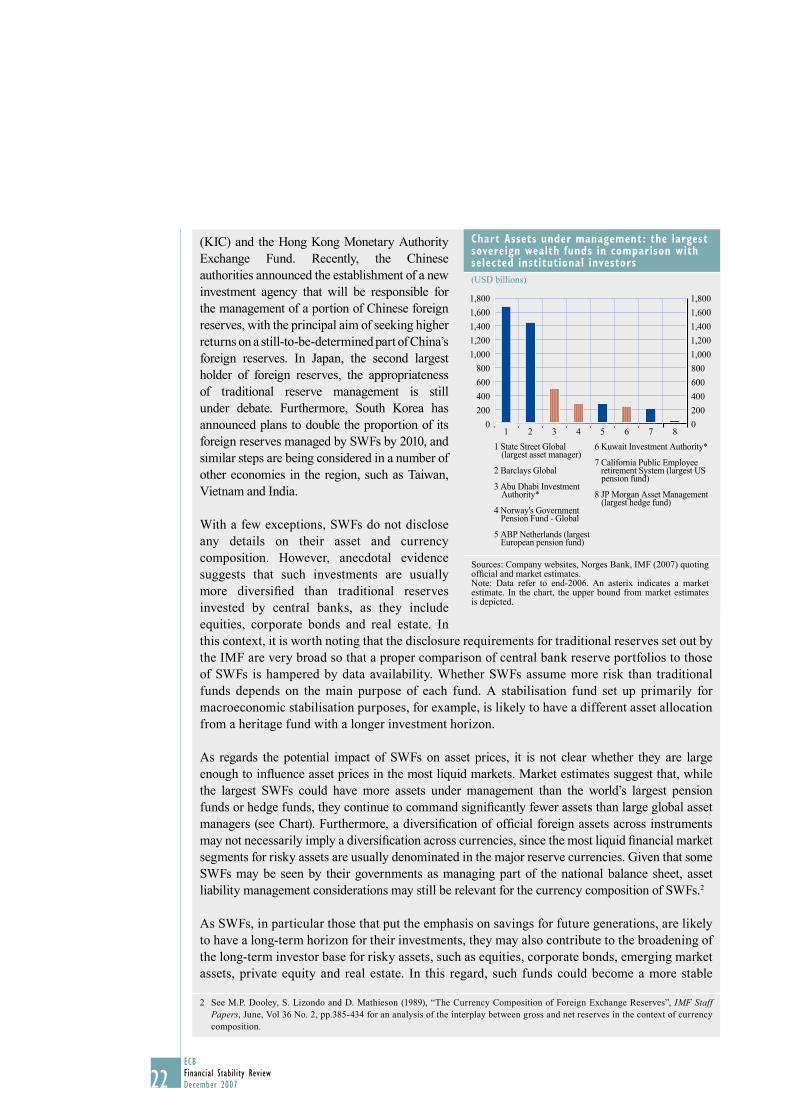
As regards the potential impact of SWFs on asset prices, it is not clear whether they are large enough to infl uence asset prices in the most liquid markets. Market estimates suggest that, while the largest SWFs could have more assets under management than the world’s largest pension funds or hedge funds, they continue to command signifi cantly fewer assets than large global asset managers (see Chart). Furthermore, a diversifi cation of offi cial foreign assets across instruments may not necessarily imply a diversifi cation across currencies, since the most liquid fi nancial market segments for risky assets are usually denominated in the major reserve currencies. Given that some SWFs may be seen by their governments as managing part of the national balance sheet, asset liability management considerations may still be relevant for the currency composition of SWFs.2
As SWFs, in particular those that put the emphasis on savings for future generations, are likely to have a long-term horizon for their investments, they may also contribute to the broadening of the long-term investor base for risky assets, such as equities, corporate bonds, emerging market assets, private equity and real estate. In this regard, such funds could become a more stable
2 See M.P. Dooley, S. Lizondo and D. Mathieson (1989), “The Currency Composition of Foreign Exchange Reserves”, IMF Staff Papers, June, Vol 36 No. 2, pp.385-434 for an analysis of the interplay between gross and net reserves in the context of currency composition.
Chart Assets under management: the largest sovereign wealth funds in comparison with selected institutional investors
(USD billions)
0
200
400
600
800
1,000
1,200
1,400
1,600
1,800
0
200
400
600
800
1,000
1,200
1,400
1,600
1,800
1 2 3 4 5 6 7 8
1 State Street Global (largest asset manager)
2 Barclays Global
3 Abu Dhabi Investment Authority*
4 Norway's Government Pension Fund - Global
5 ABP Netherlands (largest European pension fund)
6 Kuwait Investment Authority*
7 California Public Employee retirement System (largest US pension fund)
8 JP Morgan Asset Management (largest hedge fund)
Sources: Company websites, Norges Bank, IMF (2007) quoting offi cial and market estimates.Note: Data refer to end-2006. An asterix indicates a market estimate. In the chart, the upper bound from market estimates is depicted.
23ECB
Financial Stability ReviewDecember 2007
I I THE MACRO -F INANC IAL
ENVIRONMENT
23
Corporate sector
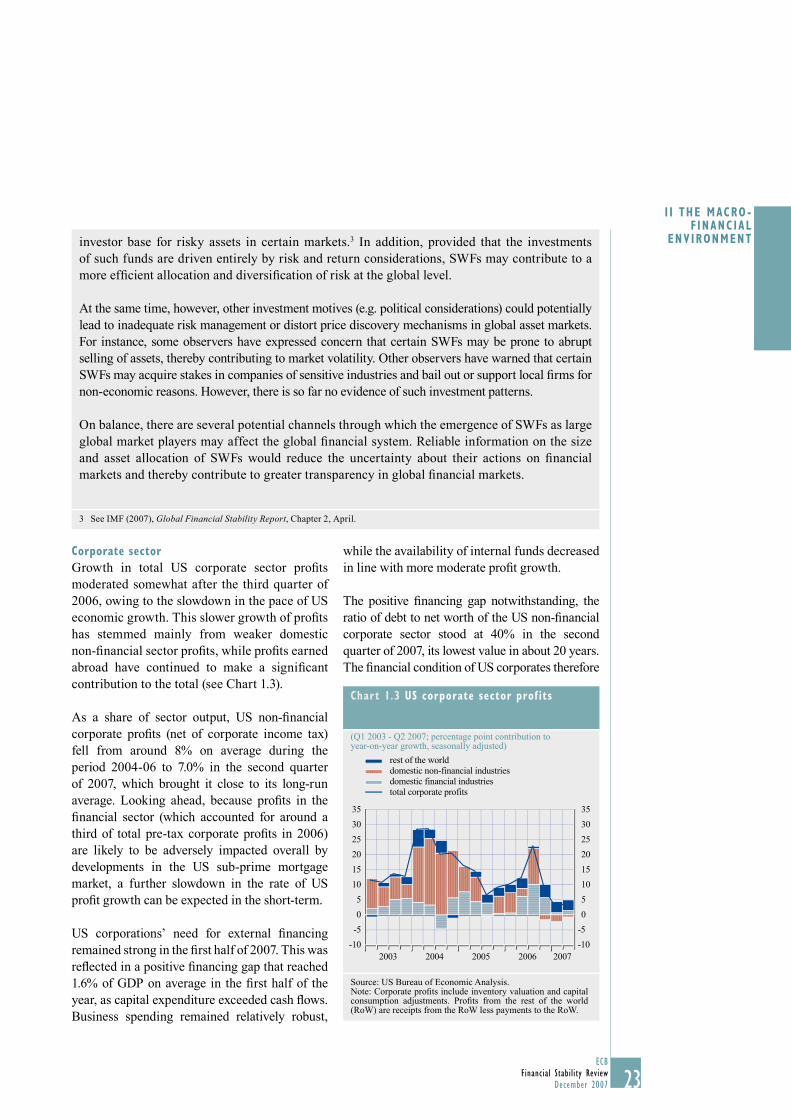
Growth in total US corporate sector profi ts moderated somewhat after the third quarter of 2006, owing to the slowdown in the pace of US economic growth. This slower growth of profi ts has stemmed mainly from weaker domestic non-fi nancial sector profi ts, while profi ts earned abroad have continued to make a signifi cant contribution to the total (see Chart 1.3).
As a share of sector output, US non-fi nancial corporate profi ts (net of corporate income tax) fell from around 8% on average during the period 2004-06 to 7.0% in the second quarter of 2007, which brought it close to its long-run average. Looking ahead, because profi ts in the fi nancial sector (which accounted for around a third of total pre-tax corporate profi ts in 2006) are likely to be adversely impacted overall by developments in the US sub-prime mortgage market, a further slowdown in the rate of US profi t growth can be expected in the short-term.
US corporations’ need for external fi nancing remained strong in the fi rst half of 2007. This was refl ected in a positive fi nancing gap that reached 1.6% of GDP on average in the fi rst half of the year, as capital expenditure exceeded cash fl ows. Business spending remained relatively robust,
while the availability of internal funds decreased in line with more moderate profi t growth.
The positive fi nancing gap notwithstanding, the ratio of debt to net worth of the US non-fi nancial corporate sector stood at 40% in the second quarter of 2007, its lowest value in about 20 years. The fi nancial condition of US corporates therefore
investor base for risky assets in certain markets.3 In addition, provided that the investments of such funds are driven entirely by risk and return considerations, SWFs may contribute to a more effi cient allocation and diversifi cation of risk at the global level.
At the same time, however, other investment motives (e.g. political considerations) could potentially lead to inadequate risk management or distort price discovery mechanisms in global asset markets. For instance, some observers have expressed concern that certain SWFs may be prone to abrupt selling of assets, thereby contributing to market volatility. Other observers have warned that certain SWFs may acquire stakes in companies of sensitive industries and bail out or support local fi rms for non-economic reasons. However, there is so far no evidence of such investment patterns.
On balance, there are several potential channels through which the emergence of SWFs as large global market players may affect the global fi nancial system. Reliable information on the size and asset allocation of SWFs would reduce the uncertainty about their actions on fi nancial markets and thereby contribute to greater transparency in global fi nancial markets.
3 See IMF (2007), Global Financial Stability Report, Chapter 2, April.
Chart 1.3 US corporate sector prof its
(Q1 2003 - Q2 2007; percentage point contribution to year-on-year growth, seasonally adjusted)
-10
-5
0
5
10
15
20
25
30
35
-10
-5
0
5
10
15
20
25
30
35
2003 2004 2005 2006 2007
rest of the worlddomestic non-financial industriesdomestic financial industriestotal corporate profits
Source: US Bureau of Economic Analysis.Note: Corporate profi ts include inventory valuation and capital consumption adjustments. Profi ts from the rest of the world (RoW) are receipts from the RoW less payments to the RoW.
24ECBFinancial Stability ReviewDecember 2007
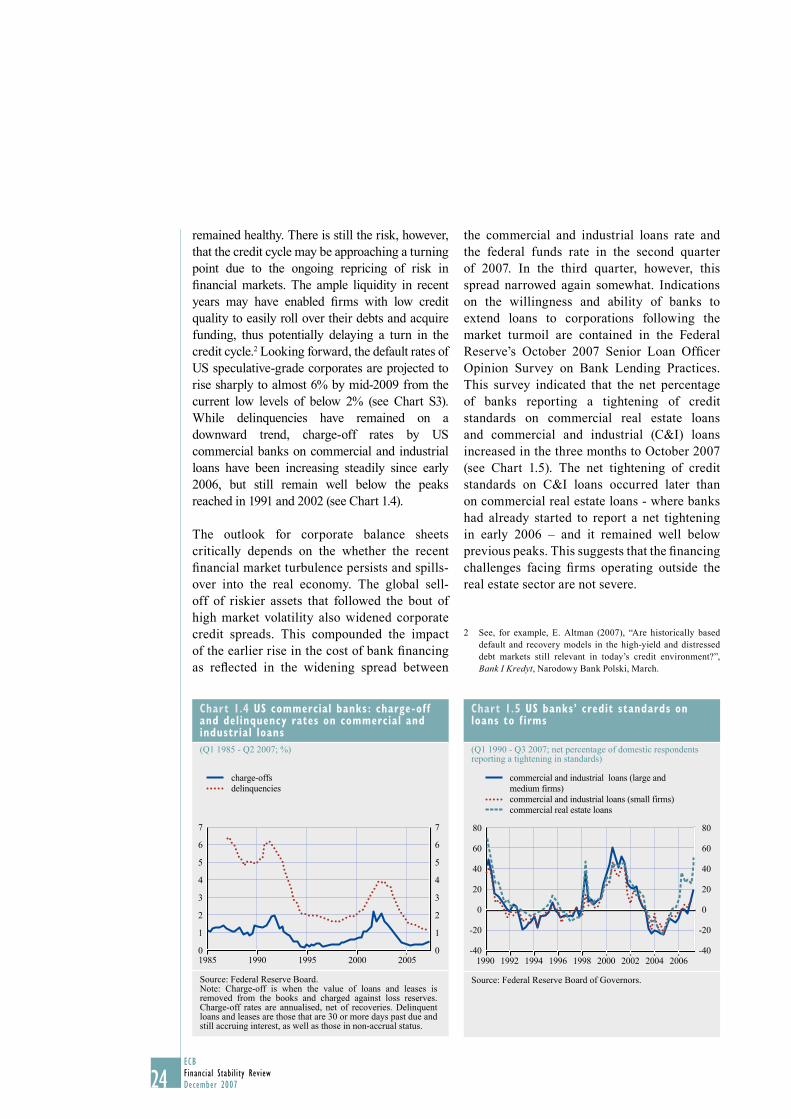
remained healthy. There is still the risk, however, that the credit cycle may be approaching a turning point due to the ongoing repricing of risk in fi nancial markets. The ample liquidity in recent years may have enabled fi rms with low credit quality to easily roll over their debts and acquire funding, thus potentially delaying a turn in the credit cycle.2 Looking forward, the default rates of US speculative-grade corporates are projected to rise sharply to almost 6% by mid-2009 from the current low levels of below 2% (see Chart S3). While delinquencies have remained on a downward trend, charge-off rates by US commercial banks on commercial and industrial loans have been increasing steadily since early 2006, but still remain well below the peaks reached in 1991 and 2002 (see Chart 1.4).
The outlook for corporate balance sheets critically depends on the whether the recent fi nancial market turbulence persists and spills-over into the real economy. The global sell-off of riskier assets that followed the bout of high market volatility also widened corporate credit spreads. This compounded the impact of the earlier rise in the cost of bank fi nancing as refl ected in the widening spread between
the commercial and industrial loans rate and the federal funds rate in the second quarter of 2007. In the third quarter, however, this spread narrowed again somewhat. Indications on the willingness and ability of banks to extend loans to corporations following the market turmoil are contained in the Federal Reserve’s October 2007 Senior Loan Offi cer Opinion Survey on Bank Lending Practices. This survey indicated that the net percentage of banks reporting a tightening of credit standards on commercial real estate loans and commercial and industrial (C&I) loans increased in the three months to October 2007 (see Chart 1.5). The net tightening of credit standards on C&I loans occurred later than on commercial real estate loans - where banks had already started to report a net tightening in early 2006 – and it remained well below previous peaks. This suggests that the fi nancing challenges facing fi rms operating outside the real estate sector are not severe.
See, for example, E. Altman (2007), “Are historically based 2 default and recovery models in the high-yield and distressed debt markets still relevant in today’s credit environment?”, Bank I Kredyt, Narodowy Bank Polski, March.
Chart 1.4 US commercial banks : charge-of f and delinquency rates on commercial and industrial loans
(Q1 1985 - Q2 2007; %)
0
1
2
3
4
5
6
7
0
1
2
3
4
5
6
7
charge-offsdelinquencies
1985 1990 1995 2000 2005
Source: Federal Reserve Board.Note: Charge-off is when the value of loans and leases is removed from the books and charged against loss reserves. Charge-off rates are annualised, net of recoveries. Delinquent loans and leases are those that are 30 or more days past due and still accruing interest, as well as those in non-accrual status.
Chart 1.5 US banks’ credit standards on loans to f irms
(Q1 1990 - Q3 2007; net percentage of domestic respondents reporting a tightening in standards)
-40
-20
0
20
40
60
80
-40
-20
0
20
40
60
80
2006
commercial and industrial loans (large and
commercial and industrial loans (small firms)commercial real estate loans
1990 1992 1994 1996 1998 2000 2002 2004
medium firms)
Source: Federal Reserve Board of Governors.
25ECB
Financial Stability ReviewDecember 2007
I I THE MACRO -F INANC IAL
ENVIRONMENT
25
Overall, substantially higher risk aversion and rising fi nancing costs could have triggered an adjustment to more sustainable long-term fi nancing conditions, following a long period of historically low fi nancing costs. This notwithstanding, a prolonged or more severe tightening of fi nancing conditions for US corporations would entail signifi cantly higher risks for fi nancial stability since it could push rates of default upwards.
Household sector
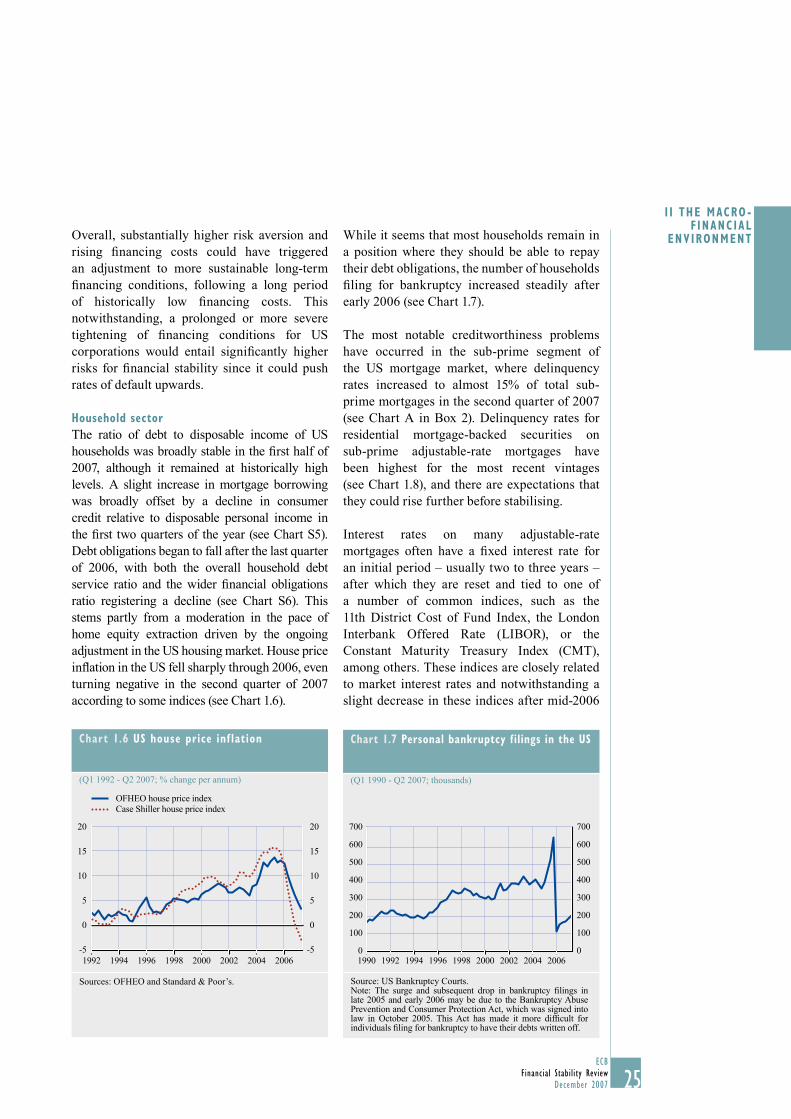
The ratio of debt to disposable income of US households was broadly stable in the fi rst half of 2007, although it remained at historically high levels. A slight increase in mortgage borrowing was broadly offset by a decline in consumer credit relative to disposable personal income in the fi rst two quarters of the year (see Chart S5). Debt obligations began to fall after the last quarter of 2006, with both the overall household debt service ratio and the wider fi nancial obligations ratio registering a decline (see Chart S6). This stems partly from a moderation in the pace of home equity extraction driven by the ongoing adjustment in the US housing market. House price infl ation in the US fell sharply through 2006, even turning negative in the second quarter of 2007 according to some indices (see Chart 1.6).
While it seems that most households remain in a position where they should be able to repay their debt obligations, the number of households fi ling for bankruptcy increased steadily after early 2006 (see Chart 1.7).
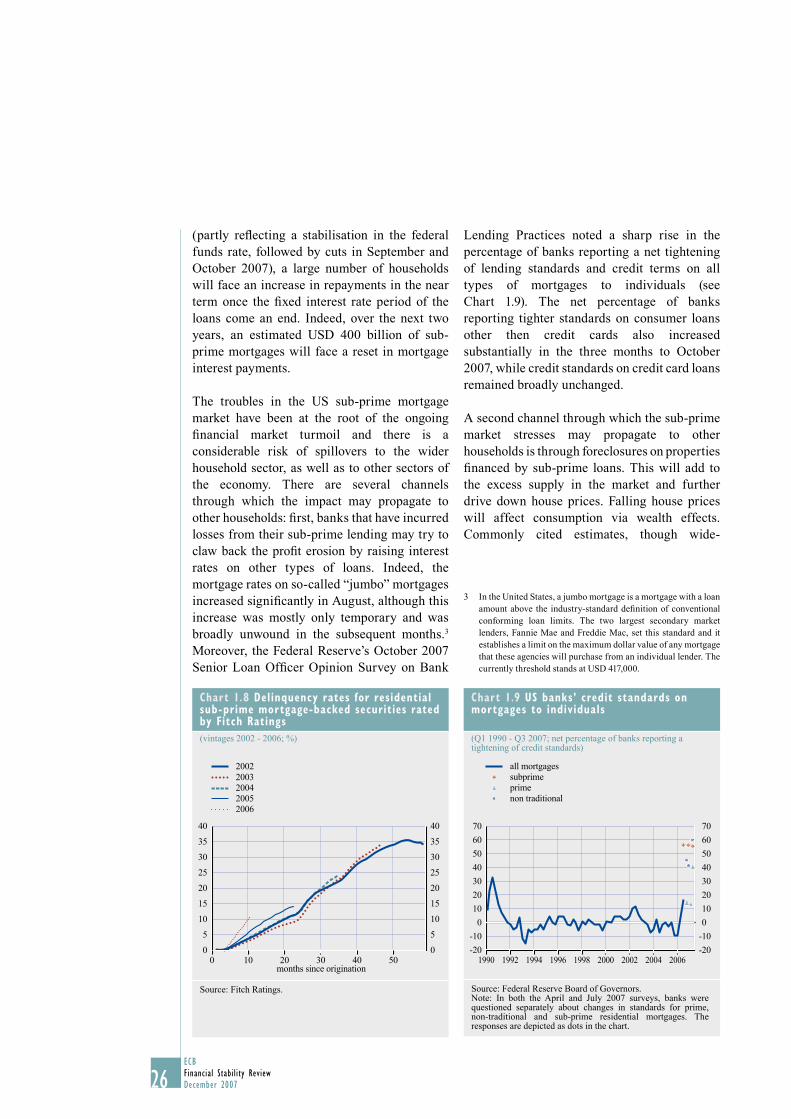
The most notable creditworthiness problems have occurred in the sub-prime segment of the US mortgage market, where delinquency rates increased to almost 15% of total sub-prime mortgages in the second quarter of 2007 (see Chart A in Box 2). Delinquency rates for residential mortgage-backed securities on sub-prime adjustable-rate mortgages have been highest for the most recent vintages (see Chart 1.8), and there are expectations that they could rise further before stabilising.
Interest rates on many adjustable-rate mortgages often have a fi xed interest rate for an initial period – usually two to three years – after which they are reset and tied to one of a number of common indices, such as the 11th District Cost of Fund Index, the London Interbank Offered Rate (LIBOR), or the Constant Maturity Treasury Index (CMT), among others. These indices are closely related to market interest rates and notwithstanding a slight decrease in these indices after mid-2006
Chart 1.6 US house price inf lation
(Q1 1992 - Q2 2007; % change per annum)
0
5
10
15
20
0
5
10
15
20
OFHEO house price indexCase Shiller house price index
-5 -51992 1994 1996 1998 2000 2002 2004 2006
Sources: OFHEO and Standard & Poor’s.
Chart 1.7 Personal bankruptcy filings in the US
(Q1 1990 - Q2 2007; thousands)
1990 1992 1994 1996 1998 2000 2002 2004 2006
100
200
300
400
500
600
700
0
100
200
300
400
500
600
700
0
Source: US Bankruptcy Courts.Note: The surge and subsequent drop in bankruptcy fi lings in late 2005 and early 2006 may be due to the Bankruptcy Abuse Prevention and Consumer Protection Act, which was signed into law in October 2005. This Act has made it more diffi cult for individuals fi ling for bankruptcy to have their debts written off.
26ECBFinancial Stability ReviewDecember 2007
(partly refl ecting a stabilisation in the federal funds rate, followed by cuts in September and October 2007), a large number of households will face an increase in repayments in the near term once the fi xed interest rate period of the loans come an end. Indeed, over the next two years, an estimated USD 400 billion of sub-prime mortgages will face a reset in mortgage interest payments.
The troubles in the US sub-prime mortgage market have been at the root of the ongoing fi nancial market turmoil and there is a considerable risk of spillovers to the wider household sector, as well as to other sectors of the economy. There are several channels through which the impact may propagate to other households: fi rst, banks that have incurred losses from their sub-prime lending may try to claw back the profi t erosion by raising interest rates on other types of loans. Indeed, the mortgage rates on so-called “jumbo” mortgages increased signifi cantly in August, although this increase was mostly only temporary and was broadly unwound in the subsequent months.3 Moreover, the Federal Reserve’s October 2007 Senior Loan Offi cer Opinion Survey on Bank
Lending Practices noted a sharp rise in the percentage of banks reporting a net tightening of lending standards and credit terms on all types of mortgages to individuals (see Chart 1.9). The net percentage of banks reporting tighter standards on consumer loans other then credit cards also increased substantially in the three months to October 2007, while credit standards on credit card loans remained broadly unchanged.
A second channel through which the sub-prime market stresses may propagate to other households is through foreclosures on properties fi nanced by sub-prime loans. This will add to the excess supply in the market and further drive down house prices. Falling house prices will affect consumption via wealth effects. Commonly cited estimates, though wide-
In the United States, a jumbo mortgage is a mortgage with a loan 3 amount above the industry-standard defi nition of conventional conforming loan limits. The two largest secondary market lenders, Fannie Mae and Freddie Mac, set this standard and it establishes a limit on the maximum dollar value of any mortgage that these agencies will purchase from an individual lender. The currently threshold stands at USD 417,000.
Chart 1.9 US banks’ credit standards on mortgages to individuals
(Q1 1990 - Q3 2007; net percentage of banks reporting a tightening of credit standards)
0
-20
-10
10
20
30
40
50
60
70
-20
-10
0
10
20
30
40
50
60
70
all mortgagessubprimeprimenon traditional
20061990 1992 1994 1996 1998 2000 2002 2004
Source: Federal Reserve Board of Governors.Note: In both the April and July 2007 surveys, banks were questioned separately about changes in standards for prime, non-traditional and sub-prime residential mortgages. The responses are depicted as dots in the chart.
Chart 1.8 Delinquency rates for residential sub-prime mortgage-backed securities rated by Fitch Ratings
(vintages 2002 - 2006; %)
0
5
10
15
20
25
30
35
40
0
5
10
15
20
25
30
35
40
2002
months since origination
2003200420052006
0 10 20 30 40 50
Source: Fitch Ratings.
27ECB
Financial Stability ReviewDecember 2007
I I THE MACRO -F INANC IAL
ENVIRONMENT
27
ranging, suggest that the marginal propensity to consume out of wealth is around two to fi ve cents for every dollar.4 Moreover, it cannot be excluded that consumer confi dence may have also been dented by developments in the sub-prime segment: recent data show that consumption remained robust in the third quarter of 2007, but that consumer confi dence fell in the three months to October.
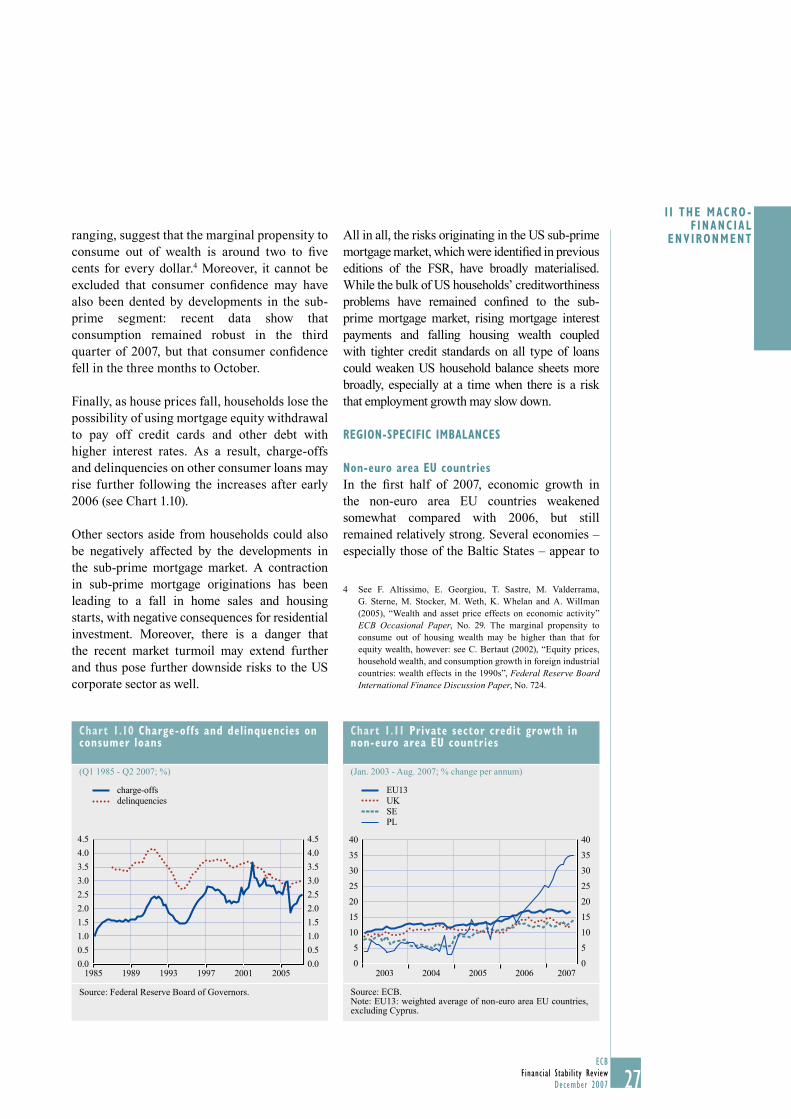
Finally, as house prices fall, households lose the possibility of using mortgage equity withdrawal to pay off credit cards and other debt with higher interest rates. As a result, charge-offs and delinquencies on other consumer loans may rise further following the increases after early 2006 (see Chart 1.10).
Other sectors aside from households could also be negatively affected by the developments in the sub-prime mortgage market. A contraction in sub-prime mortgage originations has been leading to a fall in home sales and housing starts, with negative consequences for residential investment. Moreover, there is a danger that the recent market turmoil may extend further and thus pose further downside risks to the US corporate sector as well.
All in all, the risks originating in the US sub-prime mortgage market, which were identifi ed in previous editions of the FSR, have broadly materialised. While the bulk of US households’ creditworthiness problems have remained confi ned to the sub-prime mortgage market, rising mortgage interest payments and falling housing wealth coupled with tighter credit standards on all type of loans could weaken US household balance sheets more broadly, especially at a time when there is a risk that employment growth may slow down.
REGION-SPECIFIC IMBALANCES
Non-euro area EU countries
In the fi rst half of 2007, economic growth in the non-euro area EU countries weakened somewhat compared with 2006, but still remained relatively strong. Several economies – especially those of the Baltic States – appear to
See F. Altissimo, E. Georgiou, T. Sastre, M. Valderrama, 4 G. Sterne, M. Stocker, M. Weth, K. Whelan and A. Willman (2005), “Wealth and asset price effects on economic activity” ECB Occasional Paper, No. 29. The marginal propensity to consume out of housing wealth may be higher than that for equity wealth, however: see C. Bertaut (2002), “Equity prices, household wealth, and consumption growth in foreign industrial countries: wealth effects in the 1990s”, Federal Reserve Board International Finance Discussion Paper, No. 724.
Chart 1.10 Charge-offs and delinquencies on consumer loans
(Q1 1985 - Q2 2007; %)
0.0
0.5
1.0
1.5
2.0
2.5
3.0
3.5
4.0
4.5
0.0
0.5
1.0
1.5
2.0
2.5
3.0
3.5
4.0
4.5
2005
charge-offsdelinquencies
1985 1989 1993 1997 2001
Source: Federal Reserve Board of Governors.
Chart 1.11 Private sector credit growth in non-euro area EU countries
(Jan. 2003 - Aug. 2007; % change per annum)
0
5
10
15
20
25
30
35
40
EU13UKSEPL
2003 2004 2005 2006 20070
5
10
15
20
25
30
35
40
Source: ECB.Note: EU13: weighted average of non-euro area EU countries, excluding Cyprus.
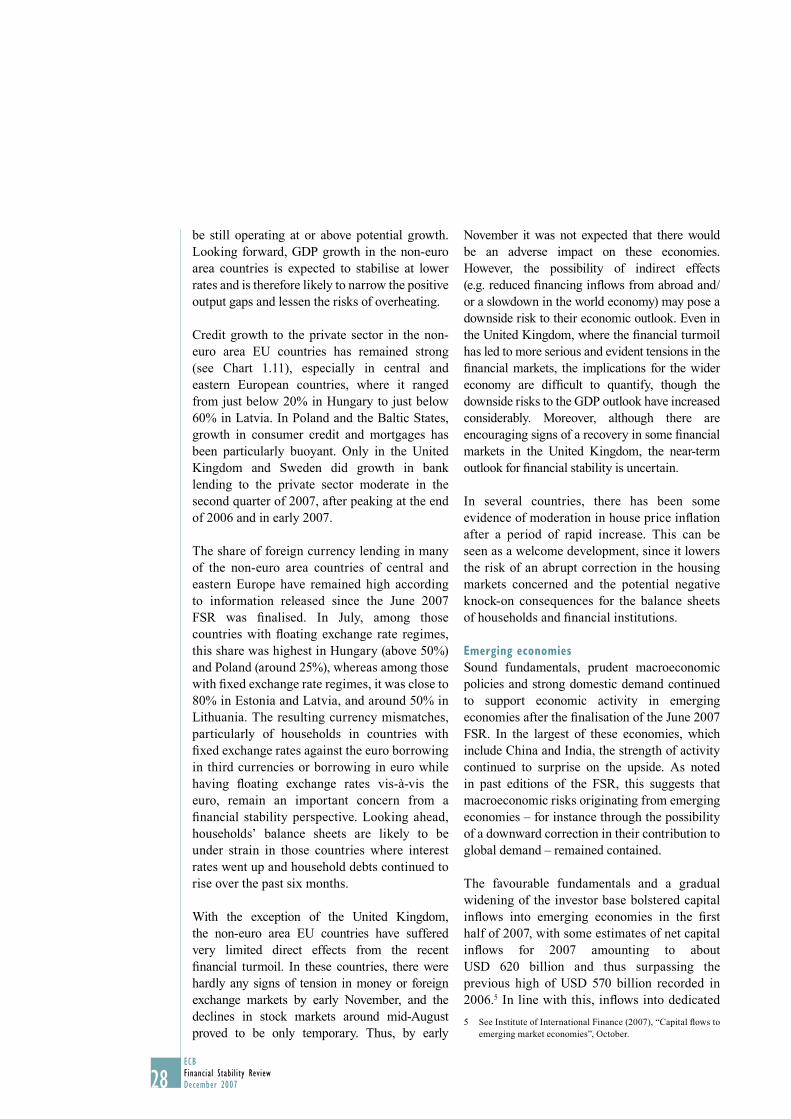
28ECBFinancial Stability ReviewDecember 2007
be still operating at or above potential growth. Looking forward, GDP growth in the non-euro area countries is expected to stabilise at lower rates and is therefore likely to narrow the positive output gaps and lessen the risks of overheating.
Credit growth to the private sector in the non-euro area EU countries has remained strong (see Chart 1.11), especially in central and eastern European countries, where it ranged from just below 20% in Hungary to just below 60% in Latvia. In Poland and the Baltic States, growth in consumer credit and mortgages has been particularly buoyant. Only in the United Kingdom and Sweden did growth in bank lending to the private sector moderate in the second quarter of 2007, after peaking at the end of 2006 and in early 2007.
The share of foreign currency lending in many of the non-euro area countries of central and eastern Europe have remained high according to information released since the June 2007 FSR was fi nalised. In July, among those countries with fl oating exchange rate regimes, this share was highest in Hungary (above 50%) and Poland (around 25%), whereas among those with fi xed exchange rate regimes, it was close to 80% in Estonia and Latvia, and around 50% in Lithuania. The resulting currency mismatches, particularly of households in countries with fi xed exchange rates against the euro borrowing in third currencies or borrowing in euro while having fl oating exchange rates vis-à-vis the euro, remain an important concern from a fi nancial stability perspective. Looking ahead, households’ balance sheets are likely to be under strain in those countries where interest rates went up and household debts continued to rise over the past six months.
With the exception of the United Kingdom, the non-euro area EU countries have suffered very limited direct effects from the recent fi nancial turmoil. In these countries, there were hardly any signs of tension in money or foreign exchange markets by early November, and the declines in stock markets around mid-August proved to be only temporary. Thus, by early
November it was not expected that there would be an adverse impact on these economies. However, the possibility of indirect effects (e.g. reduced fi nancing infl ows from abroad and/or a slowdown in the world economy) may pose a downside risk to their economic outlook. Even in the United Kingdom, where the fi nancial turmoil has led to more serious and evident tensions in the fi nancial markets, the implications for the wider economy are diffi cult to quantify, though the downside risks to the GDP outlook have increased considerably. Moreover, although there are encouraging signs of a recovery in some fi nancial markets in the United Kingdom, the near-term outlook for fi nancial stability is uncertain.
In several countries, there has been some evidence of moderation in house price infl ation after a period of rapid increase. This can be seen as a welcome development, since it lowers the risk of an abrupt correction in the housing markets concerned and the potential negative knock-on consequences for the balance sheets of households and fi nancial institutions.
Emerging economies
Sound fundamentals, prudent macroeconomic policies and strong domestic demand continued to support economic activity in emerging economies after the fi nalisation of the June 2007 FSR. In the largest of these economies, which include China and India, the strength of activity continued to surprise on the upside. As noted in past editions of the FSR, this suggests that macroeconomic risks originating from emerging economies – for instance through the possibility of a downward correction in their contribution to global demand – remained contained.
The favourable fundamentals and a gradual widening of the investor base bolstered capital infl ows into emerging economies in the fi rst half of 2007, with some estimates of net capital infl ows for 2007 amounting to about USD 620 billion and thus surpassing the previous high of USD 570 billion recorded in 2006.5 In line with this, infl ows into dedicated
See Institute of International Finance (2007), “Capital fl ows to 5 emerging market economies”, October.
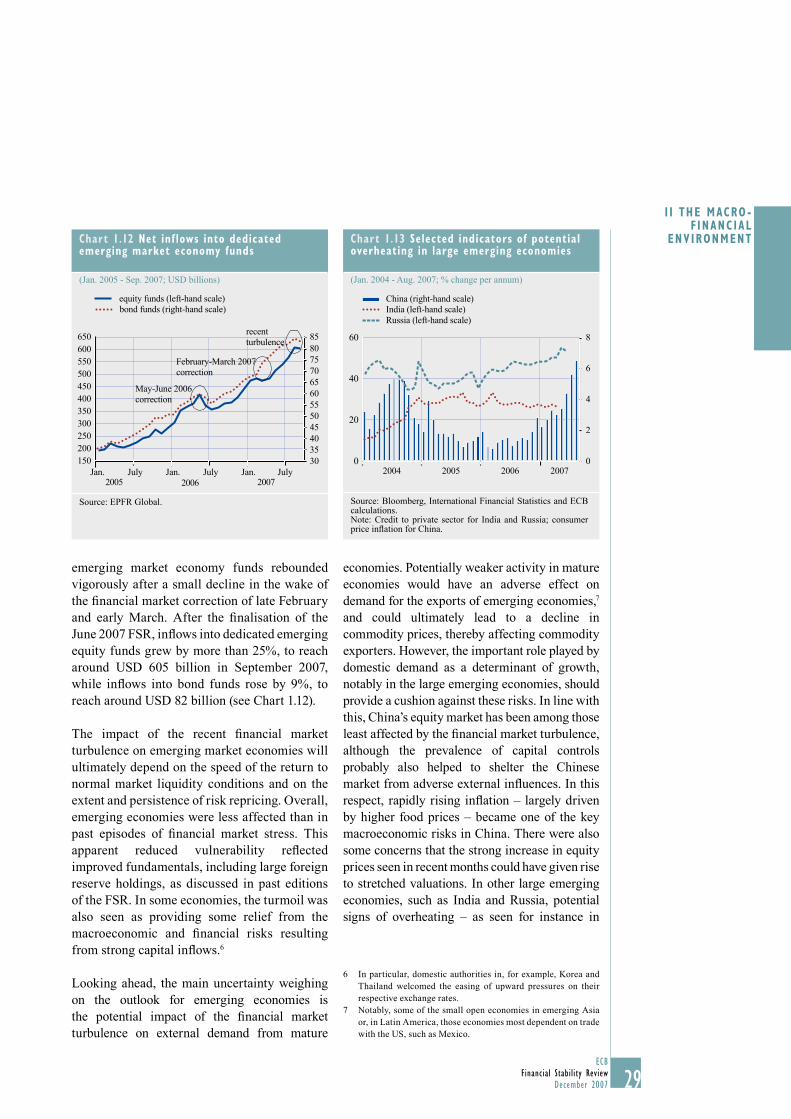
29ECB
Financial Stability ReviewDecember 2007
I I THE MACRO -F INANC IAL
ENVIRONMENT
29
emerging market economy funds rebounded vigorously after a small decline in the wake of the fi nancial market correction of late February and early March. After the fi nalisation of the June 2007 FSR, infl ows into dedicated emerging equity funds grew by more than 25%, to reach around USD 605 billion in September 2007, while infl ows into bond funds rose by 9%, to reach around USD 82 billion (see Chart 1.12).
The impact of the recent fi nancial market turbulence on emerging market economies will ultimately depend on the speed of the return to normal market liquidity conditions and on the extent and persistence of risk repricing. Overall, emerging economies were less affected than in past episodes of fi nancial market stress. This apparent reduced vulnerability refl ected improved fundamentals, including large foreign reserve holdings, as discussed in past editions of the FSR. In some economies, the turmoil was also seen as providing some relief from the macroeconomic and fi nancial risks resulting from strong capital infl ows.6
Looking ahead, the main uncertainty weighing on the outlook for emerging economies is the potential impact of the fi nancial market turbulence on external demand from mature
economies. Potentially weaker activity in mature economies would have an adverse effect on demand for the exports of emerging economies,7 and could ultimately lead to a decline in commodity prices, thereby affecting commodity exporters. However, the important role played by domestic demand as a determinant of growth, notably in the large emerging economies, should provide a cushion against these risks. In line with this, China’s equity market has been among those least affected by the fi nancial market turbulence, although the prevalence of capital controls probably also helped to shelter the Chinese market from adverse external infl uences. In this respect, rapidly rising infl ation – largely driven by higher food prices – became one of the key macroeconomic risks in China. There were also some concerns that the strong increase in equity prices seen in recent months could have given rise to stretched valuations. In other large emerging economies, such as India and Russia, potential signs of overheating – as seen for instance in
In particular, domestic authorities in, for example, Korea and 6 Thailand welcomed the easing of upward pressures on their respective exchange rates.Notably, some of the small open economies in emerging Asia 7 or, in Latin America, those economies most dependent on trade with the US, such as Mexico.
Chart 1.12 Net inf lows into dedicated emerging market economy funds
(Jan. 2005 - Sep. 2007; USD billions)
February-March 2007correction
recentturbulence
May-June 2006correction
150200250300350400450500550600650
Jan. July303540455055606570758085
equity funds (left-hand scale)bond funds (right-hand scale)
2005 2006 2007Jan. July Jan. July
Source: EPFR Global.
Chart 1.13 Selected indicators of potential overheating in large emerging economies
(Jan. 2004 - Aug. 2007; % change per annum)
0
20
40
60
0
2
4
6
8
China (right-hand scale)India (left-hand scale)Russia (left-hand scale)
2004 2005 2006 2007
Source: Bloomberg, International Financial Statistics and ECB calculations.Note: Credit to private sector for India and Russia; consumer price infl ation for China.
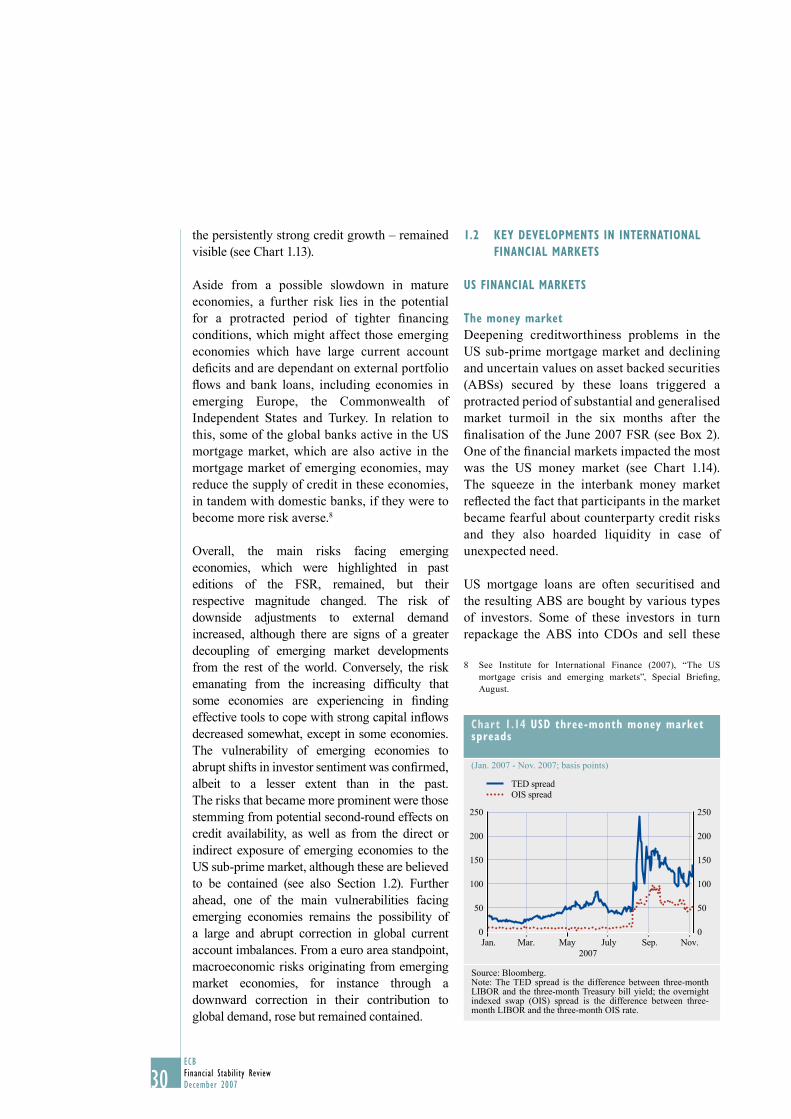
30ECBFinancial Stability ReviewDecember 2007
the persistently strong credit growth – remained visible (see Chart 1.13).
Aside from a possible slowdown in mature economies, a further risk lies in the potential for a protracted period of tighter fi nancing conditions, which might affect those emerging economies which have large current account defi cits and are dependant on external portfolio fl ows and bank loans, including economies in emerging Europe, the Commonwealth of Independent States and Turkey. In relation to this, some of the global banks active in the US mortgage market, which are also active in the mortgage market of emerging economies, may reduce the supply of credit in these economies, in tandem with domestic banks, if they were to become more risk averse.8
Overall, the main risks facing emerging economies, which were highlighted in past editions of the FSR, remained, but their respective magnitude changed. The risk of downside adjustments to external demand increased, although there are signs of a greater decoupling of emerging market developments from the rest of the world. Conversely, the risk emanating from the increasing diffi culty that some economies are experiencing in fi nding effective tools to cope with strong capital infl ows decreased somewhat, except in some economies. The vulnerability of emerging economies to abrupt shifts in investor sentiment was confi rmed, albeit to a lesser extent than in the past. The risks that became more prominent were those stemming from potential second-round effects on credit availability, as well as from the direct or indirect exposure of emerging economies to the US sub-prime market, although these are believed to be contained (see also Section 1.2). Further ahead, one of the main vulnerabilities facing emerging economies remains the possibility of a large and abrupt correction in global current account imbalances. From a euro area standpoint, macroeconomic risks originating from emerging market economies, for instance through a downward correction in their contribution to global demand, rose but remained contained.
1.2 KEY DEVELOPMENTS IN INTERNATIONAL
FINANCIAL MARKETS
US FINANCIAL MARKETS
The money market
Deepening creditworthiness problems in the US sub-prime mortgage market and declining and uncertain values on asset backed securities (ABSs) secured by these loans triggered a protracted period of substantial and generalised market turmoil in the six months after the fi nalisation of the June 2007 FSR (see Box 2). One of the fi nancial markets impacted the most was the US money market (see Chart 1.14). The squeeze in the interbank money market refl ected the fact that participants in the market became fearful about counterparty credit risks and they also hoarded liquidity in case of unexpected need.
US mortgage loans are often securitised and the resulting ABS are bought by various types of investors. Some of these investors in turn repackage the ABS into CDOs and sell these
See Institute for International Finance (2007), “The US 8 mortgage crisis and emerging markets”, Special Briefi ng, August.
Chart 1.14 USD three-month money market spreads
(Jan. 2007 - Nov. 2007; basis points)
0
50
100
150
200
250
0
50
100
150
200
250
2007
TED spreadOIS spread
Jan. Mar. May July Sep. Nov.
Source: Bloomberg.Note: The TED spread is the difference between three-month LIBOR and the three-month Treasury bill yield; the overnight indexed swap (OIS) spread is the difference between three-month LIBOR and the three-month OIS rate.
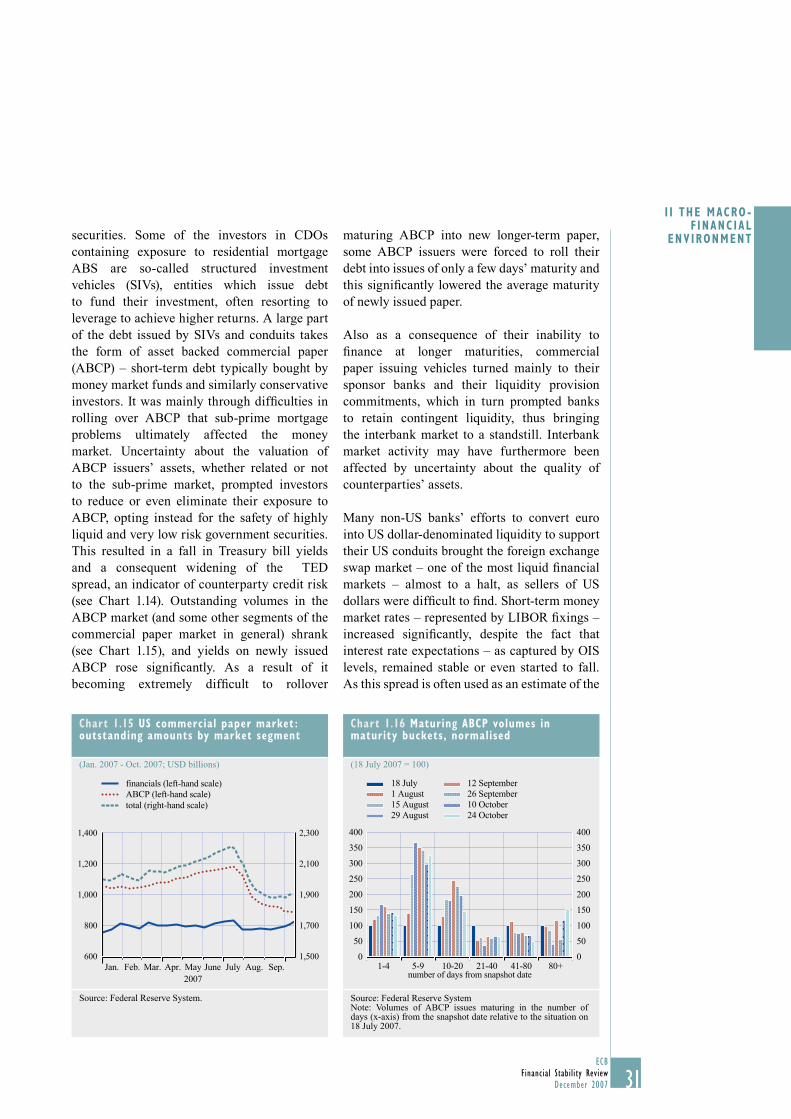
31ECB
Financial Stability ReviewDecember 2007
I I THE MACRO -F INANC IAL
ENVIRONMENT
31
securities. Some of the investors in CDOs containing exposure to residential mortgage ABS are so-called structured investment vehicles (SIVs), entities which issue debt to fund their investment, often resorting to leverage to achieve higher returns. A large part of the debt issued by SIVs and conduits takes the form of asset backed commercial paper (ABCP) – short-term debt typically bought by money market funds and similarly conservative investors. It was mainly through diffi culties in rolling over ABCP that sub-prime mortgage problems ultimately affected the money market. Uncertainty about the valuation of ABCP issuers’ assets, whether related or not to the sub-prime market, prompted investors to reduce or even eliminate their exposure to ABCP, opting instead for the safety of highly liquid and very low risk government securities. This resulted in a fall in Treasury bill yields and a consequent widening of the TED spread, an indicator of counterparty credit risk (see Chart 1.14). Outstanding volumes in the ABCP market (and some other segments of the commercial paper market in general) shrank (see Chart 1.15), and yields on newly issued ABCP rose signifi cantly. As a result of it becoming extremely diffi cult to rollover
maturing ABCP into new longer-term paper, some ABCP issuers were forced to roll their debt into issues of only a few days’ maturity and this signifi cantly lowered the average maturity of newly issued paper.
Also as a consequence of their inability to fi nance at longer maturities, commercial paper issuing vehicles turned mainly to their sponsor banks and their liquidity provision commitments, which in turn prompted banks to retain contingent liquidity, thus bringing the interbank market to a standstill. Interbank market activity may have furthermore been affected by uncertainty about the quality of counterparties’ assets.
Many non-US banks’ efforts to convert euro into US dollar-denominated liquidity to support their US conduits brought the foreign exchange swap market – one of the most liquid fi nancial markets – almost to a halt, as sellers of US dollars were diffi cult to fi nd. Short-term money market rates – represented by LIBOR fi xings – increased signifi cantly, despite the fact that interest rate expectations – as captured by OIS levels, remained stable or even started to fall. As this spread is often used as an estimate of the
Chart 1.15 US commercial paper market : outstanding amounts by market segment
(Jan. 2007 - Oct. 2007; USD billions)
600
800
1,000
1,200
1,400
1,500
1,700
1,900
2,100
2,300
financials (left-hand scale)ABCP (left-hand scale)total (right-hand scale)
Jan. Feb. Mar. Apr. May June July Aug. Sep.2007
Source: Federal Reserve System.
Chart 1.16 Maturing ABCP volumes in maturity buckets, normalised
(18 July 2007 = 100)
0
50
100
150
200
250
300
350
400
0
50
100
150
200
250
300
350
400
number of days from snapshot date
18 July1 August15 August29 August
12 September26 September10 October24 October
1-4 5-9 10-20 21-40 41-80 80+
Source: Federal Reserve SystemNote: Volumes of ABCP issues maturing in the number of days (x-axis) from the snapshot date relative to the situation on 18 July 2007.
32ECBFinancial Stability ReviewDecember 2007
Box 2
CAUSES AND CONSEQUENCES OF THE RECENT MARKET TURMOIL
The recent turmoil in fi nancial markets had its origins in a sharp re-pricing of credit risk following growing creditworthiness problems in the US sub-prime mortgage market. This led to concerns about the nature and extent of fi nancial institutions’ exposures to sub-prime mortgages both direct and indirect via structured credit products. Notwithstanding the fact that fi nancial market participants judged most of the affected institutions as having an ability to cope with the potential losses, the uncertainty surrounding the dispersion of these losses and the lack of transparency as to the magnitude of the risks faced by fi nancial institutions triggered a loss of risk appetite. Higher risk aversion spread to several other asset markets and it led to disruptions in some money market segments. The fact that markets were unprepared and had underpriced the risks of these events was refl ected in very tight credit spreads and low implied volatilities across a range of markets. This box recalls some of the major triggering events behind the market turmoil and it assesses the consequences.
Delinquency rates on sub-prime mortgages started to pick up in the US as early as 2005 (see Chart A), as higher interest rates and a slowdown of house price infl ation made it more diffi cult for some borrowers to meet their fi nancial obligations. At the same time, and notwithstanding deteriorating fundamentals, intense competition between lenders for market share in the sub-prime mortgage market apparently led to an undue relaxation of credit standards and excessive risk-taking by some lenders. Indicators of fi nancial market risk showed that market participants perceived
credit and/or liquidity risk in the money market, its widening signalled a growing perception of risk in the market.
The Federal Reserve System’s actions in response to the unfolding turmoil were gradual and started with an increase in the amounts provided in the regular liquidity-providing open market operations. As the tensions in the market did not show signs of easing and the deposit/OIS spreads continued to widen, additional measures were implemented to ease the pressure in the interbank market.9 In an effort to “help forestall some of the adverse effects on the broader economy that might otherwise arise from the disruptions in fi nancial markets”, the FOMC decided on 18 September to lower both the federal funds target rate and the discount rate by 50 basis points. Short-term rates as well as money market spreads subsequently declined (see Chart 1.14) and commercial paper market issuance stabilised, with the average maturities
sold gradually increasing (see Chart 1.16). This notwithstanding, investors remained selective, and certain types of issuer continued to experience diffi culties.
Even though various other indicators of market stress also eased, conditions remained tense, and the prospect of a prompt improvement in the money market seemed relatively limited. The LIBOR/OIS and TED spreads remained wide at the cut-off date for this publication, as the uncertainties in the asset valuations are likely to prevail as long as the full extent of losses from re-pricing of complex securities on fi nancial institutions’ balance sheets remains unknown.
The FOMC decided on 17 August to lower the rate on its 9 discount window borrowing facility by 50 basis points, effectively reducing the spread against the policy target rate, and to lengthen the maximum maturity from one day to 30 days. The discount window can be accessed by a large number of institutions and a wider spectrum of collateral can be provided than in the regular open market operations.
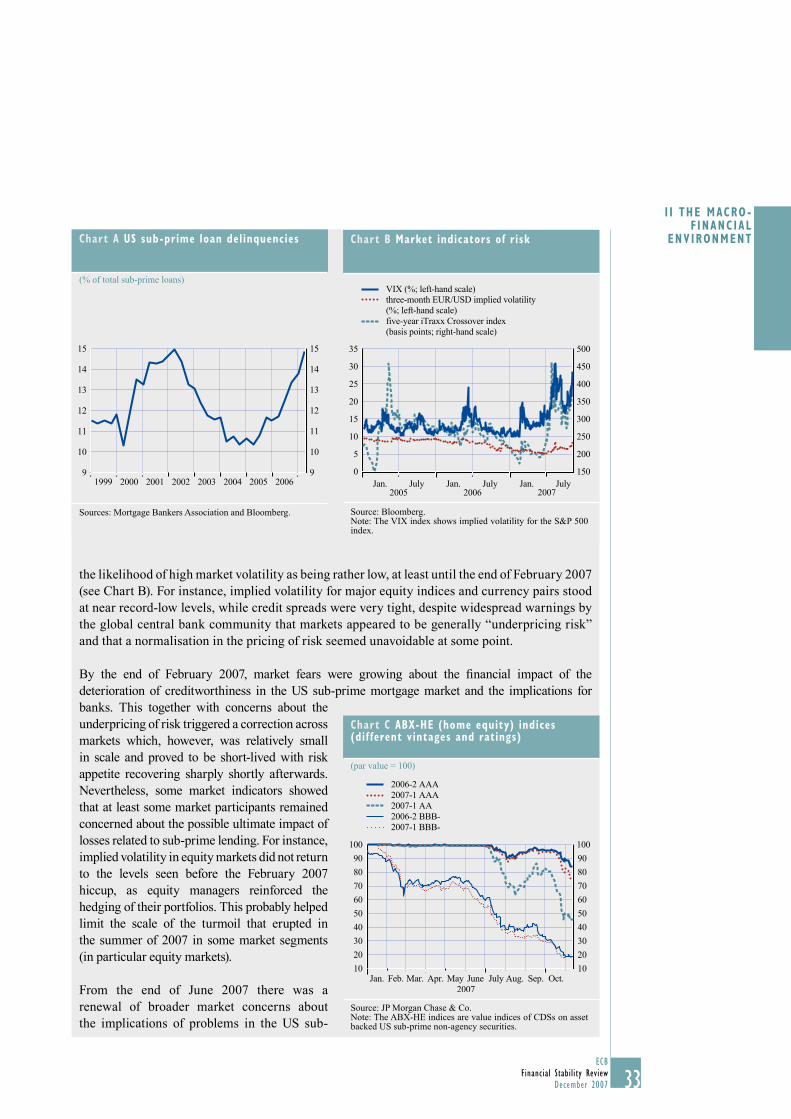
33ECB
Financial Stability ReviewDecember 2007
I I THE MACRO -F INANC IAL
ENVIRONMENT
33
the likelihood of high market volatility as being rather low, at least until the end of February 2007 (see Chart B). For instance, implied volatility for major equity indices and currency pairs stood at near record-low levels, while credit spreads were very tight, despite widespread warnings by the global central bank community that markets appeared to be generally “underpricing risk” and that a normalisation in the pricing of risk seemed unavoidable at some point.
By the end of February 2007, market fears were growing about the fi nancial impact of the deterioration of creditworthiness in the US sub-prime mortgage market and the implications for banks. This together with concerns about the underpricing of risk triggered a correction across markets which, however, was relatively small in scale and proved to be short-lived with risk appetite recovering sharply shortly afterwards. Nevertheless, some market indicators showed that at least some market participants remained concerned about the possible ultimate impact of losses related to sub-prime lending. For instance, implied volatility in equity markets did not return to the levels seen before the February 2007 hiccup, as equity managers reinforced the hedging of their portfolios. This probably helped limit the scale of the turmoil that erupted in the summer of 2007 in some market segments (in particular equity markets).
From the end of June 2007 there was a renewal of broader market concerns about the implications of problems in the US sub-
Chart A US sub-prime loan delinquencies
(% of total sub-prime loans)
9
10
11
12
13
14
15
9
10
11
12
13
14
15
1999 2000 2001 2002 2003 20052004 2006
Sources: Mortgage Bankers Association and Bloomberg.
Chart B Market indicators of risk
2005 2006 2007
VIX (%; left-hand scale)three-month EUR/USD implied volatility (%; left-hand scale)five-year iTraxx Crossover index (basis points; right-hand scale)
0
5
10
15
20
25
30
35
150
200
250
300
350
400
450
500
Jan. July Jan. July Jan. July
Source: Bloomberg.Note: The VIX index shows implied volatility for the S&P 500 index.
Chart C ABX-HE (home equity) indices (dif ferent vintages and ratings)
(par value = 100)
10
20
30
40
50
60
70
80
90
100
10
20
30
40
50
60
70
80
90
100
2006-2 AAA2007-1 AAA2007-1 AA 2006-2 BBB- 2007-1 BBB-
Jan. Feb. Mar. Apr. May June July Aug. Sep. Oct.2007
Source: JP Morgan Chase & Co.Note: The ABX-HE indices are value indices of CDSs on asset backed US sub-prime non-agency securities.
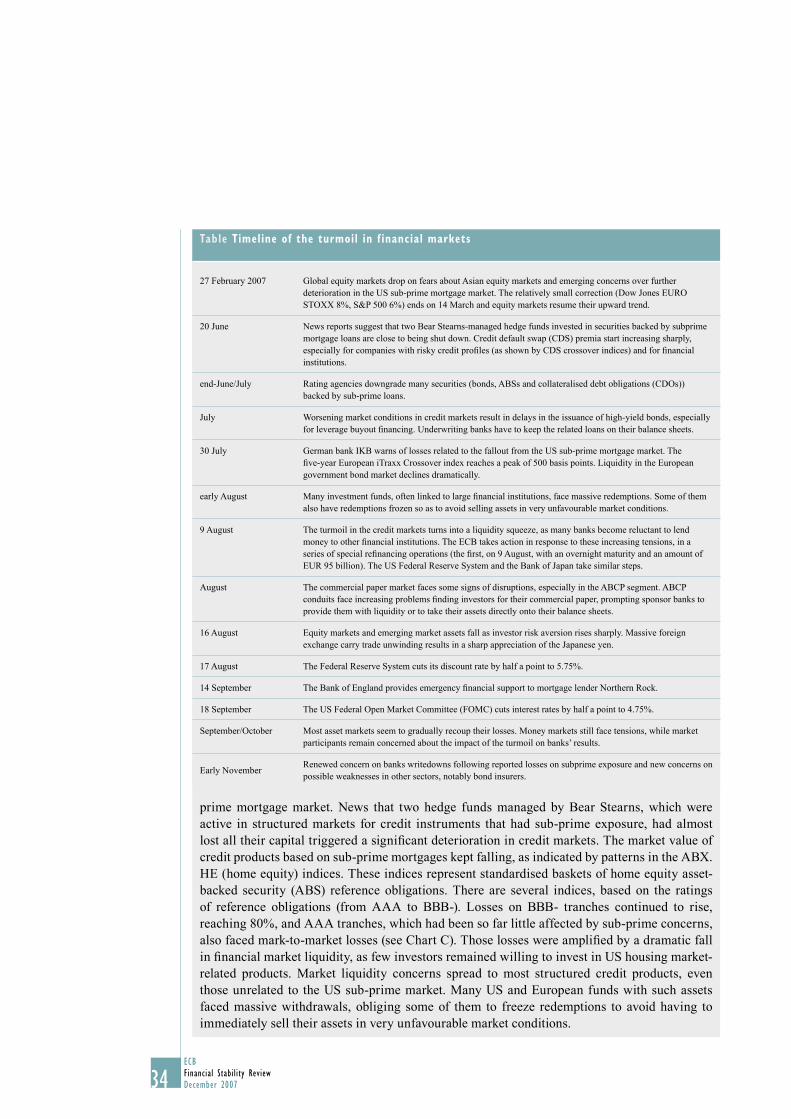
34ECBFinancial Stability ReviewDecember 2007
prime mortgage market. News that two hedge funds managed by Bear Stearns, which were active in structured markets for credit instruments that had sub-prime exposure, had almost lost all their capital triggered a signifi cant deterioration in credit markets. The market value of credit products based on sub-prime mortgages kept falling, as indicated by patterns in the ABX.HE (home equity) indices. These indices represent standardised baskets of home equity asset-backed security (ABS) reference obligations. There are several indices, based on the ratings of reference obligations (from AAA to BBB-). Losses on BBB- tranches continued to rise, reaching 80%, and AAA tranches, which had been so far little affected by sub-prime concerns, also faced mark-to-market losses (see Chart C). Those losses were amplifi ed by a dramatic fall in fi nancial market liquidity, as few investors remained willing to invest in US housing market-related products. Market liquidity concerns spread to most structured credit products, even those unrelated to the US sub-prime market. Many US and European funds with such assets faced massive withdrawals, obliging some of them to freeze redemptions to avoid having to immediately sell their assets in very unfavourable market conditions.
Table Timeline of the turmoil in f inancial markets
27 February 2007 Global equity markets drop on fears about Asian equity markets and emerging concerns over further deterioration in the US sub-prime mortgage market. The relatively small correction (Dow Jones EURO STOXX 8%, S&P 500 6%) ends on 14 March and equity markets resume their upward trend.
20 June News reports suggest that two Bear Stearns-managed hedge funds invested in securities backed by subprime mortgage loans are close to being shut down. Credit default swap (CDS) premia start increasing sharply, especially for companies with risky credit profi les (as shown by CDS crossover indices) and for fi nancial institutions.
end-June/July Rating agencies downgrade many securities (bonds, ABSs and collateralised debt obligations (CDOs)) backed by sub-prime loans.
July Worsening market conditions in credit markets result in delays in the issuance of high-yield bonds, especially for leverage buyout fi nancing. Underwriting banks have to keep the related loans on their balance sheets.
30 July German bank IKB warns of losses related to the fallout from the US sub-prime mortgage market. The fi ve-year European iTraxx Crossover index reaches a peak of 500 basis points. Liquidity in the European government bond market declines dramatically.
early August Many investment funds, often linked to large fi nancial institutions, face massive redemptions. Some of them also have redemptions frozen so as to avoid selling assets in very unfavourable market conditions.
9 August The turmoil in the credit markets turns into a liquidity squeeze, as many banks become reluctant to lend money to other fi nancial institutions. The ECB takes action in response to these increasing tensions, in a series of special refi nancing operations (the fi rst, on 9 August, with an overnight maturity and an amount of EUR 95 billion). The US Federal Reserve System and the Bank of Japan take similar steps.
August The commercial paper market faces some signs of disruptions, especially in the ABCP segment. ABCP conduits face increasing problems fi nding investors for their commercial paper, prompting sponsor banks to provide them with liquidity or to take their assets directly onto their balance sheets.
16 August Equity markets and emerging market assets fall as investor risk aversion rises sharply. Massive foreign exchange carry trade unwinding results in a sharp appreciation of the Japanese yen.
17 August The Federal Reserve System cuts its discount rate by half a point to 5.75%.
14 September The Bank of England provides emergency fi nancial support to mortgage lender Northern Rock.
18 September The US Federal Open Market Committee (FOMC) cuts interest rates by half a point to 4.75%.
September/October Most asset markets seem to gradually recoup their losses. Money markets still face tensions, while market participants remain concerned about the impact of the turmoil on banks’ results.
Early NovemberRenewed concern on banks writedowns following reported losses on subprime exposure and new concerns on possible weaknesses in other sectors, notably bond insurers.
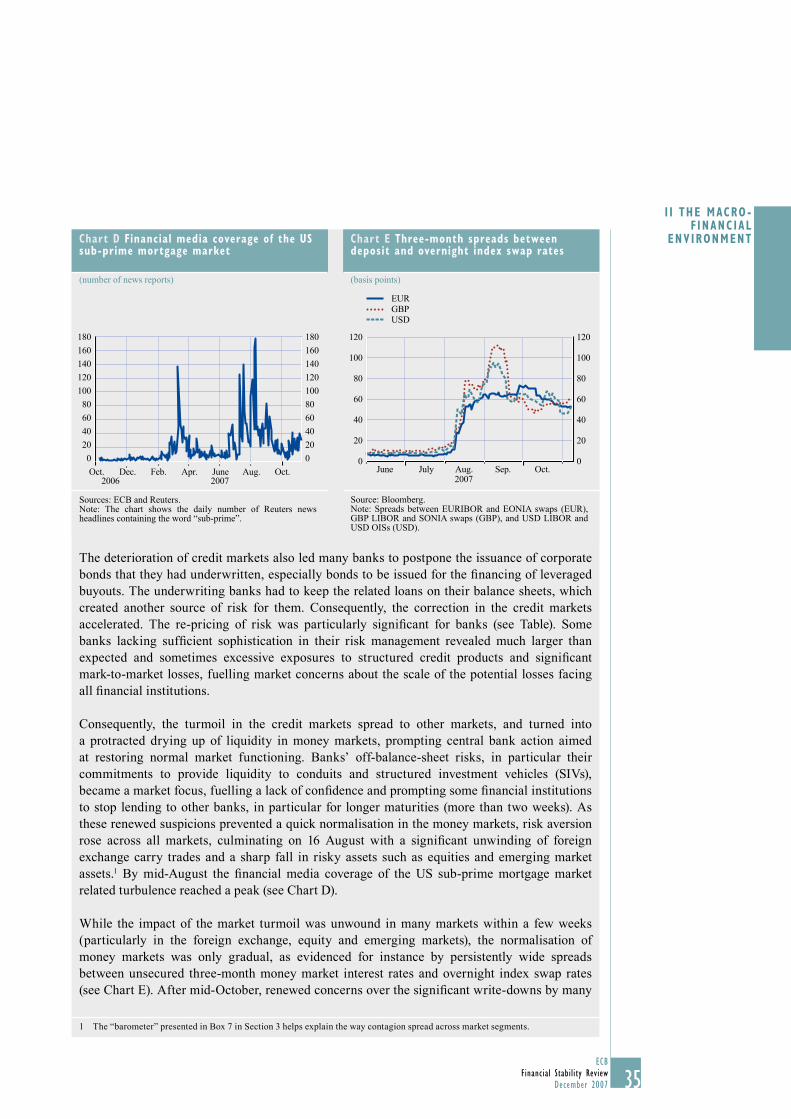
35ECB
Financial Stability ReviewDecember 2007
I I THE MACRO -F INANC IAL
ENVIRONMENT
35
The deterioration of credit markets also led many banks to postpone the issuance of corporate bonds that they had underwritten, especially bonds to be issued for the fi nancing of leveraged buyouts. The underwriting banks had to keep the related loans on their balance sheets, which created another source of risk for them. Consequently, the correction in the credit markets accelerated. The re-pricing of risk was particularly signifi cant for banks (see Table). Some banks lacking suffi cient sophistication in their risk management revealed much larger than expected and sometimes excessive exposures to structured credit products and signifi cant mark-to-market losses, fuelling market concerns about the scale of the potential losses facing all fi nancial institutions.
Consequently, the turmoil in the credit markets spread to other markets, and turned into a protracted drying up of liquidity in money markets, prompting central bank action aimed at restoring normal market functioning. Banks’ off-balance-sheet risks, in particular their commitments to provide liquidity to conduits and structured investment vehicles (SIVs), became a market focus, fuelling a lack of confi dence and prompting some fi nancial institutions to stop lending to other banks, in particular for longer maturities (more than two weeks). As these renewed suspicions prevented a quick normalisation in the money markets, risk aversion rose across all markets, culminating on 16 August with a signifi cant unwinding of foreign exchange carry trades and a sharp fall in risky assets such as equities and emerging market assets.1 By mid-August the fi nancial media coverage of the US sub-prime mortgage market related turbulence reached a peak (see Chart D).
While the impact of the market turmoil was unwound in many markets within a few weeks (particularly in the foreign exchange, equity and emerging markets), the normalisation of money markets was only gradual, as evidenced for instance by persistently wide spreads between unsecured three-month money market interest rates and overnight index swap rates (see Chart E). After mid-October, renewed concerns over the signifi cant write-downs by many
1 The “barometer” presented in Box 7 in Section 3 helps explain the way contagion spread across market segments.
Chart D Financial media coverage of the US sub-prime mortgage market
(number of news reports)
0
20
40
60
80
100
120
140
160
180
0
20
40
60
80
100
120
140
160
180
Oct. Dec. Feb. Apr. June Aug. Oct.2006 2007
Sources: ECB and Reuters.Note: The chart shows the daily number of Reuters news headlines containing the word “sub-prime”.
Chart E Three-month spreads between deposit and overnight index swap rates
(basis points)
0
20
40
60
80
100
120
0
20
40
60
80
100
120
EURGBPUSD
June July Aug.2007
Sep. Oct.
Source: Bloomberg.Note: Spreads between EURIBOR and EONIA swaps (EUR), GBP LIBOR and SONIA swaps (GBP), and USD LIBOR and USD OISs (USD).
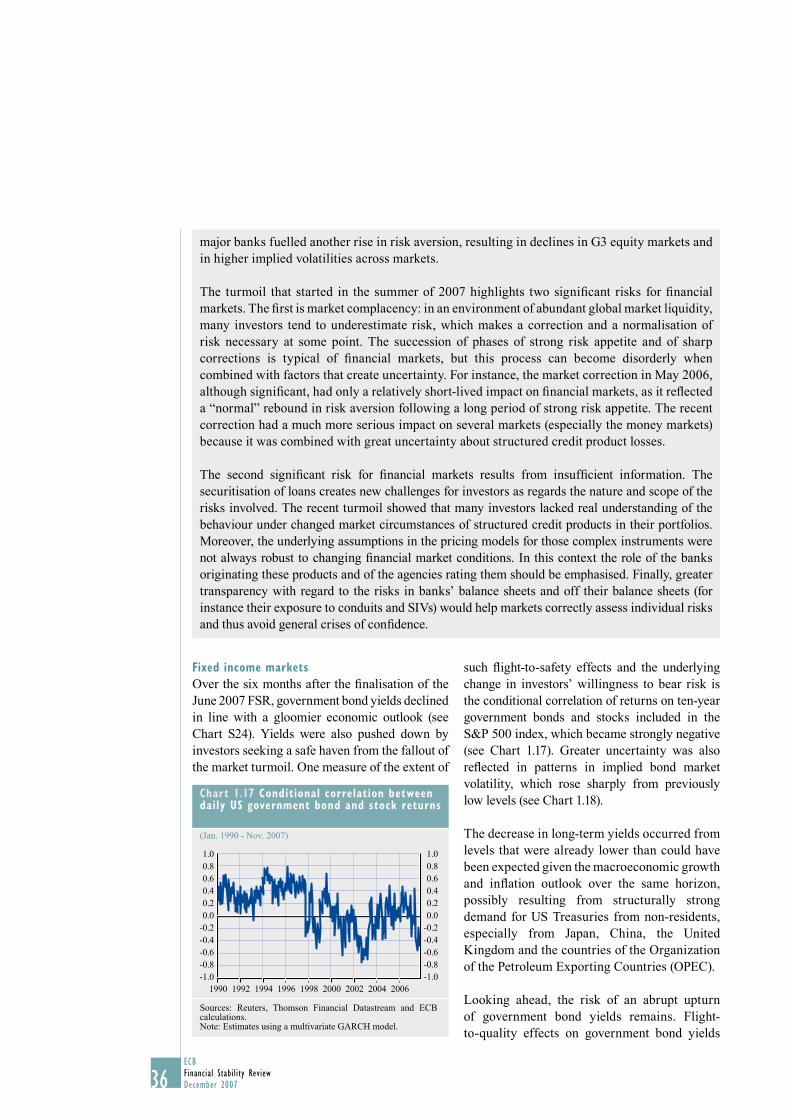
36ECBFinancial Stability ReviewDecember 2007
Fixed income markets
Over the six months after the fi nalisation of the June 2007 FSR, government bond yields declined in line with a gloomier economic outlook (see Chart S24). Yields were also pushed down by investors seeking a safe haven from the fallout of the market turmoil. One measure of the extent of
such fl ight-to-safety effects and the underlying change in investors’ willingness to bear risk is the conditional correlation of returns on ten-year government bonds and stocks included in the S&P 500 index, which became strongly negative (see Chart 1.17). Greater uncertainty was also refl ected in patterns in implied bond market volatility, which rose sharply from previously low levels (see Chart 1.18).
The decrease in long-term yields occurred from levels that were already lower than could have been expected given the macroeconomic growth and infl ation outlook over the same horizon, possibly resulting from structurally strong demand for US Treasuries from non-residents, especially from Japan, China, the United Kingdom and the countries of the Organization of the Petroleum Exporting Countries (OPEC).
Looking ahead, the risk of an abrupt upturn of government bond yields remains. Flight-to-quality effects on government bond yields
Chart 1.17 Conditional correlation between daily US government bond and stock returns
(Jan. 1990 - Nov. 2007)
-1.0-0.8-0.6-0.4-0.20.00.20.40.60.81.0
-1.0-0.8-0.6-0.4-0.20.00.20.40.60.81.0
1990 1992 1994 1996 1998 2000 2002 2004 2006
Sources: Reuters, Thomson Financial Datastream and ECB calculations.Note: Estimates using a multivariate GARCH model.
major banks fuelled another rise in risk aversion, resulting in declines in G3 equity markets and in higher implied volatilities across markets.
The turmoil that started in the summer of 2007 highlights two signifi cant risks for fi nancial markets. The fi rst is market complacency: in an environment of abundant global market liquidity, many investors tend to underestimate risk, which makes a correction and a normalisation of risk necessary at some point. The succession of phases of strong risk appetite and of sharp corrections is typical of fi nancial markets, but this process can become disorderly when combined with factors that create uncertainty. For instance, the market correction in May 2006, although signifi cant, had only a relatively short-lived impact on fi nancial markets, as it refl ected a “normal” rebound in risk aversion following a long period of strong risk appetite. The recent correction had a much more serious impact on several markets (especially the money markets) because it was combined with great uncertainty about structured credit product losses.
The second signifi cant risk for fi nancial markets results from insuffi cient information. The securitisation of loans creates new challenges for investors as regards the nature and scope of the risks involved. The recent turmoil showed that many investors lacked real understanding of the behaviour under changed market circumstances of structured credit products in their portfolios. Moreover, the underlying assumptions in the pricing models for those complex instruments were not always robust to changing fi nancial market conditions. In this context the role of the banks originating these products and of the agencies rating them should be emphasised. Finally, greater transparency with regard to the risks in banks’ balance sheets and off their balance sheets (for instance their exposure to conduits and SIVs) would help markets correctly assess individual risks and thus avoid general crises of confi dence.
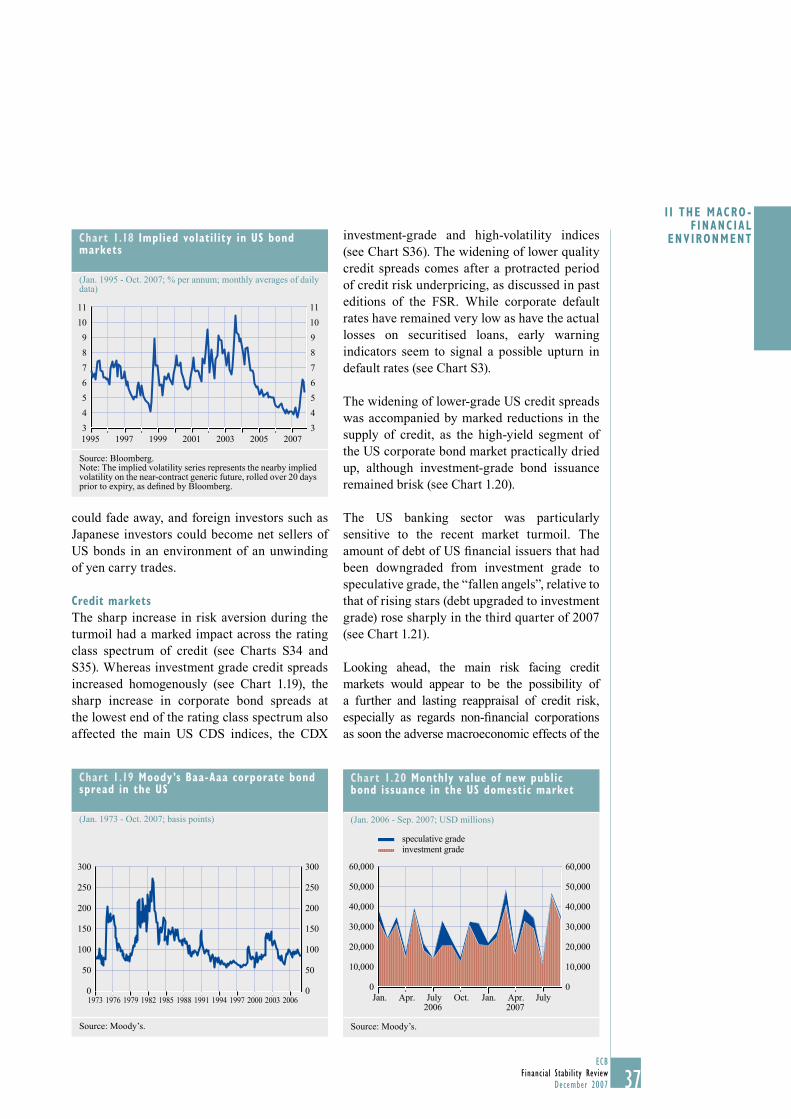
37ECB
Financial Stability ReviewDecember 2007
I I THE MACRO -F INANC IAL
ENVIRONMENT
37
could fade away, and foreign investors such as Japanese investors could become net sellers of US bonds in an environment of an unwinding of yen carry trades.
Credit markets
The sharp increase in risk aversion during the turmoil had a marked impact across the rating class spectrum of credit (see Charts S34 and S35). Whereas investment grade credit spreads increased homogenously (see Chart 1.19), the sharp increase in corporate bond spreads at the lowest end of the rating class spectrum also affected the main US CDS indices, the CDX
investment-grade and high-volatility indices (see Chart S36). The widening of lower quality credit spreads comes after a protracted period of credit risk underpricing, as discussed in past editions of the FSR. While corporate default rates have remained very low as have the actual losses on securitised loans, early warning indicators seem to signal a possible upturn in default rates (see Chart S3).
The widening of lower-grade US credit spreads was accompanied by marked reductions in the supply of credit, as the high-yield segment of the US corporate bond market practically dried up, although investment-grade bond issuance remained brisk (see Chart 1.20).
The US banking sector was particularly sensitive to the recent market turmoil. The amount of debt of US fi nancial issuers that had been downgraded from investment grade to speculative grade, the “fallen angels”, relative to that of rising stars (debt upgraded to investment grade) rose sharply in the third quarter of 2007 (see Chart 1.21).
Looking ahead, the main risk facing credit markets would appear to be the possibility of a further and lasting reappraisal of credit risk, especially as regards non-fi nancial corporations as soon the adverse macroeconomic effects of the
Chart 1.18 Implied volatility in US bond markets
(Jan. 1995 - Oct. 2007; % per annum; monthly averages of daily data)
3
4
5
6
7
8
9
10
11
3
4
5
6
7
8
9
10
11
20071995 1997 1999 2001 2003 2005
Source: Bloomberg.Note: The implied volatility series represents the nearby implied volatility on the near-contract generic future, rolled over 20 days prior to expiry, as defi ned by Bloomberg.
Chart 1.19 Moody’s Baa-Aaa corporate bond spread in the US
(Jan. 1973 - Oct. 2007; basis points)
0
50
100
150
200
250
300
0
50
100
150
200
250
300
1973 1976 1979 1982 1985 1988 1991 1994 1997 2000 2003 2006
Source: Moody’s.
Chart 1.20 Monthly value of new public bond issuance in the US domestic market
(Jan. 2006 - Sep. 2007; USD millions)
0
10,000
20,000
30,000
40,000
50,000
60,000
0
10,000
20,000
30,000
40,000
50,000
60,000
2006
speculative gradeinvestment grade
2007Jan. Apr. July Oct. Jan. Apr. July
Source: Moody’s.
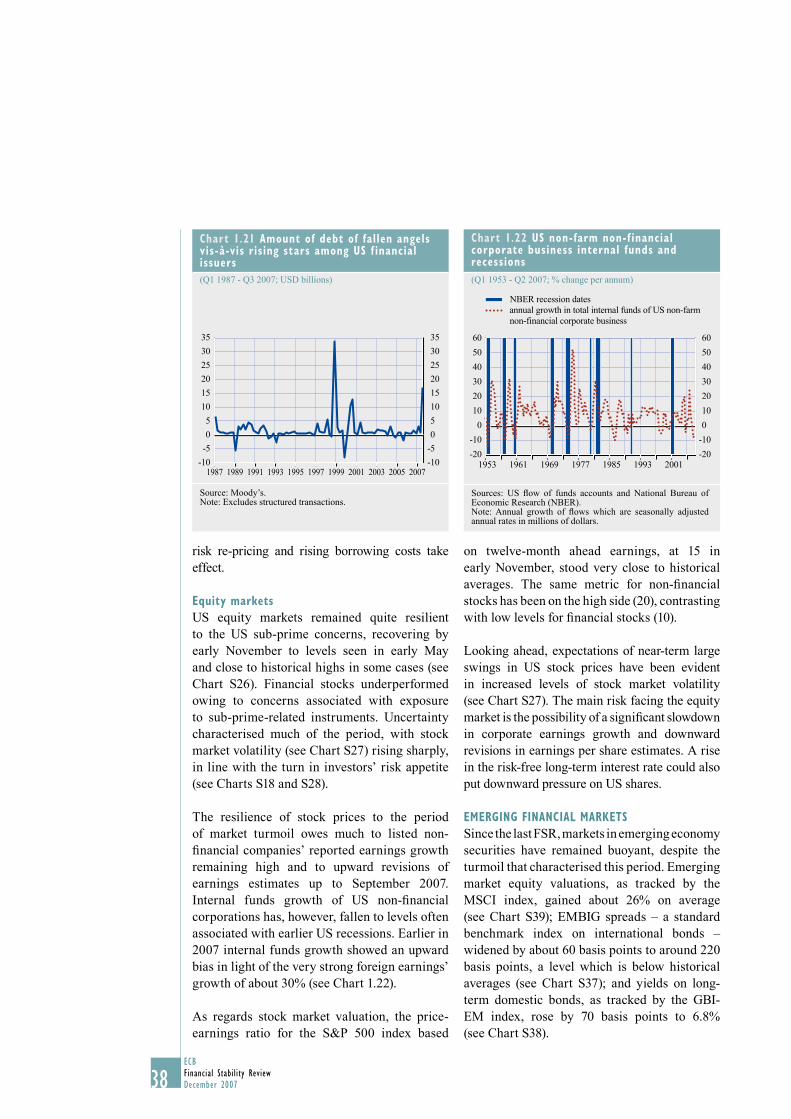
38ECBFinancial Stability ReviewDecember 2007
risk re-pricing and rising borrowing costs take effect.
Equity markets
US equity markets remained quite resilient to the US sub-prime concerns, recovering by early November to levels seen in early May and close to historical highs in some cases (see Chart S26). Financial stocks underperformed owing to concerns associated with exposure to sub-prime-related instruments. Uncertainty characterised much of the period, with stock market volatility (see Chart S27) rising sharply, in line with the turn in investors’ risk appetite (see Charts S18 and S28).
The resilience of stock prices to the period of market turmoil owes much to listed non-fi nancial companies’ reported earnings growth remaining high and to upward revisions of earnings estimates up to September 2007. Internal funds growth of US non-fi nancial corporations has, however, fallen to levels often associated with earlier US recessions. Earlier in 2007 internal funds growth showed an upward bias in light of the very strong foreign earnings’ growth of about 30% (see Chart 1.22).
As regards stock market valuation, the price-earnings ratio for the S&P 500 index based
on twelve-month ahead earnings, at 15 in early November, stood very close to historical averages. The same metric for non-fi nancial stocks has been on the high side (20), contrasting with low levels for fi nancial stocks (10).
Looking ahead, expectations of near-term large swings in US stock prices have been evident in increased levels of stock market volatility (see Chart S27). The main risk facing the equity market is the possibility of a signifi cant slowdown in corporate earnings growth and downward revisions in earnings per share estimates. A rise in the risk-free long-term interest rate could also put downward pressure on US shares.
EMERGING FINANCIAL MARKETS
Since the last FSR, markets in emerging economy securities have remained buoyant, despite the turmoil that characterised this period. Emerging market equity valuations, as tracked by the MSCI index, gained about 26% on average (see Chart S39); EMBIG spreads – a standard benchmark index on international bonds – widened by about 60 basis points to around 220 basis points, a level which is below historical averages (see Chart S37); and yields on long-term domestic bonds, as tracked by the GBI-EM index, rose by 70 basis points to 6.8% (see Chart S38).
Chart 1.22 US non-farm non-f inancial corporate business internal funds and recessions
(Q1 1953 - Q2 2007; % change per annum)
0
10
20
30
40
50
60
-10
-20
-10
-20
0
10
20
30
40
50
60
1961 1969 1977 1985 1993 2001
NBER recession datesannual growth in total internal funds of US non-farmnon-financial corporate business
1953
Sources: US fl ow of funds accounts and National Bureau of Economic Research (NBER). Note: Annual growth of fl ows which are seasonally adjusted annual rates in millions of dollars.
Chart 1.21 Amount of debt of fallen angels vis-à-vis rising stars among US f inancial issuers
(Q1 1987 - Q3 2007; USD billions)
-10
-5
0
5
10
15
20
25
30
35
-10
-5
0
5
10
15
20
25
30
35
1987 1989 1991 1993 1995 1997 1999 2001 2003 2005 2007
Source: Moody’s.Note: Excludes structured transactions.
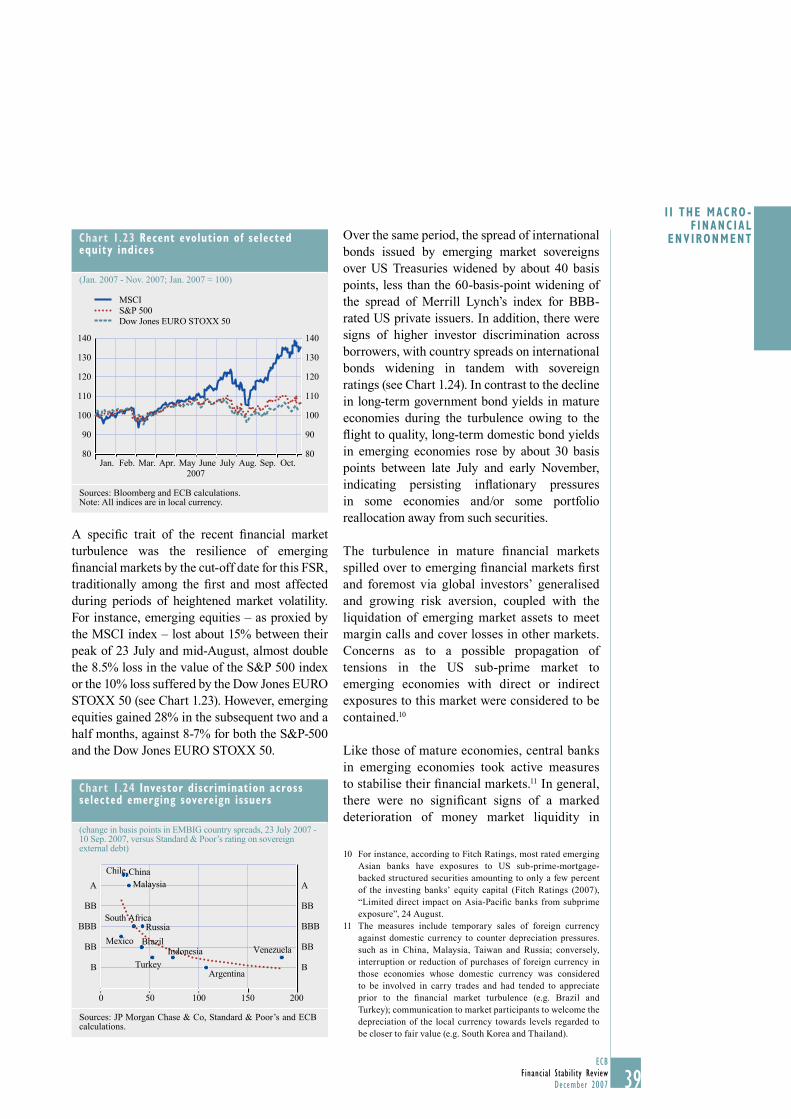
39ECB
Financial Stability ReviewDecember 2007
I I THE MACRO -F INANC IAL
ENVIRONMENT
39
A specifi c trait of the recent fi nancial market turbulence was the resilience of emerging fi nancial markets by the cut-off date for this FSR, traditionally among the fi rst and most affected during periods of heightened market volatility. For instance, emerging equities – as proxied by the MSCI index – lost about 15% between their peak of 23 July and mid-August, almost double the 8.5% loss in the value of the S&P 500 index or the 10% loss suffered by the Dow Jones EURO STOXX 50 (see Chart 1.23). However, emerging equities gained 28% in the subsequent two and a half months, against 8-7% for both the S&P-500 and the Dow Jones EURO STOXX 50.
Over the same period, the spread of international bonds issued by emerging market sovereigns over US Treasuries widened by about 40 basis points, less than the 60-basis-point widening of the spread of Merrill Lynch’s index for BBB-rated US private issuers. In addition, there were signs of higher investor discrimination across borrowers, with country spreads on international bonds widening in tandem with sovereign ratings (see Chart 1.24). In contrast to the decline in long-term government bond yields in mature economies during the turbulence owing to the fl ight to quality, long-term domestic bond yields in emerging economies rose by about 30 basis points between late July and early November, indicating persisting infl ationary pressures in some economies and/or some portfolio reallocation away from such securities.
The turbulence in mature fi nancial markets spilled over to emerging fi nancial markets fi rst and foremost via global investors’ generalised and growing risk aversion, coupled with the liquidation of emerging market assets to meet margin calls and cover losses in other markets. Concerns as to a possible propagation of tensions in the US sub-prime market to emerging economies with direct or indirect exposures to this market were considered to be contained.10
Like those of mature economies, central banks in emerging economies took active measures to stabilise their fi nancial markets.11 In general, there were no signifi cant signs of a marked deterioration of money market liquidity in
For instance, according to Fitch Ratings, most rated emerging 10 Asian banks have exposures to US sub-prime-mortgage-backed structured securities amounting to only a few percent of the investing banks’ equity capital (Fitch Ratings (2007), “Limited direct impact on Asia-Pacifi c banks from subprime exposure”, 24 August.The measures include temporary sales of foreign currency 11 against domestic currency to counter depreciation pressures. such as in China, Malaysia, Taiwan and Russia; conversely, interruption or reduction of purchases of foreign currency in those economies whose domestic currency was considered to be involved in carry trades and had tended to appreciate prior to the fi nancial market turbulence (e.g. Brazil and Turkey); communication to market participants to welcome the depreciation of the local currency towards levels regarded to be closer to fair value (e.g. South Korea and Thailand).
Chart 1.23 Recent evolution of selected equity indices
(Jan. 2007 - Nov. 2007; Jan. 2007 = 100)
80
90
100
110
120
130
140
80
90
100
110
120
130
140
2007
MSCIS&P 500Dow Jones EURO STOXX 50
Jan. Feb. Mar. May June July Aug. Sep. Oct.Apr.
Sources: Bloomberg and ECB calculations.Note: All indices are in local currency.
Chart 1.24 Investor discrimination across selected emerging sovereign issuers
(change in basis points in EMBIG country spreads, 23 July 2007 - 10 Sep. 2007, versus Standard & Poor’s rating on sovereign external debt)
200
A
BB
BBB
BB
B
A
BB
BBB
BB
B
ChinaMalaysia
South AfricaRussia
MexicoVenezuela
Turkey
Indonesia
Argentina
Chile
Brazil
0 50 100 150
Sources: JP Morgan Chase & Co, Standard & Poor’s and ECB calculations.
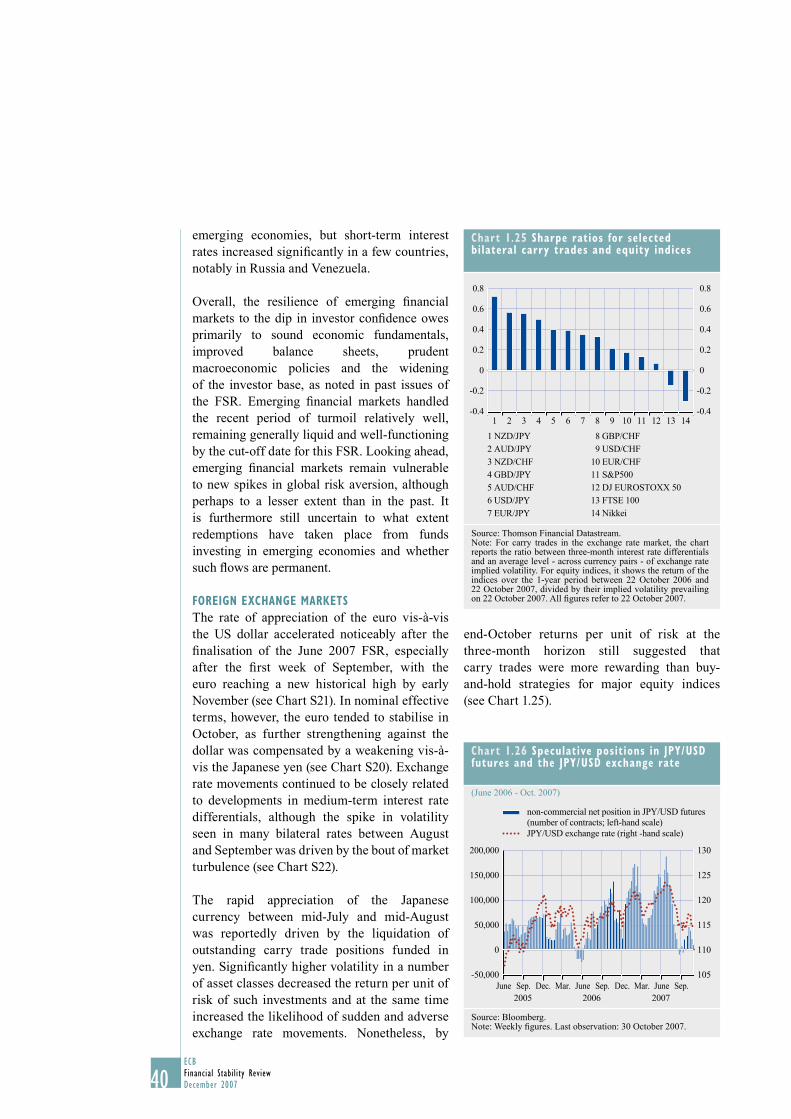
40ECBFinancial Stability ReviewDecember 2007
emerging economies, but short-term interest rates increased signifi cantly in a few countries, notably in Russia and Venezuela.
Overall, the resilience of emerging fi nancial markets to the dip in investor confi dence owes primarily to sound economic fundamentals, improved balance sheets, prudent macroeconomic policies and the widening of the investor base, as noted in past issues of the FSR. Emerging fi nancial markets handled the recent period of turmoil relatively well, remaining generally liquid and well-functioning by the cut-off date for this FSR. Looking ahead, emerging fi nancial markets remain vulnerable to new spikes in global risk aversion, although perhaps to a lesser extent than in the past. It is furthermore still uncertain to what extent redemptions have taken place from funds investing in emerging economies and whether such fl ows are permanent.
FOREIGN EXCHANGE MARKETS
The rate of appreciation of the euro vis-à-vis the US dollar accelerated noticeably after the fi nalisation of the June 2007 FSR, especially after the fi rst week of September, with the euro reaching a new historical high by early November (see Chart S21). In nominal effective terms, however, the euro tended to stabilise in October, as further strengthening against the dollar was compensated by a weakening vis-à-vis the Japanese yen (see Chart S20). Exchange rate movements continued to be closely related to developments in medium-term interest rate differentials, although the spike in volatility seen in many bilateral rates between August and September was driven by the bout of market turbulence (see Chart S22).
The rapid appreciation of the Japanese currency between mid-July and mid-August was reportedly driven by the liquidation of outstanding carry trade positions funded in yen. Signifi cantly higher volatility in a number of asset classes decreased the return per unit of risk of such investments and at the same time increased the likelihood of sudden and adverse exchange rate movements. Nonetheless, by
end-October returns per unit of risk at the three-month horizon still suggested that carry trades were more rewarding than buy-and-hold strategies for major equity indices (see Chart 1.25).
Chart 1.25 Sharpe ratios for selected bilateral carry trades and equity indices
1 NZD/JPY2 AUD/JPY3 NZD/CHF4 GBD/JPY5 AUD/CHF6 USD/JPY7 EUR/JPY
8 GBP/CHF 9 USD/CHF10 EUR/CHF11 S&P50012 DJ EUROSTOXX 5013 FTSE 10014 Nikkei
0.8
0.6
0.4
0.2
0
-0.4
-0.2
0.8
0.6
0.4
0.2
0
-0.4
-0.2
1 2 43 5 6 7 8 9 10 11 13 1412
Source: Thomson Financial Datastream.Note: For carry trades in the exchange rate market, the chart reports the ratio between three-month interest rate differentials and an average level - across currency pairs - of exchange rate implied volatility. For equity indices, it shows the return of the indices over the 1-year period between 22 October 2006 and 22 October 2007, divided by their implied volatility prevailing on 22 October 2007. All fi gures refer to 22 October 2007.
Chart 1.26 Speculative positions in JPY/USD futures and the JPY/USD exchange rate
(June 2006 - Oct. 2007)
June Sep. Dec. June Sep. Dec.Mar. June Sep.Mar.2005 2006 2007
200,000
150,000
100,000
50,000
0
-50,000
130
125
120
115
110
105
non-commercial net position in JPY/USD futures(number of contracts; left-hand scale)JPY/USD exchange rate (right -hand scale)
Source: Bloomberg.Note: Weekly fi gures. Last observation: 30 October 2007.
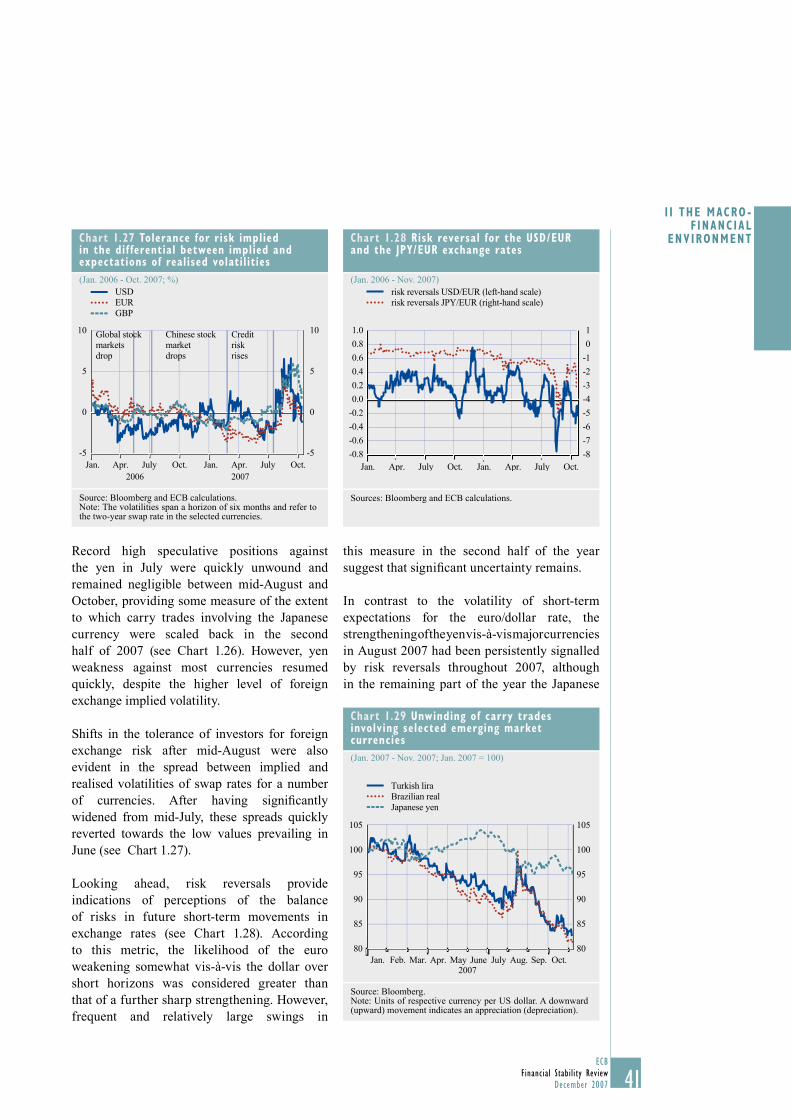
41ECB
Financial Stability ReviewDecember 2007
I I THE MACRO -F INANC IAL
ENVIRONMENT
41
Record high speculative positions against the yen in July were quickly unwound and remained negligible between mid-August and October, providing some measure of the extent to which carry trades involving the Japanese currency were scaled back in the second half of 2007 (see Chart 1.26). However, yen weakness against most currencies resumed quickly, despite the higher level of foreign exchange implied volatility.
Shifts in the tolerance of investors for foreign exchange risk after mid-August were also evident in the spread between implied and realised volatilities of swap rates for a number of currencies. After having signifi cantly widened from mid-July, these spreads quickly reverted towards the low values prevailing in June (see Chart 1.27).
Looking ahead, risk reversals provide indications of perceptions of the balance of risks in future short-term movements in exchange rates (see Chart 1.28). According to this metric, the likelihood of the euro weakening somewhat vis-à-vis the dollar over short horizons was considered greater than that of a further sharp strengthening. However, frequent and relatively large swings in
this measure in the second half of the year suggest that signifi cant uncertainty remains.
In contrast to the volatility of short-term expectations for the euro/dollar rate, the strengthening of the yen vis-à-vis major currencies in August 2007 had been persistently signalled by risk reversals throughout 2007, although in the remaining part of the year the Japanese
Chart 1.27 Tolerance for risk implied in the dif ferential between implied and expectations of realised volatil ities
(Jan. 2006 - Oct. 2007; %)
-5
0
5
10
-5
0
5
10
2007
USDEURGBP
Global stock markets drop
Chinese stock market drops
Credit risk rises
2006Jan. Apr. July Oct. Jan. Apr. July Oct.
Source: Bloomberg and ECB calculations. Note: The volatilities span a horizon of six months and refer to the two-year swap rate in the selected currencies.
Chart 1.28 Risk reversal for the USD/EUR and the JPY/EUR exchange rates
(Jan. 2006 - Nov. 2007)
-0.8
-0.6
-0.4
-0.2
0.0
0.2
0.4
0.6
0.8
1.0
-8
-7
-6
-5
-4
-3
-2
-1
0
1
risk reversals USD/EUR (left-hand scale)risk reversals JPY/EUR (right-hand scale)
Jan. Apr. July Oct. Jan. Apr. July Oct.
Sources: Bloomberg and ECB calculations.
Chart 1.29 Unwinding of carry trades involving selected emerging market currencies
(Jan. 2007 - Nov. 2007; Jan. 2007 = 100)
80
85
90
95
100
105
80
85
90
95
100
105
Turkish liraBrazilian realJapanese yen
Jan. Feb. Mar. May June July Aug. Sep. Oct.Apr.2007
Source: Bloomberg.Note: Units of respective currency per US dollar. A downward (upward) movement indicates an appreciation (depreciation).
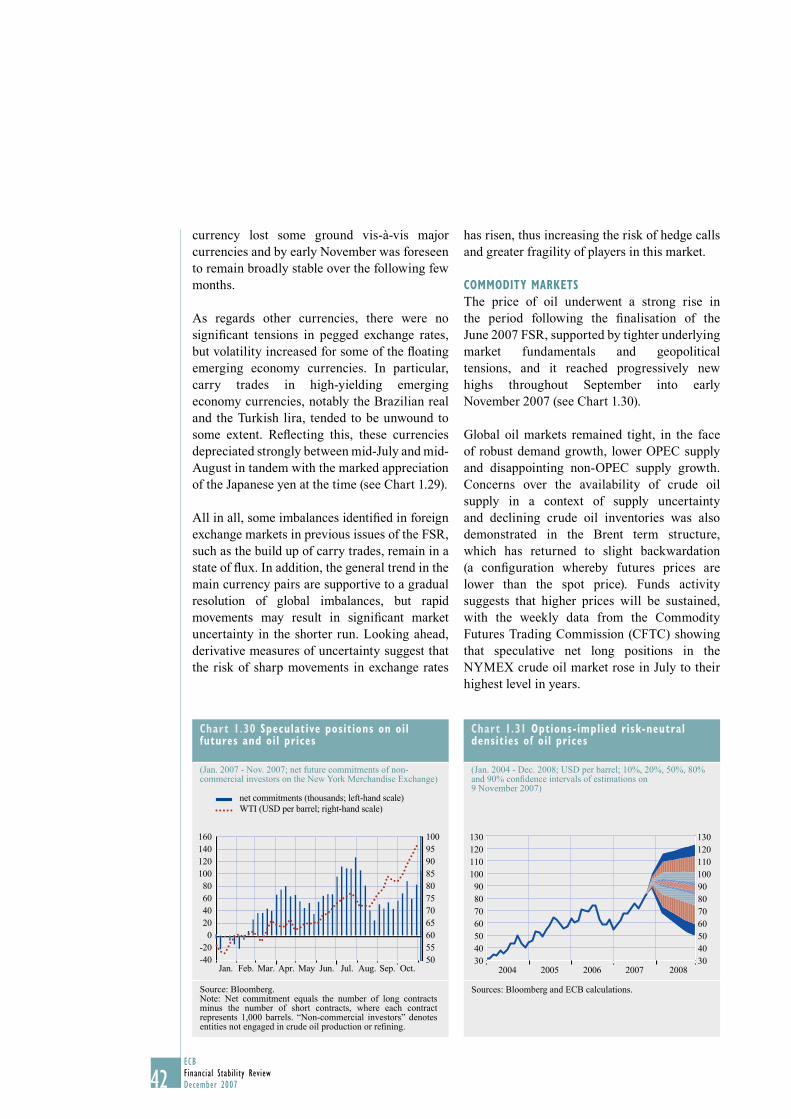
42ECBFinancial Stability ReviewDecember 2007
currency lost some ground vis-à-vis major currencies and by early November was foreseen to remain broadly stable over the following few months.
As regards other currencies, there were no signifi cant tensions in pegged exchange rates, but volatility increased for some of the fl oating emerging economy currencies. In particular, carry trades in high-yielding emerging economy currencies, notably the Brazilian real and the Turkish lira, tended to be unwound to some extent. Refl ecting this, these currencies depreciated strongly between mid-July and mid-August in tandem with the marked appreciation of the Japanese yen at the time (see Chart 1.29).
All in all, some imbalances identifi ed in foreign exchange markets in previous issues of the FSR, such as the build up of carry trades, remain in a state of fl ux. In addition, the general trend in the main currency pairs are supportive to a gradual resolution of global imbalances, but rapid movements may result in signifi cant market uncertainty in the shorter run. Looking ahead, derivative measures of uncertainty suggest that the risk of sharp movements in exchange rates
has risen, thus increasing the risk of hedge calls and greater fragility of players in this market.
COMMODITY MARKETS
The price of oil underwent a strong rise in the period following the fi nalisation of the June 2007 FSR, supported by tighter underlying market fundamentals and geopolitical tensions, and it reached progressively new highs throughout September into early November 2007 (see Chart 1.30).
Global oil markets remained tight, in the face of robust demand growth, lower OPEC supply and disappointing non-OPEC supply growth. Concerns over the availability of crude oil supply in a context of supply uncertainty and declining crude oil inventories was also demonstrated in the Brent term structure, which has returned to slight backwardation (a confi guration whereby futures prices are lower than the spot price). Funds activity suggests that higher prices will be sustained, with the weekly data from the Commodity Futures Trading Commission (CFTC) showing that speculative net long positions in the NYMEX crude oil market rose in July to their highest level in years.
Chart 1.30 Speculative positions on oil futures and oil prices
(Jan. 2007 - Nov. 2007; net future commitments of non-commercial investors on the New York Merchandise Exchange)
16014012010080604020
-20-40
0
1009590
8075706560
5055
85
net commitments (thousands; left-hand scale)WTI (USD per barrel; right-hand scale)
Jan. Mar. Jun.Feb. May Jul. Aug. Sep. Oct.Apr.
Source: Bloomberg.Note: Net commitment equals the number of long contracts minus the number of short contracts, where each contract represents 1,000 barrels. “Non-commercial investors” denotes entities not engaged in crude oil production or refi ning.
Chart 1.31 Options-implied risk-neutral densities of oil prices
(Jan. 2004 - Dec. 2008; USD per barrel; 10%, 20%, 50%, 80% and 90% confi dence intervals of estimations on 9 November 2007)
30405060708090
100110120130
30405060708090100110120130
20082004 2005 2006 2007
Sources: Bloomberg and ECB calculations.
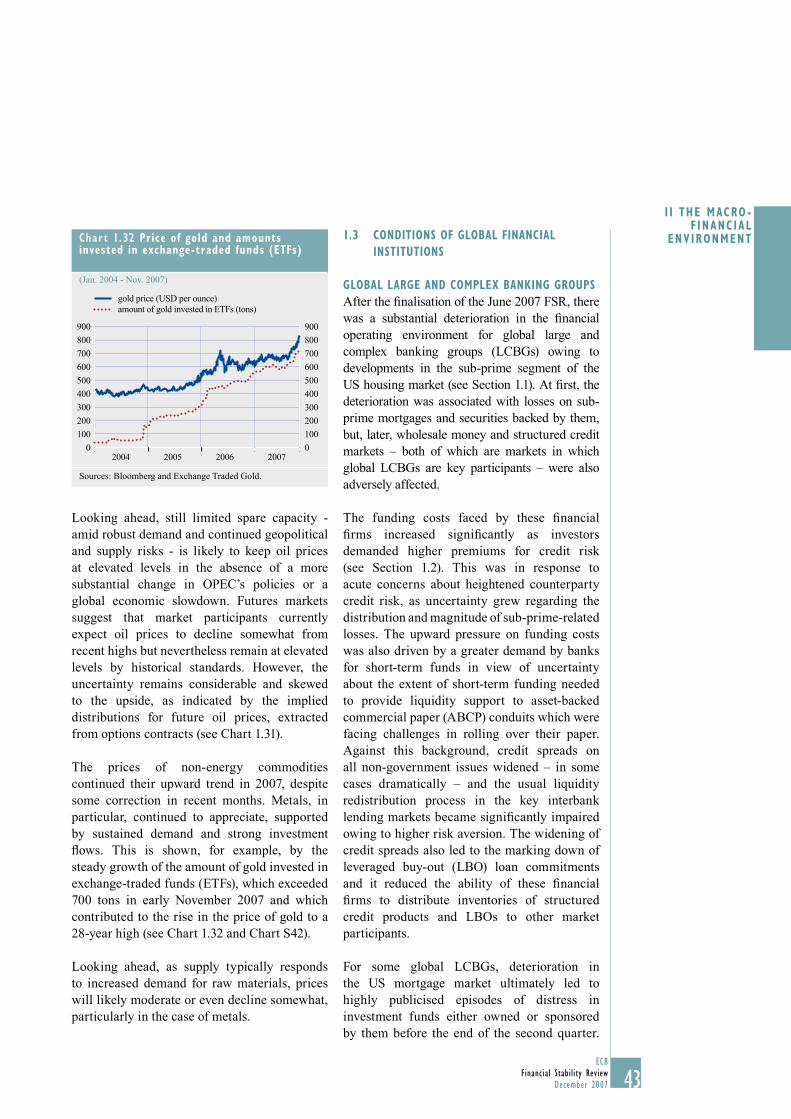
43ECB
Financial Stability ReviewDecember 2007
I I THE MACRO -F INANC IAL
ENVIRONMENT
43
Looking ahead, still limited spare capacity - amid robust demand and continued geopolitical and supply risks - is likely to keep oil prices at elevated levels in the absence of a more substantial change in OPEC’s policies or a global economic slowdown. Futures markets suggest that market participants currently expect oil prices to decline somewhat from recent highs but nevertheless remain at elevated levels by historical standards. However, the uncertainty remains considerable and skewed to the upside, as indicated by the implied distributions for future oil prices, extracted from options contracts (see Chart 1.31).
The prices of non-energy commodities continued their upward trend in 2007, despite some correction in recent months. Metals, in particular, continued to appreciate, supported by sustained demand and strong investment fl ows. This is shown, for example, by the steady growth of the amount of gold invested in exchange-traded funds (ETFs), which exceeded 700 tons in early November 2007 and which contributed to the rise in the price of gold to a 28-year high (see Chart 1.32 and Chart S42).
Looking ahead, as supply typically responds to increased demand for raw materials, prices will likely moderate or even decline somewhat, particularly in the case of metals.
1.3 CONDITIONS OF GLOBAL FINANCIAL
INSTITUTIONS
GLOBAL LARGE AND COMPLEX BANKING GROUPS
After the fi nalisation of the June 2007 FSR, there was a substantial deterioration in the fi nancial operating environment for global large and complex banking groups (LCBGs) owing to developments in the sub-prime segment of the US housing market (see Section 1.1). At fi rst, the deterioration was associated with losses on sub-prime mortgages and securities backed by them, but, later, wholesale money and structured credit markets – both of which are markets in which global LCBGs are key participants – were also adversely affected.
The funding costs faced by these fi nancial fi rms increased signifi cantly as investors demanded higher premiums for credit risk (see Section 1.2). This was in response to acute concerns about heightened counterparty credit risk, as uncertainty grew regarding the distribution and magnitude of sub-prime-related losses. The upward pressure on funding costs was also driven by a greater demand by banks for short-term funds in view of uncertainty about the extent of short-term funding needed to provide liquidity support to asset-backed commercial paper (ABCP) conduits which were facing challenges in rolling over their paper. Against this background, credit spreads on all non-government issues widened – in some cases dramatically – and the usual liquidity redistribution process in the key interbank lending markets became signifi cantly impaired owing to higher risk aversion. The widening of credit spreads also led to the marking down of leveraged buy-out (LBO) loan commitments and it reduced the ability of these fi nancial fi rms to distribute inventories of structured credit products and LBOs to other market participants.
For some global LCBGs, deterioration in the US mortgage market ultimately led to highly publicised episodes of distress in investment funds either owned or sponsored by them before the end of the second quarter.
Chart 1.32 Price of gold and amounts invested in exchange-traded funds (ETFs)
(Jan. 2004 - Nov. 2007)
0
100
200
300
400
500
600
700
800
900
0
100
200
300
400
500
600
700
800
900
2007
gold price (USD per ounce)amount of gold invested in ETFs (tons)
2004 2005 2006
Sources: Bloomberg and Exchange Traded Gold.
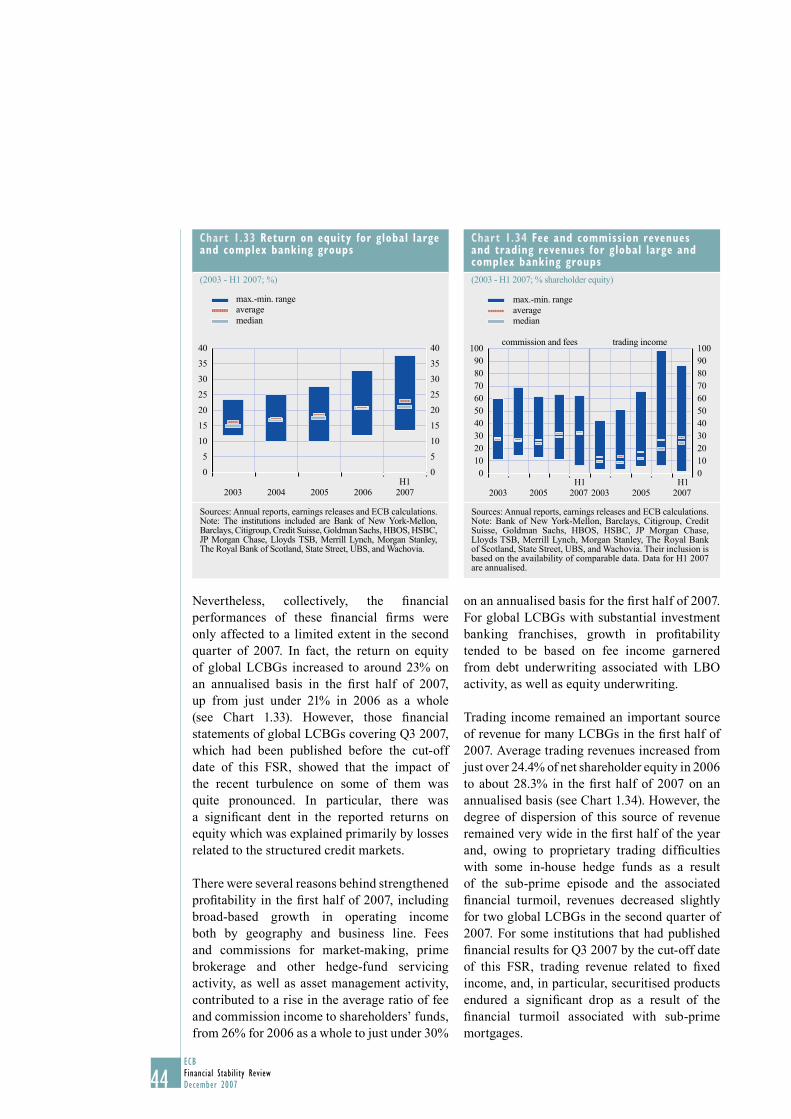
44ECBFinancial Stability ReviewDecember 2007
Nevertheless, collectively, the fi nancial performances of these fi nancial fi rms were only affected to a limited extent in the second quarter of 2007. In fact, the return on equity of global LCBGs increased to around 23% on an annualised basis in the fi rst half of 2007, up from just under 21% in 2006 as a whole (see Chart 1.33). However, those fi nancial statements of global LCBGs covering Q3 2007, which had been published before the cut-off date of this FSR, showed that the impact of the recent turbulence on some of them was quite pronounced. In particular, there was a signifi cant dent in the reported returns on equity which was explained primarily by losses related to the structured credit markets.
There were several reasons behind strengthened profi tability in the fi rst half of 2007, including broad-based growth in operating income both by geography and business line. Fees and commissions for market-making, prime brokerage and other hedge-fund servicing activity, as well as asset management activity, contributed to a rise in the average ratio of fee and commission income to shareholders’ funds, from 26% for 2006 as a whole to just under 30%
on an annualised basis for the fi rst half of 2007. For global LCBGs with substantial investment banking franchises, growth in profi tability tended to be based on fee income garnered from debt underwriting associated with LBO activity, as well as equity underwriting.
Trading income remained an important source of revenue for many LCBGs in the fi rst half of 2007. Average trading revenues increased from just over 24.4% of net shareholder equity in 2006 to about 28.3% in the fi rst half of 2007 on an annualised basis (see Chart 1.34). However, the degree of dispersion of this source of revenue remained very wide in the fi rst half of the year and, owing to proprietary trading diffi culties with some in-house hedge funds as a result of the sub-prime episode and the associated fi nancial turmoil, revenues decreased slightly for two global LCBGs in the second quarter of 2007. For some institutions that had published fi nancial results for Q3 2007 by the cut-off date of this FSR, trading revenue related to fi xed income, and, in particular, securitised products endured a signifi cant drop as a result of the fi nancial turmoil associated with sub-prime mortgages.
Chart 1.34 Fee and commission revenues and trading revenues for global large and complex banking groups
(2003 - H1 2007; % shareholder equity)
0102030405060708090
100
0102030405060708090100
max.-min. range
medianaverage
2003 2005H1
2007 2003 2005H1
2007
commission and fees trading income
Sources: Annual reports, earnings releases and ECB calculations.Note: Bank of New York-Mellon, Barclays, Citigroup, Credit Suisse, Goldman Sachs, HBOS, HSBC, JP Morgan Chase, Lloyds TSB, Merrill Lynch, Morgan Stanley, The Royal Bank of Scotland, State Street, UBS, and Wachovia. Their inclusion is based on the availability of comparable data. Data for H1 2007 are annualised.
Chart 1.33 Return on equity for global large and complex banking groups
(2003 - H1 2007; %)
0
5
10
15
20
25
30
35
40
0
5
10
15
20
25
30
35
40
max.-min. rangeaveragemedian
2003 2004 2005 2006H1
2007
Sources: Annual reports, earnings releases and ECB calculations.Note: The institutions included are Bank of New York-Mellon, Barclays, Citigroup, Credit Suisse, Goldman Sachs, HBOS, HSBC, JP Morgan Chase, Lloyds TSB, Merrill Lynch, Morgan Stanley, The Royal Bank of Scotland, State Street, UBS, and Wachovia.
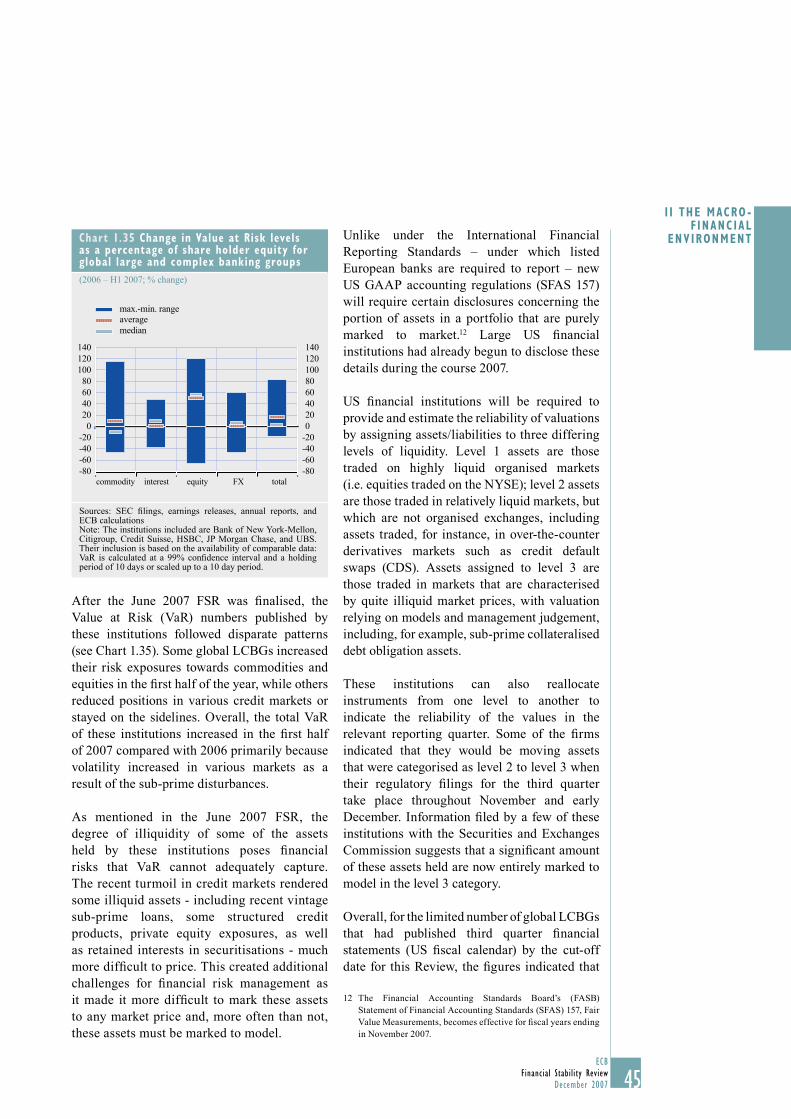
45ECB
Financial Stability ReviewDecember 2007
I I THE MACRO -F INANC IAL
ENVIRONMENT
45
After the June 2007 FSR was fi nalised, the Value at Risk (VaR) numbers published by these institutions followed disparate patterns (see Chart 1.35). Some global LCBGs increased their risk exposures towards commodities and equities in the fi rst half of the year, while others reduced positions in various credit markets or stayed on the sidelines. Overall, the total VaR of these institutions increased in the fi rst half of 2007 compared with 2006 primarily because volatility increased in various markets as a result of the sub-prime disturbances.
As mentioned in the June 2007 FSR, the degree of illiquidity of some of the assets held by these institutions poses fi nancial risks that VaR cannot adequately capture. The recent turmoil in credit markets rendered some illiquid assets - including recent vintage sub-prime loans, some structured credit products, private equity exposures, as well as retained interests in securitisations - much more diffi cult to price. This created additional challenges for fi nancial risk management as it made it more diffi cult to mark these assets to any market price and, more often than not, these assets must be marked to model.
Unlike under the International Financial Reporting Standards – under which listed European banks are required to report – new US GAAP accounting regulations (SFAS 157) will require certain disclosures concerning the portion of assets in a portfolio that are purely marked to market.12 Large US fi nancial institutions had already begun to disclose these details during the course 2007.
US fi nancial institutions will be required to provide and estimate the reliability of valuations by assigning assets/liabilities to three differing levels of liquidity. Level 1 assets are those traded on highly liquid organised markets (i.e. equities traded on the NYSE); level 2 assets are those traded in relatively liquid markets, but which are not organised exchanges, including assets traded, for instance, in over-the-counter derivatives markets such as credit default swaps (CDS). Assets assigned to level 3 are those traded in markets that are characterised by quite illiquid market prices, with valuation relying on models and management judgement, including, for example, sub-prime collateralised debt obligation assets.
These institutions can also reallocate instruments from one level to another to indicate the reliability of the values in the relevant reporting quarter. Some of the fi rms indicated that they would be moving assets that were categorised as level 2 to level 3 when their regulatory fi lings for the third quarter take place throughout November and early December. Information fi led by a few of these institutions with the Securities and Exchanges Commission suggests that a signifi cant amount of these assets held are now entirely marked to model in the level 3 category.
Overall, for the limited number of global LCBGs that had published third quarter fi nancial statements (US fi scal calendar) by the cut-off date for this Review, the fi gures indicated that
The Financial Accounting Standards Board’s (FASB) 12 Statement of Financial Accounting Standards (SFAS) 157, Fair Value Measurements, becomes effective for fi scal years ending in November 2007.
Chart 1.35 Change in Value at Risk levels as a percentage of share holder equity for global large and complex banking groups
(2006 – H1 2007; % change)
-80-60-40-20
020406080
100120140
-80-60-40-20020406080100120140
max.-min. rangeaveragemedian
commodity interest equity FX total
Sources: SEC fi lings, earnings releases, annual reports, and ECB calculationsNote: The institutions included are Bank of New York-Mellon, Citigroup, Credit Suisse, HSBC, JP Morgan Chase, and UBS. Their inclusion is based on the availability of comparable data: VaR is calculated at a 99% confi dence interval and a holding period of 10 days or scaled up to a 10 day period.
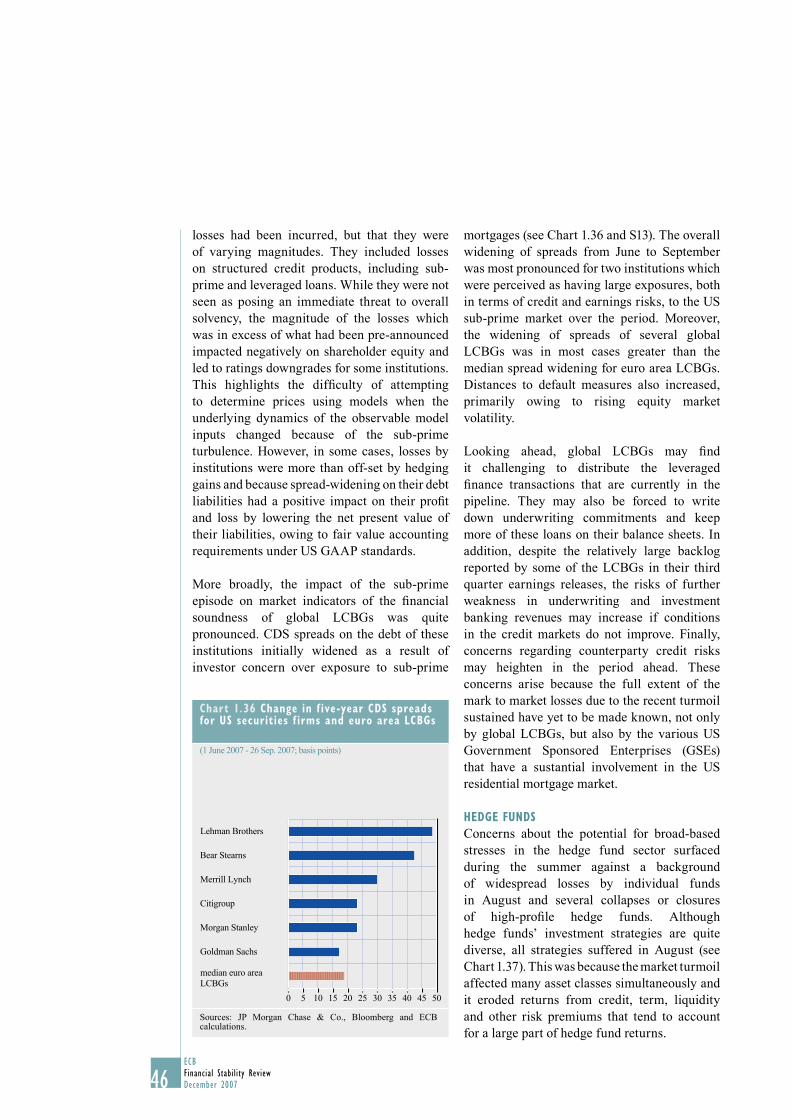
46ECBFinancial Stability ReviewDecember 2007
losses had been incurred, but that they were of varying magnitudes. They included losses on structured credit products, including sub-prime and leveraged loans. While they were not seen as posing an immediate threat to overall solvency, the magnitude of the losses which was in excess of what had been pre-announced impacted negatively on shareholder equity and led to ratings downgrades for some institutions. This highlights the diffi culty of attempting to determine prices using models when the underlying dynamics of the observable model inputs changed because of the sub-prime turbulence. However, in some cases, losses by institutions were more than off-set by hedging gains and because spread-widening on their debt liabilities had a positive impact on their profi t and loss by lowering the net present value of their liabilities, owing to fair value accounting requirements under US GAAP standards.
More broadly, the impact of the sub-prime episode on market indicators of the fi nancial soundness of global LCBGs was quite pronounced. CDS spreads on the debt of these institutions initially widened as a result of investor concern over exposure to sub-prime
mortgages (see Chart 1.36 and S13). The overall widening of spreads from June to September was most pronounced for two institutions which were perceived as having large exposures, both in terms of credit and earnings risks, to the US sub-prime market over the period. Moreover, the widening of spreads of several global LCBGs was in most cases greater than the median spread widening for euro area LCBGs. Distances to default measures also increased, primarily owing to rising equity market volatility.
Looking ahead, global LCBGs may fi nd it challenging to distribute the leveraged fi nance transactions that are currently in the pipeline. They may also be forced to write down underwriting commitments and keep more of these loans on their balance sheets. In addition, despite the relatively large backlog reported by some of the LCBGs in their third quarter earnings releases, the risks of further weakness in underwriting and investment banking revenues may increase if conditions in the credit markets do not improve. Finally, concerns regarding counterparty credit risks may heighten in the period ahead. These concerns arise because the full extent of the mark to market losses due to the recent turmoil sustained have yet to be made known, not only by global LCBGs, but also by the various US Government Sponsored Enterprises (GSEs) that have a sustantial involvement in the US residential mortgage market.
HEDGE FUNDS
Concerns about the potential for broad-based stresses in the hedge fund sector surfaced during the summer against a background of widespread losses by individual funds in August and several collapses or closures of high-profi le hedge funds. Although hedge funds’ investment strategies are quite diverse, all strategies suffered in August (see Chart 1.37). This was because the market turmoil affected many asset classes simultaneously and it eroded returns from credit, term, liquidity and other risk premiums that tend to account for a large part of hedge fund returns.
Chart 1.36 Change in f ive-year CDS spreads for US securities f irms and euro area LCBGs
(1 June 2007 - 26 Sep. 2007; basis points)
0 5 10 15 20 25 30 35 40 45 50
Lehman Brothers
Bear Stearns
Merrill Lynch
Citigroup
Morgan Stanley
Goldman Sachs
median euro areaLCBGs
Sources: JP Morgan Chase & Co., Bloomberg and ECB calculations.
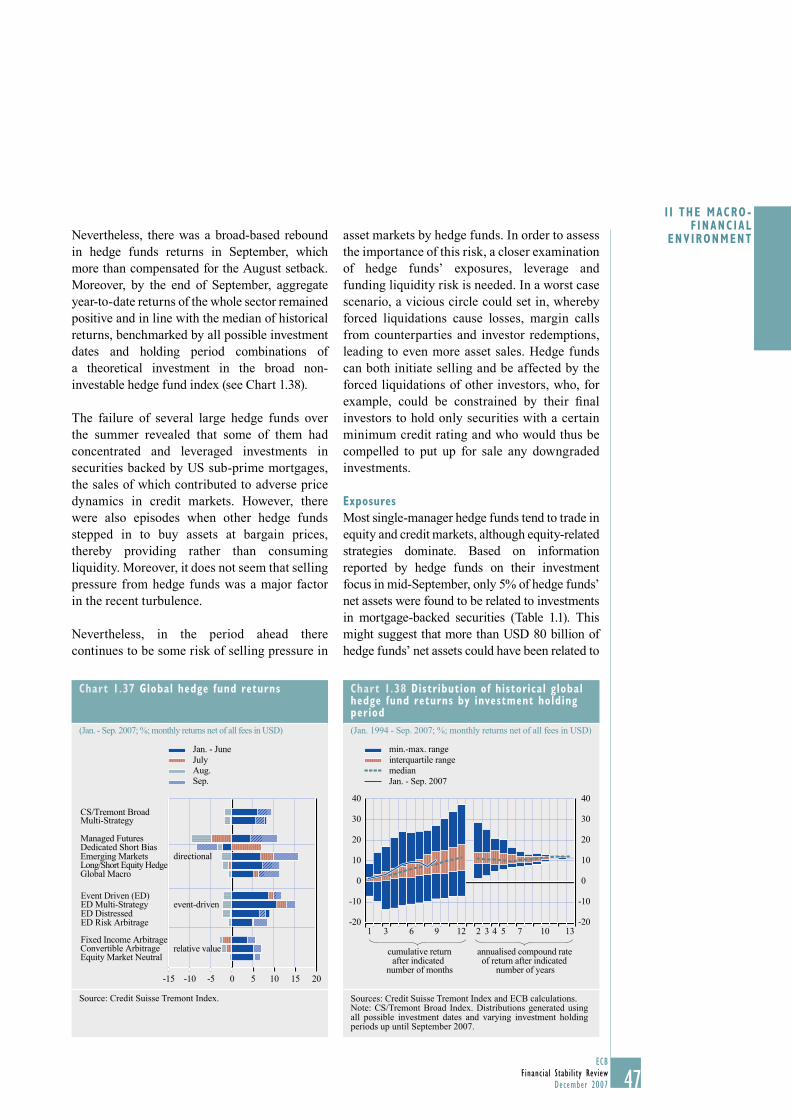
47ECB
Financial Stability ReviewDecember 2007
I I THE MACRO -F INANC IAL
ENVIRONMENT
47
Nevertheless, there was a broad-based rebound in hedge funds returns in September, which more than compensated for the August setback. Moreover, by the end of September, aggregate year-to-date returns of the whole sector remained positive and in line with the median of historical returns, benchmarked by all possible investment dates and holding period combinations of a theoretical investment in the broad non-investable hedge fund index (see Chart 1.38).
The failure of several large hedge funds over the summer revealed that some of them had concentrated and leveraged investments in securities backed by US sub-prime mortgages, the sales of which contributed to adverse price dynamics in credit markets. However, there were also episodes when other hedge funds stepped in to buy assets at bargain prices, thereby providing rather than consuming liquidity. Moreover, it does not seem that selling pressure from hedge funds was a major factor in the recent turbulence.
Nevertheless, in the period ahead there continues to be some risk of selling pressure in
asset markets by hedge funds. In order to assess the importance of this risk, a closer examination of hedge funds’ exposures, leverage and funding liquidity risk is needed. In a worst case scenario, a vicious circle could set in, whereby forced liquidations cause losses, margin calls from counterparties and investor redemptions, leading to even more asset sales. Hedge funds can both initiate selling and be affected by the forced liquidations of other investors, who, for example, could be constrained by their fi nal investors to hold only securities with a certain minimum credit rating and who would thus be compelled to put up for sale any downgraded investments.
Exposures
Most single-manager hedge funds tend to trade in equity and credit markets, although equity-related strategies dominate. Based on information reported by hedge funds on their investment focus in mid-September, only 5% of hedge funds’ net assets were found to be related to investments in mortgage-backed securities (Table 1.1). This might suggest that more than USD 80 billion of hedge funds’ net assets could have been related to
Chart 1.37 Global hedge fund returns
(Jan. - Sep. 2007; %; monthly returns net of all fees in USD)
Event Driven (ED)
Global Macro
Jan. - JuneJulyAug.Sep.
relative value
directional
event-driven
-15 -10 -5 0 5 10 15 20
CS/Tremont BroadMulti-Strategy
Managed FuturesDedicated Short BiasEmerging MarketsLong/Short Equity Hedge
Fixed Income ArbitrageConvertible ArbitrageEquity Market Neutral
ED Risk ArbitrageED DistressedED Multi-Strategy
Source: Credit Suisse Tremont Index.
Chart 1.38 Distribution of historical global hedge fund returns by investment holding period
(Jan. 1994 - Sep. 2007; %; monthly returns net of all fees in USD)
cumulative returnafter indicated
number of months
annualised compound rate of return after indicated
number of years
-20
-10
0
10
20
30
40
-10
0
10
20
30
40
min.-max. rangeinterquartile rangemedianJan. - Sep. 2007
-201 3 6 9 12 2 3 4 5 7 10 13
Sources: Credit Suisse Tremont Index and ECB calculations.Note: CS/Tremont Broad Index. Distributions generated using all possible investment dates and varying investment holding periods up until September 2007.
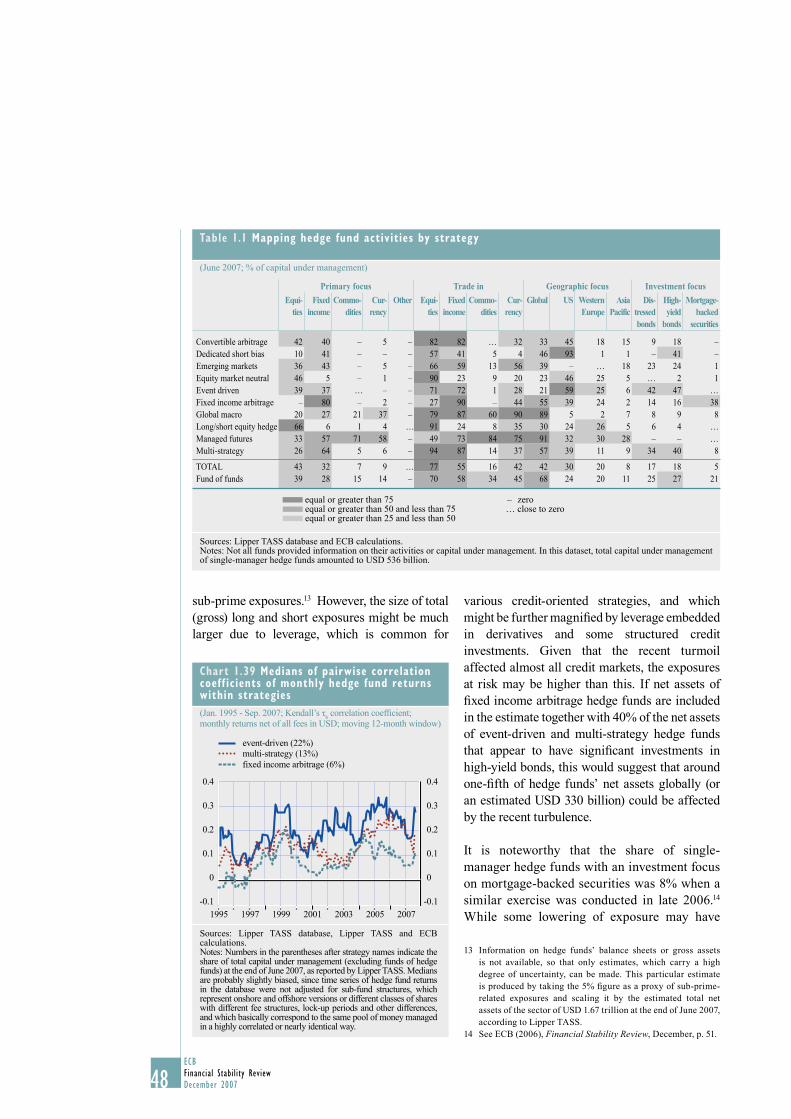
48ECBFinancial Stability ReviewDecember 2007
sub-prime exposures.13 However, the size of total (gross) long and short exposures might be much larger due to leverage, which is common for
various credit-oriented strategies, and which might be further magnifi ed by leverage embedded in derivatives and some structured credit investments. Given that the recent turmoil affected almost all credit markets, the exposures at risk may be higher than this. If net assets of fi xed income arbitrage hedge funds are included in the estimate together with 40% of the net assets of event-driven and multi-strategy hedge funds that appear to have signifi cant investments in high-yield bonds, this would suggest that around one-fi fth of hedge funds’ net assets globally (or an estimated USD 330 billion) could be affected by the recent turbulence.
It is noteworthy that the share of single-manager hedge funds with an investment focus on mortgage-backed securities was 8% when a similar exercise was conducted in late 2006.14 While some lowering of exposure may have
Information on hedge funds’ balance sheets or gross assets 13 is not available, so that only estimates, which carry a high degree of uncertainty, can be made. This particular estimate is produced by taking the 5% fi gure as a proxy of sub-prime-related exposures and scaling it by the estimated total net assets of the sector of USD 1.67 trillion at the end of June 2007, according to Lipper TASS.See ECB (2006), 14 Financial Stability Review, December, p. 51.
Chart 1.39 Medians of pairwise correlation coeff icients of monthly hedge fund returns within strategies
(Jan. 1995 - Sep. 2007; Kendall’s τb correlation coeffi cient;
monthly returns net of all fees in USD; moving 12-month window)
-0.1
0
0.1
0.2
0.3
0.4
-0.1
0
0.1
0.2
0.3
0.4
event-driven (22%)multi-strategy (13%)fixed income arbitrage (6%)
1995 1997 1999 2001 2003 2005 2007
Sources: Lipper TASS database, Lipper TASS and ECB calculations.Notes: Numbers in the parentheses after strategy names indicate the share of total capital under management (excluding funds of hedge funds) at the end of June 2007, as reported by Lipper TASS. Medians are probably slightly biased, since time series of hedge fund returns in the database were not adjusted for sub-fund structures, which represent onshore and offshore versions or different classes of shares with different fee structures, lock-up periods and other differences, and which basically correspond to the same pool of money managed in a highly correlated or nearly identical way.
Table 1.1 Mapping hedge fund activities by strategy
(June 2007; % of capital under management)
Primary focus Trade in Geographic focus Investment focus
Equi -ties
Fixed income
Commo-dities
Cur -rency
Other Equi -ties
Fixed income
Commo-dities
Cur-rency
Global US Western Europe
Asia Pacific
Dis- tre ssed bonds
High-yield
bonds
Mortgage-backed
securities
Convertible arbitrage 42 40 – 5 – 82 82 … 32 33 45 18 15 9 18 –Dedicated short bias 10 41 – – – 57 41 5 4 46 93 1 1 – 41 –Emerging markets 36 43 – 5 – 66 59 13 56 39 – … 18 23 24 1Equity market neutral 46 5 – 1 – 90 23 9 20 23 46 25 5 … 2 1Event driven 39 37 … – – 71 72 1 28 21 59 25 6 42 47 …Fixed income arbitrage – 80 – 2 – 27 90 – 44 55 39 24 2 14 16 38Global macro 20 27 21 37 – 79 87 60 90 89 5 2 7 8 9 8Long/short equity hedge 66 6 1 4 … 91 24 8 35 30 24 26 5 6 4 …Managed futures 33 57 71 58 – 49 73 84 75 91 32 30 28 – – …Multi-strategy 26 64 5 6 – 94 87 14 37 57 39 11 9 34 40 8
TOTAL 43 32 7 9 … 77 55 16 42 42 30 20 8 17 18 5Fund of funds 39 28 15 14 – 70 58 34 45 68 24 20 11 25 27 21
equal or greater than 75 – zero equal or greater than 50 and less than 75 … close to zero equal or greater than 25 and less than 50
Sources: Lipper TASS database and ECB calculations.Notes: Not all funds provided information on their activities or capital under management. In this dataset, total capital under management of single-manager hedge funds amounted to USD 536 billion.
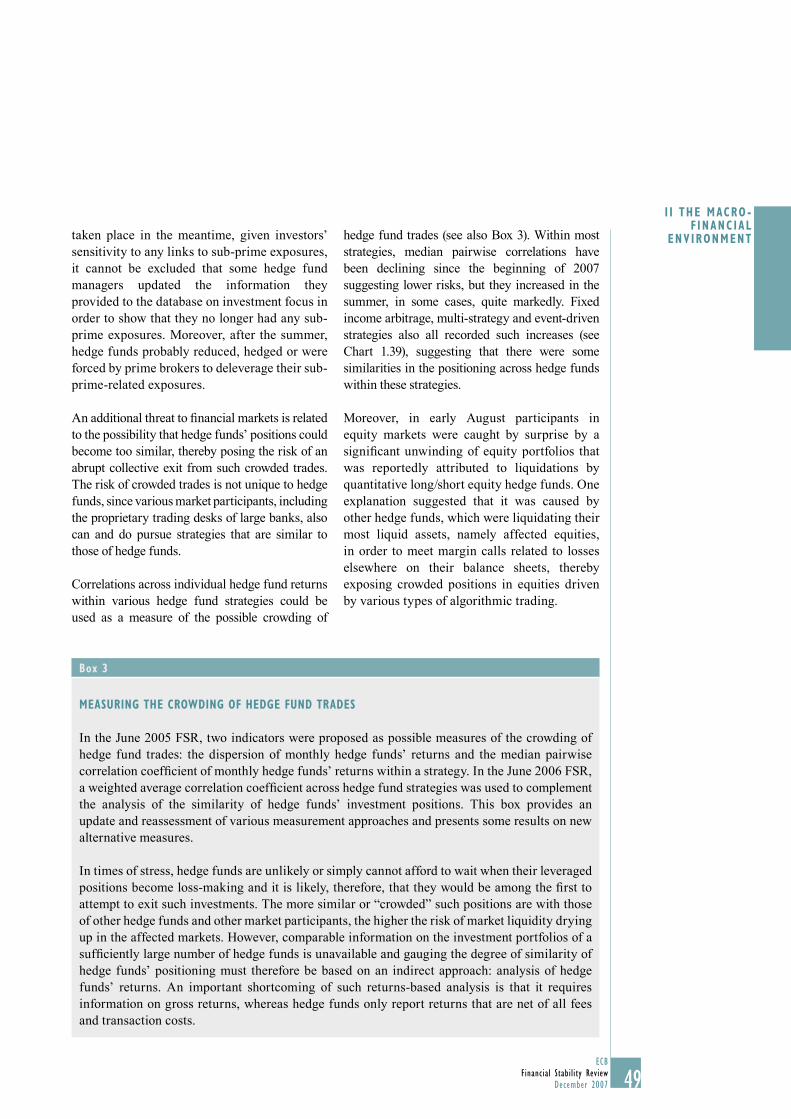
49ECB
Financial Stability ReviewDecember 2007
I I THE MACRO -F INANC IAL
ENVIRONMENT
49
Box 3
MEASURING THE CROWDING OF HEDGE FUND TRADES
In the June 2005 FSR, two indicators were proposed as possible measures of the crowding of hedge fund trades: the dispersion of monthly hedge funds’ returns and the median pairwise correlation coeffi cient of monthly hedge funds’ returns within a strategy. In the June 2006 FSR, a weighted average correlation coeffi cient across hedge fund strategies was used to complement the analysis of the similarity of hedge funds’ investment positions. This box provides an update and reassessment of various measurement approaches and presents some results on new alternative measures.
In times of stress, hedge funds are unlikely or simply cannot afford to wait when their leveraged positions become loss-making and it is likely, therefore, that they would be among the fi rst to attempt to exit such investments. The more similar or “crowded” such positions are with those of other hedge funds and other market participants, the higher the risk of market liquidity drying up in the affected markets. However, comparable information on the investment portfolios of a suffi ciently large number of hedge funds is unavailable and gauging the degree of similarity of hedge funds’ positioning must therefore be based on an indirect approach: analysis of hedge funds’ returns. An important shortcoming of such returns-based analysis is that it requires information on gross returns, whereas hedge funds only report returns that are net of all fees and transaction costs.
taken place in the meantime, given investors’ sensitivity to any links to sub-prime exposures, it cannot be excluded that some hedge fund managers updated the information they provided to the database on investment focus in order to show that they no longer had any sub-prime exposures. Moreover, after the summer, hedge funds probably reduced, hedged or were forced by prime brokers to deleverage their sub-prime-related exposures.
An additional threat to fi nancial markets is related to the possibility that hedge funds’ positions could become too similar, thereby posing the risk of an abrupt collective exit from such crowded trades. The risk of crowded trades is not unique to hedge funds, since various market participants, including the proprietary trading desks of large banks, also can and do pursue strategies that are similar to those of hedge funds.
Correlations across individual hedge fund returns within various hedge fund strategies could be used as a measure of the possible crowding of
hedge fund trades (see also Box 3). Within most strategies, median pairwise correlations have been declining since the beginning of 2007 suggesting lower risks, but they increased in the summer, in some cases, quite markedly. Fixed income arbitrage, multi-strategy and event-driven strategies also all recorded such increases (see Chart 1.39), suggesting that there were some similarities in the positioning across hedge funds within these strategies.
Moreover, in early August participants in equity markets were caught by surprise by a signifi cant unwinding of equity portfolios that was reportedly attributed to liquidations by quantitative long/short equity hedge funds. One explanation suggested that it was caused by other hedge funds, which were liquidating their most liquid assets, namely affected equities, in order to meet margin calls related to losses elsewhere on their balance sheets, thereby exposing crowded positions in equities driven by various types of algorithmic trading.

50ECBFinancial Stability ReviewDecember 2007
Recently, researchers have been devoting a lot of effort to explaining the sources of hedge funds’ returns using multi-factor models. Although this work is still ongoing, several fi nancial institutions have launched products that aim at replicating the returns of broad hedge fund indices more cheaply by investing in liquid traditional assets. The emergence of such products and the investor demand for them can be attributed to growing evidence that a signifi cant part of average hedge funds’ returns can be explained by time-varying exposures to traditional betas (e.g. stock and bond indices) and alternative betas, such as volatility or rule-based trading strategies.
Comparing and aggregating the coeffi cients (factor loadings) obtained from regressions of individual hedge funds’ returns on various risk factors could give an indication of the similarity of hedge funds’ exposures to selected risk factors and the size of such exposures relative to the size of the markets associated with chosen risk factors. However, to date, only the returns of broadly diversifi ed hedge fund indices have been replicated with some success owing to the fact that such broad indices average out idiosyncratic differences, leaving only exposures to a set of systematic risk factors. By contrast, the mimicking of returns of specifi c hedge fund investment strategies has not been as fruitful. Replicating the returns of a particular hedge fund is even more diffi cult, not least because of the non-linearity of returns, hedge funds’ ability to invest in illiquid assets and derivatives and to take short positions in a wide range of markets. As noted by Fung and Hsieh (1997), the return of any fund is a function of where it trades (asset class), how it trades (strategy), and the size of its trades (leverage).1 Furthermore, the returns of hedge funds may exhibit high co-movement during times of stress not only because they follow similar strategies and invest in the same assets, but also because they have the same type of liabilities towards a limited number of major prime brokers whose actions may force hedge fund managers to deleverage at the same time. As a result, any conclusion on the similarity of hedge funds’ exposures based on a regression analysis of returns will only be as good as the model used to estimate them.
To avoid model risk, another solution could be to compare hedge fund returns directly.2 The more similar and correlated the returns of hedge funds, the more likely their trades are crowded. However, for this kind of analysis it is important to select only relatively homogenous hedge funds, particularly in terms of investment strategy and leverage. Otherwise, a measure would also be capturing the correlations of the returns on different assets in which hedge funds invest. This is the main reason why average correlations across hedge fund strategies or across all hedge funds irrespective of their strategy are not appropriate indicators for the crowding of hedge funds’ trades. Nevertheless, they might be useful indicators for funds of hedge funds and other investors who seek to build diversifi ed portfolios of investments into single-manager hedge funds.
Regime-switching models applied to the indices of hedge fund strategies’ returns have also been proposed as measures of systemic risk in the hedge fund sector.3 When applied to the returns of individual hedge funds, the results of a regime-switching model would indicate when the selected hedge funds were in distress based on individually or jointly-specifi ed regime-switching processes. However, when two hedge funds are both in high-volatility and typically
1 See W. Fung and D. A. Hsieh (1997), “Empirical characteristics of dynamic trading strategies: the case of hedge funds”, Review of Financial Studies, No. 2, pp. 275-302.
2 See also T. Garbaravicius and F. Dierick (2005), “Hedge funds and their implications for fi nancial stability”, ECB Occasional Paper, No. 34, August.
3 See N. Chan, M. Getmansky, S. M. Haas and A. W. Lo (2006), “Do Hedge Funds Increase Systemic Risk?”, Federal Reserve Bank of Atlanta, Economic Review, Vol. 91, No. 4, pp. 49-80.
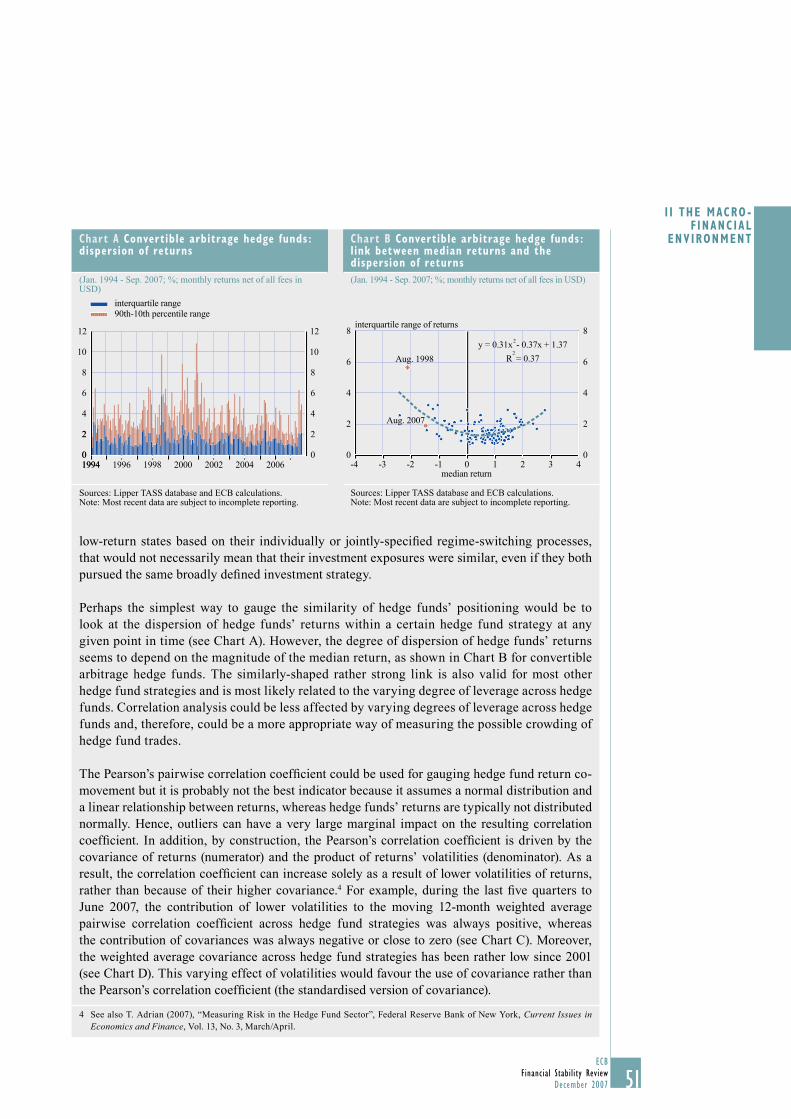
51ECB
Financial Stability ReviewDecember 2007
I I THE MACRO -F INANC IAL
ENVIRONMENT
51
low-return states based on their individually or jointly-specifi ed regime-switching processes, that would not necessarily mean that their investment exposures were similar, even if they both pursued the same broadly defi ned investment strategy.
Perhaps the simplest way to gauge the similarity of hedge funds’ positioning would be to look at the dispersion of hedge funds’ returns within a certain hedge fund strategy at any given point in time (see Chart A). However, the degree of dispersion of hedge funds’ returns seems to depend on the magnitude of the median return, as shown in Chart B for convertible arbitrage hedge funds. The similarly-shaped rather strong link is also valid for most other hedge fund strategies and is most likely related to the varying degree of leverage across hedge funds. Correlation analysis could be less affected by varying degrees of leverage across hedge funds and, therefore, could be a more appropriate way of measuring the possible crowding of hedge fund trades.
The Pearson’s pairwise correlation coeffi cient could be used for gauging hedge fund return co-movement but it is probably not the best indicator because it assumes a normal distribution and a linear relationship between returns, whereas hedge funds’ returns are typically not distributed normally. Hence, outliers can have a very large marginal impact on the resulting correlation coeffi cient. In addition, by construction, the Pearson’s correlation coeffi cient is driven by the covariance of returns (numerator) and the product of returns’ volatilities (denominator). As a result, the correlation coeffi cient can increase solely as a result of lower volatilities of returns, rather than because of their higher covariance.4 For example, during the last fi ve quarters to June 2007, the contribution of lower volatilities to the moving 12-month weighted average pairwise correlation coeffi cient across hedge fund strategies was always positive, whereas the contribution of covariances was always negative or close to zero (see Chart C). Moreover, the weighted average covariance across hedge fund strategies has been rather low since 2001 (see Chart D). This varying effect of volatilities would favour the use of covariance rather than the Pearson’s correlation coeffi cient (the standardised version of covariance).
4 See also T. Adrian (2007), “Measuring Risk in the Hedge Fund Sector”, Federal Reserve Bank of New York, Current Issues in Economics and Finance, Vol. 13, No. 3, March/April.
Chart A Convertible arbitrage hedge funds : dispersion of returns
(Jan. 1994 - Sep. 2007; %; monthly returns net of all fees in USD)
19940
2
0
2
4
6
8
10
12
0
2
4
6
8
10
12
interquartile range90th-10th percentile range
1994 1996 1998 2000 2002 2004 2006
Sources: Lipper TASS database and ECB calculations.Note: Most recent data are subject to incomplete reporting.
Chart B Convertible arbitrage hedge funds : link between median returns and the dispersion of returns
(Jan. 1994 - Sep. 2007; %; monthly returns net of all fees in USD)
2
0
4
6
8
2
0
4
6
8
4median return
Aug. 2007
Aug. 1998
y = 0.31x2 - 0.37x + 1.372
R = 0.37
-4 -3 -1-2 0 1 2 3
interquartile range of returns
Sources: Lipper TASS database and ECB calculations.Note: Most recent data are subject to incomplete reporting.
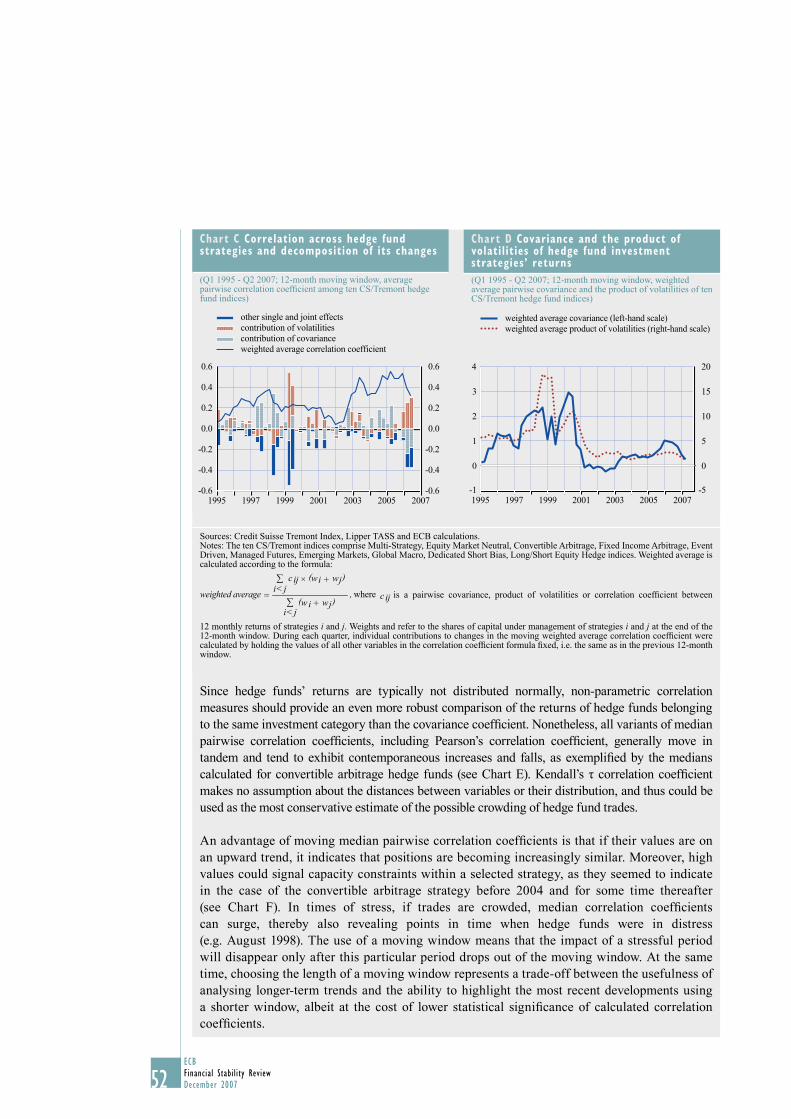
52ECBFinancial Stability ReviewDecember 2007
Since hedge funds’ returns are typically not distributed normally, non-parametric correlation measures should provide an even more robust comparison of the returns of hedge funds belonging to the same investment category than the covariance coeffi cient. Nonetheless, all variants of median pairwise correlation coeffi cients, including Pearson’s correlation coeffi cient, generally move in tandem and tend to exhibit contemporaneous increases and falls, as exemplifi ed by the medians calculated for convertible arbitrage hedge funds (see Chart E). Kendall’s τ correlation coeffi cient makes no assumption about the distances between variables or their distribution, and thus could be used as the most conservative estimate of the possible crowding of hedge fund trades.
An advantage of moving median pairwise correlation coeffi cients is that if their values are on an upward trend, it indicates that positions are becoming increasingly similar. Moreover, high values could signal capacity constraints within a selected strategy, as they seemed to indicate in the case of the convertible arbitrage strategy before 2004 and for some time thereafter (see Chart F). In times of stress, if trades are crowded, median correlation coeffi cients can surge, thereby also revealing points in time when hedge funds were in distress (e.g. August 1998). The use of a moving window means that the impact of a stressful period will disappear only after this particular period drops out of the moving window. At the same time, choosing the length of a moving window represents a trade-off between the usefulness of analysing longer-term trends and the ability to highlight the most recent developments using a shorter window, albeit at the cost of lower statistical signifi cance of calculated correlation coeffi cients.
Chart D Covariance and the product of volatilities of hedge fund investment strategies’ returns
(Q1 1995 - Q2 2007; 12-month moving window, weighted average pairwise covariance and the product of volatilities of ten CS/Tremont hedge fund indices)
weighted average covariance (left-hand scale)weighted average product of volatilities (right-hand scale)
4
0
1
2
3
0
5
10
15
20
2007-1 -51995 1997 1999 2001 2003 2005
Sources: Credit Suisse Tremont Index, Lipper TASS and ECB calculations.Notes: The ten CS/Tremont indices comprise Multi-Strategy, Equity Market Neutral, Convertible Arbitrage, Fixed Income Arbitrage, Event Driven, Managed Futures, Emerging Markets, Global Macro, Dedicated Short Bias, Long/Short Equity Hedge indices. Weighted average is calculated according to the formula:
( )
( )c,
ww
wwc
ij
jiji
jijiij
where∑ +
∑ +×
=
<
<weighted average is a pairwise covariance, product of volatilities or correlation coeffi cient between
12 monthly returns of strategies i and j. Weights and refer to the shares of capital under management of strategies i and j at the end of the 12-month window. During each quarter, individual contributions to changes in the moving weighted average correlation coeffi cient were calculated by holding the values of all other variables in the correlation coeffi cient formula fi xed, i.e. the same as in the previous 12-month window.
Chart C Correlation across hedge fund strategies and decomposition of its changes
(Q1 1995 - Q2 2007; 12-month moving window, average pairwise correlation coeffi cient among ten CS/Tremont hedge fund indices)
-0.6
-0.4
-0.2
0.0
0.2
0.4
0.6
-0.4
-0.2
0.0
0.2
0.4
0.6
other single and joint effectscontribution of volatilitiescontribution of covarianceweighted average correlation coefficient
-0.61995 1997 1999 2001 2003 2005 2007
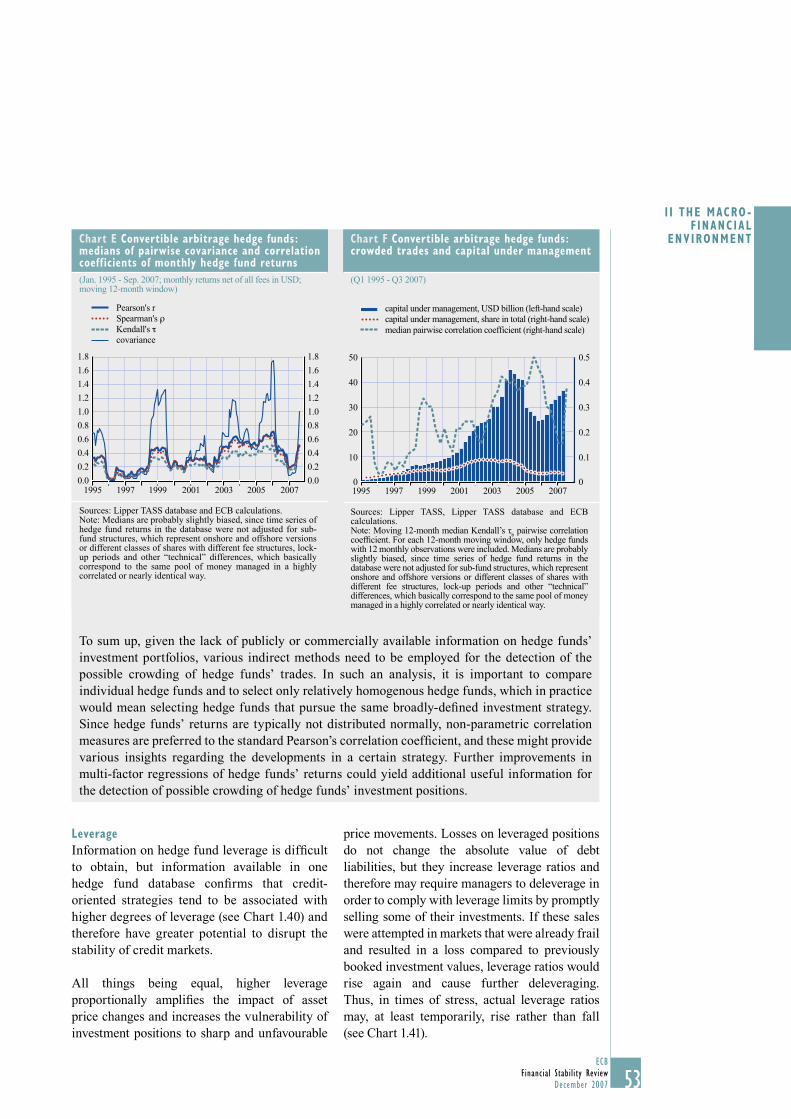
53ECB
Financial Stability ReviewDecember 2007
I I THE MACRO -F INANC IAL
ENVIRONMENT
53
To sum up, given the lack of publicly or commercially available information on hedge funds’ investment portfolios, various indirect methods need to be employed for the detection of the possible crowding of hedge funds’ trades. In such an analysis, it is important to compare individual hedge funds and to select only relatively homogenous hedge funds, which in practice would mean selecting hedge funds that pursue the same broadly-defi ned investment strategy. Since hedge funds’ returns are typically not distributed normally, non-parametric correlation measures are preferred to the standard Pearson’s correlation coeffi cient, and these might provide various insights regarding the developments in a certain strategy. Further improvements in multi-factor regressions of hedge funds’ returns could yield additional useful information for the detection of possible crowding of hedge funds’ investment positions.
Chart E Convertible arbitrage hedge funds: medians of pairwise covariance and correlation coefficients of monthly hedge fund returns
(Jan. 1995 - Sep. 2007; monthly returns net of all fees in USD; moving 12-month window)
Pearson's rSpearman's ρKendall's τcovariance
0.0
0.2
0.4
0.6
0.8
1.0
1.2
1.4
1.6
1.8
0.0
0.2
0.4
0.6
0.8
1.0
1.2
1.4
1.6
1.8
1995 1997 1999 2001 2003 2005 2007
Sources: Lipper TASS database and ECB calculations.Note: Medians are probably slightly biased, since time series of hedge fund returns in the database were not adjusted for sub-fund structures, which represent onshore and offshore versions or different classes of shares with different fee structures, lock-up periods and other “technical” differences, which basically correspond to the same pool of money managed in a highly correlated or nearly identical way.
Chart F Convertible arbitrage hedge funds: crowded trades and capital under management
(Q1 1995 - Q3 2007)
0
10
20
30
40
50
0
0.1
0.2
0.3
0.4
0.5
capital under management, USD billion (left-hand scale)capital under management, share in total (right-hand scale)median pairwise correlation coefficient (right-hand scale)
1995 1997 1999 2001 2003 2005 2007
Sources: Lipper TASS, Lipper TASS database and ECB calculations.Note: Moving 12-month median Kendall’s τ
b pairwise correlation
coeffi cient. For each 12-month moving window, only hedge funds with 12 monthly observations were included. Medians are probably slightly biased, since time series of hedge fund returns in the database were not adjusted for sub-fund structures, which represent onshore and offshore versions or different classes of shares with different fee structures, lock-up periods and other “technical” differences, which basically correspond to the same pool of money managed in a highly correlated or nearly identical way.
Leverage
Information on hedge fund leverage is diffi cult to obtain, but information available in one hedge fund database confi rms that credit-oriented strategies tend to be associated with higher degrees of leverage (see Chart 1.40) and therefore have greater potential to disrupt the stability of credit markets.
All things being equal, higher leverage proportionally amplifi es the impact of asset price changes and increases the vulnerability of investment positions to sharp and unfavourable
price movements. Losses on leveraged positions do not change the absolute value of debt liabilities, but they increase leverage ratios and therefore may require managers to deleverage in order to comply with leverage limits by promptly selling some of their investments. If these sales were attempted in markets that were already frail and resulted in a loss compared to previously booked investment values, leverage ratios would rise again and cause further deleveraging. Thus, in times of stress, actual leverage ratios may, at least temporarily, rise rather than fall (see Chart 1.41).
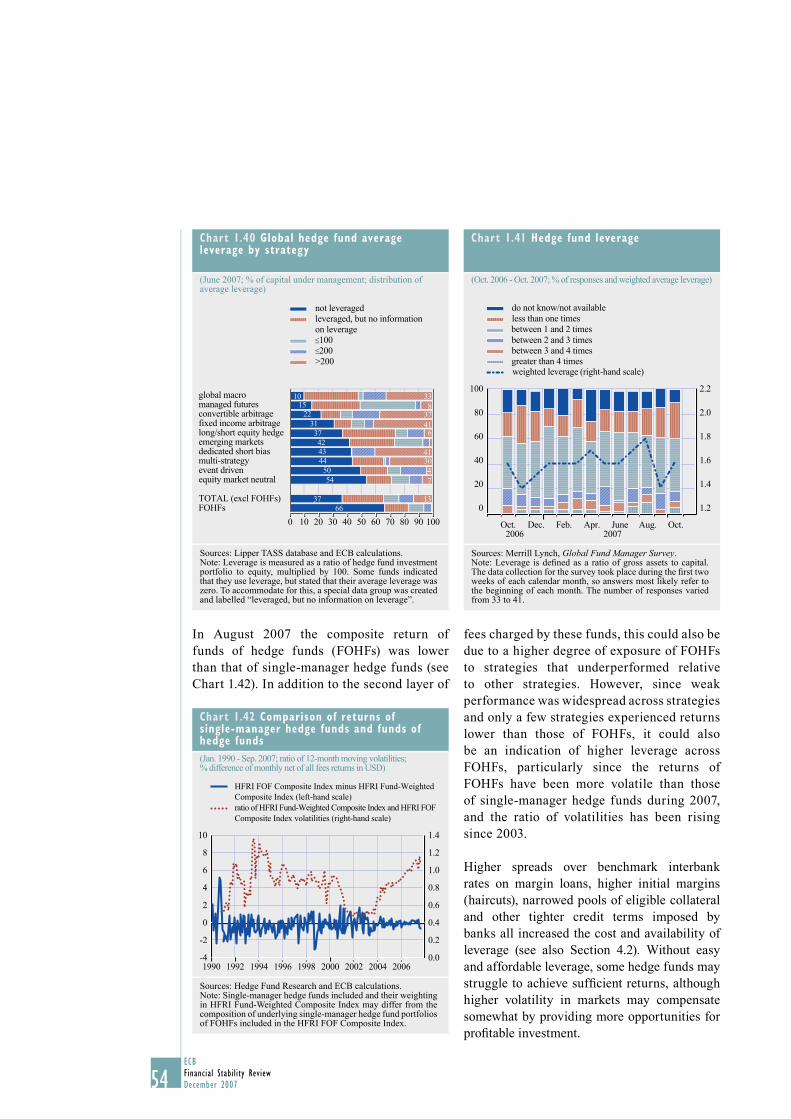
54ECBFinancial Stability ReviewDecember 2007
In August 2007 the composite return of funds of hedge funds (FOHFs) was lower than that of single-manager hedge funds (see Chart 1.42). In addition to the second layer of
fees charged by these funds, this could also be due to a higher degree of exposure of FOHFs to strategies that underperformed relative to other strategies. However, since weak performance was widespread across strategies and only a few strategies experienced returns lower than those of FOHFs, it could also be an indication of higher leverage across FOHFs, particularly since the returns of FOHFs have been more volatile than those of single-manager hedge funds during 2007, and the ratio of volatilities has been rising since 2003.
Higher spreads over benchmark interbank rates on margin loans, higher initial margins (haircuts), narrowed pools of eligible collateral and other tighter credit terms imposed by banks all increased the cost and availability of leverage (see also Section 4.2). Without easy and affordable leverage, some hedge funds may struggle to achieve suffi cient returns, although higher volatility in markets may compensate somewhat by providing more opportunities for profi table investment.
Chart 1.42 Comparison of returns of single-manager hedge funds and funds of hedge funds
(Jan. 1990 - Sep. 2007; ratio of 12-month moving volatilities;% difference of monthly net of all fees returns in USD)
-4
-2
0
2
4
6
8
10
0.0
0.2
0.4
0.6
0.8
1.0
1.2
1.4
HFRI FOF Composite Index minus HFRI Fund-WeightedComposite Index (left-hand scale)ratio of HFRI Fund-Weighted Composite Index and HFRI FOFComposite Index volatilities (right-hand scale)
1990 1992 1994 1996 1998 2000 2002 2004 2006
Sources: Hedge Fund Research and ECB calculations.Note: Single-manager hedge funds included and their weighting in HFRI Fund-Weighted Composite Index may differ from the composition of underlying single-manager hedge fund portfolios of FOHFs included in the HFRI FOF Composite Index.
Chart 1.40 Global hedge fund average leverage by strategy
(June 2007; % of capital under management; distribution of average leverage)
1015
223137424344
5054
3766
338
37416
413047
13
0 20 30 40 50 60 70 80 90 10010
not leveragedleveraged, but no informationon leverage100200
>200
global macromanaged futuresconvertible arbitragefixed income arbitragelong/short equity hedgeemerging marketsdedicated short biasmulti-strategyevent drivenequity market neutral
TOTAL (excl FOHFs)FOHFs
Sources: Lipper TASS database and ECB calculations. Note: Leverage is measured as a ratio of hedge fund investment portfolio to equity, multiplied by 100. Some funds indicated that they use leverage, but stated that their average leverage was zero. To accommodate for this, a special data group was created and labelled “leveraged, but no information on leverage”.
Chart 1.41 Hedge fund leverage
(Oct. 2006 - Oct. 2007; % of responses and weighted average leverage)
0
20
40
60
80
100
2006 2007
1.2
1.4
1.6
1.8
2.0
2.2
do not know/not availableless than one timesbetween 1 and 2 timesbetween 2 and 3 timesbetween 3 and 4 timesgreater than 4 timesweighted leverage
Oct. Dec. Feb. Apr. June Aug. Oct.
(right-hand scale)
Sources: Merrill Lynch, Global Fund Manager Survey. Note: Leverage is defi ned as a ratio of gross assets to capital. The data collection for the survey took place during the fi rst two weeks of each calendar month, so answers most likely refer to the beginning of each month. The number of responses varied from 33 to 41.
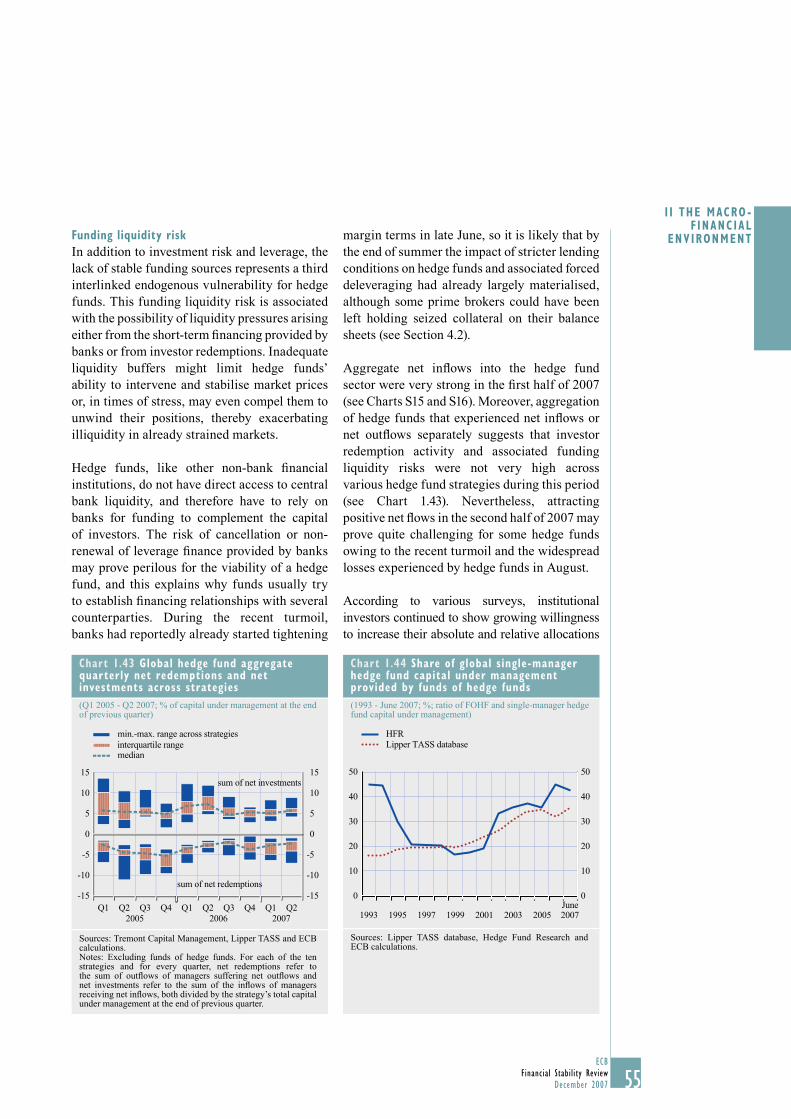
55ECB
Financial Stability ReviewDecember 2007
I I THE MACRO -F INANC IAL
ENVIRONMENT
55
Funding liquidity risk
In addition to investment risk and leverage, the lack of stable funding sources represents a third interlinked endogenous vulnerability for hedge funds. This funding liquidity risk is associated with the possibility of liquidity pressures arising either from the short-term fi nancing provided by banks or from investor redemptions. Inadequate liquidity buffers might limit hedge funds’ ability to intervene and stabilise market prices or, in times of stress, may even compel them to unwind their positions, thereby exacerbating illiquidity in already strained markets.
Hedge funds, like other non-bank fi nancial institutions, do not have direct access to central bank liquidity, and therefore have to rely on banks for funding to complement the capital of investors. The risk of cancellation or non-renewal of leverage fi nance provided by banks may prove perilous for the viability of a hedge fund, and this explains why funds usually try to establish fi nancing relationships with several counterparties. During the recent turmoil, banks had reportedly already started tightening
margin terms in late June, so it is likely that by the end of summer the impact of stricter lending conditions on hedge funds and associated forced deleveraging had already largely materialised, although some prime brokers could have been left holding seized collateral on their balance sheets (see Section 4.2).
Aggregate net infl ows into the hedge fund sector were very strong in the fi rst half of 2007 (see Charts S15 and S16). Moreover, aggregation of hedge funds that experienced net infl ows or net outfl ows separately suggests that investor redemption activity and associated funding liquidity risks were not very high across various hedge fund strategies during this period (see Chart 1.43). Nevertheless, attracting positive net fl ows in the second half of 2007 may prove quite challenging for some hedge funds owing to the recent turmoil and the widespread losses experienced by hedge funds in August.
According to various surveys, institutional investors continued to show growing willingness to increase their absolute and relative allocations
Chart 1.43 Global hedge fund aggregate quarterly net redemptions and net investments across strategies
(Q1 2005 - Q2 2007; % of capital under management at the end of previous quarter)
-10
-5
0
5
10
15
-10
-5
0
5
10
15
min.-max. range across strategiesinterquartile rangemedian
sum of net investments
sum of net redemptions-15 -15
2005 2006 2007Q1 Q2 Q3 Q4 Q1 Q2 Q1 Q2Q3 Q4
Sources: Tremont Capital Management, Lipper TASS and ECB calculations.Notes: Excluding funds of hedge funds. For each of the ten strategies and for every quarter, net redemptions refer to the sum of outfl ows of managers suffering net outfl ows and net investments refer to the sum of the infl ows of managers receiving net infl ows, both divided by the strategy’s total capital under management at the end of previous quarter.
Chart 1.44 Share of global single-manager hedge fund capital under management provided by funds of hedge funds
(1993 - June 2007; %; ratio of FOHF and single-manager hedge fund capital under management)
0
10
20
30
40
50
0
10
20
30
40
50
HFRLipper TASS database
June1993 1995 1997 1999 2001 2003 2005 2007
Sources: Lipper TASS database, Hedge Fund Research and ECB calculations.
56ECBFinancial Stability ReviewDecember 2007
Box 4
HEDGE FUND INVESTOR REDEMPTION RESTRICTIONS AND THE RISK OF RUNS BY INVESTORS
In contrast to traditional open-end investment funds, which provide daily liquidity for investors, hedge funds are well known for having complicated redemption restrictions. Moreover, various combinations of these restrictions further mask the true vulnerability of hedge funds to investor withdrawals. Against this background, this box provides an overview of various investor redemption restrictions used by hedge funds and assesses the amount of time that would be needed before investors could withdraw all of their capital from the hedge fund sector.
In principle, the main purpose of the various redemption restrictions used by hedge funds should be to match investor redemption risk with the liquidity of the underlying investments (see Table A). However, stricter redemption terms also ensure longer and therefore larger fl ows of management fee income for hedge fund managers, who may therefore prefer to tie up investors money for as long as possible, subject to personal liquidity preferences when personal capital is invested in a fund. In practice, in the case of an individual hedge fund, the ultimate mix of redemption terms depends on the supply and demand for investments into this particular hedge fund, and the strength of broader demand for hedge fund-like investments. It is also noteworthy that hedge fund redemption frequencies tend to coincide with subscription
to alternative investments and hedge funds in particular. However, FOHFs have probably remained the largest institutional investor bloc in single-manager hedge funds (see Chart 1.44), and any analysis of redemption risk faced by hedge funds needs to take account of the behaviour of FOHFs. Since some FOHFs use leverage, partly to compensate for the second layer of fees, higher leverage within FOHFs could force them to withdraw money from underperforming credit-oriented hedge funds, particularly if their perceived outlook for credit markets and related investment strategies were not favourable.
Some FOHFs have also issued leveraged share classes for investors, and it is likely that the most leveraged versions of these issues triggered redemptions from underlying single-manager hedge funds owing to losses in July and August. Furthermore, withdrawals from both single-manager and FOHFs might also be triggered by automatic rebalancing rules linked to various fund-linked derivatives and structured notes.
In order to manage the funding liquidity pressures that arise from investor redemptions, hedge funds use various redemption restrictions, which can be chosen and combined to refl ect the liquidity of underlying investments. These restrictions can sometimes be quite complex, but since most single-manager hedge funds allow either monthly or quarterly redemptions, the largest redemptions typically occur at the turn of a calendar quarter, when both monthly and quarterly redemption dates coincide (see Box 4).
Amid the market turmoil, there were reports that some hedge funds suspended redemptions simply because they were unable to assign values to their less liquid investments, while some other credit-oriented hedge funds, following losses on sub-prime-related exposures, were reportedly fl ooded with redemption requests, and opted to invoke “gate” provisions. These provisions restrict the amount of total capital under management which can be withdrawn during a certain period.
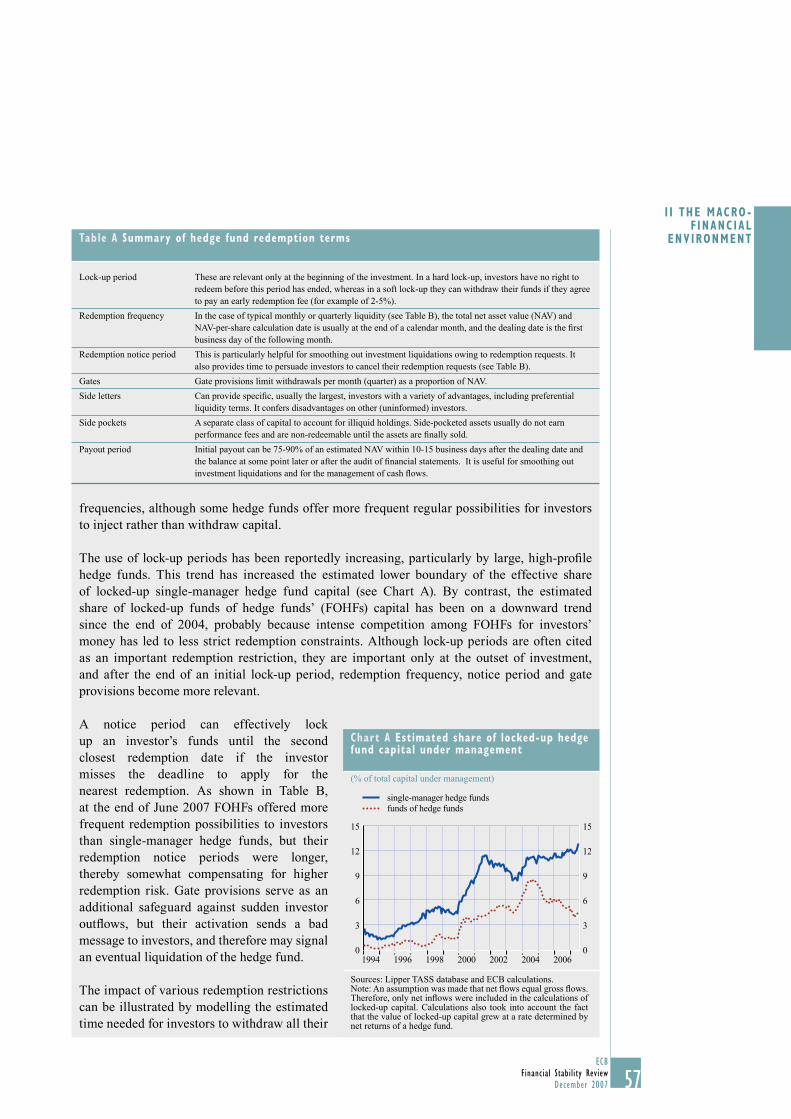
57ECB
Financial Stability ReviewDecember 2007
I I THE MACRO -F INANC IAL
ENVIRONMENT
57
frequencies, although some hedge funds offer more frequent regular possibilities for investors to inject rather than withdraw capital.
The use of lock-up periods has been reportedly increasing, particularly by large, high-profi le hedge funds. This trend has increased the estimated lower boundary of the effective share of locked-up single-manager hedge fund capital (see Chart A). By contrast, the estimated share of locked-up funds of hedge funds’ (FOHFs) capital has been on a downward trend since the end of 2004, probably because intense competition among FOHFs for investors’ money has led to less strict redemption constraints. Although lock-up periods are often cited as an important redemption restriction, they are important only at the outset of investment, and after the end of an initial lock-up period, redemption frequency, notice period and gate provisions become more relevant.
A notice period can effectively lock up an investor’s funds until the second closest redemption date if the investor misses the deadline to apply for the nearest redemption. As shown in Table B, at the end of June 2007 FOHFs offered more frequent redemption possibilities to investors than single-manager hedge funds, but their redemption notice periods were longer, thereby somewhat compensating for higher redemption risk. Gate provisions serve as an additional safeguard against sudden investor outfl ows, but their activation sends a bad message to investors, and therefore may signal an eventual liquidation of the hedge fund.
The impact of various redemption restrictions can be illustrated by modelling the estimated time needed for investors to withdraw all their
Chart A Estimated share of locked-up hedge fund capital under management
(% of total capital under management)
0
3
6
9
12
15
0
3
6
9
12
15
single-manager hedge fundsfunds of hedge funds
1994 1996 1998 2000 2002 2004 2006
Sources: Lipper TASS database and ECB calculations.Note: An assumption was made that net fl ows equal gross fl ows. Therefore, only net infl ows were included in the calculations of locked-up capital. Calculations also took into account the fact that the value of locked-up capital grew at a rate determined by net returns of a hedge fund.
Table A Summary of hedge fund redemption terms
Lock-up period These are relevant only at the beginning of the investment. In a hard lock-up, investors have no right to redeem before this period has ended, whereas in a soft lock-up they can withdraw their funds if they agree to pay an early redemption fee (for example of 2-5%).
Redemption frequency In the case of typical monthly or quarterly liquidity (see Table B), the total net asset value (NAV) and NAV-per-share calculation date is usually at the end of a calendar month, and the dealing date is the fi rst business day of the following month.
Redemption notice period This is particularly helpful for smoothing out investment liquidations owing to redemption requests. It also provides time to persuade investors to cancel their redemption requests (see Table B).
Gates Gate provisions limit withdrawals per month (quarter) as a proportion of NAV.
Side letters Can provide specifi c, usually the largest, investors with a variety of advantages, including preferential liquidity terms. It confers disadvantages on other (uninformed) investors.
Side pockets A separate class of capital to account for illiquid holdings. Side-pocketed assets usually do not earn performance fees and are non-redeemable until the assets are fi nally sold.
Payout period Initial payout can be 75-90% of an estimated NAV within 10-15 business days after the dealing date and the balance at some point later or after the audit of fi nancial statements. It is useful for smoothing out investment liquidations and for the management of cash fl ows.
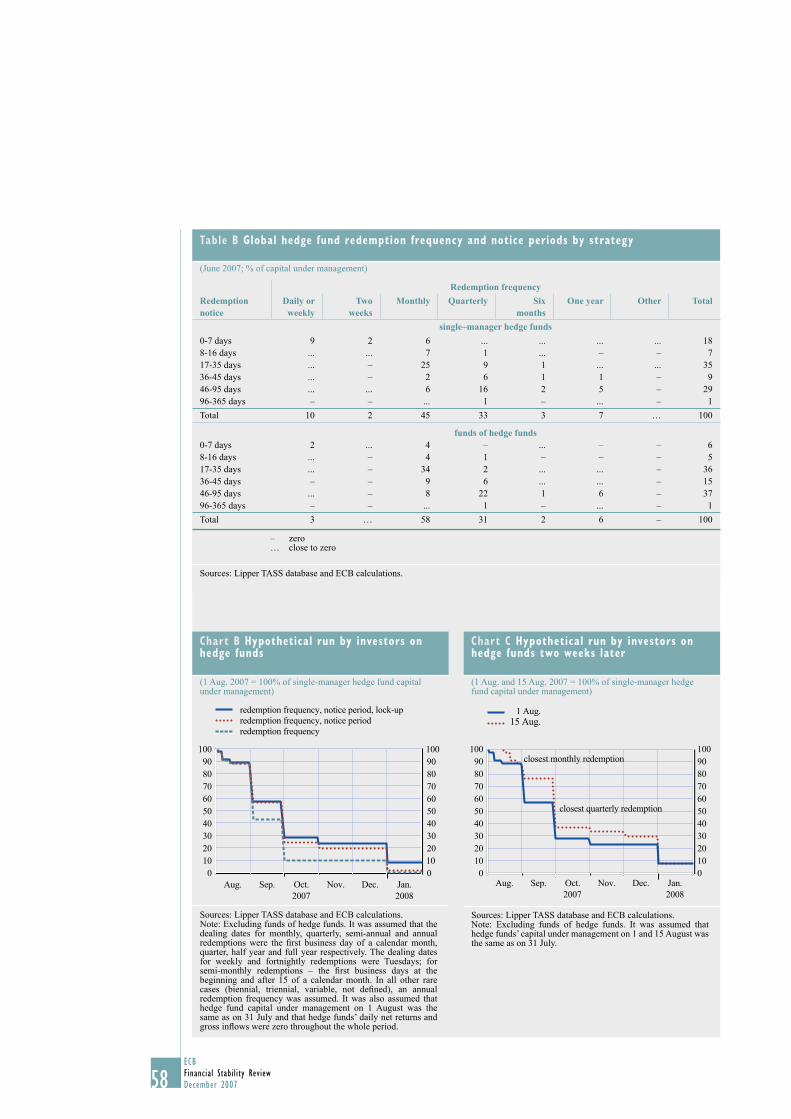
58ECBFinancial Stability ReviewDecember 2007
Chart B Hypothetical run by investors on hedge funds
(1 Aug. 2007 = 100% of single-manager hedge fund capital under management)
0102030405060708090
100
0102030405060708090100
Aug. Sep. Oct. Nov. Dec. Jan.2007 2008
redemption frequency, notice period, lock-upredemption frequency, notice periodredemption frequency
Sources: Lipper TASS database and ECB calculations.Note: Excluding funds of hedge funds. It was assumed that the dealing dates for monthly, quarterly, semi-annual and annual redemptions were the fi rst business day of a calendar month, quarter, half year and full year respectively. The dealing dates for weekly and fortnightly redemptions were Tuesdays; for semi-monthly redemptions – the fi rst business days at the beginning and after 15 of a calendar month. In all other rare cases (biennial, triennial, variable, not defi ned), an annual redemption frequency was assumed. It was also assumed that hedge fund capital under management on 1 August was the same as on 31 July and that hedge funds’ daily net returns and gross infl ows were zero throughout the whole period.
Chart C Hypothetical run by investors on hedge funds two weeks later
(1 Aug. and 15 Aug. 2007 = 100% of single-manager hedge fund capital under management)
0102030405060708090
100
0102030405060708090100
1 Aug.15 Aug.
closest monthly redemption
closest quarterly redemption
Aug. Sep. Oct. Nov. Dec. Jan.20082007
Sources: Lipper TASS database and ECB calculations.Note: Excluding funds of hedge funds. It was assumed that hedge funds’ capital under management on 1 and 15 August was the same as on 31 July.
Table B Global hedge fund redemption frequency and notice periods by strategy
(June 2007; % of capital under management)
Redemption frequency
Redemption notice
Daily or weekly
Two weeks
Monthly Quarterly Six months
One year Other Total
single–manager hedge funds
0-7 days 9 2 6 ... ... ... ... 188-16 days ... ... 7 1 ... – – 717-35 days ... – 25 9 1 ... ... 3536-45 days ... – 2 6 1 1 – 946-95 days ... ... 6 16 2 5 – 2996-365 days – – ... 1 – ... – 1
Total 10 2 45 33 3 7 … 100
funds of hedge funds0-7 days 2 ... 4 – ... – – 68-16 days ... – 4 1 – – – 517-35 days ... – 34 2 ... ... – 3636-45 days – – 9 6 ... ... – 1546-95 days ... – 8 22 1 6 – 3796-365 days – – ... 1 – ... – 1
Total 3 … 58 31 2 6 – 100
– zero… close to zero
Sources: Lipper TASS database and ECB calculations.
59ECB
Financial Stability ReviewDecember 2007
I I THE MACRO -F INANC IAL
ENVIRONMENT
59
capital from the hedge fund sector. Moreover, several versions of this type of “fi re sale” stress test could be implemented by sequentially incorporating the impact of additional redemption restrictions. For this purpose, it was assumed that all investors could place their redemption requests on 1 August 2007. It was also assumed that all reported lock-ups were hard lock-ups, although in some cases, hedge funds reported that early redemption was possible before the expiry of a lock-up period subject to the payment of a penalty fee. Furthermore, judging from some notes provided by hedge funds to the database, there were also some soft lock-ups that were not reported as lock-ups.
As shown in Chart B, redemption notice and lock-up periods would signifi cantly slow down the decline of hedge fund capital under management in the event of widespread investor exodus. The different lines in Chart B show estimated capital withdrawal patterns depending on how many redemption restrictions were taken into account, and indicate that the largest outfl ows can occur when both monthly and quarterly redemption dates coincide. Furthermore, the time when investors start placing their redemption requests is also very important. For example, if investors were to start a run on hedge funds on 15 August instead of 1 August, this would have resulted in a very different “fi re sale” redemption profi le (see Chart C). Nevertheless, regardless of the start-date, it seems that within a period of around six months investors could withdraw the bulk of their funds from the hedge fund sector.
All in all, the average duration of an investment in a hedge fund is not known, but lock-up periods do not seem to provide the main protection against investor withdrawals, since their shielding effect disappears upon their expiry and many can be avoided with the payment of an early redemption fee. Lower redemption frequencies, longer redemption notice periods and gate provisions may be far more effective measures against the disruptive effects of investor exodus. Furthermore, in times of stress, some hedge fund managers may also decide to move certain assets to side pockets, thereby making these investments non-redeemable, or suspend redemptions altogether and enter into negotiations with investors regarding the future of the fund. As a result, it is very diffi cult to estimate the time needed for investors to withdraw all their capital from the hedge fund sector, not least because the starting date of mass withdrawals is also very important owing to redemption notice periods. However, points in time when monthly and quarterly redemptions coincide pose the largest redemption risk for the hedge fund sector.
Continued strains in credit markets have raised the risks of further hedge failures in the short-term, particularly if investors react by redeeming their money from hedge funds. This is because investor fl ows ultimately determine the viability of a hedge fund.15 Information on hedge fund liquidations only becomes available with a lag, and by the cut-off date of this FSR there was no hard evidence that liquidations of single-manager hedge funds had risen signifi cantly in 2007 (see Chart 1.45).
To sum up, hedge funds quickly recovered from the widespread setback in August, and it
does not appear that they played a major role in recent market turbulence. Banks’ sub-prime and leveraged buyout-related exposures were far more signifi cant. Nevertheless, asset sales by some hedge funds did apparently contribute to strained conditions in several fi nancial markets, especially in credit markets. At the same time, there have been counter-examples, whereby hedge funds had a market-stabilising infl uence, making it diffi cult to draw an overall conclusion about their net impact. Looking ahead, there still remain some uncertainties
See Box 6 on hedge fund liquidations in the June 2007 FSR.15
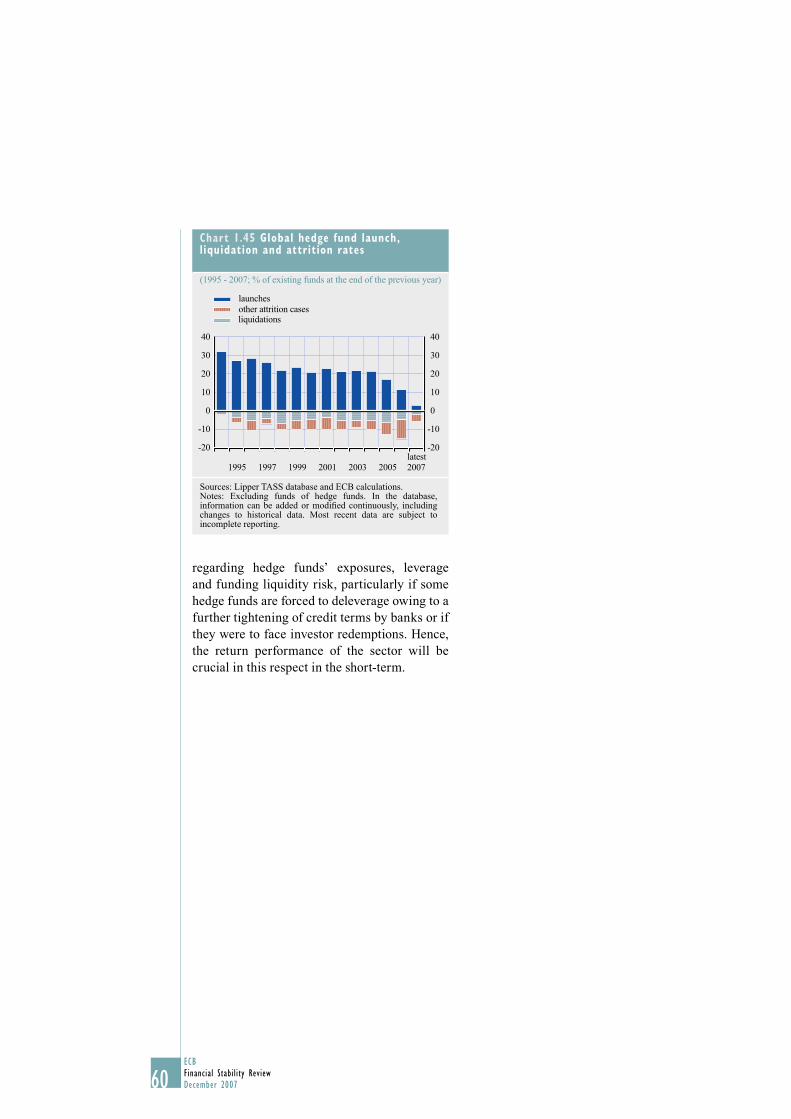
60ECBFinancial Stability ReviewDecember 2007
regarding hedge funds’ exposures, leverage and funding liquidity risk, particularly if some hedge funds are forced to deleverage owing to a further tightening of credit terms by banks or if they were to face investor redemptions. Hence, the return performance of the sector will be crucial in this respect in the short-term.
Chart 1.45 Global hedge fund launch, liquidation and attrition rates
(1995 - 2007; % of existing funds at the end of the previous year)
-20
-10
0
10
20
30
40
latest 2007
launchesother attrition casesliquidations
1995 1997 1999 2001 2003 2005
-20
-10
0
10
20
30
40
Sources: Lipper TASS database and ECB calculations.Notes: Excluding funds of hedge funds. In the database, information can be added or modifi ed continuously, including changes to historical data. Most recent data are subject to incomplete reporting.
61ECB
Financial Stability ReviewDecember 2007
I I THE MACRO - F INANC IAL
ENVIRONMENT
61
2 THE EURO AREA ENVIRONMENT
The overall macro economic environment has remained relatively stable over the past six months against the backdrop of the abrupt re-pricing of risk in fi nancial markets that began in the summer of 2007. In the period since the fi nalisation of the June 2007 Review, downside risks to growth have increased somewhat. Increased funding costs for fi rms as well as slightly increased interest repayment burdens for households, together with the increasing stock of debt outstanding for both sectors, point to a slight increasein the vulnerability of the non-fi nancial sectors. However, at the current juncture – against a background of fi nancial market volatility and heightened uncertainty related to the market turbulence – the central macro economic scenario remains broadly conducive to fi nancial stability in theeuro area.
2.1 ECONOMIC OUTLOOK AND RISKS
After the fi nalisation of the June 2007 FSR, the pace of growth of euro area macroeconomic activity deteriorated slightly as did the outlook. Nevertheless it still remained relatively benign, thereby providing a broadly supportive environment for fi nancial system stability. During the fi rst half of the year, growth in economic activity moderated, as had been anticipated both in ECB staff projections and private sector forecasts. Year-on-year GDP growth declined from 3.1% in the fi rst quarter of the year to 2.5% in the second quarter (see Chart S43). Economic growth continued to be supported by robust external demand and strong domestic investment, while growth in private consumption moderated somewhat, mainly as a result of fi scal measures in one large euro area country. Confi dence amongst businesses and consumers fell following the turmoil in the fi nancial markets that began in late July, but continued to point to economic growth broadly in line with historic averages being maintained during the third quarter.
Looking ahead, the central short-term macroeconomic outlook remains positive. ECB staff macroeconomic projections published in September point to real GDP growth of between 2.2% and 2.8% in 2007 and between 1.8% and 2.8% in 2008. Both ranges are slightly lower than those which had been envisaged in earlier projections, refl ecting the impact of the sharp rise in credit spreads as well as higher oil prices, non-oil commodity prices and exchange rates. The re-pricing of risk in fi nancial markets could suggest a more subdued outlook for investment and consumption. Nevertheless, prospects for the household sector are supportive, with strong employment growth and further falls in the unemployment rate contributing to improving disposable income over the forecast horizon. Concerning the corporate sector, profi tability is expected to remain robust, driven by sustained external and domestic demand.
The risks surrounding the broadly favourable macroeconomic outlook, however, are tilted mainly towards the downside and they increased after the fi nalisation of the June 2007 FSR. These relate to the possibility of a rise in protectionist pressures, risks of increases in oil and commodity prices or of a disorderly unwinding of global imbalances or a stronger than expected downturn in the US economy. In addition, concerns remain about the possibility of further abrupt shifts in global fi nancial market sentiment leading to further re-pricing of risks – a protracted period of market turbulence could affect the availability of credit for fi rms and households, thereby dampening the economic growth outlook. The likelihood of these risks materialising remains small: private sector assessments of the probabilities of low growth available since the fi nalisation of the June 2007 FSR remained low (see Chart S44). However, these assessments were made before the fi nancial market turmoil. In this light, while the most likely scenario is that the macroeconomic environment will remain supportive for fi nancial system stability, the risks of an adverse disturbance have increased somewhat over the past six months.
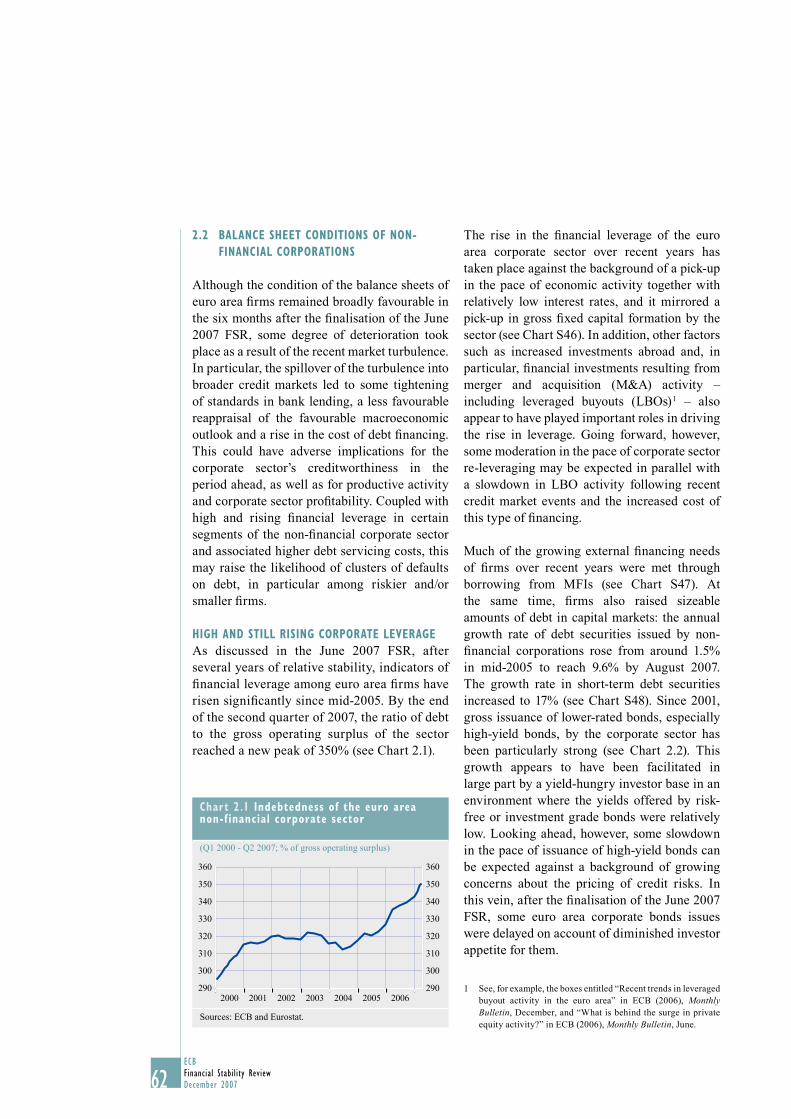
62ECBFinancial Stability ReviewDecember 2007
2.2 BALANCE SHEET CONDITIONS OF NON-
FINANCIAL CORPORATIONS
Although the condition of the balance sheets of euro area fi rms remained broadly favourable in the six months after the fi nalisation of the June 2007 FSR, some degree of deterioration took place as a result of the recent market turbulence. In particular, the spillover of the turbulence into broader credit markets led to some tightening of standards in bank lending, a less favourable reappraisal of the favourable macroeconomic outlook and a rise in the cost of debt fi nancing. This could have adverse implications for the corporate sector’s creditworthiness in the period ahead, as well as for productive activity and corporate sector profi tability. Coupled with high and rising fi nancial leverage in certain segments of the non-fi nancial corporate sector and associated higher debt servicing costs, this may raise the likelihood of clusters of defaults on debt, in particular among riskier and/or smaller fi rms.
HIGH AND STILL RISING CORPORATE LEVERAGE
As discussed in the June 2007 FSR, after several years of relative stability, indicators of fi nancial leverage among euro area fi rms have risen signifi cantly since mid-2005. By the end of the second quarter of 2007, the ratio of debt to the gross operating surplus of the sector reached a new peak of 350% (see Chart 2.1).
The rise in the fi nancial leverage of the euro area corporate sector over recent years has taken place against the background of a pick-up in the pace of economic activity together with relatively low interest rates, and it mirrored a pick-up in gross fi xed capital formation by the sector (see Chart S46). In addition, other factors such as increased investments abroad and, in particular, fi nancial investments resulting from merger and acquisition (M&A) activity – including leveraged buyouts (LBOs) 1 – also appear to have played important roles in driving the rise in leverage. Going forward, however, some moderation in the pace of corporate sector re-leveraging may be expected in parallel with a slowdown in LBO activity following recent credit market events and the increased cost of this type of fi nancing.
Much of the growing external fi nancing needs of fi rms over recent years were met through borrowing from MFIs (see Chart S47). At the same time, fi rms also raised sizeable amounts of debt in capital markets: the annual growth rate of debt securities issued by non-fi nancial corporations rose from around 1.5% in mid-2005 to reach 9.6% by August 2007. The growth rate in short-term debt securities increased to 17% (see Chart S48). Since 2001, gross issuance of lower-rated bonds, especially high-yield bonds, by the corporate sector has been particularly strong (see Chart 2.2). This growth appears to have been facilitated in large part by a yield-hungry investor base in an environment where the yields offered by risk-free or investment grade bonds were relatively low. Looking ahead, however, some slowdown in the pace of issuance of high-yield bonds can be expected against a background of growing concerns about the pricing of credit risks. In this vein, after the fi nalisation of the June 2007 FSR, some euro area corporate bonds issues were delayed on account of diminished investor appetite for them.
See, for example, the boxes entitled “Recent trends in leveraged 1 buyout activity in the euro area” in ECB (2006), Monthly Bulletin, December, and “What is behind the surge in private equity activity?” in ECB (2006), Monthly Bulletin, June.
Chart 2.1 Indebtedness of the euro area non-f inancial corporate sector
(Q1 2000 - Q2 2007; % of gross operating surplus)
360
350
340
330
320
310
300
290
360
350
340
330
320
310
300
2902000 2001 2002 2003 2004 2005 2006
Sources: ECB and Eurostat.
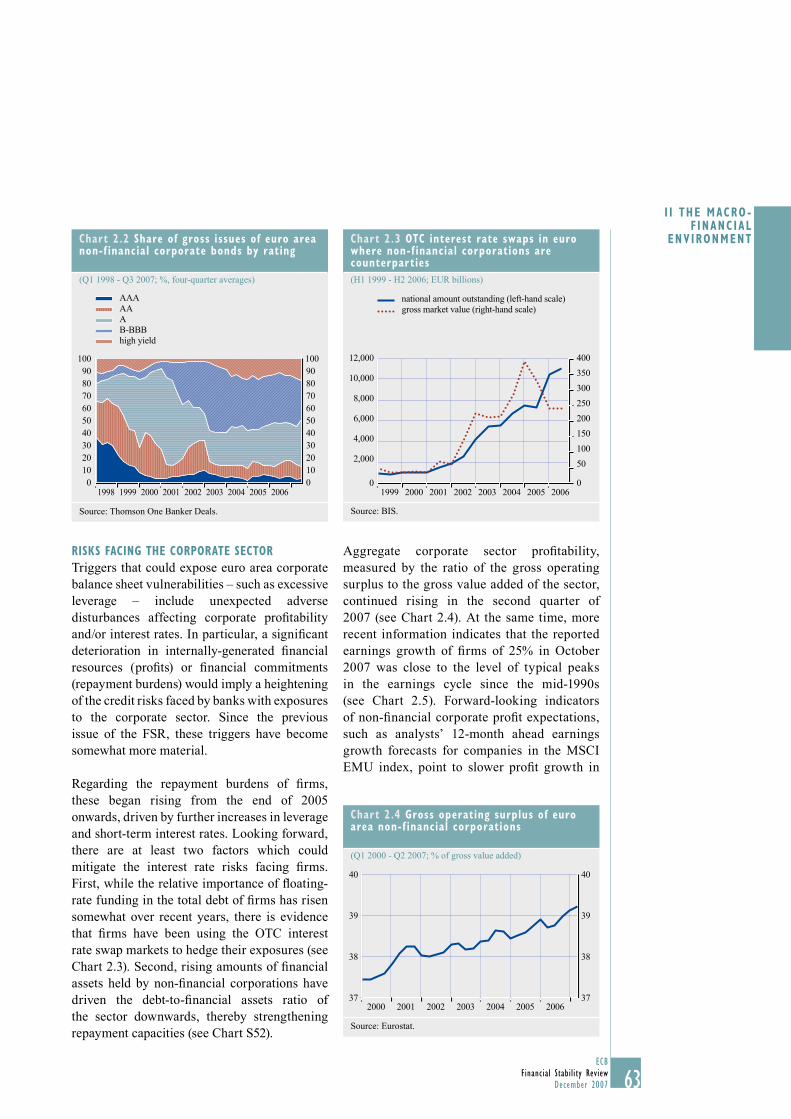
63ECB
Financial Stability ReviewDecember 2007
I I THE MACRO - F INANC IAL
ENVIRONMENT
63
RISKS FACING THE CORPORATE SECTOR
Triggers that could expose euro area corporate balance sheet vulnerabilities – such as excessive leverage – include unexpected adverse disturbances affecting corporate profi tability and/or interest rates. In particular, a signifi cant deterioration in internally-generated fi nancial resources (profi ts) or fi nancial commitments (repayment burdens) would imply a heightening of the credit risks faced by banks with exposures to the corporate sector. Since the previous issue of the FSR, these triggers have become somewhat more material.
Regarding the repayment burdens of fi rms, these began rising from the end of 2005 onwards, driven by further increases in leverage and short-term interest rates. Looking forward, there are at least two factors which could mitigate the interest rate risks facing fi rms. First, while the relative importance of fl oating-rate funding in the total debt of fi rms has risen somewhat over recent years, there is evidence that fi rms have been using the OTC interest rate swap markets to hedge their exposures (see Chart 2.3). Second, rising amounts of fi nancial assets held by non-fi nancial corporations have driven the debt-to-fi nancial assets ratio of the sector downwards, thereby strengthening repayment capacities (see Chart S52).
Aggregate corporate sector profi tability, measured by the ratio of the gross operating surplus to the gross value added of the sector, continued rising in the second quarter of 2007 (see Chart 2.4). At the same time, more recent information indicates that the reported earnings growth of fi rms of 25% in October 2007 was close to the level of typical peaks in the earnings cycle since the mid-1990s (see Chart 2.5). Forward-looking indicators of non-fi nancial corporate profi t expectations, such as analysts’ 12-month ahead earnings growth forecasts for companies in the MSCI EMU index, point to slower profi t growth in
Chart 2.2 Share of gross issues of euro area non-f inancial corporate bonds by rating
(Q1 1998 - Q3 2007; %, four-quarter averages)
0102030405060708090
100
0102030405060708090100
AAAAAAB-BBBhigh yield
1998 1999 2000 2001 2002 2003 2004 2005 2006
Source: Thomson One Banker Deals.
Chart 2.3 OTC interest rate swaps in euro where non-f inancial corporations are counterparties
(H1 1999 - H2 2006; EUR billions)
12,000
10,000
8,000
6,000
4,000
2,000
400
350
300
250
200
150
100
50
national amount outstanding (left-hand scale)gross market value (right-hand scale)
0 01999 2000 2001 2002 2003 2004 2005 2006
Source: BIS.
Chart 2.4 Gross operating surplus of euro area non-f inancial corporations
(Q1 2000 - Q2 2007; % of gross value added)
37
38
39
40
37
38
39
40
2000 2001 2002 2003 2004 2005 2006
Source: Eurostat.
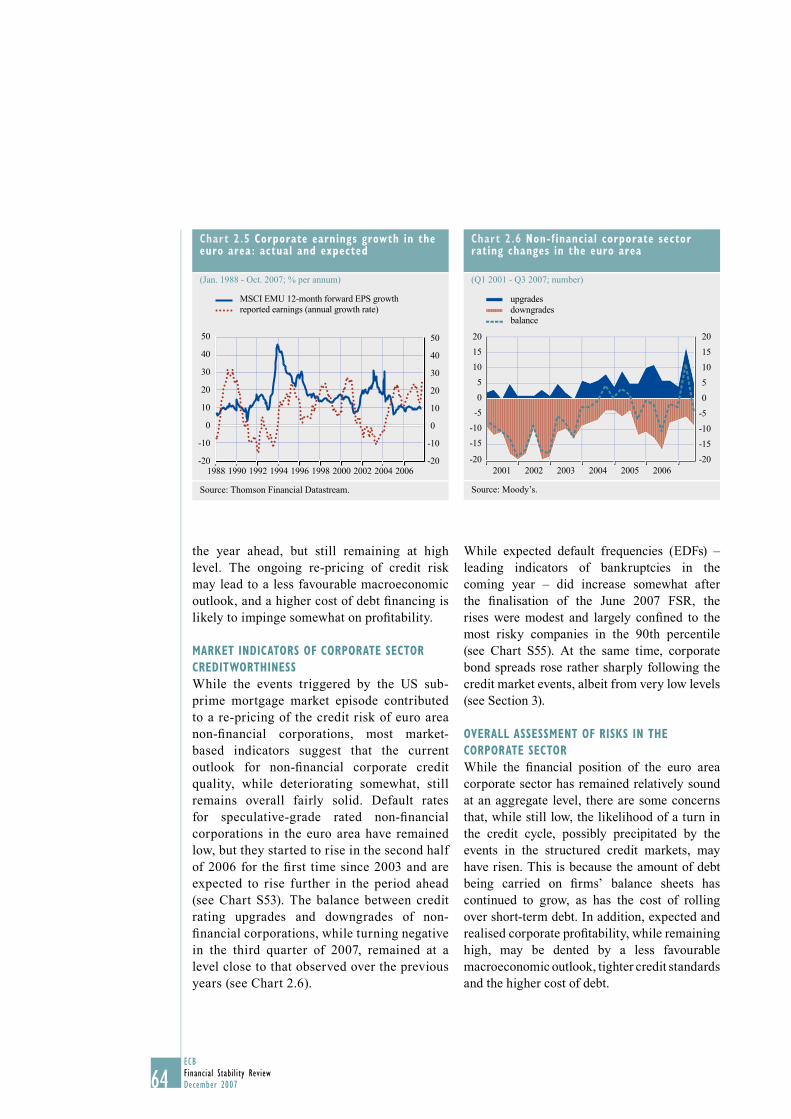
64ECBFinancial Stability ReviewDecember 2007
the year ahead, but still remaining at high level. The ongoing re-pricing of credit risk may lead to a less favourable macroeconomic outlook, and a higher cost of debt fi nancing is likely to impinge somewhat on profi tability.
MARKET INDICATORS OF CORPORATE SECTOR
CREDITWORTHINESS
While the events triggered by the US sub-prime mortgage market episode contributed to a re-pricing of the credit risk of euro area non-fi nancial corporations, most market-based indicators suggest that the current outlook for non-fi nancial corporate credit quality, while deteriorating somewhat, still remains overall fairly solid. Default rates for speculative-grade rated non-fi nancial corporations in the euro area have remained low, but they started to rise in the second half of 2006 for the fi rst time since 2003 and are expected to rise further in the period ahead (see Chart S53). The balance between credit rating upgrades and downgrades of non-fi nancial corporations, while turning negative in the third quarter of 2007, remained at a level close to that observed over the previous years (see Chart 2.6).
While expected default frequencies (EDFs) – leading indicators of bankruptcies in the coming year – did increase somewhat after the fi nalisation of the June 2007 FSR, the rises were modest and largely confi ned to the most risky companies in the 90th percentile (see Chart S55). At the same time, corporate bond spreads rose rather sharply following the credit market events, albeit from very low levels (see Section 3).
OVERALL ASSESSMENT OF RISKS IN THE
CORPORATE SECTOR
While the fi nancial position of the euro area corporate sector has remained relatively sound at an aggregate level, there are some concerns that, while still low, the likelihood of a turn in the credit cycle, possibly precipitated by the events in the structured credit markets, may have risen. This is because the amount of debt being carried on fi rms’ balance sheets has continued to grow, as has the cost of rolling over short-term debt. In addition, expected and realised corporate profi tability, while remaining high, may be dented by a less favourable macroeconomic outlook, tighter credit standards and the higher cost of debt.
Chart 2.5 Corporate earnings growth in the euro area : actual and expected
(Jan. 1988 - Oct. 2007; % per annum)
50
40
30
20
10
0
-10
50
40
30
20
10
0
-10
MSCI EMU 12-month forward EPS growthreported earnings (annual growth rate)
-20-2019901988 1992 1994 1996 1998 2000 2002 2004 2006
Source: Thomson Financial Datastream.
Chart 2.6 Non-f inancial corporate sector rating changes in the euro area
(Q1 2001 - Q3 2007; number)
20
15
10
5
0
-5
-10
-15
-20
20
15
10
5
0
-5
-10
-15
-20
upgradesdowngradesbalance
2001 2002 2003 2004 2005 2006
Source: Moody’s.
65ECB
Financial Stability ReviewDecember 2007
I I THE MACRO - F INANC IAL
ENVIRONMENT
65
Box 5
POTENTIAL IMPLICATIONS OF RECENT CREDIT MARKET STRESS ON THE EURO AREA CREDIT CYCLE
The global re-pricing of risk in the credit market which commenced in July and August 2007 was more severe and longer-lasting than the episodes of market turbulence in May 2005 and in February-March 2006. Some market observers have suggested that the episode, which involved substantial de-leveraging by investors in securitized credit markets and which resulted in sizeable income and investment losses for banks, could – if it results in tighter credit availability – have increased the risk of a downturn in the global credit cycle. This box describes some of the important channels through which de-leveraging by the fi nancial sector can interact with the underlying phase of the credit cycle.1
From late September 2007 until the cut-off date for this Review, signs started to emerge that the risk re-assessment in the global credit markets was adversely affecting economic confi dence indicators both in the US and in the euro area. In addition, the October 2007 ECB Bank Lending Survey revealed that banks had substantially tightened their credit standards for new loans, particularly to large enterprises, from the previous quarter. Nevertheless, against the background of several years of strong profi tability and comfortable capital ratios relative to regulatory requirements, the potential losses from the credit market turbulence were not seen as being suffi ciently signifi cant to materially impact on the soundness of core euro area fi nancial institutions. This alleviated concerns that the intermediation of credit in the euro area fi nancial system would be hampered to such an extent that it would have a bearing on the performance of the real economy. In a negative scenario, however, a protracted disruption in the money and credit markets could lead to a more persistent hoarding of liquidity by banks and further tightening of availability of credit, which could expose vulnerabilities among those fi rms and households which are highly indebted or particularly dependent on short-term external fi nancing. Although the average debt-to-income ratios among euro area households and non-fi nancial corporations – one measure of their vulnerability to tighter fi nancing conditions – are relatively low when compared to other mature economies, pockets of vulnerability do exist at the lower ends of the household income and corporate credit quality spectrums, posing risks which could crystallise in the event of a credit crunch.
To protect themselves against the fi nancial consequences of “normal” credit cycle fl uctuations, banks ordinarily include a premium in their lending rates and make impairment charges. However, in an environment where bank loans are widely used as collateral for asset-backed securities, a sudden increase in corporate default rates and household delinquencies could have implications for the fi nancial performance of banks not only via credit, but also through market and income risks. In view of this, an important issue for the euro area fi nancial stability outlook is the way in which the re-pricing of credit risk feeds into the development of the euro area credit cycle, which is already at quite a mature stage in those Member States in particular where credit growth is showing signs of deceleration and/or default rates are picking up.
The fi gure provides a stylised illustration of the development of the credit cycle in a phase where monetary policy is being tightened. It is important to stress that the fi gure abstracts from many additional channels of monetary transmission, providing only an incomplete picture focusing on
1 Many of the features described in this box also relate to a more general issue regarding the links between market risk and credit risk, which is currently a topic of active research in the fi nancial and academic communities.
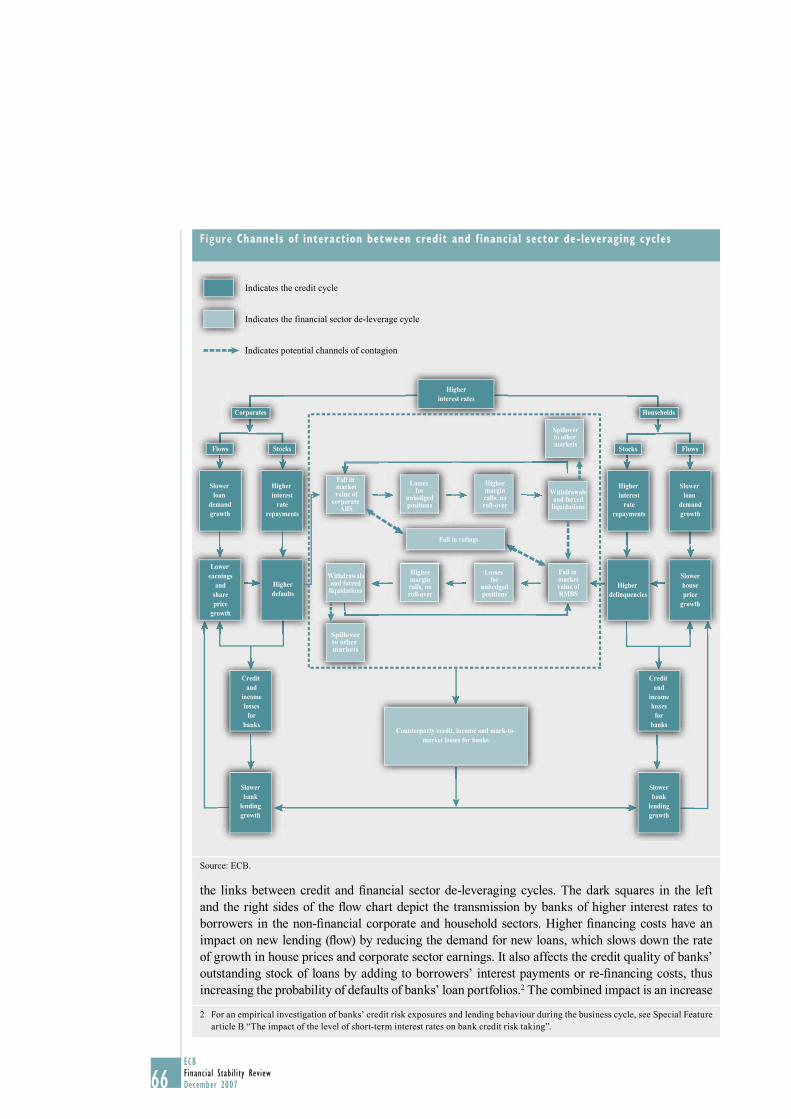
66ECBFinancial Stability ReviewDecember 2007
the links between credit and fi nancial sector de-leveraging cycles. The dark squares in the left and the right sides of the fl ow chart depict the transmission by banks of higher interest rates to borrowers in the non-fi nancial corporate and household sectors. Higher fi nancing costs have an impact on new lending (fl ow) by reducing the demand for new loans, which slows down the rate of growth in house prices and corporate sector earnings. It also affects the credit quality of banks’ outstanding stock of loans by adding to borrowers’ interest payments or re-fi nancing costs, thus increasing the probability of defaults of banks’ loan portfolios.2 The combined impact is an increase
2 For an empirical investigation of banks’ credit risk exposures and lending behaviour during the business cycle, see Special Feature article B “The impact of the level of short-term interest rates on bank credit risk taking”.
Figure Channels of interaction between credit and f inancial sector de-leveraging cycles
Indicates the credit cycle
Indicates the financial sector de-leverage cycle
Indicates potential channels of contagion
Stocks
Higher interest
raterepayments
Fall in marketvalue of
corporate ABS
Fall in marketvalue ofRMBS
Losses for
unhedgedpositions
Losses for
unhedgedpositions
Highermargincalls, noroll-over
Spilloverto other markets
Spilloverto other markets
Highermargincalls, noroll-over
Withdrawalsand forcedliquidations
Withdrawalsand forcedliquidations
Slower loan
demandgrowth
Lower earnings
andshareprice
growth
Higherdefaults
Fall in ratings
Credit and
incomelosses
forbanks
Slowerbank
lendinggrowth
Credit and
incomelosses
forbanks
Slowerbank
lendinggrowth
Higher delinquencies
Slowerhouseprice
growth
Slower loan
demandgrowth
Higher interest
raterepayments
Flows
Corporates
Higherinterest rates
FlowsStocks
Households
Counterparty credit, income and mark-to-market losses for banks
Source: ECB.
67ECB
Financial Stability ReviewDecember 2007
I I THE MACRO - F INANC IAL
ENVIRONMENT
67
in the expected credit and income losses of banks, which in turn tends to contribute to a tightening of bank lending standards and a reduced supply of new credit. Several possible feedback channels can be identifi ed in this process, of which the most important ones are included in the fi gure.
The fi gure also shows - in the light squares in the middle - the potential impact of higher interest rates and expectations of higher default probabilities on the market for asset-backed securities (ABSs), which include securitised household and corporate loans in their collateral pools. The term “de-leveraging cycle” refers to the process whereby investors reduce their exposures to fi nancial assets which have been acquired by borrowed funds or to assets which themselves contain leverage, such as many ABSs. As expectations of increased default probabilities are formed, they contribute to a widening of credit spreads and a lowering of the market value of securitised credit products, such as corporate ABSs and residential mortgage backed securities (RMBSs). To the extent that the positions of investors in these assets are incompletely hedged, they may face margin calls (higher collateral requirements) and, possibly, forced liquidations. If such sales prove challenging to execute or raise insuffi cient liquidity, sales may also extend to unrelated liquid assets, such as other ABS products and stock markets.3 The increase in expected losses on securitised credits may also prompt downgrades of various ABS tranches for which rating agencies provide ratings. If these negative rating actions are large, or even involve revisions of the rating methodologies, a more general loss of confi dence in ratings could constitute an additional channel for contagion from the sector that was downgraded to other parts of the securitised credit market that remain fundamentally sound. This process too has several possible feedback channels that can accelerate the price adjustment movement of the fi nancial assets. Its impact on banks is likely to materialise in direct mark-to-market losses on the institutions’ own investment exposures and counterparty credit losses on their fi nancing exposures.
The scale of income erosion or outright losses for banks that may result from the fi nancial sector de-leveraging process depends on multiple factors, including the initial degree of leverage in the system, the extent of spill-over to other markets, and whether the process of adjustment takes place in an orderly fashion. Should the losses be high relative to banks’ value-at-risk and expected loss estimates, they might need to scale back their risk exposures across the board, which could further reduce the availability of credit in the fi nancial system. The process is likely to continue until asset and collateral prices have adjusted to a new equilibrium level where investor confi dence is restored. An important issue in the current context is how swiftly the fi nancial market de-leveraging process will result in a new equilibrium, and to what extent the various feedback channels will be invoked before this happens. A protracted period of uncertainty is likely to contribute to a more substantial tightening of credit in the fi nancial system, thus increasing the probability of real economic implications of the fi nancial market turmoil.
It can be argued that the fi nancial sector de-leveraging process and the counterparty credit risk involved in it forms a connection between market risk and credit risk. This has important implications for the expected losses in a fi nancial system where securitisation and loan re-packaging is widespread, and could present substantial new challenges for the risk management practices of fi nancial institutions. The Basel Committee is currently working on methodologies that would improve the understanding among banks and investors of the various links between credit risk and market risk and how these could be better taken into account in stress tests, expected loss calculations and in setting capital reserves.
3 This form of contagion to other asset markets was witnessed in the early stages of the recent market turbulence in July and August 2007.
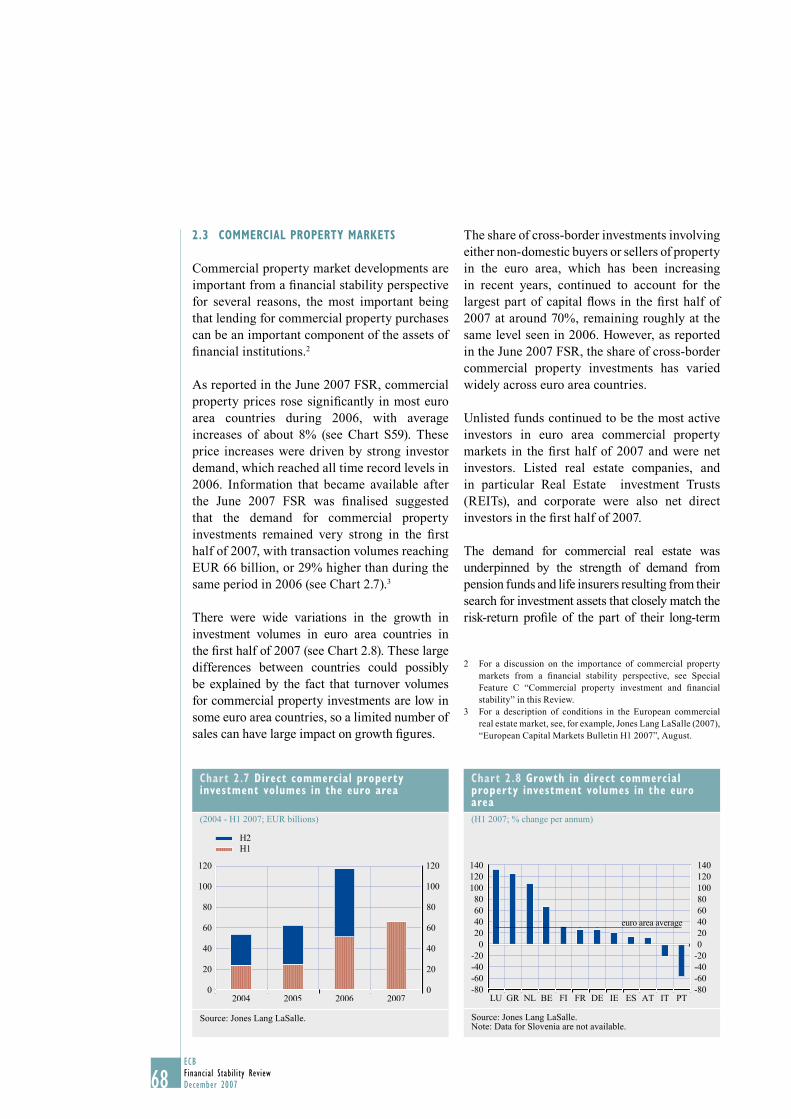
68ECBFinancial Stability ReviewDecember 2007
2.3 COMMERCIAL PROPERTY MARKETS
Commercial property market developments are important from a fi nancial stability perspective for several reasons, the most important being that lending for commercial property purchases can be an important component of the assets of fi nancial institutions.2
As reported in the June 2007 FSR, commercial property prices rose signifi cantly in most euro area countries during 2006, with average increases of about 8% (see Chart S59). These price increases were driven by strong investor demand, which reached all time record levels in 2006. Information that became available after the June 2007 FSR was fi nalised suggested that the demand for commercial property investments remained very strong in the fi rst half of 2007, with transaction volumes reaching EUR 66 billion, or 29% higher than during the same period in 2006 (see Chart 2.7).3
There were wide variations in the growth in investment volumes in euro area countries in the fi rst half of 2007 (see Chart 2.8). These large differences between countries could possibly be explained by the fact that turnover volumes for commercial property investments are low in some euro area countries, so a limited number of sales can have large impact on growth fi gures.
The share of cross-border investments involving either non-domestic buyers or sellers of property in the euro area, which has been increasing in recent years, continued to account for the largest part of capital fl ows in the fi rst half of 2007 at around 70%, remaining roughly at the same level seen in 2006. However, as reported in the June 2007 FSR, the share of cross-border commercial property investments has varied widely across euro area countries.
Unlisted funds continued to be the most active investors in euro area commercial property markets in the fi rst half of 2007 and were net investors. Listed real estate companies, and in particular Real Estate investment Trusts (REITs), and corporate were also net direct investors in the fi rst half of 2007.
The demand for commercial real estate was underpinned by the strength of demand from pension funds and life insurers resulting from their search for investment assets that closely match the risk-return profi le of the part of their long-term
For a discussion on the importance of commercial property 2 markets from a fi nancial stability perspective, see Special Feature C “Commercial property investment and fi nancial stability” in this Review.For a description of conditions in the European commercial 3 real estate market, see, for example, Jones Lang LaSalle (2007), “European Capital Markets Bulletin H1 2007”, August.
Chart 2.7 Direct commercial property investment volumes in the euro area
(2004 - H1 2007; EUR billions)
H2H1
120
100
80
60
40
20
0
120
100
80
60
40
20
02004 2005 2006 2007
Source: Jones Lang LaSalle.
Chart 2.8 Growth in direct commercial property investment volumes in the euro area
(H1 2007; % change per annum)
-80-60-40-20
020406080
100120140
-80-60-40-20020406080100120140
PT
euro area average
LU GR NL BE FI FR DE ESIE AT IT
Source: Jones Lang LaSalle.Note: Data for Slovenia are not available.
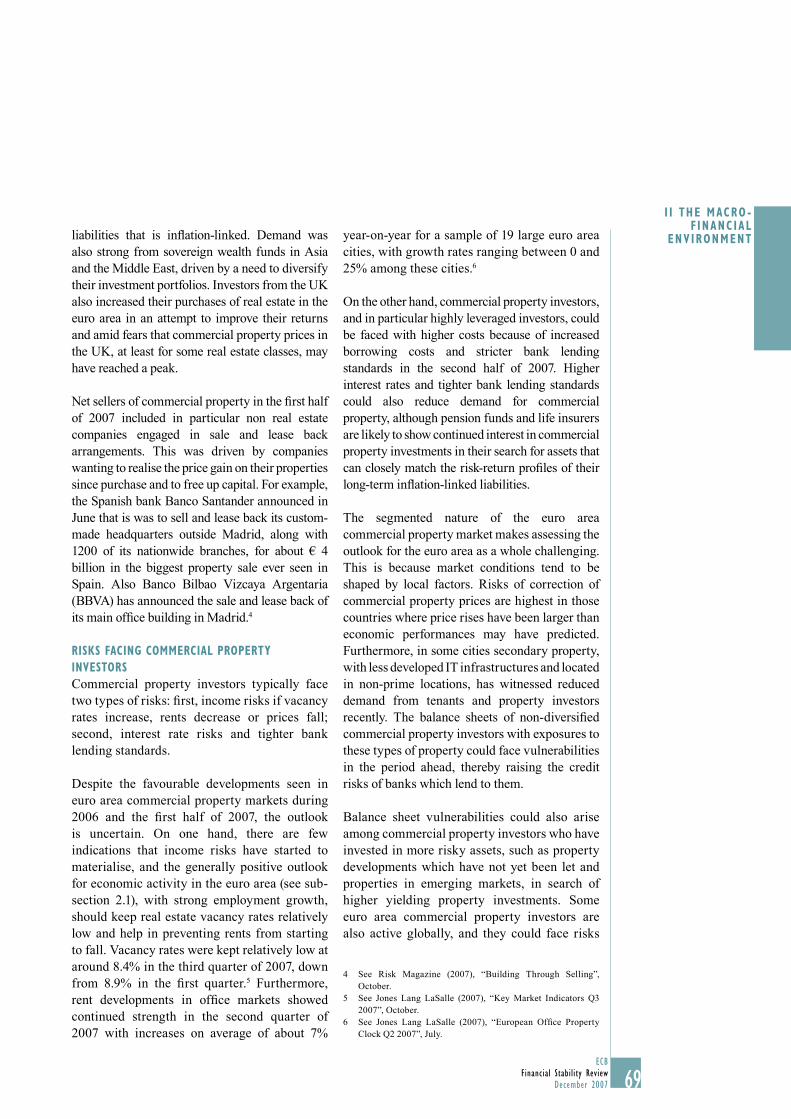
69ECB
Financial Stability ReviewDecember 2007
I I THE MACRO - F INANC IAL
ENVIRONMENT
69
liabilities that is infl ation-linked. Demand was also strong from sovereign wealth funds in Asia and the Middle East, driven by a need to diversify their investment portfolios. Investors from the UK also increased their purchases of real estate in the euro area in an attempt to improve their returns and amid fears that commercial property prices in the UK, at least for some real estate classes, may have reached a peak.
Net sellers of commercial property in the fi rst half of 2007 included in particular non real estate companies engaged in sale and lease back arrangements. This was driven by companies wanting to realise the price gain on their properties since purchase and to free up capital. For example, the Spanish bank Banco Santander announced in June that is was to sell and lease back its custom-made headquarters outside Madrid, along with 1200 of its nationwide branches, for about € 4 billion in the biggest property sale ever seen in Spain. Also Banco Bilbao Vizcaya Argentaria (BBVA) has announced the sale and lease back of its main offi ce building in Madrid.4
RISKS FACING COMMERCIAL PROPERTY
INVESTORS
Commercial property investors typically face two types of risks: fi rst, income risks if vacancy rates increase, rents decrease or prices fall; second, interest rate risks and tighter bank lending standards.
Despite the favourable developments seen in euro area commercial property markets during 2006 and the fi rst half of 2007, the outlook is uncertain. On one hand, there are few indications that income risks have started to materialise, and the generally positive outlook for economic activity in the euro area (see sub-section 2.1), with strong employment growth, should keep real estate vacancy rates relatively low and help in preventing rents from starting to fall. Vacancy rates were kept relatively low at around 8.4% in the third quarter of 2007, down from 8.9% in the fi rst quarter.5 Furthermore, rent developments in offi ce markets showed continued strength in the second quarter of 2007 with increases on average of about 7%
year-on-year for a sample of 19 large euro area cities, with growth rates ranging between 0 and 25% among these cities.6
On the other hand, commercial property investors, and in particular highly leveraged investors, could be faced with higher costs because of increased borrowing costs and stricter bank lending standards in the second half of 2007. Higher interest rates and tighter bank lending standards could also reduce demand for commercial property, although pension funds and life insurers are likely to show continued interest in commercial property investments in their search for assets that can closely match the risk-return profi les of their long-term infl ation-linked liabilities.
The segmented nature of the euro area commercial property market makes assessing the outlook for the euro area as a whole challenging. This is because market conditions tend to be shaped by local factors. Risks of correction of commercial property prices are highest in those countries where price rises have been larger than economic performances may have predicted. Furthermore, in some cities secondary property, with less developed IT infrastructures and located in non-prime locations, has witnessed reduced demand from tenants and property investors recently. The balance sheets of non-diversifi ed commercial property investors with exposures to these types of property could face vulnerabilities in the period ahead, thereby raising the credit risks of banks which lend to them.
Balance sheet vulnerabilities could also arise among commercial property investors who have invested in more risky assets, such as property developments which have not yet been let and properties in emerging markets, in search of higher yielding property investments. Some euro area commercial property investors are also active globally, and they could face risks
See Risk Magazine (2007), “Building Through Selling”, 4 October.See Jones Lang LaSalle (2007), “Key Market Indicators Q3 5 2007”, October.See Jones Lang LaSalle (2007), “European Offi ce Property 6 Clock Q2 2007”, July.
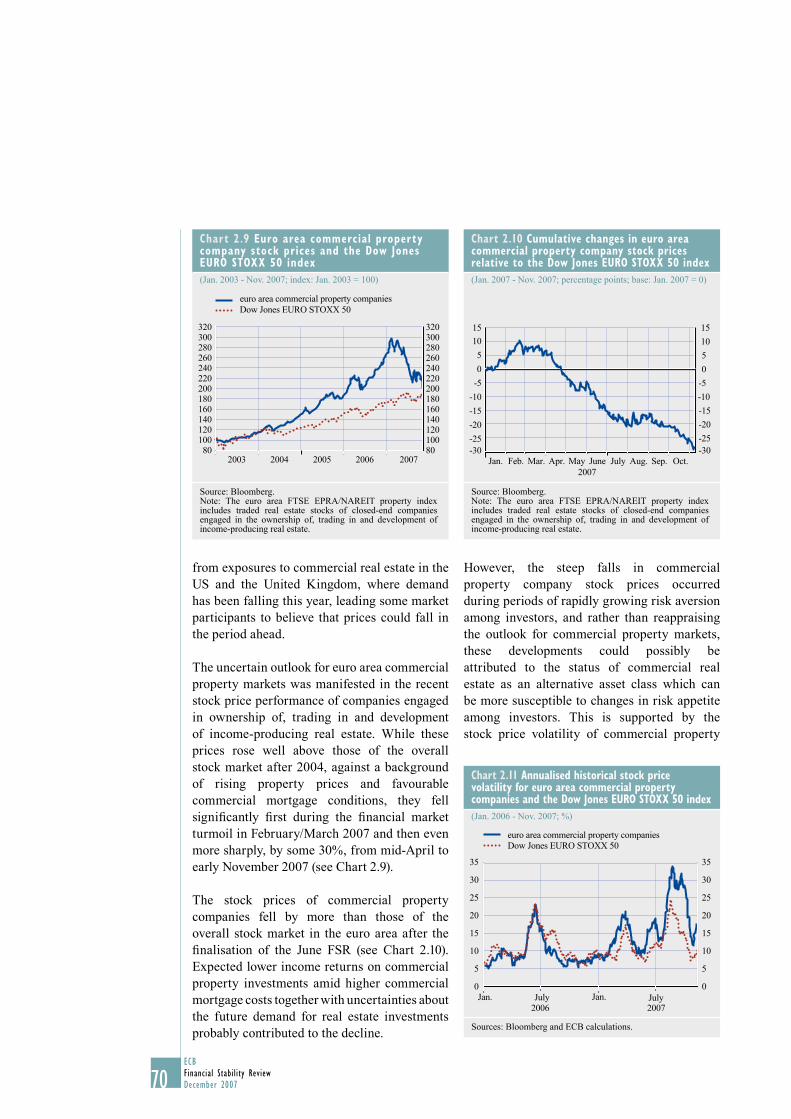
70ECBFinancial Stability ReviewDecember 2007
from exposures to commercial real estate in the US and the United Kingdom, where demand has been falling this year, leading some market participants to believe that prices could fall in the period ahead.
The uncertain outlook for euro area commercial property markets was manifested in the recent stock price performance of companies engaged in ownership of, trading in and development of income-producing real estate. While these prices rose well above those of the overall stock market after 2004, against a background of rising property prices and favourable commercial mortgage conditions, they fell signifi cantly fi rst during the fi nancial market turmoil in February/March 2007 and then even more sharply, by some 30%, from mid-April to early November 2007 (see Chart 2.9).
The stock prices of commercial property companies fell by more than those of the overall stock market in the euro area after the fi nalisation of the June FSR (see Chart 2.10). Expected lower income returns on commercial property investments amid higher commercial mortgage costs together with uncertainties about the future demand for real estate investments probably contributed to the decline.
However, the steep falls in commercial property company stock prices occurred during periods of rapidly growing risk aversion among investors, and rather than reappraising the outlook for commercial property markets, these developments could possibly be attributed to the status of commercial real estate as an alternative asset class which can be more susceptible to changes in risk appetite among investors. This is supported by the stock price volatility of commercial property
Chart 2.11 Annualised historical stock price volatility for euro area commercial property companies and the Dow Jones EURO STOXX 50 index
(Jan. 2006 - Nov. 2007; %)
0
5
10
15
20
25
30
35
0
5
10
15
20
25
30
35
euro area commercial property companiesDow Jones EURO STOXX 50
Jan. July Jan. July2006 2007
Sources: Bloomberg and ECB calculations.
Chart 2.9 Euro area commercial property company stock prices and the Dow Jones EURO STOXX 50 index
(Jan. 2003 - Nov. 2007; index: Jan. 2003 = 100)
80100120140160180200220240260280300320
100120140160180200220240260280300320
euro area commercial property companiesDow Jones EURO STOXX 50
8020072003 2004 2005 2006
Source: Bloomberg.Note: The euro area FTSE EPRA/NAREIT property index includes traded real estate stocks of closed-end companies engaged in the ownership of, trading in and development of income-producing real estate.
Chart 2.10 Cumulative changes in euro area commercial property company stock prices relative to the Dow Jones EURO STOXX 50 index
(Jan. 2007 - Nov. 2007; percentage points; base: Jan. 2007 = 0)
-30-25
-20
-15
-10
-5
0
5
10
15
-30-25
-20
-15
-10
-5
0
5
10
15
Jan. Feb. Mar. Apr. May June July Aug. Sep. Oct.2007
Source: Bloomberg.Note: The euro area FTSE EPRA/NAREIT property index includes traded real estate stocks of closed-end companies engaged in the ownership of, trading in and development of income-producing real estate.
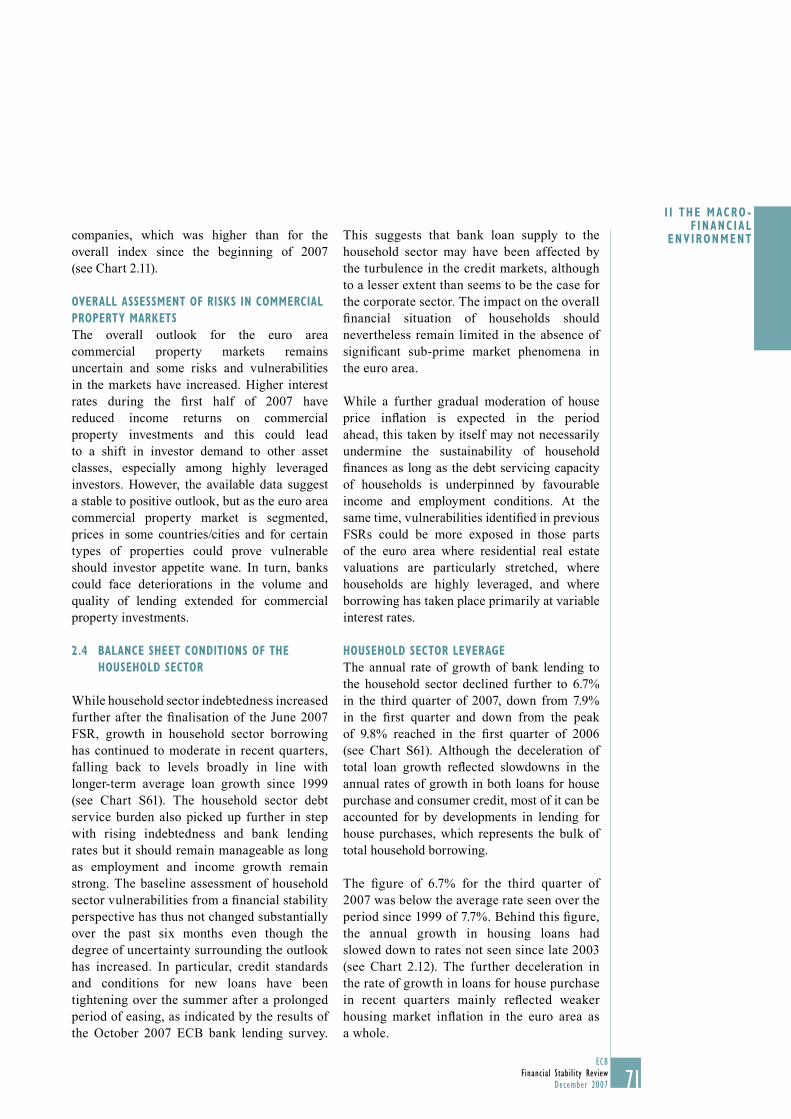
71ECB
Financial Stability ReviewDecember 2007
I I THE MACRO - F INANC IAL
ENVIRONMENT
71
companies, which was higher than for the overall index since the beginning of 2007 (see Chart 2.11).
OVERALL ASSESSMENT OF RISKS IN COMMERCIAL
PROPERTY MARKETS
The overall outlook for the euro area commercial property markets remains uncertain and some risks and vulnerabilities in the markets have increased. Higher interest rates during the fi rst half of 2007 have reduced income returns on commercial property investments and this could lead to a shift in investor demand to other asset classes, especially among highly leveraged investors. However, the available data suggest a stable to positive outlook, but as the euro area commercial property market is segmented, prices in some countries/cities and for certain types of properties could prove vulnerable should investor appetite wane. In turn, banks could face deteriorations in the volume and quality of lending extended for commercial property investments.
2.4 BALANCE SHEET CONDITIONS OF THE
HOUSEHOLD SECTOR
While household sector indebtedness increased further after the fi nalisation of the June 2007 FSR, growth in household sector borrowing has continued to moderate in recent quarters, falling back to levels broadly in line with longer-term average loan growth since 1999 (see Chart S61). The household sector debt service burden also picked up further in step with rising indebtedness and bank lending rates but it should remain manageable as long as employment and income growth remain strong. The baseline assessment of household sector vulnerabilities from a fi nancial stability perspective has thus not changed substantially over the past six months even though the degree of uncertainty surrounding the outlook has increased. In particular, credit standards and conditions for new loans have been tightening over the summer after a prolonged period of easing, as indicated by the results of the October 2007 ECB bank lending survey.
This suggests that bank loan supply to the household sector may have been affected by the turbulence in the credit markets, although to a lesser extent than seems to be the case for the corporate sector. The impact on the overall fi nancial situation of households should nevertheless remain limited in the absence of signifi cant sub-prime market phenomena in the euro area.
While a further gradual moderation of house price infl ation is expected in the period ahead, this taken by itself may not necessarily undermine the sustainability of household fi nances as long as the debt servicing capacity of households is underpinned by favourable income and employment conditions. At the same time, vulnerabilities identifi ed in previous FSRs could be more exposed in those parts of the euro area where residential real estate valuations are particularly stretched, where households are highly leveraged, and where borrowing has taken place primarily at variable interest rates.
HOUSEHOLD SECTOR LEVERAGE
The annual rate of growth of bank lending to the household sector declined further to 6.7% in the third quarter of 2007, down from 7.9% in the fi rst quarter and down from the peak of 9.8% reached in the fi rst quarter of 2006 (see Chart S61). Although the deceleration of total loan growth refl ected slowdowns in the annual rates of growth in both loans for house purchase and consumer credit, most of it can be accounted for by developments in lending for house purchases, which represents the bulk of total household borrowing.
The fi gure of 6.7% for the third quarter of 2007 was below the average rate seen over the period since 1999 of 7.7%. Behind this fi gure, the annual growth in housing loans had slowed down to rates not seen since late 2003 (see Chart 2.12). The further deceleration in the rate of growth in loans for house purchase in recent quarters mainly refl ected weaker housing market infl ation in the euro area as a whole.
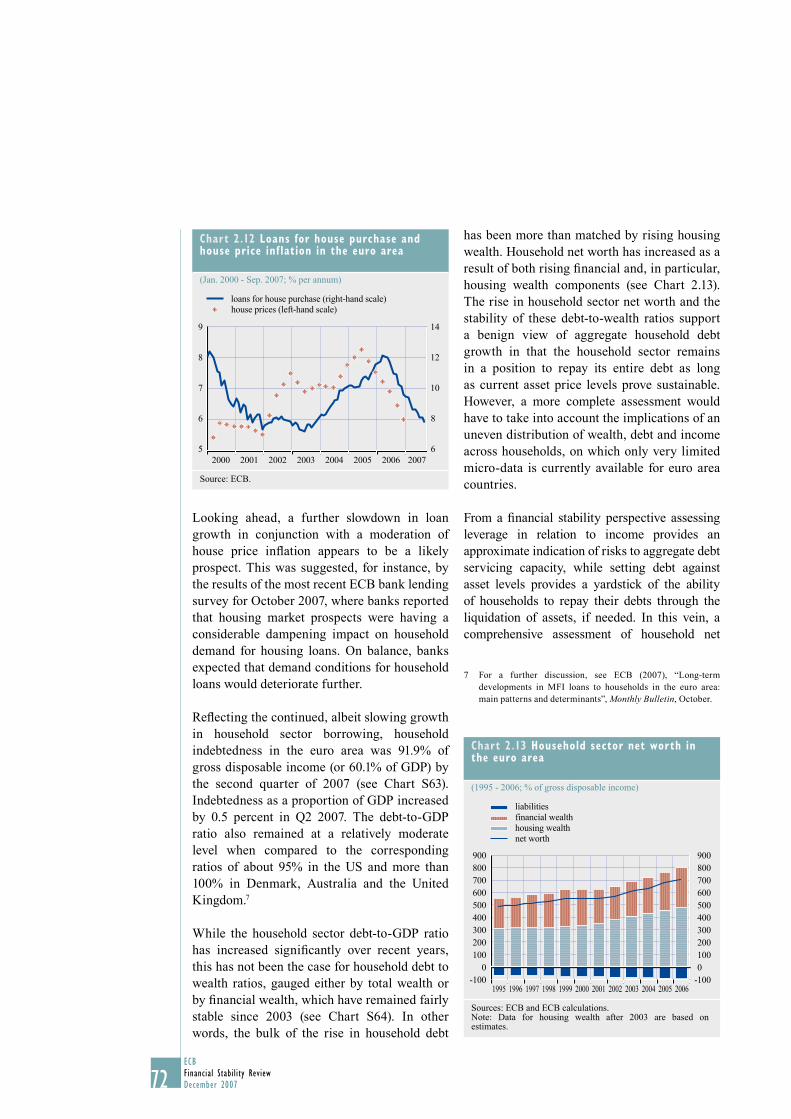
72ECBFinancial Stability ReviewDecember 2007
Looking ahead, a further slowdown in loan growth in conjunction with a moderation of house price infl ation appears to be a likely prospect. This was suggested, for instance, by the results of the most recent ECB bank lending survey for October 2007, where banks reported that housing market prospects were having a considerable dampening impact on household demand for housing loans. On balance, banks expected that demand conditions for household loans would deteriorate further.
Refl ecting the continued, albeit slowing growth in household sector borrowing, household indebtedness in the euro area was 91.9% of gross disposable income (or 60.1% of GDP) by the second quarter of 2007 (see Chart S63). Indebtedness as a proportion of GDP increased by 0.5 percent in Q2 2007. The debt-to-GDP ratio also remained at a relatively moderate level when compared to the corresponding ratios of about 95% in the US and more than 100% in Denmark, Australia and the United Kingdom.7
While the household sector debt-to-GDP ratio has increased signifi cantly over recent years, this has not been the case for household debt to wealth ratios, gauged either by total wealth or by fi nancial wealth, which have remained fairly stable since 2003 (see Chart S64). In other words, the bulk of the rise in household debt
has been more than matched by rising housing wealth. Household net worth has increased as a result of both rising fi nancial and, in particular, housing wealth components (see Chart 2.13). The rise in household sector net worth and the stability of these debt-to-wealth ratios support a benign view of aggregate household debt growth in that the household sector remains in a position to repay its entire debt as long as current asset price levels prove sustainable. However, a more complete assessment would have to take into account the implications of an uneven distribution of wealth, debt and income across households, on which only very limited micro-data is currently available for euro area countries.
From a fi nancial stability perspective assessing leverage in relation to income provides an approximate indication of risks to aggregate debt servicing capacity, while setting debt against asset levels provides a yardstick of the ability of households to repay their debts through the liquidation of assets, if needed. In this vein, a comprehensive assessment of household net
For a further discussion, see ECB (2007), “Long-term 7 developments in MFI loans to households in the euro area: main patterns and determinants”, Monthly Bulletin, October.
Chart 2.12 Loans for house purchase and house price inf lation in the euro area
(Jan. 2000 - Sep. 2007; % per annum)
5
6
7
8
9
20076
8
10
12
14
loans for house purchase (right-hand scale)house prices (left-hand scale)
2000 2001 2002 2003 2004 2005 2006
Source: ECB.
Chart 2.13 Household sector net worth in the euro area
(1995 - 2006; % of gross disposable income)
-1000
100200300400500600700800900
-1000100200300400500600700800900
liabilitiesfinancial wealthhousing wealthnet worth
1995 1996 1997 1998 1999 2000 2001 2002 2003 2004 2005 2006
Sources: ECB and ECB calculations.Note: Data for housing wealth after 2003 are based on estimates.
73ECB
Financial Stability ReviewDecember 2007
I I THE MACRO - F INANC IAL
ENVIRONMENT
73
worth positions and balance sheet vulnerabilities would also need to take into account the fact that the volatility of household assets is typically higher than the volatility of liabilities to the extent that a broader range of assets are priced at market value, while liabilities in the form of loans are fi xed in nominal terms. In particular, euro area household balance sheets have become increasingly exposed to possible corrections in house prices given that housing wealth comprised around 60% of total wealth in 2006.
By contrast, the composition of household sector fi nancial assets suggests that direct exposures to stock markets and to fi nancial risks more generally are rather limited. Most euro area household sector fi nancial wealth continues to be held in deposits and insurance products, whereas market sensitive investments in equity and mutual fund shares or debt securities tend to be less signifi cant. Nevertheless, in addition to direct exposure to housing market related risks due to the importance of housing wealth in the portfolios of euro area households, exposure to US mortgage market risks may have been built up through exposures to related fi nancial instruments held indirectly via holdings of asset-backed securities and structured credit products by institutional investors such as money market funds, insurance corporations and pension funds.
Despite the recent trend towards sharing and distributing fi nancial market risks more widely, household sector exposures to risky fi nancial assets typically remain concentrated among the higher net worth or higher income households which are in a stronger position to bear such risks. By contrast, exposure to housing markets is much more widespread across the population both on the asset side and with respect to mortgage debt, depending in particular on the diffusion of home ownership and the characteristics of the housing fi nance systems.
Although no well-defi ned sub-prime market segments exist in euro area economies, access by lower income and lower net worth
individuals to credit has generally increased in recent years in the context of mortgage market innovation, the lending boom of recent years and a general lowering of credit standards in the face of strong competition among fi nancial institutions (see Box 6).
RISKS FACING THE HOUSEHOLD SECTOR
The ability of households to service their debt can be affected by two main factors: interest rates changes (in the case of adjustable-rate contracts) and income shocks.
Interest rate risks of households
After the fi nalisation of the June 2006 FSR, the ECB increased its key interest rates by a further 25 basis points. Owing to the consecutive rises in interest rates from late 2005 onwards and the continued strength of household borrowing, the interest burden of the household sector as a proportion of disposable income increased to 2.7% in 2006 from 2.4% in 2005. This reversed the gradual decrease that had taken place after 2001 and, when combined with the increase in principal repayments, it resulted in an overall increase in the total debt servicing burden of the household sector (see Chart S65).
Looking ahead, the impact of rising interest rates on the debt servicing costs of individual households depends on the nature of their mortgage contracts. In the case of adjustable rate mortgages the households have to bear the interest rate risk, while in the case of fi xed-rate mortgages the risks are borne by the lender or passed on to capital market participants through the securitisation of fi xed-rate mortgages. The share of loans with a fi xed-rate period of longer than ten years in all new housing loans increased during 2005 and 2006 following a previous decline. Owing to the inverted term structure of lending rates, which refl ects the continued low levels of long-term interest rates, loans with the longest initial fi xed-rate period have carried the lowest interest rate. Against this background, the share of loans with an initial fi xed-rate period of over ten years in new business increased further during the fi rst half of 2007. In July 2007 the share of fi xed-rate borrowing stood at 30%, the
74ECBFinancial Stability ReviewDecember 2007
highest level seen since data for the euro area became available in 2003. Nevertheless, loans with a variable rate or with fi xed-rate periods of up to one year still accounted for the largest share of new business at 42%.
With respect to outstanding mortgages, the majority of mortgage contracts have a signifi cant fi xed-rate period, but the nature of mortgage contracts varies widely across countries. In some countries, variable-rate mortgages are typically adjusted in line with three or 12-month EURIBOR, which has been affected signifi cantly by the drying up of liquidity in the interbank money markets since early August. This suggests that during this period household mortgage payments for such variable-rate contracts will have risen beyond what would, under normal market conditions, be implied by the short-term policy rates, thus adding to the household debt service burden.
When assessing the impact of rising interest rates on household fi nances, the favourable effect from interest receipts also needs to be taken into account. In the euro area as a whole the household sector’s outstanding stock of interest-bearing assets exceeds its stock of liabilities and thus in the aggregate an increase in interest rates should therefore have a modest positive impact on household net interest income. However, the aggregate net lending (or in some cases net borrowing) positions of the household sector differs across countries. In addition, looking at the microeconomic level, the most indebted households are unlikely to hold signifi cant amounts of interest bearing assets at the same time. Similarly, households in the lower percentiles of the income distribution are likely to face disproportionate diffi culties in keeping up with mortgage payments in the face of rising interest burdens.
Risks to household income
In normal circumstances, in an upswing of the business cycle an improving macroeconomic environment, enhancing disposable income and job creation, is likely to offset adverse effects on debt
servicing from rising interest rates. Conversely, lower interest rates should have a cushioning effect in the event of an economic downturn.
As noted in the June 2007 FSR the most challenging (albeit low probability) risk scenario for households would arise if adverse interest rate changes and income shocks were to coincide, e.g. in the form of a generalised rise in risk premiums, refl ected in bank lending rates, combined with a more severe correction in housing and other asset markets and a concomitant reversal in the growth outlook. Despite some elements of such an adverse scenario materialising since the publication of the June 2007 FSR, a continued positive outlook for employment and income should remain the dominant factor, thus containing risks to household fi nancial sustainability.
Indeed after the fi nalisation of the June FSR data from most macroeconomic indicators continued to point to a solid growth outlook for 2007 and slightly lower growth than previously forecast for 2008. Employment creation also remained strong during the course of 2007. This assessment is also supported by survey evidence from the European Commission which shows that euro area households have overcome the pessimism about their employment prospects that had prevailed between mid-2001 and early 2006 (see Chart 2.14), even if the outlook has clouded somewhat in the third quarter of 2007.
Reduced pessimism about employment prospects contrasts with a more subdued assessment of future fi nancial conditions. This may refl ect the fact that improvement in labour markets have not been commonly associated with signifi cant income gains and increased job security to the same extent as in the past. The persistent strength of house price infl ation may also have undermined housing affordability for many households, and thus possibly acted as a drag on fi nancial expectations compared to the boost during the 1999-2001 period when strong employment performance accompanied the new economy boom in equity markets.
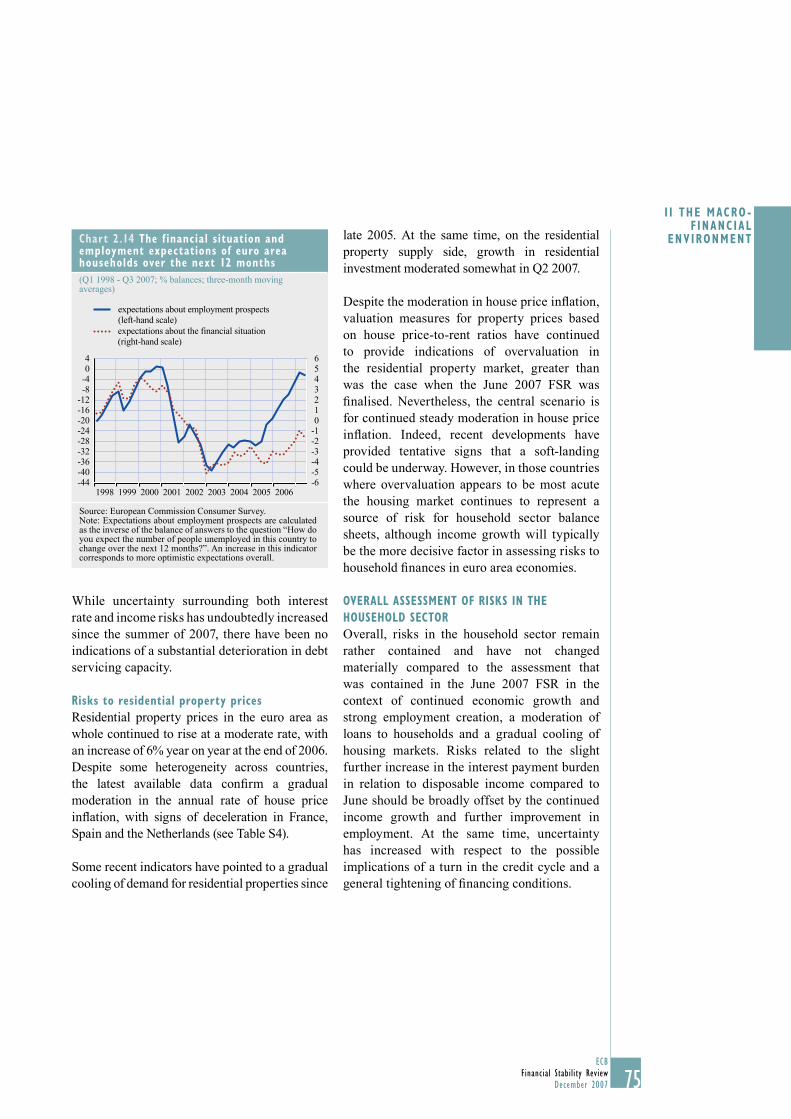
75ECB
Financial Stability ReviewDecember 2007
I I THE MACRO - F INANC IAL
ENVIRONMENT
75
While uncertainty surrounding both interest rate and income risks has undoubtedly increased since the summer of 2007, there have been no indications of a substantial deterioration in debt servicing capacity.
Risks to residential property prices
Residential property prices in the euro area as whole continued to rise at a moderate rate, with an increase of 6% year on year at the end of 2006. Despite some heterogeneity across countries, the latest available data confi rm a gradual moderation in the annual rate of house price infl ation, with signs of deceleration in France, Spain and the Netherlands (see Table S4).
Some recent indicators have pointed to a gradual cooling of demand for residential properties since
late 2005. At the same time, on the residential property supply side, growth in residential investment moderated somewhat in Q2 2007.
Despite the moderation in house price infl ation, valuation measures for property prices based on house price-to-rent ratios have continued to provide indications of overvaluation in the residential property market, greater than was the case when the June 2007 FSR was fi nalised. Nevertheless, the central scenario is for continued steady moderation in house price infl ation. Indeed, recent developments have provided tentative signs that a soft-landing could be underway. However, in those countries where overvaluation appears to be most acute the housing market continues to represent a source of risk for household sector balance sheets, although income growth will typically be the more decisive factor in assessing risks to household fi nances in euro area economies.
OVERALL ASSESSMENT OF RISKS IN THE
HOUSEHOLD SECTOR
Overall, risks in the household sector remain rather contained and have not changed materially compared to the assessment that was contained in the June 2007 FSR in the context of continued economic growth and strong employment creation, a moderation of loans to households and a gradual cooling of housing markets. Risks related to the slight further increase in the interest payment burden in relation to disposable income compared to June should be broadly offset by the continued income growth and further improvement in employment. At the same time, uncertainty has increased with respect to the possible implications of a turn in the credit cycle and a general tightening of fi nancing conditions.
Chart 2.14 The f inancial situation and employment expectations of euro area households over the next 12 months
(Q1 1998 - Q3 2007; % balances; three-month moving averages)
-44-40-36-32-28-24-20-16-12-8-404
-6-5-4-3-2-10123456
expectations about employment prospects(left-hand scale)expectations about the financial situation(right-hand scale)
1998 1999 2000 2001 2002 2003 2004 2005 2006
Source: European Commission Consumer Survey. Note: Expectations about employment prospects are calculated as the inverse of the balance of answers to the question “How do you expect the number of people unemployed in this country to change over the next 12 months?”. An increase in this indicator corresponds to more optimistic expectations overall.
76ECBFinancial Stability ReviewDecember 2007
Box 6
AN OVERVIEW OF DEVELOPMENTS IN EURO AREA HOUSING AND MORTGAGE MARKETS
In spite of increasing economic integration within the EU, the performances of national housing markets and the characteristics of mortgage markets have remained rather heterogeneous.1 This has meant that the balance sheet conditions of households and the nature and extent of exposures of banks to household sectors differ signifi cantly across countries within the euro area. Therefore, in order to identify fi nancial stability risks and vulnerabilities, it is important to look behind euro area average or aggregate fi gures and examine developments at the national level as well. With this in mind, this box draws upon indicators that are available at the national level to analyse country-specifi c housing market developments that are relevant from a fi nancial stability perspective.
One illustration of the degree of heterogeneity of potential housing market-related vulnerabilities across euro area countries is that, compared with a euro area average of just over 60% at the end of 2006, the stock of housing loans as a percentage of disposable income ranged from 21.3% in Italy (14.2% in Slovenia) to nearly 160% in the Netherlands. Similarly, while average household indebtedness as a percentage of GDP was 60% in the euro area at the end of 2006 (on a non-weighted basis), for some countries the same ratio was signifi cantly in excess of this: in the Netherlands it was more than 120% of GDP while Ireland (the latest data available are for 2005), Portugal, Spain and Luxembourg had ratios of between 80 and 90% of GDP. At the same time, there are wide differences in the degree of exposure of national banking systems to mortgage market-related risks. For instance, compared with an average (non-weighted) share of housing loans in the non-MFI loan portfolios of banks of around one third in the euro area at the end of the second quarter of 2007, this share varied from around 10 to 12% in countries such as Slovenia and Luxembourg to around 40 to 43% in the Netherlands, Portugal and Finland.2 In short, the distribution of mortgage credit risks across euro area countries is likely to be biased towards those countries with the most stretched household balance sheets.3
The relentless rise in household indebtedness witnessed over recent years, facilitated by the low interest rate environment, has left the households concerned more vulnerable to income and interest rate shocks, while the concomitant shift in the composition of household wealth towards illiquid housing wealth has left them more vulnerable to house price shocks.4 That being said, the strengthening of the net wealth positions of households provides a buffer against such shocks. Within the euro area, for those countries where data are available, household net total
1 Some convergence is evidenced by the decline in the dispersion of interest rates charged on MFI housing loans in the euro area (see ECB (2007), “Financial integration in Europe”, March). While foreign bank penetration has been rising rapidly, the bulk of housing loans continue to be granted by domestic fi nancial institutions.
2 For further discussion, see ECB (2007), “EU Banking Sector Stability”, November.3 Note, however, that the degree of fi nancial and mortgage market sophistication or completeness and housing market policies
(e.g. tax treatment) vary within the euro area (see e.g. P. Catte, N. Girouard, R. Price and C. André (2004), “Housing markets, wealth and the business cycle”, OECD Working Paper, No. 394). Therefore, plain household debt and bank lending ratios measured at the national level that do not correct for the proportion of households that are indebted or for credit risk mitigating factors do not accurately capture credit risk exposures.
4 The body of literature on the issue of rising household indebtedness and its consequences for debt sustainability has been expanding in recent years. See, for example, G. Debelle (2004), “Macroeconomic implications of rising household debt”, BIS Working Paper, No. 153; BIS (2006), “Housing Finance in the Global Financial Market”, CGFS Paper, No. 26; L. Rinaldi and A. Sanchis-Arellano (2006), “Household debt sustainability; What explains household non-performing loans?”, ECB Working Paper, No. 570; N. Girouard, M. Kennedy and C. André (2006), “Has the rise in debt made households more vulnerable?”, OECD Working Paper, No. 535; Fitch Ratings (2007), “House Prices and Household Debt – Where are the Risks?”, Fitch Special Report, July.
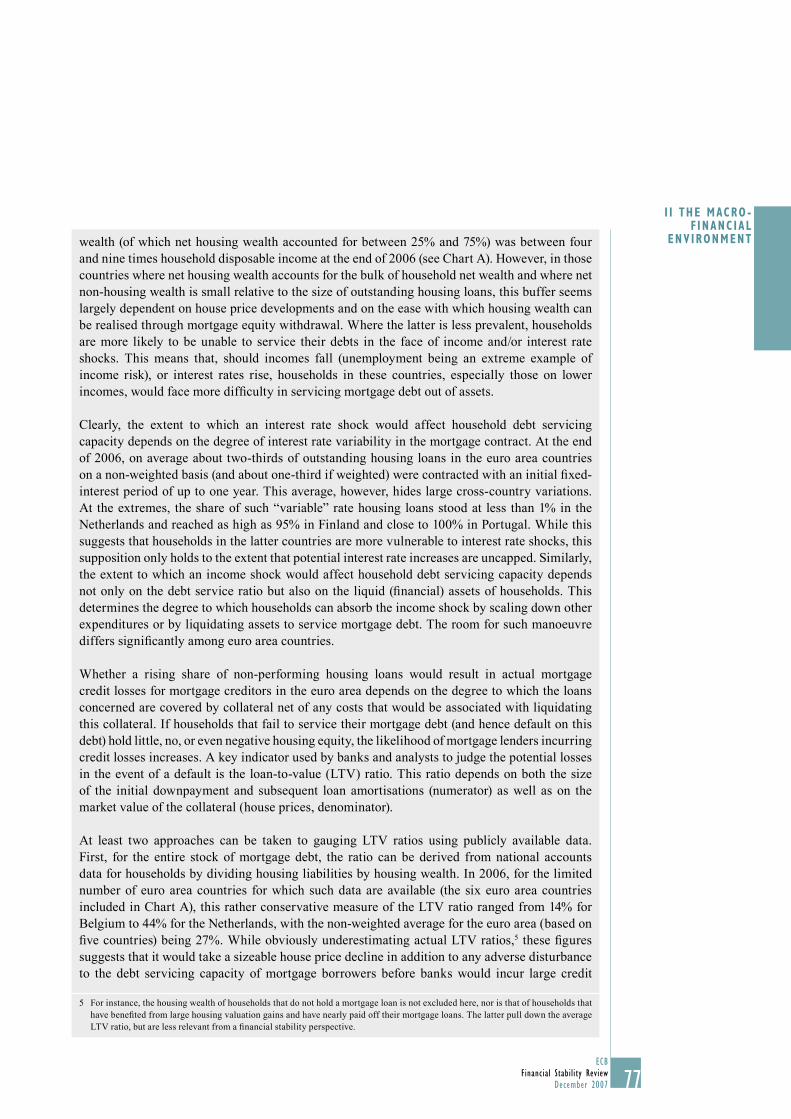
77ECB
Financial Stability ReviewDecember 2007
I I THE MACRO - F INANC IAL
ENVIRONMENT
77
wealth (of which net housing wealth accounted for between 25% and 75%) was between four and nine times household disposable income at the end of 2006 (see Chart A). However, in those countries where net housing wealth accounts for the bulk of household net wealth and where net non-housing wealth is small relative to the size of outstanding housing loans, this buffer seems largely dependent on house price developments and on the ease with which housing wealth can be realised through mortgage equity withdrawal. Where the latter is less prevalent, households are more likely to be unable to service their debts in the face of income and/or interest rate shocks. This means that, should incomes fall (unemployment being an extreme example of income risk), or interest rates rise, households in these countries, especially those on lower incomes, would face more diffi culty in servicing mortgage debt out of assets.
Clearly, the extent to which an interest rate shock would affect household debt servicing capacity depends on the degree of interest rate variability in the mortgage contract. At the end of 2006, on average about two-thirds of outstanding housing loans in the euro area countries on a non-weighted basis (and about one-third if weighted) were contracted with an initial fi xed-interest period of up to one year. This average, however, hides large cross-country variations. At the extremes, the share of such “variable” rate housing loans stood at less than 1% in the Netherlands and reached as high as 95% in Finland and close to 100% in Portugal. While this suggests that households in the latter countries are more vulnerable to interest rate shocks, this supposition only holds to the extent that potential interest rate increases are uncapped. Similarly, the extent to which an income shock would affect household debt servicing capacity depends not only on the debt service ratio but also on the liquid (fi nancial) assets of households. This determines the degree to which households can absorb the income shock by scaling down other expenditures or by liquidating assets to service mortgage debt. The room for such manoeuvre differs signifi cantly among euro area countries.
Whether a rising share of non-performing housing loans would result in actual mortgage credit losses for mortgage creditors in the euro area depends on the degree to which the loans concerned are covered by collateral net of any costs that would be associated with liquidating this collateral. If households that fail to service their mortgage debt (and hence default on this debt) hold little, no, or even negative housing equity, the likelihood of mortgage lenders incurring credit losses increases. A key indicator used by banks and analysts to judge the potential losses in the event of a default is the loan-to-value (LTV) ratio. This ratio depends on both the size of the initial downpayment and subsequent loan amortisations (numerator) as well as on the market value of the collateral (house prices, denominator).
At least two approaches can be taken to gauging LTV ratios using publicly available data. First, for the entire stock of mortgage debt, the ratio can be derived from national accounts data for households by dividing housing liabilities by housing wealth. In 2006, for the limited number of euro area countries for which such data are available (the six euro area countries included in Chart A), this rather conservative measure of the LTV ratio ranged from 14% for Belgium to 44% for the Netherlands, with the non-weighted average for the euro area (based on fi ve countries) being 27%. While obviously underestimating actual LTV ratios,5 these fi gures suggests that it would take a sizeable house price decline in addition to any adverse disturbance to the debt servicing capacity of mortgage borrowers before banks would incur large credit
5 For instance, the housing wealth of households that do not hold a mortgage loan is not excluded here, nor is that of households that have benefi ted from large housing valuation gains and have nearly paid off their mortgage loans. The latter pull down the average LTV ratio, but are less relevant from a fi nancial stability perspective.
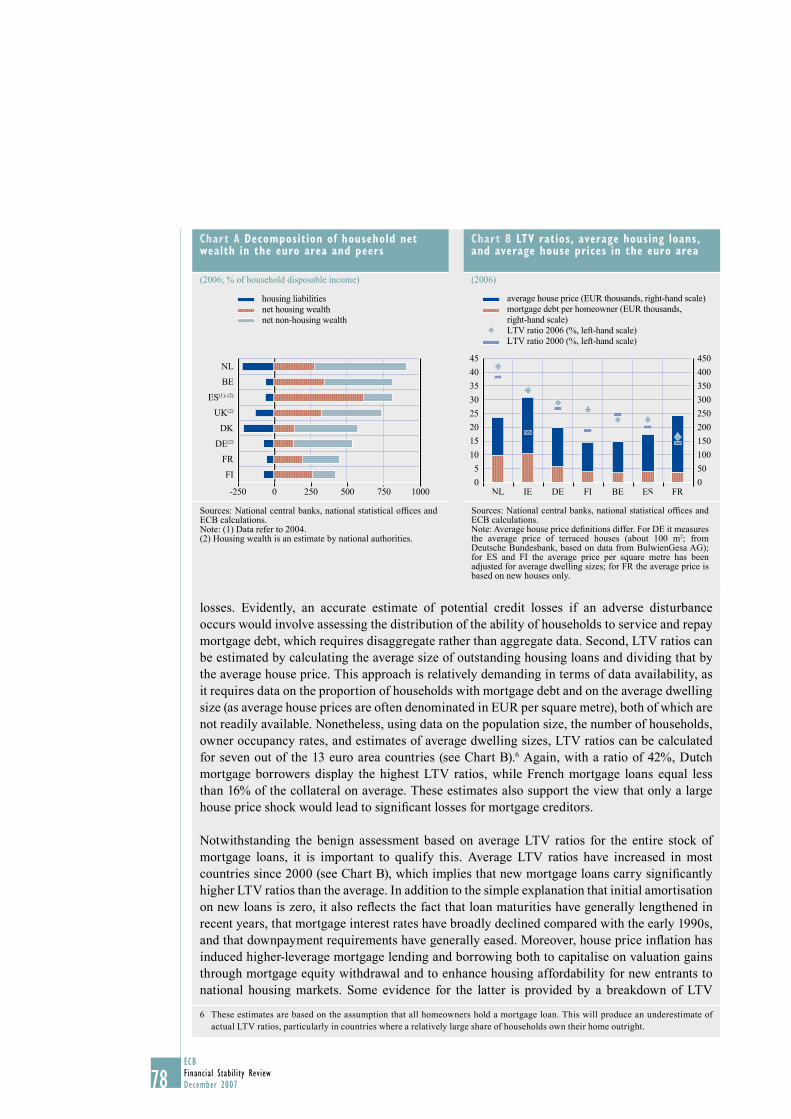
78ECBFinancial Stability ReviewDecember 2007
losses. Evidently, an accurate estimate of potential credit losses if an adverse disturbance occurs would involve assessing the distribution of the ability of households to service and repay mortgage debt, which requires disaggregate rather than aggregate data. Second, LTV ratios can be estimated by calculating the average size of outstanding housing loans and dividing that by the average house price. This approach is relatively demanding in terms of data availability, as it requires data on the proportion of households with mortgage debt and on the average dwelling size (as average house prices are often denominated in EUR per square metre), both of which are not readily available. Nonetheless, using data on the population size, the number of households, owner occupancy rates, and estimates of average dwelling sizes, LTV ratios can be calculated for seven out of the 13 euro area countries (see Chart B).6 Again, with a ratio of 42%, Dutch mortgage borrowers display the highest LTV ratios, while French mortgage loans equal less than 16% of the collateral on average. These estimates also support the view that only a large house price shock would lead to signifi cant losses for mortgage creditors.
Notwithstanding the benign assessment based on average LTV ratios for the entire stock of mortgage loans, it is important to qualify this. Average LTV ratios have increased in most countries since 2000 (see Chart B), which implies that new mortgage loans carry signifi cantly higher LTV ratios than the average. In addition to the simple explanation that initial amortisation on new loans is zero, it also refl ects the fact that loan maturities have generally lengthened in recent years, that mortgage interest rates have broadly declined compared with the early 1990s, and that downpayment requirements have generally eased. Moreover, house price infl ation has induced higher-leverage mortgage lending and borrowing both to capitalise on valuation gains through mortgage equity withdrawal and to enhance housing affordability for new entrants to national housing markets. Some evidence for the latter is provided by a breakdown of LTV
6 These estimates are based on the assumption that all homeowners hold a mortgage loan. This will produce an underestimate of actual LTV ratios, particularly in countries where a relatively large share of households own their home outright.
Chart B LTV ratios, average housing loans, and average house prices in the euro area
(2006)
0
5
10
15
20
25
30
35
40
45
FR0
50
100
150
200
250
300
350
400
450
average house price (EUR thousands, right-hand scale)mortgage debt per homeowner (EUR thousands,
LTV ratio 2006 (%, left-hand scale)LTV ratio 2000 (%, left-hand scale)
NL IE DE FI BE ES
right-hand scale)
Sources: National central banks, national statistical offi ces and ECB calculations.Note: Average house price defi nitions differ. For DE it measures the average price of terraced houses (about 100 m2; from Deutsche Bundesbank, based on data from BulwienGesa AG); for ES and FI the average price per square metre has been adjusted for average dwelling sizes; for FR the average price is based on new houses only.
Chart A Decomposition of household net wealth in the euro area and peers
(2006; % of household disposable income)
1000
FI
FR
DE(2)
DK
UK(2)
ES(1), (2)
BE
NL
housing liabilitiesnet housing wealthnet non-housing wealth
-250 0 250 500 750
Sources: National central banks, national statistical offi ces and ECB calculations.Note: (1) Data refer to 2004. (2) Housing wealth is an estimate by national authorities.
79ECB
Financial Stability ReviewDecember 2007
I I THE MACRO - F INANC IAL
ENVIRONMENT
79
ratios using disaggregated household level data at the individual EU country level, which shows that younger households (e.g. starters) tend to hold mortgage loans with higher than average LTV ratios.7
All in all, two key points can be made. First, in order to obtain a detailed mapping of the risks to euro area fi nancial stability posed by the interaction between the fi nancial system and housing markets, it is necessary both to analyse euro area aggregate data and to complement this by occasional monitoring of country level data in order to build up a more accurate picture of where the fi nancial stability risks and vulnerabilities lie. Second, better and more comparable micro-level or survey-based data for the euro area is needed for a comprehensive and meaningful fi nancial stability analysis of household mortgage developments. To this end efforts are currently being made to assess the feasibility of conducting a euro area household survey to obtain such comparable data.
7 See ECB (2007), “EU Banking Sector Stability”, November. The analysis in that report only includes two euro area countries – the Netherlands and Italy.

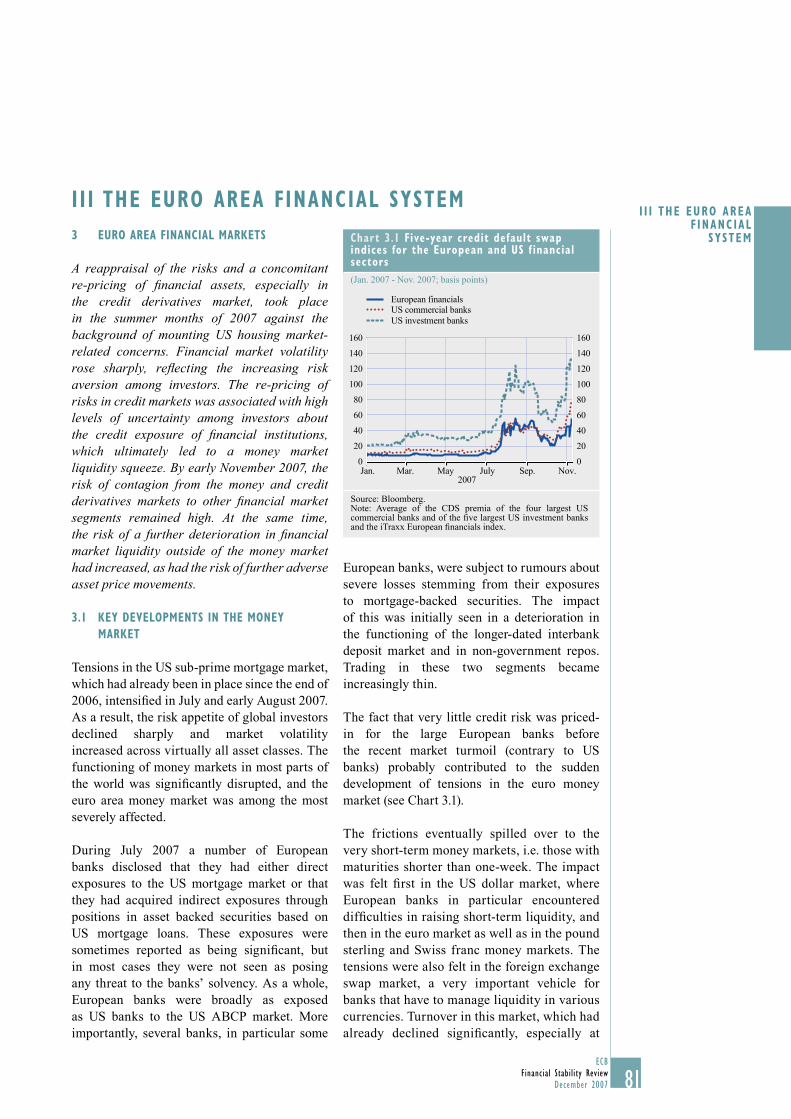
81ECB
Financial Stability ReviewDecember 2007
I I I THE EURO AREA F INANC IAL
SYSTEM
81
3 EURO AREA FINANCIAL MARKETS
A reappraisal of the risks and a concomitant re-pricing of fi nancial assets, especially in the credit derivatives market, took place in the summer months of 2007 against the background of mounting US housing market-related concerns. Financial market volatility rose sharply, refl ecting the increasing risk aversion among investors. The re-pricing of risks in credit markets was associated with high levels of uncertainty among investors about the credit exposure of fi nancial institutions, which ultimately led to a money market liquidity squeeze. By early November 2007, the risk of contagion from the money and credit derivatives markets to other fi nancial market segments remained high. At the same time, the risk of a further deterioration in fi nancial market liquidity outside of the money market had increased, as had the risk of further adverse asset price movements.
3.1 KEY DEVELOPMENTS IN THE MONEY
MARKET
Tensions in the US sub-prime mortgage market, which had already been in place since the end of 2006, intensifi ed in July and early August 2007. As a result, the risk appetite of global investors declined sharply and market volatility increased across virtually all asset classes. The functioning of money markets in most parts of the world was signifi cantly disrupted, and the euro area money market was among the most severely affected.
During July 2007 a number of European banks disclosed that they had either direct exposures to the US mortgage market or that they had acquired indirect exposures through positions in asset backed securities based on US mortgage loans. These exposures were sometimes reported as being signifi cant, but in most cases they were not seen as posing any threat to the banks’ solvency. As a whole, European banks were broadly as exposed as US banks to the US ABCP market. More importantly, several banks, in particular some
European banks, were subject to rumours about severe losses stemming from their exposures to mortgage-backed securities. The impact of this was initially seen in a deterioration in the functioning of the longer-dated interbank deposit market and in non-government repos. Trading in these two segments became increasingly thin.
The fact that very little credit risk was priced-in for the large European banks before the recent market turmoil (contrary to US banks) probably contributed to the sudden development of tensions in the euro money market (see Chart 3.1).
The frictions eventually spilled over to the very short-term money markets, i.e. those with maturities shorter than one-week. The impact was felt fi rst in the US dollar market, where European banks in particular encountered diffi culties in raising short-term liquidity, and then in the euro market as well as in the pound sterling and Swiss franc money markets. The tensions were also felt in the foreign exchange swap market, a very important vehicle for banks that have to manage liquidity in various currencies. Turnover in this market, which had already declined signifi cantly, especially at
I I I THE EURO AREA FINANCIAL SYSTEM
Chart 3.1 Five-year credit default swap indices for the European and US f inancial sectors
(Jan. 2007 - Nov. 2007; basis points)
2007
0
20
40
60
80
100
120
140
160
0
20
40
60
80
100
120
140
160
European financialsUS commercial banksUS investment banks
Jan. Mar. May July Sep. Nov.
Source: Bloomberg.Note: Average of the CDS premia of the four largest US commercial banks and of the fi ve largest US investment banks and the iTraxx European fi nancials index.
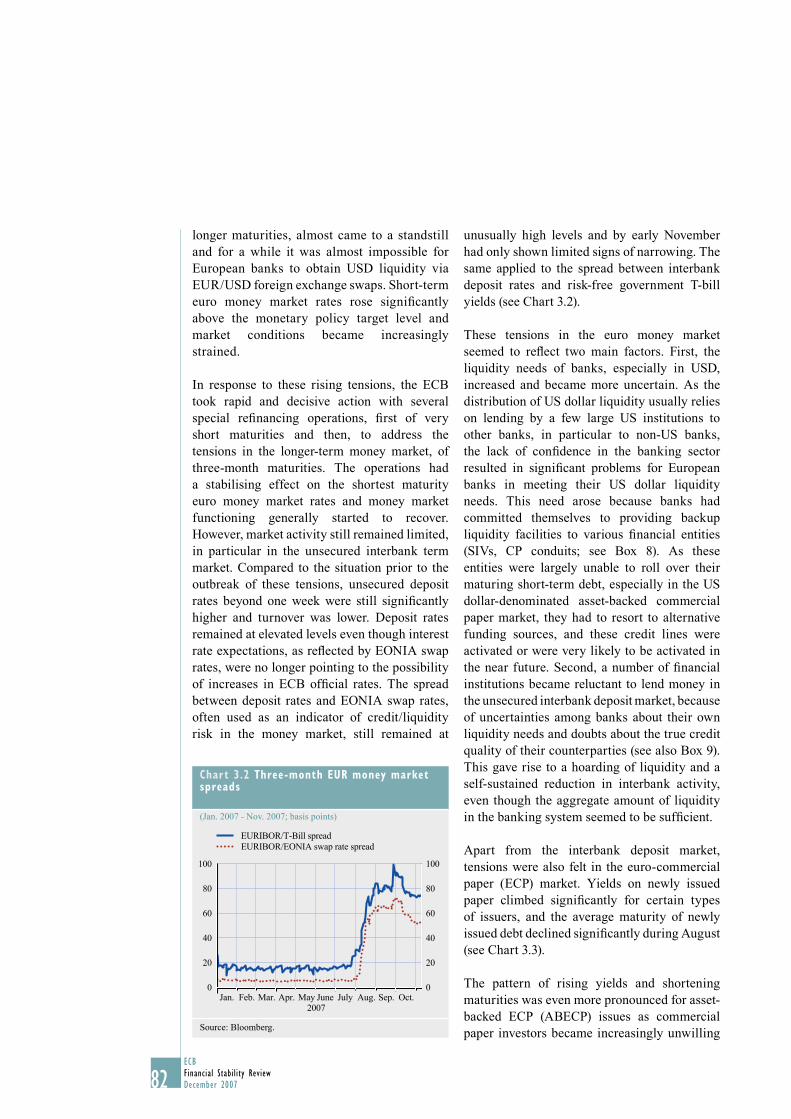
82ECBFinancial Stability ReviewDecember 2007
longer maturities, almost came to a standstill and for a while it was almost impossible for European banks to obtain USD liquidity via EUR/USD foreign exchange swaps. Short-term euro money market rates rose signifi cantly above the monetary policy target level and market conditions became increasingly strained.
In response to these rising tensions, the ECB took rapid and decisive action with several special refi nancing operations, fi rst of very short maturities and then, to address the tensions in the longer-term money market, of three-month maturities. The operations had a stabilising effect on the shortest maturity euro money market rates and money market functioning generally started to recover. However, market activity still remained limited, in particular in the unsecured interbank term market. Compared to the situation prior to the outbreak of these tensions, unsecured deposit rates beyond one week were still signifi cantly higher and turnover was lower. Deposit rates remained at elevated levels even though interest rate expectations, as refl ected by EONIA swap rates, were no longer pointing to the possibility of increases in ECB offi cial rates. The spread between deposit rates and EONIA swap rates, often used as an indicator of credit/liquidity risk in the money market, still remained at
unusually high levels and by early November had only shown limited signs of narrowing. The same applied to the spread between interbank deposit rates and risk-free government T-bill yields (see Chart 3.2).
These tensions in the euro money market seemed to refl ect two main factors. First, the liquidity needs of banks, especially in USD, increased and became more uncertain. As the distribution of US dollar liquidity usually relies on lending by a few large US institutions to other banks, in particular to non-US banks, the lack of confi dence in the banking sector resulted in signifi cant problems for European banks in meeting their US dollar liquidity needs. This need arose because banks had committed themselves to providing backup liquidity facilities to various fi nancial entities (SIVs, CP conduits; see Box 8). As these entities were largely unable to roll over their maturing short-term debt, especially in the US dollar-denominated asset-backed commercial paper market, they had to resort to alternative funding sources, and these credit lines were activated or were very likely to be activated in the near future. Second, a number of fi nancial institutions became reluctant to lend money in the unsecured interbank deposit market, because of uncertainties among banks about their own liquidity needs and doubts about the true credit quality of their counterparties (see also Box 9). This gave rise to a hoarding of liquidity and a self-sustained reduction in interbank activity, even though the aggregate amount of liquidity in the banking system seemed to be suffi cient.
Apart from the interbank deposit market, tensions were also felt in the euro-commercial paper (ECP) market. Yields on newly issued paper climbed signifi cantly for certain types of issuers, and the average maturity of newly issued debt declined signifi cantly during August (see Chart 3.3).
The pattern of rising yields and shortening maturities was even more pronounced for asset-backed ECP (ABECP) issues as commercial paper investors became increasingly unwilling
Chart 3.2 Three-month EUR money market spreads
(Jan. 2007 - Nov. 2007; basis points)
2007
0
20
40
60
80
100
0
20
40
60
80
100
EURIBOR/T-Bill spreadEURIBOR/EONIA swap rate spread
Jan. Feb. Mar. Apr. May June July Aug. Sep. Oct.
Source: Bloomberg.
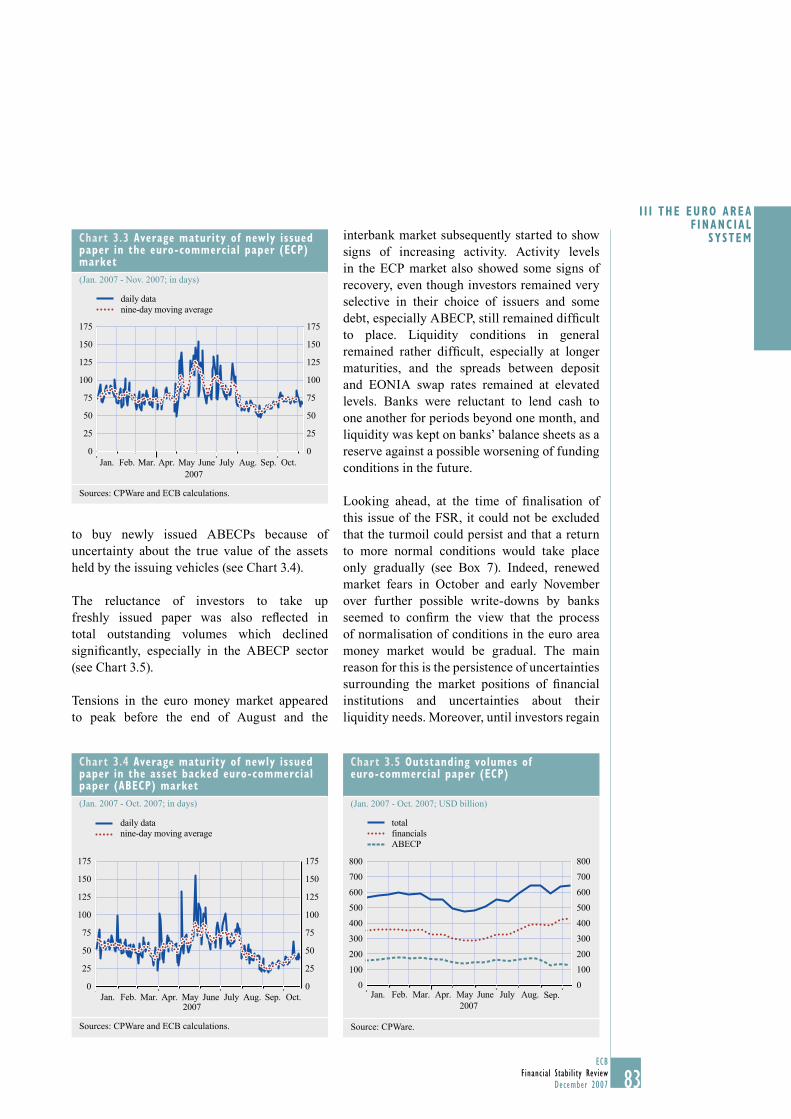
83ECB
Financial Stability ReviewDecember 2007
I I I THE EURO AREA F INANC IAL
SYSTEM
83
to buy newly issued ABECPs because of uncertainty about the true value of the assets held by the issuing vehicles (see Chart 3.4).
The reluctance of investors to take up freshly issued paper was also refl ected in total outstanding volumes which declined signifi cantly, especially in the ABECP sector (see Chart 3.5).
Tensions in the euro money market appeared to peak before the end of August and the
interbank market subsequently started to show signs of increasing activity. Activity levels in the ECP market also showed some signs of recovery, even though investors remained very selective in their choice of issuers and some debt, especially ABECP, still remained diffi cult to place. Liquidity conditions in general remained rather diffi cult, especially at longer maturities, and the spreads between deposit and EONIA swap rates remained at elevated levels. Banks were reluctant to lend cash to one another for periods beyond one month, and liquidity was kept on banks’ balance sheets as a reserve against a possible worsening of funding conditions in the future.
Looking ahead, at the time of fi nalisation of this issue of the FSR, it could not be excluded that the turmoil could persist and that a return to more normal conditions would take place only gradually (see Box 7). Indeed, renewed market fears in October and early November over further possible write-downs by banks seemed to confi rm the view that the process of normalisation of conditions in the euro area money market would be gradual. The main reason for this is the persistence of uncertainties surrounding the market positions of fi nancial institutions and uncertainties about their liquidity needs. Moreover, until investors regain
Chart 3.3 Average maturity of newly issued paper in the euro-commercial paper (ECP) market
(Jan. 2007 - Nov. 2007; in days)
daily datanine-day moving average
25
50
75
100
125
150
175
25
50
75
100
125
150
175
Jan. Feb. Mar. Apr. May June July Aug. Sep. Oct.2007
00
Sources: CPWare and ECB calculations.
Chart 3.4 Average maturity of newly issued paper in the asset backed euro-commercial paper (ABECP) market
(Jan. 2007 - Oct. 2007; in days)
0
2007
25
50
75
100
125
150
175
0
25
50
75
100
125
150
175
daily datanine-day moving average
Jan. Feb. Mar. Apr. May June July Aug. Sep. Oct.
Sources: CPWare and ECB calculations.
Chart 3.5 Outstanding volumes of euro-commercial paper (ECP)
(Jan. 2007 - Oct. 2007; USD billion)
800
700
600
500
400
300
200
100
0
800
700
600
500
400
300
200
100
0
totalfinancialsABECP
Jan. Feb. Mar. Apr. May June July Aug. Sep.2007
Source: CPWare.
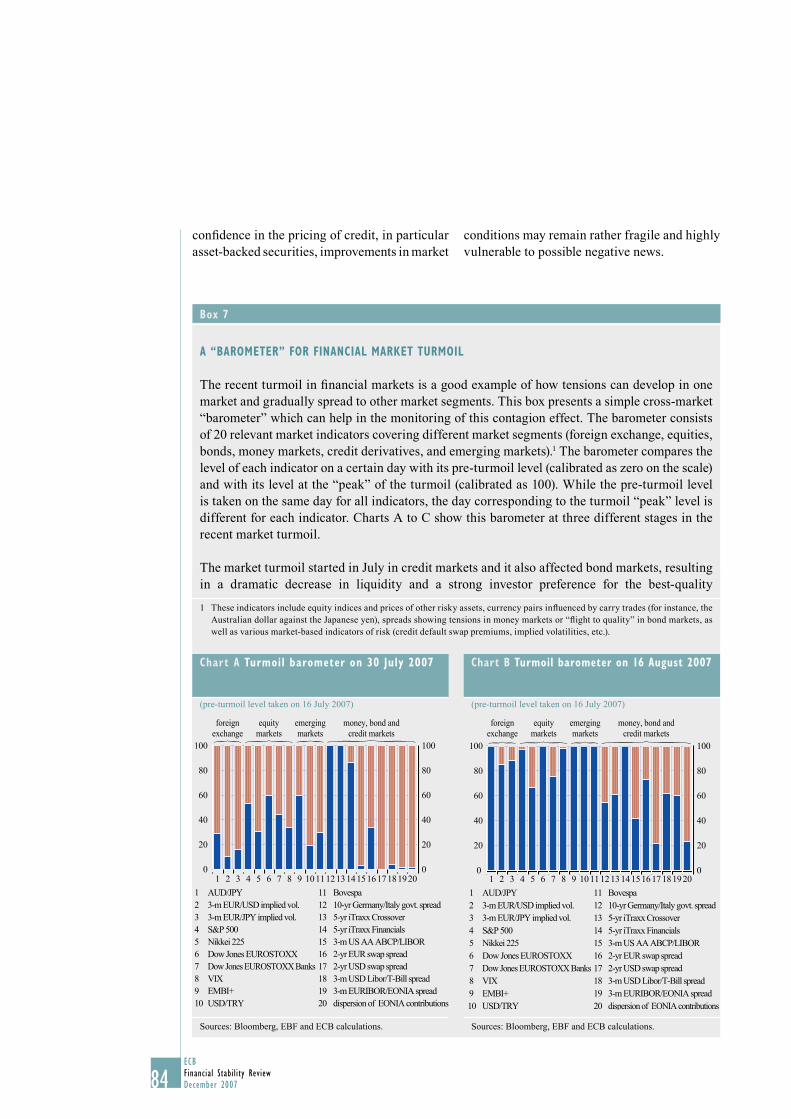
84ECBFinancial Stability ReviewDecember 2007
confi dence in the pricing of credit, in particular asset-backed securities, improvements in market
conditions may remain rather fragile and highly vulnerable to possible negative news.
Chart A Turmoil barometer on 30 July 2007
(pre-turmoil level taken on 16 July 2007)
{ { { {
0
20
40
60
80
100
0
20
40
60
80
100
AUD/JPY3-m EUR/USD implied vol.3-m EUR/JPY implied vol.S&P 500Nikkei 225Dow Jones EUROSTOXXDow Jones EUROSTOXX BanksVIXEMBI+USD/TRY
Bovespa10-yr Germany/Italy govt. spread5-yr iTraxx Crossover5-yr iTraxx Financials3-m US AA ABCP/LIBOR2-yr EUR swap spread2-yr USD swap spread3-m USD Libor/T-Bill spread3-m EURIBOR/EONIA spreaddispersion of EONIA contributions
foreignexchange
equitymarkets
emergingmarkets
money, bond andcredit markets
1 2 3 4 5 6 7 8 109 1112131415161718 2019
12345678
109
1112131415161718
2019
Sources: Bloomberg, EBF and ECB calculations.
Chart B Turmoil barometer on 16 August 2007
(pre-turmoil level taken on 16 July 2007)
{ { { {
0
20
40
60
80
100
0
20
40
60
80
100
AUD/JPY3-m EUR/USD implied vol.3-m EUR/JPY implied vol.S&P 500Nikkei 225Dow Jones EUROSTOXXDow Jones EUROSTOXX BanksVIXEMBI+USD/TRY
Bovespa10-yr Germany/Italy govt. spread5-yr iTraxx Crossover5-yr iTraxx Financials3-m US AA ABCP/LIBOR2-yr EUR swap spread2-yr USD swap spread3-m USD Libor/T-Bill spread3-m EURIBOR/EONIA spreaddispersion of EONIA contributions
1 2 3 4 5 6 7 8 9 1011121314151617181920
12345678910
11121314151617181920
foreignexchange
equitymarkets
emergingmarkets
money, bond andcredit markets
Sources: Bloomberg, EBF and ECB calculations.
Box 7
A “BAROMETER” FOR FINANCIAL MARKET TURMOIL
The recent turmoil in fi nancial markets is a good example of how tensions can develop in one market and gradually spread to other market segments. This box presents a simple cross-market “barometer” which can help in the monitoring of this contagion effect. The barometer consists of 20 relevant market indicators covering different market segments (foreign exchange, equities, bonds, money markets, credit derivatives, and emerging markets).1 The barometer compares the level of each indicator on a certain day with its pre-turmoil level (calibrated as zero on the scale) and with its level at the “peak” of the turmoil (calibrated as 100). While the pre-turmoil level is taken on the same day for all indicators, the day corresponding to the turmoil “peak” level is different for each indicator. Charts A to C show this barometer at three different stages in the recent market turmoil.
The market turmoil started in July in credit markets and it also affected bond markets, resulting in a dramatic decrease in liquidity and a strong investor preference for the best-quality
1 These indicators include equity indices and prices of other risky assets, currency pairs infl uenced by carry trades (for instance, the Australian dollar against the Japanese yen), spreads showing tensions in money markets or “fl ight to quality” in bond markets, as well as various market-based indicators of risk (credit default swap premiums, implied volatilities, etc.).
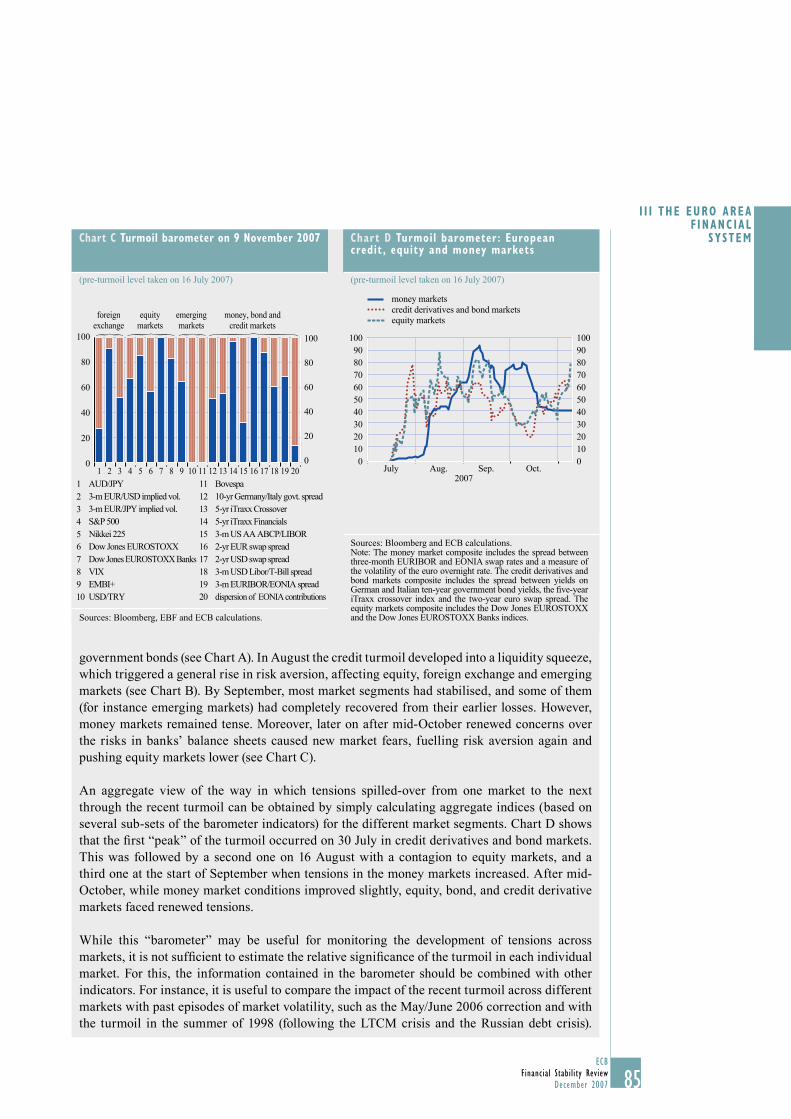
85ECB
Financial Stability ReviewDecember 2007
I I I THE EURO AREA F INANC IAL
SYSTEM
85
government bonds (see Chart A). In August the credit turmoil developed into a liquidity squeeze, which triggered a general rise in risk aversion, affecting equity, foreign exchange and emerging markets (see Chart B). By September, most market segments had stabilised, and some of them (for instance emerging markets) had completely recovered from their earlier losses. However, money markets remained tense. Moreover, later on after mid-October renewed concerns over the risks in banks’ balance sheets caused new market fears, fuelling risk aversion again and pushing equity markets lower (see Chart C).
An aggregate view of the way in which tensions spilled-over from one market to the next through the recent turmoil can be obtained by simply calculating aggregate indices (based on several sub-sets of the barometer indicators) for the different market segments. Chart D shows that the fi rst “peak” of the turmoil occurred on 30 July in credit derivatives and bond markets. This was followed by a second one on 16 August with a contagion to equity markets, and a third one at the start of September when tensions in the money markets increased. After mid-October, while money market conditions improved slightly, equity, bond, and credit derivative markets faced renewed tensions.
While this “barometer” may be useful for monitoring the development of tensions across markets, it is not suffi cient to estimate the relative signifi cance of the turmoil in each individual market. For this, the information contained in the barometer should be combined with other indicators. For instance, it is useful to compare the impact of the recent turmoil across different markets with past episodes of market volatility, such as the May/June 2006 correction and with the turmoil in the summer of 1998 (following the LTCM crisis and the Russian debt crisis).
Chart C Turmoil barometer on 9 November 2007
(pre-turmoil level taken on 16 July 2007)
0
20
40
60
80
100
0
20
40
60
80
100
AUD/JPY3-m EUR/USD implied vol.3-m EUR/JPY implied vol.S&P 500Nikkei 225Dow Jones EUROSTOXXDow Jones EUROSTOXX BanksVIXEMBI+USD/TRY
Bovespa10-yr Germany/Italy govt. spread5-yr iTraxx Crossover5-yr iTraxx Financials3-m US AA ABCP/LIBOR2-yr EUR swap spread2-yr USD swap spread3-m USD Libor/T-Bill spread3-m EURIBOR/EONIA spreaddispersion of EONIA contributions
1 2 3 4 5 6 7 8 9 10 11 12 13 14 15 16 17 18 19 20123456789
1112131415161718192010
foreignexchange
equitymarkets
emergingmarkets
money, bond andcredit markets{ { { {
Sources: Bloomberg, EBF and ECB calculations.
Chart D Turmoil barometer : European credit, equity and money markets
(pre-turmoil level taken on 16 July 2007)
0102030405060708090
100
0102030405060708090100
money marketscredit derivatives and bond marketsequity markets
July Aug. Sep. Oct.2007
Sources: Bloomberg and ECB calculations. Note: The money market composite includes the spread between three-month EURIBOR and EONIA swap rates and a measure of the volatility of the euro overnight rate. The credit derivatives and bond markets composite includes the spread between yields on German and Italian ten-year government bond yields, the fi ve-year iTraxx crossover index and the two-year euro swap spread. The equity markets composite includes the Dow Jones EUROSTOXX and the Dow Jones EUROSTOXX Banks indices.
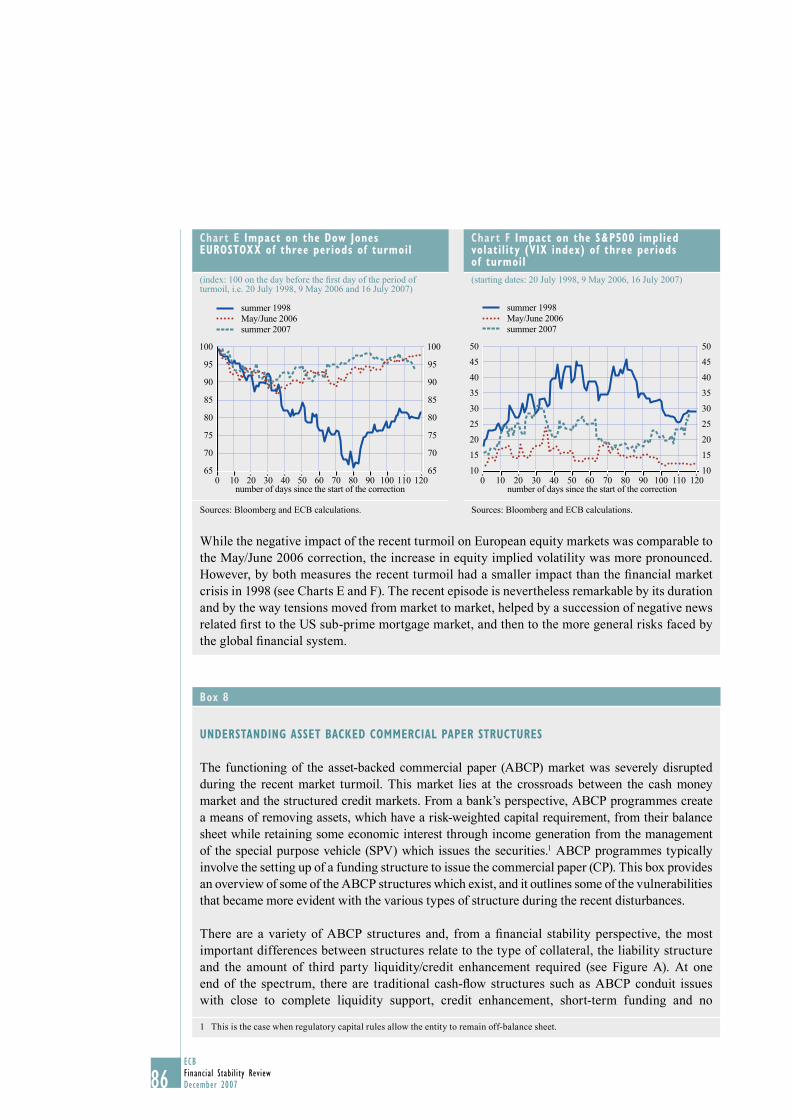
86ECBFinancial Stability ReviewDecember 2007
While the negative impact of the recent turmoil on European equity markets was comparable to the May/June 2006 correction, the increase in equity implied volatility was more pronounced. However, by both measures the recent turmoil had a smaller impact than the fi nancial market crisis in 1998 (see Charts E and F). The recent episode is nevertheless remarkable by its duration and by the way tensions moved from market to market, helped by a succession of negative news related fi rst to the US sub-prime mortgage market, and then to the more general risks faced by the global fi nancial system.
Chart F Impact on the S&P500 implied volatility (VIX index) of three periods of turmoil
(starting dates: 20 July 1998, 9 May 2006, 16 July 2007)
number of days since the start of the correction
summer 1998
summer 2007May/June 2006
50
45
40
35
30
25
20
15
10
50
45
40
35
30
25
20
15
100 10 20 30 40 50 60 70 80 90 100 110 120
Sources: Bloomberg and ECB calculations.
Chart E Impact on the Dow Jones EUROSTOXX of three periods of turmoil
(index: 100 on the day before the fi rst day of the period of turmoil, i.e. 20 July 1998, 9 May 2006 and 16 July 2007)
summer 1998May/June 2006summer 2007
100
95
90
85
80
75
70
65
100
95
90
85
80
75
70
650 10 20 30 40 50 60 70 80 90 100 110 120
number of days since the start of the correction
Sources: Bloomberg and ECB calculations.
Box 8
UNDERSTANDING ASSET BACKED COMMERCIAL PAPER STRUCTURES
The functioning of the asset-backed commercial paper (ABCP) market was severely disrupted during the recent market turmoil. This market lies at the crossroads between the cash money market and the structured credit markets. From a bank’s perspective, ABCP programmes create a means of removing assets, which have a risk-weighted capital requirement, from their balance sheet while retaining some economic interest through income generation from the management of the special purpose vehicle (SPV) which issues the securities.1 ABCP programmes typically involve the setting up of a funding structure to issue the commercial paper (CP). This box provides an overview of some of the ABCP structures which exist, and it outlines some of the vulnerabilities that became more evident with the various types of structure during the recent disturbances.
There are a variety of ABCP structures and, from a fi nancial stability perspective, the most important differences between structures relate to the type of collateral, the liability structure and the amount of third party liquidity/credit enhancement required (see Figure A). At one end of the spectrum, there are traditional cash-fl ow structures such as ABCP conduit issues with close to complete liquidity support, credit enhancement, short-term funding and no
1 This is the case when regulatory capital rules allow the entity to remain off-balance sheet.
87ECB
Financial Stability ReviewDecember 2007
I I I THE EURO AREA F INANC IAL
SYSTEM
87
marking-to-market of assets. At the other end are structured investment vehicles (SIVs) and SIV-lites which issue paper which depends primarily on the market value of assets for both liquidity and credit enhancement and consequently mark their assets to market.
Traditional ABCP conduits may invest in a broad variety of assets including both structured fi nance securities and other assets, such as trade receivables and commercial loans, thereby diversifying the collateral portfolio. Credit arbitrage structures are set up for banks and other institutions to invest in highly rated securities – usually but not exclusively structured fi nance securities – to earn a spread through higher expected returns on the assets than the funding cost of the liabilities.2 Overall, the portfolio composition of SIVs is quite similar to credit arbitrage with one important difference: SIVs tend to invest much more in fi nancial institution debt, including banks’ senior and subordinated notes and hybrid capital instruments. Finally, SIV-lites have tended to have a high concentration of residential mortgage-backed securities (RMBSs), including those backed by US sub-prime mortgages, with only a small portion of their collateral diversifi ed into other assets such as collateralised debt obligations (CDOs) and commercial mortgage-backed securities (CMBSs).
The recent market upheaval vividly illustrated the nature of the funding liabilities of these vehicles and it drew attention to the maturity mismatches between assets and liabilities in the structures as well as the fact that some of these structures did not have their own equity capital. To some extent, all of the ABCP structures have a maturity mismatch. Traditional ABCP conduits funded themselves solely in the CP market, usually with short-term issues, exposing them to liquidity risks in the event of disruption in the functioning of the short end of the CP market. Credit arbitrage conduits tend to have a similar funding profi le. By contrast, SIVs fund their own capital base through the issuance of capital notes as well as senior and junior medium term notes (MTNs). Therefore, they have slightly different funding structures as they can issue both CPs and MTNs, the maturity of which is typically longer than one year. SIV-lites typically had a similar funding structure except that CPs were the most important funding source, followed by MTNs. Traditional ABCP conduits are not capitalised as they depend totally on liquidity provision to solve any funding problems. Market value structures have their own capital. For example, SIV-lites had taken on more leverage in terms of their investment assets (sub-prime RMBSs and CDOs) as well as having slightly less capital (5-7%) compared with SIVs (7-9%).3 SIV-lite structures and some SIVs have built-in features – including weighted average life (WAL) targets for their liabilities and market value tests – that could prevent new issuance of ABCPs or even lead to an orderly deleveraging of some collateral to provide liquidity.
Problems in assessing the vehicle’s collateral default risk and an attendant evaporation of investor confi dence in the collateral backing the outstanding commercial paper prevented fresh issuance of ABCPs. In the case of traditional conduits, this required liquidity support. This is available in several forms, such as credit lines, letters of credit, cash-reserve accounts or swaps, and is usually provided by the sponsor of the vehicle which is often a bank with a high credit rating. As can be seen in Figure, back-up funding from credit lines becomes progressively less prominent as the structure moves towards a market value structure. In these partially funded structures, sponsoring banks have used other methods to mitigate liquidity risk, such as extending the maturity profi le of the ABCPs outstanding by exercising options to extend the
2 The term securities arbitrage is also used in industry reports on the topic. However, securities arbitrage vehicles can also refer to a broader range of programmes including market value structures that invest in any rated security.
3 See Bear Stearns (2007), “Asset-Backed Commercial Paper (ABCP) Conduits and SIVs: What are the issues?”, August.
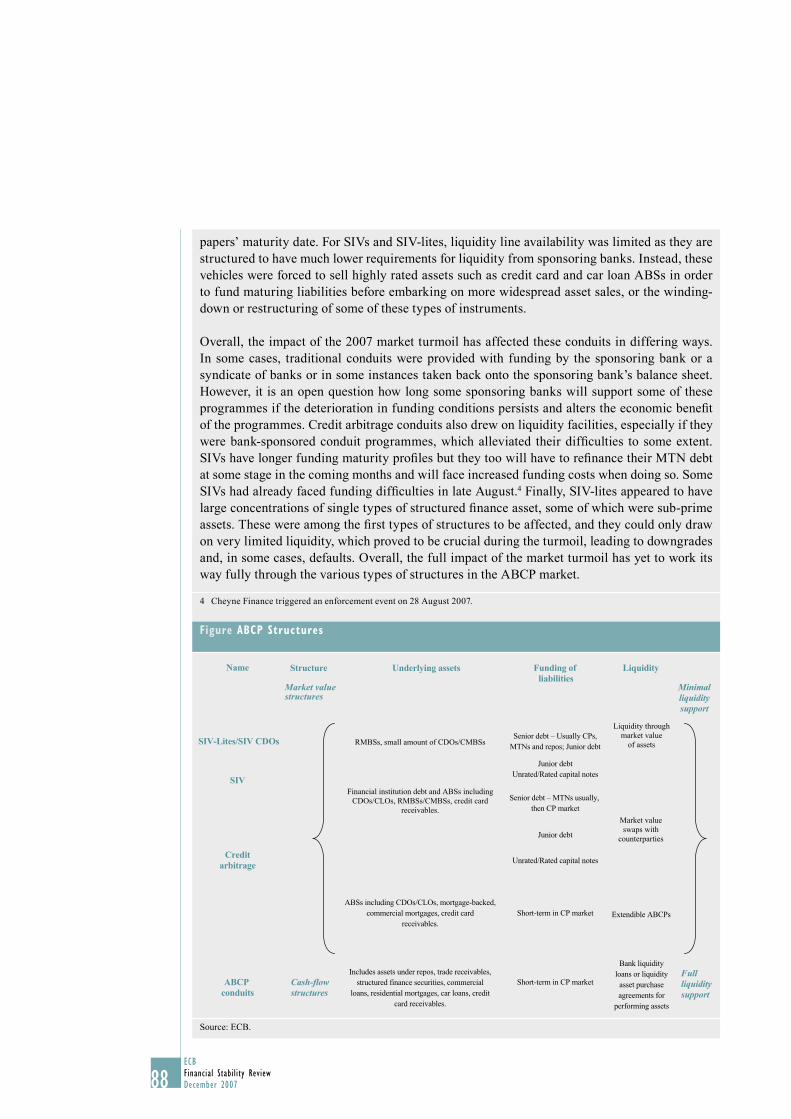
88ECBFinancial Stability ReviewDecember 2007
Figure ABCP Structures
RMBSs, small amount of CDOs/CMBSs
Financial institution debt and ABSs includingCDOs/CLOs, RMBSs/CMBSs, credit card
receivables.
ABSs including CDOs/CLOs, mortgage-backed,commercial mortgages, credit card
receivables.
Includes assets under repos, trade receivables,structured finance securities, commercial
loans, residential mortgages, car loans, creditcard receivables.
Senior debt – Usually CPs,MTNs and repos; Junior debt
Junior debtUnrated/Rated capital notes
Senior debt – MTNs usually, then CP market
Junior debt
Unrated/Rated capital notes
Short-term in CP market
Short-term in CP market
Market valueswaps with
counterparties
Liquidity throughmarket value
of assets
Extendible ABCPs
Bank liquidityloans or liquidity
asset purchaseagreements for
performing assets
Name
SIV-Lites/SIV CDOs
SIV
Creditarbitrage
ABCP conduits
Cash-flow structures
Structure
Market valuestructures
Underlying assets Funding of liabilities
Liquidity
Minimalliquiditysupport
Full liquiditysupport
Source: ECB.
papers’ maturity date. For SIVs and SIV-lites, liquidity line availability was limited as they are structured to have much lower requirements for liquidity from sponsoring banks. Instead, these vehicles were forced to sell highly rated assets such as credit card and car loan ABSs in order to fund maturing liabilities before embarking on more widespread asset sales, or the winding-down or restructuring of some of these types of instruments.
Overall, the impact of the 2007 market turmoil has affected these conduits in differing ways. In some cases, traditional conduits were provided with funding by the sponsoring bank or a syndicate of banks or in some instances taken back onto the sponsoring bank’s balance sheet. However, it is an open question how long some sponsoring banks will support some of these programmes if the deterioration in funding conditions persists and alters the economic benefi t of the programmes. Credit arbitrage conduits also drew on liquidity facilities, especially if they were bank-sponsored conduit programmes, which alleviated their diffi culties to some extent. SIVs have longer funding maturity profi les but they too will have to refi nance their MTN debt at some stage in the coming months and will face increased funding costs when doing so. Some SIVs had already faced funding diffi culties in late August.4 Finally, SIV-lites appeared to have large concentrations of single types of structured fi nance asset, some of which were sub-prime assets. These were among the fi rst types of structures to be affected, and they could only draw on very limited liquidity, which proved to be crucial during the turmoil, leading to downgrades and, in some cases, defaults. Overall, the full impact of the market turmoil has yet to work its way fully through the various types of structures in the ABCP market.
4 Cheyne Finance triggered an enforcement event on 28 August 2007.
89ECB
Financial Stability ReviewDecember 2007
I I I THE EURO AREA F INANC IAL
SYSTEM
89
Box 9
RECENT ISSUES IN THE EURO AREA MONEY MARKET: CAUSES, CONSEQUENCES AND PROPOSED
MITIGATING MEASURES
In early August 2007 two interrelated factors seemed to simultaneously cause an evaporation of liquidity in the euro area money market. First, those banks which knew that they were exposed to US sub-prime related assets – either directly or indirectly via contingent liquidity lines – started to build up precautionary balances in anticipation of likely future liquidity needs. Second, liquidity providing banks in the interbank market became wary of lending funds to other banks as a result of uncertainty about counterparty asset quality. The result of this hoarding of liquidity was that interbank money market rates at long-term maturities increased sharply and remained elevated until the cut-off date of this FSR. The ECB and other major central banks met the increased liquidity needs in a series of operations, some of which were also extended to longer term maturities. While the operations were successful in bringing down and stabilising overnight interest rates close to the key policy rates, banks’ willingness to lend funds in the interbank market remained affected by the disturbances. Against this background, the need to fi nd a solution to the root cause of banks’ unwillingness to extend credit in the interbank market has been accelerated by the risk that the volatility in the term money market could have implications on banks' ability to fund themselves which, in a negative scenario, could in turn hamper the intermediation of credit to the non-fi nancial sectors of the economy. This box discusses the sources of the problems in the interbank money markets and presents some private sector initiatives to mitigate market tension.
Beyond the motives to hoard liquidity for the purposes of pre-cautionary saving, the unwillingness of banks to lend funds in the interbank money market refl ects the negative implications of adverse selection incentives. In a situation where fi nancial institutions are not able to distinguish between potential counterparties that are exposed to assets for which investors’ risk aversion has increased and those for which it has not, lenders in the unsecured interbank market have an incentive to hoard funds and raise the liquidity premiums in their lending rates.1 Central banks as the ultimate liquidity providers to the fi nancial system may mitigate banks’ funding liquidity problems by conducting operations that make additional liquidity available to everyone in the fi nancial system. However, if the liquidity injections are carried out at rates that are lower than prevailing market rates – these being elevated due to liquidity hoarding incentives – in theory interbank trading activity may shrink further with the risk that the system will become increasingly reliant on the funds provided by the central bank.
While central bank operations can contribute to ensure that banks’ very short-term liquidity needs are met, to rid itself from the adverse selection problems the market needs to develop mechanisms that allow investors to distinguish between different types of counterparty and to apply fair margins in transactions. At the time when this Review went to print, at least three alternative but interrelated proposals had been put forward and partially implemented by banks and market participants which, from different angles, try to address the sources of the problems created by asymmetric information and adverse selection.
1 In the secured market, banks can obtain funds as long as they are able to post suffi cient collateral.
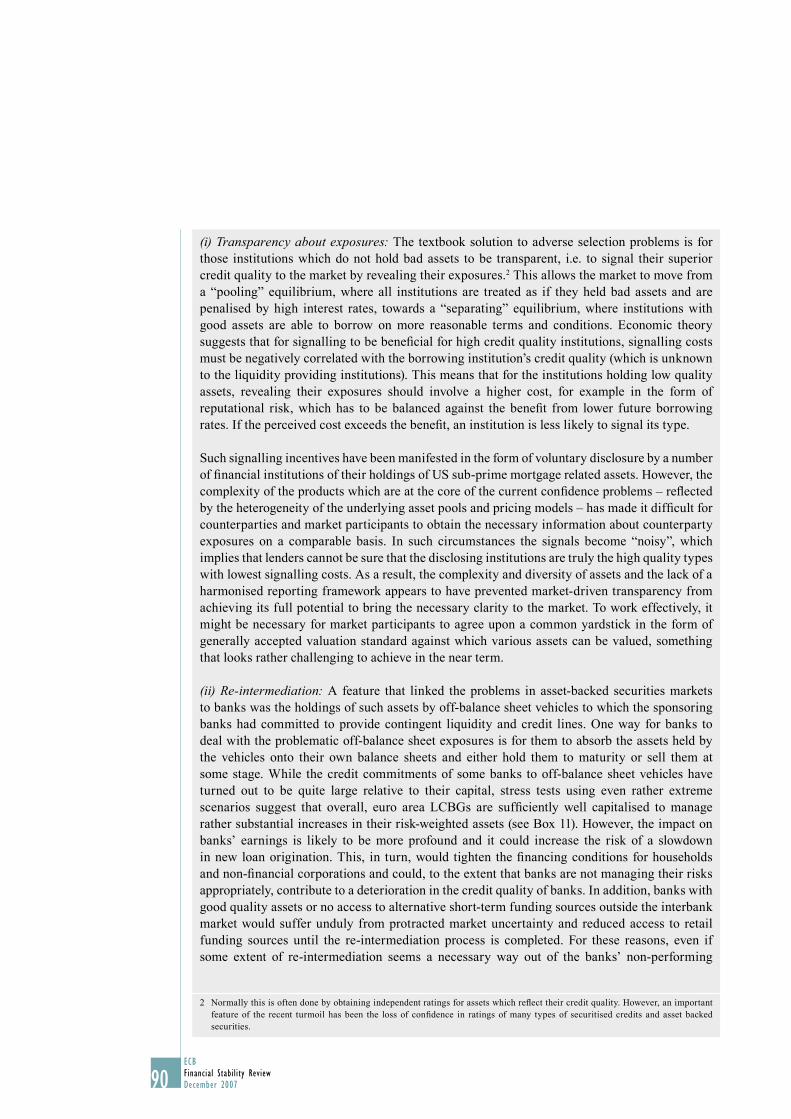
90ECBFinancial Stability ReviewDecember 2007
(i) Transparency about exposures: The textbook solution to adverse selection problems is for those institutions which do not hold bad assets to be transparent, i.e. to signal their superior credit quality to the market by revealing their exposures.2 This allows the market to move from a “pooling” equilibrium, where all institutions are treated as if they held bad assets and are penalised by high interest rates, towards a “separating” equilibrium, where institutions with good assets are able to borrow on more reasonable terms and conditions. Economic theory suggests that for signalling to be benefi cial for high credit quality institutions, signalling costs must be negatively correlated with the borrowing institution’s credit quality (which is unknown to the liquidity providing institutions). This means that for the institutions holding low quality assets, revealing their exposures should involve a higher cost, for example in the form of reputational risk, which has to be balanced against the benefi t from lower future borrowing rates. If the perceived cost exceeds the benefi t, an institution is less likely to signal its type.
Such signalling incentives have been manifested in the form of voluntary disclosure by a number of fi nancial institutions of their holdings of US sub-prime mortgage related assets. However, the complexity of the products which are at the core of the current confi dence problems – refl ected by the heterogeneity of the underlying asset pools and pricing models – has made it diffi cult for counterparties and market participants to obtain the necessary information about counterparty exposures on a comparable basis. In such circumstances the signals become “noisy”, which implies that lenders cannot be sure that the disclosing institutions are truly the high quality types with lowest signalling costs. As a result, the complexity and diversity of assets and the lack of a harmonised reporting framework appears to have prevented market-driven transparency from achieving its full potential to bring the necessary clarity to the market. To work effectively, it might be necessary for market participants to agree upon a common yardstick in the form of generally accepted valuation standard against which various assets can be valued, something that looks rather challenging to achieve in the near term.
(ii) Re-intermediation: A feature that linked the problems in asset-backed securities markets to banks was the holdings of such assets by off-balance sheet vehicles to which the sponsoring banks had committed to provide contingent liquidity and credit lines. One way for banks to deal with the problematic off-balance sheet exposures is for them to absorb the assets held by the vehicles onto their own balance sheets and either hold them to maturity or sell them at some stage. While the credit commitments of some banks to off-balance sheet vehicles have turned out to be quite large relative to their capital, stress tests using even rather extreme scenarios suggest that overall, euro area LCBGs are suffi ciently well capitalised to manage rather substantial increases in their risk-weighted assets (see Box 11). However, the impact on banks’ earnings is likely to be more profound and it could increase the risk of a slowdown in new loan origination. This, in turn, would tighten the fi nancing conditions for households and non-fi nancial corporations and could, to the extent that banks are not managing their risks appropriately, contribute to a deterioration in the credit quality of banks. In addition, banks with good quality assets or no access to alternative short-term funding sources outside the interbank market would suffer unduly from protracted market uncertainty and reduced access to retail funding sources until the re-intermediation process is completed. For these reasons, even if some extent of re-intermediation seems a necessary way out of the banks’ non-performing
2 Normally this is often done by obtaining independent ratings for assets which refl ect their credit quality. However, an important feature of the recent turmoil has been the loss of confi dence in ratings of many types of securitised credits and asset backed securities.
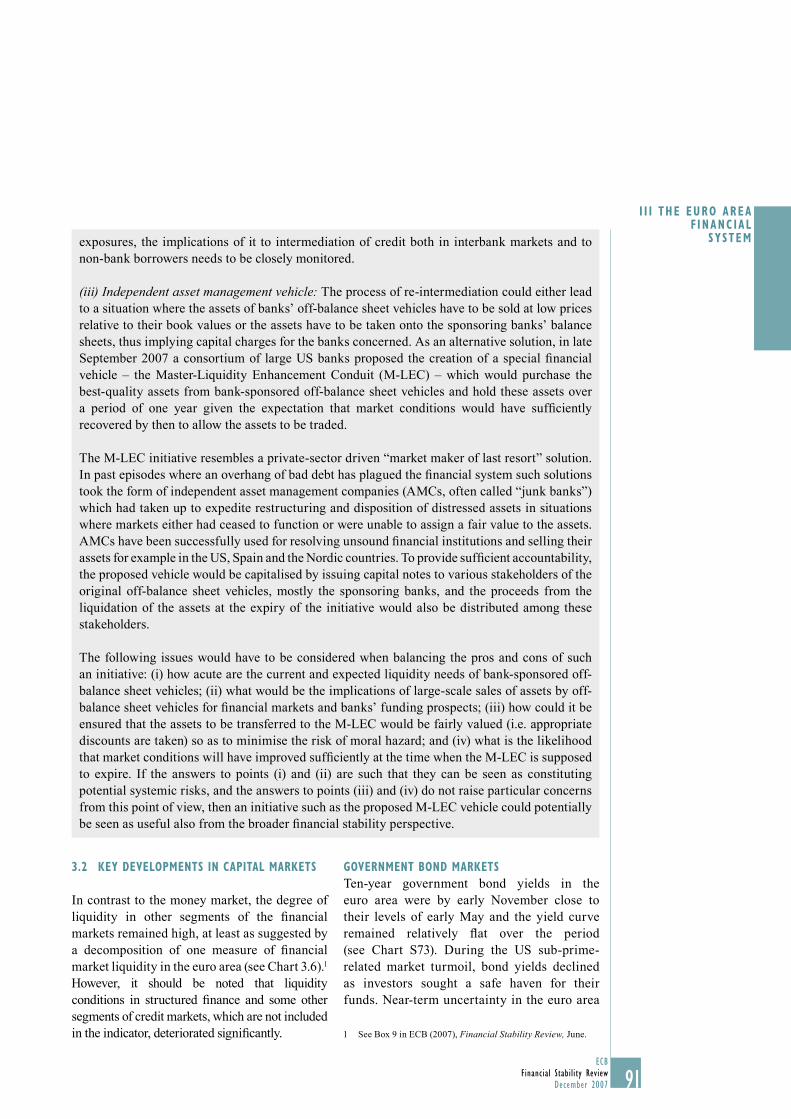
91ECB
Financial Stability ReviewDecember 2007
I I I THE EURO AREA F INANC IAL
SYSTEM
91
exposures, the implications of it to intermediation of credit both in interbank markets and to non-bank borrowers needs to be closely monitored.
(iii) Independent asset management vehicle: The process of re-intermediation could either lead to a situation where the assets of banks’ off-balance sheet vehicles have to be sold at low prices relative to their book values or the assets have to be taken onto the sponsoring banks’ balance sheets, thus implying capital charges for the banks concerned. As an alternative solution, in late September 2007 a consortium of large US banks proposed the creation of a special fi nancial vehicle – the Master-Liquidity Enhancement Conduit (M-LEC) – which would purchase the best-quality assets from bank-sponsored off-balance sheet vehicles and hold these assets over a period of one year given the expectation that market conditions would have suffi ciently recovered by then to allow the assets to be traded.
The M-LEC initiative resembles a private-sector driven “market maker of last resort” solution. In past episodes where an overhang of bad debt has plagued the fi nancial system such solutions took the form of independent asset management companies (AMCs, often called “junk banks”) which had taken up to expedite restructuring and disposition of distressed assets in situations where markets either had ceased to function or were unable to assign a fair value to the assets. AMCs have been successfully used for resolving unsound fi nancial institutions and selling their assets for example in the US, Spain and the Nordic countries. To provide suffi cient accountability, the proposed vehicle would be capitalised by issuing capital notes to various stakeholders of the original off-balance sheet vehicles, mostly the sponsoring banks, and the proceeds from the liquidation of the assets at the expiry of the initiative would also be distributed among these stakeholders.
The following issues would have to be considered when balancing the pros and cons of such an initiative: (i) how acute are the current and expected liquidity needs of bank-sponsored off-balance sheet vehicles; (ii) what would be the implications of large-scale sales of assets by off-balance sheet vehicles for fi nancial markets and banks’ funding prospects; (iii) how could it be ensured that the assets to be transferred to the M-LEC would be fairly valued (i.e. appropriate discounts are taken) so as to minimise the risk of moral hazard; and (iv) what is the likelihood that market conditions will have improved suffi ciently at the time when the M-LEC is supposed to expire. If the answers to points (i) and (ii) are such that they can be seen as constituting potential systemic risks, and the answers to points (iii) and (iv) do not raise particular concerns from this point of view, then an initiative such as the proposed M-LEC vehicle could potentially be seen as useful also from the broader fi nancial stability perspective.
3.2 KEY DEVELOPMENTS IN CAPITAL MARKETS
In contrast to the money market, the degree of liquidity in other segments of the fi nancial markets remained high, at least as suggested by a decomposition of one measure of fi nancial market liquidity in the euro area (see Chart 3.6).1
However, it should be noted that liquidity conditions in structured fi nance and some other segments of credit markets, which are not included in the indicator, deteriorated signifi cantly.
GOVERNMENT BOND MARKETS
Ten-year government bond yields in the euro area were by early November close to their levels of early May and the yield curve remained relatively fl at over the period (see Chart S73). During the US sub-prime-related market turmoil, bond yields declined as investors sought a safe haven for their funds. Near-term uncertainty in the euro area
See Box 9 in ECB (2007), 1 Financial Stability Review, June.
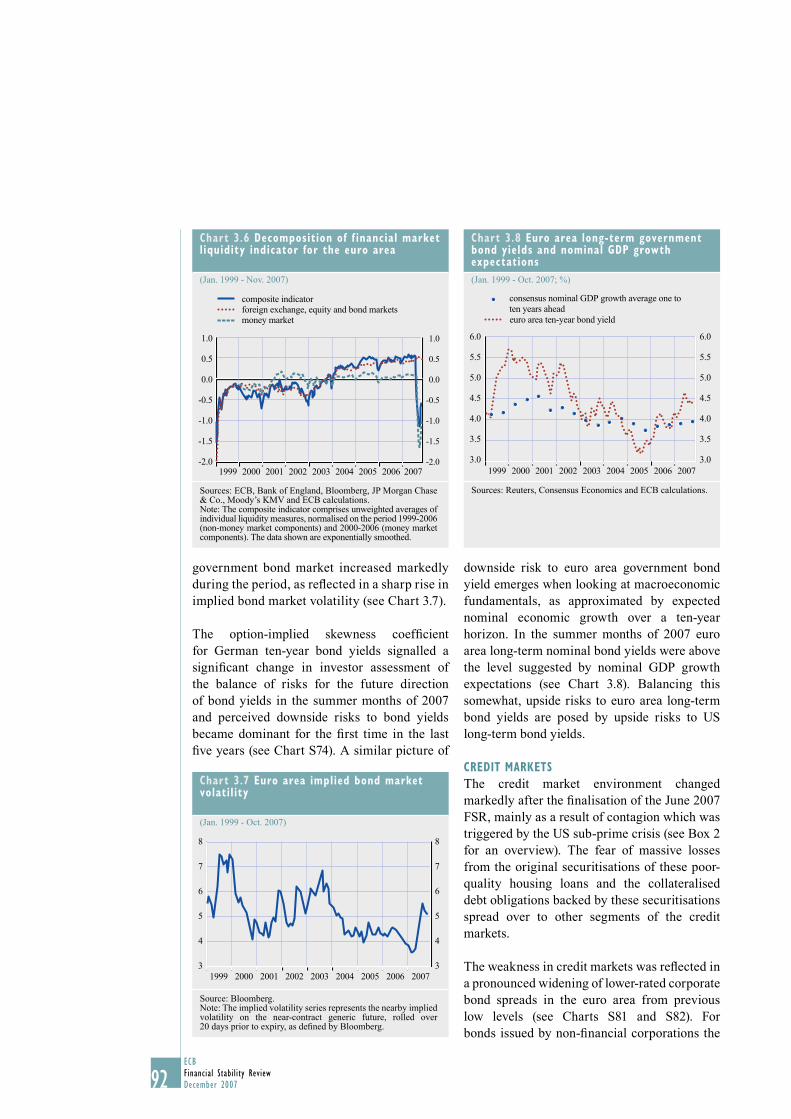
92ECBFinancial Stability ReviewDecember 2007
government bond market increased markedly during the period, as refl ected in a sharp rise in implied bond market volatility (see Chart 3.7).
The option-implied skewness coeffi cient for German ten-year bond yields signalled a signifi cant change in investor assessment of the balance of risks for the future direction of bond yields in the summer months of 2007 and perceived downside risks to bond yields became dominant for the fi rst time in the last fi ve years (see Chart S74). A similar picture of
downside risk to euro area government bond yield emerges when looking at macroeconomic fundamentals, as approximated by expected nominal economic growth over a ten-year horizon. In the summer months of 2007 euro area long-term nominal bond yields were above the level suggested by nominal GDP growth expectations (see Chart 3.8). Balancing this somewhat, upside risks to euro area long-term bond yields are posed by upside risks to US long-term bond yields.
CREDIT MARKETS
The credit market environment changed markedly after the fi nalisation of the June 2007 FSR, mainly as a result of contagion which was triggered by the US sub-prime crisis (see Box 2 for an overview). The fear of massive losses from the original securitisations of these poor-quality housing loans and the collateralised debt obligations backed by these securitisations spread over to other segments of the credit markets.
The weakness in credit markets was refl ected in a pronounced widening of lower-rated corporate bond spreads in the euro area from previous low levels (see Charts S81 and S82). For bonds issued by non-fi nancial corporations the
Chart 3.7 Euro area implied bond market volatility
(Jan. 1999 - Oct. 2007)
3
4
5
6
7
8
3
4
5
6
7
8
1999 20012000 2002 2003 2004 2005 2006 2007
Source: Bloomberg.Note: The implied volatility series represents the nearby implied volatility on the near-contract generic future, rolled over 20 days prior to expiry, as defi ned by Bloomberg.
Chart 3.8 Euro area long-term government bond yields and nominal GDP growth expectations
(Jan. 1999 - Oct. 2007; %)
6.0
5.5
5.0
4.5
4.0
3.5
3.0
6.0
5.5
5.0
4.5
4.0
3.5
3.01999 20012000 2002 2003 2004 2005 2006 2007
consensus nominal GDP growth average one to ten years aheadeuro area ten-year bond yield
Sources: Reuters, Consensus Economics and ECB calculations.
Chart 3.6 Decomposition of f inancial market liquidity indicator for the euro area
(Jan. 1999 - Nov. 2007)
1.0
0.5
0.0
-0.5
-1.0
-1.5
-2.0
1.0
0.5
0.0
-0.5
-1.0
-1.5
-2.01999 2000 2001 2002 2003 2004 2005 2006 2007
composite indicatorforeign exchange, equity and bond marketsmoney market
Sources: ECB, Bank of England, Bloomberg, JP Morgan Chase & Co., Moody’s KMV and ECB calculations.Note: The composite indicator comprises unweighted averages of individual liquidity measures, normalised on the period 1999-2006 (non-money market components) and 2000-2006 (money market components). The data shown are exponentially smoothed.
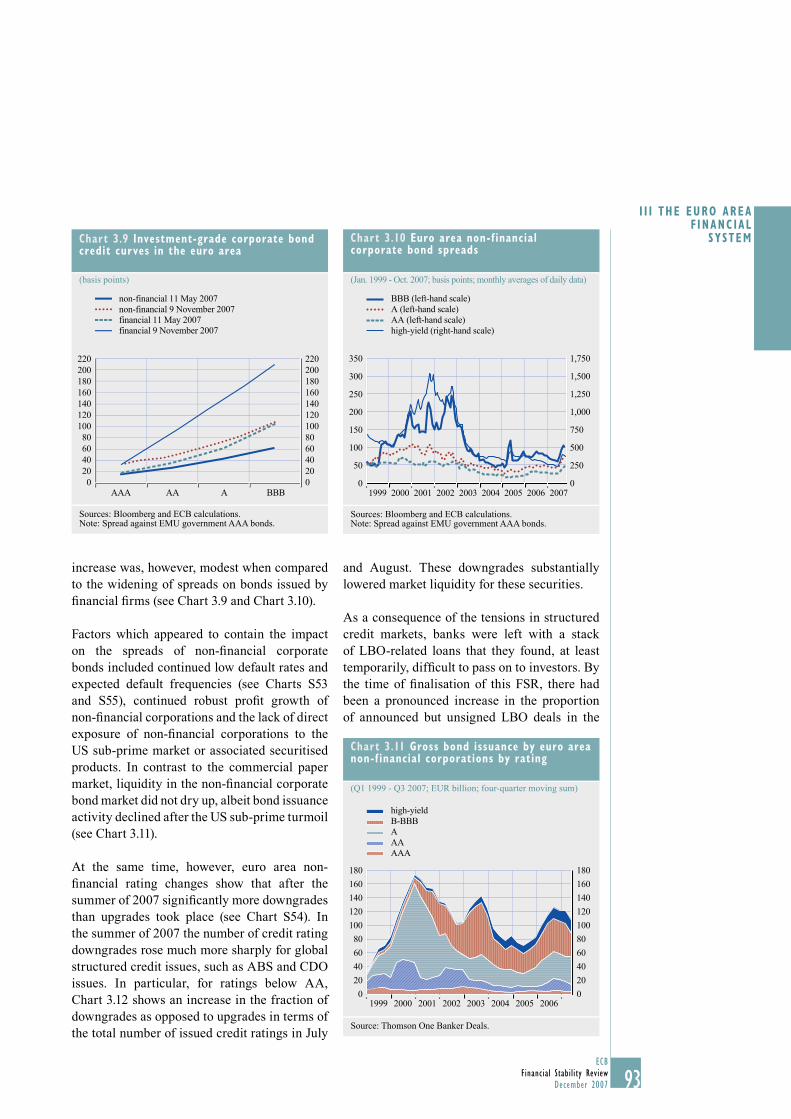
93ECB
Financial Stability ReviewDecember 2007
I I I THE EURO AREA F INANC IAL
SYSTEM
93
Chart 3.9 Investment-grade corporate bond credit curves in the euro area
(basis points)
AAA AA A BBB
220200180160140120100806040200
220200180160140120100806040200
non-financial 11 May 2007non-financial 9 November 2007financial 11 May 2007financial 9 November 2007
Sources: Bloomberg and ECB calculations.Note: Spread against EMU government AAA bonds.
increase was, however, modest when compared to the widening of spreads on bonds issued by fi nancial fi rms (see Chart 3.9 and Chart 3.10).
Factors which appeared to contain the impact on the spreads of non-fi nancial corporate bonds included continued low default rates and expected default frequencies (see Charts S53 and S55), continued robust profi t growth of non-fi nancial corporations and the lack of direct exposure of non-fi nancial corporations to the US sub-prime market or associated securitised products. In contrast to the commercial paper market, liquidity in the non-fi nancial corporate bond market did not dry up, albeit bond issuance activity declined after the US sub-prime turmoil (see Chart 3.11).
At the same time, however, euro area non-fi nancial rating changes show that after the summer of 2007 signifi cantly more downgrades than upgrades took place (see Chart S54). In the summer of 2007 the number of credit rating downgrades rose much more sharply for global structured credit issues, such as ABS and CDO issues. In particular, for ratings below AA, Chart 3.12 shows an increase in the fraction of downgrades as opposed to upgrades in terms of the total number of issued credit ratings in July
and August. These downgrades substantially lowered market liquidity for these securities.
As a consequence of the tensions in structured credit markets, banks were left with a stack of LBO-related loans that they found, at least temporarily, diffi cult to pass on to investors. By the time of fi nalisation of this FSR, there had been a pronounced increase in the proportion of announced but unsigned LBO deals in the
Chart 3.10 Euro area non-f inancial corporate bond spreads
(Jan. 1999 - Oct. 2007; basis points; monthly averages of daily data)
0
50
100
150
200
250
300
350
20070
250
500
750
1,000
1,250
1,500
1,750
BBB (left-hand scale)A (left-hand scale)AA (left-hand scale)high-yield (right-hand scale)
1999 2000 2001 2002 2003 2004 2005 2006
Sources: Bloomberg and ECB calculations.Note: Spread against EMU government AAA bonds.
Chart 3.11 Gross bond issuance by euro area non-f inancial corporations by rating
(Q1 1999 - Q3 2007; EUR billion; four-quarter moving sum)
0
20
40
60
80
100
120
140
160
180
0
20
40
60
80
100
120
140
160
180
high-yieldB-BBBAAAAAA
1999 2000 2001 2002 2003 2004 2005 2006
Source: Thomson One Banker Deals.
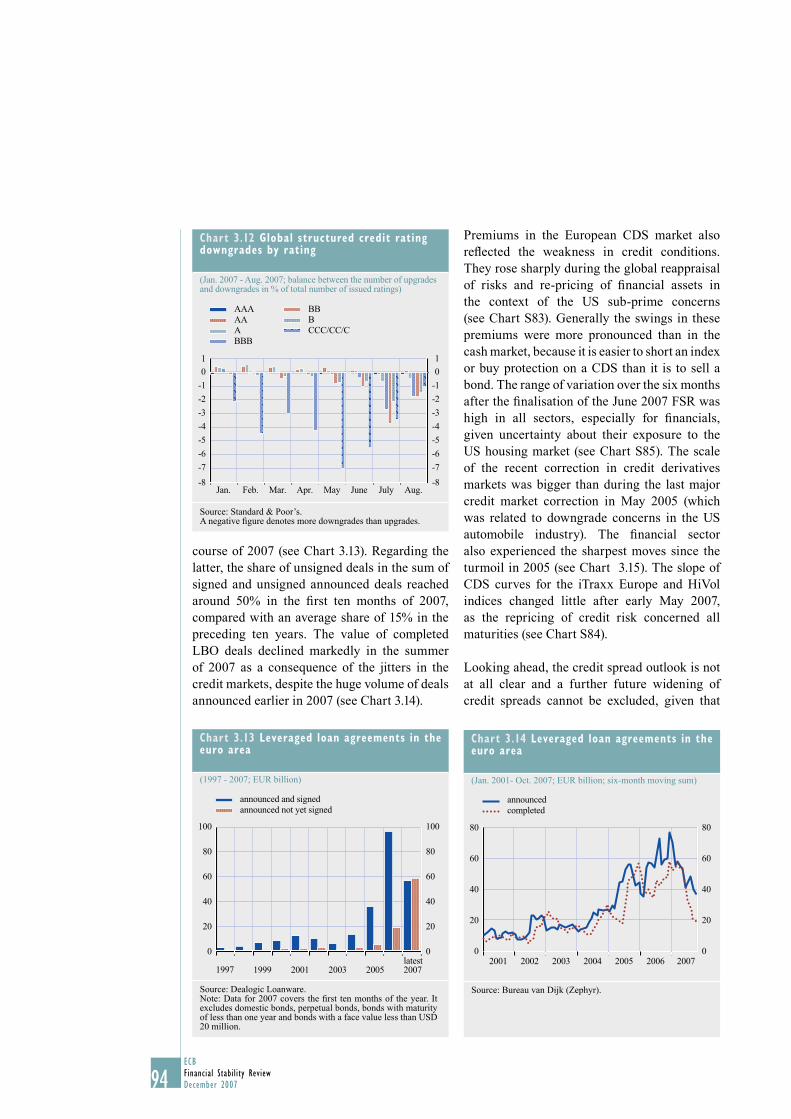
94ECBFinancial Stability ReviewDecember 2007
course of 2007 (see Chart 3.13). Regarding the latter, the share of unsigned deals in the sum of signed and unsigned announced deals reached around 50% in the fi rst ten months of 2007, compared with an average share of 15% in the preceding ten years. The value of completed LBO deals declined markedly in the summer of 2007 as a consequence of the jitters in the credit markets, despite the huge volume of deals announced earlier in 2007 (see Chart 3.14).
Premiums in the European CDS market also refl ected the weakness in credit conditions. They rose sharply during the global reappraisal of risks and re-pricing of fi nancial assets in the context of the US sub-prime concerns (see Chart S83). Generally the swings in these premiums were more pronounced than in the cash market, because it is easier to short an index or buy protection on a CDS than it is to sell a bond. The range of variation over the six months after the fi nalisation of the June 2007 FSR was high in all sectors, especially for fi nancials, given uncertainty about their exposure to the US housing market (see Chart S85). The scale of the recent correction in credit derivatives markets was bigger than during the last major credit market correction in May 2005 (which was related to downgrade concerns in the US automobile industry). The fi nancial sector also experienced the sharpest moves since the turmoil in 2005 (see Chart 3.15). The slope of CDS curves for the iTraxx Europe and HiVol indices changed little after early May 2007, as the repricing of credit risk concerned all maturities (see Chart S84).
Looking ahead, the credit spread outlook is not at all clear and a further future widening of credit spreads cannot be excluded, given that
Chart 3.13 Leveraged loan agreements in the euro area
(1997 - 2007; EUR billion)
0
20
40
60
80
100
0
20
40
60
80
100
announced and signedannounced not yet signed
1997 1999 2001 2003 2005 2007latest
Source: Dealogic Loanware.Note: Data for 2007 covers the fi rst ten months of the year. It excludes domestic bonds, perpetual bonds, bonds with maturity of less than one year and bonds with a face value less than USD 20 million.
Chart 3.14 Leveraged loan agreements in the euro area
(Jan. 2001- Oct. 2007; EUR billion; six-month moving sum)
0
20
40
60
80
0
20
40
60
80
announcedcompleted
2001 2002 2003 2004 2005 2006 2007
Source: Bureau van Dijk (Zephyr).
Chart 3.12 Global structured credit rating downgrades by rating
(Jan. 2007 - Aug. 2007; balance between the number of upgrades and downgrades in % of total number of issued ratings)
-8
-7
-6
-5
-4
-3
-2
-1
0
1
-8
-7
-6
-5
-4
-3
-2
-1
0
1
Aug.
AAAAAABBB
BBBCCC/CC/C
Jan. Feb. Mar. Apr. May June July
Source: Standard & Poor’s.A negative fi gure denotes more downgrades than upgrades.
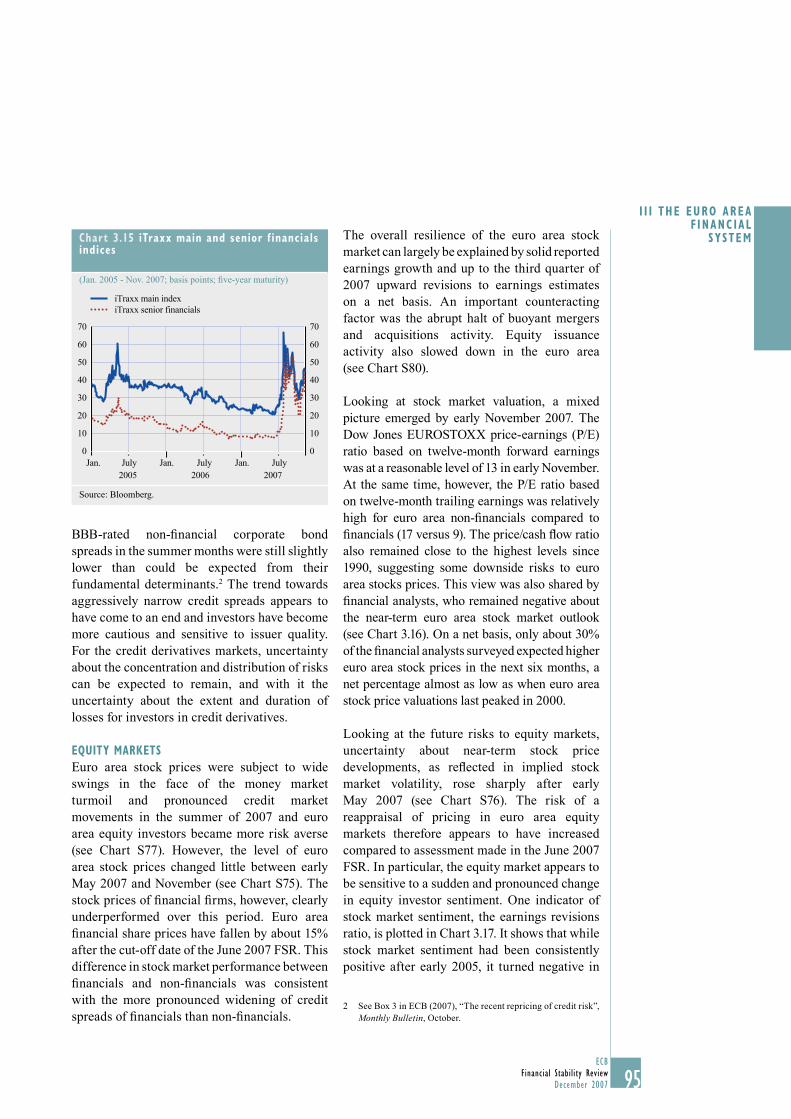
95ECB
Financial Stability ReviewDecember 2007
I I I THE EURO AREA F INANC IAL
SYSTEM
95
Chart 3.15 iTraxx main and senior f inancials indices
(Jan. 2005 - Nov. 2007; basis points; fi ve-year maturity)
0
10
20
30
40
50
60
70
0
10
20
30
40
50
60
70
July
iTraxx main indexiTraxx senior financials
Jan. July Jan. July Jan.2005 2006 2007
Source: Bloomberg.
BBB-rated non-fi nancial corporate bond spreads in the summer months were still slightly lower than could be expected from their fundamental determinants.2 The trend towards aggressively narrow credit spreads appears to have come to an end and investors have become more cautious and sensitive to issuer quality. For the credit derivatives markets, uncertainty about the concentration and distribution of risks can be expected to remain, and with it the uncertainty about the extent and duration of losses for investors in credit derivatives.
EQUITY MARKETS
Euro area stock prices were subject to wide swings in the face of the money market turmoil and pronounced credit market movements in the summer of 2007 and euro area equity investors became more risk averse (see Chart S77). However, the level of euro area stock prices changed little between early May 2007 and November (see Chart S75). The stock prices of fi nancial fi rms, however, clearly underperformed over this period. Euro area fi nancial share prices have fallen by about 15% after the cut-off date of the June 2007 FSR. This difference in stock market performance between fi nancials and non-fi nancials was consistent with the more pronounced widening of credit spreads of fi nancials than non-fi nancials.
The overall resilience of the euro area stock market can largely be explained by solid reported earnings growth and up to the third quarter of 2007 upward revisions to earnings estimates on a net basis. An important counteracting factor was the abrupt halt of buoyant mergers and acquisitions activity. Equity issuance activity also slowed down in the euro area (see Chart S80).
Looking at stock market valuation, a mixed picture emerged by early November 2007. The Dow Jones EUROSTOXX price-earnings (P/E) ratio based on twelve-month forward earnings was at a reasonable level of 13 in early November. At the same time, however, the P/E ratio based on twelve-month trailing earnings was relatively high for euro area non-fi nancials compared to fi nancials (17 versus 9). The price/cash fl ow ratio also remained close to the highest levels since 1990, suggesting some downside risks to euro area stocks prices. This view was also shared by fi nancial analysts, who remained negative about the near-term euro area stock market outlook (see Chart 3.16). On a net basis, only about 30% of the fi nancial analysts surveyed expected higher euro area stock prices in the next six months, a net percentage almost as low as when euro area stock price valuations last peaked in 2000.
Looking at the future risks to equity markets, uncertainty about near-term stock price developments, as refl ected in implied stock market volatility, rose sharply after early May 2007 (see Chart S76). The risk of a reappraisal of pricing in euro area equity markets therefore appears to have increased compared to assessment made in the June 2007 FSR. In particular, the equity market appears to be sensitive to a sudden and pronounced change in equity investor sentiment. One indicator of stock market sentiment, the earnings revisions ratio, is plotted in Chart 3.17. It shows that while stock market sentiment had been consistently positive after early 2005, it turned negative in
See Box 3 in ECB (2007), “The recent repricing of credit risk”, 2 Monthly Bulletin, October.
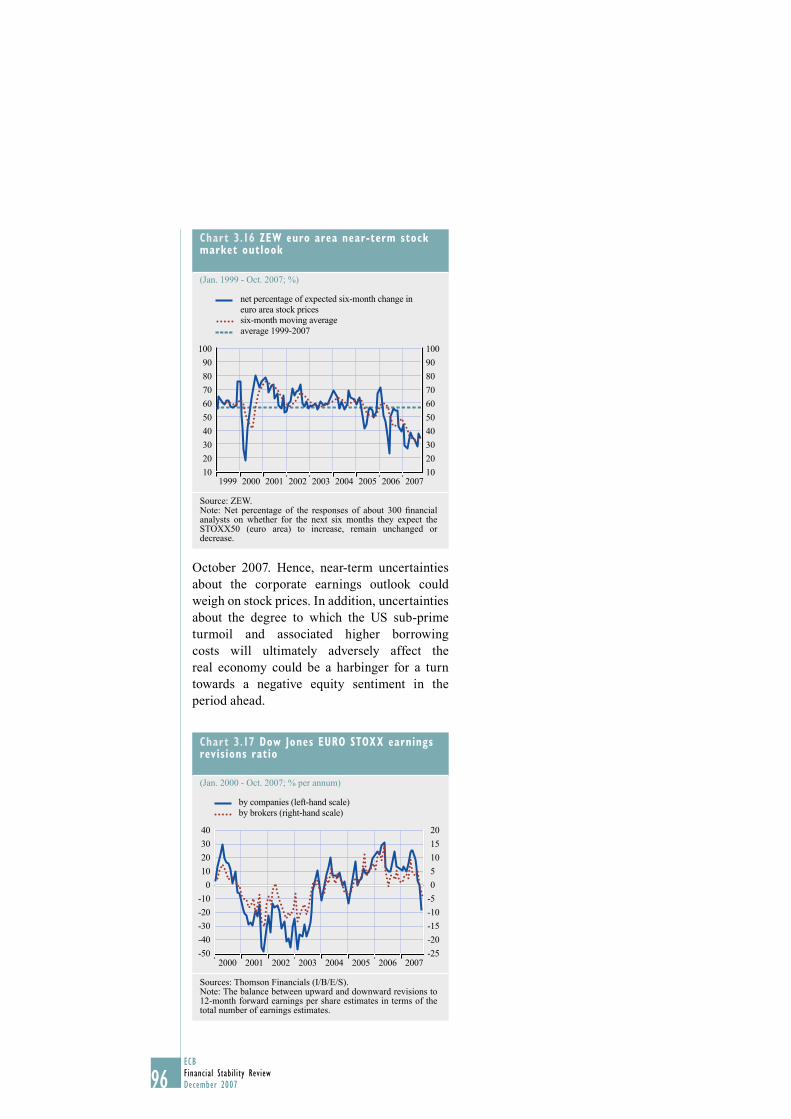
96ECBFinancial Stability ReviewDecember 2007
October 2007. Hence, near-term uncertainties about the corporate earnings outlook could weigh on stock prices. In addition, uncertainties about the degree to which the US sub-prime turmoil and associated higher borrowing costs will ultimately adversely affect the real economy could be a harbinger for a turn towards a negative equity sentiment in the period ahead.
Chart 3.17 Dow Jones EURO STOXX earnings revisions ratio
(Jan. 2000 - Oct. 2007; % per annum)
2007-25
-20
-15
-10
-5
0
5
10
15
20
-50
-40
-30
-20
-10
0
10
20
30
40
by companies (left-hand scale)by brokers (right-hand scale)
2000 2001 2002 2003 2004 2005 2006
Sources: Thomson Financials (I/B/E/S). Note: The balance between upward and downward revisions to 12-month forward earnings per share estimates in terms of the total number of earnings estimates.
Chart 3.16 ZEW euro area near-term stock market outlook
(Jan. 1999 - Oct. 2007; %)
10
20
30
40
50
60
70
80
90
100
10
20
30
40
50
60
70
80
90
100
2007
net percentage of expected six-month change in euro area stock pricessix-month moving averageaverage 1999-2007
1999 2000 2001 20032002 2004 2005 2006
Source: ZEW.Note: Net percentage of the responses of about 300 fi nancial analysts on whether for the next six months they expect the STOXX50 (euro area) to increase, remain unchanged or decrease.
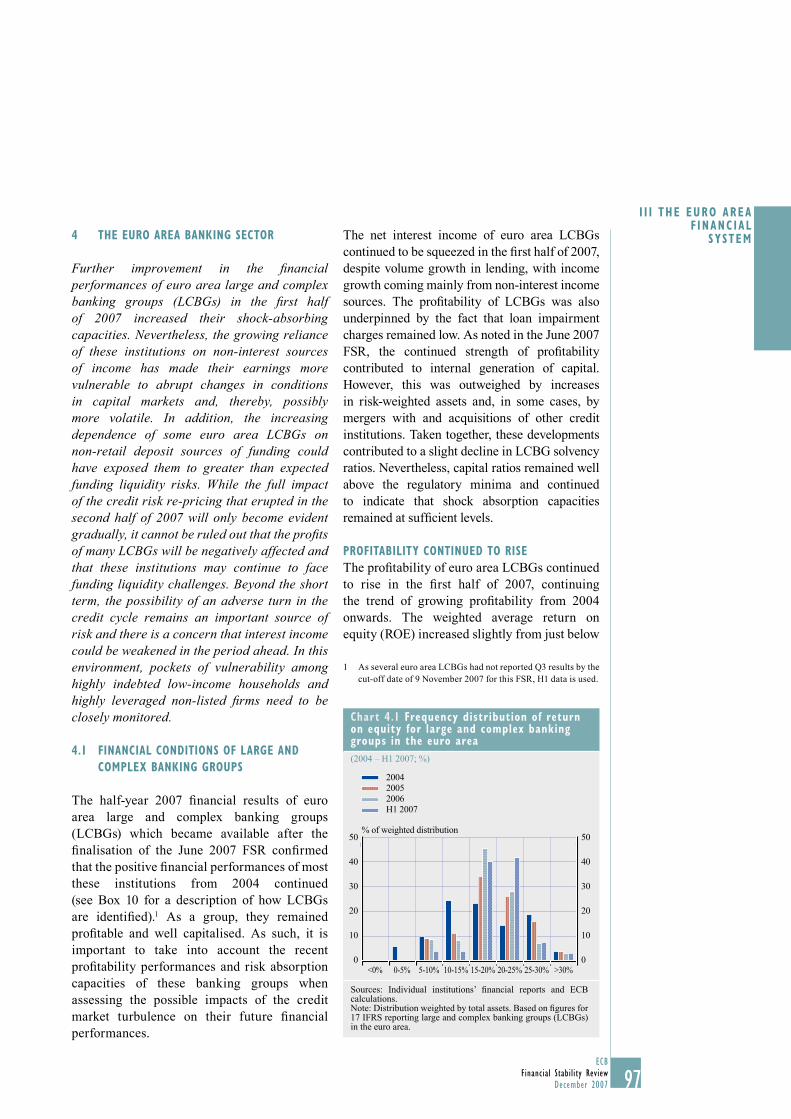
97ECB
Financial Stability ReviewDecember 2007
I I I THE EURO AREA F INANC IAL
SYSTEM4 THE EURO AREA BANKING SECTOR
Further improvement in the fi nancial performances of euro area large and complex banking groups (LCBGs) in the fi rst half of 2007 increased their shock-absorbing capacities. Nevertheless, the growing reliance of these institutions on non-interest sources of income has made their earnings more vulnerable to abrupt changes in conditions in capital markets and, thereby, possibly more volatile. In addition, the increasing dependence of some euro area LCBGs on non-retail deposit sources of funding could have exposed them to greater than expected funding liquidity risks. While the full impact of the credit risk re-pricing that erupted in the second half of 2007 will only become evident gradually, it cannot be ruled out that the profi ts of many LCBGs will be negatively affected and that these institutions may continue to face funding liquidity challenges. Beyond the short term, the possibility of an adverse turn in the credit cycle remains an important source of risk and there is a concern that interest income could be weakened in the period ahead. In this environment, pockets of vulnerability among highly indebted low-income households and highly leveraged non-listed fi rms need to be closely monitored.
4.1 FINANCIAL CONDITIONS OF LARGE AND
COMPLEX BANKING GROUPS
The half-year 2007 fi nancial results of euro area large and complex banking groups (LCBGs) which became available after the fi nalisation of the June 2007 FSR confi rmed that the positive fi nancial performances of most these institutions from 2004 continued (see Box 10 for a description of how LCBGs are identifi ed).1 As a group, they remained profi table and well capitalised. As such, it is important to take into account the recent profi tability performances and risk absorption capacities of these banking groups when assessing the possible impacts of the credit market turbulence on their future fi nancial performances.
The net interest income of euro area LCBGs continued to be squeezed in the fi rst half of 2007, despite volume growth in lending, with income growth coming mainly from non-interest income sources. The profi tability of LCBGs was also underpinned by the fact that loan impairment charges remained low. As noted in the June 2007 FSR, the continued strength of profi tability contributed to internal generation of capital. However, this was outweighed by increases in risk-weighted assets and, in some cases, by mergers with and acquisitions of other credit institutions. Taken together, these developments contributed to a slight decline in LCBG solvency ratios. Nevertheless, capital ratios remained well above the regulatory minima and continued to indicate that shock absorption capacities remained at suffi cient levels.
PROFITABILITY CONTINUED TO RISE
The profi tability of euro area LCBGs continued to rise in the fi rst half of 2007, continuing the trend of growing profi tability from 2004 onwards. The weighted average return on equity (ROE) increased slightly from just below
As several euro area LCBGs had not reported Q3 results by the 1 cut-off date of 9 November 2007 for this FSR, H1 data is used.
Chart 4.1 Frequency distribution of return on equity for large and complex banking groups in the euro area
(2004 – H1 2007; %)
0
10
20
30
40
50
0
10
20
30
40
50
>30%
% of weighted distribution
200420052006H1 2007
<0% 0-5% 5-10% 10-15% 15-20% 20-25% 25-30%
Sources: Individual institutions’ fi nancial reports and ECB calculations.Note: Distribution weighted by total assets. Based on fi gures for 17 IFRS reporting large and complex banking groups (LCBGs) in the euro area.
98ECBFinancial Stability ReviewDecember 2007
19% in 2006 to an annualised rate of just above 20% in the fi rst half of 2007. The median ROE increased from 18.5% to just over 21% over the same period. At the same time, institutions in
the fi rst quartile of the distribution managed to increase their profi tability slightly from about 17% in 2006 to just under 18% in 2007 (see Chart 4.1 and Table S5).
Table Indicators used to identify large and complex banking groups
Indicators used in 2006 and 2007 Additional indicators used in 2007
1 Assets under custody 14 Cross-border assets2 Contingent liabilities 15 Eonia overnight lending contributions3 Customer loans 16 Market capitalisation4 Deposits 17 Number of recorded subsidiaries5 Interbank assets 18 Subordinated debt issuance6 Interbank liabilities 19 Trading income7 Mortgages8 Net interest revenue9 Net non-interest revenue
10 Other assets11 Proceeds from bond issuance12 Proceeds from equity issuance13 Proceeds from syndicated loan issuance
Sources: ECB, Banking Supervision Committee, Bureau van Dijk’s Bankscope, Thomson Financial’s Thomson ONE Banker - Deals and GlobalCustody.netNote: Cross-border assets data are for 2005 and were collected by the Banking Supervision Committee. They represent the total assets of subsidiaries and branches of EU banks outside the home country.
Box 10
IDENTIFYING LARGE AND COMPLEX BANKING GROUPS FOR FINANCIAL SYSTEM STABILITY
ASSESSMENT: AN UPDATE
The fi nancial performances of large and complex banking groups (LCBGs) are regularly monitored and analysed for the fi nancial system stability assessment in the ECB’s FSR.1 As noted in the December 2006 FSR, updates of the identifi cation of LCBGs are periodically needed to take into account the effects of structural change such as mergers, acquisitions and organic growth in the banking sector.2 It was also noted that the analysis could benefi t from expanding the set of variables used to identify LCBGs to make the analysis more robust and complete. This box presents the results of the fi rst update of the analysis used to identify LCBGs.
The LCBG identifi cation process for this issue of the FSR uses as a starting point 2006 data covering a sample of 415 euro area and non-euro area banks.3 In addition, where available, six new indicators were included to refi ne the notion of a bank’s size in the various aspects of fi nancial intermediation as well as the degree of interconnectedness of the institution within the system (see Table).
1 Global LCBGs are analysed in Section 1.3 “Conditions of global fi nancial institutions” and LCBGs located in the euro area are analysed in Section 4 “The euro area banking sector”.
2 See ECB (2006), “Identifying large and complex banking groups for fi nancial system stability assessment”, Financial Stability Review, December, for a detailed presentation of how LCBGs are identifi ed. This box only discusses changes made in that analysis.
3 A bank is included in the analysis if it met one or more of the following criteria in 2006: 1) domiciled in Europe and with total assets in excess of one billion euro; 2) domiciled outside Europe with total assets above ten billion euro; 3) included in the top 50 bookrunners in the European equity, bond and syndicated lending markets; 4) among the top 51 worldwide custodian banks.
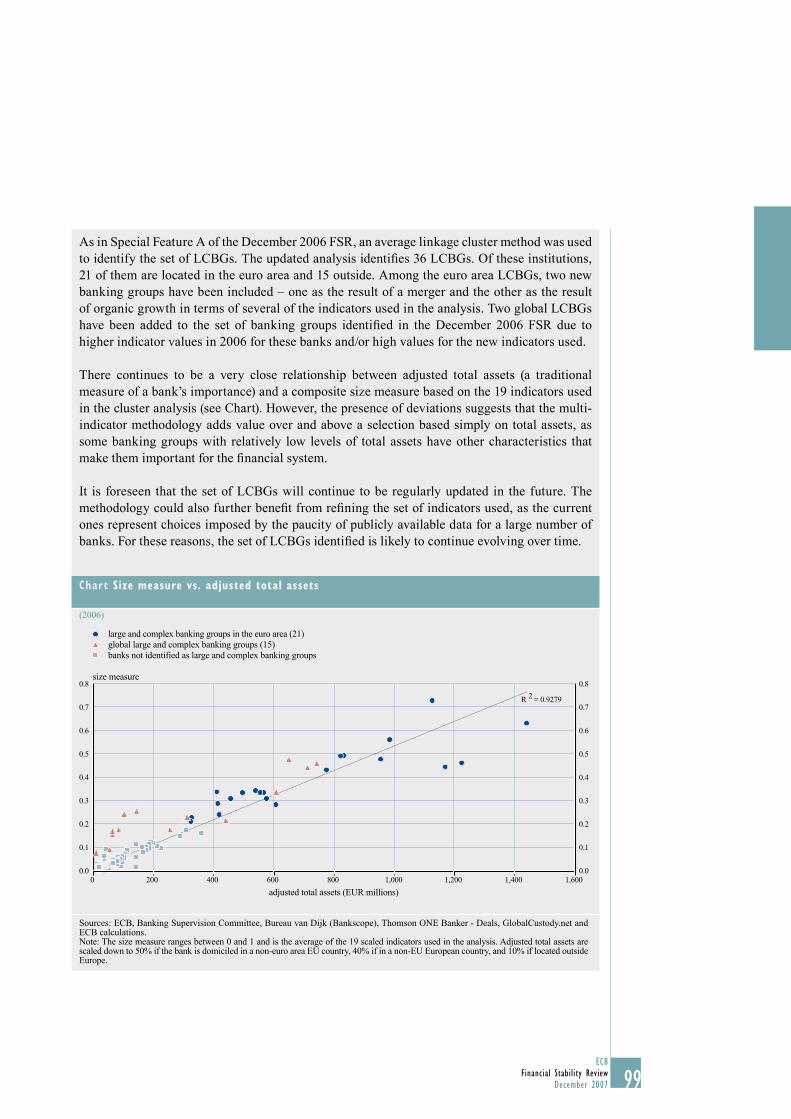
99ECB
Financial Stability ReviewDecember 2007 99
As in Special Feature A of the December 2006 FSR, an average linkage cluster method was used to identify the set of LCBGs. The updated analysis identifi es 36 LCBGs. Of these institutions, 21 of them are located in the euro area and 15 outside. Among the euro area LCBGs, two new banking groups have been included – one as the result of a merger and the other as the result of organic growth in terms of several of the indicators used in the analysis. Two global LCBGs have been added to the set of banking groups identifi ed in the December 2006 FSR due to higher indicator values in 2006 for these banks and/or high values for the new indicators used.
There continues to be a very close relationship between adjusted total assets (a traditional measure of a bank’s importance) and a composite size measure based on the 19 indicators used in the cluster analysis (see Chart). However, the presence of deviations suggests that the multi-indicator methodology adds value over and above a selection based simply on total assets, as some banking groups with relatively low levels of total assets have other characteristics that make them important for the fi nancial system.
It is foreseen that the set of LCBGs will continue to be regularly updated in the future. The methodology could also further benefi t from refi ning the set of indicators used, as the current ones represent choices imposed by the paucity of publicly available data for a large number of banks. For these reasons, the set of LCBGs identifi ed is likely to continue evolving over time.
Chart Size measure vs. adjusted total assets
(2006)
0.1
0.2
0.3
0.4
0.5
0.6
0.7
0.8
0.1
0.2
0.3
0.4
0.5
0.6
0.7
0.8
adjusted total assets (EUR millions)
size measure
large and complex banking groups in the euro area (21)global large and complex banking groups (15)
R 2 = 0.9279
0.0
banks not identified as large and complex banking groups
0 200 400 600 800 1,000 1,200 1,4000.0
1,600
Sources: ECB, Banking Supervision Committee, Bureau van Dijk (Bankscope), Thomson ONE Banker - Deals, GlobalCustody.net and ECB calculations.Note: The size measure ranges between 0 and 1 and is the average of the 19 scaled indicators used in the analysis. Adjusted total assets are scaled down to 50% if the bank is domiciled in a non-euro area EU country, 40% if in a non-EU European country, and 10% if located outside Europe.
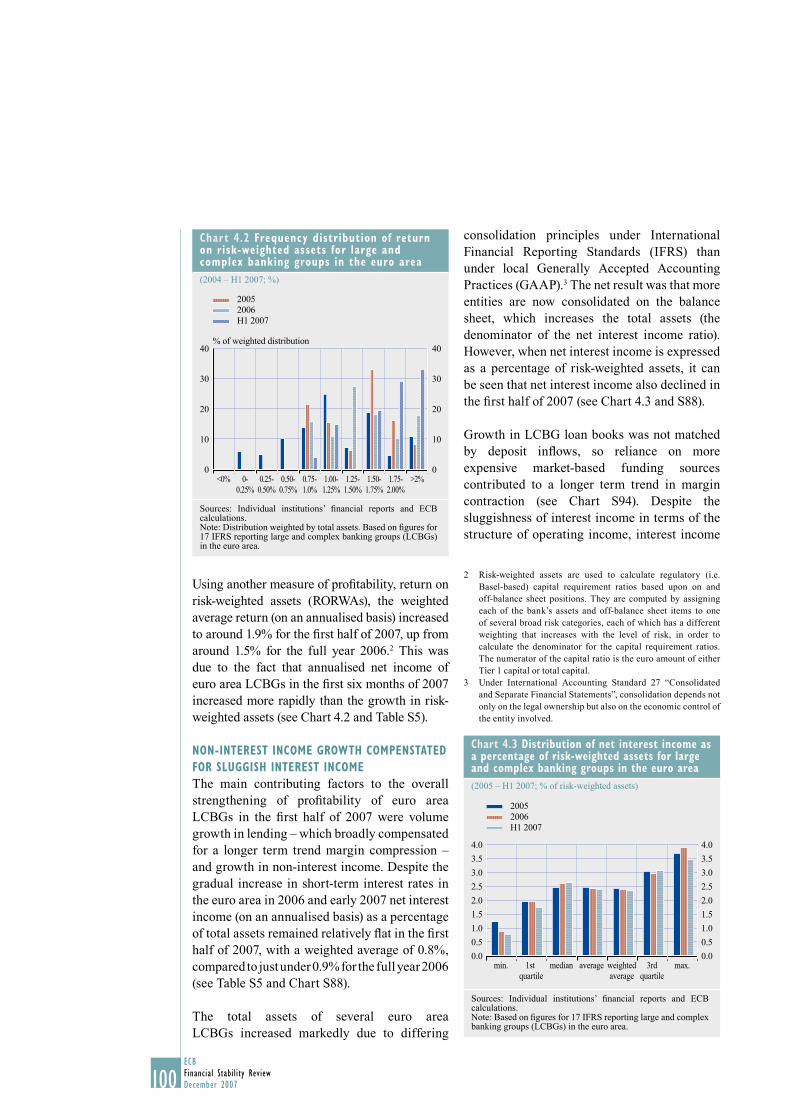
100ECBFinancial Stability ReviewDecember 2007
Using another measure of profi tability, return on risk-weighted assets (RORWAs), the weighted average return (on an annualised basis) increased to around 1.9% for the fi rst half of 2007, up from around 1.5% for the full year 2006.2 This was due to the fact that annualised net income of euro area LCBGs in the fi rst six months of 2007 increased more rapidly than the growth in risk-weighted assets (see Chart 4.2 and Table S5).
NON-INTEREST INCOME GROWTH COMPENSTATED
FOR SLUGGISH INTEREST INCOME
The main contributing factors to the overall strengthening of profi tability of euro area LCBGs in the fi rst half of 2007 were volume growth in lending – which broadly compensated for a longer term trend margin compression – and growth in non-interest income. Despite the gradual increase in short-term interest rates in the euro area in 2006 and early 2007 net interest income (on an annualised basis) as a percentage of total assets remained relatively fl at in the fi rst half of 2007, with a weighted average of 0.8%, compared to just under 0.9% for the full year 2006 (see Table S5 and Chart S88).
The total assets of several euro area LCBGs increased markedly due to differing
consolidation principles under International Financial Reporting Standards (IFRS) than under local Generally Accepted Accounting Practices (GAAP).3 The net result was that more entities are now consolidated on the balance sheet, which increases the total assets (the denominator of the net interest income ratio). However, when net interest income is expressed as a percentage of risk-weighted assets, it can be seen that net interest income also declined in the fi rst half of 2007 (see Chart 4.3 and S88).
Growth in LCBG loan books was not matched by deposit infl ows, so reliance on more expensive market-based funding sources contributed to a longer term trend in margin contraction (see Chart S94). Despite the sluggishness of interest income in terms of the structure of operating income, interest income
Risk-weighted assets are used to calculate regulatory (i.e. 2 Basel-based) capital requirement ratios based upon on and off-balance sheet positions. They are computed by assigning each of the bank’s assets and off-balance sheet items to one of several broad risk categories, each of which has a different weighting that increases with the level of risk, in order to calculate the denominator for the capital requirement ratios. The numerator of the capital ratio is the euro amount of either Tier 1 capital or total capital.Under International Accounting Standard 27 “Consolidated 3 and Separate Financial Statements”, consolidation depends not only on the legal ownership but also on the economic control of the entity involved.
Chart 4.3 Distribution of net interest income as a percentage of risk-weighted assets for large and complex banking groups in the euro area
(2005 – H1 2007; % of risk-weighted assets)
4.0
3.5
3.0
2.5
2.0
1.5
1.0
0.5
0.0
4.0
3.5
3.0
2.5
2.0
1.5
1.0
0.5
0.0min. 1st
quartilemedian average weighted
average3rd
quartilemax.
20052006H1 2007
Sources: Individual institutions’ fi nancial reports and ECB calculations.Note: Based on fi gures for 17 IFRS reporting large and complex banking groups (LCBGs) in the euro area.
Chart 4.2 Frequency distribution of return on risk-weighted assets for large and complex banking groups in the euro area
(2004 – H1 2007; %)
40
30
20
10
0
40
30
20
10
0
20052006H1 2007
% of weighted distribution
<0% 0-0.25%
0.25-0.50%
0.50-0.75%
0.75-1.0%
1.00-1.25%
1.25-1.50%
1.50-1.75%
1.75-2.00%
>2%
Sources: Individual institutions’ fi nancial reports and ECB calculations.Note: Distribution weighted by total assets. Based on fi gures for 17 IFRS reporting large and complex banking groups (LCBGs) in the euro area.
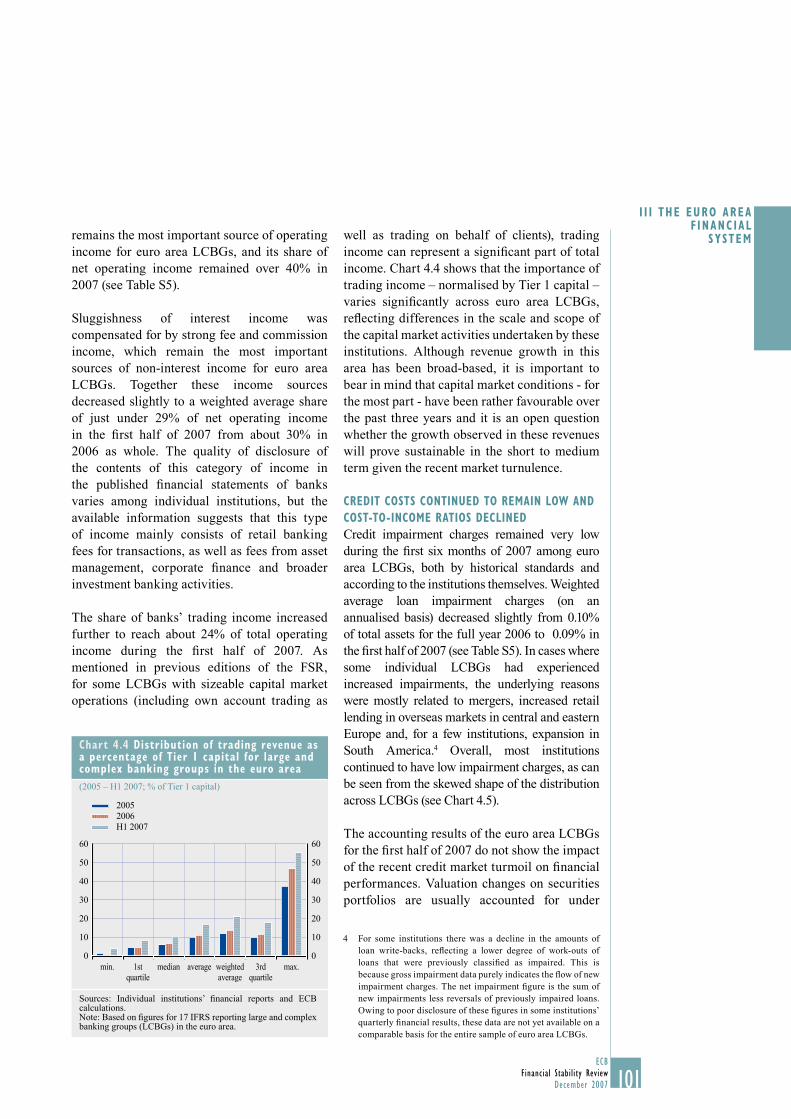
101ECB
Financial Stability ReviewDecember 2007
I I I THE EURO AREA F INANC IAL
SYSTEM
101
remains the most important source of operating income for euro area LCBGs, and its share of net operating income remained over 40% in 2007 (see Table S5).
Sluggishness of interest income was compensated for by strong fee and commission income, which remain the most important sources of non-interest income for euro area LCBGs. Together these income sources decreased slightly to a weighted average share of just under 29% of net operating income in the fi rst half of 2007 from about 30% in 2006 as whole. The quality of disclosure of the contents of this category of income in the published fi nancial statements of banks varies among individual institutions, but the available information suggests that this type of income mainly consists of retail banking fees for transactions, as well as fees from asset management, corporate fi nance and broader investment banking activities.
The share of banks’ trading income increased further to reach about 24% of total operating income during the fi rst half of 2007. As mentioned in previous editions of the FSR, for some LCBGs with sizeable capital market operations (including own account trading as
well as trading on behalf of clients), trading income can represent a signifi cant part of total income. Chart 4.4 shows that the importance of trading income – normalised by Tier 1 capital – varies signifi cantly across euro area LCBGs, refl ecting differences in the scale and scope of the capital market activities undertaken by these institutions. Although revenue growth in this area has been broad-based, it is important to bear in mind that capital market conditions - for the most part - have been rather favourable over the past three years and it is an open question whether the growth observed in these revenues will prove sustainable in the short to medium term given the recent market turnulence.
CREDIT COSTS CONTINUED TO REMAIN LOW AND
COST-TO-INCOME RATIOS DECLINED
Credit impairment charges remained very low during the fi rst six months of 2007 among euro area LCBGs, both by historical standards and according to the institutions themselves. Weighted average loan impairment charges (on an annualised basis) decreased slightly from 0.10% of total assets for the full year 2006 to 0.09% in the fi rst half of 2007 (see Table S5). In cases where some individual LCBGs had experienced increased impairments, the underlying reasons were mostly related to mergers, increased retail lending in overseas markets in central and eastern Europe and, for a few institutions, expansion in South America.4 Overall, most institutions continued to have low impairment charges, as can be seen from the skewed shape of the distribution across LCBGs (see Chart 4.5).
The accounting results of the euro area LCBGs for the fi rst half of 2007 do not show the impact of the recent credit market turmoil on fi nancial performances. Valuation changes on securities portfolios are usually accounted for under
For some institutions there was a decline in the amounts of 4 loan write-backs, refl ecting a lower degree of work-outs of loans that were previously classifi ed as impaired. This is because gross impairment data purely indicates the fl ow of new impairment charges. The net impairment fi gure is the sum of new impairments less reversals of previously impaired loans. Owing to poor disclosure of these fi gures in some institutions’ quarterly fi nancial results, these data are not yet available on a comparable basis for the entire sample of euro area LCBGs.
Chart 4.4 Distribution of trading revenue as a percentage of Tier 1 capital for large and complex banking groups in the euro area
(2005 – H1 2007; % of Tier 1 capital)
60
50
40
30
20
10
0
60
50
40
30
20
10
0min. 1st
quartilemedian average weighted
average3rd
quartilemax.
20052006H1 2007
Sources: Individual institutions’ fi nancial reports and ECB calculations.Note: Based on fi gures for 17 IFRS reporting large and complex banking groups (LCBGs) in the euro area.
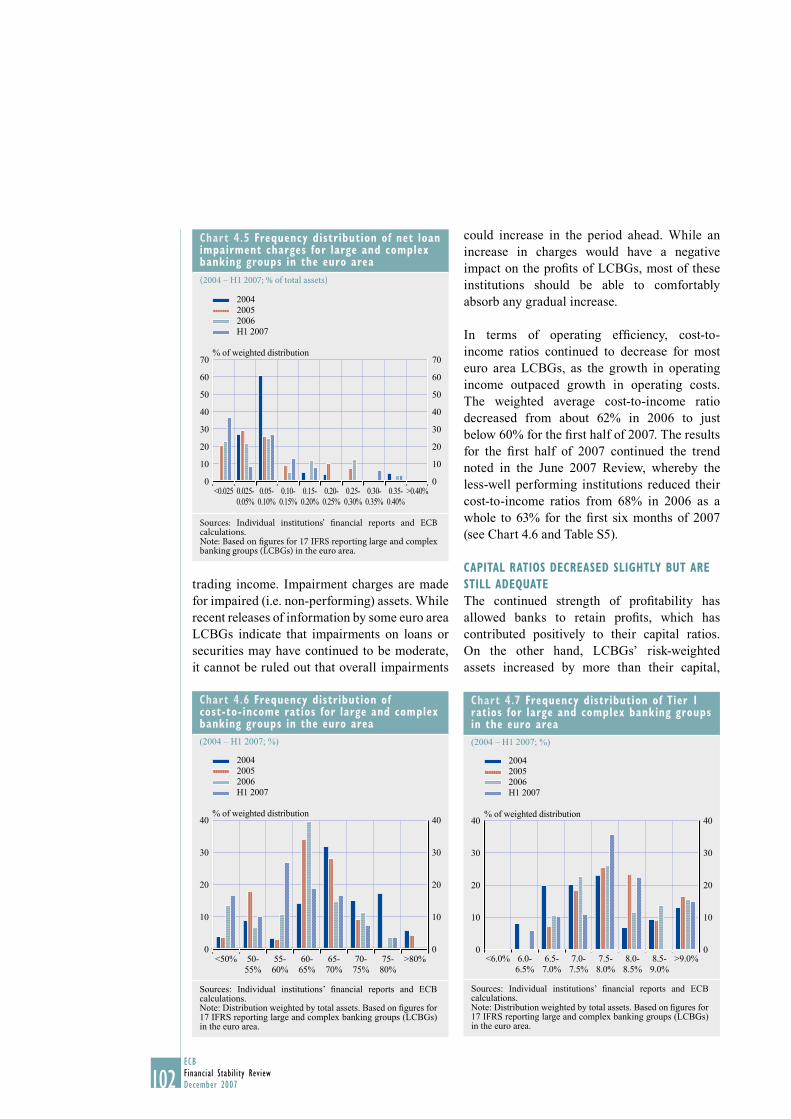
102ECBFinancial Stability ReviewDecember 2007
trading income. Impairment charges are made for impaired (i.e. non-performing) assets. While recent releases of information by some euro area LCBGs indicate that impairments on loans or securities may have continued to be moderate, it cannot be ruled out that overall impairments
could increase in the period ahead. While an increase in charges would have a negative impact on the profi ts of LCBGs, most of these institutions should be able to comfortably absorb any gradual increase.
In terms of operating effi ciency, cost-to-income ratios continued to decrease for most euro area LCBGs, as the growth in operating income outpaced growth in operating costs. The weighted average cost-to-income ratio decreased from about 62% in 2006 to just below 60% for the fi rst half of 2007. The results for the fi rst half of 2007 continued the trend noted in the June 2007 Review, whereby the less-well performing institutions reduced their cost-to-income ratios from 68% in 2006 as a whole to 63% for the fi rst six months of 2007 (see Chart 4.6 and Table S5).
CAPITAL RATIOS DECREASED SLIGHTLY BUT ARE
STILL ADEQUATE
The continued strength of profi tability has allowed banks to retain profi ts, which has contributed positively to their capital ratios. On the other hand, LCBGs’ risk-weighted assets increased by more than their capital,
Chart 4.6 Frequency distribution of cost-to-income ratios for large and complex banking groups in the euro area
(2004 – H1 2007; %)
40
30
20
10
0
40
30
20
10
0
200420052006H1 2007
% of weighted distribution
<50% 50-55%
55-60%
60-65%
65-70%
70-75%
75-80%
>80%
Sources: Individual institutions’ fi nancial reports and ECB calculations.Note: Distribution weighted by total assets. Based on fi gures for 17 IFRS reporting large and complex banking groups (LCBGs) in the euro area.
Chart 4.7 Frequency distribution of Tier 1 ratios for large and complex banking groups in the euro area
(2004 – H1 2007; %)
200420052006H1 2007
% of weighted distribution40
30
20
10
0
40
30
20
10
0<6.0% 6.0-
6.5%6.5-7.0%
7.0-7.5%
7.5-8.0%
8.0-8.5%
8.5-9.0%
>9.0%
Sources: Individual institutions’ fi nancial reports and ECB calculations.Note: Distribution weighted by total assets. Based on fi gures for 17 IFRS reporting large and complex banking groups (LCBGs) in the euro area.
Chart 4.5 Frequency distribution of net loan impairment charges for large and complex banking groups in the euro area
(2004 – H1 2007; % of total assets)
70
60
50
40
30
20
10
0
70
60
50
40
30
20
10
0
200420052006H1 2007
% of weighted distribution
<0.025 0.025-0.05%
0.05-0.10%
0.10-0.15%
0.15-0.20%
0.20-0.25%
0.25-0.30%
0.30-0.35%
0.35-0.40%
>0.40%
Sources: Individual institutions’ fi nancial reports and ECB calculations.Note: Based on fi gures for 17 IFRS reporting large and complex banking groups (LCBGs) in the euro area.
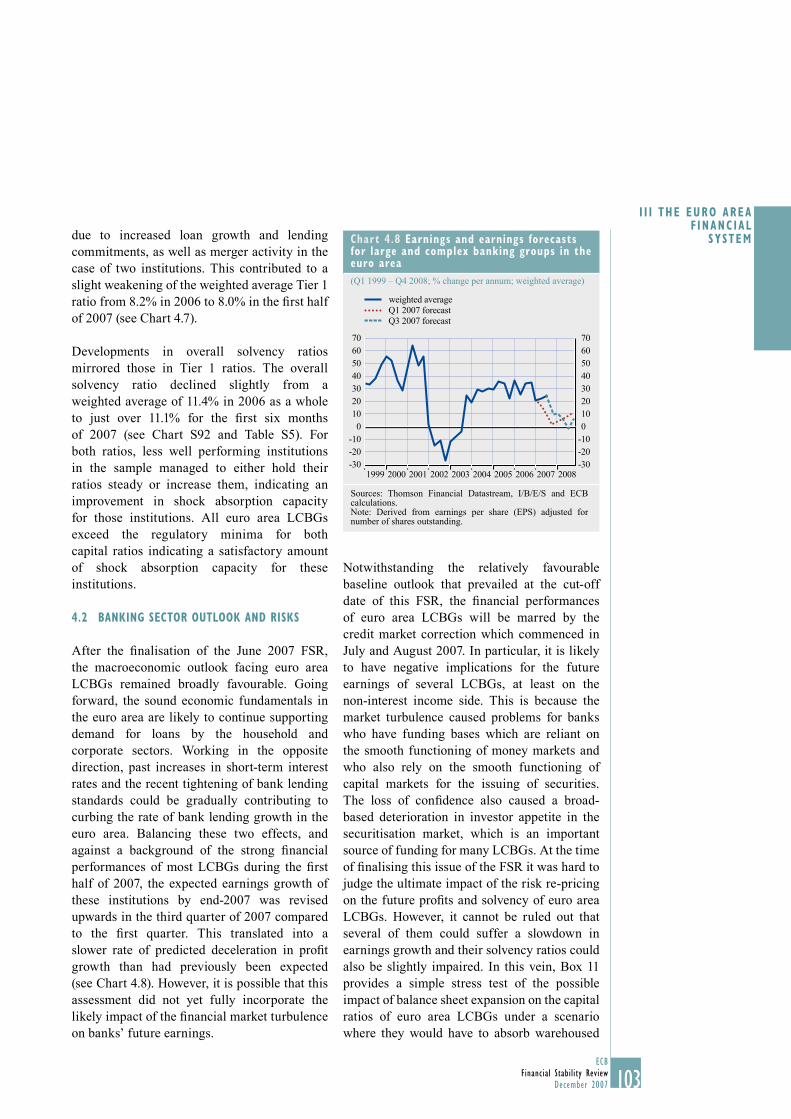
103ECB
Financial Stability ReviewDecember 2007
I I I THE EURO AREA F INANC IAL
SYSTEM
103
due to increased loan growth and lending commitments, as well as merger activity in the case of two institutions. This contributed to a slight weakening of the weighted average Tier 1 ratio from 8.2% in 2006 to 8.0% in the fi rst half of 2007 (see Chart 4.7).
Developments in overall solvency ratios mirrored those in Tier 1 ratios. The overall solvency ratio declined slightly from a weighted average of 11.4% in 2006 as a whole to just over 11.1% for the fi rst six months of 2007 (see Chart S92 and Table S5). For both ratios, less well performing institutions in the sample managed to either hold their ratios steady or increase them, indicating an improvement in shock absorption capacity for those institutions. All euro area LCBGs exceed the regulatory minima for both capital ratios indicating a satisfactory amount of shock absorption capacity for these institutions.
4.2 BANKING SECTOR OUTLOOK AND RISKS
After the fi nalisation of the June 2007 FSR, the macroeconomic outlook facing euro area LCBGs remained broadly favourable. Going forward, the sound economic fundamentals in the euro area are likely to continue supporting demand for loans by the household and corporate sectors. Working in the opposite direction, past increases in short-term interest rates and the recent tightening of bank lending standards could be gradually contributing to curbing the rate of bank lending growth in the euro area. Balancing these two effects, and against a background of the strong fi nancial performances of most LCBGs during the fi rst half of 2007, the expected earnings growth of these institutions by end-2007 was revised upwards in the third quarter of 2007 compared to the fi rst quarter. This translated into a slower rate of predicted deceleration in profi t growth than had previously been expected (see Chart 4.8). However, it is possible that this assessment did not yet fully incorporate the likely impact of the fi nancial market turbulence on banks’ future earnings.
Notwithstanding the relatively favourable baseline outlook that prevailed at the cut-off date of this FSR, the fi nancial performances of euro area LCBGs will be marred by the credit market correction which commenced in July and August 2007. In particular, it is likely to have negative implications for the future earnings of several LCBGs, at least on the non-interest income side. This is because the market turbulence caused problems for banks who have funding bases which are reliant on the smooth functioning of money markets and who also rely on the smooth functioning of capital markets for the issuing of securities. The loss of confi dence also caused a broad-based deterioration in investor appetite in the securitisation market, which is an important source of funding for many LCBGs. At the time of fi nalising this issue of the FSR it was hard to judge the ultimate impact of the risk re-pricing on the future profi ts and solvency of euro area LCBGs. However, it cannot be ruled out that several of them could suffer a slowdown in earnings growth and their solvency ratios could also be slightly impaired. In this vein, Box 11 provides a simple stress test of the possible impact of balance sheet expansion on the capital ratios of euro area LCBGs under a scenario where they would have to absorb warehoused
Chart 4.8 Earnings and earnings forecasts for large and complex banking groups in the euro area
(Q1 1999 – Q4 2008; % change per annum; weighted average)
-30-20-10
010203040506070
0
-30-20-10
10203040506070
1999 2000 2001 2002 2003 2004 2005 2006 2007 2008
weighted averageQ1 2007 forecastQ3 2007 forecast
Sources: Thomson Financial Datastream, I/B/E/S and ECB calculations.Note: Derived from earnings per share (EPS) adjusted for number of shares outstanding.
104ECBFinancial Stability ReviewDecember 2007
Box 11
ASSESSING THE IMPACT OF RECENT MARKET TURMOIL ON EURO AREA LARGE AND COMPLEX
BANKING GROUPS: A STRESS TEST OF POTENTIAL BALANCE SHEET EXPANSION
The credit market turmoil that erupted in late July and early August 2007 is likely to have negative implications for the funding requirements, earnings and even capital ratios of several euro area LCBGs. The turbulence, which had its origins in a loss of confi dence in assets that are backed by mortgage loans extended to US sub-prime borrowers, triggered contingent credit lines to be drawn on some LCBGs to fund off-balance sheet vehicles, after these vehicles were no longer able to roll over their short-term funding in the asset-backed commercial paper (ABCP) market. The loss of confi dence also contributed to market liquidity problems across a wide range of related securitisation activities. As a consequence, several LCBGs endured a crystallisation of warehousing risks on household and corporate loans – some of which are extended to fi nance leveraged buy-out (LBO) transactions – which they were not intending to hold on their balance sheets.
The size of the off-balance sheet ABCP programmes and LBO warehousing exposures of individual LCBGs was, in some cases, relatively large relative to their total equity. After the initial shock to the credit market, which was amplifi ed by the failure of two mid-sized European banks that had large exposures in the ABCP market, other banks with illiquid off-balance sheet vehicles or large loan warehouses gradually started to either sell some of the assets in these vehicles, or to take them back onto their own balance sheets. This process of re-intermediation prompted some banks to hoard liquidity for precautionary reasons which ultimately had a marked negative impact on the ability and willingness of banks to lend to each other.
When liquidity commitments provided by banks to off-balance sheet vehicles are drawn on, either the loans or the underlying assets will fl ow back onto the bank’s balance sheet. In the latter case, the assets are valued according to the relevant risk weights. Such fl ows back onto balance sheets tend to boost banks’ risk-weighted assets and reduce their capital ratios. The increase in risk-weighted assets also means that banks have to obtain additional funding to fi nance the balance sheet expansion. Among the 21 euro area LCBGs, publicly available information in early November 2007 showed that 18 of them had exposures to ABCP programmes and 9 to leveraged loan warehousing risks. The bulk of the exposures are to US commercial paper (see Chart A). When converted into balance sheet exposures using a 100% risk weight, in aggregate these exposures correspond to an additional funding requirement for these banks of approximately € 244 billion. This represents 5.2% of total loans outstanding of these LCBGs, or 10.4% of their deposit base. The median funding requirement of these requirements is around € 11.1 billion, corresponding to ratios of 6.0% and 9.1% relative to loans and deposits, respectively (see Chart B).
loans and assets of illiquid off-balance sheet vehicles onto their balance sheets.
Beyond short-term considerations, the main vulnerabilities for LCBGs relate to the evolution of the credit cycle (which could also be affected by the credit market turmoil,
should it persist) and its impact on borrowers’ credit quality and banks’ credit risk. In addition, the fi nancial performances of LCBGs are likely to be depressed by weakened non-interest income should activity in the market for securitised loans remain subdued for a protracted period.
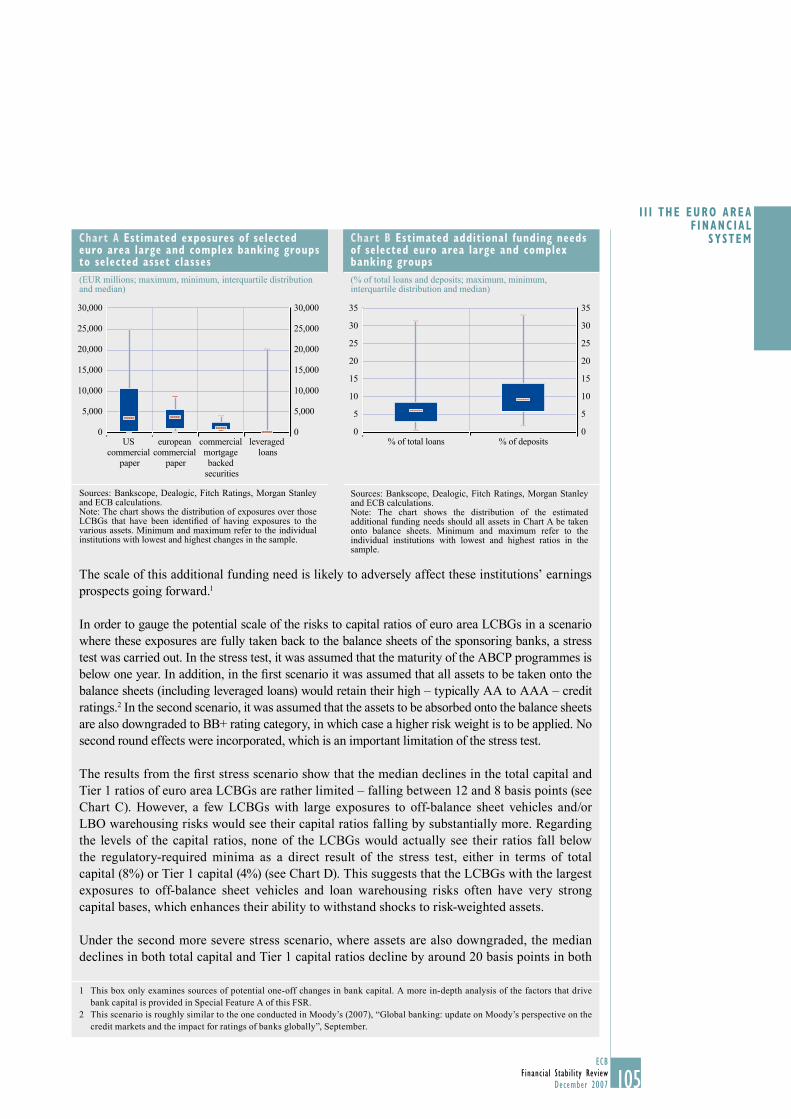
105ECB
Financial Stability ReviewDecember 2007
I I I THE EURO AREA F INANC IAL
SYSTEM
105
The scale of this additional funding need is likely to adversely affect these institutions’ earnings prospects going forward.1
In order to gauge the potential scale of the risks to capital ratios of euro area LCBGs in a scenario where these exposures are fully taken back to the balance sheets of the sponsoring banks, a stress test was carried out. In the stress test, it was assumed that the maturity of the ABCP programmes is below one year. In addition, in the fi rst scenario it was assumed that all assets to be taken onto the balance sheets (including leveraged loans) would retain their high – typically AA to AAA – credit ratings.2 In the second scenario, it was assumed that the assets to be absorbed onto the balance sheets are also downgraded to BB+ rating category, in which case a higher risk weight is to be applied. No second round effects were incorporated, which is an important limitation of the stress test.
The results from the fi rst stress scenario show that the median declines in the total capital and Tier 1 ratios of euro area LCBGs are rather limited – falling between 12 and 8 basis points (see Chart C). However, a few LCBGs with large exposures to off-balance sheet vehicles and/or LBO warehousing risks would see their capital ratios falling by substantially more. Regarding the levels of the capital ratios, none of the LCBGs would actually see their ratios fall below the regulatory-required minima as a direct result of the stress test, either in terms of total capital (8%) or Tier 1 capital (4%) (see Chart D). This suggests that the LCBGs with the largest exposures to off-balance sheet vehicles and loan warehousing risks often have very strong capital bases, which enhances their ability to withstand shocks to risk-weighted assets.
Under the second more severe stress scenario, where assets are also downgraded, the median declines in both total capital and Tier 1 capital ratios decline by around 20 basis points in both
1 This box only examines sources of potential one-off changes in bank capital. A more in-depth analysis of the factors that drive bank capital is provided in Special Feature A of this FSR.
2 This scenario is roughly similar to the one conducted in Moody’s (2007), “Global banking: update on Moody’s perspective on the credit markets and the impact for ratings of banks globally”, September.
Chart B Estimated additional funding needs of selected euro area large and complex banking groups
(% of total loans and deposits; maximum, minimum, interquartile distribution and median)
0
5
10
15
20
25
30
35
0
5
10
15
20
25
30
35
% of total loans % of deposits
Sources: Bankscope, Dealogic, Fitch Ratings, Morgan Stanley and ECB calculations.Note: The chart shows the distribution of the estimated additional funding needs should all assets in Chart A be taken onto balance sheets. Minimum and maximum refer to the individual institutions with lowest and highest ratios in the sample.
Chart A Estimated exposures of selected euro area large and complex banking groups to selected asset classes
(EUR millions; maximum, minimum, interquartile distribution and median)
0
5,000
10,000
15,000
20,000
25,000
30,000
0
5,000
10,000
15,000
20,000
25,000
30,000
US commercial
paper
european commercial
paper
commercial mortgage backed
securities
leveraged loans
Sources: Bankscope, Dealogic, Fitch Ratings, Morgan Stanley and ECB calculations.Note: The chart shows the distribution of exposures over those LCBGs that have been identifi ed of having exposures to the various assets. Minimum and maximum refer to the individual institutions with lowest and highest changes in the sample.
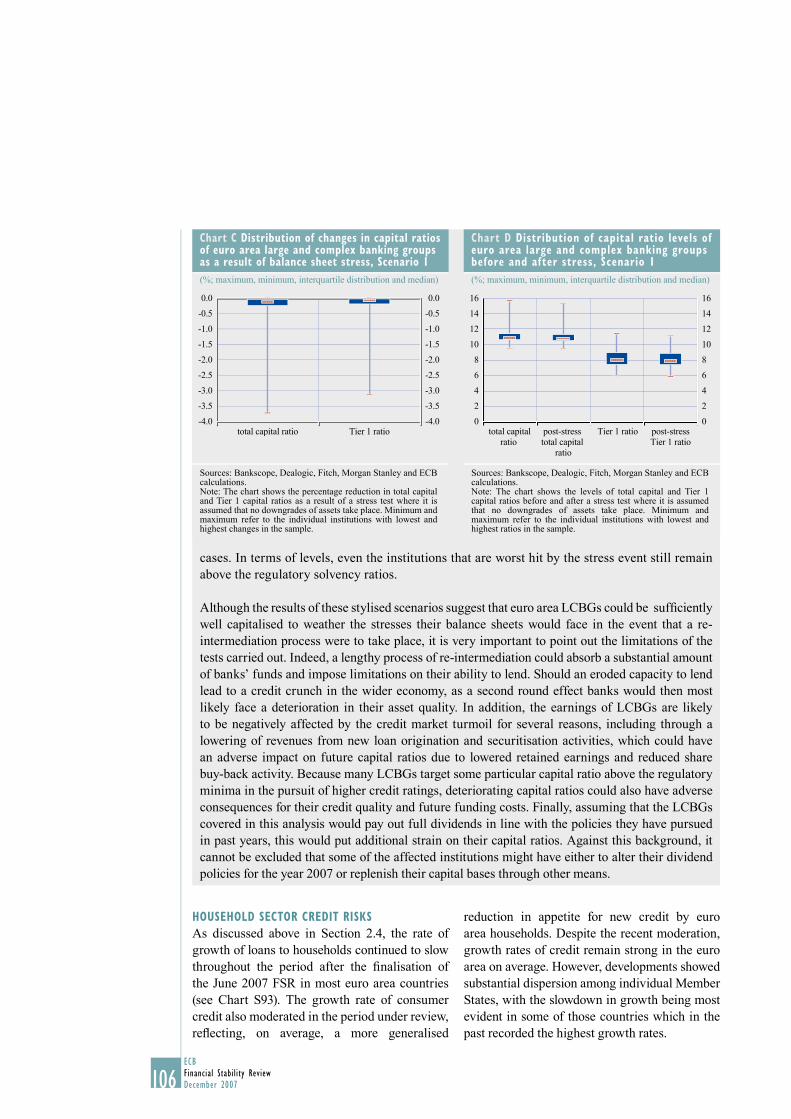
106ECBFinancial Stability ReviewDecember 2007
HOUSEHOLD SECTOR CREDIT RISKS
As discussed above in Section 2.4, the rate of growth of loans to households continued to slow throughout the period after the fi nalisation of the June 2007 FSR in most euro area countries (see Chart S93). The growth rate of consumer credit also moderated in the period under review, refl ecting, on average, a more generalised
reduction in appetite for new credit by euro area households. Despite the recent moderation, growth rates of credit remain strong in the euro area on average. However, developments showed substantial dispersion among individual Member States, with the slowdown in growth being most evident in some of those countries which in the past recorded the highest growth rates.
cases. In terms of levels, even the institutions that are worst hit by the stress event still remain above the regulatory solvency ratios.
Although the results of these stylised scenarios suggest that euro area LCBGs could be suffi ciently well capitalised to weather the stresses their balance sheets would face in the event that a re-intermediation process were to take place, it is very important to point out the limitations of the tests carried out. Indeed, a lengthy process of re-intermediation could absorb a substantial amount of banks’ funds and impose limitations on their ability to lend. Should an eroded capacity to lend lead to a credit crunch in the wider economy, as a second round effect banks would then most likely face a deterioration in their asset quality. In addition, the earnings of LCBGs are likely to be negatively affected by the credit market turmoil for several reasons, including through a lowering of revenues from new loan origination and securitisation activities, which could have an adverse impact on future capital ratios due to lowered retained earnings and reduced share buy-back activity. Because many LCBGs target some particular capital ratio above the regulatory minima in the pursuit of higher credit ratings, deteriorating capital ratios could also have adverse consequences for their credit quality and future funding costs. Finally, assuming that the LCBGs covered in this analysis would pay out full dividends in line with the policies they have pursued in past years, this would put additional strain on their capital ratios. Against this background, it cannot be excluded that some of the affected institutions might have either to alter their dividend policies for the year 2007 or replenish their capital bases through other means.
Chart D Distribution of capital ratio levels of euro area large and complex banking groups before and after stress, Scenario 1
(%; maximum, minimum, interquartile distribution and median)
0
2
4
6
8
10
12
14
16
0
2
4
6
8
10
12
14
16
total capitalratio
post-stress total capital
ratio
Tier 1 ratio post-stressTier 1 ratio
Sources: Bankscope, Dealogic, Fitch, Morgan Stanley and ECB calculations.Note: The chart shows the levels of total capital and Tier 1 capital ratios before and after a stress test where it is assumed that no downgrades of assets take place. Minimum and maximum refer to the individual institutions with lowest and highest ratios in the sample.
Chart C Distribution of changes in capital ratios of euro area large and complex banking groups as a result of balance sheet stress, Scenario 1
(%; maximum, minimum, interquartile distribution and median)
-4.0
-3.5
-3.0
-2.5
-2.0
-1.5
-1.0
-0.5
0.0
-4.0
-3.5
-3.0
-2.5
-2.0
-1.5
-1.0
-0.5
0.0
total capital ratio Tier 1 ratio
Sources: Bankscope, Dealogic, Fitch, Morgan Stanley and ECB calculations.Note: The chart shows the percentage reduction in total capital and Tier 1 capital ratios as a result of a stress test where it is assumed that no downgrades of assets take place. Minimum and maximum refer to the individual institutions with lowest and highest changes in the sample.
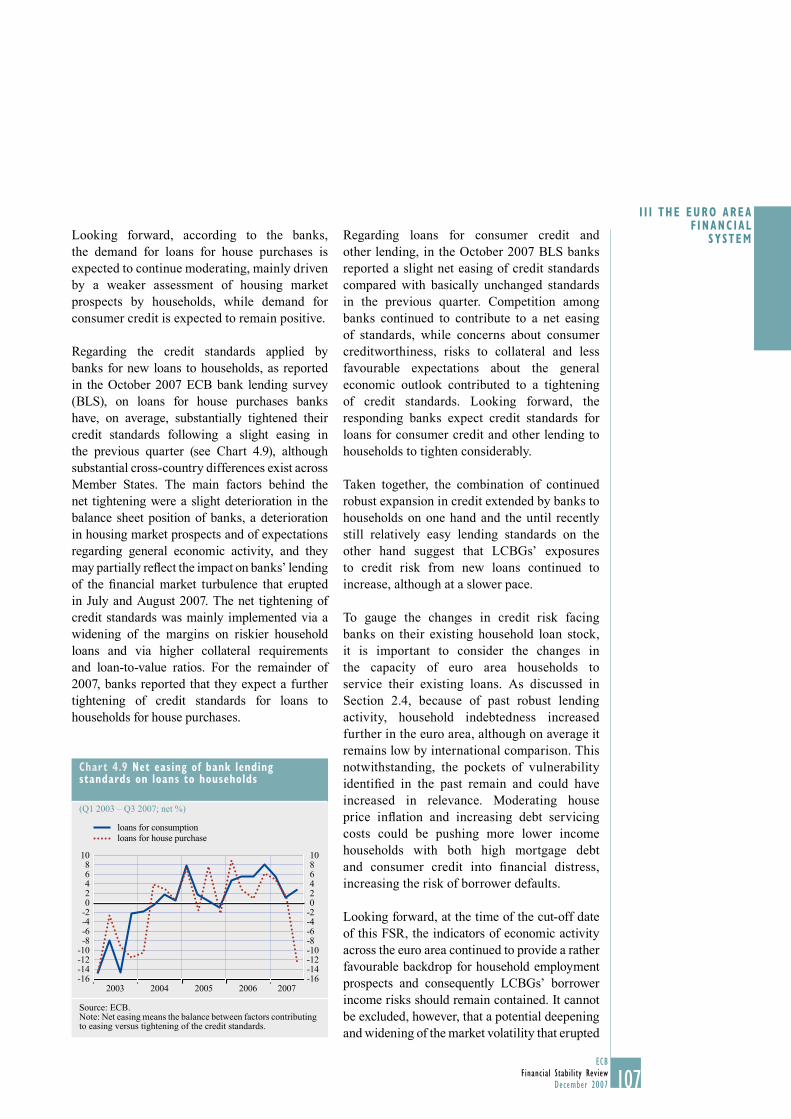
107ECB
Financial Stability ReviewDecember 2007
I I I THE EURO AREA F INANC IAL
SYSTEM
107
Looking forward, according to the banks, the demand for loans for house purchases is expected to continue moderating, mainly driven by a weaker assessment of housing market prospects by households, while demand for consumer credit is expected to remain positive.
Regarding the credit standards applied by banks for new loans to households, as reported in the October 2007 ECB bank lending survey (BLS), on loans for house purchases banks have, on average, substantially tightened their credit standards following a slight easing in the previous quarter (see Chart 4.9), although substantial cross-country differences exist across Member States. The main factors behind the net tightening were a slight deterioration in the balance sheet position of banks, a deterioration in housing market prospects and of expectations regarding general economic activity, and they may partially refl ect the impact on banks’ lending of the fi nancial market turbulence that erupted in July and August 2007. The net tightening of credit standards was mainly implemented via a widening of the margins on riskier household loans and via higher collateral requirements and loan-to-value ratios. For the remainder of 2007, banks reported that they expect a further tightening of credit standards for loans to households for house purchases.
Regarding loans for consumer credit and other lending, in the October 2007 BLS banks reported a slight net easing of credit standards compared with basically unchanged standards in the previous quarter. Competition among banks continued to contribute to a net easing of standards, while concerns about consumer creditworthiness, risks to collateral and less favourable expectations about the general economic outlook contributed to a tightening of credit standards. Looking forward, the responding banks expect credit standards for loans for consumer credit and other lending to households to tighten considerably.
Taken together, the combination of continued robust expansion in credit extended by banks to households on one hand and the until recently still relatively easy lending standards on the other hand suggest that LCBGs’ exposures to credit risk from new loans continued to increase, although at a slower pace.
To gauge the changes in credit risk facing banks on their existing household loan stock, it is important to consider the changes in the capacity of euro area households to service their existing loans. As discussed in Section 2.4, because of past robust lending activity, household indebtedness increased further in the euro area, although on average it remains low by international comparison. This notwithstanding, the pockets of vulnerability identifi ed in the past remain and could have increased in relevance. Moderating house price infl ation and increasing debt servicing costs could be pushing more lower income households with both high mortgage debt and consumer credit into fi nancial distress, increasing the risk of borrower defaults.
Looking forward, at the time of the cut-off date of this FSR, the indicators of economic activity across the euro area continued to provide a rather favourable backdrop for household employment prospects and consequently LCBGs’ borrower income risks should remain contained. It cannot be excluded, however, that a potential deepening and widening of the market volatility that erupted
Chart 4.9 Net easing of bank lending standards on loans to households
(Q1 2003 – Q3 2007; net %)
-16-14-12-10-8-6-4-202468
10
-16-14-12-10-8-6-4-20246810
loans for consumptionloans for house purchase
2003 2004 2005 2006 2007
Source: ECB.Note: Net easing means the balance between factors contributing to easing versus tightening of the credit standards.
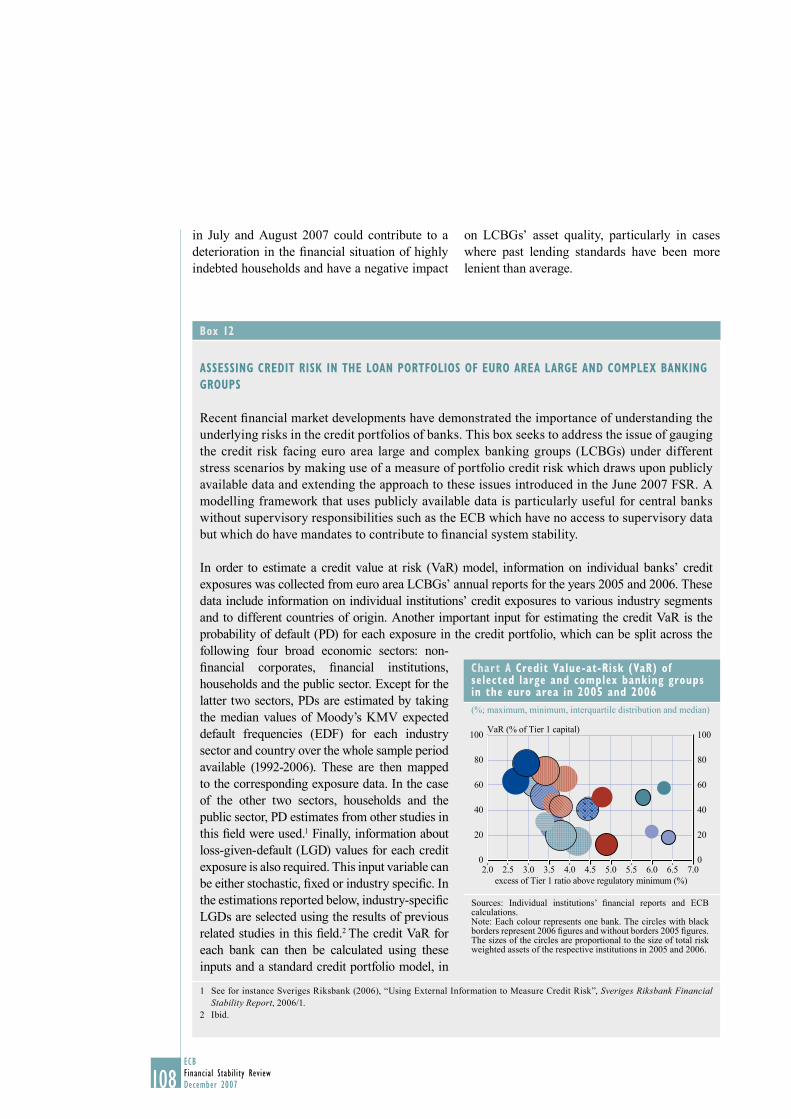
108ECBFinancial Stability ReviewDecember 2007
Box 12
ASSESSING CREDIT RISK IN THE LOAN PORTFOLIOS OF EURO AREA LARGE AND COMPLEX BANKING
GROUPS
Recent fi nancial market developments have demonstrated the importance of understanding the underlying risks in the credit portfolios of banks. This box seeks to address the issue of gauging the credit risk facing euro area large and complex banking groups (LCBGs) under different stress scenarios by making use of a measure of portfolio credit risk which draws upon publicly available data and extending the approach to these issues introduced in the June 2007 FSR. A modelling framework that uses publicly available data is particularly useful for central banks without supervisory responsibilities such as the ECB which have no access to supervisory data but which do have mandates to contribute to fi nancial system stability.
In order to estimate a credit value at risk (VaR) model, information on individual banks’ credit exposures was collected from euro area LCBGs’ annual reports for the years 2005 and 2006. These data include information on individual institutions’ credit exposures to various industry segments and to different countries of origin. Another important input for estimating the credit VaR is the probability of default (PD) for each exposure in the credit portfolio, which can be split across the following four broad economic sectors: non-fi nancial corporates, fi nancial institutions, households and the public sector. Except for the latter two sectors, PDs are estimated by taking the median values of Moody’s KMV expected default frequencies (EDF) for each industry sector and country over the whole sample period available (1992-2006). These are then mapped to the corresponding exposure data. In the case of the other two sectors, households and the public sector, PD estimates from other studies in this fi eld were used.1 Finally, information about loss-given-default (LGD) values for each credit exposure is also required. This input variable can be either stochastic, fi xed or industry specifi c. In the estimations reported below, industry-specifi c LGDs are selected using the results of previous related studies in this fi eld.2 The credit VaR for each bank can then be calculated using these inputs and a standard credit portfolio model, in
1 See for instance Sveriges Riksbank (2006), “Using External Information to Measure Credit Risk”, Sveriges Riksbank Financial Stability Report, 2006/1.
2 Ibid.
Chart A Credit Value-at-Risk (VaR) of selected large and complex banking groups in the euro area in 2005 and 2006
(%; maximum, minimum, interquartile distribution and median)
VaR (% of Tier 1 capital)
excess of Tier 1 ratio above regulatory minimum (%)2.0 2.5 3.0 3.5 4.0 4.5 5.0 5.5 6.0 6.5 7.0
100
80
60
40
20
0
100
80
60
40
20
0
Sources: Individual institutions’ fi nancial reports and ECB calculations.Note: Each colour represents one bank. The circles with black borders represent 2006 fi gures and without borders 2005 fi gures. The sizes of the circles are proportional to the size of total risk weighted assets of the respective institutions in 2005 and 2006.
in July and August 2007 could contribute to a deterioration in the fi nancial situation of highly indebted households and have a negative impact
on LCBGs’ asset quality, particularly in cases where past lending standards have been more lenient than average.
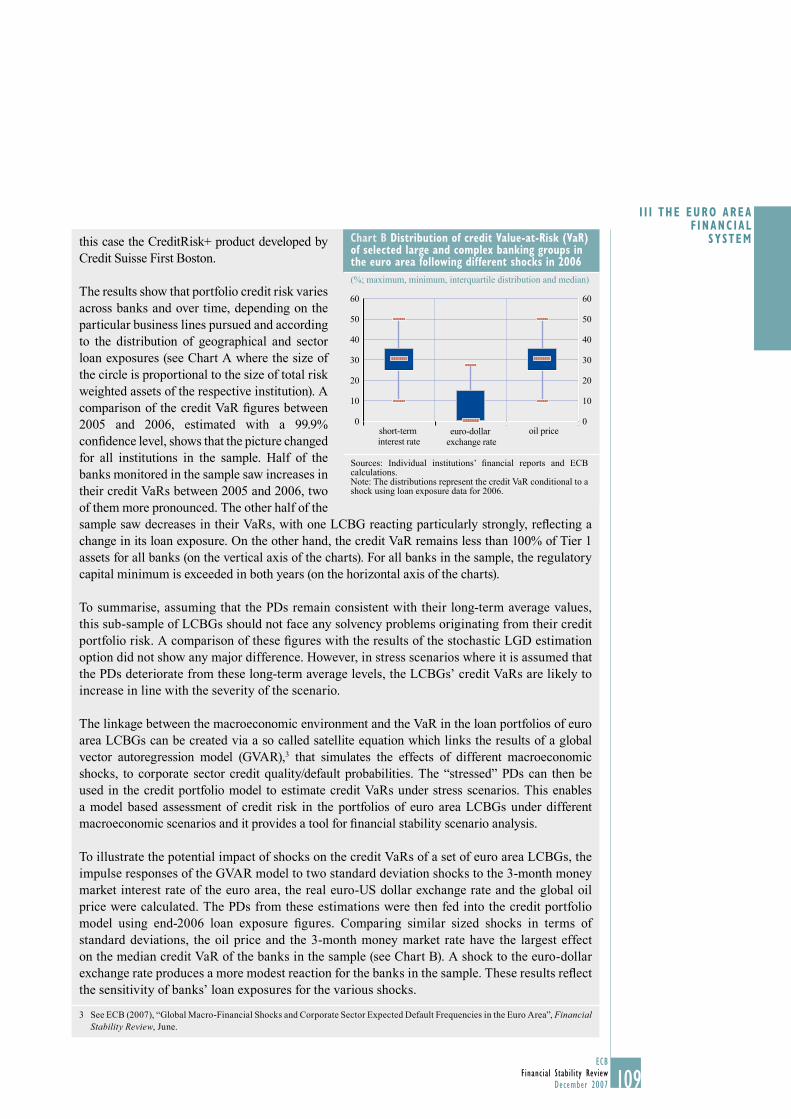
109ECB
Financial Stability ReviewDecember 2007
I I I THE EURO AREA F INANC IAL
SYSTEM
109
this case the CreditRisk+ product developed by Credit Suisse First Boston.
The results show that portfolio credit risk varies across banks and over time, depending on the particular business lines pursued and according to the distribution of geographical and sector loan exposures (see Chart A where the size of the circle is proportional to the size of total risk weighted assets of the respective institution). A comparison of the credit VaR fi gures between 2005 and 2006, estimated with a 99.9% confi dence level, shows that the picture changed for all institutions in the sample. Half of the banks monitored in the sample saw increases in their credit VaRs between 2005 and 2006, two of them more pronounced. The other half of the sample saw decreases in their VaRs, with one LCBG reacting particularly strongly, refl ecting a change in its loan exposure. On the other hand, the credit VaR remains less than 100% of Tier 1 assets for all banks (on the vertical axis of the charts). For all banks in the sample, the regulatory capital minimum is exceeded in both years (on the horizontal axis of the charts).
To summarise, assuming that the PDs remain consistent with their long-term average values, this sub-sample of LCBGs should not face any solvency problems originating from their credit portfolio risk. A comparison of these fi gures with the results of the stochastic LGD estimation option did not show any major difference. However, in stress scenarios where it is assumed that the PDs deteriorate from these long-term average levels, the LCBGs’ credit VaRs are likely to increase in line with the severity of the scenario.
The linkage between the macroeconomic environment and the VaR in the loan portfolios of euro area LCBGs can be created via a so called satellite equation which links the results of a global vector autoregression model (GVAR),3 that simulates the effects of different macroeconomic shocks, to corporate sector credit quality/default probabilities. The “stressed” PDs can then be used in the credit portfolio model to estimate credit VaRs under stress scenarios. This enables a model based assessment of credit risk in the portfolios of euro area LCBGs under different macroeconomic scenarios and it provides a tool for fi nancial stability scenario analysis.
To illustrate the potential impact of shocks on the credit VaRs of a set of euro area LCBGs, the impulse responses of the GVAR model to two standard deviation shocks to the 3-month money market interest rate of the euro area, the real euro-US dollar exchange rate and the global oil price were calculated. The PDs from these estimations were then fed into the credit portfolio model using end-2006 loan exposure fi gures. Comparing similar sized shocks in terms of standard deviations, the oil price and the 3-month money market rate have the largest effect on the median credit VaR of the banks in the sample (see Chart B). A shock to the euro-dollar exchange rate produces a more modest reaction for the banks in the sample. These results refl ect the sensitivity of banks’ loan exposures for the various shocks.
3 See ECB (2007), “Global Macro-Financial Shocks and Corporate Sector Expected Default Frequencies in the Euro Area”, Financial Stability Review, June.
Chart B Distribution of credit Value-at-Risk (VaR) of selected large and complex banking groups in the euro area following different shocks in 2006
(%; maximum, minimum, interquartile distribution and median)
0
10
20
30
40
50
60
0
10
20
30
40
50
60
euro-dollar exchange rate
oil priceshort-term interest rate
Sources: Individual institutions’ fi nancial reports and ECB calculations.Note: The distributions represent the credit VaR conditional to a shock using loan exposure data for 2006.
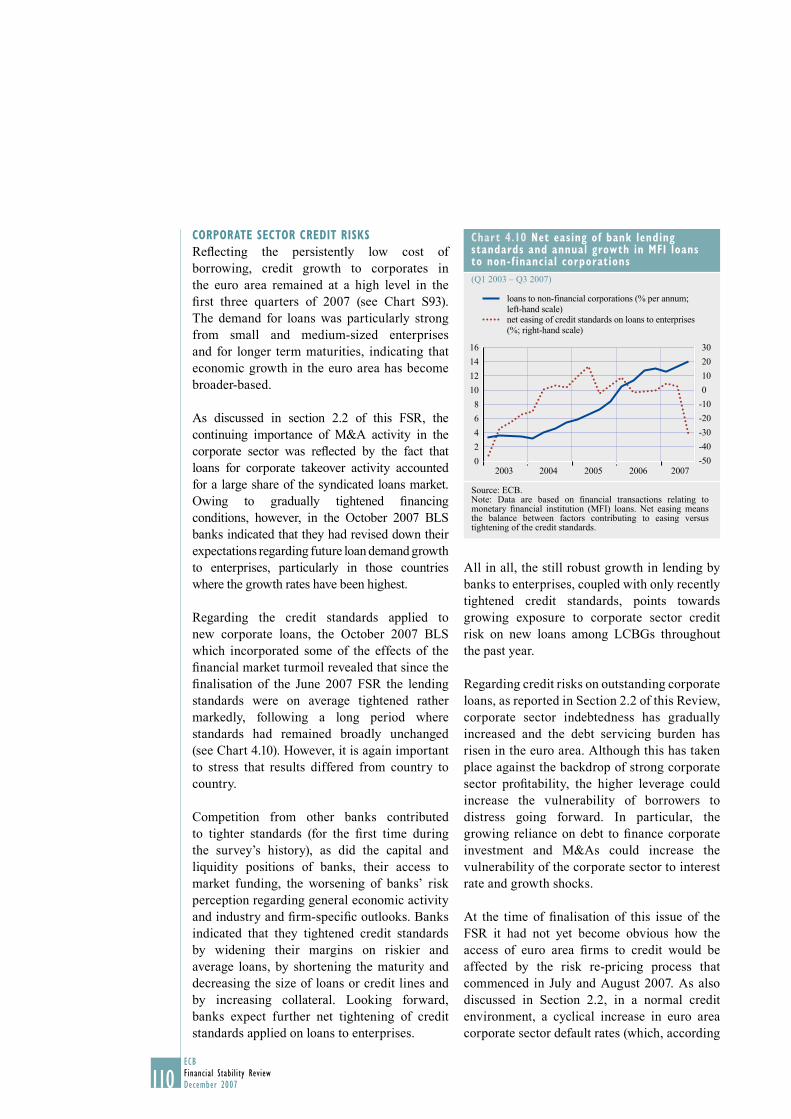
110ECBFinancial Stability ReviewDecember 2007
Chart 4.10 Net easing of bank lending standards and annual growth in MFI loans to non-f inancial corporations
(Q1 2003 – Q3 2007)
0
2
4
6
8
10
12
14
16
2007-50
-40
-30
-20
-10
0
10
20
30
loans to non-financial corporations (% per annum; left-hand scale)net easing of credit standards on loans to enterprises (%; right-hand scale)
2003 2004 2005 2006
Source: ECB.Note: Data are based on fi nancial transactions relating to monetary fi nancial institution (MFI) loans. Net easing means the balance between factors contributing to easing versus tightening of the credit standards.
CORPORATE SECTOR CREDIT RISKS
Refl ecting the persistently low cost of borrowing, credit growth to corporates in the euro area remained at a high level in the fi rst three quarters of 2007 (see Chart S93). The demand for loans was particularly strong from small and medium-sized enterprises and for longer term maturities, indicating that economic growth in the euro area has become broader-based.
As discussed in section 2.2 of this FSR, the continuing importance of M&A activity in the corporate sector was refl ected by the fact that loans for corporate takeover activity accounted for a large share of the syndicated loans market. Owing to gradually tightened fi nancing conditions, however, in the October 2007 BLS banks indicated that they had revised down their expectations regarding future loan demand growth to enterprises, particularly in those countries where the growth rates have been highest.
Regarding the credit standards applied to new corporate loans, the October 2007 BLS which incorporated some of the effects of the fi nancial market turmoil revealed that since the fi nalisation of the June 2007 FSR the lending standards were on average tightened rather markedly, following a long period where standards had remained broadly unchanged (see Chart 4.10). However, it is again important to stress that results differed from country to country.
Competition from other banks contributed to tighter standards (for the fi rst time during the survey’s history), as did the capital and liquidity positions of banks, their access to market funding, the worsening of banks’ risk perception regarding general economic activity and industry and fi rm-specifi c outlooks. Banks indicated that they tightened credit standards by widening their margins on riskier and average loans, by shortening the maturity and decreasing the size of loans or credit lines and by increasing collateral. Looking forward, banks expect further net tightening of credit standards applied on loans to enterprises.
All in all, the still robust growth in lending by banks to enterprises, coupled with only recently tightened credit standards, points towards growing exposure to corporate sector credit risk on new loans among LCBGs throughout the past year.
Regarding credit risks on outstanding corporate loans, as reported in Section 2.2 of this Review, corporate sector indebtedness has gradually increased and the debt servicing burden has risen in the euro area. Although this has taken place against the backdrop of strong corporate sector profi tability, the higher leverage could increase the vulnerability of borrowers to distress going forward. In particular, the growing reliance on debt to fi nance corporate investment and M&As could increase the vulnerability of the corporate sector to interest rate and growth shocks.
At the time of fi nalisation of this issue of the FSR it had not yet become obvious how the access of euro area fi rms to credit would be affected by the risk re-pricing process that commenced in July and August 2007. As also discussed in Section 2.2, in a normal credit environment, a cyclical increase in euro area corporate sector default rates (which, according
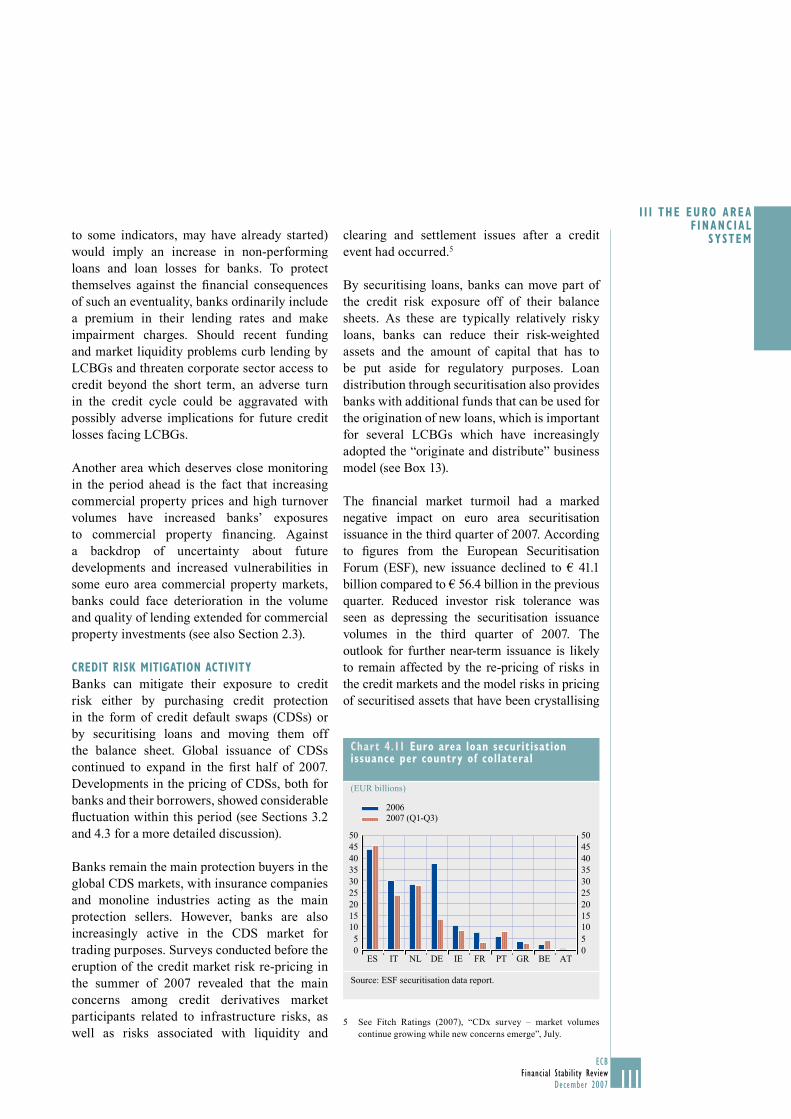
111ECB
Financial Stability ReviewDecember 2007
I I I THE EURO AREA F INANC IAL
SYSTEM
111
to some indicators, may have already started) would imply an increase in non-performing loans and loan losses for banks. To protect themselves against the fi nancial consequences of such an eventuality, banks ordinarily include a premium in their lending rates and make impairment charges. Should recent funding and market liquidity problems curb lending by LCBGs and threaten corporate sector access to credit beyond the short term, an adverse turn in the credit cycle could be aggravated with possibly adverse implications for future credit losses facing LCBGs.
Another area which deserves close monitoring in the period ahead is the fact that increasing commercial property prices and high turnover volumes have increased banks’ exposures to commercial property fi nancing. Against a backdrop of uncertainty about future developments and increased vulnerabilities in some euro area commercial property markets, banks could face deterioration in the volume and quality of lending extended for commercial property investments (see also Section 2.3).
CREDIT RISK MITIGATION ACTIVITY
Banks can mitigate their exposure to credit risk either by purchasing credit protection in the form of credit default swaps (CDSs) or by securitising loans and moving them off the balance sheet. Global issuance of CDSs continued to expand in the fi rst half of 2007. Developments in the pricing of CDSs, both for banks and their borrowers, showed considerable fl uctuation within this period (see Sections 3.2 and 4.3 for a more detailed discussion).
Banks remain the main protection buyers in the global CDS markets, with insurance companies and monoline industries acting as the main protection sellers. However, banks are also increasingly active in the CDS market for trading purposes. Surveys conducted before the eruption of the credit market risk re-pricing in the summer of 2007 revealed that the main concerns among credit derivatives market participants related to infrastructure risks, as well as risks associated with liquidity and
clearing and settlement issues after a credit event had occurred.5
By securitising loans, banks can move part of the credit risk exposure off of their balance sheets. As these are typically relatively risky loans, banks can reduce their risk-weighted assets and the amount of capital that has to be put aside for regulatory purposes. Loan distribution through securitisation also provides banks with additional funds that can be used for the origination of new loans, which is important for several LCBGs which have increasingly adopted the “originate and distribute” business model (see Box 13).
The fi nancial market turmoil had a marked negative impact on euro area securitisation issuance in the third quarter of 2007. According to fi gures from the European Securitisation Forum (ESF), new issuance declined to € 41.1 billion compared to € 56.4 billion in the previous quarter. Reduced investor risk tolerance was seen as depressing the securitisation issuance volumes in the third quarter of 2007. The outlook for further near-term issuance is likely to remain affected by the re-pricing of risks in the credit markets and the model risks in pricing of securitised assets that have been crystallising
See Fitch Ratings (2007), “CDx survey – market volumes 5 continue growing while new concerns emerge”, July.
Chart 4.11 Euro area loan securitisation issuance per country of collateral
(EUR billions)
05
101520253035404550
05101520253035404550
20062007 (Q1-Q3)
ES IT NL DE IE FR PT GR BE AT
Source: ESF securitisation data report.
112ECBFinancial Stability ReviewDecember 2007
(see Box 14 for a detailed discussion of model risk and how it can be managed).
Despite the more recent slowdown in issuance, the outstanding amount of euro area securitised credit at the end of the third quarter of 2007 was € 594 billion, an increase of almost 14% from a year earlier. At € 137 billion, new issuance in the fi rst three quarters of 2007 represented an increase of 56% compared with the same period in 2006. Of the individual collateral
sectors, residential mortgage-backed securities (RMBSs) continued to see the largest volumes, followed by collateralised debt obligations (CDOs) and commercial mortgage-backed securities (CMBSs). Of individual euro area countries, in the fi rst three quarters of 2007 Spain, the Netherlands and Italy were the main issuers (see Chart 4.11). However, the highest individual euro area country issuances are still, for example, less than one third of the issuance volumes by UK banks.
Box 13
THE “ORIGINATE AND DISTRIBUTE” BANKING BUSINESS MODEL AND RECENT CREDIT MARKET
TURMOIL: SOME TENTATIVE LESSONS
Since the issuance of the fi rst mortgage-backed securities in the 1980s, banks have been moving towards greater segmentation of their fi nancial intermediation activities. Rather than retaining loans they originated, banks gradually began to distribute loans to the secondary market, either directly or by repackaging them into various fi nancial instruments which fall under the general category of asset-backed securities (ABSs). This activity has the advantages of diversifying banks’ funding sources, reducing concentrations of credit risk, minimising overall funding costs and, under certain conditions, reducing regulatory capital. Furthermore, the process frees up capital for new lending, provides income from the sale of the loans, and generates fees from continuing servicing of the underlying loans (collecting interest and principal repayments and passing them on to the holders of the securities). In the last couple of years, in the US in particular, non-bank institutions, such as mortgage brokers, have also became important participants in the origination of loans that could be sold on to banks which specialise in structuring various fi nancial instruments. This box recaps some of the lessons that have been learnt for the originate and distribute model as a result of recent market turmoil.
Financial innovations of the past decade facilitated the expansion of the “originate and distribute” model across a wider pool of credit. These innovations included the design of instruments such as collateralised debt obligations (CDOs) that pool the cash fl ows of the underlying assets, which can include mortgage-backed securities and other asset-backed securities, and reallocate them to a second layer of securities. The credit quality of the CDO is usually enhanced by various structural features, including subordination (which involves dividing the cash fl ows into tranches with different degrees of seniority in terms of exposure to possible credit losses), over-collateralisation, water-fall payment structures and credit risk protection provided by specialist insurers. Due to these features, the expected losses from the tranches higher up in the subordination structure are generally suffi ciently low to qualify them for the highest available credit ratings. Lower-rated and unrated tranches are more exposed to credit risk and consequently pay out higher returns. Generally speaking, however, the yields on all structured fi nance securities are typically higher than those on conventional corporate and government bonds. The upshot of the past decade of fi nancial innovation is that risk is now more widely
113ECB
Financial Stability ReviewDecember 2007
I I I THE EURO AREA F INANC IAL
SYSTEM
113
repackaged and dispersed, making concentrations of risk among individual institutions much more unlikely, and allocating risk – at least in theory and most of the time – to those who have an understanding of the various risks inherent in complex securities.
In the low-yield environment which was a characteristic of the euro area and most fi nancial systems for a good part of the past decade investors had strong incentives to take on more leverage with the possibility of further boosting expected returns on tranches with given credit ratings. This was typically done by using the packaged securitised instruments themselves as collateral in additional layers of structured fi nancing.1 Soaring demand for CDOs and other structured credit products increased the revenues of the banks that distributed assets to the secondary market. It also attracted new banks to the business model and may have encouraged some banks to dilute their lending standards by excessively originating loans that are particularly attractive for the purposes of securitisation and re-packaging, i.e. loans characterised by a higher risk profi le (in terms of the rating of the borrower and conditions of the loan) and higher yield. In order to convince investors that the originating banks had incentives to continue monitoring the borrowers after the loans had been securitised, they typically retained a “fi rst-loss exposure” to credit risk, meaning that they themselves would absorb the loss from a relatively small number of borrower defaults. More recently, however, the intensifying search for yield by investors allowed banks to rid themselves of even these riskiest tranches, which were often purchased by hedge funds and institutional investors with aggressive investment strategies. This, in turn, most likely impaired banks’ incentives to screen and monitor borrowers properly.
The credit market risk re-pricing that started in July-August 2007 contributed to a marked decline in investors’ appetite for structure fi nance securities. Consequently, there was also a dramatic slowdown in issuance of securities backed by structured credit products which quickly spread through various parts of the structured fi nance market with feedback effects to the primary issuance market. Several types of banks involved to varying degrees in the originate and distribute business model turned out to be vulnerable to the rapid re-pricing of the ABS products. These included banks with small deposit bases and strong reliance on wholesale funding, banks which held loans originating from the US sub-prime mortgage markets and banks with substantial pipelines of other loans to be distributed to the secondary market. These institutions suddenly found themselves in situations where the asset side of their balance sheets had become larger than originally planned, requiring them to seek fi nancing from an already stressed money market. Other banks, as a way of generating leveraged returns, had set up multiple off-balance sheet vehicles that held structured assets and fi nanced themselves through the issuance of short-term asset-backed commercial paper (ABCP), and to which banks had extensive back-stop funding commitments. For some banks, the contingent credit lines were triggered after investors refused to roll over any ABCP where there was a possibility that the asset pools included US sub-prime mortgage assets. Overall, the liquidity problems that originated from the rapid deterioration in credit quality in a rather minor part of the US mortgage markets seemed to have particularly severe implications for banks that were either actively pursuing the originate and distribute model or had no diversifi cation benefi ts in the form of earnings from business lines that were not directly affected by the turbulence.
1 In an environment of tight credit spreads, taking on more leverage can generate additional returns for investors and institutions structuring these securities. Investors who purchased the securities sometimes used them as collateral for other structures including “CDO squared”, which represent an additional layer of CDOs, or as collateral for asset-backed commercial paper (ABCP) structures.
114ECBFinancial Stability ReviewDecember 2007
All in all, the originate and distribute model has many advantages and, in principle, it has the capacity to enhance fi nancial system stability. That said, at the time of fi nalisation of this FSR, the severity and breadth of the effects of the risk re-pricing appears to have created an important argument in favour of enhanced and more meaningful transparency on the part of all the main actors in the fi nancial system. There is also a need for investors to better understand the potential risks embedded in complex structured products. This calls for increased stress-testing to analyse the likely behaviour of the prices of such instruments following low-probability but high-impact events. Some of the banks that had adopted elements of the originate and distribute model, but were not suffi ciently well capitalised or sophisticated enough in their credit and liquidity risk management to weather the storm, may need to reconsider the suitability of the business model. Individual institutions may also face the need to take some of the distributed assets back onto their balance sheets in order to avoid adverse reputational consequences. From a broader fi nancial stability perspective, the potential problems with the originate and distribute model may become acute if the failure of the distribution leg of the banks’ business model causes problems with the origination leg, thus threatening a credit crunch in the wider economy. This is because key prerequisites for the success of this business model are a constant demand from investors for the fi nancial instruments created by banks by the re-packaging of loans and an ability on the part of investors to adequately appreciate both the risk and return profi les of these instruments.
Box 14
MODEL RISK: AN OVERVIEW OF THE ISSUES
“Model risk” is the risk of error due to inadequacies in fi nancial risk measurement and valuation models. Insuffi cient attention to model risk can lead to fi nancial losses. In an ever complex fi nancial world in which esoteric pricing and risk measurement models are continually being introduced, the consequences of model risk are an apparent and increasing source of risk to fi nancial stability.
A wide variety of different model types are used in the fi nancial industry. The most important class of models used are “fundamental models” such as the Black-Scholes option pricing model that makes assumptions about dynamic processes and interrelationships between different variables. Another widely used group are “statistical models” that aim at capturing statistical relationships between variables, usually focusing on the correlation between variables. Both fundamental and statistical models are used routinely to take fi nancial decisions concerning the loss limits and risk budgets of fi nancial institutions. However, by their very nature, models are simplifi ed structures, and are a representation of something more complex, so some degree of error is to be expected. Therefore, it is important to understand when and how models can go wrong.
Model risk can arise from a variety of sources. An important one is incorrect model specifi cation which could come in the form of missing risk factors, misspecifying stochastic processes underlying the model or ignoring important variables. Incorrect model application is often a source of model risk. It can arise from using the wrong model for the problem at hand or using a model that is no longer best practice. Implementation risk is another source of model risk which typically manifests itself in the context of a complex environment when a partially knowledgeable user tries to mechanistically implement a model as a deterministic black box. A

115ECB
Financial Stability ReviewDecember 2007
I I I THE EURO AREA F INANC IAL
SYSTEM
115
related implementation risk is incorrect calibration of model parameters, programming errors or problems with data when up-to-date model input information is not available.
Model risk can be mitigated in different ways. Different layers in a fi nancial organisation should be involved in such risk mitigating efforts: from the individual practitioner building and using the models, to the senior manager who oversees the introduction, implementation and roll-out of models. Even at a higher level, at the institutional level, checks and controls can be implemented through an adequate organisational set-up to minimize such risks. The following methods and practices provide a non-exhaustive battery of tools and recommendations to manage model risk:
• Model risk exists: awareness of the issue includes understanding the strengths and weaknesses of different models and how to use them correctly.
• Evaluate and check key assumptions: models should be re-calibrated and estimated regularly and methods should be kept up to date.
• Use the simplest reasonable model and escape from unnecessary complexity: if a more complex model is used instead of a simpler one, a clear justifi cation for such a decision needs to be given.
• Back-testing and stress-testing should be performed regularly to evaluate model adequacy.
• Small problems that are unexplained by the model should not be ignored: they often serve as important warning signals that the model may not be suffi ciently robust.
• Whenever possible, model risk should be quantifi ed through, for example, scenario or simulation methods, keeping in mind that this process is subject to model risk itself.
• Senior managers should have a clear understanding of model assumptions, scope of application and model weaknesses.
• Encourage a multidisciplinary approach to model building in which a variety of staff with different profi les (e.g. fi nance experts, mathematicians, computer experts, traders, economists, etc.) interact in a climate of constructive criticism.
• At a fi rm level, an independent risk oversight function with responsibility for monitoring risk (including model risk) independently of other business units is necessary. Risk managers should have access to the complete specifi cation (i.e. documentation) of the models, enabling checks on model soundness, and develop benchmark tests to check the performance of the models.
Model risk is often treated as if it was a minor consideration, and sometimes it is even ignored altogether. However, model risk could cast a shadow on the risk management area if ignored. Constant fi nancial innovation continuously pushes the boundaries of theoretical and practical fi nance, creating the need for new models or for adjusting old ones. Prudence suggests that the possible outcomes if model assumptions fail to hold should be continuously assessed. Ignoring this basic principle could undermine appropriate risk management at the fi rm level and cause dislocations in broader fi nancial markets as evidenced by events related to the latest market turmoil.

116ECBFinancial Stability ReviewDecember 2007
FUNDING LIQUIDITY RISKS
Information on the structure of the liabilities of euro area LCBGs is more scarce than that available on their asset structure. This complicates the assessment of the funding liquidity risks facing banks, which often relate to maturity mis-matches between the two sides of their balance sheets. According to available information, although still relatively moderate in size, the customer funding gap (the proportion of customer loans not covered by customer deposits) has widened for most LCBGs owing to the strength of lending growth over the past couple of years. A positive funding gap indicates the extent to which banks are reliant on interbank funding or on funding from sources other than deposits. Interbank funding is not only more costly than deposit funding, but it is also short-term in nature, requiring frequent renewal and, hence, implying a higher funding volatility. For most LCBGs the amount of liabilities owed to credit institutions and other wholesale sources is still not very substantial. However, signifi cant differences exist across institutions. Those LCBGs which actively pursue the originate and distribute business model and/or have substantial investment banking operations are typically more reliant on wholesale funding sources. It should be mentioned, however, that over the last few years, banks have taken signifi cant steps to diversify their funding programmes and to reduce structural funding risks. In particular, longer-term wholesale funding sources, such as securitisation, have contributed to a lengthening of the maturity of the wholesale funding of banks, thereby reducing the maturity mismatch between assets and liabilities.
By highlighting both the speed at which liquidity can evaporate and how funding liquidity risk
and market liquidity risk can be interlinked and subject to the same triggers, the fi nancial market dislocation that erupted in July and August 2007 underlined the importance of analysing the funding structures of banks, thereby increasing concerns with regard to banks that rely predominantly on the wholesale markets to fund their activities. In particular, the turbulence highlighted the need for banks to reassess the robustness of their liquidity risk management policies and their degree of reliance on more volatile funding sources in times of stress.
Off-balance-sheet items, such as credit lines, contingent liabilities and other commitments where liquidity mis-matches amplifi ed the recent credit market turmoil, can be quite signifi cant when gauged against the size of the balance sheets of many LCBGs.6
All in all, recent events have illustrated that there seems to have been an underestimation of the extent to which funding liquidity risk in various parts of banks’ balance sheets and market liquidity in different market segments can become correlated in times of stress, as well as a lack of appreciation of the fact that funding liquidity risk events, owing to their circular nature, can quickly metamorphose into credit risks in situations when market liquidity unexpectedly evaporates. Box 15 elaborates on the ways to measure market liquidity risk which is a different concept to funding liquidity risk.
Indeed, information collected by the Banking Supervision 6 Committee shows that such exposures often exceed 50% of the balance sheet total. For details, see ECB (2007), “EU banking sector stability”, November.
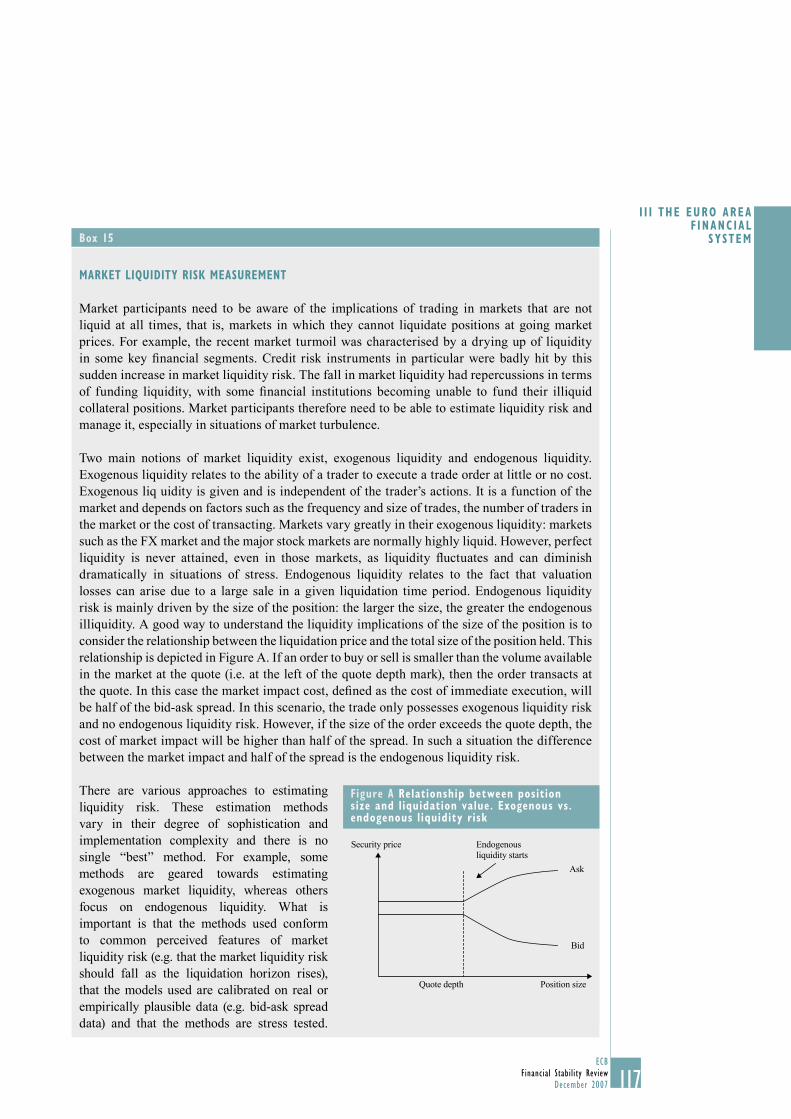
117ECB
Financial Stability ReviewDecember 2007
I I I THE EURO AREA F INANC IAL
SYSTEM
117
Box 15
MARKET LIQUIDITY RISK MEASUREMENT
Market participants need to be aware of the implications of trading in markets that are not liquid at all times, that is, markets in which they cannot liquidate positions at going market prices. For example, the recent market turmoil was characterised by a drying up of liquidity in some key fi nancial segments. Credit risk instruments in particular were badly hit by this sudden increase in market liquidity risk. The fall in market liquidity had repercussions in terms of funding liquidity, with some fi nancial institutions becoming unable to fund their illiquid collateral positions. Market participants therefore need to be able to estimate liquidity risk and manage it, especially in situations of market turbulence.
Two main notions of market liquidity exist, exogenous liquidity and endogenous liquidity. Exogenous liquidity relates to the ability of a trader to execute a trade order at little or no cost. Exogenous liq uidity is given and is independent of the trader’s actions. It is a function of the market and depends on factors such as the frequency and size of trades, the number of traders in the market or the cost of transacting. Markets vary greatly in their exogenous liquidity: markets such as the FX market and the major stock markets are normally highly liquid. However, perfect liquidity is never attained, even in those markets, as liquidity fl uctuates and can diminish dramatically in situations of stress. Endogenous liquidity relates to the fact that valuation losses can arise due to a large sale in a given liquidation time period. Endogenous liquidity risk is mainly driven by the size of the position: the larger the size, the greater the endogenous illiquidity. A good way to understand the liquidity implications of the size of the position is to consider the relationship between the liquidation price and the total size of the position held. This relationship is depicted in Figure A. If an order to buy or sell is smaller than the volume available in the market at the quote (i.e. at the left of the quote depth mark), then the order transacts at the quote. In this case the market impact cost, defi ned as the cost of immediate execution, will be half of the bid-ask spread. In this scenario, the trade only possesses exogenous liquidity risk and no endogenous liquidity risk. However, if the size of the order exceeds the quote depth, the cost of market impact will be higher than half of the spread. In such a situation the difference between the market impact and half of the spread is the endogenous liquidity risk.
There are various approaches to estimating liquidity risk. These estimation methods vary in their degree of sophistication and implementation complexity and there is no single “best” method. For example, some methods are geared towards estimating exogenous market liquidity, whereas others focus on endogenous liquidity. What is important is that the methods used conform to common perceived features of market liquidity risk (e.g. that the market liquidity risk should fall as the liquidation horizon rises), that the models used are calibrated on real or empirically plausible data (e.g. bid-ask spread data) and that the methods are stress tested.
Figure A Relationship between position size and liquidation value. Exogenous vs. endogenous liquidity risk
Security price Endogenous liquidity starts
Ask
Bid
Position sizeQuote depth
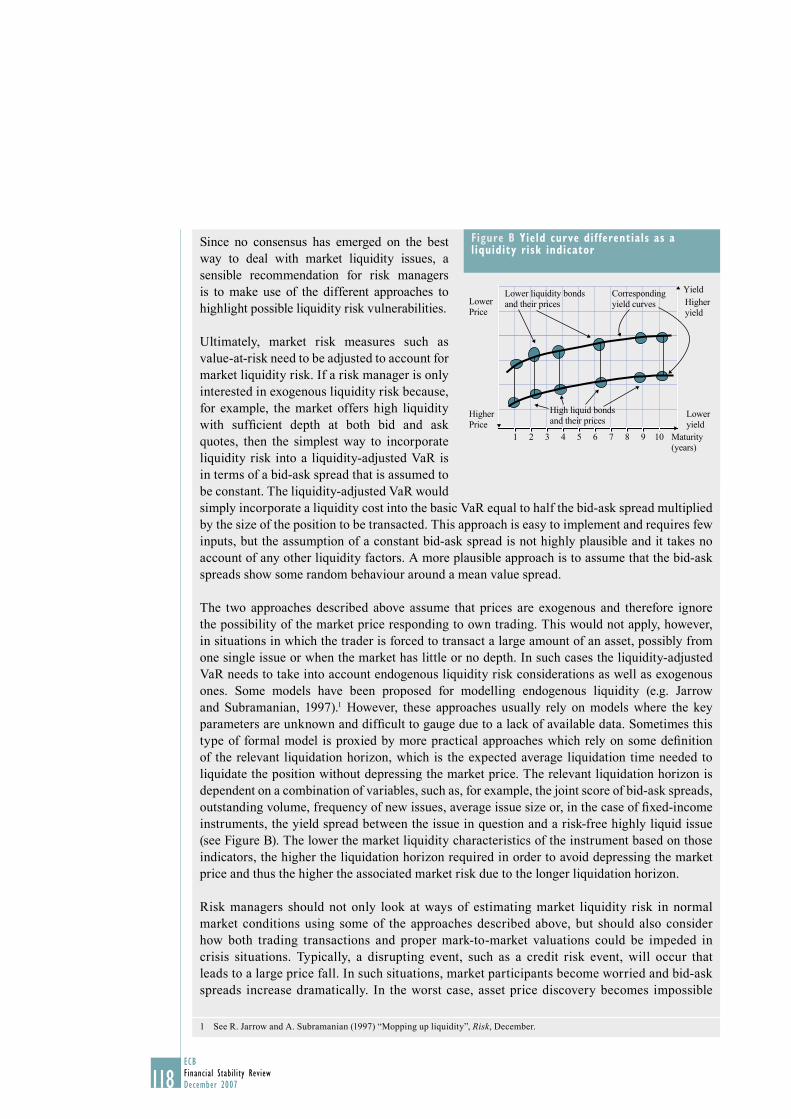
118ECBFinancial Stability ReviewDecember 2007
Since no consensus has emerged on the best way to deal with market liquidity issues, a sensible recommendation for risk managers is to make use of the different approaches to highlight possible liquidity risk vulnerabilities.
Ultimately, market risk measures such as value-at-risk need to be adjusted to account for market liquidity risk. If a risk manager is only interested in exogenous liquidity risk because, for example, the market offers high liquidity with suffi cient depth at both bid and ask quotes, then the simplest way to incorporate liquidity risk into a liquidity-adjusted VaR is in terms of a bid-ask spread that is assumed to be constant. The liquidity-adjusted VaR would simply incorporate a liquidity cost into the basic VaR equal to half the bid-ask spread multiplied by the size of the position to be transacted. This approach is easy to implement and requires few inputs, but the assumption of a constant bid-ask spread is not highly plausible and it takes no account of any other liquidity factors. A more plausible approach is to assume that the bid-ask spreads show some random behaviour around a mean value spread.
The two approaches described above assume that prices are exogenous and therefore ignore the possibility of the market price responding to own trading. This would not apply, however, in situations in which the trader is forced to transact a large amount of an asset, possibly from one single issue or when the market has little or no depth. In such cases the liquidity-adjusted VaR needs to take into account endogenous liquidity risk considerations as well as exogenous ones. Some models have been proposed for modelling endogenous liquidity (e.g. Jarrow and Subramanian, 1997).1 However, these approaches usually rely on models where the key parameters are unknown and diffi cult to gauge due to a lack of available data. Sometimes this type of formal model is proxied by more practical approaches which rely on some defi nition of the relevant liquidation horizon, which is the expected average liquidation time needed to liquidate the position without depressing the market price. The relevant liquidation horizon is dependent on a combination of variables, such as, for example, the joint score of bid-ask spreads, outstanding volume, frequency of new issues, average issue size or, in the case of fi xed-income instruments, the yield spread between the issue in question and a risk-free highly liquid issue (see Figure B). The lower the market liquidity characteristics of the instrument based on those indicators, the higher the liquidation horizon required in order to avoid depressing the market price and thus the higher the associated market risk due to the longer liquidation horizon.
Risk managers should not only look at ways of estimating market liquidity risk in normal market conditions using some of the approaches described above, but should also consider how both trading transactions and proper mark-to-market valuations could be impeded in crisis situations. Typically, a disrupting event, such as a credit risk event, will occur that leads to a large price fall. In such situations, market participants become worried and bid-ask spreads increase dramatically. In the worst case, asset price discovery becomes impossible
1 See R. Jarrow and A. Subramanian (1997) “Mopping up liquidity”, Risk, December.
Figure B Yield curve dif ferentials as a liquidity risk indicator
1 2 3 4 5 6 7 8 9 10
Lower liquidity bonds and their prices
Corresponding yield curves
YieldHigheryield
Loweryield
Maturity (years)
High liquid bonds and their prices
Higher Price
Lower Price
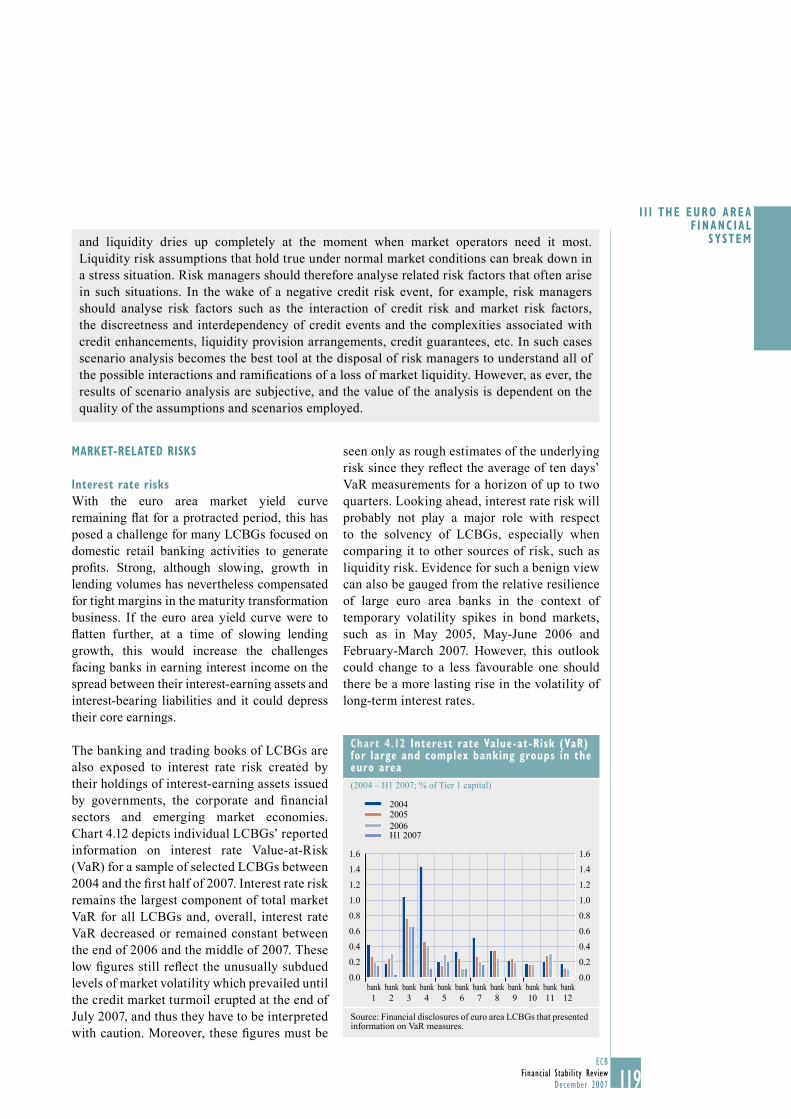
119ECB
Financial Stability ReviewDecember 2007
I I I THE EURO AREA F INANC IAL
SYSTEM
119
MARKET-RELATED RISKS
Interest rate risks
With the euro area market yield curve remaining fl at for a protracted period, this has posed a challenge for many LCBGs focused on domestic retail banking activities to generate profi ts. Strong, although slowing, growth in lending volumes has nevertheless compensated for tight margins in the maturity transformation business. If the euro area yield curve were to fl atten further, at a time of slowing lending growth, this would increase the challenges facing banks in earning interest income on the spread between their interest-earning assets and interest-bearing liabilities and it could depress their core earnings.
The banking and trading books of LCBGs are also exposed to interest rate risk created by their holdings of interest-earning assets issued by governments, the corporate and fi nancial sectors and emerging market economies. Chart 4.12 depicts individual LCBGs’ reported information on interest rate Value-at-Risk (VaR) for a sample of selected LCBGs between 2004 and the fi rst half of 2007. Interest rate risk remains the largest component of total market VaR for all LCBGs and, overall, interest rate VaR decreased or remained constant between the end of 2006 and the middle of 2007. These low fi gures still refl ect the unusually subdued levels of market volatility which prevailed until the credit market turmoil erupted at the end of July 2007, and thus they have to be interpreted with caution. Moreover, these fi gures must be
seen only as rough estimates of the underlying risk since they refl ect the average of ten days’ VaR measurements for a horizon of up to two quarters. Looking ahead, interest rate risk will probably not play a major role with respect to the solvency of LCBGs, especially when comparing it to other sources of risk, such as liquidity risk. Evidence for such a benign view can also be gauged from the relative resilience of large euro area banks in the context of temporary volatility spikes in bond markets, such as in May 2005, May-June 2006 and February-March 2007. However, this outlook could change to a less favourable one should there be a more lasting rise in the volatility of long-term interest rates.
and liquidity dries up completely at the moment when market operators need it most. Liquidity risk assumptions that hold true under normal market conditions can break down in a stress situation. Risk managers should therefore analyse related risk factors that often arise in such situations. In the wake of a negative credit risk event, for example, risk managers should analyse risk factors such as the interaction of credit risk and market risk factors, the discreetness and interdependency of credit events and the complexities associated with credit enhancements, liquidity provision arrangements, credit guarantees, etc. In such cases scenario analysis becomes the best tool at the disposal of risk managers to understand all of the possible interactions and ramifi cations of a loss of market liquidity. However, as ever, the results of scenario analysis are subjective, and the value of the analysis is dependent on the quality of the assumptions and scenarios employed.
Chart 4.12 Interest rate Value-at-Risk (VaR) for large and complex banking groups in the euro area
(2004 – H1 2007; % of Tier 1 capital)
0.0
0.2
0.4
0.6
0.8
1.0
1.2
1.4
1.6
0.0
0.2
0.4
0.6
0.8
1.0
1.2
1.4
1.6
200420052006H1 2007
1 2 3 4 5 6 7 8 9 10 11 12bank bank bank bank bank bank bank bank bank bank bank bank
Source: Financial disclosures of euro area LCBGs that presented information on VaR measures.
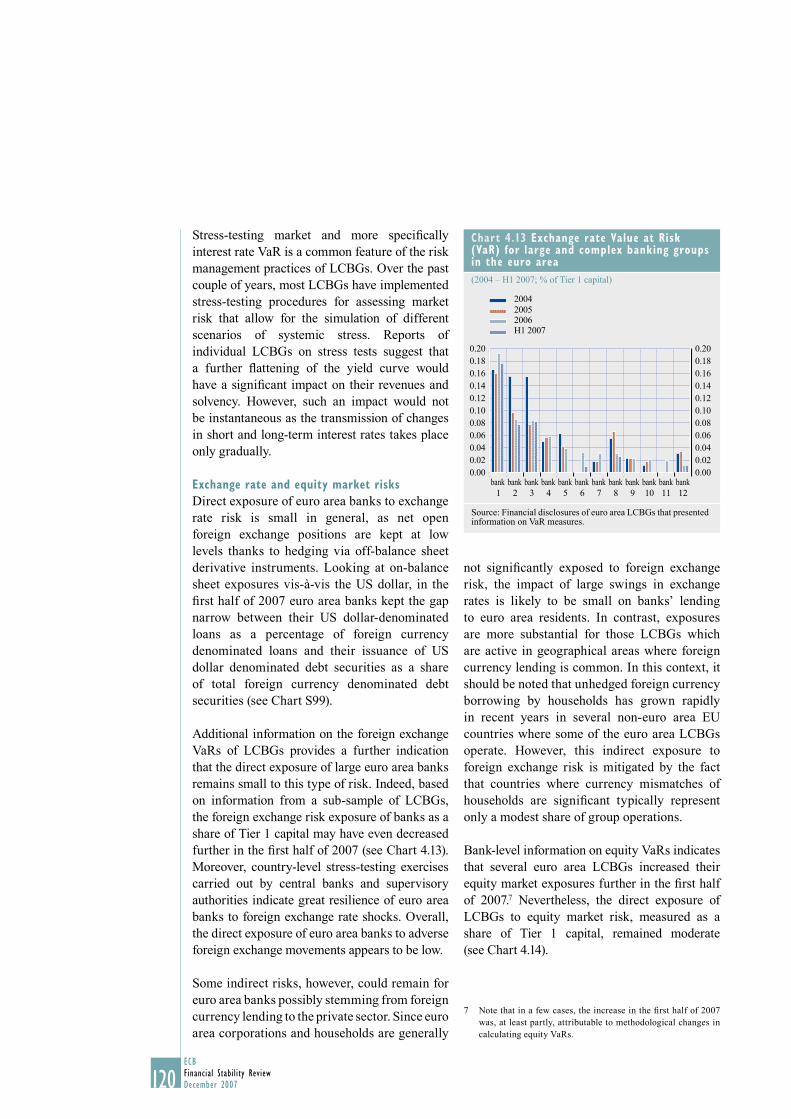
120ECBFinancial Stability ReviewDecember 2007
Chart 4.13 Exchange rate Value at Risk (VaR) for large and complex banking groups in the euro area
(2004 – H1 2007; % of Tier 1 capital)
0.000.020.040.060.080.100.120.140.160.180.20
0.000.020.040.060.080.100.120.140.160.180.20
200420052006H1 2007
1 2 3 4 5 6 7 8 9 10 11 12bank bank bank bank bank bank bank bank bank bank bank bank
Source: Financial disclosures of euro area LCBGs that presented information on VaR measures.
Stress-testing market and more specifi cally interest rate VaR is a common feature of the risk management practices of LCBGs. Over the past couple of years, most LCBGs have implemented stress-testing procedures for assessing market risk that allow for the simulation of different scenarios of systemic stress. Reports of individual LCBGs on stress tests suggest that a further fl attening of the yield curve would have a signifi cant impact on their revenues and solvency. However, such an impact would not be instantaneous as the transmission of changes in short and long-term interest rates takes place only gradually.
Exchange rate and equity market risks
Direct exposure of euro area banks to exchange rate risk is small in general, as net open foreign exchange positions are kept at low levels thanks to hedging via off-balance sheet derivative instruments. Looking at on-balance sheet exposures vis-à-vis the US dollar, in the fi rst half of 2007 euro area banks kept the gap narrow between their US dollar-denominated loans as a percentage of foreign currency denominated loans and their issuance of US dollar denominated debt securities as a share of total foreign currency denominated debt securities (see Chart S99).
Additional information on the foreign exchange VaRs of LCBGs provides a further indication that the direct exposure of large euro area banks remains small to this type of risk. Indeed, based on information from a sub-sample of LCBGs, the foreign exchange risk exposure of banks as a share of Tier 1 capital may have even decreased further in the fi rst half of 2007 (see Chart 4.13). Moreover, country-level stress-testing exercises carried out by central banks and supervisory authorities indicate great resilience of euro area banks to foreign exchange rate shocks. Overall, the direct exposure of euro area banks to adverse foreign exchange movements appears to be low.
Some indirect risks, however, could remain for euro area banks possibly stemming from foreign currency lending to the private sector. Since euro area corporations and households are generally
not signifi cantly exposed to foreign exchange risk, the impact of large swings in exchange rates is likely to be small on banks’ lending to euro area residents. In contrast, exposures are more substantial for those LCBGs which are active in geographical areas where foreign currency lending is common. In this context, it should be noted that unhedged foreign currency borrowing by households has grown rapidly in recent years in several non-euro area EU countries where some of the euro area LCBGs operate. However, this indirect exposure to foreign exchange risk is mitigated by the fact that countries where currency mismatches of households are signifi cant typically represent only a modest share of group operations.
Bank-level information on equity VaRs indicates that several euro area LCBGs increased their equity market exposures further in the fi rst half of 2007.7 Nevertheless, the direct exposure of LCBGs to equity market risk, measured as a share of Tier 1 capital, remained moderate (see Chart 4.14).
Note that in a few cases, the increase in the fi rst half of 2007 7 was, at least partly, attributable to methodological changes in calculating equity VaRs.
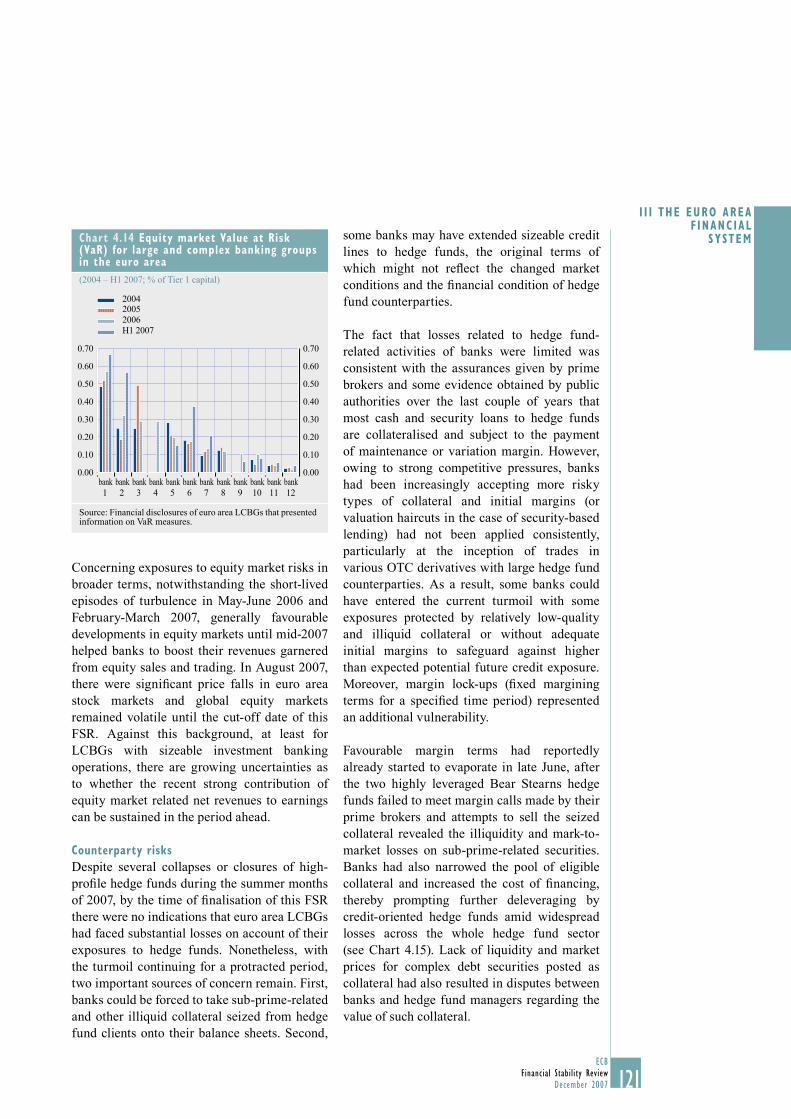
121ECB
Financial Stability ReviewDecember 2007
I I I THE EURO AREA F INANC IAL
SYSTEM
121
Concerning exposures to equity market risks in broader terms, notwithstanding the short-lived episodes of turbulence in May-June 2006 and February-March 2007, generally favourable developments in equity markets until mid-2007helped banks to boost their revenues garnered from equity sales and trading. In August 2007, there were signifi cant price falls in euro area stock markets and global equity markets remained volatile until the cut-off date of this FSR. Against this background, at least for LCBGs with sizeable investment banking operations, there are growing uncertainties as to whether the recent strong contribution of equity market related net revenues to earnings can be sustained in the period ahead.
Counterparty risks
Despite several collapses or closures of high-profi le hedge funds during the summer months of 2007, by the time of fi nalisation of this FSR there were no indications that euro area LCBGs had faced substantial losses on account of their exposures to hedge funds. Nonetheless, with the turmoil continuing for a protracted period, two important sources of concern remain. First, banks could be forced to take sub-prime-related and other illiquid collateral seized from hedge fund clients onto their balance sheets. Second,
some banks may have extended sizeable credit lines to hedge funds, the original terms of which might not refl ect the changed market conditions and the fi nancial condition of hedge fund counterparties.
The fact that losses related to hedge fund-related activities of banks were limited was consistent with the assurances given by prime brokers and some evidence obtained by public authorities over the last couple of years that most cash and security loans to hedge funds are collateralised and subject to the payment of maintenance or variation margin. However, owing to strong competitive pressures, banks had been increasingly accepting more risky types of collateral and initial margins (or valuation haircuts in the case of security-based lending) had not been applied consistently, particularly at the inception of trades in various OTC derivatives with large hedge fund counterparties. As a result, some banks could have entered the current turmoil with some exposures protected by relatively low-quality and illiquid collateral or without adequate initial margins to safeguard against higher than expected potential future credit exposure. Moreover, margin lock-ups (fi xed margining terms for a specifi ed time period) represented an additional vulnerability.
Favourable margin terms had reportedly already started to evaporate in late June, after the two highly leveraged Bear Stearns hedge funds failed to meet margin calls made by their prime brokers and attempts to sell the seized collateral revealed the illiquidity and mark-to-market losses on sub-prime-related securities. Banks had also narrowed the pool of eligible collateral and increased the cost of fi nancing, thereby prompting further deleveraging by credit-oriented hedge funds amid widespread losses across the whole hedge fund sector (see Chart 4.15). Lack of liquidity and market prices for complex debt securities posted as collateral had also resulted in disputes between banks and hedge fund managers regarding the value of such collateral.
Chart 4.14 Equity market Value at Risk (VaR) for large and complex banking groups in the euro area
(2004 – H1 2007; % of Tier 1 capital)
0.00
0.10
0.20
0.30
0.40
0.50
0.60
0.70
0.00
0.10
0.20
0.30
0.40
0.50
0.60
0.70
200420052006H1 2007
1 2 3 4 5 6 7 8 9 10 11 12bank bank bank bank bank bank bank bank bank bank bank bank
Source: Financial disclosures of euro area LCBGs that presented information on VaR measures.
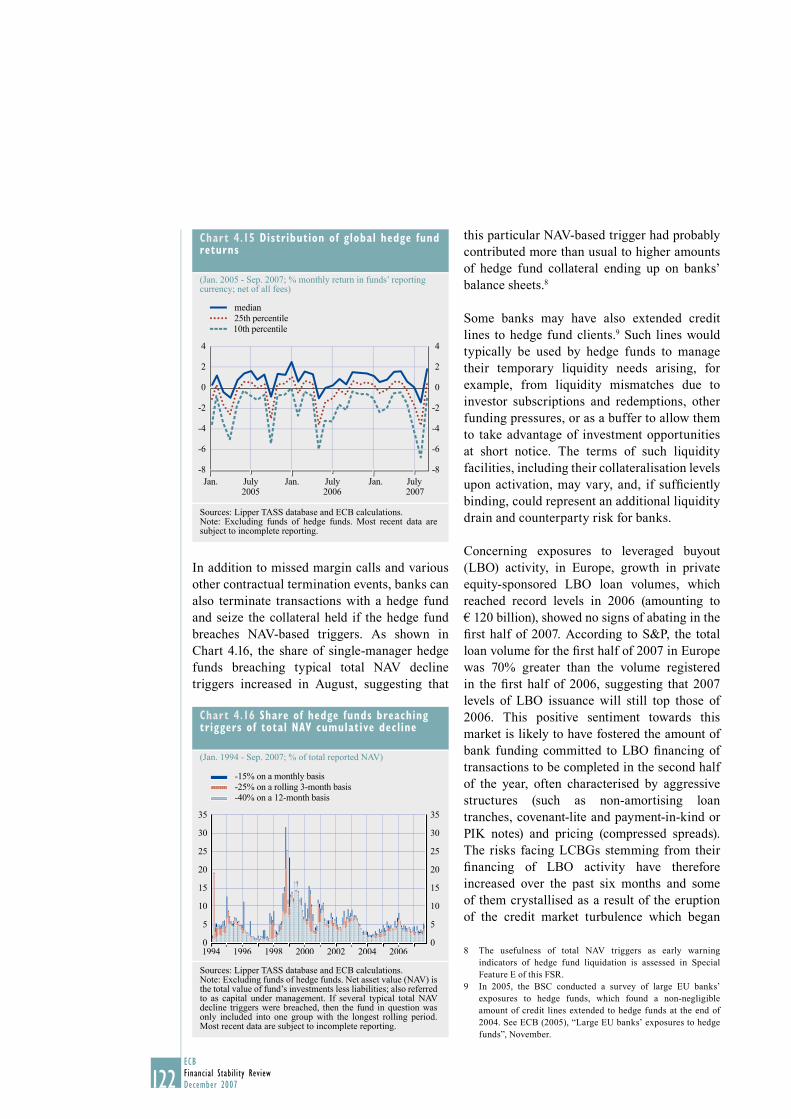
122ECBFinancial Stability ReviewDecember 2007
Chart 4.15 Distribution of global hedge fund returns
(Jan. 2005 - Sep. 2007; % monthly return in funds’ reporting currency; net of all fees)
-8
-6
-4
-2
0
2
4
-8
-6
-4
-2
0
2
4
median25th percentile10th percentile
Jan. July Jan. July JulyJan.2005 2006 2007
Sources: Lipper TASS database and ECB calculations.Note: Excluding funds of hedge funds. Most recent data are subject to incomplete reporting.
In addition to missed margin calls and various other contractual termination events, banks can also terminate transactions with a hedge fund and seize the collateral held if the hedge fund breaches NAV-based triggers. As shown in Chart 4.16, the share of single-manager hedge funds breaching typical total NAV decline triggers increased in August, suggesting that
this particular NAV-based trigger had probably contributed more than usual to higher amounts of hedge fund collateral ending up on banks’ balance sheets.8
Some banks may have also extended credit lines to hedge fund clients.9 Such lines would typically be used by hedge funds to manage their temporary liquidity needs arising, for example, from liquidity mismatches due to investor subscriptions and redemptions, other funding pressures, or as a buffer to allow them to take advantage of investment opportunities at short notice. The terms of such liquidity facilities, including their collateralisation levels upon activation, may vary, and, if suffi ciently binding, could represent an additional liquidity drain and counterparty risk for banks.
Concerning exposures to leveraged buyout (LBO) activity, in Europe, growth in private equity-sponsored LBO loan volumes, which reached record levels in 2006 (amounting to € 120 billion), showed no signs of abating in the fi rst half of 2007. According to S&P, the total loan volume for the fi rst half of 2007 in Europe was 70% greater than the volume registered in the fi rst half of 2006, suggesting that 2007 levels of LBO issuance will still top those of 2006. This positive sentiment towards this market is likely to have fostered the amount of bank funding committed to LBO fi nancing of transactions to be completed in the second half of the year, often characterised by aggressive structures (such as non-amortising loan tranches, covenant-lite and payment-in-kind or PIK notes) and pricing (compressed spreads). The risks facing LCBGs stemming from their fi nancing of LBO activity have therefore increased over the past six months and some of them crystallised as a result of the eruption of the credit market turbulence which began
The usefulness of total NAV triggers as early warning 8 indicators of hedge fund liquidation is assessed in Special Feature E of this FSR.In 2005, the BSC conducted a survey of large EU banks’ 9 exposures to hedge funds, which found a non-negligible amount of credit lines extended to hedge funds at the end of 2004. See ECB (2005), “Large EU banks’ exposures to hedge funds”, November.
Chart 4.16 Share of hedge funds breaching triggers of total NAV cumulative decline
(Jan. 1994 - Sep. 2007; % of total reported NAV)
0
5
10
15
20
25
30
35
0
5
10
15
20
25
30
35
-15% on a monthly basis-25% on a rolling 3-month basis-40% on a 12-month basis
1994 1996 1998 2000 2002 20062004
Sources: Lipper TASS database and ECB calculations.Note: Excluding funds of hedge funds. Net asset value (NAV) is the total value of fund’s investments less liabilities; also referred to as capital under management. If several typical total NAV decline triggers were breached, then the fund in question was only included into one group with the longest rolling period. Most recent data are subject to incomplete reporting.
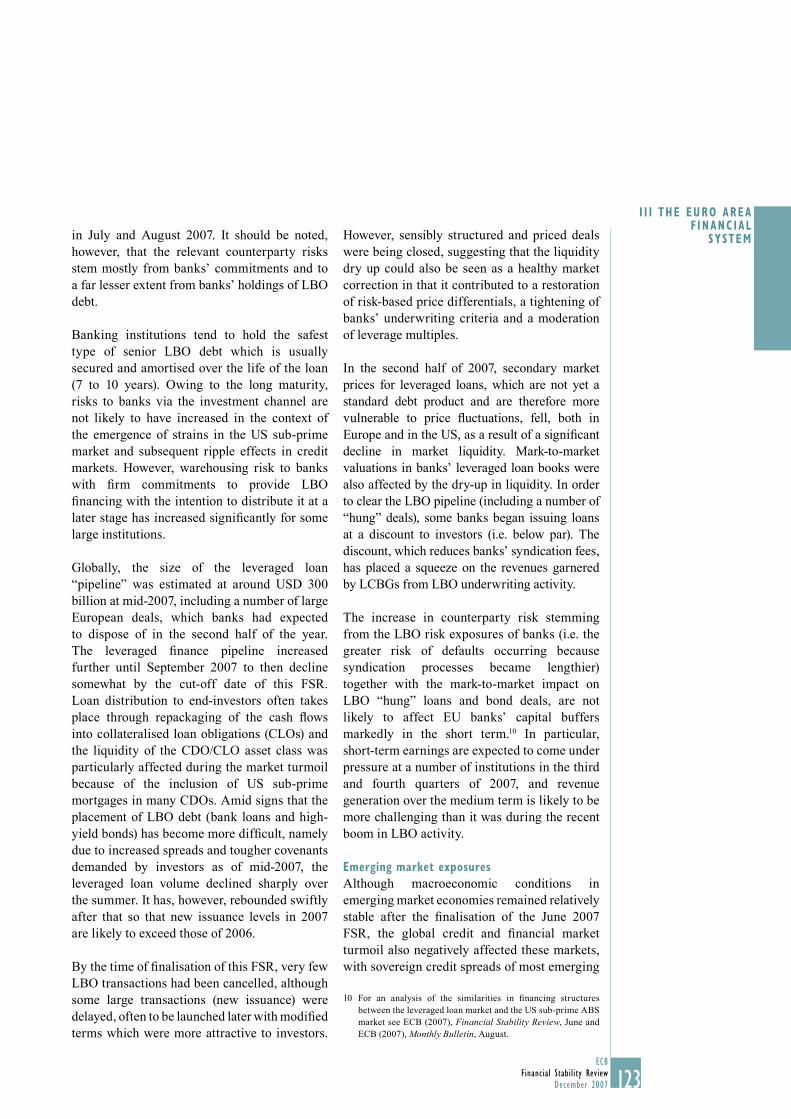
123ECB
Financial Stability ReviewDecember 2007
I I I THE EURO AREA F INANC IAL
SYSTEM
123
in July and August 2007. It should be noted, however, that the relevant counterparty risks stem mostly from banks’ commitments and to a far lesser extent from banks’ holdings of LBO debt.
Banking institutions tend to hold the safest type of senior LBO debt which is usually secured and amortised over the life of the loan (7 to 10 years). Owing to the long maturity, risks to banks via the investment channel are not likely to have increased in the context of the emergence of strains in the US sub-prime market and subsequent ripple effects in credit markets. However, warehousing risk to banks with fi rm commitments to provide LBO fi nancing with the intention to distribute it at a later stage has increased signifi cantly for some large institutions.
Globally, the size of the leveraged loan “pipeline” was estimated at around USD 300 billion at mid-2007, including a number of large European deals, which banks had expected to dispose of in the second half of the year. The leveraged fi nance pipeline increased further until September 2007 to then decline somewhat by the cut-off date of this FSR. Loan distribution to end-investors often takes place through repackaging of the cash fl ows into collateralised loan obligations (CLOs) and the liquidity of the CDO/CLO asset class was particularly affected during the market turmoil because of the inclusion of US sub-prime mortgages in many CDOs. Amid signs that the placement of LBO debt (bank loans and high-yield bonds) has become more diffi cult, namely due to increased spreads and tougher covenants demanded by investors as of mid-2007, the leveraged loan volume declined sharply over the summer. It has, however, rebounded swiftly after that so that new issuance levels in 2007 are likely to exceed those of 2006.
By the time of fi nalisation of this FSR, very few LBO transactions had been cancelled, although some large transactions (new issuance) were delayed, often to be launched later with modifi ed terms which were more attractive to investors.
However, sensibly structured and priced deals were being closed, suggesting that the liquidity dry up could also be seen as a healthy market correction in that it contributed to a restoration of risk-based price differentials, a tightening of banks’ underwriting criteria and a moderation of leverage multiples.
In the second half of 2007, secondary market prices for leveraged loans, which are not yet a standard debt product and are therefore more vulnerable to price fl uctuations, fell, both in Europe and in the US, as a result of a signifi cant decline in market liquidity. Mark-to-market valuations in banks’ leveraged loan books were also affected by the dry-up in liquidity. In order to clear the LBO pipeline (including a number of “hung” deals), some banks began issuing loans at a discount to investors (i.e. below par). The discount, which reduces banks’ syndication fees, has placed a squeeze on the revenues garnered by LCBGs from LBO underwriting activity.
The increase in counterparty risk stemming from the LBO risk exposures of banks (i.e. the greater risk of defaults occurring because syndication processes became lengthier) together with the mark-to-market impact on LBO “hung” loans and bond deals, are not likely to affect EU banks’ capital buffers markedly in the short term.10 In particular, short-term earnings are expected to come under pressure at a number of institutions in the third and fourth quarters of 2007, and revenue generation over the medium term is likely to be more challenging than it was during the recent boom in LBO activity.
Emerging market exposures
Although macroeconomic conditions in emerging market economies remained relatively stable after the fi nalisation of the June 2007 FSR, the global credit and fi nancial market turmoil also negatively affected these markets, with sovereign credit spreads of most emerging
For an analysis of the similarities in fi nancing structures 10 between the leveraged loan market and the US sub-prime ABS market see ECB (2007), Financial Stability Review, June and ECB (2007), Monthly Bulletin, August.
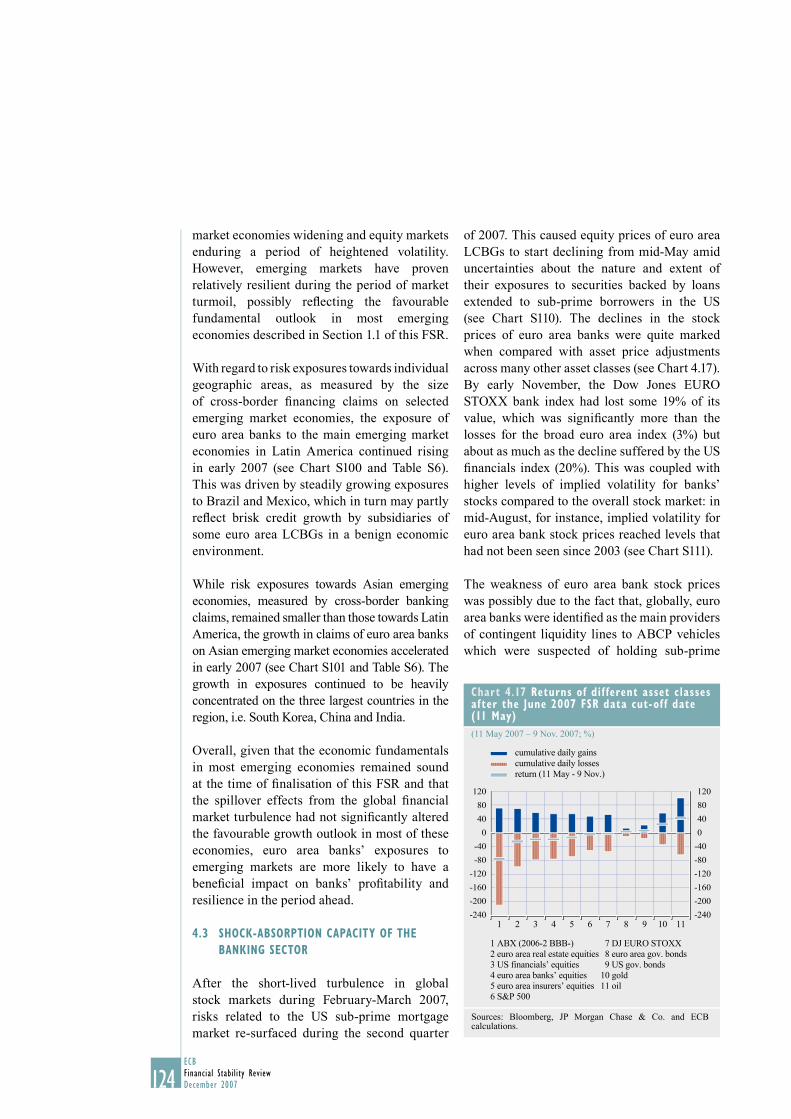
124ECBFinancial Stability ReviewDecember 2007
market economies widening and equity markets enduring a period of heightened volatility. However, emerging markets have proven relatively resilient during the period of market turmoil, possibly refl ecting the favourable fundamental outlook in most emerging economies described in Section 1.1 of this FSR.
With regard to risk exposures towards individual geographic areas, as measured by the size of cross-border fi nancing claims on selected emerging market economies, the exposure of euro area banks to the main emerging market economies in Latin America continued rising in early 2007 (see Chart S100 and Table S6). This was driven by steadily growing exposures to Brazil and Mexico, which in turn may partly refl ect brisk credit growth by subsidiaries of some euro area LCBGs in a benign economic environment.
While risk exposures towards Asian emerging economies, measured by cross-border banking claims, remained smaller than those towards Latin America, the growth in claims of euro area banks on Asian emerging market economies accelerated in early 2007 (see Chart S101 and Table S6). The growth in exposures continued to be heavily concentrated on the three largest countries in the region, i.e. South Korea, China and India.
Overall, given that the economic fundamentals in most emerging economies remained sound at the time of fi nalisation of this FSR and that the spillover effects from the global fi nancial market turbulence had not signifi cantly altered the favourable growth outlook in most of these economies, euro area banks’ exposures to emerging markets are more likely to have a benefi cial impact on banks’ profi tability and resilience in the period ahead.
4.3 SHOCK-ABSORPTION CAPACITY OF THE
BANKING SECTOR
After the short-lived turbulence in global stock markets during February-March 2007, risks related to the US sub-prime mortgage market re-surfaced during the second quarter
of 2007. This caused equity prices of euro area LCBGs to start declining from mid-May amid uncertainties about the nature and extent of their exposures to securities backed by loans extended to sub-prime borrowers in the US (see Chart S110). The declines in the stock prices of euro area banks were quite marked when compared with asset price adjustments across many other asset classes (see Chart 4.17). By early November, the Dow Jones EURO STOXX bank index had lost some 19% of its value, which was signifi cantly more than the losses for the broad euro area index (3%) but about as much as the decline suffered by the US fi nancials index (20%). This was coupled with higher levels of implied volatility for banks’ stocks compared to the overall stock market: in mid-August, for instance, implied volatility for euro area bank stock prices reached levels that had not been seen since 2003 (see Chart S111).
The weakness of euro area bank stock prices was possibly due to the fact that, globally, euro area banks were identifi ed as the main providers of contingent liquidity lines to ABCP vehicles which were suspected of holding sub-prime
Chart 4.17 Returns of dif ferent asset classes after the June 2007 FSR data cut-off date(11 May)
(11 May 2007 – 9 Nov. 2007; %)
-200
-240
-160
-120
-80
-40
0
40
80
120
-200
-240
-160
-120
-80
-40
0
40
80
120
1 ABX (2006-2 BBB-)2 euro area real estate equities3 US financials’ equities4 euro area banks’ equities5 euro area insurers’ equities6 S&P 500
7 DJ EURO STOXX 8 euro area gov. bonds 9 US gov. bonds10 gold11 oil
cumulative daily gainscumulative daily lossesreturn (11 May - 9 Nov.)
1 2 3 4 5 6 7 8 9 10 11
Sources: Bloomberg, JP Morgan Chase & Co. and ECB calculations.
125ECB
Financial Stability ReviewDecember 2007
I I I THE EURO AREA F INANC IAL
SYSTEM
125
backed assets. Indeed, euro area banks were estimated to account for more than half of total potential liquidity exposure to US ABCP issuances, compared with about 30% for US and Japanese banks combined.11
Distances-to-default for euro area LCBGs already began declining in the second quarter of 2007 and growing uncertainty about their fi nancial outlooks, which began in July, continued to push this yardstick of default risk slightly lower, although they still suggested that market participants considered shock-absorption capacities to be comfortable (see Chart S107). This was also the case of the weakest LCBGs in terms of perceived shock-absorption capacity. The slight rise in perceived default risk indicated by distances-to-default was corroborated by a substantial widening of CDS spreads: they increased more than fi vefold for some institutions, albeit from very low levels (see Chart S108). To some extent this widening of CDS spreads may have refl ected a normalisation of risk premiums, bringing prices closer to intrinsic values, although most of the change in CDS prices seems to have been triggered by concerns about higher future risk to be faced by euro area LCBGs.
The increased volatility of LCBG stock prices and the widening of CDS spreads during the recent fi nancial market turmoil occurred
together with rising correlations between equity returns and changes in credit spreads among euro area LCBGs. This raises concerns from a fi nancial stability perspective as it could be seen as an indication of perceptions that the likelihood of a systemic event – i.e. an adverse event affecting several institutions simultaneously – increased. This view seems to be supported by a substantial rise in an indicator of systemic risk (see Box 16). An empirical evaluation of the probabilities of defaults of LCBGs – using CDS data – shows that the recent market turmoil was perceived as having the potential for much more far-reaching systemic consequences than was the case during the May 2005, May/June 2006 and February/March 2007 market turbulences. In mid-August and again in early November 2007 the probability of a systemic event reached the highest levels seen since early 2003, when the banking sector last faced a very challenging operating environment in the aftermath of the bursting of the new economy bubble. This is noteworthy because the fi nancial conditions of LCBGs at that time were considerably weaker than has been the case more recently.
See JP Morgan (2007), “US Fixed Income Markets Weekly”, 11 10 August.
Box 16
A MARKET-BASED INDICATOR OF THE PROBABILITY OF ADVERSE SYSTEMIC EVENTS INVOLVING
LARGE AND COMPLEX BANKING GROUPS
One of the defi ning features of the recent market turmoil was the extent to which cash credit and related derivative markets were affected. Credit default swap (CDS) spreads widened signifi cantly for banks and other fi nancial institutions and in August/September and again in early November they reached levels not seen since the beginning of 2003. The recent market turmoil can be distinguished from the turbulent episodes observed during May 2005, May-June 2006, and February-March 2007 by its more protracted nature and because it may imply more serious consequences for the banking sector. Using the CDS spreads and equity returns of large and complex banking groups (LCBGs), this box provides an empirical evaluation of the probabilities of simultaneous defaults among
126ECBFinancial Stability ReviewDecember 2007
LCBGs. More specifi cally, it outlines a new fi nancial stability indicator – the market perception of the probability of an adverse systemic event occurring among euro area LCBGs as well as among global LCBGs, whose fi nancial condition is likely to have an important bearing on systemic stability in the euro area – and it assesses how this indicator was affected by recent market turmoil.
The risk-neutral forward-looking implied probability of default of an individual bank can be evaluated using CDS spreads. Taking into account default correlations within the framework of an nth-to-default CDS basket pricing model,1 it is possible to assess the probability of the joint default of two or more banks. In this approach, the default correlation matrix between banks is approximated by their equity return correlation matrix. Then, using factor analysis, the equity returns are decomposed into unobserved m systematic factors (M
1,...,M
m) and idiosyncratic
parts.
The default probability of each bank, conditional on common factors, can be evaluated using the standard Merton approach:2
⎡
⎣⎢
⎤
⎦⎥ Pr(x
i < x
i⎟ M) = H – x
i −
(a
i1M
1 + ... + a
imM
m)
–
√1 − ai1 − ... − a
im2 2 ,
where the aij’s are the factor loadings of the underlying latent factor model of equity returns of
bank i, and xi is a random variable representing the value of the fi nancial institution. A fall in this
value below a specifi ed threshold ‾хi indicates default of a bank. Qi(t
i ≤ t) is the cumulative risk-
neutral probability that institution i will default before time t. Using a percentile-to-percentile transformation, the probability distribution of x
i is mapped to the probability distribution of t
i.
The model requires various other inputs such as the default hazard rates of individual LCBGs which are inferred from the quoted CDS spreads. Finally, the probabilities (both conditional on the estimated common factors and unconditional) that exactly n defaults will occur over time t are computed.
The probability of default of two or more institutions can be interpreted as the probability of an adverse systemic event because this evaluation technique takes account of default correlations between institutions (based on market information). Thus, the probability of an adverse systemic event should be a good indicator of the systemic risk to which LCBGs included in the basket are exposed.
Based on a CDS basket of 22 global LCBGs, including euro area and non euro area based institutions (for which data are available), the evaluation of the probability of an adverse systemic event in the euro area increased markedly over the July-August 2007 period and again from mid-October onwards. At the beginning of November 2007, the probability of two or more LCBGs defaulting simultaneously over horizons of one quarter, one year, two years and fi ve years all exceeded the high levels of early 2003, when the euro area banking sector last faced a very challenging operating environment (see Chart A). Similar calculations made for a sub-set CDS basket of ten euro area LCBGs, for which the necessary data was available, indicates that
1 The methodology applied in this box draws heavily on the methods proposed in R.G. Avesani (2005), “FIRST: A Market-Based Approach to Evaluate Financial System Risk and Stability,” IMF Working Paper, No. 05/232, and R.G. Avesani, A.I. Garcia Pascual and J. Li (2006), “A New Risk Indicator and Stress Testing Tool: A Multifactor Nth-to-Default CDS Basket”, IMF Working Paper, No. 06/105.
2 See R.C. Merton (1974), “On the Pricing of Corporate Debt: The Risk Structure of Interest Rates”, Journal of Finance, Vol. 29.
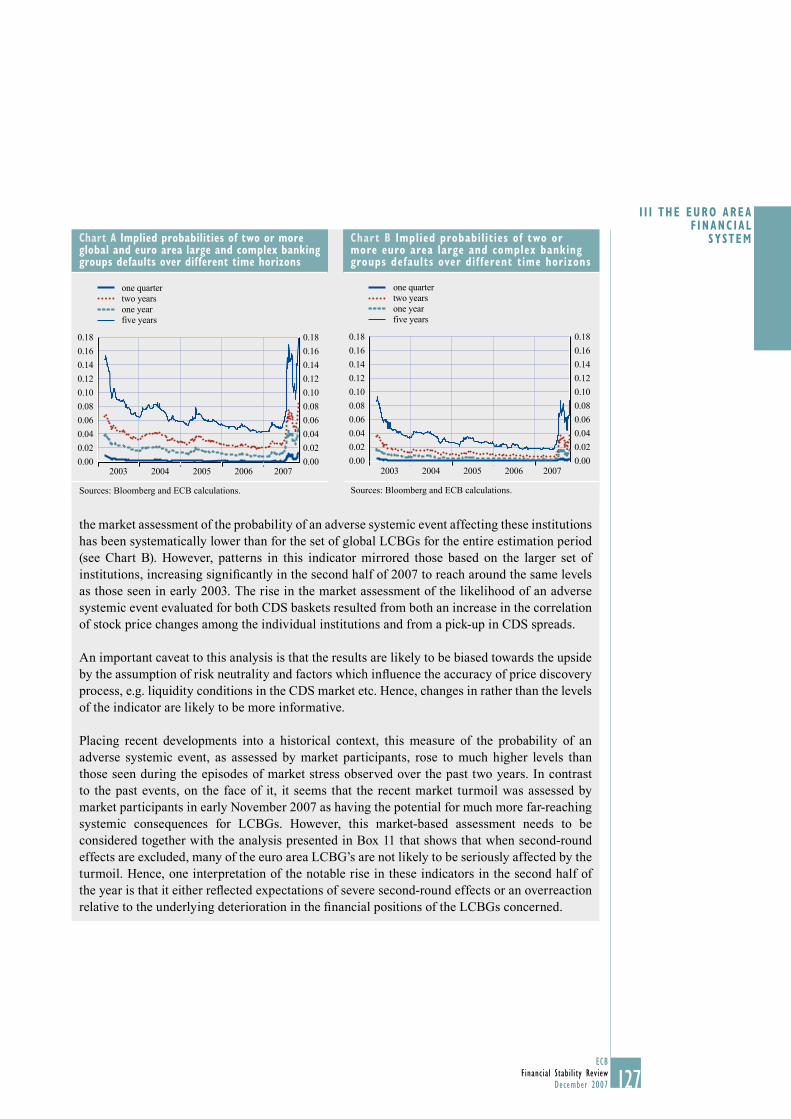
127ECB
Financial Stability ReviewDecember 2007
I I I THE EURO AREA F INANC IAL
SYSTEM
127
the market assessment of the probability of an adverse systemic event affecting these institutions has been systematically lower than for the set of global LCBGs for the entire estimation period (see Chart B). However, patterns in this indicator mirrored those based on the larger set of institutions, increasing signifi cantly in the second half of 2007 to reach around the same levels as those seen in early 2003. The rise in the market assessment of the likelihood of an adverse systemic event evaluated for both CDS baskets resulted from both an increase in the correlation of stock price changes among the individual institutions and from a pick-up in CDS spreads.
An important caveat to this analysis is that the results are likely to be biased towards the upside by the assumption of risk neutrality and factors which infl uence the accuracy of price discovery process, e.g. liquidity conditions in the CDS market etc. Hence, changes in rather than the levels of the indicator are likely to be more informative.
Placing recent developments into a historical context, this measure of the probability of an adverse systemic event, as assessed by market participants, rose to much higher levels than those seen during the episodes of market stress observed over the past two years. In contrast to the past events, on the face of it, it seems that the recent market turmoil was assessed by market participants in early November 2007 as having the potential for much more far-reaching systemic consequences for LCBGs. However, this market-based assessment needs to be considered together with the analysis presented in Box 11 that shows that when second-round effects are excluded, many of the euro area LCBG’s are not likely to be seriously affected by the turmoil. Hence, one interpretation of the notable rise in these indicators in the second half of the year is that it either refl ected expectations of severe second-round effects or an overreaction relative to the underlying deterioration in the fi nancial positions of the LCBGs concerned.
Chart A Implied probabilities of two or more global and euro area large and complex banking groups defaults over different time horizons
0.00
0.02
0.04
0.06
0.08
0.10
0.12
0.14
0.16
0.18
0.00
0.02
0.04
0.06
0.08
0.10
0.12
0.14
0.16
0.18
2007
one quarter
one yeartwo years
five years
2003 2004 2005 2006
Sources: Bloomberg and ECB calculations.
Chart B Implied probabilities of two or more euro area large and complex banking groups defaults over dif ferent time horizons
0.00
0.02
0.04
0.06
0.08
0.10
0.12
0.14
0.16
0.18
0.00
0.02
0.04
0.06
0.08
0.10
0.12
0.14
0.16
0.18
2007
one quarter
one yeartwo years
five years
2003 2004 2005 2006
Sources: Bloomberg and ECB calculations.
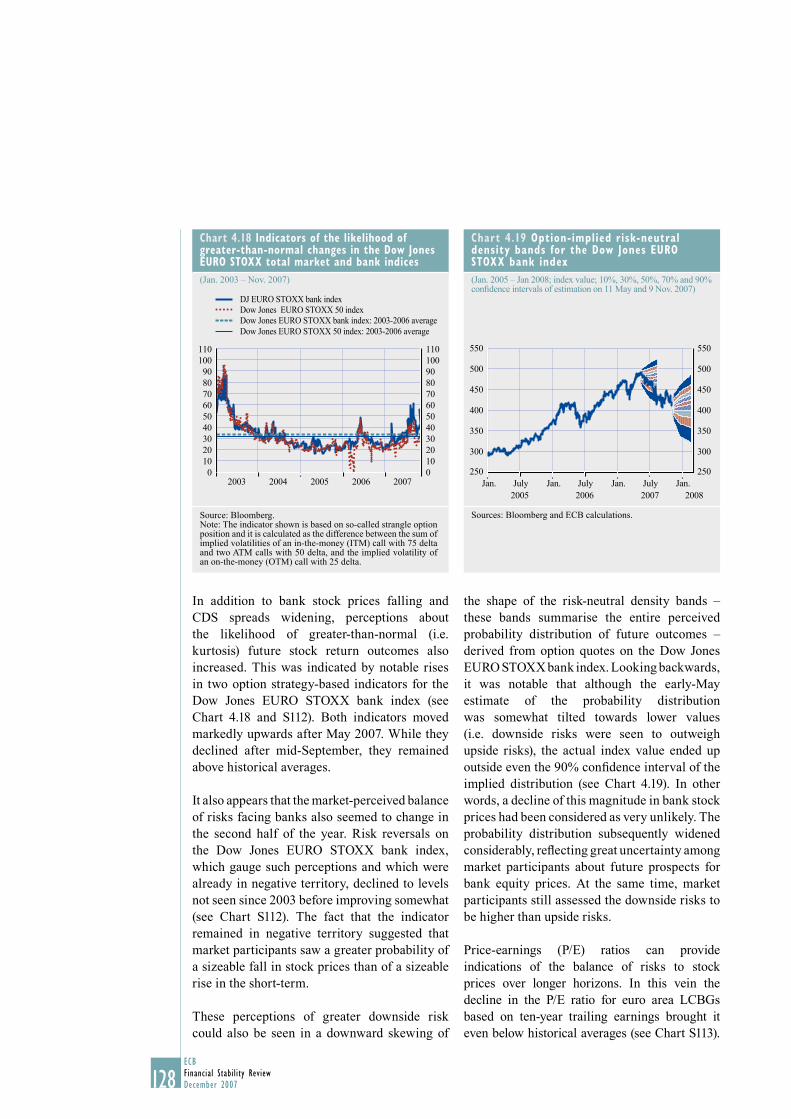
128ECBFinancial Stability ReviewDecember 2007
In addition to bank stock prices falling and CDS spreads widening, perceptions about the likelihood of greater-than-normal (i.e. kurtosis) future stock return outcomes also increased. This was indicated by notable rises in two option strategy-based indicators for the Dow Jones EURO STOXX bank index (see Chart 4.18 and S112). Both indicators moved markedly upwards after May 2007. While they declined after mid-September, they remained above historical averages.
It also appears that the market-perceived balance of risks facing banks also seemed to change in the second half of the year. Risk reversals on the Dow Jones EURO STOXX bank index, which gauge such perceptions and which were already in negative territory, declined to levels not seen since 2003 before improving somewhat (see Chart S112). The fact that the indicator remained in negative territory suggested that market participants saw a greater probability of a sizeable fall in stock prices than of a sizeable rise in the short-term.
These perceptions of greater downside risk could also be seen in a downward skewing of
the shape of the risk-neutral density bands – these bands summarise the entire perceived probability distribution of future outcomes – derived from option quotes on the Dow Jones EURO STOXX bank index. Looking backwards, it was notable that although the early-May estimate of the probability distribution was somewhat tilted towards lower values (i.e. downside risks were seen to outweigh upside risks), the actual index value ended up outside even the 90% confi dence interval of the implied distribution (see Chart 4.19). In other words, a decline of this magnitude in bank stock prices had been considered as very unlikely. The probability distribution subsequently widened considerably, refl ecting great uncertainty among market participants about future prospects for bank equity prices. At the same time, market participants still assessed the downside risks to be higher than upside risks.
Price-earnings (P/E) ratios can provide indications of the balance of risks to stock prices over longer horizons. In this vein the decline in the P/E ratio for euro area LCBGs based on ten-year trailing earnings brought it even below historical averages (see Chart S113).
Chart 4.18 Indicators of the likelihood of greater-than-normal changes in the Dow Jones EURO STOXX total market and bank indices
(Jan. 2003 – Nov. 2007)
0102030405060708090
100110
0102030405060708090100110
DJ EURO STOXX bank indexDow Jones EURO STOXX 50 indexDow Jones EURO STOXX bank index: 2003-2006 average Dow Jones EURO STOXX 50 index: 2003-2006 average
2003 2004 2005 2006 2007
Source: Bloomberg.Note: The indicator shown is based on so-called strangle option position and it is calculated as the difference between the sum of implied volatilities of an in-the-money (ITM) call with 75 delta and two ATM calls with 50 delta, and the implied volatility of an on-the-money (OTM) call with 25 delta.
Chart 4.19 Option-implied risk-neutral density bands for the Dow Jones EURO STOXX bank index
(Jan. 2005 – Jan 2008; index value; 10%, 30%, 50%, 70% and 90% confi dence intervals of estimation on 11 May and 9 Nov. 2007)
300
350
400
450
500
550
300
350
400
450
500
550
250 250Jan. July Jan. July Jan. Jan.July
2005 2006 2007 2008
Sources: Bloomberg and ECB calculations.
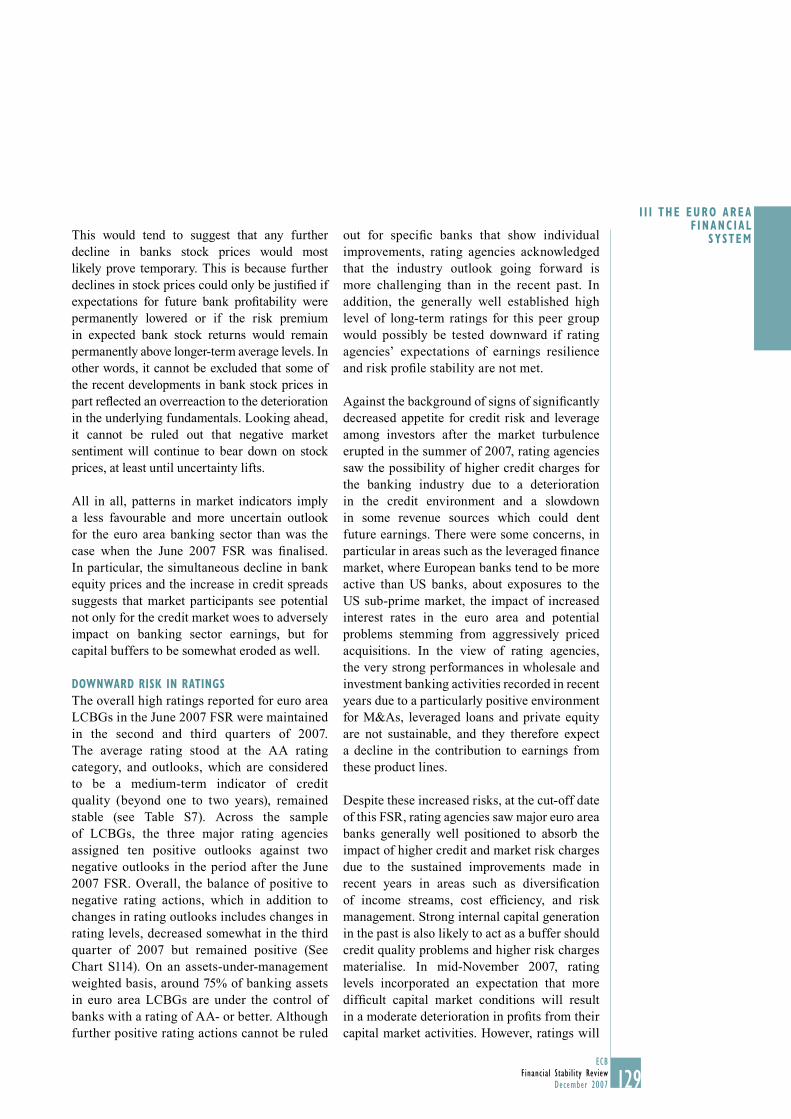
129ECB
Financial Stability ReviewDecember 2007
I I I THE EURO AREA F INANC IAL
SYSTEM
129
This would tend to suggest that any further decline in banks stock prices would most likely prove temporary. This is because further declines in stock prices could only be justifi ed if expectations for future bank profi tability were permanently lowered or if the risk premium in expected bank stock returns would remain permanently above longer-term average levels. In other words, it cannot be excluded that some of the recent developments in bank stock prices in part refl ected an overreaction to the deterioration in the underlying fundamentals. Looking ahead, it cannot be ruled out that negative market sentiment will continue to bear down on stock prices, at least until uncertainty lifts.
All in all, patterns in market indicators imply a less favourable and more uncertain outlook for the euro area banking sector than was the case when the June 2007 FSR was fi nalised. In particular, the simultaneous decline in bank equity prices and the increase in credit spreads suggests that market participants see potential not only for the credit market woes to adversely impact on banking sector earnings, but for capital buffers to be somewhat eroded as well.
DOWNWARD RISK IN RATINGS
The overall high ratings reported for euro area LCBGs in the June 2007 FSR were maintained in the second and third quarters of 2007. The average rating stood at the AA rating category, and outlooks, which are considered to be a medium-term indicator of credit quality (beyond one to two years), remained stable (see Table S7). Across the sample of LCBGs, the three major rating agencies assigned ten positive outlooks against two negative outlooks in the period after the June 2007 FSR. Overall, the balance of positive to negative rating actions, which in addition to changes in rating outlooks includes changes in rating levels, decreased somewhat in the third quarter of 2007 but remained positive (See Chart S114). On an assets-under-management weighted basis, around 75% of banking assets in euro area LCBGs are under the control of banks with a rating of AA- or better. Although further positive rating actions cannot be ruled
out for specifi c banks that show individual improvements, rating agencies acknowledged that the industry outlook going forward is more challenging than in the recent past. In addition, the generally well established high level of long-term ratings for this peer group would possibly be tested downward if rating agencies’ expectations of earnings resilience and risk profi le stability are not met.
Against the background of signs of signifi cantly decreased appetite for credit risk and leverage among investors after the market turbulence erupted in the summer of 2007, rating agencies saw the possibility of higher credit charges for the banking industry due to a deterioration in the credit environment and a slowdown in some revenue sources which could dent future earnings. There were some concerns, in particular in areas such as the leveraged fi nance market, where European banks tend to be more active than US banks, about exposures to the US sub-prime market, the impact of increased interest rates in the euro area and potential problems stemming from aggressively priced acquisitions. In the view of rating agencies, the very strong performances in wholesale and investment banking activities recorded in recent years due to a particularly positive environment for M&As, leveraged loans and private equity are not sustainable, and they therefore expect a decline in the contribution to earnings from these product lines.
Despite these increased risks, at the cut-off date of this FSR, rating agencies saw major euro area banks generally well positioned to absorb the impact of higher credit and market risk charges due to the sustained improvements made in recent years in areas such as diversifi cation of income streams, cost effi ciency, and risk management. Strong internal capital generation in the past is also likely to act as a buffer should credit quality problems and higher risk charges materialise. In mid-November 2007, rating levels incorporated an expectation that more diffi cult capital market conditions will result in a moderate deterioration in profi ts from their capital market activities. However, ratings will

130ECBFinancial Stability ReviewDecember 2007
need to be adjusted downwards if capital market conditions prove to be tougher than expected. On the other hand, economic conditions have been generally supportive of retail banking which should underpin overall profi tability, even if in some markets or segments some deterioration in profi tability has been experienced. Improved effi ciency and tighter cost management will continue to be a contributing positive driver for ratings going forward, even in a less benign capital market environment.
4.4 OVERALL ASSESSMENT
Although the fi nancial conditions of euro area LCBGs improved further in the fi rst half of 2007, the extent of the negative impact of the credit risk re-pricing that erupted in the global fi nancial markets in July and August 2007 on their fi nancial condition remained uncertain by the time of fi nalisation of this FSR. The full impact will only become clear once banks have reported on their earnings performances in the second half of the year. However, it is probable that non-interest sources of income will be weakened across the board, impinging on profi tability levels. In addition, those LCBGs which rely strongly on non-deposit sources for their funding as well as those institutions which are particularly active in securitisation businesses, could see a material decline in their net revenues. Finally, the role of second-round effects originating from the possible impact of the turmoil on the broader economy are diffi cult to estimate at the current juncture.
The re-pricing of risk could be seen as a welcome development to the extent that it represents a correction of market valuations from levels that had refl ected overly optimistic expectations of future market liquidity and economic outcomes. However, it cannot be excluded that the adverse impact of a more protracted market turbulence on the functioning of the wholesale funding market could mean that even those LCBGs which had followed prudent risk management practices in the past could face a
more challenging environment, including higher funding costs. Despite the fact that most LCBGs have solid balance sheets, a swift resolution of the market tensions in the various segments of the global credit markets is nevertheless crucial for ensuring that the fi nancial soundness of these institutions is not impaired going forward. This is particularly important against a background that the share of non-interest income sources in the total revenues of LCBGs has steadily increased and currently constitutes a substantial share of their earnings.
Beyond the implications of the credit market turbulence, future risks to LCBGs mainly relate to the uncertainties about the likely evolution of the credit cycle which had developed particularly favourably until the second half of 2007 and had also supported the buoyancy of fi nancial markets. Against this background, the gradual stabilisation or slowing down of lending growth to households and non-fi nancial corporations, as well as indications of tightening lending standards, are signs that banks are taking action against the risk that their future asset quality would deteriorate from the current high levels. Nevertheless, pockets of vulnerability among highly indebted, low-income households and highly leveraged, non-listed fi rms have become more relevant and bank exposures to such borrowers will warrant closer monitoring in the period ahead.
Looking forward, the completion of the implementation phases of the Basel II capital regime by early 2008 together with the IFRS accounting standards will further improve the transparency of fi nancial reporting and risk management practices of euro area LCBGs. Despite these structural changes, an important lesson of the credit risk re-pricing is that banks must have comprehensive contingency liquidity plans in place and they should also set aside suffi cient capital for their off-balance sheet and counterparty credit risk exposures. Furthermore, continuing investment by LCBGs in their stress-testing - including for liquidity risk - methods and practices, is needed.
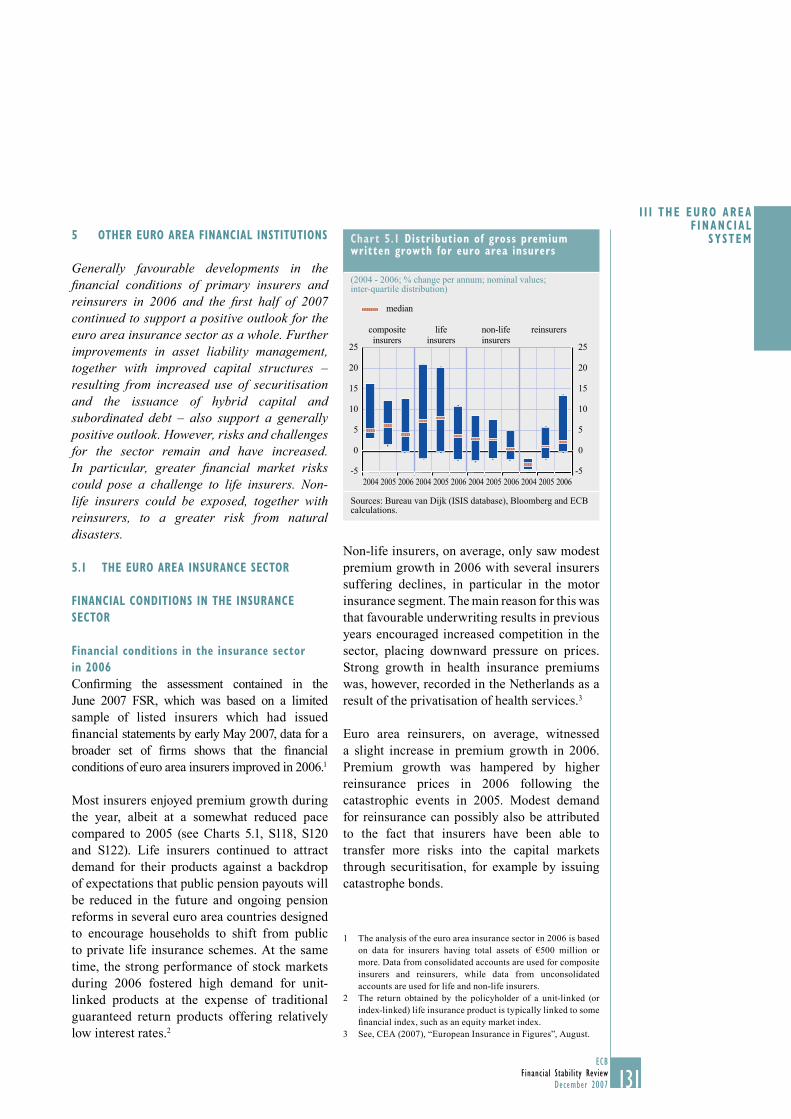
131ECB
Financial Stability ReviewDecember 2007
I I I THE EURO AREA F INANC IAL
SYSTEM
131
5 OTHER EURO AREA FINANCIAL INSTITUTIONS
Generally favourable developments in the fi nancial conditions of primary insurers and reinsurers in 2006 and the fi rst half of 2007 continued to support a positive outlook for the euro area insurance sector as a whole. Further improvements in asset liability management, together with improved capital structures – resulting from increased use of securitisation and the issuance of hybrid capital and subordinated debt – also support a generally positive outlook. However, risks and challenges for the sector remain and have increased. In particular, greater fi nancial market risks could pose a challenge to life insurers. Non-life insurers could be exposed, together with reinsurers, to a greater risk from natural disasters.
5.1 THE EURO AREA INSURANCE SECTOR
FINANCIAL CONDITIONS IN THE INSURANCE
SECTOR
Financial conditions in the insurance sector
in 2006
Confi rming the assessment contained in theJune 2007 FSR, which was based on a limited sample of listed insurers which had issued fi nancial statements by early May 2007, data for a broader set of fi rms shows that the fi nancial conditions of euro area insurers improved in 2006.1
Most insurers enjoyed premium growth during the year, albeit at a somewhat reduced pace compared to 2005 (see Charts 5.1, S118, S120 and S122). Life insurers continued to attract demand for their products against a backdrop of expectations that public pension payouts will be reduced in the future and ongoing pension reforms in several euro area countries designed to encourage households to shift from public to private life insurance schemes. At the same time, the strong performance of stock markets during 2006 fostered high demand for unit-linked products at the expense of traditional guaranteed return products offering relatively low interest rates.2
Non-life insurers, on average, only saw modest premium growth in 2006 with several insurers suffering declines, in particular in the motor insurance segment. The main reason for this was that favourable underwriting results in previous years encouraged increased competition in the sector, placing downward pressure on prices. Strong growth in health insurance premiums was, however, recorded in the Netherlands as a result of the privatisation of health services.3
Euro area reinsurers, on average, witnessed a slight increase in premium growth in 2006.Premium growth was hampered by higher reinsurance prices in 2006 following the catastrophic events in 2005. Modest demand for reinsurance can possibly also be attributed to the fact that insurers have been able to transfer more risks into the capital markets through securitisation, for example by issuing catastrophe bonds.
The analysis of the euro area insurance sector in 2006 is based 1 on data for insurers having total assets of €500 million or more. Data from consolidated accounts are used for composite insurers and reinsurers, while data from unconsolidated accounts are used for life and non-life insurers.The return obtained by the policyholder of a unit-linked (or 2 index-linked) life insurance product is typically linked to some fi nancial index, such as an equity market index. See, CEA (2007), “European Insurance in Figures”, August.3
Chart 5.1 Distribution of gross premium written growth for euro area insurers
(2004 - 2006; % change per annum; nominal values; inter-quartile distribution)
median
-5
0
5
10
15
20
25
-5
0
5
10
15
20
25
2004 2005 2006 2004 2005 2006 2004 2005 2006 2004 2005 2006
compositeinsurers
lifeinsurers
non-lifeinsurers
reinsurers
Sources: Bureau van Dijk (ISIS database), Bloomberg and ECB calculations.
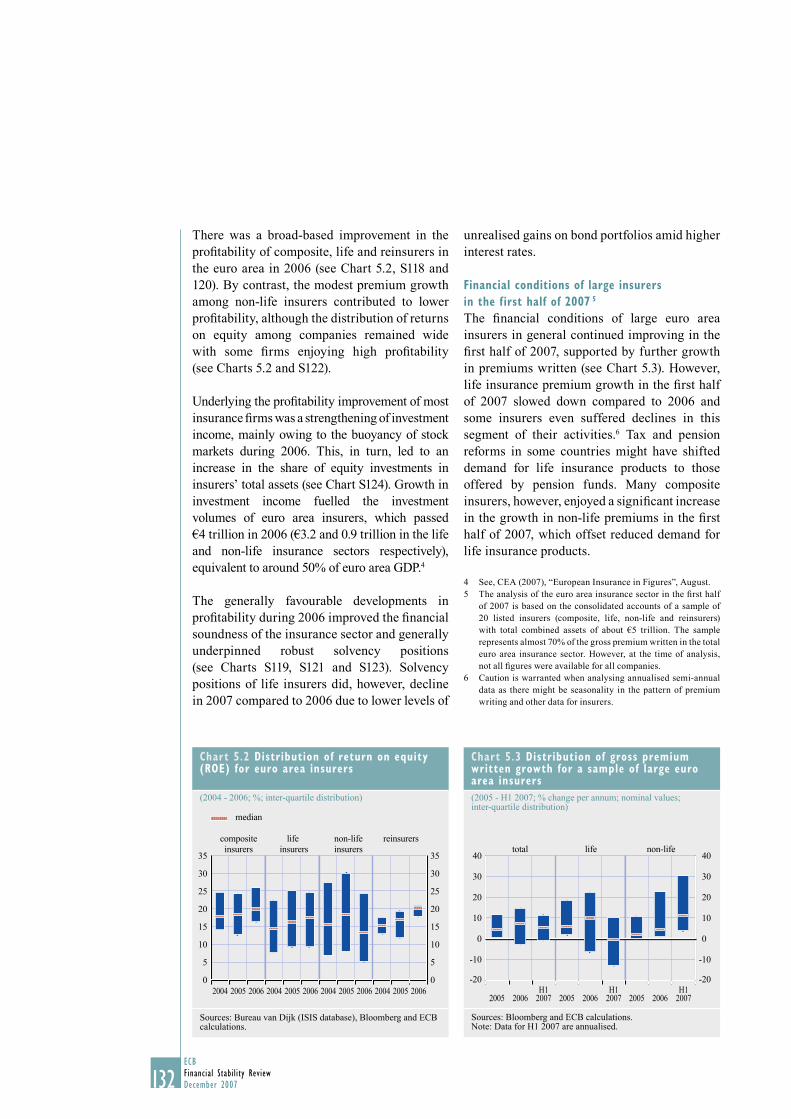
132ECBFinancial Stability ReviewDecember 2007132
There was a broad-based improvement in the profi tability of composite, life and reinsurers in the euro area in 2006 (see Chart 5.2, S118 and 120). By contrast, the modest premium growth among non-life insurers contributed to lower profi tability, although the distribution of returns on equity among companies remained wide with some fi rms enjoying high profi tability(see Charts 5.2 and S122).
Underlying the profi tability improvement of most insurance fi rms was a strengthening of investment income, mainly owing to the buoyancy of stock markets during 2006. This, in turn, led to an increase in the share of equity investments in insurers’ total assets (see Chart S124). Growth in investment income fuelled the investment volumes of euro area insurers, which passed €4 trillion in 2006 (€3.2 and 0.9 trillion in the life and non-life insurance sectors respectively), equivalent to around 50% of euro area GDP.4
The generally favourable developments in profi tability during 2006 improved the fi nancial soundness of the insurance sector and generally underpinned robust solvency positions(see Charts S119, S121 and S123). Solvency positions of life insurers did, however, decline in 2007 compared to 2006 due to lower levels of
unrealised gains on bond portfolios amid higher interest rates.
Financial conditions of large insurers
in the first half of 2007 5
The fi nancial conditions of large euro area insurers in general continued improving in the fi rst half of 2007, supported by further growth in premiums written (see Chart 5.3). However, life insurance premium growth in the fi rst half of 2007 slowed down compared to 2006 and some insurers even suffered declines in this segment of their activities.6 Tax and pension reforms in some countries might have shifted demand for life insurance products to those offered by pension funds. Many composite insurers, however, enjoyed a signifi cant increase in the growth in non-life premiums in the fi rst half of 2007, which offset reduced demand for life insurance products.
See, CEA (2007), “European Insurance in Figures”, August.4 The analysis of the euro area insurance sector in the fi rst half 5 of 2007 is based on the consolidated accounts of a sample of 20 listed insurers (composite, life, non-life and reinsurers) with total combined assets of about €5 trillion. The sample represents almost 70% of the gross premium written in the total euro area insurance sector. However, at the time of analysis, not all fi gures were available for all companies.Caution is warranted when analysing annualised semi-annual 6 data as there might be seasonality in the pattern of premium writing and other data for insurers.
Chart 5.2 Distribution of return on equity (ROE) for euro area insurers
(2004 - 2006; %; inter-quartile distribution)
0
5
10
15
20
25
30
35
0
5
10
15
20
25
30
35
2004 2005 2006 2004 2005 2006 2004 2005 2006 2004 2005 2006
compositeinsurers
life insurers
non-lifeinsurers
reinsurers
median
Sources: Bureau van Dijk (ISIS database), Bloomberg and ECB calculations.
Chart 5.3 Distribution of gross premium written growth for a sample of large euro area insurers
(2005 - H1 2007; % change per annum; nominal values; inter-quartile distribution)
-20
2005 2006
total life non-life
H12005 2006 2005 2006
-10
0
10
20
30
40
-20
-10
0
10
20
30
40
2007H1
2007H1
2007
Sources: Bloomberg and ECB calculations.Note: Data for H1 2007 are annualised.
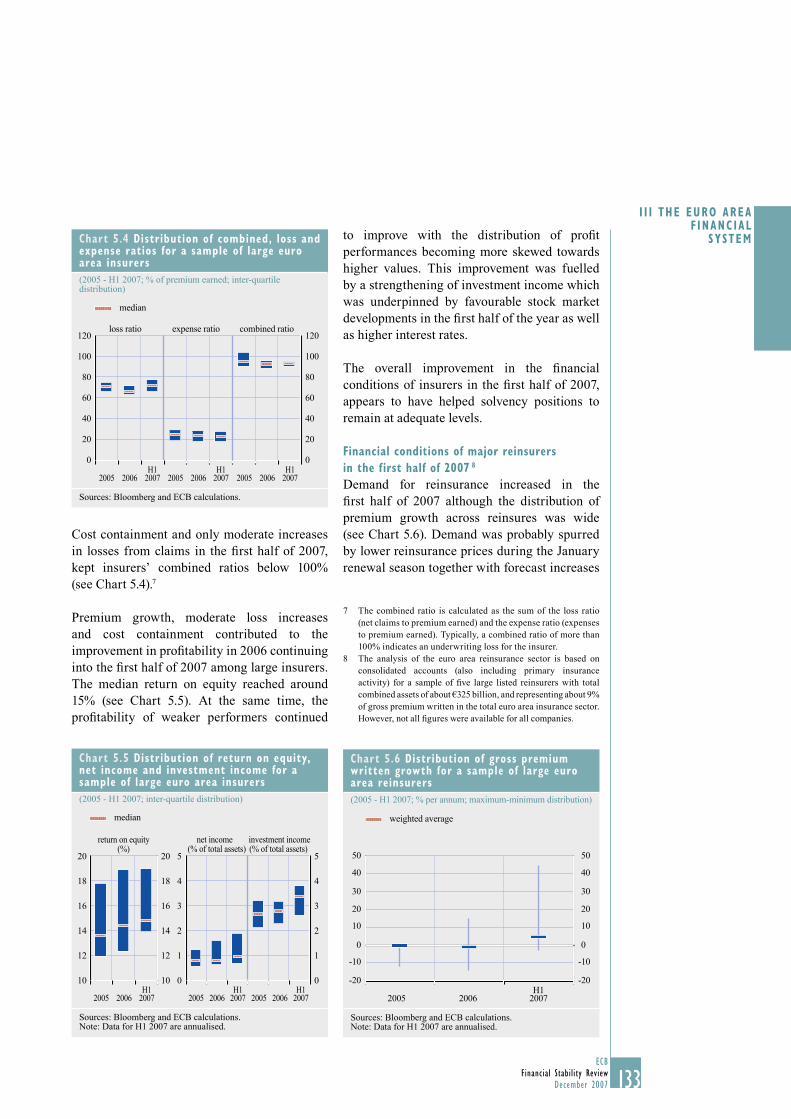
133ECB
Financial Stability ReviewDecember 2007
I I I THE EURO AREA F INANC IAL
SYSTEM
133
Cost containment and only moderate increases in losses from claims in the fi rst half of 2007, kept insurers’ combined ratios below 100%(see Chart 5.4).7
Premium growth, moderate loss increases and cost containment contributed to the improvement in profi tability in 2006 continuing into the fi rst half of 2007 among large insurers. The median return on equity reached around 15% (see Chart 5.5). At the same time, the profi tability of weaker performers continued
to improve with the distribution of profi t performances becoming more skewed towards higher values. This improvement was fuelled by a strengthening of investment income which was underpinned by favourable stock market developments in the fi rst half of the year as well as higher interest rates.
The overall improvement in the fi nancial conditions of insurers in the fi rst half of 2007, appears to have helped solvency positions to remain at adequate levels.
Financial conditions of major reinsurers
in the first half of 2007 8
Demand for reinsurance increased in the fi rst half of 2007 although the distribution of premium growth across reinsures was wide (see Chart 5.6). Demand was probably spurred by lower reinsurance prices during the January renewal season together with forecast increases
The combined ratio is calculated as the sum of the loss ratio 7 (net claims to premium earned) and the expense ratio (expenses to premium earned). Typically, a combined ratio of more than 100% indicates an underwriting loss for the insurer.The analysis of the euro area reinsurance sector is based on 8 consolidated accounts (also including primary insurance activity) for a sample of fi ve large listed reinsurers with total combined assets of about €325 billion, and representing about 9% of gross premium written in the total euro area insurance sector. However, not all fi gures were available for all companies.
Chart 5.4 Distribution of combined, loss and expense ratios for a sample of large euro area insurers
(2005 - H1 2007; % of premium earned; inter-quartile distribution)
0
20
40
60
80
100
120
0
20
40
60
80
100
120combined ratioexpense ratio
2005 2005 20052006 2007 2007 2007H1 H1 H1
2006 2006
loss ratio
median
Sources: Bloomberg and ECB calculations.
Chart 5.5 Distribution of return on equity, net income and investment income for a sample of large euro area insurers
(2005 - H1 2007; inter-quartile distribution)
0
1
2
3
4
5
0
1
2
3
4
5
net income (% of total assets)
investment income(% of total assets)
10
12
14
16
18
20
10
12
14
16
18
20
median
return on equity(%)
2005 2005 20052006 2006 2006H1 H1
2007 2007H1
2007
Sources: Bloomberg and ECB calculations.Note: Data for H1 2007 are annualised.
Chart 5.6 Distribution of gross premium written growth for a sample of large euro area reinsurers
(2005 - H1 2007; % per annum; maximum-minimum distribution)
-20
-10
0
10
20
30
40
50
-20
-10
0
10
20
30
40
50
weighted average
2005 2006H1
2007
Sources: Bloomberg and ECB calculations.Note: Data for H1 2007 are annualised.
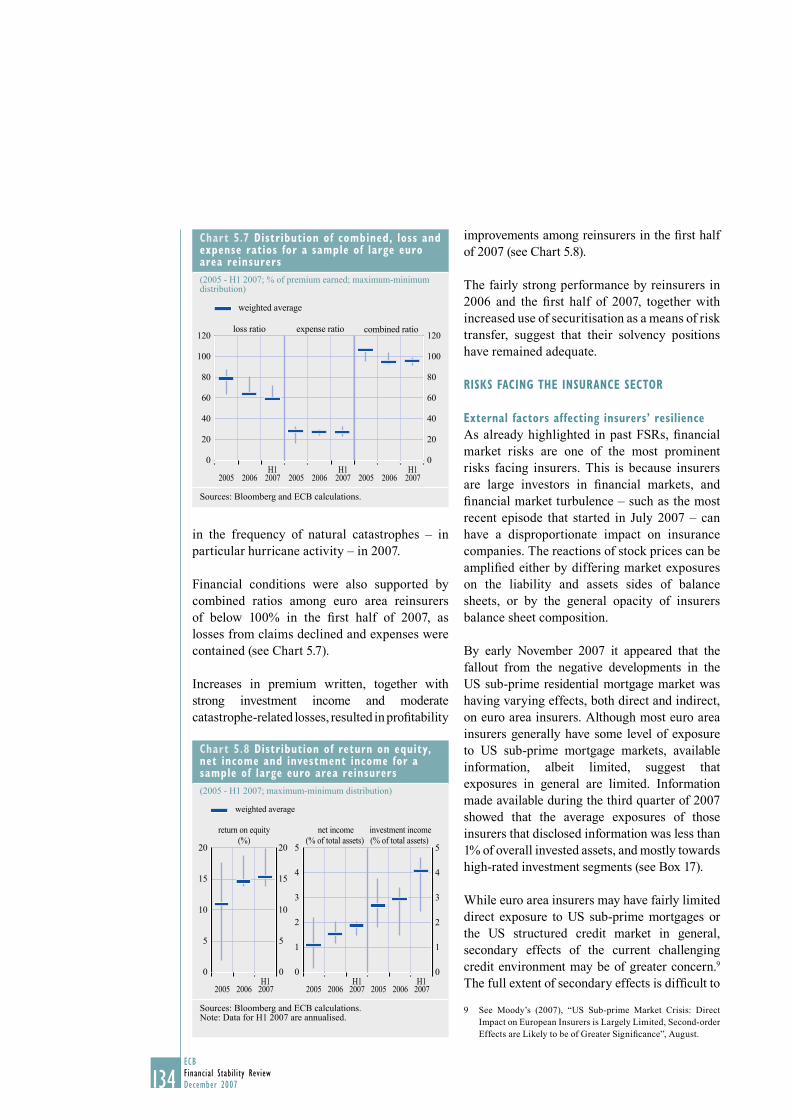
134ECBFinancial Stability ReviewDecember 2007134
in the frequency of natural catastrophes – in particular hurricane activity – in 2007.
Financial conditions were also supported by combined ratios among euro area reinsurers of below 100% in the fi rst half of 2007, as losses from claims declined and expenses were contained (see Chart 5.7).
Increases in premium written, together with strong investment income and moderate catastrophe-related losses, resulted in profi tability
improvements among reinsurers in the fi rst half of 2007 (see Chart 5.8).
The fairly strong performance by reinsurers in 2006 and the fi rst half of 2007, together with increased use of securitisation as a means of risk transfer, suggest that their solvency positions have remained adequate.
RISKS FACING THE INSURANCE SECTOR
External factors affecting insurers’ resilience
As already highlighted in past FSRs, fi nancial market risks are one of the most prominent risks facing insurers. This is because insurers are large investors in fi nancial markets, and fi nancial market turbulence – such as the most recent episode that started in July 2007 – can have a disproportionate impact on insurance companies. The reactions of stock prices can be amplifi ed either by differing market exposures on the liability and assets sides of balance sheets, or by the general opacity of insurers balance sheet composition.
By early November 2007 it appeared that the fallout from the negative developments in the US sub-prime residential mortgage market was having varying effects, both direct and indirect, on euro area insurers. Although most euro area insurers generally have some level of exposure to US sub-prime mortgage markets, available information, albeit limited, suggest that exposures in general are limited. Information made available during the third quarter of 2007 showed that the average exposures of those insurers that disclosed information was less than 1% of overall invested assets, and mostly towards high-rated investment segments (see Box 17).
While euro area insurers may have fairly limited direct exposure to US sub-prime mortgages or the US structured credit market in general, secondary effects of the current challenging credit environment may be of greater concern.9 The full extent of secondary effects is diffi cult to
See Moody’s (2007), “US Sub-prime Market Crisis: Direct 9 Impact on European Insurers is Largely Limited, Second-order Effects are Likely to be of Greater Signifi cance”, August.
Chart 5.7 Distribution of combined, loss and expense ratios for a sample of large euro area reinsurers
(2005 - H1 2007; % of premium earned; maximum-minimum distribution)
0
20
40
60
80
100
120
0
20
40
60
80
100
120
weighted average
combined ratioexpense ratio
2005 2006H1
2005 2006 2005 2006
loss ratio
2007H1
2007H1
2007
Sources: Bloomberg and ECB calculations.
Chart 5.8 Distribution of return on equity, net income and investment income for a sample of large euro area reinsurers
(2005 - H1 2007; maximum-minimum distribution)
0
1
2
3
4
5
0
1
2
3
4
5
weighted average
0
5
10
15
20
0
5
10
15
20
2005 2006H1
2005 2006 2005 2006
return on equity(%)
net income(% of total assets)
investment income(% of total assets)
2007H1
2007H1
2007
Sources: Bloomberg and ECB calculations.Note: Data for H1 2007 are annualised.
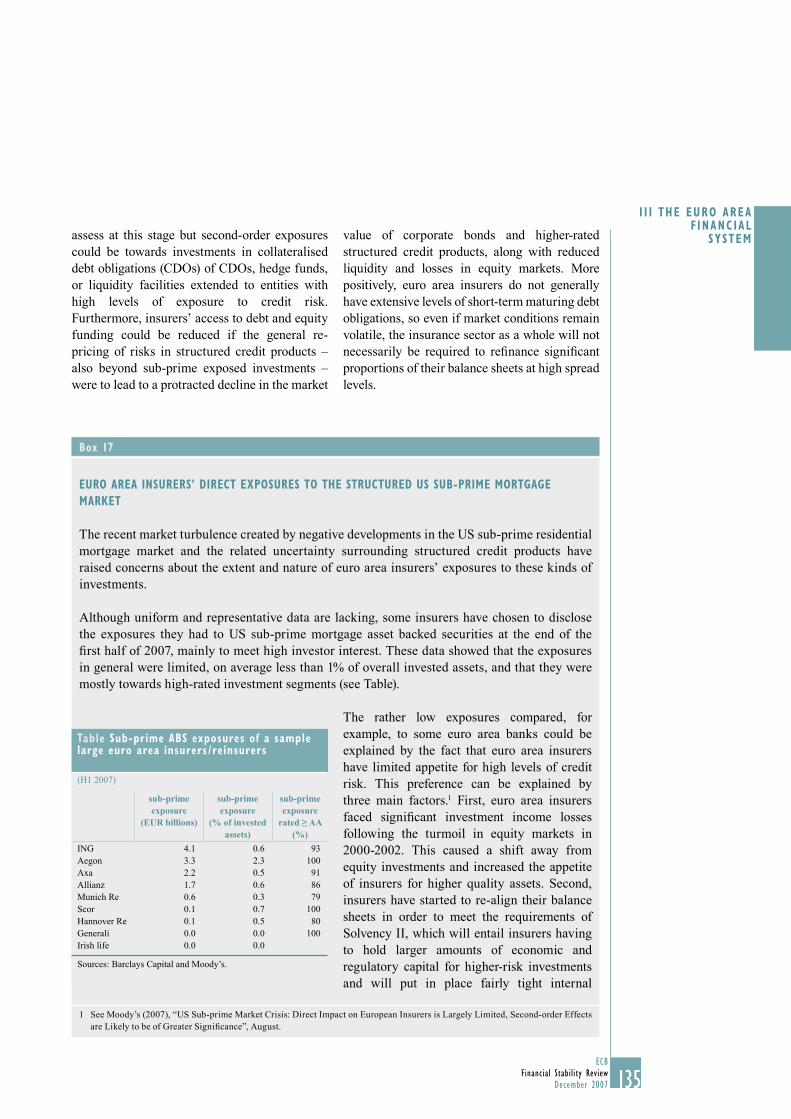
135ECB
Financial Stability ReviewDecember 2007
I I I THE EURO AREA F INANC IAL
SYSTEM
135
assess at this stage but second-order exposures could be towards investments in collateralised debt obligations (CDOs) of CDOs, hedge funds, or liquidity facilities extended to entities with high levels of exposure to credit risk. Furthermore, insurers’ access to debt and equity funding could be reduced if the general re-pricing of risks in structured credit products – also beyond sub-prime exposed investments – were to lead to a protracted decline in the market
value of corporate bonds and higher-rated structured credit products, along with reduced liquidity and losses in equity markets. More positively, euro area insurers do not generally have extensive levels of short-term maturing debt obligations, so even if market conditions remain volatile, the insurance sector as a whole will not necessarily be required to refi nance signifi cant proportions of their balance sheets at high spread levels.
Box 17
EURO AREA INSURERS’ DIRECT EXPOSURES TO THE STRUCTURED US SUB-PRIME MORTGAGE
MARKET
The recent market turbulence created by negative developments in the US sub-prime residential mortgage market and the related uncertainty surrounding structured credit products have raised concerns about the extent and nature of euro area insurers’ exposures to these kinds of investments.
Although uniform and representative data are lacking, some insurers have chosen to disclose the exposures they had to US sub-prime mortgage asset backed securities at the end of the fi rst half of 2007, mainly to meet high investor interest. These data showed that the exposures in general were limited, on average less than 1% of overall invested assets, and that they were mostly towards high-rated investment segments (see Table).
The rather low exposures compared, for example, to some euro area banks could be explained by the fact that euro area insurers have limited appetite for high levels of credit risk. This preference can be explained by three main factors.1 First, euro area insurers faced signifi cant investment income losses following the turmoil in equity markets in 2000-2002. This caused a shift away from equity investments and increased the appetite of insurers for higher quality assets. Second, insurers have started to re-align their balance sheets in order to meet the requirements of Solvency II, which will entail insurers having to hold larger amounts of economic and regulatory capital for higher-risk investments and will put in place fairly tight internal
1 See Moody’s (2007), “US Sub-prime Market Crisis: Direct Impact on European Insurers is Largely Limited, Second-order Effects are Likely to be of Greater Signifi cance”, August.
Table Sub-prime ABS exposures of a sample large euro area insurers /reinsurers
(H1 2007)
sub-prime exposure
(EUR billions)
sub-prime exposure
(% of invested assets)
sub-prime exposure
rated ≥ AA (%)
ING 4.1 0.6 93Aegon 3.3 2.3 100Axa 2.2 0.5 91Allianz 1.7 0.6 86Munich Re 0.6 0.3 79Scor 0.1 0.7 100Hannover Re 0.1 0.5 80Generali 0.0 0.0 100Irish life 0.0 0.0
Sources: Barclays Capital and Moody’s.
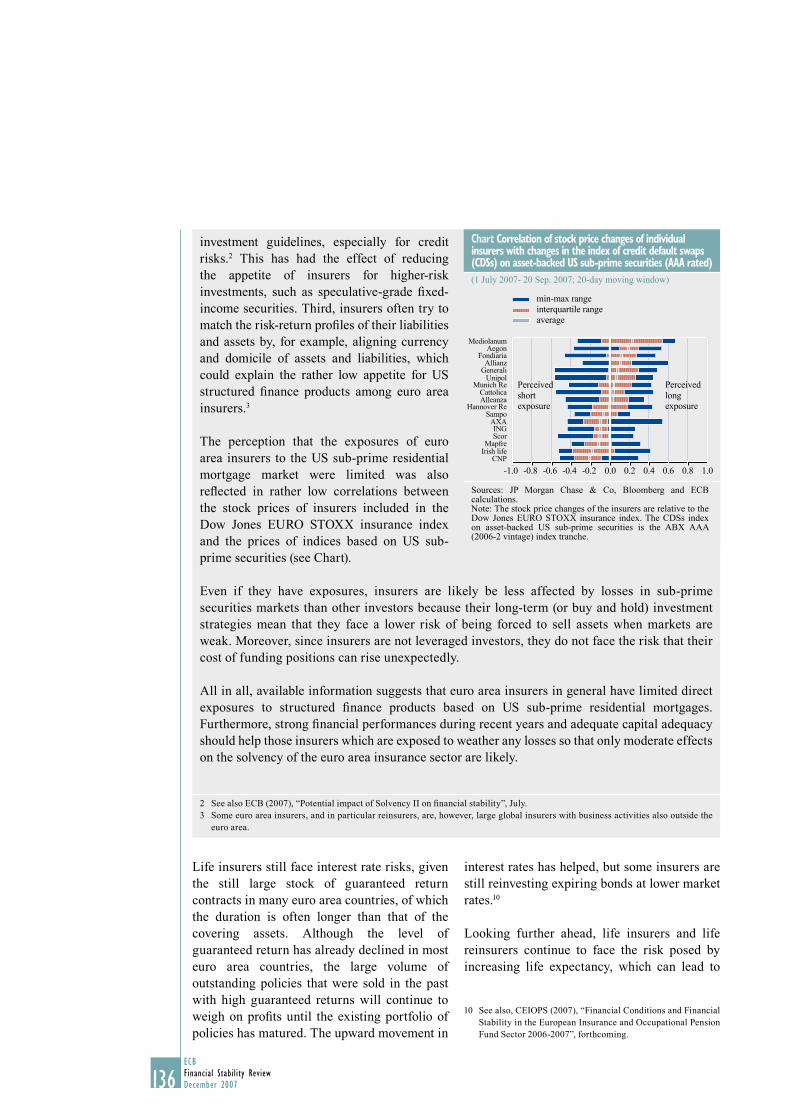
136ECBFinancial Stability ReviewDecember 2007136
investment guidelines, especially for credit risks.2 This has had the effect of reducing the appetite of insurers for higher-risk investments, such as speculative-grade fi xed-income securities. Third, insurers often try to match the risk-return profi les of their liabilities and assets by, for example, aligning currency and domicile of assets and liabilities, which could explain the rather low appetite for US structured fi nance products among euro area insurers.3
The perception that the exposures of euro area insurers to the US sub-prime residential mortgage market were limited was also refl ected in rather low correlations between the stock prices of insurers included in the Dow Jones EURO STOXX insurance index and the prices of indices based on US sub-prime securities (see Chart).
Even if they have exposures, insurers are likely be less affected by losses in sub-prime securities markets than other investors because their long-term (or buy and hold) investment strategies mean that they face a lower risk of being forced to sell assets when markets are weak. Moreover, since insurers are not leveraged investors, they do not face the risk that their cost of funding positions can rise unexpectedly.
All in all, available information suggests that euro area insurers in general have limited direct exposures to structured fi nance products based on US sub-prime residential mortgages. Furthermore, strong fi nancial performances during recent years and adequate capital adequacy should help those insurers which are exposed to weather any losses so that only moderate effects on the solvency of the euro area insurance sector are likely.
2 See also ECB (2007), “Potential impact of Solvency II on fi nancial stability”, July.3 Some euro area insurers, and in particular reinsurers, are, however, large global insurers with business activities also outside the
euro area.
Life insurers still face interest rate risks, given the still large stock of guaranteed return contracts in many euro area countries, of which the duration is often longer than that of the covering assets. Although the level of guaranteed return has already declined in most euro area countries, the large volume of outstanding policies that were sold in the past with high guaranteed returns will continue to weigh on profi ts until the existing portfolio of policies has matured. The upward movement in
interest rates has helped, but some insurers are still reinvesting expiring bonds at lower market rates.10
Looking further ahead, life insurers and life reinsurers continue to face the risk posed by increasing life expectancy, which can lead to
See also, CEIOPS (2007), “Financial Conditions and Financial 10 Stability in the European Insurance and Occupational Pension Fund Sector 2006-2007”, forthcoming.
Chart Correlation of stock price changes of individual insurers with changes in the index of credit default swaps (CDSs) on asset-backed US sub-prime securities (AAA rated)
(1 July 2007- 20 Sep. 2007; 20-day moving window)
-1.0 -0.8 -0.6 -0.4 -0.2 0.0 0.2 0.4 0.6 0.8 1.0
MediolanumAegon
FondiariaAllianz
GeneraliUnipol
Munich ReCattolicaAlleanza
Hannover ReSampo
AXAINGScor
MapfreIrish life
CNP
min-max rangeinterquartile range
Perceivedshortexposure
Perceivedlongexposure
average
Sources: JP Morgan Chase & Co, Bloomberg and ECB calculations.Note: The stock price changes of the insurers are relative to the Dow Jones EURO STOXX insurance index. The CDSs index on asset-backed US sub-prime securities is the ABX AAA (2006-2 vintage) index tranche.
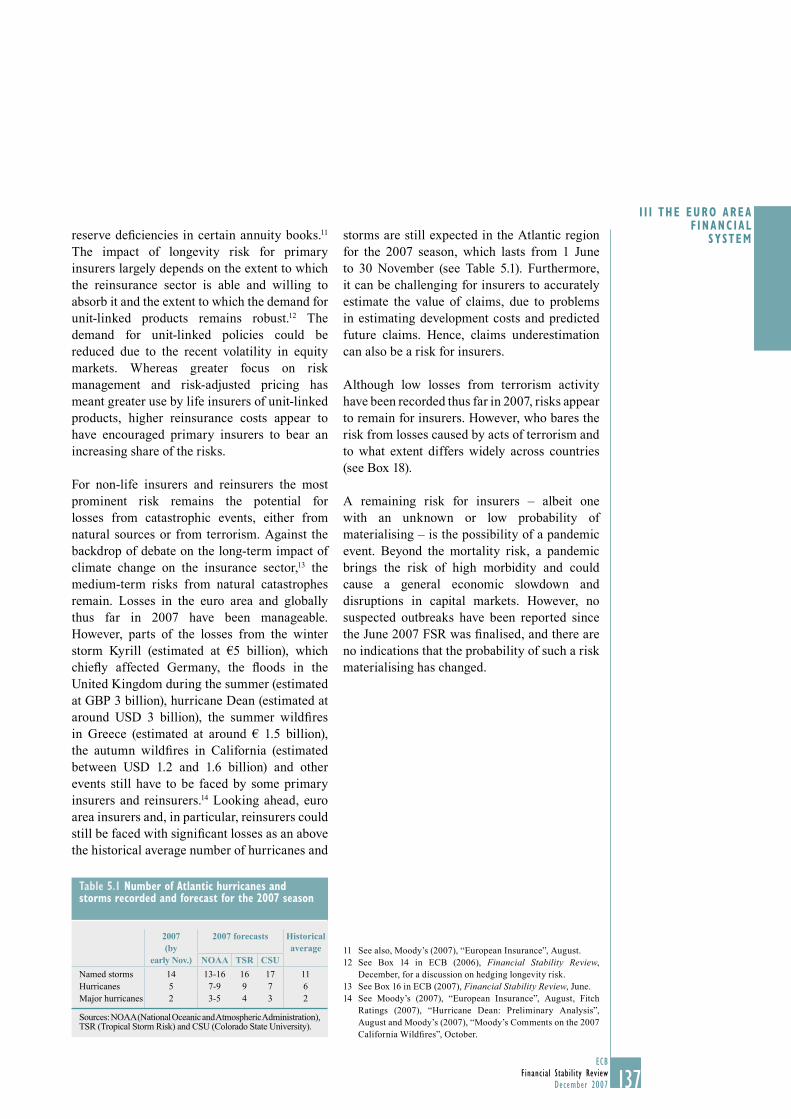
137ECB
Financial Stability ReviewDecember 2007
I I I THE EURO AREA F INANC IAL
SYSTEM
137
reserve defi ciencies in certain annuity books.11 The impact of longevity risk for primary insurers largely depends on the extent to which the reinsurance sector is able and willing to absorb it and the extent to which the demand for unit-linked products remains robust.12 The demand for unit-linked policies could be reduced due to the recent volatility in equity markets. Whereas greater focus on risk management and risk-adjusted pricing has meant greater use by life insurers of unit-linked products, higher reinsurance costs appear to have encouraged primary insurers to bear an increasing share of the risks.
For non-life insurers and reinsurers the most prominent risk remains the potential for losses from catastrophic events, either from natural sources or from terrorism. Against the backdrop of debate on the long-term impact of climate change on the insurance sector,13 the medium-term risks from natural catastrophes remain. Losses in the euro area and globally thus far in 2007 have been manageable. However, parts of the losses from the winter storm Kyrill (estimated at €5 billion), which chiefl y affected Germany, the fl oods in the United Kingdom during the summer (estimated at GBP 3 billion), hurricane Dean (estimated at around USD 3 billion), the summer wildfi res in Greece (estimated at around € 1.5 billion), the autumn wildfi res in California (estimated between USD 1.2 and 1.6 billion) and other events still have to be faced by some primary insurers and reinsurers.14 Looking ahead, euro area insurers and, in particular, reinsurers could still be faced with signifi cant losses as an above the historical average number of hurricanes and
storms are still expected in the Atlantic region for the 2007 season, which lasts from 1 June to 30 November (see Table 5.1). Furthermore, it can be challenging for insurers to accurately estimate the value of claims, due to problems in estimating development costs and predicted future claims. Hence, claims underestimation can also be a risk for insurers.
Although low losses from terrorism activity have been recorded thus far in 2007, risks appear to remain for insurers. However, who bares the risk from losses caused by acts of terrorism and to what extent differs widely across countries (see Box 18).
A remaining risk for insurers – albeit one with an unknown or low probability of materialising – is the possibility of a pandemic event. Beyond the mortality risk, a pandemic brings the risk of high morbidity and could cause a general economic slowdown and disruptions in capital markets. However, no suspected outbreaks have been reported since the June 2007 FSR was fi nalised, and there are no indications that the probability of such a risk materialising has changed.
See also, Moody’s (2007), “European Insurance”, August.11 See Box 14 in ECB (2006), 12 Financial Stability Review, December, for a discussion on hedging longevity risk.See Box 16 in ECB (2007), 13 Financial Stability Review, June.See Moody’s (2007), “European Insurance”, August, Fitch 14 Ratings (2007), “Hurricane Dean: Preliminary Analysis”, August and Moody’s (2007), “Moody’s Comments on the 2007 California Wildfi res”, October.
Table 5.1 Number of Atlantic hurricanes and storms recorded and forecast for the 2007 season
2007(by
early Nov.)
2007 forecasts Historicalaverage
NOAA TSR CSU
Named storms 14 13-16 16 17 11Hurricanes 5 7-9 9 7 6Major hurricanes 2 3-5 4 3 2
Sources: NOAA (National Oceanic and Atmospheric Administration), TSR (Tropical Storm Risk) and CSU (Colorado State University).
138ECBFinancial Stability ReviewDecember 2007138
Box 18
TERRORISM INSURANCE: WHO INSURES AND WHO IS INSURED
Terrorism insurance is designed to cover potential losses and liabilities that might occur as a result of terrorist activities. Before the events of 11 September 2001 in the US, terror risks were often covered by private insurers – or at least not specifi cally excluded – in property insurance. After these events there were many changes in the global terrorism insurance market with a trend among global insurers towards excluding terror coverage from their contracts. Many governments have, however, become more involved in mitigating the risk exposure of insurers by developing explicit schemes or terror pools to address terror risks.1 These developments raise questions about who could face losses caused by terrorism activity. This box describes who provides terrorism insurance and who is insured in the euro area.
Several sectors could potentially be faced with large fi nancial losses as a result of terrorism:
i) Households and corporations with insuffi cient insurance coverage
ii) Insurance companies which are unable to reinsure or transfer risks to capital markets via securitisation, which are active in markets without a government backstop, or which are members of terror pools created to spread insurance risk.
iii) Reinsurance companies which are unable to shed exposures to other reinsurers or capital markets via securitisations, or are active in markets without a government backstop.
iv) Governments providing backstop for the terrorism insurance market.
Many households and companies can face large losses, mainly on residential and commercial property and aerospace damages, as a result of a terrorist event. For households or companies, the decision to purchase terrorism insurance depends both on their perception of the risk and whether or not there are specifi c requirements, such as clauses in loan covenants or commercial mortgage agreements or, indeed, if taking out such insurance is made compulsory by governments. Households and companies can sometimes be forced to bear the risk of losses from terrorism, as insurance policies that provide coverage for terrorism losses are sometimes hard to obtain. Furthermore, consumer understanding of the coverage provided in a policy is often limited, as general insurance policies are frequently bought on the basis of price alone.2
For insurance companies, terrorism insurance is considered to be a diffi cult product to construct and price. This is because the odds of terrorist attacks are very diffi cult to predict but the potential liabilities can be enormous. For example, the 11 September 2001 attacks resulted in an estimated USD 32 billion of losses. Many insurance companies therefore exclude terrorism from property insurance coverage, or else they require endorsements to provide coverage. Insurers (or reinsurers) that do provide coverage for losses caused by terrorism may have diffi culties in passing the risks on to reinsurers, as the availability of reinsurance is sometimes low.
1 See also Guy Carpenter (2007), “Global Terror Insurance Market”, June. A terror pool typically functions as a reinsurance whereby primary insurers issue separate terrorism policies that are ceded to the terror pool. Losses facing the terror pool are typically borne by the insurers participating in the pool in relation to their market share.
2 See, UK Financial Services Authority (2007), “Financial Risk Outlook”, January.

139ECB
Financial Stability ReviewDecember 2007
I I I THE EURO AREA F INANC IAL
SYSTEM
139
Table Terrorism insurance coverage in selected euro area countries
Country Type of terrorism insurance programme Distribution of potential losses
Austria Terror pool introduced in 2002. The terror pool functions as a reinsurance whereby the primary insurer issues a separate terrorism policy which is ceded to the terror pool.
The fi rst € 50 million of annual aggregate losses is covered by primary insurers (in relation to their market share in property insurance) and the next € 150 million is covered by the international reinsurance market.
Belgium Currently terrorism insurance is compulsory for workers’ compensation, motor liability and fi re policies. A law is expected to be introduced in 2008 to establish a terror fund and also make terrorism insurance compulsory for accident and health and life policies.
The fi rst € 300 million (not yet fi xed) of losses will be covered by primary insurers (in relation to market share). The next € 400 million will be reinsured. Losses between € 700 million and € 1 billion will be covered by the Belgian Government.
Finland The Finnish Terrorism Pool includes all Finnish insurance companies except two. The pool is intended as a last resort in the event of major terrorism loss.
Coverage will be available under the terrorism pool only after all traditional reinsurance programmes have been exhausted.
France French legislation requires all property insurers to provide terrorism coverage. In January 2002 a terror pool was set up by the public authorities and France’s two main insurance associations. There is a distinction between small risks (the responsibility of traditional reinsurers) and medium and large risks (terror pool responsibility).
The fi rst € 400 million of losses is shared by the members of the pool (in relation to market size). Losses between € 400 million and € 2.2 billion (2.4 billion for small risks scheme) are reinsured. Unlimited state guarantee of losses above € 2.2 billion (2.4 billion in the small risks scheme).
Germany Terrorism insurance is generally included in policies. To reduce the vulnerability of insurers in 2002, a specialist company covering terror-related property damage called EXTREMUS was created by the Government and the Association of German Insurers. The primary objective of EXTREMUS is to protect medium-sized companies against property and business interruption losses caused by terrorism.
The fi rst € 2 billion is covered by primary insurers and domestic and foreign reinsurers. Losses between € 2 and 10 billion are covered by state guarantee.
Furthermore, the insurance securitisation market is still under development – no bond which would generate cash-fl ows following terrorist events has yet been issued – and not large enough to spread the huge potential losses from terrorism events.
To provide relief for insurers offering terrorism insurance and to support the supply of insurance polices that include terrorism insurance, several euro area and other countries have developed government and insurance industry wide programmes for terror coverage. In the euro area the type of arrangement and coverage provided for terrorism insurance varies (see Table). Most countries have established some sort of terror pool or government sponsored insurance entity to spread losses across primary insurers and reinsurers. In addition, many governments provide large and sometimes unlimited guarantees over and above the losses than can be borne by terror pools or government sponsored insurance entities. The main reason why governments often offer guarantees is that large losses from terrorism can have economic domino effects as insurers could be faced with insuffi cient fi nancial resources to cover all claims. Furthermore, many observers believe that the government could have no choice but to provide aid to households, companies and insurers who suffer devastating losses from terrorism, even if they are not insured.3
3 See R. W. Ferguson (2007), “The Need to Extend the Terrorism Risk Insurance Act”, testimony before the US House of Representatives, 5 March.
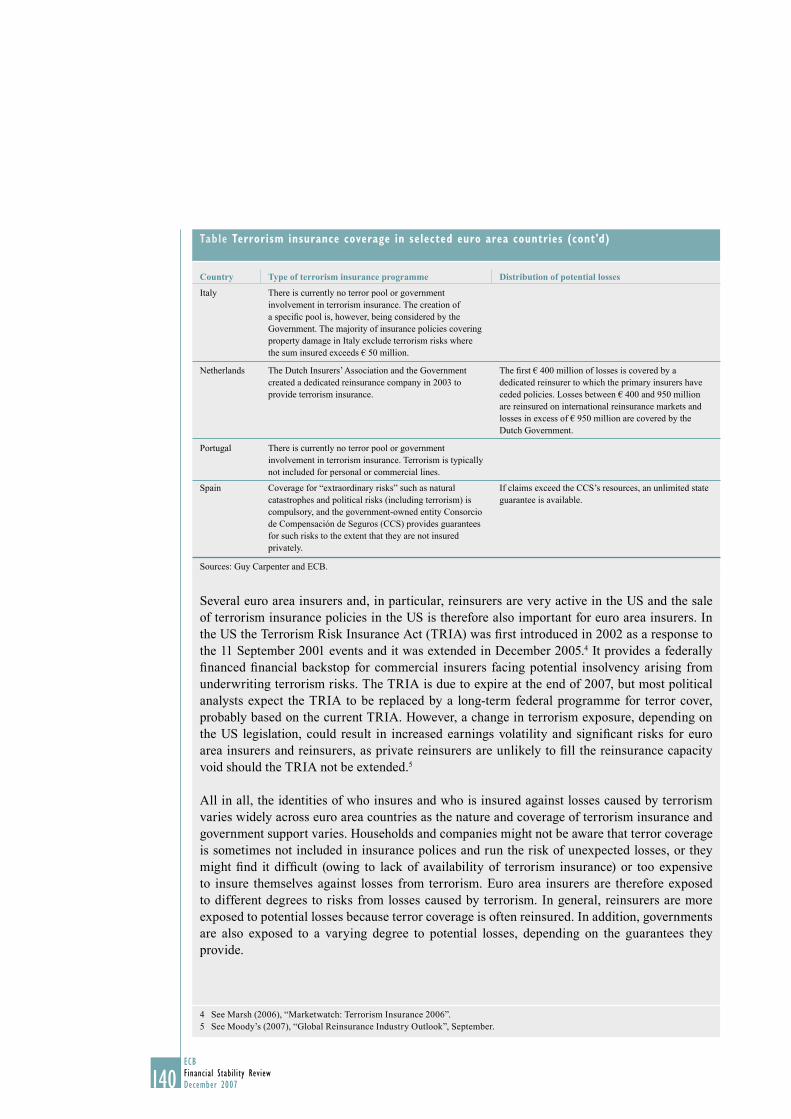
140ECBFinancial Stability ReviewDecember 2007140
Several euro area insurers and, in particular, reinsurers are very active in the US and the sale of terrorism insurance policies in the US is therefore also important for euro area insurers. In the US the Terrorism Risk Insurance Act (TRIA) was fi rst introduced in 2002 as a response to the 11 September 2001 events and it was extended in December 2005.4 It provides a federally fi nanced fi nancial backstop for commercial insurers facing potential insolvency arising from underwriting terrorism risks. The TRIA is due to expire at the end of 2007, but most political analysts expect the TRIA to be replaced by a long-term federal programme for terror cover, probably based on the current TRIA. However, a change in terrorism exposure, depending on the US legislation, could result in increased earnings volatility and signifi cant risks for euro area insurers and reinsurers, as private reinsurers are unlikely to fi ll the reinsurance capacity void should the TRIA not be extended.5
All in all, the identities of who insures and who is insured against losses caused by terrorism varies widely across euro area countries as the nature and coverage of terrorism insurance and government support varies. Households and companies might not be aware that terror coverage is sometimes not included in insurance polices and run the risk of unexpected losses, or they might fi nd it diffi cult (owing to lack of availability of terrorism insurance) or too expensive to insure themselves against losses from terrorism. Euro area insurers are therefore exposed to different degrees to risks from losses caused by terrorism. In general, reinsurers are more exposed to potential losses because terror coverage is often reinsured. In addition, governments are also exposed to a varying degree to potential losses, depending on the guarantees they provide.
4 See Marsh (2006), “Marketwatch: Terrorism Insurance 2006”.5 See Moody’s (2007), “Global Reinsurance Industry Outlook”, September.
Table Terrorism insurance coverage in selected euro area countries (cont'd)
Country Type of terrorism insurance programme Distribution of potential losses
Italy There is currently no terror pool or government involvement in terrorism insurance. The creation of a specifi c pool is, however, being considered by the Government. The majority of insurance policies covering property damage in Italy exclude terrorism risks where the sum insured exceeds € 50 million.
Netherlands The Dutch Insurers’ Association and the Government created a dedicated reinsurance company in 2003 to provide terrorism insurance.
The fi rst € 400 million of losses is covered by a dedicated reinsurer to which the primary insurers have ceded policies. Losses between € 400 and 950 million are reinsured on international reinsurance markets and losses in excess of € 950 million are covered by the Dutch Government.
Portugal There is currently no terror pool or government involvement in terrorism insurance. Terrorism is typically not included for personal or commercial lines.
Spain Coverage for “extraordinary risks” such as natural catastrophes and political risks (including terrorism) is compulsory, and the government-owned entity Consorcio de Compensación de Seguros (CCS) provides guarantees for such risks to the extent that they are not insured privately.
If claims exceed the CCS’s resources, an unlimited state guarantee is available.
Sources: Guy Carpenter and ECB.
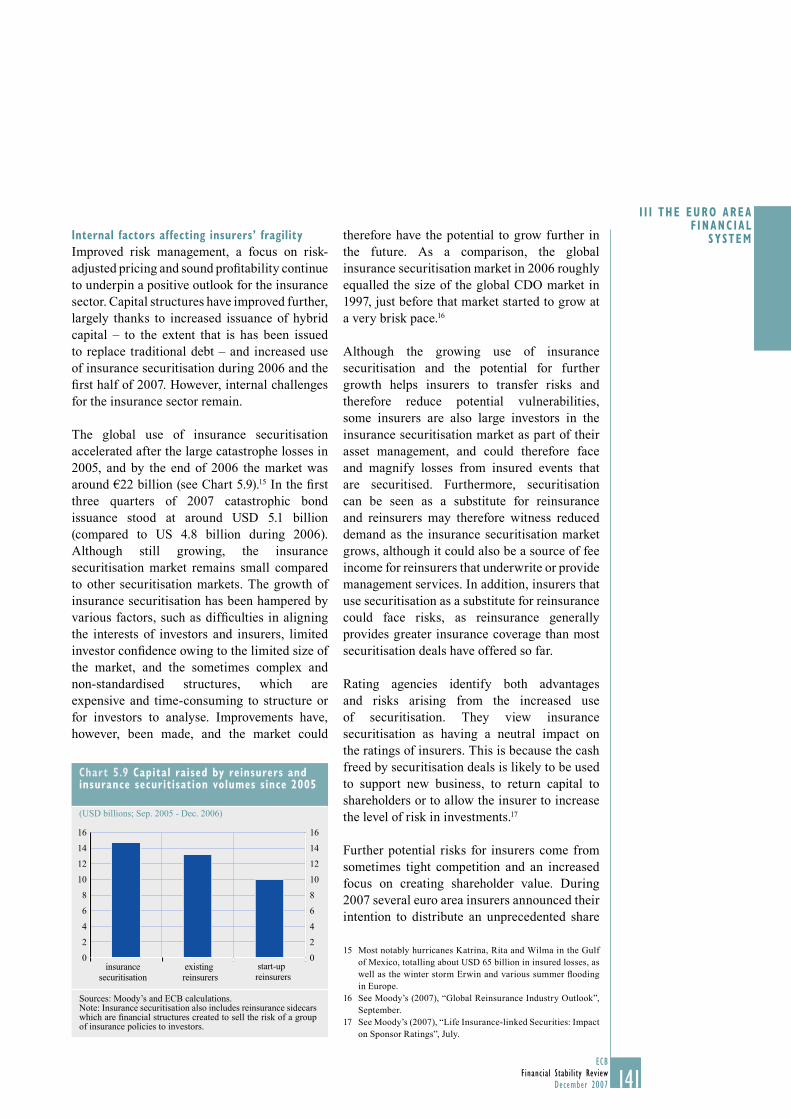
141ECB
Financial Stability ReviewDecember 2007
I I I THE EURO AREA F INANC IAL
SYSTEM
141
Internal factors affecting insurers’ fragility
Improved risk management, a focus on risk-adjusted pricing and sound profi tability continue to underpin a positive outlook for the insurance sector. Capital structures have improved further, largely thanks to increased issuance of hybrid capital – to the extent that is has been issued to replace traditional debt – and increased use of insurance securitisation during 2006 and the fi rst half of 2007. However, internal challenges for the insurance sector remain.
The global use of insurance securitisation accelerated after the large catastrophe losses in 2005, and by the end of 2006 the market was around €22 billion (see Chart 5.9).15 In the fi rst three quarters of 2007 catastrophic bond issuance stood at around USD 5.1 billion (compared to US 4.8 billion during 2006). Although still growing, the insurance securitisation market remains small compared to other securitisation markets. The growth of insurance securitisation has been hampered by various factors, such as diffi culties in aligning the interests of investors and insurers, limited investor confi dence owing to the limited size of the market, and the sometimes complex and non-standardised structures, which are expensive and time-consuming to structure or for investors to analyse. Improvements have, however, been made, and the market could
therefore have the potential to grow further in the future. As a comparison, the global insurance securitisation market in 2006 roughly equalled the size of the global CDO market in 1997, just before that market started to grow at a very brisk pace.16
Although the growing use of insurance securitisation and the potential for further growth helps insurers to transfer risks and therefore reduce potential vulnerabilities, some insurers are also large investors in the insurance securitisation market as part of their asset management, and could therefore face and magnify losses from insured events that are securitised. Furthermore, securitisation can be seen as a substitute for reinsurance and reinsurers may therefore witness reduced demand as the insurance securitisation market grows, although it could also be a source of fee income for reinsurers that underwrite or provide management services. In addition, insurers that use securitisation as a substitute for reinsurance could face risks, as reinsurance generally provides greater insurance coverage than most securitisation deals have offered so far.
Rating agencies identify both advantages and risks arising from the increased use of securitisation. They view insurance securitisation as having a neutral impact on the ratings of insurers. This is because the cash freed by securitisation deals is likely to be used to support new business, to return capital to shareholders or to allow the insurer to increase the level of risk in investments.17
Further potential risks for insurers come from sometimes tight competition and an increased focus on creating shareholder value. During 2007 several euro area insurers announced their intention to distribute an unprecedented share
Most notably hurricanes Katrina, Rita and Wilma in the Gulf 15 of Mexico, totalling about USD 65 billion in insured losses, as well as the winter storm Erwin and various summer fl ooding in Europe.See Moody’s (2007), “Global Reinsurance Industry Outlook”, 16 September.See Moody’s (2007), “Life Insurance-linked Securities: Impact 17 on Sponsor Ratings”, July.
Chart 5.9 Capital raised by reinsurers and insurance securitisation volumes since 2005
(USD billions; Sep. 2005 - Dec. 2006)
0
2
4
6
8
10
12
14
16
0
2
4
6
8
10
12
14
16
start-upreinsurers
insurancesecuritisation
existingreinsurers
Sources: Moody’s and ECB calculations.Note: Insurance securitisation also includes reinsurance sidecars which are fi nancial structures created to sell the risk of a group of insurance policies to investors.
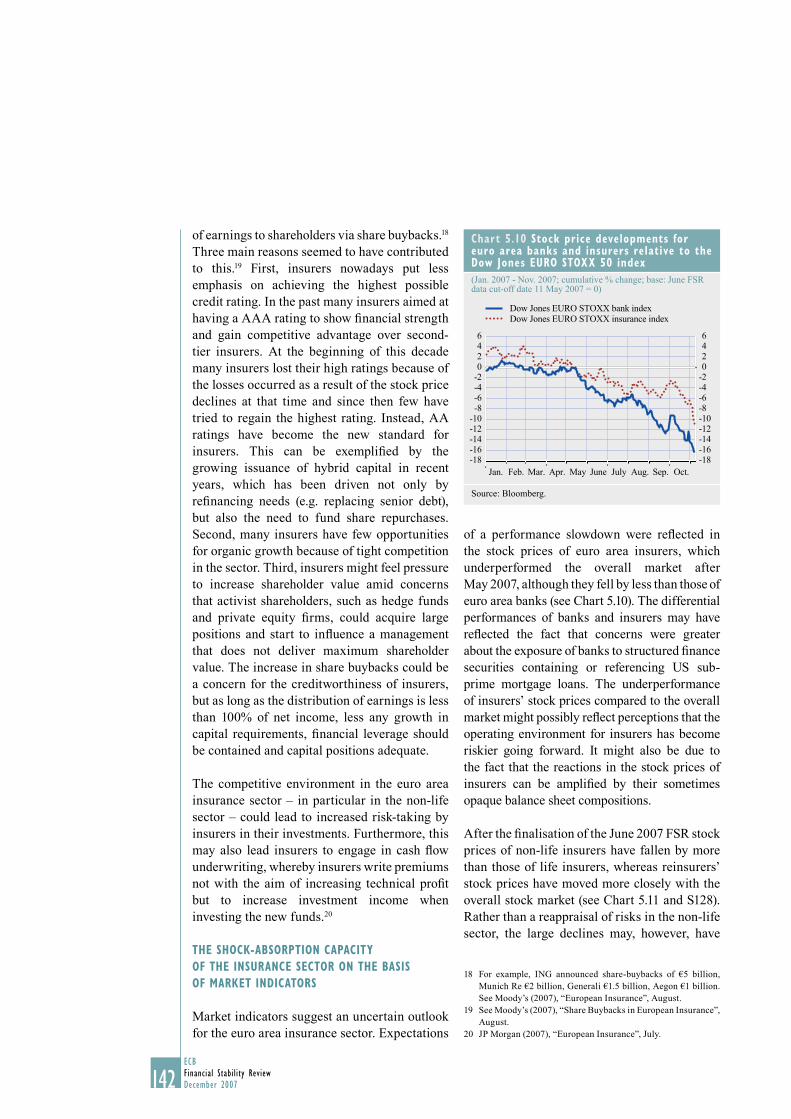
142ECBFinancial Stability ReviewDecember 2007142
of earnings to shareholders via share buybacks.18
Three main reasons seemed to have contributed to this.19 First, insurers nowadays put less emphasis on achieving the highest possible credit rating. In the past many insurers aimed at having a AAA rating to show fi nancial strength and gain competitive advantage over second-tier insurers. At the beginning of this decade many insurers lost their high ratings because of the losses occurred as a result of the stock price declines at that time and since then few have tried to regain the highest rating. Instead, AA ratings have become the new standard for insurers. This can be exemplifi ed by the growing issuance of hybrid capital in recent years, which has been driven not only by refi nancing needs (e.g. replacing senior debt), but also the need to fund share repurchases. Second, many insurers have few opportunities for organic growth because of tight competition in the sector. Third, insurers might feel pressure to increase shareholder value amid concerns that activist shareholders, such as hedge funds and private equity fi rms, could acquire large positions and start to infl uence a management that does not deliver maximum shareholder value. The increase in share buybacks could be a concern for the creditworthiness of insurers, but as long as the distribution of earnings is less than 100% of net income, less any growth in capital requirements, fi nancial leverage should be contained and capital positions adequate.
The competitive environment in the euro area insurance sector – in particular in the non-life sector – could lead to increased risk-taking by insurers in their investments. Furthermore, this may also lead insurers to engage in cash fl ow underwriting, whereby insurers write premiums not with the aim of increasing technical profi t but to increase investment income when investing the new funds.20
THE SHOCK-ABSORPTION CAPACITY
OF THE INSURANCE SECTOR ON THE BASIS
OF MARKET INDICATORS
Market indicators suggest an uncertain outlook for the euro area insurance sector. Expectations
of a performance slowdown were refl ected in the stock prices of euro area insurers, which underperformed the overall market afterMay 2007, although they fell by less than those of euro area banks (see Chart 5.10). The differential performances of banks and insurers may have refl ected the fact that concerns were greater about the exposure of banks to structured fi nance securities containing or referencing US sub-prime mortgage loans. The underperformance of insurers’ stock prices compared to the overall market might possibly refl ect perceptions that the operating environment for insurers has become riskier going forward. It might also be due to the fact that the reactions in the stock prices of insurers can be amplifi ed by their sometimes opaque balance sheet compositions.
After the fi nalisation of the June 2007 FSR stock prices of non-life insurers have fallen by more than those of life insurers, whereas reinsurers’ stock prices have moved more closely with the overall stock market (see Chart 5.11 and S128). Rather than a reappraisal of risks in the non-life sector, the large declines may, however, have
For example, ING announced share-buybacks of €5 billion, 18 Munich Re €2 billion, Generali €1.5 billion, Aegon €1 billion. See Moody’s (2007), “European Insurance”, August.See Moody’s (2007), “Share Buybacks in European Insurance”, 19 August.JP Morgan (2007), “European Insurance”, July.20
Chart 5.10 Stock price developments for euro area banks and insurers relative to the Dow Jones EURO STOXX 50 index
(Jan. 2007 - Nov. 2007; cumulative % change; base: June FSR data cut-off date 11 May 2007 = 0)
-18-16-14-12-10-8-6-4-20246
-18-16-14-12-10-8-6-4-20246
Jan. Feb. Mar. Apr. May June July Aug. Sep. Oct.
Dow Jones EURO STOXX bank indexDow Jones EURO STOXX insurance index
Source: Bloomberg.
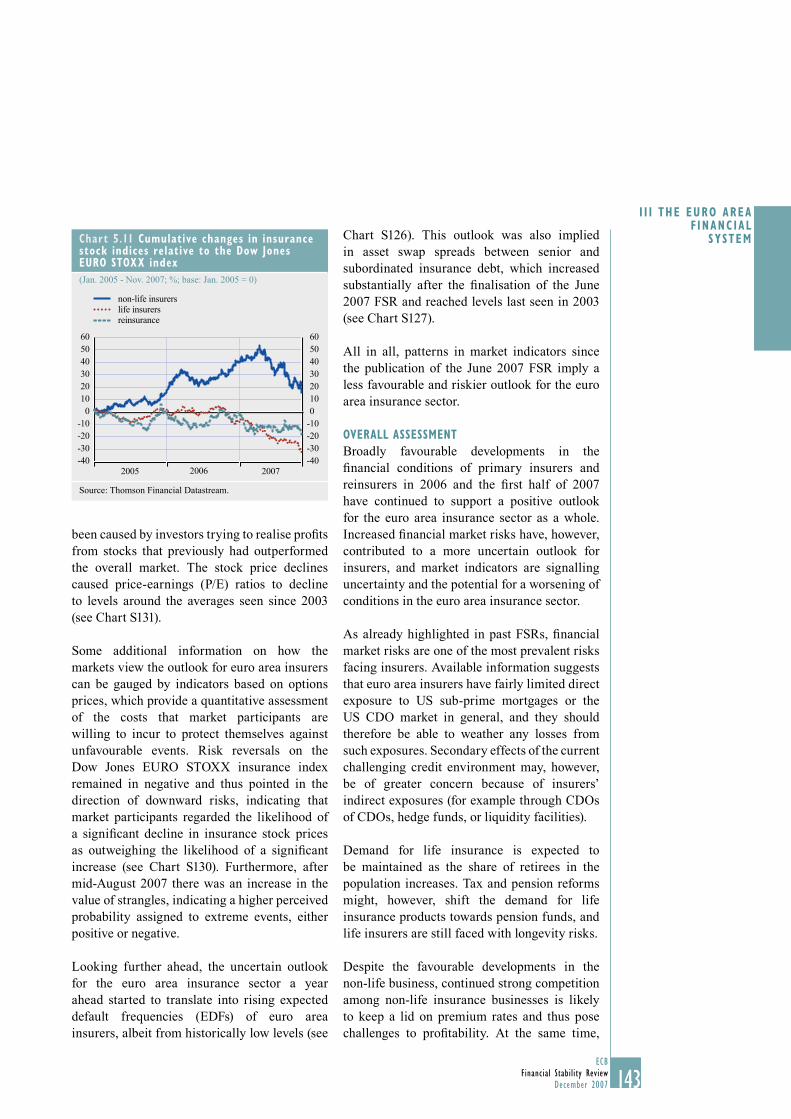
143ECB
Financial Stability ReviewDecember 2007
I I I THE EURO AREA F INANC IAL
SYSTEM
143
been caused by investors trying to realise profi ts from stocks that previously had outperformed the overall market. The stock price declines caused price-earnings (P/E) ratios to decline to levels around the averages seen since 2003(see Chart S131).
Some additional information on how the markets view the outlook for euro area insurers can be gauged by indicators based on options prices, which provide a quantitative assessment of the costs that market participants are willing to incur to protect themselves against unfavourable events. Risk reversals on the Dow Jones EURO STOXX insurance index remained in negative and thus pointed in the direction of downward risks, indicating that market participants regarded the likelihood of a signifi cant decline in insurance stock prices as outweighing the likelihood of a signifi cant increase (see Chart S130). Furthermore, after mid-August 2007 there was an increase in the value of strangles, indicating a higher perceived probability assigned to extreme events, either positive or negative.
Looking further ahead, the uncertain outlook for the euro area insurance sector a year ahead started to translate into rising expected default frequencies (EDFs) of euro area insurers, albeit from historically low levels (see
Chart S126). This outlook was also implied in asset swap spreads between senior and subordinated insurance debt, which increased substantially after the fi nalisation of the June 2007 FSR and reached levels last seen in 2003(see Chart S127).
All in all, patterns in market indicators since the publication of the June 2007 FSR imply a less favourable and riskier outlook for the euro area insurance sector.
OVERALL ASSESSMENT
Broadly favourable developments in the fi nancial conditions of primary insurers and reinsurers in 2006 and the fi rst half of 2007 have continued to support a positive outlook for the euro area insurance sector as a whole. Increased fi nancial market risks have, however, contributed to a more uncertain outlook for insurers, and market indicators are signalling uncertainty and the potential for a worsening of conditions in the euro area insurance sector.
As already highlighted in past FSRs, fi nancial market risks are one of the most prevalent risks facing insurers. Available information suggests that euro area insurers have fairly limited direct exposure to US sub-prime mortgages or the US CDO market in general, and they should therefore be able to weather any losses from such exposures. Secondary effects of the current challenging credit environment may, however, be of greater concern because of insurers’ indirect exposures (for example through CDOs of CDOs, hedge funds, or liquidity facilities).
Demand for life insurance is expected to be maintained as the share of retirees in the population increases. Tax and pension reforms might, however, shift the demand for life insurance products towards pension funds, and life insurers are still faced with longevity risks.
Despite the favourable developments in the non-life business, continued strong competition among non-life insurance businesses is likely to keep a lid on premium rates and thus pose challenges to profi tability. At the same time,
Chart 5.11 Cumulative changes in insurance stock indices relative to the Dow Jones EURO STOXX index
(Jan. 2005 - Nov. 2007; %; base: Jan. 2005 = 0)
-40-30-20-10
0102030405060
-40-30-20-100102030405060
non-life insurerslife insurersreinsurance
2005 2006 2007
Source: Thomson Financial Datastream.
144ECBFinancial Stability ReviewDecember 2007144
tight competition among non-life insurers may increase their willingness to take on more risk and to transfer some of this risk to the reinsurance sector, which may in turn pass it on to the capital markets.
The fi nancial conditions of reinsurers have improved thanks to premium growth and contained losses from catastrophes, although the forecast increase in natural catastrophes in the period ahead still poses risks for reinsurers (and non-life insurers). Reinsurers could see reduced demand because of the increased use of insurance securitisation as a means of transferring risk to fi nancial markets. Insurance securitisation does, however, also provide a source of fee income for reinsurers that underwrite or provide management services.
Forward-looking market indicators signal uncertainty and the potential for a worsening of conditions in the euro area insurance sector. Insurers’ stock prices have fallen by more than the overall stock market since the fi nalisation of the June 2007 FSR and, in particular, during the fi nancial market turmoil that started during the summer, and other forward-looking indicators suggest that fragilities in the sector have increased as earnings prospects are judged to be lower going forward.
145ECB
Financial Stability ReviewDecember 2007
I I I THE EURO AREA F INANC IAL
SYSTEM6 STRENGTHENING FINANCIAL SYSTEM
INFRASTRUCTURES
This Section discusses from an oversight perspective key developments in the Trans-European Automated Real-Time Gross-settlement Express Transfer system (TARGET) and the Continuous Linked Settlement system (CLS) since the fi nalisation of the June 2007 FSR. An account is also provided of the latest developments regarding the Eurosystem’s work on the common methodology for the assessment of systemically and prominently important euro payment systems. Furthermore, some insight is provided on the ongoing analytical work which the G10 Committee on Payment and Settlement Systems (CPSS) has been carrying out in the survey it conducted in 2006 on the size, duration, concentration and control of Foreign Exchange (FX) settlement exposures (the FX survey). Finally, the fi ve high level oversight expectations that the central banks of the Group of Ten (G10) countries have recently adopted with the aim of contributing to ensuring the safety, availability and resilience of the services provided by SWIFT are explained.
Key euro market infrastructures and infrastructure service providers were faced with signifi cant settlement volumes and values in an environment of high market volatility in the second and third quarters of 2007. The assessment of the Eurosystem’s oversight function is that they continued to function safely and effi ciently during this challenging period. In particular, the central bank operated Trans-European Automated Real-Time Gross-settlement Express Transfer system (TARGET) and the Continuous Linked Settlement system (CLS) operated by CLS Bank International again proved their high degree of operational reliability. Higher than normal volumes and values were channelled through these systems in recent months, in particular through CLS. The few operational problems that occurred in these systems after the June 2007 FSR was fi nalised were handled in an appropriate manner by all relevant stakeholders. This
ensured that these payment infrastructures did not become an additional source of uncertainty for the stability of the fi nancial system in an otherwise turbulent environment. The Eurosystem’s oversight function will continue to contribute to the smooth functioning of payment and settlement systems by being vigilant and safeguarding the consistent enforcement of oversight standards and ensuring that there is a level-playing fi eld for all relevant stakeholders.
6.1 PAYMENT INFRASTRUCTURES AND
INFRASTRUCTURE SERVICES
OVERSIGHT OF PAYMENT INFRASTRUCTURES
Payments oversight is a central bank task which is principally intended to promote the smooth functioning of payment infrastructures and payment infrastructure service providers and, thus, to contribute to the stability of the fi nancial system. The objectives of oversight are to protect the fi nancial system from possible “domino effects” (systemic risk), which may occur when one or more participants in the payment system introduce legal risks into the system and/or incur credit or liquidity problems, and to foster the effi ciency and soundness of payment systems. Overseers carry out this task by setting and enforcing oversight standards using a variety of tools and methods. The Eurosystem has been applying the “Core Principles for Systemically Important Payment Systems” as its minimum oversight standard for payment infrastructures since January 2001,1 the “Oversight standards for euro retail payment systems” since June 2003 and the “Business continuity oversight expectations for systemically important
See Committee on Payment and Settlement Systems (CPSS) 1 (2001), “Core Principles for Systemically Important Payment Systems”, BIS, January. The Core Principles are also part of the compendium of 12 standards that the BIS-located Financial Stability Forum considers essential for safeguarding fi nancial stability.
146ECBFinancial Stability ReviewDecember 2007146
payment systems” since May 2006.2 With respect to the oversight of SWIFT, which is the most important messaging services provider to market infrastructures, a specifi c set of principles (High Level Expectations) was developed by the overseers of SWIFT 3 and published in June 2007.4
DEVELOPMENTS IN KEY EURO PAYMENT
INFRASTRUCTURES
TARGET
TARGET is the system through which banks established in the European Economic Area (EEA) can make (primarily large-value) interbank and customer payments in euro. It is a real-time gross settlement (RTGS) system, i.e. all payments are individually settled with immediate fi nality in central bank money, thus eliminating credit risk and contributing to lowering systemic risk. TARGET successfully commenced live operation on 4 January 1999 when the euro replaced the national currencies in 11 EU Member States. In 2007 TARGET was available for all credit transfers in euro between banks in 17 EU Member States – including the 13 euro area countries plus Denmark, Estonia, Poland and the United Kingdom. As a result, it is one of the largest wholesale payment systems in the world.
Owing to TARGET’s pivotal role in contributing to the stability of the fi nancial system in the EU, the Eurosystem pays very close attention to its safety and effi ciency. The compliance of TARGET with the “Core Principles for Systemically Important Payment Systems” is verifi ed as part of the TARGET oversight.5
Average daily volumes and values of transactions processed in TARGET continued growing steadily between April 2007 and September 2007. During this period the average daily value settled in TARGET reached €2.4 trillion, whereas the average daily volume of transactions exceeded 365,000. With a share of around 90% in terms of value and 60% in terms of the total volume of euro payments settled in systemically important euro payment
systems located in the euro area, TARGET maintained its leading position (see Chart S132). In comparison, EURO1, the second largest euro payment system in the euro area in terms of value, processed a daily average volume of 212,605 transactions and a daily average value of €229 billion over the same period.6
The fi ve largest national RTGS systems (notably those of Germany, France, Spain, Italy and the United Kingdom) continued to concentrate most of the TARGET turnover in their systems, i.e. 79% of the value and 80% of the total volume of TARGET transactions in the second and third quarters of 2007. The German RTGS plus system remains the most important national TARGET component with a 28% share of total settlement value and 44% share of total volume (see Chart S133).
The real-time processing capability of TARGET can be characterised by its operational availability and the average processing time length. Between April 2007 and September 2007 TARGET maintained a very high level of operational availability; the overall availability ratio reached 99.91% (see Chart S134). Moreover, 98.03% of all TARGET transactions were processed, i.e. debited and credited, in less than fi ve minutes (compared with 95.60% in 2005). At the same time, 1.59% were processed in between fi ve and 15 minutes (3.58% in 2005), and 0.06% in between 15 and 30 minutes (0.40% in 2005). Only in 0.07% of cases did the processing time of TARGET transactions exceed 30 minutes.
See ECB (2003), “Oversight standards for euro retail payment 2 systems”, June; ECB (2006), “Business Continuity Oversight Expectations for Systemically Important Payment Systems (SIPS)”, June; and ECB (2006), Financial Stability Review, December.See ECB (2005), 3 Financial Stability Review, December, for details regarding the SWIFT oversight arrangement.See National Bank of Belgium (2007), “High Level 4 Expectations for the Oversight of SWIFT”, National Bank of Belgium Financial Stability Review, June.See Committee on Payment and Settlement Systems (CPSS) 5 (2001), “Core Principles for Systemically Important Payment Systems”, BIS, January.The EURO1 system is the largest privately-run payment 6 system for euro credit transfers. It is operated by the CLEARING company of the Euro Banking Association (EBA CLEARING).
147ECB
Financial Stability ReviewDecember 2007
I I I THE EURO AREA F INANC IAL
SYSTEM
147
In order to ensure a high level of availability, as well as a high level of security, the TARGET operation function has a comprehensive TARGET risk management framework in place. To manage as effi ciently as possible events that could potentially reduce the TARGET service level, the Eurosystem ensures that the system’s business continuity and contingency measures are fully operable.
As part of their regular TARGET oversight activities related to ensuring the robustness and resilience of TARGET and with a view to contributing to TARGET’s continued compliance with Core Principle VII,7 TARGET overseers also analyse information on the number, duration and types of TARGET incidents, as well as whether or not there have been any material changes to the system design that could have negatively impacted on the smooth functioning of the system. A particular focus is on the analysis of signifi cant incidents, i.e. those lasting more than two hours and/or resulting in a delayed closing of TARGET, and their possible impact on the security and operational reliability of the system. There were three such operational incidents in the second and third quarters of 2007. None of these incidents caused a delay in TARGET closing. The oversight function concluded that these incidents have been properly followed up by the TARGET operation function to prevent them from recurring and that there has been no systemic impact on the secure and operationally reliable functioning of TARGET in the reporting period. With TARGET2 on the horizon, there have not been any changes to the structure and features of the existing TARGET system in the period between April 2007 and September 2007.
TARGET2
At the time of fi nalisation of this FSR on 9 November, TARGET2 was expected to go live on 19 November 2007. TARGET2 is based on a centralised IT platform on which all Eurosystem central banks and seven other EU central banks manage the RTGS accounts of their TARGET2 participants. This is a signifi cant improvement compared
to the fi rst generation of TARGET which was characterised by a fully decentralised set-up. TARGET2 offers a harmonised service level based on a common pricing scheme to all its participants. Furthermore, it includes advanced liquidity management features, in particular the liquidity pooling function, as well as a higher level of resilience as a result of the multi-region/multi-site concept.
Despite its achievements, the existing TARGET system had diffi culties in adapting in a cost-effective way to changing market needs. Nowadays, fi nancial institutions constantly demand more advanced and harmonised payment and settlement services across Europe. This is why, as from October 2002, the Eurosystem began developing a new and enhanced version of the TARGET system, TARGET2. With the aim of appropriately controlling the potential risks related to migration from an old to a new system, the migration from the existing TARGET system to TARGET2 has been split into “country groups”. This allows TARGET users to migrate to TARGET2 in different waves and on different pre-defi ned dates. Each migration group consists of a group of national central banks and their respective TARGET user communities. TARGET users are allocated to the respective groups according to the central bank with which they maintain their business relationship. The total migration period is limited to six months (or ten months if the fourth window which is a contingency window were to be used).
Liquidity management
The needs of cash and collateral managers were taken into account by the Eurosystem when developing TARGET2. Cash and collateral managers need automated processes to optimise payment and liquidity management. They also need the appropriate tools to track activity across accounts, and to make accurate intraday and overnight funding decisions. Therefore,
Core Principle VII reads as follows: “The system should ensure 7 a high degree of security and operational reliability and should have contingency arrangements for timely completion of daily processing”.
148ECBFinancial Stability ReviewDecember 2007148
a number of enhanced payment and liquidity management tools have been built into the TARGET2 system.
TARGET2 participants have the option to control the use of the supplied liquidity by means of a reservation and limit system, which can also be combined with each other according to individual needs. In TARGET2 it is possible for participants to reserve liquidity for “urgent” and, separately, for “highly urgent” payments, which represent two of three existing priority classes for payment orders in TARGET2 (the third one being “normal” payments), as well as to dedicate liquidity for the settlement of ancillary systems. Participants are also able to defi ne bilateral and multilateral sender limits and actively manage their payment queues (e.g. by changing the priority or the order of queued transactions). Furthermore, banks are able to use a liquidity pooling functionality within a group to view or use the liquidity of all accounts belonging to the group, irrespective of the RTGS account on which the liquidity is held.
Improved settlement services for ancillary
systems
TARGET2 provides a harmonised set of cash settlement services in central bank money for all kinds of ancillary systems, including retail payment systems, other large-value payment systems, foreign exchange settlement systems, money market systems, clearing houses and securities settlement systems. The main advantage for ancillary systems is that they will be able to access any of their participants’ account in TARGET2 via a standardised interface. TARGET2 participants only need one RTGS account to settle balances stemming from any ancillary system (settling in TARGET2) in which they participate. While there are currently more than 70 ancillary systems, each settling in its own way, TARGET2 offers six generic procedures for settlement, thus resulting in a substantial harmonisation of current practices.
Business continuity
The business continuity concept of TARGET2 consists of a multi-region/multi-site architecture. For the payment processing and accounting services there will be two regions. In each region, there will be two remote sites. This will be combined with the principle of region rotation in order to ensure the presence of experienced staff in both regions.
Following an event that renders the fi rst site inoperative, the second site (in the same region) is expected to resume the normal payment processing and accounting services within one hour. Likewise, following an event that renders the fi rst region inoperative, the second region is expected to resume the normal payment processing and accounting services within two hours.
Oversight assessment of the TARGET2 design
Like any existing systemically important payment system, TARGET2 has to comply with the Core Principles for Systemically Important Payment Systems. Therefore, the oversight function has, from the outset, followed the TARGET2 project very closely by reviewing relevant system documentation and discussing oversight fi ndings with and providing recommendations to the TARGET2 operators. This process was organised based on a strict separation of roles within the Eurosystem. The assessment of TARGET2 against the Core Principles led to the conclusion that there are no obstacles to the going live of the system within the envisaged time frame and that TARGET2 is likely to observe all relevant Core Principles. However, certain oversight fi ndings and recommendations, including the time line for their follow-up and implementation, will be discussed among the overseers and TARGET2 operators. Once this process has been completed, there will be a fi nal decision on the compliance level of TARGET2 with each of the relevant Core Principles. In line with general Eurosystem transparency principles,
149ECB
Financial Stability ReviewDecember 2007
I I I THE EURO AREA F INANC IAL
SYSTEM
149
the assessment result will be published in the form of a dedicated assessment report.
CLS
The Continuous Linked Settlement system (CLS) is a multi-currency settlement system whose primary purpose has been the settlement of payment instructions related to foreign exchange (FX) trades on a payment-versus-payment (PVP) basis in the books of a commercial bank, i.e. CLS Bank International, New York, the operator of CLS. PVP ensures that the two legs of an FX trade are paid simultaneously. This eliminates FX settlement risk.8 CLS w as launched in September 2002. It is regarded as the industry’s main response to the second track of the G10 policy objective and strategy for a reduction in FX settlement risk (see also Box 19). The Federal Reserve is the primary supervisor of CLS Bank and it is the lead overseer of CLS within a cooperative oversight arrangement comprising the G10 central banks and the central banks whose currencies are settled in CLS. The ECB is the lead overseer for settlement of euro in CLS.
The safety and effi ciency of CLS is extremely important from a euro area and global fi nancial stability perspective for a number of reasons. First, CLS settles fi fteen of the world’s mostly traded currencies, including USD, EUR, JPY, GBP and CHF. Second, the volumes and values of the FX settlement obligations processed and settled through CLS are such that FX settlement risk is substantially reduced, thereby enhancing the stability of the fi nancial system. Third, CLS is the largest payment infrastructure settling euro-denominated payment transactions outside the euro area.
Looking at the period between April 2007 and September 2007, on 19 September 2007, which was a quarterly fi nancial futures settlement day, CLS settled a record volume (905,478 sides) and a record value (USD 8.4 trillion equivalent) of transactions. The average daily
FX settlement risk is defi ned as the risk that one party to an 8 FX transaction will pay the currency it sold, but not receive the currency it bought.
Box 19
MORE THAN THIRTY YEARS AFTER THE “HERSTATT” CASE, FOREIGN EXCHANGE SETTLEMENT RISK
IS STILL AN ISSUE
On 26 June 1974, the German banking supervisory authority decided to close a German bank, Bankhaus Herstatt, because of heavy losses it had endured as a result of speculative foreign exchange positions it had taken. Its foreign exchange dealers had sold a sizeable amount of US dollars against the Deutsche mark, but the market moved against them. The bank was closed in the middle of the German business day, before the opening of US markets. By this time, it had already received – via the German payment system – the marks it had bought two days earlier. However, because of the time zone difference, Bankhaus Herstatt had not yet delivered the dollars it had sold. As a result, several fi nancial institutions were adversely affected and the US-based CHIPS system had to close for 24 hours.1
Up until the Herstatt incident, market participants had thought that their foreign exchange risk was limited to market movements. However, the Herstatt case demonstrated very clearly how risky the lack of synchronism between the settlement of the two legs of a foreign exchange
1 CHIPS denotes Clearing House Interbank Payments System. Today, it is the premier bank-owned payments system for clearing large value US dollar payments using bilateral and multilateral netting for maximum liquidity effi ciency.

150ECBFinancial Stability ReviewDecember 2007150ECBFinancial Stability ReviewDecember 2007
trade could be, and market participants realised that they also faced a principal risk. “Herstatt risk”, as it has come to be known, is a type of risk that payment systems had not been, and for a long time afterwards were still not, designed to cope with adequately. In the mid-1990s, the Basel-based Committee on Payment and Settlement Systems (CPSS) created a sub-group to investigate potential solutions to the issue, and a risk-reduction strategy to eliminate foreign exchange (FX) settlement risk was subsequently agreed upon by G10 central banks.2 This strategy included three tracks:
Track 1: Action by individual banks to control their FX settlement exposures
Individual banks should take immediate steps to apply an appropriate credit control process to their FX settlement exposures. This recognises the considerable scope for individual banks to address the problem by improving their practices for measuring and managing their FX settlement exposures.
Track 2: Action by industry groups to provide risk-reducing multi-currency services
Industry groups are encouraged to develop well constructed multi-currency services that would contribute to the risk-reduction efforts of individual banks. This recognises the signifi cant potential benefi ts of multi-currency settlement mechanisms and bilateral and multilateral obligation netting arrangements, and the G10 central banks’ view that such services would best be provided by the private sector rather than the public sector.
Track 3: Action by central banks to induce rapid private sector progress
Each central bank, in cooperation, where appropriate, with the relevant supervisory authorities, will choose the most effective steps to foster satisfactory private sector action over the next two years in its domestic market. In addition, where appropriate and feasible, central banks will make or seek to achieve certain key enhancements to national payment systems and will consider other steps to facilitate private sector risk-reduction efforts. This recognises the likely need for public authorities to encourage action by individual banks and industry groups, and to cooperate with these groups, to bring about timely, market-wide progress.
In July 1998 the CPSS published its fi rst progress report.3 This report acknowledged that “encouraging progress” had been made on all three tracks of the strategy but that “more needs to be done.” The creation of the Continuous Linked Settlement system (CLS) by major private sector banks and operated by CLS Bank International, a single-purpose bank, is a direct consequence of the central banks’ FX risk reduction strategy. CLS started its operations in September 2002. Similar payment-versus-payment (PVP) arrangements operate elsewhere, for instance in Hong Kong, involving HKD, USD and EUR.
Ten years after the fi rst CPSS report and four years after the launch of CLS, the G10 central banks considered the time to be right to organise a survey on whether further progress has been made or whether more needs to be done to contain FX settlement risk. This survey,
2 See CPSS (1996), “Settlement Risk in Foreign Exchange Transactions”, BIS, March.3 See CPSS (1998), “Reducing foreign exchange settlement risk: a progress report”, BIS, July.
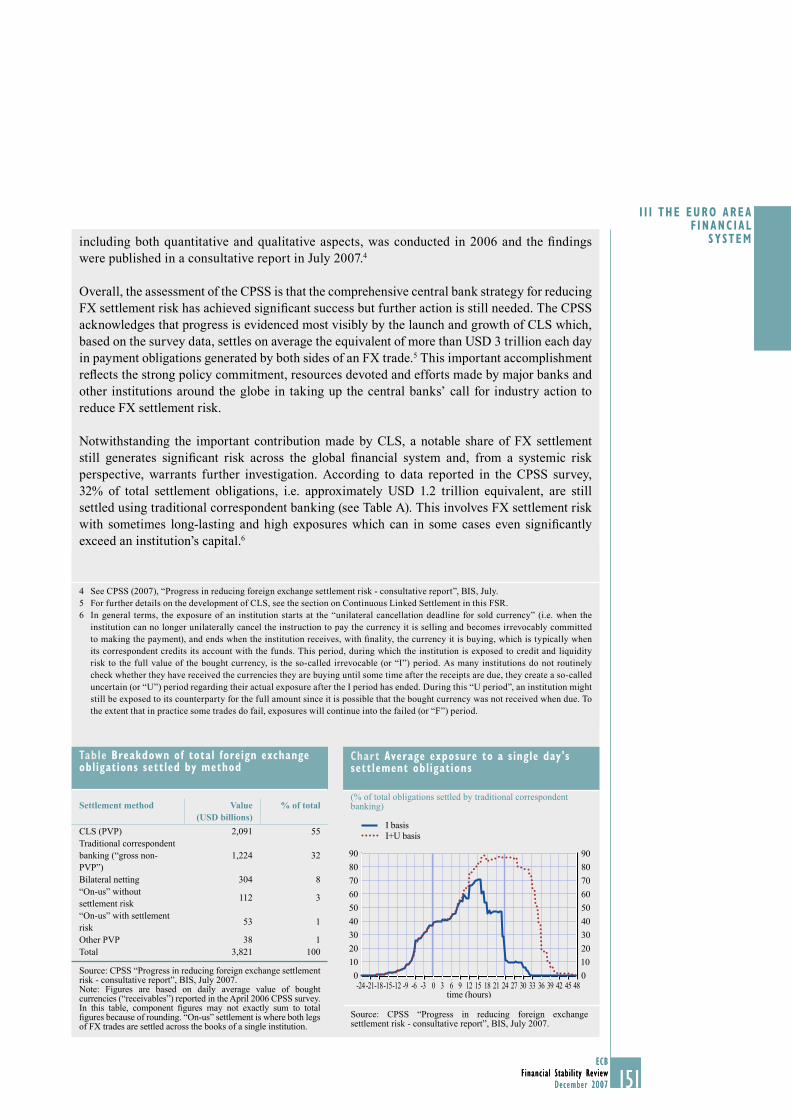
151ECB
Financial Stability ReviewDecember 2007
I I I THE EURO AREA F INANC IAL
SYSTEM
ECBFinancial Stability Review
December 2007 151
Table Breakdown of total foreign exchange obligations settled by method
Settlement method Value (USD billions)
% of total
CLS (PVP) 2,091 55Traditional correspondent banking (“gross non-PVP”)
1,224 32
Bilateral netting 304 8“On-us” without settlement risk
112 3
“On-us” with settlement risk
53 1
Other PVP 38 1Total 3,821 100
Source: CPSS “Progress in reducing foreign exchange settlement risk - consultative report”, BIS, July 2007.Note: Figures are based on daily average value of bought currencies (“receivables”) reported in the April 2006 CPSS survey. In this table, component fi gures may not exactly sum to total fi gures because of rounding. “On-us” settlement is where both legs of FX trades are settled across the books of a single institution.
Chart Average exposure to a single day's settlement obligations
(% of total obligations settled by traditional correspondent banking)
0
10
20
30
40
50
60
70
80
90
0
10
20
30
40
50
60
70
80
90
I basisI+U basis
-24-21-18-15-12 -9 -6 -3 0 3 6 9 12 15 18 21 24 27 30 33 36 39 42 45 48time (hours)
Source: CPSS “Progress in reducing foreign exchange settlement risk - consultative report”, BIS, July 2007.
including both quantitative and qualitative aspects, was conducted in 2006 and the fi ndings were published in a consultative report in July 2007.4
Overall, the assessment of the CPSS is that the comprehensive central bank strategy for reducing FX settlement risk has achieved signifi cant success but further action is still needed. The CPSS acknowledges that progress is evidenced most visibly by the launch and growth of CLS which, based on the survey data, settles on average the equivalent of more than USD 3 trillion each day in payment obligations generated by both sides of an FX trade.5 This important accomplishment refl ects the strong policy commitment, resources devoted and efforts made by major banks and other institutions around the globe in taking up the central banks’ call for industry action to reduce FX settlement risk.
Notwithstanding the important contribution made by CLS, a notable share of FX settlement still generates signifi cant risk across the global fi nancial system and, from a systemic risk perspective, warrants further investigation. According to data reported in the CPSS survey, 32% of total settlement obligations, i.e. approximately USD 1.2 trillion equivalent, are still settled using traditional correspondent banking (see Table A). This involves FX settlement risk with sometimes long-lasting and high exposures which can in some cases even signifi cantly exceed an institution’s capital.6
4 See CPSS (2007), “Progress in reducing foreign exchange settlement risk - consultative report”, BIS, July.5 For further details on the development of CLS, see the section on Continuous Linked Settlement in this FSR.6 In general terms, the exposure of an institution starts at the “unilateral cancellation deadline for sold currency” (i.e. when the
institution can no longer unilaterally cancel the instruction to pay the currency it is selling and becomes irrevocably committed to making the payment), and ends when the institution receives, with fi nality, the currency it is buying, which is typically when its correspondent credits its account with the funds. This period, during which the institution is exposed to credit and liquidity risk to the full value of the bought currency, is the so-called irrevocable (or “I”) period. As many institutions do not routinely check whether they have received the currencies they are buying until some time after the receipts are due, they create a so-called uncertain (or “U”) period regarding their actual exposure after the I period has ended. During this “U period”, an institution might still be exposed to its counterparty for the full amount since it is possible that the bought currency was not received when due. To the extent that in practice some trades do fail, exposures will continue into the failed (or “F”) period.
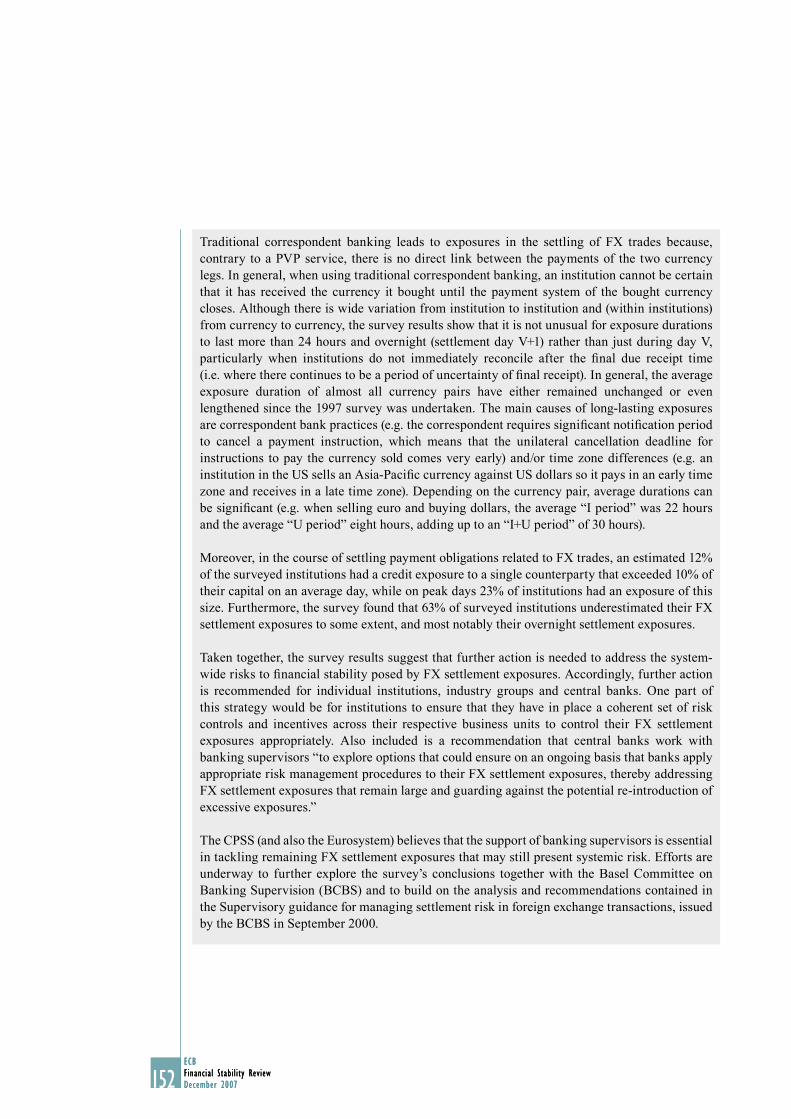
152ECBFinancial Stability ReviewDecember 2007152ECBFinancial Stability ReviewDecember 2007
Traditional correspondent banking leads to exposures in the settling of FX trades because, contrary to a PVP service, there is no direct link between the payments of the two currency legs. In general, when using traditional correspondent banking, an institution cannot be certain that it has received the currency it bought until the payment system of the bought currency closes. Although there is wide variation from institution to institution and (within institutions) from currency to currency, the survey results show that it is not unusual for exposure durations to last more than 24 hours and overnight (settlement day V+1) rather than just during day V, particularly when institutions do not immediately reconcile after the fi nal due receipt time (i.e. where there continues to be a period of uncertainty of fi nal receipt). In general, the average exposure duration of almost all currency pairs have either remained unchanged or even lengthened since the 1997 survey was undertaken. The main causes of long-lasting exposures are correspondent bank practices (e.g. the correspondent requires signifi cant notifi cation period to cancel a payment instruction, which means that the unilateral cancellation deadline for instructions to pay the currency sold comes very early) and/or time zone differences (e.g. an institution in the US sells an Asia-Pacifi c currency against US dollars so it pays in an early time zone and receives in a late time zone). Depending on the currency pair, average durations can be signifi cant (e.g. when selling euro and buying dollars, the average “I period” was 22 hours and the average “U period” eight hours, adding up to an “I+U period” of 30 hours).
Moreover, in the course of settling payment obligations related to FX trades, an estimated 12% of the surveyed institutions had a credit exposure to a single counterparty that exceeded 10% of their capital on an average day, while on peak days 23% of institutions had an exposure of this size. Furthermore, the survey found that 63% of surveyed institutions underestimated their FX settlement exposures to some extent, and most notably their overnight settlement exposures.
Taken together, the survey results suggest that further action is needed to address the system-wide risks to fi nancial stability posed by FX settlement exposures. Accordingly, further action is recommended for individual institutions, industry groups and central banks. One part of this strategy would be for institutions to ensure that they have in place a coherent set of risk controls and incentives across their respective business units to control their FX settlement exposures appropriately. Also included is a recommendation that central banks work with banking supervisors “to explore options that could ensure on an ongoing basis that banks apply appropriate risk management procedures to their FX settlement exposures, thereby addressing FX settlement exposures that remain large and guarding against the potential re-introduction of excessive exposures.”
The CPSS (and also the Eurosystem) believes that the support of banking supervisors is essential in tackling remaining FX settlement exposures that may still present systemic risk. Efforts are underway to further explore the survey’s conclusions together with the Basel Committee on Banking Supervision (BCBS) and to build on the analysis and recommendations contained in the Supervisory guidance for managing settlement risk in foreign exchange transactions, issued by the BCBS in September 2000.
153ECB
Financial Stability ReviewDecember 2007
I I I THE EURO AREA F INANC IAL
SYSTEM
ECBFinancial Stability Review
December 2007 153
number of sides settled in CLS during this period was 363,967 and the average total daily value was USD 3.7 trillion equivalent (see Chart S135), eliminating FX settlement risk of approximately USD 3.6 trillion equivalent.9 The euro values settled via CLS in this period amounted to USD 708 billion equivalent, eliminating FX settlement risk of approximately USD 677 billion equivalent (see Chart S135).10
In terms of operational reliability, CLS has shown continuous robustness and resiliency since it began operations fi ve years ago. In particular during August and September 2007, a period which saw extraordinary volatility in the foreign exchange markets, coinciding with exceptional levels of trading activity, a signifi cant strain was put on the entire fi nancial industry and its broader fi nancial infrastructure. During this period of stress, CLS was directly impacted by these extraordinary volumes, experiencing record input and settlement days but it performed well as a pillar of fi nancial stability. CLS Bank worked with all relevant stakeholders – including its settlement members, the nostro agents, the real-time gross settlement (RTGS) system operators and the regulatory community – in a structured and proactive manner, ensuring that a smooth operation of the settlement process occurred as expected. This enabled the fi nancial industry to meet the challenges it faced in a controlled and consistent way. Also on 19 September 2007, a day of record volumes and values, the core system behaved fl awlessly with settlement completing ahead of schedule. In addition to these unprecedented events in the foreign exchange market, there were only very few issues, e.g. pay-in delays because of connectivity problems, that caused some slight delays to the achievement of business deadlines. However, these incidents had no serious systemic implications. Since the fi nalisation of the June 2007 FSR, CLS has continued to have a 100% settlement completion rate for the FX settlement instructions that could be settled. In addition, the pay out rate of the funds in the currencies involved via the relevant RTGS systems, such as TARGET, continued to be 100% throughout each month.
Following an initial announcement in 2005, CLS Bank is in the fi nal process of launching services for the settlement of non-deliverable forwards (NDFs); settlement services for FX option premiums will not be introduced before early 2008. CLS Bank has also been granted regulatory approval for its request to act as the central settlement provider for the settlement of all payment instructions associated with over-the-counter (OTC) credit derivatives calculated or matched by the DTCC Deriv/SERV Trade Information Warehouse. 11
As regards the settlement by CLS of the approved single currency payment instructions denominated in euro, i.e. NDFs, FX option premiums, and OTC credit derivatives, the approval is subject to the continued compliance of CLS with the Core Principles and the Eurosystem policy principles on the location and operation of infrastructures settling euro-denominated payment transactions. As regards CLS Bank’s efforts to increase the number of CLS eligible currencies, substantial progress has been made. In principle, the inclusion of new currencies in CLS is welcome from an oversight perspective, as long as the overall stability of CLS, in particular its risk management framework, remains robust and
The volumes and values of settled FX transactions amount 9 to double the volumes and values of FX trades because every trade involves two settlements legs (sides), one in each currency. Thus, CLS settled an average of 181,984 trades a day with a total value of USD 1.85 trillion equivalent.The reduction in FX settlement risk is smaller than the values 10 actually settled in CLS because participants trade down their positions in CLS via so-called inside/outside swaps (“I/O swaps”), whereby two CLS settlement members conclude two opposite trades, one to be settled in CLS (the inside leg of the swap) and the other one (the outside leg of the swap) to be settled outside CLS, e.g. via traditional FX settlement methods such as correspondent banking. Because the outside leg of the swap reintroduces FX settlement risk, the value of the “I/O swaps” needs to be deducted from the values settled in CLS to obtain the true reduction in FX settlement risk achieved by CLS.DTCC Deriv/SERV LLC is a wholly-owned subsidiary of the 11 Depository Trust & Clearing Corporation. DTCC Deriv/SERV Trade Information Warehouse is a comprehensive centralised trade database of OTC credit derivative transactions. The DTCC Warehouse will either centrally calculate the payments for those OTC credit derivatives for which it maintains the offi cial legal record (“gold record”) or match/affi rm payments for those OTC credit derivative transactions for which the DTCC Warehouse maintains basic economic information (“bronze record”), and such payment instructions will, in turn, be submitted to CLS Bank for settlement.
154ECBFinancial Stability ReviewDecember 2007154ECBFinancial Stability ReviewDecember 2007
sound. The potential inclusion of the Mexican peso and the Israeli shekel are currently under review by CLS Bank and the overseers.
ENHANCEMENTS TO THE EUROSYSTEM’S COMMON
OVERSIGHT FRAMEWORK
In the June 2007 FSR it was explained that the Eurosystem had developed a draft Eurosystem common methodology for the assessment of euro systemically and prominently important payment systems against the Core Principles (hereafter referred to as “the Eurosystem common methodology”). It includes two parts: (i) the “Terms of Reference for the oversight assessment of euro systemically and prominently important payment systems against the Core Principles”; and (ii) the “Guide for the Assessment against the Business Continuity Oversight Expectations for Systemically Important Payment Systems”. The ECB carried out a public consultation on the draft Eurosystem common methodology between 14 May and 14 August. No comments were received. The fi nal Eurosystem common methodology has become part of the Eurosystem’s common oversight framework and was published by the ECB in November 2007.12
OVERSIGHT OF INFRASTRUCTURE SERVICE
PROVIDERS
SWIFT
The National Bank of Belgium is the lead overseer of SWIFT within a cooperative oversight arrangement comprising all G10 central banks. The overseers of SWIFT recently developed the “High Level Expectations for the Oversight of SWIFT” (HLEs) as a specifi c set of principles that expound various dimensions of operational risk.13 The HLEs differ from the Core Principles, as the overseers of SWIFT concluded that the Core Principles only had partial relevance to SWIFT because SWIFT is not itself a payment system, but a provider of messaging services to such systems. By formulating HLEs, the overseers of SWIFT emphasise the importance they attach to the good functioning of SWIFT, while clarifying their objectives to various stakeholders (i.e. the SWIFT management and Board, central banks
and other public authorities). In this way, the choice of IT security framework methodology is also left to SWIFT. On purpose, the wording of what is expected from SWIFT is “high-level”, as overseers do not want to impose a specifi c IT security framework methodology onto SWIFT, but offer SWIFT maximum fl exibility to demonstrate compliance with the expectations by reference to the framework, processes, standards and security baselines in use at SWIFT.
The overseers’ focus on SWIFT’s management of operational risks has been translated into fi ve HLEs. Two of them focus on the management of risks: “Risk Identifi cation” and “Management; Communication with Users”. Three HLEs deal with specifi c types of risk that should be managed: “Information Security”, “Reliability and Resilience” and “Technology Planning”.
The HLEs provide the basis on which SWIFT will prepare a self-assessment and report to central banks how it lives up to overseers’ expectations. Furthermore, the HLEs provide a framework within which the overseers organise their activities and on the basis of which risk-based oversight planning is prepared.
The fi ve High Level Expectations for the Oversight of SWIFT and the rationale of the framework are presented in detail in the June 2007 Financial Stability Review of the National Bank of Belgium.
See ECB (2007), “Oversight of payment systems: The 12 Eurosystem’s common methodology”, November.For the objectives, scope and structure of the oversight 13 of SWIFT, see ECB (2005), Financial Stability Review, December.
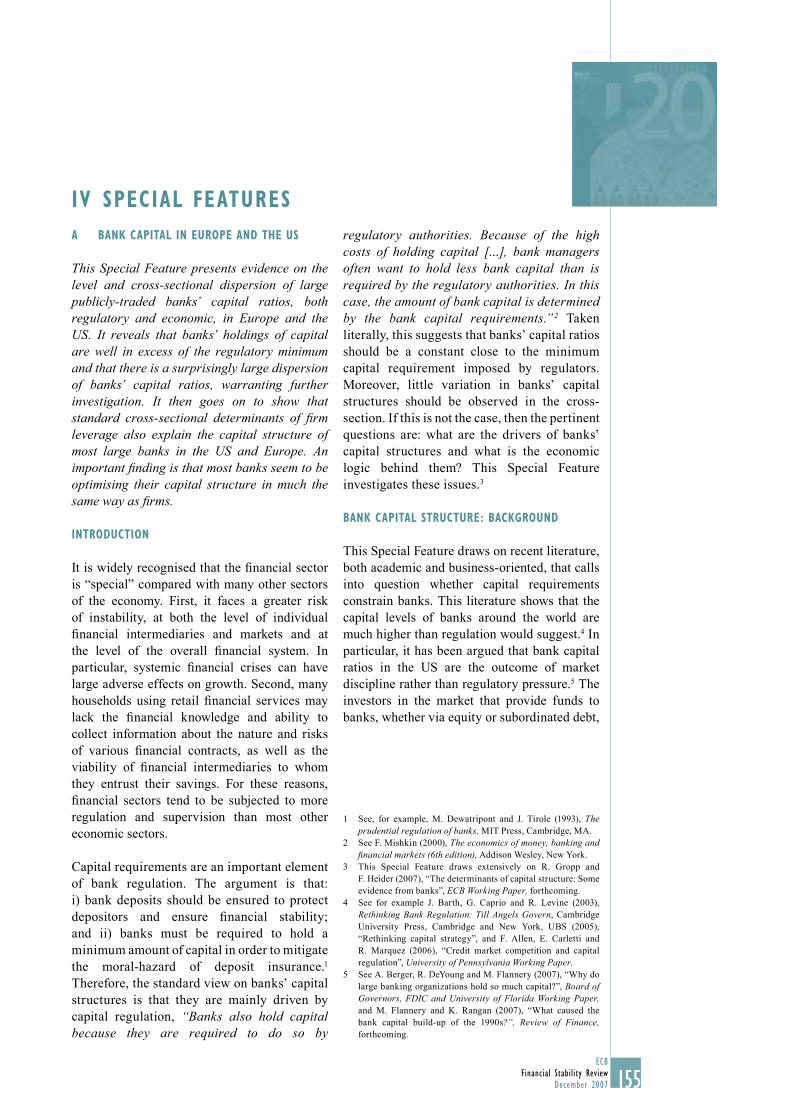
155ECB
Financial Stability ReviewDecember 2007
IV SPECIAL FEATURES
A BANK CAPITAL IN EUROPE AND THE US
This Special Feature presents evidence on the level and cross-sectional dispersion of large publicly-traded banks’ capital ratios, both regulatory and economic, in Europe and the US. It reveals that banks’ holdings of capital are well in excess of the regulatory minimum and that there is a surprisingly large dispersion of banks’ capital ratios, warranting further investigation. It then goes on to show that standard cross-sectional determinants of fi rm leverage also explain the capital structure of most large banks in the US and Europe. An important fi nding is that most banks seem to be optimising their capital structure in much the same way as fi rms.
INTRODUCTION
It is widely recognised that the fi nancial sector is “special” compared with many other sectors of the economy. First, it faces a greater risk of instability, at both the level of individual fi nancial intermediaries and markets and at the level of the overall fi nancial system. In particular, systemic fi nancial crises can have large adverse effects on growth. Second, many households using retail fi nancial services may lack the fi nancial knowledge and ability to collect information about the nature and risks of various fi nancial contracts, as well as the viability of fi nancial intermediaries to whom they entrust their savings. For these reasons, fi nancial sectors tend to be subjected to more regulation and supervision than most other economic sectors.
Capital requirements are an important element of bank regulation. The argument is that: i) bank deposits should be ensured to protect depositors and ensure fi nancial stability; and ii) banks must be required to hold a minimum amount of capital in order to mitigate the moral-hazard of deposit insurance.1 Therefore, the standard view on banks’ capital structures is that they are mainly driven by capital regulation, “Banks also hold capital because they are required to do so by
regulatory authorities. Because of the high costs of holding capital […], bank managers often want to hold less bank capital than is required by the regulatory authorities. In this case, the amount of bank capital is determined by the bank capital requirements.” 2 Taken literally, this suggests that banks’ capital ratios should be a constant close to the minimum capital requirement imposed by regulators. Moreover, little variation in banks’ capital structures should be observed in the cross-section. If this is not the case, then the pertinent questions are: what are the drivers of banks’ capital structures and what is the economic logic behind them? This Special Feature investigates these issues.3
BANK CAPITAL STRUCTURE: BACKGROUND
This Special Feature draws on recent literature, both academic and business-oriented, that calls into question whether capital requirements constrain banks. This literature shows that the capital levels of banks around the world are much higher than regulation would suggest.4 In particular, it has been argued that bank capital ratios in the US are the outcome of market discipline rather than regulatory pressure.5 The investors in the market that provide funds to banks, whether via equity or subordinated debt,
See, for example, M. Dewatripont and J. Tirole (1993), 1 The prudential regulation of banks, MIT Press, Cambridge, MA.See F. Mishkin (2000), 2 The economics of money, banking and fi nancial markets (6th edition), Addison Wesley, New York.This Special Feature draws extensively on R. Gropp and 3 F. Heider (2007), “The determinants of capital structure: Some evidence from banks”, ECB Working Paper, forthcoming.See for example J. Barth, G. Caprio and R. Levine (2003), 4 Rethinking Bank Regulation: Till Angels Govern, Cambridge University Press, Cambridge and New York, UBS (2005), “Rethinking capital strategy”, and F. Allen, E. Carletti and R. Marquez (2006), “Credit market competition and capital regulation”, University of Pennsylvania Working Paper.See A. Berger, R. DeYoung and M. Flannery (2007), “Why do 5 large banking organizations hold so much capital?”, Board of Governors, FDIC and University of Florida Working Paper, and M. Flannery and K. Rangan (2007), “What caused the bank capital build-up of the 1990s?”, Review of Finance, forthcoming.
156ECBFinancial Stability ReviewDecember 2007
monitor them and price debt and equity accordingly.6
This Special Feature complements the market discipline view by suggesting that: i) the dispersion and level of banks’ capital ratios is too high to be caused by regulatory concerns only; and ii) banks’ capital structures are driven by the same factors as those of fi rms, which of course are not subject to capital regulation.
Once it has been established that banks’ capital ratios are neither constant nor close to the regulatory minimum, the next step is to investigate the determinants of banks’ capital structures. However, the banking literature offers little guidance in this regard, as it does not consider the signifi cant cross-sectional variation in banks’ capital ratios. By contrast, various corporate fi nance theories have produced a long list of factors that could drive fi rms’ capital structures.7 The empirical corporate fi nance literature has converged on the following set of variables as being able to predict reliably the leverage of non-fi nancial fi rms in the cross-section.8 First, leverage is positively related to size. It is usually argued that larger fi rms are safer, better known in the market, more exposed to agency problems or enjoy market power vis-à-vis investors, all of which may explain why larger fi rms have more debt in their capital structures.9 Second, more profi table fi rms tend to have less leverage. This is consistent with the pecking-order theory and dynamic versions of the trade-off theory, while static versions of the trade-off theory predict that more profi table fi rms should lever up to shield their profi ts from corporate income tax.10 Third, leverage is negatively related to a fi rm’s market-to-book value ratio. Firms with high market-to-book value ratios have little free cash-fl ow as they appear to have numerous profi table investment opportunities. Such fi rms need less debt in their capital structure to prevent managers from investing the free cash-fl ow in negative net present value projects.11 Firms experiencing high levels of growth also have more to lose in the event of bankruptcy and may suffer more from a debt-overhang problem, so they should
be relatively less leveraged.12 Market timing can also explain the negative relationship between leverage and the market-to-book value ratio, as fi rms issue equity when it is overvalued.13 Fourth, fi rms with more collateral have higher leverage. When more assets can be used as collateral, less is lost in distress, reducing the bankruptcy costs of debt. Moreover, collateral reduces the agency cost of debt since it makes it easier to monitor the use of assets. Fifth, fi rms
M. Flannery and S. Sorescu (1996), “Evidence of bank market 6 discipline on subordinated debenture yields”, Journal of Finance, 51, pp. 1347-1377, D. Morgan and K. Stiroh (2001), “Market discipline of banks: The asset test”, Journal of Financial Services Research, 20, pp. 195-208, and R. Gropp, J. Vessala and G. Vulpes (2006), “Equity and bond market signals as leading indicators of bank fragility”, Journal of Money, Credit and Banking, 38, pp. 399-428, all present evidence of market discipline in the banking sector.For surveys, see M. Harris and A. Raviv (1991), “The theory 7 of capital structure”, Journal of Finance, 46, pp. 297-356, and M. Frank and V. Goyal (2007), “Trade-off and pecking order theories of debt”, to appear in E. Eckbo (ed.). Handbook of Corporate Finance: Empirical Corporate Finance, Vol.2, Elsevier, Amsterdam.See S. Titman and D. Wessels (1988), “The determinants 8 of capital structure choice”, Journal of Finance, 43, 1-19, R. Rajan and L. Zingales (1995), “What do we know about capital structure? Some evidence from international data”, Journal of Finance, 50, pp. 1421-1460, and M. Frank and V. Goyal (2005), “Capital structure decisions: Which factors are reliably important?”, Financial Management, forthcoming.The agency problem of fi rms was fi rst analysed by M. Jensen 9 and W. Meckling (1976), “Theory of the fi rm: Managerial behaviour, agency costs and ownership structure”, Journal of Financial Economics, 3, pp. 305-360.For the pecking order theory, see S. Myers and N. Majluf 10 (1984), “Corporate fi nancing and investment decisions when fi rms have information that investors do not have”, Journal of Financial Economics, 13, pp. 187-221, and S. Myers (1984), “The capital structure puzzle” Journal of Finance, 39,pp. 575-592. For the static trade-off theory, see M. Bradley,G. Jarrell and E. Kim (1984), “On the existence of an optimal capital structure: theory and evidence” Journal of Finance, 39, pp. 857-877. For the dynamic trade-off theory, see C. Hennessy and T. Whited (2005), “Debt dynamics” Journal of Finance, 60, pp. 1129-1165.See M. Jensen (1986), “The agency costs of free cash fl ow: 11 Corporate fi nance and takeovers”, American Economic Review, 76, pp. 323-329.The debt-overhang problem is attributed to S. Myers (1977), 12 “Determinants of corporate borrowing”, Journal of Financial Economics, 5, pp. 147-175. See also M. Barclay, E. Morrellec and C. Smith (2006), “On the debt capacity of growth options”, Journal of Business, 79, pp. 37-59.See M. Baker and J. Wurgler (2002), “Market timing and 13 capital structure”, Journal of Finance, 57, pp. 1-32. Another explanation is provided in A. Dittmar and A. Thakor (2007), “Why do fi rms issue equity?”, Journal of Finance, 62, pp. 1-54. Firms issue equity when their valuation is high as this indicates agreement between managers and investors about the prospects of investment opportunities.
157ECB
Financial Stability ReviewDecember 2007 157
I V SPEC IAL FEATURES
that pay dividends have less leverage.14 One reason for this could be that paying dividends exposes fi rms to the scrutiny of capital markets and reduces the agency cost of equity.15 Finally, a further reliable determinant of fi rms’ leverage consists of the average leverage of their industry. But since this Special Feature considers just one industry, namely banking, this is not an issue here.16
All these arguments extend naturally to banks, unless the textbook view that banks’ capital structures are predominately determined by capital regulation is adhered to. The following empirical analysis seeks to determine which view prevails.
DATA AND SURVIVORSHIP BIAS IN THE
BANKSCOPE DATABASE
Selection bias is a problem encountered when using fi nance panel datasets. It is not correct to assume that the population of fi rms or banks remains constant over the time span of the sample. Firms and banks appear and disappear from the sample in a non-random way. The reason for entry and exit from the sample is often related to the issue that the researcher wants to explore, e.g. the link between fi rm/bank characteristics and capital structure. A fi rm exits the sample, for example, when it goes bankrupt, which is linked to high leverage and low profi tability.17
Special care has been taken here to eliminate survivorship bias in the Bankscope database compiled by Bureau van Dijk. The selection issue is particularly acute for this widely-used dataset because, in its most recent release of the database, the Bureau van Dijk deletes historical information on banks that no longer exist. For example, the 2004 release of Bankscope does not contain information on banks that did not exist in 2004, but which existed in 1999. Following a bank merger, for example, information about the target prior to the merger is lost. So, when the Banque National de Paris (BNP) acquired Paribas in 2000, forming the current BNP Paribas bank, the 2004 release of Bankscope
no longer contained information about Paribas prior to 2000. However, information about BNP prior to 2000 is contained in the database because it was the acquirer.
The survivorship bias in the Bankscope database is addressed in this analysis by reassembling the panel data set based on individual cross-sections using historical, archived releases of the database. The Bureau Van Dijk provides monthly releases of the Bankscope database. The last release of each year from 1991 to 2004 is used to provide information about banks in that year only. For example, information about banks in the sample in 1999 comes from the December 1999 release of Bankscope. This procedure also allows the magnitude of the survivorship bias to be quantifi ed: 12% of the banks present in 1994 no longer appeared in the 2004 release of the Bankscope dataset.
The sample period starts in 1991 and ends in 2004. The sample is constructed to ensure that it contains the 100 largest publicly-traded commercial banks and bank-holding companies in the US and the same number of banks/bank-holding companies across 15 countries of the European Union.18 Overall, the sample consists of 327 individual banks and 2,415 bank-year observations.19
See M. Frank and V. Goyal (2005), op.cit.14 See F. Easterbrook (1984), “Two agency costs explanations of 15 dividends”, American Economic Review, 74, pp. 650-659.For a more detailed analysis of the interaction between industry 16 characteristics and fi rms’ capital structure see P. MacKay and G. Phillips (2005), “How does industry affect fi rm fi nancial structure?”, Review of Financial Studies, 18, pp. 1433-1466.For a discussion of this and other issues in empirical capital 17 structure research, see I. Welch (2006), “Common fl aws in empirical capital structure research”, Brown University Working Paper.The EU Member States in the sample are Austria, Belgium, 18 Denmark, Germany, Spain, Finland, France, Greece, Ireland, Italy, Luxembourg, the Netherlands, Portugal, Sweden and the United Kingdom.Each year 200 banks are selected anew according to their book 19 value of assets. There were less than 100 publicly traded banks in the EU at the beginning of the time period. There are no data for the US for 1991 and 1992.
158ECBFinancial Stability ReviewDecember 2007
DESCRIPTIVE EVIDENCE
Chart A.1 shows the distribution of the ratio of Tier 1 regulatory capital for the 100 largest publicly-traded banks in each the US and 15 EU Member States. The ratio (mostly) consists of equity, measured at book value, over risk-weighted assets. The large banks in the US and EU hold substantially more regulatory capital than the minimum of 4% specifi ed in the Basel Capital Accord (Basel I).20 The average regulatory capital was 11.1% in the US and 8.2% in the 15 EU countries. Moreover, there was a large variation in banks’ capital ratios – they are not as uniformly close to the regulatory minimum as the quotation cited in the introduction of this Special Feature suggests.
Chart A.2 shows the distribution of the ratio of book equity to book assets. The ratio represents the real economic capital of a bank. This differs from the ratio shown in Chart A.1 in that the book value of assets as it appears in the bank’s balance sheet replaces the risk weighted assets calculated for regulatory purposes in the denominator. The economic capital ratio is therefore an understatement of the regulatory Tier 1 capital ratio.
Even in terms of this more conservative measure – it is as if all assets were in the highest regulatory risk class, e.g. loans to companies – banks’ capital levels were well in excess of the regulatory minimum. The average ratio of book equity to assets was 8.7% in the US and 6.2% in the 15 EU countries. Again, there is a surprising amount of dispersion of banks’ capital ratios that is not in line with capital regulation being a fi rst-order determinant of banks’ capital structures.
Chart A.3 shows the evolution over time of banks’ average capital ratios both in book and market values. The capital ratio in market values replaces book equity with market equity, i.e. the number of shares times the end-of-year stock price, and the market value of assets is the market value of equity plus the book value of debt. The market capital ratio can be interpreted as the market’s forward-looking assessment of the net value of a bank.
For more information see, for example, Morgan Stanley (2003), 20 “Bank capital A-Z”. From 2008, European banks will adopt the new Basel II framework that may well shift the emphasis of the conclusions drawn in this Special Feature. For example, the new capital adequacy ratios may lead to less capital being held by banks.
Chart A.1 Distribution of banks’ regulatory Tier 1 capital
0.00
0.02
0.04
0.06
0.08
0.10
0.00
0.02
0.04
0.06
0.08
0.10
fraction
Tier 1 capital ratio
large US banks large EU banks
0.00 0.10 0.20 0.30
Sources: Bureau van Dijk (Bankscope) and ECB calculations.Note: The chart shows the distribution of banks’ Tier 1 capital ratio for 2007 bank-year observations in the sample (15 EU countries and the US) from 1991 to 2004. Information on the Tier 1 capital ratio is missing for 408 bank-year observations.
Chart A.2 Distribution of banks’ economic equity capital
0.00
0.05
0.10
0.15
0.00
0.05
0.10
0.15fraction
0.00 0.05 0.10 0.15 0.20economic capital ratio
large US bankslarge EU banks
Sources: Bureau van Dijk (Bankscope) and ECB calculations.Note: The chart shows the distribution of banks’ book capital ratio (book equity divided by book assets) for the 2,415 bank-year observations in the sample (15 EU countries and the US) from 1991 to 2004.
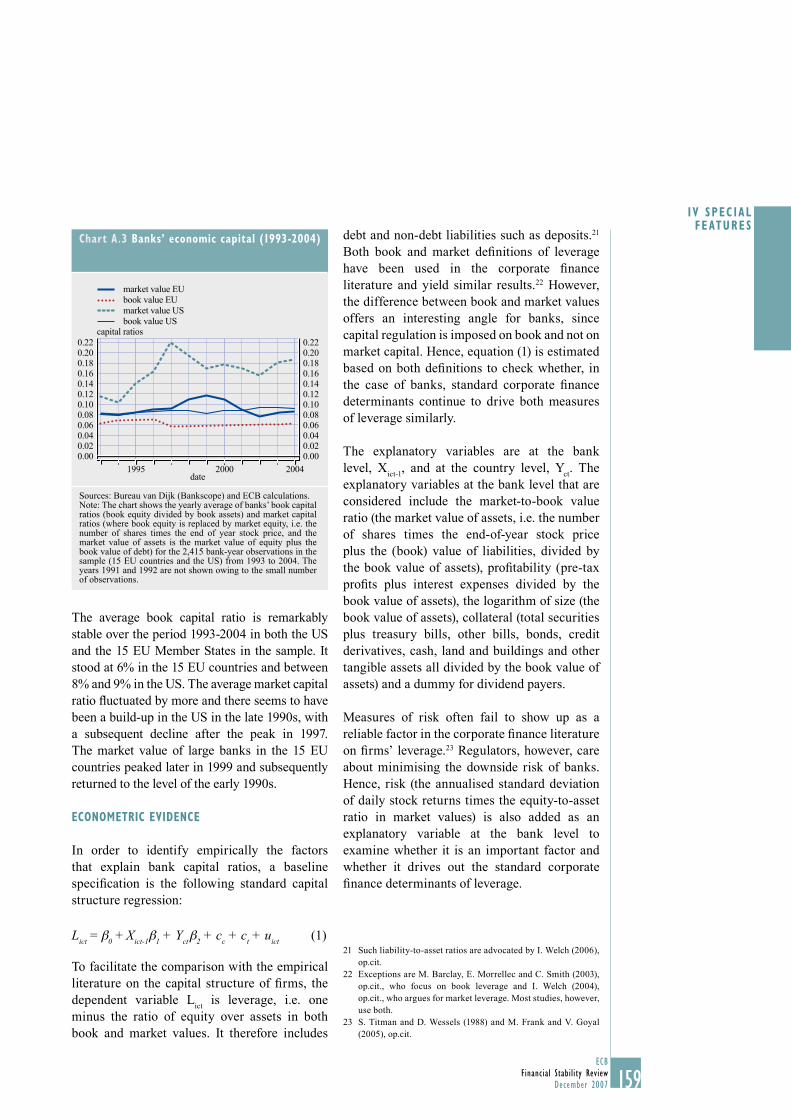
159ECB
Financial Stability ReviewDecember 2007
I V SPEC IAL FEATURES
159
The average book capital ratio is remarkably stable over the period 1993-2004 in both the US and the 15 EU Member States in the sample. It stood at 6% in the 15 EU countries and between 8% and 9% in the US. The average market capital ratio fl uctuated by more and there seems to have been a build-up in the US in the late 1990s, with a subsequent decline after the peak in 1997. The market value of large banks in the 15 EU countries peaked later in 1999 and subsequently returned to the level of the early 1990s.
ECONOMETRIC EVIDENCE
In order to identify empirically the factors that explain bank capital ratios, a baseline specifi cation is the following standard capital structure regression:
Lict
= β0 + X
ict-1β
1 + Y
ct β
2 + c
c + c
t + u
ict (1)
To facilitate the comparison with the empirical literature on the capital structure of fi rms, the dependent variable L
ict is leverage, i.e. one
minus the ratio of equity over assets in both book and market values. It therefore includes
debt and non-debt liabilities such as deposits.21 Both book and market defi nitions of leverage have been used in the corporate fi nance literature and yield similar results.22 However, the difference between book and market values offers an interesting angle for banks, since capital regulation is imposed on book and not on market capital. Hence, equation (1) is estimated based on both defi nitions to check whether, in the case of banks, standard corporate fi nance determinants continue to drive both measures of leverage similarly.
The explanatory variables are at the bank level, X
ict-1, and at the country level, Y
ct. The
explanatory variables at the bank level that are considered include the market-to-book value ratio (the market value of assets, i.e. the number of shares times the end-of-year stock price plus the (book) value of liabilities, divided by the book value of assets), profi tability (pre-tax profi ts plus interest expenses divided by the book value of assets), the logarithm of size (the book value of assets), collateral (total securities plus treasury bills, other bills, bonds, credit derivatives, cash, land and buildings and other tangible assets all divided by the book value of assets) and a dummy for dividend payers.
Measures of risk often fail to show up as a reliable factor in the corporate fi nance literature on fi rms’ leverage.23 Regulators, however, care about minimising the downside risk of banks. Hence, risk (the annualised standard deviation of daily stock returns times the equity-to-asset ratio in market values) is also added as an explanatory variable at the bank level to examine whether it is an important factor and whether it drives out the standard corporate fi nance determinants of leverage.
Such liability-to-asset ratios are advocated by I. Welch (2006), 21 op.cit.Exceptions are M. Barclay, E. Morrellec and C. Smith (2003), 22 op.cit., who focus on book leverage and I. Welch (2004), op.cit., who argues for market leverage. Most studies, however, use both.S. Titman and D. Wessels (1988) and M. Frank and V. Goyal 23 (2005), op.cit.
Chart A.3 Banks’ economic capital (1993-2004)
0.000.020.040.060.080.100.120.140.160.180.200.22
0.000.020.040.060.080.100.120.140.160.180.200.22
capital ratios
1995 2000 2004date
market value EUbook value EUmarket value USbook value US
Sources: Bureau van Dijk (Bankscope) and ECB calculations.Note: The chart shows the yearly average of banks’ book capital ratios (book equity divided by book assets) and market capital ratios (where book equity is replaced by market equity, i.e. the number of shares times the end of year stock price, and the market value of assets is the market value of equity plus the book value of debt) for the 2,415 bank-year observations in the sample (15 EU countries and the US) from 1993 to 2004. The years 1991 and 1992 are not shown owing to the small number of observations.
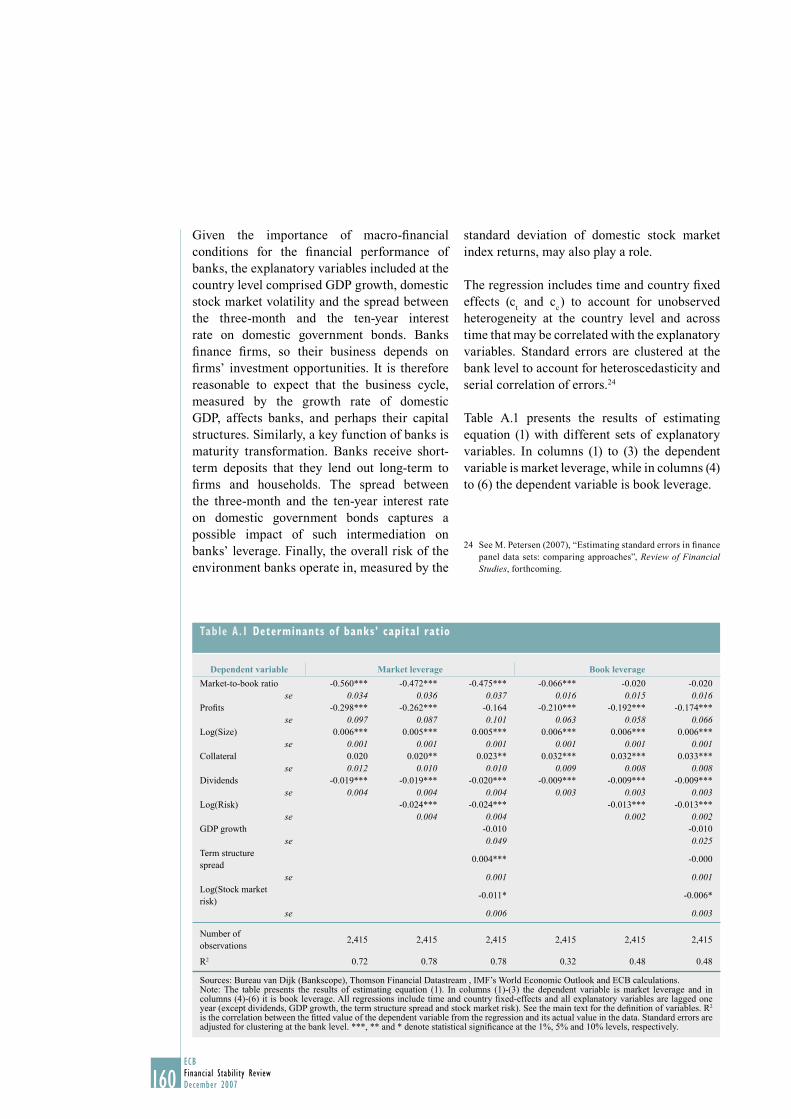
160ECBFinancial Stability ReviewDecember 2007
Given the importance of macro-fi nancial conditions for the fi nancial performance of banks, the explanatory variables included at the country level comprised GDP growth, domestic stock market volatility and the spread between the three-month and the ten-year interest rate on domestic government bonds. Banks fi nance fi rms, so their business depends on fi rms’ investment opportunities. It is therefore reasonable to expect that the business cycle, measured by the growth rate of domestic GDP, affects banks, and perhaps their capital structures. Similarly, a key function of banks is maturity transformation. Banks receive short-term deposits that they lend out long-term to fi rms and households. The spread between the three-month and the ten-year interest rate on domestic government bonds captures a possible impact of such intermediation on banks’ leverage. Finally, the overall risk of the environment banks operate in, measured by the
standard deviation of domestic stock market index returns, may also play a role.
The regression includes time and country fi xed effects (c
t and c
c ) to account for unobserved
heterogeneity at the country level and across time that may be correlated with the explanatory variables. Standard errors are clustered at the bank level to account for heteroscedasticity and serial correlation of errors.24
Table A.1 presents the results of estimating equation (1) with different sets of explanatory variables. In columns (1) to (3) the dependent variable is market leverage, while in columns (4) to (6) the dependent variable is book leverage.
See M. Petersen (2007), “Estimating standard errors in fi nance 24 panel data sets: comparing approaches”, Review of Financial Studies, forthcoming.
Table A.1 Determinants of banks’ capital ratio
Dependent variable Market leverage Book leverage
Market-to-book ratio -0.560*** -0.472*** -0.475*** -0.066*** -0.020 -0.020se 0.034 0.036 0.037 0.016 0.015 0.016
Profi ts -0.298*** -0.262*** -0.164 -0.210*** -0.192*** -0.174***se 0.097 0.087 0.101 0.063 0.058 0.066
Log(Size) 0.006*** 0.005*** 0.005*** 0.006*** 0.006*** 0.006***se 0.001 0.001 0.001 0.001 0.001 0.001
Collateral 0.020 0.020** 0.023** 0.032*** 0.032*** 0.033***se 0.012 0.010 0.010 0.009 0.008 0.008
Dividends -0.019*** -0.019*** -0.020*** -0.009*** -0.009*** -0.009***se 0.004 0.004 0.004 0.003 0.003 0.003
Log(Risk) -0.024*** -0.024*** -0.013*** -0.013***se 0.004 0.004 0.002 0.002
GDP growth -0.010 -0.010se 0.049 0.025
Term structure spread
0.004*** -0.000
se 0.001 0.001Log(Stock market risk)
-0.011* -0.006*
se 0.006 0.003
Number of observations
2,415 2,415 2,415 2,415 2,415 2,415
R2 0.72 0.78 0.78 0.32 0.48 0.48
Sources: Bureau van Dijk (Bankscope), Thomson Financial Datastream , IMF’s World Economic Outlook and ECB calculations.Note: The table presents the results of estimating equation (1). In columns (1)-(3) the dependent variable is market leverage and in columns (4)-(6) it is book leverage. All regressions include time and country fi xed-effects and all explanatory variables are lagged one year (except dividends, GDP growth, the term structure spread and stock market risk). See the main text for the defi nition of variables. R2 is the correlation between the fi tted value of the dependent variable from the regression and its actual value in the data. Standard errors are adjusted for clustering at the bank level. ***, ** and * denote statistical signifi cance at the 1%, 5% and 10% levels, respectively.
161ECB
Financial Stability ReviewDecember 2007
I V SPEC IAL FEATURES
161
Column (1) uses only the standard corporate fi nance determinants of leverage as explanatory variables. All the coeffi cients are statistically signifi cant, except for collateral, and all have the same sign as in the corporate fi nance literature. Banks’ leverage depends positively on size and collateral, and negatively on the market-to-book ratio, profi ts and dividends. Moreover, the elasticity of leverage for banks to the explanatory variables (not reported) is comparable to the elasticity of leverage for fi rms.25 A 1% change in the market-to-book ratio decreases bank leverage by 0.683%. The elasticity of leverage to profi ts is -0.018 for banks. This means that a 1% increase in median profi ts, that is $7.3 million, decreases median liabilities by $250 million. This is an economically signifi cant effect. Hence, it appears that the standard corporate fi nance determinants of capital structure also apply to banks’ market leverage.
Column (4) reports that, as in the case of market leverage, regressing book leverage on the standard corporate fi nance determinants of capital structure produces estimated coeffi cients that are all statistically signifi cant at the 1% level and all have the same sign as in studies of non-fi nancial fi rms. Moreover, the magnitude of the coeffi cients and their elasticity (not reported) are again roughly comparable to the ones found for fi rms (except for collateral).26 As in the corporate fi nance literature, large differences between the results for book and market leverage of banks are not detected. This does not support the hypothesis that regulatory concerns create a wedge between the determinants of banks’ book and market capital structures.
Columns (2) and (5) show that banks with more volatile assets have signifi cantly less leverage, both in book and market values. The negative coeffi cient on this measure of risk is consistent with both regulatory concerns and the corporate fi nance argument that debt is costly owing to the expected cost of bankruptcy. However, risk does not drive out the other variables. An F-test on the joint insignifi cance of all non-
risk coeffi cients is rejected. All coeffi cients from columns (1) and (4) remain statistically signifi cant at the 1% level, except: i) the coeffi cient of the market-to-book value ratio on book leverage, which is not signifi cant; and ii) the coeffi cient of collateral on market leverage, which is signifi cant at the 5% level. The asset volatility lowers the coeffi cient on the market-to-book value ratio by two thirds. The reason for this is that risk strongly correlates positively with the market-to-book ratio (the correlation coeffi cient is 0.85).
Columns (3) and (6) present the results of estimating equation (1) when macro-economic explanatory variables are added. Controlling for macro-economic factors does not change the coeffi cients or the signifi cance of the standard determinants of leverage. Stock market volatility is a signifi cant macroeconomic determinant of both book and market leverage (at the 10% level). Similar to banks’ individual risk, a riskier macroeconomic environment is associated with less leverage. A larger term structure spread is associated with higher market leverage, but not book leverage, and this effect is statistically signifi cant at the 1% level. GDP growth is not found to be statistically signifi cant. Once individual banks’ asset risk is controlled for, adding macroeconomic factors is not particularly helpful in explaining the cross-sectional variation in banks’ capital structures.
Although the standard corporate fi nance determinants of fi rm leverage also explain banks’ capital structures in the whole sample, and therefore capital regulation does not appear to be of fi rst-order importance for all banks, they could be less relevant for banks that are close to the regulatory threshold. Therefore the leverage of banks that have little discretionary capital, i.e. capital in excess of the regulatory threshold, should be examined. In this vein,
See, for example, Table 8, column 7, in M. Frank and 25 V. Goyal (2005), op.cit., and Table 9, panel B, in R. Rajan and L. Zingales (1995), op.cit.See for example Table 9, column 7, in M. Frank and 26 V. Goyal (2005), op.cit., and Table 9, panel A, in R. Rajan and L. Zingales (1995), op.cit.
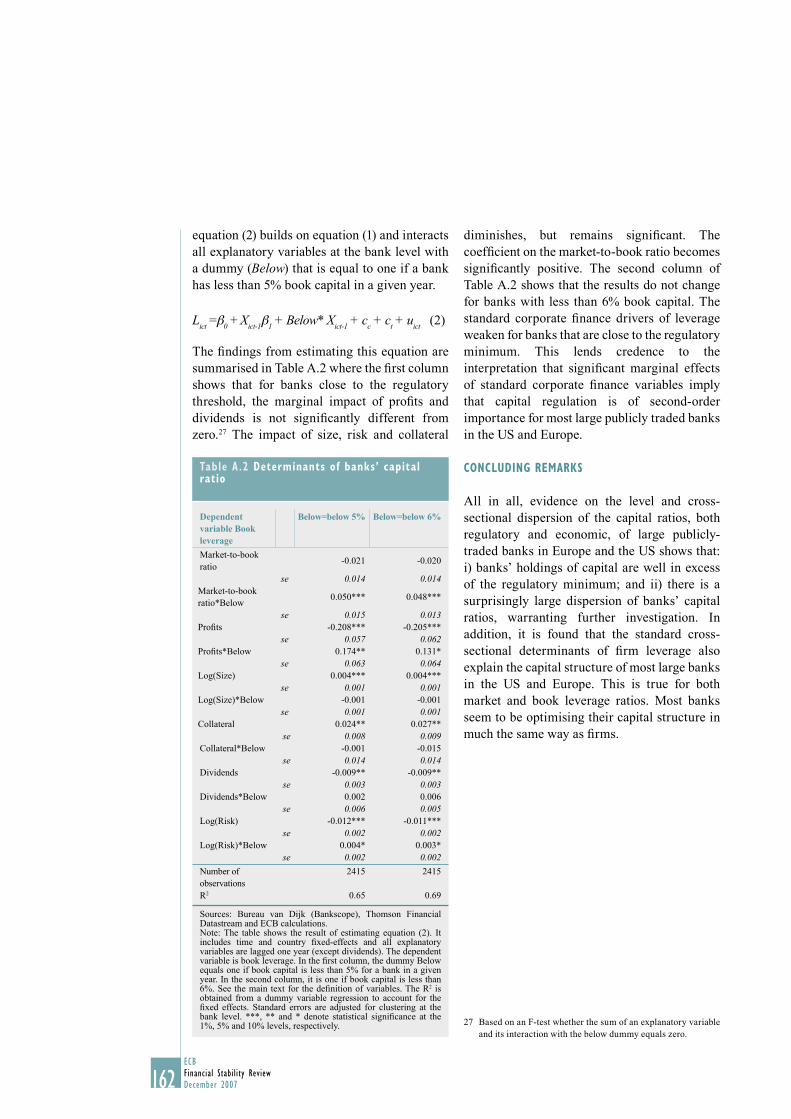
162ECBFinancial Stability ReviewDecember 2007
equation (2) builds on equation (1) and interacts all explanatory variables at the bank level with a dummy (Below) that is equal to one if a bank has less than 5% book capital in a given year.
Lict
=β0 + X
ict-1β
1 + Below* X
ict-1 + c
c + c
t + u
ict (2)
The fi ndings from estimating this equation are summarised in Table A.2 where the fi rst column shows that for banks close to the regulatory threshold, the marginal impact of profi ts and dividends is not signifi cantly different from zero.27 The impact of size, risk and collateral
diminishes, but remains signifi cant. The coeffi cient on the market-to-book ratio becomes signifi cantly positive. The second column of Table A.2 shows that the results do not change for banks with less than 6% book capital. The standard corporate fi nance drivers of leverage weaken for banks that are close to the regulatory minimum. This lends credence to the interpretation that signifi cant marginal effects of standard corporate fi nance variables imply that capital regulation is of second-order importance for most large publicly traded banks in the US and Europe.
CONCLUDING REMARKS
All in all, evidence on the level and cross-sectional dispersion of the capital ratios, both regulatory and economic, of large publicly-traded banks in Europe and the US shows that: i) banks’ holdings of capital are well in excess of the regulatory minimum; and ii) there is a surprisingly large dispersion of banks’ capital ratios, warranting further investigation. In addition, it is found that the standard cross-sectional determinants of fi rm leverage also explain the capital structure of most large banks in the US and Europe. This is true for both market and book leverage ratios. Most banks seem to be optimising their capital structure in much the same way as fi rms.
Based on an F-test whether the sum of an explanatory variable 27 and its interaction with the below dummy equals zero.
Table A.2 Determinants of banks’ capital ratio
Dependent variable Book leverage
Below=below 5% Below=below 6%
Market-to-book ratio
-0.021 -0.020
se 0.014 0.014Market-to-book ratio*Below
0.050*** 0.048***
se 0.015 0.013Profi ts -0.208*** -0.205***
se 0.057 0.062Profi ts*Below 0.174** 0.131*
se 0.063 0.064Log(Size) 0.004*** 0.004***
se 0.001 0.001Log(Size)*Below -0.001 -0.001
se 0.001 0.001Collateral 0.024** 0.027**
se 0.008 0.009Collateral*Below -0.001 -0.015
se 0.014 0.014Dividends -0.009** -0.009**
se 0.003 0.003Dividends*Below 0.002 0.006
se 0.006 0.005Log(Risk) -0.012*** -0.011***
se 0.002 0.002Log(Risk)*Below 0.004* 0.003*
se 0.002 0.002
Number of observations
2415 2415
R2 0.65 0.69
Sources: Bureau van Dijk (Bankscope), Thomson Financial Datastream and ECB calculations.Note: The table shows the result of estimating equation (2). It includes time and country fi xed-effects and all explanatory variables are lagged one year (except dividends). The dependent variable is book leverage. In the fi rst column, the dummy Below equals one if book capital is less than 5% for a bank in a given year. In the second column, it is one if book capital is less than 6%. See the main text for the defi nition of variables. The R2 is obtained from a dummy variable regression to account for the fi xed effects. Standard errors are adjusted for clustering at the bank level. ***, ** and * denote statistical signifi cance at the 1%, 5% and 10% levels, respectively.
163ECB
Financial Stability ReviewDecember 2007
I V SPEC IAL FEATURES
B THE IMPACT OF SHORT-TERM INTEREST
RATES ON BANK CREDIT RISK-TAKING
This Special Feature discusses the effect of short-term interest rates on bank credit risk-taking. In addition, it examines the dynamic impact of monetary policy on the credit risk of loans. It presents evidence that low short-term interest rates encourage bank risk-taking and reduce the credit risk of outstanding loans. However, credit risk becomes high at times when interest rates return to or rise above their average level after having been very low for a long period.
INTRODUCTION
Does the level of short-term interest rates affect bank risk-taking? Do low rates encourage risk-taking? Do they reduce credit risk in the very short run but increase it in the medium run? Despite increased risk-taking, are risk premia lower? This Special Feature addresses these questions by reviewing the empirical evidence on the impact of monetary policy on fi nancial stability.1
Empirical evidence shows that when short-term interest rates are low, banks relax their lending standards and grant new loans with higher credit risk, but reduce the associated loan spreads.2 This suggests that low interest rates increase banks’ appetite for risk. Despite this increase in risk-taking, low interest rates are found to reduce credit risk in the very short run since they reduce refi nancing costs and increase borrowers’ net worth, thereby lowering the credit risk of outstanding bank loans. As the volume of outstanding bank loans is greater than that of new loans, low interest rates may make banks loan portfolios less risky in the very short run. In the medium run, however, interest rates that are too low encourage bank risk-taking which increases credit risk, thereby adversely affecting fi nancial stability, especially if interest rates then return to or rise above average levels.3
The rest of this Special Feature briefl y reviews the theoretical links between the level of short-term interest rates and risk-taking. It then considers the empirical evidence on the impact of the stance and path of monetary policy on bank risk-taking and credit risk. Finally, it summarises the main fi ndings.
MONETARY POLICY, INTEREST RATES AND
FINANCIAL STABILITY
Banks are at the core of the fi nancial system and credit risk is the main risk that they face. Therefore, it is crucial for fi nancial stability to understand the effects of monetary policy on bank risk-taking and credit risk. These effects have not been studied to any great extent. By contrast, the effects of monetary policy on the volume of bank credit in the economy have been widely studied.4 These studies have concluded that an expansionary monetary policy increases the volume of bank loans in the economy.
This Special Feature draws extensively on V.P. Ioannidou, 1 S. Ongena and J.L. Peydró-Alcalde (2007), “Monetary Policy and Subprime Lending: A Tall Tale of Low Federal Funds Rates, Hazardous Loans and Reduced Loan Spreads”, CEPR Discussion Paper, forthcoming.See Ioannidou, Ongena and Peydró-Alcalde (2007), op. cit.2 The term medium run refers to the median maturity of bank 3 loans. Low rates mean (i) low nominal interest rates and (ii) (conditioning on GDP growth, general risk and infl ation) low rates mean expansive monetary policy. Too low rates mean rates signifi cantly below the averages levels.See B.S. Bernanke, M. Gertler and S. Gilchrist (1996), “The 4 Financial Accelerator and the Flight to Quality”, Review of Economics and Statistics, 78, pp. 1-15; B.S. Bernanke and A.S. Blinder (1992), “The Federal Funds Rate and the Channels of Monetary Transmission”, American Economic Review, 82, pp. 901-921; B.S. Bernanke and M. Gertler (1995), “Inside the Black Box: The Credit Channel of Monetary Policy Transmission”, Journal of Economic Perspectives, 9, pp. 27-48; A.K. Kashyap and J.C. Stein (2000), “What Do a Million Banks Have to Say about the Transmission of Monetary Policy?”, American Economic Review, 90, pp. 407-428; W.J. Den Haan, S. Sumner and G. Yamashiro (2007), “Bank Loan Portfolios and the Monetary Transmission Mechanism”, Journal of Monetary Economics, forthcoming.
164ECBFinancial Stability ReviewDecember 2007
Recent theoretical studies provide a basis for understanding how changes in short-term interest rates may affect bank risk-taking. This section briefl y reviews the fi ndings.5
One recent contribution models the impact of borrowers’ net worth on the composition of credit.6 Low interest rates increase borrowers’ net worth, thereby reducing the agency costs of lending and making banks more willing to lend to higher risk borrowers who have less collateral. On the other hand, when borrowers have low net worth (e.g. interest rates are high), there may be a fl ight to quality on the part of banks.7 Low interest rates may also mitigate adverse selection problems in credit markets, causing banks to relax their lending standards and increase risk-taking.8 In addition, when interest rates are low and liquidity is high, banks are less concerned about their fi nancing (deposits) and hence can lend more to riskier borrowers.9
In general, low interest rates make (ceteris paribus) risk-free assets less attractive for banks, increasing their demand for higher risk assets with higher potential returns, especially in fi nancial institutions in which moral hazard is important.10 In addition, low short-term interest rates reduce the difference between the policy rate and deposit rates, thus reducing bank profi ts. Since loan contracts feature profi t targets (that are not perfectly adjusted to changes in nominal interest rates), when policy rates are low, banks have more incentive to grant loans to higher risk borrowers (for higher potential returns) in order to boost profi ts.
EMPIRICAL EVIDENCE
An important question is whether low short-term interest rates encourage banks to grant loans to higher risk borrowers and relax their lending standards. This section reviews the empirical fi ndings and considers the empirical context that enables inferences to be made regarding whether low interest rates encourage risk-taking and, if so, why.
ECONOMETRIC IDENTIFICATION
To carry out an empirical analysis of the impact of monetary policy (in particular, low interest rates) on risk-taking, monetary policy conditions must fi rst be fairly exogenous. If they were endogenous - this could be the case when fi nancial stability has been threatened and monetary policy responded by lowering interest rates - the econometric identifi cation of the impact of monetary policy on fi nancial stability would be rendered extremely diffi cult.11
Another important aspect for econometric identifi cation is the need to have access to very detailed loan data; in particular, new and outstanding loans at any given moment, with very detailed information on measures of risk such as loan performance, loan rates, lending standards, whether loans are collateralised or not and whether the borrower has a bad credit history or is graded sub-prime according to the bank’s internal ratings.
A third requirement for econometric identifi cation is to have a measure of loan default risk per unit of time. For an analysis of the impact of monetary policy on credit risk, to construct the ideal measure would require access to the precise and evolving assessments made by bank loan offi cers on the default
See K. Matsuyama (2007), “Credit Traps and Credit Cycles”, 5 American Economic Review, 97, pp. 503-516; D. Diamond and R. Rajan (2006) “Money in a Theory of Banking”, American Economic Review, 96, pp. 30-53; R. Rajan, (2006), “Has Finance Made the World Riskier?”, European Financial Management, 12, pp. 499-533; C. Borio, (2003), “Towards a Macroprudential Framework for Financial Supervision and Regulation”, BIS Working Paper, No. 128; C. Borio and P. Lowe (2002), “Asset Prices, Financial and Monetary Stability: Exploring the Nexus”, BIS Working Paper, No. 114; A. Crockett (2003), “Monetary Stability, Financial Stability and the Business Cycle: Five Views”, BIS Paper, No. 18; G. Dell’Ariccia and R. Marquez (2006), “Lending Booms and Lending Standards”, Journal of Finance, 61, pp. 2511-2546.See Matsuyama (2007), op. cit.6 See Bernanke, Gertler and Gilchrist (1996), op. cit.7 See Dell’Ariccia and Marquez (2006), op. cit.8 See Diamond and Rajan (2006), op. cit.9 See Rajan (2006), op. cit.10 For instance, the Federal Reserve System reduced interest rates 11 because of the heightened uncertainty created by the collapse of LTCM in 1998.
165ECB
Financial Stability ReviewDecember 2007
I V SPEC IAL FEATURES
165
probability of each individual loan at any given moment in time. Duration analysis provides an excellent measure of credit risk per unit of time (the hazard rate). This measure – in conjunction with the ex-ante lending standards – is an ideal basis for analysing risk-taking and credit risk.
DATA
The closest setting to an ideal econometric environment for analysing the impact of monetary policy on bank risk-taking is detailed in an analysis of Bolivian data.12 During the sample period (1999-2004) the boliviano was pegged to the US dollar and the Bolivian banking sector was almost completely “dollarised”. More than 90% of deposits and credits were denominated in US dollars in Bolivia, which makes it one of the most dollarised economies among those that have stopped short of full dollarisation. This, together with the exchange rate regime, makes the federal funds rate an appropriate and exogenous measure of short-term interest rates in Bolivia.13
The Central de Información de Riesgos Crediticios, the public credit registry of Bolivia, is a database managed by the Bolivian banking superintendent in which all banks are required to participate. It contains detailed information, updated on a monthly basis, on all outstanding loans granted by banks operating in the country. For each loan, detailed information is supplied about the contract (e.g. date of loan origination, maturity, amount, loan interest rate, rating, currency denomination, value and type of collateral, type of loan, etc.) and about the borrower (e.g. region, industry, legal status, number and scope of banking relationships, total bank debt and, in particular, credit history and internal bank rating), as well as information on ex-post performance (e.g. whether a loan was downgraded to default status in a given month). To this dataset is added information on bank characteristics (e.g. capital ratios, non-performing loans, liquid assets, size, etc.) which is obtained from balance sheets and income statements.
The richness of the database allows several, complementary measures of bank risk-taking to be constructed. Since theoretical models show that monetary policy may affect risk-taking and lending standards and, therefore, also loan maturity, a measure of loan default that is normalised per unit of time – which in this case is a month – (hazard rate) is constructed. Within the framework of a fully specifi ed duration model, the time to default is used as a dynamic measure of risk. In particular, the determinants of the hazard rate in each period are analysed (i.e. the probability that a loan will default in period t+1, conditional on surviving until period t). Default (the event to be modelled) is defi ned as occurring when a bank downgrades a loan to the lowest category, and the way in which monetary policy — both at origination and also during the “life” of the loan — affects the hazard rate is estimated.
In addition to the hazard rate, the static ex-ante measures of risk are analysed. Whether the stance of monetary policy affects the volume of lending to borrowers with sub-prime credit ratings or bad credit histories is studied. Finally, loan pricing is analysed and, in particular – given the level of risk of the borrowers – whether the stance of monetary policy affects loan risk premia.
MAIN RESULTS
Using a variety of duration models and controlling for bank, borrower, bank-borrower relationship, loan features and macroeconomic characteristics (e.g. GDP growth and infl ation), the way in which short-term interest rates at origination and during the life of a loan affect the loan hazard rate is analysed (default probability per unit of time). The hazard rate is found to increase when interest rates are low at loan
See Ioannidou, Ongena, and Peydró-Alcalde (2007), op. cit.12 During the sample period, the correlation between the federal 13 funds rate and GDP growth in Bolivia was -0.2 and infl ation in Bolivia was low. Therefore, lower interest rates corresponded to expansive monetary policy.
166ECBFinancial Stability ReviewDecember 2007
origination but also when rates are higher during the life of the loan. That is, monetary policy has a dual impact on credit risk: low interest rates increase bank risk-taking (they grant new loans with higher credit risk) but reduce the credit risk of outstanding bank loans.
When interest rates are low at loan origination not only do banks grant loans with higher credit risk, but they also relax their lending standards and lend more to borrowers with bad credit histories and sub-prime credit ratings. All of these results suggest that bank risk-taking increases when interest rates are low at loan origination and that – in this way – monetary policy affects the composition of bank credit in the economy (i.e. the quality distribution of borrowers in banks’ loan portfolios).
In addition, low interest rates reduce the credit risk of outstanding loans. Consequently, the impact of low interest rates on the credit risk of new loans is completely different from the impact on outstanding loans. In the short-term, low interest rates reduce the total credit risk of banks since the volume of outstanding loans is larger than the volume of new loans. In the medium-term, however, if interest rates are too low this increases the total credit risk of banks, especially if interest rates then return to or rise above average levels. The results, therefore, suggest that low interest rates encourage risk-taking and reduce credit risk in the short-term but may increase it in the medium-term. A related analysis that uses European data obtains very similar results.14
Another fi nding of this analysis is that when interest rates are low, not only do banks lend more to sub-prime borrowers and take on higher credit risk but they also reduce loan spreads. Hence, low short-term interest rates lead to increased risk-taking but lower risk premia.15
It is also found that banks that borrow more from foreign debtholders (which are fi nancial institutions) reduce risk-taking when interest rates are low.16 This could suggest that banks which have more sophisticated depositors
(i.e. banks as depositors which are more sophisticated than retail depositors) – and, therefore, less subject to moral hazard – engage in less risk-taking when interest rates are low. This result suggests that low interest rates could imply excessive risk-taking and, in consequence, better banking regulation and corporate governance could reduce the impact of low short-term interest rates on bank risk-taking.
THE IMPACT OF THE PATH OF MONETARY POLICY
ON CREDIT RISK
To quantify the impact of the stance and path of monetary policy on bank credit risk, it is necessary to analyse how different paths of monetary policy (i.e. different paths of short-term interest rates, controlling for the other macroeconomic and banking variables) affect the hazard rate.17 Employing the coeffi cients of the baseline model used in the study, the annualised hazard rate for a loan with a 12-month term but otherwise average characteristics is calculated for various short-term interest rate paths (see Figure B.1).
For example, if the federal funds rate is equal to its sample mean throughout the life of a loan, the annualised loan hazard rate is estimated at 1.84%. In sharp contrast, if the federal funds rate is equal to its sample minimum (1.01%) at origination, but increases to its sample maximum (6.54%) at maturity, the hazard rate more than doubles, to 4.98%. On the other hand, if the path of monetary policy is reversed and the federal funds rate drops from its sample maximum to its sample minimum, the hazard rate more than halves, to 0.72%. If the
G. Jiménez, S. Ongena, J.L. Peydró-Alcalde and J. Saurina 14 (2007), “Hazardous Times for Monetary Policy: What Do Twenty-Three Million Bank Loans Say About the Effects of Monetary Policy on Credit Risk?”, CEPR Discussion Paper No 6514.See Ioannidou, Ongena and Peydró-Alcalde (2007), op. cit.15 See Ioannidou, Ongena and Peydró-Alcalde (2007), op. cit.16 This section is based on Ioannidou, Ongena and Peydró-Alcalde 17 (2007), op. cit. It is also shown that low levels of interest rate at origination increase credit risk even after controlling for the posterior change of interest rates over the life of the loan (see their table 2 – III).
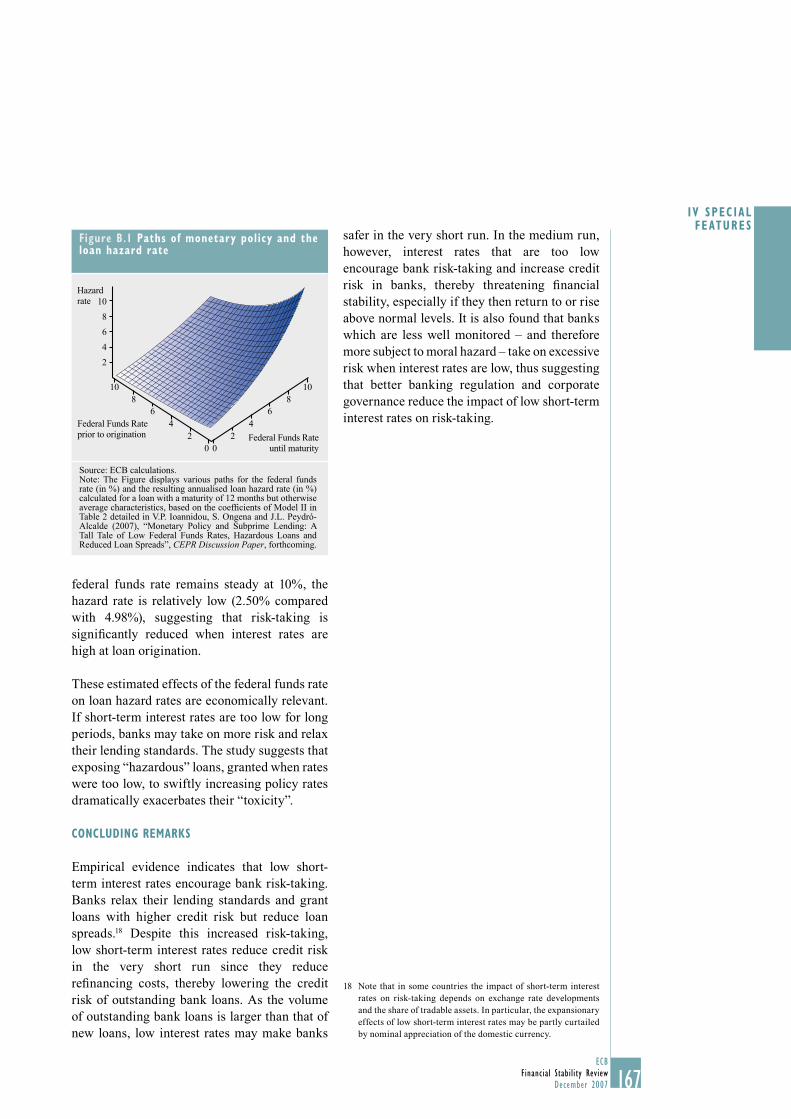
167ECB
Financial Stability ReviewDecember 2007
I V SPEC IAL FEATURES
167
federal funds rate remains steady at 10%, the hazard rate is relatively low (2.50% compared with 4.98%), suggesting that risk-taking is signifi cantly reduced when interest rates are high at loan origination.
These estimated effects of the federal funds rate on loan hazard rates are economically relevant. If short-term interest rates are too low for long periods, banks may take on more risk and relax their lending standards. The study suggests that exposing “hazardous” loans, granted when rates were too low, to swiftly increasing policy rates dramatically exacerbates their “toxicity”.
CONCLUDING REMARKS
Empirical evidence indicates that low short-term interest rates encourage bank risk-taking. Banks relax their lending standards and grant loans with higher credit risk but reduce loan spreads.18 Despite this increased risk-taking, low short-term interest rates reduce credit risk in the very short run since they reduce refi nancing costs, thereby lowering the credit risk of outstanding bank loans. As the volume of outstanding bank loans is larger than that of new loans, low interest rates may make banks
safer in the very short run. In the medium run, however, interest rates that are too low encourage bank risk-taking and increase credit risk in banks, thereby threatening fi nancial stability, especially if they then return to or rise above normal levels. It is also found that banks which are less well monitored – and therefore more subject to moral hazard – take on excessive risk when interest rates are low, thus suggesting that better banking regulation and corporate governance reduce the impact of low short-term interest rates on risk-taking.
Note that in some countries the impact of short-term interest 18 rates on risk-taking depends on exchange rate developments and the share of tradable assets. In particular, the expansionary effects of low short-term interest rates may be partly curtailed by nominal appreciation of the domestic currency.
Figure B.1 Paths of monetary policy and the loan hazard rate
Hazardrate
Federal Funds Rate prior to origination Federal Funds Rate
until maturity02
46
810
2
4
6
8
10
02
46
810
Source: ECB calculations.Note: The Figure displays various paths for the federal funds rate (in %) and the resulting annualised loan hazard rate (in %) calculated for a loan with a maturity of 12 months but otherwise average characteristics, based on the coeffi cients of Model II in Table 2 detailed in V.P. Ioannidou, S. Ongena and J.L. Peydró-Alcalde (2007), “Monetary Policy and Subprime Lending: A Tall Tale of Low Federal Funds Rates, Hazardous Loans and Reduced Loan Spreads”, CEPR Discussion Paper, forthcoming.
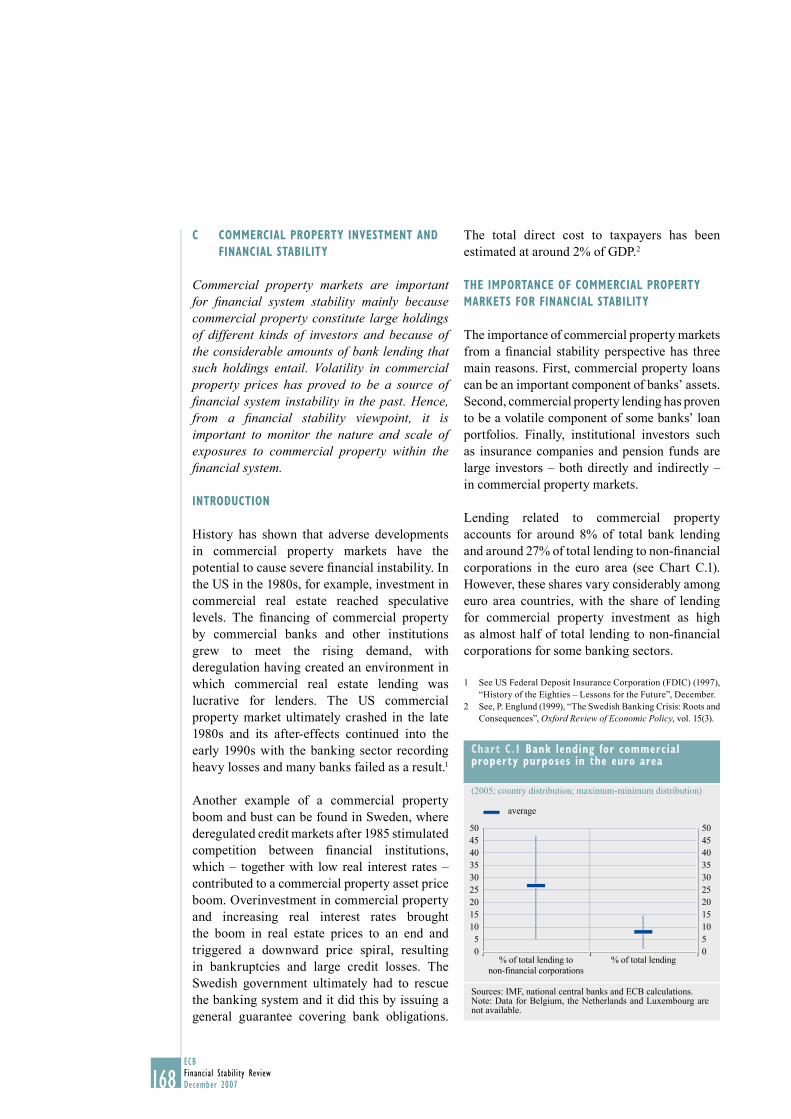
168ECBFinancial Stability ReviewDecember 2007
C COMMERCIAL PROPERTY INVESTMENT AND
FINANCIAL STABILITY
Commercial property markets are important for fi nancial system stability mainly because commercial property constitute large holdings of different kinds of investors and because of the considerable amounts of bank lending that such holdings entail. Volatility in commercial property prices has proved to be a source of fi nancial system instability in the past. Hence, from a fi nancial stability viewpoint, it is important to monitor the nature and scale of exposures to commercial property within the fi nancial system.
INTRODUCTION
History has shown that adverse developments in commercial property markets have the potential to cause severe fi nancial instability. In the US in the 1980s, for example, investment in commercial real estate reached speculative levels. The fi nancing of commercial property by commercial banks and other institutions grew to meet the rising demand, with deregulation having created an environment in which commercial real estate lending was lucrative for lenders. The US commercial property market ultimately crashed in the late 1980s and its after-effects continued into the early 1990s with the banking sector recording heavy losses and many banks failed as a result.1
Another example of a commercial property boom and bust can be found in Sweden, where deregulated credit markets after 1985 stimulated competition between fi nancial institutions, which – together with low real interest rates – contributed to a commercial property asset price boom. Overinvestment in commercial property and increasing real interest rates brought the boom in real estate prices to an end and triggered a downward price spiral, resulting in bankruptcies and large credit losses. The Swedish government ultimately had to rescue the banking system and it did this by issuing a general guarantee covering bank obligations.
The total direct cost to taxpayers has been estimated at around 2% of GDP.2
THE IMPORTANCE OF COMMERCIAL PROPERTY
MARKETS FOR FINANCIAL STABILITY
The importance of commercial property markets from a fi nancial stability perspective has three main reasons. First, commercial property loans can be an important component of banks’ assets. Second, commercial property lending has proven to be a volatile component of some banks’ loan portfolios. Finally, institutional investors such as insurance companies and pension funds are large investors – both directly and indirectly – in commercial property markets.
Lending related to commercial property accounts for around 8% of total bank lending and around 27% of total lending to non-fi nancial corporations in the euro area (see Chart C.1). However, these shares vary considerably among euro area countries, with the share of lending for commercial property investment as high as almost half of total lending to non-fi nancial corporations for some banking sectors.
See US Federal Deposit Insurance Corporation (FDIC) (1997), 1 “History of the Eighties – Lessons for the Future”, December.See, P. Englund (1999), “The Swedish Banking Crisis: Roots and 2 Consequences”, Oxford Review of Economic Policy, vol. 15(3).
Chart C.1 Bank lending for commercial property purposes in the euro area
(2005; country distribution; maximum-minimum distribution)
05
101520253035404550
05101520253035404550
average
% of total lending tonon-financial corporations
% of total lending
Sources: IMF, national central banks and ECB calculations.Note: Data for Belgium, the Netherlands and Luxembourg are not available.
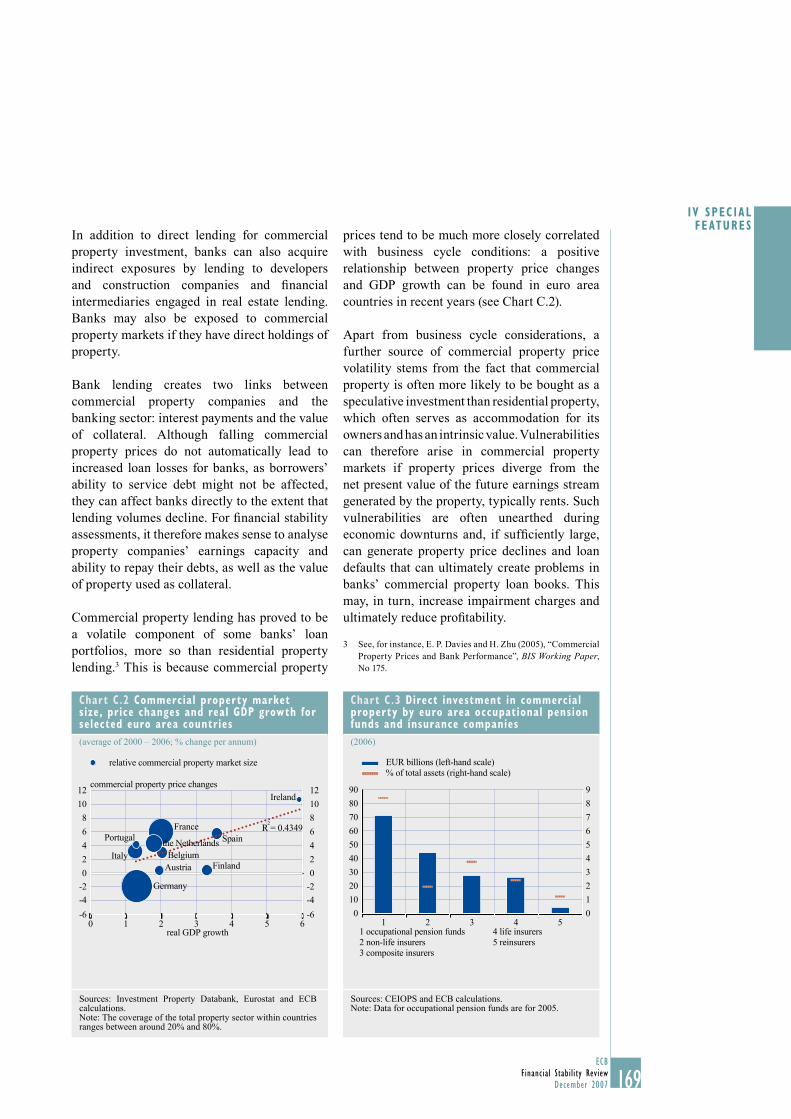
169ECB
Financial Stability ReviewDecember 2007
I V SPEC IAL FEATURES
169
In addition to direct lending for commercial property investment, banks can also acquire indirect exposures by lending to developers and construction companies and fi nancial intermediaries engaged in real estate lending. Banks may also be exposed to commercial property markets if they have direct holdings of property.
Bank lending creates two links between commercial property companies and the banking sector: interest payments and the value of collateral. Although falling commercial property prices do not automatically lead to increased loan losses for banks, as borrowers’ ability to service debt might not be affected, they can affect banks directly to the extent that lending volumes decline. For fi nancial stability assessments, it therefore makes sense to analyse property companies’ earnings capacity and ability to repay their debts, as well as the value of property used as collateral.
Commercial property lending has proved to be a volatile component of some banks’ loan portfolios, more so than residential property lending.3 This is because commercial property
prices tend to be much more closely correlated with business cycle conditions: a positive relationship between property price changes and GDP growth can be found in euro area countries in recent years (see Chart C.2).
Apart from business cycle considerations, a further source of commercial property price volatility stems from the fact that commercial property is often more likely to be bought as a speculative investment than residential property, which often serves as accommodation for its owners and has an intrinsic value. Vulnerabilities can therefore arise in commercial property markets if property prices diverge from the net present value of the future earnings stream generated by the property, typically rents. Such vulnerabilities are often unearthed during economic downturns and, if suffi ciently large, can generate property price declines and loan defaults that can ultimately create problems in banks’ commercial property loan books. This may, in turn, increase impairment charges and ultimately reduce profi tability.
See, for instance, E. P. Davies and H. Zhu (2005), “Commercial 3 Property Prices and Bank Performance”, BIS Working Paper, No 175.
Chart C.2 Commercial property market size, price changes and real GDP growth for selected euro area countries
(average of 2000 – 2006; % change per annum)
Belgium
Ireland
FinlandAustria
France
Germany
Italy
SpainPortugalR
2 = 0.4349
-6
-4
-2
0
2
4
6
8
10
12
-6
-4
-2
0
2
4
6
8
10
12
relative commercial property market size
0 1 2 3 4 5 6
the Netherlands
real GDP growth
commercial property price changes
Sources: Investment Property Databank, Eurostat and ECB calculations.Note: The coverage of the total property sector within countries ranges between around 20% and 80%.
Chart C.3 Direct investment in commercial property by euro area occupational pension funds and insurance companies
(2006)
10
20
30
40
50
60
70
80
90
1
2
3
4
5
6
7
8
9
EUR billions (left-hand scale)% of total assets (right-hand scale)
1 occupational pension funds2 non-life insurers3 composite insurers
4 life insurers5 reinsurers
0 01 2 3 4 5
Sources: CEIOPS and ECB calculations.Note: Data for occupational pension funds are for 2005.
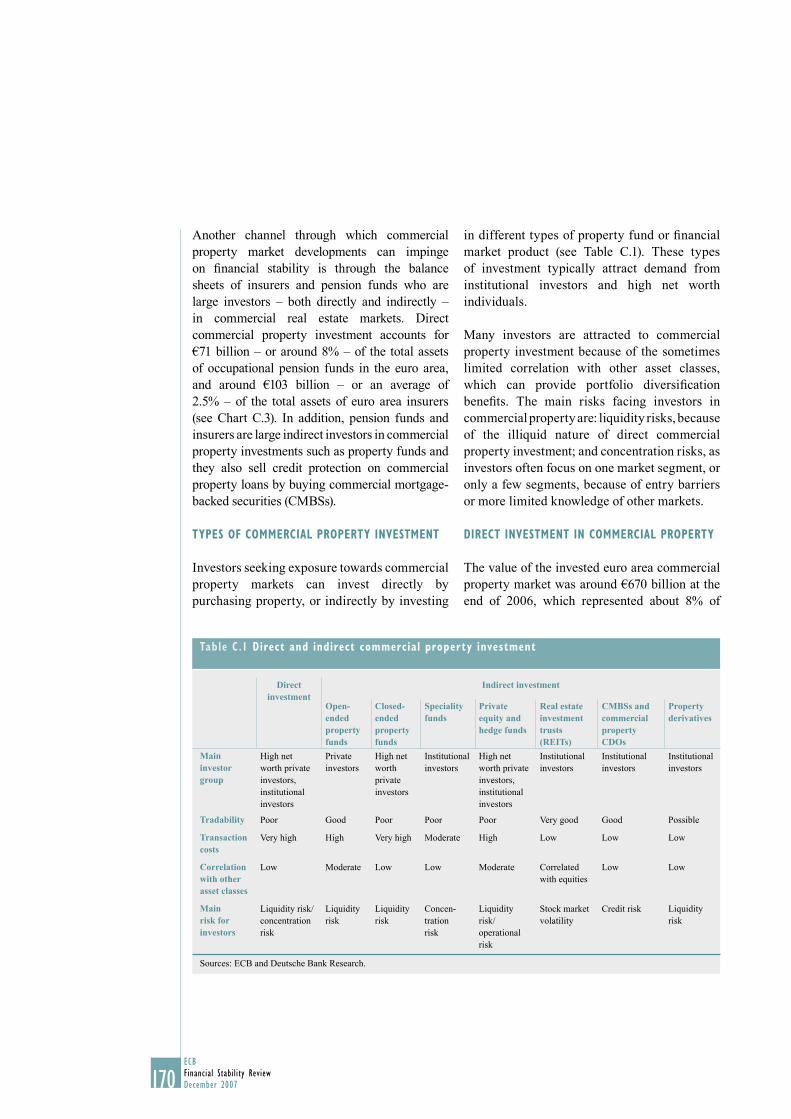
170ECBFinancial Stability ReviewDecember 2007
Another channel through which commercial property market developments can impinge on fi nancial stability is through the balance sheets of insurers and pension funds who are large investors – both directly and indirectly – in commercial real estate markets. Direct commercial property investment accounts for €71 billion – or around 8% – of the total assets of occupational pension funds in the euro area, and around €103 billion – or an average of 2.5% – of the total assets of euro area insurers (see Chart C.3). In addition, pension funds and insurers are large indirect investors in commercial property investments such as property funds and they also sell credit protection on commercial property loans by buying commercial mortgage-backed securities (CMBSs).
TYPES OF COMMERCIAL PROPERTY INVESTMENT
Investors seeking exposure towards commercial property markets can invest directly by purchasing property, or indirectly by investing
in different types of property fund or fi nancial market product (see Table C.1). These types of investment typically attract demand from institutional investors and high net worth individuals.
Many investors are attracted to commercial property investment because of the sometimes limited correlation with other asset classes, which can provide portfolio diversifi cation benefi ts. The main risks facing investors in commercial property are: liquidity risks, because of the illiquid nature of direct commercial property investment; and concentration risks, as investors often focus on one market segment, or only a few segments, because of entry barriers or more limited knowledge of other markets.
DIRECT INVESTMENT IN COMMERCIAL PROPERTY
The value of the invested euro area commercial property market was around €670 billion at the end of 2006, which represented about 8% of
Table C.1 Direct and indirect commercial property investment
Directinvestment
Indirect investment
Open-endedpropertyfunds
Closed-ended propertyfunds
Specialityfunds
Private equity and hedge funds
Real estate investment trusts (REITs)
CMBSs andcommercialpropertyCDOs
Propertyderivatives
Main investor group
High net worth private investors, institutional investors
Privateinvestors
High net worth privateinvestors
Institutional investors
High net worth private investors, institutional investors
Institutional investors
Institutional investors
Institutional investors
Tradability Poor Good Poor Poor Poor Very good Good Possible
Transaction costs
Very high High Very high Moderate High Low Low Low
Correlation with other asset classes
Low Moderate Low Low Moderate Correlatedwith equities
Low Low
Main risk for investors
Liquidity risk/concentration risk
Liquidityrisk
Liquidityrisk
Concen-trationrisk
Liquidityrisk/operationalrisk
Stock market volatility
Credit risk Liquidityrisk
Sources: ECB and Deutsche Bank Research.
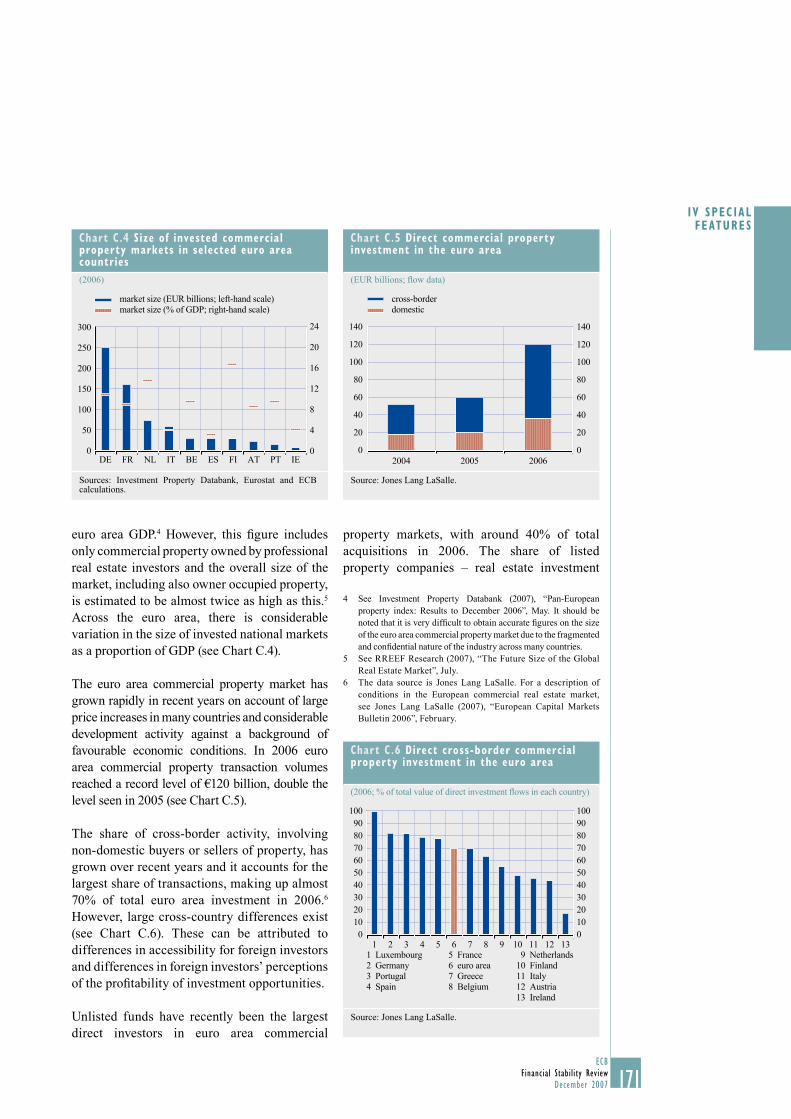
171ECB
Financial Stability ReviewDecember 2007
I V SPEC IAL FEATURES
171
euro area GDP.4 However, this fi gure includes only commercial property owned by professional real estate investors and the overall size of the market, including also owner occupied property, is estimated to be almost twice as high as this.5 Across the euro area, there is considerable variation in the size of invested national markets as a proportion of GDP (see Chart C.4).
The euro area commercial property market has grown rapidly in recent years on account of large price increases in many countries and considerable development activity against a background of favourable economic conditions. In 2006 euro area commercial property transaction volumes reached a record level of €120 billion, double the level seen in 2005 (see Chart C.5).
The share of cross-border activity, involving non-domestic buyers or sellers of property, has grown over recent years and it accounts for the largest share of transactions, making up almost 70% of total euro area investment in 2006.6 However, large cross-country differences exist (see Chart C.6). These can be attributed to differences in accessibility for foreign investors and differences in foreign investors’ perceptions of the profi tability of investment opportunities.
Unlisted funds have recently been the largest direct investors in euro area commercial
property markets, with around 40% of total acquisitions in 2006. The share of listed property companies – real estate investment
See Investment Property Databank (2007), “Pan-European 4 property index: Results to December 2006”, May. It should be noted that it is very diffi cult to obtain accurate fi gures on the size of the euro area commercial property market due to the fragmented and confi dential nature of the industry across many countries.See RREEF Research (2007), “The Future Size of the Global 5 Real Estate Market”, July.The data source is Jones Lang LaSalle. For a description of 6 conditions in the European commercial real estate market, see Jones Lang LaSalle (2007), “European Capital Markets Bulletin 2006”, February.
Chart C.4 Size of invested commercial property markets in selected euro area countries
(2006)
0
4
8
12
16
20
24300
250
200
150
100
50
0DE FR NL IT BE ES FI AT PT IE
market size (EUR billions; left-hand scale)market size (% of GDP; right-hand scale)
Sources: Investment Property Databank, Eurostat and ECB calculations.
Chart C.5 Direct commercial property investment in the euro area
(EUR billions; fl ow data)
0
20
40
60
80
100
120
140
0
20
40
60
80
100
120
140
cross-borderdomestic
2004 2005 2006
Source: Jones Lang LaSalle.
Chart C.6 Direct cross-border commercial property investment in the euro area
(2006; % of total value of direct investment fl ows in each country)
0102030405060708090100
0102030405060708090
100
1 2 3 4 5 6 7 8 9 10 11 12 131 Luxembourg2 Germany3 Portugal4 Spain
5 France6 euro area7 Greece8 Belgium
9 Netherlands10 Finland11 Italy12 Austria13 Ireland
Source: Jones Lang LaSalle.
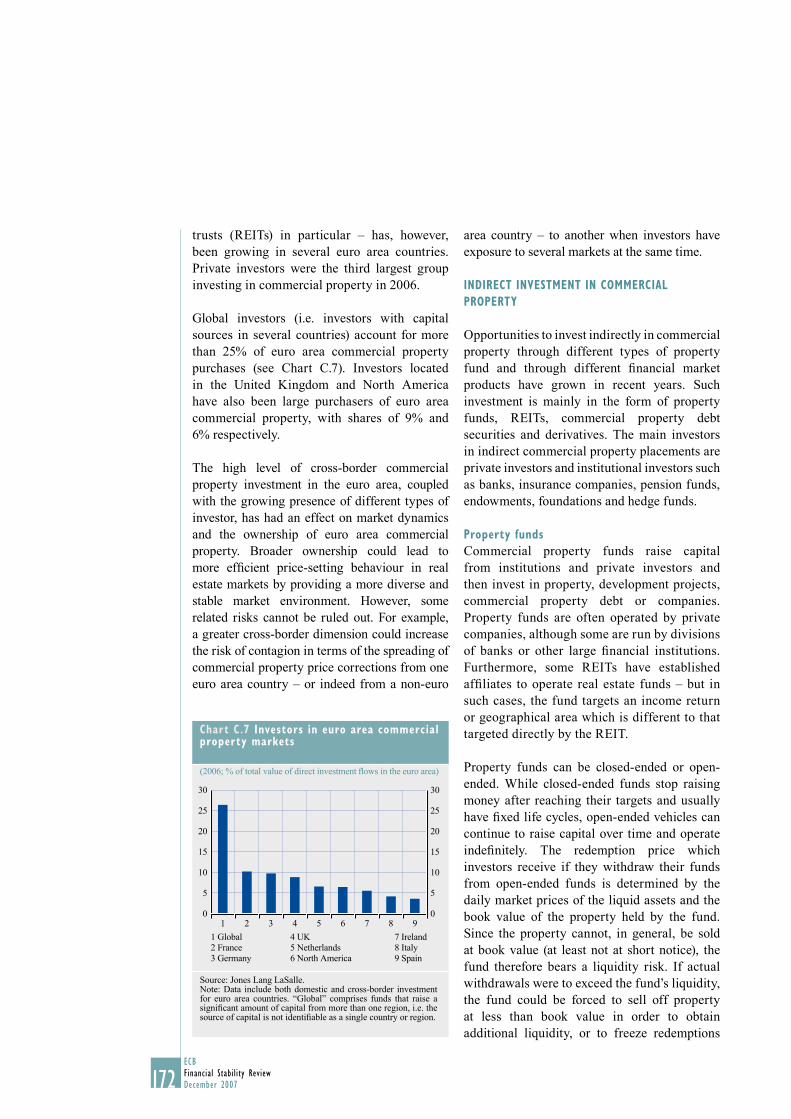
172ECBFinancial Stability ReviewDecember 2007
trusts (REITs) in particular – has, however, been growing in several euro area countries. Private investors were the third largest group investing in commercial property in 2006.
Global investors (i.e. investors with capital sources in several countries) account for more than 25% of euro area commercial property purchases (see Chart C.7). Investors located in the United Kingdom and North America have also been large purchasers of euro area commercial property, with shares of 9% and 6% respectively.
The high level of cross-border commercial property investment in the euro area, coupled with the growing presence of different types of investor, has had an effect on market dynamics and the ownership of euro area commercial property. Broader ownership could lead to more effi cient price-setting behaviour in real estate markets by providing a more diverse and stable market environment. However, some related risks cannot be ruled out. For example, a greater cross-border dimension could increase the risk of contagion in terms of the spreading of commercial property price corrections from one euro area country – or indeed from a non-euro
area country – to another when investors have exposure to several markets at the same time.
INDIRECT INVESTMENT IN COMMERCIAL
PROPERTY
Opportunities to invest indirectly in commercial property through different types of property fund and through different fi nancial market products have grown in recent years. Such investment is mainly in the form of property funds, REITs, commercial property debt securities and derivatives. The main investors in indirect commercial property placements are private investors and institutional investors such as banks, insurance companies, pension funds, endowments, foundations and hedge funds.
Property funds
Commercial property funds raise capital from institutions and private investors and then invest in property, development projects, commercial property debt or companies. Property funds are often operated by private companies, although some are run by divisions of banks or other large fi nancial institutions. Furthermore, some REITs have established affi liates to operate real estate funds – but in such cases, the fund targets an income return or geographical area which is different to that targeted directly by the REIT.
Property funds can be closed-ended or open-ended. While closed-ended funds stop raising money after reaching their targets and usually have fi xed life cycles, open-ended vehicles can continue to raise capital over time and operate indefi nitely. The redemption price which investors receive if they withdraw their funds from open-ended funds is determined by the daily market prices of the liquid assets and the book value of the property held by the fund. Since the property cannot, in general, be sold at book value (at least not at short notice), the fund therefore bears a liquidity risk. If actual withdrawals were to exceed the fund’s liquidity, the fund could be forced to sell off property at less than book value in order to obtain additional liquidity, or to freeze redemptions
Chart C.7 Investors in euro area commercial property markets
(2006; % of total value of direct investment fl ows in the euro area)
0
5
10
15
20
25
30
0
5
10
15
20
25
30
1 Global2 France3 Germany
7 Ireland8 Italy9 Spain
1 2 3 4 5 6 7 8 9
4 UK5 Netherlands6 North America
Source: Jones Lang LaSalle.Note: Data include both domestic and cross-border investment for euro area countries. “Global” comprises funds that raise a signifi cant amount of capital from more than one region, i.e. the source of capital is not identifi able as a single country or region.
173ECB
Financial Stability ReviewDecember 2007
I V SPEC IAL FEATURES
173
temporarily where the sale of property at less than book value is, in general, not permitted.
Liquidity shortages have surfaced in some open-ended funds in the euro area in recent years, which has not only resulted in the closure of individual funds, but has also led to the disappearance of this type of investment in some countries.7
Speciality commercial property funds invest primarily in REITs of various types. The risks related to speciality funds are similar to those associated with direct ownership of real estate, including: changes in real estate values and property taxes; interest rates; the cash fl ows associated with the underlying real estate assets; supply and demand; and the management skill and creditworthiness of the issuer.
Private equity funds and hedge funds
Investors can gain exposure to commercial property markets by investing in private equity funds or hedge funds specialising in different kinds of commercial property investment. Private equity fi rms acquire real estate-owning companies, or stakes in such companies, rather than investing in individual properties or commercial property debt. Another form of private equity real estate investment is the creation of a company which invests in real estate-owning companies, properties, debt or a combination of the three.
Moreover, hedge funds are sometimes large investors in commercial property markets. Some invest directly, but most invest in equities of commercial property companies or structured credit products.
Real estate investment trusts
REITs are publicly traded real estate stock corporations which are exempt from both corporate income tax and trade income tax. They must derive at least 75% of their income from property investment and pay at least 90% of their income to shareholders.
REITs are listed on stock exchanges and, although their value should depend entirely on the value of the property they represent, their values tend to move with the rest of the equity market. This can be a problem for investors seeking exposure to commercial property, and not exposure to equities.
Most REITs acquire or develop offi ces, apartments, shopping centres or industrial properties. In recent years some REITs have invested in niche or alternative property types, including prisons and self-storage properties.
Commercial mortgage-backed securities and
commercial property collateralised debt
obligations
The large volumes of direct investment in commercial property witnessed in recent years, which have, in large part, been debt-fi nanced, have created a need for banks to spread some of the related credit risk via debt securities. Moreover, the proactive measures taken by banks in view of the introduction of Basel II have fuelled the transfer of such credit risks to non-bank investors – particularly for the more subordinated parts of those risks.
This credit risk transfer is achieved mainly by means of the issuance of commercial mortgage-backed securities, which are a type of bond issued in security markets. These were fi rst introduced in the US in the early 1990s, when they were used to clean up bad loans. They are a type of mortgage-backed security, but are backed by mortgages on commercial rather than residential real estate, and are usually structured into various tranches.
Record issuance levels were observed for CMBSs in Europe in 2006, with growth rates standing at around 60% year on year. Rising commercial property prices and declining property yields contributed to this development.
See Box 6 in ECB (2006), 7 Financial Stability Review, December.
174ECBFinancial Stability ReviewDecember 2007
The United Kingdom is the largest market for CMBSs in Europe, but activity in euro area countries is increasing. In Germany, for example, the total value of CMBS issuance stood at €25.9 billion in 2006, compared with €4.9 billion in 2005, mainly because of the sale of large housing portfolios.8
Lately, commercial property collateralised debt obligations (CDOs) have joined CMBS transactions as an additional vehicle for the fi nancing of commercial real estate. It is only in recent years that commercial property CDOs have started to emerge in Europe, with lenders beginning to follow the US practices of dividing commercial real estate loans into senior and junior pieces, which, in turn, has stimulated demand from investors with different risk appetites and allowed banks to transfer more subordinated real estate loan products (such as B notes and mezzanine loans).9 Commercial property CDOs can be backed either by rated collateral, such as CMBSs, or by commercial real estate loans.10
CMBSs and commercial property CDOs have become popular among banks in order to transfer credit risks stemming from commercial lending loan portfolios. Such credit risk reduction activities on the part of banks are, in general, positive from a fi nancial stability perspective, as they can reduce banks’ exposure to credit events in commercial property markets. Banks could, however, face risks if demand for these products were to fall. Furthermore, banks, together with other fi nancial institutions, such as insurers and hedge funds, also buy CMBSs and commercial property CDOs as part of their trading activities, and it is therefore important, from a fi nancial stability perspective, to know who is selling protection against defaults on commercial property loans and to analyse developments in these markets. A further fi nancial stability concern related to the growing CMBS and commercial property CDO markets stems from the sometimes complex structures of these instruments and their lack of transparency, which makes it diffi cult for investors to understand the risks involved.
Property derivatives
Property derivatives have several features that are positive from a fi nancial stability viewpoint. They provide hedging functions for owners of commercial property and allow investors to gain exposure to – and diversify their investments into – commercial property markets without having to invest directly in property, thereby contributing to the effi ciency of real estate markets. Furthermore, property derivatives (provided that they are not based on REITs) are not correlated with the stock market and thus provide opportunities for investors to spread investment risks. Although the commercial property derivatives market is still relatively small in the euro area, strong growth observed during recent years, together with the opaqueness of derivatives markets, which makes it diffi cult to know who is exposed to these instruments, and the danger that some investors do not have adequate risk management practices in place for investing in property derivatives, means that these markets need to be monitored in the context of fi nancial stability assessments.
Property derivatives have existed for around 15 years, but signifi cant growth has been witnessed only during the last three years in Europe, and mainly in the United Kingdom, Germany and France. The growth of the market has been weaker than expected by market participants.11 Demand for commercial property derivatives has been hampered mainly by the fact that commercial property markets are often illiquid, as well as by the lack of transparency, standardisation and high-quality databases. Some market participants do, however, expect strong growth in property derivatives in the coming years given the size of the property market in Europe and thanks to improvements in the standardisation of derivatives and
See Moody’s (2007), “2006 Review and 2007 Outlook: EMEA 8 CMBS: Another record year with tremendous growth in the German CMBS and Multifamily market”, January.See Fitch Ratings (2006), “Laying the Foundations – the 9 Potential for European Real Estate CDOs”, September.See Fitch Ratings (2007), “Commercial Real Estate CDO 10 Servicing: A La Carte or Prix Fixe?”, February.See Risk Magazine (2007), “Property derivatives”, September. 11
175ECB
Financial Stability ReviewDecember 2007
I V SPEC IAL FEATURES
175
improved databases.12 The high underlying amount of commercial property in the euro area provides a large base for derivative transactions. Furthermore, progress has been made in standardising property derivatives in order to make them easier for investors to analyse and, therefore, in order to increase their demand and reduce the set-up time needed. The establishment of commercial property price indices for derivatives by the Investment Property Databank has also supported the growth of the market – especially in the United Kingdom – and recent initiatives to broaden the geographical coverage of the indices could further develop property derivative markets in Europe.
CONCLUDING REMARKS
History has shown that adverse developments in commercial property markets have the potential to cause severe fi nancial instability. This, together with the growth seen in euro area commercial property markets in recent years, means that there is a need from a fi nancial stability viewpoint to monitor and analyse the nature and scale of exposures within the fi nancial system to the various available types of commercial property investment.
See, for example, Deutsche Bank Research (2007), “Property 12 derivatives marching across Europe”, June.
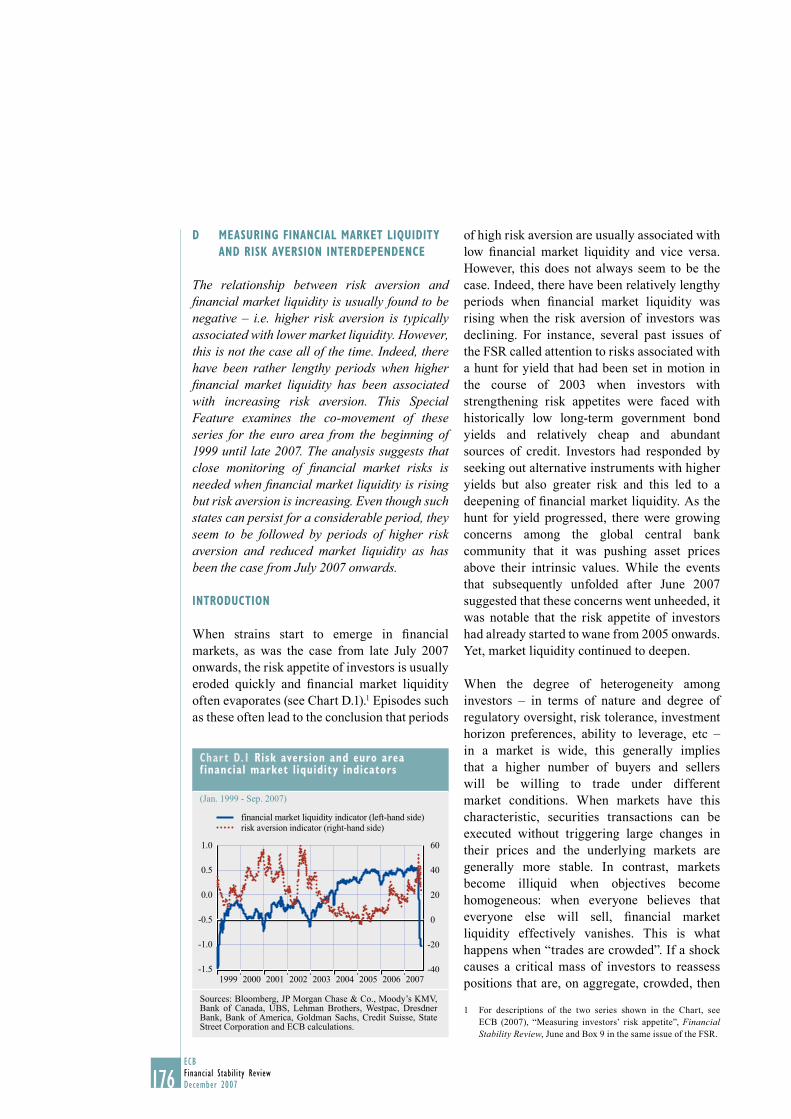
176ECBFinancial Stability ReviewDecember 2007
D MEASURING FINANCIAL MARKET LIQUIDITY
AND RISK AVERSION INTERDEPENDENCE
The relationship between risk aversion and fi nancial market liquidity is usually found to be negative – i.e. higher risk aversion is typically associated with lower market liquidity. However, this is not the case all of the time. Indeed, there have been rather lengthy periods when higher fi nancial market liquidity has been associated with increasing risk aversion. This Special Feature examines the co-movement of these series for the euro area from the beginning of 1999 until late 2007. The analysis suggests that close monitoring of fi nancial market risks is needed when fi nancial market liquidity is rising but risk aversion is increasing. Even though such states can persist for a considerable period, they seem to be followed by periods of higher risk aversion and reduced market liquidity as has been the case from July 2007 onwards.
INTRODUCTION
When strains start to emerge in fi nancial markets, as was the case from late July 2007 onwards, the risk appetite of investors is usually eroded quickly and fi nancial market liquidity often evaporates (see Chart D.1).1 Episodes such as these often lead to the conclusion that periods
of high risk aversion are usually associated with low fi nancial market liquidity and vice versa. However, this does not always seem to be the case. Indeed, there have been relatively lengthy periods when fi nancial market liquidity was rising when the risk aversion of investors was declining. For instance, several past issues of the FSR called attention to risks associated with a hunt for yield that had been set in motion in the course of 2003 when investors with strengthening risk appetites were faced with historically low long-term government bond yields and relatively cheap and abundant sources of credit. Investors had responded by seeking out alternative instruments with higher yields but also greater risk and this led to a deepening of fi nancial market liquidity. As the hunt for yield progressed, there were growing concerns among the global central bank community that it was pushing asset prices above their intrinsic values. While the events that subsequently unfolded after June 2007 suggested that these concerns went unheeded, it was notable that the risk appetite of investors had already started to wane from 2005 onwards. Yet, market liquidity continued to deepen.
When the degree of heterogeneity among investors – in terms of nature and degree of regulatory oversight, risk tolerance, investment horizon preferences, ability to leverage, etc – in a market is wide, this generally implies that a higher number of buyers and sellers will be willing to trade under different market conditions. When markets have this characteristic, securities transactions can be executed without triggering large changes in their prices and the underlying markets are generally more stable. In contrast, markets become illiquid when objectives become homogeneous: when everyone believes that everyone else will sell, fi nancial market liquidity effectively vanishes. This is what happens when “trades are crowded”. If a shock causes a critical mass of investors to reassess positions that are, on aggregate, crowded, then
For descriptions of the two series shown in the Chart, see 1 ECB (2007), “Measuring investors’ risk appetite”, Financial Stability Review, June and Box 9 in the same issue of the FSR.
Chart D.1 Risk aversion and euro area f inancial market liquidity indicators
(Jan. 1999 - Sep. 2007)
-1.5
-1.0
-0.5
0.0
0.5
1.0
2007
-20
0
20
40
60
financial market liquidity indicator (left-hand side)risk aversion indicator (right-hand side)
-401999 2000 2001 2002 2003 2004 2005 2006
Sources: Bloomberg, JP Morgan Chase & Co., Moody’s KMV, Bank of Canada, UBS, Lehman Brothers, Westpac, Dresdner Bank, Bank of America, Goldman Sachs, Credit Suisse, State Street Corporation and ECB calculations.

177ECB
Financial Stability ReviewDecember 2007
I V SPEC IAL FEATURES
177
a “rush for the exit” normally ensues, bringing adverse market dynamics and much larger asset price volatility than might otherwise have been expected, given the size of the shock.
The widening of investor diversity over the past few years seemed to have contributed to greater stability in fi nancial markets. By making them more liquid, greater investor diversity had contributed to a signifi cant decline in market volatility. At the same time, lower volatility had helped reduce investor uncertainty, boosting confi dence in the smooth functioning of markets, and, as a result, a greater number of buyers and sellers were attracted into the markets, thereby further enhancing liquidity.
In the June 2007 issue of the FSR, the importance for fi nancial system stability of market liquidity remaining durable under stress was emphasised. In this respect, a key factor in determining the durability of fi nancial market liquidity appears to be the risk appetite of investors. Against this background, this Special Feature empirically examines the relationship between risk aversion and fi nancial market liquidity in order to pinpoint conditions where the durability of market liquidity may be vulnerable.
MEASURING THE RELATIONSHIP BETWEEN
LIQUIDITY AND RISK AVERSION
A casual inspection suggests that the relationship between a composite measure of risk aversion and euro area market liquidity is predominantly negative and that this is especially the case when risk aversion suddenly increases (see Chart D.1). During such episodes rises in
risk aversion have been associated with declining fi nancial market liquidity. The predominance of a negative relationship is confi rmed by various correlation measures calculated over various data frequencies (see Table D.1).
Dependence in a multivariate setting
A closer examination of the nature of the relationship between risk aversion and fi nancial market volatility is possible with a scatter plot of the joint distribution of the two variables (see Chart D.2). This analysis reveals, overall, that the broad relationship between the two variables (considering the concentrations of points) is negative, supporting the view that high levels of risk aversion are broadly associated with low levels of fi nancial market liquidity. However, the joint density has multiple peaks, suggesting the existence of distinct states in the relationship between the two variables over the sample period considered. Indeed, in some periods the relationship between the two has been relatively loose and in others it has even been positive.
Chart D.2 Joint distribution of risk aversion and f inancial market liquidity
(Jan. 1999 - Sep. 2007; daily observations)
risk aversion finan
cial
mar
ket
liqui
dity
density
0 10 20 30 40 50 60
0.5
0.0
-0.5
-1.0
-1.5
risk aversion
financial market liquidity
Source: ECB calculations. Note: Non-parametric kernel density estimation of a level plot (right) and a 3-D surface (left). A higher level denotes higher concentration of points.
Table D.1 Simple correlation measures for risk aversion and f inancial market liquidity at dif ferent data frequencies
(Jan. 1999 - Sep. 2007)
Frequency Correlation measure
Pearson Kendall Spearman
monthly -0.595 -0.407 -0.601weekly -0.581 -0.398 -0.588daily -0.581 -0.395 -0.580
Source: ECB calculations.
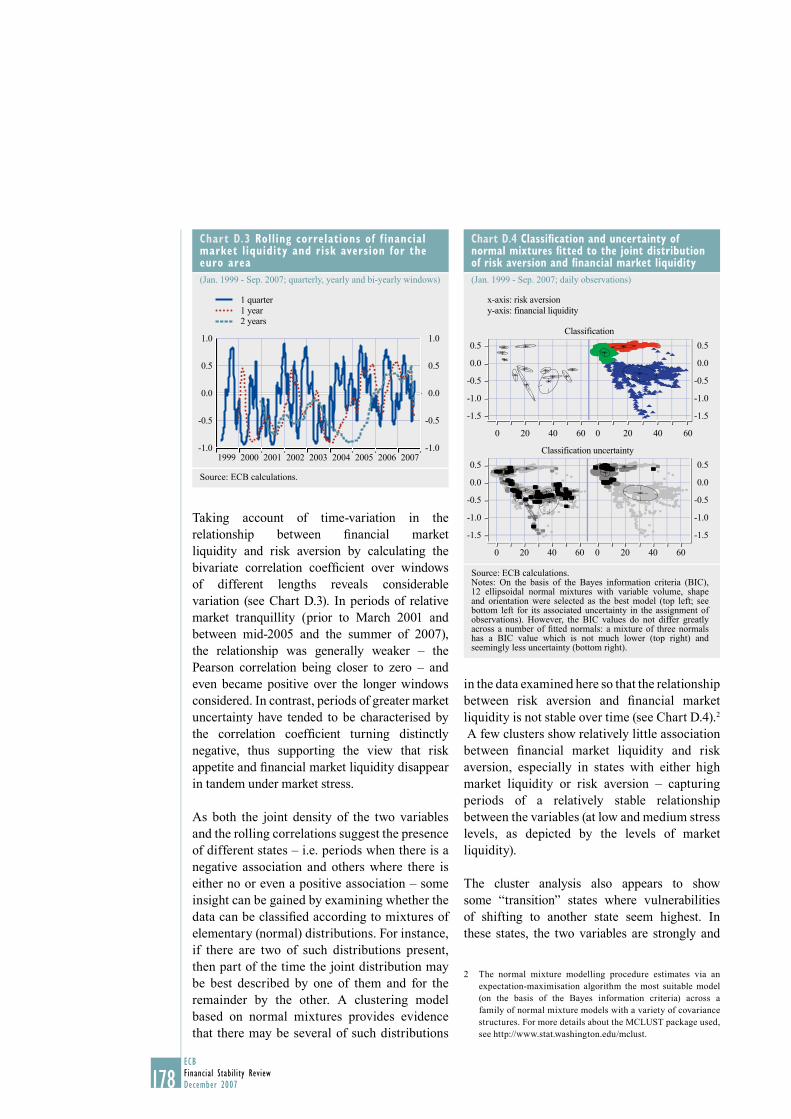
178ECBFinancial Stability ReviewDecember 2007
Taking account of time-variation in the relationship between fi nancial market liquidity and risk aversion by calculating the bivariate correlation coeffi cient over windows of different lengths reveals considerable variation (see Chart D.3). In periods of relative market tranquillity (prior to March 2001 and between mid-2005 and the summer of 2007), the relationship was generally weaker – the Pearson correlation being closer to zero – and even became positive over the longer windows considered. In contrast, periods of greater market uncertainty have tended to be characterised by the correlation coeffi cient turning distinctly negative, thus supporting the view that risk appetite and fi nancial market liquidity disappear in tandem under market stress.
As both the joint density of the two variables and the rolling correlations suggest the presence of different states – i.e. periods when there is a negative association and others where there is either no or even a positive association – some insight can be gained by examining whether the data can be classifi ed according to mixtures of elementary (normal) distributions. For instance, if there are two of such distributions present, then part of the time the joint distribution may be best described by one of them and for the remainder by the other. A clustering model based on normal mixtures provides evidence that there may be several of such distributions
in the data examined here so that the relationship between risk aversion and fi nancial market liquidity is not stable over time (see Chart D.4).2
A few clusters show relatively little association between fi nancial market liquidity and risk aversion, especially in states with either high market liquidity or risk aversion – capturing periods of a relatively stable relationship between the variables (at low and medium stress levels, as depicted by the levels of market liquidity).
The cluster analysis also appears to show some “transition” states where vulnerabilities of shifting to another state seem highest. In these states, the two variables are strongly and
The normal mixture modelling procedure estimates via an 2 expectation-maximisation algorithm the most suitable model (on the basis of the Bayes information criteria) across a family of normal mixture models with a variety of covariance structures. For more details about the MCLUST package used, see http://www.stat.washington.edu/mclust.
Chart D.4 Classifi cation and uncertainty of normal mixtures fi tted to the joint distribution of risk aversion and fi nancial market liquidity
(Jan. 1999 - Sep. 2007; daily observations)
Classification
0 20 40 60
x-axis: risk aversiony-axis: financial liquidity
0 20 40 60
0.5
0.0
-0.5
-1.0
-1.5
0.5
0.0
-0.5
-1.0
-1.5
�
������ �
�
�
��
��
����
������������
������
��� ��
�����
�����
����
�� ������
������
����
�������
�������������
�������� � �����
��������������
��
���������
���������� �� �� ��� ���
� � ��������� � ������
�� �� �������� �� ��� ��� ������������ � �
� ������������������������������ � ������������������������
�������
����� ���� ���� � ������� ������� �� ��������� � ���� ����������� �� ��� � ��� ���� �������� ���� � � �����
������ � �������������
���������� ������������������������������������������������������ ������������
��������� �� � � � ��� ������ � ���������� ���������
������ �������������� ��������� ������������
�������
������
�������
��� �� ������������ �� ������ ���� ���� ������������
� � ����
���� ������
�������������������������� �������������� �� � ����� ��������������������� ���������� ����� ������� ��� � �������
�
��� ��
�� ��� �������� � ��������� ������������ ��� ����
� ���������������������������������������� � ���������� �����������
��������������������������������� ��� �
���������������� ���
����� �� ��������� ��� � �� �� ���� � ��� � � � �� � ��� � � ������� � � ����� ���������
��� ���� �� ���
������ ��� � ���� ���� � �� �������������� ��������
� ����������� ����� � � ��������� � ������ ����
����
���������
� �� � ������ �������������� � ����� ���� �
���� ����� ����
���������
����������
������������������ ����������������
�������� ��������
�����������
����������������������������������
������
�����������
�
���
��������������������� ������������������������������
������������������������
�������������������������� ������� ��������� ���������� ���������������������
���
��� � �� �� ���� ����
����� � ��������� ���� ���������� ����������
����������������
���������������������������
� ������������ � ��� � ��������������� ����
��������� ����������������
������� �� � � ������ � �� ������ �� ������������
���������������������������������������
��� ������ ��� � ���� ������
������������ � ��� �� � ��� �
��
�
�
��
�
�
�
�
�
��
��� �
�� ����� ��������� �
�������������������������
���������������������������������������
���������������������������
�������������������������� �������������������������������
���� ������������������������������������
�������������������������������
��������������� ����������
������������������������������������������������������������ ������� �������������������������������������������������������������������������������
������������������������� ���������
��������������������
������������
����������������
�������������������������� ������������������������������������������������������������������������ �
Classification uncertainty
0 20 40 60 0 20 40 60
0.5
0.0
-0.5
-1.0
-1.5
0.5
0.0
-0.5
-1.0
-1.5
�
��� �
�
�
��
�
���
�
������
������
��� ��
��������
���������
�����
����
�������
�������������
�������� �
�������
��
���������
����������
�� ��� ���� � �������� � ������
�� �� �������� �� ��� �������������� � �
� ����������������������������� � ������������������������
�������
������� ���� � ������� ������� ������� ���� ���� ������ � �����
������ � �������������
������ ��������������������
���� ������������������
� ��� � �������
�
����� ��������� �����
��������
���
�����
����������� �� �� �� ���������� � ����
�����
�������������������������� �������������� �� � ����� ��������������������� ���������� ����� ��
�� �
�� ������� � �������� ����
�������� ���
������������������������������������� � ��������� �����������
���
���������������� �� ��������
� ��� � �� ���� � ��� � �� ������� � � ����� ���
�
���� �������� ��������
� ���
�����
��� ����
��
���
����� ������
���� ���
������
���������������������� ����������������
�������������
����������������������������������
����������
�����������������������������������
�
����������
������������������
��������������� � �� ����� ��������������������������� ������ �� �����
��������
���������� ������������������������
��� ������������
���������������������������������������������
���� ������� ��������������������������������������������� �������������������������
������������ �������������
� ���������� �
�������������������������������������
���������������������������������� ���� �� ������ ���� �� ��������
�� ����������������
�������������������� ��� ������� �������������
�������������� �
�� � �� �� ���� ��������� � ��������� ������� ��
���� � ����������� ���������������������
�����������
�������
���������������������������
� ������������� � ��� � ���������������������� ����
������������� ����������������
������� �� � � ������ � �� ������ �� ������������
���������������������������������������
��� ������ ��� � ���� ������
������������ � ��� �� � ��� �
��
�
�
�
�
��
��� �
�� ����� ����
�� ���
����
��
��
��
���������� �����
���������������� ����������������������������
������������� � �������
���������� ���������
�
����������
���� ��� ���������
����� �����������
���������������������
������������� � �� ���� �
���������� ���������� ��������������
� ��������������
������ �������������
���� ������������
��������������������������������
������������
�
���
���
������������������������������������������������������������������������������������������������������������������ �
�
��
�
�
����
�
������
�������������� �����������������
�����
������������������ �
�� ������������
����� ��� ����
�
�������
��� ��������������
�
Source: ECB calculations.Notes: On the basis of the Bayes information criteria (BIC), 12 ellipsoidal normal mixtures with variable volume, shape and orientation were selected as the best model (top left; see bottom left for its associated uncertainty in the assignment of observations). However, the BIC values do not differ greatly across a number of fi tted normals: a mixture of three normals has a BIC value which is not much lower (top right) and seemingly less uncertainty (bottom right).
Chart D.3 Rolling correlations of f inancial market liquidity and risk aversion for the euro area
(Jan. 1999 - Sep. 2007; quarterly, yearly and bi-yearly windows)
-1.0
-0.5
0.0
0.5
1.0
-1.0
-0.5
0.0
0.5
1.0
1 quarter1 year2 years
1999 2000 2001 2002 2003 2004 2005 2006 2007
Source: ECB calculations.
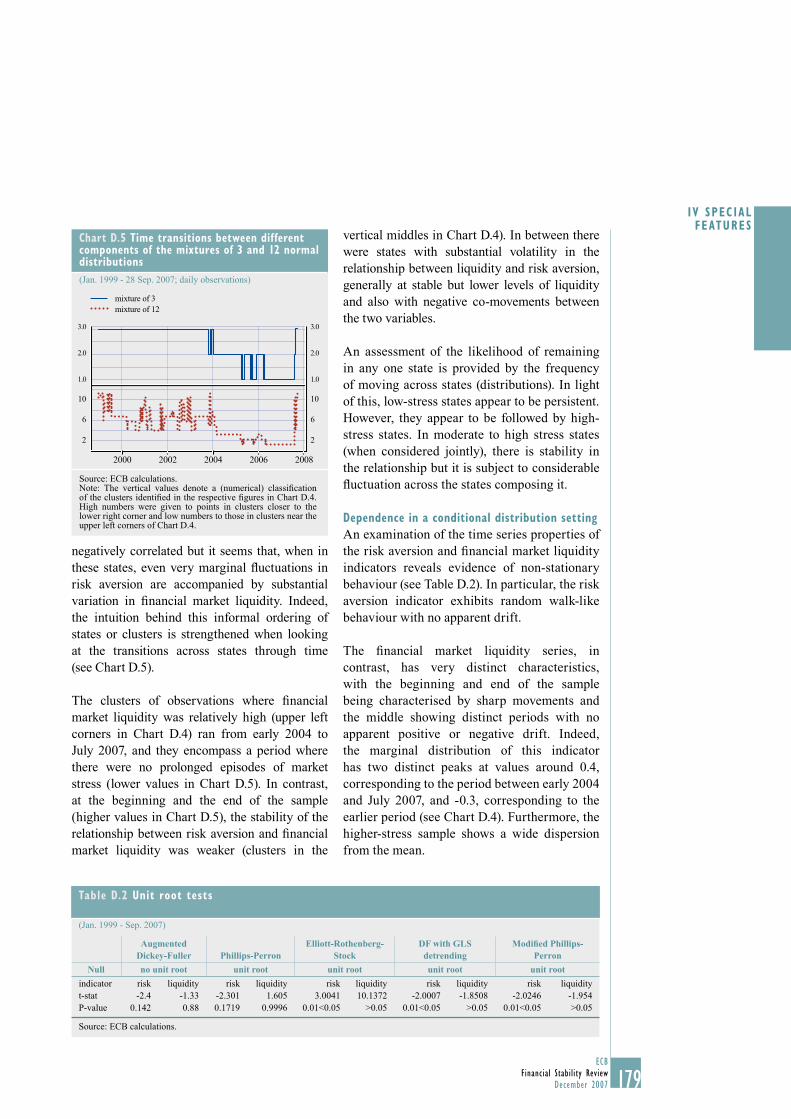
179ECB
Financial Stability ReviewDecember 2007
I V SPEC IAL FEATURES
179
negatively correlated but it seems that, when in these states, even very marginal fl uctuations in risk aversion are accompanied by substantial variation in fi nancial market liquidity. Indeed, the intuition behind this informal ordering of states or clusters is strengthened when looking at the transitions across states through time (see Chart D.5).
The clusters of observations where fi nancial market liquidity was relatively high (upper left corners in Chart D.4) ran from early 2004 to July 2007, and they encompass a period where there were no prolonged episodes of market stress (lower values in Chart D.5). In contrast, at the beginning and the end of the sample (higher values in Chart D.5), the stability of the relationship between risk aversion and fi nancial market liquidity was weaker (clusters in the
vertical middles in Chart D.4). In between there were states with substantial volatility in the relationship between liquidity and risk aversion, generally at stable but lower levels of liquidity and also with negative co-movements between the two variables.
An assessment of the likelihood of remaining in any one state is provided by the frequency of moving across states (distributions). In light of this, low-stress states appear to be persistent. However, they appear to be followed by high-stress states. In moderate to high stress states (when considered jointly), there is stability in the relationship but it is subject to considerable fl uctuation across the states composing it.
Dependence in a conditional distribution setting
An examination of the time series properties of the risk aversion and fi nancial market liquidity indicators reveals evidence of non-stationary behaviour (see Table D.2). In particular, the risk aversion indicator exhibits random walk-like behaviour with no apparent drift.
The fi nancial market liquidity series, in contrast, has very distinct characteristics, with the beginning and end of the sample being characterised by sharp movements and the middle showing distinct periods with no apparent positive or negative drift. Indeed, the marginal distribution of this indicator has two distinct peaks at values around 0.4, corresponding to the period between early 2004 and July 2007, and -0.3, corresponding to the earlier period (see Chart D.4). Furthermore, the higher-stress sample shows a wide dispersion from the mean.
Chart D.5 Time transitions between different components of the mixtures of 3 and 12 normal distributions
(Jan. 1999 - 28 Sep. 2007; daily observations)
mixture of 3mixture of 12
3.0
2.0
1.0
3.0
2.0
1.0
2
6
2
6
10 10
2000 2002 2004 2006 2008
Source: ECB calculations.Note: The vertical values denote a (numerical) classifi cation of the clusters identifi ed in the respective fi gures in Chart D.4. High numbers were given to points in clusters closer to the lower right corner and low numbers to those in clusters near the upper left corners of Chart D.4.
Table D.2 Unit root tests
(Jan. 1999 - Sep. 2007)
Augmented Dickey-Fuller Phillips-Perron
Elliott-Rothenberg-Stock
DF with GLS detrending
Modifi ed Phillips-Perron
Null no unit root unit root unit root unit root unit root
indicator risk liquidity risk liquidity risk liquidity risk liquidity risk liquidityt-stat -2.4 -1.33 -2.301 1.605 3.0041 10.1372 -2.0007 -1.8508 -2.0246 -1.954P-value 0.142 0.88 0.1719 0.9996 0.01<0.05 >0.05 0.01<0.05 >0.05 0.01<0.05 >0.05
Source: ECB calculations.
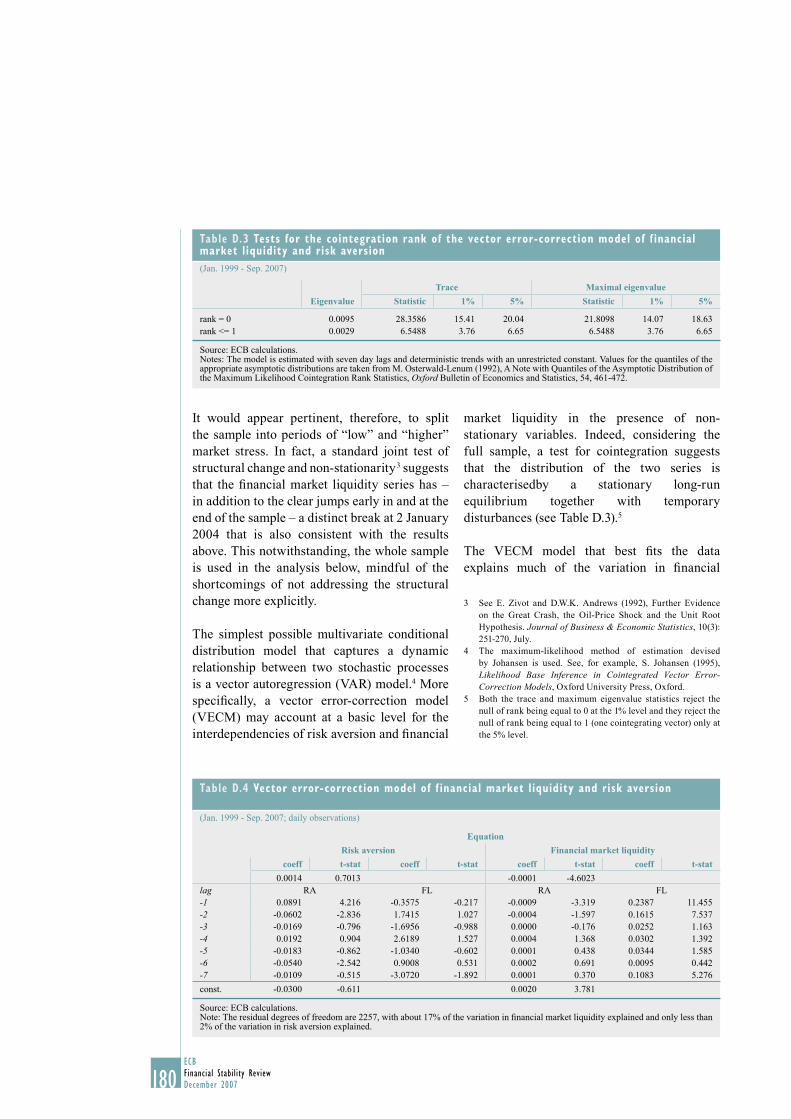
180ECBFinancial Stability ReviewDecember 2007
It would appear pertinent, therefore, to split the sample into periods of “low” and “higher” market stress. In fact, a standard joint test of structural change and non-stationarity 3 suggests that the fi nancial market liquidity series has – in addition to the clear jumps early in and at the end of the sample – a distinct break at 2 January 2004 that is also consistent with the results above. This notwithstanding, the whole sample is used in the analysis below, mindful of the shortcomings of not addressing the structural change more explicitly.
The simplest possible multivariate conditional distribution model that captures a dynamic relationship between two stochastic processes is a vector autoregression (VAR) model.4 More specifi cally, a vector error-correction model (VECM) may account at a basic level for the interdependencies of risk aversion and fi nancial
market liquidity in the presence of non-stationary variables. Indeed, considering the full sample, a test for cointegration suggests that the distribution of the two series is characterisedby a stationary long-run equilibrium together with temporary disturbances (see Table D.3).5
The VECM model that best fi ts the data explains much of the variation in fi nancial
See E. Zivot and D.W.K. Andrews (1992), Further Evidence 3 on the Great Crash, the Oil-Price Shock and the Unit Root Hypothesis. Journal of Business & Economic Statistics, 10(3): 251-270, July.The maximum-likelihood method of estimation devised 4 by Johansen is used. See, for example, S. Johansen (1995), Likelihood Base Inference in Cointegrated Vector Error-Correction Models, Oxford University Press, Oxford.Both the trace and maximum eigenvalue statistics reject the 5 null of rank being equal to 0 at the 1% level and they reject the null of rank being equal to 1 (one cointegrating vector) only at the 5% level.
Table D.3 Tests for the cointegration rank of the vector error-correction model of f inancial market liquidity and risk aversion
(Jan. 1999 - Sep. 2007)
Trace Maximal eigenvalue
Eigenvalue Statistic 1% 5% Statistic 1% 5%
rank = 0 0.0095 28.3586 15.41 20.04 21.8098 14.07 18.63rank <= 1 0.0029 6.5488 3.76 6.65 6.5488 3.76 6.65
Source: ECB calculations. Notes: The model is estimated with seven day lags and deterministic trends with an unrestricted constant. Values for the quantiles of the appropriate asymptotic distributions are taken from M. Osterwald-Lenum (1992), A Note with Quantiles of the Asymptotic Distribution of the Maximum Likelihood Cointegration Rank Statistics, Oxford Bulletin of Economics and Statistics, 54, 461-472.
Table D.4 Vector error-correction model of f inancial market liquidity and risk aversion
(Jan. 1999 - Sep. 2007; daily observations)
Equation
Risk aversion Financial market liquidity
coeff t-stat coeff t-stat coeff t-stat coeff t-stat
0.0014 0.7013 -0.0001 -4.6023lag RA FL RA FL-1 0.0891 4.216 -0.3575 -0.217 -0.0009 -3.319 0.2387 11.455 -2 -0.0602 -2.836 1.7415 1.027 -0.0004 -1.597 0.1615 7.537-3 -0.0169 -0.796 -1.6956 -0.988 0.0000 -0.176 0.0252 1.163 -4 0.0192 0.904 2.6189 1.527 0.0004 1.368 0.0302 1.392 -5 -0.0183 -0.862 -1.0340 -0.602 0.0001 0.438 0.0344 1.585 -6 -0.0540 -2.542 0.9008 0.531 0.0002 0.691 0.0095 0.442 -7 -0.0109 -0.515 -3.0720 -1.892 0.0001 0.370 0.1083 5.276
const. -0.0300 -0.611 0.0020 3.781
Source: ECB calculations.Note: The residual degrees of freedom are 2257, with about 17% of the variation in fi nancial market liquidity explained and only less than 2% of the variation in risk aversion explained.
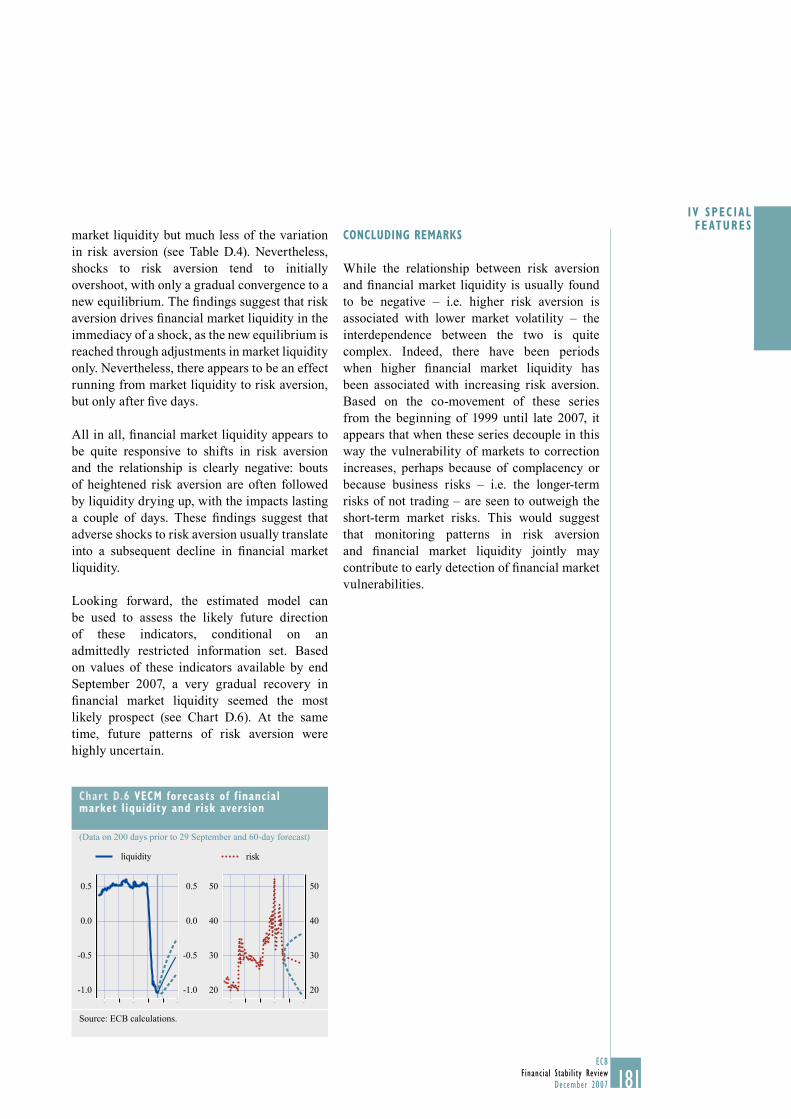
181ECB
Financial Stability ReviewDecember 2007
I V SPEC IAL FEATURES
181
market liquidity but much less of the variation in risk aversion (see Table D.4). Nevertheless, shocks to risk aversion tend to initially overshoot, with only a gradual convergence to a new equilibrium. The fi ndings suggest that risk aversion drives fi nancial market liquidity in the immediacy of a shock, as the new equilibrium is reached through adjustments in market liquidity only. Nevertheless, there appears to be an effect running from market liquidity to risk aversion, but only after fi ve days.
All in all, fi nancial market liquidity appears to be quite responsive to shifts in risk aversion and the relationship is clearly negative: bouts of heightened risk aversion are often followed by liquidity drying up, with the impacts lasting a couple of days. These fi ndings suggest that adverse shocks to risk aversion usually translate into a subsequent decline in fi nancial market liquidity.
Looking forward, the estimated model can be used to assess the likely future direction of these indicators, conditional on an admittedly restricted information set. Based on values of these indicators available by end September 2007, a very gradual recovery in fi nancial market liquidity seemed the most likely prospect (see Chart D.6). At the same time, future patterns of risk aversion were highly uncertain.
CONCLUDING REMARKS
While the relationship between risk aversion and fi nancial market liquidity is usually found to be negative – i.e. higher risk aversion is associated with lower market volatility – the interdependence between the two is quite complex. Indeed, there have been periods when higher fi nancial market liquidity has been associated with increasing risk aversion. Based on the co-movement of these series from the beginning of 1999 until late 2007, it appears that when these series decouple in this way the vulnerability of markets to correction increases, perhaps because of complacency or because business risks – i.e. the longer-term risks of not trading – are seen to outweigh the short-term market risks. This would suggest that monitoring patterns in risk aversion and fi nancial market liquidity jointly may contribute to early detection of fi nancial market vulnerabilities.
Chart D.6 VECM forecasts of f inancial market liquidity and risk aversion
(Data on 200 days prior to 29 September and 60-day forecast)
0.5
0.0
-0.5
-1.0
0.5
0.0
-0.5
-1.0
liquidity risk
50
40
30
20
50
40
30
20
Source: ECB calculations.
182ECBFinancial Stability ReviewDecember 2007
E NET ASSET VALUE TRIGGERS AS EARLY
WARNING INDICATORS OF HEDGE FUND
LIQUIDATION
Hedge funds are fl exible and relatively unconstrained institutional investors, which may also use leverage to boost their returns. This investment freedom and their ability to leverage can pose risks for their creditors and trading counterparties, who need to safeguard their credit exposures. Triggers based on the cumulative decline in the total net asset value of a fund are frequently used by banks to protect themselves against credit losses stemming from hedge fund failures. An empirical examination of the indicator properties of such triggers as early warning signals of impending hedge fund liquidation fi nds that they are not very precise in detecting future problems. Nonetheless, they still provide opportunities for banks to review the risk profi les of the hedge funds they are exposed to, thereby allowing them to take necessary protective action against risks.
INTRODUCTION
Banks’ trading agreements with hedge fund clients include various risk management and mitigation measures including the specifi cation of termination events, which, if they occur, allow them to terminate trades outstanding and seize the collateral held. These events will also often trigger termination rights that cut across all agreements with a particular bank. However, in contrast to events of default, termination events generally do not trigger cross-defaults with third parties. For credit counterparties, net asset value or NAV-based triggers, in particular triggers of total NAV cumulative decline (total NAV triggers), represent a very important set of termination events. They can also be used by hedge fund investors for investment monitoring purposes.
In contrast to NAV-per-share cumulative decline triggers that only take into account the size of negative investment returns, triggers of total NAV cumulative decline refer to the percentage decline of a fund’s total NAV.
Hence, they capture the joint impact of negative performance and investor redemptions, both of which are very important and interdependent factors in determining the viability of a hedge fund. However, investor withdrawals appear to be the main reason behind cases of hedge fund liquidation, although lacklustre returns also undoubtedly play an important and often leading role.1 When a hedge fund is losing money, investors, or both, it is very important for the bank to prevent a situation whereby there would be insuffi cient investor capital left to guarantee the fulfi lment of contractual commitments and potential future credit exposures. The provisional nature of hedge fund capital owing to potential investor redemptions poses a signifi cant risk for hedge fund counterparties and is one of the main reasons why hedge funds are unlikely to receive high credit ratings from rating agencies.
HISTORICAL PERFORMANCE
The predictive power of total NAV triggers may be tested using so-called “signal-to-noise” ratio (STNR) analysis and other related indicators. STNR analysis compares the share of predicted cases of liquidation to the proportion of bad signals or noise in no liquidation situations (see Table E.1) and is neutral with respect to the relative frequency of cases of liquidation in all the episodes analysed.2
See Box 6 in ECB (2007), 1 Financial Stability Review, June.For an application to banking and balance-of-payments crises, 2 see G. L. Kaminsky and C. M. Reinhart (1999), “The Twin Crises: The Causes of Banking and Balance-of-Payments Problems”, The American Economic Review, Vol. 89, No 3, June. In the article, however, the inverse of the signal-to-noise ratio was used, i.e. the noise-to-signal ratio.
Table E.1 Calculation of signal-to-noise ratio and other related indicators
Liquidation No liquidation
Signal issued A BNo signal C D
Signal-to-noise ratio = [ A/(A+C) ] / [ B/(B+D) ]Share of predicted cases of liquidation = A/(A+C)Share of good signals = A/(A+B)
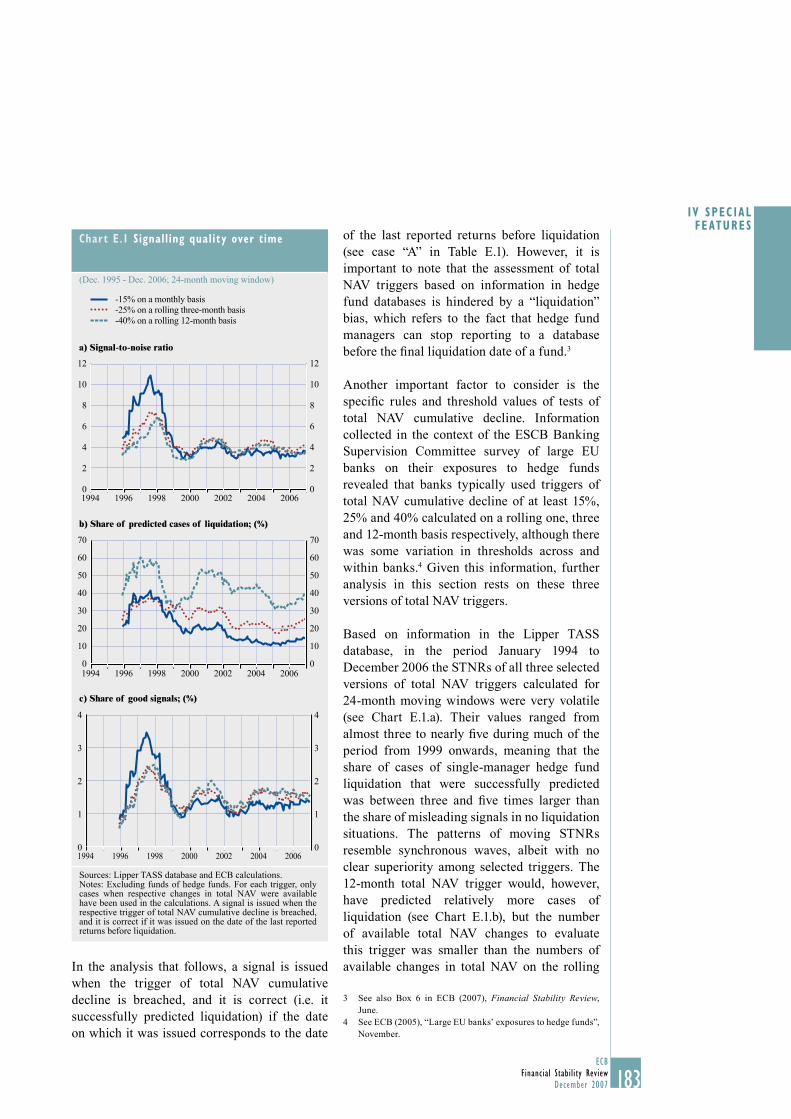
183ECB
Financial Stability ReviewDecember 2007
I V SPEC IAL FEATURES
183
In the analysis that follows, a signal is issued when the trigger of total NAV cumulative decline is breached, and it is correct (i.e. it successfully predicted liquidation) if the date on which it was issued corresponds to the date
of the last reported returns before liquidation (see case “A” in Table E.1). However, it is important to note that the assessment of total NAV triggers based on information in hedge fund databases is hindered by a “liquidation” bias, which refers to the fact that hedge fund managers can stop reporting to a database before the fi nal liquidation date of a fund.3
Another important factor to consider is the specifi c rules and threshold values of tests of total NAV cumulative decline. Information collected in the context of the ESCB Banking Supervision Committee survey of large EU banks on their exposures to hedge funds revealed that banks typically used triggers of total NAV cumulative decline of at least 15%, 25% and 40% calculated on a rolling one, three and 12-month basis respectively, although there was some variation in thresholds across and within banks.4 Given this information, further analysis in this section rests on these three versions of total NAV triggers.
Based on information in the Lipper TASS database, in the period January 1994 to December 2006 the STNRs of all three selected versions of total NAV triggers calculated for 24-month moving windows were very volatile (see Chart E.1.a). Their values ranged from almost three to nearly fi ve during much of the period from 1999 onwards, meaning that the share of cases of single-manager hedge fund liquidation that were successfully predicted was between three and fi ve times larger than the share of misleading signals in no liquidation situations. The patterns of moving STNRs resemble synchronous waves, albeit with no clear superiority among selected triggers. The 12-month total NAV trigger would, however, have predicted relatively more cases of liquidation (see Chart E.1.b), but the number of available total NAV changes to evaluate this trigger was smaller than the numbers of available changes in total NAV on the rolling
See also Box 6 in ECB (2007), 3 Financial Stability Review, June.See ECB (2005), “Large EU banks’ exposures to hedge funds”, 4 November.
Chart E.1 Signalling quality over time
(Dec. 1995 - Dec. 2006; 24-month moving window)
-15% on a monthly basis-25% on a rolling three-month basis-40% on a rolling 12-month basis
a) Signal-to-noise ratio
0
2
4
6
8
10
12
0
2
4
6
8
10
12
1994 1996 1998 2000 2002 2004 2006
b) Share of predicted cases of liquidation; (%)
0
10
20
30
40
50
60
70
0
10
20
30
40
50
60
70
1994 1996 1998 2000 2002 2004 2006
c) Share of good signals; (%)
0
1
2
3
4
0
1
2
3
4
1994 1996 1998 2000 2002 2004 2006
Sources: Lipper TASS database and ECB calculations.Notes: Excluding funds of hedge funds. For each trigger, only cases when respective changes in total NAV were available have been used in the calculations. A signal is issued when the respective trigger of total NAV cumulative decline is breached, and it is correct if it was issued on the date of the last reported returns before liquidation.
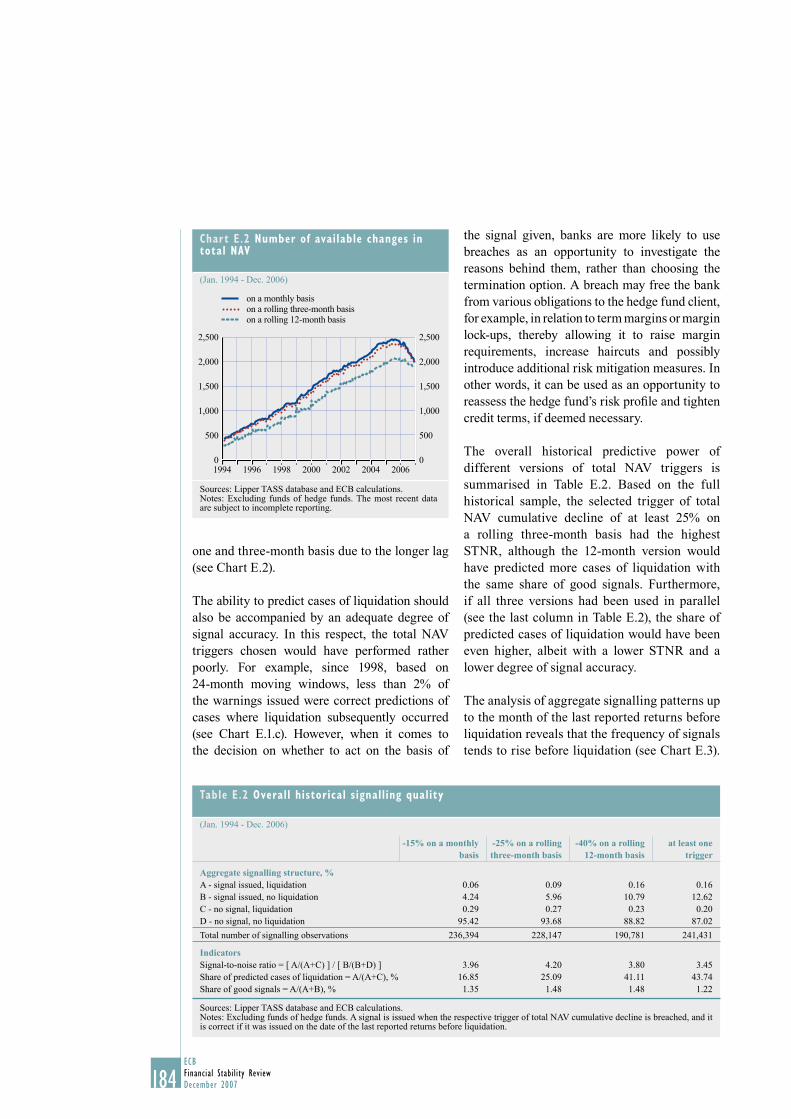
184ECBFinancial Stability ReviewDecember 2007
one and three-month basis due to the longer lag (see Chart E.2).
The ability to predict cases of liquidation should also be accompanied by an adequate degree of signal accuracy. In this respect, the total NAV triggers chosen would have performed rather poorly. For example, since 1998, based on 24-month moving windows, less than 2% of the warnings issued were correct predictions of cases where liquidation subsequently occurred (see Chart E.1.c). However, when it comes to the decision on whether to act on the basis of
the signal given, banks are more likely to use breaches as an opportunity to investigate the reasons behind them, rather than choosing the termination option. A breach may free the bank from various obligations to the hedge fund client, for example, in relation to term margins or margin lock-ups, thereby allowing it to raise margin requirements, increase haircuts and possibly introduce additional risk mitigation measures. In other words, it can be used as an opportunity to reassess the hedge fund’s risk profi le and tighten credit terms, if deemed necessary.
The overall historical predictive power of different versions of total NAV triggers is summarised in Table E.2. Based on the full historical sample, the selected trigger of total NAV cumulative decline of at least 25% on a rolling three-month basis had the highest STNR, although the 12-month version would have predicted more cases of liquidation with the same share of good signals. Furthermore, if all three versions had been used in parallel (see the last column in Table E.2), the share of predicted cases of liquidation would have been even higher, albeit with a lower STNR and a lower degree of signal accuracy.
The analysis of aggregate signalling patterns up to the month of the last reported returns before liquidation reveals that the frequency of signals tends to rise before liquidation (see Chart E.3).
Chart E.2 Number of available changes in total NAV
(Jan. 1994 - Dec. 2006)
0
500
1,000
1,500
2,000
2,500
0
500
1,000
1,500
2,000
2,500
on a monthly basison a rolling three-month basison a rolling 12-month basis
1994 1996 1998 2006200420022000
Sources: Lipper TASS database and ECB calculations.Notes: Excluding funds of hedge funds. The most recent data are subject to incomplete reporting.
Table E.2 Overall historical signalling quality
(Jan. 1994 - Dec. 2006)
-15% on a monthly basis
-25% on a rolling three-month basis
-40% on a rolling 12-month basis
at least one trigger
Aggregate signalling structure, %A - signal issued, liquidation 0.06 0.09 0.16 0.16B - signal issued, no liquidation 4.24 5.96 10.79 12.62C - no signal, liquidation 0.29 0.27 0.23 0.20D - no signal, no liquidation 95.42 93.68 88.82 87.02
Total number of signalling observations 236,394 228,147 190,781 241,431
IndicatorsSignal-to-noise ratio = [ A/(A+C) ] / [ B/(B+D) ] 3.96 4.20 3.80 3.45Share of predicted cases of liquidation = A/(A+C), % 16.85 25.09 41.11 43.74Share of good signals = A/(A+B), % 1.35 1.48 1.48 1.22
Sources: Lipper TASS database and ECB calculations. Notes: Excluding funds of hedge funds. A signal is issued when the respective trigger of total NAV cumulative decline is breached, and it is correct if it was issued on the date of the last reported returns before liquidation.
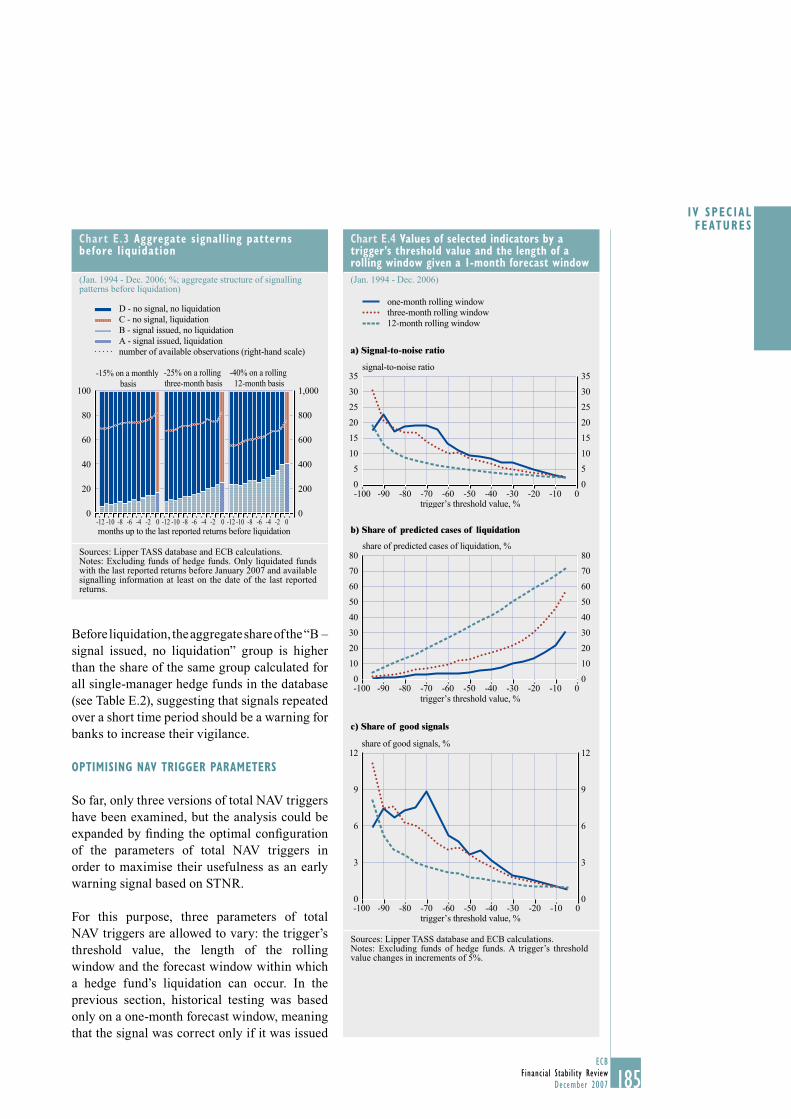
185ECB
Financial Stability ReviewDecember 2007
I V SPEC IAL FEATURES
185
Before liquidation, the aggregate share of the “B – signal issued, no liquidation” group is higher than the share of the same group calculated for all single-manager hedge funds in the database (see Table E.2), suggesting that signals repeated over a short time period should be a warning for banks to increase their vigilance.
OPTIMISING NAV TRIGGER PARAMETERS
So far, only three versions of total NAV triggers have been examined, but the analysis could be expanded by fi nding the optimal confi guration of the parameters of total NAV triggers in order to maximise their usefulness as an early warning signal based on STNR.
For this purpose, three parameters of total NAV triggers are allowed to vary: the trigger’s threshold value, the length of the rolling window and the forecast window within which a hedge fund’s liquidation can occur. In the previous section, historical testing was based only on a one-month forecast window, meaning that the signal was correct only if it was issued
Chart E.3 Aggregate signall ing patterns before liquidation
(Jan. 1994 - Dec. 2006; %; aggregate structure of signalling patterns before liquidation)
0
20
40
60
80
100
0
200
400
600
800
1,000
D - no signal, no liquidationC - no signal, liquidationB - signal issued, no liquidationA - signal issued, liquidationnumber of available observations (right-hand scale)
months up to the last reported returns before liquidation
-15% on a monthly basis
-25% on a rolling three-month basis
-40% on a rolling 12-month basis
-12 -10 -8 -6 -4 -2 0 -12 -10 -8 -6 -4 -2 0 -12 -10 -8 -6 -4 -2 0
Sources: Lipper TASS database and ECB calculations.Notes: Excluding funds of hedge funds. Only liquidated funds with the last reported returns before January 2007 and available signalling information at least on the date of the last reported returns.
Chart E.4 Values of selected indicators by a trigger’s threshold value and the length of a rolling window given a 1-month forecast window
(Jan. 1994 - Dec. 2006)
one-month rolling windowthree-month rolling window12-month rolling window
a) Signal-to-noise ratio
0
5
10
15
20
25
30
35
0
5
10
15
20
25
30
35
trigger’s threshold value, %
signal-to-noise ratio
-100 -90 -80 -70 -60 -50 -40 -30 -20 -10 0
b) Share of predicted cases of liquidation
0
10
20
30
40
50
60
70
80
0
10
20
30
40
50
60
70
80
-100 -90 -80 -70 -60 -50 -40 -30 -20 -10 0
share of predicted cases of liquidation, %
trigger’s threshold value, %
c) Share of good signals
0
3
6
9
12
0
3
6
9
12share of good signals, %
-100 -90 -80 -70 -60 -50 -40 -30 -20 -10 0trigger’s threshold value, %
Sources: Lipper TASS database and ECB calculations.Notes: Excluding funds of hedge funds. A trigger’s threshold value changes in increments of 5%.
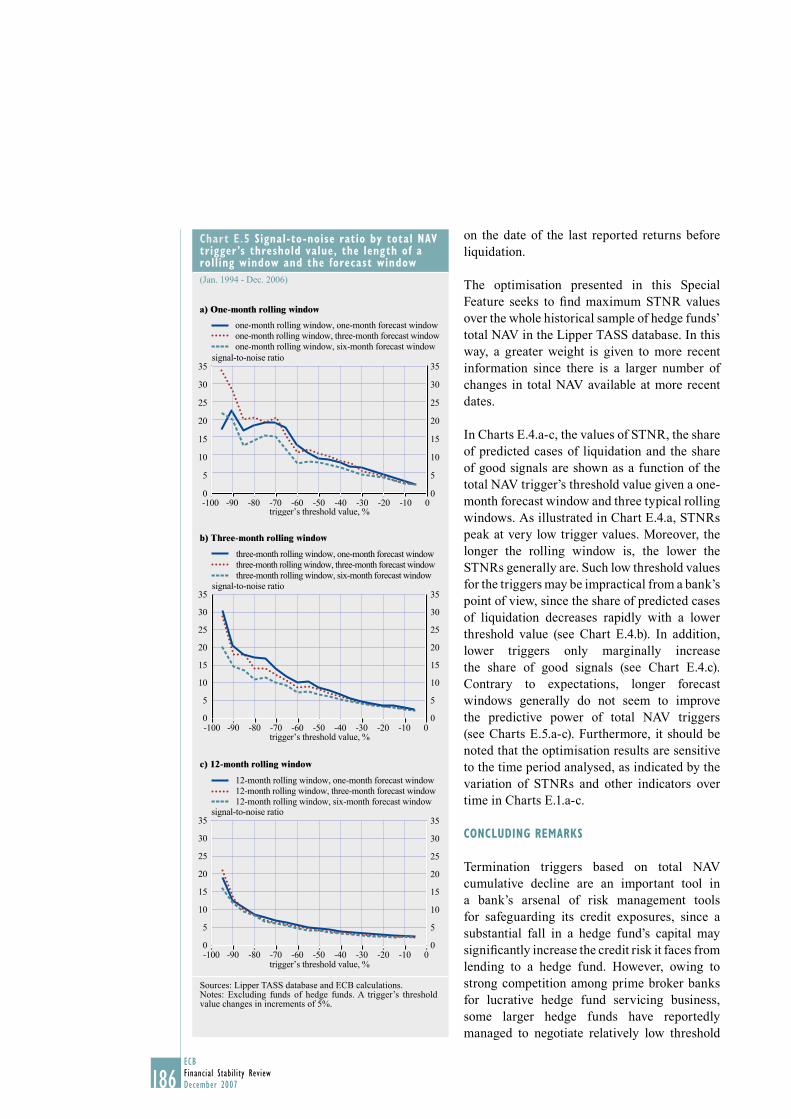
186ECBFinancial Stability ReviewDecember 2007
on the date of the last reported returns before liquidation.
The optimisation presented in this Special Feature seeks to fi nd maximum STNR values over the whole historical sample of hedge funds’ total NAV in the Lipper TASS database. In this way, a greater weight is given to more recent information since there is a larger number of changes in total NAV available at more recent dates.
In Charts E.4.a-c, the values of STNR, the share of predicted cases of liquidation and the share of good signals are shown as a function of the total NAV trigger’s threshold value given a one-month forecast window and three typical rolling windows. As illustrated in Chart E.4.a, STNRs peak at very low trigger values. Moreover, the longer the rolling window is, the lower the STNRs generally are. Such low threshold values for the triggers may be impractical from a bank’s point of view, since the share of predicted cases of liquidation decreases rapidly with a lower threshold value (see Chart E.4.b). In addition, lower triggers only marginally increase the share of good signals (see Chart E.4.c). Contrary to expectations, longer forecast windows generally do not seem to improve the predictive power of total NAV triggers (see Charts E.5.a-c). Furthermore, it should be noted that the optimisation results are sensitive to the time period analysed, as indicated by the variation of STNRs and other indicators over time in Charts E.1.a-c.
CONCLUDING REMARKS
Termination triggers based on total NAV cumulative decline are an important tool in a bank’s arsenal of risk management tools for safeguarding its credit exposures, since a substantial fall in a hedge fund’s capital may signifi cantly increase the credit risk it faces from lending to a hedge fund. However, owing to strong competition among prime broker banks for lucrative hedge fund servicing business, some larger hedge funds have reportedly managed to negotiate relatively low threshold
Chart E.5 Signal-to-noise ratio by total NAV trigger’s threshold value, the length of a rolling window and the forecast window
(Jan. 1994 - Dec. 2006)
a) One-month rolling window
one-month rolling window, one-month forecast windowone-month rolling window, three-month forecast windowone-month rolling window, six-month forecast window
35
30
25
20
15
10
5
0
35
30
25
20
15
10
5
00-10-20-30-40-50-60-70-80-90-100
trigger’s threshold value, %
signal-to-noise ratio
b) Three-month rolling window
0
5
10
15
20
25
30
35
0
5
10
15
20
25
30
35
-100 -90 -80 -70 -60 -50 -40 -30 -20 -10 0
three-month rolling window, one-month forecast windowthree-month rolling window, three-month forecast windowthree-month rolling window, six-month forecast window
trigger’s threshold value, %
signal-to-noise ratio
c) 12-month rolling window
0
5
10
15
20
25
30
35
0
5
10
15
20
25
30
35
-100 -90 -80 -70 -60 -50 -40 -30 -20 -10 0
12-month rolling window, one-month forecast window12-month rolling window, three-month forecast window12-month rolling window, six-month forecast window
trigger’s threshold value, %
signal-to-noise ratio
Sources: Lipper TASS database and ECB calculations.Notes: Excluding funds of hedge funds. A trigger’s threshold value changes in increments of 5%.
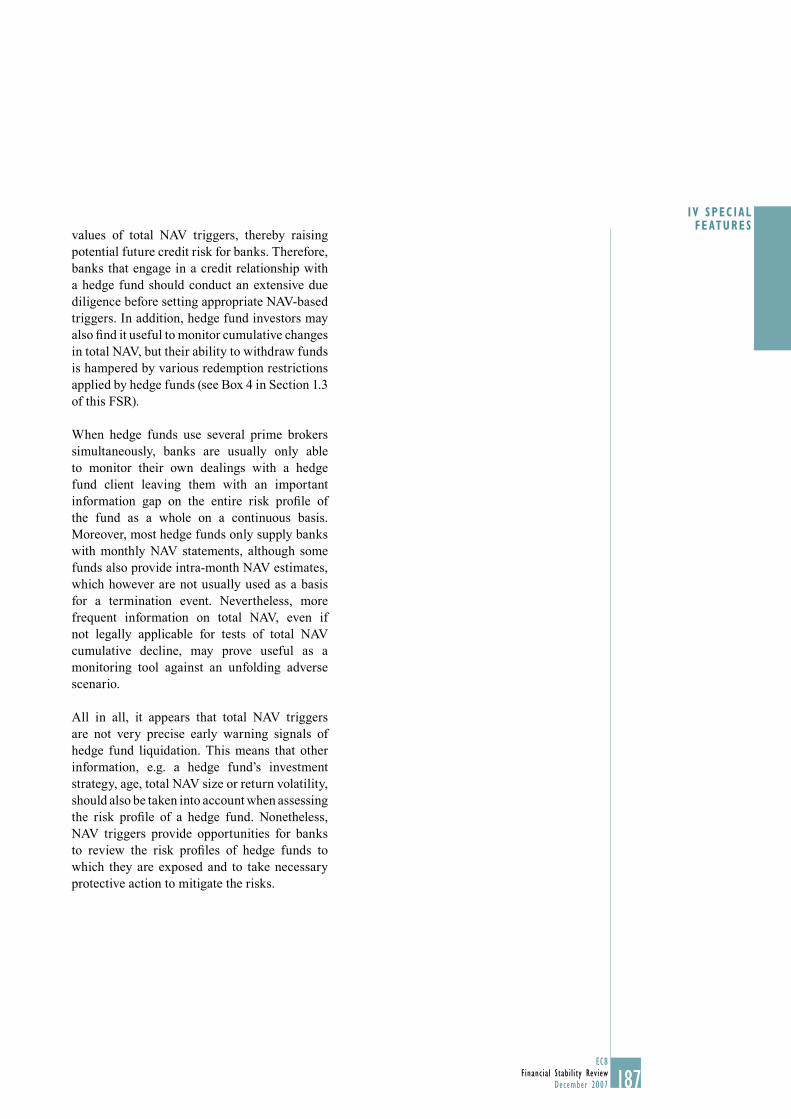
187ECB
Financial Stability ReviewDecember 2007
I V SPEC IAL FEATURES
187
values of total NAV triggers, thereby raising potential future credit risk for banks. Therefore, banks that engage in a credit relationship with a hedge fund should conduct an extensive due diligence before setting appropriate NAV-based triggers. In addition, hedge fund investors may also fi nd it useful to monitor cumulative changes in total NAV, but their ability to withdraw funds is hampered by various redemption restrictions applied by hedge funds (see Box 4 in Section 1.3 of this FSR).
When hedge funds use several prime brokers simultaneously, banks are usually only able to monitor their own dealings with a hedge fund client leaving them with an important information gap on the entire risk profi le of the fund as a whole on a continuous basis. Moreover, most hedge funds only supply banks with monthly NAV statements, although some funds also provide intra-month NAV estimates, which however are not usually used as a basis for a termination event. Nevertheless, more frequent information on total NAV, even if not legally applicable for tests of total NAV cumulative decline, may prove useful as a monitoring tool against an unfolding adverse scenario.
All in all, it appears that total NAV triggers are not very precise early warning signals of hedge fund liquidation. This means that other information, e.g. a hedge fund’s investment strategy, age, total NAV size or return volatility, should also be taken into account when assessing the risk profi le of a hedge fund. Nonetheless, NAV triggers provide opportunities for banks to review the risk profi les of hedge funds to which they are exposed and to take necessary protective action to mitigate the risks.

189ECB
Financial Stability ReviewDecember 2007
ABX index: The brand name of a series of credit default swaps (CDSs) based on 20 bonds that consist of sub-prime mortgages. A decline in the ABX index signifi es investor sentiment that sub-prime mortgage holders will suffer increased fi nancial losses from those investments.
Adjustable-rate mortgage (ARM): A mortgage with an interest rate that remains at a predetermined (usually favourable) level for an initial fi xation period, but can thereafter be changed by the lender. While ARMs in many countries allow rate changes at the lender’s discretion (also referred to as “discretionary ARMs”), rate changes for most ARMs in the United States are based on a pre-selected interest rate index over which the lender has no control.
Alternative-A (Alt-A): A mortgage risk category that falls between prime and sub-prime. The credit risk associated with Alt-A mortgage lending tends to be higher than that of prime mortgage lending on account of e.g. little or no borrower documentation (i.e. income and/or asset certainties) and/or a higher loan-to-value ratio, but lower than that of sub-prime mortgage lending due to a less (or non-)adverse credit history (also referred to as “A minus”).
Asset-backed commercial paper (ABCP): A short-term debt instrument that is backed by a form of collateral provided by the issuer, that generally has a maturity of no more than 270 days and that is either interest-bearing or discounted. The assets commonly used as collateral in the case of fi nancing through ABCP conduits include trade receivables, consumer debt receivables and collateralised debt obligations.
Collateralised debt obligation (CDO): A structured debt instrument backed by the performance of a portfolio of diversifi ed securities, loans or credit default swaps, the securitised interests in which are divided into tranches with differing streams of redemption and interest payments. When the tranches are backed by securities or loans, the structured instrument is called a “cash” CDO. Where it is backed only by loans, it is referred to as a collateralised loan obligation (CLO) and when backed by credit default swaps, it is a “synthetic” CDO.
Combined ratio: A fi nancial ratio for insurers, which is calculated as the sum of the loss ratio and the expense ratio. Typically, a combined ratio of more than 100% indicates an underwriting loss for the insurer.
Commercial mortgage-backed security (CMBS): A security with cash fl ows generated by debt on property that focuses on commercial rather than residential property. Holders of such securities receive payments of interest and principal from the holders of the underlying commercial mortgage debt.
Commercial paper: Short-term obligations with maturities ranging from 2 to 270 days issued by banks, corporations and other borrowers. Such instruments are unsecured and usually discounted, although some are interest-bearing.
Conduit: A fi nancial intermediary, such as a special-purpose vehicle (SPV) or a special investment vehicle (SIV), which funds the purchase of assets through the issuance of asset-backed securities such as commercial paper.
Credit default swap (CDS): A swap designed to transfer the credit exposure of fi xed-income products between parties. The buyer of a credit swap receives credit protection, whereas the seller
GLOSSARY
190ECBFinancial Stability ReviewDecember 2007
of the swap guarantees the creditworthiness of the product. By doing this, the risk of default is transferred from the holder of the fi xed-income security to the seller of the swap.
Credit risk transfer (CRT) market: A market in which various techniques are applied for the transfer of credit risk, e.g. the creation of credit derivatives and structured credit products. These techniques enable institutions to reduce their concentration of risks by passing on the “unwanted” risks. In other words, they provide a stabilisation mechanism similar to that of reinsurance for the insurance sector.
Debit balance: The amount that an enterprise or individual owes a lender, seller or factor.
Delinquency: A (mortgage) debt service payment that is more than a pre-defi ned number of days behind schedule (typically at least 30 days late).
Distance to default: A measure of default risk that combines the asset value, the business risk and the leverage of an asset. The distance to default compares the market net worth to the size of a one standard deviation move in the asset value.
Earnings per share (EPS): The amount of a company’s earnings that is available per ordinary share issued. These earnings may be distributed in dividends, used to pay tax, or retained and used to expand the business. Earnings per share are a major determinant of share prices.
EMBIG spreads: J.P. Morgan’s Emerging Markets Bond Index Global (EMBI Global) spreads. The EMBI Global tracks U.S. dollar-denominated debt instruments issued by emerging markets sovereign and quasi-sovereign entities, such as Brady bonds, loans, and Eurobonds. It covers over 30 emerging market countries. Data on spreads are available since 31 December 1997.
EONIA swap index: A reference rate for the euro on the derivatives market, i.e. the mid-market rate at which euro overnight index average (EONIA) swaps, as quoted by a representative panel of prime banks that provide quotes in the EONIA swap market, are traded. The index is calculated daily at 16:30 CET and rounded to three decimal places using an actual/360 day-count convention.
Euro commercial paper (ECP): A short-term debt instrument with a maturity of generally between one week and one year that is issued by prime issuers on the euro market, using US commercial paper as a model. Interest is accrued or paid by discounting the nominal value, and is infl uenced by the issuer’s credit rating.
Exchange-traded fund (ETF): A collective investment scheme that can be traded on an organised exchange at any time in the course of the business day.
Expected default frequency (EDF): A measure of the probability that an enterprise will fail to meet its obligations within a specifi ed period of time (usually the next 12 months).
Expense ratio: For insurers, the expense ratio denotes the ratio of expenses to the premium earned.
Financial obligations ratio: A fi nancial ratio for the household sector which covers a broader range of fi nancial obligations than the debt service ratio, including automobile lease payments, rental payments on tenant-occupied property, homeowners’ insurance and property tax payments.

191ECB
Financial Stability ReviewDecember 2007 191
GLOSSARY
Foreclosure: The legal process through which a lender acquires possession of the property securing a mortgage loan when the borrower defaults.
Funding liquidity: A measure of the ease with which asset portfolios can be funded.
High-yield bond: A debt security with a rating that is below investment grade, so that investors are offered a higher return to offset the risk involved (also referred to as a “junk bond” or “speculative-grade bond”.
Household debt service ratio: The ratio of debt payments to disposable personal income. Debt payments consist of the estimated required payments on outstanding mortgage and consumer debt.
Implied volatility: A measure of expected volatility (standard deviation in terms of annualised percentage changes) in the prices of e.g. bonds and stocks (or of corresponding futures contracts) that can be extracted from option prices In general, implied volatility increases when market uncertainty rises and decreases when market uncertainty falls.
Initial margin: A proportion of the value of a transaction that traders have to deposit to guarantee that they will complete it. Buying shares on margin means contracting to buy them without actually paying the full cash price immediately. To safeguard the other party, a buyer is required to deposit a margin, i.e. a percentage of the price suffi cient to protect the seller against loss if the buyer fails to complete the transaction.
Interest rate swap: A contractual agreement between two counterparties to exchange cash fl ows representing streams of periodic interest payments in one currency. Often, an interest rate swap involves exchanging a fi xed amount per payment period for a payment that is not fi xed (the fl oating side of the swap would usually be linked to another interest rate, often the LIBOR). Such swaps can be used by hedgers to manage their fi xed or fl oating assets and liabilities. They can also be used by speculators to replicate unfunded bond exposures to profi t from changes in interest rates.
Investment-grade bonds: A bond that has been given a relatively high credit rating by a major rating agency, e.g. “BBB” or above by Standard & Poor’s. Lower-rated bonds may promise a higher yield but are inherently more speculative.
iTraxx: The brand name of a family of indices that cover a large part of the overall credit derivatives markets in Europe and Asia.
Leverage: The ratio of a company’s debt to its equity, i.e. to that part of its total capital that is owned by its shareholders. High leverage means a high degree of reliance on debt fi nancing. The higher a company’s leverage, the more of its total earnings are absorbed by paying debt interest, and the more variable are the net earnings available for distribution to shareholders.
Leveraged buyout (LBO): The acquisition of one company by another through the use of primarily borrowed funds, the intention being that the loans will be repaid from the cash fl ow generated by the acquired company.
Leveraged loan: A bank loan that is rated below investment grade (e.g. “BB+” and lower by S&P and Fitch, or “Ba1” and lower by Moody’s) to fi rms characterised by high leverage.

192ECBFinancial Stability ReviewDecember 2007
Loss ratio: For insurers, the loss ratio is the net sum total of the claims paid out by an insurance company or underwriting syndicate, expressed as a percentage of the sum total of the premiums paid in during the same period.
Margin call: A procedure related to the application of variation margins, implying that if the value, as regularly measured, of the underlying assets falls below a certain level, the (central) bank requires counterparties to supply additional assets (or cash). Similarly, if the value of the underlying assets, following their revaluation, were to exceed the amount owed by the counterparties plus the variation margin, the counterparty may ask the (central) bank to return the excess assets (or cash) to the counterparty.
Mark to market: The revaluation of a security, commodity, a futures or option contract or any other negotiable asset position to its current market, or realisable, value.
Market liquidity: A measure of the ease with which an asset can be traded on a given market.
Mezzanine debt: Debt that, given its higher degree of embedded credit risk due to equity-like characteristics (on account of its including equity-based options, for instance), ranks lower in seniority than both senior and high-yield debt.
Monetary financial institution (MFI): One of a category of fi nancial institutions which together form the money-issuing sector of the euro area. Included are the Eurosystem, resident credit institutions (as defi ned in Community law) and all other resident fi nancial institutions, the business of which is to receive deposits and/or close substitutes for deposits from entities other than MFIs and, for their own account (at least in economic terms), to grant credit and/or invest in securities. The latter group consists predominantly of money market funds.
Mortgage-backed security (MBS): A security with cash fl ows that derive from the redemption of principal and interest payments relating to a pool of mortgage loans.
Open interest: The total number of contracts in a commodity or options market that are still open, i.e. that have not been exercised, closed out or allowed to expire.
Origination-and-distribution model: A business model in which debt is generated, i.e. originated, and subsequently broken up into tranches for sale to investors, thereby spreading the risk of default among a wide group of investors.
Price/earnings (P/E) ratio: The ratio between the value of a corporation, as refl ected in its stock price, and its annual profi ts. It is often calculated on the basis of the profi ts generated by a corporation over the previous calendar year (i.e. a four-quarter moving average of profi ts). For a market index such as the Standard & Poor’s 500, the P/E ratio is the average of the P/E ratios of the individual corporations in that index.
Primary market: The market in which new issues of securities are sold or placed.
Profit and loss (P&L) statement: The fi nancial statement that summarises the difference between the revenues and expenses of a fi rm – non-fi nancial or fi nancial – over a given period. Such statements may be drawn up frequently for the managers of a business, but a full audited statement is normally only published for each accounting year.

193ECB
Financial Stability ReviewDecember 2007 193
GLOSSARY
Residential mortgage-backed security (RMBS): A security with cash fl ows that derive from residential debt such as mortgages (prime, Alt-A, and sub-prime) and home-equity loans.
Retention ratio: That percentage of the earnings of an enterprise that are not paid out to shareholders as dividends, but are either reinvested in the fi rm or are retained as a reserve for specifi ed purposes (e.g. to pay off a debt or to purchase a capital asset).
Return on equity (ROE): A measure of the profi tability of holding (usually) ordinary shares in a company that is arrived at by dividing the company’s net after-tax profi t, less dividends on preference shares, by the ordinary shares outstanding.
Risk reversal: A specifi c manner of quoting similar out-of-the-money call and put options, usually foreign exchange options. Instead of quoting the prices of these options, dealers quote their volatility. The greater the demand for an options contract, the greater its volatility and its price. A positive risk reversal means that the volatility of calls is greater than the volatility of similar puts, which implies that more market participants are betting on an appreciation of the currency than on a depreciation.
Risk-weighted asset: An asset that is weighted by factors representing its riskiness and potential for default, i.e. in line with the concept developed by the Basel Committee on Banking Supervision (BCBS) for its capital adequacy requirements.
Secondary market: A market in which existing securities (i.e. issues that have already been sold or placed through an initial private or public offering) are traded.
Secured debt: Debt backed by collateral, i.e. assets that can be sold in the event of default.
Securitisation: The process of issuing new negotiable securities backed by existing assets such as loans, mortgages, credit card debt, or other assets (including accounts receivable).
Senior debt: Debt that has precedence over other obligations with respect to repayment if the loans made to a company are called in for repayment. Such debt is generally issued as loans of various types with different risk-return profi les, repayment conditions and maturities.
Skewness: A measure of data distributions that shows whether large deviations from the mean are more likely towards one side than towards the other. In the case of a symmetrical distribution, deviations either side of the mean are equally likely. Positive skewness means that large upward deviations are more likely than large downward ones. Negative skewness means that large downward deviations are more likely than large upward ones.
Solvency ratio: The ratio of a bank’s own assets to its liabilities, i.e. a measure used to assess a bank’s ability to meet its long-term obligations and thereby remain solvent. The higher the ratio, the more sound the bank.
Special-purpose vehicle (SPV): A legal entity set up to acquire and hold certain assets on its balance sheet and to issue securities backed by those assets for sale to third parties.

194ECBFinancial Stability ReviewDecember 2007
Speculative-grade bond: A bond that has a credit rating that is not investment grade, i.e. below that determined by bank regulators to be suitable for investments, currently “Baa” (Moody’s) or “BBB” (Standard & Poor’s).
Strangle: An options strategy that involves buying a put option with a strike price below that of the underlying asset, and a call option with a strike price above that of the underlying asset (i.e. strike prices that are both out-of-the-money). Such an options strategy is profi table only if there are large movements in the price of the underlying asset.
Stress testing: The estimation of credit and market valuation losses that would result from the realisation of extreme scenarios, so as to determine the stability of the fi nancial system or entity.
Structured credit product: A transaction in which a bank, typically, sells a pool of loans it has originated itself to a bankruptcy-remote special-purpose vehicle (SPV), which pays for these assets by issuing tranches of a set of liabilities with different seniorities.
Structured investment vehicle (SIV): A special-purpose vehicle (SPV) that undertakes arbitrage activities by purchasing mostly highly rated medium and long-term, fi xed-income assets and that funds itself with cheaper, mostly short-term, highly rated commercial paper and medium-term notes (MTNs). While there are a number of costs associated with running a structured investment vehicle, these are balanced by economic incentives: the creation of net spread to pay subordinated noteholder returns and the creation of management fee income. Vehicles sponsored by fi nancial institutions also have the incentive to create off-balance-sheet fund management structures with products that can be fed to existing and new clients by way of investment in the capital notes of the vehicle.
Subordinated debt: A debt that can only be claimed by an unsecured creditor, in the event of a liquidation, after the claims of secured creditors have been met, i.e. the rights of the holders of the stock of debt are subordinate to the interests of depositors. Debts involving speculative-grade bonds are always subordinated to debts vis-à-vis banks, irrespective of whether or not they are secured.
Subordination: A mechanism to protect higher-rated tranches against shortfalls in cash fl ows from underlying collateral provided in the form of residential mortgage-backed securities (RMBSs), by way of which losses from defaults of the underlying mortgages are applied to junior tranches before they are applied to more senior tranches. Only once a junior tranche is completely exhausted will defaults impair the next tranche. Consequently, the most senior tranches are extremely secure against credit risk, are rated “AAA”, and trade at lower spreads.
Sub-prime borrower: A borrower with a poor credit history and/or insuffi cient collateral who does not, as a consequence thereof, qualify for a conventional loan and can borrow only from lenders that specialise in dealing with such borrowers. The interest rates charged on loans to such borrowers include a risk premium, so that it is offered at a rate above prime to individuals who do not qualify for prime rate loans.
Tier 1 capital: Equity represented by ordinary shares and retained profi t or earnings plus qualifying non-cumulative preference shares (up to a maximum of 25% of total Tier 1 capital) plus minority interests in equity accounts of consolidated subsidiaries. The level of tier 1 capital is a measure of the capital adequacy of a bank, which is calculated as the ratio of a bank’s core equity capital to its total risk-weighted assets.

195ECB
Financial Stability ReviewDecember 2007 195
GLOSSARY
Tier 2 capital: The second most reliable form of fi nancial capital, from a regulator’s point of view that is also used as a measure of a bank’s fi nancial strength. It includes, according to the concept developed by the Basel Committee on Banking Supervision (BCBS) for its capital adequacy requirements, undisclosed reserves, revaluation reserves, general provisions, hybrid instruments and subordinated term debt.
Value at risk (VaR): A risk measure of a portfolio’s maximum loss during a specifi c period of time at a given level of probability.
Variation margin: In margin deposit trading, these are the funds required to be deposited by an investor when a price movement has caused funds to fall below the initial margin requirement. Conversely funds may be withdrawn by an investor when a price movement has caused funds to rise above the margin requirement.
Yield curve: A curve describing the relationship between the interest rate or yield and the maturity at a given point in time for debt securities with the same credit risk but different maturity dates. The slope of the yield curve can be measured as the difference between the interest rates at two selected maturities.

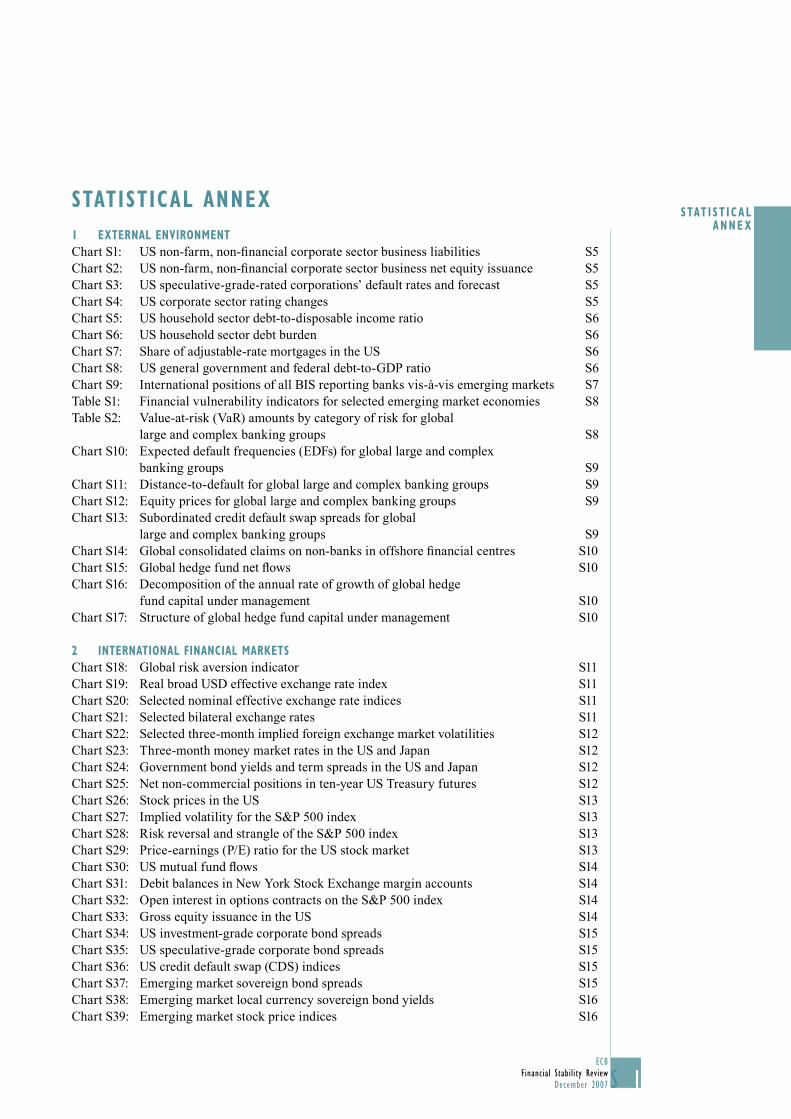
1ECB
Financial Stability ReviewDecember 2007 S
STAT I ST ICAL ANNEX
STATISTICAL ANNEX
1 EXTERNAL ENVIRONMENT
Chart S1: US non-farm, non-fi nancial corporate sector business liabilities S5Chart S2: US non-farm, non-fi nancial corporate sector business net equity issuance S5Chart S3: US speculative-grade-rated corporations’ default rates and forecast S5Chart S4: US corporate sector rating changes S5Chart S5: US household sector debt-to-disposable income ratio S6Chart S6: US household sector debt burden S6Chart S7: Share of adjustable-rate mortgages in the US S6Chart S8: US general government and federal debt-to-GDP ratio S6Chart S9: International positions of all BIS reporting banks vis-à-vis emerging markets S7Table S1: Financial vulnerability indicators for selected emerging market economies S8Table S2: Value-at-risk (VaR) amounts by category of risk for global
large and complex banking groups S8Chart S10: Expected default frequencies (EDFs) for global large and complex
banking groups S9Chart S11: Distance-to-default for global large and complex banking groups S9Chart S12: Equity prices for global large and complex banking groups S9Chart S13: Subordinated credit default swap spreads for global
large and complex banking groups S9Chart S14: Global consolidated claims on non-banks in offshore fi nancial centres S10Chart S15: Global hedge fund net fl ows S10Chart S16: Decomposition of the annual rate of growth of global hedge
fund capital under management S10Chart S17: Structure of global hedge fund capital under management S10
2 INTERNATIONAL FINANCIAL MARKETS
Chart S18: Global risk aversion indicator S11Chart S19: Real broad USD effective exchange rate index S11Chart S20: Selected nominal effective exchange rate indices S11Chart S21: Selected bilateral exchange rates S11Chart S22: Selected three-month implied foreign exchange market volatilities S12Chart S23: Three-month money market rates in the US and Japan S12Chart S24: Government bond yields and term spreads in the US and Japan S12Chart S25: Net non-commercial positions in ten-year US Treasury futures S12Chart S26: Stock prices in the US S13Chart S27: Implied volatility for the S&P 500 index S13Chart S28: Risk reversal and strangle of the S&P 500 index S13Chart S29: Price-earnings (P/E) ratio for the US stock market S13Chart S30: US mutual fund fl ows S14Chart S31: Debit balances in New York Stock Exchange margin accounts S14Chart S32: Open interest in options contracts on the S&P 500 index S14Chart S33: Gross equity issuance in the US S14Chart S34: US investment-grade corporate bond spreads S15Chart S35: US speculative-grade corporate bond spreads S15Chart S36: US credit default swap (CDS) indices S15Chart S37: Emerging market sovereign bond spreads S15Chart S38: Emerging market local currency sovereign bond yields S16Chart S39: Emerging market stock price indices S16
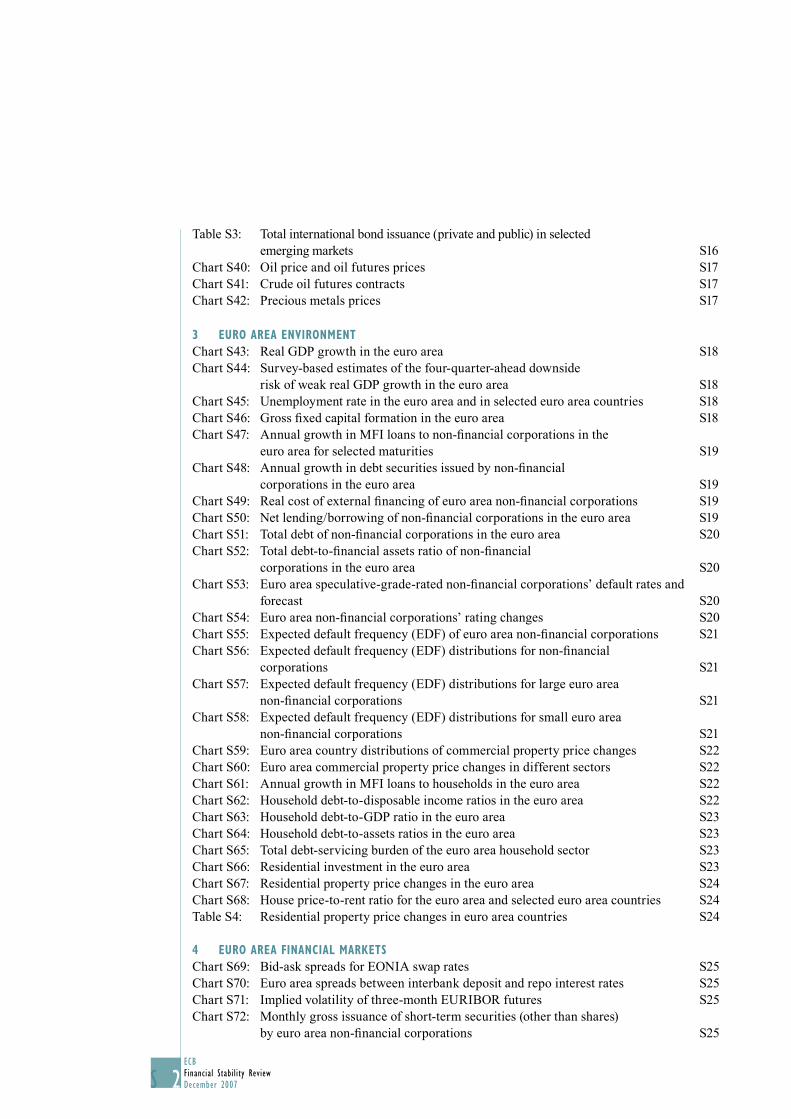
2ECBFinancial Stability ReviewDecember 2007S
Table S3: Total international bond issuance (private and public) in selected emerging markets S16
Chart S40: Oil price and oil futures prices S17Chart S41: Crude oil futures contracts S17Chart S42: Precious metals prices S17
3 EURO AREA ENVIRONMENT
Chart S43: Real GDP growth in the euro area S18Chart S44: Survey-based estimates of the four-quarter-ahead downside
risk of weak real GDP growth in the euro area S18Chart S45: Unemployment rate in the euro area and in selected euro area countries S18Chart S46: Gross fi xed capital formation in the euro area S18Chart S47: Annual growth in MFI loans to non-fi nancial corporations in the
euro area for selected maturities S19Chart S48: Annual growth in debt securities issued by non-fi nancial
corporations in the euro area S19Chart S49: Real cost of external fi nancing of euro area non-fi nancial corporations S19Chart S50: Net lending/borrowing of non-fi nancial corporations in the euro area S19Chart S51: Total debt of non-fi nancial corporations in the euro area S20Chart S52: Total debt-to-fi nancial assets ratio of non-fi nancial
corporations in the euro area S20Chart S53: Euro area speculative-grade-rated non-fi nancial corporations’ default rates and
forecast S20Chart S54: Euro area non-fi nancial corporations’ rating changes S20Chart S55: Expected default frequency (EDF) of euro area non-fi nancial corporations S21Chart S56: Expected default frequency (EDF) distributions for non-fi nancial
corporations S21Chart S57: Expected default frequency (EDF) distributions for large euro area
non-fi nancial corporations S21Chart S58: Expected default frequency (EDF) distributions for small euro area
non-fi nancial corporations S21Chart S59: Euro area country distributions of commercial property price changes S22Chart S60: Euro area commercial property price changes in different sectors S22Chart S61: Annual growth in MFI loans to households in the euro area S22Chart S62: Household debt-to-disposable income ratios in the euro area S22Chart S63: Household debt-to-GDP ratio in the euro area S23Chart S64: Household debt-to-assets ratios in the euro area S23Chart S65: Total debt-servicing burden of the euro area household sector S23Chart S66: Residential investment in the euro area S23Chart S67: Residential property price changes in the euro area S24Chart S68: House price-to-rent ratio for the euro area and selected euro area countries S24Table S4: Residential property price changes in euro area countries S24
4 EURO AREA FINANCIAL MARKETS
Chart S69: Bid-ask spreads for EONIA swap rates S25Chart S70: Euro area spreads between interbank deposit and repo interest rates S25Chart S71: Implied volatility of three-month EURIBOR futures S25Chart S72: Monthly gross issuance of short-term securities (other than shares)
by euro area non-fi nancial corporations S25
3ECB
Financial Stability ReviewDecember 2007 S
STAT I ST ICAL ANNEX
Chart S73: Euro area government bond yields and term spread S26Chart S74: Option-implied skewness coeffi cient for ten-year bond yields in Germany S26Chart S75: Stock prices in the euro area S26Chart S76: Implied volatility for the Dow Jones EURO STOXX 50 index S26Chart S77: Risk reversal and strangle of the Dow Jones EURO STOXX 50 index S27Chart S78: Price-earnings (P/E) ratio for the euro area stock market S27Chart S79: Open interest in options contracts on the Dow Jones EURO STOXX 50 index S27Chart S80: Gross equity issuance and pipeline deals in the euro area S27Chart S81: Investment-grade corporate bond spreads in the euro area S28Chart S82: Speculative-grade corporate bond spreads in the euro area S28Chart S83: iTraxx Europe fi ve-year credit default swap indices S28Chart S84: Term structures of premiums for iTraxx Europe and HiVol S28Chart S85: iTraxx sector indices S29
5 EURO AREA FINANCIAL INSTITUTIONS
Table S5: Financial conditions of large and complex banking groups in the euro area S30Chart S86: Frequency distribution of return on equity (ROE) for large and complex
banking groups in the euro area S31Chart S87: Frequency distribution of return on risk-weighted assets for large and complex
banking groups in the euro area S31Chart S88: Frequency distribution of net interest income for large and complex
banking groups in the euro area S31Chart S89: Frequency distribution of net loan impairment charges for large and complex
banking groups in the euro area S31Chart S90: Frequency distribution of cost-to-income ratios for large and complex
banking groups in the euro area S32Chart S91: Frequency distribution of Tier 1 ratios for large and complex banking
groups in the euro area S32Chart S92: Frequency distribution of overall solvency ratios for large and complex
banking groups in the euro area S32Chart S93: Annual growth in euro area MFI loans extended by sector S32Chart S94: Lending margins of euro area MFIs S33Chart S95: Euro area MFIs’ loan spreads S33Chart S96: Write-off rates on euro area MFIs’ loans S33Chart S97: Annual growth in euro area MFIs’ securities and shares issuance S33Chart S98: Deposit margins of euro area MFIs S34Chart S99: Euro area MFIs’ foreign currency-denominated assets, selected balance
sheet items S34Chart S100: International exposure of euro area banks to Latin American countries S34Chart S101: International exposure of euro area banks to Asian countries S34Table S6: Euro area consolidated foreign claims of reporting
banks on individual countries S35Chart S102: Euro area banks’ credit standards applied to loans and credit lines
to enterprises and contributing factors S36Chart S103: Euro area banks’ credit standards applied to loans and credit lines
to enterprises and terms and conditions S36Chart S104: Euro area banks’ credit standards applied to loans to households for
house purchase and contributing factors S36Chart S105: Euro area banks’ credit standards applied to consumer credit loans
4ECBFinancial Stability ReviewDecember 2007S
to households and contributing factors S36Chart S106: Expected default frequencies (EDFs) for large and complex banking
groups in the euro area S37Chart S107: Distance-to-default for large and complex banking groups in the euro area S37Chart S108: European fi nancial institutions’ and euro area large and complex banking
groups’ credit default swaps S37Chart S109: Earnings and earnings forecasts for large and complex banking groups
in the euro area S37Chart S110: Dow Jones EURO STOXX total market and bank indices S38Chart S111: Implied volatility for Dow Jones EURO STOXX total market and bank indices S38Chart S112: Risk reversal and strangle of the Dow Jones EURO STOXX bank index S38Chart S113: Price-earnings (P/E) ratios for large and complex banking groups in
the euro area S38Chart S114: Rating changes for large and complex banking groups in the euro area S39Chart S115: Distribution of ratings for large and complex banking groups in the euro area S39Table S7: Rating averages and outlooks for large and complex banking groups in
the euro area S39Chart S116: Value of mergers and acquisitions by euro area banks S40Chart S117: Number of mergers and acquisitions by euro area banks S40Chart S118: Distribution of gross premium written and return on equity of large euro area
composite insurers S40Chart S119: Distribution of liquid assets and solvency ratios of large euro area
composite insurers S40Chart S120: Distribution of gross premium written and return on equity of large
euro area life insurers S41Chart S121: Distribution of liquid assets and solvency ratios of large euro area
life insurers S41Chart S122: Distribution of gross premium written and return on equity of large
euro area non-life insurers S41Chart S123: Distribution of liquid assets and solvency ratios of large euro area
non-life insurers S41Chart S124: Distribution of equity asset shares of euro area insurers S42Chart S125: Distribution of bond asset shares of euro area insurers S42Chart S126: Expected default frequencies (EDFs) for the euro area insurance sector S42Chart S127: Subordinated bond asset swap spread for the euro area insurance sector S42Chart S128: Dow Jones EURO STOXX total market and insurance indices S43Chart S129: Implied volatility for Dow Jones EURO STOXX total market and
insurance indices S43Chart S130: Risk reversal and strangle of the Dow Jones EURO STOXX insurance index S43Chart S131: Price-earnings (P/E) ratios for euro area insurers S43
6 EURO AREA FINANCIAL SYSTEM INFRASTRUCTURES
Chart S132: Large-value payments processed via TARGET S44Chart S133: Large-value payments processed via TARGET, by country S44Chart S134: TARGET availability S44Chart S135: Volumes and values of foreign exchange trades settled via Continuous
Linked System (CLS) S44
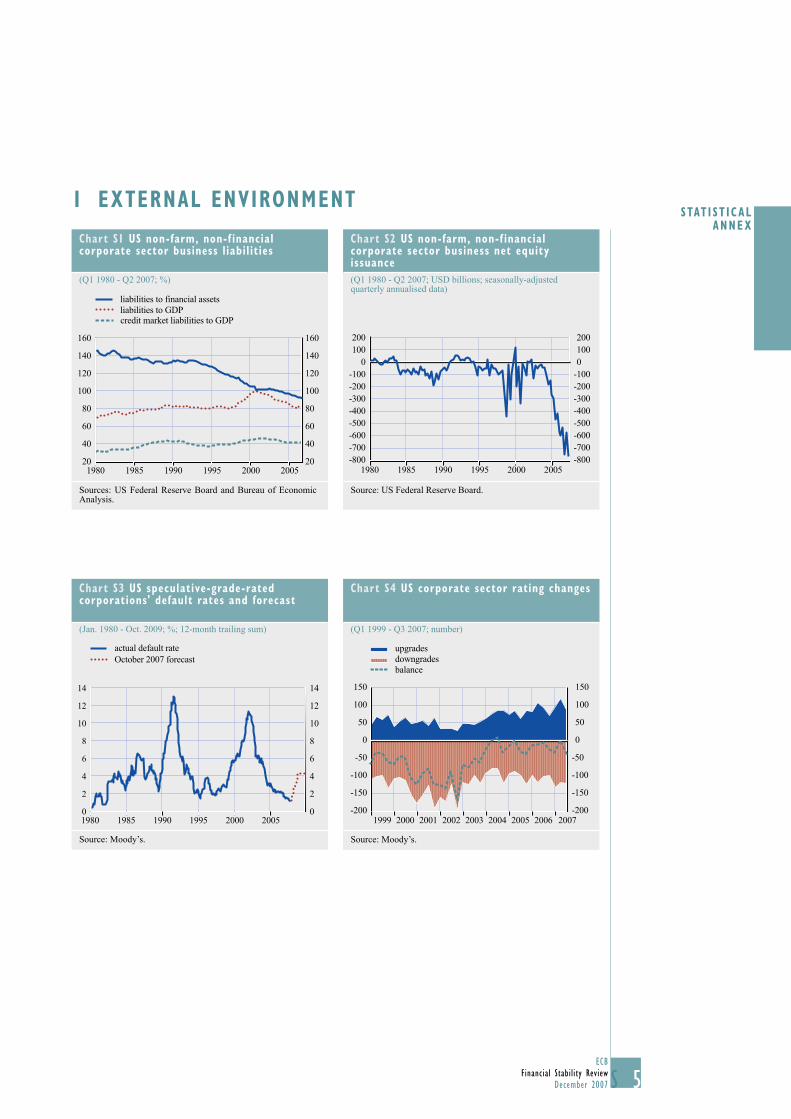
5ECB
Financial Stability ReviewDecember 2007 S
STAT I ST ICAL ANNEX
1 EXTERNAL ENVIRONMENT
Chart S1 US non-farm, non-f inancial corporate sector business liabilities
(Q1 1980 - Q2 2007; %)
liabilities to financial assetsliabilities to GDPcredit market liabilities to GDP
20
40
60
80
100
120
140
160
20
40
60
80
100
120
140
160
1980 1985 1990 1995 2000 2005
Sources: US Federal Reserve Board and Bureau of Economic Analysis.
Chart S2 US non-farm, non-f inancial corporate sector business net equity issuance
(Q1 1980 - Q2 2007; USD billions; seasonally-adjusted quarterly annualised data)
200100
0-100-200-300-400-500-600-700-800
2001000
-100-200-300-400-500-600-700-800
1980 1985 1990 1995 2000 2005
Source: US Federal Reserve Board.
Chart S3 US speculative-grade-rated corporations' default rates and forecast
(Jan. 1980 - Oct. 2009; %; 12-month trailing sum)
1980 1985 1990 1995 2000 2005
14
12
10
8
6
4
2
0
14
12
10
8
6
4
2
0
actual default rateOctober 2007 forecast
Source: Moody’s.
Chart S4 US corporate sector rating changes
(Q1 1999 - Q3 2007; number)
150
100
50
0
-50
-100
-150
-200
150
100
50
0
-50
-100
-150
-2001999 2000 2001 2002 2003 2004 2005 2006 2007
upgradesdowngradesbalance
Source: Moody’s.
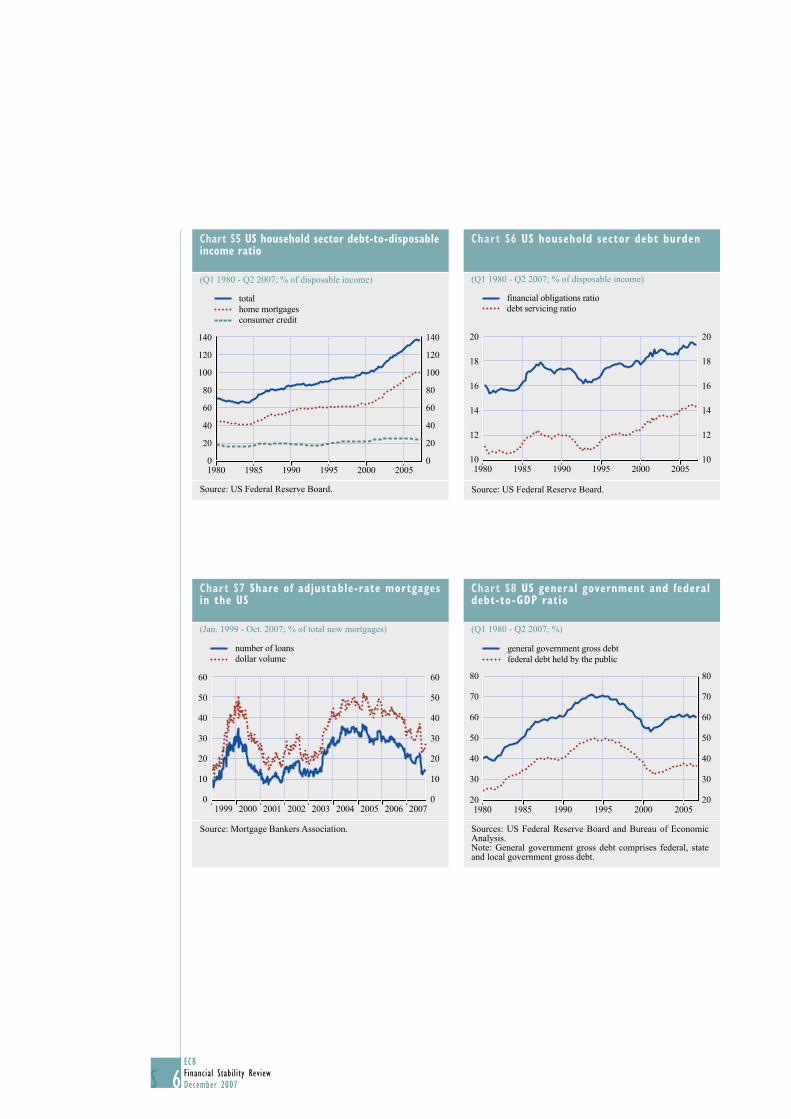
6ECBFinancial Stability ReviewDecember 2007S
Chart S5 US household sector debt-to-disposable income ratio
(Q1 1980 - Q2 2007; % of disposable income)
totalhome mortgagesconsumer credit
140
120
100
80
60
40
20
0
140
120
100
80
60
40
20
01980 1985 1990 1995 2000 2005
Source: US Federal Reserve Board.
Chart S6 US household sector debt burden
(Q1 1980 - Q2 2007; % of disposable income)
financial obligations ratiodebt servicing ratio
20
18
16
14
12
10
20
18
16
14
12
101980 1985 1990 1995 2000 2005
Source: US Federal Reserve Board.
Chart S7 Share of adjustable-rate mortgages in the US
(Jan. 1999 - Oct. 2007; % of total new mortgages)
number of loansdollar volume
1999 2000 2001 2002 2003 2004 2005 2006 2007
60
50
40
30
20
10
0
60
50
40
30
20
10
0
Source: Mortgage Bankers Association.
Chart S8 US general government and federal debt-to-GDP ratio
(Q1 1980 - Q2 2007; %)
general government gross debtfederal debt held by the public
20
30
40
50
60
70
80
20
30
40
50
60
70
80
1980 1985 1990 1995 2000 2005
Sources: US Federal Reserve Board and Bureau of Economic Analysis.Note: General government gross debt comprises federal, state and local government gross debt.
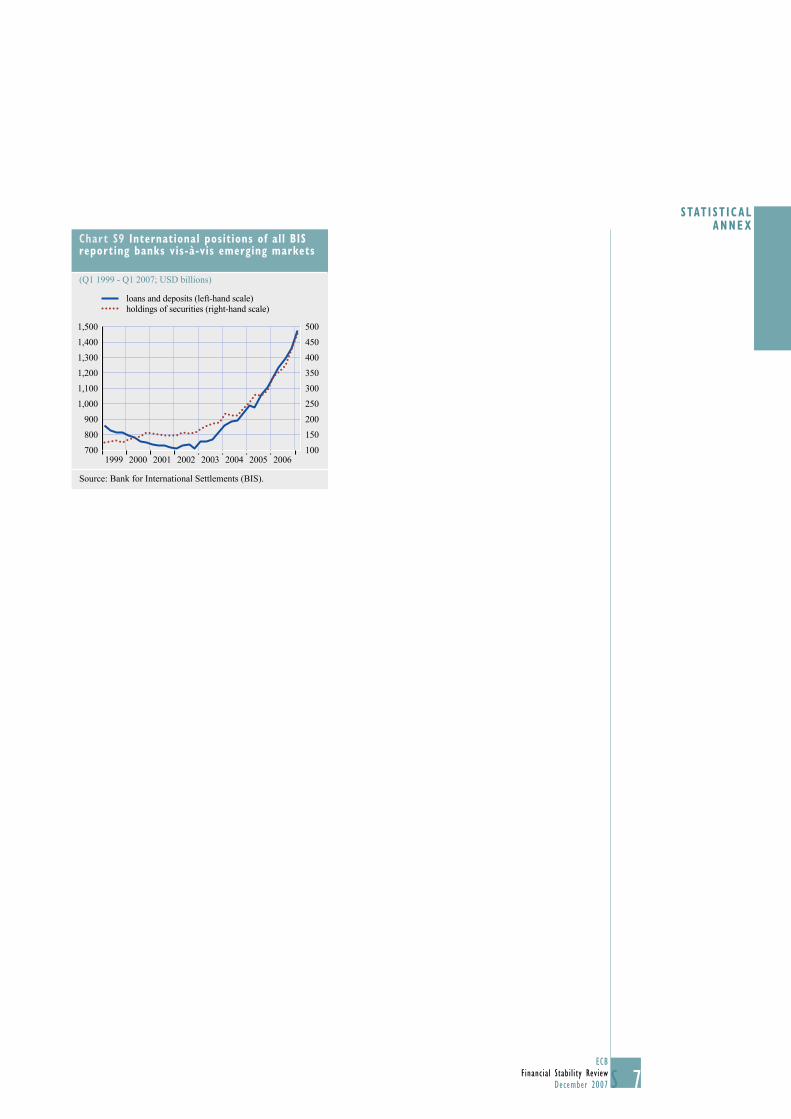
7ECB
Financial Stability ReviewDecember 2007 S
STAT I ST ICAL ANNEX
Chart S9 International positions of all BIS reporting banks vis-à-vis emerging markets
(Q1 1999 - Q1 2007; USD billions)
700
800
900
1,000
1,100
1,200
1,300
1,400
1,500
100
150
200
250
300
350
400
450
500
loans and deposits (left-hand scale)holdings of securities (right-hand scale)
1999 2000 2001 2002 2003 2004 2005 2006
Source: Bank for International Settlements (BIS).
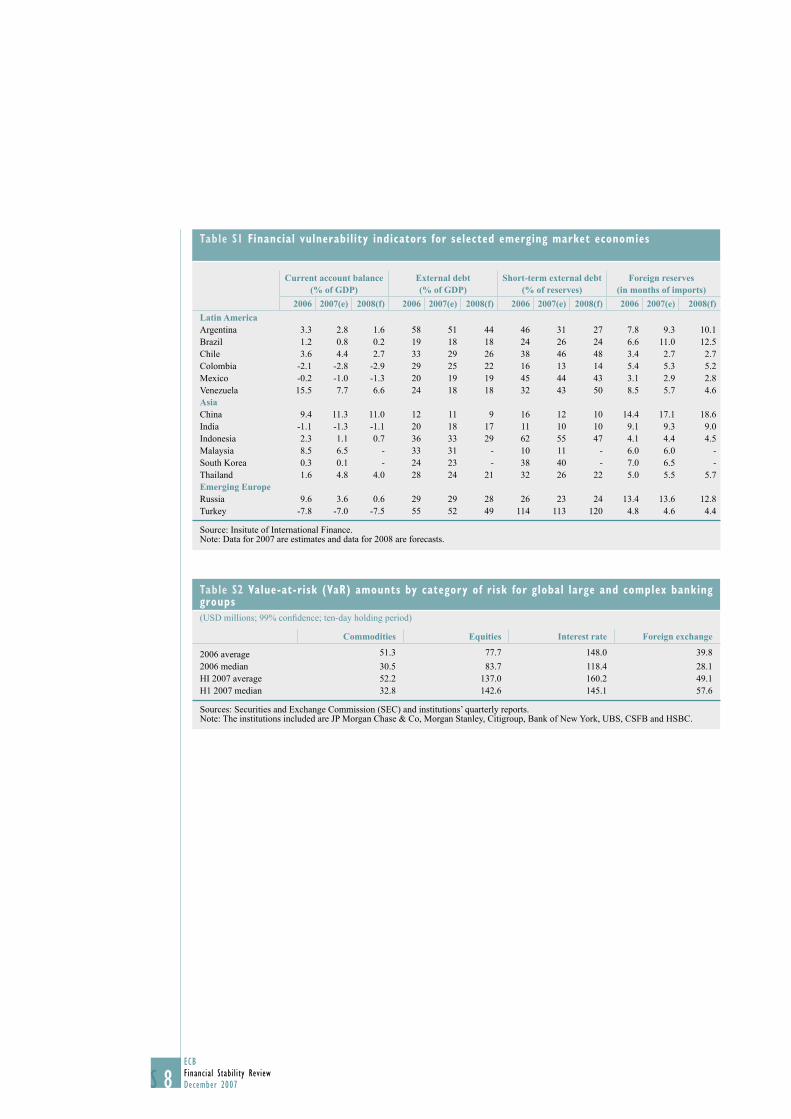
8ECBFinancial Stability ReviewDecember 2007S
Table S1 Financial vulnerability indicators for selected emerging market economies
Current account balance (% of GDP)
External debt (% of GDP)
Short-term external debt (% of reserves)
Foreign reserves (in months of imports)
2006 2007(e) 2008(f) 2006 2007(e) 2008(f) 2006 2007(e) 2008(f) 2006 2007(e) 2008(f)
Latin AmericaArgentina 3.3 2.8 1.6 58 51 44 46 31 27 7.8 9.3 10.1Brazil 1.2 0.8 0.2 19 18 18 24 26 24 6.6 11.0 12.5Chile 3.6 4.4 2.7 33 29 26 38 46 48 3.4 2.7 2.7Colombia -2.1 -2.8 -2.9 29 25 22 16 13 14 5.4 5.3 5.2Mexico -0.2 -1.0 -1.3 20 19 19 45 44 43 3.1 2.9 2.8Venezuela 15.5 7.7 6.6 24 18 18 32 43 50 8.5 5.7 4.6AsiaChina 9.4 11.3 11.0 12 11 9 16 12 10 14.4 17.1 18.6India -1.1 -1.3 -1.1 20 18 17 11 10 10 9.1 9.3 9.0Indonesia 2.3 1.1 0.7 36 33 29 62 55 47 4.1 4.4 4.5Malaysia 8.5 6.5 - 33 31 - 10 11 - 6.0 6.0 -South Korea 0.3 0.1 - 24 23 - 38 40 - 7.0 6.5 -Thailand 1.6 4.8 4.0 28 24 21 32 26 22 5.0 5.5 5.7Emerging EuropeRussia 9.6 3.6 0.6 29 29 28 26 23 24 13.4 13.6 12.8Turkey -7.8 -7.0 -7.5 55 52 49 114 113 120 4.8 4.6 4.4
Source: Insitute of International Finance.Note: Data for 2007 are estimates and data for 2008 are forecasts.
Table S2 Value-at-risk (VaR) amounts by category of risk for global large and complex banking groups
(USD millions; 99% confi dence; ten-day holding period)
Commodities Equities Interest rate Foreign exchange
2006 average 51.3 77.7 148.0 39.8
2006 median 30.5 83.7 118.4 28.1HI 2007 average 52.2 137.0 160.2 49.1H1 2007 median 32.8 142.6 145.1 57.6
Sources: Securities and Exchange Commission (SEC) and institutions’ quarterly reports.Note: The institutions included are JP Morgan Chase & Co, Morgan Stanley, Citigroup, Bank of New York, UBS, CSFB and HSBC.
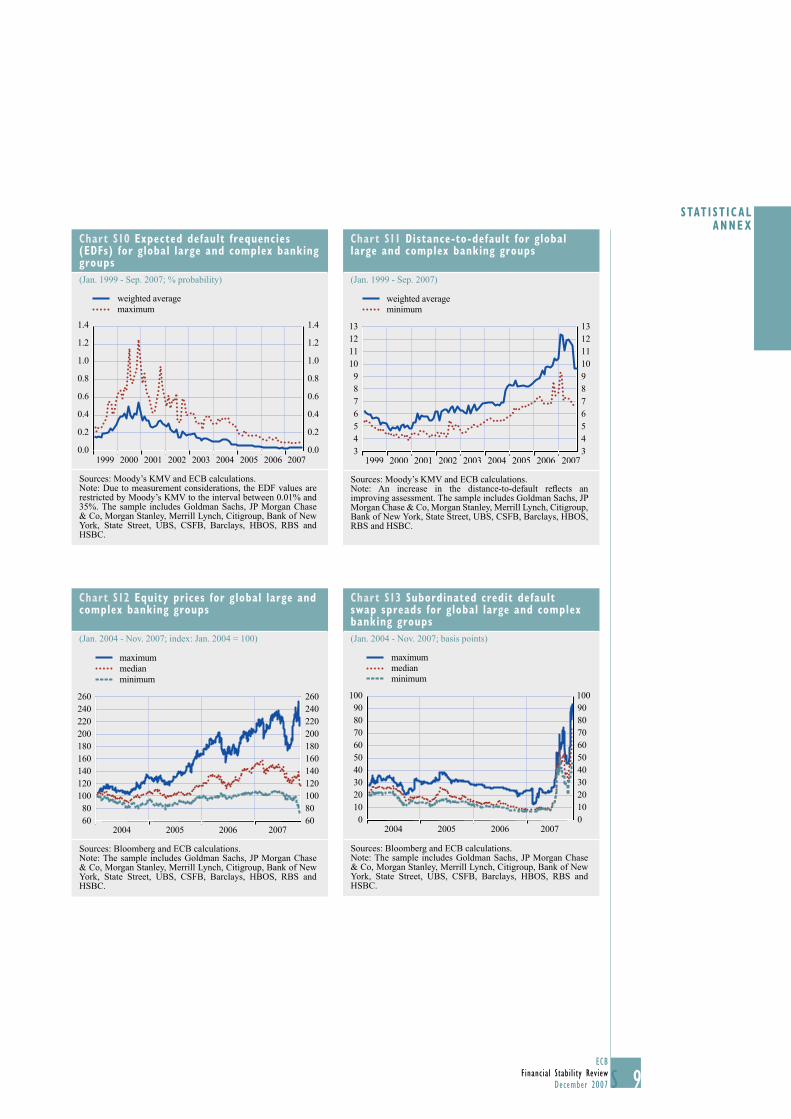
9ECB
Financial Stability ReviewDecember 2007 S
STAT I ST ICAL ANNEX
Chart S10 Expected default frequencies (EDFs) for global large and complex banking groups
(Jan. 1999 - Sep. 2007; % probability)
0.0
0.2
0.4
0.6
0.8
1.0
1.2
1.4
0.0
0.2
0.4
0.6
0.8
1.0
1.2
1.4
weighted averagemaximum
1999 2000 2001 2002 2003 2004 2005 2006 2007
Sources: Moody’s KMV and ECB calculations.Note: Due to measurement considerations, the EDF values are restricted by Moody’s KMV to the interval between 0.01% and 35%. The sample includes Goldman Sachs, JP Morgan Chase & Co, Morgan Stanley, Merrill Lynch, Citigroup, Bank of New York, State Street, UBS, CSFB, Barclays, HBOS, RBS and HSBC.
Chart S11 Distance-to-default for global large and complex banking groups
(Jan. 1999 - Sep. 2007)
3456789
10111213
345678910111213
weighted averageminimum
1999 2000 2001 2002 2003 2004 2005 2006 2007
Sources: Moody’s KMV and ECB calculations.Note: An increase in the distance-to-default refl ects an improving assessment. The sample includes Goldman Sachs, JP Morgan Chase & Co, Morgan Stanley, Merrill Lynch, Citigroup, Bank of New York, State Street, UBS, CSFB, Barclays, HBOS, RBS and HSBC.
Chart S12 Equity prices for global large and complex banking groups
(Jan. 2004 - Nov. 2007; index: Jan. 2004 = 100)
6080
100120140160180200220240260
6080100120140160180200220240260
2007
maximummedianminimum
2004 2005 2006
Sources: Bloomberg and ECB calculations.Note: The sample includes Goldman Sachs, JP Morgan Chase & Co, Morgan Stanley, Merrill Lynch, Citigroup, Bank of New York, State Street, UBS, CSFB, Barclays, HBOS, RBS and HSBC.
Chart S13 Subordinated credit default swap spreads for global large and complex banking groups
(Jan. 2004 - Nov. 2007; basis points)
0102030405060708090
100
0102030405060708090100
2007
maximummedianminimum
2004 2005 2006
Sources: Bloomberg and ECB calculations.Note: The sample includes Goldman Sachs, JP Morgan Chase & Co, Morgan Stanley, Merrill Lynch, Citigroup, Bank of New York, State Street, UBS, CSFB, Barclays, HBOS, RBS and HSBC.
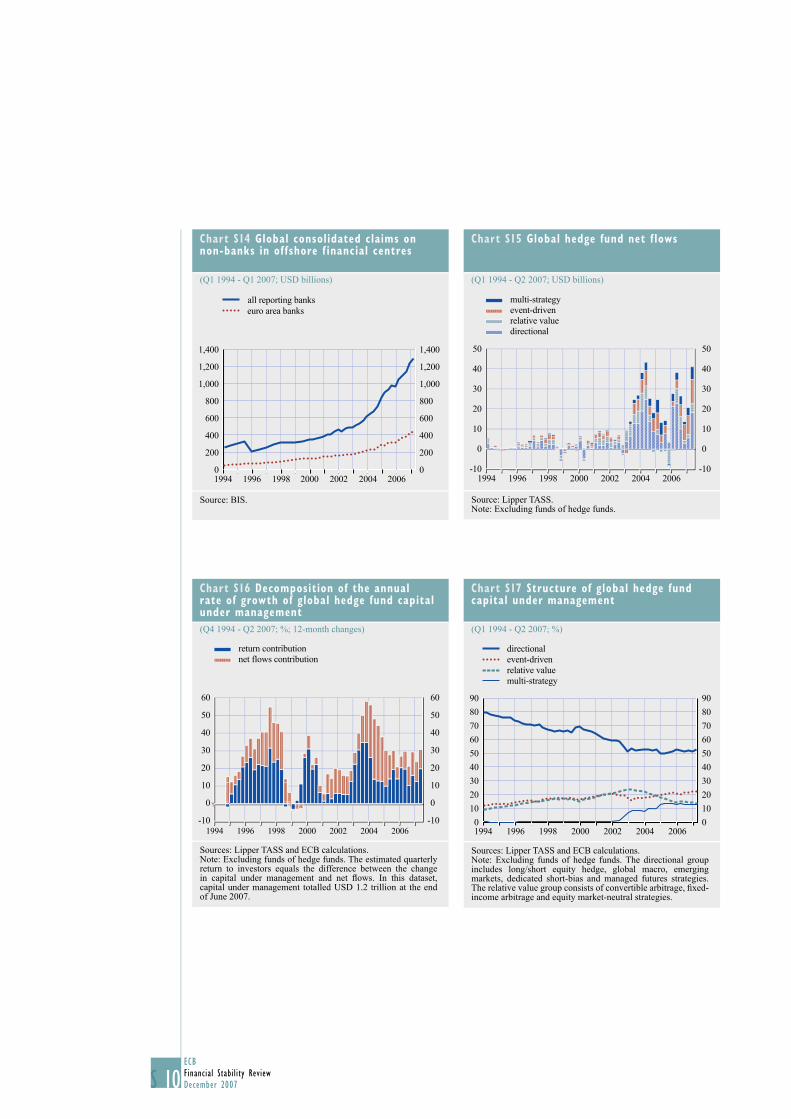
10ECBFinancial Stability ReviewDecember 2007S
Chart S14 Global consolidated claims on non-banks in of fshore f inancial centres
(Q1 1994 - Q1 2007; USD billions)
0
200
400
600
800
1,000
1,200
1,400
0
200
400
600
800
1,000
1,200
1,400
1994 1996 1998 2000 2002 2004 2006
all reporting bankseuro area banks
Source: BIS.
Chart S15 Global hedge fund net f lows
(Q1 1994 - Q2 2007; USD billions)
-10
10
0
20
30
40
50
-10
10
0
20
30
40
50
multi-strategyevent-drivenrelative valuedirectional
1994 1996 1998 2000 2002 2004 2006
Source: Lipper TASS.Note: Excluding funds of hedge funds.
Chart S16 Decomposition of the annual rate of growth of global hedge fund capital under management
(Q4 1994 - Q2 2007; %; 12-month changes)
-10
0
10
20
30
40
50
60
-10
0
10
20
30
40
50
60
1994 1996 1998 2000 2002 2004 2006
return contributionnet flows contribution
Sources: Lipper TASS and ECB calculations.Note: Excluding funds of hedge funds. The estimated quarterly return to investors equals the difference between the change in capital under management and net fl ows. In this dataset, capital under management totalled USD 1.2 trillion at the end of June 2007.
Chart S17 Structure of global hedge fund capital under management
(Q1 1994 - Q2 2007; %)
0
10
20
30
40
50
60
70
80
90
0
10
20
30
40
50
60
70
80
90
directionalevent-drivenrelative valuemulti-strategy
1994 1996 1998 2000 2002 2004 2006
Sources: Lipper TASS and ECB calculations.Note: Excluding funds of hedge funds. The directional group includes long/short equity hedge, global macro, emerging markets, dedicated short-bias and managed futures strategies. The relative value group consists of convertible arbitrage, fi xed-income arbitrage and equity market-neutral strategies.
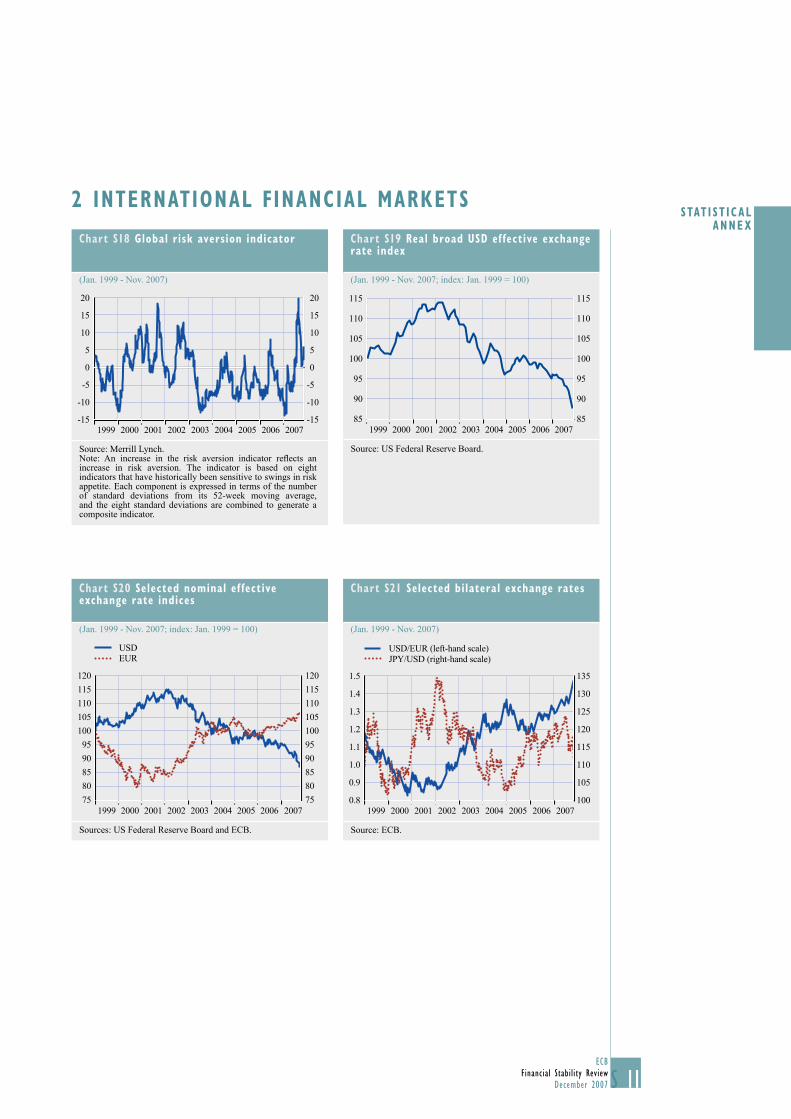
11ECB
Financial Stability ReviewDecember 2007 S
STAT I ST ICAL ANNEX
2 INTERNATIONAL FINANCIAL MARKETS
Chart S18 Global risk aversion indicator
(Jan. 1999 - Nov. 2007)
-15
-10
-5
0
5
10
15
20
-15
-10
-5
0
5
10
15
20
20071999 2000 2001 2002 2003 2004 2005 2006
Source: Merrill Lynch.Note: An increase in the risk aversion indicator refl ects an increase in risk aversion. The indicator is based on eight indicators that have historically been sensitive to swings in risk appetite. Each component is expressed in terms of the number of standard deviations from its 52-week moving average, and the eight standard deviations are combined to generate a composite indicator.
Chart S19 Real broad USD ef fective exchange rate index
(Jan. 1999 - Nov. 2007; index: Jan. 1999 = 100)
85
90
95
100
105
110
115
85
90
95
100
105
110
115
20071999 2000 2001 2002 2003 2004 2005 2006
Source: US Federal Reserve Board.
Chart S20 Selected nominal ef fective exchange rate indices
(Jan. 1999 - Nov. 2007; index: Jan. 1999 = 100)
75
80
85
90
95
100
105
110
115
120
75
80
85
90
95
100
105
110
115
120
2007
USDEUR
1999 2000 2001 2002 2003 2004 2005 2006
Sources: US Federal Reserve Board and ECB.
Chart S21 Selected bilateral exchange rates
(Jan. 1999 - Nov. 2007)
0.8
0.9
1.0
1.1
1.2
1.3
1.4
1.5
2007100
105
110
115
120
125
130
135
USD/EUR (left-hand scale)JPY/USD (right-hand scale)
1999 2000 2001 2002 2003 2004 2005 2006
Source: ECB.
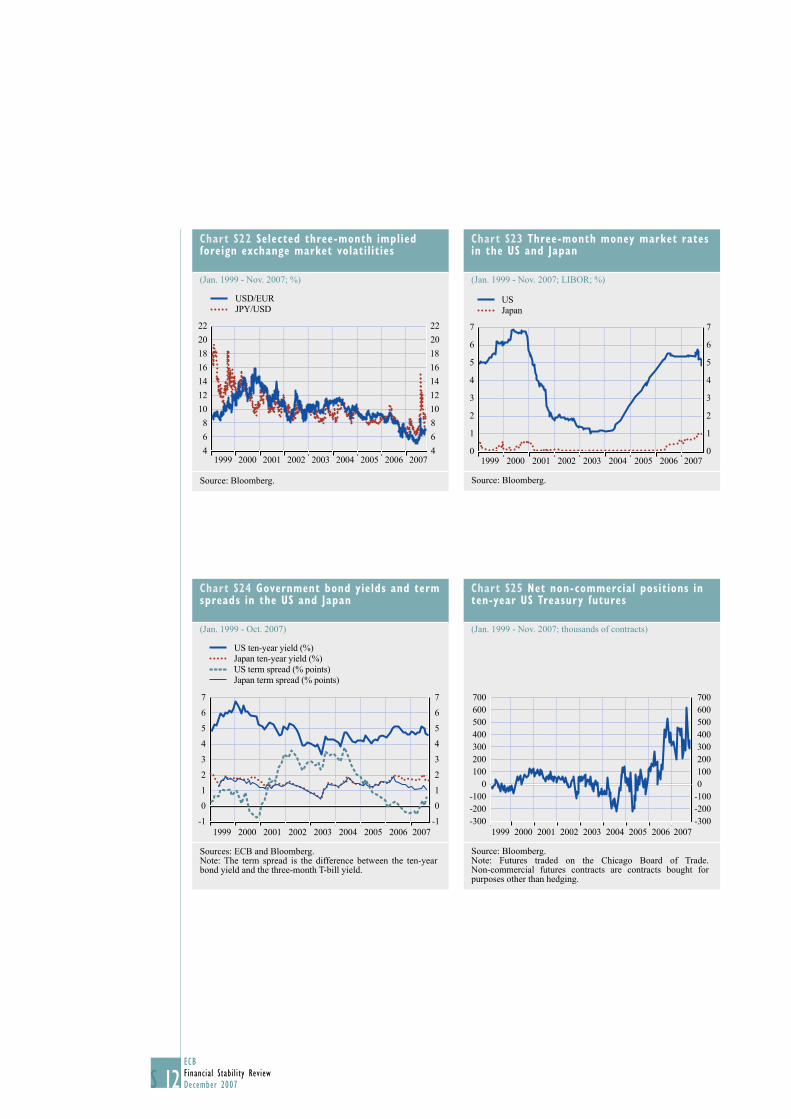
12ECBFinancial Stability ReviewDecember 2007S
Chart S22 Selected three-month implied foreign exchange market volatilities
(Jan. 1999 - Nov. 2007; %)
4
6
8
10
12
14
16
18
20
22
4
6
8
10
12
14
16
18
20
22
2007
USD/EURJPY/USD
1999 2000 2001 2002 2003 2004 2005 2006
Source: Bloomberg.
Chart S23 Three-month money market rates in the US and Japan
(Jan. 1999 - Nov. 2007; LIBOR; %)
0
1
2
3
4
5
6
7
0
1
2
3
4
5
6
7
USJapan
1999 2000 2001 2002 2003 2004 2005 2006 2007
Source: Bloomberg.
Chart S24 Government bond yields and term spreads in the US and Japan
(Jan. 1999 - Oct. 2007)
-1
0
1
2
3
4
5
6
7
0
1
2
3
4
5
6
7
US ten-year yield (%)Japan ten-year yield (%)US term spread (% points)Japan term spread (% points)
-11999 2000 2001 2002 2003 2004 2005 2006 2007
Sources: ECB and Bloomberg.Note: The term spread is the difference between the ten-year bond yield and the three-month T-bill yield.
Chart S25 Net non-commercial positions in ten-year US Treasury futures
(Jan. 1999 - Nov. 2007; thousands of contracts)
-300-200-100
0100200300400500600700
-200-1000100200300400500600700
-3001999 2000 2001 2002 2003 2004 2005 2006 2007
Source: Bloomberg.Note: Futures traded on the Chicago Board of Trade.Non-commercial futures contracts are contracts bought for purposes other than hedging.
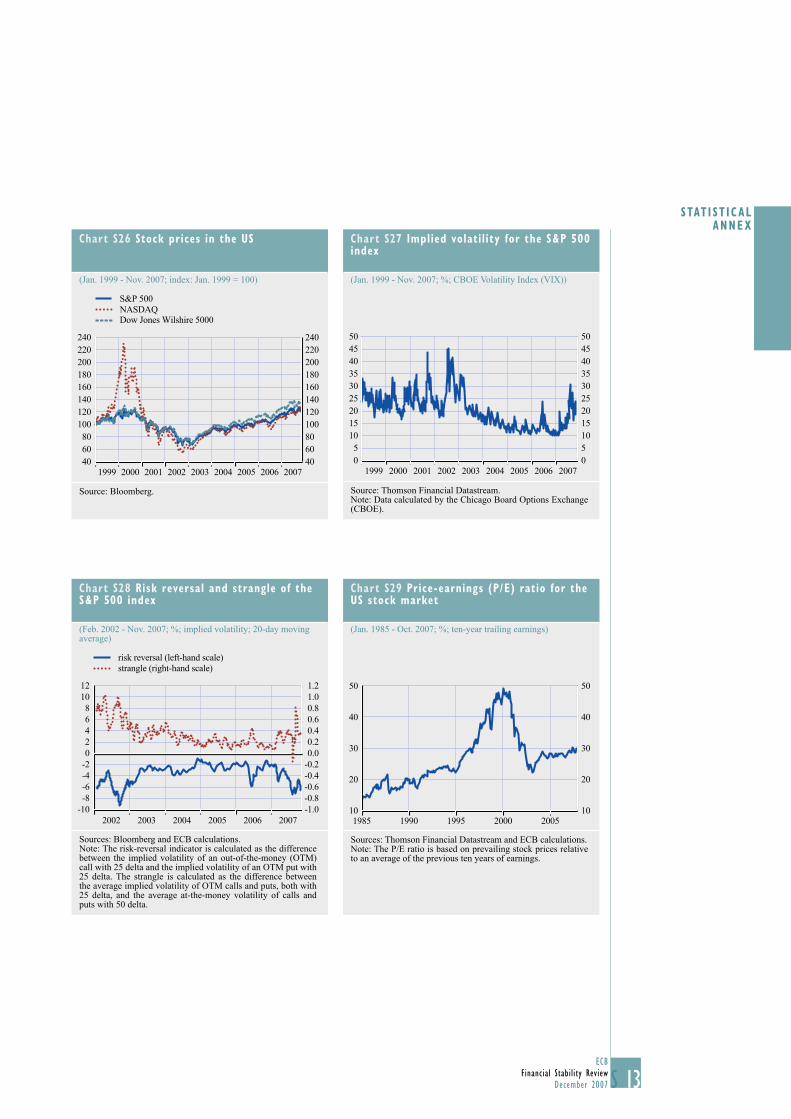
13ECB
Financial Stability ReviewDecember 2007 S
STAT I ST ICAL ANNEX
Chart S26 Stock prices in the US
(Jan. 1999 - Nov. 2007; index: Jan. 1999 = 100)
406080
100120140160180200220240
406080100120140160180200220240
2007
S&P 500NASDAQDow Jones Wilshire 5000
1999 2000 2001 2002 2003 2004 2005 2006
Source: Bloomberg.
Chart S27 Implied volatility for the S&P 500 index
(Jan. 1999 - Nov. 2007; %; CBOE Volatility Index (VIX))
05
101520253035404550
05101520253035404550
20071999 2000 2001 2002 2003 2004 2005 2006
Source: Thomson Financial Datastream.Note: Data calculated by the Chicago Board Options Exchange (CBOE).
Chart S28 Risk reversal and strangle of the S&P 500 index
(Feb. 2002 - Nov. 2007; %; implied volatility; 20-day moving average)
risk reversal (left-hand scale)strangle (right-hand scale)
-10-8-6-4-202468
1012
2007-1.0-0.8-0.6-0.4-0.20.00.20.40.60.81.01.2
2002 2003 2004 2005 2006
Sources: Bloomberg and ECB calculations.Note: The risk-reversal indicator is calculated as the difference between the implied volatility of an out-of-the-money (OTM) call with 25 delta and the implied volatility of an OTM put with 25 delta. The strangle is calculated as the difference between the average implied volatility of OTM calls and puts, both with25 delta, and the average at-the-money volatility of calls and puts with 50 delta.
Chart S29 Price-earnings (P/E) ratio for the US stock market
(Jan. 1985 - Oct. 2007; %; ten-year trailing earnings)
10
20
30
40
50
20
30
40
50
1020051985 1990 1995 2000
Sources: Thomson Financial Datastream and ECB calculations.Note: The P/E ratio is based on prevailing stock prices relative to an average of the previous ten years of earnings.
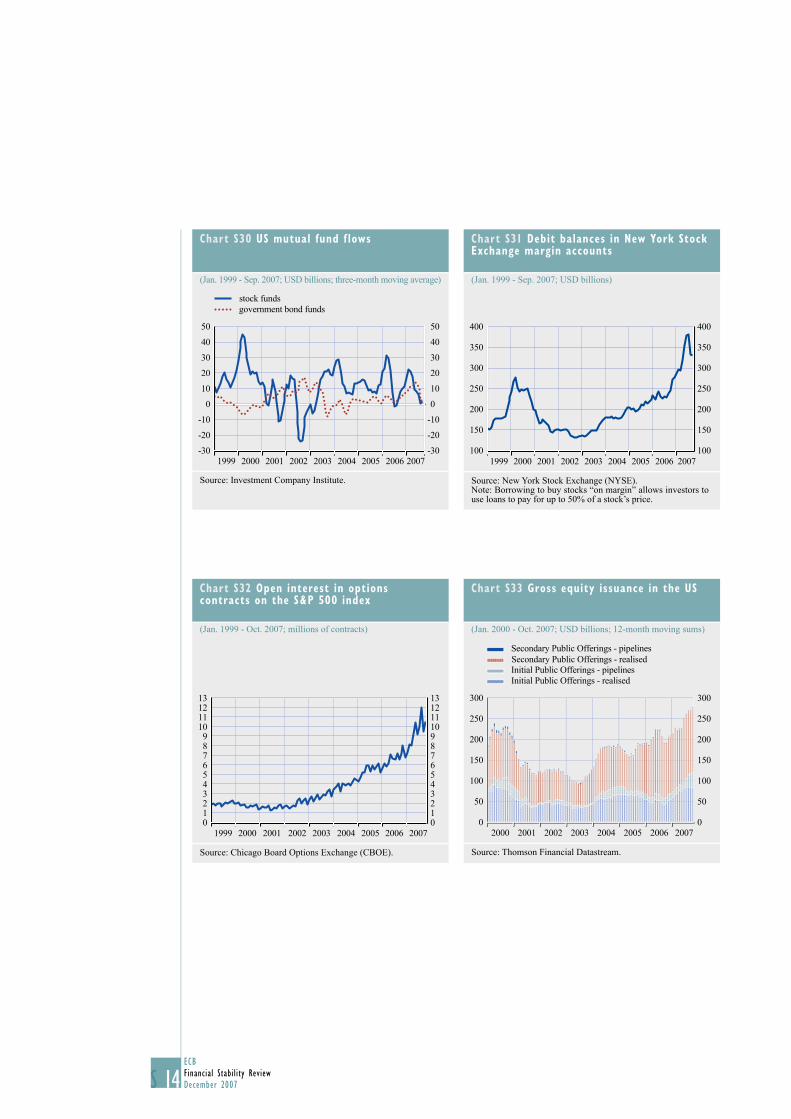
14ECBFinancial Stability ReviewDecember 2007S
Chart S30 US mutual fund f lows
(Jan. 1999 - Sep. 2007; USD billions; three-month moving average)
-30
-20
-10
0
10
20
30
40
50
-30
-20
-10
0
10
20
30
40
50
stock fundsgovernment bond funds
1999 2000 2001 2002 2003 2004 2005 2006 2007
Source: Investment Company Institute.
Chart S31 Debit balances in New York Stock Exchange margin accounts
(Jan. 1999 - Sep. 2007; USD billions)
100
150
200
250
300
350
400
100
150
200
250
300
350
400
20071999 2000 2001 2002 2003 2004 2005 2006
Source: New York Stock Exchange (NYSE).Note: Borrowing to buy stocks “on margin” allows investors to use loans to pay for up to 50% of a stock’s price.
Chart S32 Open interest in options contracts on the S&P 500 index
(Jan. 1999 - Oct. 2007; millions of contracts)
0123456789
10111213
012345678910111213
20071999 2000 2001 2002 2003 2004 2005 2006
Source: Chicago Board Options Exchange (CBOE).
Chart S33 Gross equity issuance in the US
(Jan. 2000 - Oct. 2007; USD billions; 12-month moving sums)
Secondary Public Offerings - pipelinesSecondary Public Offerings - realisedInitial Public Offerings - pipelinesInitial Public Offerings - realised
50
100
150
200
250
300
50
0 0
100
150
200
250
300
20072000 2001 2002 2003 2004 2005 2006
Source: Thomson Financial Datastream.
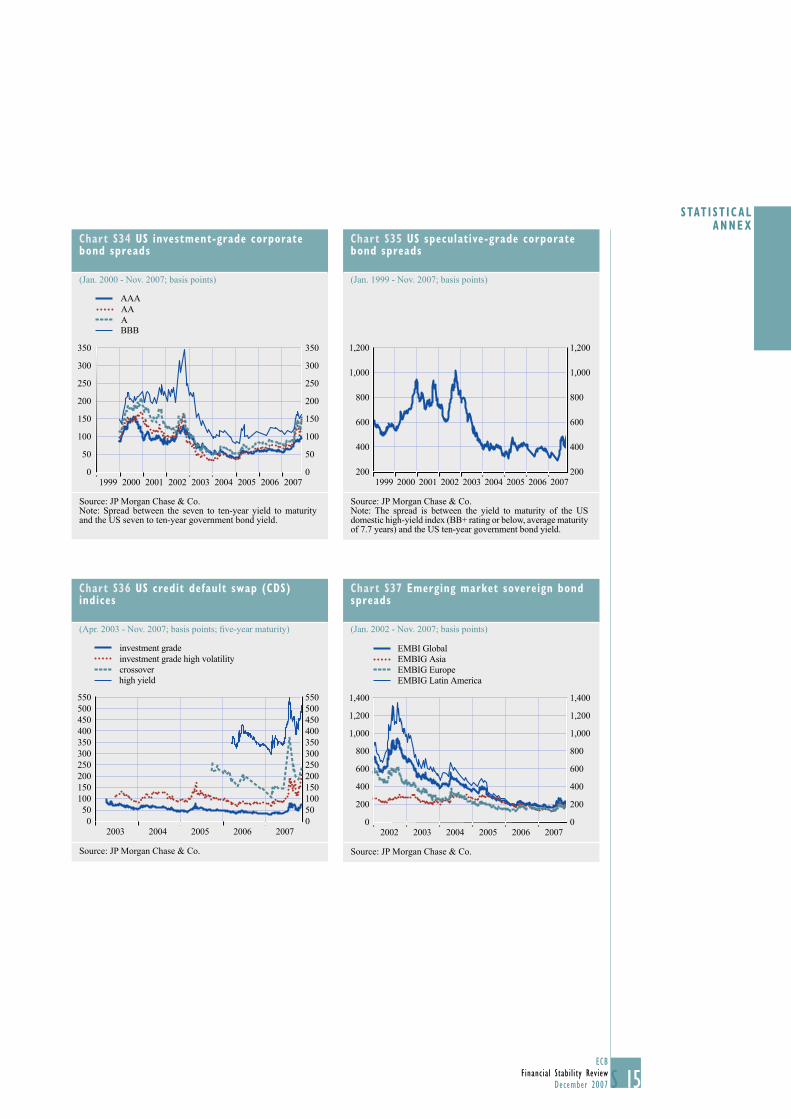
15ECB
Financial Stability ReviewDecember 2007 S
STAT I ST ICAL ANNEX
Chart S34 US investment-grade corporate bond spreads
(Jan. 2000 - Nov. 2007; basis points)
0
50
100
150
200
250
300
350
0
50
100
150
200
250
300
350
2007
AAAAAABBB
1999 2000 2001 2002 2003 2004 2005 2006
Source: JP Morgan Chase & Co.Note: Spread between the seven to ten-year yield to maturity and the US seven to ten-year government bond yield.
Chart S35 US speculative-grade corporate bond spreads
(Jan. 1999 - Nov. 2007; basis points)
200
400
600
800
1,000
1,200
200
400
600
800
1,000
1,200
20071999 2000 2001 2002 2003 2004 2005 2006
Source: JP Morgan Chase & Co.Note: The spread is between the yield to maturity of the US domestic high-yield index (BB+ rating or below, average maturity of 7.7 years) and the US ten-year government bond yield.
Chart S36 US credit default swap (CDS) indices
(Apr. 2003 - Nov. 2007; basis points; fi ve-year maturity)
050
100150200250300350400450500550
050100150200250300350400450500550
2007
investment grade investment grade high volatilitycrossoverhigh yield
2003 2004 2005 2006
Source: JP Morgan Chase & Co.
Chart S37 Emerging market sovereign bond spreads
(Jan. 2002 - Nov. 2007; basis points)
EMBI GlobalEMBIG AsiaEMBIG EuropeEMBIG Latin America
0
200
400
600
800
1,000
1,200
1,400
0
200
400
600
800
1,000
1,200
1,400
20072002 2003 2004 2005 2006
Source: JP Morgan Chase & Co.
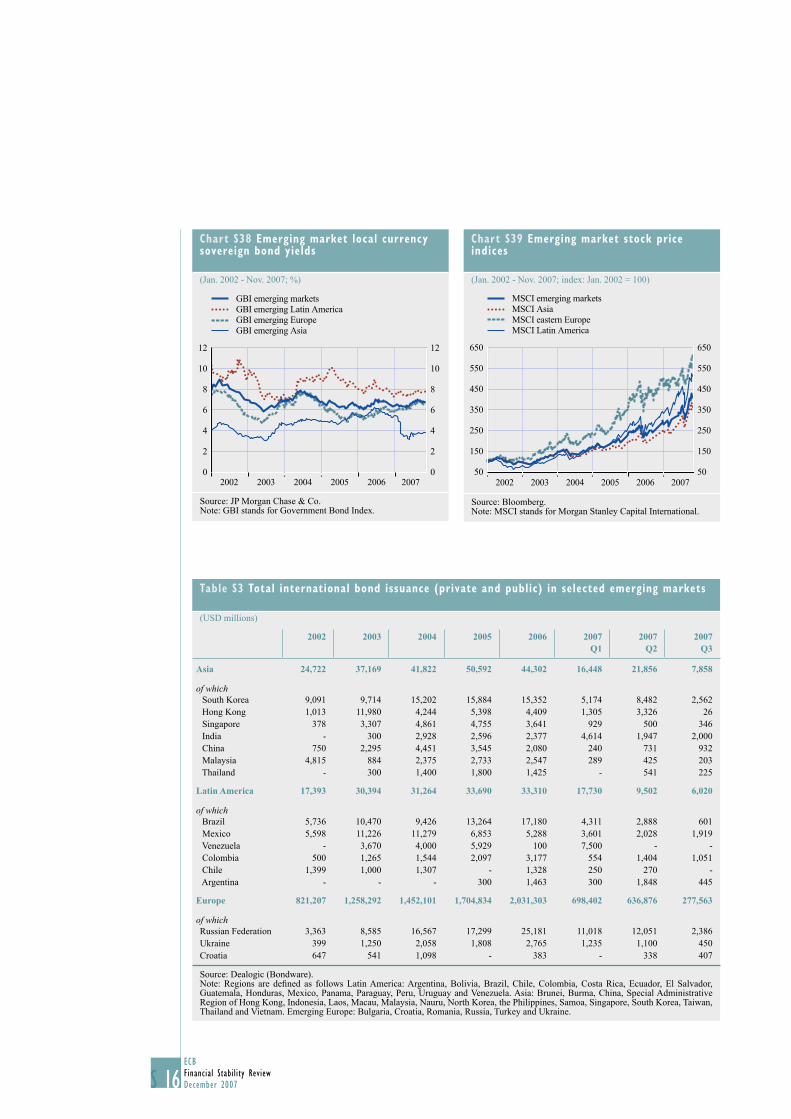
16ECBFinancial Stability ReviewDecember 2007S
Chart S38 Emerging market local currency sovereign bond yields
(Jan. 2002 - Nov. 2007; %)
20070
2
4
6
8
10
12
0
2
4
6
8
10
12
GBI emerging marketsGBI emerging Latin AmericaGBI emerging EuropeGBI emerging Asia
2002 2003 2004 2005 2006
Source: JP Morgan Chase & Co.Note: GBI stands for Government Bond Index.
Chart S39 Emerging market stock price indices
(Jan. 2002 - Nov. 2007; index: Jan. 2002 = 100)
50
150
250
350
450
550
650
50
150
250
350
450
550
650
MSCI emerging marketsMSCI AsiaMSCI eastern EuropeMSCI Latin America
2002 2003 2004 20062005 2007
Source: Bloomberg.Note: MSCI stands for Morgan Stanley Capital International.
Table S3 Total international bond issuance (private and public) in selected emerging markets
(USD millions)
2002 2003 2004 2005 2006 2007 Q1
2007 Q2
2007 Q3
Asia 24,722 37,169 41,822 50,592 44,302 16,448 21,856 7,858
of which South Korea 9,091 9,714 15,202 15,884 15,352 5,174 8,482 2,562 Hong Kong 1,013 11,980 4,244 5,398 4,409 1,305 3,326 26 Singapore 378 3,307 4,861 4,755 3,641 929 500 346 India - 300 2,928 2,596 2,377 4,614 1,947 2,000 China 750 2,295 4,451 3,545 2,080 240 731 932 Malaysia 4,815 884 2,375 2,733 2,547 289 425 203 Thailand - 300 1,400 1,800 1,425 - 541 225
Latin America 17,393 30,394 31,264 33,690 33,310 17,730 9,502 6,020
of which Brazil 5,736 10,470 9,426 13,264 17,180 4,311 2,888 601 Mexico 5,598 11,226 11,279 6,853 5,288 3,601 2,028 1,919 Venezuela - 3,670 4,000 5,929 100 7,500 - - Colombia 500 1,265 1,544 2,097 3,177 554 1,404 1,051 Chile 1,399 1,000 1,307 - 1,328 250 270 - Argentina - - - 300 1,463 300 1,848 445
Europe 821,207 1,258,292 1,452,101 1,704,834 2,031,303 698,402 636,876 277,563
of whichRussian Federation 3,363 8,585 16,567 17,299 25,181 11,018 12,051 2,386Ukraine 399 1,250 2,058 1,808 2,765 1,235 1,100 450Croatia 647 541 1,098 - 383 - 338 407
Source: Dealogic (Bondware).Note: Regions are defi ned as follows Latin America: Argentina, Bolivia, Brazil, Chile, Colombia, Costa Rica, Ecuador, El Salvador, Guatemala, Honduras, Mexico, Panama, Paraguay, Peru, Uruguay and Venezuela. Asia: Brunei, Burma, China, Special Administrative Region of Hong Kong, Indonesia, Laos, Macau, Malaysia, Nauru, North Korea, the Philippines, Samoa, Singapore, South Korea, Taiwan, Thailand and Vietnam. Emerging Europe: Bulgaria, Croatia, Romania, Russia, Turkey and Ukraine.
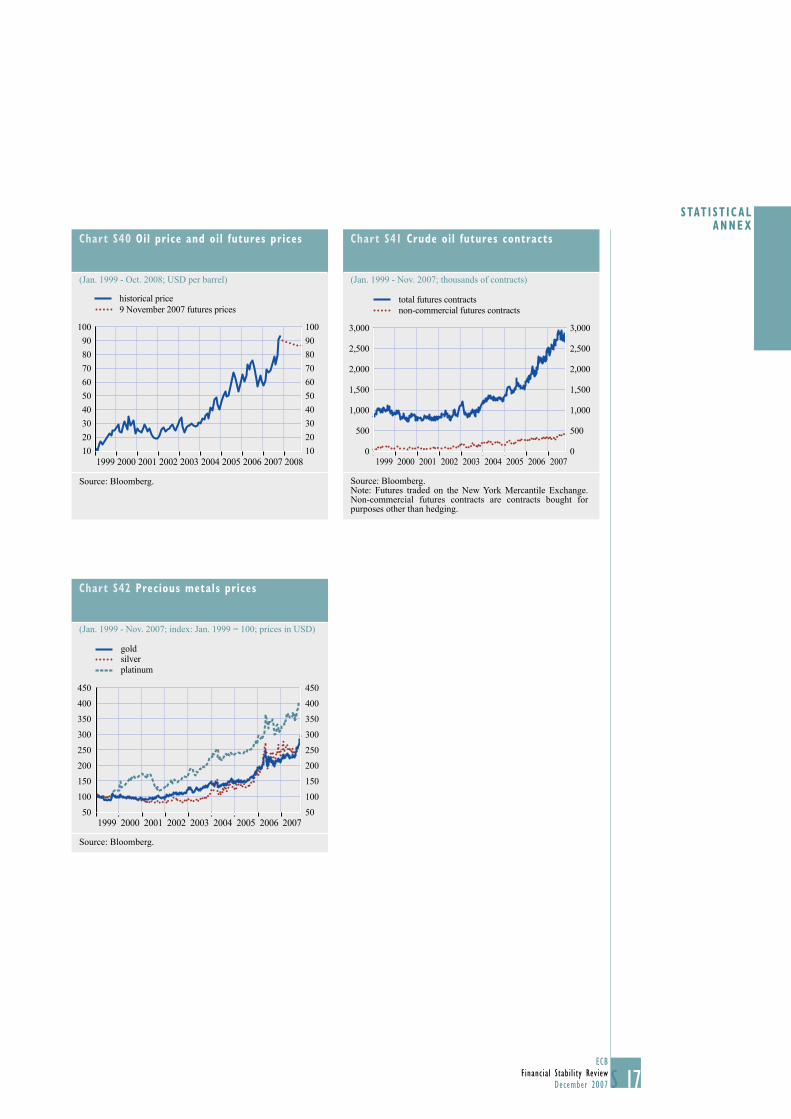
17ECB
Financial Stability ReviewDecember 2007 S
STAT I ST ICAL ANNEX
Chart S40 Oil price and oil futures prices
(Jan. 1999 - Oct. 2008; USD per barrel)
10
20
30
40
50
60
70
80
90
100
10
20
30
40
50
60
70
80
90
100
historical price9 November 2007 futures prices
1999 2000 2001 2002 2003 2004 2005 2006 2007 2008
Source: Bloomberg.
Chart S41 Crude oil futures contracts
(Jan. 1999 - Nov. 2007; thousands of contracts)
0
500
1,000
1,500
2,000
2,500
3,000
0
500
1,000
1,500
2,000
2,500
3,000
total futures contractsnon-commercial futures contracts
1999 2000 2001 2002 2003 2004 2005 2006 2007
Source: Bloomberg.Note: Futures traded on the New York Mercantile Exchange. Non-commercial futures contracts are contracts bought for purposes other than hedging.
Chart S42 Precious metals prices
(Jan. 1999 - Nov. 2007; index: Jan. 1999 = 100; prices in USD)
50
100
150
200
250
300
350
400
450
50
100
150
200
250
300
350
400
450
goldsilverplatinum
1999 2000 2001 2002 2003 2004 2005 2006 2007
Source: Bloomberg.
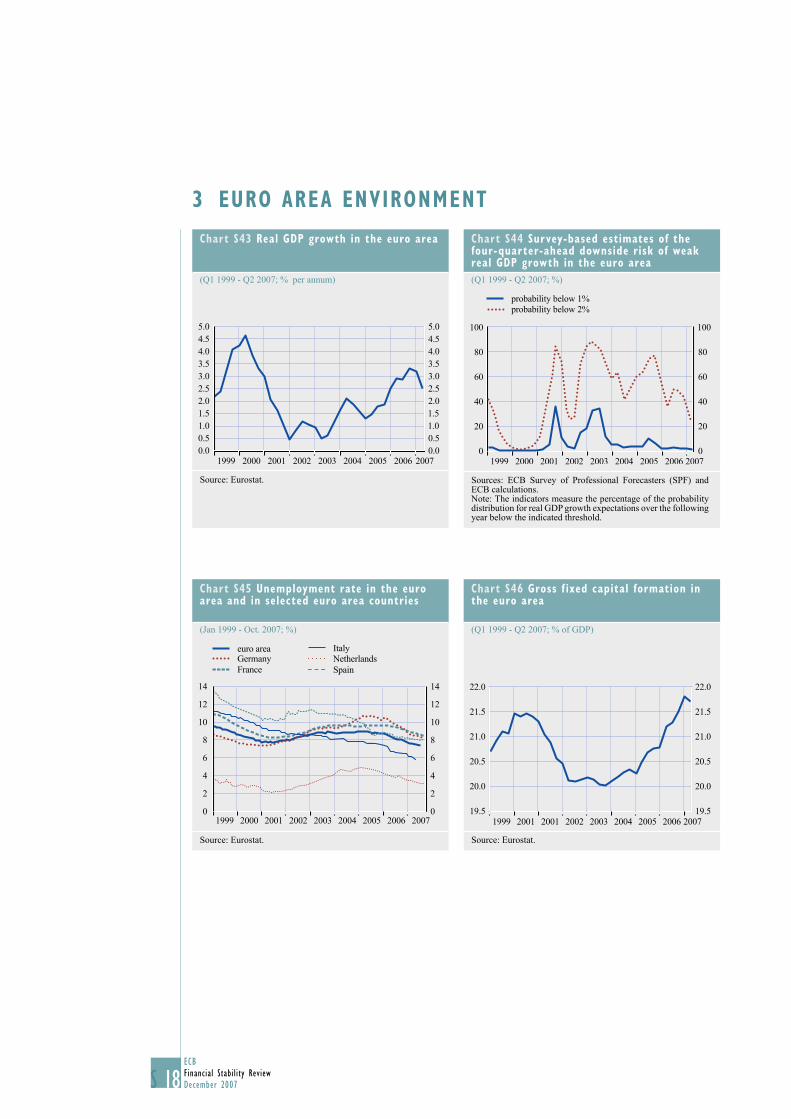
18ECBFinancial Stability ReviewDecember 2007S
3 EURO AREA ENVIRONMENT
Chart S43 Real GDP growth in the euro area
(Q1 1999 - Q2 2007; % per annum)
5.04.54.03.53.02.52.01.51.00.50.0
5.04.54.03.53.02.52.01.51.00.50.0
1999 2001 20022000 2003 2004 2005 2006 2007
Source: Eurostat.
Chart S44 Survey-based estimates of the four-quarter-ahead downside risk of weak real GDP growth in the euro area
(Q1 1999 - Q2 2007; %)
0
20
40
60
80
100
0
20
40
60
80
100
probability below 1%probability below 2%
1999 2001 20022000 2003 2004 2005 2006 2007
Sources: ECB Survey of Professional Forecasters (SPF) and ECB calculations. Note: The indicators measure the percentage of the probability distribution for real GDP growth expectations over the following year below the indicated threshold.
Chart S45 Unemployment rate in the euro area and in selected euro area countries
(Jan 1999 - Oct. 2007; %)
0
2
4
6
8
10
12
14
0
2
4
6
8
10
12
14
euro areaGermanyFrance
ItalyNetherlandsSpain
1999 2000 2001 2002 2003 2004 2005 2006 2007
Source: Eurostat.
Chart S46 Gross f ixed capital formation in the euro area
(Q1 1999 - Q2 2007; % of GDP)
19.5
20.0
20.5
21.0
21.5
22.0
19.5
20.0
20.5
21.0
21.5
22.0
1999 2001 20022001 2003 2004 2005 2006 2007
Source: Eurostat.
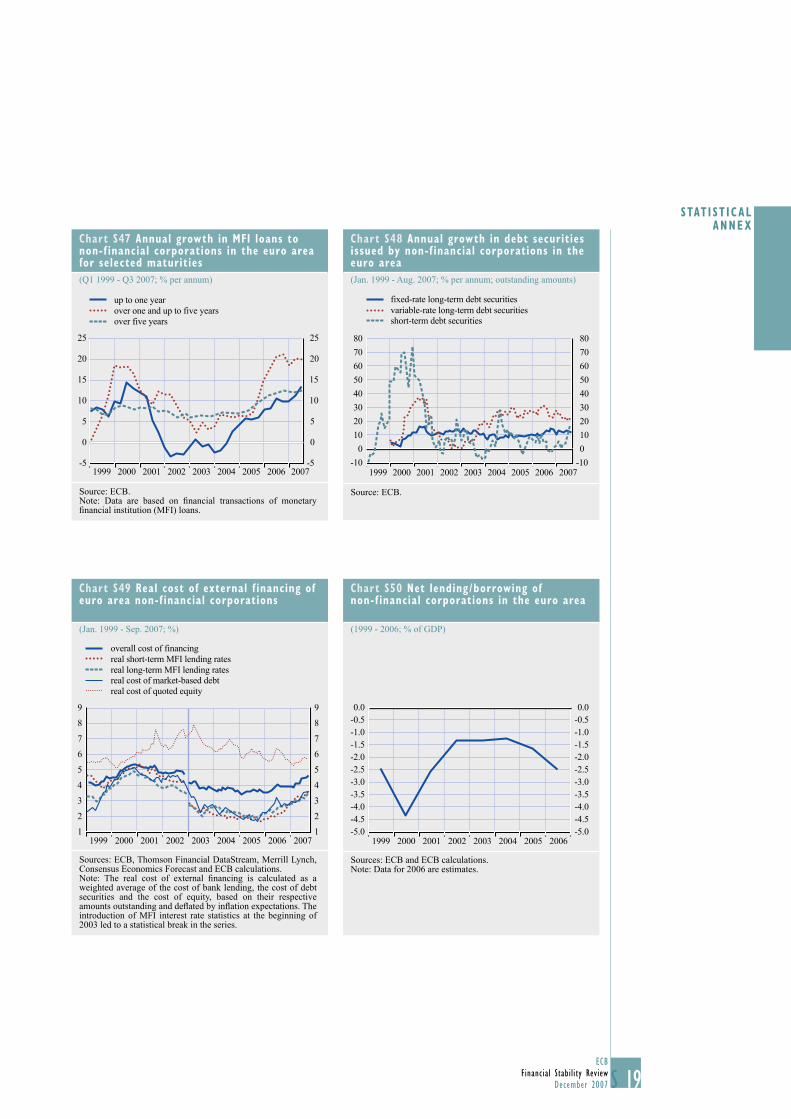
19ECB
Financial Stability ReviewDecember 2007 S
STAT I ST ICAL ANNEX
Chart S47 Annual growth in MFI loans to non-f inancial corporations in the euro area for selected maturities
(Q1 1999 - Q3 2007; % per annum)
0
5
10
15
20
25
0
5
10
15
20
25
up to one yearover one and up to five yearsover five years
-5 -51999 2000 2001 2002 2003 2004 2005 2006 2007
Source: ECB.Note: Data are based on fi nancial transactions of monetary fi nancial institution (MFI) loans.
Chart S48 Annual growth in debt securities issued by non-f inancial corporations in the euro area
(Jan. 1999 - Aug. 2007; % per annum; outstanding amounts)
-10
0
10
20
30
40
50
60
70
80
-10
0
10
20
30
40
50
60
70
80
2007
fixed-rate long-term debt securitiesvariable-rate long-term debt securitiesshort-term debt securities
1999 2000 2001 2002 2003 2004 2005 2006
Source: ECB.
Chart S49 Real cost of external f inancing of euro area non-f inancial corporations
(Jan. 1999 - Sep. 2007; %)
1
2
3
4
5
6
7
8
9
1
2
3
4
5
6
7
8
9
overall cost of financingreal short-term MFI lending ratesreal long-term MFI lending ratesreal cost of market-based debtreal cost of quoted equity
1999 2000 2001 2002 2003 2004 2005 2006 2007
Sources: ECB, Thomson Financial DataStream, Merrill Lynch, Consensus Economics Forecast and ECB calculations.Note: The real cost of external fi nancing is calculated as a weighted average of the cost of bank lending, the cost of debt securities and the cost of equity, based on their respective amounts outstanding and defl ated by infl ation expectations. The introduction of MFI interest rate statistics at the beginning of 2003 led to a statistical break in the series.
Chart S50 Net lending /borrowing of non-f inancial corporations in the euro area
(1999 - 2006; % of GDP)
-5.0-4.5-4.0-3.5-3.0-2.5-2.0-1.5-1.0-0.50.0
-4.5-4.0-3.5-3.0-2.5-2.0-1.5-1.0-0.50.0
-5.01999 2000 2001 2002 2003 2004 2005 2006
Sources: ECB and ECB calculations.Note: Data for 2006 are estimates.
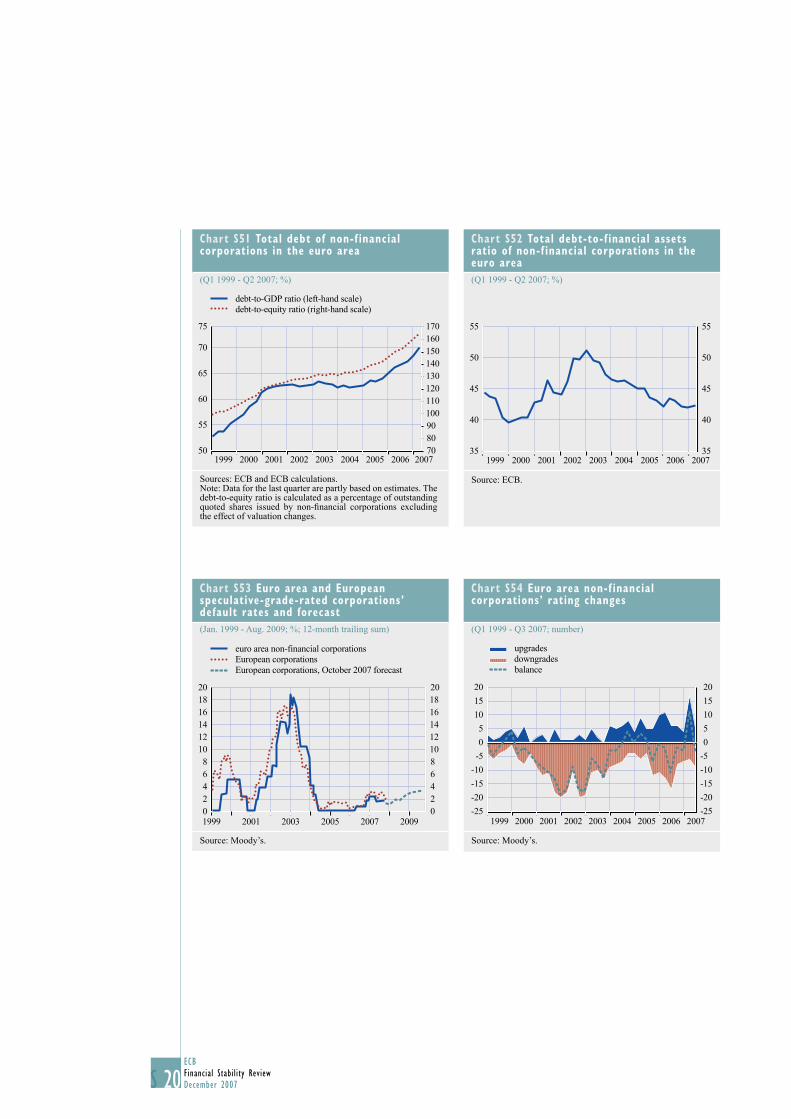
20ECBFinancial Stability ReviewDecember 2007S
Chart S51 Total debt of non-f inancial corporations in the euro area
(Q1 1999 - Q2 2007; %)
50
55
60
65
70
75
708090100110120130140150160170
debt-to-GDP ratio (left-hand scale)debt-to-equity ratio (right-hand scale)
1999 2000 2001 2002 2003 2004 2005 2006 2007
Sources: ECB and ECB calculations.Note: Data for the last quarter are partly based on estimates. The debt-to-equity ratio is calculated as a percentage of outstanding quoted shares issued by non-fi nancial corporations excluding the effect of valuation changes.
Chart S52 Total debt-to-f inancial assets ratio of non-f inancial corporations in the euro area
(Q1 1999 - Q2 2007; %)
35
40
45
50
55
35
40
45
50
55
1999 2000 2001 2002 2003 2004 2005 2006 2007
Source: ECB.
Chart S53 Euro area and European speculative-grade-rated corporations’ default rates and forecast
(Jan. 1999 - Aug. 2009; %; 12-month trailing sum)
02468
101214161820
02468101214161820
euro area non-financial corporationsEuropean corporationsEuropean corporations, October 2007 forecast
1999 2001 2003 2005 2007 2009
Source: Moody’s.
Chart S54 Euro area non-f inancial corporations’ rating changes
(Q1 1999 - Q3 2007; number)
-25
-20
-15
-10
-5
0
5
10
15
20
-25
-20
-15
-10
-5
0
5
10
15
20
1999 2000 2001 2002 2003 2004 2005 2006 2007
upgradesdowngradesbalance
Source: Moody’s.
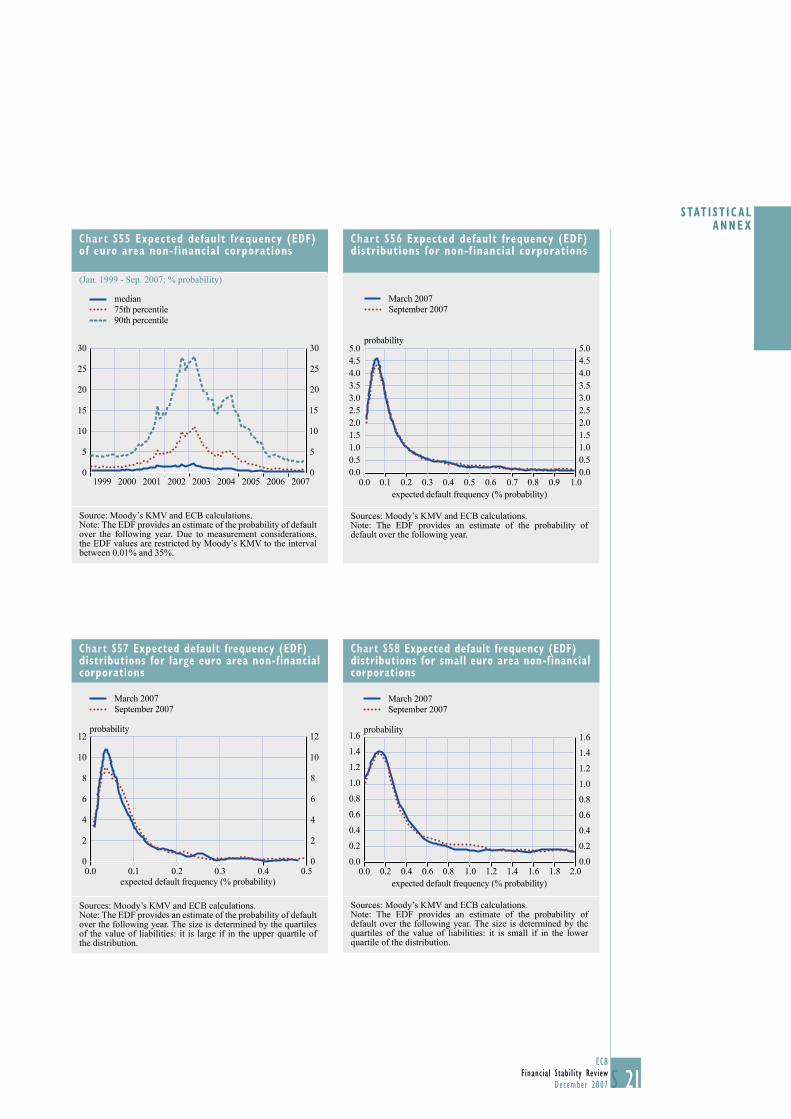
21ECB
Financial Stability ReviewDecember 2007 S
STAT I ST ICAL ANNEX
Chart S55 Expected default frequency (EDF) of euro area non-f inancial corporations
(Jan. 1999 - Sep. 2007; % probability)
0
5
10
15
20
25
30
0
5
10
15
20
25
30
median75th percentile90th percentile
1999 2000 2001 2002 2003 2004 2005 2006 2007
Source: Moody’s KMV and ECB calculations.Note: The EDF provides an estimate of the probability of default over the following year. Due to measurement considerations, the EDF values are restricted by Moody’s KMV to the interval between 0.01% and 35%.
Chart S56 Expected default frequency (EDF) distributions for non-f inancial corporations
0.00.51.01.52.02.53.03.54.04.55.0
0.00.51.01.52.02.53.03.54.04.55.0
1.0expected default frequency (% probability)
probability
March 2007September 2007
0.0 0.1 0.2 0.3 0.4 0.5 0.6 0.7 0.8 0.9
Sources: Moody’s KMV and ECB calculations.Note: The EDF provides an estimate of the probability of default over the following year.
Chart S57 Expected default frequency (EDF) distributions for large euro area non-f inancial corporations
0
2
4
6
8
10
12
0
2
4
6
8
10
12
expected default frequency (% probability)
probability
March 2007September 2007
0.0 0.1 0.2 0.3 0.4 0.5
Sources: Moody’s KMV and ECB calculations.Note: The EDF provides an estimate of the probability of default over the following year. The size is determined by the quartiles of the value of liabilities: it is large if in the upper quartile of the distribution.
Chart S58 Expected default frequency (EDF) distributions for small euro area non-financial corporations
0.0
0.2
0.4
0.6
0.8
1.0
1.2
1.4
1.6
0.0
0.2
0.4
0.6
0.8
1.0
1.2
1.4
1.6
2.0expected default frequency (% probability)
probability
March 2007September 2007
0.0 0.2 0.4 0.6 0.8 1.0 1.2 1.4 1.6 1.8
Sources: Moody’s KMV and ECB calculations.Note: The EDF provides an estimate of the probability of default over the following year. The size is determined by the quartiles of the value of liabilities: it is small if in the lower quartile of the distribution.
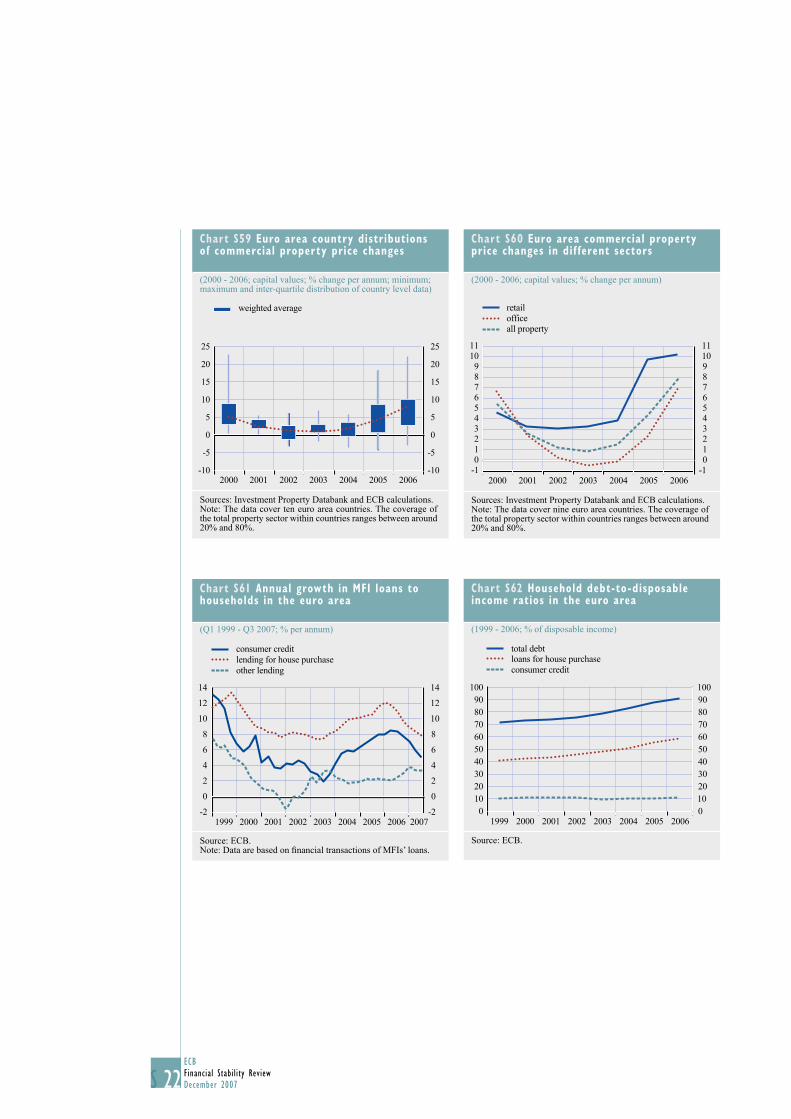
22ECBFinancial Stability ReviewDecember 2007S
Chart S59 Euro area country distributions of commercial property price changes
(2000 - 2006; capital values; % change per annum; minimum; maximum and inter-quartile distribution of country level data)
-10
-5
0
5
10
15
20
25
-10
-5
0
5
10
15
20
25
2006
weighted average
2000 2001 2002 2003 2004 2005
Sources: Investment Property Databank and ECB calculations.Note: The data cover ten euro area countries. The coverage of the total property sector within countries ranges between around 20% and 80%.
Chart S60 Euro area commercial property price changes in dif ferent sectors
(2000 - 2006; capital values; % change per annum)
-10123456789
1011
retailofficeall property
01234567891011
-12000 2001 2002 2003 2004 2005 2006
Sources: Investment Property Databank and ECB calculations.Note: The data cover nine euro area countries. The coverage of the total property sector within countries ranges between around 20% and 80%.
Chart S61 Annual growth in MFI loans to households in the euro area
(Q1 1999 - Q3 2007; % per annum)
-2
0
2
4
6
8
10
12
14
-2
0
2
4
6
8
10
12
14
consumer creditlending for house purchaseother lending
1999 2000 2001 2002 2003 2004 2005 2006 2007
Source: ECB.Note: Data are based on fi nancial transactions of MFIs’ loans.
Chart S62 Household debt-to-disposable income ratios in the euro area
(1999 - 2006; % of disposable income)
0102030405060708090
100
0102030405060708090100
1999 2000 2001 2002 2003 2004 2005 2006
total debtloans for house purchaseconsumer credit
Source: ECB.
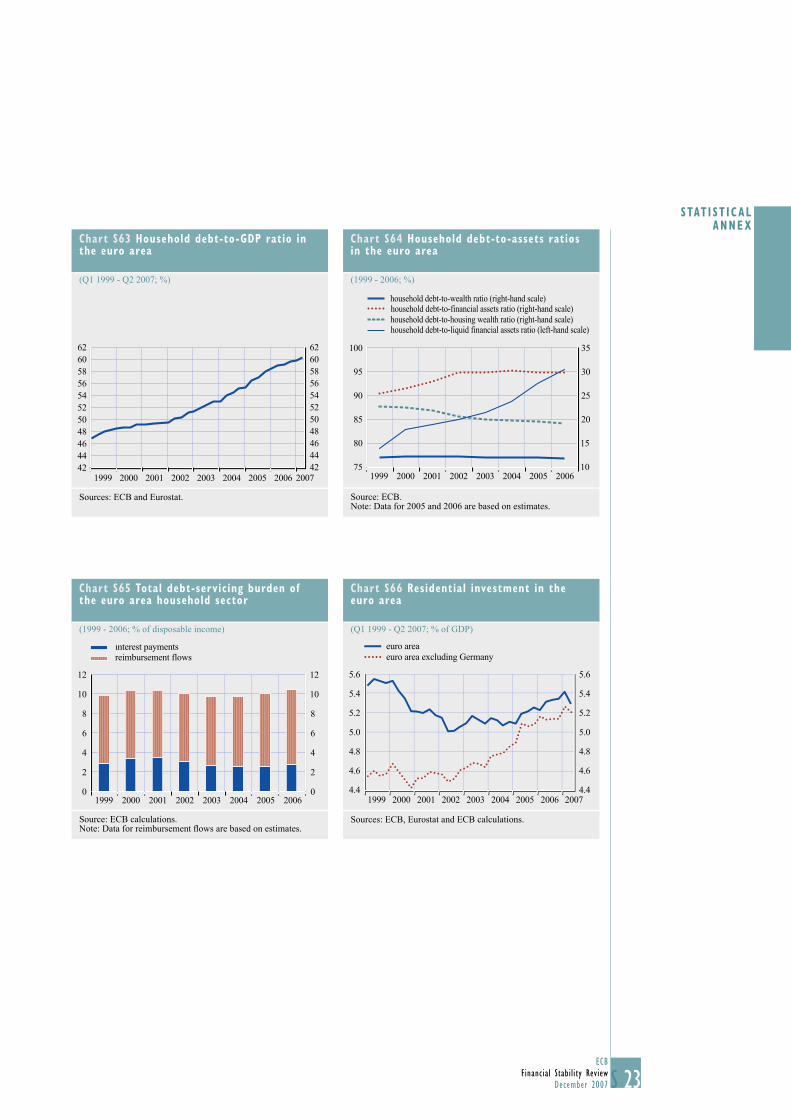
23ECB
Financial Stability ReviewDecember 2007 S
STAT I ST ICAL ANNEX
Chart S63 Household debt-to-GDP ratio in the euro area
(Q1 1999 - Q2 2007; %)
4244464850525456586062
4244464850525456586062
1999 2000 2001 2002 2003 2004 2005 2006 2007
Sources: ECB and Eurostat.
Chart S64 Household debt-to-assets ratios in the euro area
(1999 - 2006; %)
75
80
85
90
95
100
2005 200610
15
20
25
30
35
household debt-to-wealth ratio (right-hand scale)household debt-to-financial assets ratio (right-hand scale)household debt-to-housing wealth ratio (right-hand scale)household debt-to-liquid financial assets ratio (left-hand scale)
1999 2000 2001 2002 2003 2004
Source: ECB. Note: Data for 2005 and 2006 are based on estimates.
Chart S65 Total debt-servicing burden of the euro area household sector
(1999 - 2006; % of disposable income)
interest paymentsreimbursement flows
0
2
4
6
8
10
12
0
2
4
6
8
10
12
20061999 2000 2001 2002 2003 2004 2005
Source: ECB calculations. Note: Data for reimbursement fl ows are based on estimates.
Chart S66 Residential investment in the euro area
(Q1 1999 - Q2 2007; % of GDP)
1999 2000 2001 2002 2003 2004 2005 2006 2007
euro areaeuro area excluding Germany
4.4
4.6
4.8
5.0
5.2
5.4
5.6
4.4
4.6
4.8
5.0
5.2
5.4
5.6
Sources: ECB, Eurostat and ECB calculations.
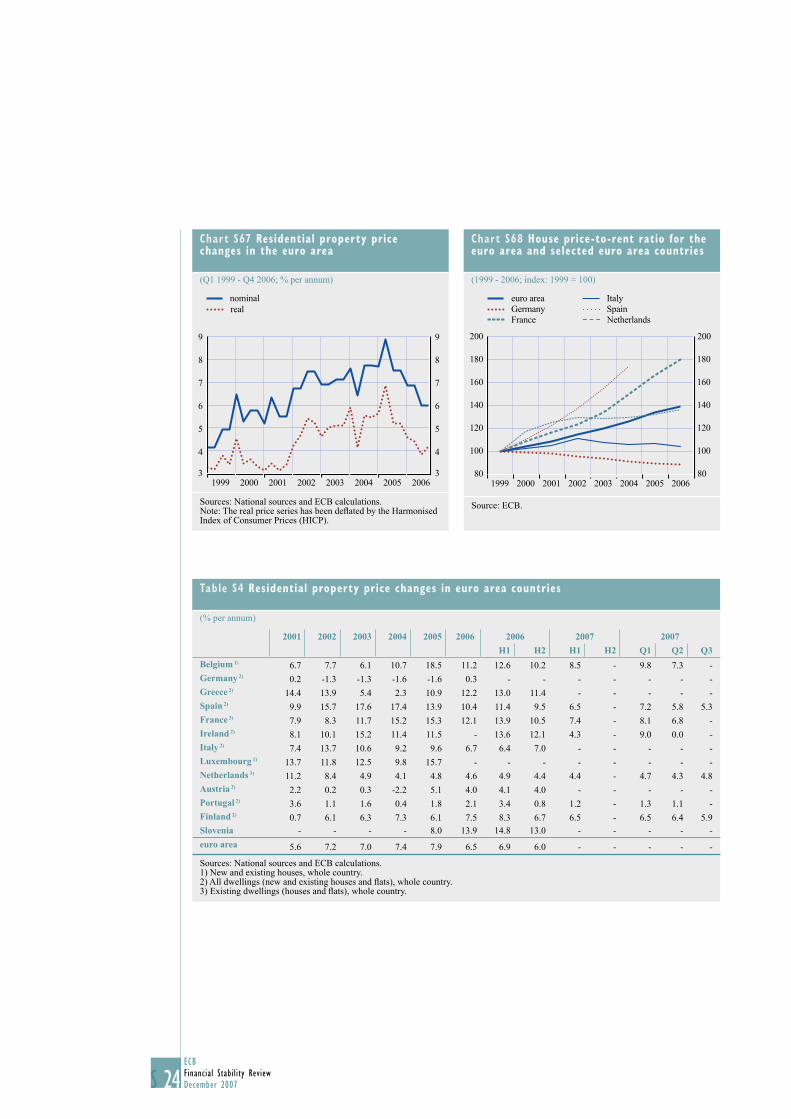
24ECBFinancial Stability ReviewDecember 2007S
Chart S67 Residential property price changes in the euro area
(Q1 1999 - Q4 2006; % per annum)
nominalreal
3
4
5
6
7
9
8
3
4
5
6
7
9
8
20061999 2000 2001 2002 2003 2004 2005
Sources: National sources and ECB calculations.Note: The real price series has been defl ated by the Harmonised Index of Consumer Prices (HICP).
Chart S68 House price-to-rent ratio for the euro area and selected euro area countries
(1999 - 2006; index: 1999 = 100)
80
100
120
140
160
180
200
80
100
120
140
160
180
200
2006
euro areaGermanyFrance
Italy Spain Netherlands
1999 2000 2001 2002 2003 2004 2005
Source: ECB.
Table S4 Residential property price changes in euro area countries
(% per annum)
2001 2002 2003 2004 2005 2006 2006 2007 2007
H1 H2 H1 H2 Q1 Q2 Q3
Belgium 1) 6.7 7.7 6.1 10.7 18.5 11.2 12.6 10.2 8.5 - 9.8 7.3 -Germany 2) 0.2 -1.3 -1.3 -1.6 -1.6 0.3 - - - - - - -Greece 2) 14.4 13.9 5.4 2.3 10.9 12.2 13.0 11.4 - - - - -Spain 2) 9.9 15.7 17.6 17.4 13.9 10.4 11.4 9.5 6.5 - 7.2 5.8 5.3France 3) 7.9 8.3 11.7 15.2 15.3 12.1 13.9 10.5 7.4 - 8.1 6.8 -Ireland 2) 8.1 10.1 15.2 11.4 11.5 - 13.6 12.1 4.3 - 9.0 0.0 -Italy 2) 7.4 13.7 10.6 9.2 9.6 6.7 6.4 7.0 - - - - -Luxembourg 1) 13.7 11.8 12.5 9.8 15.7 - - - - - - - -Netherlands 3) 11.2 8.4 4.9 4.1 4.8 4.6 4.9 4.4 4.4 - 4.7 4.3 4.8Austria 2) 2.2 0.2 0.3 -2.2 5.1 4.0 4.1 4.0 - - - - -Portugal 2) 3.6 1.1 1.6 0.4 1.8 2.1 3.4 0.8 1.2 - 1.3 1.1 -Finland 2) 0.7 6.1 6.3 7.3 6.1 7.5 8.3 6.7 6.5 - 6.5 6.4 5.9Slovenia - - - - 8.0 13.9 14.8 13.0 - - - - -
euro area 5.6 7.2 7.0 7.4 7.9 6.5 6.9 6.0 - - - - -
Sources: National sources and ECB calculations.1) New and existing houses, whole country.2) All dwellings (new and existing houses and fl ats), whole country.3) Existing dwellings (houses and fl ats), whole country.
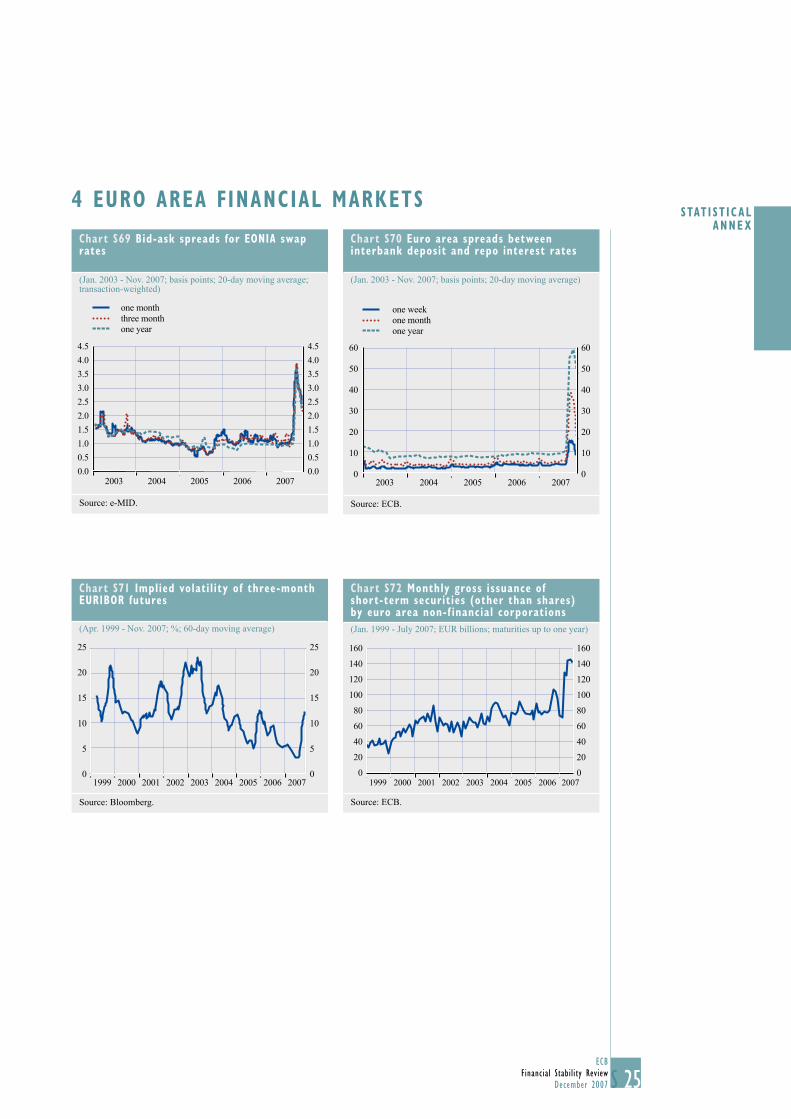
25ECB
Financial Stability ReviewDecember 2007 S
STAT I ST ICAL ANNEX
4 EURO AREA FINANCIAL MARKETS
Chart S69 Bid-ask spreads for EONIA swap rates
(Jan. 2003 - Nov. 2007; basis points; 20-day moving average; transaction-weighted)
2003 2004 2005 2006 2007
4.5
4.0
3.5
3.0
2.5
2.0
1.5
1.0
0.5
0.0
4.5
4.0
3.5
3.0
2.5
2.0
1.5
1.0
0.5
0.0
one monththree monthone year
Source: e-MID.
Chart S70 Euro area spreads between interbank deposit and repo interest rates
(Jan. 2003 - Nov. 2007; basis points; 20-day moving average)
0
10
20
30
40
50
60
0
10
20
30
40
50
60
one monthone year
one week
2003 2004 2005 2006 2007
Source: ECB.
Chart S71 Implied volatility of three-month EURIBOR futures
(Apr. 1999 - Nov. 2007; %; 60-day moving average)
0
5
10
15
20
25
0
5
10
15
20
25
1999 2000 2001 2002 2003 2004 2005 2006 2007
Source: Bloomberg.
Chart S72 Monthly gross issuance of short-term securities (other than shares) by euro area non-f inancial corporations
(Jan. 1999 - July 2007; EUR billions; maturities up to one year)
0
20
40
60
80
100
120
140
160
0
20
40
60
80
100
120
140
160
1999 2000 2001 2002 2003 2004 2005 2006 2007
Source: ECB.
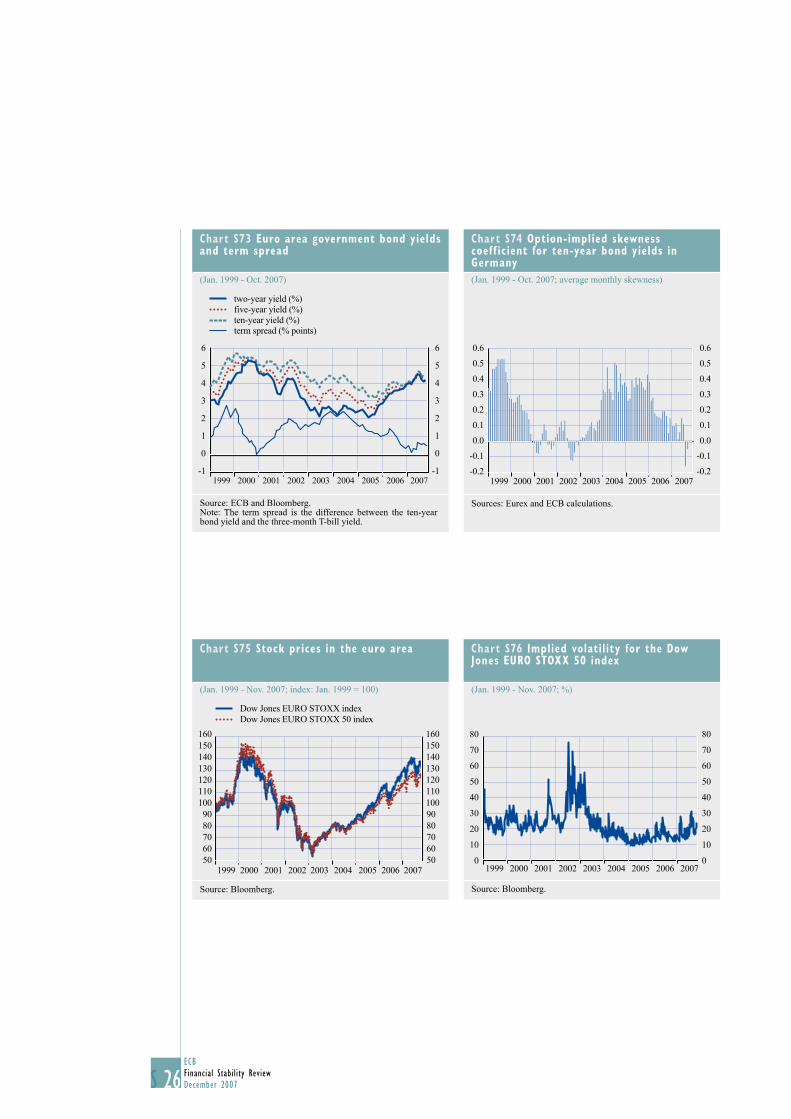
26ECBFinancial Stability ReviewDecember 2007S
Chart S73 Euro area government bond yields and term spread
(Jan. 1999 - Oct. 2007)
-1
0
1
2
3
4
5
6
-1
0
1
2
3
4
5
6
1999 2000 2001 2002 2003 2004 2005 2006 2007
two-year yield (%)five-year yield (%)ten-year yield (%)term spread (% points)
Source: ECB and Bloomberg.Note: The term spread is the difference between the ten-year bond yield and the three-month T-bill yield.
Chart S74 Option-implied skewness coeff icient for ten-year bond yields in Germany
(Jan. 1999 - Oct. 2007; average monthly skewness)
0.6
0.5
0.4
0.3
0.2
0.1
0.0
-0.1
-0.2
0.6
0.5
0.4
0.3
0.2
0.1
0.0
-0.1
-0.21999 2000 2001 2002 2003 2004 2005 2006 2007
Sources: Eurex and ECB calculations.
Chart S75 Stock prices in the euro area
(Jan. 1999 - Nov. 2007; index: Jan. 1999 = 100)
5060708090
100110120130140150160
5060708090100110120130140150160
1999 2000 2001 2002 2003 2004 2005 2006 2007
Dow Jones EURO STOXX indexDow Jones EURO STOXX 50 index
Source: Bloomberg.
Chart S76 Implied volatility for the Dow Jones EURO STOXX 50 index
(Jan. 1999 - Nov. 2007; %)
0
10
20
30
40
50
60
70
80
0
10
20
30
40
50
60
70
80
1999 2000 2001 2002 2003 2004 2005 2006 2007
Source: Bloomberg.
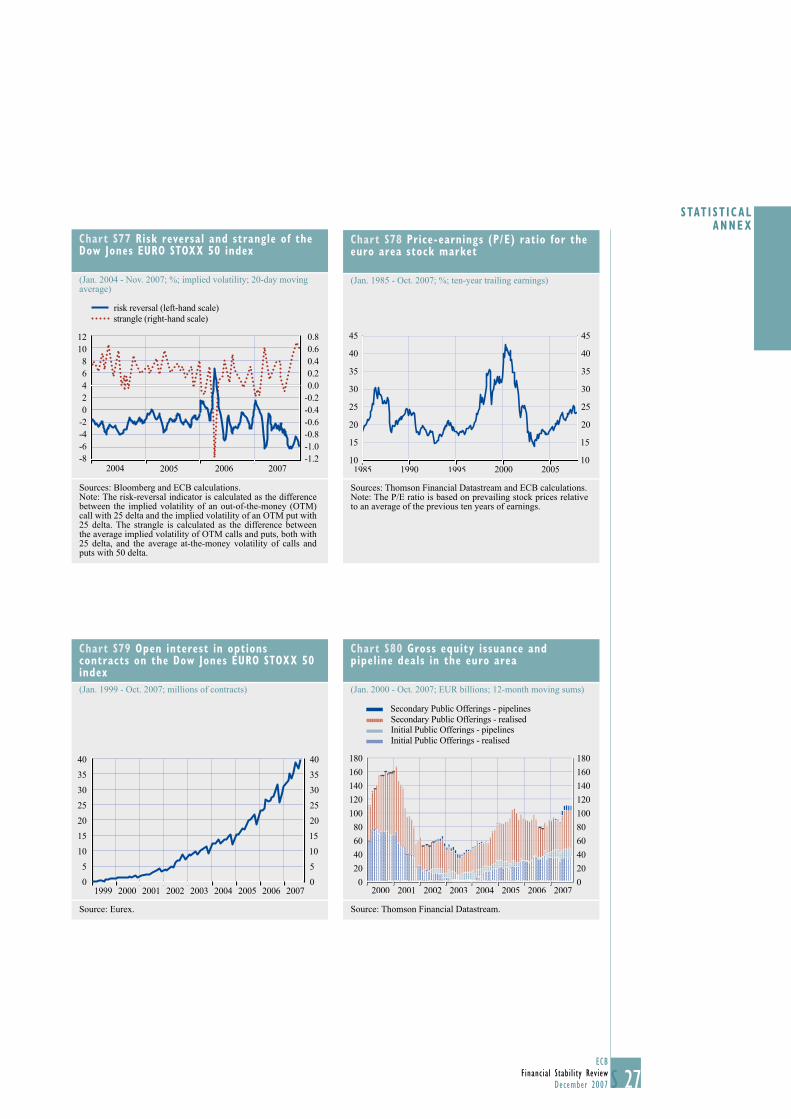
27ECB
Financial Stability ReviewDecember 2007 S
STAT I ST ICAL ANNEX
Chart S77 Risk reversal and strangle of the Dow Jones EURO STOXX 50 index
(Jan. 2004 - Nov. 2007; %; implied volatility; 20-day moving average)
-8-6-4-202468
1012
20052004 2006 2007-1.2-1.0-0.8-0.6-0.4-0.20.00.20.40.60.8
risk reversal (left-hand scale)strangle (right-hand scale)
Sources: Bloomberg and ECB calculations.Note: The risk-reversal indicator is calculated as the difference between the implied volatility of an out-of-the-money (OTM) call with 25 delta and the implied volatility of an OTM put with 25 delta. The strangle is calculated as the difference between the average implied volatility of OTM calls and puts, both with 25 delta, and the average at-the-money volatility of calls and puts with 50 delta.
Chart S78 Price-earnings (P/E) ratio for the euro area stock market
(Jan. 1985 - Oct. 2007; %; ten-year trailing earnings)
10
15
20
25
30
35
40
45
10
15
20
25
30
35
40
45
1985 1990 1995 2000 2005
Sources: Thomson Financial Datastream and ECB calculations.Note: The P/E ratio is based on prevailing stock prices relative to an average of the previous ten years of earnings.
Chart S79 Open interest in options contracts on the Dow Jones EURO STOXX 50 index
(Jan. 1999 - Oct. 2007; millions of contracts)
0
5
10
15
20
25 25
30
35
40
0
5
10
15
20
30
35
40
1999 2000 2001 2002 2003 2004 2005 2006 2007
Source: Eurex.
Chart S80 Gross equity issuance and pipeline deals in the euro area
(Jan. 2000 - Oct. 2007; EUR billions; 12-month moving sums)
Secondary Public Offerings - pipelinesSecondary Public Offerings - realisedInitial Public Offerings - pipelinesInitial Public Offerings - realised
20
40
60
80
100
120
140
160
180
20
0 0
40
60
80
100
120
140
160
180
200320012000 2002 2004 2005 2006 2007
Source: Thomson Financial Datastream.
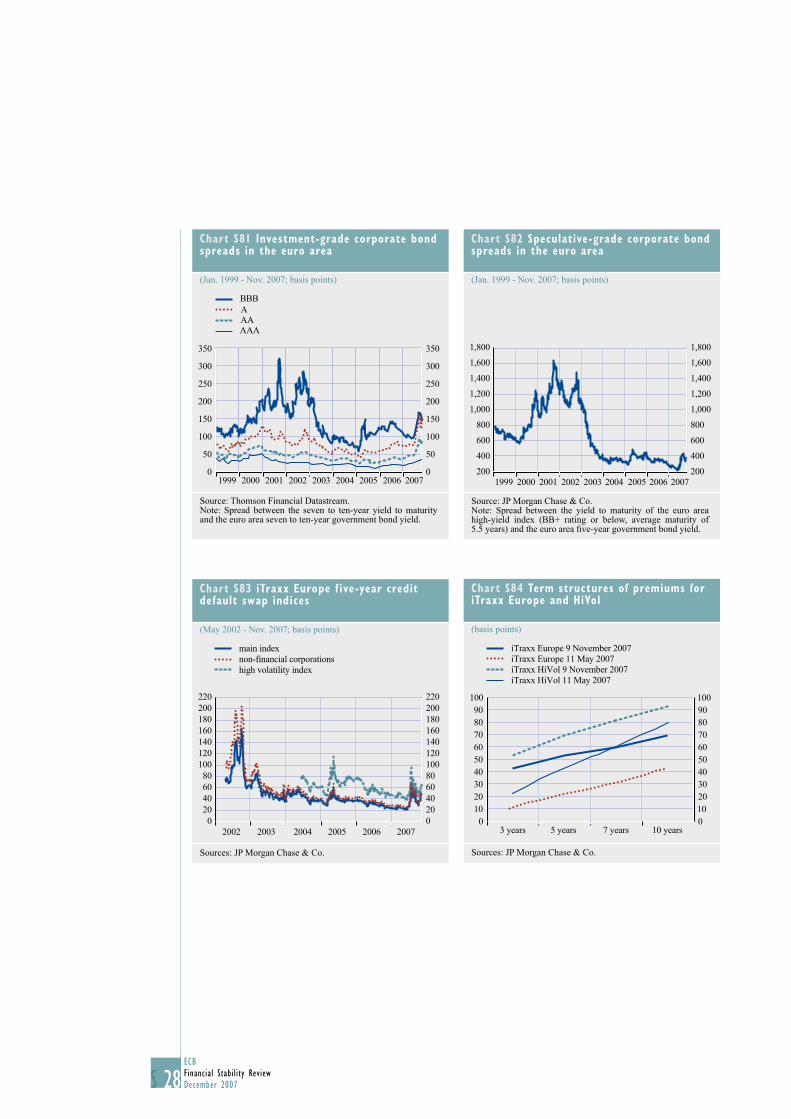
28ECBFinancial Stability ReviewDecember 2007S
Chart S81 Investment-grade corporate bond spreads in the euro area
(Jan. 1999 - Nov. 2007; basis points)
0
50
100
150
200
250
300
350
0
50
100
150
200
250
300
350
BBBAAAAAA
1999 2000 2001 2002 2003 2004 2005 2006 2007
Source: Thomson Financial Datastream.Note: Spread between the seven to ten-year yield to maturity and the euro area seven to ten-year government bond yield.
Chart S82 Speculative-grade corporate bond spreads in the euro area
(Jan. 1999 - Nov. 2007; basis points)
200
400
600
800
1,000
1,200
1,400
1,600
1,800
200
400
600
800
1,000
1,200
1,400
1,600
1,800
1999 2000 2001 2002 2003 2004 2005 2006 2007
Source: JP Morgan Chase & Co.Note: Spread between the yield to maturity of the euro area high-yield index (BB+ rating or below, average maturity of5.5 years) and the euro area fi ve-year government bond yield.
Chart S83 iTraxx Europe f ive-year credit default swap indices
(May 2002 - Nov. 2007; basis points)
020406080
100120140160180200220
020406080100120140160180200220
2002 2003 2004 2005 2006 2007
main indexnon-financial corporationshigh volatility index
Sources: JP Morgan Chase & Co.
Chart S84 Term structures of premiums for iTraxx Europe and HiVol
(basis points)
0102030405060708090
100
0102030405060708090100
3 years 5 years 7 years 10 years
iTraxx Europe 9 November 2007iTraxx Europe 11 May 2007iTraxx HiVol 9 November 2007iTraxx HiVol 11 May 2007
Sources: JP Morgan Chase & Co.
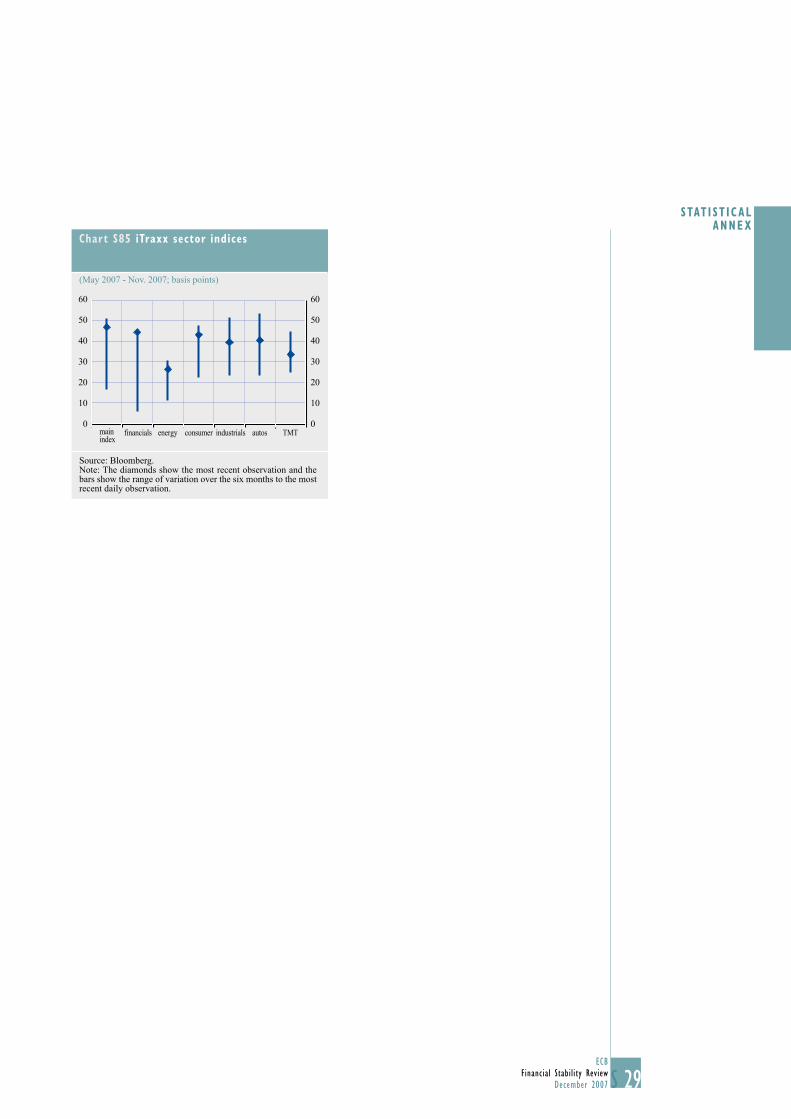
29ECB
Financial Stability ReviewDecember 2007 S
STAT I ST ICAL ANNEX
Chart S85 iTraxx sector indices
(May 2007 - Nov. 2007; basis points)
0
10
20
30
40
50
60
0
10
20
30
40
50
60
main financials energy consumer industrials autos TMTindex
Source: Bloomberg.Note: The diamonds show the most recent observation and the bars show the range of variation over the six months to the most recent daily observation.
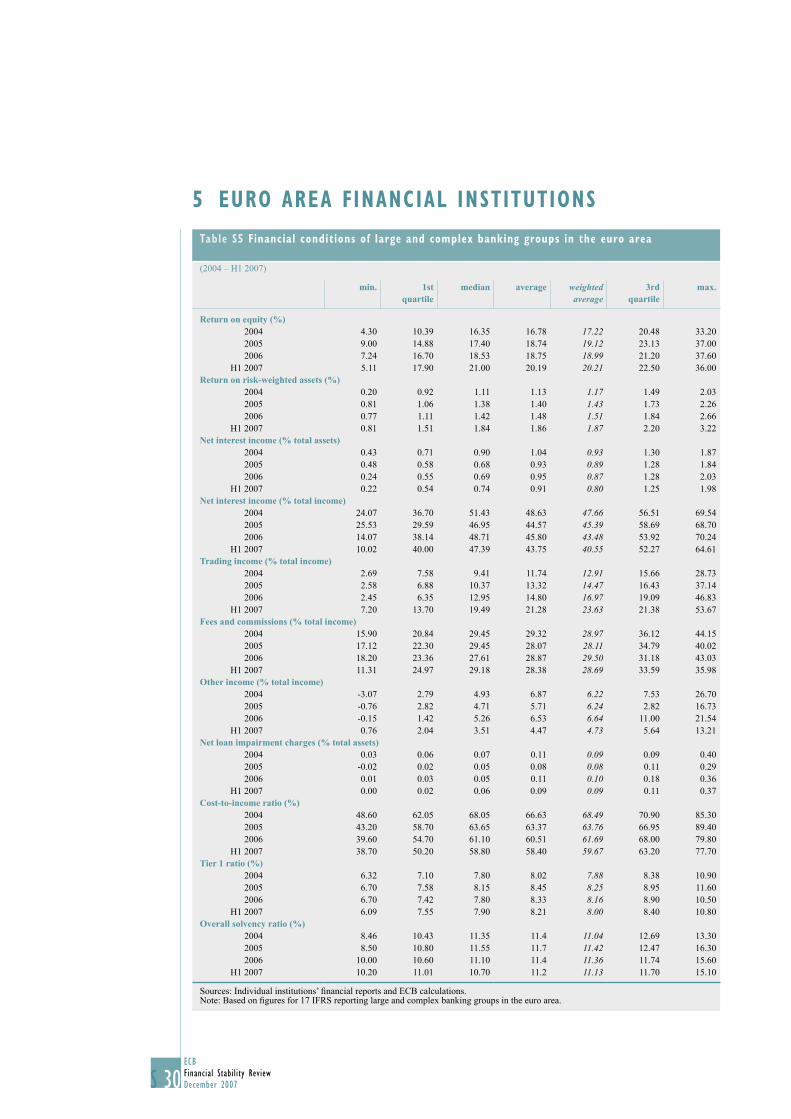
30ECBFinancial Stability ReviewDecember 2007S
5 EURO AREA FINANCIAL INSTITUTIONS
Table S5 Financial conditions of large and complex banking groups in the euro area
(2004 – H1 2007)
min. 1st quartile
median average weighted average
3rd quartile
max.
Return on equity (%)2004 4.30 10.39 16.35 16.78 17.22 20.48 33.202005 9.00 14.88 17.40 18.74 19.12 23.13 37.002006 7.24 16.70 18.53 18.75 18.99 21.20 37.60
H1 2007 5.11 17.90 21.00 20.19 20.21 22.50 36.00Return on risk-weighted assets (%)
2004 0.20 0.92 1.11 1.13 1.17 1.49 2.032005 0.81 1.06 1.38 1.40 1.43 1.73 2.262006 0.77 1.11 1.42 1.48 1.51 1.84 2.66
H1 2007 0.81 1.51 1.84 1.86 1.87 2.20 3.22Net interest income (% total assets)
2004 0.43 0.71 0.90 1.04 0.93 1.30 1.872005 0.48 0.58 0.68 0.93 0.89 1.28 1.842006 0.24 0.55 0.69 0.95 0.87 1.28 2.03
H1 2007 0.22 0.54 0.74 0.91 0.80 1.25 1.98Net interest income (% total income)
2004 24.07 36.70 51.43 48.63 47.66 56.51 69.542005 25.53 29.59 46.95 44.57 45.39 58.69 68.702006 14.07 38.14 48.71 45.80 43.48 53.92 70.24
H1 2007 10.02 40.00 47.39 43.75 40.55 52.27 64.61Trading income (% total income)
2004 2.69 7.58 9.41 11.74 12.91 15.66 28.732005 2.58 6.88 10.37 13.32 14.47 16.43 37.142006 2.45 6.35 12.95 14.80 16.97 19.09 46.83
H1 2007 7.20 13.70 19.49 21.28 23.63 21.38 53.67 Fees and commissions (% total income)
2004 15.90 20.84 29.45 29.32 28.97 36.12 44.152005 17.12 22.30 29.45 28.07 28.11 34.79 40.022006 18.20 23.36 27.61 28.87 29.50 31.18 43.03
H1 2007 11.31 24.97 29.18 28.38 28.69 33.59 35.98Other income (% total income)
2004 -3.07 2.79 4.93 6.87 6.22 7.53 26.702005 -0.76 2.82 4.71 5.71 6.24 2.82 16.732006 -0.15 1.42 5.26 6.53 6.64 11.00 21.54
H1 2007 0.76 2.04 3.51 4.47 4.73 5.64 13.21Net loan impairment charges (% total assets)
2004 0.03 0.06 0.07 0.11 0.09 0.09 0.402005 -0.02 0.02 0.05 0.08 0.08 0.11 0.292006 0.01 0.03 0.05 0.11 0.10 0.18 0.36
H1 2007 0.00 0.02 0.06 0.09 0.09 0.11 0.37Cost-to-income ratio (%)
2004 48.60 62.05 68.05 66.63 68.49 70.90 85.30 2005 43.20 58.70 63.65 63.37 63.76 66.95 89.402006 39.60 54.70 61.10 60.51 61.69 68.00 79.80
H1 2007 38.70 50.20 58.80 58.40 59.67 63.20 77.70Tier 1 ratio (%)
2004 6.32 7.10 7.80 8.02 7.88 8.38 10.902005 6.70 7.58 8.15 8.45 8.25 8.95 11.602006 6.70 7.42 7.80 8.33 8.16 8.90 10.50
H1 2007 6.09 7.55 7.90 8.21 8.00 8.40 10.80Overall solvency ratio (%)
2004 8.46 10.43 11.35 11.4 11.04 12.69 13.302005 8.50 10.80 11.55 11.7 11.42 12.47 16.302006 10.00 10.60 11.10 11.4 11.36 11.74 15.60
H1 2007 10.20 11.01 10.70 11.2 11.13 11.70 15.10
Sources: Individual institutions’ fi nancial reports and ECB calculations.Note: Based on fi gures for 17 IFRS reporting large and complex banking groups in the euro area.
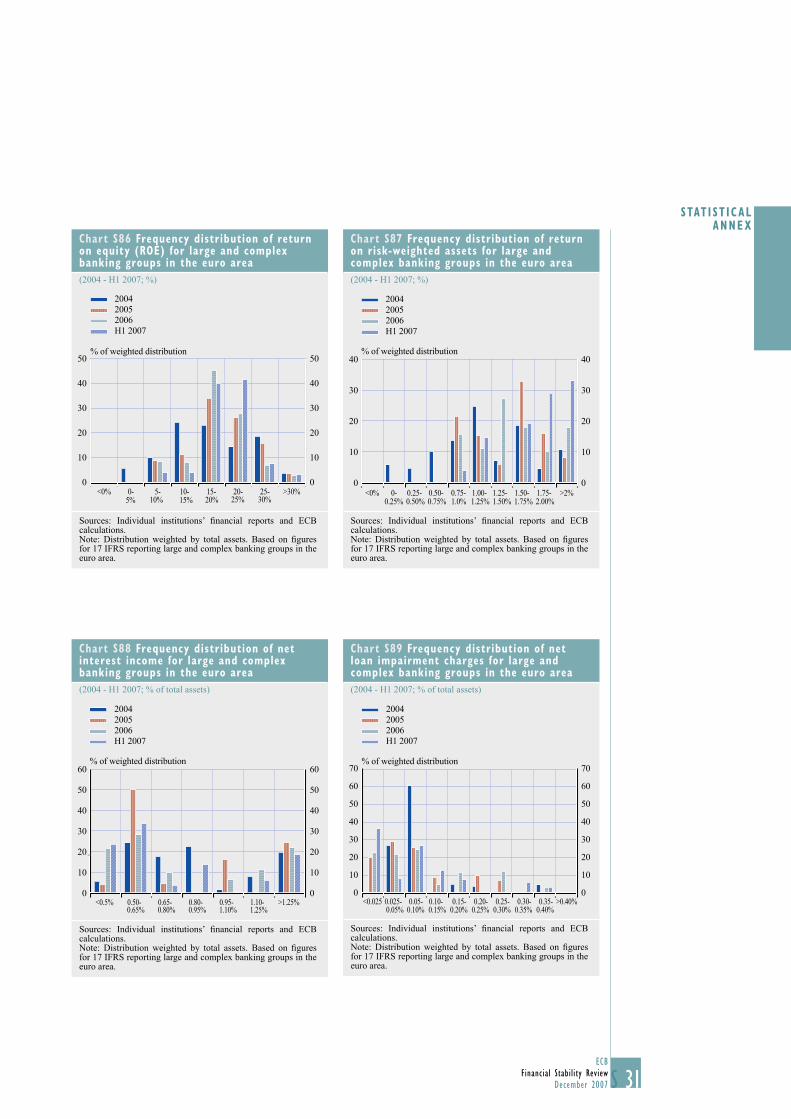
31ECB
Financial Stability ReviewDecember 2007 S
STAT I ST ICAL ANNEX
Chart S86 Frequency distribution of return on equity (ROE) for large and complex banking groups in the euro area
(2004 - H1 2007; %)
0
10
20
30
40
50
0
10
20
30
40
50
<0% 0- 5- 10- 15- 20- 25- >30%
2004
% of weighted distribution
20052006H1 2007
5% 10% 15% 20% 25% 30%
Sources: Individual institutions’ fi nancial reports and ECB calculations.Note: Distribution weighted by total assets. Based on fi gures for 17 IFRS reporting large and complex banking groups in the euro area.
Chart S87 Frequency distribution of return on risk-weighted assets for large and complex banking groups in the euro area
(2004 - H1 2007; %)
0
10
20
30
40
0
10
20
30
40
0-0.25%
0.25-0.50%
0.50-0.75%
0.75-1.0%
1.00-1.25%
1.25-1.50%
1.50-1.75%
1.75-2.00%
>2%
% of weighted distribution
200420052006H1 2007
<0%
Sources: Individual institutions’ fi nancial reports and ECB calculations.Note: Distribution weighted by total assets. Based on fi gures for 17 IFRS reporting large and complex banking groups in the euro area.
Chart S88 Frequency distribution of net interest income for large and complex banking groups in the euro area
(2004 - H1 2007; % of total assets)
0
10
20
30
40
50
60
0
10
20
30
40
50
60
>1.25%
% of weighted distribution
200420052006H1 2007
<0.5% 0.50-0.65%
0.65-0.80%
0.80-0.95%
0.95-1.10%
1.10-1.25%
Sources: Individual institutions’ fi nancial reports and ECB calculations.Note: Distribution weighted by total assets. Based on fi gures for 17 IFRS reporting large and complex banking groups in the euro area.
Chart S89 Frequency distribution of net loan impairment charges for large and complex banking groups in the euro area
(2004 - H1 2007; % of total assets)
0
10
20
30
40
50
60
70
0
10
20
30
40
50
60
70
<0.025 0.025-0.05%
0.05-0.10%
0.10-0.15%
0.15-0.20%
0.20-0.25%
0.25-0.30%
0.30-0.35%
0.35-0.40%
>0.40%
% of weighted distribution
200420052006H1 2007
Sources: Individual institutions’ fi nancial reports and ECB calculations.Note: Distribution weighted by total assets. Based on fi gures for 17 IFRS reporting large and complex banking groups in the euro area.
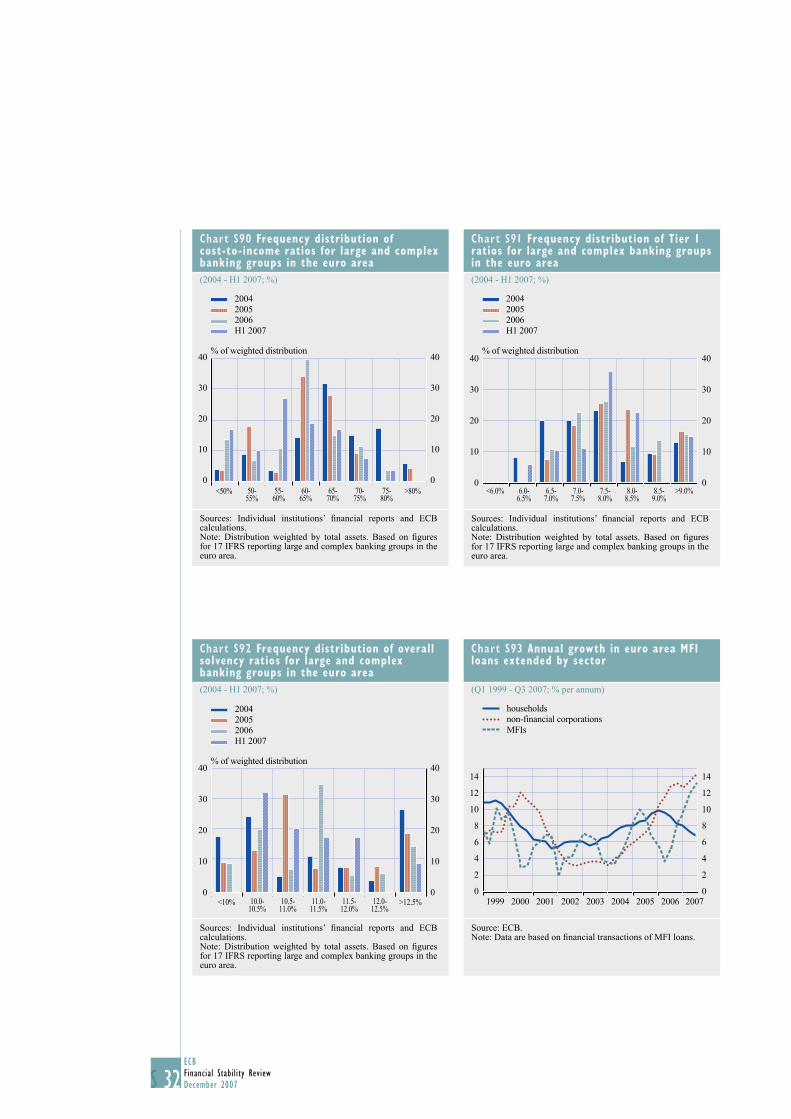
32ECBFinancial Stability ReviewDecember 2007S
Chart S90 Frequency distribution of cost-to-income ratios for large and complex banking groups in the euro area
(2004 - H1 2007; %)
% of weighted distribution
0
10
20
30
40
0
10
20
30
40
<50% >80%
200420052006H1 2007
50-55%
55-60%
60-65%
65-70%
70-75%
75-80%
Sources: Individual institutions’ fi nancial reports and ECB calculations.Note: Distribution weighted by total assets. Based on fi gures for 17 IFRS reporting large and complex banking groups in the euro area.
Chart S91 Frequency distribution of Tier 1 ratios for large and complex banking groups in the euro area
(2004 - H1 2007; %)
6.0-6.5%
6.5-7.0%
7.0-7.5%
7.5-8.0%
8.0-8.5%
8.5-9.0%
0
10
20
30
40
0
10
20
30
40% of weighted distribution
>9.0%<6.0%
200420052006H1 2007
Sources: Individual institutions’ fi nancial reports and ECB calculations.Note: Distribution weighted by total assets. Based on fi gures for 17 IFRS reporting large and complex banking groups in the euro area.
Chart S92 Frequency distribution of overall solvency ratios for large and complex banking groups in the euro area
(2004 - H1 2007; %)
% of weighted distribution
200420052006H1 2007
0
10
20
30
40
0
10
20
30
40
<10% >12.5%11.0-11.5%
11.5-12.0%
12.0-12.5%
10.0-10.5%
10.5-11.0%
Sources: Individual institutions’ fi nancial reports and ECB calculations.Note: Distribution weighted by total assets. Based on fi gures for 17 IFRS reporting large and complex banking groups in the euro area.
Chart S93 Annual growth in euro area MFI loans extended by sector
(Q1 1999 - Q3 2007; % per annum)
14
12
10
8
6
4
2
0
14
12
10
8
6
4
2
0
households
MFIsnon-financial corporations
1999 2000 2001 2002 2003 2004 2005 2006 2007
Source: ECB.Note: Data are based on fi nancial transactions of MFI loans.
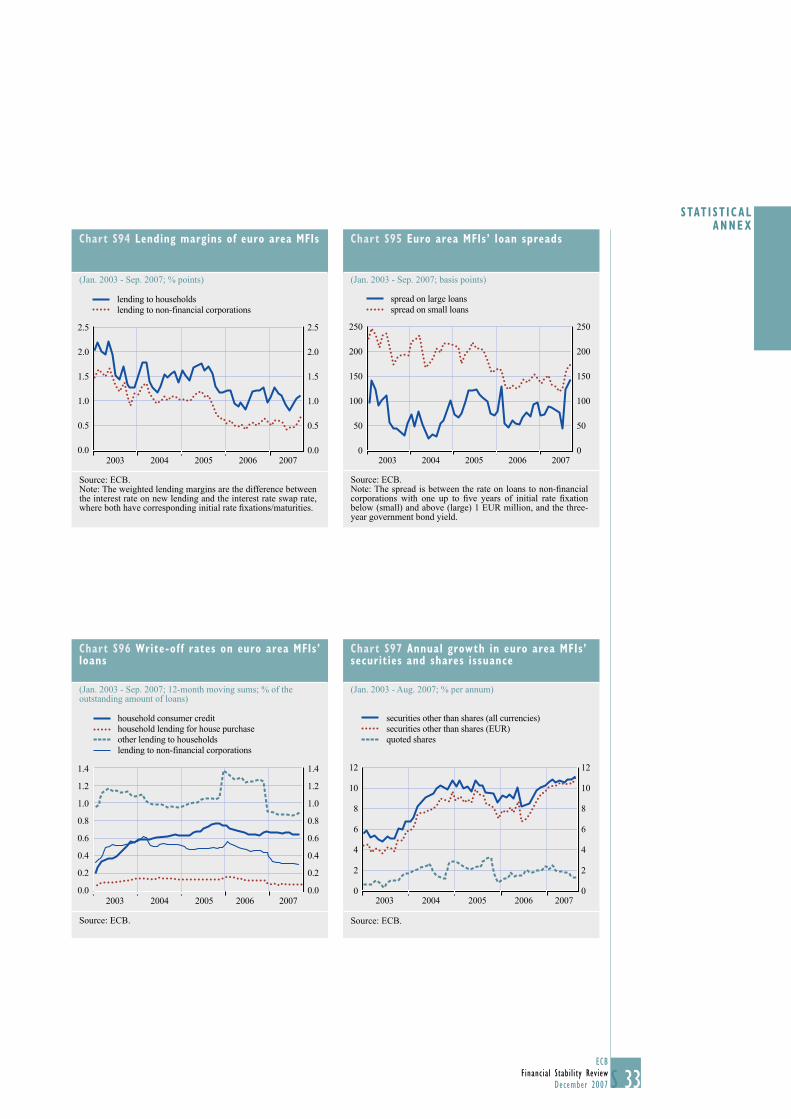
33ECB
Financial Stability ReviewDecember 2007 S
STAT I ST ICAL ANNEX
Chart S94 Lending margins of euro area MFIs
(Jan. 2003 - Sep. 2007; % points)
lending to householdslending to non-financial corporations
2003 2004 2005 2006 2007
2.5
2.0
1.5
1.0
0.5
0.0
2.5
2.0
1.5
1.0
0.5
0.0
Source: ECB.Note: The weighted lending margins are the difference between the interest rate on new lending and the interest rate swap rate, where both have corresponding initial rate fi xations/maturities.
Chart S95 Euro area MFIs’ loan spreads
(Jan. 2003 - Sep. 2007; basis points)
spread on large loansspread on small loans
2003 2004 2005 2006 2007
250
200
150
100
50
0
250
200
150
100
50
0
Source: ECB.Note: The spread is between the rate on loans to non-fi nancial corporations with one up to fi ve years of initial rate fi xation below (small) and above (large) 1 EUR million, and the three-year government bond yield.
Chart S96 Write-of f rates on euro area MFIs’ loans
(Jan. 2003 - Sep. 2007; 12-month moving sums; % of the outstanding amount of loans)
household consumer credithousehold lending for house purchaseother lending to householdslending to non-financial corporations
1.4
1.2
1.0
0.8
0.6
0.4
0.2
0.0
1.4
1.2
1.0
0.8
0.6
0.4
0.2
0.02003 2004 2005 2006 2007
Source: ECB.
Chart S97 Annual growth in euro area MFIs’ securities and shares issuance
(Jan. 2003 - Aug. 2007; % per annum)
securities other than shares (all currencies)securities other than shares (EUR)quoted shares
12
10
8
6
4
2
0
12
10
8
6
4
2
02003 2004 2005 2006 2007
Source: ECB.
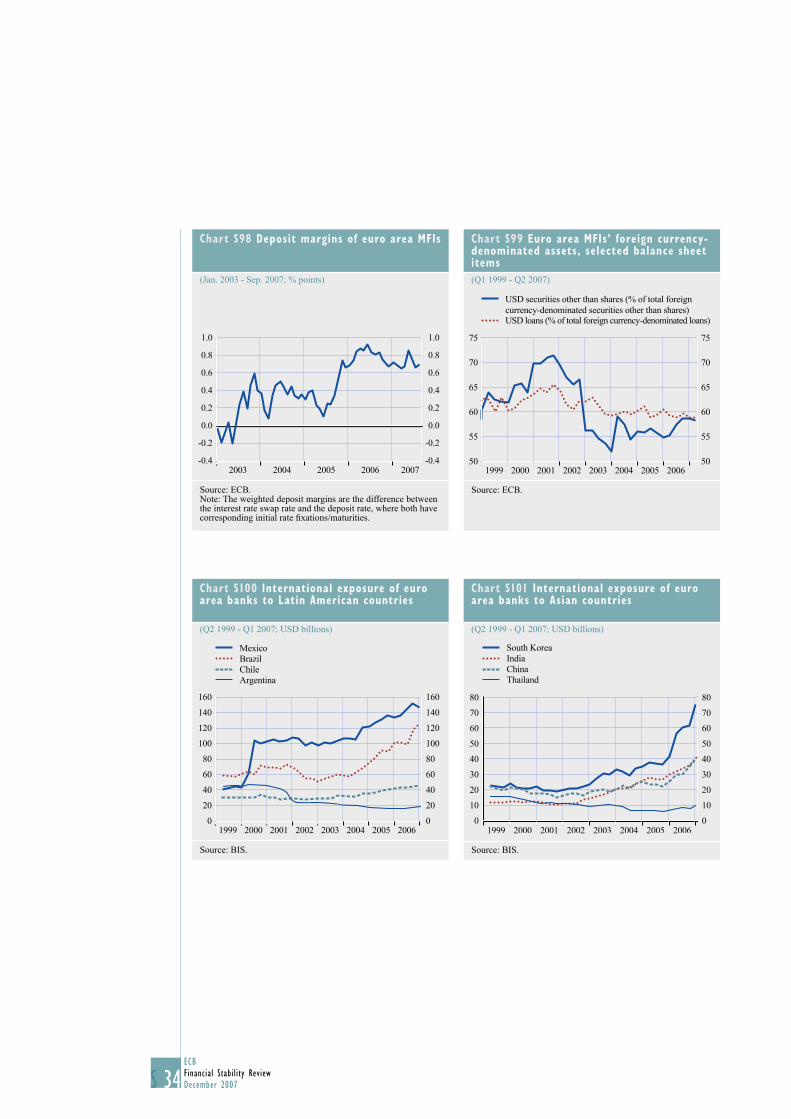
34ECBFinancial Stability ReviewDecember 2007S
Chart S98 Deposit margins of euro area MFIs
(Jan. 2003 - Sep. 2007; % points)
-0.2
0.0
0.2
0.4
0.6
0.8
1.0
-0.4 -0.4
-0.2
0.0
0.2
0.4
0.6
0.8
1.0
2003 2004 2005 2006 2007
Source: ECB.Note: The weighted deposit margins are the difference between the interest rate swap rate and the deposit rate, where both have corresponding initial rate fi xations/maturities.
Chart S99 Euro area MFIs’ foreign currency-denominated assets, selected balance sheet items
(Q1 1999 - Q2 2007)
50
55
60
65
70
75
50
55
60
65
70
75
1999 2002 20042003 2005 200620012000
USD securities other than shares (% of total foreigncurrency-denominated securities other than shares)USD loans (% of total foreign currency-denominated loans)
Source: ECB.
Chart S100 International exposure of euro area banks to Latin American countries
(Q2 1999 - Q1 2007; USD billions)
0
20
40
60
80
100
120
140
160
0
20
40
60
80
100
120
140
160
1999 2000 2001 2002 2003 2004 2005 2006
MexicoBrazil ChileArgentina
Source: BIS.
Chart S101 International exposure of euro area banks to Asian countries
(Q2 1999 - Q1 2007; USD billions)
0
10
20
30
40
50
60
70
80
0
10
20
30
40
50
60
70
80
1999 2000 2001 2002 2003 2004 2005 2006
South KoreaIndiaChinaThailand
Source: BIS.
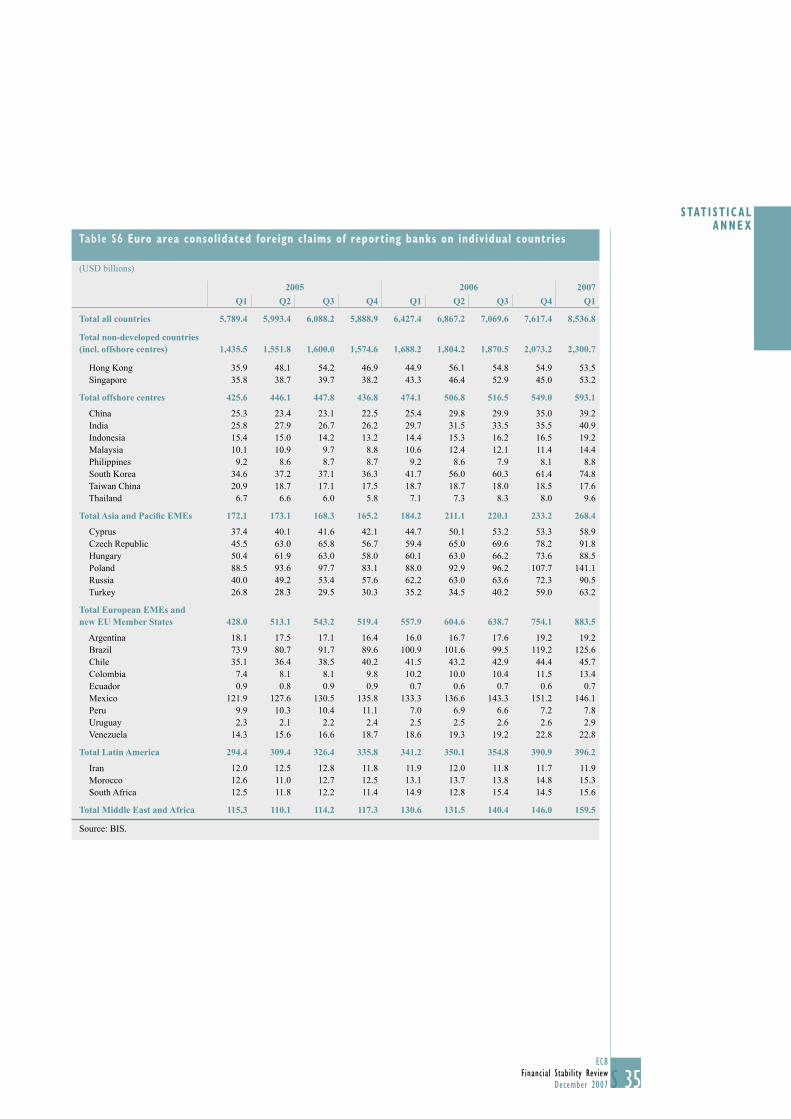
35ECB
Financial Stability ReviewDecember 2007 S
STAT I ST ICAL ANNEX
Table S6 Euro area consolidated foreign claims of reporting banks on individual countries
(USD billions)
2005 2006 2007
Q1 Q2 Q3 Q4 Q1 Q2 Q3 Q4 Q1
Total all countries 5,789.4 5,993.4 6,088.2 5,888.9 6,427.4 6,867.2 7,069.6 7,617.4 8,536.8
Total non-developed countries (incl. offshore centres) 1,435.5 1,551.8 1,600.0 1,574.6 1,688.2 1,804.2 1,870.5 2,073.2 2,300.7
Hong Kong 35.9 48.1 54.2 46.9 44.9 56.1 54.8 54.9 53.5 Singapore 35.8 38.7 39.7 38.2 43.3 46.4 52.9 45.0 53.2
Total offshore centres 425.6 446.1 447.8 436.8 474.1 506.8 516.5 549.0 593.1
China 25.3 23.4 23.1 22.5 25.4 29.8 29.9 35.0 39.2 India 25.8 27.9 26.7 26.2 29.7 31.5 33.5 35.5 40.9 Indonesia 15.4 15.0 14.2 13.2 14.4 15.3 16.2 16.5 19.2 Malaysia 10.1 10.9 9.7 8.8 10.6 12.4 12.1 11.4 14.4 Philippines 9.2 8.6 8.7 8.7 9.2 8.6 7.9 8.1 8.8 South Korea 34.6 37.2 37.1 36.3 41.7 56.0 60.3 61.4 74.8 Taiwan China 20.9 18.7 17.1 17.5 18.7 18.7 18.0 18.5 17.6 Thailand 6.7 6.6 6.0 5.8 7.1 7.3 8.3 8.0 9.6
Total Asia and Pacifi c EMEs 172.1 173.1 168.3 165.2 184.2 211.1 220.1 233.2 268.4
Cyprus 37.4 40.1 41.6 42.1 44.7 50.1 53.2 53.3 58.9 Czech Republic 45.5 63.0 65.8 56.7 59.4 65.0 69.6 78.2 91.8 Hungary 50.4 61.9 63.0 58.0 60.1 63.0 66.2 73.6 88.5 Poland 88.5 93.6 97.7 83.1 88.0 92.9 96.2 107.7 141.1 Russia 40.0 49.2 53.4 57.6 62.2 63.0 63.6 72.3 90.5 Turkey 26.8 28.3 29.5 30.3 35.2 34.5 40.2 59.0 63.2
Total European EMEs and new EU Member States 428.0 513.1 543.2 519.4 557.9 604.6 638.7 754.1 883.5
Argentina 18.1 17.5 17.1 16.4 16.0 16.7 17.6 19.2 19.2 Brazil 73.9 80.7 91.7 89.6 100.9 101.6 99.5 119.2 125.6 Chile 35.1 36.4 38.5 40.2 41.5 43.2 42.9 44.4 45.7 Colombia 7.4 8.1 8.1 9.8 10.2 10.0 10.4 11.5 13.4 Ecuador 0.9 0.8 0.9 0.9 0.7 0.6 0.7 0.6 0.7 Mexico 121.9 127.6 130.5 135.8 133.3 136.6 143.3 151.2 146.1 Peru 9.9 10.3 10.4 11.1 7.0 6.9 6.6 7.2 7.8 Uruguay 2.3 2.1 2.2 2.4 2.5 2.5 2.6 2.6 2.9 Venezuela 14.3 15.6 16.6 18.7 18.6 19.3 19.2 22.8 22.8
Total Latin America 294.4 309.4 326.4 335.8 341.2 350.1 354.8 390.9 396.2
Iran 12.0 12.5 12.8 11.8 11.9 12.0 11.8 11.7 11.9 Morocco 12.6 11.0 12.7 12.5 13.1 13.7 13.8 14.8 15.3 South Africa 12.5 11.8 12.2 11.4 14.9 12.8 15.4 14.5 15.6
Total Middle East and Africa 115.3 110.1 114.2 117.3 130.6 131.5 140.4 146.0 159.5
Source: BIS.
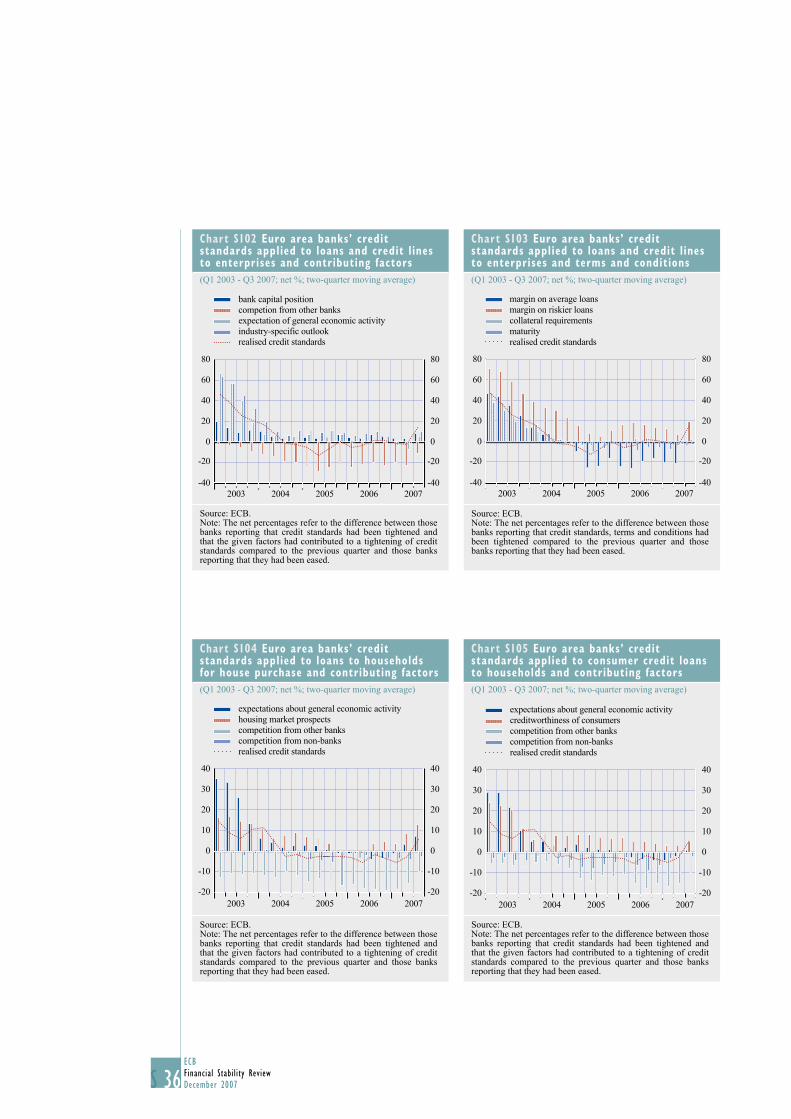
36ECBFinancial Stability ReviewDecember 2007S
Chart S102 Euro area banks’ credit standards applied to loans and credit lines to enterprises and contributing factors
(Q1 2003 - Q3 2007; net %; two-quarter moving average)
-40
-20
0
20
40
60
80
-40
-20
0
20
40
60
80
2003 2004 2005 2006 2007
bank capital positioncompetion from other banksexpectation of general economic activityindustry-specific outlookrealised credit standards
Source: ECB.Note: The net percentages refer to the difference between those banks reporting that credit standards had been tightened and that the given factors had contributed to a tightening of credit standards compared to the previous quarter and those banks reporting that they had been eased.
Chart S103 Euro area banks’ credit standards applied to loans and credit lines to enterprises and terms and conditions
(Q1 2003 - Q3 2007; net %; two-quarter moving average)
-40
-20
0
20
40
60
80
-40
-20
0
20
40
60
80
2003 2004 2005 2006 2007
margin on average loansmargin on riskier loanscollateral requirementsmaturityrealised credit standards
Source: ECB.Note: The net percentages refer to the difference between those banks reporting that credit standards, terms and conditions had been tightened compared to the previous quarter and those banks reporting that they had been eased.
Chart S104 Euro area banks’ credit standards applied to loans to households for house purchase and contributing factors
(Q1 2003 - Q3 2007; net %; two-quarter moving average)
-20
-10
0
10
20
30
40
-20
-10
0
10
20
30
40
2003 2004 2005 2006 2007
expectations about general economic activityhousing market prospectscompetition from other bankscompetition from non-banks realised credit standards
Source: ECB.Note: The net percentages refer to the difference between those banks reporting that credit standards had been tightened and that the given factors had contributed to a tightening of credit standards compared to the previous quarter and those banks reporting that they had been eased.
Chart S105 Euro area banks’ credit standards applied to consumer credit loans to households and contributing factors
(Q1 2003 - Q3 2007; net %; two-quarter moving average)
-20
-10
0
10
20
30
40
-20
-10
0
10
20
30
40
2003 2004 2005 2006 2007
expectations about general economic activitycreditworthiness of consumerscompetition from other bankscompetition from non-banks realised credit standards
Source: ECB.Note: The net percentages refer to the difference between those banks reporting that credit standards had been tightened and that the given factors had contributed to a tightening of credit standards compared to the previous quarter and those banks reporting that they had been eased.
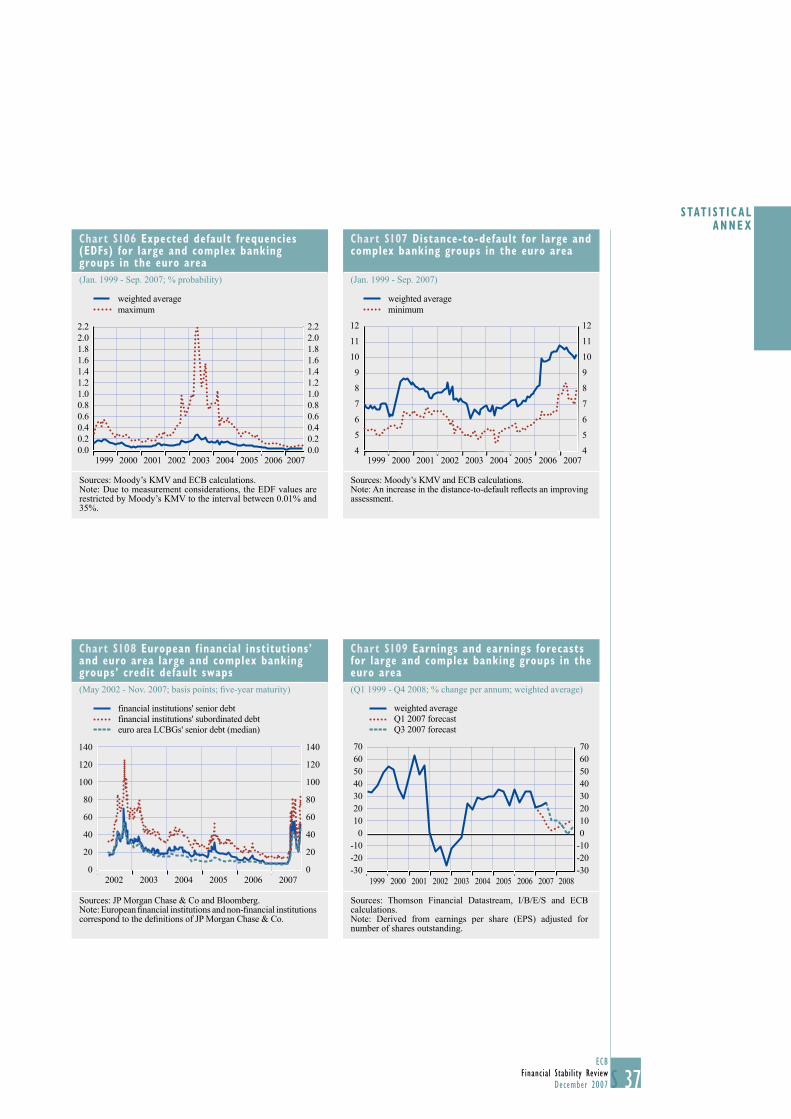
37ECB
Financial Stability ReviewDecember 2007 S
STAT I ST ICAL ANNEX
Chart S106 Expected default frequencies (EDFs) for large and complex banking groups in the euro area
(Jan. 1999 - Sep. 2007; % probability)
0.00.20.40.60.81.01.21.41.61.82.02.2
0.00.20.40.60.81.01.21.41.61.82.02.2
1999 2000 2001 2002 2003 2004 2005 2006 2007
weighted averagemaximum
Sources: Moody’s KMV and ECB calculations.Note: Due to measurement considerations, the EDF values are restricted by Moody’s KMV to the interval between 0.01% and 35%.
Chart S107 Distance-to-default for large and complex banking groups in the euro area
(Jan. 1999 - Sep. 2007)
4
5
6
7
8
9
10
11
12
4
5
6
7
8
9
10
11
12
1999 2000 2001 2002 2003 2004 2005 2006 2007
weighted averageminimum
Sources: Moody’s KMV and ECB calculations.Note: An increase in the distance-to-default refl ects an improving assessment.
Chart S108 European f inancial institutions’ and euro area large and complex banking groups’ credit default swaps
(May 2002 - Nov. 2007; basis points; fi ve-year maturity)
financial institutions' senior debtfinancial institutions' subordinated debteuro area LCBGs' senior debt (median)
0
20
40
60
80
100
120
140
0
20
40
60
80
100
120
140
2002 2003 2004 2005 2006 2007
Sources: JP Morgan Chase & Co and Bloomberg.Note: European fi nancial institutions and non-fi nancial institutions correspond to the defi nitions of JP Morgan Chase & Co.
Chart S109 Earnings and earnings forecasts for large and complex banking groups in the euro area
(Q1 1999 - Q4 2008; % change per annum; weighted average)
706050403020100
-10-20-30
706050403020100
-10-20-30
weighted average
Q3 2007 forecastQ1 2007 forecast
1999 2000 2001 2002 2003 2004 2005 2006 2007 2008
Sources: Thomson Financial Datastream, I/B/E/S and ECB calculations.Note: Derived from earnings per share (EPS) adjusted for number of shares outstanding.
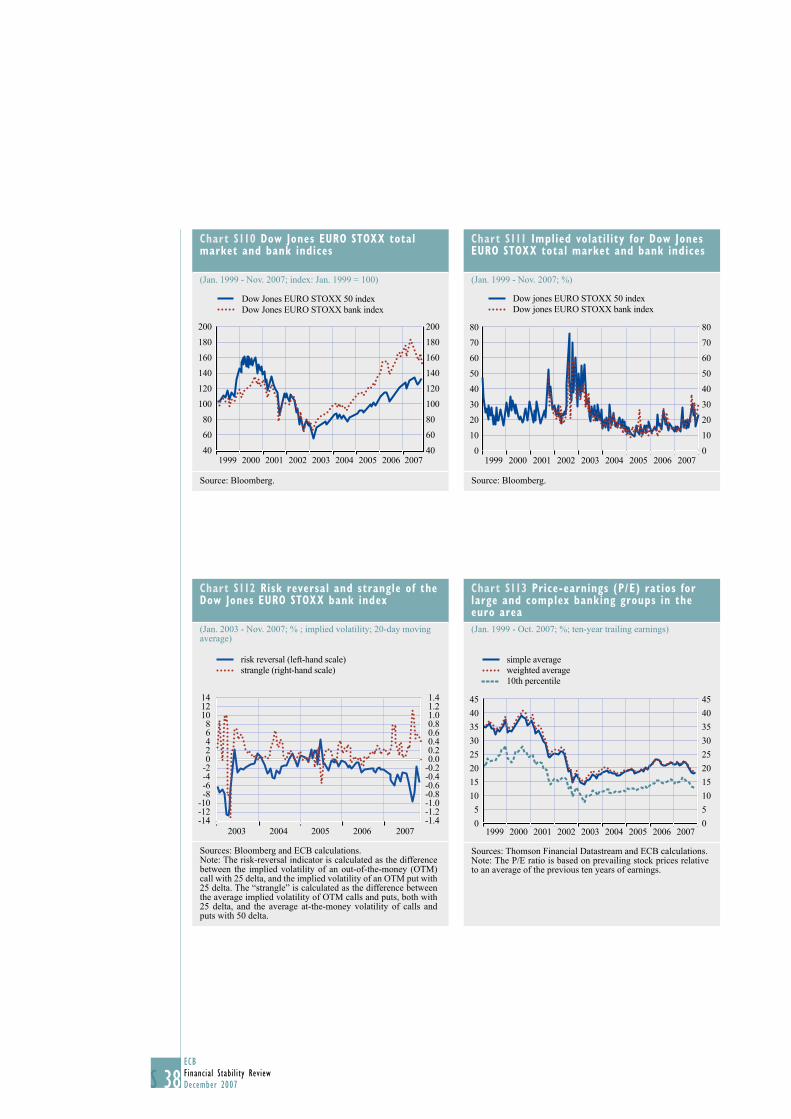
38ECBFinancial Stability ReviewDecember 2007S
Chart S110 Dow Jones EURO STOXX total market and bank indices
(Jan. 1999 - Nov. 2007; index: Jan. 1999 = 100)
200
180
160
140
120
100
80
60
40
200
180
160
140
120
100
80
60
401999 2000 2001 2002 2003 2004 2005 2006 2007
Dow Jones EURO STOXX 50 indexDow Jones EURO STOXX bank index
Source: Bloomberg.
Chart S111 Implied volatility for Dow Jones EURO STOXX total market and bank indices
(Jan. 1999 - Nov. 2007; %)
80
70
60
50
40
30
20
10
0
80
70
60
50
40
30
20
10
01999 2000 2001 2002 2003 2004 2005 2006 2007
Dow jones EURO STOXX 50 indexDow jones EURO STOXX bank index
Source: Bloomberg.
Chart S112 Risk reversal and strangle of the Dow Jones EURO STOXX bank index
(Jan. 2003 - Nov. 2007; % ; implied volatility; 20-day moving average)
0.0-0.2-0.4-0.6-0.8-1.0-1.2-1.4
0.20.40.60.81.01.21.4
0-2-4-6-8
-10-12-14
2468
101214
risk reversal (left-hand scale)strangle (right-hand scale)
2003 2004 2005 2006 2007
Sources: Bloomberg and ECB calculations.Note: The risk-reversal indicator is calculated as the difference between the implied volatility of an out-of-the-money (OTM) call with 25 delta, and the implied volatility of an OTM put with 25 delta. The “strangle” is calculated as the difference between the average implied volatility of OTM calls and puts, both with 25 delta, and the average at-the-money volatility of calls and puts with 50 delta.
Chart S113 Price-earnings (P/E) ratios for large and complex banking groups in the euro area
(Jan. 1999 - Oct. 2007; %; ten-year trailing earnings)
45
40
35
30
25
20
15
10
5
0
45
40
35
30
25
20
15
10
5
01999 2000 2001 2002 2003 2004 2005 2006 2007
simple averageweighted average10th percentile
Sources: Thomson Financial Datastream and ECB calculations.Note: The P/E ratio is based on prevailing stock prices relative to an average of the previous ten years of earnings.
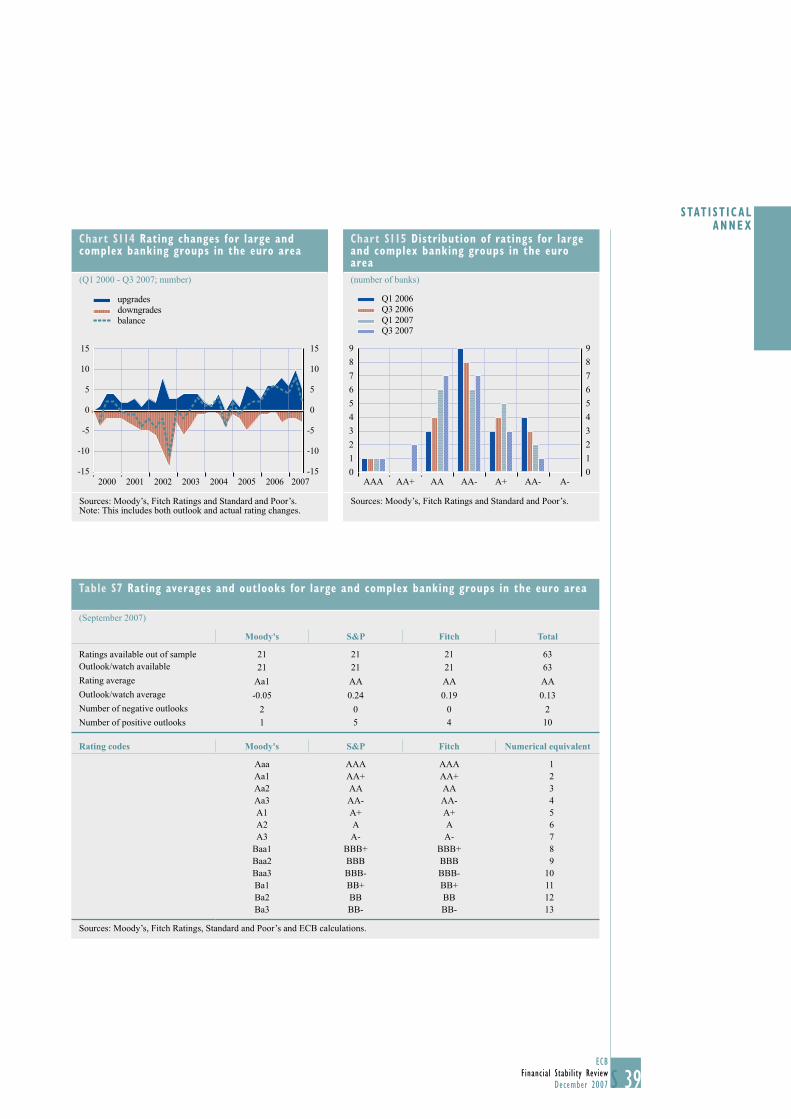
39ECB
Financial Stability ReviewDecember 2007 S
STAT I ST ICAL ANNEX
Chart S114 Rating changes for large and complex banking groups in the euro area
(Q1 2000 - Q3 2007; number)
-15
-10
-5
0
5
10
15
-15
-10
-5
0
5
10
15
upgradesdowngradesbalance
2000 2001 2002 2003 2004 2005 2006 2007
Sources: Moody’s, Fitch Ratings and Standard and Poor’s.Note: This includes both outlook and actual rating changes.
Chart S115 Distribution of ratings for large and complex banking groups in the euro area
(number of banks)
0
1
2
3
4
5
6
7
8
9
0
1
2
3
4
5
6
7
8
9
AA-
Q1 2006Q3 2006Q1 2007Q3 2007
AAA AA+ AA AA- A+ A-
Sources: Moody’s, Fitch Ratings and Standard and Poor’s.
Table S7 Rating averages and outlooks for large and complex banking groups in the euro area
(September 2007)
Moody's S&P Fitch Total
Ratings available out of sample 21 21 21 63Outlook/watch available 21 21 21 63Rating average Aa1 AA AA AAOutlook/watch average -0.05 0.24 0.19 0.13Number of negative outlooks 2 0 0 2Number of positive outlooks 1 5 4 10
Rating codes Moody's S&P Fitch Numerical equivalent
Aaa AAA AAA 1Aa1 AA+ AA+ 2Aa2 AA AA 3Aa3 AA- AA- 4A1 A+ A+ 5A2 A A 6A3 A- A- 7
Baa1 BBB+ BBB+ 8Baa2 BBB BBB 9Baa3 BBB- BBB- 10Ba1 BB+ BB+ 11Ba2 BB BB 12Ba3 BB- BB- 13
Sources: Moody’s, Fitch Ratings, Standard and Poor’s and ECB calculations.
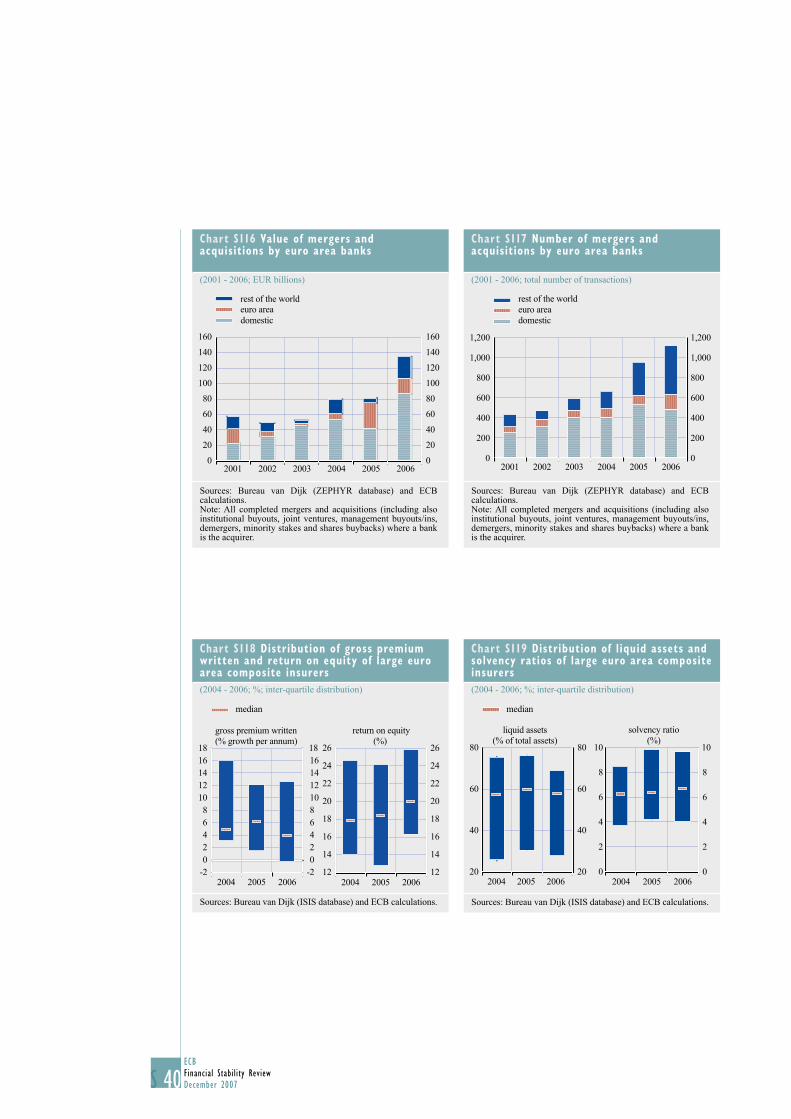
40ECBFinancial Stability ReviewDecember 2007S
Chart S116 Value of mergers and acquisitions by euro area banks
(2001 - 2006; EUR billions)
0
20
40
60
80
100
120
140
160
0
20
40
60
80
100
120
140
160
2001 2002 2003 2004 2005 2006
rest of the worldeuro areadomestic
Sources: Bureau van Dijk (ZEPHYR database) and ECB calculations.Note: All completed mergers and acquisitions (including also institutional buyouts, joint ventures, management buyouts/ins, demergers, minority stakes and shares buybacks) where a bank is the acquirer.
Chart S117 Number of mergers and acquisitions by euro area banks
(2001 - 2006; total number of transactions)
0
200
400
600
800
1,000
1,200
0
200
400
600
800
1,000
1,200
2001 2002 2003 2004 2005 2006
rest of the worldeuro areadomestic
Sources: Bureau van Dijk (ZEPHYR database) and ECB calculations.Note: All completed mergers and acquisitions (including also institutional buyouts, joint ventures, management buyouts/ins, demergers, minority stakes and shares buybacks) where a bank is the acquirer.
Chart S118 Distribution of gross premium written and return on equity of large euro area composite insurers
(2004 - 2006; %; inter-quartile distribution)
-202468
1012141618 18
-20246810121416
gross premium written(% growth per annum)
median
12
14
16
18
20
22
24
26
12
14
16
18
20
22
24
26
return on equity(%)
200620052004 200620052004
Sources: Bureau van Dijk (ISIS database) and ECB calculations.
Chart S119 Distribution of liquid assets and solvency ratios of large euro area composite insurers
(2004 - 2006; %; inter-quartile distribution)
20
40
60
80
20
40
60
80
200620052004
median
0
4
6
8
10
0
2 2
4
6
8
10
200620052004
liquid assets(% of total assets)
solvency ratio(%)
Sources: Bureau van Dijk (ISIS database) and ECB calculations.
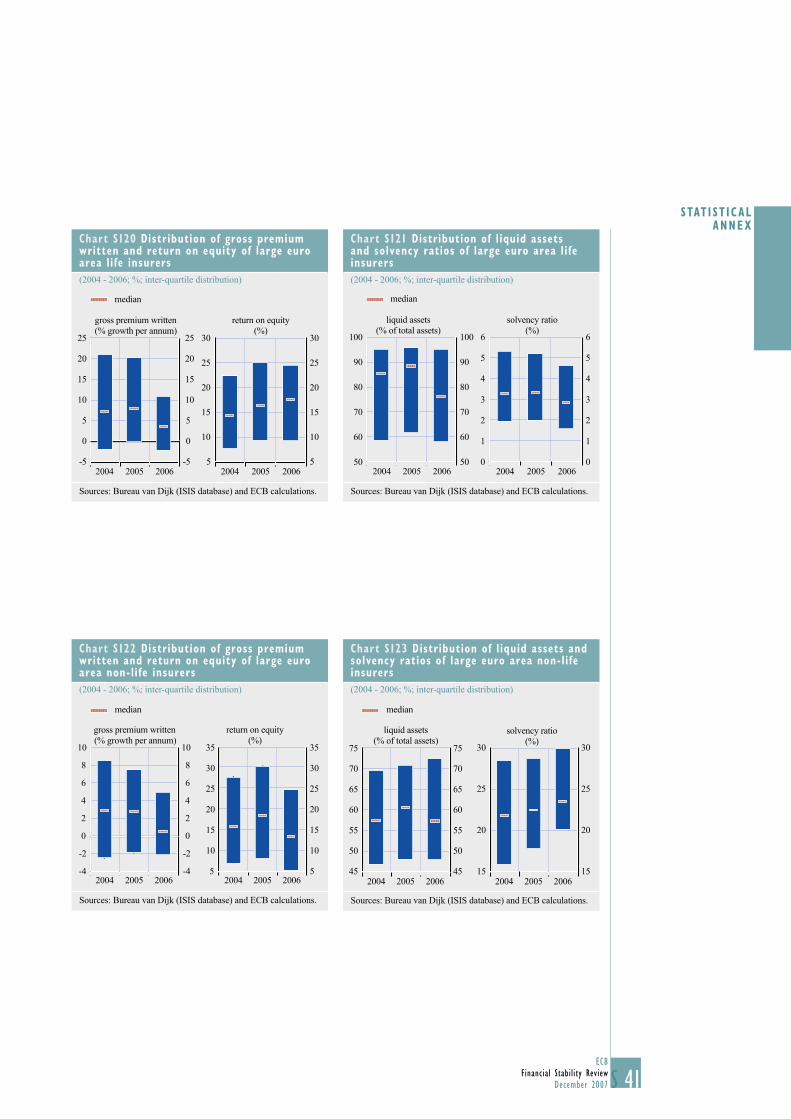
41ECB
Financial Stability ReviewDecember 2007 S
STAT I ST ICAL ANNEX
Chart S120 Distribution of gross premium written and return on equity of large euro area life insurers
(2004 - 2006; %; inter-quartile distribution)
25
20
15
10
5
30 30
25
20
15
10
5
25
20
15
10
5
0
-5
25
20
15
10
5
0
-52004 2005 2006 2004 2005 2006
median
gross premium written(% growth per annum)
return on equity(%)
Sources: Bureau van Dijk (ISIS database) and ECB calculations.
Chart S121 Distribution of liquid assets and solvency ratios of large euro area life insurers
(2004 - 2006; %; inter-quartile distribution)
2004 2005 2006
median
liquid assets(% of total assets)
solvency ratio(%)
100
90
80
70
60
50
100
90
80
70
60
50
6
5
4
3
2
1
0
6
5
4
3
2
1
02004 2005 2006
Sources: Bureau van Dijk (ISIS database) and ECB calculations.
Chart S122 Distribution of gross premium written and return on equity of large euro area non-life insurers
(2004 - 2006; %; inter-quartile distribution)
median
-4
-2
0
2
4
6
8
10
-4
-2
0
2
4
6
8
10
5
10
15
20
25
30
35
5
10
15
20
25
30
35
gross premium written(% growth per annum)
return on equity(%)
2004 2005 2006 2004 2005 2006
Sources: Bureau van Dijk (ISIS database) and ECB calculations.
Chart S123 Distribution of liquid assets and solvency ratios of large euro area non-life insurers
(2004 - 2006; %; inter-quartile distribution)
50
55
60
65
70
75
45 45
50
55
60
65
70
75
200620052004
liquid assets(% of total assets)
median
15
20
25
30
15
20
25
30
200620052004
solvency ratio(%)
Sources: Bureau van Dijk (ISIS database) and ECB calculations.
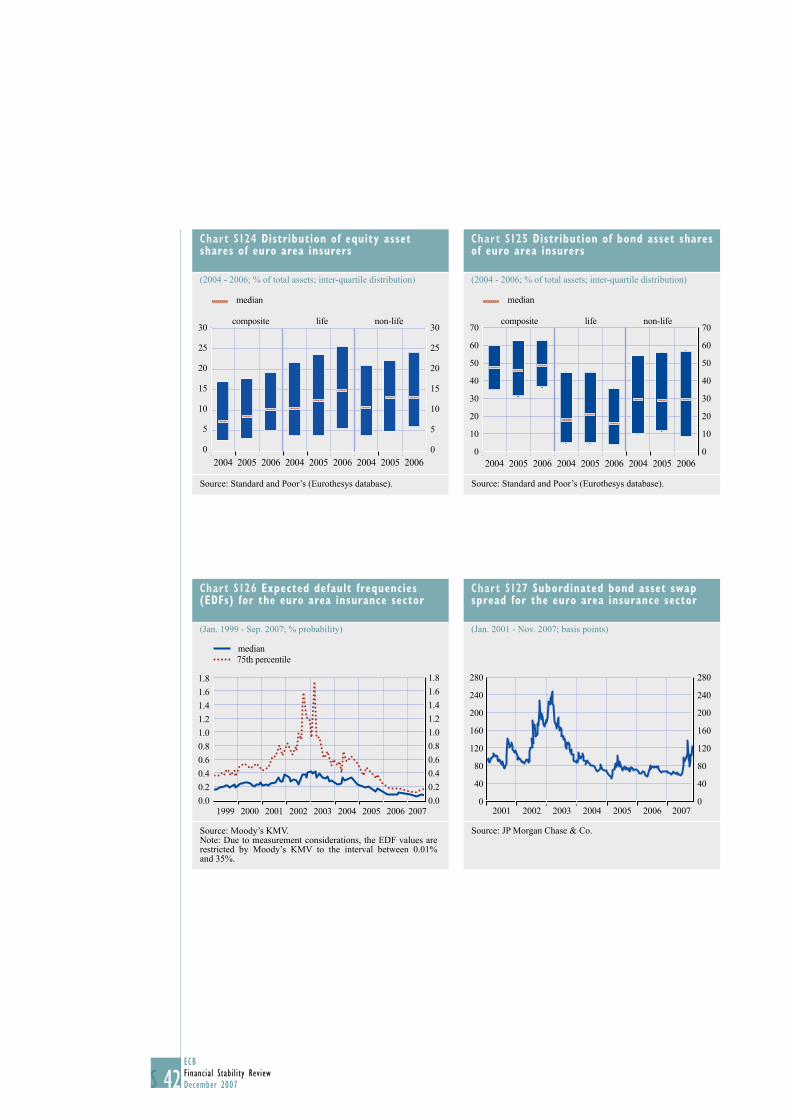
42ECBFinancial Stability ReviewDecember 2007S
Chart S124 Distribution of equity asset shares of euro area insurers
(2004 - 2006; % of total assets; inter-quartile distribution)
0
5
10
15
20
25
30
0
5
10
15
20
25
30
median
composite life non-life
2004 2005 2006 2004 2005 2006 2004 2005 2006
Source: Standard and Poor’s (Eurothesys database).
Chart S125 Distribution of bond asset shares of euro area insurers
(2004 - 2006; % of total assets; inter-quartile distribution)
0
10
20
30
40
50
60
70
0
10
20
30
40
50
60
70
median
2004 2005 2006 2004 2005 2006 2004 2005 2006
composite life non-life
Source: Standard and Poor’s (Eurothesys database).
Chart S126 Expected default frequencies (EDFs) for the euro area insurance sector
(Jan. 1999 - Sep. 2007; % probability)
0.0
0.2
0.4
0.6
0.8
1.0
1.2
1.4
1.6
1.8
0.0
0.2
0.4
0.6
0.8
1.0
1.2
1.4
1.6
1.8
1999 2000 2001 2002 2003 2004 2005 2006 2007
median75th percentile
Source: Moody’s KMV.Note: Due to measurement considerations, the EDF values are restricted by Moody’s KMV to the interval between 0.01%and 35%.
Chart S127 Subordinated bond asset swap spread for the euro area insurance sector
(Jan. 2001 - Nov. 2007; basis points)
0
40
80
120
160
200
240
280
0
40
80
120
160
200
240
280
2001 2002 2003 2004 2005 2006 2007
Source: JP Morgan Chase & Co.
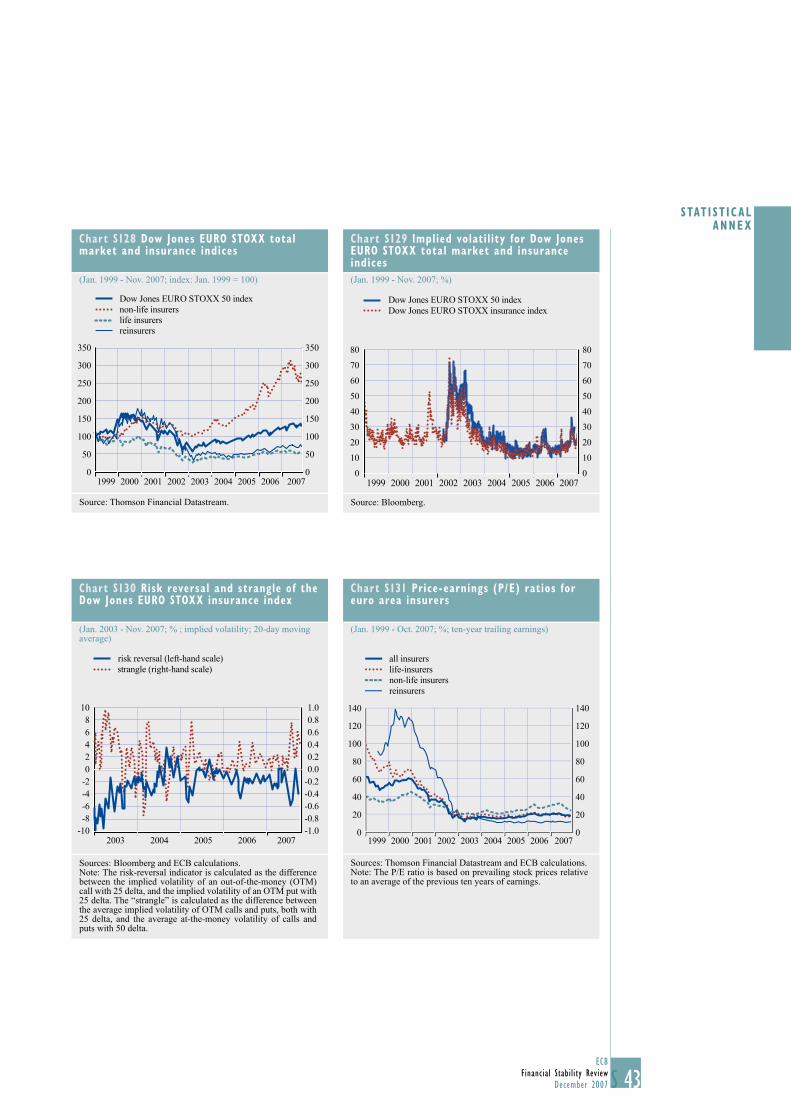
43ECB
Financial Stability ReviewDecember 2007 S
STAT I ST ICAL ANNEX
Chart S128 Dow Jones EURO STOXX total market and insurance indices
(Jan. 1999 - Nov. 2007; index: Jan. 1999 = 100)
0
50
100
150
200
250
300
350
0
50
100
150
200
250
300
350
Dow Jones EURO STOXX 50 indexnon-life insurerslife insurersreinsurers
1999 2000 2001 2002 2003 2004 2005 2006 2007
Source: Thomson Financial Datastream.
Chart S129 Implied volatility for Dow Jones EURO STOXX total market and insurance indices
(Jan. 1999 - Nov. 2007; %)
0
10
20
30
40
50
60
70
80
0
10
20
30
40
50
60
70
80
Dow Jones EURO STOXX 50 indexDow Jones EURO STOXX insurance index
1999 2000 2001 2002 2003 2004 2005 2006 2007
Source: Bloomberg.
Chart S130 Risk reversal and strangle of the Dow Jones EURO STOXX insurance index
(Jan. 2003 - Nov. 2007; % ; implied volatility; 20-day moving average)
-8-6-4-202468
10
-0.8-0.6-0.4-0.20.00.20.40.60.81.0
risk reversal (left-hand scale)strangle (right-hand scale)
-10 -1.02003 2004 2005 2006 2007
Sources: Bloomberg and ECB calculations.Note: The risk-reversal indicator is calculated as the difference between the implied volatility of an out-of-the-money (OTM) call with 25 delta, and the implied volatility of an OTM put with 25 delta. The “strangle” is calculated as the difference between the average implied volatility of OTM calls and puts, both with 25 delta, and the average at-the-money volatility of calls and puts with 50 delta.
Chart S131 Price-earnings (P/E) ratios for euro area insurers
(Jan. 1999 - Oct. 2007; %; ten-year trailing earnings)
0
20
40
60
80
100
120
140
0
20
40
60
80
100
140
120
200120001999 2002 2003 2004 2005 2006
all insurerslife-insurersnon-life insurersreinsurers
2007
Sources: Thomson Financial Datastream and ECB calculations.Note: The P/E ratio is based on prevailing stock prices relative to an average of the previous ten years of earnings.
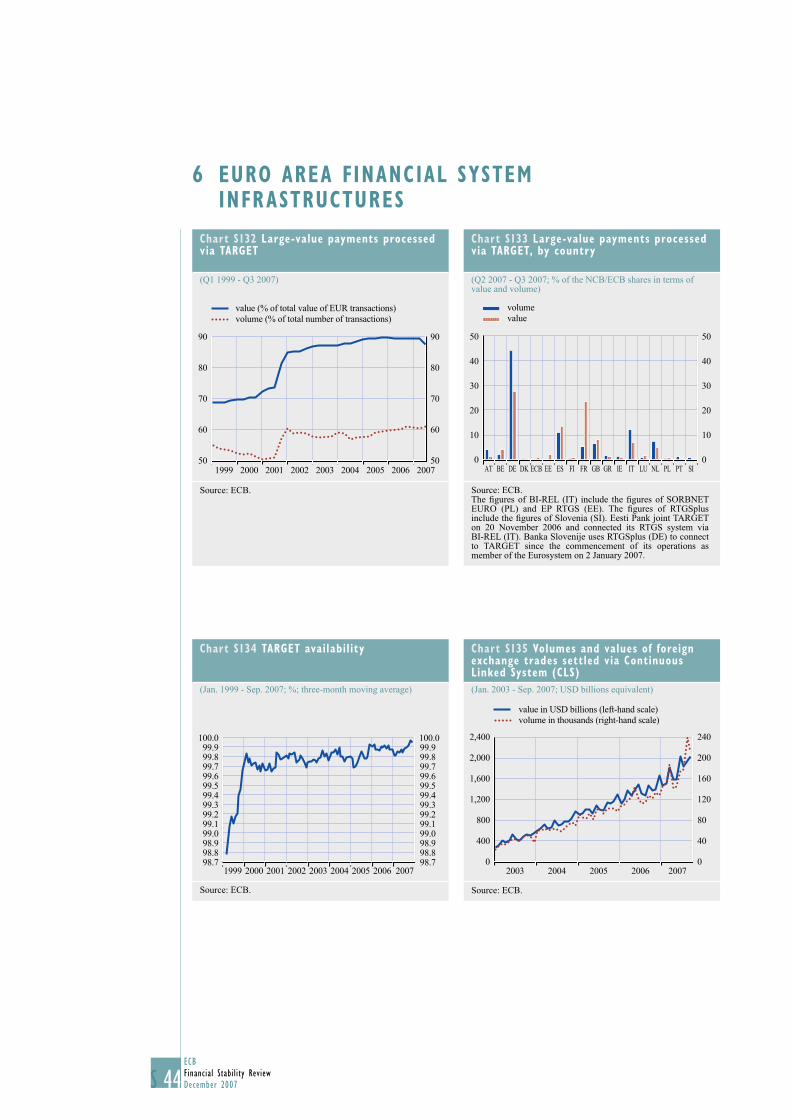
44ECBFinancial Stability ReviewDecember 2007S
6 EURO AREA FINANCIAL SYSTEM INFRASTRUCTURES
Chart S132 Large-value payments processed via TARGET
(Q1 1999 - Q3 2007)
50
60
70
80
90
60
70
80
90
value (% of total value of EUR transactions)volume (% of total number of transactions)
501999 2000 2001 2002 2003 2004 2005 2006 2007
Source: ECB.
Chart S133 Large-value payments processed via TARGET, by country
(Q2 2007 - Q3 2007; % of the NCB/ECB shares in terms of value and volume)
0
10
20
30
40
50
0
10
20
30
40
50
AT
volumevalue
SIPTPLNLLUITIEGRGBFRFIESEEECBDKDEBE
Source: ECB.The fi gures of BI-REL (IT) include the fi gures of SORBNET EURO (PL) and EP RTGS (EE). The fi gures of RTGSplus include the fi gures of Slovenia (SI). Eesti Pank joint TARGET on 20 November 2006 and connected its RTGS system via BI-REL (IT). Banka Slovenije uses RTGSplus (DE) to connect to TARGET since the commencement of its operations as member of the Eurosystem on 2 January 2007.
Chart S135 Volumes and values of foreign exchange trades settled via Continuous Linked System (CLS)
(Jan. 2003 - Sep. 2007; USD billions equivalent)
0
400
800
1,200
1,600
2,000
2,400
20070
40
80
120
160
200
240
value in USD billions (left-hand scale)volume in thousands (right-hand scale)
2003 2004 2005 2006
Source: ECB.
Chart S134 TARGET availability
(Jan. 1999 - Sep. 2007; %; three-month moving average)
98.798.898.999.099.199.299.399.499.599.699.799.899.9
100.0
98.798.898.999.099.199.299.399.499.599.699.799.899.9100.0
1999 2000 2001 2002 2003 2004 2005 2006 2007
Source: ECB.


![19-95------------•PNc•l•][i•id.Uid•i#?fJUJ ·----...... ------------N-2-s ...](https://static.fdokumen.com/doc/165x107/6327fdbd051fac18490e8572/19-95-pncliiduidifjuj-n-2-s.jpg)