![Jet [Novela] Biblioteca](https://static.fdokumen.com/doc/165x107/6321c71564690856e108db2b/jet-novela-biblioteca.jpg)
Jet Streaks in the Gulf Stream
15
1910 VOLUME 29 JOURNAL OF PHYSICAL OCEANOGRAPHY q 1999 American Meteorological Society Jet Streaks in the Gulf Stream STEPHAN D. HOWDEN* AND D. RANDOLPH WATTS Graduate School of Oceanography, University of Rhode Island, Kingston, Rhode Island (Manuscript received 18 September 1997, in final form 1 October 1998) ABSTRACT Mesoscale alongstream speed changes of the Gulf Stream are diagnosed from an array of current meters at depths 400, 700, and 1000 m, near 688W, during the development of steep [ratio of ‘‘amplitude’’ to ‘‘wavelength’’ O(1)] meanders. Speed maxima (jet streaks) are generally found between trough and crest axes in steep meanders with local speed minima near the trough and crest axes. Speed changes along streamlines can be quite dramatic. Speed changes along the jet axis, between jet streaks and local minima in excess of 0.60, 0.40, and 0.35 m s 21 , are observed at depth 400, 700, and 1000 m, respectively. This is in comparison with peak speeds in a frontal coordinates system mean of 1.22, 0.67, and 0.28 m s 21 , at depth 400, 700, and 1000 m, respectively, from a previous study. The presence of the jet streaks can be explained kinematically as a superposition of the Gulf Stream and barotropic vortices. The development of these jet streaks in relation to the developing steep meanders differs from the canonical picture of jet streak/baroclinic wave development in the atmospheric jet stream in that the jet streaks in the Gulf Stream are predominantly fixed in place with respect to meanders as they steepen. 1. Background on Gulf Stream current structure Frequently the Gulf Stream is idealized as a current that preserves its vertical and cross-stream structure [also known as ‘‘the rigid structure’’ or the ‘‘wiggly hose’’ view of the Gulf Stream (Halkin and Rossby 1985, hereafter HR)] while meandering. This view has arisen from the robustness of the structure of the Gulf Stream baroclinic jet and the associated density front. From 16 Gulf Stream transects at 728W, HR constructed a mean synoptic Gulf Stream cross section (i.e., each section was translated into a frontal coordinate system to eliminate the effect of Eulerian smearing of the me- andering jet/front) of velocity and temperature and fo- cused upon its robust structure. Within the core of the jet the ratio of the standard deviation to the mean is only 0.2 at 400 m, rising to nearly 0.4 at 1000 m. Figure 1a illustrates the mean downstream velocity component as a function of cross-stream position for the HR data at 3 selected depths. Figure 1b shows the corresponding ratio of standard deviation to mean. Similar results were found by Hall and Bryden (1985) and Johns et al. (1995) (the standard deviation about the mean on the jet axis * Postdoctoral fellow for Universities Space Research Association, NASA/Goddard Space Flight Center, Greenbelt, Maryland. Corresponding author address: Dr. Stephan D. Howden, NASA/ Goddard Space Flight Center, Mailcode 971, Greenbelt, MD 20771. E-mail: [email protected] was found to be nearly 25%, 30%, and 35% at depth 400, 700, and 1000 m, respectively) at 688W. In frontal coordinates, the mean baroclinic transport in the upper 1000 m remains essentially constant from Cape Hatteras in the west to the Grand Banks in the east (Hogg 1992). However, as mentioned above, the frontal Gulf Stream profiles of velocity and density have variances of the order of 25%. The ‘‘rigid structure’’ idealization of the Gulf Stream has been a useful construct because it has allowed the use of vorticity and potential vorticity budgets in dy- namical diagnostics for measuring all of the terms. For example, Bower (1989) used cross-stream shear vortic- ity profiles constructed from the HR data to estimate the time series of shear vorticity of isopycnal-following RAFOS floats in the Gulf Stream. In that and similar applications, the Gulf Stream cross sections of density and downstream velocity were treated as rigid (in a frontal coordinate system that meanders), while cross- frontal and vertical motions were allowed. Extending beyond the rigid-structure model, several observational studies have examined systematic changes in the Gulf Stream structure with changes in flow cur- vature. That is, part of the variance measured in the frontal coordinate mean studies is due to systematic changes in the mesoscale flow and mass fields. Using drogued surface drifters, Chew (1974) showed how the flow and mass field of a meandering current adjust to changes in curvature, with adjustments between shear vorticity, curvature vorticity, and stretching, which cause the front to steepen in troughs and relax in crests
-
Upload
independent -
Category
Documents
-
view
3 -
download
0
Transcript of Jet Streaks in the Gulf Stream
1910 VOLUME 29J O U R N A L O F P H Y S I C A L O C E A N O G R A P H Y
q 1999 American Meteorological Society
Jet Streaks in the Gulf Stream
STEPHAN D. HOWDEN* AND D. RANDOLPH WATTS
Graduate School of Oceanography, University of Rhode Island, Kingston, Rhode Island
(Manuscript received 18 September 1997, in final form 1 October 1998)
ABSTRACT
Mesoscale alongstream speed changes of the Gulf Stream are diagnosed from an array of current meters atdepths 400, 700, and 1000 m, near 688W, during the development of steep [ratio of ‘‘amplitude’’ to ‘‘wavelength’’O(1)] meanders. Speed maxima (jet streaks) are generally found between trough and crest axes in steep meanderswith local speed minima near the trough and crest axes. Speed changes along streamlines can be quite dramatic.Speed changes along the jet axis, between jet streaks and local minima in excess of 0.60, 0.40, and 0.35 m s21,are observed at depth 400, 700, and 1000 m, respectively. This is in comparison with peak speeds in a frontalcoordinates system mean of 1.22, 0.67, and 0.28 m s21, at depth 400, 700, and 1000 m, respectively, from aprevious study.
The presence of the jet streaks can be explained kinematically as a superposition of the Gulf Stream andbarotropic vortices. The development of these jet streaks in relation to the developing steep meanders differsfrom the canonical picture of jet streak/baroclinic wave development in the atmospheric jet stream in that thejet streaks in the Gulf Stream are predominantly fixed in place with respect to meanders as they steepen.
1. Background on Gulf Stream current structure
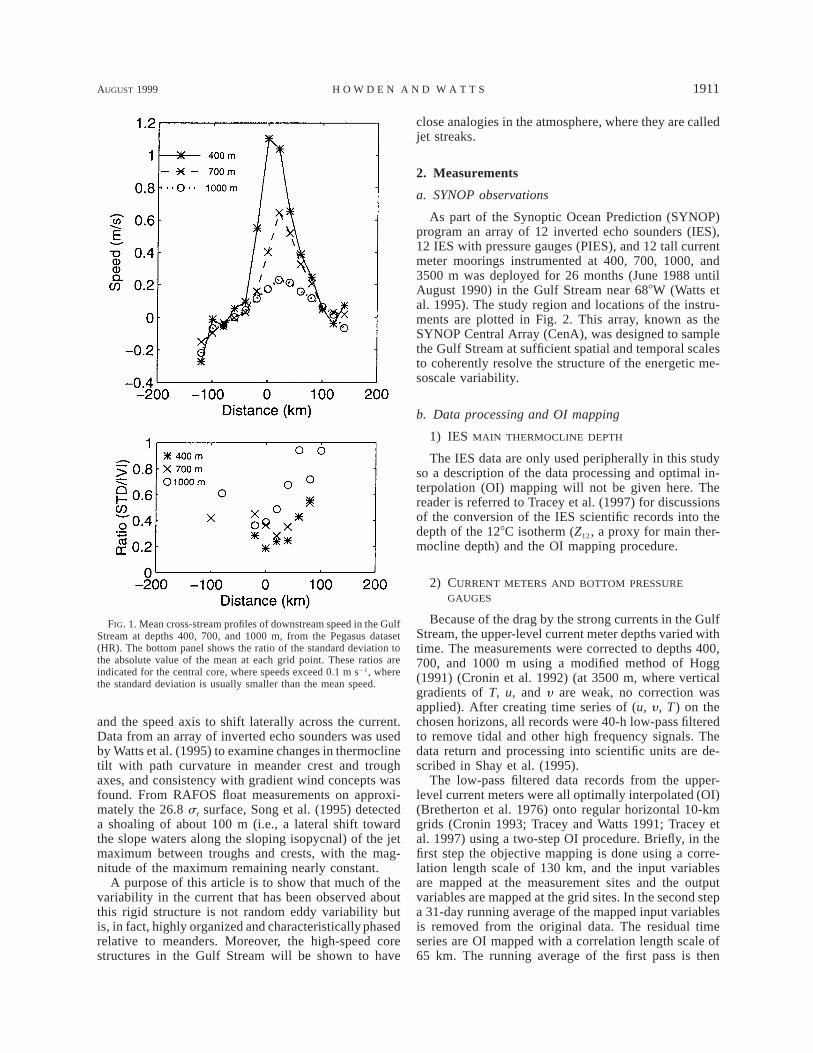
Frequently the Gulf Stream is idealized as a currentthat preserves its vertical and cross-stream structure[also known as ‘‘the rigid structure’’ or the ‘‘wigglyhose’’ view of the Gulf Stream (Halkin and Rossby1985, hereafter HR)] while meandering. This view hasarisen from the robustness of the structure of the GulfStream baroclinic jet and the associated density front.From 16 Gulf Stream transects at 728W, HR constructeda mean synoptic Gulf Stream cross section (i.e., eachsection was translated into a frontal coordinate systemto eliminate the effect of Eulerian smearing of the me-andering jet/front) of velocity and temperature and fo-cused upon its robust structure. Within the core of thejet the ratio of the standard deviation to the mean isonly 0.2 at 400 m, rising to nearly 0.4 at 1000 m. Figure1a illustrates the mean downstream velocity componentas a function of cross-stream position for the HR dataat 3 selected depths. Figure 1b shows the correspondingratio of standard deviation to mean. Similar results werefound by Hall and Bryden (1985) and Johns et al. (1995)(the standard deviation about the mean on the jet axis
* Postdoctoral fellow for Universities Space Research Association,NASA/Goddard Space Flight Center, Greenbelt, Maryland.
Corresponding author address: Dr. Stephan D. Howden, NASA/Goddard Space Flight Center, Mailcode 971, Greenbelt, MD 20771.E-mail: [email protected]
was found to be nearly 25%, 30%, and 35% at depth400, 700, and 1000 m, respectively) at 688W. In frontalcoordinates, the mean baroclinic transport in the upper1000 m remains essentially constant from Cape Hatterasin the west to the Grand Banks in the east (Hogg 1992).However, as mentioned above, the frontal Gulf Streamprofiles of velocity and density have variances of theorder of 25%.
The ‘‘rigid structure’’ idealization of the Gulf Streamhas been a useful construct because it has allowed theuse of vorticity and potential vorticity budgets in dy-namical diagnostics for measuring all of the terms. Forexample, Bower (1989) used cross-stream shear vortic-ity profiles constructed from the HR data to estimatethe time series of shear vorticity of isopycnal-followingRAFOS floats in the Gulf Stream. In that and similarapplications, the Gulf Stream cross sections of densityand downstream velocity were treated as rigid (in afrontal coordinate system that meanders), while cross-frontal and vertical motions were allowed.
Extending beyond the rigid-structure model, severalobservational studies have examined systematic changesin the Gulf Stream structure with changes in flow cur-vature. That is, part of the variance measured in thefrontal coordinate mean studies is due to systematicchanges in the mesoscale flow and mass fields. Usingdrogued surface drifters, Chew (1974) showed how theflow and mass field of a meandering current adjust tochanges in curvature, with adjustments between shearvorticity, curvature vorticity, and stretching, whichcause the front to steepen in troughs and relax in crests
AUGUST 1999 1911H O W D E N A N D W A T T S
FIG. 1. Mean cross-stream profiles of downstream speed in the GulfStream at depths 400, 700, and 1000 m, from the Pegasus dataset(HR). The bottom panel shows the ratio of the standard deviation tothe absolute value of the mean at each grid point. These ratios areindicated for the central core, where speeds exceed 0.1 m s21, wherethe standard deviation is usually smaller than the mean speed.
and the speed axis to shift laterally across the current.Data from an array of inverted echo sounders was usedby Watts et al. (1995) to examine changes in thermoclinetilt with path curvature in meander crest and troughaxes, and consistency with gradient wind concepts wasfound. From RAFOS float measurements on approxi-mately the 26.8 s t surface, Song et al. (1995) detecteda shoaling of about 100 m (i.e., a lateral shift towardthe slope waters along the sloping isopycnal) of the jetmaximum between troughs and crests, with the mag-nitude of the maximum remaining nearly constant.
A purpose of this article is to show that much of thevariability in the current that has been observed aboutthis rigid structure is not random eddy variability butis, in fact, highly organized and characteristically phasedrelative to meanders. Moreover, the high-speed corestructures in the Gulf Stream will be shown to have
close analogies in the atmosphere, where they are calledjet streaks.
2. Measurements
a. SYNOP observations
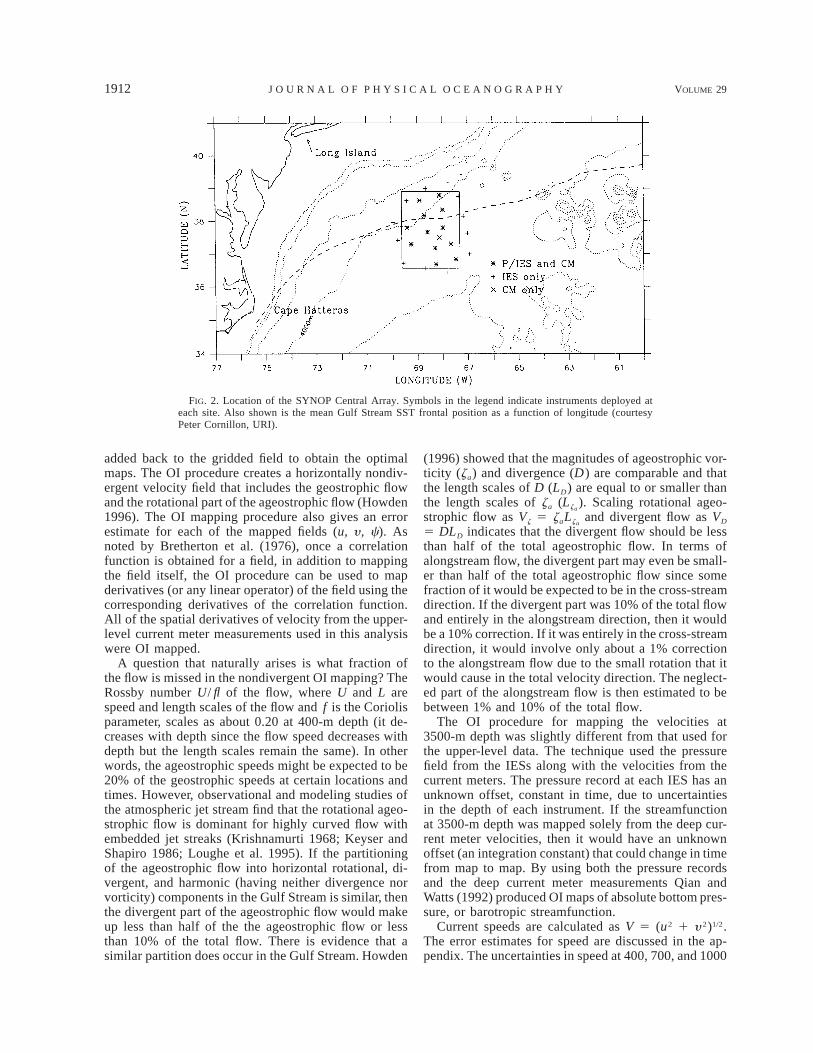
As part of the Synoptic Ocean Prediction (SYNOP)program an array of 12 inverted echo sounders (IES),12 IES with pressure gauges (PIES), and 12 tall currentmeter moorings instrumented at 400, 700, 1000, and3500 m was deployed for 26 months (June 1988 untilAugust 1990) in the Gulf Stream near 688W (Watts etal. 1995). The study region and locations of the instru-ments are plotted in Fig. 2. This array, known as theSYNOP Central Array (CenA), was designed to samplethe Gulf Stream at sufficient spatial and temporal scalesto coherently resolve the structure of the energetic me-soscale variability.
b. Data processing and OI mapping
1) IES MAIN THERMOCLINE DEPTH
The IES data are only used peripherally in this studyso a description of the data processing and optimal in-terpolation (OI) mapping will not be given here. Thereader is referred to Tracey et al. (1997) for discussionsof the conversion of the IES scientific records into thedepth of the 128C isotherm (Z12, a proxy for main ther-mocline depth) and the OI mapping procedure.
2) CURRENT METERS AND BOTTOM PRESSURE
GAUGES
Because of the drag by the strong currents in the GulfStream, the upper-level current meter depths varied withtime. The measurements were corrected to depths 400,700, and 1000 m using a modified method of Hogg(1991) (Cronin et al. 1992) (at 3500 m, where verticalgradients of T, u, and y are weak, no correction wasapplied). After creating time series of (u, y , T) on thechosen horizons, all records were 40-h low-pass filteredto remove tidal and other high frequency signals. Thedata return and processing into scientific units are de-scribed in Shay et al. (1995).
The low-pass filtered data records from the upper-level current meters were all optimally interpolated (OI)(Bretherton et al. 1976) onto regular horizontal 10-kmgrids (Cronin 1993; Tracey and Watts 1991; Tracey etal. 1997) using a two-step OI procedure. Briefly, in thefirst step the objective mapping is done using a corre-lation length scale of 130 km, and the input variablesare mapped at the measurement sites and the outputvariables are mapped at the grid sites. In the second stepa 31-day running average of the mapped input variablesis removed from the original data. The residual timeseries are OI mapped with a correlation length scale of65 km. The running average of the first pass is then
1912 VOLUME 29J O U R N A L O F P H Y S I C A L O C E A N O G R A P H Y
FIG. 2. Location of the SYNOP Central Array. Symbols in the legend indicate instruments deployed ateach site. Also shown is the mean Gulf Stream SST frontal position as a function of longitude (courtesyPeter Cornillon, URI).
added back to the gridded field to obtain the optimalmaps. The OI procedure creates a horizontally nondiv-ergent velocity field that includes the geostrophic flowand the rotational part of the ageostrophic flow (Howden1996). The OI mapping procedure also gives an errorestimate for each of the mapped fields (u, y , c). Asnoted by Bretherton et al. (1976), once a correlationfunction is obtained for a field, in addition to mappingthe field itself, the OI procedure can be used to mapderivatives (or any linear operator) of the field using thecorresponding derivatives of the correlation function.All of the spatial derivatives of velocity from the upper-level current meter measurements used in this analysiswere OI mapped.
A question that naturally arises is what fraction ofthe flow is missed in the nondivergent OI mapping? TheRossby number U/ fl of the flow, where U and L arespeed and length scales of the flow and f is the Coriolisparameter, scales as about 0.20 at 400-m depth (it de-creases with depth since the flow speed decreases withdepth but the length scales remain the same). In otherwords, the ageostrophic speeds might be expected to be20% of the geostrophic speeds at certain locations andtimes. However, observational and modeling studies ofthe atmospheric jet stream find that the rotational ageo-strophic flow is dominant for highly curved flow withembedded jet streaks (Krishnamurti 1968; Keyser andShapiro 1986; Loughe et al. 1995). If the partitioningof the ageostrophic flow into horizontal rotational, di-vergent, and harmonic (having neither divergence norvorticity) components in the Gulf Stream is similar, thenthe divergent part of the ageostrophic flow would makeup less than half of the the ageostrophic flow or lessthan 10% of the total flow. There is evidence that asimilar partition does occur in the Gulf Stream. Howden
(1996) showed that the magnitudes of ageostrophic vor-ticity (za) and divergence (D) are comparable and thatthe length scales of D (LD) are equal to or smaller thanthe length scales of za ( ). Scaling rotational ageo-Lza
strophic flow as Vz 5 and divergent flow as VDz La za
5 DLD indicates that the divergent flow should be lessthan half of the total ageostrophic flow. In terms ofalongstream flow, the divergent part may even be small-er than half of the total ageostrophic flow since somefraction of it would be expected to be in the cross-streamdirection. If the divergent part was 10% of the total flowand entirely in the alongstream direction, then it wouldbe a 10% correction. If it was entirely in the cross-streamdirection, it would involve only about a 1% correctionto the alongstream flow due to the small rotation that itwould cause in the total velocity direction. The neglect-ed part of the alongstream flow is then estimated to bebetween 1% and 10% of the total flow.
The OI procedure for mapping the velocities at3500-m depth was slightly different from that used forthe upper-level data. The technique used the pressurefield from the IESs along with the velocities from thecurrent meters. The pressure record at each IES has anunknown offset, constant in time, due to uncertaintiesin the depth of each instrument. If the streamfunctionat 3500-m depth was mapped solely from the deep cur-rent meter velocities, then it would have an unknownoffset (an integration constant) that could change in timefrom map to map. By using both the pressure recordsand the deep current meter measurements Qian andWatts (1992) produced OI maps of absolute bottom pres-sure, or barotropic streamfunction.
Current speeds are calculated as V 5 (u2 1 y 2)1/2.The error estimates for speed are discussed in the ap-pendix. The uncertainties in speed at 400, 700, and 1000

AUGUST 1999 1913H O W D E N A N D W A T T S
m are roughly 0.08, 0.05, and 0.04 m s21, respectively.The contour interval for speed used in the figures at400, 700, and 1000 m are 0.20, 0.10, and 0.05 m s21,respectively. Hence, changes of 1 contour interval inthose figures are significant. Alongstream speed changes]V/]s and the cyclostrophic ageostrophic flow
1 ]a22 V ,
f ]s
where the horizontal velocity is given by V 5 Vs, anda is the angle that s makes with x (the eastward direc-tion) were computed from their Cartesian coordinaterepresentations,
12 2[u u 1 y y 1 uy (y 1 u )]x y x y2V
and
1 u y2 22 (u y 2 y u 1 uy (y 2 u )) x 1 y ,x y y x 1 2f V V
respectively.
3. Background on steep meander development
a. Gulf Stream
During the SYNOP observation period a great varietyof phenomena was observed (Watts et al. 1995; Shayet al. 1995). Meanders developed and propagatedthrough the array. Rings propagated into the array andinteracted with the Gulf Stream. Six steep [ratio of am-plitude to wavelength O(1)] trough events, each lastingapproximately one month, occurred in the CenA (for atotal of about six months out of the two-year deploymenttime). Statistical evidence shows that the steepening ofthese meander troughs is primarily a result of baroclinicconversions (available potential energy release from thebaroclinic front) with the inference that baroclinic in-stability processes are responsible (Cronin and Watts1996). Concurrent with each steep trough, a strong abys-sal cyclone developed with pressure anomaly lows typ-ically below 20.25 dbar. A sequence of articles on theseobservations has built our present understanding thatthe abyssal cyclones and anticyclones mapped at 3500m are, in fact, associated with nearly barotropic geo-strophic current structures.
Shay et al. (1995) showed that swirl speeds in thesevortices commonly exceeded 0.25 m s21 (reaching 0.5m s21), and, because often a substantial componentcrossed normal to the baroclinic front, the currents inthe upper baroclinic jet were observed to turn system-atically with height. Consequently, these vortices canfacilitate large cross-frontal heat advection.
Lindstrom et al. (1997) showed that the cross-frontalcomponent of motion at upper levels was consistent withthe cross-frontal component at 3500 m. They treated thevelocity field observed at 3500 m in the abyssal cyclones
and anticyclones as barotropic, advecting water parcelsacross the the baroclinic zone along density surfaces,and thereby they diagnosed vertical motion in the me-anders, which agreed well with independently measuredvertical motion from RAFOS float trajectories.
Howden (1996) argued that abyssal pressure anom-alies equivalent to 25% or more of the sea surface heightacross the Gulf Stream should have a surface manifes-tation. He found that the upper-level current velocitiesmeasured by current meters in steep troughs eventsagree with the vector sum of the baroclinic velocitiesmapped from the IES plus the 3500 m velocities actingas a barotropic reference level.
Savidge (1997) and Savidge and Bane (1999a, here-after SB99a) demonstrated explicitly that the strongabyssal cyclones are indeed the deep manifestation ofnearly barotropic vortices. For all events observed withsteep meander trough and abyssal cyclone, they sub-tracted from the measured upper-level currents a featuremodel of the upper baroclinic jet, based on the stream-coordinate mean Gulf Stream structure reported in Johnset al. (1995) with a correction applied for cyclostrophicflow. The residual velocities and streamfunction patternswere demonstrated to be lined up vertically above the3500-m low pressure centers and to be depth indepen-dent. Furthermore, using the density tendency equationSavidge and Bane (1999b, hereafter SB99b) diagnosedthat a sea level drop (of as much as 0.50 m in one case)had to occur over the abyssal cyclones to explain theirspinup.
b. Atmospheric analogies and jet streaks
Similarities between the development of the steep me-anders and abyssal cyclones or anticyclones in the GulfStream and the development of an upper-level atmo-spheric jet stream trough and surface cyclone systemwere first noted by Lindstrom et al. (1992). More de-tailed dynamical comparisons of the development ofoceanic and atmospheric systems were conducted byHowden (1996), Savidge (1997), and (SB99b).
In the atmosphere, an important kinematic and dy-namic component of baroclinic waves is the develop-ment of jet streaks, which are localized speed maximawithin the wind-speed core and its associated frontalzone. [Jet streaks were defined by Palmen and Newton(1969) as isotach maxima at the level of maximumwind.] Jet streaks observed in the flow from the north-west between an upper-level ridge and trough can actas precursors to baroclinic wave amplification (e.g., Pal-men and Newton 1969; Keyser and Shapiro 1986). Thelatter authors note that the horizontal divergence pat-terns associated with jet streaks in the upper tropospherecan play an important role in lower-troposphere cyclonedevelopment by contributing to lower-level geopotentialheight falls. Bell and Keyser (1993) diagnose how con-versions between shear potential vorticity and curvaturepotential vorticity resulted in steepening of the trough
1914 VOLUME 29J O U R N A L O F P H Y S I C A L O C E A N O G R A P H Y
as a jet streak located southeast of a ridge propagateddownstream into a following trough.
Keyser and Shapiro (1986) have described the ca-nonical development of a jet streak as follows: a jetstreak forms in the confluent region between a midlat-itude ridge and trough; as the jet streak propagates intothe base of the trough, the cyclone steepens and sub-sequently cuts off (develops closed streamlines); as thejet streak further propagates downstream out of thetrough axis, the cyclone decays or ‘‘opens up’’ and theflow becomes more zonal.
This study documents changes in the Gulf Streamcurrent structure over entire meanders. Jet streaks willbe shown to form within steep meanders with systematicphasing, characteristically located between meandercrests and troughs. However, the life cycle of a jet streakin the Gulf Stream does not follow that of the above‘‘canonical’’ atmospheric system. Instead, the strengthand location of the jet streaks in the Gulf Stream willbe shown to be associated with the nearly barotropicvortices that spin up with the steep meanders.
4. Case studies
In this section, plan view plots of isotachs for twosteep meander events will be used to illustrate the ex-istence and development of jet streaks in the GulfStream. Additionally, the steepest crest event will beanalyzed for comparison. In all of the plots the stream-function decreases toward the top of the figure so thatthe zonal component of flow is from left to right (u 52]c/]y). The contours of streamlines are not labeledsince each map has in general a unique offset, thoughthe contour interval at each depth is the same in eachmap.
The location and strength of the strongest jet streakscan be substantially explained by the superposition ofa Gulf Stream trough with a rigid structure plus baro-tropic vortices and ageostrophic flow. This will be il-lustrated for selected days by comparing the isotachs ofthe upper-level flow with isotachs of the residual upper-level flow VR, defined for each level as the full currentminus the nearly barotropic 3500-m velocity and thecyclostrophic flow:
VR 5 (u 2 u3500 2 ucyc)x 1 (y 2 y 3500 2 y cyc)y, (1)
where u and y are upper-level velocity components andthe subscript cyc refers to components of the cyclos-trophic flow. As discussed in the appendix, the errorestimates of VR are 9, 6, and 5 cm s21 at 400, 700, and1000 m, respectively.
a. September 1988: Steep meander trough
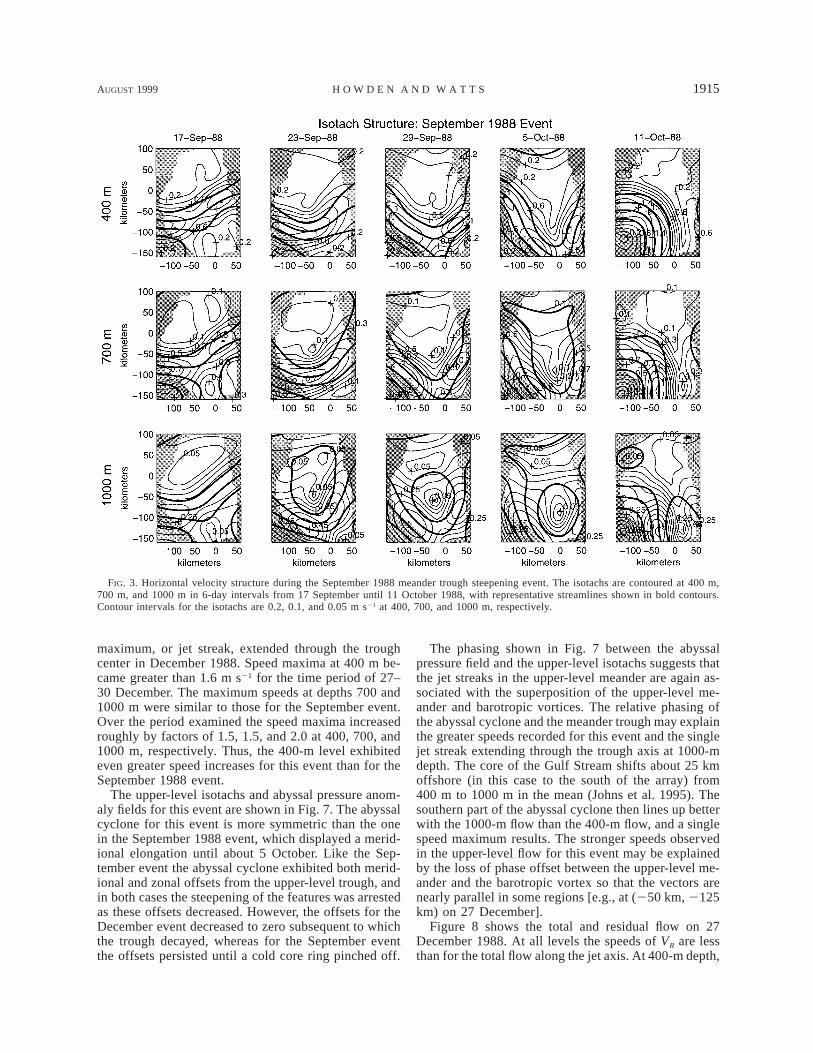
This meander trough began to form in the CentralArray in mid-September, steepened in place, and sub-sequently pinched off to form a cold core ring in mid-October, slightly east of the array. Figure 3 shows iso-
tachs at 400 m, 700 m, and 1000 m at 6-day intervalswith representative streamlines. On all three levels,speed maxima (jet streaks) are nearly always presentflanking the trough axis. There are some exceptions,such as on 23 September at 400-m depth, where onlyone speed maximum is present, and at 700-m depthwhere a speed maximum is evident on the trough axis.
On 17 September, at the beginning of the event, themaximum speed on the jet axis was between 1.20 and1.40 m s21, 0.60 and 0.70 m s21, and 0.20 and 0.25 ms21 at depths 400, 700, and 1000 m, respectively. By11 October the maximum speed at the 400, 700, and1000 m reached 1.40–1.60, 1.10–1.20, and 0.55–0.60m s21, respectively. From 400 to 1000 m the maximumspeed increased by roughly factors of 1.2, 1.5, and 2.The increase was not smooth: there were periods of nochange, periods of decrease, and periods of increase.Speed changes following streamlines can be quite dra-matic: changes along streamlines from jet streaks tospeed minima are observed in excess of 0.60, 0.40 and0.25 m s21 at 400-, 700-, and 1000-m depth, respec-tively.
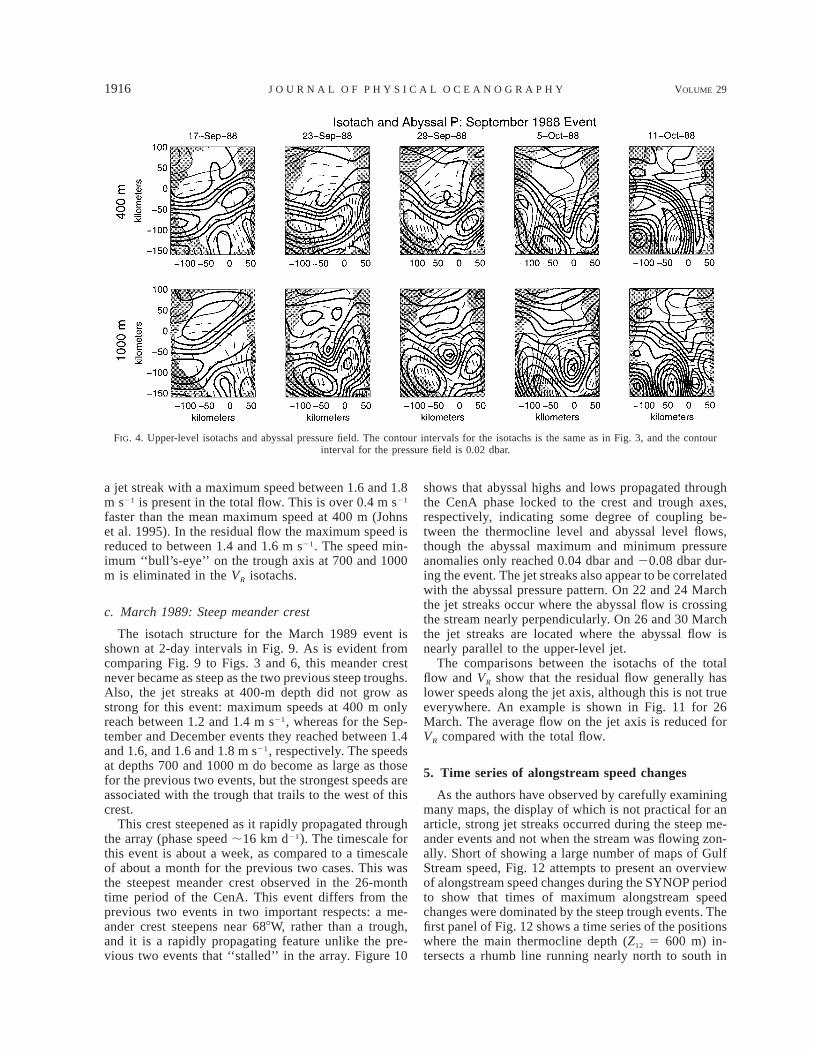
Isotachs at 400 and 1000 m are plotted over the abys-sal pressure field in Fig. 4 for the same set of days usedin Fig. 3. Circulation at 3500-m depth is counterclock-wise around the pressure anomalies (dashed contours)and clockwise around the positive anomalies (solid con-tours). The negative pressure anomaly center drops from20.11 dbar on 17 September to less than 20.21 dbarby 5 October (the center of the pressure minimum isnot well resolved on 11 October). The phasing of thepressure anomaly centers and isotach maxima in theupper-level current fields suggests that the jet streakscould be the result of a superposition of upper-levelgeostrophic flow and barotropic vortices. In general, thejet streaks are situated where the ‘‘barotropic flow’’ cutsacross the Gulf Stream. A notable exception is seen inthe eastward side of the trough on 23 September at 400m where a local speed maximum does not exist despitethe relatively strong cross-frontal flow indicated by thetightly packed isobars. When the 3500-m current vectorsand the diagnosed cyclostrophic flow are subtractedfrom the upper-level current vectors, the jet streaks arereduced in size and magnitude nearly everywhere asshown in Fig. 5 for 29 September. The exception is thejet streak downstream of the trough axis at 400-m depth.
b. December 1988: Steep meander trough
This trough began to form in mid-December. It steep-ened in place and then relaxed as it propagated out ofthe array in mid-January. Isotachs for the December1988 event are shown in Fig. 6. A greater fraction ofthe structure of this trough is lost out of the southernend of the array than for the September event. Jet streaksare usually found flanking the trough axis at depths 400and 700 m, similar to the September event. However,unlike the September 1988 event, at 1000 m a speed
AUGUST 1999 1915H O W D E N A N D W A T T S
FIG. 3. Horizontal velocity structure during the September 1988 meander trough steepening event. The isotachs are contoured at 400 m,700 m, and 1000 m in 6-day intervals from 17 September until 11 October 1988, with representative streamlines shown in bold contours.Contour intervals for the isotachs are 0.2, 0.1, and 0.05 m s21 at 400, 700, and 1000 m, respectively.
maximum, or jet streak, extended through the troughcenter in December 1988. Speed maxima at 400 m be-came greater than 1.6 m s21 for the time period of 27–30 December. The maximum speeds at depths 700 and1000 m were similar to those for the September event.Over the period examined the speed maxima increasedroughly by factors of 1.5, 1.5, and 2.0 at 400, 700, and1000 m, respectively. Thus, the 400-m level exhibitedeven greater speed increases for this event than for theSeptember 1988 event.
The upper-level isotachs and abyssal pressure anom-aly fields for this event are shown in Fig. 7. The abyssalcyclone for this event is more symmetric than the onein the September 1988 event, which displayed a merid-ional elongation until about 5 October. Like the Sep-tember event the abyssal cyclone exhibited both merid-ional and zonal offsets from the upper-level trough, andin both cases the steepening of the features was arrestedas these offsets decreased. However, the offsets for theDecember event decreased to zero subsequent to whichthe trough decayed, whereas for the September eventthe offsets persisted until a cold core ring pinched off.
The phasing shown in Fig. 7 between the abyssalpressure field and the upper-level isotachs suggests thatthe jet streaks in the upper-level meander are again as-sociated with the superposition of the upper-level me-ander and barotropic vortices. The relative phasing ofthe abyssal cyclone and the meander trough may explainthe greater speeds recorded for this event and the singlejet streak extending through the trough axis at 1000-mdepth. The core of the Gulf Stream shifts about 25 kmoffshore (in this case to the south of the array) from400 m to 1000 m in the mean (Johns et al. 1995). Thesouthern part of the abyssal cyclone then lines up betterwith the 1000-m flow than the 400-m flow, and a singlespeed maximum results. The stronger speeds observedin the upper-level flow for this event may be explainedby the loss of phase offset between the upper-level me-ander and the barotropic vortex so that the vectors arenearly parallel in some regions [e.g., at (250 km, 2125km) on 27 December].
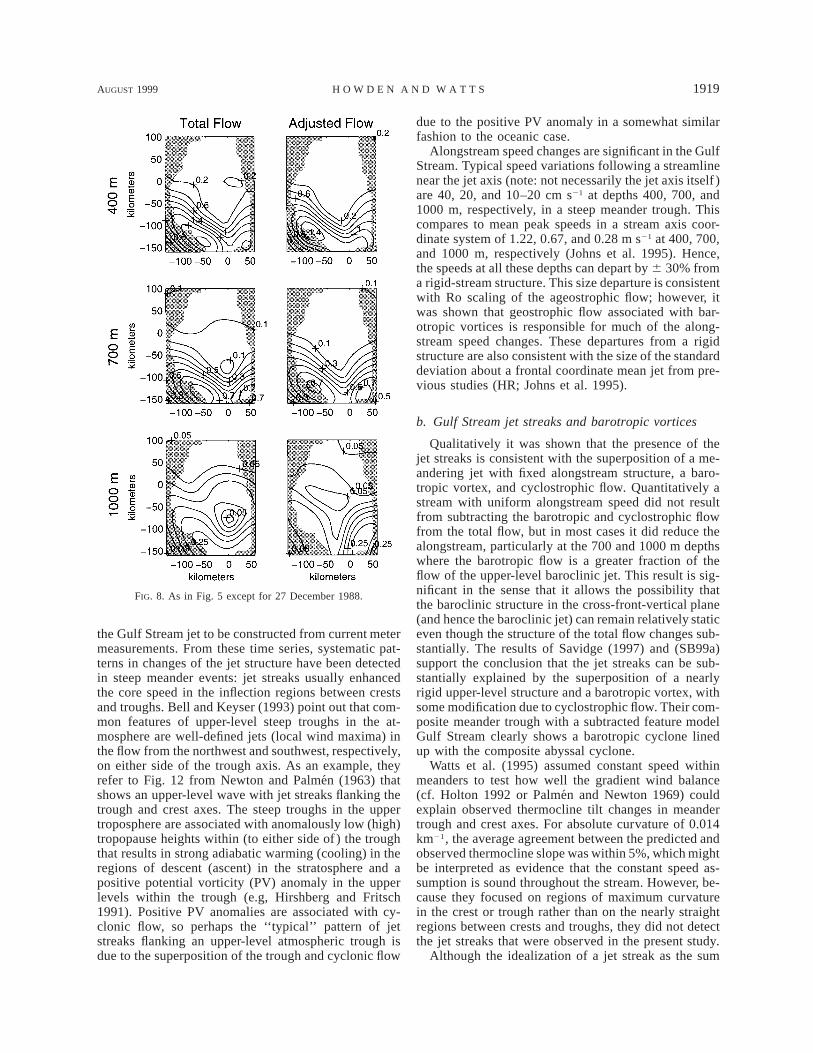
Figure 8 shows the total and residual flow on 27December 1988. At all levels the speeds of VR are lessthan for the total flow along the jet axis. At 400-m depth,
1916 VOLUME 29J O U R N A L O F P H Y S I C A L O C E A N O G R A P H Y
FIG. 4. Upper-level isotachs and abyssal pressure field. The contour intervals for the isotachs is the same as in Fig. 3, and the contourinterval for the pressure field is 0.02 dbar.
a jet streak with a maximum speed between 1.6 and 1.8m s21 is present in the total flow. This is over 0.4 m s21
faster than the mean maximum speed at 400 m (Johnset al. 1995). In the residual flow the maximum speed isreduced to between 1.4 and 1.6 m s21. The speed min-imum ‘‘bull’s-eye’’ on the trough axis at 700 and 1000m is eliminated in the VR isotachs.
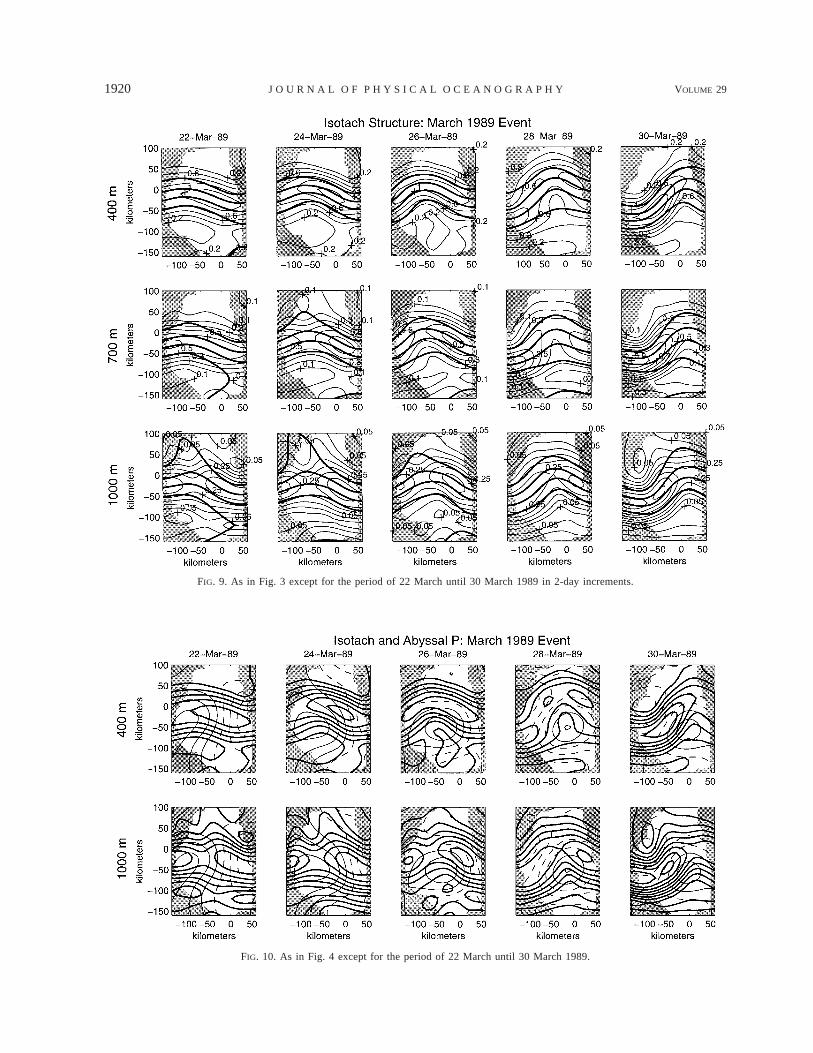
c. March 1989: Steep meander crest
The isotach structure for the March 1989 event isshown at 2-day intervals in Fig. 9. As is evident fromcomparing Fig. 9 to Figs. 3 and 6, this meander crestnever became as steep as the two previous steep troughs.Also, the jet streaks at 400-m depth did not grow asstrong for this event: maximum speeds at 400 m onlyreach between 1.2 and 1.4 m s21, whereas for the Sep-tember and December events they reached between 1.4and 1.6, and 1.6 and 1.8 m s21, respectively. The speedsat depths 700 and 1000 m do become as large as thosefor the previous two events, but the strongest speeds areassociated with the trough that trails to the west of thiscrest.
This crest steepened as it rapidly propagated throughthe array (phase speed ;16 km d21). The timescale forthis event is about a week, as compared to a timescaleof about a month for the previous two cases. This wasthe steepest meander crest observed in the 26-monthtime period of the CenA. This event differs from theprevious two events in two important respects: a me-ander crest steepens near 688W, rather than a trough,and it is a rapidly propagating feature unlike the pre-vious two events that ‘‘stalled’’ in the array. Figure 10
shows that abyssal highs and lows propagated throughthe CenA phase locked to the crest and trough axes,respectively, indicating some degree of coupling be-tween the thermocline level and abyssal level flows,though the abyssal maximum and minimum pressureanomalies only reached 0.04 dbar and 20.08 dbar dur-ing the event. The jet streaks also appear to be correlatedwith the abyssal pressure pattern. On 22 and 24 Marchthe jet streaks occur where the abyssal flow is crossingthe stream nearly perpendicularly. On 26 and 30 Marchthe jet streaks are located where the abyssal flow isnearly parallel to the upper-level jet.
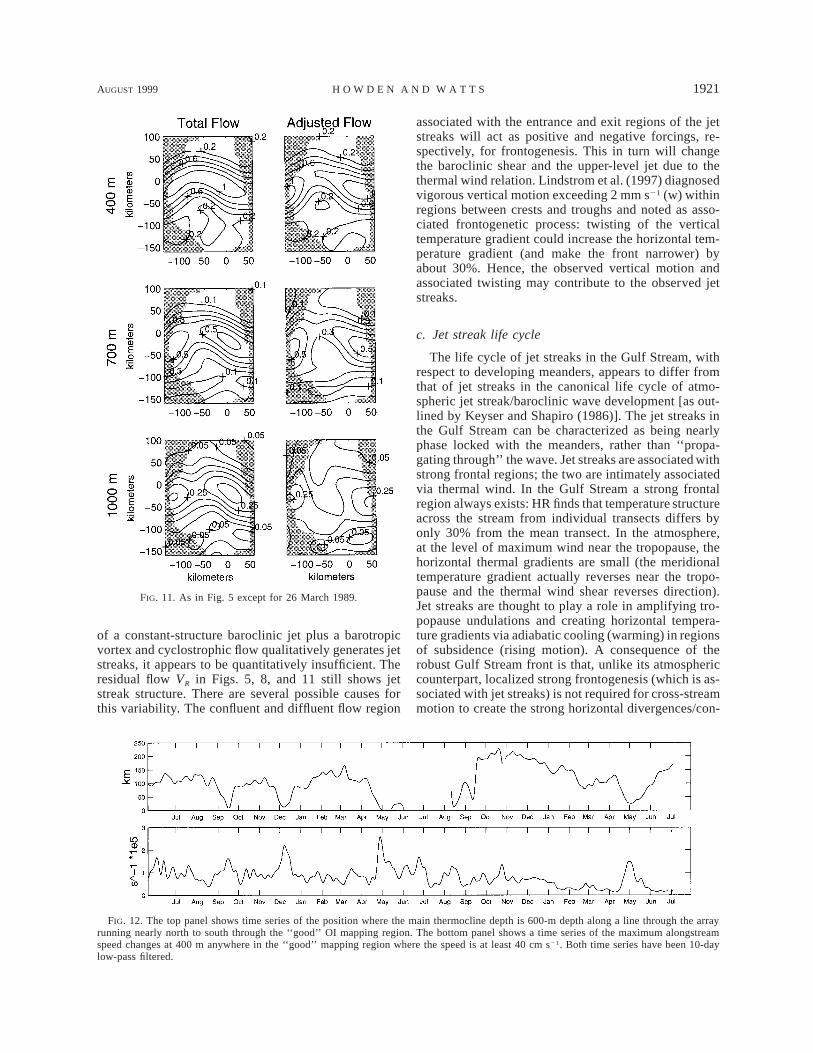
The comparisons between the isotachs of the totalflow and VR show that the residual flow generally haslower speeds along the jet axis, although this is not trueeverywhere. An example is shown in Fig. 11 for 26March. The average flow on the jet axis is reduced forVR compared with the total flow.
5. Time series of alongstream speed changes
As the authors have observed by carefully examiningmany maps, the display of which is not practical for anarticle, strong jet streaks occurred during the steep me-ander events and not when the stream was flowing zon-ally. Short of showing a large number of maps of GulfStream speed, Fig. 12 attempts to present an overviewof alongstream speed changes during the SYNOP periodto show that times of maximum alongstream speedchanges were dominated by the steep trough events. Thefirst panel of Fig. 12 shows a time series of the positionswhere the main thermocline depth (Z12 5 600 m) in-tersects a rhumb line running nearly north to south in

AUGUST 1999 1917H O W D E N A N D W A T T S
FIG. 5. The first column shows the isotach structure at depths 400,700, and 1000 m on 29 September 1988. The second column showsthe isotachs of the residual flow VR on the same date for the samesets of depths.
the CenA; this position closely underlies the core of theGulf Stream at 400-m depth. Steep trough events showup clearly in September 1988, December 1988, and May1990. From May 1989 until fall 1989 the Gulf Streamhad a steep meander or a more convoluted path. Thesecond panel shows a time series of the maximumalongstream speed gradient (|]V/]s|) anywhere in thearray where V . 0.4 m s21. Peaks in the gradient areseen during the September 1988, December 1988, May1989, and May 1990 steep trough events.
6. A simple kinematic explanation of jet streaks
Jet streaks similar to those observed in the CenA datacan be ‘‘formed’’ by the superposition of simple kine-matic models of a meandering Gulf Stream with noalongstream speed changes and a barotropic cyclonicvortex, when the scales and phasings of the features arechosen to be similar to those observed. The kinematicmodel of the meandering stream is taken from Bower
(1991) with the vt term in the trigonometric functionsset to zero to represent the relatively stationary mean-ders in the CenA. The model streamfunction is givenby
y 2 A sinkxc 5 c 1 2 tanh , (2)o 1 2[ ]l /cosa
where co and l determine the maximum speed Vmax, Agives the amplitude of the meanders, k is the meanderwavenumber, a is the alongstream direction (5tan21Akcoskx), and the cosa term ensures that the alongstreamspeed changes are nearly zero. The horizontal velocitycomponents are (u, y) 5 (2cy, cx). The following val-ues of the parameters were chosen: A 5 50 km, l 540 km, and 2p/k is taken to be 280 km. At 400-m depthco is taken to be 1.2 (m s21) · (l 3 103 m km21). At1000-m depth co is taken to be 0.28 (m s21) · (l 3 103
m km21). These choices make Vmax equal to the streamcoordinates maximum speed at 400 and 1000 m fromJohns et al. (1995).
The barotropic vortex is modeled by a Gaussian thatcan have different scale widths in the meridional andzonal directions:
2 2x yp9 5 p exp 2 1 (3)o 2 21 2[ ]l lx y
with the swirl velocities given by (us, y s) 5 (1/ fr)(2py,px). The scale widths are nominally set at 60 km, whichis approximately the radius of maximum swirl speedsaround the pressure lows (SB98a).
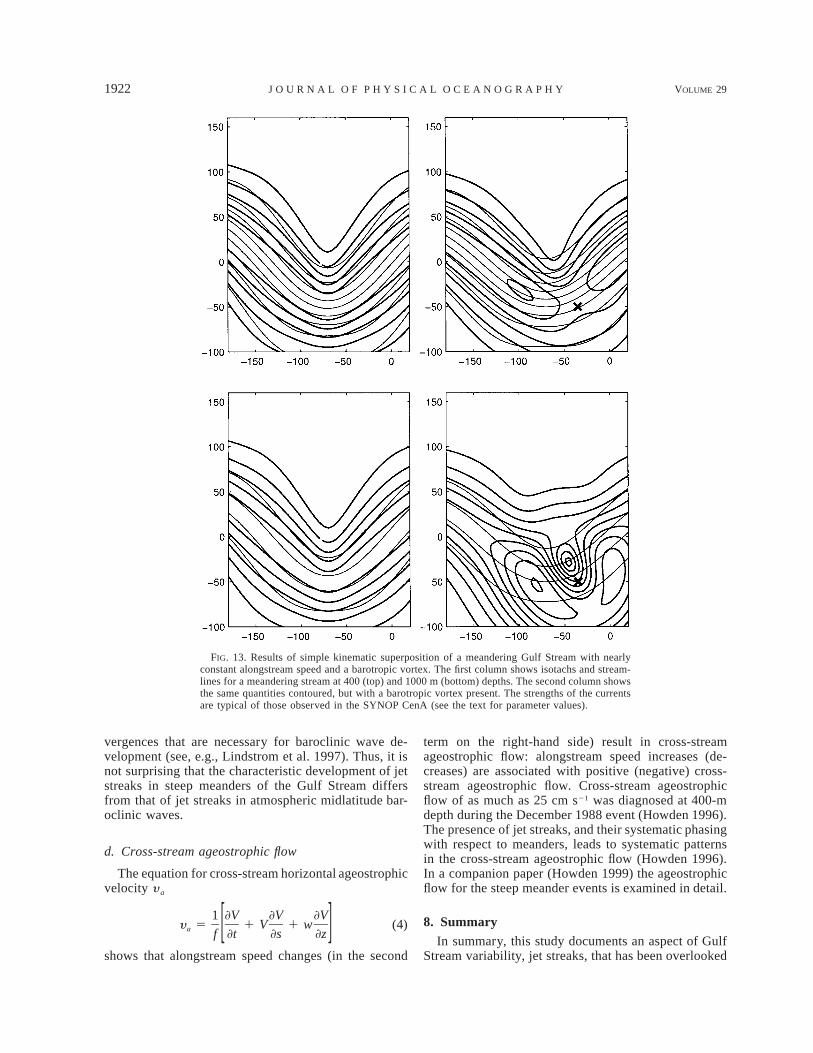
Figure 13 shows isotachs and streamlines of a fixedGulf Stream meander at depths 400 and 1000 m in thefirst column. The second column has the same meanderwith a superimposed barotropic vortex offset 40 kmdownstream and 250 km to the ‘‘south’’ with a pressureanomaly of 20.23 dbar. The structures of the isoplethsof speed for the superimposed features are very similarto what was observed in the data. Note the upstream jetstreak is closer to the trough axis in the simulation, muchlike the case for the real observations, and that the sig-nature of the barotropic vortex shows up more clearlyat 1000 m where the upper-level jet is weaker. In par-ticular, the speed minimum bull’s-eye that is evident inthe observations near the trough axis where the baro-tropic flow is directed against the baroclinic jet is re-produced. The details of the patterns of jet streaks shownhere can be modified by changing the relative phasing,abyssal pressure anomaly, length scales, and by addingcyclostrophic flow. This simple example shows that cy-clostrophic flow need not be included to account for jetstreak existence.
7. Discussion
a. Jet streak observations
The data from the SYNOP Central Array have, forthe first time, allowed time series of horizontal maps of

1918 VOLUME 29J O U R N A L O F P H Y S I C A L O C E A N O G R A P H Y
FIG. 6. As in Fig. 3 except for the period of 15 December 1988 until 8 January 1989.
FIG. 7. As in Fig. 4 except for the period of 15 December 1988 until 8 January 1989.
AUGUST 1999 1919H O W D E N A N D W A T T S
FIG. 8. As in Fig. 5 except for 27 December 1988.
the Gulf Stream jet to be constructed from current metermeasurements. From these time series, systematic pat-terns in changes of the jet structure have been detectedin steep meander events: jet streaks usually enhancedthe core speed in the inflection regions between crestsand troughs. Bell and Keyser (1993) point out that com-mon features of upper-level steep troughs in the at-mosphere are well-defined jets (local wind maxima) inthe flow from the northwest and southwest, respectively,on either side of the trough axis. As an example, theyrefer to Fig. 12 from Newton and Palmen (1963) thatshows an upper-level wave with jet streaks flanking thetrough and crest axes. The steep troughs in the uppertroposphere are associated with anomalously low (high)tropopause heights within (to either side of ) the troughthat results in strong adiabatic warming (cooling) in theregions of descent (ascent) in the stratosphere and apositive potential vorticity (PV) anomaly in the upperlevels within the trough (e.g, Hirshberg and Fritsch1991). Positive PV anomalies are associated with cy-clonic flow, so perhaps the ‘‘typical’’ pattern of jetstreaks flanking an upper-level atmospheric trough isdue to the superposition of the trough and cyclonic flow
due to the positive PV anomaly in a somewhat similarfashion to the oceanic case.
Alongstream speed changes are significant in the GulfStream. Typical speed variations following a streamlinenear the jet axis (note: not necessarily the jet axis itself )are 40, 20, and 10–20 cm s21 at depths 400, 700, and1000 m, respectively, in a steep meander trough. Thiscompares to mean peak speeds in a stream axis coor-dinate system of 1.22, 0.67, and 0.28 m s21 at 400, 700,and 1000 m, respectively (Johns et al. 1995). Hence,the speeds at all these depths can depart by 6 30% froma rigid-stream structure. This size departure is consistentwith Ro scaling of the ageostrophic flow; however, itwas shown that geostrophic flow associated with bar-otropic vortices is responsible for much of the along-stream speed changes. These departures from a rigidstructure are also consistent with the size of the standarddeviation about a frontal coordinate mean jet from pre-vious studies (HR; Johns et al. 1995).
b. Gulf Stream jet streaks and barotropic vortices
Qualitatively it was shown that the presence of thejet streaks is consistent with the superposition of a me-andering jet with fixed alongstream structure, a baro-tropic vortex, and cyclostrophic flow. Quantitatively astream with uniform alongstream speed did not resultfrom subtracting the barotropic and cyclostrophic flowfrom the total flow, but in most cases it did reduce thealongstream, particularly at the 700 and 1000 m depthswhere the barotropic flow is a greater fraction of theflow of the upper-level baroclinic jet. This result is sig-nificant in the sense that it allows the possibility thatthe baroclinic structure in the cross-front-vertical plane(and hence the baroclinic jet) can remain relatively staticeven though the structure of the total flow changes sub-stantially. The results of Savidge (1997) and (SB99a)support the conclusion that the jet streaks can be sub-stantially explained by the superposition of a nearlyrigid upper-level structure and a barotropic vortex, withsome modification due to cyclostrophic flow. Their com-posite meander trough with a subtracted feature modelGulf Stream clearly shows a barotropic cyclone linedup with the composite abyssal cyclone.
Watts et al. (1995) assumed constant speed withinmeanders to test how well the gradient wind balance(cf. Holton 1992 or Palmen and Newton 1969) couldexplain observed thermocline tilt changes in meandertrough and crest axes. For absolute curvature of 0.014km21, the average agreement between the predicted andobserved thermocline slope was within 5%, which mightbe interpreted as evidence that the constant speed as-sumption is sound throughout the stream. However, be-cause they focused on regions of maximum curvaturein the crest or trough rather than on the nearly straightregions between crests and troughs, they did not detectthe jet streaks that were observed in the present study.
Although the idealization of a jet streak as the sum
1920 VOLUME 29J O U R N A L O F P H Y S I C A L O C E A N O G R A P H Y
FIG. 9. As in Fig. 3 except for the period of 22 March until 30 March 1989 in 2-day increments.
FIG. 10. As in Fig. 4 except for the period of 22 March until 30 March 1989.
AUGUST 1999 1921H O W D E N A N D W A T T S
FIG. 11. As in Fig. 5 except for 26 March 1989.
FIG. 12. The top panel shows time series of the position where the main thermocline depth is 600-m depth along a line through the arrayrunning nearly north to south through the ‘‘good’’ OI mapping region. The bottom panel shows a time series of the maximum alongstreamspeed changes at 400 m anywhere in the ‘‘good’’ mapping region where the speed is at least 40 cm s21. Both time series have been 10-daylow-pass filtered.
of a constant-structure baroclinic jet plus a barotropicvortex and cyclostrophic flow qualitatively generates jetstreaks, it appears to be quantitatively insufficient. Theresidual flow VR in Figs. 5, 8, and 11 still shows jetstreak structure. There are several possible causes forthis variability. The confluent and diffluent flow region
associated with the entrance and exit regions of the jetstreaks will act as positive and negative forcings, re-spectively, for frontogenesis. This in turn will changethe baroclinic shear and the upper-level jet due to thethermal wind relation. Lindstrom et al. (1997) diagnosedvigorous vertical motion exceeding 2 mm s21 (w) withinregions between crests and troughs and noted as asso-ciated frontogenetic process: twisting of the verticaltemperature gradient could increase the horizontal tem-perature gradient (and make the front narrower) byabout 30%. Hence, the observed vertical motion andassociated twisting may contribute to the observed jetstreaks.
c. Jet streak life cycle
The life cycle of jet streaks in the Gulf Stream, withrespect to developing meanders, appears to differ fromthat of jet streaks in the canonical life cycle of atmo-spheric jet streak/baroclinic wave development [as out-lined by Keyser and Shapiro (1986)]. The jet streaks inthe Gulf Stream can be characterized as being nearlyphase locked with the meanders, rather than ‘‘propa-gating through’’ the wave. Jet streaks are associated withstrong frontal regions; the two are intimately associatedvia thermal wind. In the Gulf Stream a strong frontalregion always exists: HR finds that temperature structureacross the stream from individual transects differs byonly 30% from the mean transect. In the atmosphere,at the level of maximum wind near the tropopause, thehorizontal thermal gradients are small (the meridionaltemperature gradient actually reverses near the tropo-pause and the thermal wind shear reverses direction).Jet streaks are thought to play a role in amplifying tro-popause undulations and creating horizontal tempera-ture gradients via adiabatic cooling (warming) in regionsof subsidence (rising motion). A consequence of therobust Gulf Stream front is that, unlike its atmosphericcounterpart, localized strong frontogenesis (which is as-sociated with jet streaks) is not required for cross-streammotion to create the strong horizontal divergences/con-
1922 VOLUME 29J O U R N A L O F P H Y S I C A L O C E A N O G R A P H Y
FIG. 13. Results of simple kinematic superposition of a meandering Gulf Stream with nearlyconstant alongstream speed and a barotropic vortex. The first column shows isotachs and stream-lines for a meandering stream at 400 (top) and 1000 m (bottom) depths. The second column showsthe same quantities contoured, but with a barotropic vortex present. The strengths of the currentsare typical of those observed in the SYNOP CenA (see the text for parameter values).
vergences that are necessary for baroclinic wave de-velopment (see, e.g., Lindstrom et al. 1997). Thus, it isnot surprising that the characteristic development of jetstreaks in steep meanders of the Gulf Stream differsfrom that of jet streaks in atmospheric midlatitude bar-oclinic waves.
d. Cross-stream ageostrophic flow
The equation for cross-stream horizontal ageostrophicvelocity y a
1 ]V ]V ]Vy 5 1 V 1 w (4)a [ ]f ]t ]s ]z
shows that alongstream speed changes (in the second
term on the right-hand side) result in cross-streamageostrophic flow: alongstream speed increases (de-creases) are associated with positive (negative) cross-stream ageostrophic flow. Cross-stream ageostrophicflow of as much as 25 cm s21 was diagnosed at 400-mdepth during the December 1988 event (Howden 1996).The presence of jet streaks, and their systematic phasingwith respect to meanders, leads to systematic patternsin the cross-stream ageostrophic flow (Howden 1996).In a companion paper (Howden 1999) the ageostrophicflow for the steep meander events is examined in detail.
8. SummaryIn summary, this study documents an aspect of Gulf
Stream variability, jet streaks, that has been overlooked

AUGUST 1999 1923H O W D E N A N D W A T T S
observationally. The existence of jet streaks goes be-yond both the rigid structure and the gradient wind ide-alizations of the stream, at least for the velocity struc-ture. Speeds in steep Gulf Stream meanders have beenobserved to depart by more than 625% from those ofa frontal coordinate mean. It was shown qualitativelythat the presence of the jet streaks can be substantiallyexplained by the superposition of a stream with a nearlyrigid cross-stream structure, a barotropic vortex and cy-clostrophic flow. As such, the phenomenon is differentfrom that of a growing varicose instability (e.g., Hogg1994; Pratt et al. 1991), which it resembles. The de-partures of the jet from a rigid cross-frontal structureare important dynamically because they lead to cross-stream ageostrophic flow and modified shear vorticity,which in turn creates asymmetries in total relative vor-ticity within troughs versus crests. Advection of thesevorticity asymmetries plays a role in baroclinic wavedevelopment in the atmosphere (e.g., Carlson 1991) andmay also in the Gulf Stream.
Acknowledgments. This research was supported bythe Office of Naval Research and by the National Sci-ence Foundation. S.H. acknowledges additional supportfrom an ONR-AASERT grant, a fellowship from theFriends of Oceanography at the Graduate School ofOceanography, and the Henry Farmer Award during hisPhD dissertation. Revisions were made at NASA/God-dard Space Flight Center while S.H. was funded by afellowship from Universities Space Research Associa-tion. We wish to thank Meghan Cronin, Xiaoshu Qian,Karen Tracey, and Tom Shay for their work in pro-cessing of the data. This work also benefited from help-ful discussions with Xiaoshu Qian, Karen Tracey, andDan Keyser. We also thank Tom Rossby for providingthe Pegasus data. We appreciate the helpful commentsof the anonymous reviewers as well as from the editor.
APPENDIX
Error Analysis
Error estimates for optimal interpolation come di-rectly from the procedure of minimizing the error of themapped quantity. OI is used to map any variable thatis linearly related to a set of measured variables. Theestimate is optimal in that the mean square error of themapped quantity relative to its actual value is mini-mized. For a set of variables to be estimated, the ithestimate is given by
5 f [ Ci A21f,21u C Ai u ,f ffi(A1)
where ui is the ith quantity estimated, u is the actualvariable of interest, f represents the measurements,
is the covariance between ui and f, and A is theCu ,fi
covariance between the f. The mean square error isgiven by
Ei 5 ^u2& 2 ,21 TC A Cu ,f ff u ,fi i(A2)
where the superscript T refers to the transpose.Because the divergent part of the horizontal velocity
is small, we employ a nondivergent velocity mappingtechnique. This allows us to map the streamfunction andits spatial derivatives (i.e., velocity components andtheir derivatives) from the velocity measurements usinga streamfunction covariance function Ccc(x, y) (Qianand Watts 1992). Any of the covariance or cross-co-variance functions can then be derived from
Cn,m(Dx, Dy) 5 LCcc(Dx, Dy), (A3)
where n and m represent velocity or spatial derivativeof velocity, determined as derivatives of the stream-function c and L is the corresponding derivative op-erator (linear operator) applied to the correlation func-tion (Bretherton et al. 1976). Another advantage is that,since it is easier to work with correlation functions ratherthan covariances, the streamfunction covariance can bescaled to be a correlation function and the scaling carriesthrough to all of the covariances by virtue of Eq. (A3).The normalization cancels in the mapped fields [Eq.(A1)], but it produces mapped error fields with units ofpercent variance.
The rescaling of the error fields into the same unitsas the mapped fields has been attacked in a number ofways. Cronin (1993) estimated the variance of eachmapped quantity by calculating the variance of themapped fields in a region of the maps where the errorswere relatively small. Watts et al. (1989) used the dif-ference between mapped fields and independently mea-sured fields to scale the errors. The only independentmeasures of current in the CenA are from baroclinicshears estimated from IESs (He et al. 1998). These canbe referenced by the deep velocity field, but the errorsin the estimated currents will be higher than the errorsfrom the directly measured velocities of the current me-ters. Therefore, the method of Cronin (1993) was usedand the errors as a percent of variance were multipliedwith the variance in the ‘‘good mapping’’ region. A keypoint is that instead of using the variance of the entire2-yr dataset, the average variance with respect to the31-day running mean field (that was subtracted prior tomapping) was used. In the low error mapping region(the nonshaded regions in the figures), errors in u andy are less than 6 cm s21 at 400 m. The errors in u or yare less than 4 and 3 cm s21 at depths 700 and 1000 m,respectively. The bias error (the error in the mean fields)was found to have a typical value of 20% of the standarddeviation error (Cronin 1993). At 400, 700, and 1000m these values are roughly 1.2, 0.8, and 0.6 cm s21,respectively. Conservative estimates of the errors in ei-ther u or y at 400, 700, and 1000 m are 8, 5, and 4 cms21, respectively.
The error in the speed V 5 u2 1 y 2 can be esti-Ïmated by
2 2u yd(V ) 5 du 1 dy , (A4)1 2 1 2! V V

1924 VOLUME 29J O U R N A L O F P H Y S I C A L O C E A N O G R A P H Y
against which the statistical significance of the jetstreaks has been judged.
The error in the residual flow VR can be found byadding the error of the velocity components in quad-rature for the upper-level flow, the abyssal flow, and thediagnosed cyclostrophic flow. The uncertainties in theabyssal flow are approximately 2 cm s21 for each com-ponent (Qian and Watts 1992). The uncertainties in thecyclostrophic flow are estimated to be nearly 4, 2, and1 cm s21 at depths 400, 700, and 1000 m, respectively(Howden 1996). The total error in the residual speed isthen estimated to be about 9, 6, and 5 cm s21 at 400,700, and 1000 m, respectively.
REFERENCES
Bell, G. D., and D. Keyser, 1993: Shear and curvature vorticity andpotential-vorticity interchanges: Interpretation and application toa cutoff cyclone event. Mon. Wea. Rev., 121, 76–102.
Bower, A. S., 1989: Potential vorticity balances and horizontal di-vergence along particle trajectories in Gulf Stream meanders eastof Cape Hatteras. J. Phys. Oceanogr., 19, 1669–1681., 1991: A simple kinematic mechanism for mixing fluid parcelsacross a meandering jet. J. Phys. Oceanogr., 21, 173–180.
Bretherton, F. P., R. E. Davis, and C. B. Fandry, 1976: A techniquefor objective analysis and design of oceanographic experimentsapplied to MODE-73. Deep-Sea Res., 23, 559–582.
Carlson, T. N., 1991: Mid-Latitude Weather Systems. Harper Collins,507 pp.
Chew, F., 1974: The turning process in meandering currents: A casestudy. J. Phys. Oceanogr., 4, 27–57.
Cronin, M., 1993: Eddy–mean flow interaction in the Gulf Stream at688 W. Ph.D. dissertation, University of Rhode Island, Kingston,RI, 131 pp. [Available from University Microfilm, 305 N. ZeebRd., Ann Arbor, MI 48106.], and D. R. Watts, 1996: Eddy–mean flow interaction in the GulfStream at 688W. Part I: Eddy energetics. J. Phys. Oceanogr., 26,2107–2131., K. L. Tracey, and D. R. Watts, 1992: Mooring motion correctionof the SYNOP Central Array current meter data. Tech. Rep. 92-4, Graduate School of Oceanography, University of Rhode Is-land, Kingston, RI, 114 pp. [Available from Pell Marine ScienceLibrary, University of Rhode Island, Narragansett, RI 02882.]
Halkin, D., and H. T. Rossby, 1985: The structure and transport ofthe Gulf Stream at 738W. J. Phys. Oceanogr., 15, 1439–1452.
Hall, M. M., and H. L. Bryden, 1985: Profiling the Gulf Stream witha current meter mooring. Geophys. Res. Lett., 12, 203–206.
He, Y. G., D. R. Watts, and K. L. Tracey, 1998: Determining geo-strophic velocity shear profiles with inverted echo sounders. J.Geophys. Res., 103, 5607–5622.
Hirschberg, P. A., and J. M. Fritsch, 1991: Tropopause undulationsand the development of extratropical cyclones. Part II: Diag-nostic analysis and conceptual model. Mon. Wea. Rev., 119, 518–550.
Hogg, N. G., 1991: Mooring motion corrections revisited. J. Atmos.Oceanic Technol., 8, 289–295., 1992: On the transport of the Gulf Stream between Cape Hat-teras and the Grand Banks. Deep-Sea Res., 39, 1231–1246., 1994: Observations of Gulf Stream meander-induced distur-bances. J. Phys. Oceanogr., 24, 2534–2545.
Holton, J. R., 1992: An Introduction to Dynamic Meteorology. Ac-ademic Press, 511 pp.
Howden, S. D., 1996: Processes associated with steep meander de-
velopment in the Gulf Stream near 688 W. Ph.D. dissertation,University of Rhode Island, Kingston, RI, 229 pp. [Availablefrom University Microfilm, 305 N. Zeeb Rd., Ann Arbor, MI48106.], 1999: The three-dimensional secondary circulation in devel-oping Gulf Stream meanders. J. Phys. Oceanogr., in press.
Johns, W. E., T. J. Shay, J. M. Bane, and D. R. Watts, 1995: GulfStream structure, transport, and recirculation near 688W. J. Geo-phys. Res., 100, 817–838.
Keyser, D., and M. A. Shapiro, 1986: A review of the structure anddynamics of upper-level frontal zones. Mon. Wea. Rev., 114,452–499.
Krishnamurti, T. N., 1968: A study of a developing wave cyclone.Mon. Wea. Rev., 96, 208–217.
Lindstrom, S. L., X. Qian, and D. R. Watts, 1992: Do oceanic cir-culations exhibit self-development characteristics? SYNOPti-cian, 3, 1–1., , and , 1997: Vertical motion in the Gulf Stream andits relation to meanders. J. Geophys. Res., 102, 8485–8503.
Loughe, A. F., C.-C. Lai, and D. Keyser, 1995: A technique for di-agnosing three-dimensional ageostrophic circulation in baro-clinic disturbances on limited-area domains. Mon. Wea. Rev.,123, 1476–1499.
Newton, C. W., and E. Palmen, 1963: Kinematic and thermal prop-erties of a large-amplitude wave in the westerlies. Tellus, 15,99–119.
Palmen, E., and C. W. Newton, 1969: Atmospheric Circulation Sys-tems. Academic Press, 603 pp.
Pratt, L. J., J. Earles, P. Cornillon, and J.-F. Cayula, 1991: The non-linear behavior of varicose disturbances in a simple model ofthe Gulf Stream. Deep-Sea Res., 38, S591–S622.
Qian, X., and D. R. Watts, 1992: The SYNOP experiment: Bottompressure maps for the Central Array May 1988 to August 1990.Tech. Rep. 92-73, University of Rhode Island, Graduate Schoolof Oceanography, Kingston, RI, 187 pp. [Available from PellMarine Science Library, University of Rhode Island, Narragan-sett, RI 02882.]
Savidge, D. K., 1997: Cyclogenesis in the deep Atlantic associatedwith Gulf Stream trough formation. Ph.D. thesis, University ofNorth Carolina, 73 pp. [Available from University Microfilm,305 N. Zeeb Rd., Ann Arbor, MI 48106.], and J. M. Bane, 1999a: Cyclogenesis in the deep ocean beneaththe Gulf Stream: 1. Description. J. Geophys. Res., in press., and , 1999b: Cyclogenesis in the deep ocean beneath theGulf Stream: 2. Dynamics. J. Geophys. Res., in press.
Shay, T. S., J. M. Bane, D. R. Watts, and K. L. Tracey, 1995: GulfStream flow field and events near 688W. J. Geophys. Res., 100,22 565–22 589.
Song, T., E. Carter, and H. T. Rossby, 1995: Lagrangian studies offluid exchange between the Gulf Stream and surrounding waters.J. Phys. Oceanogr., 25, 46–63.
Tracey, K. L., and D. R. Watts, 1991: The SYNOP experiment: Ther-mocline depth maps for the Central Array October 1987 to Au-gust 1990. GSO Tech. Rep. 91-5, Graduate School of Ocean-ography, University of Rhode Island, Kingston, RI, 193 pp.[Available from Pell Marine Science Library, University of Rho-de Island, Narragansett, RI 02882.], S. D. Howden, and D. R. Watts, 1997: IES calibration andmapping procedures. J. Atmos. Oceanic Technol., 14, 1483–1493.
Watts, D. R., K. L. Tracey, and A. I. Friedlander, 1989: Producingaccurate maps of the Gulf Stream thermal front using objectiveanalysis. J. Geophys. Res., 94, 8040–8052., J. M. Bane, K. L. Tracey, and T. J. Shay, 1995: Gulf Streampath and thermocline structure near 748W and 688W. J. Geophys.Res., 100, 18 291–18 312.