Potent Inhibitory Ligands of the GRB2 SH2 Domain from Recombinant Peptide Libraries
Upload
independentCategory
view
1download
0
Isoform-speci®c insertion near the Grb2-binding domain modulates theintrinsic guanine nucleotide exchange activity of hSos1
Jose M Rojas1,3, Marianne Subleski2, Juan JR Coque1, Carmen Guerrero1, Rosana Saez1,Bao-Qun Li2, Eva Lopez1, Natasha Zarich3, Pilar Aroca1, Toru Kamata2 and Eugenio Santos*,1
1Laboratory of Cellular and Molecular Biology, National Cancer Institute, National Institutes of Health, Bethesda, Maryland20892, USA and 2Laboratory of Biochemical Physiology, NCI-FCRDC, Frederick, Maryland 21071, USA
Two human hSos1 isoforms (Isf I and Isf II; Rojas et al.,Oncogene 12, 2291 ± 2300, 1996) de®ned by the presenceof a distinct 15 amino acid stretch in one of them, werecompared biologically and biochemically using represen-tative NIH3T3 transfectants overexpressing either one.We showed that hSos1-Isf II is signi®cantly moree�ective than hSos1-Isf I to induce proliferation ormalignant transformation of rodent ®broblasts whentransfected alone or in conjunction with normal H-Ras(Gly12). The hSos1-Isf II-Ras cotransfectants consis-tently exhibited higher saturation density, lower cell-doubling times, increased focus-forming activity andhigher ability to grow on semisolid medium and at lowserum concentration than their hSos1-Isf I-Ras counter-parts. Furthermore, the ratio of GTP/GDP bound tocellular p21ras was consistently higher in the hSos1-Isf II-transfected clones, both under basal and stimulatedconditions. However, no signi®cant di�erences weredetected in vivo between Isf I- and Isf II-transfectedclones regarding the amount, stability and subcellularlocalization of Sos1-Grb2 complex, or the level of hSos1phosphorylation upon cellular stimulation. Interestingly,direct Ras guanine nucleotide exchange activity assays incellular lysates showed that Isf II transfectants consis-tently exhibited about threefold higher activity than Isf Itransfectants under basal, unstimulated conditions.Microinjection into Xenopus oocytes of puri®ed peptidescorresponding to the C-terminal region of both isoforms(encompassing the 15 amino acid insertion area and the®rst Grb2-binding motif) showed that only the Isf IIpeptide, but not its corresponding Isf I peptide, was ableto induce measurable rates of meiotic maturation, andsynergyzed with insulin, but not progesterone, ininduction of GVBD. Our results suggest that theincreased biological potency displayed by hSos1-Isf IIis due to higher intrinsic guanine nucleotide exchangeactivity conferred upon this isoform by the 15 a.a.insertion located in proximity to its Grb2 binding region.
Keywords: hSos1; isoforms; Ras activation; GEFactivity; oocyte maturation
Introduction
Sos guanine nucleotide exchange proteins are known tomediate Ras activation induced by various tyrosinekinase receptors (reviewed in Boguski and McCormick,1993; Schlessinger, 1993; Downward, 1994; Feig 1994;Quilliam et al., 1995). A proposed mechanism suggeststhat recruitment of Sos to the plasma membrane viaformation of a complex with Grb2 adaptor proteins isresponsible for activation of the mature, membrane-bound Ras proteins (Egan and Weinberg, 1993;McCormick, 1993; Pawson and Schlessinger, 1993).The SH3 domains of Grb2 bind to speci®c proline-richsequences (PCCPPR) located in the C-terminal regionof Sos (Chardin et al., 1993; Li et al., 1993b; Rozakis-Adcock et al., 1993) and the stimulation of receptortyrosine kinase activity by growth factors accounts forgeneration of tyrosine phosphate residues anchoringthe Sos-Grb2 complex to the membrane through theSH2 domain of Grb2 (Lowenstein et al., 1992). Rapidassociation of Grb2-Sos complex to tyrosine-phos-phorylated species such as EGF receptor, Shc, IRS-1,and Syp has been demonstrated (Balstensperger et al.,1993; Rozakis-Adcock et al., 1993; Skolnik et al., 1993;Sasaoka et al., 1994; Tauchi et al., 1994). In thisrecruitment model, both the cytosolic and membrane-bound Sos forms are thought to exhibit similarcatalytic GEF activity, and no change of Sos catalyticactivity is supposed to occur as a consequence ofrelocation inside the cell. In support of this notion,constitutive or conditional membrane targeting of theseexchange factors has been shown to potentiate Rasactivation in transfected cells (Aronheim et al., 1994;Quilliam et al., 1994; Holsinger et al., 1995). However,some recent reports suggest that, irrespective ofsubcellular location, the intrinsic guanine nucleotidereleasing activity of Sos may be di�erent before andafter stimulation of surface tyrosine kinase receptors(Li et al., 1993a, 1995, 1996). Such a notion would beconsistent with other reports suggesting that the C-terminal portion of Sos may exert negative regulationover the activity of the whole Sos1 protein (Aronheimet al., 1994; Quilliam et al., 1994; Karlovich et al.,1995; McCollam et al., 1995; Wang et al., 1995; Byrneet al., 1996; Corbalan-Garcia et al., 1998).
The proline-rich, C-terminal region of Sos contains anumber of phosphorylation sites for MAPK and p90RSK-2 (Cherniack et al., 1994; Corbalan-Garcia et al.,1996; Rozakis-Adcock et al., 1995; Por®ri andMcCormick, 1996; Douville and Downward, 1997).While no change in Sos exchange activity has beendemonstrated in response to phosphorylation, binding
*Correspondence: E Santos3Current address: Unidad de Biologia Celular, Centro Nacional deBiologia Fundamental, Instituto de Salud Carlos III. 28220Majadahonda, Madrid, SpainReceived 24 April 1998; revised 26 August 1998; accepted 9 October1998
Oncogene (1999) 18, 1651 ± 1661ã 1999 Stockton Press All rights reserved 0950 ± 9232/99 $12.00
http://www.stockton-press.co.uk/onc
to Grb2 and Shc appears to be altered, and this mayplay a negative feedback role on the Ras pathway.
Recently, we identi®ed two distinct human Sos1isoforms (hSos1-Isf I and hSos1-Isf II) with di�erentGrb2 binding a�nity (Rojas et al., 1996). Theseisoforms di�er only by the presence in Isf II of a 15amino acid stretch located close the ®rst proline-richmotif required for Grb2 binding. Some human tissuesexpress only one isoform (fetal brain, and adult skeletalmuscle, liver, lung and pancreas) whereas othersexpress di�erent proportions of both in fetal andadult stages. In vitro binding assays and yeast two-hybrid analysis showed that hSos1-Isf II exhibitshigher Grb2 a�nity than hSos1-Isf I (Rojas et al.,1996).
In this report we generated permanent NIH3T3 celllines transfected with either isoform, and comparedtheir biological and biochemical properties. Represen-tative cell lines overexpressing Isf I and Isf II isoformswere characterized in terms of their growth andtransforming properties as well as their Ras.GTPcontent, guanine nucleotide exchange activity andamount and location of the Grb2-Sos1 complexes.The signi®cantly higher biological potency exhibited invarious biological assays by hSos1-Isf II in comparisonto hSos1-Isf I correlated with an intrinsically higherRas guanine nucleotide exchange activity, in theabsence of any signi®cant di�erences in the amountor subcellular location of Grb2-Sos1 complexes in thetransfectants.
Results
hSos1 isoforms I and II exhibit di�erent transformingability when expressed in NIH3T3 transfectants
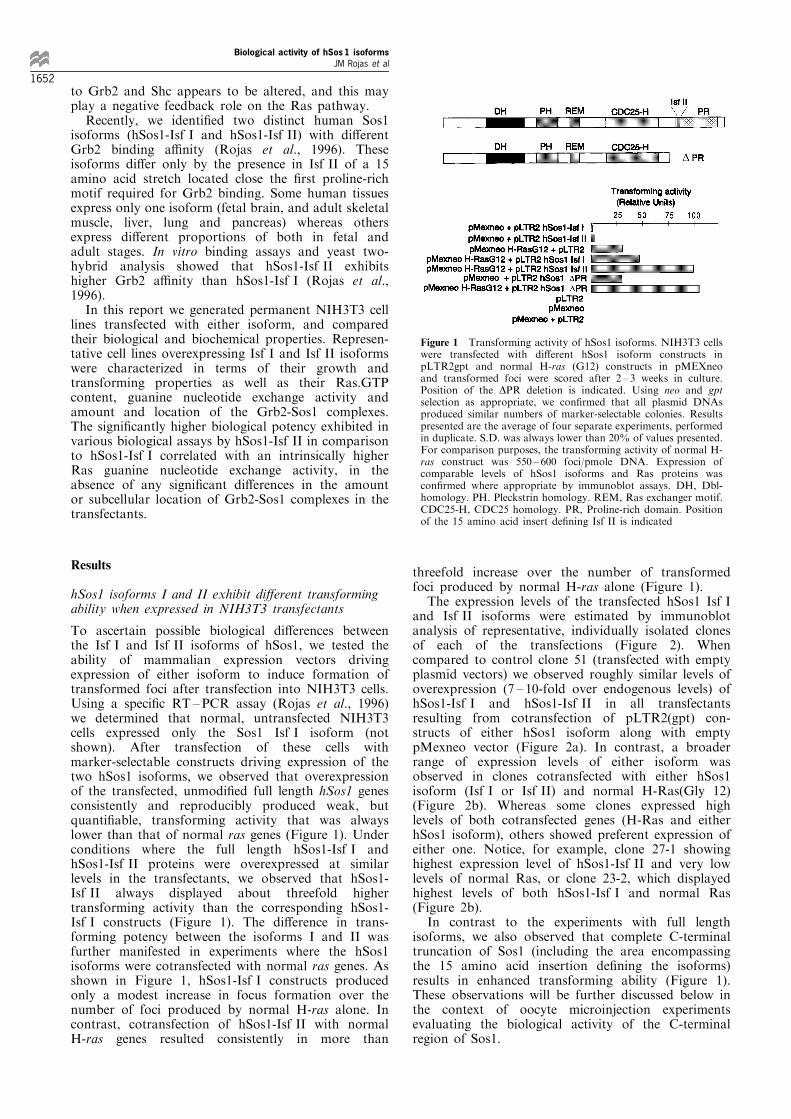
To ascertain possible biological di�erences betweenthe Isf I and Isf II isoforms of hSos1, we tested theability of mammalian expression vectors drivingexpression of either isoform to induce formation oftransformed foci after transfection into NIH3T3 cells.Using a speci®c RT ±PCR assay (Rojas et al., 1996)we determined that normal, untransfected NIH3T3cells expressed only the Sos1 Isf I isoform (notshown). After transfection of these cells withmarker-selectable constructs driving expression of thetwo hSos1 isoforms, we observed that overexpressionof the transfected, unmodi®ed full length hSos1 genesconsistently and reproducibly produced weak, butquanti®able, transforming activity that was alwayslower than that of normal ras genes (Figure 1). Underconditions where the full length hSos1-Isf I andhSos1-Isf II proteins were overexpressed at similarlevels in the transfectants, we observed that hSos1-Isf II always displayed about threefold highertransforming activity than the corresponding hSos1-Isf I constructs (Figure 1). The di�erence in trans-forming potency between the isoforms I and II wasfurther manifested in experiments where the hSos1isoforms were cotransfected with normal ras genes. Asshown in Figure 1, hSos1-Isf I constructs producedonly a modest increase in focus formation over thenumber of foci produced by normal H-ras alone. Incontrast, cotransfection of hSos1-Isf II with normalH-ras genes resulted consistently in more than
threefold increase over the number of transformedfoci produced by normal H-ras alone (Figure 1).
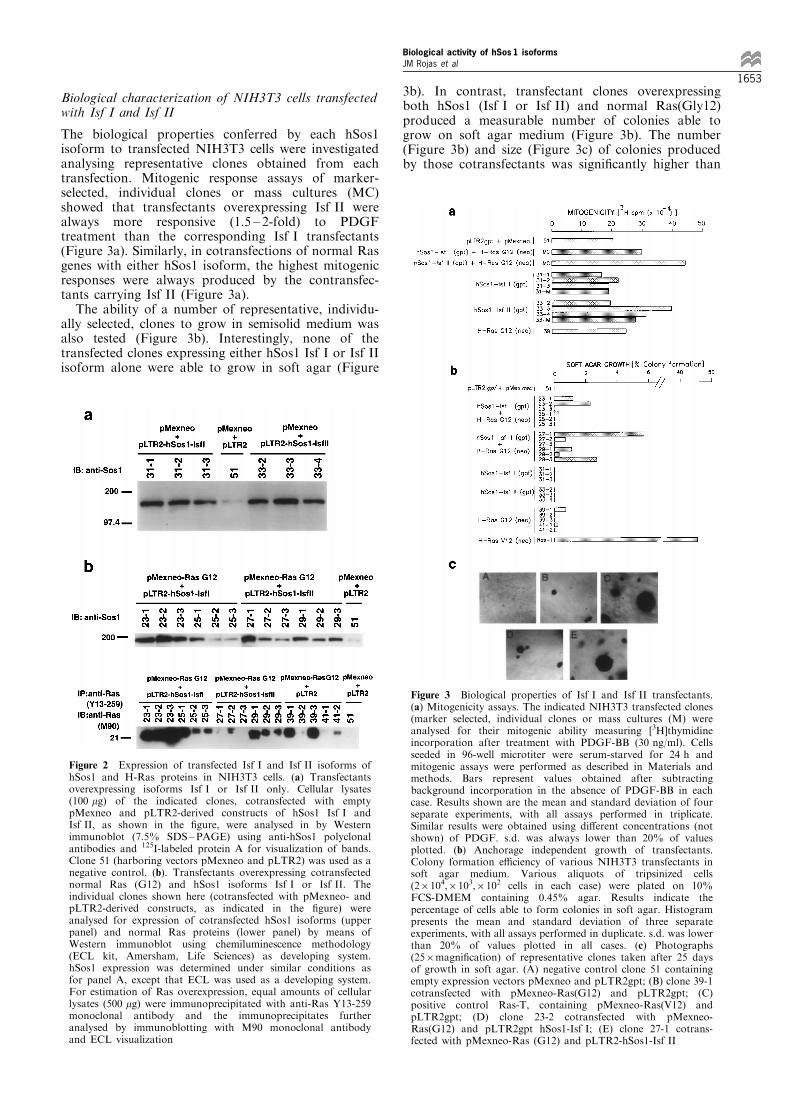
The expression levels of the transfected hSos1 Isf Iand Isf II isoforms were estimated by immunoblotanalysis of representative, individually isolated clonesof each of the transfections (Figure 2). Whencompared to control clone 51 (transfected with emptyplasmid vectors) we observed roughly similar levels ofoverexpression (7 ± 10-fold over endogenous levels) ofhSos1-Isf I and hSos1-Isf II in all transfectantsresulting from cotransfection of pLTR2(gpt) con-structs of either hSos1 isoform along with emptypMexneo vector (Figure 2a). In contrast, a broaderrange of expression levels of either isoform wasobserved in clones cotransfected with either hSos1isoform (Isf I or Isf II) and normal H-Ras(Gly 12)(Figure 2b). Whereas some clones expressed highlevels of both cotransfected genes (H-Ras and eitherhSos1 isoform), others showed preferent expression ofeither one. Notice, for example, clone 27-1 showinghighest expression level of hSos1-Isf II and very lowlevels of normal Ras, or clone 23-2, which displayedhighest levels of both hSos1-Isf I and normal Ras(Figure 2b).
In contrast to the experiments with full lengthisoforms, we also observed that complete C-terminaltruncation of Sos1 (including the area encompassingthe 15 amino acid insertion de®ning the isoforms)results in enhanced transforming ability (Figure 1).These observations will be further discussed below inthe context of oocyte microinjection experimentsevaluating the biological activity of the C-terminalregion of Sos1.
Figure 1 Transforming activity of hSos1 isoforms. NIH3T3 cellswere transfected with di�erent hSos1 isoform constructs inpLTR2gpt and normal H-ras (G12) constructs in pMEXneoand transformed foci were scored after 2 ± 3 weeks in culture.Position of the DPR deletion is indicated. Using neo and gptselection as appropriate, we con®rmed that all plasmid DNAsproduced similar numbers of marker-selectable colonies. Resultspresented are the average of four separate experiments, performedin duplicate. S.D. was always lower than 20% of values presented.For comparison purposes, the transforming activity of normal H-ras construct was 550 ± 600 foci/pmole DNA. Expression ofcomparable levels of hSos1 isoforms and Ras proteins wascon®rmed where appropriate by immunoblot assays. DH, Dbl-homology. PH. Pleckstrin homology. REM, Ras exchanger motif.CDC25-H, CDC25 homology. PR, Proline-rich domain. Positionof the 15 amino acid insert de®ning Isf II is indicated
Biological activity of hSos 1 isoformsJM Rojas et al
1652
Biological characterization of NIH3T3 cells transfectedwith Isf I and Isf II
The biological properties conferred by each hSos1isoform to transfected NIH3T3 cells were investigatedanalysing representative clones obtained from eachtransfection. Mitogenic response assays of marker-selected, individual clones or mass cultures (MC)showed that transfectants overexpressing Isf II werealways more responsive (1.5 ± 2-fold) to PDGFtreatment than the corresponding Isf I transfectants(Figure 3a). Similarly, in cotransfections of normal Rasgenes with either hSos1 isoform, the highest mitogenicresponses were always produced by the contransfec-tants carrying Isf II (Figure 3a).
The ability of a number of representative, individu-ally selected, clones to grow in semisolid medium wasalso tested (Figure 3b). Interestingly, none of thetransfected clones expressing either hSos1 Isf I or Isf IIisoform alone were able to grow in soft agar (Figure
3b). In contrast, transfectant clones overexpressingboth hSos1 (Isf I or Isf II) and normal Ras(Gly12)produced a measurable number of colonies able togrow on soft agar medium (Figure 3b). The number(Figure 3b) and size (Figure 3c) of colonies producedby those cotransfectants was signi®cantly higher than
Figure 2 Expression of transfected Isf I and Isf II isoforms ofhSos1 and H-Ras proteins in NIH3T3 cells. (a) Transfectantsoverexpressing isoforms Isf I or Isf II only. Cellular lysates(100 mg) of the indicated clones, cotransfected with emptypMexneo and pLTR2-derived constructs of hSos1 Isf I andIsf II, as shown in the ®gure, were analysed in by Westernimmunoblot (7.5% SDS±PAGE) using anti-hSos1 polyclonalantibodies and 125I-labeled protein A for visualization of bands.Clone 51 (harboring vectors pMexneo and pLTR2) was used as anegative control. (b). Transfectants overexpressing cotransfectednormal Ras (G12) and hSos1 isoforms Isf I or Isf II. Theindividual clones shown here (cotransfected with pMexneo- andpLTR2-derived constructs, as indicated in the ®gure) wereanalysed for expression of cotransfected hSos1 isoforms (upperpanel) and normal Ras proteins (lower panel) by means ofWestern immunoblot using chemiluminescence methodology(ECL kit, Amersham, Life Sciences) as developing system.hSos1 expression was determined under similar conditions asfor panel A, except that ECL was used as a developing system.For estimation of Ras overexpression, equal amounts of cellularlysates (500 mg) were immunoprecipitated with anti-Ras Y13-259monoclonal antibody and the immunoprecipitates furtheranalysed by immunoblotting with M90 monoclonal antibodyand ECL visualization
Figure 3 Biological properties of Isf I and Isf II transfectants.(a) Mitogenicity assays. The indicated NIH3T3 transfected clones(marker selected, individual clones or mass cultures (M) wereanalysed for their mitogenic ability measuring [3H]thymidineincorporation after treatment with PDGF-BB (30 ng/ml). Cellsseeded in 96-well microtiter were serum-starved for 24 h andmitogenic assays were performed as described in Materials andmethods. Bars represent values obtained after subtractingbackground incorporation in the absence of PDGF-BB in eachcase. Results shown are the mean and standard deviation of fourseparate experiments, with all assays performed in triplicate.Similar results were obtained using di�erent concentrations (notshown) of PDGF. s.d. was always lower than 20% of valuesplotted. (b) Anchorage independent growth of transfectants.Colony formation e�ciency of various NIH3T3 transfectants insoft agar medium. Various aliquots of tripsinized cells(26104,6103,6102 cells in each case) were plated on 10%FCS-DMEM containing 0.45% agar. Results indicate thepercentage of cells able to form colonies in soft agar. Histogrampresents the mean and standard deviation of three separateexperiments, with all assays performed in duplicate. s.d. was lowerthan 20% of values plotted in all cases. (c) Photographs(256magni®cation) of representative clones taken after 25 daysof growth in soft agar. (A) negative control clone 51 containingempty expression vectors pMexneo and pLTR2gpt; (B) clone 39-1cotransfected with pMexneo-Ras(G12) and pLTR2gpt; (C)positive control Ras-T, containing pMexneo-Ras(V12) andpLTR2gpt; (D) clone 23-2 cotransfected with pMexneo-Ras(G12) and pLTR2gpt hSos1-Isf I; (E) clone 27-1 cotrans-fected with pMexneo-Ras (G12) and pLTR2-hSos1-Isf II
Biological activity of hSos 1 isoformsJM Rojas et al
1653

those of clones only transfected with normal Ras,suggesting a cooperative e�ect between the hSos1isoforms and normal Ras to promote anchorageindependent growth. Taking into consideration thelevel of expression of the transfected hSos1 isoforms ineach of the clones analysed (Figure 2), it was apparentthat the clones expressing transfected Isf II exhibited asigni®cantly more pronounced synergism with normalRas than those cotransfected with Isf I (Figure 3b).Thus, clone 27-1, expressing highest levels of hSos1-Isf II (and low levels of H-Ras) produced the highestnumber of colonies growing in soft agar. Notice alsothat even in clones where the level of Isf II and Rasexpression was lower than in Isf I counterparts (Figure2b), the ability to grow in soft agar was still higher inthe case of those clones expressing Isf II (Figure 3b).
The double transfectants able to grow on soft agarwere also compared in regards to their growth rate inculture plates and their tumorigenicity in nude micetumor assays (Figure 4). Consistent with the results for
growth in soft agar, the double transfectants over-expressing Isf II showed signi®cantly shorter doublingtimes and higher saturation densities than thoseexpressing Isf I (Figure 4a), indicating a superiorcapability of Isf II to activate normal Ras proteins inthe cellular context. Subcutaneous inoculation of thesame transfected cells into athymic nude micecon®rmed the higher biological potency of Isf II overIsf I. Whereas the tumorigenicity of normal Ras geneswas almost nil, transfected cells overexpressing bothnormal Ras and either hSos1 isoform displayedsigni®cant tumorigenic activity (Figure 4a), indicatinga functional interaction between the cotransfected Rasgene and the hSos1 isoforms. Interestingly, and inagreement with the previous growth data, thetransfectants harboring the Isf II isoform exhibitedhigher rates, and faster kinetics, of tumorigenicity thantheir Isf I counterparts (Figure 4b). Four weeks afterinoculation all three Isf II clones tested displayed100% tumorigenicity, whereas only one (clone 23-1)of the Isf I clones showed a similar behavior.
Levels of endogenous Ras activation in NIH3T3transfectants overexpressing hSos1 Isf I and Isf II
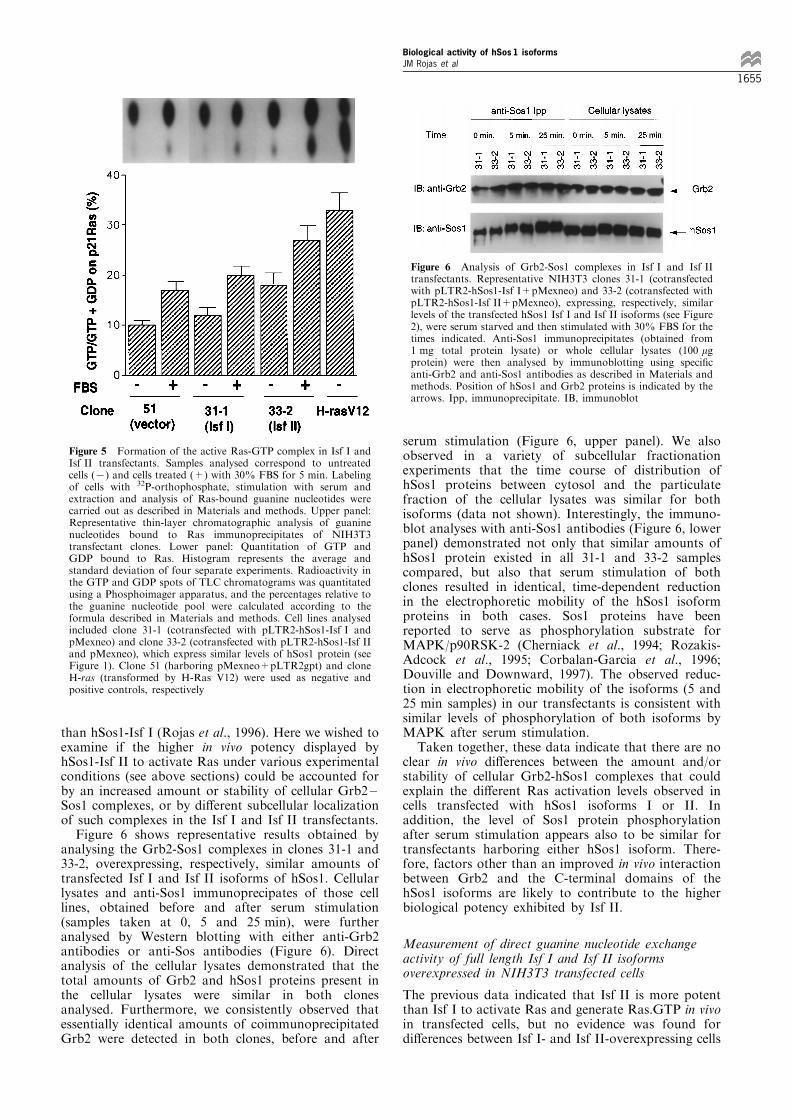
To investigate the molecular basis for the higherbiological potency exhibited by the Isf II isoform, weinitiated comparative studies of the biochemicalactivities associated with each of the isoforms in thetransfectants. Since Isf II showed a higher ability tocooperate with either endogenous or cotransfected Rasgenes in transformation and tumorigenicity assays, wedecided to measure the level of Ras.GTP formation instable transfectants overexpressing either isoform.Figure 5 shows representative results comparing thelevels of Ras.GTP in transfected clones 31-1 and 33-2expressing similar levels of hSos1-Isf I and hSos1-Isf IIrespectively, (Figure 2a) under basal (serum starved)and stimulated (fetal bovine serum, 5 min) conditions.As negative and positive controls, clone 51 (harboringempty vectors pMexneo and pLTR2) and H-Ras cells(transformed by transfected Ras(Val 12)) were analysedin parallel under similar conditions. As seen in Figure5, all clones responded to serum stimulation byincreasing the level of Ras.GTP in comparison totheir basal levels. Interestingly, the basal level ofRas.GTP in starved, unstimulated, Isf II-expressingcells was already almost as high as that measured inIsf I-expressing cells after stimulation by serum for5 min. The Isf I transfectants reached higher level ofRas.GTP content in response to serum stimulationthan control clone 51, transfected with empty vectors(Figure 5). Still, stimulation by serum resulted inhigher level of Ras.GTP formation in Isf II-expressingcells than in Isf I-expressing cells. These data furtherdemonstrate that hSos1-Isf II is signi®cantly moree�ective than hSos1-Isf I in promoting endogenousRas activation in vivo after cellular stimulation byoutside signals.
Interaction of cellular Grb2 with Isf I and Isf II isoformsof hSos1 in transfected cells
Using in vitro binding assays with GST-fusion proteinsand yeast two-hybrid analysis, we reported previouslythat hSos1-Isf II exhibited higher Grb2 binding a�nity
Figure 4 Growth properties and tumorigenic potency of Isf Iand Isf II transfectants. (a) Summary of growth properties ofdi�erent NIH3T3 transfectants. Cell doubling times andsaturation densities were measured as described in Materialsand methods in cultures of the indicated transfectants that wererefed every other day. Doubling time was determined by countingcells every 2 days. Saturation density is expressed here as thenumber of cells present in culture 8 days after reachingcon¯uence. Results shown are the mean+s.d. of threeindependent experiments where each sample was analysed intriplicate. Tumorigenicity data indicate incidence of tumorformation measured 4 weeks after subcutaneous inoculation ofthe indicated cells into athymic nude mice. (b) Kinetics of tumordevelopment in inoculated athymic mice. Results correspond tothe percentage of inoculated mice developing tumors at theindicated times. Values represented are the mean of the di�erentclones analysed. Ras (V-12) results are those of clone Ras-T. RasG12 results are those of clone 39-1; Vector results correspond tocontrol clone 51. Data labeled as Ras (G12)+Isf I correspond tothe mean of results obtained with individual clones 23-1, 23-2 and25-1. Data labeled as Ras (G12)+Isf II corresponds to mean ofthe results obtained with individual clones 27-1, 29-1 and 29-3
Biological activity of hSos 1 isoformsJM Rojas et al
1654
than hSos1-Isf I (Rojas et al., 1996). Here we wished toexamine if the higher in vivo potency displayed byhSos1-Isf II to activate Ras under various experimentalconditions (see above sections) could be accounted forby an increased amount or stability of cellular Grb2 ±Sos1 complexes, or by di�erent subcellular localizationof such complexes in the Isf I and Isf II transfectants.
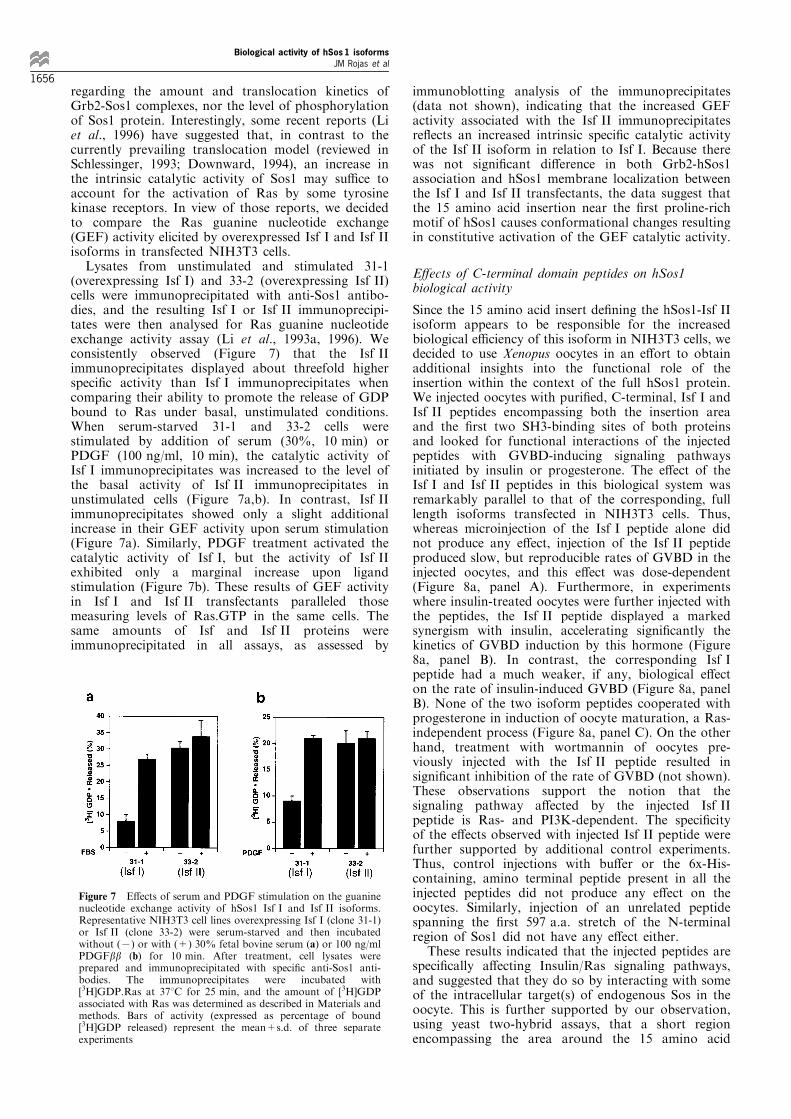
Figure 6 shows representative results obtained byanalysing the Grb2-Sos1 complexes in clones 31-1 and33-2, overexpressing, respectively, similar amounts oftransfected Isf I and Isf II isoforms of hSos1. Cellularlysates and anti-Sos1 immunoprecipates of those celllines, obtained before and after serum stimulation(samples taken at 0, 5 and 25 min), were furtheranalysed by Western blotting with either anti-Grb2antibodies or anti-Sos antibodies (Figure 6). Directanalysis of the cellular lysates demonstrated that thetotal amounts of Grb2 and hSos1 proteins present inthe cellular lysates were similar in both clonesanalysed. Furthermore, we consistently observed thatessentially identical amounts of coimmunoprecipitatedGrb2 were detected in both clones, before and after
serum stimulation (Figure 6, upper panel). We alsoobserved in a variety of subcellular fractionationexperiments that the time course of distribution ofhSos1 proteins between cytosol and the particulatefraction of the cellular lysates was similar for bothisoforms (data not shown). Interestingly, the immuno-blot analyses with anti-Sos1 antibodies (Figure 6, lowerpanel) demonstrated not only that similar amounts ofhSos1 protein existed in all 31-1 and 33-2 samplescompared, but also that serum stimulation of bothclones resulted in identical, time-dependent reductionin the electrophoretic mobility of the hSos1 isoformproteins in both cases. Sos1 proteins have beenreported to serve as phosphorylation substrate forMAPK/p90RSK-2 (Cherniack et al., 1994; Rozakis-Adcock et al., 1995; Corbalan-Garcia et al., 1996;Douville and Downward, 1997). The observed reduc-tion in electrophoretic mobility of the isoforms (5 and25 min samples) in our transfectants is consistent withsimilar levels of phosphorylation of both isoforms byMAPK after serum stimulation.
Taken together, these data indicate that there are noclear in vivo di�erences between the amount and/orstability of cellular Grb2-hSos1 complexes that couldexplain the di�erent Ras activation levels observed incells transfected with hSos1 isoforms I or II. Inaddition, the level of Sos1 protein phosphorylationafter serum stimulation appears also to be similar fortransfectants harboring either hSos1 isoform. There-fore, factors other than an improved in vivo interactionbetween Grb2 and the C-terminal domains of thehSos1 isoforms are likely to contribute to the higherbiological potency exhibited by Isf II.
Measurement of direct guanine nucleotide exchangeactivity of full length Isf I and Isf II isoformsoverexpressed in NIH3T3 transfected cells
The previous data indicated that Isf II is more potentthan Isf I to activate Ras and generate Ras.GTP in vivoin transfected cells, but no evidence was found fordi�erences between Isf I- and Isf II-overexpressing cells
Figure 5 Formation of the active Ras-GTP complex in Isf I andIsf II transfectants. Samples analysed correspond to untreatedcells (7) and cells treated (+) with 30% FBS for 5 min. Labelingof cells with 32P-orthophosphate, stimulation with serum andextraction and analysis of Ras-bound guanine nucleotides werecarried out as described in Materials and methods. Upper panel:Representative thin-layer chromatographic analysis of guaninenucleotides bound to Ras immunoprecipitates of NIH3T3transfectant clones. Lower panel: Quantitation of GTP andGDP bound to Ras. Histogram represents the average andstandard deviation of four separate experiments. Radioactivity inthe GTP and GDP spots of TLC chromatograms was quantitatedusing a Phosphoimager apparatus, and the percentages relative tothe guanine nucleotide pool were calculated according to theformula described in Materials and methods. Cell lines analysedincluded clone 31-1 (cotransfected with pLTR2-hSos1-Isf I andpMexneo) and clone 33-2 (cotransfected with pLTR2-hSos1-Isf IIand pMexneo), which express similar levels of hSos1 protein (seeFigure 1). Clone 51 (harboring pMexneo+pLTR2gpt) and cloneH-ras (transformed by H-Ras V12) were used as negative andpositive controls, respectively
Figure 6 Analysis of Grb2-Sos1 complexes in Isf I and Isf IItransfectants. Representative NIH3T3 clones 31-1 (cotransfectedwith pLTR2-hSos1-Isf I+pMexneo) and 33-2 (cotransfected withpLTR2-hSos1-Isf II+pMexneo), expressing, respectively, similarlevels of the transfected hSos1 Isf I and Isf II isoforms (see Figure2), were serum starved and then stimulated with 30% FBS for thetimes indicated. Anti-Sos1 immunoprecipitates (obtained from1 mg total protein lysate) or whole cellular lysates (100 mgprotein) were then analysed by immunoblotting using speci®canti-Grb2 and anti-Sos1 antibodies as described in Materials andmethods. Position of hSos1 and Grb2 proteins is indicated by thearrows. Ipp, immunoprecipitate. IB, immunoblot
Biological activity of hSos 1 isoformsJM Rojas et al
1655
regarding the amount and translocation kinetics ofGrb2-Sos1 complexes, nor the level of phosphorylationof Sos1 protein. Interestingly, some recent reports (Liet al., 1996) have suggested that, in contrast to thecurrently prevailing translocation model (reviewed inSchlessinger, 1993; Downward, 1994), an increase inthe intrinsic catalytic activity of Sos1 may su�ce toaccount for the activation of Ras by some tyrosinekinase receptors. In view of those reports, we decidedto compare the Ras guanine nucleotide exchange(GEF) activity elicited by overexpressed Isf I and Isf IIisoforms in transfected NIH3T3 cells.
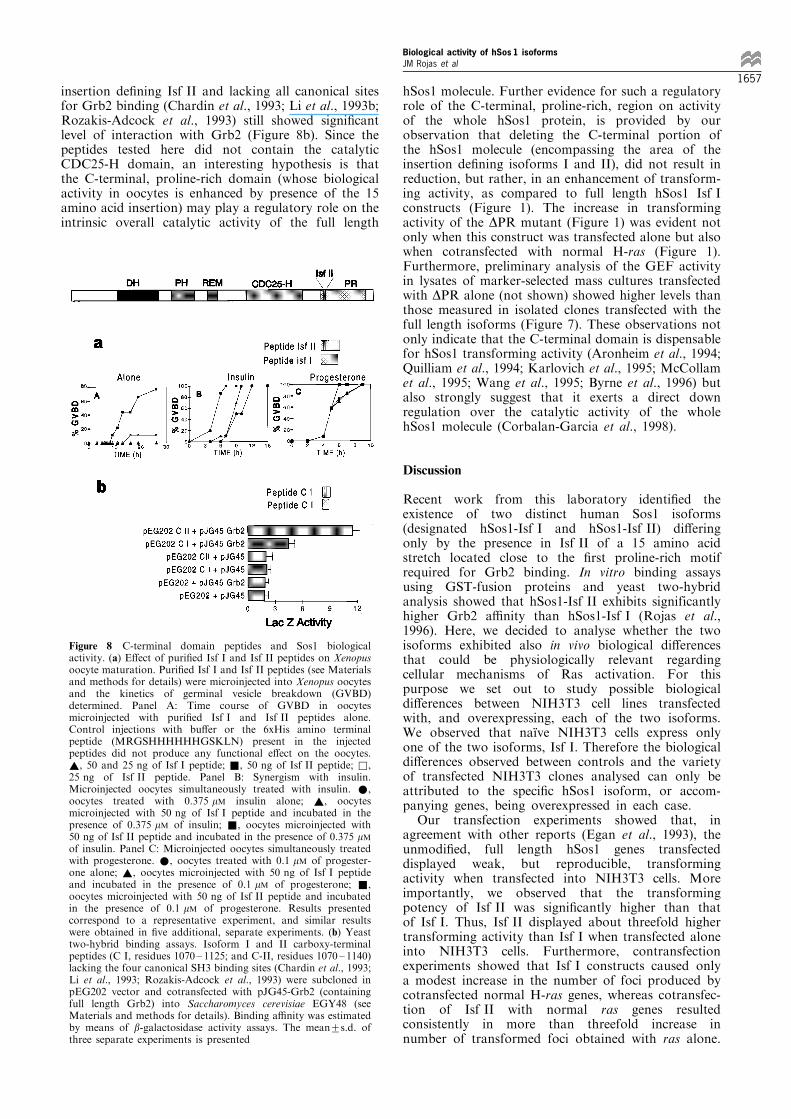
Lysates from unstimulated and stimulated 31-1(overexpressing Isf I) and 33-2 (overexpressing Isf II)cells were immunoprecipitated with anti-Sos1 antibo-dies, and the resulting Isf I or Isf II immunoprecipi-tates were then analysed for Ras guanine nucleotideexchange activity assay (Li et al., 1993a, 1996). Weconsistently observed (Figure 7) that the Isf IIimmunoprecipitates displayed about threefold higherspeci®c activity than Isf I immunoprecipitates whencomparing their ability to promote the release of GDPbound to Ras under basal, unstimulated conditions.When serum-starved 31-1 and 33-2 cells werestimulated by addition of serum (30%, 10 min) orPDGF (100 ng/ml, 10 min), the catalytic activity ofIsf I immunoprecipitates was increased to the level ofthe basal activity of Isf II immunoprecipitates inunstimulated cells (Figure 7a,b). In contrast, Isf IIimmunoprecipitates showed only a slight additionalincrease in their GEF activity upon serum stimulation(Figure 7a). Similarly, PDGF treatment activated thecatalytic activity of Isf I, but the activity of Isf IIexhibited only a marginal increase upon ligandstimulation (Figure 7b). These results of GEF activityin Isf I and Isf II transfectants paralleled thosemeasuring levels of Ras.GTP in the same cells. Thesame amounts of Isf and Isf II proteins wereimmunoprecipitated in all assays, as assessed by
immunoblotting analysis of the immunoprecipitates(data not shown), indicating that the increased GEFactivity associated with the Isf II immunoprecipitatesre¯ects an increased intrinsic speci®c catalytic activityof the Isf II isoform in relation to Isf I. Because therewas not signi®cant di�erence in both Grb2-hSos1association and hSos1 membrane localization betweenthe Isf I and Isf II transfectants, the data suggest thatthe 15 amino acid insertion near the ®rst proline-richmotif of hSos1 causes conformational changes resultingin constitutive activation of the GEF catalytic activity.
E�ects of C-terminal domain peptides on hSos1biological activity
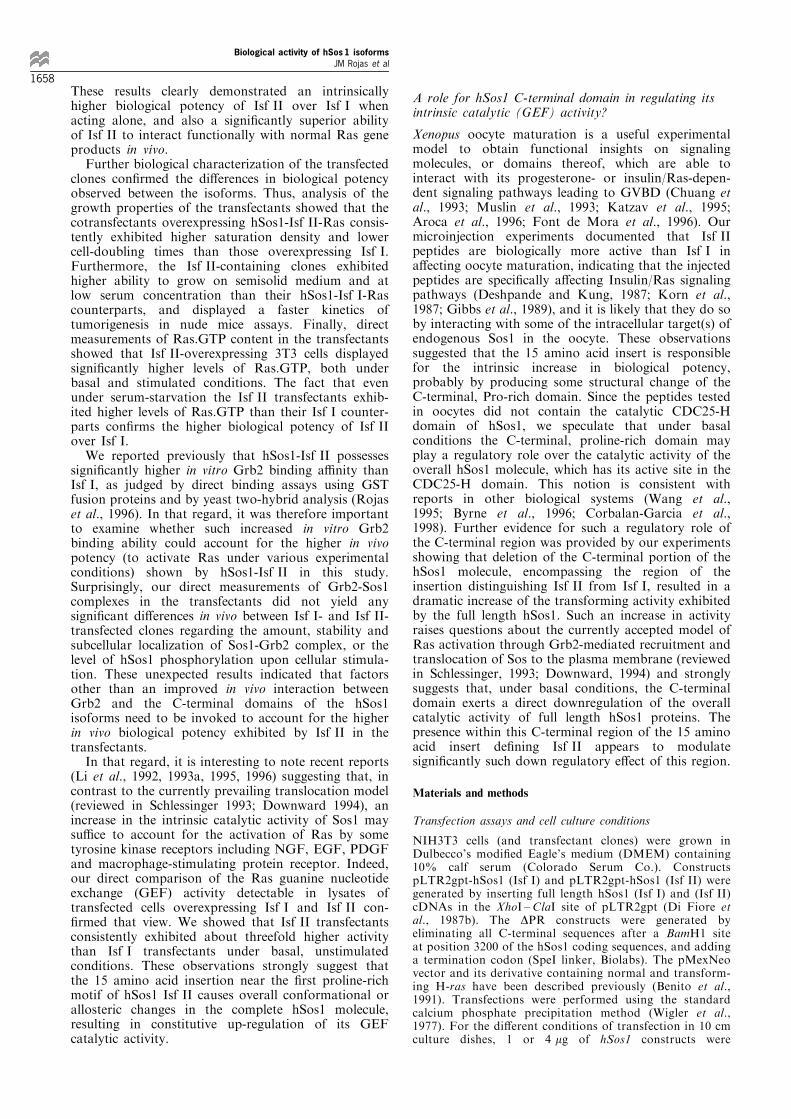
Since the 15 amino acid insert de®ning the hSos1-Isf IIisoform appears to be responsible for the increasedbiological e�ciency of this isoform in NIH3T3 cells, wedecided to use Xenopus oocytes in an e�ort to obtainadditional insights into the functional role of theinsertion within the context of the full hSos1 protein.We injected oocytes with puri®ed, C-terminal, Isf I andIsf II peptides encompassing both the insertion areaand the ®rst two SH3-binding sites of both proteinsand looked for functional interactions of the injectedpeptides with GVBD-inducing signaling pathwaysinitiated by insulin or progesterone. The e�ect of theIsf I and Isf II peptides in this biological system wasremarkably parallel to that of the corresponding, fulllength isoforms transfected in NIH3T3 cells. Thus,whereas microinjection of the Isf I peptide alone didnot produce any e�ect, injection of the Isf II peptideproduced slow, but reproducible rates of GVBD in theinjected oocytes, and this e�ect was dose-dependent(Figure 8a, panel A). Furthermore, in experimentswhere insulin-treated oocytes were further injected withthe peptides, the Isf II peptide displayed a markedsynergism with insulin, accelerating signi®cantly thekinetics of GVBD induction by this hormone (Figure8a, panel B). In contrast, the corresponding Isf Ipeptide had a much weaker, if any, biological e�ecton the rate of insulin-induced GVBD (Figure 8a, panelB). None of the two isoform peptides cooperated withprogesterone in induction of oocyte maturation, a Ras-independent process (Figure 8a, panel C). On the otherhand, treatment with wortmannin of oocytes pre-viously injected with the Isf II peptide resulted insigni®cant inhibition of the rate of GVBD (not shown).These observations support the notion that thesignaling pathway a�ected by the injected Isf IIpeptide is Ras- and PI3K-dependent. The speci®cityof the e�ects observed with injected Isf II peptide werefurther supported by additional control experiments.Thus, control injections with bu�er or the 6x-His-containing, amino terminal peptide present in all theinjected peptides did not produce any e�ect on theoocytes. Similarly, injection of an unrelated peptidespanning the ®rst 597 a.a. stretch of the N-terminalregion of Sos1 did not have any e�ect either.
These results indicated that the injected peptides arespeci®cally a�ecting Insulin/Ras signaling pathways,and suggested that they do so by interacting with someof the intracellular target(s) of endogenous Sos in theoocyte. This is further supported by our observation,using yeast two-hybrid assays, that a short regionencompassing the area around the 15 amino acid
Figure 7 E�ects of serum and PDGF stimulation on the guaninenucleotide exchange activity of hSos1 Isf I and Isf II isoforms.Representative NIH3T3 cell lines overexpressing Isf I (clone 31-1)or Isf II (clone 33-2) were serum-starved and then incubatedwithout (7) or with (+) 30% fetal bovine serum (a) or 100 ng/mlPDGFbb (b) for 10 min. After treatment, cell lysates wereprepared and immunoprecipitated with speci®c anti-Sos1 anti-bodies. The immunoprecipitates were incubated with[3H]GDP.Ras at 378C for 25 min, and the amount of [3H]GDPassociated with Ras was determined as described in Materials andmethods. Bars of activity (expressed as percentage of bound[3H]GDP released) represent the mean+s.d. of three separateexperiments
Biological activity of hSos 1 isoformsJM Rojas et al
1656
insertion de®ning Isf II and lacking all canonical sitesfor Grb2 binding (Chardin et al., 1993; Li et al., 1993b;Rozakis-Adcock et al., 1993) still showed signi®cantlevel of interaction with Grb2 (Figure 8b). Since thepeptides tested here did not contain the catalyticCDC25-H domain, an interesting hypothesis is thatthe C-terminal, proline-rich domain (whose biologicalactivity in oocytes is enhanced by presence of the 15amino acid insertion) may play a regulatory role on theintrinsic overall catalytic activity of the full length
hSos1 molecule. Further evidence for such a regulatoryrole of the C-terminal, proline-rich, region on activityof the whole hSos1 protein, is provided by ourobservation that deleting the C-terminal portion ofthe hSos1 molecule (encompassing the area of theinsertion de®ning isoforms I and II), did not result inreduction, but rather, in an enhancement of transform-ing activity, as compared to full length hSos1 Isf Iconstructs (Figure 1). The increase in transformingactivity of the DPR mutant (Figure 1) was evident notonly when this construct was transfected alone but alsowhen cotransfected with normal H-ras (Figure 1).Furthermore, preliminary analysis of the GEF activityin lysates of marker-selected mass cultures transfectedwith DPR alone (not shown) showed higher levels thanthose measured in isolated clones transfected with thefull length isoforms (Figure 7). These observations notonly indicate that the C-terminal domain is dispensablefor hSos1 transforming activity (Aronheim et al., 1994;Quilliam et al., 1994; Karlovich et al., 1995; McCollamet al., 1995; Wang et al., 1995; Byrne et al., 1996) butalso strongly suggest that it exerts a direct downregulation over the catalytic activity of the wholehSos1 molecule (Corbalan-Garcia et al., 1998).
Discussion
Recent work from this laboratory identi®ed theexistence of two distinct human Sos1 isoforms(designated hSos1-Isf I and hSos1-Isf II) di�eringonly by the presence in Isf II of a 15 amino acidstretch located close to the ®rst proline-rich motifrequired for Grb2 binding. In vitro binding assaysusing GST-fusion proteins and yeast two-hybridanalysis showed that hSos1-Isf II exhibits significantlyhigher Grb2 a�nity than hSos1-Isf I (Rojas et al.,1996). Here, we decided to analyse whether the twoisoforms exhibited also in vivo biological di�erencesthat could be physiologically relevant regardingcellular mechanisms of Ras activation. For thispurpose we set out to study possible biologicaldi�erences between NIH3T3 cell lines transfectedwith, and overexpressing, each of the two isoforms.We observed that naõÈ ve NIH3T3 cells express onlyone of the two isoforms, Isf I. Therefore the biologicaldi�erences observed between controls and the varietyof transfected NIH3T3 clones analysed can only beattributed to the speci®c hSos1 isoform, or accom-panying genes, being overexpressed in each case.
Our transfection experiments showed that, inagreement with other reports (Egan et al., 1993), theunmodi®ed, full length hSos1 genes transfecteddisplayed weak, but reproducible, transformingactivity when transfected into NIH3T3 cells. Moreimportantly, we observed that the transformingpotency of Isf II was signi®cantly higher than thatof Isf I. Thus, Isf II displayed about threefold highertransforming activity than Isf I when transfected aloneinto NIH3T3 cells. Furthermore, contransfectionexperiments showed that Isf I constructs caused onlya modest increase in the number of foci produced bycotransfected normal H-ras genes, whereas cotransfec-tion of Isf II with normal ras genes resultedconsistently in more than threefold increase innumber of transformed foci obtained with ras alone.
Figure 8 C-terminal domain peptides and Sos1 biologicalactivity. (a) E�ect of puri®ed Isf I and Isf II peptides on Xenopusoocyte maturation. Puri®ed Isf I and Isf II peptides (see Materialsand methods for details) were microinjected into Xenopus oocytesand the kinetics of germinal vesicle breakdown (GVBD)determined. Panel A: Time course of GVBD in oocytesmicroinjected with puri®ed Isf I and Isf II peptides alone.Control injections with bu�er or the 6xHis amino terminalpeptide (MRGSHHHHHHGSKLN) present in the injectedpeptides did not produce any functional e�ect on the oocytes.~, 50 and 25 ng of Isf I peptide; &, 50 ng of Isf II peptide; &,25 ng of Isf II peptide. Panel B: Synergism with insulin.Microinjected oocytes simultaneously treated with insulin. *,oocytes treated with 0.375 mM insulin alone; ~, oocytesmicroinjected with 50 ng of Isf I peptide and incubated in thepresence of 0.375 mM of insulin; &, oocytes microinjected with50 ng of Isf II peptide and incubated in the presence of 0.375 mMof insulin. Panel C: Microinjected oocytes simultaneously treatedwith progesterone. *, oocytes treated with 0.1 mM of progester-one alone; ~, oocytes microinjected with 50 ng of Isf I peptideand incubated in the presence of 0.1 mM of progesterone; &,oocytes microinjected with 50 ng of Isf II peptide and incubatedin the presence of 0.1 mM of progesterone. Results presentedcorrespond to a representative experiment, and similar resultswere obtained in ®ve additional, separate experiments. (b) Yeasttwo-hybrid binding assays. Isoform I and II carboxy-terminalpeptides (C I, residues 1070 ± 1125; and C-II, residues 1070 ± 1140)lacking the four canonical SH3 binding sites (Chardin et al., 1993;Li et al., 1993; Rozakis-Adcock et al., 1993) were subcloned inpEG202 vector and cotransfected with pJG45-Grb2 (containingfull length Grb2) into Saccharomyces cerevisiae EGY48 (seeMaterials and methods for details). Binding a�nity was estimatedby means of b-galactosidase activity assays. The mean+s.d. ofthree separate experiments is presented
Biological activity of hSos 1 isoformsJM Rojas et al
1657
These results clearly demonstrated an intrinsicallyhigher biological potency of Isf II over Isf I whenacting alone, and also a signi®cantly superior abilityof Isf II to interact functionally with normal Ras geneproducts in vivo.
Further biological characterization of the transfectedclones con®rmed the di�erences in biological potencyobserved between the isoforms. Thus, analysis of thegrowth properties of the transfectants showed that thecotransfectants overexpressing hSos1-Isf II-Ras consis-tently exhibited higher saturation density and lowercell-doubling times than those overexpressing Isf I.Furthermore, the Isf II-containing clones exhibitedhigher ability to grow on semisolid medium and atlow serum concentration than their hSos1-Isf I-Rascounterparts, and displayed a faster kinetics oftumorigenesis in nude mice assays. Finally, directmeasurements of Ras.GTP content in the transfectantsshowed that Isf II-overexpressing 3T3 cells displayedsigni®cantly higher levels of Ras.GTP, both underbasal and stimulated conditions. The fact that evenunder serum-starvation the Isf II transfectants exhib-ited higher levels of Ras.GTP than their Isf I counter-parts con®rms the higher biological potency of Isf IIover Isf I.
We reported previously that hSos1-Isf II possessessigni®cantly higher in vitro Grb2 binding a�nity thanIsf I, as judged by direct binding assays using GSTfusion proteins and by yeast two-hybrid analysis (Rojaset al., 1996). In that regard, it was therefore importantto examine whether such increased in vitro Grb2binding ability could account for the higher in vivopotency (to activate Ras under various experimentalconditions) shown by hSos1-Isf II in this study.Surprisingly, our direct measurements of Grb2-Sos1complexes in the transfectants did not yield anysigni®cant di�erences in vivo between Isf I- and Isf II-transfected clones regarding the amount, stability andsubcellular localization of Sos1-Grb2 complex, or thelevel of hSos1 phosphorylation upon cellular stimula-tion. These unexpected results indicated that factorsother than an improved in vivo interaction betweenGrb2 and the C-terminal domains of the hSos1isoforms need to be invoked to account for the higherin vivo biological potency exhibited by Isf II in thetransfectants.
In that regard, it is interesting to note recent reports(Li et al., 1992, 1993a, 1995, 1996) suggesting that, incontrast to the currently prevailing translocation model(reviewed in Schlessinger 1993; Downward 1994), anincrease in the intrinsic catalytic activity of Sos1 maysu�ce to account for the activation of Ras by sometyrosine kinase receptors including NGF, EGF, PDGFand macrophage-stimulating protein receptor. Indeed,our direct comparison of the Ras guanine nucleotideexchange (GEF) activity detectable in lysates oftransfected cells overexpressing Isf I and Isf II con-®rmed that view. We showed that Isf II transfectantsconsistently exhibited about threefold higher activitythan Isf I transfectants under basal, unstimulatedconditions. These observations strongly suggest thatthe 15 amino acid insertion near the ®rst proline-richmotif of hSos1 Isf II causes overall conformational orallosteric changes in the complete hSos1 molecule,resulting in constitutive up-regulation of its GEFcatalytic activity.
A role for hSos1 C-terminal domain in regulating itsintrinsic catalytic (GEF) activity?
Xenopus oocyte maturation is a useful experimentalmodel to obtain functional insights on signalingmolecules, or domains thereof, which are able tointeract with its progesterone- or insulin/Ras-depen-dent signaling pathways leading to GVBD (Chuang etal., 1993; Muslin et al., 1993; Katzav et al., 1995;Aroca et al., 1996; Font de Mora et al., 1996). Ourmicroinjection experiments documented that Isf IIpeptides are biologically more active than Isf I ina�ecting oocyte maturation, indicating that the injectedpeptides are speci®cally a�ecting Insulin/Ras signalingpathways (Deshpande and Kung, 1987; Korn et al.,1987; Gibbs et al., 1989), and it is likely that they do soby interacting with some of the intracellular target(s) ofendogenous Sos1 in the oocyte. These observationssuggested that the 15 amino acid insert is responsiblefor the intrinsic increase in biological potency,probably by producing some structural change of theC-terminal, Pro-rich domain. Since the peptides testedin oocytes did not contain the catalytic CDC25-Hdomain of hSos1, we speculate that under basalconditions the C-terminal, proline-rich domain mayplay a regulatory role over the catalytic activity of theoverall hSos1 molecule, which has its active site in theCDC25-H domain. This notion is consistent withreports in other biological systems (Wang et al.,1995; Byrne et al., 1996; Corbalan-Garcia et al.,1998). Further evidence for such a regulatory role ofthe C-terminal region was provided by our experimentsshowing that deletion of the C-terminal portion of thehSos1 molecule, encompassing the region of theinsertion distinguishing Isf II from Isf I, resulted in adramatic increase of the transforming activity exhibitedby the full length hSos1. Such an increase in activityraises questions about the currently accepted model ofRas activation through Grb2-mediated recruitment andtranslocation of Sos to the plasma membrane (reviewedin Schlessinger, 1993; Downward, 1994) and stronglysuggests that, under basal conditions, the C-terminaldomain exerts a direct downregulation of the overallcatalytic activity of full length hSos1 proteins. Thepresence within this C-terminal region of the 15 aminoacid insert de®ning Isf II appears to modulatesigni®cantly such down regulatory e�ect of this region.
Materials and methods
Transfection assays and cell culture conditions
NIH3T3 cells (and transfectant clones) were grown inDulbecco's modi®ed Eagle's medium (DMEM) containing10% calf serum (Colorado Serum Co.). ConstructspLTR2gpt-hSos1 (Isf I) and pLTR2gpt-hSos1 (Isf II) weregenerated by inserting full length hSos1 (Isf I) and (Isf II)cDNAs in the XhoI ±ClaI site of pLTR2gpt (Di Fiore etal., 1987b). The DPR constructs were generated byeliminating all C-terminal sequences after a BamH1 siteat position 3200 of the hSos1 coding sequences, and addinga termination codon (SpeI linker, Biolabs). The pMexNeovector and its derivative containing normal and transform-ing H-ras have been described previously (Benito et al.,1991). Transfections were performed using the standardcalcium phosphate precipitation method (Wigler et al.,1977). For the di�erent conditions of transfection in 10 cmculture dishes, 1 or 4 mg of hSos1 constructs were
Biological activity of hSos 1 isoformsJM Rojas et al
1658
transfected, alone or in combination with 0.5 or 0.1 mg ofnormal H-ras. Morphologically transformed foci werescored after 2 ± 3 weeks in culture. Transfected cells werealso selected in medium supplemented, as appropriate, withGeneticin (G418, Gibco/BRL, 750 mg/ml) and/or killerHAT (16HAT, 250 mg/ml xanthine, and 2.5 mg/mlmycophenolic acid). Expression of the hSos1 and Rasproteins in mass cultures and selected, stably transfected,clones was measured, respectively, by immunoblotting orimmunoprecipitation and immunoblotting, with speci®cantibodies [hSos1: SC256 antiserum, Santa Cruz Bio-technologies; Ras: Y13-2159 and M-90 monoclonalantibodies (Lacal et al., 1986; Sorrentino et al., 1989)].As negative controls, vectors pLTR2gpt and pMexNeo,alone or in combination, were transfected under similarconditions.
Immunoprecipitation and immunoblotting analysis
Nearly con¯uent cells were lysed in 1% Triton X-100bu�er (50 mM HEPES pH 7.4, 150 mM NaCl, 1.5 mM
MgCl2, 5 mM EGTA, 1% Triton X-100, 10% glycerol,10 mg/ml aprotinin and leupeptin, 1 mM PMSF, 1 mM
sodium orthovanadate). Immunoprecipitation of Rasproteins was done by incubation of the clari®ed (bycentrifugation) cell lysates with Y13-259 Ras monoclonalantibody (12.5 mg/ml) and protein A-Sepharose beads(Pharmacia, Uppsala, Sweden) precoated with rabbit anti-rat IgG (Cappel) for 3 h at 48C. Analysis of Grb2-Sos1 invivo complexes was performed with hSos1-(Isf I and Isf II)NIH transfectant clones. Cells were grown in CS (10%)-containing DMEM until 90% of con¯uence (160 mmplates), at which time the medium was removed and cellswere refed with FBS (0%)-containing DMEM, 20 mM
HEPES pH 7.5, 0.5% BSA (lipid free). After 18 h instarvation conditions FBS (30%)-containing DMEM wasadded and the cells were lysed at di�erent times (0, 5 and25 min). The cell lysates were clari®ed by centrifugation.Immunoprecipitation of hSos1 proteins was done byincubation of the supernatants with anti-hSos1 monoclo-nal antibody (Transduction Laboratories, Lexington, KY,USA), and protein A-Sepharose beads precoated withrabbit anti-mouse IgG (Cappel) for 16 h at 48C. In allcases the immune complexes were washed three times with1% Triton X-100 bu�er, resuspended in Laemmli samplebu�er and boiled for 5 min, and the samples were loadedonto SDS-polyacrylamide gels.
For immunoblotting analysis the material on thepolyacrylamide gels were transferred to polyvinilidenedi¯uoride membranes (Immobilon-P, Millipore) in a Hoe�erelectroblotting tank for 9 h at 0.7 amp. Filters were blockedfor 90 min at room temperature in 5% nonfat dry milk,16TTBS (50 mM Tris pH 8.0, 150 mM NaCl, 0.05% Tween-20), and probed with anti-Grb-2 monoclonal antibody(Transduction Laboratories, Lexington, KY, USA), withanti-Sos antiserum C-20 (Santa Cruz Biotechnology, SantaCruz, CA, USA), or with anti-Ras monoclonal antibody M-90 for 2 h at room temperature in 0.5% BSA, 16TTBS. The®lters were washed ®ve times in 16TTBS, and incubated for1 h at room temperature with horseradish peroxidase (HRP)-conjugated anti-mouse antibody or HRP-conjugated anti-rabbit antibody in 16TTBS for enhanced chemiluminescence(ECL) (Amersham, Arlington Heights, IL, USA). Alterna-tively the immunoblots were processed using 125I-labeledprotein A (Amersham, Arlington Heights, IL, USA)(2.46105 cpm) for 30 min, washed extensively, and exposedto Kodak X OMAT-AR ®lm.
[3H]thymidine incorporation asays
Incorporation of [3H]thymidine into NIH3T3 cell cloneswas assayed with cultures that had been seeded at a density
of 26105 cells/0.2 ml/well in 96-well microtiter dishesprecoated with ®bronectin. At con¯uence, the mediumwas changed to serum-free DMEM supplemented with30 nM Na2SeO3 and 5 mg/ml transferrin. PDGF-bb (30 ng/ml) was added as appropriate to the culture 24 h after theswitch to serum-free medium. Incorporation of[3H]thymidine (1 mCi/well) was monitored for 6 h begin-ning 17 h after addition of PDGF-bb. The cells werewashed once with Ca2+, Mg2+-free PBS and twice with 5%TCA. They were solubilized with 0.25 M NaOH and theradioactivity was counted with a liquid scintillationcounter.
Cell proliferation and tumorigenicity assays
For analysis of proliferation in semisolid medium (softagar assay) 104, 103 and 102 cells were suspended in 0.4%agarose (SeaPlaque; FMC) in FCS (10%)-containingDMEM as described elsewhere (Di Fiore et al., 1987a).Colonies were stained and scored 25 days later. Foranalysis of tumor-forming capacity, about 16105 to2.56105 cells were injected subcutaneously into athymicnude mice (Heidaran et al., 1990). Tumor occurrence andsize were monitored at least weekly. The measurement oflow-serum, doubling time and saturation density wascarried out by a modi®cation of previously describedmethods (Chan et al., 1993). NIH3T3 transfectants wereseeded at a density of 46104 cells/60 mm plate in CS(10%)-containing DMEM. Cells were counted 24 h later,and this was considered day 0. The remaining cultures wereincubated either in low (0.5%) or high (10%) serum-containing DMEM and replenished every 2 days. Cellswere trypsinized and counted by hemocytometer every 2days. Some of the cells grown under high serum conditionswere allowed to reach con¯uence and were counted 8 dayslater.
In vivo guanine nucleotide binding analysis
The GTP/GDP ratio of nucleotides bound to cellularp21Ras was quantitated in NIH3T3 transfectant cellslabeled homogeneously with 32P following proceduresdescribed previously (Benito et al., 1991; Heidaran et al.,1992). Con¯uent NIH3T3 cultures in 15-cm-diameterculture dishes were serum-starved overnight, incubated for1 h in phosphate-free DMEM, and then incubated for anadditional 6-h period in the same medium containing0.5 mCi/ml [32P]orthophosphate (Du Pont-New EnglandNuclear). To test the e�ect of serum the cells werestimulated with FBS (30%)-containing DMEM for 5 min.Cells were then washed with cold PBS containing 1 mM
sodium orthovanadate and then lysed and scrapped in0.6 ml of a solution containing 50 mM Tris/HCl pH 7.5,20 mM MgCl2, 150 mM NaCl, 0.5% Nonidet P-40, 1 mM
sodium orthovanadate, 1 mM phenylmethylsulfonyl fluor-ide, 10 mg/ml of aprotinin and leupeptin, and 25 mg/ml ofanti-Ras monoclonal antibody Y13-259. The lysates werecentrifuged at 48C for 5 min. Supernatants were thenprecleared by shaking with activated charcoal [previouslytreated with 10 mg/ml bovine serum albumin (BSA) over-night] for 15 min at 48C. Charcoal was removed bycentrifugation, and the supernatants were immunoprecipi-tated with Y13-259 Ras monoclonal antibody (12.5 mg/ml)and protein A beads precoated with rabbit anti-rat IgG. Theimmune complexes were washed three times with lysis bu�erand twice with 20 mM Tris/HCl pH 7.5, 20 mM MgCl2 andthen eluted with 1 M KH2PO4 pH 3.4, 5 mM EDTA. Theeluate was then heated at 858C for 3 min, centrifuged andspotted (equal counts from each supernatant) onto a TLCsheet of polyethyleneimine-¯uorescent cellulose. The chro-matogram was developed with 1 M KH2PO4 pH 3.4, bu�eras previously described (Gibbs et al., 1987; Satoh et al.,
Biological activity of hSos 1 isoformsJM Rojas et al
1659
1990). Quantitation of the radioactivity corresponding tothe GDP and GTP spots was done using a Phosphoimager(Molecular Dynamics) apparatus. The percentage of GTP inrelation to the total nucleotide pool (GTP+GDP) wascalculated taking into account the di�erent phosphoruscontents of GTP and GDP with the formula:%GTP=GTP6100/GDP61.5+GTP.
Ras guanine nucleotide exchange factor assay
Cells were serum-starved in the presence of 1% fetal bovineserum for 12 h. Cells treated without or with fetal bovineserum (30%) or PDGF (100 ng/ml) for 10 min werewashed with phosphate-bu�ered saline and extracted withbu�er A [50 mM Tris-Cl pH 7.5, 100 mM NaCI, 0.5% NP-40, 12 mM MgCl2, 10 mM NaF, 1 mM Na orthovanadate,leupeptin (10 mg/ml), pepstatin (10 mg/ml] by shaking for20 min at 48C. Lysates were spun at 100 000 g for 10 min,and the supernatant were immunoprecipitated with rabbitanti-SOS-1 antibody (1 mg; Santa Cruz Biotechnologies)for 90 min at 48C. The immune complexes retained ontoprotein A-Sepharose (Pharmacia) were washed four timeswith 1 ml of bu�er B [20 mM Tris HCl, pH 7.5, 1 mM
MgCl2, 10 mM NaCl, 1 mM dithiothreitol, bovine serumalbumin (50 mg/ml), leupeptin (10 mg/ml), and pepstatin(10 mg/ml)], as described (Li et al., 1993a, 1996). Then, theimmunoprecipitates were reacted with [3H]GDP.Ras(0.4 mg) binary complexes in 100 ml of the reaction mixturefor 25 min at 378C by constant agitation as described (Li etal., 1993a, 1996). [3H]GDP-Ras complexes were preparedby incubating bacterially made wild-type H-Ras proteinswith 0.2 mCi of [3H]GDP (10-15 Ci/mmol, Amersham) asdescribed previously (Li et al., 1993a, 1996).
Expression and puri®cation of 66His-tagged Isf I and Isf II
The same sequence of Isf I and Isf II described before(Rojas et al., 1996) [C-terminal coding regions of Isf I(residues 1070 ± 1176) and Isf II (residues 1070 ± 1191)]were subcloned into the pQE-30 plasmid (Qiagen),encoding a six-histidine amino-terminal tag. Isf I and Isf IIfusion proteins were expressed in M15 Escherichia coli cellsharboring plasmid pREP4 (Qiagen). Puri®cation protocolwas essentially as follows. Brie¯y, bacterial cells inducedwith 0.2 mM isopropyl-l-thio-b-D-galactopyranoside for 3 hwere harvested, resuspended in 20 mM Tris/HCl pH 8.0,50 mM phosphate bu�er pH 8.0, 300 mM NaCl, 10 mg/mlaprotinin and leupeptin, 1 mM PMSF, and sonicate. Aftercentrifugation [10 min/12 000 r.p.m/48C/SS34 rotor (Sor-vall)] the pellets were re-extracted with the same bu�er. Allsupernatant material extracted was passed through a Ni-NTA resin column (Qiagen), and the proteins retained wereeluted using 250 mM imidazol bu�er (pH 6.3). Elutedprotein fractions containing the puri®ed Isf I and Isf IIproteins were then submitted to stepwise dialysis in: ®rst(1 mM Tris/HCl pH 7.5, 0.1 mM PMSF, 150 mM NaCl,1 mM b-mercaptoethanol), second (1 mM Tris/HCl pH 7.5,75 mM NaCl, 0.5 mM b-mercaptoethanol) and, ®nally(0.5 mM Tris/HCl pH 7.5). The puri®ed proteins equili-
brated in 0.5 mM Tris/HCl bu�er (pH 7.5) were ®nallyconcentrated using Centricon 3 ®lters (Amicon), and usedat a concentration of 1 mg/ml in all microinjection assays.Both proteins were always more than 95% homogeneous asjudged by Coomassie blue staining of SDS/polyacrylamidegels.
Oocyte preparation and microinjection
Oocyte preparation and microinjection were as described(Font de Mora et al., 1996). For induction of meioticmaturation, groups of 10 ± 30 oocytes were incubated intoND-96 medium without KCl (5 mM HEPES, 96 mM NaCl,1 mM MgCl2, 1.8 mM CaCl2, pH 7.8, and 10 mg/ml each ofpenicillin and streptomycin sulfate) in the presence ofprogesterone (15 mM, Sigma) or insulin (7.5 mM, Sigma), orwere microinjected into the cytoplasm with 30 ± 60 nl ofpuri®ed Isf I or Isf II (in 20 mM Tris-HCl, pH 7.5) orappropriate controls. Total volume injected was alwayskept under 60 nl per oocyte. Control oocytes microinjectedwith either bu�er alone or up to 8 molar excess (6 ng peroocyte) of the 66His-containing peptide (MRGSHHHHHHGSKLN) located at the amino terminus of theinjected, 66His-tagged Isf I and Isf II did not undergogerminal vesicle breakdown (GVBD). Meiotic maturationwas assayed by scoring the disappearance of the nucleus(GVBD) in oocytes ®xed with 10% trichloracetic acid. Inmost cases, the absence of the nucleus correlated with theappearance of a white spot in the animal pole.
Yeast two-hybrid binding assays of Grb2 with the hSos1C-terminus shorter portions
Two C-terminal hSos1 fragments (C-I, residues 1070 ±1125; and C-II, residues 1070 ± 1140), were subcloned intoplasmid pEG202, encoding an amino-terminal Lex ADNA-binding domain. The full-length coding sequencefor Grb2 was subcloned into plasmid pJG45, encoding anamino-terminal B42 activation domain. Saccharomycescerevisiae EGY48 strain was cotransfected with pEG202-(C I or C II) together with pJG45-Grb2, or with the emptyplasmid vectors (as negative controls). Binding a�nity wasestimated as the LacZ gene expression activity (by b-galactosidase detection) following previously describedprocedures (Rojas et al., 1996). EGY48 strain andplasmids pEG202 and pJG45 were the kind gift of RBrent (Mendelson and Brent, 1994).
AcknowledgmentsHelpful suggestions and support from Drs M Alimandi, JRubin and W Taylor are gratefully acknowledged. JJRCwas a postdoctoral fellow from Fundacion Ramon Areces,Spain and NZ was a predoctoral fellow from Instituto deSalud Carlos III (Spain). JMR was supported in part bygrant DGICYT (PM95-0053).
References
Aronheim A, Engelberg LN, Al-Alawi N, Schlessinger J andKarin M. (1994). Cell, 78, 949 ± 961.
Aroca P, Mahadevan D and Santos E. (1996). Oncogene, 13,1839 ± 1846.
Baltensperger K, Kozma LM, Cherniack AD, Klarlund JK,Chawla A, Banerjee U and Czech MP. (1993). Science,260, 1950 ± 1952.
Benito M, Porras A, Nebreda AR and Santos E. (1991).Science, 253, 565 ± 568.
Boguski MS and McCormick F. (1993). Nature, 366, 643 ±654.
Buday L and Downward J. (1993). Cell, 73, 611 ± 620.Byrne JL, Paterson HF and Marshall CJ. (1996). Oncogene,
13, 2055 ± 2065.Chan AML, Fleming TP, McGovern ES, Chedid M, Miki T
and Aaronson SA. (1993). Mol. Cell. Biol., 13, 762 ± 768.
Biological activity of hSos 1 isoformsJM Rojas et al
1660
Chardin P, Camonis JH, Gale NW, Van Aelst L, Schles-singer J, Wigler MH and Bar-Sagi D. (1993). Science, 260,1338 ± 1343.
Cherniack AD, Klarlund JK and Czech MP. (1994). J. Biol.Chem., 269, 4717 ± 4720.
Chuang LM, Myers MG, Backer JM, Shoelson SE, White M,Birnbaum MJ and Khan R. (1993). Mol. Cell. Biol., 13,6653 ± 6660.
Corbalan-Garcia S, Yang SS, Degenhardt KR and Bar-SagiD. (1996). Mol. Cell. Biol., 16, 5674 ± 5682.
Corbalan-Garcia S, Margarit SM, Galron D, Yang S andBar Sagi D. (1998). Mol. Cell. Biol., 18, 880 ± 886.
Deshpande AK and Kung HF. (1987). Mol. Cell. Biol., 7,1285 ± 1288.
Di Fiore PP, Pierce JH, Fleming TP, Hazan R, Ullrich A,King CR, Schlessinger J and Aaronson SA. (1987a). Cell,51, 1063 ± 1070.
Di Fiore PP, Pierce JH, Kraus MH, Segatto O, King CR andAaronson SA. (1987b). Science, 237, 178 ± 182.
Douville E and Downward J. (1997). Oncogene, 15, 373 ±383.
Downward J. (1994). FEBS Lett., 338, 113 ± 117.Egan SE and Weinberg RA. (1993). Nature, 365, 781 ± 783.Egan SE, Giddings BW, Brooks MW, Buday L, Sizeland AM
and Weinberg RA. (1993). Nature, 363, 45 ± 51.Feig LA. (1994). Curr. Op. Cell Biol., 6, 204 ± 211.Font de Mora J, Guerrero C, Mahadevan D, Coque JJR,
Rojas JM, Esteban LM, Rebecchi M and Santos E. (1996).J. Biol. Chem., 271, 18272 ± 18276.
Gibbs JB, Schaber MD, Marshal MS, Scolnick EM and SigalIS. (1987). J. Biol. Chem., 262, 10426 ± 10429.
Gibbs JB, Schaber MD, Scho®eld TL and Scolnick EM.(1989). Proc. Natl. Acad. Sci. USA, 86, 6630 ± 6634.
Heidaran MA, Fleming TP, Bottaro DP, Bell GI, Di FiorePP and Aaronson SA. (1990). Oncogene, 5, 1265 ± 1270.
Heidaran MA, Molloy CJ, Panqelinan M, Choudhury GG,Wang LM, Fleming TP, Sagakuchi AY and Pierce JH.(1992). Oncogene, 7, 147 ± 152.
Holsinger LJ, Spencer DM, Austin DJ, Schreiber SL andCrabtree GR. (1995). Proc. Natl Acad. Sci. USA, 92,9810 ± 9814.
Karlovich CA, Bon®ni L, McCollam L, Rogge RD, Daga A,Czech MP and Banerjee U. (1995). Science, 268, 576 ± 579.
Katzav S, Packham G, Sutherland M, Aroca P, Santos E andCleveland JL. (1995). Oncogene, 11, 1079 ± 1088.
Korn LJ, Siebel CW, McCormick F and Roth RA. (1987).Science, 236, 840 ± 843.
Lacal JC and Aaronson SA. (1986). Proc. Natl. Acad. Sci.USA, 83, 5400 ± 5404.
Li BQ, Kaplan D, Kung HF and Kamata T. (1992). Science,256, 1456 ± 1459.
Li BQ, Subleski M, Shalloway D, Kung HF and Kamata T.(1993a). Proc. Natl. Acad. Sci. USA, 90, 8504 ± 8508.
Li BQ, Wang KH, Kung HF, Ronsin C, Breathnach R,Leonard EJ and Kamata T. (1995). Biochem. Biophys. Res.Commun., 216, 110 ± 118.
Li BQ, Subleski M, Fusaki N, Yamamoto T, Copeland T,Princler G, Kung HF and Kamata T. (1996). Proc. Natl.Acad. Sci. USA, 93, 1001 ± 1005.
Li N, Batzer A, Daly R, Yajnik V, Skolnik E, Chardin P,Bar-Sagi D, Margolis B and Schlessinger J. (1993b).Nature, 363, 85 ± 88.
Lowenstein EJ, Daly RJ, Batzer AG, Li W, Margolis B,Lammers R, Ullrich A, Skolnik EY, Bar Sagi D andSchlessinger J. (1992). Cell, 70, 431 ± 442.
McCollam L, Bon®ni L, Karlovich CA, Conway BR, KozmaLM, Banerjee U and Czech MP. (1995). J. Biol. Chem.,270, 15954 ± 15957.
McCormick F. (1993). Nature, 363, 15 ± 16.Mendelson AR and Brent R. (1994). Curr. Op. in
Biotechnology, 5, 482 ± 486.Muslin A, Klippel A and Williams LT. (1993). Mol. Cell.
Biol., 13, 6661 ± 6666.Pawson T and Schlessinger J. (1993). Curr. Biol., 3, 4345 ±
4442.Por®ri E and McCormick F. (1996). J. Biol. Chem., 271,
5871 ± 5877.Quilliam LA, Hu� SY, Rabun KM, Wei W, Park W, Broek
D and Der CJ. (1994). Proc. Natl. Acad. Sci. USA, 91,8512 ± 8516.
Quilliam LA, Khosravi-Far R, Hu� SY and Der CJ. (1995).Bioessays, 17, 395 ± 404.
Rojas JM, Coque JJR, Guerrero C, Aroca P, Font de MoraJ, de la Cruz X, Lorenzi MV, Esteban LM and Santos E.(1996). Oncogene, 12, 2291 ± 2300.
Rozakis-Adcock M, Fernely R, Wade J, Pawson T andBowtell D. (1993). Nature, 363, 83 ± 85.
Rozakis-Adcock M, van der Geer P, Mbamalu G andPawson T. (1995). Oncogene, 11, 1417 ± 1426.
Sasaoka T, Draznin B, Leitner JW, Langlois WJ and OlefskyJM. (1994). J. Biol. Chem., 269, 10734 ± 10738.
Satoh T, Endo M, Nakafuku M, Akiyama T, Yamamoto Tand Kaziro Y. (1990). Proc. Natl. Acad. Sci. USA, 87,7926 ± 7929.
Schlessinger J. (1993). Trends Biochem. Sci., 18, 273 ± 276.Sorrentino V, Nebreda AR, Alonso T and Santos E. (1989).
Oncogene, 4, 215 ± 221.Skolnik EY, Lee CH, Batzer A, Vicentini LM, Zhou M, Daly
R, Myers MJ, Backer JM, Ullrich A, White MF andSchlessinger J. (1993). EMBO J., 12, 1929 ± 1936.
Tauchi T, Feng GS, Marshall MS, Shen R, Mantel C,Pawson T and Broxmeyer HE. (1994). J. Biol. Chem., 269,25206 ± 25211.
Wang W, Fisher EMC, Jia Q, Dunn JM, Por®ri E,Downward J and Egan SE. (1995). Nature Gen., 10,294 ± 300.
Wigler M, Silverstein S, Lee LS, Pellicer A, Cheng Y andAxel R. (1977). Cell, 11, 223 ± 232.
Biological activity of hSos 1 isoformsJM Rojas et al
1661
Copyright © 2022 FDOKUMEN