Is sham cTBS real cTBS? The effect on EEG dynamics
12
ORIGINAL RESEARCH ARTICLE published: 08 January 2015 doi: 10.3389/fnhum.2014.01043 Is sham cTBS real cTBS? The effect on EEG dynamics Alexander Opitz 1,2,3 * † , Wynn Legon 4† , Jerel Mueller 5 , Aaron Barbour 6 , Walter Paulus 1 and William J. Tyler 7 1 Department of Clinical Neurophysiology, Georg-August-University, Göttingen, Germany 2 Center for Biomedical Imaging and Neuromodulation, Nathan Kline Institute for Psychiatric Research, Orangeburg, NY, USA 3 Center for the Developing Brain, Child Mind Institute, New York, NY, USA 4 Department of Physical Medicine and Rehabilitation, University of Minnesota, Minneapolis, MN, USA 5 School of Biomedical Engineering and Sciences, Virginia Tech, Blacksburg, VA, USA 6 Virginia Tech Carilion Research Institute, Roanoke, VA, USA 7 School of Biological and Health Systems Engineering, Arizona State University, Tempe, AZ, USA Edited by: Srikantan S. Nagarajan, University of California, San Francisco, USA Reviewed by: Shozo Tobimatsu, Kyushu University, Japan Theodore Zanto, University of California, San Francisco, USA *Correspondence: Alexander Opitz, Center for Biomedical Imaging and Neuromodulation, Nathan Kline Institute for Psychiatric Research, 140 Old Orangeburg Road Bldg.35, Orangeburg, NY 10962, USA e-mail: [email protected] † Co-first author. Increasing sensitivity of modern evaluation tools allows for the study of weaker electric stimulation effects on neural populations. In the current study we examined the effects of sham continuous theta burst (cTBS) transcranial magnetic stimulation to the left dorsolateral prefrontal cortex (DLPFC) upon somatosensory evoked potentials (SEP) and frontal-parietal phase coupling of alpha and beta bands. Sham TMS results in an induced electric field amplitude roughly 5% that of real TMS with a similar spatial extent in cortex. Both real and sham cTBS reduced the amplitude of the frontal P14-N30 SEP and increased local phase coupling in the alpha-beta frequency bands of left frontal cortex. In addition, both sham and real cTBS increased frontal-parietal phase coupling in the alpha-beta bands concomitant with an increase in amplitude of parietal P50-N70 complex. These data suggest that weak electric fields from sham cTBS can affect both local and downstream neuronal circuits, though in a different manner than high strength TMS. Keywords: TMS, EEG, electric field, sham TMS, DLPFC, evoked potentials, somatosensory INTRODUCTION Non-invasive neuromodulation methods rely on effects pro- duced by a broad range of electric field strengths ranging from 100 mV/mm for transcranial magnetic stimulation (TMS; Miranda et al., 2007; Salvador et al., 2011) to only a fraction of 1 mV/mm for transcranial direct current stimulation or tran- scranial alternating current stimulation (tDCS/tACS; Datta et al., 2009; Salvador et al., 2010; Miranda et al., 2013). It has recently been shown that low frequency (<8 Hz) extracellular electric fields smaller than 1 mV/mm can cause neuronal entrainment by ephaptic coupling in rat cortical pyramidal neurons (Anastassiou et al., 2011). Additional evidence has demonstrated that electric fields lower than 1 mV/mm can produce effects in hippocampal slices for alternating current (AC) fields having a frequency range from 10 to 100 Hz (Deans et al., 2007) and low-frequency pulsed electric fields (Francis et al., 2003), as well as for direct current (DC) fields <10 and <4 mV/mm (Bikson et al., 2004; Radman et al., 2007). Furthermore, neocortical activity can also be influ- enced by low-frequency sinusoidal electric fields <0.5 mV/mm (Frohlich and McCormick, 2010; Ozen et al., 2010). Collectively, it is important to realize that weak electric fields from both DC (Nitsche and Paulus, 2000) and AC stimulation (Moliadze et al., 2010) have been shown to transiently alter cortical excitability in humans. Continuous theta burst stimulation (cTBS) is a repetitive TMS protocol that can induce cortical excitability changes in a short stimulation period (Huang et al., 2005). cTBS typically operates at 70% of individual motor threshold which corresponds to elec- tric field strengths in the range of 50–80 mV/mm. This range of electric field strength is approximately two orders of magnitude higher than what is minimally needed to cause an effect on neu- rons (Francis et al., 2003). Despite this, the effects of weak electric fields induced by TMS have not been extensively studied. These issues are especially important for TMS studies applying sham protocols. TMS shamming has taken many forms over the years, though currently accepted approaches use coils with magnetic shields that reduce the magnetic field strength and attenuate the induced electric field by about 80–95% depending on the coil type and manufacturer. While it is generally assumed that these sham coils have no neuronal effect (Duecker and Sack, 2013) the induced electric fields are indeed on a range that could affect cortical excitability. In the present study we investigated how weak electric fields induced by sham TMS over the left dorsolateral prefrontal cortex (DLPFC) exert effects upon local and functionally connected neu- ronal circuitry using electroencephalographic (EEG) measures of phase connectivity and amplitude of somatosensory evoked potentials (SEPs). To better assess the effect of sham TMS, we included a biologically inert “sham-sham” stimulation condition. In addition, we used computational modeling to evaluate the electric field distribution induced by real and sham TMS. Our observations demonstrate that weak electric fields generated by sham TMS can exert direct neural effects that differ from real TMS as well as the sham-sham condition. Frontiers in Human Neuroscience www.frontiersin.org January 2015 | Volume 8 | Article 1043 | 1 HUMAN NEUROSCIENCE
Transcript of Is sham cTBS real cTBS? The effect on EEG dynamics

ORIGINAL RESEARCH ARTICLEpublished: 08 January 2015
doi: 10.3389/fnhum.2014.01043
Is sham cTBS real cTBS? The effect on EEG dynamicsAlexander Opitz1,2,3*†, Wynn Legon4†, Jerel Mueller5, Aaron Barbour6, Walter Paulus1 and
William J. Tyler7
1 Department of Clinical Neurophysiology, Georg-August-University, Göttingen, Germany2 Center for Biomedical Imaging and Neuromodulation, Nathan Kline Institute for Psychiatric Research, Orangeburg, NY, USA3 Center for the Developing Brain, Child Mind Institute, New York, NY, USA4 Department of Physical Medicine and Rehabilitation, University of Minnesota, Minneapolis, MN, USA5 School of Biomedical Engineering and Sciences, Virginia Tech, Blacksburg, VA, USA6 Virginia Tech Carilion Research Institute, Roanoke, VA, USA7 School of Biological and Health Systems Engineering, Arizona State University, Tempe, AZ, USA
Edited by:
Srikantan S. Nagarajan, University ofCalifornia, San Francisco, USA
Reviewed by:
Shozo Tobimatsu, KyushuUniversity, JapanTheodore Zanto, University ofCalifornia, San Francisco, USA
*Correspondence:
Alexander Opitz, Center forBiomedical Imaging andNeuromodulation, Nathan KlineInstitute for Psychiatric Research,140 Old Orangeburg Road Bldg.35,Orangeburg, NY 10962, USAe-mail: [email protected]
†Co-first author.
Increasing sensitivity of modern evaluation tools allows for the study of weaker electricstimulation effects on neural populations. In the current study we examined the effectsof sham continuous theta burst (cTBS) transcranial magnetic stimulation to the leftdorsolateral prefrontal cortex (DLPFC) upon somatosensory evoked potentials (SEP) andfrontal-parietal phase coupling of alpha and beta bands. Sham TMS results in an inducedelectric field amplitude roughly 5% that of real TMS with a similar spatial extent in cortex.Both real and sham cTBS reduced the amplitude of the frontal P14-N30 SEP and increasedlocal phase coupling in the alpha-beta frequency bands of left frontal cortex. In addition,both sham and real cTBS increased frontal-parietal phase coupling in the alpha-beta bandsconcomitant with an increase in amplitude of parietal P50-N70 complex. These datasuggest that weak electric fields from sham cTBS can affect both local and downstreamneuronal circuits, though in a different manner than high strength TMS.
Keywords: TMS, EEG, electric field, sham TMS, DLPFC, evoked potentials, somatosensory
INTRODUCTIONNon-invasive neuromodulation methods rely on effects pro-duced by a broad range of electric field strengths rangingfrom 100 mV/mm for transcranial magnetic stimulation (TMS;Miranda et al., 2007; Salvador et al., 2011) to only a fraction of1 mV/mm for transcranial direct current stimulation or tran-scranial alternating current stimulation (tDCS/tACS; Datta et al.,2009; Salvador et al., 2010; Miranda et al., 2013). It has recentlybeen shown that low frequency (<8 Hz) extracellular electricfields smaller than 1 mV/mm can cause neuronal entrainment byephaptic coupling in rat cortical pyramidal neurons (Anastassiouet al., 2011). Additional evidence has demonstrated that electricfields lower than 1 mV/mm can produce effects in hippocampalslices for alternating current (AC) fields having a frequency rangefrom 10 to 100 Hz (Deans et al., 2007) and low-frequency pulsedelectric fields (Francis et al., 2003), as well as for direct current(DC) fields <10 and <4 mV/mm (Bikson et al., 2004; Radmanet al., 2007). Furthermore, neocortical activity can also be influ-enced by low-frequency sinusoidal electric fields <0.5 mV/mm(Frohlich and McCormick, 2010; Ozen et al., 2010). Collectively,it is important to realize that weak electric fields from both DC(Nitsche and Paulus, 2000) and AC stimulation (Moliadze et al.,2010) have been shown to transiently alter cortical excitability inhumans.
Continuous theta burst stimulation (cTBS) is a repetitive TMSprotocol that can induce cortical excitability changes in a shortstimulation period (Huang et al., 2005). cTBS typically operates
at 70% of individual motor threshold which corresponds to elec-tric field strengths in the range of 50–80 mV/mm. This range ofelectric field strength is approximately two orders of magnitudehigher than what is minimally needed to cause an effect on neu-rons (Francis et al., 2003). Despite this, the effects of weak electricfields induced by TMS have not been extensively studied. Theseissues are especially important for TMS studies applying shamprotocols. TMS shamming has taken many forms over the years,though currently accepted approaches use coils with magneticshields that reduce the magnetic field strength and attenuate theinduced electric field by about 80–95% depending on the coiltype and manufacturer. While it is generally assumed that thesesham coils have no neuronal effect (Duecker and Sack, 2013) theinduced electric fields are indeed on a range that could affectcortical excitability.
In the present study we investigated how weak electric fieldsinduced by sham TMS over the left dorsolateral prefrontal cortex(DLPFC) exert effects upon local and functionally connected neu-ronal circuitry using electroencephalographic (EEG) measuresof phase connectivity and amplitude of somatosensory evokedpotentials (SEPs). To better assess the effect of sham TMS, weincluded a biologically inert “sham-sham” stimulation condition.In addition, we used computational modeling to evaluate theelectric field distribution induced by real and sham TMS. Ourobservations demonstrate that weak electric fields generated bysham TMS can exert direct neural effects that differ from realTMS as well as the sham-sham condition.
Frontiers in Human Neuroscience www.frontiersin.org January 2015 | Volume 8 | Article 1043 | 1
HUMAN NEUROSCIENCE
Opitz et al. Physiological effects of sham TMS
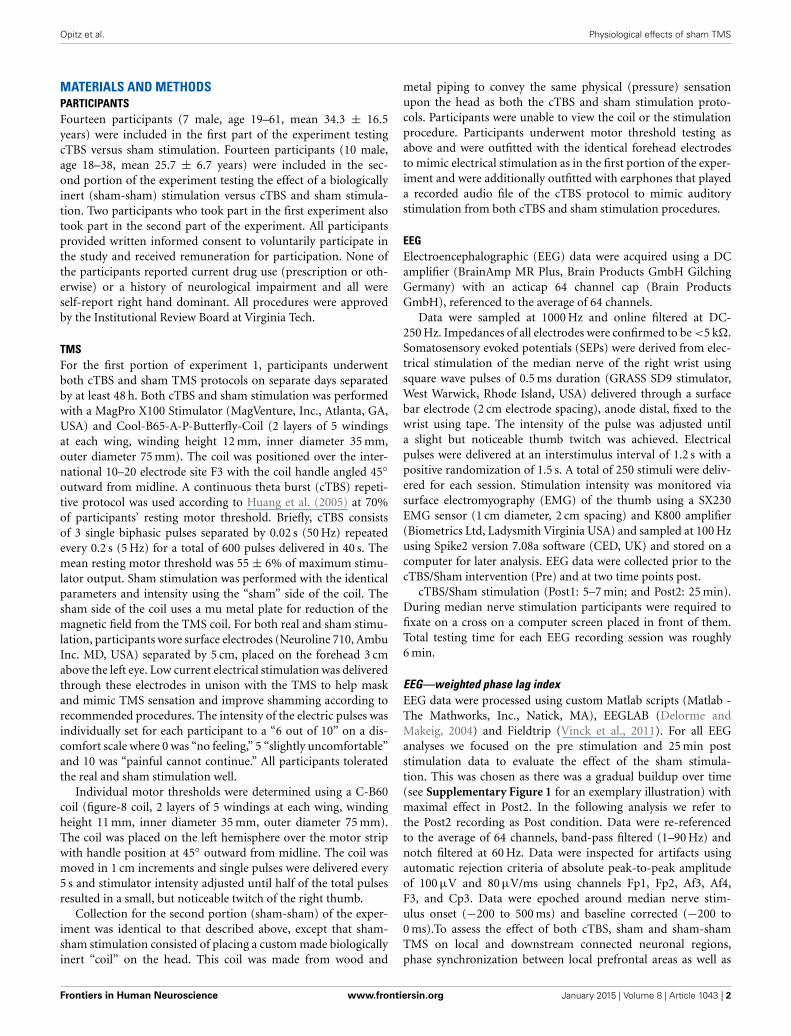
MATERIALS AND METHODSPARTICIPANTSFourteen participants (7 male, age 19–61, mean 34.3 ± 16.5years) were included in the first part of the experiment testingcTBS versus sham stimulation. Fourteen participants (10 male,age 18–38, mean 25.7 ± 6.7 years) were included in the sec-ond portion of the experiment testing the effect of a biologicallyinert (sham-sham) stimulation versus cTBS and sham stimula-tion. Two participants who took part in the first experiment alsotook part in the second part of the experiment. All participantsprovided written informed consent to voluntarily participate inthe study and received remuneration for participation. None ofthe participants reported current drug use (prescription or oth-erwise) or a history of neurological impairment and all wereself-report right hand dominant. All procedures were approvedby the Institutional Review Board at Virginia Tech.
TMSFor the first portion of experiment 1, participants underwentboth cTBS and sham TMS protocols on separate days separatedby at least 48 h. Both cTBS and sham stimulation was performedwith a MagPro X100 Stimulator (MagVenture, Inc., Atlanta, GA,USA) and Cool-B65-A-P-Butterfly-Coil (2 layers of 5 windingsat each wing, winding height 12 mm, inner diameter 35 mm,outer diameter 75 mm). The coil was positioned over the inter-national 10–20 electrode site F3 with the coil handle angled 45◦outward from midline. A continuous theta burst (cTBS) repeti-tive protocol was used according to Huang et al. (2005) at 70%of participants’ resting motor threshold. Briefly, cTBS consistsof 3 single biphasic pulses separated by 0.02 s (50 Hz) repeatedevery 0.2 s (5 Hz) for a total of 600 pulses delivered in 40 s. Themean resting motor threshold was 55 ± 6% of maximum stimu-lator output. Sham stimulation was performed with the identicalparameters and intensity using the “sham” side of the coil. Thesham side of the coil uses a mu metal plate for reduction of themagnetic field from the TMS coil. For both real and sham stimu-lation, participants wore surface electrodes (Neuroline 710, AmbuInc. MD, USA) separated by 5 cm, placed on the forehead 3 cmabove the left eye. Low current electrical stimulation was deliveredthrough these electrodes in unison with the TMS to help maskand mimic TMS sensation and improve shamming according torecommended procedures. The intensity of the electric pulses wasindividually set for each participant to a “6 out of 10” on a dis-comfort scale where 0 was “no feeling,” 5 “slightly uncomfortable”and 10 was “painful cannot continue.” All participants toleratedthe real and sham stimulation well.
Individual motor thresholds were determined using a C-B60coil (figure-8 coil, 2 layers of 5 windings at each wing, windingheight 11 mm, inner diameter 35 mm, outer diameter 75 mm).The coil was placed on the left hemisphere over the motor stripwith handle position at 45◦ outward from midline. The coil wasmoved in 1 cm increments and single pulses were delivered every5 s and stimulator intensity adjusted until half of the total pulsesresulted in a small, but noticeable twitch of the right thumb.
Collection for the second portion (sham-sham) of the exper-iment was identical to that described above, except that sham-sham stimulation consisted of placing a custom made biologicallyinert “coil” on the head. This coil was made from wood and
metal piping to convey the same physical (pressure) sensationupon the head as both the cTBS and sham stimulation proto-cols. Participants were unable to view the coil or the stimulationprocedure. Participants underwent motor threshold testing asabove and were outfitted with the identical forehead electrodesto mimic electrical stimulation as in the first portion of the exper-iment and were additionally outfitted with earphones that playeda recorded audio file of the cTBS protocol to mimic auditorystimulation from both cTBS and sham stimulation procedures.
EEGElectroencephalographic (EEG) data were acquired using a DCamplifier (BrainAmp MR Plus, Brain Products GmbH GilchingGermany) with an acticap 64 channel cap (Brain ProductsGmbH), referenced to the average of 64 channels.
Data were sampled at 1000 Hz and online filtered at DC-250 Hz. Impedances of all electrodes were confirmed to be <5 k�.Somatosensory evoked potentials (SEPs) were derived from elec-trical stimulation of the median nerve of the right wrist usingsquare wave pulses of 0.5 ms duration (GRASS SD9 stimulator,West Warwick, Rhode Island, USA) delivered through a surfacebar electrode (2 cm electrode spacing), anode distal, fixed to thewrist using tape. The intensity of the pulse was adjusted untila slight but noticeable thumb twitch was achieved. Electricalpulses were delivered at an interstimulus interval of 1.2 s with apositive randomization of 1.5 s. A total of 250 stimuli were deliv-ered for each session. Stimulation intensity was monitored viasurface electromyography (EMG) of the thumb using a SX230EMG sensor (1 cm diameter, 2 cm spacing) and K800 amplifier(Biometrics Ltd, Ladysmith Virginia USA) and sampled at 100 Hzusing Spike2 version 7.08a software (CED, UK) and stored on acomputer for later analysis. EEG data were collected prior to thecTBS/Sham intervention (Pre) and at two time points post.
cTBS/Sham stimulation (Post1: 5–7 min; and Post2: 25 min).During median nerve stimulation participants were required tofixate on a cross on a computer screen placed in front of them.Total testing time for each EEG recording session was roughly6 min.
EEG—weighted phase lag indexEEG data were processed using custom Matlab scripts (Matlab -The Mathworks, Inc., Natick, MA), EEGLAB (Delorme andMakeig, 2004) and Fieldtrip (Vinck et al., 2011). For all EEGanalyses we focused on the pre stimulation and 25 min poststimulation data to evaluate the effect of the sham stimula-tion. This was chosen as there was a gradual buildup over time(see Supplementary Figure 1 for an exemplary illustration) withmaximal effect in Post2. In the following analysis we refer tothe Post2 recording as Post condition. Data were re-referencedto the average of 64 channels, band-pass filtered (1–90 Hz) andnotch filtered at 60 Hz. Data were inspected for artifacts usingautomatic rejection criteria of absolute peak-to-peak amplitudeof 100 µV and 80 µV/ms using channels Fp1, Fp2, Af3, Af4,F3, and Cp3. Data were epoched around median nerve stim-ulus onset (−200 to 500 ms) and baseline corrected (−200 to0 ms).To assess the effect of both cTBS, sham and sham-shamTMS on local and downstream connected neuronal regions,phase synchronization between local prefrontal areas as well as
Frontiers in Human Neuroscience www.frontiersin.org January 2015 | Volume 8 | Article 1043 | 2

Opitz et al. Physiological effects of sham TMS
long range prefrontal and somatosensory brain areas was com-puted using the weighted phase lag index (WPLI) (Vinck et al.,2011) which is unaffected by volume conduction. WPLI wascomputed between local channel pairs F3-F1, F3-F5, F3-FC1,F3-FC3, and F3-FC5 as well as F3-CP3, F3-CP4, F3-F4, and
CP3-CP4. Differences in phase synchronization were computedbetween Post and Pre stimulation for all three conditions (cTBS,sham and sham-sham). Statistical analysis of the Post-Pre WPLIwas performed using non-parametric cluster threshold analy-sis (Maris and Oostenveld, 2007) with 10,000 repetitions, initial
FIGURE 1 | Real and Sham TMS fields. (A) Distributions of themagnetic vector potential for the real and sham side of the TMS coil.The upper panels illustrate measured values for both real and shamfaces of the coil while the lower panels illustrate the modeled fielddistribution. The magnetic vector potential for the real side is about 20times stronger than for the sham side. The coil models faithfully capture
the measured field distribution as illustrated. (B) The simulated electricfield distributions generated by real and sham cTBS of the left DLPFC.The electric field strength generated by real TMS is about 15 timesstronger than the electric field strength produced by sham TMS. Thespatial distributions of the electric field generated by real and sham TMSwere strikingly similar to one another.
Frontiers in Human Neuroscience www.frontiersin.org January 2015 | Volume 8 | Article 1043 | 3

Opitz et al. Physiological effects of sham TMS
cluster threshold p = 0.05 for the time points between -100 and400 ms and frequency bands 7–13 and 14–30 Hz and FDR cor-rection (Benjamini–Hochberg, false discovery rate q = 0.05) fornumber of channel combinations and conditions. This proce-dure was conducted separately for channel combinations startingfrom channel CP3 (3 combinations × 3 conditions) and chan-nel combinations starting from channel F3 (7 combinations × 3conditions). For cTBS vs sham a dependent t-test was conducted,and for cTBS vs. sham-sham, as well as sham vs. sham-sham, anindependent t-test was conducted. To control for potential exist-ing between group differences in EEG, we also tested for possiblebaseline differences between groups for the three Pre conditionsusing the same procedure as for the Post-Pre comparisons.
EEG—somatosensory evoked potentialsData were preprocessed as above and epoched around mediannerve stimulation onset (-100 to 300 ms) and baseline corrected(−100 to 0 ms). Peak to peak amplitudes were quantified fromchannel F3 and CP3. For channel F3 potentials included P14-N30, N30-P45, P45-N60, N60-P80, and P80-N100. For channelCP3, potentials included P14-N20, N20-P27, N27-N33, N33-P50,P50-N70, N70-P100, and P100-N140. Potentials were quantifiedfor each participant for each stimulation procedure (cTBS, sham,sham-sham) for both the Pre and Post conditions. A One-Wayindependent samples analysis of variance (ANOVA) was con-ducted for each of the potentials from channel F3 and CP3 on thePost-Pre data with factors (cTBS, sham, sham-sham). Significant
FIGURE 2 | Quantification of changes in cortical EEG connectivity. (A)
The baseline weighted phase lag index (WPLI) for the F3-CP3 channel pairduring median nerve stimulation is shown. The dashed lines indicate theonset of the median nerve stimulus. An increase in connectivity in the highalpha, low beta range is visible after the stimulus onset. (B) Connectivitychanges (Post-Pre) are shown for real, sham and sham-sham stimulation.
Differential effects on connectivity changes are visible depending onstimulation condition. (C) Significant differences between the connectivitychanges in real vs. sham, real vs. sham-sham, as well as sham vs.sham-sham are shown. Strongest effects were present for real vs.sham-sham, with a strong increase in the WPLI in the alpha and low betaband in the real condition.
Frontiers in Human Neuroscience www.frontiersin.org January 2015 | Volume 8 | Article 1043 | 4

Opitz et al. Physiological effects of sham TMS
(p < 0.05) F-tests were evaluated with post-hoc Tukey–Kramertests.
MAGNETIC FIELD MAPPINGThe magnetic field of the real and sham side of the TMS coilwas measured using a custom built magnetic probe made of tworectangular shaped windings of wires (1 cm2 surface area) thatwere oriented perpendicularly to each other. A grid of 19 × 19points (1 cm spacing) was placed directly on the coil face to mea-sure the magnetic field induced voltages in x and y direction forboth the real and sham face of the TMS coil. A computationalmodel of the TMS coil that reproduces the spatial pattern of themeasured magnetic field was constructed using a dipole approx-imation (Thielscher and Kammer, 2004). Small magnetic dipolesare positioned at the coil windings and the total magnetic vectorpotential is obtained by summing up individual magnetic dipoles.For the sham coil side, the effect of the magnetic shield was mim-icked by increasing the distance of the coil to the measurementplane in the computational model such that the computationaland measurement data match each other.
ELECTRIC FIELD SIMULATIONSElectric field simulations were performed for both the active andsham side of the TMS coil. A finite element model of the headfor one subject was constructed using Simnibs (Windhoff et al.,2013). From T1- and T2- weighted MR images five different tissuetypes WM, GM, CSF, skin and skull were segmented and a FEMmodel consisting of ca. 1.7 million tetrahedral elements was con-structed. TMS coil position and orientation over the left DLPFCwas recorded using a neuronavigation system (Visor 2, ANT). Formore detailed methods about the FEM simulations see (Opitzet al., 2011, 2013; Windhoff et al., 2013).
RESULTSMAGNETIC FIELD MEASUREMENTS AND ELECTRIC FIELDSIMULATIONSThe sham side of the TMS coil produced a magnetic field max-imum approximately 20-fold less than the real side (Figure 1A).The field distribution of the real side has a shape typical of figure-8 coils with highest field strength at the coil center and moderatefield strengths at the wings of the coil. The sham side of the coilexhibited a broad area of high field strength only in the centerregion of the coil. The computational model of the TMS coil wasable to accurately capture the general distribution of the measuredmagnetic field (Figure 1A). The root mean square error betweenthe measured and modeled magnetic field was 7.7 and 7.5% inthe central region of the coil (1 × 1 cm) for the real and shamsides respectively. In one circumscribed region at the coil wingthe error was up to 50% which was likely due to a small asymme-try in the coil with regard to the measurement plane. However, asthe electric field distribution is mainly driven by the center of thecoil this was unlikely to significantly influence the accuracy of theelectric field simulations.
While the maximum magnetic field of the sham coil sidewas reduced 20-fold, the maximum induced electric field wasonly reduced 15-fold (Figure 1B). Furthermore, the electric field
distribution was broader for the sham condition. The broader dis-tribution of the sham side is due to the smearing effect of themagnetic shield, which defocusses as well as reduces the magneticand the electric field.
STIMULATION EFFECTS ON PHASE SYNCHRONYBased on the observations described above, we next examined thefunctional connectivity between local frontal electrodes as wellas downstream connections using the weighted phase lag index(WPLI) as a measure of phase synchronization. Of special interestwas the effect between the stimulation site F3 and the localiza-tion site of parietal somatosensory evoked potentials recordedfrom electrode site CP3 based upon previous research demon-strating this connection (Yamaguchi and Knight, 1990). Underbaseline, the WPLI showed a significant increase in alpha andbeta (10–20 Hz) coupling between CP3 and F3 immediately aftermedian nerve stimulation (p < 0.025) (Figure 2A). This CP3-F3phase synchronization was considerably stronger than local F3channel pairs (p < 0.025) (Figure 3). After real cTBS the WPLIshowed a broad increase for alpha and beta frequencies (p <
0.025) (Figure 2B). After sham cTBS we observed a decrease inbeta as well as theta activity occurring at 100–200 ms (Figure 2B).For sham-sham a broad decrease in the WPLI after median
FIGURE 3 | Baseline Connectivity for local and interhemispheric
connections. Baseline weighted phase lag index (WPLI) during mediannerve stimulation for local channel connections (A–D) and interhemisphericconnections (E–F).
Frontiers in Human Neuroscience www.frontiersin.org January 2015 | Volume 8 | Article 1043 | 5

Opitz et al. Physiological effects of sham TMS
nerve onset could be seen in the Post-condition compared tobaseline (Figure 2B). Individual comparisons showed significanteffects between all conditions (Figure 2C). A strong enhance-ment of phase coupling in the alpha-beta frequency range (7–14 Hz) was found comparing cTBS with sham-sham (p < 0.0083)(Figure 3C middle panel). Similar effects, yet for shorter timewindows, were found for the cTBS vs. sham and sham vs. sham-sham comparisons (Figure 2C). Most importantly, sham cTBSshowed significant increases in phase coupling in the alpha-betafrequency compared to the sham-sham condition (p < 0.0083).These data indicate that both cTBS and sham cTBS can inducelasting changes amongst cortical networks which differ froma biologically inert control condition. There were no signifi-cant differences in the baseline connectivity between stimulationconditions (p > 0.05).
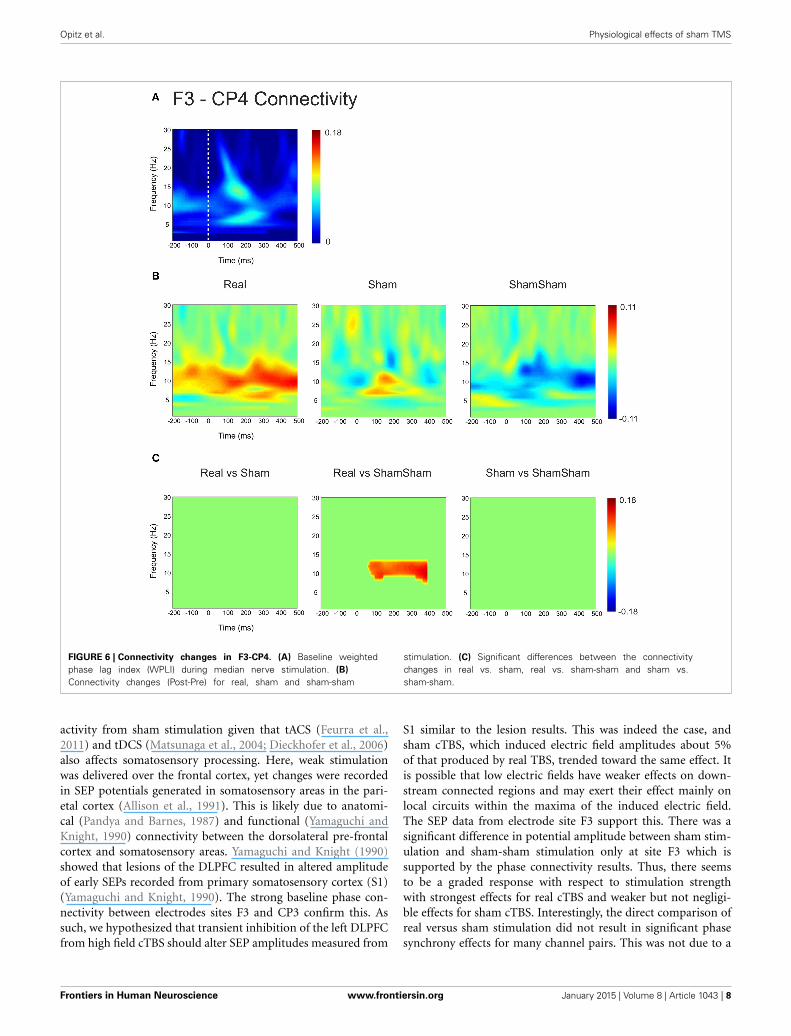
For the local channel pair F3-FC1, a similar effect as for F3-CP3 was found for real vs sham-sham (p < 0.0083) (Figure 4),however no effects were found for the other comparisons.We did not observe any stimulation related changes in cross-hemispheric phase synchronization between F3-F4 and CP3-CP4despite strong intrinsic coupling between CP3 and CP4 in thealpha-beta frequency range (Figure 3). Interestingly, stimulationeffects were apparent between F4-CP3 and F3-CP4 (Figures 5, 6)with a significant difference (p < 0.0083) between real andsham-sham.
SOMATOSENSORY EVOKED POTENTIALSSomatosensory evoked potential peak to peak amplitudes werequantified from channel F3 and CP3. For channel CP3 asignificant effect was found for the N70-P50 SEP complex
FIGURE 4 | Connectivity changes in F3-FC1. (A) Baseline weightedphase lag index (WPLI) during median nerve stimulation. (B)
Connectivity changes (Post-Pre) for real, sham and sham-sham
stimulation. (C) Significant differences between the connectivitychanges in real vs. sham, real vs. sham-sham and sham vs.sham-sham.
Frontiers in Human Neuroscience www.frontiersin.org January 2015 | Volume 8 | Article 1043 | 6

Opitz et al. Physiological effects of sham TMS
FIGURE 5 | Connectivity changes in F4-CP3. (A) Baseline weightedphase lag index (WPLI) during median nerve stimulation. (B)
Connectivity changes (Post-Pre) for real, sham and sham-sham
stimulation. (C) Significant differences between the connectivitychanges in real vs. sham, real vs. sham-sham and sham vs.sham-sham.
[F(2, 39) = 3.27, p = 0.0491]. A post-hoc Tukey–Kramer testrevealed a significant increase (p < 0.05) in amplitude of theN70-P50 for cTBS compared to sham-sham only (Figure 7A).No statistically significant differences were found for any ofthe other quantified potentials (Table 1). For channel F3 asignificant decrease in amplitude was found for the P14-N30 potential [F(2, 39) = 4.04, p = 0.0258]. Post-hoc Tukey–Kramer tests revealed a significant decrease in amplitude ofthe peak to peak P14-N30 potential for cTBS compared tosham-sham (p < 0.05), and for a significant decrease in ampli-tude for sham compared to sham-sham (p < 0.05) (Figure 7Band Table 1). No statistically significant differences were foundfor any of the other potentials quantified from channel F3(Table 1).
DISCUSSIONWe investigated the effects of weak electric fields induced by shamcTBS to the left DLPFC on EEG phase connectivity and SEPamplitudes. Results demonstrate that both real and sham cTBSover the left DLPFC increase both local and down-stream phase-coupling in the alpha-beta (7–14 Hz) frequency range and bothdecrease amplitude of frontal SEPs but only real cTBS to signif-icantly increase amplitude of parietal SEPs. The results of thisstudy provide evidence that low electric field strengths from shortduration cTBS can have an influence on local and downstreamcortical activity.
tACS and tDCS produce electric fields in the brain roughly anorder of magnitude less than sham TMS as used here. It shouldnot be too surprising then to find effects upon somatosensory
Frontiers in Human Neuroscience www.frontiersin.org January 2015 | Volume 8 | Article 1043 | 7
Opitz et al. Physiological effects of sham TMS
FIGURE 6 | Connectivity changes in F3-CP4. (A) Baseline weightedphase lag index (WPLI) during median nerve stimulation. (B)
Connectivity changes (Post-Pre) for real, sham and sham-sham
stimulation. (C) Significant differences between the connectivitychanges in real vs. sham, real vs. sham-sham and sham vs.sham-sham.
activity from sham stimulation given that tACS (Feurra et al.,2011) and tDCS (Matsunaga et al., 2004; Dieckhofer et al., 2006)also affects somatosensory processing. Here, weak stimulationwas delivered over the frontal cortex, yet changes were recordedin SEP potentials generated in somatosensory areas in the pari-etal cortex (Allison et al., 1991). This is likely due to anatomi-cal (Pandya and Barnes, 1987) and functional (Yamaguchi andKnight, 1990) connectivity between the dorsolateral pre-frontalcortex and somatosensory areas. Yamaguchi and Knight (1990)showed that lesions of the DLPFC resulted in altered amplitudeof early SEPs recorded from primary somatosensory cortex (S1)(Yamaguchi and Knight, 1990). The strong baseline phase con-nectivity between electrodes sites F3 and CP3 confirm this. Assuch, we hypothesized that transient inhibition of the left DLPFCfrom high field cTBS should alter SEP amplitudes measured from
S1 similar to the lesion results. This was indeed the case, andsham cTBS, which induced electric field amplitudes about 5%of that produced by real TBS, trended toward the same effect. Itis possible that low electric fields have weaker effects on down-stream connected regions and may exert their effect mainly onlocal circuits within the maxima of the induced electric field.The SEP data from electrode site F3 support this. There was asignificant difference in potential amplitude between sham stim-ulation and sham-sham stimulation only at site F3 which issupported by the phase connectivity results. Thus, there seemsto be a graded response with respect to stimulation strengthwith strongest effects for real cTBS and weaker but not negligi-ble effects for sham cTBS. Interestingly, the direct comparison ofreal versus sham stimulation did not result in significant phasesynchrony effects for many channel pairs. This was not due to a
Frontiers in Human Neuroscience www.frontiersin.org January 2015 | Volume 8 | Article 1043 | 8

Opitz et al. Physiological effects of sham TMS
FIGURE 7 | Somatosensory Evoked Potentials. (A) Left: Grandaverage (N = 14) somatosensory evoked potential (SEP) tracesrecorded from electrode site CP3 for the three TMS conditions(Sham-sham, Sham, cTBS). Potentials of interest are marked ontrace. The vertical dashed bar represents onset of median nervestimulation. Black trace (Pre) is before TMS intervention and redtrace (Post) is after TMS intervention. ∗Denotes significant amplitude
difference (p < 0.05). Right: Grand average (N = 14) N70 to P50 peakto peak amplitude in microvolts (µV) with ± SEM. ∗Denotesp < 0.05. (B) Left: Grand average (N = 14) SEP traces recorded fromelectrode site F3. Potentials of interest are marked on trace.*Denotes significant amplitude difference (p < 0.05). Right: Grandaverage (N = 14) N30 to P14 peak to peak amplitude in microvolts(µV) with ± SEM. ∗Denotes p < 0.05.
missing stimulation effect or non-specific effects due to habitua-tion to the task over time. On the contrary, both real and shamcTBS showed stimulation induced changes in a similar directioncompared to the sham-sham condition. The effect of weak elec-tric fields delivered to DLPFC upon somatosensory processing isnot unprecedented. Bolton and Staines (2011) also reported thattheir sham stimulation resulted in an effect upon parietal SEPs.We estimate the electric field induced by their sham condition(6% resting motor threshold) (Bolton and Staines, 2011) inducedan electric field in the left frontal cortex at around the same orderof magnitude as that applied in this study. Thus, low electricfield strength produced by sham stimulation exerts differentialeffects upon excitability in cortical areas directly under the TMScoil where the electric field is largest but also crucially can affectdownstream anatomically and functionally connected regions.While not being the main focus of our study the effects of cTBSincreased over time and we subsequently selected the post stimu-lation timepoint after 25 min to evaluate the effects of real andsham stimulation. Stronger stimulation effects are not uncom-mon in brain stimulation protocols. For example in one studyusing tDCS to induce plasticity in the motor cortex strongesteffects on motor evoked potentials have been found after 30 min(Kuo et al., 2013). Also in the original paper introducing thetaburst stimulation (TBS) (Huang et al., 2005) there were largereffects or effects at least as strong after 20 min compared to theimmediate after effect of the stimulation.
Studies of slight TMS intensity differences also report cor-respondingly varying effects: cTBS of the motor cortex at 65%of resting motor threshold decreased motor excitability while70% increased it (Doeltgen and Ridding, 2011). Similar intensitydependent effects have been found for tACS using 140 Hz overM1 (Moliadze et al., 2012), such that 0.4 mA reduced the ampli-tude of MEPs while 1.0 mA enhanced them. Also, a reversal ofstimulation effects from cathodal tDCS stimulation was foundfrom inhibition to excitation by changing intensities from 1 to2 mA (Batsikadze et al., 2013). A possible mechanism for a rever-sal in the direction of effects using different intensities might bethat inhibitory neurons are more rapidly excitable than excita-tory neurons by lower field strengths. For higher field strengthsexcitatory neurons are more strongly activated and prevail overinhibitory effects that lead to a net excitatory effect (Berger et al.,2011; Herrmann et al., 2013). We found differential effects on SEPamplitudes both at the site of stimulation and in S1 concomitantwith differences in connectivity between F3 and CP3 for sham andreal cTBS.
Sham approaches for TMS have been investigated and con-stantly improved over the last decade. Early sham approacheswere implemented by tilting the TMS coil away from the head,which was shown to induce significant residual electric fields (Looet al., 2000; Lisanby et al., 2001). For example tilting the TMS coil90◦ away from the head can still induce electric field strengthsthat are up to 30% compared to the standard coil position
Frontiers in Human Neuroscience www.frontiersin.org January 2015 | Volume 8 | Article 1043 | 9

Opitz et al. Physiological effects of sham TMS
Table 1 | Somatosensory evoked potential amplitudes.
cTBS Sham SS P-value
CP3
N20-P14 −0.19 (0.09) −0.10 (0.07) 0.06 (0.07) 0.22P27-N20 −0.18 (0.08) −0.03 (0.11) −0.18 (0.21) 0.84N33-P27 −0.06 (0.15) −0.01 (0.10) 0.02 (0.12) 0.95P50-N33 −0.18 (0.15) 0.18 (0.49) −0.10 (0.21) 0.79N70-P50 1.20 (0.30) 0.81 (0.35) 0.15 (0.23) 0.0491
P100-N70 −0.16 (0.48) 0.08 (0.26) 0.03 (0.36) 0.89N140-P100 0.28 (0.27) 0.26 (0.37) 0.30 (0.34) 0.99F3
N30-P14 −0.88 (0.29) −0.63 (0.21) 0.12 (0.26) 0.0258
P45-N30 −0.36 (0.42) 0.16 (0.25) 0.02 (0.19) 0.47N60-P45 −0.32 (0.33) 0.19 (0.24) 0.02 (0.13) 0.36P80-N60 −0.62 (0.52) −0.46 (0.33) −0.21 (0.29) 0.77N100-P80 −1.13 (0.46) −0.91 (0.56) −0.33 (0.26) 0.46
Group average (mean and SEM, N = 14) peak-to-peak amplitudes in μV from channel CP3 (top) and F3 (bottom). cTBS, real stimulation; Sham, weak field stimulation;
SS, sham-sham.
Bold values highlight significant effects (p-value < 0.05) in the Anova.
(Figure 8C). Current sham approaches are much more sophisti-cated, using a combined real or sham coil (Rossi et al., 2007) thatcan be electronically switched (Deng and Peterchev, 2011), con-comitant audio stimulation and surface electrodes attached to thehead that deliver electric current in unison with TMS pulsing tohelp ensure that skin sensations are identical between conditions.These approaches are very effective at disguising the appearanceand accompanying sensory stimulation associated with TMS andare important features needed to investigate effects between realand sham stimulation only due to the direct effect of the inducedelectric field. However, in our opinion, not enough attention hasbeen given to the residual electric field that is induced in thebrain during sham treatments. While magnetic shields reduce theelectric field effectively to about 5% of its strength during realstimulation, these fields are still in the range that has been demon-strated to induce lasting effects on neuronal populations. Thesham TMS electric field is about an order of magnitude strongerthan that produced by 1 mA tDCS (Figures 8A,B) that has provento produce both cortical excitability and behavior changes inseveral studies (Fecteau et al., 2007; Holland et al., 2011; Ruffet al., 2013). Although the temporal course of the electric fieldsis usually different between electrical and magnetic stimulationmethods and different protocols cannot easily be directly relatedto each other, this comparison shows that electric fields occurringduring sham TMS are clearly within the range where physio-logical effects are possible. While the study of effects of weakelectric fields induced by TMS is an interesting topic in itself, itis not desirable to have direct neuronal effects of sham stimu-lation during cognitive studies or especially clinical trials, sincethe sham condition could indeed be having an effect upon neu-ronal excitability. Thus the comparison of real and sham effectsis made explicitly difficult especially in the case of missing effectsbetween real and sham stimulation. Such observations taken atface value may lead one to conclude that a particular sham con-trolled TMS intervention was not effective when indeed they bothwere. It should be noted that this study employed two different
subject groups such that possible between groups effects mightinterfere with our results. However, the baseline connectivity didnot significantly differ between groups, as well as the analysisof pre-post changes that control for non-specific effects makethis unlikely. These non-specific effects (for example anticipa-tion of getting stimulated) may also contribute to effects betweenconditions though we were sensitive to keeping sensory stimuli(coil pressure on the head, auditory stimulation) the same dur-ing sham and sham-sham stimulation. Furthermore, all subjectsin all conditions were naïve to TMS and did not know whatto expect if anything across repeated sessions thus limiting thepossibility that results were due to non-specific effects. Finally,these data are the result of a single commercial sham-coil usinga cTBS rTMS protocol and may not directly transfer to othercommercial sham-coils due to differences in the technology usedto achieve shamming or to other rTMS protocols. Future stud-ies should address these effects across other sham coils and TMSprotocols.
CONCLUSIONSSham procedures are absolutely necessary to control for expec-tation effects which can manifest themselves on a physiologicallevel (Büchel et al., 2014; Fiorio et al., 2014). It is clear that shamTMS, as employed here, produces electric fields in the humancortex of a magnitude that can affect cortical excitability. It isconceivable that the effect of real TMS stimulation may be under-estimated in studies comparing it to current shamming protocols.A sham condition that mimics expectation and sensation but doesnot induce any electric field in the cortex is optimal for assess-ing effects of TMS, but, until this becomes common practice, it isour opinion that the weak electric field induced by current shamTMS approaches should be accounted for or at least consideredwhen interpreting results. Nevertheless, we cannot readily gener-alize our findings for other rTMS protocols and future researchhas to investigate whether effects of weak TMS might occur forthem as well.
Frontiers in Human Neuroscience www.frontiersin.org January 2015 | Volume 8 | Article 1043 | 10

Opitz et al. Physiological effects of sham TMS
FIGURE 8 | Comparison of real and sham TMS induced electric fields
with electric fields during tDCS. (A) The electric field distribution in thebrain for real TMS (left panel, dI/dt = 70 A/µs which corresponds to themean rate of change of coil current employed in the study, left) and shamTMS (right panel) is shown. (B) Electric field produced by 1 mA tDCS usinga 4 × 4 cm anode and a 5 × 7 cm cathode positioned over the DLPFC andcontralateral supraorbital orbit, respectively are shown for two differentscales. Comparing sham TMS to tDCS, the sham TMS electric field is about15 times stronger than the tDCS electric field while exhibiting a similarspatial distribution. (C) The electric field distribution in the brain for realTMS (as in A, left panel) compared to the electric field distribution foranother commonly used sham method implemented by tilting the coil 90◦away from the head (right panel). The induced electric field strength bytilting the coil 90◦ can reach up to 30% of the strength during normal TMS.
ACKNOWLEDGMENTSThe authors would like to thank Amanda Williams and Michael J.Wesley for help with data collection.
SUPPLEMENTARY MATERIALThe Supplementary Material for this article can be foundonline at: http://www.frontiersin.org/journal/10.3389/fnhum.
2014.01043/abstractSupplementary Figure 1 | Buildup effect for changes in cortical EEG
connectivity after cTBS. (A) The weighted phase lag index (WPLI) for the
F3-CP3 channel pair during median nerve stimulation is shown for three
different timepoints (Pre, Post1, and Post2). The WPLI shows incremental
increases in the high alpha, low beta range over the two post stimulation
timepoints. (B) Connectivity changes Post1-Pre (left panel) and Post2-Pre
(right panel) are shown to illustrate the effect of increased differences over
time.
REFERENCESAllison, T., McCarthy, G., Wood, C. C., and Jones, S. J. (1991). Potentials
evoked in human and monkey cerebral cortex by stimulation of the mediannerve. A review of scalp and intracranial recordings. Brain 114(Pt 6),2465–2503.
Anastassiou, C. A., Perin, R., Markram, H., and Koch, C. (2011). Ephaptic couplingof cortical neurons. Nat. Neurosci. 14, 217–223. doi: 10.1038/nn.2727
Batsikadze, G., Moliadze, V., Paulus, W., Kuo, M. F., and Nitsche, M. A. (2013).Partially non-linear stimulation intensity-dependent effects of direct currentstimulation on motor cortex excitability in humans. J. Physiol. 591, 1987–2000.doi: 10.1113/jphysiol.2012.249730
Berger, U., Korngreen, A., Bar-Gad, I., Friedman, A., Wolfus, S., Yeshurun, Y., et al.(2011). Magnetic stimulation intensity modulates motor inhibition. Neurosci.Lett. 504, 93–97. doi: 10.1016/j.neulet.2011.09.004
Bikson, M., Inoue, M., Akiyama, H., Deans, J. K., Fox, J. E., Miyakawa, H., et al.(2004). Effects of uniform extracellular DC electric fields on excitability inrat hippocampal slices in vitro. J. Physiol. 557, 175–190. doi: 10.1113/jphys-iol.2003.055772
Bolton, D. A., and Staines, W. R. (2011). Transient inhibition of the dorsolat-eral prefrontal cortex disrupts attention-based modulation of tactile stimuli atearly stages of somatosensory processing. Neuropsychologia 49, 1928–1937. doi:10.1016/j.neuropsychologia.2011.03.020
Büchel, C., Geuter, S., Sprenger, C., and Eippert, F. (2014). Placebo anal-gesia: a predictive coding perspective. Neuron 81, 1223–1239. doi:10.1016/j.neuron.2014.02.042
Datta, A., Bansal, V., Diaz, J., Patel, J., Reato, D., and Bikson, M. (2009). Gyri-precisehead model of transcranial direct current stimulation: improved spatial focal-ity using a ring electrode versus conventional rectangular pad. Brain Stimul. 2,
201–207, 207.e201. doi: 10.1016/j.brs.2009.03.005Deans, J. K., Powell, A. D., and Jefferys, J. G. (2007). Sensitivity of coherent oscil-
lations in rat hippocampus to AC electric fields. J. Physiol. 583, 555–565. doi:10.1113/jphysiol.2007.137711
Delorme, A., and Makeig, S., (2004). EEGLAB: an open source toolbox for analy-sis of single-trial EEG dynamics including independent component analysis. J.Neurosci. Methods 134, 9–21. doi: 10.1016/j.jneumeth.2003.10.009
Deng, Z. D., and Peterchev, A. V. (2011). Transcranial magnetic stimula-tion coil with electronically switchable active and sham modes. Conf.Proc. IEEE Eng. Med. Biol. Soc. 2011, 1993–1996. doi: 10.1109/IEMBS.2011.6090561
Dieckhofer, A., Waberski, T. D., Nitsche, M., Paulus, W., Buchner, H., andGobbele, R. (2006). Transcranial direct current stimulation applied over thesomatosensory cortex - differential effect on low and high frequency SEPs. Clin.Neurophysiol. 117, 2221–2227. doi: 10.1016/j.clinph.2006.07.136
Doeltgen, S. H., and Ridding, M. C. (2011). Low-intensity, short-interval thetaburst stimulation modulates excitatory but not inhibitory motor networks. Clin.Neurophysiol. 122, 1411–1416. doi: 10.1016/j.clinph.2010.12.034
Frontiers in Human Neuroscience www.frontiersin.org January 2015 | Volume 8 | Article 1043 | 11

Opitz et al. Physiological effects of sham TMS
Duecker, F., and Sack, A. T. (2013). Pre-stimulus sham TMS facilitates targetdetection. PLoS ONE 8:e57765. doi: 10.1371/journal.pone.0057765
Fecteau, S., Knoch, D., Fregni, F., Sultani, N., Boggio, P., and Pascual-Leone, A.(2007). Diminishing risk-taking behavior by modulating activity in the pre-frontal cortex: a direct current stimulation study. J. Neurosci. 27, 12500–12505.doi: 10.1523/JNEUROSCI.3283-07.2007
Feurra, M., Paulus, W., Walsh, V., and Kanai, R. (2011). Frequency spe-cific modulation of human somatosensory cortex. Front. Psychol. 2:13. doi:10.3389/fpsyg.2011.00013
Fiorio, M., Emadi Andani, M., Marotta, A., Classen, J., and Tinazzi, M.(2014). Placebo-Induced changes in excitatory and inhibitory corticospinalcircuits during motor performance. J. Neurosci. 34, 3993–4005. doi:10.1523/JNEUROSCI.3931-13.2014
Francis, J. T., Gluckman, B. J., and Schiff, S. J. (2003). Sensitivity of neurons to weakelectric fields. J. Neurosci. 23, 7255–7261.
Frohlich, F., and McCormick, D. A. (2010). Endogenous electric fieldsmay guide neocortical network activity. Neuron 67, 129–143. doi:10.1016/j.neuron.2010.06.005
Herrmann, C. S., Rach, S., Neuling, T., and Struber, D. (2013). Transcranialalternating current stimulation: a review of the underlying mechanismsand modulation of cognitive processes. Front. Hum. Neurosci. 7:279. doi:10.3389/fnhum.2013.00279
Holland, R., Leff, A. P., Josephs, O., Galea, J. M., Desikan, M., Price, C. J., et al.(2011). Speech facilitation by left inferior frontal cortex stimulation. Curr. Biol.21, 1403–1407. doi: 10.1016/j.cub.2011.07.021
Huang, Y. Z., Edwards, M. J., Rounis, E., Bhatia, K. P., and Rothwell, J. C. (2005).Theta burst stimulation of the human motor cortex. Neuron 45, 201–206. doi:10.1016/j.neuron.2004.12.033
Kuo, H. I., Bikson, M., Datta, A., Minhas, P., Paulus, W., Kuo, M. F., et al. (2013).Comparing cortical plasticity induced by conventional and high-definition 4x 1 ring tDCS: a neurophysiological study. Brain Stimul. 6, 644–648. doi:10.1016/j.brs.2012.09.010
Lisanby, S. H., Gutman, D., Luber, B., Schroeder, C., and Sackeim, H. A. (2001).Sham TMS: intracerebral measurement of the induced electrical field andthe induction of motor-evoked potentials. Biol. Psychiatry 49, 460–463. doi:10.1016/S0006-3223(00)01110-0
Loo, C. K., Taylor, J. L., Gandevia, S. C., McDarmont, B. N., Mitchell, P. B., andSachdev, P. S. (2000). Transcranial magnetic stimulation (TMS) in controlledtreatment studies: are some “sham” forms active? Biol. Psychiatry 47, 325–331.doi: 10.1016/S0006-3223(99)00285-1
Maris, E., and Oostenveld, R., (2007). Nonparametric statistical test-ing of EEG- and MEG-data. J. Neurosci. Methods 164, 177–190. doi:10.1016/j.jneumeth.2007.03.024
Matsunaga, K., Nitsche, M. A., Tsuji, S., and Rothwell, J. C. (2004). Effect oftranscranial DC sensorimotor cortex stimulation on somatosensory evokedpotentials in humans. Clin. Neurophysiol. 115, 456–460. doi: 10.1016/S1388-2457(03)00362-6
Miranda, P. C., Correia, L., Salvador, R., and Basser, P. J. (2007). Tissue heterogene-ity as a mechanism for localized neural stimulation by applied electric fields.Phys. Med. Biol. 52, 5603–5617. doi: 10.1088/0031-9155/52/18/009
Miranda, P. C., Mekonnen, A., Salvador, R., and Ruffini, G. (2013). The electric fieldin the cortex during transcranial current stimulation. Neuroimage 70, 48–58.doi: 10.1016/j.neuroimage.2012.12.034
Moliadze, V., Antal, A., and Paulus, W. (2010). Boosting brain excitability bytranscranial high frequency stimulation in the ripple range. J. Physiol. 588,4891–4904. doi: 10.1113/jphysiol.2010.196998
Moliadze, V., Atalay, D., Antal, A., and Paulus, W. (2012). Close to threshold tran-scranial electrical stimulation preferentially activates inhibitory networks beforeswitching to excitation with higher intensities. Brain Stimul. 5, 505–511. doi:10.1016/j.brs.2011.11.004
Nitsche, M. A., and Paulus, W. (2000). Excitability changes induced in the humanmotor cortex by weak transcranial direct current stimulation. J. Physiol. 527(Pt3), 633–639. doi: 10.1111/j.1469-7793.2000.t01-1-00633.x
Opitz, A., Legon, W., Rowlands, A., Bickel, W. K., Paulus, W., and Tyler,W. J. (2013). Physiological observations validate finite element models forestimating subject-specific electric field distributions induced by transcranialmagnetic stimulation of the human motor cortex. Neuroimage 81, 253–264. doi:10.1016/j.neuroimage.2013.04.067
Opitz, A., Windhoff, M., Heidemann, R. M., Turner, R., and Thielscher, A. (2011).How the brain tissue shapes the electric field induced by transcranial magneticstimulation. Neuroimage 58, 849–859. doi: 10.1016/j.neuroimage.2011.06.069
Ozen, S., Sirota, A., Belluscio, M. A., Anastassiou, C. A., Stark, E., Koch, C., et al.(2010). Transcranial electric stimulation entrains cortical neuronal populationsin rats. J. Neurosci. 30, 11476–11485. doi: 10.1523/JNEUROSCI.5252-09.2010
Pandya, D. N., and Barnes, C. L. (1987). “Architecture and connections of thefrontal lobe,” in The Frontal Lobes Revisited, ed E. Perecman. (New York, NY:The IRBN Press), 41–72.
Radman, T., Su, Y., An, J. H., Parra, L. C., and Bikson, M. (2007). Spike timingamplifies the effect of electric fields on neurons: implications for endogenousfield effects. J. Neurosci. 27, 3030–3036. doi: 10.1523/JNEUROSCI.0095-07.2007
Rossi, S., Ferro, M., Cincotta, M., Ulivelli, M., Bartalini, S., Miniussi, C., et al.(2007). A real electro-magnetic placebo (REMP) device for sham transcra-nial magnetic stimulation (TMS). Clin. Neurophysiol. 118, 709–716. doi:10.1016/j.clinph.2006.11.005
Ruff, C. C., Ugazio, G., and Fehr, E. (2013). Changing social norm compliancewith noninvasive brain stimulation. Science 342, 482–484. doi: 10.1126/sci-ence.1241399
Salvador, R., Mekonnen, A., Ruffini, G., and Miranda, P. C. (2010). Modeling theelectric field induced in a high resolution realistic head model during transcra-nial current stimulation. Conf. Proc. IEEE Eng. Med. Biol. Soc. 2010, 2073–2076.doi: 10.1109/IEMBS.2010.5626315
Salvador, R., Silva, S., Basser, P. J., and Miranda, P. C. (2011). Determiningwhich mechanisms lead to activation in the motor cortex: a modelingstudy of transcranial magnetic stimulation using realistic stimulus waveformsand sulcal geometry. Clin. Neurophysiol. 122, 748–758. doi: 10.1016/j.clinph.2010.09.022
Thielscher, A., and Kammer, T. (2004). Electric field properties of two commercialfigure-8 coils in TMS: calculation of focality and efficiency. Clin. Neurophysiol.115, 1697–1708. doi: 10.1016/j.clinph.2004.02.019
Vinck, M., Oostenveld, R., van Wingerden, M., Battaglia, F., and Pennartz, C.M. (2011). An improved index of phase-synchronization for electrophysiolog-ical data in the presence of volume-conduction, noise and sample-size bias.Neuroimage 55, 1548–1565. doi: 10.1016/j.neuroimage.2011.01.055
Windhoff, M., Opitz, A., and Thielscher, A. (2013). Electric field calculations inbrain stimulation based on finite elements: an optimized processing pipelinefor the generation and usage of accurate individual head models. Hum. Brain.Mapp. 34, 923–935. doi: 10.1002/hbm.21479
Yamaguchi, S., and Knight, R. T. (1990). Gating of somatosensory input by humanprefrontal cortex. Brain Res. 521, 281–288. doi: 10.1016/0006-8993(90)91553-S
Conflict of Interest Statement: The authors declare that the research was con-ducted in the absence of any commercial or financial relationships that could beconstrued as a potential conflict of interest.
Received: 07 October 2014; accepted: 14 December 2014; published online: 08 January2015.Citation: Opitz A, Legon W, Mueller J, Barbour A, Paulus W and Tyler WJ (2015) Issham cTBS real cTBS? The effect on EEG dynamics. Front. Hum. Neurosci. 8:1043.doi: 10.3389/fnhum.2014.01043This article was submitted to the journal Frontiers in Human Neuroscience.Copyright © 2015 Opitz, Legon, Mueller, Barbour, Paulus and Tyler. This is an open-access article distributed under the terms of the Creative Commons Attribution License(CC BY). The use, distribution or reproduction in other forums is permitted, providedthe original author(s) or licensor are credited and that the original publication in thisjournal is cited, in accordance with accepted academic practice. No use, distribution orreproduction is permitted which does not comply with these terms.
Frontiers in Human Neuroscience www.frontiersin.org January 2015 | Volume 8 | Article 1043 | 12