Biofeedback and Counseling for Stress and Anxiety Among College Students
Upload
khangminh22Category
view
1download
0
AttentivU: an EEG-based closed-loop biofeedbacksystem for real-time monitoring and improvement
of engagement for personalized learning
The MIT Faculty has made this article openly available. Please share how this access benefits you. Your story matters.
Citation Kosmyna, Nataliya, and Patricia Maes, "AttentivU: an EEG-basedclosed-loop biofeedback system for real-time monitoring andimprovement of engagement for personalized learning." Sensors 19,23 (Nov. 2019): no. 5200 doi 10.3390/s19235200 ©2019 Author(s)
As Published 10.3390/s19235200
Publisher Multidisciplinary Digital Publishing Institute
Version Final published version
Citable link https://hdl.handle.net/1721.1/125393
Terms of Use Creative Commons Attribution
Detailed Terms https://creativecommons.org/licenses/by/4.0/
sensors
Article
AttentivU: An EEG-Based Closed-Loop BiofeedbackSystem for Real-Time Monitoring and Improvementof Engagement for Personalized Learning
Nataliya Kosmyna * and Pattie Maes
MIT Media Lab, 75 Amherst St, E14-548, Cambridge, MA 02139, USA; [email protected]* Correspondence: [email protected]
Received: 1 October 2019; Accepted: 18 November 2019; Published: 27 November 2019�����������������
Abstract: Information about a person’s engagement and attention might be a valuable asset in manysettings including work situations, driving, and learning environments. To this end, we propose thefirst prototype of a device called AttentivU—a system that uses a wearable system which consistsof two main components. Component 1 is represented by an EEG headband used to measure theengagement of a person in real-time. Component 2 is a scarf, which provides subtle, haptic feedback(vibrations) in real-time when the drop in engagement is detected. We tested AttentivU in twoseparate studies with 48 adults. The participants were engaged in a learning scenario of eitherwatching three video lectures on different subjects or participating in a set of three face-to-face lectureswith a professor. There were three conditions administrated during both studies: (1) biofeedback,meaning the scarf (component 2 of the system) was vibrating each time the EEG headband detected adrop in engagement; (2) random feedback, where the vibrations did not correlate or depend on theengagement level detected by the system, and (3) no feedback, when no vibrations were administered.The results show that the biofeedback condition redirected the engagement of the participants to thetask at hand and improved their performance on comprehension tests.
Keywords: electroencephalography (EEG); feedback; closed loop; real-time; brain–computer interfaces
1. Introduction
Everyday work and life are becoming increasingly complex and distractive, making it harder forpeople to show extended focus, attention or engagement on a specific task or lecture, thereby directlyimpacting their level of performance in everyday tasks.
Several recent papers from human-computer interaction (HCI) conferences and journals, as wellas signal processing and biomedical venues [1–7] explored measuring engagement using physiologicalsensors such as electroencephalography (EEG) in order to augment learning activities, for example,to provide information about one’s engagement to a teacher or to a presenter. The feedback loop inthese works, however, is rarely closed, as the information about the attention or engagement level isnot presented to the person themselves. In this work, we address this issue in the context of learningsituations as we believe that real-time monitoring of engagement level and issuance of biofeedbackmight improve learning or work performance outcomes of the person. To this end, we propose the firstprototype of a system called AttentivU. a wearable system which consists of two main components.Component 1 is represented by an EEG headband used to measure the engagement of a person inreal time. Component 2 is a scarf, which provides subtle, haptic feedback (vibrations) in real timewhen the drop in engagement is detected (Figure 1).
Sensors 2019, 19, 5200; doi:10.3390/s19235200 www.mdpi.com/journal/sensors
Sensors 2019, 19, 5200 2 of 22
Sensors 2019, 19, x FOR PEER REVIEW 2 of 22
(A) (B) (C)
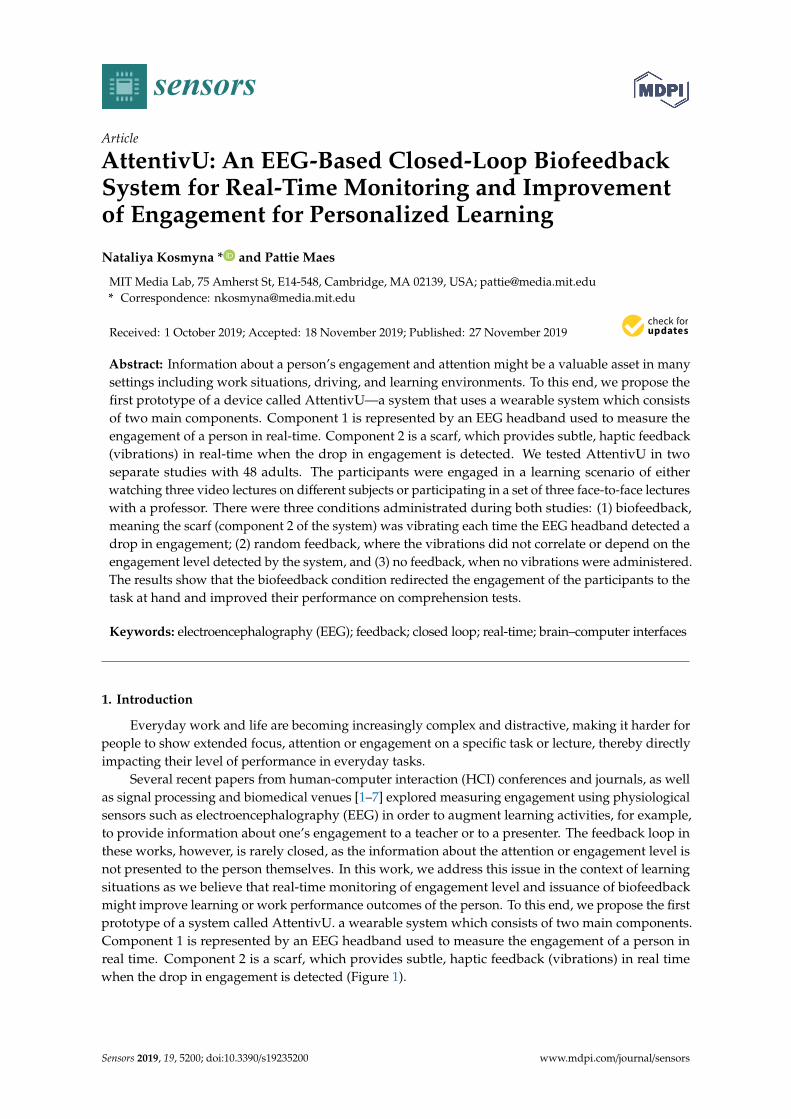
Figure 1. (A) Generic view of two main components used in AttentivU system: an electroencephalography (EEG) headband (Focus 1, BrainCo) and a blue cotton scarf, which contains two vibromotors used to provide a haptic feedback. (B) A person wearing the AttentivU system during Study 1. (C) Twelve participants wearing 12 units of AttentivU system during Study 2.
Using 24 such devices, we tested our approach on 48 adults over several sessions in both lab and lecture settings. The results show that the biofeedback redirects their engagement to the task at hand and improves their performance on comprehension tests. We first discuss some related work to better position our contribution. We then describe the design and development of the AttentivU prototype followed by two studies we performed in order to evaluate its feasibility and effectiveness.
Regarding terminology, in the literature we find publications that use a variety of different terms, including vigilance, attention and engagement. Sometimes these are even used interchangeably. Engagement is a term with multiple definitions but the most common use for it is sustained attention or tonic alertness [8]. The term usually includes energetic arousal on the sleep–wake axis, intrinsic motivation, cognitive performance, and concentration according to Kamzanova et al. [9], Reinerman et al. [10], and Freeman et al. [11]. This paper defines engagement as the ability to focus on one specific task for a continuous amount of time without being distracted. Moreover, in our study, we follow a well-documented set of research works in order to increase the reproducibility of our work, as well as comparability to existing papers. For a more extensive discussion, we refer the reader to a review by Oken et al. [8] that includes a detailed discussion of different terms like “alertness”, “arousal”, “sustained attention”, and “vigilance”. We also recommend Freeman et al. [11] and Kamzanova et al. [9] for more in-depth discussions of engagement measures using EEG.
2. Related Work
2.1. Defining and Measuring Engagement in Learning Environments
Engagement in learning environments can be characterized as “a multidimensional construct with behavioral, emotional, and cognitive dimensions” [12]. Attendance and participation in school activities are examples of behavioral engagement. A sense of belonging or valuing of the school represents an emotional engagement. Willingness to engage in effortful tasks, purposiveness, and self-regulation are examples of cognitive engagement. Reeve and Tseng [13] proposed a fourth type of engagement, which they call agentic engagement, which occurs when a student contributes to the flow of instruction.
Shernoff et al. [14] proposed to identify student engagement based on concentration, interest and enjoyment.
Sinatra et al. [5] proposed to distinguish the “grain size” of engagement, the level at which engagement is conceptualized, observed, and measured, and they presented it as the framework “continuum of engagement measurement”. It could either be measured on individual “microlevel”, which represents engagement in the moment, task, or learning activity to a group “macrolevel”, which represents a group of learners in a class, course, or school. Microlevel engagement can be measured using brain imaging, skin conductivity or eye tracking. Macrolevel indicators of engagement could include observations, ratings, or other analyses of the sociocultural contexts of learning or schooling.
Figure 1. (A) Generic view of two main components used in AttentivU system: an electroencephalography(EEG) headband (Focus 1, BrainCo) and a blue cotton scarf, which contains two vibromotors used toprovide a haptic feedback. (B) A person wearing the AttentivU system during Study 1. (C) Twelveparticipants wearing 12 units of AttentivU system during Study 2.
Using 24 such devices, we tested our approach on 48 adults over several sessions in both lab andlecture settings. The results show that the biofeedback redirects their engagement to the task at handand improves their performance on comprehension tests. We first discuss some related work to betterposition our contribution. We then describe the design and development of the AttentivU prototypefollowed by two studies we performed in order to evaluate its feasibility and effectiveness.
Regarding terminology, in the literature we find publications that use a variety of different terms,including vigilance, attention and engagement. Sometimes these are even used interchangeably.Engagement is a term with multiple definitions but the most common use for it is sustainedattention or tonic alertness [8]. The term usually includes energetic arousal on the sleep–wakeaxis, intrinsic motivation, cognitive performance, and concentration according to Kamzanova et al. [9],Reinerman et al. [10], and Freeman et al. [11]. This paper defines engagement as the ability to focuson one specific task for a continuous amount of time without being distracted. Moreover, in ourstudy, we follow a well-documented set of research works in order to increase the reproducibilityof our work, as well as comparability to existing papers. For a more extensive discussion, we referthe reader to a review by Oken et al. [8] that includes a detailed discussion of different terms like“alertness”, “arousal”, “sustained attention”, and “vigilance”. We also recommend Freeman et al. [11]and Kamzanova et al. [9] for more in-depth discussions of engagement measures using EEG.
2. Related Work
2.1. Defining and Measuring Engagement in Learning Environments
Engagement in learning environments can be characterized as “a multidimensional construct withbehavioral, emotional, and cognitive dimensions” [12]. Attendance and participation in school activitiesare examples of behavioral engagement. A sense of belonging or valuing of the school represents anemotional engagement. Willingness to engage in effortful tasks, purposiveness, and self-regulationare examples of cognitive engagement. Reeve and Tseng [13] proposed a fourth type of engagement,which they call agentic engagement, which occurs when a student contributes to the flow of instruction.
Shernoff et al. [14] proposed to identify student engagement based on concentration, interestand enjoyment.
Sinatra et al. [5] proposed to distinguish the “grain size” of engagement, the level at whichengagement is conceptualized, observed, and measured, and they presented it as the framework“continuum of engagement measurement”. It could either be measured on individual “microlevel”,which represents engagement in the moment, task, or learning activity to a group “macrolevel”,which represents a group of learners in a class, course, or school. Microlevel engagement canbe measured using brain imaging, skin conductivity or eye tracking. Macrolevel indicators of

Sensors 2019, 19, 5200 3 of 22
engagement could include observations, ratings, or other analyses of the sociocultural contexts oflearning or schooling.
We further refer the reader to Sinatra et al. [5] and Azevedo [15] as well as their special issue onbehavioral, group engagement in learning.
2.2. Measuring Individual’s Engagement Level Using EEG
We position our work with respect to the framework “continuum of engagement measurement”proposed by Sinatra et al. [5] discussed above. We measure cognitive engagement at the fine grain size,i.e., microlevel—an individual’s engagement in the moment, task, or learning activity.
Several technologies are currently available for monitoring user engagement with computerinterfaces, including gaze- and eye-tracking systems and video recording devices, although thesesolutions are prone to errors and limitations. For example, the use of cameras in the classroom isagainst the policy of some schools and universities, thus rendering video tracking impossible.
Hutt et al. [4] used a set-up with a computer and $90 eye-tracker per individual student, but thissolution is complex to set up as well as expensive (both a computer and a tracker are requiredfor each user). In addition, they reported facing calibration failures and limited accuracy of theeye-tracker. Raca et al. [16,17] reported that head measurements alone were not enough to reliablyestimate person’s attention level.
Other measures at this end of the continuum include physiological sensing such as heart-ratevariability [18], galvanic skin response [19], and EEG [20]. Of those, we chose EEG as the basisfor our engagement monitoring technique due to the numerous studies which showed that EEGsignals can be used to identify subtle shifts in user alertness, attention, perception, and workload inlaboratory, simulation, and real-world contexts [21,22]. EEG-based engagement measures were usedto provide audience feedback [1] to a presenter and to log the engagement of workers in a simulatedoffice condition [23]. Numerous studies further investigated the use of EEG-based engagementmeasures to augment learning activities. For example, the system “Pay Attention” [24] describesan embodied story-telling agent which uses modulated spoken volume and gestures to attract users’attention when their engagement level drops. “Focus” [25] monitors a child’s engagement levelin real time, and provides contextual brain–computer interface (BCI) training sessions to improvea child’s reading engagement. “Let’s Learn” by Andujar and Gilbert [7] is another EEG-augmentedreading system, similar to “Focus”, which uses content-related videos from YouTube to improve users’engagement, although no formal study was performed to validate the system. Finally, “Bravo” [26]estimates user’s attention and meditation levels and presents users with learning material that resultsin high engagement.
2.3. Delivering Feedback about Engagement Level
Very few studies deliver real-time feedback about the engagement level to the person, and existingones are mainly proposed in the context of a user manipulating an interface, such as drivinga car or playing a video game where an object would accelerate if a person is more focused [27].However, providing immediate feedback to the user while they are on the task at hand might beengaging for students as suggested by Shernoff et al. [14] or Sclater et al. [28]. The closest system tothe one proposed here is the reminder device Re:Vibe [29], which is a commercial wristband that usesvibrotactile stimuli delivered at random periods of time. However, it is not based on a scientificallyvalidated approach on the effect of the vibrations on engagement. To the best of our knowledge,no research was done regarding delivering real-time biofeedback about engagement level basedon biological data in a classroom setting. Two commercial EEG-based devices with no history ofpublications were launched recently. The first one, MindSet [30], is a device in the form of ear-coveringheadphones, thus making its use impossible in the classroom. Another one, by the recent start-upBrainCo [31], provides real-time feedback to the teacher about the attention of the students who wearEEG headbands; however, reports or studies are yet to be published.
Sensors 2019, 19, 5200 4 of 22
3. Materials and Methods: Study 1
3.1. AttentivU: Design Choices and Implementation
3.1.1. Form Factor for Engagement Measurement Component
We decided to use a lightweight, commercial EEG headband, similar to those used in other studiesthat measure engagement [1,7,23]. Using a band facilitates the reproducibility and generalizability ofthe study as well as its comparability to previous work. Because of the headband form factor and thesensitivity of EEG to noise, the system is not reliable when the wearer is walking [32]. However, as wetarget people who sit in a classroom, office, or a desk at home, we believe that this limitation is acceptable.We discuss the processing of EEG signals in the next section.
3.1.2. Form Factor for the Feedback Component
For this project, we decided to use vibrotactile feedback. It is possible that visual and auditoryfeedback will prove to be overwhelming for a student who is surrounded by 15–20 peers who may betalking, as well as a teacher who the student has to pay attention to. However, visual and auditorymodalities for feedback delivery might be considered as potential candidates for personalized learningexperiences to be investigated in more depth in future studies.
We selected a scarf as a current form-factor for the feedback component based on the prior researchwhich has identified the upper chest area below the collar bone and the wrist as the most optimal bodylocations for effective vibrotactile stimulation [33,34]. We also wanted to standardize haptic feedbackdelivery across users and avoid confusion with commercial wrist bands which use vibrations as amean of notifications. However, while the scarf is used for the studies, it is not intended to be the finalform factor.
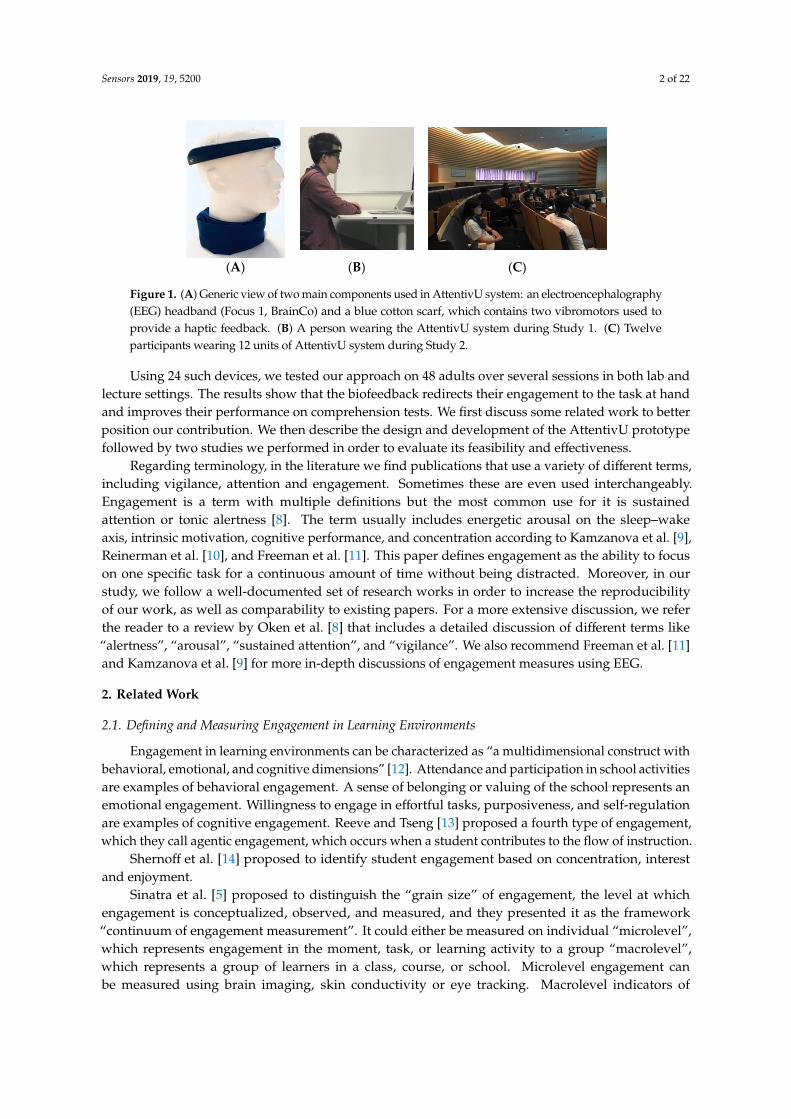
The scarf was made of a soft, cotton fabric (Figure 2, left). The full description of the scarf canbe found in [35]. The scarf has a 3D case with an Adafruit Feather M2 Wi-Fi Arduino board anda 1000 mAh LiPo battery for a full day of use (Figure 2, right). The two vibration motors were locatedoutside of the 3D case but inside of the scarf in order to avoid creating noise within the plastic case.The motors are positioned below the collar bones once the scarf is placed around the neck. The vibrationlasted for one second. In order to design subtle haptic stimuli, the low intensity of 0.3 g (40 Hz;1 g = earth’s gravitational field) was chosen and considered as appropriate and private. We did notexperiment with different vibration patterns in this study.
Sensors 2019, 19, x FOR PEER REVIEW 5 of 22
Figure 2. The scarf used in the study to provide the feedback to the users. (Left). The general view of the scarf. It is made of a soft blue fabric and contains a 3D case (in black) with all the electronics. Two motors are positioned outside the case. (Right). Electronic components of the scarf.
The engagement index also measures vigilance and alertness, which are required in a learning process at the micro grain (individual) scale. A variety of experiments used this approach as a way to measure engagement and attention-related features [4,7,11,24,26,39].
We based our system on prior research that reported using consumer EEG headbands with 1 to 6 channels. They are currently being widely used to detect cognitive engagement in the learning domain [1,4,7,24,26], as well as in other domains [6,21,40]. We use the BrainCo headband called Focus 1 (Figure 3, left), a lightweight EEG device with 3 hydrogel electrodes [35]. An electrode is located at the FPz position as well as reference and ground electrodes at TP9, according to the International 10–20 system of electrode placement (Figure 3, right). The headband collects the data at 160 Hz via Wi-Fi. An application for Mac that connects to the headband via Wi-Fi was used to collect and process EEG signals. We followed the signal processing pipeline proposed and presented in [1,24]. Raw EEG data was firstly notch-filtered with a central frequency of 60 Hz with a bandwidth of 10 Hz to remove power-line electrical disturbances and then with a band-pass filter of 4 to 20 Hz (because the starting frequency of θ band was 4 Hz and upper limit of β band was 20 Hz). We further down-sampled the filtered EEG followed by another pass through the same band-pass filter to avoid noise. The type of all filters used was IIR Butter-worth. Filtered EEG was then mean-shifted and divided by a constant scaling factor of 8. We then clipped the normalized, filtered EEG spikes that exceeded the amplitude range [−4,4] in order to avoid K-complex like spikes caused by minor external motion artefacts.
Our engagement index E is modeled from Pope et al. [36], in which we input the averaged power of alpha, beta, and theta frequency components obtained from the Power Spectral Density (PSD) over 5-second sliding windows. Next, we smooth E using an Exponentially Weighted Moving Average. This picked up general engagement trends and further removed movement artefacts. This outputs a smoothed engagement index per 15 seconds Esmooth sent to the application.
A frame of 15 s was chosen after pretesting to identify minimum timeframe that grants sufficient data to accurately make predictions and also goes in line with the previous literature, like in [24].
The smoothing duration was chosen empirically after the pilot study to identify a minimum timeframe that provides sufficient data to accurately make predictions, as was done in [24].
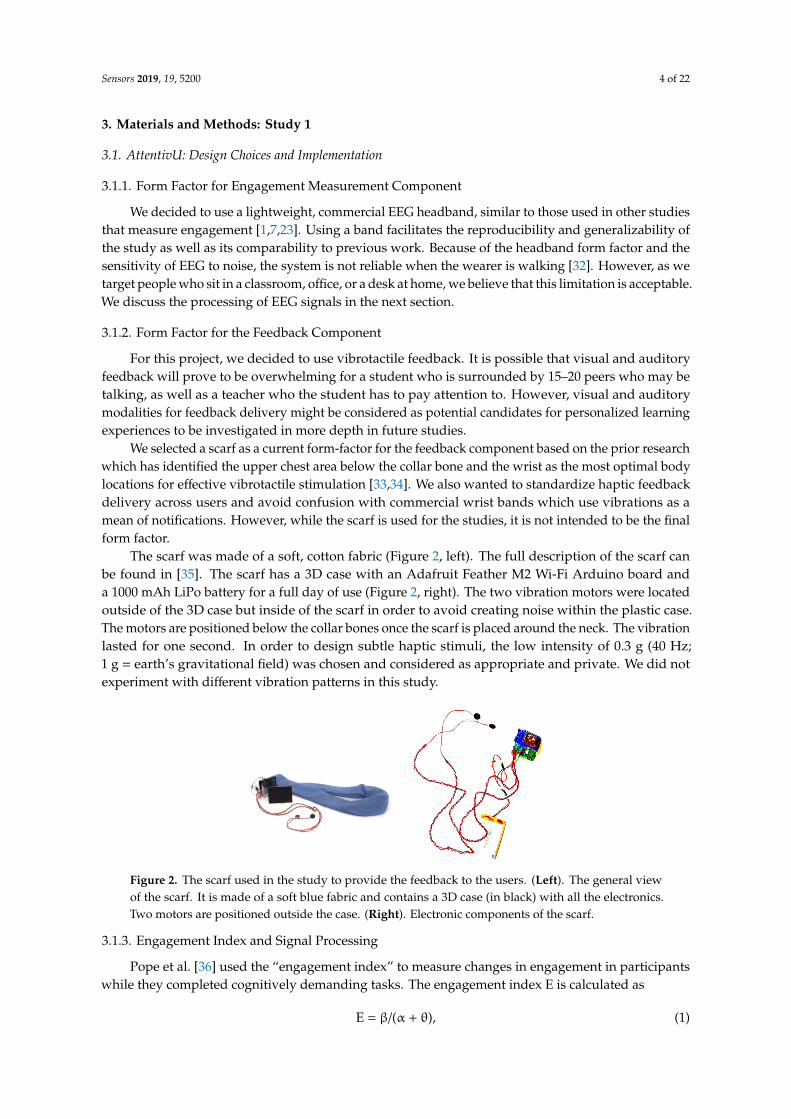
Figure 3. (Left). Focus 1 EEG headband, BrainCo used in this study. (Right). Electrode locations of Focus 1 band according to 10/20 System.
Figure 2. The scarf used in the study to provide the feedback to the users. (Left). The general viewof the scarf. It is made of a soft blue fabric and contains a 3D case (in black) with all the electronics.Two motors are positioned outside the case. (Right). Electronic components of the scarf.
3.1.3. Engagement Index and Signal Processing
Pope et al. [36] used the “engagement index” to measure changes in engagement in participantswhile they completed cognitively demanding tasks. The engagement index E is calculated as
E = β/(α + θ), (1)
Sensors 2019, 19, 5200 5 of 22
where α (7–11 Hz), β (11–20 Hz), and θ (4–7 Hz) are neural oscillations that can be measured using EEG.This index was built assuming that an increase in beta power was related to an increase in brain activityduring a mental task [19]: in fact, the beta frequency band could be associated with a number of corticalcontributions like visual system activation, motion planning activity and other cortical functionsmainly linked to an attentive state of the brain [36]. By contrast, increases in alpha and theta activityare related to lower mental vigilance and alertness. In particular, the presence of a synchronization inthe alpha rhythm could be associated with periods of rest [37,38].
Our system measures engagement index ratio E, which represents the changes in the brain activityof the user related to reduction of cognitive activity in a task at hand (task could be external like anobservation or internal—like imagination). The index E was tested in multiple set-ups and tasks,for example, a multi-attribute task battery (MATB) which includes tracking, monitoring, resourcemanagement, and communication tasks [36]; cognitive load [11], and visual processing and sustainedattention [21]; and can identify changes in attention related to external stimuli [1,23].
The engagement index also measures vigilance and alertness, which are required in a learningprocess at the micro grain (individual) scale. A variety of experiments used this approach as a way tomeasure engagement and attention-related features [4,7,11,24,26,39].
We based our system on prior research that reported using consumer EEG headbands with 1to 6 channels. They are currently being widely used to detect cognitive engagement in the learningdomain [1,4,7,24,26], as well as in other domains [6,21,40]. We use the BrainCo headband called Focus 1(Figure 3, left), a lightweight EEG device with 3 hydrogel electrodes [35]. An electrode is located atthe FPz position as well as reference and ground electrodes at TP9, according to the International10–20 system of electrode placement (Figure 3, right). The headband collects the data at 160 Hzvia Wi-Fi. An application for Mac that connects to the headband via Wi-Fi was used to collect andprocess EEG signals. We followed the signal processing pipeline proposed and presented in [1,24].Raw EEG data was firstly notch-filtered with a central frequency of 60 Hz with a bandwidth of 10 Hzto remove power-line electrical disturbances and then with a band-pass filter of 4 to 20 Hz (because thestarting frequency of θ band was 4 Hz and upper limit of β band was 20 Hz). We further down-sampledthe filtered EEG followed by another pass through the same band-pass filter to avoid noise. The typeof all filters used was IIR Butter-worth. Filtered EEG was then mean-shifted and divided by a constantscaling factor of 8. We then clipped the normalized, filtered EEG spikes that exceeded the amplituderange [−4,4] in order to avoid K-complex like spikes caused by minor external motion artefacts.
Sensors 2019, 19, x FOR PEER REVIEW 5 of 22
Figure 2. The scarf used in the study to provide the feedback to the users. (Left). The general view of the scarf. It is made of a soft blue fabric and contains a 3D case (in black) with all the electronics. Two motors are positioned outside the case. (Right). Electronic components of the scarf.
The engagement index also measures vigilance and alertness, which are required in a learning process at the micro grain (individual) scale. A variety of experiments used this approach as a way to measure engagement and attention-related features [4,7,11,24,26,39].
We based our system on prior research that reported using consumer EEG headbands with 1 to 6 channels. They are currently being widely used to detect cognitive engagement in the learning domain [1,4,7,24,26], as well as in other domains [6,21,40]. We use the BrainCo headband called Focus 1 (Figure 3, left), a lightweight EEG device with 3 hydrogel electrodes [35]. An electrode is located at the FPz position as well as reference and ground electrodes at TP9, according to the International 10–20 system of electrode placement (Figure 3, right). The headband collects the data at 160 Hz via Wi-Fi. An application for Mac that connects to the headband via Wi-Fi was used to collect and process EEG signals. We followed the signal processing pipeline proposed and presented in [1,24]. Raw EEG data was firstly notch-filtered with a central frequency of 60 Hz with a bandwidth of 10 Hz to remove power-line electrical disturbances and then with a band-pass filter of 4 to 20 Hz (because the starting frequency of θ band was 4 Hz and upper limit of β band was 20 Hz). We further down-sampled the filtered EEG followed by another pass through the same band-pass filter to avoid noise. The type of all filters used was IIR Butter-worth. Filtered EEG was then mean-shifted and divided by a constant scaling factor of 8. We then clipped the normalized, filtered EEG spikes that exceeded the amplitude range [−4,4] in order to avoid K-complex like spikes caused by minor external motion artefacts.
Our engagement index E is modeled from Pope et al. [36], in which we input the averaged power of alpha, beta, and theta frequency components obtained from the Power Spectral Density (PSD) over 5-second sliding windows. Next, we smooth E using an Exponentially Weighted Moving Average. This picked up general engagement trends and further removed movement artefacts. This outputs a smoothed engagement index per 15 seconds Esmooth sent to the application.
A frame of 15 s was chosen after pretesting to identify minimum timeframe that grants sufficient data to accurately make predictions and also goes in line with the previous literature, like in [24].
The smoothing duration was chosen empirically after the pilot study to identify a minimum timeframe that provides sufficient data to accurately make predictions, as was done in [24].
Figure 3. (Left). Focus 1 EEG headband, BrainCo used in this study. (Right). Electrode locations of Focus 1 band according to 10/20 System.
Figure 3. (Left). Focus 1 EEG headband, BrainCo used in this study. (Right). Electrode locations ofFocus 1 band according to 10/20 System.
Our engagement index E is modeled from Pope et al. [36], in which we input the averaged powerof alpha, beta, and theta frequency components obtained from the Power Spectral Density (PSD) over5-second sliding windows. Next, we smooth E using an Exponentially Weighted Moving Average.This picked up general engagement trends and further removed movement artefacts. This outputs asmoothed engagement index per 15 seconds Esmooth sent to the application.
A frame of 15 s was chosen after pretesting to identify minimum timeframe that grants sufficientdata to accurately make predictions and also goes in line with the previous literature, like in [24].
Sensors 2019, 19, 5200 6 of 22
The smoothing duration was chosen empirically after the pilot study to identify a minimumtimeframe that provides sufficient data to accurately make predictions, as was done in [24].
Participants first went through a calibration phase, then a recording phase. The calibration sessiondetermined the distribution of E from Emin to Emax, where Emin is low engagement (e.g., relaxation)and Emax is high engagement (e.g., solving arithmetic problems) [1]. Please see User Studies section forfurther details. Based on the minimum Emin and maximum Emax engagement scores collected fromthe calibration for each participant, we calculated a normalized engagement score for each participantbetween 0 and 100 as:
Enorm = (Esmooth − Emin)/(Emax − Emin) × 100 (2)
in a similar fashion to [1,35,39,40].We divided the engagement index into low, medium, and high levels of engagement in a similar
fashion to [1,35,39,40]. An engagement score of 0–30 is considered as low, 31–70 as medium, and 71–100as high. The haptic feedback in the scarf is activated (e.g., sends a vibration) only when engagement isconsidered to be low for at least 15 s (empirically determined duration accounting for the possible falsepositives in the classification output).
3.2. Pilot Studies
3.2.1. Pilot Study 1
Before the actual studies took place, we conducted a small pilot study where we asked threeparticipants (two males, one female ages 22 to 27 years old) to watch a 25 min video lecture on fastFourier transforms (FFT). The pilot test was performed to evaluate whether the engagement index Ewas indeed capable of identifying moments of focused engagement versus mind wandering.
All of the participants were aware of FFT but none of them knew the mathematical foundationof FFT. The lecture contained mathematical formulas and definitions. Participants did not wearthe feedback component of AttentivU but only the EEG headband. Prior to the start of the video,we calibrated the system by asking participants to perform six sets of arithmetic tasks. Each participantwas presented with 10 arithmetic expressions, adding two two-digit integers to one another, and enteringtheir response in a text-box. Participants were also given Logitech clickers which they were supposedto use each time they feel that they start mind-wandering. We used this task set as a calibration task,as the lecture was also heavily computational and mathematical; thus, we hoped to induce similarstates to those the user might experience during the main task of watching the FFT video. This type oftask is used in several research setups, for example, by Hinks et al. [41]. Once a session was completedby a participant, a new one started. All the sessions contained the exact same arithmetic expressions(e.g., 32 + 19 would appear in each of the six sets); their order was, however, randomized. We expectedto induce state from high to low engagement with such a set-up. We asked the participants to workas fast as possible, though we did not impose any time constraints. Once all 6 sets of tasks werecompleted, the video lecture on FFT started. We instructed the participants to use the Logitech clickerin the same manner as during the baseline task. We also told them that four different audio instructionswould be played during the lecture and we asked them to perform the instruction they would hear butto try and keep their focus on the video lecture at the same time. By doing so, we were interested intesting whether the system would be able to detect the shift in their engagement. The instructionswere provided as follows: “think about your last conversation with your family”; “think about a currentwork challenge you are facing”; “think about a bird you saw recently”; and “think about anything that crossesyour mind”.
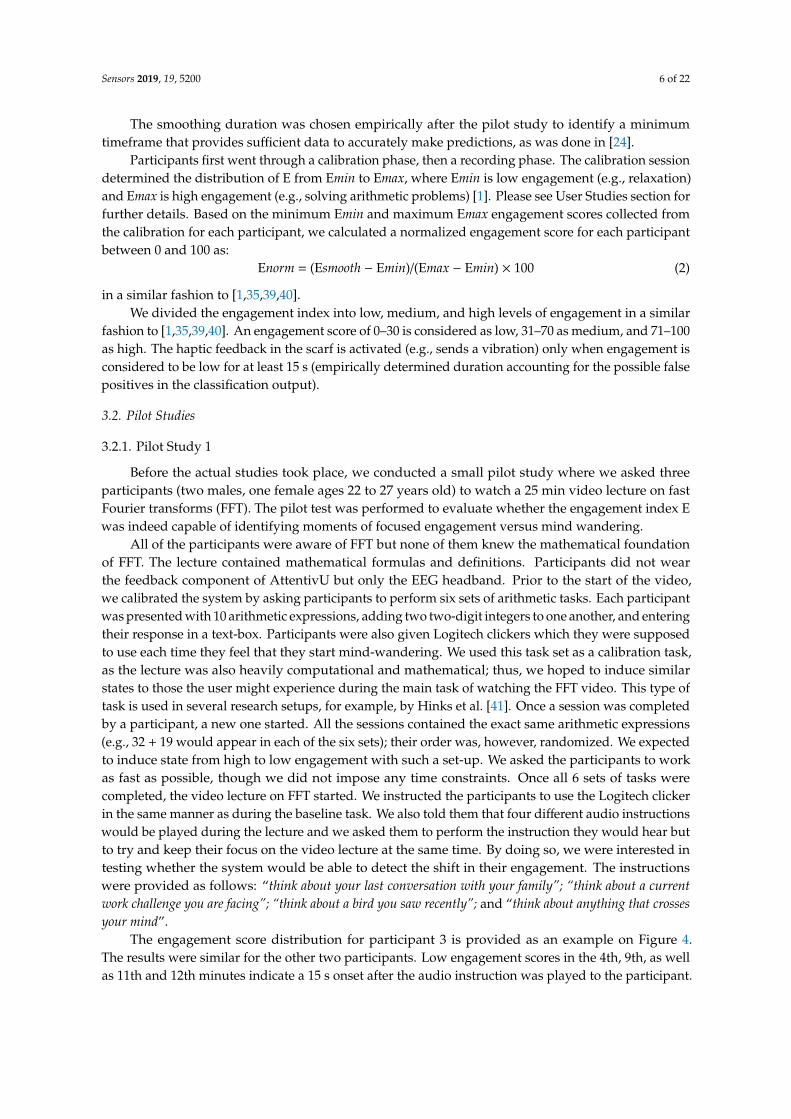
The engagement score distribution for participant 3 is provided as an example on Figure 4.The results were similar for the other two participants. Low engagement scores in the 4th, 9th, as wellas 11th and 12th minutes indicate a 15 s onset after the audio instruction was played to the participant.
Sensors 2019, 19, 5200 7 of 22
Sensors 2019, 19, x FOR PEER REVIEW 7 of 22
females, ages from 22 to 29, different from the participants in Pilot Study 1) participated in this second pilot study and were not given any vibration feedback when their engagement dropped. This was a simultaneous multiuser study in a classroom set-up where all the participants were sitting in front of a big white board where the slides were projected. This study took place in the same room as our main Study 2. We informally collected observations and opinions of the participants on how they felt and how they perceived themselves as well as their peers wearing the headset during the lecture. All the participants reported that the experience was normal and that the they did not feel particular discomfort while wearing the headset. We also checked if the recorded data were received reliably via Wi-Fi in real time and saved correctly.
3.2.3. Pilot Study 3 Finally, 9 participants (five females, four males, ages ranging from 25 to 30 years old, different
from the participants in pilot studies 1 and 2) were invited to participate in our pilot Study 3. We were interested in validating our choices for intensity and duration of the vibration feedback during this final pilot study. During a 35 min period, each of the participants was invited into an office-like room to watch a YouTube video on the future of Internet of Things (IoT) on a Macbook Air 13” placed on the desk. Participants sat comfortably in the chair approximately 50 cm from the desk. Five types of vibrations of varying intensity (starting with 0.3 g; everything below 0.3 g was not perceivable during initial set-up) were administered to the participant every 7 min of the video duration. This study took place in the same room as our main Study 1. The participants reported which vibrations they felt as noticeable but not bothersome. All participants evaluated a low intensity vibration of 0.3 g as noticeable and least bothersome on a scale from 1 to 5. We thus used this intensity in our main studies.
Figure 4. Engagement scores of participant 3 in Pilot Study 1. Low engagement scores were detected at the 4th, 9th, as well as 11th and 12th minutes (encircled).
3.3. User Study 1: Methods and Measures
Though we did not identify the same approaches as the ones used in our work, based on the works of Shernoff et al. [14] and Szafir and Mutlu [24] on immediacy cues in learning, where the system provided immediate feedback when the drop in engagement was detected, we propose the following three hypotheses in order to investigate the use of AttentivU in learning environments:
Hypothesis 1. Haptic feedback stimulation triggered by drops in EEG-monitored engagement levels will increase user’s engagement.
Hypothesis 2. Haptic feedback triggered by drops in EEG-monitored engagement will positively affect participants’ evaluations of the system during subjective evaluation and interviews.
Hypothesis 3. Haptic feedback will improve learning performance of users (retention and comprehension of presented information).
As an important disclaimer regarding the learning performance in our studies: in this paper we mean “momentary learning performance”, meaning immediate results after the information was presented to a person, in contrast to a definition of the learning performance as measuring “learning gains over time” [42]. In our studies we did not perform tests again on the same content over a longer
Figure 4. Engagement scores of participant 3 in Pilot Study 1. Low engagement scores were detected atthe 4th, 9th, as well as 11th and 12th minutes (encircled).
3.2.2. Pilot Study 2
We next performed a second pilot study to check whether we were able to successfully recordthe brain activity of several participants at the same time in a classroom setting, while a lecturerwas presenting a live 25 min lecture, in this case about deep learning. Nine participants (five males,four females, ages from 22 to 29, different from the participants in Pilot Study 1) participated inthis second pilot study and were not given any vibration feedback when their engagement dropped.This was a simultaneous multiuser study in a classroom set-up where all the participants were sittingin front of a big white board where the slides were projected. This study took place in the same roomas our main Study 2. We informally collected observations and opinions of the participants on howthey felt and how they perceived themselves as well as their peers wearing the headset during thelecture. All the participants reported that the experience was normal and that the they did not feelparticular discomfort while wearing the headset. We also checked if the recorded data were receivedreliably via Wi-Fi in real time and saved correctly.
3.2.3. Pilot Study 3
Finally, 9 participants (five females, four males, ages ranging from 25 to 30 years old, differentfrom the participants in pilot studies 1 and 2) were invited to participate in our pilot Study 3. We wereinterested in validating our choices for intensity and duration of the vibration feedback during thisfinal pilot study. During a 35 min period, each of the participants was invited into an office-like roomto watch a YouTube video on the future of Internet of Things (IoT) on a Macbook Air 13” placed onthe desk. Participants sat comfortably in the chair approximately 50 cm from the desk. Five types ofvibrations of varying intensity (starting with 0.3 g; everything below 0.3 g was not perceivable duringinitial set-up) were administered to the participant every 7 min of the video duration. This studytook place in the same room as our main Study 1. The participants reported which vibrations theyfelt as noticeable but not bothersome. All participants evaluated a low intensity vibration of 0.3 g asnoticeable and least bothersome on a scale from 1 to 5. We thus used this intensity in our main studies.
3.3. User Study 1: Methods and Measures
Though we did not identify the same approaches as the ones used in our work, based on theworks of Shernoff et al. [14] and Szafir and Mutlu [24] on immediacy cues in learning, where the systemprovided immediate feedback when the drop in engagement was detected, we propose the followingthree hypotheses in order to investigate the use of AttentivU in learning environments:
Hypothesis 1. Haptic feedback stimulation triggered by drops in EEG-monitored engagement levels willincrease user’s engagement.
Hypothesis 2. Haptic feedback triggered by drops in EEG-monitored engagement will positively affectparticipants’ evaluations of the system during subjective evaluation and interviews.
Hypothesis 3. Haptic feedback will improve learning performance of users (retention and comprehension ofpresented information).
Sensors 2019, 19, 5200 8 of 22
As an important disclaimer regarding the learning performance in our studies: in this paperwe mean “momentary learning performance”, meaning immediate results after the information waspresented to a person, in contrast to a definition of the learning performance as measuring “learninggains over time” [42]. In our studies we did not perform tests again on the same content overa longer period of time; thus, all cases of learning performance we mention here are referred to as“momentary” ones.
To investigate the effect of haptic biofeedback in a learning setting, we designed and conductedtwo studies. The first study was laboratory-based, while the second one was a series of three lecturesin a real lecture room with an actual lecturer. Both studies were approved by the ethical committee ofMassachusetts Institute of Technology (protocol 1803282107A001). Participants were compensatedwith a $15 Amazon gift card per session.
3.3.1. Participants
In total, 39 (21 males, 18 females) participants were recruited for Study 1, but three male participantswere later excluded from the final analysis due to their excessive movements during the experiment(they did not commit to the requirement of the study to try not to perform unnecessary movements andwere talking or standing during some moments of the study), thus leaving 36 (18 males, 18 females)participants with a mean age of 28. The participants were recruited through mailing lists distributedto the local research institution community as well as via a pool of prospective participants from thelocal cognitive lab, where 12 participants recruited from that pool were over 45 years old, and six hadlimited computer literacy.
3.3.2. Experimental Task
The primary intended use case for AttentivU is the learning setting, more specifically, usersabsorbing new information presented either in the form of a video or through a live lecture. For thisfirst study, we focused on videos and chose three different video lectures to be viewed by participantsin the study. The lectures were on the following three subjects: neural networks (NN), Bitcoinand DNA cloning. We chose these three topics as they are often mentioned in the media thesedays and might be of some interest to participants, but they are also complex topics. All threelectures were inundated with formulas and technical terms, thus making parts of the lectures morechallenging to follow. The NN lecture lasted 19 min, the Bitcoin lecture 26 min, and the DNA lecture11 min. Lectures were narrative-style and did not include any quizzes in the middle of the videos.Each lecture was stand-alone and did not require any prior knowledge from the participants in orderto be understood. The main task of the participants was to watch the lecture and pay attention as therewould be questions regarding the content at the end of the lecture (Figure 1B). There were ten questionsin increasing order of difficulty. The first three were multiple choice questions, while the remainingseven were open-ended. The questions were based exclusively on the content of each lecture, askingfor lecture-specific examples and analogies. In total, 34/36 participants were novices in DNA cloning,30/36 reported elementary knowledge of NN, and 24/36 participants reported having little knowledgeabout Blockchain.
3.3.3. Experimental Procedure
Each participant arrived at a quiet study room with no windows and was briefed about the studybefore signing the consent form. The goals and the set-up of the study were explicitly mentionedin the consent form as well as repeated orally by the experimenter; each participant was expectedto watch all three lectures and answer questions about the content of each lecture once each videolecture ended. Participants were instructed to stay as attentive as possible. Participants were told thatthe scarf may vibrate if a drop in engagement was detected. Participants were also briefed in verygeneral terms about BCIs and about the headband they were about to wear. They were instructed aboutmotion artifacts and were asked explicitly not to perform any unnecessary movements. Before starting
Sensors 2019, 19, 5200 9 of 22
the lectures, participants answered a background questionnaire, which included questions abouttheir education, age, and their level of knowledge of NN, Bitcoins and DNA cloning. Once thebackground questionnaire was completed, participants put on the EEG headband as well as the scarf.The experimenter ensured that the vibrations were felt by the participants and that they did notbother them. The experiment started with a calibration phase. It consisted of three successive taskssimilar to the ones used in [35]. Participants were asked to perform the following:
Task 1. Sit still with their eyes closed for 90 s.Task 2. Sit still with their eyes open for 90 s.Task 3: Alternate between 10 arithmetic and image-matching tasks (each lasting 30 s), with 10 s of
controlled rest between each task. The image-matching task asked participants to indicate whethersequences of images match each other. This setup is similar to previous BCI work using n-backtasks [41], only here n equals 1 throughout the entire task, similar to the low cognitive workloadcondition used in previous BCI work [6]. We established high and low engagement for these tasksbased on our engagement measure E. During the calibration stage users were explicitly instructed notto attend to any particular imagination or other internal process. This calibration phase lasted 5 min.EEG signals differ in each of these sessions (engagement was very low in Sessions 1 and 2, and slightlyhigher during Session 3 in the 1-back task, however the exact values were person-dependent).
For each of the calibrations tasks, the value of E over time in order to sample a representativedistribution of engagement values for each participant was recorded. We used the characteristics of thedistribution to determine a low engagement threshold for each user. Post-calibration, the experimentermoved out of the participant’s line-of-sight, and the participants started watching the lectures.The experimenter could see the participants and took notes if they were moved excessively. The orderof the lectures was randomized for each participant. After the first video lecture was over, questionsabout that lecture appeared. Once the participant answered the questions about the lecture content,he/she filled out one more questionnaire–about the behavior of the scarf, which included questionslike: “How accurate was the feedback from the scarf?”, “How much were you able to retain the concepts fromthe lecture?”, “How engaged did you feel during the lecture?”, or “Do you think that the haptic feedback(vibrations from the scarf) helped you to focus (stay engaged)?”.
After the participants finished both questionnaires, they had a two-minute break and a secondvideo lecture started. After the second and third video lectures, there was once again a quiz unique to thecontent of the lecture and a general questionnaire about the behavior of the system (the questions aboutthe system were always identical). Once participants watched all three lectures, a final questionnaireappeared on the screen; it contained several questions that were not related to the accuracy of thehaptic feedback, such as “If you were to wear this scarf in the social environment would you wear it againfrom time to time, when you felt like you needed it?”.
After participants finished answering the final questionnaire, the experimenter helped themtake off both devices. Also, the experimenter asked the participants for informal feedback abouttheir experience. The study lasted around 1 h 45 min per person.
To test our hypotheses, we manipulated whether or not participants were receiving biofeedbackfrom the scarf. There were three conditions:
(1) Biofeedback. Each time a drop in engagement from medium to low was detected, the scarf wasset to vibrate. The vibration was administered within 60 s if the engagement level remained lowafter the first vibration was already administrated.
(2) Random feedback. The scarf would vibrate, but the vibrations did not correlate or depend on theengagement level of the user. The vibrations were set up in the following manner: No vibrationwas allowed within 2 min following random vibration; a vibration could occur in a time periodof between 4 to 6 min (4 for shorter, 6 for longer lectures) to ensure that the vibrations were nottoo frequent/annoying.
(3) No feedback (NF). The scarf did not vibrate.
Sensors 2019, 19, 5200 10 of 22
We recorded the brain activity of all the participants including the ones in the NF condition.To counterbalance our study, as there were three different lectures shown to each participant,we associated each lecture with a particular feedback type for each participant, which means that eachparticipant experienced all three types of feedback during the experiment. In total, 12 participantsreceived biofeedback on the NN lecture, 12 other participants were administered a random feedbackon the NN lecture, and 12 different participants did not receive any feedback on the NN lecture,and so on. The experiment was double-blind. The dependent variables included engagement level ofthe participants, participants’ responses to the questions about the content of the lectures, as well astheir perception of the system in subjective questionnaires.
4. Results of Study 1
We used a linear mixed model (REML fit at 742.4) on a within-participant basis (engagement~ feedback + (1|participant) + (1|feedback:participant)) and then a repeated measures ANOVA onsaid model. The unit of measure was at the group level (feedback type). We had 108 observations with36 participants. For the repeated-measures ANOVA, we had F(2) = 161.14, p = 2.2 × 10⁻¹⁶. Fixed effect(biofeedback) = 16.04; Fixed effect (no feedback) = −7.68.
We also tested for the influence of feedback type, lecture types, and potential order effects oflecture types. We received nonstatistically significant results from a uniformly randomized repeatedmeasures ANOVA (F(2) = 5.33, p > 0.05).
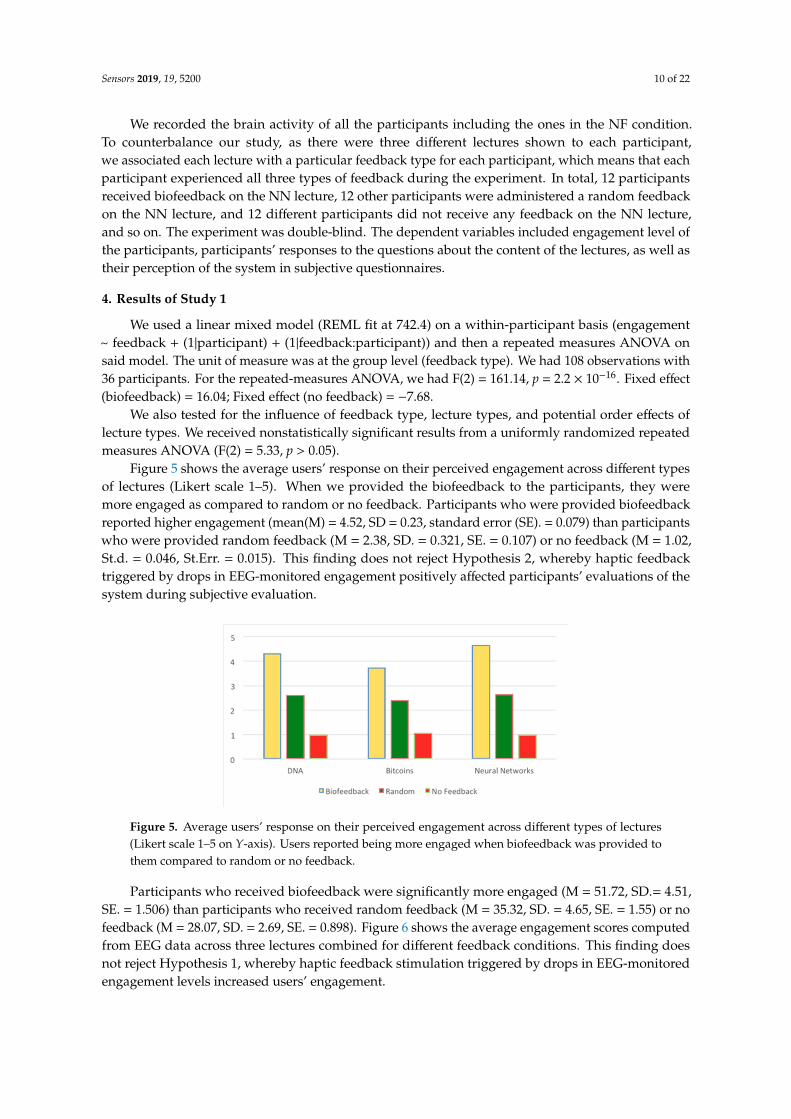
Figure 5 shows the average users’ response on their perceived engagement across different typesof lectures (Likert scale 1–5). When we provided the biofeedback to the participants, they weremore engaged as compared to random or no feedback. Participants who were provided biofeedbackreported higher engagement (mean(M) = 4.52, SD = 0.23, standard error (SE). = 0.079) than participantswho were provided random feedback (M = 2.38, SD. = 0.321, SE. = 0.107) or no feedback (M = 1.02,St.d. = 0.046, St.Err. = 0.015). This finding does not reject Hypothesis 2, whereby haptic feedbacktriggered by drops in EEG-monitored engagement positively affected participants’ evaluations of thesystem during subjective evaluation.
Sensors 2019, 19, x FOR PEER REVIEW 10 of 22
participants, participants’ responses to the questions about the content of the lectures, as well as their perception of the system in subjective questionnaires.
4. Results of Study 1
We used a linear mixed model (REML fit at 742.4) on a within-participant basis (engagement ~ feedback + (1 | participant) + (1 | feedback:participant)) and then a repeated measures ANOVA on said model. The unit of measure was at the group level (feedback type). We had 108 observations with 36 participants. For the repeated-measures ANOVA, we had F(2) = 161.14, p = 2.2 × 10⁻¹⁶. Fixed effect (biofeedback) = 16.04; Fixed effect (no feedback) = −7.68.
We also tested for the influence of feedback type, lecture types, and potential order effects of lecture types. We received nonstatistically significant results from a uniformly randomized repeated measures ANOVA (F(2) = 5.33, p > 0.05).
Figure 5 shows the average users’ response on their perceived engagement across different types of lectures (Likert scale 1–5). When we provided the biofeedback to the participants, they were more engaged as compared to random or no feedback. Participants who were provided biofeedback reported higher engagement (mean(M) = 4.52, SD = 0.23, standard error (SE). = 0.079) than participants who were provided random feedback (M = 2.38, SD. = 0.321, SE. = 0.107) or no feedback (M = 1.02, St.d. = 0.046, St.Err. = 0.015). This finding does not reject Hypothesis 2, whereby haptic feedback triggered by drops in EEG-monitored engagement positively affected participants’ evaluations of the system during subjective evaluation.
Figure 5. Average users’ response on their perceived engagement across different types of lectures (Likert scale 1–5 on Y-axis). Users reported being more engaged when biofeedback was provided to them compared to random or no feedback.
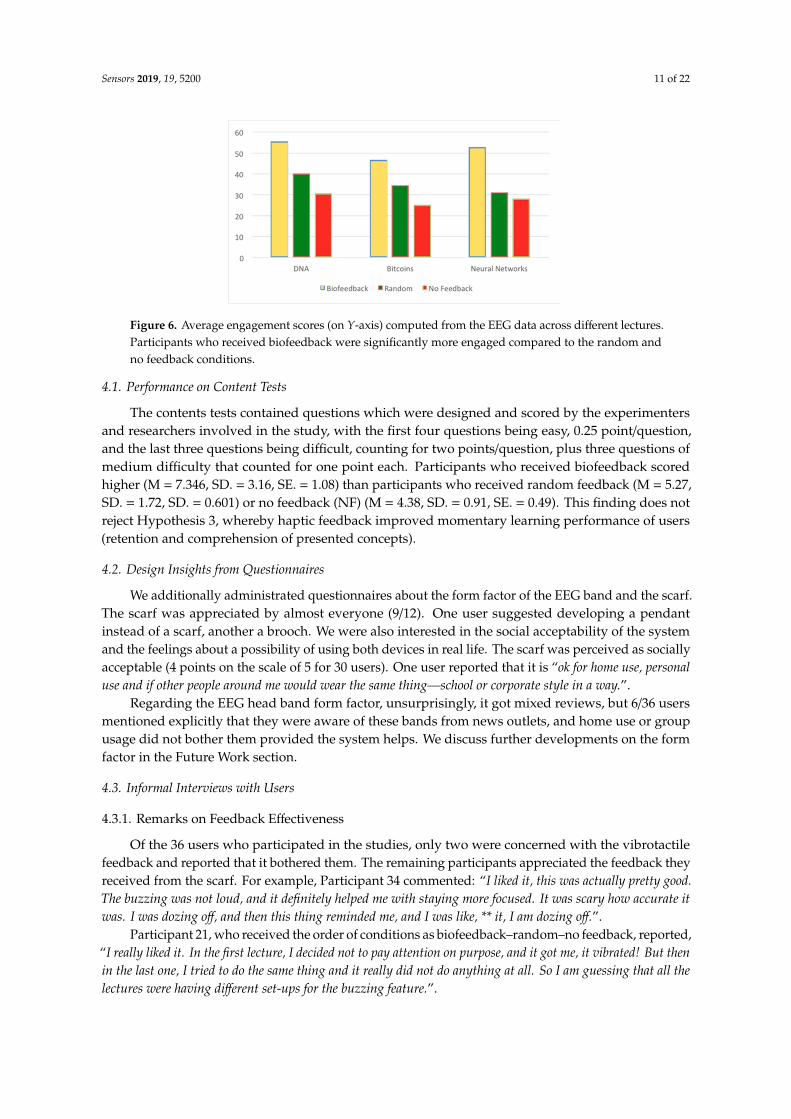
Participants who received biofeedback were significantly more engaged (M = 51.72, SD.= 4.51, SE. = 1.506) than participants who received random feedback (M = 35.32, SD. = 4.65, SE. = 1.55) or no feedback (M = 28.07, SD. = 2.69, SE. = 0.898). Figure 6 shows the average engagement scores computed from EEG data across three lectures combined for different feedback conditions. This finding does not reject Hypothesis 1, whereby haptic feedback stimulation triggered by drops in EEG-monitored engagement levels increased users’ engagement.
Figure 5. Average users’ response on their perceived engagement across different types of lectures(Likert scale 1–5 on Y-axis). Users reported being more engaged when biofeedback was provided tothem compared to random or no feedback.
Participants who received biofeedback were significantly more engaged (M = 51.72, SD.= 4.51,SE. = 1.506) than participants who received random feedback (M = 35.32, SD. = 4.65, SE. = 1.55) or nofeedback (M = 28.07, SD. = 2.69, SE. = 0.898). Figure 6 shows the average engagement scores computedfrom EEG data across three lectures combined for different feedback conditions. This finding doesnot reject Hypothesis 1, whereby haptic feedback stimulation triggered by drops in EEG-monitoredengagement levels increased users’ engagement.
Sensors 2019, 19, 5200 11 of 22
Sensors 2019, 19, x FOR PEER REVIEW 10 of 22
participants, participants’ responses to the questions about the content of the lectures, as well as their perception of the system in subjective questionnaires.
4. Results of Study 1
We used a linear mixed model (REML fit at 742.4) on a within-participant basis (engagement ~ feedback + (1 | participant) + (1 | feedback:participant)) and then a repeated measures ANOVA on said model. The unit of measure was at the group level (feedback type). We had 108 observations with 36 participants. For the repeated-measures ANOVA, we had F(2) = 161.14, p = 2.2 × 10⁻¹⁶. Fixed effect (biofeedback) = 16.04; Fixed effect (no feedback) = −7.68.
We also tested for the influence of feedback type, lecture types, and potential order effects of lecture types. We received nonstatistically significant results from a uniformly randomized repeated measures ANOVA (F(2) = 5.33, p > 0.05).
Figure 5 shows the average users’ response on their perceived engagement across different types of lectures (Likert scale 1–5). When we provided the biofeedback to the participants, they were more engaged as compared to random or no feedback. Participants who were provided biofeedback reported higher engagement (mean(M) = 4.52, SD = 0.23, standard error (SE). = 0.079) than participants who were provided random feedback (M = 2.38, SD. = 0.321, SE. = 0.107) or no feedback (M = 1.02, St.d. = 0.046, St.Err. = 0.015). This finding does not reject Hypothesis 2, whereby haptic feedback triggered by drops in EEG-monitored engagement positively affected participants’ evaluations of the system during subjective evaluation.
Figure 5. Average users’ response on their perceived engagement across different types of lectures (Likert scale 1–5 on Y-axis). Users reported being more engaged when biofeedback was provided to them compared to random or no feedback.
Participants who received biofeedback were significantly more engaged (M = 51.72, SD.= 4.51, SE. = 1.506) than participants who received random feedback (M = 35.32, SD. = 4.65, SE. = 1.55) or no feedback (M = 28.07, SD. = 2.69, SE. = 0.898). Figure 6 shows the average engagement scores computed from EEG data across three lectures combined for different feedback conditions. This finding does not reject Hypothesis 1, whereby haptic feedback stimulation triggered by drops in EEG-monitored engagement levels increased users’ engagement.
Figure 6. Average engagement scores (on Y-axis) computed from the EEG data across different lectures.Participants who received biofeedback were significantly more engaged compared to the random andno feedback conditions.
4.1. Performance on Content Tests
The contents tests contained questions which were designed and scored by the experimentersand researchers involved in the study, with the first four questions being easy, 0.25 point/question,and the last three questions being difficult, counting for two points/question, plus three questions ofmedium difficulty that counted for one point each. Participants who received biofeedback scoredhigher (M = 7.346, SD. = 3.16, SE. = 1.08) than participants who received random feedback (M = 5.27,SD. = 1.72, SD. = 0.601) or no feedback (NF) (M = 4.38, SD. = 0.91, SE. = 0.49). This finding does notreject Hypothesis 3, whereby haptic feedback improved momentary learning performance of users(retention and comprehension of presented concepts).
4.2. Design Insights from Questionnaires
We additionally administrated questionnaires about the form factor of the EEG band and the scarf.The scarf was appreciated by almost everyone (9/12). One user suggested developing a pendantinstead of a scarf, another a brooch. We were also interested in the social acceptability of the systemand the feelings about a possibility of using both devices in real life. The scarf was perceived as sociallyacceptable (4 points on the scale of 5 for 30 users). One user reported that it is “ok for home use, personaluse and if other people around me would wear the same thing—school or corporate style in a way.”.
Regarding the EEG head band form factor, unsurprisingly, it got mixed reviews, but 6/36 usersmentioned explicitly that they were aware of these bands from news outlets, and home use or groupusage did not bother them provided the system helps. We discuss further developments on the formfactor in the Future Work section.
4.3. Informal Interviews with Users
4.3.1. Remarks on Feedback Effectiveness
Of the 36 users who participated in the studies, only two were concerned with the vibrotactilefeedback and reported that it bothered them. The remaining participants appreciated the feedback theyreceived from the scarf. For example, Participant 34 commented: “I liked it, this was actually pretty good.The buzzing was not loud, and it definitely helped me with staying more focused. It was scary how accurate itwas. I was dozing off, and then this thing reminded me, and I was like, ** it, I am dozing off.”.
Participant 21, who received the order of conditions as biofeedback–random–no feedback, reported,“I really liked it. In the first lecture, I decided not to pay attention on purpose, and it got me, it vibrated! But thenin the last one, I tried to do the same thing and it really did not do anything at all. So I am guessing that all thelectures were having different set-ups for the buzzing feature.”.
Sensors 2019, 19, 5200 12 of 22
Participant 16, who also received the biofeedback–random–no feedback order of conditions, said,“During the first lecture it was fine. As it was not my field at all and not of any particular interest, I was reallylosing attention, and it caught me. I think it did help me. But during the second and the third lecture it wasbehaving much worse. I am not sure if this is the part of the test, but on the third one it was not vibrating at all(“no feedback” condition), I did not feel anything.”.
Participant 7, who received no feedback–random–biofeedback order of conditions, mentioned,“the second and the third videos were really ok, especially the third one, it really felt very precise when I wasgetting the vibrations. The second video was kind of ok, though definitely not as precise as the third one.”.
4.3.2. Measuring Engagement
Five users were aware of the device and that it might have influenced their engagement level.For example, Participant 29 reported that she was “very conscious about the necklace even when it did
not vibrate, I knew that it is there and that I am supposed to pay attention, so I told myself, ‘I should try to reallypay attention,’ it was for me a presence thing, despite the vibrations being accurate, especially when I realizedthat I started being sleepy.”.
Finally, several users like Participant 19, suggested use cases where they would use the system,“I think it was more useful in some lectures than in other ones. I felt that during one of the lectures, it was reallyrandom, but then, during another one, I was starting to drift and...it worked, it buzzed! And I instantly thoughtthat it would be awesome for classes, yes, please!”.
4.3.3. Conclusions for Study 1
Our first and third hypotheses, whereby haptic feedback will increase engagement and improvelearning performance, were not rejected in the experiment. As seen from the results, the participantswho received biofeedback demonstrated significantly higher EEG-based engagement scores than thosewho received either random or no feedback. Our second hypothesis, whereby participants wouldpositively perceive the haptic feedback when evaluating the system, was also not rejected, based onthe data collected from the questionnaires, informal interviews, and comments from the participants.It would be interesting to encounter the prior interest for the videos as well as the familiarity with thetopics of the videos to gain even more insight for the designs of future studies. We further discuss theimplications of this study in the Future Work section.
5. User Study 2: Methods and Measures
We next decided to perform another experiment, Study 2, in a set-up as close as possible to that ofan actual classroom. The experiment involved multiple simultaneous participants during an actual,live lecture in a real lecture hall. This study was conducted to test the feasibility of deploying thesystem in conditions closer to a real-life learning scenario in a classroom, with some exceptions whichare highlighted in experimental procedure.
5.1. Participants
For the second study, 12 participants (six males, six females, mean age 21 years old) were recruitedfrom the students of a large university campus. All the participants were different from Study 1participants. They were not familiar with the research or the AttentivU system.
5.2. Experimental Task
The set-up for this experiment was very similar to that of Study 1, with a few exceptions. It was asimultaneous, multiple participant study with all 12 participants present at the same time for threelive lectures (Figure 1C). The lectures took place in a real university lecture hall over a period of threeweeks (one per week). The three lectures were about different aspects of the same subject of virtualreality (VR), and they were presented in person by a lecturer who is an expert in VR. The lectures
Sensors 2019, 19, 5200 13 of 22
were related to each other and they were of increasing difficulty. Each lecture lasted between 40and 50 min. Each lecture was presented by the lecturer with the help of a deck of slides. The slidesincluded one short YouTube video per lecture, one live question from the lecturer to the students,one “live” demo from the lecturer illustrating one of the concepts of the lecture and blocks of slidesloaded with mathematical formulas. The main task of the students was to attend the lecture and listento the speaker.
As in the previous study, at the end of each lecture, participants had to answer 10 questionsabout the contents of the lecture. The questions were based exclusively on the contents of each lectureand they were lecture-specific. Each slide deck was designed by a researcher and the lecturer priorto the lecture taking place. Lecture 1 consisted of 56 slides, Lecture 2 had 50 slides, and Lecture 3had 58 slides. The lecturer tagged each slide according to one of the following categories: slideswere either labeled as “ok”, “boring”, “interesting”, or “exciting”. There was at least one interestingand exciting block (video or animations) of slides in each lecture. The slides were designed with thefollowing strategy in mind: as engagement is a fluctuating state and it might not be possible to seesome trends and changes right after a single slide, each slide category (“ok”, “boring”, and so on) wascomposed of at least 5–7 slides to establish that we could pick up the states of boredom and excitement.These annotations were based on the experience of the lecturer, a specialist in the domain. He knewabout the purpose of the study and our interest in inducing varying levels of engagement throughoutthe lectures. The lectures were video-recorded.
5.3. Experimental Procedure
The experimental procedure for this study was similar to the previous one with a few exceptions.All participants were students at the university where the study took place. There was a spare seat inbetween each of the participants. Once all the participants arrived in the room, the researcher briefedthem about the study before asking them to sign the consent form. Participants were asked to attendand listen to the lectures, which this time took place over the course of three weeks. Participants werenot explicitly instructed to stay as attentive as possible, nor were they told that there would be questionsto be answered after a lecture took place. They were asked to behave as naturally as they might ina regular class lecture. Regarding the scarf, the participants were told that it might vibrate, but noexplanation was given to the participants about the reason why it might do so. Participants underwentthe same procedure as in the previous study: They were given explanations about BCIs and motionartefacts, and they were asked not to perform unnecessary movements or restrain from taking notes.They filled out the background questionnaire (including questions on their education and level ofexpertise in VR), the devices were put on them by the experimenter, ensuring good connection,and finally they underwent a calibration phase (which lasted 5 min as in the previous study). Once thecalibration session was over, the experimenter went to the other side of the room, where no participantwas sitting, and the students started listening to the lecture. At the end of the lecture, participantswere asked to fill out three questionnaires: a quiz on the contents of the lecture they just attended,their perception of the behavior of the scarf, where almost all the questions were similar to the ones inStudy 1 (though some new ones were added, like, “When did the scarf vibrate in your opinion?”).
Finally, a third questionnaire was an actual deck of the slides of the lecture the students justattended, and the participants were asked to indicate for each slide whether they think they wereengaged or not when that slide was used during the lecture. The slides were printed in a small previewformat (16 slides per page) so participants would not really have the chance to review the content ofthe slides. Instead they just had a glimpse of what the slides were about. This was done so as not tobias their perception. Though we consider this method to not be perfect (as participants need to rely ontheir memory), we thought that it would be a better way to assess their subjective engagement scorerather than using a clicker. Clickers tend to possibly help participants get back on track, but we didnot want to bias the study by adding another device, and we wanted our lectures to be as similar toan actual lecture as possible. The second and third lectures were held in the same manner, with the
Sensors 2019, 19, 5200 14 of 22
exception that the background questionnaire was not administered. Calibration was performed beforeeach lecture took place. After the third lecture, the participants got an additional questionnaire, calledfinal, which was similar to the final questionnaire used in Study 1. Additionally, the participants wereasked to share their feedback with the experimenter in a one-on-one conversation if they felt like it.Each lecture lasted approximately 1 h 45 min.
To test our hypotheses, we varied the type of feedback the participants obtained from the scarf.As in Study 1, there were three conditions. As there were 12 participants, 4 participants were assignedto get biofeedback, 4 other participants were assigned to receive random feedback (administered inthe same way as in Study 1) and the last 4 participants did not get any feedback. Participants wereassigned the same feedback type for all three lectures with no changes. Participants did not knowwhich feedback was assigned to them, nor did they know that these three options existed. The studywas double-blind. The dependent variables included participants’ engagement level, participants’accuracy regarding their answers to the questions about the contents of the lectures, their self-reportedengagement level, as well as their perception of the system in the subjective questionnaires.
6. Results of Study 2
As we only had 12 users in this study, we consider it to be more of a proof of concept of multi-userdeployment of the system. The results of this study should be taken with precaution and they are onlyreported as preliminary as there are insufficient data to reliably estimate variances.
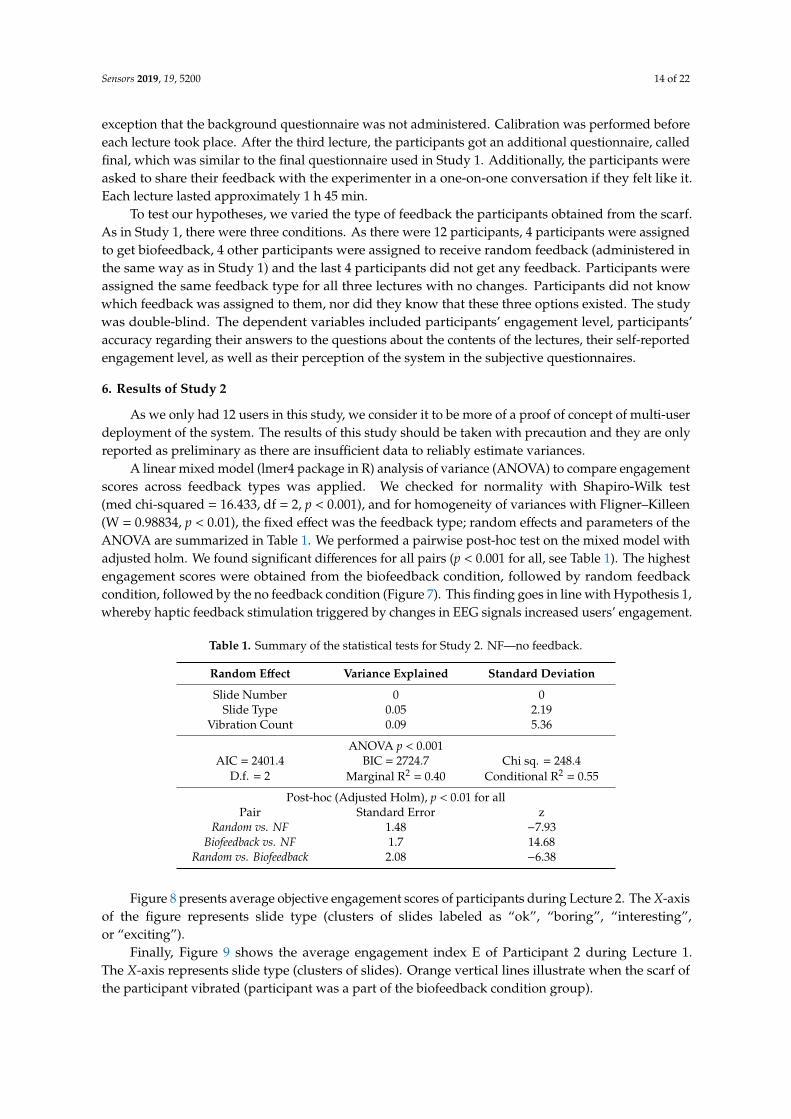
A linear mixed model (lmer4 package in R) analysis of variance (ANOVA) to compare engagementscores across feedback types was applied. We checked for normality with Shapiro-Wilk test(med chi-squared = 16.433, df = 2, p < 0.001), and for homogeneity of variances with Fligner–Killeen(W = 0.98834, p < 0.01), the fixed effect was the feedback type; random effects and parameters of theANOVA are summarized in Table 1. We performed a pairwise post-hoc test on the mixed model withadjusted holm. We found significant differences for all pairs (p < 0.001 for all, see Table 1). The highestengagement scores were obtained from the biofeedback condition, followed by random feedbackcondition, followed by the no feedback condition (Figure 7). This finding goes in line with Hypothesis 1,whereby haptic feedback stimulation triggered by changes in EEG signals increased users’ engagement.
Table 1. Summary of the statistical tests for Study 2. NF—no feedback.
Random Effect Variance Explained Standard Deviation
Slide Number 0 0Slide Type 0.05 2.19
Vibration Count 0.09 5.36
ANOVA p < 0.001AIC = 2401.4 BIC = 2724.7 Chi sq. = 248.4
D.f. = 2 Marginal R2 = 0.40 Conditional R2 = 0.55
Post-hoc (Adjusted Holm), p < 0.01 for allPair Standard Error z
Random vs. NF 1.48 −7.93Biofeedback vs. NF 1.7 14.68
Random vs. Biofeedback 2.08 −6.38
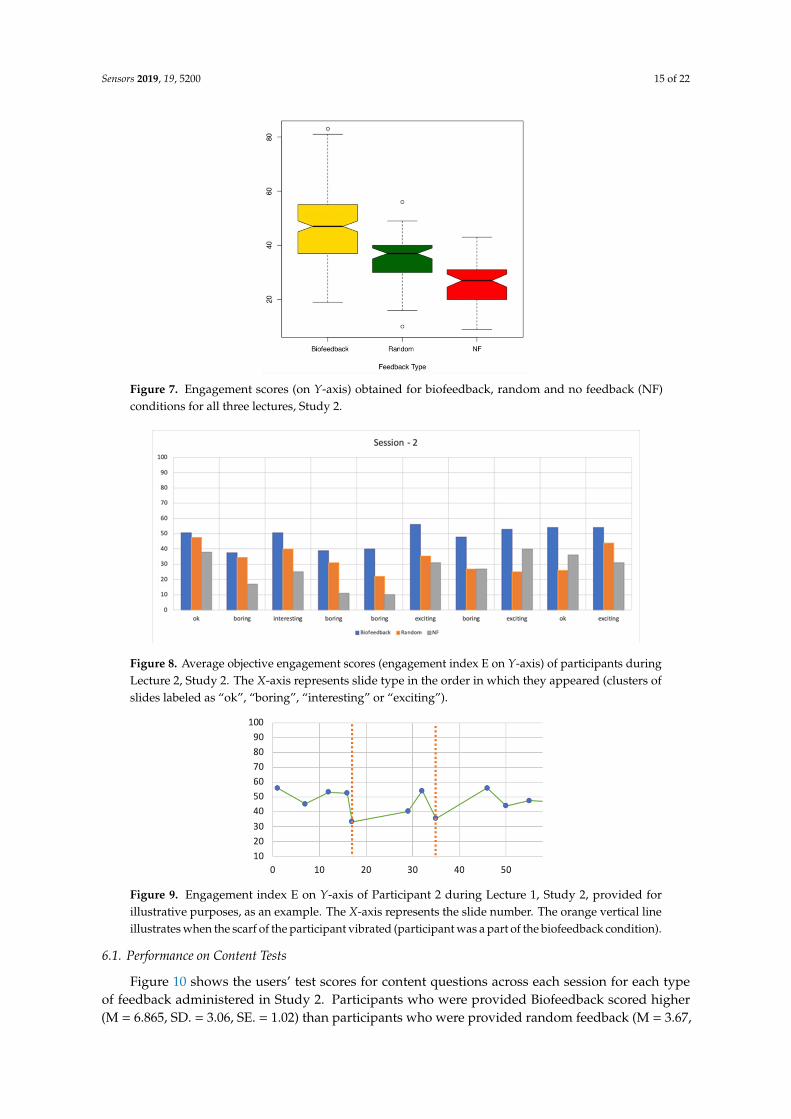
Figure 8 presents average objective engagement scores of participants during Lecture 2. The X-axisof the figure represents slide type (clusters of slides labeled as “ok”, “boring”, “interesting”,or “exciting”).
Finally, Figure 9 shows the average engagement index E of Participant 2 during Lecture 1.The X-axis represents slide type (clusters of slides). Orange vertical lines illustrate when the scarf ofthe participant vibrated (participant was a part of the biofeedback condition group).
Sensors 2019, 19, 5200 15 of 22
Sensors 2019, 19, x FOR PEER REVIEW 14 of 22
As we only had 12 users in this study, we consider it to be more of a proof of concept of multi-user deployment of the system. The results of this study should be taken with precaution and they are only reported as preliminary as there are insufficient data to reliably estimate variances.
A linear mixed model (lmer4 package in R) analysis of variance (ANOVA) to compare engagement scores across feedback types was applied. We checked for normality with Shapiro-Wilk test (med chi-squared = 16.433, df = 2, p < 0.001), and for homogeneity of variances with Fligner–Killeen (W = 0.98834, p < 0.01), the fixed effect was the feedback type; random effects and parameters of the ANOVA are summarized in Table 1. We performed a pairwise post-hoc test on the mixed model with adjusted holm. We found significant differences for all pairs (p < 0.001 for all, see Table 1). The highest engagement scores were obtained from the biofeedback condition, followed by random feedback condition, followed by the no feedback condition (Figure 7). This finding goes in line with Hypothesis 1, whereby haptic feedback stimulation triggered by changes in EEG signals increased users’ engagement.
Table 1. Summary of the statistical tests for Study 2. NF—no feedback.
Random Effect Variance Explained Standard Deviation Slide Number 0 0
Slide Type 0.05 2.19 Vibration Count 0.09 5.36
ANOVA p < 0.001 AIC = 2401.4 BIC = 2724.7 Chi sq. = 248.4
D.f. = 2 Marginal R2 = 0.40 Conditional R2 = 0.55 Post-hoc (Adjusted Holm), p<0.01 for all
Pair Standard Error z Random vs. NF 1.48 -7.93
Biofeedback vs. NF 1.7 14.68 Random vs. Biofeedback 2.08 -6.38
Figure 7. Engagement scores (on Y-axis) obtained for biofeedback, random and no feedback (NF) conditions for all three lectures, Study 2.
Figure 8 presents average objective engagement scores of participants during Lecture 2. The X-axis of the figure represents slide type (clusters of slides labeled as “ok”, “boring”, “interesting”, or “exciting”).
Figure 7. Engagement scores (on Y-axis) obtained for biofeedback, random and no feedback (NF)conditions for all three lectures, Study 2.Sensors 2019, 19, x FOR PEER REVIEW 15 of 22
Figure 8. Average objective engagement scores (engagement index E on Y-axis) of participants during Lecture 2, Study 2. The X-axis represents slide type in the order in which they appeared (clusters of slides labeled as “ok”, “boring”, “interesting” or “exciting”).
Finally, Figure 9 shows the average engagement index E of Participant 2 during Lecture 1. The X-axis represents slide type (clusters of slides). Orange vertical lines illustrate when the scarf of the participant vibrated (participant was a part of the biofeedback condition group).
6.1. Performance on Content Tests
Figure 10 shows the users’ test scores for content questions across each session for each type of feedback administered in Study 2. Participants who were provided Biofeedback scored higher (M = 6.865, SD. = 3.06, SE. = 1.02) than participants who were provided random feedback (M = 3.67, SD = 1.92, SE. = 0.641) or no feedback (NF) (M = 2.68, St.d = 0.87, Std.Err. = 0.29). This finding goes in line with Hypothesis 3, whereby haptic feedback improved learning performance of users (retention and comprehension of presented concepts).
Figure 9. Engagement index E on Y-axis of Participant 2 during Lecture 1, Study 2, provided for illustrative purposes, as an example. The X-axis represents the slide number. The orange vertical line illustrates when the scarf of the participant vibrated (participant was a part of the biofeedback condition).
6.2. Informal Interviews with Users from Study 2
We performed interviews with participants as well. The findings were very similar to ones from Study 1; in particular, on the effectiveness of the feedback, Participants 9 and 11 (biofeedback group) both reported that the “necklace did help in focusing on the lecture.”
The mere presence of the device was also mentioned as possibly helping with engagement (pointed out by two users). Participants had an opportunity to observe the effect from the system over longer period of time than their peers from Study 1. In particular, Participant 8 (biofeedback group) reported: “It was interesting to see the behavior of the necklace. So last time, when I was attending the lecture two, in the questionnaire there was a question if you feel tired, and I felt that I was not tired, and the necklace only vibrated a couple of times. But then, yesterday evening, I was studying for my finals, and I went
Figure 8. Average objective engagement scores (engagement index E on Y-axis) of participants duringLecture 2, Study 2. The X-axis represents slide type in the order in which they appeared (clusters ofslides labeled as “ok”, “boring”, “interesting” or “exciting”).
Sensors 2019, 19, x FOR PEER REVIEW 15 of 22
Figure 8. Average objective engagement scores (engagement index E on Y-axis) of participants during Lecture 2, Study 2. The X-axis represents slide type in the order in which they appeared (clusters of slides labeled as “ok”, “boring”, “interesting” or “exciting”).
Finally, Figure 9 shows the average engagement index E of Participant 2 during Lecture 1. The X-axis represents slide type (clusters of slides). Orange vertical lines illustrate when the scarf of the participant vibrated (participant was a part of the biofeedback condition group).
6.1. Performance on Content Tests
Figure 10 shows the users’ test scores for content questions across each session for each type of feedback administered in Study 2. Participants who were provided Biofeedback scored higher (M = 6.865, SD. = 3.06, SE. = 1.02) than participants who were provided random feedback (M = 3.67, SD = 1.92, SE. = 0.641) or no feedback (NF) (M = 2.68, St.d = 0.87, Std.Err. = 0.29). This finding goes in line with Hypothesis 3, whereby haptic feedback improved learning performance of users (retention and comprehension of presented concepts).
Figure 9. Engagement index E on Y-axis of Participant 2 during Lecture 1, Study 2, provided for illustrative purposes, as an example. The X-axis represents the slide number. The orange vertical line illustrates when the scarf of the participant vibrated (participant was a part of the biofeedback condition).
6.2. Informal Interviews with Users from Study 2
We performed interviews with participants as well. The findings were very similar to ones from Study 1; in particular, on the effectiveness of the feedback, Participants 9 and 11 (biofeedback group) both reported that the “necklace did help in focusing on the lecture.”
The mere presence of the device was also mentioned as possibly helping with engagement (pointed out by two users). Participants had an opportunity to observe the effect from the system over longer period of time than their peers from Study 1. In particular, Participant 8 (biofeedback group) reported: “It was interesting to see the behavior of the necklace. So last time, when I was attending the lecture two, in the questionnaire there was a question if you feel tired, and I felt that I was not tired, and the necklace only vibrated a couple of times. But then, yesterday evening, I was studying for my finals, and I went
Figure 9. Engagement index E on Y-axis of Participant 2 during Lecture 1, Study 2, provided forillustrative purposes, as an example. The X-axis represents the slide number. The orange vertical lineillustrates when the scarf of the participant vibrated (participant was a part of the biofeedback condition).
6.1. Performance on Content Tests
Figure 10 shows the users’ test scores for content questions across each session for each typeof feedback administered in Study 2. Participants who were provided Biofeedback scored higher(M = 6.865, SD. = 3.06, SE. = 1.02) than participants who were provided random feedback (M = 3.67,
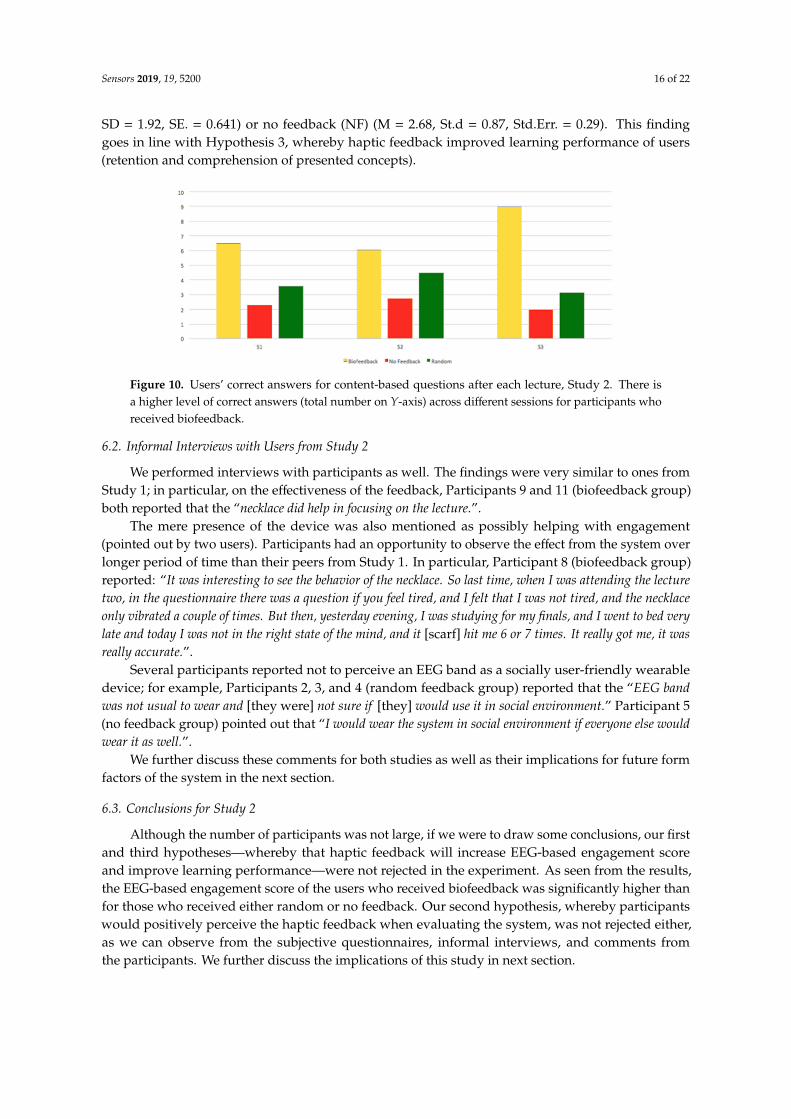
Sensors 2019, 19, 5200 16 of 22
SD = 1.92, SE. = 0.641) or no feedback (NF) (M = 2.68, St.d = 0.87, Std.Err. = 0.29). This findinggoes in line with Hypothesis 3, whereby haptic feedback improved learning performance of users(retention and comprehension of presented concepts).
Sensors 2019, 19, x FOR PEER REVIEW 16 of 22
to bed very late and today I was not in the right state of the mind, and it [scarf] hit me 6 or 7 times. It really got me, it was really accurate.”
Figure 10. Users’ correct answers for content-based questions after each lecture, Study 2. There is a higher level of correct answers (total number on Y-axis) across different sessions for participants who received biofeedback.
Several participants reported not to perceive an EEG band as a socially user-friendly wearable device; for example, Participants 2, 3, and 4 (random feedback group) reported that the “EEG band was not usual to wear and [they were] not sure if [they] would use it in social environment.” Participant 5 (no feedback group) pointed out that “I would wear the system in social environment if everyone else would wear it as well.”
We further discuss these comments for both studies as well as their implications for future form factors of the system in the next section.
6.3. Conclusions for Study 2
Although the number of participants was not large, if we were to draw some conclusions, our first and third hypotheses—whereby that haptic feedback will increase EEG-based engagement score and improve learning performance—were not rejected in the experiment. As seen from the results, the EEG-based engagement score of the users who received biofeedback was significantly higher than for those who received either random or no feedback. Our second hypothesis, whereby participants would positively perceive the haptic feedback when evaluating the system, was not rejected either, as we can observe from the subjective questionnaires, informal interviews, and comments from the participants. We further discuss the implications of this study in next section.
7. Discussion, Challenges, Future Work, and Limitations
Our first and third hypotheses, whereby haptic feedback in the form of vibrations will increase EEG-based engagement and improve momentary learning performance (see our disclaimer in Section 3.3), were not rejected in our experiments. As seen from the results, the EEG-based engagement score of the users who received biofeedback was significantly higher than those who received either random or no feedback. Our second hypothesis, whereby participants will positively perceive haptic feedback when evaluating the system, was also not rejected in Studies 1 and 2, based on the data collected from the questionnaires, informal interviews, and comments from the participants.
We do not envision AttentivU as a system to be worn 24/7 in order to keep a person continuously attentive or engaged as a continuous high level of engagement can negatively affect learning outcomes [43]. AttentivU might provide an alternative option for students or other users who have problems with staying on task when attention is required, e.g., when attending a lecture. If we are successful with further improvements of the system, AttentivU could become as simple to use as eyeglasses: a solution to improve the mental focus of users when they desire to be more attentive.
We would like to acknowledge several challenges and limitations to be addressed in follow-up projects.
Figure 10. Users’ correct answers for content-based questions after each lecture, Study 2. There isa higher level of correct answers (total number on Y-axis) across different sessions for participants whoreceived biofeedback.
6.2. Informal Interviews with Users from Study 2
We performed interviews with participants as well. The findings were very similar to ones fromStudy 1; in particular, on the effectiveness of the feedback, Participants 9 and 11 (biofeedback group)both reported that the “necklace did help in focusing on the lecture.”.
The mere presence of the device was also mentioned as possibly helping with engagement(pointed out by two users). Participants had an opportunity to observe the effect from the system overlonger period of time than their peers from Study 1. In particular, Participant 8 (biofeedback group)reported: “It was interesting to see the behavior of the necklace. So last time, when I was attending the lecturetwo, in the questionnaire there was a question if you feel tired, and I felt that I was not tired, and the necklaceonly vibrated a couple of times. But then, yesterday evening, I was studying for my finals, and I went to bed verylate and today I was not in the right state of the mind, and it [scarf] hit me 6 or 7 times. It really got me, it wasreally accurate.”.
Several participants reported not to perceive an EEG band as a socially user-friendly wearabledevice; for example, Participants 2, 3, and 4 (random feedback group) reported that the “EEG bandwas not usual to wear and [they were] not sure if [they] would use it in social environment.” Participant 5(no feedback group) pointed out that “I would wear the system in social environment if everyone else wouldwear it as well.”.
We further discuss these comments for both studies as well as their implications for future formfactors of the system in the next section.
6.3. Conclusions for Study 2
Although the number of participants was not large, if we were to draw some conclusions, our firstand third hypotheses—whereby that haptic feedback will increase EEG-based engagement scoreand improve learning performance—were not rejected in the experiment. As seen from the results,the EEG-based engagement score of the users who received biofeedback was significantly higher thanfor those who received either random or no feedback. Our second hypothesis, whereby participantswould positively perceive the haptic feedback when evaluating the system, was not rejected either,as we can observe from the subjective questionnaires, informal interviews, and comments fromthe participants. We further discuss the implications of this study in next section.
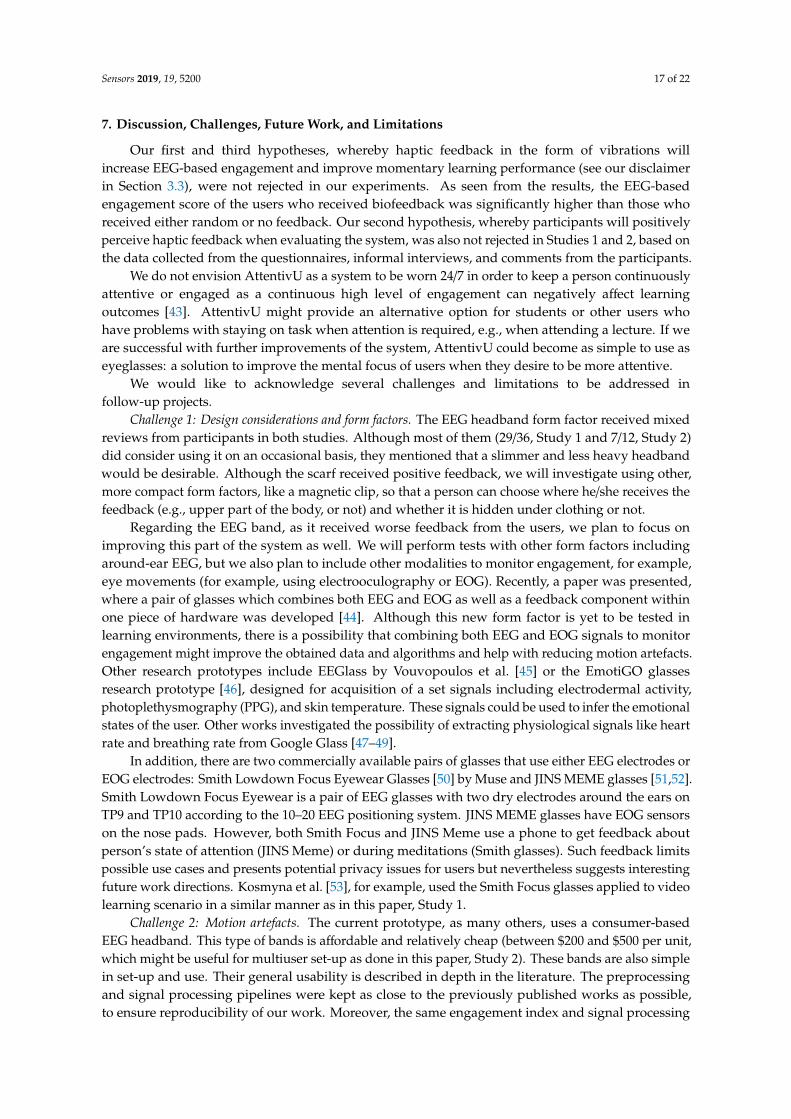
Sensors 2019, 19, 5200 17 of 22
7. Discussion, Challenges, Future Work, and Limitations
Our first and third hypotheses, whereby haptic feedback in the form of vibrations willincrease EEG-based engagement and improve momentary learning performance (see our disclaimerin Section 3.3), were not rejected in our experiments. As seen from the results, the EEG-basedengagement score of the users who received biofeedback was significantly higher than those whoreceived either random or no feedback. Our second hypothesis, whereby participants will positivelyperceive haptic feedback when evaluating the system, was also not rejected in Studies 1 and 2, based onthe data collected from the questionnaires, informal interviews, and comments from the participants.
We do not envision AttentivU as a system to be worn 24/7 in order to keep a person continuouslyattentive or engaged as a continuous high level of engagement can negatively affect learningoutcomes [43]. AttentivU might provide an alternative option for students or other users whohave problems with staying on task when attention is required, e.g., when attending a lecture. If weare successful with further improvements of the system, AttentivU could become as simple to use aseyeglasses: a solution to improve the mental focus of users when they desire to be more attentive.
We would like to acknowledge several challenges and limitations to be addressed infollow-up projects.
Challenge 1: Design considerations and form factors. The EEG headband form factor received mixedreviews from participants in both studies. Although most of them (29/36, Study 1 and 7/12, Study 2)did consider using it on an occasional basis, they mentioned that a slimmer and less heavy headbandwould be desirable. Although the scarf received positive feedback, we will investigate using other,more compact form factors, like a magnetic clip, so that a person can choose where he/she receives thefeedback (e.g., upper part of the body, or not) and whether it is hidden under clothing or not.
Regarding the EEG band, as it received worse feedback from the users, we plan to focus onimproving this part of the system as well. We will perform tests with other form factors includingaround-ear EEG, but we also plan to include other modalities to monitor engagement, for example,eye movements (for example, using electrooculography or EOG). Recently, a paper was presented,where a pair of glasses which combines both EEG and EOG as well as a feedback component withinone piece of hardware was developed [44]. Although this new form factor is yet to be tested inlearning environments, there is a possibility that combining both EEG and EOG signals to monitorengagement might improve the obtained data and algorithms and help with reducing motion artefacts.Other research prototypes include EEGlass by Vouvopoulos et al. [45] or the EmotiGO glassesresearch prototype [46], designed for acquisition of a set signals including electrodermal activity,photoplethysmography (PPG), and skin temperature. These signals could be used to infer the emotionalstates of the user. Other works investigated the possibility of extracting physiological signals like heartrate and breathing rate from Google Glass [47–49].
In addition, there are two commercially available pairs of glasses that use either EEG electrodes orEOG electrodes: Smith Lowdown Focus Eyewear Glasses [50] by Muse and JINS MEME glasses [51,52].Smith Lowdown Focus Eyewear is a pair of EEG glasses with two dry electrodes around the ears onTP9 and TP10 according to the 10–20 EEG positioning system. JINS MEME glasses have EOG sensorson the nose pads. However, both Smith Focus and JINS Meme use a phone to get feedback aboutperson’s state of attention (JINS Meme) or during meditations (Smith glasses). Such feedback limitspossible use cases and presents potential privacy issues for users but nevertheless suggests interestingfuture work directions. Kosmyna et al. [53], for example, used the Smith Focus glasses applied to videolearning scenario in a similar manner as in this paper, Study 1.
Challenge 2: Motion artefacts. The current prototype, as many others, uses a consumer-basedEEG headband. This type of bands is affordable and relatively cheap (between $200 and $500 per unit,which might be useful for multiuser set-up as done in this paper, Study 2). These bands are also simplein set-up and use. Their general usability is described in depth in the literature. The preprocessingand signal processing pipelines were kept as close to the previously published works as possible,to ensure reproducibility of our work. Moreover, the same engagement index and signal processing
Sensors 2019, 19, 5200 18 of 22
pipelines were applied in a mobile context in several papers [1,24,35]; thus, our results may remainvalid when there is movement. As we performed our experiments in a seated context, big movementswere not expected.
Challenge 3: Set-up. Though we believe that we did our best to reproduce an online learningcondition for our first study and an actual lecture condition for the second one, there are limitsto the realism of our experiments, as we wanted to control for several sources of noise, such asextensive movements. For example, we did not let our participants take notes and we also did notallow them to ask questions during the lectures. These constraints are not typical of real-life oronline lectures. We plan to test the system in actual classrooms, where current pedagogy is movingaway from lecture-style teaching (which is targeted in the current experiments), toward more engagingand interactive learning experiences. We might start with the scenarios where users would be able totake notes and/or talk, before trying to engage in any active movement scenarios.
As future work, for Study 2, an approach from DiLascio et al. [54] could be implemented; the datacould be gathered from multiple lectures and teachers to contribute to the generalizability of thestudy results.
Additionally, with respect to the disclaimer regarding the learning performance in our studies:in this paper we meant “momentary learning performance”, meaning immediate results after theinformation was presented to a person, in contrast with a definition of the learning performance asmeasuring “learning gains over time” [42]. In our studies, we did not perform tests again on the samecontent over a longer period of time, thus all cases of learning performance we mentioned here arereferred to as “momentary” ones. It would be interesting to access learning performance over severalweeks, months, or even a semester.
Another detail to take into consideration is that users knew they were being monitored, which mighthave affected their engagement. Seven users reported that they were aware of it and that it made thempay closer attention. However, that is why we included a random and no feedback condition as well.
Challenge 4: Engagement detection. Although pilot studies and calibration for each participantprior to each experiment were performed, and the engagement formula used in this work is welldocumented, additional research is needed and new algorithms could be proposed for detectingengagement level. There is a possibility that by incorporating daily mood and other factors that mighthave an effect on engagement index in the protocol, its precision would only increase, as it will bemore dynamic to capture more facets of engagement and disengagement. A similar approach was alsosuggested in [1,23]. It would be interesting to see if the choice of different subsets of features could bederived and if it could influence the performance of different classifiers, in line with DiLascio et al. [54].Additionally, based on the emerging work mentioned in Challenge 1, other physiological modalitieslike EOG could be used to deal with fatigue either offline (research paper using JINS Meme forexample, [55]), as well as to measure it in real time combined with EEG by Kosmyna et al., [55].
In future studies, we are also interested in testing other system adaptations and feedback optionsfor closing the loop using AttentivU, for example, by considering an adaptive interface, where the videocould be slowed down in the case of low engagement detection or where suggestions for additionalinformation would appear in the end of the video regarding the parts of the video where the user wasreally engaged with the content of this video. Such adaptations would also go in line with classicadaptive BCI interfaces.
We are also interested in verifying if longer-term use of the system will result in improvedengagement level when the system is no longer in use and to what extent, if any, habituation may occur.
8. Ethical Considerations
The ultimate goal of this research is to give people a new tool for improving their ability tosustain attention. To date, we have demonstrated that in the short term—immediately after biofeedbackwas administered—the individual’s engagement is improved. We have yet to evaluate whether thisimplies that their “reserve of attention” is depleted more quickly, and we also have yet to study what
Sensors 2019, 19, 5200 19 of 22
the long-term consequences of using this type of system are: Does longer-term use of the systemimprove or worsen people’s natural ability to sustain attention? We plan to study these questions infuture work. If the system ultimately proves to have the desired outcomes, our hope is that no one willbe forced to use this system, whether in work or school settings, but that instead individuals will havethe freedom and control to decide when and where they want to use the device. While the prototypediscussed in this paper is very visible to others and not very easy to take on or off, since then, we haveimproved the form-factor by building the same functionality into a set of glasses [44], so that peoplecan use this feedback system privately and discreetly whenever they desire. With respect to privacy,while the system discussed here collects data for analysis and research purposes (all within InstitutionalReview Board (IRB) regulations), the intended “real-world” version of this system would maximizeprivacy of the collected data by processing all data locally, rather than sharing or storing them forlater review. Lastly, while to date, we have only performed user experiments with neurotypical adults,in the future, we plan to do experiments with minors as well as with populations with ADHD. We planto fully engage these populations, their families, teachers, and therapists to better understand thesensitive issues involved in the real-world use and consequences of this type of technology.
9. Conclusions
Information about a person’s engagement and attention might be a valuable asset in many settings,including work situations, driving, and learning environments. To this end, we propose the firstprototype of a device called AttentivU—a wearable system which consists of two main components.Component 1 is represented by an EEG headband used to measure the engagement of a person inreal time. Component 2 is a scarf which provides subtle, haptic feedback (vibrations) in real timewhen a drop in engagement is detected. We tested AttentivU in two separate studies with 48 adults.The participants were engaged in a learning scenario of either watching three video lectures ondifferent subjects or participating in a set of three face-to-face lectures with a professor. There werethree feedback conditions administered during both studies: (1) biofeedback, during which the scarfvibrated each time a drop in engagement was detected; (2) random feedback, where the vibrationsfrom the scarf did not correlate or depend on the engagement level detected by the system, and (3) nofeedback, when no vibrations were administered. The results show that the biofeedback conditionredirected the engagement of the participants to the task at hand and improved their performance oncomprehension tests. We anticipate that with further improvements in hardware and signal processingas well as by adequately addressing the ethical questions like data privacy, AttentivU might be relevantand useful for school and college use, workforce use or even in-car driving scenarios as well as othersituations where engagement and attention are critical.
Author Contributions: Both authors contributed to the conceptualization, design, and execution of the experiment.N.K. drafted the manuscript and P.M. provided her feedback and suggestions for changes.
Funding: This research received no external funding.
Acknowledgments: We thank BrainCo for providing us with a necessary number of headbands. We thank MaeDotan with the help in making the scarves fit the electronics for this experiment. We thank Ravi Tejvani for helpingwith Study 2. We also thank Angela Vujic for her help with the final editing of the document.
Conflicts of Interest: The authors declare no conflict of interest.
References
1. Hassib, M.; Schneegass, S.; Eiglsperger, P.; Henze, N.; Schmidt, A.; Alt, F. EngageMeter: A system forimplicit audience engagement sensing using electroencephalography. In Proceedings of the 2017 CHIConference on Human Factors in Computing Systems (CHI 2017), Denver, CO, USA, 6–11 May 2017; ACM:New York, NY, USA, 2017; pp. 5114–5119.
2. Silveira, F.; Eriksson, B.; Sheth, A.; Sheppard, A. Predicting audience responses to movie content fromelectro-dermal activity signals. In Proceedings of the 2013 ACM International Joint Conference onPervasive and Ubiquitous Computing (UbiComp 2013), Zurich, Switzerland, 8–12 September 2013; ACM:New York, NY, USA, 2013; pp. 707–716.
Sensors 2019, 19, 5200 20 of 22
3. Vi, C.T.; Takashima, K.; Yokoyama, H.; Liu, G.; Itoh, Y.; Subramanian, S.; Kitamura, Y. D-FLIP: Dynamic andFlexible interactive PhotoShow. In International Conference on Advances in Computer Entertainment; Springer:Berlin, Germany, 2013; pp. 415–427.
4. Hutt, S.; Mills, C.; Bosch, N.; Krasich, K.; Brockmole, J.; D’Mello, S. Out of the Fr-Eye-ing Pan: Towardsgaze-based models of attention during learning with technology in the classroom. In Proceedings of the25th Conference on User Modeling, Adaptation and Personalization (UMAP 2017), Bratislava, Slovakia,9–12 July 2017; ACM: New York, NY, USA, 2017; pp. 94–103.
5. Sinatra, G.M.; Heddy, B.C.; Lombardi, D. The challenges of defining and measuring student engagementin science. Educ. Psychol. 2015, 50, 1–13. [CrossRef]
6. Abdelrahman, Y.; Hassib, M.; Marquez, M.G.; Funk, M.; Schmidt, A. Implicit engagement detectionfor interactive museums using brain-computer interfaces. In Proceedings of the 17th InternationalConference on Human-Computer Interaction with Mobile Devices and Services Adjunct (MobileHCI 2015),Copenhagen, Denmark, 24–27 August 2015; ACM: New York, NY, USA, 2015; pp. 838–845.
7. Andujar, M.; Gilbert, J.E. Let’s learn: Enhancing user’s engagement levels through passivebrain-computer interfaces. In CHI ’13 Extended Abstracts on Human Factors in Computing Systems (CHI EA 2013);ACM: New York, NY, USA, 2013; pp. 703–708.
8. Oken, B.S.; Salinsky, M.C.; Elsas, S.M. Vigilance, alertness, or sustained attention: Physiological basisand measurement. Clin. Neurophysiol. 2006, 117, 1885–1901. [CrossRef] [PubMed]
9. Kamzanova, A.T.; Matthews, G.; Kustubayeva, A.M.; Jakupov, S.M. EEG Indices to Time-On-Task Effectsand to a Workload Manipulation (Cueing). World Acad. Sci. Eng. Technol. 2011, 80, 19–22.
10. Reinerman, L.E.; Matthews, G.; Warm, J.S.; Langheim, L.K.; Parsons, K.; Proctor, C.A.; Siraj, T.; Tripp, L.D.;Stutz, R.M. Cerebral blood flow velocity and task engagement as predictors of vigilance performance.Proc. Hum. Factors Ergon. Soc. 2006, 50, 1254–1258. [CrossRef]
11. Freeman, F.G.; Mikulka, P.J.; Prinzel, L.J.; Scerbo, M.W. Evaluation of an adaptive automation system usingthree EEG indices with a visual tracking task. Biol. Psychol. 1999, 50, 61–76. [CrossRef]
12. Fredricks, J.A.; Blumenfeld, P.C.; Paris, A.H. School engagement: Potential of the concept, state of the evidence.Rev. Educ. Res. 2004, 74, 59–109. [CrossRef]
13. Reeve, J.M.; Tseng, C.-M. Agency as a fourth aspect of students’ engagement during learning activities.Contemp. Educ. Psychol. 2011, 36, 257–267. [CrossRef]
14. Shernoff, D.J.; Csikszentmihalyi, M.; Schneider, B.; Shernoff, E.S. Student engagement in high schoolclassrooms from the perspective of flow theory. In Applications of Flow in Human Development and Education;Springer: Dordrecht, The Netherlands, 2014; pp. 475–494.
15. Azevedo, R. Defining and measuring engagement and learning in science: Conceptual, theoretical,methodological, and analytical issues. Educ. Psychol. 2015, 50, 84–94. [CrossRef]
16. Raca, M.; Kidzinski, Ł.; Dillenbourg, P. Translating head motion into attention-towards processing ofstudent’s body language. In Proceedings of the 8th International Conference on Educational Data Mining:International Educational Data Mining Society, Madrid, Spain, 26–29 June 2015.
17. Raca, M.; Dillenbourg, P. System for assessing classroom attention. In Proceedings of the Third InternationalConference on Learning Analytics and Knowledge (LAK 2013); Suthers, D., Verbert, K., Duval, E., Ochoa, X., Eds.;ACM: New York, NY, USA, 2013; pp. 265–269.
18. Byrne, E.A.; Parasuraman, R. Psychophysiology and adaptive automation. Biol. Psychol. 1996, 42, 249–268.[CrossRef]
19. Boucsein, W.; Haarmann, A.; Schaefer, F. Combining skin conductance and heart rate variability for adaptiveautomation during simulated IFR flight. In Engineering Psychology and Cognitive Ergonomics; Springer:Berlin, Germany, 2007; Volume 4562, pp. 639–647.
20. Yuksel, B.F.; Oleson, K.B.; Harrison, L.; Peck, E.M.; Afergan, D.; Chang, R.; Jacob, R.J.K. Learn Piano withBACh: An adaptive learning interface that adjusts task difficulty based on brain state. In Proceedingsof the 2016 CHI Conference on Human Factors in Computing Systems (CHI 2016), San Jose, CA, USA,7–12 May 2016; ACM: New York, NY, USA, 2016; pp. 5372–5384.
21. Berka, C.; Levendowski, D.J.; Lumicao, M.N.; Yau, A.; Davis, G.; Zivkovic, V.T.; Olmstead, R.E.; Tremoulet, P.D.;Craven, P.L. EEG correlates of task engagement and mental workload in vigilance, learning, and memory tasks.Aviat. Space Environ. Med. 2007, 78, B231–B244. [PubMed]
Sensors 2019, 19, 5200 21 of 22
22. Frey, J.; Grabli, M.; Slyper, R.; Cauchard, J.R. Breeze: Sharing Biofeedback through Wearable Technologies.In Proceedings of the 2018 CHI Conference on Human Factors in Computing Systems (CHI 2018),Montreal, QC, Canada, 21–26 April 2018; ACM: New York, NY, USA, 2018; p. 12.
23. Hassib, M.; Khamis, M.; Friedl, S.; Schneegass, S.; Alt, F. Brainatwork: Logging cognitive engagement andtasks in the workplace using electroencephalography. In Proceedings of the 16th International Conferenceon Mobile and Ubiquitous Multimedia (MUM 2017), Stuttgart, Germany, 26–29 November 2017; ACM:New York, NY, USA, 2017; pp. 305–310.
24. Szafir, D.; Mutlu, B. Pay attention: Designing adaptive agents that monitor and improve user engagement.In Proceedings of the SIGCHI Conference on Human Factors in Computing Systems (CHI 2012),Austin, TX, USA, 5–10 May 2012; ACM: New York, NY, USA, 2012; pp. 11–20.
25. Huang, J.; Yu, C.; Wang, Y.; Zhao, Y.; Liu, S.; Mo, C.; Liu, J.; Zhang, L.; Shi, Y. FOCUS: Enhancing children’sengagement in reading by using contextual BCI training sessions. In Proceedings of the SIGCHI Conferenceon Human Factors in Computing Systems (CHI 2014), Toronto, ON, Canada, 26 April–1 May 2014; ACM:New York, NY, USA, 2014; pp. 1905–1908.
26. Marchesi, M.; Riccò, B. BRAVO: A brain virtual operator for education exploiting brain-computer interfaces.In Proceedings of the CHI 2013 Extended Abstracts on Human Factors in Computing Systems (CHI EA 2013),Paris, France, 27 April–2 May 2013; ACM: New York, NY, USA, 2013; pp. 3091–3094.
27. Qian, X.; Loo, B.R.Y.; Castellanos, F.X.; Liu, S.; Koh, H.L.; Poh, X.W.W.; Krishnan, R.; Fung, D.; Chee, M.W.L.;Guan, C.; et al. Brain-computer-interface-based intervention re-normalizes brain functional network topologyin children with attention deficit/hyperactivity disorder. Transl. Psychiatry 2018, 8, 149. [CrossRef] [PubMed]
28. Sclater, N.; Peasgood, A.; Mullan, J. Learning Analytics in Higher Education: A Review of UK andInternational Practice. Available online: https://www.jisc.ac.uk/sites/default/files/learning-analytics-in-he-v2_0.pdf(accessed on 9 November 2019).
29. Re:Vibe. Available online: https://revibetech.com (accessed on 9 November 2019).30. Mindset. Available online: https://www.thinkmindset.com/science/ (accessed on 9 November 2019).31. BrainCo. Available online: https://www.brainco.tech (accessed on 9 November 2019).32. Gwin, J.T.; Gramann, K.; Makeig, S.; Ferris, D.P. Removal of movement artifact from high-density EEG
recorded during walking and running. J. Neurophysiol. 2010, 103, 3526–3534. [CrossRef] [PubMed]33. Zeagler, C. Where to wear it: Functional, technical, and social considerations in on-body location for wearable
technology 20 years of designing for wearability. In Proceedings of the 2017 ACM International Symposiumon Wearable Computers (ISWC 2017), Maui, HI, USA, 11–15 September 2017; ACM: New York, NY, USA,2017; pp. 150–157.
34. Karuei, I.; MacLean, K.E.; Foley-Fisher, Z.; MacKenzie, R.; Koch, S.; El-Zohairy, M. Detecting vibrations acrossthe body in mobile contexts. In Proceedings of the SIGCHI Conference on Human Factors in ComputingSystems (CHI 2011), Vancouver, BC, Canada, 7–12 May 2011; ACM: New York, NY, USA, 2011; pp. 3267–3276.
35. Pope, A.T.; Bogart, E.H.; Bartolome, D.S. Biocybernetic system evaluates indices of operator engagement inautomated task. Biol. Psychol. 1995, 40, 187–195. [CrossRef]
36. Molteni, E.; Bianchi, A.M.; Butti, M.; Reni, G.; Zucca, C. Analysis of the dynamical behaviour of the EEGrhythms during a test of sustained attention. In Proceedings of the 2007 29th Annual International Conferenceof the IEEE Engineering in Medicine and Biology Society, Lyon, France, 22–26 August 2007; pp. 1298–1301.
37. Fairclough, S.H.; Moores, L.J.; Ewing, K.C.; Roberts, J. Measuring task engagement as an input to physiologicalcomputing. In Proceedings of the 2009 3rd International Conference on Affective Computing and IntelligentInteraction and Workshops, Amsterdam, The Netherlands, 10–12 September 2009; pp. 1–9.
38. Wilson, K.; Korn, J.H. Attention during lectures: Beyond ten minutes. Teach. Psychol. 2007, 34, 85–89.[CrossRef]
39. Vi, C.T.; Alexander, J.; Irani, P.; Babaee, B.; Subramanian, S. Quantifying EEG Measured Task Engagement forUse in Gaming Applications; Citeseer: University Park, PA, USA, 2014.
40. Hincks, S.W.; Bratt, S.; Poudel, S.; Phoha, V.; Jacob, R.J.K.; Dennett, D.C.; Hirshfield, L.M. Entropicbrain-computer interfaces using fNIRS & EEG to measure attentional states in a Bayesian framework.In PhyCS; SciTePress: Setúbal, Portugal, 2017; pp. 23–34.
41. Blasco-Arcas, L.; Buil, I.; Hernández-Ortega, B.; Sese, F.J. Using clickers in class. The role of interactivity,active collaborative learning and engagement in learning performance. Comput. Educ. 2013, 62, 102–110.[CrossRef]
Sensors 2019, 19, 5200 22 of 22
42. Yan, S.; Ding, G.Y.; Li, H.; Sun, N.; Wu, Y.; Guan, Z.; Zhang, L.; Huang, T. Enhancing audience engagement inperforming arts through an adaptive virtual environment with a brain-computer interface. In Proceedings ofthe 21st International Conference on Intelligent User Interfaces (IUI 2016), Sonoma, CA, USA, 7–10 March 2016;ACM: New York, NY, USA, 2016; pp. 306–316.
43. Kosmyna, N.; Morris, C.; Sarawgi, U.; Nguyen, T.; Maes, P. AttentivU: A wearable pair of EEG and EOGglasses for real-time physiological processing. In Proceedings of the 16th IEEE International Conference onWearable and Implantable Body Sensor Networks (BSN 2019), Chicago, IL, USA, 19–22 May 2019.
44. Vourvopoulos, A.; Niforatos, E.; Giannakos, M. EEGlass: An EEG-eyeware prototype for ubiquitousbrain-computer interaction. In Proceedings of the 2019 ACM International Joint Conference on Pervasive andUbiquitous Computing and Proceedings of the 2019 ACM International Symposium on Wearable Computers,London, UK, 9–13 September 2019; ACM: New York, NY, USA, 2019; pp. 647–652.
45. Saadatzi, M.N.; Tafazzoli, F.; Welch, K.C.; Graham, J.H. EmotiGO: Bluetooth-enabled eyewear for unobtrusivephysiology-based emotion recognition. In Proceedings of the IEEE International Conference on AutomationScience and Engineering (CASE), Fort Worth, TX, USA, 21–25 August 2016; pp. 903–909.
46. Dementyev, A.; Holz, C. DualBlink: A wearable device to continuously detect, track, and actuate blinking foralleviating dry eyes and computer vision syndrome. Proc. ACM Interact. Mob. Wearable Ubiquitous Technol.2017, 1, 1. [CrossRef]
47. Hernandez, J.; Li, Y.; Rehg, J.M.; Picard, R.W. Cardiac and Respiratory Parameter Estimation UsingHead-mounted Motion-sensitive Sensors. EAI Endorsed Trans. Pervasive Health Technol. 2015, 1, e2. [CrossRef]
48. Hernandez, J.; Picard, R.W. SenseGlass: Using google glass to sense daily emotions. In Proceedings ofthe Adjunct Publication of the 27th Annual ACM Symposium on User Interface Software and Technology(UIST 2014 Adjunct), Honolulu, HI, USA, 5–8 October 2014; ACM: New York, NY, USA, 2014; pp. 77–78.
49. Smith LowdownFocus Glasses. Available online: https://www.smithoptics.com/us/lowdownfocus(accessed on 9 November 2019).
50. Uema, Y.; Inoue, K. JINS MEME algorithm for estimation and tracking of concentration of users. In Proceedingsof the 2017 ACM International Joint Conference on Pervasive and Ubiquitous Computing and Proceedingsof the 2017 ACM International Symposium on Wearable Computers, Maui, HI, USA, 11–15 September 2017;ACM: New York, NY, USA, 2017; pp. 297–300.
51. JINS MEME Glasses. Available online: https://jins-meme.com/en/researchers/ (accessed on 9 November 2019).52. Kosmyna, N.; Sarawgi, U.; Maes, P. AttentivU: Evaluating the feasibility of biofeedback glasses to monitor
and improve attention. In Proceedings of the 2018 ACM International Joint Conference and 2018 InternationalSymposium on Pervasive and Ubiquitous Computing and Wearable Computers (UbiComp 2018), Singapore,8–12 October 2018; ACM: New York, NY, USA, 2018; pp. 999–1005. Available online: https://doi.org/10.1145/
3267305.3274124 (accessed on 25 November 2019).53. Di Lascio, E.; Gashi, S.; Santini, S. Unobtrusive assessment of students’ emotional engagement during
lectures using electrodermal activity sensors. Proc. ACM Interact. Mob. Wearable Ubiquitous Technol. 2018,2, 103. [CrossRef]
54. Tag, B.; Vargo, A.W.; Gupta, A.; Chernyshov, G.; Kunze, K.; Dingler, T. Continuous alertness assessments:Using EOG glasses to unobtrusively monitor fatigue levels In-The-Wild. In Proceedings of the 2019 CHIConference on Human Factors in Computing Systems (CHI 2019), Glasgow, Scotland, UK, 4–9 May 2019;ACM: New York, NY, USA, 2019; p. 12. [CrossRef]
55. Kosmyna, N.; Morris, C.; Nguyen, T.; Zepf, S.; Hernandez, J.; Maes, P. AttentivU: Designing EEG and EOGcompatible glasses for physiological sensing and feedback in the car. In Proceedings of the 11th InternationalConference on Automotive User Interfaces and Interactive Vehicular Applications (AutomotiveUI 2019),Utrecht, The Netherlands, 21–25 September 2019; ACM: New York, NY, USA, 2019; pp. 355–368. [CrossRef]
© 2019 by the authors. Licensee MDPI, Basel, Switzerland. This article is an open accessarticle distributed under the terms and conditions of the Creative Commons Attribution(CC BY) license (http://creativecommons.org/licenses/by/4.0/).
Copyright © 2022 FDOKUMEN