CLOSED-LOOP - Water Research Commission
219
A GUIDE FOR THE PLANNING, DESIGN AND IMPLEMENTATION OF WASTE-WATER TREATMENT PLANTS IN THE TEXTILE INDUSTRY PART 3 : CLOSED-LOOP TREATMENT / RECYCLE OPTIONS FOR TEXTILE SCOURING, BLEACHING AND MERCERISING EFFLUENTS Prepared for the WATER RESEARCH COMMISSION P O Box 824 PRETORIA 0001 by the POLLUTION RESEARCH GROUP Department of Chemical Engineering University of Natal Durban 4001 Republic of South Africa Group Leader : Prof. G.R. Groves / Prof. C.A. Buckley Project Leader : Mrs. A.E. Simpson WRC Project No. 122 TT 48/90 October 1990
-
Upload
khangminh22 -
Category
Documents
-
view
0 -
download
0
Transcript of CLOSED-LOOP - Water Research Commission

A GUIDE FOR THE PLANNING, DESIGN AND IMPLEMENTATION
OF WASTE-WATER TREATMENT PLANTS IN THE TEXTILE INDUSTRY
PART 3 : CLOSED-LOOP TREATMENT / RECYCLE OPTIONS FOR
TEXTILE SCOURING, BLEACHING AND MERCERISING EFFLUENTS
Prepared for the
WATER RESEARCH COMMISSIONP O Box 824PRETORIA
0001
by the
POLLUTION RESEARCH GROUPDepartment of Chemical EngineeringUniversity of NatalDurban4001
Republic of South Africa
Group Leader : Prof. G.R. Groves / Prof. C.A. BuckleyProject Leader : Mrs. A.E. Simpson
WRC Project No. 122
TT 48/90
October 1990

Available fromWater Research CommissionP.O. Box 824PRETORIA0001
Republic of South Africa
ISBN 0 947447 80 6
This publication stems from a research project entitled :
"Water Management and Effluent Treatment in the Textile Industry: Treatment of Scouring,Bleaching and Mercerising Effluents"
which was conducted by :
Pollution Research GroupDepartment of Chemical EngineeringUniversity of NatalDURBAN4001
Republic of South Africa
DISCLAIMER
This report has been reviewed by the Water Research Commission and approved forpublication. Approval does not signify that the contents necessarily reflect the views andpolicies of the Water Research Commission, nor does mention of trade names or commercialproducts constitute endorsement or recommendation for use.

(iii)
FOREWORD
This third part of "A Guide for the Planning, Design and Implementation of Waste-water
Treatment Plants in the Textile Industry - Closed-loop Treatment/Recycle Options for Textile
Scouring, Bleaching and Mercerising Effluents", is I believe, the most critical phase of this
guide. Scouring, bleaching and mercerising effluents are the most intractable of all effluents
from the Textile Industry ; the high sodium ion concentration (from the use of caustic soda on
which these processes rely), makes it impossible to be treated by conventional means and creates
a high fresh water pollution risk, particularly where the textile factory is sited inland. The
disposal of such an effluent by the use of evaporation ponds or irrigation, does not remove the
pollution potential, and marine disposal has been viewed as the only safe solution.
Effluent disposal itself implies a wastage, a wastage of water and of valuable chemicals that
may be contained in that effluent. The recycling or recovery of chemicals from the effluent
streams not only reduces the pollution risk, but also recovers costly raw materials for the Textile
Industry.
In the first part of the guide. "Closed-loop Treatment/Recycle Systems for Textile Sizing/Desizing
Effluents" it was shown how textile sizing chemicals could be recovered and reused thereby
saving one of the major cost items in textile processing. In a vertical plant (spinning, weaving,
dyeing, printing and finishing), this could represent 15 % of total dyes and chemical cost.
Recovering size and removing it from the desize effluent stream, also removes the main
contributor to the COD load in that effluent.
Sodium hydroxide is becoming an expensive basic chemical and can represent approximately
7.0 % of the total dyes and chemical costs. This third part of the guide shows how a major
portion of the cost can be saved or recovered.
The second part - "Effluent Treatment/Water Recycle Systems for Textile Dyeing and Printing
Effluents", showed how, by recycling and reclamation, reduction in the use of another scarce
and valuable commodity, water, could be achieved. In the current guide, a major part is
devoted to the reduction of the water used in the washing or rinsing process. The reduction
of specific water consumption increases the concentration of the chemicals contained in that
water and hence facilitates the recovery of these chemicals or treatment of the effluent.
The philosophy of meeting effluent disposal parameters by dilution of the effluent is one that
is becoming less acceptable - the total pollution load is not reduced and more fresh water is

(iv)
wasted. The opposite is becoming the modus operand! where specific effluent streams are
being concentration and polluting chemicals are either being recovered from these streams, or
treated to remove the pollution load at source
The high capital equipment and operational costs of "hi-tech" treatment plants - ultrafiltration.
hyperfiltration and electrochemical as described in the three guides, can be motivated by a
return on the costs of chemicals and water which can be recovered. In-house effluent
management and process control systems can reduce the effluent volumes requiring treatment
and therefore reduce the required size of plant, making the treatment recovery more feasible.
DRj j . DURRANSGRDGRDUP TECHNICAL DIRECTORDA GAMA TEXTILE COMPANY LIMITED
(v)
ACKNOWLEDGEMENTS
The efforts and contributions of the many people in the Textile Industry, the Pollution ResearchGroup, the Department of Chemical Engineering and the Water Research Commission whowere involved in the project are gratefully acknowledged.
Special mention must be made of Da Gama Textiles (Zwelitsha), Smith and Nephew Ltd.(Pinetown), Ninian and Lester (Pty) Ltd. (Pinetown), OTH Beier (Pty) Ltd., Mym Textiles,David Whitehead & Sons (SA) (Pty) Ltd. (Tongaat), Consolidated Textiles, Swazi Textiles andJohn Grant.
These research and development investigations were guided by a steering committee for theproject which comprised over the period of the project the following members :
Dr. O.O. Hart Water Research Commission (Chairman)Dr. C.F. Schutte Water Research CommissionMr. J.W. Funke Water Research CommissionMr. P. Weideman Water Research Commission (Secretary)Prof. G.R. Groves University of NatalProf. C.A. Buckley University of NatalMrs. A.E. Simpson University of NatalProf. F.G. Neytzell-de Wilde University of NatalProf. M.R. Judd University of NatalProf. J.D. Raal University of NatalDr. R.D. Friedman SA Cotton Textile Manufacturers' AssociationMr. T. lies SA Cotton Textile Manufacturers' AssociationMr. G.N. Wynne SA Cotton Textile Manufacturers' AssociationMr. J. Asivar SA Cotton Textile Manufacturers' AssociationMr. A. Elliot SA Cotton Textile Manufacturers' Association
Mr. G. Offringa National Institute for Water ResearchMr. J.J. Schoeman National Institute for Water ResearchMr. J.v.R. Stander Department of Water AffairsMr. B. Southworth David Whitehead & SonsMr. D. Simmons David Whitehead & SonsDr. D.W.F. Turpie SA Wool and Textile Manufacturers' AssociationDr. N.J.J. van Rensburg SA Wool and Textile Manufacturers' AssociationMr. A. van der Spuy Da Gama Textiles (East London)Dr. J. Durrans Da Gama Textiles (Zwelitsha)Mr. F.S. Vivier Department of Health and Welfare
Mr. R.D. Harrison Smith & Nephew Ltd.

(vi)
This publication was prepared under the guidance of the following editorial committee :
Dr. O.O. Hart Water Research Commission (Chairman)Dr. W.H.J. Hattingh Water Research CommissionProf. C.A. Buckley University of NatalMrs. A.E. Simpson University of Natal
Dr. J. Durrans Da Gama Textiles, King William's TownMr. J.v.R. Stander Department of Water Affairs
(vii)
SUMMARY
This guide is intended primarily to assist the textile industry to utilise, reduce and otherwisedispose of their effluents, with particular reference to scouring, bleaching and mercerisingeffluents. The Guide provides the necessary information for the planning, design andimplementation of various options for the treatment and/or recycle of textile scouring andbleaching effluents, in particular strong caustic scouring effluents. It will also be of value tothe policy makers of the textile industry and to assist practically design engineers, consultantsand executive bodies.
Adequate treatment of industrial waste waters is essential in order to preserve water qualityand to achieve optimal use of the Republic of South Africa's limited water resources. Scouringand bleaching effluents produced during textile processing are typical of a non-biodegradablemineral salt-rich waste water, the control of which is of prime importance to the authorities.
Recognising the need for the development of general treatment methods for textile waste watersof the type described, the Water Research Commission contracted the Pollution Research Groupat the University of Natal to investigate various process options which would enable the recycleand reuse of water, chemicals and/or energy from scouring and bleaching wastes.
The project consisted of several task areas :
(i) the characterisation of scouring and bleaching effluents from the processing of cotton,
polyester and their blends, either in the form of stock or woven or knitted,
(ii) the development of possible treatment options for each type of effluent concerned,
(iii) laboratory and pilot-scale assessment of the systems,
(iv) the development of the basic design criteria for the implementation and installation ofselected systems.
It is considered preferable to install productive equipment and systems within the factory toprevent or reduce the unnecessary loss of energy, water and chemicals, thus producing moreconsistent textile goods more effectively. At the same time the pollution load of the factoryis reduced. The alternative would be the installation of non-productive effluent treatmentequipment.
The basic procedure for ensuring proper water and chemical management within a factory isdescribed. Examples of various factory surveys, which have resulted in significant chemical,water and energy savings, together with reduced effluent discharge costs, are cited. Theemphasis in this section is placed on the utilization of minimum amounts of water and chemicalswithout sacrificing the quality of the end product. In this way effluents are produced atmaximum concentration in minimum volumes.
The remainder of the Guide discusses the results of the following laboratory and pilot-scaleinvestigations :

(i) low-temperature conventional ultrafiltration of weak polyester and polyester/cottonscouring effluents,
(ii) high-temperature dynamic ultrafiltration of weak cotton and polyester/cotton scouringeffluents,
(iii) high-temperature dynamic ultrafiltration of strong cotton and polyester/cotton scouringeffluents,
(iv) evaporation of strong cotton and polyester/cotton scouring effluents,
(v) electro-oxidation of strong cotton and polyester/cotton scouring effluents,
(vi) electrochemical recovery of chemicals, water and energy from strong cotton andpolyester/cotton scouring effluents.
Strong caustic effluents produced during the scouring of cotton and cotton blends were identifiedas the most problematic of the effluents examined in terms of pollutant type and loading. Forthis reason investigations were primarily channelled into the development of technologies whoseapplication would suitably alleviate discharge problems encountered with this class of textilescouring effluent.
The most effective solution to the strong caustic scouring effluent problem is an electrochemicalsystem which enables the recovery and closed-loop recycle of sodium hydroxide, water andenergy in the scouring process. The process sequence invohes neutralisation of the effluentwith acid gas, filtration through cross-flow microfiltration and nanofiltration membranes toremove suspended and soluble impurities and finally depletion of the sodium salt by anelectrochemical membrane cell which generates :
(i) acid gas for recycling,
(ii) high quality sodium hydroxide of suitable concentration for direct reuse during scouring,
(iii) reusable wash water.
Good performance of the electrochemical unit is ensured by maintaining the conductivity ofthe effluent as high as possible. This is achieved by :
(i) implementation of an evaporative step to concentrate the effluent prior to treatment,
(ii) maintaining a background sodium concentration in the recycled wash water andrecovering only the sodium from the effluent which has been washed from the clothafter scouring.
A detailed design of an electrochemically based treatment system has been presented. Thedesign is based on data obtained during the operation of a pilot plant at a local textile mill.Fouling and scaling of the cross-flow microfiltration, nanofiltration and electrochemicalmembranes are minimal and reversible. A long anode coating life is predicted. Current
efficiencies for the recovery of sodium hydroxide are 75 to 80 % and the electrical powerrequirements of the electrochemical unit are 3 000 to 4 000 kVVh/t of 100 % NaOH. Evaporationpilot plant trials indicated that no scaling of the heat exchanger surfaces occurs duringconcentration of caustic scouring effluent.

(ix)
A detailed economic analysis of the electrochemical recovery system is presented. The effectsof washing variables, processing temperatures, background wash-water concentration andevaporator concentration factors on the plant size requirements and capital costs are determined.
The advantages of the recovery system applied to a strong caustic scouring line are that :
(i) water consumption is reduced by 85 to 95 %,
(ii) sodium hydroxide consumption during scouring is reduced by 65 to 75 %. Sodiumhydroxide losses from the system include carry-over from the washer, losses in thecentrate from the centrifuge after evaporation and losses in the filtration concentrates,
(iii) effluent production is minimised and pollutant loading of discharges with respect toinorganics, in particular sodium, is reduced,
(iv) the closed-loop recycle system provides for water savings, chemical savings, decrease
in effluent discharge costs and energy savings.
Thus, the use of this technology at textile mills will have a significant impact on effluentdischarge and will result in chemical and water savings.

(x)
CONTENTS
PAGE
LIST OF ABBREVIATIONS (xxiv)
GLOSSARY (xxv)
CHAPTER 1 : LEGISLATION AND PLANNING FOR INDUSTRIAL
WASTE-WATER REUSE AND RECLAMATION
1.1 INTRODUCTION 1-1
1.2 THE WATER ACT 1-2
1.2.1 Industrial Water Use 1-2
1.2.2 Effluent Discharge 1-2
1.3 STRATEGY AND POLICY GUIDELINES 1-3
1.4 Industry-based Recycling and Reclamation 1-5
CHAPTER 2 : THE TEXTILE INDUSTRY
2.1 INTRODUCTION 2-1
2.1.1 South African Textile Industry 2-1
2.1.2 The Need for Pollution Control in the Textile Industry 2-1
2.2 TEXTILE PROCESSING 2-2
2.2.1 Textile Fibres 2-2
2.2.2 Textile Manufacturing 2-2
2.2.3 Textile Mill Classification 2-4
2.2.4 Water Use and Effluent Production 2-7
2.3 SCOURING TECHNOLOGY 2-7
2.3.1 Textile Scouring Methods 2-7
2.4 MERCERISING TECHNOLOGY 2-14
2.4.1 Mercerising Equipment 2-15
2.5 BLEACHING TECHNOLOGY 2-15
2.5.1 Textile Bleaching Methods 2-16

(xi)
2.6 SINGLE-STAGE DESIZING, SCOURING ANDMERCERISING 2-19
2.7 EFFLUENTS FROM WET PROCESSING : SCOURING,MERCERISING AND BLEACHING 2-19
2.7.1 Effluent Loads 2-20
2.7.2 Effluent Characteristics 2-20
CHAPTER 3 : REVIEW OF EFFLUENT TREATMENT TECHNIQUES FOR
SCOURING, BLEACHING AND MERCERISING EFFLUENTS
3.1 INTRODUCTION 3-1
3.2 SOLVENT SCOURING AND BLEACHING 3-1
3.3 EFFLUENT NEUTRALISATION 3-1
3.4 SEGREGATION OF EFFLUENT STREAMS 3-2
3.5 BIOLOGICAL TREATMENT 3-2
3.6 EVAPORATION 3-2
3.7 FLOCCULATION 3-3
3.8 FLOTATION 3-3
3.9 MEMBRANE SEPARATION 3-3
3.10 CAUSTICISING 3-4
3.11 THERMAL OXIDATION 3-4
3.12 ELECTRO-OSMOSIS 3-4
CHAPTER 4 : WATER AND EFFLUENT MANAGEMENT PROGRAMMES
4.1 INTRODUCTION 4-1
4.1 WATER, CHEMICAL AND EFFLUENT SURVEY 4-1
4.2.1 Water Balance 4-1
4.2.2 Chemical and Effluent Balance 4-5
4.3 IN-PLANT CONTROL 4-16
4.3.1 Water Use 4-18
4.3.2 Optimising Water Use During Rinsing 4-19
4.3.3 Water and Chemical Recirculation 4-28
4.3.4 Results of Cascade Trials 4-30

(xii)
4.3.5 Raw Material Modifications 4-31
4.3.6 Effluent Control 4-31
4.3.7 Housekeeping 4-31
4.3.8 Staff Motivation 4-32
4.4 EFFLUENT TREATMENT PROCESS SELECTION 4-32
CHAPTERS : ULTRAFILTRATION OF WEAK POLYESTER AND
POLYESTER/COTTON SCOURING EFFLUENTS
5.1 INTRODUCTION 5-1
5.2 POLYMERIC MEMBRANES : LOW-TEMPERATUREULTRAFILTRATION 5-1
5.2.1 Mill Process and Effluent Characterisation 5-1
5.2.2 Pilot Plant Description 5-1
5.2.3 Experimental Procedure and Results 5-3
5.2.4 Ultrafiltration Rejection Performance 5-3
5.2.5 Ultrafiltration Fluxes 5-3
5.2.6 Ultrafiltration Concentrate 5-3
5.3 DYNAMIC MEMBRANES : HIGH-TEMPERATUREULTRAFILTRATION 5-4
5.3.1 Mill Process and Effluent Characterisation 5-4
5.3.2 Plant Description 5-4
5.3.3 Plant Performance 5-6
CHAPTER 6 : ULTRAFILTRATION OF STRONG COTTON AND
POLYESTER/COTTON SCOURING EFFLUENTS
6.1 INTRODUCTION 6-1
6.2 MILL PROCESS AND EFFLUENT CHARACTERISATION 6-1
6.3 PILOT PLANT DESCRIPTION 6-3
6.4 EXPERIMENTAL PROCEDURE AND RESULTS 6-3
6.4.1 Membrane Rejection 6-4
6.4.2 Membrane Flux 6-5
6.4.3 Membrane Cleaning 6-5

(xiii)
6.4.4 Membrane Stability 6-6
CHAPTER 7 : EVAPORATION OF STRONG COTTON AND
POLYESTER/COTTON SCOURING EFFLUENTS
7.1 INTRODUCTION 7-1
7.2 MILL PROCESS AND EFFLUENT CHARACTERISATION 7-2
7.3 PILOT PLANT DESCRIPTION 7-3
7.4 EXPERIMENTAL PROCEDURE AND RESULTS 7-5
7.4.1 Prefiltration 7-6
7.4.2 Evaporation 7-6
7.4.3 Centrifugation 7-9
7.4.4 Reuse of Process Condensate 7-9
7.4.5 Reuse of Sodium Hydroxide Concentration 7-10
7.5 DESIGN CONSIDERATIONS 7-11
7.5.1 Major Equipment 7-12
CHAPTER 8 : ELECTRO-OXIDATION OF STRONG COTTON AND
POLYESTER/COTTON SCOURING EFFLUENTS
8.1 INTRODUCTION 8-1
8.2 MILL PROCESS AND EFFLUENT CHARACTERISATION 8-2
8.3 PILOT PLANT DESCRIPTION 8-3
8.4 EXPERIMENTAL PROCEDURE AND RESULTS 8-4
8.4.1 Chlorination 8-4
8.4.2 Electro-oxidation 8-4
8.5 DESIGN CONSIDERATIONS 8-8
8.5.1 Major Equipment 8-10
CHAPTER 9 : ELECTROCHEMICAL RECOVERY OF SODIUM HYDROXIDE
FROM STRONG COTTON AND POLYESTER/COTTON
SCOURING EFFLUENTS
9.1 INTRODUCTION 9-1
9.2 MILL PROCESS AND EFFLUENT CHARACTERISATION 9-3

(xiv)
9.3 PILOT-PLANT DESCRIPTION 9-4
9.4 PILOT PLANT EXPERIMENTAL PROCEDURE AND
RESULTS 9-7
9.4.1 Neutralisation 9-7
9.4.2 Cross-flow Microfiltration 9-9
9.4.3 Nanofiltration 9-9
9.4.4 Electrochemical Membrane Cell Operation 9-10
CHAPTER 10 : DESIGN OF A PLANT FOR THE ELECTROCHEMICAL
RECOVERY OF STRONG COTTON AND
POLYESTER/COTTON SCOURING EFFLUENTS
10.1 INTRODUCTION 10-1
10.2 GENERAL CONSIDERATIONS 10-2
10.2.1 Process Configuration Selection 10-6
10.2.2 Textile Processing Considerations 10-7
10.2.3 Pretreatment Requirements 10-7
10.2.4 Scaling Prevention 10-8
10.2.5 Membrane Selection and Module Arrangement 10-8
10.3 DESIGN EXAMPLE 10-9
10.3.1 Textile Process Modifications 10-9
10.4 DESIGN OF THE TREATMENT PLANT 10-11
10.5 SPECIFICATION OF EVAPORATOR 10-15
10.6 SPECIFICATIONS OF BATCH NEUTRALISATION UNIT 10-15
10.6.1 Equipment 10-15
10.6.2 Sizing of Neutralisation Unit 10-17
10.7 SPECIFICATION OF BATCH CROSS-FLOW
MICROFILTRATION 10-18
10.7.1 Equipment
10.7.2 Sizing of the Cross-flow Microfiltration Unit 10-19
10.7.3 Design Configuration 10-22
10.7.4 Overall Performance : Cross-flow Microfiltration 10-22
10.8 SPECIFICATION OF THE BATH NANOFILTRATION UNIT(PROCESS CONFIGURATIONS 1 AND 2) 10-23

(xv)
10.8.1 Equipment 10-23
10.8.2 Sizing of the Nanofiltration Unit 10-26
10.8.3 Overall Performance : Nanofiltration 10-27
10.8.4 Nanofiltration Module Configuration 10-27
10.9 SPECIFICATIONS OF THE ELECTROCHEMICAL UNIT 10-29
10.9.1 Sizing of the Electrochemical Unit Area and PowerFacilities 10-34
10.10 SPECIFICATION FOR INTEGRATED REVERSE OSMOSIS,NANOFILTRATION AND ELECTROCHEMICAL UNITS(PROCESS CONFIGURATION 3) 10-35
10.11 SYNOPSIS OF DESIGN SPECIFICATIONS 10-36
10.11.1 Process Configuration 1 (4-stage) 10-36
10.11.2 Process Configuration 2 (5-stage with Evaporator) 10-43
CHAPTER 11 : ECONOMIC EVALUATION
11.1 INTRODUCTION 11-1
11.2 CAPITAL COST ESTIMATES (1987) 11-1
11.2.1 Scouring Equipment Modifications 11-1
11.2.2 Effluent Treatment Plant 11-2
11.3 OPERATING COSTS 11-3
11.4 SAVINGS 11-4
REFERENCE R-l
INDEX 1-1
APPENDICES
APPENDIX 1 : A-l
APPENDIX 2 : A-2
APPENDIX 3 : A-3

LIST OF FIGURES
(xvi)
FIGURE 2.1
FIGURE 2.2
FIGURE 2.3
FIGURE 2.4
FIGURE 2.5
FIGURE 2.6
FIGURE 2.7
FIGURE 2.8
FIGURE 2.9
FIGURE 2.10
FIGURE 4.1
FIGURE 4.2
FIGURE 4.3
FIGURE 4.4
FIGURE 4.5
FIGURE 4.6
FIGURE 4.7
FIGURE 4.8
FIGURE 4.9
FIGURE 4.10
Product of Fabric 2-3
Textile Industry Categorisation by Fibre Processed 2-5
Woven Cotton Fabric Finishing Mill 2-6
Knit Fabric Finishing Mill 2-6
Stock and Yarn Dyeing and Finishing Mill 2-7
Schematic of a Rope/J-box Washing Machine 2-11
Schematic of an Open-width Washing Machine 2- 11
Acceptable Saponification Limits of Polyester as a Functionof Sodium Hydroxide Concentration and Temperatureand Contact Time 2-13
Composition of a Solution of Sodium Hypochlorite atVarious pH Values 2-16
Composition of a Sodium Chlorite Solution at VariouspH values 2-18
Example of a Water Survey Summary ,,,,,,, , 4-2
Sodium Hydroxide Balance at the Factory 4-7
Sodium Hydroxide Losses 4-8
Schematic of Mercerising System 4-10
Mass Balance Across Impregnator 4-11
Variation of Overflow Sodium Hydroxide Loss with
Mercerising Concentration at Various Feed SodiumHydroxide Concentrations (C±i and with Drag-inWater = 0.53 £.'kg Cloth 4-12
Mass Balance Incorporating Feed Sodium HydroxideMixing 4-13
Variation of Overflow Sodium Hydroxide Loss withFraction Recovered Sodium Hydroxide in MerceriserFeed at Various Mercerising Concentrations fC2' 4-14
Comparison of Water L'ses of Various Rinse MachineTypes 4-21
Specific Water Use in Relation to the Impurity Removalfor a Single Washing Unit for a Range of A; Values 4-23

(xvii)
FIGURE 4.11
FIGURE 4.12
FIGURE 4.13
FIGURE 4.14
FIGURE 4.15
FIGURE 4.16
FIGURE 5.1
FIGURE 5.2
FIGURE 6.1
FIGURE 6.2
FIGURE 6.3
FIGURE 7.1
FIGURE 7.2
FIGURE 8.1
FIGURE 8.2
FIGURE 8.3
FIGURE 8.4
FIGURE 8.5
Rinsing Water Dilution vs Rinse Ratio for aCounter-current Multi-unit Washing Range 4-24
Rinse Ratio Effect on Recovery of Drag-out Chemicalsfrom Rinsing Systems 4-25
Determination of Chemical Concentration of FirstFeed Tank 4-25
Impurity Removal Dependence on Specific Water Usein Counter-current and Cross-flow Washing Ranges( t - 0.3) 4-26
The Relationship Between Specific Water Consumptionand Impurity Removal for Three Washing Ranges 4-27
Predicted Washing Efficiencies 4-27
Flow Diagram of Experimental Plant 5-2
Plant Layout and Mass Balance {Flow Units areRelative) 5-5
High-temperature Ultrafiltration of Strong Effluent
from Continuous Scouring 6-2
Flow Diagram of the Experimental Unit 6-3
Correction Factor to Reduce Permeate Flux to 20 °C 6-5
Flow Diagram For Sodium Hydroxide Recovery byEvaporation of Strong Scouring Effluent 7-2
Flow Diagram of Evaporation Plant 7-3
Flow Diagram for the Electro-oxidation of Strong Cotton
and Polyester/Cotton Scouring Effluents 8-1
Flow Diagram of the Electro-oxidation Plant 8-3
Current Efficiency for the Removal oi~ COD as aFunction of the COD Removal 8-5
Dependence of Current Efficiency on Effluent pH for
a Fixed COD Removal 8-6
Dependence of COD Removal on Effluent pH for a Fixed
Current Efficiency 8-7

(xviii)
FIGURE 8.6
FIGURE 8.7
FIGURE 8.8
FIGURE 8.9
FIGURE 9.1
FIGURE 9.2
FIGURE 9.3
FIGURE 9.4
FIGURE 9.5
FIGURE 9.6
FIGURE 9.7
FIGURE 9.8
FIGURE 9.9
FIGURE 9.10
FIGURE 9.11
FIGURE 9.12
FIGURE 10.1
FIGURE 10.2
FIGURE 10.3
FIGURE 10.4
FIGURE 10.5
FIGURE 10.6
Distribution of Chlorine Species as a r-unction ofCOD Removal 8-7
Distribution of Hypochlorous Acid and Hypochloritewith pH 8-8
Cumulative Power Consumption (Electrochemical Membraneand Electro-oxidation Cells) as a Function of CODRemoved from the Effluent 8-9
Flow Diagram of the Treatment Sequence for theElectro-oxidation of Strong Scouring Effluent 8-11
Treatment Sequence for the Recovery and Recycle of
Strong Cotton Scouring Effluents 9-2
Schematic of Electrochemical Membrane Cell 9-3
Distribution of Inorganic Carbon in Solution 9-4
Flow Diagram of Neutralisation Unit 9-5
Flow Diagram of Cross-flow Microfiltration Unit 9-5
Flow Diagram of Nanofiltration Unit 9-6
Flow Diagram of Electrochemical Unit 9-6
Relationship Between Anolyte Flow Rate and Volt DropAcross Cell 9-12
Relationship Between the Conductivity, Concentrationand Temperature of Sodium Bicarbonate in Solution 9-14
Relationship Between the Conductivity, Concentrationand Temperature of Sodium Hydroxide in Solution 9-14
Relationship Between the Anolyte Concentration andpH 9-15
Effect of Anolyte Sodium Concentration on WaterTransport Number, nu 9-16
Electrochemical Membrane Cell 10-2
Process Configuration 1 10-3
Process Configuration 2 10-4
Process Configuration 3 10-5
Predicted Washing Efficiency 10-10
Predicted Effluent Concentration 10-10

(xix)
FIGURE 10.7
FIGURE 10.8
FIGURE 10.9
FIGURE 10.10
FIGURE 10.11
FIGURE 10.12
FIGURE 10.13
FIGURE 10.14
FIGURE 10.15
FIGURE 10.16
FIGURE 10.17
FIGURE 10.18
FIGURE 10.19
FIGURE 10.20
FIGURE 10.21
Process Configuration 1 : Mass Balance Basisfor Recovery Process Using Background SodiumConcentration 10-13
Process Configuration 2 : Mass Balance Basisfor Recovery Process Using an Evaporation Stage 10-13
Process Configuration 3 : Mass Balance Basis forRecovery Process Using a Reverse OsmosisConcentration Stage 10-14
Flow Diagram of Batch Neutralisation Unit 10-17
Flow Diagram of Batch Cross-flow Microfiltration
Unit 10-20
Flow Diagram of Batch Nanofiltration Unit 10-25
Basic Configuration of Spiral Elements Showing Flows
in Arbitrary Units 10-29
Flow Diagram of Batch Electrochemical Unit 10-33
Flow Diagram of the Integrated Reverse Osmosis,Nanofiltration and Electrochemical Units(Process Configuration 3) 10-36
Design Example : Process Configuration 1 : Dependenceof Effluent and Cloth Characteristics on Wash-waterConcentration 10-41
Design Example : Process Configuration 1 : Dependenceof Electromembrane Area Requirements on Wash-waterConcentration. Note : Operation at 60 °C 10-42
Design Example : Process Configuration 1 : Dependence
of Sodium Losses on Wash-water Concentration 10-42
Design Example : Process Configuration 1 : Dependence
of Electrochemical Area Requirements on Temperature 10-43
Design Example : Process Configuration 2 : Dependenceof Electromembrane Area Requirements on theEvaporation Factor 10-47
Design Example : Process Configuration 2 : Dependenceof Sodium Losses on Water Concentration 10-48

LIST OF TABLES
(xx)
TABLE 1.1
TABLE 2.1
TABLE 2.2
TABLE 2.3
TABLE 2.4
TABLE 2.5
TABLE 4.1
TABLE 4.2
TABLE 4.3
TABLE 4.4
TABLE 4.5
TABLE 4.6
TABLE 4.7
TABLE 4.8
TABLE 4.9
TABLE 4.10
TABLE 4.11
TABLE 5.1
TABLE 5.2
General and Special Standards for Discharge in Terms of theSouth African Water Act. 1956 (Act 54 of 1956)
Overall Effluent Characterisation for Various Categoriesof Textile Mills
Pollution Loads for Various Wet Preparation Operations(50/50 Polyester/Cotton)
Oil Content of Polyester Yarn
Relative Pollution Load - Singeing, Desizing, ScouringBleaching and Mercerising
Pollution Loads and Effluent Concentrations for VariousWet Preparation Operations
Example - Process Water Balance
Example - Effluent Analysis
Example - Contribution of Process Streams to Factory
Water and Effluent
Example - Goller Wash and Soap, Summary of Daily WaterConsumption
Example - Pad Steam. Summary of Daily Water Records
Forecast of Fabric Production and Resulting Effluent
Predicted Effluent Composition and Impact of itsDischarge on the Receiving River Water Quality
Possible Cascading Operations
Results of Cascade Trials
Methodology of the Improvement of EffluentCharacteristics
Treatment Options for Scouring Effluents
Average Composition of Weak Scouring Effluent Treatedby Low-temperature Ultrafiltration
Low-temperature Ultrafiltration Unit Specification
-4
2-9
2-12
2-20
2-21
4-3
4-3
4-4
4-5
4-5
4-15
4-17
4-29
4-30
4-32
4-33
5-2
5-3

TABLE 5.3
TABLE 5.4
TABLE 5.5
TABLE 6.1
TABLE 6.2
TABLE 6.3
TABLE 7.1
TABLE 7.2
TABLE 7.3
TABLE 7.4
TABLE 7.5
TABLE 7.6
TABLE 7.7
TABLE 7.8
TABLE 8.1
TABLE 8.2
TABLE 8.3
TABLE 9.1
Average Composition of Weak Scouring Effluent Treatedby High-temperature UHrafiltration 5-5
Effluent Characterisation of Weak Scouring Effluentfor High-temperature Ultrafiltration 5-6
Design Basis of Dynamic Membrane Plant for theTreatment of Weak Scouring Effluents 5-6
Average Composition of Strong Effluent fromContinuous Scouring Treated by High-temperatureUltrafiltration 6-2
High-Temperature Ultrafiltration Unit Specification 6-4
Membrane Formation Conditions for High-temperatureUltrafiltration of Strong Scouring Effluent 6-4
Average Composition of Scouring Effluent Treated by
Evaporation 7-3
Evaporator Plant Specification 7-4
Pilot Plant Operating Conditions for the Evaporative
Treatment of Strong Scouring Effluent 7-5
Sample Calculation of Evaporation Thermodynamic Data .... 7-7
Heat Transfer Coefficients vs Concentration forEvaporation of Strong Scouring Effluent 7-8Boiling Point Elevation vs Concentration for EvaporatedStrong Scouring Effluent 7-9
Sludge Composition of Centrifuged Evaporation
Concentrate 7-10
Chemical Composition of Virgin and Reclaimed ScouringLiquors 7-11
Chemical Analysis of Scouring Effluent Treated by
Electro-oxidation 8-2
Electro-oxidation Plant Specification 8-4
Estimated Electro-oxidation Plant Size 8-12
Average Composition After Each Stage of the ScouringTreatment Sequence 9-4

TABLE 10.1
TABLE 10.2
TABLE 10.3
TABLE 10.4
TABLE 10.5
TABLE 10.6
TABLE 10.7
TABLE 10.8
TABLE 10.9
TABLE 10.10
TABLE iO.ll
TABLE 10.12
TABLE 10.13
TABLE 10.14
TABLE 10.15
TABLE 10.16
TABLE 10.17
TABLE 10.18
TABLE 11.1
TABLE 11.2
TABLE 11.3
tiectrochemical Recovery Pilot Plant Specifications 9-8
Comparison of Washing Processes 10-11
Data for the Design of the Electrochemical Treatment
of Strong Scouring Effluents 10-12
Evaporator Specification 10-15
Evaporator Concentration Composition 10-16
Batch Neutralisation Equipment Requirements 10-16
Batch Cross-flow Microfiltration Equipment
Requirements 10-19
Batch Cross-flow Microfilter Specification 10-20
Summary of Cross-flow Microfilter DesignCalculations 10-22
Overall Performance of Cross-flow Microfiltration
Unit 10-23
Batch Nanofiltration Equipment Requirements 10-24
Batch Nanofiltration Specification 10-25
Overall Performance of Nanofiltration Unit 10-28
Characteristics of Bipolar Cells in Comparison with
Monopolar Cells (10 V) 10-31
Batch Electrochemical Equipment 10-32
Batch Electrochemical Unit Specification 10-34
Electrochemical Unit Operating Characteristics 10-35
Process Data on a Dry Fabric Mass Basis for ProcessConfiguration 1 (4-Stage) - Variable Wash-waterConcentration 10-37
Process Data on a Dry Fabric Mass Basis for ProcessConfiguration 2 (5-stage with Evaporation) -Variable Wash-water Concentration 10-44
Typical Costs of Utilities and Chemicals 11-1
Design Parameters for Economic Evaluation ofElectrochemical Treatment of Strong ScouringEffluents 11-2
Plant Component Cost Estimation 11-3

(xxiii)
TABLE 11.4 : Operating Cost Estimation for the Electrochemical
Treatment of Strong Scouring Effluents 11-4
TABLE 11.5 : Potential Savings 11-5
(xxiv)
LIST OF ABBREVIATIONS
RSA - Republic of South Africa
Temp - Temperature
Cond - Conductivity
COD - Chemical oxygen demand
BOD - Biological oxygen demand
SS - Suspended solids
TDS - Total dissolved solids
TS - Total solids
ADMI - American Dye Manufacturers' Institute (colour units)
OA - Oxygen absorbed
TOC - Total organic carbon
TTC - Total inorganic carbon
ED - Electrodialysis
NF - Nanofiltration
U F - Ultrafiltration
CFMF - Cross-flow microfiltration
d.c. - direct current

GLOSSARY
(xxv)
Anode
Anolyte
Beam (back)
(weavers)
Bleaching
Cathode
Catholyte
Cold pad batch
Composite membrane
Composite permeate
Cross-flow microfiltration
Curing
The electrode at which electrons are removed from an
electrochemical cell.
The liquid contained in the anode compartment of anelectrochemical cell.
A beam from which yarn is fed during the sizing process.
A roller on which large flanges are usually fixed, so thata warp may be wound on it in readiness for weaving.
The procedure, other than by scouring only, of improvingthe whiteness of textile material by decolourising it fromthe grey state, with or without the removal of naturalcolouring and/or extraneous substances.
The electrode at which electrons flow into anelectrochemical cell.
The liquid contained in the cathode compartment of anelectrochemical cell.
The cold process of padding a solution onto a batch offabric which is subject to one stage of a process at a time.
Membranes made from composite materials and usuallyprepared by depositing a polymer film on a poroussubstructure.
The combination of all the permeate produced during a
membrane process.
A pressure-driven liquid separation process in which onlycolloidal and paniculate solids are removed from the feed.In this technique the particular suspension or colloid ispassed over the surface of a filtration medium under flow-conditions favouring the transport of the suspending liquidthrough the membrane, while the concentrationsuspension is force-convected across the membranesurface and out of the filtration device. The filtrationmedia can be microporous membranes, porous ceramic,plastic or metallic tubes or woven hose.
The heat treatment of textiles designed to completepolymerisation or condensation reaction of an addedsubstance.

(xxvi)
Determinand
Finishes
Greige cloth
Hyperfiltration
Jet
Jig
Liquor ratio
Loomstate
Mercerising
A chemical species or physical characteristic of asubstance.
(a) A substance or a mixture of substances added totextile materials at any stage to impart desiredproperties.
(b) The type of process, physical or chemical, appliedto produce a desired effect.
(c) Such properties, for example, smoothness, drape.lustre, or crease-resistance, produced by (a) and/or(b) above.
(d) The state of the textile material as it leaves aprevious processor.
Woven or knitted fabrics as they leave the loom or knittingmachine, i.e.. before any bleaching, dyeing or finishingtreatment has been given to them.
A pressure-driven process which differs from re\erseosmosis in so far as relatively small organics and non-ionicspecies with low osmotic pressure are also present in thefeed stream and are rejected on a membrane which is ofthe same type as is used for reverse osmosis.
A machine for dyeing fabric in rope form in which thefabric is carried through a narrow throat by dye-liquorcirculated at a high velocity.
A dyeing machine in which fabric in open width istransferred repeatedly from one roller to another andpasses each time through a dsebath of relatively smallvolume. Jigs are frequently used for scouring, bleachingand finishing.
The ratio of the weight of liquor employed in anytreatment to the weight of fibrous material treated.
Woven or knitted fabrics as they leave the loom or knittingmachine, i.e., before any bleaching, dyeing or finishingtreatment has been given to them.
(a) The treatment of cellulosic textiles in yarn or fabricform with a concentrated solution of caustic alkali,whereby the fibres are swollen, the strength anddye affinity of the materials are increased, and theirhandle is modified.

(xxvii)
Nanofiltration
Padding
Point rejection
Reinforcement factor
Rejection
Reject
Relaxer
Rinsing
Scouring
Size
(b) The process of steeping cellulose in concentratedcaustic soda.
A pressure-driven liquid separation process in which anultrafiltration membrane, which possesses charged groupsis used. The charged membranes lead to interactions ofthe charged groups with ionic species in solution and withwater. This can result in increased membrane anti-foulingproperties, increased flux through the membrane andenhanced rejection of electrolytes. A degree of selectivityfor multivalent ions is possible.
The application of a liquor or paste to textiles, either bypassing the material through a bath and subsequentlythrough squeeze rollers or by passing it through squeezerollers, the bottom one of which carries the liquor orpaste.
The instantaneous rejection of a membrane.
The factor by which the feed to a padding operation hasto be increased so as to counteract the dilution effect ofthe moisture on the incoming fabric.
A measure of the decrease in concentration of a componentin the feed and the permeate stream.
The portion of a feed solution which has not passedthrough a membrane.
A wet process which releases the strains and stresses intextile materials. This could be combined with other wetprocesses.
Treatment of textile material in water to removesubstances employed in previous processes.
Treatment of textile materials in aqueous or other solutionsin order to remove natural fats, waxes, proteins and otherconstituents, as well as dirt, oil, and other impurities.
A gelatinous film-forming substance, in solution ordispersion, applied to warps but sometimes to wefts,generally before weaving. The objects of sizing prior toweaving are to protect the yarns from abrasion in thehealds and reed and against each other, to strengthenthem, and by the addition of oils and fats, to lubricatethem.

(xxviii)
Stenter
Texturising
Thermoplastic
Warp
Washing range
Washing
Water recovery
Weft
Winch
An open-width fabric-finishing machine in which theselvedges of a textile fabric are held by a pair of endlesstravelling chains maintaining weft tension. Such machinesare used for drying, heat-setting of thermoplastic materialand fixation of chemical finishes.
The process of introducing durable crimps, coils, loopsor other fine distortions along the length of the fibres orfilaments.
Deformable by applied heat and pressure without anyaccompanying chemical change. The feature is that thedeformation can be repeated.
(a) To arrange threads in long lengths parallel to oneanother preparatory to further processing.
(b) Threads lengthways in a fabric as woven.
(c) A number of threads in long lengths andapproximately parallel, which may be put in variousforms intended for weaving, knitting, doubling,sizing, dyeing, or lace-making.
Equipment used for washing or rinsing.
Treatment of textile material in water and detergentsolutions 10 remove substances employed in previousprocesses.
The fraction of liquid which has passed through a
membrane.
(a) Threads widthways in a fabric as woven,
fb) Yarn intended for use as in (a).
A dyeing machine in which one or more endless lengthsof fabric are drawn through the dyebath by a reel or drumrotating above the surface of the dye liquor.
A machine for dyeing garments in which the garmentsare circulated by jets of liquid rather than by mechanicalmeans.

1-1
1 LEGISLATION AND PLANNING FOR INDUSTRIAL WASTE
WATER REUSE AND RECLAMATION
1.1 INTRODUCTION
Water is the key to the continued overall development of the Republic of South Africa(RSA) (1). The critical factor for economic and industrial survival is the availabilityof water at a quality suitable for various urban and industrial uses.
Southern Africa is, for the most part, a semi-arid, water-deficient region of the world,subject to variable rainfall, droughts, floods and high evaporation losses. The annualrainfall amounts to only 58 % of the world average, run-off is distributed unfavourably,the availability of underground water is limited and the quality of the water resourcesis deteriorating (2).
The increasing salinity of the RSA's water resources is the biggest water quality problemfacing the country today (3) and industry's future is largely dependent on the controlof this problem. Added to this concern is the fact that, since Southern Africa is arelatively arid and water-deficient region, the industrial effluent return flow forms aconsiderable supplementary source of water, adding significantly to the mineralisationprocess.
In a recent publication by the Department of Water Affairs (2) it is estimated that theaverage annual run-off into rivers in the RSA is 52 000 million m3/a (143 millionm3/d), of which 40 % or 20 800 million m3/a (57 million m3/d) is the assured portionwhich can be made available for use through the provision of storage facilities. It isestimated that future developments will increase this available portion to 50 %. Aconservative estimate of the potential groundwater availability, based on currentabstraction, is 3 million m3/d, bringing the potential availability from natural waterresources to 27 400 million m3/a (75 million m3/d).
It is estimated that if the present increase in demand materialises, then the total waterneeds by the end of the century will be 29 270 million m3/a (80 million m3/d), whichexceeds the maximum expected yields.
Solutions to the problem are being sought by :
(i) improving the methods of development and utilisation of natural water sources,
(ii) raising the effectiveness of the current use of developed supplies, such as thereuse of effluents and the improved use of water for irrigation,
(iii) seeking methods for the creation of new water sources such as the desalination
of sea water.

1-2
1.2 THE WATER ACT
The use of water for industrial purposes together with the control of effluent productionand water pollution is governed in the RSA by the Water Act, 1956 (Act 54 of 1956)as amended. In the case of the Republics of Transkei, Venda, Bophuthatswana andCiskei (TVBC states), the Water Act and its amendements at the time of independencewere adopted. Subsequent amendments to the Water Act in the RSA are not necessarilyadopted.
The Water Act is administered by the Department of Water Affairs. Any relaxationof the specified effluent standards is granted only after consultation with the Departmentof Health, the South African Bureau of Standards and sometimes other departmentssuch as the Department of Environment Affairs and the Department of Agricultureand Water Supply.
The Water Act initially ser\ed its purpose well (4). It enabled water demand to beregulated in keeping with the portion of the national budget allocated to the developmentof additional water supplies. In addition, it safeguarded the limited available waterresources from catastrophic levels of pollution without seriously constraining industrialdevelopment.
In view of the general decline in the quality of many of the RSA's water sources theinitial Water Act could no longer effectively control water pollution and industrialwater use. The Water Act and effluent standards were therefore amended during1984.
The main requirements of the Water Amendment Act of 1984 retained the basicrequirements of the Water Act of 1956. The more important provisions with whichfactory management should acquaint themselves are :
1.2.1 Industrial Water Use
In terms of Section 12 any party using a quantity of water from any source; privateborehoie water, sea water or public water, exceeding i50 m3 on any one day, requiresa permit of authorisation issued by the Minister of Water Affairs.
The permits are issued subject to various conditions, infringement of which is a criminaloffence.
1.2.2 Effluent Discharge
The main requirement of Section 21 is that any person using water for industrialpurposes is responsible for the purification to prescribed standards of this water andany effluent resulting from the use of this water, and to return the water and effluentas far as is practically feasible to the stream of its origin.

1-3
Section 21 also provides for the exemption from compliance with the above if it isconsidered warranted, for example, where no technology exists to achieve the prescribedstandard or where the existing technology is prohibitively expensive. The Ministermay withdraw or amend the permit of exemption at any time and may direct that themanufacture, marketing or use of any substance which could cause serious waterpollution be restricted or terminated.
Effluent purification is seen by the Department of Water Affairs as an integral partof the normal manufacturing process and industry is expected to utilise the latestavailable technology to treat effluents to higher degrees of purity, thus reducing pollutionand making available a good quality effluent suitable for water reclamation and reuse.
Three effluent standards exist and are prescribed in terms of Section 21 of the WaterAct (5) :
(i) a general standard for discharge into most rivers and streams in the RSA,
(ii) a special standard for discharge into rivers in catchment areas specified bySchedule 1, the so-called mountain and trout streams,
(iii) a special standard for discharge into specified catchments sensitive to phosphorusspecified in Schedule II, which may cause eutrophication problems.
Table 1.1 summarises these effluent standards.
In terms of required purification to prescribed standards, the standard for total dissolvedsolids (TDS) is expressed as conductivity. A maximum increase of 75 mS/m abovethat of the intake water is generally applicable. Special standards apply in a numberof selected regions and cases.
In addition, although specific provision is made in the regulations in this regard, theDepartment does not favour the irrigation of effluents or disposal to evaporation dams(4) and considers these means of discharge as temporary measures, which isolate pollutingeffluents from the water environment. Irrigation and evaporation dams, as a meansof disposal, should be phased out as soon as the "best practicable"1 means to treat theseeffluents to acceptable standards of purity becomes available.
1.3 STRATEGY AND POLICY GUIDELINES
A recent publication (2) has defined the RSA's official water policy and has attemptedto increase the awareness of all water managers, scientists and consumers to theopportunities and limitations associated with water use and effluent disposal in theRSA. The book contains a summary of the major objectives, policies and views ofthe Department of Water Affairs.
According to the publication the major objective of the Department of Water Affairsis to "ensure the on-going, equitable provision of adequate quantities and qualities ofwater to all competing users at acceptable degrees of risk and cost under changingconditions".

1-4
TABLE 1.1GENERAL AND SPECIAL STANDARDS FOR DISCHARGE IN TERMS OF THE SOUTH
AFRICAN W
Determinand
Colour, odour, tastepH
Dissolved oxygen (%)Temperature ( * C)Typical faecal coliforms (per 100 mt)Chemical oxygen demand (mg/f)Oxygen absorbed (mg/t)Conductivity
Suspended solids (mg/t)Sodium (mg/t)Soap, oil and greaae (mg/f)Residua! chlorine - as Cl (mg/t)Free and saline ammonia - as N (mg/i)Nitrate - as N (mg/t)Arsenic (mg/t)Boron (mg/t)Chromium - total (mg/f)Chromium VI (mg/t)Copper (mg/t)Phenol (mg/£)Lead (mg/t)Copper (mg/t)Sulphides - as S (mg/i.)Fluorine [mg/t)Zinc (mg/t)Phosphate - total as P (mg/t)Iron (mg/i.)Manganese (mg/i.)Cyanide - as CN (mg/t)Sum of Cadium, Chromium, CopperMercury and Lead (mg/£)Cadmium (mg/i)Mercury (mg/£)Selenium (mg/l)
ATER ACT, 1956 (ACT 54 OF 1956)
General standard
ni!
5,5 - 9,5not less than 75
not more than 35nil
not more than 75not more than 10
not to increase morethan 75 mS/m,max 250 mS/m
not more than 25below 90 above intake
not more than 2,5not more than 0,1not more than 10
not specifiednot more than 0,5not more than 1,0not more than 0,5not more than 0,05not more than 1,0not more than 0,1not more than 1,0not more than 0,5not more than 1,0not more than 1,0not more than 5,0
not specified*not specified
not more than 0,4not more than 0,5
not more than 1,0not more than 0,05not more than 0,02not more than 0,05
Special standardSchedule I
nil
5,5 - 7,5not less than 75
not more than 25nil
not more than 30not more than 5
not to increase morethan 15 % above intake,
max 250 mS/mnot more than 10
below 50 above intakenil
nil
not more than 1,0not more than 1,5not more than 0,1not more than 0,5not more than 0,05
not specifiednot more than 0,02not more than 0,01not more than 0,1not more than 0,02not more than 0,05not more than 1,0not more than 0,3not more than 1,0not more than 0,3not more than 0,1not more than 0,5
not more than 1,0not more than 0,05not more than 0,02not more than 0,05
Special standardSchedule II
nil
5,5 - 9,5not less than 75
not more than 35nil
not more than 75not more than 10
not to increase morethan 75 mS/m,max 250 mS/m
not more than 25below 90 above intake
not more than 2,5not more than 0,1not more than 10
not specifiednot more than 0,5not more than 1,0not more than 0,5not more than 0,05not more than 1,0not more than 0,1not more than 0,1not more than 0,5not more than 1,0not more than 1,0not more than 5,0not more than 1,0
not specifiednot more than 0,4not more than 0,5
not more than 1,0not more than 0,05not more than 0,02not more than 1,0
except for "sensitive" catchments specified in Schedule II
The Department's guidelines (4) include the following :
(i) The "polluter pays" principle applies and polluters are increasingly required to
undertake and fund monitoring programmes and ecological impact studies toassess the environmental effects of their discharge.
1-5
(ii) Salinity and toxicity control measures are applied to the source of the problem.The Department will implement stricter control over industrial discharges intomunicipal sewers and will closely monitor all receiving waters.
(iii) Short-term solutions, such as discharge to evaporation ponds, irrigation ordilution and blending, will be phased out.
(iv) The necessity and extent of effluent treatment enforced in a particular instance,will be determined by the nature of the pollutant and its impact on receivingwater quality, the interests of downstream users and the cost-effectiveness andcost-benefit of the application of reclamation technology.
1.4 INDUSTRY-BASED RECYCLING AND RECLAMATION
The Department of Water Affairs relies on the co-operation of both research andindustrial organisations in the development of alternative approaches which will ensurethe industrial and economic future of the RSA. It is the Department's policy toencourage industrialists to develop improved in-plant control.
Industry-based recycling and reclamation is desirable in that pollutants may be removedat source from segregated, purer streams. In addition, heat energy, water and chemicalsavings may be achieved.
Industry-based recycling will include the reuse of minimally contaminated processwater, from one process, in another subsequent process. Reclamation measures includeprimary treatment to enable reuse of the stream, or advanced treatment to allow forthe separation, recovery and direct reuse of effluent constituents.

2-1
THE TEXTILE INDUSTRY
2.1 INTRODUCTION
2.1.1 South African Textile Industry
The textile industry in the RSA supports 180 000 people in the agricultural sector,3 000 in the cotton ginning industry. 30 000 in spinning and 250 000 in textile andclothing. It is a major industr\ with over 300 textile factories, ot" which about 50 areconcerned with the weaving of cotton and cotton/synthetic fibre cloths (6). The textileindustry uses 5 % (1976) of the energy requirements of the manufacturing sector (7).
The textile industry requires water for :
processing steam generation
product washing air conditioningplant and equipment washing transport of materialcooling systems personnel consumption and sanitation.
Steam generation, air conditioning, human consumption and certain stages in theproduction of textiles require water of potable or higher quality while a water of lowerquality may be employed for other uses.
2.1.2 The Need for Pollution Control in the Textile Industry
Recent amendments to the Water Act of 1956 (see 1.2.1 and 1.2.3) have placedconsiderable responsibility on industries to optimise their water use and to treat theireffluents to the required standards. The textile industry, because of the nature of itseffluents, is faced with a particularly serious set of problems.
Textile processing plants utilise a wide \ariety of dyes and other chemicals such asacids, bases, salts, detergents, wetting agents, sizes and finishes. Many of these arenot retained in the final product and are discharged in the effluent. Textile effluentsare in general relatively non-biodegradable and hence present problems in terms ofdischarge to both sewage systems and to the en\ironment. Mills discharging to sewageworks cause colour and chemical oxygen demand (COD) problems and those dischargingto the environment need to remove very high percentages of colour, COD and mineralsalts.
Typical textile processing water use is 150 to 1 400 I kg of product (8.9) and hencelarge volumes of textile effluents need to be disposed of in South Africa.
Unless appropriate and adequate care is exercised, the discharge of textile effluents tothe water environment may have serious and long-lasting consequences. These include :
(i) solid wastes, such as fibre, which are unsightly and ma\ result in anaerobicsludge layers in receiving streams.

2-2
(ii) many organic contaminants in textile effluents, such as dyes, synthetic sizesand detergents, which are relatively non-biodegradable and hence causeproblems in municipal sewage works and in return flow to water sources,
(iii) other organic compounds, such as starches, with very high biological oxygendemands, which increase the cost of sewer discharge or, if discharged toreceiving streams, cause anaerobic conditions,
(iv) the presence of inorganic salts, acids or alkalis in high concentrations, whichwill gradually make the receiving water unsuitable for most industrial andmunicipal purposes.
2.2 TEXTILE PROCESSING
2.2.1 Textile Fibres
The textile industry is a group of related industries which uses natural and/or syntheticfibres as the raw material to produce a wide range of finished products. Of interestin the present applications are cotton and polyester.
Cotton
Cotton is the seed hair of a wide variety of plants of the Gossypium family. Cotton fibres consist mainly ofcellulose.
Natural cotton is contaminated by oil and wax (0,5 %). Pectic acid, which is soluble in hydroxide solutionsbut insoluble in water, is present in cotton, often in the form of calcium or magnesium salts. Cotton may alsocontain small amounts of mineral matter (1 to 2 %) composed of silicon, iron, aluminium, calcium, magnesium,potassium, sodium, chloride and sulphate. Nitrogen containing impurities such as proteins or polypeptides andnatural colouring material are also present.
Polyester
Polyester is a truly synthetic fibre and is the product of a commercial chemical process involving the condensationof ethylene glycol and terephthalic acid.
Polyester fibres are produced by melt spinning and, being thermoplastic, can be easily shaped to produce texturedeffects. The fibres exhibit marked crystallinity and the closely packed, highly orientated molecules makepolyester strongly hydrophobic.
2.2.2 Textile Manufacturing
Various processing operations are involved in the transformation of the raw fibre intothe finished textile product (Figure 2.1). The conditions under which each operationis carried out vary depending on the type of raw fibre used.
The wet processing department of a textile plant commences with desizing in the caseof cotton and polyester materials. The subsequent pretreatment operations preparethe textile material for dyeing, printing and finishing. In addition, impurities aresolubilised, dissolved or dispersed and then removed by washing. Hence an adequatewashing capacity during each pretreatment operation is essential for optimum results.

FIGURE 2.1 PRODUCT !OS OF FABRIC
Accurate control of various factors is essential during wet preparation :
(i) concentration of chemicals,(ii) reaction time and temperatures.(iii) rate of water flow in washing.
The order in which the individual pretreatments are carried out often depends on thespecific production programme of the plant and on equipment availability.
This mechanical operation opens the raw fibres and blends together various components, allowing for the removalof contaminants.
Carding and Spinning
During carding, the long axes of the fibres are aligned, short fibres are removed and blending takes place. Inspinning, fibres are drawn out and twisted into yarn.
Where the yarn ia to produce cloth by the weaving process, it is divided into either the warp (longitudinalthreads) or the weft (lateral threads).
Warping
During warping parallel yarns are wound onto a back beam. The back beams are combined during sizing toform a weaver's beam In the case of coloured woven fabrics, the yarn is dyed prior to warping.

2-4
The sizing operation coats the individual yarns with a protective film of size in order to resist the abrasiveaction of the loom. The size strengthens the yarn and reduces the hairiness of the threads.
Weaving
Weaving is a dry operation but is normally carried out under conditions of high humidity. This helps tominimize breaks on the loom as the size film is flexible under moist conditions. After weaving the greige clothis inspected for faults and may be cropped and singed to remove surface hairiness.
Knitting
During the knitting operation lubricating oils are continuously applied to the yarn to reduce fibre breaks andwaste.
Desizing
The size is removed from the cloth, the technology utilised being dependent on the type of sizing agent employed.
Scouring
Where sizing is not carried out, scouring is almost invariably the first wet process applied to textile materials.During this operation oils, fats, waxes, soluble impurities and particulate and solid dirt adhering to the fibresare removed. Scouring generally consists of treatment with a detergent, with or without the addition of analkali, dependent on the type of fibre and level of contamination.
Bleaching
Bleaching is carried out using oxidizing, or less often a reducing, bleaching agent which whitens the fibre byremoving the natural colouring matter.
Mercerising
Mercerising refers to the treatment of fibre, usually cotton, under tension with concentrated sodium hydroxide.Mercerising imparts a sheen to the cotton fibre and increases its dyeability.
Dyeing and Printing
Stock, yarn or fabric is coloured to the customers requirements by the uniform or local application of colouringmatter for either dyeing or printing respectively.
Finishing
Final processing imparts special properties such as easy handling, mothproofing, antistatic, non-slip andanti-piling to the final product.
2.2.3 Textile Mill Classification
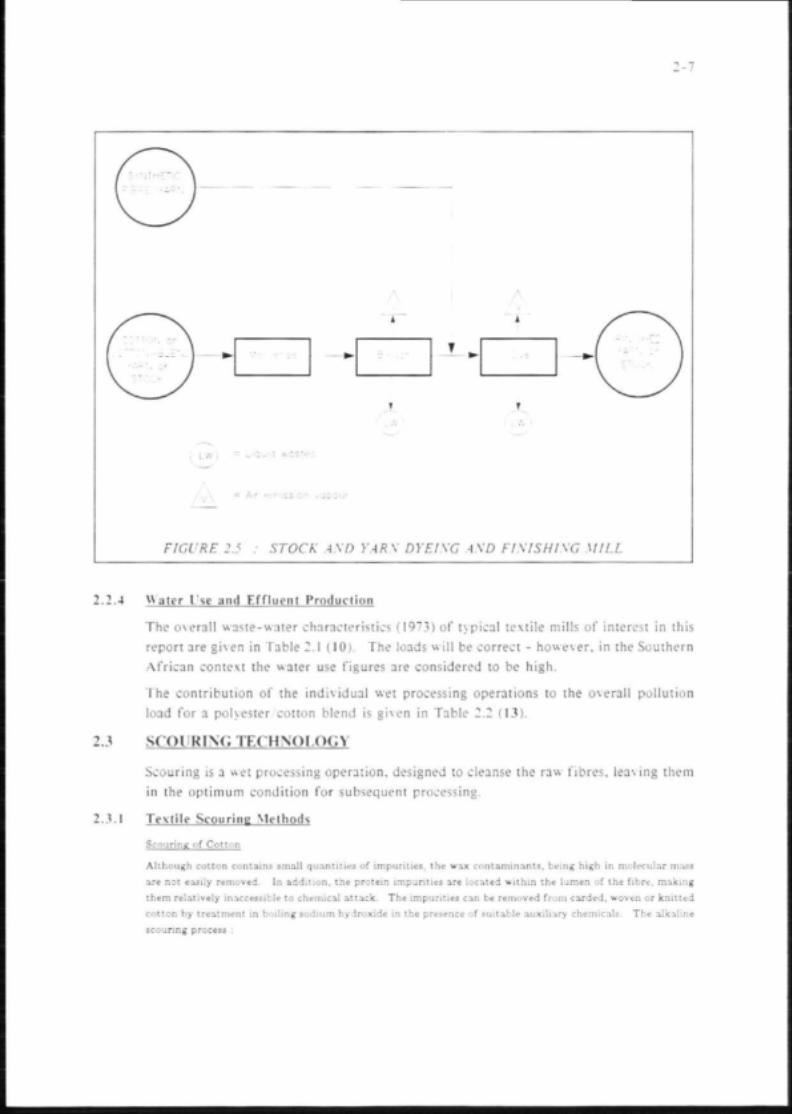
Detailed classification of the textile industry is difficult, but two main methods areuseful: fibre processing and mill operation. Figure 2.2 classifies the types of finishedproduct by the fibre processed. The main types of mill operation. Figures 2.3 to 2.5,(10,11,12) include :
(i) wool scouring and/or finishing,(ii) dry processing,(iii) woven fabric finishing,(iv) knit fabric finishing,(v) carpet manufacture,(vi) stock and yarn dyeing and finishing.
Sectors (iii), (iv), (v) and (vi) include one or more of the processes of scouring, bleachingand mercerising as applied to cotton and polyester/cotton blends.

2-5
FIGURE 2.2 : TEXTILE INDUSTRY CATEGORISATION BY FIBRE PROCESSED
Wool scouring will be covered in Part 4 of this series of guides.
Woven Fabric Finishing Mill
Woven fabrics involving cotton are sized. The size and the natural impurities on the cotton fibre, means thatthese fabrics need treatment involving desizing, scouring, mercerising and bleaching. The prepared fabric isthen either dyed or printed (Figure 2.3).
Knit Fabric Finishing Mill
Fabrics knitted with synthetic fibre receive a light scour to remove knitting oil, followed by dyeing and/orprinting (Figure 2.4).
Knitted cotton is scoured and bleached prior to dyeing or printing. The same technology as for woven cottonis used, but with different machinery.
Stock and Yarn Dyeing and Finishing Mill
Synthetic yarns are subjected to a light scour, dyed and softened. Cotton yarns are bleached and occasionallymercerised before being dyed and softened (Figure 2.5).

2-6
-—xWOVENX
300DS /
i
\
1
(V)1
{ L
*
T
("LW
\
-.rJ<h
_
t
Frlnl
1>-*
Dye
andwash
./
J
\ / ^
r
/ = Air gmisS-Ctn pCfi i ' .u ' l i "
/ y \ = Air emission vapour
LW J = Liquid watte
FIGURE 2.3 : WOVEN COTTON FABRIC FINISHING MILL
G) ^
ri__l^
(LW)1
(L WJ
.LW A A -• P)
finisn Imisn
fl-Wl
I V \ = AT errnssioi vapo.ir
(.LW) = L iquld wo^tes
FIGURE 2.4 : KNIT FABRIC FINISHING MILL
2-7
A
-
A
= niT ^rriSS'On .UpOU'
FIGURE :.5 : STOCK AXD YAR\' DYEfXG A\'D FfXfSHfXG MILL
2.2.4 Water I'se and Effluent Production
The overall waste-water characteristics (1973) of typical textile mills of interest in this
report are given in Table 2.1 (10). The loads will be correct - howe\er . in the Southern
African context the water use figures are considered to be high.
The contribution of the individual wet processing operations to the overall pollution
load for a polyester cotton blend is given in Table 2.2 (13).
2.3 SCOURING TECHNOLOGY
Scouring is a wet processing operation, designed to cleanse the raw fibres, leaving them
in the optimum condition for subsequent processing.
2.3.1 Textile Scouring Methods
Scouring of Cotton
Although cotton contains small quantities of impurities, the wax contaminants, being high in molecular mass
are not easily removed In addition, the protein impurities are located within the lumen of the fibre, making
them relatively inaccessible to chemical attack. The impurities can be removed from carded, woven or knitted
cotton by treatment in boiling sodium hydroxide in the presence of suitable auxiliary chemicals. The alkaline
scouring process :

2-8
TABLE 2.1OVERALL EFFLUENT CHARACTERISTICS FOR V
Determinand
BOD
SS
COD
SulphideColourpH
Water use
Alt units in mg/i.
CATEGORIES OF TEXTILE MILLS (10)
(ADMI units)
(*Ag)
Wovenfabric
finishing
550
185
850
3
325
7 - 11297
unless otherwise stated.
Knitfabric
finishing
250
300
850
0,2
400
6 - 9277
ARIOUS
Stock andyarn dyeingand finishing
200
50
524
-
600
7 - 12297
0)
00(iii)
(iv)
(v)
(vi)
converts the pectins and pectoses to soluble pectic salts,
degrades the proteins into soluble amino acids or into ammonia,
dissolves the mineral matter,
removes the adventitious dirt,
hydrolyses the saponifiable matter to form soaps which in turn emulsify the unsaponifiable oils andretain the dirt particles in suspension,
improves thehydrophilic properties of the fibre which govern the water absorptivity and the evennessof dye and chemical uptake.
The fraction of sodium hydroxide consumed in scouring varies from 10 to 80 % depending on the temperatureand on the reaction time of the process.
Cotton scouring processes are batch or continuous. Batch scouring produces a sequence of effluents of decreasingconcentration. Continuous scouring produces a single effluent because the scouring solution is padded ontothe cloth at high concentration and is subsequently removed in a rinsing process.
Batch Scouring
Batch scouring is generally carried out in cylindrical vessels or kiers made of cast iron or stainless steel. Thesemay be open, when the liquor boils at atmospheric pressure (boil-off) or closed, when the liquor boils underpressure at temperatures higher than 100 *C (kier-boil). In both instances, steam is used to heat and tocirculate sodium hydroxide through the cloth.
Boil-off at atmospheric pressure has been largely replaced by newer and more effective scouring methods, sincethe combination of atmospheric oxygen and alkali causes oxidative damage to the cellulose fibres. Whereboil-off is still practised, it is carried out in the presence of a reducing agent to prevent oxidative degradationof the fibre.
Typical boil-off recipes would be :
Cloth (14)
Sodium hydroxide 10 to 20 gjt.
Wetting agent and detergent (anionic) 1 to 2 gjt.Liquor ratio 3 : 1 to 7 : 1.Batching temperature 95 to 98 " C.Batching time 4 to 6 h.

2-9
POLLUTION
Process
DESIZING
Enzyme starch
Folyvinyl alcohol
Carboxyrnethyl cellulose
SCOURING
Unmercerised greige fabric
Mercerised greige fabric
MERCERISING
Greige fabric
Scoured fabric
Bleached fabric
BLEACHING
Hydrogen peroxide
(Woven goods)
Hydrogen peroxide
(Knit goods)
Hydrogen peroxide
(Yarn goods)
DYEING
Direct i: disperse
(Woven goods)
Vat <k disperse
(Woven goods)
Sulphur A: disperse
(Woven goods)
Napthol & disperse
(Woven goods)
Fibre reactive 4: disperse
(Woven goods)
PRINTING
Pigment (Woven goods)
Pigment (Knit goods)
V.it dye (Woven goods)
Vat dye (Knit goods)
FINISHING
Resin
(Woven goods)
Resin
Flat curing
(Woven goods)
LOADS
(50
PH
6 - 8
6 - 8
6 - 8
12
12
12
12
12
10
12
10
6 - 8
12
11
11
12
6 - 8
6 - 8
10
10
6 - 8
6 - 8
FOF
/50
TABLE 2.2
t VARIOL
POLY
BOD
"S/tproduct
(r
38,5
2,5
3,9
10,8
8,3
5,7
3,2
1,3
1,3
15,3
13.8
10,7
22,8
22,8
13,8
13,5
1,3
1.3
21,5
21,5
6,3
lg/3
(3 078)
(200)
(314)
(432)
(333)
(343)
(192)
(76)
(78)
(183)
(138)
(257)
(547)
(547)
(331)
(324)
(101)
(101)
(644)
(644)
(96)
(505)
S WET PREPARATION OPERATIONSESTER/COTTON) (13)
ss
kg/t
product
(
77
5
5
5
5
5
5
5
4
0,1
0,125
25
12
mg/*)
(6 155)
(400)
(400)
(200)
(2U0)
(300)
(300)
(300)
(240)
(10)
(10)
(750)
(750)
(959)
19
50
54
9,
9,
77
77
72
20
50
114
122
69
57
192
2,5
2,5
34
35
22
17
T D S
k g / t
Droduct
(mg/
8 (1
4 (4
5 (4
8
(4
(4
(4
(1
I)
583)
029)
349)
(392)
(387)
616)
616)
317)
199)
(500)
(2
(2
7 (1
2 (1
(4
(1
(1
(1
3 (1
734)
92 r.)
671)
372)
604)
(200)
(200)
019)
049)
759)
383)
3
3
9
20
15
5
1
Oil and
grease
kg/t
product
(mg/*)
6 (288)
6 (192)
4 (751)
(799)
(100)
(300)
0 (10)
n
l
2
0
II
0
0
1)
1.1
Colour
kg/tproduct(m
5
4
1
C
1
1
1
5
g/*)
(12)
(33)
(50)
(13)
(10)
(4)
(4)
(15)
(15)
Water
use
*,kg
product
12,5
12,5
12,5
25
25
10,7
16,7
IP .7
IG,7
8 3
100
42
42
42
42
42
12,5
12.5
33,3
33,3
12,5
12,5

2-10
Typical rinsing effluent parameter loadings from the boil-off of cloth for a water use of 20 £/kg cloth and awet-pick up of 100 % are :
pH alkaline.Temperature hot (>80 *C).Sodium hydroxide 10 to 20 g/kg cloth.
Cotton wool (15,16)
Sodium hydroxide 10 to 50 g/£.Detergent 2 to 3 gjl.Liquor ratio 20 : 1.Batching temperature 98 * C.Batching time 4 to 6 h.
Typical rinsing effluent parameter loadings from the boil-off of cotton wool for a water use of 20 £/kg clothand wet-pick up of 100 % are :
pH alkaline.Temperature hot (>80 ' C).Sodium hydroxide 10 to 50 g/kg cloth.Colour dark.
Typical kier-boil recipes would include (17) :
Potassium hydroxide 40 g/£(or the sodium hydroxide equivalent)Wetting agent or detergent 1 to 2 g/£.Liquor ratio 10 : 1.Pressure and temperature 100 kPa at 135 ' C.Batching time 3 to 4 h.
Typical rinsing effluent parameter loadings from kier-boiling for a water use of 25 £/kg cloth and a wet-pickup of 100% are (18) :
pH alkaline.Temperature warm (50 "C).Potassium hydroxide 40 g/kg cloth.Colour dark.
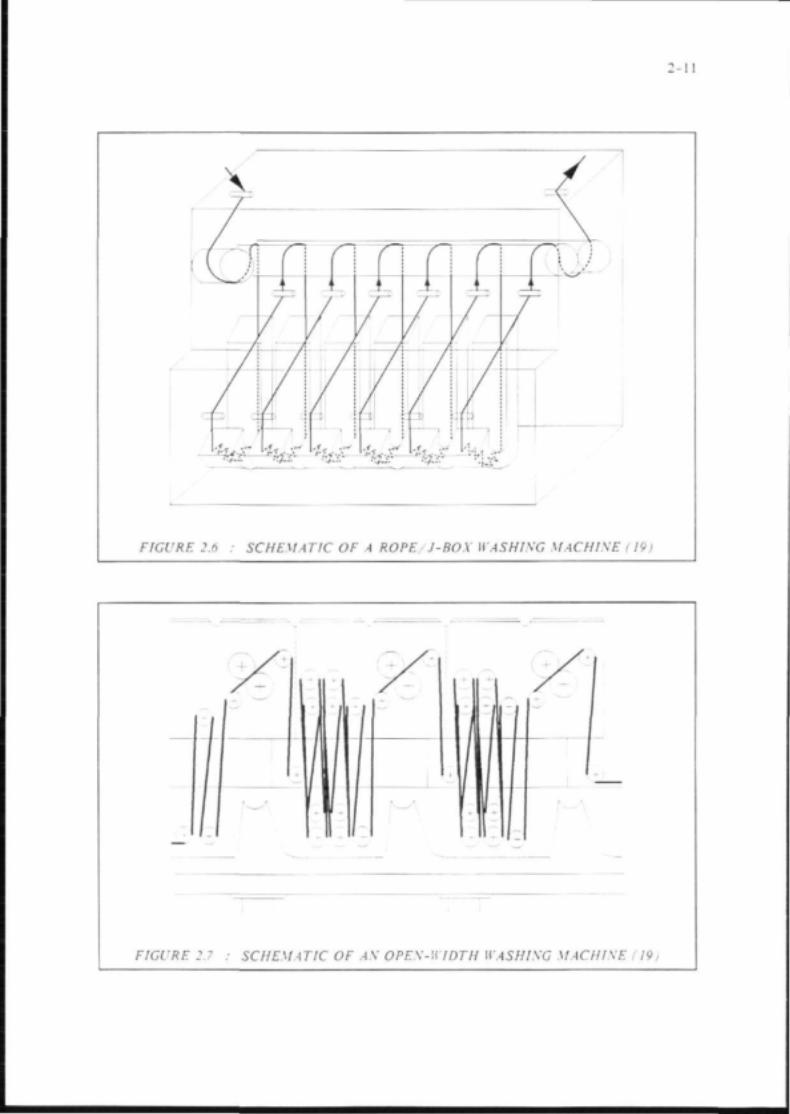
Continuous Scouring
Continuous scouring is generally achieved in one of three types of units, the J-box, caravans or open-widthreaction chambers.
J-boxes can be used to process fabric in either rope form or in open-width form. Scouring is achieved byimpregnating the cloth with sodium hydroxide, heating it to elevated temperatures (93 to 99 " C) and allowinga reaction time of approximately one hour while the fabric passes through the J-box (Figure 2.6) (19).
In the caravan system, fabric is first padded, using a solution of sodium hydroxide containing a reducing agent.It is then steamed and wound into caravans, where the cloth is rotated in a steam atmosphere (90 * C) for oneto two hours.
The Vaporloc unit, by Mather and Platt, is a high-pressure reaction unit which is designed to operate underpressures of 200 kPa with temperatures above 130 * C, and scouring is achieved in periods as short as one totwo minutes. Figure 2.7 (19) shows an open-width machine.
2-11
FIGURE 2.6 : SCHEMATIC OF A ROPE J-BOX WASH1SG MACHIXE ( 19 »
FIGURE 2.7 • SCHEMATIC OF AS OPES-WIDTH WASHISG MACH1SE ( 19)
2-12
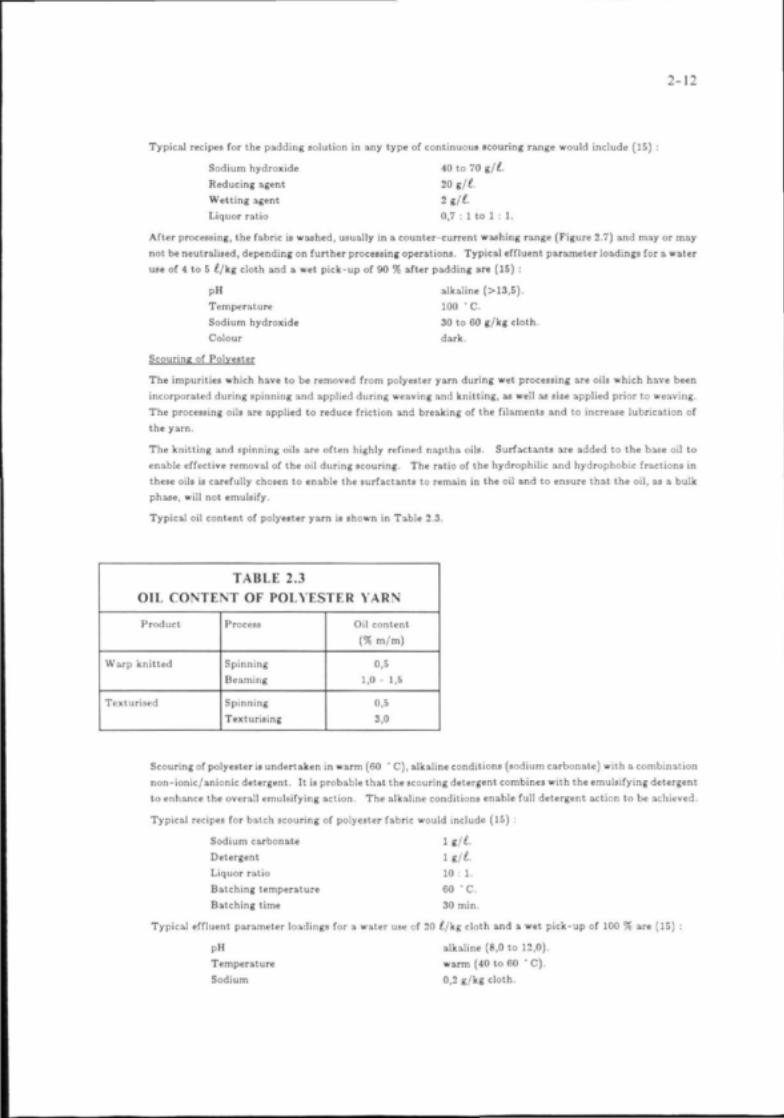
Typical recipes for the padding solution in any type of continuous scouring range would include (15) :
Sodium hydroxide 40 to 70 g/t.
Reducing agent 20 g/£.
Wetting agent 2 g/£.
Liquor ratio 0,7 : 1 to 1 : 1.
After processing, the fabric is washed, usually in a counter-current washing range (Figure 2.7) and may or may
not be neutralised, depending on further processing operations. Typical effluent parameter loadings for a water
use of 4 to 5 £/kg cloth and a wet pick-up of 90 % after padding are (15) :
pH alkaline (>1S,5).
Temperature 100 ' C.
Sodium hydroxide 30 to 60 g/kg cloth.
Colour dark.
Scouring of Polyester
The impurities which have to be removed from polyester yarn during wet processing are oils which have been
incorporated during spinning and applied during weaving and knitting, as well as size applied prior to weaving.
The processing oils are applied to reduce friction and breaking of the filaments and to increase lubrication of
the yarn.
The knitting and spinning oils are often highly refined naptha oils. Surfactants are added to the base oil to
enable effective removal of the oil during scouring. The ratio of the hydrophilic and hydrophobic fractions in
these oils is carefully chosen to enable the surfactants to remain in the oil and to ensure that the oil, as a bulk
phase, will not emulsify.
Typical oil content of polyester yarn is shown in Table 2.3.
TABLE 2.3OIL CONTENT OF POLYESTER YARN
Product
Warp knitted
Texturised
Process
Spinning
Beaming
Spinning
Texturising
Oil content
(96 m/m)
0,5
1,0 - 1,5
0,5
3,0
Scouring of polyester ia undertaken in warm (60 ' C), alkaline conditions (sodium carbonate) with a combination
non- ionic/anionic detergent. It is probable that the scouring detergent combines with the emulsifying detergent
to enhance the overall emulsifying action. The alkaline conditions enable full detergent action to be achieved.
Typical recipes for batch scouring of polyester fabric would include (15) :
Sodium carbonate 1 gjt.
Detergent 1 g/£.
Liquor ratio 10 : 1.
Batching temperature 60 * C.
Batching time 30 min.
Typical effluent parameter loadings for a water use of 20 £/kg cloth and a wet pick-up of 100 % are (15) :
pH alkaline (8,0 to 12,0).
Temperature warm (40 to 60 " C).
Sodium 0,2 g/kg cloth.

2-13
Scouring of roiyester/Cotton Blends
Polyester/cotton blends are considered either as heavily contaminated polyesters or as mildly contaminatedcottons and are scoured accordingly. The alkali concentration, reaction time and working temperature thatare used for cotton scouring must be adjusted to reduce tendering of the polyester to a minimum. Figure 2.8(14) illustrates the conditions which cause unacceptable saponification of the polyester fibre. Scouring shouldbe conducted in the region lying below the sodium hydroxide concentration lines.
FIGURE 2.S : ACCEPTABLE SAPOXIFICATIOX LIMITS OF POLYESTER AS AFUXCTIOX OF SODIUM HYDROXIDE COXCEXTRATIOX AXD TEMPERATURE -WD
CO XT ACT TIME ' 141
Typical recipes for the scouring of polyester/cotton blends would be
Polyester/cotton yarn
Sodium hydroxideDetergentSequestrantLiquor ratio
1 Sit0,5 sit10 : 1.

2-14
Polyester/cotton fabric
Sodium carbonate 1 gjt.Detergent 1,5 %ft.Sequestrant 1 g/t.Fabric lubricant 1 %jt.Liquor ratio 10 : 1.
2.4 MERCERISING TECHNOLOGY
Mercerising is the treatment given to cotton fibre, under tension, using a concentratedsodium hydroxide solution to improve various properties of the fibre. A swollen andmore cylindrical fibre is produced which :
(i) gives a higher, more uniform reflection of light and results in improved lustre,
(ii) promotes the tear strength but at the cost of elasticity,
(iii) improves the dyeability,
(iv) improves the dimensional stability in washing.
Mercerising consists of immersing the tensioned cotton in sodium hydroxide, followedby efficient rinsing while the fibre is still under tension. Mercerising liquorconcentrations of 22 to 26 % sodium hydroxide are generally employed. Duringmercerising, the cotton goes into a plastic state, whereby the dimensions of the fabriccan be influenced within certain limits. The new structure and the dimensions set areonly sufficiently stable when the residual liquor content is 50 g NaOH/kg of fabric orless, i.e. when the liquor has been practically washed out (20). It is thus importantthat the tension in the fabric at the dimension set is retained until the minimum NaOHconcentration has been reached. Temperatures are generally kept low (13 to 15 °C),since swelling of the fibres is higher at low temperatures. Some factories in the RSAmercerise at elevated temperatures (40 °C) where a weaker mercerising effect is achieved.Since the mercerising process is exothermic, cooling systems are required.
Suitable wetting agents are employed to accelerate sodium hydroxide uptake by thefibre and to improve the evenness of the mercerising effect. Such wetting agents mustbe readily soluble in concentrated sodium hydroxide and must possess no affinity forthe fibre in order to prevent rapid consumption.
Mercerisation may be carried out dry-on-wet or wet-on-wet. Constant control of thesodium hydroxide concentration is essential. Centrifugation of the recirculating liquoris necessary during the mercerising of fabrics which have not been prescoured usingan alkaline earth extractor to remove accumulated calcium and magnesium salts. Yarnsthat are to be processed into knitgoods must be prescoured using alkaline earth extractorsprior to mercerising, to ensure minimum variation in the mercerising effect.
After mercerisation it is customary to neutralise the fabric in the penultimate rinsebath of the washing range. Acetic or formic acid is commonly used for this purpose.
Typical recipes for mercerising would include (14) :

1-15
dry-on-wet
Sodium hydroxide in aaturatorSurfactant (anionic)TemperatureSodium hydroxide asreplenishing addition
wet-on-wet
Sodium hydroxide in saturatorSurfactant (anionic)TemperatureSodium hydroxide asreplenishing addition
The wash-off after mercerising constitutes the effluent,of 6 to 10 £/kg cloth and a wet pick-up of 90 % are (IS)
pHTemperatureSodium hydroxide
239 to 250 g/t.5 to 7 g/t13 to 15 " C.
296 to319g/£.
273 to 296 g/t1 to 3 g/t13 to 15 *C.
354 to 538 g/t
Typical effluent parameter loadings for a water use
highly alkaline (>13,5).100 *C.270 to 480 g/kg cloth.
2.4.1 Mercerisin2 Equipment
The standard mercerising machines in a textile finishing plant are the chain, roller andyarn types.
The chain and roller machines are used for mercerising woven fabrics. Knitgoods aremercerised using the roller machine and are stretched in both directions before enteringthe mercerising field, in order to ensure maximum lustre.
In general, woven fabrics are mercerised after desizing and scouring and either beforeor after bleaching. White goods should be mercerised before final bleaching, sincethe hydrophilic properties and the degree of whiteness are usually impaired to someextent by mercerising.
CHAIN MERCERISING MACHINES consist of the impregnation section, the draw-off rollers, a stenter forweftwise tension and a rinsing, neutralising and after-rinsing section. These machines permit exact adjustmentand control of the tension in both warp and weft directions.
ROLLER MERCERISING MACHINES are equipped with a system of rollers, arranged in two rows, one abovethe other. The fabric is tensioned between the bottom and top rollers while passing through both the sodiumhydroxide treatment and the stabilizing sections. The fabric is then neutralised in an enclosed open-widthwashing section.
YARN MERCERISING MACHINES are either batchwise or continuous types. In batchwise mercerising theyarn is tensioned by sliding rollers and is immersed in or sprayed with the mercerising liquor. After a shortreaction time (1 to 3 min) the excess liquor is removed by squeezing. The yarn is then rinsed and neutralised.In continuous mercerisation the individual yarns, running parallel to one another, are impregnated with themercerising liquor, stretched, freed from sodium hydroxide, rinsed and finally neutralised.
2.5 BLEACHING TECHNOLOGY
Bleaching destroys the colouring matter of fibres and associated impurities. Oxidisingor reducing bleaches may be used in combination with wetting, softening and stabilizing

2-16
agents. Bleaching is often carried out by passing the cloth through a standing bowlcontaining the bleaching chemicals, after which the cloth is rotated on a beam for 2to 8 hours.
2.5.1 Textile Bleaching Methods
Bleaching of Cotton and its Blends
Cotton is generally bleached with oxidising chemicals including sodium hypochlorite, sodium chlorite andhydrogen peroxide.
The impurities contained in polyester/cotton blends are almost exclusively those from the cotton and suchblends are bleached as for cotton.
Bleaching is performed batchwise in winches, jets or by cold pad batch and continuously by padding followedby steaming or in a J-box system.
Bleaching with Sodium Hypochlorite
The chemical composition of a sodium hypochlorite solution changes with pH (Figure 2.9) (14) due to thereaction :
NaOCl* NaOH + HOC!
tio
n
o
ion
o
Con
e e
nt
FIGURE 2.9 :
0
0
•J
0
8
6
4
0
\ 2 /
\ /
\ /vy
2 4
COMPOSITION OF A ,VARIOUS
\ 1vX
A6 S '0
pH vc:ue
SOLUTION OF SODIUMpH VALUES (14)
\
2 '4
HYPOCHLORITE AT

2-17
The bleaching efficsencv of the s!ia"htiv dissociated hy^ochlorous acid ss based on sta degradation to active
oxygen and hydrochloric acid :
IIOCl^ HCI+ 0°
Cellulose fibre tendering is avoided during hypochlorite bleaching by careful control of bleaching conditions.
This includes buffering the bleach solution with alkali to prevent excessive release of oxygen and carrying out
the reaction below 25 * C.
Typical recipes for continuous sodium hypochlorite bleaching would include (18) :
Sodium hypochlorite 1,2 g/t-
Sodium hydroxide 0,4 g/t.
Oxidation stable
surfactant/wetting agent 0,5 g/c.
Liquor ratio 1 : 1.
Typical recipes of batch bleaching of cotton wool in pressurised vessels would include (15) ;
Sodium carbonate 1,1 %jt.
Sodium hypochlorite 2,1 %jL.
Liquor ratio 6 : 1.
Bleaching with Sodium Chlorite
The composition of aqueous solutions of sodium chlorite at different pH values is given in Figure 2.10 (14).
The bleaching agent is active oxygen formed from chlorous acid :
IIClO2
HCIO2^ HCl + 200
Bleaching with chlorite is carried out at elevated temperatures (90 * C) and at pH 3 to 4,5, where chlorous acid
is the predominant species. Buffers are added to the bleaching bath to maintain the pH above 3. Activators
such as anhydrides of organic compounds, are present to enable gradual lowering of the pH of the bleaching
bath.
Typical recipes for padding solutions used in continuous chlorite bleaching would include (14) :
Sodium chlorite (80 %) 30 to 40 g/£.
(lower for polyester/cotton blends).
Activator
Surfactant 2 to 3 g/l.
Initial pH 6 (adjusted with formic acid).
Liquor ratio 0,7 : 1 to 1 : 1.
Reaction time 45 min-
Reaction temperature 90 ' C.
Typical recipes for winch batch chlorite bleaching would include :
Sodium chlorite (80 %) 4 to 5 g/£.
Wetting agent and stabiliser 2 to 3 g/t-
Sodium nitrate 2 to 3 g/c.
(for corrosion prevention).
pH 3,5 (adjusted with formic acid).
Liquor ratio 5 : 1.
Batching temperature 80 to 95 ' C.
Batching time 2 to 4 h.

2-18
1,0
o
ccoo
0 , 5 -
HCI02 ClOo
HCIO
0
FIGURE 2.10 : COMPOSITION OF A SODIUM CHLORITE SOLUTION AT VARIOUSpH VALUES (14)
Bleaching with Hydrogen Peroxide
This is the most common bleaching agent used since it may be used in all types of bleaching systems (winch,cold pad batch bleaching and high-temperature shock bleaching).
Hydrogen peroxide is a weak acid and in alkaline solution the hydrogen peroxide anions are the source of activeoxygen for bleaching :
- » / / 2 o + n o 2
H0~z-* OH' * 0°
Stabilisers are added in order to control the bleaching process.
During cold pad batch bleaching the goods are padded, batched, wrapped in plastic sheets and rotated at roomtemperature for a period of time. Typical recipes for the cold pad batch padding solution would include (IS):
Sodium hydroxide 11 g/l.
Sodium silicate stabiliserAdditional stabiliserDetergent /sequestrant
21 ill.6g/£.

2-19
Hydrogeii (jtrOXide 50 /cj 30 nit/ t.
Surfactant 4 g/t.Liquor ratio 1 : 1.
Winch, or long liquor bleaching is a high-temperature (85 to 95 ' C) batch process with typical recipes for thebleaching bath including (15) :
Sodium hydroxide 1 to 2 g/t.Stabiliser 1 to 2 g/t.Hydrogen peroxide (35 %) 3 to 6 mljl.Surfactant 1 g/t.Liquor ratio 5 : 1.Batching time 3 h.
Continuous bleaching in J-box or pressure chamber units is carried out using padding solutions with typicalrecipes including (18) :
Sodium hydroxide 2 to 3 g/t.Sodium silicate stabiliser 4 to 6 g/t.Additional stabiliser 4 to 6 gjt.Detergent/surfactant 2 to 3 g/t.Hydrogen peroxide (35 %) 20 to 40 ml/LLiquor ratio 0,7 : 1 to 1 : 1.
2.6 SINGLE-STAGE DESIZING. SCOURING AND BLEACHING
The one-step oxidative desizing, scouring and bleaching has the advantage of reducingthe number of textile padding and washing processes. The cost of the chemicals,however, is greater than in the conventional route.
Typical recipes for the padding solution for continuous processing would include (15) :
Sodium hydroxide 9,8 g/t.Sodium silicate 15 g/t.Hydrogen peroxide 25 mg/t.Potassium persulphate 1,5 g/t.Scouring/wetting agent 6 g/t.Sequestrant/organic peroxideStabilizer 2 g/t.Liquor ratio 1 : 1.
The characteristics of the effluent for a water use of 5 £/kg cloth and a wet pick-up of 50 % would be (15) :
pH alkaline (11,0).Sodium hydroxide 5 g/kg cloth.Total solids 184 g/kg cloth.Temperature 100 ' C.
2.7 EFFLUENTS FROM WET PROCESSING : SCOURING. MERCERISING
AND BLEACHING
In the pretreatment processes under consideration the wash-off generally constitutesthe effluent. In general the chemical composition of effluents from a particularoperation on a specific material will vary from plant to plant. The concentration ofthe effluents will show the greatest variance and will be determined by the :
(i) impurity level on the raw fibre before wet processing,

2-20
(ii) use of batch or continuous systems,
(iii) type and configuration of the wash ranges,
(iv) chemical concentration in the batch or padding solution,
(v) efficiency of the washer,
(vi) liquor ratio and the wash-water flow rate.
2.7.1 Effluent Loads
The relative pollution load of the singeing, desizing, scouring, bleaching and mercerisingeffluents of a particular mill processing cotton and polyester blends is given in Table2.4 (16).
TABLE 2.4RELATIVE POLLUTION LOAD - SINGEING, DESIZING, SCOURING,
BLEACHING AND MERCERISING (16)
Process
SingeingDesizingScouringBleachingMercerising wash 1Mercerising wash 2
Total load (g/kg cloth)
Concentration (mg/^)
Effluentvolume %
2,133,922,222,20,8
19,8
CODmass %
8,257,025,6
5,90,13,2
130
10,4
TSmass %
5,744,036,87,20,45,9
186
14,3
OAmass %
7,047,925,813,30,15,9
21
1,6
TCmass %
6,461,626,63,30,12,0
55
4,4
At this mill, the scouring effluent contributed over 25 % of the COD and over 36 %of the TS loading of the wet preparation section. On a mill basis, both the COD andTS constituted 10 % of the total factory effluent loading.
The bleaching and mercerising effluent volumes were comparable to that of the scouringeffluent. However, the contribution of these effluents to the COD and the TS of theeffluent from the wet preparation section was relatively low (3 to 7 %).
2.7.2 Effluent Characteristics
As a guide to the range of characteristics of the effluents under consideration fromthe wet processing of cotton, polyester/cotton and polyester, Table 2.5 gives theapproximate effluent concentrations and pollution loads.
The data in the table have been extracted from various surveys (15-18) and can alsobe used to predict the effluent characteristics of a process, or a series of processes.

TABLE 2.5
POLLUTION LOADS AND EFFLUENT CONCENTRATIONS FOR VARIOUS WET PREPARATION OPERATIONS (15-18)
Processandf ibre
Type
Scouring:
cotton(high grade)
cotton(low grade)cottoncottonpolycottonpolycottonpoLycottonpolycottonpolycottonpolycottonpolycottonpolyester
f i bre
f i brewovenwovenwovenwovenwovenwovenwovenk n i tknitwoven
ProductionCD
boil-off (b)kier-boil Cb)
boil-off (b)kier-boil 1 (b)kier-boil 2 Cb)caravan (c)J-box (c)openwidth 1 (c)openwidth 2 (c)openwidth 3 (c)1 (b)2 <b)Cb)
Effluent
I/kg
2017
203018
3 ,82,33 ,17,32,5422121
Oxidative desizinq, scourinq and bleaching:
polycotton woven
Mercerising:
polycottonpolycotton
wovenwoven
CO
Cc)Cc)
Notes: (1) (b) denotes batch.
(c) denotes continuous.
1-4 denotes mill examples.
5
2,93,7
PH
11-1210-13
12-1310-139-1213,5
1313,5
1310-128-10
910
11
Cond.
mS/m
1 7001 500
1 300100-3 400
7 400
8 200
100100
900
TS
g/kg g / i
20672194
93
59282713
7451
30
240 ,72,71,3
184 37
183
Na
9/kg 9/1
4533
59532265
34
51.31,9
2,31,9
2 ,91,81,117
11
0,130,10,2
2 0,4
138
Ca
g/kg
0,8
0,3
0,1
0,20,1
0
g/L
0,03
0,08
0,03
0,020,01
0
Mg
g/kg g / i
0 ,6
0,08
0
0,20
0,02
0,02
0
0,020
0 0
NaOH
g/kg
4845
8445
99185941
5
166240
g / i
TOC
g/kg 9/1
2,42,7
4 ,21,5
269196
4124
68362638
12
1341011
2,11,4
3,41,21,510
4
5,30,11,1
1
1 55 11
58
COD
g/kg g / i
6812.2
31
304
3,332
10
120,1
213 43
(Table 2.5 continued on next Page)

TABLE 2.5 (conL)
Processandfibre
Bleaching:
cottonChigh grade)cotton(low grade)cottoncottoncottoncottonpolycottonpolycottonpolyester
Notes: (1) (b)
(0M
Type
wool
wool
wovenwovenwovenknitwovenknitknit
Production(1)
1 Cb)2 Cb)3 Cb)4 Cb)
Cb)Cb)cold pad (c)
Cb)openwtdth (c)Cb)Cb)
denotes halch.
denotes continuous.
denotes mill examples.
Effluent
I/kg
5929592915155222,51538
pH
7-87-107-84-107-9
1098-9
10-119
Cond.
mS/m
9030090300
100
TS
g/kg g/i
8S1062122228
0,60,52,13,14,61.50,7
Na
g/kg
9199200,61.51,65
31.4
9/1
Ca
g/kg 9/1
Mg
g/kg g/i
0,160,60,160,70,40,10,30,2
0,20,04
0,1 0,02 0,03 0,01
NaOH
g/kg
0000
0,1
5/1
0000
0,03
TOC
g/kg 9/1
26260,90,93161,7655
0,040,20,040,20,080,060,61
0,60,41.4
COO
g/kg
1,14,51330713124
9/1
0,070,32,71,72,80,93,2
KJ

3-1
3 REVIEW OF EFFLUENT TREATMENT TECHNIQUES FOR
SCOURING, BLEACHING AND MERCERISING EFFLUENTS
3.1 INTRODUCTION
Individual textile mills tend to concentrate on one method of textile manufacture (e.g.knitting or weaving) and on the processing of one fibre or its blends e.g. cotton, woolor nylon or combinations such as polyester/viscose and polyester/cotton.
The effluent composition from a mill is a function of the major fibre utilised by themill since the techniques employed during the processing of any particular fibre areuniversal.
The textile effluents under consideration differ in characteristics from acid to stronglyalkaline depending on the textile process and on the fibre being prepared since :
(i) scouring effluents are usually alkaline and high in inorganic salts due to the
alkali used,
(ii) bleaching effluents can be acid or alkaline,
(iii) mercerising effluents are always alkaline due to the nature of the process.
For the effluents under consideration, the primary and secondary treatment methodsof screening, filtering, sedimentation, flotation and biological treatment are not generallyapplicable. In addition, the normal tertiary and advanced treatments of coagulation,multi-media filtration, activated carbon adsorption and ozonation, are not suitable.For the treatment of these effluents it is necessary to apply chemical and physicaltreatment methods, which might include the demineralisation techniques of ionexchange, conventional membrane and electromembrane processing, freezing orevaporation.
The various methods which have been proposed for the treatment of scouring, bleachingand mercerising effluents are given below.
3.2 SOLVENT SCOURING AND BLEACHING
In solvent processing, water is replaced by a solvent which is recovered by distillation.Substitution of solvent treatment systems for the scouring and bleaching of cottonproducts reduces water pollution. However, any unrecovered solvent presents a greaterdisposal problem than a waste-water stream. In addition, air pollution during solventrecovery and product drying can be high.
3.3 EFFLUENT NEUTRALISATION
The removal of excess acidity or alkalinity is often necessary before either dischargeof an effluent or further treatment. Acidic effluents are generally neutralised withan alkali, while sulphuric acid is generally used to neutralise alkaline effluents.Carbonation, using waste combustion products from boilers is a cheaper and feasible

3-2
method of neutralising alkaline streams prior to discharge (9,21). In addition, thesensible admixture of effluents of an acidic or alkaline nature within a factory willassist in neutralisation of the final effluent, although there is usually an excess of alkaliin plants treating cellulosic fibres (22).
3.4 SEGREGATION OF EFFLUENT STREAMS
Concentrated effluent streams or waste streams containing hazardous chemicals may beisolated from the main effluent discharge and confined for separate treatment or partialpurification. It is beneficial to segregate hazardous or concentrated effluents anddispose of them separately. Balancing tanks may be installed to even out the pollutionload.
3.5 BIOLOGICAL TREATMENT
Because textile wastes are carbonaceous they lend themselves to bacteriologicaldecomposition as a method of treatment if the pH is not too high or low and ifappropriate nutrients are present (23). The application of biological processes for thetreatment of textile waste waters in conjunction with domestic effluent has been reportedextensively (9,24-30). The extended aeration activated sludge process has consistentlydemonstrated its value as the best form of biological treatment (31,32). Biologicaltreatment plants do not generally diminish the concentration of the alkaline textileeffluents since the hydroxide alkalinity inhibits the biological process and hence theCOD reduction.
It is possible to treat admixtures of textile effluents and domestic sewage by the activatedsludge process. In the case of kier type liquors, fortified with ammonium phosphates,a reduction of 95 % in BOD (33) has been achieved.
It is possible to neutralise the alkaline effluents and biologically treat them in admixturewith other bleaching and dyeing wastes (9). However, only small volume ratios maybe employed due to interference of fatty matter and inorganic salts in the biologicalprocess.
It is possible to partially treat scouring and kiering liquors in percolating filters inadmixture with dyehouse waste (9). Pilot plant results on combined kiering liquorand dyehouse wastes gave a proportional BOD removal of 8 to 48 % of the initialloading. BOD removals of 24 to 92 % were obtained on dyehouse wastes.
3.6 EVAPORATION
Mercerising effluent is normally treated by filtration and/or centrifugation to removesuspended matter, followed by evaporation to produce a concentrate suitable for reusein the mercerising process (34,35).
Multi-stage circulation evaporators are commonly used (36) and are operated underpartial vacuum and with heating in the first stage. Heat is recovered from thecondensate. Since recovery of pollutants by evaporative techniques is more cost

effective when the pollutants are present at a high concentration, multi-stagecounter-current rinsing ranges are used to produce concentrated sodium hydroxideevaporator feed. The concentrated evaporator product may be purified by filtrationor centrifugation.
Scouring effluents are generally considered too contaminated with extracted impuritiesto enable addition to the mercerising effluent for recovery by evaporation (10).
The fundamental obstacle limiting the use of evaporation is energy consumption.Practical limitations include heat transfer characteristics, crystal formation, salting,scaling, corrosion, entrainrnent and foaming.
3.7 FLOCCULATION
It is possible to pretreat scouring effluents by flocculation to reduce the pollution load.Acidification of scouring effluents to pH 2 to pH 7 generally flocculates large amountsof dispersed suspended material. This material is sticky and difficult to consolidateand separate. Sedimentation trials have proven unsatisfactory in concentrating thesolid matter (9).
3.8 FLOTATION
In flotation methods gas bubbles carry the dispersed impurities to the surface of theliquid. The foam so formed is removed mechanically. The gas bubbles may begenerated (36) :
(i) mechanically by air nozzles and turbines,(ii) electrolytically,(iii) chemically from gas-forming chemicals.
The one-stage chemical flotation method developed by the Textilverein Vorarlberg andthe Institut FurTextilchemie und Textilphysik in Dornbirn. Austria, is used for purifyingconcentrated sodium hydroxide effluents under oxidising conditions with the removalof lint, dispersed matter, dyes, fatty and waxy constituents, sizes, surfactants, dissolvedimpurities and natural dyes (36).
The operation of a pilot plant (37) demonstrated that bleaching effluent could be reusedafter coagulation, flocculation and air-flotation. Aluminium sulphate, sulphuric acidand polyelectrolytes were used and there was a 41 % reduction in the suspended solidsconcentration, from 85 to 50 mg/t, and a reduction in the COD, from 3 684 to1 934 mg/L
The treated effluent was of suitable quality for reuse in the last washing stage in
mercerising, where hot water, usually acidified with acetic acid, was used.
3.9 MEMBRANE SEPARATION
Membrane separation methods include microfiltration, ultrafiltration and reverseosmosis. These processes are pressure-driven processes capable of separating solutioncomponents on the basis of molecular size and shape, and involve neither a phase change
3-4
nor interphase mass transport. Being highly cost effective, these techniques are widelyused in the textile industry (38-43). A combination of ultrafiltration and reverseosmosis to purify and concentrate caustic effluents in the textile industry has beenproposed (36). The membranes have the desired separation properties but the principlecannot be put into practice at present due to the instability of the membranes to sodiumhydroxide and various mercerising auxiliaries.
Electrodialysis (ED) has been applied as a concentrator in the treatment of mercerisingeffluents to produce a pure sodium hydroxide solution for reuse. However, the processis far more complicated than evaporation. In a full-scale installation, use of ED forthe recovery of a 9 to 10 % sodium hydroxide solution, free of organic impurities hasbeen found feasible and has resulted in a recovery of 200 t/a of sodium hydroxide(44).
3.10 CAUSTICISING
Causticising is used in the pulp and paper industry as a means of recovering pulpingchemicals for reuse in the preparation of new pulping liquor (45). The waste liquorcontains the chemicals in a dilute solution which has to be concentrated by evaporationprior to the regeneration process. The organics in the liquor are burnt for heatgeneration, leaving a sodium salt or a mixture of sodium salts, depenviv... on the pulpingprocess. If one of the salts formed is sodium carbonate (e.g. in the kraft process)causticising is achieved using calcium oxide to convert the sodium salt to sodiumhydroxide for reuse. Calcium carbonate is converted to calcium oxide in a kiln.Causticising could be applied to the treatment of selected textile effluents which aresufficiently concentrated with respect to both sodium and organics.
3.11 THERMAL OXIDATION
Wet air oxidation is a process in which aqueous wastes can be oxidised in the liquidphase using a combination of elevated temperature and pressure. The system has beencommercialised by Zimpro Inc. (USA) (46-50). It is claimed that wastes are burnedin the presence of water equally as completely as in the usual method of first evaporatingthe water and then incinerating the dried residue.
The Zimpro process has been applied principally in the pulp and paper industry butit has the potential for treating organic contaminated alkaline liquors from manyindustries.
3.12 ELECTRO-OSMOSIS
A process was proposed during the early 1920s (51) which was aimed at recoveringsodium hydroxide from kier liquors by a combination of electrolysis and electro-osmosis.The liquid was placed inside a porous pot with a suitable electrode, which was madethe anode, and the porous pot was surrounded by a vessel containing water and a nickel

3-5
gauze cathode. Lead was found to be the most suitable anode material. Approximately50 % of the total sodium present in the effluent could be recovered as sodium hydroxideand the liberated organic acids were readily sedimented.
The tests were carried out at bench scale but it was proposed that this process wouldbe "successful in dealing with large volumes and would be more economical than theestablished process of evaporation to dryr.ess, ignition and lixiviation".

4-1
4 WATER AND EFFLUENT MANAGEMENT PROGRAMMES
4.1 INTRODUCTION
The implementation of an effluent management system at a textile factory involves thedevelopment of various options which will minimize water consumption and meet therequired pollution abatement. Production related modifications are essential in reducingthe contamination and the flow of waste streams in order that subsequent effluenttreatment and chemical recovery operations may be reduced in size.
An overall strategy for the implementation of an effluent management system wouldtherefore involve several phases :
(i) a water, chemical and effluent survey (Section 4.2),(ii) in-plant control measures (Section 4.3),(iii) selection of treatment processes (Section 4.4),(iv) design and installation of treatment equipment,
(v) continual reassessment of an effluent treatment programme.
All the phases are important. The development of an optimal effluent treatmentsequence is possible only if due consideration is given to the first two phases.
This chapter outlines the principles of water and effluent management and theirimportance in the planning and implementation of an effluent management system.
4.2 WATER. CHEMICAL AND EFFLUENT SURVEY
The aim of a water, chemical and effluent survey is to understand fully the characteristicsand variability of the overall factory effluent and the wet processing streams thatproduce this effluent. This is undertaken by developing detailed water, chemical andenergy balances.
Information gathered in a water, chemical and effluent survey may be compared topublished literature. Various references (10,24,25,45) are helpful in this respect. Inaddition information on machine water, energy and chemical use is available fromtextile machinery and chemical suppliers.
4.2.1 Water Balance
An overall water balance and a process water flow sheet may be established afterdetermining the following parameters :
(i) the overall water consumption of the factory, usually from flow meters onthe mains water supply,
(ii) the quality of the mains water and the pretreatment procedures required topurify this water to a level suitable for use in processing,
(iii) the process water distribution and the water consumption in each section ofthe factory,

4-2
(iv) a detailed plan of the water, steam and waste-water distribution pipelines anddrains. Process, storm and sanitary water sources should be included, togetherwith their point of discharge;
(v) the effluent flow.
Many flow measurement devices are available (24.52,53). The accuracy of the metersmust be assessed and if necessary the meters should be recalibrated. Reported flowsshould be related to production and expressed in both m3/h or m3/d as well as in I/kgor t/m of cloth.
An example of the method for summarising the data is illustrated in Figure 4.1 (54).
Wains
Evapc •::; '"
. . — • • i
Bleach rcnge
Continuous range
Dyehouse
Chemical room
•
p
Sanitation
• da :cn'ng
Other, e.g. generalwashing, boilerblow — dov.n, etc
l /kg C cth processed
Min A,;e \'c •
FIGURE 4.1 : EXAMPLE OF A WATER SURVEY SUMMARY
Steam use, both direct and indirect, for each factory process should be determined ina similar manner with particular regard to condensate return.

4-3
Example 1 : Water Balance Spreadsheet
A textile mill waa supplied with water from the local municipality and from a borehole. In addition, steamwas purchased from a neighbouring factory.
A spreadsheet was developed to enable water consumption and effluent volumes at this textile mill to be computedon a weekly basis and summarised as illustrated in Tables 4.1 and 4.2.
Stream
Town supplyBoreholeSteam (water equiv.)Total water in
Measured effluentCalc. steam equiv.Total effluent
"SizingSingeingDesizingScouringMercerisingRelaxingGollerPad steamingJiggerPrinting#Yarn dyeing
#Jet dyeing#Winch dyeing#Boiler"Stenter effluent"Air conditioning"Cooling towers"Chemical lab.Ion exchange regeneration"EvaporationSewerMiscellaneous
Total
EXAMPLE
Volumem3
16 270596
3 73420 600
17 5790
17 579
252235439851954
58567
1 59319
1 529371
96900
320979979168672875
1 6807 090
20 600
# Denotes calculated value based on water* Denotes calculated guess.
TABLE 4.1
- PROCESS WATERWeek
% Rawwater
85,3
1,21,12,14,14,60,32,87,70,17,41,8
4,7001,64,84,80,83,34,38,2
34,4
100,0
ending
%effluent
01,32,54,85,40,33,29,10,18,72,1
5,5001,8--
1,0---
45,9
meter and cloth data.
BALANCE
Consumptionl/m
0,501,72,16,32,07,16,18,9
18,0
8,10
70,7
Comments
Expressed as £/m(i.e. kg yarn/4)
No water meter
TABLE 4.2EXAMPLE - EFFLUENT ANALYSIS
Week ending
CODOATDSNaSS
mg/£
3 998136
7 0610
1807
kg/h
41814
7390
189

4-4
The factory had made a concerted effort to install flow meters on steam, water and waste-water lines where
possible. Where flow measurements were not available, estimates were made.
The water balance indicated that a certain amount of water was unaccountable and classified as "miscellaneous".
Various measures were taken to account for this loss. The water balance indicated areas for investigation. In
particular the discrepancies were the
(i) estimated water consumption at the factory, calculated as the summation of the water consumption
in each section and the actual factory water intake. Between 10 and 30 % of the actual water
intake was classified as "miscellaneous".
(ii) sum of the individual effluent volumes which did not equal the combined factory effluent volume.
The water balance spreadsheets provided weekly information on the distribution of the water within the factory
and provided a means for pin-pointing excess water consumption and effluent discharge levels (Table 4.3).
EXAMPLE - CONTRIBUTION
Water
Type(l)
SS
sssssHscHHHSIIS
s
s
Note' (1)
Process
SingeingDesizingScouringMercerisingRelaxingGoller washing <fc soapingPad steamingPrintingYarn dyeingT - • J . . ~ : .
Cooling towersAir conditioningChemical kitchenBoilingSewageMiscellaneousSoftener regenerationEvaporationStenters
Total
S — softened water.
H = unsoftened water.
TABLE 4.3OF PROCESS STREAMS
EFFLUENT
Wat IT
m3.a
5 200IS 40034 30046 600
3 20058 80096 000
107 80073 50033 20048 00048 000
8 20014 40082 300
147 onn8 200
42 00015 700
£97 "00
Effluent
i n ' / a
2 50018 00034 00045 000
3 00059 00096 000
108 00074 00033 000
S 000
147 000
16 000
050 000
TO FAC
Temp
C
1001001001008060602060e n
202020202020202020
roRv w
% Total
water
0,62,13,85,20,46,6
10,712,0
8,24,45^35,40,91,69,2
lf\4o'.'J4,81,8
ATER AND
% Total
effluent
0,42,85,26,90,50,1
14,816,611,4
6,0001,200
22,600
2,5
Example 2 : Monitoring Individual Process Water Consumption
In addition to the overall water balance, the water consumption at two of the major wet processing machines
- the Goller washer and the pad steamer was carefully monitored. A target water consumption was set and
the actual water consumption was carefully monitored and compared with the target consumption. Where the
actual consumption exceeded the target consumption, the excess cost was calculated. Star ratings were also
employed to indicate an exceptionally high water consumption. Examples of the water consumption for the
two machines are illustrated in Tables 4.4 and 4.5.
Example 3 Consumption
Examination of the process water balance tables of the above factory, indicated that a considerable amount of
water was being discharged with the effluent which was not recorded as process water. This prompted an
investigation into the amount of steam condensate discharged from the boiler house.

4-5
EXAMPLE - GOLLER
Process
Vat printingDispersed/Reactive dyeingDispersed/Reactive printingReactive dyeingReactive printingPigment printingLoom statBleachingColoured woven
% Totallength
58,50
0
12,04,7
3,8
4,0
17,10
WASHTABLE 4.4
AND SOAP, SUMMARYCONSUMPTIONW
% Totalvolume
63,60
0
19,33,0
2,6
1,2
10,40
eek ending
% Totaltime
81,50
0
8,3
3,2
2,7
1,9
7,9
0
Flowm3/h
2,0
0
0
5,9
2,4
2,4
1,6
3,4
0
Consumptiont/m
1.7
0
0
2,5
1,0
1,0
0,4
0,9
0
OF DAILY WATER
Target
t/m
6,0
5,0
5,0
5,0
5,0
4,0
1,0
1,4
1,4
Starrate
Excesscost
0
0
0
0
0
0
0
0
0
Targetcost
993,90
0
121,047,120,713,580,5
0
EXAMPLE - PAD
Process
TerindosolDisp/vatVat
DyeingAzoicsReactives
% Totalwater
0
21,542,3
8,8
10,716,7
% Totalcloth
0
25,134,3
0,8
16,723,1
STEAM.
% Totaltime
0
6,2
8,5
0,2
4,1
5,7
TABLE 4.5SUMMARY OF DAILY WATER RECORDSWeek ending
Flowm3/h
0
26,838,7
323,420,022,8
Consumptiont/m
0
7,5
10,8
90,25,6
6,4
Target
£/m
3,0
3,5
6,2
6,2
6,0
5,0
Star rate
• * • • *
- • m
-
Excesscost R
0
65,9103,3
47,40
33,4
Targetcost R
0
58,3141,2
110,1126,3
Records for a particular month indicated that the condensate tanks were emptied on 303 occasions releasing18 m^ each time. In addition to this, a 50 mm drain line was permanently open.
The flow of discharged condensate was estimated at 9,8 m^/h, the value of which was calculated to be in excessof R60 000/a (1986) based on 270 working days.
Analysis of this condensate indicated that its quality compared favourably with that of factory soft water andits reuse, after filtering to remove rust particles, was recommended. In addition to water and energy savings,the reuse of condensate would enable additional savings in ion-exchange resin regeneration.
4.2.2 Chemical and Effluent Balance
The raw materials into a textile finishing mill are fabric, water, energy and chemicals.The products are :
(i) modified fabric,(ii) effluent,(iii) waste heat,(iv) exhausted chemicals,(v) fabric impurities.

4-6
l he effluent characteristics may be determined in one of two ways :
(i) by the analysis of samples of the effluent.
(ii) from the consumption of chemicals and their expected exhaustion in relationto the water flow.
A material balance over a wet process should include calculations of the effluentconcentration and the effluent loading in mass of pollutant per mass of fabric produced.
In the development of an effluent management strategy consideration should also begiven to the :
(i) discharge regulations and possible amendments,fii) effluent discharge costing formulae,(iii) cost of steam, water pretreatment and alternative water supplies,(iv) factory expansion plans,(v) processfes) type.
Sodium hydroxide is the major bulk chemical consumed by the textile industry andsubstantial amounts of this chemical are discharged with the effluent. Approximately6 000 t/a {2 % of the total market) of sodium hydroxide was consumed by the SouthAfrican textile industry during 1987 155). The efficient utilisation of sodium hydroxideresults in a reduced raw material cost and a reduced pollution load from a textile mill.Typical data required to determine the efficiency of sodium hydroxide utilisationincludes :
(i) sodium hydroxide purchases and transfers,
(ii) cloth production by individual processes,
(iii) variation in the specific sodium hydroxide consumption by individualprocesses,
(iv) theoretical specific sodium hydroxide consumption,
(v) mass of recycled sodium hydroxide,
(vi) potential mass of sodium hydroxide which could be recycled.
The following examples illustrate how sodium hydroxide balances over both individualprocesses and the whole factory can lead to substantial savings in chemical consumptionand reductions in effluent loading.
Example 4 : Overall Sodium Hydroxide Reticulation Survey
A survey of all the sodium hydroxide consuming processes was conducted at a textile mill processing wovencotton and polyester/cotton blends. The aim was to take a holistic approach to the sodium hydroxideconsumption as opposed to an approach where individual streams were considered in isolation.
The factory personnel had been routinely gathering and logging the following information :
(i) the amount of sodium hydroxide purchased - duplicate records existed, those at the delivery siteand those at stores,
(ii) the amount of sodium hydroxide recovered for reuse after evaporation of the mercerising effluent,

4-7
(iii) the hour and water meter readings on various machines,
(iv) the chemical consumption at each machine,
(v) the recipes used for the batch make-up and the volume of each batch,
(vi) the hour meter readings on the various pumps used for conveying the mercerising effluent and the
scouring effluent to the solar evaporation dams and the combined effluent from the other processes,
(vii) flow meter readings on some effluent pipelines,
(viii) the concentrations of various effluent and waste water streams,
(ix) cloth production data.
In addition wet pick-up data was available for various machines.
Collation and manipulation of the raw processing data, collected over a six-month period, enabled theestablishment of a sodium hydroxide balance across the entire factory, which is illustrated in Figure 4.2.
Purchosed NoOH146 g / t g cloth
kg
96 g/kgiloti
Recovered NQQH417 g/kg <lolh
EMIuenl dsthargsd lo
(500 mg/l)
•Effluent discticrged 1o. doms (20 g/ l NoOH)
5 % loss from s/slt(50 g/ l NcOH)
Note: The width of the streams are proportional to the sodium hydroxidemass flow
FIGURE 4.2 : SODIUM HYDROXIDE BALANCE AT THE FACTORY
The areas of sodium hydroxide loss were established and are summarised in Figure 4.3. Of the net sodiumhydroxide entering the factory (purchases), 17 % was discharged to the main effluent, 41 % was pumped to thesolar evaporation dams and 5 % was lost at the evaporator. The remaining 37 % of the purchases (54 g/kg cloth)was lost from the reticulation system between mercerising and evaporation. At the cost of sodium hydroxidedelivered to the factory (R800/t 100 % NaOH) this translated to a loss of almost R300 000 per annum (1986).

4-8
Note:
P ^ r - l o s e s
( ' 46 g /Kg c ioth)
e f ; l u e r l \?:5 o / k q c loth)
41 (50 a. I-'-, c loth^
The width of the streams are proportional to the sodium hydroxidemass flow
FIGURE 4.3 SODIUM HYDROXIDE LOSSES
~ _ J ~ i. „ L I _
(i) elimination of the major sodium hydroxide losses - investigations indicated faulty valves and
drainage systems in the merceriser-evaporator reticulation loop,
(ii) optimisation of the recovery and reuse of sodium hydroxide by the scheduling of all streams,
(iii) control of sodium hydroxide consumption to reduce processing variables and to achieve maximumconsistency in cloth quality,
(iv) use of a sodium hydroxide balance spreadsheet which would enable management to assess the sodiumhydroxide situation within the factory at any given time.
A similar survey was conducted the following year to reassess the situation (IS). The results indicated thatunaccounted losses had been decreased but that the specific sodium hydroxide consumption had increased from76 to 93 g/linear m. Consumption had increased by 23 % in the year but the recovery capacity of the evaporatorhad remained constant.
The inability of the evaporator to meet the demand required of it in terms of evaporative capacity resulted in31 % of the mercerising effluent (an average of 17 t/week of NaOH) by-passing the evaporator. At a replacementvalue of R800/t 100 % NaOH this translated to a loss of R675 000/a (1987).
In addition, due to environmental pressures relating to the use of the solar evaporation dams, the factorymanagement was planning the implementation of a treatment system for the recovery of sodium hydroxide fromscouring effluent. It was envisaged that this would make the continual use of the dams unnecessary. Thesurvey, however, indicated that 65 % of the sodium hydroxide loading in the dam influent was due to thedischarge of mercerising effluent. Hence, management was forced to reconsider its objectives, the solution ofthe mercerising effluent-evaporator system became the primary concern.
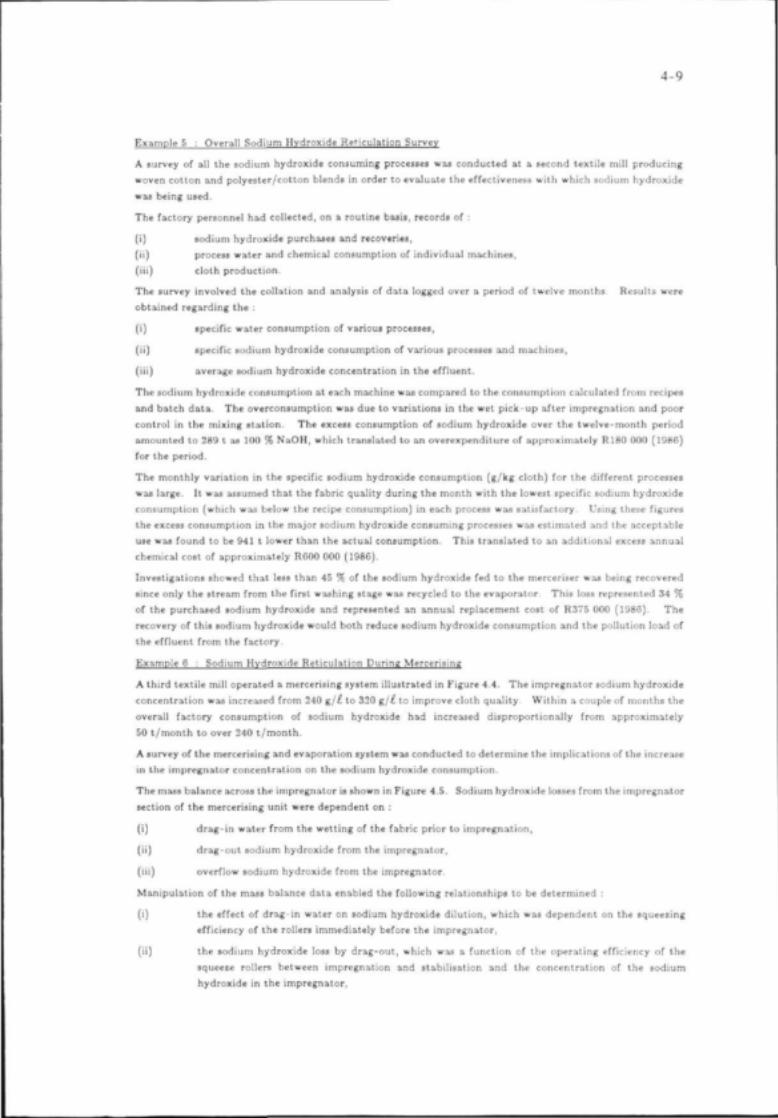
4-9
Example 5 : Overall Sodium Hydroxide Reticulation Survey
A survey of all the sodium hydroxide consuming processes was conducted at a second textile mill producingwoven cotton and polyester/cotton blends in order to evaluate the effectiveness with which sodium hydroxidewas being used.
The factory personnel had collected, on a routine basis, records of :
(i) sodium hydroxide purchases and recoveries,(ii) process water and chemical consumption of individual machines,(iii) cloth production.
The survey involved the collation and analysis of data logged over a period of twelve months. Results wereobtained regarding the :
(i) specific water consumption of various processes,
(ii) specific sodium hydroxide consumption of various processes and machines,
(iii) average sodium hydroxide concentration in the effluent.
The sodium hydroxide consumption at each machine was compared to the consumption calculated from recipesand batch data. The overconsumption was due to variations in the wet pick-up after impregnation and poorcontrol in the mixing station. The excess consumption of sodium hydroxide over the twelve-month periodamounted to 289 t as 100 % NaOH, which translated to an overexpenditure of approximately R180 000 (1986)for the period.
The monthly variation in the specific sodium hydroxide consumption (g/kg cloth) for the different processeswas large. It was assumed that the fabric quality during the month with the lowest specific sodium hydroxideconsumption (which was below the recipe consumption) in each process was satisfactory. Using these figuresthe excess consumption in the major sodium hydroxide consuming processes was estimated and the acceptableuse was found to be 941 t lower than the actual consumption. This translated to an additional excess annualchemical cost of approximately RGOO 000 (1986).
Investigations showed that less than 45 % of the sodium hydroxide fed to the merceriser was being recoveredsince only the stream from the first washing stage was recycled to the evaporator. This loss represented 34 %of the purchased sodium hydroxide and represented an annual replacement cost of R375 000 (1986). Therecovery of this sodium hydroxide would both reduce sodium hydroxide consumption and the pollution load ofthe effluent from the factory.
Example 6 : Sodium Hydroxide Reticulation During Mercerising
A third textile mill operated a mercerising system illustrated in Figure 4.4. The impregnator sodium hydroxideconcentration was increased from 240 g/l to 320 gjl to improve cloth quality. Within a couple of months theoverall factory consumption of sodium hydroxide had increased disproportionally from approximately50 t/month to over 240 t/month.
A survey of the mercerising and evaporation system was conducted to determine the implications of the increasein the impregnator concentration on the sodium hydroxide consumption.
The mass balance across the impregnator is shown in Figure 4.5. Sodium hydroxide losses from the impregnatorsection of the mercerising unit were dependent on :
(i) drag-in water from the wetting of the fabric prior to impregnation,
(ii) drag-out sodium hydroxide from the impregnator,
(iii) overflow sodium hydroxide from the impregnator.
Manipulation of the mass balance data enabled the following relationships to be determined :
(i) the effect of drag-in water on sodium hydroxide dilution, which was dependent on the squeezingefficiency of the rollers immediately before the impregnator,
(ii) the sodium hydroxide loss by drag-out, which was a function of the operating efficiency of thesqueeze rollers between impregnation and stabilisation and the concentration of the sodiumhydroxide in the impregnator,

4-10
V. ™sh I" " 0
f
hocrc
Was' 5 ; * ;
12CC
und e" luer t t.o*
(;r,k. he;
FIGURE 4.4 : SCHEMATIC OF MERCERISING SYSTEM
(iii) the overflow loss from the impregnator, which was a function of mercerising concentration and feed
sodium hydroxide concentration (Figure 4.6),
(iv) the overflow loss as a function of the fraction and concentration of the recovered sodium hydroxide
in the feed sodium hydroxide. Figure 4.7 indicates the mass balance used for this case. Figure
4.8 illustrates this relationship at various mercerising concentrations.
The conclusions were as follows :
(i) The mercerising sodium hydroxide was diluted by drag-in water on the fabric. Increased expression
of the squeeze rollers between the padding impregnation sections would decrease the dilution of
mercerising sodium hydroxide. The overall effect would be a reduction in the amount of sodium
hydroxide make-up to the impregnator.
(ii) Sodium hydroxide loss from the impregnator by drag-out on the fabric was greatest at high
mercerising concentrations. At a wet pick-up of 0,59 kg solution/kg cloth, drag-out loss was :
141 g NaOH/kg cloth for mercerising at 240 g/£ NaOH or
188 g NaOH/kg cloth for mercerising at 320 g/£ NaOH.
(iii) Sodium hydroxide loss from the impregnator by overflow was strongly dependent on the feed sodium
hydroxide concentration (closely associated with the fraction and the concentration of the recovered
sodium hydroxide) and the mercerising concentration. At a fixed-feed sodium hydroxide
concentration of 400 g/t the overflow sodium hydroxide losses were •
176 g NaOH/kg cloth for mercerising at 240 g/l NaOH or
1 001 g NaOH/kg cloth for mercerising at 320 g/l NaOH-

4-11
0,
c
R Imc-reg-iatc
/ ' , = drag-in of water by fabric (g/kg cloth), typically 53 %.
/ ' ;= drag-out of sodium hydroxide by fabric (g/kg cloth), typically 59 %.
C, = concentration of feed sodium hydroxide (g/l).
C-= concentration of merceriser sodium hydroxide (%'l).
Q, = flow of feed sodium hydroxide U/kg cloth).
Q2= overflow from impregnator (£/kg cloth).
For water : Q I = p y - p { + Q ?
For sodium hydroxide : (?/- ' , = Q,,CV * P?C2
Substituting (1) into (2) and re-arranging gives :
CO
(2)
Q7= = sodium hydroxide ovor f lou (l/k[j c/olli)
= sodium hydroxide 01 PI [lou (g/kg cloth)
FIGURE 4.5 : MASS BALASCE ACROSS 1MPREGSATOR

4-12
1 ' JU\
FIGURE 4.6 : VARIATIOS OF OVERFLOW SODIUM HYDROXIDE LOSS WITHMERCERISIXG COSCESTRATIOX AT VARIOUS FEED SODIUM HYDROXIDE
COXCEXTRATIOXS (Cxi AXD WITH DRAG-IX WATER = 0.53 t K-A CLOTH
The lower the recovered sodium hydroxide concentration and the higher the fraction of it in theimpregnator feed, the greater was the sodium hydroxide loss by overflow as the impregnator wasmaintained at a constant sodium hydroxide concentration. It was thus important that the recoveredsodium hydroxide be evaporated to as high a concentration as possible.
The calculated monthly consumption of sodium hydroxide was :
108 t for mercerising at 240 g/0. NaOH or421 t for mercerising at 320 g/£ NaOH
These figures were calculated on the assumption that the feed sodium hydroxide concentration waa400 g/1, the monthly cloth production was 3G7 t and the drag-in and drag-out of the fabric was0,53 and 0,59 g/kg respectively.
The total flow of effluent from the first stabilising, caused by overflow from the impregnator tank,was calculated as :
2 652 kg solution/h (2 433 I) at 8,5 % for mercerising at 240 g/£ NaOH or3 911 kg solution/h (3 383 I) at 16,8 % for mercerising at 320 g/i NaOH.
Inspection of the evaporator performance indicated that the flow of condensate being produced was25 % that of design specifications.

4-13
The production of a 30 % NaOH concentrate from the evaporator was estimated to require a volume
reduction of :
1 754 £/h for a feed of 2 433 £/h at 8,5 % or1 504 t/h for a feed of 3 383 l/h at 16,9 %.
Thus at the operating capacity of the evaporator about half the sodium hydroxide consumed duringmercerising could be recovered. This implied a loss of :
113 kg NaOH/h for mercerising at 240 g/t NaOH or263 kg NaOH/h for mercerising at 320 gjt NaOH.
Kecovered dilutesodium hydroxide Cfrorr evcporotor
New sodiumhydroxide
/ ' , = drag-in of water by fabric (g/kg cloth) typically 0,53.
P?= drag-out of sodium hydroxide by fabric (g/kg cloth) typically 0,59.
Co= concentration of new sodium hydroxide {g/t), typically 45 to 50 %.
Cy= concentration of mercerising sodium hydroxide (g/£).
c:i= concentration of dilute recovered sodium hydroxide from evaporator (g/t).
Qt = flow of feed sodium hydroxide {t/kg cloth).
Q?= overflow sodium hydroxide from merceriser {t/kg cloth).
/• = fraction feed sodium hydroxide as recovered sodium hydroxide from evaporator.
For water '• Qi = P?.* Q2~ pi O )
For sodium hydroxide : C3/•"<?, + Co( 1 - F)Q , = Q2C2+ P2C2 (2 )
Substituting (1) into (2) and re-arranging gives :
= P2C2-C3FP2+C3FPi-C0(\ -F)P?+C0(\-F)Pl
FIGURE 4.7 : MASS BALANCE INCORPORATING FEED SODIUM HYDROXIDE
MIXING

4-14
y
,- , . - :..<j . .O
r- „ ^ ^ • «. . r _ -j _ „ _ • , ,_._ j _ ! -j - ' - + - - -j
NOTE. Drag-out = 0,53 kg/kg cloth
Recovered sodium hydroxide concentration = 200 g/£.
Purchased sodium hydroxide concentration — 450 g/1.
FIGURE 4.8 : VARIATIOS OF OVERFLOW SODIUM HYDROXIDE LOSS WITHFRACTIOS RECOVERED SODIUM HYDROXIDE IS MERCERISER FEED AT
VARIOUS MERCERISIXG COSCESTR 1TIOSS C«
At a fabric production rate of 720 kg/h this translated to a loss of :
59 t NaOH/month for mercerising at 240 g/£ or
144 t NaOH/month for mercerising at 320 gjt.
The consumption of sodium hydroxide was far higher at a mercerising concentration of 320 g/£
NaOH than at 240 g/£ NaOH. However, assuming fixed sodium hydroxide feed concentration? and
nip expressions, the effluent at 320 g/£ was about twice as concentrated as that at 240 g/£.
Thus if the evaporator was upgraded to treat all the flow from mercerising at either 240 gjt or
320 g/£ NaOH, sodium hydroxide loss would be reduced to drag-out from the final washing bowl
only. However, at the present operational capacity of the evaporator far greater sodium hydroxide
losses were occurring for mercerising at 320 g/£ NaOH than at 240 g/£ NaOH, due to the large
discharge to dram.
Subsequent inspection of the evaporator indicated the presence of a thick scale on the heat exchange
surfaces which was mainly composed of calcium salts of mineral and organic origin. Subsequent
removal of this scale and routine maintenance/cleaning improved and maintained the performance
of the evaporator at the required level.

4-15
Example 7 : Prediction of Effluent Loadings
A spinning and weaving mill processing cotton and polyester/cotton blends was proposing an expansion toinclude the operations of wet preparation, dyeing and finishing. A forecast of normalised fabric productionand resulting effluent is shown in Table 4.6.
Clearance from the local water authorities was required before effluent from the proposed operations could bedischarged to river.
The effluent load from the various textile operations was predicted using the following information :
(i) type of chemicals to be used,(ii) estimated COD loadings of chemicals to be used,(iii) quality of water source to be used,(iv) estimated chemical and water consumptions,(v) estimated chemical exhaustion,(vi) estimated wet pick-up,(vii) production plans,(viii) type of processing equipment to be installed,(ix) number and size of wash boxes to be employed,(x) previous survey results.
FORECAST OF FABRIC
Process
SizingWeavingSingeingDesizing/Scouring
BleachingMercerisingDyeing(Jigs & Jets)Printing(Rotary screen)
Note : + This figure
Processchemical
53 g/£NaOH
H2O2
300 %jl NaOHDisperse and
vat dyes
includes 6 t/kg cloth
TABLE 4.PRODUCTION
Normalised fabricprocessing
rate(kg/h)
1,00
1,000,430,50
0,47
for dye bath liquors
6
AND RESULTING EFFLUENT
Wash waterconsumption
(£/kg cloth)
12
12
5
31*
32
Estimated normalisedchemical loading in
effluent
(g/h)
Modified starch 33,3PVA 25,0Glycoride 6,3
Pigment 13,3
A water consumption of 30 t/kg cloth was predicted which was one third that of conventional cotton processingmills.
The predicted effluent composition is given in Table 4.7. The impact of this effluent on the quality of theriver into which it was to be discharged was calculated at minimum, average and maximum predicted riverflows. At minimum river flow (1 m^/s) the effluent volume would have constituted 0,24 % of the river flow

4-16
and the concentration of the TDS in the river water was predicted to increase by 28,3 rag/i. At maximum
river flow (66,8 m^/s) the effluent volume would have made an insignificant contribution to the river flow and
the increase in the TDS in the river water would be 0,4
In order that the predicted factory discharge comply with the industrial effluent discharge regulations,
particularly regarding COD and sodium, various pollution prevention measures were proposed :
(i) the installation of additional textile processing equipment was encouraged in preference to the
installation of effluent treatment options - an example sited was the use of additional drying
cylinders preceding the mercerising process in preference to an effluent recovery system,
(ii) the institution of a strict material control strategy was encouraged to minimise excessive use of
chemicals,
(iii) the factory was urged to install water metera to all major water using areas and to institute an
audit system,
(iv) the suitable design of the colour shop to minimise water and dyestuff waste.
In terms of effluent treatment options the following recommendations were made :
(i) In the case where a sodium hydroxide recovery system was preferred to the in-plant control options
in (ii) below, the advantages of an evaporator to recover sodium hydroxide for the merceriser were
emphasized. The advantages of evaporation included its usually favourable economics and the
favourable impact which treatment of mercerising effluent would have on the sodium loading of
the final factory discharge.
(ii) In the event of such an evaporator not being installed, an in-plant sodium hydroxide cascade system
was formulated in which mercerising effluent was to be used for scouring, bleaching and dyeing and
as an ion-exchange regenerant.
(iii) The effluent pipework should be such that the individual effluents could be segregated outside the
factory at a later date.
(iv) Processing chemical baths e.g. dyebath liquor, should be segregated from weaker effluents and
treated.
(v) Final effluent options for chemical and water recovery and reuse from scouring, bleaching, dyeing
and printing effluent were given. These included primary treatment techniques such as flocculation
and settling for colour removal from printing effluents as well as advanced technologies such as
ultrafiltration for size recovery, cross-flow microfiltration for dyehouse effluents and electrolysis
for sodium hydroxide recovery from scouring effluents.
4.3 IN-PLANT CONTROL
Production-related modifications should be implemented within a plant for wasteloadreduction. This in-plant control is important in saving water, energy and processchemicals, thus reducing the effluent discharge.
In-plant control measures should include :
(i) minimising in-plant water use,(ii) optimising water use during rinsing,(iii) water and chemical recirculation,(iv) effluent control,
(v) raw material modifications,(vi) plant and process modifications,(vii) housekeeping,(viii) staff motivation.

TABLE 4.7
PREDICTED EFFLUENT COMPOSITION AND IMPACT OF ITS DISCHARGE ON THE RECEIVING RIVER WATER QUALITY
Process Sou rcc
Effluent Characteristics
DesizingScouringBleachingMercerisingPrintingDyeingDyeingDyeingDyeing
Reactive jetReactive jigDisperse
Clothproduciionkg/week
40 00040 00040 00017 10019 000
5001000
1200012 000
Total discharge
Cone, of discharge (g/l)Spec, water use u/kg cloth)Average flow (ni^/h)
River Characteristics
Average (river flow = 12,25 m-'/s)(effluent volume contribution =
Minimum (river flow = [,(W m-'/s)(effluent volume contribution =
Maximum (river flow = 66,8 m-'/s)(effluent volume contribution =
3,02 %)
),24 %)
3,00 %)
p.fflucntflow
m-Ywcck
Analysis (kg/week)
OA COD TS SS
18020020086
1332834
204408
1473
36,88.8
400320120
000000
840
0,570
3 6002 120
480000000
6 200
4,211
36005 360
6005 130
045516060
2 400
17 765
12,065
40080
160000000
640
0,435
0.113
1,389
0,021
0,837
10,251
0,153
2,398
29,373
0,440
0,086
1,058
0,016
IDS
3 2005 280
4405 130
045516060
2 400
17 125
11,630
2,31!
28,351
0,424
Na
01160
692 958
0180600
1037
5 464
3,711
0,738
9,035
0,135
NaOH
02 000
1205 130
0300
517
7 770
5,277
1,049
12,847
0,192
ColourADMIunits
00000
269 000538 000102 000
3 240 000
4 149 000
2 818
0,560
6,860
0,103
Note: The calculations are based on a lotal production of 40 000 kg/week and a product ion lime of 168 h/wcck.
4-18
4.3.1 Water Use
The volume of water used is a function of the :
(i) type of textile fibre being processed,
(ii) manner of processing,(iii) processing sequence,(iv) processing equipment.
Examples of methods for water savings should include :
(i) direct reuse of certain process water e.g. cooling water, gland water,condensate,
(ii) good housekeeping to ensure that water leaks and unnecessary washing orhose-pipe use is maintained at a minimum and that steam valves are notopened unnecessarily,
(iii) minimising water flow during processing and the prevention of water flow
when the machine is stopped,
(iv) optimisation of temperature, water flow, cloth speed, water levels and tank
sizes during washing,
(v) curtailing overflow rinsing,
(vi) use of more efficient washers with a reduction in the number of water feedpoints e.g. installation of counter-current washing,
(vii) reducing the number of process stages e.g. combination desizing-scouring orscouring-bleaching stages,
(viii) using machinery with lower specific water use,
(ix) screen washing, initially by squeegee or suction, gives low water consumption,
(x) installing a prewashing train utilising recycled water to remove impurities
before final washing,
(xi) use of solvent scouring and bleaching systems,
(xii) installing water meters in all major water using areas to enable an audit systemto be instituted,
(xiii) ensuring that mains water pressure is stabilised.
Of particular importance in the textile industry is the strong correlation between waterand energy consumption. Since many wet-processing operations are carried out atelevated temperatures, water saving measures result in energy savings. Energy savingsmay be carried out by reducing water flow rates if it can be reliably determined that,in so doing, impurity removal is not effected to the extent that final cloth quality isimpaired.
The relative costs of water and heat energy (1987) are as follows :

4-19
water R0.:5 - 1,00/m3.incremental ion exchange costs R0,05 - 0,15/m3.energy (steam at R10,00/t) R0,0l7/m3.°C rise.
Water savings do not affect the pollution load of the effluent, although decreased waterconsumption increases effluent concentration. Most municipal effluent dischargeregulations specify maximum concentration limits. Hence water saving measures mightresult in the effluent not complying with the maximum municipal discharge limits.An example of a tariff structure for effluent discharge to sewer is :
T)h\r/m
Decreasing the water consumption would result in savings of A.B c/m3.
4.3.2 Optimising Water Use During Rinsing
Washing or rinsing is a frequent operation in textile processing and it is important thatit be carried out efficiently. The impurity level on the fabric must be reduced to apredetermined level and this should be done with minimum use of water. Theconcentration of an effluent determines the capital cost of a recovery process henceconcentrated effluent is desirable.
The volume of water required for rinsing depends on the :
(i) type and concentration of impurity on the cloth,
(ii) volume and concentration of drag-out,
(iii) type of rinsing equipment and,
(iv) rinsing temperature,
(v) final concentration of impurities permissible on the cloth after rinsing.
Rinsing processes are either batch or continuous. In batch processing there is apredetermined liquor to goods ratio and a fixed volume of water per batch.
Batch rinsing machines include :
(i) jigs, which are versatile in that they can be used to process a range of fabrics.Water use during washing shows large variations and is dependent on themethod employed (overflow or drop-fill),
(ii) winches, which have high water consumption and are employed for processes
with many steps where frequent washes are required,
(iii) jets,
(iv) beams.

4-20
In continuous processing a continuous supply of water to the washers is required tomaintain steady-state conditions in each unit i.e. the rate of inflow of impurities onthe fabric is balanced by the rate of outflow of impurities in the effluent and on therinsed cloth.
Continuous rinsing machines include :
(i) rope ranges, which are used for handling large quantities of cloth. These
ranges consist of one or more boxes with squeeze rollers. Since these rangeshave high water use with light fabrics two or more ropes are often processedin parallel to reduce water use,
(ii) open-width ranges, in which the water use is generally lower than that in therope range.
Figure 4.9 (55) compares the water use of the \arious rinsing machines.
Batch Rinsing
The two methods of batch rinsing are overflow and drop-fill.
Overflow rinsing consists of adding rinsing water to a batch of cloth with continuous overflow for a certainperiod of time oruntil the discharge meets some criteria. This method often results in significant water wastage.
Drop-fill rinsing consists of the repetitive draining and refilling of the machine, allowing a dwell time afterrefilling, until the desired end point is reached. The impurity concentration of a drop will be 10 to 20 % of theimpurity concentration of the previous drop.
The simplified theoretical basis for rinsing in batch machines is analysed elsewhere (54). In summary thewashing efficiency is expressed as a normalised concentration ratio :
— concentration of impurity in the rinse water.= machine concentration at the start of the rinse.= machine concentration at the end of the rinse.— overall normalised concentration ratio at the end of the rinse.
The drop-fill water consumption, Q, , is :
Qu=l(\-CRT)
where I = the machine volume.
The overflow water consumption, Q , is :
Qa = -B\'\nCRT
where B is the bypass factor to account for non-ideal conditions, typically 1,27.
For the same concentration reduction, overflow rinsing requires over 100 % more water than does the drop-filltechnique to achieve the same rinsing results.
L. A j -
where
c I
c-c.c,CR
Co

4-21
I?§
350 -
300 -
250 -
200 -
150 -
100 -
50 -
mean values
range
OpenWidth
Beam pit Jig Winch
Machine type
FIGURE 4.9 : COMPARISON OF WATER USES OF VARIOUS RINSEMACHINE TYPES (55)
Continuous Rinsing
Continuous rinsing in which there is a steady flow of water and cloth through the machine may be carried outin a single compartment washing range or in a multi-unit range.
Single Washing Unit
Theoretical analyses (19,56,57) of washing operations have shown that the washing efficiency or the ratio ofthe impurity concentration on the fabric before and after a single continuous open-width washing bowl can beexpressed as :

4-22
CIB
where C , — impurity concentration on the fabric entering the washing bowl.
C,a, — impurity concentration on the fabric leaving the washing bowl.
k = washing parameter.
/ — specific water use (^/kg cloth),
m = fabric moisture content entering and leaving the washing bowl (g/kg cloth).
This relationship assumes that all the impurities present are dissolved in the fabric moisture. The washing
parameter, k, ranges from 0 (ideal impurity removal) to 1 (no impurity removal) and is influenced by :
(i) cloth speed: slower cloth speed allows more time for the impurities to redistribute themselves between
the cloth and the water. At faster cloth speeds, turbulence at the cloth surface is greater and
rinsing is improved,
(ii) wash water temperature: impurity removal is enhanced if washing is carried out using hot water
since the rate of diffusion is increased and the viscosity is decreased,
(iii) unit design: desirable features of the design would include turbulence promotion at the cloth surface,
long fabric retention times, measures to prevent the short circulation of the rinse water from the
inlet to the outlet and a high nip expression to minimise the final moisture content of the cloth,
(iv) type of impurity: readily soluble impurities are easier to remove than impurities which are insoluble
or which interact with the fibre;
(v) fabric type: light open weave fabrics are more easily rinsed than heavy close weave fabrics.
Figure 4.10 shows the specific water use in relation to the removal of impurities for a single washing unit. It
can be seen that :
(i) at any fixed water use the impurity removal decreases as the washer becomes less ideal,
(ii) for any given washing parameter (k) there is a specific water use, above which additional impurity
removal is minimal,
(iii) the less ideal a washer, the lower the maximum effective specific water use. Hence a less ideal
washer should be operated at a lower specific water use. In addition, the washing efficiency of a
less ideal washer cannot be improved by increasing the specific water use.
Multi-unit Washing Range
The washing efficiency, or the ratio of the impurity concentration of the fabric before and after a cross-flow
multi-unit washing range consisting of n units in series, each unit fed by the same flow rate of clean water, is :
Co Uo
where C : is the impurity concentration on the fabric after the first unit and C is the impurity concentration on
the fabric before the first unit.
The washing efficiency can be greatly improved if the units are connected to allow counter-current flow of
water. In this way the cloth leaving the range is contacted with clean water while the concentration of impurities
in the wash water is maintained at a maximum, by using it to wash the cloth where it has the highest impurity
concentration.
Typically two to five bowls are employed in a counter-current operation. The dependence of the washing
efficiency on the moisture drag-out from the rinsing units and on the washing parameter of the wash range is
analysed below.

4-23
1 -
c
O\
Z)
o"
O>
imp
uri
t
0,9
0,8
0.7
0,5
0,5
0,4
0,3
0.2
0,1
— water
k - 0,5
0 2 4 6 8 10 12 14 16 18
Specific water consumpt ion ( l / k g csoth)
FIGURE 4.10 : SPECIFIC WATER USE IN RELATION TO THE IMPURITYREMOVAL FOR A SINGLE WASHING UNIT FOR A RANGE OF k VALUES
20
The ratio of the rinse water flow to drag-out is defined as the rinse ratio (r). The relationship between therinse ratio, the number of rinsing tanks and the resulting dilution in the rinsing tanks to predict counter-currentrinsing water requirements, is shown in Figure 4.11 (58) and are based on :
where n — number of rinsing tanks.C, = saturator (padding) concentration.C —: concentration in n"1 rinsing tank (i — 1 , 2 , 3 , . . .).
r = rinse ratio.
Qr — flow of rinsing water.
Qd = drag-out
Figure 4.11 also compares the recovery of the chemicals contained in the rinsing water with that entering therinsing unit as drag-out on the unwashed fabric. This amount is potentially available for recovery and isdefined by :
( "\y (%)= 1 - ~ x 100

4-24
CCC 000-i
OCO
coo
99.99% recovery
"j 9% recovery
recover vNotes :
~Or •'. '."• j r i e r - • ; L.rr*?n t rm^ i nqZr = •: o r r - 5 " trc ' .C " V, n t h r
t in- .Cs = concentration of podd
so I Lit on.
100 I 000 100 000 1 000 000
se r 3 to (r)
FIGURE 4.11 : RINSING WATER DILUTION I'S RINSE RATIO FOR A
COUNTER-CURRENT MULTI-UNIT HASHING RANGE (58/
Usually, it is assumed that the concentration of the drag-out from the final rinsing tank is equal to theconcentration of the chemicals in the final rinsing tank (i.e. * - ()).
From Figure 4.11 then, for example, if the rinse ratio were 10 in a two-bowl system, c,/c. would be 100, A
closed-loop system would recover 99 % of the drag-out chemicals.
Figure 4.12 (58) shows different levels of chemical recovery over a range of rinse ratios for recovery from oneor two rinsing tanks. For example, if chemical recovery were from one rinsing tank only, and the rinse ratiowere 10 : 1, then it would be potentially possible to recover 90 % of the drag-out chemicals from the rinsingtank. If the rinse ratio were increased to 40 : 1, only an additional 7,5 % recovery would be possible Ifrecovery were from two rinsing tanks and the rinse ratio were 10 : 1, then 99 % recovery would be possible. Ifthe rinse ratio were increased to 40 : 1 in the two-tanks rinsing system, then 99,9 % recovery would be possible.
Figure 4.13 (58) illustrates the relationship between the rinse ratio and the concentration in the first rinsingbowl of a 3-bowl counter-current rinsing system, which would be discharged from the process, for a spread ofchemical concentrations. If the padding solution concentration, C, , is 20 g/£ and the rinse ratio is 20 : 1, theconcentration in the first rinsing tank is 1 g/£.

4-25
100from two rinsing bowls
FIGURE 4.12 : RINSE RATIO EFFECT ON RECOVERY OF DRAG-OUT CHEMICALSFROM RINSING SYSTEMS (58)
100-
Process chemical concentration
e cs = so g / i
s C5 = 40 g/l
@ C5 - 30 g/l
Cs = 20 g/l
Cs = 10 g/l
10 20 '00 1000
Rmse ratio (r)
FIGURE 4.13 ; DETERMINATION OF CHEMICAL CONCENTRATION OFFIRST FEED TANK (58)

4-26
r igure 4.14 (54) compares Che final impurity levels, c. , remaining on the fabric as a function of specific water
use for various washing ranges (* • 0.3):
(i) a three-bowl system connected in counter-current,(ii) a three-bowl system connected in cross-flow (parallel),(iii) a single washing unit.
0.3 -
\A Cloth
T T T
FIGURE 4.14 : IMPURITY REMOVAL DEPEXDEXCE O\ SPECIFIC WATER
USE IX COUXTER-CURREXT AXD CROSS-FLOW WASH IXC RAXCES (k =0,3} .U
Example 8 : The Effect of Different Washing Parameters on the Specific Water Use
Two textile mills had a similar washing duty. Mill A had two pairs of open-width washing units operated inseries. Each pair of units was operated counter-currently. The washing parameter for this system was Foundto be 0,40. Mill B had a modern three-bowl counter-current washing range with a washing parameter of 0,24.
The relation between specific water use and impurity removal from both the washing processes is shown inFigure 4.15 (54). Also included in Figure 4.15 is the effect of converting the cross-flow counter-current range(Mill A) to a fully counter-current washing range.
Figure 4.15 indicates that for the washer in Mill A, very little improvement in impurity removal occurs with aspecific water use greater than about 10 £/kg cloth. If the unit were to be converted to a counter-current unitthen the specific water use could be reduced by 20 % with the same impurity removal. Mill B, with thethree-bowl counter-current range, could achieve the same level of impurity removal with a specific water useof 5 £/kg cloth.
Advantages of the more efficient washing range are :
(i) lower specific water use leading to lower :(a) water and effluent charges;(b) steam requirements;(c) chemical requirements (where appropriate).
(ii) reduced floor area,

4-27
(iii) a higher degree of impurity removal.
100
99
98
97
96
95
.— 94
S- 93"D 92
I 91£ 90
-^ 89
I 88J! 87
86
85
84
83
82
2 4 6 8 10 12
Specific woler consumpl ion ( I / k g cloth)
FIGURE 4.15 : THE RELATION BETWEEN SPECIFIC WATER CONSUMPTION ANDIMPURITY REMOVAL FOR THREE WASHING RANGES
100
90 -
o 70E
60 -
50 -
40 -
30
.5 1 1.5 2 2,5 3 3,5 4 4,5 5 5.5 6 6.5
Specific water consumplion ( I /kg cloth)
7.5
FIGURE 4.16 : PREDICTED WASHING EFFICIENCIES

4-2!
t/Xampie 9 : The Relation Between Specific Water Use and Impurity Removal
A wet preparation section at a local textile mill contained a Vaporloc scouring range with a continuous four-bowlopen-width washing system operated counter-currently. The cloth speed was 50 m/min and the wash waterflow into the final washing bowl was 5 k£/h. The average specific water use was 6,5 £/kg cloth. The moisturecarry-over into the washing range and out of washing bowls 1 to 3 was 0,8 ^/kg cloth. The moisture carry-overout of the last washing bowl was 0,5 ^/kg cloth.
Carefully controlled trials were conducted to determine the relationship between the specific water use andimpurity removal from the padded cloth. The determining criterion was the residual sodium hydroxide on thecloth leaving the washing range. A reduced water flow would have been unacceptable if it resulted in a poorerquality product.
Washing theory was used to predict the interdependence of the washing variables (18). The washing parameter(k) was found to be 0,15. The impurity removal for the washing range was predicted as a function of specificwater use (Figure 4.16) and found to be 99,8 % at a specific water use of 6,5 £/kg cloth. This represented anexcessive use of water if it is considered that :
(i) at high water use a small increase in washing efficiency could be obtained with an increase in wateruse. For example, a reduction of G2 % in the specific water use (to 2,5 £/kg cloth) reduced thewashing efficiency by only 2 %,
(ii) high washing efficiencies were not essential since subsequent processing at the factory usuallyincluded bleaching and mercerising, where the fabric would be subjected to high sodium hydroxideenvironments.
The theoretical predictions were verified experimentally (18) and the wash water use was decreased with minimaleffect on the sodium hydroxide drag-out from the wash range, the washing efficiency or the final cloth quality.
4.3.3 Water and Chemical Recirculation
Large volumes of water are used in washing processes where the objective is to removesoluble impurities from the fabric. Wash water is therefore often dilute and thepossibility exists for the reuse of certain waste streams as :
(i) process water in other textile operations, with or without the addition of
chemicals,
(ii) rinse water for another process in which low-grade water is acceptable,
(iii) rinse water for direct use in a continuous counter-current washing systemwhere dilute rinses are reused in successively dirtier washing bowls.
Where partially treated waste streams are reused the concentration in the recycle loopincreases, requiring a constant bleed-off to maintain concentrations below apredetermined level.
The segregation and reuse of waste streams reduces the total effluent volume, oftentogether with energy, water and chemical savings. As the cost of chemicals, water,energy and waste treatment escalates, the recirculation of and recovery from variousstreams becomes justified. Cascading of waste streams is common practice e.g. :
(i) Spent bleaching streams have been successfully cascaded to scouring wherethe residual chemicals and auxiliaries improved the efficiency of the scouring(55). The spent bleaching chemicals did not affect the scouring process.

4-29
(ii) Chlorine bleaching streams have been used in the removal of starch duringdesizing. The chlorine aided in the degradation of the starch and the starchderivatives (55).
(iii) Effluent from bleaching systems is relatively clean and has been used as washwater for scouring (10,18).
(iv) Wash water from kiering is generally highly contaminated by soap, emulsifiedwaxes and lubricants, since the kiering pad solution is not normally saturatedwith these impurities and may be reconstituted and reused (18).
(v) Relaxer effluent is generally weak and has been cascaded to mercerisingsystems as wash water.
(vi) Mercerising effluent is relatively free from impurities other than sodium
hydroxide and is often concentrated for reuse as process sodium hydroxideusing evaporation techniques. Where there is no such sodium hydroxiderecovery the effluent may be reused for kier boiling, prescouring or dyeing(55). Mercerising effluent has also been used in the scouring saturator (10).
Example 10 : Effluent Cascading
Trials at a textile mill producing cotton and polyester/cotton woven fabrics have shown that substantial savingsin water, effluent discharge costs and energy costs can result from the cascading of effluent from "clean" processesfor reuse as wash water in processes which do not require high quality water (18).
A matrix of the possible cascading operations is given in Table 4.8. For each trial, effluent was pumped fromthe "source" process, via a holding tank, to the "destination" process to be used as process water.
In each case the process was operated for at least four hours on cascaded water before sampling to ensure thata minimum length of 10 000 m of cloth was processed under stable operating conditions.
Sourceeffluent
DesizingScouringBleachingMercerising 1Mercerising 2Relaxing 1Relaxing 2Ox. desizing
TABLE 4.8POSSIBLE CASCADING OPERATIONS
Cascaded to:
Oxidativedesizing
X
X
X
Scouring
X
XX
X
Bleaching
X
X
Mercerising1
X
Mercerising2
X
X
Relaxing1
X
X
Relaxing2
X
Treatment
XX
X
X
X
X
Table 4.9 summarises the results of some cascading trials. Effluent from the second stage of the mercerisingwashing range was suitable for process water in the washing of :
(i) sodium hydroxide scoured cloth,
(ii) oxidative desized cloth,

4-30
(iii) mercerised cloth which was to be subsequently bleached.
TABLE 4.9RESULTS OF CASCADE TRIALS
Source effluent
1. Mercerising 2(weak NaOH)
2. Mercerising 2(weak NaOH)
3. Mercerising 2(weak NaOH)
4. Relaxing 2(weak sodiumacetate)
Destination process
Scour washing range
Oxidative desize washing range
Mercerising 1
Relaxing 2
Comment
1) Residual NaOH on cloth increasedfrom 20 g/£ to 40 g/L
2) Residual TOC increased by 25 %.3) No difficulties experienced in further
processing of cloth.
l) Residual NaOH on cloth lower than whenwashed with fresh water.
2) Residual TOC increased by 25 %.3) No difficulties experienced in further
processing of cloth.
1) No increase in residual NaOH on cloth.2) Residual TOC and TDS increased by 50 %.3) No difficulties experienced in further
processing of cloth.
1) Residual NaOH on cloth easier to control andless acetic acid required for neutralisation.
2) No deterioration in cloth quality for reasonablyshort runs (5 to 6 hours).
Estimated energy, water and effluent discharge savings from the reuse of effluent from the second stage of themercerising washing range at the factory were approximately R14 000/a (1985).
Effluent from the rinsing stage of the relaxer was found to be suitable for recycling to the relaxer process.
4.3.4 Plant and Process Modifications
Modifications could include :
(i) chemical substitution by more easily treated alternatives. For example, highCOD organic acids such as acetic acid should be replaced with mineral acids;
(ii) the installation of facilities for the recovery of energy from hot wastes;
(iii) the optimisation of recipes. Usually established recipes are used which arefailsafe under the most extreme conditions. This leads to the use of an excessof chemicals, increased pollution and higher effluent concentrations;
(iv) the installation of chemical dosing control systems to prevent excessive useof chemicals. Redox equipment in bleaching and automatic dosing systemsin scouring and mercerising would enable improved control;
(v) the installation of instrumentation which will assist with the uniformity ofchemical application or provide temperature control,

4-31
(vi) the reduction in the number of processes. For example, oxidative desizingenables desizing, scouring and bleaching to be carried out in a single stagewith a reduced number of textile padding and washing processes. Singlestage scouring-bleaching and desizing-scouring are other examples of reducedstage operations.
4.3.5 Raw Material Modifications
Raw material modifications may result in reduced effluent discharge problems. Forexample :
(i) synthetic fibres may be processed instead of natural fibres,
(ii) higher quality raw materials containing less impurities may be purchased.
4.3.6 Effluent Control
Important in-plant control measures with regard to effluents and their discharge shouldinclude :
(i) identification, segregation and separate treatment of high-strength (desizing,mercerising, scouring and dyeing) and toxic effluents to avoid dilution anddischarge with other weaker or less toxic effluents. Certain detergents,solvents, dyes and finishes may be toxic to biological treatment plants andshould be kept separate,
(ii) dry clean-up of chemical spills,
(iii) preliminary treatment by filtration or screening to remove fibre,
(iv) identification of shock loads and a means to distribute such loads evenly in
the total factory discharge,
(v) identification of foam-producing chemicals,
(vi) evaluation of process chemical substitution by alternative less toxic, aggressiveor polluting chemicals,
(vii) optimisation of washing and rinsing operations,
(viii) evaluation of the reuse of chemicals, heat and water in weak effluents by theimplementation of a cascading system,
(ix) a strict material control strategy. A large fraction of the pollution load intextile factories is often due to excessive use of chemicals and auxiliaries.
4.3.7 Housekeeping
Good housekeeping should entail :
(i) the prevention of the indiscriminate disposal of residual chemicals and spentliquors,
(ii) careful chemical control to prevent excess make-up,
(iii) the prevention of spills,
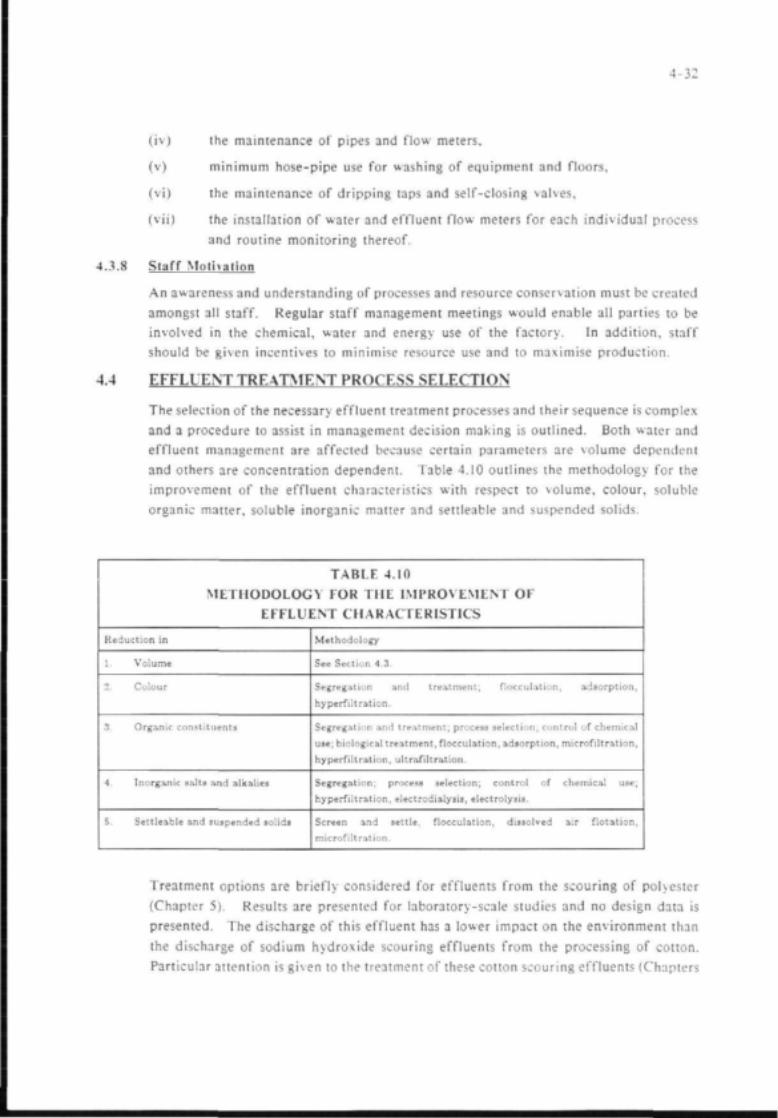
4-3:
(iv) the maintenance of pipes and flow meters,
(v) minimum hose-pipe use for washing of equipment and floors,
(vi) the maintenance of dripping taps and self-closing valves,
(vii) the installation of water and effluent flow meters for each individual processand routine monitoring thereof.
4.3.8 Staff Motivation
An awareness and understanding of processes and resource conservation must be createdamongst all staff. Regular staff management meetings would enable all parties to beinvolved in the chemical, water and energy use of the factory. In addition, staffshould be given incentives to minimise resource use and to maximise production.
4.4 EFFLUENT TREATMENT PROCESS SELECTION
The selection of the necessary effluent treatment processes and their sequence is complexand a procedure to assist in management decision making is outlined. Both water andeffluent management are affected because certain parameters are volume dependentand others are concentration dependent. Table 4.10 outlines the methodology for theimprovement of the effluent characteristics with respect to volume, colour, solubleorganic matter, soluble inorganic matter and settleable and suspended solids.
TABLE 4.10
METHODOLOGY FOR THE IMPROVEMENT OF
EFFLUENT CHARACTERISTICS
Reduction in
1. Volume
2. Colour
3. Organic constituents
4. Inorganic salts and alkalies
5. Settleable and suspended solids
Methodology
See Section 4.3.
Segregation and treatment; flocculation, adsorption,hyperfiltration.
Segregation and treatment; process selection; control of chemicaluse; biological treatment, flocculation, adsorption, microfiltration,hyperfiltration, ultrafiltration.
Segregation; process selection; control of chemical use;hyperfiltration, electrodialysis, electrolysis.
Screen and settle, flocculation, dissolved air flotation,microfiltration.
Treatment options are briefly considered for effluents from the scouring of polyester(Chapter 5). Results are presented for laboratory-scale studies and no design data ispresented. The discharge of this effluent has a lower impact on the environment thanthe discharge of sodium hydroxide scouring effluents from the processing of cotton.Particular attention is given to the treatment of these cotton scouring effluents (Chapters

4-33
6 to 11) since this effluent was identified as posing a serious pollution problem. Mostfactories do not treat this effluent since no suitable treatment system has been developed.This effluent contributes up to 25 % of both the volume and the COD loading of thedischarge from the wet preparation section and contains 37 % of the total solids load(13).
Treatment process options for scouring effluent involve either :
(i) partial treatment prior to discharge to improve the quality of the effluent,particularly with regard to pH, COD, suspended matter and organicconstituents,
(ii) complete treatment for water and chemical reuse. This involves a closedloop recycle operation yielding high removals of organics and inorganiccomponents.
The proposed options are given in Table 4.11.
General pretreatment and treatment measures for the effluents may include screening,flow balancing, water management, in-plant controls and pH adjustment.
The treatment of bleaching and mercerising effluents is not discussed further since :
(i) bleaching effluent is considered as dilute scouring effluent containing spentbleaches,
(iii) mercerising effluent may be concentrated by evaporation. Where clean sodiumhydroxide is required, mercerising effluents are considered as concentratedcotton scouring effluents and treated accordingly.
TABLE 4.11
TREATMENT OPTIONS FOR SCOURING EFFLUENTS
Effluent type
Polyester, polyester/cottonscouring (weak)
Cotton, polyester/cottonscouring (strong)
Pretreatment optionsprior to discharge
(i) neutralisation,(ii) filtration.
(i) neutralisation,(ii) acidification to pH 7
and flocculation.(iii) biological treatment in
admixture with othereffluents.
(iv) flotation.(v) electro-oxidation.
Treatment options for reuse
neutralisation, microfiltration and ultrafiltration forwater and partial chemical recovery (detergent, salt)(Chapter 5).
(i) dynamic membrane ultrafiltration for thereuse of water and chemicals (Chapter 6).
(i) evaporation for the reuse of chemicalsand water (Chapter 7).
(iii) neutralisation and electro-oxidation forreuse of water (Chapter 8).
(iv) neutralisation, microfiltration, nano-filtration and electro-chemical processingfor the reuse of water and chemicals(Chapter 9-11).
5-1
5 ULTRAFILTRATION OF WEAK POLYESTER AND POLYESTER/
COTTON SCOURING EFFLUENTS
5.1 INTRODUCTION
Polyester is the main synthetic fibre used in the Southern African textile industry. Thefibre may be scoured in the yarn, woven fabric or knitted fabric forms. In someapplications polyester and polyester/cotton blends are scoured in weak solutions ofsodium carbonate or sodium hydroxide and detergent.
5.2 POLYMERIC MEMBRANES : LOW-TEMPERATURE ULTRAFILTRATION
This section summarises the results obtained from pilot-scale ultrafiltration studies.The aim was to separate the process oils from the inorganic constituents of the effluent.The weak scouring effluent was passed through a cartridge filter prior to ultrafiltration.Design data for scale-up purposes is not included.
5.2.1 Mill Process and Effluent Characterisation
The mill from which the weak scouring effluent originated produced mostly warp andcircular knit fabrics. Fibres processed were mainly polyester, cotton, nylon and blends.Scouring was achieved in the yarn or knitted fabric form using alkali and detergent toremove knitting, spinning and antistatic oils which were absorbed by the fibre duringthe various extruding, spinning and knitting operations. Batch machines of the jettype were used.
The chemicals consumed during scouring included :
(i) sodium hydroxide for the scouring of cotton and polyester/cotton yarn,
(ii) sodium carbonate for the scouring of cotton and polyester fabrics and fabricsconsisting of cotton, polyester and nylon blends,
(iii) non-ionic or anionic detergents to enhance the emulsification action,
(iv) dye-crack prevention auxiliaries,
(v) sequestrants.
Polyester yarn was scoured in warm water (abo\e 40 °C) and nylon fabric was scouredin a warm solution of detergent and trisodium phosphate.
The scouring liquor ratio was 30 : 1. The analysis of the untreated effluent from thescouring of fabrics containing cotton and polyester is given in Table 5.1. The effluenthad the appearance of diluted milk.
5.2.2 Pilot Plant Description
The experimental plant is shown in Figure 5.1.
The ultrafiltration unit specification is given in Table 5.2.
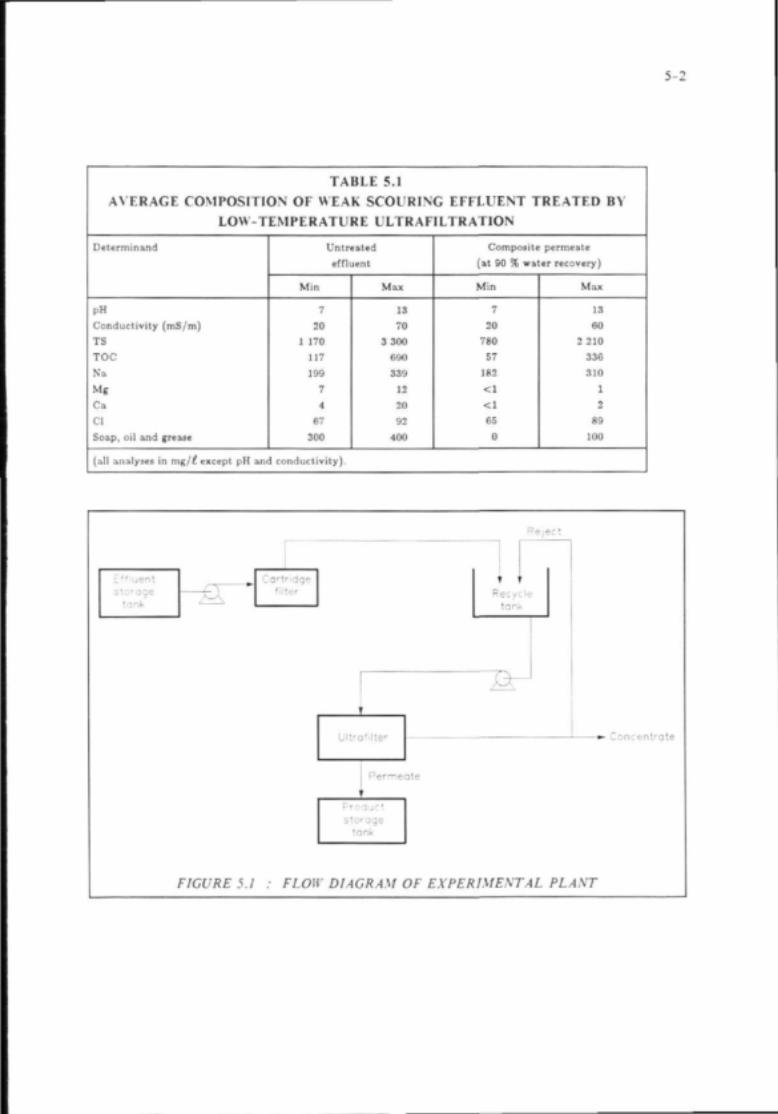
5-2
TABLE 5.1AVERAGE COMPOSITION OF WEAK SCOURING EFFLUENT TREATED BY
Determinant!
pH
ConductivityTS
TOC
NaMg
Ca
Cl
Soap, oil and
LOW-TEMPERATURE ULTRAFILTRATION
(mS/m)
jrease
Untreatedeffluent
Min
7
20
1 170117
199
7
4
67
300
(all analyses in mg/c except pH and conductivity).
Max
13
70
3 300690
339
12
20
92
400
Composite permeate(at 90 % water recovery)
Min
7
20
780
57
182
< 1
< 1
65
0
Max
13
60
2 210336
310
1
2
89
100
Eft.uentstorage
tank
Cartridge
Ultrnfilter
K eject
Recycletank
-*- Concentrate
Permeate
storagetank
FIGURE 5.1 : FLOW DIAGRAM OF EXPERIMENTAL PLANT

5-3
TABLE 5.2LOW-TEMPERATURE ULTRAFILTRATION UNIT
Membrane typeMolecular mass cut-offMembrane configurationMembrane areaOperating pressure
Pump typePermeate rateRecommended feed pH
SPECIFICATION
Abcor HFK 1323 000 to 5 000Spiral wrap, one element3,3 m2
Inlet 500 kPaOutlet 200 kPaMono1,5 m^/day1 to 13
5.2.3 Experimental Procedure and Results
The procedure and results of the pilot-scale ultrafiltration investigations are reportedin detail elsewhere (18).
Ultrafiltration trials were run for one month. The trials took the form of a series ofbatch concentrations to a final water recovery (R) of 90 %.
After each batch concentration the concentrate was diluted to the original volume(250 t) with fresh effluent. The unit was operated in the total recycle mode for twoto three days in between each batch concentration.
5.2.4 Ultrafiltration Rejection Performance
In Table 5.1 the concentrations of the composite permeate after 90 % water recoveryand the untreated effluent are given.
Rejections were as follows :
Monovalent inorganic ions : 0 to 10 %
Divalent inorganic ions : 85 to 95 %Total organic carbon : 60 to 80 %Soap, oil and grease : 40 to 60 %
The permeate was crystal clear and was of suitable qualin for recycle to the scouring
jets.
5.2.5 LUtrafiltration Fluxes
Fluxes at 90 % water recovery were 20 l/m2h and could be maintained by water anddetergent rinses.
5.2.6 L'ltrafiltration Concentrate
A concentrate, approximately 10 % of the volume of the total feed, was produced andcontained :
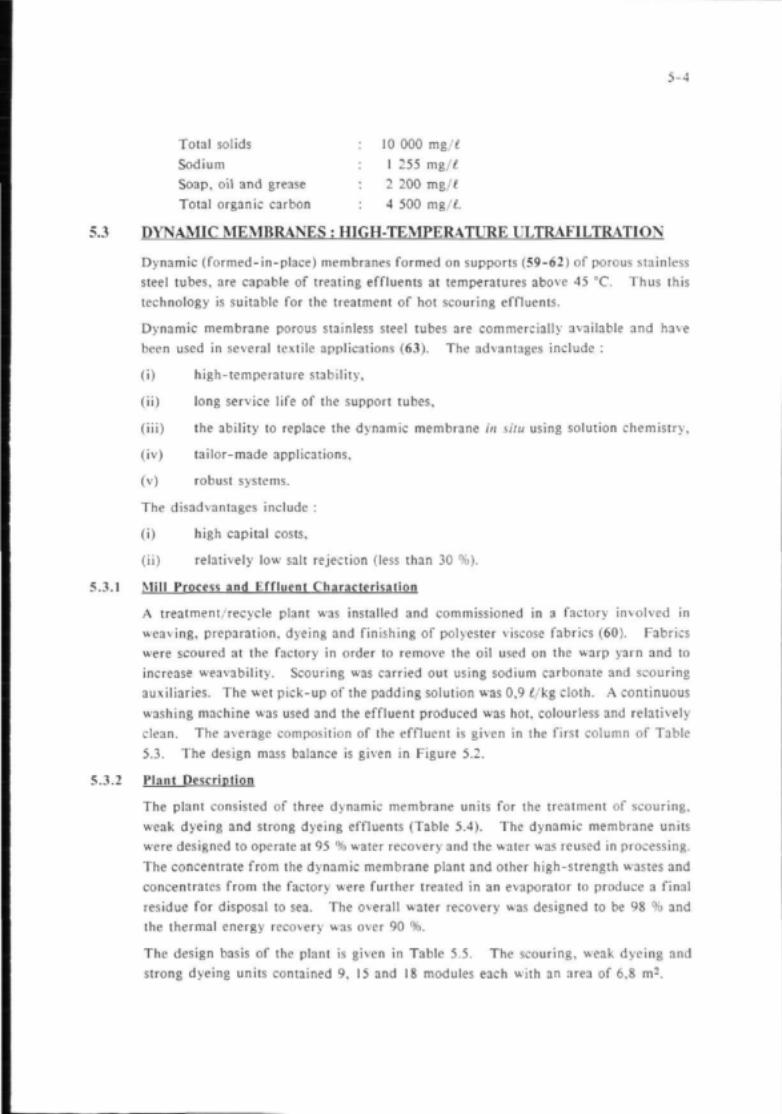
5-4
Total solids : 10 000 mg/£Sodium : 1 255 mg/tSoap, oil and grease : 2 200 mg/lTotal organic carbon : 4 500 mg/t
5.3 DYNAMIC MEMBRANES : HIGH-TEMPERATURE ULTRAFILTRATION
Dynamic (formed-in-place) membranes formed on supports (59-62) of porous stainlesssteel tubes, are capable of treating effluents at temperatures above 45 °C. Thus thistechnology is suitable for the treatment of hot scouring effluents.
Dynamic membrane porous stainless steel tubes are commercially available and havebeen used in several textile applications (63). The advantages include :
(i) high-temperature stability,
(ii) long service life of the support tubes,
(iii) the ability to replace the dynamic membrane in situ using solution chemistry,
(iv) tailor-made applications,
(v) robust systems.
The disadvantages include :
(i) high capital costs,
(ii) relatively low salt rejection (less than 30 %).
5.3.1 Mill Process and Effluent Characterisation
A treatment/recycle plant was installed and commissioned in a factory involved inweaving, preparation, dyeing and finishing of polyester viscose fabrics (60). Fabricswere scoured at the factory in order to remove the oil used on the warp yarn and toincrease weavability. Scouring was carried out using sodium carbonate and scouringauxiliaries. The wet pick-up of the padding solution was 0,9 I/kg cloth. A continuouswashing machine was used and the effluent produced was hot, colourless and relativelyclean. The average composition of the effluent is given in the first column of Table5.3. The design mass balance is given in Figure 5.2.
5.3.2 Plant Description
The plant consisted of three dynamic membrane units for the treatment of scouring,weak dyeing and strong dyeing effluents (Table 5.4). The dynamic membrane unitswere designed to operate at 95 % water recovery and the water was reused in processing.The concentrate from the dynamic membrane plant and other high-strength wastes andconcentrates from the factory were further treated in an evaporator to produce a finalresidue for disposal to sea. The overall water recovery was designed to be 98 % andthe thermal energy recovery was over 90 %.
The design basis of the plant is given in Table 5.5. The scouring, weak dyeing andstrong dyeing units contained 9, 15 and 18 modules each with an area of 6,8 m2.

AVERAGETREATED
Determinand
pH
Conductivity (mS/m)TS
TDS
TIC
TOC
C a
Mg
Colour (ADMI units)
TABLE 5.3COMPOSITION OF WEAK SCOURING EFFLUENTBY HIGH-TEMPERATURE
UntreatedEffluent
8,1
90
9 6 0
9 2 0
28
262
6
S
191
(all analyses in mg/£ except for pH, conductivity and colour
ULTRAFILTRATION
CompositePermeate"
SO
900
880
-
245
-
-
105
" Calculated from average rejections at a 95 % water recovery.
PointRejection %
-
30 to 4025
20
-
25
-
-
75
T 5 2.2 g ••
FIGURE
-
i
" • • • • • • • •
IProduct 'lo* = !-».5
5.2 .• PLAST LAYOUT ASD MASS(FLOW UMTS ARE RELATIVE)
- » •
- » -
0J3 g/1
: - • ] '
0.-3 g/l
0.05 g 'I
• - ^ • ;
\CE
- \
- = L •:-,
1
•
1

5-6
TABLE 5 4
EFFLUENT CHARACTERISATION OF WEAK SCOURING EFFLUENT FORHIGH-TEMPERATURE ULTRAFILTRATION (60)
Effluent
ScouringWeak dyeingStrong dyeing
Flowunits
17
43
26
TS
K/t
1,970,302,20
Temp"C
75
25
62
Main pollutants
oil, detergent and alkaliminor contaminantsdye, organic contaminants, salt and alkali
DESIGN BASIS OFTREATMENT
Effluent
ScouringWeak dyeingStrong dye
* based on a 22
Feedm3/d
120
300
385
TABLE 5.5DYNAMICOF WEAK
MEMBRANE PLANT FOR THESCOURING EFFLUENTS
Permeatem3/d
108
276
176
i operation per day.
Concentratem3/d
12
24
9
Flux*£/m2h
at 6,1 MPa
80
119
63
Scouring Effluent System
The system for scouring effluent consisted of nine modules in a series taper configuration of 4 : 2 : 2 : 1. Eachmodule was 10 m long and contained 143 m of tube with an inside diameter of 15 mm. A pump with a capacityof 6 m3/h was used to maintain a flow velocity of 1,2 m/s in the tubes.
Pretreatment using wedge wire screens for lint removal proved ineffective and these were replaced with vibratingscreens.
5.3.3 Plant Performance
Severe fouling and subsequent flux decline were experienced during plant operationdue to cotton waxes, microbial growth and lint.
Careful selection of scouring chemicals, control of operating temperatures and additionof biocide to the feed significantly improved the plant flux performance. However,even after the improvements the permeate production rate was 64 % below design.
The foulant(s) did not respond to a wide range of cleaning procedures. An effectivecleaning procedure consisted of :
(i) two sodium carbonate rinses,
(ii) a 30-minute recirculation of a hot solution of sodium hydroxide, hydrogenperoxide, "Butyl Cellusolve" and detergent,
(iii) two water rinses,

5-7
(iv) two acetic acid and ammonia rinses,
(v) three water rinses.
Rejection performance varied depending on the pH of the feed and the time elapsedsince the previous membrane clean.
A typical product composition from the high-temperature ultrafiltration of weakscouring effluent is given in Table 5.3. The average composition was calculated fromthe average rejections assuming a water recovery of 95 %.

6-1
6 ULTRAFILTRATION OF STRONG COTTON AND POLYESTER /COTTON SCOURING EFFLUENTS
6.1 INTRODUCTION
Batch scouring produces two effluents, one from the dumping of the scouring liquorand the other from rinsing effluent. Continuous scouring normally produces only arinsing effluent because the scouring solution which is padded onto the cloth at highconcentrations is normally not discarded.
High-temperature ultraf iltration of scouring effluent would enable the scouring paddingsolution to be reused indefinitely in the case of a batch process since it enables theseparation of the high molecular mass organic material from the sodium hydroxideprior to reuse. In a continuous scouring process or in the case of batch rinsing effluenta concentration step such as evaporation is necessary in order to concentrate the sodiumhydroxide up to reuse strength.
Polymeric ultrafiltration membranes typically have a temperature limit for solutionswith a high pH whilst dynamically formed membranes (Section 5.3) can withstand hightemperatures at these pH values . This chapter summarises the results of laboratorytests (64) in which strong scouring rinsing effluent was treated by ultrafiltration usingdynamically formed membranes.
A proposed high-temperature ultrafiltration system for the treatment of strong effluentsfrom continuous scouring is shown in Figure 6.1. The process consists of dynamicmembrane ultrafiltration to produce a concentrate of organic material and a sodiumhydroxide containing permeate stream. This sodium hydroxide stream may beconcentrated by evaporation to enable both rinse water and process chemicals to berecycled to production. Since the concentration of clean sodium hydroxide solutionsby evaporation is a commonly practiced operation in the textile industry, the evaporationstage is not discussed in this chapter.
6.2 MILL PROCESS AND EFFLUENT CHARACTERISATION
The mill from which the strong scouring effluent originated produced woven cottonand polyester/cotton fabrics. The cotton fabric was continuously scoured by paddinga solution of sodium hydroxide (70 g/^), reducing agent and wetting agent onto thefabric after desizing. The fabric was then steamed prior to being wound into caravanswhere it was rotated in a steam atmosphere for 2 h before rinsing in a four-bowlcounter-current range. The pick-up of the padding solution was 89 I/kg cloth andthe rinse water consumption was 4 £/kg cloth.
The chemical analysis of the strong scouring effluent is given in Table 6.1. Theeffluent was dark in colour and contained a small amount of suspended material.

6-2
V a x e—u o V c * e — JE
1
Concentratof orgar.icmaterial
\
Z'Z> Zi
ternperaturej't'ofi"er"
Per me! of incrc; »nater
T
- • • ' ' '
6./ ; HIGH-TEMPERATURE ULFROM COXTIXL
TRA ITOUS
O'l :r
a!
^ILTRATIOX OF STROXC EF
SCOUR!XG
FLUEXT
TABLE 6.1AVERAGE COMPOSITION OF STRONG EFFLUENT FROM
CONTINUOUS SCOURING TREATED BY HIGH-TEMPERATUREULTRAFILTRATIOrs
Determinand
pH
Conductivity (mS/m)
TS
N a
NaOH
T O C
C O D
O A
Ca
M g
Effluent
M i n
12
400
27 000
4 000
5 000
2 000
3 000
2 000
M a x
14
8 600
89 000
10 000
14 000
26 000
44 000
77 000
80
20
Treated
(composite
Min
12
4 850
1 100
effluent
at 90 % R)
M a x
14
13 600
14 000
fall analyses in mg/l except for pH and conductivity).

6-3
6.3 PILOT PLANT DESCRIPTION
A flow diagram of the experimental unit is given in Figure 6.2. The effluent wasstored before being pumped, at room temperature, into the ultrafiltration recycle tank.No pretreatment was required.
Effluentstoragetank
Recycletank • A T
Concentrate
Dynamicj ' t ra f i l te - "
Productstoragetank
FIGURE 6.2 ; FLOW DIAGRAM OF THE EXPERIMENTAL USFT
The ultrafiltration unit comprised four sintered stainless steel tubes on which thedynamic membranes had been formed. The tube arrangement consisted of two parallellines each containing two tubes in series. The specifications of the ultrafiltration rigare given in Table 6.2.
6.4 EXPERIMENTAL PROCEDURE AND RESULTS
Membrane formation conditions are given in Table 6.3.
The trials were conducted on a total recycle system in a series of five experiments.In total, 16 single- and dual-layer membranes with different flux characteristics wereformed. Each membrane was operated continuously against scouring effluent forbetween 16 and 40 days.

6-4
The chemical analysis of ihe composite permeate predicted from point rejections fora water recovery of 90 % is given in Table 6.1.
TABLE 6.2HIGH-TEMPERATURE LJLTRAFILTRATION
UNIT SPECIFICATION
Combined membrane areaTube suppliersTube diameter
Tube lengthNominal pore sizePump typeFluid velocityProduct rateOperating pressureOperating temperature
0,01 m2
CARRE, USAinside 12,7 mmoutside 15,9 mm300 mm0,5 flmHydrocell D10 diaphragm2,1 m/s2 to 6 11A
4 to 5 MPa30 to 70 ' C
TABLE 6.3MEMBRANE FORMATION CONDITIONS
ULTRAFILTRATION OF STRONG
Chemicals
Temperature
Fluid velocity
Pressure
pH
Water flux
Zr membrane '.Dual-layer membrane :
Ambient
4.5 m/s
Zr membranePolyacrylic acid layer :
Zr membrane :Polyacrylic acid layer :
Zr membranes :Dual-layer membranes :
FOR HIGH-TEMPERATURESCOURING EFFLUENT
Zircon i nm nit rat«?Zirconium nitrate/ Polyacrylic acid
6 MPa5 MPa
3 to 42 to 7
150 to 400 £/m2h100 to 170 ^'m2h
6.4.1 Membrane Rejection
Dynamically formed membrane rejection is. in general, dependent on the pH of operationsince the pH value determines the ion-exchange properties of the membrane. Ionicspecies are most effectively rejected at :
pH 4 TO 5 for Zr membranes.(i)(ii) neutral pH for dual-layer membranes.

6-5
Results indicated that high molecular mass organic material can be separated from thesodium hydroxide under the conditions employed. Inorganic species point rejectionswere 10 to 20 %, while the organic carbon point rejection was 60 to 80 %.
6.4.2 Membrane Flux
Permeate fluxes underwent a three-fold increase as the operating temperature wasincreased from 20 to 80 DC (Figure 6.3). The permeate flux (corrected to 20 °C usinga viscosity correction factor) increased with operating pressure by 2,1 £/m2h per MPa.
6 -
5 -
0 20 40 60 80 100 120 M0 160 '50
Temperature (°C)
FIGURE 6.3 : CORRECTIOS FACTOR TO REDUCE PERMEATE FLUX TO 20 °C
Temperature corrected fluxes (20 °C) at 5 MPa on the high flux membranes were 20to 30 £/m2h after 40 days of operation.
6.4.3 Membrane Cleaning
Permeate fluxes did not improve after hot water rinses. Detergent, sodium hydroxideand hydrogen peroxide rinses were only effective for short periods of time (1 h). Themost effective cleaning solution was the caustic padding solution which consisted ofwetting agent, sequestrants and sodium hydroxide. Fluxes could be maintained ifrinses using the padding solution were undertaken every eight hours.

6-6
6.4.4 Membrane Stability
The Zr membrane was more stable to highly alkaline scouring effluent for longer periodsof time than the dual-layer membranes. The membrane was also stable to hot sodiumhydroxide, detergent and hydrogen peroxide solutions at specific pH values.

7-1
7 EVAPORATION OF STRONG COTTON AND POLYESTER/
COTTON SCOURING EFFLUENTS
7.1 INTRODUCTION
The evaporation of mercerising effluents, using various evaporator configurations, toenable the recovery and recycle of sodium hydroxide is accepted technology in thetextile industry (65). Sodium hydroxide effluents from cotton scouring have beenconsidered too weak and contaminated for recovery and reuse by evaporation. Sincethe sodium hydroxide consumption during scouring is low the ratio of non-hydroxidesodium to hydroxide sodium in the effluent is also low.
The recovery of sodium hydroxide from these scouring effluents is advantageous becauseof:
(i) the serious environmental impact associated with the disposal of the effluents,either neutralised or in their alkaline state,
(ii) the escalating cost associated with purchasing new chemicals and disposing ofwaste chemical streams.
The application of evaporative techniques to the treatment of scouring effluents resultsin the concentration, not only of the recoverable chemicals, but also of the contaminants.The contaminants are not considered to be a problem since :
(i) they may be concentrated above their solubility limit during evaporation andmay be removed from the concentrated product by centrifugation,
(ii) if they are recycled in the sodium hydroxide they should not inhibit the scouringaction since it is the sodium hydroxide fraction of the liquor which performsthe scouring function.
A proposed treatment sequence involving evaporation is illustrated in Figure 7.1.
The process consists of :
(i) filtration using either cartridge filters or cloth filters to remove the lint,
(ii) evaporation to produce a condensate for reuse as rinse water and a concentrate
containing the sodium hydroxide,
(iii) centrifugation to remove suspended matter from the concentrate beforerecycling this stream.
This chapter summarises the results obtained from the operation of a pilot plantevaporator at a textile mill to concentrate sodium hydroxide scouring effluent for reuse(18). The pilot plant was of the falling film type.

7-2
- u picais
FIGUR E 7.1 : FLOW DIAGRASEVAPORATIOS OF
Ma-
rRmsmg
1
1
T
r
f FOR SODIUM HYDiSTROSG SCOURISG
- * • D i r e c t i o n o f c l o t h
Conden[:i-":".e
ROXIDE RECO\'EFFFLUEST
'RY BY
The objectives of the pilot plant operation were to determine the :
(i) degree of fouling.(ii) heat transfer coefficients,(iii) energy requirements.(iv) suitability of the concentrate for reuse.
7.2 MILL PROCESS ANT) EFFLUENT CHARACTERISATION
The mill processed woven cotton and polyester, cotton blends. Batch scouring wascarried out by padding a length of fabric with sodium hydroxide (70 %/t) and detergent.The sodium hydroxide concentration in the saturator was maintained by the additionof concentrated virgin sodium hydroxide.
The cloth was steamed and wound into a caravan, which was pressurised with steamfor two to six hours. Thereafter the residual sodium hydroxide and degraded impuritieswere rinsed from the cloth in a counter-current washing range.
Water flow rates were 5 m3 h. Cloth was padded at a rate of 60 m min and rinsedat a rate of 70 m. min. Pick-up from the saturator was 0.7 i kg cloth.
A chemical analysis of a sample of scouring effluent is given in Table 7.1.

7-3
AVERAGE
Determinand
pH
TDS
TOC
TIC
COD
Na
Ca
Mg
K
NaOH
(all analyses in mg/
TABLE 7.1COMPOSITIONTREATED BY
Effluent
14
40 0004 550
450
25 0008 000
40
8
70
16 400
- except for pH).
OF SCOURINGEVAPORATION
Concentrate
14
172 00012 3001 800
57 500105
13
171
96 000
EFFLUENT
Condensate
8
100
50
0
0
0
0
7.3 PILOT PLANT DESCRIPTION
A flow diagram of the plant is given in Figure 7.2. The manufacturers' specificationfor the evaporation plant and the pumps is given in Table 7.2.
Preheated eed Concentr-ote recycle
Steam i n — *
Stec
Prehea
1
er
Foiling
colondrio
Steam condensate to dram
-roc essvapour
Cooling water out
Cooling water in
SeparotorProcesscondensate
Concentrate Condensateto storage to drain
FIGURE 7.2 ; FLOW DIAGRAM OF EVAPORATION PLANT

7-4
TABLE 7.2EVAPORATOR PLANT SPECIFICATION
Vessel/ Equipment
Preheater
Colandria
Separator
Condenser
Feed pump
Recirculation pump
Concentrate pump
Specification
Test pressure: 600 kPaShell: 2 of BS 1387, 25 mm NB x medium x 2 490 LGTube: 2 of 316 L; 6 mm NB x SCH40 x 2 490 LGArea: 0,125 m2.
Test pressure shell: 600 kPaTest pressure tube: 150 kPaShell: BS 1387; 100 mm NB heavyFlange: 316 SS 10 mmTubes: 3 of Incaloy 825; 25 mm OD x 16 g x 2 748 LG
32 mm triangular pitch; 25,7 mm diameter hole.Area 0,658 m2
Test pressure: 150 kPa
Test pressure shell. 175 kPaTest pressure tube: 400 kPaShell: BS 1387, 100 mm NB x heavyTube: 9 of 316 SS; 18,8 mm OD x 16 g x 2 000 LG
19,3 mm diameter square pitch. 24 mmArea: 1,08 m2.
Manufacturer: Alfa Laval model GM-2
Type: CentrifugalManufacturer: Allis Chalmers model F4A5
Speed 1 440 rpm.
Manufacturer: Mono Pump model D-40
The design evaporative capacity of the plant was in the region of 25 £/h of water fora feed of 80 to 180 £/h. The utilities for the operation of the plant were as follows:
3 kW
1 000 £/h120 to 180 kPa.
Total installed powerCooling water requirement(based on a 10 °C cooling water rise)Low-pressure steam
The effluent from the counter-current scouring rinsing range was collected in a 20 m3
stainless steel storage tank. It was pumped either through nylon filament filter clothwith a mean aperture of 80 /im or through 50 ^m cartridge filters and passed to theevaporator through a rotameter; the flow was controlled manually using a needle valve.The feed was transferred through a preheater before entering the falling film colandria.
The temperature of the effluent entering the colandria was 80 to 85 °C. The concentrateand process vapour were then separated and the concentrate was recirculated to thecolandria and the vapour condensed. For the purposes of the pilot plant trials the

7-5
process condensate (from the condenser) and the steam condensate (from the preheaterand the colandria) were discharged to drain. The concentrate was stored and reusedin the scouring process.
To simulate a multi-effect evaporator the plant was operated in a feed and bleed modewith the concentrate from one run becoming the feed for the next run. To preventblockage of the needle valve the liquor was pumped through the cartridge filters betweenpasses through the evaporator.
During the operation of the evaporator the following modifications to the plant wererequired :
(i) To prevent foaming with resultant carry-over of process liquid into thecondenser, anti-foam agents were added and the centrifugal pump was replacedwith a mono pump.
(ii) The probes which gave erratic level control due to foam interference, werereplaced with a successful overflow weir control system. The overflow wasrouted to a receiving vessel and then pumped under level control.
(iii) Heat losses were reduced by the additional insulation of various pipework onthe plant.
Table 7.3 gives the conditions under which the pilot evaporator was operated.
PILOT PLANT
Parameter
Feed
Feed flowFeed tempSteam flowSteam pressure
Steam tempCooling water flowCooling water temp
Concentrate flowConcentrate temp
OPERATINGTABLE 7.3
CONDITIONS FOROF STRONG SCOURING
(kg/h)
(*c)(kg/h)(kPa)
( •c )(t/h)(*C)
<kg/h)
( -C)
in
out
Preheater
effluent
65
20
9
100
120
THE EVAPORATIVEEFFLUENT
Colandria
effluent
65
80
45
100
120
35
100
TREATMENT
Condenser
process vapour
30
100
1 300in 20out 30
7.4 EXPERIMENTAL PROCEDURE AND RESULTS
Approximately 40 m3 of scouring effluent was concentrated to a level suitable for reusein processing. Scouring trials using reclaimed sodium hydroxide were carried out aspart of the normal factory production.

7-6
7.4.1 Prefiitration
The cartridge filters showed little tendency to foul with either the raw effluent or theconcentrate which was recirculated between passes.
The flow of effluent was directed tangentially to the filter cloth. An effluent lintcontent of 3 mg/i was effectively removed by the cloth with no blinding.
7.4.2 Evaporation
The performance of the evaporation system was assessed through a heat and materialbalance.
Heat Transfer Coefficients
Heat transfer coefficients are a measure of the capacity of an evaporator. A steady decrease in the heat transfer
coefficient would be an indication of scaling.
Heat transfer coefficients were calculated for the falling film preheater and condenser from the relationship :
Q = U . A A T
where Q is the heat transferred (kJ/h).
U is the heat transfer coefficient (kJ/rn^Cs).
•t is the heat transfer area (m^).
AT is the temperature driving force ( " C).
The heat transferred was calculated from the specific enthalpy of the liquid entering the exchanger, the specific
enthalpy of the liquid leaving the system, the specific enthalpy of the vapour produced and the mass flow rates
of the vapour and the liquid.
Table 7.4 gives sample calculations and measurements which were used in the determination of the
liierniOuyiiaiinc data.
The average heat transfer coefficients for the series of experiments were :
preheater : 1,25
colandria : 1,44
condenser : 0,35
These heat transfer coefficients were particularly low for sodium hydroxide evaporative systems and indicated
one of the following :
(i) scaled heating surfaces, which was unlikely since the process condensate production rate was constant
throughout,
(ii) inadequate venting. Problems with the steam valve system were experienced during trials,
(iii) poor condensate removal,
(iv) poor falling film characteristics in which the effluent did not contact the heat exchange surface for
the length of the tubes.
These effects could be overcome if adequate provision was made during the design of such a plant.
Table 7.5 gives the relationship between the overall heat transfer coefficients (U) and the concentrations of the
feed to the preheater and the liquor in the colandria.
Energy Consumption
The steam consumption varied from 5 000 to 8 000 kJ/kg of condensate produced. This included the energy
required to preheat the stored effluent from 20 to 80 " C, which was approximately 2 700 kJ/kg of condensate.

7-7
TABLE 7.4SAMPLE CALCULATION OF EVAPORATION THERMODYNAMIC DATA
System
PreheaterSteam side
PreheaterFluid side
AreaSteam pressureSteam temperatureEnthalpySteam flowHeat inHeat out
Feed flowFeed temp inFeed temp outEnthalpy outHeat outHeat transferredHeat (in-out)
Delta temperature
Units
m2
kPa
"C
kJ/kgkg/hkJ/hkJ/h
kg/h' C
"C
kJ/kgU / h
kJ/hkJ/h
"C
Heat transfer coeff. [kJ/m^Cs]
ColandriaSteam side
ColandriaProcess fluidSide
AreaSteam pressureSteam temperatureSteam massSteam flowEnthalpyHeat in (steam)Heat out(condensate)
Feed flowPreheatEnthalpyHeat in (feed)Mass vapourMass flowVapour tempEnthalpyHeat out (vapour)Cone, flow
Cone, temperatureRecife, flowEnthalpyHeat out(concentrate)Heat transferred
m2
kPa
"C
kg
kg/hkJ/kgkJ/hkJ/h
kg/h*C
kJ/kgkJ/h
kg
kg/h
•ckJ/kgkJ/hkg/h
*C
kg/hkJ/kg
kJ/hkJ/h
Value
0,125100
120
2 7066
16 2363 015
60
20
80
335
20 10419 853-6 884
43
1,02
0.658100
120
11
41
2 706110 25320 507
60
80
335
20 1048
30
100
2 67779 307
30
100
960
419
12 72071 922
Calculation basis
Gauge pressure.Read from steam tables (saturated steam).Calculated from regression equation.Bucket and stopwatch.Steam flow x enthalpy of steam.Steam condensate flow x enthalpy of condensate.
Calibrated rotameter measurement.Assumed to be ambient.Measured.Regression calculated from temperature.Process of enthalpy x flow rate.
[Heat flow of steam + fluid in) - (Heat flow ofcondensate + fluid out).Log mean temperature difference.
Heat transferred per unit area per unit time per " C.
Gauge pressure.Read from steam tables (saturated steam).Volumetric measurement.Volume per time.Regression calculation.Enthalpy of steam x steam flow.Enthalpy of condensate at 100 ° C x steam flow.
Calibrated rotameter measurement.Measured.Regression calculation.Product fluid flow x enthalpy.Volumetric measurement.Volume per unit time.Boiling point of water at 1 atm.Enthalpy of steam at 100 " C from steam tables.Enthalpy of vapour x flow rate.Deduced from feed flow and vapour (process condensate)flow.Measured.Calibrated rotameter.Regression calculation (enthalpy of concentrate flow).
Product enthalpy x flow.Heat out (cone + vapour) - Heat in (feed).

7-8
TABLE 7.4 (cont.)
System
Delta temperatureHeat (in-out)
Units
CkJ/h
Heat transfer coeff. [kJ/m-Cs]
Condenser AreaVapour flowVapour temperatureEnthalpyHeat in (vapour)Heat out(condensate)Cooling temp inCooling temp outCooling flowEnthalpyHeat out (water)Heat (in-out)Delta temperature
i
m-kg/h
CkJ/KgkJ/h
kJ/hCC
kg/hkJ/kgkJ/hkJ/h•c
Heat transfer coeff ,kJ/m-Cs]
Value
21,3817 823
1,42
1,0830
1002 677
79 307
3 4072234
1 296,3050
65 20C10 694
52
0,33
Calculation basis
Temp of steam - average temp of fluid.Heat flow(steam + fluid in - cone - vapour - condensate).
Measured as above.Boiling point of water at 100 ' C.Regression calc of enthalpy of vapour at 1 atm.Enthalpy of vapour x flow rate.
Enthalpy of process condensate x flow rate.Measured.Measured.Volume per time.Enthalpy of water at temp, difference.Enthalpy x flow of cooling water.Heat (vapour in - condensate - cooling water).Log mean temp difference.
Heat transferred to cooling liquid.
TABLE 7.5HEAT TRANSFER COEFFICIENTS VS CONCENTRATION FOR
FeedSf't NaOH
16
21
21
28
34
52
58
OF
Colandriag/£NaOH
32
35
34
60
70
77
100
STRONG SCOURING 1
uPreheaterkJ/m2Cs
0,991,020,991,060,991,871,87
IFFLLENT
uColandriakJ/m2Cs
1,481,401,391,221,411,591,58
EVAPORATION
ucondenserkJ/m-'Cs
0,370,300,350,420,350,400,34
Fouling of Falling Film
No decline in the rate of condensate production was observed. The colandria tubes were inspected and showedno indication of scaling.
Boiling Point Elevation
The boiling point rise of the concentrated effluent is given in Table 7.6. Boiling temperature rose byapproximately 1 C for each 10 g/t increase in effluent sodium hydroxide concentration. The relatively highboiling point elevation suggests that multiple effect as opposed to vapour compression evaporation would bemore suited to the present application.

7-9
TABLE 7.6
BOILING POINT ELEVATION VS CONCENTRATION FOREVAPORATED
Cone. NaOH
zlt
16
32
34
60
77
100
STRONG SCOURING EFFLUENT
Effluent boiling point
•c100
102
102
104
106
108
7.4.3 Centrifueation
The composition of the sludge was a function of the concentration of sodium hydroxidein the evaporated effluent. Table 7.7 illustrates this relationship. Laboratory andpilot plant studies (18) indicated that significant amounts of the impurities present inthe raw effluent were precipitated with increasing concentration, particularly as theconcentrate was cooled, and could be removed by centrifugation of the concentrateafter cooling. At concentration factors of 4 to 5, the sludge (5 % of the feed) containedthe following percentages of the total impurities originally present in the effluent :
Total solids 30 %Chemical oxygen demand 30 %Calcium 25 %Magnesium 10 %Sodium 5 %
The reinforcement factor required during processing determined the degree ofconcentration required during evaporation. This in turn determined the degree ofimpurity removal during centrifugation. In the event of recycle operations a steadystate must be reached in which the mass of impurities removed from the fabric wouldbe balanced by the mass of impurities removed as sludge.
7.4.4 Reuse of Process Condensate
The process condensate, which was produced at a rate of approximately 20 to 30 £/h,was sampled and analysed regularly. The results given in Table 7.1 indicate that thecondensate produced was of suitable quality for reuse as process water in the scouringrinse range.

7-10
TABLESLUDGE COMPOSITION
7.7
OF CENTRIFUGEDEVAPORATION CONCENTRATE
Determinand
Na
Ca
Mg
TOC
TS
NaOH
Note : Approximate NaOH
x2 :x4 :x8 :x!6 :
x2
0
25
5
0
0
0
Per cent component in sludge forconcentration factors of
x4
0
29
52
15
3
5
concentrations
5 %9 %
1 7 %
32 %
x8
0
26
54
9
23
10
x l 2
50
for the concentration factors
xie
0
78
39
31
17
17
were :
7.4.5 Reuse of Sodium Hydroxide Concentrate
The composition of the reclaimed sodium hydroxide (concentrate) is given in Table 7.1.
Reclaimed sodium hydroxide was used as process sodium hydroxide for the scouringof approximately 10 000 m of fabric. Since detergent was removed during theevaporation and centrifugation processes, detergent was added to the reclaimed sodiumhydroxide according to the recipe.
In Table 7.8 the compositions of virgin and reclaimed sodium hydroxide are compared.The reclaimed sodium hydroxide contained higher levels of organic material than thevirgin sodium h\droxide. Despite the high level of organic contamination in thereclaimed sodium hydroxide, no interference with the scouring action of the sodiumhydroxide on the cotton impurities occurred and the final cloth quality was not impaired(18). The impurity carry-overs for cloth lengths scoured in virgin and in reclaimedsodium hydroxide were not significantly different.
The cloth which was scoured in reclaimed sodium hydroxide was processed by thestandard factory methods and subsequently printed and dyed as part of a normalproduction run. No problems were encountered with further processing and the clothpassed all quality control tests.

7-11
TABLE 7.8CHEMICAL COMPOSITION OF VIRGIN AND
Determinand
PHTSTOC
Na
NaOH
(all analyses in g/i. except
Virgin
pH).
LIQUORS
sodium hydroxide
13,5110 to 145
0 to 945 to 6070 to 85
RECLAIMED SCOURING
Reclaimed sodium hydroxide
13,5140 to 150
13 to 2350 to 6070 to 80
7.5 DESIGN CONSIDERATIONS
In summary, evaporation may be used in the treatment of strong scouring effluent fromthe textile industry. This treatment process :
(i) requires minimal pretreatment in the form of filtration using fine screen orwedgewire systems,
(ii) produces a good quality product water which may be reused for rinsing,
(iii) concentrates the sodium hydroxide in the effluent while at the same time itprecipitates 30 to 60 % of the other impurities, allowing them to be removedby centrifugation,
(iv) produces a concentrated sodium hydroxide stream suitable for reuse in thescouring process without impairing the cloth quality.
In the specification of an evaporator unit for the treatment of strong scouring effluentconsideration must be given to :
(i) solids removal. Lint should be removed using fine screen or wedge wiresystems;
(ii) the removal of precipitates from the concentrated sodium hydroxide bycentrifugation. This will include the removal of the waxy layer at the bottomand the sludge at the top;
(iii) minimise foaming. This should be achieved by using suitable pumps andpipework to prevent cavitation and by the addition of anti-foam;
(iv) fluctuations in the cooling water flow. These fluctuations can be caused byfluctuations in the mains supply pressure and should be avoided in order tocontrol and maximise vapour condensation;
(v) a suitable venting system for the steam jacket. This system should preventthe build-up of non-condensable gases and the blanketing of part of the heatingsurface and thus minimise energy consumption;

7-12
(vi) complete size removal in the desize washing process prior to the scouringprocess. If size removal is not effective a gelatinous evaporator concentrateis produced.
A detailed design and a costing analysis requiring a complete heat and material balanceand which are specific to each individual application, have not been prepared. Sincemost evaporators are supplied as package units, the economic assessment should becarried out in conjunction with evaporator suppliers.
7.5.1 Major Equipment
Major equipment would include :
Effluent Storage and Transfer Facilities
Effluent and product storage of 6 to 24 h duration is necessary to provide for heat transfer surface cleaning,
minor breakdowns, maintenance and fluctuations in processing. All pipes and tanks used for transferring and
storing effluent should be insulated to prevent heat loss from the effluent.
Prefiltration
The effluent should be screened to avoid clogging of the pumps and other process equipment. Wedgewire
screens with apertures of 50 to 80 /Jm are suitable for lint removal. Screens are standard units and the size/area
depends on the effluent flow.
Heat Transfer
Equipment costs are determined by heat transfer surface area, materials of construction and evaporator type.
Several types of evaporator are available. In single-effect evaporators approximately 1 kg of ateam is consumed
in evaporating 1 kg of water. Lower steam consumption can be achieved by using multi-effect evaporators
and vapour compression.
Solids-Liquids Separation
The evaporator concentrate should be centrifuged prior to storage and reuse.

8 ELECTRO-OXIDATION OF STRONG COTTON AND POLYESTER/
COTTON SCOURING EFFLUENTS
8.1 INTRODUCTION
Strong scouring effluents contribute over 25 % of the COD in the final effluent fromthe wet preparation section of a mill processing cotton and cotton blends (section 2.7.1).Oxidation of the organic material in the effluent will lower the COD and make theeffluent more amenable for discharge to the environment or to the sewer.
This chapter describes the oxidation of organic material in strong scouring effluent byhypochlorous acid, which is generated from effluent components during electrolysis inan electro-oxidation cell (18). A flow diagram of the treatment sequence is shown inFigure 8.1 and consists of :
Chemicals
Scounnc
CO,,end H-, - * -gas 10 atmosphere
Water
R ins in: Di'ection of cloth
Effluent
Absorptioncolun-'i
Electro-^oxidation h
cell
1
vessel
quality orgeme tree brinefor possible reuse
FIGURE 8.1 : FLOW DIAGRAM FOR THE ELECTRO-OXIDATION OF STRONGCOTTON AND POLYESTER/COTTON SCOURING EFFLUENTS

8-2
8.2
(i) neutralisation of the sodium hydroxide in the effluent using chlorine to producesodium chloride,
(ii) electrolysis of the sodium chloride solution in an undivided electro-oxidationcell (without a separator) to generate the oxidising agent, hypochlorous acid,
(iii) oxidation of the organic material in a reaction vessel.
A colourless, slightly alkaline and mildly oxidising brine solution is produced, whichmay be reused in bleaching or as low quality water. Hydrogen from the electrodereaction and carbon dioxide from the oxidation of organic material in theelectro-oxidation cell are also produced.
The objectives of the electro-oxidation trials were to determine the :
(i) optimum operating conditions for the removal of COD in scouring effluent,
(ii) degree of removal of COD which could be achieved and the current efficiencyat which this removal could be effected,
(iii) energy requirements of the system.
MILL PROCESS AND EFFLUENT CHARACTERISATION
The strong scouring effluent under consideration was from the same textile millprocessing woven cotton and polyester/cotton blends as was the effluent used in theevaporation trials (Chapter 7).
A chemical analysis of a scouring effluent subjected to oxidation is given in Table 8.1.
CHEMICAL ANALYSIS OF
Determinand
p l l
Cond (mS/m)T S
T O C
TICC O D
Na
CaMg
Cl
OCI
(all analyses in
TABLE 8.1SCOURING EFFLUENT
ELECTRO-OXIDATION
Effluent
13,75 100
64 0007 700
70026 00015 400
8017
1
0
mg/£ except pH and
Chlorinatedeffluent
7
2 800
7 6000
23 00015 400
8017
19 700900
conductivity).
TREATED BY
Oxidisedeffluent
5 to 63 000
2 5000
1 000 to 4 00015 400
8017
16 0005 300

8.3 PILOT PLANT DESCRIPTION
A flow diagram of the plant is shown in Figure 8.2.
ci
Scouringeffluent
Absorpt ionCOlur- •
Cooling water in
Cooling .voter out
Stirredtank
Electro-oxidationcell
\\ 1
I I
FIGURE 8.2 : FLOW DIAGRAM OF THE ELECTRO-OXIDATION PLANT
Both the chlorination and electro-oxidation functions were operated in the batch mode.Scouring effluent from the factory was chlorinated during recirculation through theadsorption column. The chlorine was either supplied from a cylinder or was generatedby the electrolysis of a sodium chloride solution in a membrane cell. The chlorinatedeffluent was transferred to the stirred tank reactor from where it was circulated throughthe electro-oxidation cell until the required degree of oxidation had been achieved.
The plant specification is given in Table 8.2.

8-4
TABLE 8.2ELECTRO-OXIDATION PLANT SPECIFICATION
Unit
Absorption column
Electro-oxidation cell
Parameter
size
construction materialpackingeffluent flowfinal effluent pHpump type
electrode sizeelectrode separationanode material
cathode materialframe construction materialpump typeeffluent flowcurrent densitypH
Specification
Height : 1 000 mmdiameter : 150 mmglassceramic saddles5 £/min7 to 7,5Magnetic coupled centrifugal
0,1 m2
30 mmDSA (titanium base,PG oxide coating)mild steelPVCMagnetic coupled centrifugal5 to 8 £/min2 200 A/m-5 to G
8.4 EXPERIMENTAL PROCEDURE AND RESULTS
The chemical analysis of the effluent after chlorination and after electro-oxidation isshown in Table 8.1.
8.4.1 Chlorination
Chlorination of the scouring effluent :
(i) removed approximately 10 % of the COD in the effluent,
(ii) decreased the effluent pll.
(iii) resulted in the formation of chloride and hypochlorite ions.
8.4.2 Eleclro-ovidalion
Foaming
Foaming which tends to occur during gas generation, was controlled by either decreasing the flow rate throughthe cell or by the addition of anti-foam.
Current Efficiency for the Removal of COD
Calculations of current efficiency for the removal of COD are based on :
(i) Faradaya law i.e. a Faraday (F) of electricity produces a mole of electrons. Hence a mole ofelectrons would be transferred in producing 0,5 moles of chlorine or a mole of oxidising agent, whichis in turn equivalent to a removal of 0,5 moles of oxygen i.e. 8 g of COD;

(ii) the following relationship :
(iii)
f26.8
where A— current passed.h — hours.F — Faradays.
the ratio between the observed COD removal and the theoretical COD removal based on theelectricity consumed.
obsQnod COD removalcurrant o f fiaoncy (%) =
thQorgtical COD removalx 100
Initially current efficiency for the removal of COD was near 100 %. As the COD concentration in the effluentdecreased (i.e. as the COD removal increased), the resistance to oxidation increased with COD removal efficienciesdropping rapidly as illustrated in Figure 8.3.
100 -
90 -
70 -
60 -
50 -
4-0 -
3090
COD removed (%)
FIGURE 83 : CURRENT EFFICIENCY FOR THE REMOVAL OF COD AS AFUNCTION OF THE COD REMOVED
The pH range in which the effluent had to be maintained during electro-oxidation was 5,5 to 6,5. Figure 8.4shows the relationship between current efficiency and effluent pH at a fixed COD removal of 70 %. Figure 8.5shows the relationship between COD removal and effluent pH at a fixed current efficiency of 85 %. Figures

8-6
8.4 and 8.5 show that for high COD removals at high current efficiencies the pH should be maintained below7. During electro-oxidation the pH increases and additional electricity was consumed in producing chlorineto control the pH at the required value.
Colour Removal
Complete colour removal occurred at approximately pH 9 during chlorination of the effluent in the absorptioncolumn. Residual turbidity was eliminated during the initial stages of electro-oxidation, after which the effluentwas crystal clear.
Distribution of Chlorine Species
Figure 8.6 shows the distribution of chlorine species as a function of the amount of COD removed. Initiallychloride iona existed which were converted to hypochlorite/ hypochlorous acid on application of an electricpotential across the system. The hypochlorous acid (HCIO\ which is the oxidising agent predominates belowpH 7,8 (Figure 8.7). After the removal of approximately 90 % of the COD, chlorate ions (,Clo.) are produced :
(i) chemically by the reaction of hypochlorite ions and hypochlorous acid in a 1 : 2 ratio;
(ii) electrochemically by the anodic oxidation of hypochlorite ions.
The predominant chlorate formation mechanism depends on the pH of the solution. If the electric potentialis maintained across the solution after complete COD removal has been achieved, perchlorates (< 'O,) are formedat the expense of the other chlorine species.
oo
O
£•?
O
c4)
"o
renl
Cur
FIGURE HA
Qf. _
80 -J1
60 -
J
10 -
DEPESDESCE OF CURREST EFFICIESCYFIXED COD REMOVAL
OS EFFLUEST pH FOR A

90 -re
nt
uu
iO03
O
"em
oval
CO
D i
70
60
50
40
30
20
10
Effluent pH
FIGURE 8.5 : DEPENDENCE OF COD REMOVAL ON EFFLUENT pH FOR A FIXEDCURRENT EFFICIENCY
0,9 -
0.8 -
0,7 -
0,6 -
0,5 -
0,4 -
0,3 -
0,2 -
0.1 -
0
Cl
20 40 60
COD removal {%)
FIGURE 8.6 : DISTRIBUTION OF CHLORINE SPECIES AS A FUNCTION OF CODREMOVAL

FIGl 7 RE
s
o
o
o
8.7
0.7 -
2.6 -
0.4 -
0,3 -
0,2 -
: • , : -
. ' 01ST RI BO TIOS OF mii
\ /\ j
ii \
i \i \\! \
pH
'POCHLOROUSITH pH
1 j
ACID ASD
-
HYPOCHLORITE
8.5
Power Consumption
The power consumption per kg of COD removed is plotted in Figure 8.8 as a function of the fraction of thetotal COD removed. Chlorination, during which the specific power consumption was below 2 kWh/kg CODremoved, oxidised the most easily oxidised COD in the effluent and removed the colour. The specific powerrequirement for COD removal increased sharply as the total amount of COD remaining in solution decreased.All the turbidity was removed at a cumulative specific power consumption of 17 kWh/kg COD. In the casewhere total COD removal was achieved the specific power consumption was nearly 70 kWh/kg COD.
Thus three scenarios are possible :
colour removal,turbidity removal,total COD removal.
The specific power requirements are dependent on the scenario chosen and increase rapidly as greater CODremovals are required.
DESIGN CONSIDERATIONS
In summary, electro-oxidation may be used in the treatment of strong scouring effluent
when the discharge of colour and COD from the factory is a problem. This process :
(i) requires filtration to effect lint removal,

8-9
*
(ii) removes all the colour and turbidity from the effluent,
(iii) allows the degree of COD removal to be varied,
(iv) neutralises the effluent to produce a colourless, slightly acidic, brine solution.This solution may be reused as low quality water in processes such as bleaching,mercerising or scouring or may be treated and used in the electrolytic generationof chlorine for the neutralisation/chlorination stage.
QO
coQ_
£I/)
CD
OQ_
"D
70 -
60 -
50 -
40 -
30 -
20 ~
10 -
o -
Chi on notion(colourremoval)
Electrc —oxidation(turbidityremoval)
Electro-oxidation(final CODremoval)
11
/
l
20 40 60
COD removal (%
80 00
FIGURE 8.8 : CUMULATIVE POWER CONSUMPTION (ELECTROCHEMICALMEMBRANE AND ELECTRO-OXIDATION CELLS) AS A FUNCTION OF COD
REMOVED FROM THE EFFLUENT
In the design of an electro-oxidation plant for the treatment of strong scouring effluentconsideration must be given to :
8-10
(i) minimising foaming by employing suitable pumps and pipework to preventcavitation, by enabling efficient release of evolved gases and by the additionof anti-foam,
(ii) the provision of cooling facilities to ensure maximum production of hypochloriteand hvpochlorous acid and to minimise the chemical conversion of these speciesto chlorate ions,
(iii) pH control to ensure that hypochlorous acid predominates over the hypochloritespecies. Hypochlorous acid is the oxidising agent and the anodic oxidationof hypochlorite to form chlorates occurs at high hypochlorite ion concentrations,
(iv) efficient mass transfer at the anode to ensure that the oxidation of chlorideions to chlorine predominates over the oxidation of water with the evolutionof oxygen. This is achieved by maintaining the current density below apredetermined level, dependent on the chloride concentration and a high fluidflow through the cell.
.5.1 Major Equipment
The flow diagram of the treatment sequence is given in Figure 8.9 and the majorequipment components are as follows :
Heat Exchanger
Heat exchangers are required to cool the liquor which circulates through the electro-oxidation cell to maintainits temperature below 20 ' C, thus minimising the loss of oxidising agent coiiouineu in Lliepiuuu^Liun uf ciiluniies.
Prefilter
Wedge-wire screens or cartridge filters are used for lint and particulate solids removal from the effluent priorto chlorination.
Storage Facilities
Storage facilities are required to smooth out variations in the flow of various streams. Where the storageequipment is exposed to oxidising solutions, it must be constructed from suitably resistant materials.
Chlorine Generator
Chlorine is required to neutralise the sodium hydroxide in the incoming scouring effluent and to maintain thepH of the circulating liquor at pH 5,5 to 6,5 (this requires an additional 5 % chlorine).
Chlorine is generated etectrolytically in an electrochemical membrane cell from sodium chloride using speciallydesigned units and a direct current (d.c.) power supply. Equipment manufacturers can supply packaged unitswith capacities which range from 0,01 to 24 t C^/d.
For a plant treating 4 m3/h of effluent containing 25 g/^NaOH (see Electro-oxidation below) the electrochemicalmembrane cell should be sized to produce 2,2 t
If chlorine is not generated on site, it may be purchased as a bulk chemical. On-site chlorine generation is,however, preferable since sodium hydroxide is produced simultaneously and may be used in processing.

Scour i Rinsing
-upNaOH
NaOHrecycle
Scouringeffluent
NaOHto scouring
Absorptioncolumn
Electro-chemicalmerntjf'in
cell
pSupply
NoClrecycle
brmerecycle
softeningsoda-l ime
ion — e*chonqt
Dilutionwater
Direction of cloth
Wedge—wire screen
Low—qualit1, s;rea™ fcrreuse in securing.bleaching or mercerising.
H., and CO,
Eleetro-Oxidatian
cell
impure make —upNaCI slurry
FIGURE 8.9 ; FLOW DIAGRAM OF THE TREATMENT SEQVESCE FOR THE
ELECTRO-OXIDATION OF STRONG SCOURING EFFLUENT
Absorption Unit
The absorption unit provides surface area for absorption of chlorine into the effluent. Chlorine gas is highlysoluble, undergoing rapid hydrolysis that accelerates the rate of absorption (66). Sophisticated mass transferequipment and excess gas recycle systems are not necessary.
pH Control systems must be installed to prevent excess chlorination of the effluent, at which stage chlorine isno longer absorbed.
Electro-oxidation Unit
The function of the electro-oxidation unit is to oxidise the chloride ions in the effluent to produce hypochlorousacid for the oxidation of organic material. The electro-oxidation stack is a standard unit supplied to complywith design specifications and consists of a series of undivided cells which may be electrically connected in eitherseries or in parallel. Different flow configurations are available.

The electrode area of each repeating unii varies depending on the manufacturer, but would be in the order of0,5 to 1 m2.
An example design is based on the following specification :
Scouring effluent flowScouring effluent COD concentrationScouring effluent Na concentrationScouring effluent NaOH concentrationProduct flowProduct COD concentration
4 m3/h25 g/£, highly coloured15g/£
4 m3/h
(i) 19 g/£ (colour removal)10 g/£ (colour and
turbidity removal)(87 % COD removal)
Product NaC! concentration 35 g/£.
Table 8.3 lists the estimated electro-oxidation plant size for the three cases (for current densities of 2 200 A/m~).
The cell frames and cell components are manufactured from materials resistant to oxidation by chlorine. Thecathodes are constructed from titanium, stainless ateel or any other suitable metal, while the anodes areconstructed from a material which possesses a low chlorine overpotential such as platinum group metal oxidecoated titanium.
TABLE 8.3ESTIMATED ELECTRO-OXIDATION PLANT SIZE
Current density = 2 200 A/m2
Design parameter
Colour removal
Turbidity removal
Further oxidation
COD removal
(%)
24
GO
S7
Current efficiency
(*)
Cell area(m2)
no electro-oxidation required
80
40
114
324
Regulated chlorine addition and pH control must be incorporated.
A reaction vessel is used to provide a residence time during which the hypochlorous acid oxidises the organicmaterial. The residence time will be determined by the COD removal requirement and should be 0,5 to 1 h.At high COD removals the oxidation reaction proceeds more slowly and longer residence times are required.
Power Requirements
Both the electrochemical membrane cell and the electro-oxidation unit must be connected to a d.c. power supply.
The combination of volt/current requirements will be a function of the configuration of the electrical connectionsof the electrochemical membrane and electro-oxidation stacks.
Rectifier control is important to prevent ripple effects which destroy the anode coating.

9-1
9 ELECTROCHEMICAL RECOVERY OF SODIUM HYDROXIDE
FROM STRONG COTTON AND POLYESTER/COTTON
SCOURING EFFLUENTS
9.1 INTRODUCTION
Strong scouring effluents are high in sodium ion concentration. In factories wherethe recovery of mercerising caustic is practiced, scouring effluents are a large contributorto the cationic load in the final factory discharge. The disposal of scouring effluentsis governed by effluent discharge regulations. Discharge to the sea or solar evaporationor irrigation is regarded as short-term measures.
Chapters 6 and 7 describe the treatment of strong scouring effluents by ultrafiltrationand electro-oxidation techniques. These techniques may be applied where the dischargeof COD is the major problem. Chapter 8 describes the evaporation and the reuse ofstrong scouring effluent to overcome the TDS problems associated with their discharge.In this system the water, the reusable chemicals and some of the impurities areconcentrated and recycled.
This chapter describes a treatment sequence which will enable the recovery of thesodium hydroxide for recycling to the scouring process.
The proposed treatment sequence is shown in Figure 9.1 and consists of :
(i) neutralisation with carbon dioxide to convert the sodium hydroxide to sodiumbicarbonate,
(ii) cross-flow microfiltration to remove suspended, colloidal and waxycontaminants from the neutralised effluent,
(iii) nanofiltration to separate the sodium bicarbonate from the soluble organic anddivalent metal contaminants,
(iv) electrochemical treatment in a membrane cell (Figure 9.2) to split the sodiumbicarbonate into sodium hydroxide, carbon dioxide and a dilute brine.
The pH dependence of the equilibrium which exists between the various forms ofinorganic carbon in solution (Figure 9.3) is used to ensure that the desired speciespredominates.
The treatment sequence produces :
(i) two concentrates containing organic material and divalent metal ions from thefiltration stages. These streams comprise up to 10 % of the initial volume ofthe scouring effluent treated,

9-2
—
1
Was
• iAbsorp
CQIU
CN ! J -
?
h , n - j
D'lut1? b r i i e ; c*-1 4 *n 7
i
vgcr^ic rr,a:«-,al
1
= • - , » =
: • =nS • : • : . -
1
JO ta 40 q/i r^rii".O_,
rr- , - r- t i ' ter— - NanoMter
1 1
'
T T
C'>n>:pnf3te f on-.en-.rctenf organic of organic mo tend
FIGURE 9.1 : TREATMENT SEQUESCE FOR THE RECOVERY AXDSTROXG COTTOX SCOURIXG EFFLUEXTS
RECYCLE OF
(ii) hydrogen and oxygen from the electrochemical unit,
(iii) a dilute brine from the anode compartment of the electrochemical unit whichcould be reused in the washing section of the scouring process,
(iv) a concentrated sodium hydroxide stream for recycling to the scouring process.
The results from the operation of a pilot plant for the electrochemical recovery ofchemicals and water from scouring effluent are summarised. The objectives of thetrials were to :
(i) assess the technical and economic feasibility of the treatment sequence for itsapplication to scouring effluents.
(ii) determine the purity and concentration at which the recovered products maybe produced,
(iii) determine the operating parameters of the treatment stages.

9-3
Dilute brinepH 7 to B
0,5 g/l NaHC
Recovered NoOH100 to 2D0 g/l
0 , onct
-
0c<
i
i
.
- oi-r—
o
k
Preheated scouring effluentpH 8.5. 20 to 30 g/ l NaHCO,
Anode reaction
Cathode reactionAnolyte reaction H' + //CO
H?+20H
H2CO3 <=>
FIGURE 9.2 : SCHEMATIC OF ELECTROCHEMICAL MEMBRANE CELL
(iv) determine the influence of the scouring effluent characteristics on the process,
(v) obtain data for the design of a full-scale plant.
92 MILL PROCESS AND EFFLUENT CHARACTERISATION
Pilot-plant trials were conducted at a textile mill processing woven cloth andpolyester/cotton blends. Scouring was achieved in an open-width Vaporloc machineusing a sodium hydroxide solution at 50 g/l for a fabric speed of 50 m./min. LufibrolTX112 (10 g/l) and Formosol (1 g/l) were also added to the saturator. A continuouscounter-current four-bowl washing range was employed with a wash-water flow rateof 4 to 5 m3/h. The wash water used was a mixture of mains water and effluent froma bleaching range at a volume ratio of 7 : 3. The effluent used in the pilot-plant trialswas collected from the first washing bowl of the range. A chemical analysis of thiseffluent is given in Table 9.1.

9-4
FIGURE
0.9 -
o s -
3.6 -
•J . -> '
3,4 -
0,3
9.3 .
H9 CO
DISTRIBUTION
\
I
1
OF
I
j \
i \\
INORGANIC
/
\ j
\ i
\ i
A/ \
CARBON
3
IN SOLUTION
A\ ERAGE COMPOSITION AFTER
Determinand
pHConductivityTSTCTICTOCC O DOH
co3HCO3
NaC a
M g
Note : CFMF
(mS/m)(s/t)(g/t)is/t)(g/t)is/t)[di)idl)is/1)is/L).(tng/£)(mg/£)
Raw scouring
effluent
13,56 400
22,0
4,0
0,3
3,7
8,3
4,12,6
0,0
8,445,0
7,0
TABLE 9.1
EACH STAGF
SEQUENCE
After
neutralisation
denotes cross-flow microfiltration
8,62 400
22,0
7,9
4,3
3,6
8,30
1,916,1
8,2
45,05,0
O F
After
CFMF
28,4
50020,0
7,6
4,6
3,0
5,30
2,0
16,58,8
3
2
THE SCOURING TREATMENT
After
NF
9,02 300
5,9
5,2
0,7
0,50
3,411,57 *"*2
1
and NF denotes nanofiltration.
After
brine
5,2200
0,5
0,40
0,4
0,50
0
00,3
2
1
electrolysis
NaOH
14,0
70,0
1,5
097,0
9.3 PILOT-PLANT DESCRIPTION
Flow diagrams of the individual unit processes of the pilot plant i.e. neutralisation,cross-flow microfiltration, nanofiltration and electrolysis are given in Figures 9.4 to9.7 respectively. A detailed design of the pilot plant is reported elsewhere (18).Table 9.2 contains the pilot-plant specification.

CO2 fromelectrochemical unit
T f
Feed
FIGURE 9.4 : FLOW DIAGRAM OF NEUTRALISATION UNIT
9-5
Manual addition ofprecoat Slurry
Dram
Cross-fio«~{PQ''r
recycle
T T I T
-k)
Per mijotunl-
FIGURE 9.5 : FLOW DIAGRAM OF CROSS-FLOW MICROFILTRATION UNIT

9-6
• \ u r i oT i i t e r
1Jcr™ic0t
tank
FIGURE 9.6 : FLOW DIAGRAM OF SANOFILTRATIOS UMT
powerSufif.1 v
T TB.p..
FIGURE 9.7 : FLOW DIAGRAM OF ELECTROCHEMICAL UNIT

9-7
The four stages of the pilot plant were designed for batch operation. Scouring effluentwas carbonated by circulation through the absorption column where it was contactedwith carbon dioxide generated in the electrolysis stage. The carbonated effluent wascirculated through the cross-flow microfilter tubes until the required degree of recoveryhad been achieved. The filtrate from the cross-flow microfilter was then circulatedthrough the spiral-wrap nanofiltration unit until the required degree of water recoveryhad been achieved. Finally, the permeate was treated in the electrochemical unit untilthe desired salt depletion was achieved.
9.4 PILOT PLANT EXPERIMENTAL PROCEDURE AND RESULTS
Detailed results of the pilot-plant investigation have been reported elsewhere (18).
The overall quality of the treated effluent and the recovered sodium hydroxide iscompared to the effluent in Table 9.1. The scouring effluent contained 10 to 20 g/tof sodium hydroxide and was contaminated by organic contaminants (10 g/£ COD) andcalcium and magnesium compounds (10 to 60 mg/£ in total).
The treatment sequence was designed to remove colour and impurities and to recoversodium hydroxide from the effluent.
The pretreatment stages neutralised the effluent and removed approximately 85 % ofthe COD, all the colour, 65 % of the organic impurities and calcium compounds and50 % of the magnesium compounds from the scouring effluent.
In the final stage the sodium hydroxide was recovered as a pure solution at a concentrationbetween 100 and 200 %/l. This stream was suitable for reuse in the scouring saturator.The depleted effluent contained low concentrations of TDS and was suitable for reusein the scouring washing range.
The performance of each of the unit operations is summarised in the following sections :
9.4.1 Neutralisation
The flow, f eand concentration, Ceof the effluent to the neutralisation unit is a function
of wash water and fabric characteristics as follows :
Fe-Fw-m,-m0 (9 .1)
m,C,- m0C0+ F u,CvC (9.2)
where F = flow (m3/h).
C = concentration (kg/m3).m= cloth moisture content (m3/t cloth).

9-8
and the subscripts are: u = wash water.e = effluent stream.i = drag-in stream.o= drag-out stream.
TABLE 9.2ELECTROCHEMICAL RECOVERY PILOT PLANT SPECIFICATTONS
Unit
Packed Column
Cross-flowmicrofilter
Nan of liter
Electrochemicalcell
Pilot plant
Parameter
Size: heightdiameter
Construction materialPackingFinal effluent pHEffluent flowPump
Tube size: diameterarea
Tube fibreTube velocityPumpOperating pressure
Membrane typeMembrane areaCartridge prefilterPumpOperating pressure
Cell pairsElectrode sizeAnode materialCathode materialFrame construction materialElectromembrane typePump typesElectrolyte flowElectrical requirements: volt
current density
Daily capacity
Specifications
1 000 mm150 mmPerspexPolyethylene saddles (25 mm length)8,510 £/minMagnetic coupled centrifugal
12 mm2,26 m2
Woven polyester2 to 3 m/sLow-pressure, high-flow positive displacement200 to 300 kPa
Spiral wrap NF'40 (FilmTec)0,56 m2
5 [Am string wound polyesterPositive displacement1,6 MPa
24 of 0,05 m2
DSAMild SteelPVCNafion 324 (du Pont)Magnetic coupled centrifugal10 to 15 £/minute4 to 10 V/cell pair300 to 3 000 A/m2
150 I effluent used to produce:3 kg NaOH (50 to 200 g/£)135 £ low quality water75 g (850 I) H2 gas600 g (420 I) O2 gas15 t concentrated impurities

9-9
The inorganic carbon balance across the electrochemical membrane cell and in theneutralising effluent indicated that carbon dioxide absorption was complete with nogas loss in the pH ranges 8,0 to 14,0.
Efficient recovery of sodium bicarbonate in the nanofiltration process could be achievedwhen the pH was lowered to between 8,0 and 8,5 where the bicarbonate ion was thepredominant inorganic carbon species (Figure 9.3).
9.4.2 Cross-flow Microfiltration
Cross-flow microfiltration removed the suspended, particulate and colloidal matter fromthe neutralised effluent. This included saponified waxes and pectins, lint and othercontaminants of the effluent. During the pilot plant study, the reduction incontamination averaged 40 % for COD, 10 % for TS and 50 % for calcium compounds.The optimum conditions for cross-flow microfiltration were :
feed velocity : 3,0 to 3,5 m/spressure : 300 kPaprecoat : limestone (15 /im) (100 g/m2).
Under these conditions calcium rejections were increased to above 90 % and fluxesaveraged 50 £/m2h at 20 °C. The method of application of the precoat was an importantfactor affecting the performance of the unit.
The most effective cleaning solution for the removal of waxy deposits on the surfaceof the cross-flow microfiltration tube was a solution containing 20 g/£ sodium hydroxideand 1 g/£ scouring detergent.
9.4.3 Nanofiltration
The nanofiltration membrane was a thin-film composite polysulphonate spiral wraptype which possessed the ability to exclude organic molecules with a molecular massabove 300 together with various inorganic species, the rejection of which was dependenton charge density. Ions of high-charge density such as carbonate, sulphate, calciumand magnesium are excluded while most monovalent ions such as sodium and bicarbonatepermeate through the membrane structure.
Control of the pH of the feed to the nanofilter was important to ensure that the sodiumpresent was predominantly associated with the monovalent bicarbonate species. In theform of sodium bicarbonate, the sodium could permeate the membrane and be separatedfrom the effluent contaminants. Since a significant portion of the ions in the effluentwere sodium and bicarbonate species, which permeated through the membrane, therewas a minimum osmotic pressure differential across the membrane and consequently ahigh flux could be obtained at a low pressure. In the pilot-plant study, nitric acidwas added to control the pH of the feed to the nanofiltration membrane at 8,0 to 8,5.This was necessary since the continued removal of bicarbonate ions in the permeatecaused an increase in the ratio of carbonate to bicarbonate in the feed, and the pH ofthe solution increased.

9-10
ihe reduction in effluent contaminants during nanofiltration averaged 90 % for CODand 50 % for calcium and magnesium compounds. In addition, all the residual colourwas removed.
Feed pH was a significant factor affecting the flux through the nanofiltration membrane.Average fluxes varied from 5 l/m2h (1 MPa, 25 °C) at pH 9,7 to 30 £/m2h (I MPa,25 °C) at pH 8,0.
Membrane cleaning was effected using scouring detergent.
In both cross-flow microfiltration and nanofiltration the concentrate and permeateflows (Fcand F p ) and compositions (Ccand C p ) are functions of water recovery, feedcharacteristics and the membrane point rejection performance. The followingrelationships hold :
F e ~ F f ( \ - R ) (9.3)
Fp = F f - F c ( 9 . 4 )
Cf(\ - ( 1 - £ ) ' ~ r )C P - — ~J —^ (9.5)
FrCf-F P.C,Cc=
f ' » ' (9.6)
where F = flow ''m^/hV
C = concentration (kg/m3VR = water recovery.r= membrane point rejection.
and subscripts c = concentrate stream.p = permeate stream./ = feed stream.
9.4.4 Electrochemical Membrane Cell Operation
The function of the electrochemical membrane cell was to split the sodium bicarbonateinto its acid and base components.
Current Efficiency and Power
The current efficiency, n , of a particular species is based on the charge passed during electrolysis and is givenby the equation :
moles of electrons used in forming productn= 'LJ- (9./)
total moles of electrons consumed
A mole of electrons is a Faraday, which is related to current and time by Faraday's Law.
current x timeFaraday = — — (9.8)
The power consumption is normally expressed in terms of kWh/t sodium hydroxide produced :

9-n
voltage* current x timePowQr~~ mass of XaOH ( 9 ' 9 ^
In calculating the electrical requirements of a system the current efficiency is taken into account :
mass of Na to bo trans ferredFaradays = (9.1 0)
23 y/mo/x current efficiency
Up to 100 % of the sodium present in the cell feed was recovered as sodium hydroxide. Current efficiency was
70 to 80 % and the power consumption was 3 500 to 4 000 kWh/t 100 % NaOH. The decomposition voltage
for the system was determined to be 2,7 V.
The current efficiency for sodium hydroxide recovery determines the plant size and the operational cost.
It is assumed that the two electrode reactions, the oxidation and the reduction of water, proceed at 100 %
current efficiency. Current inefficiencies for the recovery of sodium hydroxide occur as a result of :
(l) the passage of current through the membrane by cations other than sodium, in particular hydrogen
ions. This is minimised by :
operation of the unit such that the anolyte does not have a high hydrogen ion concentration.
ensuring that a sufficient supply of sodium ions is maintained at the membrane surface, by
controlling the electrolyte flow and the current density,
(U) the passage of current through the membrane by anions, in particular the back migration of hydroxide
ions. This is minimised by :
ensuring that the pH of the anolyte is maintained above 4,0,
ensuring that the sodium hydroxide concentration does not exceed the limit for a particular
membrane, above which the membrane loses its selectivity.
The operating parameters affecting the current efficiency and hence the specific power consumption of the
electrochemical unit were :
(i) the rate and uniformity of distribution of the flow of electrolyte, in particular the anolyte, through
the cell stack. Comparison of the individual cell volt drops served as an indication of the degree of
gas blinding or polarisation occurring within each cell of the stack.
Gas blinding of the membrane and electrode surfaces and splitting of water at the membrane surface
could be prevented by ensuring that sufficient flow of electrolyte was maintained through the system
and that the current density was maintained below the limiting current density.
Figure 9.8 shows the experimentally determined relationship between the anolyte flow rate (at
constant catholyte flow) and the volt drop across both cells and the cell stack. For the pilot plant,
the anolyte flow rate had to be maintained above 20 £/min to minimise the volt drop in the second
cell, thereby reducing the specific power requirements of the system.
(ii) the current density at which the system was operated. High current densities are desirable in that
the duty per unit area of cell increases, thus lowering plant siee requirements. The maximum current
density at which the system may operate efficiently is termed the limiting current density, which is
a function of the temperature and the concentration of the electrolytes, in particular the anolyte.
At current densities above the limiting value, the diffusive supply of sodium ions at the
electromembrane surface becomes insufficient for the transport of electric current. As a result, water
in the depleted layer is decomposed to hydroxide ions and hydrogen ions, and the electric current is
partially carried by hydrogen ions. This results in a loss in current efficiency.
The combination of the limiting current density and the current efficiency determines the eventual
membrane area requirements for a particular duty :

9-12
curront x tim.Q Ilimiting current density current efficiency
where the current required is a function of the amount of sodium to be recovered.
( 9 . 1 1 )
FIGURE 9.8
o
o
A
k
• • - • • -w
: RELATIONSHIP
5 ' 0 i'
BETWEEN ANOLYTEACROSS CELL
5! stG
A " "~
• "~
:,
•
.-r
-!!
20
RATE AND VOLT DROP
the temperature of the electrolytes. Elevated temperatures have a beneficial effect on the kineticsof all electrode processes, on the diffusion coefficients, the limiting current density and the rate ofthe chemical reactions. The pilot-plant study was conducted at temperatures ranging from ambientto 60 " C. Temperature has a significant effect on the cell volt components, in particular the voltdrop through the electrolytes. The cell voltage is the sum of the volt drops across the individualcomponents of the cell i.e. the decomposition voltage, the electrode polarisation and the ohmic dropsthrough the membrane and electrolytes.

9-13
The experimentally determined decomposition voltage for the system was 2,7 V. The membranevolt drop is dependent on the resistance of the membrane which is in turn a function of the currentdensity, the temperature and the ionic concentration of the solution inside the membrane. Theaverage experimentally determined membrane volt drop was 0,3 V.
For calculation purposes the cell potential, R,, can thus be taken as :
£ , - 2 . / + 0 . 3 + £ a + i:c ( 9 . 1 2 )
where E, and F.. are the anolyte and catholyte volt drops.
The volt drop through an electrolyte is a function of the resistance of that solution, which variesinversely with the concentration or more accurately the specific conductivity of the electrolyte.
The volt drop through an electrolyte, E, may be calculated from the equation :
E - ^ 1 (9.13)A .a
where A = conductivity(/= distance through electrolyte./ = current.ci= area.
Figures 9.9 and 9.10 give the relationships between the concentration and the conductivity of sodiumbicarbonate and sodium hydroxide solutions at various temperatures.
A relationahip was developed for predicting the conductivity of the anotyte solution at any temperatureand concentration :
Conductuitys.aliCOi-
[ ( 7 . 4 3 X "* 7 - 6 , 3 x 1O" 5 7" Z + 1 . 3 7 ) x r c m r ] +
[ ( - 1 , 0 6 x 1 0 " 3 7 + 2 . 0 6 x \0'bT2- 1 . / 8 x 1 0 " z ] +
[ O . l O 1 7 " - 2 . 8 x l 0 3 7 " 2 + 2 . 1 5 x l 0 ' 5 r 3 - 1 . 2 1 ] ( 9 - 1 4 )
Using equation 9.14 the anolyte conductivities during electrolysis may be calculated,
(iv) the interdependence of voltage, temperature, limiting current density and electrolyte conductivity.
The limiting current density, at a constant electrolyte flow, is a function of the conductivity of anelectrolyte, which is in turn dependent on the concentration and the temperature of the electrolyte.The experimentally determined ratio between the limiting current density and the conductivity ofthe anolyte was 2,6 x 10'** A/m- per mS/m. Using this ratio and knowing the conductivity, thelimiting current density for the electrolysis of pretreated scouring effluent may be predicted at anytemperature by the equation :
limiting current density = 2. 6 x 1 0 3 x conductnity (9 .15)
(v) the membrane and electrode condition. Deposits on or degradation of electrode and membranesurfaces will cause elevated voltages. This is prevented by :
routine acid flushing of the membrane surface, in particular the anode surface to remove deposits,
operation of the cell under conditions which prevent water splitting and back migration. Thesephenomena result in a high concentration of hydroxide ions in the vicinity of the anode surfaceof the membrane. The potential for precipitation and scale formation will exist in such an areaof alkalinity,

9-14
Con
duct
ivity
(n
FIGURE 9.9 :
1 :
i •
10
$
7
5
4
i
000-
ooc-ooo-iJOO
000-
oco-ooo-ooo000-
ooc-000-
0 H
c g
Conce"
4TIOXSHIP BET\YEE\AXD TEMPER ATURE OF SODIU
s o ' •: ^
s ,»'" "*" .-^^^"^
1 1 15 20 0 J-
troticn (g/l No)
' THE COSDUCTIVITY. COXCEXTRATIOX\f BICARBOXATE IX SOLUTIOX
1 AP
130
120
no
< 50
"i so^ 70
20
10
FIGURE
r. r, n
000 -
000 -
00', -
c o o M
coo -000 -
000 -
000 -
-'J'_
OGO -
ooo -
/ —
: 'oo :oo
9.10 ; RELATIOXSHIP BETWEEX THE COXDlCOXCEXTRATIOX AXD TEMPERATURE OF SODIUM H\
/.V SOLUTIOX
• • : ; ; :
1
— ^ — • — •
60" C
20^0 "
3:0
'DROXIDE

(vi)
9-15
maintaining correct flow conditions in the cell such that physical abrasion of the electrode surfacesby the membrane does not occur;
the pH and concentration of the anolyte. Under the pilot-plant conditions listed below :
anolyte pHcatholyte concentrationanolyte concentration
5 to 12.100 to 200 g/l NaOH.0,5 to 30 g/^Na.
back migration of sodium and hydroxide iona or transport of current by hydrogen ions accounted forthe 20 % loss in current efficiency of the process.
The pH of the final brine is a function of the degree of depletion of the effluent stream (Figure 9.11).At brine concentrations above 3 g/£ Na the evolution of carbon dioxide during electrolysis buffersthe pH; at low sodium concentrations the buffer capacity is reduced and the pH decreases steeply.
An
oly
te p
H
FIGURE 9
\ n —i1 U
9 -
8 -
7 -
6 -
5 -
4 -
3 -
2 -
11
m
• • "• • •
• ••
• •
• • •••
••
•••
•"i r™ ~ i 1 1
3 1 2 3 4 5
Anolyte i.oncenirjtion
RELATIONSHIP BETWEEN
PH
u
(g/i
THE
•
•
~i r r? 8 g
No)
ANOLYTE
n
m m
10 11 1 2
CONCENTRATION AND
Electrode and Electromembrane Life Expectancy
An anode coating life in excess of four years was predicted if mechanical abrasion by the electromembrane wasprevented.
No change in the resistance of the electromembrane was observed. However, a white deposit of calcium carbonateformed on the anode surface of the electromembrane. This precipitate formed in the areas where electrolyteflow distribution had been poor and localised polarisation resulted in rones of high pH at the surface of themembrane. This lowered the electromembrane area, adversely influencing current efficiencies. Theelectromembrane was descaled by contact with a 600 g/l solution of nitric acid (18,67,68). The currentefficiencies were restored to 100 %.

9-16
Water Transport Number
Water transport across ion-exchange membranes ia caused by hydrostatic and osmotic pressure differencesacross the membrane and by electro-osmosis during electrolysis.
The water transport number (n,) is the number of moles of water transported through the membrane per mole
of sodium ions and is a function of the anoiyte and catholyte concentration, in particular the former. Inelectro-osmosis, the water is transferred either as water of hydration of ions or by the momentum imparted to"free" water molecules by migrating hydrated ions. It is desirable to operate composite membranes at a lowwater transport number to prevent accumvilation of water and subsequent blistering within the membrane. Themembrane type used in the pilot plant trials was not a composite membrane.
The relationship between the anolyte sodium concentration and the water transport number is exponential andis shown in Figure 9 12. Regression of this curve gives the following relationship :
n u = 6 . S x 1 0 " V J + 6 . 6 x 1 0 t C 4 - 2 , 5 x \ 0 ~ 2 C A + Q . l C 2 - 3 . b C + 1 7 . 8 ( 9 . 1 6 )
where C ia the anolyte sodium concentration (g/£) andn, is in g water/g sodium.
• 1
FIGURE 9.12 : EFFECT OF ANOLYTE SODIUM CONCENTRATION OS WATERTRANSPORT NUMBER, tu

9-17
The transport of water from the anolyte to the catholyte during electrolysis dilutes the sodium hydroxide.
Sodium Recovery
The fraction of sodium which may be recovered from the scouring process is a function of the :
(i) drag-out on the fabric after rinsing,
(ii) water recovery achieved during cross-flow microfiltration,
(iii) water recovery achieved during nanofiltration,
(iv) degree of depletion of salt in the anolyte during electrolysis.
The fraction lost by drag-out is a function of sodium mass on the cloth entering and leaving the wash range :
m0Coloss by drag-out = ( 9 .17 )
The fraction lost in the cross-flow microfiltration and nanofiltration stages is a function of the mass in theconcentrate (C.f.)and the mass in the feed (C,F,):
[CCFC]loss in concQntralo = ( 9 .18 )
The fractional sodium hydroxide make-up to the system is equal to the sodium losses and is given by theequation :
loss by dray-out + loss in concontratos
C \ ' J
The make-up water requirement is equal to the water loss from the system.
The flow and concentration characteristics of the depleted brine and sodium hydroxide streams are given bythe following equations :
Nr- N,- A ' o - Nc- A'n (9.20)
Fr=NrXnul ( 9 . 2 1 )
A'rCr= •— (9.22)
F r
Fb = F f - FF (9.23)
„ F,C,-Nr(9.24)
Ft
Nb = Cb.Fb ( 9 . 2 5 )
where ,V — sodium mass flow, kg/h.F — flow, m^/h.C— concentration, kg/m^.
and the subscripts / = feed (anolyte) stream.r — recovered sodium hydroxide stream.6 — depleted brine stream.i — moisture of cloth into wash range.

9-18
o — moisture of cloth out of wash range.c— mass in croas-flow microfiltration concentrate.n = mass in nanofiltration concentrate.
and n. — water transport number (g water/g sodium).

10-1
10 DESIGN OF A PLANT FOR THE ELECTROCHEMICAL RECOVERY
OF STRONG COTTON AND POLYESTER/COTTON SCOURING
EFFLUENTS
10.1 INTRODUCTION
The installation of the electrochemical system described in Chapter 9 for the treatmentof textile scouring effluent for water and chemical reuse may be necessary for twomain reasons :
(i) compliance with effluent discharge regulations,
(ii) economic benefit.
The pilot-plant investigations have demonstrated the technical feasibility of the fourstage treatment system of neutralisation, cross-flow microfiltration, nanofiltration, andelectrochemical recovery to produce reusable water and sodium hydroxide.
A factory considering the implementation of a system for treating scouring effluentmust develop an overall chemical, water and effluent management strategy as outlinedin Chapter 4. In terms of scouring this includes :
(i) water, heat energy, chemical and effluent pollution load balances over the
scouring process,
(ii) identification of the minimum water quality requirements for scouring,
(iii) minimisation of water use during rinsing,
(iv) investigations into direct reuse of other factory effluents for rinsing e.g.bleaching effluent,
(v) minimisation of sodium hydroxide carry-over and maximisation of its removalfrom the cloth with minimal wash-water flow,
(vi) determination of the extent of the treatment/recycle programme necessary tomeet the particular requirements of the factory. Depending on various sitespecific factors, the extent and the type of purification of the scouring effluentwill vary from factory to factory,
(vii) development of a phased programme and a basis of decision-making (economics,reduction of water use, reduction of pollution load, elimination ofenvironmentally unacceptable chemicals).
The design details of a treatment plant are specific to each factory and depends onthe :
(i) particular characteristics of the factory's scouring process and of the cloth,
(ii) washer efficiency and water use,

(iii) purity of the rinse water,
(iv) efficacy of the individual units of the treatment process,
Chapter 11 examines the overall economics of the system. The present chapter considersa particular design example, in which the development of a treatment programme forthe electrochemical recovery of scouring effluent is described.
10.2 GENERAL CONSIDERATIONS
The electrochemical recovery of sodium hydroxide and water from scouring effluentsis detailed in Chapter 9. In summary, the following unit processes are required :
(i) an absorption column in which the scouring effluent is neutralised by contactwith carbon dioxide to produce an impure sodium bicarbonate solution,
(ii) a cross-flow microfilter in which the suspended, colloidal and particulate matteris removed from the neutralised effluent,
(iii) a nanofilter which separates the sodium bicarbonate salt from the soluble organicand other soluble inorganic contaminants of the neutralised effluent,
(iv) an electrochemical membrane cell stack in which the sodium bicarbonate isconverted into carbon dioxide and sodium hydroxide. This deionises theeffluent to produce reusable water and reusable chemicals (Figure 10.1).
Seal
Ln A •*•= in
FIGURE 10.1 : ELECTROCHEMICAL MEMBRAXE CELL (69

10-3
The area requirement of the electrochemical membrane cell stack depends on theconcentration of the anolyte which may be increased in one of the following processconfigurations :
(i) process configuration 1 : by the closed-loop recycle of rinse water with abackground concentration (Figure 10.2).
Make-up NoOH Moke —up watey g/ l Na as
—scaL"i"a
recovered NoOH100 to 200 g/ l
1
scouring effluentx + 10 g / l Na as NcOH and Na2C(>5pH 14
treatment process
10 g/l Na
1
dilute Drinez g/ l Na as NaHC03
organic and polyvalent ionconce.n:rc:'e, H2 and O2
FIGURE 10.2 ; PROCESS CONFIGURATION I
In this system a sodium bicarbonate solution is used to wash cotton fibre afterscouring, in place of mains water. Only the pick-up sodium, say 10 g/£, willbe recovered in the treatment process. Experimentally determined resultsindicated that the operation of such a recycle loop containing backgroundsodium would substantially decrease the required membrane area.
Where a background concentration is employed, two options for making upthe sodium short-fall exist :
1. sodium may be added to the washing section as sodium bicarbonate,
2. sodium may be added to the scouring section as sodium hydroxide.

10-4
(ii)
The option chosen will be primarily determined by the relative economics ofeach and will in turn determine the degree of depletion of the effluent in theelectrochemical unit. The design examples assume case (ii) above in whichelectrochemical depletion is achieved to the extent where the final effluentstream contains an equivalent amount of sodium required to yield a wash waterof the chosen background concentration after additional make-up of water.
process configuration 2 : by employing an evaporation stage as the first stepin the process, in which the effluent is concentrated and water is recovered(Figure 10.3). Preheating requirements for evaporation would be minimalsince the effluent is discharged at 95 to 100 °C. The anolyte would be depletedto a predetermined concentration and combined with the condensate, of a highvolume by comparison, for reuse as wash water.
Make-
—
1
up NCOH
--eccverec NcC"
MnKe—up wc'e '
I
T
- - - • ,
ii scouring 6
T
Lvapcro t ic"
; c a n c e n tr a
T
-erovers No.
ffluent
e
C--y.e o-ir.e
T
0' j'j"i<: and poiyvaient ionconcentrate. H2 and O2
FIGURE 10.3 : PROCESS CONFIGURATION 2
(iii) process configuration 3 : by employing a reverse osmosis stage to concentratethe cross-flow microfiitration permeate prior to nanofiltration. The reverseosmosis, nanofiltration and electrochemical stages would be operatedcontinuously in batch mode (Figure 10.4).

10-5
The advantages of options (ii) and (iii) over the background closed-loop system (i) isthat sodium loss from the system by carry-over on the washed cloth will be maintainedat lower levels since the wash water will contain lower ionic concentrations.
Make-up NaOH Make —up water
•• scounng
i
washing
recovered NaOH100 to 200 q/l
•• Direction of cloth
scouring effluent
dilute brine
rtreatment processconcentrates and
recovers Na
reverse osmosis permeate
organic and polyvalent ionconcentrate, H2 and O2
FIGURE 10.4 : PROCESS CONFIGURATION 3
In process configurations 1 and 2 the recycled wash water will have a residual sodiumcontent since the depleted brine from the electrochemical unit partially or completelyconstitutes the recycled water and there is a minimum practical limit to the degree ofdepletion which can be attained. Where an evaporator is used (process configuration 2)the depleted brine is combined with the low TDS evaporator condensate before recycleto the wash range and hence the residual sodium content in the wash water is lowerthan in process configuration 1.
In process configuration 3 the depleted brine stream is recycled within the treatmentsystem. The recycled wash water is reverse osmosis permeate which contains onlytrace amounts of sodium.
The design factors to be considered for the electrochemical recovery of sodium hydroxidefrom scouring effluents are :

10-6
process configuration selection,textile processing considerations,pretreatment requirements,scaling prevention,membrane selection and module arrangement.
10.2.1 Process Configuration Selection
Consideration must be given to the selection of either process configuration 1. 2 or 3.The selection depends on the individual factory's situation with regard to washingcharacteristics, effluent regulations and effluent reuse possibilities.
The incorporation of an evaporation stage into the process (process configuration 2)requires high capital expenditure. The advantages of evaporation over the use of abackground concentration wash water (process configuration 1) to maintain high currentdensities in the electrochemical unit are as follows :
(i) The conductivity of the wash water is reduced resulting in a smaller loss ofchemicals by drag-out on the cloth after washing. A larger fraction of the
spent chemicals can therefore be recovered,
(ii) Since chemical drag-out is reduced after washing, chemical carry-over into
subsequent wet preparation processes is lowered,
(iii) The volume of the effluent to be treated in the final four stages of the treatment
The implementation of reverse osmosis prior to nanofiltration (process configuration 3) :
(i) requires minimal additional capital expenditure since the reverse osmosis andnanofiltration membranes can be mounted in the same unit. One pump wouldbe required and nanofiltration would operate using the pressure remaining inthe feed after the reverse osmosis unit,
(ii) entails a concentration/recycle stage within the treatment process which isindependent of the scouring process i.e. high purity wash water will be recycledfrom the reverse osmosis unit,
(iii) results in a small loss of sodium from the system by drag-out. Thus a largerfraction of the sodium may be recovered.
The implications of producing a washed cloth with a high sodium loading, as wouldbe the case if the wash water contained significant amounts of sodium, must be assessedon the basis that the effluent from subsequent wet processes would contain proportionallyhigher amounts of sodium. The final option selected i.e. process configurations 1, 2or 3 should be such that the chemical nature of any effluents produced elsewhere inthe factory is not altered to such an extent that their present manner of dischargebecomes unacceptable.

10-7
10.2.2 Textile Processing Considerations
All nanofiltration and electrochemical membranes have pH and temperature limits,operation outside of which may permanently damage the membrane. Considerationshould also be given to the limits of the materials of construction of the plant.
Chemicals used during scouring should be tested for compatibility with the reverseosmosis, nanofiltration and electrochemical membranes. Chemicals such as solvents,chlorine and other oxidising agents, which will cause membrane damage are generallynot used in sodium hydroxide scouring. However, particular attention must be paidto :
(i) polymeric substances,
(ii) textile auxiliaries and detergents, in particular the cationic and non-ionictypes which may foul or damage the membranes,
(iii) sizing chemicals which must be removed efficiently during desizing. Thecarry-over of size into the scouring process results in a viscous scouringeffluent. This effluent is not easily pumped and causes blockages ofequipment.
10.2.3 Pretreatment Requirements
Screening to remove fibre and gross solids is essential to avoid pumping problems andblockage of the neutralisation unit. Other treatment considerations are flow balancing,pH control to suit the selected membranes, temperature, the removal of any chemicalswhich cause damage to the various membranes, the removal of colloidal and suspendedsolids for some module types of nanofiltration membranes and the removal of potentialscale-forming compounds.
The following chemical analysis should be carried out to characterise the scouringeffluent stream :
Temperature pHTotal dissolved solids ChlorideSuspended solids (>0,45 pm) SulphateSodium SilicaCalcium Carbonate
Magnesium HydroxideIron SolventsDetergent (all types)Organic chemicals which may be incompatible with the selected membranes.
Balancing is required to avoid wide fluctuations in the flow, temperature andconcentration of scouring effluent to the treatment plant.

10-8
Volume requirements depend on the production of scoured fabric and generally twoto six hours storage is adequate. Additional storage may be required to provide forplant maintenance.
Pretreatment requirements for the removal of colloidal and suspended solids prior toreverse osmosis and nanofiltration are module type dependent. In general, to avoidblockage :
hollow fine fibre modules require extensive filtration to 1 to 2 /im,spiral modules require extensive filtration to 5 to 10 |im,plate and frame modules require minimal filtration (100 pm),tubular modules require coarse screening for lint removal (500 /im).
Calcium and magnesium ions must be removed from the feed to the electrochemicalunit.
10.2.4 Scaling Prevention
Sparingly soluble compounds such as the carbonates, hydroxides and sulphates ofcalcium, magnesium, iron and aluminium in the absence of sequestrants will form scaleon the evaporator heat exchange surfaces and on the reverse osmosis, nanofiltrationand electrochemical membranes. The precipitation of these species is a complexfunction of composition, pH, temperature and the type of sequestrant present.Laboratory tests should be undertaken to access the different pretreatment methods(70).
10.2.5 Membrane Selection and Module Arrangement
The basis on which the cross-flow microfiltration precoat, the reverse osmosis, thenanofiltration and the electrochemical membranes are chosen depends on various factorsincluding :
(i) rejection and flux characteristics,
(ii) robustness,
(iii) compatibility with scouring chemicals and textile auxiliaries,
(iv) temperature,
(v) water recovery,
(vi) fouling and cleaning.
The concentration of the electrolyte streams in the electrochemical unit determines thechoice of electrochemical membrane.

10-9
10.3 DESIGN EXAMPLE
The design of an effluent treatment plant requires in-house plant management asdescribed in Chapter 4 as well as possible modifications to textile processing. Sincethe process is a closed-loop recycle system the treatment process must be integratedwith the factory operations.
10.3.1 Textile Process Modifications
A mill processing 30 to 40 million metres per annum of woven cotton and polyester/cottonis considered.
Scouring at the mill is achieved continuously in an open-width Vaporloc machine, usingan impregnation solution containing 50 g/£ sodium hydroxide and a sodium hydroxidereinforcement factor of four. The cloth speed is 50 m/min and the average cloth massis assumed to be 260 g/linear m. A four-bowl counter-current washing range wasused and had a specific water consumption of 6,5 £/kg cloth. The effluent wasproduced at 100 °C. One high-nip expression roller was installed after the finalwashing bowl resulting in a moisture content of 0,5 £/kg cloth. The moisture contentof the cloth after the other nip rollers averaged 0,8 £/kg cloth.
Washing theory (example 9, section 4.3.2), in combination with an experimental analysisof the washing range was used to :
(i) determine the washing parameter, k ,
(ii) predict the effect of the nip expression at each washing bowl on the finalwashing efficiency and on the effluent concentration,
(iii) predict the washing performance variation with specific water consumption,
(iv) determine the most suitable combination of washing variables for the givenapplication.
Following the washing analysis it was recommended that the roller before the washingrange be replaced with a high-expression nip roller, giving a system with two highexpression nip rollers.
For the four-bowl counter-current washing range, Figures 10.5 and 10.6 show thedependence of the washing efficiency and of the effluent concentration on the specificwash-water flow for the existing and recommended nip expression combinations. Atspecific water consumption above 1,5 £/kg cloth the relative improvement in washingefficiency with water flow is small and the concentration factor needed for sodiumhydroxide reuse is high.

10-10
90 -
53 -
> Rr.EX
o 40 -
30 -
20 -
10 -
(
!l! 1
I 17/i
FIGURE
•
Specif
10.5 :
— • • . — • -
* = 0/5
mO f*n 1
0.2 0,3
PREDICTED
:
0.30.5
Z 1
IV
. *. _ —
0,5O.S
i - g cictt*)
4SHIXG
—i :Lr—' *='*.-
0,50 5
EFFICIENCY
1
1 1 -1 -
1 1
<
O
j5 8 -
LJ fc -
J -
\\w
•
0
FIGURE
\
/
\
— _
• '_- ~=
'X
2
ioeilf'c *ct^r .:ors
: PREDICTED
- — • -
~~"~B - -
4
EFFLL TAT
- _ j_ j _. _ -,,-,
6 5
CO.VC£.\T^.47"/O.V

10-11
It was recommended that the specific water flow at the factory be reduced from 6,5 i/kgcloth to 1,5 t/kg cloth with a decrease of 3 % in the washing efficiency. The increasedcloth loading, from 0,1 to 0,7 g Na/kg cloth, was expected to have minimal effect onfinal cloth quality since the cloth was subsequently both bleached and mercerised.
Table 10.1 compares the washing variables of the existing process, the existing processat reduced water flow and the recommended process. At the expense of a small lossin washing efficiency the effluent concentration may be significantly decreased.
The recommended modifications amount to savings of 77 % of the water intake to thismachine, reducing the annual consumption from 38 000 m3 to approximately 8 000 m3.The modifications also provide an annual savings of approximately 80 t of 100 % sodiumhydroxide as well as savings in heat energy.
Washing variable
Specific wash-water flowNumber of high-expressionWashing efficiencyEffluent concentrationCloth chemical loadingEffluent chemical loading
TABLE 10.1
COMPARISON OF WASHING PROCESSES
{I/kg cloth)nips
{%)(g/l Na)(g Na/kg cloth)(g Na/kg cloth)
Existingprocess
6,5
1
99,83,4
0,1
22,9
Existing processreduced flow
1,5
1
96,712,40,8
22,2
Recommendedprocess
1.52
95,79,2
0,6
13,8
10.4 DESIGN OF THE TREATMENT PLANT
The three process configurations (section 10.2) are :
process configuration 1 : 4-stage process employing a wash water containing a
high level of sodium.
process configuration 2 : 5-stage process employing evaporation.
process configuration 3 : 5-stage process employing reverse osmosis.
The design basis for each case is given in Table 10.2 with reference to Figures 10.7,
10.8 and 10.9.
The specific design basis for the individual unit processes of the design example isdiscussed in the sections below.

10-12
DATA FOR THE DESIGN OF THESCOl
Determinand
1. Scourim variablesaverage cloth masscloth speed
production timemoisture content of cloth into wash rangemoisture content of washed clothsaturator concentrationwashing parameterspecific water usetotal wash-water flow
Generaleffluent total dissolved solidseffluent chemical oxygen demandeffluent calciumeffluent magnesium
Process configuration 1 (4-staire)background wash-water concentrationeffluent concentrationeffluent mass loadingwashing efficiency
TABLE 10.2ELECTROCHEMICALRING EFFLUENTS
(g/linear m)(m/min)(kg/h)
mim o
Ci
k
Q
Cq
C l
L1C1
Process confieuration 2 (5-staze with evaporation)effluent concentrationeffluent mass loadingwashing efficiencyrecycled wash-water concentration
C l
L1C1
Cq
Process configuration 3 (5-stage with reverse osmosis)effluent concentrationeffluent mass loadingwashing efficiencyrecycled wash-water concentration
C l
L1C1
Cq
TREATMENT OF STRONG
Value
260
50
780
20 h/d, 340 d/y0,5 £/kg cloth0,5 £/kg cloth50 g/l NaOH0,151,5 I/kg cloth1,17 m3/h24 m3/d
25 g/l
12 g/l
45 mg/£8 mg.'l
5 g/l Na12,6 g/£Na18,9 g/kg cloth79,0 %
9,7g/£Na14,6 g/kg cloth93,0 %0,8 g/l Na
9,2 g/£Na13,8 g/kg cloth95,7 %0 g/l Na
Standard membranes are available and have been assumed in the design where necessary.The standard sizes chosen are :
(i) cross-flow microfiltration tubes, each 25 mm in diameter and assembled in acurtain arrangement containing 31 tubes in parallel (surface area = 2,43 m2/linearm).

10-13
Direction of cloth
Cross —flowmicrofiHrotion
Permeate
L3
C3
4 O
luent LICl
Ni?u:ra'isation
Co Scounnq
tJanoliltrationPermeate
Wash water
QCq
Dilute brine
C7
L5
C5
.lectrochemicolecovery
ConcentrateL2C2
ConcentrateL4C4
Recovered NoOHL6C6
Make-upwater
U
FIGURE 10.7 ; PROCESS CONFIGURATION I: MASS BALANCE BASIS FORRECOVERY PROCESS USING BACKGROUND SODIUM CONCENTRATION
Co
E
n e e
r
Con
FIGURE 10.8 :RECO\
™n i . -
f luent
1
LICl
E vac oration
n;-oteLeCe
T
Neutralisation
LeCe
Cross-flowmicroBtration
i r
Condensate
Lc
Ce
PeriT.ea'.c
L3rjoncfiitraiio- Pe'mecte
Wa5n water0
Ma^e—up
water
Dilute brL7C7
E ' * C r « O ^ ' : E '
LJ | C5
1entrate Concentrate Reco
.2 L4C2 C 4
PROCESS CONFIGURATION 2: MAS'ERY PROCESS USING AN EVAPOR,
ne
vered NoOH6
.6
S BALANCE BASIS FORiTION STAGE

10-14
Ci
• -
;C
T
rCrW• : -
Recovered N.iO'L6C6
FIGURE 10.9 : PROCESS CONFIGURATION 3: MASS BALANCE BASIS FORRECOVERY PROCESS USING A REl'ERSE OSMOSIS
CONCENTRATION STAGE
Note on Figures 10.7 to 10.9 :
(i) / represents the flow of the streams in the treatment process (£/kg cloth).(ii) ^represents the wash-water flow to the scouring range (£/kg cloth).(iii) \l represents the make-up water {£/kg cloth).(iv) Crepresents the sodium ion concentration of the streams (g/£)-(v) m and .TI represent moisture content of the fabric (£/kg cloth).(vi) r and c represent the sodium ion concentration in the moisture or the fabric
(ii) spiral reverse osmosis and nanofiltration elements, each 100 mm in diameterand 1 000 mm in length (approximate membrane area = 6,5 m2). Elementsof 62 mm, 150 mm and 200 mm diameter are also available (approximatemembrane areas are 2. 13 and 26 m2 respectively).
(iii) electrochemical stack of individual cells in a plate and frame arrangement,
each cell containing 1 m2 of membrane area.
Ancillary requirements for the treatment plant would include :
(i) a pump sump within the factory,
(ii) pipeline and valves for transfer from the factory,
(iii) coarse screening to remove dirt, lint and gross suspended solids,
(iv) steam, electrical and water supplies,

10-15
(v) suitable housing facilities,
(vi) effluent handling during breakdowns,
(vii) drains.
10.5 SPECIFICATION OF EVAPORATOR
Evaporation for the concentration of scouring effluent in process configuration 2 isdiscussed in Chapter 7. Evaporators are purchased as unit items from a manufacturerwho will size and design the unit according to the effluent characteristics and thespecific evaporative requirements. In the design example a forced circulation systemis assumed, in which boiling does not occur on the heat exchange surfaces, thus loweringthe potential for scaling. Materials of construction are stainless or mild steel.
The specification of the evaporator is given in Table 10.3.
TABLE 10.3EVAPORATOR SPECIFICATION
Parameter
Evaporation factorFeed flowEvaporative capacityFeed concentrationConcentrate concentrationFeed temperature
(m3/h)(m3/h)(g/t Na)(g/f. Na)
(• c)
Value
4
1 20,9
9,7
38,895
Ancillary requirements for the evaporator include a centrifuge, preferably situated afterthe heat exchanger to remove suspended and colloidal matter from the concentrate.
The data in section 7.4.3. has been used to calculated the concentrate composition,
which is given in Table 10.4.
10.6 SPECIFICATIONS OF BATCH NEUTRALISING UNIT
10.6.1 Equipment
Table 10.5 gives a detailed list of equipment. Figure 10.10 gives the flow diagram ofthe neutralisation unit.
Due to the caustic nature of the effluent careful selection of materials of construction,
particularly for valves, seals and pump components is needed.

10-16
EVAPORATOR
Parameter
Evaporator concentrate f!
Centrifuge sludge flow
Centrate flow
Centrate composition;
Na
TDS
COD
Ca
Mg
TABLE 10.4CONCENTRATE
ow (m'/h'(m3/h)(m3/h)
tell)tell)(mg/0(mg/fl
COMPOSITION
Value
0,205
0,015
0,28
38,8
GG,5
32
128
27
TABLE 10.5
BATCH NEUTRALISATION EQUIPMENT REQUIREMENTS
1. Effluent transfer and storage
1.1 piping and valves for transfer to absorption unit.
1.2 feed tank.
1.3 product storage tank.
1.4 transfer piping and valves from the rtticulation tank to the column.
1.5 transfer piping for the oxygen and carbon dioxide from the electrochemical
1.6 transfer piping for make-up gases from waste flue gas emissions.
1.7 transfer piping to cross-flow microfittration unit.
2 i'acked bed absorber
2.1 packed column.
2.2 dispersed liquid inlet facilities and an off-gas vent at the top.
2 3 gas inlet facilities at the base.
3. Pumps
3.1 pump for effluent transfer from the factory.
3.2 low-pressure pump for recirculatioti through the packed bed.
3.3 low-pressure pump for transfer to the cross-flow microfilter.
4. Controls
4 1 flnw and pressure mtaiiirement.
4.2 pH control during batch carbonation
4.3 pump motors, starters and interlocks.
4.4 level sensors and low-level alarm.
4 5 malfunction control interlocks.
4.6 interlock with electrochemical cell.
5. Ancillaries
5.1 heat exchanger on effluent feed line to cool effluent to 35 ' C.
5 1 suitable break tank between electrochemical cell and absorption tank.

10-17
Process configuration 2 (witn evaporator) Process configuration 1 and 3
Evaporatorconcentrate
Sludg?
To cross-flowrnicrofiitration
J5%|
Centrifuge
Feedtan*
Feedrecycle
Packedcolumn
Flowcontroller
Productstorage
tan I'
Neutralisedbleed
pH controller
bcouring effluent
Off -gas vent
Gas from electrochemicc ;
unit and flue gas source
FIGURE 10.10 : FLOW DIAGRAM OF BATCH NEUTRALISATION UNIT
The residence time is controlled by a flow control valve. A pH controller on thereturn line controls the bleed from the system to the cross-flow microfiltration unitand prevents over-neutralisation, at which stage carbon dioxide is no longer absorbed.
Control instrumentation for temperatures and tank levels are required. Sampling ports
should be provided.
The carbon dioxide for neutralisation is evolved in the electrochemical unit, whichoperates in a batch mode and hence the rate of neutralisation will be dependent on theoperation of the electrochemical unit.
The effluent storage and sump facilities should provide approximately 6 to 12 h storageto provide for minor breakdowns and maintenance. The feed tank to the absorptioncolumn must accommodate the batch requirements of the treatment system.
10.6.2 Sizine of Neutralisation Unit
Carbon dioxide undergoes hydrolysis in sodium hydroxide solutions to form varioussoluble anions. Because efficient transfer occurs, specially designed gas transfer
10-18
facilities and off-gas recycle systems are not necessary. With proper mixing andadequate gas dispersion, complete absorption is achieved and minimum retention timewithin the vessel is required. The oxygen associated with the carbon dioxide is vented.
To avoid excessive pressures in the electrochemical cell the pressure drop in the absorbershould be taken into account in the sizing of the neutralisation unit.
For the design basis in Table 10.3 approximately 19 kg of sodium hydroxide (474 mol)must be neutralised per hour in either 1.17 m3, h or 0,28 m3/h of effluent (dependenton the option chosen i.e. 4-stage or 5-stage treatment). An equivalent amount of 475mol/h of carbon dioxide would be required to transform the sodium hydroxide tosodium bicarbonate. For start-up purposes and in order to compensate for losses ofinorganic carbon species from the system, a carbon dioxide make-up stream must beprovided. The flue gas from LPG fired equipment is a clean and convenient sourceof carbon dioxide.
10.7 SPECIFICATION OF BATCH CROSS-FLOW MICROFILTRATION UNIT
10.7.1 Equipment
Table 10.6 gives a detailed list of the equipment requirements.
The neutralised effluent is not corrosive to most materials of construction.
Three main types of pumps are available : multi-stage centrifugal, high-speedcentrifugal and positive displacement. Pumping duties are 500 to 600 kPa for thetubular cross-flow microfiltration membranes. The temperature of the neutralisedeffluent would be in the range of 30 to 40 °C.
The detrimental effect of pump vibration on the system must be considered.
The process control system is dependent on the module type and pump. In general,the process is required to produce a predetermined water recovery in a batch mode(Figure 10.11).
For a centrifugal pressure pump, the normal control arrangement is a flow control \ aheor a back pressure \al\e on the reject line.
For a positive displacement pump, discharge flow is not a function of the dischargepressure and the control system is a flow controller on the reject line (this alters thesystem pressure to compensate for changes in flux) and a high-pressure alarm or apressure relief valve on the pump discharge (to protect the cross-flow microfiltrationmodule).
Effluent, product and concentrate storage of the duration of a batch is necessary toprovide for microfilter cleaning, minor breakdowns and maintenance.

10-19
TABLE 10.6BATCH CROSS-FLOW MICROFILTRATION EQUIPMENT REQUIREMENTS
1. Effluent transfer and storage
1.1 two feed tanks.
1.2 concentrate storage tank.
1.3 precoat slurry and cleaning chemicals recirculation and storage tanks.
1.4 product storage tank.
1.5 transfer piping and valves for effluent transfer from neutralisation.
1.6 transfer piping and valves for feed reticulation in the cross-flow microfiltration unit.
1.7 transfer piping and valves for final concentrate storage and disposal.
1.8 transfer piping and valves for product to the nanofiltration unit.
1.9 transfer piping for waste flue gas addition to the system.
2. Cross-flow microfiltration modules
2.1 tubular curtains and assemblies.
2.2 module racks/hangers.
2.3 piping and valves for feed, final concentrate and permeate.
2.4 collection tray for permeate.
3. Pumps
3.1 high-flow pump for recirculation of feed through modules and for precoating and cleaning.
3.2 pumps for transfer of final concentrate and product (permeate).
3.3 flow and pressure measurement, indication and control of all streams.
4. Controls
4.1 pump motors, starters and interlocks.
4.2 feed recycle from controller.
4.3 permeate flow measurement.
4.4 high- and low-pressure alarms.
4.5 low-flow alarm.
4.6 permeate turbidity measurement and high alarm.
4.7 malfunction and alarm control interlocks.
4.8 pH control of feed to ensure maintenance of desired equilibrium-
4.9 control panel.
5. Ancillaries
5.1 on-line cooling of recycled streams to maintain feed temperatures of 35 ° C.
5.2 sampling ports.
10.7.2 Sizing of the Cross-flow Microfiltration Unit
Although several types of microfilter are available, good results were obtained duringthe pilot investigations (Chapter 9) using woven tubular polyester units. These areconsidered in the design example.
The pressure limitation of the tubular system is 600 kPa and a design pressure drop of400 kPa has been used. During the pilot investigations, tube velocities in the range2,5 to 3 m/s gave good fluxes on a limestone (15 ^m) precoated tube. Fouling bysolids on the tube was minimal.

10-20
T T T T
* u ' 1. 11; i ' y
, • l i r O i > - r
t Fount W.I I tLOW DIAGRAM ut BAicH LROS$-FLOV\' MICRGFiLi RAi IGS
Table 10.7 gives the design specifications for both the 4- and 5- stage treatment plantsin the design example with reference to Figures 10.6. 10.7 and 10.8.
Parameter
Feed flow:
TABLE 10.7
BATCH CROSS-FLOW MICROFILTER
dailyhourlyspecific LI
Feed sodium concentration ClTube diameterTube velocityDesign fluxTemperature
(n.3)(m3)
{t/kg cloth)
is/l)(mm)(m/s)(£/m2h)C C)
Processconfiguration 1
(4-stage)
241,171,5
12,625
2.5 to 34535
SPECIFICATION
Processconfiguration 2(5-stage withevaporator)
6
0,280,3G
38,825
2,5 to 320
35
Processconfiguration 3(5-stage with
reverse osmosis)
24
1,17
1,5
9,2
25
2,5 to 345

10-21
The pressure drop/velocity correlation for water, assuming an absolute roughness factorof 0,5 mm and 25 mm diameter tubes, is :
AP = 0 , 9 3 VZLF
where APis the pressure drop measured in kPa at ambient temperature, LF is the length
in m, and I is the velocity in m/s.
For a limestone precoat experimental results (18) suggest that
(i) at constant velocity, the flux is independent of pressure above values of 250 kPa,
(ii) at constant pressure, flux is proportional to velocity.
The membrane area of a 25 mm diameter tube is 0,0785 m2 per m of length.
The allowable lengths per parallel pass, from pressure drop considerations, for the range
of velocities are :
Velocity 2,5 m/s
400 kPa
'" (0-93 kP(ts2/m3)(2,5 m/s)2
= 69 m
Velocity 3,0 m/s
400 kPa
" ( 0 , 9 3 kP(ts2/m3)(3,0 m/s)2
= 48 m
The velocity down the tube drops below the entrance velocity due to permeation of
liquid through the tube.
The pressure drop depends on several factors including temperature and solidsconcentration. For the design example, a linear length of tube is assumed to be 60 m,which will provide for an exit velocity of 2,5 m/s. Table 10.8 summarises the designcalculations.
Since the water recovery of each length is a function of the inlet velocity and theproduction rate, the water recovery will increase at higher production rates and lowerinlet velocities.

10-22
TABLE 10.8SIMMARY OF CROSS-FLOW MICROFILTER
Design parameter
Membrane area1
Total tube length2
Tube length/pass3
Production rate/pass^Flow in/pass^Flow out/pass''Water recovery/pass'
Note:
1 (flow (£/h)) x (flux (£/m2h))2 (membrane area (rn2)) x (0,0'3 calculated in text.4 (length per pass (60 m)) x (05 given.6 (flow in) - (product rate).' (production rate) - (flow in).
(m2)(m)
(m)
(t/h)(mS/h)(m3/h)
(%)
785 ir.2/m of tube).
0785 m2/m of tube
2
26
331
60
212
5,3
5,1
4
1 x (flux (c/
DESIGN CALCl'1-ATIONS
Process configuration
2
14
178
60
94
5,3
5,2
2
n-h))
3
26
331
60
212
5,3
5,1
4
10.7.3 Design Configuration
Several design configurations are possible and these are :
(i) batch concentration,(ii) continuous feed and bleed,(iii) series taper.
For the present application the batch concentration configuration is described.
This is the simplest configuration but requires at least two batch storage tanks. Figure10.11 is a flow diagram of this system.
The number of parallel tubes, at 60 m per pass, required for a total tube length of :
331 m is 6 (process configurations 1 and 3).178 m is 3 (process configuration 2).
The pump flow required for an inlet tube velocity of 3 m/s and for 6 and 3 passes is32 m3./h and 16 m 3 h respectively.
The water recovery is set by the difference in tank levels at the start and end of each
batch. The concentrate is discharged on completion of the batch.
10.7.4 Overall Performance : Cross-flow Microfiltralion
The overall performance of the cross-flow microfiltration unit is given in Table 10.9.

10-23
TABLE 10.9OVERALL PERFORMANCE OF CROSS-FLOW MICROFILTRATION UNIT
Parameter
Feed flow (m3/h)
Feed COD (g/£)
Feed Ca (mg/l)
Feed Mg (mg/2)
Design COD rejection (%)
Design Ca rejection (%)
Design Mg rejection (%)
Design Na rejection (%)
Water recovery (%)
Product (m3/d)
Reject (m3/d)
Product COD (g/t)
Product Ca (mg/£)Product Mg (mg/f)Product Na (g/t)
Reject COD (g/l)Reject Na (mg/i)Reject Mg (mg/f)Reject Na (gft)
Process configuration 1(4-stage)
1,17124584090400
90
21,062,34
8,110,05,4
12,6
4736031
12,6
95
22,231,17
10,012,06,3
12,6
5061040
12,6
98
22,930,47
10,615,0
7,112,6
781 445
5012,6
Process configuration 2(5-stage withevaporator)
0,2832128274595500
90
5,040,56
20,712,516,638,8
1331 168
12038,8
95
5,320,28
26,216,919,938,8
1402 240
16138,8
98
5,490,11
28,322,222,738,8
2155 410
24038,8
Process configuration 3(5-stage with reverse
osmosis)
1,17124584090400
90
21,062,34
8,110,05,49,2
4736031
9,2
95
22,231,17
10,012,06,39,2
50660409,2
98
22,930,47
10,615,07,19,2
781 445
509,2
10.8 SPECIFICATION OF THE BATCH NANOFILTRATION UNIT
(PROCESS CONFIGURATIONS 1 AND 2)
10.8.1 Equipment
Table 10.10 gives a detailed list of equipment requirements. Figure 10.12 gives thelayout of the nanofiltration unit.
The cross-flow microfiltration product is neither abrasive nor corrosive to most materialsof construction.
The comments made in section 10.7.1 apply regarding pumps, control systems andstorage. Pressure pumping duties are about 1,6 MPa for nanofiltration membranes.The temperature of the effluent will be maintained at 35 °C by a cooling system onthe recycle line. During the course of the concentration the pH of the feed willincrease, hence acid addition (flue gas or nitric acid) is required.

10-24
TABLE 10.10BATCH NANOFILTRATION EQUIPMENT REQUIREMENTS
1. Effluent Transfer and Storage
1.1 feed tank.
1.2 trial concentrate storage tank.
1.3 product storage tank.
1.4 cleaning solution tank.
1.5 transfer piping for effluent from cross-flow microfiltration.
1.6 transfer piping for feed reticulation in the nanofiltration unit.
1.7 transfer piping to concentrate storage and disposal.
1.8 transfer piping for product to electrochemical recovery.
1.9 transfer piping for flue gas addition to the system to
maintain the desired equilibrium position.
2. Nanofiltration Modules
2.1 cartridge filters and associated pressure controller and control interlock.
2.2 membrane elements and assemblies.
2.3 module housings and racks.
2.4 piping and valves for feed, final concentrate and permeate
3. Pumps
3.1 high-pressure pump for recirculation of effluent and cleaning
solutions through modules.
3.2 pump for transfer of final concentrate to discharge.
3 3 pump for transfer of product to electrochemical recovery
3.4 flow and pressure measurement, indication and control of all streams.
4. Control
4.1 pump motors, starters and interlocks.
4.2 feed recycle flow controller.
4.3 permeate flow measurement.
4.4 high- and low-pressure alarms.
4.5 low-flux alarm.
4.6 permeate colour measurement and high alarm.
4.7 malfunction and alarm control interlocks.
4.8 pH controller on feed line.
4.9 control panel.
5. Ancillaries
5.1 on-line cooling facilities to maintain recycled feed at 35 to 40 C.
5.2 sampling port
Although various membrane configurations are available the design method for thenanofiltration unit is outlined using spiral-wrap membranes as the module type. Thedesign specification is given in Table 10.11. A cross-flow microfiltration water recoveryof 95 % is assumed.

10-25
ischorge | Concentratestorage
Feed from cross—flo*microfiltrotion unit
Feedtank
T iFeedtank
: recycle
Cieaninctank
pHcontroller
Nanofiltration-nodules
Reject
Pretilter Permeate
Productstorage tank To electrochemical
unit
FIGURE 10.12 : FLOW DIAGRAM OF BATCH NANOFILTRATION UNIT
Parameter
Feed flow
Feed sodium contentFeed pHMembrane element areaDesign fluxPressureTemperature
BATCH
dailyhourlyspecific
TABLE 10.11
NANOFILTRATION SPECIFICATION
(m3)
(m3)L3 (//kg)C3 (g/£)
(m2)
(£/m2h)(MPa)
CC)
Processconfiguration 1
(4-stage)
22,21,111,4312,6
8
6,5
43
1,6
35
Processconfiguration 2
(5-stage withevaporator)
5,320,270,3438,8
8
6,5 and 232
1,6
35

10-26
The relationship between membrane flux and the major operating variables is :
./ = A(P- An)
where A is the membrane permeability and is a product of the design membrane
permeability (£/m2h.MPa) and the temperature correction factor,<1.03(T-25 -C)K
P is the pressure differential across the membrane (MPa). and
An is the osmotic pressure differential across the membrane (MPa).
If the pressure of the permeate is assumed to be zero, then P is equal to the average
of the inlet and outlet pressures of each element.
The concentration of ionised species in the feed is an important flux design parameterin any membrane process because of its relationship with osmotic pressure. The majorions present during nanofiltration will be sodium and bicarbonate which are not rejectedby the nanofiltration membrane. The osmotic pressure differential across the membranewill be a function of the osmotic pressure of the rejected organic ions and the divalentions. This will be minimal and flux decline as a result of increased osmotic pressuredifferentials will be insignificant.
The maximum achievable water recovery is a function of the applied pressure and theosmotic pressure differential across the membrane, which is in turn a function of therejection characteristics of the membrane for the ionised species. Since most of theionised species permeate the nanofiltration membrane in [he present application, highwater recoveries can be achieved.
10.8.2 Sizing of the Nanofiltration I'nit
For the design example the inlet pressure is below the maximum pressure of themembrane to accommodate flux decline during the life-time of the membrane.
In the pilot plant investigations (Chapter 9) the membrane permeability of the nanofilterfeed at pH 8 was 20 t'm-h.MPa at 25 °C. Considering the effects of increased TDSon membrane permeability (71) a value of 15 rm3h.MPa at 25 °C has been predictedfor nanofiltration of cross-flow microfilter product from process configuration 2 whereevaporation has been used. These values are specific to the membrane used and tothe feed pH. Other membranes and different feed pH values will result in differentpermeability characteristics.
The membrane area requirements are calculated from the membrane permeability usingthe temperature correction factor :
Process configuration 1
1 1 1 0 l/h 7
2 6WombrariQ aroti =-\? l/m'-h
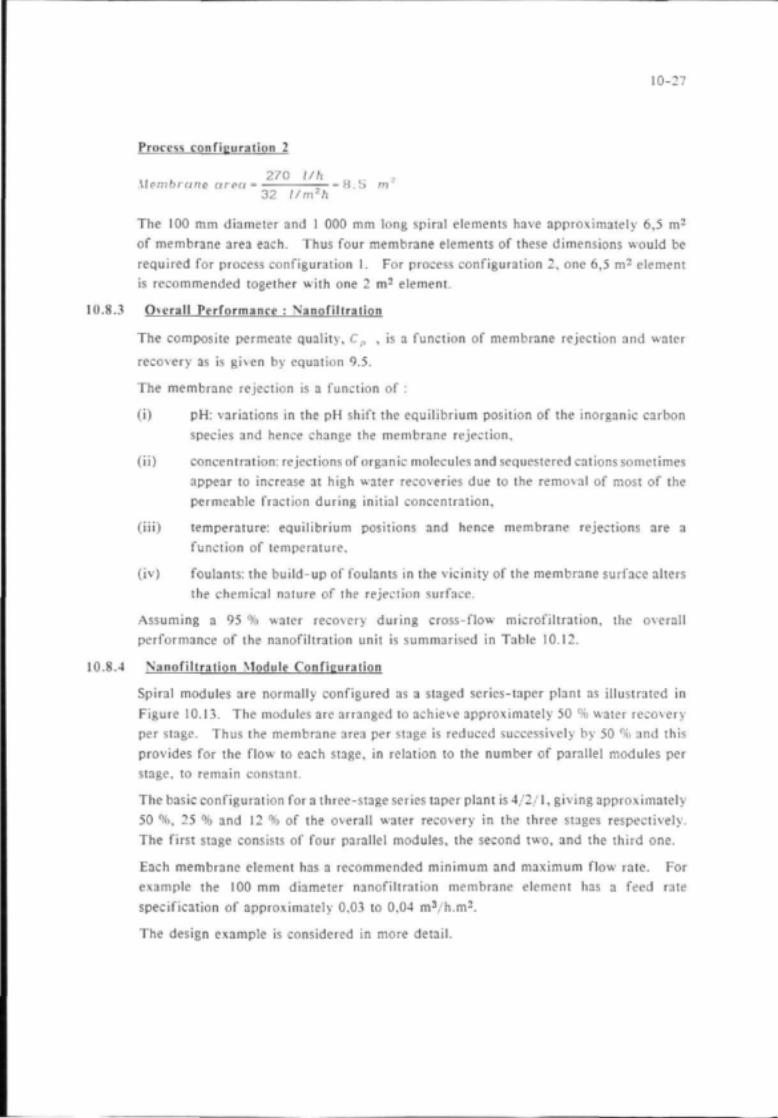
10-
Process configuration 2
270 l/h 7Membrane area = = 8,5 m32 l/m2h
The 100 mm diameter and 1 000 mm long spiral elements have approximately 6,5 m2
of membrane area each. Thus four membrane elements of these dimensions would berequired for process configuration 1. For process configuration 2, one 6,5 m2 elementis recommended together with one 2 m2 element.
10.8.3 Overall Performance : Nanofillration
The composite permeate quality, C p , is a function of membrane rejection and water
recovery as is given by equation 9.5.
The membrane rejection is a function of :
(i) pH: variations in the pH shift the equilibrium position of the inorganic carbonspecies and hence change the membrane rejection,
(ii) concentration: rejections of organic molecules and sequestered cations sometimesappear to increase at high water recoveries due to the removal of most of thepermeable fraction during initial concentration,
(iii) temperature: equilibrium positions and hence membrane rejections are afunction of temperature,
(iv) foulants: the build-up of foulants in the vicinity of the membrane surface altersthe chemical nature of the rejection surface.
Assuming a 95 % water recovery during cross-flow microfiltration, the overallperformance of the nanofiltration unit is summarised in Table 10.12.
10.8.4 Nanofiltration Module Configuration
Spiral modules are normally configured as a staged series-taper plant as illustrated inFigure 10.13. The modules are arranged to achieve approximately 50 % water recoveryper stage. Thus the membrane area per stage is reduced successively by 50 % and thisprovides for the flow to each stage, in relation to the number of parallel modules perstage, to remain constant.
The basic configuration for a three-stage series taper plant is 4/2/1, giving approximately50 %, 25 % and 12 % of the overall water recovery in the three stages respectively.The first stage consists of four parallel modules, the second two, and the third one.
Each membrane element has a recommended minimum and maximum flow rate. Forexample the 100 mm diameter nanofiltration membrane element has a feed ratespecification of approximately 0,03 to 0,04 ms/h.m2.
The design example is considered in more detail.

10-28
TABLE 10.12OVERALL PERFORMANCE OF NANOFILTRATION UNIT
Parameter
Feed flow (m3/h)
Feed COD (g/g.)
Feed Na {g/g)
Feed Ca (mg/^)
Feed Mg (mg/t)
Design COD rejection (%)
Design Na rejection (%)
Design Ca rejection (%)
Design Mg rejection {%)
Water recovery (%}
Product (m3/d)
Reject (m3/d)
Product COD [g/l)
Product Na (K/^)
Product Ca (mg/t)
Product Mg (mg/£)
Reject COD [g/t]
Reject Na [g/l]
F-j«.<^ C a (meft)
Reject Mg (mg/t)
Process configuration 1
(4-stage)
1,11
10,0
12,6
12,0
6,3
97
15
80
70
90
20,00
2,23
0,6
9,7
4,0
2,8
94
39
83
38
95
21,12
1,11
0,8
11,0
5,1
3,5
185
43
143
60
98
21,79
0,44
0,1
11,9
6,4
4,3
500
44
288
105
Process configuration 2
(5-stage with evaporator)
0,27
26,2
38,8
16,9
19,9
97
15
80
70
90
4,79
0,53
1,6
30,0
5,6
8,8
252
125
121
122
95
5,05
0,27
2,1
34,0
7,2
11,2
483
142
202
187
58
5,21
0,11
2,9
36,7
9,0
13,5
1 144
171
401
333
Process configuration 1 : 4-stage
The design feed flow is 1,1 m^/h and four spiral elements of 100 mm diameter were required. A 3/1 configuration
is closest to the basic configuration above.
This is a two-stage plant and the flow to each parallel element in the first stage will be 1,1 / 3 = 0,37 m**/h,
which is within the manufacturer's specification.
A design calculation has to be carried out for each element in the system to assess flow specifications and to
allow for module pressure drop.
Allowable water recovery is determined by the flow requirements of the last element of the system. In the
design case, the minimum is 0,2 m ' / h and hence the maximum allowable water recovery from this design
parameter is 1 - (0,2 m^/h / 1>1 rrfi/h) — 82 %. Higher water recoveries may be achieved by reducing the
element diameter on the last stage of the plant.
Alternatively the membranes may be arranged in four parallel sets with a flow rate of 1,1 / 4 = 0,28 m^/h to
each element.
Process configuration 2: 5-stage
The design flow is 0,27 m^/h and one spiral element of 100 mm diameter with two spiral elements of 62 mm
diameter were required (this incorporates a safety factor). This is a two-stage plant with the flow to the first
stage operated intermittently in batch mode as required.

10-29
Stage
25
25
25
25
T '2 ,5
T 12.5
12,5
V 12,5
12,5
12,!
' 2 . !
12,!
50
Stage
12.5
V 12,5
12.5.
25
12.51
12.5Reject12,5
12,5
Composite permeate87,5
FIGURE 10.13 ; BASIC CONFIGURATION OF SPIRAL ELEMENTS SHOWINGFLOWS IN ARBITRARY UNITS
10.9 SPECIFICATIONS OF THE ELECTROCHEMICAL UNIT
Electrochemical cell stacks, in a plate-and-frame construction, are supplied, with orwithout the ancillary pumps, tanks, piping and power source, by a number ofmanufacturers according to their own design. Particular attention must be paid to :
(i) mass transport effects which relate to different aspects of cell performance,including the uniformity of current density over the electrode surface and thelimiting current density,
(ii) fluid mechanics of the pipework between the cells, and between the cell stackand other units to minimise pumping costs,
(iii) the distributor design such that fluid enters each cell with minimal creation ofdead zones and that flow becomes uniform as quickly as possible,
(iv) the relative positions of the anode and cathode which determines the uniformityof potential distribution,

10-30
(v) the electrode geometry which, together with the local concentration ofelectroactive species determines the current distribution. Electrodes may beconstructed with slits or louvres, from expanded metal or from metal sheets,in such a way as to minimise gas collection,
(vi) the availability of a high-voltage direct current which is transmitted aroundthe cell stack with minimum energy loss,
(vii) the inclusion of switches which permit individual cells to be isolated formaintenance without disturbing the rest of the stack,
(viii) the arrangement of the cells, to ensure that the plant is electrically and chemicallysafe,
(ix) the type of electrical connection; monopolar or bipolar.
In a monopolar cell there is an external electrical contact to each electrode andthe cell voltage is applied between each cathode and anode in parallel. Bipolarconnection requires only two external electrical contacts to the two endelectrodes and it recognises that the cell reaction will occur wherever there isappropriate potential difference. Table 10.13 (72) compares the twoconfigurations. Where bipolar cells are used, attention must be given tominimising shunt current, or current leakages, by using insulating barriers inthe electrolyte flow passage.
Table i0.14 gives a detailed list ui equipment requirements. Figure 10.14 gives theflow diagram of the electrochemical unit.
Materials of construction must be resistant to the electrolytes. Particular attentionmust be given to gasket and other rubber components which are susceptible to sodiumhydroxide deterioration or embrittlement. The effluent is not abrasive or corrosiveto most materials. Suitable tank, piping and cell framework materials would bepolypropylene, polyvinyl chloride, poly (vinylidine fluoride) and stainless steel. Theformer two are cheap but operation is restricted to 60 °C.
Careful selection of the type and material used in the manufacture of the valves andflow meters on the sodium hydroxide line is required to prevent blockages or malfunctionresulting from solid sodium hydroxide precipitation.
The anodes should be constructed from a non-corroding material, totally stable in theelectrolysis medium and possessing a low overpotential for oxygen generation, with ahigh current efficiency. Typical materials include the titanium substrate electrode towhich a coating of precious metal oxides has been applied. Nickel and stainless steelare not suitable for the application.
The cathode should be stable under reducing conditions and in the presence of caustic.Suitable materials include nickel and stainless and mild steel.

10-31
TABLE 10.13CHARACTERISTICS OF BIPOLAR CELLS IN COMPARISON WITH MONOPOLAR
CELLS (10 V) (72)
Conditions of electricity
Cell-to-cell current distribution
Bus bars
Number of nozzles
Current leaks
Capacity of electrolyzer
Floor area for electrolyzer
Assembling and disassemblingof electrolyzer
Electric resistance of conductor
Switch required
Preventing of gasket leaks
Bipolar cells
small current andhigh voltage
uniform
betweenelect rolyzers(less)
more
more
easy to enlarge
small
simple
small
high voltage DCcircuit breaker
easy
Monopolar cells
large current andlow voltage
not uniform
between electrolyzersand between cells(more)
less
less
not easy to enlarge
large
complicated
large
low voltage, largecurrent by-pass switch
complicated
The tank used for storing and recirculation of cleaning chemicals must be nitric acid
resistant.
The membrane employed must be stable in sodium hydroxide and selective to thetransport of cations in the applicable concentration range.
High-flow pumps with low-pressure duties for electrolyte transfer are required. Theflow rate of the sodium hydroxide through the catholvte compartments must be slightlyhigher than the flow of effluent through the anolyte compartments to maintain anelevated pressure on the cathode side of the membrane.
A cooling system must be installed on the electrolyte feed line to control the temperaturein the cell stack below a certain level, generally dependent on the materials of constructionof the cell stack, piping and valves. If stainless steel is employed the maximumtemperature will depend on the membrane tolerance. Higher temperature operationis desirable to increase membrane swelling but temperatures must be controlled toprevent boiling within the membrane.

10-32
TABLE 10.14
BATCH ELECTROCHEMICAL EQUIPMENT
1. Electrolyte transfer and storage
1.1 feed tanks.
1.2 caustic make-up, storage and batch reticulation tanks.
1.3 depleted brine storage tank.
1.4 concentrated caustic storage tank.
1.5 flushing solution tank.
1 6 transfer piping for effluent from nanofiltration.
1.7 transfer piping for effluent, caustic and flushing solutions in the electrochemical unit.
1.8 transfer piping to liquid product storage (brine and caustic) and to factory for reuse.
1.9 transfer piping for carbon dioxide and oxygen gas stream to neutralisation unit.
1.10 transfer piping for hydrogen gas disposal.
2.1
2 2
2.3
2.4
2.5
2.6
Electrochemical cell stack
stack frames and gasket assemblies.
anode, cathode and membrane elements and assemblies.
electrolyte flow and pressure controllers.
piping and valves for electrolytes and flushing solutions.
gas-liquid separation facilities.
electrical connection points for application of the potential across the stack-
3. Electrical power supply
3 1 rectified power facilities sized according to the output required.
3.2 ripple prevention facilities such as tap change to enable controi on the primary side of the rectifier.
3.3 battery operated invertor pack for background voltage back-up during power failures.
3.4 electrical output measurement and recording.
3.G electrical programming Lu correlate current output to effluent concentration.
3.G constant voltage operation facilities.
4. Pumpa
4.1 low-pressure pumps for circulation of electrolytes and flushing solutions through cell stack.
4.2 pumps for transfer of concentrated caustic and depleted brine products to storage and factory processing.
4 3 flow and pressure measurement, indication and control of all streams.
5. Control
5.1 pump motors, starters and interlocks.
5.2 electrolyte flow controllers.
5.3 electrolyte concentration and density controllers, with alarms.
5.4 low-flow alarm.
5.5 high-pressure alarm.
5.6 malfunction and alarm control interlocks.
5.7 electrical input control with high alarm.
5 8 electrolyte temperature control with high alarm.
5.9 sodium hydroxide density controller.
5.10 depleted brine concentration and electrical input control interlocks.
5 11 control panel.
6. Ancillaries
6.1 cooling facilities to maintain the temperatures of the recycled electrolytes below the maximum stable limit of
the materials used for cell construction.
6.2 sampling ports.

10-33
CC^ arid 0 ; toneutralisation unrl •
Teed fromnanotiltration
Conductivity
Wciler forreuse
Effluent recycle NaOH recycl
To power supply
chemica'cen slack
To power supply
etectriccl input interlock
To cellstack
NeC'Htonk
Densitymoritor
-*- 'JaOH for
To ce:istack
To eelstack
Li
a.cpowe'supply
StoneJ-tyb.jttfff,
FIGURE 10.14 : FLOW DIAGRAM OF BATCH ELECTROCHEMICAL UMT
The process is required to produce a fixed ratio of feed anolyte to dilute brineconductivity.
Effluent and dilute sodium hydroxide storage of 6 to 12 h duration is necessary toprovide for electromembrane cleaning, minor breakdowns and maintenance. Depletedbrine and concentrated sodium hydroxide storage facilities of approximately 12 h arenecessary to allow for factory scheduling. No gas storage facilities are required providedthe neutralisation unit is operated simultaneously. If the neutralisation unit is shutdown, the anolyte gases may be vented to the atmosphere provided that flue gas isavailable on commencement of the operation of the neutralisation unit.
Although various electric current and flow configurations are possible the design methodfor the electrochemical unit is outlined using a plate and frame arrangement of individualcells in a cell stack, in which electrolyte flow to each cell is in parallel and in whichthe electric current to each cell is in series (bipolar). For this application high-flowpumps are required and a rectifier producing a high-voltage - low-current output.
The specification for the electrochemical unit in the design example is given in Table10.15.
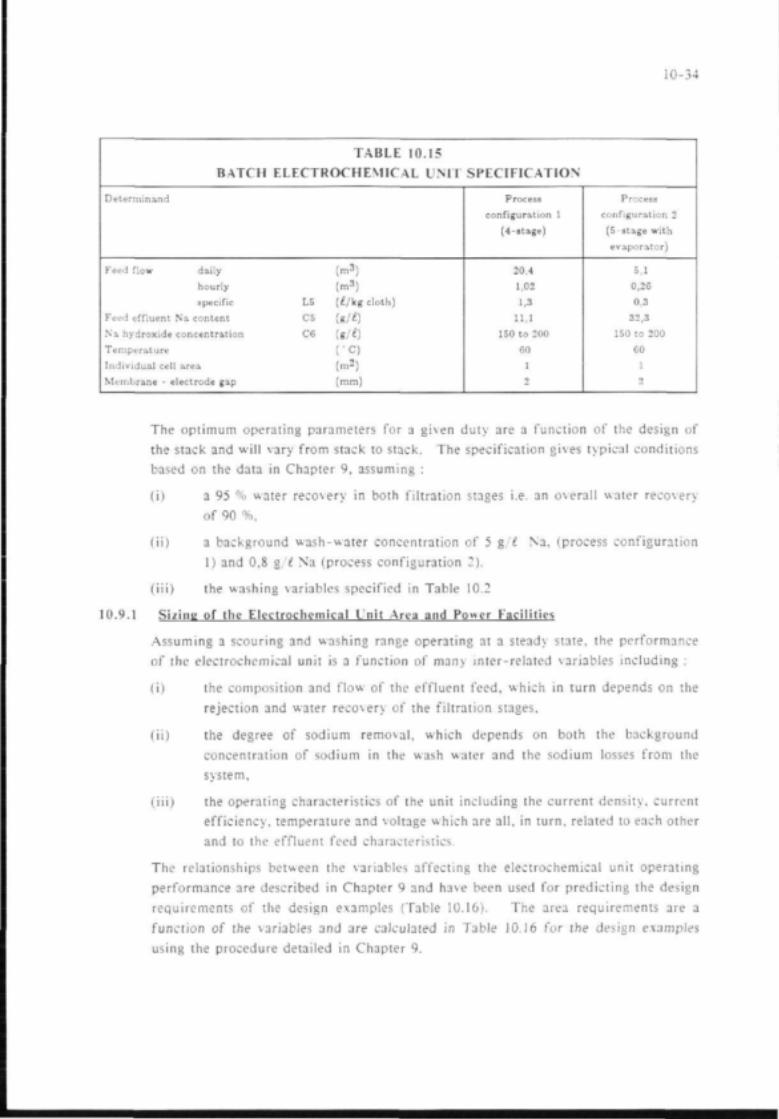
10-34
Determinand
Feed flow
BATCH
dailyhourlyspecific
Feed effluent Na contentNa hydroxide concentrationTemperatureIndividual cell areaMembrane - electrode gap
TABLE 10.15
ELECTROCHEMICAL UNIT
L5
C5
C6
(m3)
(m3)(£/kg cloth)
(«/*)U/t)( • c )
(m-J(mm)
SPECIFICATION
Processconfiguration 1
(4-stage)
20,41,021,3
11,1150 to 200
60
1
2
Processconfiguration 2(5-stage withevaporator)
5,1
0,260,3
32,3150 to 200
60
1
2
The optimum operating parameters for a given duty are a function of the design ofthe stack and will vary from stack to stack. The specification gives typical conditionsbased on the data in Chapter 9, assuming :
(i) a 95 % water recovery in both filtration stages i.e. an overall water recoveryof 90 %,
(ii) a background wash-water concentration of 5 %!t Na, (process configuration1) and 0,8 g/£ Na (process configuration 2).
(iii) the washing variables specified in Table 10.2
10.9.1 Sizing of the Electrochemical Unit Area and Power Facilities
Assuming a scouring and washing range operating at a steady state, the performanceof the electrochemical unit is a function of many inter-related variables including :
(i) the composition and flow of the effluent feed, which in turn depends on therejection and water recovery of the filtration stages,
(ii) the degree of sodium removal, which depends on both the backgroundconcentration of sodium in the wash water and the sodium losses from thesystem,
(iii) the operating characteristics of the unit including the current density, currentefficiency, temperature and voltage which are all, in turn, related to each otherand to the effluent feed characteristics.
The relationships between the variables affecting the electrochemical unit operatingperformance are described in Chapter 9 and have been used for predicting the designrequirements of the design examples (Table 10.16). The area requirements are afunction of the variables and are calculated in Table 10.16 for the design examplesusing the procedure detailed in Chapter 9.

10-35
TABLE 1 0.16
ELECTROCHEMICAL UNIT OPERATING CHARACTERISTICS
Determinand
Anolyte conductivity rangeLimiting current density rangeAverage anoiyte volt dropAverage catholyte conductivityAverage catholyte volt dropAverage cell potentialElectrical requirements
Recovered Na hydroxide mass,Depleted brine flow,Depleted brine concentration,
AreaPower
(mS/m)(A/m2)
(V)(mS/m)
(V)
(V)(A.s/kg cloth)
N6 (g/kg cloth)L7 (£/kg cloth)C7 (g/l)
(n.2)(kWh/t NaOH)
Processconfiguration 1
(4-stage)
3 000 to 5 700777 to 1 489
0,5282 0000,033,6
13,9
9,0
1,285,86
9,3
3 169
Design Calculations
Processconfiguration 2(5-stage withevaporator)
2 000 to 11 000529 to 2 857
0,5282 0000,033,6
16,9
10,90,313,91
7,5
3 181
Equation
9-149-159-13
Figure 9.109-139-129-10
9-259-239-24
9-119-9
10.10 SPECIFICATION FOR INTEGRATED REVERSE OSMOSIS.
NANOFILTRATION AND ELECTROCHEMICAL UNITS (PROCESS
CONFIGURATION 3)
The combination of reverse osmosis, nanofiltration and electrochemical units in processconfiguration 3 is operated continuously in a single batch circuit until 95 % waterrecovery from the reverse osmosis unit has been achieved.
The equipment requirements of the individual units are similar to those described forthe nanofiltration and electrochemical units for process configurations 1 and 2 (Sections10.8 and 10.9). It is envisaged that the reverse osmosis and nanofiltration membraneswill be mounted in the same module holder and that the pressure requirements fornanofiltration will be met by the residual pressure of the reverse osmosis reject stream.
Figure 10.15 gives the flow diagram of the integrated system of reverse osmosis,nanofiltration and electrochemical units for process configuration 3.
Conceptually the mass balance over this process is computed by assuming a constantsodium concentration in the feed to the electrochemical cell and by assuming that theincrease in concentration during reverse osmosis equals the decrease in concentrationin the electrochemical cell. These assumptions will enable the equipment at each stageto be sized and will determine the duty required. Depending on the flow requirementsof the cell a buffer tank holding nanofiltration permeate may be required, with aportion of the depleted brine being recycled to the anolyte compartment of the cell.
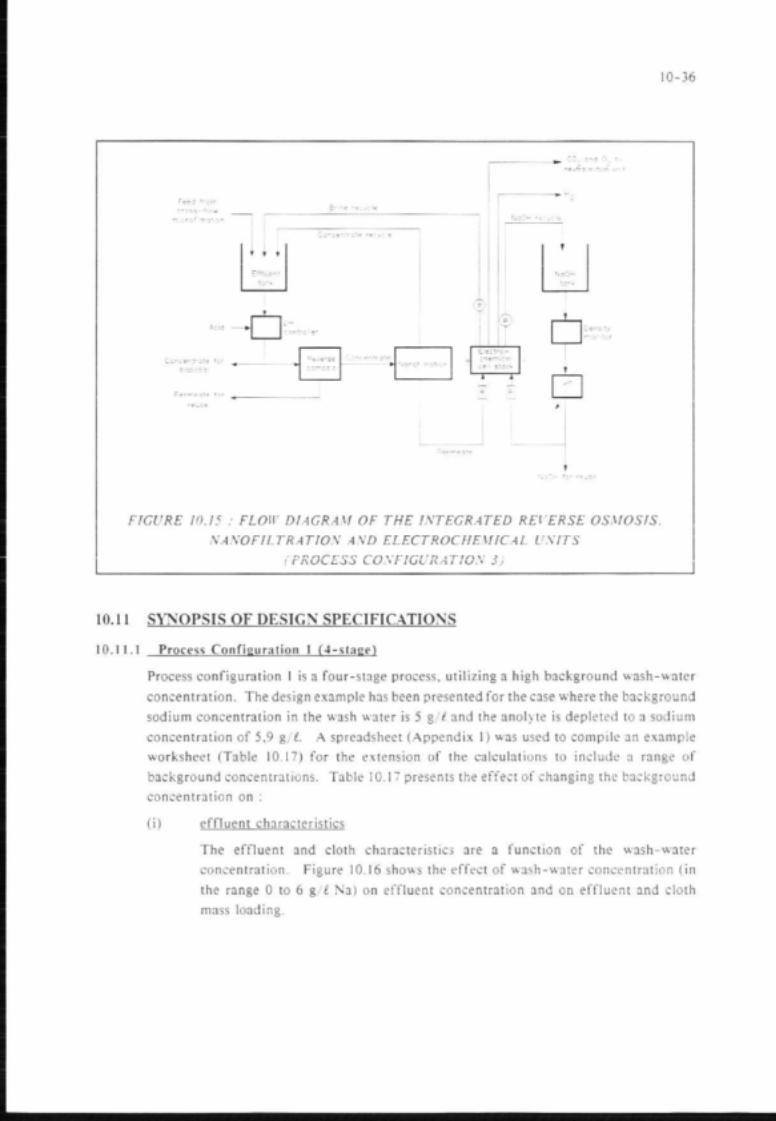
10-36
Feed Irorrcoss-flc1
T
Effluenttar-
Ccnceilrate fc
Elec: h e
: r o -
sic:-
CO, end 0 to
f
Densitynor" tor
FIGURE 10.15 : FLOW DIAGRAM OF THE INTEGRATED REVERSE OSMOSIS,NANOFILTRATION AND ELECTROCHEMICAL UNITS
10.11 SYNOPSIS OF DESIGN SPECIFICATIONS
10.11.1 Process Configuration 1 (4-stage)
Process configuration 1 is a four-stage process, utilizing a high background wash-water
concentration. The design example has been presented for the case where the backgroundsodium concentration in the wash water is 5 %jl and the anolyte is depleted to a sodiumconcentration of 5,9 %/L A spreadsheet (Appendix I) was used to compile an exampleworksheet (Table 10.17) for the extension of the calculations to include a range ofbackground concentrations. Table 10.17 presents the effect of changing the backgroundconcentration on :
(i) effluent characteristics
The effluent and cloth characteristics are a function of the wash-waterconcentration. Figure 10.16 shows the effect of wash-water concentration (inthe range 0 to 6 g/£ Na) on effluent concentration and on effluent and clothmass loading.

TABLE 10.17
PROCESS DATA ON A DRY FABRIC MASS BASIS FOR PROCESS CONFIGURATION
Temperature of cell operation = 60 °C;Background wash-water Na = 0 l o 6 g / / ( C , )
Note : Where figures are nol shown values are equal to value in firsl column.
Determinant!
1. WASHING VARIABLESMoisture content of cloth mm wash rangeNa cone of moisture on cloth inlo wash rangeMoisture content of cloth out of wash rangeNa cone of moisture on cloth oul of wash rangeAverage cloth mass("lolh speedUp-time of scouring wash range
2. 1RKATM1NTPI.AVI 'VARIABLESCross-flow microfillration water recoveryNanofillralion water recoveryNanofillralion point Na rejectionl-lcctrochemical cell current efficiencyI-'lcctrochcmical cell temperature1 electrochemical cell water transport numberI electrochemical cell electrolyte length1 electrochemical cell average catholytc conductivity1 electrochemical cell decomposition, polarisation & membrane voltageUp-time of treatment plant
3. WASH-WA'ri-RANIlI-n'I.UI'NTCHAKACrERIS'nCSNa cone in total wash walcrTotal wash-water flowI''ffluent flowNa cone in effluent
Symbol
micimoCO
fmfstm
ReRnr
rTnw/CONDCVdtp
Cq0L ICl
Unit
//kg clothg/ ' Na//kg clothg/'Nakg/mm/hh/d
%%%%Cg/gmS/mVh/d
g// Na//kg cloth//kg clothg/ ' Na
1 (4-STAGE) - VARIABLE WASH-WATER CONCENTRATION
Value for C , ( g / / N a )
0
0.52K,80,51,30.3
300020.0
95,0VSfl15.075,060,08.1
0.00282,03,020,0
0.01,51,59.2
1
2,2
1,01,51,5
2
3.2
2,01,51,510.5
3
4,1
3,01,51.5
11.2
4
5,1
4,01,51,5
11,9
5
6,0
5,01.51,5
12.6
6
7,0
6,01,51.5
13,3

Determinant)
4. MASS HA 1A NCR CALCULATIONSWash Range : Mass Na in on cloih
Mass Na oul on clothMass Na in effluent
Cross-flow microfiltralion: Concentrate flowNa cone in concentrateMass Na in concentratePermeate flowNa cone in permeateMass Na in permeate
Nanofi It ration: Concentrate flowNa cone in concentrateMass Na in concentratePermeate HowNa cone in permeateMass Na in permeate
Klectrochcmical cell Mass Na in Recovered NaOHRecovered NaOHNa cone in recovered NaOHDepleted brine HowNa cone in depleted brineMass Na in depleted brine
Make-up Na as NaOl IMake-up water
s. Nal,OSS|-;.SNa loss from drag-outNa loss in cross-flow microfiltration concentrateNa loss in nanofiltration concentrateNa loss from systemSavings on existing Na make-up
(> WATHR LOSSIISWater loss from systemSavings on existing waler make-up
TABLE
Symbol
NiNoNl1,2C2N21.3<3N314C4N41-5C5N5N6!/.(Yi
1.7C7N7NX1.8
loss 1loss 2loss 3S\ y
W1.9
10.17 (cont. i)
Unit
g/kg clothg/kg clothg/kg cloth//kgcloihS/l N«g/kg cloth//kg clothg// Nag/kg cloth//kg clothg// Nag/kgdoih//kg clothK / ' N Hg/kg clothg/kg cloth//kgcloihg// Na//kgcloihg// Nag/kg clothg/kg cloth//kgcloih
%%%r/cg/kg clothc/c
%//kg cloth
Value for C „ (g//Na)
0
14,40,613,80,19,20.71,49,213.10.114.41,0
1,35».y12.012.00,1
123,51,30,00,02,30,2
4,34,87.116,312,083,7
16,31,3
84.0
1
14,41.114,80,1').'>(1,71,49,914.0»,l15,41,1
1,359,612,91140,1
123,51,31.21,52.90.2
7,75,17,7
20.411.479.6
15,91,3
84,3
2
14,41,6
15,80.110,511,81.410,515,00,116,51,21,3510,213,810,80,1
123,51,32,43,03,50,2
11,05,5S.224,710,875,3
15,61.3
84,7
3
14,42,116,80,111,20,81,4
11,216,00.117,61,31,35io,y14,710,20,1
123,51,33,54.54.20.2
4,35,88,728, 910,270,8
15,31.3
84,7
4
14,42.517.80,111,90,91,411,916.90,118,61,31.3511,515,69,60,1
123,51,34,76,04,80,2
17,66,29,233,19,667,0
14,91.3
85,0
5
14,43,018,90,112.60,91,412.617.90,119,71,41,3512,216,59,00,1
123,51,35,97,55,40,2
21,06,69,837.39,062,7
14,61,3
85,3
6
14,43,519,90,113,31.01413,318,90,120,81,51,351.9
17,48.4D.I
123,51,37,09,06,00.2
24,36,910,341,58.4
58,5
14,31.3
86,0
oI
OO

TABLE 10.17 (cont. ii)
Detcrminand
7. i:i.i;ciU()cni;Mi(Ai.L"\]Topi;RA'HN(i PARAMKH-RSMaximum anol\ic conductivityMinimum anolyte conductivityMaximum limiting current densityMinimum limiting* current densilyAverage limiting current densityMinimum anolytc volt dropMaximum anolytc volt dropAverage anolytc volt dropAverage catholytc volt dropAverage cell potentialIilectrical requirements
8. I -UXTROCII IMICAI. UNIT ARHA AND F'OWl-K RIXJUIRI 'MiM SSpecific area requirementsTotal area requirementsPower requirements for NaOH production
Symbol
CONDA1CONDA2CD1CD2CD3VA1VA2VA3VCVc
r
AsAtI1
Unit
S/mS/m,A/mJA/mJA/m2
VVVVVF/kg cloth
m-/kg clothm-kWh/ l NaOH
Value f o r C q ( g / /Na )
0
4.40.0
1 137-135620,50,50,50,03,50.7
0.00225.0
3 157
1
4.70.6
1 2111586850.50,50.50.03,50,7
0,00119.5
3 159
2
4.91.2
1 2833228020.50.50,50,03,50,fi
0,00115.7
3 Ifi2
3
5.21.8
1 3534809170.50,50,50,03,50,6
0.00113.0
3 165
4
5.52,4
142:631
10270.50.50,50,03,50,6
0.00110.9
3 Ift7
5
5.73.0
1489111
1 1330.50.50,50,03,50.5
0,0019.3
3 169
6
6,035
1555916
12360.50,50.50,03,60,5
0,0017,9
3 171
SeeAnnexure to liihle 10.17

ANNEXURL
Temperature of cell operation = 40 to 100 °C;
Hackground wash-water Na concentration ((. „ ) =5 g//.
Dcterminand
i. i i i (•|R(>ciii:\ii(A].UNii()iii;KAriN(i CARAMI-:II:KS!electrochemical cell temperatureI electrochemical cell average catholytc conductivityMatimum anolyie conductivityMinimum anolyie conductivityMaximum limiting current densityMinimum limiting current densityAverage limiting current densityMinimum anolyic volt dropMaximum anolyic voli dropAverage anolyte volt dropAverage taihnlyle volt dropAverage cell poienlial1 electrical requirements
2 I I 1 (TRO( III M K A l . U N H A R i : A A N D P O W M R RK^I ' IRTMIMISSpecitic area requirementstotal area requirementsCower requirements tor \a( M I productinn
TO TABLE
Symbol
I(ONIKC(IM)AI(ONDA2c m(1)2(1)1V A IVA2V A IVCVc1
AsAtC
10.17
Unit
o cS/mS/mS/mA / m -A / m 2A / m -VVVVVI'/kg cloth
m-/kg clothm-kWh/t NaOIl
40
40.055,04,32.3
1 128592K600,50,50,50,0.Vi0.5
0,(H)l12.2
3 172
60
60,082,05.73.0
I 4K<>111
1 13.10,50,50,50.03,50.5
0.0019.3
3 W)
Temperature
SO
80.0100.07,2.1,8
1 Hfi.197814210,50,50,50,03,50,5
0.0007,4
1 170
100
100,0130,0H.K4,7
2 2771 2221 7500,50,50,50.03,50,5
0,0006.0
.1 \M
oI
o

10-41
2 3 4Wash —water concentration (g/ l Na)
FIGURE 10.16 : DESIGN EXAMPLE; PROCESS CONFIGURATION 1: DEPENDENCEOF EFFLUENT AND CLOTH CHARACTERISTICS ON WASH-WATER
(ii) electrochemical membrane area requirements
The duty per unit area of electromembrane increases as the final concentrationof the depleted brine is increased i.e. as the background concentration in thewash water is increased. Figure 10.17 is plotted from data in Table 10.17 andillustrates that the electromembrane area requirements decrease as thebackground concentration is elevated.
(iii) sodium hydroxide make-up requirements
Sodium losses from the system occur in the :
drag-out from the washing range,cross-flow microfiltration concentrate,nanofiltration concentrate.
These losses must be balanced by an equivalent make-up of sodium hydroxideto the saturator.
Although elevated background wash-water concentrations are advantageous interms of the operation of the electrochemical unit, sodium loss from the systemincreases substantially as the background concentration in the wash water isincreased. The sodium hydroxide make-up to the system is thus also increasedsignificantly (Figure 10.18).

10-42
.-. 23 -"E 22 -
J£ 21 -
S 2 0 -
' - . •• Q —
- c
o " 6 ~
5 ' 5 -
•3 9 -
8 --i
\\ \
• .
* \
C 2 4
Wash —water concentration (g/ l No)
-J
FIGURE 10.17 : DESIGN EXAMPLE: PROCESS CONFIGURATION 1: DEPENDENCEOF ELECTROMEMBRANE AREA REQUIREMENTS ON WASH-WATER
CONCENTRATION. NOTE: OPERATION AT 60 'C
FIGl TRE 10
kg c
loth
)
o
"—'
"5
o3
.75 ;OF
5 -
3 "
oi0
DESIGNSODIUM
2
Wo&h-*ctc
EXAMPLE:LOSSES ON
g / k g clcth^,,.--^'
^ ^
._ -
- 100
|
4 b
•" c c n ^ - H r a t i o n ',1/'I Nai
PROCESS CONFIGURATION 1: DEPENDENCEWASH-WATER CONCENTRATION

10-43
Table 10.17 contains an annex which presents a further extension of the designcalculations to cover a range of temperatures between 40 °C and 100 °C for abackground concentration of 5 %jl Na. Figure 10.19 illustrates the effect ofthe temperature at which the electrochemical process is operated on the totalarea requirements of the system.
60 SOTemperature (°C)
100
FIGURE 10.19 : DESIGN EXAMPLE: PROCESS CONFIGURATION 1: DEPENDENCEOF ELECTROCHEMICAL AREA REQUIREMENTS ON TEMPERATURE
10.11.2 Process Configuration 2 (5-stage with evaporation)
Process configuration 2 requires an additional evaporation stage. The sodium clothmass loading after washing is 66 % lower than that for process configuration 1 andgreater recovery of sodium, water and heat energy is effected. The design examplehas been presented for the case where an evaporation factor of four is applied and theanolyte is depleted to a sodium concentration of 3,7 g/L The depleted anolyte combinedwith the evaporator condensate and make-up water yields a recycled wash water witha concentration of 0,8 g/£ Na. A spreadsheet (Appendix 2) was used to compile anexample worksheet (Table 10.18) for the extension of the calculations to include a rangeof wash-water concentrations from 0 to 1 %/t.

TABLE 1( .IK
PROCESS DATA ON A DRY FABRIC MASS BASIS FOR PROCESS COM IGIJ RATION 2 (S-STAGE WITH EVAPORATION) - VARIABLE WASH-CONCI5NTRATION
evaporation factor = 4;
temperature 60 °C
Note : where data is nol shown values are equal to value in first column.
Octcrminand
1. 'ROPOSID WASIIINd VARIABI.liSMoisture content ol cloth into wash rangeNa cone of moisture on duth into wash rangeMoisture conienl of cloth out of wash rangeNa cone of moisture on clolh out of wash rangeAverage clolh mass("loth speedUp-time of scouring wash rangeTotal wash-water llowNa cone in total wash watereffluent flowNa cone in effluent
IRILATMIVI 1*1 AVI ' VAMAIH.I-S(evaporator concentration laclor(evaporator condensate concentrationSludge volumeTotal Na in sludgeCross-flow microfiliralion water recoveryNanofiltration water recoveryNanofiltration point Na rejectionHlcctrochenucal cell current efficiencyHlectrochenucal cell temperature(electrochemical cell water transport number(electrochemical cell electrolyte length(electrochemical cell average calholyie conductivity(electrochemical cell decomposition, polarisation & membrane voltageUp-time of treatment plant
Symbol
micimoCO
fmIstm0Cq1.1C l
r.crC'c
svSNReRnr( • ;
r11W
/
CONDCVd'P
Unit
//kg dothg// Na//kg dothg/ ' Nakg/mm/hh/d//kg clothg// Na//kg clothg// Na
limesg// Na<7,c/vc/f
%
<7,-f7,Cg/gmS/m
vh/d
WATER
Value for (- q (g / / Na)
0
0,528,80,51,20,3
300020.01.50.01.59.2
4,00,05,05,095,095,015,075,060,01,6
0.002K2,(t3,020,0
11.2
1,4
9,3
1,5
0,4
1,6
9,4
1,5
0.6
1,8
9,6
1,4
0.8
2,0
9.7
1,4
1,0
2,2
9.9
1.3
o

TABLE 10.18
Determinant!
3. MASS UALANCF- CALCUI.ATIONSWash range: Mass Na in on cloth
Mass Na out on clothMass Na in effluent
Hvaporator: Concentrate and sludge flowMass Na in concentrate and sludgeConcentrate and sludge concentrationConcentrate flowMass Na in concentrateConcentrate concentrationCondensate flowMass Na in condensate
Cross-flow microfiltration: Concentrate flowNa cone in concentrateMass Na in concentratePermeate flowNa cone in permeateMass Na in permeate
Nanofiltration: Concentrate flowNa cone in concentrateMass Na in concentratePermeate flowNa cone in permeateMass Na in permeate
Electrochemical cell: Mass Na in recovered NaOHRecovered NaOH HowNa cone in recovered NaOHDepleted brine HowNa cone in depleted brineMass Na in depleted brine
Make up Na as NaOHMake up water
Symbol
NiNoNlI.SNsCsIxNeCeI.CNcL2C2N2L3C3N3L4C4N4L5C5N5N6L6C6L7C7N7N8L8
cont. i)
Unit
g/kg clothg/kg clothg/kg cloth//kg clothg/kg clothg/l cloth//kg clothg/kg clothg/l cloth//kg clothg/kg cloth//kg clothg/l clothg/kg cloth//kg clothg/l clothg/kg cloth//kg clothg/l clothg/kg cloth//kg clothg/l clothg/kg clothg/kg cloth//kg clothg// cloth//kg clothg/l clothg/kg clothg/kg cloth//kg cloth
0
14,40,613.80,413.836,70,413.136,71,10,00,036,70,70,336,712,40,0
57,51,0
0,3235,611,411,40,0
642,30,30,00,02,90,1
0,2
14,40,714,00,414.037.20.413,337.21,10,00,037,20,70,337,212,60,0
58,31,0
0,3236,111,611,30,0
663,00,31,00,33.10.1
Value for C
0,4
14,40,814,20,414,237,80,413,537,81,10,00,037,80,70,337,812,80,0
59,21.0
0,3236,611,811,20,0
686,00,32,00,63,20,1
0,6
14,40,914,40,414,438,30,413,738,31.10,00,038,30,70,338,313,00,0
60,11,0
0,3237,212,011,10,0
709,90,32,90,93,30,1
0,8
14,41.0
14,60,414,638.80,413,838.81,10,00,038,80,70,338,813,10,0
60,91,0
0.3237,712,110,90,0
732,80,33,91,23,50,1
1,0
14,41,1
14,80,414,839,40,414,039,41,10,00,039,40,70,339,413,30,0
61,81,0
0,3238,212,310,80,0
758,20,34,91,53,60,1

TAItLfc, 10.18 (coiit. ii)
Determinand
4. Nil I.OSSHSNa loss in evaporator sludgeNa loss from drag-outNa loss in cross-flow microfiltration concentrateNa loss in nanofiltnilinn concentrateNa loss from systemSavings on existing Na make-up
.S WATHR1.OSSKSWater loss Irom systemSavings on enisling water make-up
6. liM-crROailiMK'AI.UNITOPliRA'I'INCi PARAM1 iTl :.RSMaximum anolytc conductivityMinimum anolytc conductivityMaximum limiting current densityMinimum limiting current densityAverage limiting current densityMinimum anolytc volt dropMaximum anolyte volt dropAverage anolyte volt dropAverage catholytc volt dropAverage cell potentialHlectrical requirements
7. EiLI iCrROCMI-MICAI. UNIT ARI-A AND l 'OWIiR Rl WUIRHMI'-N 1 SSpecific area requirementsTotal area requirementsPower requirements for NaOH production
Symbol
lossOlosslIosi2los.OSN9
W1,9
CONDA1CONDA2CD1CD2CD3VA1VA2VA3VCVc! • '
AsAt1'
Unit
%%%%
g/kgclnilir'<
S/mS/m .A/m2A/m2A / m 2
VVVVVi'/kg cloth
m-/kg clothm-kWh/ lNaOH
4.84.34,5(.,820,411,479,6
0
3,71,4
95,3
10.90,(1
2 835-13
14110,50,50,50,03,60,7
0,0019.4
3 175
4.95.04/>').921,311,378,7
0,2
3,71,4
96,3
lO.'J0,5
2 842129
1 4850,50,50,50,03,60,7
0,001K,9
3 177
Value for (
4,95,74,77.0
22,2
Iu77,7
0,4
3,61,4
96,3
11,01,0
2 848266
15570,50,50,50,03,60,6
0.0018,4
3 178
, <K// M
5,06,34,77,123,211,176,8
0,6
3,61,4
%,3
11,01,5
2 K534001 6260,50,50,50,03,60,6
0,0017,9
3 180
5,17,04,87,2
24,010,975.9
0,8
3,51,4
%,3
11,02,0
2 8575291 6930,50,50,50,03,60,6
0,0017.5
3 181
5.17,74.97.3
24,910,875,0
1.0
3.51.4
96,3
11,02,5
2 8606541 7570,50,50,50,03,60,6
0,0007.2
3 183
•U.

10-47
As with process configuration I, there is an increase in the cloth and effluent loading,a decrease in the electrochemical membrane area requirements and an increase in thesodium hydroxide make-up requirements as the sodium concentration in the wash-wateris increased.
The effect of changes in the evaporation factor on electromembrane area requirementsand on sodium make-up requirements, as a function of the wash water concentration,is shown in Figures 10.20 and 10.21. Figure 10.20 indicates that after a concentrationfactor of four the additional saving on electromembrane area is small.
The data given above for process configuration 2 is for a fixed electrochemical operationtemperature of 60 °C. The electromembrane area requirements can be expected todecrease by approximately 10 % for each additional 10 °C increase in temperature.
24 -
_ 23 -
*E 22 -
J2 2 1 "£ 20 -| 19 -
a 17 -
S 16 -° 15 -0)c 14 _| 1 3 -
| 12 -
2 i i -
% 10 -
9 -
8 -"7
^~~~~~~~~~^^^ Concentration factor
~ — — - — 2
^^r^r^—' i l l ' i i : i
0 0.2 O.-l 0.6 J.B 1
Wasri — water concentration (g/1 Na)
FIGURE 10.20 : DESIGN EXAMPLE; PROCESS CONFIGURATION 2: DEPENDENCEOF ELECTROMEMBRANE AREA REQUIREMENTS ON THE EVAPORATION FACTOR

10-48
20
FIGURE 10.21 : DESIGN EXAMPLE: PROCESS CONFIGURATION 2: DEPENDENCEOF SODIUM LOSSES ON WATER CONCENTRATION

11-1
11 ECONOMIC EVALUATION
11-1 INTRODUCTION
Cost estimation of treatment plants for scouring effluents is difficult because of thevariability of the scouring process, the effluent composition and the extent of treatmentrequired. Additional variables include site development costs, exchange rates forimported equipment, inflation rates and different materials of construction.
This chapter estimates the cost of the implementation of an integrated plant for theelectrolytic treatment and recovery of water, chemicals and heat energy from sodiumhydroxide cotton scouring effluents as is described in chapters 9 and 10. All costestimates in this chapter have been presented for guidance purposes only and must beused with caution and judgement.
The cost basis for chemicals and utilities is given in Table 11.1 (1987).
TYPICAL COSTS
Utility/Chemical
ElectricityWaterEffluent dischargeHeat energySodium hydroxideLimestone
TABLE 11.1OF UTILITIES AND CHEMICALS
Cost (1987)
R0,05/kWhR0,80/m3
R0,50/m3
Rl,00/m3 (20 to 100 " C)R800/t 100 % NaOHR0,14/kg
The design parameters on which the economics are based are summarised in Table 11.2and are the same as those specified for the design example in Chapter 10.
11.2 CAPITAL COST ESTIMATES (1987)
11.2.1 Scouring Equipment Modifications
The capital cost for the installation of additional high-expression nip rollers or vacuumextractors is R50 000 to R80 000 per unit. A minimum of two such devices isrecommended :
(i) after the saturator to minimise chemical drag-out,
(ii) after the wash range to minimise impurity and moisture drag-out.
In addition, a third device, installed before the saturator would be advantageous inminimising dilution of the padding sodium hydroxide.

11-2
TABLE 11.2
DESIGN PARAMETERS FOR ECONOMIC EVALUATION OF ELECTROCHEMICALTREATMENT OF STRONG SCOURING EFFLUENTS
Parameter
Scouring padding solution
Wash-water flow
Moisture carry-over from aaturator
Moisture carry-over from wash range
Cloth flow
Effluent flow
Process Configuration 1 :
Process Configuration 2 :
Operation
Background Na
Temperature of electrochemical
cell operation
Evaporation factor
Background Na
Temperature of electrochemical
cell operation
Value
50 g/l NaOH
1,5 t/kg cloth
0,5 £/kg cloth
0,5 I/kg cloth
780 kg/h
1,2 m3/h
5g/£
80 "C
4
0,8 g/l
80 " C
20 h/d, 300 d/a
11.2.2 Effluent Treatment Plant
The capital cost of the treatment plant is a function of :
(i) the chemical loading of the effluent,
(ii) the volume and concentration of the effluent. For a given chemical loading,a small volume, high-concentration effluent is desirable in terms of plant sizerequirements,
(iii) the degree of recovery of chemicals and water,
(iv) the means employed for maintaining an elevated sodium concentration in theanolyte of the electrochemical cell: i.e. either recycling a wash water which isonly partially depleted or by using an evaporator to concentrate the raw effluentprior to recovery,
(v) the materials of construction.
Cost estimations of the equipment for the effluent treatment plant are given in Table11.3. It is assumed that the effluent drainage facilities {sumps, pumps, pipework etc.)are already installed at the factory. The estimations in Table 11.3 may be adapted topredict rough costs of plants in cases where different levels of background sodiumconcentration in the wash water are used or where the evaporation factors are varied.Section 10.12 summarises the effect of these variables on the total plant size requirements.

11-3
TABLE 11.3
PLANT COMPONENT COST ESTIMATION
Component
Storage Tank8 hour storage of raw effluent2 hour storage after neutralisation
after cross-flow microfiltrationafter nanofiltration
8 hour depleted brine storage8 hour sodium hydroxide storage
Evaporation UnitPumps, heat exchangers, condensors, pipework,valves, coarse screening, centrifuge
Neutralisation UnitPumps, pipework, valves, absorptioncolumn, heat exchanger
Cross-flow Microfiltration UnitPumps, pipework, valves, controllers,manifolds and filter media
Nanofiltration UnitPumps, pipework, valves, controllers,membranes and membrane holders
Electrochemical Unitd.c. power supply, pumps, pipework,valves, controllers, electrochemicalmembrane stack
Scouring Machine ModificationsHigh expression nip after saturatorHigh expression nip after wash
TOTAL
Basis
Rl 000/ m3
Rl 000/m3
Rl 000/m3
Rl 000/m3
Rl 000/m3
Rl 000/m3
R2 000/m2
R2 000/m2
R40 000/m2
R50 000
Total cost (R)
Processconfiguration 1
9 6002 4002 4002 4009 0001 000
15 000
52 000
52 000
300 000
100 000
545 800
Processconfiguration 2
9 6001 0001 0001 0002 5001 000
120 000
15 000
28 000
18 000
240 000
100 000
537 100
11.3 OPERATING COSTS
The finance costs and taxation have not been taken into account in this simplisticanalysis.
The main operating costs are summarised in Table 11.4.
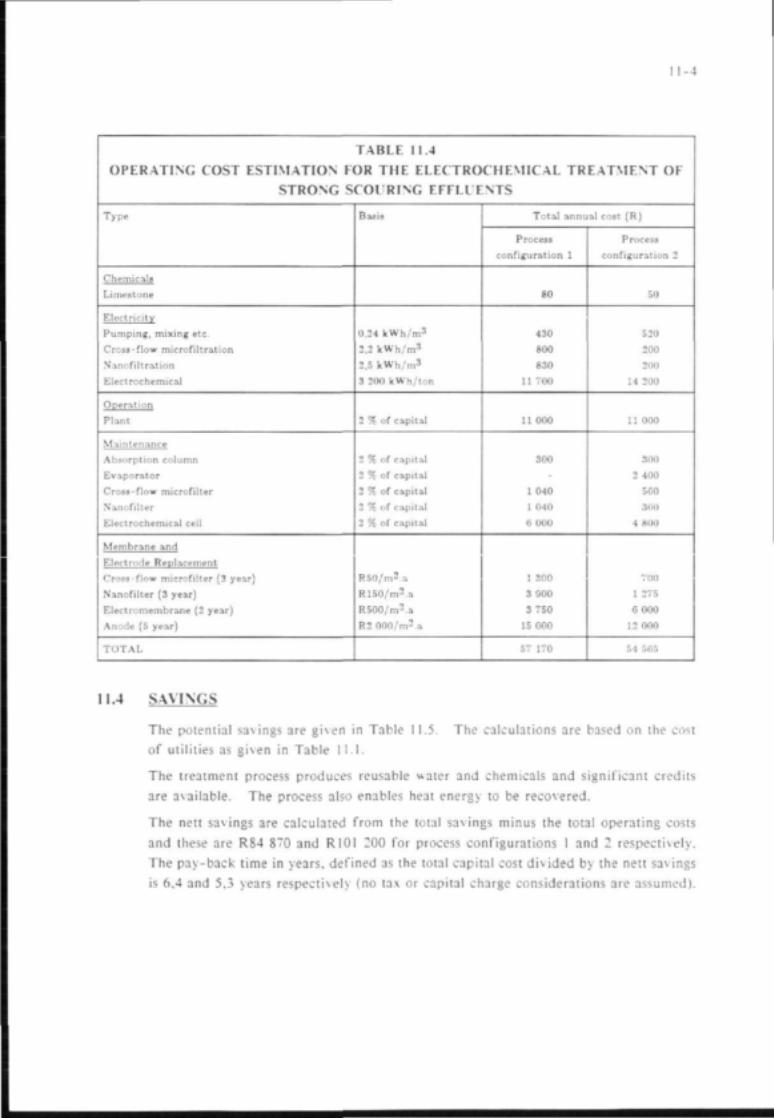
11-4
TABLE 11.4OPERATING COST ESTIMATION FOR THE ELECTROCHEMICAL TREATMENT OF
STRONG SCOURING EFFLl ENTS
Type
Chemicals
Limestone
Electricity
Pumping, mixing etc.
Cross-flow microfiltration
Nanofiltration
Electrochemical
Operation
Plant
Maintenance
Absorption column
Evaporator
Cross-flow microfilter
Nanofilter
Electrochemical ceil
Membrane and
Electrode Replacement
<"ross-f!ow microfilter (3 year)
Nanofilter (3 year)
Electromembrane (2 year)
Anode (5 year)
TOTAL
Basis
0,24 kWh/m3
2,2 kWh/m3
2,5 kWh/m3
3 200 kWh/ton
2 % of capital
2 % of capital
2 % of capital
2 % of capital
2 % of capital
2 % of capital
R5O/m2.s
R15O/m2.a
R5OO/m2.a
R2 000/m2a
Total annual cost [Rj
Processconfiguration 1
80
430800830
II 700
11 000
300
1 0401 0406 000
1 3003 9003 750
15 000
57 170
Process
configuration 2
50
520
200
200
14 200
11 000
300
2 400
560
360
4 SOU
700
1 275
6 000
12 000
54 565
11.4 SAVINGS
The potential savings are given in Table 11.5. The calculations are based on the costof utilities as given in Table 11.1.
The treatment process produces reusable water and chemicals and significant creditsare available. The process also enables heat energy to be recovered.
The nett savings are calculated from the total savings minus the total operating costsand these are R84 870 and R101 200 for process configurations 1 and 2 respectively.The pay-back time in years, defined as the total capital cost divided by the nett savingsis 6,4 and 5.3 years respectively (no tax or capital charge considerations are assumed).
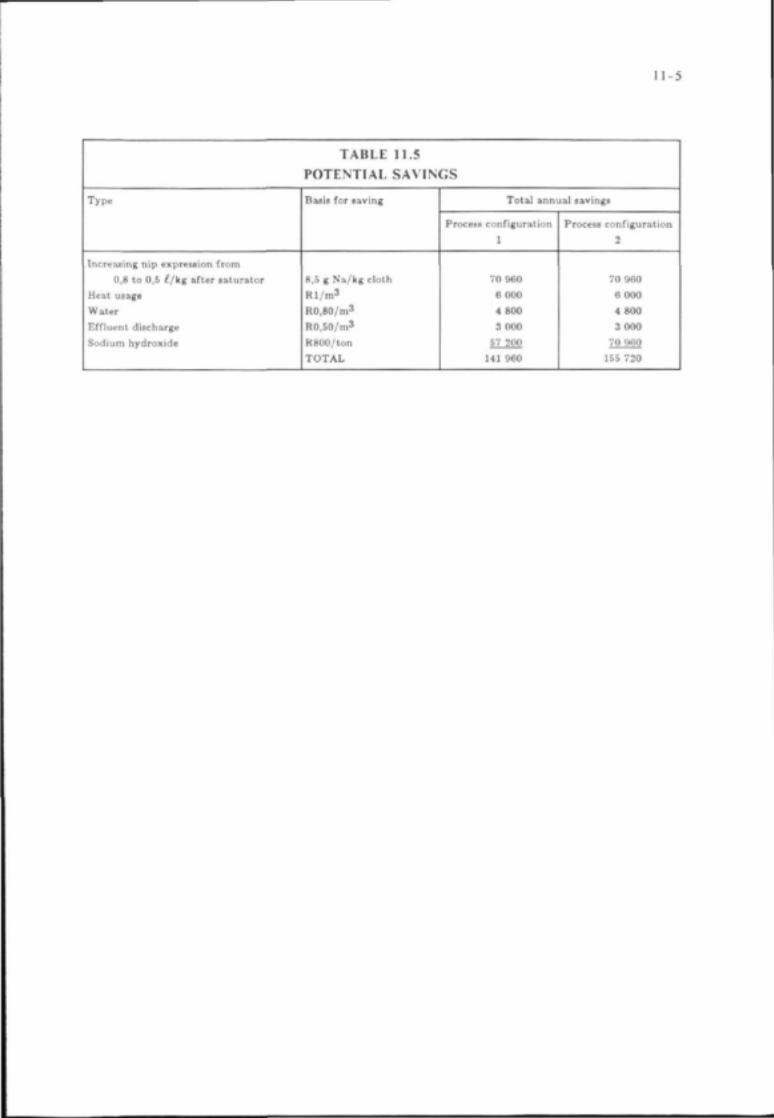
11-5
TABLE 11.5
POTENTIAL SAVINGS
Type
Increasing nip expression from0,8 to 0,5 i-/kg after saturator
Heat usageWaterEffluent dischargeSodium hydroxide
Basis for saving
8,5 g Na/kg clothRl /m 3
R0,80/m3
R0,50/m3
R800/tonTOTAL
Total annual savings
Process configuration1
70 9606 0004 8003 000
57 200141 960
Process configuration2
70 9606 0004 8003 000
70 960155 720

R - l
REFERENCES
1. Olivier, H., Our Water Resources in Perspective, Construction in Southern Africa, 25(6),pp. 71 (Sept. 1980).
2. Department of Water Affairs, Management of the Water Resources of the Republic ofSouth Africa. ISBN 0 621 11004 3, CTP Book Printers, Cape Town (1986).
3. Stander, J. v. R., Fighting SA's Salinity Problem, SA Waterbulletin, 13(5), pp. 10 (Oct.1987).
4. Best, H.J., The Water Amendment Act, 1984, J. Wat., Sew. & Effl., 18, pp. 5 (Sept.1984).
5. Government Gazette, No. 991, 18 May 1984.
6. Water Research Commission, Master Plan for Water Management and Effluent Treatment,Including Water Recycling and the Recovery of Chemicals. Pretoria (1976).
7. Department of Planning and the Environment, Energy Utilisation in South Africa,Pretoria (1978).
8. WIRA, The Use of Water by the Textile Industry, Textile Res. Conf. WIRA. Leeds,United Kingdom (1973).
9. CDTRA, Effluent Treatment and Water Conservation, Textile Res. Conf., Leeds. UnitedKingdom (1971).
10. ATMI, Recommendations and Comments for the Establishment of Best Practicable WasteWater Control Technology Currently Available for the Textile Industry. Institute ofTextile Technology and Hydroscience Inc. USA (1973).
11. US Environmental Protection Agency. Economic Analysis of Proposed EffluentGuidelines. Textile Industry EPA 230/1-73-028 (March 1974).
12. NCWQ, Textile Industry : Technology and Costs of Wastewater Control, NCWQ ContractNo. WQ5ACO21, Comm. No. 74391.01 (June 1975).
13. Pollution Research Group. A Guide for the Planning, Design and Implementation ofWaste-water Treatment Plants in the Textile Industry, Part 1: Closed LoopTreatment/Recycle System for Textile Sizing/Desizing Effluents, Report to the WaterResearch Commission, Pretoria, ISBN 0 908 356 14 5 (1983).
14. BASF Manual, Cellulosic Fibres: Sizing, Pretreatment and Dyeing, Tapp and ToothillLtd., Leeds, London.
15. Buckley. C.A.. Characterisation of the Effluents from Scouring and Bleaching of Cottonand Polyester Fibres, Report S7, Department of Chemical Engineering. University ofNatal, Durban (Sept. 1983).

R-2
16. Buckley, C.A., MacMillan, CD., Nel, P.F. and Groves, G.R., Characterisation of theEffluents from the Wet Preparation of Cotton and Cotton/Polyester Fibres, Report S6,Department of Chemical Engineering, University of Natal, Durban (March 1979).
17. Groves, G.R. and Anderson, D., Characterisation of Effluents from a Small BatchProcessing Cotton Textile Mill, Report SI, Department of Chemical Engineering,University of Natal, Durban (Dec. 1977).
18. Pollution Research Group, Final Report to the Water Research Commission for theProject "Water Management and Effluent Treatment in the Textile Industry : Treatmentof Scouring and Bleaching Effluents", Water Research Commission Project No. 122,October 1989.
19. Parish, G.J., Continuous Rinsing of Impurities from Textile Fabrics, American DyestuffReporter, 54, pp. 402 (May 1965).
20. Benninger, Stabilized Fabric Dimensions Through Mercerising, News A, No. 939-e,Benninger Co. Ltd., CH-9240 Uzwil, Switzerland.
21. Franklin, J.S., Barnes, K. and Little, A.H., Textile Effluent Treatment with Flue Gases,Ind. Dyer and Textile Printer, pp. 427 (Sept. 1969).
22. Little, A.H., Treatment of Textile Waste Liquors, J. of the Society of Dyers and Colourists,83(7), 268-273 (1967).
23. Newlin, K.D.,The Economic Feasibility of Treating Textile Wastes in Municipal Systems,J. Wat. Pollut. Control Fed., 43(11), pp. 2195 (Nov. 1971).
24. US Environmental Protection Agency, Environmental Pollution Control : TextileProcessing Industry, U.S. Report EPA 625/7-78-002 (Oct. 1978).
25. Lockwood Greene Engineers Inc., Textile Industry Water Pollution AbatementTechnology : Capabilities and Costs, Report PB 244802, US National TechnicalInformation Service (Aug. 1975).
26. Olthof, H. and Eckenfelder, W.W., Coagulation of Textile Wastewater, Textile Chemistand Colourist, 8(7), pp. 18-22 (1976).
27. Jones, H.R., Pollution Control in the Textile Industry, Noyes Data Corporation (1973).
28. Jones, A.P., The Treatment of High Proportions of Textile Effluent in Admixture withSewage Water Pollution Control, pp. 551 (1974).
29. US Environmental Protection Agency : Textile Mills: Point Source Category, Report EPA440/l-74-022a (June 1974).
30. Van Leeuwen, J., Pitt-Pladdy, A., Watson, A., Reddy, P. and Wynne, G.N., EffluentTreatment at Three South African Textile Mills, NIWR/IWPC Symposium on IndustrialEffluent : Control and Treatment, CSIR, Pretoria (Nov. 1981).
31. Porter, J.J, State of the Art of Textile Waste Treatment, US Environmental ProtectionAgency Report EPA 12090 ECS (1971).

R-3
32. Jones, E.L., Alspaugh, T.A. and Mokes H.B., Aerobic Treatment of Textile Mill Waste,J. Wat. Pollut. Control Fed., 34(5), pp. 495 (1962).
33. Biggs, A.I., Biological Treatment of Textile Effluents, Chemistry and Industry, pp. 1536(Sept. 1967).
34. Sharma, M.S., Colourage, 5, pp. 11 (1983).
35. Fosberg, T.M. and Claussen H.L., TAPPI, 65, pp. 23 (1982).
36. Bechtold, T., Burtscher, E., Sejkora, G. and Bobleter, O., Modern Methods of LyeRecovery, International Textile Bulletin, Dyeing/Printing/Finishing, pp. 5-26 (April1985).
37. Environmental Protection Service, Canada, Textile Industry Wastewater Treatment byAir Flotation, prepared by Boudreau, Dubeau and Lemieux Inc., Environment CanadaReport No. EPS-4-WP-79-6E (April 1981).
38. Brandon, C.A. and Gaddis, J.L., Desalination, 23, pp. 19 (1977).
39. Brandon, C.A., Jernigan, D.A., Gaddis, J.L. and Spencer, H.G., Closed Cycle TextileDyeing: Full Scale Renovation of Hot Wash Water by Hyperfiltration, Desalination, 39,pp. 301 (1981).
40. Brandon, C.A. and Samfield, M., Application of High-temperature Hyperfiltration toUnit Textile Processes for Direct Recycle, Desalination, 24, pp. 97 (1978).
41. Foitei, J .J . and Goodman, G.A., Desalination, 49, pp. I6i (1984).
42. Treffry-Goatley, K.., Buckley, C.A. and Groves, G.R., Reverse Osmosis Treatment ofTextile Deyhouse Effluents, Desalination, 47, pp. 313-320 (1983).
43. El-Nashar, A.M., The Desalting and Recycling of Wastewaters from Textile DyeingOperations Using Reverse Osmosis, Desalination, 20, pp. 267 (1977).
44. Iannotti, J.E. el al., An Inventory of Industrial Hazardous Waste Generation in NewYork State, New York Dept. of Environmental Conservation Technical Report SW-P14(1979).
45. Cooper, S.G., The Textile Industry: Environment Control and Energy Conservation,Noyes Data Corp., New Jersey, (June 1978).
46. Zimmerman, F.J., New Disposal Process, Chemical Engineering, 56, pp. 117-120 (Aug.1958).
47. Zimmerman, F.J. and Diddams, D.G., TAPPI, 43(8), pp. 710-715 (1960).
48. Maddern, K.N., Wet Air Oxidation Recovery at Burnie, ADDITA, 34(2), pp. 130-134(1980).
49. Randall, T.L. and Knopp, P.V., Detoxification of Specific Organic Substances by WetOxidation, J. Wat. Pollut. Control Fed., 52(8), pp. 2117-2130 (1980).
50. Morgan, J.E. and Soul, CM., The Zimmerman Process in Soda Pulp Mill RecoverySystem: Development of a Commercial Process, ADDITA, 22, pp. 60-70, (1968).

R-4
51. Bleachers Association Ltd, Manchester, The Recovery of Caustic Soda from Kier Liquors,Proceedings of Meetings of Managers, etc. 1919-1920, Vol. 1, pp. 69 (work performedat the University of Manchester).
52. Funke, J.W., A Guide to Water Conservation and Reclamation in Industry, CSIR Guide
K9, Pretoria (1969).
53. Establissements Emile Degremont (Associated with Aqua-Aid (Proprietary) Ltd, P.O.Box 6061, Johannesburg, RSA) Water Treatment Handbook.
54. Pollution Research Group, A Guide for the Planning, Design and Implementation ofWaste-water Treatment Plants in the Textile Industry: Part II: Effluent Treatment/WaterRecycle Systems for Textile Dyeing and Printing Effluent, Report to the Water ResearchCommission, Pretoria, ISBN 0 908356 66 8 (1988).
55. Water Resources Research Institute, Water Conservation Technology in Textiles; Stateof the Art, edited by D.M. Hall, W.S. Perkins and J.C. Warman, Report No. WRRI 46(May 1982).
56. Buckley, C.A. and Groves, G.R., Preliminary Report on the Analysis of Washing in theTextile Industry, Report UF1, Pollution Research Group, Department of ChemicalEngineering, University of Natal (August 1977).
57. Prabhu, M.R. et al., A Theory of Washing and Applications, American Dyestuff Reporter,61, pp. 53 (August 1972).
58. US Environmental Protection Agency, Control Technology for the Metal FinishingIndustry; Evaporators, Report EPA 625/8-79-002, developed by the IndustrialEnvironmental Research Laboratory (June 1979).
59. Johnson, J.S., Minturn, R.E. and Wadia, P.H., Hyperfiltration XXI. Dynamically FormedHydrous Zr(iv) Oxide-Polyacrylate Membranes. J. Electroanal. Chem., 37, pp. 267-281(1972).
60. Groves, G.R., Buckley, C.A., Castledon, A., Mercer, H.G., Kluk, G. and Hart, O.O.,Application of Membrane Technology to Industrial Effluent Treatment and WaterRecycling, NIWR/IWPC Symposium on Desalination: New Developments and IndustrialApplications, Pretoria (1983).
61. Groves, G.R., Buckley, C.A., Cox, J.M., Kirk, A.R.M., MacMillan, CD. and Simpson,M.P.J., Dynamic Membrane Ultrafiltration and Hyperfiltration for the Treatment ofIndustrial Effluents for Water Reuse. Desalination, 47, pp. 305-312 (1983).
62. Johnson, J.S., Minturn, R.E. and Wadia, P.H., J. Electroanal. Chem., 37, pp. 267 (1972).
63. Brandon, C.A., Gaddis, J.L. and Spencer, G., Recent Applications of DynamicMembranes, Synthetic Membranes, Vol. II, ACS Symposium Series, 154. AmericanChemical Society, Washington D.C., pp. 435 (1980).

R-5
64. Brown, A. and Buckley, L.A. : ireatment of Cotton Scouring fcffluent by DynamicMembrane Hyperfiltration, Water Research Commission Project No. 122, Report SB1(Sept. 1983).
65. Hong, Z., Xuan-rong, Z. and Ji-fang, L., The Application of MEMS Flash in Reuse ofAlkalinous Waste Water, Desalination, 56, pp. 121-130 (1985).
66. Montgomery, J.M., Water Treatment - Principles and Design, Wiley-Interscience, USA,ISBN 0 471-04384-2 (1985).
67. Hermana, E., Infanzon, A.S., Baile, M., Development of the Memmer Electrolyser,Chapter 19 of a Publication Entitled "Modern Chlor-alkali Technology", edited by Coulter,M.O./Jackson, C , Ellis Horwood Ltd., UK, Volume 2, pp. 235-246, ISBN 0 85312 535 2(1980).
68. Burney, H.S. and Gantt, G.R., US Patent 4381230, April 26, 1983, assigned to DowChemical Co.
69. Steetley Engineering, The Dished Electrode Membrane Cell : Technical Description.
70. Buckley, C.A., Bindoff, A., Kerr, C.A., Kerr, A., Simpson, A.E. and Cohen, D.W., TheUse of Speciation and X-Ray Techniques for Determining Pretreatment Steps forDesalination, Desalination, 66, pp. 327-337 (1987).
71. Simpson, A.E., Buckley, C.A. and Kerr, C.A., The Effect of pH on the Nanofiltrationof the Carbonate System in Solution, Desalination, 64, pp. 305-319 (1987).
72. Motani, K. and Saka, T., The Tokuyama Soda Membrane: Caustic-chlorine Process,Chapter 18 of a Publication Entitled "Modern Chlor-alkali Technology", edited by Coulter,M.O./Jackson, C , Ellis Horwood Ltd., UK, Volume 2, pp. 223-234, ISBN 0 85312 535 2(1980).

1-1
INDEX
Biological Treatment, 3-2
Bleaching, 2-9, 2-15cotton, 2-16hydrogen peroxide, 2-17recipes, 2-16, 2-17, 2-18, 2-19sodium chlorite, 2-17sodium hypochlorite, 2-16
Causticising, 3-4
Cotton, 2-13
Design, 10-9, 10-11absorption column, 10-2background concentration, 10-3centrifuge, 10-15chemical load, 10-1cleaning, 10-8closed-loop recycle, 10-3cotton, 10-1counter-current, 10-9cross-flow microfilter, 10-2cross-flow microfiltration, 10-12, 10-18effluent concentration, 10-9electrochemical membrane cell, 10-2electrochemical recovery, 10-1electrochemical stack, 10-14electrochemical unit, 10-29evaporation, 10-4evaporator, 10-15flow balancing, 10-7flux, 10-8, 10-20, 10-26fouling, 10-8heat energy load, 10-1membrane permeability, 10-26membrane selection, 10-8module arrangement, 10-8module type, 10-8
nanofilter, 10-2nanofiltration, 10-14nanofiltration unit, 10-23neutralising unit, 10-15nip roller, 10-9open-width, 10-9pollution load, 10-1polyester/cotton, 10-1pretreatment, 10-7process configuration, 10-6rejection, 10-8, 10-27reverse osmosis, 10-4, 10-14scaling, 10-8scouring, 10-9textile processing, 10-7washing efficiency, 10-9water flow, 10-9water load, 10-1water quality, 10-1
Desizing, 2-9
Dyeing, 2-9
Dynamic Membranes, 5-4cleaning, 5-6effluent characterisation, 5-4evaporator, 5-4flux, 5-6rejection, 5-7
Effluent Management, 4-1, 4-4bleaching, 4-16cascade system, 4-16chemical balance, 4-5cross-flow microfiltration, 4-16dyeing, 4-16effluent balance, 4-5effluent loadings, 4-15

1-2
electrolysis, 4-16evaporation, 4-16evaporator, 4-16flow measurement, 4-2pollution load, 4-6printing effluent, 4-16scouring, 4-16sodium hydroxide reticulation, 4-6, 4-9sodium hydroxide utilisation, 4-6ultrafiltration, 4-16water balance, 4-3water consumption, 4-4
Effluent Neutralisation, 3-1
Effluent Treatment, 4-33activated carbon adsorption, 3-1biological, 3-1bleaching, 3-1, 4-34coagulation, 3-1cot*nn 4-^^
effluent composition, 3-1electromembrane, 3-1evaporation, 3-1filtering, 3-1flotation, 3-1freezing, 3-1ion exchange, 3-1membrane, 3-1mercerising, 3-1mercerising effluents, 4-34multi-media filtration, 3-1ozonation, 3-1polyester, 4-33scouring, 3-1, 4-33screening, 3-1sedimentation, 3-1
Electro-osmosis, 3-4
Electro-oxidation, 8-1
chlorination, 8-4colour removal, 8-6cotton, 8-1
current efficiency, 8-4design, 8-8effluent characterisation, 8-2Faraday's law, 8-4pilot plant, 8-3polyester/cotton, 8-1power consumption, 8-8scouring, 8-1
Electrochemical recovery, 9-1anolyte flow, 9-11back migration, 9-13cleaning, 9-9conductivity, 9-13cotton, 9-1
cross-flow microfiltration, 9-1, 9-9current density, 9-11current efficiency, 9-11decomposition voltage, 9-11effluent characterisation, 9-3electrochemical, 9-1electrochemical membrane cell, 9-10electrode, 9-15
electromembrane life expectancy, 9-15gas blinding, 9-11limiting current density, 9-11membrane cleaning. 9-10nanofiltration, 9-1, 9-9neutralisation, 9-1, 9-7pilot plant, 9-2, 9-4polarisation, 19-11polyester/cotton, 9-1power consumption, 9-11recycling, 9-1scouring, 9-1volt drop. 9-13water splitting, 9-13water transport number, 19-16

Evaporation, 3-2batch scouring, 7-2boiling point elevation, 7-8centrifugation, 7-9cotton, 7-1design, 7-11
effluent characterisation, 7-2fouling, 7-8heat transfer coefficient, 7-6pilot plant, 7-3polyester/cotton scouring, 7-1
Finishing, 2-9
Flocculation, 3-3
Flotation, 3-3
In-plant Control, 4-16batch rinsing, 4-20, 4-21beams, 4-20bleaching, 4-29cascading, 4-29, 4-30chemical dosing, 4-31chemical recirculation, 4-29chemical recovery, 4-25continuous rinsing, 4-21, 4-22counter-current washing, 4-19, 4-24, 4-27cross-flow washing range, 4-23drop-fill, 4-21drop-fill rinsing, 4-21effluent control, 4-32housekeeping, 4-32impurity removal, 4-29jets, 4-20jigs, 4-20kiering, 4-30mercerising, 4-30multi-unit washing range, 4-23open-width ranges, 4-21open-width washing, 4-29
overflow, 4-21overflow rinsing, 4-19, 4-21oxidative desizing, 4-32process modifications, 4-31raw material modifications, 4-32recipes, 4-31relaxer, 4-30rinse ratio, 4-24rinsing, 4-20rope ranges, 4-21single washing unit, 4-22solvent bleaching, 4-19solvent scouring, 4-19staff motivation, 4-33washing, 4-20water recirculation, 4-29water use, 4-19, 4-20, 4-27, 4-29winches, 4-20
Legi s l a t ion , l - leffluent, 1-2effluent standards, 1-3effluents, 1-1rainfall, 1-1reclamation, 1-5recycling, 1-5Water Act, 1-2, 2-1
Membrane Separation, 3-3
Mercerising, 2-9, 2-14mercerising equipment, 2-15recipes, 2-14
Polyester, 2-13
Printing, 2-9
Scouring, 2-7, 2-9, 2-12batch scouring, 2-8boil-off, 2-8

1-4
caravans, 2-10continuous scouring, 2-10cotton, 2-7J-box, 2-10
kier-boil, 2-8kiers, 2-8knitting, 2-12open-width, 2-10polyester, 2-12
recipes, 2-8 , 2-10, 2-12, 2-13
spinning, 2-12
Segregation, 3-2
Single-stage, 2-19bleaching, 2-19desizing, 2-19recipes. 2-19
scouring, 2-19
Solvent Scourinp. 3-1
bleaching, 3-1
scouring, 3-1
Textile Processing, 2-1, 2-2bleaching, 2-4carding, 2-3cotton, 2-2desizing, 2-2, 2-4dyeing, printing, 2-4finishing, 2-4knitting, 2-4mercerising, 2-4opening, 2-3
organic contaminants, 2-2pollution load, 2-7Polyester, 2-2scouring, 2-4sizing, 2-4solid wastes, 2-1spinning, 2-3textile fibres, 2-2
textile manufacturing, 2-2textile mill classification, 2-4warping, 2-3water use, 2-1, 2-7weaving, 2-4
wet processing, 2-2
Thermal Oxidation, 3-4
Ultrafiltration, 5-1, 6-1batch concentration, 5-3batch scouring, 6-1cleaning, 6-5continuous scouring, 6-1cotton, 6-1
dynamic membrane ultrafiltration, 6-ieffluent characterisation. 5-1, 6-1evaporation, 6-1flux, 6-5fluxes, 5-3knitting, 5-1pilot plant, 5-1, 6-3polyester, 5-1
polyester/cotton scouring, 5-1, 6-ipolymeric membranes, 5-1rejections, 5-3spinning, 5-1
Wet Processing, 2-19bleaching, 2-19, 2-20desizing, 2-20effluent, 2-20effluent composition, 2-19mercerising, 2-19, 2-20pollution loads, 2-20scouring, 2-19, 2-20singeing, 2-10

APPENDIX 1 : SPREADSHEET OF MASS BALANCE FORMULAE FOR PROCESS CONFIGURATION 1 (See Figure 10.7)
Determinant
1. WASHING VAKIAHI KS
Moisture content of cloth into wash range
Na cone of moisture on cloth into wash range
Moisture content of cloth out of wash range
N'a cone of moisture on cloth out of wash range
Average clolh mass
Cloth speed
Up time of scouring wash range
2. TRIeATMI'M PLANT VARIABI.HS
Cross-(low microfiltration water recovery
Nanofillraliun water recovery
Nanofillralion point Na rejection
[Electrochemical cell current efficiency
f 'Electrochemical cell temperature
I'Electrochemical cell water transport number
[electrochemical cell electrolyte length
[•Electrochemical cell average calholyte conductivity
(electrochemical cell decomposition, polarisation and membrane voltage
Up time of treatment plant
3 WASH-WAri'RANniEl'I'LUFiNI CHARACTERISTICS
Na cone in total wash water
Total wash-water flow
L.ffluent flow
Na cone in effluent
Symbol
mi
ci
mo
CO
fm
fs
tm
Re
Rn
r
B
T
nw
1
CONDC
Vd
'P
Cq
0LI
CI
Unit
//kg cloth
g/l Na
//kg cloth
g/l Na
kg/m
m/h
h/d
%
%
%
%
C
g/gm
S/m
V
h/d
g/ 'Na
//kg cloth
//kg cloth
g/l Na
liquation
Specified
Specified
Specified
Specified
Specified
Specified
Specified
Specified
Specified
Specified
Specified
Specified, 4 ) 6 < p - 0 . 0629.CS
Specified
Specified
Specified
Specified
Specified
Specified
Specified
Specified

APPENDIX 1 (cont. i)
I >eiermin.iml
•1 MASSHAI.AXC! CA1 (1,1 A I IONS
W.isli Kange : Mass Na in on clolh
Mass Na nut on chuh
Mass Na in effluent
Cross-Mow microfillralion: Concentrate flow
Na cone in concentrate
Mass Na in concentrate
Permeate (low
Na cone in permeate
Mass Na in permeate
Nanofill ration: Concern rale HowNa cone in concern rale
Mass Na in concent rale
Permeate flow
Na cone in permeate
Mass Na in permeate
Hlcctrochemical cell: Mass Na in recovered Nut >l 1
Recovered N;i()IlNa cone in recovered Nat til
Depleted brine fluw
Na cone in depleted brine
Mass Na in depleted brine
Make-up Naas NaOH
Make-up waicr
Symbol
Ni
No
NI
1.2
C2
N21.1
( 3
N.I
CA
N-l
15
CS
N5
NYi
1.6
a.1.7
C7
N7
NX
I nit
g/kg cloth
g/kg cloth
g/kg cloth
//kg cloth
g// Na
g/kg cloth
//kg cloth
g// Nag/kg cloth
//kg cloth
S//Nag/kg cloth//kg cloth
g// Nag/kg cloth
g/kg cloth
//kg cloth
//kg clolh
«/' Nag/kg cloih
tf/kg cloth//kg tlotli
1 quation
/ / I / . C (
/no ,fo
LI .C I
Ll(\ - Rr/\OO)Cl
L2.CZ
1.1 - I.?.
( I
I.3.C3
!.:<( i - kit/ I O O )
(N3- N •})/!,!
I.I .Cl
1.3 - IA
( / : : * . ! 0 0 / A ' n ) ( 1 - ( 1 - k'n/ l < ) 0 ) " " f " M ) )
IM.CU
N'J - (-</.{)
N6.nw/1000
N6/I.6
L5- 1.6
{N'6-N6)/LY
C7.I.7
.V0- N?.~ \4
Q - LY
I

APPENDIX 1 (cont.ii)
Determinant]
5. Nal.OSSHS
Na loss from drag-out
Na loss in cross-flow microfiltration concentrate
Na loss in nanofiltration concentrate
Na loss from system
Savings on existing Na make-up
6. WATI-R LOSSES
Water loss from system
Savings on existing water make-up
7. HUKTKOCHE-MICAMJNnOPHRATINO PARAMIDCRS
Maximum anolyte conductivity
Minimum anolyte conductivity
Maximum limiting current density
Minimum limiting current density
Average limiting current density
Minimum anolyte volt drop
Maximum anolyte volt drop
Average anolyte volt drop
Average catholyte volt dropAverage cell potential
Hlcclrical requirements
8. Hl.iriROCHKMICAL UNIT AREA AND POWRR KIWUIRHMHNTSSpecific area requirements
Total area requirements
Power requirements for NaOlI production
Symbol
lossl
loss 2
loss 3
S
N9
W
L9
CONDAI
C0NDA2
CDl
CD2
CD3
VA1
VA2
VA3
VC
Vc
r
As
At
P
Unit
%
%
%
%
g/kg clothr/c
%
//kg cloth
%
S/m
S/m
A/m 2
A/m 2
A/m 2
V
V
V
V
V
iykg cloth
m2/kg clothm 2
kWh/t NaOH
Ixjuation
NO.\OO/Ni
N?..\OO/Ni
N4A00/NI
NSAOO/Ni
N 1 - N8
\<).IQO/\'I
!.8.\00/Q
!. 1 - 18
l.OAOO/Ll
[;xiuation 9.14/1000liquation 9.14/1000
7,6.CONDAI . 1000
?.,(?.C0NDA2. 1000
(CDl + CD2)/2
t.CDl /CONDAI
I.CD2/C0NDA2
(VAl +VA2)/2
I.CD3/C0NDC
VC*VA3*Vd
A/6/(23.f/100)
26,8.F/(tp.CD3)A s . { m . f s . t m23000.CD3. At.Vc/N6.fm.fsA0

APPENDIX 2 : SPREADSHEET OF MASS BALANCE FORMULAE FOR PROCESS CONFIGURATION 2
Determinandi
I. WASHING VARJAHU'SMoisture content of cloth into wash range
Na com: of moisture on cloth inio wash range
Moisiurc content of cloth out of wash range
Na cone of moisiurc on cloth oul of wash range
Average cloth mass
Cloth speedUp time of scouring w;ish range
Total wash-walcr flow
Na cone in total wash water
1 if fluent flow
Na cone in effluent
2. TRHATMl'NT PLANT VARIAI1US
IVaporaior concentration factor
livaporalor condensate concentration
livaporalor sludge volume
Total Na in evaporator sludge
Cross-flow niicrofiltration water recovery
Nanolillration waler recovery
Nanofillralion point Na rejection
lilectrochemiai! cell current efficiency
I electrochemical cell temperature
lilcctrochemical cell water transport number
Klcctrochcmical cell electrolyte length
I electrochemical cell average caiholyte conductivity
lileclrochemical cell decomposition, polarisation & membrane voltage
Up lime of treatment plant
Symbol
mi
ci
mo
CO
fmfstm
0
<q] , i
Cl
KCl-
Cc
SV
SN
Re
Rn
r
KTnw
/
CONDC
Vd
'P
Untt
//kg cloth
g//Na
//kg clolh
g//Na
kg/m
m / h
h/d
//kg cloth
g// Na//kg cloth
(!// Na
times
%
%
%
%
%
%
C
g/gmS/mVh/d
I-!quation
Specified
Specified
Specified
Specified
Specified
Specified
Specified
Specified
Specified
Specified
Specified
Specified
Specified
Specified
Specified
Specified
Specified
Specified
Specified
Specified1 1.6.P ".«?».«
Specified
Specified
Specified
Specified
>to

APPENDIX 2 (cont. i)
Determinand
3. MASS BAI.ANCH CALCUI.AT1ONS
Wash range: Mass Na in on cloth
Mass Na out on cloth
Mass Na in effluent
Evaporator: Concentrate and sludge flow
Mass Na in concentrate and sludge
Concentrate and sludge concentration
Concentrate flow
Mass Na in concentrate
Concentrate concentration
Condensate flow
Mass Na in condensate
Cross-flow microfiltration: Concentrate flow
Na cone in concentrate
Mass Na in concentrate
Permeate flow
Na cone in permeate
Mass Na in permeate
Nanofiltration: Concentrate flow
Na cone in concentrate
Mass Na in concentrate
Permeate flow
Na cone in permeate
Mass Na in permcat
Symbol
Ni
No
Nl
Is
Ns
Cs
U
Nc
Cc
Ix
Nc
1.2
C2
N2
1.3
C3
N3
\A
C4
N4
1,5
C5
N5
Unit
g/kg cloth
g/kg cloth
g/kg cloth
//kg cloth
g/kg cloth
g// Na
//kg cloth
g/kg cloth
g// Na
//kg cloth
g/kg cloth
//kg cloth
g// Na
g/kg cloth
//kg cloth
g//Na
g/kg cloth
//kg cloth
g/'Na
g/kg cloth
//kg cloth
g// Na
g/kg cloth
Ixjualion
mi .ci
mo -co
1.1 . C /
LI /HCF
N I
NS/l.S
LS{ 1 - SN/100)
NS{ 1 - SA//100)
NQ/LQ
LI - 1.6
Cc.l.c
Le( 1 - Re/ 100)
CG
L2.C2
LQ- L2
Ce
L3.C3
Z.3(l - Rn/ 100)
(N3- N5)/L4
L4.C4
Z.3 - L4
(C3.[00/Rn)(\ - ( 1 - Rn/\ 00)°" nf>0))
L'5 .C'6

APPENDIX 2 (cont.ii)
Dcterminand
Electrochemical cell: Mass Na in recovered NaOII
Recovered NaOII flow
Na cone in recovered NaOII
Depleted brine flow
Na cone in depleted brine
Mass Na in depleted brine
Make-up Na as NaOH
Make-up water
-I. Na LOSSHS
Na loss in evaporator sludge
Na loss from drag-out
Na loss in cross-flow microfiltration concentrate
Na loss in nanofiltration concentrate
Na loss from system
Savings on exisiing Na make-up
5. WATFRI.OSSI-S
Water loss from system
Savings on existing water make-up
Symbol
Nft
L6
C(>
1/7
Cl
N7
NH
1.8
lossO
Jnssl
Inss2
Ioss3
S
N9
W
i,y
Uni t
g/kg cloth
//kg cloth
g// cloth
//kg cloth
g// cloth
g/kg doth
g/kg cloth
//kg doth
%
%
%
%
9f
g/kg clothr/(.
%
V k g'/f.
1' uation
,V6 .Hii// 1000
A/6//.6
l.'J - L6
(N'S- N6)/I.7
C 7.1.7
N0+N2+N4
Q - / . / - l.c
(Nb-Ne)/Ni
NOAOO/Nt
N 2.100/Nt
;V7.100/N(
X!8.\00/Ni
N i - N 8
\'9.\00/Ni
l.fi A 00/Q
Q- 1.8
1.9A00/Q
>

APPENDIX 2 (cont.iii)
Determinant!
6. ELECTROCHEMICAL UNIT OPERATING PARAMETERS
Maximum anolyte conductivity
Minimum anolyte conductivity
Maximum limiting current density
Minimum limiting current density
Average limiting currenl density
Minimum anolyte volt drop
Maximum anolyte volt drop
Average anolyte voll drop
Average calholyte volt drop
Average cell potential
Electrical requirements
7. ELECTROCHEMICAL UNIT AREA AND POWER REQUIREMENT
Specific area requirements
Total area requirements
Power requirements for NaOH production
Symbol
CONDAI
CONDA2
CD1
CD2
CD3
VA1
VA2
VA3
vcVc
r
As
At
V
Unit
S/m
S/m
A/m 2
A/m2
A/m 2
V
V
V
V
V
F/kg cloth
m2/kg cloth
m2
kWh/t NaOH
Equation
Equation 9.14/1000
Equation 9.14/1000
2,6.C0NDAI .10002.6.C0WD/12.1000(CD1 +CDZ)/?.l.CDl /CONDAII.CD2/C0NDA2{V AI + VA?_)/2I.CD3/C0NDCVd+ VC*V A3W6/(23.£Y100)
26,8.F/(tp,CD3)As .fm.fs .tm(23000. CD3. At. Vc)/(N6 . f m . fs A0)
>
L

A3-1
APPENDIX 3 : COMPARISON OF SODIUM HYDROXIDE CONCENTRATION UMTS
USED IN THE TEXTILE INDUSTRY
Conversion of Hydrometrv Units
The following formulae can be used to convert specific gravity (SG) to degree Baume (°Be) and viceversa, for liquids heasier than water :
'B6 =14 \, 38(SG- [)
SC
144 ,38SG =
144.38-°fie
The formulae arc only exact for comparison at 15 °C.
Example I : What is the specific gravity of a 32,6 "Re sodium hydroxide at 15 °C?
Calculation :
111. 38SG = - 1 ,29
144 .38 -32 .6
The following formulae convert specific gravity and "Twaddell (°Tw)
"Tuuddctl = (SC - l ) x 2 0 0
(°Tu x 5 )
•;'° = l : IOOO
Example 2 : What is the specific gravity of 100°Tw sodium hydroxide?
Calculation :
00 x 3SG = 1 +
0 0 0 = 1.5
Table to Convert SG to °Be or °T>v
°Be
0
6
8
11
13
15
18
20
22
SG
1
1,02
1,04
1,06
1.08
1.10
1,12
1.14
1.16
1,18
Note : This table is valid
°Tw
0
4
8
12
16
20
24
28
32
36
only at 15
°Be
24
26
28
30
32^ *>
35
37
38
40
'C .
SG
1.20
1.22
1,24
1.26
1,28
1,30
1.32
1,34
1,36
1,38
Be values have
°Tw
40
44
48
52
56
60
64
68
72
76
°Be
41
43
44
46
47
48
49
51
52
53
been approximated
SG
1.40
1,42
1,44
1.46
1,48
1.50
1,52
1.54
1,56
1,58
to nearest whole
°Tw
80
84
88
92
96
100
104
108
112
116
number.

A3-2
Specific Gravity and Concentration of Sodium Hydroxide Solutions (20 °C)
SG
1,0001,0501,1001,1501,1601,1701,1801,1901.2001,2101,2201,2301,2401,2501,2601,2701,2801,2901,3001,3101,3201,3301.3401,3501,3601,3701,3801,3901,4001,4101,4201,4301,4401,4501,4601,4701,4801,4901,5001,5101,5201,530
°Be
06,7
13,018,819,820,922,023,024,025,026,026,927,928,829,730,631,532,433,334,235,035,836,637,438,239,039,840,541,242,042,743,444,144,845,446,146,847,448,148,749,450,0
°Tw
010203032343638404244464850525456586062646668707274767880828486889092949698
100102104106
Concentration ofSodium Hydroxide
% w/w
1,054,669,19
13,7314,6415,5416,4417,3518,2619,6120,0720,9821,9022,8223,2824,6525,5626,4827,4128,3329,2630,2031,1432,1033,0634,0335,0136,0036,9937,9938,9940,0041,0342,0743,1244,1745,2246,2747,3348,3049,4450,50
%lt
10,648,9
101,1157,9169,8181,8194,0206,4219,0231,8244,9258,0271,5285,2299,0312,9327,1341,6256,2371,1386,2401,6417,2433,2449,6466,0483,2500,4518,0535,6553,6572,0590,8610,0629,6646,2669,2698,2710,0730,4751,2772,4


![Coherent combining of multiple beams with multi-dithering technique: 100 KHz closed-loop compensation demonstration [6708-13]](https://static.fdokumen.com/doc/165x107/6337c45cd102fae1b6078833/coherent-combining-of-multiple-beams-with-multi-dithering-technique-100-khz-closed-loop.jpg)