Evaluation of a novel closed-loop fluid-administration system based on dynamic predictors of fluid...
12
RESEARCH Open Access Evaluation of a novel closed-loop fluid- administration system based on dynamic predictors of fluid responsiveness: an in silico simulation study Joseph Rinehart 1 , Brenton Alexander 1 , Yannick Le Manach 2,3 , Christoph K Hofer 4 , Benoit Tavernier 5 , Zeev N Kain 1 and Maxime Cannesson 1* Abstract Introduction: Dynamic predictors of fluid responsiveness have made automated management of fluid resuscitation more practical. We present initial simulation data for a novel closed-loop fluid-management algorithm (LIR, Learning Intravenous Resuscitator). Methods: The performance of the closed-loop algorithm was tested in three phases by using a patient simulator including a pulse-pressure variation output. In the first phase, LIR was tested in three different hemorrhage scenarios and compared with no management. In the second phase, we compared LIR with 20 practicing anesthesiologists for the management of a simulated hemorrhage scenario. In the third phase, LIR was tested under conditions of noise and artifact in the dynamic predictor. Results: In the first phase, we observed a significant difference between the unmanaged and the LIR groups in moderate to large hemorrhages in heart rate (76 ± 8 versus 141 ± 29 beats/min), mean arterial pressure (91 ± 6 versus 59 ± 26 mm Hg), and cardiac output (CO; (6.4 ± 0.9 versus 3.2 ± 1.8 L/min) (P < 0.005 for all comparisons). In the second phase, LIR intervened significantly earlier than the practitioners (16.0 ± 1.3 minutes versus 21.5 ± 5.6 minutes; P < 0.05) and gave more total fluid (2,675 ± 244 ml versus 1,968 ± 644 ml; P < 0.05). The mean CO was higher in the LIR group than in the practitioner group (5.9 ± 0.2 versus 5.2 ± 0.6 L/min; P < 0.05). Finally, in the third phase, despite the addition of noise to the pulse-pressure variation value, no significant difference was found across conditions in mean, final, or minimum CO. Conclusion: These data demonstrate that LIR is an effective volumetric resuscitator in simulated hemorrhage scenarios and improved physician management of the simulated hemorrhages. Introduction Automation is ubiquitous in modern life but historically has found limited application in medical care. However, recent interest has led to the rapid growth of research in automated controllers in areas ranging from glucose management to sedation to mechanical ventilation (1-3). Closed-loop (automated) controllers have been shown to manage patients safely and more consistently than clinicians for myriad applications [1-3], but a key requirement for proper function is reliable feedback data from systems being controlled. In the case of fluid responsiveness, historical measures like urine output, central venous pressure, and pulmonary capillary wedge pressure are very poor predictors and thus unsuitable for use in a closed-loop system [4]. Fortunately, great progress has been made in two areas that now make automated fluid management prac- tical [5]. The first is the description and characterization of the dynamic predictors of fluid responsiveness. Para- meters like pulse-pressure variation (PPV), stroke * Correspondence: [email protected] 1 Department of Anesthesiology & Perioperative Care, University of California, Irvine 101 S City Drive, Orange, CA 92868, USA Full list of author information is available at the end of the article Rinehart et al. Critical Care 2011, 15:R278 http://ccforum.com/content/15/6/R278 © 2011 Cannesson et al.; licensee BioMed Central Ltd. This is an open access article distributed under the terms of the Creative Commons Attribution License (http://creativecommons.org/licenses/by/2.0), which permits unrestricted use, distribution, and reproduction in any medium, provided the original work is properly cited.
-
Upload
independent -
Category
Documents
-
view
7 -
download
0
Transcript of Evaluation of a novel closed-loop fluid-administration system based on dynamic predictors of fluid...

RESEARCH Open Access
Evaluation of a novel closed-loop fluid-administration system based on dynamicpredictors of fluid responsiveness: an in silicosimulation studyJoseph Rinehart1, Brenton Alexander1, Yannick Le Manach2,3, Christoph K Hofer4, Benoit Tavernier5, Zeev N Kain1
and Maxime Cannesson1*
Abstract
Introduction: Dynamic predictors of fluid responsiveness have made automated management of fluidresuscitation more practical. We present initial simulation data for a novel closed-loop fluid-management algorithm(LIR, Learning Intravenous Resuscitator).
Methods: The performance of the closed-loop algorithm was tested in three phases by using a patient simulatorincluding a pulse-pressure variation output. In the first phase, LIR was tested in three different hemorrhagescenarios and compared with no management. In the second phase, we compared LIR with 20 practicinganesthesiologists for the management of a simulated hemorrhage scenario. In the third phase, LIR was testedunder conditions of noise and artifact in the dynamic predictor.
Results: In the first phase, we observed a significant difference between the unmanaged and the LIR groups inmoderate to large hemorrhages in heart rate (76 ± 8 versus 141 ± 29 beats/min), mean arterial pressure (91 ± 6versus 59 ± 26 mm Hg), and cardiac output (CO; (6.4 ± 0.9 versus 3.2 ± 1.8 L/min) (P < 0.005 for all comparisons).In the second phase, LIR intervened significantly earlier than the practitioners (16.0 ± 1.3 minutes versus 21.5 ± 5.6minutes; P < 0.05) and gave more total fluid (2,675 ± 244 ml versus 1,968 ± 644 ml; P < 0.05). The mean CO washigher in the LIR group than in the practitioner group (5.9 ± 0.2 versus 5.2 ± 0.6 L/min; P < 0.05). Finally, in thethird phase, despite the addition of noise to the pulse-pressure variation value, no significant difference was foundacross conditions in mean, final, or minimum CO.
Conclusion: These data demonstrate that LIR is an effective volumetric resuscitator in simulated hemorrhagescenarios and improved physician management of the simulated hemorrhages.
IntroductionAutomation is ubiquitous in modern life but historicallyhas found limited application in medical care. However,recent interest has led to the rapid growth of researchin automated controllers in areas ranging from glucosemanagement to sedation to mechanical ventilation (1-3).Closed-loop (automated) controllers have been shownto manage patients safely and more consistently than
clinicians for myriad applications [1-3], but a keyrequirement for proper function is reliable feedbackdata from systems being controlled. In the case of fluidresponsiveness, historical measures like urine output,central venous pressure, and pulmonary capillary wedgepressure are very poor predictors and thus unsuitablefor use in a closed-loop system [4].Fortunately, great progress has been made in two
areas that now make automated fluid management prac-tical [5]. The first is the description and characterizationof the dynamic predictors of fluid responsiveness. Para-meters like pulse-pressure variation (PPV), stroke
* Correspondence: [email protected] of Anesthesiology & Perioperative Care, University of California,Irvine 101 S City Drive, Orange, CA 92868, USAFull list of author information is available at the end of the article
Rinehart et al. Critical Care 2011, 15:R278http://ccforum.com/content/15/6/R278
© 2011 Cannesson et al.; licensee BioMed Central Ltd. This is an open access article distributed under the terms of the CreativeCommons Attribution License (http://creativecommons.org/licenses/by/2.0), which permits unrestricted use, distribution, andreproduction in any medium, provided the original work is properly cited.

volume variation (SVV), or respiratory variations in theplethysmographic waveform amplitude (ΔPOP) allow areliable determination of whether a mechanically venti-lated patient is likely to respond to a fluid bolus with asubsequent increase in cardiac output (CO) [6-8]. Thisstrong predictive relation can be used to guide resuscita-tion, and fluid therapy based on the dynamic predictorshas suggested improved outcomes in recently publishedprospective trials [8,9].The second area is the rapid advancement in monitor-
ing technology; noninvasive and increasingly accuratemonitors can provide vital-signs data previously availableonly through invasive approaches.As one of the first steps in the development of an auto-
mation algorithm is testing under simulation [10-15], wepresent data for a novel closed-loop fluid-managementalgorithm (LIR: Learning Intravenous Resuscitator) insimulation studies using heart rate (HR), mean arterialpressure (MAP), CO, and PPV as the input variables. Thegoals of the present study were (a) to assess the perfor-mance of LIR in a spectrum of bleeding scenarios, (b) tocompare automated fluid management by LIR with stan-dard fluid management by practitioners in simulationcases, and finally (c) specifically to challenge the relianceof LIR on the accuracy of PPV for effective resuscitation.
Materials and methodsThe study was performed during October and Novemberof 2010 and February of 2011 at the UCI Medical Centerin Orange, California. IRB exemption was obtained for thework done with faculty and residents.
Closed-loop algorithm designThe LIR algorithm is an adaptive controller that incorpo-rates data from previous clinical trials in its decisionengine. It monitors a variety of patient hemodynamicparameters (CO, dynamic predictors like PPV and strokevolume variation, heart rate, and blood pressure) and usesthis information to control fluid administration. Thedesign of the algorithm is described in the followingsections.
Database construction for use in the controllerA dataset of 414 patients, which contained hemodynamicparameters before and after a 500-ml bolus of hetastarch6% or modified fluid gelatin given over a 10- to 20-minuteperiod, was used to derive population-based formulas forguiding fluid therapy based on PPV and CO. This popula-tion, the method used, and the way CO was measuredhave been described elsewhere in detail [16]. Institutionalreview board (Comité de Protection des Personnes Hos-pices Civils de Lyon, Lyon, France, Comité de Protectiondes Personnes Paris-Ile de France, France, Comité de Pro-tection des Personnes Nord Ouest, Lille, France, and
Institutional Review Board Triemli City Hospital, Zurich,Switzerland) approvals were obtained. As described pre-viously, patients were included either as part of clinicaltrials or as part of routine clinical care [16]. CO was mea-sured in all patients (a) by thermodilution via a pulmonaryartery catheter (PAC; Swan-Ganz catheter, 7.5F; EdwardsLifeScience, Irvine, CA, USA), or (b) by the pulse-contourmethod by using a 4F thermistor-tipped arterial catheter(Pulsiocath thermodilution catheter) inserted into the leftfemoral artery and connected to a stand-alone PiCCOplusor PiCCO2 monitor (Pulsion Medical Systems, Munchen,Germany); or (c) via transesophageal echocardiography[16].
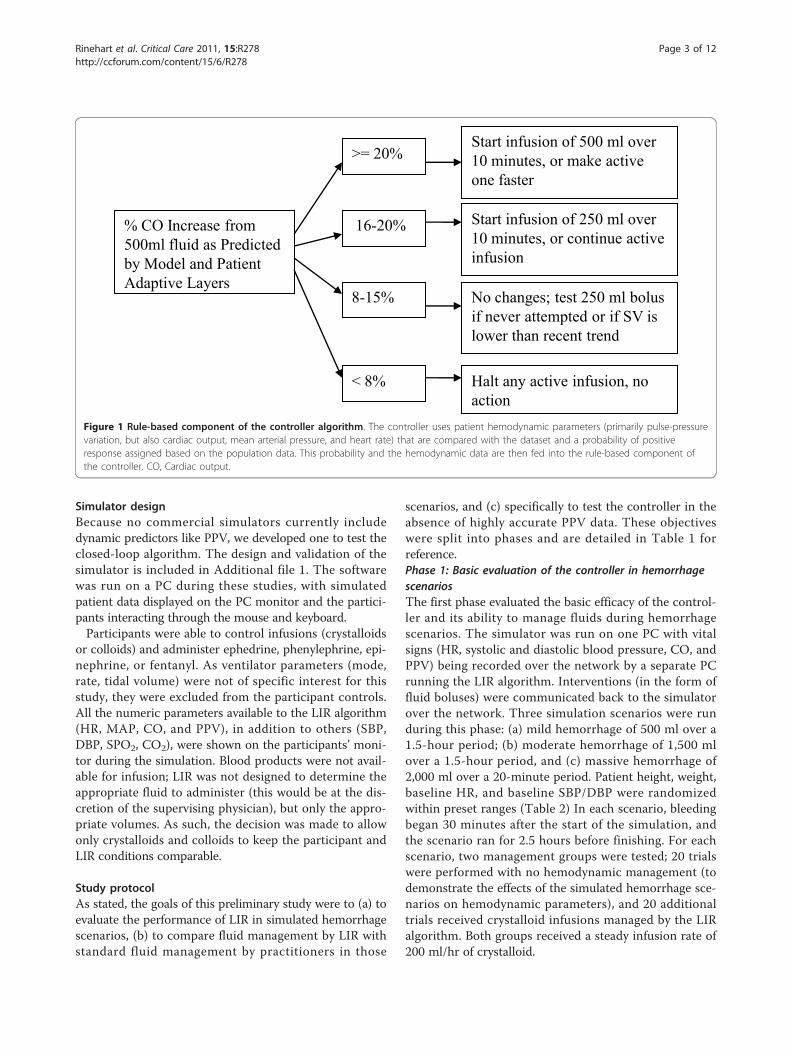
Controller characteristicsThe controller uses the resulting database to calculatewhen a patient is likely to respond to a fluid bolus andwith what degree of increase in CO. Patient hemodynamicparameters (primarily PPV, but also CO, mean arterialpressure (MAP), and HR) are compared with the dataset,and a probability of positive response is assigned based onthe population data. This probability and the hemody-namic data are then modified based on previous patientresponses to fluid administration and deviations from themodel predictions. The core rule-based component of thesystem is shown in Figure 1. The net expected percentageincrease in CO predicted by the previous layers is used todirect therapy. If little to no increase in CO is expected, nofluid bolus is given; if an infusion is already being given, itis halted. Conversely, if the expected percentage increaseis high, a fluid bolus is started (or quickened). In the mid-dle range–the portion corresponding to the recentlydescribed “gray zone” [16]–no actions are taken, and if abolus is already running, it will be allowed to continue.Under some circumstances (for example, a downwardtrend in CO), a test bolus may be given in this middlerange to assess the patient response [17].As implied earlier, the algorithm was designed to be
adaptive. It uses a bolus-based approach to fluid manage-ment (as opposed to continuous ongoing infusion) toallow the algorithm to analyze the efficacy of its interven-tions and to modify its own activity. As successiveboluses are given, the hemodynamic data before and aftereach bolus are recorded by the algorithm. These data areused to modify population predictions with regard to thecurrent patient, as well as the boundaries of the treeshown in Figure 1. In the decision tree, for example, if apatient falls into the indeterminate range of the decisiontree and a test bolus is given with no improvement inCO, then the threshold required for a test bolus in theindeterminate zone will be raised by the algorithm. Simi-larly, if a bolus is given by the system and a much largerincrease in CO is noted than was expected, the thresholdfor future boluses will be lowered.
Rinehart et al. Critical Care 2011, 15:R278http://ccforum.com/content/15/6/R278
Page 2 of 12
Simulator designBecause no commercial simulators currently includedynamic predictors like PPV, we developed one to test theclosed-loop algorithm. The design and validation of thesimulator is included in Additional file 1. The softwarewas run on a PC during these studies, with simulatedpatient data displayed on the PC monitor and the partici-pants interacting through the mouse and keyboard.Participants were able to control infusions (crystalloids
or colloids) and administer ephedrine, phenylephrine, epi-nephrine, or fentanyl. As ventilator parameters (mode,rate, tidal volume) were not of specific interest for thisstudy, they were excluded from the participant controls.All the numeric parameters available to the LIR algorithm(HR, MAP, CO, and PPV), in addition to others (SBP,DBP, SPO2, CO2), were shown on the participants’ moni-tor during the simulation. Blood products were not avail-able for infusion; LIR was not designed to determine theappropriate fluid to administer (this would be at the dis-cretion of the supervising physician), but only the appro-priate volumes. As such, the decision was made to allowonly crystalloids and colloids to keep the participant andLIR conditions comparable.
Study protocolAs stated, the goals of this preliminary study were to (a) toevaluate the performance of LIR in simulated hemorrhagescenarios, (b) to compare fluid management by LIR withstandard fluid management by practitioners in those
scenarios, and (c) specifically to test the controller in theabsence of highly accurate PPV data. These objectiveswere split into phases and are detailed in Table 1 forreference.Phase 1: Basic evaluation of the controller in hemorrhagescenariosThe first phase evaluated the basic efficacy of the control-ler and its ability to manage fluids during hemorrhagescenarios. The simulator was run on one PC with vitalsigns (HR, systolic and diastolic blood pressure, CO, andPPV) being recorded over the network by a separate PCrunning the LIR algorithm. Interventions (in the form offluid boluses) were communicated back to the simulatorover the network. Three simulation scenarios were runduring this phase: (a) mild hemorrhage of 500 ml over a1.5-hour period; (b) moderate hemorrhage of 1,500 mlover a 1.5-hour period, and (c) massive hemorrhage of2,000 ml over a 20-minute period. Patient height, weight,baseline HR, and baseline SBP/DBP were randomizedwithin preset ranges (Table 2) In each scenario, bleedingbegan 30 minutes after the start of the simulation, andthe scenario ran for 2.5 hours before finishing. For eachscenario, two management groups were tested; 20 trialswere performed with no hemodynamic management (todemonstrate the effects of the simulated hemorrhage sce-narios on hemodynamic parameters), and 20 additionaltrials received crystalloid infusions managed by the LIRalgorithm. Both groups received a steady infusion rate of200 ml/hr of crystalloid.
% CO Increase from 500ml fluid as Predicted by Model and Patient Adaptive Layers
16-20%
No changes; test 250 ml bolus if never attempted or if SV is lower than recent trend
< 8% Halt any active infusion, no action
Start infusion of 250 ml over 10 minutes, or continue active infusion
8-15%
>= 20%
Start infusion of 500 ml over 10 minutes, or make active one faster
Figure 1 Rule-based component of the controller algorithm. The controller uses patient hemodynamic parameters (primarily pulse-pressurevariation, but also cardiac output, mean arterial pressure, and heart rate) that are compared with the dataset and a probability of positiveresponse assigned based on the population data. This probability and the hemodynamic data are then fed into the rule-based component ofthe controller. CO, Cardiac output.
Rinehart et al. Critical Care 2011, 15:R278http://ccforum.com/content/15/6/R278
Page 3 of 12
Phase 2: Closed-loop system versus practitionermanagement during simulated hemorrhage scenariosThe second phase of testing compared the fluid man-agement of practitioners with that of the LIR algorithmin simulated hemorrhage cases. After IRB exemptionwas obtained, 20 academic anesthesiologists and resi-dents were asked to manage fluids and medications fora 1-hour simulated case of massive hemorrhage (2,000ml blood loss over 20 minutes). The subjects were giventhe following history:
“You are taking over management of an otherwisehealthy 40-year-old woman who is having a pelvictumor debulking. The surgery started 1 hour ago,and anesthetic management has been uncomplicated.Baseline chemistries were within normal ranges, andthe starting hematocrit was 39%.”
Subjects were allowed to ask questions, and responseswere standardized from a preset list of available informa-tion. Simulator output was presented on the PC graphi-cally similarly to the monitors used in the operating
rooms, showing HR, blood pressure, pulse oximetry, CO,and PPV. The hemorrhage began 15 minutes into thesimulation and continued for 20 minutes. Five minutesafter the hemorrhage began, the subject managing thescenario was told, “The surgical team tells you they’relosing a lot of blood.” Five minutes after the hemorrhageended, they were told that the bleeding seemed to beunder control. The practitioners could give crystalloid,ephedrine, 10 mg, phenylephrine, 100 mg, or fentanyl, 50μg, during the management of the simulated patient. Oneweek later, the subjects repeated the simulation, but thistime the rate of crystalloid infusion was secretly managedby the closed-loop system while practitioner fluid admin-istrations were ignored and only the medications affectedthe simulator. The simulation was also run 20 times withonly LIR managing crystalloids and 20 times with nomanagement. The same clinical scenario was run foreach practitioner, and the baseline characteristics of thesimulated patient were again randomized by the compu-ter within a small range of preset parameters (Table 2).The range of randomization was narrowed for this phaseso that differences in management would be highlighted,as opposed to differences in the simulation.Phase 3: Testing the controller’s dependence on accurate PPVFor the third phase of testing, the simulator was modi-fied such that PPV was no longer as accurate a predictorof fluid responsiveness. Four conditions were run duringthis phase of testing:1. Accurate PPV: the PPV was perfectly predictive of
the response to fluid;2. Biased PPV: the PPV value was constantly biased ±
5% (absolute value) from the true value throughout theentire scenario;3. Fluctuating PPV: the PPV value fluctuated randomly
from ± 5% (absolute value) of the true value at randomduring the scenario; and
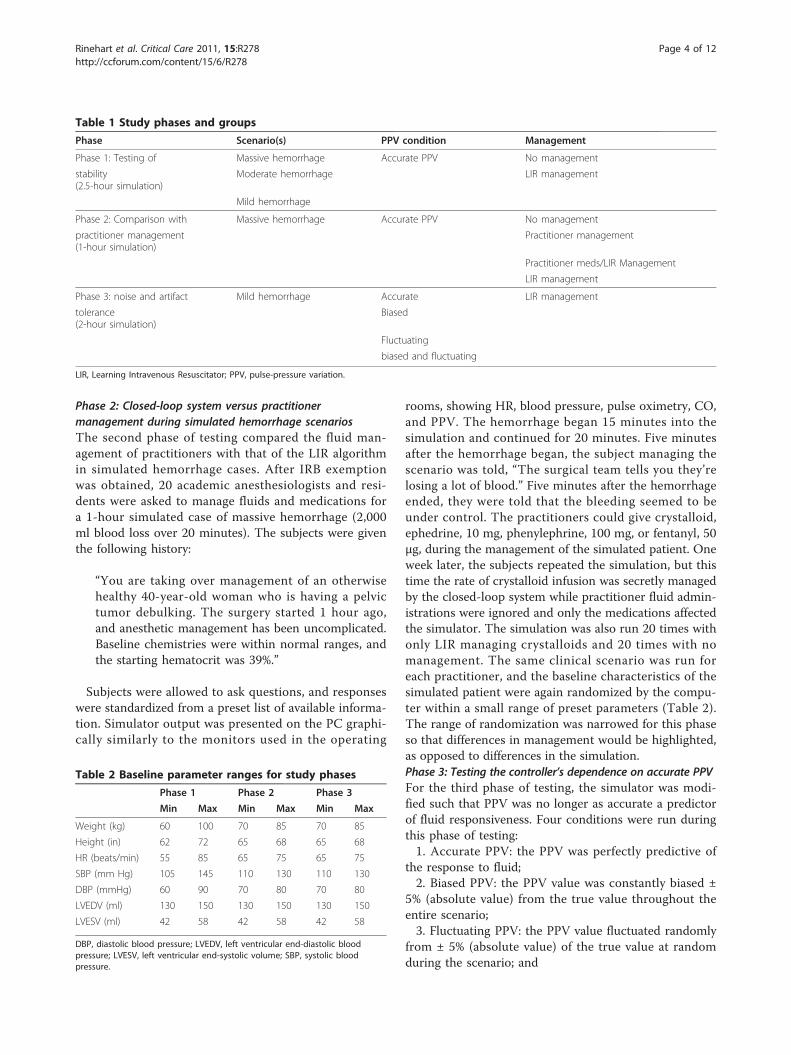
Table 1 Study phases and groups
Phase Scenario(s) PPV condition Management
Phase 1: Testing of Massive hemorrhage Accurate PPV No management
stability(2.5-hour simulation)
Moderate hemorrhage LIR management
Mild hemorrhage
Phase 2: Comparison with Massive hemorrhage Accurate PPV No management
practitioner management(1-hour simulation)
Practitioner management
Practitioner meds/LIR Management
LIR management
Phase 3: noise and artifact Mild hemorrhage Accurate LIR management
tolerance(2-hour simulation)
Biased
Fluctuating
biased and fluctuating
LIR, Learning Intravenous Resuscitator; PPV, pulse-pressure variation.
Table 2 Baseline parameter ranges for study phases
Phase 1 Phase 2 Phase 3
Min Max Min Max Min Max
Weight (kg) 60 100 70 85 70 85
Height (in) 62 72 65 68 65 68
HR (beats/min) 55 85 65 75 65 75
SBP (mm Hg) 105 145 110 130 110 130
DBP (mmHg) 60 90 70 80 70 80
LVEDV (ml) 130 150 130 150 130 150
LVESV (ml) 42 58 42 58 42 58
DBP, diastolic blood pressure; LVEDV, left ventricular end-diastolic bloodpressure; LVESV, left ventricular end-systolic volume; SBP, systolic bloodpressure.
Rinehart et al. Critical Care 2011, 15:R278http://ccforum.com/content/15/6/R278
Page 4 of 12
4. Biased and fluctuating PPV: the PPV had both asteady bias within ± 5% (absolute value) and an addi-tional fluctuating component of ± 5% (absolute value).Thus, in the final condition, the PPV reported by thesimulator may have been up 10% different from the truevalue; a “true” PPV of 15% might have been reported asanywhere from 5% to 25%). The closed loop was thenused to manage crystalloid infusions for a 2-hour, 1,000-ml blood-loss scenario under each of these four condi-tions, with bleeding starting 30 minutes into the simula-tion. A longer and slower hemorrhage scenario than wasused in Phase 2 was intentionally simulated for thisphase to accentuate the differences in the accuracy ofthe PPV across groups; a massive hemorrhage mighthave hidden small differences.
Statistical analysisData are presented as mean ± SD. For Phase 1, databetween the no intervention group and the LIR manage-ment group were compared by using a Mann-Whitneytest. For Phases 2 and 3, data were compared by usinganalysis of variance for repeated measurements(ANOVA). If significant differences were found, post hoctesting was performed by using Tukey’s honest significantdifference. A P value < 0.05 was considered statisticallysignificant. All statistic analysis was performed by usingSPSS 13.0 for Windows, SPSS, Chicago, IL, USA.
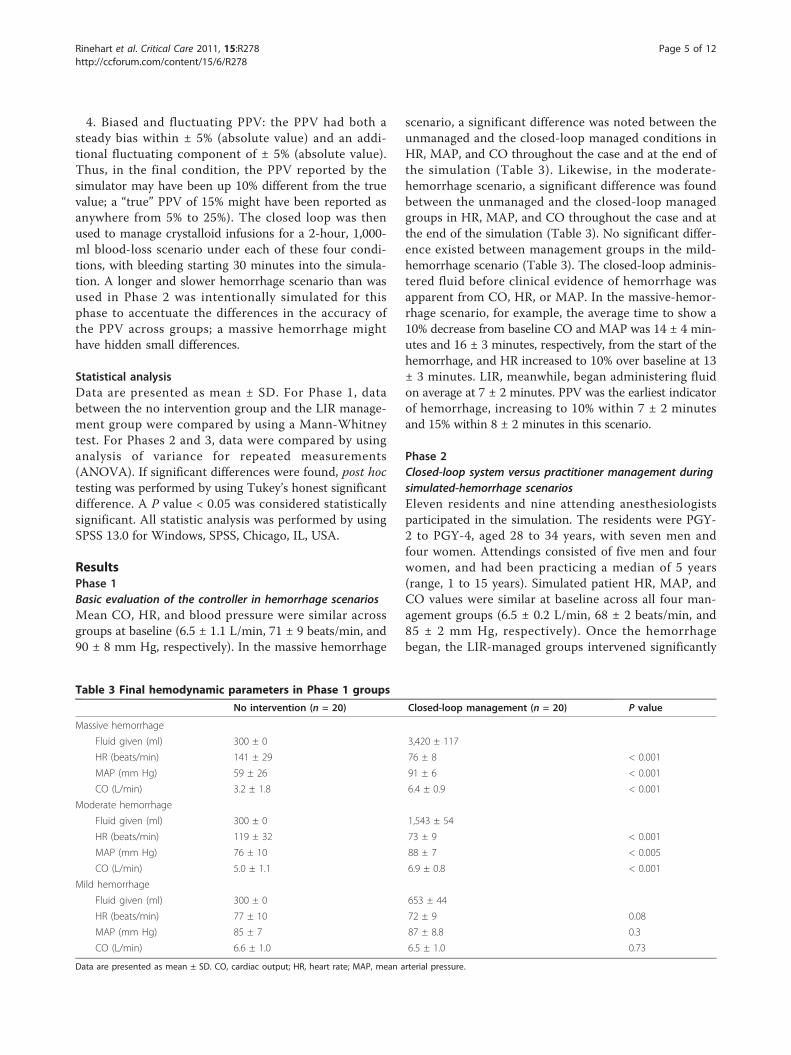
ResultsPhase 1Basic evaluation of the controller in hemorrhage scenariosMean CO, HR, and blood pressure were similar acrossgroups at baseline (6.5 ± 1.1 L/min, 71 ± 9 beats/min, and90 ± 8 mm Hg, respectively). In the massive hemorrhage
scenario, a significant difference was noted between theunmanaged and the closed-loop managed conditions inHR, MAP, and CO throughout the case and at the end ofthe simulation (Table 3). Likewise, in the moderate-hemorrhage scenario, a significant difference was foundbetween the unmanaged and the closed-loop managedgroups in HR, MAP, and CO throughout the case and atthe end of the simulation (Table 3). No significant differ-ence existed between management groups in the mild-hemorrhage scenario (Table 3). The closed-loop adminis-tered fluid before clinical evidence of hemorrhage wasapparent from CO, HR, or MAP. In the massive-hemor-rhage scenario, for example, the average time to show a10% decrease from baseline CO and MAP was 14 ± 4 min-utes and 16 ± 3 minutes, respectively, from the start of thehemorrhage, and HR increased to 10% over baseline at 13± 3 minutes. LIR, meanwhile, began administering fluidon average at 7 ± 2 minutes. PPV was the earliest indicatorof hemorrhage, increasing to 10% within 7 ± 2 minutesand 15% within 8 ± 2 minutes in this scenario.
Phase 2Closed-loop system versus practitioner management duringsimulated-hemorrhage scenariosEleven residents and nine attending anesthesiologistsparticipated in the simulation. The residents were PGY-2 to PGY-4, aged 28 to 34 years, with seven men andfour women. Attendings consisted of five men and fourwomen, and had been practicing a median of 5 years(range, 1 to 15 years). Simulated patient HR, MAP, andCO values were similar at baseline across all four man-agement groups (6.5 ± 0.2 L/min, 68 ± 2 beats/min, and85 ± 2 mm Hg, respectively). Once the hemorrhagebegan, the LIR-managed groups intervened significantly
Table 3 Final hemodynamic parameters in Phase 1 groups
No intervention (n = 20) Closed-loop management (n = 20) P value
Massive hemorrhage
Fluid given (ml) 300 ± 0 3,420 ± 117
HR (beats/min) 141 ± 29 76 ± 8 < 0.001
MAP (mm Hg) 59 ± 26 91 ± 6 < 0.001
CO (L/min) 3.2 ± 1.8 6.4 ± 0.9 < 0.001
Moderate hemorrhage
Fluid given (ml) 300 ± 0 1,543 ± 54
HR (beats/min) 119 ± 32 73 ± 9 < 0.001
MAP (mm Hg) 76 ± 10 88 ± 7 < 0.005
CO (L/min) 5.0 ± 1.1 6.9 ± 0.8 < 0.001
Mild hemorrhage
Fluid given (ml) 300 ± 0 653 ± 44
HR (beats/min) 77 ± 10 72 ± 9 0.08
MAP (mm Hg) 85 ± 7 87 ± 8.8 0.3
CO (L/min) 6.6 ± 1.0 6.5 ± 1.0 0.73
Data are presented as mean ± SD. CO, cardiac output; HR, heart rate; MAP, mean arterial pressure.
Rinehart et al. Critical Care 2011, 15:R278http://ccforum.com/content/15/6/R278
Page 5 of 12

earlier than the practitioner group and gave more totalfluid (Table 4). The mean, minimum, and final COvalues were higher in both LIR-managed groups than inthe practitioners group (Figure 2), and the coefficient ofvariance was lower (Table 4 and Figure 2). No differencein MAP was found between intervention groups, but allwere significantly higher than the unmanaged group
(Figure 3). No significant difference appeared betweenattending and resident performance in final CO, HR, orMAP values in the practitioner-management group (4.5± 1.2 L/min, 95 ± 13 beats/min, and 76 ± 10 mm Hgfor attendings, and 4.9 ± 1.7 L/min, 91 ± 28 beats/min,and 75 ± 19 mm Hg for residents). Finally, a significantreduction in vasopressor use was noted in the
Table 4 Fluid management: anesthesiologists versus closed loop
Nomanagement(1)
Anesthesiologistmanaged(2)
Anesthesiologist, pressors;closed-loop, fluids(3)
Closed-loopmanaged(4)
Time window until the application of first bolus fromstart of hemorrhage (min)
- 21.5 ± 5.6a 15.6 ± 1.1 16.0 ± 1.3
Total fluid given (ml) - 1,968 + 644a 2,875 ± 275 2,675 ± 244
Mean arterial pressure (mm Hg) 61 ± 6.9 76 ± 4.2 79 ± 2.0 79 + 1.1
Mean cardiac output (L/min) 3.8 ± 0.4 5.2 ± 0.6a 5.8 ± 0.2b 5.9 ± 0.2b
Minimum cardiac output (L/min) 1.4 ± 0.8 3.6 ± 1.3a 4.8 ± 0.5b 4.8 ± 0.4b
Final cardiac output (L/min) 1.7 ± 0.9 4.8 ± 1.5a 5.6 ± 0.5b 5.7 ± 0.4b
Cardiac output during case, coefficient of variance (%) 89 ± 29 36.7 ± 23a 16.6 ± 9b 16.3 ± 8b
n = 20 in each group. Data are reported as mean ± standard deviation. aP < 0.05 versus groups 2, 3, and 4. bP < 0.05 versus groups 1 and 4.
Figure 2 Cardiac output in Phase 2 groups; closed-loop system versus practitioner management during a simulated hemorrhagescenario. Each line represents a single case. Once the hemorrhage began, the LIR-managed groups intervened significantly earlier than thepractitioner group and gave more total fluid. The mean, minimum, and final cardiac output was higher in both LIR-managed groups than in thepractitioner group, and the coefficient of variance was lower. LIR, Learning Intravenous Resuscitator.
Rinehart et al. Critical Care 2011, 15:R278http://ccforum.com/content/15/6/R278
Page 6 of 12

Practitioners with LIR group versus the Practitionersgroup (Table 5).
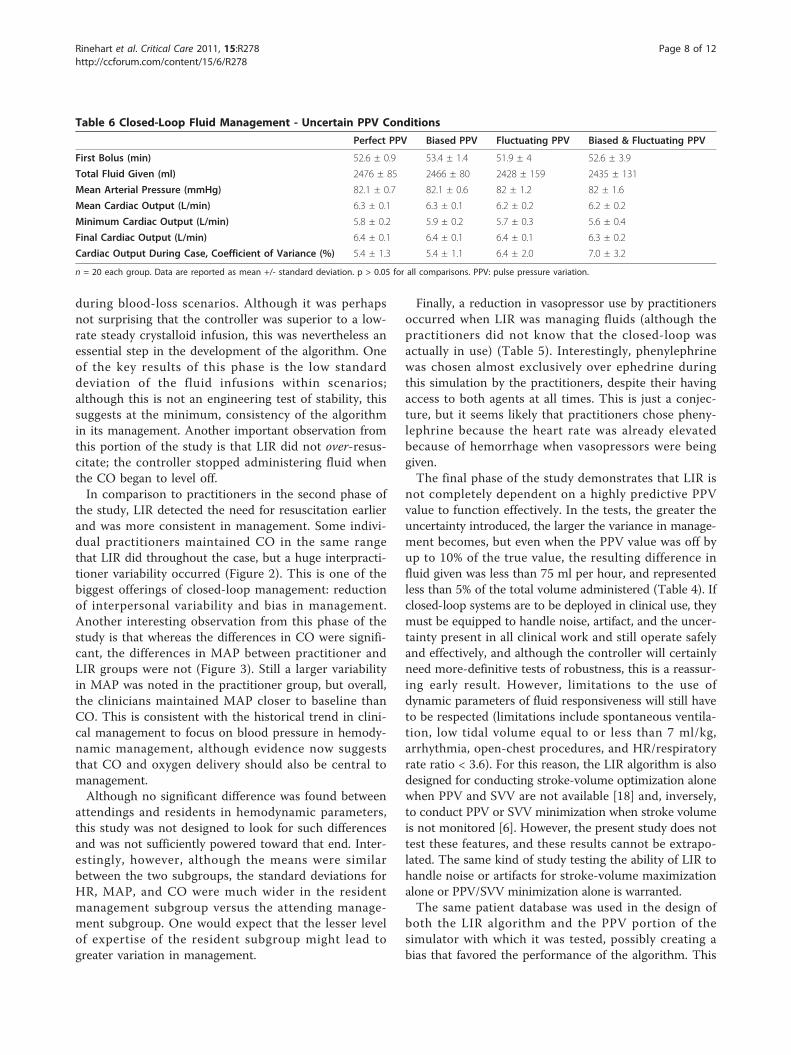
Phase 3. Testing the controller’s dependence on accuratePPVBaseline CO, HR, and MAP values across all trial condi-tions were similar at baseline in this phase (6.6 ± 0.4 L/min, 70 ± 1 beats/min, and 87 ± 2 mm Hg, respectively).No significant difference was found in mean, minimum,or final CO across PPV conditions, regardless of the type
of artifact induced in the PPV signal (Table 6). Time tofirst fluid bolus and total volume infused were likewisenonsignificant. Although the coefficient of variance ofthe CO during the case did increase from 5.4% ± 1.3% inthe perfect PPV condition to 7.0% ± 3.2% in the biasedand fluctuating PPV condition, this difference was alsonot significant (P = 0.06).
DiscussionAs simulation studies are a standard step in the testingof new controllers [10-15], these data represent the firststep in the development of an automated fluid-manage-ment system for clinical use. Overall, the results suggestthat (a) the LIR algorithm is capable of performing fluidresuscitations, at least in simulation; (b) the controllerperforms comparably to practitioners in this setting andmaintains a higher and more stable CO; and (c) thecontroller is not dependent on a highly predictive PPVvalue to function.The first phase of our simulation study was to show
that LIR is capable of adequately resuscitating patients
Table 5 Ephedrine and phenylephrine use in Phase 2 ofthe study
Ephedrine (mg) Phenylephrine (μg)
No management 0 ± 0 0 ± 0
LIR alone 0 ± 0 0 ± 0
Practitioners alone 0 ± 0 100 ± 132a
Practitioners with LIR 0.3 ± 1.1b 40 ± 94b
Data are presented as mean ± SD. a P < 0.05 for practitioners alone versus LIRalone. bP < 0.05 for practitioners with LIR versus practitioners alone. LIR,Learning Intravenous Resuscitator.
Figure 3 Mean arterial pressure in Phase 2 groups: closed-loop system versus practitioner management during a simulatedhemorrhage scenario. Each line represents a single case. We observed no difference in mean arterial pressure between intervention groups,but all were significantly higher than those in the unmanaged group.
Rinehart et al. Critical Care 2011, 15:R278http://ccforum.com/content/15/6/R278
Page 7 of 12
during blood-loss scenarios. Although it was perhapsnot surprising that the controller was superior to a low-rate steady crystalloid infusion, this was nevertheless anessential step in the development of the algorithm. Oneof the key results of this phase is the low standarddeviation of the fluid infusions within scenarios;although this is not an engineering test of stability, thissuggests at the minimum, consistency of the algorithmin its management. Another important observation fromthis portion of the study is that LIR did not over-resus-citate; the controller stopped administering fluid whenthe CO began to level off.In comparison to practitioners in the second phase of
the study, LIR detected the need for resuscitation earlierand was more consistent in management. Some indivi-dual practitioners maintained CO in the same rangethat LIR did throughout the case, but a huge interpracti-tioner variability occurred (Figure 2). This is one of thebiggest offerings of closed-loop management: reductionof interpersonal variability and bias in management.Another interesting observation from this phase of thestudy is that whereas the differences in CO were signifi-cant, the differences in MAP between practitioner andLIR groups were not (Figure 3). Still a larger variabilityin MAP was noted in the practitioner group, but overall,the clinicians maintained MAP closer to baseline thanCO. This is consistent with the historical trend in clini-cal management to focus on blood pressure in hemody-namic management, although evidence now suggeststhat CO and oxygen delivery should also be central tomanagement.Although no significant difference was found between
attendings and residents in hemodynamic parameters,this study was not designed to look for such differencesand was not sufficiently powered toward that end. Inter-estingly, however, although the means were similarbetween the two subgroups, the standard deviations forHR, MAP, and CO were much wider in the residentmanagement subgroup versus the attending manage-ment subgroup. One would expect that the lesser levelof expertise of the resident subgroup might lead togreater variation in management.
Finally, a reduction in vasopressor use by practitionersoccurred when LIR was managing fluids (although thepractitioners did not know that the closed-loop wasactually in use) (Table 5). Interestingly, phenylephrinewas chosen almost exclusively over ephedrine duringthis simulation by the practitioners, despite their havingaccess to both agents at all times. This is just a conjec-ture, but it seems likely that practitioners chose pheny-lephrine because the heart rate was already elevatedbecause of hemorrhage when vasopressors were beinggiven.The final phase of the study demonstrates that LIR is
not completely dependent on a highly predictive PPVvalue to function effectively. In the tests, the greater theuncertainty introduced, the larger the variance in manage-ment becomes, but even when the PPV value was off byup to 10% of the true value, the resulting difference influid given was less than 75 ml per hour, and representedless than 5% of the total volume administered (Table 4). Ifclosed-loop systems are to be deployed in clinical use, theymust be equipped to handle noise, artifact, and the uncer-tainty present in all clinical work and still operate safelyand effectively, and although the controller will certainlyneed more-definitive tests of robustness, this is a reassur-ing early result. However, limitations to the use ofdynamic parameters of fluid responsiveness will still haveto be respected (limitations include spontaneous ventila-tion, low tidal volume equal to or less than 7 ml/kg,arrhythmia, open-chest procedures, and HR/respiratoryrate ratio < 3.6). For this reason, the LIR algorithm is alsodesigned for conducting stroke-volume optimization alonewhen PPV and SVV are not available [18] and, inversely,to conduct PPV or SVV minimization when stroke volumeis not monitored [6]. However, the present study does nottest these features, and these results cannot be extrapo-lated. The same kind of study testing the ability of LIR tohandle noise or artifacts for stroke-volume maximizationalone or PPV/SVV minimization alone is warranted.The same patient database was used in the design of
both the LIR algorithm and the PPV portion of thesimulator with which it was tested, possibly creating abias that favored the performance of the algorithm. This
Table 6 Closed-Loop Fluid Management - Uncertain PPV Conditions
Perfect PPV Biased PPV Fluctuating PPV Biased & Fluctuating PPV
First Bolus (min) 52.6 ± 0.9 53.4 ± 1.4 51.9 ± 4 52.6 ± 3.9
Total Fluid Given (ml) 2476 ± 85 2466 ± 80 2428 ± 159 2435 ± 131
Mean Arterial Pressure (mmHg) 82.1 ± 0.7 82.1 ± 0.6 82 ± 1.2 82 ± 1.6
Mean Cardiac Output (L/min) 6.3 ± 0.1 6.3 ± 0.1 6.2 ± 0.2 6.2 ± 0.2
Minimum Cardiac Output (L/min) 5.8 ± 0.2 5.9 ± 0.2 5.7 ± 0.3 5.6 ± 0.4
Final Cardiac Output (L/min) 6.4 ± 0.1 6.4 ± 0.1 6.4 ± 0.1 6.3 ± 0.2
Cardiac Output During Case, Coefficient of Variance (%) 5.4 ± 1.3 5.4 ± 1.1 6.4 ± 2.0 7.0 ± 3.2
n = 20 each group. Data are reported as mean +/- standard deviation. p > 0.05 for all comparisons. PPV: pulse pressure variation.
Rinehart et al. Critical Care 2011, 15:R278http://ccforum.com/content/15/6/R278
Page 8 of 12

is a valid concern, but one that was both unavoidableand in part addressed in the third phase of the study.This was unavoidable because both the algorithm andthe simulator were designed, to the best of the authors’skill, by using the best available information on howPPV predicts response to fluid in human subjects (seeAdditional file 1). Because of this, and regardless of howit had actually been accomplished, the systems wouldhave been built by using the same underlying principlesgoverning the dynamic predictors or else, by definition,one (or both) would have included inferior operationalinformation. In this case, the most extensive informationavailable was the data set collected by Cannesson et al.[16]. The caveat, of course, is that if the data are erro-neous, the closed loop may nevertheless function in theartificial simulation environment because it is partiallybased on those same data. The third phase of the studywas intended in part to examine this possible bias in thedesign by making the reported PPV an imprecise predic-tor to see what impact, if any, this had on the LIR algo-rithm. As demonstrated, the controller continues tofunction even when PPV varies widely from the “true”value generated from the incorporation of the databaseinto the simulator. Although this suggests that theappropriate operation of LIR is not dependent on theincluded PPV dataset alone, only further study indepen-dent of the simulator will adequately address thisconcern.Good evidence indicates that maximizing SV in the
perioperative period will reduce complications andimprove outcomes for moderate- to high-risk surgicalpatients [19-24]. Thermodilution with a pulmonaryartery catheter remains the clinical standard, but alter-native CO monitoring devices (like esophageal Doppler)have also been used to guide therapy with positiveeffects [25]. With the proliferation of noninvasive andminimally invasive CO devices in recent years, goal-directed CO monitoring is readily achievable in a broadpatient population. Hemodynamic management of thistype requires frequent interventions, protocol-drivendecision making, and high levels of attention to be effec-tive and repeatable. Given these requirements, it may bedifficult to gain acceptance for standardized protocols.The more complex a protocol becomes, the harder it isto implement correctly and consistently, and even in thebest of cases, errors in implementation are commonbecause of care-provider time constraints [26]. Addition-ally, health care providers work in an environment fullof distractions [27] and are susceptible to fatigue, lapsesin attention, and stress, all of which can have a negativeimpact on work performance [28]. Furthermore, studieshave shown that when management protocols are imple-mented in clinical care, adherence rates are only 40% to50%, and this remains true across a variety of disciplines
from ICU glucose control to trauma assessment andeven outpatient screening guidelines [26,29-32].Closed-loop systems are a bridge across this imple-
mentation gap, allowing the closed loop to perform theoften tedious tasks of the protocols and interveningwhen needed, which then allows clinical care providersto focus on other aspects of management. Moreover, theclosed loop is not susceptible to distraction, fatigue, orpersonal bias. This means that a clinical protocol oralgorithm can be followed exactly and improved on overtime. Once a closed loop is shown to be effective inmanagement of a given clinical scenario, it can be usedrepeatedly and will produce consistent results in thatscenario.A great deal of automation is already being integrated
into clinical care. Closed-loop ventilators that adaptbreath-to-breath in response to changes in oxygenationand lung compliance are commonplace in modern ICUs[3,33]. Insulin therapy systems are being actively investi-gated for both inpatient and outpatient use [34]. Aclosed-loop propofol and remifentanil administrationsystem based on BIS (processed EEG) was recentlyreported on in a large clinical trial [35]. Closed loopslike these are demonstrating the possible uses and bene-fits of automation in medicine.
Study limitationsAlthough the LIR algorithm proved effective in manage-ment of the simulated hemorrhage scenarios, some lim-itations exist with the current study. First, the simulatorwas designed with as accurate a hemodynamic model aspossible, given the current understanding of thedynamic predictors of fluid responsiveness, but generali-zations about the possible efficacy of this controller inclinical practice would be premature based on this initialwork. In terms of the algorithm design, the controllerhas not been rigorously studied for stability and robust-ness from an engineering standpoint and will need thistesting before clinical studies can commence. Thepatient database used to seed the population-based algo-rithm is our own, which may limit applicability. Finally,the third phase of our study (in which the tolerance ofthe algorithm for error in the PPV signal was examined)suggests that the algorithm will still function well in theface of moderate levels of noise and error, but whetherthis is sufficient to tolerate the noise and uncertaintyactually present in clinical monitoring of patientsremains to be tested.A limitation in the comparison with practitioners is
the obvious difference between simulation and clinicalcare. It may well be that clinical cues and observationsare available to practitioners in the OR or ICU setting,not available in simulation, that may limit the applicabil-ity of the second phase of our study to true clinical
Rinehart et al. Critical Care 2011, 15:R278http://ccforum.com/content/15/6/R278
Page 9 of 12

practice. Only further testing and clinical trials can ade-quately address this issue.Additionally, the decision specifically to exclude
blood-product administration may have limited theapplication of these simulation results to real-worldhemorrhage and resuscitation. As previously mentioned,LIR was designed to determine the appropriate volumesfor resuscitation, but not the appropriate fluid to give ina particular situation. This decision would be left to thesupervising physician, who could hang any fluids or pro-ducts desired and allow the algorithm to determine therate and timings of administrations. As this was not apart of the algorithm, we sought to limit the study tothe question of volumetric appropriateness only byremoving the option of blood products from bothgroups. A system like LIR would never be deployed inthe absence of some form of direct supervision forexactly this reason. The supervising physician wouldneed to determine when blood products were needed;otherwise, in a slow but steady hemorrhage, the control-ler would continue to give fluids to maintain intravascu-lar volume until the patient died of anemia. Asupervising physician would recognize the need for pro-ducts and could hang them instead of a fluid bag whenappropriate. An “anemia risk” alarm could be integratedthat tracked parameters like volume given, time span,and patient weight, but this would only be an adjunct tosupervision. Moreover, the ongoing development andimprovement of continuous, noninvasive hemoglobinsensors represents another possible safety feature andenhancement for future integration [36].Because of the nature of the scenarios, we limited the
patient parameter randomization process in the simula-tor to narrower ranges than might be found in the realpatient population. The reason for this was to keep thescenarios more consistent in their evolution (for exam-ple, a 2,000-ml blood loss would have been catastrophicin a 45-kg patient versus a 100-kg patient). This keptthe scenarios more consistent across trials, but therestricted range may limit applicability of the efficacy ofthe LIR algorithm to a large and variable patientpopulation.Finally, this study did not seek to answer a host of
questions regarding this system. For example, howwould the system cope with a significant change inpatient condition like the onset of atrial fibrillation, or achange from volume control to assisted or spontaneousventilation? What about a new-onset myocardial infarc-tion? The LIR algorithm was designed to detect whenpatient responses are not matched by expectations,especially when a sudden change in responses or overallpatient condition occurs, and adjust future interventionsaccordingly, but clearly this is out of the scope of thecurrent study and requires much more testing. Further
studies testing the ability of the system to work by usingSV optimization alone or PPV/SVV optimization aloneare needed.
ConclusionThe current study demonstrates that the LIR algorithmeffectively resuscitates simulated patients in the testedscenarios and significantly improved physician manage-ment in the second phase of the study. Future studieswill focus on the stability of the controller and testing ina broader range of scenarios, including in othersimulators.
Key Messages• This study is the first to describe an automatedsystem for hemodynamic optimization based on car-diac output and pulse-pressure variation optimiza-tion. These data demonstrate that the learningintravenous resuscitator (LIR) is an effective volu-metric resuscitator in simulated hemorrhage scenar-ios and improved physician management.• The controller performs comparably to practi-tioners in this setting and maintains a higher andmore stable cardiac output• The controller is not dependent on a highly pre-dictive pulse-pressure variation value to function• This system is designed to optimize hemodynamicsbased on pulse-pressure variation and/or stroke-volume variation and/or stroke volume alone• Engineering testing and simulation studies are thefirst required steps before any testing of a closed-loop system in a living system
Additional material
Additional file 1: Hemodynamic Simulator Design. This documentdescribes how the hemodynamic simulator was design. It provides an in-depth description of the mathematical and physiological models used tobuild the hemodynamic simulator used in the present study.
AbbreviationsCO: cardiac output; DBP: diastolic blood pressure HR: heart rate; LIR: LearningIntravenous Resuscitator; MAP: mean arterial pressure; ΔPOP: respiratoryvariations in the plethysmographic waveform amplitude; PPV: pulse-pressurevariation; SBP: systolic blood pressure; SVV: stroke-volume variation.
AcknowledgementsWe thank residents and attendings from the Department of Anesthesiologyand Perioperative Care at the University of California Irvine for theirparticipation in the simulation study. This work was solely funded by theDepartment of Anesthesiology and Perioperative Care at the University ofCalifornia Irvine.
Author details1Department of Anesthesiology & Perioperative Care, University of California,Irvine 101 S City Drive, Orange, CA 92868, USA. 2Department ofAnesthesiology and Critical Care Medicine, Centre Hospitalier Universitaire
Rinehart et al. Critical Care 2011, 15:R278http://ccforum.com/content/15/6/R278
Page 10 of 12

Pitié-Salpêtrière, Paris, France. 3Centre for Statistics in Medicine, WolfsonCollege, University of Oxford, Oxford, UK. 4Institute of Anesthesiology andIntensive Care Medicine, Triemli City Hospital, Zurich, Switzerland.5Department of Anesthesiology and Critical Care Medicine, CentreHospitalier Universitaire de Lille, Lille, France.
Authors’ contributionsJR designed the controller and the simulator, designed the study, collectedand analyzed the data, drafted the manuscript, and gave final approval ofthe manuscript. BA designed the controller and the simulator, drafted themanuscript, and gave final approval of the manuscript. YLM, CH, BT, andZNK participated in data analysis and interpretation, drafted the manuscript,and gave final approval of the manuscript. MC designed the controller andthe simulator, designed and coordinated the study, analyzed the data,drafted the manuscript, and gave final approval of the manuscript.
Competing interestsMaxime Cannesson and Joseph Rinehart are co-inventors and co-owners ofUS patent serial no. 61/432,081 for a closed-loop fluid-administration systembased on the dynamic predictors of fluid responsiveness. Maxime Cannessonis a consultant for Edwards LifeSciences (Irvine, CA, USA), Covidien (Boulder,CO, USA), Masimo Corp. (Irvine, CA, USA), ConMed (Irvine, CA, USA), PhilipsMedical System (Suresnes, France), CNsystem (Vienna, Austria), BMeye(Amsterdam, Netherlands), and Fresenius Kabi (Sèvres, France). Yannick LeManach is a consultant for Air Liquide Santé (Paris, France) and receivedlectures/travel fees from Masimo Corp. (Irvine, CA, USA) and Fresenius Kabi(Sèvres, France). Chris Hofer is a consultant for Pulsion Medical Systems(Munchen, Germany), Edwards LifeSciences (Irvine, CA, USA), CSL Behring(King of Prussia, PA, USA). Benoit Tavernier received lectures/travel fees fromMasimo Corp. (Irvine, CA, USA) and Fresenius Kabi (Sèvres, France).
Received: 3 September 2011 Revised: 9 September 2011Accepted: 23 November 2011 Published: 23 November 2011
References1. Van Herpe T, De Moor B, Van den Berghe G: Towards closed-loop
glycaemic control. Best Pract Res Clin Anaesthesiol 2009, 23:69-80.2. Hemmerling TM: Automated anesthesia. Curr Opin Anaesthesiol 2009,
22:757-763.3. Wysocki M, Brunner JX: Closed-loop ventilation: an emerging standard of
care? Crit Care Clin 2007, 23:223-240, ix.4. Marik PE, Baram M, Vahid B: Does central venous pressure predict fluid
responsiveness? a systematic review of the literature and the tale ofseven mares. Chest 2008, 134:172-178.
5. Rinehart J, Liu N, Alexander B, Cannesson M: Closed loop systems inanesthesia: is there a potential for closed loop fluid management andhemodynamic optimization? Anesth Analges 2012, 114:130-143.
6. Cannesson M: Arterial pressure variation and goal-directed fluid therapy.J Cardiothorac Vasc Anesth 2010, 24:487-497.
7. Forget P, Lois F, de Kock M: Goal-directed fluid management based onthe pulse oximeter-derived pleth variability index reduces lactate levelsand improves fluid management. Anesth Analg 2010, 111:910-914.
8. Benes J, Chytra I, Altmann P, Hluchy M, Kasal E, Svitak R, Pradl R, Stepan M:Intraoperative fluid optimization using stroke volume variation in highrisk surgical patients: results of prospective randomized study. Crit Care2010, 14:R118.
9. Lopes MR, Oliveira MA, Pereira VO, Lemos IP, Auler JO Jr, Michard F: Goal-directed fluid management based on pulse pressure variationmonitoring during high-risk surgery: a pilot randomized controlled trial.Crit Care 2007, 11:R100.
10. Kamath S, George VI, Vidyasagar S: Simulation study on closed loopcontrol algorithm of type 1 diabetes mellitus patients. Iete J Res 2009,55:230-235.
11. De Smet T, Struys MMRF, Greenwald S, Mortier EP, Shafer SL: Estimation ofoptimal modeling weights for a bayesian-based closed-loop system forpropofol administration using the bispectral index as a controlledvariable: a simulation study. Anesthes Analges 2007, 105:1629-1638.
12. Struys MMRF, De Smet T, Greenwald S, Absalom AR, Binge S, Mortier EP:Performance evaluation of two published closed-loop control systemsusing bispectral index monitoring: a simulation study. Anesthesiology2004, 100:640-647.
13. Chassin LJ, Hovorka R: Closed-loop glucose control with IV glucosesampling and SC insulin infusion: evaluation by simulation studies.Diabetologia 2001, 44:A58-A58.
14. Trajanoski Z, Regittnig W, Wach P: Neural predictive controller for closed-loop control of glucose using the subcutaneous route: a simulationstudy. Control Eng Pract 1997, 5:1727-1730.
15. Linkens DA, Abbod MF, Backory JK: Closed-loop control of depth ofanaesthesia: a simulation study using auditory evoked responses. ControlEng Pract 1997, 5:1717-1726.
16. Cannesson M, Le Manach Y, Hofer CK, Goarin JP, Lehot JJ, Vallet B,Tavernier B: Assessing the diagnostic accuracy of pulse pressurevariations for the prediction of fluid responsiveness: a “gray zone”approach. Anesthesiology 2011, 115:231-241.
17. Pinsky MR, Payen D: Functional hemodynamic monitoring. Crit Care 2005,9:566-572.
18. Maguire S, Rinehart J, Vakharia S, Cannesson M: Respiratory variation inpulse pressure and plethysmographic waveforms: intraoperativeapplicability in a North American academic center. Anesth Analg 2010,112:94-96.
19. Gan TJ, Soppitt A, Maroof M, el-Moalem H, Robertson KM, Moretti E,Dwane P, Glass PS: Goal-directed intraoperative fluid administrationreduces length of hospital stay after major surgery. Anesthesiology 2002,97:820-826.
20. Pearse R, Dawson D, Fawcett J, Rhodes A, Grounds RM, Bennet ED: Earlygoal-directed therapy after major surgery reduces complications andduration of hospital stay: a randomised, controlled trial[ISRCTN38797445]. Crit Care 2005, 9:R687-R693.
21. Wakeling HG, McFall MR, Jenkins CS, Woods WG, Miles WF, Barclay GR,Fleming SC: Intraoperative oesophageal Doppler guided fluidmanagement shortens postoperative hospital stay after major bowelsurgery. Br J Anaesth 2005, 95:634-642.
22. Mayer J, Boldt J, Mengistu AM, Rohm KD, Suttner S: Goal-directedintraoperative therapy based on autocalibrated arterial pressurewaveform analysis reduces hospital stay in high-risk surgical patients: arandomized, controlled trial. Crit Care 2010, 14:R18.
23. Rhodes A, Cecconi M, Hamilton M, Poloniecki J, Woods J, Boyd O,Bennett D, Grounds RM: Goal-directed therapy in high-risk surgicalpatients: a 15-year follow-up study. Intensive Care Med 2010, 36:1327-1332.
24. Hamilton MA, Cecconi M, Rhodes A: A systematic review and meta-analysis on the use of preemptive hemodynamic intervention toimprove postoperative outcomes in moderate and high-risk surgicalpatients. Anesth Analg 2010, 112:1392-1402.
25. Roche AM, Miller TE, Gan TJ: Goal-directed fluid management with trans-oesophageal Doppler. Best Pract Res Clin Anaesthesiol 2009, 23:327-334.
26. Cyrus RM, Szumita PM, Greenwood BC, Pendergrass ML: Evaluation ofcompliance with a paper-based, multiplication-factor, intravenous insulinprotocol. Ann Pharmacother 2009, 43:1413-1418.
27. Healey AN, Sevdalis N, Vincent CA: Measuring intra-operative interferencefrom distraction and interruption observed in the operating theatre.Ergonomics 2006, 49:589-604.
28. Weinger MB, Englund CE: Ergonomic and human factors affectinganesthetic vigilance and monitoring performance in the operating roomenvironment. Anesthesiology 1990, 73:995-1021.
29. Spanjersberg WR, Bergs EA, Mushkudiani N, Klimek M, Schipper IB: Protocolcompliance and time management in blunt trauma resuscitation. EmergMed J 2009, 26:23-27.
30. Freeman BD, Kennedy C, Robertson TE, Coopersmith CM, Schallom M,Sona C, Cracchiolo L, Schuerer DJE, Boyle WA, Buchman TG: Tracheostomyprotocol: experience with development and potential utility. Critical CareMed 2008, 36:1742-1748.
31. Frame PS, Kowulich BA, Llewellyn AM: Improving physician compliancewith a health maintenance protocol. J Family Pract 1984, 19:341-344.
32. Khan AY, Shaikh MR, Ablah E: To examine the extent of compliance tothe proposed monitoring protocol among practicing psychiatrists forsecond generation antipsychotics. J Pak Med Assoc 2010, 60:446-450.
33. Branson RD, Johannigman JA, Campbell RS, Davis K Jr: Closed-loopmechanical ventilation. Respir Care 2002, 47:427-451, discussion 451-423.
34. Hovorka R, Allen JM, Elleri D, Chassin LJ, Harris J, Xing D, Kollman C,Hovorka T, Larsen AM, Nodale M, De Palma A, Wilinska ME, Acerini CL,Dunger DB: Manual closed-loop insulin delivery in children and
Rinehart et al. Critical Care 2011, 15:R278http://ccforum.com/content/15/6/R278
Page 11 of 12

adolescents with type 1 diabetes: a phase 2 randomised crossover trial.Lancet 2010, 375:743-751.
35. Liu N, Chazot T, Hamada S, Landais A, Boichut N, Dussaussoy C, Trillat B,Beydon L, Samain E, Sessler DI, Fischler M: Closed-loop coadministration ofpropofol and remifentanil guided by bispectral index: a randomizedmulticenter study. Anesth Analg 2011, 112:546-547.
36. Lamhaut L, Apriotesei R, Combes X, Lejay M, Carli P, Vivien B: Comparisonof the accuracy of noninvasive hemoglobin monitoring byspectrophotometry (SpHb) and HemoCue(R) with automated laboratoryhemoglobin measurement. Anesthesiology 2011, 115:548-554.
doi:10.1186/cc10562Cite this article as: Rinehart et al.: Evaluation of a novel closed-loopfluid-administration system based on dynamic predictors of fluidresponsiveness: an in silico simulation study. Critical Care 2011 15:R278.
Submit your next manuscript to BioMed Centraland take full advantage of:
• Convenient online submission
• Thorough peer review
• No space constraints or color figure charges
• Immediate publication on acceptance
• Inclusion in PubMed, CAS, Scopus and Google Scholar
• Research which is freely available for redistribution
Submit your manuscript at www.biomedcentral.com/submit
Rinehart et al. Critical Care 2011, 15:R278http://ccforum.com/content/15/6/R278
Page 12 of 12