Estimating alertness from the EEG power spectrum
23
-
Upload
independent -
Category
Documents
-
view
1 -
download
0
Transcript of Estimating alertness from the EEG power spectrum
JUNG ET AL.: ESTIMATING ALERTNESS FORM THE EEG POWER SPECTRUM 1Estimating Alertness from the EEG PowerSpectrumTzyy-Ping Jung, Scott Makeig, Magnus Stensmo, and Terrence J. SejnowskiAbstractIn tasks requiring sustained attention, human alertness varies on a minute time scale. This can have seriousconsequences in occupations ranging from air tra�c control to monitoring of nuclear power plants. Changesin the electroencephalographic (EEG) power spectrum accompany these uctuations in the level of alertness,as assessed by measuring simultaneous changes in EEG and performance on an auditory monitoring task. Bycombining power spectrum estimation, principal component analysis and arti�cial neural networks, we showthat continuous, accurate, noninvasive, and near real-time estimation of an operator's global level of alertnessis feasible using EEG measures recorded from as few as two central scalp sites. This demonstration could leadto a practical system for noninvasive monitoring of the cognitive state of human operators in attention-criticalsettings. KeywordsEEG; power spectrum; alertness; neural networks; vigilance; neural human-system interfacesI. INTRODUCTIONMany studies of vigilance during the past half century have shown that retaining a constant levelof alertness is di�cult or impossible for operators of automatized systems who perform monotonousbut attention-demanding monitoring tasks [1]. Alertness de�cits are a particular problem in around-the-clock operations, and can lead to severe consequences for ship, air, truck, rail, or plant operators,air tra�c controllers, security o�cers, and workers in many other occupations. In most such workenvironments, continuous measures of operator performance are not available. Accurate and non-intrusive real-time monitoring of operator alertness would thus be highly desirable in a variety ofoperational environments, particularly if this measure could be shown to predict changes in operatorperformance capacity.It has also been known for more than half a century that signal changes related to alertness, arousal,sleep, and cognition are present in electroencephalographic (EEG) recordings [2], [3], [4], [5], butrelatively little has been done to capture this information in real time. Our research investigates thefeasibility of using multichannel electroencephalographic data to estimate, continuously, accurately,noninvasively, and in near-real time, uctuations in an operator's global level of alertness.While most past vigilance research has focused on measuring group mean performance trends, in-dividual performance on monitoring tasks tends to uctuate irregularly, including periods from twoseconds to many minutes of intermittent or complete unresponsiveness [6], [7], [8], [9]. Unfortunately,most vigilance experiments designed to simulate actual work environments have used target presenta-tion rates too low to accurately observe sub-minute-scale performance dynamics. Our research focusesT-P Jung is with the Computational Neurobiology Laboratory, The Salk Institute, San Diego, CA 92186-5800 and the NationalResearch Council, National Academy of Sciences, Washington, D.C. 20418.Scott Makeig is with the Cognitive Performance and Psychophysiology Department, Naval Health Research Center, San Diego,CA 92186-5122 and the Department of Neurosciences, University of California, San Diego, La Jolla, CA 92093.M. Stensmo was with the Computational Neurobiology Laboratory, The Salk Institute, San Diego, CA 92186-5800. He is nowwith the Department of Computer Science, University of California, Berkeley, Berkeley, CA 94720-1776.T.J. Sejnowski is with the Computational Neurobiology Laboratory, The Salk Institute, San Diego, CA 92186-5800 and theDepartment of Biology, University of California, San Diego, La Jolla, CA 92093.This research was supported by the Department of the Navy, Naval Research and Development Command, Bethesda, Marylandunder ONR.WR.30020(6429) to Dr. Makeig and ONR N00014-91-J-1674 to Dr. Sejnowski. The views expressed in this paperare those of the authors and do not re ect the o�cial policy or position of the Department of the Navy, Department of Defense,or the U.S. Government. Approved for release, distribution unlimited.
JUNG ET AL.: ESTIMATING ALERTNESS FORM THE EEG POWER SPECTRUM 2on continuous changes in human performance and the EEG power spectrum on minute time scales byusing an event rate high enough (10/min) to track minute-scale changes in performance. Note that inmost complex real-world work environments (especially those involving low-arousal monitoring tasks),detailed knowledge of minute-scale changes in operator performance is not available. In such envi-ronments, an EEG-based alertness monitoring system could estimate operators' performance withoutrequiring continuous performance assessment.Most previous psychophysiological studies of alertness [10], [11], [12] have attempted to use thesame estimator for all subjects. However, the relatively large individual variability in EEG dynamicsaccompanying loss of alertness means that, for many operators, group statistics cannot be used toaccurately predict changes in alertness and performance. In contrast, Makeig and Inlow [9] usedindividualized multiple linear regression models to estimate operators' changing levels of alertnesswhile they performed a laboratory simulation of a passive sonar detection task. The discriminativepower and exibility of neural networks make them good candidates to complement more traditionalmethods for detecting and modeling the relationship between alertness and the EEG power spectrum.Subsequent analysis showed that arti�cial neural network models can estimate alertness more e�cientlythan linear models [13], and this approach was used to construct and test a laboratory model of areal-time alertness monitoring system [14]. Like other studies of the relationship between EEG spectraand performance, however, these studies used the same pre-selected frequency bands for all subjects,resulting in estimators that were partly insensitive to individual frequency-band di�erences.In this study, we assess the information on alertness available in each operator's full EEG spectrum.Next, we use this information to develop, for each operator, a neural network estimator using principalcomponent analysis to adapt to individual di�erences in EEG dynamics accompanying loss of alertness.We then compare the accuracy of our estimates to those obtained from linear regression models.Finally, we present a benchmark study in which the accuracy of our alertness estimates comparesfavorably to non-EEG based a priori models, and show that our estimation results approach a lowerbound for error rate estimation. II. METHODSA. SubjectsA total of �fteen subjects (ages from 18 to 34 years) participated in a dual-task simulation of auditoryand visual sonar target detection. All had passed standard Navy hearing tests or reported havingnormal hearing. Each subject participated in three or more simulated work sessions each lasting28 minutes. We selected for intensive analysis data from all subjects having at least two sessionscontaining a minimum of 25 lapses. For each of these (10) subjects, we selected the two sessions withthe highest number of lapses for training and testing, and reserved the session with the third highestnumber of lapses for neural network training validation. The twenty selected test sessions included amean of 68 lapses (range: 27-160).B. StimuliAuditory signals, including background noise, tone pips, and noise burst targets, were synthesizedusing a Concurrent work station which was also used to record the EEG. In a continuous 63 dBwhite-noise background, task-irrelevant auditory tones at two frequencies (568 Hz and 1098 Hz) werepresented in random order at 72 dB (normal hearing level) with stimulus onset asynchronies between2-4 s. These signals were introduced to assess the information available in event-related potentials [13],and are not reported in this study. In half of the inter-tone intervals, target noise bursts were presentedat 6 dB above their detection threshold. The mean target rate was thus 10 per minute. Positions oftarget onsets in the inter-tone intervals were pseudorandom, and did not occur within 400 ms of thenearest probe tone.
JUNG ET AL.: ESTIMATING ALERTNESS FORM THE EEG POWER SPECTRUM 3Visual stimuli were produced by a 386 PC with a VGA color display (13-cm wide by 9-cm high).The display background was composed of 1-mm grey scale squares resembling visual television noise("snow"). Visual targets were introduced at a mean rate of 1 per min, and were not correlated withauditory targets. Visual targets consisted of 20 consecutive white squares forming a vertical line. Thedisplay was updated twice each second by adding a new line of squares to the top of the screen andscrolling the existing display down one line, creating a slowly descending "waterfall" e�ect.C. ProcedureEach subject participated in three or more 28-min experimental sessions on separate days. Subjectssat in a chair with their right index and middle �ngers resting on visual and auditory target responsebuttons, respectively. The subjects viewed the CRT waterfall display while receiving auditory stimu-lation bilaterally through headphones, and pressed the auditory or visual response buttons each timethey detected an auditory or visual target respectively.D. Data CollectionEEG data were recorded at a sampling rate of 312.5 Hz from two midline sites, one central (Cz) andthe other midway between parietal and occipital sites (Pz/Oz), using 10-mm gold-plated electrodesreferenced to the right earlobe. EEG data were �rst preprocessed using a simple out-of-bounds test(with a +/-50 uV threshold) to reject epochs that were grossly contaminated by muscle and/or eye-movement artifacts. Moving-averaged spectral analysis of the EEG data was then accomplished usinga 256-point Hanning-window with 50% overlap. Windowed 256-point epochs were extended to 512points by zero-padding. Median �ltering using a moving 5-s window was used to further minimizethe presence of artifacts in the EEG records. The EEG power spectrum time series for each sessionconsisted of 1024 EEG power estimates at 81 frequencies (from 0.61 to 49.41 Hz) at 1.6384-s (512-point, an epoch) time intervals. For spectral correlation and error rate estimation, data from eachsession were �rst converted to a logarithmic scale and then normalized at each frequency separately bysubtracting the session mean and dividing the result by half the di�erence between the 25th and 75thpercentiles of the log power distribution during the session. Logarithmic scaling linearizes the expectedmultiplicative e�ects of subcortical systems involved in wake-sleep regulation on EEG amplitudes [15].E. Alertness MeasureAuditory targets were classi�ed as Hits or Lapses depending on whether or not the subject pressedthe auditory response button within 120 ms to 3000 ms of target onset. To quantify the level ofalertness, auditory responses were converted into local error rate, de�ned as the fraction of targets notdetected by the subject (i.e. lapses) within a moving time window. Each error rate time series consistedof 1024 points at 1.6384 s intervals, and was computed using a causal 93.4 s (57 epoch) exponentialwindow whose gain varied from 1.0 at the leading edge to 0.1 at the trailing edge. Error rate andEEG data from the �rst 93.4 s of each run were not used in the analysis. For each window position,the sum of window values at moments of presentation of undetected (lapse) targets was divided bythe sum of window values at moments of presentation of all targets. The window was moved throughthe session in 1.6-s steps, converting the irregularly-sampled, discontinuous performance record into aregularly-sampled, continuous error rate measure with range [0,1].F. Numerical MethodsNumerical results in this study were computed on a Silicon Graphics Indy computer (R4000PC CPU).The stability of minute-scale uctuations in performance concurrent with changes in the EEG powerspectrum over time and subjects was analyzed using a cluster analysis program, Unix pca/cluster, basedon the centroid method [16]. Multivariate linear regression and analysis of variance were performedusing Unix/stat, a set of data-manipulation an data-analysis programs [17].
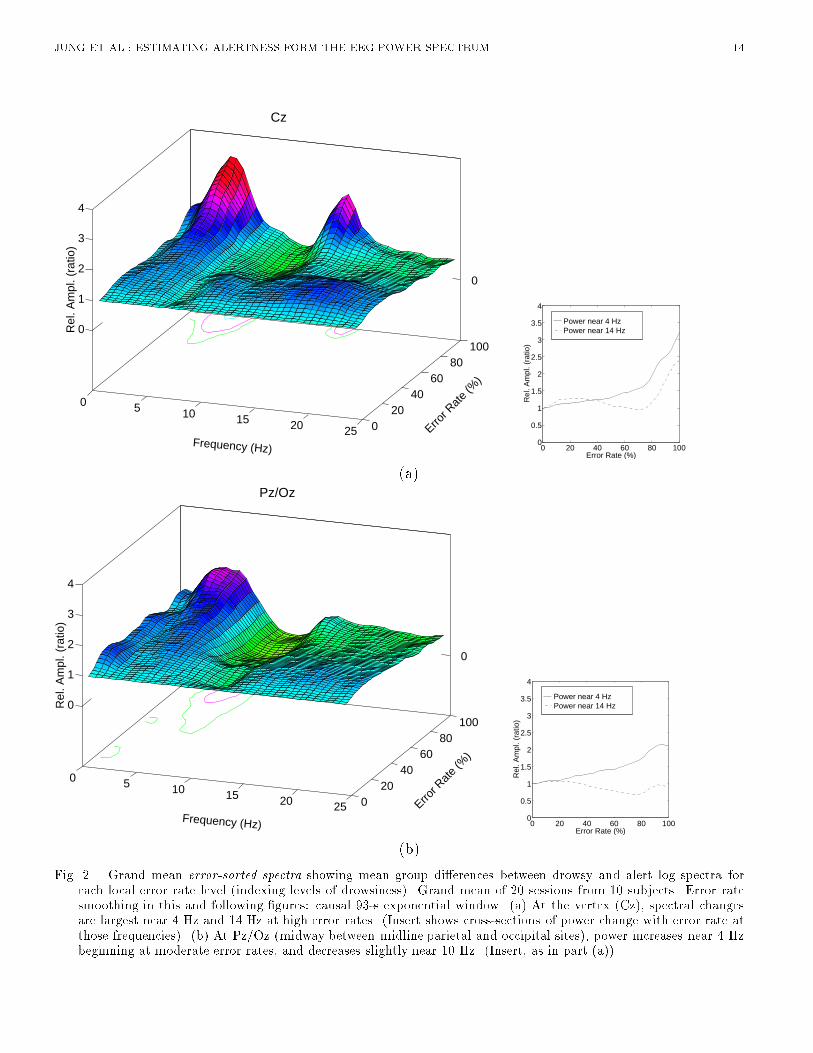
JUNG ET AL.: ESTIMATING ALERTNESS FORM THE EEG POWER SPECTRUM 4Analysis using feedforward multi-layer perceptrons was performed using the Xerion neural networksimulator [18]. A feedforward multi-layer perceptron network has an input layer, an output layer,and often one or more intermediate or hidden layers. Nodes in successive layers are connected bycontinuously adjustable parameters or weights. Each node computes a weighted sum of its inputs,which is then passed through a nonlinear monotonic squashing function. In this study, the weightsand biases of the network were adjusted using the error back-propagation algorithm [19]. The conjugategradient descent method was used to minimize sum-squared error between the network and desiredoutputs for the 967 time points (the whole session excluding the �rst 57 epochs) from the trainingsession. Cross validation [20] using 967 time points from the reserved third session from the samesubject was applied to prevent the network from over�tting the training data. Training was terminatedwhen estimation performance on validation data ceased to improve. Upon completion of the training,which typically took several minutes of CPU time, the network was tested on the last 967 data pointsfrom a separate session for the same subject. We then repeated this procedure with the roles of trainingand testing sessions reversed in order to evaluate the estimation performance on a larger quantity oftraining-testing pairs. Estimation performance of di�erent models was compared using analysis ofvariance of root mean square (rms) estimation errors during each run (excluding the �rst 93.4 s).III. RELATIONSHIP BETWEEN THE EEG SPECTRUM AND ALERTNESSFigure 1 shows changes in the log EEG spectrum at the vertex accompanying changes in local errorrate during a typical session. In the �gure, the EEG log spectrum has been normalized by subtractingthe mean log spectrum during the �rst 2 minutes of the session, during which the subject made noerrors. Note the apparent correlation between increased local error rate and EEG power below 5 Hz,and the sharp increases in power near 14 Hz (the human 'sleep-spindling' frequency) during two peakerror rate periods (minutes 18 and 28). [Figure 1 about here.]A. Error-sorted EEG spectraTo investigate the relationship of minute-scale uctuations in performance to concurrent changes inthe EEG spectrum, we �rst computed mean power spectra for \alert" (0% error rate) epochs in eachsession, then computed ratios between the spectrum at each time point and the mean \alert" spectrumfor that session. We then sorted the spectral ratios by local error rate, smoothed the sorted data usinga bell-shaped Papoulis window [21] (base width: 30% error-rate), which was advanced through thesorted spectral di�erences in small steps (2% error-rate), and averaged the resulting surfaces acrossthe 20 test sessions. [Figure 2 about here.]Figure 2(a) shows the resulting grand mean normalized error-sorted spectrum at Cz for the 10 subjects.Depth indexes local error rate, with greater depth corresponding to higher error rate. The horizontalaxis indexes EEG frequency. Figure 2(b) shows the resulting error-sorted spectrum at Pz/Oz. Severalfeatures are noteworthy. First, at Cz there is strong evidence of a monotonic relationship between uctuations in EEG power and performance in two relatively narrow bands, near 3.7 Hz and 14.7 Hz.In both bands, as local error rate increases, so does the EEG power, i.e. uctuations in EEG powerare positively correlated with uctuations in local error rate. Second, at Pz/Oz a similar monotonicrelationship exists between the uctuations in EEG power and performance in a wider frequency bandaround 4 Hz, but the peak near 14 Hz is less prominent and appears only when error rate exceeds75%. Third, at Cz, power near 4 Hz does not increase appreciably, relative to baseline, when error rateis under 50%, while at Pz/Oz, the relationship between uctuations in EEG power and performanceis more monotonic throughout the local error rate range (cross-section plots of Fig. 2). Fourth, near10 Hz the error-sorted spectral surfaces at low error rates are relatively at, in contrast to previous
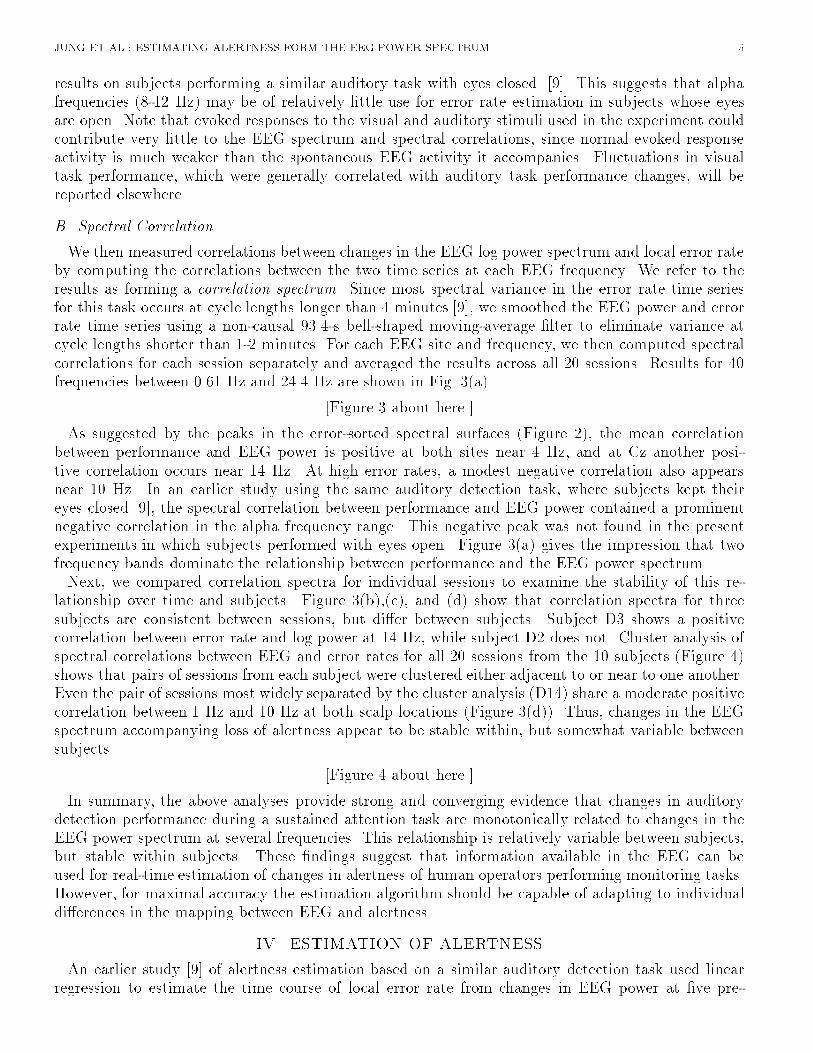
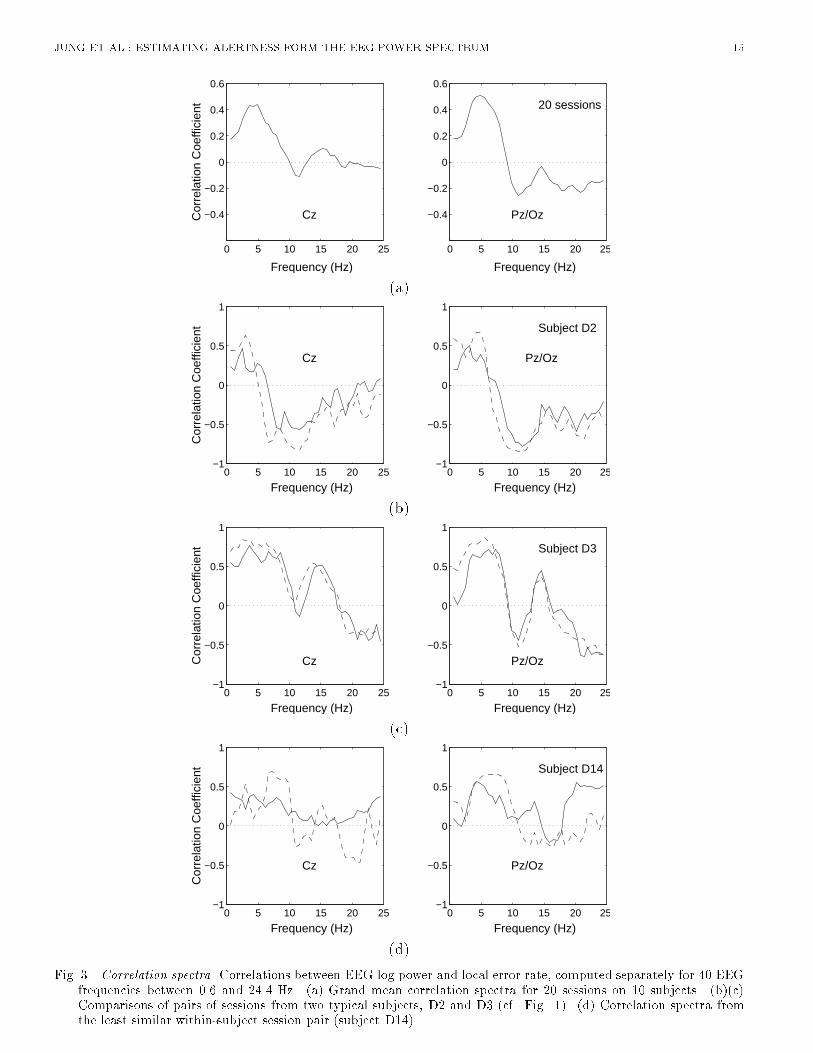
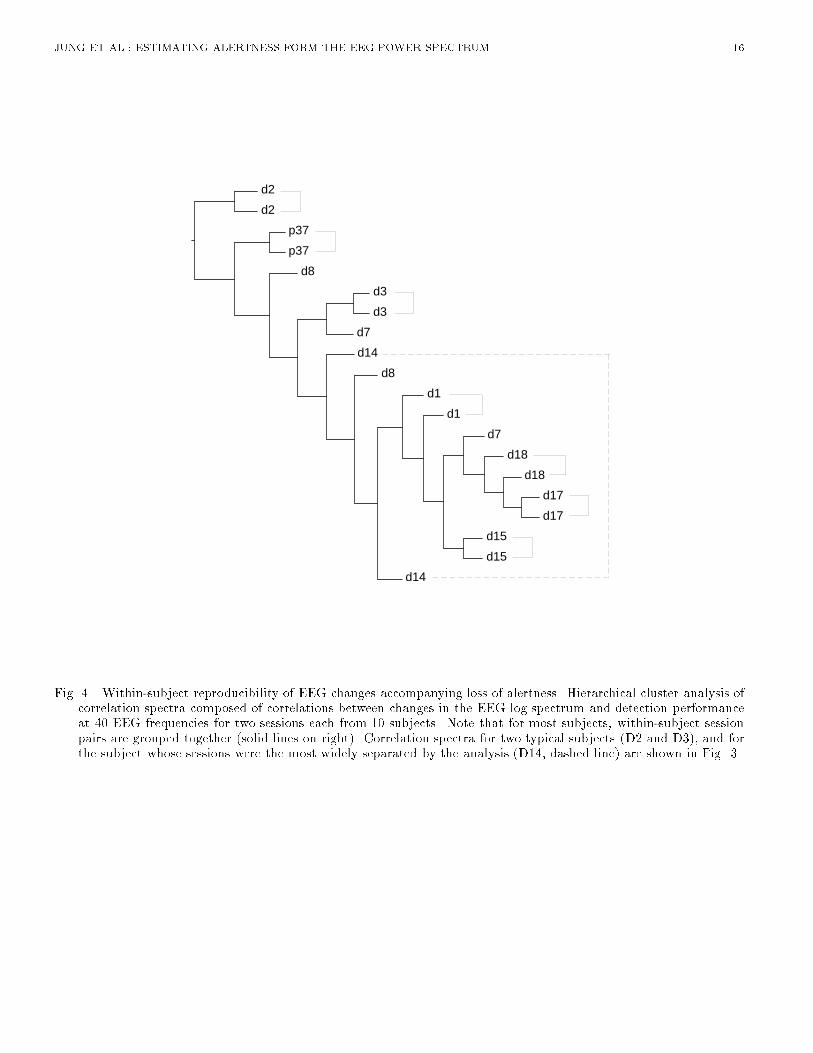
JUNG ET AL.: ESTIMATING ALERTNESS FORM THE EEG POWER SPECTRUM 5results on subjects performing a similar auditory task with eyes closed [9]. This suggests that alphafrequencies (8-12 Hz) may be of relatively little use for error rate estimation in subjects whose eyesare open. Note that evoked responses to the visual and auditory stimuli used in the experiment couldcontribute very little to the EEG spectrum and spectral correlations, since normal evoked responseactivity is much weaker than the spontaneous EEG activity it accompanies. Fluctuations in visualtask performance, which were generally correlated with auditory task performance changes, will bereported elsewhere.B. Spectral CorrelationWe then measured correlations between changes in the EEG log power spectrum and local error rateby computing the correlations between the two time series at each EEG frequency. We refer to theresults as forming a correlation spectrum. Since most spectral variance in the error rate time seriesfor this task occurs at cycle lengths longer than 4 minutes [9], we smoothed the EEG power and errorrate time series using a non-causal 93.4-s bell-shaped moving-average �lter to eliminate variance atcycle lengths shorter than 1-2 minutes. For each EEG site and frequency, we then computed spectralcorrelations for each session separately and averaged the results across all 20 sessions. Results for 40frequencies between 0.61 Hz and 24.4 Hz are shown in Fig. 3(a).[Figure 3 about here.]As suggested by the peaks in the error-sorted spectral surfaces (Figure 2), the mean correlationbetween performance and EEG power is positive at both sites near 4 Hz, and at Cz another posi-tive correlation occurs near 14 Hz. At high error rates, a modest negative correlation also appearsnear 10 Hz. In an earlier study using the same auditory detection task, where subjects kept theireyes closed [9], the spectral correlation between performance and EEG power contained a prominentnegative correlation in the alpha frequency range. This negative peak was not found in the presentexperiments in which subjects performed with eyes open. Figure 3(a) gives the impression that twofrequency bands dominate the relationship between performance and the EEG power spectrum.Next, we compared correlation spectra for individual sessions to examine the stability of this re-lationship over time and subjects. Figure 3(b),(c), and (d) show that correlation spectra for threesubjects are consistent between sessions, but di�er between subjects. Subject D3 shows a positivecorrelation between error rate and log power at 14 Hz, while subject D2 does not. Cluster analysis ofspectral correlations between EEG and error rates for all 20 sessions from the 10 subjects (Figure 4)shows that pairs of sessions from each subject were clustered either adjacent to or near to one another.Even the pair of sessions most widely separated by the cluster analysis (D14) share a moderate positivecorrelation between 1 Hz and 10 Hz at both scalp locations (Figure 3(d)). Thus, changes in the EEGspectrum accompanying loss of alertness appear to be stable within, but somewhat variable betweensubjects. [Figure 4 about here.]In summary, the above analyses provide strong and converging evidence that changes in auditorydetection performance during a sustained attention task are monotonically related to changes in theEEG power spectrum at several frequencies. This relationship is relatively variable between subjects,but stable within subjects. These �ndings suggest that information available in the EEG can beused for real-time estimation of changes in alertness of human operators performing monitoring tasks.However, for maximal accuracy the estimation algorithm should be capable of adapting to individualdi�erences in the mapping between EEG and alertness.IV. ESTIMATION OF ALERTNESSAn earlier study [9] of alertness estimation based on a similar auditory detection task used linearregression to estimate the time course of local error rate from changes in EEG power at �ve pre-
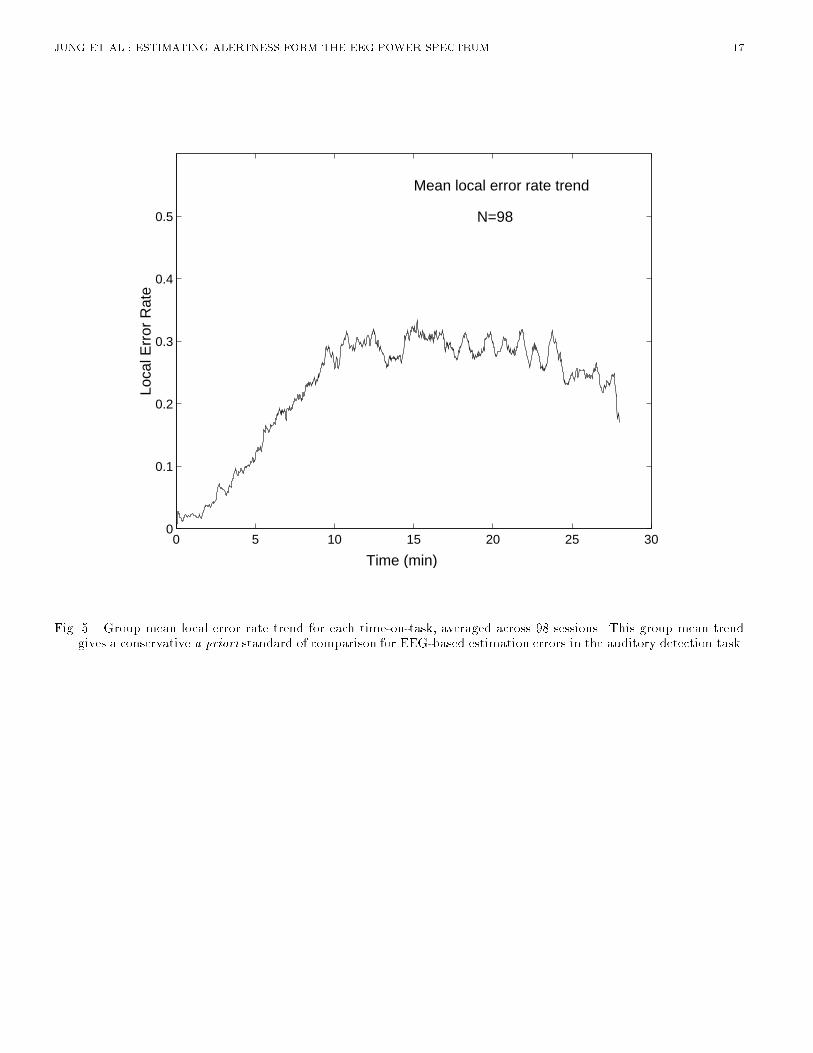
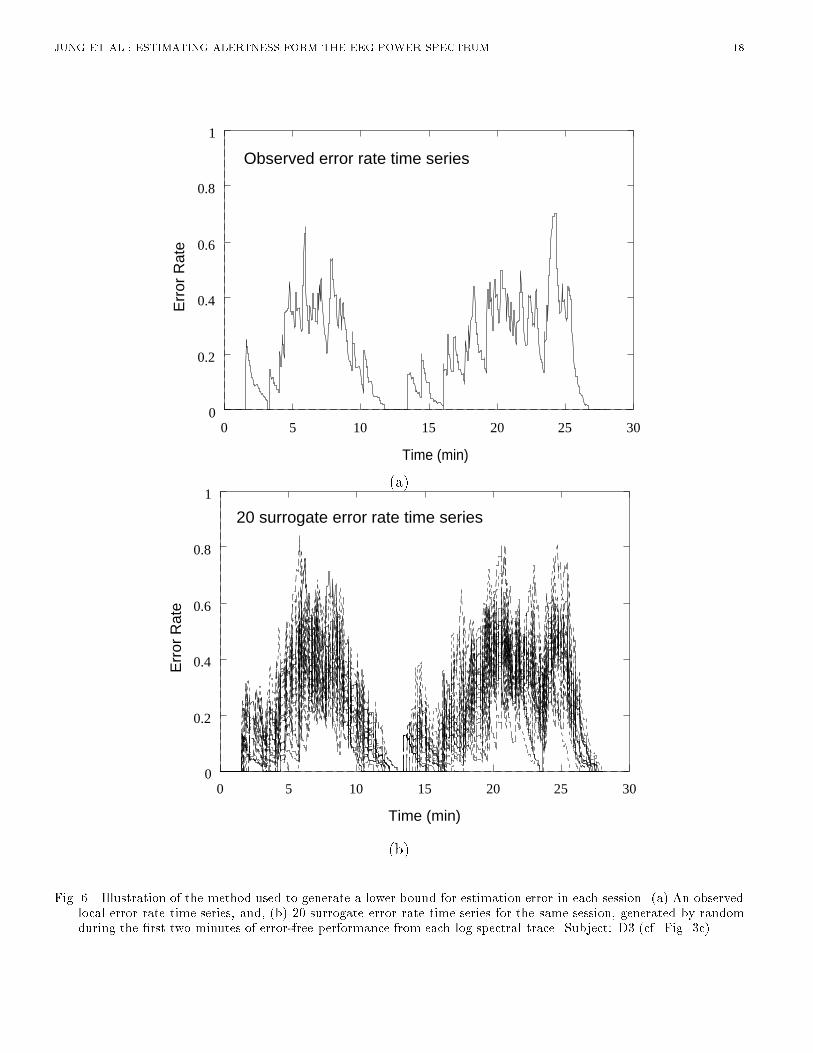
JUNG ET AL.: ESTIMATING ALERTNESS FORM THE EEG POWER SPECTRUM 6set frequencies. However, the individual variability in EEG dynamics accompanying loss of alertness,shown in previous sections, suggests that for many operators, standard narrow frequency bands cannotbe used to accurately predict individual changes in alertness and performance. Rather informationabout alertness may be distributed over the entire EEG spectrum. In this study, we assess the potentialaccuracy of error rate estimation using full spectrum EEG. First, we describe a lower bound forestimation error and two a priori error rate models. Next, we explore the bene�ts of estimating errorrate from the full EEG spectrum at two scalp sites using neural networks. Finally, we compare theresults of EEG-based error rate estimation to the lower bound and a priori models.A. Non-EEG Based EstimationA.1 Estimation Error in A Priori ModelsThe best available a priori estimate of local error rate in our task is the group mean local error rate ateach instant. The estimate is based on the assumption that for each subject and session the tendencyof failing to respond to targets is the same. We computed this \group trend" by averaging performanceresults of a total of 98 similar 28-minute auditory detection sessions, including the 30 sessions usedin the present analysis. The results (Figure 5) follows a well-known trend of vigilance data: Initialnear-perfect performance begins to decay after about one minute. Thereafter, error rate rises steadilyuntil 10 min into the task, after which it remains more or less stable near 30%. Thus, this grouptrend should give a best available a priori estimate of alertness decrements. Root mean square errorsbetween the group trend and observed error rate time courses in these experiments thus provide aconservative benchmark for the accuracy of EEG-based alertness estimation. If EEG-based estimationcan perform better than this a priori estimate, its further development would appear justi�ed. Notethat in more complex real-world work environments in which EEG-based monitoring would be of mostvalue, detailed knowledge of the time course of error rates would not normally be available.A second, less conservative standard can be derived from a model which assumes that operatorsexperience no lapses in alertness at all (a \right stu�" model), ignoring the tendency for vigilancedecrements in stimulus-poor environments. Many current system designs may incorporate this modeltacitly if they assume that their human operators will be able to respond at any time to new events orconditions. The prediction error of this \right stu�" model, the actual rms error rate for each session,thus provides a second standard against which to compare the performance of EEG-based models.[Figure 5 about here.]A.2 Expected Minimum for Estimation ErrorOur performance analysis is based on the assumption that the time-varying error-rate measureindexes more or less continuous changes in subjects' levels of alertness. As a probability measure,error rate cannot itself predict individual responses to targets, even if it is known precisely. Sincetarget stimuli in our experiments were delivered at semi-random intervals at a limited sampling rate,the resulting sparse sampling and sampling jitter in the performance records produced uncertainty inerror rate estimates computed from those records. In this sense, a local error rate time series cannotbe recaptured perfectly from a single performance record. Therefore, any measure partially or whollycorrelated with performance, including the EEG spectrum, cannot to be expected to generate an error-rate estimate with more accuracy than is possible in computing local error rate from the performancerecord.This reasoning allows us to compute an expected lower bound for error in error-rate estimation. Foreach session, we �rst generated 50 surrogate data sessions, series of simulated hits and lapses basedon target delivery times generated by the same algorithm that produced the experimental sessions,and counted each target depending on a random number weighted by the observed error rate timeseries (considered as an experimentally-derived time-varying probability of a performance lapse at each
JUNG ET AL.: ESTIMATING ALERTNESS FORM THE EEG POWER SPECTRUM 7target delivery time). Next, we low-pass �ltered the resulting surrogate performance records using thesame smoothing window used to derive the actual error-rate time series. Finally, we computed therms di�erence between the resulting surrogate error rate series and the original error rate series forthe session. By this method, 50 surrogate error rate functions were created and evaluated for each ofthe 20 experimental sessions. Figure 6 shows the error rate time series from one session (top panel)and 20 surrogate error rate time series generated from the non-EEG based model.[Figure 6 about here.]B. EEG-Based Error Rate EstimationMultiple linear regression models and feedforward multi-layer networks were trained to estimate thebehavioral error-rate time series from information available in the EEG power spectrum. Except whereindicated, principal component analysis (PCA) was applied to the full EEG log spectrum to extractthe directions of largest variance for each session used to train the network. Projections of the EEG logspectral data on the subspace formed by the eigenvectors corresponding to the largest eigenvalues werethen used as input to train various models to estimate the time course of the local error rate. Eachmodel was trained on one session and tested on a separate test session for each of the 10 subjects. PCAeigenvectors derived from the training session were used to preprocess data from the testing session,so that both training and test data were preprocessed in the same way. Mean and standard deviationof rms estimation errors between observed and estimated error rates were then computed for all 20training-testing pairs for each network architecture.B.1 Number of Principal ComponentsWe �rst studied the e�ect of the number of principal components used on estimation performanceof a linear regression model. We found that using four principal components (accounting for over89% of the variance) provided the most e�ective estimate. Any further accuracy increase from usingmore principal factors was outweighed by the additional computational expense and noise introducedinto the model. This result con�rms a recent �nding of Makeig and Jung [22] who showed signi�cantcorrelations between the �rst four eigenvectors of EEG spectral variance and alertness on the samedetection task. In further model comparisons, therefore, we used four principal components as input.B.2 Advantage of Using the Full EEG SpectrumMost studies relating task performance to the EEG spectrum have focused on a small number ofEEG spectral bands de�ned a priori, rather than the full-spectrum. To determine the improvement,if any, in error-rate estimation using the full EEG spectrum, we compared the results of error-rateestimation using linear regression on the full log spectrum, reduced to four principal factors, withresults of linear regression on EEG power at �ve frequencies previously shown to be correlated toerror rate (3.1, 9.2, 13.4, 19.5, and 39 Hz) [9]. PCA-reduced full log spectra resulted in lower meanrms estimation error across 20 training-testing pairs (rms error 0.1633 versus 0.2008). Analysis ofvariance showed this di�erence to be highly signi�cant across subjects (F (1; 9) = 197:9; p < 0:001).Therefore, in further comparisons, we used the full EEG log spectrum as input, rather than a subsetof pre-selected frequencies.B.3 Advantage of Using Two EEG ChannelsA previous investigation using a similar paradigm [9] applied linear regression models to the EEGpower spectrum at single scalp channels to estimate alertness. In this study, we �rst compared theresults of using log spectral data from two channels (Cz, and Pz/Oz) against results of using data fromeither channel alone. Table I shows that mean rms error across 20 training-testing pairs, as estimatedby linear regression on PCA-reduced log spectra (0.6-24.4 Hz), is signi�cantly lower using two datachannels than using either Cz (F (1; 10) = 19:881; p = 0:001) or Pz/Oz (F (1; 10) = 8:047; p = 0:018)
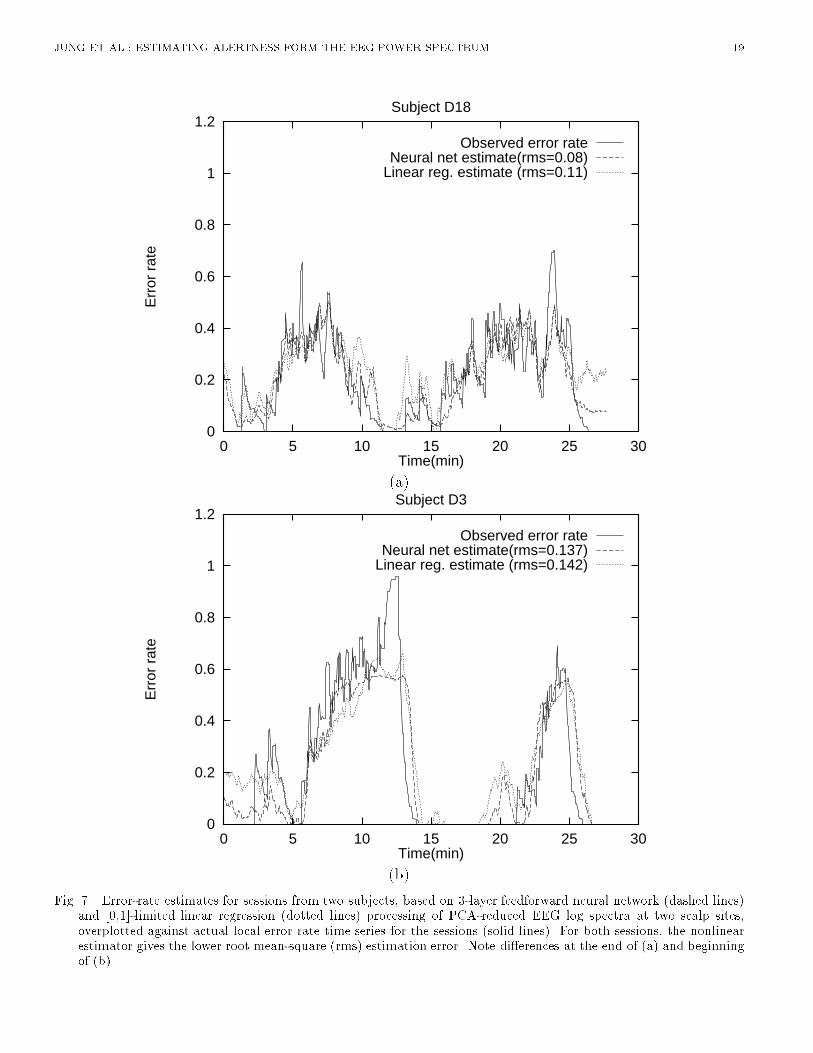
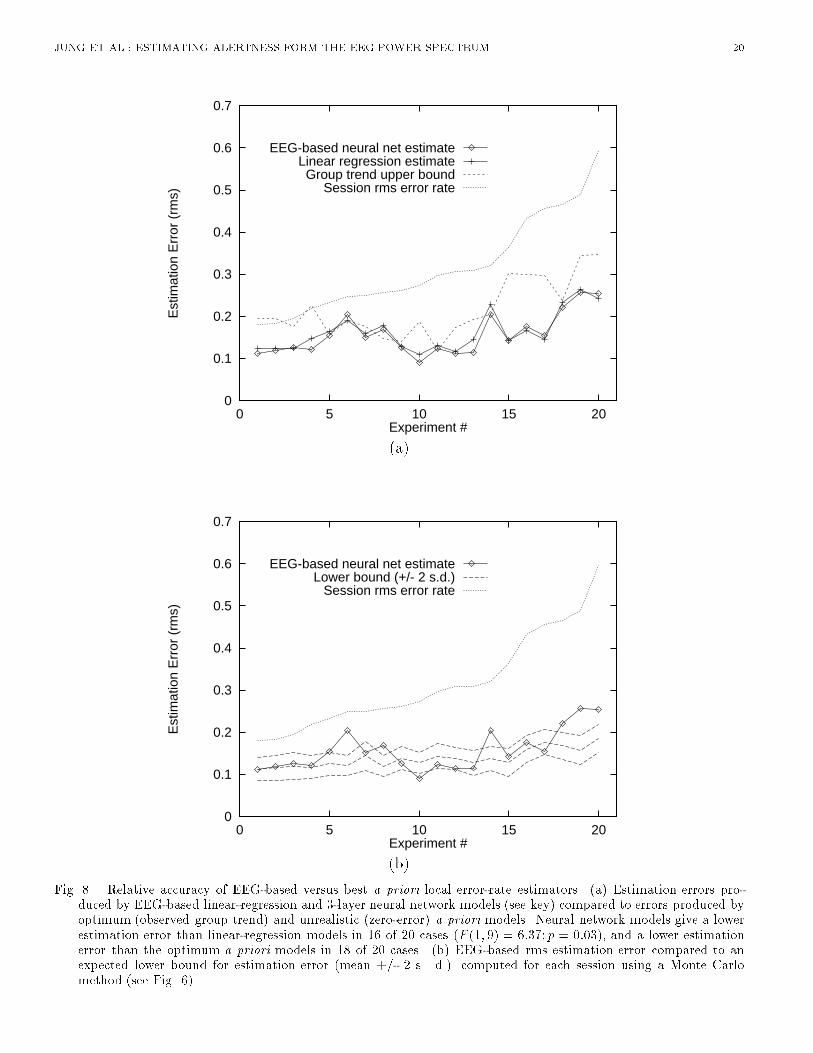
JUNG ET AL.: ESTIMATING ALERTNESS FORM THE EEG POWER SPECTRUM 8alone. Therefore, for further comparisons we used EEG log power spectra from both scalp sites asinput. [Table 1 about here.]B.4 Advantage of Using Neural NetworksNext, we compared the accuracy of linear regression against that of two-layer (no hidden layer)and three-layer (one hidden layer) neural networks. The number of hidden units in the three-layernetwork varied from 2 to 6. For each network architecture, the time course of error rate was estimated�ve times, using di�erent random initial weights in the range [-0.3,0.3] for each of the 20 training-testing session pairs. Results of neural network estimation were then compared to those using linearregression models [9]. The nonlinear adaptability of multi-layer perceptrons signi�cantly improvedestimation performance over linear regression, reducing the rms error on the testing data across subjects(F (1; 9) = 6:370; p = 0:03, Table II ). The performance of three-layer nets was only slightly (andnon-signi�cantly) better than that of two-layer nets (F(1,9)=0.335, n.s.), suggesting that the majoradvantage a�orded by the neural nets derived from their nonlinear squashing functions. In furthertesting, we chose to use three-layer networks with three hidden units.[Table 2 about here.][Figure 7 about here.]Figure 7 plots actual and estimated error rate time series for single test sessions from the two typicalsubjects. The error-rate estimates were obtained using both linear regression and three-layer neuralnetworks with three hidden units applied to two-channel EEG log power spectra projected on the fourprincipal components. As can be seen in the �gure, in both sessions the neural networks estimatechanges in local error rate occurring throughout the sessions reasonably well and with less estimationerror than the linear regression estimates.[Figure 8 about here.]B.5 Performance of EEG-based Alertness EstimatesFinally, we compared the accuracy of our best EEG-based estimates to those produced by the a prioristandards and the lower-bound for the same sessions. Figure 8 displays results for each session, sortedin increasing order of total rms error. The top panel shows that the estimation errors produced byboth the more realistic (\group trend") and unrealistic (\right stu�") a priori models were larger thanthose produced by the EEG-based linear and nonlinear (3-layer neural network) models. EEG-basednonlinear estimators gave lower rms estimation error than the conservative \group trend" estimatesfor 18 of the 20 training-testing pairs, demonstrating that suitable EEG-based algorithms are capableof giving more accurate estimates of performance than even optimum a priori estimators. EEG-basedestimators were also considerably more accurate than the predictions of the unrealistic \right stu�"model.The bottom panel of Figure 8 shows the estimation errors expected from sampling error alone(mean�2 s.d.). As can be seen, rms estimation error is within two standard deviations of the expectedlower bound for 13 of the 20 EEG-based session estimates. On average, EEG-based estimation errorswere 1.2 standard deviations above the lower bound. These results suggest that continuous EEG-basederror-rate estimation using a small number of data channels is feasible, and can give more accurateinformation about minute-to-minute changes in operator alertness than even the best a priori models.V. DISCUSSIONResults of analysis of EEG and auditory detection data from 20 eyes-open experiments on 10 subjectscon�rm that continuous and accurate estimates of operators' levels of alertness, as indexed by a local
JUNG ET AL.: ESTIMATING ALERTNESS FORM THE EEG POWER SPECTRUM 9error rate measure, can be derived from EEG data collected at two (central and posterior midline) scalpsites. The computational load imposed by our full-spectrum analysis is well within the capabilitiesof modern digital signal processing hardware to perform in real time using one or more channels ofEEG data. Once an estimator has been developed for each operator, based on limited pilot testing, themethod uses only spontaneous EEG signals from the operator, and does not require further collection oranalysis of operator performance. Also, unlike proposed methods based on event-related potentials [23],[24], [25], our method avoids introducing potentially distracting probe or secondary-task stimuli intothe operator's environment.Several important issues remain to be resolved before practical alertness monitoring systems can beimplemented. These include: (1) Determing to what extent an index of alertness based on auditorydetection performance predicts uctuations in performance on other tasks; (2) Minimizing the amountand quality of pilot training data required from individual subjects; (3) Separating muscle and eyemovement data from the EEG records, and using these to further improve the accuracy and reliabilityof the estimation; (4) Developing methods for real-time data normalization, instead of normalizingeach session separately; (5) Determining optimum recording locations; and (6) Developing and testingportable and convenient electrode technology. If these issues can be resolved satisfactorily, the meth-ods described in this paper may have important practical applications to research and operationalenvironments in which near real-time knowledge of changes in operator alertness may be useful orcritical. VI. CONCLUSIONSorting power spectra by local error rate, and correlating changes in EEG power with changes inerror rate demonstrate a monotonic relationship between minute-scale changes in performance and theEEG spectrum. This relationship appears stable within individuals across sessions, but is somewhatvariable between subjects. We have investigated the feasibility of practical alertness monitoring bycombining power spectrum estimation, principal component analysis, and arti�cial neural networks.Our results show that accurate, individualized alertness estimation using neural networks applied toEEG spectral data appears realistic. Results of neural network estimation using the full EEG spectrumcompare favorably to previous results using a linear regression model applied to EEG power at pre-selected frequencies [9]. The practical potential of EEG-based alertness estimation is suggested by therelative accuracy of EEG-based estimates compared to those of the best a priori models.References[1] N. Mackworth, \The breakdown of vigilance during prolonged visual search.," Quart. J. Exp. Psychol., vol. 1, pp. 6{21, 1948.[2] H. Davis, P. Davis, A. Loomis, E. Harvey, and G. Hobart, \Human brain potentials during the onset of sleep.," J. Neuro-physiol., vol. 1, pp. 24{38, 1938.[3] H. Williams, A. Granda, R. Jones, A. Lubin, and J. Armington, \EEG frequency and �nger pulse volume as predictors ofreaction time during sleep loss," Electroencephalogr. Clin. Neurophysiol., vol. 14, pp. 64{70, 1962.[4] H. Fruhstorfer and R. Bergstrom, \Human vigilance and auditory evoked responses.," Electroencephalogr. Clin. Neurophysiol.,vol. 27, no. 4, pp. 346{355, 1969.[5] J. Santamaria and K. Chiappa, \The EEG of drowsiness in normal adults.," J. Clinical Neurophysiology., vol. 4, no. 4,pp. 327{382, 1987.[6] J. Stroud, \The �ne structure of psychological time.," Annals of the New York Academy of Sciences, vol. 138, no. 2, pp. 623{631, 1967.[7] J. Stebel and R. Sinz, \On central nervous minute-periodicity and its coordination.," J. Interdisc. Cycle Res., vol. 2, pp. 63{72,1971.[8] M. Treisman, \Temporal rhythms and cerebral rhythms," in Timing and Time Perception (J. Gibbon and L. Allan, eds.),vol. 423, pp. 542{565, NY Acad. Sci., 1984.[9] S. Makeig and M. Inlow, \Lapses in alertness: coherence of uctuations in performance and EEG spectrum.," Electroen-cephalogr. Clin. Neurophysiol., vol. 86, pp. 23{35, 1993.[10] J. Beatty, A. Greenberg, W. P. Deibler, and J. O'Hanlon, \Operant control of occipital theta rhythm a�ects performance ina radar monitoring task.," Science, vol. 183, pp. 871{873, 1974.[11] M. Matou�sek and I. Peters�en, \A method for assessing alertness uctuations from EEG spectra.," Electroencephalogr. Clin.Neurophysiol., vol. 55, no. 1, pp. 108{113, 1983.[12] A. Belyavin and N. Wright, \Changes in electrical activity of the brain with vigilance.," Electroencephalogr. Clin. Neurophys-iol., vol. 66, no. 2, pp. 137{144, 1987.
JUNG ET AL.: ESTIMATING ALERTNESS FORM THE EEG POWER SPECTRUM 10[13] R. Venturini, W. Lytton, and T. Sejnowski, \Neural network analysis of eevent related potentials and electroencephalogram.,"in Advances in Neural Information Processing Systems (J. E. Moody, S. J. Hanson, and R. P. Lippmann, eds.), vol. 4, pp. 651{658, Morgan Kaufmann, 1992.[14] S. Makeig, F. Elliott, and M. Postal, \First demonstration of an alertness monitoring/management system," Tech. Rep.93-36, Naval Health Research Center, San Diego, CA, 1993.[15] M. Steriade, \Central core modulation of spontaneous oscillations and sensory transmission in thalamocortical systems,"Current Opinion in Neurobiology, vol. 3(4), pp. 619{25, 1993.[16] P. Sneath and R. Sokal, Numerical taxonomy: the principles and practice of numerical classi�cation. San Francisco: W. H.Freeman, 1973.[17] G. Perlman, \UNIX/STAT: Data-analysis programs," Behavior Research Methods and Instrumentation, no. 1, 1984.[18] D. van Camp, User's guide for the Xerion neural network simulator. Department of Computer Science, University of Toronto,1993.[19] D. E. Rumelhart, G. E. Hinton, and R. J. Williams, \Learning internal representation by error propagation," in: Rummelhardt"Parallel distributed processing", Chap. 8, 1986.[20] N. Morgan and H. Bourlard, \Generalization and parameter estimation in feedforward nets: some experiments," in Advancesin Neural Information Processing Systems (D. S. Touretzky, ed.), vol. 2, pp. 630{637, Morgan Kaufmann Publishers, 1990.[21] A. Papoulis, \Minimum bias windows for high resolution spectral estimation," IEEE Transactions on Information Theory,vol. IT-19, pp. 9{12, 1973.[22] S. Makeig and T. Jung, \Alertness is a principal component of variance in the EEG spectrum," NeuroReport, vol. 7, no. 1,pp. 213{216, 1995.[23] S. Makeig, F. Elliott, M. Inlow, and D. Kobus, \Lapses in alertness: Brain-evoked responses to task-irrelevant auditoryprobes," Tech. Rep. 90-39, Naval Health Research Center, San Diego, CA, 1992.[24] S. Hillyard and P. Johnston, \Event-related brain potentials as predictors of target detection performance in a movingwaterfall display simulating passive broad-band sonar monitoring," Tech. Rep. 93-33, Naval Health Research Center, SanDiego, CA, 1994.[25] J. Isreal, C. Wickens, G. Chesney, and E. Donchin, \The event-related brain potential as an index of display-monitoringworkload," Human Factors, vol. 22(n2), pp. 211{224, 1980.

JUNG ET AL.: ESTIMATING ALERTNESS FORM THE EEG POWER SPECTRUM 11Tzyy-Ping Jung received the B.S. degree in Electronics Engineering from National Chiao Tung University,Taiwan in 1984, and received his M.S. and Ph.D. degrees in Electrical Engineering from The Ohio StateUniversity in 1989 and 1993, respectively. He is currently a Research Associate at the National ResearchCouncil of the National Academy of Sciences. He is also a Research Associate with the ComputationalNeurobiology Laboratory at The Salk Institute in San Diego, CA. His research interests are in the areas ofspeech production and perception, signal processing, arti�cial neural networks, time-frequency analysis ofhuman EEG, and the development of neural human-system interfaces.Scott Makeig is a psyhobiologist specializing in applying time-frequency and neural network analysis tohuman EEG and fMRI time-series data. He received a B.A. from UC Berkeley in 1972, completed a Master'sdegree program in Music Theory from the University of South Carolina in 1979, and received an interdisplinaryPh.D. from the University of California San Diego in 1982 entitled "Music Psychobiology." Dr. Makeig is onthe faculty of the Department of Neurosciences at UCSD, and for several years has studied the EEG correlatesof alertness lapses for the O�ce of Naval Research as a research psychologist at the Naval Health ResearchCenter, San Diego.Magnus Stensmo received an MSc in Computer Science and Engineering and a PhD in Computer Sciencefrom the Royal Institute of Technology in Stockholm, Sweden. He is now a postdoctoral research associatewith the Computer Science Division at University of California, Berkeley.Terrence J. Sejnowski is an Investigator with the Howard Hughes Medical Institute and a Professor atThe Salk Institute for Biological Studies where he directs the Computational Neurobiology Laboratory. Heis also Professor of Biology and Adjunct Professor in the Departments of Physics, Neuroscience, Psychology,Cognitive Science, Electrical and Computer Engineering, and Computer Science and Engineering at theUniversity of California, San Diego, where he is Director of the Institute for Neural Computation and Directorof the McDonnell-Pew Center for Cognitive Neuroscience. Dr. Sejnowski received B.S. in physics from theCase-Western Reserve University, M.A. in physics from Princeton University, and a Ph.D. in physics fromPrinceton University in 1978.From 1978 to 1979 Dr. Sejnowski was a postdoctoral fellow in the Department of Biology at Princeton University and from1979-1982 he was a postdoctoral fellow in the Department of Neurobiology at Harvard Medical School. In 1982 he joined thefaculty of the Department of Biophysics at the Johns Hopkins University, where he achieved the rank of Professor before movingto San Diego in 1988.Dr. Sejnowski received a Presidential Young Investigator Award in 1984. He was a Wiersma Visiting Professor of Neurobiologyat the California Institute of Technology in 1987. In 1988 he founded the journal Neural Computation, published by the MITPress. He delivered the 1991 Messenger Lectures at Cornell University. With Patricia Churchland, he wrote "The ComputationalBrain", published by the MIT Press in 1992. He was a Sherman Fairchild Distinguished Scholar at the California Institute ofTechnology in 1993-1994 and continues as a Visiting Professor.The long-range goal Dr. Sejnowski's research is to build linking principles from brain to behavior using computational models.This goal is being pursued with a combination of theoretical and experimental approaches at several levels of investigationranging from the biophysical level to the systems level. Hippocampal and cortical slice preparations are being used to explorethe properties of single neurons. Network models based on these data are used to study how populations of neurons code andprocess information. These studies may lead to new insights into how sensory information is represented in the visual cortex, howmemory representations are formed, and how sensorimotor transformations are organized.
JUNG ET AL.: ESTIMATING ALERTNESS FORM THE EEG POWER SPECTRUM 12List of Figures1 Fluctuations in local error rate and in EEG log power (at site Cz) during one test session.Note the correlations between periods of high local error rate and increased spectral power,particularly near 4 Hz and near 14 Hz. Here, the local error rate is the percentage of(10/min) targets not responded to in a moving 33-s exponential window. EEG has beensmoothed using the same window and normalized by subtracting the log mean powerspectrum during the �rst two minutes of error-free performance from each log spectraltrace. Subject: D3 (cf. Fig. 3c). : : : : : : : : : : : : : : : : : : : : : : : : : : : : : : : 132 Grand mean error-sorted spectra showing mean group di�erences between drowsy and alertlog spectra for each local error rate level (indexing levels of drowsiness). Grand mean of20 sessions from 10 subjects. Error rate smoothing in this and following �gures: causal93-s exponential window. (a) At the vertex (Cz), spectral changes are largest near 4 Hzand 14 Hz at high error rates. (Insert shows cross-sections of power change with errorrate at those frequencies). (b) At Pz/Oz (midway between midline parietal and occipitalsites), power increases near 4 Hz beginning at moderate error rates, and decreases slightlynear 10 Hz. (Insert, as in part (a)). : : : : : : : : : : : : : : : : : : : : : : : : : : : : : : 143 Correlation spectra. Correlations between EEG log power and local error rate, computedseparately for 40 EEG frequencies between 0.6 and 24.4 Hz. (a) Grand mean correlationspectra for 20 sessions on 10 subjects. (b)(c) Comparisons of pairs of sessions from twotypical subjects, D2 and D3 (cf. Fig. 1). (d) Correlation spectra from the least similarwithin-subject session pair (subject D14). : : : : : : : : : : : : : : : : : : : : : : : : : : 154 Within-subject reproducibility of EEG changes accompanying loss of alertness. Hierarchi-cal cluster analysis of correlation spectra composed of correlations between changes in theEEG log spectrum and detection performance at 40 EEG frequencies for two sessions eachfrom 10 subjects. Note that for most subjects, within-subject session pairs are groupedtogether (solid lines on right). Correlation spectra for two typical subjects (D2 and D3),and for the subject whose sessions were the most widely separated by the analysis (D14,dashed line) are shown in Fig. 3. : : : : : : : : : : : : : : : : : : : : : : : : : : : : : : : : 165 Group mean local error rate trend for each time-on-task, averaged across 98 sessions. Thisgroup mean trend gives a conservative a priori standard of comparison for EEG-basedestimation errors in the auditory detection task. : : : : : : : : : : : : : : : : : : : : : : : 176 Illustration of the method used to generate a lower bound for estimation error in eachsession. (a) An observed local error rate time series, and, (b) 20 surrogate error rate timeseries for the same session, generated by random during the �rst two minutes of error-freeperformance from each log spectral trace. Subject: D3 (cf. Fig. 3c). : : : : : : : : : : : : 187 Error-rate estimates for sessions from two subjects, based on 3-layer feedforward neuralnetwork (dashed lines) and [0,1]-limited linear regression (dotted lines) processing of PCA-reduced EEG log spectra at two scalp sites, overplotted against actual local error rate timeseries for the sessions (solid lines). For both sessions, the nonlinear estimator gives thelower root mean-square (rms) estimation error. Note di�erences at the end of (a) andbeginning of (b). : : : : : : : : : : : : : : : : : : : : : : : : : : : : : : : : : : : : : : : : : 198 Relative accuracy of EEG-based versus best a priori local error-rate estimators. (a) Esti-mation errors produced by EEG-based linear-regression and 3-layer neural network models(see key) compared to errors produced by optimum (observed group trend) and unreal-istic (zero-error) a priori models. Neural network models give a lower estimation errorthan linear-regression models in 16 of 20 cases (F (1; 9) = 6:37; p = 0:03), and a lowerestimation error than the optimum a priori models in 18 of 20 cases. (b) EEG-based rmsestimation error compared to an expected lower bound for estimation error (mean +/- 2s. d.) computed for each session using a Monte Carlo method (see Fig. 6). : : : : : : : : 20
JUNG ET AL.: ESTIMATING ALERTNESS FORM THE EEG POWER SPECTRUM 13
0
5
10
15
20
25
0
5
10
15
20
25
−5
0
5
10
15
20
Freqency (H
z)
Time (m
in)
Rel
ativ
e P
ower
(dB
)Error rate and EEG spectral power during a 28−min session
Local Error Rate
100%0%
Fig. 1. Fluctuations in local error rate and in EEG log power (at site Cz) during one test session. Note the correlationsbetween periods of high local error rate and increased spectral power, particularly near 4 Hz and near 14 Hz. Here,the local error rate is the percentage of (10/min) targets not responded to in a moving 33-s exponential window.EEG has been smoothed using the same window and normalized by subtracting the log mean power spectrum duringthe �rst two minutes of error-free performance from each log spectral trace. Subject: D3 (cf. Fig. 3c).
JUNG ET AL.: ESTIMATING ALERTNESS FORM THE EEG POWER SPECTRUM 140 5 10 15 20 25 0
2040
6080
100
0
1
2
3
4
Cz
Frequency (Hz)
Error R
ate
(%)
Rel
. Am
pl. (
ratio
)
0
Power near 4 Hz Power near 14 Hz
0 20 40 60 80 1000
0.5
1
1.5
2
2.5
3
3.5
4
Error Rate (%)
Rel
. Am
pl. (
ratio
)(a)0 5 10 15 20 25 0
2040
6080
100
0
1
2
3
4
Pz/Oz
Frequency (Hz)
Error R
ate
(%)
Rel
. Am
pl. (
ratio
)
0
Power near 4 Hz Power near 14 Hz
0 20 40 60 80 1000
0.5
1
1.5
2
2.5
3
3.5
4
Error Rate (%)
Rel
. Am
pl. (
ratio
)(b)Fig. 2. Grand mean error-sorted spectra showing mean group di�erences between drowsy and alert log spectra foreach local error rate level (indexing levels of drowsiness). Grand mean of 20 sessions from 10 subjects. Error ratesmoothing in this and following �gures: causal 93-s exponential window. (a) At the vertex (Cz), spectral changesare largest near 4 Hz and 14 Hz at high error rates. (Insert shows cross-sections of power change with error rate atthose frequencies). (b) At Pz/Oz (midway between midline parietal and occipital sites), power increases near 4 Hzbeginning at moderate error rates, and decreases slightly near 10 Hz. (Insert, as in part (a)).
JUNG ET AL.: ESTIMATING ALERTNESS FORM THE EEG POWER SPECTRUM 150 5 10 15 20 25
−0.4
−0.2
0
0.2
0.4
0.6
Frequency (Hz)
Cor
rela
tion
Coe
ffici
ent
Cz
0 5 10 15 20 25
−0.4
−0.2
0
0.2
0.4
0.6
Frequency (Hz)
Pz/Oz
20 sessions
(a)0 5 10 15 20 25
−1
−0.5
0
0.5
1
Frequency (Hz)
Cor
rela
tion
Coe
ffici
ent
Cz
0 5 10 15 20 25−1
−0.5
0
0.5
1
Frequency (Hz)
Subject D2
Pz/Oz(b)0 5 10 15 20 25
−1
−0.5
0
0.5
1
Frequency (Hz)
Cor
rela
tion
Coe
ffici
ent
Cz
0 5 10 15 20 25−1
−0.5
0
0.5
1
Frequency (Hz)
Subject D3
Pz/Oz(c)0 5 10 15 20 25
−1
−0.5
0
0.5
1
Frequency (Hz)
Cor
rela
tion
Coe
ffici
ent
Cz
0 5 10 15 20 25−1
−0.5
0
0.5
1
Frequency (Hz)
Subject D14
Pz/Oz(d)Fig. 3. Correlation spectra. Correlations between EEG log power and local error rate, computed separately for 40 EEGfrequencies between 0.6 and 24.4 Hz. (a) Grand mean correlation spectra for 20 sessions on 10 subjects. (b)(c)Comparisons of pairs of sessions from two typical subjects, D2 and D3 (cf. Fig. 1). (d) Correlation spectra fromthe least similar within-subject session pair (subject D14).
JUNG ET AL.: ESTIMATING ALERTNESS FORM THE EEG POWER SPECTRUM 16
d14
d15
d15
d17
d17
d18
d18
d7
d1
d1
d8
d14
d7
d3
d3
d8
p37
p37
d2
d2
Fig. 4. Within-subject reproducibility of EEG changes accompanying loss of alertness. Hierarchical cluster analysis ofcorrelation spectra composed of correlations between changes in the EEG log spectrum and detection performanceat 40 EEG frequencies for two sessions each from 10 subjects. Note that for most subjects, within-subject sessionpairs are grouped together (solid lines on right). Correlation spectra for two typical subjects (D2 and D3), and forthe subject whose sessions were the most widely separated by the analysis (D14, dashed line) are shown in Fig. 3.
JUNG ET AL.: ESTIMATING ALERTNESS FORM THE EEG POWER SPECTRUM 17
0 5 10 15 20 25 300
0.1
0.2
0.3
0.4
0.5
Time (min)
Loca
l Err
or R
ate
Mean local error rate trend
N=98
Fig. 5. Group mean local error rate trend for each time-on-task, averaged across 98 sessions. This group mean trendgives a conservative a priori standard of comparison for EEG-based estimation errors in the auditory detection task.
JUNG ET AL.: ESTIMATING ALERTNESS FORM THE EEG POWER SPECTRUM 180
0.2
0.4
0.6
0.8
1
0 5 10 15 20 25 30
Err
or R
ate
Time (min)
Observed error rate time series
(a)0
0.2
0.4
0.6
0.8
1
0 5 10 15 20 25 30
Err
or R
ate
Time (min)
20 surrogate error rate time series
(b)Fig. 6. Illustration of the method used to generate a lower bound for estimation error in each session. (a) An observedlocal error rate time series, and, (b) 20 surrogate error rate time series for the same session, generated by randomduring the �rst two minutes of error-free performance from each log spectral trace. Subject: D3 (cf. Fig. 3c).
JUNG ET AL.: ESTIMATING ALERTNESS FORM THE EEG POWER SPECTRUM 190
0.2
0.4
0.6
0.8
1
1.2
0 5 10 15 20 25 30
Err
or r
ate
Time(min)
Subject D18
Observed error rateNeural net estimate(rms=0.08)
Linear reg. estimate (rms=0.11)
(a)0
0.2
0.4
0.6
0.8
1
1.2
0 5 10 15 20 25 30
Err
or r
ate
Time(min)
Subject D3
Observed error rateNeural net estimate(rms=0.137)
Linear reg. estimate (rms=0.142)
(b)Fig. 7. Error-rate estimates for sessions from two subjects, based on 3-layer feedforward neural network (dashed lines)and [0,1]-limited linear regression (dotted lines) processing of PCA-reduced EEG log spectra at two scalp sites,overplotted against actual local error rate time series for the sessions (solid lines). For both sessions, the nonlinearestimator gives the lower root mean-square (rms) estimation error. Note di�erences at the end of (a) and beginningof (b).
JUNG ET AL.: ESTIMATING ALERTNESS FORM THE EEG POWER SPECTRUM 200
0.1
0.2
0.3
0.4
0.5
0.6
0.7
0 5 10 15 20
Est
imat
ion
Err
or (
rms)
Experiment #
EEG-based neural net estimateLinear regression estimateGroup trend upper bound
Session rms error rate
(a)0
0.1
0.2
0.3
0.4
0.5
0.6
0.7
0 5 10 15 20
Est
imat
ion
Err
or (
rms)
Experiment #
EEG-based neural net estimateLower bound (+/- 2 s.d.)
Session rms error rate
(b)Fig. 8. Relative accuracy of EEG-based versus best a priori local error-rate estimators. (a) Estimation errors pro-duced by EEG-based linear-regression and 3-layer neural network models (see key) compared to errors produced byoptimum (observed group trend) and unrealistic (zero-error) a priori models. Neural network models give a lowerestimation error than linear-regression models in 16 of 20 cases (F (1; 9) = 6:37; p = 0:03), and a lower estimationerror than the optimum a priori models in 18 of 20 cases. (b) EEG-based rms estimation error compared to anexpected lower bound for estimation error (mean +/- 2 s. d.) computed for each session using a Monte Carlomethod (see Fig. 6).
JUNG ET AL.: ESTIMATING ALERTNESS FORM THE EEG POWER SPECTRUM 21List of TablesI Comparison of mean estimation errors in error-rate estimates using multiple linear regres-sion applied to EEG power at �ve frequencies from two EEG channels. Averages of 20sessions on 10 subjects. A regression model for each session was used to estimate the timecourse of the error rate in a second session from the same subject. : : : : : : : : : : : : : 22II Comparison of mean estimation errors in error-rate estimates using multiple linear regres-sion and neural networks. For each subject, the full EEG spectrum from one session,preprocessed using principal component analysis (PCA), was used to train the models toestimate the time course of error rate in a second session from the same subject. The tableshows the means and standard deviations of the root mean square (rms) estimation errorfor 20 sessions from 10 subjects. : : : : : : : : : : : : : : : : : : : : : : : : : : : : : : : : 23
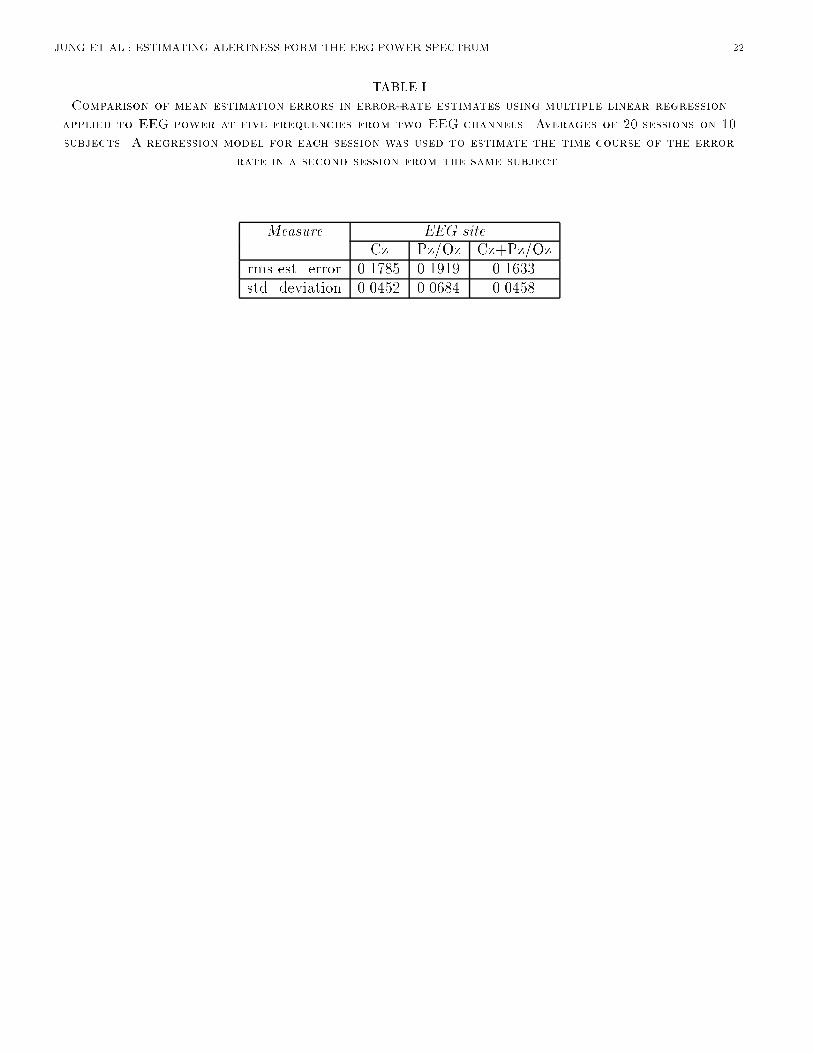
JUNG ET AL.: ESTIMATING ALERTNESS FORM THE EEG POWER SPECTRUM 22TABLE IComparison of mean estimation errors in error-rate estimates using multiple linear regressionapplied to EEG power at five frequencies from two EEG channels. Averages of 20 sessions on 10subjects. A regression model for each session was used to estimate the time course of the errorrate in a second session from the same subject.Measure EEG siteCz Pz/Oz Cz+Pz/Ozrms est. error 0.1785 0.1919 0.1633std. deviation 0.0452 0.0684 0.0458
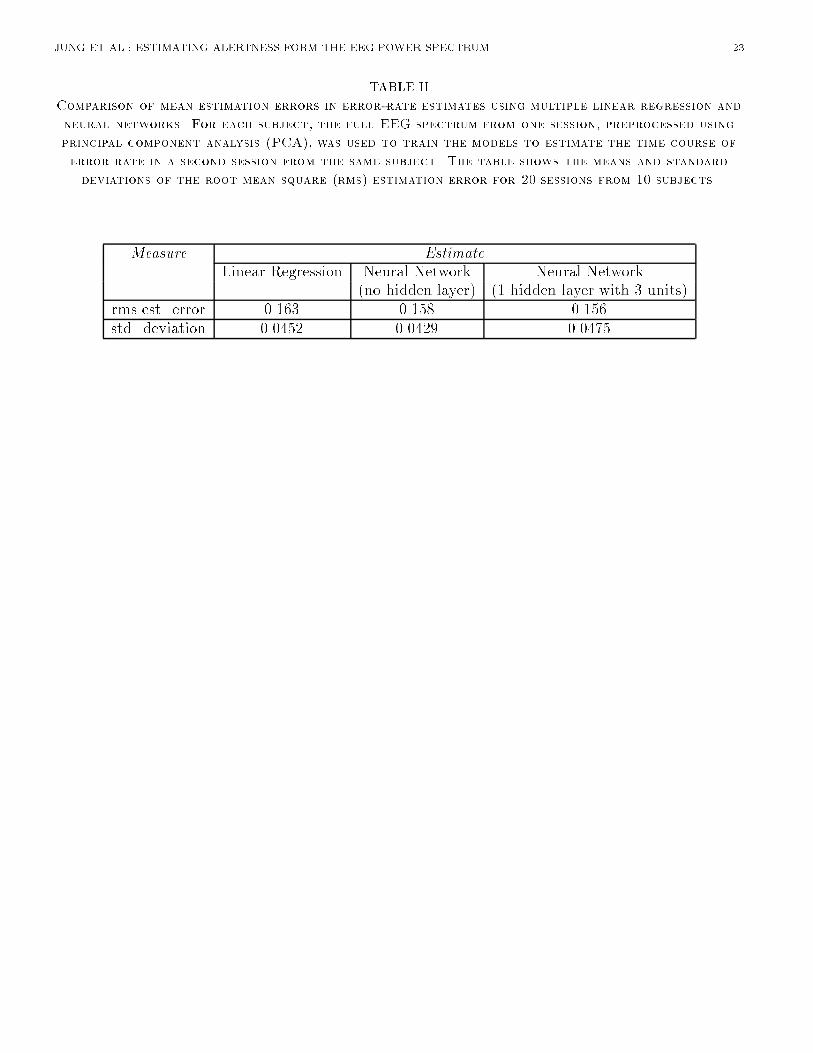
JUNG ET AL.: ESTIMATING ALERTNESS FORM THE EEG POWER SPECTRUM 23TABLE IIComparison of mean estimation errors in error-rate estimates using multiple linear regression andneural networks. For each subject, the full EEG spectrum from one session, preprocessed usingprincipal component analysis (PCA), was used to train the models to estimate the time course oferror rate in a second session from the same subject. The table shows the means and standarddeviations of the root mean square (rms) estimation error for 20 sessions from 10 subjects.Measure EstimateLinear Regression Neural Network Neural Network(no hidden layer) (1 hidden layer with 3 units)rms est. error 0.163 0.158 0.156std. deviation 0.0452 0.0429 0.0475